Table of Contents
UNITED STATES
SECURITIES AND EXCHANGE COMMISSION
Washington, D.C. 20549
FORM N-CSR
CERTIFIED SHAREHOLDER REPORT OF REGISTERED
MANAGEMENT INVESTMENT COMPANIES
Investment Company Act file number: 811-04236
JPMorgan Trust II
(Exact name of registrant as specified in charter)
270 Park Avenue
New York, NY 10017
(Address of principal executive offices) (Zip code)
Frank J. Nasta
270 Park Avenue
New York, NY 10017
(Name and Address of Agent for Service)
Registrant’s telephone number, including area code: (800) 480-4111
Date of fiscal year end: June 30
Date of reporting period: July 1, 2012 through June 30, 2013
Form N-CSR is to be used by management investment companies to file reports with the Commission not later than 10 days after the transmission to stockholders of any report that is required to be transmitted to stockholders under Rule 30e-1 under the Investment Company Act of 1940 (17 CFR 270.30e-1). The Commission may use the information provided on Form N-CSR in its regulatory, disclosure review, inspection, and policymaking roles.
A registrant is required to disclose the information specified by Form N-CSR, and the Commission will make this information public. A registrant is not required to respond to the collection of information contained in Form N-CSR unless the Form displays a currently valid Office of Management and Budget (“OMB”) control number. Please direct comments concerning the accuracy of the information collection burden estimate and any suggestions for reducing the burden to Secretary, Securities and Exchange Commission, 450 Fifth Street, NW, Washington, DC 20549-0609. The OMB has reviewed this collection of information under the clearance requirements of 44 U.S.C. Section 3507.
Table of Contents
| ITEM 1. | REPORTS TO STOCKHOLDERS. |
The following is a copy of the report transmitted to shareholders pursuant to Rule 30e-1 under the Investment Company Act of 1940 (17 CFR 270.30e-1).
Table of Contents
Annual Report
J.P. Morgan Small Cap Funds
June 30, 2013
JPMorgan Dynamic Small Cap Growth Fund
JPMorgan Small Cap Core Fund
JPMorgan Small Cap Equity Fund
JPMorgan Small Cap Growth Fund
JPMorgan Small Cap Value Fund
JPMorgan U.S. Small Company Fund

Table of Contents
Investments in a Fund are not bank deposits or obligations of, or guaranteed or endorsed by, any bank and are not insured or guaranteed by the FDIC, the Federal Reserve Board or any other government agency. You could lose money if you sell when the Fund’s share price is lower than when you invested.
Past performance is no guarantee of future performance. The general market views expressed in this report are opinions based on market and other conditions through the end of the reporting period and are subject to change without notice. These views are not intended to predict the future performance of a Fund or the securities markets. References to specific securities and their issuers are for illustrative purposes only and are not intended to be, and should not be interpreted as, recommendations to purchase or sell such securities. Such views are not meant as investment advice and may not be relied on as an indication of trading intent on behalf of any Fund.
Prospective investors should refer to the Funds’ prospectus for a discussion of the Funds’ investment objectives, strategies and risks. Call J.P. Morgan Funds Service Center at 1-800-480-4111 for a prospectus containing more complete information about a Fund, including management fees and other expenses. Please read it carefully before investing.
Table of Contents
JULY 26, 2013 (Unaudited)
Dear Shareholder:
While somewhat overshadowed by increased volatility at the end of the reporting period, global equities in aggregate posted strong returns for the twelve months ended June 30, 2013. For much of the period, stocks were supported by solid corporate earnings and robust demand from investors looking to generate higher returns in the low interest rate environment. Despite signaling a potential policy shift in June 2013, the U.S. Federal Reserve (“Fed”) continued to pursue its highly accommodative policies in an attempt to lower unemployment and spur the economy. Central banks overseas also did their part to support their economies. The European Central Bank (“ECB”) remained committed to preserving the euro, as it cut rates and introduced new programs designed to aid struggling euro zone members. Elsewhere, the Bank of Japan embarked on a major asset purchase program as a new pro-growth government came into power late in 2012.
 |
“We are encouraged by the stock market’s resiliency in the face of recent volatility.” |
Positive investor sentiment was temporarily interrupted, however, in May 2013 when Fed Chairman Bernanke indicated that the central bank may begin to “taper” its asset purchase program later this year. This triggered a sharp decline in global equities, although they quickly regained their footing and have continued to rally in July. All told, both U.S. and international developed stocks rose sharply during the twelve months ended June 30, 2013. Emerging market equities produced only modest gains given concerns regarding China’s economy and falling commodity prices.
U.S. Treasury Yields Rise Sharply
Talk of Fed tapering negatively impacted the fixed income markets. While U.S. Treasury security yields continued to be low from a historical perspective, they ended the period
sharply higher than when the reporting period began. The yield for 10-year U.S. Treasury securities ended June 30, 2013 at 2.52%, while the yields for 2- and 30-year U.S. Treasury securities finished the reporting period at 0.36% and 3.52%, respectively. Amid the rising interest rate environment, the overall U.S. fixed income market posted a modest decline for the reporting period. In contrast, high yield bonds (also known as junk bonds) posted a strong return and emerging market debt securities also moved higher, albeit to a lesser extent.
Positive Signs for Stocks
Although the global economy is far from robust, it is still on a growth path. The expansion in the U.S. certainly appears to be sustainable and, while Europe remains in a recession, there are indications that its economy may be bottoming. Elsewhere, pro-growth initiatives in Japan have thus far yielded positive results. While growth in China has moderated, we believe the government has the tools at its disposal to avoid a “hard landing.”
We are encouraged by the stock market’s resiliency in the face of recent volatility. In addition, there have been signs that equity market correlations are decreasing, which could create a more favorable environment for active managers. In addition, given the recent sell-off in the bond market, valuations in a number of fixed income sectors have become more attractive.
On behalf of everyone at J.P. Morgan Asset Management, thank you for your continued support. We look forward to managing your investment needs for years to come. Should you have any questions, please visit www.jpmorganfunds.com or contact the J.P. Morgan Funds Service Center at 1-800-480-4111.
Sincerely yours,

George C.W. Gatch
CEO, Global Funds Management
J.P. Morgan Asset Management
| JUNE 30, 2013 | J.P. MORGAN SMALL CAP FUNDS | 1 | ||||||
Table of Contents
MARKET OVERVIEW
TWELVE MONTHS ENDED JUNE 30, 2013 (Unaudited)
Despite periods of heightened volatility and several setbacks, the overall U.S. equity market generated strong results during the twelve months ended June 30, 2013. Supporting the market were overall solid corporate profits, continued economic growth and generally robust investor demand. From an economic perspective, the U.S. housing market showed signs of rebounding and there was some improvement in the labor market. Investor enthusiasm was interrupted late in the reporting period when the U.S. Federal Reserve Board (“Fed”) announced in June 2013 that it might begin tapering its asset purchases later in the year. This triggered a rapid sell-off in the overall stock market. However, U.S. equities again rallied in late June, as concerns regarding Fed tapering abated somewhat. The S&P 500 Index returned 20.60% for the twelve months ended June 30, 2013. U.S. small-cap stocks outperformed the broader U.S. stock market, as the Russell 2000 Index returned 24.21%. U.S. small-cap value stocks outperformed U.S. small-cap growth stocks during the reporting period.
| 2 | J.P. MORGAN SMALL CAP FUNDS | JUNE 30, 2013 | ||||
Table of Contents
JPMorgan Dynamic Small Cap Growth Fund
FUND COMMENTARY
TWELVE MONTHS ENDED JUNE 30, 2013 (Unaudited)
| REPORTING PERIOD RETURN: | ||||
| Fund (Class A Shares, without a sales charge)* | 27.59% | |||
| Russell 2000 Growth Index | 23.67% | |||
| Net Assets as of 06/30/2013 (In Thousands) | $ | 519,774 | ||
INVESTMENT OBJECTIVE**
The JPMorgan Dynamic Small Cap Growth Fund (the “Fund”) seeks capital growth over the long term.
WHAT WERE THE MAIN DRIVERS OF THE FUND’S PERFORMANCE?
The Fund (Class A Shares, without a sales charge) outperformed the Russell 2000 Growth Index (the “Benchmark”) for the twelve months ended June 30, 2013. The Fund’s stock selection in the health care and technology sectors was the main contributor to relative performance. The Fund’s stock selection in the utilities and producer durables sectors detracted from relative performance.
Individual contributors to relative performance included the Fund’s positions in Aegerion Pharmaceuticals, Inc., Conn’s, Inc. and Acadia Healthcare Co., Inc. Aegerion Pharmaceuticals, Inc., a biopharmaceutical company, has demonstrated solid progress on its launch of lomitapide, a treatment for severe high cholesterol. Conn’s, Inc., a specialty retailer of durable consumer products, reported stronger-than-expected revenue and raised its profit forecast for fiscal 2014. The company continued, what we believed to be, strong execution on its plan to increase sales productivity and profitability as it continues to grow into a national retailer. Acadia Healthcare Co., Inc., a provider of inpatient behavioral healthcare services, benefited from an increased earnings forecast for its 2013 fiscal year. The company continued, in our view, to execute on its clearly defined strategy of adding to solid organic growth by adding beds at existing facilities and by acquiring new facilities.
Individual detractors from relative performance included the Fund’s positions in Bazaarvoice, Inc., Boingo Wireless, Inc. and Vocera Communications, Inc. Shares of Bazaarvoice, Inc., a multinational internet marketing company, fell amid disappointing earnings and uncertainty due to a Department of Justice investigation into the company’s acquisition of Power Reviews, its largest competitor. Shares of Boingo Wireless, Inc., which provides global Wi-Fi services, fell after issuing an earnings forecast below estimates. Vocera Communications, Inc., a provider of mobile communication solutions for the health care sector, performed poorly due to delays in implementation of several pending hospital deals. The company also issued an earnings forecast below estimates.
HOW WAS THE FUND POSITIONED?
The Fund’s portfolio managers utilized a bottom-up approach to stock selection, researching individual companies in an effort to construct a portfolio of stocks that they believe have strong fundamentals. The Fund’s portfolio managers preferred to invest in high quality companies with durable franchises that, in their view, possessed the ability to generate strong future earnings growth.
| TOP TEN EQUITY HOLDINGS OF THE PORTFOLIO*** | ||||||||
| 1. | Financial Engines, Inc. | 1.6 | % | |||||
| 2. | Acadia Healthcare Co., Inc. | 1.6 | ||||||
| 3. | Wolverine World Wide, Inc. | 1.6 | ||||||
| 4. | Insulet Corp. | 1.5 | ||||||
| 5. | Middleby Corp. | 1.5 | ||||||
| 6. | Old Dominion Freight Line, Inc. | 1.5 | ||||||
| 7. | Dril-Quip, Inc. | 1.5 | ||||||
| 8. | Cornerstone OnDemand, Inc. | 1.4 | ||||||
| 9. | Conn’s, Inc. | 1.4 | ||||||
| 10. | Novadaq Technologies, Inc. | 1.4 | ||||||
PORTFOLIO COMPOSITION BY SECTOR*** | ||||
| Information Technology | 25.6 | % | ||
| Health Care | 22.5 | |||
| Industrials | 20.9 | |||
| Consumer Discretionary | 12.0 | |||
| Financials | 9.2 | |||
| Energy | 5.0 | |||
| Consumer Staples | 2.5 | |||
| Telecommunication Services | 0.5 | |||
| Short-Term Investment | 1.8 | |||
| * | The return shown is based on net asset values calculated for shareholder transactions and may differ from the return shown in the financial highlights, which reflects adjustments made to the net asset values in accordance with accounting principles generally accepted in the United States of America. |
| ** | The advisor seeks to achieve the Fund’s objective. There can be no guarantee it will be achieved. |
| *** | Percentages indicated are based on total investments as of June 30, 2013. The Fund’s portfolio composition is subject to change. |
| JUNE 30, 2013 | J.P. MORGAN SMALL CAP FUNDS | 3 | ||||||
Table of Contents
JPMorgan Dynamic Small Cap Growth Fund
FUND COMMENTARY
TWELVE MONTHS ENDED JUNE 30, 2013 (Unaudited) (continued)
AVERAGE ANNUAL TOTAL RETURNS AS OF JUNE 30, 2013 | ||||||||||||||||
| INCEPTION DATE OF CLASS | 1 YEAR | 5 YEAR | 10 YEAR | |||||||||||||
CLASS A SHARES | 5/19/97 | |||||||||||||||
Without Sales Charge | 27.61 | % | 7.61 | % | 8.63 | % | ||||||||||
With Sales Charge* | 20.93 | 6.46 | 8.04 | |||||||||||||
CLASS B SHARES | 5/19/97 | |||||||||||||||
Without CDSC | 26.97 | 7.01 | 8.11 | |||||||||||||
With CDSC** | 21.97 | 6.70 | 8.11 | |||||||||||||
CLASS C SHARES | 1/7/98 | |||||||||||||||
Without CDSC | 26.96 | 7.01 | 8.00 | |||||||||||||
With CDSC*** | 25.96 | 7.01 | 8.00 | |||||||||||||
SELECT CLASS SHARES | 4/5/99 | 28.02 | 8.00 | 9.05 | ||||||||||||
| * | Sales Charge for Class A Shares is 5.25%. |
| ** | Assumes a 5% CDSC (contingent deferred sales charge) for the one year period, 2% CDSC for the five year period and 0% CDSC thereafter. |
| *** | Assumes a 1% CDSC for the one year period and 0% CDSC thereafter. |
TEN YEAR PERFORMANCE (6/30/03 TO 6/30/13)
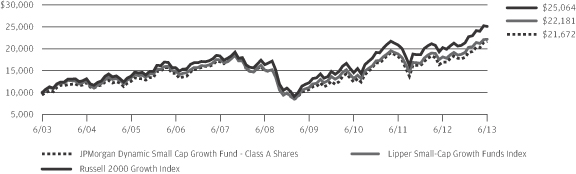
The performance quoted is past performance and is not a guarantee of future results. Mutual funds are subject to certain market risks. Investment returns and principal value of an investment will fluctuate so that an investor’s shares, when redeemed, may be worth more or less than their original cost. Current performance may be higher or lower than the performance data shown. For up-to-date month-end performance information please call 1-800-480-4111.
The graph illustrates comparative performance for $10,000 invested in Class A Shares of the JPMorgan Dynamic Small Cap Growth Fund, the Russell 2000 Growth Index and the Lipper Small-Cap Growth Funds Index from June 30, 2003 to June 30, 2013. The performance of the Fund assumes reinvestment of all dividends and capital gain distributions, if any, and includes a sales charge. The performance of the Russell 2000 Growth Index does not reflect the deduction of expenses or a sales charge associated with a mutual fund and has been adjusted to reflect reinvestment of all dividends and capital gain distributions of the securities included in the benchmark, if applicable. The performance of the Lipper Small-Cap Growth Funds Index includes expenses associated with a mutual fund, such as investment management fees. These expenses are not identical to the expenses incurred by the Fund. The Russell 2000 Growth Index is an unmanaged index which measures the performance of those Russell 2000
companies with higher price-to-book ratios and higher forecasted growth values. The Lipper Small-Cap Growth Funds Index is an index based on the total returns of certain mutual funds within the Fund’s designated category as determined by Lipper, Inc. Investors cannot invest directly in an index.
Class A Shares have a $1,000 minimum initial investment and carry a 5.25% sales charge.
Fund performance may reflect the waiver of the Fund’s fees and reimbursement of expenses for certain periods since the inception date. Without these waivers and reimbursements, performance would have been lower. Also, performance shown in this section does not reflect the deduction of taxes that a shareholder would pay on Fund distributions or redemption of Fund shares.
Because Class B Shares automatically convert to Class A Shares after eight years, the 10 year average annual total return shown above for Class B reflects Class A performance for the period after conversion.
The returns shown are based on net asset values calculated for shareholder transactions and may differ from the returns shown in the financial highlights, which reflect adjustments made to the net asset values in accordance with accounting principles generally accepted in the United States of America.
| 4 | J.P. MORGAN SMALL CAP FUNDS | JUNE 30, 2013 | ||||
Table of Contents
FUND COMMENTARY
TWELVE MONTHS ENDED JUNE 30, 2013 (Unaudited)
| REPORTING PERIOD RETURN: | ||||
| Fund (Select Class Shares)* | 29.50% | |||
| Russell 2000 Index | 24.21% | |||
| Net Assets as of 6/30/2013 (In Thousands) | $ | 522,295 | ||
INVESTMENT OBJECTIVE**
The JPMorgan Small Cap Core Fund (the “Fund”) seeks capital growth over the long term.
WHAT WERE THE MAIN DRIVERS OF THE FUND’S PERFORMANCE?
The Fund (Select Class Shares) outperformed the Russell 2000 Index (the “Benchmark”) for the twelve months ended June 30, 2013. The Fund’s stock selection in the retail and consumer cyclical sectors was the primary contributor to relative performance. The Fund’s stock selection in the semiconductors and pharmaceutical sectors detracted from relative performance.
Individual contributors to relative performance included the Fund’s positions in Conn’s, Inc., Ocwen Financial Corp. and JDA Software Group, Inc. Conn’s Inc., a specialty retailer of durable consumer products, reported stronger-than-expected revenue and raised its profit forecast for fiscal 2014. Ocwen Financial Corp., a provider of mortgage loan servicing and asset management services, reported record earnings for the first quarter of 2013. Shares of JDA Software Group, Inc., a software and consultancy company, rallied sharply after posting better-than-expected profit after the acquisition of a rival firm.
Individual detractors from relative performance included the Fund’s positions in Infinity Pharmaceuticals, Inc., Skyworks Solutions, Inc. and Affymax, Inc. Shares of Infinity Pharmaceuticals, Inc. fell amid concerns over a new cancer drug. Skyworks Solutions, Inc., a semiconductor company, saw its shares fall sharply after releasing earnings estimates that fell short of expectations. Affymax, Inc. is a biopharmaceutical company that develops peptide-based drugs for the treatment of life-threatening conditions. Its shares performed poorly as the company was suspended and subsequently delisted by NASDAQ.
HOW WAS THE FUND POSITIONED?
In accordance with its investment process, the Fund’s portfolio managers take limited sector bets and construct the Fund so that stock selection is typically the primary driver of its relative performance versus the Benchmark. The Fund’s portfolio managers employ a bottom-up approach to stock selection,
using quantitative screening and proprietary analysis to construct a portfolio of companies that they believe are attractively valued and possess strong fundamentals. During the reporting period, the Fund was managed and positioned in accordance with this investment process.
| TOP TEN EQUITY HOLDINGS OF THE PORTFOLIO*** | ||||||||
| 1. | Sanmina Corp. | 1.2 | % | |||||
| 2. | East West Bancorp, Inc. | 1.1 | ||||||
| 3. | Rite Aid Corp. | 1.1 | ||||||
| 4. | Unisys Corp. | 1.0 | ||||||
| 5. | NuVasive, Inc. | 1.0 | ||||||
| 6. | Pegasystems, Inc. | 1.0 | ||||||
| 7. | WebMD Health Corp. | 1.0 | ||||||
| 8. | Popular, Inc., (Puerto Rico) | 1.0 | ||||||
| 9. | Conn’s, Inc. | 1.0 | ||||||
| 10. | Portland General Electric Co. | 1.0 | ||||||
PORTFOLIO COMPOSITION BY SECTOR*** | ||||
| Financials | 22.5 | % | ||
| Information Technology | 16.5 | |||
| Industrials | 15.6 | |||
| Consumer Discretionary | 13.7 | |||
| Health Care | 10.6 | |||
| Energy | 4.8 | |||
| Materials | 4.6 | |||
| Consumer Staples | 4.6 | |||
| Utilities | 3.1 | |||
| Telecommunication Services | 1.2 | |||
| U.S. Treasury Obligation | 0.2 | |||
| Short-Term Investment | 2.6 | |||
| * | The return shown is based on net asset values calculated for shareholder transactions and may differ from the return shown in the financial highlights, which reflects adjustments made to the net asset values in accordance with accounting principles generally accepted in the United States of America. |
| ** | The advisor seeks to achieve the Fund’s objective. There can be no guarantee it will be achieved. |
| *** | Percentages indicated are based on total investments as of June 30, 2013. The Fund’s portfolio composition is subject to change. |
| JUNE 30, 2013 | J.P. MORGAN SMALL CAP FUNDS | 5 | ||||||
Table of Contents
JPMorgan Small Cap Core Fund
FUND COMMENTARY
TWELVE MONTHS ENDED JUNE 30, 2013 (Unaudited) (continued)
AVERAGE ANNUAL TOTAL RETURNS AS OF JUNE 30, 2013 | ||||||||||||||||
| INCEPTION DATE OF CLASS | 1 YEAR | 5 YEAR | 10 YEAR | |||||||||||||
SELECT CLASS SHARES | 1/1/97 | 29.50 | % | 8.97 | % | 9.29 | % | |||||||||
TEN YEAR PERFORMANCE (6/30/03 TO 6/30/13)
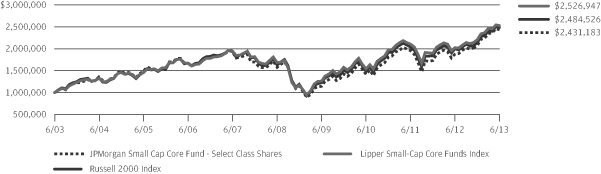
The performance quoted is past performance and is not a guarantee of future results. Mutual funds are subject to certain market risks. Investment returns and principal value of an investment will fluctuate so that an investor’s shares, when redeemed, may be worth more or less than their original cost. Current performance may be higher or lower than the performance data shown. For up-to-date month-end performance information please call 1-800-480-4111.
The graph illustrates comparative performance for $1,000,000 invested in Select Class Shares of the JPMorgan Small Cap Core Fund, the Russell 2000 Index and the Lipper Small-Cap Core Funds Index from June 30, 2003 to June 30, 2013. The performance of the Fund assumes reinvestment of all dividends and capital gain distributions, if any, and does not include a sales charge. The performance of the Russell 2000 Index does not reflect the deduction of expenses or a sales charge associated with a mutual fund and has been adjusted to reflect reinvestment of all dividends and capital gain distributions of the securities included in the benchmark, if applicable. The performance of the Lipper Small-Cap Core Funds Index includes expenses associated with a mutual fund, such as investment management fees. These expenses are not identical to
the expenses incurred by the Fund. The Russell 2000 Index is an unmanaged index which measures the performance of the 2000 smallest stocks (on the basis of capitalization) in the Russell 3000 Index. The Lipper Small-Cap Core Funds Index is an index based on the total returns of certain mutual funds within the Fund’s designated category as determined by Lipper, Inc. Investors cannot invest directly in an index.
Select Class Shares have a $1,000,000 minimum initial investment and carry no sales charge.
Fund performance may reflect the waiver of the Fund’s fees and reimbursement of expenses for certain periods since the inception date. Without these waivers and reimbursements, performance would have been lower. Also, performance shown in this section does not reflect the deduction of taxes that a shareholder would pay on Fund distributions or redemption of Fund shares.
The returns shown are based on net asset values calculated for shareholder transactions and may differ from the returns shown in the financial highlights, which reflect adjustments made to the net asset values in accordance with accounting principles generally accepted in the United States of America.
| 6 | J.P. MORGAN SMALL CAP FUNDS | JUNE 30, 2013 | ||||
Table of Contents
JPMorgan Small Cap Equity Fund
FUND COMMENTARY
TWELVE MONTHS ENDED JUNE 30, 2013 (Unaudited)
| REPORTING PERIOD RETURN: | ||||
| Fund (Class A Shares, without a sales charge)* | 23.11% | |||
| Russell 2000 Index. | 24.21% | |||
| Net Assets as of 6/30/2013 (In Thousands) | $ | 2,696,825 | ||
INVESTMENT OBJECTIVE**
The JPMorgan Small Cap Equity Fund (the “Fund”) seeks capital growth over the long term.
WHAT WERE THE MAIN DRIVERS OF THE FUND’S PERFORMANCE?
The Fund (Class A Shares, without a sales charge) underperformed the Russell 2000 Index (the “Benchmark”) for the twelve months ended June 30, 2013. The Fund’s stock selection in the materials processing and producer durables services sectors was the main detractor from the Fund’s relative performance. Stock selection in the health care and financial services sectors was the main contributor to performance.
Detracting from relative performance were the Fund’s positions in The Active Network, Inc., MICROS Systems, Inc. and Rexnord Corp. The Active Network, Inc. makes online registration and management software for event organizers. Its shares experienced a challenging fourth quarter of 2012, as the company reported in-line earnings but missed consensus revenue estimates as a result of weakness in its outdoor segment. Weaker- than-expected fourth quarter 2012 and 2013 guidance also pressured the stock. MICROS Systems, Inc. is a global manufacturer and servicer of enterprise information solutions for the global hospitality and retail industries. Its shares declined during the fourth quarter of 2012, even though the company announced earnings that beat estimates. However, organic growth was lighter than expected. An intensifying competitive landscape also weighed on MICROS Systems’ shares. Rexnord Corp. is a manufacturer of precision motion technology products. The company’s shares weakened during the second quarter of 2013 when it initiated a strategic review that could have potentially resulted in Rexnord Corp. selling itself or one of its divisions. At the end of the strategic review, the company decided to stay independent, which weighed on its shares as investors hoped to find a shorter timeline to value creation. The company’s largest shareholder subsequently sold a major stake in the company through a secondary offering, which also negatively impacted its shares.
Individual contributors to relative performance included the Fund’s positions in Jarden Corp., Waste Connections, Inc. and Coventry Health Care, Inc. Jarden Corp. owns more than 100 of the most famous consumer brands in the world. The company reported strong earnings and its shares were the beneficiary of Jarden Corp.‘s shareholder-friendly approach to capital allocation, as highlighted by its $500 million share buyback program. Waste Connections, Inc. is a solid waste management company. Waste Connections was rewarded for executing well on its strategy of focusing on markets that offer better contracts and limited competition, as evidenced by four
straight quarters of higher- than- expected revenues. Shares of Coventry Health Care, Inc., a diversified national insurer, rallied as the company agreed to be acquired by Aetna at a 20% premium in the third quarter of 2012.
HOW WAS THE FUND POSITIONED?
The Fund’s portfolio managers employed a bottom-up approach to stock selection, constructing a portfolio based on company fundamentals and proprietary analysis. The Fund’s portfolio managers looked for companies that, in their view, had leading competitive advantages, predictable and durable business models, and sustainable free cash flow generation with management teams committed to increasing intrinsic value.
| TOP TEN EQUITY HOLDINGS OF THE PORTFOLIO*** | ||||||||
| 1. | Waste Connections, Inc. | 3.1 | % | |||||
| 2. | Silgan Holdings, Inc. | 3.1 | ||||||
| 3. | ProAssurance Corp. | 2.7 | ||||||
| 4. | Associated Banc-Corp. | 2.4 | ||||||
| 5. | Jarden Corp. | 2.4 | ||||||
| 6. | Anixter International, Inc. | 2.2 | ||||||
| 7. | Brinker International, Inc. | 2.0 | ||||||
| 8. | Crown Holdings, Inc. | 2.0 | ||||||
| 9. | Aptargroup, Inc. | 1.8 | ||||||
| 10. | American Eagle Outfitters, Inc. | 1.8 | ||||||
PORTFOLIO COMPOSITION BY SECTOR*** | ||||
Financials | 22.3 | % | ||
Consumer Discretionary | 20.9 | |||
Industrials | 17.8 | |||
Information Technology | 12.5 | |||
Materials | 10.7 | |||
Energy | 5.9 | |||
Health Care | 4.4 | |||
Utilities | 2.6 | |||
Consumer Staples | 1.3 | |||
Short-Term Investment | 1.6 | |||
| * | The return shown is based on net asset values calculated for shareholder transactions and may differ from the return shown in the financial highlights, which reflects adjustments made to the net asset values in accordance with accounting principles generally accepted in the United States of America. |
| ** | The advisor seeks to achieve the Fund’s objective. There can be no guarantee it will be achieved. |
| *** | Percentages indicated are based on total investments as of June 30, 2013. The Fund’s portfolio composition is subject to change. |
| JUNE 30, 2013 | J.P. MORGAN SMALL CAP FUNDS | 7 | ||||||
Table of Contents
JPMorgan Small Cap Equity Fund
FUND COMMENTARY
TWELVE MONTHS ENDED JUNE 30, 2013 (Unaudited) (continued)
AVERAGE ANNUAL TOTAL RETURNS AS OF JUNE 30, 2013 | ||||||||||||||||
| INCEPTION DATE OF CLASS | 1 YEAR | 5 YEAR | 10 YEAR | |||||||||||||
CLASS A SHARES | 12/20/94 | |||||||||||||||
Without Sales Charge | 23.11 | % | 12.09 | % | 13.61 | % | ||||||||||
With Sales Charge* | 16.63 | 10.89 | 13.00 | |||||||||||||
CLASS B SHARES | 3/28/95 | |||||||||||||||
Without CDSC | 22.51 | 11.54 | 13.11 | |||||||||||||
With CDSC** | 17.51 | 11.28 | 13.11 | |||||||||||||
CLASS C SHARES | 2/19/05 | |||||||||||||||
Without CDSC | 22.50 | 11.54 | 13.00 | |||||||||||||
With CDSC*** | 21.50 | 11.54 | 13.00 | |||||||||||||
CLASS R2 SHARES | 11/3/08 | 22.80 | 11.83 | 13.48 | ||||||||||||
CLASS R5 SHARES | 5/15/06 | 23.71 | 12.65 | 14.19 | ||||||||||||
SELECT CLASS SHARES | 5/7/96 | 23.48 | 12.43 | 14.02 | ||||||||||||
| * | Sales Charge for Class A Shares is 5.25%. |
| ** | Assumes a 5% CDSC (contingent deferred sales charge) for the one year period, 2% CDSC for the five year period and 0% CDSC thereafter. |
| *** | Assumes a 1% CDSC for the one year period and 0% CDSC thereafter. |
TEN YEAR PERFORMANCE (6/30/03 TO 6/30/13)
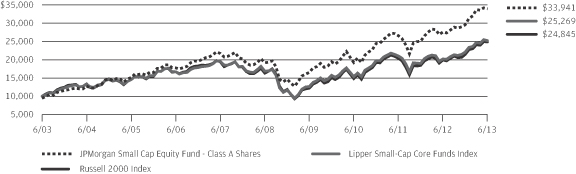
The performance quoted is past performance and is not a guarantee of future results. Mutual funds are subject to certain market risks. Investment returns and principal value of an investment will fluctuate so that an investor’s shares, when redeemed, may be worth more or less than their original cost. Current performance may be higher or lower than the performance data shown. For up-to-date month-end performance information please call 1-800-480-4111.
Returns for Class C Shares prior to its inception date are based on the performance of the Class B Shares, whose expenses are substantially similar to those of Class C Shares. Returns for Class R5 Shares prior to its inception date are based on the performance of the Select Class Shares. The actual returns of Class R5 Shares would have been different than those shown because Class R5 Shares have different expenses than Select Class Shares. Returns for Class R2 Shares prior to its inception date are based on the performance of Class A Shares. The actual returns of Class R2 Shares would have been lower than those shown because Class R2 Shares have higher expenses than Class A Shares.
The graph illustrates comparative performance for $10,000 invested in Class A Shares of the JPMorgan Small Cap Equity Fund, the Russell 2000 Index and the Lipper Small-Cap Core Funds Index from June 30, 2003 to June 30, 2013. The performance of the Fund assumes reinvestment of all dividends and capital gain distributions, if any, and includes a sales charge. The performance of the Russell 2000 Index does not reflect the deduction of expenses or a sales charge associated with a mutual fund and has been adjusted to reflect reinvestment of all dividends and capital gain distributions of the securities included in the
benchmark, if applicable. The performance of the Lipper Small-Cap Core Funds Index includes expenses associated with a mutual fund, such as investment management fees. These expenses are not identical to the expenses incurred by the Fund. The Russell 2000 Index is an unmanaged index which measures the performance of the 2000 smallest stocks (on the basis of capitalization) in the Russell 3000 Index. The Lipper Small-Cap Core Funds Index is an index based on the total returns of certain mutual funds within the Fund’s designated category as determined by Lipper, Inc. Investors cannot invest directly in an index.
Class A Shares have a $1,000 minimum initial investment and carry a 5.25% sales charge.
Fund performance may reflect the waiver of the Fund’s fees and reimbursement of expenses for certain periods since the inception date. Without these waivers and reimbursements, performance would have been lower. Also, performance shown in this section does not reflect the deduction of taxes that a shareholder would pay on Fund distributions or redemption of Fund shares.
Because Class B Shares automatically convert to Class A Shares after eight years, the 10 year average annual total return shown above for Class B reflects Class A performance for the period after conversion.
The returns shown are based on net asset values calculated for shareholder transactions and may differ from the returns shown in the financial highlights, which reflect adjustments made to the net asset values in accordance with accounting principles generally accepted in the United States of America.
| 8 | J.P. MORGAN SMALL CAP FUNDS | JUNE 30, 2013 | ||||
Table of Contents
JPMorgan Small Cap Growth Fund
FUND COMMENTARY
TWELVE MONTHS ENDED JUNE 30, 2013 (Unaudited)
| REPORTING PERIOD RETURN: | ||||
| Fund (Class A Shares, without a sales charge)* | 27.94% | |||
| Russell 2000 Growth Index | 23.67% | |||
| Net Assets as of 6/30/2013 (In Thousands) | $ | 931,918 | ||
INVESTMENT OBJECTIVE**
The JPMorgan Small Cap Growth Fund (the “Fund”) seeks long-term capital growth primarily by investing in a portfolio of equity securities of small-capitalization and emerging growth companies.
WHAT WERE THE MAIN DRIVERS OF THE FUND’S PERFORMANCE?
The Fund (Class A Shares, without a sales charge) outperformed the Russell 2000 Growth Index (the “Benchmark”) for the twelve months ended June 30, 2013. The Fund’s stock selection in the health care and technology sectors was the main contributor to relative performance. The Fund’s stock selection in the utilities and producer durables sectors detracted from relative performance.
Individual contributors to relative performance included the Fund’s positions in Aegerion Pharmaceuticals, Inc., Conn’s, Inc. and Acadia Healthcare Co., Inc. Aegerion Pharmaceuticals, Inc., a biopharmaceutical company, has demonstrated solid progress on its launch of lomitapide, a treatment for severe high cholesterol. Conn’s, Inc., a specialty retailer of durable consumer products, reported stronger-than-expected revenue and raised its profit forecast for fiscal 2014. The company continued, what we believed to be, strong execution on its plan to increase sales productivity and profitability as it continues to grow into a national retailer. Acadia Healthcare Co., Inc., a provider of inpatient behavioral healthcare services, benefited from an increased earnings forecast for its 2013 fiscal year. The company continued, in our view, to execute on its clearly defined strategy of adding to solid organic growth by adding beds at existing facilities and by acquiring new facilities.
Individual detractors from relative performance included the Fund’s positions in Bazaarvoice, Inc., Boingo Wireless, Inc. and Vocera Communications, Inc. Shares of Bazaarvoice, Inc., a multinational internet marketing company, fell amid disappointing earnings and uncertainty due to a Department of Justice investigation into the company’s acquisition of Power Reviews, its largest competitor. Shares of Boingo Wireless, Inc., which provides global Wi-Fi services, fell after issuing an earnings forecast below estimates. Vocera Communications, Inc., a provider of mobile communication solutions for the health care sector, performed poorly due to delays in implementation of several pending hospital deals. The company also issued an earnings forecast below estimates.
HOW WAS THE FUND POSITIONED?
The Fund’s portfolio managers utilized a bottom-up approach to stock selection, researching individual companies in an effort to construct a portfolio of stocks that they believe have strong fundamentals. The Fund’s portfolio managers preferred to invest in high quality companies with durable franchises that, in their view, possessed the ability to generate strong future earnings growth.
| TOP TEN EQUITY HOLDINGS OF THE PORTFOLIO*** | ||||||||
| 1. | Financial Engines, Inc. | 1.6 | % | |||||
| 2. | Acadia Healthcare Co., Inc. | 1.6 | ||||||
| 3. | Wolverine World Wide, Inc. | 1.6 | ||||||
| 4. | Insulet Corp. | 1.5 | ||||||
| 5. | Middleby Corp. | 1.5 | ||||||
| 6. | Old Dominion Freight Line, Inc. | 1.5 | ||||||
| 7. | Dril-Quip, Inc. | 1.5 | ||||||
| 8. | Cornerstone OnDemand, Inc. | 1.4 | ||||||
| 9. | Conn’s, Inc. | 1.4 | ||||||
| 10. | Novadaq Technologies, Inc. | 1.4 | ||||||
PORTFOLIO COMPOSITION BY SECTOR*** | ||||
| Information Technology | 25.7 | % | ||
| Health Care | 22.5 | |||
| Industrials | 20.9 | |||
| Consumer Discretionary | 12.1 | |||
| Financials | 9.2 | |||
| Energy | 5.0 | |||
| Consumer Staples | 2.5 | |||
| Telecommunication Services | 0.6 | |||
| Short-Term Investment | 1.5 | |||
| * | The return shown is based on net asset values calculated for shareholder transactions and may differ from the return shown in the financial highlights, which reflects adjustments made to the net asset values in accordance with accounting principles generally accepted in the United States of America. |
| ** | The advisor seeks to achieve the Fund’s objective. There can be no guarantee it will be achieved. |
| *** | Percentages indicated are based on total investments as of June 30, 2013. The Fund’s portfolio composition is subject to change. |
| JUNE 30, 2013 | J.P. MORGAN SMALL CAP FUNDS | 9 | ||||||
Table of Contents
JPMorgan Small Cap Growth Fund
FUND COMMENTARY
TWELVE MONTHS ENDED JUNE 30, 2013 (Unaudited) (continued)
AVERAGE ANNUAL TOTAL RETURNS AS OF JUNE 30, 2013 | ||||||||||||||||
| INCEPTION DATE OF CLASS | 1 YEAR | 5 YEAR | 10 YEAR | |||||||||||||
CLASS A SHARES | 7/1/91 | |||||||||||||||
Without Sales Charge | 27.94 | % | 10.20 | % | 10.79 | % | ||||||||||
With Sales Charge* | 21.19 | 9.01 | 10.19 | |||||||||||||
CLASS B SHARES | 9/12/94 | |||||||||||||||
Without CDSC | 27.32 | 9.56 | 10.22 | |||||||||||||
With CDSC** | 22.32 | 9.28 | 10.22 | |||||||||||||
CLASS C SHARES | 11/4/97 | |||||||||||||||
Without CDSC | 27.30 | 9.59 | 10.13 | |||||||||||||
With CDSC*** | 26.30 | 9.59 | 10.13 | |||||||||||||
CLASS R2 SHARES | 11/3/08 | 27.64 | 9.93 | 10.29 | ||||||||||||
CLASS R6 SHARES | 11/30/10 | 28.63 | 10.66 | 11.22 | ||||||||||||
INSTITUTIONAL CLASS SHARES | 2/19/05 | 28.39 | 10.60 | 11.19 | ||||||||||||
SELECT CLASS SHARES | 3/26/96 | 28.30 | 10.47 | 11.07 | ||||||||||||
| * | Sales Charge for Class A Shares is 5.25%. |
| ** | Assumes a 5% CDSC (contingent deferred sales charge) for the one year period, 2% CDSC for the five year period and 0% CDSC thereafter. |
| *** | Assumes a 1% CDSC for the one year period and 0% CDSC thereafter. |
TEN YEAR PERFORMANCE (6/30/03 TO 6/30/13)
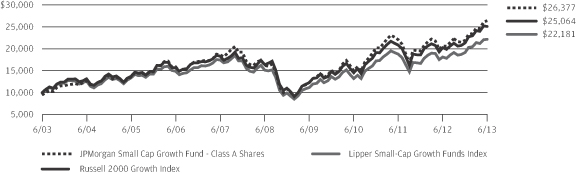
The performance quoted is past performance and is not a guarantee of future results. Mutual funds are subject to certain market risks. Investment returns and principal value of an investment will fluctuate so that an investor’s shares, when redeemed, may be worth more or less than their original cost. Current performance may be higher or lower than the performance data shown. For up-to-date month-end performance information please call 1-800-480-4111.
Returns for Institutional Class Shares prior to their inception date are based on the performance of Select Class Shares. Returns for Class R6 Shares prior to their inception date are based on the performance of Institutional Class Shares from 2/19/05 through inception and on the performance of Select Class Shares prior to 2/19/05. The actual returns for Institutional Class Shares and Class R6 Shares would have been different than those shown because Institutional Class Shares and Class R6 Shares have different expenses than the class on which the earlier performance is based. Returns for Class R2 Shares prior to its inception date are based on the performance of Class A Shares. All prior class performance for Class R2 Shares has been adjusted to reflect the differences in expenses between classes.
The graph illustrates comparative performance for $10,000 invested in Class A Shares of the JPMorgan Small Cap Growth Fund, the Russell 2000 Growth Index and the Lipper Small-Cap Growth Funds Index from June 30, 2003 to June 30, 2013. The performance of the Fund assumes reinvestment of all dividends and capital gain distributions, if any, and includes a sales charge. The performance of the Russell 2000 Growth Index does not reflect the deduction of expenses or a sales charge associated with a mutual fund and has been adjusted to reflect
reinvestment of all dividends and capital gain distributions of the securities included in the benchmark, if applicable. The performance of the Lipper Small-Cap Growth Funds Index includes expenses associated with a mutual fund, such as investment management fees. These expenses are not identical to the expenses incurred by the Fund. The Russell 2000 Growth Index is an unmanaged index which measures the performance of those Russell 2000 companies with higher price-to-book ratios and higher forecasted growth values. The Lipper Small-Cap Growth Funds Index is an index based on the total returns of certain mutual funds within the Fund’s designated category as determined by Lipper, Inc. Investors cannot invest directly in an index.
Class A Shares have a $1,000 minimum initial investment and carry a 5.25% sales charge.
Fund performance may reflect the waiver of the Fund’s fees and reimbursement of expenses for certain periods since the inception date. Without these waivers and reimbursements, performance would have been lower. Also, performance shown in this section does not reflect the deduction of taxes that a shareholder would pay on Fund distributions or redemption of Fund shares.
Because Class B Shares automatically convert to Class A Shares after eight years, the 10 year average annual total return shown above for Class B reflects Class A performance for the period after conversion.
The returns shown are based on net asset values calculated for shareholder transactions and may differ from the returns shown in the financial highlights, which reflect adjustments made to the net asset values in accordance with accounting principles generally accepted in the United States of America.
| 10 | J.P. MORGAN SMALL CAP FUNDS | JUNE 30, 2013 | ||||
Table of Contents
FUND COMMENTARY
TWELVE MONTHS ENDED JUNE 30, 2013 (Unaudited)
| REPORTING PERIOD RETURN: | ||||
| Fund (Select Class Shares)* | 28.43% | |||
| Russell 2000 Value Index. | 24.76% | |||
| Net Assets as of 6/30/2013 (In Thousands) | $ | 898,482 | ||
INVESTMENT OBJECTIVE**
The JPMorgan Small Cap Value Fund (the “Fund”) seeks long-term capital growth primarily by investing in equity securities of small-capitalization companies.
WHAT WERE THE MAIN DRIVERS OF THE FUND’S PERFORMANCE?
The Fund (Select Class Shares) outperformed the Russell 2000 Value Index (the “Benchmark”) for the twelve months ended June 30, 2013. The Fund’s stock selection in the media and basic materials sectors was the primary contributor to relative performance. The Fund’s stock selection in the consumer staples and semiconductor sectors detracted from relative performance.
Individual contributors to relative performance included the Fund’s positions in Sinclair Broadcast Group, Inc., Ocwen Financial Corp. and Conn’s, Inc. Shares of Sinclair Broadcast Group, Inc., which owns broadcast television stations in the U.S., rallied during the reporting period on strong revenue and earnings growth, as well as overall growth in the broadcast industry. Ocwen Financial Corp., a provider of mortgage loan servicing and asset management services, reported record earnings for the first quarter of 2013. Conn’s, Inc., a specialty retailer of durable consumer products, reported stronger-than-expected revenue and raised its profit forecast for fiscal 2014.
Individual detractors to relative performance included the Fund’s positions in Central Garden & Pet Co., Blyth, Inc. and Anworth Mortgage Asset Corp. Central Garden & Pet Co., a manufacturer of lawn, garden and pet supplies, reported earnings that were sharply lower- than- expected during its third fiscal quarter. Shares of Blyth, Inc., a direct to consumer marketer, fell sharply after reporting weak 2013 earnings estimates and a disappointing fourth quarter performance. Anworth Mortgage Asset Corp., a real estate investment trust (“REIT”), reported a poor third quarter and was hurt by rising interest rates.
HOW WAS THE FUND POSITIONED?
In accordance with its investment process, the Fund’s portfolio managers take limited sector bets and construct the Fund so that stock selection is typically the primary driver of its relative performance versus the Benchmark. The Fund’s portfolio
managers use a quantitative ranking methodology to identify stocks in each sector that, in their view, trade at attractive levels. Through bottom-up fundamental research, they seek companies that exhibit high earnings quality and have management teams that make effective capital deployment decisions. During the reporting period, the Fund was managed and positioned in accordance with this investment process.
| TOP TEN EQUITY HOLDINGS OF THE PORTFOLIO*** | ||||||||
| 1. | Rite Aid Corp. | 1.2 | % | |||||
| 2. | Helix Energy Solutions Group, Inc. | 1.2 | ||||||
| 3. | Portland General Electric Co. | 1.1 | ||||||
| 4. | Worthington Industries, Inc. | 1.1 | ||||||
| 5. | Universal Corp. | 1.0 | ||||||
| 6. | Ocwen Financial Corp. | 1.0 | ||||||
| 7. | DCT Industrial Trust, Inc. | 0.9 | ||||||
| 8. | Redwood Trust, Inc. | 0.9 | ||||||
| 9. | Anworth Mortgage Asset Corp. | 0.9 | ||||||
| 10. | Capstead Mortgage Corp. | 0.9 | ||||||
PORTFOLIO COMPOSITION BY SECTOR*** | ||||
| Financials | 34.8 | % | ||
| Industrials | 14.2 | |||
| Information Technology | 12.9 | |||
| Consumer Discretionary | 11.6 | |||
| Utilities | 5.9 | |||
| Energy | 5.5 | |||
| Materials | 4.9 | |||
| Health Care | 4.3 | |||
| Consumer Staples | 3.6 | |||
| Others (each less than 1.0%) | 0.8 | |||
| Short-Term Investment | 1.5 | |||
| * | The return shown is based on net asset values calculated for shareholder transactions and may differ from the return shown in the financial highlights, which reflects adjustments made to the net asset values in accordance with accounting principles generally accepted in the United States of America. |
| ** | The advisor seeks to achieve the Fund’s objective. There can be no guarantee it will be achieved. |
| *** | Percentages indicated are based on total investments as of June 30, 2013. The Fund’s portfolio composition is subject to change. |
| JUNE 30, 2013 | J.P. MORGAN SMALL CAP FUNDS | 11 | ||||||
Table of Contents
FUND COMMENTARY
TWELVE MONTHS ENDED JUNE 30, 2013 (Unaudited) (continued)
AVERAGE ANNUAL TOTAL RETURNS AS OF JUNE 30, 2013 | ||||||||||||||||
| INCEPTION DATE OF CLASS | 1 YEAR | 5 YEAR | 10 YEAR | |||||||||||||
CLASS A SHARES | 1/27/95 | |||||||||||||||
Without Sales Charge | 28.08 | % | 9.35 | % | 9.93 | % | ||||||||||
With Sales Charge* | 21.35 | 8.18 | 9.34 | |||||||||||||
CLASS B SHARES | 1/27/95 | |||||||||||||||
Without CDSC | 27.35 | 8.67 | 9.37 | |||||||||||||
With CDSC** | 22.35 | 8.38 | 9.37 | |||||||||||||
CLASS C SHARES | 3/22/99 | |||||||||||||||
Without CDSC | 27.35 | 8.70 | 9.25 | |||||||||||||
With CDSC*** | 26.35 | 8.70 | 9.25 | |||||||||||||
CLASS R2 SHARES | 11/3/08 | 27.79 | 9.07 | 9.65 | ||||||||||||
CLASS R5 SHARES | 5/15/06 | 28.53 | 9.72 | 10.28 | ||||||||||||
CLASS R6 SHARES | 2/22/05 | 28.62 | 9.77 | 10.34 | ||||||||||||
SELECT CLASS SHARES | 1/27/95 | 28.41 | 9.62 | 10.21 | ||||||||||||
| * | Sales Charge for Class A Shares is 5.25%. |
| ** | Assumes a 5% CDSC (contingent deferred sales charge) for the one year period, 2% CDSC for the five year period and 0% CDSC thereafter. |
| *** | Assumes a 1% CDSC for the one year period and 0% CDSC thereafter. |
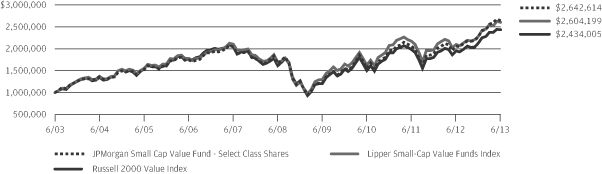
TEN YEAR PERFORMANCE (6/30/03 TO 6/30/13)
The performance quoted is past performance and is not a guarantee of future results. Mutual funds are subject to certain market risks. Investment returns and principal value of an investment will fluctuate so that an investor’s shares, when redeemed, may be worth more or less than their original cost. Current performance may be higher or lower than the performance data shown. For up-to-date month-end performance information please call 1-800-480-4111.
Returns for Class R2, Class R5 and Class R6 Shares prior to their inception dates are based on the performance of the Select Class Shares, the original class offered. All prior class performance for Class R2 Shares has been adjusted to reflect the differences in expenses between classes. The actual returns of Class R5 Shares and Class R6 Shares would have been different than those shown because Class R5 Shares and Class R6 Shares have different expenses than Select Class Shares.
The graph illustrates comparative performance for $1,000,000 invested in Select Class Shares of the JPMorgan Small Cap Value Fund, the Russell 2000 Value Index and the Lipper Small-Cap Value Funds Index from June 30, 2003 to June 30, 2013. The performance of the Fund assumes reinvestment of all dividends and capital gain distributions, if any, and does not include a sales charge. The performance of the Russell 2000 Value Index does not reflect the deduction of expenses or a sales charge associated with a mutual fund and has been adjusted to reflect reinvestment of all dividends and capital gain distributions of the securities included in the benchmark, if applicable.
The performance of the Lipper Small-Cap Value Funds Index includes expenses associated with a mutual fund, such as investment management fees. These expenses are not identical to the expenses incurred by the Fund. The Russell 2000 Value Index is an unmanaged index which measures the performance of those Russell 2000 companies with lower price-to-book ratios and lower forecasted growth values. The Lipper Small-Cap Value Funds Index is an index based on the total returns of certain mutual funds within the Fund’s designated category as determined by Lipper, Inc. Investors cannot invest directly in an index.
Select Class Shares have a $1,000,000 minimum initial investment.
Fund performance may reflect the waiver of the Fund’s fees and reimbursement of expenses for certain periods since the inception date. Without these waivers and reimbursements, performance would have been lower. Also, performance shown in this section does not reflect the deduction of taxes that a shareholder would pay on Fund distributions or redemption of Fund shares.
Because Class B Shares automatically convert to Class A Shares after eight years, the 10 year average annual total return shown above for Class B reflects Class A performance for the period after conversion.
The returns shown are based on net asset values calculated for shareholder transactions and may differ from the returns shown in the financial highlights, which reflect adjustments made to the net asset values in accordance with accounting principles generally accepted in the United States of America.
| 12 | J.P. MORGAN SMALL CAP FUNDS | JUNE 30, 2013 | ||||
Table of Contents
JPMorgan U.S. Small Company Fund
FUND COMMENTARY
TWELVE MONTHS ENDED JUNE 30, 2013 (Unaudited)
| REPORTING PERIOD RETURN: | ||||
| Fund (Institutional Class Shares)* | 29.08% | |||
| Russell 2000 Index. | 24.21% | |||
| Net Assets as of 6/30/2013 (In Thousands) | $ | 172,709 | ||
INVESTMENT OBJECTIVE**
The JPMorgan U.S. Small Company Fund (the “Fund”) seeks to provide high total return from a portfolio of small company stocks.
WHAT WERE THE MAIN DRIVERS OF THE FUND’S PERFORMANCE?
The Fund (Institutional Class Shares) outperformed the Russell 2000 Index (the “Benchmark”) for the twelve months ended June 30, 2013. The Fund’s stock selection in the retail and basic materials sectors was the primary contributor to relative performance. The Fund’s stock selection in the semiconductor and real estate investment trust (“REIT”) sectors detracted from relative performance.
Individual contributors to relative performance included the Fund’s positions in Conn’s, Inc., Questcor Pharmaceuticals, Inc. and Rite Aid Corp. Conn’s Inc., a specialty retailer of durable consumer products, reported stronger-than-expected revenue and raised its profit forecast for fiscal 2014. Shares of Questcor Pharmaceuticals, Inc. rallied after the prescription drug maker announced that it acquired the rights to develop Synacthen, a drug for treating autoimmune and inflammatory disorders. Rite Aid Corp., a national drug-store chain, posted its first annual fiscal year profit since 2006, as management shed underperforming stores.
Individual detractors from relative performance included the Fund’s positions in Blyth, Inc., FreightCar America, Inc. and Monster Worldwide, Inc. Shares of Blyth, Inc., a direct to consumer marketer, fell sharply after the company reported weak 2013 earnings estimates and a disappointing fourth quarter performance. FreightCar America, Inc., a manufacturer of freight cars for the railway industry, reported an earnings shortfall in its fiscal second quarter and suffered further pressure amid falling commodity prices. Monster Worldwide, Inc., an employment website, reported large asset write- downs and losses during the reporting period.
HOW WAS THE FUND POSITIONED?
In accordance with its investment process, the Fund’s portfolio managers take limited sector bets and construct the Fund so that stock selection is typically the primary driver of its relative performance versus the Benchmark. The Fund’s portfolio
managers use a quantitative ranking methodology to identify stocks in each sector that, in their view, trade at attractive levels. Through bottom-up fundamental research, they seek companies that exhibit high earnings quality and have management teams that make effective capital deployment decisions. During the reporting period, the Fund was managed and positioned in accordance with this investment process.
| TOP TEN EQUITY HOLDINGS OF THE PORTFOLIO*** | ||||||||
| 1. | Questcor Pharmaceuticals, Inc. | 1.4 | % | |||||
| 2. | Rite Aid Corp. | 1.3 | ||||||
| 3. | Manhattan Associates, Inc. | 1.3 | ||||||
| 4. | InterDigital, Inc. | 1.2 | ||||||
| 5. | Minerals Technologies, Inc. | 1.1 | ||||||
| 6. | Barrett Business Services, Inc. | 1.1 | ||||||
| 7. | Advanced Energy Industries, Inc. | 1.0 | ||||||
| 8. | Universal Corp. | 1.0 | ||||||
| 9. | United Stationers, Inc. | 1.0 | ||||||
| 10. | Comtech Telecommunications Corp. | 1.0 | ||||||
PORTFOLIO COMPOSITION BY SECTOR*** | ||||
| Financials | 20.6 | % | ||
| Information Technology | 17.5 | |||
| Industrials | 15.7 | |||
| Consumer Discretionary | 13.0 | |||
| Health Care | 11.8 | |||
| Energy | 5.2 | |||
| Materials | 5.0 | |||
| Consumer Staples | 4.6 | |||
| Utilities | 3.0 | |||
| Telecommunication Services | 0.9 | |||
| U.S. Treasury Obligation | 0.1 | |||
| Short-Term Investment | 2.6 | |||
| * | The return shown is based on net asset values calculated for shareholder transactions and may differ from the return shown in the financial highlights, which reflects adjustments made to the net asset values in accordance with accounting principles generally accepted in the United States of America. |
| ** | The advisor seeks to achieve the Fund’s objective. There can be no guarantee it will be achieved. |
| *** | Percentages indicated are based on total investments as of June 30, 2013. The Fund’s portfolio composition is subject to change. |
| JUNE 30, 2013 | J.P. MORGAN SMALL CAP FUNDS | 13 | ||||||
Table of Contents
JPMorgan U.S. Small Company Fund
FUND COMMENTARY
TWELVE MONTHS ENDED JUNE 30, 2013 (Unaudited) (continued)
AVERAGE ANNUAL TOTAL RETURNS AS OF JUNE 30, 2013 | ||||||||||||||||
| INCEPTION DATE OF CLASS | 1 YEAR | 5 YEAR | 10 YEAR | |||||||||||||
CLASS A SHARES | 11/1/07 | |||||||||||||||
Without Sales Charge | 28.54 | % | 10.20 | % | 9.09 | % | ||||||||||
With Sales Charge* | 21.81 | 9.03 | 8.50 | |||||||||||||
CLASS C SHARES | 11/1/07 | |||||||||||||||
Without CDSC | 27.95 | 9.66 | 8.78 | |||||||||||||
With CDSC** | 26.95 | 9.66 | 8.78 | |||||||||||||
CLASS R2 SHARES | 11/1/11 | 28.19 | 10.12 | 9.05 | ||||||||||||
CLASS R6 SHARES | 11/1/11 | 29.29 | 10.72 | 9.46 | ||||||||||||
INSTITUTIONAL CLASS SHARES | 11/4/93 | 29.08 | 10.69 | 9.45 | ||||||||||||
SELECT CLASS SHARES | 9/10/01 | 28.94 | 10.51 | 9.26 | ||||||||||||
| * | Sales Charge for Class A Shares is 5.25%. |
| ** | Assumes a 1% CDSC (contingent deferred sales charge) for the one year period and 0% CDSC thereafter. |
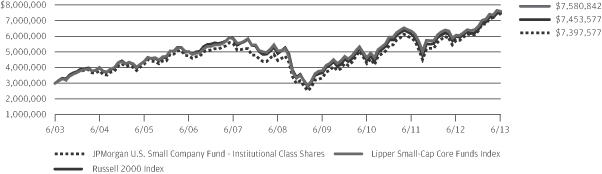
TEN YEAR PERFORMANCE (6/30/03 TO 6/30/13)
The performance quoted is past performance and is not a guarantee of future results. Mutual funds are subject to certain market risks. Investment returns and principal value of an investment will fluctuate so that an investor’s shares, when redeemed, may be worth more or less than their original cost. Current performance may be higher or lower than the performance data shown. For up-to-date month-end performance information please call 1-800-480-4111.
Returns for Class A and Class C Shares prior to their inception dates are based on the performance of the Select Class Shares. The actual returns for Class A and Class C Shares would have been lower than those shown because Class A and Class C Shares have higher expenses than Select Class Shares.
Returns for the Class R2 Shares and Class R6 Shares prior to their inception dates are based on the performance of the Class A Shares and the Institutional Class Shares, respectively. The actual returns of Class R2 Shares would have been lower than those shown because Class R2 Shares have higher expenses than Class A Shares. The actual returns of Class R6 Shares would have been different than these shown because Class R6 Shares have different expenses than Institutional Class Shares.
The graph illustrates comparative performance for $3,000,000 invested in Institutional Class Shares of the JPMorgan U.S. Small Company Fund, the Russell 2000 Index and the Lipper Small-Cap Core Funds Index from June 30, 2003 to June 30, 2013. The performance of the Fund assumes reinvestment of all dividends and capital gain distributions, if any, and does not include a sales charge. The performance of the Russell 2000 Index does not reflect the
deduction of expenses associated with a mutual fund and has been adjusted to reflect reinvestment of all dividends and capital gain distributions of the securities included in the benchmark, if applicable. The performance of the Lipper Small-Cap Core Funds Index includes expenses associated with a mutual fund, such as investment management fees. These expenses are not identical to the expenses incurred by the Fund. The Russell 2000 Index is an unmanaged index which measures the performance of the 2000 smallest stocks (on the basis of capitalization) in the Russell 3000 Index. The Lipper Small-Cap Core Funds Index is an index based on the total returns of certain mutual funds within the Fund’s designated category as determined by Lipper, Inc. Investors cannot invest directly in an index.
Institutional Class Shares have a $3,000,000 minimum initial investment and carry no sales charge.
Fund performance may reflect the waiver of the Fund’s fees and reimbursement of expenses for certain periods since the inception date. Without these waivers and reimbursements, performance would have been lower. Also, performance shown in this section does not reflect the deduction of taxes that a shareholder would pay on Fund distributions or redemptions of Fund shares.
The returns shown are based on net asset values calculated for shareholder transactions and may differ from the returns shown in the financial highlights, which reflect adjustments made to the net asset values in accordance with accounting principles generally accepted in the United States of America.
| 14 | J.P. MORGAN SMALL CAP FUNDS | JUNE 30, 2013 | ||||
Table of Contents
JPMorgan Dynamic Small Cap Growth Fund
SCHEDULE OF PORTFOLIO INVESTMENTS
AS OF JUNE 30, 2013
(Amounts in thousands)
| SHARES | SECURITY DESCRIPTION | VALUE($) | ||||||
| Common Stocks — 97.4% |
| ||||||
Consumer Discretionary — 11.9% | ||||||||
Distributors — 0.7% | ||||||||
| 70 | Pool Corp. | 3,685 | ||||||
|
| |||||||
Diversified Consumer Services — 0.6% | ||||||||
| 86 | Sotheby’s | 3,242 | ||||||
|
| |||||||
Household Durables — 0.5% | ||||||||
| 169 | TRI Pointe Homes, Inc. (a) | 2,804 | ||||||
|
| |||||||
Internet & Catalog Retail — 1.6% | ||||||||
| 59 | Blue Nile, Inc. (a) | 2,212 | ||||||
| 195 | HomeAway, Inc. (a) | 6,301 | ||||||
|
| |||||||
| 8,513 | ||||||||
|
| |||||||
Leisure Equipment & Products — 0.9% | ||||||||
| 104 | Arctic Cat, Inc. | 4,672 | ||||||
|
| |||||||
Media — 1.2% | ||||||||
| 499 | ReachLocal, Inc. (a) | 6,123 | ||||||
|
| |||||||
Specialty Retail — 4.3% | ||||||||
| 137 | Conn’s, Inc. (a) | 7,091 | ||||||
| 129 | Five Below, Inc. (a) | 4,757 | ||||||
| 216 | Francesca’s Holdings Corp. (a) | 5,997 | ||||||
| 58 | Lumber Liquidators Holdings, Inc. (a) | 4,488 | ||||||
|
| |||||||
| 22,333 | ||||||||
|
| |||||||
Textiles, Apparel & Luxury Goods — 2.1% | ||||||||
| 105 | Tumi Holdings, Inc. (a) | 2,515 | ||||||
| 150 | Wolverine World Wide, Inc. | 8,168 | ||||||
|
| |||||||
| 10,683 | ||||||||
|
| |||||||
Total Consumer Discretionary | 62,055 | |||||||
|
| |||||||
Consumer Staples — 2.5% | ||||||||
Food & Staples Retailing — 0.5% | ||||||||
| 111 | Fairway Group Holdings Corp. (a) | 2,688 | ||||||
|
| |||||||
Food Products — 2.0% | ||||||||
| 120 | Annie’s, Inc. (a) | 5,126 | ||||||
| 73 | Snyders-Lance, Inc. | 2,070 | ||||||
| 196 | WhiteWave Foods Co., Class A (a) | 3,190 | ||||||
|
| |||||||
| 10,386 | ||||||||
|
| |||||||
Total Consumer Staples | 13,074 | |||||||
|
| |||||||
Energy — 5.0% | ||||||||
Energy Equipment & Services — 2.4% | ||||||||
| 83 | Dril-Quip, Inc. (a) | 7,538 | ||||||
| 155 | Forum Energy Technologies, Inc. (a) | 4,712 | ||||||
|
| |||||||
| 12,250 | ||||||||
|
| |||||||
Oil, Gas & Consumable Fuels — 2.6% | ||||||||
| 93 | Delek U.S. Holdings, Inc. | 2,673 | ||||||
| SHARES | SECURITY DESCRIPTION | VALUE($) | ||||||
Oil, Gas & Consumable Fuels — Continued | ||||||||
| 251 | Laredo Petroleum Holdings, Inc. (a) | 5,171 | ||||||
| 144 | Oasis Petroleum, Inc. (a) | 5,605 | ||||||
|
| |||||||
| 13,449 | ||||||||
|
| |||||||
Total Energy | 25,699 | |||||||
|
| |||||||
Financials — 9.1% | ||||||||
Capital Markets — 4.6% | ||||||||
| 19 | Affiliated Managers Group, Inc. (a) | 3,087 | ||||||
| 107 | Cohen & Steers, Inc. | 3,629 | ||||||
| 183 | Financial Engines, Inc. | 8,344 | ||||||
| 474 | PennantPark Investment Corp. | 5,237 | ||||||
| 97 | Stifel Financial Corp. (a) | 3,477 | ||||||
|
| |||||||
| 23,774 | ||||||||
|
| |||||||
Commercial Banks — 0.8% | ||||||||
| 54 | Signature Bank (a) | 4,499 | ||||||
|
| |||||||
Insurance — 1.1% | ||||||||
| 158 | Amtrust Financial Services, Inc. | 5,636 | ||||||
|
| |||||||
Real Estate Investment Trusts (REITs) — 2.6% | ||||||||
| 176 | CubeSmart | 2,816 | ||||||
| 111 | Douglas Emmett, Inc. (m) | 2,777 | ||||||
| 47 | EastGroup Properties, Inc. | 2,651 | ||||||
| 242 | Glimcher Realty Trust | 2,639 | ||||||
| 72 | Highwoods Properties, Inc. | 2,568 | ||||||
|
| |||||||
| 13,451 | ||||||||
|
| |||||||
Total Financials | 47,360 | |||||||
|
| |||||||
Health Care — 22.3% | ||||||||
Biotechnology — 7.8% | ||||||||
| 153 | ACADIA Pharmaceuticals, Inc. (a) | 2,780 | ||||||
| 82 | Acorda Therapeutics, Inc. (a) | 2,710 | ||||||
| 86 | Aegerion Pharmaceuticals, Inc. (a) | 5,429 | ||||||
| 122 | AMAG Pharmaceuticals, Inc. (a) | 2,706 | ||||||
| 101 | Ariad Pharmaceuticals, Inc. (a) | 1,773 | ||||||
| 123 | Chimerix, Inc. (a) | 2,992 | ||||||
| 72 | Cubist Pharmaceuticals, Inc. (a) | 3,475 | ||||||
| 297 | Exact Sciences Corp. (a) | 4,130 | ||||||
| 394 | Halozyme Therapeutics, Inc. (a) | 3,132 | ||||||
| 419 | Keryx Biopharmaceuticals, Inc. (a) | 3,133 | ||||||
| 98 | Puma Biotechnology, Inc. (a) | 4,366 | ||||||
| 336 | Synta Pharmaceuticals Corp. (a) | 1,677 | ||||||
| 469 | Threshold Pharmaceuticals, Inc. (a) | 2,465 | ||||||
|
| |||||||
| 40,768 | ||||||||
|
| |||||||
Health Care Equipment & Supplies — 5.5% | ||||||||
| 765 | Imris, Inc., (Canada) (a) | 2,111 | ||||||
| 252 | Insulet Corp. (a) | 7,928 | ||||||
SEE NOTES TO FINANCIAL STATEMENTS.
| JUNE 30, 2013 | J.P. MORGAN SMALL CAP FUNDS | 15 | ||||||
Table of Contents
JPMorgan Dynamic Small Cap Growth Fund
SCHEDULE OF PORTFOLIO INVESTMENTS
AS OF JUNE 30, 2013 (continued)
(Amounts in thousands)
| SHARES | SECURITY DESCRIPTION | VALUE($) | ||||||
| Common Stocks — Continued |
| ||||||
Health Care Equipment & Supplies — Continued | ||||||||
| 525 | Novadaq Technologies, Inc., (Canada) (a) | 7,067 | ||||||
| 438 | Syneron Medical Ltd., (Israel) (a) | 3,810 | ||||||
| 204 | Tornier N.V., (Netherlands) (a) | 3,572 | ||||||
| 1,311 | Unilife Corp. (a) | 4,156 | ||||||
|
| |||||||
| 28,644 | ||||||||
|
| |||||||
Health Care Providers & Services — 4.6% | ||||||||
| 251 | Acadia Healthcare Co., Inc. (a) | 8,307 | ||||||
| 284 | Emeritus Corp. (a) | 6,594 | ||||||
| 136 | Health Net, Inc. (a) | 4,324 | ||||||
| 85 | WellCare Health Plans, Inc. (a) | 4,714 | ||||||
|
| |||||||
| 23,939 | ||||||||
|
| |||||||
Health Care Technology — 0.5% | ||||||||
| 167 | Vocera Communications, Inc. (a) | 2,457 | ||||||
|
| |||||||
Life Sciences Tools & Services — 1.8% | ||||||||
| 278 | Bruker Corp. (a) | 4,488 | ||||||
| 274 | Fluidigm Corp. (a) | 4,783 | ||||||
|
| |||||||
| 9,271 | ||||||||
|
| |||||||
Pharmaceuticals — 2.1% | ||||||||
| 355 | Nektar Therapeutics (a) | 4,100 | ||||||
| 190 | Sagent Pharmaceuticals, Inc. (a) | 3,988 | ||||||
| 96 | ViroPharma, Inc. (a) | 2,745 | ||||||
|
| |||||||
| 10,833 | ||||||||
|
| |||||||
Total Health Care | 115,912 | |||||||
|
| |||||||
Industrials — 20.7% | ||||||||
Aerospace & Defense — 2.2% | ||||||||
| 109 | HEICO Corp. | 5,504 | ||||||
| 177 | Hexcel Corp. (a) | 6,041 | ||||||
|
| |||||||
| 11,545 | ||||||||
|
| |||||||
Airlines — 1.0% | ||||||||
| 165 | Spirit Airlines, Inc. (a) | 5,232 | ||||||
|
| |||||||
Building Products — 3.8% | ||||||||
| 92 | Armstrong World Industries, Inc. (a) | 4,374 | ||||||
| 153 | Fortune Brands Home & Security, Inc. | 5,937 | ||||||
| 120 | Ply Gem Holdings, Inc. (a) | 2,415 | ||||||
| 142 | Trex Co., Inc. (a) | 6,763 | ||||||
|
| |||||||
| 19,489 | ||||||||
|
| |||||||
Electrical Equipment — 2.3% | ||||||||
| 90 | Acuity Brands, Inc. | 6,820 | ||||||
| 141 | Generac Holdings, Inc. | 5,203 | ||||||
|
| |||||||
| 12,023 | ||||||||
|
| |||||||
| SHARES | SECURITY DESCRIPTION | VALUE($) | ||||||
Industrial Conglomerates — 1.1% | ||||||||
| 89 | Carlisle Cos., Inc. | 5,542 | ||||||
|
| |||||||
Machinery — 2.8% | ||||||||
| 107 | Graco, Inc. | 6,770 | ||||||
| 46 | Middleby Corp. (a) | 7,817 | ||||||
|
| |||||||
| 14,587 | ||||||||
|
| |||||||
Marine — 0.9% | ||||||||
| 60 | Kirby Corp. (a) | 4,781 | ||||||
|
| |||||||
Road & Rail — 2.5% | ||||||||
| 341 | Marten Transport Ltd. | 5,351 | ||||||
| 185 | Old Dominion Freight Line, Inc. (a) | 7,716 | ||||||
|
| |||||||
| 13,067 | ||||||||
|
| |||||||
Trading Companies & Distributors — 4.1% | ||||||||
| 48 | DXP Enterprises, Inc. (a) | 3,210 | ||||||
| 68 | MSC Industrial Direct Co., Inc., Class A | 5,278 | ||||||
| 256 | Rush Enterprises, Inc., Class A (a) | 6,344 | ||||||
| 79 | Watsco, Inc. | 6,663 | ||||||
|
| |||||||
| 21,495 | ||||||||
|
| |||||||
Total Industrials | 107,761 | |||||||
|
| |||||||
Information Technology — 25.4% | ||||||||
Communications Equipment — 3.2% | ||||||||
| 250 | Aruba Networks, Inc. (a) | 3,838 | ||||||
| 580 | Infinera Corp. (a) | 6,188 | ||||||
| 56 | Palo Alto Networks, Inc. (a) | 2,382 | ||||||
| 309 | Ruckus Wireless, Inc. (a) | 3,964 | ||||||
|
| |||||||
| 16,372 | ||||||||
|
| |||||||
Computers & Peripherals — 0.4% | ||||||||
| 156 | Fusion-io, Inc. (a) | 2,224 | ||||||
|
| |||||||
Internet Software & Services — 7.2% | ||||||||
| 164 | Cornerstone OnDemand, Inc. (a) | 7,109 | ||||||
| 23 | CoStar Group, Inc. (a) | 2,975 | ||||||
| 194 | Dealertrack Technologies, Inc. (a) | 6,889 | ||||||
| 117 | Demandware, Inc. (a) | 4,977 | ||||||
| 258 | Envestnet, Inc. (a) | 6,349 | ||||||
| 52 | OpenTable, Inc. (a) | 3,353 | ||||||
| 192 | Trulia, Inc. (a) | 5,977 | ||||||
|
| |||||||
| 37,629 | ||||||||
|
| |||||||
IT Services — 0.7% | ||||||||
| 362 | ServiceSource International, Inc. (a) | 3,375 | ||||||
|
| |||||||
Semiconductors & Semiconductor Equipment — 3.3% |
| |||||||
| 173 | Cavium, Inc. (a) | 6,116 | ||||||
| 80 | Hittite Microwave Corp. (a) | 4,655 | ||||||
SEE NOTES TO FINANCIAL STATEMENTS.
| 16 | J.P. MORGAN SMALL CAP FUNDS | JUNE 30, 2013 | ||||
Table of Contents
| SHARES | SECURITY DESCRIPTION | VALUE($) | ||||||
| Common Stocks — Continued |
| ||||||
Semiconductors & Semiconductor Equipment — Continued |
| |||||||
| 406 | Inphi Corp. (a) | 4,466 | ||||||
| 110 | Teradyne, Inc. (a) | 1,934 | ||||||
|
| |||||||
| 17,171 | ||||||||
|
| |||||||
Software — 10.6% | ||||||||
| 159 | BroadSoft, Inc. (a) | 4,387 | ||||||
| 41 | CommVault Systems, Inc. (a) | 3,117 | ||||||
| 274 | Cyan, Inc. (a) | 2,862 | ||||||
| 143 | Fortinet, Inc. (a) | 2,502 | ||||||
| 72 | Gigamon, Inc. (a) | 1,980 | ||||||
| 77 | Guidewire Software, Inc. (a) | 3,245 | ||||||
| 119 | Imperva, Inc. (a) | 5,364 | ||||||
| 211 | Infoblox, Inc. (a) | 6,185 | ||||||
| 196 | Model N, Inc. (a) | 4,573 | ||||||
| 38 | NetSuite, Inc. (a) | 3,488 | ||||||
| 173 | Rally Software Development Corp., Class C (a) | 4,305 | ||||||
| 60 | SolarWinds, Inc. (a) | 2,334 | ||||||
| 76 | Sourcefire, Inc. (a) | 4,205 | ||||||
| 110 | Splunk, Inc. (a) | 5,122 | ||||||
| 26 | Tableau Software, Inc., Class A (a) | 1,426 | ||||||
|
| |||||||
| 55,095 | ||||||||
|
| |||||||
Total Information Technology | 131,866 | |||||||
|
| |||||||
| SHARES | SECURITY DESCRIPTION | VALUE($) | ||||||
Telecommunication Services — 0.5% | ||||||||
Wireless Telecommunication Services — 0.5% | ||||||||
| 438 | Boingo Wireless, Inc. (a) | 2,719 | ||||||
|
| |||||||
Total Common Stocks | 506,446 | |||||||
|
| |||||||
| NUMBER OF WARRANTS | ||||||||
| Warrants — 0.0% (g) |
| ||||||
Energy — 0.0% (g) | ||||||||
Oil, Gas & Consumable Fuels — 0.0% (g) | ||||||||
| 51 | Magnum Hunter Resources Corp., expiring 10/14/13 (a) | 7 | ||||||
|
| |||||||
| SHARES | ||||||||
| Short-Term Investment — 1.8% |
| ||||||
Investment Company — 1.8% | ||||||||
| 9,373 | JPMorgan Prime Money Market Fund, Institutional Class Shares, 0.030% (b) (l) | 9,373 | ||||||
|
| |||||||
Total Investments — 99.2% | 515,826 | |||||||
Other Assets in Excess of | 3,948 | |||||||
|
| |||||||
NET ASSETS — 100.0% | $ | 519,774 | ||||||
|
| |||||||
Percentages indicated are based on net assets.
SEE NOTES TO FINANCIAL STATEMENTS.
| JUNE 30, 2013 | J.P. MORGAN SMALL CAP FUNDS | 17 | ||||||
Table of Contents
JPMorgan Small Cap Core Fund
SCHEDULE OF PORTFOLIO INVESTMENTS
AS OF JUNE 30, 2013
(Amounts in thousands)
| SHARES | SECURITY DESCRIPTION | VALUE($) | ||||||
| Common Stocks — 96.8% |
| ||||||
Consumer Discretionary — 13.7% | ||||||||
Auto Components — 1.5% | ||||||||
| 145 | Cooper Tire & Rubber Co. | 4,813 | ||||||
| 79 | Standard Motor Products, Inc. | 2,723 | ||||||
| 36 | Stoneridge, Inc. (a) | 424 | ||||||
|
| |||||||
| 7,960 | ||||||||
|
| |||||||
Distributors — 0.4% | ||||||||
| 20 | Core-Mark Holding Co., Inc. | 1,251 | ||||||
| 51 | VOXX International Corp. (a) | 625 | ||||||
|
| |||||||
| 1,876 | ||||||||
|
| |||||||
Diversified Consumer Services — 0.2% |
| |||||||
| 13 | Bridgepoint Education, Inc. (a) | 163 | ||||||
| 9 | Capella Education Co. (a) | 383 | ||||||
| 9 | Carriage Services, Inc. | 148 | ||||||
| 5 | Coinstar, Inc. (a) | 299 | ||||||
| 93 | Corinthian Colleges, Inc. (a) | 207 | ||||||
|
| |||||||
| 1,200 | ||||||||
|
| |||||||
Hotels, Restaurants & Leisure — 2.2% |
| |||||||
| 68 | Ameristar Casinos, Inc. | 1,798 | ||||||
| 11 | Cracker Barrel Old Country Store, Inc. | 994 | ||||||
| 40 | Domino’s Pizza, Inc. | 2,343 | ||||||
| 23 | Jack in the Box, Inc. (a) | 912 | ||||||
| 178 | Ruth’s Hospitality Group, Inc. | 2,150 | ||||||
| 45 | SeaWorld Entertainment, Inc. | 1,593 | ||||||
| 115 | Sonic Corp. (a) | 1,679 | ||||||
|
| |||||||
| 11,469 | ||||||||
|
| |||||||
Household Durables — 2.0% | ||||||||
| 1 | CSS Industries, Inc. | 12 | ||||||
| 95 | Helen of Troy Ltd., (Bermuda) (a) | 3,626 | ||||||
| 20 | Jarden Corp. (a) | 853 | ||||||
| 68 | KB Home | 1,335 | ||||||
| 14 | Libbey, Inc. (a) | 333 | ||||||
| 49 | Lifetime Brands, Inc. | 668 | ||||||
| 14 | MDC Holdings, Inc. | 465 | ||||||
| 10 | NACCO Industries, Inc., Class A | 556 | ||||||
| 86 | Taylor Morrison Home Corp., Class A (a) | 2,099 | ||||||
| 27 | William Lyon Homes, Class A (a) | 691 | ||||||
|
| |||||||
| 10,638 | ||||||||
|
| |||||||
Leisure Equipment & Products — 0.3% |
| |||||||
| 2 | Arctic Cat, Inc. | 81 | ||||||
| 10 | Johnson Outdoors, Inc., Class A (a) | 254 | ||||||
| 84 | LeapFrog Enterprises, Inc. (a) | 823 | ||||||
| 6 | Sturm Ruger & Co., Inc. | 269 | ||||||
|
| |||||||
| 1,427 | ||||||||
|
| |||||||
| SHARES | SECURITY DESCRIPTION | VALUE($) | ||||||
Media — 0.9% | ||||||||
| 25 | Carmike Cinemas, Inc. (a) | 480 | ||||||
| 81 | Entercom Communications Corp., Class A (a) | 765 | ||||||
| 74 | Gray Television, Inc. (a) | 532 | ||||||
| 86 | Journal Communications, Inc., Class A (a) | 642 | ||||||
| 131 | LIN TV Corp., Class A (a) | 2,003 | ||||||
| 16 | Sinclair Broadcast Group, Inc., Class A | 476 | ||||||
|
| |||||||
| 4,898 | ||||||||
|
| |||||||
Multiline Retail — 0.9% | ||||||||
| 43 | Dillard’s, Inc., Class A | 3,500 | ||||||
| 99 | Tuesday Morning Corp. (a) | 1,026 | ||||||
|
| |||||||
| 4,526 | ||||||||
|
| |||||||
Specialty Retail — 3.6% | ||||||||
| 106 | Brown Shoe Co., Inc. | 2,289 | ||||||
| 58 | Cabela’s, Inc. (a) | 3,743 | ||||||
| 99 | Conn’s, Inc. (a) | 5,098 | ||||||
| 30 | Destination Maternity Corp. | 743 | ||||||
| 121 | Express, Inc. (a) | 2,545 | ||||||
| 12 | Finish Line, Inc. (The), Class A | 271 | ||||||
| 248 | OfficeMax, Inc. | 2,534 | ||||||
| 33 | Rent-A-Center, Inc. | 1,252 | ||||||
| 11 | Tilly’s, Inc., Class A (a) | 181 | ||||||
| 1 | Trans World Entertainment Corp. | 7 | ||||||
|
| |||||||
| 18,663 | ||||||||
|
| |||||||
Textiles, Apparel & Luxury Goods — 1.7% |
| |||||||
| 77 | G-III Apparel Group Ltd. (a) | 3,686 | ||||||
| 124 | Iconix Brand Group, Inc. (a) | 3,656 | ||||||
| 55 | Perry Ellis International, Inc. | 1,117 | ||||||
| 14 | RG Barry Corp. | 227 | ||||||
|
| |||||||
| 8,686 | ||||||||
|
| |||||||
Total Consumer Discretionary | 71,343 | |||||||
|
| |||||||
Consumer Staples — 4.6% | ||||||||
Beverages — 0.1% | ||||||||
| 7 | Coca-Cola Bottling Co. Consolidated | 422 | ||||||
|
| |||||||
Food & Staples Retailing — 2.2% |
| |||||||
| 9 | Andersons, Inc. (The) | 474 | ||||||
| 14 | Fairway Group Holdings Corp. (a) | 339 | ||||||
| 21 | Nash Finch Co. | 462 | ||||||
| 1,901 | Rite Aid Corp. (a) | 5,437 | ||||||
| 39 | Roundy’s, Inc. | 323 | ||||||
| 170 | Spartan Stores, Inc. | 3,142 | ||||||
| 169 | SUPERVALU, Inc. (a) | 1,051 | ||||||
| 10 | Village Super Market, Inc., Class A | 344 | ||||||
|
| |||||||
| 11,572 | ||||||||
|
| |||||||
SEE NOTES TO FINANCIAL STATEMENTS.
| 18 | J.P. MORGAN SMALL CAP FUNDS | JUNE 30, 2013 | ||||
Table of Contents
| SHARES | SECURITY DESCRIPTION | VALUE($) | ||||||
| Common Stocks — Continued |
| ||||||
Food Products — 1.5% | ||||||||
| 40 | B&G Foods, Inc. | 1,372 | ||||||
| 34 | Darling International, Inc. (a) | 636 | ||||||
| 19 | Fresh Del Monte Produce, Inc. | 516 | ||||||
| 16 | John B Sanfilippo & Son, Inc. | 317 | ||||||
| 184 | Pilgrim’s Pride Corp. (a) | 2,744 | ||||||
| 52 | Pinnacle Foods, Inc. | 1,265 | ||||||
| 17 | Sanderson Farms, Inc. | 1,103 | ||||||
|
| |||||||
| 7,953 | ||||||||
|
| |||||||
Personal Products — 0.8% | ||||||||
| 58 | Prestige Brands Holdings, Inc. (a) | 1,684 | ||||||
| 28 | Revlon, Inc., Class A (a) | 607 | ||||||
| 22 | USANA Health Sciences, Inc. (a) | 1,563 | ||||||
|
| |||||||
| 3,854 | ||||||||
|
| |||||||
Total Consumer Staples | 23,801 | |||||||
|
| |||||||
Energy — 4.8% | ||||||||
Energy Equipment & Services — 1.7% |
| |||||||
| 56 | C&J Energy Services, Inc. (a) | 1,089 | ||||||
| 49 | Dawson Geophysical Co. (a) | 1,821 | ||||||
| 62 | Forum Energy Technologies, Inc. (a) | 1,880 | ||||||
| 19 | Gulfmark Offshore, Inc., Class A | 866 | ||||||
| 63 | Helix Energy Solutions Group, Inc. (a) | 1,440 | ||||||
| 66 | Superior Energy Services, Inc. (a) | 1,703 | ||||||
|
| |||||||
| 8,799 | ||||||||
|
| |||||||
Oil, Gas & Consumable Fuels — 3.1% |
| |||||||
| 12 | Alon USA Energy, Inc. | 172 | ||||||
| 14 | Bonanza Creek Energy, Inc. (a) | 482 | ||||||
| 19 | Ceres, Inc. (a) | 59 | ||||||
| 70 | Delek U.S. Holdings, Inc. | 2,009 | ||||||
| 35 | Energy XXI Bermuda Ltd., (Bermuda) | 775 | ||||||
| 143 | EPL Oil & Gas, Inc. (a) | 4,198 | ||||||
| 63 | EXCO Resources, Inc. | 481 | ||||||
| 83 | Gastar Exploration Ltd. (a) | 221 | ||||||
| 189 | Renewable Energy Group, Inc. (a) | 2,694 | ||||||
| 12 | REX American Resources Corp. (a) | 357 | ||||||
| 25 | Vaalco Energy, Inc. (a) | 144 | ||||||
| 99 | W&T Offshore, Inc. | 1,415 | ||||||
| 308 | Warren Resources, Inc. (a) | 786 | ||||||
| 69 | Western Refining, Inc. | 1,931 | ||||||
| 4 | Westmoreland Coal Co. (a) | 46 | ||||||
| 15 | World Fuel Services Corp. | 596 | ||||||
|
| |||||||
| 16,366 | ||||||||
|
| |||||||
Total Energy | 25,165 | |||||||
|
| |||||||
| SHARES | SECURITY DESCRIPTION | VALUE($) | ||||||
Financials — 22.4% | ||||||||
Capital Markets — 0.7% | ||||||||
| 7 | Artisan Partners Asset Management, Inc. (a) | 364 | ||||||
| 87 | BGC Partners, Inc., Class A | 515 | ||||||
| 113 | Cowen Group, Inc., Class A (a) | 329 | ||||||
| 31 | Gladstone Capital Corp. | 255 | ||||||
| 92 | KCAP Financial, Inc. | 1,033 | ||||||
| 32 | Manning & Napier, Inc. | 570 | ||||||
| 20 | Piper Jaffray Cos. (a) | 638 | ||||||
| 8 | Prospect Capital Corp. | 83 | ||||||
| 8 | SWS Group, Inc. (a) | 42 | ||||||
|
| |||||||
| 3,829 | ||||||||
|
| |||||||
Commercial Banks — 7.3% | ||||||||
| 18 | Banco Latinoamericano de Comercio Exterior S.A., (Panama), Class E | 401 | ||||||
| 68 | BBCN Bancorp, Inc. | 967 | ||||||
| 12 | BNC Bancorp | 141 | ||||||
| 7 | Bridge Bancorp, Inc. | 155 | ||||||
| 101 | Cardinal Financial Corp. | 1,477 | ||||||
| 40 | Cathay General Bancorp | 812 | ||||||
| 8 | Center Bancorp, Inc. | 95 | ||||||
| 23 | Citizens & Northern Corp. | 444 | ||||||
| 4 | City Holding Co. | 160 | ||||||
| 8 | Community Trust Bancorp, Inc. | 278 | ||||||
| 203 | East West Bancorp, Inc. | 5,569 | ||||||
| 17 | Fidelity Southern Corp. (a) | 205 | ||||||
| 24 | Financial Institutions, Inc. | 447 | ||||||
| 150 | First Commonwealth Financial Corp. | 1,108 | ||||||
| 29 | First Community Bancshares, Inc. | 458 | ||||||
| 29 | First Financial Bancorp | 434 | ||||||
| 4 | First M&F Corp. | 55 | ||||||
| 23 | First Merchants Corp. | 386 | ||||||
| 49 | FirstMerit Corp. | 991 | ||||||
| 75 | FNB Corp. | 902 | ||||||
| 174 | Hanmi Financial Corp. (a) | 3,078 | ||||||
| 23 | Heartland Financial USA, Inc. | 643 | ||||||
| 23 | Huntington Bancshares, Inc. | 182 | ||||||
| 6 | Iberiabank Corp. | 306 | ||||||
| 11 | Lakeland Financial Corp. | 291 | ||||||
| 21 | MainSource Financial Group, Inc. | 281 | ||||||
| 19 | MetroCorp Bancshares, Inc. | 187 | ||||||
| 5 | National Bankshares, Inc. | 167 | ||||||
| 15 | NBT Bancorp, Inc. | 320 | ||||||
| 85 | OFG Bancorp, (Puerto Rico) | 1,538 | ||||||
| 7 | PacWest Bancorp | 224 | ||||||
| 49 | Park Sterling Corp. (a) | 289 | ||||||
SEE NOTES TO FINANCIAL STATEMENTS.
| JUNE 30, 2013 | J.P. MORGAN SMALL CAP FUNDS | 19 | ||||||
Table of Contents
JPMorgan Small Cap Core Fund
SCHEDULE OF PORTFOLIO INVESTMENTS
AS OF JUNE 30, 2013 (continued)
(Amounts in thousands)
| SHARES | SECURITY DESCRIPTION | VALUE($) | ||||||
| Common Stocks — Continued |
| ||||||
Commercial Banks — Continued | ||||||||
| 11 | Peoples Bancorp, Inc. | 234 | ||||||
| 50 | Pinnacle Financial Partners, Inc. (a) | 1,275 | ||||||
| 169 | Popular, Inc., (Puerto Rico) (a) | 5,132 | ||||||
| 15 | Preferred Bank (a) | 239 | ||||||
| 25 | PrivateBancorp, Inc. | 537 | ||||||
| 8 | Prosperity Bancshares, Inc. | 394 | ||||||
| 1 | Renasant Corp. | 32 | ||||||
| 28 | Sierra Bancorp | 420 | ||||||
| 79 | Southwest Bancorp, Inc. (a) | 1,048 | ||||||
| 70 | Susquehanna Bancshares, Inc. | 894 | ||||||
| 8 | SVB Financial Group (a) | 650 | ||||||
| 18 | Texas Capital Bancshares, Inc. (a) | 812 | ||||||
| 37 | Tristate Capital Holdings, Inc. (a) | 503 | ||||||
| 14 | WesBanco, Inc. | 362 | ||||||
| 22 | West Bancorporation, Inc. | 257 | ||||||
| 342 | Wilshire Bancorp, Inc. | 2,267 | ||||||
|
| |||||||
| 38,047 | ||||||||
|
| |||||||
Consumer Finance — 2.9% | ||||||||
| 19 | Cash America International, Inc. | 855 | ||||||
| 96 | DFC Global Corp. (a) | 1,319 | ||||||
| 94 | Encore Capital Group, Inc. (a) | 3,119 | ||||||
| 24 | Ezcorp, Inc., Class A (a) | 403 | ||||||
| 84 | Green Dot Corp., Class A (a) | 1,674 | ||||||
| 38 | Nelnet, Inc., Class A | 1,382 | ||||||
| 13 | Portfolio Recovery Associates, Inc. (a) | 1,967 | ||||||
| 48 | World Acceptance Corp. (a) | 4,173 | ||||||
|
| |||||||
| 14,892 | ||||||||
|
| |||||||
Insurance — 2.5% | ||||||||
| 216 | American Equity Investment Life Holding Co. | 3,385 | ||||||
| 23 | American Safety Insurance Holdings Ltd., (Bermuda) (a) | 657 | ||||||
| 38 | Aspen Insurance Holdings Ltd., (Bermuda) | 1,395 | ||||||
| 256 | CNO Financial Group, Inc. | 3,314 | ||||||
| 13 | Crawford & Co., Class B | 74 | ||||||
| 9 | Horace Mann Educators Corp. | 215 | ||||||
| 57 | Meadowbrook Insurance Group, Inc. | 458 | ||||||
| 7 | Montpelier Re Holdings Ltd., (Bermuda) | 175 | ||||||
| 92 | National Financial Partners Corp. (a) | 2,318 | ||||||
| 18 | Selective Insurance Group, Inc. | 424 | ||||||
| 8 | Stewart Information Services Corp. | 196 | ||||||
| 6 | Validus Holdings Ltd., (Bermuda) | 223 | ||||||
|
| |||||||
| 12,834 | ||||||||
|
| |||||||
Real Estate Investment Trusts (REITs) — 7.8% |
| |||||||
| 5 | Agree Realty Corp. (m) | 151 | ||||||
| SHARES | SECURITY DESCRIPTION | VALUE($) | ||||||
Real Estate Investment Trusts (REITs) — Continued |
| |||||||
| 23 | American Campus Communities, Inc. | 919 | ||||||
| 485 | Anworth Mortgage Asset Corp. | 2,713 | ||||||
| 104 | Ashford Hospitality Trust, Inc. | 1,186 | ||||||
| 76 | CapLease, Inc. | 643 | ||||||
| 355 | Capstead Mortgage Corp. | 4,295 | ||||||
| 75 | CBL & Associates Properties, Inc. | 1,598 | ||||||
| 46 | Chatham Lodging Trust | 789 | ||||||
| 40 | Chesapeake Lodging Trust | 823 | ||||||
| 17 | Colonial Properties Trust | 415 | ||||||
| 59 | Coresite Realty Corp. | �� | 1,890 | |||||
| 149 | DCT Industrial Trust, Inc. | 1,064 | ||||||
| 49 | DDR Corp. | 809 | ||||||
| 16 | EastGroup Properties, Inc. | 912 | ||||||
| 120 | Education Realty Trust, Inc. | 1,230 | ||||||
| 217 | First Industrial Realty Trust, Inc. | 3,298 | ||||||
| 82 | GEO Group, Inc. (The) | 2,767 | ||||||
| 44 | Glimcher Realty Trust | 483 | ||||||
| 8 | Home Properties, Inc. | 510 | ||||||
| 32 | LaSalle Hotel Properties | 785 | ||||||
| 260 | Lexington Realty Trust | 3,039 | ||||||
| 20 | LTC Properties, Inc. | 785 | ||||||
| 8 | Mission West Properties, Inc. (a) (i) | — | ||||||
| 16 | Parkway Properties, Inc. | 271 | ||||||
| 69 | Pennsylvania Real Estate Investment Trust | 1,310 | ||||||
| 109 | Potlatch Corp. | 4,424 | ||||||
| 12 | PS Business Parks, Inc. | 873 | ||||||
| 83 | RAIT Financial Trust | 625 | ||||||
| 15 | Ramco-Gershenson Properties Trust | 225 | ||||||
| 103 | Redwood Trust, Inc. | 1,756 | ||||||
| 7 | Sun Communities, Inc. | 363 | ||||||
|
| |||||||
| 40,951 | ||||||||
|
| |||||||
Thrifts & Mortgage Finance — 1.2% |
| |||||||
| 12 | BofI Holding, Inc. (a) | 541 | ||||||
| 10 | Heritage Financial Group, Inc. | 145 | ||||||
| 31 | HomeStreet, Inc. | 654 | ||||||
| 15 | OceanFirst Financial Corp. | 229 | ||||||
| 114 | Ocwen Financial Corp. (a) | 4,703 | ||||||
| 12 | PennyMac Financial Services, Inc., Class A (a) | 255 | ||||||
|
| |||||||
| 6,527 | ||||||||
|
| |||||||
Total Financials | 117,080 | |||||||
|
| |||||||
Health Care — 10.6% | ||||||||
Biotechnology — 2.6% | ||||||||
| 9 | Acorda Therapeutics, Inc. (a) (m) | 297 | ||||||
| 37 | Aegerion Pharmaceuticals, Inc. (a) (m) | 2,325 | ||||||
SEE NOTES TO FINANCIAL STATEMENTS.
| 20 | J.P. MORGAN SMALL CAP FUNDS | JUNE 30, 2013 | ||||
Table of Contents
| SHARES | SECURITY DESCRIPTION | VALUE($) | ||||||
| Common Stocks — Continued |
| ||||||
Biotechnology — Continued | ||||||||
| 17 | Alnylam Pharmaceuticals, Inc. (a) | 512 | ||||||
| 69 | AMAG Pharmaceuticals, Inc. (a) (m) | 1,524 | ||||||
| 104 | Ambit Biosciences Corp. (a) | 727 | ||||||
| 11 | Bluebird Bio, Inc. (a) | 270 | ||||||
| 36 | Celldex Therapeutics, Inc. (a) | 557 | ||||||
| 10 | Cytokinetics, Inc. (a) | 116 | ||||||
| 6 | Durata Therapeutics, Inc. (a) | 40 | ||||||
| 29 | Esperion Therapeutics, Inc. (a) | 407 | ||||||
| 73 | Infinity Pharmaceuticals, Inc. (a) | 1,188 | ||||||
| 2 | MiMedx Group, Inc. (a) | 11 | ||||||
| 43 | Pharmacyclics, Inc. (a) | 3,433 | ||||||
| 18 | PTC Therapeutics, Inc. (a) | 270 | ||||||
| 10 | Raptor Pharmaceutical Corp. (a) | 96 | ||||||
| 317 | Threshold Pharmaceuticals, Inc. (a) | 1,668 | ||||||
|
| |||||||
| 13,441 | ||||||||
|
| |||||||
Health Care Equipment & Supplies — 2.6% |
| |||||||
| 102 | Greatbatch, Inc. (a) | 3,331 | ||||||
| 33 | MAKO Surgical Corp. (a) | 400 | ||||||
| 19 | Medical Action Industries, Inc. (a) | 149 | ||||||
| 216 | NuVasive, Inc. (a) | 5,364 | ||||||
| 13 | Orthofix International N.V., (Netherlands) (a) | 360 | ||||||
| 24 | PhotoMedex, Inc. (a) | 374 | ||||||
| 219 | RTI Biologics, Inc. (a) | 824 | ||||||
| 20 | Sirona Dental Systems, Inc. (a) | 1,285 | ||||||
| 31 | STERIS Corp. | 1,321 | ||||||
|
| |||||||
| 13,408 | ||||||||
|
| |||||||
Health Care Providers & Services — 2.7% |
| |||||||
| 127 | Amsurg Corp. (a) | 4,459 | ||||||
| 61 | Centene Corp. (a) | 3,179 | ||||||
| 115 | Gentiva Health Services, Inc. (a) | 1,143 | ||||||
| 80 | Molina Healthcare, Inc. (a) | 2,967 | ||||||
| 51 | Owens & Minor, Inc. | 1,732 | ||||||
| 36 | Select Medical Holdings Corp. | 293 | ||||||
| 7 | Triple-S Management Corp., (Puerto Rico), Class B (a) | 153 | ||||||
|
| |||||||
| 13,926 | ||||||||
|
| |||||||
Health Care Technology — 0.1% | ||||||||
| 42 | MedAssets, Inc. (a) | 752 | ||||||
|
| |||||||
Life Sciences Tools & Services — 0.6% | ||||||||
| 86 | Cambrex Corp. (a) | 1,208 | ||||||
| 46 | Furiex Pharmaceuticals, Inc. (a) | 1,574 | ||||||
| 75 | NanoString Technologies, Inc. (a) | 602 | ||||||
|
| |||||||
| 3,384 | ||||||||
|
| |||||||
| SHARES | SECURITY DESCRIPTION | VALUE($) | ||||||
Pharmaceuticals — 2.0% | ||||||||
| 13 | Cornerstone Therapeutics, Inc. (a) | 107 | ||||||
| 59 | Impax Laboratories, Inc. (a) | 1,185 | ||||||
| 35 | Jazz Pharmaceuticals plc, (Ireland) (a) | 2,371 | ||||||
| 79 | Lannett Co., Inc. (a) | 947 | ||||||
| 162 | Medicines Co. (The) (a) | 4,995 | ||||||
| 103 | Sciclone Pharmaceuticals, Inc. (a) | 511 | ||||||
| 15 | ViroPharma, Inc. (a) | 430 | ||||||
|
| |||||||
| 10,546 | ||||||||
|
| |||||||
Total Health Care | 55,457 | |||||||
|
| |||||||
Industrials — 15.5% | ||||||||
Aerospace & Defense — 1.8% | ||||||||
| 56 | AAR Corp. (m) | 1,240 | ||||||
| 7 | Curtiss-Wright Corp. | 245 | ||||||
| 36 | Engility Holdings, Inc. (a) | 1,017 | ||||||
| 28 | Esterline Technologies Corp. (a) | 2,039 | ||||||
| 28 | LMI Aerospace, Inc. (a) | 528 | ||||||
| 62 | Sypris Solutions, Inc. | 198 | ||||||
| 56 | Triumph Group, Inc. | 4,401 | ||||||
|
| |||||||
| 9,668 | ||||||||
|
| |||||||
Air Freight & Logistics — 0.3% | ||||||||
| 20 | Atlas Air Worldwide Holdings, Inc. (a) | 884 | ||||||
| 19 | Park-Ohio Holdings Corp. (a) | 633 | ||||||
|
| |||||||
| 1,517 | ||||||||
|
| |||||||
Airlines — 1.3% | ||||||||
| 58 | Alaska Air Group, Inc. (a) (m) | 3,005 | ||||||
| 236 | Republic Airways Holdings, Inc. (a) | 2,672 | ||||||
| 70 | SkyWest, Inc. | 948 | ||||||
|
| |||||||
| 6,625 | ||||||||
|
| |||||||
Building Products — 0.1% | ||||||||
| 6 | Gibraltar Industries, Inc. (a) | 83 | ||||||
| 17 | Ply Gem Holdings, Inc. (a) | 349 | ||||||
|
| |||||||
| 432 | ||||||||
|
| |||||||
Commercial Services & Supplies — 3.2% |
| |||||||
| 38 | Ceco Environmental Corp. | 466 | ||||||
| 437 | Cenveo, Inc. (a) | 931 | ||||||
| 7 | Courier Corp. | 96 | ||||||
| 130 | Deluxe Corp. | 4,508 | ||||||
| 13 | Herman Miller, Inc. | 357 | ||||||
| 141 | Kimball International, Inc., Class B | 1,373 | ||||||
| 60 | Knoll, Inc. | 853 | ||||||
| 100 | Quad/Graphics, Inc. | 2,407 | ||||||
| 150 | Steelcase, Inc., Class A | 2,180 | ||||||
| 14 | TMS International Corp., Class A | 201 | ||||||
SEE NOTES TO FINANCIAL STATEMENTS.
| JUNE 30, 2013 | J.P. MORGAN SMALL CAP FUNDS | 21 | ||||||
Table of Contents
JPMorgan Small Cap Core Fund
SCHEDULE OF PORTFOLIO INVESTMENTS
AS OF JUNE 30, 2013 (continued)
(Amounts in thousands)
| SHARES | SECURITY DESCRIPTION | VALUE($) | ||||||
| Common Stocks — Continued |
| ||||||
Commercial Services & Supplies — Continued | ||||||||
| 6 | UniFirst Corp. | 584 | ||||||
| 21 | United Stationers, Inc. | 688 | ||||||
| 75 | Viad Corp. | 1,846 | ||||||
|
| |||||||
| 16,490 | ||||||||
|
| |||||||
Construction & Engineering — 0.8% |
| |||||||
| 13 | Argan, Inc. | 206 | ||||||
| 56 | EMCOR Group, Inc. | 2,276 | ||||||
| 13 | Michael Baker Corp. | 347 | ||||||
| 79 | Tutor Perini Corp. (a) | 1,435 | ||||||
|
| |||||||
| 4,264 | ||||||||
|
| |||||||
Electrical Equipment — 1.6% | ||||||||
| 22 | Acuity Brands, Inc. (m) | 1,684 | ||||||
| 73 | Brady Corp., Class A | 2,238 | ||||||
| 37 | EnerSys, Inc. | 1,790 | ||||||
| 31 | Generac Holdings, Inc. | 1,143 | ||||||
| 23 | LSI Industries, Inc. | 188 | ||||||
| 17 | Regal-Beloit Corp. | 1,089 | ||||||
|
| |||||||
| 8,132 | ||||||||
|
| |||||||
Machinery — 3.9% | ||||||||
| 17 | Albany International Corp., Class A | 557 | ||||||
| 29 | Barnes Group, Inc. | 879 | ||||||
| 24 | Columbus McKinnon Corp. (a) | 518 | ||||||
| 70 | EnPro Industries, Inc. (a) | 3,568 | ||||||
| 79 | Federal Signal Corp. (a) | 692 | ||||||
| 37 | FreightCar America, Inc. | 620 | ||||||
| 34 | Global Brass & Copper Holdings, Inc. (a) | 444 | ||||||
| 22 | Hardinge, Inc. | 330 | ||||||
| 20 | Hyster-Yale Materials Handling, Inc. | 1,237 | ||||||
| 38 | Kadant, Inc. | 1,134 | ||||||
| 27 | LB Foster Co., Class A | 1,183 | ||||||
| 50 | NN, Inc. | 565 | ||||||
| 1 | Proto Labs, Inc. (a) | 58 | ||||||
| 5 | Standex International Corp. | 253 | ||||||
| 49 | Trimas Corp. (a) | 1,816 | ||||||
| 93 | Wabash National Corp. (a) | 945 | ||||||
| 90 | Wabtec Corp. | 4,814 | ||||||
| 6 | Watts Water Technologies, Inc., Class A | 267 | ||||||
| 43 | Xerium Technologies, Inc. (a) | 433 | ||||||
|
| |||||||
| 20,313 | ||||||||
|
| |||||||
Professional Services — 1.1% | ||||||||
| 43 | Barrett Business Services, Inc. | 2,266 | ||||||
| 10 | Kelly Services, Inc., Class A | 173 | ||||||
| 132 | RPX Corp. (a) | 2,224 | ||||||
| 33 | TrueBlue, Inc. (a) | 697 | ||||||
| SHARES | SECURITY DESCRIPTION | VALUE($) | ||||||
Professional Services — Continued | ||||||||
| 12 | VSE Corp. | 481 | ||||||
|
| |||||||
| 5,841 | ||||||||
|
| |||||||
Road & Rail — 0.8% | ||||||||
| 3 | AMERCO | 486 | ||||||
| 13 | Avis Budget Group, Inc. (a) | 365 | ||||||
| 23 | Celadon Group, Inc. | 428 | ||||||
| 111 | Quality Distribution, Inc. (a) | 980 | ||||||
| 19 | Saia, Inc. (a) | 571 | ||||||
| 78 | Swift Transportation Co. (a) | 1,289 | ||||||
| 13 | Universal Truckload Services, Inc. (a) | 316 | ||||||
|
| |||||||
| 4,435 | ||||||||
|
| |||||||
Trading Companies & Distributors — 0.6% |
| |||||||
| 42 | Applied Industrial Technologies, Inc. | 2,006 | ||||||
| 9 | Beacon Roofing Supply, Inc. (a) | 333 | ||||||
| 16 | Edgen Group, Inc. (a) | 102 | ||||||
| 17 | United Rentals, Inc. (a) | 833 | ||||||
|
| |||||||
| 3,274 | ||||||||
|
| |||||||
Total Industrials | 80,991 | |||||||
|
| |||||||
Information Technology — 16.4% | ||||||||
Communications Equipment — 1.1% | ||||||||
| 2 | Alliance Fiber Optic Products, Inc. | 48 | ||||||
| 122 | ARRIS Group, Inc. (a) | 1,743 | ||||||
| 73 | Aviat Networks, Inc. (a) | 192 | ||||||
| 12 | CalAmp Corp. (a) | 177 | ||||||
| 21 | Comtech Telecommunications Corp. | 551 | ||||||
| 335 | Harmonic, Inc. (a) | 2,125 | ||||||
| 11 | Oplink Communications, Inc. (a) | 189 | ||||||
| 24 | PC-Tel, Inc. | 202 | ||||||
| 15 | Plantronics, Inc. | 659 | ||||||
|
| |||||||
| 5,886 | ||||||||
|
| |||||||
Computers & Peripherals — 0.5% |
| |||||||
| 64 | Avid Technology, Inc. (a) | 374 | ||||||
| 50 | Datalink Corp. (a) | 536 | ||||||
| — | (h) | Hutchinson Technology, Inc. (a) | 2 | |||||
| 86 | Silicon Graphics International Corp. (a) | 1,149 | ||||||
| 15 | Synaptics, Inc. (a) | 586 | ||||||
|
| |||||||
| 2,647 | ||||||||
|
| |||||||
Electronic Equipment, Instruments & Components — 3.0% |
| |||||||
| 154 | Audience, Inc. (a) | 2,036 | ||||||
| 92 | Benchmark Electronics, Inc. (a) | 1,853 | ||||||
| 72 | Insight Enterprises, Inc. (a) | 1,269 | ||||||
| 13 | Littelfuse, Inc. | 948 | ||||||
| 45 | Newport Corp. (a) | 628 | ||||||
SEE NOTES TO FINANCIAL STATEMENTS.
| 22 | J.P. MORGAN SMALL CAP FUNDS | JUNE 30, 2013 | ||||
Table of Contents
| SHARES | SECURITY DESCRIPTION | VALUE($) | ||||||
| Common Stocks — Continued |
| ||||||
Electronic Equipment, Instruments & Components — Continued |
| |||||||
| 448 | Sanmina Corp. (a) | 6,426 | ||||||
| 55 | SYNNEX Corp. (a) | 2,321 | ||||||
| 32 | TTM Technologies, Inc. (a) | 271 | ||||||
|
| |||||||
| 15,752 | ||||||||
|
| |||||||
Internet Software & Services — 2.9% |
| |||||||
| 142 | Digital River, Inc. (a) | 2,656 | ||||||
| 32 | Gogo, Inc. (a) | 440 | ||||||
| 9 | Marketo, Inc. (a) | 216 | ||||||
| 10 | RealNetworks, Inc. (a) | 73 | ||||||
| 15 | Textura Corp. (a) | 377 | ||||||
| 195 | Tremor Video, Inc. (a) | 1,751 | ||||||
| 533 | United Online, Inc. | 4,038 | ||||||
| 177 | WebMD Health Corp. (a) | 5,204 | ||||||
| 5 | Xoom Corp. (a) | 122 | ||||||
|
| |||||||
| 14,877 | ||||||||
|
| |||||||
IT Services — 2.2% | ||||||||
| 11 | Blackhawk Network Holdings, Inc. (a) | 264 | ||||||
| 12 | CACI International, Inc., Class A (a) | 781 | ||||||
| 131 | CSG Systems International, Inc. (a) | 2,841 | ||||||
| 12 | EVERTEC, Inc., (Puerto Rico) (a) | 259 | ||||||
| 3 | Gartner, Inc. (a) | 148 | ||||||
| 35 | Global Cash Access Holdings, Inc. (a) | 218 | ||||||
| 48 | Hackett Group, Inc. (The) | 248 | ||||||
| 70 | Lionbridge Technologies, Inc. (a) | 203 | ||||||
| 7 | ManTech International Corp., Class A | 170 | ||||||
| 18 | TeleTech Holdings, Inc. (a) | 422 | ||||||
| 243 | Unisys Corp. (a) | 5,370 | ||||||
| 35 | VeriFone Systems, Inc. (a) | 595 | ||||||
|
| |||||||
| 11,519 | ||||||||
|
| |||||||
Semiconductors & Semiconductor Equipment — 3.0% |
| |||||||
| 17 | Alpha & Omega Semiconductor Ltd. (a) | 131 | ||||||
| 124 | Amkor Technology, Inc. (a) | 523 | ||||||
| 34 | Brooks Automation, Inc. | 334 | ||||||
| 4 | Cirrus Logic, Inc. (a) | 76 | ||||||
| 107 | Entegris, Inc. (a) | 1,006 | ||||||
| 95 | First Solar, Inc. (a) | 4,254 | ||||||
| 76 | Integrated Silicon Solution, Inc. (a) | 833 | ||||||
| 4 | Intermolecular, Inc. (a) | 31 | ||||||
| 62 | Lattice Semiconductor Corp. (a) | 313 | ||||||
| 9 | M/A-COM Technology Solutions Holdings, Inc. (a) | 131 | ||||||
| 63 | Nanometrics, Inc. (a) | 930 | ||||||
| 56 | Pericom Semiconductor Corp. (a) | 396 | ||||||
| 34 | Photronics, Inc. (a) | 274 | ||||||
| SHARES | SECURITY DESCRIPTION | VALUE($) | ||||||
Semiconductors & Semiconductor Equipment — Continued |
| |||||||
| 141 | PMC-Sierra, Inc. (a) | 893 | ||||||
| 100 | Skyworks Solutions, Inc. (a) | 2,178 | ||||||
| 220 | Spansion, Inc., Class A (a) | 2,749 | ||||||
| 115 | Ultra Clean Holdings (a) | 696 | ||||||
|
| |||||||
| 15,748 | ||||||||
|
| |||||||
Software — 3.7% | ||||||||
| 71 | Actuate Corp. (a) (m) | 469 | ||||||
| 38 | Advent Software, Inc. (a) (m) | 1,325 | ||||||
| 85 | Aspen Technology, Inc. (a) | 2,453 | ||||||
| 43 | Cyan, Inc. (a) | 451 | ||||||
| 18 | Gigamon, Inc. (a) | 499 | ||||||
| 9 | Manhattan Associates, Inc. (a) | 694 | ||||||
| 17 | Monotype Imaging Holdings, Inc. | 440 | ||||||
| 159 | Pegasystems, Inc. | 5,270 | ||||||
| 28 | Progress Software Corp. (a) | 647 | ||||||
| 45 | PTC, Inc. (a) | 1,106 | ||||||
| 8 | Rovi Corp. (a) | 178 | ||||||
| 17 | Tableau Software, Inc., Class A (a) | 953 | ||||||
| 254 | Take-Two Interactive Software, Inc. (a) | 3,801 | ||||||
| 98 | TeleCommunication Systems, Inc., Class A (a) | 229 | ||||||
| 53 | Telenav, Inc. (a) | 277 | ||||||
| 22 | TIBCO Software, Inc. (a) | 473 | ||||||
|
| |||||||
| 19,265 | ||||||||
|
| |||||||
Total Information Technology | 85,694 | |||||||
|
| |||||||
Materials — 4.6% | ||||||||
Chemicals — 1.9% | ||||||||
| 41 | A Schulman, Inc. | 1,094 | ||||||
| 16 | American Pacific Corp. (a) | 442 | ||||||
| 65 | Axiall Corp. | 2,759 | ||||||
| 5 | FutureFuel Corp. | 65 | ||||||
| 28 | H.B. Fuller Co. | 1,040 | ||||||
| 6 | Innospec, Inc. | 233 | ||||||
| 39 | Koppers Holdings, Inc. | 1,493 | ||||||
| 46 | Minerals Technologies, Inc. | 1,894 | ||||||
| 71 | OMNOVA Solutions, Inc. (a) | 569 | ||||||
|
| |||||||
| 9,589 | ||||||||
|
| |||||||
Construction Materials — 0.3% | ||||||||
| 185 | Headwaters, Inc. (a) | 1,637 | ||||||
|
| |||||||
Containers & Packaging — 1.1% | ||||||||
| 25 | Boise, Inc. | 209 | ||||||
| 243 | Graphic Packaging Holding Co. (a) | 1,882 | ||||||
| 36 | Rock Tenn Co., Class A | 3,586 | ||||||
|
| |||||||
| 5,677 | ||||||||
|
| |||||||
SEE NOTES TO FINANCIAL STATEMENTS.
| JUNE 30, 2013 | J.P. MORGAN SMALL CAP FUNDS | 23 | ||||||
Table of Contents
JPMorgan Small Cap Core Fund
SCHEDULE OF PORTFOLIO INVESTMENTS
AS OF JUNE 30, 2013 (continued)
(Amounts in thousands, except number of contracts)
| SHARES | SECURITY DESCRIPTION | VALUE($) | ||||||
| Common Stocks — Continued |
| ||||||
Metals & Mining — 0.8% | ||||||||
| 94 | Coeur Mining, Inc. (a) | 1,245 | ||||||
| 31 | Revett Minerals, Inc. (a) | 20 | ||||||
| 27 | SunCoke Energy, Inc. (a) | 372 | ||||||
| 11 | U.S. Silica Holdings, Inc. | 220 | ||||||
| 77 | Worthington Industries, Inc. | 2,435 | ||||||
|
| |||||||
| 4,292 | ||||||||
|
| |||||||
Paper & Forest Products — 0.5% | ||||||||
| 23 | Boise Cascade Co. (a) | 574 | ||||||
| 40 | Buckeye Technologies, Inc. | 1,463 | ||||||
| 56 | Resolute Forest Products, Inc., (Canada) (a) | 741 | ||||||
|
| |||||||
| 2,778 | ||||||||
|
| |||||||
Total Materials | 23,973 | |||||||
|
| |||||||
Telecommunication Services — 1.2% | ||||||||
Diversified Telecommunication Services — 1.1% |
| |||||||
| 30 | Atlantic Tele-Network, Inc. | 1,495 | ||||||
| 8 | Consolidated Communications Holdings, Inc. | 141 | ||||||
| 58 | IDT Corp., Class B | 1,081 | ||||||
| 90 | Neutral Tandem, Inc. | 515 | ||||||
| 108 | Premiere Global Services, Inc. (a) | 1,307 | ||||||
| 473 | Vonage Holdings Corp. (a) | 1,337 | ||||||
|
| |||||||
| 5,876 | ||||||||
|
| |||||||
Wireless Telecommunication Services — 0.1% |
| |||||||
| 19 | NII Holdings, Inc. (a) | 128 | ||||||
| 22 | USA Mobility, Inc. | 297 | ||||||
|
| |||||||
| 425 | ||||||||
|
| |||||||
Total Telecommunication Services | 6,301 | |||||||
|
| |||||||
Utilities — 3.0% | ||||||||
Electric Utilities — 2.2% | ||||||||
| 58 | El Paso Electric Co. | 2,038 | ||||||
| 20 | Empire District Electric Co. (The) | 453 | ||||||
| 33 | IDACORP, Inc. | 1,595 | ||||||
| 12 | MGE Energy, Inc. | 635 | ||||||
| 163 | Portland General Electric Co. | 4,999 | ||||||
| 32 | UNS Energy Corp. | 1,431 | ||||||
| 11 | Westar Energy, Inc. | 364 | ||||||
|
| |||||||
| 11,515 | ||||||||
|
| |||||||
| SHARES | SECURITY DESCRIPTION | VALUE($) | ||||||
Gas Utilities — 0.7% | ||||||||
| 2 | AGL Resources, Inc. (m) | 102 | ||||||
| 6 | Chesapeake Utilities Corp. | 288 | ||||||
| 20 | Laclede Group, Inc. (The) | 891 | ||||||
| 28 | New Jersey Resources Corp. | 1,171 | ||||||
| 9 | Northwest Natural Gas Co. | 374 | ||||||
| 16 | Southwest Gas Corp. | 753 | ||||||
| 10 | WGL Holdings, Inc. | 441 | ||||||
|
| |||||||
| ‘ | 4,020 | |||||||
|
| |||||||
Water Utilities — 0.1% | ||||||||
| 6 | Artesian Resources Corp., Class A | 122 | ||||||
| 25 | Consolidated Water Co., Ltd., (Cayman Islands) | 281 | ||||||
|
| |||||||
| 403 | ||||||||
|
| |||||||
Total Utilities | 15,938 | |||||||
|
| |||||||
Total Common Stocks | 505,743 | |||||||
|
| |||||||
| PRINCIPAL AMOUNT($) | ||||||||
| U.S. Treasury Obligation — 0.2% |
| ||||||
| 1,025 | U.S. Treasury Note, | 1,025 | ||||||
|
| |||||||
| SHARES | ||||||||
| Short-Term Investment — 2.6% | |||||||
Investment Company — 2.6% | ||||||||
| 13,324 | JPMorgan Prime Money Market Fund, Institutional Class Shares, | 13,324 | ||||||
|
| |||||||
Total Investments — 99.6% | 520,092 | |||||||
Other Assets in Excess of | 2,203 | |||||||
|
| |||||||
NET ASSETS — 100.0% | $ | 522,295 | ||||||
|
| |||||||
Percentages indicated are based on net assets.
| Futures Contracts | ||||||||||||||||
| NUMBER OF CONTRACTS | DESCRIPTION | EXPIRATION DATE | NOTIONAL VALUE AT 06/30/13 | NET UNREALIZED APPRECIATION (DEPRECIATION) | ||||||||||||
Long Futures Outstanding | ||||||||||||||||
| 156 | E-mini Russell 2000 | 09/20/13 | $ | 15,205 | $ | 202 | ||||||||||
|
| |||||||||||||||
SEE NOTES TO FINANCIAL STATEMENTS.
| 24 | J.P. MORGAN SMALL CAP FUNDS | JUNE 30, 2013 | ||||
Table of Contents
JPMorgan Small Cap Equity Fund
SCHEDULE OF PORTFOLIO INVESTMENTS
AS OF JUNE 30, 2013
(Amounts in thousands)
| SHARES | SECURITY DESCRIPTION | VALUE($) | ||||||
| Common Stocks — 97.2% |
| ||||||
Consumer Discretionary — 20.7% |
| |||||||
Auto Components — 1.8% |
| |||||||
| 1,359 | Allison Transmission Holdings, Inc. | 31,355 | ||||||
| 396 | Drew Industries, Inc. | 15,575 | ||||||
|
| |||||||
| 46,930 | ||||||||
|
| |||||||
Distributors — 1.2% |
| |||||||
| 617 | Pool Corp. | 32,359 | ||||||
|
| |||||||
Hotels, Restaurants & Leisure — 6.9% |
| |||||||
| 1,359 | Brinker International, Inc. | 53,583 | ||||||
| 379 | Cracker Barrel Old Country Store, Inc. | 35,850 | ||||||
| 725 | Monarch Casino & Resort, Inc. (a) | 12,216 | ||||||
| 412 | Papa John’s International, Inc. (a) | 26,924 | ||||||
| 791 | Penn National Gaming, Inc. (a) | 41,816 | ||||||
| 876 | SHFL Entertainment, Inc. (a) | 15,513 | ||||||
|
| |||||||
| 185,902 | ||||||||
|
| |||||||
Household Durables — 2.3% |
| |||||||
| 1,434 | Jarden Corp. (a) | 62,741 | ||||||
|
| |||||||
Leisure Equipment & Products — 0.6% |
| |||||||
| 522 | Brunswick Corp. | 16,683 | ||||||
|
| |||||||
Media — 2.2% |
| |||||||
| 1,231 | Cinemark Holdings, Inc. | 34,371 | ||||||
| 327 | Morningstar, Inc. | 25,350 | ||||||
|
| |||||||
| 59,721 | ||||||||
|
| |||||||
Specialty Retail — 2.8% |
| |||||||
| 2,565 | American Eagle Outfitters, Inc. | 46,839 | ||||||
| 1,669 | Chico’s FAS, Inc. | 28,470 | ||||||
|
| |||||||
| 75,309 | ||||||||
|
| |||||||
Textiles, Apparel & Luxury Goods — 2.9% |
| |||||||
| 1,062 | Crocs, Inc. (a) | 17,531 | ||||||
| 458 | Deckers Outdoor Corp. (a) | 23,131 | ||||||
| 615 | Iconix Brand Group, Inc. (a) | 18,091 | ||||||
| 2,914 | Quiksilver, Inc. (a) | 18,766 | ||||||
|
| |||||||
| 77,519 | ||||||||
|
| |||||||
Total Consumer Discretionary | 557,164 | |||||||
|
| |||||||
Consumer Staples — 1.2% |
| |||||||
Food Products — 1.2% |
| |||||||
| 426 | J&J Snack Foods Corp. | 33,152 | ||||||
|
| |||||||
Energy — 5.8% |
| |||||||
Energy Equipment & Services — 2.8% |
| |||||||
| 2,157 | Patterson-UTI Energy, Inc. | 41,749 | ||||||
| 607 | Tidewater, Inc. | 34,561 | ||||||
|
| |||||||
| 76,310 | ||||||||
|
| |||||||
| SHARES | SECURITY DESCRIPTION | VALUE($) | ||||||
Oil, Gas & Consumable Fuels — 3.0% |
| |||||||
| 708 | Approach Resources, Inc. (a) | 17,405 | ||||||
| 641 | Cimarex Energy Co. | 41,662 | ||||||
| 2,785 | Resolute Energy Corp. (a) | 22,226 | ||||||
|
| |||||||
| 81,293 | ||||||||
|
| |||||||
Total Energy | 157,603 | |||||||
|
| |||||||
Financials — 22.0% |
| |||||||
Capital Markets — 3.5% |
| |||||||
| 553 | Calamos Asset Management, Inc., Class A | 5,803 | ||||||
| 447 | Greenhill & Co., Inc. | 20,426 | ||||||
| 2,360 | HFF, Inc., Class A | 41,944 | ||||||
| 2,823 | Janus Capital Group, Inc. | 24,024 | ||||||
| 401 | JMP Group, Inc. | 2,665 | ||||||
|
| |||||||
| 94,862 | ||||||||
|
| |||||||
Commercial Banks — 9.2% |
| |||||||
| 4,146 | Associated Banc-Corp. | 64,471 | ||||||
| 1,513 | First Financial Bancorp | 22,545 | ||||||
| 111 | First of Long Island Corp. (The) | 3,693 | ||||||
| 929 | First Republic Bank | 35,747 | ||||||
| 942 | Glacier Bancorp, Inc. | 20,906 | ||||||
| 430 | Iberiabank Corp. | 23,074 | ||||||
| 3,103 | Umpqua Holdings Corp. | 46,575 | ||||||
| 1,973 | Western Alliance Bancorp (a) | 31,226 | ||||||
|
| |||||||
| 248,237 | ||||||||
|
| |||||||
Insurance — 2.7% |
| |||||||
| 1,391 | ProAssurance Corp. | 72,577 | ||||||
|
| |||||||
Real Estate Investment Trusts (REITs) — 6.1% |
| |||||||
| 703 | EastGroup Properties, Inc. | 39,577 | ||||||
| 642 | Mid-America Apartment Communities, Inc. | 43,523 | ||||||
| 988 | National Retail Properties, Inc. | 33,983 | ||||||
| 2,059 | RLJ Lodging Trust | 46,300 | ||||||
|
| |||||||
| 163,383 | ||||||||
|
| |||||||
Real Estate Management & Development — 0.5% |
| |||||||
| 311 | Realogy Holdings Corp. (a) | 14,941 | ||||||
|
| |||||||
Total Financials | 594,000 | |||||||
|
| |||||||
Health Care — 4.4% |
| |||||||
Health Care Equipment & Supplies — 1.7% |
| |||||||
| 494 | IDEXX Laboratories, Inc. (a) | 44,388 | ||||||
|
| |||||||
Health Care Providers & Services — 1.8% |
| |||||||
| 239 | MWI Veterinary Supply, Inc. (a) | 29,487 | ||||||
| 346 | WellCare Health Plans, Inc. (a) | 19,201 | ||||||
|
| |||||||
| 48,688 | ||||||||
|
| |||||||
SEE NOTES TO FINANCIAL STATEMENTS.
| JUNE 30, 2013 | J.P. MORGAN SMALL CAP FUNDS | 25 | ||||||
Table of Contents
JPMorgan Small Cap Equity Fund
SCHEDULE OF PORTFOLIO INVESTMENTS
AS OF JUNE 30, 2013 (continued)
(Amounts in thousands)
| SHARES | SECURITY DESCRIPTION | VALUE($) | ||||||
| Common Stocks — Continued |
| ||||||
Health Care Technology — 0.9% |
| |||||||
| 1,182 | Omnicell, Inc. (a) | 24,297 | ||||||
|
| |||||||
Total Health Care | 117,373 | |||||||
|
| |||||||
Industrials — 17.6% |
| |||||||
Aerospace & Defense — 0.9% |
| |||||||
| 160 | TransDigm Group, Inc. | 25,120 | ||||||
|
| |||||||
Air Freight & Logistics — 0.8% |
| |||||||
| 562 | Forward Air Corp. | 21,525 | ||||||
|
| |||||||
Building Products — 0.4% |
| |||||||
| 505 | Ply Gem Holdings, Inc. (a) | 10,136 | ||||||
|
| |||||||
Commercial Services & Supplies — 6.2% |
| |||||||
| 1,634 | ACCO Brands Corp. (a) | 10,391 | ||||||
| 1,607 | Herman Miller, Inc. | 43,499 | ||||||
| 1,333 | KAR Auction Services, Inc. | 30,493 | ||||||
| 2,026 | Waste Connections, Inc. | 83,347 | ||||||
|
| |||||||
| 167,730 | ||||||||
|
| |||||||
Construction & Engineering — 0.8% |
| |||||||
| 1,419 | Comfort Systems USA, Inc. | 21,177 | ||||||
|
| |||||||
Electrical Equipment — 1.6% |
| |||||||
| 503 | Generac Holdings, Inc. | 18,622 | ||||||
| 383 | Regal-Beloit Corp. | 24,806 | ||||||
|
| |||||||
| 43,428 | ||||||||
|
| |||||||
Machinery — 5.5% |
| |||||||
| 655 | Altra Holdings, Inc. | 17,931 | ||||||
| 1,378 | Douglas Dynamics, Inc. | 17,881 | ||||||
| 721 | RBC Bearings, Inc. (a) | 37,469 | ||||||
| 2,201 | Rexnord Corp. (a) | 37,094 | ||||||
| 836 | Toro Co. (The) | 37,984 | ||||||
|
| |||||||
| 148,359 | ||||||||
|
| |||||||
Road & Rail — 1.4% |
| |||||||
| 2,230 | Knight Transportation, Inc. | 37,506 | ||||||
|
| |||||||
Total Industrials | 474,981 | |||||||
|
| |||||||
Information Technology — 12.3% |
| |||||||
Electronic Equipment, Instruments & Components — 2.2% |
| |||||||
| 779 | Anixter International, Inc. (a) | 59,066 | ||||||
|
| |||||||
Internet Software & Services — 2.3% |
| |||||||
| 1,730 | Dice Holdings, Inc. (a) | 15,930 | ||||||
| 356 | SciQuest, Inc. (a) | 8,915 | ||||||
| 413 | Trulia, Inc. (a) | 12,849 | ||||||
| 450 | Zillow, Inc., Class A (a) | 25,354 | ||||||
|
| |||||||
| 63,048 | ||||||||
|
| |||||||
| SHARES | SECURITY DESCRIPTION | VALUE($) | ||||||
IT Services — 0.8% |
| |||||||
| 884 | CoreLogic, Inc. (a) | 20,479 | ||||||
|
| |||||||
Semiconductors & Semiconductor Equipment — 0.4% |
| |||||||
| 898 | Freescale Semiconductor Ltd. (a) | 12,165 | ||||||
|
| |||||||
Software — 6.6% |
| |||||||
| 147 | FactSet Research Systems, Inc. | 14,975 | ||||||
| 555 | Imperva, Inc. (a) | 24,988 | ||||||
| 667 | MICROS Systems, Inc. (a) | 28,790 | ||||||
| 870 | Monotype Imaging Holdings, Inc. | 22,101 | ||||||
| 153 | NetSuite, Inc. (a) | 14,065 | ||||||
| 1,010 | Rovi Corp. (a) | 23,079 | ||||||
| 233 | SolarWinds, Inc. (a) | 9,031 | ||||||
| 363 | Solera Holdings, Inc. | 20,176 | ||||||
| 254 | Splunk, Inc. (a) | 11,783 | ||||||
| 139 | Tableau Software, Inc., Class A (a) | 7,692 | ||||||
|
| |||||||
| 176,680 | ||||||||
|
| |||||||
Total Information Technology | 331,438 | |||||||
|
| |||||||
Materials — 10.6% |
| |||||||
Chemicals — 2.9% |
| |||||||
| 334 | Airgas, Inc. | 31,889 | ||||||
| 502 | Scotts Miracle-Gro Co. (The), Class A | 24,243 | ||||||
| 1,155 | Taminco Corp. (a) | 23,542 | ||||||
|
| |||||||
| 79,674 | ||||||||
|
| |||||||
Containers & Packaging — 6.8% |
| |||||||
| 887 | Aptargroup, Inc. | 48,961 | ||||||
| 1,273 | Crown Holdings, Inc. (a) | 52,373 | ||||||
| 1,736 | Silgan Holdings, Inc. | 81,524 | ||||||
|
| |||||||
| 182,858 | ||||||||
|
| |||||||
Metals & Mining — 0.9% |
| |||||||
| 274 | Compass Minerals International, Inc. | 23,199 | ||||||
|
| |||||||
Total Materials | 285,731 | |||||||
|
| |||||||
Utilities — 2.6% |
| |||||||
Electric Utilities — 0.8% |
| |||||||
| 699 | Portland General Electric Co. | 21,378 | ||||||
|
| |||||||
Gas Utilities — 0.4% |
| |||||||
| 222 | Northwest Natural Gas Co. | 9,421 | ||||||
|
| |||||||
Multi-Utilities — 1.4% |
| |||||||
| 950 | NorthWestern Corp. | 37,914 | ||||||
|
| |||||||
Total Utilities | 68,713 | |||||||
|
| |||||||
Total Common Stocks | 2,620,155 | |||||||
|
| |||||||
SEE NOTES TO FINANCIAL STATEMENTS.
| 26 | J.P. MORGAN SMALL CAP FUNDS | JUNE 30, 2013 | ||||
Table of Contents
| SHARES | SECURITY DESCRIPTION | VALUE($) | ||||||
| Short-Term Investment — 1.6% |
| ||||||
Investment Company — 1.6% | ||||||||
| 43,071 | JPMorgan Prime Money Market Fund, Institutional Class Shares, 0.030% (b) (l) (m) | 43,071 | ||||||
|
| |||||||
Total Investments — 98.8% | 2,663,226 | |||||||
Other Assets in Excess of | 33,599 | |||||||
|
| |||||||
NET ASSETS — 100.0% | $ | 2,696,825 | ||||||
|
| |||||||
Percentages indicated are based on net assets.
SEE NOTES TO FINANCIAL STATEMENTS.
| JUNE 30, 2013 | J.P. MORGAN SMALL CAP FUNDS | 27 | ||||||
Table of Contents
JPMorgan Small Cap Growth Fund
SCHEDULE OF PORTFOLIO INVESTMENTS
AS OF JUNE 30, 2013
(Amounts in thousands)
| SHARES | SECURITY DESCRIPTION | VALUE($) | ||||||
| Common Stocks — 98.2% |
| ||||||
Consumer Discretionary — 12.0% |
| |||||||
Distributors — 0.7% |
| |||||||
| 127 | Pool Corp. | 6,646 | ||||||
|
| |||||||
Diversified Consumer Services — 0.6% |
| |||||||
| 154 | Sotheby’s | 5,838 | ||||||
|
| |||||||
Household Durables — 0.5% |
| |||||||
| 304 | TRI Pointe Homes, Inc. (a) | 5,047 | ||||||
|
| |||||||
Internet & Catalog Retail — 1.7% |
| |||||||
| 106 | Blue Nile, Inc. (a) | 3,997 | ||||||
| 351 | HomeAway, Inc. (a) | 11,364 | ||||||
|
| |||||||
| 15,361 | ||||||||
|
| |||||||
Leisure Equipment & Products — 0.9% |
| |||||||
| 187 | Arctic Cat, Inc. | 8,420 | ||||||
|
| |||||||
Media — 1.2% |
| |||||||
| 901 | ReachLocal, Inc. (a) | 11,044 | ||||||
|
| |||||||
Specialty Retail — 4.3% |
| |||||||
| 247 | Conn’s, Inc. (a) | 12,790 | ||||||
| 233 | Five Below, Inc. (a) | 8,572 | ||||||
| 389 | Francesca’s Holdings Corp. (a) | 10,814 | ||||||
| 104 | Lumber Liquidators Holdings, Inc. (a) | 8,091 | ||||||
|
| |||||||
| 40,267 | ||||||||
|
| |||||||
Textiles, Apparel & Luxury Goods — 2.1% |
| |||||||
| 189 | Tumi Holdings, Inc. (a) | 4,524 | ||||||
| 270 | Wolverine World Wide, Inc. | 14,734 | ||||||
|
| |||||||
| 19,258 | ||||||||
|
| |||||||
Total Consumer Discretionary | 111,881 | |||||||
|
| |||||||
Consumer Staples — 2.5% |
| |||||||
Food & Staples Retailing — 0.5% |
| |||||||
| 200 | Fairway Group Holdings Corp. (a) | 4,837 | ||||||
|
| |||||||
Food Products — 2.0% |
| |||||||
| 216 | Annie’s, Inc. (a) | 9,241 | ||||||
| 132 | Snyders-Lance, Inc. | 3,741 | ||||||
| 354 | WhiteWave Foods Co., Class A (a) | 5,746 | ||||||
|
| |||||||
| 18,728 | ||||||||
|
| |||||||
Total Consumer Staples | 23,565 | |||||||
|
| |||||||
Energy — 5.0% |
| |||||||
Energy Equipment & Services — 2.4% |
| |||||||
| 151 | Dril-Quip, Inc. (a) | 13,598 | ||||||
| 279 | Forum Energy Technologies, Inc. (a) | 8,496 | ||||||
|
| |||||||
| 22,094 | ||||||||
|
| |||||||
Oil, Gas & Consumable Fuels — 2.6% |
| |||||||
| 167 | Delek U.S. Holdings, Inc. | 4,812 | ||||||
| SHARES | SECURITY DESCRIPTION | VALUE($) | ||||||
Oil, Gas & Consumable Fuels — Continued |
| |||||||
| 453 | Laredo Petroleum Holdings, Inc. (a) | 9,322 | ||||||
| 260 | Oasis Petroleum, Inc. (a) | 10,110 | ||||||
|
| |||||||
| 24,244 | ||||||||
|
| |||||||
Total Energy | 46,338 | |||||||
|
| |||||||
Financials — 9.2% |
| |||||||
Capital Markets — 4.6% |
| |||||||
| 34 | Affiliated Managers Group, Inc. (a) | 5,558 | ||||||
| 192 | Cohen & Steers, Inc. | 6,538 | ||||||
| 330 | Financial Engines, Inc. | 15,058 | ||||||
| 855 | PennantPark Investment Corp. | 9,443 | ||||||
| 176 | Stifel Financial Corp. (a) | 6,264 | ||||||
|
| |||||||
| 42,861 | ||||||||
|
| |||||||
Commercial Banks — 0.9% |
| |||||||
| 98 | Signature Bank (a) | 8,111 | ||||||
|
| |||||||
Insurance — 1.1% |
| |||||||
| 285 | Amtrust Financial Services, Inc. | 10,162 | ||||||
|
| |||||||
Real Estate Investment Trusts (REITs) — 2.6% |
| |||||||
| 317 | CubeSmart | 5,069 | ||||||
| 200 | Douglas Emmett, Inc. (m) | 4,997 | ||||||
| 85 | EastGroup Properties, Inc. | 4,772 | ||||||
| 435 | Glimcher Realty Trust | 4,749 | ||||||
| 130 | Highwoods Properties, Inc. | 4,622 | ||||||
|
| |||||||
| 24,209 | ||||||||
|
| |||||||
Total Financials | 85,343 | |||||||
|
| |||||||
Health Care — 22.4% |
| |||||||
Biotechnology — 7.9% |
| |||||||
| 276 | ACADIA Pharmaceuticals, Inc. (a) | 5,006 | ||||||
| 148 | Acorda Therapeutics, Inc. (a) | 4,876 | ||||||
| 155 | Aegerion Pharmaceuticals, Inc. (a) | 9,786 | ||||||
| 219 | AMAG Pharmaceuticals, Inc. (a) | 4,868 | ||||||
| 182 | Ariad Pharmaceuticals, Inc. (a) | 3,185 | ||||||
| 222 | Chimerix, Inc. (a) | 5,384 | ||||||
| 130 | Cubist Pharmaceuticals, Inc. (a) | 6,260 | ||||||
| 535 | Exact Sciences Corp. (a) | 7,439 | ||||||
| 710 | Halozyme Therapeutics, Inc. (a) | 5,634 | ||||||
| 757 | Keryx Biopharmaceuticals, Inc. (a) | 5,652 | ||||||
| 177 | Puma Biotechnology, Inc. (a) | 7,867 | ||||||
| 603 | Synta Pharmaceuticals Corp. (a) | 3,006 | ||||||
| 843 | Threshold Pharmaceuticals, Inc. (a) | 4,435 | ||||||
|
| |||||||
| 73,398 | ||||||||
|
| |||||||
Health Care Equipment & Supplies — 5.6% |
| |||||||
| 1,424 | Imris, Inc., (Canada) (a) | 3,929 | ||||||
| 455 | Insulet Corp. (a) | 14,303 | ||||||
SEE NOTES TO FINANCIAL STATEMENTS.
| 28 | J.P. MORGAN SMALL CAP FUNDS | JUNE 30, 2013 | ||||
Table of Contents
| SHARES | SECURITY DESCRIPTION | VALUE($) | ||||||
| Common Stocks — Continued |
| ||||||
Health Care Equipment & Supplies — Continued |
| |||||||
| 947 | Novadaq Technologies, Inc., (Canada) (a) | 12,749 | ||||||
| 817 | Syneron Medical Ltd., (Israel) (a) | 7,110 | ||||||
| 368 | Tornier N.V., (Netherlands) (a) | 6,433 | ||||||
| 2,362 | Unilife Corp. (a) | 7,487 | ||||||
|
| |||||||
| 52,011 | ||||||||
|
| |||||||
Health Care Providers & Services — 4.6% |
| |||||||
| 453 | Acadia Healthcare Co., Inc. (a) | 14,989 | ||||||
| 513 | Emeritus Corp. (a) | 11,896 | ||||||
| 245 | Health Net, Inc. (a) | 7,793 | ||||||
| 153 | WellCare Health Plans, Inc. (a) | 8,494 | ||||||
|
| |||||||
| 43,172 | ||||||||
|
| |||||||
Health Care Technology — 0.4% |
| |||||||
| 301 | Vocera Communications, Inc. (a) | 4,420 | ||||||
|
| |||||||
Life Sciences Tools & Services — 1.8% |
| |||||||
| 501 | Bruker Corp. (a) | 8,089 | ||||||
| 494 | Fluidigm Corp. (a) | 8,620 | ||||||
|
| |||||||
| 16,709 | ||||||||
|
| |||||||
Pharmaceuticals — 2.1% |
| |||||||
| 639 | Nektar Therapeutics (a) | 7,384 | ||||||
| 342 | Sagent Pharmaceuticals, Inc. (a) | 7,184 | ||||||
| 172 | ViroPharma, Inc. (a) | 4,940 | ||||||
|
| |||||||
| 19,508 | ||||||||
|
| |||||||
Total Health Care | 209,218 | |||||||
|
| |||||||
Industrials — 20.9% |
| |||||||
Aerospace & Defense — 2.3% |
| |||||||
| 197 | HEICO Corp. | 9,924 | ||||||
| 320 | Hexcel Corp. (a) | 10,896 | ||||||
|
| |||||||
| 20,820 | ||||||||
|
| |||||||
Airlines — 1.0% |
| |||||||
| 297 | Spirit Airlines, Inc. (a) | 9,432 | ||||||
|
| |||||||
Building Products — 3.8% |
| |||||||
| 165 | Armstrong World Industries, Inc. (a) | 7,885 | ||||||
| 276 | Fortune Brands Home & Security, Inc. | 10,708 | ||||||
| 217 | Ply Gem Holdings, Inc. (a) | 4,347 | ||||||
| 257 | Trex Co., Inc. (a) | 12,198 | ||||||
|
| |||||||
| 35,138 | ||||||||
|
| |||||||
Electrical Equipment — 2.3% |
| |||||||
| 163 | Acuity Brands, Inc. | 12,302 | ||||||
| 253 | Generac Holdings, Inc. | 9,379 | ||||||
|
| |||||||
| 21,681 | ||||||||
|
| |||||||
Industrial Conglomerates — 1.1% |
| |||||||
| 160 | Carlisle Cos., Inc. | 9,995 | ||||||
|
| |||||||
| SHARES | SECURITY DESCRIPTION | VALUE($) | ||||||
Machinery — 2.8% |
| |||||||
| 193 | Graco, Inc. | 12,212 | ||||||
| 83 | Middleby Corp. (a) | 14,101 | ||||||
|
| |||||||
| 26,313 | ||||||||
|
| |||||||
Marine — 0.9% |
| |||||||
| 108 | Kirby Corp. (a) | 8,622 | ||||||
|
| |||||||
Road & Rail — 2.5% |
| |||||||
| 616 | Marten Transport Ltd. | 9,648 | ||||||
| 335 | Old Dominion Freight Line, Inc. (a) | 13,922 | ||||||
|
| |||||||
| 23,570 | ||||||||
|
| |||||||
Trading Companies & Distributors — 4.2% |
| |||||||
| 87 | DXP Enterprises, Inc. (a) | 5,781 | ||||||
| 123 | MSC Industrial Direct Co., Inc., Class A | 9,520 | ||||||
| 462 | Rush Enterprises, Inc., Class A (a) | 11,424 | ||||||
| 143 | Watsco, Inc. | 12,015 | ||||||
|
| |||||||
| 38,740 | ||||||||
|
| |||||||
Total Industrials | 194,311 | |||||||
|
| |||||||
Information Technology — 25.6% |
| |||||||
Communications Equipment — 3.2% |
| |||||||
| 450 | Aruba Networks, Inc. (a) | 6,915 | ||||||
| 1,046 | Infinera Corp. (a) | 11,161 | ||||||
| 102 | Palo Alto Networks, Inc. (a) | 4,284 | ||||||
| 559 | Ruckus Wireless, Inc. (a) | 7,154 | ||||||
|
| |||||||
| 29,514 | ||||||||
|
| |||||||
Computers & Peripherals — 0.4% |
| |||||||
| 281 | Fusion-io, Inc. (a) | 3,998 | ||||||
|
| |||||||
Internet Software & Services — 7.3% |
| |||||||
| 296 | Cornerstone OnDemand, Inc. (a) | 12,827 | ||||||
| 42 | CoStar Group, Inc. (a) | 5,357 | ||||||
| 351 | Dealertrack Technologies, Inc. (a) | 12,427 | ||||||
| 211 | Demandware, Inc. (a) | 8,961 | ||||||
| 466 | Envestnet, Inc. (a) | 11,451 | ||||||
| 94 | OpenTable, Inc. (a) | 6,037 | ||||||
| 347 | Trulia, Inc. (a) | 10,779 | ||||||
|
| |||||||
| 67,839 | ||||||||
|
| |||||||
IT Services — 0.8% |
| |||||||
| 760 | ServiceSource International, Inc. (a) | 7,084 | ||||||
|
| |||||||
Semiconductors & Semiconductor Equipment — 3.3% |
| |||||||
| 312 | Cavium, Inc. (a) | 11,028 | ||||||
| 145 | Hittite Microwave Corp. (a) | 8,390 | ||||||
| 732 | Inphi Corp. (a) | 8,047 | ||||||
| 198 | Teradyne, Inc. (a) | 3,481 | ||||||
|
| |||||||
| 30,946 | ||||||||
|
| |||||||
SEE NOTES TO FINANCIAL STATEMENTS.
| JUNE 30, 2013 | J.P. MORGAN SMALL CAP FUNDS | 29 | ||||||
Table of Contents
JPMorgan Small Cap Growth Fund
SCHEDULE OF PORTFOLIO INVESTMENTS
AS OF JUNE 30, 2013 (continued)
(Amounts in thousands)
| SHARES | SECURITY DESCRIPTION | VALUE($) | ||||||
| Common Stocks — Continued |
| ||||||
Software — 10.6% |
| |||||||
| 287 | BroadSoft, Inc. (a) | 7,907 | ||||||
| 74 | CommVault Systems, Inc. (a) | 5,616 | ||||||
| 494 | Cyan, Inc. (a) | 5,164 | ||||||
| 257 | Fortinet, Inc. (a) | 4,501 | ||||||
| 129 | Gigamon, Inc. (a) | 3,552 | ||||||
| 139 | Guidewire Software, Inc. (a) | 5,841 | ||||||
| 215 | Imperva, Inc. (a) | 9,670 | ||||||
| 381 | Infoblox, Inc. (a) | 11,145 | ||||||
| 353 | Model N, Inc. (a) | 8,239 | ||||||
| 68 | NetSuite, Inc. (a) | 6,280 | ||||||
| 313 | Rally Software Development Corp., Class C (a) | 7,759 | ||||||
| 108 | SolarWinds, Inc. (a) | 4,199 | ||||||
| 137 | Sourcefire, Inc. (a) | 7,594 | ||||||
| 199 | Splunk, Inc. (a) | 9,230 | ||||||
| 46 | Tableau Software, Inc., Class A (a) | 2,572 | ||||||
|
| |||||||
| 99,269 | ||||||||
|
| |||||||
Total Information Technology | 238,650 | |||||||
|
| |||||||
| SHARES | SECURITY DESCRIPTION | VALUE($) | ||||||
Telecommunication Services — 0.6% |
| |||||||
Wireless Telecommunication Services — 0.6% |
| |||||||
| 924 | Boingo Wireless, Inc. (a) | 5,739 | ||||||
|
| |||||||
Total Common Stocks | 915,045 | |||||||
|
| |||||||
| Short-Term Investment — 1.5% |
| ||||||
Investment Company — 1.5% | ||||||||
| 14,084 | JPMorgan Liquid Assets Money Market Fund, Institutional Class Shares, 0.030% (b) (l) | 14,084 | ||||||
|
| |||||||
Total Investments — 99.7% | 929,129 | |||||||
Other Assets in Excess of | 2,789 | |||||||
|
| |||||||
NET ASSETS — 100.0% | $ | 931,918 | ||||||
|
| |||||||
Percentages indicated are based on net assets.
SEE NOTES TO FINANCIAL STATEMENTS.
| 30 | J.P. MORGAN SMALL CAP FUNDS | JUNE 30, 2013 | ||||
Table of Contents
JPMorgan Small Cap Value Fund
SCHEDULE OF PORTFOLIO INVESTMENTS
AS OF JUNE 30, 2013
(Amounts in thousands)
| SHARES | SECURITY DESCRIPTION | VALUE($) | ||||||
| Common Stocks — 97.6% |
| ||||||
Consumer Discretionary — 11.5% | ||||||||
Auto Components — 0.5% | ||||||||
| 17 | Cooper Tire & Rubber Co. | 564 | ||||||
| 48 | Dana Holding Corp. | 917 | ||||||
| 19 | Stoneridge, Inc. (a) | 222 | ||||||
| 141 | Superior Industries International, Inc. | 2,418 | ||||||
|
| |||||||
| 4,121 | ||||||||
|
| |||||||
Diversified Consumer Services — 1.0% | ||||||||
| 384 | Corinthian Colleges, Inc. (a) | 861 | ||||||
| 149 | Lincoln Educational Services Corp. | 785 | ||||||
| 268 | Regis Corp. | 4,397 | ||||||
| 241 | Stewart Enterprises, Inc., Class A | 3,156 | ||||||
|
| |||||||
| 9,199 | ||||||||
|
| |||||||
Hotels, Restaurants & Leisure — 1.7% | ||||||||
| 11 | Biglari Holdings, Inc. (a) | 4,637 | ||||||
| 36 | Einstein Noah Restaurant Group, Inc. | 504 | ||||||
| 167 | Isle of Capri Casinos, Inc. (a) | 1,249 | ||||||
| 25 | Multimedia Games Holding Co., Inc. (a) | 644 | ||||||
| 27 | Red Robin Gourmet Burgers, Inc. (a) | 1,512 | ||||||
| 167 | Ruth’s Hospitality Group, Inc. | 2,012 | ||||||
| 21 | Scientific Games Corp., Class A (a) | 231 | ||||||
| 124 | SeaWorld Entertainment, Inc. | 4,345 | ||||||
| 15 | Town Sports International Holdings, Inc. | 161 | ||||||
|
| |||||||
| 15,295 | ||||||||
|
| |||||||
Household Durables — 1.5% | ||||||||
| 133 | American Greetings Corp., Class A | 2,423 | ||||||
| 94 | Blyth, Inc. | 1,311 | ||||||
| 53 | CSS Industries, Inc. | 1,316 | ||||||
| 86 | Leggett & Platt, Inc. | 2,667 | ||||||
| 1 | Lifetime Brands, Inc. | 10 | ||||||
| 21 | NACCO Industries, Inc., Class A | 1,203 | ||||||
| 158 | Taylor Morrison Home Corp., Class A (a) | 3,849 | ||||||
| 41 | William Lyon Homes, Class A (a) | 1,044 | ||||||
|
| |||||||
| 13,823 | ||||||||
|
| |||||||
Internet & Catalog Retail — 0.3% | ||||||||
| 289 | Orbitz Worldwide, Inc. (a) | 2,320 | ||||||
|
| |||||||
Leisure Equipment & Products — 0.2% | ||||||||
| 150 | JAKKS Pacific, Inc. | 1,686 | ||||||
|
| |||||||
Media — 2.1% | ||||||||
| 148 | Digital Generation, Inc. (a) | 1,090 | ||||||
| 150 | Entercom Communications Corp., Class A (a) | 1,420 | ||||||
| 210 | Journal Communications, Inc., Class A (a) | 1,570 | ||||||
| 292 | LIN TV Corp., Class A (a) | 4,466 | ||||||
| 214 | McClatchy Co. (The), Class A (a) | 488 | ||||||
| 28 | Nexstar Broadcasting Group, Inc., Class A | 996 | ||||||
| SHARES | SECURITY DESCRIPTION | VALUE($) | ||||||
Media — Continued | ||||||||
| 5 | Saga Communications, Inc., Class A | 250 | ||||||
| 66 | Scholastic Corp. | 1,939 | ||||||
| 163 | Sinclair Broadcast Group, Inc., Class A | 4,776 | ||||||
| 65 | Valassis Communications, Inc. | 1,598 | ||||||
|
| |||||||
| 18,593 | ||||||||
|
| |||||||
Multiline Retail — 1.1% | ||||||||
| 219 | Bon-Ton Stores, Inc. (The) | 3,955 | ||||||
| 76 | Dillard’s, Inc., Class A | 6,238 | ||||||
|
| |||||||
| 10,193 | ||||||||
|
| |||||||
Specialty Retail — 1.9% | ||||||||
| 109 | Brown Shoe Co., Inc. | 2,356 | ||||||
| 17 | Children’s Place Retail Stores, Inc. (The) (a) | 909 | ||||||
| 14 | Conn’s, Inc. (a) | 709 | ||||||
| 50 | hhgregg, Inc. (a) | 805 | ||||||
| 104 | New York & Co., Inc. (a) | 663 | ||||||
| 1,047 | Office Depot, Inc. (a) | 4,052 | ||||||
| 512 | OfficeMax, Inc. | 5,240 | ||||||
| 97 | Stein Mart, Inc. | 1,320 | ||||||
| 263 | Wet Seal, Inc. (The), Class A (a) | 1,236 | ||||||
|
| |||||||
| 17,290 | ||||||||
|
| |||||||
Textiles, Apparel & Luxury Goods — 1.2% | ||||||||
| 71 | Cherokee, Inc. | 901 | ||||||
| 160 | Iconix Brand Group, Inc. (a) | 4,705 | ||||||
| 140 | Jones Group, Inc. (The) | 1,919 | ||||||
| 51 | Perry Ellis International, Inc. | 1,032 | ||||||
| 98 | Unifi, Inc. (a) | 2,028 | ||||||
|
| |||||||
| 10,585 | ||||||||
|
| |||||||
Total Consumer Discretionary | 103,105 | |||||||
|
| |||||||
Consumer Staples — 3.6% | ||||||||
Food & Staples Retailing — 1.7% | ||||||||
| 29 | Fairway Group Holdings Corp. (a) | 711 | ||||||
| 9 | Nash Finch Co. | 192 | ||||||
| 5 | Pantry, Inc. (The) (a) | 66 | ||||||
| 3,759 | Rite Aid Corp. (a) | 10,752 | ||||||
| 25 | Roundy’s, Inc. | 212 | ||||||
| 52 | Spartan Stores, Inc. | 953 | ||||||
| 413 | SUPERVALU, Inc. (a) | 2,569 | ||||||
|
| |||||||
| 15,455 | ||||||||
|
| |||||||
Food Products — 0.3% | ||||||||
| 15 | Farmer Bros Co. (a) | 207 | ||||||
| 2 | John B Sanfilippo & Son, Inc. | 41 | ||||||
| 93 | Pinnacle Foods, Inc. | 2,236 | ||||||
| 13 | Seneca Foods Corp., Class A (a) | 396 | ||||||
|
| |||||||
| 2,880 | ||||||||
|
| |||||||
SEE NOTES TO FINANCIAL STATEMENTS.
| JUNE 30, 2013 | J.P. MORGAN SMALL CAP FUNDS | 31 | ||||||
Table of Contents
JPMorgan Small Cap Value Fund
SCHEDULE OF PORTFOLIO INVESTMENTS
AS OF JUNE 30, 2013 (continued)
(Amounts in thousands)
| SHARES | SECURITY DESCRIPTION | VALUE($) | ||||||
| Common Stocks — Continued |
| ||||||
Household Products — 0.5% | ||||||||
| 596 | Central Garden & Pet Co., Class A (a) | 4,110 | ||||||
|
| |||||||
Tobacco — 1.1% | ||||||||
| 119 | Alliance One International, Inc. (a) (m) | 453 | ||||||
| 160 | Universal Corp. | 9,262 | ||||||
|
| |||||||
| 9,715 | ||||||||
|
| |||||||
Total Consumer Staples | 32,160 | |||||||
|
| |||||||
Energy — 5.4% | ||||||||
Energy Equipment & Services — 2.7% | ||||||||
| 531 | Cal Dive International, Inc. (a) | 998 | ||||||
| 41 | Dawson Geophysical Co. (a) | 1,526 | ||||||
| 150 | Exterran Holdings, Inc. (a) | 4,204 | ||||||
| 15 | Global Geophysical Services, Inc. (a) | 73 | ||||||
| 452 | Helix Energy Solutions Group, Inc. (a) | 10,416 | ||||||
| 463 | Hercules Offshore, Inc. (a) | 3,259 | ||||||
| 30 | Key Energy Services, Inc. (a) | 179 | ||||||
| 40 | Natural Gas Services Group, Inc. (a) | 942 | ||||||
| 189 | Parker Drilling Co. (a) | 942 | ||||||
| 39 | Pioneer Energy Services Corp. (a) | 259 | ||||||
| 21 | SEACOR Holdings, Inc. | 1,760 | ||||||
| 19 | Tesco Corp. (a) | 255 | ||||||
|
| |||||||
| 24,813 | ||||||||
|
| |||||||
Oil, Gas & Consumable Fuels — 2.7% | ||||||||
| 29 | Alon USA Energy, Inc. (m) | 419 | ||||||
| 325 | Alpha Natural Resources, Inc. (a) | 1,705 | ||||||
| 198 | Arch Coal, Inc. | 750 | ||||||
| 5 | Delek U.S. Holdings, Inc. | 135 | ||||||
| 174 | EPL Oil & Gas, Inc. (a) | 5,115 | ||||||
| 11 | Equal Energy Ltd., (Canada) | 43 | ||||||
| 547 | Forest Oil Corp. (a) | 2,239 | ||||||
| 33 | Frontline Ltd., (Bermuda) (a) | 58 | ||||||
| 28 | Green Plains Renewable Energy, Inc. (a) | 378 | ||||||
| 14 | Knightsbridge Tankers Ltd., (Bermuda) | 102 | ||||||
| 10 | Panhandle Oil and Gas, Inc., Class A | 276 | ||||||
| 448 | Penn Virginia Corp. (a) | 2,107 | ||||||
| 338 | PetroQuest Energy, Inc. (a) | 1,337 | ||||||
| 22 | REX American Resources Corp. (a) | 635 | ||||||
| 101 | Stone Energy Corp. (a) | 2,229 | ||||||
| 169 | W&T Offshore, Inc. | 2,414 | ||||||
| 143 | Western Refining, Inc. | 4,000 | ||||||
| 1 | Westmoreland Coal Co. (a) | 11 | ||||||
|
| |||||||
| 23,953 | ||||||||
|
| |||||||
Total Energy | 48,766 | |||||||
|
| |||||||
| SHARES | SECURITY DESCRIPTION | VALUE($) | ||||||
Financials — 34.6% | ||||||||
Capital Markets — 1.4% | ||||||||
| 136 | Apollo Investment Corp. | 1,053 | ||||||
| 63 | Arlington Asset Investment Corp., Class A | 1,690 | ||||||
| 11 | Artisan Partners Asset Management, Inc. (a) | 539 | ||||||
| 53 | Cowen Group, Inc., Class A (a) | 155 | ||||||
| 21 | GAMCO Investors, Inc., Class A | 1,169 | ||||||
| 130 | Gladstone Capital Corp. | 1,059 | ||||||
| 223 | Investment Technology Group, Inc. (a) | 3,112 | ||||||
| 41 | Janus Capital Group, Inc. | 348 | ||||||
| 226 | MCG Capital Corp. | 1,176 | ||||||
| 37 | MVC Capital, Inc. | 460 | ||||||
| 60 | NGP Capital Resources Co. | 370 | ||||||
| 34 | Oppenheimer Holdings, Inc., Class A | 647 | ||||||
| 29 | Piper Jaffray Cos. (a) | 923 | ||||||
|
| |||||||
| 12,701 | ||||||||
|
| |||||||
Commercial Banks — 12.8% | ||||||||
| 60 | 1st Source Corp. | 1,428 | ||||||
| 5 | 1st United Bancorp, Inc. | 30 | ||||||
| 2 | American National Bankshares, Inc. | 48 | ||||||
| 45 | BancFirst Corp. | 2,095 | ||||||
| 229 | BancorpSouth, Inc. | 4,050 | ||||||
| 100 | Bank of Hawaii Corp. | 5,047 | ||||||
| 38 | Banner Corp. | 1,274 | ||||||
| 82 | BBCN Bancorp, Inc. | 1,169 | ||||||
| 1 | Bridge Capital Holdings (a) | 13 | ||||||
| 15 | Cascade Bancorp (a) | 94 | ||||||
| 126 | Cathay General Bancorp | 2,572 | ||||||
| 13 | Center Bancorp, Inc. | 164 | ||||||
| 137 | Central Pacific Financial Corp. (a) | 2,464 | ||||||
| 5 | Century Bancorp, Inc., Class A | 168 | ||||||
| 44 | Chemical Financial Corp. | 1,154 | ||||||
| 12 | Citizens & Northern Corp. | 226 | ||||||
| 108 | City Holding Co. | 4,191 | ||||||
| 60 | CoBiz Financial, Inc. | 497 | ||||||
| 34 | Columbia Banking System, Inc. | 801 | ||||||
| 83 | Community Bank System, Inc. | 2,564 | ||||||
| 68 | Community Trust Bancorp, Inc. | 2,426 | ||||||
| 23 | Cullen/Frost Bankers, Inc. | 1,509 | ||||||
| 43 | Financial Institutions, Inc. | 788 | ||||||
| 19 | First Bancorp | 261 | ||||||
| 33 | First BanCorp, (Puerto Rico) (a) | 235 | ||||||
| 133 | First Busey Corp. | 599 | ||||||
| 5 | First Citizens BancShares, Inc., Class A | 941 | ||||||
| 812 | First Commonwealth Financial Corp. | 5,984 | ||||||
| 27 | First Community Bancshares, Inc. | 422 | ||||||
SEE NOTES TO FINANCIAL STATEMENTS.
| 32 | J.P. MORGAN SMALL CAP FUNDS | JUNE 30, 2013 | ||||
Table of Contents
| SHARES | SECURITY DESCRIPTION | VALUE($) | ||||||
| Common Stocks — Continued |
| ||||||
Commercial Banks — Continued | ||||||||
| 126 | First Financial Bancorp | 1,876 | ||||||
| 23 | First Financial Bankshares, Inc. | 1,286 | ||||||
| 71 | First Interstate Bancsystem, Inc. | 1,474 | ||||||
| 28 | First Merchants Corp. | 477 | ||||||
| 271 | FirstMerit Corp. | 5,419 | ||||||
| 285 | FNB Corp. | 3,443 | ||||||
| 1 | Fulton Financial Corp. | 14 | ||||||
| 34 | Glacier Bancorp, Inc. | 763 | ||||||
| 22 | Great Southern Bancorp, Inc. | 604 | ||||||
| 3 | Guaranty Bancorp | 35 | ||||||
| 52 | Hancock Holding Co. | 1,552 | ||||||
| 34 | Heartland Financial USA, Inc. | 921 | ||||||
| 32 | Hudson Valley Holding Corp. | 542 | ||||||
| 36 | Lakeland Bancorp, Inc. | 376 | ||||||
| 17 | Lakeland Financial Corp. | 472 | ||||||
| 172 | MainSource Financial Group, Inc. | 2,311 | ||||||
| 73 | MB Financial, Inc. | 1,967 | ||||||
| 36 | Metro Bancorp, Inc. (a) | 727 | ||||||
| 35 | MetroCorp Bancshares, Inc. | 345 | ||||||
| 345 | OFG Bancorp, (Puerto Rico) | 6,244 | ||||||
| 23 | OmniAmerican Bancorp, Inc. (a) | 504 | ||||||
| 29 | Pacific Continental Corp. | 341 | ||||||
| 96 | PacWest Bancorp | 2,927 | ||||||
| 5 | Preferred Bank (a) | 88 | ||||||
| 2 | Republic Bancorp, Inc., Class A | 34 | ||||||
| 13 | S&T Bancorp, Inc. | 263 | ||||||
| 3 | S.Y. Bancorp, Inc. | 74 | ||||||
| 19 | Seacoast Banking Corp of Florida (a) | 41 | ||||||
| 11 | Sierra Bancorp | 155 | ||||||
| 33 | Simmons First National Corp., Class A | 864 | ||||||
| 8 | Southside Bancshares, Inc. | 196 | ||||||
| 153 | Southwest Bancorp, Inc. (a) | 2,018 | ||||||
| 22 | StellarOne Corp. | 426 | ||||||
| 127 | Sterling Financial Corp. | 3,020 | ||||||
| 11 | Suffolk Bancorp (a) | 173 | ||||||
| 239 | Susquehanna Bancshares, Inc. | 3,074 | ||||||
| 34 | SVB Financial Group (a) | 2,866 | ||||||
| 270 | TCF Financial Corp. | 3,829 | ||||||
| 24 | Tompkins Financial Corp. | 1,098 | ||||||
| 53 | Tristate Capital Holdings, Inc. (a) | 730 | ||||||
| 88 | Trustmark Corp. | 2,165 | ||||||
| 115 | UMB Financial Corp. | 6,374 | ||||||
| 45 | Umpqua Holdings Corp. | 678 | ||||||
| 115 | Union First Market Bankshares Corp. | 2,369 | ||||||
| 2 | Univest Corp of Pennsylvania | 47 | ||||||
| 38 | Valley National Bancorp | 356 | ||||||
| SHARES | SECURITY DESCRIPTION | VALUE($) | ||||||
Commercial Banks — Continued | ||||||||
| 23 | Washington Trust Bancorp, Inc. | 662 | ||||||
| 69 | Webster Financial Corp. | 1,759 | ||||||
| 12 | West Bancorporation, Inc. | 136 | ||||||
| 47 | Westamerica Bancorporation | 2,140 | ||||||
| 252 | Wilshire Bancorp, Inc. | 1,668 | ||||||
|
| |||||||
| 115,137 | ||||||||
|
| |||||||
Consumer Finance — 1.4% |
| |||||||
| 170 | DFC Global Corp. (a) | 2,344 | ||||||
| 21 | Green Dot Corp., Class A (a) | 414 | ||||||
| 67 | Nelnet, Inc., Class A | 2,429 | ||||||
| 90 | World Acceptance Corp. (a) | 7,816 | ||||||
|
| |||||||
| 13,003 | ||||||||
|
| |||||||
Diversified Financial Services — 0.6% |
| |||||||
| 76 | Marlin Business Services Corp. | 1,734 | ||||||
| 172 | PHH Corp. (a) | 3,513 | ||||||
| 22 | Resource America, Inc., Class A | 184 | ||||||
|
| |||||||
| 5,431 | ||||||||
|
| |||||||
Insurance — 5.0% |
| |||||||
| 407 | American Equity Investment Life Holding Co. (m) | 6,393 | ||||||
| 28 | American Safety Insurance Holdings Ltd., (Bermuda) (a) | 799 | ||||||
| 36 | Arch Capital Group Ltd., (Bermuda) (a) | 1,842 | ||||||
| 64 | Argo Group International Holdings Ltd., (Bermuda) | 2,716 | ||||||
| 460 | CNO Financial Group, Inc. | 5,958 | ||||||
| 7 | Global Indemnity plc, (Ireland) (a) | 167 | ||||||
| 45 | Hallmark Financial Services (a) | 409 | ||||||
| 192 | Horace Mann Educators Corp. | 4,676 | ||||||
| 62 | Meadowbrook Insurance Group, Inc. | 496 | ||||||
| 126 | Platinum Underwriters Holdings Ltd., (Bermuda) | 7,233 | ||||||
| 66 | Primerica, Inc. | 2,482 | ||||||
| 117 | ProAssurance Corp. | 6,108 | ||||||
| 39 | StanCorp Financial Group, Inc. | 1,932 | ||||||
| 13 | Stewart Information Services Corp. | 343 | ||||||
| 193 | Symetra Financial Corp. | 3,091 | ||||||
|
| |||||||
| 44,645 | ||||||||
|
| |||||||
Real Estate Investment Trusts (REITs) — 11.7% |
| |||||||
| 1,452 | Anworth Mortgage Asset Corp. | 8,133 | ||||||
| 120 | Apartment Investment & Management Co., Class A | 3,614 | ||||||
| 400 | Ashford Hospitality Trust, Inc. | 4,585 | ||||||
| 663 | Capstead Mortgage Corp. | 8,026 | ||||||
| 256 | CBL & Associates Properties, Inc. | 5,490 | ||||||
| 24 | Colonial Properties Trust | 591 | ||||||
| 204 | Coresite Realty Corp. | 6,489 | ||||||
SEE NOTES TO FINANCIAL STATEMENTS.
| JUNE 30, 2013 | J.P. MORGAN SMALL CAP FUNDS | 33 | ||||||
Table of Contents
JPMorgan Small Cap Value Fund
SCHEDULE OF PORTFOLIO INVESTMENTS
AS OF JUNE 30, 2013 (continued)
(Amounts in thousands)
| SHARES | SECURITY DESCRIPTION | VALUE($) | ||||||
| Common Stocks — Continued |
| ||||||
Real Estate Investment Trusts (REITs) — Continued |
| |||||||
| 336 | CubeSmart | 5,369 | ||||||
| 318 | CYS Investments, Inc. | 2,927 | ||||||
| 1,166 | DCT Industrial Trust, Inc. | 8,340 | ||||||
| 194 | DiamondRock Hospitality Co. | 1,813 | ||||||
| 46 | EPR Properties | 2,307 | ||||||
| 434 | FelCor Lodging Trust, Inc. (a) | 2,564 | ||||||
| 77 | First Industrial Realty Trust, Inc. | 1,168 | ||||||
| 38 | First Potomac Realty Trust (m) | 491 | ||||||
| 50 | Getty Realty Corp. | 1,039 | ||||||
| 40 | Home Properties, Inc. | 2,628 | ||||||
| 97 | Hospitality Properties Trust | 2,557 | ||||||
| 49 | LaSalle Hotel Properties | 1,198 | ||||||
| 166 | Lexington Realty Trust | 1,936 | ||||||
| 60 | LTC Properties, Inc. | 2,355 | ||||||
| 86 | Mission West Properties, Inc. (a) (i) | — | ||||||
| 92 | Parkway Properties, Inc. | 1,545 | ||||||
| 140 | Pennsylvania Real Estate Investment Trust | 2,634 | ||||||
| 186 | Potlatch Corp. | 7,526 | ||||||
| 22 | PS Business Parks, Inc. | 1,573 | ||||||
| 595 | RAIT Financial Trust | 4,477 | ||||||
| 479 | Redwood Trust, Inc. | 8,146 | ||||||
| 46 | Strategic Hotels & Resorts, Inc. (a) | 408 | ||||||
| 264 | Sunstone Hotel Investors, Inc. (a) | 3,193 | ||||||
| 8 | Taubman Centers, Inc. | 624 | ||||||
| 36 | Washington Real Estate Investment Trust | 962 | ||||||
|
| |||||||
| 104,708 | ||||||||
|
| |||||||
Real Estate Management & Development — 0.3% |
| |||||||
| 16 | Alexander & Baldwin, Inc. (a) (m) | 620 | ||||||
| 94 | Forestar Group, Inc. (a) | 1,880 | ||||||
|
| |||||||
| 2,500 | ||||||||
|
| |||||||
Thrifts & Mortgage Finance — 1.4% |
| |||||||
| 15 | BankFinancial Corp. | 127 | ||||||
| 60 | Beneficial Mutual Bancorp, Inc. (a) | 500 | ||||||
| 7 | Charter Financial Corp. | 69 | ||||||
| 18 | ESB Financial Corp. | 223 | ||||||
| 3 | Fox Chase Bancorp, Inc. | 50 | ||||||
| 5 | Kearny Financial Corp. (a) | 57 | ||||||
| 34 | OceanFirst Financial Corp. | 530 | ||||||
| 212 | Ocwen Financial Corp. (a) | 8,726 | ||||||
| 15 | PennyMac Financial Services, Inc., Class A (a) | 313 | ||||||
| 59 | Rockville Financial, Inc. | 774 | ||||||
| 13 | Westfield Financial, Inc. | 90 | ||||||
| 16 | WSFS Financial Corp. | 823 | ||||||
|
| |||||||
| 12,282 | ||||||||
|
| |||||||
Total Financials | 310,407 | |||||||
|
| |||||||
| SHARES | SECURITY DESCRIPTION | VALUE($) | ||||||
Health Care — 4.3% |
| |||||||
Biotechnology — 1.5% |
| |||||||
| 17 | Achillion Pharmaceuticals, Inc. (a) (m) | 141 | ||||||
| 51 | Clovis Oncology, Inc. (a) | 3,443 | ||||||
| 28 | Durata Therapeutics, Inc. (a) | 202 | ||||||
| 40 | Esperion Therapeutics, Inc. (a) | 558 | ||||||
| 162 | Insmed, Inc. (a) | 1,939 | ||||||
| 68 | InterMune, Inc. (a) | 651 | ||||||
| 339 | Lexicon Pharmaceuticals, Inc. (a) | 736 | ||||||
| 2 | MiMedx Group, Inc. (a) | 13 | ||||||
| 828 | Oncothyreon, Inc. (a) | 1,292 | ||||||
| 374 | PDL BioPharma, Inc. | 2,887 | ||||||
| 85 | Receptos, Inc. (a) | 1,697 | ||||||
| — | (h) | Stemline Therapeutics, Inc. (a) | 10 | |||||
|
| |||||||
| 13,569 | ||||||||
|
| |||||||
Health Care Equipment & Supplies — 0.9% |
| |||||||
| 54 | Greatbatch, Inc. (a) | 1,761 | ||||||
| 21 | Medical Action Industries, Inc. (a) | 160 | ||||||
| 91 | NuVasive, Inc. (a) | 2,263 | ||||||
| 10 | Orthofix International N.V., (Netherlands) (a) | 258 | ||||||
| 134 | SurModics, Inc. (a) | 2,687 | ||||||
| 95 | Symmetry Medical, Inc. (a) | 799 | ||||||
|
| |||||||
| 7,928 | ||||||||
|
| |||||||
Health Care Providers & Services — 1.5% |
| |||||||
| 130 | Amedisys, Inc. (a) (m) | 1,506 | ||||||
| 41 | Gentiva Health Services, Inc. (a) | 407 | ||||||
| 58 | HealthSouth Corp. (a) | 1,673 | ||||||
| 48 | Magellan Health Services, Inc. (a) | 2,709 | ||||||
| 102 | Molina Healthcare, Inc. (a) | 3,800 | ||||||
| 27 | Providence Service Corp. (The) (a) | 783 | ||||||
| 213 | Skilled Healthcare Group, Inc., Class A (a) | 1,423 | ||||||
| 55 | Triple-S Management Corp., (Puerto Rico), Class B (a) | 1,170 | ||||||
|
| |||||||
| 13,471 | ||||||||
|
| |||||||
Health Care Technology — 0.1% |
| |||||||
| 66 | MedAssets, Inc. (a) | 1,169 | ||||||
|
| |||||||
Life Sciences Tools & Services — 0.1% |
| |||||||
| 129 | NanoString Technologies, Inc. (a) | 1,034 | ||||||
|
| |||||||
Pharmaceuticals — 0.2% |
| |||||||
| 12 | Cornerstone Therapeutics, Inc. (a) | 99 | ||||||
| 43 | ViroPharma, Inc. (a) | 1,221 | ||||||
|
| |||||||
| 1,320 | ||||||||
|
| |||||||
Total Health Care | 38,491 | |||||||
|
| |||||||
SEE NOTES TO FINANCIAL STATEMENTS.
| 34 | J.P. MORGAN SMALL CAP FUNDS | JUNE 30, 2013 | ||||
Table of Contents
| SHARES | SECURITY DESCRIPTION | VALUE($) | ||||||
| Common Stocks — Continued |
| ||||||
Industrials — 14.0% |
| |||||||
Aerospace & Defense — 0.7% |
| |||||||
| 27 | AAR Corp. (m) | 601 | ||||||
| 5 | API Technologies Corp. (a) (m) | 15 | ||||||
| 26 | Engility Holdings, Inc. (a) | 730 | ||||||
| 337 | GenCorp, Inc. (a) | 5,475 | ||||||
|
| |||||||
| 6,821 | ||||||||
|
| |||||||
Airlines — 1.3% |
| |||||||
| 25 | Alaska Air Group, Inc. (a) (m) | 1,290 | ||||||
| 556 | Republic Airways Holdings, Inc. (a) | 6,301 | ||||||
| 197 | SkyWest, Inc. | 2,666 | ||||||
| 73 | U.S. Airways Group, Inc. (a) | 1,195 | ||||||
|
| |||||||
| 11,452 | ||||||||
|
| |||||||
Building Products — 1.0% |
| |||||||
| 193 | Gibraltar Industries, Inc. (a) | 2,811 | ||||||
| 149 | NCI Building Systems, Inc. (a) | 2,278 | ||||||
| 270 | PGT, Inc. (a) | 2,344 | ||||||
| 28 | Ply Gem Holdings, Inc. (a) | 564 | ||||||
| 22 | Trex Co., Inc. (a) | 1,035 | ||||||
|
| |||||||
| 9,032 | ||||||||
|
| |||||||
Commercial Services & Supplies — 3.2% |
| |||||||
| 11 | ABM Industries, Inc. (m) | 259 | ||||||
| 283 | ARC Document Solutions, Inc. (a) (m) | 1,133 | ||||||
| 1,150 | Cenveo, Inc. (a) | 2,449 | ||||||
| 66 | Consolidated Graphics, Inc. (a) | 3,103 | ||||||
| 24 | Courier Corp. | 348 | ||||||
| 67 | G&K Services, Inc., Class A | 3,189 | ||||||
| 72 | HNI Corp. | 2,597 | ||||||
| 307 | Quad/Graphics, Inc. | 7,407 | ||||||
| 154 | Steelcase, Inc., Class A | 2,240 | ||||||
| 186 | United Stationers, Inc. | 6,224 | ||||||
|
| |||||||
| 28,949 | ||||||||
|
| |||||||
Construction & Engineering — 1.3% |
| |||||||
| 93 | Argan, Inc. | 1,448 | ||||||
| 86 | Comfort Systems USA, Inc. | 1,279 | ||||||
| 187 | EMCOR Group, Inc. | 7,602 | ||||||
| 53 | Michael Baker Corp. | 1,446 | ||||||
| 27 | Orion Marine Group, Inc. (a) | 329 | ||||||
|
| |||||||
| 12,104 | ||||||||
|
| |||||||
Electrical Equipment — 0.3% |
| |||||||
| 144 | LSI Industries, Inc. | 1,163 | ||||||
| 28 | Powell Industries, Inc. (a) | 1,463 | ||||||
|
| |||||||
| 2,626 | ||||||||
|
| |||||||
| SHARES | SECURITY DESCRIPTION | VALUE($) | ||||||
Machinery — 3.2% |
| |||||||
| 58 | AGCO Corp. (m) | 2,916 | ||||||
| 3 | Ampco-Pittsburgh Corp. | 65 | ||||||
| 174 | Briggs & Stratton Corp. | 3,439 | ||||||
| 182 | Douglas Dynamics, Inc. | 2,366 | ||||||
| 122 | Federal Signal Corp. (a) | 1,068 | ||||||
| 251 | FreightCar America, Inc. | 4,265 | ||||||
| 64 | Global Brass & Copper Holdings, Inc. (a) | 846 | ||||||
| 45 | Hurco Cos., Inc. | 1,286 | ||||||
| 42 | Hyster-Yale Materials Handling, Inc. | 2,644 | ||||||
| 79 | Kadant, Inc. | 2,380 | ||||||
| 12 | Kaydon Corp. | 332 | ||||||
| 4 | Lydall, Inc. (a) | 65 | ||||||
| 42 | Mueller Industries, Inc. | 2,138 | ||||||
| 180 | Mueller Water Products, Inc., Class A | 1,242 | ||||||
| 55 | Standex International Corp. | 2,885 | ||||||
| 13 | Watts Water Technologies, Inc., Class A | 576 | ||||||
|
| |||||||
| 28,513 | ||||||||
|
| |||||||
Marine — 0.1% |
| |||||||
| 36 | International Shipholding Corp. | 833 | ||||||
|
| |||||||
Professional Services — 0.8% |
| |||||||
| 129 | Barrett Business Services, Inc. | 6,753 | ||||||
| 1 | CDI Corp. | 18 | ||||||
| 9 | VSE Corp. | 374 | ||||||
|
| |||||||
| 7,145 | ||||||||
|
| |||||||
Road & Rail — 1.1% |
| |||||||
| 3 | AMERCO (m) | 437 | ||||||
| 69 | Arkansas Best Corp. | 1,572 | ||||||
| 30 | Celadon Group, Inc. | 555 | ||||||
| 24 | Heartland Express, Inc. | 336 | ||||||
| 229 | Saia, Inc. (a) | 6,858 | ||||||
|
| |||||||
| 9,758 | ||||||||
|
| |||||||
Trading Companies & Distributors — 1.0% |
| |||||||
| 101 | Aircastle Ltd. | 1,617 | ||||||
| 151 | Applied Industrial Technologies, Inc. | 7,319 | ||||||
|
| |||||||
| 8,936 | ||||||||
|
| |||||||
Total Industrials | 126,169 | |||||||
|
| |||||||
Information Technology — 12.8% |
| |||||||
Communications Equipment — 2.0% |
| |||||||
| 324 | ARRIS Group, Inc. (a) | 4,642 | ||||||
| 245 | Aviat Networks, Inc. (a) | 641 | ||||||
| 43 | Bel Fuse, Inc., Class B | 579 | ||||||
| 66 | Black Box Corp. | 1,666 | ||||||
| 51 | Calix, Inc. (a) | 513 | ||||||
SEE NOTES TO FINANCIAL STATEMENTS.
| JUNE 30, 2013 | J.P. MORGAN SMALL CAP FUNDS | 35 | ||||||
Table of Contents
JPMorgan Small Cap Value Fund
SCHEDULE OF PORTFOLIO INVESTMENTS
AS OF JUNE 30, 2013 (continued)
(Amounts in thousands)
| SHARES | SECURITY DESCRIPTION | VALUE($) | ||||||
| Common Stocks — Continued |
| ||||||
Communications Equipment — Continued | ||||||||
| 280 | Comtech Telecommunications Corp. | 7,529 | ||||||
| 21 | Oplink Communications, Inc. (a) | 360 | ||||||
| 139 | Symmetricom, Inc. (a) | 626 | ||||||
| 830 | Tellabs, Inc. | 1,643 | ||||||
|
| |||||||
| 18,199 | ||||||||
|
| |||||||
Computers & Peripherals — 0.7% |
| |||||||
| 221 | Avid Technology, Inc. (a) | 1,300 | ||||||
| 1 | Hutchinson Technology, Inc. (a) | 4 | ||||||
| 247 | QLogic Corp. (a) | 2,365 | ||||||
| 344 | STEC, Inc. (a) | 2,315 | ||||||
|
| |||||||
| 5,984 | ||||||||
|
| |||||||
Electronic Equipment, Instruments & Components — 2.7% |
| |||||||
| 240 | Aeroflex Holding Corp. (a) (m) | 1,897 | ||||||
| 62 | Agilysys, Inc. (a) (m) | 699 | ||||||
| 11 | Anixter International, Inc. (a) | 804 | ||||||
| 31 | Audience, Inc. (a) | 409 | ||||||
| 141 | Checkpoint Systems, Inc. (a) | 1,999 | ||||||
| 67 | Cognex Corp. | 3,025 | ||||||
| 59 | Coherent, Inc. | 3,233 | ||||||
| 42 | Electro Scientific Industries, Inc. | 451 | ||||||
| 95 | Newport Corp. (a) | 1,323 | ||||||
| 64 | Park Electrochemical Corp. | 1,537 | ||||||
| 423 | Power-One, Inc. (a) | 2,675 | ||||||
| 17 | RealD, Inc. (a) | 231 | ||||||
| 35 | Richardson Electronics Ltd. | 414 | ||||||
| 49 | Tech Data Corp. (a) | 2,284 | ||||||
| 235 | TTM Technologies, Inc. (a) | 1,974 | ||||||
| 87 | Vishay Intertechnology, Inc. (a) | 1,201 | ||||||
|
| |||||||
| 24,156 | ||||||||
|
| |||||||
Internet Software & Services — 1.7% |
| |||||||
| 170 | Digital River, Inc. (a) | 3,191 | ||||||
| 54 | Gogo, Inc. (a) | 760 | ||||||
| 384 | IntraLinks Holdings, Inc. (a) | 2,785 | ||||||
| 11 | Marketo, Inc. (a) | 261 | ||||||
| 53 | Monster Worldwide, Inc. (a) | 259 | ||||||
| 89 | QuinStreet, Inc. (a) | 770 | ||||||
| 13 | Textura Corp. (a) | 338 | ||||||
| 343 | Tremor Video, Inc. (a) | 3,091 | ||||||
| 89 | WebMD Health Corp. (a) | 2,608 | ||||||
| 64 | XO Group, Inc. (a) | 716 | ||||||
| 11 | Xoom Corp. (a) | 243 | ||||||
|
| |||||||
| 15,022 | ||||||||
|
| |||||||
IT Services — 1.8% |
| |||||||
| 21 | Blackhawk Network Holdings, Inc. (a) | 476 | ||||||
| SHARES | SECURITY DESCRIPTION | VALUE($) | ||||||
IT Services — Continued | ||||||||
| 55 | CACI International, Inc., Class A (a) | 3,517 | ||||||
| 108 | Convergys Corp. | 1,884 | ||||||
| 147 | CSG Systems International, Inc. (a) | 3,181 | ||||||
| 74 | Euronet Worldwide, Inc. (a) | 2,367 | ||||||
| 21 | EVERTEC, Inc., (Puerto Rico) (a) | 464 | ||||||
| 193 | Global Cash Access Holdings, Inc. (a) | 1,206 | ||||||
| 86 | Unisys Corp. (a) | 1,903 | ||||||
| 49 | Vantiv, Inc., Class A (a) | 1,355 | ||||||
|
| |||||||
| 16,353 | ||||||||
|
| |||||||
Semiconductors & Semiconductor Equipment — 2.8% |
| |||||||
| 407 | Advanced Energy Industries, Inc. (a) (m) | 7,084 | ||||||
| 130 | Amkor Technology, Inc. (a) | 547 | ||||||
| 57 | Brooks Automation, Inc. | 558 | ||||||
| 151 | DSP Group, Inc. (a) | 1,252 | ||||||
| 51 | Entropic Communications, Inc. (a) | 216 | ||||||
| 63 | First Solar, Inc. (a) | 2,818 | ||||||
| 43 | GSI Technology, Inc. (a) | 271 | ||||||
| 36 | GT Advanced Technologies, Inc. (a) | 148 | ||||||
| 48 | Integrated Device Technology, Inc. (a) | 384 | ||||||
| 13 | Intermolecular, Inc. (a) | 91 | ||||||
| 40 | IXYS Corp. | 446 | ||||||
| 389 | LTX-Credence Corp. (a) | 2,327 | ||||||
| 48 | Pericom Semiconductor Corp. (a) | 341 | ||||||
| 187 | Photronics, Inc. (a) | 1,505 | ||||||
| 52 | Rudolph Technologies, Inc. (a) | 587 | ||||||
| 474 | Spansion, Inc., Class A (a) | 5,929 | ||||||
| 162 | STR Holdings, Inc. (a) | 368 | ||||||
| 28 | Supertex, Inc. | 662 | ||||||
|
| |||||||
| 25,534 | ||||||||
|
| |||||||
Software — 1.1% | ||||||||
| 103 | Aspen Technology, Inc. (a) | 2,960 | ||||||
| 78 | Cyan, Inc. (a) | 814 | ||||||
| 39 | Fair Isaac Corp. | 1,792 | ||||||
| 29 | Gigamon, Inc. (a) | 799 | ||||||
| 17 | Infoblox, Inc. (a) | 489 | ||||||
| 29 | Rosetta Stone, Inc. (a) | 427 | ||||||
| 31 | Tableau Software, Inc., Class A (a) | 1,712 | ||||||
| 116 | Telenav, Inc. (a) | 605 | ||||||
|
| |||||||
| 9,598 | ||||||||
|
| |||||||
Total Information Technology | 114,846 | |||||||
|
| |||||||
Materials — 4.9% | ||||||||
Chemicals — 1.2% | ||||||||
| 19 | Axiall Corp. | 818 | ||||||
| 150 | Minerals Technologies, Inc. | 6,205 | ||||||
SEE NOTES TO FINANCIAL STATEMENTS.
| 36 | J.P. MORGAN SMALL CAP FUNDS | JUNE 30, 2013 | ||||
Table of Contents
| SHARES | SECURITY DESCRIPTION | VALUE($) | ||||||
| Common Stocks — Continued |
| ||||||
Chemicals — Continued | ||||||||
| 143 | Tredegar Corp. | 3,675 | ||||||
|
| |||||||
| 10,698 | ||||||||
|
| |||||||
Construction Materials — 0.0% (g) | ||||||||
| 33 | Headwaters, Inc. (a) | 293 | ||||||
|
| |||||||
Containers & Packaging — 0.5% | ||||||||
| 386 | Graphic Packaging Holding Co. (a) | 2,986 | ||||||
| 101 | Myers Industries, Inc. | 1,515 | ||||||
|
| |||||||
| 4,501 | ||||||||
|
| |||||||
Metals & Mining — 1.6% | ||||||||
| 254 | Coeur Mining, Inc. (a) | 3,376 | ||||||
| 9 | Olympic Steel, Inc. | 217 | ||||||
| 24 | Schnitzer Steel Industries, Inc., Class A | 563 | ||||||
| 32 | SunCoke Energy, Inc. (a) | 448 | ||||||
| 21 | Walter Energy, Inc. | 219 | ||||||
| 300 | Worthington Industries, Inc. | 9,523 | ||||||
|
| |||||||
| 14,346 | ||||||||
|
| |||||||
Paper & Forest Products — 1.6% | ||||||||
| 41 | Buckeye Technologies, Inc. | 1,530 | ||||||
| 39 | Domtar Corp., (Canada) | 2,567 | ||||||
| 42 | Neenah Paper, Inc. | 1,334 | ||||||
| 244 | PH Glatfelter Co. | 6,132 | ||||||
| 160 | Resolute Forest Products, Inc., (Canada) (a) | 2,104 | ||||||
| 11 | Schweitzer-Mauduit International, Inc. | 551 | ||||||
|
| |||||||
| 14,218 | ||||||||
|
| |||||||
Total Materials | 44,056 | |||||||
|
| |||||||
Telecommunication Services — 0.6% | ||||||||
Diversified Telecommunication Services — 0.5% |
| |||||||
| 5 | Fairpoint Communications, Inc. (a) | 39 | ||||||
| 281 | magicJack VocalTec Ltd., (Israel) (a) | 3,991 | ||||||
| 92 | Neutral Tandem, Inc. | 526 | ||||||
| 55 | Vonage Holdings Corp. (a) | 157 | ||||||
|
| |||||||
| 4,713 | ||||||||
|
| |||||||
Wireless Telecommunication Services — 0.1% | ||||||||
| 110 | Leap Wireless International, Inc. (a) | 740 | ||||||
| 11 | USA Mobility, Inc. | 152 | ||||||
|
| |||||||
| 892 | ||||||||
|
| |||||||
Total Telecommunication Services | 5,605 | |||||||
|
| |||||||
Utilities — 5.9% | ||||||||
Electric Utilities — 2.4% | ||||||||
| 182 | El Paso Electric Co. | 6,419 | ||||||
| 87 | PNM Resources, Inc. | 1,932 | ||||||
| 318 | Portland General Electric Co. | 9,737 | ||||||
| SHARES | SECURITY DESCRIPTION | VALUE($) | ||||||
Electric Utilities — Continued | ||||||||
| 31 | Unitil Corp. | 907 | ||||||
| 62 | UNS Energy Corp. | 2,769 | ||||||
|
| |||||||
| 21,764 | ||||||||
|
| |||||||
Gas Utilities — 1.7% | ||||||||
| 52 | AGL Resources, Inc. (m) | 2,228 | ||||||
| 12 | Chesapeake Utilities Corp. | 639 | ||||||
| 158 | Laclede Group, Inc. (The) | 7,192 | ||||||
| 2 | New Jersey Resources Corp. | 87 | ||||||
| 28 | Piedmont Natural Gas Co., Inc. | 941 | ||||||
| 92 | Southwest Gas Corp. | 4,309 | ||||||
|
| |||||||
| 15,396 | ||||||||
|
| |||||||
Independent Power Producers & Energy Traders — 0.2% |
| |||||||
| 95 | Atlantic Power Corp. | 373 | ||||||
| 60 | NRG Energy, Inc. | 1,606 | ||||||
|
| |||||||
| 1,979 | ||||||||
|
| |||||||
Multi-Utilities — 1.4% | ||||||||
| 211 | Avista Corp. | 5,696 | ||||||
| 173 | NorthWestern Corp. | 6,910 | ||||||
|
| |||||||
| 12,606 | ||||||||
|
| |||||||
Water Utilities — 0.2% | ||||||||
| 39 | California Water Service Group | 767 | ||||||
| 39 | Consolidated Water Co., Ltd., (Cayman Islands) | 442 | ||||||
|
| |||||||
| 1,209 | ||||||||
|
| |||||||
Total Utilities | 52,954 | |||||||
|
| |||||||
Total Common Stocks | 876,559 | |||||||
|
| |||||||
| PRINCIPAL AMOUNT($) | ||||||||
| U.S. Treasury Obligation — 0.2% |
| ||||||
| 1,955 | U.S. Treasury Note, 0.250%, 11/30/13 (k) (m) | 1,956 | ||||||
|
| |||||||
| SHARES | ||||||||
| Short-Term Investment — 1.5% |
| ||||||
Investment Company — 1.5% | ||||||||
| 13,786 | JPMorgan Liquid Assets Money Market Fund, Institutional Class Shares, 0.030% (b) (l) (m) | 13,786 | ||||||
|
| |||||||
Total Investments — 99.3% | 892,301 | |||||||
Other Assets in Excess of | 6,181 | |||||||
|
| |||||||
NET ASSETS — 100.0% | $ | 898,482 | ||||||
|
| |||||||
Percentages indicated are based on net assets.
SEE NOTES TO FINANCIAL STATEMENTS.
| JUNE 30, 2013 | J.P. MORGAN SMALL CAP FUNDS | 37 | ||||||
Table of Contents
JPMorgan Small Cap Value Fund
SCHEDULE OF PORTFOLIO INVESTMENTS
AS OF JUNE 30, 2013 (continued)
(Amounts in thousands, except number of contracts)
| Futures Contracts | ||||||||||||||||
| NUMBER OF CONTRACTS | DESCRIPTION | EXPIRATION DATE | NOTIONAL VALUE AT 06/30/13 | NET UNREALIZED APPRECIATION (DEPRECIATION) | ||||||||||||
Long Futures Outstanding | ||||||||||||||||
| 194 | E-mini Russell 2000 | 09/20/13 | $ | 18,909 | $ | 172 | ||||||||||
|
| |||||||||||||||
SEE NOTES TO FINANCIAL STATEMENTS.
| 38 | J.P. MORGAN SMALL CAP FUNDS | JUNE 30, 2013 | ||||
Table of Contents
JPMorgan U.S. Small Company Fund
SCHEDULE OF PORTFOLIO INVESTMENTS
AS OF JUNE 30, 2013
(Amounts in thousands)
| SHARES | SECURITY DESCRIPTION | VALUE($) | ||||||
| Common Stocks — 97.7% |
| ||||||
Consumer Discretionary — 13.0% | ||||||||
Auto Components — 0.6% | ||||||||
| 14 | Cooper Tire & Rubber Co. | 474 | ||||||
| 21 | Dana Holding Corp. | 397 | ||||||
| 20 | Stoneridge, Inc. (a) | 229 | ||||||
|
| |||||||
| 1,100 | ||||||||
|
| |||||||
Diversified Consumer Services — 0.8% |
| |||||||
| 18 | Coinstar, Inc. (a) | 1,027 | ||||||
| 6 | Mac-Gray Corp. | 84 | ||||||
| 13 | Regis Corp. | 218 | ||||||
|
| |||||||
| 1,329 | ||||||||
|
| |||||||
Hotels, Restaurants & Leisure — 3.5% |
| |||||||
| 19 | Ameristar Casinos, Inc. | 510 | ||||||
| 4 | Biglari Holdings, Inc. (a) | 1,477 | ||||||
| 7 | CEC Entertainment, Inc. | 304 | ||||||
| 3 | Domino’s Pizza, Inc. | 180 | ||||||
| 13 | Interval Leisure Group, Inc. | 265 | ||||||
| 2 | MTR Gaming Group, Inc. (a) | 6 | ||||||
| 13 | Red Robin Gourmet Burgers, Inc. (a) | 723 | ||||||
| 27 | SeaWorld Entertainment, Inc. | 958 | ||||||
| 5 | Six Flags Entertainment Corp. | 176 | ||||||
| 66 | Sonic Corp. (a) | 964 | ||||||
| 52 | Town Sports International Holdings, Inc. | 561 | ||||||
|
| |||||||
| 6,124 | ||||||||
|
| |||||||
Household Durables — 1.8% |
| |||||||
| 44 | American Greetings Corp., Class A | 796 | ||||||
| 11 | Blyth, Inc. | 157 | ||||||
| 11 | CSS Industries, Inc. | 279 | ||||||
| 15 | Leggett & Platt, Inc. | 460 | ||||||
| 19 | Lifetime Brands, Inc. | 258 | ||||||
| 2 | NACCO Industries, Inc., Class A | 126 | ||||||
| 34 | Taylor Morrison Home Corp., Class A (a) | 829 | ||||||
| 9 | William Lyon Homes, Class A (a) | 222 | ||||||
|
| |||||||
| 3,127 | ||||||||
|
| |||||||
Internet & Catalog Retail — 0.7% |
| |||||||
| 98 | PetMed Express, Inc. | 1,236 | ||||||
|
| |||||||
Leisure Equipment & Products — 0.1% |
| |||||||
| 8 | Brunswick Corp. | 249 | ||||||
|
| |||||||
Media — 1.3% |
| |||||||
| 13 | Entercom Communications Corp., Class A (a) | 119 | ||||||
| 51 | Harte-Hanks, Inc. | 439 | ||||||
| 19 | Journal Communications, Inc., Class A (a) | 145 | ||||||
| 14 | Nexstar Broadcasting Group, Inc., Class A | 507 | ||||||
| 29 | Scholastic Corp. | 843 | ||||||
| SHARES | SECURITY DESCRIPTION | VALUE($) | ||||||
Media — Continued | ||||||||
| 6 | Sinclair Broadcast Group, Inc., Class A | 182 | ||||||
|
| |||||||
| 2,235 | ||||||||
|
| |||||||
Multiline Retail — 1.2% |
| |||||||
| 17 | Bon-Ton Stores, Inc. (The) | 312 | ||||||
| 17 | Dillard’s, Inc., Class A | 1,426 | ||||||
| 19 | Saks, Inc. (a) | 261 | ||||||
|
| |||||||
| 1,999 | ||||||||
|
| |||||||
Specialty Retail — 2.1% |
| |||||||
| 15 | ANN, Inc. (a) | 505 | ||||||
| 26 | Brown Shoe Co., Inc. | 562 | ||||||
| 1 | Children’s Place Retail Stores, Inc. (The) (a) | 66 | ||||||
| 23 | Conn’s, Inc. (a) | 1,191 | ||||||
| 3 | Express, Inc. (a) | 62 | ||||||
| 98 | Office Depot, Inc. (a) | 379 | ||||||
| 3 | Rent-A-Center, Inc. | 98 | ||||||
| 52 | Stein Mart, Inc. | 715 | ||||||
| 8 | Trans World Entertainment Corp. | 38 | ||||||
|
| |||||||
| 3,616 | ||||||||
|
| |||||||
Textiles, Apparel & Luxury Goods — 0.9% |
| |||||||
| 26 | Iconix Brand Group, Inc. (a) | 770 | ||||||
| 35 | Jones Group, Inc. (The) | 477 | ||||||
| 12 | Unifi, Inc. (a) | 240 | ||||||
|
| |||||||
| 1,487 | ||||||||
|
| |||||||
Total Consumer Discretionary | 22,502 | |||||||
|
| |||||||
Consumer Staples — 4.6% |
| |||||||
Food & Staples Retailing — 1.9% |
| |||||||
| 2 | Arden Group, Inc., Class A | 232 | ||||||
| 6 | Fairway Group Holdings Corp. (a) | 150 | ||||||
| 794 | Rite Aid Corp. (a) | 2,271 | ||||||
| 8 | Roundy’s, Inc. | 67 | ||||||
| 96 | SUPERVALU, Inc. (a) | 600 | ||||||
|
| |||||||
| 3,320 | ||||||||
|
| |||||||
Food Products — 0.9% |
| |||||||
| 13 | B&G Foods, Inc. | 439 | ||||||
| 21 | Pinnacle Foods, Inc. | 510 | ||||||
| 7 | Sanderson Farms, Inc. | 458 | ||||||
| 5 | Seneca Foods Corp., Class A (a) | 144 | ||||||
|
| |||||||
| 1,551 | ||||||||
|
| |||||||
Personal Products — 0.8% |
| |||||||
| 2 | Herbalife Ltd., (Cayman Islands) | 81 | ||||||
| 24 | Prestige Brands Holdings, Inc. (a) | 685 | ||||||
| 9 | USANA Health Sciences, Inc. (a) | 615 | ||||||
|
| |||||||
| 1,381 | ||||||||
|
| |||||||
SEE NOTES TO FINANCIAL STATEMENTS.
| JUNE 30, 2013 | J.P. MORGAN SMALL CAP FUNDS | 39 | ||||||
Table of Contents
JPMorgan U.S. Small Company Fund
SCHEDULE OF PORTFOLIO INVESTMENTS
AS OF JUNE 30, 2013 (continued)
(Amounts in thousands)
| SHARES | SECURITY DESCRIPTION | VALUE($) | ||||||
| Common Stocks — Continued |
| ||||||
Tobacco — 1.0% |
| |||||||
| 31 | Universal Corp. | 1,782 | ||||||
|
| |||||||
Total Consumer Staples | 8,034 | |||||||
|
| |||||||
Energy — 5.2% |
| |||||||
Energy Equipment & Services — 2.3% |
| |||||||
| 117 | Cal Dive International, Inc. (a) | 221 | ||||||
| 6 | Dawson Geophysical Co. (a) | 210 | ||||||
| 3 | Dresser-Rand Group, Inc. (a) | 168 | ||||||
| 2 | Dril-Quip, Inc. (a) | 180 | ||||||
| 43 | Exterran Holdings, Inc. (a) | 1,215 | ||||||
| 55 | Helix Energy Solutions Group, Inc. (a) | 1,274 | ||||||
| 13 | ION Geophysical Corp. (a) | 78 | ||||||
| 3 | Parker Drilling Co. (a) | 14 | ||||||
| 8 | SEACOR Holdings, Inc. | 648 | ||||||
|
| |||||||
| 4,008 | ||||||||
|
| |||||||
Oil, Gas & Consumable Fuels — 2.9% |
| |||||||
| 2 | Clayton Williams Energy, Inc. (a) | 96 | ||||||
| 3 | Contango Oil & Gas Co. | 91 | ||||||
| 4 | CVR Energy, Inc. | 171 | ||||||
| 34 | Delek U.S. Holdings, Inc. | 967 | ||||||
| 53 | EPL Oil & Gas, Inc. (a) | 1,556 | ||||||
| 23 | Equal Energy Ltd., (Canada) | 91 | ||||||
| — | (h) | Isramco, Inc. (a) | 30 | |||||
| 31 | PetroQuest Energy, Inc. (a) | 123 | ||||||
| 4 | REX American Resources Corp. (a) | 125 | ||||||
| 17 | Stone Energy Corp. (a) | 381 | ||||||
| 3 | Swift Energy Co. (a) | 41 | ||||||
| 39 | Vaalco Energy, Inc. (a) | 222 | ||||||
| 56 | W&T Offshore, Inc. | 803 | ||||||
| 11 | Western Refining, Inc. | 300 | ||||||
| 2 | Westmoreland Coal Co. (a) | 18 | ||||||
|
| |||||||
| 5,015 | ||||||||
|
| |||||||
Total Energy | 9,023 | |||||||
|
| |||||||
Financials — 20.7% |
| |||||||
Capital Markets — 1.0% |
| |||||||
| 8 | Arlington Asset Investment Corp., Class A | 209 | ||||||
| 2 | Artisan Partners Asset Management, Inc. (a) | 105 | ||||||
| 4 | FBR & Co. (a) | 88 | ||||||
| 9 | Federated Investors, Inc., Class B | 252 | ||||||
| 68 | Investment Technology Group, Inc. (a) | 955 | ||||||
| 2 | Janus Capital Group, Inc. | 18 | ||||||
|
| |||||||
| 1,627 | ||||||||
|
| |||||||
Commercial Banks — 6.2% |
| |||||||
| 8 | 1st Source Corp. | 185 | ||||||
| SHARES | SECURITY DESCRIPTION | VALUE($) | ||||||
Commercial Banks — Continued | ||||||||
| 16 | BancFirst Corp. | 722 | ||||||
| 37 | BancorpSouth, Inc. | 650 | ||||||
| 8 | Banner Corp. | 260 | ||||||
| 13 | BBCN Bancorp, Inc. | 186 | ||||||
| 14 | Cathay General Bancorp | 291 | ||||||
| 7 | Central Pacific Financial Corp. (a) | 130 | ||||||
| 5 | Chemical Financial Corp. | 138 | ||||||
| 2 | Citizens & Northern Corp. | 44 | ||||||
| 14 | City Holding Co. | 549 | ||||||
| 12 | CoBiz Financial, Inc. | 98 | ||||||
| 64 | CVB Financial Corp. | 751 | ||||||
| 103 | First Commonwealth Financial Corp. | 757 | ||||||
| 7 | First Financial Bancorp | 103 | ||||||
| 7 | First Interstate Bancsystem, Inc. | 147 | ||||||
| 4 | First Merchants Corp. | 72 | ||||||
| 25 | FNB Corp. | 297 | ||||||
| 8 | Heartland Financial USA, Inc. | 217 | ||||||
| 8 | MainSource Financial Group, Inc. | 113 | ||||||
| 7 | MetroCorp Bancshares, Inc. | 67 | ||||||
| 41 | OFG Bancorp, (Puerto Rico) | 743 | ||||||
| 5 | OmniAmerican Bancorp, Inc. (a) | 115 | ||||||
| 11 | PacWest Bancorp | 328 | ||||||
| 7 | Sierra Bancorp | 108 | ||||||
| 10 | Simmons First National Corp., Class A | 258 | ||||||
| 33 | Southwest Bancorp, Inc. (a) | 436 | ||||||
| 4 | StellarOne Corp. | 83 | ||||||
| 21 | Suffolk Bancorp (a) | 348 | ||||||
| 23 | Susquehanna Bancshares, Inc. | 298 | ||||||
| 4 | SVB Financial Group (a) | 325 | ||||||
| 37 | TCF Financial Corp. | 525 | ||||||
| 20 | Tristate Capital Holdings, Inc. (a) | 269 | ||||||
| 5 | UMB Financial Corp. | 289 | ||||||
| 10 | Union First Market Bankshares Corp. | 208 | ||||||
| 3 | Webster Financial Corp. | 80 | ||||||
| 11 | West Bancorporation, Inc. | 133 | ||||||
| 5 | Westamerica Bancorporation | 215 | ||||||
| 25 | Wilshire Bancorp, Inc. | 165 | ||||||
|
| |||||||
| 10,703 | ||||||||
|
| |||||||
Consumer Finance — 1.7% |
| |||||||
| 38 | DFC Global Corp. (a) | 525 | ||||||
| 16 | Nelnet, Inc., Class A | 588 | ||||||
| 4 | Portfolio Recovery Associates, Inc. (a) | 599 | ||||||
| 15 | World Acceptance Corp. (a) | 1,296 | ||||||
|
| |||||||
| 3,008 | ||||||||
|
| |||||||
SEE NOTES TO FINANCIAL STATEMENTS.
| 40 | J.P. MORGAN SMALL CAP FUNDS | JUNE 30, 2013 | ||||
Table of Contents
| SHARES | SECURITY DESCRIPTION | VALUE($) | ||||||
| Common Stocks — Continued |
| ||||||
Diversified Financial Services — 0.3% |
| |||||||
| 17 | Marlin Business Services Corp. | 376 | ||||||
| 10 | PHH Corp. (a) | 200 | ||||||
|
| |||||||
| 576 | ||||||||
|
| |||||||
Insurance — 2.6% |
| |||||||
| 47 | American Equity Investment Life Holding Co. | 738 | ||||||
| 4 | Aspen Insurance Holdings Ltd., (Bermuda) | 145 | ||||||
| 66 | CNO Financial Group, Inc. | 860 | ||||||
| 4 | EMC Insurance Group, Inc. | 92 | ||||||
| 4 | Global Indemnity plc, (Ireland) (a) | 87 | ||||||
| 13 | Meadowbrook Insurance Group, Inc. | 104 | ||||||
| 7 | Navigators Group, Inc. (The) (a) | 388 | ||||||
| 15 | Platinum Underwriters Holdings Ltd., (Bermuda) | 870 | ||||||
| 8 | Primerica, Inc. | 314 | ||||||
| 14 | ProAssurance Corp. | 704 | ||||||
| 5 | Stewart Information Services Corp. | 128 | ||||||
|
| |||||||
| 4,430 | ||||||||
|
| |||||||
Real Estate Investment Trusts (REITs) — 7.7% |
| |||||||
| 66 | Anworth Mortgage Asset Corp. | 370 | ||||||
| 7 | Ashford Hospitality Trust, Inc. | 79 | ||||||
| 3 | Associated Estates Realty Corp. | 43 | ||||||
| 8 | BioMed Realty Trust, Inc. | 158 | ||||||
| 75 | Capstead Mortgage Corp. | 910 | ||||||
| 18 | CBL & Associates Properties, Inc. | 375 | ||||||
| 52 | Coresite Realty Corp. | 1,651 | ||||||
| 5 | Cousins Properties, Inc. | 48 | ||||||
| 24 | CYS Investments, Inc. | 216 | ||||||
| 36 | DCT Industrial Trust, Inc. | 260 | ||||||
| 19 | DiamondRock Hospitality Co. | 178 | ||||||
| 8 | EastGroup Properties, Inc. | 433 | ||||||
| 11 | EPR Properties | 543 | ||||||
| 3 | Equity Lifestyle Properties, Inc. | 204 | ||||||
| 8 | FelCor Lodging Trust, Inc. (a) | 50 | ||||||
| 6 | First Industrial Realty Trust, Inc. | 93 | ||||||
| 16 | Franklin Street Properties Corp. | 211 | ||||||
| 9 | Home Properties, Inc. | 595 | ||||||
| 17 | Hospitality Properties Trust | 455 | ||||||
| 6 | Lexington Realty Trust | 70 | ||||||
| 29 | LTC Properties, Inc. | 1,121 | ||||||
| 6 | Mission West Properties, Inc. (a) (i) | — | ||||||
| 6 | National Retail Properties, Inc. | 203 | ||||||
| 6 | Omega Healthcare Investors, Inc. | 177 | ||||||
| 18 | Pennsylvania Real Estate Investment Trust | 344 | ||||||
| 9 | Post Properties, Inc. | 440 | ||||||
| 33 | Potlatch Corp. | 1,335 | ||||||
| 2 | PS Business Parks, Inc. | 166 | ||||||
| SHARES | SECURITY DESCRIPTION | VALUE($) | ||||||
Real Estate Investment Trusts (REITs) — Continued |
| |||||||
| 43 | RAIT Financial Trust | 321 | ||||||
| 33 | Ramco-Gershenson Properties Trust | 512 | ||||||
| 50 | Redwood Trust, Inc. | 845 | ||||||
| 7 | Saul Centers, Inc. | 311 | ||||||
| 22 | Strategic Hotels & Resorts, Inc. (a) | 197 | ||||||
| 5 | Taubman Centers, Inc. | 391 | ||||||
|
| |||||||
| 13,305 | ||||||||
|
| |||||||
Real Estate Management & Development — 0.1% |
| |||||||
| 6 | Alexander & Baldwin, Inc. (a) (m) | 238 | ||||||
|
| |||||||
Thrifts & Mortgage Finance — 1.1% |
| |||||||
| 5 | Astoria Financial Corp. | 50 | ||||||
| 3 | BankFinancial Corp. | 23 | ||||||
| 11 | Beneficial Mutual Bancorp, Inc. (a) | 94 | ||||||
| 3 | Capitol Federal Financial, Inc. | 33 | ||||||
| 2 | Nationstar Mortgage Holdings, Inc. (a) | 90 | ||||||
| 12 | OceanFirst Financial Corp. | 183 | ||||||
| 31 | Ocwen Financial Corp. (a) | 1,261 | ||||||
| 4 | PennyMac Financial Services, Inc., Class A (a) | 89 | ||||||
|
| |||||||
| 1,823 | ||||||||
|
| |||||||
Total Financials | 35,710 | |||||||
|
| |||||||
Health Care — 11.8% |
| |||||||
Biotechnology — 2.6% |
| |||||||
| 50 | Achillion Pharmaceuticals, Inc. (a) (m) | 408 | ||||||
| 6 | Alkermes plc, (Ireland) (a) | 178 | ||||||
| 84 | Amicus Therapeutics, Inc. (a) | 196 | ||||||
| 5 | ArQule, Inc. (a) | 11 | ||||||
| 4 | Bluebird Bio, Inc. (a) | 92 | ||||||
| 31 | ChemoCentryx, Inc. (a) | 437 | ||||||
| 17 | Chimerix, Inc. (a) | 400 | ||||||
| 1 | Cytokinetics, Inc. (a) | 8 | ||||||
| 28 | Dynavax Technologies Corp. (a) | 31 | ||||||
| 10 | Esperion Therapeutics, Inc. (a) | 138 | ||||||
| 46 | Merrimack Pharmaceuticals, Inc. (a) | 307 | ||||||
| 33 | Neurocrine Biosciences, Inc. (a) | 439 | ||||||
| 140 | Oncothyreon, Inc. (a) | 218 | ||||||
| 62 | Orexigen Therapeutics, Inc. (a) | 365 | ||||||
| 6 | PTC Therapeutics, Inc. (a) | 86 | ||||||
| 146 | Threshold Pharmaceuticals, Inc. (a) | 770 | ||||||
| 46 | Trius Therapeutics, Inc. (a) | 377 | ||||||
|
| |||||||
| 4,461 | ||||||||
|
| |||||||
Health Care Equipment & Supplies — 2.3% |
| |||||||
| 16 | Accuray, Inc. (a) (m) | 92 | ||||||
| 33 | CONMED Corp. | 1,015 | ||||||
| 4 | Cyberonics, Inc. (a) | 213 | ||||||
SEE NOTES TO FINANCIAL STATEMENTS.
| JUNE 30, 2013 | J.P. MORGAN SMALL CAP FUNDS | 41 | ||||||
Table of Contents
JPMorgan U.S. Small Company Fund
SCHEDULE OF PORTFOLIO INVESTMENTS
AS OF JUNE 30, 2013 (continued)
(Amounts in thousands)
| SHARES | SECURITY DESCRIPTION | VALUE($) | ||||||
| Common Stocks — Continued |
| ||||||
Health Care Equipment & Supplies — Continued |
| |||||||
| 21 | Greatbatch, Inc. (a) | 679 | ||||||
| 36 | Invacare Corp. | 520 | ||||||
| 20 | Medical Action Industries, Inc. (a) | 150 | ||||||
| 11 | NuVasive, Inc. (a) | 278 | ||||||
| 4 | Orthofix International N.V., (Netherlands) (a) | 105 | ||||||
| 43 | SurModics, Inc. (a) | 858 | ||||||
|
| |||||||
| 3,910 | ||||||||
|
| |||||||
Health Care Providers & Services — 2.1% |
| |||||||
| 9 | Addus HomeCare Corp. (a) | 170 | ||||||
| 25 | Amedisys, Inc. (a) | 289 | ||||||
| 8 | Centene Corp. (a) | 414 | ||||||
| 16 | Cross Country Healthcare, Inc. (a) | 82 | ||||||
| 43 | Gentiva Health Services, Inc. (a) | 433 | ||||||
| 3 | HealthSouth Corp. (a) | 95 | ||||||
| 2 | Magellan Health Services, Inc. (a) | 118 | ||||||
| 23 | Molina Healthcare, Inc. (a) | 866 | ||||||
| 17 | Owens & Minor, Inc. | 562 | ||||||
| 12 | Providence Service Corp. (The) (a) | 352 | ||||||
| 28 | Select Medical Holdings Corp. | 229 | ||||||
|
| |||||||
| 3,610 | ||||||||
|
| |||||||
Health Care Technology — 0.4% |
| |||||||
| 44 | MedAssets, Inc. (a) | 783 | ||||||
|
| |||||||
Life Sciences Tools & Services — 0.8% |
| |||||||
| 19 | Cambrex Corp. (a) | 259 | ||||||
| — | (h) | Mettler-Toledo International, Inc. (a) | 60 | |||||
| 26 | NanoString Technologies, Inc. (a) | 208 | ||||||
| 19 | PAREXEL International Corp. (a) | 882 | ||||||
|
| |||||||
| 1,409 | ||||||||
|
| |||||||
Pharmaceuticals — 3.6% |
| |||||||
| 20 | Aratana Therapeutics, Inc. (a) | 147 | ||||||
| 41 | BioDelivery Sciences International, Inc. (a) | 168 | ||||||
| 16 | Cornerstone Therapeutics, Inc. (a) | 126 | ||||||
| 3 | Jazz Pharmaceuticals plc, (Ireland) (a) | 179 | ||||||
| 44 | Nektar Therapeutics (a) | 502 | ||||||
| 14 | Pacira Pharmaceuticals, Inc. (a) | 403 | ||||||
| 52 | Questcor Pharmaceuticals, Inc. | 2,350 | ||||||
| 15 | Repros Therapeutics, Inc. (a) | 277 | ||||||
| 79 | Sciclone Pharmaceuticals, Inc. (a) | 394 | ||||||
| 3 | Transcept Pharmaceuticals, Inc. (a) | 10 | ||||||
| 58 | ViroPharma, Inc. (a) | 1,668 | ||||||
|
| |||||||
| 6,224 | ||||||||
|
| |||||||
Total Health Care | 20,397 | |||||||
|
| |||||||
| SHARES | SECURITY DESCRIPTION | VALUE($) | ||||||
Industrials — 15.8% |
| |||||||
Aerospace & Defense — 1.5% |
| |||||||
| 10 | AAR Corp. (m) | 222 | ||||||
| 63 | GenCorp, Inc. (a) | 1,024 | ||||||
| 160 | Taser International, Inc. (a) | 1,362 | ||||||
|
| |||||||
| 2,608 | ||||||||
|
| |||||||
Air Freight & Logistics — 0.1% |
| |||||||
| 4 | Park-Ohio Holdings Corp. (a) | 132 | ||||||
|
| |||||||
Airlines — 1.6% |
| |||||||
| 16 | Alaska Air Group, Inc. (a) (m) | 842 | ||||||
| 154 | Republic Airways Holdings, Inc. (a) | 1,745 | ||||||
| 7 | U.S. Airways Group, Inc. (a) | 112 | ||||||
|
| |||||||
| 2,699 | ||||||||
|
| |||||||
Building Products — 0.9% |
| |||||||
| 5 | A.O. Smith Corp. | 171 | ||||||
| 52 | Gibraltar Industries, Inc. (a) | 753 | ||||||
| 4 | Nortek, Inc. (a) | 264 | ||||||
| 6 | Ply Gem Holdings, Inc. (a) | 114 | ||||||
| 5 | Trex Co., Inc. (a) | 247 | ||||||
|
| |||||||
| 1,549 | ||||||||
|
| |||||||
Commercial Services & Supplies — 3.3% |
| |||||||
| 142 | ARC Document Solutions, Inc. (a) (m) | 567 | ||||||
| 6 | Consolidated Graphics, Inc. (a) | 292 | ||||||
| 38 | Courier Corp. | 537 | ||||||
| 19 | Deluxe Corp. | 641 | ||||||
| 8 | G&K Services, Inc., Class A | 367 | ||||||
| 25 | Intersections, Inc. | 218 | ||||||
| 48 | Quad/Graphics, Inc. | 1,151 | ||||||
| 2 | Standard Parking Corp. (a) | 34 | ||||||
| 7 | Steelcase, Inc., Class A | 105 | ||||||
| 53 | United Stationers, Inc. | 1,765 | ||||||
|
| |||||||
| 5,677 | ||||||||
|
| |||||||
Construction & Engineering — 1.4% |
| |||||||
| 18 | Argan, Inc. | 277 | ||||||
| 37 | EMCOR Group, Inc. | 1,504 | ||||||
| 7 | MasTec, Inc. (a) | 214 | ||||||
| 6 | Michael Baker Corp. | 152 | ||||||
| 25 | Orion Marine Group, Inc. (a) | 300 | ||||||
|
| |||||||
| 2,447 | ||||||||
|
| |||||||
Electrical Equipment — 0.7% |
| |||||||
| 11 | Acuity Brands, Inc. (m) | 808 | ||||||
| 15 | Coleman Cable, Inc. | 263 | ||||||
| 5 | SolarCity Corp. (a) | 185 | ||||||
|
| |||||||
| 1,256 | ||||||||
|
| |||||||
SEE NOTES TO FINANCIAL STATEMENTS.
| 42 | J.P. MORGAN SMALL CAP FUNDS | JUNE 30, 2013 | ||||
Table of Contents
| SHARES | SECURITY DESCRIPTION | VALUE($) | ||||||
| Common Stocks — Continued |
| ||||||
Machinery — 2.8% |
| |||||||
| 5 | Alamo Group, Inc. (m) | 212 | ||||||
| 2 | Ampco-Pittsburgh Corp. | 45 | ||||||
| 29 | Douglas Dynamics, Inc. | 374 | ||||||
| 54 | FreightCar America, Inc. | 923 | ||||||
| 14 | Global Brass & Copper Holdings, Inc. (a) | 185 | ||||||
| 7 | Hurco Cos., Inc. | 201 | ||||||
| 4 | Hyster-Yale Materials Handling, Inc. | 232 | ||||||
| 16 | Kadant, Inc. | 483 | ||||||
| 17 | Mueller Industries, Inc. | 868 | ||||||
| 4 | Nordson Corp. | 298 | ||||||
| 13 | Standex International Corp. | 659 | ||||||
| 1 | Watts Water Technologies, Inc., Class A | 36 | ||||||
| 37 | Xerium Technologies, Inc. (a) | 375 | ||||||
|
| |||||||
| 4,891 | ||||||||
|
| |||||||
Marine — 0.0% (g) |
| |||||||
| — | (h) | Rand Logistics, Inc. (a) | 1 | |||||
|
| |||||||
Professional Services — 1.3% |
| |||||||
| 36 | Barrett Business Services, Inc. | 1,892 | ||||||
| 8 | VSE Corp. | 337 | ||||||
|
| |||||||
| 2,229 | ||||||||
|
| |||||||
Road & Rail — 1.7% |
| |||||||
| 1 | AMERCO | 81 | ||||||
| 12 | Arkansas Best Corp. | 278 | ||||||
| 6 | Avis Budget Group, Inc. (a) | 172 | ||||||
| 5 | Celadon Group, Inc. | 95 | ||||||
| 8 | Con-way, Inc. | 300 | ||||||
| 18 | Heartland Express, Inc. | 244 | ||||||
| 45 | Saia, Inc. (a) | 1,358 | ||||||
| 22 | Swift Transportation Co. (a) | 367 | ||||||
|
| |||||||
| 2,895 | ||||||||
|
| |||||||
Trading Companies & Distributors — 0.5% |
| |||||||
| 18 | Aircastle Ltd. | 282 | ||||||
| 13 | Applied Industrial Technologies, Inc. | 604 | ||||||
|
| |||||||
| 886 | ||||||||
|
| |||||||
Total Industrials | 27,270 | |||||||
|
| |||||||
Information Technology — 17.6% |
| |||||||
Communications Equipment — 3.3% |
| |||||||
| 3 | Alliance Fiber Optic Products, Inc. | 64 | ||||||
| 61 | ARRIS Group, Inc. (a) | 877 | ||||||
| 30 | Aviat Networks, Inc. (a) | 79 | ||||||
| 65 | Comtech Telecommunications Corp. | 1,756 | ||||||
| 47 | InterDigital, Inc. | 2,107 | ||||||
| 1 | Plantronics, Inc. | 35 | ||||||
| SHARES | SECURITY DESCRIPTION | VALUE($) | ||||||
Communications Equipment — Continued | ||||||||
| 48 | Ubiquiti Networks, Inc. | 843 | ||||||
|
| |||||||
| �� | 5,761 | |||||||
|
| |||||||
Computers & Peripherals — 0.1% |
| |||||||
| 11 | Avid Technology, Inc. (a) | 62 | ||||||
| — | (h) | Hutchinson Technology, Inc. (a) | 1 | |||||
| 10 | QLogic Corp. (a) | 99 | ||||||
|
| |||||||
| 162 | ||||||||
|
| |||||||
Electronic Equipment, Instruments & Components — 1.7% |
| |||||||
| 31 | Aeroflex Holding Corp. (a) (m) | 242 | ||||||
| 8 | Audience, Inc. (a) | 106 | ||||||
| 35 | Benchmark Electronics, Inc. (a) | 704 | ||||||
| 13 | Checkpoint Systems, Inc. (a) | 179 | ||||||
| 17 | Coherent, Inc. | 909 | ||||||
| 25 | Newport Corp. (a) | 352 | ||||||
| 4 | RealD, Inc. (a) | 58 | ||||||
| 6 | TTM Technologies, Inc. (a) | 53 | ||||||
| 18 | Vishay Intertechnology, Inc. (a) | 244 | ||||||
|
| |||||||
| 2,847 | ||||||||
|
| |||||||
Internet Software & Services — 3.2% |
| |||||||
| 72 | Digital River, Inc. (a) | 1,348 | ||||||
| 10 | Gogo, Inc. (a) | 141 | ||||||
| 35 | IntraLinks Holdings, Inc. (a) | 256 | ||||||
| 4 | Marketo, Inc. (a) | 92 | ||||||
| 27 | Millennial Media, Inc. (a) | 239 | ||||||
| 204 | Monster Worldwide, Inc. (a) | 1,002 | ||||||
| 12 | Move, Inc. (a) | 150 | ||||||
| 30 | QuinStreet, Inc. (a) | 255 | ||||||
| 6 | Textura Corp. (a) | 161 | ||||||
| 116 | Tremor Video, Inc. (a) | 1,046 | ||||||
| 24 | WebMD Health Corp. (a) | 711 | ||||||
| 2 | Xoom Corp. (a) | 48 | ||||||
|
| |||||||
| 5,449 | ||||||||
|
| |||||||
IT Services — 1.9% | ||||||||
| 5 | Blackhawk Network Holdings, Inc. (a) | 109 | ||||||
| 17 | CACI International, Inc., Class A (a) | 1,105 | ||||||
| 36 | CSG Systems International, Inc. (a) | 788 | ||||||
| 5 | EVERTEC, Inc., (Puerto Rico) (a) | 103 | ||||||
| 44 | Hackett Group, Inc. (The) | 226 | ||||||
| 11 | Heartland Payment Systems, Inc. | 402 | ||||||
| 8 | Unisys Corp. (a) | 170 | ||||||
| 9 | Vantiv, Inc., Class A (a) | 248 | ||||||
| 9 | VeriFone Systems, Inc. (a) | 149 | ||||||
|
| |||||||
| 3,300 | ||||||||
|
| |||||||
SEE NOTES TO FINANCIAL STATEMENTS.
| JUNE 30, 2013 | J.P. MORGAN SMALL CAP FUNDS | 43 | ||||||
Table of Contents
JPMorgan U.S. Small Company Fund
SCHEDULE OF PORTFOLIO INVESTMENTS
AS OF JUNE 30, 2013 (continued)
(Amounts in thousands, except number of contracts)
| SHARES | SECURITY DESCRIPTION | VALUE($) | ||||||
| Common Stocks — Continued |
| ||||||
Semiconductors & Semiconductor Equipment — 3.8% |
| |||||||
| 103 | Advanced Energy Industries, Inc. (a) (m) | 1,799 | ||||||
| 12 | DSP Group, Inc. (a) | 101 | ||||||
| 11 | First Solar, Inc. (a) | 483 | ||||||
| 121 | LSI Corp. (a) | 866 | ||||||
| 38 | Micrel, Inc. | 378 | ||||||
| 40 | Photronics, Inc. (a) | 319 | ||||||
| 230 | PLX Technology, Inc. (a) | 1,093 | ||||||
| 40 | RF Micro Devices, Inc. (a) | 212 | ||||||
| 13 | Rudolph Technologies, Inc. (a) | 143 | ||||||
| 44 | STR Holdings, Inc. (a) | 100 | ||||||
| 8 | SunPower Corp. (a) | 162 | ||||||
| 89 | TriQuint Semiconductor, Inc. (a) | 614 | ||||||
| 57 | Ultra Clean Holdings (a) | 344 | ||||||
|
| |||||||
| 6,614 | ||||||||
|
| |||||||
Software — 3.6% | ||||||||
| 37 | Aspen Technology, Inc. (a) | 1,065 | ||||||
| 20 | Cyan, Inc. (a) | 206 | ||||||
| 8 | Fair Isaac Corp. | 353 | ||||||
| 8 | Gigamon, Inc. (a) | 215 | ||||||
| 29 | Manhattan Associates, Inc. (a) | 2,230 | ||||||
| 23 | Monotype Imaging Holdings, Inc. | 574 | ||||||
| 24 | Pegasystems, Inc. | 788 | ||||||
| 7 | Tableau Software, Inc., Class A (a) | 399 | ||||||
| 31 | Telenav, Inc. (a) | 161 | ||||||
| 11 | TIBCO Software, Inc. (a) | 240 | ||||||
|
| |||||||
| 6,231 | ||||||||
|
| |||||||
Total Information Technology | 30,364 | |||||||
|
| |||||||
Materials — 5.0% | ||||||||
Chemicals — 1.7% | ||||||||
| 7 | Axiall Corp. | 292 | ||||||
| 46 | Minerals Technologies, Inc. | 1,897 | ||||||
| 11 | OM Group, Inc. (a) | 338 | ||||||
| 17 | Tredegar Corp. | 445 | ||||||
|
| |||||||
| 2,972 | ||||||||
|
| |||||||
Construction Materials — 0.6% | ||||||||
| 107 | Headwaters, Inc. (a) | 947 | ||||||
|
| |||||||
Containers & Packaging — 0.6% | ||||||||
| 106 | Graphic Packaging Holding Co. (a) | 820 | ||||||
| 19 | Myers Industries, Inc. | 291 | ||||||
|
| |||||||
| 1,111 | ||||||||
|
| |||||||
Metals & Mining — 1.0% | ||||||||
| 15 | Coeur Mining, Inc. (a) | 203 | ||||||
| 46 | Worthington Industries, Inc. | 1,443 | ||||||
|
| |||||||
| 1,646 | ||||||||
|
| |||||||
| SHARES | SECURITY DESCRIPTION | VALUE($) | ||||||
Paper & Forest Products — 1.1% | ||||||||
| 12 | Buckeye Technologies, Inc. | 452 | ||||||
| 4 | Domtar Corp., (Canada) | 259 | ||||||
| 33 | PH Glatfelter Co. | 815 | ||||||
| 32 | Resolute Forest Products, Inc., (Canada) (a) | 423 | ||||||
|
| |||||||
| 1,949 | ||||||||
|
| |||||||
Total Materials | 8,625 | |||||||
|
| |||||||
Telecommunication Services — 1.0% | ||||||||
Diversified Telecommunication Services — 0.8% |
| |||||||
| 21 | Fairpoint Communications, Inc. (a) | 171 | ||||||
| 79 | magicJack VocalTec Ltd., (Israel) (a) | 1,120 | ||||||
| 16 | Neutral Tandem, Inc. | 93 | ||||||
|
| |||||||
| 1,384 | ||||||||
|
| |||||||
Wireless Telecommunication Services — 0.2% | ||||||||
| 35 | NII Holdings, Inc. (a) | 234 | ||||||
| 2 | NTELOS Holdings Corp. | 26 | ||||||
|
| |||||||
| 260 | ||||||||
|
| |||||||
Total Telecommunication Services | 1,644 | |||||||
|
| |||||||
Utilities — 3.0% | ||||||||
Electric Utilities — 1.3% | ||||||||
| 17 | El Paso Electric Co. | 607 | ||||||
| 15 | PNM Resources, Inc. | 328 | ||||||
| 31 | Portland General Electric Co. | 936 | ||||||
| 8 | UNS Energy Corp. | 345 | ||||||
|
| |||||||
| 2,216 | ||||||||
|
| |||||||
Gas Utilities — 0.9% | ||||||||
| 7 | AGL Resources, Inc. (m) | 294 | ||||||
| 10 | Laclede Group, Inc. (The) | 466 | ||||||
| 11 | Piedmont Natural Gas Co., Inc. | 361 | ||||||
| 8 | Southwest Gas Corp. | 360 | ||||||
|
| |||||||
| 1,481 | ||||||||
|
| |||||||
Multi-Utilities — 0.8% | ||||||||
| 36 | NorthWestern Corp. | 1,452 | ||||||
|
| |||||||
Total Utilities | 5,149 | |||||||
|
| |||||||
Total Common Stocks | 168,718 | |||||||
|
| |||||||
| PRINCIPAL AMOUNT($) | ||||||||
| U.S. Treasury Obligation — 0.1% |
| ||||||
| 165 | U.S. Treasury Note, 0.250%, 11/30/13 (k) | 165 | ||||||
|
| |||||||
SEE NOTES TO FINANCIAL STATEMENTS.
| 44 | J.P. MORGAN SMALL CAP FUNDS | JUNE 30, 2013 | ||||
Table of Contents
| SHARES | SECURITY DESCRIPTION | VALUE($) | ||||||
| Short-Term Investment — 2.6% | |||||||
Investment Company — 2.6% | ||||||||
| 4,514 | JPMorgan Prime Money Market Fund, Institutional Class Shares, | 4,514 | ||||||
|
| |||||||
Total Investments — 100.4% | 173,397 | |||||||
Liabilities in Excess of | (688 | ) | ||||||
|
| |||||||
NET ASSETS — 100.0% | $ | 172,709 | ||||||
|
| |||||||
Percentages indicated are based on net assets.
| Futures Contracts | ||||||||||||||||
| NUMBER OF CONTRACTS | DESCRIPTION | EXPIRATION DATE | NOTIONAL VALUE AT 06/30/13 | NET UNREALIZED APPRECIATION (DEPRECIATION) | ||||||||||||
Long Futures Outstanding | ||||||||||||||||
| 32 | E-mini Russell 2000 | 09/20/13 | $ | 3,119 | $ | 30 | ||||||||||
|
| |||||||||||||||
SEE NOTES TO FINANCIAL STATEMENTS.
| JUNE 30, 2013 | J.P. MORGAN SMALL CAP FUNDS | 45 | ||||||
Table of Contents
JPMorgan Small Cap Funds
NOTES TO SCHEDULES OF PORTFOLIO INVESTMENTS
AS OF JUNE 30, 2013
| (a) | — Non-income producing security. | |
| (b) | — Investment in affiliate. Money market fund registered under the Investment Company Act of 1940, as amended, and advised by J.P. Morgan Investment Management Inc. | |
| (g) | — Amount rounds to less than 0.1%. | |
| (h) | — Amount rounds to less than one thousand (shares or dollars). | |
| (i) | — Security has been deemed illiquid pursuant to procedures approved by the Board of Trustees and may be difficult to sell. |
| (k) | — All or a portion of this security is deposited with the broker as collateral for futures or with brokers as initial margin for futures contracts. | |
| (l) | — The rate shown is the current yield as of June 30, 2013. | |
| (m) | — All or a portion of this security is reserved and/or pledged with the custodian for current or potential holdings of futures, swaps, options, TBAs, when-issued securities, delayed delivery securities, reverse repurchase agreements, unfunded commitments and/or forward foreign currency exchange contracts. |
SEE NOTES TO FINANCIAL STATEMENTS.
| 46 | J.P. MORGAN SMALL CAP FUNDS | JUNE 30, 2013 | ||||
Table of Contents
STATEMENTS OF ASSETS AND LIABILITIES
AS OF JUNE 30, 2013
(Amounts in thousands, except per share amounts)
| Dynamic Small Cap Growth Fund | Small Cap Core Fund | Small Cap Equity Fund | ||||||||||
ASSETS: | ||||||||||||
Investments in non-affiliates, at value | $ | 506,453 | $ | 506,768 | $ | 2,620,155 | ||||||
Investments in affiliates, at value | 9,373 | 13,324 | 43,071 | |||||||||
|
|
|
|
|
| |||||||
Total investment securities, at value | 515,826 | 520,092 | 2,663,226 | |||||||||
Receivables: | ||||||||||||
Investment securities sold | 6,404 | 14,656 | 43,991 | |||||||||
Fund shares sold | 1,886 | 515 | 4,563 | |||||||||
Interest and dividends from non-affiliates | 245 | 899 | 3,213 | |||||||||
Dividends from affiliates | — | (a) | — | (a) | 416 | |||||||
Due from Advisor | — | 38 | — | |||||||||
|
|
|
|
|
| |||||||
Total Assets | 524,361 | 536,200 | 2,715,409 | |||||||||
|
|
|
|
|
| |||||||
LIABILITIES: | ||||||||||||
Payables: | ||||||||||||
Investment securities purchased | 2,858 | 13,633 | 2,422 | |||||||||
Fund shares redeemed | 1,097 | 55 | 13,341 | |||||||||
Variation margin on futures contracts | — | 6 | — | |||||||||
Accrued liabilities: | ||||||||||||
Investment advisory fees | 272 | — | 1,403 | |||||||||
Administration fees | 35 | — | (a) | — | ||||||||
Shareholder servicing fees | 72 | — | 339 | |||||||||
Distribution fees | 50 | — | 173 | |||||||||
Custodian and accounting fees | 11 | 12 | 27 | |||||||||
Trustees’ and Chief Compliance Officer’s fees | — | (a) | — | (a) | 2 | |||||||
Other | 192 | 199 | 877 | |||||||||
|
|
|
|
|
| |||||||
Total Liabilities | 4,587 | 13,905 | 18,584 | |||||||||
|
|
|
|
|
| |||||||
Net Assets | $ | 519,774 | $ | 522,295 | $ | 2,696,825 | ||||||
|
|
|
|
|
| |||||||
| (a) | Amount rounds to less than $1,000. |
SEE NOTES TO FINANCIAL STATEMENTS.
| JUNE 30, 2013 | J.P. MORGAN SMALL CAP FUNDS | 47 | ||||||
Table of Contents
STATEMENTS OF ASSETS AND LIABILITIES
AS OF JUNE 30, 2013 (continued)
(Amounts in thousands, except per share amounts)
| Dynamic Small Cap Growth Fund | Small Cap Core Fund | Small Cap Equity Fund | ||||||||||
NET ASSETS: | ||||||||||||
Paid-in-Capital | $ | 397,434 | $ | 375,557 | $ | 1,736,687 | ||||||
Accumulated undistributed (distributions in excess of) net investment income | (1,915 | ) | 1,795 | 4,114 | ||||||||
Accumulated net realized gains (losses) | 15,156 | 2,816 | 65,184 | |||||||||
Net unrealized appreciation (depreciation) | 109,099 | 142,127 | 890,840 | |||||||||
|
|
|
|
|
| |||||||
Total Net Assets | $ | 519,774 | $ | 522,295 | $ | 2,696,825 | ||||||
|
|
|
|
|
| |||||||
Net Assets: | ||||||||||||
Class A | $ | 77,408 | $ | — | $ | 696,784 | ||||||
Class B | 793 | — | 8,264 | |||||||||
Class C | 54,171 | — | 37,039 | |||||||||
Class R2 | — | — | 4,909 | |||||||||
Class R5 | — | — | 814,942 | |||||||||
Select Class | 387,402 | 522,295 | 1,134,887 | |||||||||
|
|
|
|
|
| |||||||
Total | $ | 519,774 | $ | 522,295 | $ | 2,696,825 | ||||||
|
|
|
|
|
| |||||||
Outstanding units of beneficial interest (shares) ($0.0001 par value; unlimited number of shares authorized): | ||||||||||||
Class A | 3,351 | — | 17,446 | |||||||||
Class B | 39 | — | 249 | |||||||||
Class C | 2,675 | — | 1,120 | |||||||||
Class R2 | — | — | 124 | |||||||||
Class R5 | — | — | 18,432 | |||||||||
Select Class | 15,686 | 10,857 | 25,710 | |||||||||
Net Asset Value (a): | ||||||||||||
Class A — Redemption price per share | $ | 23.10 | $ | — | $ | 39.94 | ||||||
Class B — Offering price per share (b) | 20.29 | — | 33.16 | |||||||||
Class C — Offering price per share (b) | 20.25 | — | 33.06 | |||||||||
Class R2 — Offering and redemption price per share | — | — | 39.52 | |||||||||
Class R5 — Offering and redemption price per share | — | — | 44.21 | |||||||||
Select Class — Offering and redemption price per share | 24.70 | 48.11 | 44.14 | |||||||||
Class A maximum sales charge | 5.25 | % | — | % | 5.25 | % | ||||||
Class A maximum public offering price per share | $ | 24.38 | $ | — | $ | 42.15 | ||||||
|
|
|
|
|
| |||||||
Cost of investments in non-affiliates | $ | 397,354 | $ | 364,843 | $ | 1,729,315 | ||||||
Cost of investments in affiliates | 9,373 | 13,324 | 43,071 | |||||||||
| (a) | Per share amounts may not recalculate due to rounding of net assets and/or shares outstanding. |
| (b) | Redemption price for Class B and Class C Shares varies based upon length of time the shares are held. |
SEE NOTES TO FINANCIAL STATEMENTS.
| 48 | J.P. MORGAN SMALL CAP FUNDS | JUNE 30, 2013 | ||||
Table of Contents
| Small Cap Growth Fund | Small Cap Value Fund | U.S. Small Company Fund | ||||||||||
ASSETS: | ||||||||||||
Investments in non-affiliates, at value | $ | 915,045 | $ | 878,515 | $ | 168,883 | ||||||
Investments in affiliates, at value | 14,084 | 13,786 | 4,514 | |||||||||
|
|
|
|
|
| |||||||
Total investment securities, at value | 929,129 | 892,301 | 173,397 | |||||||||
Cash | — | — | 651 | |||||||||
Deposits at broker for futures contracts | — | — | 240 | |||||||||
Receivables: | ||||||||||||
Investment securities sold | 11,579 | 29,862 | 6,449 | |||||||||
Fund shares sold | 1,392 | 2,085 | 714 | |||||||||
Interest and dividends from non-affiliates | 442 | 2,330 | 168 | |||||||||
Dividends from affiliates | 1 | 1 | — | (a) | ||||||||
Variation margin on futures contracts | — | 5 | — | |||||||||
|
|
|
|
|
| |||||||
Total Assets | 942,543 | 926,584 | 181,619 | |||||||||
|
|
|
|
|
| |||||||
LIABILITIES: | ||||||||||||
Payables: | ||||||||||||
Due to custodian | — | (a) | — | — | ||||||||
Dividends | — | 473 | — | |||||||||
Investment securities purchased | 5,153 | 25,164 | 8,437 | |||||||||
Fund shares redeemed | 4,513 | 1,495 | 298 | |||||||||
Variation margin on futures contracts | — | — | 5 | |||||||||
Accrued liabilities: | ||||||||||||
Investment advisory fees | 456 | 491 | 65 | |||||||||
Administration fees | — | 20 | — | |||||||||
Shareholder servicing fees | 111 | 84 | 27 | |||||||||
Distribution fees | 80 | 101 | 15 | |||||||||
Custodian and accounting fees | 12 | 16 | 24 | |||||||||
Trustees’ and Chief Compliance Officer’s fees | 2 | — | (a) | — | (a) | |||||||
Other | 298 | 258 | 39 | |||||||||
|
|
|
|
|
| |||||||
Total Liabilities | 10,625 | 28,102 | 8,910 | |||||||||
|
|
|
|
|
| |||||||
Net Assets | $ | 931,918 | $ | 898,482 | $ | 172,709 | ||||||
|
|
|
|
|
| |||||||
| (a) | Amount rounds to less than $1,000. |
SEE NOTES TO FINANCIAL STATEMENTS.
| JUNE 30, 2013 | J.P. MORGAN SMALL CAP FUNDS | 49 | ||||||
Table of Contents
STATEMENTS OF ASSETS AND LIABILITIES
AS OF JUNE 30, 2013 (continued)
(Amounts in thousands, except per share amounts)
| Small Cap Growth Fund | Small Cap Value Fund | U.S. Small Company Fund | ||||||||||
NET ASSETS: | ||||||||||||
Paid-in-Capital | $ | 668,500 | $ | 708,364 | $ | 146,787 | ||||||
Accumulated undistributed (distributions in excess of) net investment income | (2,896 | ) | (1,062 | ) | 255 | |||||||
Accumulated net realized gains (losses) | 49,670 | (13,308 | ) | (2,744 | ) | |||||||
Net unrealized appreciation (depreciation) | 216,644 | 204,488 | 28,411 | |||||||||
|
|
|
|
|
| |||||||
Total Net Assets | $ | 931,918 | $ | 898,482 | $ | 172,709 | ||||||
|
|
|
|
|
| |||||||
Net Assets: | ||||||||||||
Class A | $ | 249,986 | $ | 332,177 | $ | 49,607 | ||||||
Class B | 3,005 | 3,762 | — | |||||||||
Class C | 25,415 | 41,108 | 6,972 | |||||||||
Class R2 | 26,561 | 15,500 | 1,744 | |||||||||
Class R5 | — | 32,304 | — | |||||||||
Class R6 | 248,415 | 207,613 | 17,232 | |||||||||
Institutional Class | 230,458 | — | 30,226 | |||||||||
Select Class | 148,078 | 266,018 | 66,928 | |||||||||
|
|
|
|
|
| |||||||
Total | $ | 931,918 | $ | 898,482 | $ | 172,709 | ||||||
|
|
|
|
|
| |||||||
Outstanding units of beneficial interest (shares) ($0.0001 par value; unlimited number of shares authorized): | ||||||||||||
Class A | 19,228 | 13,975 | 3,768 | |||||||||
Class B | 290 | 180 | — | |||||||||
Class C | 2,339 | 1,983 | 540 | |||||||||
Class R2 | 2,069 | 654 | 133 | |||||||||
Class R5 | — | 1,300 | — | |||||||||
Class R6 | 17,743 | 8,348 | 1,291 | |||||||||
Institutional Class | 16,504 | — | 2,265 | |||||||||
Select Class | 10,758 | 10,703 | 5,006 | |||||||||
Net Asset Value (a): | ||||||||||||
Class A — Redemption price per share | $ | 13.00 | $ | 23.77 | $ | 13.17 | ||||||
Class B — Offering price per share (b) | 10.35 | 20.92 | — | |||||||||
Class C — Offering price per share (b) | 10.87 | 20.73 | 12.91 | |||||||||
Class R2 — Offering and redemption price per share | 12.84 | 23.67 | 13.09 | |||||||||
Class R5 — Offering and redemption price per share | — | 24.85 | — | |||||||||
Class R6 — Offering and redemption price per share | 14.00 | 24.87 | 13.35 | |||||||||
Institutional Class — Offering and redemption price per share | 13.96 | — | 13.35 | |||||||||
Select Class — Offering and redemption price per share | 13.77 | 24.86 | 13.37 | |||||||||
Class A maximum sales charge | 5.25 | % | 5.25 | % | 5.25 | % | ||||||
Class A maximum public offering price per share | $ | 13.72 | $ | 25.09 | $ | 13.90 | ||||||
|
|
|
|
|
| |||||||
Cost of investments in non-affiliates | $ | 698,401 | $ | 674,199 | $ | 140,502 | ||||||
Cost of investments in affiliates | 14,084 | 13,786 | 4,514 | |||||||||
| (a) | Per share amounts may not recalculate due to rounding of net assets and/or shares outstanding. |
| (b) | Redemption price for Class B and Class C Shares varies based upon length of time the shares are held. |
SEE NOTES TO FINANCIAL STATEMENTS.
| 50 | J.P. MORGAN SMALL CAP FUNDS | JUNE 30, 2013 | ||||
Table of Contents
STATEMENTS OF OPERATIONS
FOR THE YEAR ENDED JUNE 30, 2013
(Amounts in thousands)
| Dynamic Small Cap Growth Fund | Small Cap Core Fund | Small Cap Equity Fund | ||||||||||
INVESTMENT INCOME: | ||||||||||||
Interest income from non-affiliates | $ | — | $ | 2 | $ | — | ||||||
Interest income from affiliates | 1 | — | — | |||||||||
Dividend income from non-affiliates | 3,062 | 7,417 | 52,010 | |||||||||
Dividend income from affiliates | 7 | 9 | 63 | |||||||||
Income from securities lending (net) | 4 | 2 | — | |||||||||
|
|
|
|
|
| |||||||
Total investment income | 3,074 | 7,430 | 52,073 | |||||||||
|
|
|
|
|
| |||||||
EXPENSES: | ||||||||||||
Investment advisory fees | 2,627 | 2,957 | 16,431 | |||||||||
Administration fees | 344 | 387 | 2,154 | |||||||||
Distribution fees: | ||||||||||||
Class A | 173 | — | 1,591 | |||||||||
Class B | 7 | — | 70 | |||||||||
Class C | 381 | — | 268 | |||||||||
Class R2 | — | — | 27 | |||||||||
Shareholder servicing fees: | ||||||||||||
Class A | 173 | — | 1,591 | |||||||||
Class B | 2 | — | 23 | |||||||||
Class C | 127 | — | 89 | |||||||||
Class R2 | — | — | 14 | |||||||||
Class R5 | — | — | 356 | |||||||||
Select Class | 708 | 1,137 | 2,820 | |||||||||
Custodian and accounting fees | 40 | 33 | 102 | |||||||||
Interest expense to affiliates | 1 | — | — | (a) | ||||||||
Professional fees | 49 | 46 | 71 | |||||||||
Trustees’ and Chief Compliance Officer’s fees | 2 | 5 | 29 | |||||||||
Printing and mailing costs | 94 | 50 | 242 | |||||||||
Registration and filing fees | 52 | 18 | 82 | |||||||||
Transfer agent fees | 598 | 783 | 3,295 | |||||||||
Other | 11 | 6 | 31 | |||||||||
|
|
|
|
|
| |||||||
Total expenses | 5,389 | 5,422 | 29,286 | |||||||||
|
|
|
|
|
| |||||||
Less amounts waived | (281 | ) | (1,697 | ) | (3,288 | ) | ||||||
Less earnings credits | — | — | — | (a) | ||||||||
Less expense reimbursements | — | (103 | ) | — | ||||||||
|
|
|
|
|
| |||||||
Net expenses | 5,108 | 3,622 | 25,998 | |||||||||
|
|
|
|
|
| |||||||
Net investment income (loss) | (2,034 | ) | 3,808 | 26,075 | ||||||||
|
|
|
|
|
| |||||||
REALIZED/UNREALIZED GAINS (LOSSES): | ||||||||||||
Net realized gain (loss) on transactions from: | ||||||||||||
Investments in non-affiliates | 36,792 | 52,946 | 165,490 | |||||||||
Futures | — | 2,239 | — | |||||||||
|
|
|
|
|
| |||||||
Net realized gain (loss) | 36,792 | 55,185 | 165,490 | |||||||||
|
|
|
|
|
| |||||||
Change in net unrealized appreciation/depreciation of: | ||||||||||||
Investments in non-affiliates | 65,852 | 57,804 | 335,447 | |||||||||
Futures | — | (231 | ) | — | ||||||||
|
|
|
|
|
| |||||||
Change in net unrealized appreciation/depreciation | 65,852 | 57,573 | 335,447 | |||||||||
|
|
|
|
|
| |||||||
Net realized/unrealized gains (losses) | 102,644 | 112,758 | 500,937 | |||||||||
|
|
|
|
|
| |||||||
Change in net assets resulting from operations | $ | 100,610 | $ | 116,566 | $ | 527,012 | ||||||
|
|
|
|
|
| |||||||
| (a) | Amount rounds to less than $1,000. |
SEE NOTES TO FINANCIAL STATEMENTS.
| JUNE 30, 2013 | J.P. MORGAN SMALL CAP FUNDS | 51 | ||||||
Table of Contents
STATEMENTS OF OPERATIONS
FOR THE YEAR ENDED JUNE 30, 2013 (continued)
(Amounts in thousands)
| Small Cap Growth Fund | Small Cap Value Fund | U.S. Small Company Fund | ||||||||||
INVESTMENT INCOME: | ||||||||||||
Interest income from non-affiliates | $ | — | $ | 4 | $ | — | (a) | |||||
Dividend income from non-affiliates | 6,142 | 15,963 | 1,696 | |||||||||
Dividend income from affiliates | 12 | 18 | 3 | |||||||||
Income from securities lending (net) | 4 | 2 | 1 | |||||||||
|
|
|
|
|
| |||||||
Total investment income | 6,158 | 15,987 | 1,700 | |||||||||
|
|
|
|
|
| |||||||
EXPENSES: | ||||||||||||
Investment advisory fees | 5,377 | 4,731 | 627 | |||||||||
Administration fees | 705 | 619 | 89 | |||||||||
Distribution fees: | ||||||||||||
Class A | 577 | 611 | 55 | |||||||||
Class B | 24 | 29 | — | |||||||||
Class C | 178 | 253 | 26 | |||||||||
Class R2 | 118 | 50 | 3 | |||||||||
Shareholder servicing fees: | ||||||||||||
Class A | 577 | 611 | 55 | |||||||||
Class B | 8 | 10 | — | |||||||||
Class C | 59 | 84 | 9 | |||||||||
Class R2 | 59 | 25 | 1 | |||||||||
Class R5 | — | 11 | — | |||||||||
Institutional Class | 223 | — | 14 | |||||||||
Select Class | 331 | 596 | 123 | |||||||||
Custodian and accounting fees | 50 | 75 | 71 | |||||||||
Professional fees | 54 | 54 | 48 | |||||||||
Trustees’ and Chief Compliance Officer’s fees | 1 | 7 | 1 | |||||||||
Printing and mailing costs | 83 | 88 | 15 | |||||||||
Registration and filing fees | 96 | 80 | 69 | |||||||||
Transfer agent fees | 1,234 | 822 | 67 | |||||||||
Other | 28 | 22 | 11 | |||||||||
|
|
|
|
|
| |||||||
Total expenses | 9,782 | 8,778 | 1,284 | |||||||||
|
|
|
|
|
| |||||||
Less amounts waived | (1,447 | ) | (820 | ) | (215 | ) | ||||||
|
|
|
|
|
| |||||||
Net expenses | 8,335 | 7,958 | 1,069 | |||||||||
|
|
|
|
|
| |||||||
Net investment income (loss) | (2,177 | ) | 8,029 | 631 | ||||||||
|
|
|
|
|
| |||||||
REALIZED/UNREALIZED GAINS (LOSSES): | ||||||||||||
Net realized gain (loss) on transactions from: | ||||||||||||
Investments in non-affiliates | 86,555 | 42,009 | 5,930 | |||||||||
Futures | — | 5,217 | 561 | |||||||||
|
|
|
|
|
| |||||||
Net realized gain (loss) | 86,555 | 47,226 | 6,491 | |||||||||
|
|
|
|
|
| |||||||
Change in net unrealized appreciation/depreciation of: | ||||||||||||
Investments in non-affiliates | 124,133 | 126,152 | 18,070 | |||||||||
Futures | — | (408 | ) | (38 | ) | |||||||
|
|
|
|
|
| |||||||
Change in net unrealized appreciation/depreciation | 124,133 | 125,744 | 18,032 | |||||||||
|
|
|
|
|
| |||||||
Net realized/unrealized gains (losses) | 210,688 | 172,970 | 24,523 | |||||||||
|
|
|
|
|
| |||||||
Change in net assets resulting from operations | $ | 208,511 | $ | 180,999 | $ | 25,154 | ||||||
|
|
|
|
|
| |||||||
| (a) | Amount rounds to less than $1,000. |
SEE NOTES TO FINANCIAL STATEMENTS.
| 52 | J.P. MORGAN SMALL CAP FUNDS | JUNE 30, 2013 | ||||
Table of Contents
STATEMENTS OF CHANGES IN NET ASSETS
FOR THE PERIODS INDICATED
(Amounts in thousands)
| Dynamic Small Cap Growth Fund | Small Cap Core Fund | |||||||||||||||
| Year Ended 6/30/2013 | Year Ended 6/30/2012 | Year Ended 6/30/2013 | Year Ended 6/30/2012 | |||||||||||||
CHANGE IN NET ASSETS RESULTING FROM OPERATIONS: | ||||||||||||||||
Net investment income (loss) | $ | (2,034 | ) | $ | (2,013 | ) | $ | 3,808 | $ | 2,544 | ||||||
Net realized gain (loss) | 36,792 | 12,478 | 55,185 | 14,478 | ||||||||||||
Change in net unrealized appreciation/depreciation | 65,852 | (36,437 | ) | 57,573 | (37,850 | ) | ||||||||||
|
|
|
|
|
|
|
| |||||||||
Change in net assets resulting from operations | 100,610 | (25,972 | ) | 116,566 | (20,828 | ) | ||||||||||
|
|
|
|
|
|
|
| |||||||||
DISTRIBUTIONS TO SHAREHOLDERS: | ||||||||||||||||
Class A | ||||||||||||||||
From net realized gains | (2,519 | ) | — | — | — | |||||||||||
Class B | ||||||||||||||||
From net realized gains | (39 | ) | — | — | — | |||||||||||
Class C | ||||||||||||||||
From net realized gains | (2,102 | ) | — | — | — | |||||||||||
Select Class | ||||||||||||||||
From net investment income | — | — | (4,488 | ) | (2,078 | ) | ||||||||||
From net realized gains | (9,120 | ) | — | — | — | |||||||||||
|
|
|
|
|
|
|
| |||||||||
Total distributions to shareholders | (13,780 | ) | — | (4,488 | ) | (2,078 | ) | |||||||||
|
|
|
|
|
|
|
| |||||||||
CAPITAL TRANSACTIONS: | ||||||||||||||||
Change in net assets resulting from capital transactions | 96,943 | (14,401 | ) | 3,627 | (120,034 | ) | ||||||||||
|
|
|
|
|
|
|
| |||||||||
NET ASSETS: | ||||||||||||||||
Change in net assets | 183,773 | (40,373 | ) | 115,705 | (142,940 | ) | ||||||||||
Beginning of period | 336,001 | 376,374 | 406,590 | 549,530 | ||||||||||||
|
|
|
|
|
|
|
| |||||||||
End of period | $ | 519,774 | $ | 336,001 | $ | 522,295 | $ | 406,590 | ||||||||
|
|
|
|
|
|
|
| |||||||||
Accumulated undistributed (distributions in excess of) net | $ | (1,915 | ) | $ | (1,196 | ) | $ | 1,795 | $ | 2,422 | ||||||
|
|
|
|
|
|
|
| |||||||||
SEE NOTES TO FINANCIAL STATEMENTS.
| JUNE 30, 2013 | J.P. MORGAN SMALL CAP FUNDS | 53 | ||||||
Table of Contents
STATEMENTS OF CHANGES IN NET ASSETS
FOR THE PERIODS INDICATED (continued)
(Amounts in thousands)
| Small Cap Equity Fund | Small Cap Growth Fund | |||||||||||||||
| Year Ended 6/30/2013 | Year Ended 6/30/2012 | Year Ended 6/30/2013 | Year Ended 6/30/2012 | |||||||||||||
CHANGE IN NET ASSETS RESULTING FROM OPERATIONS: | ||||||||||||||||
Net investment income (loss) | $ | 26,075 | $ | 10,984 | $ | (2,177 | ) | $ | (1,885 | ) | ||||||
Net realized gain (loss) | 165,490 | 126,071 | 86,555 | 33,713 | ||||||||||||
Change in net unrealized appreciation/depreciation | 335,447 | (59,698 | ) | 124,133 | (76,118 | ) | ||||||||||
|
|
|
|
|
|
|
| |||||||||
Change in net assets resulting from operations | 527,012 | 77,357 | 208,511 | (44,290 | ) | |||||||||||
|
|
|
|
|
|
|
| |||||||||
DISTRIBUTIONS TO SHAREHOLDERS: | ||||||||||||||||
Class A | ||||||||||||||||
From net investment income | (6,332 | ) | (1,784 | ) | — | — | ||||||||||
From net realized gains | (54,507 | ) | (29,961 | ) | (18,796 | ) | (4,635 | ) | ||||||||
Class B | ||||||||||||||||
From net investment income | (65 | ) | — | — | — | |||||||||||
From net realized gains | (953 | ) | (645 | ) | (333 | ) | (107 | ) | ||||||||
Class C | ||||||||||||||||
From net investment income | (285 | ) | — | — | — | |||||||||||
From net realized gains | (3,639 | ) | (2,059 | ) | (2,309 | ) | (598 | ) | ||||||||
Class R2 | ||||||||||||||||
From net investment income | (40 | ) | (6 | ) | — | — | ||||||||||
From net realized gains | (478 | ) | (264 | ) | (1,927 | ) | (408 | ) | ||||||||
Class R5 | ||||||||||||||||
From net investment income | (8,958 | ) | (4,589 | ) | — | — | ||||||||||
From net realized gains | (52,088 | ) | (27,407 | ) | — | — | ||||||||||
Class R6 | ||||||||||||||||
From net realized gains | — | — | (13,119 | ) | (2,268 | ) | ||||||||||
Institutional Class | ||||||||||||||||
From net realized gains | — | — | (17,399 | ) | (4,220 | ) | ||||||||||
Select Class | ||||||||||||||||
From net investment income | (12,603 | ) | (5,722 | ) | — | — | ||||||||||
From net realized gains | (88,266 | ) | (48,444 | ) | (10,618 | ) | (2,322 | ) | ||||||||
|
|
|
|
|
|
|
| |||||||||
Total distributions to shareholders | (228,214 | ) | (120,881 | ) | (64,501 | ) | (14,558 | ) | ||||||||
|
|
|
|
|
|
|
| |||||||||
CAPITAL TRANSACTIONS: | ||||||||||||||||
Change in net assets resulting from capital transactions | (44,004 | ) | (39,038 | ) | (33,612 | ) | 134,888 | |||||||||
|
|
|
|
|
|
|
| |||||||||
NET ASSETS: | ||||||||||||||||
Change in net assets | 254,794 | (82,562 | ) | 110,398 | 76,040 | |||||||||||
Beginning of period | 2,442,031 | 2,524,593 | 821,520 | 745,480 | ||||||||||||
|
|
|
|
|
|
|
| |||||||||
End of period | $ | 2,696,825 | $ | 2,442,031 | $ | 931,918 | $ | 821,520 | ||||||||
|
|
|
|
|
|
|
| |||||||||
Accumulated undistributed (distributions in excess of) net investment income | $ | 4,114 | $ | 6,322 | $ | (2,896 | ) | $ | (1,501 | ) | ||||||
|
|
|
|
|
|
|
| |||||||||
SEE NOTES TO FINANCIAL STATEMENTS.
| 54 | J.P. MORGAN SMALL CAP FUNDS | JUNE 30, 2013 | ||||
Table of Contents
| Small Cap Value Fund | U.S. Small Company Fund | |||||||||||||||
| Year Ended 6/30/2013 | Year Ended 6/30/2012 | Year Ended 6/30/2013 | Year Ended 6/30/2012 | |||||||||||||
CHANGE IN NET ASSETS RESULTING FROM OPERATIONS: | ||||||||||||||||
Net investment income (loss) | $ | 8,029 | $ | 5,239 | $ | 631 | $ | 311 | ||||||||
Net realized gain (loss) | 47,226 | 8,625 | 6,491 | (2,684 | ) | |||||||||||
Change in net unrealized appreciation/depreciation | 125,744 | (10,600 | ) | 18,032 | (1,183 | ) | ||||||||||
|
|
|
|
|
|
|
| |||||||||
Change in net assets resulting from operations | 180,999 | 3,264 | 25,154 | (3,556 | ) | |||||||||||
|
|
|
|
|
|
|
| |||||||||
DISTRIBUTIONS TO SHAREHOLDERS: | ||||||||||||||||
Class A | ||||||||||||||||
From net investment income | (2,867 | ) | (1,662 | ) | (99 | ) | — | |||||||||
Class B | ||||||||||||||||
From net investment income | (26 | ) | (19 | ) | — | — | ||||||||||
Class C | ||||||||||||||||
From net investment income | (269 | ) | (136 | ) | (11 | ) | — | |||||||||
Class R2 (a) | ||||||||||||||||
From net investment income | (97 | ) | (41 | ) | — | (b) | — | (b) | ||||||||
Class R5 | ||||||||||||||||
From net investment income | (323 | ) | (157 | ) | — | — | ||||||||||
Class R6 (a) | ||||||||||||||||
From net investment income | (2,410 | ) | (1,736 | ) | (137 | ) | — | (b) | ||||||||
Institutional Class | ||||||||||||||||
From net investment income | — | — | (90 | ) | (59 | ) | ||||||||||
Select Class | ||||||||||||||||
From net investment income | (2,935 | ) | (2,049 | ) | (295 | ) | (108 | ) | ||||||||
|
|
|
|
|
|
|
| |||||||||
Total distributions to shareholders | (8,927 | ) | (5,800 | ) | (632 | ) | (167 | ) | ||||||||
|
|
|
|
|
|
|
| |||||||||
CAPITAL TRANSACTIONS: | ||||||||||||||||
Change in net assets resulting from capital transactions | 109,344 | 47,225 | 78,228 | 4,531 | ||||||||||||
|
|
|
|
|
|
|
| |||||||||
NET ASSETS: | ||||||||||||||||
Change in net assets | 281,416 | 44,689 | 102,750 | 808 | ||||||||||||
Beginning of period | 617,066 | 572,377 | 69,959 | 69,151 | ||||||||||||
|
|
|
|
|
|
|
| |||||||||
End of period | $ | 898,482 | $ | 617,066 | $ | 172,709 | $ | 69,959 | ||||||||
|
|
|
|
|
|
|
| |||||||||
Accumulated undistributed (distributions in excess of) net investment income | $ | (1,062 | ) | $ | (638 | ) | $ | 255 | $ | 283 | ||||||
|
|
|
|
|
|
|
| |||||||||
| (a) | Commencement of offering of class of shares effective November 1, 2011 for U.S. Small Company Fund. |
| (b) | Amount rounds to less than $1,000. |
SEE NOTES TO FINANCIAL STATEMENTS.
| JUNE 30, 2013 | J.P. MORGAN SMALL CAP FUNDS | 55 | ||||||
Table of Contents
STATEMENTS OF CHANGES IN NET ASSETS
FOR THE PERIODS INDICATED (continued)
(Amounts in thousands)
| Dynamic Small Cap Growth Fund | Small Cap Core Fund | |||||||||||||||
| Year Ended 6/30/2013 | Year Ended 6/30/2012 | Year Ended 6/30/2013 | Year Ended 6/30/2012 | |||||||||||||
CAPITAL TRANSACTIONS: | ||||||||||||||||
Class A | ||||||||||||||||
Proceeds from shares issued | $ | 19,767 | $ | 41,460 | $ | — | $ | — | ||||||||
Distributions reinvested | 1,796 | — | — | — | ||||||||||||
Cost of shares redeemed | (23,718 | ) | (122,824 | ) | — | — | ||||||||||
|
|
|
|
|
|
|
| |||||||||
Change in net assets resulting from Class A capital transactions | $ | (2,155 | ) | $ | (81,364 | ) | $ | — | $ | — | ||||||
|
|
|
|
|
|
|
| |||||||||
Class B | ||||||||||||||||
Proceeds from shares issued | $ | 8 | $ | 3 | $ | — | $ | — | ||||||||
Distributions reinvested | 35 | — | — | — | ||||||||||||
Cost of shares redeemed | (479 | ) | (653 | ) | — | — | ||||||||||
|
|
|
|
|
|
|
| |||||||||
Change in net assets resulting from Class B capital transactions | $ | (436 | ) | $ | (650 | ) | $ | — | $ | — | ||||||
|
|
|
|
|
|
|
| |||||||||
Class C | ||||||||||||||||
Proceeds from shares issued | $ | 13,062 | $ | 17,007 | $ | — | $ | — | ||||||||
Distributions reinvested | 231 | — | — | — | ||||||||||||
Cost of shares redeemed | (19,369 | ) | (26,284 | ) | — | — | ||||||||||
|
|
|
|
|
|
|
| |||||||||
Change in net assets resulting from Class C capital transactions | $ | (6,076 | ) | $ | (9,277 | ) | $ | — | $ | — | ||||||
|
|
|
|
|
|
|
| |||||||||
Select Class | ||||||||||||||||
Proceeds from shares issued | $ | 174,453 | $ | 154,205 | $ | 44,658 | $ | 25,529 | ||||||||
Distributions reinvested | 8,987 | — | 4,252 | 1,948 | ||||||||||||
Cost of shares redeemed | (77,830 | ) | (77,315 | ) | (45,283 | ) | (147,511 | ) | ||||||||
|
|
|
|
|
|
|
| |||||||||
Change in net assets resulting from Select Class capital transactions | $ | 105,610 | $ | 76,890 | $ | 3,627 | $ | (120,034 | ) | |||||||
|
|
|
|
|
|
|
| |||||||||
Total change in net assets resulting from capital transactions | $ | 96,943 | $ | (14,401 | ) | $ | 3,627 | $ | (120,034 | ) | ||||||
|
|
|
|
|
|
|
| |||||||||
SHARE TRANSACTIONS: | ||||||||||||||||
Class A | ||||||||||||||||
Issued | 959 | 2,340 | — | — | ||||||||||||
Reinvested | 96 | — | — | — | ||||||||||||
Redeemed | (1,155 | ) | (6,774 | ) | — | — | ||||||||||
|
|
|
|
|
|
|
| |||||||||
Change in Class A Shares | (100 | ) | (4,434 | ) | — | — | ||||||||||
|
|
|
|
|
|
|
| |||||||||
Class B | ||||||||||||||||
Issued | 1 | — | (a) | — | — | |||||||||||
Reinvested | 2 | — | — | — | ||||||||||||
Redeemed | (27 | ) | (41 | ) | — | — | ||||||||||
|
|
|
|
|
|
|
| |||||||||
Change in Class B Shares | (24 | ) | (41 | ) | — | — | ||||||||||
|
|
|
|
|
|
|
| |||||||||
Class C | ||||||||||||||||
Issued | 734 | 1,047 | — | — | ||||||||||||
Reinvested | 14 | — | — | — | ||||||||||||
Redeemed | (1,079 | ) | (1,617 | ) | — | — | ||||||||||
|
|
|
|
|
|
|
| |||||||||
Change in Class C Shares | (331 | ) | (570 | ) | — | — | ||||||||||
|
|
|
|
|
|
|
| |||||||||
Select Class | ||||||||||||||||
Issued | 7,839 | 7,902 | 995 | 697 | ||||||||||||
Reinvested | 447 | — | 104 | 57 | ||||||||||||
Redeemed | (3,580 | ) | (3,977 | ) | (1,072 | ) | (3,858 | ) | ||||||||
|
|
|
|
|
|
|
| |||||||||
Change in Select Class Shares | 4,706 | 3,925 | 27 | (3,104 | ) | |||||||||||
|
|
|
|
|
|
|
| |||||||||
| (a) | Amount rounds to less than 1,000. |
SEE NOTES TO FINANCIAL STATEMENTS.
| 56 | J.P. MORGAN SMALL CAP FUNDS | JUNE 30, 2013 | ||||
Table of Contents
| Small Cap Equity Fund | Small Cap Growth Fund | |||||||||||||||
| Year Ended 6/30/2013 | Year Ended 6/30/2012 | Year Ended 6/30/2013 | Year Ended 6/30/2012 | |||||||||||||
CAPITAL TRANSACTIONS: | ||||||||||||||||
Class A | ||||||||||||||||
Proceeds from shares issued | $ | 161,823 | �� | $ | 157,234 | $ | 46,904 | $ | 69,558 | |||||||
Distributions reinvested | 53,154 | 27,278 | 18,018 | 4,447 | ||||||||||||
Cost of shares redeemed | (205,174 | ) | (245,335 | ) | (73,629 | ) | (101,851 | ) | ||||||||
|
|
|
|
|
|
|
| |||||||||
Change in net assets resulting from Class A capital transactions | $ | 9,803 | $ | (60,823 | ) | $ | (8,707 | ) | $ | (27,846 | ) | |||||
|
|
|
|
|
|
|
| |||||||||
Class B | ||||||||||||||||
Proceeds from shares issued | $ | 53 | $ | 153 | $ | 143 | $ | 141 | ||||||||
Distributions reinvested | 947 | 586 | 276 | 93 | ||||||||||||
Cost of shares redeemed | (3,625 | ) | (3,284 | ) | (1,529 | ) | (2,023 | ) | ||||||||
|
|
|
|
|
|
|
| |||||||||
Change in net assets resulting from Class B capital transactions | $ | (2,625 | ) | $ | (2,545 | ) | $ | (1,110 | ) | $ | (1,789 | ) | ||||
|
|
|
|
|
|
|
| |||||||||
Class C | ||||||||||||||||
Proceeds from shares issued | $ | 2,901 | $ | 2,701 | $ | 2,220 | $ | 3,039 | ||||||||
Distributions reinvested | 3,051 | 1,591 | 1,897 | 488 | ||||||||||||
Cost of shares redeemed | (7,195 | ) | (7,520 | ) | (5,854 | ) | (8,525 | ) | ||||||||
|
|
|
|
|
|
|
| |||||||||
Change in net assets resulting from Class C capital transactions | $ | (1,243 | ) | $ | (3,228 | ) | $ | (1,737 | ) | $ | (4,998 | ) | ||||
|
|
|
|
|
|
|
| |||||||||
Class R2 | ||||||||||||||||
Proceeds from shares issued | $ | 2,486 | $ | 2,320 | $ | 5,964 | $ | 10,502 | ||||||||
Distributions reinvested | 238 | 114 | 1,827 | 377 | ||||||||||||
Cost of shares redeemed | (4,016 | ) | (1,956 | ) | (7,599 | ) | (3,289 | ) | ||||||||
|
|
|
|
|
|
|
| |||||||||
Change in net assets resulting from Class R2 capital transactions | $ | (1,292 | ) | $ | 478 | $ | 192 | $ | 7,590 | |||||||
|
|
|
|
|
|
|
| |||||||||
Class R5 | ||||||||||||||||
Proceeds from shares issued | $ | 242,098 | $ | 220,906 | $ | — | $ | — | ||||||||
Distributions reinvested | 58,492 | 30,874 | — | — | ||||||||||||
Cost of shares redeemed | (270,542 | ) | (127,695 | ) | — | — | ||||||||||
|
|
|
|
|
|
|
| |||||||||
Change in net assets resulting from Class R5 capital transactions | $ | 30,048 | $ | 124,085 | $ | — | $ | — | ||||||||
|
|
|
|
|
|
|
| |||||||||
Class R6 | ||||||||||||||||
Proceeds from shares issued | $ | — | $ | — | $ | 66,621 | $ | 130,056 | ||||||||
Distributions reinvested | — | — | 13,119 | 2,269 | ||||||||||||
Cost of shares redeemed | — | — | (68,638 | ) | (8,891 | ) | ||||||||||
|
|
|
|
|
|
|
| |||||||||
Change in net assets resulting from Class R6 capital transactions | $ | — | $ | — | $ | 11,102 | $ | 123,434 | ||||||||
|
|
|
|
|
|
|
| |||||||||
Institutional Class | ||||||||||||||||
Proceeds from shares issued | $ | — | $ | — | $ | 59,220 | $ | 106,591 | ||||||||
Distributions reinvested | — | — | 15,569 | 3,608 | ||||||||||||
Cost of shares redeemed | — | — | (109,142 | ) | (77,557 | ) | ||||||||||
|
|
|
|
|
|
|
| |||||||||
Change in net assets resulting from Institutional Class capital transactions | $ | — | $ | — | $ | (34,353 | ) | $ | 32,642 | |||||||
|
|
|
|
|
|
|
| |||||||||
Select Class | ||||||||||||||||
Proceeds from shares issued | $ | 381,057 | $ | 287,957 | $ | 36,031 | $ | 50,639 | ||||||||
Distributions reinvested | 89,504 | 47,121 | 8,954 | 1,909 | ||||||||||||
Cost of shares redeemed | (549,256 | ) | (432,083 | ) | (43,984 | ) | (46,693 | ) | ||||||||
|
|
|
|
|
|
|
| |||||||||
Change in net assets resulting from Select Class capital transactions | $ | (78,695 | ) | $ | (97,005 | ) | $ | 1,001 | $ | 5,855 | ||||||
|
|
|
|
|
|
|
| |||||||||
Total change in net assets resulting from capital transactions | $ | (44,004 | ) | $ | (39,038 | ) | $ | (33,612 | ) | $ | 134,888 | |||||
|
|
|
|
|
|
|
| |||||||||
SEE NOTES TO FINANCIAL STATEMENTS.
| JUNE 30, 2013 | J.P. MORGAN SMALL CAP FUNDS | 57 | ||||||
Table of Contents
STATEMENTS OF CHANGES IN NET ASSETS
FOR THE PERIODS INDICATED (continued)
(Amounts in thousands)
| Small Cap Equity Fund | Small Cap Growth Fund | |||||||||||||||
| Year Ended 6/30/2013 | Year Ended 6/30/2012 | Year Ended 6/30/2013 | Year Ended 6/30/2012 | |||||||||||||
SHARE TRANSACTIONS: | ||||||||||||||||
Class A | ||||||||||||||||
Issued | 4,277 | 4,564 | 3,976 | 6,342 | ||||||||||||
Reinvested | 1,546 | 849 | 1,704 | 436 | ||||||||||||
Redeemed | (5,554 | ) | (7,273 | ) | (6,214 | ) | (9,342 | ) | ||||||||
|
|
|
|
|
|
|
| |||||||||
Change in Class A Shares | 269 | (1,860 | ) | (534 | ) | (2,564 | ) | |||||||||
|
|
|
|
|
|
|
| |||||||||
Class B | ||||||||||||||||
Issued | 2 | 5 | 14 | 16 | ||||||||||||
Reinvested | 33 | 22 | 33 | 11 | ||||||||||||
Redeemed | (115 | ) | (112 | ) | (163 | ) | (223 | ) | ||||||||
|
|
|
|
|
|
|
| |||||||||
Change in Class B Shares | (80 | ) | (85 | ) | (116 | ) | (196 | ) | ||||||||
|
|
|
|
|
|
|
| |||||||||
Class C | ||||||||||||||||
Issued | 94 | 92 | 228 | 320 | ||||||||||||
Reinvested | 107 | 59 | 214 | 56 | ||||||||||||
Redeemed | (230 | ) | (257 | ) | (595 | ) | (905 | ) | ||||||||
|
|
|
|
|
|
|
| |||||||||
Change in Class C Shares | (29 | ) | (106 | ) | (153 | ) | (529 | ) | ||||||||
|
|
|
|
|
|
|
| |||||||||
Class R2 | ||||||||||||||||
Issued | 66 | 70 | 518 | 977 | ||||||||||||
Reinvested | 7 | 4 | 175 | 37 | ||||||||||||
Redeemed | (106 | ) | (57 | ) | (665 | ) | (306 | ) | ||||||||
|
|
|
|
|
|
|
| |||||||||
Change in Class R2 Shares | (33 | ) | 17 | 28 | 708 | |||||||||||
|
|
|
|
|
|
|
| |||||||||
Class R5 | ||||||||||||||||
Issued | 5,779 | 5,986 | — | — | ||||||||||||
Reinvested | 1,535 | 874 | — | — | ||||||||||||
Redeemed | (6,521 | ) | (3,399 | ) | — | — | ||||||||||
|
|
|
|
|
|
|
| |||||||||
Change in Class R5 Shares | 793 | 3,461 | — | — | ||||||||||||
|
|
|
|
|
|
|
| |||||||||
Class R6 | ||||||||||||||||
Issued | — | — | 5,288 | 11,045 | ||||||||||||
Reinvested | — | — | 1,156 | 210 | ||||||||||||
Redeemed | — | — | (5,654 | ) | (783 | ) | ||||||||||
|
|
|
|
|
|
|
| |||||||||
Change in Class R6 Shares | — | — | 790 | 10,472 | ||||||||||||
|
|
|
|
|
|
|
| |||||||||
Institutional Class | ||||||||||||||||
Issued | — | — | 4,672 | 9,441 | ||||||||||||
Reinvested | — | — | 1,374 | 334 | ||||||||||||
Redeemed | — | — | (8,706 | ) | (6,770 | ) | ||||||||||
|
|
|
|
|
|
|
| |||||||||
Change in Institutional Class Shares | — | — | (2,660 | ) | 3,005 | |||||||||||
|
|
|
|
|
|
|
| |||||||||
Select Class | ||||||||||||||||
Issued | 9,223 | 7,666 | 2,935 | 4,414 | ||||||||||||
Reinvested | 2,355 | 1,338 | 801 | 178 | ||||||||||||
Redeemed | (13,183 | ) | (11,713 | ) | (3,567 | ) | (4,096 | ) | ||||||||
|
|
|
|
|
|
|
| |||||||||
Change in Select Class Shares | (1,605 | ) | (2,709 | ) | 169 | 496 | ||||||||||
|
|
|
|
|
|
|
| |||||||||
SEE NOTES TO FINANCIAL STATEMENTS.
| 58 | J.P. MORGAN SMALL CAP FUNDS | JUNE 30, 2013 | ||||
Table of Contents
| Small Cap Value Fund | U.S. Small Company Fund | |||||||||||||||
| Year Ended 6/30/2013 | Year Ended 6/30/2012 | Year Ended 6/30/2013 | Year Ended 6/30/2012 | |||||||||||||
CAPITAL TRANSACTIONS: | ||||||||||||||||
Class A | ||||||||||||||||
Proceeds from shares issued | $ | 151,702 | $ | 64,696 | $ | 44,054 | $ | 7,833 | ||||||||
Distributions reinvested | 2,758 | 1,559 | 84 | — | ||||||||||||
Cost of shares redeemed | (66,421 | ) | (80,683 | ) | (7,813 | ) | (10,500 | ) | ||||||||
|
|
|
|
|
|
|
| |||||||||
Change in net assets resulting from Class A capital transactions | $ | 88,039 | $ | (14,428 | ) | $ | 36,325 | $ | (2,667 | ) | ||||||
|
|
|
|
|
|
|
| |||||||||
Class B | ||||||||||||||||
Proceeds from shares issued | $ | 65 | $ | 60 | $ | — | $ | — | ||||||||
Distributions reinvested | 25 | 17 | — | — | ||||||||||||
Cost of shares redeemed | (1,168 | ) | (2,513 | ) | — | — | ||||||||||
|
|
|
|
|
|
|
| |||||||||
Change in net assets resulting from Class B capital transactions | $ | (1,078 | ) | $ | (2,436 | ) | $ | — | $ | — | ||||||
|
|
|
|
|
|
|
| |||||||||
Class C | ||||||||||||||||
Proceeds from shares issued | $ | 11,253 | $ | 6,277 | $ | 5,881 | $ | 597 | ||||||||
Distributions reinvested | 232 | 116 | 9 | — | ||||||||||||
Cost of shares redeemed | (7,039 | ) | (8,373 | ) | (975 | ) | (505 | ) | ||||||||
|
|
|
|
|
|
|
| |||||||||
Change in net assets resulting from Class C capital transactions | $ | 4,446 | $ | (1,980 | ) | $ | 4,915 | $ | 92 | |||||||
|
|
|
|
|
|
|
| |||||||||
Class R2 (a) | ||||||||||||||||
Proceeds from shares issued | $ | 9,668 | $ | 2,994 | $ | 1,677 | $ | 50 | ||||||||
Distributions reinvested | 88 | 38 | — | (b) | — | (b) | ||||||||||
Cost of shares redeemed | (3,260 | ) | (2,261 | ) | (93 | ) | — | |||||||||
|
|
|
|
|
|
|
| |||||||||
Change in net assets resulting from Class R2 capital transactions | $ | 6,496 | $ | 771 | $ | 1,584 | $ | 50 | ||||||||
|
|
|
|
|
|
|
| |||||||||
Class R5 | ||||||||||||||||
Proceeds from shares issued | $ | 23,814 | $ | 6,690 | $ | — | $ | — | ||||||||
Distributions reinvested | 38 | 4 | — | — | ||||||||||||
Cost of shares redeemed | (12,450 | ) | (22,164 | ) | — | — | ||||||||||
|
|
|
|
|
|
|
| |||||||||
Change in net assets resulting from Class R5 capital transactions | $ | 11,402 | $ | (15,470 | ) | $ | — | $ | — | |||||||
|
|
|
|
|
|
|
| |||||||||
Class R6 (a) | ||||||||||||||||
Proceeds from shares issued | $ | 38,682 | $ | 79,242 | $ | 1,911 | $ | 13,638 | ||||||||
Distributions reinvested | 2,410 | 1,736 | 137 | — | (b) | |||||||||||
Cost of shares redeemed | (54,454 | ) | 5,770 | (1,549 | ) | (260 | ) | |||||||||
|
|
|
|
|
|
|
| |||||||||
Change in net assets resulting from Class R6 capital transactions | $ | (13,362 | ) | $ | 75,208 | $ | 499 | $ | 13,378 | |||||||
|
|
|
|
|
|
|
| |||||||||
Institutional Class | ||||||||||||||||
Proceeds from shares issued | $ | — | $ | — | $ | 31,733 | $ | 6,490 | ||||||||
Distributions reinvested | — | — | 89 | 59 | ||||||||||||
Cost of shares redeemed | — | — | (13,968 | ) | (17,366 | ) | ||||||||||
|
|
|
|
|
|
|
| |||||||||
Change in net assets resulting from Institutional Class capital transactions | $ | — | $ | — | $ | 17,854 | $ | (10,817 | ) | |||||||
|
|
|
|
|
|
|
| |||||||||
Select Class | ||||||||||||||||
Proceeds from shares issued | $ | 101,704 | $ | 54,314 | $ | 24,841 | $ | 15,804 | ||||||||
Distributions reinvested | 1,569 | 905 | 236 | 88 | ||||||||||||
Cost of shares redeemed | (89,872 | ) | (49,659 | ) | (8,026 | ) | (11,397 | ) | ||||||||
|
|
|
|
|
|
|
| |||||||||
Change in net assets resulting from Select Class capital transactions | $ | 13,401 | $ | 5,560 | $ | 17,051 | $ | 4,495 | ||||||||
|
|
|
|
|
|
|
| |||||||||
Total change in net assets resulting from capital transactions | $ | 109,344 | $ | 47,225 | $ | 78,228 | $ | 4,531 | ||||||||
|
|
|
|
|
|
|
| |||||||||
| (a) | Commencement of offering of class of shares effective November 1, 2011 for U.S. Small Company Fund. |
| (b) | Amount rounds to less than 1,000. |
SEE NOTES TO FINANCIAL STATEMENTS.
| JUNE 30, 2013 | J.P. MORGAN SMALL CAP FUNDS | 59 | ||||||
Table of Contents
STATEMENTS OF CHANGES IN NET ASSETS
FOR THE PERIODS INDICATED (continued)
(Amounts in thousands)
| Small Cap Value Fund | U.S. Small Company Fund | |||||||||||||||
| Year Ended 6/30/2013 | Year Ended 6/30/2012 | Year Ended 6/30/2013 | Year Ended 6/30/2012 | |||||||||||||
SHARE TRANSACTIONS: | ||||||||||||||||
Class A | ||||||||||||||||
Issued | 7,097 | 3,659 | 3,627 | 803 | ||||||||||||
Reinvested | 124 | 89 | 7 | — | ||||||||||||
Redeemed | (3,110 | ) | (4,528 | ) | (682 | ) | (1,142 | ) | ||||||||
|
|
|
|
|
|
|
| |||||||||
Change in Class A Shares | 4,111 | (780 | ) | 2,952 | (339 | ) | ||||||||||
|
|
|
|
|
|
|
| |||||||||
Class B | ||||||||||||||||
Issued | 5 | 3 | — | — | ||||||||||||
Reinvested | 1 | 1 | — | — | ||||||||||||
Redeemed | (63 | ) | (161 | ) | — | — | ||||||||||
|
|
|
|
|
|
|
| |||||||||
Change in Class B Shares | (57 | ) | (157 | ) | — | — | ||||||||||
|
|
|
|
|
|
|
| |||||||||
Class C | ||||||||||||||||
Issued | 594 | 402 | 496 | 63 | ||||||||||||
Reinvested | 12 | 7 | 1 | — | ||||||||||||
Redeemed | (381 | ) | (550 | ) | (80 | ) | (52 | ) | ||||||||
|
|
|
|
|
|
|
| |||||||||
Change in Class C Shares | 225 | (141 | ) | 417 | 11 | |||||||||||
|
|
|
|
|
|
|
| |||||||||
Class R2 (a) | ||||||||||||||||
Issued | 437 | 170 | 135 | 5 | ||||||||||||
Reinvested | 4 | 2 | — | (b) | — | (b) | ||||||||||
Redeemed | (149 | ) | (131 | ) | (7 | ) | — | |||||||||
|
|
|
|
|
|
|
| |||||||||
Change in Class R2 Shares | 292 | 41 | 128 | 5 | ||||||||||||
|
|
|
|
|
|
|
| |||||||||
Class R5 | ||||||||||||||||
Issued | 1,043 | 359 | — | — | ||||||||||||
Reinvested | 2 | — | (b) | — | — | |||||||||||
Redeemed | (545 | ) | (1,168 | ) | — | — | ||||||||||
|
|
|
|
|
|
|
| |||||||||
Change in Class R5 Shares | 500 | (809 | ) | — | — | |||||||||||
|
|
|
|
|
|
|
| |||||||||
Class R6 (a) | ||||||||||||||||
Issued | 1,686 | 4,227 | 161 | 1,267 | ||||||||||||
Reinvested | 104 | 94 | 12 | — | (b) | |||||||||||
Redeemed | (2,672 | ) | (307 | ) | (125 | ) | (24 | ) | ||||||||
|
|
|
|
|
|
|
| |||||||||
Change in Class R6 Shares | (882 | ) | 4,014 | 48 | 1,243 | |||||||||||
|
|
|
|
|
|
|
| |||||||||
Institutional Class | ||||||||||||||||
Issued | — | — | 2,505 | 615 | ||||||||||||
Reinvested | — | — | 8 | 6 | ||||||||||||
Redeemed | — | — | (1,144 | ) | (1,657 | ) | ||||||||||
|
|
|
|
|
|
|
| |||||||||
Change in Institutional Class Shares | — | — | 1,369 | (1,036 | ) | |||||||||||
|
|
|
|
|
|
|
| |||||||||
Select Class | ||||||||||||||||
Issued | 4,528 | 3,087 | 2,020 | 1,545 | ||||||||||||
Reinvested | 67 | 49 | 21 | 9 | ||||||||||||
Redeemed | (3,905 | ) | (2,739 | ) | (666 | ) | (1,169 | ) | ||||||||
|
|
|
|
|
|
|
| |||||||||
Change in Select Class Shares | 690 | 397 | 1,375 | 385 | ||||||||||||
|
|
|
|
|
|
|
| |||||||||
| (a) | Commencement of offering of class of shares effective November 1, 2011 for U.S. Small Company Fund. |
| (b) | Amount rounds to less than 1,000. |
SEE NOTES TO FINANCIAL STATEMENTS.
| 60 | J.P. MORGAN SMALL CAP FUNDS | JUNE 30, 2013 | ||||
Table of Contents
THIS PAGE IS INTENTIONALLY LEFT BLANK
| JUNE 30, 2013 | J.P. MORGAN SMALL CAP FUNDS | 61 | ||||||
Table of Contents
FOR THE PERIODS INDICATED
| Per share operating performance | |||||||||||||||||||
| Investment operations | Distributions | |||||||||||||||||||
| Net asset value, beginning of period | Net investment income (loss) | Net realized and unrealized gains (losses) on investments | Total from investment operations | Net realized gain | ||||||||||||||||
Dynamic Small Cap Growth Fund | ||||||||||||||||||||
Class A | ||||||||||||||||||||
Year Ended June 30, 2013 | $ | 18.83 | $ | (0.14 | )(d)(e) | $ | 5.17 | $ | 5.03 | $ | (0.76 | ) | ||||||||
Year Ended June 30, 2012 | 20.20 | (0.13 | )(d)(f) | (1.24 | ) | (1.37 | ) | — | ||||||||||||
Year Ended June 30, 2011 | 13.80 | (0.16 | )(d) | 6.56 | 6.40 | — | ||||||||||||||
Year Ended June 30, 2010 | 11.89 | (0.13 | )(d) | 2.04 | 1.91 | — | ||||||||||||||
Year Ended June 30, 2009 | 16.65 | (0.11 | )(d) | (4.65 | ) | (4.76 | ) | — | ||||||||||||
Class B | ||||||||||||||||||||
Year Ended June 30, 2013 | 16.71 | (0.22 | )(d)(e) | 4.56 | 4.34 | (0.76 | ) | |||||||||||||
Year Ended June 30, 2012 | 18.01 | (0.20 | )(d)(f) | (1.10 | ) | (1.30 | ) | — | ||||||||||||
Year Ended June 30, 2011 | 12.37 | (0.23 | )(d) | 5.87 | 5.64 | — | ||||||||||||||
Year Ended June 30, 2010 | 10.73 | (0.19 | )(d) | 1.83 | 1.64 | — | ||||||||||||||
Year Ended June 30, 2009 | 15.12 | (0.16 | )(d) | (4.23 | ) | (4.39 | ) | — | ||||||||||||
Class C | ||||||||||||||||||||
Year Ended June 30, 2013 | 16.68 | (0.22 | )(d)(e) | 4.55 | 4.33 | (0.76 | ) | |||||||||||||
Year Ended June 30, 2012 | 17.98 | (0.20 | )(d)(f) | (1.10 | ) | (1.30 | ) | — | ||||||||||||
Year Ended June 30, 2011 | 12.35 | (0.23 | )(d) | 5.86 | 5.63 | — | ||||||||||||||
Year Ended June 30, 2010 | 10.71 | (0.19 | )(d) | 1.83 | 1.64 | — | ||||||||||||||
Year Ended June 30, 2009 | 15.09 | (0.16 | )(d) | (4.22 | ) | (4.38 | ) | — | ||||||||||||
Select Class | ||||||||||||||||||||
Year Ended June 30, 2013 | 20.02 | (0.07 | )(d)(e) | 5.51 | 5.44 | (0.76 | ) | |||||||||||||
Year Ended June 30, 2012 | 21.39 | (0.06 | )(d)(f) | (1.31 | ) | (1.37 | ) | — | ||||||||||||
Year Ended June 30, 2011 | 14.56 | (0.11 | )(d) | 6.94 | 6.83 | — | ||||||||||||||
Year Ended June 30, 2010 | 12.50 | (0.08 | )(d) | 2.14 | 2.06 | — | ||||||||||||||
Year Ended June 30, 2009 | 17.44 | (0.06 | )(d) | (4.88 | ) | (4.94 | ) | — | ||||||||||||
| (a) | Includes adjustments in accordance with accounting principles generally accepted in the United States of America and as such, the net asset values for financial reporting purposes and the returns based upon those net asset values may differ from the net asset values and returns for shareholder transactions. |
| (b) | Includes earnings credits and interest expense, if applicable, each of which is less than 0.01% unless otherwise noted. |
| (c) | Portfolio turnover is calculated by dividing the lesser of total purchases or sales of portfolio securities for the reporting period by the monthly average value of portfolio securities owned during the reporting period. Excluded from both the numerator and denominator are amounts relating to derivatives and securities whose maturities or expiration dates at the time of acquisition were one year or less. |
| (d) | Calculated based upon average shares outstanding. |
| (e) | Reflects special dividends paid out during the period by one of the Fund’s holdings. Had the Fund not received the special dividends, the net investment income (loss) per share would have been $(0.20), $(0.27), $(0.27) and $(0.14) for Class A, Class B, Class C and Select Class Shares, respectively, and the net investment income (loss) ratio would have been (1.00)%, (1.53)%, (1.51)% and (0.64)% for Class A, Class B, Class C and Select Class Shares, respectively. |
| (f) | Reflects special dividends paid out during the period by one of the Fund’s holdings. Had the Fund not received the special dividends, the net investment income (loss) per share would have been $(0.17), $(0.23), $(0.23) and $(0.10) for Class A, Class B, Class C and Select Class Shares, respectively, and the net investment income (loss) ratio would have been (0.94)%, (1.43)%, (1.43)% and (0.53)% for Class A, Class B, Class C and Select Class Shares, respectively. |
SEE NOTES TO FINANCIAL STATEMENTS.
| 62 | J.P. MORGAN SMALL CAP FUNDS | JUNE 30, 2013 | ||||
Table of Contents
| Ratios/Supplemental data | |||||||||||||||||||||||||
| Ratios to average net assets | ||||||||||||||||||||||||||
| Net asset value, end of period | Total return (excludes sales charge) (a) | Net assets, end of period (000’s) | Net expenses (b) | Net investment income (loss) | Expenses without waivers, reimbursements and earnings credits | Portfolio turnover rate (c) | ||||||||||||||||||||
| $ | 23.10 | 27.61 | % | $ | 77,408 | 1.44 | % | (0.70 | )%(e) | 1.44 | % | 65 | % | |||||||||||||
| 18.83 | (6.78 | ) | 64,997 | 1.47 | (0.72 | )(f) | 1.48 | 63 | ||||||||||||||||||
| 20.20 | 46.38 | 159,290 | 1.42 | (0.91 | ) | 1.50 | 79 | |||||||||||||||||||
| 13.80 | 16.06 | 72,134 | 1.49 | (0.92 | ) | 1.78 | 120 | |||||||||||||||||||
| 11.89 | (28.59 | ) | 51,434 | 1.50 | (0.86 | ) | 2.16 | 83 | ||||||||||||||||||
| 20.29 | 26.97 | 793 | 1.94 | (1.22 | )(e) | 1.95 | 65 | |||||||||||||||||||
| 16.71 | (7.22 | ) | 1,055 | 1.97 | (1.21 | )(f) | 1.98 | 63 | ||||||||||||||||||
| 18.01 | 45.59 | 1,865 | 1.99 | (1.48 | ) | 2.04 | 79 | |||||||||||||||||||
| 12.37 | 15.28 | 2,326 | 2.09 | (1.58 | ) | 2.39 | 120 | |||||||||||||||||||
| 10.73 | (29.03 | ) | 16,081 | 2.10 | (1.46 | ) | 2.65 | 83 | ||||||||||||||||||
| 20.25 | 26.96 | 54,171 | 1.94 | (1.20 | )(e) | 1.94 | 65 | |||||||||||||||||||
| 16.68 | (7.23 | ) | 50,144 | 1.97 | (1.21 | )(f) | 1.98 | 63 | ||||||||||||||||||
| 17.98 | 45.59 | 64,298 | 1.98 | (1.47 | ) | 2.02 | 79 | |||||||||||||||||||
| 12.35 | 15.31 | 45,949 | 2.09 | (1.53 | ) | 2.30 | 120 | |||||||||||||||||||
| 10.71 | (29.03 | ) | 40,775 | 2.10 | (1.46 | ) | 2.66 | 83 | ||||||||||||||||||
| 24.70 | 28.02 | 387,402 | 1.09 | (0.33 | )(e) | 1.19 | 65 | |||||||||||||||||||
| 20.02 | (6.40 | ) | 219,805 | 1.10 | (0.32 | )(f) | 1.22 | 63 | ||||||||||||||||||
| 21.39 | 46.91 | 150,921 | 1.08 | (0.57 | ) | 1.24 | 79 | |||||||||||||||||||
| 14.56 | 16.48 | 51,872 | 1.09 | (0.52 | ) | 1.53 | 120 | |||||||||||||||||||
| 12.50 | (28.33 | ) | 36,584 | 1.10 | (0.46 | ) | 1.92 | 83 | ||||||||||||||||||
SEE NOTES TO FINANCIAL STATEMENTS.
| JUNE 30, 2013 | J.P. MORGAN SMALL CAP FUNDS | 63 | ||||||
Table of Contents
FINANCIAL HIGHLIGHTS
FOR THE PERIODS INDICATED (continued)
| Per share operating performance | |||||||||||||||||||||||||||
| Investment operations | Distributions | |||||||||||||||||||||||||||
| Net asset value, beginning of period | Net investment income (loss) | Net realized and unrealized gains (losses) on investments | Total from investment operations | Net investment income | Net realized gain | Total distributions | ||||||||||||||||||||||
Small Cap Core Fund | ||||||||||||||||||||||||||||
Select Class | ||||||||||||||||||||||||||||
Year Ended June 30, 2013 | $ | 37.54 | $ | 0.37 | (d) | $ | 10.63 | $ | 11.00 | $ | (0.43 | ) | $ | — | $ | (0.43 | ) | |||||||||||
Year Ended June 30, 2012 | 39.44 | 0.27 | (e) | (1.98 | ) | (1.71 | ) | (0.19 | ) | — | (0.19 | ) | ||||||||||||||||
Year Ended June 30, 2011 | 28.60 | 0.17 | 10.80 | 10.97 | (0.13 | ) | — | (0.13 | ) | |||||||||||||||||||
Year Ended June 30, 2010 | 23.28 | 0.09 | 5.47 | 5.56 | (0.24 | ) | — | (0.24 | ) | |||||||||||||||||||
Year Ended June 30, 2009 | 35.77 | 0.27 | (10.26 | ) | (9.99 | ) | (0.14 | ) | (2.36 | ) | (2.50 | ) | ||||||||||||||||
| (a) | Includes adjustments in accordance with accounting principles generally accepted in the United States of America and as such, the net asset values for financial reporting purposes and the returns based upon those net asset values may differ from the net asset values and returns for shareholder transactions. |
| (b) | Includes earnings credits and interest expense, if applicable, each of which is less than 0.01% unless otherwise noted. |
| (c) | Portfolio turnover is calculated by dividing the lesser of total purchases or sales of portfolio securities for the reporting period by the monthly average value of portfolio securities owned during the reporting period. Excluded from both the numerator and denominator are amounts relating to derivatives and securities whose maturities or expiration dates at the time of acquisition were one year or less. |
| (d) | Reflects special dividends paid out during the period by one of the Fund’s holdings. Had the Fund not received the special dividends, the net investment income (loss) per share would have been $0.19 and the net investment income (loss) ratio would have been 0.44% for Select Class Shares. |
| (e) | Reflects special dividends paid out during the period by one of the Fund’s holdings. Had the Fund not received the special dividends, the net investment income (loss) per share would have been $0.14 and the net investment income (loss) ratio would have been 0.39% for Select Class Shares. |
SEE NOTES TO FINANCIAL STATEMENTS.
| 64 | J.P. MORGAN SMALL CAP FUNDS | JUNE 30, 2013 | ||||
Table of Contents
| Ratios/Supplemental data | |||||||||||||||||||||||||
| Ratios to average net assets | ||||||||||||||||||||||||||
| Net asset value, end of period | Total return (excludes sales charge) (a) | Net assets, end of period (000’s) | Net expenses (b) | Net investment income (loss) | Expenses without waivers, reimbursements and earnings credits | Portfolio turnover rate (c) | ||||||||||||||||||||
| $ | 48.11 | 29.50 | % | $ | 522,295 | 0.79 | % | 0.84 | %(d) | 1.19 | % | 55 | % | |||||||||||||
| 37.54 | (4.29 | ) | 406,590 | 0.80 | 0.64 | (e) | 1.02 | 45 | ||||||||||||||||||
| 39.44 | 38.37 | 549,530 | 0.79 | 0.39 | 1.09 | 38 | ||||||||||||||||||||
| 28.60 | 23.89 | 491,061 | 0.80 | 0.40 | 1.09 | 40 | ||||||||||||||||||||
| 23.28 | (27.66 | ) | 337,981 | 0.80 | 0.96 | 1.10 | 42 | |||||||||||||||||||
SEE NOTES TO FINANCIAL STATEMENTS.
| JUNE 30, 2013 | J.P. MORGAN SMALL CAP FUNDS | 65 | ||||||
Table of Contents
FINANCIAL HIGHLIGHTS
FOR THE PERIODS INDICATED (continued)
| Per share operating performance | |||||||||||||||||||||||||||
| Investment operations | Distributions | |||||||||||||||||||||||||||
| Net asset value, beginning of period | Net investment income (loss) | Net realized and unrealized gains (losses) on investments | Total from investment operations | Net investment income | Net realized gain | Total distributions | ||||||||||||||||||||||
Small Cap Equity Fund | ||||||||||||||||||||||||||||
Class A | ||||||||||||||||||||||||||||
Year Ended June 30, 2013 | $ | 36.02 | $ | 0.29 | (f)(g) | $ | 7.39 | $ | 7.68 | $ | (0.36 | ) | $ | (3.40 | ) | $ | (3.76 | ) | ||||||||||
Year Ended June 30, 2012 | 36.72 | 0.07 | (f) | 1.09 | 1.16 | (0.10 | ) | (1.76 | ) | (1.86 | ) | |||||||||||||||||
Year Ended June 30, 2011 | 27.54 | 0.14 | (f) | 10.15 | 10.29 | (0.06 | ) | (1.05 | ) | (1.11 | ) | |||||||||||||||||
Year Ended June 30, 2010 | 23.59 | 0.05 | (f) | 3.94 | 3.99 | (0.04 | ) | — | (0.04 | ) | ||||||||||||||||||
Year Ended June 30, 2009 | 27.42 | (0.03 | )(f) | (3.80 | ) | (3.83 | ) | — | — | — | ||||||||||||||||||
Class B | ||||||||||||||||||||||||||||
Year Ended June 30, 2013 | 30.51 | 0.09 | (f)(g) | 6.17 | 6.26 | (0.21 | ) | (3.40 | ) | (3.61 | ) | |||||||||||||||||
Year Ended June 30, 2012 | 31.46 | (0.09 | )(f) | 0.90 | 0.81 | — | (1.76 | ) | (1.76 | ) | ||||||||||||||||||
Year Ended June 30, 2011 | 23.79 | (0.01 | )(f) | 8.73 | 8.72 | — | (1.05 | ) | (1.05 | ) | ||||||||||||||||||
Year Ended June 30, 2010 | 20.46 | (0.08 | )(f) | 3.41 | 3.33 | — | — | — | ||||||||||||||||||||
Year Ended June 30, 2009 | 23.90 | �� | (0.12 | )(f) | (3.32 | ) | (3.44 | ) | — | — | — | |||||||||||||||||
Class C | ||||||||||||||||||||||||||||
Year Ended June 30, 2013 | 30.46 | 0.09 | (f)(g) | 6.15 | 6.24 | (0.24 | ) | (3.40 | ) | (3.64 | ) | |||||||||||||||||
Year Ended June 30, 2012 | 31.41 | (0.08 | )(f) | 0.89 | 0.81 | — | (1.76 | ) | (1.76 | ) | ||||||||||||||||||
Year Ended June 30, 2011 | 23.75 | (0.02 | )(f) | 8.73 | 8.71 | — | (1.05 | ) | (1.05 | ) | ||||||||||||||||||
Year Ended June 30, 2010 | 20.42 | (0.08 | )(f) | 3.41 | 3.33 | — | — | — | ||||||||||||||||||||
Year Ended June 30, 2009 | 23.86 | (0.12 | )(f) | (3.32 | ) | (3.44 | ) | — | — | — | ||||||||||||||||||
Class R2 | ||||||||||||||||||||||||||||
Year Ended June 30, 2013 | 35.67 | 0.20 | (f)(g) | 7.31 | 7.51 | (0.26 | ) | (3.40 | ) | (3.66 | ) | |||||||||||||||||
Year Ended June 30, 2012 | 36.41 | (0.01 | )(f) | 1.07 | 1.06 | (0.04 | ) | (1.76 | ) | (1.80 | ) | |||||||||||||||||
Year Ended June 30, 2011 | 27.33 | 0.07 | (f) | 10.06 | 10.13 | — | (1.05 | ) | (1.05 | ) | ||||||||||||||||||
Year Ended June 30, 2010 | 23.48 | (0.04 | )(f) | 3.92 | 3.88 | (0.03 | ) | — | (0.03 | ) | ||||||||||||||||||
November 3, 2008 (h) through June 30, 2009 | 20.98 | (0.06 | )(f) | 2.63 | 2.57 | (0.07 | ) | — | (0.07 | ) | ||||||||||||||||||
Class R5 | ||||||||||||||||||||||||||||
Year Ended June 30, 2013 | 39.47 | 0.52 | (f)(g) | 8.16 | 8.68 | (0.54 | ) | (3.40 | ) | (3.94 | ) | |||||||||||||||||
Year Ended June 30, 2012 | 40.04 | 0.28 | (f) | 1.19 | 1.47 | (0.28 | ) | (1.76 | ) | (2.04 | ) | |||||||||||||||||
Year Ended June 30, 2011 | 29.92 | 0.31 | (f) | 11.06 | 11.37 | (0.20 | ) | (1.05 | ) | (1.25 | ) | |||||||||||||||||
Year Ended June 30, 2010 | 25.60 | 0.19 | (f) | 4.27 | 4.46 | (0.14 | ) | — | (0.14 | ) | ||||||||||||||||||
Year Ended June 30, 2009 | 29.72 | 0.09 | (f) | (4.12 | ) | (4.03 | ) | (0.09 | ) | — | (0.09 | ) | ||||||||||||||||
Select Class | ||||||||||||||||||||||||||||
Year Ended June 30, 2013 | 39.41 | 0.44 | (f)(g) | 8.15 | 8.59 | (0.46 | ) | (3.40 | ) | (3.86 | ) | |||||||||||||||||
Year Ended June 30, 2012 | 39.98 | 0.19 | (f) | 1.20 | 1.39 | (0.20 | ) | (1.76 | ) | (1.96 | ) | |||||||||||||||||
Year Ended June 30, 2011 | 29.88 | 0.27 | (f) | 11.02 | 11.29 | (0.14 | ) | (1.05 | ) | (1.19 | ) | |||||||||||||||||
Year Ended June 30, 2010 | 25.58 | 0.13 | (f) | 4.27 | 4.40 | (0.10 | ) | — | (0.10 | ) | ||||||||||||||||||
Year Ended June 30, 2009 | 29.68 | 0.04 | (f) | (4.11 | ) | (4.07 | ) | (0.03 | ) | — | (0.03 | ) | ||||||||||||||||
| (a) | Annualized for periods less than one year. |
| (b) | Not annualized for periods less than one year. |
| (c) | Includes adjustments in accordance with accounting principles generally accepted in the United States of America and as such, the net asset values for financial reporting purposes and the returns based upon those net asset values may differ from the net asset values and returns for shareholder transactions. |
| (d) | Includes earnings credits and interest expense, if applicable, each of which is less than 0.01% unless otherwise noted. |
| (e) | Portfolio turnover is calculated by dividing the lesser of total purchases or sales of portfolio securities for the reporting period by the monthly average value of portfolio securities owned during the reporting period. Excluded from both the numerator and denominator are amounts relating to derivatives and securities whose maturities or expiration dates at the time of acquisition were one year or less. |
| (f) | Calculated based upon average shares outstanding. |
| (g) | Reflects special dividends paid out during the period by several of the Fund’s holdings. Had the Fund not received the special dividends the net investment income (loss) per share would have been $0.05, $(0.11), $(0.11), $(0.04), $0.26 and $0.18 for Class A, Class B, Class C, Class R2, Class R5 and Select Class Shares, respectively, and the net investment income (loss) ratio would have been 0.14%, (0.35)%, (0.36)%, (0.10)%, 0.62% and 0.44% for Class A, Class B, Class C, Class R2, Class R5 and Select Class Shares, respectively. |
| (h) | Commencement of offering of class of shares. |
SEE NOTES TO FINANCIAL STATEMENTS.
| 66 | J.P. MORGAN SMALL CAP FUNDS | JUNE 30, 2013 | ||||
Table of Contents
| Ratios/Supplemental data | |||||||||||||||||||||||||
| Ratios to average net assets (a) | ||||||||||||||||||||||||||
| Net asset value, end of period | Total return (excludes sales charge) (b)(c) | Net assets, end of period (000’s) | Net expenses (d) | Net investment income (loss) | Expenses without waivers, reimbursements and earnings credits | Portfolio turnover rate (b)(e) | ||||||||||||||||||||
| $ | 39.94 | 23.11 | % | $ | 696,784 | 1.29 | % | 0.78 | %(g) | 1.39 | % | 25 | % | |||||||||||||
| 36.02 | 3.79 | 618,705 | 1.30 | 0.21 | 1.41 | 27 | ||||||||||||||||||||
| 36.72 | 37.77 | 699,042 | 1.29 | 0.43 | 1.40 | 39 | ||||||||||||||||||||
| 27.54 | 16.91 | 528,676 | 1.29 | 0.16 | 1.38 | 44 | ||||||||||||||||||||
| 23.59 | (13.97 | ) | 372,525 | 1.30 | (0.13 | ) | 1.44 | 45 | ||||||||||||||||||
| 33.16 | 22.51 | 8,264 | 1.79 | 0.28 | (g) | 1.88 | 25 | |||||||||||||||||||
| 30.51 | 3.26 | 10,036 | 1.80 | (0.30 | ) | 1.91 | 27 | |||||||||||||||||||
| 31.46 | 37.10 | 13,032 | 1.79 | (0.05 | ) | 1.90 | 39 | |||||||||||||||||||
| 23.79 | 16.28 | 12,890 | 1.79 | (0.33 | ) | 1.88 | 44 | |||||||||||||||||||
| 20.46 | (14.39 | ) | 13,711 | 1.80 | (0.64 | ) | 1.94 | 45 | ||||||||||||||||||
| 33.06 | 22.50 | 37,039 | 1.79 | 0.28 | (g) | 1.88 | 25 | |||||||||||||||||||
| 30.46 | 3.26 | 34,994 | 1.80 | (0.29 | ) | 1.91 | 27 | |||||||||||||||||||
| 31.41 | 37.13 | 39,403 | 1.79 | (0.06 | ) | 1.90 | 39 | |||||||||||||||||||
| 23.75 | 16.31 | 32,259 | 1.79 | (0.33 | ) | 1.88 | 44 | |||||||||||||||||||
| 20.42 | (14.42 | ) | 30,661 | 1.80 | (0.64 | ) | 1.94 | 45 | ||||||||||||||||||
| 39.52 | 22.80 | 4,909 | 1.54 | 0.53 | (g) | 1.64 | 25 | |||||||||||||||||||
| 35.67 | 3.51 | 5,587 | 1.55 | (0.03 | ) | 1.66 | 27 | |||||||||||||||||||
| 36.41 | 37.46 | 5,109 | 1.54 | 0.22 | 1.65 | 39 | ||||||||||||||||||||
| 27.33 | 16.53 | 4,634 | 1.54 | (0.16 | ) | 1.63 | 44 | |||||||||||||||||||
| 23.48 | 12.30 | 1,461 | 1.55 | (0.39 | ) | 1.75 | 45 | |||||||||||||||||||
| 44.21 | 23.71 | 814,942 | 0.79 | 1.25 | (g) | 0.94 | 25 | |||||||||||||||||||
| 39.47 | 4.31 | 696,200 | 0.79 | 0.73 | 0.96 | 27 | ||||||||||||||||||||
| 40.04 | 38.46 | 567,675 | 0.79 | 0.85 | 0.96 | 39 | ||||||||||||||||||||
| 29.92 | 17.44 | 256,458 | 0.79 | 0.63 | 0.93 | 44 | ||||||||||||||||||||
| 25.60 | (13.50 | ) | 86,024 | 0.80 | 0.38 | 0.99 | 45 | |||||||||||||||||||
| 44.14 | 23.48 | 1,134,887 | 0.99 | 1.07 | (g) | 1.14 | 25 | |||||||||||||||||||
| 39.41 | 4.09 | 1,076,509 | 1.00 | 0.51 | 1.16 | 27 | ||||||||||||||||||||
| 39.98 | 38.21 | 1,200,332 | 0.99 | 0.75 | 1.15 | 39 | ||||||||||||||||||||
| 29.88 | 17.21 | 935,388 | 0.99 | 0.45 | 1.13 | 44 | ||||||||||||||||||||
| 25.58 | (13.69 | ) | 603,628 | 1.00 | 0.17 | 1.19 | 45 | |||||||||||||||||||
SEE NOTES TO FINANCIAL STATEMENTS.
| JUNE 30, 2013 | J.P. MORGAN SMALL CAP FUNDS | 67 | ||||||
Table of Contents
FINANCIAL HIGHLIGHTS
FOR THE PERIODS INDICATED (continued)
| Per share operating performance | |||||||||||||||||||
| Investment operations | Distributions | |||||||||||||||||||
| Net asset value, beginning of period | Net investment income (loss) | Net realized and unrealized gains (losses) on investments | Total from investment operations | Net realized gain | ||||||||||||||||
Small Cap Growth Fund | ||||||||||||||||||||
Class A | ||||||||||||||||||||
Year Ended June 30, 2013 | $ | 11.13 | $ | (0.06 | )(f)(g) | $ | 2.94 | $ | 2.88 | $ | (1.01 | ) | ||||||||
Year Ended June 30, 2012 | 12.17 | (0.05 | )(f)(h) | (0.77 | ) | (0.82 | ) | (0.22 | ) | |||||||||||
Year Ended June 30, 2011 | 8.28 | (0.08 | )(f) | 3.97 | 3.89 | — | ||||||||||||||
Year Ended June 30, 2010 | 6.80 | (0.06 | )(f) | 1.54 | 1.48 | — | ||||||||||||||
Year Ended June 30, 2009 | 8.94 | (0.04 | )(f) | (2.10 | ) | (2.14 | ) | — | ||||||||||||
Class B | ||||||||||||||||||||
Year Ended June 30, 2013 | 9.10 | (0.10 | )(f)(g) | 2.36 | 2.26 | (1.01 | ) | |||||||||||||
Year Ended June 30, 2012 | 10.04 | (0.09 | )(f)(h) | (0.63 | ) | (0.72 | ) | (0.22 | ) | |||||||||||
Year Ended June 30, 2011 | 6.87 | (0.11 | )(f) | 3.28 | 3.17 | — | ||||||||||||||
Year Ended June 30, 2010 | 5.67 | (0.09 | )(f) | 1.29 | 1.20 | — | ||||||||||||||
Year Ended June 30, 2009 | 7.52 | (0.07 | )(f) | (1.78 | ) | (1.85 | ) | — | ||||||||||||
Class C | ||||||||||||||||||||
Year Ended June 30, 2013 | 9.51 | (0.10 | )(f)(g) | 2.47 | 2.37 | (1.01 | ) | |||||||||||||
Year Ended June 30, 2012 | 10.48 | (0.09 | )(f)(h) | (0.66 | ) | (0.75 | ) | (0.22 | ) | |||||||||||
Year Ended June 30, 2011 | 7.17 | (0.12 | )(f) | 3.43 | 3.31 | — | ||||||||||||||
Year Ended June 30, 2010 | 5.92 | (0.09 | )(f) | 1.34 | 1.25 | — | ||||||||||||||
Year Ended June 30, 2009 | 7.84 | (0.07 | )(f) | (1.85 | ) | (1.92 | ) | — | ||||||||||||
Class R2 | ||||||||||||||||||||
Year Ended June 30, 2013 | 11.03 | (0.09 | )(f)(g) | 2.91 | 2.82 | (1.01 | ) | |||||||||||||
Year Ended June 30, 2012 | 12.09 | (0.08 | )(f)(h) | (0.76 | ) | (0.84 | ) | (0.22 | ) | |||||||||||
Year Ended June 30, 2011 | 8.25 | (0.11 | )(f) | 3.95 | 3.84 | — | ||||||||||||||
Year Ended June 30, 2010 | 6.79 | (0.08 | )(f) | 1.54 | 1.46 | — | ||||||||||||||
November 3, 2008 (i) through June 30, 2009 | 6.28 | (0.03 | )(f) | 0.54 | 0.51 | — | ||||||||||||||
Class R6 | ||||||||||||||||||||
Year Ended June 30, 2013 | 11.85 | — | (f)(g)(j) | 3.16 | 3.16 | (1.01 | ) | |||||||||||||
Year Ended June 30, 2012 | 12.88 | — | (f)(h)(j) | (0.81 | ) | (0.81 | ) | (0.22 | ) | |||||||||||
November 30, 2010 (i) through June 30, 2011 | 11.02 | (0.02 | )(f) | 1.88 | 1.86 | — | ||||||||||||||
Institutional Class | ||||||||||||||||||||
Year Ended June 30, 2013 | 11.84 | (0.01 | )(f)(g) | 3.14 | 3.13 | (1.01 | ) | |||||||||||||
Year Ended June 30, 2012 | 12.87 | (0.01 | )(f)(h) | (0.80 | ) | (0.81 | ) | (0.22 | ) | |||||||||||
Year Ended June 30, 2011 | 8.73 | (0.04 | )(f) | 4.18 | 4.14 | — | ||||||||||||||
Year Ended June 30, 2010 | 7.13 | (0.03 | )(f) | 1.63 | 1.60 | — | ||||||||||||||
Year Ended June 30, 2009 | 9.36 | (0.01 | )(f) | (2.22 | ) | (2.23 | ) | — | ||||||||||||
Select Class | ||||||||||||||||||||
Year Ended June 30, 2013 | 11.70 | (0.03 | )(f)(g) | 3.11 | 3.08 | (1.01 | ) | |||||||||||||
Year Ended June 30, 2012 | 12.74 | (0.02 | )(f)(h) | (0.80 | ) | (0.82 | ) | (0.22 | ) | |||||||||||
Year Ended June 30, 2011 | 8.65 | (0.05 | )(f) | 4.14 | 4.09 | — | ||||||||||||||
Year Ended June 30, 2010 | 7.08 | (0.04 | )(f) | 1.61 | 1.57 | — | ||||||||||||||
Year Ended June 30, 2009 | 9.30 | (0.03 | )(f) | (2.19 | ) | (2.22 | ) | — | ||||||||||||
| (a) | Annualized for periods less than one year. |
| (b) | Not annualized for periods less than one year. |
| (c) | Includes adjustments in accordance with accounting principles generally accepted in the United States of America and as such, the net asset values for financial reporting purposes and the returns based upon those net asset values may differ from the net asset values and returns for shareholder transactions. |
| (d) | Includes earnings credits and interest expense, if applicable, each of which is less than 0.01% unless otherwise noted. |
| (e) | Portfolio turnover is calculated by dividing the lesser of total purchases or sales of portfolio securities for the reporting period by the monthly average value of portfolio securities owned during the reporting period. Excluded from both the numerator and denominator are amounts relating to derivatives and securities whose maturities or expiration dates at the time of acquisition were one year or less. |
| (f) | Calculated based upon average shares outstanding. |
| (g) | Reflects special dividends paid out during the period by one of the Fund’s holdings. Had the Fund not received the special dividends, the net investment income (loss) per share would have been $(0.09), $(0.12), $(0.13), $(0.12), $(0.04), $(0.05) and $(0.07) for Class A, Class B, Class C, Class R2, Class R6, Institutional Class and Select Class Shares, respectively, and the net investment income (loss) ratio would have been (0.80)%, (1.30)%, (1.30)%, (1.04)%, (0.29)%, (0.40)% and (0.54)% for Class A, Class B, Class C, Class R2, Class R6, Institutional Class and Select Class Shares, respectively. |
| (h) | Reflects special dividends paid out during the period by one of the Fund’s holdings. Had the Fund not received the special dividends, the net investment income (loss) per share would have been $(0.07), $(0.11), $(0.11), $(0.10), $(0.02),(0.27)% and (0.40)% for Class A, Class B, Class C, Class R2, Class R6 Shares, Institutional Class and Select Class Shares, respectively, and the net investment income (loss) ratio would have been (0.68)%, (1.18)%, (1.18)%, (0.92)%, (0.19)%,$(0.03) and $(0.05) for Class A, Class B, Class C, Class R2, Class R6 Shares, Institutional Class and Select Class Shares, respectively. |
| (i) | Commencement of offering of class of shares. |
| (j) | Amount rounds to less than $0.01. |
| (k) | Amount rounds to less than 0.01%. |
SEE NOTES TO FINANCIAL STATEMENTS.
| 68 | J.P. MORGAN SMALL CAP FUNDS | JUNE 30, 2013 | ||||
Table of Contents
| Ratios/Supplemental data | |||||||||||||||||||||||||
| Ratios to average net assets (a) | ||||||||||||||||||||||||||
| Net asset value, end of period | Total return (excludes sales charge) (b)(c) | Net assets, end of period (000’s) | Net expenses (d) | Net investment income (loss) | Expenses without waivers, reimbursements and earnings credits | Portfolio turnover rate (b)(e) | ||||||||||||||||||||
| $ | 13.00 | 27.94 | % | $ | 249,986 | 1.24 | % | (0.50 | )%(g) | 1.42 | % | 60 | % | |||||||||||||
| 11.13 | (6.59 | ) | 219,946 | 1.25 | (0.46 | )(h) | 1.44 | 58 | ||||||||||||||||||
| 12.17 | 46.98 | 271,606 | 1.24 | (0.72 | ) | 1.39 | 79 | |||||||||||||||||||
| 8.28 | 21.76 | 144,214 | 1.25 | (0.71 | ) | 1.44 | 83 | |||||||||||||||||||
| 6.80 | (23.94 | ) | 107,591 | 1.25 | (0.55 | ) | 1.58 | 83 | ||||||||||||||||||
| 10.35 | 27.32 | 3,005 | 1.74 | (1.01 | )(g) | 1.92 | 60 | |||||||||||||||||||
| 9.10 | (7.00 | ) | 3,690 | 1.75 | (0.97 | )(h) | 1.94 | 58 | ||||||||||||||||||
| 10.04 | 46.14 | 6,049 | 1.78 | (1.26 | ) | 1.89 | 79 | |||||||||||||||||||
| 6.87 | 21.16 | 6,318 | 1.85 | (1.33 | ) | 1.94 | 83 | |||||||||||||||||||
| 5.67 | (24.60 | ) | 7,967 | 1.85 | (1.15 | ) | 2.06 | 83 | ||||||||||||||||||
| 10.87 | 27.30 | 25,415 | 1.74 | (1.00 | )(g) | 1.92 | 60 | |||||||||||||||||||
| 9.51 | (6.99 | ) | 23,689 | 1.75 | (0.97 | )(h) | 1.94 | 58 | ||||||||||||||||||
| 10.48 | 46.16 | 31,665 | 1.78 | (1.26 | ) | 1.89 | 79 | |||||||||||||||||||
| 7.17 | 21.11 | 19,472 | 1.85 | (1.31 | ) | 1.94 | 83 | |||||||||||||||||||
| 5.92 | (24.49 | ) | 14,396 | 1.85 | (1.15 | ) | 2.07 | 83 | ||||||||||||||||||
| 12.84 | 27.64 | 26,561 | 1.49 | (0.75 | )(g) | 1.67 | 60 | |||||||||||||||||||
| 11.03 | (6.80 | ) | 22,514 | 1.50 | (0.71 | )(h) | 1.69 | 58 | ||||||||||||||||||
| 12.09 | 46.55 | 16,109 | 1.50 | (0.98 | ) | 1.64 | 79 | |||||||||||||||||||
| 8.25 | 21.50 | 1,561 | 1.50 | (0.89 | ) | 1.66 | 83 | |||||||||||||||||||
| 6.79 | 8.12 | 54 | 1.50 | (0.72 | ) | 1.93 | 83 | |||||||||||||||||||
| 14.00 | 28.63 | 248,415 | 0.75 | — | (g)(k) | 0.92 | 60 | |||||||||||||||||||
| 11.85 | (6.14 | ) | 200,960 | 0.75 | 0.02 | (h) | 0.94 | 58 | ||||||||||||||||||
| 12.88 | 16.88 | 83,457 | 0.74 | (0.24 | ) | 0.88 | 79 | |||||||||||||||||||
| 13.96 | 28.39 | 230,458 | 0.85 | (0.11 | )(g) | 1.02 | 60 | |||||||||||||||||||
| 11.84 | (6.15 | ) | 226,834 | 0.85 | (0.06 | )(h) | 1.04 | 58 | ||||||||||||||||||
| 12.87 | 47.42 | 207,977 | 0.85 | (0.32 | ) | 1.00 | 79 | |||||||||||||||||||
| 8.73 | 22.44 | 146,161 | 0.85 | (0.31 | ) | 1.04 | 83 | |||||||||||||||||||
| 7.13 | (23.82 | ) | 102,695 | 0.85 | (0.15 | ) | 1.19 | 83 | ||||||||||||||||||
| 13.77 | 28.30 | 148,078 | 1.00 | (0.25 | )(g) | 1.17 | 60 | |||||||||||||||||||
| 11.70 | (6.29 | ) | 123,887 | 1.00 | (0.21 | )(h) | 1.19 | 58 | ||||||||||||||||||
| 12.74 | 47.28 | 128,617 | 0.99 | (0.47 | ) | 1.14 | 79 | |||||||||||||||||||
| 8.65 | 22.18 | 100,499 | 1.00 | (0.46 | ) | 1.19 | 83 | |||||||||||||||||||
| 7.08 | (23.87 | ) | 87,612 | 1.00 | (0.31 | ) | 1.30 | 83 | ||||||||||||||||||
SEE NOTES TO FINANCIAL STATEMENTS.
| JUNE 30, 2013 | J.P. MORGAN SMALL CAP FUNDS | 69 | ||||||
Table of Contents
FINANCIAL HIGHLIGHTS
FOR THE PERIODS INDICATED (continued)
| Per share operating performance | |||||||||||||||||||||||||||
| Investment operations | Distributions | |||||||||||||||||||||||||||
| Net asset value, beginning of period | Net investment income (loss) | Net realized and unrealized gains (losses) on investments | Total from investment operations | Net investment income | Net realized gain | Total distributions | ||||||||||||||||||||||
Small Cap Value Fund | ||||||||||||||||||||||||||||
Class A | ||||||||||||||||||||||||||||
Year Ended June 30, 2013 | $ | 18.75 | $ | 0.21 | (f)(g) | $ | 5.04 | $ | 5.25 | $ | (0.23 | ) | $ | — | $ | (0.23 | ) | |||||||||||
Year Ended June 30, 2012 | 18.99 | 0.14 | (f) | (0.22 | ) | (0.08 | ) | (0.16 | ) | — | (0.16 | ) | ||||||||||||||||
Year Ended June 30, 2011 | 14.53 | 0.12 | (f) | 4.46 | 4.58 | (0.12 | ) | — | (0.12 | ) | ||||||||||||||||||
Year Ended June 30, 2010 | 11.46 | 0.09 | (f) | 3.06 | 3.15 | (0.08 | ) | — | (0.08 | ) | ||||||||||||||||||
Year Ended June 30, 2009 | 17.45 | 0.18 | (f) | (4.93 | ) | (4.75 | ) | (0.21 | ) | (1.03 | ) | (1.24 | ) | |||||||||||||||
Class B | ||||||||||||||||||||||||||||
Year Ended June 30, 2013 | 16.55 | 0.06 | (f)(g) | 4.44 | 4.50 | (0.13 | ) | — | (0.13 | ) | ||||||||||||||||||
Year Ended June 30, 2012 | 16.78 | 0.02 | (f) | (0.18 | ) | (0.16 | ) | (0.07 | ) | — | (0.07 | ) | ||||||||||||||||
Year Ended June 30, 2011 | 12.88 | 0.01 | (f) | 3.95 | 3.96 | (0.06 | ) | — | (0.06 | ) | ||||||||||||||||||
Year Ended June 30, 2010 | 10.17 | — | (f)(h) | 2.72 | 2.72 | (0.01 | ) | — | (0.01 | ) | ||||||||||||||||||
Year Ended June 30, 2009 | 15.72 | 0.09 | (f) | (4.45 | ) | (4.36 | ) | (0.16 | ) | (1.03 | ) | (1.19 | ) | |||||||||||||||
Class C | ||||||||||||||||||||||||||||
Year Ended June 30, 2013 | 16.40 | 0.06 | (f)(g) | 4.41 | 4.47 | (0.14 | ) | — | (0.14 | ) | ||||||||||||||||||
Year Ended June 30, 2012 | 16.64 | 0.03 | (f) | (0.19 | ) | (0.16 | ) | (0.08 | ) | — | (0.08 | ) | ||||||||||||||||
Year Ended June 30, 2011 | 12.78 | 0.01 | (f) | 3.92 | 3.93 | (0.07 | ) | — | (0.07 | ) | ||||||||||||||||||
Year Ended June 30, 2010 | 10.10 | — | (f)(h) | 2.70 | 2.70 | (0.02 | ) | — | (0.02 | ) | ||||||||||||||||||
Year Ended June 30, 2009 | 15.61 | 0.09 | (f) | (4.41 | ) | (4.32 | ) | (0.16 | ) | (1.03 | ) | (1.19 | ) | |||||||||||||||
Class R2 | ||||||||||||||||||||||||||||
Year Ended June 30, 2013 | 18.68 | 0.15 | (f)(g) | 5.03 | 5.18 | (0.19 | ) | — | (0.19 | ) | ||||||||||||||||||
Year Ended June 30, 2012 | 18.93 | 0.10 | (f) | (0.23 | ) | (0.13 | ) | (0.12 | ) | — | (0.12 | ) | ||||||||||||||||
Year Ended June 30, 2011 | 14.51 | 0.08 | (f) | 4.45 | 4.53 | (0.11 | ) | — | (0.11 | ) | ||||||||||||||||||
Year Ended June 30, 2010 | 11.45 | 0.06 | (f) | 3.06 | 3.12 | (0.06 | ) | — | (0.06 | ) | ||||||||||||||||||
November 3, 2008(i) through June 30, 2009 | 13.84 | 0.10 | (f) | (1.29 | ) | (1.19 | ) | (0.17 | ) | (1.03 | ) | (1.20 | ) | |||||||||||||||
Class R5 | ||||||||||||||||||||||||||||
Year Ended June 30, 2013 | 19.58 | 0.29 | (f)(g) | 5.27 | 5.56 | (0.29 | ) | — | (0.29 | ) | ||||||||||||||||||
Year Ended June 30, 2012 | 19.82 | 0.20 | (f) | (0.22 | ) | (0.02 | ) | (0.22 | ) | — | (0.22 | ) | ||||||||||||||||
Year Ended June 30, 2011 | 15.15 | 0.18 | (f) | 4.66 | 4.84 | (0.17 | ) | — | (0.17 | ) | ||||||||||||||||||
Year Ended June 30, 2010 | 11.94 | 0.15 | (f) | 3.19 | 3.34 | (0.13 | ) | — | (0.13 | ) | ||||||||||||||||||
Year Ended June 30, 2009 | 18.08 | 0.22 | (f) | (5.09 | ) | (4.87 | ) | (0.24 | ) | (1.03 | ) | (1.27 | ) | |||||||||||||||
Class R6 (j) | ||||||||||||||||||||||||||||
Year Ended June 30, 2013 | 19.59 | 0.29 | (f)(g) | 5.29 | 5.58 | (0.30 | ) | — | (0.30 | ) | ||||||||||||||||||
Year Ended June 30, 2012 | 19.83 | 0.22 | (f) | (0.23 | ) | (0.01 | ) | (0.23 | ) | — | (0.23 | ) | ||||||||||||||||
Year Ended June 30, 2011 | 15.15 | 0.20 | (f) | 4.65 | 4.85 | (0.17 | ) | — | (0.17 | ) | ||||||||||||||||||
Year Ended June 30, 2010 | 11.95 | 0.15 | (f) | 3.19 | 3.34 | (0.14 | ) | — | (0.14 | ) | ||||||||||||||||||
Year Ended June 30, 2009 | 18.09 | 0.24 | (f) | (5.11 | ) | (4.87 | ) | (0.24 | ) | (1.03 | ) | (1.27 | ) | |||||||||||||||
Select Class | ||||||||||||||||||||||||||||
Year Ended June 30, 2013 | 19.58 | 0.26 | (f)(g) | 5.29 | 5.55 | (0.27 | ) | — | (0.27 | ) | ||||||||||||||||||
Year Ended June 30, 2012 | 19.82 | 0.19 | (f) | (0.23 | ) | (0.04 | ) | (0.20 | ) | — | (0.20 | ) | ||||||||||||||||
Year Ended June 30, 2011 | 15.15 | 0.17 | (f) | 4.65 | 4.82 | (0.15 | ) | — | (0.15 | ) | ||||||||||||||||||
Year Ended June 30, 2010 | 11.94 | 0.13 | (f) | 3.20 | 3.33 | (0.12 | ) | — | (0.12 | ) | ||||||||||||||||||
Year Ended June 30, 2009 | 18.09 | 0.22 | (f) | (5.11 | ) | (4.89 | ) | (0.23 | ) | (1.03 | ) | (1.26 | ) | |||||||||||||||
| (a) | Annualized for periods less than one year. |
| (b) | Not annualized for periods less than one year. |
| (c) | Includes adjustments in accordance with accounting principles generally accepted in the United States of America and as such, the net asset values for financial reporting purposes and the returns based upon those net asset values may differ from the net asset values and returns for shareholder transactions. |
| (d) | Includes earnings credits and interest expense, if applicable, each of which is less than 0.01% unless otherwise noted. |
| (e) | Portfolio turnover is calculated by dividing the lesser of total purchases or sales of portfolio securities for the reporting period by the monthly average value of portfolio securities owned during the reporting period. Excluded from both the numerator and denominator are amounts relating to derivatives and securities whose maturities or expiration dates at the time of acquisition were one year or less. |
| (f) | Calculated based upon average shares outstanding. |
| (g) | Reflects special dividends paid out during the period by one of the Fund’s holdings. Had the Fund not received the special dividends, the net investment income (loss) per share would have been $0.12, $(0.01), $(0.01), $0.06, $0.19, $0.20 and $0.17 for Class A, Class B, Class C, Class R2, Class R5, Class R6 and Select Class Shares, respectively, and the net investment income (loss) ratio would have been 0.57%, (0.08)%, (0.08)%, 0.27%, 0.86%, 0.89% and 0.77% for Class A, Class B, Class C, Class R2, Class R5, Class R6 and Select Class Shares, respectively. |
| (h) | Amount rounds to less than $0.01. |
| (i) | Commencement of offering of class of shares. |
| (j) | Effective November 30, 2010 Ultra Shares were renamed Class R6 Shares. |
SEE NOTES TO FINANCIAL STATEMENTS.
| 70 | J.P. MORGAN SMALL CAP FUNDS | JUNE 30, 2013 | ||||
Table of Contents
| Ratios/Supplemental data | |||||||||||||||||||||||||
| Ratios to average net assets (a) | ||||||||||||||||||||||||||
| Net asset value, end of period | Total return (excludes sales charge) (b)(c) | Net assets, end of period (000’s) | Net expenses (d) | Net income | Expenses without waivers, reimbursements and earnings credits | Portfolio turnover rate (b)(e) | ||||||||||||||||||||
| $ | 23.77 | 28.08 | % | $ | 332,177 | 1.24 | % | 0.98 | %(g) | 1.39 | % | 38 | % | |||||||||||||
| 18.75 | (0.36 | ) | 184,920 | 1.25 | 0.79 | 1.41 | 38 | |||||||||||||||||||
| 18.99 | 31.56 | 202,094 | 1.25 | 0.68 | 1.43 | 43 | ||||||||||||||||||||
| 14.53 | 27.50 | 150,297 | 1.25 | 0.64 | 1.48 | 50 | ||||||||||||||||||||
| 11.46 | (26.91 | ) | 108,414 | 1.25 | 1.42 | 1.55 | 33 | |||||||||||||||||||
| 20.92 | 27.27 | 3,762 | 1.85 | 0.34 | (g) | 1.89 | 38 | |||||||||||||||||||
| 16.55 | (0.95 | ) | 3,931 | 1.86 | 0.16 | 1.91 | 38 | |||||||||||||||||||
| 16.78 | 30.75 | 6,611 | 1.85 | 0.06 | 1.93 | 43 | ||||||||||||||||||||
| 12.88 | 26.77 | 7,355 | �� | 1.86 | 0.03 | 1.98 | 50 | |||||||||||||||||||
| 10.17 | (27.42 | ) | 10,614 | 1.86 | 0.79 | 2.04 | 33 | |||||||||||||||||||
| 20.73 | 27.35 | 41,108 | 1.85 | 0.34 | (g) | 1.89 | 38 | |||||||||||||||||||
| 16.40 | (0.96 | ) | 28,834 | 1.86 | 0.18 | 1.91 | 38 | |||||||||||||||||||
| 16.64 | 30.72 | 31,602 | 1.85 | 0.07 | 1.93 | 43 | ||||||||||||||||||||
| 12.78 | 26.74 | 23,499 | 1.86 | 0.03 | 1.98 | 50 | ||||||||||||||||||||
| 10.10 | (27.34 | ) | 17,402 | 1.86 | 0.79 | 2.04 | 33 | |||||||||||||||||||
| 23.67 | 27.79 | 15,500 | 1.49 | 0.69 | (g) | 1.64 | 38 | |||||||||||||||||||
| 18.68 | (0.64 | ) | 6,758 | 1.50 | 0.55 | 1.66 | 38 | |||||||||||||||||||
| 18.93 | 31.22 | 6,082 | 1.49 | 0.45 | 1.64 | 43 | ||||||||||||||||||||
| 14.51 | 27.20 | 534 | 1.50 | 0.39 | 1.71 | 50 | ||||||||||||||||||||
| | 11.45 | | (8.17 | ) | 59 | 1.50 | 1.34 | 1.91 | 33 | |||||||||||||||||
| 24.85 | 28.53 | 32,304 | 0.90 | 1.28 | (g) | 0.94 | 38 | |||||||||||||||||||
| 19.58 | (0.03 | ) | 15,668 | 0.91 | 1.09 | 0.95 | 38 | |||||||||||||||||||
| 19.82 | 31.95 | 31,899 | 0.90 | 1.03 | 1.00 | 43 | ||||||||||||||||||||
| 15.15 | 27.96 | 48,135 | 0.91 | 0.98 | 1.02 | 50 | ||||||||||||||||||||
| 11.94 | (26.63 | ) | 13,342 | 0.91 | 1.74 | 1.14 | 33 | |||||||||||||||||||
| 24.87 | 28.62 | 207,613 | 0.85 | 1.32 | (g) | 0.89 | 38 | |||||||||||||||||||
| 19.59 | 0.02 | 180,853 | 0.86 | 1.21 | 0.91 | 38 | ||||||||||||||||||||
| 19.83 | 32.06 | 103,457 | 0.85 | 1.06 | 0.89 | 43 | ||||||||||||||||||||
| 15.15 | 27.91 | 23,660 | 0.86 | 1.02 | 0.98 | 50 | ||||||||||||||||||||
| 11.95 | (26.59 | ) | 18,137 | 0.86 | 1.80 | 1.05 | 33 | |||||||||||||||||||
| 24.86 | 28.47 | 266,018 | 0.99 | 1.19 | (g) | 1.14 | 38 | |||||||||||||||||||
| 19.58 | (0.11 | ) | 196,102 | 1.00 | 1.04 | 1.16 | 38 | |||||||||||||||||||
| 19.82 | 31.86 | 190,632 | 0.99 | 0.92 | 1.18 | 43 | ||||||||||||||||||||
| 15.15 | 27.83 | 175,578 | 1.00 | 0.90 | 1.23 | 50 | ||||||||||||||||||||
| 11.94 | (26.72 | ) | 201,486 | 1.00 | 1.64 | 1.30 | 33 | |||||||||||||||||||
SEE NOTES TO FINANCIAL STATEMENTS.
| JUNE 30, 2013 | J.P. MORGAN SMALL CAP FUNDS | 71 | ||||||
Table of Contents
FINANCIAL HIGHLIGHTS
FOR THE PERIODS INDICATED (continued)
| Per share operating performance | |||||||||||||||||||||||||||
| Investment operations | Distributions | |||||||||||||||||||||||||||
| Net asset value, beginning of period | Net investment income (loss) | Net realized and unrealized gains (losses) on investments | Total from investment operations | Net investment income | Net realized gain | Total distributions | ||||||||||||||||||||||
U.S. Small Company Fund | ||||||||||||||||||||||||||||
Class A | ||||||||||||||||||||||||||||
Year Ended June 30, 2013 | $ | 10.31 | $ | 0.04 | (f)(g) | $ | 2.89 | $ | 2.93 | $ | (0.07 | ) | $ | — | $ | (0.07 | ) | |||||||||||
Year Ended June 30, 2012 | 10.62 | 0.02 | (f) | (0.33 | )(h) | (0.31 | ) | — | — | — | ||||||||||||||||||
Year Ended June 30, 2011 | 7.79 | — | (f)(i) | 2.86 | 2.86 | (0.03 | ) | — | (0.03 | ) | ||||||||||||||||||
Year Ended June 30, 2010 | 6.17 | 0.01 | (f) | 1.68 | 1.69 | (0.07 | ) | — | (0.07 | ) | ||||||||||||||||||
Year Ended June 30, 2009 | 8.37 | 0.05 | (f) | (2.17 | ) | (2.12 | ) | (0.02 | ) | (0.06 | ) | (0.08 | ) | |||||||||||||||
Class C | ||||||||||||||||||||||||||||
Year Ended June 30, 2013 | 10.14 | (0.02 | )(f)(g) | 2.83 | 2.81 | (0.04 | ) | — | (0.04 | ) | ||||||||||||||||||
Year Ended June 30, 2012 | 10.50 | (0.02 | )(f) | (0.34 | )(h) | (0.36 | ) | — | — | — | ||||||||||||||||||
Year Ended June 30, 2011 | 7.71 | (0.05 | )(f) | 2.84 | 2.79 | — | — | — | ||||||||||||||||||||
Year Ended June 30, 2010 | 6.14 | (0.03 | )(f) | 1.68 | 1.65 | (0.08 | ) | — | (0.08 | ) | ||||||||||||||||||
Year Ended June 30, 2009 | 8.34 | 0.02 | (f) | (2.16 | ) | (2.14 | ) | — | (h) | (0.06 | ) | (0.06 | ) | |||||||||||||||
Class R2 | ||||||||||||||||||||||||||||
Year Ended June 30, 2013 | 10.25 | (0.02 | )(f)(g) | 2.90 | 2.88 | (0.04 | ) | — | (0.04 | ) | ||||||||||||||||||
November 1, 2011 (j) through June 30, 2012 | 9.02 | — | (f)(i) | 1.27 | (h) | 1.27 | (0.04 | ) | — | (0.04 | ) | |||||||||||||||||
Class R6 | ||||||||||||||||||||||||||||
Year Ended June 30, 2013 | 10.43 | 0.11 | (f)(g) | 2.91 | 3.02 | (0.10 | ) | — | (0.10 | ) | ||||||||||||||||||
November 1, 2011 (j) through June 30, 2012 | 9.13 | 0.05 | (f) | 1.29 | (h) | 1.34 | (0.04 | ) | — | (0.04 | ) | |||||||||||||||||
Institutional Class | ||||||||||||||||||||||||||||
Year Ended June 30, 2013 | 10.43 | 0.10 | (f)(g) | 2.92 | 3.02 | (0.10 | ) | — | (0.10 | ) | ||||||||||||||||||
Year Ended June 30, 2012 | 10.75 | 0.06 | (f) | (0.34 | )(h) | (0.28 | ) | (0.04 | ) | — | (0.04 | ) | ||||||||||||||||
Year Ended June 30, 2011 | 7.84 | 0.04 | (f) | 2.90 | 2.94 | (0.03 | ) | — | (0.03 | ) | ||||||||||||||||||
Year Ended June 30, 2010 | 6.20 | 0.04 | (f) | 1.68 | 1.72 | (0.08 | ) | — | (0.08 | ) | ||||||||||||||||||
Year Ended June 30, 2009 | 8.39 | 0.07 | (f) | (2.16 | ) | (2.09 | ) | (0.04 | ) | (0.06 | ) | (0.10 | ) | |||||||||||||||
Select Class | ||||||||||||||||||||||||||||
Year Ended June 30, 2013 | 10.45 | 0.08 | (f)(g) | 2.92 | 3.00 | (0.08 | ) | — | (0.08 | ) | ||||||||||||||||||
Year Ended June 30, 2012 | 10.76 | 0.05 | (f) | (0.33 | )(h) | (0.28 | ) | (0.03 | ) | — | (0.03 | ) | ||||||||||||||||
Year Ended June 30, 2011 | 7.86 | 0.03 | (f) | 2.89 | 2.92 | (0.02 | ) | — | (0.02 | ) | ||||||||||||||||||
Year Ended June 30, 2010 | 6.22 | 0.02 | (f) | 1.70 | 1.72 | (0.08 | ) | — | (0.08 | ) | ||||||||||||||||||
Year Ended June 30, 2009 | 8.40 | 0.07 | (f) | (2.17 | ) | (2.10 | ) | (0.02 | ) | (0.06 | ) | (0.08 | ) | |||||||||||||||
| (a) | Annualized for periods less than one year. |
| (b) | Not annualized for periods less than one year. |
| (c) | Includes adjustments in accordance with accounting principles generally accepted in the United States of America and as such, the net asset values for financial reporting purposes and the returns based upon those net asset values may differ from the net asset values and returns for shareholder transactions. |
| (d) | Includes earnings credits and interest expense, if applicable, each of which is less than 0.01% unless otherwise noted. |
| (e) | Portfolio turnover is calculated by dividing the lesser of total purchases or sales of portfolio securities for the reporting period by the monthly average value of portfolio securities owned during the reporting period. Excluded from both the numerator and denominator are amounts relating to derivatives and securities whose maturities or expiration dates at the time of acquisition were one year or less. |
| (f) | Calculated based upon average shares outstanding. |
| (g) | Reflects special dividends paid out during the period by one of the Fund’s holdings. Had the Fund not received the special dividends, the net investment income (loss) per share would have been $(0.01), $(0.07), $(0.07), $0.07, $0.05 and $0.03 for Class A, Class C, Class R2, Class R6, Institutional Class and Select Class Shares, respectively, and the net investment income (loss) ratio would have been (0.08)%, (0.57)%, (0.58)%, 0.56%, 0.41% and 0.25% for Class A, Class C, Class R2, Class R6, Institutional Class and Select Class Shares, respectively. |
| (h) | An affiliate of JPMorgan made a payment to the Fund for losses incurred from an operational error. Without this payment, the net realized and unrealized gains (losses) on investments per share would have been $(0.34), $(0.35), $1.28 and $(0.34) for Class A, Class C, Class R6 and Select Class Shares, respectively, and the total return would have been (3.01)%, (3.52)%, 14.66% and (2.70)% for Class A, Class C, Class R6 and Select Class Shares, respectively. The impact was less than $0.01 to the net realized and unrealized gains (losses) on investments per share and less than 0.01% to total return for Class R2 and Institutional Class Shares. |
| (i) | Amount rounds to less than $0.01. |
| (j) | Commencement of offering of class of shares. |
SEE NOTES TO FINANCIAL STATEMENTS.
| 72 | J.P. MORGAN SMALL CAP FUNDS | JUNE 30, 2013 | ||||
Table of Contents
| Ratios/Supplemental data | |||||||||||||||||||||||||
| Ratios to average net assets (a) | ||||||||||||||||||||||||||
| Net asset value, end of period | Total return (excludes sales charge) (b)(c) | Net assets, end of period (000’s) | Net expenses (d) | Net investment income (loss) | Expenses without waivers, reimbursements and earnings credits | Portfolio turnover rate (b)(e) | ||||||||||||||||||||
| $ | 13.17 | 28.54 | % | $ | 49,607 | 1.25 | % | 0.31 | %(g) | 1.43 | % | 54 | % | |||||||||||||
| 10.31 | (2.92 | )(h) | 8,411 | 1.26 | 0.17 | 1.59 | 74 | |||||||||||||||||||
| 10.62 | 36.78 | 12,271 | 1.25 | 0.02 | 1.50 | 48 | ||||||||||||||||||||
| 7.79 | 27.48 | 576 | 1.26 | 0.06 | 1.67 | 56 | ||||||||||||||||||||
| 6.17 | (25.30 | ) | 240 | 1.26 | 0.75 | 1.70 | 52 | |||||||||||||||||||
| 12.91 | 27.83 | 6,972 | 1.75 | (0.18 | )(g) | 1.93 | 54 | |||||||||||||||||||
| 10.14 | (3.43 | )(h) | 1,247 | 1.76 | (0.26 | ) | 2.10 | 74 | ||||||||||||||||||
| 10.50 | 36.19 | 1,173 | 1.75 | (0.50 | ) | 2.02 | 48 | |||||||||||||||||||
| 7.71 | 26.81 | 381 | 1.76 | (0.44 | ) | 2.18 | 56 | |||||||||||||||||||
| 6.14 | (25.62 | ) | 94 | 1.76 | 0.27 | 2.20 | 52 | |||||||||||||||||||
| 13.09 | 28.19 | 1,744 | 1.50 | (0.20 | )(g) | 1.65 | 54 | |||||||||||||||||||
| 10.25 | 14.17 | (h) | 57 | 1.51 | 0.02 | 1.91 | 74 | |||||||||||||||||||
| 13.35 | 29.17 | 17,232 | 0.75 | 0.95 | (g) | 0.97 | 54 | |||||||||||||||||||
| 10.43 | 14.77 | (h) | 12,959 | 0.75 | 0.70 | 1.08 | 74 | |||||||||||||||||||
| 13.35 | 29.08 | 30,226 | 0.82 | 0.79 | (g) | 1.05 | 54 | |||||||||||||||||||
| 10.43 | (2.59 | )(h) | 9,350 | 0.83 | 0.62 | 1.19 | 74 | |||||||||||||||||||
| 10.75 | 37.58 | 20,763 | 0.82 | 0.42 | 1.13 | 48 | ||||||||||||||||||||
| 7.84 | 27.78 | 10,729 | 0.83 | 0.48 | 1.30 | 56 | ||||||||||||||||||||
| 6.20 | (24.84 | ) | 9,086 | 0.83 | 1.17 | 1.30 | 52 | |||||||||||||||||||
| 13.37 | 28.81 | 66,928 | 1.00 | 0.64 | (g) | 1.21 | 54 | |||||||||||||||||||
| 10.45 | (2.60 | )(h) | 37,935 | 1.01 | 0.49 | 1.35 | 74 | |||||||||||||||||||
| 10.76 | 37.14 | 34,944 | 1.00 | 0.27 | 1.29 | 48 | ||||||||||||||||||||
| 7.86 | 27.61 | 24,229 | 1.01 | 0.30 | 1.45 | 56 | ||||||||||||||||||||
| 6.22 | (24.92 | ) | 20,698 | 1.01 | 1.00 | 1.44 | 52 | |||||||||||||||||||
SEE NOTES TO FINANCIAL STATEMENTS.
| JUNE 30, 2013 | J.P. MORGAN SMALL CAP FUNDS | 73 | ||||||
Table of Contents
AS OF JUNE 30, 2013
1. Organization
JPMorgan Trust I (“JPM I”) and JPMorgan Trust II (“JPM II”) (the “Trusts”) were formed on November 12, 2004, as Delaware statutory trusts, pursuant to Declarations of Trust dated November 5, 2004 and are registered under the Investment Company Act of 1940, as amended (the “1940 Act”), as open-end management investment companies.
The following are 6 separate funds of the Trusts (collectively, the “Funds”) covered by this report:
| Classes Offered | Trust | Diversified/Non-Diversified | ||||
| Dynamic Small Cap Growth Fund | Class A, Class B, Class C and Select Class | JPM I | Diversified | |||
| Small Cap Core Fund | Select Class | JPM I | Diversified | |||
| Small Cap Equity Fund | Class A, Class B, Class C, Class R2, Class R5 and Select Class | JPM I | Diversified | |||
| Small Cap Growth Fund | Class A, Class B, Class C, Class R2, Class R6, Institutional Class and Select Class | JPM II | Diversified | |||
| Small Cap Value Fund | Class A, Class B, Class C, Class R2, Class R5, Class R6 and Select Class | JPM II | Diversified | |||
| U.S. Small Company Fund | Class A, Class C, Class R2, Class R6, Institutional Class and Select Class | JPM I | Diversified |
The investment objectives of Dynamic Small Cap Growth Fund, Small Cap Core Fund and Small Cap Equity Fund are to seek capital growth over the long term.
The investment objective of Small Cap Growth Fund is to seek long-term capital growth primarily by investing in a portfolio of equity securities of small-capitalization and emerging growth companies.
The investment objective of Small Cap Value Fund is to seek long-term capital growth primarily by investing in equity securities of small-capitalization companies.
The investment objective of U.S. Small Company Fund is to seek to provide high total return from a portfolio of small company stocks.
All share classes of the Small Cap Equity Fund, Dynamic Small Cap Growth Fund and Small Cap Growth Fund are publically offered only on a limited basis. Investors are not eligible to purchase shares of the Funds unless they meet certain requirements as described in the Classes’ prospectuses.
Effective November 1, 2009, Class B Shares of the Dynamic Small Cap Growth Fund, Small Cap Equity Fund, Small Cap Growth Fund and Small Cap Value Fund may not be purchased or acquired by new or existing shareholders, except through exchanges from Class B Shares of another J.P. Morgan Fund and dividend reinvestments. Shareholders who have invested in Class B Shares prior to November 1, 2009 may continue to hold their Class B Shares until they automatically convert to Class A Shares.
Class A Shares generally provide for a front-end sales charge while Class B and Class C Shares provide for a contingent deferred sales charge (“CDSC”). Class B Shares automatically convert to Class A Shares after eight years. No sales charges are assessed with respect to Class R2, Class R5, Class R6, Institutional Class and Select Class Shares. All classes of shares have equal rights as to earnings, assets and voting privileges, except that each class may bear different distribution and shareholder servicing fees and each class has exclusive voting rights with respect to its distribution plan and shareholder servicing agreements. Certain Class A Shares, for which front-end sales charges have been waived, may be subject to a CDSC as described in the Funds’ prospectus.
2. Significant Accounting Policies
The following is a summary of significant accounting policies followed by the Funds in the preparation of their financial statements. The policies are in accordance with accounting principles generally accepted in the United States of America (“GAAP”). The preparation of financial statements requires management to make estimates and assumptions that affect the reported amounts and disclosures in the financial statements. Actual results could differ from those estimates.
A. Valuation of Investments — Equity securities listed on a North American, Central American, South American or Caribbean securities exchange shall generally be valued at the last sale price on the exchange on which the security is principally traded that is reported before the time when the net assets of the Funds are valued. Securities listed on the NASDAQ Stock Market LLC are generally valued at the NASDAQ Official Closing Price. Fixed income securities (other than certain short-term investments maturing in less than 61 days) are valued each day based on prices received from independent or affiliated pricing services approved by the Board of Trustees or third party broker-dealers. The pricing services or broker-dealers use multiple valuation techniques to determine fair value. In instances where sufficient market activity exists, the pricing services or broker-dealers may utilize a market-based approach through which quotes from market makers are used to determine fair value. In instances where sufficient market activity may not exist or is limited, the pricing services or broker-dealers also utilize proprietary valuation models which may consider market transactions in comparable securities and the various relationships between securities in determining fair value and/or market characteristics such as benchmark yield curves, option-adjusted spreads, credit spreads, estimated default rates, coupon-rates, anticipated timing of principal repayments, underlying collateral, and other unique security features in order to estimate the relevant cash flows, which are then discounted to calculate the fair values. Generally, short-term investments of sufficient credit quality maturing in less than 61 days are valued at amortized cost, which approximates fair value. Investments in other open-end investment companies are valued at each investment company’s net asset value per share (“NAV”) as of the report date.
| 74 | J.P. MORGAN SMALL CAP FUNDS | JUNE 30, 2013 | ||||
Table of Contents
Certain investments of the Funds may, depending upon market conditions, trade in relatively thin markets and/or in markets that experience significant volatility. As a result of these conditions, the prices used by the Funds to value these securities may differ from the value that would be realized if these securities were sold, and the differences could be material. Futures and options are generally valued on the basis of available market quotations. Swaps and other derivatives are valued daily, primarily using independent or affiliated pricing services approved by the Board of Trustees. If valuations are not available from such services or values received are deemed not representative of fair value, values will be obtained from a third party broker-dealer or counterparty.
Securities or other assets for which market quotations are not readily available or for which market quotations are deemed to not represent the fair value of the security or asset at the time of pricing (including certain illiquid securities) are fair valued in accordance with procedures established by and under the supervision and responsibility of the Board of Trustees. The Board of Trustees has established an Audit and Valuation Committee to assist with the oversight of the valuation of the Funds’ securities. JPMorgan Funds Management, Inc. (the “Administrator”, or “JPMFM”), an indirect, wholly-owned subsidiary of JPMorgan Chase & Co. (“JPMorgan”), has established a Valuation Committee (“VC”) that is comprised of senior representatives from JPMFM, J.P. Morgan Investment Management Inc. (“JPMIM” or the “Advisor”), a wholly-owned subsidiary of JPMorgan Asset Management Holdings Inc. (“JPMAM”), which is a wholly-owned subsidiary of JPMorgan, JPMorgan’s Legal and Compliance and JPMAM’s Risk Management and the Funds’ Chief Compliance Officer. The VC’s responsibilities include making determinations regarding Level 3 fair value measurements (“Fair Values”) and/or providing recommendations for approval to the Board of Trustees’ Audit and Valuation Committee, in accordance with the Funds’ valuation policies.
The VC or Board of Trustees, as applicable, primarily employs a market-based approach which may use related or comparable assets or liabilities, recent transactions, market multiples, book values, and other relevant information for the investment to determine the fair value of the investment. The VC or Board of Trustees may also use an income-based valuation approach in which the anticipated future cash flows of the investment are discounted to calculate fair value. Discounts may also be applied due to the nature or duration of any restrictions on the disposition of the investments. Valuations may be based upon current market prices of securities that are comparable in coupon, rating, maturity and industry.
It is possible that the estimated values may differ significantly from the values that would have been used had a ready market for the investments existed, and such differences could be material. JPMFM and JPMIM are responsible for monitoring developments that may impact Fair Values and for discussing and assessing Fair Values on an ongoing, and at least a quarterly, basis with the VC and Board of Trustees, as applicable. The appropriateness of Fair Values is assessed based on results of unchanged price review and consideration of macro or security specific events, back testing and broker and vendor due diligence.
Valuations reflected in this report are as of the report date. As a result, changes in valuation due to market events and/or issuer related events after the report date and prior to issuance of the report are not reflected herein.
The various inputs that are used in determining the fair value of the Funds’ investments are summarized into the three broad levels listed below.
| Ÿ | Level 1 — quoted prices in active markets for identical securities |
| Ÿ | Level 2 — other significant observable inputs (including quoted prices for similar securities, interest rates, prepayment speeds, credit risk, etc.) |
| Ÿ | Level 3 — significant unobservable inputs (including the Funds’ own assumptions in determining the fair value of investments) |
A financial instrument’s level within the fair value hierarchy is based on the lowest level of any input, both individually and in the aggregate, that is significant to the fair value measurement. The inputs or methodology used for valuing securities are not necessarily an indication of the risk associated with investing in those securities.
The following tables represent each valuation input as presented on the Schedules of Portfolio Investments (“SOIs”) (amounts in thousands):
| Level 1 Quoted prices | Level 2 Other significant observable inputs | Level 3 unobservable inputs | Total | |||||||||||||
Dynamic Small Cap Growth Fund | ||||||||||||||||
Total Investments in Securities (a) | $ | 515,826 | $ | — | $ | — | $ | 515,826 | ||||||||
|
|
|
|
|
|
|
| |||||||||
Small Cap Core Fund | ||||||||||||||||
Total Investments in Securities (b) | $ | 519,067 | $ | 1,025 | $ | — | $ | 520,092 | ||||||||
|
|
|
|
|
|
|
| |||||||||
Appreciation in Other Financial Instruments | ||||||||||||||||
Futures Contracts | $ | 202 | $ | — | $ | — | $ | 202 | ||||||||
|
|
|
|
|
|
|
| |||||||||
Small Cap Equity Fund | ||||||||||||||||
Total Investments in Securities (a) | $ | 2,663,226 | $ | — | $ | — | $ | 2,663,226 | ||||||||
|
|
|
|
|
|
|
| |||||||||
Small Cap Growth Fund | ||||||||||||||||
Total Investments in Securities (a) | $ | 929,129 | $ | — | $ | — | $ | 929,129 | ||||||||
|
|
|
|
|
|
|
| |||||||||
Small Cap Value Fund | ||||||||||||||||
Total Investments in Securities (b) | $ | 890,345 | $ | 1,956 | $ | — | $ | 892,301 | ||||||||
|
|
|
|
|
|
|
| |||||||||
| JUNE 30, 2013 | J.P. MORGAN SMALL CAP FUNDS | 75 | ||||||
Table of Contents
NOTES TO FINANCIAL STATEMENTS
AS OF JUNE 30, 2013 (continued)
| Level 1 Quoted prices | Level 2 Other significant observable inputs | Level 3 unobservable inputs | Total | |||||||||||||
Appreciation in Other Financial Instruments | ||||||||||||||||
Futures Contracts | $ | 172 | $ | — | $ | — | $ | 172 | ||||||||
|
|
|
|
|
|
|
| |||||||||
U.S. Small Company Fund | ||||||||||||||||
Total Investments in Securities (b) | $ | 173,232 | $ | 165 | $ | — | $ | 173,397 | ||||||||
|
|
|
|
|
|
|
| |||||||||
Appreciation in Other Financial Instruments | ||||||||||||||||
Futures Contracts | $ | 30 | $ | — | $ | — | $ | 30 | ||||||||
|
|
|
|
|
|
|
| |||||||||
| (a) | All portfolio holdings designated as Level 1 are disclosed individually on the SOIs. Please refer to the SOIs for industry specifics of portfolio holdings. |
| (b) | All portfolio holdings designated as Level 1 and Level 2 are disclosed individually on the SOIs. Level 2 consists of a U.S. Treasury Note that is held for futures collateral. Please refer to the SOIs for industry specifics of portfolio holdings. |
There were no transfers between any levels during the year ended June 30, 2013.
B. Restricted and Illiquid — Certain securities held by the Funds may be subject to legal or contractual restrictions on resale and/or are illiquid. Restricted securities generally are resold in transactions exempt from registration under the Securities Act of 1933 (the “Securities Act”). An illiquid security is a security which cannot be disposed of promptly (within seven days) and in the usual course of business at approximately its fair value and includes, but is not limited to, repurchase agreements maturing in excess of seven days, time deposits with a withdrawal penalty, non-negotiable instruments and instruments for which no market exists. Disposal of these securities may involve time-consuming negotiations and expense. Prompt sale at the current valuation may be difficult and could adversely affect the net assets of the Funds. As of June 30, 2013, the Funds had no investments in restricted securities other than securities sold to the Portfolio under Rule 144A and/or Regulation S under the Securities Act.
The following are the values and percentages of net assets of illiquid securities as of June 30, 2013 (amounts in thousands):
| Value | Percentage | |||||||
| Small Cap Core Fund | — | (a) | — | % | ||||
| Small Cap Value Fund | — | (a) | — | |||||
| U.S. Small Company Fund | — | (a) | — | |||||
| (a) | Value is zero. |
C. Futures Contracts — The Small Cap Core Fund, Small Cap Value Fund and U.S. Small Company Fund use index futures contracts to gain or reduce exposure to the stock market, maintain liquidity and minimize transaction costs. The Funds also buy futures contracts to immediately invest incoming cash in the market or sell futures in response to cash outflows, thereby simulating an invested position in the underlying index while maintaining a cash balance for liquidity. The use of futures contracts exposes the Funds to equity price risk.
Futures contracts provide for the delayed delivery of the underlying instrument at a fixed price or are settled for a cash amount based on the change in the value of the underlying instrument at a specific date in the future. Upon entering into a futures contract, the Funds are required to deposit with the broker, cash or securities in an amount equal to a certain percentage of the contract amount, which is referred to as the initial margin deposit. Subsequent payments, referred to as variation margin, are made or received by the Funds periodically and are based on changes in the market value of open futures contracts. Changes in the market value of open futures contracts are recorded as unrealized appreciation or depreciation on the Statements of Operations. Realized gains or losses, representing the difference between the value of the contract at the time it was opened and the value at the time it was closed, are reported in the Statements of Operations at the closing or expiration of the futures contract. Securities deposited as initial margin are designated in the SOIs and cash deposited is recorded on the Statements of Assets and Liabilities. A receivable from and/or a payable to brokers for the daily variation margin is also recorded on the Statements of Assets and Liabilities.
The Funds may be subject to the risk that the change in the value of the futures contract may not correlate perfectly with the underlying instrument. Use of long futures contracts subjects the Funds to risk of loss in excess of the amounts shown on the Statements of Assets and Liabilities, up to the notional amount of the futures contracts. Use of short futures contracts subjects the Funds to unlimited risk of loss. The Funds may enter into futures contracts only on exchanges or boards of trade. The exchange or board of trade acts as the counterparty to each futures transaction; therefore, the Funds’ credit risk is limited to failure of the exchange or board of trade. Under some circumstances, futures exchanges may establish daily limits on the amount that the price of a futures contract can vary from the previous day’s settlement price, which could effectively prevent liquidation of positions.
| 76 | J.P. MORGAN SMALL CAP FUNDS | JUNE 30, 2013 | ||||
Table of Contents
The table below discloses the volume of the Funds’ futures contracts activity during the year ended June 30, 2013 (amounts in thousands):
| Small Cap Core Fund | Small Cap Value Fund | U.S. Small Company Fund | ||||||||||
Futures Contracts: | ||||||||||||
Average Notional Balance Long | $ | 11,242 | $ | 22,912 | $ | 3,256 | ||||||
Ending Notional Balance Long | 15,205 | 18,909 | 3,119 | |||||||||
D. Securities Lending — Each Fund may lend securities to brokers, approved by the Advisor in order to generate additional income. Goldman Sachs Bank USA, doing business as Goldman Sachs Agency Lending (“GSAL”), serves as lending agent for the Funds pursuant to a Securities Lending Agreement (the “GSAL Securities Lending Agreement”). The Funds receive cash collateral, which is invested in Capital Shares of the JPMorgan Prime Money Market Fund (“Collateral Investments”). Upon termination of a loan, the Funds are required to return to the borrower the posted cash collateral. Loans are subject to termination by the Funds or the borrower at any time.
Securities lending income is comprised of income earned on Collateral Investments, net amount of a rebate received from or paid to borrowers for use of cash collateral and lending agent fees. This amount is recorded as Income from securities lending (net) on the Statements of Operations. The Funds also receive payments from the borrower during the period of the loan, equivalent to dividends and interest earned on the securities loaned, which are recorded as Dividend or Interest income, respectively, on the Statements of Operations.
For the year ended June 30, 2013, the Funds earned the following amounts from the investment of cash collateral, prior to rebates or fees, from an investment in an affiliated fund as described below (amounts in thousands):
Dynamic Small Cap Growth Fund | $ | 2 | ||
Small Cap Core Fund | — | (a) | ||
Small Cap Growth Fund | 1 | |||
Small Cap Value Fund | — | (a) | ||
U.S. Small Company Fund | — | (a) |
| (a) | Amount rounds to less than $1,000. |
At the inception of a loan, securities are exchanged for cash collateral equal to at least 102% of the value of loaned U.S. dollar-denominated securities, plus accrued interest. The GSAL Securities Lending Agreement requires that the loaned securities be marked to market on a daily basis and additional cash collateral is requested from borrowers when the cash received from borrowers becomes less than 102% of the value of loaned securities.
The value of the cash collateral received is recorded as a liability on the Statements of Assets and Liabilities and details of Collateral Investments are disclosed in the SOIs. At June 30, 2013, there were no outstanding securities on loan.
The Funds bear the risk of loss associated with the Collateral Investments and are not entitled to additional collateral from the borrower to cover any such losses. To the extent that the value of the Collateral Investments declines below the amount owed to a borrower, a Fund may incur losses that exceed the amount it earned on lending the security. Upon termination of a loan, a Fund may use leverage (borrow money) to repay the borrower for cash collateral posted, if the Advisor does not believe that it is prudent to sell the Collateral Investments to fund the payment of this liability.
Securities lending also involves counterparty risks, including the risk that the loaned securities may not be returned in a timely manner or at all. Subject to certain conditions, GSAL has agreed to indemnify the Funds from losses resulting from a borrower’s failure to return a loaned security.
JPMIM waived fees associated with the Funds’ investment of collateral in JPMorgan Prime Money Market Fund as follows (amounts in thousands):
Dynamic Small Cap Growth Fund | $ | 1 | ||
Small Cap Core Fund | — | (a) | ||
Small Cap Growth Fund | — | (a) | ||
Small Cap Value Fund | — | (a) | ||
U.S. Small Company Fund | — | (a) |
| (a) | Amount rounds to less than $1,000. |
These amounts offset the administration fees and shareholder servicing fees incurred by JPMorgan Prime Money Market Fund related to the Funds’ investment in such fund. A portion of the waiver is voluntary.
E. Security Transactions and Investment Income — Investment transactions are accounted for on the trade date (the date the order to buy or sell is executed). Securities gains and losses are calculated on a specifically identified cost basis. Interest income is determined on the basis of coupon interest accrued using the effective interest method which adjusts for amortization of premiums and accretion of discounts. Dividend income net of foreign taxes withheld, if any, are recorded on the ex-dividend date or when a Fund first learns of the dividend.
| JUNE 30, 2013 | J.P. MORGAN SMALL CAP FUNDS | 77 | ||||||
Table of Contents
NOTES TO FINANCIAL STATEMENTS
AS OF JUNE 30, 2013 (continued)
To the extent such information is publicly available, the Funds record distributions received in excess of income earned from underlying investments as a reduction of cost of investments and/or realized gain. Such amounts are based on estimates if actual amounts are not available and actual amounts of income, realized gain and return of capital may differ from the estimated amounts. The Funds adjust the estimated amounts of the components of distributions (and consequently their net investment income) as necessary once the issuers provide information about the actual composition of the distributions.
F. Allocation of Income and Expenses — Expenses directly attributable to a fund are charged directly to that fund, while the expenses attributable to more than one fund of the Trusts are allocated among the respective funds. In calculating the NAV of each class, investment income, realized and unrealized gains and losses and expenses, other than class specific expenses, are allocated daily to each class of shares based upon the proportion of net assets of each class at the beginning of each day.
G. Federal Income Taxes — Each Fund is treated as a separate taxable entity for Federal income tax purposes. Each Fund’s policy is to comply with the provisions of the Internal Revenue Code of 1986, as amended (the “Code”), applicable to regulated investment companies and to distribute to shareholders all of its distributable net investment income and net realized gain on investments. Accordingly, no provision for Federal income tax is necessary. Management has reviewed the Funds’ tax positions for all open tax years and has determined that as of June 30, 2013, no liability for income tax is required in the Funds’ financial statements for net unrecognized tax benefits. However, management’s conclusions may be subject to future review based on changes in, or the interpretation of, the accounting standards or tax laws and regulations. Each of the Fund’s Federal tax returns for the prior three fiscal years remain subject to examination by the Internal Revenue Service.
H. Distributions to Shareholders — Distributions from net investment income are generally declared and paid at least annually, except for Small Cap Value Fund, which are generally declared and paid quarterly. Distributions are declared separately for each class. No class has preferential dividend rights; differences in per share rates are due to differences in separate class expenses. Net realized capital gains, if any, are distributed by each Fund at least annually. The amount of distributions from net investment income and net realized capital gains is determined in accordance with Federal income tax regulations, which may differ from GAAP. To the extent these “book/tax” differences are permanent in nature (i.e., that they result from other than timing of recognition — “temporary differences”), such amounts are reclassified within the capital accounts based on their Federal tax-basis treatment.
The following amounts were reclassified within the capital accounts (amounts in thousands):
| Paid-in-Capital | Accumulated Undistributed (Distributions Net Investment Income | Accumulated Net Realized Gains (Losses) | ||||||||||
Dynamic Small Cap Growth Fund | $ | — | $ | 1,315 | $ | (1,315 | ) | |||||
Small Cap Core Fund | — | (a) | 53 | (53 | ) | |||||||
Small Cap Equity Fund | — | (a) | — | — | (a) | |||||||
Small Cap Growth Fund | (2,488 | ) | 782 | 1,706 | ||||||||
Small Cap Value Fund | (656 | ) | 474 | 182 | ||||||||
U.S. Small Company Fund | — | (a) | (27 | ) | 27 | |||||||
| (a) | Amount rounds to less than $1,000. |
The reclassifications for the Funds relate primarily to non-taxable special dividends (Dynamic Small Cap Growth Fund, Small Cap Core Fund, Small Cap Growth Fund, Small Cap Value Fund and U.S. Small Company Fund), investments in passive foreign investment companies (Small Cap Core Fund and Small Cap Value Fund), net operating losses (Dynamic Small Cap Growth Fund and Small Cap Growth Fund) and taxable overdistributions (Small Cap Value Fund).
3. Fees and Other Transactions with Affiliates
A. Investment Advisory Fee — Pursuant to the Investment Advisory Agreement, JPMIM supervises the investments of each Fund and for such services is paid a fee. The fee is accrued daily and paid monthly based on each Fund’s respective average daily net assets. The annual rate for each Fund is as follows:
Dynamic Small Cap Growth Fund | 0.65 | % | ||
Small Cap Core Fund | 0.65 | |||
Small Cap Equity Fund | 0.65 | |||
Small Cap Growth Fund | 0.65 | |||
Small Cap Value Fund | 0.65 | |||
U.S. Small Company Fund | 0.60 |
The Advisor waived Investment Advisory fees and/or reimbursed expenses as outlined in Note 3.F.
B. Administration Fee — Pursuant to an Administration Agreement, the Administrator provides certain administration services to the Funds. In consideration of these services, the Administrator receives a fee accrued daily and paid monthly at an annual rate of 0.15% of the first $25 billion of the average daily net assets of all funds in the J.P. Morgan Funds Complex (excluding certain funds of funds and money market funds) and 0.075%
| 78 | J.P. MORGAN SMALL CAP FUNDS | JUNE 30, 2013 | ||||
Table of Contents
of the average daily net assets in excess of $25 billion of all such funds. For the year ended June 30, 2013, the annual effective rate of each Fund’s average daily net assets, notwithstanding any fee waivers and/or expense reimbursements, was as follows:
Dynamic Small Cap Growth Fund | 0.09 | % | ||
Small Cap Core Fund | 0.09 | |||
Small Cap Equity Fund | 0.09 | |||
Small Cap Growth Fund | 0.09 | |||
Small Cap Value Fund | 0.08 | |||
U.S. Small Company Fund | 0.09 |
The Administrator waived Administration fees as outlined in Note 3.F.
JPMorgan Chase Bank, N.A. (“JPMCB”), a wholly-owned subsidiary of JPMorgan, serves as the Funds’ sub-administrator (the “Sub-administrator”). For its services as Sub-administrator, JPMCB receives a portion of the fees payable to the Administrator.
C. Distribution Fees — Pursuant to a Distribution Agreement, JPMorgan Distribution Services, Inc. (the “Distributor”), a wholly-owned subsidiary of JPMorgan, serves as the Trusts’ exclusive underwriter and promotes and arranges for the sale of each Fund’s shares.
The Board of Trustees has adopted a Distribution Plan (the “Distribution Plan”) for Class A, Class B, Class C and Class R2 Shares of the Funds in accordance with Rule 12b-1 under the 1940 Act. The Distribution Plan provides that each Fund shall pay distribution fees, including payments to the Distributor, at annual rates of the average daily net assets as shown in the table below:
| Class A | Class B | Class C | Class R2 | |||||||||||||
Dynamic Small Cap Growth Fund | 0.25 | % | 0.75 | % | 0.75 | % | n/a | |||||||||
Small Cap Equity Fund | 0.25 | 0.75 | 0.75 | 0.50 | % | |||||||||||
Small Cap Growth Fund | 0.25 | 0.75 | 0.75 | 0.50 | ||||||||||||
Small Cap Value Fund | 0.25 | 0.75 | 0.75 | 0.50 | ||||||||||||
U.S. Small Company Fund | 0.25 | n/a | 0.75 | 0.50 | ||||||||||||
In addition, the Distributor is entitled to receive the front-end sales charges from purchases of Class A Shares and the CDSC from redemptions of Class B and Class C Shares and certain Class A Shares for which front-end sales charges have been waived. For the year ended June 30, 2013, the Distributor retained the following amounts (in thousands):
| Front-End Sales Charge | CDSC | |||||||
Dynamic Small Cap Growth Fund | $ | 2 | $ | — | (a) | |||
Small Cap Equity Fund | 4 | 2 | ||||||
Small Cap Growth Fund | 7 | 1 | ||||||
Small Cap Value Fund | 69 | 1 | ||||||
U.S. Small Company Fund | 12 | — | (a) | |||||
| (a) | Amount rounds to less than $1,000. |
D. Shareholder Servicing Fees — The Trusts, on behalf of the Funds, have entered into Shareholder Servicing Agreements with the Distributor under which the Distributor provides certain support services to the shareholders. The Class R6 Shares do not participate in the Shareholder Servicing Agreement. For performing these services, the Distributor receives a fee that is accrued daily and paid monthly equal to a percentage of the average daily net assets as shown in the table below:
| Class A | Class B | Class C | Class R2 | Class R5 | Institutional Class | Select Class | ||||||||||||||||||||||
Dynamic Small Cap Growth Fund | 0.25 | % | 0.25 | % | 0.25 | % | n/a | n/a | n/a | 0.25 | % | |||||||||||||||||
Small Cap Core Fund | n/a | n/a | n/a | n/a | n/a | n/a | 0.25 | |||||||||||||||||||||
Small Cap Equity Fund | 0.25 | 0.25 | 0.25 | 0.25 | % | 0.05 | % | n/a | 0.25 | |||||||||||||||||||
Small Cap Growth Fund | 0.25 | 0.25 | 0.25 | 0.25 | n/a | 0.10 | % | 0.25 | ||||||||||||||||||||
Small Cap Value Fund | 0.25 | 0.25 | 0.25 | 0.25 | 0.05 | n/a | 0.25 | |||||||||||||||||||||
U.S. Small Company Fund | 0.25 | n/a | 0.25 | 0.25 | n/a | 0.10 | 0.25 | |||||||||||||||||||||
The Distributor has entered into shareholder services contracts with affiliated and unaffiliated financial intermediaries who provide shareholder services and other related services to their clients or customers who invest in the Funds under which the Distributor will pay all or a portion of such fees earned to financial intermediaries for performing such services.
The Distributor waived Shareholder Servicing fees as outlined in Note 3.F.
E. Custodian and Accounting Fees — JPMCB provides portfolio custody and accounting services to the Funds. The amounts paid directly to JPMCB by the Funds for custody and accounting services are included in Custodian and accounting fees in the Statements of Operations. Payments to the custodian may be reduced by credits earned by each Fund, based on uninvested cash balances held by the custodian. Such earnings credits, if any, are presented separately in the Statements of Operations.
| JUNE 30, 2013 | J.P. MORGAN SMALL CAP FUNDS | 79 | ||||||
Table of Contents
NOTES TO FINANCIAL STATEMENTS
AS OF JUNE 30, 2013 (continued)
Interest expense, if any, paid to the custodian related to cash overdrafts is included in Interest expense to affiliates in the Statements of Operations.
F. Waivers and Reimbursements — The Advisor, Administrator and Distributor have contractually agreed to waive fees and/or reimburse the Funds to the extent that total annual operating expenses (excluding acquired fund fees and expenses, dividend expenses related to short sales, interest, taxes, expenses related to litigation and potential litigation, extraordinary expenses and expenses related to the Board of Trustees’ deferred compensation plan) exceed the percentages of the Funds’ respective average daily net assets as shown in the table below:
| Class A | Class B | Class C | Class R2 | Class R5 | Class R6 | Institutional Class | Select Class | |||||||||||||||||||||||||
Dynamic Small Cap Growth Fund | 1.50 | % | 2.10 | % | 2.10 | % | n/a | n/a | n/a | n/a | 1.10 | % | ||||||||||||||||||||
Small Cap Core Fund | n/a | n/a | n/a | n/a | n/a | n/a | n/a | 0.80 | ||||||||||||||||||||||||
Small Cap Equity Fund | 1.30 | 1.80 | 1.80 | 1.55 | % | 0.80 | % | n/a | n/a | 1.00 | ||||||||||||||||||||||
Small Cap Growth Fund | 1.25 | 1.75 | 1.75 | 1.50 | n/a | 0.75 | % | 0.85 | % | 1.00 | ||||||||||||||||||||||
Small Cap Value Fund | 1.25 | 1.86 | 1.86 | 1.50 | 0.91 | 0.86 | n/a | 1.00 | ||||||||||||||||||||||||
U.S. Small Company Fund | 1.26 | n/a | 1.76 | 1.51 | n/a | 0.76 | 0.83 | 1.01 | ||||||||||||||||||||||||
The expense limitation agreements were in effect for the year ended June 30, 2013. The contractual expense limitation percentages in the table above are in place until at least October 31, 2013. In addition, the Funds’ service providers have voluntarily waived fees during the year ended June 30, 2013. However, the Funds’ service providers are under no obligation to do so and may discontinue such voluntary waivers at any time.
For the year ended June 30, 2013, the Funds’ service providers waived fees and/or reimbursed expenses for each of the Funds as follows (amounts in thousands). None of these parties expect the Funds to repay any such waived fees and reimbursed expenses in future years.
| Contractual Waivers | ||||||||||||||||||||
Investment Advisory | Administration | Shareholder Servicing | Total | Contractual Reimbursements | ||||||||||||||||
Dynamic Small Cap Growth Fund | $ | — | $ | — | $ | 266 | $ | 266 | $ | — | ||||||||||
Small Cap Core Fund | 567 | 73 | 1,040 | 1,680 | 103 | |||||||||||||||
Small Cap Equity Fund | 115 | 2,099 | 920 | 3,134 | — | |||||||||||||||
Small Cap Growth Fund | 718 | 705 | — | (a) | 1,423 | — | ||||||||||||||
Small Cap Value Fund | 7 | 241 | 535 | 783 | — | |||||||||||||||
U.S. Small Company Fund | 125 | 79 | 4 | 208 | — | |||||||||||||||
| Voluntary Waivers | ||||||||
| Investment Advisory | Total | |||||||
Small Cap Growth Fund | $ | — | (a) | $ | — | (a) | ||
Small Cap Value Fund | — | (a) | — | (a) | ||||
| (a) | Amount rounds to less than $1,000. |
Additionally, the Funds may invest in one or more money market funds advised by the Advisor or its affiliates. The Advisor, Administrator and Distributor, as shareholder servicing agent, waive fees in an amount sufficient to offset the respective fees each charges to the affiliated money market fund on the Funds’ investment in such affiliated money market fund. A portion of the waiver is voluntary.
The amount of waivers resulting from investments in these money market funds for the year ended June 30, 2013 was as follows (excluding the waiver disclosed in Note 2.C. regarding cash collateral for securities lending invested in the JPMorgan Prime Money Market Fund) (amounts in thousands):
Dynamic Small Cap Growth Fund | $ | 15 | ||
Small Cap Core Fund | 17 | |||
Small Cap Equity Fund | 154 | |||
Small Cap Growth Fund | 24 | |||
Small Cap Value Fund | 37 | |||
U.S. Small Company Fund | 7 |
G. Other — Certain officers of the Trusts are affiliated with the Advisor, the Administrator and the Distributor. Such officers, with the exception of the Chief Compliance Officer, receive no compensation from the Funds for serving in their respective roles.
The Board of Trustees appointed a Chief Compliance Officer to the Funds in accordance with Federal securities regulations. Each Fund, along with other affiliated funds, makes reimbursement payments, on a pro-rata basis, to the Administrator for a portion of the fees associated with the Office of the Chief Compliance Officer. Such fees are included in Trustees’ and Chief Compliance Officer’s fees in the Statements of Operations.
The Trusts adopted a Trustee Deferred Compensation Plan (the “Plan”) which allows the Independent Trustees to defer the receipt of all or a portion of compensation related to performance of their duties as Trustees. The deferred fees are invested in various J.P. Morgan Funds until distribution in accordance with the Plan.
| 80 | J.P. MORGAN SMALL CAP FUNDS | JUNE 30, 2013 | ||||
Table of Contents
During the year ended June 30, 2013, the Funds may have purchased securities from an underwriting syndicate in which the principal underwriter or members of the syndicate are affiliated with the Advisor.
The Funds may use related party broker-dealers. For the year ended June 30, 2013, the Funds did not incur any brokerage commissions with broker-dealers affiliated with the Advisor.
The Securities and Exchange Commission (“SEC”) has granted an exemptive order permitting the Funds to engage in principal transactions with J.P. Morgan Securities, Inc., an affiliated broker, involving taxable money market instruments, subject to certain conditions.
4. Investment Transactions
During the year ended June 30, 2013, purchases and sales of investments (excluding short-term investments) were as follows (amounts in thousands):
Purchases (excluding | Sales (excluding | Purchases of U.S. Government | Sales of U.S. Government | |||||||||||||
Dynamic Small Cap Growth Fund | $ | 333,372 | $ | 258,184 | $ | — | $ | — | ||||||||
Small Cap Core Fund | 245,547 | 246,368 | 345 | 1,300 | ||||||||||||
Small Cap Equity Fund | 610,659 | 875,373 | — | — | ||||||||||||
Small Cap Growth Fund | 489,101 | 591,914 | — | — | ||||||||||||
Small Cap Value Fund | 372,543 | 264,766 | 1,606 | 1,725 | ||||||||||||
U.S. Small Company Fund | 131,809 | 55,301 | 125 | 215 | ||||||||||||
5. Federal Income Tax Matters
For Federal income tax purposes, the cost and unrealized appreciation (depreciation) in value of investment securities held at June 30, 2013 were as follows (amounts in thousands):
Aggregate Cost | Gross Unrealized Appreciation | Gross Unrealized Depreciation | Net Unrealized Appreciation (Depreciation) | |||||||||||||
Dynamic Small Cap Growth Fund | $ | 410,765 | $ | 124,173 | $ | 19,112 | $ | 105,061 | ||||||||
Small Cap Core Fund | 380,796 | 150,478 | 11,182 | 139,296 | ||||||||||||
Small Cap Equity Fund | 1,774,562 | 922,123 | 33,459 | 888,664 | ||||||||||||
Small Cap Growth Fund | 719,121 | 247,471 | 37,463 | 210,008 | ||||||||||||
Small Cap Value Fund | 697,780 | 223,688 | 29,167 | 194,521 | ||||||||||||
U.S. Small Company Fund | 147,867 | 28,528 | 2,998 | 25,530 | ||||||||||||
The difference between book and tax basis appreciation (depreciation) on investments is primarily attributed to non-taxable dividends, wash sale loss deferrals and mark-to-market of passive foreign investment companies (Dynamic Small Cap Growth Fund, Small Cap Growth Fund, Small Cap Value Fund and U.S. Small Company Fund).
The tax character of distributions paid during the fiscal year ended June 30, 2013 was as follows (amounts in thousands):
Ordinary Income | Net Long Term Capital Gains | Total Distributions Paid | ||||||||||
Dynamic Small Cap Growth Fund | $ | — | $ | 13,780 | $ | 13,780 | ||||||
Small Cap Core Fund | 4,488 | — | 4,488 | |||||||||
Small Cap Equity Fund | 57,029 | 171,185 | 228,214 | |||||||||
Small Cap Growth Fund | — | 64,501 | 64,501 | |||||||||
Small Cap Value Fund | 8,927 | — | 8,927 | |||||||||
U.S. Small Company Fund | 632 | — | 632 | |||||||||
The tax character of distributions paid during the fiscal year ended June 30, 2012 was as follows (amounts in thousands):
| Ordinary Income | Net Long Term Capital Gains | Total Distributions Paid | ||||||||||
Small Cap Core Fund | $ | 2,078 | $ | — | $ | 2,078 | ||||||
Small Cap Equity Fund | 67,876 | 53,005 | 120,881 | |||||||||
Small Cap Growth Fund | — | 14,558 | 14,558 | |||||||||
Small Cap Value Fund | 5,800 | — | 5,800 | |||||||||
U.S. Small Company Fund | 167 | — | 167 | |||||||||
| JUNE 30, 2013 | J.P. MORGAN SMALL CAP FUNDS | 81 | ||||||
Table of Contents
NOTES TO FINANCIAL STATEMENTS
AS OF JUNE 30, 2013 (continued)
As of June 30, 2013, the components of net assets (excluding paid-in-capital) on a tax basis were as follows (amounts in thousands):
Current Distributable Ordinary Income | Current Distributable Long-Term Capital Gain or (Tax Basis Capital Loss Carryover) | Unrealized Appreciation (Depreciation) | ||||||||||
Dynamic Small Cap Growth Fund | $ | 3,698 | $ | 15,226 | $ | 105,061 | ||||||
Small Cap Core Fund | 1,822 | 5,647 | 139,296 | |||||||||
Small Cap Equity Fund | 13,233 | 58,273 | 888,664 | |||||||||
Small Cap Growth Fund | — | 55,762 | 210,008 | |||||||||
Small Cap Value Fund | — | (3,910 | ) | 194,521 | ||||||||
U.S. Small Company Fund | 332 | 65 | 25,530 | |||||||||
For the Funds, the cumulative timing differences primarily consist of non-taxable dividends, wash sale loss deferrals, trustee deferred compensation, late-year ordinary loss deferral (Dynamic Small Cap Growth Fund and Small Cap Growth Fund), mark-to-market of passive foreign investment companies (Dynamic Small Cap Growth Fund, Small Cap Growth Fund, Small Cap Value Fund and U.S. Small Company Fund) and mark-to-market on futures contracts (Small Cap Core Fund, Small Cap Value Fund and U.S. Small Company Fund).
Under the Regulated Investment Company Modernization Act of 2010 (the “Act”), net capital losses recognized by the Funds after June 30, 2011 are carried forward indefinitely, and retain their character as short-term and/or long-term losses. Prior to the Act, net capital losses incurred by the Funds were carried forward for eight years and treated as short-term losses. The Act requires that post-enactment net capital losses be used before pre-enactment net capital losses.
As of June 30, 2013, the following Funds had pre-enactment net capital loss carryforwards, expiring during the year indicated, which are available to offset future realized gains (amounts in thousands):
| 2018 | Total | |||||||
Small Cap Value Fund | $ | 3,910 | $ | 3,910 | ||||
During the year ended June 30, 2013, the Funds utilized capital loss carryforwards as follows (amounts in thousands):
Small Cap Core Fund | $ | 48,049 | ||
Small Cap Value Fund | 44,571 | |||
U.S. Small Company Fund | 6,462 |
Net capital losses and net specified gains (losses) incurred after October 31 and within the taxable year are deemed to arise on the first business day of the Fund’s next taxable year. For the year ended June 30, 2013, the Funds deferred to July 1, 2013 post-October capital losses of (amounts in thousands):
Late Year Loss Deferral | Post-October Capital Loss Character | |||||||||||
| Short-Term | Long-Term | |||||||||||
Dynamic Small Cap Growth Fund | $ | 1,632 | $ | — | $ | — | ||||||
Small Cap Growth Fund | 2,333 | — | — | |||||||||
6. Borrowings
The Funds rely upon an exemptive order granted by the SEC (the “Order”) permitting the establishment and operation of an Interfund Lending Facility (the “Facility”). The Facility allows the Funds to directly lend and borrow money to or from any other fund relying upon the Order at rates beneficial to both the borrowing and lending funds. Advances under the Facility are taken primarily for temporary or emergency purposes, including the meeting of redemption requests that otherwise might require the untimely disposition of securities, and are subject to each Fund’s borrowing restrictions. The Interfund loan rate is determined, as specified in the Order, by averaging the current repurchase agreement rate and the current bank loan rate. The Order was granted to JPM II and may be relied upon by the Funds because they are investment companies in the same “group of investment companies” (as defined in Section 12(d)(1)(G) of the 1940 Act).
In addition, the Trusts and JPMCB have entered into a financing arrangement. Under this arrangement, JPMCB provides an unsecured, uncommitted credit facility in the aggregate amount of $100 million to certain of the J.P. Morgan Funds, including the Funds. Advances under the arrangement are taken primarily for temporary or emergency purposes, including the meeting of redemption requests that otherwise might require the untimely disposition of securities, and are subject to each Fund’s borrowing restrictions. Interest on borrowings is payable at a rate determined by JPMCB at the time of borrowing. This agreement has been extended until November 11, 2013.
| 82 | J.P. MORGAN SMALL CAP FUNDS | JUNE 30, 2013 | ||||
Table of Contents
The Funds had no borrowings outstanding from another fund or from the unsecured, uncommitted credit facility at June 30, 2013. Average borrowings from the Facility for the year ended June 30, 2013, were as follows (amounts in thousands):
Average Borrowings | Number of Days | Interest Paid | ||||||||||
Small Cap Equity Fund | $ | 12,936 | 1 | $ | — | (a) | ||||||
| (a) | Amount rounds to less than $1,000. |
Interest expense paid, if any, as a result of borrowings from another fund or from the unsecured, uncommitted credit facility is included in Interest expense to affiliates in the Statements of Operations.
7. Risks, Concentrations and Indemnifications
In the normal course of business, the Funds enter into contracts that contain a variety of representations which provide general indemnifications. Each Fund’s maximum exposure under these arrangements is unknown. The amount of exposure would depend on future claims that may be made against each Fund that have not yet occurred. However, based on experience, the Funds expect the risk of loss to be remote.
Dynamic Small Cap Growth Fund, Small Cap Equity Fund, Small Cap Value Fund and U.S. Small Company Fund each have a shareholder, which is an account maintained by a financial intermediary on behalf of its clients, that owns a significant portion of the Funds’ outstanding shares.
One or more affiliates of the Advisor have investment discretion with respect to their clients’ holdings in the Funds, which collectively represent a significant portion of the Fund’s assets for Small Cap Core Fund.
In addition, the J.P. Morgan Investor Funds and JPMorgan SmartRetirement Funds, which are affiliated funds of funds, own in the aggregate more than 10% of the net assets of the following Funds:
| J.P. Morgan Investor Funds | JPMorgan SmartRetirement Funds | |||||||
Small Cap Growth Fund | — | 11.5 | % | |||||
Small Cap Value Fund | 11.0 | % | 11.3 | % | ||||
Significant shareholder transactions by these shareholders, if any, may impact the Funds’ performance.
| JUNE 30, 2013 | J.P. MORGAN SMALL CAP FUNDS | 83 | ||||||
Table of Contents
REPORT OF INDEPENDENT REGISTERED PUBLIC ACCOUNTING FIRM
To the Board of Trustees of JPMorgan Trust I and JPMorgan Trust II and the Shareholders of JPMorgan Dynamic Small Cap Growth Fund, JPMorgan Small Cap Core Fund, JPMorgan Small Cap Equity Fund, JPMorgan Small Cap Growth Fund, JPMorgan Small Cap Value Fund and JPMorgan U.S. Small Company Fund:
In our opinion, the accompanying statements of assets and liabilities, including the schedules of portfolio investments, and the related statements of operations and of changes in net assets and the financial highlights present fairly, in all material respects, the financial position of JPMorgan Dynamic Small Cap Growth Fund, JPMorgan Small Cap Core Fund, JPMorgan Small Cap Equity Fund and JPMorgan U.S. Small Company Fund (each a separate fund of JPMorgan Trust I) and JPMorgan Small Cap Growth Fund and JPMorgan Small Cap Value Fund (each a separate fund of JPMorgan Trust II) (hereafter collectively referred to as the “Funds”) at June 30, 2013, the results of each of their operations for the year then ended, the changes in each of their net assets for each of the two years in the period then ended and the financial highlights for each of the five years in the period then ended, in conformity with accounting principles generally accepted in the United States of America. These financial statements and financial highlights (hereafter referred to as “financial statements”) are the responsibility of the Funds’ management. Our responsibility is to express an opinion on these financial statements based on our audits. We conducted our audits of these financial statements in accordance with the standards of the Public Company Accounting Oversight Board (United States). Those standards require that we plan and perform the audit to obtain reasonable assurance about whether the financial statements are free of material misstatement. An audit includes examining, on a test basis, evidence supporting the amounts and disclosures in the financial statements, assessing the accounting principles used and significant estimates made by management, and evaluating the overall financial statement presentation. We believe that our audits, which included confirmation of securities at June 30, 2013 by correspondence with the custodian and brokers, provide a reasonable basis for our opinion.
PricewaterhouseCoopers LLP
New York, New York
August 28, 2013
| 84 | J.P. MORGAN SMALL CAP FUNDS | JUNE 30, 2013 | ||||
Table of Contents
(Unaudited)
The Funds’ Statement of Additional Information includes additional information about the Funds’ Trustees and is available, without charge, upon request by calling 1-800-480-4111 or on the J.P. Morgan Funds’ website at www.jpmorganfunds.com.
Name (Year of Birth); Positions With the Funds (1) | Principal Occupations During Past 5 Years | Number of Portfolios in Fund Complex Overseen by Trustee (2) | Other Directorships Held Outside Fund Complex During Past 5 Years | |||
Independent Trustees | ||||||
| John F. Finn (1947); Trustee of Trusts since 2005; Trustee of heritage One Group Mutual Funds since 1998. | Chairman (1985-present), President and Chief Executive Officer, Gardner, Inc. (supply chain management company serving industrial and consumer markets) (1974-present). | 172 | Director, Cardinal Health, Inc. (CAH) (1994-present); Director, Greif, Inc. (GEF) (industrial package products and services) (2007-present). | |||
| Dr. Matthew Goldstein (1941); Chairman since 2013; Trustee of Trusts since 2005; Trustee of heritage J.P. Morgan Funds since 2003. | Professor, City University of New York (effective 7/1/13); Chancellor, City University of New York (1999-2013); President, Adelphi University (New York) (1998-1999). | 172 | Director, Bronx-Lebanon Hospital Center; Director, United Way of New York City (2002-present); Trustee, Museum of Jewish Heritage (2011-present). | |||
| Robert J. Higgins (1945); Trustee of Trusts since 2005; Trustee of heritage J.P. Morgan Funds since 2002. | Retired; Director of Administration of the State of Rhode Island (2003-2004); President — Consumer Banking and Investment Services, Fleet Boston Financial (1971-2001). | 172 | None | |||
| Peter C. Marshall (1942); Trustee of Trusts since 2005; Trustee of heritage One Group Mutual Funds since 1985. | Self-employed business consultant (2002-present). | 172 | Director, Center for Communication, Hearing and Deafness (1990-present). | |||
| Mary E. Martinez (1960); Trustee of Trusts since 2013. | Associate, Special Properties, a Christie’s International Real Estate Affiliate (2010-Present); Managing Director, Bank of America (Asset Management) (2007-2008); Chief Operating Officer, U.S. Trust Asset Management; U.S. Trust Company (asset management) (2003-2007); President, Excelsior Funds (registered investment companies) (2004-2005). | 172 | Member, New York City Center Advisory Council (oversees public performing arts facilities) (2006-present). | |||
| Marilyn McCoy* (1948); Trustee of Trusts since 2005; Trustee of heritage One Group Mutual Funds since 1999. | Vice President of Administration and Planning, Northwestern University (1985-present). | 172 | Trustee, Carleton College (2003-present). | |||
| Mitchell M. Merin (1953); Trustee of Trusts since 2013. | Retired (2005-Present); President and Chief Operating Officer, Morgan Stanley Investment Management, Member Morgan Stanley & Co. Management Committee (registered investment adviser) (1998-2005). | 172 | Director, Sun Life Financial (SLF) (2007 to Present) (financial services and insurance); Trustee, Trinity College, Hartford, CT (2002-2010). | |||
| William G. Morton, Jr. (1937); Trustee of Trusts since 2005; Trustee of heritage J.P. Morgan Funds since 2003. | Retired; Chairman Emeritus (2001-2002), and Chairman and Chief Executive Officer, Boston Stock Exchange (1985-2001). | 172 | Director, Radio Shack Corp. (1987-2008); Trustee, Stratton Mountain School (2001-present). | |||
| Dr. Robert A. Oden, Jr. (1946); Trustee of Trusts since 2005; Trustee of heritage One Group Mutual Funds since 1997. | Retired; President, Carleton College (2002-2010); President, Kenyon College (1995-2002). | 172 | Trustee, American University in Cairo (1999-present); Chairman, Dartmouth-Hitchcock Medical Center (2013-present); Trustee, Dartmouth-Hitchcock Medical Center (2011-present); Trustee, American Schools of Oriental Research (2011-present); Trustee, Carleton College (2002-2010). | |||
| JUNE 30, 2013 | J.P. MORGAN SMALL CAP FUNDS | 85 | ||||||
Table of Contents
TRUSTEES
(Unaudited) (continued)
Name (Year of Birth); Positions With the Funds (1) | Principal Occupations During Past 5 Years | Number of Complex Overseen by Trustee (2) | Other Directorships Held Outside Fund Complex During Past 5 Years | |||
Independent Trustees (continued) | ||||||
| Marian U. Pardo** (1946); Trustee of Trusts since 2013. | Managing Director and Founder, Virtual Capital Management LLC (Investment Consulting) (2007-present); Managing Director, Credit Suisse Asset Management (portfolio manager) (2003-2006). | 172 | Member, Board of Governors, Columbus Citizens Foundation (not-for-profit supporting philanthropic and cultural programs) (2006-present). | |||
| Frederick W. Ruebeck (1939); Trustee of Trusts since 2005; Trustee of heritage One Group Mutual Funds since 1994. | Consultant (2000-present); Advisor, JP Greene & Associates, LLC (broker-dealer) (2000-2009); Chief Investment Officer, Wabash College (2004-present); Director of Investments, Eli Lilly and Company (pharmaceuticals) (1988-1999). | 172 | Trustee, Wabash College (1988-present); Chairman, Indianapolis Symphony Orchestra Foundation (1994-present). | |||
| James J. Schonbachler (1943); Trustee of Trusts since 2005; Trustee of heritage J.P. Morgan Funds since 2001. | Retired; Managing Director of Bankers Trust Company (financial services) (1968-1998). | 172 | None | |||
Interested Trustee Not Affiliated With the Adviser | ||||||
| Frankie D. Hughes*** (1952), Trustee of Trusts since 2008. | President and Chief Investment Officer, Hughes Capital Management, Inc. (fixed income asset management) (1993-present). | 172 | Trustee, The Victory Portfolios (2000-2008). | |||
| (1) | The Trustees serve for an indefinite term, subject to the Trusts’ current retirement policy, which is age 75 for all Trustees, except that the Board has determined Mr. Morton should continue to serve until December 31, 2014. In order to fill the vacancies created by the retirement of the Fergus Reid, III, William J. Armstrong, and Leonard J. Spalding Jr., effective December 31, 2012, the Board appointed Ms. Martinez and Mr. Merin to serve as Trustees effective January 1, 2013 and Ms. Pardo to serve as Trustee effective February 1, 2013. |
| (2) | A Fund Complex means two or more registered investment companies that hold themselves out to investors as related companies for purposes of investment and investor services or have a common investment advisor or have an investment advisor that is an affiliated person of the investment advisor of any of the other registered investment companies. The J.P. Morgan Funds Complex for which the Board of Trustees serves currently includes eleven registered investment companies (172 funds), including JPMorgan Mutual Fund Group which liquidated November 29, 2012 and is in the process of winding up its affairs. |
| * | Ms. McCoy has served as Vice President of Administration and Planning for Northwestern University since 1985. William M. Daley was the Head of Corporate Responsibility for JPMorgan Chase & Co. prior to January 2011 and served as a member of the Board of Trustees of Northwestern University from 2005 through 2010. JPMIM, the Funds’ investment advisor, is a wholly-owned subsidiary of JPMorgan Chase & Co. Five other members of the Board of Trustees of Northwestern University are executive officers of registered investment advisors (not affiliated with JPMorgan) that are under common control with subadvisors to certain J.P. Morgan Funds. |
| ** | In connection with prior employment with JPMorgan Chase, Ms. Pardo is the recipient of non-qualified pension plan payments from JPMorgan Chase in the amount of approximately $2,055 per month, which she irrevocably waived effective January 1, 2013, and deferred compensation payments from JPMorgan Chase in the amount of approximately $7,294 per year, which ended in January 2013. In addition, Ms. Pardo receives payments from a fully funded qualified plan, which is not an obligation of JPMorgan Chase. |
| *** | Ms. Hughes is treated as an “interested person” based on the portfolio holdings of clients of Hughes Capital Management, Inc. |
The contact address for each of the Trustees is 270 Park Avenue, New York, NY 10017.
| 86 | J.P. MORGAN SMALL CAP FUNDS | JUNE 30, 2013 | ||||
Table of Contents
(Unaudited)
Name (Year of Birth), Positions Held with the Trusts (Since) | Principal Occupations During Past 5 Years | |
Patricia A. Maleski (1960), | Managing Director, J.P. Morgan Investment Management Inc. and Chief Administrative Officer, J.P. Morgan Funds and Institutional Pooled Vehicles since 2010; previously, Treasurer and Principal Financial Officer of the Trusts from 2008 to 2010; previously, Head of Funds Administration and Board Liaison, J.P. Morgan Funds prior to 2010. Ms. Maleski has been with JPMorgan Chase & Co. since 2001. | |
| Joy C. Dowd (1972), Treasurer and Principal Financial Officer (2010) | Assistant Treasurer of the Trusts from 2009 to 2010; Executive Director, JPMorgan Funds Management, Inc. from February 2011; Vice President, JPMorgan Funds Management, Inc. from December 2008 to February 2011; prior to joining JPMorgan Chase, Ms. Dowd worked in MetLife’s investments audit group from 2005 through 2008. | |
| Frank J. Nasta (1964), Secretary (2008) | Managing Director and Associate General Counsel, JPMorgan Chase since 2008; Previously, Director, Managing Director, General Counsel and Corporate Secretary, J. & W. Seligman & Co. Incorporated; Secretary of each of the investment companies of the Seligman Group of Funds and Seligman Data Corp.; Director and Corporate Secretary, Seligman Advisors, Inc. and Seligman Services, Inc. | |
| Stephen M. Ungerman (1953), Chief Compliance Officer (2005) | Managing Director, JPMorgan Chase & Co.; Mr. Ungerman has been with JPMorgan Chase & Co. since 2000. | |
Kathryn A. Jackson (1962), | Vice President and AML Compliance Manager for JPMorgan Asset Management Compliance since 2011; Senior On-Boarding Specialist for JPMorgan Distribution Services, Inc. in Global Liquidity from 2008 to 2011; prior to joining JPMorgan, Ms. Jackson was a Financial Services Analyst responsible for on-boarding, compliance and training with Nationwide Securities LLC and 1717 Capital Management Company, both registered broker-dealers, from 2005 until 2008. | |
Elizabeth A. Davin (1964), Assistant Secretary (2005)** | Executive Director and Assistant General Counsel, JPMorgan Chase since February 2012; formerly Vice President and Assistant General Counsel, JPMorgan Chase from 2005 until February 2012; Senior Counsel, JPMorgan Chase (formerly Bank One Corporation) from 2004 to 2005. | |
| Jessica K. Ditullio (1962), Assistant Secretary (2005)** | Executive Director and Assistant General Counsel, JPMorgan Chase since February 2011; Ms. Ditullio has served as an attorney with various titles for JPMorgan Chase (formerly Bank One Corporation) since 1990. | |
| John T. Fitzgerald (1975), Assistant Secretary (2008) | Executive Director and Assistant General Counsel, JPMorgan chase since February 2011; formerly, Vice President and Assistant General Counsel, JPMorgan Chase from 2005 until February 2011. | |
| Carmine Lekstutis (1980), Assistant Secretary (2011) | Vice President and Assistant General Counsel, JPMorgan Chase since 2011; Associate, Skadden, Arps, Slate, Meagher & Flom LLP (law firm) from 2006 to 2011. | |
| Gregory S. Samuels (1980), Assistant Secretary (2010) | Vice President and Assistant General Counsel, JPMorgan Chase since 2010; Associate, Ropes & Gray (law firm) from 2008 to 2010; Associate, Clifford Chance LLP (law firm) from 2005 to 2008. | |
| Pamela L. Woodley (1971), Assistant Secretary (2012) | Vice President and Assistant General Counsel, JPMorgan Chase since November 2004. | |
Michael M. D’Ambrosio (1969), Assistant Treasurer (2012) | Executive Director, JPMorgan Funds Management, Inc. from July 2012; prior to joining JPMorgan Chase, Mr. D’Ambrosio was a Tax Director at PricewaterhouseCoopers LLP since 2006. | |
| Joseph Parascondola (1963), Assistant Treasurer (2011) | Vice President, JPMorgan Funds Management, Inc. since August 2006. | |
| Matthew J. Plastina (1970), Assistant Treasurer (2011) | Vice President, JPMorgan Funds Management, Inc. since August 2010; prior to August 2010, Vice President and Controller, Legg Mason Global Asset Management. | |
Julie A. Roach (1971), Assistant Treasurer (2012)** | Vice President, JPMorgan Funds Management, Inc. from August 2012; prior to joining JPMorgan Chase, Ms. Roach was a Senior Manager with Deloitte since 2001. | |
Gillian I. Sands (1969), Assistant Treasurer (2012) | Vice President, JPMorgan Funds Management, Inc. from September 2012; Assistant Treasurer, Wells Fargo Funds Management (2007-2009). | |
Timothy J. Stewart (1974), Assistant Treasurer (2012)*** | Executive Director, JPMorgan Funds Management, Inc. from July 2012; Managing Director of Robeco Investment Management, Inc. (2011-2012); Chief Financial Officer (2008-2011) and Director of Operations (2003-2008), Robeco-Sage, a division of Robeco Investment Management, Inc. | |
The contact address for each of the officers, unless otherwise noted, is 270 Park Avenue, New York, NY 10017.
| * | The contact address for the officer is 500 Stanton Christiana Road, Ops 1, Floor 02, Newark, DE 19173-2107. |
| ** | The contact address for the officer is 460 Polaris Parkway, Westerville, OH 43082. |
| *** | Mr. Stewart is the Assistant Treasurer of JPMorgan Trust I only. |
| JUNE 30, 2013 | J.P. MORGAN SMALL CAP FUNDS | 87 | ||||||
Table of Contents
SCHEDULE OF SHAREHOLDER EXPENSES
(Unaudited)
Hypothetical $1,000 Investment
As a shareholder of the Funds, you incur two types of costs: (1) transaction costs, including sales charges (loads) on purchase payments and redemption fees and (2) ongoing costs, including investment advisory fees, administration fees, distribution fees and other Fund expenses. The examples below are intended to help you understand your ongoing costs (in dollars) of investing in the Funds and to compare these ongoing costs with the ongoing costs of investing in other mutual funds. The examples assume that you had a $1,000 investment in each Class at the beginning of the reporting period, January 1, 2013, and continued to hold your shares at the end of the reporting period, June 30, 2013.
Actual Expenses
For each Class of each Fund in the table below, the first line provides information about actual account values and actual expenses. You may use the information in this line, together with the amount you invested, to estimate the expenses that you paid over the period. Simply divide your account value by $1,000 (for example, an $8,600 account value divided by $1,000 = 8.6), then multiply the result by the number in the first line of each Class under the heading entitled “Expenses Paid During the period” to estimate the expenses you paid on your account during this period.
Hypothetical Example for Comparison Purposes
The second line of each Class in the table below provides information about hypothetical account values and hypothetical expenses based on the Class’ actual expense ratio and an assumed rate of return of 5% per year before expenses, which is not the Class’ actual return. The hypothetical account values and expenses may not be used to estimate the actual ending account balance or expenses you paid for the period. You may use this information to compare the ongoing costs of investing in the Class of the Funds and other funds. To do so, compare this 5% hypothetical example with the 5% hypothetical examples that appear in the shareholder reports of the other funds. Please note that the expenses shown in the table are meant to highlight your ongoing costs only and do not reflect any transaction costs, such as sales charges (loads) or redemption fees. Therefore, the second line for each Class in the table is useful in comparing ongoing costs only, and will not help you determine the relative total costs of owning different funds. In addition, if these transaction costs were included, your costs would have been higher. The examples also assume all dividends and distributions have been reinvested.
| Beginning Account Value, January 1, 2013 | Ending Account Value June 30, 2013 | Expenses Paid During the Period* | Annualized Expense Ratio | |||||||||||||
Dynamic Small Cap Growth Fund | ||||||||||||||||
Class A | ||||||||||||||||
Actual | $ | 1,000.00 | $ | 1,200.00 | $ | 7.75 | 1.42 | % | ||||||||
Hypothetical | 1,000.00 | 1,017.75 | 7.10 | 1.42 | ||||||||||||
Class B | ||||||||||||||||
Actual | 1,000.00 | 1,197.10 | 10.40 | 1.91 | ||||||||||||
Hypothetical | 1,000.00 | 1,015.32 | 9.54 | 1.91 | ||||||||||||
Class C | ||||||||||||||||
Actual | 1,000.00 | 1,196.80 | 10.40 | 1.91 | ||||||||||||
Hypothetical | 1,000.00 | 1,015.32 | 9.54 | 1.91 | ||||||||||||
Select Class | ||||||||||||||||
Actual | 1,000.00 | 1,201.90 | 6.01 | 1.10 | ||||||||||||
Hypothetical | 1,000.00 | 1,019.34 | 5.51 | 1.10 | ||||||||||||
Small Cap Core Fund | ||||||||||||||||
Select Class | ||||||||||||||||
Actual | 1,000.00 | 1,172.30 | 4.31 | 0.80 | ||||||||||||
Hypothetical | 1,000.00 | 1,020.83 | 4.01 | 0.80 | ||||||||||||
Small Cap Equity Fund | ||||||||||||||||
Class A | ||||||||||||||||
Actual | 1,000.00 | 1,149.00 | 6.87 | 1.29 | ||||||||||||
Hypothetical | 1,000.00 | 1,018.40 | 6.46 | 1.29 | ||||||||||||
Class B | ||||||||||||||||
Actual | 1,000.00 | 1,146.20 | 9.53 | 1.79 | ||||||||||||
Hypothetical | 1,000.00 | 1,015.92 | 8.95 | 1.79 | ||||||||||||
Class C | ||||||||||||||||
Actual | 1,000.00 | 1,146.30 | 9.53 | 1.79 | ||||||||||||
Hypothetical | 1,000.00 | 1,015.92 | 8.95 | 1.79 | ||||||||||||
| 88 | J.P. MORGAN SMALL CAP FUNDS | JUNE 30, 2013 | ||||
Table of Contents
| Beginning Account Value, January 1, 2013 | Ending Account Value June 30, 2013 | Expenses Paid During the Period* | Annualized Expense Ratio | |||||||||||||
Small Cap Equity Fund (continued) | ||||||||||||||||
Class R2 | ||||||||||||||||
Actual | $ | 1,000.00 | $ | 1,147.50 | $ | 8.20 | 1.54 | % | ||||||||
Hypothetical | 1,000.00 | 1,017.16 | 7.70 | 1.54 | ||||||||||||
Class R5 | ||||||||||||||||
Actual | 1,000.00 | 1,151.90 | 4.22 | 0.79 | ||||||||||||
Hypothetical | 1,000.00 | 1,020.88 | 3.96 | 0.79 | ||||||||||||
Select Class | ||||||||||||||||
Actual | 1,000.00 | 1,150.70 | 5.28 | 0.99 | ||||||||||||
Hypothetical | 1,000.00 | 1,019.89 | 4.96 | 0.99 | ||||||||||||
Small Cap Growth Fund | ||||||||||||||||
Class A | ||||||||||||||||
Actual | 1,000.00 | 1,202.60 | 6.83 | 1.25 | ||||||||||||
Hypothetical | 1,000.00 | 1,018.60 | 6.26 | 1.25 | ||||||||||||
Class B | ||||||||||||||||
Actual | 1,000.00 | 1,199.30 | 9.54 | 1.75 | ||||||||||||
Hypothetical | 1,000.00 | 1,016.12 | 8.75 | 1.75 | ||||||||||||
Class C | ||||||||||||||||
Actual | 1,000.00 | 1,199.80 | 9.55 | 1.75 | ||||||||||||
Hypothetical | 1,000.00 | 1,016.12 | 8.75 | 1.75 | ||||||||||||
Class R2 | ||||||||||||||||
Actual | 1,000.00 | 1,201.10 | 8.19 | 1.50 | ||||||||||||
Hypothetical | 1,000.00 | 1,017.36 | 7.50 | 1.50 | ||||||||||||
Class R6 | ||||||||||||||||
Actual | 1,000.00 | 1,205.90 | 4.10 | 0.75 | ||||||||||||
Hypothetical | 1,000.00 | 1,021.08 | 3.76 | 0.75 | ||||||||||||
Institutional Class | ||||||||||||||||
Actual | 1,000.00 | 1,204.50 | 4.65 | 0.85 | ||||||||||||
Hypothetical | 1,000.00 | 1,020.58 | 4.26 | 0.85 | ||||||||||||
Select Class | ||||||||||||||||
Actual | 1,000.00 | 1,204.70 | 5.47 | 1.00 | ||||||||||||
Hypothetical | 1,000.00 | 1,019.84 | 5.01 | 1.00 | ||||||||||||
Small Cap Value Fund | ||||||||||||||||
Class A | ||||||||||||||||
Actual | 1,000.00 | 1,161.80 | 6.65 | 1.24 | ||||||||||||
Hypothetical | 1,000.00 | 1,018.65 | 6.21 | 1.24 | ||||||||||||
Class B | ||||||||||||||||
Actual | 1,000.00 | 1,158.50 | 9.90 | 1.85 | ||||||||||||
Hypothetical | 1,000.00 | 1,015.62 | 9.25 | 1.85 | ||||||||||||
Class C | ||||||||||||||||
Actual | 1,000.00 | 1,158.80 | 9.90 | 1.85 | ||||||||||||
Hypothetical | 1,000.00 | 1,015.62 | 9.25 | 1.85 | ||||||||||||
Class R2 | ||||||||||||||||
Actual | 1,000.00 | 1,160.30 | 7.98 | 1.49 | ||||||||||||
Hypothetical | 1,000.00 | 1,017.41 | 7.45 | 1.49 | ||||||||||||
Class R5 | ||||||||||||||||
Actual | 1,000.00 | 1,163.60 | 4.83 | 0.90 | ||||||||||||
Hypothetical | 1,000.00 | 1,020.33 | 4.51 | 0.90 | ||||||||||||
Class R6 | ||||||||||||||||
Actual | 1,000.00 | 1,164.30 | 4.56 | 0.85 | ||||||||||||
Hypothetical | 1,000.00 | 1,020.58 | 4.26 | 0.85 | ||||||||||||
Select Class | ||||||||||||||||
Actual | 1,000.00 | 1,163.50 | 5.31 | 0.99 | ||||||||||||
Hypothetical | 1,000.00 | 1,019.89 | 4.96 | 0.99 | ||||||||||||
| JUNE 30, 2013 | J.P. MORGAN SMALL CAP FUNDS | 89 | ||||||
Table of Contents
SCHEDULE OF SHAREHOLDER EXPENSES
(Unaudited) (continued)
Hypothetical $1,000 Investment
| Beginning Account Value, January 1, 2013 | Ending Account Value June 30, 2013 | Expenses Paid During the Period* | Annualized Expense Ratio | |||||||||||||
U.S. Small Company Fund | ||||||||||||||||
Class A | ||||||||||||||||
Actual | $ | 1,000.00 | $ | 1,163.40 | $ | 6.71 | 1.25 | % | ||||||||
Hypothetical | 1,000.00 | 1,018.60 | 6.26 | 1.25 | ||||||||||||
Class C | ||||||||||||||||
Actual | 1,000.00 | 1,159.90 | 9.37 | 1.75 | ||||||||||||
Hypothetical | 1,000.00 | 1,016.12 | 8.75 | 1.75 | ||||||||||||
Class R2 | ||||||||||||||||
Actual | 1,000.00 | 1,161.50 | 8.04 | 1.50 | ||||||||||||
Hypothetical | 1,000.00 | 1,017.36 | 7.50 | 1.50 | ||||||||||||
Class R6 | ||||||||||||||||
Actual | 1,000.00 | 1,165.90 | 4.03 | 0.75 | ||||||||||||
Hypothetical | 1,000.00 | 1,021.08 | 3.76 | 0.75 | ||||||||||||
Institutional Class | ||||||||||||||||
Actual | 1,000.00 | 1,165.90 | 4.40 | 0.82 | ||||||||||||
Hypothetical | 1,000.00 | 1,020.73 | 4.11 | 0.82 | ||||||||||||
Select Class | ||||||||||||||||
Actual | 1,000.00 | 1,164.60 | 5.37 | 1.00 | ||||||||||||
Hypothetical | 1,000.00 | 1,019.84 | 5.01 | 1.00 | ||||||||||||
| * | Expenses are equal to each Class’ respective annualized expense ratio, multiplied by the average account value over the period, multiplied by 181/365 (to reflect the one-half year period). |
| 90 | J.P. MORGAN SMALL CAP FUNDS | JUNE 30, 2013 | ||||
Table of Contents
(Unaudited)
Certain tax information for the J.P. Morgan Funds is required to be provided to shareholders based upon the Funds’ income and distributions for the taxable year ended June 30, 2013. The information and distributions reported in this letter may differ from the information and taxable distributions reported to the shareholders for the calendar year ending December 31, 2013. The information necessary to complete your income tax returns for the calendar year ending December 31, 2013 will be provided under separate cover.
Dividends Received Deductions (DRD)
Each Fund hereby designates the following percentage or the maximum allowable percentage as ordinary income distributions eligible for the 70% dividends received deduction for corporate rate shareholders for the fiscal year ended June 30, 2013:
| Dividends Received Deduction | ||||
Dynamic Small Cap Growth Fund | 77.72 | % | ||
Small Cap Core Fund | 100.00 | |||
Small Cap Equity Fund | 100.00 | |||
Small Cap Value Fund | 100.00 | |||
U.S. Small Company Fund | 100.00 | |||
Long Term Capital Gain Designation — 20%
Each Fund hereby designates the following amount or maximum allowable amount as long-term capital gain distributions for the purpose of the dividend paid deduction on its respective tax return for the fiscal year ended June 30, 2013 (amounts in thousands):
| Long-Term Capital Gain Distribution | ||||
Dynamic Small Cap Growth Fund | $ | 13,780 | ||
Small Cap Equity Fund | 171,185 | |||
Small Cap Growth Fund | 64,501 | |||
Qualified Dividend Income (QDI)
For the fiscal year ended June 30, 2013, certain dividends paid by the Funds may be subject to a maximum tax rate of 20%. Each Fund hereby designates the following amount or maximum allowable amount of ordinary income distributions as qualified dividends (amounts in thousands):
| Qualified Dividend Income | ||||
Small Cap Core Fund | $ | 4,488 | ||
Small Cap Equity | 57,029 | |||
Small Cap Value | 8,927 | |||
U.S. Small Company Fund | 632 | |||
| JUNE 30, 2013 | J.P. MORGAN SMALL CAP FUNDS | 91 | ||||||
Table of Contents

| FACTS | WHAT DOES J.P. MORGAN FUNDS DO WITH YOUR PERSONAL INFORMATION? |
| Why? | Financial companies choose how they share your personal information. Federal law gives consumers the right to limit some but not all sharing. Federal law also requires us to tell you how we collect, share, and protect your personal information. Please read this notice carefully to understand what we do. |
| What? | The types of personal information we collect and share depend on the product or service you have with us. This information can include:
¡ Social Security number and account balances
¡ transaction history and account transactions
¡ checking account information and wire transfer instructions
When you are no longer our customer, we continue to share your information as described in this notice. |
| How? | All financial companies need to share customers’ personal information to run their everyday business. In the section below, we list the reasons financial companies can share their customers’ personal information; the reasons J.P. Morgan Funds chooses to share; and whether you can limit this sharing. |
| Reasons we can share your personal information | Does J.P. Morgan Funds share? | Can you limit this sharing? | ||
For our everyday business purposes — such as to process your transactions, maintain your account(s), respond to court orders and legal investigations, or report to credit bureaus | Yes | No | ||
For marketing purposes — to offer our products and services to you | Yes | No | ||
| For joint marketing with other financial companies | No | We don’t share | ||
For our affiliates’ everyday business purposes — information about your transactions and experiences | No | We don’t share | ||
For our affiliates’ everyday business purposes — information about your creditworthiness | No | We don’t share | ||
| For nonaffiliates to market to you | No | We don’t share |
| Questions? | Call 1-800-480-4111 or go to www.jpmorganfunds.com | |

Table of Contents
Page 2 |
| Who we are | ||
| Who is providing this notice? | J.P. Morgan Funds | |
| What we do | ||
| How does J.P. Morgan Funds protect my personal information? | To protect your personal information from unauthorized access and use, we use security measures that comply with federal law. These measures include computer safeguards and secured files and buildings. We authorize our employees to access your information only when they need it to do their work and we require companies that work for us to protect your information. | |
How does J.P. Morgan Funds collect my personal information? | We collect your personal information, for example, when you:
¡ open an account or provide contact information
¡ give us your account information or pay us by check
¡ make a wire transfer
We also collect your personal information from others, such as credit bureaus, affiliates and other companies. | |
| Why can’t I limit all sharing? | Federal law gives you the right to limit only
¡ sharing for affiliates’ everyday business purposes – information about your creditworthiness
¡ affiliates from using your information to market to you
¡ sharing for nonaffiliates to market to you
State laws and individual companies may give you additional rights to limit sharing. | |
| Definitions | ||
| Affiliates | Companies related by common ownership or control. They can be financial and nonfinancial companies.
¡ J.P. Morgan Funds does not share with our affiliates. | |
| Nonaffiliates | Companies not related by common ownership or control. They can be financial and nonfinancial companies.
¡ J.P. Morgan Funds does not share with nonaffiliates so they can market to you. | |
| Joint Marketing | A formal agreement between nonaffiliated financial companies that together market financial products or services to you.
¡ J.P. Morgan Funds doesn’t jointly market. | |
Table of Contents
J.P. Morgan Funds are distributed by JPMorgan Distribution Services, Inc., which is an affiliate of JPMorgan Chase & Co. Affiliates of JPMorgan Chase & Co. receive fees for providing various services to the funds.
Contact JPMorgan Distribution Services, Inc. at 1-800-480-4111 for a fund prospectus. You can also visit us at www.jpmorganfunds.com. Investors should carefully consider the investment objectives and risk as well as charges and expenses of the mutual fund before investing. The prospectus contains this and other information about the mutual fund. Read the prospectus carefully before investing.
Investors may obtain information about the Securities Investor Protection Corporation (SIPC), including the SIPC brochure by visiting www.sipc.org or by calling SIPC at 202-371-8300.
Each Fund files a complete schedule of its fund holdings for the first and third quarters of its fiscal year with the SEC on Form N-Q. The Funds’ Forms N-Q are available on the SEC’s website at http://www.sec.gov and may be reviewed and copied at the SEC’s Public Reference Room in Washington, DC. Information on the operation of the SEC’s Public Reference Room may be obtained by calling 1-800-SEC-0330. Shareholders may request the Form N-Q without charge by calling 1-800-480-4111 or by visiting the J.P. Morgan Funds’ website at www.jpmorganfunds.com.
A description of each Fund’s policies and procedures with respect to the disclosure of each Fund’s holdings is available in the prospectus and Statement of Additional Information.
A copy of proxy policies and procedures is available without charge upon request by calling 1-800-480-4111 and on the Funds’ website at www.jpmorganfunds.com. A description of such policies and procedures is on the SEC’s website at www.sec.gov. The Trustees have delegated the authority to vote proxies for securities owned by the Funds to the Advisor. A copy of the Funds’ voting record for the most recent 12-month period ended June 30 is available on the SEC’s website at www.sec.gov or at the Funds’ website at www.jpmorganfunds.com no later than August 31 of each year. The Funds’ proxy voting record will include, among other things, a brief description of the matter voted on for each fund security, and will state how each vote was cast, for example, for or against the proposal.

Table of Contents

J.P. Morgan Asset Management is the marketing name for the asset management business of JPMorgan Chase & Co. Those businesses include, but are not limited to, J.P. Morgan Investment Management Inc., Security Capital Research & Management Incorporated and J.P. Morgan Alternative Asset Management, Inc.
| © JPMorgan Chase & Co., 2013. All rights reserved. June 2013. | AN-SC-613 |
Table of Contents
Annual Report
J.P. Morgan Mid Cap/Multi-Cap Funds
June 30, 2013
JPMorgan Growth Advantage Fund
JPMorgan Mid Cap Core Fund
JPMorgan Mid Cap Equity Fund
JPMorgan Mid Cap Growth Fund
JPMorgan Mid Cap Value Fund
JPMorgan Multi-Cap Market Neutral Fund
JPMorgan Value Advantage Fund

Table of Contents
Investments in a Fund are not bank deposits or obligations of, or guaranteed or endorsed by, any bank and are not insured or guaranteed by the FDIC, the Federal Reserve Board or any other government agency. You could lose money if you sell when the Fund’s share price is lower than when you invested.
Past performance is no guarantee of future performance. The general market views expressed in this report are opinions based on market and other conditions through the end of the reporting period and are subject to change without notice. These views are not intended to predict the future performance of a Fund or the securities markets. References to specific securities and their issuers are for illustrative purposes only and are not intended to be, and should not be interpreted as, recommendations to purchase or sell such securities. Such views are not meant as investment advice and may not be relied on as an indication of trading intent on behalf of any Fund.
Prospective investors should refer to the Funds’ prospectus for a discussion of the Funds’ investment objectives, strategies and risks. Call J.P. Morgan Funds Service Center at 1-800-480-4111 for a prospectus containing more complete information about a Fund, including management fees and other expenses. Please read it carefully before investing.
Table of Contents
JULY 26, 2013 (Unaudited)
Dear Shareholder:
While somewhat overshadowed by increased volatility at the end of the reporting period, global equities in aggregate posted strong returns for the twelve months ended June 30, 2013. For much of the period, stocks were supported by solid corporate earnings and robust demand from investors looking to generate higher returns in the low interest rate environment.
 |
“We are encouraged by the stock market’s resiliency in the face of recent volatility.” |
Despite signaling a potential policy shift in June 2013, the U.S. Federal Reserve (“Fed”) continued to pursue its highly accommodative policies in an attempt to lower unemployment and spur the economy. Central banks overseas also did their part to support their economies. The European Central Bank (“ECB”) remained committed to preserving the euro, as it cut rates and introduced new programs designed to aid struggling euro zone members. Elsewhere, the Bank of Japan embarked on a major asset purchase program as a new pro-growth government came into power late in 2012.
Positive investor sentiment was temporarily interrupted, however, in May 2013 when Fed Chairman Bernanke indicated that the central bank may begin to “taper” its asset purchase program later this year. This triggered a sharp decline in global equities, although they quickly regained their footing and have continued to rally in July. All told, both U.S. and international developed stocks rose sharply during the twelve months ended June 30, 2013. Emerging market equities produced only modest gains given concerns regarding China’s economy and falling commodity prices.
U.S. Treasury Yields Rise Sharply
Talk of Fed tapering negatively impacted the fixed income markets. While U.S. Treasury security yields continued to be
low from a historical perspective, they ended the period sharply higher than when the reporting period began. The yield for 10-year U.S. Treasury securities ended June 30, 2013 at 2.52%, while the yields for 2- and 30-year U.S. Treasury securities finished the reporting period at 0.36% and 3.52%, respectively. Amid the rising interest rate environment, the overall U.S. fixed income market posted a modest decline for the reporting period. In contrast, high yield bonds (also known as junk bonds) posted a strong return and emerging market debt securities also moved higher, albeit to a lesser extent.
Positive Signs for Stocks
Although the global economy is far from robust, it is still on a growth path. The expansion in the U.S. certainly appears to be sustainable and, while Europe remains in a recession, there are indications that its economy may be bottoming. Elsewhere, pro-growth initiatives in Japan have thus far yielded positive results. While growth in China has moderated, we believe the government has the tools at its disposal to avoid a “hard landing.”
We are encouraged by the stock market’s resiliency in the face of recent volatility. In addition, there have been signs that equity market correlations are decreasing, which could create a more favorable environment for active managers. In addition, given the recent sell-off in the bond market, valuations in a number of fixed income sectors have become more attractive.
On behalf of everyone at J.P. Morgan Asset Management, thank you for your continued support. We look forward to managing your investment needs for years to come. Should you have any questions, please visit www.jpmorganfunds.com or contact the J.P. Morgan Funds Service Center at 1-800-480-4111.
Sincerely yours,

George C.W. Gatch
CEO, Global Funds Management
J.P. Morgan Asset Management
| JUNE 30, 2013 | J.P. MORGAN MID CAP/MULTI-CAP FUNDS | 1 | ||||||
Table of Contents
J.P. Morgan Mid Cap/Multi-Cap Funds
TWELVE MONTHS ENDED JUNE 30, 2013 (Unaudited)
Despite periods of heightened volatility and several setbacks, the overall U.S. equity market generated strong results during the twelve months ended June 30, 2013. Supporting the market were overall solid corporate profits, continued economic growth and generally robust investor demand. From an economic perspective, the U.S. housing market showed signs of rebounding and there was some improvement in the labor market. Investor enthusiasm was interrupted late in the reporting period when the U.S. Federal Reserve Board (“Fed”) announced in June 2013 that it might begin tapering its asset purchases later in the year. This triggered a rapid sell-off in the overall stock market. However, U.S. equities again rallied in late June, as concerns regarding Fed tapering abated somewhat. The S&P 500 Index returned 20.60% for the twelve months ended June 30, 2013. U.S. mid-cap stocks outperformed the broader U.S. stock market, as the Russell Midcap Index returned 25.41%. U.S. mid-cap value stocks outperformed U.S. mid-cap growth stocks during the reporting period.
| 2 | J.P. MORGAN MID CAP/MULTI-CAP FUNDS | JUNE 30, 2013 | ||||
Table of Contents
JPMorgan Growth Advantage Fund
TWELVE MONTHS ENDED JUNE 30, 2013 (Unaudited)
| REPORTING PERIOD RETURN: | ||||
| Fund (Class A Shares, without a sales charge)* | 20.63% | |||
| Russell 3000 Growth Index | 17.56% | |||
| Net Assets as of 6/30/2013 (In Thousands) | $ | 1,999,422 | ||
INVESTMENT OBJECTIVE**
The JPMorgan Growth Advantage Fund (the “Fund”) seeks to provide long-term capital growth.
WHAT WERE THE MAIN DRIVERS OF THE FUND’S PERFORMANCE?
The Fund (Class A Shares, without a sales charge) outperformed the Russell 3000 Growth Index (the “Benchmark”) for the twelve months ended June 30, 2013. The Fund’s stock selection in the health care and financial services sectors contributed to performance relative to the Benchmark. Stock selection in the consumer staples sector, and an overweight to technology, were detractors to relative performance.
Individual contributors to relative performance included the Fund’s positions in Aegerion Pharmaceuticals, Inc., Valeant Pharmaceuticals International, Inc. and Biogen Idec, Inc. Shares of Aegerion Pharmaceuticals, Inc., a biopharmaceutical company, rose with the company’s solid progress on its launch of lomitapide, a treatment for HoFH, a form of severe familial high cholesterol. Shares of Valeant Pharmaceuticals International, Inc. continue to benefit from solid execution on the firm’s core strategy, including the announced acquisition of Bausch and Lomb, which could be a highly accretive deal set to close later this year. Biogen Idec, Inc., a biotechnology company, was a net contributor as its multiple sclerosis drug, Tecfidera, got off to a very strong start following its launch, outperforming some of the most optimistic expectations.
Individual detractors from relative performance included the Fund’s positions in Aruba Networks, Inc., ServiceSource International, Inc. and International Game Technology. Aruba Networks, Inc., a networking vendor selling enterprise wireless local area network (LAN) and networking equipment, has struggled with meeting high growth expectations and, as a result, has experienced a sharp decline in its stock price. Shares of ServiceSource International, Inc. suffered after the computer services company’s outlook for its fourth quarter earnings 2012 was lower than investors had expected. International Gaming Technology suffered largely in the third quarter of 2012, due to a lack of casino openings and a decline in game yields, which negatively impacted its share price.
HOW WAS THE FUND POSITIONED?
The Fund’s portfolio managers utilized a bottom-up approach to stock selection, researching individual companies across market capitalizations in an effort to construct a portfolio of stocks that have strong fundamentals. The Fund’s portfolio managers sought to invest in high quality companies with durable franchises that, in their view, possessed the ability to generate strong future earnings growth.
| TOP TEN EQUITY HOLDINGS OF THE PORTFOLIO*** | ||||||||
| 1. | Google, Inc., Class A | 4.2 | % | |||||
| 2. | Apple, Inc. | 3.6 | ||||||
| 3. | Biogen Idec, Inc. | 2.5 | ||||||
| 4. | Home Depot, Inc. (The) | 2.0 | ||||||
| 5. | Amazon.com, Inc. | 2.0 | ||||||
| 6. | Gilead Sciences, Inc. | 1.9 | ||||||
| 7. | Visa, Inc., Class A | 1.8 | ||||||
| 8. | Valeant Pharmaceuticals International, Inc. | 1.7 | ||||||
| 9. | Avago Technologies Ltd. | 1.6 | ||||||
| 10. | Michael Kors Holdings Ltd. | 1.6 | ||||||
PORTFOLIO COMPOSITION BY SECTOR*** | ||||
| Information Technology | 27.4 | % | ||
| Consumer Discretionary | 19.6 | |||
| Industrials | 17.2 | |||
| Health Care | 16.5 | |||
| Financials | 7.7 | |||
| Energy | 4.5 | |||
| Materials | 2.6 | |||
| Consumer Staples | 0.7 | |||
| Short-Term Investment | 3.8 | |||
| * | The return shown is based on net asset values calculated for shareholder transactions and may differ from the return shown in the financial highlights, which reflects adjustments made to the net asset values in accordance with accounting principles generally accepted in the United States of America. |
| ** | The advisor seeks to achieve the Fund’s objective. There can be no guarantee it will be achieved. |
| *** | Percentages indicated are based on total investments as of June 30, 2013. The Fund’s portfolio composition is subject to change. |
| JUNE 30, 2013 | J.P. MORGAN MID CAP/MULTI-CAP FUNDS | 3 | ||||||
Table of Contents
JPMorgan Growth Advantage Fund
FUND COMMENTARY
TWELVE MONTHS ENDED JUNE 30, 2013 (Unaudited) (continued)
AVERAGE ANNUAL TOTAL RETURNS AS OF JUNE 30, 2013 | ||||||||||||||||
| INCEPTION DATE OF CLASS | 1 YEAR | 5 YEAR | 10 YEAR | |||||||||||||
CLASS A SHARES | 10/29/99 | |||||||||||||||
Without Sales Charge | 20.63 | % | 7.06 | % | 10.68 | % | ||||||||||
With Sales Charge* | 14.25 | 5.91 | 10.08 | |||||||||||||
CLASS B SHARES | 10/29/99 | |||||||||||||||
Without CDSC | 20.06 | 6.52 | 10.11 | |||||||||||||
With CDSC** | 15.06 | 6.21 | 10.11 | |||||||||||||
CLASS C SHARES | 5/1/06 | |||||||||||||||
Without CDSC | 20.04 | 6.51 | 10.02 | |||||||||||||
With CDSC*** | 19.04 | 6.51 | 10.02 | |||||||||||||
CLASS R5 SHARES | 1/8/09 | 21.17 | 7.50 | 10.96 | ||||||||||||
SELECT CLASS SHARES | 5/1/06 | 20.93 | 7.32 | 10.87 | ||||||||||||
| * | Sales Charge for Class A Shares is 5.25%. |
| ** | Assumes 5% CDSC (contingent deferred sales charge) for the one year period, 2% CDSC for the five year period and 0% CDSC thereafter. |
| *** | Assumes a 1% CDSC for the one year period and 0% CDSC thereafter. |
TEN YEAR PERFORMANCE (6/30/03 TO 6/30/13)
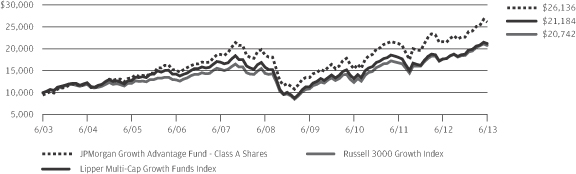
The performance quoted is past performance and is not a guarantee of future results. Mutual funds are subject to certain market risks. Investment returns and principal value of an investment will fluctuate so that an investor’s shares, when redeemed, may be worth more or less than their original cost. Current performance may be higher or lower than the performance data shown. For up-to-date month-end performance information please call 1-800-480-4111.
As of August 17, 2005, the Fund changed its name, investment objective, certain investment policies and benchmark. Prior to that time, the Fund operated as JPMorgan Mid Cap Growth Fund. Although past performance is not necessarily an indication of how the Fund will perform in the future, in view of these changes, the Fund’s performance record prior to August 17, 2005 might be less pertinent for investors considering whether to purchase shares of the Fund. Returns for the Class C Shares prior to its inception date are based on the performance of Class B Shares, whose expenses are substantially similar to those of Class C Shares. Returns for the Select Class Shares prior to its inception date are based on the performance of Class A Shares. During this period, the actual returns of Select Class Shares would have been different than those shown because Select Class Shares have different expenses than Class A Shares. Returns for Class R5 Shares prior to its inception date are based on the performance of Select Class Shares from May 1, 2006 to January 8, 2009 and Class A Shares prior to May 1, 2006. The actual returns of Class R5 Shares would have been different than those shown because Class R5 Shares have different expenses than Select Class and Class A Shares.
The graph illustrates comparative performance for $10,000 invested in Class A Shares of the JPMorgan Growth Advantage Fund, the Russell 3000 Growth Index and the Lipper Multi-Cap Growth Funds Index from June 30, 2003 to June 30, 2013. The performance of the Fund assumes reinvestment of all dividends and capital gain distributions, if any, and includes a sales charge. The performance of the Russell 3000 Growth Index does not reflect the deduction of expenses or a sales charge associated with a mutual fund and has been adjusted to reflect reinvestment of all dividends and capital gain distributions of the securities included in the benchmark, if applicable. The performance of the Lipper Multi-Cap Growth Funds Index includes expenses associated with a mutual fund, such as investment management fees. These expenses are not identical to the expenses incurred by the Fund. The Russell 3000 Growth Index is an unmanaged index which measures the performance of those Russell 3000 Index companies (largest 3000 U.S. companies) with higher price-to-book ratios and higher forecasted growth values. The Lipper Multi-Cap Growth Funds Index is an index based on total returns of certain mutual funds within the Fund’s designated category as determined by Lipper, Inc. Investors cannot invest directly in an index.
Class A Shares have a $1,000 minimum initial investment and carry a 5.25% sales charge.
Fund performance may reflect the waiver of the Fund’s fees and reimbursement of expenses for certain periods since the inception date. Without these waivers and reimbursements, performance would have been lower. Also,
| 4 | J.P. MORGAN MID CAP/MULTI-CAP FUNDS | JUNE 30, 2013 | ||||
Table of Contents
performance shown in this section does not reflect the deduction of taxes that a shareholder would pay on Fund distributions or redemption of Fund shares.
Because Class B Shares automatically convert to Class A Shares after 8 years, the 10 year annual average total return shown above for Class B reflects Class A performance for the period after conversion.
The returns shown are based on net asset values calculated for shareholder transactions and may differ from the returns shown in the financial highlights, which reflect adjustments made to the net asset values in accordance with accounting principles generally accepted in the United States of America.
| JUNE 30, 2013 | J.P. MORGAN MID CAP/MULTI-CAP FUNDS | 5 | ||||||
Table of Contents
FUND COMMENTARY
TWELVE MONTHS ENDED JUNE 30, 2013 (Unaudited)
| REPORTING PERIOD RETURN: | ||||
| Fund (Select Class Shares)* | 22.79% | |||
| Russell Midcap Index | 25.41% | |||
| Net Assets as of 6/30/2013 (In Thousands) | $ | 863,420 | ||
INVESTMENT OBJECTIVE**
The JPMorgan Mid Cap Core Fund (the “Fund”) seeks long-term capital appreciation.
WHAT WERE THE MAIN DRIVERS OF THE FUND’S PERFORMANCE?
The Fund (Select Class Shares) underperformed the Russell Midcap Index (the “Benchmark”) for the twelve months ended June 30, 2013. The Fund’s stock selection in the producer durables and energy sectors detracted from relative performance. The Fund’s stock selection in the financial services and consumer discretionary sectors contributed to relative performance.
Individual detractors from relative performance included the Fund’s positions in Devon Energy Corp., MICROS Systems, Inc. and UnitedHealth Group, Inc. Devon Energy Corp. was adversely affected by weaker natural gas prices, as evidenced by three straight quarters of asset write-downs by the company. MICROS Systems, Inc., a global designer, manufacturer, marketer and servicer of enterprise information solutions for the global hospitality and retail industries, announced a new President and Chief Executive amid challenging business conditions. Shares of insurer UnitedHealth Group, Inc. traded modestly lower in the face of an uncertain regulatory environment for the managed care industry. The Fund sold its UnitedHealth Group position in March 2013.
Individual contributors to relative performance included the Fund’s positions in Patterson-UTI Energy, Inc., Jarden Corp. and Coventry Health Care, Inc. Patterson-UTI Energy, Inc., which provides drilling services for oil and gas companies, benefited from increased demand. Jarden Corp., which owns over 100 well-known consumer brands, was rewarded for strong earnings and its shareholder-friendly approach to capital allocation, as highlighted by its $500 million share buyback program. Shares of national insurer Coventry Health Care, Inc. traded higher as the company agreed in the third quarter of 2012 to be acquired by Aetna at a 20% premium.
HOW WAS THE FUND POSITIONED?
The Fund’s portfolio managers employed a bottom-up approach to stock selection, constructing a portfolio based on company fundamentals, quantitative screening and proprietary fundamental analysis. The Fund’s portfolio managers invested
in companies that, in their view, had leading competitive advantages, predictable and durable business models, sustainable free cash flow generation and management teams committed to increasing shareholder value.
A change in the portfolio management team in February 2013 resulted in higher turnover during the reporting period. There was no material change to the Fund’s investment strategy or objective.
| TOP TEN EQUITY HOLDINGS OF THE PORTFOLIO*** | ||||||||
| 1. | Amphenol Corp., Class A | 1.6 | % | |||||
| 2. | Xilinx, Inc. | 1.4 | ||||||
| 3. | Sherwin-Williams Co. (The) | 1.3 | ||||||
| 4. | Carlisle Cos., Inc. | 1.3 | ||||||
| 5. | O’Reilly Automotive, Inc. | 1.3 | ||||||
| 6. | Williams-Sonoma, Inc. | 1.3 | ||||||
| 7. | Marriott International, Inc., Class A | 1.3 | ||||||
| 8. | T. Rowe Price Group, Inc. | 1.2 | ||||||
| 9. | M&T Bank Corp. | 1.1 | ||||||
| 10. | MSC Industrial Direct Co., Inc., Class A | 1.1 | ||||||
PORTFOLIO COMPOSITION BY SECTOR*** | ||||
| Consumer Discretionary | 22.0 | % | ||
| Financials | 18.8 | |||
| Industrials | 14.9 | |||
| Information Technology | 13.6 | |||
| Health Care | 10.0 | |||
| Materials | 5.5 | |||
| Energy | 5.4 | |||
| Utilities | 4.6 | |||
| Consumer Staples | 3.0 | |||
| Telecommunication Services | 0.2 | |||
| Short-Term Investment | 2.0 | |||
| * | The return shown is based on net asset values calculated for shareholder transactions and may differ from the return shown in the financial highlights, which reflects adjustments made to the net asset values in accordance with accounting principles generally accepted in the United States of America. |
| ** | The advisor seeks to achieve the Fund’s objective. There can be no guarantee it will be achieved. |
| *** | Percentages indicated are based on total investments as of June 30, 2013. The Fund’s portfolio composition is subject to change. |
| 6 | J.P. MORGAN MID CAP/MULTI-CAP FUNDS | JUNE 30, 2013 | ||||
Table of Contents
AVERAGE ANNUAL TOTAL RETURNS AS OF JUNE 30, 2013 | ||||||||||||
| INCEPTION DATE OF CLASS | 1 YEAR | SINCE INCEPTION | ||||||||||
CLASS A SHARES | 11/30/10 | |||||||||||
Without Sales Charge | 22.45 | % | 13.98 | % | ||||||||
With Sales Charge* | 16.03 | 11.63 | ||||||||||
CLASS C SHARES | 11/30/10 | |||||||||||
Without CDSC | 21.82 | 13.41 | ||||||||||
With CDSC** | 20.82 | 13.41 | ||||||||||
CLASS R2 SHARES | 11/30/10 | 22.13 | 13.68 | |||||||||
CLASS R5 SHARES | 11/30/10 | 22.95 | 14.49 | |||||||||
CLASS R6 SHARES | 1/31/11 | 23.01 | 14.53 | |||||||||
SELECT CLASS SHARES | 11/30/10 | 22.79 | 14.27 | |||||||||
| * | Sales Charge for Class A Shares is 5.25%. |
| ** | Assumes a 1% CDSC (contingent deferred sales charge) for the one year period and 0% CDSC thereafter. |
LIFE OF FUND PERFORMANCE (11/30/10 TO 6/30/13)
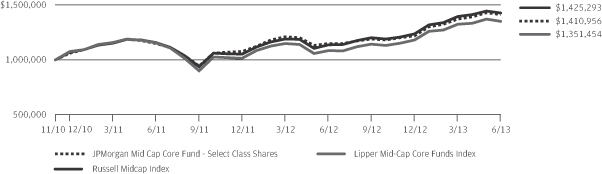
The performance quoted is past performance and is not a guarantee of future results. Mutual funds are subject to certain market risks. Investment returns and principal value of an investment will fluctuate so that an investor’s shares, when redeemed, may be worth more or less than their original cost. Current performance may be higher or lower than the performance data shown. For up-to-date, month-end performance information please call 1-800-480-4111.
The fund commenced operations on November 30, 2010.
Returns for Class R6 Shares prior to its inception date are based on the performance of Class R5 Shares. The actual returns of Class R6 Shares would have been different than those shown because Class R6 Shares have different expenses than Class R5 Shares.
The graph illustrates comparative performance for $1,000,000 invested in Select Class Shares of the JPMorgan Mid Cap Core Fund, the Russell Midcap Index and the Lipper Mid-Cap Core Funds Index from November 30, 2010 to June 30, 2013. The performance of the Fund assumes reinvestment of all dividends and capital gain distributions, if any, and does not include a sales charge. The performance of the Russell Midcap Index does not reflect the deduction of expenses or a sales charge associated with a mutual fund and has been
adjusted to reflect reinvestment of all dividends and capital gain distributions of the securities included in the benchmark, if applicable. The performance of the Lipper Mid-Cap Core Funds Index includes expenses associated with a mutual fund, such as investment management fees. These expenses are not identical to the expenses incurred by the Fund. The Russell Midcap Index is an unmanaged index which measures the performance of the 800 smallest companies in the Russell 1000 Index. The Lipper Mid-Cap Core Funds Index is an index based on total returns of certain mutual funds within the Fund’s designated category as determined by Lipper, Inc. Investors cannot invest directly in an index.
Select Class Shares have a $1,000,000 minimum initial investment.
Fund performance may reflect the waiver of the Fund’s fees and reimbursement of expenses for certain periods since the inception date. Without these waivers and reimbursements, performance would have been lower. Also, performance shown in this section does not reflect the deduction of taxes that a shareholder would pay on Fund distributions or redemption of Fund shares.
The returns shown are based on net asset values calculated for shareholder transactions and may differ from the returns shown in the financial highlights, which reflect adjustments made to the net asset values in accordance with accounting principles generally accepted in the United States of America.
| JUNE 30, 2013 | J.P. MORGAN MID CAP/MULTI-CAP FUNDS | 7 | ||||||
Table of Contents
FUND COMMENTARY
TWELVE MONTHS ENDED JUNE 30, 2013 (Unaudited)
| REPORTING PERIOD RETURN: | ||||
| Fund (Select Class Shares)* | 24.51% | |||
| Russell Midcap Index | 25.41% | |||
| Net Assets as of 6/30/2013 (In Thousands) | $ | 960,227 | ||
INVESTMENT OBJECTIVE**
The JPMorgan Mid Cap Equity Fund (the “Fund”) seeks long-term capital growth.
WHAT WERE THE MAIN DRIVERS OF THE FUND’S PERFORMANCE?
The Fund (Select Class Shares) underperformed the Russell Midcap Index (the “Benchmark”) for the twelve months ended June 30, 2013. The Fund’s stock selection in the technology and consumer staples sectors was the main detractor from relative performance. The Fund’s stock selection in the financial services and health care sectors contributed to relative performance.
Individual detractors from relative performance included F5 Networks, Inc., Sprint Nextel Corp. and PetSmart, Inc. F5 Networks, Inc. is a leader in application delivery networking. Its shares traded lower after three straight quarters of underperforming revenue expectations. Not owning telecommunications holding company Sprint Nextel Corp. detracted from the Fund’s relative performance as its shares performed well during the reporting period. Shares of specialty pet supply retailer PetSmart, Inc. were slightly negative during the reporting period and significantly lagged the Benchmark. The company came under pressure in the first quarter of 2013, as momentum in the business showed signs of slowing, as evidenced by its reduced 2013 outlook. In addition, during the first quarter of 2013, its Chief Executive Officer and Chief Financial Officer announced their plans to retire, further weighing on the stock.
Individual contributors to relative performance included FleetCor Technologies, Inc., Valeant Pharmaceuticals International, Inc. and Telsa Motors, Inc. Shares of FleetCor Technologies, Inc., a global provider of fuel cards and workforce payment products, rose as the company was rewarded for its strong organic growth and consistently surpassing earnings expectations over the last four quarters. Valeant Pharmaceuticals International, Inc. benefited as it executed well on its core strategy, which is focused on generating strong organic growth, coupled with accretive and highly strategic acquisitions. Tesla Motors, Inc. manufactures electric cars and electric vehicle powertrain components. It experienced a breakout second quarter of 2013 as the company proved it was a successful new entrant into the automotive industry. The company was ramping up production of its
Model S luxury electric sedan and appeared to be getting into positive free cash flow territory. Later in the quarter, the company paid back its initial Department of Energy loan by issuing equity after a significant rally in its stock.
HOW WAS THE FUND POSITIONED?
The Fund’s portfolio managers employed a bottom-up approach to stock selection, constructing a portfolio based on company fundamentals, quantitative screening and proprietary fundamental analysis. The Fund’s portfolio managers sought to identify dominant franchises with predictable business models deemed capable of achieving, in their view, sustained growth, as well as undervalued companies with the potential to grow their intrinsic value per share.
| TOP TEN EQUITY HOLDINGS OF THE PORTFOLIO*** | ||||||||
| 1. | Amphenol Corp., Class A | 1.6 | % | |||||
| 2. | Xilinx, Inc. | 1.4 | ||||||
| 3. | Sherwin-Williams Co. (The) | 1.3 | ||||||
| 4. | Carlisle Cos., Inc. | 1.3 | ||||||
| 5. | Marriott International, Inc., Class A | 1.3 | ||||||
| 6. | Williams-Sonoma, Inc. | 1.3 | ||||||
| 7. | O’Reilly Automotive, Inc. | 1.2 | ||||||
| 8. | T. Rowe Price Group, Inc. | 1.2 | ||||||
| 9. | M&T Bank Corp. | 1.1 | ||||||
| 10. | MSC Industrial Direct Co., Inc., Class A | 1.1 | ||||||
PORTFOLIO COMPOSITION BY SECTOR*** | ||||
| Consumer Discretionary | 21.7 | % | ||
| Financials | 18.6 | |||
| Industrials | 14.8 | |||
| Information Technology | 13.5 | |||
| Health Care | 9.9 | |||
| Energy | 6.0 | |||
| Materials | 5.6 | |||
| Utilities | 4.6 | |||
| Consumer Staples | 2.9 | |||
| Telecommunication Services | 0.2 | |||
| Short-Term Investment | 2.2 | |||
| * | The return shown is based on net asset values calculated for shareholder transactions and may differ from the return shown in the financial highlights, which reflects adjustments made to the net asset values in accordance with accounting principles generally accepted in the United States of America. |
| ** | The advisor seeks to achieve the Fund’s objective. There can be no guarantee it will be achieved. |
| *** | Percentages indicated are based on total investments as of June 30, 2013. The Fund’s portfolio composition is subject to change. |
| 8 | J.P. MORGAN MID CAP/MULTI-CAP FUNDS | JUNE 30, 2013 | ||||
Table of Contents
AVERAGE ANNUAL TOTAL RETURNS AS OF JUNE 30, 2013 | ||||||||||||||||
| INCEPTION DATE OF CLASS | 1 YEAR | 5 YEAR | 10 YEAR | |||||||||||||
CLASS A SHARES | 11/2/09 | |||||||||||||||
Without Sales Charge | 24.07 | % | 8.02 | % | 9.93 | % | ||||||||||
With Sales Charge* | 17.54 | 6.85 | 9.34 | |||||||||||||
CLASS C SHARES | 11/2/09 | |||||||||||||||
Without CDSC | 23.44 | 7.62 | 9.73 | |||||||||||||
With CDSC** | 22.44 | 7.62 | 9.73 | |||||||||||||
SELECT CLASS SHARES | 1/1/97 | 24.51 | 8.29 | 10.07 | ||||||||||||
| * | Sales Charge for Class A Shares is 5.25%. |
| ** | Assumes a 1% CDSC (contingent deferred sales charge) for the one year period and 0% CDSC thereafter. |
TEN YEAR PERFORMANCE (6/30/03 TO 6/30/13)
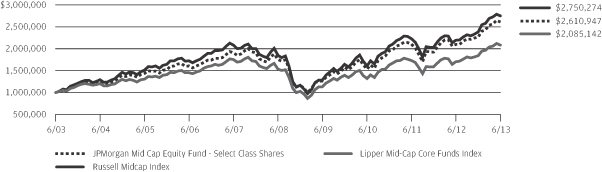
The performance quoted is past performance and is not a guarantee of future results. Mutual funds are subject to certain market risks. Investment returns and principal value of an investment will fluctuate so that an investor’s shares, when redeemed, may be worth more or less than their original cost. Current performance may be higher or lower than the performance data shown. For up-to-date month-end performance information please call 1-800-480-4111.
Returns for Class A and Class C Shares prior to their inception date are based on the performance of Select Class Shares. The actual returns of Class A and Class C Shares would have been lower than those shown because Class A and Class C Shares have higher expenses than Select Class Shares.
The graph illustrates comparative performance for $1,000,000 invested in the Select Class Shares of JPMorgan Mid Cap Equity Fund, the Russell Midcap Index and the Lipper Mid-Cap Core Funds Index from June 30, 2003 to June 30, 2013. The performance of the Fund assumes reinvestment of all dividends and capital gain distributions, if any, and does not include a sales charge. The performance of the Russell Midcap Index does not reflect the deduction of expenses or a sales charge associated with a mutual fund and has been adjusted to reflect reinvestment of all dividends and capital gain distributions of the securities
included in the benchmark, if applicable. The performance of the Lipper Mid-Cap Core Funds Index includes expenses associated with a mutual fund, such as investment management fees. These expenses are not identical to the expenses incurred by the Fund. The Russell Midcap Index is an unmanaged index which measures the performance of the 800 smallest companies in the Russell 1000 Index. The Lipper Mid-Cap Core Funds Index is an index based on total returns of certain mutual funds within the Fund’s designated category as determined by Lipper, Inc. Investors cannot invest directly in an index.
Select Class Shares have a $1,000,000 minimum initial investment.
Fund performance may reflect the waiver of the Fund’s fees and reimbursement of expenses for certain periods since the inception date. Without these waivers and reimbursements, performance would have been lower. Also, performance shown in this section does not reflect the deduction of taxes that a shareholder would pay on Fund distributions or redemption of Fund shares.
The returns shown are based on net asset values calculated for shareholder transactions and may differ from the returns shown in the financial highlights, which reflect adjustments made to the net asset values in accordance with accounting principles generally accepted in the United States of America.
| JUNE 30, 2013 | J.P. MORGAN MID CAP/MULTI-CAP FUNDS | 9 | ||||||
Table of Contents
FUND COMMENTARY
TWELVE MONTHS ENDED JUNE 30, 2013 (Unaudited)
| REPORTING PERIOD RETURN: | ||||
| Fund (Select Class Shares)* | 23.76% | |||
| Russell Midcap Growth Index | 22.88% | |||
| Net Assets as of 6/30/2013 (In Thousands) | $ | 1,577,797 | ||
INVESTMENT OBJECTIVE**
The JPMorgan Mid Cap Growth Fund (the “Fund”) seeks growth of capital and secondarily, current income by investing primarily in equity securities.
WHAT WERE THE MAIN DRIVERS OF THE FUND’S PERFORMANCE?
The Fund (Select Class Shares) outperformed the Russell
Midcap Growth Index (the “Benchmark”) for the twelve months ended June 30, 2013. The Fund’s stock selection in the financial services and health care sectors contributed to relative performance. The Fund’s stock selection in the technology and consumer staples sectors detracted from relative performance.
Individual contributors to relative performance included the Fund’s positions in FleetCor Technologies, Inc., Valeant Pharmaceuticals International, Inc. and Tesla Motors, Inc. FleetCor Technologies, Inc., a global payments solutions provider in the transportation sector, was a net contributor as the company continued to have organic growth and make progress on improving its recent acquisitions in international markets where the industry is in its infancy of development. Shares of Valeant Pharmaceuticals International, Inc. continued to benefit from solid execution on the firm’s core strategy, including the announced acquisition of Bausch and Lomb, which could be a highly accretive deal set to close later this year. Tesla Motors, Inc., an electric car maker, released strong first quarter 2013 results, as the company showed that it was a successful new entrant into the automotive industry. The company ramped up production of its technology-leading Model S luxury electric sedan, and appeared to be moving into positive free cash flow territory.
Individual detractors from relative performance included an overweight in F5 Networks, Inc., a leader in application delivery networking, and two companies that the Fund did not own during the reporting period, Delphi Automotive PLC, a multinational automotive parts manufacturing company, and Netflix, Inc., a provider of on-demand Internet streaming media and DVD delivery services. F5 Networks, Inc. has struggled as its price to earnings multiple has fallen as investors have questioned the validity of its growth rate. Shares of Delphi Automotive PLC and Netflix, Inc. performed well on strong execution of their business plans and not owning them, therefore,was detrimental to the Fund’s relative performance.
HOW WAS THE FUND POSITIONED?
The Fund’s portfolio managers utilized a bottom-up approach to stock selection, researching individual companies in an effort to construct a portfolio of stocks that have strong fundamentals. The Fund’s portfolio managers sought to invest in high quality companies with durable franchises that, in their view, possessed the ability to generate strong future earnings growth.
| TOP TEN EQUITY HOLDINGS OF THE PORTFOLIO*** | ||||||||
| 1. | O’Reilly Automotive, Inc. | 2.6 | % | |||||
| 2. | Sherwin-Williams Co. (The) | 2.1 | ||||||
| 3. | Alliance Data Systems Corp. | 1.9 | ||||||
| 4. | Harley-Davidson, Inc. | 1.8 | ||||||
| 5. | Michael Kors Holdings Ltd. | 1.8 | ||||||
| 6. | Pall Corp. | 1.8 | ||||||
| 7. | Valeant Pharmaceuticals International, Inc. | 1.8 | ||||||
| 8. | Avago Technologies Ltd. | 1.7 | ||||||
| 9. | Amphenol Corp., Class A | 1.7 | ||||||
| 10. | J.B. Hunt Transport Services, Inc. | 1.7 | ||||||
PORTFOLIO COMPOSITION BY SECTOR*** | ||||
| Consumer Discretionary | 22.4 | % | ||
| Industrials | 20.0 | |||
| Information Technology | 18.7 | |||
| Health Care | 15.1 | |||
| Financials | 10.5 | |||
| Energy | 6.6 | |||
| Materials | 3.6 | |||
| Consumer Staples | 1.4 | |||
| Short-Term Investment | 1.7 | |||
| * | The return shown is based on net asset values calculated for shareholder transactions and may differ from the return shown in the financial highlights, which reflects adjustments made to the net asset values in accordance with accounting principles generally accepted in the United States of America. |
| ** | The advisor seeks to achieve the Fund’s objective. There can be no guarantee it will be achieved. |
| *** | Percentages indicated are based on total investments as of June 30, 2013. The Fund’s portfolio composition is subject to change. |
| 10 | J.P. MORGAN MID CAP/MULTI-CAP FUNDS | JUNE 30, 2013 | ||||
Table of Contents
AVERAGE ANNUAL TOTAL RETURNS AS OF JUNE 30, 2013 | ||||||||||||||||
| INCEPTION DATE OF CLASS | 1 YEAR | 5 YEAR | 10 YEAR | |||||||||||||
CLASS A SHARES | 2/18/92 | |||||||||||||||
Without Sales Charge | 23.38 | % | 6.26 | % | 8.72 | % | ||||||||||
With Sales Charge* | 16.91 | 5.13 | 8.13 | |||||||||||||
CLASS B SHARES | 1/14/94 | |||||||||||||||
Without CDSC | 22.70 | 5.69 | 8.17 | |||||||||||||
With CDSC** | 17.70 | 5.37 | 8.17 | |||||||||||||
CLASS C SHARES | 11/4/97 | |||||||||||||||
Without CDSC | 22.72 | 5.69 | 8.06 | |||||||||||||
With CDSC*** | 21.72 | 5.69 | 8.06 | |||||||||||||
CLASS R2 SHARES | 6/19/09 | 23.15 | 6.10 | 8.54 | ||||||||||||
CLASS R5 SHARES | 11/1/11 | 23.92 | 6.64 | 9.05 | ||||||||||||
CLASS R6 SHARES | 11/1/11 | 23.96 | 6.66 | 9.06 | ||||||||||||
SELECT CLASS SHARES | 3/2/89 | 23.76 | 6.59 | 9.02 | ||||||||||||
| * | Sales Charge for Class A Shares is 5.25%. |
| ** | Assumes a 5% CDSC (contingent deferred sales charge) for the one year period, 2% CDSC for the five year period and 0% CDSC thereafter. |
| *** | Assumes a 1% CDSC for the one year period and 0% CDSC thereafter. |
TEN YEAR PERFORMANCE (6/30/03 TO 6/30/13)
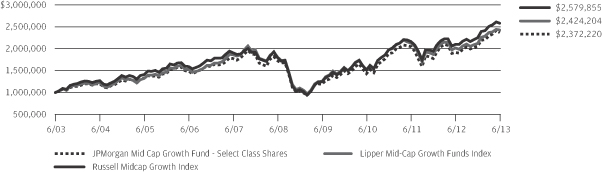
The performance quoted is past performance and is not a guarantee of future results. Mutual funds are subject to certain market risks. Investment returns and principal value of an investment will fluctuate so that an investor’s shares, when redeemed, may be worth more or less than their original cost. Current performance may be higher or lower than the performance data shown. For up-to-date month-end performance information please call 1-800-480-4111.
Returns for the Class R2, Class R5 and Class R6 Shares prior to their inception dates are based on the performance of Select Class Shares. Prior performance for Class R2 Shares has been adjusted to reflect the differences in expenses between classes. The actual returns of Class R5 and Class R6 Shares would have been different than those shown because Class R5 and Class R6 Shares have different expenses than Select Class Shares.
The graph illustrates comparative performance for $1,000,000 invested in Select Class Shares of the JPMorgan Mid Cap Growth Fund, the Russell Midcap Growth Index and the Lipper Mid-Cap Growth Funds Index from June 30, 2003 to June 30, 2013. The performance of the Fund assumes reinvestment of all dividends and capital gain distributions, if any, and does not include a sales charge. The performance of the Russell Midcap Growth Index does not reflect the deduction of expenses or a sales charge associated with a mutual fund and has been adjusted to reflect reinvestment of all dividends and capital gain distributions of the securities included in the benchmark, if applicable. The
performance of the Lipper Mid-Cap Growth Funds Index includes expenses associated with a mutual fund, such as investment management fees. These expenses are not identical to the expenses incurred by the Fund. The Russell Midcap Growth Index is an unmanaged index which measures the performance of those Russell Midcap companies with higher price-to-book ratios and higher forecasted growth values. The Lipper Mid-Cap Growth Funds Index is an index based on total returns of certain mutual funds as determined by Lipper, Inc. Investors cannot invest directly in an index.
Select Class Shares have a $1,000,000 minimum initial investment.
Fund performance may reflect the waiver of the Fund’s fees and reimbursement of expenses for certain periods since the inception date. Without these waivers and reimbursements, performance would have been lower. Also, performance shown in this section does not reflect the deduction of taxes that a shareholder would pay on Fund distributions or redemption of Fund shares.
Because Class B Shares automatically convert to Class A Shares after 8 years, the 10 year average annual total return shown above for Class B reflects Class A performance for the period after conversion.
The returns shown are based on net asset values calculated for shareholder transactions and may differ from the returns shown in the financial highlights, which reflect adjustments made to the net asset values in accordance with accounting principles generally accepted in the United States of America.
| JUNE 30, 2013 | J.P. MORGAN MID CAP/MULTI-CAP FUNDS | 11 | ||||||
Table of Contents
FUND COMMENTARY
TWELVE MONTHS ENDED JUNE 30, 2013 (Unaudited)
| REPORTING PERIOD RETURN: | ||||
| Fund (Institutional Class Shares)* | 25.68% | |||
| Russell Midcap Value Index | 27.65% | |||
| Net Assets as of 6/30/2013 (In Thousands) | $ | 13,262,982 | ||
INVESTMENT OBJECTIVE**
The JPMorgan Mid Cap Value Fund (the “Fund”) seeks growth from capital appreciation.
WHAT WERE THE MAIN DRIVERS OF THE FUND’S PERFORMANCE?
The Fund (Institutional Class Shares) underperformed the
Russell Midcap Value Index (the “Benchmark”) for the twelve months ended June 30, 2013. The Fund’s relative underperformance versus the Benchmark was primarily driven by underweighting and stock selection in the industrials and telecommunications services sectors. The Fund’s stock selection in the financials and health care sectors contributed to relative performance.
Individual detractors from the Fund’s relative performance included three stocks that the Fund did not hold during the reporting period: telecommunications holding company Sprint Nextel Corp., Eaton Corp PLC, a diversified power management company, and Valero Energy Corp., a manufacturer of transportation fuels and other petrochemical products. Stocks of all three companies performed well during the reporting period and not owning them was detrimental to the Fund’s relative performance.
Individual contributors to the Fund’s relative performance during the reporting period included Charles Schwab Corp., PVH Corp. and Williams-Sonoma, Inc. Shares of Charles Schwab Corp., a brokerage and financial services company, rose as investors began shifting assets from cash and fixed income products into equities. PVH Corp., an apparel maker, saw increased growth in its key Asian and Latin American markets. Williams-Sonoma, Inc., a high-end consumer retailer, benefited from the strengthening U.S. housing market.
HOW WAS THE FUND POSITIONED?
The Fund’s portfolio managers utilized a bottom-up approach to stock selection and sought to identify durable franchises possessing the ability to generate, in their view, sustainable levels of free cash flow. The Fund’s portfolio managers believed
that these types of companies should perform relatively well in what they view as a slow but sustainable economic recovery in the U.S.
| TOP TEN EQUITY HOLDINGS OF THE PORTFOLIO*** | ||||||||
| 1. | Marsh & McLennan Cos., Inc. | 1.7 | % | |||||
| 2. | Loews Corp. | 1.7 | ||||||
| 3. | Ball Corp. | 1.7 | ||||||
| 4. | Kohl’s Corp. | 1.6 | ||||||
| 5. | AutoZone, Inc. | 1.5 | ||||||
| 6. | Analog Devices, Inc. | 1.5 | ||||||
| 7. | Ameriprise Financial, Inc. | 1.5 | ||||||
| 8. | Amphenol Corp., Class A | 1.5 | ||||||
| 9. | Fifth Third Bancorp | 1.4 | ||||||
| 10. | Bed Bath & Beyond, Inc. | 1.4 | ||||||
PORTFOLIO COMPOSITION BY SECTOR*** | ||||
| Financials | 26.5 | % | ||
| Consumer Discretionary | 21.2 | |||
| Industrials | 9.7 | |||
| Utilities | 9.2 | |||
| Information Technology | 8.5 | |||
| Materials | 7.5 | |||
| Energy | 5.3 | |||
| Health Care | 4.9 | |||
| Consumer Staples | 4.5 | |||
| Telecommunication Services | 0.3 | |||
| Short-Term Investment | 2.4 | |||
| * | The return shown is based on net asset values calculated for shareholder transactions and may differ from the return shown in the financial highlights, which reflects adjustments made to the net asset values in accordance with accounting principles generally accepted in the United States of America. |
| ** | The advisor seeks to achieve the Fund’s objective. There can be no guarantee it will be achieved. |
| *** | Percentages indicated are based on total investments as of June 30, 2013. The Fund’s portfolio composition is subject to change. |
| 12 | J.P. MORGAN MID CAP/MULTI-CAP FUNDS | JUNE 30, 2013 | ||||
Table of Contents
AVERAGE ANNUAL TOTAL RETURNS AS OF JUNE 30, 2013 | ||||||||||||||||
| INCEPTION DATE OF CLASS | 1 YEAR | 5 YEAR | 10 YEAR | |||||||||||||
CLASS A SHARES | 4/30/01 | |||||||||||||||
Without Sales Charge | 25.06 | % | 9.87 | % | 10.18 | % | ||||||||||
With Sales Charge* | 18.49 | 8.69 | 9.58 | |||||||||||||
CLASS B SHARES | 4/30/01 | |||||||||||||||
Without CDSC | 24.42 | 9.31 | 9.71 | |||||||||||||
With CDSC** | 19.42 | 9.03 | 9.71 | |||||||||||||
CLASS C SHARES | 4/30/01 | |||||||||||||||
Without CDSC | 24.43 | 9.31 | 9.59 | |||||||||||||
With CDSC*** | 23.43 | 9.31 | 9.59 | |||||||||||||
CLASS R2 SHARES | 11/3/08 | 24.71 | 9.60 | 10.04 | ||||||||||||
INSTITUTIONAL CLASS SHARES | 11/13/97 | 25.68 | 10.40 | 10.72 | ||||||||||||
SELECT CLASS SHARES | 10/31/01 | 25.35 | 10.13 | 10.45 | ||||||||||||
| * | Sales Charge for Class A Shares is 5.25%. |
| ** | Assumes a 5% CDSC (contingent deferred sales charge) for the one year period, 2% CDSC for the five year period and 0% CDSC thereafter. |
| *** | Assumes a 1% CDSC for the one year period and 0% CDSC thereafter. |
TEN YEAR PERFORMANCE (6/30/03 TO 6/30/13)
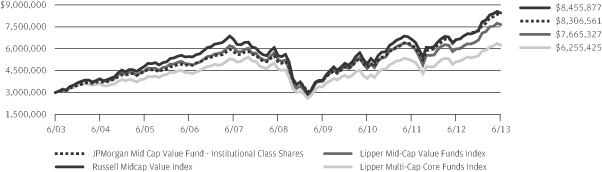
The performance quoted is past performance and is not a guarantee of future results. Mutual funds are subject to certain market risks. Investment returns and principal value of an investment will fluctuate so that an investor’s shares, when redeemed, may be worth more or less than their original cost. Current performance may be higher or lower than the performance data shown. For up-to-date month-end performance information please call 1-800-480-4111.
Returns for Class R2 Shares prior to its inception date are based on the performance of Class A Shares. The actual returns of Class R2 Shares would have been lower than those shown because Class R2 Shares have higher expenses than Class A Shares.
The graph illustrates comparative performance for $3,000,000 invested in Institutional Class Shares of the JPMorgan Mid Cap Value Fund, the Russell Midcap Value Index, the Lipper Mid-Cap Value Funds Index and the Lipper Multi-Cap Core Funds Index from June 30, 2003 to June 30, 2013. The performance of the Fund assumes reinvestment of all dividends and capital gain distributions, if any, and does not include a sales charge. The performance of the Russell Midcap Value Index does not reflect the deduction of expenses or a sales charge associated with a mutual fund and has been adjusted to reflect reinvestment of all dividends and capital gain distributions of the securities included in the benchmark, if applicable. The performance of the Lipper Mid-Cap Value Funds Index and the Lipper Multi-Cap Core Funds Index includes
expenses associated with a mutual fund, such as investment management fees. These expenses are not identical to the expenses incurred by the Fund. The Russell Midcap Value Index is an unmanaged index which measures the performance of those Russell Midcap companies with lower price-to-book ratios and lower forecasted growth values. The Lipper Mid-Cap Value Funds Index and the Lipper Multi-Cap Core Funds Index are indexes based on total returns of certain groups of mutual funds within the Fund’s designated category as determined by Lipper, Inc. Investors cannot invest directly in an index.
Institutional Class Shares have a $3,000,000 minimum initial investment.
Fund performance may reflect the waiver of the Fund’s fees and reimbursement of expenses for certain periods since the inception date. Without these waivers and reimbursements, performance would have been lower. Also, performance shown in this section does not reflect the deduction of taxes that a shareholder would pay on Fund distributions or redemption of Fund shares.
Because Class B Shares automatically convert to Class A Shares after 8 years, the 10 year average annual total return shown above for Class B reflects Class A performance for the period after conversion.
The returns shown are based on net asset values calculated for shareholder transactions and may differ from the returns shown in the financial highlights, which reflect adjustments made to the net asset values in accordance with accounting principles generally accepted in the United States of America.
| JUNE 30, 2013 | J.P. MORGAN MID CAP/MULTI-CAP FUNDS | 13 | ||||||
Table of Contents
JPMorgan Multi-Cap Market Neutral Fund
FUND COMMENTARY
TWELVE MONTHS ENDED JUNE 30, 2013 (Unaudited)
| REPORTING PERIOD RETURN: | ||||
| Fund (Select Class Shares)* | 1.22% | |||
| BofA Merrill Lynch 3-Month U.S. Treasury Bill Index | 0.11% | |||
| Net Assets as of 6/30/13 (In Thousands) | $ | 343,786 | ||
INVESTMENT OBJECTIVE**
The JPMorgan Multi-Cap Market Neutral Fund (the “Fund”) seeks long-term capital preservation and growth by using strategies designed to produce returns which have no correlation with general domestic market performance.
WHAT WERE THE MAIN DRIVERS OF THE FUND’S PERFORMANCE?
The Fund (Select Class Shares) outperformed the BofA Merrill Lynch 3-Month U.S. Treasury Bill Index for the twelve months ended June 30, 2013.
During the first seven months of the reporting period, the Fund’s stock selection process produced a negative return. The Fund’s quantitative bottom-up stock selection process resulted in negative returns in the consumer, technology and financial sectors and positive returns in the industrial and health care sectors.
Over the last part of the reporting period, the Fund’s stock selection in the consumer staples and health care sectors was the main contributor to relative performance. The Fund’s stock selection in the energy and financials sectors detracted from relative performance.
HOW WAS THE FUND POSITIONED?
Prior to February 2013, the Fund’s portfolio managers ranked stocks within a universe of approximately 1,300 large cap, mid cap and small cap stocks and sought to go long on what they perceived to be inexpensive stocks with improving fundamentals and short on expensive stocks with deteriorating fundamentals. The portfolio management team changed in February 2013 and since that time the new team has employed a bottom up approach to stock selection, constructing a portfolio based on company fundamentals, quantitative screening and proprietary fundamental analysis. The Fund’s portfolio managers sought to identify dominant franchises with predictable business models deemed capable of achieving, in their
view, sustained growth, as well as undervalued companies with the potential to grow their intrinsic value per share.
The Fund attempts to neutralize exposure to general domestic market risk by primarily investing in common stocks that the Fund’s portfolio managers consider to be attractive and “short selling” stocks that they consider to be unattractive. The Fund intends to maintain approximately equal value exposure in its long and short positions in order to offset the effects on its performance resulting from general domestic stock market movements or sector swings. By using this strategy, the Fund seeks to generate returns independent of the direction of the stock market.
| TOP TEN LONG POSITIONS OF THE PORTFOLIO*** | ||||||||
| 1. | CareFusion Corp. | 1.0 | % | |||||
| 2. | AECOM Technology Corp. | 1.0 | ||||||
| 3. | Amdocs Ltd. | 1.0 | ||||||
| 4. | UGI Corp. | 1.0 | ||||||
| 5. | Staples, Inc. | 1.0 | ||||||
| 6. | Dillard’s, Inc., Class A | 1.0 | ||||||
| 7. | Computer Sciences Corp. | 0.9 | ||||||
| 8. | AES Corp. | 0.9 | ||||||
| 9. | Hewlett-Packard Co. | 0.9 | ||||||
| 10. | Crane Co. | 0.9 | ||||||
| TOP TEN SHORT POSITIONS OF THE PORTFOLIO**** | ||||||||
| 1. | Cooper Cos., Inc. (The) | 1.2 | % | |||||
| 2. | Family Dollar Stores, Inc. | 1.0 | ||||||
| 3. | Caterpillar, Inc. | 1.0 | ||||||
| 4. | Fastenal Co. | 1.0 | ||||||
| 5. | Paychex, Inc. | 1.0 | ||||||
| 6. | Concho Resources, Inc. | 1.0 | ||||||
| 7. | United Natural Foods, Inc. | 0.9 | ||||||
| 8. | Intrepid Potash, Inc. | 0.7 | ||||||
| 9. | DaVita HealthCare Partners, Inc. | 0.7 | ||||||
| 10. | Joy Global, Inc. | 0.7 | ||||||
| 14 | J.P. MORGAN MID CAP/MULTI-CAP FUNDS | JUNE 30, 2013 | ||||
Table of Contents
LONG POSITION PORTFOLIO COMPOSITION BY SECTOR*** | ||||
| Information Technology | 16.3 | % | ||
| Consumer Discretionary | 15.9 | |||
| Industrials | 14.2 | |||
| Health Care | 11.6 | |||
| Financials | 9.3 | |||
| Energy | 7.4 | |||
| Consumer Staples | 7.0 | |||
| Materials | 5.7 | |||
| Utilities | 4.5 | |||
| Others (each less than 1.0%) | 0.5 | |||
| Short-Term Investment | 7.6 | |||
SHORT POSITION PORTFOLIO COMPOSITION BY SECTOR**** | ||||
| Industrials | 16.8 | % | ||
| Consumer Discretionary | 16.1 | |||
| Information Technology | 16.0 | |||
| Health Care | 11.6 | |||
| Financials | 11.0 | |||
| Energy | 9.5 | |||
| Consumer Staples | 7.3 | |||
| Materials | 6.0 | |||
| Utilities | 4.8 | |||
| Telecommunication Services | 0.9 | |||
| * | The return shown is based on net asset values calculated for shareholder transactions and may differ from the return shown in the financial highlights, which reflects adjustments made to the net asset values in accordance with accounting principles generally accepted in the United States of America. |
| ** | The advisor seeks to achieve the Fund’s objective. There can be no guarantee it will be achieved. |
| *** | Percentages indicated are based on total long investments as of June 30, 2013. The Fund’s portfolio composition is subject to change. |
| **** | Percentages indicated are based on total short investments as of June 30, 2013. The Fund’s portfolio composition is subject to change. |
| JUNE 30, 2013 | J.P. MORGAN MID CAP/MULTI-CAP FUNDS | 15 | ||||||
Table of Contents
JPMorgan Multi-Cap Market Neutral Fund
FUND COMMENTARY
TWELVE MONTHS ENDED JUNE 30, 2013 (Unaudited) (continued)
AVERAGE ANNUAL TOTAL RETURNS AS OF JUNE 30, 2013 | ||||||||||||||||
| INCEPTION DATE OF CLASS | 1 YEAR | 5 YEAR | 10 YEAR | |||||||||||||
CLASS A SHARES | 5/23/03 | |||||||||||||||
Without Sales Charge | 1.03 | % | (0.88 | )% | 1.15 | % | ||||||||||
With Sales Charge* | (4.30 | ) | (1.94 | ) | 0.61 | |||||||||||
CLASS B SHARES | 5/23/03 | |||||||||||||||
Without CDSC | 0.32 | (1.62 | ) | 0.56 | ||||||||||||
With CDSC** | (4.68 | ) | (2.05 | ) | 0.56 | |||||||||||
CLASS C SHARES | 5/23/03 | |||||||||||||||
Without CDSC | 0.32 | (1.61 | ) | 0.41 | ||||||||||||
With CDSC*** | (0.68 | ) | (1.61 | ) | 0.41 | |||||||||||
SELECT CLASS SHARES | 5/23/03 | 1.22 | (0.65 | ) | 1.40 | |||||||||||
| * | Sales Charge for Class A Shares is 5.25%. |
| ** | Assumes a 5% CDSC (contingent deferred sales charge) for the one year period, 2% CDSC for the five year period and 0% CDSC thereafter. |
| *** | Assumes a 1% CDSC for the one year period and 0% CDSC thereafter. |
TEN YEAR PERFORMANCE (6/30/03 TO 6/30/13)
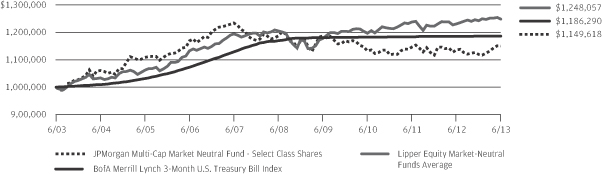
The performance quoted is past performance and is not a guarantee of future results. Mutual funds are subject to certain market risks. Investment returns and principal value of an investment will fluctuate so that an investor’s shares, when redeemed, may be worth more or less than their original cost. Current performance may be higher or lower than the performance data shown. For up-to-date month-end performance information please call 1-800-480-4111.
The graph illustrates comparative performance for $1,000,000 invested in Select Class Shares of the JPMorgan Multi-Cap Market Neutral Fund, the BofA Merrill Lynch 3-Month U.S. Treasury Bill Index and the Lipper Equity Market-Neutral Funds Average from June 30, 2003 to June 30, 2013. The performance of the Fund assumes reinvestment of all dividends and capital gain distributions, if any, and does not include a sales charge. The performance of the indices reflects an initial investment at the end of the month following the Fund’s inception. The performance of the BofA Merrill Lynch 3-Month U.S. Treasury Bill Index does not reflect the deduction of expenses or a sales charge associated with a mutual fund and has been adjusted to reflect reinvestment of all dividends and capital gain distributions of the securities included in the benchmark, if applicable. The performance of the Lipper Equity Market-Neutral Funds Average includes expenses associated with a mutual fund, such as investment management fees. These expenses are not identical to the expenses incurred by the Fund. The BofA Merrill Lynch 3-Month U.S. Treasury Bill Index is
comprised of a single issue purchased at the beginning of the month and held for a full month. Each month the index is rebalanced and the issue selected is the outstanding Treasury Bill that matures closest to, but not beyond, 3 months from the rebalancing date. Investors cannot invest directly in an index. The Lipper Equity Market-Neutral Funds Average is an average based on the total returns of all mutual funds within the Fund’s designated category as determined by Lipper, Inc.
Select Class Shares have a $1,000,000 minimum initial investment.
Fund performance may reflect the waiver of the Fund’s fees and reimbursement of expenses for certain periods since the inception date. Without these waivers and reimbursements, performance would have been lower. Also, performance shown in this section does not reflect the deduction of taxes that a shareholder would pay on Fund distributions or redemption of Fund shares.
Because the Class B Shares automatically convert to Class A Shares after eight years, the since inception average annual total return shown above for Class B reflects Class A performance for the period after conversion.
The returns shown are based on net asset values calculated for shareholder transactions and may differ from the returns shown in the financial highlights, which reflect adjustments made to the net asset values in accordance with accounting principles generally accepted in the United States of America.
| 16 | J.P. MORGAN MID CAP/MULTI-CAP FUNDS | JUNE 30, 2013 | ||||
Table of Contents
FUND COMMENTARY
TWELVE MONTHS ENDED JUNE 30, 2013 (Unaudited)
| REPORTING PERIOD RETURN: | ||||
| Fund (Institutional Class Shares)* | 25.73% | |||
| Russell 3000 Value Index | 25.28% | |||
| Net Assets as of 6/30/2013 (In Thousands) | $ | 3,696,923 | ||
INVESTMENT OBJECTIVE**
The JPMorgan Value Advantage Fund (the “Fund”) seeks to provide long-term total return from a combination of income and capital gains.
WHAT WERE THE MAIN DRIVERS OF THE FUND’S PERFORMANCE?
The Fund (Institutional Class Shares) outperformed the Russell 3000 Value Index (the “Benchmark”) for the twelve months ended June 30, 2013. The Fund’s stock selection in the materials and financials sectors contributed to relative performance. The Fund’s stock selection in the energy and consumer discretionary sectors detracted from relative performance.
Individual contributors to relative performance included the Fund’s positions in Rock-Tenn Co., American International Group, Inc. and Charles Schwab Corp. Shares of Rock-Tenn Co., a container and packaging company, rose on the news that the company would initiate a quarterly dividend to investors. American International Group, Inc., a global insurer, paid back the last of its 2008-09 U.S. government bailout and has emerged, once again, as a major company in the insurance industry. Shares of Charles Schwab Corp., a brokerage and financial services company, rose as investors began shifting assets from cash and fixed income products into equities.
Principal detractors from relative performance included three companies whose stock the Fund did not own during the reporting period: Berkshire Hathaway, Inc., a conglomerate holding company, General Electric Co., a multinational conglomerate corporation, and Chevron Corp., a multinational energy company. Stocks of all three companies performed well during the reporting period and not owning them was detrimental to the Fund’s relative performance.
HOW WAS THE FUND POSITIONED?
The Fund’s portfolio managers utilized a bottom-up approach to stock selection and sought to identify durable franchises possessing the ability to generate, in their view, significant levels of free cash flow. As a result of bottom-up fundamental
research, the Fund was overweight versus the Benchmark in the financials and consumer discretionary sectors.
| TOP TEN EQUITY HOLDINGS OF THE PORTFOLIO*** | ||||||||
| 1. | Exxon Mobil Corp. | 4.1 | % | |||||
| 2. | Wells Fargo & Co. | 3.3 | ||||||
| 3. | Pfizer, Inc. | 2.3 | ||||||
| 4. | Johnson & Johnson | 2.1 | ||||||
| 5. | Loews Corp. | 1.9 | ||||||
| 6. | Capital One Financial Corp. | 1.9 | ||||||
| 7. | Bank of America Corp. | 1.8 | ||||||
| 8. | AutoZone, Inc. | 1.7 | ||||||
| 9. | Procter & Gamble Co. (The) | 1.6 | ||||||
| 10. | American International Group, Inc. | 1.6 | ||||||
PORTFOLIO COMPOSITION BY SECTOR*** | ||||
| Financials | 33.1 | % | ||
| Consumer Discretionary | 15.8 | |||
| Health Care | 10.1 | |||
| Energy | 9.2 | |||
| Utilities | 6.4 | |||
| Information Technology | 5.7 | |||
| Industrials | 5.6 | |||
| Consumer Staples | 4.7 | |||
| Materials | 2.5 | |||
| Telecommunication Services | 1.4 | |||
| Investment Company | 0.2 | |||
| Short-Term Investment | 5.3 | |||
| * | The return shown is based on net asset values calculated for shareholder transactions and may differ from the return shown in the financial highlights, which reflects adjustments made to the net asset values in accordance with accounting principles generally accepted in the United States of America. |
| ** | The advisor seeks to achieve the Fund’s objective. There can be no guarantee it will be achieved. |
| *** | Percentages indicated are based on total investments as of June 30, 2013. The Fund’s portfolio composition is subject to change. |
| JUNE 30, 2013 | J.P. MORGAN MID CAP/MULTI-CAP FUNDS | 17 | ||||||
Table of Contents
FUND COMMENTARY
TWELVE MONTHS ENDED JUNE 30, 2013 (Unaudited) (continued)
AVERAGE ANNUAL TOTAL RETURNS AS OF JUNE 30, 2013 | ||||||||||||||||
| INCEPTION DATE OF CLASS | 1 YEAR | 5 YEAR | SINCE INCEPTION | |||||||||||||
CLASS A SHARES | 2/28/05 | |||||||||||||||
Without Sales Charge | 25.09 | % | 10.06 | % | 8.36 | % | ||||||||||
With Sales Charge* | 18.50 | 8.88 | 7.66 | |||||||||||||
CLASS C SHARES | 2/28/05 | |||||||||||||||
Without CDSC | 24.45 | 9.52 | 7.82 | |||||||||||||
With CDSC** | 23.45 | 9.52 | 7.82 | |||||||||||||
INSTITUTIONAL CLASS SHARES | 2/28/05 | 25.73 | 10.63 | 8.84 | ||||||||||||
SELECT CLASS SHARES | 2/28/05 | 25.38 | 10.34 | 8.64 | ||||||||||||
| * | Sales Charge for Class A Shares is 5.25%. |
| ** | Assumes a 1% CDSC (contingent deferred sales charge) for the one year period and 0% CDSC thereafter. |
LIFE OF FUND PERFORMANCE (2/28/05 TO 6/30/13)
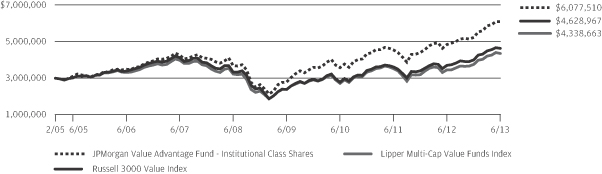
The performance quoted is past performance and is not a guarantee of future results. Mutual funds are subject to certain market risks. Investment returns and principal value of an investment will fluctuate so that an investor’s shares, when redeemed, may be worth more or less than their original cost. Current performance may be higher or lower than the performance data shown. For up-to-date month-end performance information please call 1-800-480-4111.
The Fund commenced operations on February 28, 2005.
The graph illustrates comparative performance for $3,000,000 invested in Institutional Class Shares of the JPMorgan Value Advantage Fund, the Russell 3000 Value Index and the Lipper Multi-Cap Value Funds Index from February 28, 2005 to June 30, 2013. The performance of the Fund assumes reinvestment of all dividends and capital gain distributions, if any, and does not include a sales charge. The performance of the Russell 3000 Value Index does not reflect the deduction of expenses or a sales charge associated with a mutual fund and has been adjusted to reflect reinvestment of all dividends and capital gain distributions of the securities included in the benchmark, if applicable. The performance of the Lipper Multi-Cap Value Funds Index includes expenses associated with a mutual fund, such as investment management fees. These expenses are not identical to the expenses incurred by the Fund. The
Russell 3000 Value Index is an unmanaged index which measures the performance of those Russell 3000 companies (largest 3000 U.S. companies) with lower price-to-book ratios and lower forecasted growth values. The Lipper Multi-Cap Value Funds Index is an index based on total returns of certain mutual funds within the Fund’s designated category as determined by Lipper, Inc. Investors cannot invest directly in an index.
Institutional Class Shares have a $3,000,000 minimum initial investment.
Fund performance may reflect the waiver of the Fund’s fees and reimbursement of expenses for certain periods since the inception date. Without these waivers and reimbursements, performance would have been lower. Also, performance shown in this section does not reflect the deduction of taxes that a shareholder would pay on Fund distributions or redemption of Fund shares.
The returns shown are based on net asset values calculated for shareholder transactions and may differ from the returns shown in the financial highlights, which reflect adjustments made to the net asset values in accordance with accounting principles generally accepted in the United States of America.
| 18 | J.P. MORGAN MID CAP/MULTI-CAP FUNDS | JUNE 30, 2013 | ||||
Table of Contents
JPMorgan Growth Advantage Fund
SCHEDULE OF PORTFOLIO INVESTMENTS
AS OF JUNE 30, 2013
(Amounts in thousands)
| SHARES | SECURITY DESCRIPTION | VALUE($) | ||||||
| Common Stocks — 97.4% |
| ||||||
Consumer Discretionary — 19.8% | ||||||||
Automobiles — 2.0% |
| |||||||
| 515 | Harley-Davidson, Inc. | 28,232 | ||||||
| 117 | Tesla Motors, Inc. (a) | 12,527 | ||||||
|
| |||||||
| 40,759 | ||||||||
|
| |||||||
Diversified Consumer Services — 0.6% |
| |||||||
| 346 | Sotheby’s | 13,105 | ||||||
|
| |||||||
Hotels, Restaurants & Leisure — 2.5% |
| |||||||
| 686 | Apollo Global Management LLC, Class A | 16,539 | ||||||
| 360 | Las Vegas Sands Corp. | 19,028 | ||||||
| 353 | Marriott International, Inc., Class A | 14,239 | ||||||
|
| |||||||
| 49,806 | ||||||||
|
| |||||||
Internet & Catalog Retail — 2.8% |
| |||||||
| 143 | Amazon.com, Inc. (a) | 39,682 | ||||||
| 20 | priceline.com, Inc. (a) | 16,212 | ||||||
|
| |||||||
| 55,894 | ||||||||
|
| |||||||
Media — 2.5% |
| |||||||
| 363 | DIRECTV (a) | 22,362 | ||||||
| 431 | Walt Disney Co. (The) | 27,205 | ||||||
|
| |||||||
| 49,567 | ||||||||
|
| |||||||
Specialty Retail — 5.6% |
| |||||||
| 519 | Home Depot, Inc. (The) | 40,215 | ||||||
| 260 | O’Reilly Automotive, Inc. (a) | 29,292 | ||||||
| 261 | Ross Stores, Inc. | 16,915 | ||||||
| 444 | Williams-Sonoma, Inc. | 24,793 | ||||||
|
| |||||||
| 111,215 | ||||||||
|
| |||||||
Textiles, Apparel & Luxury Goods — 3.8% |
| |||||||
| 305 | Lululemon Athletica, Inc., (Canada) (a) | 19,997 | ||||||
| 520 | Michael Kors Holdings Ltd., (Hong Kong) (a) | 32,263 | ||||||
| 440 | Wolverine World Wide, Inc. | 24,017 | ||||||
|
| |||||||
| 76,277 | ||||||||
|
| |||||||
Total Consumer Discretionary | 396,623 | |||||||
|
| |||||||
Consumer Staples — 0.8% |
| |||||||
Food Products — 0.8% |
| |||||||
| 756 | Dean Foods Co. (a) | 7,578 | ||||||
| 193 | WhiteWave Foods Co., Class A (a) | 3,140 | ||||||
| 275 | WhiteWave Foods Co., Class B (a) | 4,182 | ||||||
|
| |||||||
Total Consumer Staples | 14,900 | |||||||
|
| |||||||
Energy — 4.6% |
| |||||||
Energy Equipment & Services — 2.1% |
| |||||||
| 232 | Dril-Quip, Inc. (a) | 20,911 | ||||||
| 297 | Oceaneering International, Inc. | 21,458 | ||||||
|
| |||||||
| 42,369 | ||||||||
|
| |||||||
| SHARES | SECURITY DESCRIPTION | VALUE($) | ||||||
Oil, Gas & Consumable Fuels — 2.5% |
| |||||||
| 275 | Cabot Oil & Gas Corp. | 19,531 | ||||||
| 198 | Concho Resources, Inc. (a) | 16,585 | ||||||
| 227 | Phillips 66 | 13,390 | ||||||
|
| |||||||
| 49,506 | ||||||||
|
| |||||||
Total Energy | 91,875 | |||||||
|
| |||||||
Financials — 7.8% |
| |||||||
Capital Markets — 1.3% |
| |||||||
| 375 | Lazard Ltd., (Bermuda), Class A | 12,053 | ||||||
| 184 | T. Rowe Price Group, Inc. | 13,489 | ||||||
|
| |||||||
| 25,542 | ||||||||
|
| |||||||
Commercial Banks — 1.9% |
| |||||||
| 192 | M&T Bank Corp. | 21,501 | ||||||
| 203 | Signature Bank (a) | 16,869 | ||||||
|
| |||||||
| 38,370 | ||||||||
|
| |||||||
Diversified Financial Services — 1.1% |
| |||||||
| 350 | Moody’s Corp. | 21,313 | ||||||
|
| |||||||
Insurance — 3.2% |
| |||||||
| 358 | ACE Ltd., (Switzerland) | 32,007 | ||||||
| 867 | Amtrust Financial Services, Inc. | 30,949 | ||||||
|
| |||||||
| 62,956 | ||||||||
|
| |||||||
Real Estate Management & Development — 0.3% |
| |||||||
| 283 | CBRE Group, Inc., Class A (a) | 6,611 | ||||||
|
| |||||||
Total Financials | 154,792 | |||||||
|
| |||||||
Health Care — 16.7% |
| |||||||
Biotechnology — 8.9% |
| |||||||
| 375 | Aegerion Pharmaceuticals, Inc. (a) | 23,771 | ||||||
| 240 | Biogen Idec, Inc. (a) | 51,605 | ||||||
| 936 | Exact Sciences Corp. (a) | 13,017 | ||||||
| 752 | Gilead Sciences, Inc. (a) | 38,495 | ||||||
| 196 | Onyx Pharmaceuticals, Inc. (a) | 21,353 | ||||||
| 70 | Regeneron Pharmaceuticals, Inc. (a) | 15,629 | ||||||
| 180 | Vertex Pharmaceuticals, Inc. (a) | 14,369 | ||||||
|
| |||||||
| 178,239 | ||||||||
|
| |||||||
Health Care Equipment & Supplies — 0.5% |
| |||||||
| 728 | Novadaq Technologies, Inc., (Canada) (a) | 9,795 | ||||||
|
| |||||||
Health Care Providers & Services — 2.5% |
| |||||||
| 663 | Acadia Healthcare Co., Inc. (a) | 21,925 | ||||||
| 440 | UnitedHealth Group, Inc. | 28,798 | ||||||
|
| |||||||
| 50,723 | ||||||||
|
| |||||||
Life Sciences Tools & Services — 2.2% |
| |||||||
| 515 | Agilent Technologies, Inc. | 22,013 | ||||||
SEE NOTES TO FINANCIAL STATEMENTS.
| JUNE 30, 2013 | J.P. MORGAN MID CAP/MULTI-CAP FUNDS | 19 | ||||||
Table of Contents
JPMorgan Growth Advantage Fund
SCHEDULE OF PORTFOLIO INVESTMENTS
AS OF JUNE 30, 2013 (continued)
(Amounts in thousands)
| SHARES | SECURITY DESCRIPTION | VALUE($) | ||||||
| Common Stocks — Continued |
| ||||||
Life Sciences Tools & Services — Continued |
| |||||||
| 279 | Illumina, Inc. (a) | 20,910 | ||||||
|
| |||||||
| 42,923 | ||||||||
|
| |||||||
Pharmaceuticals — 2.6% |
| |||||||
| 216 | Allergan, Inc. | 18,187 | ||||||
| 392 | Valeant Pharmaceuticals International, Inc. (a) | 33,735 | ||||||
|
| |||||||
| 51,922 | ||||||||
|
| |||||||
Total Health Care | 333,602 | |||||||
|
| |||||||
Industrials — 17.4% |
| |||||||
Aerospace & Defense — 1.3% |
| |||||||
| 112 | Precision Castparts Corp. | 25,336 | ||||||
|
| |||||||
Airlines — 0.6% |
| |||||||
| 705 | Delta Air Lines, Inc. (a) | 13,190 | ||||||
|
| |||||||
Building Products — 1.1% |
| |||||||
| 576 | Fortune Brands Home & Security, Inc. | 22,318 | ||||||
|
| |||||||
Construction & Engineering — 1.0% |
| |||||||
| 352 | Fluor Corp. | 20,859 | ||||||
|
| |||||||
Electrical Equipment — 1.8% |
| |||||||
| 264 | Acuity Brands, Inc. | 19,945 | ||||||
| 427 | Generac Holdings, Inc. | 15,785 | ||||||
|
| |||||||
| 35,730 | ||||||||
|
| |||||||
Industrial Conglomerates — 1.4% |
| |||||||
| 455 | Carlisle Cos., Inc. | 28,320 | ||||||
|
| |||||||
Machinery — 1.6% |
| |||||||
| 472 | Pall Corp. | 31,342 | ||||||
|
| |||||||
Marine — 1.1% |
| |||||||
| 276 | Kirby Corp. (a) | 21,985 | ||||||
|
| |||||||
Road & Rail — 3.3% |
| |||||||
| 154 | Canadian Pacific Railway Ltd., (Canada) | 18,668 | ||||||
| 405 | J.B. Hunt Transport Services, Inc. | 29,279 | ||||||
| 430 | Old Dominion Freight Line, Inc. (a) | 17,911 | ||||||
|
| |||||||
| 65,858 | ||||||||
|
| |||||||
Trading Companies & Distributors — 4.2% |
| |||||||
| 736 | Air Lease Corp. | 20,295 | ||||||
| 979 | HD Supply Holdings, Inc. (a) | 18,401 | ||||||
| 254 | MSC Industrial Direct Co., Inc., Class A | 19,636 | ||||||
| 484 | Rush Enterprises, Inc., Class A (a) | 11,972 | ||||||
| 160 | Watsco, Inc. | 13,459 | ||||||
|
| |||||||
| 83,763 | ||||||||
|
| |||||||
Total Industrials | 348,701 | |||||||
|
| |||||||
| SHARES | SECURITY DESCRIPTION | VALUE($) | ||||||
Information Technology — 27.7% |
| |||||||
Communications Equipment — 1.0% |
| |||||||
| 612 | Aruba Networks, Inc. (a) | 9,402 | ||||||
| 240 | Palo Alto Networks, Inc. (a) | 10,097 | ||||||
|
| |||||||
| 19,499 | ||||||||
|
| |||||||
Computers & Peripherals — 3.6% |
| |||||||
| 182 | Apple, Inc. | 72,225 | ||||||
|
| |||||||
Electronic Equipment, Instruments & Components — 1.2% |
| |||||||
| 302 | Amphenol Corp., Class A | 23,499 | ||||||
|
| |||||||
Internet Software & Services — 8.5% |
| |||||||
| 785 | Dealertrack Technologies, Inc. (a) | 27,795 | ||||||
| 553 | eBay, Inc. (a) | 28,575 | ||||||
| 97 | Google, Inc., Class A (a) | 84,956 | ||||||
| 96 | LinkedIn Corp., Class A (a) | 17,063 | ||||||
| 199 | OpenTable, Inc. (a) | 12,752 | ||||||
|
| |||||||
| 171,141 | ||||||||
|
| |||||||
IT Services — 5.7% |
| |||||||
| 140 | Alliance Data Systems Corp. (a) | 25,417 | ||||||
| 299 | FleetCor Technologies, Inc. (a) | 24,276 | ||||||
| 50 | MasterCard, Inc., Class A | 28,955 | ||||||
| 195 | Visa, Inc., Class A | 35,581 | ||||||
|
| |||||||
| 114,229 | ||||||||
|
| |||||||
Semiconductors & Semiconductor Equipment — 4.2% |
| |||||||
| 2,074 | Applied Materials, Inc. | 30,919 | ||||||
| 867 | Avago Technologies Ltd., (Singapore) | 32,416 | ||||||
| 591 | Broadcom Corp., Class A | 19,955 | ||||||
|
| |||||||
| 83,290 | ||||||||
|
| |||||||
Software — 3.5% |
| |||||||
| 414 | Infoblox, Inc. (a) | 12,122 | ||||||
| 320 | Red Hat, Inc. (a) | 15,317 | ||||||
| 379 | Salesforce.com, Inc. (a) | 14,486 | ||||||
| 284 | Splunk, Inc. (a) | 13,152 | ||||||
| 243 | Workday, Inc., Class A (a) | 15,542 | ||||||
|
| |||||||
| 70,619 | ||||||||
|
| |||||||
Total Information Technology | 554,502 | |||||||
|
| |||||||
Materials — 2.6% |
| |||||||
Chemicals — 2.6% |
| |||||||
| 141 | PPG Industries, Inc. | 20,658 | ||||||
| 182 | Sherwin-Williams Co. (The) | 32,106 | ||||||
|
| |||||||
Total Materials | 52,764 | |||||||
|
| |||||||
Total Common Stocks | 1,947,759 | |||||||
|
| |||||||
SEE NOTES TO FINANCIAL STATEMENTS.
| 20 | J.P. MORGAN MID CAP/MULTI-CAP FUNDS | JUNE 30, 2013 | ||||
Table of Contents
| SHARES | SECURITY DESCRIPTION | VALUE($) | ||||||
| Short-Term Investment — 3.9% | |||||||
Investment Company — 3.9% | ||||||||
| 77,133 | JPMorgan Prime Money Market Fund, Institutional Class Shares, 0.030% (b) (l) (m) | 77,133 | ||||||
|
| |||||||
Total Investments — 101.3% | 2,024,892 | |||||||
Liabilities in Excess of | (25,470 | ) | ||||||
|
| |||||||
NET ASSETS — 100.0% | $ | 1,999,422 | ||||||
|
| |||||||
Percentages indicated are based on net assets.
SEE NOTES TO FINANCIAL STATEMENTS.
| JUNE 30, 2013 | J.P. MORGAN MID CAP/MULTI-CAP FUNDS | 21 | ||||||
Table of Contents
JPMorgan Mid Cap Core Fund
SCHEDULE OF PORTFOLIO INVESTMENTS
AS OF JUNE 30, 2013
(Amounts in thousands)
| SHARES | SECURITY DESCRIPTION | VALUE($) | ||||||
| Common Stocks — 98.0% |
| ||||||
Consumer Discretionary — 22.0% |
| |||||||
Automobiles — 1.3% |
| |||||||
| 146 | Harley-Davidson, Inc. | 7,984 | ||||||
| 31 | Tesla Motors, Inc. (a) | 3,352 | ||||||
|
| |||||||
| 11,336 | ||||||||
|
| |||||||
Distributors — 0.4% |
| |||||||
| 47 | Genuine Parts Co. | 3,648 | ||||||
|
| |||||||
Hotels, Restaurants & Leisure — 2.6% |
| |||||||
| 40 | Darden Restaurants, Inc. | 2,030 | ||||||
| 269 | Marriott International, Inc., Class A | 10,849 | ||||||
| 49 | Wynn Resorts Ltd. | 6,234 | ||||||
| 53 | Yum! Brands, Inc. | 3,703 | ||||||
|
| |||||||
| 22,816 | ||||||||
|
| |||||||
Household Durables — 1.3% |
| |||||||
| 41 | Jarden Corp. (a) | 1,784 | ||||||
| 84 | Mohawk Industries, Inc. (a) | 9,435 | ||||||
|
| |||||||
| 11,219 | ||||||||
|
| |||||||
Internet & Catalog Retail — 0.8% |
| |||||||
| 69 | Expedia, Inc. | 4,178 | ||||||
| 41 | TripAdvisor, Inc. (a) | 2,498 | ||||||
|
| |||||||
| 6,676 | ||||||||
|
| |||||||
Media — 2.2% |
| |||||||
| 44 | Cablevision Systems Corp., Class A | 741 | ||||||
| 67 | CBS Corp. (Non-Voting), Class B | 3,286 | ||||||
| 108 | Clear Channel Outdoor Holdings, Inc., Class A (a) | 802 | ||||||
| 52 | Discovery Communications, Inc., Class A (a) | 4,015 | ||||||
| 126 | DISH Network Corp., Class A | 5,336 | ||||||
| 59 | Gannett Co., Inc. | 1,446 | ||||||
| 51 | Madison Square Garden Co. (The), Class A (a) | 3,022 | ||||||
|
| |||||||
| 18,648 | ||||||||
|
| |||||||
Multiline Retail — 1.4% |
| |||||||
| 87 | Family Dollar Stores, Inc. | 5,444 | ||||||
| 132 | Kohl’s Corp. | 6,675 | ||||||
|
| |||||||
| 12,119 | ||||||||
|
| |||||||
Specialty Retail — 9.2% |
| |||||||
| 16 | AutoZone, Inc. (a) | 6,659 | ||||||
| 85 | Bed Bath & Beyond, Inc. (a) | 6,026 | ||||||
| 85 | GameStop Corp., Class A | 3,577 | ||||||
| 154 | Gap, Inc. (The) | 6,444 | ||||||
| 130 | GNC Holdings, Inc., Class A | 5,756 | ||||||
| 99 | O’Reilly Automotive, Inc. (a) | 11,093 | ||||||
| 62 | PetSmart, Inc. | 4,163 | ||||||
| 102 | Ross Stores, Inc. | 6,611 | ||||||
| SHARES | SECURITY DESCRIPTION | VALUE($) | ||||||
Specialty Retail — Continued |
| |||||||
| 35 | Tiffany & Co. | 2,579 | ||||||
| 83 | TJX Cos., Inc. | 4,160 | ||||||
| 51 | Tractor Supply Co. | 5,939 | ||||||
| 130 | Urban Outfitters, Inc. (a) | 5,233 | ||||||
| 198 | Williams-Sonoma, Inc. | 11,077 | ||||||
|
| |||||||
| 79,317 | ||||||||
|
| |||||||
Textiles, Apparel & Luxury Goods — 2.8% |
| |||||||
| 73 | Lululemon Athletica, Inc., (Canada) (a) | 4,750 | ||||||
| 127 | Michael Kors Holdings Ltd., (Hong Kong) (a) | 7,858 | ||||||
| 35 | PVH Corp. | 4,360 | ||||||
| 57 | Under Armour, Inc., Class A (a) | 3,374 | ||||||
| 21 | V.F. Corp. | 4,086 | ||||||
|
| |||||||
| 24,428 | ||||||||
|
| |||||||
Total Consumer Discretionary | 190,207 | |||||||
|
| |||||||
Consumer Staples — 3.0% |
| |||||||
Beverages — 1.2% |
| |||||||
| 75 | Beam, Inc. | 4,742 | ||||||
| 32 | Brown-Forman Corp., Class B | 2,145 | ||||||
| 81 | Dr. Pepper Snapple Group, Inc. | 3,713 | ||||||
|
| |||||||
| 10,600 | ||||||||
|
| |||||||
Food Products — 0.9% |
| |||||||
| 45 | Hershey Co. (The) | 4,021 | ||||||
| 12 | JM Smucker Co. (The) | 1,207 | ||||||
| 162 | WhiteWave Foods Co., Class A (a) | 2,629 | ||||||
|
| |||||||
| 7,857 | ||||||||
|
| |||||||
Household Products — 0.5% |
| |||||||
| 38 | Energizer Holdings, Inc. | 3,825 | ||||||
|
| |||||||
Personal Products — 0.4% |
| |||||||
| 162 | Avon Products, Inc. | 3,409 | ||||||
|
| |||||||
Total Consumer Staples | 25,691 | |||||||
|
| |||||||
Energy — 5.4% |
| |||||||
Energy Equipment & Services — 1.0% |
| |||||||
| 61 | Cameron International Corp. (a) | 3,712 | ||||||
| 69 | Oceaneering International, Inc. | 4,982 | ||||||
|
| |||||||
| 8,694 | ||||||||
|
| |||||||
Oil, Gas & Consumable Fuels — 4.4% |
| |||||||
| 91 | Cabot Oil & Gas Corp. | 6,463 | ||||||
| 65 | Concho Resources, Inc. (a) | 5,417 | ||||||
| 72 | Devon Energy Corp. | 3,739 | ||||||
| 57 | EQT Corp. | 4,563 | ||||||
| 91 | PBF Energy, Inc. | 2,350 | ||||||
| 76 | Plains All American Pipeline LP | 4,241 | ||||||
SEE NOTES TO FINANCIAL STATEMENTS.
| 22 | J.P. MORGAN MID CAP/MULTI-CAP FUNDS | JUNE 30, 2013 | ||||
Table of Contents
| SHARES | SECURITY DESCRIPTION | VALUE($) | ||||||
| Common Stocks — Continued |
| ||||||
Oil, Gas & Consumable Fuels — Continued |
| |||||||
| 106 | QEP Resources, Inc. | 2,942 | ||||||
| 53 | Range Resources Corp. | 4,075 | ||||||
| 119 | Williams Cos., Inc. (The) | 3,864 | ||||||
|
| |||||||
| 37,654 | ||||||||
|
| |||||||
Total Energy | 46,348 | |||||||
|
| |||||||
Financials — 18.8% |
| |||||||
Capital Markets — 4.5% |
| |||||||
| 84 | Ameriprise Financial, Inc. | 6,794 | ||||||
| 209 | Blackstone Group LP (The) | 4,399 | ||||||
| 214 | Charles Schwab Corp. (The) | 4,533 | ||||||
| 167 | Invesco Ltd. | 5,312 | ||||||
| 102 | Lazard Ltd., (Bermuda), Class A | 3,279 | ||||||
| 70 | Northern Trust Corp. | 4,039 | ||||||
| 144 | T. Rowe Price Group, Inc. | 10,524 | ||||||
|
| |||||||
| 38,880 | ||||||||
|
| |||||||
Commercial Banks — 4.6% |
| |||||||
| 50 | City National Corp. | 3,162 | ||||||
| 32 | Cullen/Frost Bankers, Inc. | 2,143 | ||||||
| 132 | East West Bancorp, Inc. | 3,625 | ||||||
| 341 | Fifth Third Bancorp | 6,160 | ||||||
| 55 | First Republic Bank | 2,123 | ||||||
| 231 | Huntington Bancshares, Inc. | 1,817 | ||||||
| 88 | M&T Bank Corp. | 9,787 | ||||||
| 50 | Signature Bank (a) | 4,143 | ||||||
| 142 | SunTrust Banks, Inc. | 4,474 | ||||||
| 85 | Zions Bancorporation | 2,467 | ||||||
|
| |||||||
| 39,901 | ||||||||
|
| |||||||
Diversified Financial Services — 0.8% |
| |||||||
| 113 | Moody’s Corp. | 6,867 | ||||||
|
| |||||||
Insurance — 5.7% |
| |||||||
| 10 | Alleghany Corp. (a) | 3,833 | ||||||
| 54 | Aon plc, (United Kingdom) | 3,475 | ||||||
| 115 | Axis Capital Holdings Ltd., (Bermuda) | 5,269 | ||||||
| 49 | Chubb Corp. (The) | 4,118 | ||||||
| 119 | Hartford Financial Services Group, Inc. | 3,664 | ||||||
| 164 | Loews Corp. | 7,264 | ||||||
| 184 | Marsh & McLennan Cos., Inc. | 7,342 | ||||||
| 190 | Old Republic International Corp. | 2,448 | ||||||
| 22 | OneBeacon Insurance Group Ltd., Class A | 311 | ||||||
| 146 | Unum Group | 4,301 | ||||||
| 88 | W.R. Berkley Corp. | 3,599 | ||||||
| 125 | XL Group plc, (Ireland) | 3,786 | ||||||
|
| |||||||
| 49,410 | ||||||||
|
| |||||||
| SHARES | SECURITY DESCRIPTION | VALUE($) | ||||||
Real Estate Investment Trusts (REITs) — 2.2% |
| |||||||
| 171 | Annaly Capital Management, Inc. | 2,154 | ||||||
| 79 | HCP, Inc. | 3,602 | ||||||
| 111 | Kimco Realty Corp. | 2,372 | ||||||
| 86 | Prologis, Inc. | 3,233 | ||||||
| 60 | Regency Centers Corp. | 3,031 | ||||||
| 50 | Vornado Realty Trust | 4,129 | ||||||
|
| |||||||
| 18,521 | ||||||||
|
| |||||||
Real Estate Management & Development — 0.5% |
| |||||||
| 171 | Brookfield Office Properties, Inc. | 2,852 | ||||||
| 62 | CBRE Group, Inc., Class A (a) | 1,446 | ||||||
|
| |||||||
| 4,298 | ||||||||
|
| |||||||
Thrifts & Mortgage Finance — 0.5% |
| |||||||
| 23 | Capitol Federal Financial, Inc. | 279 | ||||||
| 132 | Hudson City Bancorp, Inc. | 1,206 | ||||||
| 181 | People’s United Financial, Inc. | 2,697 | ||||||
|
| |||||||
| 4,182 | ||||||||
|
| |||||||
Total Financials | 162,059 | |||||||
|
| |||||||
Health Care — 10.0% |
| |||||||
Biotechnology — 1.9% |
| |||||||
| 29 | Alexion Pharmaceuticals, Inc. (a) | 2,666 | ||||||
| 48 | Onyx Pharmaceuticals, Inc. (a) | 5,178 | ||||||
| 13 | Regeneron Pharmaceuticals, Inc. (a) | 2,878 | ||||||
| 68 | Vertex Pharmaceuticals, Inc. (a) | 5,455 | ||||||
|
| |||||||
| 16,177 | ||||||||
|
| |||||||
Health Care Equipment & Supplies — 0.9% |
| |||||||
| 87 | CareFusion Corp. (a) | 3,221 | ||||||
| 69 | Sirona Dental Systems, Inc. (a) | 4,552 | ||||||
|
| |||||||
| 7,773 | ||||||||
|
| |||||||
Health Care Providers & Services — 3.9% |
| |||||||
| 70 | AmerisourceBergen Corp. | 3,910 | ||||||
| 172 | Brookdale Senior Living, Inc. (a) | 4,540 | ||||||
| 84 | Cigna Corp. | 6,064 | ||||||
| 29 | DaVita HealthCare Partners, Inc. (a) | 3,467 | ||||||
| 103 | Health Net, Inc. (a) | 3,281 | ||||||
| 33 | Henry Schein, Inc. (a) | 3,182 | ||||||
| 114 | Humana, Inc. | 9,579 | ||||||
|
| |||||||
| 34,023 | ||||||||
|
| |||||||
Life Sciences Tools & Services — 1.8% |
| |||||||
| 151 | Agilent Technologies, Inc. | 6,445 | ||||||
| 175 | Bruker Corp. (a) | 2,826 | ||||||
| 83 | Illumina, Inc. (a) | 6,234 | ||||||
|
| |||||||
| 15,505 | ||||||||
|
| |||||||
SEE NOTES TO FINANCIAL STATEMENTS.
| JUNE 30, 2013 | J.P. MORGAN MID CAP/MULTI-CAP FUNDS | 23 | ||||||
Table of Contents
JPMorgan Mid Cap Core Fund
SCHEDULE OF PORTFOLIO INVESTMENTS
AS OF JUNE 30, 2013 (continued)
(Amounts in thousands)
| SHARES | SECURITY DESCRIPTION | VALUE($) | ||||||
| Common Stocks — Continued |
| ||||||
Pharmaceuticals — 1.5% |
| |||||||
| 44 | Actavis, Inc. (a) | 5,579 | ||||||
| 89 | Valeant Pharmaceuticals International, Inc. (a) | 7,644 | ||||||
|
| |||||||
| 13,223 | ||||||||
|
| |||||||
Total Health Care | 86,701 | |||||||
|
| |||||||
Industrials — 14.9% |
| |||||||
Airlines — 0.6% |
| |||||||
| 299 | Delta Air Lines, Inc. (a) | 5,594 | ||||||
|
| |||||||
Building Products — 1.0% | ||||||||
| 215 | Fortune Brands Home & Security, Inc. | 8,332 | ||||||
|
| |||||||
Commercial Services & Supplies — 0.9% |
| |||||||
| 39 | Republic Services, Inc. | 1,312 | ||||||
| 55 | Stericycle, Inc. (a) | 6,052 | ||||||
|
| |||||||
| 7,364 | ||||||||
|
| |||||||
Construction & Engineering — 0.6% |
| |||||||
| 87 | Fluor Corp. | 5,178 | ||||||
|
| |||||||
Electrical Equipment — 2.3% |
| |||||||
| 61 | Acuity Brands, Inc. | 4,622 | ||||||
| 104 | AMETEK, Inc. | 4,403 | ||||||
| 93 | Generac Holdings, Inc. | 3,457 | ||||||
| 28 | Hubbell, Inc., Class B | 2,798 | ||||||
| 68 | Regal-Beloit Corp. | 4,407 | ||||||
|
| |||||||
| 19,687 | ||||||||
|
| |||||||
Industrial Conglomerates — 1.3% |
| |||||||
| 182 | Carlisle Cos., Inc. | 11,361 | ||||||
|
| |||||||
Machinery — 3.2% |
| |||||||
| 95 | Flowserve Corp. | 5,104 | ||||||
| 93 | IDEX Corp. | 4,978 | ||||||
| 115 | Pall Corp. | 7,666 | ||||||
| 104 | Rexnord Corp. (a) | 1,745 | ||||||
| 53 | Snap-on, Inc. | 4,697 | ||||||
| 68 | Wabtec Corp. | 3,644 | ||||||
|
| |||||||
| 27,834 | ||||||||
|
| |||||||
Marine — 0.6% |
| |||||||
| 66 | Kirby Corp. (a) | 5,258 | ||||||
|
| |||||||
Professional Services — 1.0% |
| |||||||
| 77 | Equifax, Inc. | 4,556 | ||||||
| 123 | Nielsen Holdings N.V. | 4,145 | ||||||
|
| |||||||
| 8,701 | ||||||||
|
| |||||||
Road & Rail — 1.3% |
| |||||||
| 34 | Canadian Pacific Railway Ltd., (Canada) | 4,127 | ||||||
| 99 | J.B. Hunt Transport Services, Inc. | 7,173 | ||||||
|
| |||||||
| 11,300 | ||||||||
|
| |||||||
| SHARES | SECURITY DESCRIPTION | VALUE($) | ||||||
Trading Companies & Distributors — 2.1% |
| |||||||
| 161 | Air Lease Corp. | 4,447 | ||||||
| 214 | HD Supply Holdings, Inc. (a) | 4,019 | ||||||
| 125 | MSC Industrial Direct Co., Inc., Class A | 9,656 | ||||||
|
| |||||||
| 18,122 | ||||||||
|
| |||||||
Total Industrials | 128,731 | |||||||
|
| |||||||
Information Technology — 13.6% |
| |||||||
Communications Equipment — 0.8% |
| |||||||
| 136 | Aruba Networks, Inc. (a) | 2,083 | ||||||
| 38 | F5 Networks, Inc. (a) | 2,621 | ||||||
| 63 | Palo Alto Networks, Inc. (a) | 2,660 | ||||||
|
| |||||||
| 7,364 | ||||||||
|
| |||||||
Electronic Equipment, Instruments & Components — 2.3% |
| |||||||
| 173 | Amphenol Corp., Class A | 13,505 | ||||||
| 140 | Arrow Electronics, Inc. (a) | 5,584 | ||||||
| 48 | CDW Corp. (a) | 899 | ||||||
|
| |||||||
| 19,988 | ||||||||
|
| |||||||
Internet Software & Services — 1.5% |
| |||||||
| 105 | Akamai Technologies, Inc. (a) | 4,459 | ||||||
| 30 | LinkedIn Corp., Class A (a) | 5,420 | ||||||
| 44 | OpenTable, Inc. (a) | 2,833 | ||||||
|
| |||||||
| 12,712 | ||||||||
|
| |||||||
IT Services — 2.7% |
| |||||||
| 44 | Alliance Data Systems Corp. (a) | 8,038 | ||||||
| 130 | CoreLogic, Inc. (a) | 3,007 | ||||||
| 81 | FleetCor Technologies, Inc. (a) | 6,602 | ||||||
| 117 | Jack Henry & Associates, Inc. | 5,536 | ||||||
|
| |||||||
| 23,183 | ||||||||
|
| |||||||
Semiconductors & Semiconductor Equipment — 4.3% |
| |||||||
| 141 | Analog Devices, Inc. | 6,364 | ||||||
| 374 | Applied Materials, Inc. | 5,575 | ||||||
| 202 | Avago Technologies Ltd., (Singapore) | 7,558 | ||||||
| 101 | KLA-Tencor Corp. | 5,618 | ||||||
| 297 | Xilinx, Inc. | 11,747 | ||||||
|
| |||||||
| 36,862 | ||||||||
|
| |||||||
Software — 2.0% |
| |||||||
| 96 | Red Hat, Inc. (a) | 4,591 | ||||||
| 50 | SolarWinds, Inc. (a) | 1,948 | ||||||
| 70 | Splunk, Inc. (a) | 3,236 | ||||||
| 114 | Synopsys, Inc. (a) | 4,087 | ||||||
| 54 | Workday, Inc., Class A (a) | 3,435 | ||||||
|
| |||||||
| 17,297 | ||||||||
|
| |||||||
Total Information Technology | 117,406 | |||||||
|
| |||||||
SEE NOTES TO FINANCIAL STATEMENTS.
| 24 | J.P. MORGAN MID CAP/MULTI-CAP FUNDS | JUNE 30, 2013 | ||||
Table of Contents
| SHARES | SECURITY DESCRIPTION | VALUE($) | ||||||
| Common Stocks — Continued |
| ||||||
Materials — 5.5% |
| |||||||
Chemicals — 3.7% |
| |||||||
| 52 | Airgas, Inc. | 4,928 | ||||||
| 81 | Albemarle Corp. | 5,066 | ||||||
| 43 | PPG Industries, Inc. | 6,354 | ||||||
| 65 | Sherwin-Williams Co. (The) | 11,548 | ||||||
| 53 | Sigma-Aldrich Corp. | 4,281 | ||||||
|
| |||||||
| 32,177 | ||||||||
|
| |||||||
Containers & Packaging — 1.8% |
| |||||||
| 175 | Ball Corp. | 7,254 | ||||||
| 40 | Rock Tenn Co., Class A | 3,998 | ||||||
| 92 | Silgan Holdings, Inc. | 4,305 | ||||||
|
| |||||||
| 15,557 | ||||||||
|
| |||||||
Total Materials | 47,734 | |||||||
|
| |||||||
Telecommunication Services — 0.2% |
| |||||||
Wireless Telecommunication Services — 0.2% |
| |||||||
| 51 | Telephone & Data Systems, Inc. | 1,266 | ||||||
|
| |||||||
Utilities — 4.6% |
| |||||||
Electric Utilities — 1.6% |
| |||||||
| 87 | Edison International | 4,171 | ||||||
| 46 | NV Energy, Inc. | 1,082 | ||||||
| 136 | Westar Energy, Inc. | 4,360 | ||||||
| 159 | Xcel Energy, Inc. | 4,492 | ||||||
|
| |||||||
| 14,105 | ||||||||
|
| |||||||
| SHARES | SECURITY DESCRIPTION | VALUE($) | ||||||
Gas Utilities — 0.3% |
| |||||||
| 109 | Questar Corp. | 2,600 | ||||||
|
| |||||||
Multi-Utilities — 2.7% |
| |||||||
| 188 | CenterPoint Energy, Inc. | 4,418 | ||||||
| 166 | CMS Energy Corp. | 4,509 | ||||||
| 173 | NiSource, Inc. | 4,962 | ||||||
| 68 | Sempra Energy | 5,599 | ||||||
| 89 | Wisconsin Energy Corp. | 3,655 | ||||||
|
| |||||||
| 23,143 | ||||||||
|
| |||||||
Total Utilities | 39,848 | |||||||
|
| |||||||
Total Common Stocks | 845,991 | |||||||
|
| |||||||
| Short-Term Investment — 2.0% |
| ||||||
Investment Company — 2.0% |
| |||||||
| 17,356 | JPMorgan Prime Money Market Fund, Institutional Class Shares, 0.030% (b) (l) (m) | 17,356 | ||||||
|
| |||||||
Total Investments — 100.0% | 863,347 | |||||||
Other Assets in Excess of | 73 | |||||||
|
| |||||||
NET ASSETS — 100.0% | $ | 863,420 | ||||||
|
| |||||||
Percentages indicated are based on net assets.
SEE NOTES TO FINANCIAL STATEMENTS.
| JUNE 30, 2013 | J.P. MORGAN MID CAP/MULTI-CAP FUNDS | 25 | ||||||
Table of Contents
JPMorgan Mid Cap Equity Fund
SCHEDULE OF PORTFOLIO INVESTMENTS
AS OF JUNE 30, 2013
(Amounts in thousands)
| SHARES | SECURITY DESCRIPTION | VALUE($) | ||||||
| Common Stocks — 97.4% |
| ||||||
Consumer Discretionary — 21.6% |
| |||||||
Automobiles — 1.3% |
| |||||||
| 158 | Harley-Davidson, Inc. | 8,672 | ||||||
| 34 | Tesla Motors, Inc. (a) | 3,653 | ||||||
|
| |||||||
| 12,325 | ||||||||
|
| |||||||
Distributors — 0.4% |
| |||||||
| 52 | Genuine Parts Co. | 4,062 | ||||||
|
| |||||||
Hotels, Restaurants & Leisure — 2.6% |
| |||||||
| 43 | Darden Restaurants, Inc. | 2,179 | ||||||
| 299 | Marriott International, Inc., Class A | 12,055 | ||||||
| 55 | Wynn Resorts Ltd. | 6,976 | ||||||
| 53 | Yum! Brands, Inc. | 3,700 | ||||||
|
| |||||||
| 24,910 | ||||||||
|
| |||||||
Household Durables — 1.3% |
| |||||||
| 49 | Jarden Corp. (a) | 2,154 | ||||||
| 92 | Mohawk Industries, Inc. (a) | 10,352 | ||||||
|
| |||||||
| 12,506 | ||||||||
|
| |||||||
Internet & Catalog Retail — 0.8% |
| |||||||
| 76 | Expedia, Inc. | 4,585 | ||||||
| 46 | TripAdvisor, Inc. (a) | 2,782 | ||||||
|
| |||||||
| 7,367 | ||||||||
|
| |||||||
Media — 2.1% |
| |||||||
| 51 | Cablevision Systems Corp., Class A | 858 | ||||||
| 72 | CBS Corp. (Non-Voting), Class B | 3,523 | ||||||
| 115 | Clear Channel Outdoor Holdings, Inc., Class A (a) | 859 | ||||||
| 57 | Discovery Communications, Inc., Class A (a) | 4,363 | ||||||
| 142 | DISH Network Corp., Class A | 6,042 | ||||||
| 59 | Gannett Co., Inc. | 1,444 | ||||||
| 54 | Madison Square Garden Co. (The), Class A (a) | 3,211 | ||||||
|
| |||||||
| 20,300 | ||||||||
|
| |||||||
Multiline Retail — 1.4% |
| |||||||
| 96 | Family Dollar Stores, Inc. | 5,982 | ||||||
| 150 | Kohl’s Corp. | 7,566 | ||||||
|
| |||||||
| 13,548 | ||||||||
|
| |||||||
Specialty Retail — 9.0% |
| |||||||
| 18 | AutoZone, Inc. (a) | 7,550 | ||||||
| 96 | Bed Bath & Beyond, Inc. (a) | 6,828 | ||||||
| 94 | GameStop Corp., Class A | 3,930 | ||||||
| 162 | Gap, Inc. (The) | 6,777 | ||||||
| 142 | GNC Holdings, Inc., Class A | 6,256 | ||||||
| 105 | O’Reilly Automotive, Inc. (a) | 11,780 | ||||||
| 70 | PetSmart, Inc. | 4,670 | ||||||
| 110 | Ross Stores, Inc. | 7,142 | ||||||
| SHARES | SECURITY DESCRIPTION | VALUE($) | ||||||
Specialty Retail — Continued |
| |||||||
| 39 | Tiffany & Co. | 2,835 | ||||||
| 89 | TJX Cos., Inc. | 4,464 | ||||||
| 54 | Tractor Supply Co. | 6,304 | ||||||
| 141 | Urban Outfitters, Inc. (a) | 5,687 | ||||||
| 215 | Williams-Sonoma, Inc. | 12,011 | ||||||
|
| |||||||
| 86,234 | ||||||||
|
| |||||||
Textiles, Apparel & Luxury Goods — 2.7% |
| |||||||
| 79 | Lululemon Athletica, Inc., (Canada) (a) | 5,166 | ||||||
| 136 | Michael Kors Holdings Ltd., (Hong Kong) (a) | 8,447 | ||||||
| 39 | PVH Corp. | 4,931 | ||||||
| 60 | Under Armour, Inc., Class A (a) | 3,582 | ||||||
| 22 | V.F. Corp. | 4,294 | ||||||
|
| |||||||
| 26,420 | ||||||||
|
| |||||||
Total Consumer Discretionary | 207,672 | |||||||
|
| |||||||
Consumer Staples — 2.9% |
| |||||||
Beverages — 1.2% |
| |||||||
| 82 | Beam, Inc. | 5,188 | ||||||
| 36 | Brown-Forman Corp., Class B | 2,414 | ||||||
| 88 | Dr. Pepper Snapple Group, Inc. | 4,064 | ||||||
|
| |||||||
| 11,666 | ||||||||
|
| |||||||
Food Products — 0.9% |
| |||||||
| 48 | Hershey Co. (The) | 4,309 | ||||||
| 13 | JM Smucker Co. (The) | 1,300 | ||||||
| 176 | WhiteWave Foods Co., Class A (a) | 2,857 | ||||||
|
| |||||||
| 8,466 | ||||||||
|
| |||||||
Household Products — 0.4% |
| |||||||
| 42 | Energizer Holdings, Inc. | 4,191 | ||||||
|
| |||||||
Personal Products — 0.4% |
| |||||||
| 178 | Avon Products, Inc. | 3,739 | ||||||
|
| |||||||
Total Consumer Staples | 28,062 | |||||||
|
| |||||||
Energy — 5.9% |
| |||||||
Energy Equipment & Services — 1.0% |
| |||||||
| 66 | Cameron International Corp. (a) | 4,033 | ||||||
| 75 | Oceaneering International, Inc. | 5,415 | ||||||
|
| |||||||
| 9,448 | ||||||||
|
| |||||||
Oil, Gas & Consumable Fuels — 4.9% |
| |||||||
| 100 | Cabot Oil & Gas Corp. | 7,109 | ||||||
| 70 | Concho Resources, Inc. (a) | 5,886 | ||||||
| 76 | Devon Energy Corp. | 3,935 | ||||||
| 128 | Energen Corp. | 6,666 | ||||||
| 65 | EQT Corp. | 5,161 | ||||||
| 98 | PBF Energy, Inc. | 2,550 | ||||||
SEE NOTES TO FINANCIAL STATEMENTS.
| 26 | J.P. MORGAN MID CAP/MULTI-CAP FUNDS | JUNE 30, 2013 | ||||
Table of Contents
| SHARES | SECURITY DESCRIPTION | VALUE($) | ||||||
| Common Stocks — Continued |
| ||||||
Oil, Gas & Consumable Fuels — Continued |
| |||||||
| 82 | Plains All American Pipeline LP | 4,588 | ||||||
| 119 | QEP Resources, Inc. | 3,319 | ||||||
| 57 | Range Resources Corp. | 4,431 | ||||||
| 125 | Williams Cos., Inc. (The) | 4,063 | ||||||
|
| |||||||
| 47,708 | ||||||||
|
| |||||||
Total Energy | 57,156 | |||||||
|
| |||||||
Financials — 18.6% |
| |||||||
Capital Markets — 4.4% |
| |||||||
| 89 | Ameriprise Financial, Inc. | 7,207 | ||||||
| 227 | Blackstone Group LP (The) | 4,781 | ||||||
| 227 | Charles Schwab Corp. (The) | 4,809 | ||||||
| 184 | Invesco Ltd. | 5,840 | ||||||
| 111 | Lazard Ltd., (Bermuda), Class A | 3,565 | ||||||
| 79 | Northern Trust Corp. | 4,565 | ||||||
| 153 | T. Rowe Price Group, Inc. | 11,210 | ||||||
|
| |||||||
| 41,977 | ||||||||
|
| |||||||
Commercial Banks — 4.6% |
| |||||||
| 50 | City National Corp. | 3,158 | ||||||
| 32 | Cullen/Frost Bankers, Inc. | 2,140 | ||||||
| 145 | East West Bancorp, Inc. | 3,993 | ||||||
| 387 | Fifth Third Bancorp | 6,980 | ||||||
| 63 | First Republic Bank | 2,426 | ||||||
| 264 | Huntington Bancshares, Inc. | 2,077 | ||||||
| 97 | M&T Bank Corp. | 10,795 | ||||||
| 55 | Signature Bank (a) | 4,566 | ||||||
| 160 | SunTrust Banks, Inc. | 5,060 | ||||||
| 96 | Zions Bancorporation | 2,774 | ||||||
|
| |||||||
| 43,969 | ||||||||
|
| |||||||
Diversified Financial Services — 0.8% |
| |||||||
| 123 | Moody’s Corp. | 7,464 | ||||||
|
| |||||||
Insurance — 5.7% |
| |||||||
| 12 | Alleghany Corp. (a) | 4,431 | ||||||
| 59 | Aon plc, (United Kingdom) | 3,771 | ||||||
| 125 | Axis Capital Holdings Ltd., (Bermuda) | 5,727 | ||||||
| 47 | Chubb Corp. (The) | 3,974 | ||||||
| 134 | Hartford Financial Services Group, Inc. | 4,139 | ||||||
| 186 | Loews Corp. | 8,238 | ||||||
| 202 | Marsh & McLennan Cos., Inc. | 8,064 | ||||||
| 214 | Old Republic International Corp. | 2,759 | ||||||
| 23 | OneBeacon Insurance Group Ltd., Class A | 328 | ||||||
| 166 | Unum Group | 4,863 | ||||||
| 96 | W.R. Berkley Corp. | 3,938 | ||||||
| 144 | XL Group plc, (Ireland) | 4,375 | ||||||
|
| |||||||
| 54,607 | ||||||||
|
| |||||||
| SHARES | SECURITY DESCRIPTION | VALUE($) | ||||||
Real Estate Investment Trusts (REITs) — 2.1% |
| |||||||
| 184 | Annaly Capital Management, Inc. | 2,311 | ||||||
| 88 | HCP, Inc. | 3,980 | ||||||
| 119 | Kimco Realty Corp. | 2,546 | ||||||
| 93 | Prologis, Inc. | 3,512 | ||||||
| 67 | Regency Centers Corp. | 3,424 | ||||||
| 60 | Vornado Realty Trust | 4,983 | ||||||
|
| |||||||
| 20,756 | ||||||||
|
| |||||||
Real Estate Management & Development — 0.5% |
| |||||||
| 193 | Brookfield Office Properties, Inc. | 3,220 | ||||||
| 68 | CBRE Group, Inc., Class A (a) | 1,593 | ||||||
|
| |||||||
| 4,813 | ||||||||
|
| |||||||
Thrifts & Mortgage Finance — 0.5% |
| |||||||
| 27 | Capitol Federal Financial, Inc. | 323 | ||||||
| 145 | Hudson City Bancorp, Inc. | 1,324 | ||||||
| 203 | People’s United Financial, Inc. | 3,024 | ||||||
|
| |||||||
| 4,671 | ||||||||
|
| |||||||
Total Financials | 178,257 | |||||||
|
| |||||||
Health Care — 9.9% |
| |||||||
Biotechnology — 1.8% |
| |||||||
| 31 | Alexion Pharmaceuticals, Inc. (a) | 2,896 | ||||||
| 52 | Onyx Pharmaceuticals, Inc. (a) | 5,701 | ||||||
| 14 | Regeneron Pharmaceuticals, Inc. (a) | 3,216 | ||||||
| 75 | Vertex Pharmaceuticals, Inc. (a) | 5,974 | ||||||
|
| |||||||
| 17,787 | ||||||||
|
| |||||||
Health Care Equipment & Supplies — 0.9% |
| |||||||
| 97 | CareFusion Corp. (a) | 3,574 | ||||||
| 75 | Sirona Dental Systems, Inc. (a) | 4,954 | ||||||
|
| |||||||
| 8,528 | ||||||||
|
| |||||||
Health Care Providers & Services — 3.9% |
| |||||||
| 79 | AmerisourceBergen Corp. | 4,420 | ||||||
| 187 | Brookdale Senior Living, Inc. (a) | 4,934 | ||||||
| 90 | Cigna Corp. | 6,497 | ||||||
| 31 | DaVita HealthCare Partners, Inc. (a) | 3,769 | ||||||
| 112 | Health Net, Inc. (a) | 3,564 | ||||||
| 38 | Henry Schein, Inc. (a) | 3,591 | ||||||
| 125 | Humana, Inc. | 10,533 | ||||||
|
| |||||||
| 37,308 | ||||||||
|
| |||||||
Life Sciences Tools & Services — 1.8% |
| |||||||
| 167 | Agilent Technologies, Inc. | 7,158 | ||||||
| 190 | Bruker Corp. (a) | 3,072 | ||||||
| 90 | Illumina, Inc. (a) | 6,749 | ||||||
|
| |||||||
| 16,979 | ||||||||
|
| |||||||
SEE NOTES TO FINANCIAL STATEMENTS.
| JUNE 30, 2013 | J.P. MORGAN MID CAP/MULTI-CAP FUNDS | 27 | ||||||
Table of Contents
JPMorgan Mid Cap Equity Fund
SCHEDULE OF PORTFOLIO INVESTMENTS
AS OF JUNE 30, 2013 (continued)
(Amounts in thousands)
| SHARES | SECURITY DESCRIPTION | VALUE($) | ||||||
| Common Stocks — Continued |
| ||||||
Pharmaceuticals — 1.5% |
| |||||||
| 49 | Actavis, Inc. (a) | 6,134 | ||||||
| 97 | Valeant Pharmaceuticals International, Inc. (a) | 8,307 | ||||||
|
| |||||||
| 14,441 | ||||||||
|
| |||||||
Total Health Care | 95,043 | |||||||
|
| |||||||
Industrials — 14.7% |
| |||||||
Airlines — 0.6% |
| |||||||
| 328 | Delta Air Lines, Inc. (a) | 6,139 | ||||||
|
| |||||||
Building Products — 1.0% |
| |||||||
| 241 | Fortune Brands Home & Security, Inc. | 9,339 | ||||||
|
| |||||||
Commercial Services & Supplies — 0.8% |
| |||||||
| 42 | Republic Services, Inc. | 1,427 | ||||||
| 60 | Stericycle, Inc. (a) | 6,577 | ||||||
|
| |||||||
| 8,004 | ||||||||
|
| |||||||
Construction & Engineering — 0.6% |
| |||||||
| 96 | Fluor Corp. | 5,694 | ||||||
|
| |||||||
Electrical Equipment — 2.2% |
| |||||||
| 67 | Acuity Brands, Inc. | 5,022 | ||||||
| 118 | AMETEK, Inc. | 4,981 | ||||||
| 102 | Generac Holdings, Inc. | 3,783 | ||||||
| 31 | Hubbell, Inc., Class B | 3,089 | ||||||
| 75 | Regal-Beloit Corp. | 4,890 | ||||||
|
| |||||||
| 21,765 | ||||||||
|
| |||||||
Industrial Conglomerates — 1.3% |
| |||||||
| 199 | Carlisle Cos., Inc. | 12,390 | ||||||
|
| |||||||
Machinery — 3.2% |
| |||||||
| 102 | Flowserve Corp. | 5,525 | ||||||
| 101 | IDEX Corp. | 5,455 | ||||||
| 127 | Pall Corp. | 8,443 | ||||||
| 117 | Rexnord Corp. (a) | 1,964 | ||||||
| 59 | Snap-on, Inc. | 5,315 | ||||||
| 75 | Wabtec Corp. | 4,004 | ||||||
|
| |||||||
| 30,706 | ||||||||
|
| |||||||
Marine — 0.6% |
| |||||||
| 72 | Kirby Corp. (a) | 5,719 | ||||||
|
| |||||||
Professional Services — 1.0% |
| |||||||
| 85 | Equifax, Inc. | 5,003 | ||||||
| 134 | Nielsen Holdings N.V. | 4,505 | ||||||
|
| |||||||
| 9,508 | ||||||||
|
| |||||||
Road & Rail — 1.3% |
| |||||||
| 37 | Canadian Pacific Railway Ltd., (Canada) | 4,491 | ||||||
| 108 | J.B. Hunt Transport Services, Inc. | 7,802 | ||||||
|
| |||||||
| 12,293 | ||||||||
|
| |||||||
| SHARES | SECURITY DESCRIPTION | VALUE($) | ||||||
Trading Companies & Distributors — 2.1% |
| |||||||
| 176 | Air Lease Corp. | 4,845 | ||||||
| 236 | HD Supply Holdings, Inc. (a) | 4,442 | ||||||
| 137 | MSC Industrial Direct Co., Inc., Class A | 10,626 | ||||||
|
| |||||||
| 19,913 | ||||||||
|
| |||||||
Total Industrials | 141,470 | |||||||
|
| |||||||
Information Technology — 13.4% |
| |||||||
Communications Equipment — 0.8% |
| |||||||
| 149 | Aruba Networks, Inc. (a) | 2,281 | ||||||
| 41 | F5 Networks, Inc. (a) | 2,849 | ||||||
| 69 | Palo Alto Networks, Inc. (a) | 2,892 | ||||||
|
| |||||||
| 8,022 | ||||||||
|
| |||||||
Electronic Equipment, Instruments & Components — 2.3% |
| |||||||
| 192 | Amphenol Corp., Class A | 14,971 | ||||||
| 154 | Arrow Electronics, Inc. (a) | 6,121 | ||||||
| 53 | CDW Corp. (a) | 994 | ||||||
|
| |||||||
| 22,086 | ||||||||
|
| |||||||
Internet Software & Services — 1.4% |
| |||||||
| 113 | Akamai Technologies, Inc. (a) | 4,825 | ||||||
| 33 | LinkedIn Corp., Class A (a) | 5,866 | ||||||
| 48 | OpenTable, Inc. (a) | 3,044 | ||||||
|
| |||||||
| 13,735 | ||||||||
|
| |||||||
IT Services — 2.7% |
| |||||||
| 49 | Alliance Data Systems Corp. (a) | 8,798 | ||||||
| 141 | CoreLogic, Inc. (a) | 3,267 | ||||||
| 89 | FleetCor Technologies, Inc. (a) | 7,227 | ||||||
| 132 | Jack Henry & Associates, Inc. | 6,219 | ||||||
|
| |||||||
| 25,511 | ||||||||
|
| |||||||
Semiconductors & Semiconductor Equipment — 4.2% |
| |||||||
| 156 | Analog Devices, Inc. | 7,012 | ||||||
| 405 | Applied Materials, Inc. | 6,031 | ||||||
| 220 | Avago Technologies Ltd., (Singapore) | 8,216 | ||||||
| 110 | KLA-Tencor Corp. | 6,149 | ||||||
| 328 | Xilinx, Inc. | 13,007 | ||||||
|
| |||||||
| 40,415 | ||||||||
|
| |||||||
Software — 2.0% |
| |||||||
| 104 | Red Hat, Inc. (a) | 4,988 | ||||||
| 55 | SolarWinds, Inc. (a) | 2,115 | ||||||
| 76 | Splunk, Inc. (a) | 3,514 | ||||||
| 129 | Synopsys, Inc. (a) | 4,622 | ||||||
| 58 | Workday, Inc., Class A (a) | 3,711 | ||||||
|
| |||||||
| 18,950 | ||||||||
|
| |||||||
Total Information Technology | 128,719 | |||||||
|
| |||||||
SEE NOTES TO FINANCIAL STATEMENTS.
| 28 | J.P. MORGAN MID CAP/MULTI-CAP FUNDS | JUNE 30, 2013 | ||||
Table of Contents
| SHARES | SECURITY DESCRIPTION | VALUE($) | ||||||
| Common Stocks — Continued |
| ||||||
Materials — 5.6% |
| |||||||
Chemicals — 3.8% |
| |||||||
| 58 | Airgas, Inc. | 5,579 | ||||||
| 92 | Albemarle Corp. | 5,736 | ||||||
| 48 | PPG Industries, Inc. | 7,086 | ||||||
| 73 | Sherwin-Williams Co. (The) | 12,805 | ||||||
| 60 | Sigma-Aldrich Corp. | 4,842 | ||||||
|
| |||||||
| 36,048 | ||||||||
|
| |||||||
Containers & Packaging — 1.8% |
| |||||||
| 191 | Ball Corp. | 7,942 | ||||||
| 46 | Rock Tenn Co., Class A | 4,620 | ||||||
| 104 | Silgan Holdings, Inc. | 4,871 | ||||||
|
| |||||||
| 17,433 | ||||||||
|
| |||||||
Total Materials | 53,481 | |||||||
|
| |||||||
Telecommunication Services — 0.2% |
| |||||||
Wireless Telecommunication Services — 0.2% |
| |||||||
| 59 | Telephone & Data Systems, Inc. | 1,466 | ||||||
|
| |||||||
Utilities — 4.6% |
| |||||||
Electric Utilities — 1.6% |
| |||||||
| 96 | Edison International | 4,606 | ||||||
| 51 | NV Energy, Inc. | 1,196 | ||||||
| 151 | Westar Energy, Inc. | 4,813 | ||||||
| 175 | Xcel Energy, Inc. | 4,960 | ||||||
|
| |||||||
| 15,575 | ||||||||
|
| |||||||
| SHARES | SECURITY DESCRIPTION | VALUE($) | ||||||
Gas Utilities — 0.3% |
| |||||||
| 120 | Questar Corp. | 2,871 | ||||||
|
| |||||||
Multi-Utilities — 2.7% |
| |||||||
| 213 | CenterPoint Energy, Inc. | 5,000 | ||||||
| 183 | CMS Energy Corp. | 4,978 | ||||||
| 190 | NiSource, Inc. | 5,445 | ||||||
| 74 | Sempra Energy | 6,013 | ||||||
| 103 | Wisconsin Energy Corp. | 4,224 | ||||||
|
| |||||||
| 25,660 | ||||||||
|
| |||||||
Total Utilities | 44,106 | |||||||
|
| |||||||
Total Common Stocks | 935,432 | |||||||
|
| |||||||
| Short-Term Investment — 2.2% | |||||||
Investment Company — 2.2% |
| |||||||
| 20,751 | JPMorgan Prime Money Market Fund, Institutional Class Shares, 0.030% (b) (l) (m) | 20,751 | ||||||
|
| |||||||
Total Investments — 99.6% | 956,183 | |||||||
Other Assets in Excess of | 4,044 | |||||||
|
| |||||||
NET ASSETS — 100.0% | $ | 960,227 | ||||||
|
| |||||||
Percentages indicated are based on net assets.
SEE NOTES TO FINANCIAL STATEMENTS.
| JUNE 30, 2013 | J.P. MORGAN MID CAP/MULTI-CAP FUNDS | 29 | ||||||
Table of Contents
JPMorgan Mid Cap Growth Fund
SCHEDULE OF PORTFOLIO INVESTMENTS
AS OF JUNE 30, 2013
(Amounts in thousands)
| SHARES | SECURITY DESCRIPTION | VALUE($) | ||||||
| Common Stocks — 97.8% |
| ||||||
Consumer Discretionary — 22.3% |
| |||||||
Automobiles — 2.6% |
| |||||||
| 529 | Harley-Davidson, Inc. | 28,984 | ||||||
| 113 | Tesla Motors, Inc. (a) | 12,150 | ||||||
|
| |||||||
| 41,134 | ||||||||
|
| |||||||
Hotels, Restaurants & Leisure — 3.0% |
| |||||||
| 625 | Marriott International, Inc., Class A | 25,231 | ||||||
| 176 | Wynn Resorts Ltd. | 22,515 | ||||||
|
| |||||||
| 47,746 | ||||||||
|
| |||||||
Household Durables — 1.1% |
| |||||||
| 159 | Mohawk Industries, Inc. (a) | 17,841 | ||||||
|
| |||||||
Media — 1.6% |
| |||||||
| 187 | Discovery Communications, Inc., Class A (a) | 14,462 | ||||||
| 181 | Madison Square Garden Co. (The), Class A (a) | 10,712 | ||||||
|
| |||||||
| 25,174 | ||||||||
|
| |||||||
Specialty Retail — 10.3% |
| |||||||
| 303 | GameStop Corp., Class A | 12,752 | ||||||
| 469 | GNC Holdings, Inc., Class A | 20,748 | ||||||
| 356 | O’Reilly Automotive, Inc. (a) | 40,138 | ||||||
| 33 | PetSmart, Inc. | 2,204 | ||||||
| 370 | Ross Stores, Inc. | 23,960 | ||||||
| 180 | Tractor Supply Co. | 21,111 | ||||||
| 469 | Urban Outfitters, Inc. (a) | 18,855 | ||||||
| 405 | Williams-Sonoma, Inc. | 22,613 | ||||||
|
| |||||||
| 162,381 | ||||||||
|
| |||||||
Textiles, Apparel & Luxury Goods — 3.7% |
| |||||||
| 261 | Lululemon Athletica, Inc., (Canada) (a) | 17,100 | ||||||
| 459 | Michael Kors Holdings Ltd., (Hong Kong) (a) | 28,455 | ||||||
| 201 | Under Armour, Inc., Class A (a) | 11,972 | ||||||
|
| |||||||
| 57,527 | ||||||||
|
| |||||||
Total Consumer Discretionary | 351,803 | |||||||
|
| |||||||
Consumer Staples — 1.4% |
| |||||||
Food Products — 0.6% |
| |||||||
| 581 | WhiteWave Foods Co., Class A (a) | 9,445 | ||||||
|
| |||||||
Personal Products — 0.8% |
| |||||||
| 587 | Avon Products, Inc. | 12,334 | ||||||
|
| |||||||
Total Consumer Staples | 21,779 | |||||||
|
| |||||||
Energy — 6.6% |
| |||||||
Energy Equipment & Services — 2.0% |
| |||||||
| 218 | Cameron International Corp. (a) | 13,349 | ||||||
| 249 | Oceaneering International, Inc. | 17,942 | ||||||
|
| |||||||
| 31,291 | ||||||||
|
| |||||||
| SHARES | SECURITY DESCRIPTION | VALUE($) | ||||||
Oil, Gas & Consumable Fuels — 4.6% |
| |||||||
| 331 | Cabot Oil & Gas Corp. | 23,472 | ||||||
| 233 | Concho Resources, Inc. (a) | 19,524 | ||||||
| 275 | Plains All American Pipeline LP | 15,353 | ||||||
| 190 | Range Resources Corp. | 14,675 | ||||||
|
| |||||||
| 73,024 | ||||||||
|
| |||||||
Total Energy | 104,315 | |||||||
|
| |||||||
Financials — 10.4% |
| |||||||
Capital Markets — 3.0% |
| |||||||
| 752 | Blackstone Group LP (The) | 15,841 | ||||||
| 367 | Lazard Ltd., (Bermuda), Class A | 11,796 | ||||||
| 272 | T. Rowe Price Group, Inc. | 19,886 | ||||||
|
| |||||||
| 47,523 | ||||||||
|
| |||||||
Commercial Banks — 2.8% |
| |||||||
| 478 | East West Bancorp, Inc. | 13,142 | ||||||
| 137 | M&T Bank Corp. | 15,343 | ||||||
| 181 | Signature Bank (a) | 15,035 | ||||||
|
| |||||||
| 43,520 | ||||||||
|
| |||||||
Diversified Financial Services — 1.6% |
| |||||||
| 407 | Moody’s Corp. | 24,768 | ||||||
|
| |||||||
Insurance — 2.0% |
| |||||||
| 194 | Aon plc, (United Kingdom) | 12,490 | ||||||
| 415 | Axis Capital Holdings Ltd., (Bermuda) | 18,990 | ||||||
|
| |||||||
| 31,480 | ||||||||
|
| |||||||
Real Estate Investment Trusts (REITs) — 0.7% |
| |||||||
| 308 | Prologis, Inc. | 11,622 | ||||||
|
| |||||||
Real Estate Management & Development — 0.3% |
| |||||||
| 225 | CBRE Group, Inc., Class A (a) | 5,244 | ||||||
|
| |||||||
Total Financials | 164,157 | |||||||
|
| |||||||
Health Care — 15.0% |
| |||||||
Biotechnology — 3.7% |
| |||||||
| 104 | Alexion Pharmaceuticals, Inc. (a) | 9,574 | ||||||
| 172 | Onyx Pharmaceuticals, Inc. (a) | 18,792 | ||||||
| 47 | Regeneron Pharmaceuticals, Inc. (a) | 10,614 | ||||||
| 249 | Vertex Pharmaceuticals, Inc. (a) | 19,848 | ||||||
|
| |||||||
| 58,828 | ||||||||
|
| |||||||
Health Care Equipment & Supplies — 1.0% |
| |||||||
| 249 | Sirona Dental Systems, Inc. (a) | 16,411 | ||||||
|
| |||||||
Health Care Providers & Services — 3.7% |
| |||||||
| 618 | Brookdale Senior Living, Inc. (a) | 16,345 | ||||||
| 103 | DaVita HealthCare Partners, Inc. (a) | 12,466 | ||||||
| 371 | Health Net, Inc. (a) | 11,796 | ||||||
SEE NOTES TO FINANCIAL STATEMENTS.
| 30 | J.P. MORGAN MID CAP/MULTI-CAP FUNDS | JUNE 30, 2013 | ||||
Table of Contents
| SHARES | SECURITY DESCRIPTION | VALUE($) | ||||||
| Common Stocks — Continued |
| ||||||
Health Care Providers & Services — Continued |
| |||||||
| 203 | Humana, Inc. | 17,148 | ||||||
|
| |||||||
| 57,755 | ||||||||
|
| |||||||
Life Sciences Tools & Services — 3.6% |
| |||||||
| 551 | Agilent Technologies, Inc. | 23,541 | ||||||
| 629 | Bruker Corp. (a) | 10,158 | ||||||
| 302 | Illumina, Inc. (a) | 22,602 | ||||||
|
| |||||||
| 56,301 | ||||||||
|
| |||||||
Pharmaceuticals — 3.0% |
| |||||||
| 160 | Actavis, Inc. (a) | 20,246 | ||||||
| 320 | Valeant Pharmaceuticals International, Inc. (a) | 27,554 | ||||||
|
| |||||||
| 47,800 | ||||||||
|
| |||||||
Total Health Care | 237,095 | |||||||
|
| |||||||
Industrials — 19.9% |
| |||||||
Airlines — 1.3% |
| |||||||
| 1,088 | Delta Air Lines, Inc. (a) | 20,355 | ||||||
|
| |||||||
Building Products — 1.1% |
| |||||||
| 457 | Fortune Brands Home & Security, Inc. | 17,716 | ||||||
|
| |||||||
Commercial Services & Supplies — 1.4% |
| |||||||
| 198 | Stericycle, Inc. (a) | 21,829 | ||||||
|
| |||||||
Construction & Engineering — 1.2% |
| |||||||
| 317 | Fluor Corp. | 18,777 | ||||||
|
| |||||||
Electrical Equipment — 1.8% |
| |||||||
| 220 | Acuity Brands, Inc. | 16,629 | ||||||
| 338 | Generac Holdings, Inc. | 12,506 | ||||||
|
| |||||||
| 29,135 | ||||||||
|
| |||||||
Industrial Conglomerates — 1.5% |
| |||||||
| 380 | Carlisle Cos., Inc. | 23,678 | ||||||
|
| |||||||
Machinery — 3.8% |
| |||||||
| 343 | Flowserve Corp. | 18,509 | ||||||
| 418 | Pall Corp. | 27,775 | ||||||
| 248 | Wabtec Corp. | 13,236 | ||||||
|
| |||||||
| 59,520 | ||||||||
|
| |||||||
Marine — 1.2% |
| |||||||
| 238 | Kirby Corp. (a) | 18,946 | ||||||
|
| |||||||
Professional Services — 0.9% |
| |||||||
| 444 | Nielsen Holdings N.V. | 14,924 | ||||||
|
| |||||||
Road & Rail — 2.6% |
| |||||||
| 123 | Canadian Pacific Railway Ltd., (Canada) | 14,881 | ||||||
| 358 | J.B. Hunt Transport Services, Inc. | 25,869 | ||||||
|
| |||||||
| 40,750 | ||||||||
|
| |||||||
| SHARES | SECURITY DESCRIPTION | VALUE($) | ||||||
Trading Companies & Distributors — 3.1% |
| |||||||
| 586 | Air Lease Corp. | 16,168 | ||||||
| 777 | HD Supply Holdings, Inc. (a) | 14,600 | ||||||
| 233 | MSC Industrial Direct Co., Inc., Class A | 18,048 | ||||||
|
| |||||||
| 48,816 | ||||||||
|
| |||||||
Total Industrials | 314,446 | |||||||
|
| |||||||
Information Technology — 18.6% |
| |||||||
Communications Equipment — 1.7% |
| |||||||
| 491 | Aruba Networks, Inc. (a) | 7,546 | ||||||
| 137 | F5 Networks, Inc. (a) | 9,419 | ||||||
| 227 | Palo Alto Networks, Inc. (a) | 9,566 | ||||||
|
| |||||||
| 26,531 | ||||||||
|
| |||||||
Electronic Equipment, Instruments & Components — 1.7% |
| |||||||
| 336 | Amphenol Corp., Class A | 26,188 | ||||||
|
| |||||||
Internet Software & Services — 2.9% |
| |||||||
| 380 | Akamai Technologies, Inc. (a) | 16,147 | ||||||
| 110 | LinkedIn Corp., Class A (a) | 19,631 | ||||||
| 160 | OpenTable, Inc. (a) | 10,245 | ||||||
|
| |||||||
| 46,023 | ||||||||
|
| |||||||
IT Services — 4.1% |
| |||||||
| 162 | Alliance Data Systems Corp. (a) | 29,291 | ||||||
| 467 | CoreLogic, Inc. (a) | 10,811 | ||||||
| 296 | FleetCor Technologies, Inc. (a) | 24,032 | ||||||
|
| |||||||
| 64,134 | ||||||||
|
| |||||||
Semiconductors & Semiconductor Equipment — 5.2% |
| |||||||
| 1,355 | Applied Materials, Inc. | 20,205 | ||||||
| 729 | Avago Technologies Ltd., (Singapore) | 27,257 | ||||||
| 210 | KLA-Tencor Corp. | 11,675 | ||||||
| 595 | Xilinx, Inc. | 23,568 | ||||||
|
| |||||||
| 82,705 | ||||||||
|
| |||||||
Software — 3.0% |
| |||||||
| 346 | Red Hat, Inc. (a) | 16,529 | ||||||
| 180 | SolarWinds, Inc. (a) | 6,982 | ||||||
| 251 | Splunk, Inc. (a) | 11,636 | ||||||
| 194 | Workday, Inc., Class A (a) | 12,421 | ||||||
|
| |||||||
| 47,568 | ||||||||
|
| |||||||
Total Information Technology | 293,149 | |||||||
|
| |||||||
Materials — 3.6% |
| |||||||
Chemicals — 3.6% |
| |||||||
| 159 | PPG Industries, Inc. | 23,294 | ||||||
| 187 | Sherwin-Williams Co. (The) | 33,024 | ||||||
|
| |||||||
Total Materials | 56,318 | |||||||
|
| |||||||
Total Common Stocks | 1,543,062 | |||||||
|
| |||||||
SEE NOTES TO FINANCIAL STATEMENTS.
| JUNE 30, 2013 | J.P. MORGAN MID CAP/MULTI-CAP FUNDS | 31 | ||||||
Table of Contents
JPMorgan Mid Cap Growth Fund
SCHEDULE OF PORTFOLIO INVESTMENTS
AS OF JUNE 30, 2013 (continued)
(Amounts in thousands)
| SHARES | SECURITY DESCRIPTION | VALUE($) | ||||||
| Short-Term Investment — 1.7% |
| ||||||
Investment Company — 1.7% |
| |||||||
| 27,053 | JPMorgan Liquid Assets Money Market Fund, Institutional Class Shares, 0.030% (b) (l) (m) | 27,053 | ||||||
|
| |||||||
Total Investments — 99.5% | 1,570,115 | |||||||
Other Assets in Excess of | 7,682 | |||||||
|
| |||||||
NET ASSETS — 100.0% | $ | 1,577,797 | ||||||
|
| |||||||
Percentages indicated are based on net assets.
SEE NOTES TO FINANCIAL STATEMENTS.
| 32 | J.P. MORGAN MID CAP/MULTI-CAP FUNDS | JUNE 30, 2013 | ||||
Table of Contents
JPMorgan Mid Cap Value Fund
SCHEDULE OF PORTFOLIO INVESTMENTS
AS OF JUNE 30, 2013
(Amounts in thousands)
| SHARES | SECURITY DESCRIPTION | VALUE($) | ||||||
| Common Stocks — 97.5% |
| ||||||
Consumer Discretionary — 21.2% |
| |||||||
Distributors — 0.9% |
| |||||||
| 1,441 | Genuine Parts Co. | 112,465 | ||||||
|
| |||||||
Hotels, Restaurants & Leisure — 2.1% |
| |||||||
| 1,211 | Darden Restaurants, Inc. | 61,121 | ||||||
| 2,941 | Marriott International, Inc., Class A | 118,714 | ||||||
| 1,457 | Yum! Brands, Inc. | 100,994 | ||||||
|
| |||||||
| 280,829 | ||||||||
|
| |||||||
Household Durables — 1.5% |
| |||||||
| 1,387 | Jarden Corp. (a) | 60,689 | ||||||
| 1,235 | Mohawk Industries, Inc. (a) | 138,970 | ||||||
|
| |||||||
| 199,659 | ||||||||
|
| |||||||
Internet & Catalog Retail — 1.6% |
| |||||||
| 2,141 | Expedia, Inc. | 128,796 | ||||||
| 1,265 | TripAdvisor, Inc. (a) | 77,018 | ||||||
|
| |||||||
| 205,814 | ||||||||
|
| |||||||
Media — 2.6% |
| |||||||
| 1,360 | Cablevision Systems Corp., Class A | 22,870 | ||||||
| 1,996 | CBS Corp. (Non-Voting), Class B | 97,538 | ||||||
| 3,065 | Clear Channel Outdoor Holdings, Inc., Class A (a) | 22,866 | ||||||
| 3,868 | DISH Network Corp., Class A | 164,487 | ||||||
| 1,574 | Gannett Co., Inc. | 38,510 | ||||||
|
| |||||||
| 346,271 | ||||||||
|
| |||||||
Multiline Retail — 2.8% |
| |||||||
| 2,693 | Family Dollar Stores, Inc. | 167,801 | ||||||
| 4,073 | Kohl’s Corp. | 205,727 | ||||||
|
| |||||||
| 373,528 | ||||||||
|
| |||||||
Specialty Retail — 7.8% |
| |||||||
| 484 | AutoZone, Inc. (a) | 205,234 | ||||||
| 2,620 | Bed Bath & Beyond, Inc. (a) | 185,747 | ||||||
| 4,419 | Gap, Inc. (The) | 184,394 | ||||||
| 1,637 | PetSmart, Inc. | 109,683 | ||||||
| 1,092 | Tiffany & Co. | 79,519 | ||||||
| 2,502 | TJX Cos., Inc. | 125,227 | ||||||
| 2,661 | Williams-Sonoma, Inc. | 148,715 | ||||||
|
| |||||||
| 1,038,519 | ||||||||
|
| |||||||
Textiles, Apparel & Luxury Goods — 1.9% |
| |||||||
| 1,075 | PVH Corp. | 134,435 | ||||||
| 607 | V.F. Corp. | 117,200 | ||||||
|
| |||||||
| 251,635 | ||||||||
|
| |||||||
Total Consumer Discretionary | 2,808,720 | |||||||
|
| |||||||
| SHARES | SECURITY DESCRIPTION | VALUE($) | ||||||
Consumer Staples — 4.5% |
| |||||||
Beverages — 2.4% |
| |||||||
| 2,316 | Beam, Inc. | 146,148 | ||||||
| 979 | Brown-Forman Corp., Class B | 66,134 | ||||||
| 2,492 | Dr. Pepper Snapple Group, Inc. | 114,470 | ||||||
|
| |||||||
| 326,752 | ||||||||
|
| |||||||
Food Products — 1.2% |
| |||||||
| 1,336 | Hershey Co. (The) | 119,322 | ||||||
| 348 | JM Smucker Co. (The) | 35,909 | ||||||
|
| |||||||
| 155,231 | ||||||||
|
| |||||||
Household Products — 0.9% |
| |||||||
| 1,173 | Energizer Holdings, Inc. | 117,918 | ||||||
|
| |||||||
Total Consumer Staples | 599,901 | |||||||
|
| |||||||
Energy — 5.3% |
| |||||||
Oil, Gas & Consumable Fuels — 5.3% |
| |||||||
| 2,068 | Devon Energy Corp. | 107,294 | ||||||
| 3,403 | Energen Corp. | 177,843 | ||||||
| 1,772 | EQT Corp. | 140,644 | ||||||
| 2,756 | PBF Energy, Inc. | 71,389 | ||||||
| 3,265 | QEP Resources, Inc. | 90,700 | ||||||
| 3,410 | Williams Cos., Inc. (The) | 110,739 | ||||||
|
| |||||||
Total Energy | 698,609 | |||||||
|
| |||||||
Financials — 26.5% |
| |||||||
Capital Markets — 5.7% | ||||||||
| 2,408 | Ameriprise Financial, Inc. | 194,786 | ||||||
| 6,236 | Charles Schwab Corp. (The) | 132,401 | ||||||
| 5,140 | Invesco Ltd. | 163,438 | ||||||
| 2,150 | Northern Trust Corp. | 124,496 | ||||||
| 1,902 | T. Rowe Price Group, Inc. | 139,149 | ||||||
|
| |||||||
| 754,270 | ||||||||
|
| |||||||
Commercial Banks — 6.2% |
| |||||||
| 1,329 | City National Corp. | 84,250 | ||||||
| 855 | Cullen/Frost Bankers, Inc. | 57,079 | ||||||
| 10,519 | Fifth Third Bancorp | 189,866 | ||||||
| 1,701 | First Republic Bank | 65,473 | ||||||
| 7,112 | Huntington Bancshares, Inc. | 56,046 | ||||||
| 1,460 | M&T Bank Corp. | 163,100 | ||||||
| 4,368 | SunTrust Banks, Inc. | 137,910 | ||||||
| 2,634 | Zions Bancorporation | 76,069 | ||||||
|
| |||||||
| 829,793 | ||||||||
|
| |||||||
Insurance — 9.3% |
| |||||||
| 308 | Alleghany Corp. (a) | 118,150 | ||||||
| 1,253 | Chubb Corp. (The) | 106,038 | ||||||
SEE NOTES TO FINANCIAL STATEMENTS.
| JUNE 30, 2013 | J.P. MORGAN MID CAP/MULTI-CAP FUNDS | 33 | ||||||
Table of Contents
JPMorgan Mid Cap Value Fund
SCHEDULE OF PORTFOLIO INVESTMENTS
AS OF JUNE 30, 2013 (continued)
(Amounts in thousands)
| SHARES | SECURITY DESCRIPTION | VALUE($) | ||||||
| Common Stocks — Continued |
| ||||||
Insurance — Continued |
| |||||||
| 3,653 | Hartford Financial Services Group, Inc. | 112,958 | ||||||
| 5,042 | Loews Corp. | 223,874 | ||||||
| 5,681 | Marsh & McLennan Cos., Inc. | 226,794 | ||||||
| 5,865 | Old Republic International Corp. | 75,477 | ||||||
| 570 | OneBeacon Insurance Group Ltd., Class A | 8,257 | ||||||
| 4,514 | Unum Group | 132,576 | ||||||
| 2,715 | W.R. Berkley Corp. | 110,936 | ||||||
| 3,850 | XL Group plc, (Ireland) | 116,719 | ||||||
|
| |||||||
| 1,231,779 | ||||||||
|
| |||||||
Real Estate Investment Trusts (REITs) — 3.6% |
| |||||||
| 5,179 | Annaly Capital Management, Inc. | 65,103 | ||||||
| 2,436 | HCP, Inc. | 110,678 | ||||||
| 3,346 | Kimco Realty Corp. | 71,711 | ||||||
| 1,839 | Regency Centers Corp. | 93,453 | ||||||
| 1,694 | Vornado Realty Trust | 140,368 | ||||||
|
| |||||||
| 481,313 | ||||||||
|
| |||||||
Real Estate Management & Development — 0.7% |
| |||||||
| 5,272 | Brookfield Office Properties, Inc. | 87,932 | ||||||
|
| |||||||
Thrifts & Mortgage Finance — 1.0% |
| |||||||
| 708 | Capitol Federal Financial, Inc. | 8,597 | ||||||
| 3,902 | Hudson City Bancorp, Inc. | 35,744 | ||||||
| 5,571 | People’s United Financial, Inc. | 83,003 | ||||||
|
| |||||||
| 127,344 | ||||||||
|
| |||||||
Total Financials | 3,512,431 | |||||||
|
| |||||||
Health Care — 4.9% |
| |||||||
Health Care Equipment & Supplies — 0.8% |
| |||||||
| 2,694 | CareFusion Corp. (a) | 99,280 | ||||||
|
| |||||||
Health Care Providers & Services — 4.1% |
| |||||||
| 2,159 | AmerisourceBergen Corp. | 120,546 | ||||||
| 2,482 | Cigna Corp. | 179,886 | ||||||
| 1,024 | Henry Schein, Inc. (a) | 98,094 | ||||||
| 1,771 | Humana, Inc. | 149,474 | ||||||
|
| |||||||
| 548,000 | ||||||||
|
| |||||||
Total Health Care | 647,280 | |||||||
|
| |||||||
Industrials — 9.7% |
| |||||||
Building Products — 0.8% |
| |||||||
| 2,757 | Fortune Brands Home & Security, Inc. | 106,794 | ||||||
|
| |||||||
Commercial Services & Supplies — 0.3% |
| |||||||
| 1,168 | Republic Services, Inc. | 39,640 | ||||||
|
| |||||||
Electrical Equipment — 2.7% |
| |||||||
| 3,209 | AMETEK, Inc. | 135,741 | ||||||
| 869 | Hubbell, Inc., Class B | 86,054 | ||||||
| SHARES | SECURITY DESCRIPTION | VALUE($) | ||||||
Electrical Equipment — Continued |
| |||||||
| 2,095 | Regal-Beloit Corp. | 135,848 | ||||||
|
| |||||||
| 357,643 | ||||||||
|
| |||||||
Industrial Conglomerates — 1.1% |
| |||||||
| 2,371 | Carlisle Cos., Inc. | 147,734 | ||||||
|
| |||||||
Machinery — 2.6% |
| |||||||
| 2,851 | IDEX Corp. | 153,433 | ||||||
| 3,194 | Rexnord Corp. (a) | 53,820 | ||||||
| 1,620 | Snap-on, Inc. | 144,790 | ||||||
|
| |||||||
| 352,043 | ||||||||
|
| |||||||
Professional Services — 1.1% |
| |||||||
| 2,383 | Equifax, Inc. | 140,449 | ||||||
|
| |||||||
Trading Companies & Distributors — 1.1% |
| |||||||
| 1,871 | MSC Industrial Direct Co., Inc., Class A | 144,913 | ||||||
|
| |||||||
Total Industrials | 1,289,216 | |||||||
|
| |||||||
Information Technology — 8.4% |
| |||||||
Electronic Equipment, Instruments & Components — 3.0% |
| |||||||
| 2,469 | Amphenol Corp., Class A | 192,420 | ||||||
| 4,319 | Arrow Electronics, Inc. (a) | 172,113 | ||||||
| 1,484 | CDW Corp. (a) | 27,623 | ||||||
|
| |||||||
| 392,156 | ||||||||
|
| |||||||
IT Services — 1.3% |
| |||||||
| 3,612 | Jack Henry & Associates, Inc. | 170,256 | ||||||
|
| |||||||
Semiconductors & Semiconductor Equipment — 3.2% |
| |||||||
| 4,353 | Analog Devices, Inc. | 196,145 | ||||||
| 1,306 | KLA-Tencor Corp. | 72,805 | ||||||
| 4,056 | Xilinx, Inc. | 160,640 | ||||||
|
| |||||||
| 429,590 | ||||||||
|
| |||||||
Software — 0.9% |
| |||||||
| 3,524 | Synopsys, Inc. (a) | 125,998 | ||||||
|
| |||||||
Total Information Technology | 1,118,000 | |||||||
|
| |||||||
Materials — 7.5% |
| |||||||
Chemicals — 3.9% |
| |||||||
| 1,591 | Airgas, Inc. | 151,913 | ||||||
| 2,507 | Albemarle Corp. | 156,149 | ||||||
| 435 | Sherwin-Williams Co. (The) | 76,855 | ||||||
| 1,642 | Sigma-Aldrich Corp. | 131,950 | ||||||
|
| |||||||
| 516,867 | ||||||||
|
| |||||||
Containers & Packaging — 3.6% |
| |||||||
| 5,382 | Ball Corp. | 223,568 | ||||||
| 1,234 | Rock Tenn Co., Class A | 123,248 | ||||||
SEE NOTES TO FINANCIAL STATEMENTS.
| 34 | J.P. MORGAN MID CAP/MULTI-CAP FUNDS | JUNE 30, 2013 | ||||
Table of Contents
| SHARES | SECURITY DESCRIPTION | VALUE($) | ||||||
| Common Stocks — Continued |
| ||||||
Containers & Packaging — Continued |
| |||||||
| 2,826 | Silgan Holdings, Inc. | 132,705 | ||||||
|
| |||||||
| 479,521 | ||||||||
|
| |||||||
Total Materials | 996,388 | |||||||
|
| |||||||
Telecommunication Services — 0.3% |
| |||||||
Wireless Telecommunication Services — 0.3% |
| |||||||
| 1,585 | Telephone & Data Systems, Inc. | 39,077 | ||||||
|
| |||||||
Utilities — 9.2% |
| |||||||
Electric Utilities — 3.3% |
| |||||||
| 2,657 | Edison International | 127,959 | ||||||
| 1,416 | NV Energy, Inc. | 33,224 | ||||||
| 4,183 | Westar Energy, Inc. | 133,681 | ||||||
| 4,862 | Xcel Energy, Inc. | 137,796 | ||||||
|
| |||||||
| 432,660 | ||||||||
|
| |||||||
Gas Utilities — 0.6% |
| |||||||
| 3,344 | Questar Corp. | 79,758 | ||||||
|
| |||||||
Multi-Utilities — 5.3% |
| |||||||
| 5,798 | CenterPoint Energy, Inc. | 136,198 | ||||||
| 5,093 | CMS Energy Corp. | 138,389 | ||||||
| 5,340 | NiSource, Inc. | 152,948 | ||||||
| SHARES | SECURITY DESCRIPTION | VALUE($) | ||||||
Multi-Utilities — Continued |
| |||||||
| 2,066 | Sempra Energy | 168,950 | ||||||
| 2,749 | Wisconsin Energy Corp. | 112,681 | ||||||
|
| |||||||
| 709,166 | ||||||||
|
| |||||||
Total Utilities | 1,221,584 | |||||||
|
| |||||||
Total Common Stocks | 12,931,206 | |||||||
|
| |||||||
| Short-Term Investment — 2.4% |
| ||||||
Investment Company — 2.4% |
| |||||||
| 322,830 | JPMorgan Prime Money Market Fund, Institutional Class Shares, 0.030% (b) (l) (m) | 322,830 | ||||||
|
| |||||||
Total Investments — 99.9% | 13,254,036 | |||||||
Other Assets in Excess of | 8,946 | |||||||
|
| |||||||
NET ASSETS — 100.0% | $ | 13,262,982 | ||||||
|
| |||||||
Percentages indicated are based on net assets.
SEE NOTES TO FINANCIAL STATEMENTS.
| JUNE 30, 2013 | J.P. MORGAN MID CAP/MULTI-CAP FUNDS | 35 | ||||||
Table of Contents
JPMorgan Multi-Cap Market Neutral Fund
SCHEDULE OF PORTFOLIO INVESTMENTS
AS OF JUNE 30, 2013
(Amounts in thousands)
| SHARES | SECURITY DESCRIPTION | VALUE($) | ||||||
| Long Positions — 98.5% (j) |
| ||||||
| Common Stocks — 91.0% |
| ||||||
Consumer Discretionary — 15.7% |
| |||||||
Auto Components — 0.4% |
| |||||||
| 70 | Dana Holding Corp. | 1,340 | ||||||
|
| |||||||
Automobiles — 0.8% |
| |||||||
| 76 | Ford Motor Co. | 1,183 | ||||||
| 43 | General Motors Co. (a) | 1,426 | ||||||
|
| |||||||
| 2,609 | ||||||||
|
| |||||||
Diversified Consumer Services — 0.9% |
| |||||||
| 26 | Apollo Group, Inc., Class A (a) | 455 | ||||||
| 20 | Coinstar, Inc. (a) | 1,176 | ||||||
| 47 | Service Corp. International | 843 | ||||||
| 16 | Weight Watchers International, Inc. | 749 | ||||||
|
| |||||||
| 3,223 | ||||||||
|
| |||||||
Hotels, Restaurants & Leisure — 2.5% |
| |||||||
| 17 | Bally Technologies, Inc. (a) | 959 | ||||||
| 43 | Brinker International, Inc. | 1,681 | ||||||
| 15 | Cracker Barrel Old Country Store, Inc. | 1,378 | ||||||
| 57 | International Game Technology | 948 | ||||||
| 20 | Marriott Vacations Worldwide Corp. (a) | 858 | ||||||
| 53 | MGM Resorts International (a) | 786 | ||||||
| 41 | Texas Roadhouse, Inc. | 1,034 | ||||||
| 17 | Wyndham Worldwide Corp. | 954 | ||||||
|
| |||||||
| 8,598 | ||||||||
|
| |||||||
Household Durables — 1.5% |
| |||||||
| 17 | Garmin Ltd., (Switzerland) | 618 | ||||||
| 40 | Jarden Corp. (a) | 1,754 | ||||||
| 71 | PulteGroup, Inc. (a) | 1,345 | ||||||
| 10 | Ryland Group, Inc. (The) | 411 | ||||||
| 8 | Whirlpool Corp. | 882 | ||||||
|
| |||||||
| 5,010 | ||||||||
|
| |||||||
Internet & Catalog Retail — 1.0% |
| |||||||
| 18 | Expedia, Inc. | 1,054 | ||||||
| 36 | HomeAway, Inc. (a) | 1,180 | ||||||
| 45 | Liberty Interactive Corp., Class A (a) | 1,037 | ||||||
|
| |||||||
| 3,271 | ||||||||
|
| |||||||
Leisure Equipment & Products — 0.5% |
| |||||||
| 23 | Hasbro, Inc. | 1,046 | ||||||
| 13 | Sturm Ruger & Co., Inc. | 607 | ||||||
|
| |||||||
| 1,653 | ||||||||
|
| |||||||
Media — 2.6% |
| |||||||
| 17 | AMC Networks, Inc., Class A (a) | 1,131 | ||||||
| 27 | Comcast Corp., Class A | 1,124 | ||||||
| 19 | DISH Network Corp., Class A | 815 | ||||||
| SHARES | SECURITY DESCRIPTION | VALUE($) | ||||||
Media — Continued |
| |||||||
| 32 | Gannett Co., Inc. | 787 | ||||||
| 48 | Lions Gate Entertainment Corp. (a) | 1,309 | ||||||
| 9 | Meredith Corp. | 418 | ||||||
| 15 | News Corp., Class A | 473 | ||||||
| 17 | Omnicom Group, Inc. | 1,094 | ||||||
| 5 | Regal Entertainment Group, Class A | 98 | ||||||
| 15 | Scripps Networks Interactive, Inc., Class A | 1,005 | ||||||
| 35 | Valassis Communications, Inc. | 858 | ||||||
|
| |||||||
| 9,112 | ||||||||
|
| |||||||
Multiline Retail — 0.9% |
| |||||||
| 40 | Dillard’s, Inc., Class A | 3,245 | ||||||
|
| |||||||
Specialty Retail — 3.9% |
| |||||||
| 16 | Abercrombie & Fitch Co., Class A | 733 | ||||||
| 40 | American Eagle Outfitters, Inc. | 737 | ||||||
| 25 | Buckle, Inc. (The) | 1,313 | ||||||
| 32 | Foot Locker, Inc. | 1,116 | ||||||
| 39 | GameStop Corp., Class A | 1,630 | ||||||
| 25 | Gap, Inc. (The) | 1,059 | ||||||
| 159 | Office Depot, Inc. (a) | 617 | ||||||
| 9 | O’Reilly Automotive, Inc. (a) | 992 | ||||||
| 26 | Penske Automotive Group, Inc. | 806 | ||||||
| 2 | PetSmart, Inc. | 135 | ||||||
| 206 | Staples, Inc. | 3,262 | ||||||
| 20 | TJX Cos., Inc. | 1,008 | ||||||
|
| |||||||
| 13,408 | ||||||||
|
| |||||||
Textiles, Apparel & Luxury Goods — 0.7% |
| |||||||
| 18 | Carter’s, Inc. | 1,341 | ||||||
| 22 | Hanesbrands, Inc. | 1,139 | ||||||
|
| |||||||
| 2,480 | ||||||||
|
| |||||||
Total Consumer Discretionary | 53,949 | |||||||
|
| |||||||
Consumer Staples — 6.9% |
| |||||||
Beverages — 0.5% |
| |||||||
| 12 | Constellation Brands, Inc., Class A (a) | 644 | ||||||
| 24 | Molson Coors Brewing Co., Class B | 1,135 | ||||||
|
| |||||||
| 1,779 | ||||||||
|
| |||||||
Food & Staples Retailing — 2.1% |
| |||||||
| 24 | CVS Caremark Corp. | 1,372 | ||||||
| 35 | Kroger Co. (The) | 1,217 | ||||||
| 700 | Rite Aid Corp. (a) | 2,002 | ||||||
| 54 | Safeway, Inc. | 1,275 | ||||||
| 33 | Walgreen Co. | 1,477 | ||||||
|
| |||||||
| 7,343 | ||||||||
|
| |||||||
SEE NOTES TO FINANCIAL STATEMENTS.
| 36 | J.P. MORGAN MID CAP/MULTI-CAP FUNDS | JUNE 30, 2013 | ||||
Table of Contents
| SHARES | SECURITY DESCRIPTION | VALUE($) | ||||||
| Long Positions — Continued |
| ||||||
| Common Stocks — Continued |
| ||||||
Food Products — 2.0% |
| |||||||
| 68 | Dean Foods Co. (a) | 685 | ||||||
| 20 | Green Mountain Coffee Roasters, Inc. (a) | 1,494 | ||||||
| 23 | Ingredion, Inc. | 1,481 | ||||||
| 10 | JM Smucker Co. (The) | 1,003 | ||||||
| 16 | Sanderson Farms, Inc. | 1,057 | ||||||
| 51 | Tyson Foods, Inc., Class A | 1,320 | ||||||
|
| |||||||
| 7,040 | ||||||||
|
| |||||||
Household Products — 0.8% |
| |||||||
| 28 | Energizer Holdings, Inc. | 2,764 | ||||||
|
| |||||||
Personal Products — 0.7% |
| |||||||
| 19 | Herbalife Ltd., (Cayman Islands) | 868 | ||||||
| 23 | Nu Skin Enterprises, Inc., Class A | 1,383 | ||||||
|
| |||||||
| 2,251 | ||||||||
|
| |||||||
Tobacco — 0.8% |
| |||||||
| 24 | Altria Group, Inc. | 854 | ||||||
| 20 | Lorillard, Inc. | 892 | ||||||
| 16 | Universal Corp. | 902 | ||||||
|
| |||||||
| 2,648 | ||||||||
|
| |||||||
Total Consumer Staples | 23,825 | |||||||
|
| |||||||
Energy — 7.3% |
| |||||||
Energy Equipment & Services — 3.4% |
| |||||||
| 5 | Bristow Group, Inc. | 358 | ||||||
| 44 | C&J Energy Services, Inc. (a) | 857 | ||||||
| 35 | Diamond Offshore Drilling, Inc. | 2,408 | ||||||
| 17 | Ensco plc, (United Kingdom), Class A | 980 | ||||||
| 21 | Helix Energy Solutions Group, Inc. (a) | 482 | ||||||
| 73 | McDermott International, Inc. (a) | 598 | ||||||
| 44 | Nabors Industries Ltd., (Bermuda) | 678 | ||||||
| 12 | Oil States International, Inc. (a) | 1,076 | ||||||
| 13 | Rowan Cos. plc, Class A (a) | 450 | ||||||
| 67 | RPC, Inc. | 928 | ||||||
| 40 | Superior Energy Services, Inc. (a) | 1,041 | ||||||
| 17 | Tidewater, Inc. | 989 | ||||||
| 21 | Unit Corp. (a) | 896 | ||||||
|
| |||||||
| 11,741 | ||||||||
|
| |||||||
Oil, Gas & Consumable Fuels — 3.9% |
| |||||||
| 33 | Anadarko Petroleum Corp. | 2,863 | ||||||
| 6 | Chevron Corp. | 739 | ||||||
| 16 | ConocoPhillips | 995 | ||||||
| 31 | Delek U.S. Holdings, Inc. | 883 | ||||||
| 9 | HollyFrontier Corp. | 374 | ||||||
| 25 | Newfield Exploration Co. (a) | 592 | ||||||
| 15 | Noble Energy, Inc. | 924 | ||||||
| SHARES | SECURITY DESCRIPTION | VALUE($) | ||||||
Oil, Gas & Consumable Fuels — Continued |
| |||||||
| 24 | Oasis Petroleum, Inc. (a) | 950 | ||||||
| 21 | Phillips 66 | 1,248 | ||||||
| 18 | Rosetta Resources, Inc. (a) | 750 | ||||||
| 32 | Ship Finance International Ltd., (Bermuda) | 472 | ||||||
| 24 | Southwestern Energy Co. (a) | 883 | ||||||
| 38 | Stone Energy Corp. (a) | 829 | ||||||
| 4 | Tesoro Corp. | 184 | ||||||
| 28 | Western Refining, Inc. | 774 | ||||||
|
| |||||||
| 13,460 | ||||||||
|
| |||||||
Total Energy | 25,201 | |||||||
|
| |||||||
Financials — 9.1% |
| |||||||
Capital Markets — 1.0% |
| |||||||
| 6 | Ameriprise Financial, Inc. | 477 | ||||||
| 49 | Ares Capital Corp. | 849 | ||||||
| 37 | Bank of New York Mellon Corp. (The) | 1,033 | ||||||
| 30 | Fifth Street Finance Corp. | 308 | ||||||
| 6 | Goldman Sachs Group, Inc. (The) | 957 | ||||||
|
| |||||||
| 3,624 | ||||||||
|
| |||||||
Commercial Banks — 2.4% |
| |||||||
| 10 | BB&T Corp. | 326 | ||||||
| 37 | East West Bancorp, Inc. | 1,015 | ||||||
| 23 | Fifth Third Bancorp | 424 | ||||||
| 25 | First Republic Bank | 967 | ||||||
| 163 | Huntington Bancshares, Inc. | 1,287 | ||||||
| 11 | PNC Financial Services Group, Inc. (The) | 818 | ||||||
| 90 | Regions Financial Corp. | 858 | ||||||
| 38 | U.S. Bancorp | 1,386 | ||||||
| 31 | Wells Fargo & Co. | 1,268 | ||||||
|
| |||||||
| 8,349 | ||||||||
|
| |||||||
Consumer Finance — 0.7% |
| |||||||
| 21 | Discover Financial Services | 1,009 | ||||||
| 66 | SLM Corp. | 1,499 | ||||||
|
| |||||||
| 2,508 | ||||||||
|
| |||||||
Diversified Financial Services — 0.7% |
| |||||||
| 26 | Citigroup, Inc. | 1,232 | ||||||
| 19 | Moody’s Corp. | 1,127 | ||||||
|
| |||||||
| 2,359 | ||||||||
|
| |||||||
Insurance — 3.1% |
| |||||||
| 6 | Allied World Assurance Co. Holdings AG, (Switzerland) | 565 | ||||||
| 29 | Allstate Corp. (The) | 1,372 | ||||||
| 9 | American Financial Group, Inc. | 442 | ||||||
| 12 | Aspen Insurance Holdings Ltd., (Bermuda) | 430 | ||||||
SEE NOTES TO FINANCIAL STATEMENTS.
| JUNE 30, 2013 | J.P. MORGAN MID CAP/MULTI-CAP FUNDS | 37 | ||||||
Table of Contents
JPMorgan Multi-Cap Market Neutral Fund
SCHEDULE OF PORTFOLIO INVESTMENTS
AS OF JUNE 30, 2013 (continued)
(Amounts in thousands)
| SHARES | SECURITY DESCRIPTION | VALUE($) | ||||||
| Long Positions — Continued |
| ||||||
| Common Stocks — Continued |
| ||||||
Insurance — Continued |
| |||||||
| 7 | Everest Re Group Ltd., (Bermuda) | 902 | ||||||
| 33 | Fidelity National Financial, Inc., Class A | 776 | ||||||
| 33 | First American Financial Corp. | 732 | ||||||
| 11 | HCC Insurance Holdings, Inc. | 459 | ||||||
| 35 | Montpelier Re Holdings Ltd., (Bermuda) | 886 | ||||||
| 12 | PartnerRe Ltd., (Bermuda) | 1,111 | ||||||
| 17 | Platinum Underwriters Holdings Ltd., (Bermuda) | 989 | ||||||
| 14 | Prudential Financial, Inc. | 1,002 | ||||||
| 4 | RenaissanceRe Holdings Ltd., (Bermuda) | 384 | ||||||
| 6 | Travelers Cos., Inc. (The) | 457 | ||||||
|
| |||||||
| 10,507 | ||||||||
|
| |||||||
Real Estate Investment Trusts (REITs) — 0.9% |
| |||||||
| 3 | AvalonBay Communities, Inc. | 376 | ||||||
| 32 | Brandywine Realty Trust | 428 | ||||||
| 18 | CBL & Associates Properties, Inc. | 393 | ||||||
| 13 | Corporate Office Properties Trust | 343 | ||||||
| 10 | Highwoods Properties, Inc. | 355 | ||||||
| 6 | Post Properties, Inc. | 301 | ||||||
| 5 | SL Green Realty Corp. | 407 | ||||||
| 12 | Weingarten Realty Investors | 374 | ||||||
|
| |||||||
| 2,977 | ||||||||
|
| |||||||
Thrifts & Mortgage Finance — 0.3% |
| |||||||
| 24 | Ocwen Financial Corp. (a) | 990 | ||||||
|
| |||||||
Total Financials | 31,314 | |||||||
|
| |||||||
Health Care — 11.4% |
| |||||||
Biotechnology — 2.2% |
| |||||||
| 15 | Amgen, Inc. | 1,439 | ||||||
| 11 | Cubist Pharmaceuticals, Inc. (a) | 544 | ||||||
| 10 | Gilead Sciences, Inc. (a) | 514 | ||||||
| 23 | Isis Pharmaceuticals, Inc. (a) | 606 | ||||||
| 54 | PDL BioPharma, Inc. | 418 | ||||||
| 38 | Quintiles Transnational Holdings, Inc. (a) | 1,608 | ||||||
| 24 | United Therapeutics Corp. (a) | 1,549 | ||||||
| 10 | Vertex Pharmaceuticals, Inc. (a) | 761 | ||||||
|
| |||||||
| 7,439 | ||||||||
|
| |||||||
Health Care Equipment & Supplies — 3.0% |
| |||||||
| 39 | Alere, Inc. (a) | 954 | ||||||
| 10 | Becton, Dickinson & Co. | 948 | ||||||
| 105 | Boston Scientific Corp. (a) | 970 | ||||||
| 94 | CareFusion Corp. (a) | 3,466 | ||||||
| 38 | Medtronic, Inc. | 1,981 | ||||||
| 33 | ResMed, Inc. | 1,468 | ||||||
| 21 | Thoratec Corp. (a) | 669 | ||||||
|
| |||||||
| 10,456 | ||||||||
|
| |||||||
| SHARES | SECURITY DESCRIPTION | VALUE($) | ||||||
Health Care Providers & Services — 3.6% |
| |||||||
| 23 | Aetna, Inc. | 1,443 | ||||||
| 40 | AmerisourceBergen Corp. | 2,211 | ||||||
| 20 | Centene Corp. (a) | 1,024 | ||||||
| 22 | Cigna Corp. | 1,616 | ||||||
| 25 | Community Health Systems, Inc. | 1,191 | ||||||
| 29 | HealthSouth Corp. (a) | 830 | ||||||
| 29 | Molina Healthcare, Inc. (a) | 1,079 | ||||||
| 40 | Omnicare, Inc. | 1,887 | ||||||
| 13 | WellPoint, Inc. | 1,062 | ||||||
|
| |||||||
| 12,343 | ||||||||
|
| |||||||
Health Care Technology — 0.2% |
| |||||||
| 34 | MedAssets, Inc. (a) | 610 | ||||||
|
| |||||||
Life Sciences Tools & Services — 0.3% |
| |||||||
| 24 | PAREXEL International Corp. (a) | 1,118 | ||||||
|
| |||||||
Pharmaceuticals — 2.1% |
| |||||||
| 14 | Actavis, Inc. (a) | 1,795 | ||||||
| 6 | Eli Lilly & Co. | 293 | ||||||
| 31 | Endo Health Solutions, Inc. (a) | 1,129 | ||||||
| 13 | Hospira, Inc. (a) | 500 | ||||||
| 29 | Mylan, Inc. (a) | 911 | ||||||
| 32 | Questcor Pharmaceuticals, Inc. | 1,470 | ||||||
| 17 | Salix Pharmaceuticals Ltd. (a) | 1,109 | ||||||
|
| |||||||
| 7,207 | ||||||||
|
| |||||||
Total Health Care | 39,173 | |||||||
|
| |||||||
Industrials — 14.0% |
| |||||||
Aerospace & Defense — 1.8% |
| |||||||
| 13 | Boeing Co. (The) | 1,330 | ||||||
| 12 | Esterline Technologies Corp. (a) | 883 | ||||||
| 19 | Huntington Ingalls Industries, Inc. | 1,054 | ||||||
| 3 | Northrop Grumman Corp. | 259 | ||||||
| 55 | Textron, Inc. | 1,433 | ||||||
| 9 | TransDigm Group, Inc. | 1,334 | ||||||
|
| |||||||
| 6,293 | ||||||||
|
| |||||||
Air Freight & Logistics — 0.1% |
| |||||||
| 2 | United Parcel Service, Inc., Class B | 176 | ||||||
|
| |||||||
Airlines — 0.7% |
| |||||||
| 7 | Alaska Air Group, Inc. (a) | 375 | ||||||
| 83 | Delta Air Lines, Inc. (a) | 1,547 | ||||||
| 48 | Southwest Airlines Co. | 619 | ||||||
|
| |||||||
| 2,541 | ||||||||
|
| |||||||
Commercial Services & Supplies — 1.6% |
| |||||||
| 30 | Avery Dennison Corp. | 1,265 | ||||||
| 204 | Pitney Bowes, Inc. | 2,992 | ||||||
SEE NOTES TO FINANCIAL STATEMENTS.
| 38 | J.P. MORGAN MID CAP/MULTI-CAP FUNDS | JUNE 30, 2013 | ||||
Table of Contents
| SHARES | SECURITY DESCRIPTION | VALUE($) | ||||||
| Long Positions — Continued |
| ||||||
| Common Stocks — Continued |
| ||||||
Commercial Services & Supplies — Continued |
| |||||||
| 89 | R.R. Donnelley & Sons Co. | 1,249 | ||||||
|
| |||||||
| 5,506 | ||||||||
|
| |||||||
Construction & Engineering — 2.4% |
| |||||||
| 106 | AECOM Technology Corp. (a) | 3,383 | ||||||
| 29 | Chicago Bridge & Iron Co. N.V., (Netherlands) | 1,756 | ||||||
| 24 | EMCOR Group, Inc. | 996 | ||||||
| 14 | Fluor Corp. | 808 | ||||||
| 30 | URS Corp. | 1,398 | ||||||
|
| |||||||
| 8,341 | ||||||||
|
| |||||||
Electrical Equipment — 0.8% |
| |||||||
| 20 | Brady Corp., Class A | 619 | ||||||
| 25 | EnerSys, Inc. | 1,204 | ||||||
| 25 | General Cable Corp. | 784 | ||||||
|
| |||||||
| 2,607 | ||||||||
|
| |||||||
Industrial Conglomerates — 0.2% |
| |||||||
| 37 | General Electric Co. | 861 | ||||||
|
| |||||||
Machinery — 4.1% |
| |||||||
| 18 | AGCO Corp. | 892 | ||||||
| 29 | Briggs & Stratton Corp. | 572 | ||||||
| 52 | Crane Co. | 3,092 | ||||||
| 25 | Ingersoll-Rand plc, (Ireland) | 1,382 | ||||||
| 51 | ITT Corp. | 1,506 | ||||||
| 6 | Middleby Corp. (a) | 1,000 | ||||||
| 59 | Oshkosh Corp. (a) | 2,229 | ||||||
| — | (h) | Standex International Corp. | 17 | |||||
| 53 | Terex Corp. (a) | 1,382 | ||||||
| 46 | Titan International, Inc. | 769 | ||||||
| 29 | Trinity Industries, Inc. | 1,108 | ||||||
|
| |||||||
| 13,949 | ||||||||
|
| |||||||
Marine — 0.2% |
| |||||||
| 21 | Matson, Inc. | 525 | ||||||
|
| |||||||
Professional Services — 0.9% |
| |||||||
| 8 | Corporate Executive Board Co. (The) | 530 | ||||||
| 16 | Manpowergroup, Inc. | 884 | ||||||
| 21 | Towers Watson & Co., Class A | 1,702 | ||||||
|
| |||||||
| 3,116 | ||||||||
|
| |||||||
Road & Rail — 1.1% |
| |||||||
| 46 | Avis Budget Group, Inc. (a) | 1,330 | ||||||
| 29 | Hertz Global Holdings, Inc. (a) | 708 | ||||||
| 40 | Swift Transportation Co. (a) | 658 | ||||||
| 8 | Union Pacific Corp. | 1,259 | ||||||
|
| |||||||
| 3,955 | ||||||||
|
| |||||||
| SHARES | SECURITY DESCRIPTION | VALUE($) | ||||||
Trading Companies & Distributors — 0.1% |
| |||||||
| 7 | United Rentals, Inc. (a) | 332 | ||||||
|
| |||||||
Total Industrials | 48,202 | |||||||
|
| |||||||
Information Technology — 16.1% |
| |||||||
Communications Equipment — 1.1% |
| |||||||
| 59 | ARRIS Group, Inc. (a) | 854 | ||||||
| 15 | Aruba Networks, Inc. (a) | 225 | ||||||
| 59 | Cisco Systems, Inc. | 1,433 | ||||||
| 17 | Harris Corp. | 843 | ||||||
| 1 | Plantronics, Inc. | 59 | ||||||
| 39 | Polycom, Inc. (a) | 412 | ||||||
|
| |||||||
| 3,826 | ||||||||
|
| |||||||
Computers & Peripherals — 2.5% |
| |||||||
| 126 | Hewlett-Packard Co. | 3,124 | ||||||
| 53 | NetApp, Inc. (a) | 1,988 | ||||||
| 30 | Seagate Technology plc, (Ireland) | 1,363 | ||||||
| 34 | Western Digital Corp. | 2,123 | ||||||
|
| |||||||
| 8,598 | ||||||||
|
| |||||||
Electronic Equipment, Instruments & Components — 1.2% |
| |||||||
| 20 | Avnet, Inc. (a) | 660 | ||||||
| 56 | Corning, Inc. | 803 | ||||||
| 6 | Dolby Laboratories, Inc., Class A | 204 | ||||||
| 23 | Ingram Micro, Inc., Class A (a) | 436 | ||||||
| 52 | Jabil Circuit, Inc. | 1,064 | ||||||
| 21 | SYNNEX Corp. (a) | 890 | ||||||
|
| |||||||
| 4,057 | ||||||||
|
| |||||||
Internet Software & Services — 1.4% |
| |||||||
| 4 | Equinix, Inc. (a) | 775 | ||||||
| 1 | Google, Inc., Class A (a) | 968 | ||||||
| 6 | ValueClick, Inc. (a) | 139 | ||||||
| 122 | Yahoo!, Inc. (a) | 3,057 | ||||||
|
| |||||||
| 4,939 | ||||||||
|
| |||||||
IT Services — 3.7% |
| |||||||
| 91 | Amdocs Ltd. | 3,361 | ||||||
| 20 | CACI International, Inc., Class A (a) | 1,249 | ||||||
| 72 | Computer Sciences Corp. | 3,162 | ||||||
| 49 | Convergys Corp. | 859 | ||||||
| 13 | CoreLogic, Inc. (a) | 292 | ||||||
| 23 | Fidelity National Information Services, Inc. | 989 | ||||||
| 19 | Gartner, Inc. (a) | 1,104 | ||||||
| 9 | Jack Henry & Associates, Inc. | 428 | ||||||
| 25 | NeuStar, Inc., Class A (a) | 1,234 | ||||||
|
| |||||||
| 12,678 | ||||||||
|
| |||||||
SEE NOTES TO FINANCIAL STATEMENTS.
| JUNE 30, 2013 | J.P. MORGAN MID CAP/MULTI-CAP FUNDS | 39 | ||||||
Table of Contents
JPMorgan Multi-Cap Market Neutral Fund
SCHEDULE OF PORTFOLIO INVESTMENTS
AS OF JUNE 30, 2013 (continued)
(Amounts in thousands)
| SHARES | SECURITY DESCRIPTION | VALUE($) | ||||||
| Long Positions — Continued |
| ||||||
| Common Stocks — Continued |
| ||||||
Office Electronics — 0.3% | ||||||||
| 90 | Xerox Corp. | 817 | ||||||
| 9 | Zebra Technologies Corp., Class A (a) | 382 | ||||||
|
| |||||||
| 1,199 | ||||||||
|
| |||||||
Semiconductors & Semiconductor Equipment — 2.5% |
| |||||||
| 46 | Applied Materials, Inc. | 690 | ||||||
| 30 | Broadcom Corp., Class A | 1,021 | ||||||
| 21 | Freescale Semiconductor Ltd. (a) | 287 | ||||||
| 19 | KLA-Tencor Corp. | 1,063 | ||||||
| 7 | Lam Research Corp. (a) | 308 | ||||||
| 96 | Marvell Technology Group Ltd., (Bermuda) | 1,127 | ||||||
| 162 | Micron Technology, Inc. (a) | 2,328 | ||||||
| 70 | NVIDIA Corp. | 981 | ||||||
| 101 | PMC-Sierra, Inc. (a) | 639 | ||||||
|
| |||||||
| 8,444 | ||||||||
|
| |||||||
Software — 3.4% | ||||||||
| 62 | Activision Blizzard, Inc. | 891 | ||||||
| 13 | BMC Software, Inc. (a) | 599 | ||||||
| 48 | CA, Inc. | 1,380 | ||||||
| 91 | Cadence Design Systems, Inc. (a) | 1,312 | ||||||
| 37 | Microsoft Corp. | 1,291 | ||||||
| 20 | Oracle Corp. | 606 | ||||||
| 13 | PTC, Inc. (a) | 330 | ||||||
| 125 | Rovi Corp. (a) | 2,866 | ||||||
| 68 | Symantec Corp. | 1,536 | ||||||
| 48 | Take-Two Interactive Software, Inc. (a) | 713 | ||||||
|
| |||||||
| 11,524 | ||||||||
|
| |||||||
Total Information Technology | 55,265 | |||||||
|
| |||||||
Materials — 5.6% | ||||||||
Chemicals — 1.7% | ||||||||
| 20 | Cabot Corp. | 745 | ||||||
| 6 | CF Industries Holdings, Inc. | 1,104 | ||||||
| 24 | H.B. Fuller Co. | 924 | ||||||
| 71 | Huntsman Corp. | 1,176 | ||||||
| 5 | Monsanto Co. | 535 | ||||||
| 3 | NewMarket Corp. | 905 | ||||||
| 24 | Olin Corp. | 568 | ||||||
|
| |||||||
| 5,957 | ||||||||
|
| |||||||
Containers & Packaging — 1.3% | ||||||||
| 17 | Ball Corp. | 711 | ||||||
| 19 | Greif, Inc., Class A | 978 | ||||||
| 36 | Owens-Illinois, Inc. (a) | 992 | ||||||
| 49 | Sealed Air Corp. | 1,183 | ||||||
| 13 | Silgan Holdings, Inc. | 588 | ||||||
|
| |||||||
| 4,452 | ||||||||
|
| |||||||
| SHARES | SECURITY DESCRIPTION | VALUE($) | ||||||
Metals & Mining — 1.4% | ||||||||
| 88 | Alcoa, Inc. | 685 | ||||||
| 13 | Kaiser Aluminum Corp. | 788 | ||||||
| 13 | Reliance Steel & Aluminum Co. | 876 | ||||||
| 30 | Steel Dynamics, Inc. | 452 | ||||||
| 18 | SunCoke Energy, Inc. (a) | 257 | ||||||
| 36 | United States Steel Corp. | 631 | ||||||
| 35 | Worthington Industries, Inc. | 1,117 | ||||||
|
| |||||||
| 4,806 | ||||||||
|
| |||||||
Paper & Forest Products — 1.2% | ||||||||
| 43 | Domtar Corp., (Canada) | 2,885 | ||||||
| 21 | Schweitzer-Mauduit International, Inc. | 1,064 | ||||||
|
| |||||||
| 3,949 | ||||||||
|
| |||||||
Total Materials | 19,164 | |||||||
|
| |||||||
Telecommunication Services — 0.4% | ||||||||
Diversified Telecommunication Services — 0.2% |
| |||||||
| 188 | Frontier Communications Corp. | 761 | ||||||
| 2 | Verizon Communications, Inc. | 108 | ||||||
|
| |||||||
| 869 | ||||||||
|
| |||||||
Wireless Telecommunication Services — 0.2% | ||||||||
| 23 | T-Mobile US, Inc. (a) | 561 | ||||||
|
| |||||||
Total Telecommunication Services | 1,430 | |||||||
|
| |||||||
Utilities — 4.5% | ||||||||
Electric Utilities — 1.1% | ||||||||
| 16 | Edison International | 768 | ||||||
| 24 | Exelon Corp. | 748 | ||||||
| 20 | FirstEnergy Corp. | 745 | ||||||
| 53 | Portland General Electric Co. | 1,615 | ||||||
|
| |||||||
| 3,876 | ||||||||
|
| |||||||
Gas Utilities — 1.2% | ||||||||
| 20 | AGL Resources, Inc. | 840 | ||||||
| 84 | UGI Corp. | 3,291 | ||||||
|
| |||||||
| 4,131 | ||||||||
|
| |||||||
Independent Power Producers & Energy Traders — 1.5% |
| |||||||
| 261 | AES Corp. | 3,125 | ||||||
| 94 | Calpine Corp. (a) | 1,992 | ||||||
|
| |||||||
| 5,117 | ||||||||
|
| |||||||
Multi-Utilities — 0.4% |
| |||||||
| 12 | Ameren Corp. | 419 | ||||||
| 29 | CMS Energy Corp. | 795 | ||||||
|
| |||||||
| 1,214 | ||||||||
|
| |||||||
SEE NOTES TO FINANCIAL STATEMENTS.
| 40 | J.P. MORGAN MID CAP/MULTI-CAP FUNDS | JUNE 30, 2013 | ||||
Table of Contents
| SHARES | SECURITY DESCRIPTION | VALUE($) | ||||||
| Long Positions — Continued |
| ||||||
| Common Stocks — Continued |
| ||||||
Water Utilities — 0.3% |
| |||||||
| 31 | Aqua America, Inc. | 965 | ||||||
|
| |||||||
Total Utilities | 15,303 | |||||||
|
| |||||||
Total Common Stocks | 312,826 | |||||||
|
| |||||||
| Short-Term Investment — 7.5% |
| ||||||
Investment Company — 7.5% |
| |||||||
| 25,816 | JPMorgan Liquid Assets Money Market Fund, Institutional Class Shares, 0.030% (b) (l) | 25,816 | ||||||
|
| |||||||
Total Investments — 98.5% | 338,642 | |||||||
Other Assets in Excess of | 5,144 | |||||||
|
| |||||||
NET ASSETS — 100.0% | $ | 343,786 | ||||||
|
| |||||||
| Short Positions — 89.1% |
| ||||||
| Common Stocks — 89.1% |
| ||||||
Consumer Discretionary — 14.4% |
| |||||||
Auto Components — 0.5% |
| |||||||
| 44 | Johnson Controls, Inc. | 1,564 | ||||||
|
| |||||||
Automobiles — 0.7% |
| |||||||
| 14 | Harley-Davidson, Inc. | 787 | ||||||
| 15 | Tesla Motors, Inc. (a) | 1,630 | ||||||
|
| |||||||
| 2,417 | ||||||||
|
| |||||||
Distributors — 0.1% |
| |||||||
| 18 | LKQ Corp. (a) | 464 | ||||||
|
| |||||||
Diversified Consumer Services — 0.8% |
| |||||||
| 28 | DeVry, Inc. | 862 | ||||||
| 42 | Regis Corp. | 685 | ||||||
| 34 | Sotheby’s | 1,308 | ||||||
|
| |||||||
| 2,855 | ||||||||
|
| |||||||
Hotels, Restaurants & Leisure — 2.7% |
| |||||||
| 28 | BJ’s Restaurants, Inc. (a) | 1,023 | ||||||
| 31 | Carnival Corp. | 1,079 | ||||||
| 4 | Chipotle Mexican Grill, Inc. (a) | 1,310 | ||||||
| 25 | Dunkin’ Brands Group, Inc. | 1,076 | ||||||
| 22 | Hyatt Hotels Corp., Class A (a) | 900 | ||||||
| 12 | Las Vegas Sands Corp. | 653 | ||||||
| 4 | McDonald’s Corp. | 388 | ||||||
| 18 | Royal Caribbean Cruises Ltd. | 605 | ||||||
| 18 | Vail Resorts, Inc. | 1,131 | ||||||
| 14 | Yum! Brands, Inc. | 999 | ||||||
|
| |||||||
| 9,164 | ||||||||
|
| |||||||
| SHARES | SECURITY DESCRIPTION | VALUE($) | ||||||
Household Durables — 0.4% |
| |||||||
| 15 | Harman International Industries, Inc. | 818 | ||||||
| 16 | Tempur Sealy International, Inc. (a) | 719 | ||||||
|
| |||||||
| 1,537 | ||||||||
|
| |||||||
Media — 2.5% |
| |||||||
| 14 | Discovery Communications, Inc., Class A (a) | 1,067 | ||||||
| 48 | DreamWorks Animation SKG, Inc., Class A (a) | 1,222 | ||||||
| 79 | Interpublic Group of Cos., Inc. (The) | 1,146 | ||||||
| 13 | John Wiley & Sons, Inc., Class A | 532 | ||||||
| 10 | Lamar Advertising Co., Class A (a) | 423 | ||||||
| 6 | Liberty Global plc, (United Kingdom), Class A (a) | 475 | ||||||
| 80 | Live Nation Entertainment, Inc. (a) | 1,234 | ||||||
| 49 | New York Times Co. (The), Class A (a) | 544 | ||||||
| 368 | Sirius XM Radio, Inc. | 1,234 | ||||||
| 17 | Thomson Reuters Corp. | 544 | ||||||
|
| |||||||
| 8,421 | ||||||||
|
| |||||||
Multiline Retail — 1.1% |
| |||||||
| 52 | Family Dollar Stores, Inc. | 3,214 | ||||||
| 9 | Kohl’s Corp. | 470 | ||||||
|
| |||||||
| 3,684 | ||||||||
|
| |||||||
Specialty Retail — 3.5% |
| |||||||
| 28 | CarMax, Inc. (a) | 1,303 | ||||||
| 31 | Finish Line, Inc. (The), Class A | 671 | ||||||
| 16 | Group 1 Automotive, Inc. | 1,033 | ||||||
| 20 | Jos. A. Bank Clothiers, Inc. (a) | 827 | ||||||
| 11 | L Brands, Inc. | 564 | ||||||
| 29 | Monro Muffler Brake, Inc. | 1,411 | ||||||
| 42 | Pier 1 Imports, Inc. | 976 | ||||||
| 38 | Sally Beauty Holdings, Inc. (a) | 1,194 | ||||||
| 26 | Signet Jewelers Ltd., (Bermuda) | 1,764 | ||||||
| 12 | Tractor Supply Co. | 1,418 | ||||||
| 10 | Ulta Salon Cosmetics & Fragrance, Inc. (a) | 1,035 | ||||||
|
| |||||||
| 12,196 | ||||||||
|
| |||||||
Textiles, Apparel & Luxury Goods — 2.1% |
| |||||||
| 77 | Fifth & Pacific Cos., Inc. (a) | 1,715 | ||||||
| 8 | Lululemon Athletica, Inc., (Canada) (a) | 553 | ||||||
| 142 | Quiksilver, Inc. (a) | 918 | ||||||
| 6 | Ralph Lauren Corp. | 1,067 | ||||||
| 21 | Under Armour, Inc., Class A (a) | 1,261 | ||||||
| 30 | Wolverine World Wide, Inc. | 1,614 | ||||||
|
| |||||||
| 7,128 | ||||||||
|
| |||||||
Total Consumer Discretionary | 49,430 | |||||||
|
| |||||||
SEE NOTES TO FINANCIAL STATEMENTS.
| JUNE 30, 2013 | J.P. MORGAN MID CAP/MULTI-CAP FUNDS | 41 | ||||||
Table of Contents
JPMorgan Multi-Cap Market Neutral Fund
SCHEDULE OF PORTFOLIO INVESTMENTS
AS OF JUNE 30, 2013 (continued)
(Amounts in thousands)
| SHARES | SECURITY DESCRIPTION | VALUE($) | ||||||
| Short Positions — Continued |
| ||||||
| Common Stocks — Continued |
| ||||||
Consumer Staples — 6.5% |
| |||||||
Beverages — 1.2% |
| |||||||
| 15 | Beam, Inc. | 957 | ||||||
| 18 | Brown-Forman Corp., Class B | 1,208 | ||||||
| 21 | Coca-Cola Co. (The) | 854 | ||||||
| 19 | Monster Beverage Corp. (a) | 1,166 | ||||||
|
| |||||||
| 4,185 | ||||||||
|
| |||||||
Food & Staples Retailing — 1.8% |
| |||||||
| 7 | Casey’s General Stores, Inc. | 404 | ||||||
| 24 | Harris Teeter Supermarkets, Inc. | 1,111 | ||||||
| 13 | Pricesmart, Inc. | 1,124 | ||||||
| 52 | United Natural Foods, Inc. (a) | 2,801 | ||||||
| 18 | Whole Foods Market, Inc. | 943 | ||||||
|
| |||||||
| 6,383 | ||||||||
|
| |||||||
Food Products — 2.5% |
| |||||||
| 13 | B&G Foods, Inc. | 452 | ||||||
| 30 | Hain Celestial Group, Inc. (The) (a) | 1,960 | ||||||
| 12 | Hershey Co. (The) | 1,041 | ||||||
| 23 | Hormel Foods Corp. | 874 | ||||||
| 19 | McCormick & Co., Inc. (Non-Voting) | 1,304 | ||||||
| 15 | Mead Johnson Nutrition Co. | 1,193 | ||||||
| 22 | Mondelez International, Inc., Class A | 637 | ||||||
| 17 | TreeHouse Foods, Inc. (a) | 1,091 | ||||||
|
| |||||||
| 8,552 | ||||||||
|
| |||||||
Household Products — 0.2% |
| |||||||
| 8 | Procter & Gamble Co. (The) | 609 | ||||||
|
| |||||||
Personal Products — 0.8% |
| |||||||
| 22 | Elizabeth Arden, Inc. (a) | 978 | ||||||
| 27 | Estee Lauder Cos., Inc. (The), Class A | 1,768 | ||||||
|
| |||||||
| 2,746 | ||||||||
|
| |||||||
Total Consumer Staples | 22,475 | |||||||
|
| |||||||
Energy — 8.5% |
| |||||||
Energy Equipment & Services — 1.9% |
| |||||||
| 12 | Baker Hughes, Inc. | 560 | ||||||
| 5 | CARBO Ceramics, Inc. | 334 | ||||||
| 18 | Dresser-Rand Group, Inc. (a) | 1,058 | ||||||
| 17 | Dril-Quip, Inc. (a) | 1,521 | ||||||
| 22 | FMC Technologies, Inc. (a) | 1,233 | ||||||
| 30 | Forum Energy Technologies, Inc. (a) | 920 | ||||||
| 140 | Key Energy Services, Inc. (a) | 834 | ||||||
|
| |||||||
| 6,460 | ||||||||
|
| |||||||
Oil, Gas & Consumable Fuels — 6.6% |
| |||||||
| 91 | Alpha Natural Resources, Inc. (a) | 478 | ||||||
| 41 | Approach Resources, Inc. (a) | 997 | ||||||
| SHARES | SECURITY DESCRIPTION | VALUE($) | ||||||
Oil, Gas & Consumable Fuels — Continued |
| |||||||
| 5 | Cimarex Energy Co. | 339 | ||||||
| 37 | Cobalt International Energy, Inc. (a) | 983 | ||||||
| 36 | Concho Resources, Inc. (a) | 3,052 | ||||||
| 34 | CONSOL Energy, Inc. | 911 | ||||||
| 11 | Continental Resources, Inc. (a) | 980 | ||||||
| 18 | EQT Corp. | 1,398 | ||||||
| 23 | Golar LNG Ltd., (Bermuda) | 744 | ||||||
| 41 | Gulfport Energy Corp. (a) | 1,917 | ||||||
| 16 | Kinder Morgan, Inc. | 597 | ||||||
| 46 | Kodiak Oil & Gas Corp. (a) | 408 | ||||||
| 21 | PDC Energy, Inc. (a) | 1,090 | ||||||
| 32 | QEP Resources, Inc. | 902 | ||||||
| 13 | Range Resources Corp. | 998 | ||||||
| 25 | SemGroup Corp., Class A | 1,363 | ||||||
| 20 | SM Energy Co. | 1,193 | ||||||
| 39 | Spectra Energy Corp. | 1,329 | ||||||
| 19 | Targa Resources Corp. | 1,241 | ||||||
| 14 | World Fuel Services Corp. | 542 | ||||||
| 62 | WPX Energy, Inc. (a) | 1,182 | ||||||
|
| |||||||
| 22,644 | ||||||||
|
| |||||||
Total Energy | 29,104 | |||||||
|
| |||||||
Financials — 9.8% |
| |||||||
Capital Markets — 1.6% |
| |||||||
| 101 | Janus Capital Group, Inc. | 862 | ||||||
| 34 | LPL Financial Holdings, Inc. | 1,269 | ||||||
| 20 | Northern Trust Corp. | 1,141 | ||||||
| 16 | T. Rowe Price Group, Inc. | 1,184 | ||||||
| 44 | TD Ameritrade Holding Corp. | 1,077 | ||||||
|
| |||||||
| 5,533 | ||||||||
|
| |||||||
Commercial Banks — 2.5% |
| |||||||
| 19 | Bank of Hawaii Corp. | 962 | ||||||
| 31 | Commerce Bancshares, Inc. | 1,366 | ||||||
| 24 | Cullen/Frost Bankers, Inc. | 1,586 | ||||||
| 32 | Hancock Holding Co. | 958 | ||||||
| 18 | SVB Financial Group (a) | 1,504 | ||||||
| 106 | TCF Financial Corp. | 1,510 | ||||||
| 2 | United Bankshares, Inc. | 54 | ||||||
| 77 | Valley National Bancorp | 729 | ||||||
|
| |||||||
| 8,669 | ||||||||
|
| |||||||
Consumer Finance — 0.1% |
| |||||||
| 3 | American Express Co. | 210 | ||||||
|
| |||||||
Diversified Financial Services — 1.0% |
| |||||||
| 19 | CME Group, Inc. | 1,445 | ||||||
SEE NOTES TO FINANCIAL STATEMENTS.
| 42 | J.P. MORGAN MID CAP/MULTI-CAP FUNDS | JUNE 30, 2013 | ||||
Table of Contents
| SHARES | SECURITY DESCRIPTION | VALUE($) | ||||||
| Short Positions — Continued |
| ||||||
| Common Stocks — Continued |
| ||||||
Diversified Financial Services — Continued |
| |||||||
| 7 | IntercontinentalExchange, Inc. (a) | 1,292 | ||||||
| 19 | NASDAQ OMX Group, Inc. (The) | 607 | ||||||
|
| |||||||
| 3,344 | ||||||||
|
| |||||||
Insurance — 2.9% |
| |||||||
| 1 | Alleghany Corp. (a) | 514 | ||||||
| 11 | Arch Capital Group Ltd., (Bermuda) (a) | 544 | ||||||
| 21 | Cincinnati Financial Corp. | 960 | ||||||
| 24 | Endurance Specialty Holdings Ltd., (Bermuda) | 1,212 | ||||||
| 2 | Markel Corp. (a) | 1,304 | ||||||
| 12 | Marsh & McLennan Cos., Inc. | 469 | ||||||
| 87 | MBIA, Inc. (a) | 1,156 | ||||||
| 24 | Mercury General Corp. | 1,075 | ||||||
| 117 | Old Republic International Corp. | 1,507 | ||||||
| 46 | Progressive Corp. (The) | 1,171 | ||||||
|
| |||||||
| 9,912 | ||||||||
|
| |||||||
Real Estate Investment Trusts (REITs) — 1.1% |
| |||||||
| 8 | BRE Properties, Inc. | 392 | ||||||
| 30 | Duke Realty Corp. | 462 | ||||||
| 22 | Kimco Realty Corp. | 467 | ||||||
| 12 | Liberty Property Trust | 437 | ||||||
| 7 | Mack-Cali Realty Corp. | 163 | ||||||
| 22 | Ryman Hospitality Properties | 846 | ||||||
| 34 | Weyerhaeuser Co. | 966 | ||||||
|
| |||||||
| 3,733 | ||||||||
|
| |||||||
Thrifts & Mortgage Finance — 0.6% |
| |||||||
| 91 | Capitol Federal Financial, Inc. | 1,108 | ||||||
| 77 | People’s United Financial, Inc. | 1,145 | ||||||
|
| |||||||
| 2,253 | ||||||||
|
| |||||||
Total Financials | 33,654 | |||||||
|
| |||||||
Health Care — 10.3% |
| |||||||
Biotechnology — 0.8% |
| |||||||
| 33 | Ariad Pharmaceuticals, Inc. (a) | 585 | ||||||
| 8 | BioMarin Pharmaceutical, Inc. (a) | 472 | ||||||
| 13 | Cepheid, Inc. (a) | 459 | ||||||
| 24 | Incyte Corp., Ltd. (a) | 519 | ||||||
| 14 | Medivation, Inc. (a) | 694 | ||||||
|
| |||||||
| 2,729 | ||||||||
|
| |||||||
Health Care Equipment & Supplies — 2.8% |
| |||||||
| 33 | Align Technology, Inc. (a) | 1,225 | ||||||
| 30 | Cooper Cos., Inc. (The) | 3,607 | ||||||
| 16 | DENTSPLY International, Inc. | 648 | ||||||
| 33 | Haemonetics Corp. (a) | 1,359 | ||||||
| 14 | HeartWare International, Inc. (a) | 1,355 | ||||||
| SHARES | SECURITY DESCRIPTION | VALUE($) | ||||||
Health Care Equipment & Supplies — Continued |
| |||||||
| 2 | Intuitive Surgical, Inc. (a) | 820 | ||||||
| 39 | Volcano Corp. (a) | 714 | ||||||
|
| |||||||
| 9,728 | ||||||||
|
| |||||||
Health Care Providers & Services — 3.3% |
| |||||||
| 73 | Accretive Health, Inc. (a) | 794 | ||||||
| 54 | Brookdale Senior Living, Inc. (a) | 1,433 | ||||||
| 18 | Catamaran Corp. (a) | 869 | ||||||
| 9 | Chemed Corp. | 650 | ||||||
| 17 | DaVita HealthCare Partners, Inc. (a) | 2,069 | ||||||
| 10 | Henry Schein, Inc. (a) | 991 | ||||||
| 17 | LifePoint Hospitals, Inc. (a) | 844 | ||||||
| 29 | Owens & Minor, Inc. | 988 | ||||||
| 16 | Quest Diagnostics, Inc. | 986 | ||||||
| 16 | Tenet Healthcare Corp. (a) | 727 | ||||||
| 17 | WellCare Health Plans, Inc. (a) | 961 | ||||||
|
| |||||||
| 11,312 | ||||||||
|
| |||||||
Health Care Technology — 0.9% |
| |||||||
| 16 | athenahealth, Inc. (a) | 1,335 | ||||||
| 38 | HMS Holdings Corp. (a) | 879 | ||||||
| 47 | Quality Systems, Inc. | 886 | ||||||
|
| |||||||
| 3,100 | ||||||||
|
| |||||||
Life Sciences Tools & Services — 0.5% |
| |||||||
| 6 | Bio-Rad Laboratories, Inc., Class A (a) | 687 | ||||||
| 15 | Covance, Inc. (a) | 1,156 | ||||||
|
| |||||||
| 1,843 | ||||||||
|
| |||||||
Pharmaceuticals — 2.0% |
| |||||||
| 44 | Akorn, Inc. (a) | 595 | ||||||
| 4 | Allergan, Inc. | 356 | ||||||
| 53 | Auxilium Pharmaceuticals, Inc. (a) | 877 | ||||||
| 33 | Bristol-Myers Squibb Co. | 1,485 | ||||||
| 31 | Forest Laboratories, Inc. (a) | 1,262 | ||||||
| 9 | Perrigo Co. | 1,142 | ||||||
| 36 | ViroPharma, Inc. (a) | 1,036 | ||||||
|
| |||||||
| 6,753 | ||||||||
|
| |||||||
Total Health Care | 35,465 | |||||||
|
| |||||||
Industrials — 15.0% | ||||||||
Aerospace & Defense — 1.3% | ||||||||
| 8 | Curtiss-Wright Corp. | 295 | ||||||
| 45 | Hexcel Corp. (a) | 1,543 | ||||||
| 7 | Precision Castparts Corp. | 1,670 | ||||||
| 14 | Teledyne Technologies, Inc. (a) | 1,085 | ||||||
|
| |||||||
| 4,593 | ||||||||
|
| |||||||
SEE NOTES TO FINANCIAL STATEMENTS.
| JUNE 30, 2013 | J.P. MORGAN MID CAP/MULTI-CAP FUNDS | 43 | ||||||
Table of Contents
JPMorgan Multi-Cap Market Neutral Fund
SCHEDULE OF PORTFOLIO INVESTMENTS
AS OF JUNE 30, 2013 (continued)
(Amounts in thousands)
| SHARES | SECURITY DESCRIPTION | VALUE($) | ||||||
| Short Positions — Continued |
| ||||||
| Common Stocks — Continued |
| ||||||
Airlines — 0.4% | ||||||||
| 39 | United Continental Holdings, Inc. (a) | 1,222 | ||||||
|
| |||||||
Building Products — 1.2% | ||||||||
| 19 | Armstrong World Industries, Inc. (a) | 905 | ||||||
| 23 | Fortune Brands Home & Security, Inc. | 904 | ||||||
| 35 | Owens Corning (a) | 1,358 | ||||||
| 33 | Simpson Manufacturing Co., Inc. | 985 | ||||||
|
| |||||||
| 4,152 | ||||||||
|
| |||||||
Commercial Services & Supplies — 2.2% | ||||||||
| 20 | Clean Harbors, Inc. (a) | 991 | ||||||
| 34 | Covanta Holding Corp. | 691 | ||||||
| 23 | Iron Mountain, Inc. | 599 | ||||||
| 33 | Republic Services, Inc. | 1,136 | ||||||
| 5 | Rollins, Inc. | 137 | ||||||
| 11 | Stericycle, Inc. (a) | 1,201 | ||||||
| 36 | Waste Connections, Inc. | 1,489 | ||||||
| 34 | Waste Management, Inc. | 1,358 | ||||||
|
| |||||||
| 7,602 | ||||||||
|
| |||||||
Electrical Equipment — 0.7% | ||||||||
| 11 | Acuity Brands, Inc. | 861 | ||||||
| 15 | Eaton Corp. plc, (Ireland) | 1,011 | ||||||
| 86 | GrafTech International Ltd. (a) | 626 | ||||||
|
| |||||||
| 2,498 | ||||||||
|
| |||||||
Machinery — 5.3% | ||||||||
| 38 | Caterpillar, Inc. | 3,152 | ||||||
| 14 | Chart Industries, Inc. (a) | 1,337 | ||||||
| 22 | CLARCOR, Inc. | 1,157 | ||||||
| 18 | Colfax Corp. (a) | 936 | ||||||
| 8 | Cummins, Inc. | 875 | ||||||
| 26 | Donaldson Co., Inc. | 913 | ||||||
| 17 | Graco, Inc. | 1,044 | ||||||
| 48 | Harsco Corp. | 1,122 | ||||||
| 43 | Joy Global, Inc. | 2,069 | ||||||
| 26 | Kennametal, Inc. | 1,011 | ||||||
| 29 | Navistar International Corp. (a) | 802 | ||||||
| 24 | PACCAR, Inc. | 1,294 | ||||||
| 9 | Toro Co. (The) | 428 | ||||||
| 7 | WABCO Holdings, Inc. (a) | 532 | ||||||
| 33 | Woodward, Inc. | 1,328 | ||||||
|
| |||||||
| 18,000 | ||||||||
|
| |||||||
Marine — 0.4% | ||||||||
| 16 | Kirby Corp. (a) | 1,292 | ||||||
|
| |||||||
Professional Services — 0.6% | ||||||||
| 19 | Advisory Board Co. (The) (a) | 1,059 | ||||||
| SHARES | SECURITY DESCRIPTION | VALUE($) | ||||||
Professional Services — Continued | ||||||||
| 10 | IHS, Inc., Class A (a) | 1,087 | ||||||
|
| |||||||
| 2,146 | ||||||||
|
| |||||||
Road & Rail — 0.7% | ||||||||
| 19 | Genesee & Wyoming, Inc., Class A (a) | 1,623 | ||||||
| 13 | Ryder System, Inc. | 799 | ||||||
|
| |||||||
| 2,422 | ||||||||
|
| |||||||
Trading Companies & Distributors — 2.2% | ||||||||
| 21 | Applied Industrial Technologies, Inc. | 999 | ||||||
| 24 | Beacon Roofing Supply, Inc. (a) | 928 | ||||||
| 67 | Fastenal Co. | 3,086 | ||||||
| 19 | GATX Corp. | 892 | ||||||
| 22 | Textainer Group Holdings Ltd., (Bermuda) | 847 | ||||||
| 3 | W.W. Grainger, Inc. | 847 | ||||||
|
| |||||||
| 7,599 | ||||||||
|
| |||||||
Total Industrials | 51,526 | |||||||
|
| |||||||
Information Technology — 14.3% | ||||||||
Communications Equipment — 1.1% | ||||||||
| 9 | F5 Networks, Inc. (a) | 624 | ||||||
| 50 | JDS Uniphase Corp. (a) | 714 | ||||||
| 12 | NETGEAR, Inc. (a) | 354 | ||||||
| 28 | ViaSat, Inc. (a) | 2,002 | ||||||
|
| |||||||
| 3,694 | ||||||||
|
| |||||||
Computers & Peripherals — 0.7% | ||||||||
| 15 | NCR Corp. (a) | 486 | ||||||
| 79 | QLogic Corp. (a) | 753 | ||||||
| 12 | Stratasys Ltd. (a) | 1,015 | ||||||
|
| |||||||
| 2,254 | ||||||||
|
| |||||||
Electronic Equipment, Instruments & Components — 1.8% |
| |||||||
| 8 | Arrow Electronics, Inc. (a) | 337 | ||||||
| 52 | FLIR Systems, Inc. | 1,416 | ||||||
| 8 | IPG Photonics Corp. | 486 | ||||||
| 46 | National Instruments Corp. | 1,284 | ||||||
| 57 | Trimble Navigation Ltd. (a) | 1,478 | ||||||
| 38 | Universal Display Corp. (a) | 1,067 | ||||||
|
| |||||||
| 6,068 | ||||||||
|
| |||||||
Internet Software & Services — 2.7% |
| |||||||
| 25 | Akamai Technologies, Inc. (a) | 1,082 | ||||||
| 34 | Bankrate, Inc. (a) | 487 | ||||||
| 17 | Cornerstone OnDemand, Inc. (a) | 730 | ||||||
| 15 | CoStar Group, Inc. (a) | 1,891 | ||||||
| 30 | Dealertrack Technologies, Inc. (a) | 1,070 | ||||||
| 12 | eBay, Inc. (a) | 641 | ||||||
SEE NOTES TO FINANCIAL STATEMENTS.
| 44 | J.P. MORGAN MID CAP/MULTI-CAP FUNDS | JUNE 30, 2013 | ||||
Table of Contents
| SHARES | SECURITY DESCRIPTION | VALUE($) | ||||||
| Short Positions — Continued |
| ||||||
| Common Stocks — Continued |
| ||||||
Internet Software & Services — Continued |
| |||||||
| 34 | Facebook, Inc., Class A (a) | 839 | ||||||
| 27 | Liquidity Services, Inc. (a) | 927 | ||||||
| 46 | Rackspace Hosting, Inc. (a) | 1,732 | ||||||
|
| |||||||
| 9,399 | ||||||||
|
| |||||||
IT Services — 2.2% |
| |||||||
| 16 | Automatic Data Processing, Inc. | 1,122 | ||||||
| 6 | FleetCor Technologies, Inc. (a) | 525 | ||||||
| 1 | MasterCard, Inc., Class A | 670 | ||||||
| 3 | MAXIMUS, Inc. | 255 | ||||||
| 84 | Paychex, Inc. | 3,074 | ||||||
| 35 | Sapient Corp. (a) | 457 | ||||||
| 16 | Teradata Corp. (a) | 794 | ||||||
| 35 | VeriFone Systems, Inc. (a) | 586 | ||||||
|
| |||||||
| 7,483 | ||||||||
|
| |||||||
Semiconductors & Semiconductor Equipment — 2.5% |
| |||||||
| 38 | Cavium, Inc. (a) | 1,336 | ||||||
| 17 | Hittite Microwave Corp. (a) | 987 | ||||||
| 54 | International Rectifier Corp. (a) | 1,131 | ||||||
| 35 | Microchip Technology, Inc. | 1,308 | ||||||
| 26 | Power Integrations, Inc. | 1,059 | ||||||
| 33 | Semtech Corp. (a) | 1,163 | ||||||
| 21 | Silicon Laboratories, Inc. (a) | 881 | ||||||
| 23 | Veeco Instruments, Inc. (a) | 824 | ||||||
|
| |||||||
| 8,689 | ||||||||
|
| |||||||
Software — 3.3% |
| |||||||
| 22 | ACI Worldwide, Inc. (a) | 1,000 | ||||||
| 29 | BroadSoft, Inc. (a) | 808 | ||||||
| 3 | Citrix Systems, Inc. (a) | 166 | ||||||
| — | (h) | Compuware Corp. | 5 | |||||
| 8 | FactSet Research Systems, Inc. | 847 | ||||||
| 47 | Fortinet, Inc. (a) | 830 | ||||||
| 26 | MICROS Systems, Inc. (a) | 1,127 | ||||||
| 19 | NetSuite, Inc. (a) | 1,765 | ||||||
| 51 | QLIK Technologies, Inc. (a) | 1,436 | ||||||
| 27 | Red Hat, Inc. (a) | 1,298 | ||||||
| 18 | Splunk, Inc. (a) | 820 | ||||||
| 41 | TIBCO Software, Inc. (a) | 888 | ||||||
| 7 | Tyler Technologies, Inc. (a) | 449 | ||||||
|
| |||||||
| 11,439 | ||||||||
|
| |||||||
Total Information Technology | 49,026 | |||||||
|
| |||||||
Materials — 5.3% |
| |||||||
Chemicals — 3.3% |
| |||||||
| 12 | Air Products & Chemicals, Inc. | 1,082 | ||||||
| SHARES | SECURITY DESCRIPTION | VALUE($) | ||||||
Chemicals — Continued |
| |||||||
| 6 | Airgas, Inc. | 527 | ||||||
| 22 | Celanese Corp., Series A, | 1,000 | ||||||
| 48 | Chemtura Corp. (a) | 973 | ||||||
| 17 | FMC Corp. | 1,060 | ||||||
| 7 | Innophos Holdings, Inc. | 329 | ||||||
| 117 | Intrepid Potash, Inc. | 2,226 | ||||||
| 15 | Mosaic Co. (The) | 815 | ||||||
| 9 | Praxair, Inc. | 1,013 | ||||||
| 24 | Rockwood Holdings, Inc. | 1,536 | ||||||
| 1 | Sensient Technologies Corp. | 57 | ||||||
| 10 | Sigma-Aldrich Corp. | 793 | ||||||
|
| |||||||
| 11,411 | ||||||||
|
| |||||||
Construction Materials — 0.4% |
| |||||||
| 23 | Texas Industries, Inc. (a) | 1,482 | ||||||
|
| |||||||
Containers & Packaging — 0.7% |
| |||||||
| 20 | Aptargroup, Inc. | 1,093 | ||||||
| 31 | MeadWestvaco Corp. | 1,045 | ||||||
| 2 | Rock Tenn Co., Class A | 216 | ||||||
|
| |||||||
| 2,354 | ||||||||
|
| |||||||
Metals & Mining — 0.7% |
| |||||||
| 3 | Allegheny Technologies, Inc. | 91 | ||||||
| 41 | Allied Nevada Gold Corp. (a) | 265 | ||||||
| 2 | Carpenter Technology Corp. | 101 | ||||||
| 49 | Cliffs Natural Resources, Inc. | 803 | ||||||
| 5 | Coeur Mining, Inc. (a) | 66 | ||||||
| 199 | Hecla Mining Co. | 592 | ||||||
| 2 | Nucor Corp. | 106 | ||||||
| 28 | Walter Energy, Inc. | 292 | ||||||
|
| |||||||
| 2,316 | ||||||||
|
| |||||||
Paper & Forest Products — 0.2% |
| |||||||
| 18 | Buckeye Technologies, Inc. | 667 | ||||||
|
| |||||||
Total Materials | 18,230 | |||||||
|
| |||||||
Telecommunication Services — 0.8% |
| |||||||
Diversified Telecommunication Services — 0.5% |
| |||||||
| 11 | AT&T, Inc. | 379 | ||||||
| 9 | CenturyLink, Inc. | 315 | ||||||
| 201 | Cincinnati Bell, Inc. (a) | 615 | ||||||
| 24 | Level 3 Communications, Inc. (a) | 501 | ||||||
|
| |||||||
| 1,810 | ||||||||
|
| |||||||
Wireless Telecommunication Services — 0.3% |
| |||||||
| 13 | Crown Castle International Corp. (a) | 976 | ||||||
|
| |||||||
Total Telecommunication Services | 2,786 | |||||||
|
| |||||||
SEE NOTES TO FINANCIAL STATEMENTS.
| JUNE 30, 2013 | J.P. MORGAN MID CAP/MULTI-CAP FUNDS | 45 | ||||||
Table of Contents
JPMorgan Multi-Cap Market Neutral Fund
SCHEDULE OF PORTFOLIO INVESTMENTS
AS OF JUNE 30, 2013 (continued)
(Amounts in thousands, except number of contracts)
| SHARES | SECURITY DESCRIPTION | VALUE($) | ||||||
| Short Positions — Continued |
| ||||||
| Common Stocks — Continued |
| ||||||
Utilities — 4.2% |
| |||||||
Electric Utilities — 1.7% |
| |||||||
| 15 | Duke Energy Corp. | 986 | ||||||
| 12 | NextEra Energy, Inc. | 998 | ||||||
| 30 | Northeast Utilities | 1,274 | ||||||
| 8 | OGE Energy Corp. | 577 | ||||||
| 32 | PNM Resources, Inc. | 709 | ||||||
| 28 | Southern Co. (The) | 1,251 | ||||||
|
| |||||||
| 5,795 | ||||||||
|
| |||||||
Gas Utilities — 0.8% |
| |||||||
| 12 | New Jersey Resources Corp. | 480 | ||||||
| 21 | Northwest Natural Gas Co. | 909 | ||||||
| 17 | Piedmont Natural Gas Co., Inc. | 588 | ||||||
| 13 | South Jersey Industries, Inc. | 719 | ||||||
|
| |||||||
| 2,696 | ||||||||
|
| |||||||
| SHARES | SECURITY DESCRIPTION | VALUE($) | ||||||
Independent Power Producers & Energy Traders — 0.3% |
| |||||||
| 81 | Atlantic Power Corp. | 320 | ||||||
| 29 | NRG Energy, Inc. | 779 | ||||||
|
| |||||||
| 1,099 | ||||||||
|
| |||||||
Multi-Utilities — 1.4% |
| |||||||
| 17 | Consolidated Edison, Inc. | 976 | ||||||
| 22 | Dominion Resources, Inc. | 1,274 | ||||||
| 10 | MDU Resources Group, Inc. | 269 | ||||||
| 45 | NiSource, Inc. | 1,303 | ||||||
| 24 | SCANA Corp. | 1,179 | ||||||
|
| |||||||
| 5,001 | ||||||||
|
| |||||||
Total Utilities | 14,591 | |||||||
|
| |||||||
Total Short Positions | $ | 306,287 | ||||||
|
| |||||||
Percentages indicated are based on net assets.
| Futures Contracts | ||||||||||||||||
| NUMBER OF CONTRACTS | DESCRIPTION | EXPIRATION DATE | NOTIONAL VALUE AT 06/30/13 | NET UNREALIZED APPRECIATION (DEPRECIATION) | ||||||||||||
Short Futures Outstanding | ||||||||||||||||
| (11 | ) | E-mini S&P 500 | 09/20/13 | $ | (879 | ) | $ | 4 | ||||||||
| (15 | ) | S&P Mid Cap 400 | 09/20/13 | (1,737 | ) | 3 | ||||||||||
|
| |||||||||||||||
| $ | 7 | |||||||||||||||
|
| |||||||||||||||
SEE NOTES TO FINANCIAL STATEMENTS.
| 46 | J.P. MORGAN MID CAP/MULTI-CAP FUNDS | JUNE 30, 2013 | ||||
Table of Contents
JPMorgan Value Advantage Fund
SCHEDULE OF PORTFOLIO INVESTMENTS
AS OF JUNE 30, 2013
(Amounts in thousands)
| SHARES | SECURITY DESCRIPTION | VALUE($) | ||||||
| Common Stocks — 93.8% |
| ||||||
Consumer Discretionary — 15.8% |
| |||||||
Distributors — 1.1% |
| |||||||
| 496 | Genuine Parts Co. | 38,723 | ||||||
|
| |||||||
Hotels, Restaurants & Leisure — 1.5% | ||||||||
| 402 | Brinker International, Inc. | 15,839 | ||||||
| 575 | Marriott International, Inc., Class A | 23,225 | ||||||
| 163 | McDonald’s Corp. | 16,157 | ||||||
|
| |||||||
| 55,221 | ||||||||
|
| |||||||
Household Durables — 0.5% | ||||||||
| 816 | Brookfield Residential Properties, Inc., (Canada) (a) | 18,008 | ||||||
|
| |||||||
Internet & Catalog Retail — 0.6% | ||||||||
| 392 | Expedia, Inc. | 23,585 | ||||||
|
| |||||||
Media — 4.1% | ||||||||
| 1,029 | Belo Corp., Class A | 14,352 | ||||||
| 505 | CBS Corp. (Non-Voting), Class B | 24,679 | ||||||
| 960 | Clear Channel Outdoor Holdings, Inc., Class A (a) | 7,161 | ||||||
| 240 | DIRECTV (a) | 14,764 | ||||||
| 888 | DISH Network Corp., Class A | 37,762 | ||||||
| 1,109 | Entercom Communications Corp., Class A (a) | 10,473 | ||||||
| 391 | Time Warner Cable, Inc. | 43,991 | ||||||
|
| |||||||
| 153,182 | ||||||||
|
| |||||||
Multiline Retail — 1.6% | ||||||||
| 1,133 | Kohl’s Corp. | 57,202 | ||||||
|
| |||||||
Specialty Retail — 5.4% | ||||||||
| 146 | AutoZone, Inc. (a) | 61,994 | ||||||
| 554 | Bed Bath & Beyond, Inc. (a) | 39,293 | ||||||
| 473 | Gap, Inc. (The) | 19,755 | ||||||
| 356 | Home Depot, Inc. (The) | 27,571 | ||||||
| 436 | PetSmart, Inc. | 29,228 | ||||||
| 408 | Williams-Sonoma, Inc. | 22,820 | ||||||
|
| |||||||
| 200,661 | ||||||||
|
| |||||||
Textiles, Apparel & Luxury Goods — 1.0% | ||||||||
| 682 | Hanesbrands, Inc. | 35,043 | ||||||
|
| |||||||
Total Consumer Discretionary | 581,625 | |||||||
|
| |||||||
Consumer Staples — 4.6% | ||||||||
Beverages — 1.9% | ||||||||
| 317 | Diageo plc, (United Kingdom), ADR | 36,474 | ||||||
| 720 | Dr. Pepper Snapple Group, Inc. | 33,074 | ||||||
|
| |||||||
| 69,548 | ||||||||
|
| |||||||
Food & Staples Retailing — 1.1% | ||||||||
| 944 | Walgreen Co. | 41,712 | ||||||
|
| |||||||
| SHARES | SECURITY DESCRIPTION | VALUE($) | ||||||
Household Products — 1.6% | ||||||||
| 771 | Procter & Gamble Co. (The) | 59,336 | ||||||
|
| |||||||
Total Consumer Staples | 170,596 | |||||||
|
| |||||||
Energy — 9.2% | ||||||||
Oil, Gas & Consumable Fuels — 9.2% | ||||||||
| 968 | Devon Energy Corp. | 50,194 | ||||||
| 381 | Energen Corp. | 19,916 | ||||||
| 1,647 | Exxon Mobil Corp. | 148,834 | ||||||
| 511 | Kinder Morgan, Inc. | 19,506 | ||||||
| 670 | NuStar GP Holdings LLC | 17,897 | ||||||
| 697 | PBF Energy, Inc. | 18,061 | ||||||
| 254 | Phillips 66 | 14,945 | ||||||
| 768 | QEP Resources, Inc. | 21,335 | ||||||
| 405 | Southwestern Energy Co. (a) | 14,798 | ||||||
| 325 | Teekay Corp., (Bermuda) | 13,215 | ||||||
|
| |||||||
Total Energy | 338,701 | |||||||
|
| |||||||
Financials — 32.9% | ||||||||
Capital Markets — 4.3% | ||||||||
| 379 | Ameriprise Financial, Inc. | 30,670 | ||||||
| 1,683 | Charles Schwab Corp. (The) | 35,737 | ||||||
| 1,157 | Invesco Ltd. | 36,783 | ||||||
| 882 | Legg Mason, Inc. | 27,357 | ||||||
| 488 | Northern Trust Corp. | 28,249 | ||||||
|
| |||||||
| 158,796 | ||||||||
|
| |||||||
Commercial Banks — 8.1% | ||||||||
| 497 | First Republic Bank | 19,143 | ||||||
| 297 | M&T Bank Corp. | 33,195 | ||||||
| 644 | National Bank Holdings Corp., Class A | 12,695 | ||||||
| 529 | PNC Financial Services Group, Inc. (The) | 38,560 | ||||||
| 878 | SunTrust Banks, Inc. | 27,725 | ||||||
| 1,292 | U.S. Bancorp | 46,710 | ||||||
| 2,944 | Wells Fargo & Co. | 121,515 | ||||||
|
| |||||||
| 299,543 | ||||||||
|
| |||||||
Consumer Finance — 1.9% | ||||||||
| 1,109 | Capital One Financial Corp. | 69,637 | ||||||
|
| |||||||
Diversified Financial Services — 3.2% | ||||||||
| 5,214 | Bank of America Corp. | 67,055 | ||||||
| 1,113 | Citigroup, Inc. | 53,368 | ||||||
|
| |||||||
| 120,423 | ||||||||
|
| |||||||
Insurance — 11.6% | ||||||||
| 318 | Aflac, Inc. | 18,465 | ||||||
| 63 | Alleghany Corp. (a) | 24,246 | ||||||
| 145 | Allied World Assurance Co. Holdings AG, (Switzerland) | 13,278 | ||||||
SEE NOTES TO FINANCIAL STATEMENTS.
| JUNE 30, 2013 | J.P. MORGAN MID CAP/MULTI-CAP FUNDS | 47 | ||||||
Table of Contents
JPMorgan Value Advantage Fund
SCHEDULE OF PORTFOLIO INVESTMENTS
AS OF JUNE 30, 2013 (continued)
(Amounts in thousands)
| SHARES | SECURITY DESCRIPTION | VALUE($) | ||||||
| Common Stocks — Continued |
| ||||||
Insurance — Continued | ||||||||
| 1,308 | American International Group, Inc. (a) | 58,481 | ||||||
| — | (h) | Berkshire Hathaway, Inc., Class A (a) | 35,406 | |||||
| 298 | Endurance Specialty Holdings Ltd., (Bermuda) | 15,312 | ||||||
| 829 | Hartford Financial Services Group, Inc. | 25,623 | ||||||
| 1,605 | Loews Corp. | 71,266 | ||||||
| 565 | Marsh & McLennan Cos., Inc. | 22,567 | ||||||
| 1,401 | Old Republic International Corp. | 18,035 | ||||||
| 538 | Prudential Financial, Inc. | 39,297 | ||||||
| 471 | Travelers Cos., Inc. (The) | 37,666 | ||||||
| 1,084 | Unum Group | 31,849 | ||||||
| 410 | W.R. Berkley Corp. | 16,753 | ||||||
|
| |||||||
| 428,244 | ||||||||
|
| |||||||
Real Estate Investment Trusts (REITs) — 2.1% | ||||||||
| 213 | Agree Realty Corp. | 6,274 | ||||||
| 1,040 | American Residential Properties, Inc. (a) | 17,883 | ||||||
| 1,453 | Annaly Capital Management, Inc. | 18,260 | ||||||
| 569 | Excel Trust, Inc. | 7,293 | ||||||
| 501 | Rayonier, Inc. | 27,756 | ||||||
|
| |||||||
| 77,466 | ||||||||
|
| |||||||
Real Estate Management & Development — 0.3% |
| |||||||
| 330 | Brookfield Asset Management, Inc., (Canada), Class A | 11,869 | ||||||
|
| |||||||
Thrifts & Mortgage Finance — 1.4% | ||||||||
| 1,836 | Hudson City Bancorp, Inc. | 16,813 | ||||||
| 343 | Ocwen Financial Corp. (a) | 14,151 | ||||||
| 1,292 | People’s United Financial, Inc. | 19,245 | ||||||
|
| |||||||
| 50,209 | ||||||||
|
| |||||||
Total Financials | 1,216,187 | |||||||
|
| |||||||
Health Care — 10.0% | ||||||||
Health Care Equipment & Supplies — 0.8% | ||||||||
| 461 | Covidien plc, (Ireland) | 28,937 | ||||||
|
| |||||||
Health Care Providers & Services — 2.1% | ||||||||
| 377 | Humana, Inc. | 31,845 | ||||||
| 263 | McKesson Corp. | 30,068 | ||||||
| 345 | National Healthcare Corp. | 16,475 | ||||||
|
| |||||||
| 78,388 | ||||||||
|
| |||||||
Pharmaceuticals — 7.1% | ||||||||
| 549 | AbbVie, Inc. | 22,692 | ||||||
| 609 | Bristol-Myers Squibb Co. | 27,212 | ||||||
| 877 | Johnson & Johnson | 75,273 | ||||||
| 872 | Merck & Co., Inc. | 40,481 | ||||||
| 3,004 | Pfizer, Inc. | 84,139 | ||||||
| SHARES | SECURITY DESCRIPTION | VALUE($) | ||||||
Pharmaceuticals — Continued | ||||||||
| 159 | Valeant Pharmaceuticals International, Inc. (a) | 13,687 | ||||||
|
| |||||||
| 263,484 | ||||||||
|
| |||||||
Total Health Care | 370,809 | |||||||
|
| |||||||
Industrials — 5.5% | ||||||||
Aerospace & Defense — 1.2% | ||||||||
| 490 | United Technologies Corp. | 45,578 | ||||||
|
| |||||||
Electrical Equipment — 0.4% | ||||||||
| 254 | Emerson Electric Co. | 13,837 | ||||||
|
| |||||||
Industrial Conglomerates — 0.9% | ||||||||
| 558 | Carlisle Cos., Inc. | 34,783 | ||||||
|
| |||||||
Machinery — 1.8% | ||||||||
| 595 | Dover Corp. | 46,169 | ||||||
| 280 | Illinois Tool Works, Inc. | 19,340 | ||||||
|
| |||||||
| 65,509 | ||||||||
|
| |||||||
Professional Services — 0.9% | ||||||||
| 586 | Equifax, Inc. | 34,515 | ||||||
|
| |||||||
Trading Companies & Distributors — 0.3% | ||||||||
| 354 | Air Lease Corp. | 9,772 | ||||||
|
| |||||||
Total Industrials | 203,994 | |||||||
|
| |||||||
Information Technology — 5.6% | ||||||||
Communications Equipment — 2.2% | ||||||||
| 2,315 | Cisco Systems, Inc. | 56,265 | ||||||
| 404 | QUALCOMM, Inc. | 24,655 | ||||||
|
| |||||||
| 80,920 | ||||||||
|
| |||||||
Computers & Peripherals — 0.6% | ||||||||
| 976 | Hewlett-Packard Co. | 24,210 | ||||||
|
| |||||||
Internet Software & Services — 0.1% | ||||||||
| 192 | Gogo, Inc. (a) | 2,677 | ||||||
|
| |||||||
Semiconductors & Semiconductor Equipment — 1.9% |
| |||||||
| 727 | Analog Devices, Inc. | 32,750 | ||||||
| 302 | KLA-Tencor Corp. | 16,853 | ||||||
| 606 | Texas Instruments, Inc. | 21,124 | ||||||
|
| |||||||
| 70,727 | ||||||||
|
| |||||||
Software — 0.8% | ||||||||
| 843 | Microsoft Corp. | 29,105 | ||||||
|
| |||||||
Total Information Technology | 207,639 | |||||||
|
| |||||||
Materials — 2.5% |
| |||||||
Chemicals — 0.9% |
| |||||||
| 519 | Albemarle Corp. | 32,335 | ||||||
|
| |||||||
SEE NOTES TO FINANCIAL STATEMENTS.
| 48 | J.P. MORGAN MID CAP/MULTI-CAP FUNDS | JUNE 30, 2013 | ||||
Table of Contents
| SHARES | SECURITY DESCRIPTION | VALUE($) | ||||||
| Common Stocks — Continued |
| ||||||
Construction Materials — 0.4% |
| |||||||
| 151 | Martin Marietta Materials, Inc. | 14,851 | ||||||
|
| |||||||
Containers & Packaging — 0.7% |
| |||||||
| 249 | Rock Tenn Co., Class A | 24,850 | ||||||
|
| |||||||
Metals & Mining — 0.5% |
| |||||||
| 244 | Compass Minerals International, Inc. | 20,583 | ||||||
|
| |||||||
Total Materials | 92,619 | |||||||
|
| |||||||
Telecommunication Services — 1.4% |
| |||||||
Diversified Telecommunication Services — 1.4% |
| |||||||
| 1,492 | AT&T, Inc. | 52,799 | ||||||
|
| |||||||
Utilities — 6.3% |
| |||||||
Electric Utilities — 3.7% |
| |||||||
| 473 | Duke Energy Corp. | 31,914 | ||||||
| 236 | Edison International | 11,342 | ||||||
| 469 | NextEra Energy, Inc. | 38,230 | ||||||
| 591 | Northeast Utilities | 24,834 | ||||||
| 696 | Southern Co. (The) | 30,710 | ||||||
|
| |||||||
| 137,030 | ||||||||
|
| |||||||
Gas Utilities — 0.4% |
| |||||||
| 402 | Atmos Energy Corp. | 16,503 | ||||||
|
| |||||||
| SHARES | SECURITY DESCRIPTION | VALUE($) | ||||||
Multi-Utilities — 2.2% |
| |||||||
| 1,509 | CenterPoint Energy, Inc. | 35,437 | ||||||
| 548 | Sempra Energy | 44,821 | ||||||
|
| |||||||
| 80,258 | ||||||||
|
| |||||||
Total Utilities | 233,791 | |||||||
|
| |||||||
Total Common Stocks | 3,468,760 | |||||||
|
| |||||||
| Investment Company — 0.2% |
| ||||||
| 387 | Cohen & Steers Infrastructure Fund, Inc. | 7,307 | ||||||
|
| |||||||
| Short-Term Investment — 5.3% |
| ||||||
Investment Company — 5.3% |
| |||||||
| 194,956 | JPMorgan Prime Money Market Fund, Institutional Class Shares, | 194,956 | ||||||
|
| |||||||
Total Investments — 99.3% | 3,671,023 | |||||||
Other Assets in Excess of | 25,900 | |||||||
|
| |||||||
NET ASSETS — 100.0% | $ | 3,696,923 | ||||||
|
| |||||||
Percentages indicated are based on net assets.
SEE NOTES TO FINANCIAL STATEMENTS.
| JUNE 30, 2013 | J.P. MORGAN MID CAP/MULTI-CAP FUNDS | 49 | ||||||
Table of Contents
J.P. Morgan Mid Cap/Multi-Cap Funds
NOTES TO SCHEDULES OF PORTFOLIO INVESTMENTS
AS OF JUNE 30, 2013
| ADR | — American Depositary Receipt | |||||
| (a) | — Non-income producing security. | |||||
| (b) | — Investment in affiliate. Money market fund registered under the Investment Company Act of 1940, as amended, and advised by J.P. Morgan Investment Management Inc. | |||||
| (g) | — Amount rounds to less than 0.1%. | |||||
| (h) | — Amount rounds to less than one thousand (shares or dollars). | |||||
| (j) | — All or a portion of these securities are segregated for short sales. | |||||
| (l) | — The rate shown is the current yield as of June 30, 2013. | |||||
| (m) | — All or a portion of this security is reserved and/or pledged with the custodian for current or potential holdings of futures, swaps, options, TBAs, when-issued securities, delayed delivery securities, reverse repurchase agreements, unfunded commitments and/or forward foreign currency exchange contracts. | |||||
SEE NOTES TO FINANCIAL STATEMENTS.
| 50 | J.P. MORGAN MID CAP/MULTI-CAP FUNDS | JUNE 30, 2013 | ||||
Table of Contents
THIS PAGE IS INTENTIONALLY LEFT BLANK
| JUNE 30, 2013 | J.P. MORGAN MID CAP/MULTI-CAP FUNDS | 51 | ||||||
Table of Contents
STATEMENTS OF ASSETS AND LIABILITIES
AS OF JUNE 30, 2013
(Amounts in thousands, except per share amounts)
| Growth Advantage Fund | Mid Cap Core Fund | Mid Cap Equity Fund | Mid Cap Growth Fund | |||||||||||||
ASSETS: | ||||||||||||||||
Investments in non-affiliates, at value | $ | 1,947,759 | $ | 845,991 | $ | 935,432 | $ | 1,543,062 | ||||||||
Investments in affiliates, at value | 77,133 | 17,356 | 20,751 | 27,053 | ||||||||||||
|
|
|
|
|
|
|
| |||||||||
Total investment securities, at value | 2,024,892 | 863,347 | 956,183 | 1,570,115 | ||||||||||||
Receivables: | ||||||||||||||||
Investment securities sold | — | 13,057 | 13,544 | 29,429 | ||||||||||||
Fund shares sold | 5,657 | 154 | 3,935 | 2,159 | ||||||||||||
Dividends from non-affiliates | 386 | 656 | 703 | 427 | ||||||||||||
Dividends from affiliates | 2 | — | (a) | 7 | 1 | |||||||||||
|
|
|
|
|
|
|
| |||||||||
Total Assets | 2,030,937 | 877,214 | 974,372 | 1,602,131 | ||||||||||||
|
|
|
|
|
|
|
| |||||||||
LIABILITIES: | ||||||||||||||||
Payables: | ||||||||||||||||
Distributions | — | — | 198 | — | ||||||||||||
Investment securities purchased | 28,995 | 9,825 | 11,015 | 19,496 | ||||||||||||
Fund shares redeemed | 874 | 3,363 | 1,938 | 3,322 | ||||||||||||
Accrued liabilities: | ||||||||||||||||
Investment advisory fees | 1,049 | 462 | 406 | 216 | ||||||||||||
Administration fees | 137 | 11 | — | — | ||||||||||||
Shareholder servicing fees | 266 | 60 | 2 | 268 | ||||||||||||
Distribution fees | 82 | 6 | 7 | 142 | ||||||||||||
Custodian and accounting fees | 18 | 13 | 10 | 18 | ||||||||||||
Trustees’ and Chief Compliance Officer’s fees | 1 | 1 | 1 | 1 | ||||||||||||
Other | 93 | 53 | 568 | 871 | ||||||||||||
|
|
|
|
|
|
|
| |||||||||
Total Liabilities | 31,515 | 13,794 | 14,145 | 24,334 | ||||||||||||
|
|
|
|
|
|
|
| |||||||||
Net Assets | $ | 1,999,422 | $ | 863,420 | $ | 960,227 | $ | 1,577,797 | ||||||||
|
|
|
|
|
|
|
| |||||||||
SEE NOTES TO FINANCIAL STATEMENTS.
| 52 | J.P. MORGAN MID CAP/MULTI-CAP FUNDS | JUNE 30, 2013 | ||||
Table of Contents
| Growth Advantage Fund | Mid Cap Core Fund | Mid Cap Equity Fund | Mid Cap Growth Fund | |||||||||||||
NET ASSETS: | ||||||||||||||||
Paid-in-Capital | $ | 1,486,854 | $ | 705,999 | $ | 647,184 | $ | 1,120,095 | ||||||||
Accumulated undistributed net investment income (loss) | (353 | ) | 1,652 | (214 | ) | (1,822 | ) | |||||||||
Accumulated net realized gains (losses) | 35,591 | 97,730 | 45,184 | 47,620 | ||||||||||||
Net unrealized appreciation (depreciation) | 477,330 | 58,039 | 268,073 | 411,904 | ||||||||||||
|
|
|
|
|
|
|
| |||||||||
Total Net Assets | $ | 1,999,422 | $ | 863,420 | $ | 960,227 | $ | 1,577,797 | ||||||||
|
|
|
|
|
|
|
| |||||||||
Net Assets: | ||||||||||||||||
Class A | $ | 276,670 | $ | 28,329 | $ | 21,171 | $ | 586,787 | ||||||||
Class B | 2,081 | — | — | 6,923 | ||||||||||||
Class C | 42,655 | 422 | 6,136 | 23,745 | ||||||||||||
Class R2 | — | 210 | — | 320 | ||||||||||||
Class R5 | 835,233 | 71 | — | 17,848 | ||||||||||||
Class R6 | — | 401,578 | — | 47,434 | ||||||||||||
Select Class | 842,783 | 432,810 | 932,920 | 894,740 | ||||||||||||
|
|
|
|
|
|
|
| |||||||||
Total | $ | 1,999,422 | $ | 863,420 | $ | 960,227 | $ | 1,577,797 | ||||||||
|
|
|
|
|
|
|
| |||||||||
Outstanding units of beneficial interest (shares) | ||||||||||||||||
($0.0001 par value; unlimited number of shares authorized): | ||||||||||||||||
Class A | 24,213 | 1,375 | 556 | 25,524 | ||||||||||||
Class B | 198 | — | — | 407 | ||||||||||||
Class C | 4,058 | 21 | 163 | 1,189 | ||||||||||||
Class R2 | — | 10 | — | 13 | ||||||||||||
Class R5 | 71,512 | 3 | — | 710 | ||||||||||||
Class R6 | — | 19,357 | — | 1,884 | ||||||||||||
Select Class | 72,647 | 20,920 | 24,406 | 35,670 | ||||||||||||
Net Asset Value (b): | ||||||||||||||||
Class A — Redemption price per share | $ | 11.43 | $ | 20.60 | $ | 38.10 | $ | 22.99 | ||||||||
Class B — Offering price per share (c) | 10.50 | — | — | 17.00 | ||||||||||||
Class C — Offering price per share (c) | 10.51 | 20.49 | 37.71 | 19.97 | ||||||||||||
Class R2 — Offering and redemption price per share | — | 20.55 | — | 24.56 | ||||||||||||
Class R5 — Offering and redemption price per share | 11.68 | 20.75 | — | 25.15 | ||||||||||||
Class R6 — Offering and redemption price per share | — | 20.75 | — | 25.17 | ||||||||||||
Select Class — Offering and redemption price per share | 11.60 | 20.69 | 38.22 | 25.08 | ||||||||||||
Class A maximum sales charge | 5.25 | % | 5.25 | % | 5.25 | % | 5.25 | % | ||||||||
Class A maximum public offering price per share | $ | 12.06 | $ | 21.74 | $ | 40.21 | $ | 24.26 | ||||||||
|
|
|
|
|
|
|
| |||||||||
Cost of investments in non-affiliates | $ | 1,470,429 | $ | 787,952 | $ | 667,359 | $ | 1,131,158 | ||||||||
Cost of investments in affiliates | 77,133 | 17,356 | 20,751 | 27,053 | ||||||||||||
| (a) | Amount rounds to less than $1,000. |
| (b) | Per share amounts may not recalculate due to rounding of net assets and/or shares outstanding. |
| (c) | Redemption price for Class B and Class C Shares varies based upon length of time the shares are held. |
SEE NOTES TO FINANCIAL STATEMENTS.
| JUNE 30, 2013 | J.P. MORGAN MID CAP/MULTI-CAP FUNDS | 53 | ||||||
Table of Contents
STATEMENTS OF ASSETS AND LIABILITIES
AS OF JUNE 30, 2013 (continued)
(Amounts in thousands, except per share amounts)
| Mid Cap Value Fund | Multi-Cap Market Neutral Fund | Value Advantage Fund | ||||||||||
ASSETS: | ||||||||||||
Investments in non-affiliates, at value | $ | 12,931,206 | $ | 312,826 | $ | 3,476,067 | ||||||
Investments in affiliates, at value | 322,830 | 25,816 | 194,956 | |||||||||
|
|
|
|
|
| |||||||
Total investment securities, at value | 13,254,036 | 338,642 | 3,671,023 | |||||||||
Cash | — | 123 | — | |||||||||
Deposits at broker for securities sold short | — | 317,585 | — | |||||||||
Deposits at broker for futures contracts | — | 225 | — | |||||||||
Receivables: | ||||||||||||
Investment securities sold | 128,669 | 19,214 | 16,171 | |||||||||
Fund shares sold | 35,528 | 28 | 21,834 | |||||||||
Dividends from non-affiliates | 15,813 | 283 | 3,473 | |||||||||
Dividends from affiliates | 14 | 1 | 8 | |||||||||
|
|
|
|
|
| |||||||
Total Assets | 13,434,060 | 676,101 | 3,712,509 | |||||||||
|
|
|
|
|
| |||||||
LIABILITIES: | ||||||||||||
Payables: | ||||||||||||
Securities sold short, at value | — | 306,287 | — | |||||||||
Dividend expense to non-affiliates on securities sold short | — | 194 | — | |||||||||
Investment securities purchased | 139,889 | 25,190 | 7,570 | |||||||||
Interest expense to non-affiliates on securities sold short | — | 42 | — | |||||||||
Fund shares redeemed | 20,895 | 57 | 5,437 | |||||||||
Variation margin on futures contracts | — | 97 | — | |||||||||
Accrued liabilities: | ||||||||||||
Investment advisory fees | 5,809 | 350 | 1,721 | |||||||||
Shareholder servicing fees | 1,317 | — | 447 | |||||||||
Distribution fees | 1,012 | 10 | 286 | |||||||||
Custodian and accounting fees | 98 | 12 | 28 | |||||||||
Trustees’ and Chief Compliance Officer’s fees | 12 | — | 5 | |||||||||
Other | 2,046 | 76 | 92 | |||||||||
|
|
|
|
|
| |||||||
Total Liabilities | 171,078 | 332,315 | 15,586 | |||||||||
|
|
|
|
|
| |||||||
Net Assets | $ | 13,262,982 | $ | 343,786 | $ | 3,696,923 | ||||||
|
|
|
|
|
| |||||||
SEE NOTES TO FINANCIAL STATEMENTS.
| 54 | J.P. MORGAN MID CAP/MULTI-CAP FUNDS | JUNE 30, 2013 | ||||
Table of Contents
| Mid Cap Value Fund | Multi-Cap Market Neutral Fund | Value Advantage Fund | ||||||||||
NET ASSETS: | ||||||||||||
Paid-in-Capital | $ | 9,561,677 | $ | 378,647 | $ | 3,081,545 | ||||||
Accumulated undistributed net investment income (loss) | 48,644 | (2,483 | ) | 14,270 | ||||||||
Accumulated net realized gains (losses) | 225,647 | (70,885 | ) | 19,101 | ||||||||
Net unrealized appreciation (depreciation) | 3,427,014 | 38,507 | 582,007 | |||||||||
|
|
|
|
|
| |||||||
Total Net Assets | $ | 13,262,982 | $ | 343,786 | $ | 3,696,923 | ||||||
|
|
|
|
|
| |||||||
Net Assets: | ||||||||||||
Class A | $ | 3,157,503 | $ | 14,101 | $ | 784,359 | ||||||
Class B | 15,382 | 530 | — | |||||||||
Class C | 534,813 | 11,181 | 212,198 | |||||||||
Class R2 | 57,003 | — | — | |||||||||
Institutional Class | 6,627,529 | — | 1,455,125 | |||||||||
Select Class | 2,870,752 | 317,974 | 1,245,241 | |||||||||
|
|
|
|
|
| |||||||
Total | $ | 13,262,982 | $ | 343,786 | $ | 3,696,923 | ||||||
|
|
|
|
|
| |||||||
Outstanding units of beneficial interest (shares) | ||||||||||||
($0.0001 par value; unlimited number of shares authorized): | ||||||||||||
Class A | 99,680 | 1,441 | 31,835 | |||||||||
Class B | 495 | 57 | — | |||||||||
Class C | 17,343 | 1,199 | 8,622 | |||||||||
Class R2 | 1,850 | — | — | |||||||||
Institutional Class | 205,460 | — | 58,819 | |||||||||
Select Class | 89,851 | 31,990 | 50,379 | |||||||||
Net Asset Value (a): | ||||||||||||
Class A — Redemption price per share | $ | 31.68 | $ | 9.79 | $ | 24.64 | ||||||
Class B — Offering price per share (b) | 31.05 | 9.31 | — | |||||||||
Class C — Offering price per share (b) | 30.84 | 9.33 | 24.61 | |||||||||
Class R2 — Offering and redemption price per share | 30.81 | — | — | |||||||||
Institutional Class — Offering and redemption price per share | 32.26 | — | 24.74 | |||||||||
Select Class — Offering and redemption price per share | 31.95 | 9.94 | 24.72 | |||||||||
Class A maximum sales charge | 5.25 | % | 5.25 | % | 5.25 | % | ||||||
Class A maximum public offering price per share | $ | 33.44 | $ | 10.33 | $ | 26.01 | ||||||
|
|
|
|
|
| |||||||
Cost of investments in non-affiliates | $ | 9,504,192 | $ | 252,790 | $ | 2,894,060 | ||||||
Cost of investments in affiliates | 322,830 | 25,816 | 194,956 | |||||||||
Proceeds received from securities sold short | — | 284,751 | — | |||||||||
| (a) | Per share amounts may not recalculate due to rounding of net assets and/or shares outstanding. |
| (b) | Redemption price for Class B and Class C Shares varies based upon length of time the shares are held. |
SEE NOTES TO FINANCIAL STATEMENTS.
| JUNE 30, 2013 | J.P. MORGAN MID CAP/MULTI-CAP FUNDS | 55 | ||||||
Table of Contents
STATEMENTS OF OPERATIONS
FOR THE YEAR ENDED JUNE 30, 2013
(Amounts in thousands)
| Growth Advantage Fund | Mid Cap Core Fund | Mid Cap Equity Fund | Mid Cap Growth Fund | |||||||||||||
INVESTMENT INCOME: | ||||||||||||||||
Dividend income from non-affiliates | $ | 22,117 | $ | 14,687 | $ | 14,117 | $ | 15,780 | ||||||||
Dividend income from affiliates | 33 | 23 | 21 | 20 | ||||||||||||
Income from securities lending (net) | — | — | 1 | 3 | ||||||||||||
|
|
|
|
|
|
|
| |||||||||
Total investment income | 22,150 | 14,710 | 14,139 | 15,803 | ||||||||||||
|
|
|
|
|
|
|
| |||||||||
EXPENSES: | ||||||||||||||||
Investment advisory fees | 10,394 | 4,772 | 6,256 | 9,640 | ||||||||||||
Administration fees | 1,362 | 624 | 820 | 1,264 | ||||||||||||
Distribution fees: | ||||||||||||||||
Class A | 561 | 53 | 29 | 1,391 | ||||||||||||
Class B | 17 | — | — | 63 | ||||||||||||
Class C | 248 | 1 | 20 | 167 | ||||||||||||
Class R2 | — | 1 | — | 1 | ||||||||||||
Shareholder servicing fees: | ||||||||||||||||
Class A | 561 | 53 | 29 | 1,391 | ||||||||||||
Class B | 5 | — | — | 21 | ||||||||||||
Class C | 83 | — | (a) | 6 | 56 | |||||||||||
Class R2 | — | — | (a) | — | 1 | |||||||||||
Class R5 | 334 | — | (a) | — | 8 | |||||||||||
Select Class | 1,677 | 1,067 | 2,371 | 2,130 | ||||||||||||
Custodian and accounting fees | 67 | 50 | 40 | 70 | ||||||||||||
Interest expense to affiliates | — | (a) | — | — | (a) | — | (a) | |||||||||
Professional fees | 59 | 51 | 51 | 58 | ||||||||||||
Trustees’ and Chief Compliance Officer’s fees | 18 | 8 | 10 | 17 | ||||||||||||
Printing and mailing costs | 68 | 43 | 166 | 192 | ||||||||||||
Registration and filing fees | 76 | 67 | 57 | 81 | ||||||||||||
Transfer agent fees | 445 | 80 | 2,037 | 2,768 | ||||||||||||
Other | 89 | 11 | 12 | 42 | ||||||||||||
|
|
|
|
|
|
|
| |||||||||
Total expenses | 16,064 | 6,881 | 11,904 | 19,361 | ||||||||||||
|
|
|
|
|
|
|
| |||||||||
Less amounts waived | (174 | ) | (407 | ) | (3,239 | ) | (3,713 | ) | ||||||||
|
|
|
|
|
|
|
| |||||||||
Net expenses | 15,890 | 6,474 | 8,665 | 15,648 | ||||||||||||
|
|
|
|
|
|
|
| |||||||||
Net investment income (loss) | 6,260 | 8,236 | 5,474 | 155 | ||||||||||||
|
|
|
|
|
|
|
| |||||||||
REALIZED/UNREALIZED GAINS (LOSSES): | ||||||||||||||||
Net realized gain (loss) on transactions from investments in non-affiliates | 56,467 | 107,445 | 64,936 | 146,094 | ||||||||||||
|
|
|
|
|
|
|
| |||||||||
Change in net unrealized appreciation/depreciation of investments in non-affiliates | 252,716 | 43,825 | 143,890 | 169,741 | ||||||||||||
|
|
|
|
|
|
|
| |||||||||
Net realized/unrealized gains (losses) | 309,183 | 151,270 | 208,826 | 315,835 | ||||||||||||
|
|
|
|
|
|
|
| |||||||||
Change in net assets resulting from operations | $ | 315,443 | $ | 159,506 | $ | 214,300 | $ | 315,990 | ||||||||
|
|
|
|
|
|
|
| |||||||||
| (a) | Amount rounds to less than $1,000. |
SEE NOTES TO FINANCIAL STATEMENTS.
| 56 | J.P. MORGAN MID CAP/MULTI-CAP FUNDS | JUNE 30, 2013 | ||||
Table of Contents
| Mid Cap Value Fund | Multi-Cap Market Neutral Fund | Value Advantage Fund | ||||||||||
INVESTMENT INCOME: | ||||||||||||
Interest income from non-affiliates | $ | — | $ | 1 | $ | — | ||||||
Interest income from affiliates | — | 7 | — | |||||||||
Dividend income from non-affiliates | 198,971 | 8,571 | 49,708 | |||||||||
Dividend income from affiliates | 368 | 45 | 107 | |||||||||
Income from securities lending (net) | 10 | — | — | |||||||||
|
|
|
|
|
| |||||||
Total investment income | 199,349 | 8,624 | 49,815 | |||||||||
|
|
|
|
|
| |||||||
EXPENSES: | ||||||||||||
Investment advisory fees | 68,080 | 5,730 | 14,531 | |||||||||
Administration fees | 8,910 | 391 | 1,897 | |||||||||
Distribution fees: | ||||||||||||
Class A | 6,476 | 46 | 1,199 | |||||||||
Class B | 267 | 7 | — | |||||||||
Class C | 3,411 | 96 | 1,131 | |||||||||
Class R2 | 180 | — | — | |||||||||
Shareholder servicing fees: | ||||||||||||
Class A | 6,476 | 46 | 1,199 | |||||||||
Class B | 89 | 2 | — | |||||||||
Class C | 1,137 | 32 | 377 | |||||||||
Class R2 | 90 | — | — | |||||||||
Institutional Class | 4,990 | — | 829 | |||||||||
Select Class | 5,917 | 1,066 | 1,941 | |||||||||
Custodian and accounting fees | 376 | 52 | 90 | |||||||||
Professional fees | 142 | 54 | 62 | |||||||||
Trustees’ and Chief Compliance Officer’s fees | 119 | 6 | 25 | |||||||||
Printing and mailing costs | 1,231 | 4 | 187 | |||||||||
Registration and filing fees | 508 | 42 | 69 | |||||||||
Transfer agent fees | 12,671 | 55 | 1,677 | |||||||||
Other | 204 | 18 | 25 | |||||||||
Dividend expense to non-affiliates on securities sold short | — | 6,575 | — | |||||||||
Interest expense to non-affiliates on securities sold short | — | 536 | — | |||||||||
|
|
|
|
|
| |||||||
Total expenses | 121,274 | 14,758 | 25,239 | |||||||||
|
|
|
|
|
| |||||||
Less amounts waived | (20,049 | ) | (1,832 | ) | (2,900 | ) | ||||||
|
|
|
|
|
| |||||||
Net expenses | 101,225 | 12,926 | 22,339 | |||||||||
|
|
|
|
|
| |||||||
Net investment income (loss) | 98,124 | (4,302 | ) | 27,476 | ||||||||
|
|
|
|
|
| |||||||
REALIZED/UNREALIZED GAINS (LOSSES): | ||||||||||||
Net realized gain (loss) on transactions from: | ||||||||||||
Investments in non-affiliates | 465,647 | 70,742 | 52,298 | |||||||||
Futures | — | 7 | — | |||||||||
Securities sold short | — | (49,223 | ) | — | ||||||||
Foreign currency transactions | — | — | (a) | — | ||||||||
|
|
|
|
|
| |||||||
Net realized gain (loss) | 465,647 | 21,526 | 52,298 | |||||||||
|
|
|
|
|
| |||||||
Change in net unrealized appreciation/depreciation of: | ||||||||||||
Investments in non-affiliates | 1,779,184 | 28,674 | 438,061 | |||||||||
Futures | — | 7 | — | |||||||||
Securities sold short | — | (41,666 | ) | — | ||||||||
|
|
|
|
|
| |||||||
Change in net unrealized appreciation/depreciation | 1,779,184 | (12,985 | ) | 438,061 | ||||||||
|
|
|
|
|
| |||||||
Net realized/unrealized gains (losses) | 2,244,831 | 8,541 | 490,359 | |||||||||
|
|
|
|
|
| |||||||
Change in net assets resulting from operations | $ | 2,342,955 | $ | 4,239 | $ | 517,835 | ||||||
|
|
|
|
|
| |||||||
| (a) | Amount rounds to less than $1,000. |
SEE NOTES TO FINANCIAL STATEMENTS.
| JUNE 30, 2013 | J.P. MORGAN MID CAP/MULTI-CAP FUNDS | 57 | ||||||
Table of Contents
STATEMENTS OF CHANGES IN NET ASSETS
FOR THE PERIODS INDICATED
(Amounts in thousands)
| Growth Advantage Fund | Mid Cap Core Fund | |||||||||||||||
| Year Ended 6/30/2013 | Year Ended 6/30/2012 | Year Ended 6/30/2013 | Year Ended 6/30/2012 | |||||||||||||
CHANGE IN NET ASSETS RESULTING FROM OPERATIONS: | ||||||||||||||||
Net investment income (loss) | $ | 6,260 | $ | (1,993 | ) | $ | 8,236 | $ | 1,921 | |||||||
Net realized gain (loss) | 56,467 | 36,525 | 107,445 | (1,412 | ) | |||||||||||
Change in net unrealized appreciation/depreciation | 252,716 | (18,846 | ) | 43,825 | 13,816 | |||||||||||
|
|
|
|
|
|
|
| |||||||||
Change in net assets resulting from operations | 315,443 | 15,686 | 159,506 | 14,325 | ||||||||||||
|
|
|
|
|
|
|
| |||||||||
DISTRIBUTIONS TO SHAREHOLDERS: | ||||||||||||||||
Class A | ||||||||||||||||
From net investment income | (188 | ) | — | (194 | ) | — | (a) | |||||||||
From net realized gains | (670 | ) | — | (241 | ) | — | (a) | |||||||||
Class B | ||||||||||||||||
From net realized gains | (8 | ) | — | — | — | |||||||||||
Class C | ||||||||||||||||
From net investment income | — | — | — | (a) | — | (a) | ||||||||||
From net realized gains | (106 | ) | — | (2 | ) | — | (a) | |||||||||
Class R2 | ||||||||||||||||
From net investment income | — | — | (1 | ) | — | (a) | ||||||||||
From net realized gains | — | — | (1 | ) | — | (a) | ||||||||||
Class R5 | ||||||||||||||||
From net investment income | (2,904 | ) | — | (1 | ) | — | (a) | |||||||||
From net realized gains | (1,960 | ) | — | (1 | ) | — | (a) | |||||||||
Class R6 | ||||||||||||||||
From net investment income | — | — | (3,133 | ) | — | (a) | ||||||||||
From net realized gains | — | — | (3,322 | ) | — | (a) | ||||||||||
Select Class | ||||||||||||||||
From net investment income | (1,645 | ) | — | (4,129 | ) | (632 | ) | |||||||||
From net realized gains | (2,119 | ) | — | (5,178 | ) | (94 | ) | |||||||||
|
|
|
|
|
|
|
| |||||||||
Total distributions to shareholders | (9,600 | ) | — | (16,203 | ) | (726 | ) | |||||||||
|
|
|
|
|
|
|
| |||||||||
CAPITAL TRANSACTIONS: | ||||||||||||||||
Change in net assets resulting from capital transactions | 338,022 | 123,715 | 370,595 | 244,141 | ||||||||||||
|
|
|
|
|
|
|
| |||||||||
NET ASSETS: | ||||||||||||||||
Change in net assets | 643,865 | 139,401 | 513,898 | 257,740 | ||||||||||||
Beginning of period | 1,355,557 | 1,216,156 | 349,522 | 91,782 | ||||||||||||
|
|
|
|
|
|
|
| |||||||||
End of period | $ | 1,999,422 | $ | 1,355,557 | $ | 863,420 | $ | 349,522 | ||||||||
|
|
|
|
|
|
|
| |||||||||
Accumulated undistributed net investment income (loss) | $ | (353 | ) | $ | (340 | ) | $ | 1,652 | $ | 1,332 | ||||||
|
|
|
|
|
|
|
| |||||||||
| (a) | Amount rounds to less than $1,000. |
SEE NOTES TO FINANCIAL STATEMENTS.
| 58 | J.P. MORGAN MID CAP/MULTI-CAP FUNDS | JUNE 30, 2013 | ||||
Table of Contents
| Mid Cap Equity Fund | Mid Cap Growth Fund | |||||||||||||||
| Year Ended 6/30/2013 | Year Ended 6/30/2012 | Year Ended 6/30/2013 | Year Ended 6/30/2012 | |||||||||||||
CHANGE IN NET ASSETS RESULTING FROM OPERATIONS: | ||||||||||||||||
Net investment income (loss) | $ | 5,474 | $ | 3,845 | $ | 155 | $ | (867 | ) | |||||||
Net realized gain (loss) | 64,936 | 7,873 | 146,094 | 74,384 | ||||||||||||
Change in net unrealized appreciation/depreciation | 143,890 | (3,327 | ) | 169,741 | (186,566 | ) | ||||||||||
|
|
|
|
|
|
|
| |||||||||
Change in net assets resulting from operations | 214,300 | 8,391 | 315,990 | (113,049 | ) | |||||||||||
|
|
|
|
|
|
|
| |||||||||
DISTRIBUTIONS TO SHAREHOLDERS: | ||||||||||||||||
Class A | ||||||||||||||||
From net investment income | (31 | ) | (15 | ) | — | — | ||||||||||
From net realized gains | (75 | ) | — | (25,563 | ) | (55,641 | ) | |||||||||
Class B | ||||||||||||||||
From net realized gains | — | — | (531 | ) | (1,640 | ) | ||||||||||
Class C | ||||||||||||||||
From net investment income | (1 | ) | — | (a) | — | — | ||||||||||
From net realized gains | (15 | ) | — | (1,148 | ) | (2,514 | ) | |||||||||
Class R2 | ||||||||||||||||
From net realized gains | — | — | (11 | ) | (16 | ) | ||||||||||
Class R5 (b) | ||||||||||||||||
From net realized gains | — | — | (664 | ) | (5 | ) | ||||||||||
Class R6 (b) | ||||||||||||||||
From net realized gains | — | — | (826 | ) | (5 | ) | ||||||||||
Select Class | ||||||||||||||||
From net investment income | (4,620 | ) | (3,722 | ) | — | — | ||||||||||
From net realized gains | (6,960 | ) | — | (36,115 | ) | (74,559 | ) | |||||||||
|
|
|
|
|
|
|
| |||||||||
Total distributions to shareholders | (11,702 | ) | (3,737 | ) | (64,858 | ) | (134,380 | ) | ||||||||
|
|
|
|
|
|
|
| |||||||||
CAPITAL TRANSACTIONS: | ||||||||||||||||
Change in net assets resulting from capital transactions | (63,705 | ) | 244,461 | (100,151 | ) | (101,508 | ) | |||||||||
|
|
|
|
|
|
|
| |||||||||
NET ASSETS: | ||||||||||||||||
Change in net assets | 138,893 | 249,115 | 150,981 | (348,937 | ) | |||||||||||
Beginning of period | 821,334 | 572,219 | 1,426,816 | 1,775,753 | ||||||||||||
|
|
|
|
|
|
|
| |||||||||
End of period | $ | 960,227 | $ | 821,334 | $ | 1,577,797 | $ | 1,426,816 | ||||||||
|
|
|
|
|
|
|
| |||||||||
Accumulated undistributed net investment income (loss) | $ | (214 | ) | $ | (206 | ) | $ | (1,822 | ) | $ | (84 | ) | ||||
|
|
|
|
|
|
|
| |||||||||
| (a) | Amount rounds to less than $1,000. |
| (b) | Commencement of offering of class of shares effective November 1, 2011 for Mid Cap Growth Fund. |
SEE NOTES TO FINANCIAL STATEMENTS.
| JUNE 30, 2013 | J.P. MORGAN MID CAP/MULTI-CAP FUNDS | 59 | ||||||
Table of Contents
STATEMENTS OF CHANGES IN NET ASSETS
FOR THE PERIODS INDICATED (continued)
(Amounts in thousands)
| Mid Cap Value Fund | Multi-Cap Market Neutral Fund | |||||||||||||||
| Year Ended 6/30/2013 | Year Ended 6/30/2012 | Year Ended 6/30/2013 | Year Ended 6/30/2012 | |||||||||||||
CHANGE IN NET ASSETS RESULTING FROM OPERATIONS: | ||||||||||||||||
Net investment income (loss) | $ | 98,124 | $ | 72,482 | $ | (4,302 | ) | $ | (6,364 | ) | ||||||
Net realized gain (loss) | 465,647 | 226,074 | 21,526 | 27,034 | ||||||||||||
Change in net unrealized appreciation/depreciation | 1,779,184 | 80,566 | (12,985 | ) | (26,538 | ) | ||||||||||
|
|
|
|
|
|
|
| |||||||||
Change in net assets resulting from operations | 2,342,955 | 379,122 | 4,239 | (5,868 | ) | |||||||||||
|
|
|
|
|
|
|
| |||||||||
DISTRIBUTIONS TO SHAREHOLDERS: | ||||||||||||||||
Class A | ||||||||||||||||
From net investment income | (25,622 | ) | (12,100 | ) | — | — | ||||||||||
From net realized gains | (19,155 | ) | — | — | — | |||||||||||
Class B | ||||||||||||||||
From net realized gains | (292 | ) | — | — | — | |||||||||||
Class C | ||||||||||||||||
From net investment income | (2,608 | ) | (616 | ) | — | — | ||||||||||
From net realized gains | (3,426 | ) | — | — | — | |||||||||||
Class R2 | ||||||||||||||||
From net investment income | (363 | ) | (67 | ) | — | — | ||||||||||
From net realized gains | (258 | ) | — | — | — | |||||||||||
Institutional Class | ||||||||||||||||
From net investment income | (64,280 | ) | (33,157 | ) | — | — | ||||||||||
From net realized gains | (34,137 | ) | — | — | — | |||||||||||
Select Class | ||||||||||||||||
From net investment income | (27,916 | ) | (14,296 | ) | — | — | ||||||||||
From net realized gains | (17,242 | ) | — | — | — | |||||||||||
|
|
|
|
|
|
|
| |||||||||
Total distributions to shareholders | (195,299 | ) | (60,236 | ) | — | — | ||||||||||
|
|
|
|
|
|
|
| |||||||||
CAPITAL TRANSACTIONS: | ||||||||||||||||
Change in net assets resulting from capital transactions | 3,305,779 | 714,827 | (174,093 | ) | (26,939 | ) | ||||||||||
|
|
|
|
|
|
|
| |||||||||
NET ASSETS: | ||||||||||||||||
Change in net assets | 5,453,435 | 1,033,713 | (169,854 | ) | (32,807 | ) | ||||||||||
Beginning of period | 7,809,547 | 6,775,834 | 513,640 | 546,447 | ||||||||||||
|
|
|
|
|
|
|
| |||||||||
End of period | $ | 13,262,982 | $ | 7,809,547 | $ | 343,786 | $ | 513,640 | ||||||||
|
|
|
|
|
|
|
| |||||||||
Accumulated undistributed net investment income (loss) | $ | 48,644 | $ | 72,280 | $ | (2,483 | ) | $ | (3,153 | ) | ||||||
|
|
|
|
|
|
|
| |||||||||
SEE NOTES TO FINANCIAL STATEMENTS.
| 60 | J.P. MORGAN MID CAP/MULTI-CAP FUNDS | JUNE 30, 2013 | ||||
Table of Contents
| Value Advantage Fund | ||||||||
| Year Ended 6/30/2013 | Year Ended 6/30/2012 | |||||||
CHANGE IN NET ASSETS RESULTING FROM OPERATIONS: | ||||||||
Net investment income (loss) | $ | 27,476 | $ | 14,184 | ||||
Net realized gain (loss) | 52,298 | 35,802 | ||||||
Change in net unrealized appreciation/depreciation | 438,061 | 1,096 | ||||||
|
|
|
| |||||
Change in net assets resulting from operations | 517,835 | 51,082 | ||||||
|
|
|
| |||||
DISTRIBUTIONS TO SHAREHOLDERS: | ||||||||
Class A | ||||||||
From net investment income | (4,504 | ) | (2,164 | ) | ||||
From net realized gains | (1,946 | ) | — | |||||
Class C | ||||||||
From net investment income | (368 | ) | (619 | ) | ||||
From net realized gains | (536 | ) | — | |||||
Institutional Class | ||||||||
From net investment income | (8,338 | ) | (4,920 | ) | ||||
From net realized gains | (2,763 | ) | — | |||||
Select Class | ||||||||
From net investment income | (7,570 | ) | (3,577 | ) | ||||
From net realized gains | (2,914 | ) | — | |||||
|
|
|
| |||||
Total distributions to shareholders | (28,939 | ) | (11,280 | ) | ||||
|
|
|
| |||||
CAPITAL TRANSACTIONS: | ||||||||
Change in net assets resulting from capital transactions | 2,075,888 | 173,496 | ||||||
|
|
|
| |||||
NET ASSETS: | ||||||||
Change in net assets | 2,564,784 | 213,298 | ||||||
Beginning of period | 1,132,139 | 918,841 | ||||||
|
|
|
| |||||
End of period | $ | 3,696,923 | $ | 1,132,139 | ||||
|
|
|
| |||||
Accumulated undistributed net investment income (loss) | $ | 14,270 | $ | 9,188 | ||||
|
|
|
| |||||
SEE NOTES TO FINANCIAL STATEMENTS.
| JUNE 30, 2013 | J.P. MORGAN MID CAP/MULTI-CAP FUNDS | 61 | ||||||
Table of Contents
STATEMENTS OF CHANGES IN NET ASSETS
FOR THE PERIODS INDICATED (continued)
(Amounts in thousands)
| Growth Advantage Fund | Mid Cap Core Fund | |||||||||||||||
| Year Ended 6/30/2013 | Year Ended 6/30/2012 | Year Ended 6/30/2013 | Year Ended 6/30/2012 | |||||||||||||
CAPITAL TRANSACTIONS: | ||||||||||||||||
Class A | ||||||||||||||||
Proceeds from shares issued | $ | 118,895 | $ | 81,189 | $ | 30,581 | $ | 463 | ||||||||
Distributions reinvested | 834 | — | 434 | — | (a) | |||||||||||
Cost of shares redeemed | (80,737 | ) | (65,978 | ) | (7,742 | ) | (281 | ) | ||||||||
|
|
|
|
|
|
|
| |||||||||
Change in net assets resulting from Class A capital transactions | $ | 38,992 | $ | 15,211 | $ | 23,273 | $ | 182 | ||||||||
|
|
|
|
|
|
|
| |||||||||
Class B | ||||||||||||||||
Proceeds from shares issued | $ | 106 | $ | 158 | $ | — | $ | — | ||||||||
Distributions reinvested | 7 | — | — | — | ||||||||||||
Cost of shares redeemed | (752 | ) | (1,004 | ) | — | — | ||||||||||
|
|
|
|
|
|
|
| |||||||||
Change in net assets resulting from Class B capital transactions | $ | (639 | ) | $ | (846 | ) | $ | — | $ | — | ||||||
|
|
|
|
|
|
|
| |||||||||
Class C | ||||||||||||||||
Proceeds from shares issued | $ | 15,313 | $ | 15,180 | $ | 402 | $ | 50 | ||||||||
Distributions reinvested | 83 | — | 2 | — | (a) | |||||||||||
Cost of shares redeemed | (6,338 | ) | (8,713 | ) | (134 | ) | (24 | ) | ||||||||
|
|
|
|
|
|
|
| |||||||||
Change in net assets resulting from Class C capital transactions | $ | 9,058 | $ | 6,467 | $ | 270 | $ | 26 | ||||||||
|
|
|
|
|
|
|
| |||||||||
Class R2 | ||||||||||||||||
Proceeds from shares issued | $ | — | $ | — | $ | 139 | $ | — | (a) | |||||||
Distributions reinvested | — | — | 2 | — | (a) | |||||||||||
Cost of shares redeemed | — | — | (1 | ) | — | |||||||||||
|
|
|
|
|
|
|
| |||||||||
Change in net assets resulting from Class R2 capital transactions | $ | — | $ | — | $ | 140 | $ | — | (a) | |||||||
|
|
|
|
|
|
|
| |||||||||
Class R5 | ||||||||||||||||
Proceeds from shares issued | $ | 327,999 | $ | 289,698 | $ | — | $ | — | ||||||||
Distributions reinvested | 4,864 | — | 2 | — | (a) | |||||||||||
Cost of shares redeemed | (97,306 | ) | (4,352 | ) | — | — | ||||||||||
|
|
|
|
|
|
|
| |||||||||
Change in net assets resulting from Class R5 capital transactions | $ | 235,557 | $ | 285,346 | $ | 2 | $ | — | (a) | |||||||
|
|
|
|
|
|
|
| |||||||||
Class R6 | ||||||||||||||||
Proceeds from shares issued | $ | — | $ | — | $ | 370,724 | $ | 33,949 | ||||||||
Distributions reinvested | — | — | 6,360 | — | (a) | |||||||||||
Cost of shares redeemed | — | — | (60,026 | ) | (6,403 | ) | ||||||||||
|
|
|
|
|
|
|
| |||||||||
Change in net assets resulting from Class R6 capital transactions | $ | — | $ | — | $ | 317,058 | $ | 27,546 | ||||||||
|
|
|
|
|
|
|
| |||||||||
Select Class | ||||||||||||||||
Proceeds from shares issued | $ | 347,648 | $ | 124,637 | $ | 184,036 | $ | 282,102 | ||||||||
Distributions reinvested | 264 | — | 201 | 9 | ||||||||||||
Cost of shares redeemed | (292,858 | ) | (307,100 | ) | (154,385 | ) | (65,724 | ) | ||||||||
|
|
|
|
|
|
|
| |||||||||
Change in net assets resulting from Select Class capital transactions | $ | 55,054 | $ | (182,463 | ) | $ | 29,852 | $ | 216,387 | |||||||
|
|
|
|
|
|
|
| |||||||||
Total change in net assets resulting from capital transactions | $ | 338,022 | $ | 123,715 | $ | 370,595 | $ | 244,141 | ||||||||
|
|
|
|
|
|
|
| |||||||||
SEE NOTES TO FINANCIAL STATEMENTS.
| 62 | J.P. MORGAN MID CAP/MULTI-CAP FUNDS | JUNE 30, 2013 | ||||
Table of Contents
| Growth Advantage Fund | Mid Cap Core Fund | |||||||||||||||
| Year Ended 6/30/2013 | Year Ended 6/30/2012 | Year Ended 6/30/2013 | Year Ended 6/30/2012 | |||||||||||||
SHARE TRANSACTIONS: | ||||||||||||||||
Class A | ||||||||||||||||
Issued | 11,374 | 8,808 | 1,728 | 28 | ||||||||||||
Reinvested | 85 | — | 25 | — | (a) | |||||||||||
Redeemed | (7,790 | ) | (7,290 | ) | (405 | ) | (17 | ) | ||||||||
|
|
|
|
|
|
|
| |||||||||
Change in Class A Shares | 3,669 | 1,518 | 1,348 | 11 | ||||||||||||
|
|
|
|
|
|
|
| |||||||||
Class B | ||||||||||||||||
Issued | 10 | 19 | — | — | ||||||||||||
Reinvested | 1 | — | — | — | ||||||||||||
Redeemed | (79 | ) | (120 | ) | — | — | ||||||||||
|
|
|
|
|
|
|
| |||||||||
Change in Class B Shares | (68 | ) | (101 | ) | — | — | ||||||||||
|
|
|
|
|
|
|
| |||||||||
Class C | ||||||||||||||||
Issued | 1,585 | 1,759 | 21 | 2 | ||||||||||||
Reinvested | 9 | — | — | (a) | — | (a) | ||||||||||
Redeemed | (669 | ) | (1,026 | ) | (7 | ) | (1 | ) | ||||||||
|
|
|
|
|
|
|
| |||||||||
Change in Class C Shares | 925 | 733 | 14 | 1 | ||||||||||||
|
|
|
|
|
|
|
| |||||||||
Class R2 | ||||||||||||||||
Issued | — | — | 7 | — | (a) | |||||||||||
Reinvested | — | — | — | (a) | — | (a) | ||||||||||
Redeemed | — | — | — | (a) | — | |||||||||||
|
|
|
|
|
|
|
| |||||||||
Change in Class R2 Shares | — | — | 7 | — | (a) | |||||||||||
|
|
|
|
|
|
|
| |||||||||
Class R5 | ||||||||||||||||
Issued | 32,409 | 29,732 | — | — | ||||||||||||
Reinvested | 481 | — | — | (a) | — | (a) | ||||||||||
Redeemed | (9,664 | ) | (477 | ) | — | — | ||||||||||
|
|
|
|
|
|
|
| |||||||||
Change in Class R5 Shares | 23,226 | 29,255 | — | (a) | — | (a) | ||||||||||
|
|
|
|
|
|
|
| |||||||||
Class R6 | ||||||||||||||||
Issued | — | — | 20,721 | 2,008 | ||||||||||||
Reinvested | — | — | 356 | — | (a) | |||||||||||
Redeemed | — | — | (3,360 | ) | (371 | ) | ||||||||||
|
|
|
|
|
|
|
| |||||||||
Change in Class R6 Shares | — | — | 17,717 | 1,637 | ||||||||||||
|
|
|
|
|
|
|
| |||||||||
Select Class | ||||||||||||||||
Issued | 31,902 | 13,293 | 10,273 | 17,322 | ||||||||||||
Reinvested | 26 | — | 11 | — | (a) | |||||||||||
Redeemed | (28,131 | ) | (33,452 | ) | (8,021 | ) | (3,965 | ) | ||||||||
|
|
|
|
|
|
|
| |||||||||
Change in Select Class Shares | 3,797 | (20,159 | ) | 2,263 | 13,357 | |||||||||||
|
|
|
|
|
|
|
| |||||||||
| (a) | Amount rounds to less than 1,000 (shares or dollars). |
SEE NOTES TO FINANCIAL STATEMENTS.
| JUNE 30, 2013 | J.P. MORGAN MID CAP/MULTI-CAP FUNDS | 63 | ||||||
Table of Contents
STATEMENTS OF CHANGES IN NET ASSETS
FOR THE PERIODS INDICATED (continued)
(Amounts in thousands)
| Mid Cap Equity Fund | Mid Cap Growth Fund | |||||||||||||||
| Year Ended 6/30/2013 | Year Ended 6/30/2012 | Year Ended 6/30/2013 | Year Ended 6/30/2012 | |||||||||||||
CAPITAL TRANSACTIONS: | ||||||||||||||||
Class A | ||||||||||||||||
Proceeds from shares issued | $ | 17,130 | $ | 5,617 | $ | 48,342 | $ | 56,755 | ||||||||
Distributions reinvested | 106 | 15 | 23,844 | 51,675 | ||||||||||||
Cost of shares redeemed | (5,274 | ) | (1,592 | ) | (115,922 | ) | (161,251 | ) | ||||||||
|
|
|
|
|
|
|
| |||||||||
Change in net assets resulting from Class A capital transactions | $ | 11,962 | $ | 4,040 | $ | (43,736 | ) | $ | (52,821 | ) | ||||||
|
|
|
|
|
|
|
| |||||||||
Class B | ||||||||||||||||
Proceeds from shares issued | $ | — | $ | — | $ | 163 | $ | 386 | ||||||||
Distributions reinvested | — | — | 512 | 1,556 | ||||||||||||
Cost of shares redeemed | — | — | (4,906 | ) | (7,602 | ) | ||||||||||
|
|
|
|
|
|
|
| |||||||||
Change in net assets resulting from Class B capital transactions | $ | — | $ | — | $ | (4,231 | ) | $ | (5,660 | ) | ||||||
|
|
|
|
|
|
|
| |||||||||
Class C | ||||||||||||||||
Proceeds from shares issued | $ | 4,723 | $ | 1,031 | $ | 2,471 | $ | 2,483 | ||||||||
Distributions reinvested | 16 | — | (a) | 948 | 2,079 | |||||||||||
Cost of shares redeemed | (349 | ) | (204 | ) | (5,306 | ) | (6,708 | ) | ||||||||
|
|
|
|
|
|
|
| |||||||||
Change in net assets resulting from Class C capital transactions | $ | 4,390 | $ | 827 | $ | (1,887 | ) | $ | (2,146 | ) | ||||||
|
|
|
|
|
|
|
| |||||||||
Class R2 | ||||||||||||||||
Proceeds from shares issued | $ | — | $ | — | $ | 122 | $ | 149 | ||||||||
Distributions reinvested | — | — | 11 | 16 | ||||||||||||
Cost of shares redeemed | — | — | (90 | ) | (20 | ) | ||||||||||
|
|
|
|
|
|
|
| |||||||||
Change in net assets resulting from Class R2 capital transactions | $ | — | $ | — | $ | 43 | $ | 145 | ||||||||
|
|
|
|
|
|
|
| |||||||||
Class R5 (b) | ||||||||||||||||
Proceeds from shares issued | $ | — | $ | — | $ | 4,842 | $ | 16,731 | ||||||||
Distributions reinvested | — | — | 664 | 5 | ||||||||||||
Cost of shares redeemed | — | — | (5,382 | ) | (1,084 | ) | ||||||||||
|
|
|
|
|
|
|
| |||||||||
Change in net assets resulting from Class R5 capital transactions | $ | — | $ | — | $ | 124 | $ | 15,652 | ||||||||
|
|
|
|
|
|
|
| |||||||||
Class R6 (b) | ||||||||||||||||
Proceeds from shares issued | $ | — | $ | — | $ | 32,440 | $ | 15,116 | ||||||||
Distributions reinvested | — | — | 826 | 5 | ||||||||||||
Cost of shares redeemed | — | — | (4,753 | ) | (388 | ) | ||||||||||
|
|
|
|
|
|
|
| |||||||||
Change in net assets resulting from Class R6 capital transactions | $ | — | $ | — | $ | 28,513 | $ | 14,733 | ||||||||
|
|
|
|
|
|
|
| |||||||||
Select Class | ||||||||||||||||
Proceeds from shares issued | $ | 425,901 | $ | 389,366 | $ | 131,018 | $ | 195,789 | ||||||||
Distributions reinvested | 10,102 | 3,142 | 30,576 | 62,923 | ||||||||||||
Cost of shares redeemed | (516,060 | ) | (152,914 | ) | (240,571 | ) | (330,123 | ) | ||||||||
|
|
|
|
|
|
|
| |||||||||
Change in net assets resulting from Select Class capital transactions | $ | (80,057 | ) | $ | 239,594 | $ | (78,977 | ) | $ | (71,411 | ) | |||||
|
|
|
|
|
|
|
| |||||||||
Total change in net assets resulting from capital transactions | $ | (63,705 | ) | $ | 244,461 | $ | (100,151 | ) | $ | (101,508 | ) | |||||
|
|
|
|
|
|
|
| |||||||||
SEE NOTES TO FINANCIAL STATEMENTS.
| 64 | J.P. MORGAN MID CAP/MULTI-CAP FUNDS | JUNE 30, 2013 | ||||
Table of Contents
| Mid Cap Equity Fund | Mid Cap Growth Fund | |||||||||||||||
| Year Ended 6/30/2013 | Year Ended 6/30/2012 | Year Ended 6/30/2013 | Year Ended 6/30/2012 | |||||||||||||
SHARE TRANSACTIONS: | ||||||||||||||||
Class A | ||||||||||||||||
Issued | 475 | 186 | 2,246 | 2,826 | ||||||||||||
Reinvested | 3 | 1 | 1,214 | 2,951 | ||||||||||||
Redeemed | (147 | ) | (55 | ) | (5,508 | ) | (8,087 | ) | ||||||||
|
|
|
|
|
|
|
| |||||||||
Change in Class A Shares | 331 | 132 | (2,048 | ) | (2,310 | ) | ||||||||||
|
|
|
|
|
|
|
| |||||||||
Class B | ||||||||||||||||
Issued | — | — | 11 | 26 | ||||||||||||
Reinvested | — | — | 35 | 117 | ||||||||||||
Redeemed | — | — | (313 | ) | (489 | ) | ||||||||||
|
|
|
|
|
|
|
| |||||||||
Change in Class B Shares | — | — | (267 | ) | (346 | ) | ||||||||||
|
|
|
|
|
|
|
| |||||||||
Class C | ||||||||||||||||
Issued | 132 | 33 | 134 | 137 | ||||||||||||
Reinvested | 1 | — | (a) | 55 | 135 | |||||||||||
Redeemed | (10 | ) | (7 | ) | (292 | ) | (378 | ) | ||||||||
|
|
|
|
|
|
|
| |||||||||
Change in Class C Shares | 123 | 26 | (103 | ) | (106 | ) | ||||||||||
|
|
|
|
|
|
|
| |||||||||
Class R2 | ||||||||||||||||
Issued | — | — | 5 | 6 | ||||||||||||
Reinvested | — | — | 1 | 1 | ||||||||||||
Redeemed | — | — | (4 | ) | (1 | ) | ||||||||||
|
|
|
|
|
|
|
| |||||||||
Change in Class R2 Shares | — | — | 2 | 6 | ||||||||||||
|
|
|
|
|
|
|
| |||||||||
Class R5 (b) | ||||||||||||||||
Issued | — | — | 207 | 749 | ||||||||||||
Reinvested | — | — | 31 | — | (a) | |||||||||||
Redeemed | — | — | (229 | ) | (48 | ) | ||||||||||
|
|
|
|
|
|
|
| |||||||||
Change in Class R5 Shares | — | — | 9 | 701 | ||||||||||||
|
|
|
|
|
|
|
| |||||||||
Class R6 (b) | ||||||||||||||||
Issued | — | — | 1,389 | 677 | ||||||||||||
Reinvested | — | — | 39 | — | (a) | |||||||||||
Redeemed | — | — | (204 | ) | (17 | ) | ||||||||||
|
|
|
|
|
|
|
| |||||||||
Change in Class R6 Shares | — | — | 1,224 | 660 | ||||||||||||
|
|
|
|
|
|
|
| |||||||||
Select Class | ||||||||||||||||
Issued | 12,148 | 13,099 | 5,687 | 9,090 | ||||||||||||
Reinvested | 297 | 105 | 1,429 | 3,322 | ||||||||||||
Redeemed | (14,229 | ) | (5,154 | ) | (10,555 | ) | (14,607 | ) | ||||||||
|
|
|
|
|
|
|
| |||||||||
Change in Select Class Shares | (1,784 | ) | 8,050 | (3,439 | ) | (2,195 | ) | |||||||||
|
|
|
|
|
|
|
| |||||||||
| (a) | Amount rounds to less than 1,000 (shares or dollars). |
| (b) | Commencement of offering of class of shares effective November 1, 2011 for Mid Cap Growth Fund. |
SEE NOTES TO FINANCIAL STATEMENTS.
| JUNE 30, 2013 | J.P. MORGAN MID CAP/MULTI-CAP FUNDS | 65 | ||||||
Table of Contents
STATEMENTS OF CHANGES IN NET ASSETS
FOR THE PERIODS INDICATED (continued)
(Amounts in thousands)
| Mid Cap Value Fund | Multi-Cap Market Neutral Fund | |||||||||||||||
| Year Ended 6/30/2013 | Year Ended 6/30/2012 | Year Ended 6/30/2013 | Year Ended 6/30/2012 | |||||||||||||
CAPITAL TRANSACTIONS: | ||||||||||||||||
Class A | ||||||||||||||||
Proceeds from shares issued | $ | 1,210,890 | $ | 443,021 | $ | 5,478 | $ | 5,323 | ||||||||
Distributions reinvested | 42,247 | 11,492 | — | — | ||||||||||||
Cost of shares redeemed | (610,574 | ) | (520,453 | ) | (11,203 | ) | (14,467 | ) | ||||||||
|
|
|
|
|
|
|
| |||||||||
Change in net assets resulting from Class A capital transactions | $ | 642,563 | $ | (65,940 | ) | $ | (5,725 | ) | $ | (9,144 | ) | |||||
|
|
|
|
|
|
|
| |||||||||
Class B | ||||||||||||||||
Proceeds from shares issued | $ | 334 | $ | 333 | $ | 3 | $ | 11 | ||||||||
Distributions reinvested | 267 | — | — | — | ||||||||||||
Cost of shares redeemed | (49,930 | ) | (34,648 | ) | (870 | ) | (2,045 | ) | ||||||||
|
|
|
|
|
|
|
| |||||||||
Change in net assets resulting from Class B capital transactions | $ | (49,329 | ) | $ | (34,315 | ) | $ | (867 | ) | $ | (2,034 | ) | ||||
|
|
|
|
|
|
|
| |||||||||
Class C | ||||||||||||||||
Proceeds from shares issued | $ | 133,195 | $ | 48,613 | $ | 751 | $ | 572 | ||||||||
Distributions reinvested | 4,745 | 474 | — | — | ||||||||||||
Cost of shares redeemed | (66,664 | ) | (64,672 | ) | (5,233 | ) | (6,619 | ) | ||||||||
|
|
|
|
|
|
|
| |||||||||
Change in net assets resulting from Class C capital transactions | $ | 71,276 | $ | (15,585 | ) | $ | (4,482 | ) | $ | (6,047 | ) | |||||
|
|
|
|
|
|
|
| |||||||||
Class R2 | ||||||||||||||||
Proceeds from shares issued | $ | 45,141 | $ | 10,239 | $ | — | $ | — | ||||||||
Distributions reinvested | 576 | 59 | — | — | ||||||||||||
Cost of shares redeemed | (10,908 | ) | (2,629 | ) | — | — | ||||||||||
|
|
|
|
|
|
|
| |||||||||
Change in net assets resulting from Class R2 capital transactions | $ | 34,809 | $ | 7,669 | $ | — | $ | — | ||||||||
|
|
|
|
|
|
|
| |||||||||
Institutional Class | ||||||||||||||||
Proceeds from shares issued | $ | 2,982,640 | $ | 1,125,771 | $ | — | $ | — | ||||||||
Distributions reinvested | 79,639 | 25,512 | — | — | ||||||||||||
Cost of shares redeemed | (1,002,437 | ) | (575,416 | ) | — | — | ||||||||||
|
|
|
|
|
|
|
| |||||||||
Change in net assets resulting from Institutional Class capital transactions | $ | 2,059,842 | $ | 575,867 | $ | — | $ | — | ||||||||
|
|
|
|
|
|
|
| |||||||||
Select Class | ||||||||||||||||
Proceeds from shares issued | $ | 1,124,563 | $ | 675,718 | $ | 29,513 | $ | 42,277 | ||||||||
Distributions reinvested | 34,904 | 10,362 | — | — | ||||||||||||
Cost of shares redeemed | (612,849 | ) | (438,949 | ) | (192,532 | ) | (51,991 | ) | ||||||||
|
|
|
|
|
|
|
| |||||||||
Change in net assets resulting from Select Class capital transactions | $ | 546,618 | $ | 247,131 | $ | (163,019 | ) | $ | (9,714 | ) | ||||||
|
|
|
|
|
|
|
| |||||||||
Total change in net assets resulting from capital transactions | $ | 3,305,779 | $ | 714,827 | $ | (174,093 | ) | $ | (26,939 | ) | ||||||
|
| �� |
|
|
|
|
| |||||||||
SEE NOTES TO FINANCIAL STATEMENTS.
| 66 | J.P. MORGAN MID CAP/MULTI-CAP FUNDS | JUNE 30, 2013 | ||||
Table of Contents
| Mid Cap Value Fund | Multi-Cap Market Neutral Fund | |||||||||||||||
| Year Ended 6/30/2013 | Year Ended 6/30/2012 | Year Ended 6/30/2013 | Year Ended 6/30/2012 | |||||||||||||
SHARE TRANSACTIONS: | ||||||||||||||||
Class A | ||||||||||||||||
Issued | 42,201 | 18,306 | 567 | 546 | ||||||||||||
Reinvested | 1,526 | 500 | — | — | ||||||||||||
Redeemed | (21,054 | ) | (21,746 | ) | (1,165 | ) | (1,486 | ) | ||||||||
|
|
|
|
|
|
|
| |||||||||
Change in Class A Shares | 22,673 | (2,940 | ) | (598 | ) | (940 | ) | |||||||||
|
|
|
|
|
|
|
| |||||||||
Class B | ||||||||||||||||
Issued | 12 | 14 | — | (a) | 1 | |||||||||||
Reinvested | 10 | — | — | — | ||||||||||||
Redeemed | (1,796 | ) | (1,497 | ) | (94 | ) | (218 | ) | ||||||||
|
|
|
|
|
|
|
| |||||||||
Change in Class B Shares | (1,774 | ) | (1,483 | ) | (94 | ) | (217 | ) | ||||||||
|
|
|
|
|
|
|
| |||||||||
Class C | ||||||||||||||||
Issued | 4,806 | 2,044 | 81 | 60 | ||||||||||||
Reinvested | 176 | 21 | — | — | ||||||||||||
Redeemed | (2,386 | ) | (2,794 | ) | (568 | ) | (705 | ) | ||||||||
|
|
|
|
|
|
|
| |||||||||
Change in Class C Shares | 2,596 | (729 | ) | (487 | ) | (645 | ) | |||||||||
|
|
|
|
|
|
|
| |||||||||
Class R2 | ||||||||||||||||
Issued | 1,617 | 428 | — | — | ||||||||||||
Reinvested | 22 | 3 | — | — | ||||||||||||
Redeemed | (378 | ) | (110 | ) | — | — | ||||||||||
|
|
|
|
|
|
|
| |||||||||
Change in Class R2 Shares | 1,261 | 321 | — | — | ||||||||||||
|
|
|
|
|
|
|
| |||||||||
Institutional Class | ||||||||||||||||
Issued | 101,790 | 45,939 | — | — | ||||||||||||
Reinvested | 2,827 | 1,094 | — | — | ||||||||||||
Redeemed | (34,195 | ) | (23,648 | ) | — | — | ||||||||||
|
|
|
|
|
|
|
| |||||||||
Change in Institutional Class Shares | 70,422 | 23,385 | — | — | ||||||||||||
|
|
|
|
|
|
|
| |||||||||
Select Class | ||||||||||||||||
Issued | 38,813 | 27,581 | 3,039 | 4,266 | ||||||||||||
Reinvested | 1,250 | 448 | — | — | ||||||||||||
Redeemed | (20,799 | ) | (18,067 | ) | (19,620 | ) | (5,300 | ) | ||||||||
|
|
|
|
|
|
|
| |||||||||
Change in Select Class Shares | 19,264 | 9,962 | (16,581 | ) | (1,034 | ) | ||||||||||
|
|
|
|
|
|
|
| |||||||||
| (a) | Amount rounds to less than 1,000 (shares or dollars). |
SEE NOTES TO FINANCIAL STATEMENTS.
| JUNE 30, 2013 | J.P. MORGAN MID CAP/MULTI-CAP FUNDS | 67 | ||||||
Table of Contents
STATEMENTS OF CHANGES IN NET ASSETS
FOR THE PERIODS INDICATED (continued)
(Amounts in thousands)
| Value Advantage Fund | ||||||||
| Year Ended 6/30/2013 | Year Ended 6/30/2012 | |||||||
CAPITAL TRANSACTIONS: | ||||||||
Class A | ||||||||
Proceeds from shares issued | $ | 586,395 | $ | 54,549 | ||||
Distributions reinvested | 6,154 | 2,006 | ||||||
Cost of shares redeemed | (121,764 | ) | (89,323 | ) | ||||
|
|
|
| |||||
Change in net assets resulting from Class A capital transactions | $ | 470,785 | $ | (32,768 | ) | |||
|
|
|
| |||||
Class C | ||||||||
Proceeds from shares issued | $ | 82,479 | $ | 11,596 | ||||
Distributions reinvested | 752 | 513 | ||||||
Cost of shares redeemed | (20,667 | ) | (30,037 | ) | ||||
|
|
|
| |||||
Change in net assets resulting from Class C capital transactions | $ | 62,564 | $ | (17,928 | ) | |||
|
|
|
| |||||
Institutional Class | ||||||||
Proceeds from shares issued | $ | 953,269 | $ | 136,991 | ||||
Distributions reinvested | 10,007 | 4,597 | ||||||
Cost of shares redeemed | (69,891 | ) | (56,466 | ) | ||||
|
|
|
| |||||
Change in net assets resulting from Institutional Class capital transactions | $ | 893,385 | $ | 85,122 | ||||
|
|
|
| |||||
Select Class | ||||||||
Proceeds from shares issued | $ | 759,414 | $ | 260,984 | ||||
Distributions reinvested | 7,729 | 2,687 | ||||||
Cost of shares redeemed | (117,989 | ) | (124,601 | ) | ||||
|
|
|
| |||||
Change in net assets resulting from Select Class capital transactions | $ | 649,154 | $ | 139,070 | ||||
|
|
|
| |||||
Total change in net assets resulting from capital transactions | $ | 2,075,888 | $ | 173,496 | ||||
|
|
|
| |||||
SHARE TRANSACTIONS: | ||||||||
Class A | ||||||||
Issued | 26,590 | 2,947 | ||||||
Reinvested | 287 | 112 | ||||||
Redeemed | (5,402 | ) | (4,870 | ) | ||||
|
|
|
| |||||
Change in Class A Shares | 21,475 | (1,811 | ) | |||||
|
|
|
| |||||
Class C | ||||||||
Issued | 3,602 | 620 | ||||||
Reinvested | 35 | 29 | ||||||
Redeemed | (938 | ) | (1,655 | ) | ||||
|
|
|
| |||||
Change in Class C Shares | 2,699 | (1,006 | ) | |||||
|
|
|
| |||||
Institutional Class | ||||||||
Issued | 42,258 | 7,210 | ||||||
Reinvested | 466 | 258 | ||||||
Redeemed | (3,137 | ) | (3,118 | ) | ||||
|
|
|
| |||||
Change in Institutional Class Shares | 39,587 | 4,350 | ||||||
|
|
|
| |||||
Select Class | ||||||||
Issued | 34,123 | 13,542 | ||||||
Reinvested | 360 | 150 | ||||||
Redeemed | (5,249 | ) | (6,701 | ) | ||||
|
|
|
| |||||
Change in Select Class Shares | 29,234 | 6,991 | ||||||
|
|
|
| |||||
SEE NOTES TO FINANCIAL STATEMENTS.
| 68 | J.P. MORGAN MID CAP/MULTI-CAP FUNDS | JUNE 30, 2013 | ||||
Table of Contents
THIS PAGE IS INTENTIONALLY LEFT BLANK
| JUNE 30, 2013 | J.P. MORGAN MID CAP/MULTI-CAP FUNDS | 69 | ||||||
Table of Contents
FOR THE PERIODS INDICATED
| Per share operating performance | |||||||||||||||||||||||||||
| Investment operations | Distributions | |||||||||||||||||||||||||||
| Net asset value, beginning of period | Net investment income (loss) | Net realized and unrealized gains (losses) on investments | Total from investment operations | Net investment income | Net realized gain | Total distributions | ||||||||||||||||||||||
Growth Advantage Fund |
| |||||||||||||||||||||||||||
Class A |
| |||||||||||||||||||||||||||
Year Ended June 30, 2013 | $ | 9.49 | $ | 0.01 | (f)(g) | $ | 1.97 | $ | 1.98 | $ | (0.01 | ) | $ | (0.03 | ) | $ | (0.04 | ) | ||||||||||
Year Ended June 30, 2012 | 9.28 | (0.03 | )(f)(h) | 0.24 | 0.21 | — | — | — | ||||||||||||||||||||
Year Ended June 30, 2011 | 6.76 | (0.04 | )(f) | 2.56 | 2.52 | — | — | — | ||||||||||||||||||||
Year Ended June 30, 2010 | 5.88 | (0.03 | )(f) | 0.91 | 0.88 | — | — | — | ||||||||||||||||||||
Year Ended June 30, 2009 | 8.14 | (0.03 | )(f) | (2.23 | ) | (2.26 | ) | — | — | — | ||||||||||||||||||
Class B | ||||||||||||||||||||||||||||
Year Ended June 30, 2013 | 8.76 | (0.04 | )(f)(g) | 1.81 | 1.77 | — | (0.03 | ) | (0.03 | ) | ||||||||||||||||||
Year Ended June 30, 2012 | 8.61 | (0.07 | )(f)(h) | 0.22 | 0.15 | — | — | — | ||||||||||||||||||||
Year Ended June 30, 2011 | 6.31 | (0.07 | )(f) | 2.37 | 2.30 | — | — | — | ||||||||||||||||||||
Year Ended June 30, 2010 | 5.51 | (0.06 | )(f) | 0.86 | 0.80 | — | — | — | ||||||||||||||||||||
Year Ended June 30, 2009 | 7.67 | (0.06 | )(f) | (2.10 | ) | (2.16 | ) | — | — | — | ||||||||||||||||||
Class C | ||||||||||||||||||||||||||||
Year Ended June 30, 2013 | 8.77 | (0.04 | )(f)(g) | 1.81 | 1.77 | — | (0.03 | ) | (0.03 | ) | ||||||||||||||||||
Year Ended June 30, 2012 | 8.61 | (0.07 | )(f)(h) | 0.23 | 0.16 | — | — | — | ||||||||||||||||||||
Year Ended June 30, 2011 | 6.31 | (0.08 | )(f) | 2.38 | 2.30 | — | — | — | ||||||||||||||||||||
Year Ended June 30, 2010 | 5.52 | (0.06 | )(f) | 0.85 | 0.79 | — | — | — | ||||||||||||||||||||
Year Ended June 30, 2009 | 7.68 | (0.06 | )(f) | (2.10 | ) | (2.16 | ) | — | — | — | ||||||||||||||||||
Class R5 | ||||||||||||||||||||||||||||
Year Ended June 30, 2013 | 9.69 | 0.06 | (f)(g) | 2.01 | 2.07 | (0.05 | ) | (0.03 | ) | (0.08 | ) | |||||||||||||||||
Year Ended June 30, 2012 | 9.44 | 0.01 | (f)(h) | 0.24 | 0.25 | — | — | — | ||||||||||||||||||||
Year Ended June 30, 2011 | 6.86 | — | (f)(j) | 2.58 | 2.58 | — | — | — | ||||||||||||||||||||
Year Ended June 30, 2010 | 5.93 | — | (f)(j) | 0.93 | 0.93 | — | — | — | ||||||||||||||||||||
January 8, 2009 (i) through June 30, 2009 | 5.37 | — | (f)(j) | 0.56 | 0.56 | — | — | — | ||||||||||||||||||||
Select Class | ||||||||||||||||||||||||||||
Year Ended June 30, 2013 | 9.63 | 0.04 | (f)(g) | 1.98 | 2.02 | (0.02 | ) | (0.03 | ) | (0.05 | ) | |||||||||||||||||
Year Ended June 30, 2012 | 9.39 | (0.02 | )(f)(h) | 0.26 | 0.24 | — | — | — | ||||||||||||||||||||
Year Ended June 30, 2011 | 6.83 | (0.02 | )(f) | 2.58 | 2.56 | — | — | — | ||||||||||||||||||||
Year Ended June 30, 2010 | 5.93 | (0.01 | )(f) | 0.91 | 0.90 | — | — | — | ||||||||||||||||||||
Year Ended June 30, 2009 | 8.18 | (0.01 | )(f) | (2.24 | ) | (2.25 | ) | — | — | — | ||||||||||||||||||
| (a) | Annualized for periods less than one year. |
| (b) | Not annualized for periods less than one year. |
| (c) | Includes adjustments in accordance with accounting principles generally accepted in the United States of America and as such, the net asset values for financial reporting purposes and the returns based upon those net asset values may differ from the net asset values and returns for shareholder transactions. |
| (d) | Includes earnings credits and interest expense, if applicable, each of which is less than 0.01% or unless otherwise noted. |
| (e) | Portfolio turnover is calculated by dividing the lesser of total purchases or sales of portfolio securities for the reporting period by the monthly average of portfolio securities owned during the reporting period. Excluded from both the numerator and denominator are amounts relating to derivatives and securities whose maturities or expiration dates at the time of acquisition were one year or less. |
| (f) | Calculated based upon average shares outstanding. |
| (g) | Reflects special dividends paid out during the period by several of the Fund’s holdings. Had the Fund not received the special dividends the net investment income (loss) per share would have been $(0.02), $(0.06), $(0.06), $0.03 and $0.01 for Class A, Class B, Class C, Class R5 and Select Class Shares, respectively and the net investment income (loss) ratio would have been (0.17)%, (0.66)%, (0.66)%, 0.27% and 0.09% for Class A, Class B, Class C, Class R5 and Select Class Shares, respectively. |
| (h) | Reflects a special dividend paid out during the period by one of the Fund’s holdings. Had the Fund not received the special dividend the net investment income (loss) per share would have been $(0.05), $(0.09), $(0.09), $(0.01) and $(0.03) for Class A, Class B, Class C, Class R5 and Select Class Shares, respectively and the net investment income (loss) ratio would have been (0.56)%, (1.08)%, (1.03)%, (0.12)% and (0.37)% for Class A, Class B, Class C, Class R5 and Select Class Shares, respectively. |
| (i) | Commencement of offering of class of shares. |
| (j) | Amount rounds to less than $0.01. |
SEE NOTES TO FINANCIAL STATEMENTS.
| 70 | J.P. MORGAN MID CAP/MULTI-CAP FUNDS | JUNE 30, 2013 | ||||
Table of Contents
| Ratios/Supplemental data | |||||||||||||||||||||||||
| Ratios to average net assets (a) | ||||||||||||||||||||||||||
| Net asset value, end of period | Total return (excludes sales charge) (b)(c) | Net assets, end of period (000’s) | Net expenses (d) | Net investment income (loss) | Expenses without waivers, reimbursements and earnings credits | Portfolio turnover rate (b)(e) | ||||||||||||||||||||
| $ | 11.43 | 20.95 | % | $ | 276,670 | 1.24 | % | 0.11 | %(g) | 1.28 | % | 76 | % | |||||||||||||
| 9.49 | 2.26 | 194,911 | 1.25 | (0.37 | )(h) | 1.30 | 86 | |||||||||||||||||||
| 9.28 | 37.28 | 176,492 | 1.25 | (0.45 | ) | 1.31 | 96 | |||||||||||||||||||
| 6.76 | 14.97 | 101,814 | 1.31 | (0.41 | ) | 1.31 | 102 | |||||||||||||||||||
| 5.88 | (27.76 | ) | 71,841 | 1.35 | (0.48 | ) | 1.42 | 119 | ||||||||||||||||||
| 10.50 | 20.29 | 2,081 | 1.74 | (0.38 | )(g) | 1.78 | 76 | |||||||||||||||||||
| 8.76 | 1.74 | 2,327 | 1.75 | (0.89 | )(h) | 1.80 | 86 | |||||||||||||||||||
| 8.61 | 36.45 | 3,157 | 1.75 | (0.94 | ) | 1.81 | 96 | |||||||||||||||||||
| 6.31 | 14.52 | 3,070 | 1.81 | (0.91 | ) | 1.81 | 102 | |||||||||||||||||||
| 5.51 | (28.16 | ) | 3,304 | 1.87 | (1.02 | ) | 1.92 | 119 | ||||||||||||||||||
| 10.51 | 20.27 | 42,655 | 1.74 | (0.38 | )(g) | 1.78 | 76 | |||||||||||||||||||
| 8.77 | 1.86 | 27,469 | 1.75 | (0.84 | )(h) | 1.80 | 86 | |||||||||||||||||||
| 8.61 | 36.45 | 20,676 | 1.75 | (0.95 | ) | 1.81 | 96 | |||||||||||||||||||
| 6.31 | 14.31 | 12,811 | 1.81 | (0.91 | ) | 1.81 | 102 | |||||||||||||||||||
| 5.52 | (28.13 | ) | 9,300 | 1.87 | (1.02 | ) | 1.91 | 119 | ||||||||||||||||||
| 11.68 | 21.49 | 835,233 | 0.83 | 0.55 | (g) | 0.84 | 76 | |||||||||||||||||||
| 9.69 | 2.65 | 468,064 | 0.85 | 0.07 | (h) | 0.85 | 86 | |||||||||||||||||||
| 9.44 | 37.61 | 179,677 | 0.86 | (0.05 | ) | 0.86 | 96 | |||||||||||||||||||
| 6.86 | 15.68 | 76,767 | 0.86 | 0.05 | 0.86 | 102 | ||||||||||||||||||||
| 5.93 | 10.43 | 46,312 | 0.90 | (0.08 | ) | 1.06 | 119 | |||||||||||||||||||
| 11.60 | 21.14 | 842,783 | 1.03 | 0.37 | (g) | 1.03 | 76 | |||||||||||||||||||
| 9.63 | 2.56 | 662,786 | 1.05 | (0.18 | )(h) | 1.05 | 86 | |||||||||||||||||||
| 9.39 | 37.48 | 836,154 | 1.06 | (0.27 | ) | 1.06 | 96 | |||||||||||||||||||
| 6.83 | 15.18 | 604,663 | 1.06 | (0.16 | ) | 1.06 | 102 | |||||||||||||||||||
| 5.93 | (27.51 | ) | 441,345 | 1.10 | (0.24 | ) | 1.17 | 119 | ||||||||||||||||||
SEE NOTES TO FINANCIAL STATEMENTS.
| JUNE 30, 2013 | J.P. MORGAN MID CAP/MULTI-CAP FUNDS | 71 | ||||||
Table of Contents
FINANCIAL HIGHLIGHTS
FOR THE PERIODS INDICATED (continued)
| Per share operating performance | |||||||||||||||||||||||||||
| Investment operations | Distributions | |||||||||||||||||||||||||||
| Net asset value, beginning of period | Net investment income (loss) | Net realized and unrealized gains (losses) on investments | Total from investment operations | Net investment income | Net realized gain | Total distributions | ||||||||||||||||||||||
Mid Cap Core Fund | ||||||||||||||||||||||||||||
Class A | ||||||||||||||||||||||||||||
Year Ended June 30, 2013 | $ | 17.16 | $ | 0.15 | (f)(g) | $ | 3.66 | $ | 3.81 | $ | (0.16 | ) | $ | (0.21 | ) | $ | (0.37 | ) | ||||||||||
Year Ended June 30, 2012 | 17.19 | 0.08 | (f) | (0.10 | ) | (0.02 | ) | — | (h) | (0.01 | ) | (0.01 | ) | |||||||||||||||
November 30, 2010 (i) through June 30, 2011 | 15.00 | 0.01 | (f) | 2.18 | 2.19 | — | (h) | — | — | (h) | ||||||||||||||||||
Class C | ||||||||||||||||||||||||||||
Year Ended June 30, 2013 | 17.03 | 0.04 | (f)(g) | 3.67 | 3.71 | (0.04 | ) | (0.21 | ) | (0.25 | ) | |||||||||||||||||
Year Ended June 30, 2012 | 17.15 | — | (f)(h) | (0.11 | ) | (0.11 | ) | — | (h) | (0.01 | ) | (0.01 | ) | |||||||||||||||
November 30, 2010 (i) through June 30, 2011 | 15.00 | (0.04 | )(f) | 2.19 | 2.15 | — | — | — | ||||||||||||||||||||
Class R2 | ||||||||||||||||||||||||||||
Year Ended June 30, 2013 | 17.10 | 0.10 | (f)(g) | 3.65 | 3.75 | (0.09 | ) | (0.21 | ) | (0.30 | ) | |||||||||||||||||
Year Ended June 30, 2012 | 17.17 | 0.04 | (f) | (0.10 | ) | (0.06 | ) | — | (h) | (0.01 | ) | (0.01 | ) | |||||||||||||||
November 30, 2010 (i) through June 30, 2011 | 15.00 | (0.02 | )(f) | 2.19 | 2.17 | — | — | — | ||||||||||||||||||||
Class R5 | ||||||||||||||||||||||||||||
Year Ended June 30, 2013 | 17.23 | 0.22 | (f)(g) | 3.70 | 3.92 | (0.19 | ) | (0.21 | ) | (0.40 | ) | |||||||||||||||||
Year Ended June 30, 2012 | 17.23 | 0.15 | (f) | (0.09 | ) | 0.06 | (0.05 | ) | (0.01 | ) | (0.06 | ) | ||||||||||||||||
November 30, 2010 (i) through June 30, 2011 | 15.00 | 0.05 | (f) | 2.19 | 2.24 | (0.01 | ) | — | (0.01 | ) | ||||||||||||||||||
Class R6 | ||||||||||||||||||||||||||||
Year Ended June 30, 2013 | 17.23 | 0.24 | (f)(g) | 3.69 | 3.93 | (0.20 | ) | (0.21 | ) | (0.41 | ) | |||||||||||||||||
Year Ended June 30, 2012 | 17.24 | 0.21 | (f) | (0.15 | ) | 0.06 | (0.06 | ) | (0.01 | ) | (0.07 | ) | ||||||||||||||||
January 31, 2011 (l) through June 30, 2011 | 16.36 | 0.05 | (f) | 0.83 | 0.88 | — | — | — | ||||||||||||||||||||
Select Class | ||||||||||||||||||||||||||||
Year Ended June 30, 2013 | 17.18 | 0.20 | (f)(g) | 3.69 | 3.89 | (0.17 | ) | (0.21 | ) | (0.38 | ) | |||||||||||||||||
Year Ended June 30, 2012 | 17.22 | 0.13 | (f) | (0.12 | ) | 0.01 | (0.04 | ) | (0.01 | ) | (0.05 | ) | ||||||||||||||||
November 30, 2010 (i) through June 30, 2011 | 15.00 | 0.04 | (f) | 2.19 | 2.23 | (0.01 | ) | — | (0.01 | ) | ||||||||||||||||||
| (a) | Annualized for periods less than one year. |
| (b) | Not annualized for periods less than one year. |
| (c) | Includes adjustments in accordance with accounting principles generally accepted in the United States of America and as such, the net asset values for financial reporting purposes and the returns based upon those net asset values may differ from the net asset values and returns for shareholder transactions. |
| (d) | Includes earnings credits and interest expense, if applicable, each of which is less than 0.01% or unless otherwise noted. |
| (e) | Portfolio turnover is calculated by dividing the lesser of total purchases or sales of portfolio securities for the reporting period by the monthly average of portfolio securities owned during the reporting period. Excluded from both the numerator and denominator are amounts relating to derivatives and securities whose maturities or expiration dates at the time of acquisition were one year or less. |
| (f) | Calculated based upon average shares outstanding. |
| (g) | Reflects special dividends paid out during the period by several of the Fund’s holdings. Had the Fund not received the special dividends the net investment income (loss) per share would have been $0.06, $(0.05), $0.01, $0.13, $0.15 and $0.11 for Class A, Class C, Class R2, Class R5, Class R6 and Select Class Shares, respectively and the net investment income (loss) ratio would have been 0.32%, (0.29)%, 0.03%, 0.70%, 0.77% and 0.56% for Class A, Class C, Class R2, Class R5, Class R6 and Select Class Shares, respectively. |
| (h) | Amount rounds to less than $0.01. |
| (i) | Commencement of operations. |
| (j) | Certain non-recurring expenses incurred by the Fund were not annualized for the period ended June 30, 2011. |
| (k) | Ratios are disproportionate between classes due to the size of net assets and fixed expenses. |
| (l) | Commencement of offering of class of shares. |
SEE NOTES TO FINANCIAL STATEMENTS.
| 72 | J.P. MORGAN MID CAP/MULTI-CAP FUNDS | JUNE 30, 2013 | ||||
Table of Contents
| Ratios/Supplemental data | |||||||||||||||||||||||||
| Ratios to average net assets (a) | ||||||||||||||||||||||||||
| Net asset value, end of period | Total return (excludes sales charge) (b)(c) | Net assets, end of period (000’s) | Net expenses (d) | Net investment income (loss) | Expenses without waivers, reimbursements and earnings credits | Portfolio turnover rate (b)(e) | ||||||||||||||||||||
| $ | 20.60 | 22.57 | % | $ | 28,329 | 1.24 | % | 0.80 | %(g) | 1.28 | % | 159 | % | |||||||||||||
| 17.16 | (0.13 | ) | 455 | 1.24 | 0.50 | 1.31 | 44 | |||||||||||||||||||
| 17.19 | 14.70 | 276 | 1.24 | (j) | 0.11 | (j) | 5.79 | (j)(k) | 13 | |||||||||||||||||
| 20.49 | 22.00 | 422 | 1.74 | 0.20 | (g) | 1.78 | 159 | |||||||||||||||||||
| 17.03 | (0.65 | ) | 125 | 1.74 | (0.02 | ) | 1.81 | 44 | ||||||||||||||||||
| 17.15 | 14.33 | 99 | 1.75 | (j) | (0.39 | )(j) | 6.49 | (j)(k) | 13 | |||||||||||||||||
| 20.55 | 22.24 | 210 | 1.49 | 0.51 | (g) | 1.53 | 159 | |||||||||||||||||||
| 17.10 | (0.36 | ) | 57 | 1.49 | 0.22 | 1.57 | 44 | |||||||||||||||||||
| 17.17 | 14.53 | 57 | 1.49 | (j) | (0.17 | )(j) | 6.84 | (j)(k) | 13 | |||||||||||||||||
| 20.75 | 23.13 | 71 | 0.79 | 1.19 | (g) | 0.83 | 159 | |||||||||||||||||||
| 17.23 | 0.33 | 58 | 0.79 | 0.92 | 0.86 | 44 | ||||||||||||||||||||
| 17.23 | 15.00 | 57 | 0.80 | (j) | 0.52 | (j) | 6.17 | (j)(k) | 13 | |||||||||||||||||
| 20.75 | 23.19 | 401,578 | 0.74 | 1.26 | (g) | 0.78 | 159 | |||||||||||||||||||
| 17.23 | 0.33 | 28,251 | 0.74 | 1.18 | 0.78 | 44 | ||||||||||||||||||||
| 17.24 | 5.38 | 53 | 0.75 | (j) | 0.68 | (j) | 5.52 | (j)(k) | 13 | |||||||||||||||||
| 20.69 | 22.97 | 432,810 | 0.95 | 1.05 | (g) | 1.03 | 159 | |||||||||||||||||||
| 17.18 | 0.06 | 320,576 | 0.99 | 0.76 | 1.06 | 44 | ||||||||||||||||||||
| 17.22 | 14.84 | 91,240 | 1.00 | (j) | 0.41 | (j) | 3.41 | (j)(k) | 13 | |||||||||||||||||
SEE NOTES TO FINANCIAL STATEMENTS.
| JUNE 30, 2013 | J.P. MORGAN MID CAP/MULTI-CAP FUNDS | 73 | ||||||
Table of Contents
FINANCIAL HIGHLIGHTS
FOR THE PERIODS INDICATED (continued)
| Per share operating performance | |||||||||||||||||||||||||||
| Investment operations | Distributions | |||||||||||||||||||||||||||
| Net asset value, beginning of period | Net investment income (loss) | Net realized and unrealized gains (losses) on investments | Total from investment operations | Net investment income | Net realized gain | Total distributions | ||||||||||||||||||||||
Mid Cap Equity Fund | ||||||||||||||||||||||||||||
Class A | ||||||||||||||||||||||||||||
Year Ended June 30, 2013 | $ | 30.97 | $ | 0.10 | (f)(g) | $ | 7.36 | $ | 7.46 | $ | (0.07 | ) | $ | (0.26 | ) | $ | (0.33 | ) | ||||||||||
Year Ended June 30, 2012 | 31.29 | 0.10 | (f)(h) | (0.34 | ) | (0.24 | ) | (0.08 | ) | — | (0.08 | ) | ||||||||||||||||
Year Ended June 30, 2011 | 22.95 | 0.04 | (f) | 8.36 | 8.40 | (0.06 | ) | — | (0.06 | ) | ||||||||||||||||||
November 2, 2009 (i) through June 30, 2010 | 21.55 | 0.05 | 1.41 | 1.46 | (0.06 | ) | — | (0.06 | ) | |||||||||||||||||||
Class C | ||||||||||||||||||||||||||||
Year Ended June 30, 2013 | 30.75 | (0.07 | )(f)(g) | 7.29 | 7.22 | (0.00 | )(j) | (0.26 | ) | (0.26 | ) | |||||||||||||||||
Year Ended June 30, 2012 | 31.16 | (0.05 | )(f)(h) | (0.35 | ) | (0.40 | ) | (0.01 | ) | — | (0.01 | ) | ||||||||||||||||
Year Ended June 30, 2011 | 22.93 | (0.12 | )(f) | 8.37 | 8.25 | (0.02 | ) | — | (0.02 | ) | ||||||||||||||||||
November 2, 2009 (i) through June 30, 2010 | 21.55 | (0.03 | ) | 1.41 | 1.38 | — | (j) | — | — | (j) | ||||||||||||||||||
Select Class | ||||||||||||||||||||||||||||
Year Ended June 30, 2013 | 31.05 | 0.20 | (f)(g) | 7.40 | 7.60 | (0.17 | ) | (0.26 | ) | (0.43 | ) | |||||||||||||||||
Year Ended June 30, 2012 | 31.36 | 0.19 | (f)(h) | (0.33 | ) | (0.14 | ) | (0.17 | ) | — | (0.17 | ) | ||||||||||||||||
Year Ended June 30, 2011 | 22.97 | 0.14 | (f) | 8.37 | 8.51 | (0.12 | ) | — | (0.12 | ) | ||||||||||||||||||
Year Ended June 30, 2010 | 18.97 | 0.12 | 4.00 | 4.12 | (0.12 | ) | — | (0.12 | ) | |||||||||||||||||||
Year Ended June 30, 2009 | 28.63 | 0.18 | (8.37 | ) | (8.19 | ) | (0.17 | ) | (1.30 | ) | (1.47 | ) | ||||||||||||||||
| (a) | Annualized for periods less than one year. |
| (b) | Not annualized for periods less than one year. |
| (c) | Includes adjustments in accordance with accounting principles generally accepted in the United States of America and as such, the net asset values for financial reporting purposes and the returns based upon those net asset values may differ from the net asset values and returns for shareholder transactions. |
| (d) | Includes earnings credits and interest expense, if applicable, each of which is less than 0.01% or unless otherwise noted. |
| (e) | Portfolio turnover is calculated by dividing the lesser of total purchases or sales of portfolio securities for the reporting period by the monthly average of portfolio securities owned during the reporting period. Excluded from both the numerator and denominator are amounts relating to derivatives and securities whose maturities or expiration dates at the time of acquisition were one year or less. |
| (f) | Calculated based upon average shares outstanding. |
| (g) | Reflects special dividends paid out during the period by several of the Fund’s holdings. Had the Fund not received the special dividends the net investment income (loss) per share would have been $0.03, $(0.14) and $0.14 for Class A, Class C and Select Class Shares, respectively and the net investment income (loss) ratio would have been 0.09%, (0.39)% and 0.39% for Class A, Class C and Select Class Shares, respectively. |
| (h) | Reflects a special dividend paid out during the period by one of the Fund’s holdings. Had the Fund not received the special dividend the net investment income (loss) per share would have been $0.05, $(0.10) and $0.14 for Class A, Class C and Select Class Shares, respectively and the net investment income (loss) ratio would have been 0.18%, (0.33)% and 0.48% for Class A, Class C and Select Class Shares, respectively. |
| (i) | Commencement of offering of class of shares. |
| (j) | Amount rounds to less than $0.01. |
SEE NOTES TO FINANCIAL STATEMENTS.
| 74 | J.P. MORGAN MID CAP/MULTI-CAP FUNDS | JUNE 30, 2013 | ||||
Table of Contents
| Ratios/Supplemental data | |||||||||||||||||||||||||
| Ratios to average net assets (a) | ||||||||||||||||||||||||||
| Net asset value, end of period | Total return (excludes sales charge) (b)(c) | Net assets, end of period (000’s) | Net expenses (d) | Net investment income (loss) | Expenses without waivers, reimbursements and earnings credits | Portfolio turnover rate (b)(e) | ||||||||||||||||||||
| $ | 38.10 | 24.23 | % | $ | 21,171 | 1.24 | % | 0.27 | %(g) | 1.49 | % | 67 | % | |||||||||||||
| 30.97 | (0.76 | ) | 6,965 | 1.24 | 0.34 | (h) | 1.54 | 55 | ||||||||||||||||||
| 31.29 | 36.60 | 2,918 | 1.24 | 0.14 | 1.53 | 88 | ||||||||||||||||||||
| 22.95 | 6.77 | 1,394 | 1.24 | 0.30 | 1.44 | 56 | ||||||||||||||||||||
| 37.71 | 23.60 | 6,136 | 1.74 | (0.21 | )(g) | 2.00 | 67 | |||||||||||||||||||
| 30.75 | (1.29 | ) | 1,244 | 1.75 | (0.18 | )(h) | 2.03 | 55 | ||||||||||||||||||
| 31.16 | 35.98 | 447 | 1.74 | (0.40 | ) | 2.06 | 88 | |||||||||||||||||||
| 22.93 | 6.40 | 65 | 1.74 | (0.23 | ) | 1.92 | 56 | |||||||||||||||||||
| 38.22 | 24.64 | 932,920 | 0.89 | 0.57 | (g) | 1.23 | 67 | |||||||||||||||||||
| 31.05 | (0.42 | ) | 813,125 | 0.89 | 0.64 | (h) | 1.30 | 55 | ||||||||||||||||||
| 31.36 | 37.09 | 568,854 | 0.89 | 0.50 | 1.27 | 88 | ||||||||||||||||||||
| 22.97 | 21.72 | 463,478 | 0.89 | 0.55 | 1.17 | 56 | ||||||||||||||||||||
| 18.97 | (28.02 | ) | 195,785 | 0.90 | 0.94 | 1.20 | 107 | |||||||||||||||||||
SEE NOTES TO FINANCIAL STATEMENTS.
| JUNE 30, 2013 | J.P. MORGAN MID CAP/MULTI-CAP FUNDS | 75 | ||||||
Table of Contents
FINANCIAL HIGHLIGHTS
FOR THE PERIODS INDICATED (continued)
| Per share operating performance | |||||||||||||||||||
| Investment operations | Distributions | |||||||||||||||||||
| Net asset value, beginning of period | Net investment income (loss) | Net realized and unrealized gains (losses) on investments | Total from investment operations | Net realized gain | ||||||||||||||||
Mid Cap Growth Fund |
| |||||||||||||||||||
Class A | ||||||||||||||||||||
Year Ended June 30, 2013 | $ | 19.52 | $ | (0.04 | )(f)(g) | $ | 4.50 | $ | 4.46 | $ | (0.99 | ) | ||||||||
Year Ended June 30, 2012 | 23.30 | (0.05 | )(f)(h) | (1.72 | ) | (1.77 | ) | (2.01 | ) | |||||||||||
Year Ended June 30, 2011 | 16.35 | (0.09 | )(f) | 7.04 | 6.95 | — | ||||||||||||||
Year Ended June 30, 2010 | 13.68 | (0.09 | )(f) | 2.76 | 2.67 | — | ||||||||||||||
Year Ended June 30, 2009 | 20.46 | (0.07 | )(f) | (6.33 | ) | (6.40 | ) | (0.38 | ) | |||||||||||
Class B | ||||||||||||||||||||
Year Ended June 30, 2013 | 14.76 | (0.11 | )(f)(g) | 3.34 | 3.23 | (0.99 | ) | |||||||||||||
Year Ended June 30, 2012 | 18.29 | (0.12 | )(f)(h) | (1.40 | ) | (1.52 | ) | (2.01 | ) | |||||||||||
Year Ended June 30, 2011 | 12.90 | (0.16 | )(f) | 5.55 | 5.39 | — | ||||||||||||||
Year Ended June 30, 2010 | 10.85 | (0.14 | )(f) | 2.19 | 2.05 | — | ||||||||||||||
Year Ended June 30, 2009 | 16.45 | (0.13 | )(f) | (5.09 | ) | (5.22 | ) | (0.38 | ) | |||||||||||
Class C | ||||||||||||||||||||
Year Ended June 30, 2013 | 17.17 | (0.12 | )(f)(g) | 3.91 | 3.79 | (0.99 | ) | |||||||||||||
Year Ended June 30, 2012 | 20.88 | (0.13 | )(f)(h) | (1.57 | ) | (1.70 | ) | (2.01 | ) | |||||||||||
Year Ended June 30, 2011 | 14.73 | (0.18 | )(f) | 6.33 | 6.15 | — | ||||||||||||||
Year Ended June 30, 2010 | 12.39 | (0.16 | )(f) | 2.50 | 2.34 | — | ||||||||||||||
Year Ended June 30, 2009 | 18.70 | (0.15 | )(f) | (5.78 | ) | (5.93 | ) | (0.38 | ) | |||||||||||
Class R2 | ||||||||||||||||||||
Year Ended June 30, 2013 | 20.83 | (0.07 | )(f)(g) | 4.79 | 4.72 | (0.99 | ) | |||||||||||||
Year Ended June 30, 2012 | 24.73 | (0.07 | )(f)(h) | (1.82 | ) | (1.89 | ) | (2.01 | ) | |||||||||||
Year Ended June 30, 2011 | 17.38 | (0.13 | )(f) | 7.48 | 7.35 | — | ||||||||||||||
Year Ended June 30, 2010 | 14.56 | (0.12 | )(f) | 2.94 | 2.82 | — | ||||||||||||||
June 19, 2009 (i) through June 30, 2009 | 14.56 | — | (f)(j) | — | (j) | — | (j) | — | ||||||||||||
Class R5 | ||||||||||||||||||||
Year Ended June 30, 2013 | 21.18 | 0.06 | (f)(g) | 4.90 | 4.96 | (0.99 | ) | |||||||||||||
November 1, 2011 (i) through June 30, 2012 | 21.75 | 0.04 | (f)(h) | 1.40 | 1.44 | (2.01 | ) | |||||||||||||
Class R6 | ||||||||||||||||||||
Year Ended June 30, 2013 | 21.19 | 0.08 | (f)(g) | 4.89 | 4.97 | (0.99 | ) | |||||||||||||
November 1, 2011 (i) through June 30, 2012 | 21.75 | 0.08 | (f)(h) | 1.37 | 1.45 | (2.01 | ) | |||||||||||||
Select Class | ||||||||||||||||||||
Year Ended June 30, 2013 | 21.15 | 0.03 | (f)(g) | 4.89 | 4.92 | (0.99 | ) | |||||||||||||
Year Ended June 30, 2012 | 24.97 | 0.02 | (f)(h) | (1.83 | ) | (1.81 | ) | (2.01 | ) | |||||||||||
Year Ended June 30, 2011 | 17.47 | (0.03 | )(f) | 7.53 | 7.50 | — | ||||||||||||||
Year Ended June 30, 2010 | 14.57 | (0.04 | )(f) | 2.94 | 2.90 | — | ||||||||||||||
Year Ended June 30, 2009 | 21.68 | (0.03 | )(f) | (6.70 | ) | (6.73 | ) | (0.38 | ) | |||||||||||
| (a) | Annualized for periods less than one year. |
| (b) | Not annualized for periods less than one year. |
| (c) | Includes adjustments in accordance with accounting principles generally accepted in the United States of America and as such, the net asset values for financial reporting purposes and the returns based upon those net asset values may differ from the net asset values and returns for shareholder transactions. |
| (d) | Includes earnings credits and interest expense, if applicable, each of which is less than 0.01% or unless otherwise noted. |
| (e) | Portfolio turnover is calculated by dividing the lesser of total purchases or sales of portfolio securities for the reporting period by the monthly average of portfolio securities owned during the reporting period. Excluded from both the numerator and denominator are amounts relating to derivatives and securities whose maturities or expiration dates at the time of acquisition were one year or less. |
| (f) | Calculated based upon average shares outstanding. |
| (g) | Reflects special dividends paid out during the period by several of the Fund’s holdings. Had the Fund not received the special dividends the net investment income (loss) per share would have been $(0.09), $(0.15), $(0.17), $(0.13), $0.01, $0.02 and $(0.02) for Class A, Class B, Class C, Class R2, Class R5, Class R6 and Select Class Shares, respectively and the net investment income (loss) ratio would have been (0.42)%, (0.94)%, (0.92)%, (0.57)%, 0.04%, 0.09% and (0.10)% for Class A, Class B, Class C, Class R2, Class R5, Class R6 and Select Class Shares, respectively. |
| (h) | Reflects a special dividend paid out during the period by one of the Fund’s holdings. Had the Fund not received the special dividend the net investment income (loss) per share would have been $(0.09), $(0.15), $(0.17), $(0.12), less than $0.01, $0.03 and $(0.03) for Class A, Class B, Class C, Class R2, Class R5, Class R6 and Select Class Shares, respectively and the net investment income (loss) ratio would have been (0.46)%, (0.99)%, (0.97)%, (0.57)%, (0.03)%, 0.24% and (0.14)% for Class A, Class B, Class C, Class R2, Class R5, Class R6 and Select Class Shares, respectively. |
| (i) | Commencement of offering of class of shares. |
| (j) | Amount rounds to less than $1,000. |
SEE NOTES TO FINANCIAL STATEMENTS.
| 76 | J.P. MORGAN MID CAP/MULTI-CAP FUNDS | JUNE 30, 2013 | ||||
Table of Contents
| Ratios/Supplemental data | |||||||||||||||||||||||||
| Ratios to average net assets (a) | ||||||||||||||||||||||||||
| Net asset value, end of period | Total return (excludes sales charge) (b)(c) | Net assets, end of period (000’s) | Net expenses (d) | Net investment income (loss) | Expenses without waivers, reimbursements and earnings credits | Portfolio turnover rate (b)(e) | ||||||||||||||||||||
| $ | 22.99 | 23.70 | % | $ | 586,787 | 1.23 | % | (0.17 | )%(g) | 1.45 | % | 70 | % | |||||||||||||
| 19.52 | (6.61 | ) | 538,323 | 1.24 | (0.23 | )(h) | 1.38 | 70 | ||||||||||||||||||
| 23.30 | 42.51 | 696,334 | 1.24 | (0.44 | ) | 1.36 | 79 | |||||||||||||||||||
| 16.35 | 19.52 | 560,054 | 1.24 | (0.53 | ) | 1.42 | 82 | |||||||||||||||||||
| 13.68 | (30.97 | ) | 520,201 | 1.24 | (0.48 | ) | 1.56 | 96 | ||||||||||||||||||
| 17.00 | 22.99 | 6,923 | 1.73 | (0.69 | )(g) | 1.94 | 70 | |||||||||||||||||||
| 14.76 | (7.08 | ) | 9,948 | 1.75 | (0.77 | )(h) | 1.88 | 70 | ||||||||||||||||||
| 18.29 | 41.78 | 18,648 | 1.77 | (0.97 | ) | 1.86 | 79 | |||||||||||||||||||
| 12.90 | 18.89 | 20,893 | 1.77 | (1.07 | ) | 1.92 | 82 | |||||||||||||||||||
| 10.85 | (31.35 | ) | 29,963 | 1.88 | (1.14 | ) | 2.03 | 96 | ||||||||||||||||||
| 19.97 | 23.03 | 23,745 | 1.73 | (0.67 | )(g) | 1.95 | 70 | |||||||||||||||||||
| 17.17 | (7.06 | ) | 22,190 | 1.75 | (0.75 | )(h) | 1.88 | 70 | ||||||||||||||||||
| 20.88 | 41.75 | 29,187 | 1.77 | (0.97 | ) | 1.86 | 79 | |||||||||||||||||||
| 14.73 | 18.89 | 23,389 | 1.77 | (1.06 | ) | 1.92 | 82 | |||||||||||||||||||
| 12.39 | (31.38 | ) | 25,624 | 1.88 | (1.13 | ) | 2.04 | 96 | ||||||||||||||||||
| 24.56 | 23.46 | 320 | 1.39 | (0.32 | )(g) | 1.71 | 70 | |||||||||||||||||||
| 20.83 | (6.72 | ) | 230 | 1.40 | (0.35 | )(h) | 1.63 | 70 | ||||||||||||||||||
| 24.73 | 42.29 | 121 | 1.40 | (0.59 | ) | 1.60 | 79 | |||||||||||||||||||
| 17.38 | 19.37 | 63 | 1.40 | (0.69 | ) | 1.67 | 82 | |||||||||||||||||||
| 14.56 | 0.00 | 83 | 1.22 | (0.31 | ) | 1.94 | 96 | |||||||||||||||||||
| 25.15 | 24.22 | 17,848 | 0.79 | 0.28 | (g) | 1.00 | 70 | |||||||||||||||||||
| 21.18 | 7.71 | 14,837 | 0.78 | 0.31 | (h) | 0.92 | 70 | |||||||||||||||||||
| 25.17 | 24.26 | 47,434 | 0.74 | 0.34 | (g) | 0.98 | 70 | |||||||||||||||||||
| 21.19 | 7.76 | 13,982 | 0.73 | 0.58 | (h) | 0.87 | 70 | |||||||||||||||||||
| 25.08 | 24.06 | 894,740 | 0.93 | 0.14 | (g) | 1.20 | 70 | |||||||||||||||||||
| 21.15 | (6.31 | ) | 827,306 | 0.93 | 0.09 | (h) | 1.13 | 70 | ||||||||||||||||||
| 24.97 | 42.93 | 1,031,463 | 0.93 | (0.13 | ) | 1.10 | 79 | |||||||||||||||||||
| 17.47 | 19.90 | 685,843 | 0.93 | (0.22 | ) | 1.17 | 82 | |||||||||||||||||||
| 14.57 | (30.74 | ) | 631,380 | 0.98 | (0.23 | ) | 1.30 | 96 | ||||||||||||||||||
SEE NOTES TO FINANCIAL STATEMENTS.
| JUNE 30, 2013 | J.P. MORGAN MID CAP/MULTI-CAP FUNDS | 77 | ||||||
Table of Contents
FINANCIAL HIGHLIGHTS
FOR THE PERIODS INDICATED (continued)
| Per share operating performance | |||||||||||||||||||||||||||
| Investment operations | Distributions | |||||||||||||||||||||||||||
| Net asset value, beginning of period | Net investment income (loss) | Net realized and unrealized gains (losses) on investments | Total from investment operations | Net investment income | Net realized gain | Total distributions | ||||||||||||||||||||||
Mid Cap Value Fund | ||||||||||||||||||||||||||||
Class A | ||||||||||||||||||||||||||||
Year Ended June 30, 2013 | $ | 25.80 | $ | 0.19 | (f)(g) | $ | 6.20 | $ | 6.39 | $ | (0.29 | ) | $ | (0.22 | ) | $ | (0.51 | ) | ||||||||||
Year Ended June 30, 2012 | 24.76 | 0.20 | (f) | 1.00 | 1.20 | (0.16 | ) | — | (0.16 | ) | ||||||||||||||||||
Year Ended June 30, 2011 | 18.91 | 0.18 | (f) | 5.85 | 6.03 | (0.18 | ) | — | (0.18 | ) | ||||||||||||||||||
Year Ended June 30, 2010 | 15.24 | 0.19 | (f) | 3.48 | 3.67 | — | — | — | ||||||||||||||||||||
Year Ended June 30, 2009 | 21.91 | 0.28 | (f) | (5.92 | ) | (5.64 | ) | (0.34 | ) | (0.69 | ) | (1.03 | ) | |||||||||||||||
Class B | ||||||||||||||||||||||||||||
Year Ended June 30, 2013 | 25.16 | 0.03 | (f)(g) | 6.08 | 6.11 | — | (0.22 | ) | (0.22 | ) | ||||||||||||||||||
Year Ended June 30, 2012 | 24.10 | 0.07 | (f) | 0.99 | 1.06 | — | — | — | ||||||||||||||||||||
Year Ended June 30, 2011 | 18.38 | 0.07 | (f) | 5.69 | 5.76 | (0.04 | ) | — | (0.04 | ) | ||||||||||||||||||
Year Ended June 30, 2010 | 14.89 | 0.10 | (f) | 3.39 | 3.49 | — | — | — | ||||||||||||||||||||
Year Ended June 30, 2009 | 21.39 | 0.20 | (f) | (5.79 | ) | (5.59 | ) | (0.22 | ) | (0.69 | ) | (0.91 | ) | |||||||||||||||
Class C | ||||||||||||||||||||||||||||
Year Ended June 30, 2013 | 25.14 | 0.05 | (f)(g) | 6.03 | 6.08 | (0.16 | ) | (0.22 | ) | (0.38 | ) | |||||||||||||||||
Year Ended June 30, 2012 | 24.13 | 0.07 | (f) | 0.98 | 1.05 | (0.04 | ) | — | (0.04 | ) | ||||||||||||||||||
Year Ended June 30, 2011 | 18.44 | 0.07 | (f) | 5.69 | 5.76 | (0.07 | ) | — | (0.07 | ) | ||||||||||||||||||
Year Ended June 30, 2010 | 14.94 | 0.10 | (f) | 3.40 | 3.50 | — | — | — | ||||||||||||||||||||
Year Ended June 30, 2009 | 21.45 | 0.20 | (f) | (5.80 | ) | (5.60 | ) | (0.22 | ) | (0.69 | ) | (0.91 | ) | |||||||||||||||
Class R2 | ||||||||||||||||||||||||||||
Year Ended June 30, 2013 | 25.18 | 0.12 | (f)(g) | 6.03 | 6.15 | (0.30 | ) | (0.22 | ) | (0.52 | ) | |||||||||||||||||
Year Ended June 30, 2012 | 24.27 | 0.14 | (f) | 0.97 | 1.11 | (0.20 | ) | — | (0.20 | ) | ||||||||||||||||||
Year Ended June 30, 2011 | 18.63 | 0.12 | (f) | 5.76 | 5.88 | (0.24 | ) | — | (0.24 | ) | ||||||||||||||||||
Year Ended June 30, 2010 | 15.06 | 0.15 | (f) | 3.42 | 3.57 | — | — | — | ||||||||||||||||||||
November 3, 2008 (h) through June 30, 2009 | 16.34 | 0.20 | (f) | (0.30 | ) | (0.10 | ) | (0.49 | ) | (0.69 | ) | (1.18 | ) | |||||||||||||||
Institutional Class | ||||||||||||||||||||||||||||
Year Ended June 30, 2013 | 26.24 | 0.34 | (f)(g) | 6.31 | 6.65 | (0.41 | ) | (0.22 | ) | (0.63 | ) | |||||||||||||||||
Year Ended June 30, 2012 | 25.19 | 0.32 | (f) | 1.01 | 1.33 | (0.28 | ) | — | (0.28 | ) | ||||||||||||||||||
Year Ended June 30, 2011 | 19.22 | 0.30 | (f) | 5.95 | 6.25 | (0.28 | ) | — | (0.28 | ) | ||||||||||||||||||
Year Ended June 30, 2010 | 15.43 | 0.29 | (f) | 3.52 | 3.81 | (0.02 | ) | — | (0.02 | ) | ||||||||||||||||||
Year Ended June 30, 2009 | 22.31 | 0.38 | (f) | (6.06 | ) | (5.68 | ) | (0.51 | ) | (0.69 | ) | (1.20 | ) | |||||||||||||||
Select Class | ||||||||||||||||||||||||||||
Year Ended June 30, 2013 | 26.01 | 0.27 | (f)(g) | 6.24 | 6.51 | (0.35 | ) | (0.22 | ) | (0.57 | ) | |||||||||||||||||
Year Ended June 30, 2012 | 24.97 | 0.26 | (f) | 1.01 | 1.27 | (0.23 | ) | — | (0.23 | ) | ||||||||||||||||||
Year Ended June 30, 2011 | 19.07 | 0.24 | (f) | 5.90 | 6.14 | (0.24 | ) | — | (0.24 | ) | ||||||||||||||||||
Year Ended June 30, 2010 | 15.34 | 0.24 | (f) | 3.49 | 3.73 | — | (i) | — | — | (i) | ||||||||||||||||||
Year Ended June 30, 2009 | 22.14 | 0.34 | (f) | (6.01 | ) | (5.67 | ) | (0.44 | ) | (0.69 | ) | (1.13 | ) | |||||||||||||||
| (a) | Annualized for periods less than one year. |
| (b) | Not annualized for periods less than one year. |
| (c) | Includes adjustments in accordance with accounting principles generally accepted in the United States of America and as such, the net asset values for financial reporting purposes and the returns based upon those net asset values may differ from the net asset values and returns for shareholder transactions. |
| (d) | Includes earnings credits and interest expense, if applicable, each of which is less than 0.01% or unless otherwise noted. |
| (e) | Portfolio turnover is calculated by dividing the lesser of total purchases or sales of portfolio securities for the reporting period by the monthly average of portfolio securities owned during the reporting period. Excluded from both the numerator and denominator are amounts relating to derivatives and securities whose maturities or expiration dates at the time of acquisition were one year or less. |
| (f) | Calculated based upon average shares outstanding. |
| (g) | Reflects special dividends paid out during the period by several of the Fund’s holdings. Had the Fund not received the special dividends the net investment income (loss) per share would have been $0.16, $0.00, $0.01, $0.09, $0.31 and $0.23 for Class A, Class B, Class C, Class R2, Institutional Class and Select Class Shares, respectively and the net investment income (loss) ratio would have been 0.55%, 0.00%, 0.04%, 0.31%, 1.04% and 0.80% for Class A, Class B, Class C, Class R2, Institutional Class and Select Class Shares, respectively. |
| (h) | Commencement of offering of class of shares. |
| (i) | Amount rounds to less than $0.01. |
SEE NOTES TO FINANCIAL STATEMENTS.
| 78 | J.P. MORGAN MID CAP/MULTI-CAP FUNDS | JUNE 30, 2013 | ||||
Table of Contents
| Ratios/Supplemental data | |||||||||||||||||||||||||
| Ratios to average net assets (a) | ||||||||||||||||||||||||||
| Net asset value, end of period | Total return (excludes sales charge) (b)(c) | Net assets, end of period (000’s) | Net expenses (d) | Net investment income (loss) | Expenses without waivers, reimbursements and earnings credits | Portfolio turnover rate (b)(e) | ||||||||||||||||||||
| $ | 31.68 | 25.06 | % | $ | 3,157,503 | 1.23 | % | 0.67 | %(g) | 1.38 | % | 23 | % | |||||||||||||
| 25.80 | 4.92 | 1,986,930 | 1.24 | 0.83 | 1.41 | 30 | ||||||||||||||||||||
| 24.76 | 31.96 | 1,979,270 | 1.23 | 0.81 | 1.39 | 41 | ||||||||||||||||||||
| 18.91 | 24.08 | 1,705,572 | 1.23 | 1.04 | 1.40 | 34 | ||||||||||||||||||||
| 15.24 | (25.49 | ) | 1,600,044 | 1.25 | 1.71 | 1.42 | 47 | |||||||||||||||||||
| 31.05 | 24.42 | 15,382 | 1.74 | 0.13 | (g) | 1.88 | 23 | |||||||||||||||||||
| 25.16 | 4.40 | 57,100 | 1.75 | 0.30 | 1.91 | 30 | ||||||||||||||||||||
| 24.10 | 31.33 | 90,427 | 1.74 | 0.30 | 1.89 | 41 | ||||||||||||||||||||
| 18.38 | 23.44 | 96,966 | 1.74 | 0.53 | 1.90 | 34 | ||||||||||||||||||||
| 14.89 | (25.89 | ) | 108,114 | 1.75 | 1.21 | 1.92 | 47 | |||||||||||||||||||
| 30.84 | 24.43 | 534,813 | 1.74 | 0.16 | (g) | 1.88 | 23 | |||||||||||||||||||
| 25.14 | 4.38 | 370,781 | 1.75 | 0.32 | 1.91 | 30 | ||||||||||||||||||||
| 24.13 | 31.29 | 373,415 | 1.74 | 0.30 | 1.89 | 41 | ||||||||||||||||||||
| 18.44 | 23.43 | 309,513 | 1.74 | 0.53 | 1.90 | 34 | ||||||||||||||||||||
| 14.94 | (25.88 | ) | 299,956 | 1.75 | 1.20 | 1.92 | 47 | |||||||||||||||||||
| 30.81 | 24.71 | 57,003 | 1.49 | 0.43 | (g) | 1.63 | 23 | |||||||||||||||||||
| 25.18 | 4.65 | 14,824 | 1.49 | 0.59 | 1.66 | 30 | ||||||||||||||||||||
| 24.27 | 31.66 | 6,500 | 1.49 | 0.50 | 1.65 | 41 | ||||||||||||||||||||
| 18.63 | 23.71 | 1,441 | 1.49 | 0.77 | 1.65 | 34 | ||||||||||||||||||||
| 15.06 | (0.24 | ) | 294 | 1.50 | 2.12 | 1.69 | 47 | |||||||||||||||||||
| 32.26 | 25.68 | 6,627,529 | 0.74 | 1.16 | (g) | 0.98 | 23 | |||||||||||||||||||
| 26.24 | 5.43 | 3,543,900 | 0.74 | 1.33 | 1.01 | 30 | ||||||||||||||||||||
| 25.19 | 32.66 | 2,812,296 | 0.74 | 1.29 | 0.99 | 41 | ||||||||||||||||||||
| 19.22 | 24.68 | 1,913,930 | 0.74 | 1.52 | 1.00 | 34 | ||||||||||||||||||||
| 15.43 | (25.15 | ) | 1,424,004 | 0.75 | 2.26 | 1.02 | 47 | |||||||||||||||||||
| 31.95 | 25.35 | 2,870,752 | 0.98 | 0.92 | (g) | 1.13 | 23 | |||||||||||||||||||
| 26.01 | 5.20 | 1,836,012 | 0.98 | 1.09 | 1.16 | 30 | ||||||||||||||||||||
| 24.97 | 32.29 | 1,513,926 | 0.98 | 1.05 | 1.14 | 41 | ||||||||||||||||||||
| 19.07 | 24.35 | 1,061,308 | 0.98 | 1.29 | 1.15 | 34 | ||||||||||||||||||||
| 15.34 | (25.31 | ) | 766,965 | 1.00 | 2.05 | 1.18 | 47 | |||||||||||||||||||
SEE NOTES TO FINANCIAL STATEMENTS.
| JUNE 30, 2013 | J.P. MORGAN MID CAP/MULTI-CAP FUNDS | 79 | ||||||
Table of Contents
FINANCIAL HIGHLIGHTS
FOR THE PERIODS INDICATED (continued)
| Per share operating performance | |||||||||||||||
| Investment operations | ||||||||||||||||
| Net asset value, beginning of period | Net investment income (loss) | Net realized and unrealized gains (losses) on investments | Total from investment operations | |||||||||||||
Multi-Cap Market Neutral Fund | ||||||||||||||||
Class A | ||||||||||||||||
Year Ended June 30, 2013 | $ | 9.69 | $ | (0.11 | )(e)(f) | $ | 0.21 | $ | 0.10 | |||||||
Year Ended June 30, 2012 | 9.81 | (0.14 | )(e) | 0.02 | (0.12 | ) | ||||||||||
Year Ended June 30, 2011 | 9.71 | (0.16 | )(e) | 0.26 | 0.10 | |||||||||||
Year Ended June 30, 2010 | 10.21 | (0.17 | )(e) | (0.33 | ) | (0.50 | ) | |||||||||
Year Ended June 30, 2009 | 10.23 | (0.08 | )(e) | 0.06 | (0.02 | ) | ||||||||||
Class B | ||||||||||||||||
Year Ended June 30, 2013 | 9.29 | (0.17 | )(e)(f) | 0.19 | 0.02 | |||||||||||
Year Ended June 30, 2012 | 9.47 | (0.20 | )(e) | 0.02 | (0.18 | ) | ||||||||||
Year Ended June 30, 2011 | 9.44 | (0.23 | )(e) | 0.26 | 0.03 | |||||||||||
Year Ended June 30, 2010 | 10.01 | (0.23 | )(e) | (0.34 | ) | (0.57 | ) | |||||||||
Year Ended June 30, 2009 | 10.10 | (0.15 | )(e) | 0.06 | (0.09 | ) | ||||||||||
Class C | ||||||||||||||||
Year Ended June 30, 2013 | 9.30 | (0.17 | )(e)(f) | 0.20 | 0.03 | |||||||||||
Year Ended June 30, 2012 | 9.48 | (0.20 | )(e) | 0.02 | (0.18 | ) | ||||||||||
Year Ended June 30, 2011 | 9.46 | (0.23 | )(e) | 0.25 | 0.02 | |||||||||||
Year Ended June 30, 2010 | 10.02 | (0.23 | )(e) | (0.33 | ) | (0.56 | ) | |||||||||
Year Ended June 30, 2009 | 10.12 | (0.15 | )(e) | 0.05 | (0.10 | ) | ||||||||||
Select Class | ||||||||||||||||
Year Ended June 30, 2013 | 9.82 | (0.09 | )(e)(f) | 0.21 | 0.12 | |||||||||||
Year Ended June 30, 2012 | 9.91 | (0.12 | )(e) | 0.03 | (0.09 | ) | ||||||||||
Year Ended June 30, 2011 | 9.79 | (0.14 | )(e) | 0.26 | 0.12 | |||||||||||
Year Ended June 30, 2010 | 10.27 | (0.14 | )(e) | (0.34 | ) | (0.48 | ) | |||||||||
Year Ended June 30, 2009 | 10.27 | (0.05 | )(e) | 0.05 | — | (g) | ||||||||||
| (a) | Includes adjustments in accordance with accounting principles generally accepted in the United States of America and as such, the net asset values for financial reporting purposes and the returns based upon those net asset values may differ from the net asset values and returns for shareholder transactions. |
| (b) | Includes earnings credits and interest expense, if applicable, each of which is less than 0.01% or unless otherwise noted. |
| (c) | The net expenses and expenses without waivers, reimbursements and earnings credits (excluding dividend expense and interest expense for securities sold short) for Class A are 1.48% and 1.88% for the year ended June 30, 2013, 1.48% and 1.94% for 2012, 1.49% and 1.95% for 2011, 1.49% and 1.94% for 2010, 1.50% and 1.95% for 2009; for Class B are 2.16% and 2.38 for the year ended June 30, 2013, 2.23% and 2.45% for 2012, 2.24% and 2.45% for 2011, 2.24% and 2.44% for 2010, 2.25% and 2.45% for 2009; for Class C are 2.15% and 2.38% for the year ended June 30, 2013, 2.23% and 2.44% for 2012, 2.24% and 2.45% for 2011, 2.24% and 2.44% for 2010, 2.25% and 2.45% for 2009; for Select Class are 1.23% and 1.63% for the year ended June 30, 2013, 1.23% and 1.69% for 2012, 1.24% and 1.70% for 2011, 1.24% and 1.69% for 2010, 1.25% and 1.70% for 2009, respectively. |
| (d) | Portfolio turnover is calculated by dividing the lesser of total purchases or sales of portfolio securities for the reporting period by the monthly average of portfolio securities owned during the reporting period. Excluded from both the numerator and denominator are amounts relating to derivatives and securities whose maturities or expiration dates at the time of acquisition were one year or less. |
| (e) | Calculated based upon average shares outstanding. |
| (f) | Reflects special dividends paid out during the period by several of the Fund’s holdings. Had the Fund not received the special dividends the net investment income (loss) per share would have been $(0.13), $(0.19), $(0.19) and $(0.11) for Class A, Class B, Class C and Select Class Shares, respectively and the net investment income (loss) ratio would have been (1.38)%, (2.07)%, (2.06)% and (1.16)% for Class A, Class B, Class C and Select Class Shares, respectively. |
| (g) | Amount rounds to less than $0.01. |
SEE NOTES TO FINANCIAL STATEMENTS.
| 80 | J.P. MORGAN MID CAP/MULTI-CAP FUNDS | JUNE 30, 2013 | ||||
Table of Contents
| Ratios/Supplemental data | |||||||||||||||||||||||||||||
| Ratios to average net assets | ||||||||||||||||||||||||||||||
| Net asset value, end of period | Total return (excludes sales charge) (a) | Net assets, end of period (000’s) | Net expenses (including dividend and interest expense for securities sold short) (b)(c ) | Net investment income (loss) | Expenses without waivers, reimbursements and earnings credits (including dividend and interest expense for securities sold short) (c) | Portfolio turnover rate (excluding short sales) (d) | Portfolio turnover rate (including short sales) (d) | |||||||||||||||||||||||
| $ | 9.79 | 1.03 | % | $ | 14,101 | 3.04 | % | (1.13 | )%(f) | 3.44 | % | 94 | % | 251 | % | |||||||||||||||
| 9.69 | (1.22 | ) | 19,759 | 2.86 | (1.42 | ) | 3.32 | 151 | 316 | |||||||||||||||||||||
| 9.81 | 1.03 | 29,216 | 2.92 | (1.65 | ) | 3.38 | 145 | 339 | ||||||||||||||||||||||
| 9.71 | (4.90 | ) | 94,549 | 2.94 | (1.65 | ) | 3.39 | 146 | 348 | |||||||||||||||||||||
| 10.21 | (0.20 | ) | 67,884 | 2.84 | (0.79 | ) | 3.29 | 175 | 350 | |||||||||||||||||||||
| 9.31 | 0.22 | 530 | 3.70 | (1.82 | )(f) | 3.92 | 94 | 251 | ||||||||||||||||||||||
| 9.29 | (1.90 | ) | 1,401 | 3.61 | (2.18 | ) | 3.83 | 151 | 316 | |||||||||||||||||||||
| 9.47 | 0.32 | 3,484 | 3.67 | (2.47 | ) | 3.88 | 145 | 339 | ||||||||||||||||||||||
| 9.44 | (5.69 | ) | 7,849 | 3.69 | (2.39 | ) | 3.89 | 146 | 348 | |||||||||||||||||||||
| 10.01 | (0.89 | ) | 12,766 | 3.59 | (1.55 | ) | 3.79 | 175 | 350 | |||||||||||||||||||||
| 9.33 | 0.32 | 11,181 | 3.69 | (1.81 | )(f) | 3.92 | 94 | 251 | ||||||||||||||||||||||
| 9.30 | (1.90 | ) | 15,677 | 3.61 | (2.17 | ) | 3.82 | 151 | 316 | |||||||||||||||||||||
| 9.48 | 0.21 | 22,094 | 3.67 | (2.46 | ) | 3.88 | 145 | 339 | ||||||||||||||||||||||
| 9.46 | (5.59 | ) | 39,610 | 3.70 | (2.39 | ) | 3.89 | 146 | 348 | |||||||||||||||||||||
| 10.02 | (0.99 | ) | 61,467 | 3.59 | (1.54 | ) | 3.79 | 175 | 350 | |||||||||||||||||||||
| 9.94 | 1.22 | 317,974 | 2.78 | (0.90 | )(f) | 3.18 | 94 | 251 | ||||||||||||||||||||||
| 9.82 | (0.91 | ) | 476,803 | 2.61 | (1.17 | ) | 3.07 | 151 | 316 | |||||||||||||||||||||
| 9.91 | 1.23 | 491,653 | 2.67 | (1.39 | ) | 3.13 | 145 | 339 | ||||||||||||||||||||||
| 9.79 | (4.67 | ) | 433,539 | 2.70 | (1.39 | ) | 3.15 | 146 | 348 | |||||||||||||||||||||
| 10.27 | 0.00 | 528,478 | 2.59 | (0.45 | ) | 3.04 | 175 | 350 | ||||||||||||||||||||||
SEE NOTES TO FINANCIAL STATEMENTS.
| JUNE 30, 2013 | J.P. MORGAN MID CAP/MULTI-CAP FUNDS | 81 | ||||||
Table of Contents
FINANCIAL HIGHLIGHTS
FOR THE PERIODS INDICATED (continued)
| Per share operating performance | |||||||||||||||||||||||||||
| Investment operations | Distributions | |||||||||||||||||||||||||||
| Net asset value, beginning of period | Net investment income (loss) | Net realized and unrealized gains (losses) on investments | Total from investment operations | Net investment income | Net realized gain | Total distributions | ||||||||||||||||||||||
Value Advantage Fund |
| |||||||||||||||||||||||||||
Class A | ||||||||||||||||||||||||||||
Year Ended June 30, 2013 | $ | 19.96 | $ | 0.22 | (d) | $ | 4.75 | $ | 4.97 | $ | (0.20 | ) | $ | (0.09 | ) | $ | (0.29 | ) | ||||||||||
Year Ended June 30, 2012 | 19.07 | 0.25 | (d) | 0.84 | 1.09 | (0.20 | ) | — | (0.20 | ) | ||||||||||||||||||
Year Ended June 30, 2011 | 15.22 | 0.23 | (d) | 3.79 | 4.02 | (0.17 | ) | — | (0.17 | ) | ||||||||||||||||||
Year Ended June 30, 2010 | 12.01 | 0.23 | (d) | 3.17 | 3.40 | (0.19 | ) | — | (0.19 | ) | ||||||||||||||||||
Year Ended June 30, 2009 | 16.38 | 0.30 | (d) | (4.40 | ) | (4.10 | ) | (0.20 | ) | (0.07 | ) | (0.27 | ) | |||||||||||||||
Class C | ||||||||||||||||||||||||||||
Year Ended June 30, 2013 | 19.91 | 0.11 | (d) | 4.74 | 4.85 | (0.06 | ) | (0.09 | ) | (0.15 | ) | |||||||||||||||||
Year Ended June 30, 2012 | 19.01 | 0.16 | (d) | 0.84 | 1.00 | (0.10 | ) | — | (0.10 | ) | ||||||||||||||||||
Year Ended June 30, 2011 | 15.17 | 0.14 | (d) | 3.77 | 3.91 | (0.07 | ) | — | (0.07 | ) | ||||||||||||||||||
Year Ended June 30, 2010 | 11.97 | 0.15 | (d) | 3.17 | 3.32 | (0.12 | ) | — | (0.12 | ) | ||||||||||||||||||
Year Ended June 30, 2009 | 16.25 | 0.23 | (d) | (4.34 | ) | (4.11 | ) | (0.10 | ) | (0.07 | ) | (0.17 | ) | |||||||||||||||
Institutional Class | ||||||||||||||||||||||||||||
Year Ended June 30, 2013 | 19.99 | 0.34 | (d) | 4.75 | 5.09 | (0.25 | ) | (0.09 | ) | (0.34 | ) | |||||||||||||||||
Year Ended June 30, 2012 | 19.11 | 0.35 | (d) | 0.83 | 1.18 | (0.30 | ) | — | (0.30 | ) | ||||||||||||||||||
Year Ended June 30, 2011 | 15.24 | 0.32 | (d) | 3.79 | 4.11 | (0.24 | ) | — | (0.24 | ) | ||||||||||||||||||
Year Ended June 30, 2010 | 12.01 | 0.31 | (d) | 3.18 | 3.49 | (0.26 | ) | — | (0.26 | ) | ||||||||||||||||||
Year Ended June 30, 2009 | 16.40 | 0.37 | (d) | (4.42 | ) | (4.05 | ) | (0.27 | ) | (0.07 | ) | (0.34 | ) | |||||||||||||||
Select Class | ||||||||||||||||||||||||||||
Year Ended June 30, 2013 | 20.00 | 0.28 | (d) | 4.75 | 5.03 | (0.22 | ) | (0.09 | ) | (0.31 | ) | |||||||||||||||||
Year Ended June 30, 2012 | 19.12 | 0.30 | (d) | 0.83 | 1.13 | (0.25 | ) | — | (0.25 | ) | ||||||||||||||||||
Year Ended June 30, 2011 | 15.27 | 0.28 | (d) | 3.79 | 4.07 | (0.22 | ) | — | (0.22 | ) | ||||||||||||||||||
Year Ended June 30, 2010 | 12.04 | 0.27 | (d) | 3.19 | 3.46 | (0.23 | ) | — | (0.23 | ) | ||||||||||||||||||
Year Ended June 30, 2009 | 16.44 | 0.34 | (d) | (4.42 | ) | (4.08 | ) | (0.25 | ) | (0.07 | ) | (0.32 | ) | |||||||||||||||
| (a) | Includes adjustments in accordance with accounting principles generally accepted in the United States of America and as such, the net asset values for financial reporting purposes and the returns based upon those net asset values may differ from the net asset values and returns for shareholder transactions. |
| (b) | Includes earnings credits and interest expense, if applicable, each of which is less than 0.01% or unless otherwise noted. |
| (c) | Portfolio turnover is calculated by dividing the lesser of total purchases or sales of portfolio securities for the reporting period by the monthly average of portfolio securities owned during the reporting period. Excluded from both the numerator and denominator are amounts relating to derivatives and securities whose maturities or expiration dates at the time of acquisition were one year or less. |
| (d) | Calculated based upon average shares outstanding. |
SEE NOTES TO FINANCIAL STATEMENTS.
| 82 | J.P. MORGAN MID CAP/MULTI-CAP FUNDS | JUNE 30, 2013 | ||||
Table of Contents
| Ratios/Supplemental data | |||||||||||||||||||||||||
| Ratios to average net assets | ||||||||||||||||||||||||||
| �� Net asset value, end of period | Total return (excludes sales charge) (a) | Net assets, end of period (000’s) | Net expenses (b) | Net investment income (loss) | Expenses without waivers, reimbursements and earnings credits | Portfolio turnover rate (c) | ||||||||||||||||||||
| $ | 24.64 | 25.09 | % | $ | 784,359 | 1.24 | % | 0.98 | % | 1.33 | % | 22 | % | |||||||||||||
| 19.96 | 5.83 | 206,816 | 1.25 | 1.34 | 1.41 | 49 | ||||||||||||||||||||
| 19.07 | 26.45 | 232,103 | 1.24 | 1.28 | 1.34 | 33 | ||||||||||||||||||||
| 15.22 | 28.35 | 150,081 | 1.24 | 1.52 | 1.38 | 45 | ||||||||||||||||||||
| 12.01 | (24.82 | ) | 112,739 | 1.25 | 2.45 | 1.50 | 70 | |||||||||||||||||||
| 24.61 | 24.45 | 212,198 | 1.74 | 0.49 | 1.83 | 22 | ||||||||||||||||||||
| 19.91 | 5.32 | 117,937 | 1.75 | 0.84 | 1.91 | 49 | ||||||||||||||||||||
| 19.01 | 25.82 | 131,743 | 1.74 | 0.78 | 1.84 | 33 | ||||||||||||||||||||
| 15.17 | 27.72 | 108,165 | 1.74 | 1.01 | 1.88 | 45 | ||||||||||||||||||||
| 11.97 | (25.19 | ) | 97,723 | 1.75 | 1.86 | 1.99 | 70 | |||||||||||||||||||
| 24.74 | 25.73 | 1,455,125 | 0.74 | 1.50 | 0.93 | 22 | ||||||||||||||||||||
| 19.99 | 6.36 | 384,525 | 0.75 | 1.86 | 1.01 | 49 | ||||||||||||||||||||
| 19.11 | 27.06 | 284,433 | 0.74 | 1.79 | 0.94 | 33 | ||||||||||||||||||||
| 15.24 | 29.03 | 156,531 | 0.74 | 2.04 | 0.98 | 45 | ||||||||||||||||||||
| 12.01 | (24.41 | ) | 70,825 | 0.75 | 3.11 | 1.15 | 70 | |||||||||||||||||||
| 24.72 | 25.38 | 1,245,241 | 0.99 | 1.23 | 1.08 | 22 | ||||||||||||||||||||
| 20.00 | 6.09 | 422,861 | 1.00 | 1.62 | 1.16 | 49 | ||||||||||||||||||||
| 19.12 | 26.75 | 270,562 | 0.99 | 1.53 | 1.09 | 33 | ||||||||||||||||||||
| 15.27 | 28.70 | 71,209 | 0.99 | 1.77 | 1.13 | 45 | ||||||||||||||||||||
| 12.04 | (24.62 | ) | 51,000 | 1.00 | 2.75 | 1.25 | 70 | |||||||||||||||||||
SEE NOTES TO FINANCIAL STATEMENTS.
| JUNE 30, 2013 | J.P. MORGAN MID CAP/MULTI-CAP FUNDS | 83 | ||||||
Table of Contents
AS OF JUNE 30, 2013
1. Organization
JPMorgan Trust I (“JPM I”) and JPMorgan Trust II (“JPM II”) (the “Trusts”) were formed on November 12, 2004, as Delaware statutory trusts, pursuant to Declarations of Trust dated November 5, 2004 and are registered under the Investment Company Act of 1940, as amended (the “1940 Act”), as open-end management investment companies.
J.P. Morgan Mutual Fund Investment Trust (“JPMMFIT”), an open-end management investment company, was organized as a Massachusetts business trust on September 23, 1997.
J.P. Morgan Fleming Mutual Fund Group, Inc. (“JPMFMFG”), an open-end management investment company, was organized as a Maryland corporation on August 19, 1997.
The following are 7 separate funds of the Trusts (collectively, the “Funds”) covered by this report:
| Classes Offered | Trust | Diversified/Non-Diversified | ||||
| Growth Advantage Fund | Class A, Class B, Class C, Class R5 and Select Class | JPMMFIT | Diversified | |||
| Mid Cap Core Fund | Class A, Class C, Class R2, Class R5, Class R6 and Select Class | JPM I | Diversified | |||
| Mid Cap Equity Fund | Class A, Class C, and Select Class | JPM I | Diversified | |||
| Mid Cap Growth Fund | Class A, Class B, Class C, Class R2, Class R5, Class R6 and Select Class | JPM II | Diversified | |||
| Mid Cap Value Fund | Class A, Class B, Class C, Class R2, Institutional Class and Select Class | JPMFMFG | Diversified | |||
| Multi-Cap Market Neutral Fund | Class A, Class B, Class C, and Select Class | JPM II | Diversified | |||
| Value Advantage Fund | Class A, Class C, Institutional Class and Select Class | JPM I | Diversified |
The investment objective of Growth Advantage Fund is to seek to provide long-term capital growth.
The investment objective of Mid Cap Core Fund is to seek long-term capital appreciation.
The investment objective of Mid Cap Equity Fund is to seek long-term capital growth.
The investment objective of Mid Cap Growth Fund is to seek growth of capital and secondarily, current income by investing primarily in equity securities.
The investment objective of Mid Cap Value Fund is to seek growth from capital appreciation.
The investment objective of Multi-Cap Market Neutral Fund is to seek long-term capital preservation and growth by using strategies designed to produce returns which have no correlation with general domestic market performance.
The investment objective of Value Advantage Fund is to seek to provide long-term total return from a combination of income and capital gains.
Effective as of the close of business on February 22, 2013, all share classes of the Mid Cap Value Fund are publicly offered only on a limited basis. Investors are not eligible to purchase shares of the Fund unless they meet certain requirements as described in the Classes’ prospectuses.
Effective November 1, 2009, Class B Shares of the Growth Advantage Fund, Mid Cap Growth Fund, Mid Cap Value Fund and Multi-Cap Market Neutral Fund may not be purchased or acquired by new or existing shareholders, except through exchanges from Class B Shares of another J.P. Morgan Fund and dividend reinvestments. Shareholders who have invested in Class B Shares prior to November 1, 2009 may continue to hold their Class B Shares until they automatically convert to Class A Shares.
Class A Shares generally provide for a front-end sales charge while Class B and Class C Shares provide for a contingent deferred sales charge (“CDSC”). Class B Shares automatically convert to Class A Shares after eight years. No sales charges are assessed with respect to Class R2, Class R5, Class R6, Institutional Class and Select Class Shares. All classes of shares have equal rights as to earnings, assets and voting privileges, except that each class may bear different distribution and shareholder servicing fees and each class has exclusive voting rights with respect to its distribution plan and shareholder servicing agreements. Certain Class A Shares, for which front-end sales charges have been waived, may be subject to a CDSC as described in the Funds’ prospectus.
2. Significant Accounting Policies
The following is a summary of significant accounting policies followed by the Funds in the preparation of their financial statements. The policies are in accordance with accounting principles generally accepted in the United States of America (“GAAP”). The preparation of financial statements requires management to make estimates and assumptions that affect the reported amounts and disclosures in the financial statements. Actual results could differ from those estimates.
A. Valuation of Investments — Equity securities listed on a North American, Central American, South American or Caribbean securities exchange shall generally be valued at the last sale price on the exchange on which the security is principally traded that is reported before the time when the net assets of the Funds are valued. Securities listed on the NASDAQ Stock Market LLC are generally valued at the NASDAQ Official Closing Price. Generally, short-term investments of sufficient credit quality maturing in less than 61 days are valued at amortized cost, which approximates fair value. Investments in other open-end investment companies are valued at each investment company’s net asset value per share (“NAV”) as of the report date.
| 84 | J.P. MORGAN MID CAP/MULTI-CAP FUNDS | JUNE 30, 2013 | ||||
Table of Contents
Certain investments of the Funds may, depending upon market conditions, trade in relatively thin markets and/or in markets that experience significant volatility. As a result of these conditions, the prices used by the Funds to value these securities may differ from the value that would be realized if these securities were sold, and the differences could be material. Futures and options are generally valued on the basis of available market quotations. Swaps and other derivatives are valued daily, primarily using independent or affiliated pricing services approved by the Board of Trustees. If valuations are not available from such services or values received are deemed not representative of fair value, values will be obtained from a third party broker-dealer or counterparty.
Securities or other assets for which market quotations are not readily available or for which market quotations are deemed to not represent the fair value of the security or asset at the time of pricing (including certain illiquid securities) are fair valued in accordance with procedures established by and under the supervision and responsibility of the Board of Trustees. The Board of Trustees has established an Audit and Valuation Committee to assist with the oversight of the valuation of the Funds’ securities. JPMorgan Funds Management, Inc. (the “Administrator”, or “JPMFM”), an indirect, wholly-owned subsidiary of JPMorgan Chase & Co. (“JPMorgan”), has established a Valuation Committee (“VC”) that is comprised of senior representatives from JPMFM, J.P. Morgan Investment Management Inc. (“JPMIM” or the “Advisor”) , a wholly-owned subsidiary of JPMorgan Asset Management Holdings Inc. (“JPMAM”), which is a wholly-owned subsidiary of JPMorgan, JPMorgan’s Legal and Compliance and JPMAM’s Risk Management and the Funds’ Chief Compliance Officer. The VC’s responsibilities include making determinations regarding Level 3 fair value measurements (“Fair Values”) and/or providing recommendations for approval to the Board of Trustees’ Audit and Valuation Committee, in accordance with the Funds’ valuation policies.
The VC or Board of Trustees, as applicable, primarily employs a market-based approach which may use related or comparable assets or liabilities, recent transactions, market multiples, book values, and other relevant information for the investment to determine the fair value of the investment. The VC or Board of Trustees may also use an income-based valuation approach in which the anticipated future cash flows of the investment are discounted to calculate fair value. Discounts may also be applied due to the nature or duration of any restrictions on the disposition of the investments. Valuations may be based upon current market prices of securities that are comparable in coupon, rating, maturity and industry.
It is possible that the estimated values may differ significantly from the values that would have been used had a ready market for the investments existed, and such differences could be material. JPMFM and JPMIM are responsible for monitoring developments that may impact Fair Values and for discussing and assessing Fair Values on an ongoing, and at least a quarterly, basis with the VC and Board of Trustees, as applicable. The appropriateness of Fair Values is assessed based on results of unchanged price review and consideration of macro or security specific events, back testing and broker and vendor due diligence.
Valuations reflected in this report are as of the report date. As a result, changes in valuation due to market events and/or issuer related events after the report date and prior to issuance of the report, are not reflected herein.
The various inputs that are used in determining the fair value of the Funds’ investments are summarized into the three broad levels listed below.
| Ÿ | Level 1 — quoted prices in active markets for identical securities |
| Ÿ | Level 2 — other significant observable inputs (including quoted prices for similar securities, interest rates, prepayment speeds, credit risk, etc.) |
| Ÿ | Level 3 — significant unobservable inputs (including the Funds’ own assumptions in determining the fair value of investments) |
A financial instrument’s level within the fair value hierarchy is based on the lowest level of any input, both individually and in the aggregate, that is significant to the fair value measurement. The inputs or methodology used for valuing securities are not necessarily an indication of the risk associated with investing in those securities.
The following tables represent each valuation input as presented on the Schedules of Portfolio Investments (“SOIs”) (amounts in thousands):
Growth Advantage Fund
| Level 1 Quoted prices | Level 2 Other significant observable inputs | Level 3 Significant unobservable inputs | Total | |||||||||||||
Total Investments in Securities (a) | $ | 2,024,892 | $ | — | $ | — | $ | 2,024,892 | ||||||||
|
|
|
|
|
|
|
| |||||||||
Mid Cap Core Fund | ||||||||||||||||
| Level 1 Quoted prices | Level 2 Other significant observable inputs | Level 3 Significant unobservable inputs | Total | |||||||||||||
Total Investments in Securities (a) | $ | 863,347 | $ | — | $ | — | $ | 863,347 | ||||||||
|
|
|
|
|
|
|
| |||||||||
Mid Cap Equity Fund | ||||||||||||||||
| Level 1 Quoted prices | Level 2 Other significant observable inputs | Level 3 Significant unobservable inputs | Total | |||||||||||||
Total Investments in Securities (a) | $ | 956,183 | $ | — | $ | — | $ | 956,183 | ||||||||
|
|
|
|
|
|
|
| |||||||||
| JUNE 30, 2013 | J.P. MORGAN MID CAP/MULTI-CAP FUNDS | 85 | ||||||
Table of Contents
NOTES TO FINANCIAL STATEMENTS
AS OF JUNE 30, 2013 (continued)
Mid Cap Growth Fund | ||||||||||||||||
| Level 1 Quoted prices | Level 2 Other significant observable inputs | Level 3 Significant unobservable inputs | Total | |||||||||||||
Total Investments in Securities (a) | $ | 1,570,115 | $ | — | $ | — | $ | 1,570,115 | ||||||||
|
|
|
|
|
|
|
| |||||||||
Mid Cap Value Fund | ||||||||||||||||
| Level 1 Quoted prices | Level 2 Other significant observable inputs | Level 3 Significant unobservable inputs | Total | |||||||||||||
Total Investments in Securities (a) | $ | 13,254,036 | $ | — | $ | — | $ | 13,254,036 | ||||||||
|
|
|
|
|
|
|
| |||||||||
Multi-Cap Market Neutral Fund | ||||||||||||||||
| Level 1 Quoted prices | Level 2 Other significant observable inputs | Level 3 Significant unobservable inputs | Total | |||||||||||||
Total Investments in Securities (a) | $ | 338,642 | $ | — | $ | — | $ | 338,642 | ||||||||
|
|
|
|
|
|
|
| |||||||||
Total Liabilities (a) | $ | (306,287 | ) | $ | — | $ | — | $ | (306,287 | ) | ||||||
|
|
|
|
|
|
|
| |||||||||
Appreciation in Other Financial Instruments | ||||||||||||||||
Futures Contracts | $ | 7 | $ | — | $ | — | $ | 7 | ||||||||
|
|
|
|
|
|
|
| |||||||||
Value Advantage Fund | ||||||||||||||||
| Level 1 Quoted prices | Level 2 Other significant observable inputs | Level 3 Significant unobservable inputs | Total | |||||||||||||
Total Investments in Securities (a) | $ | 3,671,023 | $ | — | $ | — | $ | 3,671,023 | ||||||||
|
|
|
|
|
|
|
| |||||||||
| (a) | All portfolio holdings designated as Level 1 are disclosed individually on the SOIs. Please refer to the SOIs for industry specifics of portfolio holdings. |
There were no transfers between any levels during the year ended June 30, 2013.
B. Short Sales — The Multi-Cap Market Neutral Fund engages in short sales as part of its normal investment activities. In a short sale, the Fund sells securities it does not own. In order to deliver securities to the purchaser, the Fund borrows securities from a broker. To close out a short position, the Fund delivers the same securities to the broker.
The Fund is required to pledge cash or securities to the broker as collateral for the securities sold short. Collateral requirements are calculated daily based on the current market value of the short positions. Cash collateral deposited with the broker is recorded as an asset on the Statements of Assets and Liabilities. Securities segregated as collateral are denoted in the SOI. The Fund may receive or pay the net of the following amounts: (i) a portion of the income from the investment of cash collateral; (ii) the broker’s fee on the borrowed securities (calculated daily based upon the market value of each borrowed security and a variable rate that is dependent on availability of the security); and (iii) a financing charge for the difference between the market value of the short position and cash collateral deposited with the broker. The net income or fee is reported as interest income or interest expense, respectively, on securities sold short in the Statements of Operations.
The Fund is obligated to pay the broker dividends declared on short positions when a position is open on the record date. Dividends on short positions are reported on ex-dividend date on the Statements of Operations as dividend expense on securities sold short.
Liabilities for securities sold short are reported at market value on the Statements of Assets and Liabilities and the change in market value is recorded as unrealized gain or loss on the Statements of Operations. Short sale transactions may result in unlimited losses as the security’s price increases and the short position loses value. There is no upward limit on the price a borrowed security could attain. The Fund is also subject to risk of loss if the broker were to fail to perform its obligations under the contractual terms.
The Fund will record a realized loss if the price of the borrowed security increases between the date of the short sale and the date on which the Fund replaces the borrowed security. The Fund will record a realized gain if the price of the borrowed security declines between those dates.
As of June 30, 2013, the Fund had outstanding short sales as listed on its SOI.
C. Futures Contracts — The Multi-Cap Market Neutral Fund uses index futures contracts to gain or reduce exposure to their respective indices, maintain liquidity and minimize transaction costs. The Fund also buys futures contracts to immediately invest incoming cash in the market or sell
| 86 | J.P. MORGAN MID CAP/MULTI-CAP FUNDS | JUNE 30, 2013 | ||||
Table of Contents
futures in response to cash outflows, thereby simulating an invested position in the underlying index while maintaining a cash balance for liquidity. The use of futures contracts exposes the Fund to equity price risk.
Futures contracts provide for the delayed delivery of the underlying instrument at a fixed price or are settled for a cash amount based on the change in the value of the underlying instrument at a specific date in the future. Upon entering into a futures contract, the Fund is required to deposit with the broker, cash or securities in an amount equal to a certain percentage of the contract amount, which is referred to as the initial margin deposit. Subsequent payments, referred to as variation margin, are made or received by the Fund periodically and are based on changes in the market value of open futures contracts. Changes in the market value of open futures contracts are recorded as unrealized appreciation or depreciation in the Statements of Operations. Realized gains or losses, representing the difference between the value of the contract at the time it was opened and the value at the time it was closed, are reported in the Statements of Operations at the closing or expiration of the futures contract. Securities deposited as initial margin are designated in the SOIs and cash deposited is recorded on the Statements of Assets and Liabilities. A receivable from and/or a payable to brokers for the daily variation margin is also recorded on the Statements of Assets and Liabilities.
The Fund may be subject to the risk that the change in the value of the futures contract may not correlate perfectly with the underlying instrument. Use of long futures contracts subjects the Fund to risk of loss in excess of the amounts shown on the Statements of Assets and Liabilities, up to the notional amount of the futures contracts. Use of short futures contracts subjects the Fund to unlimited risk of loss. The Fund may enter into futures contracts only on exchanges or boards of trade. The exchange or board of trade acts as the counterparty to each futures transaction; therefore, the Fund’s credit risk is limited to failure of the exchange or board of trade. Under some circumstances, futures exchanges may establish daily limits on the amount that the price of a futures contract can vary from the previous day’s settlement price, which could effectively prevent liquidation of positions.
The table below discloses the volume of the Fund’s futures contracts activity during the year ended June 30, 2013 (amounts in thousands):
| Multi-Cap Market Neutral Fund | ||||
Futures Contracts: | ||||
Average Notional Balance Long | $ | 3,507 | (a) | |
Ending Notional Balance Long | — | |||
Average Notional Balance Short | 4,485 | (b) | ||
Ending Notional Balance Short | 2,616 | |||
| (a) | For the period, May 1, 2013 through May 31, 2013. |
| (b) | For the periods, April 1, 2013 through April 30, 2013 and June 1, 2013 through June 30, 2013. |
D. Securities Lending — Each Fund (except Mid Cap Core Fund, Multi-Cap Market Neutral Fund and Value Advantage Fund) may lend securities to brokers approved by the Advisor in order to generate additional income. Goldman Sachs Bank USA, doing business as Goldman Sachs Agency Lending (“GSAL”) serves as lending agent for the Growth Advantage Fund, Mid Cap Equity Fund, Mid Cap Growth Fund and Mid Cap Value Fund pursuant to a Securities Lending Agreement (the “GSAL Securities Lending Agreement”). The Funds receive cash collateral, which is invested in Capital Shares of the JPMorgan Prime Money Market Fund (“Collateral Investments”). Upon termination of a loan, the Funds are required to return to the borrower the posted cash collateral. Loans are subject to termination by the Funds or the borrower at any time.
Securities lending income is comprised of income earned on Collateral Investments, net amount of a rebate received from or paid to borrowers for use of cash collateral and lending agent fees. This amount is recorded as Income from securities lending (net) on the Statements of Operations. The Funds also receive payments from the borrower during the period of the loan, equivalent to dividends and interest earned on the securities loaned, which are recorded as Dividend or Interest income, respectively, on the Statements of Operations.
For the year ended June 30, 2013, the Funds earned the following amounts from the investment of cash collateral, prior to rebates or fees, in Collateral Investments as described below (amounts in thousands):
Mid Cap Equity Fund | $ | 1 | ||
Mid Cap Growth Fund | 2 | |||
Mid Cap Value Fund | 3 |
At the inception of a loan, securities are exchanged for cash collateral equal to at least 102% of the value of the loaned U.S. securities, plus accrued interest. The GSAL Securities Lending Agreement requires that the loaned securities be marked to market on a daily basis and additional cash collateral is requested from borrowers when the cash received from borrowers becomes less than 102% of the value of loaned securities.
The value of the cash collateral received is recorded as a liability on the Statements of Assets and Liabilities and details of Collateral Investments are disclosed in the SOIs. At June 30, 2013, there were no outstanding securities on loan.
The Funds bear the risk of loss associated with the Collateral Investments and are not entitled to additional collateral from the borrower to cover any such losses. To the extent that the value of the Collateral Investments declines below the amount owed to a borrower, a Fund may incur losses that exceed the amount it earned on lending the security. Upon termination of a loan, a Fund may use leverage (borrow money) to repay the borrower for cash collateral posted, if the Advisor does not believe that it is prudent to sell the Collateral Investments to fund the payment of this liability.
| JUNE 30, 2013 | J.P. MORGAN MID CAP/MULTI-CAP FUNDS | 87 | ||||||
Table of Contents
NOTES TO FINANCIAL STATEMENTS
AS OF JUNE 30, 2013 (continued)
Securities lending also involves counterparty risks, including the risk that the loaned securities may not be returned in a timely manner or at all. Subject to certain conditions, GSAL has agreed to indemnify the Funds from losses resulting from a borrower’s failure to return a loaned security.
JPMIM waived fees associated with the following Funds’ investment of collateral in JPMorgan Prime Money Market Fund as follows (amounts in thousands):
Mid Cap Equity Fund | $ | 1 | ||
Mid Cap Growth Fund | 1 | |||
Mid Cap Value Fund | 2 |
These amounts offset the administration fees and shareholder servicing fees incurred by JPMorgan Prime Money Market Fund related to the Funds’ investment in such fund. A portion of the waiver is voluntary.
E. Foreign Currency Translation — The books and records of the Multi-Cap Market Neutral Fund are maintained in U.S. dollars. Foreign currency amounts are translated into U.S. dollars at the prevailing exchange rates of such currencies against the U.S. dollar. The market value of investment securities and other assets and liabilities are translated at the exchange rate as of the valuation date. Purchases and sales of investment securities, income and expenses are translated at the exchange rate prevailing on the respective dates of such transactions.
Although the net assets of the Fund are presented at the foreign exchange rates and market values at the close of the period, the Fund does not isolate that portion of the results of operations arising as a result of changes in the foreign exchange rates from the fluctuations arising from changes in the market prices of securities held or sold during the period. Accordingly, such foreign currency gains (losses) are included in the reported net realized and unrealized gains (losses) on investment transactions on the Statements of Operations.
Reported realized foreign currency gains or losses arise from the disposition of foreign currency, purchases of foreign currency in certain countries (such as Brazil) that impose a tax on such purchases, currency gains or losses realized between the trade and settlement dates on securities transactions, and the difference between the amounts of dividends, interest and foreign withholding taxes recorded on the Fund’s books on the transaction date and the U.S. dollar equivalent of the amounts actually received or paid. Unrealized foreign currency gains and losses arise from changes (due to changes in the exchange rate) in the value of foreign currency and other assets and liabilities denominated in foreign currencies, which are held at period end.
F. Security Transactions and Investment Income — Investment transactions are accounted for on the trade date (the date the order to buy or sell is executed). Securities gains and losses are calculated on a specifically identified cost basis. Interest income is determined on the basis of coupon interest accrued using the effective interest method which adjusts for amortization of premiums and accretion of discounts. Dividend income net of foreign taxes withheld, if any, less dividend expense on securities sold short, is recorded on the ex-dividend date or when a Fund first learns of the dividend.
To the extent such information is publicly available, the Funds record distributions received in excess of income earned from underlying investments as a reduction of cost of investments and/or realized gain. Such amounts are based on estimates if actual amounts are not available and actual amounts of income, realized gain and return of capital may differ from the estimated amounts. The Funds adjust the estimated amounts of the components of distributions (and consequently their net investment income) as necessary once the issuers provide information about the actual composition of the distributions.
G. Allocation of Income and Expenses — Expenses directly attributable to a fund are charged directly to that fund, while the expenses attributable to more than one fund of the Trusts are allocated among the respective funds. In calculating the NAV of each class, investment income, realized and unrealized gains and losses and expenses, other than class specific expenses, are allocated daily to each class of shares based upon the proportion of net assets of each class at the beginning of each day.
H. Federal Income Taxes — Each Fund is treated as a separate taxable entity for Federal income tax purposes. Each Fund’s policy is to comply with the provisions of the Internal Revenue Code of 1986, as amended (the “Code”), applicable to regulated investment companies and to distribute to shareholders all of its distributable net investment income and net realized gain on investments. Accordingly, no provision for Federal income tax is necessary. Management has reviewed the Funds’ tax positions for all open tax years and has determined that as of June 30, 2013, no liability for income tax is required in the Funds’ financial statements for net unrecognized tax benefits. However, management’s conclusions may be subject to future review based on changes in, or the interpretation of, the accounting standards or tax laws and regulations. Each of the Fund’s Federal tax returns for the prior three fiscal years, or since inception if shorter, remain subject to examination by the Internal Revenue Service.
I. Distributions to Shareholders — Distributions from net investment income are generally declared and paid at least annually, except for the Mid Cap Equity Fund, Mid Cap Growth Fund and Multi-Cap Market Neutral Fund, whose distributions are generally declared and paid at least quarterly. Distributions are declared separately for each class. No class has preferential dividend rights; differences in per share rates are due to differences in separate class expenses. Net realized capital gains, if any, are distributed by each Fund at least annually. The amount of distributions from net investment income and net realized capital gains is determined in accordance with Federal income tax regulations, which may differ from GAAP. To the extent these “book/tax” differences are permanent in nature (i.e., that they result from other than timing of recognition — “temporary differences”), such amounts are reclassified within the capital accounts based on their Federal tax-basis treatment.
| 88 | J.P. MORGAN MID CAP/MULTI-CAP FUNDS | JUNE 30, 2013 | ||||
Table of Contents
The following amounts were reclassified within the capital accounts (amounts in thousands):
| Paid-in-Capital | Accumulated undistributed (distributions net investment income | Accumulated net realized gains (losses) | ||||||||||
Growth Advantage Fund | $ | — | $ | (1,536 | ) | $ | 1,536 | |||||
Mid Cap Core Fund | — | (458 | ) | 458 | ||||||||
Mid Cap Equity Fund | — | (830 | ) | 830 | ||||||||
Mid Cap Growth Fund | (1,461 | ) | (1,893 | ) | 3,354 | |||||||
Mid Cap Value Fund | 1,460 | (971 | ) | (489 | ) | |||||||
Multi-Cap Market Neutral Fund | (5,082 | ) | 4,972 | 110 | ||||||||
Value Advantage Fund | — | (1,614 | ) | 1,614 | ||||||||
The reclassifications for the Funds relate primarily to investments in real estate investment trusts (Growth Advantage Fund, Mid Cap Growth Fund and Multi-Cap Market Neutral Fund), investments in partnerships (Growth Advantage Fund, Mid Cap Core Fund, Mid Cap Equity Fund, Mid Cap Growth Fund and Value Advantage Fund), non-taxable dividends (Growth Advantage Fund, Mid Cap Core Fund, Mid Cap Equity Fund, Mid Cap Growth Fund, Mid Cap Value Fund, Multi-Cap Market Neutral Fund and Value Advantage Fund), net operating losses (Mid Cap Growth Fund and Multi-Cap Market Neutral Fund), corporate actions from underlying fund investments (Mid Cap Value Fund), foreign currency gains or losses (Multi-Cap Market Neutral Fund), short sales dividend in-lieu (Multi-Cap Market Neutral Fund) and investments in regulated investment companies (Multi-Cap Market Neutral Fund).
3. Fees and Other Transactions with Affiliates
A. Investment Advisory Fee — Pursuant to the Investment Advisory Agreements, JPMIM supervises the investments of each Fund and for such services is paid a fee. The fee is accrued daily and paid monthly based on each Fund’s respective average daily net assets. The annual rate for each Fund is as follows:
Growth Advantage Fund | 0.65 | % | ||
Mid Cap Core Fund | 0.65 | |||
Mid Cap Equity Fund | 0.65 | |||
Mid Cap Growth Fund | 0.65 | |||
Mid Cap Value Fund | �� | 0.65 | ||
Multi-Cap Market Neutral Fund | 1.25 | |||
Value Advantage Fund | 0.65 |
The Advisor waived Investment Advisory fees and/or reimbursed expenses as outlined in Note 3.F.
B. Administration Fee — Pursuant to an Administration Agreement, the Administrator provides certain administration services to the Funds. In consideration of these services, the Administrator receives a fee accrued daily and paid monthly at an annual rate of 0.15% of the first $25 billion of the average daily net assets of all funds in the J.P. Morgan Funds Complex (excluding certain funds of funds and money market funds) and 0.075% of the average daily net assets in excess of $25 billion of all such funds. For the year ended June 30, 2013, the annual effective rate was 0.09% of each Fund’s average daily net assets, notwithstanding any fee waivers and/or expense reimbursements.
The Administrator waived Administration fees as outlined in Note 3.F.
JPMorgan Chase Bank, N.A. (“JPMCB”), a wholly-owned subsidiary of JPMorgan, serves as the Funds’ sub-administrator (the “Sub-administrator”). For its services as Sub-administrator, JPMCB receives a portion of the fees payable to the Administrator.
C. Distribution Fees — Pursuant to a Distribution Agreement, JPMorgan Distribution Services, Inc. (the “Distributor”), a wholly-owned subsidiary of JPMorgan, serves as the Trusts’ exclusive underwriter and promotes and arranges for the sale of each Fund’s shares.
The Board of Trustees has adopted a Distribution Plan (the “Distribution Plan”) for Class A, Class B, Class C and Class R2 Shares of the Funds in accordance with Rule 12b-1 under the 1940 Act. The Distribution Plan provides that each Fund shall pay distribution fees, including payments to the Distributor, at annual rates of the average daily net assets as shown in the table below:
| Class A | Class B | Class C | Class R2 | |||||||||||||
Growth Advantage Fund | 0.25 | % | 0.75 | % | 0.75 | % | n/a | |||||||||
Mid Cap Core Fund | 0.25 | n/a | 0.75 | 0.50 | % | |||||||||||
Mid Cap Equity Fund | 0.25 | n/a | 0.75 | n/a | ||||||||||||
Mid Cap Growth Fund | 0.25 | 0.75 | 0.75 | 0.50 | ||||||||||||
Mid Cap Value Fund | 0.25 | 0.75 | 0.75 | 0.50 | ||||||||||||
Multi-Cap Market Neutral Fund | 0.25 | 0.75 | 0.75 | n/a | ||||||||||||
Value Advantage Fund | 0.25 | n/a | 0.75 | n/a | ||||||||||||
| JUNE 30, 2013 | J.P. MORGAN MID CAP/MULTI-CAP FUNDS | 89 | ||||||
Table of Contents
NOTES TO FINANCIAL STATEMENTS
AS OF JUNE 30, 2013 (continued)
In addition, the Distributor is entitled to receive the front-end sales charges from purchases of Class A Shares and the CDSC from redemptions of Class B and Class C Shares and certain Class A Shares for which front-end sales charges have been waived. For the year ended June 30, 2013, the Distributor retained the following amounts (in thousands):
| Front-End Sales Charge | CDSC | |||||||
Growth Advantage Fund | $ | 81 | $ | 1 | ||||
Mid Cap Core Fund | 2 | — | (a) | |||||
Mid Cap Equity Fund | 26 | 4 | ||||||
Mid Cap Growth Fund | 18 | 2 | ||||||
Mid Cap Value Fund | 222 | 9 | ||||||
Multi-Cap Market Neutral Fund | 1 | — | (a) | |||||
Value Advantage Fund | 146 | 2 | ||||||
| (a) | Amount rounds to less than $1,000. |
D. Shareholder Servicing Fees — The Trusts, on behalf of the Funds, have entered into Shareholder Servicing Agreements with the Distributor under which the Distributor provides certain support services to the shareholders. The Class R6 Shares do not participate in the Shareholder Servicing Agreement. For performing these services, the Distributor receives a fee that is accrued daily and paid monthly equal to a percentage of the average daily net assets as shown in the table below:
| Class A | Class B | Class C | Class R2 | Class R5 | Institutional Class | Select Class | ||||||||||||||||||||||
Growth Advantage Fund | 0.25 | % | 0.25 | % | 0.25 | % | n/a | 0.05 | % | n/a | 0.25 | % | ||||||||||||||||
Mid Cap Core Fund | 0.25 | n/a | 0.25 | 0.25 | % | 0.05 | n/a | 0.25 | ||||||||||||||||||||
Mid Cap Equity Fund | 0.25 | n/a | 0.25 | n/a | n/a | n/a | 0.25 | |||||||||||||||||||||
Mid Cap Growth Fund | 0.25 | 0.25 | 0.25 | 0.25 | 0.05 | n/a | 0.25 | |||||||||||||||||||||
Mid Cap Value Fund | 0.25 | 0.25 | 0.25 | 0.25 | n/a | 0.10 | % | 0.25 | ||||||||||||||||||||
Multi-Cap Market Neutral Fund | 0.25 | 0.25 | 0.25 | n/a | n/a | n/a | 0.25 | |||||||||||||||||||||
Value Advantage Fund | 0.25 | n/a | 0.25 | n/a | n/a | 0.10 | 0.25 | |||||||||||||||||||||
The Distributor has entered into shareholder services contracts with affiliated and unaffiliated financial intermediaries who provide shareholder services and other related services to their clients or customers who invest in the Funds under which the Distributor will pay all or a portion of such fees earned to financial intermediaries for performing such services.
The Distributor waived Shareholder Servicing fees as outlined in Note 3.F.
E. Custodian and Accounting Fees — JPMCB provides portfolio custody and accounting services to the Funds. The amounts paid directly to JPMCB by the Funds for custody and accounting services are included in Custodian and accounting fees in the Statements of Operations. Payments to the custodian may be reduced by credits earned by each Fund, based on uninvested cash balances held by the custodian. Such earnings credits, if any, are presented separately in the Statements of Operations.
Interest expense, if any, paid to the custodian related to cash overdrafts is included in Interest expense to affiliates in the Statements of Operations.
F. Waivers and Reimbursements — The Advisor, Administrator and Distributor have contractually agreed to waive fees and/or reimburse the Funds to the extent that total annual operating expenses (excluding acquired fund fees and expenses, dividend expenses related to short sales, interest, taxes, expenses related to litigation and potential litigation, extraordinary expenses and expenses related to the Board of Trustees’ deferred compensation plan) exceed the percentages of the Funds’ respective average daily net assets as shown in the table below:
| Class A | Class B | Class C | Class R2 | Class R5 | Class R6 | Institutional Class | Select Class | |||||||||||||||||||||||||
Growth Advantage Fund | 1.25 | % | 1.75 | % | 1.75 | % | n/a | 0.90 | % | n/a | n/a | 1.10 | % | |||||||||||||||||||
Mid Cap Core Fund | 1.25 | n/a | 1.75 | 1.50 | % | 0.80 | 0.75 | % | n/a | 0.90 | ||||||||||||||||||||||
Mid Cap Equity Fund | 1.25 | n/a | 1.75 | n/a | n/a | n/a | n/a | 0.90 | ||||||||||||||||||||||||
Mid Cap Growth Fund | 1.24 | 1.74 | 1.74 | 1.40 | 0.79 | 0.74 | n/a | 0.93 | ||||||||||||||||||||||||
Mid Cap Value Fund | 1.24 | 1.75 | 1.75 | 1.50 | n/a | n/a | 0.75 | % | 0.99 | |||||||||||||||||||||||
Multi-Cap Market Neutral Fund | 1.50 | 2.00 | 2.00 | n/a | n/a | n/a | n/a | 1.25 | ||||||||||||||||||||||||
Value Advantage Fund | 1.25 | n/a | 1.75 | n/a | n/a | n/a | 0.75 | 1.00 | ||||||||||||||||||||||||
The expense limitation agreements were in effect for the year ended June 30, 2013, except on February 28, 2013, Mid Cap Core Fund Select Class changed from 1.00% to 0.90% and Multi-Cap Market Neutral Fund Class A changed from 1.75% to 1.50%, Class B and Class C changed from 2.50% to 2.00% and Select Class changed from 1.50% to 1.25%. The contractual expense limitation percentages in the table above are in place until at least October 31, 2013, except Mid Cap Core Fund Select Class which is in place until at least October 31, 2014 and Multi-Cap Market Neutral Fund which is in place until at least February 28, 2014. In addition, the Funds’ service providers have voluntarily waived fees during the year ended June 30, 2013. However, the Funds’ service providers are under no obligation to do so and may discontinue such voluntary waivers at any time.
| 90 | J.P. MORGAN MID CAP/MULTI-CAP FUNDS | JUNE 30, 2013 | ||||
Table of Contents
For the year ended June 30, 2013, the Funds’ service providers waived fees and/or reimbursed expenses for each of the Funds as follows (amounts in thousands). None of these parties expect the Funds to repay any such waived fees and reimbursed expenses in future years.
| Contractual Waivers | ||||||||||||||||
| Investment Advisory | Administration | Shareholder Servicing | Total | |||||||||||||
Growth Advantage Fund | $ | — | $ | — | $ | 95 | $ | 95 | ||||||||
Mid Cap Core Fund | — | 201 | 156 | 357 | ||||||||||||
Mid Cap Equity Fund | 160 | 626 | 2,392 | 3,178 | ||||||||||||
Mid Cap Growth Fund | 1,894 | 1,264 | 512 | 3,670 | ||||||||||||
Mid Cap Value Fund | 4,777 | 8,910 | 5,486 | 19,173 | ||||||||||||
Multi-Cap Market Neutral Fund | 40 | 107 | 776 | 923 | ||||||||||||
Value Advantage Fund | 298 | 1,499 | 829 | 2,626 | ||||||||||||
| Voluntary Waivers | ||||||||||||||||
| Investment Advisory | Administration | Shareholder Servicing | Total | |||||||||||||
Mid Cap Growth Fund | $ | — | (a) | $ | — | $ | — | $ | — | (a) | ||||||
Multi-Cap Market Neutral Fund | 190 | 284 | 346 | 820 | ||||||||||||
| (a) | Amount rounds to less than $1,000. |
Additionally, the Funds may invest in one or more money market funds advised by the Advisor or its affiliates. The Advisor, Administrator and Distributor, as shareholder servicing agent, waive fees in an amount sufficient to offset the respective fees each charges to the affiliated money market fund on the Funds’ investment in such affiliated money market fund. A portion of the waiver is voluntary.
The amount of waivers resulting from investments in these money market funds for the year ended June 30, 2013 was as follows (excluding the waiver disclosed in Note 2.D. regarding cash collateral for securities lending invested in the JPMorgan Prime Money Market Fund) (amounts in thousands):
Growth Advantage Fund | $ | 79 | ||
Mid Cap Core Fund | 50 | |||
Mid Cap Equity Fund | 61 | |||
Mid Cap Growth Fund | 43 | |||
Mid Cap Value Fund | 876 | |||
Multi-Cap Market Neutral Fund | 89 | |||
Value Advantage Fund | 274 |
G. Other — Certain officers of the Trusts are affiliated with the Advisor, the Administrator and the Distributor. Such officers, with the exception of the Chief Compliance Officer, receive no compensation from the Funds for serving in their respective roles.
The Board of Trustees appointed a Chief Compliance Officer to the Funds in accordance with Federal securities regulations. Each Fund, along with other affiliated funds, makes reimbursement payments, on a pro-rata basis, to the Administrator for a portion of the fees associated with the Office of the Chief Compliance Officer. Such fees are included in Trustees’ and Chief Compliance Officer’s fees in the Statements of Operations.
The Trusts adopted a Trustee Deferred Compensation Plan (the “Plan”) which allows the Independent Trustees to defer the receipt of all or a portion of compensation related to performance of their duties as Trustees. The deferred fees are invested in various J.P. Morgan Funds until distribution in accordance with the Plan.
During the year ended June 30, 2013, the Funds may have purchased securities from an underwriting syndicate in which the principal underwriter or members of the syndicate are affiliated with the Advisor.
The Funds may use related party broker-dealers. For the year ended June 30, 2013, the Funds did not incur any brokerage commissions with brokers-dealers affiliated with the Advisor.
The Securities and Exchange Commission (“SEC”) has granted an exemptive order permitting the Funds to engage in principal transactions with J.P. Morgan Securities, Inc., an affiliated broker, involving taxable money market instruments, subject to certain conditions.
| JUNE 30, 2013 | J.P. MORGAN MID CAP/MULTI-CAP FUNDS | 91 | ||||||
Table of Contents
NOTES TO FINANCIAL STATEMENTS
AS OF JUNE 30, 2013 (continued)
4. Investment Transactions
During the year ended June 30, 2013, purchases and sales of investments (excluding short-term investments) were as follows (amounts in thousands):
Purchases U.S. Government) | Sales (excluding U.S. Government) | Securities Sold Short | Covers on Securities Sold Short | |||||||||||||
Growth Advantage Fund | $ | 1,527,368 | $ | 1,183,455 | $ | — | $ | — | ||||||||
Mid Cap Core Fund | 1,468,451 | 1,114,696 | — | — | ||||||||||||
Mid Cap Equity Fund | 620,886 | 684,537 | — | — | ||||||||||||
Mid Cap Growth Fund | 1,025,391 | 1,178,223 | — | — | ||||||||||||
Mid Cap Value Fund | 5,475,549 | 2,277,462 | — | — | ||||||||||||
Multi-Cap Market Neutral Fund | 390,686 | 643,014 | 401,558 | 646,391 | ||||||||||||
Value Advantage Fund | 2,337,396 | 458,557 | — | — | ||||||||||||
During the year ended June 30, 2013, there were no purchases or sales of U.S. Government securities.
5. Federal Income Tax Matters
For Federal income tax purposes, the cost and unrealized appreciation (depreciation) in value of investment securities held at June 30, 2013 were as follows (amounts in thousands):
| Aggregate Cost | Gross Unrealized Appreciation | Gross Unrealized Depreciation | Net Unrealized Appreciation (Depreciation) | |||||||||||||
Growth Advantage Fund | $ | 1,558,832 | $ | 479,918 | $ | 13,858 | $ | 466,060 | ||||||||
Mid Cap Core Fund | 806,101 | 70,733 | 13,487 | 57,246 | ||||||||||||
Mid Cap Equity Fund | 697,487 | 262,122 | 3,426 | 258,696 | ||||||||||||
Mid Cap Growth Fund | 1,166,791 | 418,497 | 15,173 | 403,324 | ||||||||||||
Mid Cap Value Fund | 9,853,796 | 3,432,409 | 33,284 | 3,400,240 | ||||||||||||
Multi-Cap Market Neutral Fund | 280,176 | 61,808 | 3,342 | 58,466 | ||||||||||||
Value Advantage Fund | 3,099,685 | 587,180 | 15,842 | 571,338 | ||||||||||||
The difference between book and tax basis appreciation (depreciation) on investments is primarily attributed to non-taxable dividends (Growth Advantage Fund, Mid Cap Equity Fund, Mid Cap Value Fund, Multi-Cap Market Neutral Fund and Value Advantage Fund), investment in partnerships (Growth Advantage Fund, Mid Cap Core Fund, Mid Cap Equity Fund, Mid Cap Growth Fund and Value Advantage Fund) and wash sale loss deferrals.
The tax character of distributions paid during the fiscal year ended June 30, 2013 was as follows (amounts in thousands):
Ordinary Income | Net Long Term Capital Gains | Total Distributions Paid | ||||||||||
Growth Advantage Fund | $ | 3,788 | $ | 5,812 | $ | 9,600 | ||||||
Mid Cap Core Fund | 12,650 | 3,553 | 16,203 | |||||||||
Mid Cap Equity Fund | 5,458 | 6,244 | 11,702 | |||||||||
Mid Cap Growth Fund | — | 64,858 | 64,858 | |||||||||
Mid Cap Value Fund | 120,789 | 74,510 | 195,299 | |||||||||
Value Advantage Fund | 20,780 | 8,159 | 28,939 | |||||||||
The tax character of distributions paid during the fiscal year ended June 30, 2012 was as follows (amounts in thousands):
Ordinary Income | Net Long Term Capital Gains | Total Distributions Paid | ||||||||||
Mid Cap Core Fund | $ | 724 | $ | 2 | $ | 726 | ||||||
Mid Cap Equity Fund | 3,720 | 17 | 3,737 | |||||||||
Mid Cap Growth Fund | — | 134,380 | 134,380 | |||||||||
Mid Cap Value Fund | 60,236 | — | 60,236 | |||||||||
Value Advantage Fund | 11,280 | — | 11,280 | |||||||||
| 92 | J.P. MORGAN MID CAP/MULTI-CAP FUNDS | JUNE 30, 2013 | ||||
Table of Contents
As of June 30, 2013, the components of net assets (excluding paid-in-capital) on a tax basis were as follows (amounts in thousands):
| Current Distributable Ordinary Income | Current Distributable Long-Term Capital Gain | Tax Basis Capital Loss Carryover | Unrealized Appreciation (Depreciation) | |||||||||||||
Growth Advantage Fund | $ | — | $ | 46,860 | $ | — | $ | 466,060 | ||||||||
Mid Cap Core Fund | 60,924 | 39,252 | — | 57,246 | ||||||||||||
Mid Cap Equity Fund | 16,741 | 37,820 | — | 258,696 | ||||||||||||
Mid Cap Growth Fund | — | 95,221 | (39,020 | ) | 403,324 | |||||||||||
Mid Cap Value Fund | 99,287 | 243,394 | (41,385 | ) | 3,400,240 | |||||||||||
Multi-Cap Market Neutral Fund | — | — | (39,205 | ) | 28,626 | |||||||||||
Value Advantage Fund | 24,514 | 20,269 | — | 570,607 | ||||||||||||
For the Funds, the cumulative timing differences primarily consists of late year ordinary loss deferral (Growth Advantage Fund, Mid Cap Growth Fund and Multi-Cap Multi Neutral Fund), trustee deferred compensation, wash sale loss deferrals, investments in partnerships (Growth Advantage Fund, Mid Cap Core Fund, Mid Cap Equity Fund, Mid Cap Growth Fund and Value Advantage Fund), non-taxable dividends (Growth Advantage Fund, Mid Cap Equity Fund, Mid Cap Value Fund, Multi-Cap Multi Neutral Fund and Value Advantage Fund), distributions payable (Mid Cap Equity Fund), post-October loss deferral (Multi-Cap Multi Neutral Fund), unsettled short sales loss deferral (Multi-Cap Multi Neutral Fund) and mark to market of futures contracts (Multi-Cap Multi Neutral Fund).
Under the Regulated Investment Company Modernization Act of 2010 (the “Act”), net capital losses recognized by the Funds after June 30, 2011 are carried forward indefinitely, and retain their character as short-term and/or long-term losses. Prior to the Act, net capital losses incurred by the Funds were carried forward for eight years and treated as short-term losses. The Act requires that post-enactment net capital losses be used before pre-enactment net capital losses.
During the year ended June 30, 2013, the following Fund utilized post-enactment net capital loss carryforwards (amounts in thousands):
| Capital Loss Carryforward Character | ||||||||
| Short-Term | Long-Term | |||||||
Mid Cap Core Fund | $ | 636 | $ | — | ||||
As of June 30, 2013, the following Funds had pre-enactment net capital loss carryforwards, expiring during the year indicated, which are available to offset future realized gains (amounts in thousands):
| 2016 | 2017 | 2018 | Total | |||||||||||||
Mid Cap Growth Fund | $ | — | $ | — | $ | 39,020 | $ | 39,020 | * | |||||||
Mid Cap Value Fund | — | 3,017 | 38,368 | 41,385 | * | |||||||||||
Multi-Cap Market Neutral Fund | 39,205 | — | — | 39,205 | ||||||||||||
During the year ended June 30, 2013 the following Funds utilized capital loss carryforwards as follows (amounts in thousands):
Mid Cap Growth Fund | $ | 25,462 | ||
Mid Cap Value Fund | 86,259 | |||
Multi-Cap Market Neutral Fund | 26,780 | |||
Value Advantage Fund | 13,485 |
| * | Amount includes capital loss carryforwards from business combinations, which are limited in future years under Internal Revenue Code Sections 381-384. |
Net capital losses and net specified gains (losses) incurred after October 31 and within the taxable year are deemed to arise on the first business day of the Funds’ next taxable year. For the year ended June 30, 2013 the following Funds deferred to July 1, 2013 post-October capital losses of (amounts in thousands):
| Late Year Ordinary Loss Deferral | Short-Term | Long-Term | ||||||||||
Growth Advantage Fund | $ | 335 | $ | — | $ | — | ||||||
Mid Cap Growth Fund | 1,738 | — | — | |||||||||
Multi-Cap Market Neutral Fund | 2,448 | 21,799 | — | |||||||||
| JUNE 30, 2013 | J.P. MORGAN MID CAP/MULTI-CAP FUNDS | 93 | ||||||
Table of Contents
NOTES TO FINANCIAL STATEMENTS
AS OF JUNE 30, 2013 (continued)
6. Borrowings
The Funds rely upon an exemptive order granted by the SEC (the “Order”) permitting the establishment and operation of an Interfund Lending Facility (the “Facility”). The Facility allows the Funds to directly lend and borrow money to or from any other fund relying upon the Order at rates beneficial to both the borrowing and lending funds. Advances under the Facility are taken primarily for temporary or emergency purposes, including the meeting of redemption requests that otherwise might require the untimely disposition of securities, and are subject to each Fund’s borrowing restrictions. The Interfund loan rate is determined, as specified in the Order, by averaging the current repurchase agreement rate and the current bank loan rate. The Order was granted to JPM II and may be relied upon by the Funds because they are investment companies in the same “group of investment companies” (as defined in Section 12(d)(1)(G) of the 1940 Act).
In addition, the Trusts and JPMCB have entered into a financing arrangement. Under this arrangement, JPMCB provides an unsecured, uncommitted credit facility in the aggregate amount of $100 million to certain of the J.P. Morgan Funds, including the Funds. Advances under the arrangement are taken primarily for temporary or emergency purposes, including the meeting of redemption requests that otherwise might require the untimely disposition of securities, and are subject to each Fund’s borrowing restrictions. Interest on borrowings is payable at a rate determined by JPMCB at the time of borrowing. This agreement has been extended until November 11, 2013.
The Funds had no borrowings outstanding from another fund or from the unsecured, uncommitted credit facility at June 30, 2013. Average borrowings from the Facility for the year ended June 30, 2013, were as follows (amounts in thousands):
| Average Borrowings | Number of Days Outstanding | Interest Paid | ||||||||||
Mid Cap Core Fund | $ | 7,582 | 1 | $ | — | (a) | ||||||
Mid Cap Equity Fund | 31,840 | 5 | 1 | |||||||||
| (a) | Amount rounds to less than $1,000. |
Interest expense paid, if any, as a result of borrowings from another fund or from the unsecured, uncommitted credit facility is included in Interest expense to affiliates in the Statements of Operations.
7. Risks, Concentrations and Indemnifications
In the normal course of business, the Funds enter into contracts that contain a variety of representations which provide general indemnifications. Each Fund’s maximum exposure under these arrangements is unknown. The amount of exposure would depend on future claims that may be made against each Fund that have not yet occurred. However, based on experience, the Funds expect the risk of loss to be remote.
One or more affiliates of the Advisor have investment discretion with respect to their clients’ holdings in the Funds, which collectively represent a significant portion of the Funds’ assets for each of the Growth Advantage Fund, Mid Cap Core Fund and Mid Cap Growth Fund.
In addition, the J.P. Morgan Investor Funds and JPMorgan SmartRetirement Funds, which are affiliated funds of funds, own in the aggregate more than 10% of the net assets of the following Funds as follows:
| J.P. Morgan Investor Funds | JPMorgan SmartRetirement Funds | |||||||
Growth Advantage Fund | — | % | 33.4 | % | ||||
Mid Cap Core Fund | — | 43.5 | ||||||
Multi-Cap Market Neutral Fund | 88.5 | — | ||||||
Value Advantage Fund | — | 19.5 | ||||||
Additionally, Growth Advantage Fund, Mid Cap Equity Fund and Value Advantage Fund each have a shareholder, which is an account maintained by a financial intermediary on behalf of its clients, that owns a significant portion of the Funds’ outstanding shares.
Significant shareholder transactions by these shareholders, if any, may impact the Funds’ performance.
As of June 30, 2013, the Multi-Cap Market Neutral Fund pledged substantially all of its assets for securities sold short to Credit Suisse Group, who also held 100% of the Multi-Cap Market Neutral Fund’s cash proceeds for securities sold short.
| 94 | J.P. MORGAN MID CAP/MULTI-CAP FUNDS | JUNE 30, 2013 | ||||
Table of Contents
REPORT OF INDEPENDENT REGISTERED PUBLIC ACCOUNTING FIRM
To the Board of Trustees of J.P. Morgan Mutual Fund Investment Trust, J.P. Morgan Fleming Mutual Fund Group, Inc., JPMorgan Trust I and JPMorgan Trust II and the Shareholders of JPMorgan Growth Advantage Fund, JPMorgan Mid Cap Core Fund, JPMorgan Mid Cap Equity Fund, JPMorgan Mid Cap Growth Fund, JPMorgan Mid Cap Value Fund, JPMorgan Multi-Cap Market Neutral Fund and JPMorgan Value Advantage Fund:
In our opinion, the accompanying statements of assets and liabilities, including the schedules of portfolio investments, and the related statements of operations and of changes in net assets and the financial highlights present fairly, in all material respects, the financial position of JPMorgan Mid Cap Core Fund, JPMorgan Mid Cap Equity Fund and JPMorgan Value Advantage Fund (each a separate fund of JPMorgan Trust I), JPMorgan Mid Cap Growth Fund and JPMorgan Multi-Cap Market Neutral Fund (each a separate fund of JPMorgan Trust II), JPMorgan Growth Advantage Fund (a separate fund of J.P. Morgan Mutual Fund Investment Trust) and JPMorgan Mid Cap Value Fund (a separate fund of J.P. Morgan Fleming Mutual Fund Group, Inc.) at June 30, 2013, the results of each of their operations for the year then ended, the changes in each of their net assets for each of the two years in the period then ended and the financial highlights for each of the periods presented, in conformity with accounting principles generally accepted in the United States of America. These financial statements and financial highlights (hereafter referred to as “financial statements”) are the responsibility of the Funds’ management. Our responsibility is to express an opinion on these financial statements based on our audits. We conducted our audits of these financial statements in accordance with the standards of the Public Company Accounting Oversight Board (United States). Those standards require that we plan and perform the audit to obtain reasonable assurance about whether the financial statements are free of material misstatement. An audit includes examining, on a test basis, evidence supporting the amounts and disclosures in the financial statements, assessing the accounting principles used and significant estimates made by management, and evaluating the overall financial statement presentation. We believe that our audits, which included confirmation of securities at June 30, 2013 by correspondence with the custodian and brokers, provide a reasonable basis for our opinion.
PricewaterhouseCoopers LLP
New York, New York
August 28, 2013
| JUNE 30, 2013 | J.P. MORGAN MID CAP/MULTI-CAP FUNDS | 95 | ||||||
Table of Contents
(Unaudited)
The Funds’ Statement of Additional Information includes additional information about the Funds’ Trustees and is available, without charge, upon request by calling 1-800-480-4111 or on the J.P. Morgan Funds’ website at www.jpmorganfunds.com.
Name (Year of Birth); Positions With the Funds (1) | Principal Occupations During Past 5 Years | Number of Portfolios in Fund Complex Overseen by Trustee (2) | Other Directorships Held Outside Fund Complex During Past 5 Years | |||
Independent Trustees | ||||||
| John F. Finn (1947); Trustee of Trusts since 2005; Trustee of heritage One Group Mutual Funds since 1998. | Chairman (1985-present), President and Chief Executive Officer, Gardner, Inc. (supply chain management company serving industrial and consumer markets) (1974-present). | 172 | Director, Cardinal Health, Inc. (CAH) (1994-present); Director, Greif, Inc. (GEF) (industrial package products and services) (2007-present). | |||
| Dr. Matthew Goldstein (1941); Chairman since 2013; Trustee of Trusts since 2005; Trustee of heritage J.P. Morgan Funds since 2003. | Professor, City University of New York (effective 7/1/13); Chancellor, City University of New York (1999-2013); President, Adelphi University (New York) (1998-1999). | 172 | Director, Bronx-Lebanon Hospital Center; Director, United Way of New York City (2002-present); Trustee, Museum of Jewish Heritage (2011-present). | |||
| Robert J. Higgins (1945); Trustee of Trusts since 2005; Trustee of heritage J.P. Morgan Funds since 2002. | Retired; Director of Administration of the State of Rhode Island (2003-2004); President — Consumer Banking and Investment Services, Fleet Boston Financial (1971-2001). | 172 | None | |||
| Peter C. Marshall (1942); Trustee of Trusts since 2005; Trustee of heritage One Group Mutual Funds since 1985. | Self-employed business consultant (2002-present). | 172 | Director, Center for Communication, Hearing and Deafness (1990-present). | |||
| Mary E. Martinez (1960); Trustee of Trusts since 2013. | Associate, Special Properties, a Christie’s International Real Estate Affiliate (2010-Present); Managing Director, Bank of America (Asset Management) (2007-2008); Chief Operating Officer, U.S. Trust Asset Management; U.S. Trust Company (asset management) (2003-2007); President, Excelsior Funds (registered investment companies) (2004-2005). | 172 | Member, New York City Center Advisory Council (oversees public performing arts facilities) (2006-present). | |||
| Marilyn McCoy* (1948); Trustee of Trusts since 2005; Trustee of heritage One Group Mutual Funds since 1999. | Vice President of Administration and Planning, Northwestern University (1985-present). | 172 | Trustee, Carleton College (2003-present). | |||
| Mitchell M. Merin (1953); Trustee of Trusts since 2013. | Retired (2005-Present); President and Chief Operating Officer, Morgan Stanley Investment Management, Member Morgan Stanley & Co. Management Committee (registered investment adviser) (1998-2005). | 172 | Director, Sun Life Financial (SLF) (2007 to Present) (financial services and insurance); Trustee, Trinity College, Hartford, CT (2002-2010). | |||
| William G. Morton, Jr. (1937); Trustee of Trusts since 2005; Trustee of heritage J.P. Morgan Funds since 2003. | Retired; Chairman Emeritus (2001-2002), and Chairman and Chief Executive Officer, Boston Stock Exchange (1985-2001). | 172 | Director, Radio Shack Corp. (1987-2008); Trustee, Stratton Mountain School (2001-present). | |||
| Dr. Robert A. Oden, Jr. (1946); Trustee of Trusts since 2005; Trustee of heritage One Group Mutual Funds since 1997. | Retired; President, Carleton College (2002-2010); President, Kenyon College (1995-2002). | 172 | Trustee, American University in Cairo (1999-present); Chairman, Dartmouth-Hitchcock Medical Center (2013-present); Trustee, Dartmouth-Hitchcock Medical Center (2011-present); Trustee, American Schools of Oriental Research (2011-present); Trustee, Carleton College (2002-2010). | |||
| 96 | J.P. MORGAN MID CAP/MULTI-CAP FUNDS | JUNE 30, 2013 | ||||
Table of Contents
Name (Year of Birth); Positions With the Funds (1) | Principal Occupations During Past 5 Years | Number of Complex Overseen by Trustee (2) | Other Directorships Held Outside Fund Complex During Past 5 Years | |||
Independent Trustees (continued) | ||||||
| Marian U. Pardo** (1946); Trustee of Trusts since 2013. | Managing Director and Founder, Virtual Capital Management LLC (Investment Consulting) (2007-present); Managing Director, Credit Suisse Asset Management (portfolio manager) (2003-2006). | 172 | Member, Board of Governors, Columbus Citizens Foundation (not-for-profit supporting philanthropic and cultural programs) (2006-present). | |||
| Frederick W. Ruebeck (1939); Trustee of Trusts since 2005; Trustee of heritage One Group Mutual Funds since 1994. | Consultant (2000-present); Advisor, JP Greene & Associates, LLC (broker-dealer) (2000-2009); Chief Investment Officer, Wabash College (2004-present); Director of Investments, Eli Lilly and Company (pharmaceuticals) (1988-1999). | 172 | Trustee, Wabash College (1988-present); Chairman, Indianapolis Symphony Orchestra Foundation (1994-present). | |||
| James J. Schonbachler (1943); Trustee of Trusts since 2005; Trustee of heritage J.P. Morgan Funds since 2001. | Retired; Managing Director of Bankers Trust Company (financial services) (1968-1998). | 172 | None | |||
Interested Trustee Not Affiliated With the Adviser | ||||||
| Frankie D. Hughes*** (1952), Trustee of Trusts since 2008. | President and Chief Investment Officer, Hughes Capital Management, Inc. (fixed income asset management) (1993-present). | 172 | Trustee, The Victory Portfolios (2000-2008). | |||
| (1) | The Trustees serve for an indefinite term, subject to the Trusts’ current retirement policy, which is age 75 for all Trustees, except that the Board has determined Mr. Morton should continue to serve until December 31, 2014. In order to fill the vacancies created by the retirement of the Fergus Reid, III, William J. Armstrong, and Leonard J. Spalding Jr., effective December 31, 2012, the Board appointed Ms. Martinez and Mr. Merin to serve as Trustees effective January 1, 2013 and Ms. Pardo to serve as Trustee effective February 1, 2013. |
| (2) | A Fund Complex means two or more registered investment companies that hold themselves out to investors as related companies for purposes of investment and investor services or have a common investment advisor or have an investment advisor that is an affiliated person of the investment advisor of any of the other registered investment companies. The J.P. Morgan Funds Complex for which the Board of Trustees serves currently includes eleven registered investment companies (172 funds), including JPMorgan Mutual Fund Group which liquidated November 29, 2012 and is in the process of winding up its affairs. |
| * | Ms. McCoy has served as Vice President of Administration and Planning for Northwestern University since 1985. William M. Daley was the Head of Corporate Responsibility for JPMorgan Chase & Co. prior to January 2011 and served as a member of the Board of Trustees of Northwestern University from 2005 through 2010. JPMIM, the Funds’ investment advisor, is a wholly-owned subsidiary of JPMorgan Chase & Co. Five other members of the Board of Trustees of Northwestern University are executive officers of registered investment advisors (not affiliated with JPMorgan) that are under common control with subadvisors to certain J.P. Morgan Funds. |
| ** | In connection with prior employment with JPMorgan Chase, Ms. Pardo is the recipient of non-qualified pension plan payments from JPMorgan Chase in the amount of approximately $2,055 per month, which she irrevocably waived effective January 1, 2013, and deferred compensation payments from JPMorgan Chase in the amount of approximately $7,294 per year, which ended in January 2013. In addition, Ms. Pardo receives payments from a fully funded qualified plan, which is not an obligation of JPMorgan Chase. |
| *** | Ms. Hughes is treated as an “interested person” based on the portfolio holdings of clients of Hughes Capital Management, Inc. |
The contact address for each of the Trustees is 270 Park Avenue, New York, NY 10017.
| JUNE 30, 2013 | J.P. MORGAN MID CAP/MULTI-CAP FUNDS | 97 | ||||||
Table of Contents
(Unaudited)
Name (Year of Birth), Positions Held with the Trusts (Since) | Principal Occupations During Past 5 Years | |
| Patricia A. Maleski (1960), President and Principal Executive Officer (2010) | Managing Director, J.P. Morgan Investment Management Inc. and Chief Administrative Officer, J.P. Morgan Funds and Institutional Pooled Vehicles since 2010; previously, Treasurer and Principal Financial Officer of the Trusts from 2008 to 2010; previously, Head of Funds Administration and Board Liaison, J.P. Morgan Funds prior to 2010. Ms. Maleski has been with JPMorgan Chase & Co. since 2001. | |
| Joy C. Dowd (1972), Treasurer and Principal Financial Officer (2010) | Assistant Treasurer of the Trusts from 2009 to 2010; Executive Director, JPMorgan Funds Management, Inc. from February 2011; Vice President, JPMorgan Funds Management, Inc. from December 2008 to February 2011; prior to joining JPMorgan Chase, Ms. Dowd worked in MetLife’s investments audit group from 2005 through 2008. | |
| Frank J. Nasta (1964), Secretary (2008) | Managing Director and Associate General Counsel, JPMorgan Chase since 2008; Previously, Director, Managing Director, General Counsel and Corporate Secretary, J. & W. Seligman & Co. Incorporated; Secretary of each of the investment companies of the Seligman Group of Funds and Seligman Data Corp.; Director and Corporate Secretary, Seligman Advisors, Inc. and Seligman Services, Inc. | |
| Stephen M. Ungerman (1953), Chief Compliance Officer (2005) | Managing Director, JPMorgan Chase & Co.; Mr. Ungerman has been with JPMorgan Chase & Co. since 2000. | |
| Kathryn A. Jackson (1962), AML Compliance Officer (2012)* | Vice President and AML Compliance Manager for JPMorgan Asset Management Compliance since 2011; Senior On-Boarding Specialist for JPMorgan Distribution Services, Inc. in Global Liquidity from 2008 to 2011; prior to joining JPMorgan, Ms. Jackson was a Financial Services Analyst responsible for on-boarding, compliance and training with Nationwide Securities LLC and 1717 Capital Management Company, both registered broker-dealers, from 2005 until 2008. | |
Elizabeth A. Davin (1964), Assistant Secretary (2005)** | Executive Director and Assistant General Counsel, JPMorgan Chase since February 2012; formerly Vice President and Assistant General Counsel, JPMorgan Chase from 2005 until February 2012; Senior Counsel, JPMorgan Chase (formerly Bank One Corporation) from 2004 to 2005. | |
| Jessica K. Ditullio (1962), Assistant Secretary (2005)** | Executive Director and Assistant General Counsel, JPMorgan Chase since February 2011; Ms. Ditullio has served as an attorney with various titles for JPMorgan Chase (formerly Bank One Corporation) since 1990. | |
| John T. Fitzgerald (1975), Assistant Secretary (2008) | Executive Director and Assistant General Counsel, JPMorgan chase since February 2011; formerly, Vice President and Assistant General Counsel, JPMorgan Chase from 2005 until February 2011. | |
| Carmine Lekstutis (1980), Assistant Secretary (2011) | Vice President and Assistant General Counsel, JPMorgan Chase since 2011; Associate, Skadden, Arps, Slate, Meagher & Flom LLP (law firm) from 2006 to 2011. | |
| Gregory S. Samuels (1980), Assistant Secretary (2010) | Vice President and Assistant General Counsel, JPMorgan Chase since 2010; Associate, Ropes & Gray (law firm) from 2008 to 2010; Associate, Clifford Chance LLP (law firm) from 2005 to 2008. | |
| Pamela L. Woodley (1971), Assistant Secretary (2012) | Vice President and Assistant General Counsel, JPMorgan Chase since November 2004. | |
Michael M. D’Ambrosio (1969), Assistant Treasurer (2012) | Executive Director, JPMorgan Funds Management, Inc. from July 2012; prior to joining JPMorgan Chase, Mr. D’Ambrosio was a Tax Director at PricewaterhouseCoopers LLP since 2006. | |
| Joseph Parascondola (1963), Assistant Treasurer (2011) | Vice President, JPMorgan Funds Management, Inc. since August 2006. | |
| Matthew J. Plastina (1970), Assistant Treasurer (2011) | Vice President, JPMorgan Funds Management, Inc. since August 2010; prior to August 2010, Vice President and Controller, Legg Mason Global Asset Management. | |
Julie A. Roach (1971), Assistant Treasurer (2012)** | Vice President, JPMorgan Funds Management, Inc. from August 2012; prior to joining JPMorgan Chase, Ms. Roach was a Senior Manager with Deloitte since 2001. | |
Gillian I. Sands (1969), Assistant Treasurer (2012) | Vice President, JPMorgan Funds Management, Inc. from September 2012; Assistant Treasurer, Wells Fargo Funds Management (2007-2009). | |
Timothy J. Stewart (1974), Assistant Treasurer (2012)*** | Executive Director, JPMorgan Funds Management, Inc. from July 2012; Managing Director of Robeco Investment Management, Inc. (2011-2012); Chief Financial Officer (2008-2011) and Director of Operations (2003-2008), Robeco-Sage, a division of Robeco Investment Management, Inc. | |
The contact address for each of the officers, unless otherwise noted, is 270 Park Avenue, New York, NY 10017.
| * | The contact address for the officer is 500 Stanton Christiana Road, Ops 1, Floor 02, Newark, DE 19173-2107. |
| ** | The contact address for the officer is 460 Polaris Parkway, Westerville, OH 43082. |
| *** | Mr. Stewart is the Assistant Treasurer of JPMorgan Trust I only. |
| 98 | J.P. MORGAN MID CAP/MULTI-CAP FUNDS | JUNE 30, 2013 | ||||
Table of Contents
SCHEDULE OF SHAREHOLDER EXPENSES
(Unaudited)
Hypothetical $1,000 Investment
As a shareholder of the Funds, you incur two types of costs: (1) transaction costs, including sales charges (loads) on purchase payments and redemption fees and (2) ongoing costs, including investment advisory fees, administration fees, distribution fees and other Fund expenses. The examples below are intended to help you understand your ongoing costs (in dollars) of investing in the Funds and to compare these ongoing costs with the ongoing costs of investing in other mutual funds. The examples assume that you had a $1,000 investment in each Class at the beginning of the reporting period, January 1, 2013, and continued to hold your shares at the end of the reporting period, June 30, 2013.
Actual Expenses
For each Class of each Fund in the table below, the first line provides information about actual account values and actual expenses. You may use the information in this line, together with the amount you invested, to estimate the expenses that you paid over the period. Simply divide your account value by $1,000 (for example, an $8,600 account value divided by $1,000 = 8.6), then multiply the result by the number in the first line of each Class under the heading entitled “Expenses Paid During the Period” to estimate the expenses you paid on your account during this period.
Hypothetical Example for Comparison Purposes
The second line of each Class in the table below provides information about hypothetical account values and hypothetical expenses based on the Class’ actual expense ratio and an assumed rate of return of 5% per year before expenses, which is not the Class’ actual return. The hypothetical account values and expenses may not be used to estimate the actual ending account balance or expenses you paid for the period. You may use this information to compare the ongoing costs of investing in the Class of the Fund and other funds. To do so, compare this 5% hypothetical example with the 5% hypothetical examples that appear in the shareholder reports of the other funds. Please note that the expenses shown in the table are meant to highlight your ongoing costs only and do not reflect any transaction costs, such as sales charges (loads) or redemption fees. Therefore, the second line for each Class in the table is useful in comparing ongoing costs only, and will not help you determine the relative total costs of owning different funds. In addition, if these transaction costs were included, your costs would have been higher. The examples also assume all dividends and distributions have been reinvested.
| Beginning Account Value, January 1, 2013 | Ending Account Value June 30, 2013 | Expenses Paid During the Period* | Annualized Expense Ratio | |||||||||||||
Growth Advantage Fund | ||||||||||||||||
Class A | ||||||||||||||||
Actual | $ | 1,000.00 | $ | 1,155.70 | $ | 6.68 | 1.25 | % | ||||||||
Hypothetical | 1,000.00 | 1,018.60 | 6.26 | 1.25 | ||||||||||||
Class B | ||||||||||||||||
Actual | 1,000.00 | 1,152.60 | 9.29 | 1.74 | ||||||||||||
Hypothetical | 1,000.00 | 1,016.17 | 8.70 | 1.74 | ||||||||||||
Class C | ||||||||||||||||
Actual | 1,000.00 | 1,152.40 | 9.29 | 1.74 | ||||||||||||
Hypothetical | 1,000.00 | 1,016.17 | 8.70 | 1.74 | ||||||||||||
Class R5 | ||||||||||||||||
Actual | 1,000.00 | 1,157.60 | 4.44 | 0.83 | ||||||||||||
Hypothetical | 1,000.00 | 1,020.68 | 4.16 | 0.83 | ||||||||||||
Select Class | ||||||||||||||||
Actual | 1,000.00 | 1,156.50 | 5.51 | 1.03 | ||||||||||||
Hypothetical | 1,000.00 | 1,019.69 | 5.16 | 1.03 | ||||||||||||
Mid Cap Core Fund | ||||||||||||||||
Class A | ||||||||||||||||
Actual | 1,000.00 | 1,156.70 | 6.63 | 1.24 | ||||||||||||
Hypothetical | 1,000.00 | 1,018.65 | 6.21 | 1.24 | ||||||||||||
Class C | ||||||||||||||||
Actual | 1,000.00 | 1,154.40 | 9.29 | 1.74 | ||||||||||||
Hypothetical | 1,000.00 | 1,016.17 | 8.70 | 1.74 | ||||||||||||
Class R2 | ||||||||||||||||
Actual | 1,000.00 | 1,155.10 | 7.96 | 1.49 | ||||||||||||
Hypothetical | 1,000.00 | 1,017.41 | 7.45 | 1.49 | ||||||||||||
| JUNE 30, 2013 | J.P. MORGAN MID CAP/MULTI-CAP FUNDS | 99 | ||||||
Table of Contents
SCHEDULE OF SHAREHOLDER EXPENSES
(Unaudited) (continued)
Hypothetical $1,000 Investment
| Beginning Account Value, January 1, 2013 | Ending Account Value June 30, 2013 | Expenses Paid During the Period* | Annualized Expense Ratio | |||||||||||||
Mid Cap Core Fund (continued) | ||||||||||||||||
Class R5 | ||||||||||||||||
Actual | $ | 1,000.00 | $ | 1,159.20 | $ | 4.23 | 0.79 | % | ||||||||
Hypothetical | 1,000.00 | 1,020.88 | 3.96 | 0.79 | ||||||||||||
Class R6 | ||||||||||||||||
Actual | 1,000.00 | 1,159.90 | 3.96 | 0.74 | ||||||||||||
Hypothetical | 1,000.00 | 1,021.12 | 3.71 | 0.74 | ||||||||||||
Select Class | ||||||||||||||||
Actual | 1,000.00 | 1,158.50 | 4.98 | 0.93 | ||||||||||||
Hypothetical | 1,000.00 | 1,020.18 | 4.66 | 0.93 | ||||||||||||
Mid Cap Equity Fund | ||||||||||||||||
Class A | ||||||||||||||||
Actual | 1,000.00 | 1,151.30 | 6.61 | 1.24 | ||||||||||||
Hypothetical | 1,000.00 | 1,018.65 | 6.21 | 1.24 | ||||||||||||
Class C | ||||||||||||||||
Actual | 1,000.00 | 1,148.30 | 9.27 | 1.74 | ||||||||||||
Hypothetical | 1,000.00 | 1,016.17 | 8.70 | 1.74 | ||||||||||||
Select Class | ||||||||||||||||
Actual | 1,000.00 | 1,153.00 | 4.75 | 0.89 | ||||||||||||
Hypothetical | 1,000.00 | 1,020.38 | 4.46 | 0.89 | ||||||||||||
Mid Cap Growth Fund | ||||||||||||||||
Class A | ||||||||||||||||
Actual | 1,000.00 | 1,154.10 | 6.62 | 1.24 | ||||||||||||
Hypothetical | 1,000.00 | 1,018.65 | 6.21 | 1.24 | ||||||||||||
Class B | ||||||||||||||||
Actual | 1,000.00 | 1,151.00 | 9.28 | 1.74 | ||||||||||||
Hypothetical | 1,000.00 | 1,016.17 | 8.70 | 1.74 | ||||||||||||
Class C | ||||||||||||||||
Actual | 1,000.00 | 1,151.00 | 9.28 | 1.74 | ||||||||||||
Hypothetical | 1,000.00 | 1,016.17 | 8.70 | 1.74 | ||||||||||||
Class R2 | ||||||||||||||||
Actual | 1,000.00 | 1,153.10 | 7.47 | 1.40 | ||||||||||||
Hypothetical | 1,000.00 | 1,017.85 | 7.00 | 1.40 | ||||||||||||
Class R5 | ||||||||||||||||
Actual | 1,000.00 | 1,156.30 | 4.22 | 0.79 | ||||||||||||
Hypothetical | 1,000.00 | 1,020.88 | 3.96 | 0.79 | ||||||||||||
Class R6 | ||||||||||||||||
Actual | 1,000.00 | 1,156.70 | 3.96 | 0.74 | ||||||||||||
Hypothetical | 1,000.00 | 1,021.12 | 3.71 | 0.74 | ||||||||||||
Select Class | ||||||||||||||||
Actual | 1,000.00 | 1,155.80 | 4.97 | 0.93 | ||||||||||||
Hypothetical | 1,000.00 | 1,020.18 | 4.66 | 0.93 | ||||||||||||
Mid Cap Value Fund | ||||||||||||||||
Class A | ||||||||||||||||
Actual | 1,000.00 | 1,149.90 | 6.56 | 1.23 | ||||||||||||
Hypothetical | 1,000.00 | 1,018.70 | 6.16 | 1.23 | ||||||||||||
Class B | ||||||||||||||||
Actual | 1,000.00 | 1,147.00 | 9.26 | 1.74 | ||||||||||||
Hypothetical | 1,000.00 | 1,016.17 | 8.70 | 1.74 | ||||||||||||
Class C | ||||||||||||||||
Actual | 1,000.00 | 1,146.90 | 9.26 | 1.74 | ||||||||||||
Hypothetical | 1,000.00 | 1,016.17 | 8.70 | 1.74 | ||||||||||||
Class R2 | ||||||||||||||||
Actual | 1,000.00 | 1,148.30 | 7.94 | 1.49 | ||||||||||||
Hypothetical | 1,000.00 | 1,017.41 | 7.45 | 1.49 | ||||||||||||
| 100 | J.P. MORGAN MID CAP/MULTI-CAP FUNDS | JUNE 30, 2013 | ||||
Table of Contents
| Beginning Account Value, January 1, 2013 | Ending Account Value June 30, 2013 | Expenses Paid During the Period* | Annualized Expense Ratio | |||||||||||||
Mid Cap Value Fund (continued) | ||||||||||||||||
Institutional Class | ||||||||||||||||
Actual | $ | 1,000.00 | $ | 1,152.60 | $ | 3.95 | 0.74 | % | ||||||||
Hypothetical | 1,000.00 | 1,021.12 | 3.71 | 0.74 | ||||||||||||
Select Class | ||||||||||||||||
Actual | 1,000.00 | 1,150.90 | 5.23 | 0.98 | ||||||||||||
Hypothetical | 1,000.00 | 1,019.93 | 4.91 | 0.98 | ||||||||||||
Multi-Cap Market Neutral Fund | ||||||||||||||||
Class A | ||||||||||||||||
Actual | 1,000.00 | 1,026.20 | 13.56 | 2.70 | ||||||||||||
Hypothetical | 1,000.00 | 1,011.41 | 13.47 | 2.70 | ||||||||||||
Class B | ||||||||||||||||
Actual | 1,000.00 | 1,022.00 | 16.44 | 3.28 | ||||||||||||
Hypothetical | 1,000.00 | 1,008.53 | 16.33 | 3.28 | ||||||||||||
Class C | ||||||||||||||||
Actual | 1,000.00 | 1,023.00 | 16.45 | 3.28 | ||||||||||||
Hypothetical | 1,000.00 | 1,008.53 | 16.33 | 3.28 | ||||||||||||
Select Class | ||||||||||||||||
Actual | 1,000.00 | 1,026.90 | 12.31 | 2.45 | ||||||||||||
Hypothetical | 1,000.00 | 1,012.65 | 12.23 | 2.45 | ||||||||||||
Value Advantage Fund | ||||||||||||||||
Class A | ||||||||||||||||
Actual | 1,000.00 | 1,160.10 | 6.64 | 1.24 | ||||||||||||
Hypothetical | 1,000.00 | 1,018.65 | 6.21 | 1.24 | ||||||||||||
Class C | ||||||||||||||||
Actual | 1,000.00 | 1,157.00 | 9.25 | 1.73 | ||||||||||||
Hypothetical | 1,000.00 | 1,016.22 | 8.65 | 1.73 | ||||||||||||
Institutional Class | ||||||||||||||||
Actual | 1,000.00 | 1,163.10 | 3.97 | 0.74 | ||||||||||||
Hypothetical | 1,000.00 | 1,021.12 | 3.71 | 0.74 | ||||||||||||
Select Class | ||||||||||||||||
Actual | 1,000.00 | 1,161.70 | 5.31 | 0.99 | ||||||||||||
Hypothetical | 1,000.00 | 1,019.89 | 4.96 | 0.99 | ||||||||||||
| * | Expenses are equal to each Class’ respective annualized expense ratio, multiplied by the average account value over the period, multiplied by 181/365 (to reflect the one-half year period). |
| JUNE 30, 2013 | J.P. MORGAN MID CAP/MULTI-CAP FUNDS | 101 | ||||||
Table of Contents
(Unaudited)
Certain tax information for the J.P. Morgan Funds is required to be provided to shareholders based upon the Funds’ income and distributions for the taxable year ended June 30, 2013. The information and distributions reported in this letter may differ from the information and taxable distributions reported to the shareholders for the calendar year ending December 31, 2013. The information necessary to complete your income tax returns for the calendar year ending December 31, 2013 will be provided under separate cover.
Dividends Received Deductions (DRD)
Each Fund hereby designates the following percentage or the maximum allowable percentage as ordinary income distributions eligible for the 70% dividends received deduction for corporate rate shareholders for the fiscal year ended June 30, 2013:
| Dividends Received Deduction | ||||
Growth Advantage Fund | 100.00 | % | ||
Mid Cap Core Fund | 18.34 | |||
Mid Cap Equity Fund | 54.85 | |||
Mid Cap Value Fund | 100.00 | |||
Value Advantage Fund | 100.00 | |||
Long Term Capital Gain Designation — 20%
Each Fund hereby designates the following amount or maximum allowable amount as long-term capital gain distributions for the purpose of the dividend paid deduction on its respective tax return for the fiscal year ended June 30, 2013 (amounts in thousands):
| Long-Term Capital Gain Distribution | ||||
Growth Advantage Fund | $ | 5,812 | ||
Mid Cap Core | 3,553 | |||
Mid Cap Equity | 6,244 | |||
Mid Cap Growth | 64,858 | |||
Mid Cap Value | 74,510 | |||
Value Advantage Fund | 8,159 | |||
Qualified Dividend Income (QDI)
For the fiscal year ended June 30, 2013, certain dividends paid by the Funds may be subject to a maximum tax rate of 20%. Each Fund hereby designates the following amount or the maximum allowable amount of ordinary income distributions as qualified dividends (amounts in thousands):
| Qualified Dividend Income | ||||
Growth Advantage Fund | $ | 3,788 | ||
Mid Cap Core Fund | 12,650 | |||
Mid Cap Equity | 4,652 | |||
Mid Cap Value | 120,789 | |||
Value Advantage Fund | 20,780 | |||
| 102 | J.P. MORGAN MID CAP/MULTI-CAP FUNDS | JUNE 30, 2013 | ||||
Table of Contents

Rev. January 2011
| FACTS | WHAT DOES J.P. MORGAN FUNDS DO WITH YOUR PERSONAL INFORMATION? |
| Why? | Financial companies choose how they share your personal information. Federal law gives consumers the right to limit some but not all sharing. Federal law also requires us to tell you how we collect, share, and protect your personal information. Please read this notice carefully to understand what we do. |
| What? | The types of personal information we collect and share depend on the product or service you have with us. This information can include:
¡ Social Security number and account balances
¡ transaction history and account transactions
¡ checking account information and wire transfer instructions
When you are no longer our customer, we continue to share your information as described in this notice. |
| How? | All financial companies need to share customers’ personal information to run their everyday business. In the section below, we list the reasons financial companies can share their customers’ personal information; the reasons J.P. Morgan Funds chooses to share; and whether you can limit this sharing. |
| Reasons we can share your personal information | Does J.P. Morgan Funds share? | Can you limit this sharing? | ||
For our everyday business purposes — such as to process your transactions, maintain your account(s), respond to court orders and legal investigations, or report to credit bureaus | Yes | No | ||
For marketing purposes — to offer our products and services to you | Yes | No | ||
| For joint marketing with other financial companies | No | We don’t share | ||
For our affiliates’ everyday business purposes — information about your transactions and experiences | No | We don’t share | ||
For our affiliates’ everyday business purposes — information about your creditworthiness | No | We don’t share | ||
| For nonaffiliates to market to you | No | We don’t share |
| Questions? | Call 1-800-480-4111 or go to www.jpmorganfunds.com | |

Table of Contents
Page 2 |
| Who we are | ||
| Who is providing this notice? | J.P. Morgan Funds | |
| What we do | ||
| How does J.P. Morgan Funds protect my personal information? | To protect your personal information from unauthorized access and use, we use security measures that comply with federal law. These measures include computer safeguards and secured files and buildings. We authorize our employees to access your information only when they need it to do their work and we require companies that work for us to protect your information. | |
How does J.P. Morgan Funds collect my personal information? | We collect your personal information, for example, when you:
¡ open an account or provide contact information
¡ give us your account information or pay us by check
¡ make a wire transfer
We also collect your personal information from others, such as credit bureaus, affiliates and other companies. | |
| Why can’t I limit all sharing? | Federal law gives you the right to limit only
¡ sharing for affiliates’ everyday business purposes – information about your creditworthiness
¡ affiliates from using your information to market to you
¡ sharing for nonaffiliates to market to you
State laws and individual companies may give you additional rights to limit sharing. | |
| Definitions | ||
| Affiliates | Companies related by common ownership or control. They can be financial and nonfinancial companies.
¡ J.P. Morgan Funds does not share with our affiliates. | |
| Nonaffiliates | Companies not related by common ownership or control. They can be financial and nonfinancial companies.
¡ J.P. Morgan Funds does not share with nonaffiliates so they can market to you. | |
| Joint Marketing | A formal agreement between nonaffiliated financial companies that together market financial products or services to you.
¡ J.P. Morgan Funds doesn’t jointly market. | |
Table of Contents
J.P. Morgan Funds are distributed by JPMorgan Distribution Services, Inc., which is an affiliate of JPMorgan Chase & Co. Affiliates of JPMorgan Chase & Co. receive fees for providing various services to the funds.
Contact JPMorgan Distribution Services, Inc. at 1-800-480-4111 for a fund prospectus. You can also visit us at www.jpmorganfunds.com. Investors should carefully consider the investment objectives and risk as well as charges and expenses of the mutual fund before investing. The prospectus contains this and other information about the mutual fund. Read the prospectus carefully before investing.
Investors may obtain information about the Securities Investor Protection Corporation (SIPC), including the SIPC brochure by visiting www.sipc.org or by calling SIPC at 202-371-8300.
Each Fund files a complete schedule of its fund holdings for the first and third quarters of its fiscal year with the SEC on Form N-Q. The Funds’ Forms N-Q are available on the SEC’s website at http://www.sec.gov and may be reviewed and copied at the SEC’s Public Reference Room in Washington, DC. Information on the operation of the SEC’s Public Reference Room may be obtained by calling 1-800-SEC-0330. Shareholders may request the Form N-Q without charge by calling 1-800-480-4111 or by visiting the J.P. Morgan Funds’ website at www.jpmorganfunds.com.
A description of each Fund’s policies and procedures with respect to the disclosure of each Fund’s holdings is available in the prospectus and Statement of Additional Information.
A copy of proxy policies and procedures is available without charge upon request by calling 1-800-480-4111 and on the Funds’ website at www.jpmorganfunds.com. A description of such policies and procedures is on the SEC’s website at www.sec.gov. The Trustees have delegated the authority to vote proxies for securities owned by the Funds to the Advisor. A copy of the Funds’ voting record for the most recent 12-month period ended June 30 is available on the SEC’s website at www.sec.gov or at the Funds’ website at www.jpmorganfunds.com no later than August 31 of each year. The Funds’ proxy voting record will include, among other things, a brief description of the matter voted on for each fund security, and will state how each vote was cast, for example, for or against the proposal.
Table of Contents

J.P. Morgan Asset Management is the marketing name for the asset management business of JPMorgan Chase & Co. Those businesses include, but are not limited to, J.P. Morgan Investment Management Inc., Security Capital Research & Management Incorporated and J.P. Morgan Alternative Asset Management, Inc.
| © JPMorgan Chase & Co., 2013. All rights reserved. June 2013. | AN-MC-613 |
Table of Contents
Annual Report
J.P. Morgan Large Cap Funds
June 30, 2013
JPMorgan Disciplined Equity Fund
JPMorgan Dynamic Growth Fund
JPMorgan Equity Income Fund
JPMorgan Growth and Income Fund
JPMorgan Large Cap Growth Fund
JPMorgan Large Cap Value Fund
JPMorgan U.S. Equity Fund

Table of Contents
Investments in a Fund are not bank deposits or obligations of, or guaranteed or endorsed by, any bank and are not insured or guaranteed by the FDIC, the Federal Reserve Board or any other government agency. You could lose money if you sell when the Fund’s share price is lower than when you invested.
Past performance is no guarantee of future performance. The general market views expressed in this report are opinions based on market and other conditions through the end of the reporting period and are subject to change without notice. These views are not intended to predict the future performance of a Fund or the securities markets. References to specific securities and their issuers are for illustrative purposes only and are not intended to be, and should not be interpreted as, recommendations to purchase or sell such securities. Such views are not meant as investment advice and may not be relied on as an indication of trading intent on behalf of any Fund.
Prospective investors should refer to the Funds’ prospectus for a discussion of the Funds’ investment objectives, strategies and risks. Call J.P. Morgan Funds Service Center at 1-800-480-4111 for a prospectus containing more complete information about a Fund, including management fees and other expenses. Please read it carefully before investing.
Table of Contents
July 26, 2013 (Unaudited)
Dear Shareholder:
While somewhat overshadowed by increased volatility at the end of the reporting period, global equities in aggregate posted strong returns for the twelve months ended June 30, 2013. For much of the period, stocks were supported by solid corporate earnings and robust demand from investors looking to generate higher returns in the low interest rate environment. Despite signaling a potential policy shift in June 2013, the U.S. Federal Reserve (“Fed”) continued to pursue its highly accommodative policies in an attempt to lower unemployment and spur the economy. Central banks overseas also did their part to support their economies. The European Central Bank (“ECB”) remained committed to preserving the euro, as it cut rates and introduced new programs designed to aid struggling euro zone members. Elsewhere, the Bank of Japan embarked on a major asset purchase program as a new pro-growth government came into power late in 2012.
 |
“We are encouraged by the stock market’s resiliency in the face of recent volatility.” |
Positive investor sentiment was temporarily interrupted, however, in May 2013 when Fed Chairman Bernanke indicated that the central bank may begin to “taper” its asset purchase program later this year. This triggered a sharp decline in global equities, although they quickly regained their footing and have continued to rally in July. All told, both U.S. and international developed stocks rose sharply during the twelve months ended June 30, 2013. Emerging market equities produced only modest gains given concerns regarding China’s economy and falling commodity prices.
U.S. Treasury Yields Rise Sharply
Talk of Fed tapering negatively impacted the fixed income markets. While U.S. Treasury security yields continued to be low from a historical perspective, they ended the period
sharply higher than when the reporting period began. The yield for 10-year U.S. Treasury securities ended June 30, 2013 at 2.52%, while the yields for 2- and 30-year U.S. Treasury securities finished the reporting period at 0.36% and 3.52%, respectively. Amid the rising interest rate environment, the overall U.S. fixed income market posted a modest decline for the reporting period. In contrast, high yield bonds (also known as junk bonds) posted a strong return and emerging market debt securities also moved higher, albeit to a lesser extent.
Positive Signs for Stocks
Although the global economy is far from robust, it is still on a growth path. The expansion in the U.S. certainly appears to be sustainable and, while Europe remains in a recession, there are indications that its economy may be bottoming. Elsewhere, pro-growth initiatives in Japan have thus far yielded positive results. While growth in China has moderated, we believe the government has the tools at its disposal to avoid a “hard landing.”
We are encouraged by the stock market’s resiliency in the face of recent volatility. In addition, there have been signs that equity market correlations are decreasing, which could create a more favorable environment for active managers. In addition, given the recent sell-off in the bond market, valuations in a number of fixed income sectors have become more attractive.
On behalf of everyone at J.P. Morgan Asset Management, thank you for your continued support. We look forward to managing your investment needs for years to come. Should you have any questions, please visit www.jpmorganfunds.com or contact the J.P. Morgan Funds Service Center at 1-800-480-4111.
Sincerely yours,

George C.W. Gatch
CEO, Global Funds Management
J.P. Morgan Asset Management
| JUNE 30, 2013 | J.P. MORGAN LARGE CAP FUNDS | 1 | ||||||
Table of Contents
MARKET OVERVIEW
TWELVE MONTHS ENDED JUNE 30, 2013 (Unaudited)
Despite periods of heightened volatility and several setbacks, the overall U.S. equity market generated strong results during the twelve months ended June 30, 2013. Supporting the market were overall solid corporate profits, continued economic growth and generally robust investor demand. From an economic perspective, the U.S. housing market showed signs of rebounding and there was some improvement in the labor market. Investor enthusiasm was interrupted late in the reporting period when the U.S. Federal Reserve Board (“Fed”) announced in June 2013 that it might begin tapering its asset purchases later in the year. This triggered a rapid sell-off in the overall stock market. However, U.S. equities again rallied in late June, as concerns regarding Fed tapering abated somewhat. The S&P 500 Index returned 20.60% for the twelve months ended June 30, 2013. U.S. large-cap value stocks outperformed U.S. large-cap growth stocks for the period.
| 2 | J.P. MORGAN LARGE CAP FUNDS | JUNE 30, 2013 | ||||
Table of Contents
JPMorgan Disciplined Equity Fund
TWELVE MONTHS ENDED JUNE 30, 2013 (Unaudited)
| REPORTING PERIOD RETURN: | ||||
| Fund (Institutional Class Shares)* | 22.67% | |||
| S&P 500 Index | 20.60% | |||
| Net Assets as of 6/30/2013 (In Thousands) | $ | 1,826,852 | ||
INVESTMENT OBJECTIVE**
The JPMorgan Disciplined Equity Fund (the “Fund”) seeks to provide a consistently high total return from a broadly diversified portfolio of equity securities with risk characteristics similar to the Standard and Poor’s 500 Composite Stock Price Index (S&P 500 Index).
WHAT WERE THE MAIN DRIVERS OF THE FUND’S PERFORMANCE?
The Fund (Institutional Class Shares) outperformed the S&P 500 Index (the “Benchmark”) for the twelve months ended June 30, 2013. The Fund’s stock selection in the pharmaceutical and retail sectors contributed to relative performance. The Fund’s stock selection in the systems and network hardware sector and the auto and transportation sector detracted from relative performance.
Individual contributors to relative performance included the Fund’s overweight positions versus the Benchmark in Celgene Corp., Biogen Idec, Inc. and Cisco Systems, Inc. Shares of Celgene Corp., a multinational biopharmaceutical company, rose on higher projections for revenue and earnings. Shares of Biogen Idec, Inc., an American biotechnology company specializing in drugs for neurological disorders, autoimmune disorders and cancer, gained on news that the company had received patent protection for a key drug. Cisco Systems, Inc., a manufacturer of networking equipment, gained on higher-than- expected earnings during the company’s fiscal third quarter.
Individual detractors from relative performance included Norfolk Southern Corp., Gilead Sciences, Inc. and Microsoft Corp. Norfolk Southern Corp., a railroad operator, was hurt by soft coal demand. Shares of Gilead Sciences, Inc., an American biotechnology company that discovers, develops and commercializes therapeutics, rose sharply. However, as the Fund did not own shares of the company, this was a negative for the Fund’s relative performance. Shares of software technology company Microsoft Corp. rallied during the reporting period, but underperformed the Benchmark. As a result, the Fund’s overweight position in Microsoft Corp. versus the Benchmark was a relative detractor.
HOW WAS THE FUND POSITIONED?
The Fund’s portfolio managers attempted to construct the portfolio so that stock selection was the principal source of potential excess return. The Fund’s portfolio managers sought investment opportunities in companies that they believed were attractive based on valuation and strong fundamentals.
| TOP TEN EQUITY HOLDINGS OF THE PORTFOLIO*** | ||||||||
| 1. | Johnson & Johnson | 3.0 | % | |||||
| 2. | Google, Inc., Class A | 2.8 | ||||||
| 3. | Exxon Mobil Corp. | 2.7 | ||||||
| 4. | Wells Fargo & Co. | 2.2 | ||||||
| 5. | Apple, Inc. | 2.1 | ||||||
| 6. | Cisco Systems, Inc. | 1.9 | ||||||
| 7. | Citigroup, Inc. | 1.8 | ||||||
| 8. | Chevron Corp. | 1.8 | ||||||
| 9. | Microsoft Corp. | 1.8 | ||||||
| 10. | United Technologies Corp. | 1.6 | ||||||
PORTFOLIO COMPOSITION BY SECTOR*** | ||||
| Information Technology | 17.9 | % | ||
| Consumer Discretionary | 15.3 | |||
| Financials | 15.3 | |||
| Health Care | 12.8 | |||
| Energy | 11.7 | |||
| Industrials | 11.2 | |||
| Consumer Staples | 7.2 | |||
| Utilities | 3.0 | |||
| Materials | 2.2 | |||
| Telecommunication Services | 1.7 | |||
| Short-Term Investments | 1.7 | |||
| * | The return shown is based on net asset values calculated for shareholder transactions and may differ from the return shown in the financial highlights, which reflects adjustments made to the net asset values in accordance with accounting principles generally accepted in the United States of America. |
| ** | The advisor seeks to achieve the Fund’s objective. There can be no guarantee it will be achieved. |
| *** | Percentages indicated are based on total investments as of June 30, 2013. The Fund��s portfolio composition is subject to change. |
| JUNE 30, 2013 | J.P. MORGAN LARGE CAP FUNDS | 3 | ||||||
Table of Contents
JPMorgan Disciplined Equity Fund
FUND COMMENTARY
TWELVE MONTHS ENDED JUNE 30, 2013 (Unaudited) (continued)
AVERAGE ANNUAL TOTAL RETURNS AS OF JUNE 30, 2013 | ||||||||||||||||
| INCEPTION DATE OF CLASS | 1 YEAR | 5 YEAR | 10 YEAR | |||||||||||||
CLASS A SHARES | 9/28/01 | |||||||||||||||
Without Sales Charge | 22.21 | % | 7.99 | % | 7.37 | % | ||||||||||
With Sales Charge* | 15.77 | 6.82 | 6.79 | |||||||||||||
CLASS R6 SHARES | 3/24/03 | 22.78 | 8.53 | 7.93 | ||||||||||||
INSTITUTIONAL CLASS SHARES | 1/3/97 | 22.67 | 8.43 | 7.82 | ||||||||||||
SELECT CLASS SHARES | 9/10/01 | 22.49 | 8.26 | 7.66 | ||||||||||||
| * | Sales Charge for Class A Shares is 5.25%. |
TEN YEAR PERFORMANCE (6/30/03 TO 6/30/13)
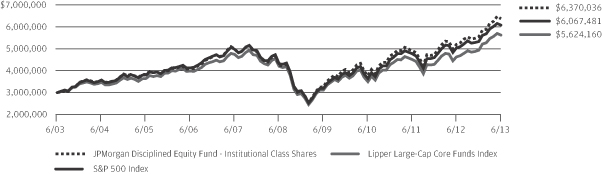
The performance quoted is past performance and is not a guarantee of future results. Mutual funds are subject to certain market risks. Investment returns and principal value of an investment will fluctuate so that an investor’s shares, when redeemed, may be worth more or less than their original cost. Current performance may be higher or lower than the performance data shown. For up-to-date month-end performance information please call 1-800-480-4111.
The graph illustrates comparative performance for $3,000,000 invested in Institutional Class Shares of the JPMorgan Disciplined Equity Fund, S&P 500 Index and Lipper Large-Cap Core Funds Index from June 30, 2003 to June 30, 2013. The performance of the Fund assumes reinvestment of all dividends and capital gain distributions, if any, and does not include a sales charge. The performance of the S&P 500 Index does not reflect the deduction of expenses or a sales charge associated with a mutual fund and has been adjusted to reflect reinvestment of all dividends and capital gain distributions of the securities included in the benchmark, if applicable. The performance of the Lipper Large-Cap Core Funds Index includes expenses associated with a mutual fund,
such as investment management fees. These expenses are not identical to the expenses incurred by the Fund. The S&P 500 Index is an unmanaged index generally representative of the performance of large companies in the U.S. stock market. The Lipper Large-Cap Core Funds Index is an index based on the total returns of certain mutual funds within the Fund’s designated category as determined by Lipper, Inc. Investors cannot invest directly in an index.
Institutional Class Shares have a $3,000,000 minimum initial investment.
Fund performance may reflect the waiver of the Fund’s fees and reimbursement of expenses for certain periods since the inception date. Without these waivers and reimbursements, performance would have been lower. Also, performance shown in this section does not reflect the deduction of taxes that a shareholder would pay on Fund distributions or redemption of Fund shares.
The returns shown are based on net asset values calculated for shareholder transactions and may differ from the returns shown in the financial highlights, which reflect adjustments made to the net asset values in accordance with accounting principles generally accepted in the United States of America.
| 4 | J.P. MORGAN LARGE CAP FUNDS | JUNE 30, 2013 | ||||
Table of Contents
FUND COMMENTARY
TWELVE MONTHS ENDED JUNE 30, 2013 (Unaudited)
| REPORTING PERIOD RETURN: | ||||
| Fund (Select Class Shares)* | 19.48% | |||
| Russell 1000 Growth Index | 17.07% | |||
| Net Assets as of 6/30/2013 (In Thousands) | $ | 102,280 | ||
INVESTMENT OBJECTIVE**
The JPMorgan Dynamic Growth Fund (the “Fund”) seeks long-term capital growth.
WHAT WERE THE MAIN DRIVERS OF THE FUND’S PERFORMANCE?
The Fund (Select Class Shares) outperformed the Russell 1000 Growth Index (the “Benchmark”) for the twelve months ended June 30, 2013. The Fund’s stock selection in the health care and producer durables sectors was the main contributor to relative performance. The Fund’s stock selection in the technology sector and an underweight versus the Benchmark in the producer durables sector detracted from relative performance.
Individual contributors to relative performance included the Fund’s positions in Biogen Idec, Inc., Kansas City Southern, and Regeneron Pharmaceuticals, Inc. Shares of biotechnology company Biogen Idec, Inc. traded higher during the reporting period. The company benefited from investors realizing the market potential for Tecfidera, the company’s oral medicine to treat relapsing forms of multiple sclerosis in adults, and the impact the drug could have on Biogen Idec’s top line growth. Railroad company Kansas City Southern benefited from industrial capacity additions in Mexico and strengthening automotive and industrial sectors in the U.S. Regeneron Pharmaceuticals, Inc., a biotechnology company, was rewarded for strong execution in its Eylea franchise, a treatment for wet macular degeneration.
Individual detractors to relative performance included Teradata Corp., Citrix Systems, Inc. and EMC Corp. Teradata Corp., which provides data warehousing, analytics software and support services, reported lower-than-expected revenue and earnings for its fiscal first quarter. Software and programming company Citrix Systems, Inc. experienced a difficult fourth quarter of 2012 in the face of a challenged enterprise spending environment. Weaker-than-expected first quarter 2013 earnings also weighed on the stock. EMC Corp. offers data storage, information security, virtualization and cloud computing services and products. Its shares traded lower following weaker-than-expected third quarter 2012 earnings and disappointing guidance announcements in the third quarter of 2012 and the first quarter of 2013.
HOW WAS THE FUND POSITIONED?
The Fund’s portfolio managers utilized a bottom-up approach to stock selection, researching individual companies in an effort to construct portfolios of stocks that have strong fundamentals and positive price momentum. The Fund’s portfolio managers sought to invest in companies with attractive fundamentals that, in their view, possessed the potential to significantly exceed expectations for a prolonged period of time.
| TOP TEN EQUITY HOLDINGS OF THE PORTFOLIO*** | ||||||||
| 1. | Biogen Idec, Inc. | 7.3 | % | |||||
| 2. | Google, Inc., Class A | 6.5 | ||||||
| 3. | Kansas City Southern | 5.3 | ||||||
| 4. | MasterCard, Inc., Class A | 5.2 | ||||||
| 5. | Regeneron Pharmaceuticals, Inc. | 4.6 | ||||||
| 6. | Gilead Sciences, Inc. | 4.4 | ||||||
| 7. | priceline.com, Inc. | 4.3 | ||||||
| 8. | Whole Foods Market, Inc. | 4.1 | ||||||
| 9. | Home Depot, Inc. (The) | 3.8 | ||||||
| 10. | Amazon.com, Inc. | 3.7 | ||||||
PORTFOLIO COMPOSITION BY SECTOR*** | ||||
| Information Technology | 30.3 | % | ||
| Consumer Discretionary | 21.4 | |||
| Health Care | 18.5 | |||
| Financials | 8.0 | |||
| Industrials | 6.9 | |||
| Energy | 6.0 | |||
| Consumer Staples | 4.1 | |||
| Materials | 3.5 | |||
| Short-Term Investment | 1.3 | |||
| * | The return shown is based on net asset values calculated for shareholder transactions and may differ from the return shown in the financial highlights, which reflects adjustments made to the net asset values in accordance with accounting principles generally accepted in the United States of America. |
| ** | The advisor seeks to achieve the Fund’s objective. There can be no guarantee it will be achieved. |
| *** | Percentages are based on total investments as of June 30, 2013. The Fund’s portfolio composition is subject to change. |
| JUNE 30, 2013 | J.P. MORGAN LARGE CAP FUNDS | 5 | ||||||
Table of Contents
JPMorgan Dynamic Growth Fund
FUND COMMENTARY
TWELVE MONTHS ENDED JUNE 30, 2013 (Unaudited) (continued)
AVERAGE ANNUAL TOTAL RETURNS AS OF JUNE 30, 2013 | ||||||||
| INCEPTION DATE OF CLASS | 1 YEAR | 5 YEAR | SINCE INCEPTION | |||||||||||||
CLASS A SHARES | 11/30/07 | |||||||||||||||
Without Sales Charge | 19.19 | % | 6.12 | % | 4.27 | % | ||||||||||
With Sales Charge* | 12.94 | 4.99 | 3.27 | |||||||||||||
CLASS C SHARES | 11/30/07 | |||||||||||||||
Without CDSC | 18.60 | 5.59 | 3.76 | |||||||||||||
With CDSC** | 17.60 | 5.59 | 3.76 | |||||||||||||
CLASS R5 SHARES | 11/30/07 | 19.73 | 6.60 | 4.74 | ||||||||||||
SELECT CLASS SHARES | 11/30/07 | 19.48 | 6.38 | 4.53 | ||||||||||||
| * | Sales Charge for Class A Shares is 5.25%. |
| ** | Assumes a 1% CDSC (contingent deferred sales charge) for the one year period and 0% CDSC thereafter. |
LIFE OF FUND PERFORMANCE (11/30/07 TO 6/30/13)
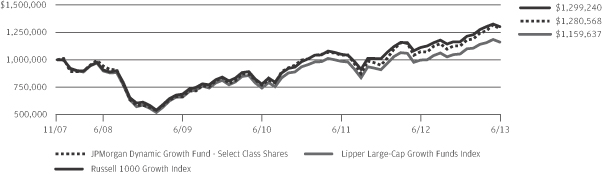
The performance quoted is past performance and is not a guarantee of future results. Mutual funds are subject to certain market risks. Investment returns and principal value of an investment will fluctuate so that an investor’s shares, when redeemed, may be worth more or less than their original cost. Current performance may be higher or lower than the performance data shown. For up-to-date, month-end performance information please call 1-800-480-4111.
The Fund commenced operations on November 30, 2007.
The graph illustrates comparative performance for $1,000,000 invested in the Select Class Shares of the JPMorgan Dynamic Growth Fund, the Russell 1000 Growth Index and the Lipper Large-Cap Growth Funds Index from November 30, 2007 to June 30, 2013. The performance of the Fund assumes reinvestment of all dividends and capital gain distributions, if any, and does not include a sales charge. The performance of the Russell 1000 Growth Index does not reflect the deduction of expenses or a sales charge associated with a mutual fund and has been adjusted to reflect reinvestment of all dividends and capital gain distributions of the securities included in the benchmark, if applicable. The performance of the Lipper Large-Cap Growth Funds Index includes expenses associated with a mutual fund, such as investment management fees. These expenses are not identical to the expenses incurred by the Fund. The Russell 1000 Growth Index is an unmanaged index which measures the
performance of those Russell 1000 companies with higher price-to-book ratios and higher forecasted growth values. The Lipper Large-Cap Growth Funds Index is an index based on the total returns of certain mutual funds within the Fund’s designated category as determined by Lipper, Inc. Investors cannot invest directly in an index.
Select Class Shares have a $1,000,000 minimum initial investment.
From the Fund’s inception through August 5, 2010, the Fund did not experience any shareholder activity. If such shareholder activity had occurred, the Fund’s performance may have been impacted.
Fund performance may reflect the waiver of the Fund’s fees and reimbursement of expenses for certain periods since the inception date. Without these waivers and reimbursements, performance would have been lower. Also, performance shown in this section does not reflect the deduction of taxes that a shareholder would pay on Fund distributions or redemption of Fund shares.
The returns shown are based on net asset values calculated for shareholder transactions and may differ from the returns shown in the financial highlights, which reflect adjustments made to the net asset values in accordance with accounting principles generally accepted in the United States of America.
| 6 | J.P. MORGAN LARGE CAP FUNDS | JUNE 30, 2013 | ||||
Table of Contents
FUND COMMENTARY
TWELVE MONTHS ENDED JUNE 30, 2013 (Unaudited)
| REPORTING PERIOD RETURN: | ||||
| Fund (Select Class Shares)* | 21.84% | |||
| Russell 1000 Value Index | 25.32% | |||
| Net Assets as of 6/30/2013 (In Thousands) | $ | 4,508,761 | ||
INVESTMENT OBJECTIVE**
The JPMorgan Equity Income Fund (the “Fund”) seeks current income through regular payment of dividends with the secondary goal of achieving capital appreciation by investing primarily in equity securities.
WHAT WERE THE MAIN DRIVERS OF THE FUND’S PERFORMANCE?
The Fund (Select Class Shares) underperformed the Russell 1000 Value Index (the “Benchmark”) for the twelve months ended June 30, 2013. The Fund’s stock selection in the information technology and consumer staples sectors was the main detractor from relative performance. The Fund’s stock selection in the utilities and materials sectors contributed to relative performance.
Individual detractors from the Fund’s relative performance included its underweight position in financial company Citigroup, Inc. Its shares moved sharply higher during the reporting period amid, among other things, improving operating results. Investors also reacted positively to Citigroup, Inc.’s proposed restructuring plan. An underweight position in Berkshire Hathaway, Inc. also detracted from the Fund’s relative performance, as the multinational conglomerate holding company benefited from the ongoing economic recovery. An overweight in Apple, Inc. was another detractor from relative performance. Shares in Apple, Inc. fell amid intense competition with rivals and an outlook that fell short of analyst expectations.
Individual contributors to relative performance included the Fund’s positions in The Home Depot, Inc., BlackRock, Inc. and the CME Group, Inc. The Home Depot, Inc., a leading home improvement chain, benefited from an improving housing market. Shares of BlackRock, Inc. were lifted by the investment service company’s strong earnings. CME Group, Inc., a financial and commodity derivative exchange, also benefited from strong revenue and earnings during the reporting period.
HOW WAS THE FUND POSITIONED?
The Fund’s portfolio managers’ focus remained on stock selection, as they believed that quality companies trading at attractive valuations have the greatest potential to outperform
in the long term. As the Fund aimed to purchase stocks with above average dividend yields, the research process was designed to identify companies with predictable and durable business models deemed capable of generating sustainable free cash flow.
| TOP TEN EQUITY HOLDINGS OF THE PORTFOLIO*** | ||||||||
| 1. | Wells Fargo & Co. | 4.2 | % | |||||
| 2. | Merck & Co., Inc. | 2.8 | ||||||
| 3. | Pfizer, Inc. | 2.7 | ||||||
| 4. | Johnson & Johnson | 2.7 | ||||||
| 5. | Exxon Mobil Corp. | 2.4 | ||||||
| 6. | ConocoPhillips | 2.3 | ||||||
| 7. | Chevron Corp. | 2.2 | ||||||
| 8. | Occidental Petroleum Corp. | 2.2 | ||||||
| 9. | CME Group, Inc. | 2.0 | ||||||
| 10. | Home Depot, Inc. (The) | 1.9 | ||||||
PORTFOLIO COMPOSITION BY SECTOR*** | ||||
| Financials | 24.5 | % | ||
| Consumer Discretionary | 14.1 | |||
| Health Care | 11.5 | |||
| Energy | 10.7 | |||
| Information Technology | 9.7 | |||
| Industrials | 7.8 | |||
| Consumer Staples | 7.2 | |||
| Utilities | 5.6 | |||
| Telecommunication Services | 2.6 | |||
| Materials | 2.6 | |||
| Short-Term Investment | 3.7 | |||
| * | The return shown is based on net asset values calculated for shareholder transactions and may differ from the return shown in the financial highlights, which reflects adjustments made to the net asset values in accordance with accounting principles generally accepted in the United States of America. |
| ** | The advisor seeks to achieve the Fund’s objective. There can be no guarantee it will be achieved. |
| *** | Percentages indicated are based on total investments as of June 30, 2013. The Fund’s portfolio composition is subject to change. |
| JUNE 30, 2013 | J.P. MORGAN LARGE CAP FUNDS | 7 | ||||||
Table of Contents
JPMorgan Equity Income Fund
FUND COMMENTARY
TWELVE MONTHS ENDED JUNE 30, 2013 (Unaudited) (continued)
AVERAGE ANNUAL TOTAL RETURNS AS OF JUNE 30, 2013 | ||||||||||||||||
| INCEPTION DATE OF CLASS | 1 YEAR | 5 YEAR | 10 YEAR | |||||||||||||
CLASS A SHARES | 2/18/92 | |||||||||||||||
Without Sales Charge | 21.53 | % | 9.21 | % | 8.21 | % | ||||||||||
With Sales Charge* | 15.09 | 8.05 | 7.63 | |||||||||||||
CLASS B SHARES | 1/14/94 | |||||||||||||||
Without CDSC | 20.90 | 8.65 | 7.73 | |||||||||||||
With CDSC** | 15.90 | 8.36 | 7.73 | |||||||||||||
CLASS C SHARES | 11/4/97 | |||||||||||||||
Without CDSC | 20.94 | 8.64 | 7.62 | |||||||||||||
With CDSC*** | 19.94 | 8.64 | 7.62 | |||||||||||||
CLASS R2 SHARES | 2/28/11 | 21.21 | 9.05 | 8.07 | ||||||||||||
CLASS R5 SHARES | 2/28/11 | 22.17 | 9.65 | 8.58 | ||||||||||||
CLASS R6 SHARES | 1/31/12 | 22.12 | 9.64 | 8.57 | ||||||||||||
SELECT CLASS SHARES | 7/2/87 | 21.84 | 9.53 | 8.52 | ||||||||||||
| * | Sales Charge for Class A Shares is 5.25%. |
| ** | Assumes a 5% CDSC (contingent deferred sales charge) for the one year period, 2% CDSC for the five year period and 0% CDSC thereafter. |
| *** | Assumes a 1% CDSC for the one year period and 0% CDSC thereafter. |
TEN YEAR PERFORMANCE (6/30/03 TO 6/30/13)
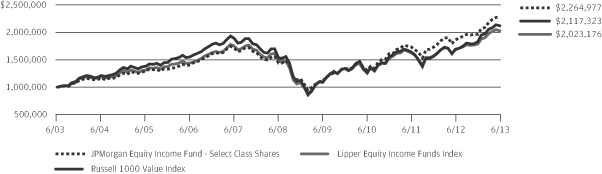
The performance quoted is past performance and is not a guarantee of future results. Mutual funds are subject to certain market risks. Investment returns and principal value of an investment will fluctuate so that an investor’s shares, when redeemed, may be worth more or less than their original cost. Current performance may be higher or lower than the performance data shown. For up-to-date month-end performance information please call 1-800-480-4111.
Returns for the Class R2 and Class R5 Shares prior to their inception date are based on the performance of Select Class Shares. With respect to Class R2 Shares, prior Class performance has been adjusted to reflect the differences in expenses between classes. The actual returns of Class R5 Shares would have been different than those shown because Class R5 Shares have different expenses than Select Class Shares.
Returns for the Class R6 Shares prior to its inception date are based on the performance of Class R5 Shares and, prior to February 28, 2011, Select Class Shares. The actual returns of Class R6 Shares would have been different than those shown because Class R6 Shares have different expenses than Class R5 and Select Class Shares.
The graph illustrates comparative performance for $1,000,000 invested in Select Class Shares of the JPMorgan Equity Income Fund, the Russell 1000 Value Index and the Lipper Equity Income Funds Index from June 30, 2003 to June 30, 2013. The performance of the Fund assumes reinvestment of all dividends and capital gain distributions, if any, and does not include a sales charge. The performance of the Russell 1000 Value Index does not reflect the deduction of expenses or a sales charge associated with a mutual fund and has
been adjusted to reflect reinvestment of all dividends and capital gain distributions of the securities included in the benchmark, if applicable. The performance of the Lipper Equity Income Funds Index includes expenses associated with a mutual fund, such as investment management fees. These expenses are not identical to the expenses incurred by the Fund. The Russell 1000 Value Index is an unmanaged index, which measures the performance of those Russell 1000 companies with lower price-to-book ratios and lower forecasted growth values. The Lipper Equity Income Funds Index is an index based on the total returns of certain mutual funds within the Fund’s designated category as determined by Lipper, Inc. Investors cannot invest directly in an index.
Select Class Shares have a $1,000,000 minimum initial investment.
Fund performance may reflect the waiver of the Fund’s fees and reimbursement of expenses for certain periods since the inception date. Without these waivers and reimbursements, performance would have been lower. Also, performance shown in this section does not reflect the deduction of taxes that a shareholder would pay on Fund distributions or redemption of Fund shares.
Because Class B Shares automatically convert to Class A Shares after eight years, the 10 year average annual total return shown above for Class B reflects Class A performance for the period after conversion.
The returns shown are based on net asset values calculated for shareholder transactions and may differ from the returns shown in the financial highlights, which reflect adjustments made to the net asset values in accordance with accounting principles generally accepted in the United States of America.
| 8 | J.P. MORGAN LARGE CAP FUNDS | JUNE 30, 2013 | ||||
Table of Contents
JPMorgan Growth and Income Fund
FUND COMMENTARY
TWELVE MONTHS ENDED JUNE 30, 2013 (Unaudited)
| REPORTING PERIOD RETURN: | ||||
| Fund (Class A Shares, without a sales charge)* | 25.65% | |||
| S&P 500/Citigroup Value Index | 25.04% | |||
| Net Assets as of 6/30/2013 (In Thousands) | $ | 395,216 | ||
INVESTMENT OBJECTIVE**
The JPMorgan Growth and Income Fund (the “Fund”) seeks to provide capital growth over the longterm and to earn income from dividends.
WHAT WERE THE MAIN DRIVERS OF THE FUND’S PERFORMANCE?
The Fund (Class A Shares, without a sales charge) outperformed the S&P 500/Citigroup Value Index (the “Benchmark”) for the twelve months ended June 30, 2013. The Fund’s stock selection in the financials and industrials sectors contributed to relative performance, while stock selection in the information technology and consumer discretionary sectors was the main detractor from relative performance.
Principal contributors to relative performance included the Fund’s positions in Prudential Financial, Inc., The Home Depot, Inc. and Hartford Financial Services Group, Inc. Prudential Financial, Inc., an insurance provider, reported strong revenue and earnings and announced a share buyback plan during the reporting period. The Home Depot, Inc., a leading home improvement chain, benefited from an improving housing market. Shares of Hartford Financial Services Group, Inc., an insurance and financial services company, rose as investors reacted positively to the company’s announced sale of its retirement plans business to Mass Mutual.
Principal detractors from relative performance included the Fund’s positioning in Berkshire Hathaway, Inc., Apple, Inc. and Ford Motor Co. An underweight position in Berkshire Hathaway, Inc. detracted from the Fund’s relative performance, as the multinational conglomerate holding company benefited from the ongoing economic recovery. An overweight position in Apple, Inc. detracted from the Fund’s relative performance as its shares fell amid intense competition with rivals and an outlook that fell short of analyst expectations. Shares of vehicle manufacturer Ford Motor Co. rallied as the company benefited from recovering car and truck sales in the U.S., as well as growing sales in emerging markets. As such, not having a position in Ford Motor Co. detracted from the Fund’s relative performance.
HOW WAS THE FUND POSITIONED?
The Fund’s portfolio managers focused on stock selection and aimed to invest in undervalued companies with durable
franchises, strong management and the ability to grow their intrinsic value per share. The Fund was overweight in the consumer discretionary sector, a sector in which the Fund’s portfolio managers found many of the qualities they typically seek, such as strong brands, recurring revenue business models and the consistent generation of free cash flow.
| TOP TEN EQUITY HOLDINGS OF THE PORTFOLIO*** | ||||||||
| 1. | Wells Fargo & Co. | 3.2 | % | |||||
| 2. | Johnson & Johnson | 2.8 | ||||||
| 3. | Exxon Mobil Corp. | 2.6 | ||||||
| 4. | Capital One Financial Corp. | 2.2 | ||||||
| 5. | Occidental Petroleum Corp. | 2.2 | ||||||
| 6. | Hartford Financial Services Group, Inc. | 2.1 | ||||||
| 7. | Home Depot, Inc. (The) | 2.0 | ||||||
| 8. | Citigroup, Inc. | 2.0 | ||||||
| 9. | Microsoft Corp. | 1.9 | ||||||
| 10. | Prudential Financial, Inc. | 1.9 | ||||||
PORTFOLIO COMPOSITION BY SECTOR*** | ||||
Financials | 32.7 | % | ||
Consumer Discretionary | 14.6 | |||
Health Care | 12.1 | |||
Energy | 11.7 | |||
Information Technology | 6.8 | |||
Consumer Staples | 6.0 | |||
Industrials | 5.9 | |||
Utilities | 2.7 | |||
Materials | 1.8 | |||
Telecommunication Services | 1.8 | |||
Short-Term Investment | 3.9 | |||
| * | The return shown is based on net asset values calculated for shareholder transactions and may differ from the return shown in the financial highlights, which reflects adjustments made to the net asset values in accordance with accounting principles generally accepted in the United States of America. |
| ** | The advisor seeks to achieve the Fund’s objective. There can be no guarantee it will be achieved. |
| *** | Percentages indicated are based on total investments as of June 30, 2013. The Fund’s portfolio composition is subject to change. |
| JUNE 30, 2013 | J.P. MORGAN LARGE CAP FUNDS | 9 | ||||||
Table of Contents
JPMorgan Growth and Income Fund
FUND COMMENTARY
TWELVE MONTHS ENDED JUNE 30, 2013 (Unaudited) (continued)
AVERAGE ANNUAL TOTAL RETURNS AS OF JUNE 30, 2013 | ||||||||||||||||
| INCEPTION DATE OF CLASS | 1 YEAR | 5 YEAR | 10 YEAR | |||||||||||||
CLASS A SHARES | 9/23/87 | |||||||||||||||
Without Sales Charge | 25.65 | % | 7.00 | % | 7.00 | % | ||||||||||
With Sales Charge* | 19.06 | 5.85 | 6.42 | |||||||||||||
CLASS B SHARES | 11/4/93 | |||||||||||||||
Without CDSC | 25.01 | 6.46 | 6.57 | |||||||||||||
With CDSC** | 20.01 | 6.15 | 6.57 | |||||||||||||
CLASS C SHARES | 1/2/98 | |||||||||||||||
Without CDSC | 25.02 | 6.47 | 6.47 | |||||||||||||
With CDSC*** | 24.02 | 6.47 | 6.47 | |||||||||||||
SELECT CLASS SHARES | 1/25/96 | 25.97 | 7.33 | 7.35 | ||||||||||||
| * | Sales Charge for Class A Shares is 5.25%. |
| ** | Assumes a 5% CDSC (contingent deferred sales charge) for the one year period, 2% CDSC for the five year period and 0% CDSC thereafter. |
| *** | Assumes a 1% CDSC for the one year period and 0% CDSC thereafter. |
TEN YEAR PERFORMANCE (6/30/03 TO 6/30/13)
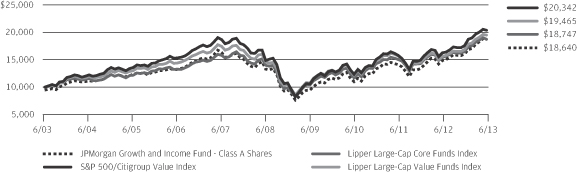
The performance quoted is past performance and is not a guarantee of future results. Mutual funds are subject to certain market risks. Investment returns and principal value of an investment will fluctuate so that an investor’s shares, when redeemed, may be worth more or less than their original cost. Current performance may be higher or lower than the performance data shown. For up-to-date month-end performance information please call 1-800-480-4111.
The graph illustrates comparative performance for $10,000 invested in Class A Shares of the JPMorgan Growth and Income Fund, S&P 500/Citigroup Value Index, the Lipper Large-Cap Core Funds Index and the Lipper Large-Cap Value Funds Index from June 30, 2003 to June 30, 2013. The performance of the Fund assumes reinvestment of all dividends and capital gain distributions, if any, and includes a sales charge. The performance of the S&P 500/Citigroup Value Index does not reflect the deduction of expenses or a sales charge associated with a mutual fund and has been adjusted to reflect reinvestment of all dividends and capital gain distributions of the securities included in the benchmark, if applicable. The performance of the Lipper Large-Cap Core Funds Index and the Lipper Large-Cap Value Funds Index includes expenses associated with a mutual fund, such as investment management fees. These expenses are not identical to the expenses incurred by the Fund. The S&P 500/Citigroup Value Index is an unmanaged index which includes the performance of large U.S.
companies with low price-to-book ratios relative to the S&P 500 Index. The Lipper Large-Cap Core Funds Index and the Lipper Large-Cap Value Funds Index are indices based on the total returns of certain groups of mutual funds as determined by Lipper, Inc. Investors cannot invest directly in an index.
Class A Shares have a $1,000 minimum initial investment and carry a 5.25% sales charge.
Fund performance may reflect the waiver of the Fund’s fees and reimbursement of expenses for certain periods since the inception date. Without these waivers and reimbursements, performance would have been lower. Also, performance shown in this section does not reflect the deduction of taxes that a shareholder would pay on Fund distributions or redemption of Fund shares.
Because Class B Shares automatically convert to Class A Shares after eight years, the 10 year average annual total return shown above for Class B reflects Class A performance for the period after conversion.
The returns shown are based on net asset values calculated for shareholder transactions and may differ from the returns shown in the financial highlights, which reflect adjustments made to the net asset values in accordance with accounting principles generally accepted in the United States of America.
| 10 | J.P. MORGAN LARGE CAP FUNDS | JUNE 30, 2013 | ||||
Table of Contents
JPMorgan Large Cap Growth Fund
FUND COMMENTARY
TWELVE MONTHS ENDED JUNE 30, 2013 (Unaudited)
| REPORTING PERIOD RETURN: | ||||
| Fund (Select Class Shares)* | 10.37% | |||
| Russell 1000 Growth Index | 17.07% | |||
| Net Assets as of 6/30/2013 (In Thousands) | $ | 11,562,905 | ||
INVESTMENT OBJECTIVE**
The JPMorgan Large Cap Growth Fund (the “Fund”) seeks long-term capital appreciation and growth of income by investing primarily in equity securities.
WHAT WERE THE MAIN DRIVERS OF THE FUND’S PERFORMANCE?
The Fund (Select Class Shares) underperformed the Russell 1000 Growth Index (the “Benchmark”) for the twelve months ended June 30, 2013. The Fund’s stock selection in the consumer discretionary and consumer staples sectors detracted from relative performance. The Fund’s stock selection in the financial services and materials and processing sectors contributed to relative performance.
Individual detractors from relative performance included the Fund’s positioning in Monster Beverage Corp., Inc., Intuitive Surgical, Inc. and Teradata Corp. Monster Beverage Corp., which manufactures energy drinks, natural soft drinks and fruit drinks, was the target of lawsuits following the death of two customers. Intuitive Surgical, Inc. manufactures robotic surgical systems, most notably the da Vinci Surgical System. Application and growth of its products in surgical procedures has fallen short of expectations, which weighed on its stock price. Teradata Corp., which provides data warehousing, analytics software and support services, reported lower-than-expected revenue and earnings for its fiscal first quarter.
Individual contributors to relative performance included the Fund’s overweight positions versus the Benchmark in Regeneron Pharmaceuticals, Inc., Biogen Idec, Inc. and MasterCard, Inc. Regeneron Pharmaceuticals, Inc., a biotechnology company, was rewarded for strong execution in its Eylea franchise, a treatment for wet macular degeneration. Shares of biotechnology company Biogen Idec, Inc. traded higher during the reporting period. It benefited from investors realizing the market potential for Tecfidera, the company’s oral medicine to treat relapsing forms of multiple sclerosis in adults, and the impact the drug could have on Biogen Idec’s top line growth. Shares of MasterCard, Inc. also benefited from strong earnings, as the credit card company was bolstered by increasing volumes.
HOW WAS THE FUND POSITIONED?
The Fund’s portfolio managers utilized a bottom-up approach to stock selection, rigorously researching individual companies in an effort to construct portfolios of stocks that have strong fundamentals and positive price momentum. The Fund’s portfolio managers sought to invest in companies with attractive fundamentals that, in their view, possessed the potential to significantly exceed expectations for a prolonged period of time.
| TOP TEN EQUITY HOLDINGS OF THE PORTFOLIO*** | ||||||||
| 1. | Google, Inc., Class A | 4.7 | % | |||||
| 2. | MasterCard, Inc., Class A | 4.0 | ||||||
| 3. | Biogen Idec, Inc. | 3.6 | ||||||
| 4. | Home Depot, Inc. (The) | 3.4 | ||||||
| 5. | Apple, Inc. | 3.2 | ||||||
| 6. | Gilead Sciences, Inc. | 3.1 | ||||||
| 7. | Visa, Inc., Class A | 2.9 | ||||||
| 8. | Union Pacific Corp. | 2.7 | ||||||
| 9. | Regeneron Pharmaceuticals, Inc. | 2.7 | ||||||
| 10. | Sherwin-Williams Co. (The) | 2.5 | ||||||
PORTFOLIO COMPOSITION BY SECTOR*** | ||||
| Information Technology | 26.3 | % | ||
| Consumer Discretionary | 20.7 | |||
| Health Care | 18.2 | |||
| Industrials | 9.5 | |||
| Consumer Staples | 7.3 | |||
| Materials | 7.2 | |||
| Financials | 4.7 | |||
| Energy | 3.7 | |||
| Short-Term Investment | 2.4 | |||
| * | The return shown is based on net asset values calculated for shareholder transactions and may differ from the return shown in the financial highlights, which reflects adjustments made to the net asset values in accordance with accounting principles generally accepted in the United States of America. |
| ** | The advisor seeks to achieve the Fund’s objective. There can be no guarantee it will be achieved. |
| *** | Percentages indicated are based on total investments as of June 30, 2013. The Fund’s portfolio composition is subject to change. |
| JUNE 30, 2013 | J.P. MORGAN LARGE CAP FUNDS | 11 | ||||||
Table of Contents
JPMorgan Large Cap Growth Fund
FUND COMMENTARY
TWELVE MONTHS ENDED JUNE 30, 2013 (Unaudited) (continued)
AVERAGE ANNUAL TOTAL RETURNS AS OF JUNE 30, 2013 | ||||||||||||||||
| INCEPTION DATE OF CLASS | 1 YEAR | 5 YEAR | 10 YEAR | |||||||||||||
CLASS A SHARES | 2/22/94 | |||||||||||||||
Without Sales Charge | 10.19 | % | 5.99 | % | 7.29 | % | ||||||||||
With Sales Charge* | 4.40 | 4.85 | 6.71 | |||||||||||||
CLASS B SHARES | 1/14/94 | |||||||||||||||
Without CDSC | 9.67 | 5.43 | 6.78 | |||||||||||||
With CDSC** | 4.67 | 5.10 | 6.78 | |||||||||||||
CLASS C SHARES | 11/4/97 | |||||||||||||||
Without CDSC | 9.60 | 5.44 | 6.69 | |||||||||||||
With CDSC*** | 8.60 | 5.44 | 6.69 | |||||||||||||
CLASS R2 SHARES | 11/3/08 | 9.91 | 5.73 | 7.02 | ||||||||||||
CLASS R5 SHARES | 4/14/09 | 10.56 | 6.39 | 7.62 | ||||||||||||
CLASS R6 SHARES | 11/30/10 | 10.66 | 6.42 | 7.64 | ||||||||||||
SELECT CLASS SHARES | 2/28/92 | 10.37 | 6.21 | 7.54 | ||||||||||||
| * | Sales Charge for Class A Shares is 5.25%. |
| ** | Assumes a 5% CDSC (contingent deferred sales charge) for the one year period, 2% CDSC for the five year period and 0% CDSC thereafter. |
| *** | Assumes a 1% CDSC for the one year period and 0% CDSC thereafter. |
TEN YEAR PERFORMANCE (6/30/03 TO 6/30/13)
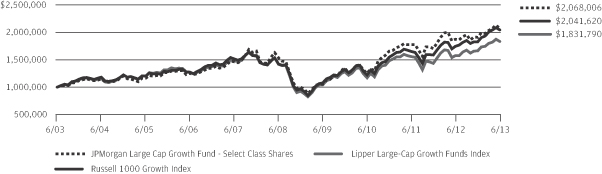
The performance quoted is past performance and is not a guarantee of future results. Mutual funds are subject to certain market risks. Investment returns and principal value of an investment will fluctuate so that an investor’s shares, when redeemed, may be worth more or less than their original cost. Current performance may be higher or lower than the performance data shown. For up-to-date month-end performance information please call 1-800-480-4111.
Returns for Class R2, Class R5 and Class R6 Shares prior to their inception date are based on the performance of Select Class Shares. With respect to Class R2 Shares, prior class performance has been adjusted to reflect the differences in expenses between classes. The actual returns of Class R5 and Class R6 Shares would have been different than shown because Class R5 and Class R6 Shares have different expenses than Select Class Shares.
The graph illustrates comparative performance for $1,000,000 invested in Select Class Shares of the JPMorgan Large Cap Growth Fund, Russell 1000 Growth Index and the Lipper Large-Cap Growth Funds Index from June 30, 2003 to June 30, 2013. The performance of the Fund assumes reinvestment of all dividends and capital gain distributions, if any, and does not include a sales charge. The performance of the Russell 1000 Growth Index does not reflect the deduction of expenses or a sales charge associated with a mutual fund and has been adjusted to reflect reinvestment of all dividends and capital gain distributions of the securities included in the benchmark, if applicable. The performance of the Lipper Large-Cap Growth Funds Index includes expenses
associated with a mutual fund, such as investment management fees. These expenses are not identical to the expenses incurred by the Fund. The Russell 1000 Growth Index is an unmanaged index which measures the performance of those Russell 1000 companies with higher price-to-book ratios and higher forecasted growth values. The Lipper Large-Cap Growth Funds Index is an index based on total returns of certain mutual funds within the Fund’s designated category as determined by Lipper, Inc. Investors cannot invest directly in an index.
Select Class Shares have a $1,000,000 minimum initial investment.
Fund performance may reflect the waiver of the Fund’s fees and reimbursement of expenses for certain periods since the inception date. Without these waivers and reimbursements, performance would have been lower. Also, performance shown in this section does not reflect the deduction of taxes that a shareholder would pay on Fund distributions or redemption of Fund shares.
Because Class B Shares automatically convert to Class A Shares after eight years, the 10 year average annual total return shown above for Class B reflects Class A performance for the period after conversion.
The returns shown are based on net asset values calculated for shareholder transactions and may differ from the returns shown in the financial highlights, which reflect adjustments made to the net asset values in accordance with accounting principles generally accepted in the United States of America.
| 12 | J.P. MORGAN LARGE CAP FUNDS | JUNE 30, 2013 | ||||
Table of Contents
FUND COMMENTARY
TWELVE MONTHS ENDED JUNE 30, 2013 (Unaudited)
| REPORTING PERIOD RETURN: | ||||
| Fund (Select Class Shares)* | 28.65% | |||
| Russell 1000 Value Index | 25.32% | |||
| Net Assets as of 6/30/2013 (In Thousands) | $ | 696,421 | ||
INVESTMENT OBJECTIVE**
The JPMorgan Large Cap Value Fund (the “Fund”) seeks capital appreciation with the incidental goal of achieving current income by investing primarily in equity securities.
Effective August 1, 2012, there was a portfolio management change for the Fund. There was no change to the Fund’s investment strategy or objective.
WHAT WERE THE MAIN DRIVERS OF THE FUND’S PERFORMANCE?
The Fund (Select Class Shares) outperformed the Russell 1000 Value Index (the “Benchmark”) for the twelve months ended June 30, 2013. The Fund’s stock selection in the financials and health care sectors was the main contributor to relative performance. Stock selection in the information technology and materials sectors detracted from relative performance.
Individual contributors to performance relative to the Benchmark included the Fund’s positions in Citigroup, Inc., Valeant Pharmaceuticals and Celgene Corp. Shares of Citigroup, Inc., a multinational banking and financial services company, moved sharply higher during the reporting period amid, among other things, improved operating results. Investors also reacted positively to Citigroup’s proposed restructuring plan. Valeant Pharmaceuticals, which focuses on neurology, dermatology and infectious diseases, raised guidance for its fiscal year 2013 earnings. Shares of Celgene Corp., a multinational biopharmaceutical company, rose on higher projections for revenue and earnings.
Principal detractors to relative performance included the Fund’s positioning in Berkshire Hathaway, Inc., Procter & Gamble Co., Inc. and General Electric Co. Berkshire Hathaway, Inc. is a multinational conglomerate holding company. Its shares moved sharply higher during the reporting period, but the Fund did not have a position in the company. As such, this was a negative for the Fund’s relative results. Also detracting from relative performance was Procter & Gamble Co., Inc., a multinational consumer goods company. Its shares fell as the company lowered its earnings forecast and replaced its Chief Executive Officer during the reporting period. An underweight in multinational conglomerate General Electric Co. detracted from relative performance as its shares rallied during the reporting period.
HOW WAS THE FUND POSITIONED?
The Fund’s portfolio managers combined a bottom-up fundamental approach to stock selection with a systematic valuation process. Overall, the Fund’s portfolio managers looked to take advantage of mispriced stocks that they believed appeared attractive relative to their fair value.
| TOP TEN EQUITY HOLDINGS OF THE PORTFOLIO*** | ||||||||
| 1. | Exxon Mobil Corp. | 4.5 | % | |||||
| 2. | Citigroup, Inc. | 4.3 | ||||||
| 3. | Chevron Corp. | 4.1 | ||||||
| 4. | Wells Fargo & Co. | 3.9 | ||||||
| 5. | Johnson & Johnson | 3.3 | ||||||
| 6. | UnitedHealth Group, Inc. | 2.8 | ||||||
| 7. | Time Warner, Inc. | 2.3 | ||||||
| 8. | Invesco Ltd. | 2.2 | ||||||
| 9. | Cisco Systems, Inc. | 2.2 | ||||||
| 10. | ACE Ltd., (Switzerland) | 2.1 | ||||||
PORTFOLIO COMPOSITION BY SECTOR*** | ||||
| Financials | 28.2 | % | ||
| Energy | 15.8 | |||
| Consumer Discretionary | 11.7 | |||
| Health Care | 11.5 | |||
| Industrials | 9.7 | |||
| Information Technology | 8.3 | |||
| Consumer Staples | 5.3 | |||
| Utilities | 3.4 | |||
| Materials | 3.3 | |||
| Telecommunication Services | 1.7 | |||
| Short-Term Investment | 1.1 | |||
| * | The return shown is based on net asset values calculated for shareholder transactions and may differ from the return shown in the financial highlights, which reflects adjustments made to the net asset values in accordance with accounting principles generally accepted in the United States of America. |
| ** | The advisor seeks to achieve the Fund’s objective. There can be no guarantee it will be achieved. |
| *** | Percentages indicated are based on total investments as of June 30, 2013. The Fund’s portfolio composition is subject to change. |
| JUNE 30, 2013 | J.P. MORGAN LARGE CAP FUNDS | 13 | ||||||
Table of Contents
JPMorgan Large Cap Value Fund
FUND COMMENTARY
TWELVE MONTHS ENDED JUNE 30, 2013 (Unaudited) (continued)
AVERAGE ANNUAL TOTAL RETURNS AS OF JUNE 30, 2013 |
| INCEPTION DATE OF CLASS | 1 YEAR | 5 YEAR | 10 YEAR | |||||||||||||
CLASS A SHARES | 2/18/92 | |||||||||||||||
Without Sales Charge | 28.38 | % | 6.99 | % | 6.75 | % | ||||||||||
With Sales Charge* | 21.65 | 5.84 | 6.18 | |||||||||||||
CLASS B SHARES | 1/14/94 | |||||||||||||||
Without CDSC | 27.88 | 6.47 | 6.26 | |||||||||||||
With CDSC** | 22.88 | 6.16 | 6.26 | |||||||||||||
CLASS C SHARES | 3/22/99 | |||||||||||||||
Without CDSC | 27.77 | 6.47 | 6.15 | |||||||||||||
With CDSC*** | 26.77 | 6.47 | 6.15 | |||||||||||||
CLASS R2 SHARES | 11/3/08 | 28.19 | 6.75 | 6.47 | ||||||||||||
CLASS R5 SHARES | 5/15/06 | 28.96 | 7.45 | 7.15 | ||||||||||||
CLASS R6 SHARES | 11/30/10 | 28.94 | 7.47 | 7.16 | ||||||||||||
SELECT CLASS SHARES | 3/1/91 | 28.65 | 7.21 | 6.98 | ||||||||||||
| * | Sales Charge for Class A Shares is 5.25%. |
| ** | Assumes a 5% CDSC (contingent deferred sales charge) for the one year period, 2% CDSC for the five year period and 0% CDSC thereafter. |
| *** | Assumes a 1% CDSC for the one year period and 0% CDSC thereafter. |
TEN YEAR PERFORMANCE (6/30/03 TO 6/30/13)
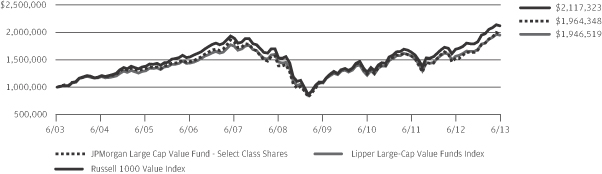
The performance quoted is past performance and is not a guarantee of future results. Mutual funds are subject to certain market risks. Investment returns and principal value of an investment will fluctuate so that an investor’s shares, when redeemed, may be worth more or less than their original cost. Current performance may be higher or lower than the performance data shown. For up-to-date month-end performance information please call 1-800-480-4111.
Returns for the Class R2 and Class R5 Shares prior to their inception date are based on the performance of Select Class Shares. With respect to Class R2 Shares, prior Class performance has been adjusted to reflect the differences in expenses between classes. The actual returns of Class R5 Shares would have been different than shown because Class R5 Shares have different expenses than Select Class Shares.
Returns for Class R6 Shares prior to its inception date are based on the performance of Class R5 Shares and, prior to May 15, 2006, Select Class Shares. The actual returns for Class R6 Shares would have been different than shown because Class R6 Shares have different expenses than Class R5 and Select Class Shares.
The graph illustrates comparative performance for $1,000,000 invested in Select Class Shares of the JPMorgan Large Cap Value Fund, Russell 1000 Value Index and the Lipper Large-Cap Value Funds Index from June 30, 2003 to June 30, 2013. The performance of the Fund assumes reinvestment of all dividends and capital gain distributions if any, and does not include a sales charge. The performance of the Russell 1000 Value Index does not reflect the deduction of expenses or a sales charge associated with a mutual fund and has
been adjusted to reflect reinvestment of all dividends and capital gain distributions of the securities included in the benchmark, if applicable. The performance of the Lipper Large-Cap Value Funds Index includes expenses associated with a mutual fund, such as investment management fees. These expenses are not identical to the expenses incurred by the Fund. The Russell 1000 Value Index is an unmanaged index which measures the performance of those Russell 1000 companies with lower price-to-book ratios and lower forecasted growth values. The Lipper Large-Cap Value Funds Index is an index based on the total returns of certain mutual funds within the Fund’s designated category as determined by Lipper, Inc. Investors cannot invest directly in an index.
Select Class Shares have a $1,000,000 minimum initial investment.
Fund performance may reflect the waiver of the Fund’s fees and reimbursement of expenses for certain periods since the inception date. Without these waivers and reimbursements, performance would have been lower. Also, performance shown in this section does not reflect the deduction of taxes that a shareholder would pay on Fund distributions or redemption of Fund shares.
Because Class B Shares automatically convert to Class A Shares after eight years, the 10 year average annual total return shown above for Class B reflects Class A performance for the period after conversion.
The returns shown are based on net asset values calculated for shareholder transactions and may differ from the returns shown in the financial highlights, which reflect adjustments made to the net asset values in accordance with accounting principles generally accepted in the United States of America.
| 14 | J.P. MORGAN LARGE CAP FUNDS | JUNE 30, 2013 | ||||
Table of Contents
FUND COMMENTARY
TWELVE MONTHS ENDED JUNE 30, 2013 (Unaudited)
| REPORTING PERIOD RETURN: | ||||
| Fund (Institutional Class Shares)* | 23.38% | |||
| S&P 500 Index | 20.60% | |||
| Net Assets as of 6/30/2013 (In Thousands) | $ | 7,987,283 | ||
INVESTMENT OBJECTIVE**
The JPMorgan U.S. Equity Fund (the “Fund”) seeks to provide high total return from a portfolio of selected equity securities.
WHAT WERE THE MAIN DRIVERS OF THE FUND’S PERFORMANCE?
The Fund (Institutional Class Shares) outperformed the S&P 500 Index (the “Benchmark”) for the twelve months ended June 30, 2013. Stock selection in the pharmaceutical/medical technology and auto and transportation sectors contributed to performance relative to the Benchmark. Stock selection in the health services and systems and systems and network hardware sectors detracted from relative performance.
Individual contributors to relative performance included the Fund’s overweight positions versus the Benchmark in General Motors Co., Cisco Systems, Inc. and Biogen Idec., Inc. Automaker General Motors Co. reported strong sales and growing market share in both the U.S. and globally during the reporting period. Cisco Systems, Inc., a manufacturer of networking equipment, gained on higher-than-expected earnings during the company’s fiscal third quarter. Shares of Biogen Idec, Inc., a biotechnology company specializing in drugs for neurological disorders, autoimmune disorders and cancer, gained after the company received patent protection for a key drug.
Individual detractors from relative performance included the Fund’s positions in Walter Energy, Inc., Occidental Petroleum Corp. and Merck & Co., Inc. Walter Energy, Inc. is a producer and exporter of metallurgical coals. The company’s share price decline underscored continued deterioration in global metallurgical coal fundamentals. Shares of Occidental Petroleum Corp., a global energy firm, struggled due to concerns about slowing profit growth. Merck & Co., a pharmaceutical company, lost patent protection for a key drug and encountered headwinds from both U.S. health care reform and European austerity.
HOW WAS THE FUND POSITIONED?
The Fund’s portfolio managers employed a bottom-up fundamental approach to stock selection, researching companies to determine what they believed to be their underlying value and potential for future earnings growth. As a result of the Fund’s
bottom-up fundamental approach to stock selection, the Fund was overweight versus the Benchmark in the auto and transportation and financial services sectors. The Fund was underweight versus the Benchmark in the industrial cyclical and consumer stable sectors.
| TOP TEN EQUITY HOLDINGS OF THE PORTFOLIO*** | ||||||||
| 1. | Johnson & Johnson | 3.3 | % | |||||
| 2. | Google, Inc., Class A | 3.0 | ||||||
| 3. | Time Warner, Inc. | 2.6 | ||||||
| 4. | United Technologies Corp. | 2.3 | ||||||
| 5. | Wells Fargo & Co. | 2.2 | ||||||
| 6. | Schlumberger Ltd. | 2.1 | ||||||
| 7. | Apple, Inc. | 2.0 | ||||||
| 8. | Microsoft Corp. | 1.8 | ||||||
| 9. | Citigroup, Inc. | 1.8 | ||||||
| 10. | Comcast Corp., Class A | 1.7 | ||||||
PORTFOLIO COMPOSITION BY SECTOR*** | ||||
| Information Technology | 18.8 | % | ||
| Consumer Discretionary | 16.9 | |||
| Financials | 15.3 | |||
| Health Care | 13.8 | |||
| Industrials | 10.4 | |||
| Energy | 10.4 | |||
| Consumer Staples | 7.8 | |||
| Materials | 2.5 | |||
| Utilities | 1.7 | |||
| Telecommunication Services | 0.9 | |||
| Short-Term Investment | 1.5 | |||
| * | The return shown is based on net asset values calculated for shareholder transactions and may differ from the return shown in the financial highlights, which reflects adjustments made to the net asset values in accordance with accounting principles generally accepted in the United States of America. |
| ** | The advisor seeks to achieve the Fund’s objective. There can be no guarantee it will be achieved. |
| *** | Percentages indicated are based on total investments as of June 30, 2013. The Fund’s portfolio composition is subject to change. |
| JUNE 30, 2013 | J.P. MORGAN LARGE CAP FUNDS | 15 | ||||||
Table of Contents
JPMorgan U.S. Equity Fund
FUND COMMENTARY
TWELVE MONTHS ENDED JUNE 30, 2013 (Unaudited) (continued)
AVERAGE ANNUAL TOTAL RETURNS AS OF JUNE 30, 2013 | ||||||||||||||||
| INCEPTION DATE OF CLASS | 1 YEAR | 5 YEAR | 10 YEAR | |||||||||||||
CLASS A SHARES | 9/10/01 | |||||||||||||||
Without Sales Charge | 22.95 | % | 7.79 | % | 8.03 | % | ||||||||||
With Sales Charge* | 16.54 | 6.64 | 7.46 | |||||||||||||
CLASS B SHARES | 9/10/01 | |||||||||||||||
Without CDSC | 22.36 | 7.24 | 7.57 | |||||||||||||
With CDSC** | 17.36 | 6.94 | 7.57 | |||||||||||||
CLASS C SHARES | 9/10/01 | |||||||||||||||
Without CDSC | 22.33 | 7.27 | 7.46 | |||||||||||||
With CDSC*** | 21.33 | 7.27 | 7.46 | |||||||||||||
CLASS R2 SHARES | 11/3/08 | 22.61 | 7.54 | 7.91 | ||||||||||||
CLASS R5 SHARES | 5/15/06 | 23.43 | 8.25 | 8.49 | ||||||||||||
CLASS R6 SHARES | 11/30/10 | 23.46 | 8.29 | 8.52 | ||||||||||||
INSTITUTIONAL CLASS SHARES | 9/17/93 | 23.38 | 8.20 | 8.46 | ||||||||||||
SELECT CLASS SHARES | 9/10/01 | 23.24 | 8.04 | 8.29 | ||||||||||||
| * | Sales Charge for Class A Shares is 5.25%. |
| ** | Assumes a 5% CDSC (contingent deferred sales charge) for the one year period, 2% CDSC for the five year period and 0% CDSC thereafter. |
| *** | Assumes a 1% CDSC for the one year period and 0% CDSC thereafter. |
TEN YEAR PERFORMANCE (6/30/03 TO 6/30/13)
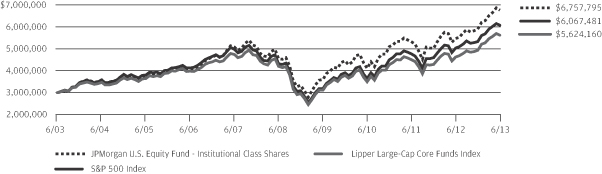
The performance quoted is past performance and is not a guarantee of future results. Mutual funds are subject to certain market risks. Investment returns and principal value of an investment will fluctuate so that an investor’s shares, when redeemed, may be worth more or less than their original cost. Current performance may be higher or lower than the performance data shown. For up-to-date month-end performance information please call 1-800-480-4111.
Returns for Class R2 Shares prior to its inception date are based on the performance of Class A Shares. The actual returns of Class R2 Shares would have been lower than shown because Class R2 Shares have higher expenses than Class A Shares. Returns for the Class R5 Shares prior to its inception date are based on the performance of Institutional Class Shares. The actual returns of Class R5 Shares would have been different than those shown because Class R5 Shares have different expenses than Institutional Class Shares.
Returns for Class R6 Shares prior to its inception date are based on the performance of Class R5 Shares and, prior to May 15, 2006, Institutional Class Shares. The actual returns for Class R6 Shares would have been different than shown because Class R6 Shares have different expenses than Class R5 and Institutional Class Shares.
The graph illustrates comparative performance for $3,000,000 invested in Institutional Class Shares of the JPMorgan U.S. Equity Fund, S&P 500 Index and Lipper Large-Cap Core Funds Index from June 30, 2003 to June 30, 2013. The performance of the Fund assumes reinvestment of all dividends and capital gain distributions, if any, and does not include a sales charge. The performance of the S&P 500 Index does not reflect the deduction of expenses or a sales
charge associated with a mutual fund and has been adjusted to reflect reinvestment of all dividends and capital gain distributions of the securities included in the benchmark, if applicable. The performance of the Lipper Large-Cap Core Funds Index includes expenses associated with a mutual fund, such as investment management fees. These expenses are not identical to the expenses incurred by the Fund. The S&P 500 Index is an unmanaged index generally representative of the performance of large companies in the U.S. stock market. The Lipper Large-Cap Core Funds Index is an index based on the total returns of certain mutual funds within the Fund’s designated category as determined by Lipper, Inc. Investors cannot invest directly in an index.
Institutional Class Shares have a $3,000,000 minimum initial investment.
Fund performance may reflect the waiver of the Fund’s fees and reimbursement of expenses for certain periods since the inception date. Without these waivers and reimbursements, performance would have been lower. Also, performance shown in this section does not reflect the deduction of taxes that a shareholder would pay on Fund distributions or redemption of Fund shares.
Because Class B Shares automatically convert to Class A Shares after eight years, the 10 year average annual total return shown above for Class B reflects Class A performance for the period after conversion.
The returns shown are based on net asset values calculated for shareholder transactions and may differ from the returns shown in the financial highlights, which reflect adjustments made to the net asset values in accordance with accounting principles generally accepted in the United States of America.
| 16 | J.P. MORGAN LARGE CAP FUNDS | JUNE 30, 2013 | ||||
Table of Contents
JPMorgan Disciplined Equity Fund
SCHEDULE OF PORTFOLIO INVESTMENTS
AS OF JUNE 30, 2013
(Amounts in thousands)
| SHARES | SECURITY DESCRIPTION | VALUE($) | ||||||
| Long Positions — 101.1% |
| ||||||
| Common Stocks — 99.3% |
| ||||||
Consumer Discretionary — 15.5% |
| |||||||
Auto Components — 0.8% |
| |||||||
| 186 | Johnson Controls, Inc. | 6,642 | ||||||
| 119 | TRW Automotive Holdings Corp. (a) | 7,900 | ||||||
|
| |||||||
| 14,542 | ||||||||
|
| |||||||
Automobiles — 1.5% |
| |||||||
| 316 | Ford Motor Co. | 4,889 | ||||||
| 653 | General Motors Co. (a) | 21,742 | ||||||
|
| |||||||
| 26,631 | ||||||||
|
| |||||||
Hotels, Restaurants & Leisure — 1.5% |
| |||||||
| 124 | McDonald’s Corp. | 12,226 | ||||||
| 156 | Royal Caribbean Cruises Ltd. | 5,211 | ||||||
| 141 | Starbucks Corp. | 9,241 | ||||||
|
| |||||||
| 26,678 | ||||||||
|
| |||||||
Household Durables — 0.4% |
| |||||||
| 108 | Lennar Corp., Class A | 3,907 | ||||||
| 222 | PulteGroup, Inc. (a) | 4,206 | ||||||
|
| |||||||
| 8,113 | ||||||||
|
| |||||||
Internet & Catalog Retail — 0.5% |
| |||||||
| 10 | Expedia, Inc. | 589 | ||||||
| 11 | priceline.com, Inc. (a) | 8,685 | ||||||
|
| |||||||
| 9,274 | ||||||||
|
| |||||||
Media — 4.2% |
| |||||||
| 621 | Comcast Corp., Class A | 26,024 | ||||||
| 197 | DIRECTV (a) | 12,145 | ||||||
| 93 | Time Warner Cable, Inc. | 10,495 | ||||||
| 495 | Time Warner, Inc. | 28,631 | ||||||
|
| |||||||
| 77,295 | ||||||||
|
| |||||||
Multiline Retail — 2.5% |
| |||||||
| 240 | J.C. Penney Co., Inc. (a) | 4,104 | ||||||
| 374 | Macy’s, Inc. | 17,952 | ||||||
| 128 | Nordstrom, Inc. | 7,696 | ||||||
| 242 | Target Corp. | 16,682 | ||||||
|
| |||||||
| 46,434 | ||||||||
|
| |||||||
Specialty Retail — 3.3% |
| |||||||
| 24 | Abercrombie & Fitch Co., Class A | 1,104 | ||||||
| 16 | AutoZone, Inc. (a) | 6,932 | ||||||
| 156 | CST Brands, Inc. (a) | 4,803 | ||||||
| 157 | Home Depot, Inc. (The) | 12,132 | ||||||
| 404 | Lowe’s Cos., Inc. | 16,509 | ||||||
| 230 | TJX Cos., Inc. | 11,519 | ||||||
| SHARES | SECURITY DESCRIPTION | VALUE($) | ||||||
Specialty Retail — Continued |
| |||||||
| 127 | Williams-Sonoma, Inc. | 7,115 | ||||||
|
| |||||||
| 60,114 | ||||||||
|
| |||||||
Textiles, Apparel & Luxury Goods — 0.8% |
| |||||||
| 73 | V.F. Corp. | 14,076 | ||||||
|
| |||||||
Total Consumer Discretionary | 283,157 | |||||||
|
| |||||||
Consumer Staples — 7.2% |
| |||||||
Beverages — 1.1% |
| |||||||
| 421 | Coca-Cola Co. (The) | 16,891 | ||||||
| 80 | Coca-Cola Enterprises, Inc. | 2,795 | ||||||
|
| |||||||
| 19,686 | ||||||||
|
| |||||||
Food & Staples Retailing — 1.0% |
| |||||||
| 336 | CVS Caremark Corp. | 19,190 | ||||||
|
| |||||||
Food Products — 1.5% |
| |||||||
| 461 | Archer-Daniels-Midland Co. | 15,626 | ||||||
| 51 | ConAgra Foods, Inc. | 1,774 | ||||||
| 217 | Mondelez International, Inc., Class A | 6,191 | ||||||
| 149 | Tyson Foods, Inc., Class A | 3,819 | ||||||
|
| |||||||
| 27,410 | ||||||||
|
| |||||||
Household Products — 2.1% |
| |||||||
| 125 | Kimberly-Clark Corp. | 12,171 | ||||||
| 343 | Procter & Gamble Co. (The) | 26,421 | ||||||
|
| |||||||
| 38,592 | ||||||||
|
| |||||||
Tobacco — 1.5% |
| |||||||
| 314 | Philip Morris International, Inc. | 27,169 | ||||||
|
| |||||||
Total Consumer Staples | 132,047 | |||||||
|
| |||||||
Energy — 11.8% |
| |||||||
Energy Equipment & Services — 4.0% |
| |||||||
| 79 | Baker Hughes, Inc. | 3,654 | ||||||
| 215 | Cameron International Corp. (a) | 13,162 | ||||||
| 304 | Ensco plc, (United Kingdom), Class A | 17,657 | ||||||
| 268 | Noble Corp., (Switzerland) | 10,083 | ||||||
| 67 | Rowan Cos. plc, Class A (a) | 2,279 | ||||||
| 380 | Schlumberger Ltd. | 27,202 | ||||||
|
| |||||||
| 74,037 | ||||||||
|
| |||||||
Oil, Gas & Consumable Fuels — 7.8% |
| |||||||
| 145 | Anadarko Petroleum Corp. | 12,443 | ||||||
| 106 | Apache Corp. | 8,886 | ||||||
| 190 | Cheniere Energy, Inc. (a) | 5,280 | ||||||
| 283 | Chevron Corp. | 33,504 | ||||||
| 242 | ConocoPhillips | 14,647 | ||||||
| 559 | Exxon Mobil Corp. | 50,550 | ||||||
SEE NOTES TO FINANCIAL STATEMENTS.
| JUNE 30, 2013 | J.P. MORGAN LARGE CAP FUNDS | 17 | ||||||
Table of Contents
JPMorgan Disciplined Equity Fund
SCHEDULE OF PORTFOLIO INVESTMENTS
AS OF JUNE 30, 2013 (continued)
(Amounts in thousands)
| SHARES | SECURITY DESCRIPTION | VALUE($) | ||||||
| Long Positions — Continued |
| ||||||
| Common Stocks — Continued |
| ||||||
Oil, Gas & Consumable Fuels — Continued |
| |||||||
| 55 | Marathon Petroleum Corp. | 3,915 | ||||||
| 119 | Phillips 66 | 6,981 | ||||||
| 175 | Williams Cos., Inc. (The) | 5,692 | ||||||
|
| |||||||
| 141,898 | ||||||||
|
| |||||||
Total Energy | 215,935 | |||||||
|
| |||||||
Financials — 15.5% |
| |||||||
Capital Markets — 2.2% |
| |||||||
| 68 | Goldman Sachs Group, Inc. (The) | 10,333 | ||||||
| 274 | Invesco Ltd. | 8,706 | ||||||
| 479 | Morgan Stanley | 11,707 | ||||||
| 147 | State Street Corp. | 9,567 | ||||||
|
| |||||||
| 40,313 | ||||||||
|
| |||||||
Commercial Banks — 3.9% |
| |||||||
| 141 | BB&T Corp. | 4,763 | ||||||
| 43 | Cathay General Bancorp | 869 | ||||||
| 67 | East West Bancorp, Inc. | 1,834 | ||||||
| 245 | Huntington Bancshares, Inc. | 1,931 | ||||||
| 119 | SunTrust Banks, Inc. | 3,760 | ||||||
| 25 | SVB Financial Group (a) | 2,058 | ||||||
| 443 | U.S. Bancorp | 16,025 | ||||||
| 990 | Wells Fargo & Co. | 40,876 | ||||||
|
| |||||||
| 72,116 | ||||||||
|
| |||||||
Consumer Finance — 0.9% |
| |||||||
| 263 | Capital One Financial Corp. | 16,533 | ||||||
|
| |||||||
Diversified Financial Services — 3.9% |
| |||||||
| 1,901 | Bank of America Corp. | 24,443 | ||||||
| 700 | Citigroup, Inc. | 33,567 | ||||||
| 71 | IntercontinentalExchange, Inc. (a) | 12,532 | ||||||
|
| |||||||
| 70,542 | ||||||||
|
| |||||||
Insurance — 3.6% |
| |||||||
| 143 | ACE Ltd., (Switzerland) | 12,798 | ||||||
| 72 | Aon plc, (United Kingdom) | 4,620 | ||||||
| 60 | Berkshire Hathaway, Inc., Class B (a) | 6,738 | ||||||
| 237 | Hartford Financial Services Group, Inc. | 7,337 | ||||||
| 67 | Lincoln National Corp. | 2,425 | ||||||
| 581 | MetLife, Inc. | 26,586 | ||||||
| 71 | Prudential Financial, Inc. | 5,157 | ||||||
|
| |||||||
| 65,661 | ||||||||
|
| |||||||
Real Estate Investment Trusts (REITs) — 0.8% |
| |||||||
| 163 | Apartment Investment & Management Co., Class A | 4,902 | ||||||
| 60 | Brandywine Realty Trust | 806 | ||||||
| SHARES | SECURITY DESCRIPTION | VALUE($) | ||||||
Real Estate Investment Trusts (REITs) — Continued |
| |||||||
| 217 | DiamondRock Hospitality Co. | 2,026 | ||||||
| 116 | LaSalle Hotel Properties | 2,865 | ||||||
| 77 | Post Properties, Inc. | 3,811 | ||||||
|
| |||||||
| 14,410 | ||||||||
|
| |||||||
Real Estate Management & Development — 0.2% |
| |||||||
| 137 | St. Joe Co. (The) (a) | 2,884 | ||||||
|
| |||||||
Total Financials | 282,459 | |||||||
|
| |||||||
Health Care — 12.9% |
| |||||||
Biotechnology — 3.0% |
| |||||||
| 108 | Alexion Pharmaceuticals, Inc. (a) | 9,925 | ||||||
| 74 | Biogen Idec, Inc. (a) | 15,839 | ||||||
| 129 | Celgene Corp. (a) | 15,078 | ||||||
| 79 | Onyx Pharmaceuticals, Inc. (a) | 8,556 | ||||||
| 67 | Vertex Pharmaceuticals, Inc. (a) | 5,319 | ||||||
|
| |||||||
| 54,717 | ||||||||
|
| |||||||
Health Care Equipment & Supplies — 1.3% |
| |||||||
| 120 | Baxter International, Inc. | 8,278 | ||||||
| 143 | Covidien plc, (Ireland) | 8,991 | ||||||
| 12 | Intuitive Surgical, Inc. (a) | 5,876 | ||||||
|
| |||||||
| 23,145 | ||||||||
|
| |||||||
Health Care Providers & Services — 2.3% |
| |||||||
| 52 | Cigna Corp. | 3,777 | ||||||
| 55 | DaVita HealthCare Partners, Inc. (a) | 6,644 | ||||||
| 123 | Humana, Inc. | 10,372 | ||||||
| 337 | UnitedHealth Group, Inc. | 22,039 | ||||||
|
| |||||||
| 42,832 | ||||||||
|
| |||||||
Health Care Technology — 0.2% |
| |||||||
| 28 | athenahealth, Inc. (a) | 2,372 | ||||||
| 25 | Cerner Corp. (a) | 2,364 | ||||||
|
| |||||||
| 4,736 | ||||||||
|
| |||||||
Life Sciences Tools & Services — 0.2% |
| |||||||
| 17 | Mettler-Toledo International, Inc. (a) | 3,461 | ||||||
|
| |||||||
Pharmaceuticals — 5.9% |
| |||||||
| 44 | Allergan, Inc. | 3,673 | ||||||
| 532 | Bristol-Myers Squibb Co. | 23,780 | ||||||
| 645 | Johnson & Johnson | 55,345 | ||||||
| 438 | Merck & Co., Inc. | 20,347 | ||||||
| 49 | Valeant Pharmaceuticals International, Inc. (a) | 4,218 | ||||||
|
| |||||||
| 107,363 | ||||||||
|
| |||||||
Total Health Care | 236,254 | |||||||
|
| |||||||
SEE NOTES TO FINANCIAL STATEMENTS.
| 18 | J.P. MORGAN LARGE CAP FUNDS | JUNE 30, 2013 | ||||
Table of Contents
| SHARES | SECURITY DESCRIPTION | VALUE($) | ||||||
| Long Positions — Continued |
| ||||||
| Common Stocks — Continued |
| ||||||
Industrials — 11.3% |
| |||||||
Aerospace & Defense — 2.7% |
| |||||||
| 237 | Honeywell International, Inc. | 18,820 | ||||||
| 14 | Rockwell Collins, Inc. | 900 | ||||||
| 322 | United Technologies Corp. | 29,881 | ||||||
|
| |||||||
| 49,601 | ||||||||
|
| |||||||
Airlines — 0.9% |
| |||||||
| 335 | Delta Air Lines, Inc. (a) | 6,262 | ||||||
| 494 | Southwest Airlines Co. | 6,368 | ||||||
| 236 | U.S. Airways Group, Inc. (a) | 3,878 | ||||||
|
| |||||||
| 16,508 | ||||||||
|
| |||||||
Building Products — 0.5% |
| |||||||
| 413 | Masco Corp. | 8,047 | ||||||
|
| |||||||
Construction & Engineering — 1.6% |
| |||||||
| 420 | Fluor Corp. | 24,890 | ||||||
| 123 | KBR, Inc. | 3,991 | ||||||
|
| |||||||
| 28,881 | ||||||||
|
| |||||||
Electrical Equipment — 0.6% |
| |||||||
| 204 | Emerson Electric Co. | 11,108 | ||||||
|
| |||||||
Machinery — 1.4% |
| |||||||
| 16 | Flowserve Corp. | 859 | ||||||
| 391 | PACCAR, Inc. | 20,968 | ||||||
| 53 | SPX Corp. | 3,812 | ||||||
|
| |||||||
| 25,639 | ||||||||
|
| |||||||
Road & Rail — 3.6% |
| |||||||
| 827 | CSX Corp. | 19,176 | ||||||
| 253 | Hertz Global Holdings, Inc. (a) | 6,262 | ||||||
| 258 | Norfolk Southern Corp. | 18,729 | ||||||
| 142 | Union Pacific Corp. | 21,859 | ||||||
|
| |||||||
| 66,026 | ||||||||
|
| |||||||
Total Industrials | 205,810 | |||||||
|
| |||||||
Information Technology — 18.1% |
| |||||||
Communications Equipment — 2.8% |
| |||||||
| 1,458 | Cisco Systems, Inc. | 35,433 | ||||||
| 271 | QUALCOMM, Inc. | 16,553 | ||||||
|
| |||||||
| 51,986 | ||||||||
|
| |||||||
Computers & Peripherals — 3.6% |
| |||||||
| 98 | Apple, Inc. | 38,939 | ||||||
| 418 | EMC Corp. | 9,864 | ||||||
| 544 | Hewlett-Packard Co. | 13,491 | ||||||
| 92 | NetApp, Inc. (a) | 3,464 | ||||||
|
| |||||||
| 65,758 | ||||||||
|
| |||||||
| SHARES | SECURITY DESCRIPTION | VALUE($) | ||||||
Internet Software & Services — 3.5% |
| |||||||
| 195 | eBay, Inc. (a) | 10,101 | ||||||
| 58 | Google, Inc., Class A (a) | 51,405 | ||||||
| 15 | LinkedIn Corp., Class A (a) | 2,674 | ||||||
|
| |||||||
| 64,180 | ||||||||
|
| |||||||
IT Services — 1.9% |
| |||||||
| 32 | Alliance Data Systems Corp. (a) | 5,702 | ||||||
| 142 | Cognizant Technology Solutions Corp., Class A (a) | 8,866 | ||||||
| 7 | Jack Henry & Associates, Inc. | 335 | ||||||
| 105 | Visa, Inc., Class A | 19,134 | ||||||
|
| |||||||
| 34,037 | ||||||||
|
| |||||||
Office Electronics — 0.2% |
| |||||||
| 350 | Xerox Corp. | 3,177 | ||||||
|
| |||||||
Semiconductors & Semiconductor Equipment — 1.9% |
| |||||||
| 94 | Avago Technologies Ltd., (Singapore) | 3,529 | ||||||
| 309 | Broadcom Corp., Class A | 10,442 | ||||||
| 169 | Freescale Semiconductor Ltd. (a) | 2,295 | ||||||
| 136 | KLA-Tencor Corp. | 7,551 | ||||||
| 69 | Lam Research Corp. (a) | 3,050 | ||||||
| 471 | ON Semiconductor Corp. (a) | 3,805 | ||||||
| 103 | Xilinx, Inc. | 4,060 | ||||||
|
| |||||||
| 34,732 | ||||||||
|
| |||||||
Software — 4.2% |
| |||||||
| 130 | Adobe Systems, Inc. (a) | 5,909 | ||||||
| 173 | CA, Inc. | 4,944 | ||||||
| 125 | Citrix Systems, Inc. (a) | 7,559 | ||||||
| 950 | Microsoft Corp. | 32,804 | ||||||
| 653 | Oracle Corp. | 20,068 | ||||||
| 50 | Splunk, Inc. (a) | 2,323 | ||||||
| 166 | Symantec Corp. | 3,723 | ||||||
|
| |||||||
| 77,330 | ||||||||
|
| |||||||
Total Information Technology | 331,200 | |||||||
|
| |||||||
Materials — 2.3% |
| |||||||
Chemicals — 1.5% |
| |||||||
| 63 | Air Products & Chemicals, Inc. | 5,790 | ||||||
| 86 | Axiall Corp. | 3,662 | ||||||
| 296 | Dow Chemical Co. (The) | 9,506 | ||||||
| 150 | E.I. du Pont de Nemours & Co. | 7,890 | ||||||
|
| |||||||
| 26,848 | ||||||||
|
| |||||||
Containers & Packaging — 0.4% |
| |||||||
| 124 | Ball Corp. | 5,135 | ||||||
SEE NOTES TO FINANCIAL STATEMENTS.
| JUNE 30, 2013 | J.P. MORGAN LARGE CAP FUNDS | 19 | ||||||
Table of Contents
JPMorgan Disciplined Equity Fund
SCHEDULE OF PORTFOLIO INVESTMENTS
AS OF JUNE 30, 2013 (continued)
(Amounts in thousands, except number of contracts)
| SHARES | SECURITY DESCRIPTION | VALUE($) | ||||||
| Long Positions — Continued |
| ||||||
| Common Stocks — Continued |
| ||||||
Containers & Packaging — Continued |
| |||||||
| 59 | Crown Holdings, Inc. (a) | 2,443 | ||||||
|
| |||||||
| 7,578 | ||||||||
|
| |||||||
Metals & Mining — 0.4% |
| |||||||
| 667 | Alcoa, Inc. | 5,218 | ||||||
| 498 | Alumina Ltd., (Australia), ADR (a) | 1,779 | ||||||
|
| |||||||
| 6,997 | ||||||||
|
| |||||||
Total Materials | 41,423 | |||||||
|
| |||||||
Telecommunication Services — 1.7% |
| |||||||
Diversified Telecommunication Services — 1.7% |
| |||||||
| 490 | AT&T, Inc. | 17,356 | ||||||
| 283 | Verizon Communications, Inc. | 14,257 | ||||||
|
| |||||||
Total Telecommunication Services | 31,613 | |||||||
|
| |||||||
Utilities — 3.0% |
| |||||||
Electric Utilities — 2.2% |
| |||||||
| 149 | Edison International | 7,157 | ||||||
| 169 | NextEra Energy, Inc. | 13,748 | ||||||
| 207 | NV Energy, Inc. | 4,861 | ||||||
| 528 | Xcel Energy, Inc. | 14,969 | ||||||
|
| |||||||
| 40,735 | ||||||||
|
| |||||||
Gas Utilities — 0.1% |
| |||||||
| 58 | Questar Corp. | 1,390 | ||||||
|
| |||||||
Multi-Utilities — 0.7% |
| |||||||
| 207 | CMS Energy Corp. | 5,622 | ||||||
| SHARES | SECURITY DESCRIPTION | VALUE($) | ||||||
Multi-Utilities — Continued |
| |||||||
| 246 | NiSource, Inc. | 7,054 | ||||||
|
| |||||||
| 12,676 | ||||||||
|
| |||||||
Total Utilities | 54,801 | |||||||
|
| |||||||
Total Common Stocks | 1,814,699 | |||||||
|
| |||||||
| PRINCIPAL AMOUNT($) | ||||||||
| Short-Term Investments — 1.8% |
| ||||||
U.S. Treasury Obligation — 0.1% |
| |||||||
| 2,125 | U.S. Treasury Bill, 0.065%, 11/14/13 (k) (n) | 2,125 | ||||||
|
| |||||||
| SHARES | ||||||||
Investment Company — 1.7% |
| |||||||
| 30,205 | JPMorgan Prime Money Market Fund, Institutional Class Shares, 0.030% (b) (l) (m) | 30,205 | ||||||
|
| |||||||
Total Short-Term Investments | 32,330 | |||||||
|
| |||||||
Total Investments — 101.1% (Cost $1,597,532) | 1,847,029 | |||||||
Liabilities in Excess of | (20,177 | ) | ||||||
|
| |||||||
NET ASSETS — 100.0% | $ | 1,826,852 | ||||||
|
| |||||||
| Short Positions — 0.0% |
| ||||||
| Common Stocks — 0.0% (g) |
| ||||||
Health Care — 0.0% (g) |
| |||||||
Pharmaceuticals — 0.0% (g) | ||||||||
| 13 | Mallinckrodt plc, (Ireland) (a) † | 601 | ||||||
|
| |||||||
Total Short Positions | $ | 601 | ||||||
|
| |||||||
Percentages indicated are based on net assets.
| Futures Contracts | ||||||||||||||||
| NUMBER OF CONTRACTS | DESCRIPTION | EXPIRATION DATE | NOTIONAL VALUE AT 06/30/13 | NET UNREALIZED APPRECIATION (DEPRECIATION) | ||||||||||||
Long Futures Outstanding | ||||||||||||||||
| 153 | E-mini S&P 500 | 09/20/13 | $ | 12,235 | $ | 48 | ||||||||||
|
| |||||||||||||||
SEE NOTES TO FINANCIAL STATEMENTS.
| 20 | J.P. MORGAN LARGE CAP FUNDS | JUNE 30, 2013 | ||||
Table of Contents
JPMorgan Dynamic Growth Fund
SCHEDULE OF PORTFOLIO INVESTMENTS
AS OF JUNE 30, 2013
(Amounts in thousands)
| SHARES | SECURITY DESCRIPTION | VALUE($) | ||||||
| Common Stocks — 99.6% |
| ||||||
Consumer Discretionary — 21.6% |
| |||||||
Hotels, Restaurants & Leisure — 6.9% |
| |||||||
| 62 | Las Vegas Sands Corp. | 3,294 | ||||||
| 57 | Starbucks Corp. | 3,713 | ||||||
|
| |||||||
| 7,007 | ||||||||
|
| |||||||
Internet & Catalog Retail — 8.0% |
| |||||||
| 14 | Amazon.com, Inc. (a) | 3,774 | ||||||
| 5 | priceline.com, Inc. (a) | 4,458 | ||||||
|
| |||||||
| 8,232 | ||||||||
|
| |||||||
Specialty Retail — 3.8% |
| |||||||
| 50 | Home Depot, Inc. (The) | 3,891 | ||||||
|
| |||||||
Textiles, Apparel & Luxury Goods — 2.9% |
| |||||||
| 47 | Michael Kors Holdings Ltd., (Hong Kong) (a) | 2,935 | ||||||
|
| |||||||
Total Consumer Discretionary | 22,065 | |||||||
|
| |||||||
Consumer Staples — 4.1% |
| |||||||
Food & Staples Retailing — 4.1% |
| |||||||
| 82 | Whole Foods Market, Inc. | 4,202 | ||||||
|
| |||||||
Energy — 6.1% |
| |||||||
Energy Equipment & Services — 3.0% |
| |||||||
| 50 | Cameron International Corp. (a) | 3,035 | ||||||
|
| |||||||
Oil, Gas & Consumable Fuels — 3.1% |
| |||||||
| 44 | Cabot Oil & Gas Corp. | 3,159 | ||||||
|
| |||||||
Total Energy | 6,194 | |||||||
|
| |||||||
Financials — 8.1% |
| |||||||
Capital Markets — 5.6% |
| |||||||
| 14 | Goldman Sachs Group, Inc. (The) | 2,133 | ||||||
| 149 | TD Ameritrade Holding Corp. | 3,614 | ||||||
|
| |||||||
| 5,747 | ||||||||
|
| |||||||
Consumer Finance — 2.5% |
| |||||||
| 41 | Capital One Financial Corp. | 2,572 | ||||||
|
| |||||||
Total Financials | 8,319 | |||||||
|
| |||||||
Health Care — 18.6% |
| |||||||
Biotechnology — 16.4% |
| |||||||
| 35 | Biogen Idec, Inc. (a) | 7,570 | ||||||
| 89 | Gilead Sciences, Inc. (a) | 4,555 | ||||||
| 21 | Regeneron Pharmaceuticals, Inc. (a) | 4,717 | ||||||
|
| |||||||
| 16,842 | ||||||||
|
| |||||||
Health Care Providers & Services — 2.2% |
| |||||||
| 36 | Express Scripts Holding Co. (a) | 2,225 | ||||||
|
| |||||||
Total Health Care | 19,067 | |||||||
|
| |||||||
Industrials — 7.0% |
| |||||||
Aerospace & Defense — 1.6% |
| |||||||
| 10 | TransDigm Group, Inc. | 1,632 | ||||||
|
| |||||||
| SHARES | SECURITY DESCRIPTION | VALUE($) | ||||||
Road & Rail — 5.4% |
| |||||||
| 52 | Kansas City Southern | 5,518 | ||||||
|
| |||||||
Total Industrials | 7,150 | |||||||
|
| |||||||
Information Technology — 30.5% |
| |||||||
Computers & Peripherals — 0.9% |
| |||||||
| 2 | Apple, Inc. | 982 | ||||||
|
| |||||||
Internet Software & Services — 9.2% |
| |||||||
| 8 | Google, Inc., Class A (a) | 6,709 | ||||||
| 15 | LinkedIn Corp., Class A (a) | 2,670 | ||||||
|
| |||||||
| 9,379 | ||||||||
|
| |||||||
IT Services — 11.0% |
| |||||||
| 20 | Alliance Data Systems Corp. (a) | 3,675 | ||||||
| 9 | MasterCard, Inc., Class A | 5,374 | ||||||
| 44 | Teradata Corp. (a) | 2,219 | ||||||
|
| |||||||
| 11,268 | ||||||||
|
| |||||||
Semiconductors & Semiconductor Equipment — 4.9% |
| |||||||
| 87 | ARM Holdings plc, (United Kingdom), ADR | 3,151 | ||||||
| 23 | ASML Holding N.V., (Netherlands) | 1,847 | ||||||
|
| |||||||
| 4,998 | ||||||||
|
| |||||||
Software — 4.5% |
| |||||||
| 29 | Citrix Systems, Inc. (a) | 1,748 | ||||||
| 75 | Salesforce.com, Inc. (a) | 2,865 | ||||||
|
| |||||||
| 4,613 | ||||||||
|
| |||||||
Total Information Technology | 31,240 | |||||||
|
| |||||||
Materials — 3.6% |
| |||||||
Chemicals — 3.6% |
| |||||||
| 37 | Monsanto Co. | 3,633 | ||||||
|
| |||||||
Total Common Stocks | 101,870 | |||||||
|
| |||||||
| Short-Term Investment — 1.3% |
| ||||||
Investment Company — 1.3% | ||||||||
| 1,379 | JPMorgan Prime Money Market Fund, Institutional Class Shares, | 1,379 | ||||||
|
| |||||||
Total Investments — 100.9% | 103,249 | |||||||
Liabilities in Excess of | (969 | ) | ||||||
|
| |||||||
NET ASSETS — 100.0% | $ | 102,280 | ||||||
|
| |||||||
Percentages indicated are based on net assets.
SEE NOTES TO FINANCIAL STATEMENTS.
| JUNE 30, 2013 | J.P. MORGAN LARGE CAP FUNDS | 21 | ||||||
Table of Contents
JPMorgan Equity Income Fund
SCHEDULE OF PORTFOLIO INVESTMENTS
AS OF JUNE 30, 2013
(Amounts in thousands)
| SHARES | SECURITY DESCRIPTION | VALUE($) | ||||||
| Common Stocks — 99.1% |
| ||||||
Consumer Discretionary — 14.5% |
| |||||||
Distributors — 1.0% |
| |||||||
| 590 | Genuine Parts Co. | 46,089 | ||||||
|
| |||||||
Hotels, Restaurants & Leisure — 3.5% | ||||||||
| 826 | Brinker International, Inc. | 32,568 | ||||||
| 1,065 | Dunkin’ Brands Group, Inc. | 45,617 | ||||||
| 248 | McDonald’s Corp. | 24,599 | ||||||
| 785 | Yum! Brands, Inc. | 54,454 | ||||||
|
| |||||||
| 157,238 | ||||||||
|
| |||||||
Household Durables — 0.5% | ||||||||
| 267 | Tupperware Brands Corp. | 20,745 | ||||||
|
| |||||||
Media — 3.6% | ||||||||
| 1,100 | Cinemark Holdings, Inc. | 30,723 | ||||||
| 659 | Comcast Corp., Class A | 26,154 | ||||||
| 344 | Time Warner Cable, Inc. | 38,690 | ||||||
| 1,159 | Time Warner, Inc. | 66,992 | ||||||
|
| |||||||
| 162,559 | ||||||||
|
| |||||||
Multiline Retail — 0.8% | ||||||||
| 588 | Nordstrom, Inc. | 35,245 | ||||||
|
| |||||||
Specialty Retail — 4.1% | ||||||||
| 1,128 | Home Depot, Inc. (The) | 87,371 | ||||||
| 728 | L Brands, Inc. | 35,839 | ||||||
| 213 | Tiffany & Co. | 15,502 | ||||||
| 846 | Williams-Sonoma, Inc. | 47,262 | ||||||
|
| |||||||
| 185,974 | ||||||||
|
| |||||||
Textiles, Apparel & Luxury Goods — 1.0% | ||||||||
| 244 | V.F. Corp. | 47,041 | ||||||
|
| |||||||
Total Consumer Discretionary | 654,891 | |||||||
|
| |||||||
Consumer Staples — 7.4% | ||||||||
Beverages — 1.1% | ||||||||
| 1,209 | Coca-Cola Co. (The) | 48,495 | ||||||
|
| |||||||
Food Products — 2.8% | ||||||||
| 578 | Hershey Co. (The) | 51,631 | ||||||
| 197 | JM Smucker Co. (The) | 20,313 | ||||||
| 1,921 | Mondelez International, Inc., Class A | 54,794 | ||||||
|
| |||||||
| 126,738 | ||||||||
|
| |||||||
Household Products — 1.4% | ||||||||
| 830 | Procter & Gamble Co. (The) | 63,927 | ||||||
|
| |||||||
Tobacco — 2.1% | ||||||||
| 778 | Lorillard, Inc. | 33,980 | ||||||
| 692 | Philip Morris International, Inc. | 59,922 | ||||||
|
| |||||||
| 93,902 | ||||||||
|
| |||||||
Total Consumer Staples | 333,062 | |||||||
|
| |||||||
| SHARES | SECURITY DESCRIPTION | VALUE($) | ||||||
Energy — 11.0% | ||||||||
Oil, Gas & Consumable Fuels — 11.0% | ||||||||
| 881 | Chevron Corp. | 104,295 | ||||||
| 1,776 | ConocoPhillips | 107,426 | ||||||
| 1,252 | Exxon Mobil Corp. | 113,150 | ||||||
| 977 | Kinder Morgan, Inc. | 37,289 | ||||||
| 1,136 | Occidental Petroleum Corp. | 101,391 | ||||||
| 997 | Williams Cos., Inc. (The) | 32,382 | ||||||
|
| |||||||
Total Energy | 495,933 | |||||||
|
| |||||||
Financials — 25.2% | ||||||||
Capital Markets — 4.7% | ||||||||
| 392 | Ameriprise Financial, Inc. | 31,690 | ||||||
| 214 | BlackRock, Inc. | 55,047 | ||||||
| 947 | Northern Trust Corp. | 54,811 | ||||||
| 988 | T. Rowe Price Group, Inc. | 72,293 | ||||||
|
| |||||||
| 213,841 | ||||||||
|
| |||||||
Commercial Banks — 9.4% | ||||||||
| 1,475 | BB&T Corp. | 49,979 | ||||||
| 430 | Cullen/Frost Bankers, Inc. | 28,714 | ||||||
| 373 | M&T Bank Corp. | 41,660 | ||||||
| 915 | PNC Financial Services Group, Inc. | 66,724 | ||||||
| 1,201 | U.S. Bancorp | 43,412 | ||||||
| 4,705 | Wells Fargo & Co. | 194,174 | ||||||
|
| |||||||
| 424,663 | ||||||||
|
| |||||||
Diversified Financial Services — 3.0% | ||||||||
| 1,216 | CME Group, Inc. | 92,388 | ||||||
| 763 | McGraw Hill Financial, Inc. | 40,604 | ||||||
|
| |||||||
| 132,992 | ||||||||
|
| |||||||
Insurance — 7.6% | ||||||||
| 999 | Arthur J. Gallagher & Co. | 43,648 | ||||||
| 647 | Cincinnati Financial Corp. | 29,695 | ||||||
| 1,676 | Hartford Financial Services Group, Inc. | 51,820 | ||||||
| 1,026 | MetLife, Inc. | 46,933 | ||||||
| 768 | Prudential Financial, Inc. | 56,105 | ||||||
| 904 | Travelers Cos., Inc. (The) | 72,281 | ||||||
| 1,163 | Validus Holdings Ltd., (Bermuda) | 42,009 | ||||||
|
| |||||||
| 342,491 | ||||||||
|
| |||||||
Real Estate Investment Trusts (REITs) — 0.5% |
| |||||||
| 351 | Alexandria Real Estate Equities, Inc. | 23,073 | ||||||
|
| |||||||
Total Financials | 1,137,060 | |||||||
|
| |||||||
Health Care — 11.8% | ||||||||
Health Care Equipment & Supplies — 2.1% | ||||||||
| 658 | Baxter International, Inc. | 45,613 | ||||||
| 507 | Becton, Dickinson & Co. | 50,093 | ||||||
|
| |||||||
| 95,706 | ||||||||
|
| |||||||
SEE NOTES TO FINANCIAL STATEMENTS.
| 22 | J.P. MORGAN LARGE CAP FUNDS | JUNE 30, 2013 | ||||
Table of Contents
| SHARES | SECURITY DESCRIPTION | VALUE($) | ||||||
| Common Stocks — Continued |
| ||||||
Pharmaceuticals — 9.7% | ||||||||
| 919 | AbbVie, Inc. | 37,983 | ||||||
| 407 | Bristol-Myers Squibb Co. | 18,188 | ||||||
| 1,434 | Johnson & Johnson | 123,158 | ||||||
| 2,822 | Merck & Co., Inc. | 131,098 | ||||||
| 4,537 | Pfizer, Inc. | 127,094 | ||||||
|
| |||||||
| 437,521 | ||||||||
|
| |||||||
Total Health Care | 533,227 | |||||||
|
| |||||||
Industrials — 8.0% | ||||||||
Aerospace & Defense — 2.4% | ||||||||
| 655 | Honeywell International, Inc. | 51,994 | ||||||
| 633 | United Technologies Corp. | 58,792 | ||||||
|
| |||||||
| 110,786 | ||||||||
|
| |||||||
Air Freight & Logistics — 1.1% | ||||||||
| 559 | United Parcel Service, Inc., Class B | 48,380 | ||||||
|
| |||||||
Electrical Equipment — 0.6% | ||||||||
| 467 | Emerson Electric Co. | 25,452 | ||||||
|
| |||||||
Industrial Conglomerates — 1.1% | ||||||||
| 458 | 3M Co. | 50,090 | ||||||
|
| |||||||
Machinery — 2.8% | ||||||||
| 674 | Illinois Tool Works, Inc. | 46,612 | ||||||
| 799 | PACCAR, Inc. | 42,866 | ||||||
| 402 | Snap-on, Inc. | 35,889 | ||||||
|
| |||||||
| 125,367 | ||||||||
|
| |||||||
Total Industrials | 360,075 | |||||||
|
| |||||||
Information Technology — 10.0% | ||||||||
Communications Equipment — 0.9% | ||||||||
| 643 | QUALCOMM, Inc. | 39,305 | ||||||
|
| |||||||
Computers & Peripherals — 0.6% | ||||||||
| 73 | Apple, Inc. | 28,854 | ||||||
|
| |||||||
Electronic Equipment, Instruments & Components — 0.5% |
| |||||||
| 848 | Molex, Inc. | 24,891 | ||||||
|
| |||||||
IT Services — 2.7% | ||||||||
| 567 | Accenture plc, (Ireland), Class A | 40,769 | ||||||
| 612 | Automatic Data Processing, Inc. | 42,128 | ||||||
| 863 | Fidelity National Information Services, Inc. | 36,971 | ||||||
|
| |||||||
| 119,868 | ||||||||
|
| |||||||
Semiconductors & Semiconductor Equipment — 4.1% |
| |||||||
| 1,289 | Analog Devices, Inc. | 58,074 | ||||||
| 944 | KLA-Tencor Corp. | 52,615 | ||||||
| 954 | Texas Instruments, Inc. | 33,277 | ||||||
| 1,001 | Xilinx, Inc. | 39,646 | ||||||
|
| |||||||
| 183,612 | ||||||||
|
| |||||||
| SHARES | SECURITY DESCRIPTION | VALUE($) | ||||||
Software — 1.2% | ||||||||
| 1,531 | Microsoft Corp. | 52,858 | ||||||
|
| |||||||
Total Information Technology | 449,388 | |||||||
|
| |||||||
Materials — 2.7% | ||||||||
Chemicals — 2.7% | ||||||||
| 543 | Air Products & Chemicals, Inc. | 49,722 | ||||||
| 779 | E.I. du Pont de Nemours & Co. | 40,921 | ||||||
| 205 | PPG Industries, Inc. | 29,943 | ||||||
|
| |||||||
Total Materials | 120,586 | |||||||
|
| |||||||
Telecommunication Services — 2.7% | ||||||||
Diversified Telecommunication Services — 2.7% |
| |||||||
| 649 | AT&T, Inc. | 22,986 | ||||||
| 585 | CenturyLink, Inc. | 20,671 | ||||||
| 1,537 | Verizon Communications, Inc. | 77,381 | ||||||
|
| |||||||
Total Telecommunication Services | 121,038 | |||||||
|
| |||||||
Utilities — 5.8% | ||||||||
Electric Utilities — 3.0% | ||||||||
| 509 | Edison International | 24,518 | ||||||
| 495 | NextEra Energy, Inc. | 40,373 | ||||||
| 521 | Northeast Utilities | 21,883 | ||||||
| 1,633 | Xcel Energy, Inc. | 46,293 | ||||||
|
| |||||||
| 133,067 | ||||||||
|
| |||||||
Multi-Utilities — 2.8% | ||||||||
| 1,115 | CMS Energy Corp. | 30,293 | ||||||
| 1,232 | NiSource, Inc. | 35,290 | ||||||
| 753 | Sempra Energy | 61,564 | ||||||
|
| |||||||
| 127,147 | ||||||||
|
| |||||||
Total Utilities | 260,214 | |||||||
|
| |||||||
Total Common Stocks | 4,465,474 | |||||||
|
| |||||||
| Short-Term Investment — 3.8% |
| ||||||
Investment Company — 3.8% |
| |||||||
| 172,744 | JPMorgan Liquid Assets Money Market Fund, | 172,744 | ||||||
|
| |||||||
Total Investments — 102.9% | 4,638,218 | |||||||
Liabilities in Excess of | (129,457 | ) | ||||||
|
| |||||||
NET ASSETS — 100.0% | $ | 4,508,761 | ||||||
|
| |||||||
Percentages indicated are based on net assets.
SEE NOTES TO FINANCIAL STATEMENTS.
| JUNE 30, 2013 | J.P. MORGAN LARGE CAP FUNDS | 23 | ||||||
Table of Contents
JPMorgan Growth and Income Fund
SCHEDULE OF PORTFOLIO INVESTMENTS
AS OF JUNE 30, 2013
(Amounts in thousands)
| SHARES | SECURITY DESCRIPTION | VALUE($) | ||||||
| Common Stocks — 97.1% |
| ||||||
Consumer Discretionary — 14.8% |
| |||||||
Hotels, Restaurants & Leisure — 2.0% |
| |||||||
| 68 | Marriott International, Inc., Class A | 2,753 | ||||||
| 71 | Yum! Brands, Inc. | 4,916 | ||||||
|
| |||||||
| 7,669 | ||||||||
|
| |||||||
Media — 6.6% |
| |||||||
| 165 | Comcast Corp., Class A | 6,894 | ||||||
| 118 | DISH Network Corp., Class A | 5,022 | ||||||
| 88 | Gannett Co., Inc. | 2,145 | ||||||
| 85 | Time Warner, Inc. | 4,897 | ||||||
| 113 | Walt Disney Co. (The) | 7,155 | ||||||
|
| |||||||
| 26,113 | ||||||||
|
| |||||||
Specialty Retail — 4.4% |
| |||||||
| 8 | AutoZone, Inc. (a) | 3,224 | ||||||
| 104 | Home Depot, Inc. (The) | 8,049 | ||||||
| 37 | Tiffany & Co. | 2,681 | ||||||
| 70 | TJX Cos., Inc. | 3,499 | ||||||
|
| |||||||
| 17,453 | ||||||||
|
| |||||||
Textiles, Apparel & Luxury Goods — 1.8% |
| |||||||
| 51 | Coach, Inc. | 2,934 | ||||||
| 21 | V.F. Corp. | 4,093 | ||||||
|
| |||||||
| 7,027 | ||||||||
|
| |||||||
Total Consumer Discretionary | 58,262 | |||||||
|
| |||||||
Consumer Staples — 6.0% |
| |||||||
Beverages — 2.6% |
| |||||||
| 41 | Beam, Inc. | 2,594 | ||||||
| 102 | Dr. Pepper Snapple Group, Inc. | 4,689 | ||||||
| 36 | PepsiCo, Inc. | 2,936 | ||||||
|
| |||||||
| 10,219 | ||||||||
|
| |||||||
Food & Staples Retailing — 1.0% |
| |||||||
| 71 | CVS Caremark Corp. | 4,031 | ||||||
|
| |||||||
Food Products — 0.8% |
| |||||||
| 32 | JM Smucker Co. (The) | 3,259 | ||||||
|
| |||||||
Household Products — 1.0% |
| |||||||
| 51 | Procter & Gamble Co. (The) | 3,915 | ||||||
|
| |||||||
Tobacco — 0.6% |
| |||||||
| 28 | Philip Morris International, Inc. | 2,417 | ||||||
|
| |||||||
Total Consumer Staples | 23,841 | |||||||
|
| |||||||
Energy — 11.8% |
| |||||||
Oil, Gas & Consumable Fuels — 11.8% |
| |||||||
| 63 | Chevron Corp. | 7,414 | ||||||
| 122 | ConocoPhillips | 7,397 | ||||||
| SHARES | SECURITY DESCRIPTION | VALUE($) | ||||||
Oil, Gas & Consumable Fuels — Continued |
| |||||||
| 89 | Devon Energy Corp. | 4,628 | ||||||
| 30 | Energen Corp. | 1,584 | ||||||
| 114 | Exxon Mobil Corp. | 10,281 | ||||||
| 97 | Occidental Petroleum Corp. | 8,691 | ||||||
| 75 | Phillips 66 | 4,432 | ||||||
| 71 | Williams Cos., Inc. (The) | 2,309 | ||||||
|
| |||||||
Total Energy | 46,736 | |||||||
|
| |||||||
Financials — 33.1% |
| |||||||
Capital Markets — 8.8% |
| |||||||
| 57 | Ameriprise Financial, Inc. | 4,635 | ||||||
| 14 | BlackRock, Inc. | 3,519 | ||||||
| 292 | Charles Schwab Corp. (The) | 6,199 | ||||||
| 43 | Goldman Sachs Group, Inc. (The) | 6,428 | ||||||
| 154 | Invesco Ltd. | 4,891 | ||||||
| 45 | Northern Trust Corp. | 2,611 | ||||||
| 86 | T. Rowe Price Group, Inc. | 6,320 | ||||||
|
| |||||||
| 34,603 | ||||||||
|
| |||||||
Commercial Banks — 7.7% |
| |||||||
| 75 | BB&T Corp. | 2,541 | ||||||
| 36 | M&T Bank Corp. | 3,967 | ||||||
| 42 | PNC Financial Services Group, Inc. (The) | 3,092 | ||||||
| 153 | SunTrust Banks, Inc. | 4,821 | ||||||
| 79 | U.S. Bancorp | 2,859 | ||||||
| 314 | Wells Fargo & Co. | 12,938 | ||||||
|
| |||||||
| 30,218 | ||||||||
|
| |||||||
Consumer Finance — 3.5% |
| |||||||
| 65 | American Express Co. | 4,822 | ||||||
| 140 | Capital One Financial Corp. | 8,806 | ||||||
|
| |||||||
| 13,628 | ||||||||
|
| |||||||
Diversified Financial Services — 3.9% |
| |||||||
| 367 | Bank of America Corp. | 4,722 | ||||||
| 167 | Citigroup, Inc. | 7,995 | ||||||
| 52 | McGraw Hill Financial, Inc. | 2,766 | ||||||
|
| |||||||
| 15,483 | ||||||||
|
| |||||||
Insurance — 8.2% |
| |||||||
| 60 | Berkshire Hathaway, Inc., Class B (a) | 6,749 | ||||||
| 265 | Hartford Financial Services Group, Inc. | 8,181 | ||||||
| 83 | Loews Corp. | 3,699 | ||||||
| 105 | Prudential Financial, Inc. | 7,661 | ||||||
| 85 | Validus Holdings Ltd., (Bermuda) | 3,060 | ||||||
| 107 | XL Group plc, (Ireland) | 3,232 | ||||||
|
| |||||||
| 32,582 | ||||||||
|
| |||||||
SEE NOTES TO FINANCIAL STATEMENTS.
| 24 | J.P. MORGAN LARGE CAP FUNDS | JUNE 30, 2013 | ||||
Table of Contents
| SHARES | SECURITY DESCRIPTION | VALUE($) | ||||||
| Common Stocks — Continued |
| ||||||
Real Estate Investment Trusts (REITs) — 1.0% |
| |||||||
| 49 | Vornado Realty Trust | 4,051 | ||||||
|
| |||||||
Total Financials | 130,565 | |||||||
|
| |||||||
Health Care — 12.2% |
| |||||||
Biotechnology — 0.8% |
| |||||||
| 14 | Biogen Idec, Inc. (a) | 3,077 | ||||||
|
| |||||||
Health Care Equipment & Supplies — 2.5% |
| |||||||
| 39 | Baxter International, Inc. | 2,695 | ||||||
| 28 | Becton, Dickinson & Co. | 2,797 | ||||||
| 71 | Covidien plc, (Ireland) | 4,482 | ||||||
|
| |||||||
| 9,974 | ||||||||
|
| |||||||
Health Care Providers & Services — 2.1% |
| |||||||
| 63 | Quest Diagnostics, Inc. | 3,844 | ||||||
| 66 | UnitedHealth Group, Inc. | 4,328 | ||||||
|
| |||||||
| 8,172 | ||||||||
|
| |||||||
Pharmaceuticals — 6.8% |
| |||||||
| 113 | Bristol-Myers Squibb Co. | 5,063 | ||||||
| 128 | Johnson & Johnson | 10,999 | ||||||
| 103 | Merck & Co., Inc. | 4,797 | ||||||
| 224 | Pfizer, Inc. | 6,269 | ||||||
|
| |||||||
| 27,128 | ||||||||
|
| |||||||
Total Health Care | 48,351 | |||||||
|
| |||||||
Industrials — 5.9% |
| |||||||
Aerospace & Defense — 2.4% |
| |||||||
| 73 | Honeywell International, Inc. | 5,760 | ||||||
| 37 | United Technologies Corp. | 3,457 | ||||||
|
| |||||||
| 9,217 | ||||||||
|
| |||||||
Electrical Equipment — 0.8% |
| |||||||
| 60 | Emerson Electric Co. | 3,289 | ||||||
|
| |||||||
Industrial Conglomerates — 1.7% |
| |||||||
| 26 | 3M Co. | 2,865 | ||||||
| 169 | General Electric Co. | 3,914 | ||||||
|
| |||||||
| 6,779 | ||||||||
|
| |||||||
Machinery — 1.0% |
| |||||||
| 76 | PACCAR, Inc. | 4,073 | ||||||
|
| |||||||
Total Industrials | 23,358 | |||||||
|
| |||||||
Information Technology — 6.8% |
| |||||||
Communications Equipment — 0.4% |
| |||||||
| 28 | QUALCOMM, Inc. | 1,716 | ||||||
|
| |||||||
Computers & Peripherals — 0.8% |
| |||||||
| 8 | Apple, Inc. | 3,169 | ||||||
|
| |||||||
| SHARES | SECURITY DESCRIPTION | VALUE($) | ||||||
Internet Software & Services — 1.0% |
| |||||||
| 5 | Google, Inc., Class A (a) | 3,962 | ||||||
|
| |||||||
IT Services — 1.7% |
| |||||||
| 41 | Accenture plc, (Ireland), Class A | 2,929 | ||||||
| 19 | International Business Machines Corp. | 3,688 | ||||||
|
| |||||||
| 6,617 | ||||||||
|
| |||||||
Semiconductors & Semiconductor Equipment — 0.9% |
| |||||||
| 132 | Applied Materials, Inc. | 1,964 | ||||||
| 51 | Texas Instruments, Inc. | 1,785 | ||||||
|
| |||||||
| 3,749 | ||||||||
|
| |||||||
Software — 2.0% |
| |||||||
| 225 | Microsoft Corp. | 7,759 | ||||||
|
| |||||||
Total Information Technology | 26,972 | |||||||
|
| |||||||
Materials — 1.9% |
| |||||||
Chemicals — 1.9% |
| |||||||
| 73 | E.I. du Pont de Nemours & Co. | 3,832 | ||||||
| 20 | Sherwin-Williams Co. (The) | 3,444 | ||||||
|
| |||||||
Total Materials | 7,276 | |||||||
|
| |||||||
Telecommunication Services — 1.8% |
| |||||||
Diversified Telecommunication Services — 1.8% |
| |||||||
| 143 | Verizon Communications, Inc. | 7,200 | ||||||
|
| |||||||
Utilities — 2.8% |
| |||||||
Electric Utilities — 0.7% |
| |||||||
| 35 | NextEra Energy, Inc. | 2,811 | ||||||
|
| |||||||
Multi-Utilities — 2.1% |
| |||||||
| 153 | CMS Energy Corp. | 4,146 | ||||||
| 49 | Sempra Energy | 4,006 | ||||||
|
| |||||||
| 8,152 | ||||||||
|
| |||||||
Total Utilities | 10,963 | |||||||
|
| |||||||
Total Common Stocks | 383,524 | |||||||
|
| |||||||
| Short-Term Investment — 3.9% |
| ||||||
Investment Company — 3.9% |
| |||||||
| 15,483 | JPMorgan Prime Money Market Fund, Institutional Class Shares, 0.030% (b) (l) (m) | 15,483 | ||||||
|
| |||||||
Total Investments — 101.0% | 399,007 | |||||||
|
| |||||||
Liabilities in Excess of | (3,791 | ) | ||||||
|
| |||||||
NET ASSETS — 100.0% | $ | 395,216 | ||||||
|
| |||||||
Percentages indicated are based on net assets.
SEE NOTES TO FINANCIAL STATEMENTS.
| JUNE 30, 2013 | J.P. MORGAN LARGE CAP FUNDS | 25 | ||||||
Table of Contents
JPMorgan Large Cap Growth Fund
SCHEDULE OF PORTFOLIO INVESTMENTS
AS OF JUNE 30, 2013
(Amounts in thousands)
| SHARES | SECURITY DESCRIPTION | VALUE($) | ||||||
| Common Stocks — 97.7% |
| ||||||
Consumer Discretionary — 20.8% |
| |||||||
Hotels, Restaurants & Leisure — 2.4% |
| |||||||
| 4,223 | Starbucks Corp. | 276,580 | ||||||
|
| |||||||
Internet & Catalog Retail — 4.8% |
| |||||||
| 1,009 | Amazon.com, Inc. (a) | 280,145 | ||||||
| 1,209 | Expedia, Inc. | 72,727 | ||||||
| 246 | priceline.com, Inc. (a) | 203,061 | ||||||
|
| |||||||
| 555,933 | ||||||||
|
| |||||||
Media — 7.4% |
| |||||||
| 6,109 | Comcast Corp., Class A | 255,828 | ||||||
| 2,144 | Discovery Communications, Inc., Class A (a) | 165,538 | ||||||
| 1,591 | Liberty Global plc, (United Kingdom), Series A (a) | 117,846 | ||||||
| 1,428 | Time Warner, Inc. | 82,550 | ||||||
| 3,641 | Walt Disney Co. (The) | 229,942 | ||||||
|
| |||||||
| 851,704 | ||||||||
|
| |||||||
Specialty Retail — 4.4% |
| |||||||
| 2,604 | Gap, Inc. (The) | 108,652 | ||||||
| 5,142 | Home Depot, Inc. (The) | 398,328 | ||||||
|
| |||||||
| 506,980 | ||||||||
|
| |||||||
Textiles, Apparel & Luxury Goods — 1.8% |
| |||||||
| 3,373 | Michael Kors Holdings Ltd., (Hong Kong) (a) | 209,176 | ||||||
|
| |||||||
Total Consumer Discretionary | 2,400,373 | |||||||
|
| |||||||
Consumer Staples — 7.0% |
| |||||||
Food & Staples Retailing — 3.9% |
| |||||||
| 1,907 | Costco Wholesale Corp. | 210,802 | ||||||
| 1,589 | CVS Caremark Corp. | 90,836 | ||||||
| 2,802 | Whole Foods Market, Inc. | 144,221 | ||||||
|
| |||||||
| 445,859 | ||||||||
|
| |||||||
Household Products — 1.8% |
| |||||||
| 1,799 | Colgate-Palmolive Co. | 103,088 | ||||||
| 1,088 | Kimberly-Clark Corp. | 105,659 | ||||||
|
| |||||||
| 208,747 | ||||||||
|
| |||||||
Personal Products — 0.6% |
| |||||||
| 1,118 | Estee Lauder Cos., Inc. (The), Class A | 73,498 | ||||||
|
| |||||||
Tobacco — 0.7% |
| |||||||
| 895 | Philip Morris International, Inc. | 77,552 | ||||||
|
| |||||||
Total Consumer Staples | 805,656 | |||||||
|
| |||||||
Energy — 3.7% |
| |||||||
Energy Equipment & Services — 0.7% |
| |||||||
| 1,448 | FMC Technologies, Inc. (a) | 80,647 | ||||||
|
| |||||||
| SHARES | SECURITY DESCRIPTION | VALUE($) | ||||||
Oil, Gas & Consumable Fuels — 3.0% |
| |||||||
| 2,226 | Cabot Oil & Gas Corp. | 158,076 | ||||||
| 128 | Concho Resources, Inc. (a) | 10,683 | ||||||
| 355 | Continental Resources, Inc. (a) | 30,508 | ||||||
| 2,162 | Marathon Petroleum Corp. | 153,646 | ||||||
|
| |||||||
| 352,913 | ||||||||
|
| |||||||
Total Energy | 433,560 | |||||||
|
| |||||||
Financials — 4.7% |
| |||||||
Capital Markets — 1.9% |
| |||||||
| 139 | BlackRock, Inc. | 35,625 | ||||||
| 2,601 | T. Rowe Price Group, Inc. | 190,249 | ||||||
|
| |||||||
| 225,874 | ||||||||
|
| |||||||
Diversified Financial Services — 1.0% |
| |||||||
| 1,970 | Moody’s Corp. | 120,020 | ||||||
|
| |||||||
Real Estate Investment Trusts (REITs) — 1.8% |
| |||||||
| 2,791 | American Tower Corp. | 204,239 | ||||||
|
| |||||||
Total Financials | 550,133 | |||||||
|
| |||||||
Health Care — 18.3% |
| |||||||
Biotechnology — 12.6% |
| |||||||
| 369 | Alexion Pharmaceuticals, Inc. (a) | 34,018 | ||||||
| 1,937 | Biogen Idec, Inc. (a) | 416,799 | ||||||
| 2,022 | Celgene Corp. (a) | 236,369 | ||||||
| 6,987 | Gilead Sciences, Inc. (a) | 357,789 | ||||||
| 988 | Onyx Pharmaceuticals, Inc. (a) | 107,692 | ||||||
| 1,379 | Regeneron Pharmaceuticals, Inc. (a) | 310,042 | ||||||
|
| |||||||
| 1,462,709 | ||||||||
|
| |||||||
Health Care Equipment & Supplies — 1.3% |
| |||||||
| 1,585 | Covidien plc, (Ireland) | 99,614 | ||||||
| 92 | Intuitive Surgical, Inc. (a) | 46,453 | ||||||
|
| |||||||
| 146,067 | ||||||||
|
| |||||||
Health Care Providers & Services — 1.5% |
| |||||||
| 1,703 | AmerisourceBergen Corp. | 95,078 | ||||||
| 1,687 | Catamaran Corp. (a) | 82,181 | ||||||
|
| |||||||
| 177,259 | ||||||||
|
| |||||||
Health Care Technology — 1.3% |
| |||||||
| 1,589 | Cerner Corp. (a) | 152,649 | ||||||
|
| |||||||
Pharmaceuticals — 1.6% |
| |||||||
| 1,049 | Allergan, Inc. | 88,351 | ||||||
| 165 | Novo Nordisk A/S, (Denmark), ADR | 25,632 | ||||||
| 793 | Valeant Pharmaceuticals International, Inc. (a) | 68,279 | ||||||
|
| |||||||
| 182,262 | ||||||||
|
| |||||||
Total Health Care | 2,120,946 | |||||||
|
| |||||||
SEE NOTES TO FINANCIAL STATEMENTS.
| 26 | J.P. MORGAN LARGE CAP FUNDS | JUNE 30, 2013 | ||||
Table of Contents
| SHARES | SECURITY DESCRIPTION | VALUE($) | ||||||
| Common Stocks — Continued |
| ||||||
Industrials — 9.5% | ||||||||
Aerospace & Defense — 2.6% | ||||||||
| 2,008 | Honeywell International, Inc. | 159,322 | ||||||
| 629 | Precision Castparts Corp. | 142,183 | ||||||
|
| |||||||
| 301,505 | ||||||||
|
| |||||||
Building Products — 0.4% | ||||||||
| 1,176 | Fortune Brands Home & Security, Inc. | 45,539 | ||||||
|
| |||||||
Machinery — 0.5% | ||||||||
| 515 | Cummins, Inc. | 55,889 | ||||||
|
| |||||||
Road & Rail — 5.0% | ||||||||
| 1,953 | J.B. Hunt Transport Services, Inc. | 141,056 | ||||||
| 1,151 | Kansas City Southern | 121,907 | ||||||
| 2,016 | Union Pacific Corp. | 311,075 | ||||||
|
| |||||||
| 574,038 | ||||||||
|
| |||||||
Trading Companies & Distributors — 1.0% | ||||||||
| 488 | W.W. Grainger, Inc. | 123,165 | ||||||
|
| |||||||
Total Industrials | 1,100,136 | |||||||
|
| |||||||
Information Technology — 26.5% | ||||||||
Communications Equipment — 1.2% | ||||||||
| 2,207 | QUALCOMM, Inc. | 134,797 | ||||||
|
| |||||||
Computers & Peripherals — 3.6% | ||||||||
| 941 | Apple, Inc. | 372,779 | ||||||
| 1,900 | EMC Corp. | 44,868 | ||||||
|
| |||||||
| 417,647 | ||||||||
|
| |||||||
Electronic Equipment, Instruments & Components — 0.1% |
| |||||||
| 149 | Amphenol Corp., Class A | 11,598 | ||||||
|
| |||||||
Internet Software & Services — 8.7% | ||||||||
| 4,718 | eBay, Inc. (a) | 244,015 | ||||||
| 622 | Google, Inc., Class A (a) | 547,832 | ||||||
| 1,206 | LinkedIn Corp., Class A (a) | 215,030 | ||||||
|
| |||||||
| 1,006,877 | ||||||||
|
| |||||||
IT Services — 8.1% | ||||||||
| 665 | International Business Machines Corp. | 127,123 | ||||||
| 812 | Mastercard, Inc., Class A | 466,264 | ||||||
| 78 | Teradata Corp. (a) | 3,898 | ||||||
| 1,836 | Visa, Inc., Class A | 335,474 | ||||||
|
| |||||||
| 932,759 | ||||||||
|
| |||||||
| SHARES | SECURITY DESCRIPTION | VALUE($) | ||||||
Semiconductors & Semiconductor Equipment — 3.8% |
| |||||||
| 5,039 | ARM Holdings plc, (United Kingdom), ADR | 182,325 | ||||||
| 3,240 | ASML Holding N.V., (Netherlands) | 256,306 | ||||||
|
| |||||||
| 438,631 | ||||||||
|
| |||||||
Software — 1.0% | ||||||||
| 347 | Intuit, Inc. | 21,147 | ||||||
| 2,119 | Salesforce.com, Inc. (a) | 80,918 | ||||||
| 293 | SolarWinds, Inc. (a) | 11,390 | ||||||
|
| |||||||
| 113,455 | ||||||||
|
| |||||||
Total Information Technology | 3,055,764 | |||||||
|
| |||||||
Materials — 7.2% | ||||||||
Chemicals — 7.2% | ||||||||
| 1,617 | FMC Corp. | 98,728 | ||||||
| 3,145 | LyondellBasell Industries N.V., (Netherlands), Class A | 208,361 | ||||||
| 1,238 | Monsanto Co. | 122,305 | ||||||
| 754 | PPG Industries, Inc. | 110,378 | ||||||
| 1,673 | Sherwin-Williams Co. (The) | 295,505 | ||||||
|
| |||||||
Total Materials | 835,277 | |||||||
|
| |||||||
Total Common Stocks | 11,301,845 | |||||||
|
| |||||||
| Preferred Stock — 0.3% |
| ||||||
Consumer Staples — 0.3% | ||||||||
Beverages — 0.3% | ||||||||
| 1,113 | Cia de Bebidas das Americas, (Brazil), ADR | 41,552 | ||||||
|
| |||||||
| Short-Term Investment — 2.5% |
| ||||||
Investment Company — 2.5% | ||||||||
| 282,910 | JPMorgan Liquid Assets Money Market Fund, Institutional Class Shares, 0.030% (b) (l) (m) | 282,910 | ||||||
|
| |||||||
Total Investments — 100.5% | 11,626,307 | |||||||
Liabilities in Excess of | (63,402 | ) | ||||||
|
| |||||||
NET ASSETS — 100.0% | $ | 11,562,905 | ||||||
|
| |||||||
Percentages indicated are based on net assets.
SEE NOTES TO FINANCIAL STATEMENTS.
| JUNE 30, 2013 | J.P. MORGAN LARGE CAP FUNDS | 27 | ||||||
Table of Contents
JPMorgan Large Cap Value Fund
SCHEDULE OF PORTFOLIO INVESTMENTS
AS OF JUNE 30, 2013
(Amounts in thousands)
| SHARES | SECURITY DESCRIPTION | VALUE($) | ||||||
| Long Positions — 101.1% |
| ||||||
| Common Stocks — 100.0% |
| ||||||
Consumer Discretionary — 11.9% |
| |||||||
Auto Components — 1.0% |
| |||||||
| 108 | TRW Automotive Holdings Corp. (a) | 7,190 | ||||||
|
| |||||||
Automobiles — 2.2% |
| |||||||
| 376 | Ford Motor Co. | 5,812 | ||||||
| 278 | General Motors Co. (a) | 9,273 | ||||||
|
| |||||||
| 15,085 | ||||||||
|
| |||||||
Hotels, Restaurants & Leisure — 1.0% |
| |||||||
| 65 | Carnival Corp. | 2,231 | ||||||
| 151 | Royal Caribbean Cruises Ltd. | 5,048 | ||||||
|
| |||||||
| 7,279 | ||||||||
|
| |||||||
Household Durables — 1.6% |
| |||||||
| 95 | Lennar Corp., Class A | 3,426 | ||||||
| 4 | NVR, Inc. (a) | 3,964 | ||||||
| 184 | PulteGroup, Inc. (a) | 3,487 | ||||||
|
| |||||||
| 10,877 | ||||||||
|
| |||||||
Media — 2.3% |
| |||||||
| 277 | Time Warner, Inc. | 16,031 | ||||||
|
| |||||||
Multiline Retail — 2.4% |
| |||||||
| 82 | J.C. Penney Co., Inc. (a) | 1,404 | ||||||
| 181 | Macy’s, Inc. | 8,702 | ||||||
| 91 | Target Corp. | 6,236 | ||||||
|
| |||||||
| 16,342 | ||||||||
|
| |||||||
Specialty Retail — 1.4% |
| |||||||
| 42 | CST Brands, Inc. (a) | 1,294 | ||||||
| 161 | Lowe’s Cos., Inc. | 6,565 | ||||||
| 35 | Williams-Sonoma, Inc. | 1,967 | ||||||
|
| |||||||
| 9,826 | ||||||||
|
| |||||||
Total Consumer Discretionary | 82,630 | |||||||
|
| |||||||
Consumer Staples — 5.3% |
| |||||||
Food & Staples Retailing — 2.3% |
| |||||||
| 247 | CVS Caremark Corp. | 14,139 | ||||||
| 56 | Kroger Co. (The) | 1,946 | ||||||
|
| |||||||
| 16,085 | ||||||||
|
| |||||||
Food Products — 1.4% |
| |||||||
| 219 | Archer-Daniels-Midland Co. | 7,438 | ||||||
| 37 | Kellogg Co. | 2,389 | ||||||
|
| |||||||
| 9,827 | ||||||||
|
| |||||||
Household Products — 1.2% |
| |||||||
| 38 | Energizer Holdings, Inc. | 3,777 | ||||||
| SHARES | SECURITY DESCRIPTION | VALUE($) | ||||||
Household Products — Continued |
| |||||||
| 61 | Procter & Gamble Co. (The) | 4,714 | ||||||
|
| |||||||
| 8,491 | ||||||||
|
| |||||||
Tobacco — 0.4% |
| |||||||
| 29 | Philip Morris International, Inc. | 2,469 | ||||||
|
| |||||||
Total Consumer Staples | 36,872 | |||||||
|
| |||||||
Energy — 16.0% |
| |||||||
Energy Equipment & Services — 3.5% |
| |||||||
| 59 | Baker Hughes, Inc. | 2,741 | ||||||
| 35 | Cameron International Corp. (a) | 2,153 | ||||||
| 132 | Ensco plc, (United Kingdom), Class A | 7,672 | ||||||
| 155 | Halliburton Co. | 6,446 | ||||||
| 60 | Noble Corp., (Switzerland) | 2,262 | ||||||
| 42 | Schlumberger Ltd. | 2,981 | ||||||
|
| |||||||
| 24,255 | ||||||||
|
| |||||||
Oil, Gas & Consumable Fuels — 12.5% |
| |||||||
| 63 | Apache Corp. | 5,270 | ||||||
| 53 | Cheniere Energy, Inc. (a) | 1,466 | ||||||
| 247 | Chevron Corp. | 29,182 | ||||||
| 171 | ConocoPhillips | 10,366 | ||||||
| 353 | Exxon Mobil Corp. | 31,893 | ||||||
| 31 | Marathon Petroleum Corp. | 2,218 | ||||||
| 66 | Phillips 66 | 3,905 | ||||||
| 85 | Valero Energy Corp. | 2,949 | ||||||
|
| |||||||
| 87,249 | ||||||||
|
| |||||||
Total Energy | 111,504 | |||||||
|
| |||||||
Financials — 28.5% |
| |||||||
Capital Markets — 6.3% |
| |||||||
| 59 | Goldman Sachs Group, Inc. (The) | 8,887 | ||||||
| 486 | Invesco Ltd. | 15,441 | ||||||
| 309 | Morgan Stanley | 7,539 | ||||||
| 183 | State Street Corp. | 11,920 | ||||||
|
| |||||||
| 43,787 | ||||||||
|
| |||||||
Commercial Banks — 7.2% |
| |||||||
| 97 | East West Bancorp, Inc. | 2,662 | ||||||
| 1,084 | Huntington Bancshares, Inc. | 8,542 | ||||||
| 96 | SunTrust Banks, Inc. | 3,022 | ||||||
| 15 | SVB Financial Group (a) | 1,233 | ||||||
| 195 | U.S. Bancorp | 7,031 | ||||||
| 664 | Wells Fargo & Co. | 27,391 | ||||||
|
| |||||||
| 49,881 | ||||||||
|
| |||||||
SEE NOTES TO FINANCIAL STATEMENTS.
| 28 | J.P. MORGAN LARGE CAP FUNDS | JUNE 30, 2013 | ||||
Table of Contents
| SHARES | SECURITY DESCRIPTION | VALUE($) | ||||||
| Long Positions — Continued |
| ||||||
| Common Stocks — Continued |
| ||||||
Consumer Finance — 1.3% |
| |||||||
| 150 | Capital One Financial Corp. | 9,419 | ||||||
|
| |||||||
Diversified Financial Services — 6.3% |
| |||||||
| 1,057 | Bank of America Corp. | 13,594 | ||||||
| 635 | Citigroup, Inc. | 30,484 | ||||||
|
| |||||||
| 44,078 | ||||||||
|
| |||||||
Insurance — 6.7% |
| |||||||
| 167 | ACE Ltd., (Switzerland) | 14,903 | ||||||
| 41 | Aflac, Inc. | 2,389 | ||||||
| 57 | Aon plc, (United Kingdom) | 3,661 | ||||||
| 230 | Hartford Financial Services Group, Inc. | 7,107 | ||||||
| 41 | Lincoln National Corp. | 1,506 | ||||||
| 251 | MetLife, Inc. | 11,501 | ||||||
| 78 | Prudential Financial, Inc. | 5,668 | ||||||
|
| |||||||
| 46,735 | ||||||||
|
| |||||||
Real Estate Investment Trusts (REITs) — 0.7% |
| |||||||
| 94 | Post Properties, Inc. | 4,655 | ||||||
|
| |||||||
Total Financials | 198,555 | |||||||
|
| |||||||
Health Care — 11.6% |
| |||||||
Health Care Equipment & Supplies — 0.6% |
| |||||||
| 68 | Covidien plc, (Ireland) | 4,263 | ||||||
|
| |||||||
Health Care Providers & Services — 4.7% |
| |||||||
| 84 | Cigna Corp. | 6,072 | ||||||
| 77 | Humana, Inc. | 6,514 | ||||||
| 304 | UnitedHealth Group, Inc. | 19,894 | ||||||
|
| |||||||
| 32,480 | ||||||||
|
| |||||||
Pharmaceuticals — 6.3% |
| |||||||
| 118 | Bristol-Myers Squibb Co. | 5,252 | ||||||
| 269 | Johnson & Johnson | 23,114 | ||||||
| 166 | Merck & Co., Inc. | 7,706 | ||||||
| 94 | Valeant Pharmaceuticals International, Inc. (a) | 8,089 | ||||||
|
| |||||||
| 44,161 | ||||||||
|
| |||||||
Total Health Care | 80,904 | |||||||
|
| |||||||
Industrials — 9.8% |
| |||||||
Aerospace & Defense — 0.5% |
| |||||||
| 45 | Honeywell International, Inc. | 3,569 | ||||||
|
| |||||||
Airlines — 0.3% |
| |||||||
| 184 | Southwest Airlines Co. | 2,376 | ||||||
|
| |||||||
Building Products — 0.5% |
| |||||||
| 168 | Masco Corp. | 3,273 | ||||||
|
| |||||||
Construction & Engineering — 1.6% |
| |||||||
| 186 | Fluor Corp. | 11,006 | ||||||
|
| |||||||
| SHARES | SECURITY DESCRIPTION | VALUE($) | ||||||
Electrical Equipment — 0.6% |
| |||||||
| 72 | Emerson Electric Co. | 3,929 | ||||||
|
| |||||||
Machinery — 2.4% |
| |||||||
| 215 | PACCAR, Inc. | 11,531 | ||||||
| 49 | SPX Corp. | 3,498 | ||||||
| 53 | Trinity Industries, Inc. | 2,018 | ||||||
|
| |||||||
| 17,047 | ||||||||
|
| |||||||
Road & Rail — 3.9% |
| |||||||
| 532 | CSX Corp. | 12,333 | ||||||
| 54 | Hertz Global Holdings, Inc. (a) | 1,339 | ||||||
| 102 | Norfolk Southern Corp. | 7,383 | ||||||
| 40 | Union Pacific Corp. | 6,098 | ||||||
|
| |||||||
| 27,153 | ||||||||
|
| |||||||
Total Industrials | 68,353 | |||||||
|
| |||||||
Information Technology — 8.3% |
| |||||||
Communications Equipment — 2.2% |
| |||||||
| 628 | Cisco Systems, Inc. | 15,263 | ||||||
|
| |||||||
Computers & Peripherals — 0.9% |
| |||||||
| 249 | Hewlett-Packard Co. | 6,178 | ||||||
|
| |||||||
Internet Software & Services — 1.1% |
| |||||||
| 9 | Google, Inc., Class A (a) | 7,650 | ||||||
|
| |||||||
IT Services — 0.5% |
| |||||||
| 57 | Cognizant Technology Solutions Corp., Class A (a) | 3,590 | ||||||
|
| |||||||
Office Electronics — 0.2% |
| |||||||
| 156 | Xerox Corp. | 1,410 | ||||||
|
| |||||||
Semiconductors & Semiconductor Equipment — 1.8% |
| |||||||
| 129 | Applied Materials, Inc. | 1,929 | ||||||
| 80 | Broadcom Corp., Class A | 2,694 | ||||||
| 135 | KLA-Tencor Corp. | 7,500 | ||||||
| 85 | ON Semiconductor Corp. (a) | 684 | ||||||
|
| |||||||
| 12,807 | ||||||||
|
| |||||||
Software — 1.6% |
| |||||||
| 135 | Microsoft Corp. | 4,677 | ||||||
| 215 | Oracle Corp. | 6,611 | ||||||
|
| |||||||
| 11,288 | ||||||||
|
| |||||||
Total Information Technology | 58,186 | |||||||
|
| |||||||
Materials — 3.4% |
| |||||||
Chemicals — 2.3% |
| |||||||
| 64 | Air Products & Chemicals, Inc. | 5,851 | ||||||
| 47 | Axiall Corp. | 1,988 | ||||||
SEE NOTES TO FINANCIAL STATEMENTS.
| JUNE 30, 2013 | J.P. MORGAN LARGE CAP FUNDS | 29 | ||||||
Table of Contents
JPMorgan Large Cap Value Fund
SCHEDULE OF PORTFOLIO INVESTMENTS
AS OF JUNE 30, 2013 (continued)
(Amounts in thousands)
| SHARES | SECURITY DESCRIPTION | VALUE($) | ||||||
| Long Positions — Continued |
| ||||||
| Common Stocks — Continued |
| ||||||
Chemicals — Continued |
| |||||||
| 243 | Dow Chemical Co. (The) | 7,807 | ||||||
|
| |||||||
| 15,646 | ||||||||
|
| |||||||
Containers & Packaging — 0.4% |
| |||||||
| 68 | Crown Holdings, Inc. (a) | 2,793 | ||||||
|
| |||||||
Metals & Mining — 0.7% |
| |||||||
| 194 | Alcoa, Inc. | 1,518 | ||||||
| 80 | Nucor Corp. | 3,483 | ||||||
|
| |||||||
| 5,001 | ||||||||
|
| |||||||
Total Materials | 23,440 | |||||||
|
| |||||||
Telecommunication Services — 1.7% |
| |||||||
Diversified Telecommunication Services — 1.4% |
| |||||||
| 278 | AT&T, Inc. | 9,852 | ||||||
|
| |||||||
Wireless Telecommunication Services — 0.3% |
| |||||||
| 314 | Sprint Nextel Corp. (a) | 2,202 | ||||||
|
| |||||||
Total Telecommunication Services | 12,054 | |||||||
|
| |||||||
Utilities — 3.5% |
| |||||||
Electric Utilities — 2.3% |
| |||||||
| 100 | Edison International | 4,799 | ||||||
| 84 | NextEra Energy, Inc. | 6,864 | ||||||
| 154 | Xcel Energy, Inc. | 4,359 | ||||||
|
| |||||||
| 16,022 | ||||||||
|
| |||||||
| SHARES | SECURITY DESCRIPTION | VALUE($) | ||||||
Multi-Utilities — 1.2% |
| |||||||
| 127 | CMS Energy Corp. | 3,443 | ||||||
| 57 | Sempra Energy | 4,698 | ||||||
|
| |||||||
| 8,141 | ||||||||
|
| |||||||
Total Utilities | 24,163 | |||||||
|
| |||||||
Total Common Stocks | 696,661 | |||||||
|
| |||||||
| Short-Term Investment — 1.1% |
| ||||||
Investment Company — 1.1% |
| |||||||
| 7,722 | JPMorgan Liquid Assets Money Market Fund, Institutional Class Shares, 0.030% (b) (l) (m) | 7,722 | ||||||
|
| |||||||
Total Investments — 101.1% | 704,383 | |||||||
|
| |||||||
Liabilities in Excess of | (7,962 | ) | ||||||
|
| |||||||
NET ASSETS — 100.0% | $ | 696,421 | ||||||
|
| |||||||
| Short Positions — 0.00% (g) |
| ||||||
| Common Stocks — 0.0% (g) |
| ||||||
Health Care — 0.0% (g) |
| |||||||
Pharmaceuticals — 0.0% (g) |
| |||||||
| 6 | Mallinckrodt plc, (Ireland) (a) † | 289 | ||||||
|
| |||||||
Total Short Positions | $ | 289 | ||||||
|
| |||||||
Percentages indicated are based on net assets.
SEE NOTES TO FINANCIAL STATEMENTS.
| 30 | J.P. MORGAN LARGE CAP FUNDS | JUNE 30, 2013 | ||||
Table of Contents
JPMorgan U.S. Equity Fund
SCHEDULE OF PORTFOLIO INVESTMENTS
AS OF JUNE 30, 2013
(Amounts in thousands)
| SHARES | SECURITY DESCRIPTION | VALUE($) | ||||||
| Long Positions — 100.1% |
| ||||||
| Common Stocks — 98.6% |
| ||||||
Consumer Discretionary — 16.9% | ||||||||
Auto Components — 1.1% | ||||||||
| 1,865 | Johnson Controls, Inc. | 66,738 | ||||||
| 82 | Lear Corp. | 4,927 | ||||||
| 122 | Magna International, Inc., (Canada) | 8,689 | ||||||
| 143 | TRW Automotive Holdings Corp. (a) | 9,504 | ||||||
|
| |||||||
| 89,858 | ||||||||
|
| |||||||
Automobiles — 1.3% | ||||||||
| 292 | Ford Motor Co. | 4,519 | ||||||
| 2,918 | General Motors Co. (a) | 97,203 | ||||||
|
| |||||||
| 101,722 | ||||||||
|
| |||||||
Hotels, Restaurants & Leisure — 1.4% | ||||||||
| 306 | McDonald’s Corp. | 30,306 | ||||||
| 874 | Royal Caribbean Cruises Ltd. | 29,144 | ||||||
| 194 | Starbucks Corp. | 12,686 | ||||||
| 620 | Yum! Brands, Inc. | 43,005 | ||||||
|
| |||||||
| 115,141 | ||||||||
|
| |||||||
Household Durables — 0.7% | ||||||||
| 429 | Lennar Corp., Class A | 15,475 | ||||||
| 13 | NVR, Inc. (a) | 11,820 | ||||||
| 1,262 | PulteGroup, Inc. (a) | 23,942 | ||||||
| 121 | Toll Brothers, Inc. (a) | 3,952 | ||||||
|
| |||||||
| 55,189 | ||||||||
|
| |||||||
Internet & Catalog Retail — 1.5% | ||||||||
| 268 | Amazon.com, Inc. (a) | 74,326 | ||||||
| 183 | Expedia, Inc. | 11,023 | ||||||
| 43 | priceline.com, Inc. (a) | 35,730 | ||||||
|
| |||||||
| 121,079 | ||||||||
|
| |||||||
Media — 5.5% | ||||||||
| 83 | CBS Corp. (Non-Voting), Class B | 4,048 | ||||||
| 3,338 | Comcast Corp., Class A | 139,779 | ||||||
| 98 | Discovery Communications, Inc., Class A (a) | 7,564 | ||||||
| 802 | DISH Network Corp., Class A | 34,109 | ||||||
| 70 | Liberty Global plc, (United Kingdom), Class A (a) | 5,175 | ||||||
| 259 | Time Warner Cable, Inc. | 29,083 | ||||||
| 3,596 | Time Warner, Inc. | 207,949 | ||||||
| 165 | Walt Disney Co. (The) | 10,421 | ||||||
|
| |||||||
| 438,128 | ||||||||
|
| |||||||
Multiline Retail — 0.9% | ||||||||
| 264 | Macy’s, Inc. | 12,693 | ||||||
| 805 | Target Corp. | 55,426 | ||||||
|
| |||||||
| 68,119 | ||||||||
|
| |||||||
| SHARES | SECURITY DESCRIPTION | VALUE($) | ||||||
Specialty Retail — 3.6% | ||||||||
| 104 | AutoNation, Inc. (a) | 4,500 | ||||||
| 121 | AutoZone, Inc. (a) | 51,237 | ||||||
| 119 | Gap, Inc. (The) | 4,983 | ||||||
| 1,267 | Home Depot, Inc. (The) | 98,123 | ||||||
| 1,526 | Lowe’s Cos., Inc. | 62,421 | ||||||
| 437 | Ross Stores, Inc. | 28,353 | ||||||
| 826 | TJX Cos., Inc. | 41,333 | ||||||
|
| |||||||
| 290,950 | ||||||||
|
| |||||||
Textiles, Apparel & Luxury Goods — 0.9% | ||||||||
| 311 | Lululemon Athletica, Inc., (Canada) (a) | 20,379 | ||||||
| 159 | Michael Kors Holdings Ltd., (Hong Kong) (a) | 9,845 | ||||||
| 219 | V.F. Corp. | 42,296 | ||||||
|
| |||||||
| 72,520 | ||||||||
|
| |||||||
Total Consumer Discretionary | 1,352,706 | |||||||
|
| |||||||
Consumer Staples — 7.8% | ||||||||
Beverages — 2.1% | ||||||||
| 51 | Cia de Bebidas das Americas (Preference Shares), (Brazil), ADR | 1,907 | ||||||
| 2,439 | Coca-Cola Co. (The) | 97,813 | ||||||
| 785 | PepsiCo, Inc. | 64,191 | ||||||
|
| |||||||
| 163,911 | ||||||||
|
| |||||||
Food & Staples Retailing — 1.4% | ||||||||
| 90 | Costco Wholesale Corp. | 9,966 | ||||||
| 1,666 | CVS Caremark Corp. | 95,237 | ||||||
| 126 | Whole Foods Market, Inc. | 6,488 | ||||||
|
| |||||||
| 111,691 | ||||||||
|
| |||||||
Food Products — 1.9% | ||||||||
| 841 | Archer-Daniels-Midland Co. | 28,533 | ||||||
| 859 | General Mills, Inc. | 41,677 | ||||||
| 222 | Kellogg Co. | 14,227 | ||||||
| 2,209 | Mondelez International, Inc., Class A | 63,013 | ||||||
|
| |||||||
| 147,450 | ||||||||
|
| |||||||
Household Products — 1.4% | ||||||||
| 121 | Clorox Co. (The) | 10,073 | ||||||
| 312 | Colgate-Palmolive Co. | 17,856 | ||||||
| 30 | Energizer Holdings, Inc. | 3,017 | ||||||
| 48 | Kimberly-Clark Corp. | 4,691 | ||||||
| 1,013 | Procter & Gamble Co. (The) | 78,001 | ||||||
|
| |||||||
| 113,638 | ||||||||
|
| |||||||
Personal Products — 0.0% (g) | ||||||||
| 50 | Estee Lauder Cos., Inc. (The), Class A | 3,302 | ||||||
|
| |||||||
SEE NOTES TO FINANCIAL STATEMENTS.
| JUNE 30, 2013 | J.P. MORGAN LARGE CAP FUNDS | 31 | ||||||
Table of Contents
JPMorgan U.S. Equity Fund
SCHEDULE OF PORTFOLIO INVESTMENTS
AS OF JUNE 30, 2013 (continued)
(Amounts in thousands)
| SHARES | SECURITY DESCRIPTION | VALUE($) | ||||||
| Long Positions — Continued |
| ||||||
| Common Stocks — Continued |
| ||||||
Tobacco — 1.0% | ||||||||
| 939 | Philip Morris International, Inc. | 81,353 | ||||||
|
| |||||||
Total Consumer Staples | 621,345 | |||||||
|
| |||||||
Energy — 10.4% | ||||||||
Energy Equipment & Services — 3.1% | ||||||||
| 413 | Cameron International Corp. (a) | 25,255 | ||||||
| 689 | Ensco plc, (United Kingdom), Class A | 40,056 | ||||||
| 68 | FMC Technologies, Inc. (a) | 3,771 | ||||||
| 152 | National Oilwell Varco, Inc. | 10,504 | ||||||
| 2,319 | Schlumberger Ltd. | 166,182 | ||||||
|
| |||||||
| 245,768 | ||||||||
|
| |||||||
Oil, Gas & Consumable Fuels — 7.3% | ||||||||
| 461 | Anadarko Petroleum Corp. | 39,602 | ||||||
| 531 | Apache Corp. | 44,503 | ||||||
| 100 | Cabot Oil & Gas Corp. | 7,104 | ||||||
| 196 | Cheniere Energy, Inc. (a) | 5,442 | ||||||
| 1,168 | Chevron Corp. | 138,173 | ||||||
| 6 | Concho Resources, Inc. (a) | 493 | ||||||
| 962 | ConocoPhillips | 58,192 | ||||||
| 16 | Continental Resources, Inc. (a) | 1,408 | ||||||
| 197 | EOG Resources, Inc. | 25,905 | ||||||
| 1,260 | Exxon Mobil Corp. | 113,813 | ||||||
| 325 | Marathon Petroleum Corp. | 23,065 | ||||||
| 438 | Occidental Petroleum Corp. | 39,084 | ||||||
| 729 | Phillips 66 | 42,931 | ||||||
| 117 | Tesoro Corp. | 6,100 | ||||||
| 201 | Valero Energy Corp. | 6,978 | ||||||
| 1,028 | Williams Cos., Inc. (The) | 33,389 | ||||||
|
| |||||||
| 586,182 | ||||||||
|
| |||||||
Total Energy | 831,950 | |||||||
|
| |||||||
Financials — 15.3% | ||||||||
Capital Markets — 3.5% | ||||||||
| 314 | Ameriprise Financial, Inc. | 25,406 | ||||||
| 6 | BlackRock, Inc. | 1,560 | ||||||
| 172 | Goldman Sachs Group, Inc. (The) | 26,033 | ||||||
| 2,210 | Invesco Ltd. | 70,277 | ||||||
| 2,582 | Morgan Stanley | 63,068 | ||||||
| 940 | State Street Corp. | 61,267 | ||||||
| 122 | T. Rowe Price Group, Inc. | 8,956 | ||||||
| 856 | TD Ameritrade Holding Corp. | 20,804 | ||||||
|
| |||||||
| 277,371 | ||||||||
|
| |||||||
Commercial Banks — 2.7% | ||||||||
| 168 | BB&T Corp. | 5,701 | ||||||
| 386 | East West Bancorp, Inc. | 10,610 | ||||||
| SHARES | SECURITY DESCRIPTION | VALUE($) | ||||||
Commercial Banks — Continued | ||||||||
| 1,720 | Huntington Bancshares, Inc. | 13,557 | ||||||
| 61 | PNC Financial Services Group, Inc. | 4,428 | ||||||
| 87 | SVB Financial Group (a) | 7,215 | ||||||
| 4,179 | Wells Fargo & Co. | 172,464 | ||||||
|
| |||||||
| 213,975 | ||||||||
|
| |||||||
Consumer Finance — 0.7% | ||||||||
| 117 | American Express Co. | 8,737 | ||||||
| 819 | Capital One Financial Corp. | 51,423 | ||||||
|
| |||||||
| 60,160 | ||||||||
|
| |||||||
Diversified Financial Services — 4.1% | ||||||||
| 10,364 | Bank of America Corp. | 133,277 | ||||||
| 2,920 | Citigroup, Inc. | 140,074 | ||||||
| 33 | CME Group, Inc. | 2,487 | ||||||
| 257 | IntercontinentalExchange, Inc. (a) | 45,715 | ||||||
| 87 | Moody’s Corp. | 5,281 | ||||||
|
| |||||||
| 326,834 | ||||||||
|
| |||||||
Insurance — 3.6% | ||||||||
| 1,404 | ACE Ltd., (Switzerland) | 125,619 | ||||||
| 194 | Aflac, Inc. | 11,264 | ||||||
| 399 | Aon plc, (United Kingdom) | 25,656 | ||||||
| 177 | Everest Re Group Ltd., (Bermuda) | 22,674 | ||||||
| 437 | Hartford Financial Services Group, Inc. | 13,514 | ||||||
| 146 | Lincoln National Corp. | 5,325 | ||||||
| 1,625 | MetLife, Inc. | 74,382 | ||||||
| 53 | PartnerRe Ltd., (Bermuda) | 4,827 | ||||||
| 84 | Prudential Financial, Inc. | 6,164 | ||||||
|
| |||||||
| 289,425 | ||||||||
|
| |||||||
Real Estate Investment Trusts (REITs) — 0.7% |
| |||||||
| 128 | American Tower Corp. | 9,394 | ||||||
| 99 | Boston Properties, Inc. | 10,463 | ||||||
| 246 | CBL & Associates Properties, Inc. | 5,261 | ||||||
| 148 | Highwoods Properties, Inc. | 5,256 | ||||||
| 139 | Simon Property Group, Inc. | 22,011 | ||||||
|
| |||||||
| 52,385 | ||||||||
|
| |||||||
Total Financials | 1,220,150 | |||||||
|
| |||||||
Health Care — 13.8% | ||||||||
Biotechnology — 3.9% | ||||||||
| 296 | Alexion Pharmaceuticals, Inc. (a) | 27,324 | ||||||
| 559 | Biogen Idec, Inc. (a) | 120,304 | ||||||
| 60 | BioMarin Pharmaceutical, Inc. (a) | 3,351 | ||||||
| 610 | Celgene Corp. (a) | 71,345 | ||||||
| 320 | Gilead Sciences, Inc. (a) | 16,411 | ||||||
SEE NOTES TO FINANCIAL STATEMENTS.
| 32 | J.P. MORGAN LARGE CAP FUNDS | JUNE 30, 2013 | ||||
Table of Contents
| SHARES | SECURITY DESCRIPTION | VALUE($) | ||||||
| Long Positions — Continued |
| ||||||
| Common Stocks — Continued |
| ||||||
Biotechnology — Continued | ||||||||
| 323 | Onyx Pharmaceuticals, Inc. (a) | 35,155 | ||||||
| 63 | Regeneron Pharmaceuticals, Inc. (a) | 14,222 | ||||||
| 361 | Vertex Pharmaceuticals, Inc. (a) | 28,850 | ||||||
|
| |||||||
| 316,962 | ||||||||
|
| |||||||
Health Care Equipment & Supplies — 1.0% | ||||||||
| 268 | CareFusion Corp. (a) | 9,862 | ||||||
| 715 | Covidien plc, (Ireland) | 44,933 | ||||||
| 58 | Intuitive Surgical, Inc. (a) | 29,564 | ||||||
|
| |||||||
| 84,359 | ||||||||
|
| |||||||
Health Care Providers & Services — 3.0% | ||||||||
| 106 | Aetna, Inc. | 6,742 | ||||||
| 75 | AmerisourceBergen Corp. | 4,203 | ||||||
| 493 | Cardinal Health, Inc. | 23,253 | ||||||
| 79 | Catamaran Corp. (a) | 3,849 | ||||||
| 86 | Cigna Corp. | 6,258 | ||||||
| 237 | DaVita HealthCare Partners, Inc. (a) | 28,619 | ||||||
| 394 | Humana, Inc. | 33,282 | ||||||
| 2,052 | UnitedHealth Group, Inc. | 134,357 | ||||||
|
| |||||||
| 240,563 | ||||||||
|
| |||||||
Health Care Technology — 0.3% | ||||||||
| 214 | Cerner Corp. (a) | 20,548 | ||||||
|
| |||||||
Life Sciences Tools & Services — 0.3% | ||||||||
| 111 | Mettler-Toledo International, Inc. (a) | 22,347 | ||||||
|
| |||||||
Pharmaceuticals — 5.3% | ||||||||
| 182 | Allergan, Inc. | 15,325 | ||||||
| 2,200 | Bristol-Myers Squibb Co. | 98,325 | ||||||
| 3,098 | Johnson & Johnson | 265,993 | ||||||
| 788 | Merck & Co., Inc. | 36,595 | ||||||
| 8 | Novo Nordisk A/S, (Denmark), ADR | 1,181 | ||||||
| 36 | Valeant Pharmaceuticals International, Inc. (a) | 3,131 | ||||||
|
| |||||||
| 420,550 | ||||||||
|
| |||||||
Total Health Care | 1,105,329 | |||||||
|
| |||||||
Industrials — 10.4% | ||||||||
Aerospace & Defense — 3.9% | ||||||||
| 1,533 | Honeywell International, Inc. | 121,645 | ||||||
| 29 | Precision Castparts Corp. | 6,542 | ||||||
| 1,989 | United Technologies Corp. | 184,861 | ||||||
|
| |||||||
| 313,048 | ||||||||
|
| |||||||
Airlines — 0.3% | ||||||||
| 927 | Delta Air Lines, Inc. (a) | 17,344 | ||||||
| 224 | United Continental Holdings, Inc. (a) | 7,003 | ||||||
|
| |||||||
| 24,347 | ||||||||
|
| |||||||
| SHARES | SECURITY DESCRIPTION | VALUE($) | ||||||
Building Products — 0.4% | ||||||||
| 52 | Fortune Brands Home & Security, Inc. | 2,027 | ||||||
| 1,567 | Masco Corp. | 30,540 | ||||||
|
| |||||||
| 32,567 | ||||||||
|
| |||||||
Commercial Services & Supplies — 0.0% (g) | ||||||||
| 19 | Tyco International Ltd., (Switzerland) | 611 | ||||||
|
| |||||||
Construction & Engineering — 1.0% | ||||||||
| 1,400 | Fluor Corp. | 83,018 | ||||||
|
| |||||||
Electrical Equipment — 0.8% | ||||||||
| 1,148 | Emerson Electric Co. | 62,594 | ||||||
|
| |||||||
Machinery — 1.6% | ||||||||
| 24 | Cummins, Inc. | 2,564 | ||||||
| 1,887 | PACCAR, Inc. | 101,258 | ||||||
| 8 | Pentair Ltd., (Switzerland) | 460 | ||||||
| 288 | SPX Corp. | 20,699 | ||||||
|
| |||||||
| 124,981 | ||||||||
|
| |||||||
Road & Rail — 2.0% | ||||||||
| 2,882 | CSX Corp. | 66,841 | ||||||
| 89 | J.B. Hunt Transport Services, Inc. | 6,433 | ||||||
| 51 | Kansas City Southern | 5,449 | ||||||
| 278 | Norfolk Southern Corp. | 20,231 | ||||||
| 384 | Union Pacific Corp. | 59,275 | ||||||
|
| |||||||
| 158,229 | ||||||||
|
| |||||||
Trading Companies & Distributors — 0.4% | ||||||||
| 131 | W.W. Grainger, Inc. | 33,005 | ||||||
|
| |||||||
Total Industrials | 832,400 | |||||||
|
| |||||||
Information Technology — 18.8% | ||||||||
Communications Equipment — 2.2% | ||||||||
| 4,742 | Cisco Systems, Inc. | 115,289 | ||||||
| 942 | QUALCOMM, Inc. | 57,550 | ||||||
|
| |||||||
| 172,839 | ||||||||
|
| |||||||
Computers & Peripherals — 2.1% | ||||||||
| 395 | Apple, Inc. | 156,279 | ||||||
| 88 | EMC Corp. | 2,074 | ||||||
| 555 | Hewlett-Packard Co. | 13,756 | ||||||
|
| |||||||
| 172,109 | ||||||||
|
| |||||||
Electronic Equipment, Instruments & Components — 0.0% (g) |
| |||||||
| 7 | Amphenol Corp., Class A | 530 | ||||||
|
| |||||||
Internet Software & Services — 3.7% | ||||||||
| 653 | eBay, Inc. (a) | 33,788 | ||||||
| 268 | Google, Inc., Class A (a) | 236,171 | ||||||
SEE NOTES TO FINANCIAL STATEMENTS.
| JUNE 30, 2013 | J.P. MORGAN LARGE CAP FUNDS | 33 | ||||||
Table of Contents
JPMorgan U.S. Equity Fund
SCHEDULE OF PORTFOLIO INVESTMENTS
AS OF JUNE 30, 2013 (continued)
(Amounts in thousands, except number of contracts)
| SHARES | SECURITY DESCRIPTION | VALUE($) | ||||||
| Long Positions — Continued |
| ||||||
| Common Stocks — Continued |
| ||||||
Internet Software & Services — Continued | ||||||||
| 153 | LinkedIn Corp., Class A (a) | 27,307 | ||||||
|
| |||||||
| 297,266 | ||||||||
|
| |||||||
IT Services — 2.3% |
| |||||||
| 27 | Alliance Data Systems Corp. (a) | 4,899 | ||||||
| 251 | Cognizant Technology Solutions Corp., Class A (a) | 15,728 | ||||||
| 970 | Genpact Ltd., (Bermuda) | 18,672 | ||||||
| 31 | International Business Machines Corp. | 5,964 | ||||||
| 79 | Jack Henry & Associates, Inc. | 3,728 | ||||||
| 63 | MasterCard, Inc., Class A | 36,088 | ||||||
| 4 | Teradata Corp. (a) | 180 | ||||||
| 520 | Visa, Inc., Class A | 95,044 | ||||||
|
| |||||||
| 180,303 | ||||||||
|
| |||||||
Semiconductors & Semiconductor Equipment — 5.0% |
| |||||||
| 320 | Altera Corp. | 10,572 | ||||||
| 3,095 | Applied Materials, Inc. | 46,142 | ||||||
| 230 | ARM Holdings plc, (United Kingdom), ADR | 8,333 | ||||||
| 218 | ASML Holding N.V., (Netherlands) | 17,275 | ||||||
| 2,760 | Avago Technologies Ltd., (Singapore) | 103,174 | ||||||
| 1,043 | Broadcom Corp., Class A | 35,216 | ||||||
| 805 | Freescale Semiconductor Ltd. (a) | 10,911 | ||||||
| 531 | KLA-Tencor Corp. | 29,604 | ||||||
| 1,847 | Lam Research Corp. (a) | 81,914 | ||||||
| 1,382 | ON Semiconductor Corp. (a) | 11,163 | ||||||
| 1,083 | Xilinx, Inc. | 42,899 | ||||||
|
| |||||||
| 397,203 | ||||||||
|
| |||||||
Software — 3.5% |
| |||||||
| 554 | Adobe Systems, Inc. (a) | 25,253 | ||||||
| 384 | Citrix Systems, Inc. (a) | 23,192 | ||||||
| 16 | Intuit, Inc. | 972 | ||||||
| 4,157 | Microsoft Corp. | 143,532 | ||||||
| 2,323 | Oracle Corp. | 71,371 | ||||||
| 98 | Salesforce.com, Inc. (a) | 3,735 | ||||||
| 13 | SolarWinds, Inc. (a) | 523 | ||||||
| 94 | Splunk, Inc. (a) | 4,370 | ||||||
| 160 | VMware, Inc., Class A (a) | 10,743 | ||||||
|
| |||||||
| 283,691 | ||||||||
|
| |||||||
Total Information Technology | 1,503,941 | |||||||
|
| |||||||
Materials — 2.6% |
| |||||||
Chemicals — 2.1% |
| |||||||
| 592 | Air Products & Chemicals, Inc. | 54,234 | ||||||
| 587 | Axiall Corp. | 25,012 | ||||||
| 1,276 | Dow Chemical Co. (The) | 41,036 | ||||||
| SHARES | SECURITY DESCRIPTION | VALUE($) | ||||||
Chemicals — Continued |
| |||||||
| 75 | FMC Corp. | 4,564 | ||||||
| 142 | LyondellBasell Industries N.V., (Netherlands), Class A | 9,418 | ||||||
| 233 | Methanex Corp., (Canada) | 9,968 | ||||||
| 55 | Monsanto Co. | 5,386 | ||||||
| 35 | PPG Industries, Inc. | 5,063 | ||||||
| 79 | Sherwin-Williams Co. (The) | 13,898 | ||||||
|
| |||||||
| 168,579 | ||||||||
|
| |||||||
Containers & Packaging — 0.2% |
| |||||||
| 361 | Crown Holdings, Inc. (a) | 14,838 | ||||||
|
| |||||||
Metals & Mining — 0.3% |
| |||||||
| 2,235 | Alcoa, Inc. | 17,476 | ||||||
| 387 | Walter Energy, Inc. | 4,028 | ||||||
|
| |||||||
| 21,504 | ||||||||
|
| |||||||
Total Materials | 204,921 | |||||||
|
| |||||||
Telecommunication Services — 0.9% |
| |||||||
Diversified Telecommunication Services — 0.9% |
| |||||||
| 1,388 | Verizon Communications, Inc. | 69,870 | ||||||
|
| |||||||
Utilities — 1.7% |
| |||||||
Electric Utilities — 1.2% |
| |||||||
| 543 | Edison International | 26,162 | ||||||
| 588 | NextEra Energy, Inc. | 47,937 | ||||||
| 847 | Xcel Energy, Inc. | 24,000 | ||||||
|
| |||||||
| 98,099 | ||||||||
|
| |||||||
Multi-Utilities — 0.5% |
| |||||||
| 732 | NiSource, Inc. | 20,955 | ||||||
| 178 | Sempra Energy | 14,522 | ||||||
|
| |||||||
| 35,477 | ||||||||
|
| |||||||
Total Utilities | 133,576 | |||||||
|
| |||||||
Total Common Stocks | 7,876,188 | |||||||
|
| |||||||
| Short-Term Investment — 1.5% |
| ||||||
Investment Company — 1.5% |
| |||||||
| 120,421 | JPMorgan Prime Money Market Fund, Institutional Class Shares, 0.030% (b) (l) (m) | 120,421 | ||||||
|
| |||||||
Total Investments — 100.1% | 7,996,609 | |||||||
Liabilities in Excess of | (9,326 | ) | ||||||
|
| |||||||
NET ASSETS — 100.0% | $ | 7,987,283 | ||||||
|
| |||||||
SEE NOTES TO FINANCIAL STATEMENTS.
| 34 | J.P. MORGAN LARGE CAP FUNDS | JUNE 30, 2013 | ||||
Table of Contents
| SHARES | SECURITY DESCRIPTION | VALUE($) | ||||||
| Short Positions — 0.0% (g) |
| ||||||
| Common Stocks — 0.0% (g) |
| ||||||
Health Care — 0.0% (g) |
| |||||||
Pharmaceuticals — 0.0% (g) |
| |||||||
| 73 | Mallinckrodt plc, (Ireland) (a) † | 3,295 | ||||||
|
| |||||||
Total Short Positions | $ | 3,295 | ||||||
|
| |||||||
Percentages indicated are based on net assets.
| Futures Contracts | ||||||||||||||||
| NUMBER OF CONTRACTS | DESCRIPTION | EXPIRATION DATE | NOTIONAL VALUE AT 06/30/13 | NET UNREALIZED APPRECIATION (DEPRECIATION) | ||||||||||||
Long Futures Outstanding | ||||||||||||||||
| 1,018 | E-mini S&P 500 | 09/20/13 | $ | 81,404 | $ | (448 | ) | |||||||||
|
| |||||||||||||||
SEE NOTES TO FINANCIAL STATEMENTS.
| JUNE 30, 2013 | J.P. MORGAN LARGE CAP FUNDS | 35 | ||||||
Table of Contents
J.P. Morgan Large Cap Funds
NOTES TO SCHEDULES OF PORTFOLIO INVESTMENTS
AS OF JUNE 30, 2013
| ADR | — American Depositary Receipt | |
| (a) | — Non-income producing security. | |
| (b) | — Investment in affiliate. Money market fund registered under the Investment Company Act of 1940, as amended, and advised by J.P. Morgan Investment Management Inc. | |
| (g) | — Amount rounds to less than 0.1%. | |
| (k) | — All or a portion of this security is deposited with the broker as collateral for futures or with brokers as initial margin for futures contracts. | |
| (l) | — The rate shown is the current yield as of June 30, 2013. | |
| (m) | — All or a portion of this security is reserved and/or pledged with the custodian for current or potential holdings of futures, swaps, options, TBAs, when-issued securities, delayed delivery securities, reverse repurchase agreements, unfunded commitments and/or forward foreign currency exchange contracts. | |
| (n) | — The rate shown is the effective yield at the date of purchase. | |
| † | — Short position is the result of the sale of a when issued security from a pending corporate action on Covidien plc. |
SEE NOTES TO FINANCIAL STATEMENTS.
| 36 | J.P. MORGAN LARGE CAP FUNDS | JUNE 30, 2013 | ||||
Table of Contents
THIS PAGE IS INTENTIONALLY LEFT BLANK
| JUNE 30, 2013 | J.P. MORGAN LARGE CAP FUNDS | 37 | ||||||
Table of Contents
STATEMENTS OF ASSETS AND LIABILITIES
AS OF JUNE 30, 2013
(Amounts in thousands, except per share amounts)
Disciplined | Dynamic Growth Fund | Equity Income Fund | Growth and Income Fund | |||||||||||||
ASSETS: | ||||||||||||||||
Investments in non-affiliates, at value | $ | 1,816,824 | $ | 101,870 | $ | 4,465,474 | $ | 383,524 | ||||||||
Investments in affiliates, at value | 30,205 | 1,379 | 172,744 | 15,483 | ||||||||||||
|
|
|
|
|
|
|
| |||||||||
Total investment securities, at value | 1,847,029 | 103,249 | 4,638,218 | 399,007 | ||||||||||||
Receivables: | ||||||||||||||||
Investment securities sold | 8,661 | — | 42,868 | 248 | ||||||||||||
Fund shares sold | 905 | — | 27,974 | 324 | ||||||||||||
Dividends from non-affiliates | 1,816 | 11 | 6,882 | 384 | ||||||||||||
Dividends from affiliates | 1 | — | (a) | 4 | — | (a) | ||||||||||
|
|
|
|
|
|
|
| |||||||||
Total Assets | 1,858,412 | 103,260 | 4,715,946 | 399,963 | ||||||||||||
|
|
|
|
|
|
|
| |||||||||
LIABILITIES: | ||||||||||||||||
Payables: | ||||||||||||||||
Distributions | 131 | — | 4,035 | 45 | ||||||||||||
Securities sold short, at value | 601 | — | — | — | ||||||||||||
Investment securities purchased | 9,046 | 869 | 193,101 | 3,942 | ||||||||||||
Fund shares redeemed | 21,059 | 1 | 6,769 | 311 | ||||||||||||
Variation margin on futures contracts | 112 | — | — | — | ||||||||||||
Accrued liabilities: | ||||||||||||||||
Investment advisory fees | 371 | 51 | 1,435 | 127 | ||||||||||||
Administration fees | 64 | 7 | 1 | 27 | ||||||||||||
Shareholder servicing fees | 47 | 19 | 829 | 81 | ||||||||||||
Distribution fees | 21 | — | (a) | 505 | 80 | |||||||||||
Custodian and accounting fees | 21 | 8 | 30 | 8 | ||||||||||||
Trustees’ and Chief Compliance Officer’s fees | 1 | — | 3 | — | ||||||||||||
Other | 86 | 25 | 477 | 126 | ||||||||||||
|
|
|
|
|
|
|
| |||||||||
Total Liabilities | 31,560 | 980 | 207,185 | 4,747 | ||||||||||||
|
|
|
|
|
|
|
| |||||||||
Net Assets | $ | 1,826,852 | $ | 102,280 | $ | 4,508,761 | $ | 395,216 | ||||||||
|
|
|
|
|
|
|
| |||||||||
| (a) | Amount rounds to less than $1,000. |
SEE NOTES TO FINANCIAL STATEMENTS.
| 38 | J.P. MORGAN LARGE CAP FUNDS | JUNE 30, 2013 | ||||
Table of Contents
Disciplined | Dynamic Growth Fund | Equity Income Fund | Growth and Income Fund | |||||||||||||
NET ASSETS: | ||||||||||||||||
Paid-in-Capital | $ | 1,492,174 | $ | 91,975 | $ | 3,766,539 | $ | 318,750 | ||||||||
Accumulated undistributed (distributions in excess of) net investment income (losses) | 294 | (159 | ) | 2,120 | (79 | ) | ||||||||||
Accumulated net realized gains (losses) | 84,871 | (4,002 | ) | 56,885 | (55,751 | ) | ||||||||||
Net unrealized appreciation (depreciation) | 249,513 | 14,466 | 683,217 | 132,296 | ||||||||||||
|
|
|
|
|
|
|
| |||||||||
Total Net Assets | $ | 1,826,852 | $ | 102,280 | $ | 4,508,761 | $ | 395,216 | ||||||||
|
|
|
|
|
|
|
| |||||||||
Net Assets: | ||||||||||||||||
Class A | $ | 103,755 | $ | 126 | $ | 1,285,400 | $ | 356,127 | ||||||||
Class B | — | — | 4,062 | 2,981 | ||||||||||||
Class C | — | 123 | 407,911 | 7,769 | ||||||||||||
Class R2 | — | — | 13,347 | — | ||||||||||||
Class R5 | — | 32 | 227,442 | — | ||||||||||||
Class R6 | 1,460,937 | — | 233,034 | — | ||||||||||||
Institutional Class | 221,638 | — | — | — | ||||||||||||
Select Class | 40,522 | 101,999 | 2,337,565 | 28,339 | ||||||||||||
|
|
|
|
|
|
|
| |||||||||
Total | $ | 1,826,852 | $ | 102,280 | $ | 4,508,761 | $ | 395,216 | ||||||||
|
|
|
|
|
|
|
| |||||||||
Outstanding units of beneficial interest (shares) ($0.0001 par value; unlimited number of shares authorized): | ||||||||||||||||
Class A | 5,119 | 7 | 110,596 | 9,750 | ||||||||||||
Class B | — | — | 352 | 84 | ||||||||||||
Class C | — | 7 | 35,498 | 230 | ||||||||||||
Class R2 | — | — | 1,150 | — | ||||||||||||
Class R5 | — | 2 | 19,315 | — | ||||||||||||
Class R6 | 71,760 | — | 19,799 | — | ||||||||||||
Institutional Class | 10,886 | — | — | — | ||||||||||||
Select Class | 1,988 | 5,311 | 198,543 | 745 | ||||||||||||
Net Asset Value (a): | ||||||||||||||||
Class A — Redemption price per share | $ | 20.27 | $ | 18.94 | $ | 11.62 | $ | 36.53 | ||||||||
Class B — Offering price per share (b) | — | — | 11.54 | 35.68 | ||||||||||||
Class C — Offering price per share (b) | — | 18.43 | 11.49 | 33.83 | ||||||||||||
Class R2 — Offering and redemption price per share | — | — | 11.61 | — | ||||||||||||
Class R5 — Offering and redemption price per share | — | 19.42 | 11.78 | — | ||||||||||||
Class R6 — Offering and redemption price per share | 20.36 | — | 11.77 | — | ||||||||||||
Institutional Class — Offering and redemption price per share | 20.36 | — | — | — | ||||||||||||
Select Class — Offering and redemption price per share | 20.39 | 19.20 | 11.77 | 38.03 | ||||||||||||
Class A maximum sales charge | 5.25 | % | 5.25 | % | 5.25 | % | 5.25 | % | ||||||||
Class A maximum public offering price per share | $ | 21.39 | $ | 19.99 | $ | 12.26 | $ | 38.55 | ||||||||
|
|
|
|
|
|
|
| |||||||||
Cost of investments in non-affiliates | $ | 1,567,327 | $ | 87,404 | $ | 3,782,257 | $ | 251,228 | ||||||||
Cost of investments in affiliates | 30,205 | 1,379 | 172,744 | 15,483 | ||||||||||||
Proceeds received from securities sold short | 569 | — | — | — | ||||||||||||
| (a) | Per share amounts may not recalculate due to rounding of net assets and/or shares outstanding. |
| (b) | Redemption price for Class B and Class C Shares varies based upon length of time the shares are held. |
SEE NOTES TO FINANCIAL STATEMENTS.
| JUNE 30, 2013 | J.P. MORGAN LARGE CAP FUNDS | 39 | ||||||
Table of Contents
STATEMENTS OF ASSETS AND LIABILITIES
AS OF JUNE 30, 2013 (continued)
(Amounts in thousands, except per share amounts)
Large Cap | Large Cap Value Fund | U.S. Equity Fund | ||||||||||
ASSETS: | ||||||||||||
Investments in non-affiliates, at value | $ | 11,343,397 | $ | 696,661 | $ | 7,876,188 | ||||||
Investments in affiliates, at value | 282,910 | 7,722 | 120,421 | |||||||||
|
|
|
|
|
| |||||||
Total investment securities, at value | 11,626,307 | 704,383 | 7,996,609 | |||||||||
Deposits at broker for futures contracts | — | — | 3,769 | |||||||||
Receivables: | ||||||||||||
Investment securities sold | 105,819 | 1,046 | 54,975 | |||||||||
Fund shares sold | 21,814 | 194 | 18,081 | |||||||||
Dividends from non-affiliates | 4,335 | 856 | 6,449 | |||||||||
Dividends from affiliates | 11 | — | (a) | 3 | ||||||||
|
|
|
|
|
| |||||||
Total Assets | 11,758,286 | 706,479 | 8,079,886 | |||||||||
|
|
|
|
|
| |||||||
LIABILITIES: | ||||||||||||
Payables: | ||||||||||||
Due to custodian | — | 276 | — | |||||||||
Distributions | — | 1,742 | 5,228 | |||||||||
Securities sold short, at value | — | 289 | 3,295 | |||||||||
Investment securities purchased | 149,309 | 7,066 | 47,920 | |||||||||
Fund shares redeemed | 36,945 | 156 | 30,316 | |||||||||
Variation margin on futures contracts | — | — | 372 | |||||||||
Accrued liabilities: | ||||||||||||
Investment advisory fees | 4,700 | 232 | 2,628 | |||||||||
Administration fees | 26 | 49 | 218 | |||||||||
Shareholder servicing fees | 1,472 | 132 | 1,079 | |||||||||
Distribution fees | 918 | 11 | 282 | |||||||||
Custodian and accounting fees | 104 | 13 | 87 | |||||||||
Trustees’ and Chief Compliance Officer’s fees | 17 | — | (a) | 4 | ||||||||
Other | 1,890 | 92 | 1,174 | |||||||||
|
|
|
|
|
| |||||||
Total Liabilities | 195,381 | 10,058 | 92,603 | |||||||||
|
|
|
|
|
| |||||||
Net Assets | $ | 11,562,905 | $ | 696,421 | $ | 7,987,283 | ||||||
|
|
|
|
|
| |||||||
| (a) | Amount rounds to less than $1,000. |
SEE NOTES TO FINANCIAL STATEMENTS.
| 40 | J.P. MORGAN LARGE CAP FUNDS | JUNE 30, 2013 | ||||
Table of Contents
Large Cap | Large Cap Value Fund | U.S. Equity Fund | ||||||||||
NET ASSETS: | ||||||||||||
Paid-in-Capital | $ | 10,386,701 | $ | 587,373 | $ | 5,854,930 | ||||||
Accumulated undistributed (distributions in excess of) net investment income | (4,932 | ) | 205 | 931 | ||||||||
Accumulated net realized gains (losses) | �� | (517,405 | ) | (10,205 | ) | 159,466 | ||||||
Net unrealized appreciation (depreciation) | 1,698,541 | 119,048 | 1,971,956 | |||||||||
|
|
|
|
|
| |||||||
Total Net Assets | $ | 11,562,905 | $ | 696,421 | $ | 7,987,283 | ||||||
|
|
|
|
|
| |||||||
Net Assets: | ||||||||||||
Class A | $ | 2,824,115 | $ | 35,030 | $ | 874,571 | ||||||
Class B | 9,278 | 1,183 | 4,466 | |||||||||
Class C | 396,862 | 4,890 | 110,837 | |||||||||
Class R2 | 191,876 | 378 | 72,664 | |||||||||
Class R5 | 1,158,856 | 19,410 | 455,939 | |||||||||
Class R6 | 2,170,011 | 43,781 | 1,379,173 | |||||||||
Institutional Class | — | — | 1,214,707 | |||||||||
Select Class | 4,811,907 | 591,749 | 3,874,926 | |||||||||
|
|
|
|
|
| |||||||
Total | $ | 11,562,905 | $ | 696,421 | $ | 7,987,283 | ||||||
|
|
|
|
|
| |||||||
Outstanding units of beneficial interest (shares) | ||||||||||||
($0.0001 par value; unlimited number of shares authorized): | ||||||||||||
Class A | 108,578 | 2,503 | 68,348 | |||||||||
Class B | 403 | 86 | 354 | |||||||||
Class C | 17,412 | 357 | 8,826 | |||||||||
Class R2 | 7,455 | 27 | 5,706 | |||||||||
Class R5 | 44,365 | 1,395 | 35,562 | |||||||||
Class R6 | 82,991 | 3,157 | 107,483 | |||||||||
Institutional Class | — | — | 94,759 | |||||||||
Select Class | 185,124 | 42,820 | 302,739 | |||||||||
Net Asset Value (a): | ||||||||||||
Class A — Redemption price per share | $ | 26.01 | $ | 13.99 | $ | 12.80 | ||||||
Class B — Offering price per share (b) | 23.01 | 13.80 | 12.62 | |||||||||
Class C — Offering price per share (b) | 22.79 | 13.70 | 12.56 | |||||||||
Class R2 — Offering and redemption price per share | 25.74 | 13.95 | 12.74 | |||||||||
Class R5 — Offering and redemption price per share | 26.12 | 13.92 | 12.82 | |||||||||
Class R6 — Offering and redemption price per share | 26.15 | 13.87 | 12.83 | |||||||||
Institutional Class — Offering and redemption price per share | — | — | 12.82 | |||||||||
Select Class — Offering and redemption price per share | 25.99 | 13.82 | 12.80 | |||||||||
Class A maximum sales charge | 5.25 | % | 5.25 | % | 5.25 | % | ||||||
Class A maximum public offering price per share | $ | 27.45 | $ | 14.77 | $ | 13.51 | ||||||
|
|
|
|
|
| |||||||
Cost of investments in non-affiliates | $ | 9,644,856 | $ | 577,600 | $ | 5,903,606 | ||||||
Cost of investments in affiliates | 282,910 | 7,722 | 120,421 | |||||||||
Proceeds received from securities sold short | — | 276 | 3,117 | |||||||||
| (a) | Per share amounts may not recalculate due to rounding of net assets and/or shares outstanding. |
| (b) | Redemption price for Class B and Class C Shares varies based upon length of time the shares are held. |
SEE NOTES TO FINANCIAL STATEMENTS.
| JUNE 30, 2013 | J.P. MORGAN LARGE CAP FUNDS | 41 | ||||||
Table of Contents
STATEMENTS OF OPERATIONS
FOR THE YEAR ENDED JUNE 30, 2013
(Amounts in thousands)
Disciplined | Dynamic Growth Fund | Equity Income Fund | Growth and Income Fund | |||||||||||||
INVESTMENT INCOME: | ||||||||||||||||
Interest income from non-affiliates | $ | 4 | $ | — | $ | — | $ | — | ||||||||
Dividend income from non-affiliates | 29,027 | 473 | 103,080 | 8,221 | ||||||||||||
Dividend income from affiliates | 20 | 1 | 65 | 5 | ||||||||||||
|
|
|
|
|
|
|
| |||||||||
Total investment income | 29,051 | 474 | 103,145 | 8,226 | ||||||||||||
|
|
|
|
|
|
|
| |||||||||
EXPENSES: | ||||||||||||||||
Investment advisory fees | 3,615 | 339 | 12,643 | 1,379 | ||||||||||||
Administration fees | 1,231 | 48 | 2,687 | 294 | ||||||||||||
Distribution fees: | ||||||||||||||||
Class A | 161 | — | (a) | 2,177 | 807 | |||||||||||
Class B | — | — | 31 | 24 | ||||||||||||
Class C | — | 1 | 1,768 | 40 | ||||||||||||
Class R2 | — | — | 28 | — | ||||||||||||
Shareholder servicing fees: | ||||||||||||||||
Class A | 161 | — | (a) | 2,177 | 807 | |||||||||||
Class B | — | — | 10 | 8 | ||||||||||||
Class C | — | — | (a) | 589 | 13 | |||||||||||
Class R2 | — | — | 14 | — | ||||||||||||
Class R5 | — | — | (a) | 76 | — | |||||||||||
Institutional Class | 191 | — | — | — | ||||||||||||
Select Class | 68 | 141 | 4,433 | 34 | ||||||||||||
Custodian and accounting fees | 79 | 29 | 121 | 30 | ||||||||||||
Professional fees | 67 | 47 | 73 | 45 | ||||||||||||
Trustees’ and Chief Compliance Officer’s fees | 16 | — | (a) | 35 | 2 | |||||||||||
Printing and mailing costs | 34 | 7 | 261 | 40 | ||||||||||||
Registration and filing fees | 55 | 16 | 313 | 51 | ||||||||||||
Transfer agent fees | 245 | 11 | 2,268 | 424 | ||||||||||||
Other | 19 | 4 | 64 | 8 | ||||||||||||
|
|
|
|
|
|
|
| |||||||||
Total expenses | 5,942 | 643 | 29,768 | 4,006 | ||||||||||||
|
|
|
|
|
|
|
| |||||||||
Less amounts waived | (350 | ) | (79 | ) | (1,535 | ) | (14 | ) | ||||||||
|
|
|
|
|
|
|
| |||||||||
Net expenses | 5,592 | 564 | 28,233 | 3,992 | ||||||||||||
|
|
|
|
|
|
|
| |||||||||
Net investment income (loss) | 23,459 | (90 | ) | 74,912 | 4,234 | |||||||||||
|
|
|
|
|
|
|
| |||||||||
REALIZED/UNREALIZED GAINS (LOSSES): | ||||||||||||||||
Net realized gain (loss) on transactions from: | ||||||||||||||||
Investments in non-affiliates | 134,186 | (26 | ) | 69,841 | 29,391 | |||||||||||
Futures | 4,937 | — | — | — | ||||||||||||
|
|
|
|
|
|
|
| |||||||||
Net realized gain (loss) | 139,123 | (26 | ) | 69,841 | 29,391 | |||||||||||
|
|
|
|
|
|
|
| |||||||||
Change in net unrealized appreciation/depreciation of: | ||||||||||||||||
Investments in non-affiliates | 123,388 | 9,369 | 479,810 | 45,073 | ||||||||||||
Futures | (617 | ) | — | — | — | |||||||||||
Securities sold short | (32 | ) | — | — | — | |||||||||||
|
|
|
|
|
|
|
| |||||||||
Change in net unrealized appreciation/depreciation | 122,739 | 9,369 | 479,810 | 45,073 | ||||||||||||
|
|
|
|
|
|
|
| |||||||||
Net realized/unrealized gains (losses) | 261,862 | 9,343 | 549,651 | 74,464 | ||||||||||||
|
|
|
|
|
|
|
| |||||||||
Change in net assets resulting from operations | $ | 285,321 | $ | 9,253 | $ | 624,563 | $ | 78,698 | ||||||||
|
|
|
|
|
|
|
| |||||||||
| (a) | Amount rounds to less than $1,000. |
SEE NOTES TO FINANCIAL STATEMENTS.
| 42 | J.P. MORGAN LARGE CAP FUNDS | JUNE 30, 2013 | ||||
Table of Contents
Large Cap | Large Cap Value Fund | U.S. Equity Fund | ||||||||||
INVESTMENT INCOME: | ||||||||||||
Dividend income from non-affiliates | $ | 136,757 | $ | 13,047 | $ | 147,200 | ||||||
Dividend income from affiliates | 345 | 6 | 91 | |||||||||
|
|
|
|
|
| |||||||
Total investment income | 137,102 | 13,053 | 147,291 | |||||||||
|
|
|
|
|
| |||||||
EXPENSES: | ||||||||||||
Investment advisory fees | 48,826 | 2,538 | 29,099 | |||||||||
Administration fees | 8,309 | 541 | 6,196 | |||||||||
Distribution fees: | ||||||||||||
Class A | 6,009 | 74 | 1,943 | |||||||||
Class B | 81 | 10 | 36 | |||||||||
Class C | 2,368 | 28 | 682 | |||||||||
Class R2 | 740 | 2 | 257 | |||||||||
Shareholder servicing fees: | ||||||||||||
Class A | 6,009 | 74 | 1,943 | |||||||||
Class B | 27 | 3 | 12 | |||||||||
Class C | 790 | 10 | 227 | |||||||||
Class R2 | 370 | 1 | 129 | |||||||||
Class R5 | 442 | 8 | 204 | |||||||||
Institutional Class | — | — | 849 | |||||||||
Select Class | 10,841 | 1,395 | 9,844 | |||||||||
Custodian and accounting fees | 384 | 52 | 331 | |||||||||
Professional fees | 134 | 53 | 125 | |||||||||
Trustees’ and Chief Compliance Officer’s fees | 110 | 7 | 84 | |||||||||
Printing and mailing costs | 784 | 9 | 500 | |||||||||
Registration and filing fees | 731 | 72 | 157 | |||||||||
Transfer agent fees | 8,411 | 172 | 4,466 | |||||||||
Other | 183 | 22 | 145 | |||||||||
|
|
|
|
|
| |||||||
Total expenses | 95,549 | 5,071 | 57,229 | |||||||||
|
|
|
|
|
| |||||||
Less amounts waived | (5,054 | ) | (100 | ) | (2,686 | ) | ||||||
Less earnings credits | — | (a) | — | — | ||||||||
|
|
|
|
|
| |||||||
Net expenses | 90,495 | 4,971 | 54,543 | |||||||||
|
|
|
|
|
| |||||||
Net investment income (loss) | 46,607 | 8,082 | 92,748 | |||||||||
|
|
|
|
|
| |||||||
REALIZED/UNREALIZED GAINS (LOSSES): | ||||||||||||
Net realized gain (loss) on transactions from: | ||||||||||||
Investments in non-affiliates | (326,384 | ) | 99,795 | 462,866 | ||||||||
Futures | — | — | 17,337 | |||||||||
|
|
|
|
|
| |||||||
Net realized gain (loss) | (326,384 | ) | 99,795 | 480,203 | ||||||||
|
|
|
|
|
| |||||||
Change in net unrealized appreciation/depreciation of: | ||||||||||||
Investments in non-affiliates | 1,289,666 | 52,191 | 950,627 | |||||||||
Futures | — | — | (2,755 | ) | ||||||||
Securities sold short | — | (13 | ) | (178 | ) | |||||||
|
|
|
|
|
| |||||||
Change in net unrealized appreciation/depreciation | 1,289,666 | 52,178 | 947,694 | |||||||||
|
|
|
|
|
| |||||||
Net realized/unrealized gains (losses) | 963,282 | 151,973 | 1,427,897 | |||||||||
|
|
|
|
|
| |||||||
Change in net assets resulting from operations | $ | 1,009,889 | $ | 160,055 | $ | 1,520,645 | ||||||
|
|
|
|
|
| |||||||
| (a) | Amount rounds to less than $1,000. |
SEE NOTES TO FINANCIAL STATEMENTS.
| JUNE 30, 2013 | J.P. MORGAN LARGE CAP FUNDS | 43 | ||||||
Table of Contents
STATEMENTS OF CHANGES IN NET ASSETS
FOR THE PERIODS INDICATED
(Amounts in thousands)
| Disciplined Equity Fund | Dynamic Growth Fund | |||||||||||||||
| Year Ended 6/30/2013 | Year Ended 6/30/2012 | Year Ended 6/30/2013 | Year Ended 6/30/2012 | |||||||||||||
CHANGE IN NET ASSETS RESULTING FROM OPERATIONS: | ||||||||||||||||
Net investment income (loss) | $ | 23,459 | $ | 14,792 | $ | (90 | ) | $ | (216 | ) | ||||||
Net realized gain (loss) | 139,123 | 12,773 | (26 | ) | (2,051 | ) | ||||||||||
Change in net unrealized appreciation/depreciation | 122,739 | 28,689 | 9,369 | 3,389 | ||||||||||||
|
|
|
|
|
|
|
| |||||||||
Change in net assets resulting from operations | 285,321 | 56,254 | 9,253 | 1,122 | ||||||||||||
|
|
|
|
|
|
|
| |||||||||
DISTRIBUTIONS TO SHAREHOLDERS: | ||||||||||||||||
Class A | ||||||||||||||||
From net investment income | (897 | ) | (137 | ) | — | — | ||||||||||
From net realized gains | (1,388 | ) | — | — | — | |||||||||||
Class R6 | ||||||||||||||||
From net investment income | (19,141 | ) | (12,011 | ) | — | — | ||||||||||
From net realized gains | (36,007 | ) | — | — | — | |||||||||||
Institutional Class | ||||||||||||||||
From net investment income | (2,982 | ) | (1,864 | ) | — | — | ||||||||||
From net realized gains | (6,783 | ) | — | — | — | |||||||||||
Select Class | ||||||||||||||||
From net investment income | (417 | ) | (173 | ) | — | — | ||||||||||
From net realized gains | (904 | ) | — | — | — | |||||||||||
|
|
|
|
|
|
|
| |||||||||
Total distributions to shareholders | (68,519 | ) | (14,185 | ) | — | — | ||||||||||
|
|
|
|
|
|
|
| |||||||||
CAPITAL TRANSACTIONS: | ||||||||||||||||
Change in net assets resulting from capital transactions | 377,140 | 478,660 | 53,837 | (5,780 | ) | |||||||||||
|
|
|
|
|
|
|
| |||||||||
NET ASSETS: | ||||||||||||||||
Change in net assets | 593,942 | 520,729 | 63,090 | (4,658 | ) | |||||||||||
Beginning of period | 1,232,910 | 712,181 | 39,190 | 43,848 | ||||||||||||
|
|
|
|
|
|
|
| |||||||||
End of period | $ | 1,826,852 | $ | 1,232,910 | $ | 102,280 | $ | 39,190 | ||||||||
|
|
|
|
|
|
|
| |||||||||
Accumulated undistributed (distributions in excess of) net investment income (losses) | $ | 294 | $ | 519 | $ | (159 | ) | $ | (122 | ) | ||||||
|
|
|
|
|
|
|
| |||||||||
SEE NOTES TO FINANCIAL STATEMENTS.
| 44 | J.P. MORGAN LARGE CAP FUNDS | JUNE 30, 2013 | ||||
Table of Contents
| Equity Income Fund | Growth and Income Fund | |||||||||||||||
| Year Ended 6/30/2013 | Year Ended 6/30/2012 | Year Ended 6/30/2013 | Year Ended 6/30/2012 | |||||||||||||
CHANGE IN NET ASSETS RESULTING FROM OPERATIONS: | ||||||||||||||||
Net investment income (loss) | $ | 74,912 | $ | 30,360 | $ | 4,234 | $ | 3,781 | ||||||||
Net realized gain (loss) | 69,841 | 10,022 | 29,391 | 9,136 | ||||||||||||
Change in net unrealized appreciation/depreciation | 479,810 | 119,295 | 45,073 | 1,887 | ||||||||||||
|
|
|
|
|
|
|
| |||||||||
Change in net assets resulting from operations | 624,563 | 159,677 | 78,698 | 14,804 | ||||||||||||
|
|
|
|
|
|
|
| |||||||||
DISTRIBUTIONS TO SHAREHOLDERS: | ||||||||||||||||
Class A | ||||||||||||||||
From net investment income | (19,317 | ) | (7,456 | ) | (4,024 | ) | (3,511 | ) | ||||||||
From net realized gains | (5,498 | ) | (1,481 | ) | — | — | ||||||||||
Class B | ||||||||||||||||
From net investment income | (70 | ) | (61 | ) | (25 | ) | (26 | ) | ||||||||
From net realized gains | (29 | ) | (20 | ) | — | — | ||||||||||
Class C | ||||||||||||||||
From net investment income | (4,350 | ) | (1,172 | ) | (55 | ) | (34 | ) | ||||||||
From net realized gains | (1,406 | ) | (240 | ) | — | — | ||||||||||
Class R2 | ||||||||||||||||
From net investment income | (121 | ) | (12 | ) | — | — | ||||||||||
From net realized gains | (24 | ) | (1 | ) | — | — | ||||||||||
Class R5 | ||||||||||||||||
From net investment income | (3,934 | ) | (1,602 | ) | — | — | ||||||||||
From net realized gains | (977 | ) | (229 | ) | — | — | ||||||||||
Class R6 (a) | ||||||||||||||||
From net investment income | (3,107 | ) | (480 | ) | — | — | ||||||||||
From net realized gains | (431 | ) | — | — | — | |||||||||||
Select Class | ||||||||||||||||
From net investment income | (42,429 | ) | (17,837 | ) | (234 | ) | (90 | ) | ||||||||
From net realized gains | (11,551 | ) | (2,850 | ) | — | — | ||||||||||
|
|
|
|
|
|
|
| |||||||||
Total distributions to shareholders | (93,244 | ) | (33,441 | ) | (4,338 | ) | (3,661 | ) | ||||||||
|
|
|
|
|
|
|
| |||||||||
CAPITAL TRANSACTIONS: | ||||||||||||||||
Change in net assets resulting from capital transactions | 1,764,743 | 1,626,785 | 12,439 | (23,585 | ) | |||||||||||
|
|
|
|
|
|
|
| |||||||||
NET ASSETS: | ||||||||||||||||
Change in net assets | 2,296,062 | 1,753,021 | 86,799 | (12,442 | ) | |||||||||||
Beginning of period | 2,212,699 | 459,678 | 308,417 | 320,859 | ||||||||||||
|
|
|
|
|
|
|
| |||||||||
End of period | $ | 4,508,761 | $ | 2,212,699 | $ | 395,216 | $ | 308,417 | ||||||||
|
|
|
|
|
|
|
| |||||||||
Accumulated undistributed (distributions in excess of) net investment income | $ | 2,120 | $ | (458 | ) | $ | (79 | ) | $ | 53 | ||||||
|
|
|
|
|
|
|
| |||||||||
| (a) | Commencement of offering of class of shares effective January 31, 2012 for Equity Income Fund. |
SEE NOTES TO FINANCIAL STATEMENTS.
| JUNE 30, 2013 | J.P. MORGAN LARGE CAP FUNDS | 45 | ||||||
Table of Contents
STATEMENTS OF CHANGES IN NET ASSETS
FOR THE PERIODS INDICATED (continued)
(Amounts in thousands)
| Large Cap Growth Fund | Large Cap Value Fund | |||||||||||||||
| Year Ended 6/30/2013 | Year Ended 6/30/2012 | Year Ended 6/30/2013 | Year Ended 6/30/2012 | |||||||||||||
CHANGE IN NET ASSETS RESULTING FROM OPERATIONS: | ||||||||||||||||
Net investment income (loss) | $ | 46,607 | $ | (2,534 | ) | $ | 8,082 | $ | 7,352 | |||||||
Net realized gain (loss) | (326,384 | ) | (142,714 | ) | 99,795 | 38,076 | ||||||||||
Change in net unrealized appreciation/depreciation | 1,289,666 | 345,625 | 52,178 | (59,886 | ) | |||||||||||
|
|
|
|
|
|
|
| |||||||||
Change in net assets resulting from operations | 1,009,889 | 200,377 | 160,055 | (14,458 | ) | |||||||||||
|
|
|
|
|
|
|
| |||||||||
DISTRIBUTIONS TO SHAREHOLDERS: | ||||||||||||||||
Class A | ||||||||||||||||
From net investment income | (8,070 | ) | — | (343 | ) | (248 | ) | |||||||||
Class B | ||||||||||||||||
From net investment income | (3 | ) | — | (9 | ) | (9 | ) | |||||||||
Class C | ||||||||||||||||
From net investment income | (501 | ) | — | (28 | ) | (16 | ) | |||||||||
Class R2 | ||||||||||||||||
From net investment income | (401 | ) | (1 | ) | (3 | ) | (1 | ) | ||||||||
Class R5 | ||||||||||||||||
From net investment income | (6,158 | ) | (140 | ) | (293 | ) | (352 | ) | ||||||||
Class R6 | ||||||||||||||||
From net investment income | (12,750 | ) | (129 | ) | (389 | ) | (156 | ) | ||||||||
Select Class | ||||||||||||||||
From net investment income | (20,306 | ) | (421 | ) | (7,078 | ) | (6,698 | ) | ||||||||
|
|
|
|
|
|
|
| |||||||||
Total distributions to shareholders | (48,189 | ) | (691 | ) | (8,143 | ) | (7,480 | ) | ||||||||
|
|
|
|
|
|
|
| |||||||||
CAPITAL TRANSACTIONS: | ||||||||||||||||
Change in net assets resulting from capital transactions | 3,684,331 | 4,791,189 | (90,864 | ) | (10,513 | ) | ||||||||||
|
|
|
|
|
|
|
| |||||||||
NET ASSETS: | ||||||||||||||||
Change in net assets | 4,646,031 | 4,990,875 | 61,048 | (32,451 | ) | |||||||||||
Beginning of period | 6,916,874 | 1,925,999 | 635,373 | 667,824 | ||||||||||||
|
|
|
|
|
|
|
| |||||||||
End of period | $ | 11,562,905 | $ | 6,916,874 | $ | 696,421 | $ | 635,373 | ||||||||
|
|
|
|
|
|
|
| |||||||||
Accumulated undistributed (distributions in excess of) net investment income | $ | (4,932 | ) | $ | (3,036 | ) | $ | 205 | $ | 261 | ||||||
|
|
|
|
|
|
|
| |||||||||
SEE NOTES TO FINANCIAL STATEMENTS.
| 46 | J.P. MORGAN LARGE CAP FUNDS | JUNE 30, 2013 | ||||
Table of Contents
| U.S. Equity Fund | ||||||||
| Year Ended 6/30/2013 | Year Ended 6/30/2012 | |||||||
CHANGE IN NET ASSETS RESULTING FROM OPERATIONS: | ||||||||
Net investment income (loss) | $ | 92,748 | $ | 61,156 | ||||
Net realized gain (loss) | 480,203 | (11,561 | ) | |||||
Change in net unrealized appreciation/depreciation | 947,694 | 132,494 | ||||||
|
|
|
| |||||
Change in net assets resulting from operations | 1,520,645 | 182,089 | ||||||
|
|
|
| |||||
DISTRIBUTIONS TO SHAREHOLDERS: | ||||||||
Class A | ||||||||
From net investment income | (8,381 | ) | (4,782 | ) | ||||
From net realized gains | (15,212 | ) | (2,714 | ) | ||||
Class B | ||||||||
From net investment income | (28 | ) | (20 | ) | ||||
From net realized gains | (97 | ) | (31 | ) | ||||
Class C | ||||||||
From net investment income | (586 | ) | (280 | ) | ||||
From net realized gains | (1,789 | ) | (317 | ) | ||||
Class R2 | ||||||||
From net investment income | (467 | ) | (148 | ) | ||||
From net realized gains | (981 | ) | (82 | ) | ||||
Class R5 | ||||||||
From net investment income | (5,910 | ) | (3,201 | ) | ||||
From net realized gains | (8,373 | ) | (1,305 | ) | ||||
Class R6 | ||||||||
From net investment income | (17,082 | ) | (10,168 | ) | ||||
From net realized gains | (21,719 | ) | (3,702 | ) | ||||
Institutional Class | ||||||||
From net investment income | (12,288 | ) | (5,886 | ) | ||||
From net realized gains | (14,514 | ) | (2,489 | ) | ||||
Select Class | ||||||||
From net investment income | (48,777 | ) | (34,893 | ) | ||||
From net realized gains | (80,114 | ) | (17,997 | ) | ||||
|
|
|
| |||||
Total distributions to shareholders | (236,318 | ) | (88,015 | ) | ||||
|
|
|
| |||||
CAPITAL TRANSACTIONS: | ||||||||
Change in net assets resulting from capital transactions | 249,947 | 1,526,527 | ||||||
|
|
|
| |||||
NET ASSETS: | ||||||||
Change in net assets | 1,534,274 | 1,620,601 | ||||||
Beginning of period | 6,453,009 | 4,832,408 | ||||||
|
|
|
| |||||
End of period | $ | 7,987,283 | $ | 6,453,009 | ||||
|
|
|
| |||||
Accumulated undistributed (distributions in excess of) net investment income | $ | 931 | $ | 1,751 | ||||
|
|
|
| |||||
SEE NOTES TO FINANCIAL STATEMENTS.
| JUNE 30, 2013 | J.P. MORGAN LARGE CAP FUNDS | 47 | ||||||
Table of Contents
STATEMENTS OF CHANGES IN NET ASSETS
FOR THE PERIODS INDICATED (continued)
(Amounts in thousands)
| Disciplined Equity Fund | Dynamic Growth Fund | |||||||||||||||
| Year Ended 6/30/2013 | Year Ended 6/30/2012 | Year Ended 6/30/2013 | Year Ended 6/30/2012 | |||||||||||||
CAPITAL TRANSACTIONS: | ||||||||||||||||
Class A | ||||||||||||||||
Proceeds from shares issued | $ | 96,937 | $ | 26,796 | $ | — | $ | — | ||||||||
Distributions reinvested | 2,272 | 137 | — | — | ||||||||||||
Cost of shares redeemed | (28,925 | ) | (10,466 | ) | — | — | ||||||||||
|
|
|
|
|
|
|
| |||||||||
Change in net assets resulting from Class A capital transactions | $ | 70,284 | $ | 16,467 | $ | — | $ | — | ||||||||
|
|
|
|
|
|
|
| |||||||||
Class R6 | ||||||||||||||||
Proceeds from shares issued | $ | 438,811 | $ | 450,054 | $ | — | $ | — | ||||||||
Distributions reinvested | 55,148 | 12,011 | — | — | ||||||||||||
Cost of shares redeemed | (227,923 | ) | (50,349 | ) | — | — | ||||||||||
|
|
|
|
|
|
|
| |||||||||
Change in net assets resulting from Class R6 capital transactions | $ | 266,036 | $ | 411,716 | $ | — | $ | — | ||||||||
|
|
|
|
|
|
|
| |||||||||
Institutional Class | ||||||||||||||||
Proceeds from shares issued | $ | 86,438 | $ | 65,484 | $ | — | $ | — | ||||||||
Distributions reinvested | 9,649 | 1,862 | — | — | ||||||||||||
Cost of shares redeemed | (75,564 | ) | (19,912 | ) | — | — | ||||||||||
|
|
|
|
|
|
|
| |||||||||
Change in net assets resulting from Institutional Class capital transactions | $ | 20,523 | $ | 47,434 | $ | — | $ | — | ||||||||
|
|
|
|
|
|
|
| |||||||||
Select Class | ||||||||||||||||
Proceeds from shares issued | $ | 26,750 | $ | 5,060 | $ | 69,660 | $ | 7,108 | ||||||||
Distributions reinvested | 943 | 86 | — | — | ||||||||||||
Cost of shares redeemed | (7,396 | ) | (2,103 | ) | (15,823 | ) | (12,888 | ) | ||||||||
|
|
|
|
|
|
|
| |||||||||
Change in net assets resulting from Select Class capital transactions | $ | 20,297 | $ | 3,043 | $ | 53,837 | $ | (5,780 | ) | |||||||
|
|
|
|
|
|
|
| |||||||||
Total change in net assets resulting from capital transactions | $ | 377,140 | $ | 478,660 | $ | 53,837 | $ | (5,780 | ) | |||||||
|
|
|
|
|
|
|
| |||||||||
SHARE TRANSACTIONS: | ||||||||||||||||
Class A | ||||||||||||||||
Issued | 5,299 | 1,584 | — | — | ||||||||||||
Reinvested | 125 | 8 | — | — | ||||||||||||
Redeemed | (1,500 | ) | (599 | ) | — | — | ||||||||||
|
|
|
|
|
|
|
| |||||||||
Change in Class A Shares | 3,924 | 993 | — | — | ||||||||||||
|
|
|
|
|
|
|
| |||||||||
Class R6 | ||||||||||||||||
Issued | 22,846 | 26,788 | — | — | ||||||||||||
Reinvested | 3,035 | 729 | — | — | ||||||||||||
Redeemed | (12,719 | ) | (3,213 | ) | — | — | ||||||||||
|
|
|
|
|
|
|
| |||||||||
Change in Class R6 Shares | 13,162 | 24,304 | — | — | ||||||||||||
|
|
|
|
|
|
|
| |||||||||
Institutional Class | ||||||||||||||||
Issued | 4,518 | 3,833 | — | — | ||||||||||||
Reinvested | 534 | 114 | — | — | ||||||||||||
Redeemed | (3,999 | ) | (1,194 | ) | — | — | ||||||||||
|
|
|
|
|
|
|
| |||||||||
Change in Institutional Class Shares | 1,053 | 2,753 | — | — | ||||||||||||
|
|
|
|
|
|
|
| |||||||||
Select Class | ||||||||||||||||
Issued | 1,414 | 293 | 3,788 | 479 | ||||||||||||
Reinvested | 52 | 5 | — | — | ||||||||||||
Redeemed | (391 | ) | (126 | ) | (900 | ) | (850 | ) | ||||||||
|
|
|
|
|
|
|
| |||||||||
Change in Select Class Shares | 1,075 | 172 | 2,888 | (371 | ) | |||||||||||
|
|
|
|
|
|
|
| |||||||||
SEE NOTES TO FINANCIAL STATEMENTS.
| 48 | J.P. MORGAN LARGE CAP FUNDS | JUNE 30, 2013 | ||||
Table of Contents
| Equity Income Fund | Growth and Income Fund | |||||||||||||||
| Year Ended 6/30/2013 | Year Ended 6/30/2012 | Year Ended 6/30/2013 | Year Ended 6/30/2012 | |||||||||||||
CAPITAL TRANSACTIONS: | ||||||||||||||||
Class A | ||||||||||||||||
Proceeds from shares issued | $ | 737,962 | $ | 424,660 | $ | 35,245 | $ | 11,165 | ||||||||
Distributions reinvested | 23,473 | 8,447 | 3,805 | 3,339 | ||||||||||||
Cost of shares redeemed | (202,721 | ) | (95,525 | ) | (46,195 | ) | (38,398 | ) | ||||||||
|
|
|
|
|
|
|
| |||||||||
Change in net assets resulting from Class A capital transactions | $ | 558,714 | $ | 337,582 | $ | (7,145 | ) | $ | (23,894 | ) | ||||||
|
|
|
|
|
|
|
| |||||||||
Class B | ||||||||||||||||
Proceeds from shares issued | $ | 666 | $ | 746 | $ | 46 | $ | 119 | ||||||||
Distributions reinvested | 87 | 72 | 24 | 26 | ||||||||||||
Cost of shares redeemed | (1,725 | ) | (2,541 | ) | (1,068 | ) | (1,356 | ) | ||||||||
|
|
|
|
|
|
|
| |||||||||
Change in net assets resulting from Class B capital transactions | $ | (972 | ) | $ | (1,723 | ) | $ | (998 | ) | $ | (1,211 | ) | ||||
|
|
|
|
|
|
|
| |||||||||
Class C | ||||||||||||||||
Proceeds from shares issued | $ | 268,094 | $ | 110,299 | $ | 3,658 | $ | 1,398 | ||||||||
Distributions reinvested | 4,630 | 1,128 | 50 | 30 | ||||||||||||
Cost of shares redeemed | (34,460 | ) | (15,205 | ) | (1,194 | ) | (1,299 | ) | ||||||||
|
|
|
|
|
|
|
| |||||||||
Change in net assets resulting from Class C capital transactions | $ | 238,264 | $ | 96,222 | $ | 2,514 | $ | 129 | ||||||||
|
|
|
|
|
|
|
| |||||||||
Class R2 | ||||||||||||||||
Proceeds from shares issued | $ | 12,892 | $ | 1,756 | $ | — | $ | — | ||||||||
Distributions reinvested | 145 | 12 | — | — | ||||||||||||
Cost of shares redeemed | (2,395 | ) | (150 | ) | — | — | ||||||||||
|
|
|
|
|
|
|
| |||||||||
Change in net assets resulting from Class R2 capital transactions | $ | 10,642 | $ | 1,618 | $ | — | $ | — | ||||||||
|
|
|
|
|
|
|
| |||||||||
Class R5 | ||||||||||||||||
Proceeds from shares issued | $ | 118,180 | $ | 138,348 | $ | — | $ | — | ||||||||
Distributions reinvested | 4,911 | 1,831 | — | — | ||||||||||||
Cost of shares redeemed | (32,438 | ) | (40,633 | ) | — | — | ||||||||||
|
|
|
|
|
|
|
| |||||||||
Change in net assets resulting from Class R5 capital transactions | $ | 90,653 | $ | 99,546 | $ | — | $ | — | ||||||||
|
|
|
|
|
|
|
| |||||||||
Class R6 (a) | ||||||||||||||||
Proceeds from shares issued | $ | 213,112 | $ | 83,915 | $ | — | $ | — | ||||||||
Distributions reinvested | 2,662 | 141 | — | — | ||||||||||||
Cost of shares redeemed | (74,123 | ) | (12,794 | ) | — | — | ||||||||||
|
|
|
|
|
|
|
| |||||||||
Change in net assets resulting from Class R6 capital transactions | $ | 141,651 | $ | 71,262 | $ | — | $ | — | ||||||||
|
|
|
|
|
|
|
| |||||||||
Select Class | ||||||||||||||||
Proceeds from shares issued | $ | 1,117,631 | $ | 1,203,854 | $ | 29,596 | $ | 2,028 | ||||||||
Distributions reinvested | 23,225 | 7,939 | 181 | 53 | ||||||||||||
Cost of shares redeemed | (415,065 | ) | (189,515 | ) | (11,709 | ) | (690 | ) | ||||||||
|
|
|
|
|
|
|
| |||||||||
Change in net assets resulting from Select Class capital transactions | $ | 725,791 | $ | 1,022,278 | $ | 18,068 | $ | 1,391 | ||||||||
|
|
|
|
|
|
|
| |||||||||
Total change in net assets resulting from capital transactions | $ | 1,764,743 | $ | 1,626,785 | $ | 12,439 | $ | (23,585 | ) | |||||||
|
|
|
|
|
|
|
| |||||||||
| (a) | Commencement of offering of class of shares effective January 31, 2012 for the Equity Income Fund. |
SEE NOTES TO FINANCIAL STATEMENTS.
| JUNE 30, 2013 | J.P. MORGAN LARGE CAP FUNDS | 49 | ||||||
Table of Contents
STATEMENTS OF CHANGES IN NET ASSETS
FOR THE PERIODS INDICATED (continued)
(Amounts in thousands)
| Equity Income Fund | Growth and Income Fund | |||||||||||||||
| Year Ended 6/30/2013 | Year Ended 6/30/2012 | Year Ended 6/30/2013 | Year Ended 6/30/2012 | |||||||||||||
SHARE TRANSACTIONS: | ||||||||||||||||
Class A | ||||||||||||||||
Issued | 68,181 | 45,117 | 1,056 | 395 | ||||||||||||
Reinvested | 2,207 | 897 | 113 | 122 | ||||||||||||
Redeemed | (18,810 | ) | (10,173 | ) | (1,393 | ) | (1,402 | ) | ||||||||
|
|
|
|
|
|
|
| |||||||||
Change in Class A Shares | 51,578 | 35,841 | (224 | ) | (885 | ) | ||||||||||
|
|
|
|
|
|
|
| |||||||||
Class B | ||||||||||||||||
Issued | 62 | 80 | 2 | 4 | ||||||||||||
Reinvested | 8 | 8 | 1 | 1 | ||||||||||||
Redeemed | (163 | ) | (282 | ) | (33 | ) | (52 | ) | ||||||||
|
|
|
|
|
|
|
| |||||||||
Change in Class B Shares | (93 | ) | (194 | ) | (30 | ) | (47 | ) | ||||||||
|
|
|
|
|
|
|
| |||||||||
Class C | ||||||||||||||||
Issued | 24,888 | 11,785 | 115 | 56 | ||||||||||||
Reinvested | 440 | 120 | 2 | 1 | ||||||||||||
Redeemed | (3,212 | ) | (1,636 | ) | (39 | ) | (51 | ) | ||||||||
|
|
|
|
|
|
|
| |||||||||
Change in Class C Shares | 22,116 | 10,269 | 78 | 6 | ||||||||||||
|
|
|
|
|
|
|
| |||||||||
Class R2 | ||||||||||||||||
Issued | 1,186 | 180 | — | — | ||||||||||||
Reinvested | 13 | 1 | — | — | ||||||||||||
Redeemed | (220 | ) | (15 | ) | — | — | ||||||||||
|
|
|
|
|
|
|
| |||||||||
Change in Class R2 Shares | 979 | 166 | — | — | ||||||||||||
|
|
|
|
|
|
|
| |||||||||
Class R5 | ||||||||||||||||
Issued | 10,685 | 15,010 | — | — | ||||||||||||
Reinvested | 456 | 193 | — | — | ||||||||||||
Redeemed | (3,032 | ) | (4,305 | ) | — | — | ||||||||||
|
|
|
|
|
|
|
| |||||||||
Change in Class R5 Shares | 8,109 | 10,898 | — | — | ||||||||||||
|
|
|
|
|
|
|
| |||||||||
Class R6 (a) | ||||||||||||||||
Issued | 19,542 | 8,367 | — | — | ||||||||||||
Reinvested | 241 | 14 | — | — | ||||||||||||
Redeemed | (7,073 | ) | (1,292 | ) | — | — | ||||||||||
|
|
|
|
|
|
|
| |||||||||
Change in Class R6 Shares | 12,710 | 7,089 | — | — | ||||||||||||
|
|
|
|
|
|
|
| |||||||||
Select Class | ||||||||||||||||
Issued | 102,846 | 128,808 | 860 | 71 | ||||||||||||
Reinvested | 2,161 | 827 | 5 | 2 | ||||||||||||
Redeemed | (38,275 | ) | (19,342 | ) | (364 | ) | (24 | ) | ||||||||
|
|
|
|
|
|
|
| |||||||||
Change in Select Class Shares | 66,732 | 110,293 | 501 | 49 | ||||||||||||
|
|
|
|
|
|
|
| |||||||||
| (a) | Commencement of offering of class of shares effective January 31, 2012 for the Equity Income Fund. |
SEE NOTES TO FINANCIAL STATEMENTS.
| 50 | J.P. MORGAN LARGE CAP FUNDS | JUNE 30, 2013 | ||||
Table of Contents
| Large Cap Growth Fund | Large Cap Value Fund | |||||||||||||||
| Year Ended 6/30/2013 | Year Ended 6/30/2012 | Year Ended 6/30/2013 | Year Ended 6/30/2012 | |||||||||||||
CAPITAL TRANSACTIONS: | ||||||||||||||||
Class A | ||||||||||||||||
Proceeds from shares issued | $ | 1,681,868 | $ | 1,485,061 | $ | 9,793 | $ | 7,733 | ||||||||
Distributions reinvested | 7,269 | — | 334 | 241 | ||||||||||||
Cost of shares redeemed | (758,726 | ) | (186,800 | ) | (7,966 | ) | (7,007 | ) | ||||||||
|
|
|
|
|
|
|
| |||||||||
Change in net assets resulting from Class A capital transactions | $ | 930,411 | $ | 1,298,261 | $ | 2,161 | $ | 967 | ||||||||
|
|
|
|
|
|
|
| |||||||||
Class B | ||||||||||||||||
Proceeds from shares issued | $ | 566 | $ | 713 | $ | 80 | $ | 50 | ||||||||
Distributions reinvested | 3 | — | 8 | 8 | ||||||||||||
Cost of shares redeemed | (4,476 | ) | (7,529 | ) | (663 | ) | (843 | ) | ||||||||
|
|
|
|
|
|
|
| |||||||||
Change in net assets resulting from Class B capital transactions | $ | (3,907 | ) | $ | (6,816 | ) | $ | (575 | ) | $ | (785 | ) | ||||
|
|
|
|
|
|
|
| |||||||||
Class C | ||||||||||||||||
Proceeds from shares issued | $ | 216,349 | $ | 188,775 | $ | 2,372 | $ | 1,321 | ||||||||
Distributions reinvested | 328 | — | 26 | 14 | ||||||||||||
Cost of shares redeemed | (55,203 | ) | (17,008 | ) | (1,593 | ) | (1,141 | ) | ||||||||
|
|
|
|
|
|
|
| |||||||||
Change in net assets resulting from Class C capital transactions | $ | 161,474 | $ | 171,767 | $ | 805 | $ | 194 | ||||||||
|
|
|
|
|
|
|
| |||||||||
Class R2 | ||||||||||||||||
Proceeds from shares issued | $ | 136,252 | $ | 92,133 | $ | 282 | $ | 83 | ||||||||
Distributions reinvested | 328 | 1 | 1 | 1 | ||||||||||||
Cost of shares redeemed | (45,030 | ) | (6,156 | ) | (125 | ) | (59 | ) | ||||||||
|
|
|
|
|
|
|
| |||||||||
Change in net assets resulting from Class R2 capital transactions | $ | 91,550 | $ | 85,978 | $ | 158 | $ | 25 | ||||||||
|
|
|
|
|
|
|
| |||||||||
Class R5 | ||||||||||||||||
Proceeds from shares issued | $ | 726,113 | $ | 597,130 | $ | 20,693 | $ | 1,737 | ||||||||
Distributions reinvested | 5,802 | 140 | 293 | 352 | ||||||||||||
Cost of shares redeemed | (248,553 | ) | (81,364 | ) | (30,349 | ) | (3,616 | ) | ||||||||
|
|
|
|
|
|
|
| |||||||||
Change in net assets resulting from Class R5 capital transactions | $ | 483,362 | $ | 515,906 | $ | (9,363 | ) | $ | (1,527 | ) | ||||||
|
|
|
|
|
|
|
| |||||||||
Class R6 | ||||||||||||||||
Proceeds from shares issued | $ | 1,276,837 | $ | 1,106,703 | $ | 30,498 | $ | 1,179 | ||||||||
Distributions reinvested | 11,769 | 129 | 389 | 156 | ||||||||||||
Cost of shares redeemed | (323,090 | ) | (87,682 | ) | (4,653 | ) | (765 | ) | ||||||||
|
|
|
|
|
|
|
| |||||||||
Change in net assets resulting from Class R6 capital transactions | $ | 965,516 | $ | 1,019,150 | $ | 26,234 | $ | 570 | ||||||||
|
|
|
|
|
|
|
| |||||||||
Select Class | ||||||||||||||||
Proceeds from shares issued | $ | 2,425,990 | $ | 2,248,235 | $ | 15,803 | $ | 25,030 | ||||||||
Distributions reinvested | 9,684 | 93 | 47 | 73 | ||||||||||||
Cost of shares redeemed | (1,379,749 | ) | (541,385 | ) | (126,134 | ) | (35,060 | ) | ||||||||
|
|
|
|
|
|
|
| |||||||||
Change in net assets resulting from Select Class capital transactions | $ | 1,055,925 | $ | 1,706,943 | $ | (110,284 | ) | $ | (9,957 | ) | ||||||
|
|
|
|
|
|
|
| |||||||||
Total change in net assets resulting from capital transactions | $ | 3,684,331 | $ | 4,791,189 | $ | (90,864 | ) | $ | (10,513 | ) | ||||||
|
|
|
|
|
|
|
| |||||||||
SEE NOTES TO FINANCIAL STATEMENTS.
| JUNE 30, 2013 | J.P. MORGAN LARGE CAP FUNDS | 51 | ||||||
Table of Contents
STATEMENTS OF CHANGES IN NET ASSETS
FOR THE PERIODS INDICATED (continued)
(Amounts in thousands)
| Large Cap Growth Fund | Large Cap Value Fund | |||||||||||||||
| Year Ended 6/30/2013 | Year Ended 6/30/2012 | Year Ended 6/30/2013 | Year Ended 6/30/2012 | |||||||||||||
SHARE TRANSACTIONS: | ||||||||||||||||
Class A | ||||||||||||||||
Issued | 68,413 | 63,642 | 764 | 723 | ||||||||||||
Reinvested | 299 | — | 26 | 23 | ||||||||||||
Redeemed | (30,354 | ) | (8,079 | ) | (627 | ) | (648 | ) | ||||||||
|
|
|
|
|
|
|
| |||||||||
Change in Class A Shares | 38,358 | 55,563 | 163 | 98 | ||||||||||||
|
|
|
|
|
|
|
| |||||||||
Class B | ||||||||||||||||
Issued | 26 | 36 | 6 | 5 | ||||||||||||
Reinvested | — | (a) | — | 1 | 1 | |||||||||||
Redeemed | (204 | ) | (377 | ) | (54 | ) | (80 | ) | ||||||||
|
|
|
|
|
|
|
| |||||||||
Change in Class B Shares | (178 | ) | (341 | ) | (47 | ) | (74 | ) | ||||||||
|
|
|
|
|
|
|
| |||||||||
Class C | ||||||||||||||||
Issued | 10,019 | 9,154 | 191 | 122 | ||||||||||||
Reinvested | 15 | — | 2 | 1 | ||||||||||||
Redeemed | (2,519 | ) | (834 | ) | (134 | ) | (109 | ) | ||||||||
|
|
|
|
|
|
|
| |||||||||
Change in Class C Shares | 7,515 | 8,320 | 59 | 14 | ||||||||||||
|
|
|
|
|
|
|
| |||||||||
Class R2 | ||||||||||||||||
Issued | 5,599 | 3,897 | 24 | 7 | ||||||||||||
Reinvested | 14 | — | (a) | — | (a) | — | (a) | |||||||||
Redeemed | (1,823 | ) | (260 | ) | (10 | ) | (5 | ) | ||||||||
|
|
|
|
|
|
|
| |||||||||
Change in Class R2 Shares | 3,790 | 3,637 | 14 | 2 | ||||||||||||
|
|
|
|
|
|
|
| |||||||||
Class R5 | ||||||||||||||||
Issued | 29,385 | 25,786 | 1,466 | 164 | ||||||||||||
Reinvested | 236 | 7 | 24 | 34 | ||||||||||||
Redeemed | (9,897 | ) | (3,549 | ) | (2,472 | ) | (331 | ) | ||||||||
|
|
|
|
|
|
|
| |||||||||
Change in Class R5 Shares | 19,724 | 22,244 | (982 | ) | (133 | ) | ||||||||||
|
|
|
|
|
|
|
| |||||||||
Class R6 | ||||||||||||||||
Issued | 51,377 | 46,377 | 2,468 | 119 | ||||||||||||
Reinvested | 478 | 6 | 29 | 15 | ||||||||||||
Redeemed | (12,934 | ) | (3,669 | ) | (372 | ) | (72 | ) | ||||||||
|
|
|
|
|
|
|
| |||||||||
Change in Class R6 Shares | 38,921 | 42,714 | 2,125 | 62 | ||||||||||||
|
|
|
|
|
|
|
| |||||||||
Select Class | ||||||||||||||||
Issued | 99,374 | 98,785 | 1,244 | 2,451 | ||||||||||||
Reinvested | 399 | 4 | 4 | 7 | ||||||||||||
Redeemed | (55,281 | ) | (23,773 | ) | (10,585 | ) | (3,125 | ) | ||||||||
|
|
|
|
|
|
|
| |||||||||
Change in Select Class Shares | 44,492 | 75,016 | (9,337 | ) | (667 | ) | ||||||||||
|
|
|
|
|
|
|
| |||||||||
| (a) | Amount rounds to less than 1,000 shares. |
SEE NOTES TO FINANCIAL STATEMENTS.
| 52 | J.P. MORGAN LARGE CAP FUNDS | JUNE 30, 2013 | ||||
Table of Contents
| U.S. Equity Fund | ||||||||
| Year Ended 6/30/2013 | Year Ended 6/30/2012 | |||||||
CAPITAL TRANSACTIONS: | ||||||||
Class A | ||||||||
Proceeds from shares issued | $ | 317,607 | $ | 412,813 | ||||
Distributions reinvested | 21,062 | 6,868 | ||||||
Cost of shares redeemed | (265,352 | ) | (193,790 | ) | ||||
|
|
|
| |||||
Change in net assets resulting from Class A capital transactions | $ | 73,317 | $ | 225,891 | ||||
|
|
|
| |||||
Class B | ||||||||
Proceeds from shares issued | $ | 82 | $ | 257 | ||||
Distributions reinvested | 121 | 49 | ||||||
Cost of shares redeemed | (1,552 | ) | (2,380 | ) | ||||
|
|
|
| |||||
Change in net assets resulting from Class B capital transactions | $ | (1,349 | ) | $ | (2,074 | ) | ||
|
|
|
| |||||
Class C | ||||||||
Proceeds from shares issued | $ | 35,948 | $ | 38,529 | ||||
Distributions reinvested | 2,151 | 526 | ||||||
Cost of shares redeemed | (19,119 | ) | (20,678 | ) | ||||
|
|
|
| |||||
Change in net assets resulting from Class C capital transactions | $ | 18,980 | $ | 18,377 | ||||
|
|
|
| |||||
Class R2 | ||||||||
Proceeds from shares issued | $ | 44,824 | $ | 28,358 | ||||
Distributions reinvested | 1,212 | 170 | ||||||
Cost of shares redeemed | (13,937 | ) | (5,907 | ) | ||||
|
|
|
| |||||
Change in net assets resulting from Class R2 capital transactions | $ | 32,099 | $ | 22,621 | ||||
|
|
|
| |||||
Class R5 | ||||||||
Proceeds from shares issued | $ | 134,146 | $ | 204,903 | ||||
Distributions reinvested | 13,036 | 4,150 | ||||||
Cost of shares redeemed | (97,891 | ) | (38,808 | ) | ||||
|
|
|
| |||||
Change in net assets resulting from Class R5 capital transactions | $ | 49,291 | $ | 170,245 | ||||
|
|
|
| |||||
Class R6 | ||||||||
Proceeds from shares issued | $ | 357,529 | $ | 580,194 | ||||
Distributions reinvested | 36,658 | 13,543 | ||||||
Cost of shares redeemed | (332,840 | ) | (40,629 | ) | ||||
|
|
|
| |||||
Change in net assets resulting from Class R6 capital transactions | $ | 61,347 | $ | 553,108 | ||||
|
|
|
| |||||
Institutional Class | ||||||||
Proceeds from shares issued | $ | 646,883 | $ | 362,823 | ||||
Distributions reinvested | 20,902 | 5,451 | ||||||
Cost of shares redeemed | (208,805 | ) | (260,526 | ) | ||||
|
|
|
| |||||
Change in net assets resulting from Institutional Class capital transactions | $ | 458,980 | $ | 107,748 | ||||
|
|
|
| |||||
Select Class | ||||||||
Proceeds from shares issued | $ | 1,142,555 | $ | 1,199,262 | ||||
Distributions reinvested | 95,824 | 33,012 | ||||||
Cost of shares redeemed | (1,681,097 | ) | (801,663 | ) | ||||
|
|
|
| |||||
Change in net assets resulting from Select Class capital transactions | $ | (442,718 | ) | $ | 430,611 | |||
|
|
|
| |||||
Total change in net assets resulting from capital transactions | $ | 249,947 | $ | 1,526,527 | ||||
|
|
|
| |||||
SEE NOTES TO FINANCIAL STATEMENTS.
| JUNE 30, 2013 | J.P. MORGAN LARGE CAP FUNDS | 53 | ||||||
Table of Contents
STATEMENTS OF CHANGES IN NET ASSETS
FOR THE PERIODS INDICATED (continued)
(Amounts in thousands)
| U.S. Equity Fund | ||||||||
| Year Ended 6/30/2013 | Year Ended 6/30/2012 | |||||||
SHARE TRANSACTIONS: | ||||||||
Class A | ||||||||
Issued | 26,919 | 39,984 | ||||||
Reinvested | 1,851 | 687 | ||||||
Redeemed | (22,129 | ) | (19,011 | ) | ||||
|
|
|
| |||||
Change in Class A Shares | 6,641 | 21,660 | ||||||
|
|
|
| |||||
Class B | ||||||||
Issued | 7 | 25 | ||||||
Reinvested | 11 | 5 | ||||||
Redeemed | (134 | ) | (237 | ) | ||||
|
|
|
| |||||
Change in Class B Shares | (116 | ) | (207 | ) | ||||
|
|
|
| |||||
Class C | ||||||||
Issued | 3,084 | 3,763 | ||||||
Reinvested | 195 | 54 | ||||||
Redeemed | (1,655 | ) | (2,067 | ) | ||||
|
|
|
| |||||
Change in Class C Shares | 1,624 | 1,750 | ||||||
|
|
|
| |||||
Class R2 | ||||||||
Issued | 3,820 | 2,720 | ||||||
Reinvested | 107 | 17 | ||||||
Redeemed | (1,185 | ) | (577 | ) | ||||
|
|
|
| |||||
Change in Class R2 Shares | 2,742 | 2,160 | ||||||
|
|
|
| |||||
Class R5 | ||||||||
Issued | 11,490 | 20,118 | ||||||
Reinvested | 1,138 | 409 | ||||||
Redeemed | (8,247 | ) | (3,739 | ) | ||||
|
|
|
| |||||
Change in Class R5 Shares | 4,381 | 16,788 | ||||||
|
|
|
| |||||
Class R6 | ||||||||
Issued | 30,187 | 54,627 | ||||||
Reinvested | 3,185 | 1,340 | ||||||
Redeemed | (29,466 | ) | (3,879 | ) | ||||
|
|
|
| |||||
Change in Class R6 Shares | 3,906 | 52,088 | ||||||
|
|
|
| |||||
Institutional Class | ||||||||
Issued | 53,674 | 34,671 | ||||||
Reinvested | 1,809 | 538 | ||||||
Redeemed | (17,530 | ) | (25,385 | ) | ||||
|
|
|
| |||||
Change in Institutional Class Shares | 37,953 | 9,824 | ||||||
|
|
|
| |||||
Select Class | ||||||||
Issued | 96,628 | 117,290 | ||||||
Reinvested | 8,441 | 3,323 | ||||||
Redeemed | (139,323 | ) | (77,448 | ) | ||||
|
|
|
| |||||
Change in Select Class Shares | (34,254 | ) | 43,165 | |||||
|
|
|
| |||||
SEE NOTES TO FINANCIAL STATEMENTS.
| 54 | J.P. MORGAN LARGE CAP FUNDS | JUNE 30, 2013 | ||||
Table of Contents
THIS PAGE IS INTENTIONALLY LEFT BLANK
| JUNE 30, 2013 | J.P. MORGAN LARGE CAP FUNDS | 55 | ||||||
Table of Contents
FOR THE PERIODS INDICATED
| Per share operating performance | ||||||||||||||||||||||||||||
| Investment operations | Distributions | |||||||||||||||||||||||||||
| Net asset value, beginning of period | Net investment income (loss) | Net realized and unrealized gains (losses) on investments | Total from investment operations | Net investment income | Net realized gain | Total distributions | ||||||||||||||||||||||
Disciplined Equity Fund | ||||||||||||||||||||||||||||
Class A | ||||||||||||||||||||||||||||
Year Ended June 30, 2013 | $ | 17.42 | $ | 0.20 | (d) | $ | 3.56 | $ | 3.76 | $ | (0.23 | ) | $ | (0.68 | ) | $ | (0.91 | ) | ||||||||||
Year Ended June 30, 2012 | 16.80 | 0.21 | (d) | 0.61 | 0.82 | (0.20 | ) | — | (0.20 | ) | ||||||||||||||||||
Year Ended June 30, 2011 | 13.07 | 0.17 | (d) | 3.72 | 3.89 | (0.16 | ) | — | (0.16 | ) | ||||||||||||||||||
Year Ended June 30, 2010 | 11.52 | 0.18 | (d) | 1.54 | 1.72 | (0.17 | ) | — | (0.17 | ) | ||||||||||||||||||
Year Ended June 30, 2009 | 15.44 | 0.31 | (d) | (3.93 | ) | (3.62 | ) | (0.30 | ) | — | (0.30 | ) | ||||||||||||||||
Class R6 | ||||||||||||||||||||||||||||
Year Ended June 30, 2013 | 17.48 | 0.32 | (d) | 3.55 | 3.87 | (0.31 | ) | (0.68 | ) | (0.99 | ) | |||||||||||||||||
Year Ended June 30, 2012 | 16.83 | 0.29 | (d) | 0.63 | 0.92 | (0.27 | ) | — | (0.27 | ) | ||||||||||||||||||
Year Ended June 30, 2011 | 13.08 | 0.25 | (d) | 3.73 | 3.98 | (0.23 | ) | — | (0.23 | ) | ||||||||||||||||||
Year Ended June 30, 2010 | 11.52 | 0.24 | (d) | 1.56 | 1.80 | (0.24 | ) | — | (0.24 | ) | ||||||||||||||||||
Year Ended June 30, 2009 | 15.45 | 0.37 | (d) | (3.94 | ) | (3.57 | ) | (0.36 | ) | — | (0.36 | ) | ||||||||||||||||
Institutional Class | ||||||||||||||||||||||||||||
Year Ended June 30, 2013 | 17.48 | 0.30 | (d) | 3.55 | 3.85 | (0.29 | ) | (0.68 | ) | (0.97 | ) | |||||||||||||||||
Year Ended June 30, 2012 | 16.83 | 0.27 | (d) | 0.63 | 0.90 | (0.25 | ) | — | (0.25 | ) | ||||||||||||||||||
Year Ended June 30, 2011 | 13.09 | 0.24 | (d) | 3.72 | 3.96 | (0.22 | ) | — | (0.22 | ) | ||||||||||||||||||
Year Ended June 30, 2010 | 11.52 | 0.23 | (d) | 1.57 | 1.80 | (0.23 | ) | — | (0.23 | ) | ||||||||||||||||||
Year Ended June 30, 2009 | 15.45 | 0.32 | (d) | (3.90 | ) | (3.58 | ) | (0.35 | ) | — | (0.35 | ) | ||||||||||||||||
Select Class | ||||||||||||||||||||||||||||
Year Ended June 30, 2013 | 17.51 | 0.27 | (d) | 3.56 | 3.83 | (0.27 | ) | (0.68 | ) | (0.95 | ) | |||||||||||||||||
Year Ended June 30, 2012 | 16.86 | 0.25 | (d) | 0.63 | 0.88 | (0.23 | ) | — | (0.23 | ) | ||||||||||||||||||
Year Ended June 30, 2011 | 13.11 | 0.21 | (d) | 3.73 | 3.94 | (0.19 | ) | — | (0.19 | ) | ||||||||||||||||||
Year Ended June 30, 2010 | 11.54 | 0.21 | (d) | 1.56 | 1.77 | (0.20 | ) | — | (0.20 | ) | ||||||||||||||||||
Year Ended June 30, 2009 | 15.48 | 0.33 | (d) | (3.94 | ) | (3.61 | ) | (0.33 | ) | — | (0.33 | ) | ||||||||||||||||
| (a) | Includes adjustments in accordance with accounting principles generally accepted in the United States of America and as such, the net asset values for financial reporting purposes and the returns based upon those net asset values may differ from the net asset values and returns for shareholder transactions. |
| (b) | Includes earnings credits and interest expense, if applicable, each of which is less than 0.01% unless otherwise noted. |
| (c) | Portfolio turnover is calculated by dividing the lesser of total purchases or sales of portfolio securities for the reporting period by the monthly average value of portfolio securities owned during the reporting period. Excluded from both the numerator and denominator are amounts relating to derivatives and securities whose maturities or expiration dates at the time of acquisition were one year or less. |
| (d) | Calculated based upon average shares outstanding. |
SEE NOTES TO FINANCIAL STATEMENTS.
| 56 | J.P. MORGAN LARGE CAP FUNDS | JUNE 30, 2013 | ||||
Table of Contents
| Ratios/Supplemental data | |||||||||||||||||||||||||
| Ratios to average net assets | ||||||||||||||||||||||||||
| Net asset value, end of period | Total return (excludes sales charge) (a) | Net assets, end of period (000’s) | Net expenses (b) | Net investment income (loss) | Expenses without waivers, reimbursements and earnings credits | Portfolio turnover rate (c) | ||||||||||||||||||||
| $ | 20.27 | 22.33 | % | $ | 103,755 | 0.85 | % | 1.04 | % | 0.87 | % | 178 | % | |||||||||||||
| 17.42 | 4.98 | 20,831 | 0.85 | 1.21 | 0.88 | 198 | ||||||||||||||||||||
| 16.80 | 29.86 | 3,399 | 0.85 | 1.07 | 0.89 | 169 | ||||||||||||||||||||
| 13.07 | 14.88 | 1,425 | 0.85 | 1.27 | 0.95 | 169 | ||||||||||||||||||||
| 11.52 | (23.29 | ) | 965 | 0.85 | 2.59 | 0.97 | 92 | |||||||||||||||||||
| 20.36 | 22.90 | 1,460,937 | 0.35 | 1.67 | 0.37 | 178 | ||||||||||||||||||||
| 17.48 | 5.57 | 1,024,228 | 0.35 | 1.76 | 0.38 | 198 | ||||||||||||||||||||
| 16.83 | 30.55 | 577,140 | 0.35 | 1.49 | 0.38 | 169 | ||||||||||||||||||||
| 13.08 | 15.51 | 35,855 | 0.35 | 1.76 | 0.45 | 169 | ||||||||||||||||||||
| 11.52 | (22.95 | ) | 83,583 | 0.35 | 3.09 | 0.47 | 92 | |||||||||||||||||||
| 20.36 | 22.79 | 221,638 | 0.45 | 1.57 | 0.47 | 178 | ||||||||||||||||||||
| 17.48 | 5.47 | 171,872 | 0.45 | 1.66 | 0.49 | 198 | ||||||||||||||||||||
| 16.83 | 30.33 | 119,152 | 0.44 | 1.59 | 0.50 | 169 | ||||||||||||||||||||
| 13.09 | 15.49 | 194,273 | 0.45 | 1.68 | 0.55 | 169 | ||||||||||||||||||||
| 11.52 | (23.03 | ) | 124,398 | 0.45 | 2.76 | 0.58 | 92 | |||||||||||||||||||
| 20.39 | 22.61 | 40,522 | 0.60 | 1.40 | 0.62 | 178 | ||||||||||||||||||||
| 17.51 | 5.31 | 15,979 | 0.60 | 1.50 | 0.64 | 198 | ||||||||||||||||||||
| 16.86 | 30.17 | 12,490 | 0.60 | 1.33 | 0.64 | 169 | ||||||||||||||||||||
| 13.11 | 15.28 | 8,983 | 0.60 | 1.55 | 0.70 | 169 | ||||||||||||||||||||
| 11.54 | (23.17 | ) | 10,514 | 0.60 | 2.76 | 0.72 | 92 | |||||||||||||||||||
SEE NOTES TO FINANCIAL STATEMENTS.
| JUNE 30, 2013 | J.P. MORGAN LARGE CAP FUNDS | 57 | ||||||
Table of Contents
FINANCIAL HIGHLIGHTS
FOR THE PERIODS INDICATED (continued)
| Per share operating performance | ||||||||||||||||
| Investment operations | ||||||||||||||||
| Net asset value, beginning of period | Net investment income (loss) | Net realized and unrealized gains (losses) on investments | Total from investment operations | |||||||||||||
Dynamic Growth Fund | ||||||||||||||||
Class A | ||||||||||||||||
Year Ended June 30, 2013 | $ | 15.89 | $ | (0.05 | )(e)(f) | $ | 3.10 | $ | 3.05 | |||||||
Year Ended June 30, 2012 | 15.47 | (0.12 | ) | 0.54 | 0.42 | |||||||||||
Year Ended June 30, 2011 | 11.44 | (0.10 | )(e) | 4.13 | 4.03 | |||||||||||
Year Ended June 30, 2010 | 9.91 | (0.07 | ) | 1.60 | 1.53 | |||||||||||
Year Ended June 30, 2009 | 14.07 | (0.04 | ) | (4.12 | ) | (4.16 | ) | |||||||||
Class C | ||||||||||||||||
Year Ended June 30, 2013 | 15.54 | (0.14 | )(e)(f) | 3.03 | 2.89 | |||||||||||
Year Ended June 30, 2012 | 15.21 | (0.19 | ) | 0.52 | 0.33 | |||||||||||
Year Ended June 30, 2011 | 11.29 | (0.17 | )(e) | 4.09 | 3.92 | |||||||||||
Year Ended June 30, 2010 | 9.84 | (0.13 | ) | 1.58 | 1.45 | |||||||||||
Year Ended June 30, 2009 | 14.04 | (0.09 | ) | (4.11 | ) | (4.20 | ) | |||||||||
Class R5 | ||||||||||||||||
Year Ended June 30, 2013 | 16.22 | 0.03 | (e)(f) | 3.17 | 3.20 | |||||||||||
Year Ended June 30, 2012 | 15.72 | (0.06 | ) | 0.56 | 0.50 | |||||||||||
Year Ended June 30, 2011 | 11.57 | (0.04 | )(e) | 4.19 | 4.15 | |||||||||||
Year Ended June 30, 2010 | 9.98 | (0.02 | ) | 1.61 | 1.59 | |||||||||||
Year Ended June 30, 2009 | 14.11 | 0.01 | (4.14 | ) | (4.13 | ) | ||||||||||
Select Class | ||||||||||||||||
Year Ended June 30, 2013 | 16.07 | (0.03 | )(e)(f) | 3.16 | 3.13 | |||||||||||
Year Ended June 30, 2012 | 15.61 | (0.09 | ) | 0.55 | 0.46 | |||||||||||
Year Ended June 30, 2011 | 11.51 | (0.06 | )(e) | 4.16 | 4.10 | |||||||||||
Year Ended June 30, 2010 | 9.95 | (0.04 | ) | 1.60 | 1.56 | |||||||||||
Year Ended June 30, 2009 | 14.09 | (0.01 | ) | (4.13 | ) | (4.14 | ) | |||||||||
| (a) | Includes adjustments in accordance with accounting principles generally accepted in the United States of America and as such, the net asset values for financial reporting purposes and the returns based upon those net asset values may differ from the net asset values and returns for shareholder transactions. |
| (b) | Includes earnings credits and interest expense, if applicable, each of which is less than 0.01% unless otherwise noted. |
| (c) | Ratios are disproportionate between classes due to the size of net assets and fixed expenses. |
| (d) | Portfolio turnover is calculated by dividing the lesser of total purchases or sales of portfolio securities for the reporting period by the monthly average value of portfolio securities owned during the reporting period. Excluded from both the numerator and denominator are amounts relating to derivatives and securities whose maturities or expiration dates at the time of acquisition were one year or less. |
| (e) | Calculated based upon average shares outstanding. |
| (f) | Reflects special dividends paid out during the period by several of the Fund’s holdings. Had the Fund not received the special dividends, the net investment income (loss) per share would have been $(0.10), $(0.19), $(0.03) and $(0.08) for Class A, Class C, Class R5 and Select Class Shares, respectively, and the net investment income (loss) ratio would have been (0.60)%, (1.10)%, (0.15)% and (0.45)% for Class A, Class C, Class R5 and Select Class Shares, respectively. |
SEE NOTES TO FINANCIAL STATEMENTS.
| 58 | J.P. MORGAN LARGE CAP FUNDS | JUNE 30, 2013 | ||||
Table of Contents
| Ratios/Supplemental data | |||||||||||||||||||||||||
| Ratios to average net assets | ||||||||||||||||||||||||||
| Net asset value, end of period | Total return (excludes sales charge) (a) | Net assets, end of period (000’s) | Net expenses (b) | Net investment income (loss) | Expenses without waivers, reimbursements and earnings credits (c) | Portfolio turnover rate (d) | ||||||||||||||||||||
| $ | 18.94 | 19.19 | % | $ | 126 | 1.25 | % | (0.30 | )%(f) | 1.42 | % | 82 | % | |||||||||||||
| 15.89 | 2.71 | 106 | 1.24 | (0.81 | ) | 1.44 | 99 | |||||||||||||||||||
| 15.47 | 35.23 | 103 | 1.23 | (0.71 | ) | 3.18 | 97 | |||||||||||||||||||
| 11.44 | 15.44 | 76 | 1.25 | (0.61 | ) | 5.82 | 39 | |||||||||||||||||||
| 9.91 | (29.57 | ) | 66 | 1.25 | (0.37 | ) | 7.27 | 73 | ||||||||||||||||||
| 18.43 | 18.60 | 123 | 1.74 | (0.80 | )(f) | 1.92 | 82 | |||||||||||||||||||
| 15.54 | 2.17 | 104 | 1.74 | (1.31 | ) | 1.94 | 99 | |||||||||||||||||||
| 15.21 | 34.72 | 102 | 1.73 | (1.21 | ) | 3.68 | 97 | |||||||||||||||||||
| 11.29 | 14.74 | 75 | 1.75 | (1.11 | ) | 6.32 | 39 | |||||||||||||||||||
| 9.84 | (29.91 | ) | 66 | 1.75 | (0.87 | ) | 7.77 | 73 | ||||||||||||||||||
| 19.42 | 19.73 | 32 | 0.80 | 0.15 | (f) | 0.97 | 82 | |||||||||||||||||||
| 16.22 | 3.18 | 27 | 0.79 | (0.36 | ) | 0.99 | 99 | |||||||||||||||||||
| 15.72 | 35.87 | 26 | 0.78 | (0.26 | ) | 2.73 | 97 | |||||||||||||||||||
| 11.57 | 15.93 | 19 | 0.80 | (0.17 | ) | 5.37 | 39 | |||||||||||||||||||
| 9.98 | (29.27 | ) | 17 | 0.80 | 0.07 | 6.82 | 73 | |||||||||||||||||||
| 19.20 | 19.48 | 101,999 | 1.00 | (0.16 | )(f) | 1.14 | 82 | |||||||||||||||||||
| 16.07 | 2.95 | 38,953 | 0.99 | (0.56 | ) | 1.19 | 99 | |||||||||||||||||||
| 15.61 | 35.62 | 43,617 | 0.97 | (0.41 | ) | 1.59 | 97 | |||||||||||||||||||
| 11.51 | 15.68 | 2,130 | 1.00 | (0.36 | ) | 5.57 | 39 | |||||||||||||||||||
| 9.95 | (29.38 | ) | 1,842 | 1.00 | (0.12 | ) | 7.02 | 73 | ||||||||||||||||||
SEE NOTES TO FINANCIAL STATEMENTS.
| JUNE 30, 2013 | J.P. MORGAN LARGE CAP FUNDS | 59 | ||||||
Table of Contents
FINANCIAL HIGHLIGHTS
FOR THE PERIODS INDICATED (continued)
| Per share operating performance | ||||||||||||||||||||||||||||
| Investment operations | Distributions | |||||||||||||||||||||||||||
| Net asset value, beginning of period | Net investment income (loss) | Net realized and unrealized gains (losses) on investments | Total from investment operations | Net investment income | Net realized gain | Total distributions | ||||||||||||||||||||||
Equity Income Fund | ||||||||||||||||||||||||||||
Class A | ||||||||||||||||||||||||||||
Year Ended June 30, 2013 | $ | 9.84 | $ | 0.24 | (f)(h) | $ | 1.84 | $ | 2.08 | $ | (0.23 | ) | $ | (0.07 | ) | $ | (0.30 | ) | ||||||||||
Year Ended June 30, 2012 | 9.38 | 0.21 | (f) | 0.46 | 0.67 | (0.17 | ) | (0.04 | ) | (0.21 | ) | |||||||||||||||||
Year Ended June 30, 2011 | 7.26 | 0.19 | (f) | 2.12 | 2.31 | (0.19 | ) | — | (0.19 | ) | ||||||||||||||||||
Year Ended June 30, 2010 | 6.35 | 0.17 | (f) | 0.91 | 1.08 | (0.17 | ) | — | (0.17 | ) | ||||||||||||||||||
Year Ended June 30, 2009 | 9.11 | 0.22 | (f) | (2.30 | ) | (2.08 | ) | (0.21 | ) | (0.47 | ) | (0.68 | ) | |||||||||||||||
Class B | ||||||||||||||||||||||||||||
Year Ended June 30, 2013 | 9.78 | 0.18 | (f)(h) | 1.83 | 2.01 | (0.18 | ) | (0.07 | ) | (0.25 | ) | |||||||||||||||||
Year Ended June 30, 2012 | 9.33 | 0.15 | (f) | 0.47 | 0.62 | (0.13 | ) | (0.04 | ) | (0.17 | ) | |||||||||||||||||
Year Ended June 30, 2011 | 7.22 | 0.14 | (f) | 2.12 | 2.26 | (0.15 | ) | — | (0.15 | ) | ||||||||||||||||||
Year Ended June 30, 2010 | 6.30 | 0.13 | (f) | 0.92 | 1.05 | (0.13 | ) | — | (0.13 | ) | ||||||||||||||||||
Year Ended June 30, 2009 | 9.05 | 0.18 | (f) | (2.29 | ) | (2.11 | ) | (0.17 | ) | (0.47 | ) | (0.64 | ) | |||||||||||||||
Class C | ||||||||||||||||||||||||||||
Year Ended June 30, 2013 | 9.74 | 0.18 | (f)(h) | 1.83 | 2.01 | (0.19 | ) | (0.07 | ) | (0.26 | ) | |||||||||||||||||
Year Ended June 30, 2012 | 9.30 | 0.16 | (f) | 0.45 | 0.61 | (0.13 | ) | (0.04 | ) | (0.17 | ) | |||||||||||||||||
Year Ended June 30, 2011 | 7.20 | 0.15 | (f) | 2.11 | 2.26 | (0.16 | ) | — | (0.16 | ) | ||||||||||||||||||
Year Ended June 30, 2010 | 6.30 | 0.13 | (f) | 0.90 | 1.03 | (0.13 | ) | — | (0.13 | ) | ||||||||||||||||||
Year Ended June 30, 2009 | 9.05 | 0.18 | (f) | (2.29 | ) | (2.11 | ) | (0.17 | ) | (0.47 | ) | (0.64 | ) | |||||||||||||||
Class R2 | ||||||||||||||||||||||||||||
Year Ended June 30, 2013 | 9.84 | 0.21 | (f)(h) | 1.84 | 2.05 | (0.21 | ) | (0.07 | ) | (0.28 | ) | |||||||||||||||||
Year Ended June 30, 2012 | 9.38 | 0.19 | (f) | 0.46 | 0.65 | (0.15 | ) | (0.04 | ) | (0.19 | ) | |||||||||||||||||
February 28, 2011 (g) through June 30, 2011 | 9.20 | 0.06 | (f) | 0.17 | 0.23 | (0.05 | ) | — | (0.05 | ) | ||||||||||||||||||
Class R5 | ||||||||||||||||||||||||||||
Year Ended June 30, 2013 | 9.96 | 0.29 | (f)(h) | 1.87 | 2.16 | (0.27 | ) | (0.07 | ) | (0.34 | ) | |||||||||||||||||
Year Ended June 30, 2012 | 9.49 | 0.26 | (f) | 0.46 | 0.72 | (0.21 | ) | (0.04 | ) | (0.25 | ) | |||||||||||||||||
February 28, 2011 (g) through June 30, 2011 | 9.31 | 0.10 | (f) | 0.16 | 0.26 | (0.08 | ) | — | (0.08 | ) | ||||||||||||||||||
Class R6 | ||||||||||||||||||||||||||||
Year Ended June 30, 2013 | 9.96 | 0.29 | (f)(h) | 1.87 | 2.16 | (0.28 | ) | (0.07 | ) | (0.35 | ) | |||||||||||||||||
January 31, 2012 (g) through June 30, 2012 | 9.64 | 0.13 | (f) | 0.30 | 0.43 | (0.11 | ) | — | (0.11 | ) | ||||||||||||||||||
Select Class | ||||||||||||||||||||||||||||
Year Ended June 30, 2013 | 9.96 | 0.27 | (f)(h) | 1.86 | 2.13 | (0.25 | ) | (0.07 | ) | (0.32 | ) | |||||||||||||||||
Year Ended June 30, 2012 | 9.50 | 0.24 | (f) | 0.45 | 0.69 | (0.19 | ) | (0.04 | ) | (0.23 | ) | |||||||||||||||||
Year Ended June 30, 2011 | 7.35 | 0.22 | (f) | 2.14 | 2.36 | (0.21 | ) | — | (0.21 | ) | ||||||||||||||||||
Year Ended June 30, 2010 | 6.42 | 0.20 | (f) | 0.92 | 1.12 | (0.19 | ) | — | (0.19 | ) | ||||||||||||||||||
Year Ended June 30, 2009 | 9.20 | 0.25 | (f) | (2.32 | ) | (2.07 | ) | (0.24 | ) | (0.47 | ) | (0.71 | ) | |||||||||||||||
| (a) | Annualized for periods less than one year. |
| (b) | Not annualized for periods less than one year. |
| (c) | Includes adjustments in accordance with accounting principles generally accepted in the United States of America and as such, the net asset values for financial reporting purposes and the returns based upon those net asset values may differ from the net asset values and returns for shareholder transactions. |
| (d) | Includes earnings credits and interest expense, if applicable, each of which is less than 0.01% unless otherwise noted. |
| (e) | Portfolio turnover is calculated by dividing the lesser of total purchases or sales of portfolio securities for the reporting period by the monthly average value of portfolio securities owned during the reporting period. Excluded from both the numerator and denominator are amounts relating to derivatives and securities whose maturities or expiration dates at the time of acquisition were one year or less. |
| (f) | Calculated based upon average shares outstanding. |
| (g) | Commencement of offering of class of shares. |
| (h) | Reflects special dividends paid out during the period by several of the Fund’s holdings. Had the Fund not received the special dividends, the net investment income (loss) per share would have been $0.21. $0.16, $0.16, $0.18, $0.27, $0.26 and $0.24 for Class A, Class B, Class C, Class R2, Class R5, Class R6 and Select Class Shares, respectively, and the net investment income (loss) ratio would have been 1.97%, 1.49%, 1.46%, 1.67%, 2.44%, 2.38% and 2.23% for Class A, Class B, Class C, Class R2, Class R5, Class R6 and Select Class Shares, respectively. |
SEE NOTES TO FINANCIAL STATEMENTS.
| 60 | J.P. MORGAN LARGE CAP FUNDS | JUNE 30, 2013 | ||||
Table of Contents
| Ratios/Supplemental data | |||||||||||||||||||||||||
| Ratios to average net assets (a) | ||||||||||||||||||||||||||
| Net asset value, end of period | Total return (excludes sales charge) (b)(c) | Net assets, end of period (000’s) | Net expenses (d) | Net investment income (loss) | Expenses without waivers, reimbursements and earnings credits | Portfolio turnover rate (b)(e) | ||||||||||||||||||||
| $ | 11.62 | 21.53 | % | $ | 1,285,400 | 1.03 | % | 2.22 | %(h) | 1.08 | % | 34 | % | |||||||||||||
| 9.84 | 7.30 | 580,848 | 1.04 | 2.22 | 1.08 | 44 | ||||||||||||||||||||
| 9.38 | 32.06 | 217,462 | 1.05 | 2.16 | 1.14 | 37 | ||||||||||||||||||||
| 7.26 | 16.94 | 79,236 | 1.20 | 2.29 | 1.22 | 43 | ||||||||||||||||||||
| 6.35 | (22.86 | ) | 66,117 | 1.23 | 3.13 | 1.39 | 54 | |||||||||||||||||||
| 11.54 | 20.90 | 4,062 | 1.52 | 1.75 | (h) | 1.58 | 34 | |||||||||||||||||||
| 9.78 | 6.75 | 4,353 | 1.54 | 1.64 | 1.59 | 44 | ||||||||||||||||||||
| 9.33 | 31.44 | 5,962 | 1.56 | 1.66 | 1.65 | 37 | ||||||||||||||||||||
| 7.22 | 16.63 | 6,563 | 1.72 | 1.77 | 1.72 | 43 | ||||||||||||||||||||
| 6.30 | (23.39 | ) | 7,829 | 1.85 | 2.49 | 1.89 | 54 | |||||||||||||||||||
| 11.49 | 20.94 | 407,911 | 1.53 | 1.71 | (h) | 1.58 | 34 | |||||||||||||||||||
| 9.74 | 6.72 | 130,366 | 1.54 | 1.74 | 1.58 | 44 | ||||||||||||||||||||
| 9.30 | 31.52 | 28,947 | 1.55 | 1.69 | 1.63 | 37 | ||||||||||||||||||||
| 7.20 | 16.34 | 5,549 | 1.71 | 1.79 | 1.72 | 43 | ||||||||||||||||||||
| 6.30 | (23.36 | ) | 3,879 | 1.85 | 2.54 | 1.90 | 54 | |||||||||||||||||||
| 11.61 | 21.21 | 13,347 | 1.28 | 1.92 | (h) | 1.34 | 34 | |||||||||||||||||||
| 9.84 | 7.13 | 1,682 | 1.29 | 1.94 | 1.32 | 44 | ||||||||||||||||||||
| 9.38 | 2.54 | 51 | 1.28 | 1.80 | 1.36 | 37 | ||||||||||||||||||||
| 11.78 | 22.17 | 227,442 | 0.58 | 2.69 | (h) | 0.63 | 34 | |||||||||||||||||||
| 9.96 | 7.78 | 111,647 | 0.58 | 2.77 | 0.63 | 44 | ||||||||||||||||||||
| 9.49 | 2.77 | 2,925 | 0.58 | 3.21 | 0.66 | 37 | ||||||||||||||||||||
| 11.77 | 22.12 | 233,034 | 0.53 | 2.63 | (h) | 0.59 | 34 | |||||||||||||||||||
| 9.96 | 4.47 | 70,589 | 0.53 | 3.28 | 0.58 | 44 | ||||||||||||||||||||
| 11.77 | 21.84 | 2,337,565 | 0.78 | 2.48 | (h) | 0.83 | 34 | |||||||||||||||||||
| 9.96 | 7.48 | 1,313,214 | 0.78 | 2.48 | 0.83 | 44 | ||||||||||||||||||||
| 9.50 | 32.42 | 204,331 | 0.80 | 2.45 | 0.89 | 37 | ||||||||||||||||||||
| 7.35 | 17.45 | 89,156 | 0.86 | 2.64 | 0.97 | 43 | ||||||||||||||||||||
| 6.42 | (22.59 | ) | 78,303 | 0.89 | 3.51 | 1.15 | 54 | |||||||||||||||||||
SEE NOTES TO FINANCIAL STATEMENTS.
| JUNE 30, 2013 | J.P. MORGAN LARGE CAP FUNDS | 61 | ||||||
Table of Contents
FINANCIAL HIGHLIGHTS
FOR THE PERIODS INDICATED (continued)
| Per share operating performance | ||||||||||||||||||||
| Investment operations | Distributions | |||||||||||||||||||
| Net asset value, beginning of period | Net investment income (loss) | Net realized and unrealized gains (losses) on investments | Total from investment operations | Net investment income | ||||||||||||||||
Growth and Income Fund | ||||||||||||||||||||
Class A | ||||||||||||||||||||
Year Ended June 30, 2013 | $ | 29.43 | $ | 0.40 | (d) | $ | 7.11 | $ | 7.51 | $ | (0.41 | ) | ||||||||
Year Ended June 30, 2012 | 28.26 | 0.35 | (d) | 1.16 | 1.51 | (0.34 | ) | |||||||||||||
Year Ended June 30, 2011 | 22.30 | 0.28 | (d) | 5.96 | 6.24 | (0.28 | ) | |||||||||||||
Year Ended June 30, 2010 | 19.46 | 0.35 | (d) | 2.83 | 3.18 | (0.34 | ) | |||||||||||||
Year Ended June 30, 2009 | 27.97 | 0.44 | (d) | (8.52 | ) | (8.08 | ) | (0.43 | ) | |||||||||||
Class B | ||||||||||||||||||||
Year Ended June 30, 2013 | 28.76 | 0.23 | (d) | 6.94 | 7.17 | (0.25 | ) | |||||||||||||
Year Ended June 30, 2012 | 27.62 | 0.21 | (d) | 1.14 | 1.35 | (0.21 | ) | |||||||||||||
Year Ended June 30, 2011 | 21.80 | 0.15 | (d) | 5.82 | 5.97 | (0.15 | ) | |||||||||||||
Year Ended June 30, 2010 | 19.03 | 0.23 | (d) | 2.76 | 2.99 | (0.22 | ) | |||||||||||||
Year Ended June 30, 2009 | 27.36 | 0.32 | (d) | (8.32 | ) | (8.00 | ) | (0.33 | ) | |||||||||||
Class C | ||||||||||||||||||||
Year Ended June 30, 2013 | 27.32 | 0.22 | (d) | 6.59 | 6.81 | (0.30 | ) | |||||||||||||
Year Ended June 30, 2012 | 26.27 | 0.20 | (d) | 1.08 | 1.28 | (0.23 | ) | |||||||||||||
Year Ended June 30, 2011 | 20.77 | 0.14 | (d) | 5.53 | 5.67 | (0.17 | ) | |||||||||||||
Year Ended June 30, 2010 | 18.15 | 0.21 | (d) | 2.66 | 2.87 | (0.25 | ) | |||||||||||||
Year Ended June 30, 2009 | 26.13 | 0.31 | (d) | (7.95 | ) | (7.64 | ) | (0.34 | ) | |||||||||||
Select Class | ||||||||||||||||||||
Year Ended June 30, 2013 | 30.63 | 0.51 | (d) | 7.40 | 7.91 | (0.51 | ) | |||||||||||||
Year Ended June 30, 2012 | 29.39 | 0.45 | (d) | 1.21 | 1.66 | (0.42 | ) | |||||||||||||
Year Ended June 30, 2011 | 23.18 | 0.37 | (d) | 6.20 | 6.57 | (0.36 | ) | |||||||||||||
Year Ended June 30, 2010 | 20.21 | 0.43 | (d) | 2.95 | 3.38 | (0.41 | ) | |||||||||||||
Year Ended June 30, 2009 | 29.02 | 0.52 | (d) | (8.82 | ) | (8.30 | ) | (0.51 | ) | |||||||||||
| (a) | Includes adjustments in accordance with accounting principles generally accepted in the United States of America and as such, the net asset values for financial reporting purposes and the returns based upon those net asset values may differ from the net asset values and returns for shareholder transactions. |
| (b) | Includes earnings credits and interest expense, if applicable, each of which is less than 0.01% unless otherwise noted. |
| (c) | Portfolio turnover is calculated by dividing the lesser of total purchases or sales of portfolio securities for the reporting period by the monthly average value of portfolio securities owned during the reporting period. Excluded from both the numerator and denominator are amounts relating to derivatives and securities whose maturities or expiration dates at the time of acquisition were one year or less. |
| (d) | Calculated based upon average shares outstanding. |
SEE NOTES TO FINANCIAL STATEMENTS.
| 62 | J.P. MORGAN LARGE CAP FUNDS | JUNE 30, 2013 | ||||
Table of Contents
| Ratios/Supplemental data | |||||||||||||||||||||||||
| Ratios to average net assets | ||||||||||||||||||||||||||
| Net asset value, end of period | Total return (excludes sales charge) (a) | Net assets, end of period (000’s) | Net expenses (b) | Net investment income (loss) | Expenses without waivers, reimbursements and earnings credits | Portfolio turnover rate (c) | ||||||||||||||||||||
| $ | 36.53 | 25.65 | % | $ | 356,127 | 1.15 | % | 1.23 | % | 1.16 | % | 35 | % | |||||||||||||
| 29.43 | 5.45 | 293,520 | 1.19 | 1.28 | 1.19 | 28 | ||||||||||||||||||||
| 28.26 | 28.03 | 306,850 | 1.19 | 1.07 | 1.19 | 23 | ||||||||||||||||||||
| 22.30 | 16.25 | 266,587 | 1.21 | 1.49 | 1.21 | 41 | ||||||||||||||||||||
| 19.46 | (28.88 | ) | 253,559 | 1.27 | 2.06 | 1.28 | 52 | |||||||||||||||||||
| 35.68 | 25.01 | 2,981 | 1.66 | 0.73 | 1.66 | 35 | ||||||||||||||||||||
| 28.76 | 4.93 | 3,286 | 1.69 | 0.77 | 1.70 | 28 | ||||||||||||||||||||
| 27.62 | 27.40 | 4,439 | 1.69 | 0.57 | 1.69 | 23 | ||||||||||||||||||||
| 21.80 | 15.66 | 4,959 | 1.71 | 1.01 | 1.72 | 41 | ||||||||||||||||||||
| 19.03 | (29.24 | ) | 5,976 | 1.77 | 1.53 | 1.78 | 52 | |||||||||||||||||||
| 33.83 | 25.02 | 7,769 | 1.65 | 0.72 | 1.65 | 35 | ||||||||||||||||||||
| 27.32 | 4.94 | 4,137 | 1.69 | 0.79 | 1.69 | 28 | ||||||||||||||||||||
| 26.27 | 27.35 | 3,837 | 1.69 | 0.56 | 1.69 | 23 | ||||||||||||||||||||
| 20.77 | 15.72 | 2,797 | 1.70 | 0.97 | 1.71 | 41 | ||||||||||||||||||||
| 18.15 | (29.24 | ) | 2,027 | 1.77 | 1.54 | 1.78 | 52 | |||||||||||||||||||
| 38.03 | 25.97 | 28,339 | 0.88 | 1.45 | 0.90 | 35 | ||||||||||||||||||||
| 30.63 | 5.78 | 7,474 | 0.89 | 1.58 | 0.94 | 28 | ||||||||||||||||||||
| 29.39 | 28.41 | 5,733 | 0.90 | 1.32 | 0.95 | 23 | ||||||||||||||||||||
| 23.18 | 16.63 | 1,646 | 0.89 | 1.80 | 0.97 | 41 | ||||||||||||||||||||
| 20.21 | (28.61 | ) | 1,905 | 0.90 | 2.14 | 1.04 | 52 | |||||||||||||||||||
SEE NOTES TO FINANCIAL STATEMENTS.
| JUNE 30, 2013 | J.P. MORGAN LARGE CAP FUNDS | 63 | ||||||
Table of Contents
FINANCIAL HIGHLIGHTS
FOR THE PERIODS INDICATED (continued)
| Per share operating performance | ||||||||||||||||||||
| Investment operations | Distributions | |||||||||||||||||||
| Net asset value, beginning of period | Net investment income (loss) | Net realized and unrealized gains (losses) on investments | Total from investment operations | Net investment income | ||||||||||||||||
Large Cap Growth Fund |
| |||||||||||||||||||
Class A | ||||||||||||||||||||
Year Ended June 30, 2013 | $ | 23.64 | $ | 0.08 | (f)(i) | $ | 2.37 | $ | 2.45 | $ | (0.08 | ) | ||||||||
Year Ended June 30, 2012 | 22.38 | (0.06 | )(f) | 1.32 | 1.26 | — | ||||||||||||||
Year Ended June 30, 2011 | 15.86 | (0.04 | )(f) | 6.56 | 6.52 | — | ||||||||||||||
Year Ended June 30, 2010 | 13.38 | (0.04 | )(f) | 2.52 | 2.48 | — | ||||||||||||||
Year Ended June 30, 2009 | 19.50 | 0.01 | (f) | (6.11 | ) | (6.10 | ) | (0.02 | ) | |||||||||||
Class B | ||||||||||||||||||||
Year Ended June 30, 2013 | 20.96 | (0.04 | )(f)(i) | 2.10 | 2.06 | (0.01 | ) | |||||||||||||
Year Ended June 30, 2012 | 19.93 | (0.15 | )(f) | 1.18 | 1.03 | — | ||||||||||||||
Year Ended June 30, 2011 | 14.20 | (0.13 | )(f) | 5.86 | 5.73 | — | ||||||||||||||
Year Ended June 30, 2010 | 12.05 | (0.12 | )(f) | 2.27 | 2.15 | — | ||||||||||||||
Year Ended June 30, 2009 | 17.65 | (0.07 | )(f) | (5.52 | ) | (5.59 | ) | (0.01 | ) | |||||||||||
Class C | ||||||||||||||||||||
Year Ended June 30, 2013 | 20.79 | (0.04 | )(f)(i) | 2.07 | 2.03 | (0.03 | ) | |||||||||||||
Year Ended June 30, 2012 | 19.77 | (0.15 | )(f) | 1.17 | 1.02 | — | ||||||||||||||
Year Ended June 30, 2011 | 14.09 | (0.13 | )(f) | 5.81 | 5.68 | — | ||||||||||||||
Year Ended June 30, 2010 | 11.95 | (0.12 | )(f) | 2.26 | 2.14 | — | ||||||||||||||
Year Ended June 30, 2009 | 17.50 | (0.06 | )(f) | (5.48 | ) | (5.54 | ) | (0.01 | ) | |||||||||||
Class R2 | ||||||||||||||||||||
Year Ended June 30, 2013 | 23.44 | 0.01 | (f)(i) | 2.36 | 2.37 | (0.07 | ) | |||||||||||||
Year Ended June 30, 2012 | 22.24 | (0.12 | )(f) | 1.32 | 1.20 | — | (h) | |||||||||||||
Year Ended June 30, 2011 | 15.81 | (0.11 | )(f) | 6.54 | 6.43 | — | ||||||||||||||
Year Ended June 30, 2010 | 13.37 | (0.08 | )(f) | 2.52 | 2.44 | — | ||||||||||||||
November 3, 2008 (g) through June 30, 2009 | 13.68 | 0.01 | (f) | (0.31 | ) | (0.30 | ) | (0.01 | ) | |||||||||||
Class R5 | ||||||||||||||||||||
Year Ended June 30, 2013 | 23.74 | 0.17 | (f)(i) | 2.38 | 2.55 | (0.17 | ) | |||||||||||||
Year Ended June 30, 2012 | 22.39 | 0.04 | (f) | 1.32 | 1.36 | (0.01 | ) | |||||||||||||
Year Ended June 30, 2011 | 15.81 | 0.04 | (f) | 6.54 | 6.58 | — | ||||||||||||||
Year Ended June 30, 2010 | 13.28 | 0.03 | (f) | 2.50 | 2.53 | — | ||||||||||||||
April 14, 2009 (g) through June 30, 2009 | 12.47 | 0.01 | (f) | 0.81 | 0.82 | (0.01 | ) | |||||||||||||
Class R6 | ||||||||||||||||||||
Year Ended June 30, 2013 | 23.76 | 0.18 | (f)(i) | 2.39 | 2.57 | (0.18 | ) | |||||||||||||
Year Ended June 30, 2012 | 22.40 | 0.05 | (f) | 1.33 | 1.38 | (0.02 | ) | |||||||||||||
November 30, 2010 (g) through June 30, 2011 | 19.94 | 0.03 | (f) | 2.43 | 2.46 | — | ||||||||||||||
Select Class | ||||||||||||||||||||
Year Ended June 30, 2013 | 23.61 | 0.12 | (f)(i) | 2.37 | 2.49 | (0.11 | ) | |||||||||||||
Year Ended June 30, 2012 | 22.31 | (0.01 | )(f) | 1.31 | 1.30 | — | (h) | |||||||||||||
Year Ended June 30, 2011 | 15.79 | — | (f)(h) | 6.52 | 6.52 | — | ||||||||||||||
Year Ended June 30, 2010 | 13.28 | — | (f)(h) | 2.51 | 2.51 | — | ||||||||||||||
Year Ended June 30, 2009 | 19.33 | 0.04 | (f) | (6.06 | ) | (6.02 | ) | (0.03 | ) | |||||||||||
| (a) | Annualized for periods less than one year. |
| (b) | Not annualized for periods less than one year. |
| (c) | Includes adjustments in accordance with accounting principles generally accepted in the United States of America and as such, the net asset values for financial reporting purposes and the returns based upon those net asset values may differ from the net asset values and returns for shareholder transactions. |
| (d) | Includes earnings credits and interest expense, if applicable, each of which is less than 0.01% unless otherwise noted. |
| (e) | Portfolio turnover is calculated by dividing the lesser of total purchases or sales of portfolio securities for the reporting period by the monthly average value of portfolio securities owned during the reporting period. Excluded from both the numerator and denominator are amounts relating to derivatives and securities whose maturities or expiration dates at the time of acquisition were one year or less. |
| (f) | Calculated based upon average shares outstanding. |
| (g) | Commencement of offering of class of shares. |
| (h) | Amount rounds ot less than $0.01. |
| (i) | Reflects special dividends paid out during the period by several of the Fund’s holdings. Had the Fund not received the special dividends, the net investment income (loss) per share would have been $0.02, $(0.09), $(0.09), $(0.04), $0.12, $0.13 and $0.07 for Class A, Class B, Class C, Class R2, Class R5, Class R6 and Select Class Shares, respectively, and the net investment income (loss) ratio would have been 0.08%, (0.41)%, (0.42)%, (0.17)%, 0.47%, 0.50% and 0.28% for Class A, Class B, Class C, Class R2, Class R5, Class R6 and Select Class Shares, respectively. |
SEE NOTES TO FINANCIAL STATEMENTS.
| 64 | J.P. MORGAN LARGE CAP FUNDS | JUNE 30, 2013 | ||||
Table of Contents
| Ratios/Supplemental data | |||||||||||||||||||||||||
| Ratios to average net assets (a) | ||||||||||||||||||||||||||
| Net asset value, end of period | Total return sales charge) (b)(c) | Net assets, end of period (000’s) | Net expenses (d) | Net investment income (loss) | Expenses without waivers, reimbursements and earnings credits | Portfolio turnover rate (b)(e) | ||||||||||||||||||||
| $ | 26.01 | 10.40 | % | $ | 2,824,115 | 1.09 | % | 0.30 | %(i) | 1.19 | % | 47 | % | |||||||||||||
| 23.64 | 5.63 | 1,660,335 | 1.09 | (0.25 | ) | 1.15 | 28 | |||||||||||||||||||
| 22.38 | 41.11 | 328,012 | 1.11 | (0.19 | ) | 1.23 | 84 | |||||||||||||||||||
| 15.86 | 18.54 | 174,585 | 1.24 | (0.27 | ) | 1.31 | 61 | |||||||||||||||||||
| 13.38 | (31.26 | ) | 160,168 | 1.24 | 0.05 | 1.45 | 124 | |||||||||||||||||||
| 23.01 | 9.81 | 9,278 | 1.59 | (0.19 | )(i) | 1.68 | 47 | |||||||||||||||||||
| 20.96 | 5.17 | 12,170 | 1.59 | (0.75 | ) | 1.65 | 28 | |||||||||||||||||||
| 19.93 | 40.35 | 18,374 | 1.62 | (0.70 | ) | 1.74 | 84 | |||||||||||||||||||
| 14.20 | 17.84 | 20,842 | 1.77 | (0.80 | ) | 1.82 | 61 | |||||||||||||||||||
| 12.05 | (31.69 | ) | 26,025 | 1.78 | (0.52 | ) | 1.93 | 124 | ||||||||||||||||||
| 22.79 | 9.80 | 396,862 | 1.59 | (0.20 | )(i) | 1.69 | 47 | |||||||||||||||||||
| 20.79 | 5.16 | 205,723 | 1.59 | (0.75 | ) | 1.65 | 28 | |||||||||||||||||||
| 19.77 | 40.31 | 31,181 | 1.60 | (0.68 | ) | 1.71 | 84 | |||||||||||||||||||
| 14.09 | 17.91 | 6,588 | 1.77 | (0.80 | ) | 1.81 | 61 | |||||||||||||||||||
| 11.95 | (31.67 | ) | 5,996 | 1.78 | (0.50 | ) | 1.94 | 124 | ||||||||||||||||||
| 25.74 | 10.12 | 191,876 | 1.34 | 0.05 | (i) | 1.45 | 47 | |||||||||||||||||||
| 23.44 | 5.41 | 85,913 | 1.34 | (0.50 | ) | 1.39 | 28 | |||||||||||||||||||
| 22.24 | 40.67 | 626 | 1.34 | (0.50 | ) | 1.42 | 84 | |||||||||||||||||||
| 15.81 | 18.25 | 58 | 1.48 | (0.52 | ) | 1.56 | 61 | |||||||||||||||||||
| 13.37 | (2.16 | ) | 49 | 1.49 | 0.16 | 1.80 | 124 | |||||||||||||||||||
| 26.12 | 10.78 | 1,158,856 | 0.71 | 0.69 | (i) | 0.75 | 47 | |||||||||||||||||||
| 23.74 | 6.10 | 584,866 | 0.69 | 0.16 | 0.70 | 28 | ||||||||||||||||||||
| 22.39 | 41.62 | 53,668 | 0.71 | 0.22 | 0.76 | 84 | ||||||||||||||||||||
| 15.81 | 19.05 | 10,618 | 0.78 | 0.20 | 0.85 | 61 | ||||||||||||||||||||
| 13.28 | 6.56 | 53 | 0.79 | 0.19 | 1.17 | 124 | ||||||||||||||||||||
| 26.15 | 10.87 | 2,170,011 | 0.67 | 0.72 | (i) | 0.70 | 47 | |||||||||||||||||||
| 23.76 | 6.15 | 1,047,184 | 0.63 | 0.20 | 0.64 | 28 | ||||||||||||||||||||
| 22.40 | 12.34 | 30,386 | 0.63 | 0.25 | 0.65 | 84 | ||||||||||||||||||||
| 25.99 | 10.58 | 4,811,907 | 0.91 | 0.50 | (i) | 0.94 | 47 | |||||||||||||||||||
| 23.61 | 5.85 | 3,320,683 | 0.89 | (0.04 | ) | 0.90 | 28 | |||||||||||||||||||
| 22.31 | 41.29 | 1,463,752 | 0.91 | (0.01 | ) | 0.95 | 84 | |||||||||||||||||||
| 15.79 | 18.90 | 300,304 | 0.99 | (0.02 | ) | 1.07 | 61 | |||||||||||||||||||
| 13.28 | (31.13 | ) | 335,992 | 0.99 | 0.29 | 1.19 | 124 | |||||||||||||||||||
SEE NOTES TO FINANCIAL STATEMENTS.
| JUNE 30, 2013 | J.P. MORGAN LARGE CAP FUNDS | 65 | ||||||
Table of Contents
FINANCIAL HIGHLIGHTS
FOR THE PERIODS INDICATED (continued)
| Per share operating performance | ||||||||||||||||||||
| Investment operations | Distributions | |||||||||||||||||||
| Net asset value, beginning of period | Net investment income (loss) | Net realized and unrealized gains (losses) on investments | Total from investment operations | Net investment income | ||||||||||||||||
Large Cap Value Fund | ||||||||||||||||||||
Class A | ||||||||||||||||||||
Year Ended June 30, 2013 | $ | 11.02 | $ | 0.14 | (f) | $ | 2.97 | $ | 3.11 | $ | (0.14 | ) | ||||||||
Year Ended June 30, 2012 | 11.45 | 0.11 | (f) | (0.43 | ) | (0.32 | ) | (0.11 | ) | |||||||||||
Year Ended June 30, 2011 | 9.15 | 0.12 | (f) | 2.29 | 2.41 | (0.11 | ) | |||||||||||||
Year Ended June 30, 2010 | 8.09 | 0.09 | (f) | 1.04 | 1.13 | (0.07 | ) | |||||||||||||
Year Ended June 30, 2009 | 10.66 | 0.18 | (f) | (2.54 | ) | (2.36 | ) | (0.21 | ) | |||||||||||
Class B | ||||||||||||||||||||
Year Ended June 30, 2013 | 10.86 | 0.07 | (f) | 2.95 | 3.02 | (0.08 | ) | |||||||||||||
Year Ended June 30, 2012 | 11.28 | 0.05 | (f) | (0.42 | ) | (0.37 | ) | (0.05 | ) | |||||||||||
Year Ended June 30, 2011 | 9.02 | 0.06 | (f) | 2.26 | 2.32 | (0.06 | ) | |||||||||||||
Year Ended June 30, 2010 | 7.99 | 0.04 | (f) | 1.02 | 1.06 | (0.03 | ) | |||||||||||||
Year Ended June 30, 2009 | 10.52 | 0.13 | (f) | (2.50 | ) | (2.37 | ) | (0.16 | ) | |||||||||||
Class C | ||||||||||||||||||||
Year Ended June 30, 2013 | 10.80 | 0.08 | (f) | 2.91 | 2.99 | (0.09 | ) | |||||||||||||
Year Ended June 30, 2012 | 11.22 | 0.05 | (f) | (0.41 | ) | (0.36 | ) | (0.06 | ) | |||||||||||
Year Ended June 30, 2011 | 8.97 | 0.06 | (f) | 2.25 | 2.31 | (0.06 | ) | |||||||||||||
Year Ended June 30, 2010 | 7.95 | 0.04 | (f) | 1.01 | 1.05 | (0.03 | ) | |||||||||||||
Year Ended June 30, 2009 | 10.47 | 0.14 | (f) | (2.50 | ) | (2.36 | ) | (0.16 | ) | |||||||||||
Class R2 | ||||||||||||||||||||
Year Ended June 30, 2013 | 10.99 | 0.11 | (f) | 2.96 | 3.07 | (0.11 | ) | |||||||||||||
Year Ended June 30, 2012 | 11.42 | 0.08 | (f) | (0.42 | ) | (0.34 | ) | (0.09 | ) | |||||||||||
Year Ended June 30, 2011 | 9.13 | 0.09 | (f) | 2.29 | 2.38 | (0.09 | ) | |||||||||||||
Year Ended June 30, 2010 | 8.08 | 0.07 | (f) | 1.03 | 1.10 | (0.05 | ) | |||||||||||||
November 3, 2008 (g) through June 30, 2009 | 8.10 | 0.11 | (f) | 0.02 | 0.13 | (0.15 | ) | |||||||||||||
Class R5 | ||||||||||||||||||||
Year Ended June 30, 2013 | 10.92 | 0.17 | (f) | 2.98 | 3.15 | (0.15 | ) | |||||||||||||
Year Ended June 30, 2012 | 11.34 | 0.14 | (f) | (0.41 | ) | (0.27 | ) | (0.15 | ) | |||||||||||
Year Ended June 30, 2011 | 9.07 | 0.16 | (f) | 2.26 | 2.42 | (0.15 | ) | |||||||||||||
Year Ended June 30, 2010 | 8.01 | 0.14 | (f) | 1.02 | 1.16 | (0.10 | ) | |||||||||||||
Year Ended June 30, 2009 | 10.52 | 0.25 | (f) | (2.54 | ) | (2.29 | ) | (0.22 | ) | |||||||||||
Class R6 | ||||||||||||||||||||
Year Ended June 30, 2013 | 10.92 | 0.20 | (f) | 2.94 | 3.14 | (0.19 | ) | |||||||||||||
Year Ended June 30, 2012 | 11.34 | 0.15 | (f) | (0.42 | ) | (0.27 | ) | (0.15 | ) | |||||||||||
November 30, 2010 (g) through June 30, 2011 | 10.19 | 0.10 | (f) | 1.17 | 1.27 | (0.12 | ) | |||||||||||||
Select Class | ||||||||||||||||||||
Year Ended June 30, 2013 | 10.88 | 0.16 | (f) | 2.94 | 3.10 | (0.16 | ) | |||||||||||||
Year Ended June 30, 2012 | 11.30 | 0.12 | (f) | (0.41 | ) | (0.29 | ) | (0.13 | ) | |||||||||||
Year Ended June 30, 2011 | 9.04 | 0.13 | (f) | 2.26 | 2.39 | (0.13 | ) | |||||||||||||
Year Ended June 30, 2010 | 7.99 | 0.12 | (f) | 1.01 | 1.13 | (0.08 | ) | |||||||||||||
Year Ended June 30, 2009 | 10.53 | 0.20 | (f) | (2.51 | ) | (2.31 | ) | (0.23 | ) | |||||||||||
| (a) | Annualized for periods less than one year. |
| (b) | Not annualized for periods less than one year. |
| (c) | Includes adjustments in accordance with accounting principles generally accepted in the United States of America and as such, the net asset values for financial reporting purposes and the returns based upon those net asset values may differ from the net asset values and returns for shareholder transactions. |
| (d) | Includes earnings credits and interest expense, if applicable, each of which is less than 0.01% unless otherwise noted. |
| (e) | Portfolio turnover is calculated by dividing the lesser of total purchases or sales of portfolio securities for the reporting period by the monthly average value of portfolio securities owned during the reporting period. Excluded from both the numerator and denominator are amounts relating to derivatives and securities whose maturities or expiration dates at the time of acquisition were one year or less. |
| (f) | Calculated based upon average shares outstanding. |
| (g) | Commencement of offering of class of shares. |
SEE NOTES TO FINANCIAL STATEMENTS.
| 66 | J.P. MORGAN LARGE CAP FUNDS | JUNE 30, 2013 | ||||
Table of Contents
| Ratios/Supplemental data | |||||||||||||||||||||||||
| Ratios to average net assets (a) | ||||||||||||||||||||||||||
| Net asset value, end of period | Total return (excludes sales charge) (b)(c) | Net assets, end of period (000’s) | Net expenses (d) | Net investment income (loss) | Expenses without waivers, reimbursements and earnings credits | Portfolio turnover rate (b)(e) | ||||||||||||||||||||
| $ | 13.99 | 28.38 | % | $ | 35,030 | 0.94 | % | 1.11 | % | 1.04 | % | 119 | % | |||||||||||||
| 11.02 | (2.75 | ) | 25,789 | 0.95 | 1.00 | 1.06 | 144 | |||||||||||||||||||
| 11.45 | 26.42 | 25,668 | 0.97 | 1.09 | 1.08 | 65 | ||||||||||||||||||||
| 9.15 | 13.86 | 22,273 | 1.10 | 0.95 | 1.10 | 86 | ||||||||||||||||||||
| 8.09 | (22.00 | ) | 20,557 | 1.16 | 2.17 | 1.17 | 108 | |||||||||||||||||||
| 13.80 | 27.88 | 1,183 | 1.43 | 0.60 | 1.55 | 119 | ||||||||||||||||||||
| 10.86 | (3.22 | ) | 1,442 | 1.45 | 0.51 | 1.57 | 144 | |||||||||||||||||||
| 11.28 | 25.71 | 2,336 | 1.47 | 0.58 | 1.58 | 65 | ||||||||||||||||||||
| 9.02 | 13.19 | 2,891 | 1.60 | 0.45 | 1.60 | 86 | ||||||||||||||||||||
| 7.99 | (22.32 | ) | 3,858 | 1.66 | 1.61 | 1.67 | 108 | |||||||||||||||||||
| 13.70 | 27.77 | 4,890 | 1.44 | 0.62 | 1.54 | 119 | ||||||||||||||||||||
| 10.80 | (3.17 | ) | 3,215 | 1.45 | 0.50 | 1.56 | 144 | |||||||||||||||||||
| 11.22 | 25.76 | 3,186 | 1.47 | 0.58 | 1.58 | 65 | ||||||||||||||||||||
| 8.97 | 13.22 | 3,473 | 1.59 | 0.45 | 1.60 | 86 | ||||||||||||||||||||
| 7.95 | (22.34 | ) | 1,551 | 1.66 | 1.67 | 1.67 | 108 | |||||||||||||||||||
| 13.95 | 28.10 | 378 | 1.20 | 0.87 | 1.29 | 119 | ||||||||||||||||||||
| 10.99 | (2.97 | ) | 142 | 1.20 | 0.76 | 1.31 | 144 | |||||||||||||||||||
| 11.42 | 26.15 | 123 | 1.21 | 0.84 | 1.32 | 65 | ||||||||||||||||||||
| 9.13 | 13.54 | 58 | 1.35 | 0.70 | 1.35 | 86 | ||||||||||||||||||||
| 8.08 | 1.95 | 51 | 1.46 | 2.29 | 1.47 | 108 | ||||||||||||||||||||
| 13.92 | 28.96 | 19,410 | 0.59 | 1.48 | 0.60 | 119 | ||||||||||||||||||||
| 10.92 | (2.34 | ) | 25,965 | 0.59 | 1.36 | 0.61 | 144 | |||||||||||||||||||
| 11.34 | 26.78 | 28,479 | 0.60 | 1.48 | 0.63 | 65 | ||||||||||||||||||||
| 9.07 | 14.39 | 9,930 | 0.64 | 1.43 | 0.64 | 86 | ||||||||||||||||||||
| 8.01 | (21.58 | ) | 57 | 0.70 | 3.04 | 0.70 | 108 | |||||||||||||||||||
| 13.87 | 28.94 | 43,781 | 0.53 | 1.52 | 0.54 | 119 | ||||||||||||||||||||
| 10.92 | (2.30 | ) | 11,269 | 0.54 | 1.41 | 0.56 | 144 | |||||||||||||||||||
| 11.34 | 12.50 | 11,006 | 0.54 | 1.48 | 0.55 | 65 | ||||||||||||||||||||
| 13.82 | 28.65 | 591,749 | 0.78 | 1.27 | 0.79 | 119 | ||||||||||||||||||||
| 10.88 | (2.54 | ) | 567,551 | 0.79 | 1.16 | 0.81 | 144 | |||||||||||||||||||
| 11.30 | 26.52 | 597,026 | 0.80 | 1.26 | 0.83 | 65 | ||||||||||||||||||||
| 9.04 | 14.13 | 418,647 | 0.85 | 1.20 | 0.85 | 86 | ||||||||||||||||||||
| 7.99 | (21.78 | ) | 351,537 | 0.91 | 2.44 | 0.92 | 108 | |||||||||||||||||||
SEE NOTES TO FINANCIAL STATEMENTS.
| JUNE 30, 2013 | J.P. MORGAN LARGE CAP FUNDS | 67 | ||||||
Table of Contents
FINANCIAL HIGHLIGHTS
FOR THE PERIODS INDICATED (continued)
| Per share operating performance | ||||||||||||||||||||||||||||
| Investment operations | Distributions | |||||||||||||||||||||||||||
| Net asset value, beginning of period | Net investment income (loss) | Net realized and unrealized gains (losses) on investments | Total from investment operations | Net investment income | Net realized gain | Total distributions | ||||||||||||||||||||||
U.S. Equity Fund | ||||||||||||||||||||||||||||
Class A | ||||||||||||||||||||||||||||
Year Ended June 30, 2013 | $ | 10.73 | $ | 0.13 | (f) | $ | 2.31 | $ | 2.44 | $ | (0.13 | ) | $ | (0.24 | ) | $ | (0.37 | ) | ||||||||||
Year Ended June 30, 2012 | 10.65 | 0.10 | (f) | 0.13 | 0.23 | (0.09 | ) | (0.06 | ) | (0.15 | ) | |||||||||||||||||
Year Ended June 30, 2011 | 8.30 | 0.08 | (f) | 2.35 | 2.43 | (0.08 | ) | — | (0.08 | ) | ||||||||||||||||||
Year Ended June 30, 2010 | 7.35 | 0.07 | (f) | 0.95 | 1.02 | (0.07 | ) | — | (0.07 | ) | ||||||||||||||||||
Year Ended June 30, 2009 | 9.56 | 0.11 | (f) | (2.17 | ) | (2.06 | ) | (0.10 | ) | (0.05 | ) | (0.15 | ) | |||||||||||||||
Class B | ||||||||||||||||||||||||||||
Year Ended June 30, 2013 | 10.59 | 0.07 | (f) | 2.27 | 2.34 | (0.07 | ) | (0.24 | ) | (0.31 | ) | |||||||||||||||||
Year Ended June 30, 2012 | 10.51 | 0.04 | (f) | 0.14 | 0.18 | (0.04 | ) | (0.06 | ) | (0.10 | ) | |||||||||||||||||
Year Ended June 30, 2011 | 8.20 | 0.03 | (f) | 2.32 | 2.35 | (0.04 | ) | — | (0.04 | ) | ||||||||||||||||||
Year Ended June 30, 2010 | 7.26 | 0.03 | (f) | 0.93 | 0.96 | (0.02 | ) | — | (0.02 | ) | ||||||||||||||||||
Year Ended June 30, 2009 | 9.45 | 0.07 | (f) | (2.13 | ) | (2.06 | ) | (0.08 | ) | (0.05 | ) | (0.13 | ) | |||||||||||||||
Class C | ||||||||||||||||||||||||||||
Year Ended June 30, 2013 | 10.55 | 0.06 | (f) | 2.26 | 2.32 | (0.07 | ) | (0.24 | ) | (0.31 | ) | |||||||||||||||||
Year Ended June 30, 2012 | 10.47 | 0.04 | (f) | 0.15 | 0.19 | (0.05 | ) | (0.06 | ) | (0.11 | ) | |||||||||||||||||
Year Ended June 30, 2011 | 8.18 | 0.03 | (f) | 2.31 | 2.34 | (0.05 | ) | — | (0.05 | ) | ||||||||||||||||||
Year Ended June 30, 2010 | 7.25 | 0.03 | (f) | 0.93 | 0.96 | (0.03 | ) | — | (0.03 | ) | ||||||||||||||||||
Year Ended June 30, 2009 | 9.44 | 0.07 | (f) | (2.13 | ) | (2.06 | ) | (0.08 | ) | (0.05 | ) | (0.13 | ) | |||||||||||||||
Class R2 | ||||||||||||||||||||||||||||
Year Ended June 30, 2013 | 10.69 | 0.10 | (f) | 2.29 | 2.39 | (0.10 | ) | (0.24 | ) | (0.34 | ) | |||||||||||||||||
Year Ended June 30, 2012 | 10.62 | 0.07 | (f) | 0.13 | 0.20 | (0.07 | ) | (0.06 | ) | (0.13 | ) | |||||||||||||||||
Year Ended June 30, 2011 | 8.29 | 0.05 | (f) | 2.35 | 2.40 | (0.07 | ) | — | (0.07 | ) | ||||||||||||||||||
Year Ended June 30, 2010 | 7.35 | 0.05 | (f) | 0.95 | 1.00 | (0.06 | ) | — | (0.06 | ) | ||||||||||||||||||
November 3, 2008 (g) through June 30, 2009 | 7.36 | 0.07 | (f) | 0.04 | 0.11 | (0.07 | ) | (0.05 | ) | (0.12 | ) | |||||||||||||||||
Class R5 | ||||||||||||||||||||||||||||
Year Ended June 30, 2013 | 10.75 | 0.17 | (f) | 2.31 | 2.48 | (0.17 | ) | (0.24 | ) | (0.41 | ) | |||||||||||||||||
Year Ended June 30, 2012 | 10.66 | 0.14 | (f) | 0.14 | 0.28 | (0.13 | ) | (0.06 | ) | (0.19 | ) | |||||||||||||||||
Year Ended June 30, 2011 | 8.31 | 0.12 | (f) | 2.34 | 2.46 | (0.11 | ) | — | (0.11 | ) | ||||||||||||||||||
Year Ended June 30, 2010 | 7.36 | 0.12 | (f) | 0.94 | 1.06 | (0.11 | ) | — | (0.11 | ) | ||||||||||||||||||
Year Ended June 30, 2009 | 9.55 | 0.16 | (f) | (2.17 | ) | (2.01 | ) | (0.13 | ) | (0.05 | ) | (0.18 | ) | |||||||||||||||
Class R6 | ||||||||||||||||||||||||||||
Year Ended June 30, 2013 | 10.76 | 0.17 | (f) | 2.31 | 2.48 | (0.17 | ) | (0.24 | ) | (0.41 | ) | |||||||||||||||||
Year Ended June 30, 2012 | 10.67 | 0.14 | (f) | 0.14 | 0.28 | (0.13 | ) | (0.06 | ) | (0.19 | ) | |||||||||||||||||
November 30, 2010 (g) through June 30, 2011 | 9.59 | 0.07 | (f) | 1.10 | 1.17 | (0.09 | ) | — | (0.09 | ) | ||||||||||||||||||
Institutional Class | ||||||||||||||||||||||||||||
Year Ended June 30, 2013 | 10.75 | 0.16 | (f) | 2.31 | 2.47 | (0.16 | ) | (0.24 | ) | (0.40 | ) | |||||||||||||||||
Year Ended June 30, 2012 | 10.66 | 0.13 | (f) | 0.14 | 0.27 | (0.12 | ) | (0.06 | ) | (0.18 | ) | |||||||||||||||||
Year Ended June 30, 2011 | 8.31 | 0.11 | (f) | 2.35 | 2.46 | (0.11 | ) | — | (0.11 | ) | ||||||||||||||||||
Year Ended June 30, 2010 | 7.35 | 0.11 | (f) | 0.95 | 1.06 | (0.10 | ) | — | (0.10 | ) | ||||||||||||||||||
Year Ended June 30, 2009 | 9.55 | 0.14 | (f) | (2.16 | ) | (2.02 | ) | (0.13 | ) | (0.05 | ) | (0.18 | ) | |||||||||||||||
Select Class | ||||||||||||||||||||||||||||
Year Ended June 30, 2013 | 10.74 | 0.15 | (f) | 2.30 | 2.45 | (0.15 | ) | (0.24 | ) | (0.39 | ) | |||||||||||||||||
Year Ended June 30, 2012 | 10.65 | 0.12 | (f) | 0.14 | 0.26 | (0.11 | ) | (0.06 | ) | (0.17 | ) | |||||||||||||||||
Year Ended June 30, 2011 | 8.30 | 0.10 | (f) | 2.34 | 2.44 | (0.09 | ) | — | (0.09 | ) | ||||||||||||||||||
Year Ended June 30, 2010 | 7.35 | 0.10 | (f) | 0.94 | 1.04 | (0.09 | ) | — | (0.09 | ) | ||||||||||||||||||
Year Ended June 30, 2009 | 9.54 | 0.13 | (f) | (2.15 | ) | (2.02 | ) | (0.12 | ) | (0.05 | ) | (0.17 | ) | |||||||||||||||
| (a) | Annualized for periods less than one year. |
| (b) | Not annualized for periods less than one year. |
| (c) | Includes adjustments in accordance with accounting principles generally accepted in the United States of America and as such, the net asset values for financial reporting purposes and the returns based upon those net asset values may differ from the net asset values and returns for shareholder transactions. |
| (d) | Includes earnings credits and interest expense, if applicable, each of which is less than 0.01% unless otherwise noted. |
| (e) | Portfolio turnover is calculated by dividing the lesser of total purchases or sales of portfolio securities for the reporting period by the monthly average value of portfolio securities owned during the reporting period. Excluded from both the numerator and denominator are amounts relating to derivatives and securities whose maturities or expiration dates at the time of acquisition were one year or less. |
| (f) | Calculated based upon average shares outstanding. |
| (g) | Commencement of offering of class of shares. |
SEE NOTES TO FINANCIAL STATEMENTS.
| 68 | J.P. MORGAN LARGE CAP FUNDS | JUNE 30, 2013 | ||||
Table of Contents
| Ratios/Supplemental data | |||||||||||||||||||||||||
| Ratios to average net assets (a) | ||||||||||||||||||||||||||
| Net asset value, end of period | Total return (excludes sales charge) (b)(c) | Net assets, end of period (000’s) | Net expenses (d) | Net investment income (loss) | Expenses without waivers, reimbursements and earnings credits | Portfolio turnover rate (b)(e) | ||||||||||||||||||||
| $ | 12.80 | 23.14 | % | $ | 874,571 | 0.97 | % | 1.06 | % | 1.06 | % | 88 | % | |||||||||||||
| 10.73 | 2.27 | 662,367 | 0.97 | 0.93 | 1.08 | 83 | ||||||||||||||||||||
| 10.65 | 29.29 | 426,536 | 0.97 | 0.81 | 1.07 | 69 | ||||||||||||||||||||
| 8.30 | 13.83 | 184,862 | 1.05 | 0.84 | 1.08 | 84 | ||||||||||||||||||||
| 7.35 | (21.36 | ) | 103,103 | 1.05 | 1.49 | 1.12 | 101 | |||||||||||||||||||
| 12.62 | 22.45 | 4,466 | 1.46 | 0.57 | 1.56 | 88 | ||||||||||||||||||||
| 10.59 | 1.74 | 4,979 | 1.47 | 0.43 | 1.58 | 83 | ||||||||||||||||||||
| 10.51 | 28.66 | 7,113 | 1.48 | 0.31 | 1.56 | 69 | ||||||||||||||||||||
| 8.20 | 13.25 | 8,190 | 1.57 | 0.33 | 1.58 | 84 | ||||||||||||||||||||
| 7.26 | (21.70 | ) | 8,559 | 1.57 | 0.96 | 1.61 | 101 | |||||||||||||||||||
| 12.56 | 22.43 | 110,837 | 1.46 | 0.56 | 1.56 | 88 | ||||||||||||||||||||
| 10.55 | 1.83 | 75,962 | 1.47 | 0.43 | 1.58 | 83 | ||||||||||||||||||||
| 10.47 | 28.56 | 57,089 | 1.48 | 0.30 | 1.57 | 69 | ||||||||||||||||||||
| 8.18 | 13.26 | 27,838 | 1.57 | 0.32 | 1.58 | 84 | ||||||||||||||||||||
| 7.25 | (21.69 | ) | 10,216 | 1.57 | 0.97 | 1.62 | 101 | |||||||||||||||||||
| 12.74 | 22.81 | 72,664 | 1.22 | 0.81 | 1.31 | 88 | ||||||||||||||||||||
| 10.69 | 2.00 | 31,686 | 1.22 | 0.68 | 1.32 | 83 | ||||||||||||||||||||
| 10.62 | 28.96 | 8,533 | 1.22 | 0.51 | 1.32 | 69 | ||||||||||||||||||||
| 8.29 | 13.56 | 492 | 1.30 | 0.57 | 1.33 | 84 | ||||||||||||||||||||
| 7.35 | 1.70 | 51 | 1.30 | 1.47 | 1.39 | 101 | ||||||||||||||||||||
| 12.82 | 23.52 | 455,939 | 0.59 | 1.45 | 0.61 | 88 | ||||||||||||||||||||
| 10.75 | 2.72 | 335,220 | 0.59 | 1.32 | 0.63 | 83 | ||||||||||||||||||||
| 10.66 | 29.66 | 153,501 | 0.59 | 1.27 | 0.61 | 69 | ||||||||||||||||||||
| 8.31 | 14.30 | 209,619 | 0.59 | 1.39 | 0.63 | 84 | ||||||||||||||||||||
| 7.36 | (20.91 | ) | 596 | 0.59 | 2.08 | 0.65 | 101 | |||||||||||||||||||
| 12.83 | 23.56 | 1,379,173 | 0.54 | 1.47 | 0.56 | 88 | ||||||||||||||||||||
| 10.76 | 2.76 | 1,114,492 | 0.54 | 1.38 | 0.57 | 83 | ||||||||||||||||||||
| 10.67 | 12.17 | 549,478 | 0.54 | 1.15 | 0.57 | 69 | ||||||||||||||||||||
| 12.82 | 23.48 | 1,214,707 | 0.64 | 1.36 | 0.67 | 88 | ||||||||||||||||||||
| 10.75 | 2.67 | 610,670 | 0.64 | 1.25 | 0.68 | 83 | ||||||||||||||||||||
| 10.66 | 29.60 | 500,991 | 0.64 | 1.16 | 0.66 | 69 | ||||||||||||||||||||
| 8.31 | 14.40 | 441,540 | 0.64 | 1.25 | 0.68 | 84 | ||||||||||||||||||||
| 7.35 | (21.04 | ) | 263,859 | 0.64 | 1.88 | 0.72 | 101 | |||||||||||||||||||
| 12.80 | 23.22 | 3,874,926 | 0.79 | 1.24 | 0.81 | 88 | ||||||||||||||||||||
| 10.74 | 2.52 | 3,617,633 | 0.79 | 1.12 | 0.83 | 83 | ||||||||||||||||||||
| 10.65 | 29.47 | 3,129,167 | 0.79 | 1.00 | 0.82 | 69 | ||||||||||||||||||||
| 8.30 | 14.10 | 1,741,650 | 0.79 | 1.10 | 0.83 | 84 | ||||||||||||||||||||
| 7.35 | (21.04 | ) | 1,138,732 | 0.79 | 1.76 | 0.87 | 101 | |||||||||||||||||||
SEE NOTES TO FINANCIAL STATEMENTS.
| JUNE 30, 2013 | J.P. MORGAN LARGE CAP FUNDS | 69 | ||||||
Table of Contents
AS OF JUNE 30, 2013
1. Organization
JPMorgan Trust I (“JPM I”) and JPMorgan Trust II (“JPM II”) (the “Trusts”) were formed on November 12, 2004, as Delaware statutory trusts, pursuant to Declarations of Trust dated November 5, 2004 and are registered under the Investment Company Act of 1940, as amended (the “1940 Act”), as open-end management investment companies.
The following are 7 separate funds of the Trusts (collectively, the “Funds”) covered by this report:
| Classes Offered | Trust | Diversified/Non-Diversified | ||||
| Disciplined Equity Fund | Class A, Class R6, Institutional Class and Select Class | JPM I | Diversified | |||
| Dynamic Growth Fund | Class A, Class C, Class R5 and Select Class | JPM I | Non-Diversified | |||
| Equity Income Fund | Class A, Class B, Class C, Class R2, Class R5, Class R6 and Select Class | JPM II | Diversified | |||
| Growth and Income Fund | Class A, Class B, Class C and Select Class | JPM I | Diversified | |||
| Large Cap Growth Fund | Class A, Class B, Class C, Class R2, Class R5, Class R6 and Select Class | JPM II | Diversified | |||
| Large Cap Value Fund | Class A, Class B, Class C, Class R2, Class R5, Class R6 and Select Class | JPM II | Diversified | |||
| U.S. Equity Fund | Class A, Class B, Class C, Class R2, Class R5, Class R6, Institutional Class and Select Class | JPM I | Diversified |
Prior to July 19, 2013, Class A, Class C and Class R5 Shares and prior to August 6, 2010, Select Class Shares of the Dynamic Growth Fund were not publicly offered for investment.
Class R6 Shares commenced operations on January 31, 2012 for Equity Income Fund.
The investment objective of the Disciplined Equity Fund is to seek to provide a consistently high total return from a broadly diversified portfolio of equity securities with risk characteristics similar to the Standard and Poor’s 500 Composite Stock Price Index.
The investment objective of the Dynamic Growth Fund is to seek long-term capital growth.
The investment objective of the Equity Income Fund is to seek current income through regular payment of dividends with the secondary goal of achieving capital appreciation by investing primarily in equity securities.
The investment objective of the Growth and Income Fund is to seek to provide capital growth over the long-term and earn income from dividends.
The investment objective of the Large Cap Growth Fund is to seek long-term capital appreciation and growth of income by investing primarily in equity securities.
The investment objective of the Large Cap Value Fund is to seek capital appreciation with the incidental goal of achieving current income by investing primarily in equity securities.
The investment objective of the U.S. Equity Fund is to seek to provide high total return from a portfolio of selected equity securities.
Effective November 1, 2009, Class B Shares of the Equity Income Fund, Growth and Income Fund, Large Cap Growth Fund, Large Cap Value Fund and U.S. Equity Fund may not be purchased or acquired by new or existing shareholders, except through exchanges from Class B Shares of another J.P. Morgan Fund and dividend reinvestments. Shareholders who have invested in Class B Shares prior to November 1, 2009 may continue to hold their Class B Shares until they automatically convert to Class A Shares.
Class A Shares generally provide for a front-end sales charge while Class B and Class C Shares provide for a contingent deferred sales charge (“CDSC”). Class B Shares automatically convert to Class A Shares after eight years. No sales charges are assessed with respect to Class R2, Class R5, Class R6, Institutional Class and Select Class Shares. All classes of shares have equal rights as to earnings, assets and voting privileges, except that each class may bear different distribution and shareholder servicing fees and each class has exclusive voting rights with respect to its distribution plan and shareholder servicing agreements. Certain Class A Shares, for which front-end sales charges have been waived, may be subject to a CDSC as described in the Funds’ prospectus.
2. Significant Accounting Policies
The following is a summary of significant accounting policies followed by the Funds in the preparation of their financial statements. The policies are in accordance with accounting principles generally accepted in the United States of America (“GAAP”). The preparation of financial statements requires management to make estimates and assumptions that affect the reported amounts and disclosures in the financial statements. Actual results could differ from those estimates.
A. Valuation of Investments — Equity securities listed on a North American, Central American, South American or Caribbean securities exchange shall generally be valued at the last sale price on the exchange on which the security is principally traded that is reported before the time when the net assets of the Funds are valued. Securities listed on the NASDAQ Stock Market LLC are generally valued at the NASDAQ Official Closing Price. Fixed income securities (other than certain short-term investments maturing in less than 61 days) are valued each day based on prices received from independent or affiliated pricing services approved by the Board of Trustees or third party broker-dealers. The pricing services or broker-dealers use multiple valuation techniques to determine fair value. In instances where sufficient market activity exists, the pricing services or broker-dealers may utilize a market-based approach through which quotes from market makers are used to determine fair value. In instances where
| 70 | J.P. MORGAN LARGE CAP FUNDS | JUNE 30, 2013 | ||||
Table of Contents
sufficient market activity may not exist or is limited, the pricing services or broker-dealers also utilize proprietary valuation models which may consider market transactions in comparable securities and the various relationships between securities in determining fair value and/or market characteristics such as benchmark yield curves, option-adjusted spreads, credit spreads, estimated default rates, coupon rates, anticipated timing of principal repayments, underlying collateral, and other unique security features in order to estimate the relevant cash flows, which are then discounted to calculate the fair values. Generally, short-term investments of sufficient credit quality maturing in less than 61 days are valued at amortized cost, which approximates fair value. Investments in other open-end investment companies are valued at each investment company’s net asset value per share (“NAV”) as of the report date.
Certain investments of the Funds may, depending upon market conditions, trade in relatively thin markets and/or in markets that experience significant volatility. As a result of these conditions, the prices used by the Funds to value these securities may differ from the value that would be realized if these securities were sold, and the differences could be material. Futures and options are generally valued on the basis of available market quotations. Swaps and other derivatives are valued daily, primarily using independent or affiliated pricing services approved by the Board of Trustees. If valuations are not available from such services or values received are deemed not representative of fair value, values will be obtained from a third party broker-dealer or counterparty.
Securities or other assets for which market quotations are not readily available or for which market quotations are deemed to not represent the fair value of the security or asset at the time of pricing (including certain illiquid securities) are fair valued in accordance with procedures established by and under the supervision and responsibility of the Board of Trustees. The Board of Trustees has established an Audit and Valuation Committee to assist with the oversight of the valuation of the Funds’ securities. JPMorgan Funds Management, Inc. (the “Administrator”, or “JPMFM”), an indirect, wholly-owned subsidiary of JPMorgan Chase & Co. (“JPMorgan”), has established a Valuation Committee (“VC”) that is comprised of senior representatives from JPMFM, J.P. Morgan Investment Management Inc. (“JPMIM” or the “Advisor”), a wholly-owned subsidiary of JPMorgan Asset Management Holdings Inc. (“JPMAM”), which is a wholly-owned subsidiary of JPMorgan, JPMorgan’s Legal and Compliance and JPMAM’s Risk Management and the Funds’ Chief Compliance Officer. The VC’s responsibilities include making determinations regarding Level 3 fair value measurements (“Fair Values”) and/or providing recommendations for approval to the Board of Trustees’ Audit and Valuation Committee, in accordance with the Funds’ valuation policies.
The VC or Board of Trustees, as applicable, primarily employs a market-based approach which may use related or comparable assets or liabilities, recent transactions, market multiples, book values, and other relevant information for the investment to determine the fair value of the investment. The VC or Board of Trustees may also use an income-based valuation approach in which the anticipated future cash flows of the investment are discounted to calculate fair value. Discounts may also be applied due to the nature or duration of any restrictions on the disposition of the investments. Valuations may be based upon current market prices of securities that are comparable in coupon, rating, maturity and industry.
It is possible that the estimated values may differ significantly from the values that would have been used had a ready market for the investments existed, and such differences could be material. JPMFM and JPMIM are responsible for monitoring developments that may impact Fair Values and for discussing and assessing Fair Values on an ongoing, and at least a quarterly, basis with the VC and Board of Trustees, as applicable. The appropriateness of Fair Values is assessed based on results of unchanged price review and consideration of macro or security specific events, back testing and broker and vendor due diligence.
Valuations reflected in this report are as of the report date. As a result, changes in valuation due to market events and/or issuer related events after the report date and prior to issuance of the report, are not reflected herein.
The various inputs that are used in determining the fair value of the Funds’ investments are summarized into the three broad levels listed below.
| Ÿ | Level 1 — quoted prices in active markets for identical securities |
| Ÿ | Level 2 — other significant observable inputs (including quoted prices for similar securities, interest rates, prepayment speeds, credit risk, etc.) |
| Ÿ | Level 3 — significant unobservable inputs (including the Funds’ own assumptions in determining the fair value of investments) |
A financial instrument’s level within the fair value hierarchy is based on the lowest level of any input, both individually and in the aggregate, that is significant to the fair value measurement. The inputs or methodology used for valuing securities are not necessarily an indication of the risk associated with investing in those securities.
The following tables represent each valuation input by sector as presented on the Schedules of Portfolio Investments (“SOIs”) (amounts in thousands):
Disciplined Equity Fund
Level 1 Quoted prices | Level 2 Other significant observable inputs | Level 3 Significant unobservable inputs | Total | |||||||||||||
Total Investments in Securities (a) | $ | 1,844,904 | $ | 2,125 | $ | — | $ | 1,847,029 | ||||||||
|
|
|
|
|
|
|
| |||||||||
Total Liabilities in Securities Sold Short (b) | $ | (601 | ) | $ | $ | — | $ | (601 | ) | |||||||
|
|
|
|
|
|
|
| |||||||||
Appreciation in Other Financial Instruments | ||||||||||||||||
Futures Contracts | $ | 48 | $ | — | $ | — | $ | 48 | ||||||||
|
|
|
|
|
|
|
| |||||||||
| JUNE 30, 2013 | J.P. MORGAN LARGE CAP FUNDS | 71 | ||||||
Table of Contents
NOTES TO FINANCIAL STATEMENTS
AS OF JUNE 30, 2013 (continued)
| Dynamic Growth Fund | ||||||||||||||||
Level 1 Quoted prices | Level 2 Other significant observable inputs | Level 3 Significant unobservable inputs | Total | |||||||||||||
Total Investments in Securities (b) | $ | 103,249 | $ | $ | — | $ | 103,249 | |||||||||
|
|
|
|
|
|
|
| |||||||||
| Equity Income Fund | ||||||||||||||||
Level 1 Quoted prices | Level 2 Other significant observable inputs | Level 3 Significant unobservable inputs | Total | |||||||||||||
Total Investments in Securities (b) | $ | 4,638,218 | $ | — | $ | — | $ | 4,638,218 | ||||||||
|
|
|
|
|
|
|
| |||||||||
| Growth and Income Fund | ||||||||||||||||
Level 1 Quoted prices | Level 2 Other significant observable inputs | Level 3 Significant unobservable inputs | Total | |||||||||||||
Total Investments in Securities (b) | $ | 399,007 | $ | — | $ | — | $ | 399,007 | ||||||||
|
|
|
|
|
|
|
| |||||||||
| Large Cap Growth Fund | ||||||||||||||||
Level 1 Quoted prices | Level 2 Other significant observable inputs | Level 3 Significant unobservable inputs | Total | |||||||||||||
Total Investments in Securities (b) | $ | 11,626,307 | $ | $ | — | $ | 11,626,307 | |||||||||
|
|
|
|
|
|
|
| |||||||||
| Large Cap Value Fund | ||||||||||||||||
Level 1 Quoted prices | Level 2 Other significant observable inputs | Level 3 Significant unobservable inputs | Total | |||||||||||||
Total Investments in Securities (b) | $ | 704,383 | $ | — | $ | $ | 704,383 | |||||||||
|
|
|
|
|
|
|
| |||||||||
Total Liabilities in Securities Sold Short (b) | $ | (289 | ) | $ | — | $ | $ | (289 | ) | |||||||
|
|
|
|
|
|
|
| |||||||||
| U.S. Equity Fund | ||||||||||||||||
Level 1 Quoted prices | Level 2 Other significant observable inputs | Level 3 Significant unobservable inputs | Total | |||||||||||||
Total Investments in Securities (b) | $ | 7,996,609 | $ | $ | — | $ | 7,996,609 | |||||||||
|
|
|
|
|
|
|
| |||||||||
Total Liabilities in Securities Sold Short (b) | $ | (3,295 | ) | $ | $ | — | $ | (3,295 | ) | |||||||
|
|
|
|
|
|
|
| |||||||||
Depreciation in Other Financial Instruments | ||||||||||||||||
Futures Contracts | $ | (448 | ) | $ | — | $ | — | $ | (448 | ) | ||||||
|
|
|
|
|
|
|
| |||||||||
| (a) | All portfolio holdings designated as Level 1 and Level 2 are disclosed individually on the SOIs. Level 2 consists of a U.S. Treasury Bill that is held for futures collateral. Please refer to the SOIs for industry specifics of portfolio holdings. |
| (b) | All portfolio holdings designated as Level 1 are disclosed individually on the SOIs. Please refer to the SOIs for industry specifics of portfolio holdings. |
There were no transfers between any levels during the year ended June 30, 2013.
B. Restricted and Illiquid Securities — Certain securities held by the Funds may be subject to legal or contractual restrictions on resale and/or are illiquid. Restricted securities generally are resold in transactions exempt from registration under the Securities Act of 1933 . An illiquid security is a security which cannot be disposed of promptly (within seven days) and in the usual course of business at approximately its fair value and includes, but is not limited to, repurchase agreements maturing in excess of seven days, time deposits with a withdrawal penalty, non-negotiable instruments and instruments for which no market exists. Disposal of these securities may involve time-consuming negotiations and expense. Prompt sale at the current valuation may be difficult and could adversely affect the net assets of the Funds. As of June 30, 2013, the Funds had no investments in restricted or illiquid securities.
| 72 | J.P. MORGAN LARGE CAP FUNDS | JUNE 30, 2013 | ||||
Table of Contents
C. Futures Contracts — The Disciplined Equity Fund and U.S. Equity Fund use index futures contracts to gain or reduce exposure to the stock market, maintain liquidity and minimize transaction costs. The Funds also buy futures contracts to immediately invest incoming cash in the market or sell futures in response to cash outflows, thereby simulating an invested position in the underlying index while maintaining a cash balance for liquidity. The use of futures contracts exposes the Funds to equity price risk.
Futures contracts provide for the delayed delivery of the underlying instrument at a fixed price or are settled for a cash amount based on the change in the value of the underlying instrument at a specific date in the future. Upon entering into a futures contract, the Funds are required to deposit with the broker, cash or securities in an amount equal to a certain percentage of the contract amount, which is referred to as the initial margin deposit. Subsequent payments, referred to as variation margin, are made or received by the Funds periodically and are based on changes in the market value of open futures contracts. Changes in the market value of open futures contracts are recorded as unrealized appreciation or depreciation on the Statements of Operations. Realized gains or losses, representing the difference between the value of the contract at the time it was opened and the value at the time it was closed, are reported on the Statements of Operations at the closing or expiration of the futures contract. Securities deposited as initial margin are designated in the SOIs and cash deposited is recorded on the Statements of Assets and Liabilities. A receivable from and/or a payable to brokers for the daily variation margin is also recorded on the Statements of Assets and Liabilities.
The Funds may be subject to the risk that the change in the value of the futures contract may not correlate perfectly with the underlying instrument. Use of long futures contracts subjects the Funds to risk of loss in excess of the amounts shown on the Statements of Assets and Liabilities, up to the notional amount of the futures contracts. Use of short futures contracts subjects the Funds to unlimited risk of loss. The Funds may enter into futures contracts only on exchanges or boards of trade. The exchange or board of trade acts as the counterparty to each futures transaction; therefore, the Funds’ credit risk is limited to failure of the exchange or board of trade. Under some circumstances, futures exchanges may establish daily limits on the amount that the price of a futures contract can vary from the previous day’s settlement price, which could effectively prevent liquidation of positions.
The table below discloses the volume of the Funds’ futures contracts activity during the year ended June 30, 2013 (amounts in thousands):
| Disciplined Equity Fund | U.S. Equity Fund | |||||||
Futures Contracts: | ||||||||
Average Notional Balance Long | $ | 22,195 | $ | 59,394 | ||||
Ending Notional Balance Long | 12,235 | 81,404 | ||||||
D. Security Transactions and Investment Income — Investment transactions are accounted for on the trade date (the date the order to buy or sell is executed). Securities gains and losses are calculated on a specifically identified cost basis. Interest income is determined on the basis of coupon interest accrued using the effective interest method which adjusts for amortization of premiums and accretion of discounts. Dividend income net of foreign taxes withheld, if any, are recorded on the ex-dividend date or when a Fund first learns of the dividend.
To the extent such information is publicly available, the Funds record distributions received in excess of income earned from underlying investments as a reduction of cost of investments and/or realized gain. Such amounts are based on estimates if actual amounts are not available and actual amounts of income, realized gain and return of capital may differ from the estimated amounts. The Funds adjust the estimated amounts of the components of distributions (and consequently their net investment income) as necessary once the issuers provide information about the actual composition of the distributions.
E. Allocation of Income and Expenses — Expenses directly attributable to a fund are charged directly to that fund, while the expenses attributable to more than one fund of the Trusts are allocated among the respective funds. In calculating the NAV of each class, investment income, realized and unrealized gains and losses and expenses, other than class specific expenses, are allocated daily to each class of shares based upon the proportion of net assets of each class at the beginning of each day.
F. Federal Income Taxes — Each Fund is treated as a separate taxable entity for Federal income tax purposes. Each Fund’s policy is to comply with the provisions of the Internal Revenue Code of 1986, as amended (the “Code”), applicable to regulated investment companies and to distribute to shareholders all of its distributable net investment income and net realized gain on investments. Accordingly, no provision for Federal income tax is necessary. Management has reviewed the Funds’ tax positions for all open tax years and has determined that as of June 30, 2013, no liability for income tax is required in the Funds’ financial statements for net unrecognized tax benefits. However, management’s conclusions may be subject to future review based on changes in, or the interpretation of, the accounting standards or tax laws and regulations. Each of the Fund’s Federal tax returns for the prior three fiscal years remain subject to examination by the Internal Revenue Service.
G. Foreign Taxes — The Funds may be subject to foreign taxes on income, gains on investments or currency purchases/repatriation, a portion of which may be recoverable. The Funds will accrue such taxes and recoveries as applicable, based upon their current interpretation of tax rules and regulations that exist in the markets in which they invest.
H. Distributions to Shareholders — Distributions from net investment income are generally declared and paid quarterly, except for the Dynamic Growth Fund, which are generally declared and paid annually, and the Equity Income Fund, which are generally declared and paid monthly. Distributions are declared separately for each class. No class has preferential dividend rights; differences in per share rates are due to differences in separate class expenses. Net realized capital gains, if any, are distributed by each Fund at least annually. The amount of distributions from net
| JUNE 30, 2013 | J.P. MORGAN LARGE CAP FUNDS | 73 | ||||||
Table of Contents
NOTES TO FINANCIAL STATEMENTS
AS OF JUNE 30, 2013 (continued)
investment income and net realized capital gains is determined in accordance with Federal income tax regulations, which may differ from GAAP. To the extent these “book/tax” differences are permanent in nature (i.e., that they result from other than timing of recognition — “temporary differences”), such amounts are reclassified within the capital accounts based on their Federal tax-basis treatment.
The following amounts were reclassified within the capital accounts (amounts in thousands):
| Paid-in-Capital | Accumulated Undistributed (Distributions in Net Investment Income | Accumulated Net Realized Gains (Losses) | ||||||||||
Disciplined Equity Fund | $ | — | (a) | $ | (247 | ) | $ | 247 | ||||
Dynamic Growth Fund | (53 | ) | 53 | — | (a) | |||||||
Equity Income Fund | — | (a) | 994 | (994 | ) | |||||||
Growth and Income Fund | (151 | ) | (28 | ) | 179 | |||||||
Large Cap Growth Fund | (1,374 | ) | (314 | ) | 1,688 | |||||||
Large Cap Value Fund | — | (a) | 5 | (5 | ) | |||||||
U.S. Equity Fund | — | (a) | (49 | ) | 49 | |||||||
| (a) | Amount rounds to less than $1,000. |
The reclassifications for the Funds relate primarily to non-taxable dividends (Disciplined Equity Fund, Equity Income Fund, Growth and Income Fund, Large Cap Growth Fund, Large Cap Value Fund and U.S. Equity Fund), taxable overdistributions (Growth and Income Fund and Large Cap Growth Fund), net operating losses (Dynamic Growth Fund), investments in real estate investment trusts (Disciplined Equity Fund, Growth and Income Fund, U.S. Equity Fund) and investments in partnerships (Equity Income Fund).
3. Fees and Other Transactions with Affiliates
A. Investment Advisory Fee — Pursuant to the Investment Advisory Agreements, JPMIM supervises the investments of each Fund and for such services is paid a fee. The fee is accrued daily and paid monthly based on each Fund’s respective average daily net assets. The annual rate for each Fund is as follows:
Disciplined Equity Fund | 0.25 | % | ||
Dynamic Growth Fund | 0.60 | |||
Equity Income Fund | 0.40 | |||
Growth and Income Fund | 0.40 | |||
Large Cap Growth Fund | 0.50 | |||
Large Cap Value Fund | 0.40 | |||
U.S. Equity Fund | 0.40 |
The Advisor waived Investment Advisory fees and/or reimbursed expenses as outlined in Note 3.F.
B. Administration Fee — Pursuant to an Administration Agreement, the Administrator provides certain administration services to the Funds. In consideration of these services, the Administrator receives a fee accrued daily and paid monthly at an annual rate of 0.15% of the first $25 billion of the average daily net assets of all funds in the J.P. Morgan Funds Complex (excluding certain funds of funds and money market funds) and 0.075% of the average daily net assets in excess of $25 billion of all such funds. For the year ended June 30, 2013, the annual effective rate of each Fund’s average daily net assets, notwithstanding any fee waivers and/or expense reimbursements, was as follows:
Disciplined Equity Fund | 0.09 | % | ||
Dynamic Growth Fund | 0.08 | |||
Equity Income Fund | 0.08 | |||
Growth and Income Fund | 0.09 | |||
Large Cap Growth Fund | 0.09 | |||
Large Cap Value Fund | 0.09 | |||
U.S. Equity Fund | 0.09 |
The Administrator waived Administration fees as outlined in Note 3.F.
JPMorgan Chase Bank, N.A. (“JPMCB”), a wholly-owned subsidiary of JPMorgan, serves as the Funds’ sub-administrator (the “Sub-administrator”). For its services as Sub-administrator, JPMCB receives a portion of the fees payable to the Administrator.
C. Distribution Fees — Pursuant to a Distribution Agreement, JPMorgan Distribution Services, Inc. (the “Distributor”), a wholly-owned subsidiary of JPMorgan, serves as the Trusts’ exclusive underwriter and promotes and arranges for the sale of each Fund’s shares.
| 74 | J.P. MORGAN LARGE CAP FUNDS | JUNE 30, 2013 | ||||
Table of Contents
The Board of Trustees has adopted a Distribution Plan (the “Distribution Plan”) for Class A, Class B, Class C and Class R2 Shares of the Funds in accordance with Rule 12b-1 under the 1940 Act. The Distribution Plan provides that each Fund shall pay distribution fees, including payments to the Distributor, at annual rates of the average daily net assets as shown in the table below:
| Class A | Class B | Class C | Class R2 | |||||||||||||
Disciplined Equity Fund | 0.25 | % | n/a | n/a | n/a | |||||||||||
Dynamic Growth Fund | 0.25 | n/a | 0.75 | % | n/a | |||||||||||
Equity Income Fund | 0.25 | 0.75 | % | 0.75 | 0.50 | % | ||||||||||
Growth and Income Fund | 0.25 | 0.75 | 0.75 | n/a | ||||||||||||
Large Cap Growth Fund | 0.25 | 0.75 | 0.75 | 0.50 | ||||||||||||
Large Cap Value Fund | 0.25 | 0.75 | 0.75 | 0.50 | ||||||||||||
U.S. Equity Fund | 0.25 | 0.75 | 0.75 | 0.50 | ||||||||||||
In addition, the Distributor is entitled to receive the front-end sales charges from purchases of Class A Shares and the CDSC from redemptions of Class B and Class C Shares and certain Class A Shares for which front-end sales charges have been waived. For the year ended June 30, 2013, the Distributor retained the following amounts (in thousands):
| Front-End Sales Charge | CDSC | |||||||
Disciplined Equity Fund | $ | 6 | $ | — | ||||
Equity Income Fund | 653 | 13 | ||||||
Growth and Income Fund | 41 | — | (a) | |||||
Large Cap Growth Fund | 344 | 30 | ||||||
Large Cap Value Fund | 11 | — | (a) | |||||
U.S. Equity Fund | 173 | 5 | ||||||
| (a) | Amount rounds to less than $1,000. |
D. Shareholder Servicing Fees — The Trusts, on behalf of the Funds, have entered into Shareholder Servicing Agreements with the Distributor under which the Distributor provides certain support services to the shareholders. The Class R6 Shares do not participate in the Shareholder Servicing Agreement. For performing these services, the Distributor receives a fee that is accrued daily and paid monthly equal to a percentage of the average daily net assets as shown in the table below:
| Class A | Class B | Class C | Class R2 | Class R5 | Institutional Class | Select Class | ||||||||||||||||||||||
Disciplined Equity Fund | 0.25 | % | n/a | n/a | n/a | n/a | 0.10 | % | 0.25 | % | ||||||||||||||||||
Dynamic Growth Fund | 0.25 | n/a | 0.25 | % | n/a | 0.05 | % | n/a | 0.25 | |||||||||||||||||||
Equity Income Fund | 0.25 | 0.25 | % | 0.25 | 0.25 | % | 0.05 | n/a | 0.25 | |||||||||||||||||||
Growth and Income Fund | 0.25 | 0.25 | 0.25 | n/a | n/a | n/a | 0.25 | |||||||||||||||||||||
Large Cap Growth Fund | 0.25 | 0.25 | 0.25 | 0.25 | 0.05 | n/a | 0.25 | |||||||||||||||||||||
Large Cap Value Fund | 0.25 | 0.25 | 0.25 | 0.25 | 0.05 | n/a | 0.25 | |||||||||||||||||||||
U.S. Equity Fund | 0.25 | 0.25 | 0.25 | 0.25 | 0.05 | 0.10 | 0.25 | |||||||||||||||||||||
The Distributor has entered into shareholder services contracts with affiliated and unaffiliated financial intermediaries who provide shareholder services and other related services to their clients or customers who invest in the Funds under which the Distributor will pay all or a portion of such fees earned to financial intermediaries for performing such services.
The Distributor waived Shareholder Servicing fees as outlined in Note 3.F.
E. Custodian and Accounting Fees — JPMCB provides portfolio custody and accounting services to the Funds. The amounts paid directly to JPMCB by the Funds for custody and accounting services are included in Custodian and accounting fees in the Statements of Operations. Payments to the custodian may be reduced by credits earned by each Fund, based on uninvested cash balances held by the custodian. Such earnings credits, if any, are presented separately in the Statements of Operations.
Interest expense, if any, paid to the custodian related to cash overdrafts is included in Interest expense to affiliates in the Statements of Operations.
F. Waivers and Reimbursements — The Advisor, Administrator and Distributor have contractually agreed to waive fees and/or reimburse the Funds to the extent that total annual operating expenses (excluding acquired fund fees and expenses, dividend expenses related to short sales, interest,
| JUNE 30, 2013 | J.P. MORGAN LARGE CAP FUNDS | 75 | ||||||
Table of Contents
NOTES TO FINANCIAL STATEMENTS
AS OF JUNE 30, 2013 (continued)
taxes, expenses related to litigation and potential litigation, extraordinary expenses and expenses related to the Board of Trustees’ deferred compensation plan) exceed the percentages of the Funds’ respective average daily net assets as shown in the table below:
| Class A | Class B | Class C | Class R2 | Class R5 | Class R6 | Institutional Class | Select Class | |||||||||||||||||||||||||
Disciplined Equity Fund | 0.85 | % | n/a | n/a | n/a | n/a | 0.35 | % | 0.45 | % | 0.60 | % | ||||||||||||||||||||
Dynamic Growth Fund | 1.25 | n/a | 1.75 | % | n/a | 0.80 | % | n/a | n/a | 1.00 | ||||||||||||||||||||||
Equity Income Fund | 1.04 | 1.54 | % | 1.54 | 1.29 | % | 0.59 | 0.54 | n/a | 0.79 | ||||||||||||||||||||||
Growth and Income Fund | 1.30 | 1.80 | 1.80 | n/a | n/a | n/a | n/a | 0.90 | ||||||||||||||||||||||||
Large Cap Growth Fund | 1.10 | 1.60 | 1.60 | 1.35 | 0.75 | 0.70 | n/a | 0.95 | ||||||||||||||||||||||||
Large Cap Value Fund | 0.95 | 1.45 | 1.45 | 1.20 | 0.60 | 0.55 | n/a | 0.80 | ||||||||||||||||||||||||
U.S. Equity Fund | 0.97 | 1.47 | 1.47 | 1.22 | 0.59 | 0.54 | 0.64 | 0.79 | ||||||||||||||||||||||||
The expense limitation agreements were in effect for the year ended June 30, 2013. The contractual expense limitation percentages in the table above are in place until at least October 31, 2013. In addition, the Funds’ service providers have voluntarily waived fees during the year ended June 30, 2013. However, the Funds’ service providers are under no obligation to do so and may discontinue such voluntary waivers at any time.
For the year ended June 30, 2013, the Funds’ service providers waived fees and/or reimbursed expenses for each of the Funds as follows (amounts in thousands). None of these parties expect the Funds to repay any such waived fees and reimbursed expenses in future years.
| Contractual Waivers | ||||||||||||||||
| Investment Advisory | Administration | Shareholder Servicing | Total | |||||||||||||
Disciplined Equity Fund | $ | — | $ | 300 | $ | — | $ | 300 | ||||||||
Dynamic Growth Fund | 29 | 26 | 23 | 78 | ||||||||||||
Equity Income Fund | 27 | 1,372 | — | 1,399 | ||||||||||||
Growth and Income Fund | — | — | 2 | 2 | ||||||||||||
Large Cap Growth Fund | 398 | 1,898 | 2,055 | 4,351 | ||||||||||||
Large Cap Value Fund | 7 | 33 | 32 | 72 | ||||||||||||
U.S. Equity Fund | 69 | 1,751 | 647 | 2,467 | ||||||||||||
| Voluntary Waivers | ||||||||||||
Investment Advisory | Shareholder Servicing | Total | ||||||||||
Equity Income Fund | $ | — | (a) | $ | 1 | $ | 1 | |||||
Large Cap Growth Fund | 27 | — | 27 | |||||||||
Large Cap Value Fund | — | (a) | 15 | 15 | ||||||||
U.S. Equity Fund | 1 | — | (a) | 1 | ||||||||
| (a) | Amount rounds to less than $1,000. |
Additionally, the Funds may invest in one or more money market funds advised by the Advisor or its affiliates. The Advisor, Administrator and Distributor, as shareholder servicing agent, waive fees in an amount sufficient to offset the respective fees each charges to the affiliated money market fund on the Funds’ investment in such affiliated money market fund. A portion of the waiver is voluntary.
The amount of waivers resulting from investments in these money market funds for the year ended June 30, 2013 was as follows (amounts in thousands):
Disciplined Equity Fund | $ | 50 | ||
Dynamic Growth Fund | 1 | |||
Equity Income Fund | 135 | |||
Growth and Income Fund | 12 | |||
Large Cap Growth Fund | 676 | |||
Large Cap Value Fund | 13 | |||
U.S. Equity Fund | 218 |
G. Other — Certain officers of the Trusts are affiliated with the Advisor, the Administrator and the Distributor. Such officers, with the exception of the Chief Compliance Officer, receive no compensation from the Funds for serving in their respective roles.
The Board of Trustees appointed a Chief Compliance Officer to the Funds in accordance with Federal securities regulations. Each Fund, along with other affiliated funds, makes reimbursement payments, on a pro-rata basis, to the Administrator for a portion of the fees associated with the Office of the Chief Compliance Officer. Such fees are included in Trustees’ and Chief Compliance Officer’s fees on the Statements of Operations.
| 76 | J.P. MORGAN LARGE CAP FUNDS | JUNE 30, 2013 | ||||
Table of Contents
The Trusts adopted a Trustee Deferred Compensation Plan (the “Plan”) which allows the Independent Trustees to defer the receipt of all or a portion of compensation related to performance of their duties as Trustees. The deferred fees are invested in various J.P. Morgan Funds until distribution in accordance with the Plan.
During the year ended June 30, 2013, the Funds may have purchased securities from an underwriting syndicate in which the principal underwriter or members of the syndicate are affiliated with the Advisor.
The Funds may use related party broker-dealers. For the year ended June 30, 2013, the Funds did not incur any brokerage commissions with broker-dealers affiliated with the Advisor.
The Securities and Exchange Commission (“SEC”) has granted an exemptive order permitting the Funds to engage in principal transactions with J.P. Morgan Securities, Inc., an affiliated broker, involving taxable money market instruments, subject to certain conditions.
4. Investment Transactions
During the year ended June 30, 2013, purchases and sales of investments (excluding short-term investments) were as follows (amounts in thousands):
| Purchases (excluding U.S. Government) | Sales (excluding U.S. Government) | |||||||
Disciplined Equity Fund | $ | 2,875,011 | $ | 2,534,680 | ||||
Dynamic Growth Fund | 100,873 | 46,127 | ||||||
Equity Income Fund | 2,801,730 | 1,058,495 | ||||||
Growth and Income Fund | 126,440 | 118,223 | ||||||
Large Cap Growth Fund | 8,258,280 | 4,436,126 | ||||||
Large Cap Value Fund | 750,288 | 838,946 | ||||||
U.S. Equity Fund | 6,404,582 | 6,246,850 | ||||||
During the year ended June 30, 2013, there were no purchases or sales of U.S. Government securities.
5. Federal Income Tax Matters
For Federal income tax purposes, the cost and unrealized appreciation (depreciation) in value of investment securities held at June 30, 2013 were as follows (amounts in thousands):
| Aggregate Cost | Gross Unrealized Appreciation | Gross Unrealized Depreciation | Net Unrealized Appreciation (Depreciation) | |||||||||||||
Disciplined Equity Fund | $ | 1,625,176 | $ | 231,987 | $ | 10,134 | $ | 221,853 | ||||||||
Dynamic Growth Fund | 89,586 | 14,234 | 571 | 13,663 | ||||||||||||
Equity Income Fund | 3,964,438 | 688,890 | 15,110 | 673,780 | ||||||||||||
Growth and Income Fund | 269,634 | 129,655 | 282 | 129,373 | ||||||||||||
Large Cap Growth Fund | 9,951,885 | 1,775,614 | 101,192 | 1,674,422 | ||||||||||||
Large Cap Value Fund | 593,228 | 115,356 | 4,201 | 111,155 | ||||||||||||
U.S. Equity Fund | 6,254,789 | 1,761,488 | 19,668 | 1,741,820 | ||||||||||||
The difference between book and tax basis appreciation (depreciation) on investments is primarily attributed to investments in partnerships (Growth and Income Fund), non-taxable dividends (Disciplined Equity Fund, Large Cap Growth Fund and U.S. Equity Fund) and wash sale loss deferrals.
The tax character of distributions paid during the fiscal year ended June 30, 2013 was as follows (amounts in thousands):
| Ordinary Income | Net Long Term Capital Gains | Total Distributions Paid | ||||||||||
Disciplined Equity Fund | $ | 46,178 | $ | 22,341 | $ | 68,519 | ||||||
Equity Income Fund | 77,626 | 15,618 | 93,244 | |||||||||
Growth and Income Fund | 4,338 | — | 4,338 | |||||||||
Large Cap Growth Fund | 48,189 | — | 48,189 | |||||||||
Large Cap Value Fund | 8,143 | — | 8,143 | |||||||||
U.S. Equity Fund | 129,252 | 107,066 | 236,318 | |||||||||
| JUNE 30, 2013 | J.P. MORGAN LARGE CAP FUNDS | 77 | ||||||
Table of Contents
NOTES TO FINANCIAL STATEMENTS
AS OF JUNE 30, 2013 (continued)
The tax character of distributions paid during the fiscal year ended June 30, 2012 was as follows (amounts in thousands):
Ordinary Income | Net Long Term Capital Gains | Total Distributions Paid | ||||||||||
Disciplined Equity Fund | $ | 14,185 | $ | — | $ | 14,185 | ||||||
Equity Income Fund | 28,620 | 4,821 | 33,441 | |||||||||
Growth and Income Fund | 3,661 | — | 3,661 | |||||||||
Large Cap Growth Fund | 691 | — | 691 | |||||||||
Large Cap Value Fund | 7,480 | — | 7,480 | |||||||||
U.S. Equity Fund | 59,378 | 28,637 | 88,015 | |||||||||
As of June 30, 2013, the components of net assets (excluding paid-in-capital) on a tax basis were as follows (amounts in thousands):
Current Distributable Ordinary Income | Current Distributable Long-Term Capital Gain or (Tax Basis Capital Loss Carryover) | Unrealized Appreciation (Depreciation) | ||||||||||
Disciplined Equity Fund | $ | 78,716 | $ | 34,292 | $ | 221,820 | ||||||
Dynamic Growth Fund | — | (2,816 | ) | 13,663 | ||||||||
Equity Income Fund | 21,483 | 51,016 | 673,780 | |||||||||
Growth and Income Fund | — | (52,829 | ) | 129,373 | ||||||||
Large Cap Growth Fund | — | (273,783 | ) | 1,674,422 | ||||||||
Large Cap Value Fund | 1,973 | (2,302 | ) | 111,141 | ||||||||
U.S. Equity Fund | 173,494 | 222,532 | 1,741,642 | |||||||||
For the Funds, the cumulative timing differences primarily consist of investments in partnerships (Growth and Income Fund), Post-October loss deferral (Dynamic Growth Fund and Large Cap Growth Fund), late-year ordinary loss deferral (Dynamic Growth Fund and Large Cap Growth Fund), distributions payable (Disciplined Equity Fund, Equity Income Fund, Growth and Income Fund, Large Cap Value Fund and U.S. Equity Fund), mark to market of futures contracts (Disciplined Equity Fund and U.S. Equity Fund), non-taxable dividends (Disciplined Equity Fund, Large Cap Growth and U.S Equity Fund), trustee deferred compensation and wash sale loss deferrals.
Under the Regulated Investment Company Modernization Act of 2010 (the “Act”), net capital losses recognized by the Funds after June 30, 2011 are carried forward indefinitely, and retain their character as short-term and/or long-term losses. Prior to the Act, net capital losses incurred by the Funds were carried forward for eight years and treated as short-term losses. The Act requires that post-enactment net capital losses be used before pre-enactment net capital losses.
At June 30, 2013, the Funds had post-enactment net capital loss carryforwards (amounts in thousands):
| Capital Loss Carryforward Character | ||||||||
| Short-Term | Long-Term | |||||||
Dynamic Growth Fund | $ | 1,907 | $ | — | ||||
Large Cap Growth Fund | 224,612 | — | ||||||
At June 30, 2013, the Funds had the pre-enactment net capital loss carryforwards, expiring during the year indicated, which are available to offset future realized gains (amounts in thousands):
| 2017 | 2018 | 2019 | Total | |||||||||||||
Dynamic Growth Fund | $ | 473 | $ | 436 | $ | — | (a) | 909 | ||||||||
Growth and Income Fund | — | 52,829 | — | 52,829 | ||||||||||||
Large Cap Growth Fund | — | 49,171 | — | 49,171 | ||||||||||||
Large Cap Value Fund | — | 2,302 | — | 2,302 | ||||||||||||
| (a) | Amount rounds to less than $1,000. |
During the year ended June 30, 2013, the Funds utilized capital loss carryforwards as follows (amounts in thousands):
Dynamic Growth Fund | $ | 42 | ||
Growth and Income Fund | 28,898 | |||
Large Cap Growth Fund | 3,626 | |||
Large Cap Value Fund | 93,396 |
| 78 | J.P. MORGAN LARGE CAP FUNDS | JUNE 30, 2013 | ||||
Table of Contents
Net capital losses and currency losses incurred after October 31, and within the taxable year are deemed to arise on the first business day of the Funds’ next taxable year. For the year ended June 30, 2013, the Funds deferred to July 1, 2013 post-October capital losses of (amounts in thousands):
| Late Year Ordinary Loss Deferral | Short-Term | Long-Term | ||||||||||
Dynamic Growth Fund | $ | 159 | $ | 384 | $ | — | ||||||
Large Cap Growth Fund | 4,867 | 219,502 | — | |||||||||
6. Borrowings
The Funds rely upon an exemptive order granted by the SEC (the “Order”) permitting the establishment and operation of an Interfund Lending Facility (the “Facility”). The Facility allows the Funds to directly lend and borrow money to or from any other fund relying upon the Order at rates beneficial to both the borrowing and lending funds. Advances under the Facility are taken primarily for temporary or emergency purposes, including the meeting of redemption requests that otherwise might require the untimely disposition of securities, and are subject to each Fund’s borrowing restrictions. The Interfund loan rate is determined, as specified in the Order, by averaging the current repurchase agreement rate and the current bank loan rate. The Order was granted to JPM II and may be relied upon by the Funds because they are investment companies in the same “group of investment companies” (as defined in Section 12(d)(1)(G) of the 1940 Act).
In addition, the Trusts and JPMCB have entered into a financing arrangement. Under this arrangement, JPMCB provides an unsecured, uncommitted credit facility in the aggregate amount of $100 million to certain of the J.P. Morgan Funds, including the Funds. Advances under the arrangement are taken primarily for temporary or emergency purposes, including the meeting of redemption requests that otherwise might require the untimely disposition of securities, and are subject to each Fund’s borrowing restrictions. Interest on borrowings is payable at a rate determined by JPMCB at the time of borrowing. This agreement has been extended until November 11, 2013.
The Funds had no borrowings outstanding from another fund or from the unsecured, uncommitted credit facility at June 30, 2013 or at any time during the year then ended.
Interest expense paid, if any, as a result of borrowings from another fund or from the unsecured, uncommitted credit facility is included in Interest expense to affiliates in the Statements of Operations.
7. Risks, Concentrations and Indemnifications
In the normal course of business, the Funds enter into contracts that contain a variety of representations which provide general indemnifications. Each Fund’s maximum exposure under these arrangements is unknown. The amount of exposure would depend on future claims that may be made against each Fund that have not yet occurred. However, based on experience, the Funds expect the risk of loss to be remote.
One or more affiliates of the Advisor have investment discretion with respect to their clients’ holdings in the Funds, which collectively represent a significant portion of the Fund’s assets for each of the Disciplined Equity Fund, Dynamic Growth Fund, Equity Income Fund and Large Cap Value Fund.
In addition, the J.P. Morgan Investor Funds and JPMorgan SmartRetirement Funds, which are affiliated funds of funds, own in the aggregate more than 10% of the net assets of the Funds as follows:
| J.P. Morgan Investor Funds | JPMorgan SmartRetirement Funds | |||||||
Disciplined Equity Fund | n/a | 71.5 | % | |||||
Dynamic Growth Fund | 88.1 | % | n/a | |||||
Large Cap Value Fund | 83.8 | n/a | ||||||
U.S. Equity Fund | 14.3 | n/a | ||||||
Additionally, Growth and Income Fund and U.S. Equity Fund have a shareholder, which is an account maintained by a financial intermediary on behalf of its clients, that owns a significant portion of the Funds’ outstanding shares.
Significant shareholder transactions by these shareholders, if any, may impact the Funds’ performance.
| JUNE 30, 2013 | J.P. MORGAN LARGE CAP FUNDS | 79 | ||||||
Table of Contents
REPORT OF INDEPENDENT REGISTERED PUBLIC ACCOUNTING FIRM
To the Board of Trustees of JPMorgan Trust I and JPMorgan Trust II and the Shareholders of JPMorgan Disciplined Equity Fund, JPMorgan Dynamic Growth Fund, JPMorgan Equity Income Fund, JPMorgan Growth and Income Fund, JPMorgan Large Cap Growth Fund, JPMorgan Large Cap Value Fund and JPMorgan U.S. Equity Fund:
In our opinion, the accompanying statements of assets and liabilities, including the schedules of portfolio investments, and the related statements of operations and of changes in net assets and the financial highlights present fairly, in all material respects, the financial position of JPMorgan Disciplined Equity Fund, JPMorgan Dynamic Growth Fund, JPMorgan Growth and Income Fund and JPMorgan U.S. Equity Fund (each a separate fund of JPMorgan Trust I) and JPMorgan Equity Income Fund, JPMorgan Large Cap Growth Fund and JPMorgan Large Cap Value Fund (each a separate fund of JPMorgan Trust II) (hereafter collectively referred to as the “Funds”) at June 30, 2013, the results of each of their operations for the year then ended, the changes in each of their net assets for each of the two years in the period then ended and the financial highlights for each of the five years in the period then ended, in conformity with accounting principles generally accepted in the United States of America. These financial statements and financial highlights (hereafter referred to as “financial statements”) are the responsibility of the Funds’ management. Our responsibility is to express an opinion on these financial statements based on our audits. We conducted our audits of these financial statements in accordance with the standards of the Public Company Accounting Oversight Board (United States). Those standards require that we plan and perform the audit to obtain reasonable assurance about whether the financial statements are free of material misstatement. An audit includes examining, on a test basis, evidence supporting the amounts and disclosures in the financial statements, assessing the accounting principles used and significant estimates made by management, and evaluating the overall financial statement presentation. We believe that our audits, which included confirmation of securities at June 30, 2013 by correspondence with the custodian and brokers, provide a reasonable basis for our opinion.
PricewaterhouseCoopers LLP
New York, New York
August 28, 2013
| 80 | J.P. MORGAN LARGE CAP FUNDS | JUNE 30, 2013 | ||||
Table of Contents
(Unaudited)
The Funds’ Statement of Additional Information includes additional information about the Funds’ Trustees and is available, without charge, upon request by calling 1-800-480-4111 or on the J.P. Morgan Funds’ website at www.jpmorganfunds.com.
Name (Year of Birth); Positions With the Funds (1) | Principal Occupations During Past 5 Years | Number of Portfolios in Fund Complex Overseen by Trustee (2) | Other Directorships Held Outside Fund Complex During Past 5 Years | |||
Independent Trustees | ||||||
| John F. Finn (1947); Trustee of Trusts since 2005; Trustee of heritage One Group Mutual Funds since 1998. | Chairman (1985-present), President and Chief Executive Officer, Gardner, Inc. (supply chain management company serving industrial and consumer markets) (1974-present). | 172 | Director, Cardinal Health, Inc. (CAH) (1994-present); Director, Greif, Inc. (GEF) (industrial package products and services) (2007-present). | |||
| Dr. Matthew Goldstein (1941); Chairman since 2013; Trustee of Trusts since 2005; Trustee of heritage J.P. Morgan Funds since 2003. | Professor, City University of New York (effective 7/1/13); Chancellor, City University of New York (1999-2013); President, Adelphi University (New York) (1998-1999). | 172 | Director, Bronx-Lebanon Hospital Center; Director, United Way of New York City (2002-present); Trustee, Museum of Jewish Heritage (2011-present). | |||
| Robert J. Higgins (1945); Trustee of Trusts since 2005; Trustee of heritage J.P. Morgan Funds since 2002. | Retired; Director of Administration of the State of Rhode Island (2003-2004); President — Consumer Banking and Investment Services, Fleet Boston Financial (1971-2001). | 172 | None | |||
| Peter C. Marshall (1942); Trustee of Trusts since 2005; Trustee of heritage One Group Mutual Funds since 1985. | Self-employed business consultant (2002-present). | 172 | Director, Center for Communication, Hearing and Deafness (1990-present). | |||
| Mary E. Martinez (1960); Trustee of Trusts since 2013. | Associate, Special Properties, a Christie’s International Real Estate Affiliate (2010-Present); Managing Director, Bank of America (Asset Management) (2007-2008); Chief Operating Officer, U.S. Trust Asset Management; U.S. Trust Company (asset management) (2003-2007); President, Excelsior Funds (registered investment companies) (2004-2005). | 172 | Member, New York City Center Advisory Council (oversees public performing arts facilities) (2006-present). | |||
| Marilyn McCoy* (1948); Trustee of Trusts since 2005; Trustee of heritage One Group Mutual Funds since 1999. | Vice President of Administration and Planning, Northwestern University (1985-present). | 172 | Trustee, Carleton College (2003-present). | |||
| Mitchell M. Merin (1953); Trustee of Trusts since 2013. | Retired (2005-Present); President and Chief Operating Officer, Morgan Stanley Investment Management, Member Morgan Stanley & Co. Management Committee (registered investment adviser) (1998-2005). | 172 | Director, Sun Life Financial (SLF) (2007 to Present) (financial services and insurance); Trustee, Trinity College, Hartford, CT (2002-2010). | |||
| William G. Morton, Jr. (1937); Trustee of Trusts since 2005; Trustee of heritage J.P. Morgan Funds since 2003. | Retired; Chairman Emeritus (2001-2002), and Chairman and Chief Executive Officer, Boston Stock Exchange (1985-2001). | 172 | Director, Radio Shack Corp. (1987-2008); Trustee, Stratton Mountain School (2001-present). | |||
| Dr. Robert A. Oden, Jr. (1946); Trustee of Trusts since 2005; Trustee of heritage One Group Mutual Funds since 1997. | Retired; President, Carleton College (2002-2010); President, Kenyon College (1995-2002). | 172 | Trustee, American University in Cairo (1999-present); Chairman, Dartmouth-Hitchcock Medical Center (2013-present); Trustee, Dartmouth-Hitchcock Medical Center (2011-present); Trustee, American Schools of Oriental Research (2011-present); Trustee, Carleton College (2002-2010). | |||
| JUNE 30, 2013 | J.P. MORGAN LARGE CAP FUNDS | 81 | ||||||
Table of Contents
TRUSTEES
(Unaudited) (continued)
Name (Year of Birth); Positions With the Funds (1) | Principal Occupations During Past 5 Years | Number of Complex Overseen by Trustee (2) | Other Directorships Held Outside Fund Complex During Past 5 Years | |||
Independent Trustees (continued) | ||||||
| Marian U. Pardo** (1946); Trustee of Trusts since 2013. | Managing Director and Founder, Virtual Capital Management LLC (Investment Consulting) (2007-present); Managing Director, Credit Suisse Asset Management (portfolio manager) (2003-2006). | 172 | Member, Board of Governors, Columbus Citizens Foundation (not-for-profit supporting philanthropic and cultural programs) (2006-present). | |||
| Frederick W. Ruebeck (1939); Trustee of Trusts since 2005; Trustee of heritage One Group Mutual Funds since 1994. | Consultant (2000-present); Advisor, JP Greene & Associates, LLC (broker-dealer) (2000-2009); Chief Investment Officer, Wabash College (2004-present); Director of Investments, Eli Lilly and Company (pharmaceuticals) (1988-1999). | 172 | Trustee, Wabash College (1988-present); Chairman, Indianapolis Symphony Orchestra Foundation (1994-present). | |||
| James J. Schonbachler (1943); Trustee of Trusts since 2005; Trustee of heritage J.P. Morgan Funds since 2001. | Retired; Managing Director of Bankers Trust Company (financial services) (1968-1998). | 172 | None | |||
Interested Trustee Not Affiliated With the Adviser | ||||||
| Frankie D. Hughes*** (1952), Trustee of Trusts since 2008. | President and Chief Investment Officer, Hughes Capital Management, Inc. (fixed income asset management) (1993-present). | 172 | Trustee, The Victory Portfolios (2000-2008). | |||
| (1) | The Trustees serve for an indefinite term, subject to the Trusts’ current retirement policy, which is age 75 for all Trustees, except that the Board has determined Mr. Morton should continue to serve until December 31, 2014. In order to fill the vacancies created by the retirement of the Fergus Reid, III, William J. Armstrong, and Leonard J. Spalding Jr., effective December 31, 2012, the Board appointed Ms. Martinez and Mr. Merin to serve as Trustees effective January 1, 2013 and Ms. Pardo to serve as Trustee effective February 1, 2013. |
| (2) | A Fund Complex means two or more registered investment companies that hold themselves out to investors as related companies for purposes of investment and investor services or have a common investment advisor or have an investment advisor that is an affiliated person of the investment advisor of any of the other registered investment companies. The J.P. Morgan Funds Complex for which the Board of Trustees serves currently includes eleven registered investment companies (172 funds), including JPMorgan Mutual Fund Group which liquidated November 29, 2012 and is in the process of winding up its affairs. |
| * | Ms. McCoy has served as Vice President of Administration and Planning for Northwestern University since 1985. William M. Daley was the Head of Corporate Responsibility for JPMorgan Chase & Co. prior to January 2011 and served as a member of the Board of Trustees of Northwestern University from 2005 through 2010. JPMIM, the Funds’ investment advisor, is a wholly-owned subsidiary of JPMorgan Chase & Co. Five other members of the Board of Trustees of Northwestern University are executive officers of registered investment advisors (not affiliated with JPMorgan) that are under common control with subadvisors to certain J.P. Morgan Funds. |
| ** | In connection with prior employment with JPMorgan Chase, Ms. Pardo is the recipient of non-qualified pension plan payments from JPMorgan Chase in the amount of approximately $2,055 per month, which she irrevocably waived effective January 1, 2013, and deferred compensation payments from JPMorgan Chase in the amount of approximately $7,294 per year, which ended in January 2013. In addition, Ms. Pardo receives payments from a fully funded qualified plan, which is not an obligation of JPMorgan Chase. |
| *** | Ms. Hughes is treated as an “interested person” based on the portfolio holdings of clients of Hughes Capital Management, Inc. |
The contact address for each of the Trustees is 270 Park Avenue, New York, NY 10017.
| 82 | J.P. MORGAN LARGE CAP FUNDS | JUNE 30, 2013 | ||||
Table of Contents
(Unaudited)
Name (Year of Birth), Positions Held with the Trusts (Since) | Principal Occupations During Past 5 Years | |
| Patricia A. Maleski (1960), President and Principal Executive Officer (2010) | Managing Director, J.P. Morgan Investment Management Inc. and Chief Administrative Officer, J.P. Morgan Funds and Institutional Pooled Vehicles since 2010; previously, Treasurer and Principal Financial Officer of the Trusts from 2008 to 2010; previously, Head of Funds Administration and Board Liaison, J.P. Morgan Funds prior to 2010. Ms. Maleski has been with JPMorgan Chase & Co. since 2001. | |
| Joy C. Dowd (1972), Treasurer and Principal Financial Officer (2010) | Assistant Treasurer of the Trusts from 2009 to 2010; Executive Director, JPMorgan Funds Management, Inc. from February 2011; Vice President, JPMorgan Funds Management, Inc. from December 2008 to February 2011; prior to joining JPMorgan Chase, Ms. Dowd worked in MetLife’s investments audit group from 2005 through 2008. | |
| Frank J. Nasta (1964), Secretary (2008) | Managing Director and Associate General Counsel, JPMorgan Chase since 2008; Previously, Director, Managing Director, General Counsel and Corporate Secretary, J. & W. Seligman & Co. Incorporated; Secretary of each of the investment companies of the Seligman Group of Funds and Seligman Data Corp.; Director and Corporate Secretary, Seligman Advisors, Inc. and Seligman Services, Inc. | |
| Stephen M. Ungerman (1953), Chief Compliance Officer (2005) | Managing Director, JPMorgan Chase & Co.; Mr. Ungerman has been with JPMorgan Chase & Co. since 2000. | |
| Kathryn A. Jackson (1962), AML Compliance Officer (2012)* | Vice President and AML Compliance Manager for JPMorgan Asset Management Compliance since 2011; Senior On-Boarding Specialist for JPMorgan Distribution Services, Inc. in Global Liquidity from 2008 to 2011; prior to joining JPMorgan, Ms. Jackson was a Financial Services Analyst responsible for on-boarding, compliance and training with Nationwide Securities LLC and 1717 Capital Management Company, both registered broker-dealers, from 2005 until 2008. | |
Elizabeth A. Davin (1964), Assistant Secretary (2005)** | Executive Director and Assistant General Counsel, JPMorgan Chase since February 2012; formerly Vice President and Assistant General Counsel, JPMorgan Chase from 2005 until February 2012; Senior Counsel, JPMorgan Chase (formerly Bank One Corporation) from 2004 to 2005. | |
| Jessica K. Ditullio (1962), Assistant Secretary (2005)** | Executive Director and Assistant General Counsel, JPMorgan Chase since February 2011; Ms. Ditullio has served as an attorney with various titles for JPMorgan Chase (formerly Bank One Corporation) since 1990. | |
| John T. Fitzgerald (1975), Assistant Secretary (2008) | Executive Director and Assistant General Counsel, JPMorgan chase since February 2011; formerly, Vice President and Assistant General Counsel, JPMorgan Chase from 2005 until February 2011. | |
| Carmine Lekstutis (1980), Assistant Secretary (2011) | Vice President and Assistant General Counsel, JPMorgan Chase since 2011; Associate, Skadden, Arps, Slate, Meagher & Flom LLP (law firm) from 2006 to 2011. | |
| Gregory S. Samuels (1980), Assistant Secretary (2010) | Vice President and Assistant General Counsel, JPMorgan Chase since 2010; Associate, Ropes & Gray (law firm) from 2008 to 2010; Associate, Clifford Chance LLP (law firm) from 2005 to 2008. | |
| Pamela L. Woodley (1971), Assistant Secretary (2012) | Vice President and Assistant General Counsel, JPMorgan Chase since November 2004. | |
Michael M. D’Ambrosio (1969), Assistant Treasurer (2012) | Executive Director, JPMorgan Funds Management, Inc. from July 2012; prior to joining JPMorgan Chase, Mr. D’Ambrosio was a Tax Director at PricewaterhouseCoopers LLP since 2006. | |
| Joseph Parascondola (1963), Assistant Treasurer (2011) | Vice President, JPMorgan Funds Management, Inc. since August 2006. | |
| Matthew J. Plastina (1970), Assistant Treasurer (2011) | Vice President, JPMorgan Funds Management, Inc. since August 2010; prior to August 2010, Vice President and Controller, Legg Mason Global Asset Management. | |
Julie A. Roach (1971), Assistant Treasurer (2012)** | Vice President, JPMorgan Funds Management, Inc. from August 2012; prior to joining JPMorgan Chase, Ms. Roach was a Senior Manager with Deloitte since 2001. | |
Gillian I. Sands (1969), Assistant Treasurer (2012) | Vice President, JPMorgan Funds Management, Inc. from September 2012; Assistant Treasurer, Wells Fargo Funds Management (2007-2009). | |
Timothy J. Stewart (1974), Assistant Treasurer (2012)*** | Executive Director, JPMorgan Funds Management, Inc. from July 2012; Managing Director of Robeco Investment Management, Inc. (2011-2012); Chief Financial Officer (2008-2011) and Director of Operations (2003-2008), Robeco-Sage, a division of Robeco Investment Management, Inc. | |
The contact address for each of the officers, unless otherwise noted, is 270 Park Avenue, New York, NY 10017.
| * | The contact address for the officer is 500 Stanton Christiana Road, Ops 1, Floor 02, Newark, DE 19173-2107. |
| ** | The contact address for the officer is 460 Polaris Parkway, Westerville, OH 43082. |
| *** | Mr. Stewart is the Assistant Treasurer of JPMorgan Trust I only. |
| JUNE 30, 2013 | J.P. MORGAN LARGE CAP FUNDS | 83 | ||||||
Table of Contents
SCHEDULE OF SHAREHOLDER EXPENSES
(Unaudited)
Hypothetical $1,000 Investment
As a shareholder of the Funds, you incur two types of costs: (1) transaction costs, including sales charges (loads) on purchase payments and redemption fees and (2) ongoing costs, including investment advisory fees, administration fees, distribution fees and other Fund expenses. The examples below are intended to help you understand your ongoing costs (in dollars) of investing in the Funds and to compare these ongoing costs with the ongoing costs of investing in other mutual funds. The examples assume that you had a $1,000 investment in each Class at the beginning of the reporting period, January 1, 2013 and continued to hold your shares at the end of the reporting period, June 30, 2013.
Actual Expenses
For each Class of each Fund in the table below, the first line provides information about actual account values and actual expenses. You may use the information in this line, together with the amount you invested, to estimate the expenses that you paid over the period. Simply divide your account value by $1,000 (for example, an $8,600 account value divided by $1,000 = 8.6), then multiply the result by the number in the first line of each Class under the heading entitled “Expenses Paid During the Period” to estimate the expenses you paid on your account during this period.
Hypothetical Example for Comparison Purposes
The second line of each Class in the table below provides information about hypothetical account values and hypothetical expenses based on the Class’ actual expense ratio and an assumed rate of return of 5% per year before expenses, which is not the Class’ actual return. The hypothetical account values and expenses may not be used to estimate the actual ending account balance or expenses you paid for the period. You may use this information to compare the ongoing costs of investing in the Class of the Fund and other funds. To do so, compare this 5% hypothetical example with the 5% hypothetical examples that appear in the shareholder reports of the other funds. Please note that the expenses shown in the table are meant to highlight your ongoing costs only and do not reflect any transaction costs, such as sales charges (loads) or redemption fees. Therefore, the second line for each Class in the table is useful in comparing ongoing costs only, and will not help you determine the relative total costs of owning different funds. In addition, if these transaction costs were included, your costs would have been higher. The examples also assume all dividends and distributions have been reinvested.
| Beginning Account Value, January 1, 2013 | Ending Account Value June 30, 2013 | Expenses Paid During the Period* | Annualized Expense Ratio | |||||||||||||
Disciplined Equity Fund | ||||||||||||||||
Class A | ||||||||||||||||
Actual | $ | 1,000.00 | $ | 1,148.70 | $ | 4.53 | 0.85 | % | ||||||||
Hypothetical | 1,000.00 | 1,020.58 | 4.26 | 0.85 | ||||||||||||
Class R6 | ||||||||||||||||
Actual | 1,000.00 | 1,151.40 | 1.87 | 0.35 | ||||||||||||
Hypothetical | 1,000.00 | 1,023.06 | 1.76 | 0.35 | ||||||||||||
Institutional Class | ||||||||||||||||
Actual | 1,000.00 | 1,150.80 | 2.40 | 0.45 | ||||||||||||
Hypothetical | 1,000.00 | 1,022.56 | 2.26 | 0.45 | ||||||||||||
Select Class | ||||||||||||||||
Actual | 1,000.00 | 1,150.40 | 3.20 | 0.60 | ||||||||||||
Hypothetical | 1,000.00 | 1,021.82 | 3.01 | 0.60 | ||||||||||||
Dynamic Growth Fund | ||||||||||||||||
Class A | ||||||||||||||||
Actual | 1,000.00 | 1,136.90 | 6.62 | 1.25 | ||||||||||||
Hypothetical | 1,000.00 | 1,018.60 | 6.26 | 1.25 | ||||||||||||
Class C | ||||||||||||||||
Actual | 1,000.00 | 1,134.20 | 9.26 | 1.75 | ||||||||||||
Hypothetical | 1,000.00 | 1,016.12 | 8.75 | 1.75 | ||||||||||||
Class R2 | ||||||||||||||||
Actual | 1,000.00 | 1,139.70 | 4.24 | 0.80 | ||||||||||||
Hypothetical | 1,000.00 | 1,020.83 | 4.01 | 0.80 | ||||||||||||
Select Class | ||||||||||||||||
Actual | 1,000.00 | 1,138.10 | 5.30 | 1.00 | ||||||||||||
Hypothetical | 1,000.00 | 1,019.84 | 5.01 | 1.00 | ||||||||||||
| 84 | J.P. MORGAN LARGE CAP FUNDS | JUNE 30, 2013 | ||||
Table of Contents
| Beginning Account Value, January 1, 2013 | Ending Account Value June 30, 2013 | Expenses Paid During the Period* | Annualized Expense Ratio | |||||||||||||
Equity Income Fund | ||||||||||||||||
Class A | ||||||||||||||||
Actual | $ | 1,000.00 | $ | 1,153.90 | $ | 5.50 | 1.03 | % | ||||||||
Hypothetical | 1,000.00 | 1,019.69 | 5.16 | 1.03 | ||||||||||||
Class B | ||||||||||||||||
Actual | 1,000.00 | 1,151.40 | 8.16 | 1.53 | ||||||||||||
Hypothetical | 1,000.00 | 1,017.21 | 7.65 | 1.53 | ||||||||||||
Class C | ||||||||||||||||
Actual | 1,000.00 | 1,151.40 | 8.16 | 1.53 | ||||||||||||
Hypothetical | 1,000.00 | 1,017.21 | 7.65 | 1.53 | ||||||||||||
Class R2 | ||||||||||||||||
Actual | 1,000.00 | 1,153.10 | 6.83 | 1.28 | ||||||||||||
Hypothetical | 1,000.00 | 1,018.45 | 6.41 | 1.28 | ||||||||||||
Class R5 | ||||||||||||||||
Actual | 1,000.00 | 1,157.20 | 3.16 | 0.59 | ||||||||||||
Hypothetical | 1,000.00 | 1,021.87 | 2.96 | 0.59 | ||||||||||||
Class R6 | ||||||||||||||||
Actual | 1,000.00 | 1,156.50 | 2.89 | 0.54 | ||||||||||||
Hypothetical | 1,000.00 | 1,022.12 | 2.71 | 0.54 | ||||||||||||
Select Class | ||||||||||||||||
Actual | 1,000.00 | 1,155.10 | 4.17 | 0.78 | ||||||||||||
Hypothetical | 1,000.00 | 1,020.93 | 3.91 | 0.78 | ||||||||||||
Growth and Income Fund | ||||||||||||||||
Class A | ||||||||||||||||
Actual | 1,000.00 | 1,163.70 | 6.06 | 1.13 | ||||||||||||
Hypothetical | 1,000.00 | 1,019.19 | 5.66 | 1.13 | ||||||||||||
Class B | ||||||||||||||||
Actual | 1,000.00 | 1,160.40 | 8.73 | 1.63 | ||||||||||||
Hypothetical | 1,000.00 | 1,016.71 | 8.15 | 1.63 | ||||||||||||
Class C | ||||||||||||||||
Actual | 1,000.00 | 1,160.40 | 8.73 | 1.63 | ||||||||||||
Hypothetical | 1,000.00 | 1,016.71 | 8.15 | 1.63 | ||||||||||||
Select Class | ||||||||||||||||
Actual | 1,000.00 | 1,164.80 | 4.67 | 0.87 | ||||||||||||
Hypothetical | 1,000.00 | 1,020.48 | 4.36 | 0.87 | ||||||||||||
Large Cap Growth Fund | ||||||||||||||||
Class A | ||||||||||||||||
Actual | 1,000.00 | 1,084.70 | 5.63 | 1.09 | ||||||||||||
Hypothetical | 1,000.00 | 1,019.39 | 5.46 | 1.09 | ||||||||||||
Class B | ||||||||||||||||
Actual | 1,000.00 | 1,081.80 | 8.21 | 1.59 | ||||||||||||
Hypothetical | 1,000.00 | 1,016.91 | 7.95 | 1.59 | ||||||||||||
Class C | ||||||||||||||||
Actual | 1,000.00 | 1,081.60 | 8.21 | 1.59 | ||||||||||||
Hypothetical | 1,000.00 | 1,016.91 | 7.95 | 1.59 | ||||||||||||
Class R2 | ||||||||||||||||
Actual | 1,000.00 | 1,083.30 | 6.92 | 1.34 | ||||||||||||
Hypothetical | 1,000.00 | 1,018.15 | 6.71 | 1.34 | ||||||||||||
Class R5 | ||||||||||||||||
Actual | 1,000.00 | 1,086.20 | 3.78 | 0.73 | ||||||||||||
Hypothetical | 1,000.00 | 1,021.17 | 3.66 | 0.73 | ||||||||||||
Class R6 | ||||||||||||||||
Actual | 1,000.00 | 1,086.80 | 3.52 | 0.68 | ||||||||||||
Hypothetical | 1,000.00 | 1,021.42 | 3.41 | 0.68 | ||||||||||||
| JUNE 30, 2013 | J.P. MORGAN LARGE CAP FUNDS | 85 | ||||||
Table of Contents
SCHEDULE OF SHAREHOLDER EXPENSES
(Unaudited) (continued)
Hypothetical $1,000 Investment
| Beginning Account Value, January 1, 2013 | Ending Account Value June 30, 2013 | Expenses Paid During the Period* | Annualized Expense Ratio | |||||||||||||
Large Cap Growth Fund (continued) | ||||||||||||||||
Select Class | ||||||||||||||||
Actual | $ | 1,000.00 | $ | 1,085.20 | $ | 4.81 | 0.93 | % | ||||||||
Hypothetical | 1,000.00 | 1,020.18 | 4.66 | 0.93 | ||||||||||||
Large Cap Value Fund | ||||||||||||||||
Class A | ||||||||||||||||
Actual | 1,000.00 | 1,172.30 | 5.12 | 0.95 | ||||||||||||
Hypothetical | 1,000.00 | 1,020.08 | 4.76 | 0.95 | ||||||||||||
Class B | ||||||||||||||||
Actual | 1,000.00 | 1,170.70 | 7.80 | 1.45 | ||||||||||||
Hypothetical | 1,000.00 | 1,017.60 | 7.25 | 1.45 | ||||||||||||
Class C | ||||||||||||||||
Actual | 1,000.00 | 1,170.00 | 7.80 | 1.45 | ||||||||||||
Hypothetical | 1,000.00 | 1,017.60 | 7.25 | 1.45 | ||||||||||||
Class R2 | ||||||||||||||||
Actual | 1,000.00 | 1,171.20 | 6.46 | 1.20 | ||||||||||||
Hypothetical | 1,000.00 | 1,018.84 | 6.01 | 1.20 | ||||||||||||
Class R5 | ||||||||||||||||
Actual | 1,000.00 | 1,175.90 | 3.08 | 0.57 | ||||||||||||
Hypothetical | 1,000.00 | 1,021.97 | 2.86 | 0.57 | ||||||||||||
Class R6 | ||||||||||||||||
Actual | 1,000.00 | 1,175.50 | 2.86 | 0.53 | ||||||||||||
Hypothetical | 1,000.00 | 1,022.17 | 2.66 | 0.53 | ||||||||||||
Select Class | ||||||||||||||||
Actual | 1,000.00 | 1,173.80 | 4.20 | 0.78 | ||||||||||||
Hypothetical | 1,000.00 | 1,020.93 | 3.91 | 0.78 | ||||||||||||
U.S. Equity Fund | ||||||||||||||||
Class A | ||||||||||||||||
Actual | 1,000.00 | 1,146.00 | 5.16 | 0.97 | ||||||||||||
Hypothetical | 1,000.00 | 1,019.98 | 4.86 | 0.97 | ||||||||||||
Class B | ||||||||||||||||
Actual | 1,000.00 | 1,142.20 | 7.81 | 1.47 | ||||||||||||
Hypothetical | 1,000.00 | 1,017.50 | 7.35 | 1.47 | ||||||||||||
Class C | ||||||||||||||||
Actual | 1,000.00 | 1,143.40 | 7.81 | 1.47 | ||||||||||||
Hypothetical | 1,000.00 | 1,017.50 | 7.35 | 1.47 | ||||||||||||
Class R2 | ||||||||||||||||
Actual | 1,000.00 | 1,144.60 | 6.49 | 1.22 | ||||||||||||
Hypothetical | 1,000.00 | 1,018.74 | 6.11 | 1.22 | ||||||||||||
Class R5 | ||||||||||||||||
Actual | 1,000.00 | 1,148.00 | 3.14 | 0.59 | ||||||||||||
Hypothetical | 1,000.00 | 1,021.87 | 2.96 | 0.59 | ||||||||||||
Class R6 | ||||||||||||||||
Actual | 1,000.00 | 1,148.20 | 2.88 | 0.54 | ||||||||||||
Hypothetical | 1,000.00 | 1,022.12 | 2.71 | 0.54 | ||||||||||||
Institutional Class | ||||||||||||||||
Actual | 1,000.00 | 1,147.80 | 3.41 | 0.64 | ||||||||||||
Hypothetical | 1,000.00 | 1,021.62 | 3.21 | 0.64 | ||||||||||||
Select Class | ||||||||||||||||
Actual | 1,000.00 | 1,147.10 | 4.21 | 0.79 | ||||||||||||
Hypothetical | 1,000.00 | 1,020.88 | 3.96 | 0.79 | ||||||||||||
| * | Expenses are equal to each Class’ respective annualized expense ratio, multiplied by the average account value over the period, multiplied by 181/365 (to reflect the one-half year period). |
| 86 | J.P. MORGAN LARGE CAP FUNDS | JUNE 30, 2013 | ||||
Table of Contents
(Unaudited)
Certain tax information for the J.P. Morgan Funds is required to be provided to shareholders based upon the Funds’ income and distributions for the taxable year ended June 30, 2013. The information and distributions reported in this letter may differ from the information and taxable distributions reported to the shareholders for the calendar year ending December 31, 2013. The information necessary to complete your income tax returns for the calendar year ending December 31, 2013 will be provided under separate cover.
Dividends Received Deductions (DRD)
Each Fund hereby designates the following percentage or the maximum allowable percentage as ordinary income distributions eligible for the 70% dividends received deduction for corporate rate shareholders for the fiscal year ended June 30, 2013:
| Dividends Received Deduction | ||||
Disciplined Equity Fund | 21.53 | % | ||
Dynamic Growth Fund | 100.00 | |||
Equity Income Fund | 100.00 | |||
Growth and Income Fund | 100.00 | |||
Large Cap Growth Fund | 100.00 | |||
Large Cap Value Fund | 100.00 | |||
U.S. Equity Fund | 43.71 | |||
Long Term Capital Gain Designation — 20%
Each Fund hereby designates the following amount or the maximum allowable amount as long-term capital gain distributions for the purpose of the dividend paid deduction on its respective tax return for the fiscal year ended June 30, 2013 (amounts in thousands):
| Long-Term Capital Gain Distribution | ||||
Disciplined Equity | $ | 22,341 | ||
Equity Income Fund | 15,618 | |||
U.S. Equity Fund | 107,066 | |||
Qualified Dividend Income (QDI)
For the fiscal year ended June 30, 2013, certain dividends paid by the Funds may be subject to a maximum tax rate of 20%. Each Fund hereby designates the following amount or the maximum allowable amount of ordinary income distributions as qualified dividends (amounts in thousands):
| Qualified Dividend Income | ||||
Disciplined Equity Fund | $ | 46,178 | ||
Equity Income Fund | 77,626 | |||
Growth and Income Fund | 4,338 | |||
Large Cap Growth Fund | 48,189 | |||
Large Cap Value Fund | 8,143 | |||
U.S. Equity Fund | 129,252 | |||
| JUNE 30, 2013 | J.P. MORGAN LARGE CAP FUNDS | 87 | ||||||
Table of Contents

Rev. January 2011
| FACTS | WHAT DOES J.P. MORGAN FUNDS DO WITH YOUR PERSONAL INFORMATION? |
| Why? | Financial companies choose how they share your personal information. Federal law gives consumers the right to limit some but not all sharing. Federal law also requires us to tell you how we collect, share, and protect your personal information. Please read this notice carefully to understand what we do. |
| What? | The types of personal information we collect and share depend on the product or service you have with us. This information can include:
¡ Social Security number and account balances
¡ transaction history and account transactions
¡ checking account information and wire transfer instructions
When you are no longer our customer, we continue to share your information as described in this notice. |
| How? | All financial companies need to share customers’ personal information to run their everyday business. In the section below, we list the reasons financial companies can share their customers’ personal information; the reasons J.P. Morgan Funds chooses to share; and whether you can limit this sharing. |
| Reasons we can share your personal information | Does J.P. Morgan Funds share? | Can you limit this sharing? | ||
For our everyday business purposes — such as to process your transactions, maintain your account(s), respond to court orders and legal investigations, or report to credit bureaus | Yes | No | ||
For marketing purposes — to offer our products and services to you | Yes | No | ||
| For joint marketing with other financial companies | No | We don’t share | ||
For our affiliates’ everyday business purposes — information about your transactions and experiences | No | We don’t share | ||
For our affiliates’ everyday business purposes — information about your creditworthiness | No | We don’t share | ||
| For nonaffiliates to market to you | No | We don’t share |
| Questions? | Call 1-800-480-4111 or go to www.jpmorganfunds.com | |

Table of Contents
Page 2 |
| Who we are | ||
| Who is providing this notice? | J.P. Morgan Funds | |
| What we do | ||
| How does J.P. Morgan Funds protect my personal information? | To protect your personal information from unauthorized access and use, we use security measures that comply with federal law. These measures include computer safeguards and secured files and buildings. We authorize our employees to access your information only when they need it to do their work and we require companies that work for us to protect your information. | |
How does J.P. Morgan Funds collect my personal information? | We collect your personal information, for example, when you:
¡ open an account or provide contact information
¡ give us your account information or pay us by check
¡ make a wire transfer
We also collect your personal information from others, such as credit bureaus, affiliates and other companies. | |
| Why can’t I limit all sharing? | Federal law gives you the right to limit only
¡ sharing for affiliates’ everyday business purposes – information about your creditworthiness
¡ affiliates from using your information to market to you
¡ sharing for nonaffiliates to market to you
State laws and individual companies may give you additional rights to limit sharing. | |
| Definitions | ||
| Affiliates | Companies related by common ownership or control. They can be financial and nonfinancial companies.
¡ J.P. Morgan Funds does not share with our affiliates. | |
| Nonaffiliates | Companies not related by common ownership or control. They can be financial and nonfinancial companies.
¡ J.P. Morgan Funds does not share with nonaffiliates so they can market to you. | |
| Joint Marketing | A formal agreement between nonaffiliated financial companies that together market financial products or services to you.
¡ J.P. Morgan Funds doesn’t jointly market. | |
Table of Contents
J.P. Morgan Funds are distributed by JPMorgan Distribution Services, Inc., which is an affiliate of JPMorgan Chase & Co. Affiliates of JPMorgan Chase & Co. receive fees for providing various services to the funds.
Contact JPMorgan Distribution Services, Inc. at 1-800-480-4111 for a fund prospectus. You can also visit us at www.jpmorganfunds.com. Investors should carefully consider the investment objectives and risk as well as charges and expenses of the mutual fund before investing. The prospectus contains this and other information about the mutual fund. Read the prospectus carefully before investing.
Investors may obtain information about the Securities Investor Protection Corporation (SIPC), including the SIPC brochure by visiting www.sipc.org or by calling SIPC at 202-371-8300.
Each Fund files a complete schedule of its fund holdings for the first and third quarters of its fiscal year with the SEC on Form N-Q. The Funds’ Forms N-Q are available on the SEC’s website at http://www.sec.gov and may be reviewed and copied at the SEC’s Public Reference Room in Washington, DC. Information on the operation of the SEC’s Public Reference Room may be obtained by calling 1-800-SEC-0330. Shareholders may request the Form N-Q without charge by calling 1-800-480-4111 or by visiting the J.P. Morgan Funds’ website at www.jpmorganfunds.com.
A description of each Fund’s policies and procedures with respect to the disclosure of each Fund’s holdings is available in the prospectus and Statement of Additional Information.
A copy of proxy policies and procedures is available without charge upon request by calling 1-800-480-4111 and on the Funds’ website at www.jpmorganfunds.com. A description of such policies and procedures is on the SEC’s website at www.sec.gov. The Trustees have delegated the authority to vote proxies for securities owned by the Funds to the Advisor. A copy of the Funds’ voting record for the most recent 12-month period ended June 30 is available on the SEC’s website at www.sec.gov or at the Funds’ website at www.jpmorganfunds.com no later than August 31 of each year. The Funds’ proxy voting record will include, among other things, a brief description of the matter voted on for each fund security, and will state how each vote was cast, for example, for or against the proposal.
Table of Contents

J.P. Morgan Asset Management is the marketing name for the asset management business of JPMorgan Chase & Co. Those businesses include, but are not limited to, J.P. Morgan Investment Management Inc., Security Capital Research & Management Incorporated and J.P. Morgan Alternative Asset Management, Inc.
| © JPMorgan Chase & Co., 2013. All rights reserved. June 30, 2013. | AN-LCE-613 |
Table of Contents
Annual Report
J.P. Morgan Equity Funds
June 30, 2013
JPMorgan Equity Index Fund
JPMorgan Market Expansion Enhanced Index Fund
(formerly JPMorgan Market Expansion Index Fund)

Table of Contents
Investments in a Fund are not bank deposits or obligations of, or guaranteed or endorsed by, any bank and are not insured or guaranteed by the FDIC, the Federal Reserve Board or any other government agency. You could lose money if you sell when the Fund’s share price is lower than when you invested.
Past performance is no guarantee of future performance. The general market views expressed in this report are opinions based on market and other conditions through the end of the reporting period and are subject to change without notice. These views are not intended to predict the future performance of a Fund or the securities markets. References to specific securities and their issuers are for illustrative purpose only and are not intended to be, and should not be interpreted as, recommendations to purchase or sell such securities. Such views are not meant as investment advice and may not be relied on as indication of trading intent on behalf of any Fund.
Prospective investors should refer to the Funds’ prospectus for a discussion of the Funds’ investment objectives, strategies and risks. Call J.P. Morgan Funds Service Center at (800) 480-4111 for a prospectus containing more complete information about a Fund, including management fees and other expenses. Please read it carefully before investing.
Table of Contents
July 26, 2013 (Unaudited)
Dear Shareholder:
While somewhat overshadowed by increased volatility at the end of the reporting period, global equities in aggregate posted strong returns for the twelve months ended June 30, 2013. For much of the period, stocks were supported by solid corporate earnings and robust demand from investors looking to generate higher returns in the low interest rate environment. Despite signaling a potential policy shift in June 2013, the U.S. Federal Reserve (“Fed”) continued to pursue its highly accommodative policies in an attempt to lower unemployment and spur the economy. Central banks overseas also did their part to support their economies. The European Central Bank (“ECB”) remained committed to preserving the euro, as it cut rates and introduced new programs designed to aid struggling euro zone members. Elsewhere, the Bank of Japan embarked on a major asset purchase program as a new pro-growth government came into power late in 2012.
 |
“We are encouraged by the stock market’s resiliency in the face of recent volatility.” |
Positive investor sentiment was temporarily interrupted, however, in May 2013 when Fed Chairman Bernanke indicated that the central bank may begin to “taper” its asset purchase program later this year. This triggered a sharp decline in global equities, although they quickly regained their footing and have continued to rally in July. All told, both U.S. and international developed stocks rose sharply during the twelve months ended June 30, 2013. Emerging market equities produced only modest gains given concerns regarding China’s economy and falling commodity prices.
U.S. Treasury Yields Rise Sharply
Talk of Fed tapering negatively impacted the fixed income markets. While U.S. Treasury security yields continued to be low from a historical perspective, they ended the period
sharply higher than when the reporting period began. The yield for 10-year U.S. Treasury securities ended June 30, 2013 at 2.52%, while the yields for 2- and 30-year U.S. Treasury securities finished the reporting period at 0.36% and 3.52%, respectively. Amid the rising interest rate environment, the overall U.S. fixed income market posted a modest decline for the reporting period. In contrast, high yield bonds (also known as junk bonds) posted a strong return and emerging market debt securities also moved higher, albeit to a lesser extent.
Positive Signs for Stocks
Although the global economy is far from robust, it is still on a growth path. The expansion in the U.S. certainly appears to be sustainable and, while Europe remains in a recession, there are indications that its economy may be bottoming. Elsewhere, pro-growth initiatives in Japan have thus far yielded positive results. While growth in China has moderated, we believe the government has the tools at its disposal to avoid a “hard landing.”
We are encouraged by the stock market’s resiliency in the face of recent volatility. In addition, there have been signs that equity market correlations are decreasing, which could create a more favorable environment for active managers. In addition, given the recent sell-off in the bond market, valuations in a number of fixed income sectors have become more attractive.
On behalf of everyone at J.P. Morgan Asset Management, thank you for your continued support. We look forward to managing your investment needs for years to come. Should you have any questions, please visit www.jpmorganfunds.com or contact the J.P. Morgan Funds Service Center at 1-800-480-4111.
Sincerely yours,

George C.W. Gatch
CEO, Global Funds Management
J.P. Morgan Asset Management
| JUNE 30, 2013 | J.P. MORGAN EQUITY FUNDS | 1 | ||||||
Table of Contents
TWELVE MONTHS ENDED JUNE 30, 2013 (Unaudited)
| REPORTING PERIOD RETURN: | ||||
| Fund (Select Class Shares)* | 20.35% | |||
| S&P 500 Index | 20.60% | |||
| Net Assets as of 6/30/2013 (In Thousands) | $ | 1,744,796 | ||
INVESTMENT OBJECTIVE**
The JPMorgan Equity Index Fund (the “Fund”) seeks investment results that correspond to the aggregate price and dividend performance of securities in the Standard & Poor’s 500 Composite Stock Price Index (S&P 500 Index)*** (the “Benchmark”).
WHAT WERE THE MAIN DRIVERS OF THE FUND’S PERFORMANCE?
The Fund (Select Class Shares) performed largely in line with the Benchmark for the twelve months ended June 30, 2013. This was consistent with its indexing strategy and investment objective, as the Fund looks to generate returns that are comparable to those of the Benchmark.
Despite periods of heightened volatility and several setbacks, the overall U.S. equity market generated strong results during the twelve months ended June 30, 2013. Supporting the market were overall solid corporate profits, continued economic growth and generally robust investor demand. From an economic perspective, the housing market showed signs of rebounding and there was some improvement in the labor market. Investor enthusiasm was interrupted late in the reporting period when the U.S. Federal Reserve Board (“Fed”) announced in June 2013 that it could begin tapering its asset purchases later in the year. This triggered a sharp sell-off in the overall equity market. However, equities again rallied in late June, as concerns regarding Fed tapering abated somewhat. All told, the Benchmark finished the twelve months ended June 30, 2013 with a 20.60% return.
All ten sectors within the Benchmark generated positive absolute returns during the reporting period. Financials and consumer discretionary were the strongest performing sectors, while utilities and information technology produced the smallest absolute returns.
HOW WAS THE FUND POSITIONED?
Regardless of the market outlook, the Fund was managed in strict conformity with a full index replication strategy and aimed to hold the same stocks in nearly the same proportions as those found in the Benchmark.
| TOP TEN EQUITY HOLDINGS OF THE PORTFOLIO**** | ||||||||
| 1. | Exxon Mobil Corp. | 2.8 | % | |||||
| 2. | Apple, Inc. | 2.6 | ||||||
| 3. | Microsoft Corp. | 1.8 | ||||||
| 4. | Johnson & Johnson | 1.7 | ||||||
| 5. | General Electric Co. | 1.7 | ||||||
| 6. | Google, Inc., Class A | 1.6 | ||||||
| 7. | Chevron Corp. | 1.6 | ||||||
| 8. | Procter & Gamble Co. (The) | 1.5 | ||||||
| 9. | Berkshire Hathaway, Inc., Class B | 1.4 | ||||||
| 10. | Wells Fargo & Co. | 1.4 | ||||||
PORTFOLIO COMPOSITION BY SECTOR**** | ||||
| Information Technology | 17.6 | % | ||
| Financials | 16.5 | |||
| Health Care | 12.6 | |||
| Consumer Discretionary | 12.1 | |||
| Energy | 10.4 | |||
| Consumer Staples | 10.4 | |||
| Industrials | 10.2 | |||
| Utilities | 3.3 | |||
| Materials | 3.2 | |||
| Telecommunication Services | 2.8 | |||
| Short-Term Investment | 0.9 | |||
| * | The return shown is based on net asset value calculated for shareholder transactions and may differ from the return shown in the financial highlights, which reflects adjustments made to the net asset value in accordance with accounting principles generally accepted in the United States of America. |
| ** | The advisor seeks to achieve the Fund’s objective. There can be no guarantee it will be achieved. |
| *** | “S&P 500 Index” is a registered service mark of Standard & Poor’s Corporation, which does not sponsor and is in no way affiliated with the Fund. |
| **** | Percentages indicated are based on total investments as of June 30, 2013. The Fund’s composition is subject to change. |
| 2 | J.P. MORGAN EQUITY FUNDS | JUNE 30, 2013 | ||||
Table of Contents
AVERAGE ANNUAL TOTAL RETURNS AS OF JUNE 30, 2013 | ||||||||||||||||
| INCEPTION DATE OF CLASS | 1 YEAR | 5 YEAR | 10 YEAR | |||||||||||||
CLASS A SHARES | 2/18/92 | |||||||||||||||
Without Sales Charge | 20.08 | % | 6.59 | % | 6.83 | % | ||||||||||
With Sales Charge* | 13.78 | 5.45 | 6.26 | |||||||||||||
CLASS B SHARES | 1/14/94 | |||||||||||||||
Without CDSC | 19.17 | 5.79 | 6.19 | |||||||||||||
With CDSC** | 14.17 | 5.47 | 6.19 | |||||||||||||
CLASS C SHARES | 11/4/97 | |||||||||||||||
Without CDSC | 19.16 | 5.80 | 6.04 | |||||||||||||
With CDSC*** | 18.16 | 5.80 | 6.04 | |||||||||||||
SELECT CLASS SHARES | 7/2/91 | 20.35 | 6.86 | 7.09 | ||||||||||||
| * | Sales Charge for Class A Shares is 5.25%. |
| ** | Assumes a 5% CDSC (contingent deferred sales charge) for the one year period, 2% CDSC for the five year period and 0% CDSC thereafter. |
| *** | Assumes a 1% CDSC for the one year period and 0% CDSC thereafter. |
TEN YEAR PERFORMANCE (6/30/03 TO 6/30/13)
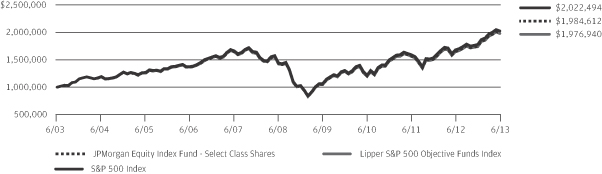
The performance quoted is past performance and is not a guarantee of future results. Mutual funds are subject to certain market risks. Investment returns and principal value of an investment will fluctuate so that an investor’s shares, when redeemed, may be worth more or less than their original cost. Current performance may be higher or lower than the performance data shown. For up-to-date month-end performance information please call 1-800-480-4111.
The graph illustrates comparative performance for $1,000,000 invested in Select Class Shares of the JPMorgan Equity Index Fund, the S&P 500 Index and the Lipper S&P 500 Objective Funds Index from June 30, 2003 to June 30, 2013. The performance of the Fund assumes reinvestment of all dividends and capital gain distributions, if any, and does not include a sales charge. The performance of the S&P 500 Index does not reflect the deduction of expenses or a sales charge associated with a mutual fund and has been adjusted to reflect reinvestment of all dividends and capital gain distributions of the securities included in the benchmark, if applicable. The performance of the Lipper S&P 500 Objective Funds Index includes expenses associated with a mutual fund, such as investment management fees. These expenses are not identical to the expenses incurred by the Fund. The S&P 500 Index is an unmanaged index generally representative of the performance of large companies in the U.S.
stock market. The Lipper S&P 500 Objective Funds Index is an index based on the total returns of certain mutual funds within the Fund’s designated category as determined by Lipper, Inc. Investors cannot invest directly in an index.
Select Class Shares have a $1,000,000 minimum initial investment and carry no sales charge.
Fund performance may reflect the waiver of the Fund’s fees and reimbursement of expenses for certain periods since the inception date. Without these waivers and reimbursements, performance would have been lower. Also, performance shown in this section does not reflect the deduction of taxes that a shareholder would pay on Fund distributions or redemption of Fund shares.
Because Class B Shares automatically convert to Class A Shares after 8 years, the 10 year average annual total return shown above for Class B reflects Class A performance for the period after conversion.
The returns shown are based on net asset values calculated for shareholder transactions and may differ from the returns shown in the financial highlights, which reflect adjustments made to the net asset values in accordance with accounting principles generally accepted in the United States of America.
| JUNE 30, 2013 | J.P. MORGAN EQUITY FUNDS | 3 | ||||||
Table of Contents
JPMorgan Market Expansion Enhanced Index Fund
(formerly JPMorgan Market Expansion Index Fund)
FUND COMMENTARY
TWELVE MONTHS ENDED JUNE 30, 2013 (Unaudited)
| REPORTING PERIOD RETURN: | ||||
| Fund (Select Class Shares)* | 26.26% | |||
| S&P 1000 Index | 25.19% | |||
| Net Assets as of 6/30/2013 (In Thousands) | $ | 1,406,601 | ||
INVESTMENT OBJECTIVE**
The JPMorgan Market Expansion Enhanced Index Fund (the “Fund”) seeks to provide a return which substantially duplicates the price and yield performance of domestically traded common stocks in the small- and mid-capitalization equity markets, as represented by a market capitalization weighted combination of the Standard & Poor’s SmallCap 600 Index (S&P SmallCap 600) and the Standard & Poor’s MidCap 400 Index (S&P MidCap 400).***
WHAT WERE THE MAIN DRIVERS OF THE FUND’S PERFORMANCE?
The Fund (Select Class Shares) outperformed the S&P 1000 Index*** (the “Benchmark”), which is a combination of the S&P SmallCap 600 and the S&P MidCap 400 Indexes, for the twelve months ended June 30, 2013. The Fund’s stock selection in the health services and systems and basic materials sectors contributed to relative performance. The Fund’s stock selection in the semiconductor and systems hardware sectors detracted from relative performance.
Individual contributors to relative performance included the Fund’s positions in Regeneron Pharmaceuticals, Inc., Cree, Inc. and Green Mountain Coffee Roasters, Inc. Shares of Regeneron Pharmaceuticals, Inc., a biotechnology company, benefited from strong earnings during the reporting period. Shares of Cree, Inc., which develops, manufactures and markets electronic devices made from silicon carbide and other semiconductor material, performed well as the company issued an earnings forecast that exceeded expectations. Shares of Green Mountain Coffee Roasters, Inc., a specialty coffee company based in Vermont, moved sharply higher as the company expanded its product line and received several analyst upgrades.
Individual detractors to relative performance included the Fund’s positions in Cirrus Logic Corp., Outerwall, Inc. and Questcor Pharmaceuticals, Inc. Shares of Cirrus Logic Corp., a semiconductor supplier, fell sharply as its largest customer, Apple, Inc., experienced declining market share for its smartphones. Outerwall, Inc. operates a network of movie and game rental kiosks, including Redbox. Its shares fell given declining sales for its DVD rental services due to increased popularity of online streaming services. Questcor Pharmaceuticals, Inc. focuses on the products used in the treatment of diseases and disorders of the central nervous system. Its shares fell sharply in October 2012 given reimbursement concerns regarding Acthar, which is one of their medications that is used for the treatment of dermatomyositis and polymyositis.
HOW WAS THE FUND POSITIONED?
The Fund seeks to closely track the sector and industry weights within the Benchmark. Because the Fund uses an enhanced index strategy, not all of the stocks in the Benchmark are held by the Fund, and the Fund’s position in an individual stock may be overweight or underweight as compared to the Benchmark. Looking at valuation and fundamentals, the Fund’s portfolio managers overweighted what they believed were attractively priced stocks with improving fundamentals and underweighted what they believed were expensive stocks with deteriorating fundamentals, based on their bottom-up approach to stock selection. In addition, the Fund may modestly overweight or underweight the sectors and industries within the Benchmark.
On February 28, 2013, the portfolio managers of the Fund changed. In addition to the management change, on April 30, 2013, the Fund changed its name from JPMorgan Market Expansion Index Fund to JPMorgan Market Expansion Enhanced Index Fund. The change in the Fund’s name and management did not materially change the enhanced index strategy described above or how the Fund was positioned compared to the Benchmark.
| 4 | J.P. MORGAN EQUITY FUNDS | JUNE 30, 2013 | ||||
Table of Contents
| TOP TEN EQUITY HOLDINGS OF THE PORTFOLIO**** | ||||||||
| 1. | Vertex Pharmaceuticals, Inc. | 1.0 | % | |||||
| 2. | HollyFrontier Corp. | 0.7 | ||||||
| 3. | Rock Tenn Co., Class A | 0.6 | ||||||
| 4. | Community Health Systems, Inc. | 0.6 | ||||||
| 5. | Everest Re Group Ltd., (Bermuda) | 0.6 | ||||||
| 6. | Omnicare, Inc. | 0.6 | ||||||
| 7. | NV Energy, Inc. | 0.6 | ||||||
| 8. | Oil States International, Inc. | 0.5 | ||||||
| 9. | Affiliated Managers Group, Inc. | 0.5 | ||||||
| 10. | Hanesbrands, Inc. | 0.5 | ||||||
PORTFOLIO COMPOSITION BY SECTOR**** | ||||
| Financials | 21.9 | % | ||
| Industrials | 16.3 | |||
| Information Technology | 15.8 | |||
| Consumer Discretionary | 13.7 | |||
| Health Care | 9.6 | |||
| Materials | 6.5 | |||
| Utilities | 4.9 | |||
| Energy | 4.7 | |||
| Consumer Staples | 3.9 | |||
| Others (each less than 1.0%) | 0.8 | |||
| Short-Term Investment | 1.9 | |||
| * | The return shown is based on net asset value calculated for shareholder transactions and may differ from the return shown in the financial highlights, which reflects adjustments made to the net asset value in accordance with accounting principles generally accepted in the United States of America. |
| ** | The advisor seeks to achieve the Fund’s objective. There can be no guarantee it will be achieved. |
| *** | “S&P SmallCap 600 Index”, “S&P MidCap 400 Index” and “S&P 1000 Index” are registered service marks of Standard & Poor’s Corporation, which does not sponsor and is in no way affiliated with the Fund. |
| **** | Percentages indicated are based on total investments as of June 30, 2013. The Fund’s composition is subject to change. |
| JUNE 30, 2013 | J.P. MORGAN EQUITY FUNDS | 5 | ||||||
Table of Contents
JPMorgan Market Expansion Enhanced Index Fund
FUND COMMENTARY
TWELVE MONTHS ENDED JUNE 30, 2013 (Unaudited) (continued)
AVERAGE ANNUAL TOTAL RETURNS AS OF JUNE 30, 2013 | ||||||||||||||||
| INCEPTION DATE OF CLASS | 1 YEAR | 5 YEAR | 10 YEAR | |||||||||||||
CLASS A SHARES | 7/31/98 | |||||||||||||||
Without Sales Charge | 25.91 | % | 8.40 | % | 10.19 | % | ||||||||||
With Sales Charge* | 19.32 | 7.23 | 9.60 | |||||||||||||
CLASS B SHARES | 7/31/98 | |||||||||||||||
Without CDSC | 25.11 | 7.63 | 9.56 | |||||||||||||
With CDSC** | 20.11 | 7.33 | 9.56 | |||||||||||||
CLASS C SHARES | 3/22/99 | |||||||||||||||
Without CDSC | 25.07 | 7.63 | 9.40 | |||||||||||||
With CDSC*** | 24.07 | 7.63 | 9.40 | |||||||||||||
CLASS R2 SHARES | 11/3/08 | 25.72 | 8.04 | 9.82 | ||||||||||||
SELECT CLASS SHARES | 7/31/98 | 26.26 | 8.67 | 10.47 | ||||||||||||
| * | Sales Charge for Class A Shares is 5.25%. |
| ** | Assumes 5% CDSC (contingent deferred sales charge) for the one year period, 2% CDSC for the five year period and 0% CDSC thereafter. |
| *** | Assumes a 1% CDSC for the one year period and 0% CDSC thereafter. |
TEN YEAR PERFORMANCE (6/30/03 TO 6/30/13)
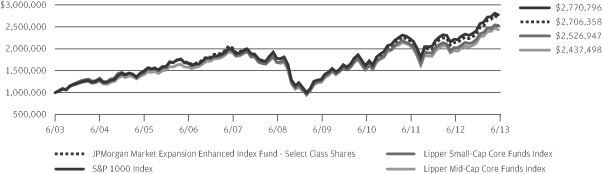
The performance quoted is past performance and is not a guarantee of future results. Mutual funds are subject to certain market risks. Investment returns and principal value of an investment will fluctuate so that an investor’s shares, when redeemed, may be worth more or less than their original cost. Current performance may be higher or lower than the performance data shown. For up-to-date month-end performance information please call 1-800-480-4111.
Returns for Class R2 Shares prior to its inception date are based on the performance of Select Class Shares. All prior class performance for Class R2 Shares has been adjusted to reflect the differences in expenses between classes.
The graph illustrates comparative performance for $1,000,000 invested in Select Class Shares of the JPMorgan Market Expansion Enhanced Index Fund, the S&P 1000 Index, the Lipper Small-Cap Core Funds Index, and the Lipper Mid-Cap Core Funds Index from June 30, 2003 to June 30, 2013. The performance of the Fund assumes reinvestment of all dividends and capital gain distributions, if any, and does not include a sales charge. The performance of the S&P 1000 Index does not reflect the deduction of expenses or a sales charge associated with a mutual fund and has been adjusted to reflect reinvestment of all dividends and capital gain distributions of the securities included in the benchmark, if applicable. The performance of the Lipper Small-Cap Core Funds Index and the Lipper Mid-Cap Core Funds Index include expenses associated with a mutual fund, such as investment management fees. These expenses are
not identical to the expenses incurred by the Fund. The S&P 1000 Index is an unmanaged index generally representative of the performance of small and mid-size companies in the U.S. stock market. The S&P 1000 Index is a combination of the S&P MidCap 400 Index and the S&P SmallCap 600 Index. The Lipper Small-Cap Core Funds Index and the Lipper Mid-Cap Core Funds Index are indexes based on total returns of certain groups of mutual funds as determined by Lipper, Inc. Investors cannot invest directly in an index.
Select Class Shares have a $1,000,000 minimum initial investment and carry no sales charge.
Fund performance may reflect the waiver of the Fund’s fees and reimbursement of expenses for certain periods since the inception date. Without these waivers and reimbursements, performance would have been lower. Also, performance shown in this section does not reflect the deduction of taxes that a shareholder would pay on Fund distributions or redemption of Fund shares.
Because Class B Shares automatically convert to Class A Shares after 8 years, the 10 year average annual total return shown above for Class B reflects Class A performance for the period after conversion.
The returns shown are based on net asset values calculated for shareholder transactions and may differ from the returns shown in the financial highlights, which reflect adjustments made to the net asset values in accordance with accounting principles generally accepted in the United States of America.
| 6 | J.P. MORGAN EQUITY FUNDS | JUNE 30, 2013 | ||||
Table of Contents
JPMorgan Equity Index Fund
SCHEDULE OF PORTFOLIO INVESTMENTS
AS OF JUNE 30, 2013
(Amounts in thousands)
| SHARES | SECURITY DESCRIPTION | VALUE($) | ||||||
| Common Stocks — 99.2% | |||||||
Consumer Discretionary — 12.1% | ||||||||
Auto Components — 0.4% | ||||||||
| 14 | BorgWarner, Inc. (a) | 1,202 | ||||||
| 35 | Delphi Automotive plc, (United Kingdom) | 1,780 | ||||||
| 30 | Goodyear Tire & Rubber Co. (The) (a) | 454 | ||||||
| 83 | Johnson Controls, Inc. | 2,961 | ||||||
|
| |||||||
| 6,397 | ||||||||
|
| |||||||
Automobiles — 0.7% | ||||||||
| 475 | Ford Motor Co. | 7,346 | ||||||
| 93 | General Motors Co. (a) | 3,097 | ||||||
| 27 | Harley-Davidson, Inc. | 1,484 | ||||||
|
| |||||||
| 11,927 | ||||||||
|
| |||||||
Distributors — 0.1% | ||||||||
| 19 | Genuine Parts Co. | 1,461 | ||||||
|
| |||||||
Diversified Consumer Services — 0.1% | ||||||||
| 33 | H&R Block, Inc. | 913 | ||||||
|
| |||||||
Hotels, Restaurants & Leisure — 1.8% | ||||||||
| 54 | Carnival Corp. | 1,839 | ||||||
| 4 | Chipotle Mexican Grill, Inc. (a) | 1,360 | ||||||
| 16 | Darden Restaurants, Inc. | 791 | ||||||
| 31 | International Game Technology | 526 | ||||||
| 29 | Marriott International, Inc., Class A | 1,168 | ||||||
| 121 | McDonald’s Corp. | 11,988 | ||||||
| 90 | Starbucks Corp. | 5,922 | ||||||
| 23 | Starwood Hotels & Resorts Worldwide, Inc. | 1,485 | ||||||
| 16 | Wyndham Worldwide Corp. | 939 | ||||||
| 10 | Wynn Resorts Ltd. | 1,234 | ||||||
| 54 | Yum! Brands, Inc. | 3,767 | ||||||
|
| |||||||
| 31,019 | ||||||||
|
| |||||||
Household Durables — 0.3% | ||||||||
| 34 | D.R. Horton, Inc. | 721 | ||||||
| 13 | Garmin Ltd., (Switzerland) | 478 | ||||||
| 8 | Harman International Industries, Inc. | 445 | ||||||
| 17 | Leggett & Platt, Inc. | 537 | ||||||
| 20 | Lennar Corp., Class A | 720 | ||||||
| 35 | Newell Rubbermaid, Inc. | 915 | ||||||
| 41 | PulteGroup, Inc. (a) | 781 | ||||||
| 10 | Whirlpool Corp. | 1,093 | ||||||
|
| |||||||
| 5,690 | ||||||||
|
| |||||||
Internet & Catalog Retail — 1.2% | ||||||||
| 44 | Amazon.com, Inc. (a) | 12,215 | ||||||
| 11 | Expedia, Inc. | 677 | ||||||
| 7 | Netflix, Inc. (a) | 1,431 | ||||||
| 6 | priceline.com, Inc. (a) | 5,153 | ||||||
| SHARES | SECURITY DESCRIPTION | VALUE($) | ||||||
Internet & Catalog Retail — Continued | ||||||||
| 13 | TripAdvisor, Inc. (a) | 812 | ||||||
|
| |||||||
| 20,288 | ||||||||
|
| |||||||
Leisure Equipment & Products — 0.1% | ||||||||
| 14 | Hasbro, Inc. | 624 | ||||||
| 42 | Mattel, Inc. | 1,890 | ||||||
|
| |||||||
| 2,514 | ||||||||
|
| |||||||
Media — 3.6% | ||||||||
| 26 | Cablevision Systems Corp., Class A | 439 | ||||||
| 69 | CBS Corp. (Non-Voting), Class B | 3,368 | ||||||
| 318 | Comcast Corp., Class A | 13,321 | ||||||
| 67 | DIRECTV (a) | 4,157 | ||||||
| 30 | Discovery Communications, Inc., Class A (a) | 2,282 | ||||||
| 28 | Gannett Co., Inc. | 676 | ||||||
| 52 | Interpublic Group of Cos., Inc. (The) | 753 | ||||||
| 240 | News Corp., Class A | 7,837 | ||||||
| 31 | Omnicom Group, Inc. | 1,963 | ||||||
| 10 | Scripps Networks Interactive, Inc., Class A | 686 | ||||||
| 35 | Time Warner Cable, Inc. | 3,953 | ||||||
| 113 | Time Warner, Inc. | 6,510 | ||||||
| 54 | Viacom, Inc., Class B | 3,667 | ||||||
| 218 | Walt Disney Co. (The) | 13,736 | ||||||
| 1 | Washington Post Co. (The), Class B | 265 | ||||||
|
| |||||||
| 63,613 | ||||||||
|
| |||||||
Multiline Retail — 0.8% | ||||||||
| 36 | Dollar General Corp. (a) | 1,835 | ||||||
| 27 | Dollar Tree, Inc. (a) | 1,374 | ||||||
| 12 | Family Dollar Stores, Inc. | 718 | ||||||
| 17 | J.C. Penney Co., Inc. (a) | 295 | ||||||
| 25 | Kohl’s Corp. | 1,243 | ||||||
| 46 | Macy’s, Inc. | 2,224 | ||||||
| 18 | Nordstrom, Inc. | 1,077 | ||||||
| 78 | Target Corp. | 5,337 | ||||||
|
| |||||||
| 14,103 | ||||||||
|
| |||||||
Specialty Retail — 2.3% | ||||||||
| 9 | Abercrombie & Fitch Co., Class A | 428 | ||||||
| 5 | AutoNation, Inc. (a) | 203 | ||||||
| 4 | AutoZone, Inc. (a) | 1,859 | ||||||
| 26 | Bed Bath & Beyond, Inc. (a) | 1,872 | ||||||
| 32 | Best Buy Co., Inc. | 886 | ||||||
| 27 | CarMax, Inc. (a) | 1,252 | ||||||
| 14 | GameStop Corp., Class A | 604 | ||||||
| 35 | Gap, Inc. (The) | 1,461 | ||||||
| 176 | Home Depot, Inc. (The) | 13,669 | ||||||
SEE NOTES TO FINANCIAL STATEMENTS.
| JUNE 30, 2013 | J.P. MORGAN EQUITY FUNDS | 7 | ||||||
Table of Contents
JPMorgan Equity Index Fund
SCHEDULE OF PORTFOLIO INVESTMENTS
AS OF JUNE 30, 2013 (continued)
(Amounts in thousands)
| SHARES | SECURITY DESCRIPTION | VALUE($) | ||||||
| Common Stocks — Continued | |||||||
Specialty Retail — Continued | ||||||||
| 29 | L Brands, Inc. | 1,429 | ||||||
| 130 | Lowe’s Cos., Inc. | 5,298 | ||||||
| 13 | O’Reilly Automotive, Inc. (a) | 1,503 | ||||||
| 12 | PetSmart, Inc. | 836 | ||||||
| 27 | Ross Stores, Inc. | 1,721 | ||||||
| 80 | Staples, Inc. | 1,272 | ||||||
| 14 | Tiffany & Co. | 1,055 | ||||||
| 87 | TJX Cos., Inc. | 4,352 | ||||||
| 13 | Urban Outfitters, Inc. (a) | 535 | ||||||
|
| |||||||
| 40,235 | ||||||||
|
| |||||||
Textiles, Apparel & Luxury Goods — 0.7% |
| |||||||
| 34 | Coach, Inc. | 1,938 | ||||||
| 6 | Fossil Group, Inc. (a) | 659 | ||||||
| 87 | NIKE, Inc., Class B | 5,567 | ||||||
| 10 | PVH Corp. | 1,224 | ||||||
| 7 | Ralph Lauren Corp. | 1,278 | ||||||
| 11 | V.F. Corp. | 2,043 | ||||||
|
| |||||||
| 12,709 | ||||||||
|
| |||||||
Total Consumer Discretionary | 210,869 | |||||||
|
| |||||||
Consumer Staples — 10.4% | ||||||||
Beverages — 2.4% |
| |||||||
| 19 | Beam, Inc. | 1,226 | ||||||
| 18 | Brown-Forman Corp., Class B | 1,237 | ||||||
| 463 | Coca-Cola Co. (The) | 18,556 | ||||||
| 31 | Coca-Cola Enterprises, Inc. | 1,094 | ||||||
| 19 | Constellation Brands, Inc., Class A (a) | 970 | ||||||
| 25 | Dr. Pepper Snapple Group, Inc. | 1,132 | ||||||
| 19 | Molson Coors Brewing Co., Class B | 908 | ||||||
| 17 | Monster Beverage Corp. (a) | 1,060 | ||||||
| 187 | PepsiCo, Inc. | 15,276 | ||||||
|
| |||||||
| 41,459 | ||||||||
|
| |||||||
Food & Staples Retailing — 2.4% |
| |||||||
| 53 | Costco Wholesale Corp. | 5,832 | ||||||
| 148 | CVS Caremark Corp. | 8,456 | ||||||
| 63 | Kroger Co. (The) | 2,169 | ||||||
| 29 | Safeway, Inc. | 689 | ||||||
| 72 | Sysco Corp. | 2,449 | ||||||
| 104 | Walgreen Co. | 4,603 | ||||||
| 198 | Wal-Mart Stores, Inc. | 14,740 | ||||||
| 42 | Whole Foods Market, Inc. | 2,145 | ||||||
|
| |||||||
| 41,083 | ||||||||
|
| |||||||
Food Products — 1.6% |
| |||||||
| 80 | Archer-Daniels-Midland Co. | 2,699 | ||||||
| SHARES | SECURITY DESCRIPTION | VALUE($) | ||||||
Food Products — Continued |
| |||||||
| 22 | Campbell Soup Co. | 966 | ||||||
| 50 | ConAgra Foods, Inc. | 1,758 | ||||||
| 78 | General Mills, Inc. | 3,779 | ||||||
| 18 | Hershey Co. (The) | 1,616 | ||||||
| 16 | Hormel Foods Corp. | 629 | ||||||
| 13 | JM Smucker Co. (The) | 1,336 | ||||||
| 31 | Kellogg Co. | 1,969 | ||||||
| 72 | Kraft Foods Group, Inc. | 4,012 | ||||||
| 16 | McCormick & Co., Inc. (Non-Voting) | 1,121 | ||||||
| 24 | Mead Johnson Nutrition Co. | 1,938 | ||||||
| 216 | Mondelez International, Inc., Class A | 6,149 | ||||||
| 34 | Tyson Foods, Inc., Class A | 880 | ||||||
|
| |||||||
| 28,852 | ||||||||
|
| |||||||
Household Products — 2.1% |
| |||||||
| 16 | Clorox Co. (The) | 1,322 | ||||||
| 106 | Colgate-Palmolive Co. | 6,067 | ||||||
| 46 | Kimberly-Clark Corp. | 4,513 | ||||||
| 331 | Procter & Gamble Co. (The) | 25,486 | ||||||
|
| |||||||
| 37,388 | ||||||||
|
| |||||||
Personal Products — 0.2% |
| |||||||
| 52 | Avon Products, Inc. | 1,100 | ||||||
| 29 | Estee Lauder Cos., Inc. (The), Class A | 1,910 | ||||||
|
| |||||||
| 3,010 | ||||||||
|
| |||||||
Tobacco — 1.7% |
| |||||||
| 243 | Altria Group, Inc. | 8,489 | ||||||
| 46 | Lorillard, Inc. | 1,993 | ||||||
| 198 | Philip Morris International, Inc. | 17,110 | ||||||
| 38 | Reynolds American, Inc. | 1,860 | ||||||
|
| |||||||
| 29,452 | ||||||||
|
| |||||||
Total Consumer Staples | 181,244 | |||||||
|
| |||||||
Energy — 10.4% | ||||||||
Energy Equipment & Services — 1.8% |
| |||||||
| 53 | Baker Hughes, Inc. | 2,462 | ||||||
| 30 | Cameron International Corp. (a) | 1,832 | ||||||
| 8 | Diamond Offshore Drilling, Inc. | 577 | ||||||
| 28 | Ensco plc, (United Kingdom), Class A | 1,635 | ||||||
| 29 | FMC Technologies, Inc. (a) | 1,595 | ||||||
| 113 | Halliburton Co. | 4,696 | ||||||
| 13 | Helmerich & Payne, Inc. | 803 | ||||||
| 36 | Nabors Industries Ltd., (Bermuda) | 545 | ||||||
| 52 | National Oilwell Varco, Inc. | 3,556 | ||||||
| 31 | Noble Corp., (Switzerland) | 1,150 | ||||||
| 15 | Rowan Cos. plc, Class A (a) | 511 | ||||||
SEE NOTES TO FINANCIAL STATEMENTS.
| 8 | J.P. MORGAN EQUITY FUNDS | JUNE 30, 2013 | ||||
Table of Contents
| SHARES | SECURITY DESCRIPTION | VALUE($) | ||||||
| Common Stocks — Continued | |||||||
Energy Equipment & Services — Continued | ||||||||
| 161 | Schlumberger Ltd. | 11,507 | ||||||
|
| |||||||
| 30,869 | ||||||||
|
| |||||||
Oil, Gas & Consumable Fuels — 8.6% | ||||||||
| 61 | Anadarko Petroleum Corp. | 5,205 | ||||||
| 47 | Apache Corp. | 3,968 | ||||||
| 25 | Cabot Oil & Gas Corp. | 1,808 | ||||||
| 63 | Chesapeake Energy Corp. | 1,277 | ||||||
| 234 | Chevron Corp. | 27,714 | ||||||
| 148 | ConocoPhillips | 8,934 | ||||||
| 28 | CONSOL Energy, Inc. | 748 | ||||||
| 45 | Denbury Resources, Inc. (a) | 781 | ||||||
| 46 | Devon Energy Corp. | 2,366 | ||||||
| 33 | EOG Resources, Inc. | 4,327 | ||||||
| 18 | EQT Corp. | 1,442 | ||||||
| 537 | Exxon Mobil Corp. | 48,521 | ||||||
| 36 | Hess Corp. | 2,399 | ||||||
| 76 | Kinder Morgan, Inc. | 2,911 | ||||||
| 86 | Marathon Oil Corp. | 2,960 | ||||||
| 39 | Marathon Petroleum Corp. | 2,788 | ||||||
| 22 | Murphy Oil Corp. | 1,334 | ||||||
| 16 | Newfield Exploration Co. (a) | 391 | ||||||
| 43 | Noble Energy, Inc. | 2,604 | ||||||
| 97 | Occidental Petroleum Corp. | 8,683 | ||||||
| 33 | Peabody Energy Corp. | 477 | ||||||
| 75 | Phillips 66 | 4,406 | ||||||
| 16 | Pioneer Natural Resources Co. | 2,388 | ||||||
| 22 | QEP Resources, Inc. | 602 | ||||||
| 20 | Range Resources Corp. | 1,523 | ||||||
| 42 | Southwestern Energy Co. (a) | 1,551 | ||||||
| 81 | Spectra Energy Corp. | 2,785 | ||||||
| 16 | Tesoro Corp. | 858 | ||||||
| 66 | Valero Energy Corp. | 2,290 | ||||||
| 82 | Williams Cos., Inc. (The) | 2,677 | ||||||
| 24 | WPX Energy, Inc. (a) | 458 | ||||||
|
| |||||||
| 151,176 | ||||||||
|
| |||||||
Total Energy | 182,045 | |||||||
|
| |||||||
Financials — 16.5% | ||||||||
Capital Markets — 2.1% | ||||||||
| 24 | Ameriprise Financial, Inc. | 1,969 | ||||||
| 140 | Bank of New York Mellon Corp. (The) | 3,932 | ||||||
| 15 | BlackRock, Inc. | 3,873 | ||||||
| 133 | Charles Schwab Corp. (The) | 2,823 | ||||||
| 35 | E*TRADE Financial Corp. (a) | 439 | ||||||
| 17 | Franklin Resources, Inc. | 2,270 | ||||||
| SHARES | SECURITY DESCRIPTION | VALUE($) | ||||||
Capital Markets — Continued | ||||||||
| 52 | Goldman Sachs Group, Inc. (The) | 7,873 | ||||||
| 54 | Invesco Ltd. | 1,708 | ||||||
| 13 | Legg Mason, Inc. | 418 | ||||||
| 166 | Morgan Stanley | 4,048 | ||||||
| 26 | Northern Trust Corp. | 1,522 | ||||||
| 55 | State Street Corp. | 3,592 | ||||||
| 31 | T. Rowe Price Group, Inc. | 2,285 | ||||||
|
| |||||||
| 36,752 | ||||||||
|
| |||||||
Commercial Banks — 2.9% | ||||||||
| 85 | BB&T Corp. | 2,871 | ||||||
| 23 | Comerica, Inc. | 898 | ||||||
| 106 | Fifth Third Bancorp | 1,907 | ||||||
| 101 | Huntington Bancshares, Inc. | 798 | ||||||
| 111 | KeyCorp | 1,227 | ||||||
| 15 | M&T Bank Corp. | 1,637 | ||||||
| 64 | PNC Financial Services Group, Inc. (The) | 4,663 | ||||||
| 171 | Regions Financial Corp. | 1,627 | ||||||
| 65 | SunTrust Banks, Inc. | 2,055 | ||||||
| 223 | U.S. Bancorp | 8,076 | ||||||
| 595 | Wells Fargo & Co. | 24,552 | ||||||
| 22 | Zions Bancorporation | 643 | ||||||
|
| |||||||
| 50,954 | ||||||||
|
| |||||||
Consumer Finance — 1.0% | ||||||||
| 115 | American Express Co. | 8,631 | ||||||
| 71 | Capital One Financial Corp. | 4,432 | ||||||
| 59 | Discover Financial Services | 2,822 | ||||||
| 54 | SLM Corp. | 1,226 | ||||||
|
| |||||||
| 17,111 | ||||||||
|
| |||||||
Diversified Financial Services — 3.9% | ||||||||
| 1,302 | Bank of America Corp. | 16,745 | ||||||
| 368 | Citigroup, Inc. | 17,630 | ||||||
| 37 | CME Group, Inc. | 2,819 | ||||||
| 9 | IntercontinentalExchange, Inc. (a) | 1,562 | ||||||
| 457 | JPMorgan Chase & Co. (q) | 24,099 | ||||||
| 36 | Leucadia National Corp. | 935 | ||||||
| 33 | McGraw Hill Financial, Inc. | 1,761 | ||||||
| 23 | Moody’s Corp. | 1,427 | ||||||
| 14 | NASDAQ OMX Group, Inc. (The) | 466 | ||||||
| 29 | NYSE Euronext | 1,215 | ||||||
|
| |||||||
| 68,659 | ||||||||
|
| |||||||
Insurance — 4.4% | ||||||||
| 41 | ACE Ltd., (Switzerland) | 3,676 | ||||||
| 56 | Aflac, Inc. | 3,273 | ||||||
| 57 | Allstate Corp. (The) | 2,724 | ||||||
SEE NOTES TO FINANCIAL STATEMENTS.
| JUNE 30, 2013 | J.P. MORGAN EQUITY FUNDS | 9 | ||||||
Table of Contents
JPMorgan Equity Index Fund
SCHEDULE OF PORTFOLIO INVESTMENTS
AS OF JUNE 30, 2013 (continued)
(Amounts in thousands)
| SHARES | SECURITY DESCRIPTION | VALUE($) | ||||||
| Common Stocks — Continued | |||||||
Insurance — Continued | ||||||||
| 178 | American International Group, Inc. (a) | 7,971 | ||||||
| 37 | Aon plc, (United Kingdom) | 2,403 | ||||||
| 9 | Assurant, Inc. | 473 | ||||||
| 220 | Berkshire Hathaway, Inc., Class B (a) | 24,660 | ||||||
| 31 | Chubb Corp. (The) | 2,650 | ||||||
| 18 | Cincinnati Financial Corp. | 815 | ||||||
| 60 | Genworth Financial, Inc., Class A (a) | 679 | ||||||
| 55 | Hartford Financial Services Group, Inc. | 1,702 | ||||||
| 32 | Lincoln National Corp. | 1,183 | ||||||
| 37 | Loews Corp. | 1,648 | ||||||
| 66 | Marsh & McLennan Cos., Inc. | 2,654 | ||||||
| 132 | MetLife, Inc. | 6,052 | ||||||
| 33 | Principal Financial Group, Inc. | 1,248 | ||||||
| 67 | Progressive Corp. (The) | 1,701 | ||||||
| 56 | Prudential Financial, Inc. | 4,110 | ||||||
| 11 | Torchmark Corp. | 728 | ||||||
| 45 | Travelers Cos., Inc. (The) | 3,633 | ||||||
| 32 | Unum Group | 947 | ||||||
| 35 | XL Group plc, (Ireland) | 1,061 | ||||||
|
| |||||||
| 75,991 | ||||||||
|
| |||||||
Real Estate Investment Trusts (REITs) — 2.1% | ||||||||
| 48 | American Tower Corp. | 3,495 | ||||||
| 18 | Apartment Investment & Management Co., Class A | 529 | ||||||
| 15 | AvalonBay Communities, Inc. | 1,982 | ||||||
| 18 | Boston Properties, Inc. | 1,933 | ||||||
| 39 | Equity Residential | 2,248 | ||||||
| 55 | HCP, Inc. | 2,494 | ||||||
| 34 | Health Care REIT, Inc. | 2,303 | ||||||
| 90 | Host Hotels & Resorts, Inc. | 1,517 | ||||||
| 49 | Kimco Realty Corp. | 1,058 | ||||||
| 17 | Macerich Co. (The) | 1,013 | ||||||
| 20 | Plum Creek Timber Co., Inc. | 918 | ||||||
| 60 | Prologis, Inc. | 2,270 | ||||||
| 17 | Public Storage | 2,673 | ||||||
| 38 | Simon Property Group, Inc. | 5,929 | ||||||
| 35 | Ventas, Inc. | 2,460 | ||||||
| 21 | Vornado Realty Trust | 1,702 | ||||||
| 70 | Weyerhaeuser Co. | 1,987 | ||||||
|
| |||||||
| 36,511 | ||||||||
|
| |||||||
Real Estate Management & Development — 0.0% (g) |
| |||||||
| 37 | CBRE Group, Inc., Class A (a) | 857 | ||||||
|
| |||||||
Thrifts & Mortgage Finance — 0.1% | ||||||||
| 57 | Hudson City Bancorp, Inc. | 526 | ||||||
| SHARES | SECURITY DESCRIPTION | VALUE($) | ||||||
Thrifts & Mortgage Finance — Continued | ||||||||
| 41 | People’s United Financial, Inc. | 610 | ||||||
|
| |||||||
| 1,136 | ||||||||
|
| |||||||
Total Financials | 287,971 | |||||||
|
| |||||||
Health Care — 12.6% | ||||||||
Biotechnology — 2.0% | ||||||||
| 24 | Alexion Pharmaceuticals, Inc. (a) | 2,174 | ||||||
| 91 | Amgen, Inc. | 8,937 | ||||||
| 29 | Biogen Idec, Inc. (a) | 6,170 | ||||||
| 50 | Celgene Corp. (a) | 5,890 | ||||||
| 184 | Gilead Sciences, Inc. (a) | 9,435 | ||||||
| 9 | Regeneron Pharmaceuticals, Inc. (a) | 2,074 | ||||||
|
| |||||||
| 34,680 | ||||||||
|
| |||||||
Health Care Equipment & Supplies — 2.1% | ||||||||
| 188 | Abbott Laboratories | 6,567 | ||||||
| 65 | Baxter International, Inc. | 4,534 | ||||||
| 23 | Becton, Dickinson & Co. | 2,319 | ||||||
| 163 | Boston Scientific Corp. (a) | 1,511 | ||||||
| 9 | C.R. Bard, Inc. | 982 | ||||||
| 27 | CareFusion Corp. (a) | 978 | ||||||
| 57 | Covidien plc, (Ireland) | 3,571 | ||||||
| 17 | DENTSPLY International, Inc. | 709 | ||||||
| 14 | Edwards Lifesciences Corp. (a) | 917 | ||||||
| 5 | Intuitive Surgical, Inc. (a) | 2,457 | ||||||
| 122 | Medtronic, Inc. | 6,287 | ||||||
| 34 | St. Jude Medical, Inc. | 1,562 | ||||||
| 35 | Stryker Corp. | 2,245 | ||||||
| 13 | Varian Medical Systems, Inc. (a) | 883 | ||||||
| 20 | Zimmer Holdings, Inc. | 1,524 | ||||||
|
| |||||||
| 37,046 | ||||||||
|
| |||||||
Health Care Providers & Services — 2.0% | ||||||||
| 46 | Aetna, Inc. | 2,903 | ||||||
| 28 | AmerisourceBergen Corp. | 1,557 | ||||||
| 41 | Cardinal Health, Inc. | 1,949 | ||||||
| 34 | Cigna Corp. | 2,498 | ||||||
| 10 | DaVita HealthCare Partners, Inc. (a) | 1,235 | ||||||
| 99 | Express Scripts Holding Co. (a) | 6,082 | ||||||
| 19 | Humana, Inc. | 1,605 | ||||||
| 11 | Laboratory Corp. of America Holdings (a) | 1,124 | ||||||
| 29 | McKesson Corp. | 3,295 | ||||||
| 10 | Patterson Cos., Inc. | 380 | ||||||
| 19 | Quest Diagnostics, Inc. | 1,157 | ||||||
| 13 | Tenet Healthcare Corp. (a) | 576 | ||||||
| 123 | UnitedHealth Group, Inc. | 8,067 | ||||||
| 36 | WellPoint, Inc. | 2,969 | ||||||
|
| |||||||
| 35,397 | ||||||||
|
| |||||||
SEE NOTES TO FINANCIAL STATEMENTS.
| 10 | J.P. MORGAN EQUITY FUNDS | JUNE 30, 2013 | ||||
Table of Contents
| SHARES | SECURITY DESCRIPTION | VALUE($) | ||||||
| Common Stocks — Continued | |||||||
Health Care Technology — 0.1% |
| |||||||
| 18 | Cerner Corp. (a) | 1,696 | ||||||
|
| |||||||
Life Sciences Tools & Services — 0.5% | ||||||||
| 42 | Agilent Technologies, Inc. | 1,779 | ||||||
| 21 | Life Technologies Corp. (a) | 1,540 | ||||||
| 14 | PerkinElmer, Inc. | 439 | ||||||
| 43 | Thermo Fisher Scientific, Inc. | 3,669 | ||||||
| 10 | Waters Corp. (a) | 1,036 | ||||||
|
| |||||||
| 8,463 | ||||||||
|
| |||||||
Pharmaceuticals — 5.9% |
| |||||||
| 191 | AbbVie, Inc. | 7,908 | ||||||
| 15 | Actavis, Inc. (a) | 1,947 | ||||||
| 36 | Allergan, Inc. | 3,016 | ||||||
| 198 | Bristol-Myers Squibb Co. | 8,866 | ||||||
| 120 | Eli Lilly & Co. | 5,881 | ||||||
| 28 | Forest Laboratories, Inc. (a) | 1,162 | ||||||
| 20 | Hospira, Inc. (a) | 766 | ||||||
| 339 | Johnson & Johnson | 29,129 | ||||||
| 365 | Merck & Co., Inc. | 16,941 | ||||||
| 46 | Mylan, Inc. (a) | 1,428 | ||||||
| 11 | Perrigo Co. | 1,292 | ||||||
| 806 | Pfizer, Inc. | 22,576 | ||||||
| 60 | Zoetis, Inc. | 1,865 | ||||||
|
| |||||||
| 102,777 | ||||||||
|
| |||||||
Total Health Care | 220,059 | |||||||
|
| |||||||
Industrials — 10.2% |
| |||||||
Aerospace & Defense — 2.5% |
| |||||||
| 82 | Boeing Co. (The) | 8,448 | ||||||
| 40 | General Dynamics Corp. | 3,141 | ||||||
| 95 | Honeywell International, Inc. | 7,540 | ||||||
| 11 | L-3 Communications Holdings, Inc. | 932 | ||||||
| 32 | Lockheed Martin Corp. | 3,484 | ||||||
| 28 | Northrop Grumman Corp. | 2,352 | ||||||
| 18 | Precision Castparts Corp. | 3,994 | ||||||
| 39 | Raytheon Co. | 2,592 | ||||||
| 16 | Rockwell Collins, Inc. | 1,039 | ||||||
| 34 | Textron, Inc. | 874 | ||||||
| 102 | United Technologies Corp. | 9,494 | ||||||
|
| |||||||
| 43,890 | ||||||||
|
| |||||||
Air Freight & Logistics — 0.7% |
| |||||||
| 19 | C.H. Robinson Worldwide, Inc. | 1,092 | ||||||
| 25 | Expeditors International of Washington, Inc. | 948 | ||||||
| 36 | FedEx Corp. | 3,509 | ||||||
| 86 | United Parcel Service, Inc., Class B | 7,421 | ||||||
|
| |||||||
| 12,970 | ||||||||
|
| |||||||
| SHARES | SECURITY DESCRIPTION | VALUE($) | ||||||
Airlines — 0.1% |
| |||||||
| 87 | Southwest Airlines Co. | 1,125 | ||||||
|
| |||||||
Building Products — 0.1% |
| |||||||
| 43 | Masco Corp. | 840 | ||||||
|
| |||||||
Commercial Services & Supplies — 0.5% |
| |||||||
| 26 | ADT Corp. (The) (a) | 1,053 | ||||||
| 12 | Avery Dennison Corp. | 514 | ||||||
| 13 | Cintas Corp. | 573 | ||||||
| 20 | Iron Mountain, Inc. | 539 | ||||||
| 24 | Pitney Bowes, Inc. | 357 | ||||||
| 36 | Republic Services, Inc. | 1,217 | ||||||
| 10 | Stericycle, Inc. (a) | 1,151 | ||||||
| 56 | Tyco International Ltd., (Switzerland) | 1,847 | ||||||
| 53 | Waste Management, Inc. | 2,138 | ||||||
|
| |||||||
| 9,389 | ||||||||
|
| |||||||
Construction & Engineering — 0.2% |
| |||||||
| 20 | Fluor Corp. | 1,167 | ||||||
| 16 | Jacobs Engineering Group, Inc. (a) | 871 | ||||||
| 26 | Quanta Services, Inc. (a) | 680 | ||||||
|
| |||||||
| 2,718 | ||||||||
|
| |||||||
Electrical Equipment — 0.7% |
| |||||||
| 57 | Eaton Corp. plc, (Ireland) | 3,761 | ||||||
| 87 | Emerson Electric Co. | 4,735 | ||||||
| 17 | Rockwell Automation, Inc. | 1,402 | ||||||
| 12 | Roper Industries, Inc. | 1,486 | ||||||
|
| |||||||
| 11,384 | ||||||||
|
| |||||||
Industrial Conglomerates — 2.4% |
| |||||||
| 77 | 3M Co. | 8,386 | ||||||
| 70 | Danaher Corp. | 4,449 | ||||||
| 1,249 | General Electric Co. (k) | 28,962 | ||||||
|
| |||||||
| 41,797 | ||||||||
|
| |||||||
Machinery — 1.8% |
| |||||||
| 79 | Caterpillar, Inc. | 6,551 | ||||||
| 21 | Cummins, Inc. | 2,312 | ||||||
| 47 | Deere & Co. | 3,808 | ||||||
| 21 | Dover Corp. | 1,605 | ||||||
| 52 | Flowserve Corp. | 2,798 | ||||||
| 50 | Illinois Tool Works, Inc. | 3,462 | ||||||
| 34 | Ingersoll-Rand plc, (Ireland) | 1,864 | ||||||
| 13 | Joy Global, Inc. | 623 | ||||||
| 43 | PACCAR, Inc. | 2,292 | ||||||
| 13 | Pall Corp. | 895 | ||||||
| 18 | Parker Hannifin Corp. | 1,720 | ||||||
| 25 | Pentair Ltd., (Switzerland) | 1,423 | ||||||
SEE NOTES TO FINANCIAL STATEMENTS.
| JUNE 30, 2013 | J.P. MORGAN EQUITY FUNDS | 11 | ||||||
Table of Contents
JPMorgan Equity Index Fund
SCHEDULE OF PORTFOLIO INVESTMENTS
AS OF JUNE 30, 2013 (continued)
(Amounts in thousands)
| SHARES | SECURITY DESCRIPTION | VALUE($) | ||||||
| Common Stocks — Continued | |||||||
Machinery — Continued |
| |||||||
| 7 | Snap-on, Inc. | 629 | ||||||
| 20 | Stanley Black & Decker, Inc. | 1,512 | ||||||
| 22 | Xylem, Inc. | 603 | ||||||
|
| |||||||
| 32,097 | ||||||||
|
| |||||||
Professional Services — 0.1% |
| |||||||
| 5 | Dun & Bradstreet Corp. (The) | 470 | ||||||
| 15 | Equifax, Inc. | 859 | ||||||
| 17 | Robert Half International, Inc. | 560 | ||||||
|
| |||||||
| 1,889 | ||||||||
|
| |||||||
Road & Rail — 0.9% |
| |||||||
| 123 | CSX Corp. | 2,862 | ||||||
| 13 | Kansas City Southern | 1,410 | ||||||
| 38 | Norfolk Southern Corp. | 2,765 | ||||||
| 6 | Ryder System, Inc. | 381 | ||||||
| 56 | Union Pacific Corp. | 8,698 | ||||||
|
| |||||||
| 16,116 | ||||||||
|
| |||||||
Trading Companies & Distributors — 0.2% |
| |||||||
| 33 | Fastenal Co. | 1,495 | ||||||
| 7 | W.W. Grainger, Inc. | 1,822 | ||||||
|
| |||||||
| 3,317 | ||||||||
|
| |||||||
Total Industrials | 177,532 | |||||||
|
| |||||||
Information Technology — 17.6% |
| |||||||
Communications Equipment — 1.9% |
| |||||||
| 645 | Cisco Systems, Inc. | 15,692 | ||||||
| 10 | F5 Networks, Inc. (a) | 655 | ||||||
| 13 | Harris Corp. | 652 | ||||||
| 29 | JDS Uniphase Corp. (a) | 411 | ||||||
| 61 | Juniper Networks, Inc. (a) | 1,181 | ||||||
| 33 | Motorola Solutions, Inc. | 1,894 | ||||||
| 209 | QUALCOMM, Inc. | 12,746 | ||||||
|
| |||||||
| 33,231 | ||||||||
|
| |||||||
Computers & Peripherals — 3.8% |
| |||||||
| 113 | Apple, Inc. | 44,904 | ||||||
| 177 | Dell, Inc. | 2,366 | ||||||
| 254 | EMC Corp. | 5,993 | ||||||
| 233 | Hewlett-Packard Co. | 5,777 | ||||||
| 44 | NetApp, Inc. (a) | 1,645 | ||||||
| 29 | SanDisk Corp. (a) | 1,796 | ||||||
| 39 | Seagate Technology plc, (Ireland) | 1,728 | ||||||
| 26 | Western Digital Corp. | 1,595 | ||||||
|
| |||||||
| 65,804 | ||||||||
|
| |||||||
| SHARES | SECURITY DESCRIPTION | VALUE($) | ||||||
Electronic Equipment, Instruments & Components — 0.4% |
| |||||||
| 19 | Amphenol Corp., Class A | 1,505 | ||||||
| 178 | Corning, Inc. | 2,535 | ||||||
| 17 | FLIR Systems, Inc. | 462 | ||||||
| 22 | Jabil Circuit, Inc. | 454 | ||||||
| 17 | Molex, Inc. | 491 | ||||||
| 50 | TE Connectivity Ltd., (Switzerland) | 2,285 | ||||||
|
| |||||||
| 7,732 | ||||||||
|
| |||||||
Internet Software & Services — 2.3% |
| |||||||
| 21 | Akamai Technologies, Inc. (a) | 913 | ||||||
| 141 | eBay, Inc. (a) | 7,296 | ||||||
| 32 | Google, Inc., Class A (a) | 28,574 | ||||||
| 18 | VeriSign, Inc. (a) | 813 | ||||||
| 115 | Yahoo!, Inc. (a) | 2,890 | ||||||
|
| |||||||
| 40,486 | ||||||||
|
| |||||||
IT Services — 3.6% |
| |||||||
| 79 | Accenture plc, (Ireland), Class A | 5,650 | ||||||
| 59 | Automatic Data Processing, Inc. | 4,036 | ||||||
| 36 | Cognizant Technology Solutions Corp., Class A (a) | 2,281 | ||||||
| 18 | Computer Sciences Corp. | 794 | ||||||
| 35 | Fidelity National Information Services, Inc. | 1,517 | ||||||
| 16 | Fiserv, Inc. (a) | 1,406 | ||||||
| 126 | International Business Machines Corp. | 24,058 | ||||||
| 13 | MasterCard, Inc., Class A | 7,254 | ||||||
| 39 | Paychex, Inc. | 1,429 | ||||||
| 34 | SAIC, Inc. | 478 | ||||||
| 20 | Teradata Corp. (a) | 991 | ||||||
| 19 | Total System Services, Inc. | 476 | ||||||
| 61 | Visa, Inc., Class A | 11,186 | ||||||
| 67 | Western Union Co. (The) | 1,151 | ||||||
|
| |||||||
| 62,707 | ||||||||
|
| |||||||
Office Electronics — 0.1% |
| |||||||
| 148 | Xerox Corp. | 1,345 | ||||||
|
| |||||||
Semiconductors & Semiconductor Equipment — 2.1% |
| |||||||
| 73 | Advanced Micro Devices, Inc. (a) | 299 | ||||||
| 39 | Altera Corp. | 1,276 | ||||||
| 37 | Analog Devices, Inc. | 1,677 | ||||||
| 145 | Applied Materials, Inc. | 2,164 | ||||||
| 63 | Broadcom Corp., Class A | 2,142 | ||||||
| 8 | First Solar, Inc. (a) | 359 | ||||||
| 600 | Intel Corp. | 14,542 | ||||||
| 20 | KLA-Tencor Corp. | 1,117 | ||||||
| 20 | Lam Research Corp. (a) | 868 | ||||||
| 28 | Linear Technology Corp. | 1,038 | ||||||
SEE NOTES TO FINANCIAL STATEMENTS.
| 12 | J.P. MORGAN EQUITY FUNDS | JUNE 30, 2013 | ||||
Table of Contents
| SHARES | SECURITY DESCRIPTION | VALUE($) | ||||||
| Common Stocks — Continued | |||||||
Semiconductors & Semiconductor Equipment — Continued |
| |||||||
| 66 | LSI Corp. (a) | 474 | ||||||
| 24 | Microchip Technology, Inc. | 887 | ||||||
| 124 | Micron Technology, Inc. (a) | 1,783 | ||||||
| 70 | NVIDIA Corp. | 979 | ||||||
| 23 | Teradyne, Inc. (a) | 404 | ||||||
| 134 | Texas Instruments, Inc. | 4,671 | ||||||
| 32 | Xilinx, Inc. | 1,262 | ||||||
|
| |||||||
| 35,942 | ||||||||
|
| |||||||
Software — 3.4% | ||||||||
| 61 | Adobe Systems, Inc. (a) | 2,762 | ||||||
| 27 | Autodesk, Inc. (a) | 921 | ||||||
| 16 | BMC Software, Inc. (a) | 722 | ||||||
| 40 | CA, Inc. | 1,145 | ||||||
| 23 | Citrix Systems, Inc. (a) | 1,364 | ||||||
| 37 | Electronic Arts, Inc. (a) | 840 | ||||||
| 34 | Intuit, Inc. | 2,057 | ||||||
| 908 | Microsoft Corp. | 31,346 | ||||||
| 444 | Oracle Corp. | 13,633 | ||||||
| 23 | Red Hat, Inc. (a) | 1,095 | ||||||
| 66 | Salesforce.com, Inc. (a) | 2,503 | ||||||
| 84 | Symantec Corp. | 1,891 | ||||||
|
| |||||||
| 60,279 | ||||||||
|
| |||||||
Total Information Technology | 307,526 | |||||||
|
| |||||||
Materials — 3.3% | ||||||||
Chemicals — 2.4% | ||||||||
| 25 | Air Products & Chemicals, Inc. | 2,304 | ||||||
| 8 | Airgas, Inc. | 760 | ||||||
| 7 | CF Industries Holdings, Inc. | 1,228 | ||||||
| 146 | Dow Chemical Co. (The) | 4,700 | ||||||
| 111 | E.I. du Pont de Nemours & Co. | 5,837 | ||||||
| 19 | Eastman Chemical Co. | 1,311 | ||||||
| 32 | Ecolab, Inc. | 2,741 | ||||||
| 16 | FMC Corp. | 1,004 | ||||||
| 10 | International Flavors & Fragrances, Inc. | 739 | ||||||
| 46 | LyondellBasell Industries N.V., (Netherlands), Class A | 3,040 | ||||||
| 64 | Monsanto Co. | 6,370 | ||||||
| 33 | Mosaic Co. (The) | 1,799 | ||||||
| 17 | PPG Industries, Inc. | 2,522 | ||||||
| 36 | Praxair, Inc. | 4,114 | ||||||
| 10 | Sherwin-Williams Co. (The) | 1,826 | ||||||
| 15 | Sigma-Aldrich Corp. | 1,168 | ||||||
|
| |||||||
| 41,463 | ||||||||
|
| |||||||
| SHARES | SECURITY DESCRIPTION | VALUE($) | ||||||
Construction Materials — 0.1% | ||||||||
| 16 | Vulcan Materials Co. | 760 | ||||||
|
| |||||||
Containers & Packaging — 0.2% | ||||||||
| 18 | Ball Corp. | 746 | ||||||
| 12 | Bemis Co., Inc. | 486 | ||||||
| 21 | MeadWestvaco Corp. | 729 | ||||||
| 20 | Owens-Illinois, Inc. (a) | 552 | ||||||
| 24 | Sealed Air Corp. | 567 | ||||||
|
| |||||||
| 3,080 | ||||||||
|
| |||||||
Metals & Mining — 0.5% | ||||||||
| 129 | Alcoa, Inc. | 1,010 | ||||||
| 13 | Allegheny Technologies, Inc. | 343 | ||||||
| 18 | Cliffs Natural Resources, Inc. | 300 | ||||||
| 125 | Freeport-McMoRan Copper & Gold, Inc. | 3,462 | ||||||
| 60 | Newmont Mining Corp. | 1,799 | ||||||
| 38 | Nucor Corp. | 1,663 | ||||||
| 17 | United States Steel Corp. | 306 | ||||||
|
| |||||||
| 8,883 | ||||||||
|
| |||||||
Paper & Forest Products — 0.1% | ||||||||
| 54 | International Paper Co. | 2,381 | ||||||
|
| |||||||
Total Materials | 56,567 | |||||||
|
| |||||||
Telecommunication Services — 2.8% | ||||||||
Diversified Telecommunication Services — 2.5% |
| |||||||
| 650 | AT&T, Inc. | 23,003 | ||||||
| 74 | CenturyLink, Inc. | 2,600 | ||||||
| 121 | Frontier Communications Corp. | 488 | ||||||
| 346 | Verizon Communications, Inc. | 17,396 | ||||||
| 72 | Windstream Corp. | 552 | ||||||
|
| |||||||
| 44,039 | ||||||||
|
| |||||||
Wireless Telecommunication Services — 0.3% | ||||||||
| 35 | Crown Castle International Corp. (a) | 2,563 | ||||||
| 365 | Sprint Nextel Corp. (a) | 2,559 | ||||||
|
| |||||||
| 5,122 | ||||||||
|
| |||||||
Total Telecommunication Services | 49,161 | |||||||
|
| |||||||
Utilities — 3.3% | ||||||||
Electric Utilities — 1.9% | ||||||||
| 59 | American Electric Power Co., Inc. | 2,629 | ||||||
| 85 | Duke Energy Corp. | 5,754 | ||||||
| 39 | Edison International | 1,895 | ||||||
| 22 | Entergy Corp. | 1,499 | ||||||
| 103 | Exelon Corp. | 3,192 | ||||||
| 51 | FirstEnergy Corp. | 1,886 | ||||||
| 51 | NextEra Energy, Inc. | 4,179 | ||||||
SEE NOTES TO FINANCIAL STATEMENTS.
| JUNE 30, 2013 | J.P. MORGAN EQUITY FUNDS | 13 | ||||||
Table of Contents
JPMorgan Equity Index Fund
SCHEDULE OF PORTFOLIO INVESTMENTS
AS OF JUNE 30, 2013 (continued)
(Amounts in thousands)
| SHARES | SECURITY DESCRIPTION | VALUE($) | ||||||
| Common Stocks — Continued | |||||||
Electric Utilities — Continued | ||||||||
| 38 | Northeast Utilities | 1,597 | ||||||
| 30 | Pepco Holdings, Inc. | 605 | ||||||
| 13 | Pinnacle West Capital Corp. | 737 | ||||||
| 72 | PPL Corp. | 2,165 | ||||||
| 105 | Southern Co. (The) | 4,639 | ||||||
| 60 | Xcel Energy, Inc. | 1,702 | ||||||
|
| |||||||
| 32,479 | ||||||||
|
| |||||||
Gas Utilities — 0.1% | ||||||||
| 14 | AGL Resources, Inc. | 612 | ||||||
| 25 | ONEOK, Inc. | 1,028 | ||||||
|
| |||||||
| 1,640 | ||||||||
|
| |||||||
Independent Power Producers & Energy Traders — 0.1% |
| |||||||
| 75 | AES Corp. | 898 | ||||||
| 39 | NRG Energy, Inc. | 1,040 | ||||||
|
| |||||||
| 1,938 | ||||||||
|
| |||||||
Multi-Utilities — 1.2% | ||||||||
| 29 | Ameren Corp. | 1,009 | ||||||
| 52 | CenterPoint Energy, Inc. | 1,216 | ||||||
| 32 | CMS Energy Corp. | 872 | ||||||
| 35 | Consolidated Edison, Inc. | 2,063 | ||||||
| 70 | Dominion Resources, Inc. | 3,965 | ||||||
| 21 | DTE Energy Co. | 1,408 | ||||||
| 10 | Integrys Energy Group, Inc. | 559 | ||||||
| SHARES | SECURITY DESCRIPTION | VALUE($) | ||||||
Multi-Utilities — Continued | ||||||||
| 38 | NiSource, Inc. | 1,079 | ||||||
| 53 | PG&E Corp. | 2,442 | ||||||
| 61 | Public Service Enterprise Group, Inc. | 1,996 | ||||||
| 17 | SCANA Corp. | 827 | ||||||
| 27 | Sempra Energy | 2,226 | ||||||
| 25 | TECO Energy, Inc. | 425 | ||||||
| 28 | Wisconsin Energy Corp. | 1,132 | ||||||
|
| |||||||
| 21,219 | ||||||||
|
| |||||||
Total Utilities | 57,276 | |||||||
|
| |||||||
Total Common Stocks | 1,730,250 | |||||||
|
| |||||||
| Short-Term Investment — 0.9% | |||||||
Investment Company — 0.9% | ||||||||
| 16,563 | JPMorgan Liquid Assets Money Market Fund, Institutional Class Shares, 0.030% (b) (l) (m) | 16,563 | ||||||
|
| |||||||
Total Investments — 100.1% | 1,746,813 | |||||||
Liabilities in Excess of | (2,017 | ) | ||||||
|
| |||||||
NET ASSETS — 100.0% | $ | 1,744,796 | ||||||
|
| |||||||
Percentages indicated are based on net assets.
| Futures Contracts | ||||||||||||||||
| NUMBER OF CONTRACTS | DESCRIPTION | EXPIRATION DATE | NOTIONAL VALUE AT 06/30/13 | NET UNREALIZED APPRECIATION (DEPRECIATION) | ||||||||||||
Long Futures Outstanding | ||||||||||||||||
| 205 | E-mini S&P 500 | 09/20/13 | $ | 16,393 | $ | (53 | ) | |||||||||
|
| |||||||||||||||
SEE NOTES TO FINANCIAL STATEMENTS.
| 14 | J.P. MORGAN EQUITY FUNDS | JUNE 30, 2013 | ||||
Table of Contents
JPMorgan Market Expansion Enhanced Index Fund
(formerly JPMorgan Market Expansion Index Fund)
SCHEDULE OF PORTFOLIO INVESTMENTS
AS OF JUNE 30, 2013
(Amounts in thousands)
| SHARES | SECURITY DESCRIPTION | VALUE($) | ||||||
| Common Stocks — 98.2% | |||||||
Consumer Discretionary — 13.7% | ||||||||
Auto Components — 0.2% | ||||||||
| 103 | Gentex Corp. | 2,367 | ||||||
| 14 | Standard Motor Products, Inc. | 472 | ||||||
| 16 | Superior Industries International, Inc. | 284 | ||||||
|
| |||||||
| 3,123 | ||||||||
|
| |||||||
Automobiles — 0.1% | ||||||||
| 31 | Thor Industries, Inc. | 1,517 | ||||||
| 20 | Winnebago Industries, Inc. (a) | 422 | ||||||
|
| |||||||
| 1,939 | ||||||||
|
| |||||||
Distributors — 0.6% | ||||||||
| 171 | LKQ Corp. (a) | 4,411 | ||||||
| 67 | Pool Corp. | 3,513 | ||||||
| 12 | VOXX International Corp. (a) | 150 | ||||||
|
| |||||||
| 8,074 | ||||||||
|
| |||||||
Diversified Consumer Services — 0.9% | ||||||||
| 14 | American Public Education, Inc. (a) | 521 | ||||||
| 11 | Capella Education Co. (a) | 448 | ||||||
| 72 | Coinstar, Inc. (a) | 4,241 | ||||||
| 29 | DeVry, Inc. | 903 | ||||||
| 49 | Hillenbrand, Inc. | 1,164 | ||||||
| 2 | ITT Educational Services, Inc. (a) | 53 | ||||||
| 12 | Lincoln Educational Services Corp. | 63 | ||||||
| 20 | Matthews International Corp., Class A | 749 | ||||||
| 274 | Service Corp. International | 4,947 | ||||||
|
| |||||||
| 13,089 | ||||||||
|
| |||||||
Hotels, Restaurants & Leisure — 2.2% | ||||||||
| 16 | Bally Technologies, Inc. (a) | 882 | ||||||
| 1 | Biglari Holdings, Inc. (a) | 421 | ||||||
| 21 | Bob Evans Farms, Inc. | 976 | ||||||
| 37 | Boyd Gaming Corp. (a) | 422 | ||||||
| 159 | Brinker International, Inc. | 6,268 | ||||||
| 14 | CEC Entertainment, Inc. | 578 | ||||||
| 21 | Cheesecake Factory, Inc. (The) | 863 | ||||||
| 56 | Cracker Barrel Old Country Store, Inc. | 5,275 | ||||||
| 1 | DineEquity, Inc. | 98 | ||||||
| 20 | International Speedway Corp., Class A | 643 | ||||||
| 28 | Interval Leisure Group, Inc. | 551 | ||||||
| 14 | Marcus Corp. | 178 | ||||||
| 52 | Marriott Vacations Worldwide Corp. (a) | 2,254 | ||||||
| 6 | Monarch Casino & Resort, Inc. (a) | 97 | ||||||
| 18 | Multimedia Games Holding Co., Inc. (a) | 481 | ||||||
| 18 | Panera Bread Co., Class A (a) | 3,301 | ||||||
| 13 | Papa John’s International, Inc. (a) | 840 | ||||||
| SHARES | SECURITY DESCRIPTION | VALUE($) | ||||||
Hotels, Restaurants & Leisure — Continued | ||||||||
| 9 | Red Robin Gourmet Burgers, Inc. (a) | 470 | ||||||
| 45 | Ruby Tuesday, Inc. (a) | 415 | ||||||
| 24 | Ruth’s Hospitality Group, Inc. | 294 | ||||||
| 48 | Scientific Games Corp., Class A (a) | 535 | ||||||
| 39 | SHFL Entertainment, Inc. (a) | 689 | ||||||
| 41 | Sonic Corp. (a) | 602 | ||||||
| 101 | Texas Roadhouse, Inc. | 2,531 | ||||||
| 75 | Wendy’s Co. (The) | 436 | ||||||
| 5 | WMS Industries, Inc. (a) | 131 | ||||||
|
| |||||||
| 30,231 | ||||||||
|
| |||||||
Household Durables — 2.4% | ||||||||
| 28 | American Greetings Corp., Class A | 502 | ||||||
| 7 | Blyth, Inc. | 103 | ||||||
| 22 | Helen of Troy Ltd., (Bermuda) (a) | 851 | ||||||
| 19 | iRobot Corp. (a) | 738 | ||||||
| 148 | Jarden Corp. (a) | 6,490 | ||||||
| 60 | KB Home | 1,178 | ||||||
| 36 | La-Z-Boy, Inc. | 732 | ||||||
| 77 | MDC Holdings, Inc. | 2,515 | ||||||
| 44 | Mohawk Industries, Inc. (a) | 4,929 | ||||||
| 5 | NVR, Inc. (a) | 4,969 | ||||||
| 99 | Ryland Group, Inc. (The) | 3,963 | ||||||
| 45 | Tempur Sealy International, Inc. (a) | 1,984 | ||||||
| 11 | Toll Brothers, Inc. (a) | 369 | ||||||
| 31 | Tupperware Brands Corp. | 2,421 | ||||||
| 88 | Universal Electronics, Inc. (a) | 2,473 | ||||||
|
| |||||||
| 34,217 | ||||||||
|
| |||||||
Internet & Catalog Retail — 0.1% | ||||||||
| 10 | Blue Nile, Inc. (a) | 364 | ||||||
| 20 | Nutrisystem, Inc. | 234 | ||||||
| 15 | PetMed Express, Inc. | 194 | ||||||
|
| |||||||
| 792 | ||||||||
|
| |||||||
Leisure Equipment & Products — 0.5% | ||||||||
| 9 | Arctic Cat, Inc. | 400 | ||||||
| 18 | JAKKS Pacific, Inc. | 207 | ||||||
| 38 | Polaris Industries, Inc. | 3,589 | ||||||
| 73 | Sturm Ruger & Co., Inc. | 3,510 | ||||||
|
| |||||||
| 7,706 | ||||||||
|
| |||||||
Media — 0.7% | ||||||||
| 41 | AMC Networks, Inc., Class A (a) | 2,702 | ||||||
| 12 | Arbitron, Inc. | 552 | ||||||
| 54 | Cinemark Holdings, Inc. | 1,514 | ||||||
| 22 | E.W. Scripps Co., Class A (a) | 335 | ||||||
SEE NOTES TO FINANCIAL STATEMENTS.
| JUNE 30, 2013 | J.P. MORGAN EQUITY FUNDS | 15 | ||||||
Table of Contents
JPMorgan Market Expansion Enhanced Index Fund
SCHEDULE OF PORTFOLIO INVESTMENTS
AS OF JUNE 30, 2013 (continued)
(Amounts in thousands)
| SHARES | SECURITY DESCRIPTION | VALUE($) | ||||||
| Common Stocks — Continued | |||||||
Media — Continued | ||||||||
| 145 | Harte-Hanks, Inc. | 1,244 | ||||||
| 3 | John Wiley & Sons, Inc., Class A | 127 | ||||||
| 99 | Live Nation Entertainment, Inc. (a) | 1,540 | ||||||
| 9 | Meredith Corp. | 408 | ||||||
| 17 | Scholastic Corp. | 511 | ||||||
| 29 | Valassis Communications, Inc. | 721 | ||||||
|
| |||||||
| 9,654 | ||||||||
|
| |||||||
Multiline Retail — 0.1% | ||||||||
| 41 | Big Lots, Inc. (a) | 1,287 | ||||||
| 26 | Fred’s, Inc., Class A | 410 | ||||||
| 29 | Tuesday Morning Corp. (a) | 301 | ||||||
|
| |||||||
| 1,998 | ||||||||
|
| |||||||
Specialty Retail — 4.3% | ||||||||
| 30 | Aaron’s, Inc. | 844 | ||||||
| 23 | Advance Auto Parts, Inc. | 1,865 | ||||||
| 9 | Aeropostale, Inc. (a) | 120 | ||||||
| 272 | American Eagle Outfitters, Inc. | 4,970 | ||||||
| 118 | ANN, Inc. (a) | 3,921 | ||||||
| 97 | Ascena Retail Group, Inc. (a) | 1,701 | ||||||
| 29 | Barnes & Noble, Inc. (a) | 456 | ||||||
| 21 | Big 5 Sporting Goods Corp. | 463 | ||||||
| 30 | Brown Shoe Co., Inc. | 646 | ||||||
| 30 | Buckle, Inc. (The) | 1,564 | ||||||
| 10 | Cabela’s, Inc. (a) | 618 | ||||||
| 22 | Cato Corp. (The), Class A | 538 | ||||||
| 270 | Chico’s FAS, Inc. | 4,607 | ||||||
| 6 | Children’s Place Retail Stores, Inc. (The) (a) | 342 | ||||||
| 25 | Christopher & Banks Corp. (a) | 167 | ||||||
| 8 | Coldwater Creek, Inc. (a) | 21 | ||||||
| 57 | Dick’s Sporting Goods, Inc. | 2,844 | ||||||
| 205 | Foot Locker, Inc. | 7,197 | ||||||
| 3 | Genesco, Inc. (a) | 232 | ||||||
| 16 | Group 1 Automotive, Inc. | 1,045 | ||||||
| 17 | Guess?, Inc. | 525 | ||||||
| 12 | Haverty Furniture Cos., Inc. | 282 | ||||||
| 45 | Hibbett Sports, Inc. (a) | 2,508 | ||||||
| 10 | Kirkland’s, Inc. (a) | 170 | ||||||
| 15 | Lithia Motors, Inc., Class A | 801 | ||||||
| 69 | Lumber Liquidators Holdings, Inc. (a) | 5,393 | ||||||
| 15 | MarineMax, Inc. (a) | 169 | ||||||
| 9 | Men’s Wearhouse, Inc. (The) | 340 | ||||||
| 491 | Office Depot, Inc. (a) | 1,902 | ||||||
| 59 | OfficeMax, Inc. | 606 | ||||||
| 35 | Pep Boys-Manny Moe & Jack (The) (a) | 406 | ||||||
| SHARES | SECURITY DESCRIPTION | VALUE($) | ||||||
Specialty Retail — Continued | ||||||||
| 44 | Rent-A-Center, Inc. | 1,636 | ||||||
| 11 | rue21, Inc. (a) | 452 | ||||||
| 16 | Signet Jewelers Ltd., (Bermuda) | 1,059 | ||||||
| 13 | Sonic Automotive, Inc., Class A | 277 | ||||||
| 22 | Stage Stores, Inc. | 508 | ||||||
| 18 | Stein Mart, Inc. | 239 | ||||||
| 16 | Tractor Supply Co. | 1,933 | ||||||
| 12 | Vitamin Shoppe, Inc. (a) | 517 | ||||||
| 103 | Williams-Sonoma, Inc. | 5,734 | ||||||
| 19 | Zale Corp. (a) | 173 | ||||||
|
| |||||||
| 59,791 | ||||||||
|
| |||||||
Textiles, Apparel & Luxury Goods — 1.6% | ||||||||
| 86 | Carter’s, Inc. | 6,400 | ||||||
| 87 | Crocs, Inc. (a) | 1,432 | ||||||
| 146 | Hanesbrands, Inc. | 7,485 | ||||||
| 17 | Iconix Brand Group, Inc. (a) | 504 | ||||||
| 16 | Maidenform Brands, Inc. (a) | 279 | ||||||
| 12 | Movado Group, Inc. | 413 | ||||||
| 8 | Perry Ellis International, Inc. | 160 | ||||||
| 27 | Skechers U.S.A., Inc., Class A (a) | 656 | ||||||
| 37 | Steven Madden Ltd. (a) | 1,793 | ||||||
| 17 | True Religion Apparel, Inc. | 551 | ||||||
| 42 | Under Armour, Inc., Class A (a) | 2,521 | ||||||
|
| |||||||
| 22,194 | ||||||||
|
| |||||||
Total Consumer Discretionary | 192,808 | |||||||
|
| |||||||
Consumer Staples — 3.9% | ||||||||
Beverages — 0.1% | ||||||||
| 6 | Boston Beer Co., Inc. (The), Class A (a) | 1,084 | ||||||
|
| |||||||
Food & Staples Retailing — 0.5% | ||||||||
| 13 | Andersons, Inc. (The) | 677 | ||||||
| 16 | Casey’s General Stores, Inc. | 936 | ||||||
| 9 | Harris Teeter Supermarkets, Inc. | 418 | ||||||
| 8 | Nash Finch Co. | 186 | ||||||
| 1,316 | Rite Aid Corp. (a) | 3,765 | ||||||
| 15 | Spartan Stores, Inc. | 275 | ||||||
| 143 | SUPERVALU, Inc. (a) | 887 | ||||||
|
| |||||||
| 7,144 | ||||||||
|
| |||||||
Food Products — 2.4% | ||||||||
| 8 | B&G Foods, Inc. | 271 | ||||||
| 8 | Calavo Growers, Inc. | 221 | ||||||
| 10 | Cal-Maine Foods, Inc. | 462 | ||||||
| 44 | Darling International, Inc. (a) | 813 | ||||||
| 15 | Diamond Foods, Inc. (a) | 311 | ||||||
SEE NOTES TO FINANCIAL STATEMENTS.
| 16 | J.P. MORGAN EQUITY FUNDS | JUNE 30, 2013 | ||||
Table of Contents
| SHARES | SECURITY DESCRIPTION | VALUE($) | ||||||
| Common Stocks — Continued | |||||||
Food Products — Continued | ||||||||
| 88 | Flowers Foods, Inc. | 1,943 | ||||||
| 99 | Green Mountain Coffee Roasters, Inc. (a) | 7,417 | ||||||
| 25 | Hain Celestial Group, Inc. (The) (a) | 1,608 | ||||||
| 72 | Hillshire Brands Co. | 2,398 | ||||||
| 63 | Ingredion, Inc. | 4,165 | ||||||
| 10 | J&J Snack Foods Corp. | 770 | ||||||
| 11 | Lancaster Colony Corp. | 891 | ||||||
| 17 | Post Holdings, Inc. (a) | 747 | ||||||
| 63 | Sanderson Farms, Inc. | 4,186 | ||||||
| 6 | Seneca Foods Corp., Class A (a) | 179 | ||||||
| 198 | Smithfield Foods, Inc. (a) | 6,469 | ||||||
| 33 | Snyders-Lance, Inc. | 925 | ||||||
| 19 | Tootsie Roll Industries, Inc. | 590 | ||||||
|
| |||||||
| 34,366 | ||||||||
|
| |||||||
Household Products — 0.7% | ||||||||
| 34 | Central Garden & Pet Co., Class A (a) | 233 | ||||||
| 85 | Church & Dwight Co., Inc. | 5,244 | ||||||
| 37 | Energizer Holdings, Inc. | 3,733 | ||||||
| 12 | WD-40 Co. | 627 | ||||||
|
| |||||||
| 9,837 | ||||||||
|
| |||||||
Personal Products — 0.1% | ||||||||
| 10 | Inter Parfums, Inc. | 296 | ||||||
| 10 | Medifast, Inc. (a) | 248 | ||||||
| 35 | Prestige Brands Holdings, Inc. (a) | 1,022 | ||||||
|
| |||||||
| 1,566 | ||||||||
|
| |||||||
Tobacco — 0.1% | ||||||||
| 59 | Alliance One International, Inc. (a) | 224 | ||||||
| 16 | Universal Corp. | 951 | ||||||
|
| |||||||
| 1,175 | ||||||||
|
| |||||||
Total Consumer Staples | 55,172 | |||||||
|
| |||||||
Energy — 4.7% | ||||||||
Energy Equipment & Services — 3.1% | ||||||||
| 29 | Atwood Oceanics, Inc. (a) | 1,507 | ||||||
| 22 | Basic Energy Services, Inc. (a) | 260 | ||||||
| 70 | Bristow Group, Inc. | 4,580 | ||||||
| 31 | C&J Energy Services, Inc. (a) | 606 | ||||||
| 15 | Dril-Quip, Inc. (a) | 1,364 | ||||||
| 15 | Era Group, Inc. (a) | 380 | ||||||
| 11 | Exterran Holdings, Inc. (a) | 300 | ||||||
| 9 | Geospace Technologies Corp. (a) | 594 | ||||||
| 9 | Gulf Island Fabrication, Inc. | 182 | ||||||
| 106 | Helix Energy Solutions Group, Inc. (a) | 2,442 | ||||||
| 52 | Hornbeck Offshore Services, Inc. (a) | 2,778 | ||||||
| SHARES | SECURITY DESCRIPTION | VALUE($) | ||||||
Energy Equipment & Services — Continued | ||||||||
| 93 | ION Geophysical Corp. (a) | 558 | ||||||
| 7 | Lufkin Industries, Inc. | 596 | ||||||
| 14 | Matrix Service Co. (a) | 219 | ||||||
| 65 | Oceaneering International, Inc. | 4,698 | ||||||
| 82 | Oil States International, Inc. (a) | 7,584 | ||||||
| 71 | Patterson-UTI Energy, Inc. | 1,365 | ||||||
| 137 | Superior Energy Services, Inc. (a) | 3,553 | ||||||
| 53 | TETRA Technologies, Inc. (a) | 541 | ||||||
| 107 | Tidewater, Inc. | 6,090 | ||||||
| 66 | Unit Corp. (a) | 2,799 | ||||||
|
| |||||||
| 42,996 | ||||||||
|
| |||||||
Oil, Gas & Consumable Fuels — 1.6% | ||||||||
| 31 | Bill Barrett Corp. (a) | 632 | ||||||
| 25 | Carrizo Oil & Gas, Inc. (a) | 717 | ||||||
| 8 | Cimarex Energy Co. | 543 | ||||||
| 14 | Cloud Peak Energy, Inc. (a) | 229 | ||||||
| 34 | Comstock Resources, Inc. | 529 | ||||||
| 9 | Contango Oil & Gas Co. | 317 | ||||||
| 226 | HollyFrontier Corp. | 9,649 | ||||||
| 31 | Penn Virginia Corp. (a) | 147 | ||||||
| 39 | PetroQuest Energy, Inc. (a) | 155 | ||||||
| 81 | Quicksilver Resources, Inc. (a) | 136 | ||||||
| 103 | Rosetta Resources, Inc. (a) | 4,390 | ||||||
| 28 | SM Energy Co. | 1,698 | ||||||
| 88 | Stone Energy Corp. (a) | 1,936 | ||||||
| 53 | World Fuel Services Corp. | 2,106 | ||||||
|
| |||||||
| 23,184 | ||||||||
|
| |||||||
Total Energy | 66,180 | |||||||
|
| |||||||
Financials — 22.0% | ||||||||
Capital Markets — 2.4% | ||||||||
| 46 | Affiliated Managers Group, Inc. (a) | 7,507 | ||||||
| 402 | Apollo Investment Corp. | 3,113 | ||||||
| 36 | Eaton Vance Corp. | 1,357 | ||||||
| 79 | Federated Investors, Inc., Class B | 2,161 | ||||||
| 21 | HFF, Inc., Class A | 374 | ||||||
| 28 | Investment Technology Group, Inc. (a) | 398 | ||||||
| 10 | Piper Jaffray Cos. (a) | 329 | ||||||
| 428 | Prospect Capital Corp. | 4,619 | ||||||
| 62 | Raymond James Financial, Inc. | 2,646 | ||||||
| 214 | SEI Investments Co. | 6,071 | ||||||
| 6 | Stifel Financial Corp. (a) | 197 | ||||||
| 8 | SWS Group, Inc. (a) | 43 | ||||||
| 6 | Virtus Investment Partners, Inc. (a) | 1,010 | ||||||
| 105 | Waddell & Reed Financial, Inc., Class A | 4,586 | ||||||
|
| |||||||
| 34,411 | ||||||||
|
| |||||||
SEE NOTES TO FINANCIAL STATEMENTS.
| JUNE 30, 2013 | J.P. MORGAN EQUITY FUNDS | 17 | ||||||
Table of Contents
JPMorgan Market Expansion Enhanced Index Fund
SCHEDULE OF PORTFOLIO INVESTMENTS
AS OF JUNE 30, 2013 (continued)
(Amounts in thousands)
| SHARES | SECURITY DESCRIPTION | VALUE($) | ||||||
| Common Stocks — Continued | |||||||
Commercial Banks — 4.6% | ||||||||
| 235 | Associated Banc-Corp. | 3,648 | ||||||
| 77 | BancorpSouth, Inc. | 1,365 | ||||||
| 47 | Bank of Hawaii Corp. | 2,347 | ||||||
| 20 | Bank of the Ozarks, Inc. | 848 | ||||||
| 12 | Banner Corp. | 406 | ||||||
| 54 | BBCN Bancorp, Inc. | 774 | ||||||
| 55 | Boston Private Financial Holdings, Inc. | 584 | ||||||
| 57 | Cathay General Bancorp | 1,161 | ||||||
| 10 | City Holding Co. | 407 | ||||||
| 16 | City National Corp. | 1,005 | ||||||
| 28 | Columbia Banking System, Inc. | 658 | ||||||
| 3 | Commerce Bancshares, Inc. | 118 | ||||||
| 30 | Community Bank System, Inc. | 915 | ||||||
| 11 | Cullen/Frost Bankers, Inc. | 761 | ||||||
| 61 | CVB Financial Corp. | 716 | ||||||
| 239 | East West Bancorp, Inc. | 6,582 | ||||||
| 12 | First Bancorp (a) | 82 | ||||||
| 73 | First Commonwealth Financial Corp. | 537 | ||||||
| 39 | First Financial Bancorp | 587 | ||||||
| 22 | First Financial Bankshares, Inc. | 1,211 | ||||||
| 51 | First Midwest Bancorp, Inc. | 705 | ||||||
| 206 | First Niagara Financial Group, Inc. | 2,078 | ||||||
| 252 | FirstMerit Corp. | 5,048 | ||||||
| 42 | FNB Corp. | 508 | ||||||
| 315 | Fulton Financial Corp. | 3,613 | ||||||
| 50 | Glacier Bancorp, Inc. | 1,100 | ||||||
| 21 | Hanmi Financial Corp. (a) | 380 | ||||||
| 30 | Home BancShares, Inc. | 778 | ||||||
| 15 | Independent Bank Corp. | 503 | ||||||
| 36 | International Bancshares Corp. | 819 | ||||||
| 39 | MB Financial, Inc. | 1,033 | ||||||
| 50 | National Penn Bancshares, Inc. | 503 | ||||||
| 25 | NBT Bancorp, Inc. | 528 | ||||||
| 14 | Old National Bancorp | 197 | ||||||
| 24 | PacWest Bancorp | 721 | ||||||
| 24 | Pinnacle Financial Partners, Inc. (a) | 623 | ||||||
| 17 | PrivateBancorp, Inc. | 365 | ||||||
| 31 | Prosperity Bancshares, Inc. | 1,604 | ||||||
| 19 | S&T Bancorp, Inc. | 381 | ||||||
| 12 | Simmons First National Corp., Class A | 303 | ||||||
| 21 | Sterling Bancorp | 242 | ||||||
| 180 | Susquehanna Bancshares, Inc. | 2,312 | ||||||
| 93 | Texas Capital Bancshares, Inc. (a) | 4,140 | ||||||
| 8 | Tompkins Financial Corp. | 341 | ||||||
| 56 | Trustmark Corp. | 1,384 | ||||||
| SHARES | SECURITY DESCRIPTION | VALUE($) | ||||||
Commercial Banks — Continued | ||||||||
| 18 | UMB Financial Corp. | 974 | ||||||
| 126 | Umpqua Holdings Corp. | 1,893 | ||||||
| 12 | United Bankshares, Inc. | 330 | ||||||
| 13 | United Community Banks, Inc. (a) | 161 | ||||||
| 165 | Webster Financial Corp. | 4,234 | ||||||
| 12 | Westamerica Bancorporation | 556 | ||||||
| 42 | Wilshire Bancorp, Inc. | 280 | ||||||
| 19 | Wintrust Financial Corp. | 724 | ||||||
|
| |||||||
| 64,073 | ||||||||
|
| |||||||
Consumer Finance — 0.4% | ||||||||
| 38 | Cash America International, Inc. | 1,744 | ||||||
| 15 | Encore Capital Group, Inc. (a) | 489 | ||||||
| 39 | Ezcorp, Inc., Class A (a) | 653 | ||||||
| 6 | First Cash Financial Services, Inc. (a) | 281 | ||||||
| 11 | Portfolio Recovery Associates, Inc. (a) | 1,724 | ||||||
| 10 | World Acceptance Corp. (a) | 875 | ||||||
|
| |||||||
| 5,766 | ||||||||
|
| |||||||
Diversified Financial Services — 0.3% | ||||||||
| 57 | CBOE Holdings, Inc. | 2,656 | ||||||
| 67 | MSCI, Inc. (a) | 2,231 | ||||||
|
| |||||||
| 4,887 | ||||||||
|
| |||||||
Insurance — 4.5% | ||||||||
| 7 | Alleghany Corp. (a) | 2,746 | ||||||
| 61 | American Financial Group, Inc. | 2,977 | ||||||
| 12 | AMERISAFE, Inc. | 402 | ||||||
| 113 | Aspen Insurance Holdings Ltd., (Bermuda) | 4,196 | ||||||
| 63 | Brown & Brown, Inc. | 2,022 | ||||||
| 15 | eHealth, Inc. (a) | 342 | ||||||
| 28 | Employers Holdings, Inc. | 687 | ||||||
| 66 | Everest Re Group Ltd., (Bermuda) | 8,486 | ||||||
| 240 | Fidelity National Financial, Inc., Class A | 5,707 | ||||||
| 210 | First American Financial Corp. | 4,619 | ||||||
| 8 | Hanover Insurance Group, Inc. (The) | 408 | ||||||
| 149 | HCC Insurance Holdings, Inc. | 6,416 | ||||||
| 27 | Horace Mann Educators Corp. | 667 | ||||||
| 9 | Infinity Property & Casualty Corp. | 523 | ||||||
| 35 | Kemper Corp. | 1,187 | ||||||
| 37 | Meadowbrook Insurance Group, Inc. | 293 | ||||||
| 31 | National Financial Partners Corp. (a) | 776 | ||||||
| 9 | Navigators Group, Inc. (The) (a) | 493 | ||||||
| 31 | Primerica, Inc. | 1,149 | ||||||
| 14 | ProAssurance Corp. | 736 | ||||||
| 164 | Protective Life Corp. | 6,310 | ||||||
| 84 | Reinsurance Group of America, Inc. | 5,802 | ||||||
SEE NOTES TO FINANCIAL STATEMENTS.
| 18 | J.P. MORGAN EQUITY FUNDS | JUNE 30, 2013 | ||||
Table of Contents
| SHARES | SECURITY DESCRIPTION | VALUE($) | ||||||
| Common Stocks — Continued | |||||||
Insurance — Continued | ||||||||
| 3 | RLI Corp. | 265 | ||||||
| 10 | Safety Insurance Group, Inc. | 504 | ||||||
| 38 | Selective Insurance Group, Inc. | 879 | ||||||
| 7 | StanCorp Financial Group, Inc. | 332 | ||||||
| 13 | Stewart Information Services Corp. | 352 | ||||||
| 30 | Tower Group International Ltd., (Bermuda) | 624 | ||||||
| 14 | United Fire Group, Inc. | 357 | ||||||
| 63 | W.R. Berkley Corp. | 2,585 | ||||||
|
| |||||||
| 62,842 | ||||||||
|
| |||||||
Real Estate Investment Trusts (REITs) — 8.5% | ||||||||
| 31 | Acadia Realty Trust | 756 | ||||||
| 43 | Alexandria Real Estate Equities, Inc. | 2,849 | ||||||
| 72 | American Campus Communities, Inc. | 2,918 | ||||||
| 108 | BioMed Realty Trust, Inc. | 2,176 | ||||||
| 54 | BRE Properties, Inc. | 2,700 | ||||||
| 56 | Camden Property Trust | 3,869 | ||||||
| 49 | Cedar Realty Trust, Inc. | 254 | ||||||
| 61 | Colonial Properties Trust | 1,480 | ||||||
| 16 | Coresite Realty Corp. | 509 | ||||||
| 51 | Corporate Office Properties Trust | 1,299 | ||||||
| 60 | Corrections Corp. of America | 2,026 | ||||||
| 187 | Cousins Properties, Inc. | 1,891 | ||||||
| 131 | DiamondRock Hospitality Co. | 1,222 | ||||||
| 219 | Duke Realty Corp. | 3,414 | ||||||
| 20 | EastGroup Properties, Inc. | 1,106 | ||||||
| 33 | EPR Properties | 1,640 | ||||||
| 42 | Equity One, Inc. | 957 | ||||||
| 25 | Essex Property Trust, Inc. | 3,907 | ||||||
| 72 | Extra Space Storage, Inc. | 3,039 | ||||||
| 45 | Federal Realty Investment Trust | 4,628 | ||||||
| 50 | Franklin Street Properties Corp. | 665 | ||||||
| 81 | GEO Group, Inc. (The) | 2,747 | ||||||
| 18 | Getty Realty Corp. | 376 | ||||||
| 27 | Government Properties Income Trust | 675 | ||||||
| 54 | Healthcare Realty Trust, Inc. | 1,369 | ||||||
| 52 | Highwoods Properties, Inc. | 1,852 | ||||||
| 34 | Home Properties, Inc. | 2,252 | ||||||
| 86 | Hospitality Properties Trust | 2,264 | ||||||
| 54 | Inland Real Estate Corp. | 553 | ||||||
| 51 | Kilroy Realty Corp. | 2,712 | ||||||
| 43 | Kite Realty Group Trust | 260 | ||||||
| 61 | LaSalle Hotel Properties | 1,502 | ||||||
| 70 | Lexington Realty Trust | 816 | ||||||
| 81 | Liberty Property Trust | 3,008 | ||||||
| 21 | LTC Properties, Inc. | 831 | ||||||
| SHARES | SECURITY DESCRIPTION | VALUE($) | ||||||
Real Estate Investment Trusts (REITs) — Continued |
| |||||||
| 61 | Mack-Cali Realty Corp. | 1,501 | ||||||
| 95 | Medical Properties Trust, Inc. | 1,354 | ||||||
| 29 | Mid-America Apartment Communities, Inc. | 1,940 | ||||||
| 75 | National Retail Properties, Inc. | 2,570 | ||||||
| 74 | Omega Healthcare Investors, Inc. | 2,291 | ||||||
| 15 | Parkway Properties, Inc. | 251 | ||||||
| 40 | Pennsylvania Real Estate Investment Trust | 760 | ||||||
| 37 | Post Properties, Inc. | 1,856 | ||||||
| 98 | Potlatch Corp. | 3,980 | ||||||
| 13 | PS Business Parks, Inc. | 928 | ||||||
| 85 | Rayonier, Inc. | 4,695 | ||||||
| 121 | Realty Income Corp. | 5,052 | ||||||
| 62 | Regency Centers Corp. | 3,173 | ||||||
| 25 | Sabra Health Care REIT, Inc. | 654 | ||||||
| 8 | Saul Centers, Inc. | 368 | ||||||
| 130 | Senior Housing Properties Trust | 3,366 | ||||||
| 63 | SL Green Realty Corp. | 5,519 | ||||||
| 21 | Sovran Self Storage, Inc. | 1,372 | ||||||
| 65 | Tanger Factory Outlet Centers | 2,165 | ||||||
| 41 | Taubman Centers, Inc. | 3,080 | ||||||
| 175 | UDR, Inc. | 4,454 | ||||||
| 9 | Universal Health Realty Income Trust | 369 | ||||||
| 16 | Urstadt Biddle Properties, Inc., Class A | 327 | ||||||
| 85 | Weingarten Realty Investors | 2,602 | ||||||
|
| |||||||
| 119,149 | ||||||||
|
| |||||||
Real Estate Management & Development — 0.6% |
| |||||||
| 131 | Alexander & Baldwin, Inc. (a) | 5,225 | ||||||
| 24 | Forestar Group, Inc. (a) | 479 | ||||||
| 31 | Jones Lang LaSalle, Inc. | 2,783 | ||||||
|
| |||||||
| 8,487 | ||||||||
|
| |||||||
Thrifts & Mortgage Finance — 0.7% | ||||||||
| 45 | Astoria Financial Corp. | 485 | ||||||
| 30 | Bank Mutual Corp. | 169 | ||||||
| 48 | Brookline Bancorp, Inc. | 414 | ||||||
| 19 | Dime Community Bancshares, Inc. | 295 | ||||||
| 261 | New York Community Bancorp, Inc. | 3,656 | ||||||
| 67 | Northwest Bancshares, Inc. | 904 | ||||||
| 39 | Oritani Financial Corp. | 614 | ||||||
| 37 | Provident Financial Services, Inc. | 590 | ||||||
| 63 | TrustCo Bank Corp. | 342 | ||||||
| 23 | ViewPoint Financial Group, Inc. | 479 | ||||||
| 65 | Washington Federal, Inc. | 1,223 | ||||||
|
| |||||||
| 9,171 | ||||||||
|
| |||||||
Total Financials | 308,786 | |||||||
|
| |||||||
SEE NOTES TO FINANCIAL STATEMENTS.
| JUNE 30, 2013 | J.P. MORGAN EQUITY FUNDS | 19 | ||||||
Table of Contents
JPMorgan Market Expansion Enhanced Index Fund
SCHEDULE OF PORTFOLIO INVESTMENTS
AS OF JUNE 30, 2013 (continued)
(Amounts in thousands)
| SHARES | SECURITY DESCRIPTION | VALUE($) | ||||||
| Common Stocks — Continued | |||||||
Health Care — 9.6% |
| |||||||
Biotechnology — 1.5% |
| |||||||
| 28 | Acorda Therapeutics, Inc. (a) | 930 | ||||||
| 43 | Arqule, Inc. (a) | 100 | ||||||
| 70 | Cubist Pharmaceuticals, Inc. (a) | 3,402 | ||||||
| 30 | Momenta Pharmaceuticals, Inc. (a) | 453 | ||||||
| 34 | United Therapeutics Corp. (a) | 2,216 | ||||||
| 175 | Vertex Pharmaceuticals, Inc. (a) | 13,938 | ||||||
|
| |||||||
| 21,039 | ||||||||
|
| |||||||
Health Care Equipment & Supplies — 2.2% |
| |||||||
| 25 | ABIOMED, Inc. (a) | 546 | ||||||
| 19 | CONMED Corp. | 599 | ||||||
| 24 | Cooper Cos., Inc. (The) | 2,818 | ||||||
| 19 | CryoLife, Inc. | 116 | ||||||
| 4 | Cynosure, Inc., Class A (a) | 97 | ||||||
| 16 | Greatbatch, Inc. (a) | 520 | ||||||
| 141 | Hill-Rom Holdings, Inc. | 4,753 | ||||||
| 150 | Hologic, Inc. (a) | 2,886 | ||||||
| 9 | ICU Medical, Inc. (a) | 625 | ||||||
| 39 | IDEXX Laboratories, Inc. (a) | 3,520 | ||||||
| 14 | Masimo Corp. | 287 | ||||||
| 18 | Natus Medical, Inc. (a) | 247 | ||||||
| 94 | NuVasive, Inc. (a) | 2,336 | ||||||
| 86 | ResMed, Inc. | 3,869 | ||||||
| 79 | STERIS Corp. | 3,406 | ||||||
| 9 | SurModics, Inc. (a) | 172 | ||||||
| 24 | Symmetry Medical, Inc. (a) | 201 | ||||||
| 37 | Teleflex, Inc. | 2,841 | ||||||
| 27 | Thoratec Corp. (a) | 832 | ||||||
|
| |||||||
| 30,671 | ||||||||
|
| |||||||
Health Care Providers & Services — 4.0% |
| |||||||
| 27 | AMN Healthcare Services, Inc. (a) | 388 | ||||||
| 22 | Amsurg Corp. (a) | 777 | ||||||
| 39 | Centene Corp. (a) | 2,045 | ||||||
| 5 | Chemed Corp. | 362 | ||||||
| 185 | Community Health Systems, Inc. | 8,656 | ||||||
| 9 | Corvel Corp. (a) | 265 | ||||||
| 102 | Cross Country Healthcare, Inc. (a) | 527 | ||||||
| 11 | Ensign Group, Inc. (The) | 397 | ||||||
| 21 | Gentiva Health Services, Inc. (a) | 205 | ||||||
| 99 | Health Management Associates, Inc., Class A (a) | 1,559 | ||||||
| 179 | Health Net, Inc. (a) | 5,711 | ||||||
| 62 | Henry Schein, Inc. (a) | 5,906 | ||||||
| 36 | Kindred Healthcare, Inc. (a) | 475 | ||||||
| 11 | LHC Group, Inc. (a) | 206 | ||||||
| SHARES | SECURITY DESCRIPTION | VALUE($) | ||||||
Health Care Providers & Services — Continued | ||||||||
| 86 | Magellan Health Services, Inc. (a) | 4,799 | ||||||
| 27 | MEDNAX, Inc. (a) | 2,440 | ||||||
| 23 | Molina Healthcare, Inc. (a) | 870 | ||||||
| 9 | MWI Veterinary Supply, Inc. (a) | 1,093 | ||||||
| 176 | Omnicare, Inc. | 8,381 | ||||||
| 148 | Owens & Minor, Inc. | 4,996 | ||||||
| 20 | PharMerica Corp. (a) | 276 | ||||||
| 32 | Universal Health Services, Inc., Class B | 2,132 | ||||||
| 67 | VCA Antech, Inc. (a) | 1,742 | ||||||
| 31 | WellCare Health Plans, Inc. (a) | 1,705 | ||||||
|
| |||||||
| 55,913 | ||||||||
|
| |||||||
Health Care Technology — 0.2% |
| |||||||
| 60 | Allscripts Healthcare Solutions, Inc. (a) | 782 | ||||||
| 8 | Computer Programs & Systems, Inc. | 370 | ||||||
| 13 | HealthStream, Inc. (a) | 342 | ||||||
| 15 | Medidata Solutions, Inc. (a) | 1,172 | ||||||
| 22 | Omnicell, Inc. (a) | 462 | ||||||
|
| |||||||
| 3,128 | ||||||||
|
| |||||||
Life Sciences Tools & Services — 0.9% |
| |||||||
| 49 | Affymetrix, Inc. (a) | 218 | ||||||
| 26 | Cambrex Corp. (a) | 357 | ||||||
| 61 | Charles River Laboratories International, Inc. (a) | 2,503 | ||||||
| 25 | Covance, Inc. (a) | 1,867 | ||||||
| 22 | Enzo Biochem, Inc. (a) | 45 | ||||||
| 26 | Luminex Corp. (a) | 530 | ||||||
| 5 | Mettler-Toledo International, Inc. (a) | 1,061 | ||||||
| 127 | PAREXEL International Corp. (a) | 5,850 | ||||||
| 8 | Techne Corp. | 535 | ||||||
|
| |||||||
| 12,966 | ||||||||
|
| |||||||
Pharmaceuticals — 0.8% |
| |||||||
| 150 | Endo Health Solutions, Inc. (a) | 5,507 | ||||||
| 7 | Hi-Tech Pharmacal Co., Inc. | 241 | ||||||
| 39 | Medicines Co. (The) (a) | 1,187 | ||||||
| 43 | Questcor Pharmaceuticals, Inc. | 1,934 | ||||||
| 38 | Salix Pharmaceuticals Ltd. (a) | 2,481 | ||||||
|
| |||||||
| 11,350 | ||||||||
|
| |||||||
Total Health Care | 135,067 | |||||||
|
| |||||||
Industrials — 16.4% |
| |||||||
Aerospace & Defense — 1.9% |
| |||||||
| 27 | AAR Corp. | 597 | ||||||
| 72 | Alliant Techsystems, Inc. | 5,892 | ||||||
| 6 | American Science & Engineering, Inc. | 343 | ||||||
| 73 | B/E Aerospace, Inc. (a) | 4,633 | ||||||
SEE NOTES TO FINANCIAL STATEMENTS.
| 20 | J.P. MORGAN EQUITY FUNDS | JUNE 30, 2013 | ||||
Table of Contents
| SHARES | SECURITY DESCRIPTION | VALUE($) | ||||||
| Common Stocks — Continued | |||||||
Aerospace & Defense — Continued | ||||||||
| 11 | Cubic Corp. | 545 | ||||||
| 84 | Engility Holdings, Inc. (a) | 2,397 | ||||||
| 14 | Esterline Technologies Corp. (a) | 1,013 | ||||||
| 101 | Exelis, Inc. | 1,395 | ||||||
| 40 | GenCorp, Inc. (a) | 650 | ||||||
| 100 | Huntington Ingalls Industries, Inc. | 5,623 | ||||||
| 22 | Moog, Inc., Class A (a) | 1,143 | ||||||
| 4 | National Presto Industries, Inc. | 264 | ||||||
| 42 | Orbital Sciences Corp. (a) | 737 | ||||||
| 25 | Triumph Group, Inc. | 2,002 | ||||||
|
| |||||||
| 27,234 | ||||||||
|
| |||||||
Air Freight & Logistics — 0.1% |
| |||||||
| 20 | Forward Air Corp. | 760 | ||||||
| 24 | Hub Group, Inc., Class A (a) | 884 | ||||||
|
| |||||||
| 1,644 | ||||||||
|
| |||||||
Airlines — 0.5% |
| |||||||
| 53 | Alaska Air Group, Inc. (a) | 2,780 | ||||||
| 33 | Allegiant Travel Co. | 3,480 | ||||||
| 36 | SkyWest, Inc. | 481 | ||||||
|
| |||||||
| 6,741 | ||||||||
|
| |||||||
Building Products — 1.0% |
| |||||||
| 137 | A.O. Smith Corp. | 4,953 | ||||||
| 12 | AAON, Inc. | 403 | ||||||
| 116 | Fortune Brands Home & Security, Inc. | 4,502 | ||||||
| 13 | Gibraltar Industries, Inc. (a) | 193 | ||||||
| 37 | Lennox International, Inc. | 2,411 | ||||||
| 19 | NCI Building Systems, Inc. (a) | 292 | ||||||
| 25 | Quanex Building Products Corp. | 419 | ||||||
| 13 | Universal Forest Products, Inc. | 530 | ||||||
|
| |||||||
| 13,703 | ||||||||
|
| |||||||
Commercial Services & Supplies — 1.1% |
| |||||||
| 32 | ABM Industries, Inc. | 786 | ||||||
| 36 | Brink’s Co. (The) | 930 | ||||||
| 7 | Consolidated Graphics, Inc. (a) | 330 | ||||||
| 38 | Deluxe Corp. | 1,304 | ||||||
| 13 | G&K Services, Inc., Class A | 622 | ||||||
| 12 | Herman Miller, Inc. | 324 | ||||||
| 21 | HNI Corp. | 764 | ||||||
| 22 | Mine Safety Appliances Co. | 1,010 | ||||||
| 25 | Mobile Mini, Inc. (a) | 820 | ||||||
| 402 | R.R. Donnelley & Sons Co. | 5,633 | ||||||
| 55 | Tetra Tech, Inc. (a) | 1,302 | ||||||
| 11 | UniFirst Corp. | 998 | ||||||
| SHARES | SECURITY DESCRIPTION | VALUE($) | ||||||
Commercial Services & Supplies — Continued | ||||||||
| 23 | United Stationers, Inc. | 787 | ||||||
| 14 | Viad Corp. | 332 | ||||||
|
| |||||||
| 15,942 | ||||||||
|
| |||||||
Construction & Engineering — 1.5% |
| |||||||
| 201 | AECOM Technology Corp. (a) | 6,386 | ||||||
| 27 | Aegion Corp. (a) | 611 | ||||||
| 25 | Comfort Systems USA, Inc. | 376 | ||||||
| 25 | Dycom Industries, Inc. (a) | 569 | ||||||
| 98 | EMCOR Group, Inc. | 3,998 | ||||||
| 27 | Granite Construction, Inc. | 800 | ||||||
| 65 | KBR, Inc. | 2,117 | ||||||
| 18 | Orion Marine Group, Inc. (a) | 224 | ||||||
| 132 | URS Corp. | 6,216 | ||||||
|
| |||||||
| 21,297 | ||||||||
|
| |||||||
Electrical Equipment — 1.7% |
| |||||||
| 114 | AMETEK, Inc. | 4,823 | ||||||
| 18 | AZZ, Inc. | 675 | ||||||
| 23 | Belden, Inc. | 1,150 | ||||||
| 10 | Brady Corp., Class A | 293 | ||||||
| 97 | EnerSys, Inc. | 4,743 | ||||||
| 26 | Franklin Electric Co., Inc. | 884 | ||||||
| 144 | General Cable Corp. | 4,431 | ||||||
| 30 | Hubbell, Inc., Class B | 3,008 | ||||||
| 10 | II-VI, Inc. (a) | 166 | ||||||
| 6 | Powell Industries, Inc. (a) | 300 | ||||||
| 40 | Regal-Beloit Corp. | 2,623 | ||||||
|
| |||||||
| 23,096 | ||||||||
|
| |||||||
Industrial Conglomerates — 0.5% |
| |||||||
| 100 | Carlisle Cos., Inc. | 6,245 | ||||||
|
| |||||||
Machinery — 4.7% |
| |||||||
| 48 | Actuant Corp., Class A | 1,568 | ||||||
| 130 | AGCO Corp. | 6,531 | ||||||
| 19 | Albany International Corp., Class A | 630 | ||||||
| 14 | Astec Industries, Inc. | 494 | ||||||
| 36 | Barnes Group, Inc. | 1,080 | ||||||
| 35 | Briggs & Stratton Corp. | 690 | ||||||
| 12 | CIRCOR International, Inc. | 600 | ||||||
| 78 | Crane Co. | 4,669 | ||||||
| 14 | EnPro Industries, Inc. (a) | 708 | ||||||
| 19 | ESCO Technologies, Inc. | 626 | ||||||
| 42 | Federal Signal Corp. (a) | 371 | ||||||
| 26 | Gardner Denver, Inc. | 1,979 | ||||||
| 44 | IDEX Corp. | 2,378 | ||||||
| 145 | ITT Corp. | 4,274 | ||||||
SEE NOTES TO FINANCIAL STATEMENTS.
| JUNE 30, 2013 | J.P. MORGAN EQUITY FUNDS | 21 | ||||||
Table of Contents
JPMorgan Market Expansion Enhanced Index Fund
SCHEDULE OF PORTFOLIO INVESTMENTS
AS OF JUNE 30, 2013 (continued)
(Amounts in thousands)
| SHARES | SECURITY DESCRIPTION | VALUE($) | ||||||
| Common Stocks — Continued | |||||||
Machinery — Continued | ||||||||
| 19 | John Bean Technologies Corp. | 405 | ||||||
| 35 | Lincoln Electric Holdings, Inc. | 2,002 | ||||||
| 9 | Lindsay Corp. | 650 | ||||||
| 11 | Lydall, Inc. (a) | 161 | ||||||
| 43 | Mueller Industries, Inc. | 2,193 | ||||||
| 29 | Nordson Corp. | 1,978 | ||||||
| 73 | Oshkosh Corp. (a) | 2,762 | ||||||
| 14 | SPX Corp. | 1,014 | ||||||
| 9 | Standex International Corp. | 464 | ||||||
| 13 | Tennant Co. | 635 | ||||||
| 174 | Terex Corp. (a) | 4,576 | ||||||
| 120 | Timken Co. | 6,745 | ||||||
| 34 | Titan International, Inc. | 569 | ||||||
| 144 | Trinity Industries, Inc. | 5,547 | ||||||
| 37 | Valmont Industries, Inc. | 5,280 | ||||||
| 75 | Wabtec Corp. | 3,993 | ||||||
| 7 | Watts Water Technologies, Inc., Class A | 331 | ||||||
|
| |||||||
| 65,903 | ||||||||
|
| |||||||
Marine — 0.1% |
| |||||||
| 73 | Matson, Inc. | 1,825 | ||||||
|
| |||||||
Professional Services — 1.1% |
| |||||||
| 9 | CDI Corp. | 120 | ||||||
| 38 | Corporate Executive Board Co. (The) | 2,388 | ||||||
| 21 | Dolan Co. (The) (a) | 34 | ||||||
| 9 | Exponent, Inc. | 556 | ||||||
| 5 | FTI Consulting, Inc. (a) | 163 | ||||||
| 12 | Heidrick & Struggles International, Inc. | 198 | ||||||
| 16 | Insperity, Inc. | 492 | ||||||
| 20 | Kelly Services, Inc., Class A | 352 | ||||||
| 33 | Korn/Ferry International (a) | 626 | ||||||
| 117 | Manpowergroup, Inc. | 6,411 | ||||||
| 35 | Navigant Consulting, Inc. (a) | 420 | ||||||
| 32 | Resources Connection, Inc. | 366 | ||||||
| 39 | Towers Watson & Co., Class A | 3,214 | ||||||
| 28 | TrueBlue, Inc. (a) | 593 | ||||||
|
| |||||||
| 15,933 | ||||||||
|
| |||||||
Road & Rail — 1.6% |
| |||||||
| 192 | Arkansas Best Corp. | 4,399 | ||||||
| 138 | Con-way, Inc. | 5,365 | ||||||
| 39 | Heartland Express, Inc. | 543 | ||||||
| 73 | J.B. Hunt Transport Services, Inc. | 5,264 | ||||||
| 39 | Kansas City Southern | 4,108 | ||||||
| 31 | Landstar System, Inc. | 1,574 | ||||||
| 38 | Old Dominion Freight Line, Inc. (a) | 1,581 | ||||||
|
| |||||||
| 22,834 | ||||||||
|
| |||||||
| SHARES | SECURITY DESCRIPTION | VALUE($) | ||||||
Trading Companies & Distributors — 0.6% |
| |||||||
| 18 | Kaman Corp. | 618 | ||||||
| 24 | MSC Industrial Direct Co., Inc., Class A | 1,883 | ||||||
| 53 | United Rentals, Inc. (a) | 2,632 | ||||||
| 35 | Watsco, Inc. | 2,905 | ||||||
|
| |||||||
| 8,038 | ||||||||
|
| |||||||
Total Industrials | 230,435 | |||||||
|
| |||||||
Information Technology — 15.8% |
| |||||||
Communications Equipment — 1.1% |
| |||||||
| 201 | ARRIS Group, Inc. (a) | 2,891 | ||||||
| 8 | Bel Fuse, Inc., Class B | 102 | ||||||
| 32 | Ciena Corp. (a) | 616 | ||||||
| 14 | Comtech Telecommunications Corp. | 368 | ||||||
| 17 | Digi International, Inc. (a) | 156 | ||||||
| 80 | Harmonic, Inc. (a) | 510 | ||||||
| 30 | InterDigital, Inc. | 1,334 | ||||||
| 14 | NETGEAR, Inc. (a) | 429 | ||||||
| 14 | Oplink Communications, Inc. (a) | 238 | ||||||
| 13 | PC-Tel, Inc. | 108 | ||||||
| 80 | Plantronics, Inc. | 3,512 | ||||||
| 367 | Polycom, Inc. (a) | 3,866 | ||||||
| 62 | Riverbed Technology, Inc. (a) | 959 | ||||||
| 29 | Symmetricom, Inc. (a) | 131 | ||||||
|
| |||||||
| 15,220 | ||||||||
|
| |||||||
Computers & Peripherals — 0.9% |
| |||||||
| 37 | 3D Systems Corp. (a) | 1,631 | ||||||
| 103 | Avid Technology, Inc. (a) | 604 | ||||||
| 37 | Diebold, Inc. | 1,249 | ||||||
| 33 | Electronics for Imaging, Inc. (a) | 920 | ||||||
| 34 | Intermec, Inc. (a) | 337 | ||||||
| 15 | Intevac, Inc. (a) | 87 | ||||||
| 61 | Lexmark International, Inc., Class A | 1,863 | ||||||
| 116 | NCR Corp. (a) | 3,837 | ||||||
| 59 | QLogic Corp. (a) | 566 | ||||||
| 23 | Super Micro Computer, Inc. (a) | 246 | ||||||
| 24 | Synaptics, Inc. (a) | 929 | ||||||
|
| |||||||
| 12,269 | ||||||||
|
| |||||||
Electronic Equipment, Instruments & Components — 3.2% |
| |||||||
| 14 | Agilysys, Inc. (a) | 159 | ||||||
| 166 | Arrow Electronics, Inc. (a) | 6,621 | ||||||
| 207 | Avnet, Inc. (a) | 6,947 | ||||||
| 228 | Benchmark Electronics, Inc. (a) | 4,575 | ||||||
| 27 | Checkpoint Systems, Inc. (a) | 379 | ||||||
| 6 | Cognex Corp. | 282 | ||||||
| 16 | Coherent, Inc. | 908 | ||||||
SEE NOTES TO FINANCIAL STATEMENTS.
| 22 | J.P. MORGAN EQUITY FUNDS | JUNE 30, 2013 | ||||
Table of Contents
| SHARES | SECURITY DESCRIPTION | VALUE($) | ||||||
| Common Stocks — Continued | |||||||
Electronic Equipment, Instruments & |
| |||||||
| 23 | CTS Corp. | 308 | ||||||
| 26 | Daktronics, Inc. | 263 | ||||||
| 17 | Electro Scientific Industries, Inc. | 186 | ||||||
| 13 | FARO Technologies, Inc. (a) | 423 | ||||||
| 27 | FEI Co. | 1,979 | ||||||
| 18 | Gerber Scientific, Inc. (a) (i) | — | ||||||
| 111 | Ingram Micro, Inc., Class A (a) | 2,102 | ||||||
| 32 | Insight Enterprises, Inc. (a) | 568 | ||||||
| 15 | Itron, Inc. (a) | 635 | ||||||
| 15 | Littelfuse, Inc. | 1,135 | ||||||
| 10 | Measurement Specialties, Inc. (a) | 482 | ||||||
| 25 | Methode Electronics, Inc. | 424 | ||||||
| 11 | MTS Systems Corp. | 614 | ||||||
| 25 | Newport Corp. (a) | 352 | ||||||
| 14 | Park Electrochemical Corp. | 347 | ||||||
| 36 | Plexus Corp. (a) | 1,073 | ||||||
| 16 | Radisys Corp. (a) | 78 | ||||||
| 20 | Rofin-Sinar Technologies, Inc. (a) | 492 | ||||||
| 11 | Rogers Corp. (a) | 516 | ||||||
| 20 | ScanSource, Inc. (a) | 647 | ||||||
| 54 | SYNNEX Corp. (a) | 2,288 | ||||||
| 98 | Tech Data Corp. (a) | 4,621 | ||||||
| 145 | Trimble Navigation Ltd. (a) | 3,780 | ||||||
| 35 | TTM Technologies, Inc. (a) | 296 | ||||||
| 98 | Vishay Intertechnology, Inc. (a) | 1,361 | ||||||
|
| |||||||
| 44,841 | ||||||||
|
| |||||||
Internet Software & Services — 1.4% |
| |||||||
| 70 | AOL, Inc. (a) | 2,546 | ||||||
| 25 | comScore, Inc. (a) | 601 | ||||||
| 30 | Dealertrack Technologies, Inc. (a) | 1,049 | ||||||
| 25 | Digital River, Inc. (a) | 474 | ||||||
| 34 | Equinix, Inc. (a) | 6,318 | ||||||
| 32 | j2 Global, Inc. | 1,345 | ||||||
| 15 | LogMeIn, Inc. (a) | 356 | ||||||
| 41 | NIC, Inc. | 679 | ||||||
| 15 | OpenTable, Inc. (a) | 985 | ||||||
| 22 | Perficient, Inc. (a) | 294 | ||||||
| 99 | QuinStreet, Inc. (a) | 854 | ||||||
| 13 | Rackspace Hosting, Inc. (a) | 484 | ||||||
| 12 | Stamps.com, Inc. (a) | 458 | ||||||
| 63 | United Online, Inc. | 480 | ||||||
| 132 | ValueClick, Inc. (a) | 3,256 | ||||||
| 17 | XO Group, Inc. (a) | 194 | ||||||
|
| |||||||
| 20,373 | ||||||||
|
| |||||||
| SHARES | SECURITY DESCRIPTION | VALUE($) | ||||||
IT Services — 2.8% |
| |||||||
| 39 | Acxiom Corp. (a) | 876 | ||||||
| 35 | Alliance Data Systems Corp. (a) | 6,318 | ||||||
| 17 | CACI International, Inc., Class A (a) | 1,048 | ||||||
| 10 | Cardtronics, Inc. (a) | 267 | ||||||
| 47 | CIBER, Inc. (a) | 158 | ||||||
| 126 | Convergys Corp. | 2,192 | ||||||
| 53 | CoreLogic, Inc. (a) | 1,222 | ||||||
| 23 | CSG Systems International, Inc. (a) | 507 | ||||||
| 70 | DST Systems, Inc. | 4,572 | ||||||
| 66 | ExlService Holdings, Inc. (a) | 1,953 | ||||||
| 68 | Gartner, Inc. (a) | 3,861 | ||||||
| 24 | Global Payments, Inc. | 1,089 | ||||||
| 96 | Heartland Payment Systems, Inc. | 3,564 | ||||||
| 20 | iGATE Corp. (a) | 334 | ||||||
| 46 | Jack Henry & Associates, Inc. | 2,176 | ||||||
| 194 | Lender Processing Services, Inc. | 6,270 | ||||||
| 16 | ManTech International Corp., Class A | 423 | ||||||
| 6 | MAXIMUS, Inc. | 429 | ||||||
| 30 | Sykes Enterprises, Inc. (a) | 467 | ||||||
| 20 | TeleTech Holdings, Inc. (a) | 479 | ||||||
| 81 | VeriFone Systems, Inc. (a) | 1,359 | ||||||
| 13 | Virtusa Corp. (a) | 284 | ||||||
|
| |||||||
| 39,848 | ||||||||
|
| |||||||
Office Electronics — 0.1% |
| |||||||
| 28 | Zebra Technologies Corp., Class A (a) | 1,202 | ||||||
|
| |||||||
Semiconductors & Semiconductor Equipment — 2.2% |
| |||||||
| 30 | Advanced Energy Industries, Inc. (a) | 527 | ||||||
| 318 | Atmel Corp. (a) | 2,335 | ||||||
| 23 | ATMI, Inc. (a) | 543 | ||||||
| 45 | Brooks Automation, Inc. | 438 | ||||||
| 16 | Cabot Microelectronics Corp. (a) | 533 | ||||||
| 17 | Ceva, Inc. (a) | 328 | ||||||
| 44 | Cirrus Logic, Inc. (a) | 768 | ||||||
| 16 | Cohu, Inc. | 205 | ||||||
| 84 | Cree, Inc. (a) | 5,360 | ||||||
| 12 | Diodes, Inc. (a) | 315 | ||||||
| 47 | DSP Group, Inc. (a) | 389 | ||||||
| 31 | Exar Corp. (a) | 329 | ||||||
| 85 | Fairchild Semiconductor International, Inc. (a) | 1,169 | ||||||
| 92 | GT Advanced Technologies, Inc. (a) | 380 | ||||||
| 66 | Integrated Device Technology, Inc. (a) | 520 | ||||||
| 43 | Kopin Corp. (a) | 158 | ||||||
| 200 | Kulicke & Soffa Industries, Inc. (a) | 2,214 | ||||||
| 94 | Microsemi Corp. (a) | 2,145 | ||||||
| 33 | MKS Instruments, Inc. | 867 | ||||||
SEE NOTES TO FINANCIAL STATEMENTS.
| JUNE 30, 2013 | J.P. MORGAN EQUITY FUNDS | 23 | ||||||
Table of Contents
JPMorgan Market Expansion Enhanced Index Fund
SCHEDULE OF PORTFOLIO INVESTMENTS
AS OF JUNE 30, 2013 (continued)
(Amounts in thousands)
| SHARES | SECURITY DESCRIPTION | VALUE($) | ||||||
| Common Stocks — Continued | |||||||
Semiconductors & Semiconductor Equipment — Continued |
| |||||||
| 12 | Nanometrics, Inc. (a) | 172 | ||||||
| 98 | Pericom Semiconductor Corp. (a) | 700 | ||||||
| 27 | Power Integrations, Inc. | 1,097 | ||||||
| 344 | RF Micro Devices, Inc. (a) | 1,841 | ||||||
| 23 | Rudolph Technologies, Inc. (a) | 252 | ||||||
| 23 | Sigma Designs, Inc. (a) | 116 | ||||||
| 218 | Skyworks Solutions, Inc. (a) | 4,771 | ||||||
| 29 | STR Holdings, Inc. (a) | 67 | ||||||
| 35 | Supertex, Inc. | 838 | ||||||
| 35 | Tessera Technologies, Inc. | 733 | ||||||
| 18 | Ultratech, Inc. (a) | 667 | ||||||
| 17 | Volterra Semiconductor Corp. (a) | 242 | ||||||
|
| |||||||
| 31,019 | ||||||||
|
| |||||||
Software — 4.1% |
| |||||||
| 22 | Advent Software, Inc. (a) | 766 | ||||||
| 56 | ANSYS, Inc. (a) | 4,100 | ||||||
| 31 | Blackbaud, Inc. | 1,005 | ||||||
| 26 | Bottomline Technologies de, Inc. (a) | 647 | ||||||
| 444 | Cadence Design Systems, Inc. (a) | 6,424 | ||||||
| 31 | CommVault Systems, Inc. (a) | 2,347 | ||||||
| 73 | Compuware Corp. | 757 | ||||||
| 22 | EPIQ Systems, Inc. | 303 | ||||||
| 63 | Fair Isaac Corp. | 2,890 | ||||||
| 60 | Informatica Corp. (a) | 2,102 | ||||||
| 10 | Interactive Intelligence Group, Inc. (a) | 496 | ||||||
| 14 | Manhattan Associates, Inc. (a) | 1,059 | ||||||
| 34 | Mentor Graphics Corp. | 668 | ||||||
| 6 | MicroStrategy, Inc., Class A (a) | 492 | ||||||
| 25 | Monotype Imaging Holdings, Inc. | 633 | ||||||
| 9 | Progress Software Corp. (a) | 205 | ||||||
| 189 | PTC, Inc. (a) | 4,624 | ||||||
| 230 | Rovi Corp. (a) | 5,258 | ||||||
| 38 | SolarWinds, Inc. (a) | 1,458 | ||||||
| 113 | Solera Holdings, Inc. | 6,283 | ||||||
| 23 | Sourcefire, Inc. (a) | 1,274 | ||||||
| 109 | Synopsys, Inc. (a) | 3,905 | ||||||
| 226 | Take-Two Interactive Software, Inc. (a) | 3,389 | ||||||
| 267 | TIBCO Software, Inc. (a) | 5,707 | ||||||
| 120 | VASCO Data Security International, Inc. (a) | 996 | ||||||
|
| |||||||
| 57,788 | ||||||||
|
| |||||||
Total Information Technology | 222,560 | |||||||
|
| |||||||
| SHARES | SECURITY DESCRIPTION | VALUE($) | ||||||
Materials — 6.5% |
| |||||||
Chemicals — 2.6% |
| |||||||
| 22 | A Schulman, Inc. | 587 | ||||||
| 52 | Albemarle Corp. | 3,215 | ||||||
| 16 | American Vanguard Corp. | 378 | ||||||
| 53 | Ashland, Inc. | 4,424 | ||||||
| 21 | Balchem Corp. | 941 | ||||||
| 46 | Cabot Corp. | 1,738 | ||||||
| 41 | Calgon Carbon Corp. (a) | 681 | ||||||
| 41 | Cytec Industries, Inc. | 2,995 | ||||||
| 66 | H.B. Fuller Co. | 2,499 | ||||||
| 6 | Hawkins, Inc. | 229 | ||||||
| 14 | Koppers Holdings, Inc. | 551 | ||||||
| 22 | Kraton Performance Polymers, Inc. (a) | 465 | ||||||
| 13 | LSB Industries, Inc. (a) | 388 | ||||||
| 18 | Minerals Technologies, Inc. | 725 | ||||||
| 190 | Olin Corp. | 4,553 | ||||||
| 19 | OM Group, Inc. (a) | 602 | ||||||
| 9 | Quaker Chemical Corp. | 540 | ||||||
| 156 | RPM International, Inc. | 4,998 | ||||||
| 17 | Sensient Technologies Corp. | 685 | ||||||
| 13 | Stepan Co. | 716 | ||||||
| 16 | Tredegar Corp. | 420 | ||||||
| 68 | Valspar Corp. (The) | 4,369 | ||||||
| 15 | Zep, Inc. | 230 | ||||||
|
| |||||||
| 36,929 | ||||||||
|
| |||||||
Construction Materials — 0.4% |
| |||||||
| 78 | Eagle Materials, Inc. | 5,146 | ||||||
| 42 | Headwaters, Inc. (a) | 370 | ||||||
| 6 | Martin Marietta Materials, Inc. | 618 | ||||||
|
| |||||||
| 6,134 | ||||||||
|
| |||||||
Containers & Packaging — 1.3% |
| |||||||
| 62 | Greif, Inc., Class A | 3,263 | ||||||
| 23 | Myers Industries, Inc. | 347 | ||||||
| 45 | Packaging Corp. of America | 2,225 | ||||||
| 87 | Rock Tenn Co., Class A | 8,694 | ||||||
| 45 | Silgan Holdings, Inc. | 2,110 | ||||||
| 43 | Sonoco Products Co. | 1,500 | ||||||
|
| |||||||
| 18,139 | ||||||||
|
| |||||||
Metals & Mining — 1.3% |
| |||||||
| 11 | AM Castle & Co. (a) | 172 | ||||||
| 17 | AMCOL International Corp. | 544 | ||||||
| 40 | Commercial Metals Co. | 587 | ||||||
| 8 | Haynes International, Inc. | 398 | ||||||
| 25 | Kaiser Aluminum Corp. | 1,571 | ||||||
SEE NOTES TO FINANCIAL STATEMENTS.
| 24 | J.P. MORGAN EQUITY FUNDS | JUNE 30, 2013 | ||||
Table of Contents
| SHARES | SECURITY DESCRIPTION | VALUE($) | ||||||
| Common Stocks — Continued | |||||||
Metals & Mining — Continued | ||||||||
| 15 | Materion Corp. | 398 | ||||||
| 6 | Olympic Steel, Inc. | 143 | ||||||
| 66 | Reliance Steel & Aluminum Co. | 4,306 | ||||||
| 14 | Royal Gold, Inc. | 593 | ||||||
| 22 | RTI International Metals, Inc. (a) | 620 | ||||||
| 122 | Steel Dynamics, Inc. | 1,815 | ||||||
| 121 | SunCoke Energy, Inc. (a) | 1,702 | ||||||
| 164 | Worthington Industries, Inc. | 5,192 | ||||||
|
| |||||||
| 18,041 | ||||||||
|
| |||||||
Paper & Forest Products — 0.9% |
| |||||||
| 16 | Clearwater Paper Corp. (a) | 746 | ||||||
| 8 | Deltic Timber Corp. | 468 | ||||||
| 68 | Domtar Corp., (Canada) | 4,501 | ||||||
| 27 | KapStone Paper & Packaging Corp. | 1,095 | ||||||
| 63 | Louisiana-Pacific Corp. (a) | 935 | ||||||
| 13 | Neenah Paper, Inc. | 407 | ||||||
| 30 | PH Glatfelter Co. | 748 | ||||||
| 59 | Schweitzer-Mauduit International, Inc. | 2,965 | ||||||
| 34 | Wausau Paper Corp. | 393 | ||||||
|
| |||||||
| 12,258 | ||||||||
|
| |||||||
Total Materials | 91,501 | |||||||
|
| |||||||
Telecommunication Services — 0.7% |
| |||||||
Diversified Telecommunication Services — 0.5% |
| |||||||
| 47 | Atlantic Tele-Network, Inc. | 2,320 | ||||||
| 246 | Cbeyond, Inc. (a) | 1,927 | ||||||
| 11 | Lumos Networks Corp. | 183 | ||||||
| 105 | tw telecom, inc. (a) | 2,953 | ||||||
|
| |||||||
| 7,383 | ||||||||
|
| |||||||
Wireless Telecommunication Services — 0.2% |
| |||||||
| 11 | NTELOS Holdings Corp. | 176 | ||||||
| 69 | Telephone & Data Systems, Inc. | 1,709 | ||||||
| 15 | USA Mobility, Inc. | 198 | ||||||
|
| |||||||
| 2,083 | ||||||||
|
| |||||||
Total Telecommunication Services | 9,466 | |||||||
|
| |||||||
Utilities — 4.9% |
| |||||||
Electric Utilities — 2.1% |
| |||||||
| 59 | El Paso Electric Co. | 2,072 | ||||||
| 209 | Great Plains Energy, Inc. | 4,719 | ||||||
| 138 | Hawaiian Electric Industries, Inc. | 3,480 | ||||||
| 62 | IDACORP, Inc. | 2,960 | ||||||
| 341 | NV Energy, Inc. | 8,003 | ||||||
| 48 | OGE Energy Corp. | 3,257 | ||||||
| 97 | PNM Resources, Inc. | 2,146 | ||||||
| 2 | UNS Energy Corp. | 107 | ||||||
| SHARES | SECURITY DESCRIPTION | VALUE($) | ||||||
Electric Utilities — Continued | ||||||||
| 67 | Westar Energy, Inc. | 2,156 | ||||||
|
| |||||||
| 28,900 | ||||||||
|
| |||||||
Gas Utilities — 1.5% |
| |||||||
| 144 | Atmos Energy Corp. | 5,911 | ||||||
| 16 | Laclede Group, Inc. (The) | 715 | ||||||
| 22 | National Fuel Gas Co. | 1,288 | ||||||
| 7 | New Jersey Resources Corp. | 293 | ||||||
| 6 | Northwest Natural Gas Co. | 269 | ||||||
| 153 | Questar Corp. | 3,654 | ||||||
| 42 | Southwest Gas Corp. | 1,982 | ||||||
| 168 | UGI Corp. | 6,555 | ||||||
| 6 | WGL Holdings, Inc. | 272 | ||||||
|
| |||||||
| 20,939 | ||||||||
|
| |||||||
| - | Multi-Utilities — 1.3% |
| ||||||
| 77 | Alliant Energy Corp. | 3,860 | ||||||
| 63 | Avista Corp. | 1,700 | ||||||
| 64 | Black Hills Corp. | 3,117 | ||||||
| 161 | MDU Resources Group, Inc. | 4,179 | ||||||
| 27 | NorthWestern Corp. | 1,071 | ||||||
| 132 | Vectren Corp. | 4,479 | ||||||
|
| |||||||
| 18,406 | ||||||||
|
| |||||||
Water Utilities — 0.0% (g) |
| |||||||
| 13 | American States Water Co. | 720 | ||||||
|
| |||||||
Total Utilities | 68,965 | |||||||
|
| |||||||
Total Common Stocks | 1,380,940 | |||||||
|
| |||||||
| PRINCIPAL AMOUNT($) | ||||||||
| U.S. Treasury Obligation — 0.1% |
| ||||||
| 2,165 | U.S. Treasury Note, 0.250%, 11/30/13 (k) | 2,166 | ||||||
|
| |||||||
| SHARES | ||||||||
| Short-Term Investment — 1.9% |
| ||||||
Investment Company — 1.9% |
| |||||||
| 26,886 | JPMorgan Liquid Assets Money Market Fund, Institutional Class Shares, 0.030% (b) (l) (m) | 26,886 | ||||||
|
| |||||||
Total Investments — 100.2% | 1,409,992 | |||||||
Liabilities in Excess of | (3,391 | ) | ||||||
|
| |||||||
NET ASSETS — 100.0% | $ | 1,406,601 | ||||||
|
| |||||||
Percentages indicated are based on net assets.
SEE NOTES TO FINANCIAL STATEMENTS.
| JUNE 30, 2013 | J.P. MORGAN EQUITY FUNDS | 25 | ||||||
Table of Contents
JPMorgan Market Expansion Enhanced Index Fund
SCHEDULE OF PORTFOLIO INVESTMENTS
AS OF JUNE 30, 2013 (continued)
(Amounts in thousands)
| Futures Contracts | ||||||||||||||||
| NUMBER OF CONTRACTS | DESCRIPTION | EXPIRATION DATE | NOTIONAL VALUE AT 06/30/13 | NET UNREALIZED APPRECIATION (DEPRECIATION) | ||||||||||||
Long Futures Outstanding | ||||||||||||||||
| 74 | E-mini Russell 2000 | 09/20/13 | $ | 7,213 | $ | 104 | ||||||||||
| 187 | S&P Mid Cap 400 | 09/20/13 | 21,653 | 314 | ||||||||||||
|
| |||||||||||||||
| $ | 418 | |||||||||||||||
|
| |||||||||||||||
SEE NOTES TO FINANCIAL STATEMENTS.
| 26 | J.P. MORGAN EQUITY FUNDS | JUNE 30, 2013 | ||||
Table of Contents
| (a) | — Non-income producing security | |||||
| (b) | — Investment in affiliate. Money market fund registered under the Investment Company Act of 1940, as amended, and advised by J.P. Morgan Investment Management Inc. | |||||
| (g) | — Amount rounds to less than 0.1% | |
| (i) | — Security has been deemed illiquid pursuant to procedures approved by the Board of Trustees and may be difficult to sell. | |
| (k) | — All or a portion of this security is deposited with the broker as collateral for futures or with brokers as initial margin for futures contracts. |
| (l) | — The rate shown is the current yield as of June 30, 2013. | |
| (m) | — All or a portion of this security is reserved and/or pledged with the custodian for current or potential holdings of futures, swaps, options, TBAs, when-issued securities, delayed delivery securities, reverse repurchase agreements, unfunded commitments and/or forward foreign currency exchange contracts. | |
| (q) | — Investment in affiliate. This security is included in an index in which the Fund, as an index fund, invests. |
SEE NOTES TO FINANCIAL STATEMENTS.
| JUNE 30, 2013 | J.P. MORGAN EQUITY FUNDS | 27 | ||||||
Table of Contents
STATEMENTS OF ASSETS AND LIABILITIES
AS OF JUNE 30, 2013
(Amounts in thousands, except per share amounts)
| Equity Index Fund | Market Expansion Enhanced Index Fund | |||||||
ASSETS: |
| |||||||
Investments in non-affiliates, at value | $ | 1,706,151 | $ | 1,383,106 | ||||
Investments in affiliates, at value | 40,662 | 26,886 | ||||||
|
|
|
| |||||
Total investment securities, at value | 1,746,813 | 1,409,992 | ||||||
Cash | — | 694 | ||||||
Receivables: | ||||||||
Investment securities sold | 214 | 786 | ||||||
Fund shares sold | 2,192 | 703 | ||||||
Dividends from non-affiliates | 2,149 | 1,342 | ||||||
Dividends from affiliates | — | (a) | 1 | |||||
Due from Advisor | 108 | — | ||||||
|
|
|
| |||||
Total Assets | 1,751,476 | 1,413,518 | ||||||
|
|
|
| |||||
LIABILITIES: | ||||||||
Payables: | ||||||||
Distributions | 874 | 3,608 | ||||||
Investment securities purchased | 103 | 1,893 | ||||||
Fund shares redeemed | 4,896 | 706 | ||||||
Variation margin on futures contracts | 71 | 68 | ||||||
Accrued liabilities: | ||||||||
Investment advisory fees | — | 288 | ||||||
Administration fees | — | 98 | ||||||
Shareholder servicing fees | 15 | 47 | ||||||
Distribution fees | 166 | 31 | ||||||
Custodian and accounting fees | 24 | 20 | ||||||
Trustees’ and Chief Compliance Officer’s fees | 7 | — | (a) | |||||
Transfer agent fees | 414 | 76 | ||||||
Other | 110 | 82 | ||||||
|
|
|
| |||||
Total Liabilities | 6,680 | 6,917 | ||||||
|
|
|
| |||||
Net Assets | $ | 1,744,796 | $ | 1,406,601 | ||||
|
|
|
| |||||
| (a) | Amount rounds to less than $1,000. |
SEE NOTES TO FINANCIAL STATEMENTS.
| 28 | J.P. MORGAN EQUITY FUNDS | JUNE 30, 2013 | ||||
Table of Contents
| Equity Index Fund | Market Expansion Enhanced Index Fund | |||||||
NET ASSETS: |
| |||||||
Paid-in-Capital | $ | 658,249 | $ | 984,571 | ||||
Accumulated undistributed (distributions in excess of) net investment income | 153 | (1,259 | ) | |||||
Accumulated net realized gains (losses) | 28,337 | 70,241 | ||||||
Net unrealized appreciation (depreciation) | 1,058,057 | 353,048 | ||||||
|
|
|
| |||||
Total Net Assets | $ | 1,744,796 | $ | 1,406,601 | ||||
|
|
|
| |||||
Net Assets: | ||||||||
Class A | $ | 585,946 | $ | 84,296 | ||||
Class B | 12,142 | 2,082 | ||||||
Class C | 58,831 | 16,636 | ||||||
Class R2 | — | 6,985 | ||||||
Select Class | 1,087,877 | 1,296,602 | ||||||
|
|
|
| |||||
Total | $ | 1,744,796 | $ | 1,406,601 | ||||
|
|
|
| |||||
Outstanding units of beneficial interest (shares) | ||||||||
($0.0001 par value; unlimited number of shares authorized): | ||||||||
Class A | 16,084 | 6,926 | ||||||
Class B | 334 | 178 | ||||||
Class C | 1,622 | 1,488 | ||||||
Class R2 | — | 578 | ||||||
Select Class | 29,855 | 105,914 | ||||||
Net Asset Value (a): | ||||||||
Class A — Redemption price per share | $ | 36.43 | $ | 12.17 | ||||
Class B — Offering price per share (b) | 36.33 | 11.70 | ||||||
Class C — Offering price per share (b) | 36.28 | 11.18 | ||||||
Class R2 — Offering and redemption price per share | — | 12.09 | ||||||
Select Class — Offering and redemption price per share | 36.44 | 12.24 | ||||||
Class A maximum sales charge | 5.25 | % | 5.25 | % | ||||
Class A maximum public offering price per share | $ | 38.45 | $ | 12.84 | ||||
|
|
|
| |||||
Cost of investments in non-affiliates | $ | 661,409 | $ | 1,030,476 | ||||
Cost of investments in affiliates | 27,294 | 26,886 | ||||||
| (a) | Per share amounts may not recalculate due to rounding of net assets and/or shares outstanding. |
| (b) | Redemption price for Class B and Class C Shares varies based upon length of time the shares are held. |
SEE NOTES TO FINANCIAL STATEMENTS.
| JUNE 30, 2013 | J.P. MORGAN EQUITY FUNDS | 29 | ||||||
Table of Contents
STATEMENTS OF OPERATIONS
FOR THE YEAR ENDED JUNE 30, 2013
(Amounts in thousands)
| Equity Index Fund | Market Expansion Enhanced Index Fund | |||||||
INVESTMENT INCOME: |
| |||||||
Interest income from non-affiliates | $ | — | $ | 2 | ||||
Dividend income from non-affiliates | 40,251 | 21,368 | ||||||
Dividend income from affiliates | 627 | 23 | ||||||
Income from securities lending (net) | — | 8 | ||||||
|
|
|
| |||||
Total investment income | 40,878 | 21,401 | ||||||
|
|
|
| |||||
EXPENSES: | ||||||||
Investment advisory fees | 4,417 | 3,251 | ||||||
Administration fees | 1,507 | 1,108 | ||||||
Distribution fees: | ||||||||
Class A | 1,365 | 180 | ||||||
Class B | 100 | 20 | ||||||
Class C | 384 | 106 | ||||||
Class R2 | — | 29 | ||||||
Shareholder servicing fees: | ||||||||
Class A | 1,365 | 180 | ||||||
Class B | 33 | 7 | ||||||
Class C | 128 | 35 | ||||||
Class R2 | — | 14 | ||||||
Select Class | 2,891 | 3,015 | ||||||
Custodian and accounting fees | 94 | 70 | ||||||
Interest expense to affiliates | — | (a) | — | |||||
Professional fees | 62 | 57 | ||||||
Trustees’ and Chief Compliance Officer’s fees | 24 | 5 | ||||||
Printing and mailing costs | 172 | 91 | ||||||
Registration and filing fees | 55 | 61 | ||||||
Transfer agent fees | 1,479 | 307 | ||||||
Other | 46 | 37 | ||||||
|
|
|
| |||||
Total expenses | 14,122 | 8,573 | ||||||
|
|
|
| |||||
Less amounts waived | (8,485 | ) | (2,533 | ) | ||||
Less expense reimbursements | (108 | ) | — | |||||
|
|
|
| |||||
Net expenses | 5,529 | 6,040 | ||||||
|
|
|
| |||||
Net investment income (loss) | 35,349 | 15,361 | ||||||
|
|
|
| |||||
REALIZED/UNREALIZED GAINS (LOSSES): | ||||||||
Net realized gain (loss) on transactions from: | ||||||||
Investments in non-affiliates | 158,305 | 99,711 | ||||||
Investment in affiliates | 1,470 | — | ||||||
Futures | 1,287 | 5,636 | ||||||
|
|
|
| |||||
Net realized gain (loss) | 161,062 | 105,347 | ||||||
|
|
|
| |||||
Change in net unrealized appreciation/depreciation of: | ||||||||
Investments in non-affiliates | 123,269 | 181,842 | ||||||
Investments in affiliates | 7,258 | — | ||||||
Futures | (142 | ) | (498 | ) | ||||
|
|
|
| |||||
Change in net unrealized appreciation/depreciation | 130,385 | 181,344 | ||||||
|
|
|
| |||||
Net realized/unrealized gains (losses) | 291,447 | 286,691 | ||||||
|
|
|
| |||||
Change in net assets resulting from operations | $ | 326,796 | $ | 302,052 | ||||
|
|
|
| |||||
| (a) | Amount rounds to less than $1,000. |
SEE NOTES TO FINANCIAL STATEMENTS.
| 30 | J.P. MORGAN EQUITY FUNDS | JUNE 30, 2013 | ||||
Table of Contents
STATEMENTS OF CHANGES IN NET ASSETS
FOR THE PERIODS INDICATED
(Amounts in thousands)
| Equity Index Fund | Market Expansion Enhanced Index Fund | |||||||||||||||
| Year Ended 6/30/2013 | Year Ended 6/30/2012 | Year Ended 6/30/2013 | Year Ended 6/30/2012 | |||||||||||||
CHANGE IN NET ASSETS RESULTING FROM OPERATIONS: | ||||||||||||||||
Net Investment Income (loss) | $ | 35,349 | $ | 32,791 | $ | 15,361 | $ | 9,960 | ||||||||
Net realized gain (loss) | 161,062 | 45,275 | 105,347 | 43,131 | ||||||||||||
Change in net unrealized appreciation/depreciation | 130,385 | (2,791 | ) | 181,344 | (81,621 | ) | ||||||||||
|
|
|
|
|
|
|
| |||||||||
Change in net assets resulting from operations | 326,796 | 75,275 | 302,052 | (28,530 | ) | |||||||||||
|
|
|
|
|
|
|
| |||||||||
DISTRIBUTIONS TO SHAREHOLDERS: | ||||||||||||||||
Class A | ||||||||||||||||
From net investment income | (10,338 | ) | (8,762 | ) | (718 | ) | (449 | ) | ||||||||
From net realized gains | — | — | (3,661 | ) | (5,003 | ) | ||||||||||
Class B | ||||||||||||||||
From net investment income | (149 | ) | (167 | ) | (10 | ) | (4 | ) | ||||||||
From net realized gains | — | — | (147 | ) | (329 | ) | ||||||||||
Class C | ||||||||||||||||
From net investment income | (616 | ) | (453 | ) | (80 | ) | (20 | ) | ||||||||
From net realized gains | — | — | (812 | ) | (1,060 | ) | ||||||||||
Class R2 | ||||||||||||||||
From net investment income | — | — | (46 | ) | (14 | ) | ||||||||||
From net realized gains | — | — | (297 | ) | (251 | ) | ||||||||||
Select Class | ||||||||||||||||
From net investment income | (24,117 | ) | (22,770 | ) | (14,476 | ) | (9,910 | ) | ||||||||
From net realized gains | — | — | (62,228 | ) | (78,847 | ) | ||||||||||
|
|
|
|
|
|
|
| |||||||||
Total distributions to shareholders | (35,220 | ) | (32,152 | ) | (82,475 | ) | (95,887 | ) | ||||||||
|
|
|
|
|
|
|
| |||||||||
CAPITAL TRANSACTIONS: | ||||||||||||||||
Change in net assets resulting from capital transactions | (316,991 | ) | (166,073 | ) | 3,452 | 62,469 | ||||||||||
|
|
|
|
|
|
|
| |||||||||
NET ASSETS: | ||||||||||||||||
Change in net assets | (25,415 | ) | (122,950 | ) | 223,029 | (61,948 | ) | |||||||||
Beginning of period | 1,770,211 | 1,893,161 | 1,183,572 | 1,245,520 | ||||||||||||
|
|
|
|
|
|
|
| |||||||||
End of period | $ | 1,744,796 | $ | 1,770,211 | $ | 1,406,601 | $ | 1,183,572 | ||||||||
|
|
|
|
|
|
|
| |||||||||
Accumulated undistributed (distributions in excess of) net investment income | $ | 153 | $ | 605 | $ | (1,259 | ) | $ | (1,205 | ) | ||||||
|
|
|
|
|
|
|
| |||||||||
SEE NOTES TO FINANCIAL STATEMENTS.
| JUNE 30, 2013 | J.P. MORGAN EQUITY FUNDS | 31 | ||||||
Table of Contents
STATEMENTS OF CHANGES IN NET ASSETS
FOR THE PERIODS INDICATED (continued)
(Amounts in thousands)
| Equity Index Fund | Market Expansion Enhanced Index Fund | |||||||||||||||
| Year Ended 6/30/2013 | Year Ended 6/30/2012 | Year Ended 6/30/2013 | Year Ended 6/30/2012 | |||||||||||||
CAPITAL TRANSACTIONS: | ||||||||||||||||
Class A | ||||||||||||||||
Proceeds from shares issued | $ | 121,369 | $ | 99,357 | $ | 26,208 | $ | 16,148 | ||||||||
Distributions reinvested | 10,250 | 8,689 | 3,719 | 4,676 | ||||||||||||
Cost of shares redeemed | (154,592 | ) | (142,765 | ) | (20,528 | ) | (27,749 | ) | ||||||||
|
|
|
|
|
|
|
| |||||||||
Change in net assets resulting from Class A capital transactions | $ | (22,973 | ) | $ | (34,719 | ) | $ | 9,399 | $ | (6,925 | ) | |||||
|
|
|
|
|
|
|
| |||||||||
Class B | ||||||||||||||||
Proceeds from shares issued | $ | 61 | $ | 113 | $ | 26 | $ | 34 | ||||||||
Distributions reinvested | 144 | 162 | 145 | 312 | ||||||||||||
Cost of shares redeemed | (5,651 | ) | (7,129 | ) | (2,146 | ) | (1,996 | ) | ||||||||
|
|
|
|
|
|
|
| |||||||||
Change in net assets resulting from Class B capital transactions | $ | (5,446 | ) | $ | (6,854 | ) | $ | (1,975 | ) | $ | (1,650 | ) | ||||
|
|
|
|
|
|
|
| |||||||||
Class C | ||||||||||||||||
Proceeds from shares issued | $ | 14,986 | $ | 8,152 | $ | 6,159 | $ | 3,714 | ||||||||
Distributions reinvested | 442 | 311 | 731 | 894 | ||||||||||||
Cost of shares redeemed | (10,856 | ) | (13,075 | ) | (4,916 | ) | (4,570 | ) | ||||||||
|
|
|
|
|
|
|
| |||||||||
Change in net assets resulting from Class C capital transactions | $ | 4,572 | $ | (4,612 | ) | $ | 1,974 | $ | 38 | |||||||
|
|
|
|
|
|
|
| |||||||||
Class R2 | ||||||||||||||||
Proceeds from shares issued | $ | — | $ | — | $ | 2,754 | $ | 2,397 | ||||||||
Distributions reinvested | — | — | 170 | 140 | ||||||||||||
Cost of shares redeemed | — | — | (1,371 | ) | (1,029 | ) | ||||||||||
|
|
|
|
|
|
|
| |||||||||
Change in net assets resulting from Class R2 capital transactions | $ | — | $ | — | $ | 1,553 | $ | 1,508 | ||||||||
|
|
|
|
|
|
|
| |||||||||
Select Class | ||||||||||||||||
Proceeds from shares issued | $ | 222,766 | $ | 299,768 | $ | 221,548 | $ | 237,908 | ||||||||
Distributions reinvested | 20,534 | 19,621 | 26,158 | 34,362 | ||||||||||||
Cost of shares redeemed | (536,444 | ) | (439,277 | ) | (255,205 | ) | (202,772 | ) | ||||||||
|
|
|
|
|
|
|
| |||||||||
Change in net assets resulting from Select Class capital transactions | $ | (293,144 | ) | $ | (119,888 | ) | $ | (7,499 | ) | $ | 69,498 | |||||
|
|
|
|
|
|
|
| |||||||||
Total change in net assets resulting from capital transactions | $ | (316,991 | ) | $ | (166,073 | ) | $ | 3,452 | $ | 62,469 | ||||||
|
|
|
|
|
|
|
| |||||||||
SEE NOTES TO FINANCIAL STATEMENTS.
| 32 | J.P. MORGAN EQUITY FUNDS | JUNE 30, 2013 | ||||
Table of Contents
| Equity Index Fund | Market Expansion Enhanced Index Fund | |||||||||||||||
| Year Ended 6/30/2013 | Year Ended 6/30/2012 | Year Ended 6/30/2013 | Year Ended 6/30/2012 | |||||||||||||
SHARE TRANSACTIONS: | ||||||||||||||||
Class A | ||||||||||||||||
Issued | 3,581 | 3,394 | 2,300 | 1,572 | ||||||||||||
Reinvested | 300 | 300 | 354 | 500 | ||||||||||||
Redeemed | (4,625 | ) | (4,913 | ) | (1,817 | ) | (2,724 | ) | ||||||||
|
|
|
|
|
|
|
| |||||||||
Change in Class A Shares | (744 | ) | (1,219 | ) | 837 | (652 | ) | |||||||||
|
|
|
|
|
|
|
| |||||||||
Class B | ||||||||||||||||
Issued | 2 | 4 | 2 | 4 | ||||||||||||
Reinvested | 4 | 6 | 15 | 35 | ||||||||||||
Redeemed | (171 | ) | (245 | ) | (202 | ) | (199 | ) | ||||||||
|
|
|
|
|
|
|
| |||||||||
Change in Class B Shares | (165 | ) | (235 | ) | (185 | ) | (160 | ) | ||||||||
|
|
|
|
|
|
|
| |||||||||
Class C | ||||||||||||||||
Issued | 443 | 279 | 590 | 395 | ||||||||||||
Reinvested | 13 | 11 | 76 | 104 | ||||||||||||
Redeemed | (322 | ) | (447 | ) | (470 | ) | (474 | ) | ||||||||
|
|
|
|
|
|
|
| |||||||||
Change in Class C Shares | 134 | (157 | ) | 196 | 25 | |||||||||||
|
|
|
|
|
|
|
| |||||||||
Class R2 | ||||||||||||||||
Issued | — | — | 250 | 232 | ||||||||||||
Reinvested | — | — | 16 | 15 | ||||||||||||
Redeemed | — | — | (124 | ) | (100 | ) | ||||||||||
|
|
|
|
|
|
|
| |||||||||
Change in Class R2 Shares | — | — | 142 | 147 | ||||||||||||
|
|
|
|
|
|
|
| |||||||||
Select Class | ||||||||||||||||
Issued | 6,634 | 10,176 | 19,837 | 23,196 | ||||||||||||
Reinvested | 603 | 677 | 2,495 | 3,668 | ||||||||||||
Redeemed | (15,824 | ) | (15,173 | ) | (22,524 | ) | (19,720 | ) | ||||||||
|
|
|
|
|
|
|
| |||||||||
Change in Select Class Shares | (8,587 | ) | (4,320 | ) | (192 | ) | 7,144 | |||||||||
|
|
|
|
|
|
|
| |||||||||
SEE NOTES TO FINANCIAL STATEMENTS.
| JUNE 30, 2013 | J.P. MORGAN EQUITY FUNDS | 33 | ||||||
Table of Contents
FOR THE PERIODS INDICATED
| Per share operating performance | ||||||||||||||||||||||||
| Investment operations | Distributions | |||||||||||||||||||||||
| Net asset value, beginning of period | Net investment income (loss) | Net realized and unrealized gains (losses) on investments | Total from investment operations | Net investment income | Net asset value, end of period | |||||||||||||||||||
Equity Index Fund | ||||||||||||||||||||||||
Class A | ||||||||||||||||||||||||
Year Ended June 30, 2013 | $ | 30.92 | $ | 0.63 | (d) | $ | 5.52 | $ | 6.15 | $ | (0.64 | ) | $ | 36.43 | ||||||||||
Year Ended June 30, 2012 | 29.96 | 0.51 | (d) | 0.96 | 1.47 | (0.51 | ) | 30.92 | ||||||||||||||||
Year Ended June 30, 2011 | 23.40 | 0.45 | (d) | 6.56 | 7.01 | (0.45 | ) | 29.96 | ||||||||||||||||
Year Ended June 30, 2010 | 20.90 | 0.45 | (d) | 2.49 | 2.94 | (0.44 | ) | 23.40 | ||||||||||||||||
Year Ended June 30, 2009 | 29.08 | 0.51 | (d) | (8.19 | ) | (7.68 | ) | (0.50 | ) | 20.90 | ||||||||||||||
Class B | ||||||||||||||||||||||||
Year Ended June 30, 2013 | 30.83 | 0.37 | (d) | 5.51 | 5.88 | (0.38 | ) | 36.33 | ||||||||||||||||
Year Ended June 30, 2012 | 29.88 | 0.29 | (d) | 0.94 | 1.23 | (0.28 | ) | 30.83 | ||||||||||||||||
Year Ended June 30, 2011 | 23.34 | 0.24 | (d) | 6.54 | 6.78 | (0.24 | ) | 29.88 | ||||||||||||||||
Year Ended June 30, 2010 | 20.84 | 0.26 | (d) | 2.49 | 2.75 | (0.25 | ) | 23.34 | ||||||||||||||||
Year Ended June 30, 2009 | 28.98 | 0.34 | (d) | (8.15 | ) | (7.81 | ) | (0.33 | ) | 20.84 | ||||||||||||||
Class C | ||||||||||||||||||||||||
Year Ended June 30, 2013 | 30.81 | 0.37 | (d) | 5.50 | 5.87 | (0.40 | ) | 36.28 | ||||||||||||||||
Year Ended June 30, 2012 | 29.87 | 0.29 | (d) | 0.94 | 1.23 | (0.29 | ) | 30.81 | ||||||||||||||||
Year Ended June 30, 2011 | 23.34 | 0.24 | (d) | 6.54 | 6.78 | (0.25 | ) | 29.87 | ||||||||||||||||
Year Ended June 30, 2010 | 20.84 | 0.26 | (d) | 2.49 | 2.75 | (0.25 | ) | 23.34 | ||||||||||||||||
Year Ended June 30, 2009 | 28.98 | 0.34 | (d) | (8.14 | ) | (7.80 | ) | (0.34 | ) | 20.84 | ||||||||||||||
Select Class | ||||||||||||||||||||||||
Year Ended June 30, 2013 | 30.92 | 0.71 | (d) | 5.53 | 6.24 | (0.72 | ) | 36.44 | ||||||||||||||||
Year Ended June 30, 2012 | 29.97 | 0.58 | (d) | 0.95 | 1.53 | (0.58 | ) | 30.92 | ||||||||||||||||
Year Ended June 30, 2011 | 23.40 | 0.52 | (d) | 6.57 | 7.09 | (0.52 | ) | 29.97 | ||||||||||||||||
Year Ended June 30, 2010 | 20.90 | 0.51 | (d) | 2.49 | 3.00 | (0.50 | ) | 23.40 | ||||||||||||||||
Year Ended June 30, 2009 | 29.08 | 0.56 | (d) | (8.18 | ) | (7.62 | ) | (0.56 | ) | 20.90 | ||||||||||||||
| (a) | Includes adjustments in accordance with accounting principles generally accepted in the United States of America and as such, the net asset values for financial reporting purposes and the returns based upon those net asset values may differ from the net asset values and returns for shareholder transactions. |
| (b) | Includes earnings credits and interest expense, if applicable, each of which is less than 0.01% unless otherwise noted. |
| (c) | Portfolio turnover is calculated by dividing the lesser of total purchases or sales of portfolio securities for the reporting period by the monthly average value of portfolio securities owned during the reporting period. Excluded from both the numerator and denominator are amounts relating to derivatives and securities whose maturities or expiration dates at the time of acquisition were one year or less. |
| (d) | Calculated based upon average shares outstanding. |
SEE NOTES TO FINANCIAL STATEMENTS.
| 34 | J.P. MORGAN EQUITY FUNDS | JUNE 30, 2013 | ||||
Table of Contents
| Ratios/Supplemental data | ||||||||||||||||||||||
| Ratios to average net assets | ||||||||||||||||||||||
| Total return (excludes sales charge) (a) | Net assets, end of period (000's) | Net expenses (b) | Net investment income (loss) | Expenses without waivers, reimbursements and earnings credits | Portfolio turnover rate (c) | |||||||||||||||||
| 20.04 | % | $ | 585,946 | 0.45 | % | 1.86 | % | 0.94 | % | 4 | % | |||||||||||
| 5.03 | 520,294 | 0.45 | 1.74 | 0.94 | 7 | |||||||||||||||||
| 30.09 | 540,743 | 0.45 | 1.63 | 0.94 | 7 | |||||||||||||||||
| 13.96 | 491,906 | 0.45 | 1.80 | 0.96 | 8 | |||||||||||||||||
| (26.38 | ) | 439,950 | 0.45 | 2.29 | 1.04 | 18 | ||||||||||||||||
| 19.17 | 12,142 | 1.20 | 1.11 | 1.44 | 4 | |||||||||||||||||
| 4.20 | 15,380 | 1.20 | 0.99 | 1.44 | 7 | |||||||||||||||||
| 29.10 | 21,922 | 1.20 | 0.88 | 1.44 | 7 | |||||||||||||||||
| 13.12 | 27,677 | 1.20 | 1.07 | 1.46 | 8 | |||||||||||||||||
| (26.92 | ) | 36,524 | 1.20 | 1.53 | 1.53 | 18 | ||||||||||||||||
| 19.16 | 58,831 | 1.20 | 1.10 | 1.45 | 4 | |||||||||||||||||
| 4.21 | 45,854 | �� | 1.20 | 0.99 | 1.44 | 7 | ||||||||||||||||
| 29.11 | 49,126 | 1.20 | 0.88 | 1.44 | 7 | |||||||||||||||||
| 13.14 | 42,819 | 1.20 | 1.06 | 1.46 | 8 | |||||||||||||||||
| (26.91 | ) | 44,210 | 1.20 | 1.53 | 1.54 | 18 | ||||||||||||||||
| 20.35 | 1,087,877 | 0.20 | 2.11 | 0.69 | 4 | |||||||||||||||||
| 5.26 | 1,188,683 | 0.20 | 1.99 | 0.69 | 7 | |||||||||||||||||
| 30.45 | 1,281,370 | 0.20 | 1.87 | 0.69 | 7 | |||||||||||||||||
| 14.24 | 1,001,783 | 0.20 | 2.05 | 0.71 | 8 | |||||||||||||||||
| (26.20 | ) | 887,055 | 0.20 | 2.57 | 0.79 | 18 | ||||||||||||||||
SEE NOTES TO FINANCIAL STATEMENTS.
| JUNE 30, 2013 | J.P. MORGAN EQUITY FUNDS | 35 | ||||||
Table of Contents
FINANCIAL HIGHLIGHTS
FOR THE PERIODS INDICATED (continued)
| Per share operating performance | ||||||||||||||||||||||||||||
| Investment operations | Distributions | |||||||||||||||||||||||||||
| Net asset value, beginning of period | Net investment income (loss) | Net realized and unrealized gains (losses) on investments | Total from investment operations | Net investment income | Net realized gain | Total distributions | ||||||||||||||||||||||
Market Expansion Enhanced Index Fund | ||||||||||||||||||||||||||||
Class A | ||||||||||||||||||||||||||||
Year Ended June 30, 2013 | $ | 10.32 | $ | 0.11 | (f)(i) | $ | 2.45 | $ | 2.56 | $ | (0.11 | ) | $ | (0.60 | ) | $ | (0.71 | ) | ||||||||||
Year Ended June 30, 2012 | 11.52 | 0.07 | (f) | (0.42 | ) | (0.35 | ) | (0.07 | ) | (0.78 | ) | (0.85 | ) | |||||||||||||||
Year Ended June 30, 2011 | 8.42 | 0.05 | (f) | 3.11 | 3.16 | (0.06 | ) | — | (0.06 | ) | ||||||||||||||||||
Year Ended June 30, 2010 | 6.88 | 0.06 | (f) | 1.55 | 1.61 | (0.07 | ) | — | (0.07 | ) | ||||||||||||||||||
Year Ended June 30, 2009 | 10.21 | 0.09 | (f) | (3.02 | ) | (2.93 | ) | (0.08 | ) | (0.32 | ) | (0.40 | ) | |||||||||||||||
Class B | ||||||||||||||||||||||||||||
Year Ended June 30, 2013 | 9.95 | 0.03 | (f)(i) | 2.36 | 2.39 | (0.04 | ) | (0.60 | ) | (0.64 | ) | |||||||||||||||||
Year Ended June 30, 2012 | 11.16 | (0.01 | )(f) | (0.41 | ) | (0.42 | ) | (0.01 | ) | (0.78 | ) | (0.79 | ) | |||||||||||||||
Year Ended June 30, 2011 | 8.18 | (0.02 | )(f) | 3.02 | 3.00 | (0.02 | ) | — | (0.02 | ) | ||||||||||||||||||
Year Ended June 30, 2010 | 6.70 | — | (f)(g) | 1.49 | 1.49 | (0.01 | ) | — | (0.01 | ) | ||||||||||||||||||
Year Ended June 30, 2009 | 9.97 | 0.03 | (f) | (2.94 | ) | (2.91 | ) | (0.04 | ) | (0.32 | ) | (0.36 | ) | |||||||||||||||
Class C | ||||||||||||||||||||||||||||
Year Ended June 30, 2013 | 9.55 | 0.03 | (f)(i) | 2.25 | 2.28 | (0.05 | ) | (0.60 | ) | (0.65 | ) | |||||||||||||||||
Year Ended June 30, 2012 | 10.74 | (0.01 | )(f) | (0.39 | ) | (0.40 | ) | (0.01 | ) | (0.78 | ) | (0.79 | ) | |||||||||||||||
Year Ended June 30, 2011 | 7.88 | (0.02 | )(f) | 2.90 | 2.88 | (0.02 | ) | — | (0.02 | ) | ||||||||||||||||||
Year Ended June 30, 2010 | 6.45 | — | (f)(g) | 1.44 | 1.44 | (0.01 | ) | — | (0.01 | ) | ||||||||||||||||||
Year Ended June 30, 2009 | 9.63 | 0.03 | (f) | (2.84 | ) | (2.81 | ) | (0.05 | ) | (0.32 | ) | (0.37 | ) | |||||||||||||||
Class R2 | ||||||||||||||||||||||||||||
Year Ended June 30, 2013 | 10.25 | 0.08 | (f)(i) | 2.44 | 2.52 | (0.08 | ) | (0.60 | ) | (0.68 | ) | |||||||||||||||||
Year Ended June 30, 2012 | 11.46 | 0.03 | (f) | (0.42 | ) | (0.39 | ) | (0.04 | ) | (0.78 | ) | (0.82 | ) | |||||||||||||||
Year Ended June 30, 2011 | 8.39 | 0.01 | (f) | 3.09 | 3.10 | (0.03 | ) | — | (0.03 | ) | ||||||||||||||||||
Year Ended June 30, 2010 | 6.87 | 0.02 | (f) | 1.55 | 1.57 | (0.05 | ) | — | (0.05 | ) | ||||||||||||||||||
November 3, 2008(h) through June 30, 2009 | 7.32 | 0.04 | (f) | (0.11 | ) | (0.07 | ) | (0.06 | ) | (0.32 | ) | (0.38 | ) | |||||||||||||||
Select Class | ||||||||||||||||||||||||||||
Year Ended June 30, 2013 | 10.37 | 0.14 | (f)(i) | 2.46 | 2.60 | (0.13 | ) | (0.60 | ) | (0.73 | ) | |||||||||||||||||
Year Ended June 30, 2012 | 11.57 | 0.09 | (f) | (0.42 | ) | (0.33 | ) | (0.09 | ) | (0.78 | ) | (0.87 | ) | |||||||||||||||
Year Ended June 30, 2011 | 8.45 | 0.08 | (f) | 3.11 | 3.19 | (0.07 | ) | — | (0.07 | ) | ||||||||||||||||||
Year Ended June 30, 2010 | 6.91 | 0.09 | (f) | 1.54 | 1.63 | (0.09 | ) | — | (0.09 | ) | ||||||||||||||||||
Year Ended June 30, 2009 | 10.24 | 0.10 | (f) | (3.01 | ) | (2.91 | ) | (0.10 | ) | (0.32 | ) | (0.42 | ) | |||||||||||||||
| (a) | Annualized for periods less than one year. |
| (b) | Not annualized for periods less than one year. |
| (c) | Includes adjustments in accordance with accounting principles generally accepted in the United States of America and as such, the net asset values for financial reporting purposes and the returns based upon those net asset values may differ from the net asset values and returns for shareholder transactions. |
| (d) | Includes earnings credits and interest expense, if applicable, each of which is less than 0.01% unless otherwise noted. |
| (e) | Portfolio turnover is calculated by dividing the lesser of total purchases or sales of portfolio securities for the reporting period by the monthly average value of portfolio securities owned during the reporting period. Excluded from both the numerator and denominator are amounts relating to derivatives and securities whose maturities or expiration dates at the time of acquisition were one year or less. |
| (f) | Calculated based upon average shares outstanding. |
| (g) | Amount rounds to less than $0.01. |
| (h) | Commencement of offering of class of shares. |
| (i) | Reflects special dividends paid out during the period by several of the Fund’s holdings. Had the Fund not received the special dividends, the net investment income (loss) per share would have been $0.09, $0.02, $0.01, $0.06 and $0.12 for Class A, Class B, Class C, Class R2 and Select Class Shares, respectively, and the net investment income (loss) ratio would have been 0.82%, 0.15%, 0.13%, 0.58% and 1.07% for Class A, Class B, Class C, Class R2 and Select Class Shares, respectively. |
SEE NOTES TO FINANCIAL STATEMENTS.
| 36 | J.P. MORGAN EQUITY FUNDS | JUNE 30, 2013 | ||||
Table of Contents
| Ratios/Supplemental data | |||||||||||||||||||||||||
| Ratios to average net assets (a) | ||||||||||||||||||||||||||
| Net asset value, end of period | Total return (excludes sales charge) (b)(c) | Net assets, end of period (000's) | Net expenses (d) | Net investment income (loss) | Expenses without waivers, reimbursements and earnings credits | Portfolio turnover rate (b)(e) | ||||||||||||||||||||
| $ | 12.17 | 25.91 | % | $ | 84,296 | 0.69 | % | 0.95 | %(i) | 0.88 | % | 51 | % | |||||||||||||
| 10.32 | (2.22 | ) | 62,820 | 0.69 | 0.64 | 0.89 | 77 | |||||||||||||||||||
| 11.52 | 37.50 | 77,638 | 0.69 | 0.50 | 0.89 | 78 | ||||||||||||||||||||
| 8.42 | 23.30 | 57,906 | 0.69 | 0.75 | 0.91 | 61 | ||||||||||||||||||||
| 6.88 | (28.22 | ) | 45,589 | 0.75 | 1.18 | 1.01 | 70 | |||||||||||||||||||
| 11.70 | 25.11 | 2,082 | 1.36 | 0.28 | (i) | 1.38 | 51 | |||||||||||||||||||
| 9.95 | (2.98 | ) | 3,613 | 1.39 | (0.08 | ) | 1.39 | 77 | ||||||||||||||||||
| 11.16 | 36.63 | 5,839 | 1.39 | (0.20 | ) | 1.39 | 78 | |||||||||||||||||||
| 8.18 | 22.21 | 7,104 | 1.41 | 0.03 | 1.41 | 61 | ||||||||||||||||||||
| 6.70 | (28.69 | ) | 8,587 | 1.49 | 0.44 | 1.50 | 70 | |||||||||||||||||||
| 11.18 | 25.07 | 16,636 | 1.37 | 0.27 | (i) | 1.38 | 51 | |||||||||||||||||||
| 9.55 | (2.85 | ) | 12,330 | 1.39 | (0.07 | ) | 1.39 | 77 | ||||||||||||||||||
| 10.74 | 36.53 | 13,613 | 1.39 | (0.21 | ) | 1.39 | 78 | |||||||||||||||||||
| 7.88 | 22.34 | 9,919 | 1.41 | 0.03 | 1.41 | 61 | ||||||||||||||||||||
| 6.45 | (28.75 | ) | 8,906 | 1.49 | 0.44 | 1.50 | 70 | |||||||||||||||||||
| 12.09 | 25.72 | 6,985 | 0.93 | 0.72 | (i) | 1.13 | 51 | |||||||||||||||||||
| 10.25 | (2.64 | ) | 4,477 | 1.07 | 0.27 | 1.14 | 77 | |||||||||||||||||||
| 11.46 | 36.97 | 3,309 | 1.07 | 0.10 | 1.14 | 78 | ||||||||||||||||||||
| 8.39 | 22.83 | 1,527 | 1.07 | 0.24 | 1.16 | 61 | ||||||||||||||||||||
| 6.87 | (0.31 | ) | 50 | 1.07 | 1.06 | 1.30 | 70 | |||||||||||||||||||
| 12.24 | 26.26 | 1,296,602 | 0.44 | 1.21 | (i) | 0.63 | 51 | |||||||||||||||||||
| 10.37 | (1.96 | ) | 1,100,332 | 0.44 | 0.89 | 0.64 | 77 | |||||||||||||||||||
| 11.57 | 37.84 | 1,145,121 | 0.44 | 0.75 | 0.64 | 78 | ||||||||||||||||||||
| 8.45 | 23.49 | 774,830 | 0.44 | 1.00 | 0.66 | 61 | ||||||||||||||||||||
| 6.91 | (28.00 | ) | 591,735 | 0.51 | 1.43 | 0.76 | 70 | |||||||||||||||||||
SEE NOTES TO FINANCIAL STATEMENTS.
| JUNE 30, 2013 | J.P. MORGAN EQUITY FUNDS | 37 | ||||||
Table of Contents
AS OF JUNE 30, 2013
1. Organization
JPMorgan Trust II (“JPM II” or the “Trust”) was formed on November 12, 2004, as a Delaware statutory trust, pursuant to a Declaration of Trust dated November 5, 2004 and is registered under the Investment Company Act of 1940, as amended (the “1940 Act”), as an open-end management investment company.
The following are 2 separate funds of the Trust (collectively, the “Funds”) covered by this report:
| Classes Offered | Diversified/Non-Diversified | |||
| Equity Index Fund | Class A, Class B, Class C and Select Class | Diversified | ||
| Market Expansion Enhanced Index Fund | Class A, Class B, Class C, Class R2 and Select Class | Diversified |
The investment objective of the Equity Index Fund is to seek investment results that correspond to the aggregate price and dividend performance of securities in the Standard & Poor’s 500 Composite Stock Price Index (“S&P 500 Index”).
The investment objective of the Market Expansion Enhanced Index Fund is to seek to provide a return which substantially duplicates the price and yield performance of domestically traded common stocks in the small- and mid-capitalization equity markets as represented by a market capitalization weighted combination of the Standard & Poor’s SmallCap 600 Index and the Standard & Poor’s MidCap 400 Index.
Effective April 29, 2013, the Market Expansion Enhanced Index Fund changed its name from Market Expansion Index Fund.
Effective November 1, 2009, Class B Shares of the Funds may not be purchased or acquired by new or existing shareholders, except through exchanges from Class B Shares of another J.P. Morgan Fund and dividend reinvestments. Shareholders who have invested in Class B Shares prior to November 1, 2009 may continue to hold their Class B Shares until they convert automatically to Class A Shares.
Class A Shares generally provide for a front-end sales charge while Class B and Class C Shares provide for a contingent deferred sales charge (“CDSC”). Class B Shares automatically convert to Class A Shares after eight years. No sales charges are assessed with respect to Class R2 and Select Class Shares. All classes of shares have equal rights as to earnings, assets and voting privileges, except that each class may bear different distribution and shareholder servicing fees and each class has exclusive voting rights with respect to its distribution plan and shareholder servicing agreements. Certain Class A Shares, for which front-end sales charges have been waived, may be subject to a CDSC as described in the Funds’ prospectus.
2. Significant Accounting Policies
The following is a summary of significant accounting policies followed by the Funds in the preparation of their financial statements. The policies are in accordance with accounting principles generally accepted in the United States of America (“GAAP”). The preparation of financial statements requires management to make estimates and assumptions that affect the reported amounts and disclosures in the financial statements. Actual results could differ from those estimates.
A. Valuation of Investments — Equity securities listed on a North American, Central American, South American or Caribbean securities exchange shall generally be valued at the last sale price on the exchange on which the security is principally traded that is reported before the time when the net assets of the Funds are valued. Securities listed on the NASDAQ Stock Market LLC are generally valued at the NASDAQ Official Closing Price. Fixed income securities (other than certain short-term investments maturing in less than 61 days) are valued each day based on prices received from independent or affiliated pricing services approved by the Board of Trustees or third party broker-dealers. The pricing services or broker-dealers use multiple valuation techniques to determine fair value. In instances where sufficient market activity exists, the pricing services or broker-dealers may utilize a market-based approach through which quotes from market makers are used to determine fair value. In instances where sufficient market activity may not exist or is limited, the pricing services or broker-dealers also utilize proprietary valuation models which may consider market transactions in comparable securities and the various relationships between securities in determining fair value and/or market characteristics such as benchmark yield curves, option-adjusted spreads, credit spreads, estimated default rates, coupon-rates, anticipated timing of principal repayments, underlying collateral, and other unique security features in order to estimate the relevant cash flows, which are then discounted to calculate the fair values. Generally, short-term investments of sufficient credit quality maturing in less than 61 days are valued at amortized cost, which approximates fair value. Investments in other open-end investment companies are valued at each investment company’s net asset value per share (“NAV”) as of the report date.
Certain investments of the Funds may, depending upon market conditions, trade in relatively thin markets and/or in markets that experience significant volatility. As a result of these conditions, the prices used by the Funds to value these securities may differ from the value that would be realized if these securities were sold, and the differences could be material. Futures and options are generally valued on the basis of available market quotations. Swaps and other derivatives are valued daily, primarily using independent or affiliated pricing services approved by the Board of Trustees. If valuations are not available from such services or values received are deemed not representative of fair value, values will be obtained from a third party broker-dealer or counterparty.
Securities or other assets for which market quotations are not readily available or for which market quotations are deemed to not represent the fair value of the security or asset at the time of pricing (including certain illiquid securities) are fair valued in accordance with procedures established by and under the supervision and responsibility of the Board of Trustees. The Board of Trustees has established an Audit and Valuation Committee to
| 38 | J.P. MORGAN EQUITY FUNDS | JUNE 30, 2013 | ||||
Table of Contents
assist with the oversight of the valuation of the Funds’ securities. JPMorgan Funds Management, Inc. (the “Administrator”, or “JPMFM”), an indirect, wholly-owned subsidiary of JPMorgan Chase & Co. (“JPMorgan”), has established a Valuation Committee (“VC”) that is comprised of senior representatives from JPMFM, J.P. Morgan Investment Management Inc. (“JPMIM” or the “Advisor”), a wholly-owned subsidiary of JPMorgan Asset Management Holdings Inc. (“JPMAM”), which is a wholly-owned subsidiary of JPMorgan, JPMorgan’s Legal and Compliance and JPMAM’s Risk Management and the Funds’ Chief Compliance Officer. The VC’s responsibilities include making determinations regarding Level 3 fair value measurements (“Fair Values”) and/or providing recommendations for approval to the Board of Trustees’ Audit and Valuation Committee, in accordance with the Funds’ valuation policies.
The VC or Board of Trustees, as applicable, primarily employs a market-based approach which may use related or comparable assets or liabilities, recent transactions, market multiples, book values, and other relevant information for the investment to determine the fair value of the investment. The VC or Board of Trustees may also use an income-based valuation approach in which the anticipated future cash flows of the investment are discounted to calculate fair value. Discounts may also be applied due to the nature or duration of any restrictions on the disposition of the investments. Valuations may be based upon current market prices of securities that are comparable in coupon, rating, maturity and industry.
It is possible that the estimated values may differ significantly from the values that would have been used had a ready market for the investments existed, and such differences could be material. JPMFM and JPMIM are responsible for monitoring developments that may impact Fair Values and for discussing and assessing Fair Values on an ongoing, and at least a quarterly, basis with the VC and Board of Trustees, as applicable. The appropriateness of Fair Values is assessed based on results of unchanged price review and consideration of macro or security specific events, back testing and broker and vendor due diligence.
Valuations reflected in this report are as of the report date. As a result, changes in valuation due to market events and/or issuer related events after the report date and prior to issuance of the report, are not reflected herein.
The various inputs that are used in determining the fair value of the Funds’ investments are summarized into the three broad levels listed below.
| Ÿ | Level 1 — quoted prices in active markets for identical securities |
| Ÿ | Level 2 — other significant observable inputs (including quoted prices for similar securities, interest rates, prepayment speeds, credit risk, etc.) |
| Ÿ | Level 3 — significant unobservable inputs (including the Funds’ own assumptions in determining the fair value of investments) |
A financial instrument’s level within the fair value hierarchy is based on the lowest level of any input, both individually and in the aggregate, that is significant to the fair value measurement. The inputs or methodology used for valuing securities are not necessarily an indication of the risk associated with investing in those securities.
The following tables represent each valuation input as presented on the Schedules of Portfolio Investments (“SOIs”) (amounts in thousands):
Equity Index Fund
| Level 1 Quoted prices | Level 2 Other significant observable inputs | Level 3 Significant unobservable inputs | Total | |||||||||||||
Total Investments in Securities (a) | $ | 1,746,813 | $ | — | $ | — | $ | 1,746,813 | ||||||||
|
|
|
|
|
|
|
| |||||||||
Depreciation in Other Financial Instruments | ||||||||||||||||
Futures Contracts | $ | (53 | ) | $ | — | $ | — | $ | (53 | ) | ||||||
|
|
|
|
|
|
|
| |||||||||
Market Expansion Enhanced Index Fund | ||||||||||||||||
| Level 1 Quoted prices | Level 2 Other significant observable inputs | Level 3 Significant unobservable inputs | Total | |||||||||||||
Investments in Securities | ||||||||||||||||
Common Stocks | ||||||||||||||||
Consumer Discretionary | $ | 192,808 | $ | — | $ | — | $ | 192,808 | ||||||||
Consumer Staples | 55,172 | — | — | 55,172 | ||||||||||||
Energy | 66,180 | — | — | 66,180 | ||||||||||||
Financials | 308,786 | — | — | 308,786 | ||||||||||||
Health Care | 135,067 | — | — | 135,067 | ||||||||||||
Industrials | 230,435 | — | — | 230,435 | ||||||||||||
Information Technology | 222,560 | — | — | (b) | 222,560 | |||||||||||
Materials | 91,501 | — | — | 91,501 | ||||||||||||
Telecommunication Services | 9,466 | — | — | 9,466 | ||||||||||||
Utilities | 68,965 | — | — | 68,965 | ||||||||||||
|
|
|
|
|
|
|
| |||||||||
Total Common Stocks | 1,380,940 | — | — | (b) | 1,380,940 | |||||||||||
|
|
|
|
|
|
|
| |||||||||
| JUNE 30, 2013 | J.P. MORGAN EQUITY FUNDS | 39 | ||||||
Table of Contents
NOTES TO FINANCIAL STATEMENTS
AS OF JUNE 30, 2013 (continued)
Market Expansion Enhanced Index Fund (continued)
| Level 1 Quoted prices | Level 2 Other significant observable inputs | Level 3 Significant unobservable inputs | Total | |||||||||||||
Debt Securities | ||||||||||||||||
U.S. Treasury Obligations | $ | — | $ | 2,166 | $ | — | $ | 2,166 | ||||||||
Short-Term Investment | ||||||||||||||||
Investment Company | 26,886 | — | — | 26,886 | ||||||||||||
|
|
|
|
|
|
|
| |||||||||
Total Investments in Securities | $ | 1,407,826 | $ | 2,166 | $ | — | (b) | $ | 1,409,992 | |||||||
|
|
|
|
|
|
|
| |||||||||
Appreciation in Other Financial Instruments | ||||||||||||||||
Futures Contracts | $ | 418 | $ | — | $ | — | $ | 418 | ||||||||
|
|
|
|
|
|
|
| |||||||||
| (a) | All portfolio holdings designated as Level 1 are disclosed individually on the SOIs. Please refer to the SOIs for industry specifics of portfolio holdings. |
| (b) | Value is zero. |
There were no transfers between any levels during the year ended June 30, 2013.
B. Restricted and Illiquid Securities — Certain securities held by the Funds may be subject to legal or contractual restrictions on resale and/or are illiquid. Restricted securities generally are resold in transactions exempt from registration under the Securities Act of 1933. An illiquid security is a security which cannot be disposed of promptly (within seven days) and in the usual course of business at approximately its fair value and includes, but is not limited to, repurchase agreements maturing in excess of seven days, time deposits with a withdrawal penalty, non-negotiable instruments and instruments for which no market exists. Disposal of these securities may involve time-consuming negotiations and expense. Prompt sale at the current valuation may be difficult and could adversely affect the net assets of the Funds. As of June 30, 2013, the Funds had no investments in restricted securities.
The following is the value and percentage of net assets of illiquid securities as of June 30, 2013 (amounts in thousands):
| Value | Percentage | |||||||
Market Expansion Enhanced Index Fund | $ | — | (a) | — | % | |||
| (a) | Value is zero. |
C. Futures Contracts — The Funds use index futures contracts to gain or reduce exposure to their respective indices, maintain liquidity and minimize transaction costs. The Funds also buy futures contracts to immediately invest incoming cash in the market or sell futures in response to cash outflows, thereby simulating an invested position in the underlying index while maintaining a cash balance for liquidity. The use of futures contracts exposes the Funds to equity price risk.
Futures contracts provide for the delayed delivery of the underlying instrument at a fixed price or are settled for a cash amount based on the change in the value of the underlying instrument at a specific date in the future. Upon entering into a futures contract, the Funds are required to deposit with the broker, cash or securities in an amount equal to a certain percentage of the contract amount, which is referred to as the initial margin deposit. Subsequent payments, referred to as variation margin, are made or received by the Funds periodically and are based on changes in the market value of open futures contracts. Changes in the market value of open futures contracts are recorded as unrealized appreciation or depreciation in the Statements of Operations. Realized gains or losses, representing the difference between the value of the contract at the time it was opened and the value at the time it was closed, are reported in the Statements of Operations at the closing or expiration of the futures contract. Securities deposited as initial margin are designated in the SOIs and cash deposited is recorded on the Statements of Assets and Liabilities. A receivable from and/or a payable to brokers for the daily variation margin is also recorded on the Statements of Assets and Liabilities.
The Funds may be subject to the risk that the change in the value of the futures contract may not correlate perfectly with the underlying instrument. Use of long futures contracts subjects the Funds to risk of loss in excess of the amounts shown on the Statements of Assets and Liabilities, up to the notional amount of the futures contracts. Use of short futures contracts subjects the Funds to unlimited risk of loss. The Funds may enter into futures contracts only on exchanges or boards of trade. The exchange or board of trade acts as the counterparty to each futures transaction; therefore, the Funds’ credit risk is limited to failure of the exchange or board of trade. Under some circumstances, futures exchanges may establish daily limits on the amount that the price of a futures contract can vary from the previous day’s settlement price, which could effectively prevent liquidation of positions.
The table below discloses the volume of the Funds’ futures contracts activity during the year ended June 30, 2013 (amounts in thousands):
| Equity Index Fund | Market Expansion Enhanced Index Fund | |||||||
Futures Contracts: | ||||||||
Average Notional Balance Long | $ | 10,902 | $ | 28,793 | ||||
Ending Notional Balance Long | 16,393 | 28,866 | ||||||
| 40 | J.P. MORGAN EQUITY FUNDS | JUNE 30, 2013 | ||||
Table of Contents
D. Investment Transactions with Affiliates — An issuer which is under common control with a Fund may be considered an affiliate. For the purposes of the financial statements, the Funds assume the following to be an affiliated issuer (amounts in thousands):
| For the year ended June 30, 2013 | ||||||||||||||||||||||||||||
| Affiliate | Value at June 30, 2012 | Purchase Cost | Sales Proceeds | Realized Gain/Loss | Dividend Income | Shares at June 30, 2013 | Value at June 30, 2013 | |||||||||||||||||||||
Equity Index Fund | ||||||||||||||||||||||||||||
JPMorgan Chase & Co. (common stock)* | $ | 19,468 | $ | 442 | $ | 4,540 | $ | 1,470 | $ | 618 | 457 | $ | 24,099 | |||||||||||||||
JPMorgan Liquid Assets Money Market Fund, Institutional Class Shares | 5,027 | 175,446 | 163,910 | — | 9 | 16,563 | 16,563 | |||||||||||||||||||||
|
|
|
|
|
|
|
| |||||||||||||||||||||
Total | $ | 24,495 | $ | 1,470 | $ | 627 | $ | 40,662 | ||||||||||||||||||||
|
|
|
|
|
|
|
| |||||||||||||||||||||
| For the year ended June 30, 2013 | ||||||||||||||||||||||||||||
| Affiliate | Value at June 30, 2012 | Purchase Cost | Sales Proceeds | Realized Gain/Loss | Dividend Income | Shares at June 30, 2013 | Value at June 30, 2013 | |||||||||||||||||||||
Market Expansion Enhanced Index Fund | ||||||||||||||||||||||||||||
JPMorgan Liquid Assets Money Market Fund, Institutional Class | $ | 21,942 | $ | 220,532 | $ | 215,588 | $ | — | $ | 23 | 26,886 | $ | 26,886 | |||||||||||||||
JPMorgan Prime Money Market Fund, Capital Shares** | 1,127 | 715 | 1,842 | — | 1 | — | — | |||||||||||||||||||||
|
|
|
|
|
|
|
| |||||||||||||||||||||
Total | $ | 23,069 | $ | — | $ | 24 | $ | 26,886 | ||||||||||||||||||||
|
|
|
|
|
|
|
| |||||||||||||||||||||
| * | Security is included in an index in which the Fund, as an index fund, invests. |
| ** | Represents investment of cash collateral related to securities on loan, as described in Note 2.E. Dividend income earned from this investment is included in, and represents a significant portion of, Income from securities lending (net) on the Statements of Operations. |
E. Securities Lending — Each Fund may lend securities to brokers approved by the Advisor in order to generate additional income. Goldman Sachs Bank USA, doing business as Goldman Sachs Agency Lending (“GSAL”) serves as lending agent for the Funds pursuant to a Securities Lending Agreement (the “GSAL Securities Lending Agreement”). The Funds receive cash collateral, which is invested in Capital Shares of the JPMorgan Prime Money Market Fund (“Collateral Investments”). Upon termination of a loan, the Funds are required to return to the borrower the posted cash collateral. Loans are subject to termination by the Funds or the borrower at any time.
Securities lending income is comprised of income earned on Collateral Investments, net amount of a rebate received from or paid to borrowers for use of cash collateral and lending agent fees. This amount is recorded as Income from securities lending (net) on the Statements of Operations. The Funds also receive payments from the borrower during the period of the loan, equivalent to dividends and interest earned on the securities loaned, which are recorded as Dividend or Interest income, respectively, on the Statements of Operations.
For the year ended June 30, 2013, Market Expansion Enhanced Index Fund earned approximately $1,000 from the investment of cash collateral, prior to rebates or fees, in collateral investments as described below.
At the inception of a loan, securities are exchanged for cash collateral equal to at least 102% of the value of the loaned U.S. securities, plus accrued interest. The GSAL Securities Lending Agreement requires that the loaned securities be marked to market on a daily basis and additional cash collateral is requested from borrowers when the cash received from borrowers becomes less than 102% of the value of loaned securities.
The value of the cash collateral received is recorded as a liability on the Statements of Assets and Liabilities and details of Collateral Investments are disclosed in the SOIs. At June 30, 2013, there were no outstanding securities on loan.
The Funds bear the risk of loss associated with the Collateral Investments and are not entitled to additional collateral from the borrower to cover any such losses. To the extent that the value of the Collateral Investments declines below the amount owed to a borrower, a Fund may incur losses that exceed the amount it earned on lending the security. Upon termination of a loan, a Fund may use leverage (borrow money) to repay the borrower for cash collateral posted, if the Advisor does not believe that it is prudent to sell the Collateral Investments to fund the payment of this liability.
Securities lending also involves counterparty risks, including the risk that the loaned securities may not be returned in a timely manner or at all. Subject to certain conditions, GSAL has agreed to indemnify the Funds from losses resulting from a borrower’s failure to return a loaned security.
The Advisor waived fees associated with the Fund’s investment in JPMorgan Prime Money Market Fund in the amount of approximately less than $1,000. This amount offset the administration fees and shareholder servicing fees incurred by JPMorgan Prime Money Market Fund related to the Fund’s investment in such fund. A portion of the waiver is voluntary.
F. Security Transactions and Investment Income — Investment transactions are accounted for on the trade date (the date the order to buy or sell is executed). Securities gains and losses are calculated on a specifically identified cost basis. Interest income is determined on the basis of coupon interest accrued using the effective interest method which adjusts for amortization of premiums and accretion of discounts. Dividend income, net of foreign taxes withheld, if any, less dividend expense on securities sold short, is recorded on the ex-dividend date or when a Fund first learns of the dividend.
| JUNE 30, 2013 | J.P. MORGAN EQUITY FUNDS | 41 | ||||||
Table of Contents
NOTES TO FINANCIAL STATEMENTS
AS OF JUNE 30, 2013 (continued)
To the extent such information is publically available, the Funds record distributions received in excess of income earned from underlying investments as a reduction of cost of investments and/or realized gain. Such amounts are based on estimates if actual amounts are not available and actual amounts of income, realized gain and return of capital may differ from the estimated amounts. The Funds adjust the estimated amounts of the components of distributions (and consequently their net investment income) as necessary once the issuers provide information about the actual composition of the distributions.
G. Allocation of Income and Expenses — Expenses directly attributable to a fund are charged directly to that fund, while the expenses attributable to more than one fund of the Trust are allocated among the respective funds. In calculating the NAV of each class, investment income, realized and unrealized gains and losses and expenses, other than class specific expenses, are allocated daily to each class of shares based upon the proportion of net assets of each class at the beginning of each day.
H. Federal Income Taxes — Each Fund is treated as a separate taxable entity for Federal income tax purposes. Each Fund’s policy is to comply with the provisions of the Internal Revenue Code of 1986, as amended (the “Code”), applicable to regulated investment companies and to distribute to shareholders all of its distributable net investment income and net realized gain on investments. Accordingly, no provision for Federal income tax is necessary. Management has reviewed the Funds’ tax positions for all open tax years and has determined that as of June 30, 2013, no liability for income tax is required in the Funds’ financial statements for net unrecognized tax benefits. However, management’s conclusions may be subject to future review based on changes in, or the interpretation of, the accounting standards or tax laws and regulations. Each of the Fund’s Federal tax returns for the prior three fiscal years remain subject to examination by the Internal Revenue Service.
I. Distributions to Shareholders — Distributions from net investment income are generally declared and paid quarterly and are declared separately for each class. No class has preferential dividend rights; differences in per share rates are due to differences in separate class expenses. Net realized capital gains, if any, are distributed by each Fund at least annually. The amount of distributions from net investment income and net realized capital gains is determined in accordance with Federal income tax regulations, which may differ from GAAP. To the extent these “book/tax” differences are permanent in nature (i.e., that they result from other than timing of recognition — “temporary differences”), such amounts are reclassified within the capital accounts based on their Federal tax-basis treatment.
The following amounts were reclassified within the capital accounts (amounts in thousands):
| Paid-in-Capital | Accumulated undistributed (distributions in net investment income | Accumulated net realized gains (losses) | ||||||||||
Equity Index Fund | $ | (34 | ) | $ | (581 | ) | $ | 615 | ||||
Market Expansion Enhanced Index Fund | (2 | ) | (85 | ) | 87 | |||||||
The reclassifications for the Funds relate primarily to non-taxable dividends, investment in Real Estate Investment Trusts (Equity Index Fund and Market Expansion Enhanced Index Fund) and investments in partnerships (Equity Index Fund).
3. Fees and Other Transactions with Affiliates
A. Investment Advisory Fee — Pursuant to the Investment Advisory Agreements, JPMIM supervises the investments of each Fund and for such services is paid a fee. The fee is accrued daily and paid monthly at an annual rate of 0.25% of each Fund’s average daily net assets.
The Advisor waived Investment Advisory fees and/or reimbursed expenses as outlined in Note 3.F.
B. Administration Fee — Pursuant to an Administration Agreement, the Administrator provides certain administration services to the Funds. In consideration of these services, the Administrator receives a fee accrued daily and paid monthly at an annual rate of 0.15% of the first $25 billion of the average daily net assets of all funds in the J.P. Morgan Funds Complex (excluding certain funds of funds and money market funds) and 0.075% of the average daily net assets in excess of $25 billion of all such funds. For the year ended June 30, 2013, the annual effective rate was 0.09% of each Fund’s average daily net assets, notwithstanding any fee waivers and/or expense reimbursements.
The Administrator waived Administration fees as outlined in Note 3.F.
JPMorgan Chase Bank, N.A. (“JPMCB”), a wholly-owned subsidiary of JPMorgan, serves as the Funds’ sub-administrator (the “Sub-administrator”). For its services as Sub-administrator, JPMCB receives a portion of the fees payable to the Administrator.
C. Distribution Fees — Pursuant to a Distribution Agreement, JPMorgan Distribution Services, Inc. (the “Distributor”), a wholly-owned subsidiary of JPMorgan, serves as the Trust’s exclusive underwriter and promotes and arranges for the sale of each Fund’s shares.
| 42 | J.P. MORGAN EQUITY FUNDS | JUNE 30, 2013 | ||||
Table of Contents
The Board of Trustees has adopted a Distribution Plan (the “Distribution Plan”) for Class A, Class B, Class C and Class R2 Shares of the Funds in accordance with Rule 12b-1 under the 1940 Act. The Distribution Plan provides that each Fund shall pay distribution fees, including payments to the Distributor, at annual rates of the average daily net assets as shown in the table below:
| Class A | Class B | Class C | Class R2 | |||||||||||||
Equity Index Fund | 0.25 | % | 0.75 | % | 0.75 | % | n/a | |||||||||
Market Expansion Enhanced Index Fund | 0.25 | 0.75 | 0.75 | 0.50 | % | |||||||||||
In addition, the Distributor is entitled to receive the front-end sales charges from purchases of Class A Shares and the CDSC from redemptions of Class B and Class C Shares and certain Class A Shares for which front-end sales charges have been waived. For the year ended June 30, 2013, the Distributor retained the following amounts (in thousands):
| Front-End Sales Charge | CDSC | |||||||
Equity Index Fund | $ | 31 | $ | 2 | ||||
Market Expansion Enhanced Index Fund | 14 | — | (a) | |||||
| (a) | Amount rounds to less than $1,000. |
D. Shareholder Servicing Fees — The Trust, on behalf of the Funds, has entered into Shareholder Servicing Agreements with the Distributor under which the Distributor provides certain support services to the shareholders. For performing these services, the Distributor receives a fee that is accrued daily and paid monthly equal to an annual rate of 0.25% of the average daily net assets of each share class.
The Distributor has entered into shareholder services contracts with affiliated and unaffiliated financial intermediaries who provide shareholder services and other related services to their clients or customers who invest in the Funds under which the Distributor will pay all or a portion of such fees earned to financial intermediaries for performing such services.
The Distributor waived Shareholder Servicing fees as outlined in Note 3.F.
E. Custodian and Accounting Fees — JPMCB provides portfolio custody and accounting services to the Funds. The amounts paid directly to JPMCB by the Funds for custody and accounting services are included in Custodian and accounting fees in the Statements of Operations. Payments to the custodian may be reduced by credits earned by each Fund, based on uninvested cash balances held by the custodian. Such earnings credits, if any, are presented separately in the Statements of Operations.
Interest expense, if any, paid to the custodian related to cash overdrafts is included in Interest expense to affiliates in the Statements of Operations.
F. Waivers and Reimbursements — The Advisor, Administrator and Distributor have contractually agreed to waive fees and/or reimburse the Funds to the extent that total annual operating expenses (excluding acquired fund fees and expenses, dividend expenses related to short sales, interest, taxes, expenses related to litigation and potential litigation, extraordinary expenses and expenses related to the Board of Trustees’ deferred compensation plan) exceed the percentages of the Funds’ respective average daily net assets as shown in the table below:
| Class A | Class B | Class C | Class R2 | Select Class | ||||||||||||||||
Equity Index Fund | 0.45 | % | 1.20 | % | 1.20 | % | n/a | 0.20 | % | |||||||||||
Market Expansion Enhanced Index Fund | 0.69 | 1.39 | 1.39 | 0.92 | % | 0.44 | ||||||||||||||
The expense limitation agreements were in effect for the year ended June 30, 2013 for Equity Index Fund and for the period November 1, 2012 through June 30, 2013 for Market Expansion Enhanced Index Fund. The expense limitation percentages in the table above are in place until at least October 31, 2013. The Funds’ service providers have voluntarily waived fees during the year ended June 30, 2013. However, the Funds’ service providers are under no obligation to do so and may discontinue such voluntary waivers at any time.
Prior to November 1, 2012, the contractual expense limitation percentages for Market Expansion Enhanced Index Fund were as follows:
| Class A | Class B | Class C | Class R2 | Select Class | ||||||||||||||||
Market Expansion Enhanced Index Fund | 0.82 | % | 1.57 | % | 1.57 | % | 1.07 | % | 0.57 | % | ||||||||||
For the year ended June 30, 2013, the Funds’ service providers waived fees and/or reimbursed expenses for each of the Funds as follows (amounts in thousands). None of these parties expect the Funds to repay any such waived fees and reimbursed expenses in future years.
| Contractual Waivers | ||||||||||||||||||||
| Investment Advisory | Administration | Shareholder Servicing | Total | Reimbursements | ||||||||||||||||
Equity Index Fund | $ | 2,708 | $ | 1,507 | $ | 4,256 | $ | 8,471 | $ | 108 | ||||||||||
Market Expansion Enhanced Index Fund | 14 | — | 1,651 | 1,665 | — | |||||||||||||||
| JUNE 30, 2013 | J.P. MORGAN EQUITY FUNDS | 43 | ||||||
Table of Contents
NOTES TO FINANCIAL STATEMENTS
AS OF JUNE 30, 2013 (continued)
| Voluntary Waivers | ||||||||||||
| Investment Advisory | Shareholder Servicing | Total | ||||||||||
Equity Index Fund | $ | — | (a) | $ | — | $ | — | (a) | ||||
Market Expansion Enhanced Index Fund | — | (a) | 819 | 819 | ||||||||
| (a) | Amount rounds to less than $1,000. |
Additionally, the Funds may invest in one or more money market funds advised by the Advisor or its affiliates. The Advisor, Administrator and the Distributor, as shareholder servicing agent, waive fees in an amount sufficient to offset the respective fees each charges to the affiliated money market fund on the Funds’ investment in such affiliated money market fund. A portion of the waiver is voluntary.
The amount of waivers resulting from investments in these money market funds for the year ended June 30, 2013 was as follows (excluding the waiver disclosed in Note 2.E. regarding cash collateral for securities lending invested in the JPMorgan Prime Money Market Fund) (amounts in thousands):
Equity Index Fund | $ | 14 | ||
Market Expansion Enhanced Index Fund | 49 |
G. Other — Certain officers of the Trust are affiliated with the Advisor, the Administrator and the Distributor. Such officers, with the exception of the Chief Compliance Officer, receive no compensation from the Funds for serving in their respective roles.
The Board of Trustees appointed a Chief Compliance Officer to the Funds in accordance with Federal securities regulations. Each Fund, along with other affiliated funds, makes reimbursement payments, on a pro-rata basis, to the Administrator for a portion of the fees associated with the Office of the Chief Compliance Officer. Such fees are included in Trustees’ and Chief Compliance Officer’s fees in the Statements of Operations.
The Trust adopted a Trustee Deferred Compensation Plan (the “Plan”) which allows the Independent Trustees to defer the receipt of all or a portion of compensation related to performance of their duties as Trustees. The deferred fees are invested in various J. P. Morgan Funds until distribution in accordance with the Plan.
During the year ended June 30, 2013, the Funds may have purchased securities from an underwriting syndicate in which the principal underwriter or members of the syndicate are affiliated with the Advisor.
The Funds may use related party broker-dealers. For the year ended June 30, 2013, the Funds did not incur any brokerage commissions with broker-dealers affiliated with the Advisor.
The Securities and Exchange Commission (“SEC”) has granted an exemptive order permitting the Funds to engage in principal transactions with J.P. Morgan Securities, Inc., an affiliated broker, involving taxable money market instruments, subject to certain conditions.
4. Investment Transactions
During the year ended June 30, 2013, purchases and sales of investments (excluding short-term investments) were as follows (amounts in thousands):
| Purchases (excluding U.S. Government) | Sales (excluding U.S. Government) | |||||||
Equity Index Fund | $ | 65,279 | $ | 387,485 | ||||
Market Expansion Enhanced Index Fund | 651,016 | 708,231 | ||||||
During the year ended June 30, 2013, there were no purchases or sales of U.S. Government securities.
5. Federal Income Tax Matters
For Federal income tax purposes, the cost and unrealized appreciation (depreciation) in value of investment securities held at June 30, 2013 were as follows (amounts in thousands):
| Aggregate Cost | Gross Unrealized Appreciation | Gross Unrealized Depreciation | Net Unrealized Appreciation (Depreciation) | |||||||||||||
Equity Index Fund | $ | 754,701 | $ | 1,007,826 | $ | 15,714 | $ | 992,112 | ||||||||
Market Expansion Enhanced Index Fund | 1,065,972 | 365,091 | 21,071 | 344,020 | ||||||||||||
The difference between book and tax basis appreciation (depreciation) on investments is primarily attributed to non-taxable dividends and wash sale loss deferrals.
| 44 | J.P. MORGAN EQUITY FUNDS | JUNE 30, 2013 | ||||
Table of Contents
The tax character of distributions paid during the fiscal year ended June 30, 2013 was as follows (amounts in thousands):
Ordinary Income | Net Long Term Capital Gains | Total Distributions Paid | ||||||||||
Equity Index Fund | $ | 35,220 | $ | — | $ | 35,220 | ||||||
Market Expansion Enhanced Index Fund | 15,330 | 67,145 | 82,475 | |||||||||
The tax character of distributions paid during the fiscal year ended June 30, 2012 was as follows (amounts in thousands):
Ordinary Income | Net Long Term Capital Gains | Total Distributions | ||||||||||
Equity Index Fund | $ | 32,152 | $ | — | $ | 32,152 | ||||||
Market Expansion Enhanced Index Fund | 10,397 | 85,490 | 95,887 | |||||||||
As of June 30, 2013, the components of net assets (excluding paid-in-capital) on a tax basis were as follows (amounts in thousands):
Current Distributable Ordinary Income | Current Distributable Long-Term Capital Gain or (Tax Basis Capital Loss Carryover) | Unrealized Appreciation (Depreciation) | ||||||||||
Equity Index Fund | $ | 1,080 | $ | 94,282 | $ | 992,112 | ||||||
Market Expansion Enhanced Index Fund | 5,460 | 76,181 | 344,020 | |||||||||
For the Funds, the cumulative timing differences primarily consist of trustee deferred compensation, distributions payable, mark to market of futures contracts, non-taxable dividends and wash sale loss deferrals.
Under the Regulated Investment Company Modernization Act of 2010 (the “Act”), net capital losses recognized by the Funds after June 30, 2011 are carried forward indefinitely, and retain their character as short-term and/or long-term losses. Prior to the Act, net capital losses incurred by the Funds were carried forward for eight years and treated as short-term losses. The Act requires that post-enactment net capital losses be used before pre-enactment net capital losses.
As of June 30, 2013, the Funds did not have any post-enactment or pre-enactment net capital loss carryforwards.
During the year ended June 30, 2013, the Equity Index Fund utilized approximately $49,123,000 in capital loss carryforwards.
6. Borrowings
The Funds rely upon an exemptive order granted by the SEC (the “Order”) permitting the establishment and operation of an Interfund Lending Facility (the “Facility”). The Facility allows the Funds to directly lend and borrow money to or from any other fund relying upon the Order at rates beneficial to both the borrowing and lending funds. Advances under the Facility are taken primarily for temporary or emergency purposes, including the meeting of redemption requests that otherwise might require the untimely disposition of securities, and are subject to each Fund’s borrowing restrictions. The Interfund loan rate is determined, as specified in the Order, by averaging the current repurchase agreement rate and the current bank loan rate. The Order was granted to JPM II and may be relied upon by the Funds because they are investment companies in the same “group of investment companies” (as defined in Section 12(d)(1)(G) of the 1940 Act).
In addition, the Trust and JPMCB have entered into a financing arrangement. Under this arrangement, JPMCB provides an unsecured, uncommitted credit facility in the aggregate amount of $100 million to certain of the J.P. Morgan Funds, including the Funds. Advances under the arrangement are taken primarily for temporary or emergency purposes, including the meeting of redemption requests that otherwise might require the untimely disposition of securities, and are subject to each Fund’s borrowing restrictions. Interest on borrowings is payable at a rate determined by JPMCB at the time of borrowing. This agreement has been extended until November 11, 2013.
The Funds had no borrowings outstanding from another fund or from the unsecured, uncommitted credit facility at June 30, 2013. Average borrowings from the Facility for the year ended June 30, 2013, were as follows (amounts in thousands):
| Average Borrowings | Number of Days Outstanding | Interest Paid | ||||||||||
Equity Index Fund | $ | 13,559 | 1 | $ | — | (a) | ||||||
| (a) | Amount rounds to less than $1,000. |
Interest expense paid, if any, as a result of borrowings from another fund or from the unsecured, uncommitted credit facility is included in Interest expense to affiliates in the Statements of Operations.
| JUNE 30, 2013 | J.P. MORGAN EQUITY FUNDS | 45 | ||||||
Table of Contents
NOTES TO FINANCIAL STATEMENTS
AS OF JUNE 30, 2013 (continued)
7. Risks, Concentrations and Indemnifications
In the normal course of business, the Funds enter into contracts that contain a variety of representations which provide general indemnifications. Each Fund’s maximum exposure under these arrangements is unknown. The amount of exposure would depend on future claims that may be made against each Fund that have not yet occurred. However, based on experience, the Funds expect the risk of loss to be remote.
One or more affiliates of the Advisor have investment discretion with respect to their clients’ holdings in the Funds, which collectively represent a significant portion of the Fund’s assets for the Market Expansion Enhanced Index Fund.
In addition, the J.P. Morgan Investor Funds, which are affiliated funds of funds, own in the aggregate approximately 30.9% of the net assets of Market Expansion Enhanced Index Fund.
Significant shareholder transactions by these shareholders, if any, may impact the Funds’ performance.
| 46 | J.P. MORGAN EQUITY FUNDS | JUNE 30, 2013 | ||||
Table of Contents
REPORT OF INDEPENDENT REGISTERED PUBLIC ACCOUNTING FIRM
To the Board of Trustees of JPMorgan Trust II and the Shareholders of JPMorgan Equity Index Fund and JPMorgan Market Expansion Enhanced Index Fund (formerly known as JPMorgan Market Expansion Index Fund):
In our opinion, the accompanying statements of assets and liabilities, including the schedules of portfolio investments, and the related statements of operations and of changes in net assets and the financial highlights present fairly, in all material respects, the financial position of JPMorgan Equity Index Fund and JPMorgan Market Expansion Enhanced Index Fund (formerly known as JPMorgan Market Expansion Index Fund) (each a separate fund of JPMorgan Trust II) (hereafter collectively referred to as the “Funds”) at June 30, 2013, the results of each of their operations for the year then ended, the changes in each of their net assets for each of the two years in the period then ended and the financial highlights for each of the five years in the period then ended, in conformity with accounting principles generally accepted in the United States of America. These financial statements and financial highlights (hereafter referred to as “financial statements”) are the responsibility of the Funds’ management. Our responsibility is to express an opinion on these financial statements based on our audits. We conducted our audits of these financial statements in accordance with the standards of the Public Company Accounting Oversight Board (United States). Those standards require that we plan and perform the audit to obtain reasonable assurance about whether the financial statements are free of material misstatement. An audit includes examining, on a test basis, evidence supporting the amounts and disclosures in the financial statements, assessing the accounting principles used and significant estimates made by management, and evaluating the overall financial statement presentation. We believe that our audits, which included confirmation of securities at June 30, 2013 by correspondence with the custodian and brokers, provide a reasonable basis for our opinion.
PricewaterhouseCoopers LLP
New York, New York
August 28, 2013
| JUNE 30, 2013 | J.P. MORGAN EQUITY FUNDS | 47 | ||||||
Table of Contents
(Unaudited)
The Funds’ Statement of Additional Information includes additional information about the Funds’ Trustees and is available, without charge, upon request by calling 1-800-480-4111 or on the J.P. Morgan Funds’ website at www.jpmorganfunds.com.
Name (Year of Birth); Positions With the Funds (1) | Principal Occupations During Past 5 Years | Number of Portfolios in Fund Complex Overseen by Trustee (2) | Other Directorships Held Outside Fund Complex During Past 5 Years | |||
Independent Trustees | ||||||
| John F. Finn (1947); Trustee of Trust since 2005; Trustee of heritage One Group Mutual Funds since 1998. | Chairman (1985-present), President and Chief Executive Officer, Gardner, Inc. (supply chain management company serving industrial and consumer markets) (1974-present). | 172 | Director, Cardinal Health, Inc. (CAH) (1994-present); Director, Greif, Inc. (GEF) (industrial package products and services) (2007-present). | |||
| Dr. Matthew Goldstein (1941); Chairman since 2013; Trustee of Trust since 2005; Trustee of heritage J.P. Morgan Funds since 2003. | Professor, City University of New York (effective 7/1/13); Chancellor, City University of New York (1999-2013); President, Adelphi University (New York) (1998-1999). | 172 | Director, Bronx-Lebanon Hospital Center; Director, United Way of New York City (2002-present); Trustee, Museum of Jewish Heritage (2011-present). | |||
| Robert J. Higgins (1945); Trustee of Trust since 2005; Trustee of heritage J.P. Morgan Funds since 2002. | Retired; Director of Administration of the State of Rhode Island (2003-2004); President — Consumer Banking and Investment Services, Fleet Boston Financial (1971-2001). | 172 | None | |||
| Peter C. Marshall (1942); Trustee of Trust since 2005; Trustee of heritage One Group Mutual Funds since 1985. | Self-employed business consultant (2002-present). | 172 | Director, Center for Communication, Hearing and Deafness (1990-present). | |||
| Mary E. Martinez (1960); Trustee of Trust since 2013. | Associate, Special Properties, a Christie’s International Real Estate Affiliate (2010-Present); Managing Director, Bank of America (Asset Management) (2007-2008); Chief Operating Officer, U.S. Trust Asset Management; U.S. Trust Company (asset management) (2003-2007); President, Excelsior Funds (registered investment companies) (2004-2005). | 172 | Member, New York City Center Advisory Council (oversees public performing arts facilities) (2006-present). | |||
| Marilyn McCoy* (1948); Trustee of Trust since 2005; Trustee of heritage One Group Mutual Funds since 1999. | Vice President of Administration and Planning, Northwestern University (1985-present). | 172 | Trustee, Carleton College (2003-present). | |||
| Mitchell M. Merin (1953); Trustee of Trust since 2013. | Retired (2005-Present); President and Chief Operating Officer, Morgan Stanley Investment Management, Member Morgan Stanley & Co. Management Committee (registered investment adviser) (1998-2005). | 172 | Director, Sun Life Financial (SLF) (2007 to Present) (financial services and insurance); Trustee, Trinity College, Hartford, CT (2002-2010). | |||
| William G. Morton, Jr. (1937); Trustee of Trust since 2005; Trustee of heritage J.P. Morgan Funds since 2003. | Retired; Chairman Emeritus (2001-2002), and Chairman and Chief Executive Officer, Boston Stock Exchange (1985-2001). | 172 | Director, Radio Shack Corp. (1987-2008); Trustee, Stratton Mountain School (2001-present). | |||
| Dr. Robert A. Oden, Jr. (1946); Trustee of Trust since 2005; Trustee of heritage One Group Mutual Funds since 1997. | Retired; President, Carleton College (2002-2010); President, Kenyon College (1995-2002). | 172 | Trustee, American University in Cairo (1999-present); Chairman, Dartmouth-Hitchcock Medical Center (2013-present); Trustee, Dartmouth-Hitchcock Medical Center (2011-present); Trustee, American Schools of Oriental Research (2011-present); Trustee, Carleton College (2002-2010). | |||
| 48 | J.P. MORGAN EQUITY FUNDS | JUNE 30, 2013 | ||||
Table of Contents
Name (Year of Birth); Positions With the Funds (1) | Principal Occupations During Past 5 Years | Number of Complex Overseen by Trustee (2) | Other Directorships Held Outside Fund Complex During Past 5 Years | |||
Independent Trustees (continued) | ||||||
| Marian U. Pardo** (1946); Trustee of Trust since 2013. | Managing Director and Founder, Virtual Capital Management LLC (Investment Consulting) (2007-present); Managing Director, Credit Suisse Asset Management (portfolio manager) (2003-2006). | 172 | Member, Board of Governors, Columbus Citizens Foundation (not-for-profit supporting philanthropic and cultural programs) (2006-present). | |||
| Frederick W. Ruebeck (1939); Trustee of Trust since 2005; Trustee of heritage One Group Mutual Funds since 1994. | Consultant (2000-present); Advisor, JP Greene & Associates, LLC (broker-dealer) (2000-2009); Chief Investment Officer, Wabash College (2004-present); Director of Investments, Eli Lilly and Company (pharmaceuticals) (1988-1999). | 172 | Trustee, Wabash College (1988-present); Chairman, Indianapolis Symphony Orchestra Foundation (1994-present). | |||
| James J. Schonbachler (1943); Trustee of Trust since 2005; Trustee of heritage J.P. Morgan Funds since 2001. | Retired; Managing Director of Bankers Trust Company (financial services) (1968-1998). | 172 | None | |||
Interested Trustee Not Affiliated With the Adviser | ||||||
| Frankie D. Hughes*** (1952), Trustee of Trust since 2008. | President and Chief Investment Officer, Hughes Capital Management, Inc. (fixed income asset management) (1993-present). | 172 | Trustee, The Victory Portfolios (2000-2008). | |||
| (1) | The Trustees serve for an indefinite term, subject to the Trust’s current retirement policy, which is age 75 for all Trustees, except that the Board has determined Mr. Morton should continue to serve until December 31, 2014. In order to fill the vacancies created by the retirement of the Fergus Reid, III, William J. Armstrong, and Leonard J. Spalding Jr., effective December 31, 2012, the Board appointed Ms. Martinez and Mr. Merin to serve as Trustees effective January 1, 2013 and Ms. Pardo to serve as Trustee effective February 1, 2013. |
| (2) | A Fund Complex means two or more registered investment companies that hold themselves out to investors as related companies for purposes of investment and investor services or have a common investment advisor or have an investment advisor that is an affiliated person of the investment advisor of any of the other registered investment companies. The J.P. Morgan Funds Complex for which the Board of Trustees serves currently includes eleven registered investment companies (172 funds), including JPMorgan Mutual Fund Group which liquidated November 29, 2012 and is in the process of winding up its affairs. |
| * | Ms. McCoy has served as Vice President of Administration and Planning for Northwestern University since 1985. William M. Daley was the Head of Corporate Responsibility for JPMorgan Chase & Co. prior to January 2011 and served as a member of the Board of Trustees of Northwestern University from 2005 through 2010. JPMIM, the Funds’ investment advisor, is a wholly-owned subsidiary of JPMorgan Chase & Co. Five other members of the Board of Trustees of Northwestern University are executive officers of registered investment advisors (not affiliated with JPMorgan) that are under common control with subadvisors to certain J.P. Morgan Funds. |
| ** | In connection with prior employment with JPMorgan Chase, Ms. Pardo is the recipient of non-qualified pension plan payments from JPMorgan Chase in the amount of approximately $2,055 per month, which she irrevocably waived effective January 1, 2013, and deferred compensation payments from JPMorgan Chase in the amount of approximately $7,294 per year, which ended in January 2013. In addition, Ms. Pardo receives payments from a fully funded qualified plan, which is not an obligation of JPMorgan Chase. |
| *** | Ms. Hughes is treated as an “interested person” based on the portfolio holdings of clients of Hughes Capital Management, Inc. |
The contact address for each of the Trustees is 270 Park Avenue, New York, NY 10017.
| JUNE 30, 2013 | J.P. MORGAN EQUITY FUNDS | 49 | ||||||
Table of Contents
(Unaudited)
Name (Year of Birth), Positions Held with the Trust (Since) | Principal Occupations During Past 5 Years | |
| Patricia A. Maleski (1960), President and Principal Executive Officer (2010) | Managing Director, J.P. Morgan Investment Management Inc. and Chief Administrative Officer, J.P. Morgan Funds and Institutional Pooled Vehicles since 2010; previously, Treasurer and Principal Financial Officer of the Trusts from 2008 to 2010; previously, Head of Funds Administration and Board Liaison, J.P. Morgan Funds prior to 2010. Ms. Maleski has been with JPMorgan Chase & Co. since 2001. | |
| Joy C. Dowd (1972), Treasurer and Principal Financial Officer (2010) | Assistant Treasurer of the Trusts from 2009 to 2010; Executive Director, JPMorgan Funds Management, Inc. from February 2011; Vice President, JPMorgan Funds Management, Inc. from December 2008 to February 2011; prior to joining JPMorgan Chase, Ms. Dowd worked in MetLife’s investments audit group from 2005 through 2008. | |
| Frank J. Nasta (1964), Secretary (2008) | Managing Director and Associate General Counsel, JPMorgan Chase since 2008; Previously, Director, Managing Director, General Counsel and Corporate Secretary, J. & W. Seligman & Co. Incorporated; Secretary of each of the investment companies of the Seligman Group of Funds and Seligman Data Corp.; Director and Corporate Secretary, Seligman Advisors, Inc. and Seligman Services, Inc. | |
| Stephen M. Ungerman (1953), Chief Compliance Officer (2005) | Managing Director, JPMorgan Chase & Co.; Mr. Ungerman has been with JPMorgan Chase & Co. since 2000. | |
| Kathryn A. Jackson (1962), AML Compliance Officer (2012)* | Vice President and AML Compliance Manager for JPMorgan Asset Management Compliance since 2011; Senior On-Boarding Specialist for JPMorgan Distribution Services, Inc. in Global Liquidity from 2008 to 2011; prior to joining JPMorgan, Ms. Jackson was a Financial Services Analyst responsible for on-boarding, compliance and training with Nationwide Securities LLC and 1717 Capital Management Company, both registered broker-dealers, from 2005 until 2008. | |
Elizabeth A. Davin (1964), Assistant Secretary (2005)** | Executive Director and Assistant General Counsel, JPMorgan Chase since February 2012; formerly Vice President and Assistant General Counsel, JPMorgan Chase from 2005 until February 2012; Senior Counsel, JPMorgan Chase (formerly Bank One Corporation) from 2004 to 2005. | |
| Jessica K. Ditullio (1962), Assistant Secretary (2005)** | Executive Director and Assistant General Counsel, JPMorgan Chase since February 2011; Ms. Ditullio has served as an attorney with various titles for JPMorgan Chase (formerly Bank One Corporation) since 1990. | |
| John T. Fitzgerald (1975), Assistant Secretary (2008) | Executive Director and Assistant General Counsel, JPMorgan Chase since February 2011; formerly, Vice President and Assistant General Counsel, JPMorgan Chase from 2005 until February 2011. | |
| Carmine Lekstutis (1980), Assistant Secretary (2011) | Vice President and Assistant General Counsel, JPMorgan Chase since 2011; Associate, Skadden, Arps, Slate, Meagher & Flom LLP (law firm) from 2006 to 2011. | |
| Gregory S. Samuels (1980), Assistant Secretary (2010) | Vice President and Assistant General Counsel, JPMorgan Chase since 2010; Associate, Ropes & Gray (law firm) from 2008 to 2010; Associate, Clifford Chance LLP (law firm) from 2005 to 2008. | |
| Pamela L. Woodley (1971), Assistant Secretary (2012) | Vice President and Assistant General Counsel, JPMorgan Chase since November 2004. | |
Michael M. D’Ambrosio (1969), Assistant Treasurer (2012) | Executive Director, JPMorgan Funds Management, Inc. from July 2012; prior to joining JPMorgan Chase, Mr. D’Ambrosio was a Tax Director at PricewaterhouseCoopers LLP since 2006. | |
| Joseph Parascondola (1963), Assistant Treasurer (2011) | Vice President, JPMorgan Funds Management, Inc. since August 2006. | |
| Matthew J. Plastina (1970), Assistant Treasurer (2011) | Vice President, JPMorgan Funds Management, Inc. since August 2010; prior to August 2010, Vice President and Controller, Legg Mason Global Asset Management. | |
Julie A. Roach (1971), Assistant Treasurer (2012)** | Vice President, JPMorgan Funds Management, Inc. from August 2012; prior to joining JPMorgan Chase, Ms. Roach was a Senior Manager with Deloitte since 2001. | |
Gillian I. Sands (1969), Assistant Treasurer (2012) | Vice President, JPMorgan Funds Management, Inc. from September 2012; Assistant Treasurer, Wells Fargo Funds Management (2007-2009). | |
The contact address for each of the officers, unless otherwise noted, is 270 Park Avenue, New York, NY 10017.
| * | The contact address for the officer is 500 Stanton Christiana Road, Ops 1, Floor 02, Newark, DE 19173-2107. |
| ** | The contact address for the officer is 460 Polaris Parkway, Westerville, OH 43082. |
| 50 | J.P. MORGAN EQUITY FUNDS | JUNE 30, 2013 | ||||
Table of Contents
SCHEDULE OF SHAREHOLDER EXPENSES
(Unaudited)
Hypothetical $1,000 Investment
As a shareholder of the Funds, you incur two types of costs: (1) transaction costs, including sales charges (loads) on purchase payments and redemption fees and (2) ongoing costs, including investment advisory fees, administration fees, distribution fees and other Fund expenses. The examples below are intended to help you understand your ongoing costs (in dollars) of investing in the Funds and to compare these ongoing costs with the ongoing costs of investing in other mutual funds. The examples assume that you had a $1,000 investment in each Class at the beginning of the reporting period, January 1, 2013, and continued to hold your shares at the end of the reporting period, June 30, 2013.
Actual Expenses
For each Class of each Fund in the table below, the first line provides information about actual account values and actual expenses. You may use the information in this line, together with the amount you invested, to estimate the expenses that you paid over the period. Simply divide your account value by $1,000 (for example, an $8,600 account value divided by $1,000 = 8.6), then multiply the result by the number in the first line of each Class under the heading entitled “Expenses Paid During the Period” to estimate the expenses you paid on your account during this period.
Hypothetical Example for Comparison Purposes
The second line of each Class in the table below provides information about hypothetical account values and hypothetical expenses based on the Class’ actual expense ratio and an assumed rate of return of 5% per year before expenses, which is not the Class’ actual return. The hypothetical account values and expenses may not be used to estimate the actual ending account balance or expenses you paid for the period. You may use this information to compare the ongoing costs of investing in the Class of the Funds and other funds. To do so, compare this 5% hypothetical example with the 5% hypothetical examples that appear in the shareholder reports of the other funds. Please note that the expenses shown in the table are meant to highlight your ongoing costs only and do not reflect any transaction costs, such as sales charges (loads) or redemption fees. Therefore, the second line for each Class in the table is useful in comparing ongoing costs only, and will not help you determine the relative total costs of owning different funds. In addition, if these transaction costs were included, your costs would have been higher. The examples also assume all dividends and distributions have been reinvested.
| Beginning Account Value, January 1, 2013 | Ending Account Value June 30, 2013 | Expenses Paid During the Period* | Annualized Expense Ratio | |||||||||||||
Equity Index Fund | ||||||||||||||||
Class A | ||||||||||||||||
Actual | $ | 1,000.00 | $ | 1,135.70 | $ | 2.38 | 0.45 | % | ||||||||
Hypothetical | 1,000.00 | 1,022.56 | 2.26 | 0.45 | ||||||||||||
Class B | ||||||||||||||||
Actual | 1,000.00 | 1,131.40 | 6.34 | 1.20 | ||||||||||||
Hypothetical | 1,000.00 | 1,018.84 | 6.01 | 1.20 | ||||||||||||
Class C | ||||||||||||||||
Actual | 1,000.00 | 1,131.40 | 6.34 | 1.20 | ||||||||||||
Hypothetical | 1,000.00 | 1,018.84 | 6.01 | 1.20 | ||||||||||||
Select Class | ||||||||||||||||
Actual | 1,000.00 | 1,137.10 | 1.06 | 0.20 | ||||||||||||
Hypothetical | 1,000.00 | 1,023.80 | 1.00 | 0.20 | ||||||||||||
Market Expansion Enhanced Index Fund | ||||||||||||||||
Class A | ||||||||||||||||
Actual | 1,000.00 | 1,158.80 | 3.69 | 0.69 | ||||||||||||
Hypothetical | 1,000.00 | 1,021.37 | 3.46 | 0.69 | ||||||||||||
Class B | ||||||||||||||||
Actual | 1,000.00 | 1,154.70 | 7.32 | 1.37 | ||||||||||||
Hypothetical | 1,000.00 | 1,018.00 | 6.85 | 1.37 | ||||||||||||
Class C | ||||||||||||||||
Actual | 1,000.00 | 1,155.70 | 7.32 | 1.37 | ||||||||||||
Hypothetical | 1,000.00 | 1,018.00 | 6.85 | 1.37 | ||||||||||||
Class R2 | ||||||||||||||||
Actual | 1,000.00 | 1,158.70 | 4.92 | 0.92 | ||||||||||||
Hypothetical | 1,000.00 | 1,020.23 | 4.61 | 0.92 | ||||||||||||
Select Class | ||||||||||||||||
Actual | 1,000.00 | 1,160.30 | 2.36 | 0.44 | ||||||||||||
Hypothetical | 1,000.00 | 1,022.61 | 2.21 | 0.44 | ||||||||||||
| * | Expenses are equal to each Class’ respective annualized expense ratio, multiplied by the average account value over the period, multiplied by 181/365 (to reflect the one-half year period). |
| JUNE 30, 2013 | J.P. MORGAN EQUITY FUNDS | 51 | ||||||
Table of Contents
(Unaudited)
Certain tax information for the J.P. Morgan Funds is required to be provided to shareholders based upon the Funds’ income and distributions for the taxable year ended June 30, 2013. The information and distributions reported in this letter may differ from the information and taxable distributions reported to the shareholders for the calendar year ending December 31, 2013. The information necessary to complete your income tax returns for the calendar year ending December 31, 2013 will be provided under separate cover.
Dividends Received Deductions (DRD)
Each Fund hereby designates the following percentage or the maximum allowable percentage as ordinary income distributions eligible for the 70% dividends received deduction for corporate rate shareholders for the fiscal year ended June 30, 2013:
| Dividends Received Deduction | ||||
Equity Index Fund | 100.00 | % | ||
Market Expansion Enhanced Index Fund | 97.75 | |||
Long Term Capital Gain Designation — 20%
The Market Expansion Enhanced Index Fund hereby designates approximately $67,145,000 or the maximum allowable amount as long-term capital gain distributions for the purpose of the dividend paid deduction on its tax return for the fiscal year ended June 30, 2013.
Qualified Dividend Income (QDI)
For the fiscal year ended June 30, 2013, certain dividends paid by the Funds may be subject to a maximum tax rate of 20%. Each Fund hereby designates the following amount or the maximum allowable amount of ordinary income distributions as qualified dividends (amounts in thousands):
| Qualified Dividend Income | ||||
Equity Index Fund | $ | 35,220 | ||
Market Expansion Enhanced Index Fund | 15,330 | |||
| 52 | J.P. MORGAN EQUITY FUNDS | JUNE 30, 2013 | ||||
Table of Contents

Rev. January 2011
| FACTS | WHAT DOES J.P. MORGAN FUNDS DO WITH YOUR PERSONAL INFORMATION? |
| Why? | Financial companies choose how they share your personal information. Federal law gives consumers the right to limit some but not all sharing. Federal law also requires us to tell you how we collect, share, and protect your personal information. Please read this notice carefully to understand what we do. |
| What? | The types of personal information we collect and share depend on the product or service you have with us. This information can include:
¡ Social Security number and account balances
¡ transaction history and account transactions
¡ checking account information and wire transfer instructions
When you are no longer our customer, we continue to share your information as described in this notice. |
| How? | All financial companies need to share customers’ personal information to run their everyday business. In the section below, we list the reasons financial companies can share their customers’ personal information; the reasons J.P. Morgan Funds chooses to share; and whether you can limit this sharing. |
| Reasons we can share your personal information | Does J.P. Morgan Funds share? | Can you limit this sharing? | ||
For our everyday business purposes — such as to process your transactions, maintain your account(s), respond to court orders and legal investigations, or report to credit bureaus | Yes | No | ||
For marketing purposes — to offer our products and services to you | Yes | No | ||
| For joint marketing with other financial companies | No | We don’t share | ||
For our affiliates’ everyday business purposes — information about your transactions and experiences | No | We don’t share | ||
For our affiliates’ everyday business purposes — information about your creditworthiness | No | We don’t share | ||
| For nonaffiliates to market to you | No | We don’t share |
| Questions? | Call 1-800-480-4111 or go to www.jpmorganfunds.com | |

Table of Contents
Page 2 |
| Who we are | ||
| Who is providing this notice? | J.P. Morgan Funds | |
| What we do | ||
| How does J.P. Morgan Funds protect my personal information? | To protect your personal information from unauthorized access and use, we use security measures that comply with federal law. These measures include computer safeguards and secured files and buildings. We authorize our employees to access your information only when they need it to do their work and we require companies that work for us to protect your information. | |
How does J.P. Morgan Funds collect my personal information? | We collect your personal information, for example, when you:
¡ open an account or provide contact information
¡ give us your account information or pay us by check
¡ make a wire transfer
We also collect your personal information from others, such as credit bureaus, affiliates and other companies. | |
| Why can’t I limit all sharing? | Federal law gives you the right to limit only
¡ sharing for affiliates’ everyday business purposes – information about your creditworthiness
¡ affiliates from using your information to market to you
¡ sharing for nonaffiliates to market to you
State laws and individual companies may give you additional rights to limit sharing. | |
| Definitions | ||
| Affiliates | Companies related by common ownership or control. They can be financial and nonfinancial companies.
¡ J.P. Morgan Funds does not share with our affiliates. | |
| Nonaffiliates | Companies not related by common ownership or control. They can be financial and nonfinancial companies.
¡ J.P. Morgan Funds does not share with nonaffiliates so they can market to you. | |
| Joint Marketing | A formal agreement between nonaffiliated financial companies that together market financial products or services to you.
¡ J.P. Morgan Funds doesn’t jointly market. | |
Table of Contents
J.P. Morgan Funds are distributed by JPMorgan Distribution Services, Inc., which is an affiliate of JPMorgan Chase & Co. Affiliates of JPMorgan Chase & Co. receive fees for providing various services to the funds.
Contact JPMorgan Distribution Services, Inc. at 1-800-480-4111 for a fund prospectus. You can also visit us at www.jpmorganfunds.com. Investors should carefully consider the investment objectives and risk as well as charges and expenses of the mutual fund before investing. The prospectus contains this and other information about the mutual fund. Read the prospectus carefully before investing.
Investors may obtain information about the Securities Investor Protection Corporation (SIPC), including the SIPC brochure by visiting www.sipc.org or by calling SIPC at 202-371-8300.
Each Fund files a complete schedule of its fund holdings for the first and third quarters of its fiscal year with the SEC on Form N-Q. The Funds’ Forms N-Q are available on the SEC’s website at http://www.sec.gov and may be reviewed and copied at the SEC’s Public Reference Room in Washington, DC. Information on the operation of the SEC’s Public Reference Room may be obtained by calling 1-800-SEC-0330. Shareholders may request the Form N-Q without charge by calling 1-800-480-4111 or by visiting the J.P. Morgan Funds’ website at www.jpmorganfunds.com.
A description of each Fund’s policies and procedures with respect to the disclosure of each Fund’s holdings is available in the prospectus and Statement of Additional Information.
A copy of proxy policies and procedures is available without charge upon request by calling 1-800-480-4111 and on the Funds’ website at www.jpmorganfunds.com. A description of such policies and procedures is on the SEC’s website at www.sec.gov. The Trustees have delegated the authority to vote proxies for securities owned by the Funds to the Advisor. A copy of the Funds’ voting record for the most recent 12-month period ended June 30 is available on the SEC’s website at www.sec.gov or at the Funds’ website at www.jpmorganfunds.com no later than August 31 of each year. The Funds’ proxy voting record will include, among other things, a brief description of the matter voted on for each fund security, and will state how each vote was cast, for example, for or against the proposal.
Table of Contents

J.P. Morgan Asset Management is the marketing name for the asset management business of JPMorgan Chase & Co. Those business include, but are not limited to, J.P. Morgan Investment Management Inc., Security Capital Research & Management incorporated and J.P. Morgan Alternative Asset Management, Inc.
| © JPMorgan Chase & Co., 2013. All rights reserved. June 2013. | AN-INDEX-613 |
Table of Contents
Annual Report
J.P. Morgan Investor Funds
June 30, 2013
JPMorgan Investor Balanced Fund
JPMorgan Investor Conservative Growth Fund
JPMorgan Investor Growth Fund
JPMorgan Investor Growth & Income Fund

Table of Contents
| CEO’s Letter | 1 | |||
| Fund Facts | 2 | |||
| Funds Commentary | 3 | |||
| Schedules of Portfolio Investments | 8 | |||
| Financial Statements | 13 | |||
| Financial Highlights | 20 | |||
| Notes to Financial Statements | 28 | |||
| 40 | ||||
| Trustees | 41 | |||
| Officers | 43 | |||
| Schedule of Shareholder Expenses | 44 | |||
| Tax Letter | 46 | |||
| Privacy Notice — Located at the back of this Annual Report | ||||
Investments in a Fund are not bank deposits or obligations of, or guaranteed or endorsed by, any bank and are not insured or guaranteed by the FDIC, the Federal Reserve Board or any other government agency. You could lose money if you sell when the Fund’s share price is lower than when you invested.
Past performance is no guarantee of future performance. The general market views expressed in this report are opinions based on market and other conditions through the end of the reporting period and are subject to change without notice. These views are not intended to predict the future performance of a Fund or the securities markets. References to specific securities and their issuers are for illustrative purposes only and are not intended to be, and should not be interpreted as, recommendations to purchase or sell such securities. Such views are not meant as investment advice and may not be relied on as an indication of trading intent on behalf of any Fund.
Prospective investors should refer to the Funds’ prospectus for a discussion of the Funds’ investment objectives, strategies and risks. Call J.P. Morgan Funds Service Center at 1-800-480-4111 for a prospectus containing more complete information about a Fund, including management fees and other expenses. Please read it carefully before investing.
Table of Contents
July 26, 2013 (Unaudited)
Dear Shareholder:
While somewhat overshadowed by increased volatility at the end of the reporting period, global equities in aggregate posted strong returns for the twelve months ended June 30, 2013. For much of the period, stocks were supported by solid corporate earnings and robust demand from investors looking to generate higher returns in the low interest rate environment. Despite signaling a potential policy shift in June 2013, the U.S. Federal Reserve (“Fed”) continued to pursue its highly accommodative policies in an attempt to lower unemployment and spur the economy. Central banks overseas also did their part to support their economies. The European Central Bank (“ECB”) remained committed to preserving the euro, as it cut rates and introduced new programs designed to aid struggling euro zone members. Elsewhere, the Bank of Japan embarked on a major asset purchase program as a new pro-growth government came into power late in 2012.
 |
“We are encouraged by the stock market’s resiliency in the face of recent volatility.” |
Positive investor sentiment was temporarily interrupted, however, in May 2013 when Fed Chairman Bernanke indicated that the central bank may begin to “taper” its asset purchase program later this year. This triggered a sharp decline in global equities, although they quickly regained their footing and have continued to rally in July. All told, both U.S. and international developed stocks rose sharply during the twelve months ended June 30, 2013. Emerging market equities produced only modest gains given concerns regarding China’s economy and falling commodity prices.
U.S. Treasury Yields Rise Sharply
Talk of Fed tapering negatively impacted the fixed income markets. While U.S. Treasury security yields continued to be
low from a historical perspective, they ended the period sharply higher than when the reporting period began. The yield for 10-year U.S. Treasury securities ended June 30, 2013 at 2.52%, while the yields for 2- and 30-year U.S. Treasury securities finished the reporting period at 0.36% and 3.52%, respectively. Amid the rising interest rate environment, the overall U.S. fixed income market posted a modest decline for the reporting period. In contrast, high yield bonds (also known as junk bonds) posted a strong return and emerging market debt securities also moved higher, albeit to a lesser extent.
Positive Signs for Stocks
Although the global economy is far from robust, it is still on a growth path. The expansion in the U.S. certainly appears to be sustainable and, while Europe remains in a recession, there are indications that its economy may be bottoming. Elsewhere, pro-growth initiatives in Japan have thus far yielded positive results. While growth in China has moderated, we believe the government has the tools at its disposal to avoid a “hard landing.”
We are encouraged by the stock market’s resiliency in the face of recent volatility. In addition, there have been signs that equity market correlations are decreasing, which could create a more favorable environment for active managers. In addition, given the recent sell-off in the bond market, valuations in a number of fixed income sectors have become more attractive.
On behalf of everyone at J.P. Morgan Asset Management, thank you for your continued support. We look forward to managing your investment needs for years to come. Should you have any questions, please visit www.jpmorganfunds.com or contact the J.P. Morgan Funds Service Center at 1-800-480-4111.
Sincerely yours,

George C.W. Gatch
CEO, Global Funds Management
J.P. Morgan Asset Management
| JUNE 30, 2013 | J.P. MORGAN INVESTOR FUNDS | 1 | ||||||
Table of Contents
J.P. Morgan Investor Funds
TWELVE MONTHS ENDED JUNE 30, 2013 (Unaudited)
Fund | Fund Return* | Barclays U.S. Intermediate Aggregate Index Return (Broad Based Fixed Income Benchmark) | Russell 3000 Index Return (Broad- Based Equity Benchmark) | Composite Benchmark Return | Fund Net Assets as of 6/30/2013 (in thousands) | |||||||||||||||
JPMorgan Investor Balanced Fund, Class A (no sales charge) | 10.54% | (0.12 | )% | 21.46% | 10.25% | ** | $ | 3,768,552 | ||||||||||||
JPMorgan Investor Conservative Growth Fund, Class A | 6.76% | (0.12 | )% | 21.46% | 6.01% | *** | 3,535,661 | |||||||||||||
JPMorgan Investor Growth Fund, Class A (no sales charge) | 18.28% | (0.12 | )% | 21.46% | 19.15% | **** | 1,737,973 | |||||||||||||
| JPMorgan Investor Growth & Income Fund, Class A (no sales charge) | 13.91% | (0.12 | )% | 21.46% | 14.63% | ***** | 2,318,995 | |||||||||||||
Portfolio Composition by Asset Class******
Investor Balanced Fund | ||||
| U.S. Equity | 44.0 | % | ||
| Fixed Income | 39.0 | |||
| International Equity | 7.2 | |||
| Alternative Assets | 5.9 | |||
| Money Market | 3.9 | |||
Investor Conservative Growth Fund | ||||
| Fixed Income | 55.8 | % | ||
| U.S. Equity | 28.4 | |||
| Alternative Assets | 6.4 | |||
| Money Market | 5.7 | |||
| International Equity | 3.7 | |||
Investor Growth Fund | ||||
| U.S. Equity | 79.1 | % | ||
| International Equity | 9.9 | |||
| Fixed Income | 7.2 | |||
| Alternative Assets | 2.4 | |||
| Money Market | 1.4 | |||
Investor Growth & Income Fund | ||||
| U.S. Equity | 57.1 | % | ||
| Fixed Income | 23.9 | |||
| International Equity | 8.6 | |||
| Alternative Assets | 6.4 | |||
| Money Market | 4.0 | |||
| * | The return shown is based on net asset values calculated for shareholder transactions and may differ from the return shown in the financial highlights, which reflects adjustments made to the net asset values in accordance with accounting principles generally accepted in the United States of America. |
| ** | The Composite Benchmark is comprised of unmanaged indices that correspond to the Investor Balanced Fund’s model allocation and consists of the Barclays U.S. Intermediate Aggregate Index (50%) and the Russell 3000 Index (50%). |
| *** | The Composite Benchmark is comprised of unmanaged indices that correspond to the Investor Conservative Growth Fund’s model allocation and consists of the Barclays U.S. Intermediate Aggregate Index (70%) and the Russell 3000 Index (30%). |
| **** | The Composite Benchmark is comprised of unmanaged indices that correspond to the Investor Growth Fund’s model allocation and consists of the Russell 3000 Index (90%) and the Barclays U.S. Intermediate Aggregate Index (10%). |
| ***** | The Composite Benchmark is comprised of unmanaged indices that correspond to the Investor Growth & Income Fund’s model allocation and consists of the Russell 3000 Index (70%) and the Barclays U.S. Intermediate Aggregate Index (30%). |
| ****** | Percentages indicated are based on total investments as of June 30, 2013. The Funds’ composition is subject to change. |
| 2 | J.P. MORGAN INVESTOR FUNDS | JUNE 30, 2013 | ||||
Table of Contents
J.P. Morgan Investor Funds
TWELVE MONTHS ENDED JUNE 30, 2013 (Unaudited)
INVESTMENT OBJECTIVES*
The JPMorgan Investor Balanced Fund seeks high total return consistent with the preservation of capital by investing primarily in a diversified group of mutual funds within the same group of investment companies that invest primarily in equity and fixed income securities.
The JPMorgan Investor Conservative Growth Fund seeks income and capital appreciation by investing primarily in a diversified group of mutual funds within the same group of investment companies that invest primarily in fixed income and equity securities.
The JPMorgan Investor Growth Fund seeks long-term capital appreciation by investing primarily in a diversified group of mutual funds within the same group of investment companies that invest primarily in equity securities.
The JPMorgan Investor Growth & Income Fund seeks long-term capital appreciation and growth of income by investing primarily in a diversified group of mutual funds within the same group of investment companies that invest primarily in equity securities.
HOW DID THE MARKET PERFORM?
Despite periods of heightened volatility and several setbacks, the overall U.S. equity market generated strong results during the twelve months ended June 30, 2013. Supporting the market were overall solid corporate profits, continued economic growth and generally robust investor demand. From an economic perspective, the housing market showed signs of rebounding and there was some improvement in the labor market. Against this backdrop, the Russell 3000 Index returned 21.46% for the twelve months ended June 30, 2013. U.S. small- and mid-cap stocks outperformed U.S. large-cap stocks. International and emerging markets stocks underperformed U.S. stocks during the reporting period.
U.S. fixed income securities, as measured by the Barclays U.S. Intermediate Aggregate Index, substantially underperformed U.S. equities during the twelve months ended June 30, 2013. This was partially due to the U.S. Federal Reserve Board’s announcement in June 2013 that it could begin tapering its asset purchases later in the year. This triggered a sharp sell-off in the overall bond market. Despite this weakness, high-yield bonds performed strongly during the reporting period, as investor demand was generally solid given their search for yield in the low interest rate environment. Emerging market debt securities, however, largely treaded water over the same period. Prices for commodities generally declined during the reporting period given signs of moderating global growth and fears of a “hard landing” for China’s economy.
WHAT WERE THE MAIN DRIVERS OF THE FUNDS’ PERFORMANCE?
In accordance with their model allocations, each of the JPMorgan Investor Funds (the “Investor Funds”) allocated its assets among fixed income, equity and alternative investments. For the twelve months ended June 30, 2013, each of the Investor Funds outperformed the Barclays U.S. Intermediate Aggregate Index, their broad based fixed income benchmark. In contrast, each of the Investor Funds underperformed the Russell 3000 Index, the Investor Funds’ broad based equity benchmark. This was due to the Investor Funds’ allocation to fixed income securities, as they performed poorly during the reporting period.
Each Investor Fund’s performance is also compared to a composite benchmark, which is constructed of different percentages of the Investor Funds’ broad based fixed income and equity benchmarks. These composite benchmarks correspond to each Investor Fund’s model allocation.
The JPMorgan Investor Balanced Fund and the JPMorgan Investor Conservative Growth Fund outperformed their respective composite benchmark during the reporting period. In contrast, the JPMorgan Investor Growth Fund and the JPMorgan Investor Growth & Income Fund underperformed their respective composite benchmark during the reporting period.
HOW WERE THE FUNDS POSITIONED?
Each Investor Fund invested in underlying JPMorgan Funds (“underlying funds”). The underlying funds invest in fixed income securities, equities and other alternative fixed income and equity strategies, such as below investment-grade, high-yield bonds, commodities, equity long/short and market-neutral strategies. Among equities, the underlying funds in which the Investor Funds invested were allocated among large-cap, mid-cap, small-cap, and international stocks. The Investor Funds’ portfolio managers made investments for each Investor Fund based on an evaluation of three components: underlying fund selection, tactical asset allocation and strategic asset allocation. They determined the strategic weight for each asset class in the Investor Funds by making investments that they believed would perform well over the long term, and maintained a level of volatility similar to that of each Investor Fund’s blended composite benchmark.
| * | The advisor seeks to achieve each Fund’s objective. There can be no guarantee it will be achieved. |
| JUNE 30, 2013 | J.P. MORGAN INVESTOR FUNDS | 3 | ||||||
Table of Contents
JPMorgan Investor Balanced Fund
FUND COMMENTARY
TWELVE MONTHS ENDED JUNE 30, 2013 (Unaudited)
AVERAGE ANNUAL TOTAL RETURNS AS OF JUNE 30, 2013 | ||||||||||||||||
| INCEPTION DATE OF CLASS | 1 YEAR | 5 YEAR | 10 YEAR | |||||||||||||
CLASS A SHARES | 12/10/96 | |||||||||||||||
Without Sales Charge | 10.54 | % | 5.72 | % | 6.22 | % | ||||||||||
With Sales Charge* | 5.57 | 4.75 | 5.73 | |||||||||||||
CLASS B SHARES | 12/10/96 | |||||||||||||||
Without CDSC | 9.86 | 5.15 | 5.72 | |||||||||||||
With CDSC** | 4.86 | 4.82 | 5.72 | |||||||||||||
CLASS C SHARES | 7/1/97 | |||||||||||||||
Without CDSC | 9.89 | 5.15 | 5.61 | |||||||||||||
With CDSC*** | 8.89 | 5.15 | 5.61 | |||||||||||||
SELECT CLASS SHARES | 12/10/96 | 10.71 | 5.97 | 6.48 | ||||||||||||
| * | Sales Charge for Class A Shares is 4.50%. |
| ** | Assumes a 5% CDSC (contingent deferred sales charge) for the one year period, 2% CDSC for the five year period and 0% CDSC thereafter. |
| *** | Assumes a 1% CDSC for the one year period and 0% CDSC thereafter. |
TEN YEAR PERFORMANCE (6/30/03 TO 6/30/13)
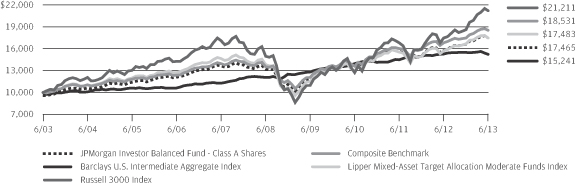
The performance quoted is past performance and is not a guarantee of future results. Mutual funds are subject to certain market risks. Investment returns and principal value of an investment will fluctuate so that an investor’s shares, when redeemed, may be worth more or less than their original cost. Current performance may be higher or lower than the performance data shown. For up-to-date month-end performance information please call 1-800-480-4111.
The graph illustrates comparative performance for $10,000 invested in Class A Shares of the JPMorgan Investor Balanced Fund, the Barclays U.S. Intermediate Aggregate Index, the Russell 3000 Index, the Composite Benchmark and the Lipper Mixed-Asset Target Allocation Moderate Funds Index from June 30, 2003 to June 30, 2013. The performance of the Fund assumes reinvestment of all dividends and capital gain distributions, if any, and includes a sales charge. The performance of the broad-based securities indices and the Composite Benchmark does not reflect the deduction of expenses or a sales charge associated with a mutual fund and has been adjusted to reflect reinvestment of all dividends and capital gain distributions of the securities included in the benchmark, if applicable. The performance of the Lipper Mixed-Asset Target Allocation Moderate Funds Index, which is not a broad-based securities index, includes expenses associated with a mutual fund, such as investment management fees. These expenses are not identical to the expenses incurred by the Fund. The Barclays U.S. Intermediate Aggregate Index is an unmanaged index comprised of U.S. Government, mortgage, corporate, and asset-backed securities with maturities of one to 10 years. The Russell 3000 Index is an unmanaged index
which measures the performance of the 3,000 largest U.S. companies based on total market capitalization, which represents approximately 98% of the investable U.S. equity market. The Composite Benchmark is comprised of unmanaged indices that correspond to the Fund’s model allocation and consists of the Barclays U.S. Intermediate Aggregate Index (50%) and the Russell 3000 Index (50%). The Lipper Mixed-Asset Target Allocation Moderate Funds Index consists of funds that by portfolio practice maintain a mix of between 40% to 60% equity securities, with the remainder invested in bonds, cash and cash equivalents. Investors cannot invest directly in an index.
Class A Shares have a $500 minimum initial investment and carry a 4.50% sales charge.
Fund performance may reflect the waiver of the Fund’s fees and reimbursement of expenses for certain periods since the inception date. Without these waivers and reimbursements, performance would have been lower. Also, performance shown in this section does not reflect the deduction of taxes that a shareholder would pay on Fund distributions or redemption of Fund shares.
Because Class B Shares automatically convert to Class A Shares after 8 years, the 10 year average annual total return shown above for Class B reflects Class A performance for the period after conversion.
The returns shown are based on net asset values calculated for shareholder transactions and may differ from the returns shown in the financial highlights, which reflect adjustments made to the net asset values in accordance with accounting principles generally accepted in the United States of America.
| 4 | J.P. MORGAN INVESTOR FUNDS | JUNE 30, 2013 | ||||
Table of Contents
JPMorgan Investor Conservative Growth Fund
FUND COMMENTARY
TWELVE MONTHS ENDED JUNE 30, 2013 (Unaudited)
AVERAGE ANNUAL TOTAL RETURNS AS OF JUNE 30, 2013 | ||||||||||||||||
| INCEPTION DATE OF CLASS | 1 YEAR | 5 YEAR | 10 YEAR | |||||||||||||
CLASS A SHARES | 12/10/96 | |||||||||||||||
Without Sales Charge | 6.76 | % | 5.39 | % | 5.20 | % | ||||||||||
With Sales Charge* | 1.96 | 4.42 | 4.71 | |||||||||||||
CLASS B SHARES | 12/10/96 | |||||||||||||||
Without CDSC | 6.22 | 4.84 | 4.69 | |||||||||||||
With CDSC** | 1.22 | 4.51 | 4.69 | |||||||||||||
CLASS C SHARES | 7/1/97 | |||||||||||||||
Without CDSC | 6.27 | 4.84 | 4.60 | |||||||||||||
With CDSC*** | 5.27 | 4.84 | 4.60 | |||||||||||||
SELECT CLASS SHARES | 12/10/96 | 6.97 | 5.66 | 5.46 | ||||||||||||
| * | Sales Charge for Class A Shares is 4.50%. |
| ** | Assumes a 5% CDSC (contingent deferred sales charge) for the one year period, 2% CDSC for the five year period and 0% CDSC thereafter. |
| *** | Assumes a 1% CDSC for the one year period and 0% CDSC thereafter. |
TEN YEAR PERFORMANCE (6/30/03 TO 6/30/13)
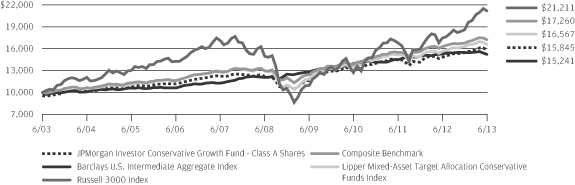
The performance quoted is past performance and is not a guarantee of future results. Mutual funds are subject to certain market risks. Investment returns and principal value of an investment will fluctuate so that an investor’s shares, when redeemed, may be worth more or less than their original cost. Current performance may be higher or lower than the performance data shown. For up-to-date month-end performance information please call 1-800-480-4111.
The graph illustrates comparative performance for $10,000 invested in Class A Shares of the JPMorgan Investor Conservative Growth Fund, the Barclays U.S. Intermediate Aggregate Index, the Russell 3000 Index, the Composite Benchmark, and the Lipper Mixed-Asset Target Allocation Conservative Funds Index from June 30, 2003 to June 30, 2013. The performance of the Fund assumes reinvestment of all dividends and capital gain distributions, if any, and includes a sales charge. The performance of the broad-based securities indices and the Composite Benchmark does not reflect the deduction of expenses or a sales charge associated with a mutual fund and has been adjusted to reflect reinvestment of all dividends and capital gain distributions of the securities included in the benchmark, if applicable. The performance of the Lipper Mixed-Asset Target Allocation Conservative Funds Index, which is not a broad-based securities index, includes expenses associated with a mutual fund, such as investment management fees. These expenses are not identical to the expenses incurred by the Fund. The Barclays U.S. Intermediate Aggregate Index is an unmanaged index comprised of U.S. Government, mortgage, corporate, and asset-backed securities with maturities of one to 10 years. The Russell 3000 Index is an unmanaged index which measures the performance of the 3,000 largest U.S. companies
based on total market capitalization, which represents approximately 98% of the investable U.S. equity market. The Composite Benchmark is comprised of unmanaged indices that correspond to the Fund’s model allocation and consists of the Barclays U.S. Intermediate Aggregate Index (70%) and the Russell 3000 Index (30%). The Lipper Mixed-Asset Target Allocation Conservative Funds Index consists of funds that by portfolio practice maintain a mix of between 20% to 40% equity securities, with the remainder invested in bonds, cash and cash equivalents. Investors cannot invest directly in an index.
Class A Shares have a $500 minimum initial investment and carry a 4.50% charge.
Fund performance may reflect the waiver of the Fund’s fees and reimbursement of expenses for certain periods since the inception date. Without these waivers and reimbursements, performance would have been lower. Also, performance shown in this section does not reflect the deduction of taxes that a shareholder would pay on Fund distributions or redemption of Fund shares.
Because Class B Shares automatically convert to Class A Shares after 8 years, the 10 year average annual total return shown above for Class B reflects Class A performance for the period after conversion.
The returns shown are based on net asset values calculated for shareholder transactions and may differ from the returns shown in the financial highlights, which reflect adjustments made to the net asset values in accordance with accounting principles generally accepted in the United States of America.
| JUNE 30, 2013 | J.P. MORGAN INVESTOR FUNDS | 5 | ||||||
Table of Contents
JPMorgan Investor Growth Fund
FUND COMMENTARY
TWELVE MONTHS ENDED JUNE 30, 2013 (Unaudited)
AVERAGE ANNUAL TOTAL RETURNS AS OF JUNE 30, 2013
| INCEPTION DATE OF CLASS | 1 YEAR | 5 YEAR | 10 YEAR | |||||||||||||
CLASS A SHARES | 12/10/96 | |||||||||||||||
Without Sales Charge | 18.28 | % | 5.55 | % | 7.30 | % | ||||||||||
With Sales Charge* | 12.99 | 4.58 | 6.81 | |||||||||||||
CLASS B SHARES | 12/10/96 | |||||||||||||||
Without CDSC | 17.63 | 4.94 | 6.77 | |||||||||||||
With CDSC** | 12.63 | 4.61 | 6.77 | |||||||||||||
CLASS C SHARES | 7/1/97 | |||||||||||||||
Without CDSC | 17.69 | 4.94 | 6.66 | |||||||||||||
With CDSC*** | 16.69 | 4.94 | 6.66 | |||||||||||||
SELECT CLASS SHARES | 12/10/96 | 18.64 | 5.80 | 7.57 | ||||||||||||
| * | Sales Charge for Class A Shares is 4.50%. |
| ** | Assumes a 5% CDSC (contingent deferred sales charge) for the one year period, 2% CDSC for the five year period and 0% CDSC thereafter. |
| *** | Assumes a 1% CDSC for the one year period and 0% CDSC thereafter. |
TEN YEAR PERFORMANCE (6/30/03 TO 6/30/13)
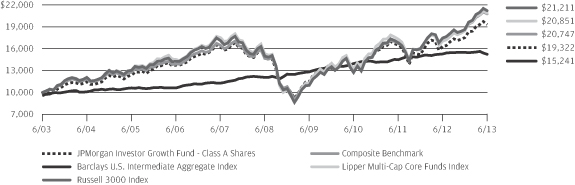
The performance quoted is past performance and is not a guarantee of future results. Mutual funds are subject to certain market risks. Investment returns and principal value of an investment will fluctuate so that an investor’s shares, when redeemed, may be worth more or less than their original cost. Current performance may be higher or lower than the performance data shown. For up-to-date month-end performance information please call 1-800-480-4111.
The graph illustrates comparative performance for $10,000 invested in Class A Shares of the JPMorgan Investor Growth Fund, the Russell 3000 Index, the Barclays U.S. Intermediate Aggregate Index, the Composite Benchmark and the Lipper Multi-Cap Core Funds Index from June 30, 2003 to June 30, 3013. The performance of the Fund assumes reinvestment of all dividends and capital gain distributions, if any, and includes a sales charge. The performance of the broad-based securities indices and the Composite Benchmark does not reflect the deduction of expenses or a sales charge associated with a mutual fund and has been adjusted to reflect reinvestment of all dividends and capital gain distributions of the securities included in the benchmark, if applicable. The performance of the Lipper Multi-Cap Core Funds Index, which is not a broad-based securities index, includes expenses associated with a mutual fund, such as investment management fees. These expenses are not identical to the expenses incurred by the Fund. The Russell 3000 Index is an unmanaged index which measures the performance of the 3,000 largest U.S. companies based on total market capitalization, which represents approximately 98% of the investable U.S. equity market. The Barclays U.S. Intermediate Aggregate Index is an unmanaged index comprised of U.S. Government, mortgage, corporate,
and asset-backed securities with maturities of one to 10 years. The Composite Benchmark is comprised of unmanaged indices that correspond to the Fund’s model allocation and consists of the Russell 3000 Index (90%) and the Barclays U.S. Intermediate Aggregate Index (10%). The Lipper Multi-Cap Core Funds Index consists of funds that invest in a variety of market capitalization ranges without concentrating 75% of their equity assets in any one market capitalization range over an extended period of time. Investors cannot invest directly in an index.
Class A Shares have a $500 minimum initial investment and carry a 4.50% sales charge.
Fund performance may reflect the waiver of the Fund’s fees and reimbursement of expenses for certain periods since the inception date. Without these waivers and reimbursements, performance would have been lower. Also, performance shown in this section does not reflect the deduction of taxes that a shareholder would pay on Fund distributions or redemption of Fund shares.
Because Class B Shares automatically convert to Class A Shares after 8 years, the 10 year average annual total return shown above for Class B reflects Class A performance for the period after conversion.
The returns shown are based on net asset values calculated for shareholder transactions and may differ from the returns shown in the financial highlights, which reflect adjustments made to the net asset values in accordance with accounting principles generally accepted in the United States of America.
| 6 | J.P. MORGAN INVESTOR FUNDS | JUNE 30, 2013 | ||||
Table of Contents
JPMorgan Investor Growth & Income Fund
FUND COMMENTARY
TWELVE MONTHS ENDED JUNE 30, 2013 (Unaudited)
AVERAGE ANNUAL TOTAL RETURNS AS OF JUNE 30, 2013 | ||||||||||||||||
| INCEPTION DATE OF CLASS | 1 YEAR | 5 YEAR | 10 YEAR | |||||||||||||
CLASS A SHARES | 12/10/96 | |||||||||||||||
Without Sales Charge | 13.91 | % | 5.70 | % | 6.81 | % | ||||||||||
With Sales Charge* | 8.79 | 4.73 | 6.32 | |||||||||||||
CLASS B SHARES | 12/10/96 | |||||||||||||||
Without CDSC | 13.35 | 5.12 | 6.29 | |||||||||||||
With CDSC** | 8.35 | 4.79 | 6.29 | |||||||||||||
CLASS C SHARES | 7/1/97 | |||||||||||||||
Without CDSC | 13.34 | 5.12 | 6.18 | |||||||||||||
With CDSC*** | 12.34 | 5.12 | 6.18 | |||||||||||||
SELECT CLASS SHARES | 12/10/96 | 14.22 | 5.96 | 7.08 | ||||||||||||
| * | Sales Charge for Class A Shares is 4.50%. |
| ** | Assumes a 5% CDSC (contingent deferred sales charge) for the one year period, 2% CDSC for the five year period and 0% CDSC thereafter. |
| *** | Assumes a 1% CDSC for the one year period and 0% CDSC thereafter. |
TEN YEAR PERFORMANCE (6/30/03 TO 6/30/13)
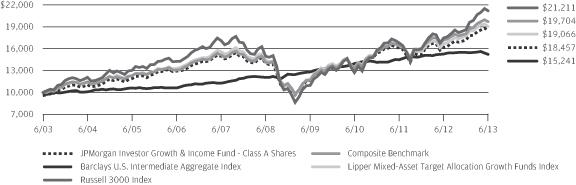
The performance quoted is past performance and is not a guarantee of future results. Mutual funds are subject to certain market risks. Investment returns and principal value of an investment will fluctuate so that an investor’s shares, when redeemed, may be worth more or less than their original cost. Current performance may be higher or lower than the performance data shown. For up-to-date month-end performance information please call 1-800-480-4111.
The graph illustrates comparative performance for $10,000 invested in Class A Shares of the JPMorgan Investor Growth & Income Fund, the Russell 3000 Index, the Barclays U.S. Intermediate Aggregate Index, the Composite Benchmark and the Lipper Mixed-Asset Target Allocation Growth Funds Index from June 30, 2003 to June 30, 2013. The performance of the Fund assumes reinvestment of all dividends and capital gain distributions, if any, and includes a sales charge. The performance of the broad-based securities indices and the Composite Benchmark does not reflect the deduction of expenses or a sales charge associated with a mutual fund and has been adjusted to reflect reinvestment of all dividends and capital gain distributions of the securities included in the benchmark, if applicable. The performance of the Lipper Mixed-Asset Target Allocation Growth Funds Index, which is not a broad-based securities index, includes expenses associated with a mutual fund, such as investment management fees. These expenses are not identical to the expenses incurred by the Fund. The Russell 3000 Index is an unmanaged index which measures the performance of the 3,000 largest U.S. companies based on total market capitalization, which represents approximately 98% of the investable U.S. equity market. The Barclays U.S. Intermediate Aggregate Index is an
unmanaged index comprised of U.S. Government, mortgage, corporate, and asset-backed securities with maturities of one to 10 years. The Composite Benchmark is comprised of unmanaged indices that correspond to the Fund’s model allocation and consists of the Russell 3000 Index (70%) and the Barclays U.S. Intermediate Aggregate Index (30%). The Lipper Mixed-Asset Target Allocation Growth Funds Index consists of funds that by portfolio practice maintain a mix of between 60% to 80% equity securities, with the remainder invested in bonds, cash and cash equivalents. Investors cannot invest directly in an index.
Class A Shares have a $500 minimum initial investment and carry a 4.50% sales charge.
Fund performance may reflect the waiver of the Fund’s fees and reimbursement of expenses for certain periods since the inception date. Without these waivers and reimbursements, performance would have been lower. Also, performance shown in this section does not reflect the deduction of taxes that a shareholder would pay on Fund distributions or redemption of Fund shares.
Because Class B Shares automatically convert to Class A Shares after 8 years, the 10 year average annual total return shown above for Class B reflects Class A performance for the period after conversion.
The returns shown are based on net asset values calculated for shareholder transactions and may differ from the returns shown in the financial highlights, which reflect adjustments made to the net asset values in accordance with accounting principles generally accepted in the United States of America.
| JUNE 30, 2013 | J.P. MORGAN INVESTOR FUNDS | 7 | ||||||
Table of Contents
JPMorgan Investor Balanced Fund
SCHEDULE OF PORTFOLIO INVESTMENTS
AS OF JUNE 30, 2013
(Amounts in thousands)
| SHARES | SECURITY DESCRIPTION | VALUE($) | ||||||
| Investment Companies — 99.7% (b) |
| ||||||
Alternative Assets — 5.9% |
| |||||||
| 960 | Highbridge Dynamic Commodities Strategy Fund, Select Class Shares (a) | 11,475 | ||||||
| 935 | JPMorgan Commodities Strategy Fund, Select Class Shares (a) | 12,337 | ||||||
| 1,070 | JPMorgan Global Natural Resources Fund, Select Class Shares | 8,529 | ||||||
| 11,011 | JPMorgan Multi-Cap Market Neutral Fund, Select Class Shares (a) | 109,449 | ||||||
| 5,408 | JPMorgan Research Market Neutral Fund, Select Class Shares (a) | 81,333 | ||||||
|
| |||||||
Total Alternative Assets | 223,123 | |||||||
|
| |||||||
Fixed Income — 38.9% |
| |||||||
| 26,317 | JPMorgan Core Bond Fund, Select Class Shares | 307,123 | ||||||
| 50,993 | JPMorgan Core Plus Bond Fund, Select Class Shares | 420,179 | ||||||
| 3,479 | JPMorgan Credit Opportunities Fund, Select Class Shares | 35,554 | ||||||
| 2,403 | JPMorgan Emerging Markets Debt Fund, Select Class Shares | 19,824 | ||||||
| 2,249 | JPMorgan Emerging Markets Local Currency Debt Fund, Select Class Shares | 21,343 | ||||||
| 11,874 | JPMorgan Floating Rate Income Fund, Select Class Shares | 118,385 | ||||||
| 7,847 | JPMorgan Government Bond Fund, Select Class Shares | 87,651 | ||||||
| 14,214 | JPMorgan High Yield Fund, Select Class Shares | 114,141 | ||||||
| 11,054 | JPMorgan Inflation Managed Bond Fund, Select Class Shares | 115,072 | ||||||
| 9,224 | JPMorgan Limited Duration Bond Fund, Select Class Shares | 90,860 | ||||||
| 5,617 | JPMorgan Short Duration Bond Fund, Select Class Shares | 61,220 | ||||||
| 6,136 | JPMorgan Strategic Income Opportunities Fund, Select Class Shares | 72,708 | ||||||
|
| |||||||
Total Fixed Income | 1,464,060 | |||||||
|
| |||||||
International Equity — 7.2% |
| |||||||
| 3,747 | JPMorgan Emerging Economies Fund, Select Class Shares | 46,497 | ||||||
| 2,197 | JPMorgan Emerging Markets Equity Fund, Select Class Shares | 48,121 | ||||||
| 6,869 | JPMorgan Global Research Enhanced Index Fund, Select Class Shares (a) | 106,533 | ||||||
| 2,916 | JPMorgan International Equity Index Fund, Select Class Shares | 53,602 | ||||||
| 909 | JPMorgan Latin America Fund, Select Class Shares | 16,101 | ||||||
|
| |||||||
Total International Equity | 270,854 | |||||||
|
| |||||||
| SHARES | SECURITY DESCRIPTION | VALUE($) | ||||||
Money Market — 3.9% |
| |||||||
| 147,292 | JPMorgan Liquid Assets Money Market Fund, Institutional Class Shares, 0.030% (l) | 147,292 | ||||||
|
| |||||||
U.S. Equity — 43.8% |
| |||||||
| 2,710 | JPMorgan Dynamic Growth Fund, Select Class Shares (a) | 52,031 | ||||||
| 3,825 | JPMorgan Equity Income Fund, Select Class Shares | 45,023 | ||||||
| 9,483 | JPMorgan Intrepid America Fund, Select Class Shares | 284,486 | ||||||
| 4,722 | JPMorgan Intrepid Growth Fund, Select Class Shares | 139,380 | ||||||
| 6,141 | JPMorgan Intrepid Mid Cap Fund, Select Class Shares | 119,507 | ||||||
| 1,699 | JPMorgan Large Cap Growth Fund, Select Class Shares | 44,075 | ||||||
| 11,365 | JPMorgan Large Cap Value Fund, Select Class Shares | 157,065 | ||||||
| 12,278 | JPMorgan Market Expansion Enhanced Index Fund, Select Class Shares | 150,279 | ||||||
| 2,287 | JPMorgan U.S. Dynamic Plus Fund, Select Class Shares | 35,500 | ||||||
| 31,229 | JPMorgan U.S. Equity Fund, Select Class Shares | 399,419 | ||||||
| 6,964 | JPMorgan U.S. Large Cap Core Plus Fund, Select Class Shares | 177,727 | ||||||
| 1,890 | JPMorgan Value Advantage Fund, Select Class Shares | 46,727 | ||||||
|
| |||||||
Total U.S. Equity | 1,651,219 | |||||||
|
| |||||||
Total Investments — 99.7% | 3,756,548 | |||||||
Other Assets in Excess of | 12,004 | |||||||
|
| |||||||
NET ASSETS — 100.0% | $ | 3,768,552 | ||||||
|
| |||||||
Percentages indicated are based on net assets.
SEE NOTES TO FINANCIAL STATEMENTS.
| 8 | J.P. MORGAN INVESTOR FUNDS | JUNE 30, 2013 | ||||
Table of Contents
JPMorgan Investor Conservative Growth Fund
SCHEDULE OF PORTFOLIO INVESTMENTS
AS OF JUNE 30, 2013
(Amounts in thousands)
| SHARES | SECURITY DESCRIPTION | VALUE($) | ||||||
| Investment Companies — 99.7% (b) |
| ||||||
Alternative Assets — 6.4% |
| |||||||
| 869 | Highbridge Dynamic Commodities Strategy Fund, Select Class Shares (a) | 10,382 | ||||||
| 791 | JPMorgan Commodities Strategy Fund, Select Class Shares (a) | 10,439 | ||||||
| 992 | JPMorgan Global Natural Resources Fund, Select Class Shares | 7,904 | ||||||
| 10,452 | JPMorgan Multi-Cap Market Neutral Fund, Select Class Shares (a) | 103,889 | ||||||
| 6,180 | JPMorgan Research Market Neutral Fund, Select Class Shares (a) | 92,947 | ||||||
|
| |||||||
Total Alternative Assets | 225,561 | |||||||
|
| |||||||
Fixed Income — 55.6% |
| |||||||
| 29,291 | JPMorgan Core Bond Fund, Select Class Shares | 341,824 | ||||||
| 59,809 | JPMorgan Core Plus Bond Fund, Select Class Shares | 492,830 | ||||||
| 4,286 | JPMorgan Credit Opportunities Fund, Select Class Shares | 43,802 | ||||||
| 2,573 | JPMorgan Emerging Markets Debt Fund, Select Class Shares | 21,227 | ||||||
| 2,271 | JPMorgan Emerging Markets Local Currency Debt Fund, Select Class Shares | 21,554 | ||||||
| 13,564 | JPMorgan Floating Rate Income Fund, Select Class Shares | 135,238 | ||||||
| 23,308 | JPMorgan Government Bond Fund, Select Class Shares | 260,347 | ||||||
| 9,575 | JPMorgan High Yield Fund, Select Class Shares | 76,884 | ||||||
| 13,702 | JPMorgan Inflation Managed Bond Fund, Select Class Shares | 142,634 | ||||||
| 19,017 | JPMorgan Limited Duration Bond Fund, Select Class Shares | 187,313 | ||||||
| 15,141 | JPMorgan Short Duration Bond Fund, Select Class Shares | 165,040 | ||||||
| 6,610 | JPMorgan Strategic Income Opportunities Fund, Select Class Shares | 78,333 | ||||||
|
| |||||||
Total Fixed Income | 1,967,026 | |||||||
|
| |||||||
International Equity — 3.7% |
| |||||||
| 2,116 | JPMorgan Emerging Economies Fund, Select Class Shares | 26,260 | ||||||
| 1,233 | JPMorgan Emerging Markets Equity Fund, Select Class Shares | 27,004 | ||||||
| 2,232 | JPMorgan Global Research Enhanced Index Fund, Select Class Shares (a) | 34,623 | ||||||
| 1,515 | JPMorgan International Equity Index Fund, Select Class Shares | 27,846 | ||||||
| 872 | JPMorgan Latin America Fund, Select Class Shares | 15,447 | ||||||
|
| |||||||
Total International Equity | 131,180 | |||||||
|
| |||||||
| SHARES | SECURITY DESCRIPTION | VALUE($) | ||||||
Money Market — 5.7% |
| |||||||
| 202,147 | JPMorgan Liquid Assets Money Market Fund, Institutional Class Shares, 0.030% (l) | 202,147 | ||||||
|
| |||||||
U.S. Equity — 28.3% |
| |||||||
| 541 | JPMorgan Dynamic Growth Fund, Select Class Shares (a) | 10,382 | ||||||
| 4,908 | JPMorgan Equity Income Fund, Select Class Shares | 57,765 | ||||||
| 8,137 | JPMorgan Intrepid America Fund, Select Class Shares | 244,103 | ||||||
| 3,528 | JPMorgan Intrepid Growth Fund, Select Class Shares | 104,151 | ||||||
| 3,115 | JPMorgan Intrepid Mid Cap Fund, Select Class Shares | 60,619 | ||||||
| 3,931 | JPMorgan Large Cap Value Fund, Select Class Shares | 54,322 | ||||||
| 4,749 | JPMorgan Market Expansion Enhanced Index Fund, Select Class Shares | 58,133 | ||||||
| 867 | JPMorgan Mid Cap Growth Fund, Select Class Shares | 21,694 | ||||||
| 2,205 | JPMorgan U.S. Dynamic Plus Fund, Select Class Shares | 34,214 | ||||||
| 16,177 | JPMorgan U.S. Equity Fund, Select Class Shares | 206,904 | ||||||
| 4,142 | JPMorgan U.S. Large Cap Core Plus Fund, Select Class Shares | 105,706 | ||||||
| 1,665 | JPMorgan Value Advantage Fund, Select Class Shares | 41,153 | ||||||
|
| |||||||
Total U.S. Equity | 999,146 | |||||||
|
| |||||||
Total Investments — 99.7% | 3,525,060 | |||||||
Other Assets in Excess of | 10,601 | |||||||
|
| |||||||
NET ASSETS — 100.0% | $ | 3,535,661 | ||||||
|
| |||||||
Percentages indicated are based on net assets.
SEE NOTES TO FINANCIAL STATEMENTS.
| JUNE 30, 2013 | J.P. MORGAN INVESTOR FUNDS | 9 | ||||||
Table of Contents
JPMorgan Investor Growth Fund
SCHEDULE OF PORTFOLIO INVESTMENTS
AS OF JUNE 30, 2013
(Amounts in thousands)
| SHARES | SECURITY DESCRIPTION | VALUE($) | ||||||
| Investment Companies — 99.9% (b) |
| ||||||
Alternative Assets — 2.4% |
| |||||||
| 486 | Highbridge Dynamic Commodities Strategy Fund, Select Class Shares (a) | 5,813 | ||||||
| 431 | JPMorgan Commodities Strategy Fund, Select Class Shares (a) | 5,694 | ||||||
| 515 | JPMorgan Global Natural Resources Fund, Select Class Shares | 4,108 | ||||||
| 1,727 | JPMorgan Multi-Cap Market Neutral Fund, Select Class Shares (a) | 17,167 | ||||||
| 608 | JPMorgan Research Market Neutral Fund, Select Class Shares (a) | 9,144 | ||||||
|
| |||||||
Total Alternative Assets | 41,926 | |||||||
|
| |||||||
Fixed Income — 7.2% |
| |||||||
| 1,695 | JPMorgan Core Plus Bond Fund, Select Class Shares | 13,971 | ||||||
| 660 | JPMorgan Credit Opportunities Fund, Select Class Shares | 6,747 | ||||||
| 1,110 | JPMorgan Emerging Markets Debt Fund, Select Class Shares | 9,155 | ||||||
| 1,032 | JPMorgan Emerging Markets Local Currency Debt Fund, Select Class Shares | 9,795 | ||||||
| 1,679 | JPMorgan Floating Rate Income Fund, Select Class Shares | 16,740 | ||||||
| 80 | JPMorgan Government Bond Fund, Select Class Shares | 897 | ||||||
| 2,221 | JPMorgan High Yield Fund, Select Class Shares | 17,832 | ||||||
| 3,299 | JPMorgan Inflation Managed Bond Fund, Select Class Shares | 34,339 | ||||||
| 234 | JPMorgan Limited Duration Bond Fund, Select Class Shares | 2,306 | ||||||
| 1,133 | JPMorgan Strategic Income Opportunities Fund, Select Class Shares | 13,423 | ||||||
|
| |||||||
Total Fixed Income | 125,205 | |||||||
|
| |||||||
International Equity — 9.9% |
| |||||||
| 2,177 | JPMorgan Emerging Economies Fund, Select Class Shares | 27,016 | ||||||
| 1,316 | JPMorgan Emerging Markets Equity Fund, Select Class Shares | 28,830 | ||||||
| 2,742 | JPMorgan Global Research Enhanced Index Fund, Select Class Shares (a) | 42,522 | ||||||
| 1,930 | JPMorgan International Equity Fund, Select Class Shares | 27,638 | ||||||
| 2,118 | JPMorgan International Equity Index Fund, Select Class Shares | 38,922 | ||||||
| 360 | JPMorgan Latin America Fund, Select Class Shares | 6,368 | ||||||
|
| |||||||
Total International Equity | 171,296 | |||||||
|
| |||||||
| SHARES | SECURITY DESCRIPTION | VALUE($) | ||||||
Money Market — 1.4% |
| |||||||
| 24,719 | JPMorgan Liquid Assets Money Market Fund, Institutional Class Shares, 0.030% (l) | 24,719 | ||||||
|
| |||||||
U.S. Equity — 79.0% |
| |||||||
| 481 | JPMorgan Dynamic Growth Fund, Select Class Shares (a) | 9,236 | ||||||
| 1,472 | JPMorgan Equity Income Fund, Select Class Shares | 17,330 | ||||||
| 7,499 | JPMorgan Intrepid America Fund, Select Class Shares | 224,977 | ||||||
| 3,738 | JPMorgan Intrepid Growth Fund, Select Class Shares | 110,338 | ||||||
| 3,675 | JPMorgan Intrepid Mid Cap Fund, Select Class Shares | 71,524 | ||||||
| 5,814 | JPMorgan Large Cap Growth Fund, Select Class Shares | 150,807 | ||||||
| 15,259 | JPMorgan Large Cap Value Fund, Select Class Shares | 210,886 | ||||||
| 9,086 | JPMorgan Market Expansion Enhanced Index Fund, Select Class Shares | 111,210 | ||||||
| 409 | JPMorgan Mid Cap Growth Fund, Select Class Shares | 10,229 | ||||||
| 2,271 | JPMorgan Small Cap Value Fund, Select Class Shares | 56,428 | ||||||
| 1,142 | JPMorgan U.S. Dynamic Plus Fund, Select Class Shares | 17,723 | ||||||
| 21,291 | JPMorgan U.S. Equity Fund, Select Class Shares | 272,318 | ||||||
| 3,580 | JPMorgan U.S. Large Cap Core Plus Fund, Select Class Shares | 91,373 | ||||||
| 754 | JPMorgan Value Advantage Fund, Select Class Shares | 18,637 | ||||||
|
| |||||||
Total U.S. Equity | 1,373,016 | |||||||
|
| |||||||
Total Investments — 99.9% | 1,736,162 | |||||||
Other Assets in Excess of | 1,811 | |||||||
|
| |||||||
NET ASSETS — 100.0% | $ | 1,737,973 | ||||||
|
| |||||||
Percentages indicated are based on net assets.
SEE NOTES TO FINANCIAL STATEMENTS.
| 10 | J.P. MORGAN INVESTOR FUNDS | JUNE 30, 2013 | ||||
Table of Contents
JPMorgan Investor Growth & Income Fund
SCHEDULE OF PORTFOLIO INVESTMENTS
AS OF JUNE 30, 2013
(Amounts in thousands)
| SHARES | SECURITY DESCRIPTION | VALUE($) | ||||||
| Investment Companies — 99.8% (b) |
| ||||||
Alternative Assets — 6.4% |
| |||||||
| 644 | Highbridge Dynamic Commodities Strategy Fund, Select Class Shares (a) | 7,693 | ||||||
| 539 | JPMorgan Commodities Strategy Fund, Select Class Shares (a) | 7,117 | ||||||
| 688 | JPMorgan Global Natural Resources Fund, Select Class Shares | 5,481 | ||||||
| 7,416 | JPMorgan Multi-Cap Market Neutral Fund, Select Class Shares (a) | 73,718 | ||||||
| 3,606 | JPMorgan Research Market Neutral Fund, Select Class Shares (a) | 54,236 | ||||||
|
| |||||||
Total Alternative Assets | 148,245 | |||||||
|
| |||||||
Fixed Income — 23.9% |
| |||||||
| 7,757 | JPMorgan Core Bond Fund, Select Class Shares | 90,521 | ||||||
| 19,261 | JPMorgan Core Plus Bond Fund, Select Class Shares | 158,709 | ||||||
| 1,953 | JPMorgan Credit Opportunities Fund, Select Class Shares | 19,957 | ||||||
| 1,406 | JPMorgan Emerging Markets Debt Fund, Select Class Shares | 11,603 | ||||||
| 1,432 | JPMorgan Emerging Markets Local Currency Debt Fund, Select Class Shares | 13,586 | ||||||
| 7,442 | JPMorgan Floating Rate Income Fund, Select Class Shares | 74,201 | ||||||
| 9,191 | JPMorgan High Yield Fund, Select Class Shares | 73,801 | ||||||
| 6,146 | JPMorgan Inflation Managed Bond Fund, Select Class Shares | 63,977 | ||||||
| 4,041 | JPMorgan Strategic Income Opportunities Fund, Select Class Shares | 47,889 | ||||||
|
| |||||||
Total Fixed Income | 554,244 | |||||||
|
| |||||||
International Equity — 8.6% |
| |||||||
| 2,678 | JPMorgan Emerging Economies Fund, Select Class Shares | 33,236 | ||||||
| 1,532 | JPMorgan Emerging Markets Equity Fund, Select Class Shares | 33,550 | ||||||
| 4,493 | JPMorgan Global Research Enhanced Index Fund, Select Class Shares (a) | 69,686 | ||||||
| 1,413 | JPMorgan International Equity Fund, Select Class Shares | 20,236 | ||||||
| 1,927 | JPMorgan International Equity Index Fund, Select Class Shares | 35,412 | ||||||
| 381 | JPMorgan Latin America Fund, Select Class Shares | 6,752 | ||||||
|
| |||||||
Total International Equity | 198,872 | |||||||
|
| |||||||
Money Market — 4.0% |
| |||||||
| 91,732 | JPMorgan Liquid Assets Money Market Fund, Institutional Class Shares, 0.030% (l) | 91,732 | ||||||
|
| |||||||
| SHARES | SECURITY DESCRIPTION | VALUE($) | ||||||
U.S. Equity — 56.9% |
| |||||||
| 958 | JPMorgan Dynamic Growth Fund, Select Class Shares (a) | 18,391 | ||||||
| 2,468 | JPMorgan Equity Income Fund, Select Class Shares | 29,045 | ||||||
| 8,723 | JPMorgan Intrepid America Fund, Select Class Shares | 261,676 | ||||||
| 3,158 | JPMorgan Intrepid Growth Fund, Select Class Shares | 93,224 | ||||||
| 2,242 | JPMorgan Intrepid Mid Cap Fund, Select Class Shares | 43,623 | ||||||
| 4,832 | JPMorgan Large Cap Growth Fund, Select Class Shares | 125,346 | ||||||
| 11,625 | JPMorgan Large Cap Value Fund, Select Class Shares | 160,651 | ||||||
| 9,312 | JPMorgan Market Expansion Enhanced Index Fund, Select Class Shares | 113,977 | ||||||
| 484 | JPMorgan Mid Cap Growth Fund, Select Class Shares | 12,113 | ||||||
| 1,686 | JPMorgan Small Cap Value Fund, Select Class Shares | 41,894 | ||||||
| 1,413 | JPMorgan U.S. Dynamic Plus Fund, Select Class Shares | 21,925 | ||||||
| 20,609 | JPMorgan U.S. Equity Fund, Select Class Shares | 263,588 | ||||||
| 4,375 | JPMorgan U.S. Large Cap Core Plus Fund, Select Class Shares | 111,638 | ||||||
| 978 | JPMorgan Value Advantage Fund, Select Class Shares | 24,168 | ||||||
|
| |||||||
Total U.S. Equity | 1,321,259 | |||||||
|
| |||||||
Total Investments — 99.8% | 2,314,352 | |||||||
Other Assets in Excess of | 4,643 | |||||||
|
| |||||||
NET ASSETS — 100.0% | $ | 2,318,995 | ||||||
|
| |||||||
Percentages indicated are based on net assets.
SEE NOTES TO FINANCIAL STATEMENTS.
| JUNE 30, 2013 | J.P. MORGAN INVESTOR FUNDS | 11 | ||||||
Table of Contents
J.P. Morgan Investor Funds
NOTES TO SCHEDULES OF PORTFOLIO INVESTMENTS
AS OF JUNE 30, 2013
| (a) | — Non-income producing security. | |
| (b) | — Investment in affiliate. Fund is registered under the Investment Company Act of 1940, as amended, and advised by J.P. Morgan Investment Management Inc. |
| (l) | — The rate shown is the current yield as of June 30, 2013. |
Detailed information about investment portfolios of the underlying funds can be found in shareholder reports filed with the Securities and Exchange Commission (SEC) by each such underlying fund semi-annually on Form N-CSR and in certified portfolio holdings filed quarterly on Form N-Q, and are available for download from both the SEC’s as well as each respective underlying fund’s website.
SEE NOTES TO FINANCIAL STATEMENTS.
| 12 | J.P. MORGAN INVESTOR FUNDS | JUNE 30, 2013 | ||||
Table of Contents
STATEMENTS OF ASSETS AND LIABILITIES
AS OF JUNE 30, 2013
(Amounts in thousands, except per share amounts)
Investor Balanced Fund | Investor Conservative Growth Fund | Investor Growth Fund | Investor Growth & Income Fund | |||||||||||||
ASSETS: | ||||||||||||||||
Investments in affiliates, at value | $ | 3,756,548 | $ | 3,525,060 | $ | 1,736,162 | $ | 2,314,352 | ||||||||
Receivables: | ||||||||||||||||
Fund shares sold | 12,809 | 11,276 | 2,371 | 4,902 | ||||||||||||
Dividends from affiliates | 5,924 | 5,562 | 2,583 | 3,518 | ||||||||||||
|
|
|
|
|
|
|
| |||||||||
Total Assets | 3,775,281 | 3,541,898 | 1,741,116 | 2,322,772 | ||||||||||||
|
|
|
|
|
|
|
| |||||||||
LIABILITIES: | ||||||||||||||||
Payables: | ||||||||||||||||
Dividends | 539 | 97 | 122 | 187 | ||||||||||||
Fund shares redeemed | 3,867 | 3,813 | 1,646 | 1,993 | ||||||||||||
Accrued liabilities: | ||||||||||||||||
Investment advisory fees | 154 | 143 | 72 | 95 | ||||||||||||
Administration fees | 188 | 177 | 105 | 128 | ||||||||||||
Shareholder servicing fees | 202 | 208 | 73 | 116 | ||||||||||||
Distribution fees | 980 | 1,171 | 444 | 589 | ||||||||||||
Custodian and accounting fees | 5 | 6 | 4 | 5 | ||||||||||||
Trustees’ and Chief Compliance Officer’s fees | 3 | 2 | 1 | 1 | ||||||||||||
Transfer agent fees | 693 | 552 | 585 | 553 | ||||||||||||
Other | 98 | 68 | 91 | 110 | ||||||||||||
|
|
|
|
|
|
|
| |||||||||
Total Liabilities | 6,729 | 6,237 | 3,143 | 3,777 | ||||||||||||
|
|
|
|
|
|
|
| |||||||||
Net Assets | $ | 3,768,552 | $ | 3,535,661 | $ | 1,737,973 | $ | 2,318,995 | ||||||||
|
|
|
|
|
|
|
| |||||||||
SEE NOTES TO FINANCIAL STATEMENTS.
| JUNE 30, 2013 | J.P. MORGAN INVESTOR FUNDS | 13 | ||||||
Table of Contents
STATEMENTS OF ASSETS AND LIABILITIES
AS OF JUNE 30, 2013 (continued)
(Amounts in thousands, except per share amounts)
Investor Balanced Fund | Investor Conservative Growth Fund | Investor Growth Fund | Investor Growth & Income Fund | |||||||||||||
NET ASSETS: | ||||||||||||||||
Paid-in-Capital | $ | 3,313,957 | $ | 3,255,467 | $ | 1,411,236 | $ | 1,984,843 | ||||||||
Accumulated undistributed (distributions in excess of) net investment income | (323 | ) | (134 | ) | (149 | ) | (208 | ) | ||||||||
Accumulated net realized gains (losses) | (79,683 | ) | (38,791 | ) | (90,699 | ) | (111,360 | ) | ||||||||
Net unrealized appreciation (depreciation) | 534,601 | 319,119 | 417,585 | 445,720 | ||||||||||||
|
|
|
|
|
|
|
| |||||||||
Total Net Assets | $ | 3,768,552 | $ | 3,535,661 | $ | 1,737,973 | $ | 2,318,995 | ||||||||
|
|
|
|
|
|
|
| |||||||||
Net Assets: | ||||||||||||||||
Class A | $ | 2,797,749 | $ | 2,220,725 | $ | 1,344,928 | $ | 1,812,603 | ||||||||
Class B | 112,689 | 59,190 | 111,593 | 124,521 | ||||||||||||
Class C | 564,358 | 1,142,903 | 157,546 | 225,157 | ||||||||||||
Select Class | 293,756 | 112,843 | 123,906 | 156,714 | ||||||||||||
|
|
|
|
|
|
|
| |||||||||
Total | $ | 3,768,552 | $ | 3,535,661 | $ | 1,737,973 | $ | 2,318,995 | ||||||||
|
|
|
|
|
|
|
| |||||||||
Outstanding units of beneficial interest (shares) ($0.0001 par value; unlimited number of shares authorized): | ||||||||||||||||
Class A | 205,629 | 184,885 | 82,779 | 122,629 | ||||||||||||
Class B | 8,284 | 4,925 | 7,029 | 8,462 | ||||||||||||
Class C | 41,993 | 95,515 | 10,101 | 15,569 | ||||||||||||
Select Class | 21,564 | 9,356 | 7,506 | 10,738 | ||||||||||||
Net Asset Value (a): | ||||||||||||||||
Class A — Redemption price per share | $ | 13.61 | $ | 12.01 | $ | 16.25 | $ | 14.78 | ||||||||
Class B — Offering price per share (b) | 13.60 | 12.02 | 15.88 | 14.72 | ||||||||||||
Class C — Offering price per share (b) | 13.44 | 11.97 | 15.60 | 14.46 | ||||||||||||
Select Class — Offering and redemption price per share | 13.62 | 12.06 | 16.51 | 14.59 | ||||||||||||
Class A maximum sales charge | 4.50 | % | 4.50 | % | 4.50 | % | 4.50 | % | ||||||||
Class A maximum public offering price per share | ||||||||||||||||
[net asset value per share/(100% — maximum sales charge)] | $ | 14.25 | $ | 12.58 | $ | 17.02 | $ | 15.48 | ||||||||
|
|
|
|
|
|
|
| |||||||||
Cost of investments in affiliates | $ | 3,221,947 | $ | 3,205,941 | $ | 1,318,577 | $ | 1,868,632 | ||||||||
| (a) | Per share amounts may not recalculate due to rounding of net assets and/or shares outstanding. |
| (b) | Redemption price for Class B and Class C Shares varies based upon length of time the shares are held. |
SEE NOTES TO FINANCIAL STATEMENTS.
| 14 | J.P. MORGAN INVESTOR FUNDS | JUNE 30, 2013 | ||||
Table of Contents
STATEMENTS OF OPERATIONS
FOR THE YEAR ENDED JUNE 30, 2013
(Amounts in thousands)
| Investor Balanced Fund | Investor Conservative Growth Fund | Investor Growth Fund | Investor Growth & Income Fund | |||||||||||||
INVESTMENT INCOME: | ||||||||||||||||
Dividend income from affiliates | $ | 67,797 | $ | 66,731 | $ | 22,017 | $ | 37,922 | ||||||||
|
|
|
|
|
|
|
| |||||||||
EXPENSES: | ||||||||||||||||
Investment advisory fees | 1,692 | 1,568 | 797 | 1,063 | ||||||||||||
Administration fees | 2,084 | 1,960 | 1,185 | 1,452 | ||||||||||||
Distribution fees: | ||||||||||||||||
Class A | 6,304 | 5,050 | 3,035 | 4,098 | ||||||||||||
Class B | 1,020 | 525 | 967 | 1,136 | ||||||||||||
Class C | 3,454 | 7,041 | 1,042 | 1,465 | ||||||||||||
Shareholder servicing fees: | ||||||||||||||||
Class A | 6,304 | 5,050 | 3,035 | 4,098 | ||||||||||||
Class B | 340 | 175 | 323 | 379 | ||||||||||||
Class C | 1,151 | 2,347 | 347 | 488 | ||||||||||||
Select Class | 666 | 269 | 278 | 349 | ||||||||||||
Custodian and accounting fees | 19 | 20 | 16 | 20 | ||||||||||||
Professional fees | 67 | 60 | 51 | 57 | ||||||||||||
Trustees’ and Chief Compliance Officer’s fees | 39 | 36 | 18 | 24 | ||||||||||||
Printing and mailing costs | 396 | 340 | 253 | 269 | ||||||||||||
Registration and filing fees | 134 | 125 | 80 | 80 | ||||||||||||
Transfer agent fees | 2,057 | 1,635 | 1,663 | 1,597 | ||||||||||||
Other | 72 | 68 | 33 | 49 | ||||||||||||
|
|
|
|
|
|
|
| |||||||||
Total expenses | 25,799 | 26,269 | 13,123 | 16,624 | ||||||||||||
|
|
|
|
|
|
|
| |||||||||
Less amounts waived | (6,601 | ) | (5,770 | ) | (4,082 | ) | (4,638 | ) | ||||||||
|
|
|
|
|
|
|
| |||||||||
Net expenses | 19,198 | 20,499 | 9,041 | 11,986 | ||||||||||||
|
|
|
|
|
|
|
| |||||||||
Net investment income (loss) | 48,599 | 46,232 | 12,976 | 25,936 | ||||||||||||
|
|
|
|
|
|
|
| |||||||||
REALIZED/UNREALIZED GAINS (LOSSES): | ||||||||||||||||
Net realized gain (loss) on investments in affiliates | 5,374 | 1,730 | 9,147 | 16,481 | ||||||||||||
Distributions of realized gains by investment company affiliates | 24,197 | 13,477 | 14,763 | 17,423 | ||||||||||||
Change in net unrealized appreciation/depreciation of investments in affiliates | 247,278 | 129,648 | 226,857 | 210,815 | ||||||||||||
|
|
|
|
|
|
|
| |||||||||
Net realized/unrealized gains (losses) | 276,849 | 144,855 | 250,767 | 244,719 | ||||||||||||
|
|
|
|
|
|
|
| |||||||||
Change in net assets resulting from operations | $ | 325,448 | $ | 191,087 | $ | 263,743 | $ | 270,655 | ||||||||
|
|
|
|
|
|
|
| |||||||||
SEE NOTES TO FINANCIAL STATEMENTS.
| JUNE 30, 2013 | J.P. MORGAN INVESTOR FUNDS | 15 | ||||||
Table of Contents
STATEMENTS OF CHANGES IN NET ASSETS
FOR THE PERIODS INDICATED
(Amounts in thousands)
| Investor Balanced Fund | Investor Conservative Growth Fund | |||||||||||||||
| Year Ended 6/30/2013 | Year Ended 6/30/2012 | Year Ended 6/30/2013 | Year Ended 6/30/2012 | |||||||||||||
CHANGE IN NET ASSETS RESULTING FROM OPERATIONS: | ||||||||||||||||
Net Investment Income (loss) | $ | 48,599 | $ | 50,277 | $ | 46,232 | $ | 50,146 | ||||||||
Net realized gain (loss) on investments in affiliates | 5,374 | (10,483 | ) | 1,730 | (8,234 | ) | ||||||||||
Distributions of realized gains by investment company affiliates | 24,197 | 20,960 | 13,477 | 13,599 | ||||||||||||
Change in net unrealized appreciation/depreciation of investments in affiliates | 247,278 | (24,973 | ) | 129,648 | 9,677 | |||||||||||
|
|
|
|
|
|
|
| |||||||||
Change in net assets resulting from operations | 325,448 | 35,781 | 191,087 | 65,188 | ||||||||||||
|
|
|
|
|
|
|
| |||||||||
DISTRIBUTIONS TO SHAREHOLDERS: | ||||||||||||||||
Class A | ||||||||||||||||
From net investment income | (44,361 | ) | (38,618 | ) | (37,372 | ) | (34,626 | ) | ||||||||
Class B | ||||||||||||||||
From net investment income | (1,653 | ) | (2,382 | ) | (958 | ) | (1,501 | ) | ||||||||
Class C | ||||||||||||||||
From net investment income | (5,932 | ) | (5,228 | ) | (12,795 | ) | (12,571 | ) | ||||||||
Select Class | ||||||||||||||||
From net investment income | (5,309 | ) | (4,881 | ) | (2,217 | ) | (2,014 | ) | ||||||||
|
|
|
|
|
|
|
| |||||||||
Total distributions to shareholders | (57,255 | ) | (51,109 | ) | (53,342 | ) | (50,712 | ) | ||||||||
|
|
|
|
|
|
|
| |||||||||
CAPITAL TRANSACTIONS: | ||||||||||||||||
Change in net assets resulting from capital transactions | 381,913 | 146,175 | 526,226 | 219,149 | ||||||||||||
|
|
|
|
|
|
|
| |||||||||
NET ASSETS: | ||||||||||||||||
Change in net assets | 650,106 | 130,847 | 663,971 | 233,625 | ||||||||||||
Beginning of period | 3,118,446 | 2,987,599 | 2,871,690 | 2,638,065 | ||||||||||||
|
|
|
| �� |
|
|
|
| ||||||||
End of period | $ | 3,768,552 | $ | 3,118,446 | $ | 3,535,661 | $ | 2,871,690 | ||||||||
|
|
|
|
|
|
|
| |||||||||
Accumulated undistributed (distributions in excess of) net investment income | $ | (323 | ) | $ | 5,057 | $ | (134 | ) | $ | 4,261 | ||||||
|
|
|
|
|
|
|
| |||||||||
SEE NOTES TO FINANCIAL STATEMENTS.
| 16 | J.P. MORGAN INVESTOR FUNDS | JUNE 30, 2013 | ||||
Table of Contents
| Investor Growth Fund | Investor Growth & Income Fund | |||||||||||||||
| Year Ended 6/30/2013 | Year Ended 6/30/2012 | Year Ended 6/30/2013 | Year Ended 6/30/2012 | |||||||||||||
CHANGE IN NET ASSETS RESULTING FROM OPERATIONS: | ||||||||||||||||
Net Investment Income (loss) | $ | 12,976 | $ | 9,183 | $ | 25,936 | $ | 23,931 | ||||||||
Net realized gain (loss) on investments in affiliates | 9,147 | (6,532 | ) | 16,481 | 680 | |||||||||||
Distributions of realized gains by investment company affiliates | 14,763 | 11,781 | 17,423 | 15,097 | ||||||||||||
Change in net unrealized appreciation/depreciation of investments in affiliates | 226,857 | (34,335 | ) | 210,815 | (36,829 | ) | ||||||||||
|
|
|
|
|
|
|
| |||||||||
Change in net assets resulting from operations | 263,743 | (19,903 | ) | 270,655 | 2,879 | |||||||||||
|
|
|
|
|
|
|
| |||||||||
DISTRIBUTIONS TO SHAREHOLDERS: | ||||||||||||||||
Class A | ||||||||||||||||
From net investment income | (12,253 | ) | (8,453 | ) | (24,418 | ) | (19,773 | ) | ||||||||
Class B | ||||||||||||||||
From net investment income | (770 | ) | (681 | ) | (1,441 | ) | (1,798 | ) | ||||||||
Class C | ||||||||||||||||
From net investment income | (844 | ) | (484 | ) | (1,975 | ) | (1,588 | ) | ||||||||
Select Class | ||||||||||||||||
From net investment income | (1,369 | ) | (1,193 | ) | (2,455 | ) | (2,176 | ) | ||||||||
|
|
|
|
|
|
|
| |||||||||
Total distributions to shareholders | (15,236 | ) | (10,811 | ) | (30,289 | ) | (25,335 | ) | ||||||||
|
|
|
|
|
|
|
| |||||||||
CAPITAL TRANSACTIONS: | ||||||||||||||||
Change in net assets resulting from capital transactions | 7,991 | (42,812 | ) | 101,741 | (47,878 | ) | ||||||||||
|
|
|
|
|
|
|
| |||||||||
NET ASSETS: | ||||||||||||||||
Change in net assets | 256,498 | (73,526 | ) | 342,107 | (70,334 | ) | ||||||||||
Beginning of period | 1,481,475 | 1,555,001 | 1,976,888 | 2,047,222 | ||||||||||||
|
|
|
|
|
|
|
| |||||||||
End of period | $ | 1,737,973 | $ | 1,481,475 | $ | 2,318,995 | $ | 1,976,888 | ||||||||
|
|
|
|
|
|
|
| |||||||||
Accumulated undistributed (distributions in excess of) net investment income | $ | (149 | ) | $ | 587 | $ | (208 | ) | $ | 1,973 | ||||||
|
|
|
|
|
|
|
| |||||||||
SEE NOTES TO FINANCIAL STATEMENTS.
| JUNE 30, 2013 | J.P. MORGAN INVESTOR FUNDS | 17 | ||||||
Table of Contents
STATEMENTS OF CHANGES IN NET ASSETS
FOR THE PERIODS INDICATED (continued)
(Amounts in thousands)
| Investor Balanced Fund | Investor Conservative Growth Fund | |||||||||||||||
| Year Ended 6/30/2013 | Year Ended 6/30/2012 | Year Ended 6/30/2013 | Year Ended 6/30/2012 | |||||||||||||
CAPITAL TRANSACTIONS: | ||||||||||||||||
Class A | ||||||||||||||||
Proceeds from shares issued | $ | 786,158 | $ | 730,615 | $ | 741,095 | $ | 752,074 | ||||||||
Distributions reinvested | 44,125 | 38,341 | 37,219 | 34,317 | ||||||||||||
Cost of shares redeemed | (519,840 | ) | (577,312 | ) | (494,825 | ) | (539,952 | ) | ||||||||
|
|
|
|
|
|
|
| |||||||||
Change in net assets resulting from Class A capital transactions | $ | 310,443 | $ | 191,644 | $ | 283,489 | $ | 246,439 | ||||||||
|
|
|
|
|
|
|
| |||||||||
Class B | ||||||||||||||||
Proceeds from shares issued | $ | 3,365 | $ | 7,310 | $ | 3,772 | $ | 6,726 | ||||||||
Distributions reinvested | 1,644 | 2,369 | 954 | 1,489 | ||||||||||||
Cost of shares redeemed | (71,230 | ) | (76,357 | ) | (36,953 | ) | (36,963 | ) | ||||||||
|
|
|
|
|
|
|
| |||||||||
Change in net assets resulting from Class B capital transactions | $ | (66,221 | ) | $ | (66,678 | ) | $ | (32,227 | ) | $ | (28,748 | ) | ||||
|
|
|
|
|
|
|
| |||||||||
Class C | ||||||||||||||||
Proceeds from shares issued | $ | 219,514 | $ | 129,142 | $ | 466,732 | $ | 294,727 | ||||||||
Distributions reinvested | 5,817 | 5,110 | 12,703 | 12,411 | ||||||||||||
Cost of shares redeemed | (110,069 | ) | (132,499 | ) | (217,267 | ) | (311,228 | ) | ||||||||
|
|
|
|
|
|
|
| |||||||||
Change in net assets resulting from Class C capital transactions | $ | 115,262 | $ | 1,753 | $ | 262,168 | $ | (4,090 | ) | |||||||
|
|
|
|
|
|
|
| |||||||||
Select Class | ||||||||||||||||
Proceeds from shares issued | $ | 79,748 | $ | 68,801 | $ | 40,066 | $ | 28,903 | ||||||||
Distributions reinvested | 2,506 | 2,558 | 1,061 | 1,022 | ||||||||||||
Cost of shares redeemed | (59,825 | ) | (51,903 | ) | (28,331 | ) | (24,377 | ) | ||||||||
|
|
|
|
|
|
|
| |||||||||
Change in net assets resulting from Select Class capital transactions | $ | 22,429 | $ | 19,456 | $ | 12,796 | $ | 5,548 | ||||||||
|
|
|
|
|
|
|
| |||||||||
Total change in net assets resulting from capital transactions | $ | 381,913 | $ | 146,175 | $ | 526,226 | $ | 219,149 | ||||||||
|
|
|
|
|
|
|
| |||||||||
SHARE TRANSACTIONS: | ||||||||||||||||
Class A | ||||||||||||||||
Issued | 59,008 | 59,328 | 62,122 | 66,705 | ||||||||||||
Reinvested | 3,334 | 3,165 | 3,139 | 3,051 | ||||||||||||
Redeemed | (39,241 | ) | (47,215 | ) | (41,556 | ) | (48,056 | ) | ||||||||
|
|
|
|
|
|
|
| |||||||||
Change in Class A Shares | 23,101 | 15,278 | 23,705 | 21,700 | ||||||||||||
|
|
|
|
|
|
|
| |||||||||
Class B | ||||||||||||||||
Issued | 254 | 598 | 317 | 601 | ||||||||||||
Reinvested | 125 | 197 | 81 | 133 | ||||||||||||
Redeemed | (5,431 | ) | (6,225 | ) | (3,131 | ) | (3,281 | ) | ||||||||
|
|
|
|
|
|
|
| |||||||||
Change in Class B Shares | (5,052 | ) | (5,430 | ) | (2,733 | ) | (2,547 | ) | ||||||||
|
|
|
|
|
|
|
| |||||||||
Class C | ||||||||||||||||
Issued | 16,557 | 10,574 | 39,118 | 26,167 | ||||||||||||
Reinvested | 445 | 428 | 1,076 | 1,109 | ||||||||||||
Redeemed | (8,418 | ) | (10,978 | ) | (18,337 | ) | (27,844 | ) | ||||||||
|
|
|
|
|
|
|
| |||||||||
Change in Class C Shares | 8,584 | 24 | 21,857 | (568 | ) | |||||||||||
|
|
|
|
|
|
|
| |||||||||
Select Class | ||||||||||||||||
Issued | 5,986 | 5,536 | 3,357 | 2,552 | ||||||||||||
Reinvested | 189 | 211 | 89 | 90 | ||||||||||||
Redeemed | (4,541 | ) | (4,200 | ) | (2,362 | ) | (2,163 | ) | ||||||||
|
|
|
|
|
|
|
| |||||||||
Change in Select Class Shares | 1,634 | 1,547 | 1,084 | 479 | ||||||||||||
|
|
|
|
|
|
|
| |||||||||
SEE NOTES TO FINANCIAL STATEMENTS.
| 18 | J.P. MORGAN INVESTOR FUNDS | JUNE 30, 2013 | ||||
Table of Contents
| Investor Growth Fund | Investor Growth & Income Fund | |||||||||||||||
| Year Ended 6/30/2013 | Year Ended 6/30/2012 | Year Ended 6/30/2013 | Year Ended 6/30/2012 | |||||||||||||
CAPITAL TRANSACTIONS: | ||||||||||||||||
Class A | ||||||||||||||||
Proceeds from shares issued | $ | 258,064 | $ | 248,735 | $ | 418,638 | $ | 371,643 | ||||||||
Distributions reinvested | 12,176 | 8,402 | 24,284 | 19,659 | ||||||||||||
Cost of shares redeemed | (215,007 | ) | (225,071 | ) | (300,252 | ) | (334,754 | ) | ||||||||
|
|
|
|
|
|
|
| |||||||||
Change in net assets resulting from Class A capital transactions | $ | 55,233 | $ | 32,066 | $ | 142,670 | $ | 56,548 | ||||||||
|
|
|
|
|
|
|
| |||||||||
Class B | ||||||||||||||||
Proceeds from shares issued | $ | 917 | $ | 1,330 | $ | 2,076 | $ | 3,279 | ||||||||
Distributions reinvested | 764 | 675 | 1,434 | 1,787 | ||||||||||||
Cost of shares redeemed | (57,935 | ) | (62,712 | ) | (82,327 | ) | (86,518 | ) | ||||||||
|
|
|
|
|
|
|
| |||||||||
Change in net assets resulting from Class B capital transactions | $ | (56,254 | ) | $ | (60,707 | ) | $ | (78,817 | ) | $ | (81,452 | ) | ||||
|
|
|
|
|
|
|
| |||||||||
Class C | ||||||||||||||||
Proceeds from shares issued | $ | 37,737 | $ | 31,754 | $ | 62,981 | $ | 42,033 | ||||||||
Distributions reinvested | 788 | 447 | 1,823 | 1,446 | ||||||||||||
Cost of shares redeemed | (27,701 | ) | (32,919 | ) | (40,695 | ) | (48,479 | ) | ||||||||
|
|
|
|
|
|
|
| |||||||||
Change in net assets resulting from Class C capital transactions | $ | 10,824 | $ | (718 | ) | $ | 24,109 | $ | (5,000 | ) | ||||||
|
|
|
|
|
|
|
| |||||||||
Select Class | ||||||||||||||||
Proceeds from shares issued | $ | 42,795 | $ | 26,915 | $ | 35,873 | $ | 23,379 | ||||||||
Distributions reinvested | 429 | 503 | 1,539 | 1,585 | ||||||||||||
Cost of shares redeemed | (45,036 | ) | (40,871 | ) | (23,633 | ) | (42,938 | ) | ||||||||
|
|
|
|
|
|
|
| |||||||||
Change in net assets resulting from Select Class capital transactions | $ | (1,812 | ) | $ | (13,453 | ) | $ | 13,779 | $ | (17,974 | ) | |||||
|
|
|
|
|
|
|
| |||||||||
Total change in net assets resulting from capital transactions | $ | 7,991 | $ | (42,812 | ) | $ | 101,741 | $ | (47,878 | ) | ||||||
|
|
|
|
|
|
|
| |||||||||
SHARE TRANSACTIONS: | ||||||||||||||||
Class A | ||||||||||||||||
Issued | 16,839 | 18,359 | 29,415 | 28,782 | ||||||||||||
Reinvested | 810 | 636 | 1,720 | 1,558 | ||||||||||||
Redeemed | (14,189 | ) | (16,730 | ) | (21,279 | ) | (26,229 | ) | ||||||||
|
|
|
|
|
|
|
| |||||||||
Change in Class A Shares | 3,460 | 2,265 | 9,856 | 4,111 | ||||||||||||
|
|
|
|
|
|
|
| |||||||||
Class B | ||||||||||||||||
Issued | 61 | 101 | 145 | 256 | ||||||||||||
Reinvested | 53 | 53 | 103 | 144 | ||||||||||||
Redeemed | (3,932 | ) | (4,745 | ) | (5,907 | ) | (6,771 | ) | ||||||||
|
|
|
|
|
|
|
| |||||||||
Change in Class B Shares | (3,818 | ) | (4,591 | ) | (5,659 | ) | (6,371 | ) | ||||||||
|
|
|
|
|
|
|
| |||||||||
Class C | ||||||||||||||||
Issued | 2,546 | 2,443 | 4,473 | 3,325 | ||||||||||||
Reinvested | 55 | 36 | 133 | 117 | ||||||||||||
Redeemed | (1,898 | ) | (2,554 | ) | (2,947 | ) | (3,881 | ) | ||||||||
|
|
|
|
|
|
|
| |||||||||
Change in Class C Shares | 703 | (75 | ) | 1,659 | (439 | ) | ||||||||||
|
|
|
|
|
|
|
| |||||||||
Select Class | ||||||||||||||||
Issued | 2,810 | 1,956 | 2,537 | 1,829 | ||||||||||||
Reinvested | 28 | 38 | 110 | 128 | ||||||||||||
Redeemed | (3,009 | ) | (2,889 | ) | (1,698 | ) | (3,337 | ) | ||||||||
|
|
|
|
|
|
|
| |||||||||
Change in Select Class Shares | (171 | ) | (895 | ) | 949 | (1,380 | ) | |||||||||
|
|
|
|
|
|
|
| |||||||||
SEE NOTES TO FINANCIAL STATEMENTS.
| JUNE 30, 2013 | J.P. MORGAN INVESTOR FUNDS | 19 | ||||||
Table of Contents
FOR THE PERIODS INDICATED
| Per share operating performance | |||||||||||||||||||||||||||
| Investment operations | Distributions | |||||||||||||||||||||||||||
| Net asset value, beginning of period | Net investment income (loss) | Net realized and unrealized gains (losses) on investments | Total from investment operations | Net investment income | Net realized gain | Total distributions | ||||||||||||||||||||||
Investor Balanced Fund | ||||||||||||||||||||||||||||
Class A | ||||||||||||||||||||||||||||
Year Ended June 30, 2013 | $ | 12.53 | $ | 0.20 | (f) | $ | 1.11 | $ | 1.31 | $ | (0.23 | ) | $ | — | $ | (0.23 | ) | |||||||||||
Year Ended June 30, 2012 | 12.58 | 0.22 | (f) | (0.05 | ) | 0.17 | (0.22 | ) | — | (0.22 | ) | |||||||||||||||||
Year Ended June 30, 2011 | 11.00 | 0.23 | 1.58 | 1.81 | (0.23 | ) | — | (0.23 | ) | |||||||||||||||||||
Year Ended June 30, 2010 | 10.03 | 0.26 | 0.97 | 1.23 | (0.26 | ) | — | (0.26 | ) | |||||||||||||||||||
Year Ended June 30, 2009 | 11.90 | 0.31 | (1.54 | ) | (1.23 | ) | (0.31 | ) | (0.33 | ) | (0.64 | ) | ||||||||||||||||
Class B | ||||||||||||||||||||||||||||
Year Ended June 30, 2013 | 12.53 | 0.13 | (f) | 1.10 | 1.23 | (0.16 | ) | — | (0.16 | ) | ||||||||||||||||||
Year Ended June 30, 2012 | 12.57 | 0.15 | (f) | (0.03 | ) | 0.12 | (0.16 | ) | — | (0.16 | ) | |||||||||||||||||
Year Ended June 30, 2011 | 10.99 | 0.17 | 1.57 | 1.74 | (0.16 | ) | — | (0.16 | ) | |||||||||||||||||||
Year Ended June 30, 2010 | 10.01 | 0.20 | 0.97 | 1.17 | (0.19 | ) | — | (0.19 | ) | |||||||||||||||||||
Year Ended June 30, 2009 | 11.88 | 0.26 | (1.55 | ) | (1.29 | ) | (0.25 | ) | (0.33 | ) | (0.58 | ) | ||||||||||||||||
Class C | ||||||||||||||||||||||||||||
Year Ended June 30, 2013 | 12.39 | 0.13 | (f) | 1.09 | 1.22 | (0.17 | ) | — | (0.17 | ) | ||||||||||||||||||
Year Ended June 30, 2012 | 12.44 | 0.15 | (f) | (0.04 | ) | 0.11 | (0.16 | ) | — | (0.16 | ) | |||||||||||||||||
Year Ended June 30, 2011 | 10.88 | 0.17 | 1.56 | 1.73 | (0.17 | ) | — | (0.17 | ) | |||||||||||||||||||
Year Ended June 30, 2010 | 9.93 | 0.20 | 0.95 | 1.15 | (0.20 | ) | — | (0.20 | ) | |||||||||||||||||||
Year Ended June 30, 2009 | 11.79 | 0.25 | (1.53 | ) | (1.28 | ) | (0.25 | ) | (0.33 | ) | (0.58 | ) | ||||||||||||||||
Select Class | ||||||||||||||||||||||||||||
Year Ended June 30, 2013 | 12.55 | 0.23 | (f) | 1.10 | 1.33 | (0.26 | ) | — | (0.26 | ) | ||||||||||||||||||
Year Ended June 30, 2012 | 12.60 | 0.25 | (f) | (0.05 | ) | 0.20 | (0.25 | ) | — | (0.25 | ) | |||||||||||||||||
Year Ended June 30, 2011 | 11.01 | 0.26 | 1.59 | 1.85 | (0.26 | ) | — | (0.26 | ) | |||||||||||||||||||
Year Ended June 30, 2010 | 10.04 | 0.28 | 0.97 | 1.25 | (0.28 | ) | — | (0.28 | ) | |||||||||||||||||||
Year Ended June 30, 2009 | 11.91 | 0.34 | (1.54 | ) | (1.20 | ) | (0.34 | ) | (0.33 | ) | (0.67 | ) | ||||||||||||||||
| (a) | Includes adjustments in accordance with accounting principles generally accepted in the United States of America and as such, the net asset values for financial reporting purposes and the returns based upon those net asset values may differ from the net asset values and returns for shareholder transactions. |
| (b) | Includes earnings credits and interest expense, if applicable, each of which is less than 0.01% unless otherwise noted. |
| (c) | Does not include expenses of Underlying Funds. |
| (d) | Net investment income (loss) is affected by timing of distributions from Underlying Funds. |
| (e) | Portfolio turnover is calculated by dividing the lesser of total purchases or sales of portfolio securities for the reporting period by the monthly average value of portfolio securities owned during the reporting period. Excluded from both the numerator and denominator are amounts relating to derivatives and securities whose maturities or expiration dates at the time of acquisition were one year or less. |
| (f) | Calculated based upon average shares outstanding. |
SEE NOTES TO FINANCIAL STATEMENTS.
| 20 | J.P. MORGAN INVESTOR FUNDS | JUNE 30, 2013 | ||||
Table of Contents
| Ratios/Supplemental data | |||||||||||||||||||||||||
| Ratios to average net assets | ||||||||||||||||||||||||||
| Net asset value, end of period | Total return (excludes sales charge) (a) | Net assets, end of period (000's) | Net expenses (b)(c) | Net | Expenses without waivers, reimbursements and earnings credits (c) | Portfolio turnover rate (e) | ||||||||||||||||||||
| $ | 13.61 | 10.54 | % | $ | 2,797,749 | 0.50 | % | 1.51 | % | 0.69 | % | 19 | % | |||||||||||||
| 12.53 | 1.45 | 2,287,495 | 0.50 | 1.79 | 0.69 | 9 | ||||||||||||||||||||
| 12.58 | 16.53 | 2,104,717 | 0.50 | 1.92 | 0.69 | 5 | ||||||||||||||||||||
| 11.00 | 12.19 | 1,410,998 | 0.50 | 2.34 | 0.71 | 12 | ||||||||||||||||||||
| 10.03 | (9.91 | ) | 899,136 | 0.50 | 3.10 | 0.75 | 24 | |||||||||||||||||||
| 13.60 | 9.86 | 112,689 | 1.01 | 1.00 | 1.19 | 19 | ||||||||||||||||||||
| 12.53 | 0.97 | 167,057 | 1.02 | 1.26 | 1.19 | 9 | ||||||||||||||||||||
| 12.57 | 15.91 | 235,961 | 1.02 | 1.37 | 1.19 | 5 | ||||||||||||||||||||
| 10.99 | 11.66 | 287,519 | 1.05 | 1.75 | 1.21 | 12 | ||||||||||||||||||||
| 10.01 | (10.47 | ) | 341,604 | 1.08 | 2.49 | 1.25 | 24 | |||||||||||||||||||
| 13.44 | 9.89 | 564,358 | 1.01 | 0.99 | 1.19 | 19 | ||||||||||||||||||||
| 12.39 | 0.94 | 413,805 | 1.02 | 1.27 | 1.19 | 9 | ||||||||||||||||||||
| 12.44 | 15.98 | 415,301 | 1.02 | 1.40 | 1.19 | 5 | ||||||||||||||||||||
| 10.88 | 11.55 | 216,667 | 1.05 | 1.80 | 1.21 | 12 | ||||||||||||||||||||
| 9.93 | (10.44 | ) | 107,948 | 1.08 | 2.50 | 1.25 | 24 | |||||||||||||||||||
| 13.62 | 10.71 | 293,756 | 0.25 | 1.75 | 0.44 | 19 | ||||||||||||||||||||
| 12.55 | 1.70 | 250,089 | 0.25 | 2.03 | 0.44 | 9 | ||||||||||||||||||||
| 12.60 | 16.88 | 231,620 | 0.25 | 2.15 | 0.44 | 5 | ||||||||||||||||||||
| 11.01 | 12.44 | 160,959 | 0.25 | 2.60 | 0.46 | 12 | ||||||||||||||||||||
| 10.04 | (9.67 | ) | 114,631 | 0.25 | 3.37 | 0.50 | 24 | |||||||||||||||||||
SEE NOTES TO FINANCIAL STATEMENTS.
| JUNE 30, 2013 | J.P. MORGAN INVESTOR FUNDS | 21 | ||||||
Table of Contents
FINANCIAL HIGHLIGHTS
FOR THE PERIODS INDICATED (continued)
| Per share operating performance | |||||||||||||||||||||||||||
| Investment operations | Distributions | |||||||||||||||||||||||||||
| Net asset value, beginning of period | Net investment income (loss) | Net realized and unrealized gains (losses) on investments | Total from investment operations | Net investment income | Net realized gain | Total distributions | ||||||||||||||||||||||
Investor Conservative Growth Fund | ||||||||||||||||||||||||||||
Class A | ||||||||||||||||||||||||||||
Year Ended June 30, 2013 | $ | 11.46 | $ | 0.19 | (f) | $ | 0.58 | $ | 0.77 | $ | (0.22 | ) | $ | — | $ | (0.22 | ) | |||||||||||
Year Ended June 30, 2012 | 11.40 | 0.23 | (f) | 0.06 | 0.29 | (0.23 | ) | — | (0.23 | ) | ||||||||||||||||||
Year Ended June 30, 2011 | 10.47 | 0.25 | 0.93 | 1.18 | (0.25 | ) | — | (0.25 | ) | |||||||||||||||||||
Year Ended June 30, 2010 | 9.67 | 0.29 | 0.80 | 1.09 | (0.29 | ) | — | (0.29 | ) | |||||||||||||||||||
Year Ended June 30, 2009 | 10.56 | 0.34 | (0.81 | ) | (0.47 | ) | (0.34 | ) | (0.08 | ) | (0.42 | ) | ||||||||||||||||
Class B | ||||||||||||||||||||||||||||
Year Ended June 30, 2013 | 11.47 | 0.13 | (f) | 0.58 | 0.71 | (0.16 | ) | — | (0.16 | ) | ||||||||||||||||||
Year Ended June 30, 2012 | 11.40 | 0.17 | (f) | 0.07 | 0.24 | (0.17 | ) | — | (0.17 | ) | ||||||||||||||||||
Year Ended June 30, 2011 | 10.48 | 0.18 | 0.93 | 1.11 | (0.19 | ) | — | (0.19 | ) | |||||||||||||||||||
Year Ended June 30, 2010 | 9.67 | 0.23 | 0.81 | 1.04 | (0.23 | ) | — | (0.23 | ) | |||||||||||||||||||
Year Ended June 30, 2009 | 10.56 | 0.28 | (0.81 | ) | (0.53 | ) | (0.28 | ) | (0.08 | ) | (0.36 | ) | ||||||||||||||||
Class C | ||||||||||||||||||||||||||||
Year Ended June 30, 2013 | 11.42 | 0.13 | (f) | 0.58 | 0.71 | (0.16 | ) | — | (0.16 | ) | ||||||||||||||||||
Year Ended June 30, 2012 | 11.36 | 0.17 | (f) | 0.06 | 0.23 | (0.17 | ) | — | (0.17 | ) | ||||||||||||||||||
Year Ended June 30, 2011 | 10.44 | 0.19 | 0.92 | 1.11 | (0.19 | ) | — | (0.19 | ) | |||||||||||||||||||
Year Ended June 30, 2010 | 9.64 | 0.23 | 0.81 | 1.04 | (0.24 | ) | — | (0.24 | ) | |||||||||||||||||||
Year Ended June 30, 2009 | 10.53 | 0.28 | (0.81 | ) | (0.53 | ) | (0.28 | ) | (0.08 | ) | (0.36 | ) | ||||||||||||||||
Select Class | ||||||||||||||||||||||||||||
Year Ended June 30, 2013 | 11.51 | 0.22 | (f) | 0.58 | 0.80 | (0.25 | ) | — | (0.25 | ) | ||||||||||||||||||
Year Ended June 30, 2012 | 11.44 | 0.26 | (f) | 0.07 | 0.33 | (0.26 | ) | — | (0.26 | ) | ||||||||||||||||||
Year Ended June 30, 2011 | 10.51 | 0.27 | 0.94 | 1.21 | (0.28 | ) | — | (0.28 | ) | |||||||||||||||||||
Year Ended June 30, 2010 | 9.70 | 0.30 | 0.83 | 1.13 | (0.32 | ) | — | (0.32 | ) | |||||||||||||||||||
Year Ended June 30, 2009 | 10.59 | 0.37 | (0.82 | ) | (0.45 | ) | (0.36 | ) | (0.08 | ) | (0.44 | ) | ||||||||||||||||
| (a) | Includes adjustments in accordance with accounting principles generally accepted in the United States of America and as such, the net asset values for financial reporting purposes and the returns based upon those net asset values may differ from the net asset values and returns for shareholder transactions. |
| (b) | Includes earnings credits and interest expense, if applicable, each of which is less than 0.01% unless otherwise noted. |
| (c) | Does not include expenses of Underlying Funds. |
| (d) | Net investment income (loss) is affected by timing of distributions from Underlying Funds. |
| (e) | Portfolio turnover is calculated by dividing the lesser of total purchases or sales of portfolio securities for the reporting period by the monthly average value of portfolio securities owned during the reporting period. Excluded from both the numerator and denominator are amounts relating to derivatives and securities whose maturities or expiration dates at the time of acquisition were one year or less. |
| (f) | Calculated based upon average shares outstanding. |
SEE NOTES TO FINANCIAL STATEMENTS.
| 22 | J.P. MORGAN INVESTOR FUNDS | JUNE 30, 2013 | ||||
Table of Contents
| Ratios/Supplemental data | |||||||||||||||||||||||||
| Ratios to average net assets |
| |||||||||||||||||||||||||
| Net asset value, end of period | Total return (excludes sales charge) (a) | Net assets, end of period (000's) | Net expenses (b)(c) | Net | Expenses without waivers, reimbursements and earnings credits (c) | Portfolio turnover rate (e) | ||||||||||||||||||||
| $ | 12.01 | 6.76 | % | $ | 2,220,725 | 0.50 | % | 1.63 | % | 0.68 | % | 14 | % | |||||||||||||
| 11.46 | 2.60 | 1,847,352 | 0.50 | 2.03 | 0.68 | 9 | ||||||||||||||||||||
| 11.40 | 11.36 | 1,589,494 | 0.50 | 2.26 | 0.68 | 3 | ||||||||||||||||||||
| 10.47 | 11.32 | 927,164 | 0.50 | 2.78 | 0.72 | 11 | ||||||||||||||||||||
| 9.67 | (4.25 | ) | 479,238 | 0.50 | 3.56 | 0.76 | 32 | |||||||||||||||||||
| 12.02 | 6.22 | 59,190 | 1.00 | 1.12 | 1.18 | 14 | ||||||||||||||||||||
| 11.47 | 2.16 | 87,831 | 1.01 | 1.50 | 1.18 | 9 | ||||||||||||||||||||
| 11.40 | 10.64 | 116,375 | 1.02 | 1.69 | 1.18 | 3 | ||||||||||||||||||||
| 10.48 | 10.80 | 145,639 | 1.06 | 2.17 | 1.22 | 11 | ||||||||||||||||||||
| 9.67 | (4.80 | ) | 167,499 | 1.09 | 2.96 | 1.26 | 32 | |||||||||||||||||||
| 11.97 | 6.27 | 1,142,903 | 1.01 | 1.12 | 1.18 | 14 | ||||||||||||||||||||
| 11.42 | 2.09 | 841,332 | 1.01 | 1.50 | 1.18 | 9 | ||||||||||||||||||||
| 11.36 | 10.73 | 843,076 | 1.01 | 1.76 | 1.18 | 3 | ||||||||||||||||||||
| 10.44 | 10.78 | 341,942 | 1.06 | 2.25 | 1.22 | 11 | ||||||||||||||||||||
| 9.64 | (4.82 | ) | 110,141 | 1.09 | 2.96 | 1.26 | 32 | |||||||||||||||||||
| 12.06 | 6.97 | 112,843 | 0.25 | 1.87 | 0.43 | 14 | ||||||||||||||||||||
| 11.51 | 2.92 | 95,175 | 0.25 | 2.27 | 0.43 | 9 | ||||||||||||||||||||
| 11.44 | 11.57 | 89,120 | 0.25 | 2.48 | 0.43 | 3 | ||||||||||||||||||||
| 10.51 | 11.66 | 60,791 | 0.25 | 3.03 | 0.47 | 11 | ||||||||||||||||||||
| 9.70 | (4.01 | ) | 40,734 | 0.25 | 3.80 | 0.51 | 32 | |||||||||||||||||||
SEE NOTES TO FINANCIAL STATEMENTS.
| JUNE 30, 2013 | J.P. MORGAN INVESTOR FUNDS | 23 | ||||||
Table of Contents
FINANCIAL HIGHLIGHTS
FOR THE PERIODS INDICATED (continued)
| Per share operating performance | |||||||||||||||||||||||||||
| Investment operations | Distributions | |||||||||||||||||||||||||||
| Net asset value, beginning of period | Net investment income (loss) | Net realized and unrealized gains (losses) on investments | Total from investment operations | Net investment income | Net realized gain | Total distributions | ||||||||||||||||||||||
Investor Growth Fund | ||||||||||||||||||||||||||||
Class A | ||||||||||||||||||||||||||||
Year Ended June 30, 2013 | $ | 13.88 | $ | 0.14 | (f) | $ | 2.38 | $ | 2.52 | $ | (0.15 | ) | $ | — | $ | (0.15 | ) | |||||||||||
Year Ended June 30, 2012 | 14.14 | 0.10 | (f) | (0.25 | ) | (0.15 | ) | (0.11 | ) | — | (0.11 | ) | ||||||||||||||||
Year Ended June 30, 2011 | 11.22 | 0.09 | (f) | 2.92 | 3.01 | (0.09 | ) | — | (0.09 | ) | ||||||||||||||||||
Year Ended June 30, 2010 | 9.94 | 0.10 | (f) | 1.26 | 1.36 | (0.08 | ) | — | (0.08 | ) | ||||||||||||||||||
Year Ended June 30, 2009 | 14.23 | 0.15 | (f) | (3.44 | ) | (3.29 | ) | (0.16 | ) | (0.84 | ) | (1.00 | ) | |||||||||||||||
Class B | ||||||||||||||||||||||||||||
Year Ended June 30, 2013 | 13.58 | 0.05 | (f) | 2.34 | 2.39 | (0.09 | ) | — | (0.09 | ) | ||||||||||||||||||
Year Ended June 30, 2012 | 13.85 | 0.02 | (f) | (0.24 | ) | (0.22 | ) | (0.05 | ) | — | (0.05 | ) | ||||||||||||||||
Year Ended June 30, 2011 | 11.00 | 0.02 | (f) | 2.86 | 2.88 | (0.03 | ) | — | (0.03 | ) | ||||||||||||||||||
Year Ended June 30, 2010 | 9.79 | 0.02 | (f) | 1.24 | 1.26 | (0.05 | ) | — | (0.05 | ) | ||||||||||||||||||
Year Ended June 30, 2009 | 14.03 | 0.08 | (f) | (3.39 | ) | (3.31 | ) | (0.09 | ) | (0.84 | ) | (0.93 | ) | |||||||||||||||
Class C | ||||||||||||||||||||||||||||
Year Ended June 30, 2013 | 13.34 | 0.05 | (f) | 2.30 | 2.35 | (0.09 | ) | — | (0.09 | ) | ||||||||||||||||||
Year Ended June 30, 2012 | 13.61 | 0.02 | (f) | (0.24 | ) | (0.22 | ) | (0.05 | ) | — | (0.05 | ) | ||||||||||||||||
Year Ended June 30, 2011 | 10.82 | 0.02 | (f) | 2.80 | 2.82 | (0.03 | ) | — | (0.03 | ) | ||||||||||||||||||
Year Ended June 30, 2010 | 9.62 | 0.03 | (f) | 1.22 | 1.25 | (0.05 | ) | — | (0.05 | ) | ||||||||||||||||||
Year Ended June 30, 2009 | 13.82 | 0.08 | (f) | (3.34 | ) | (3.26 | ) | (0.10 | ) | (0.84 | ) | (0.94 | ) | |||||||||||||||
Select Class | ||||||||||||||||||||||||||||
Year Ended June 30, 2013 | 14.09 | 0.17 | (f) | 2.44 | 2.61 | (0.19 | ) | — | (0.19 | ) | ||||||||||||||||||
Year Ended June 30, 2012 | 14.35 | 0.14 | (f) | (0.26 | ) | (0.12 | ) | (0.14 | ) | — | (0.14 | ) | ||||||||||||||||
Year Ended June 30, 2011 | 11.39 | 0.13 | (f) | 2.95 | 3.08 | (0.12 | ) | — | (0.12 | ) | ||||||||||||||||||
Year Ended June 30, 2010 | 10.09 | 0.13 | (f) | 1.28 | 1.41 | (0.11 | ) | — | (0.11 | ) | ||||||||||||||||||
Year Ended June 30, 2009 | 14.42 | 0.17 | (f) | (3.48 | ) | (3.31 | ) | (0.18 | ) | (0.84 | ) | (1.02 | ) | |||||||||||||||
| (a) | Includes adjustments in accordance with accounting principles generally accepted in the United States of America and as such, the net asset values for financial reporting purposes and the returns based upon those net asset values may differ from the net asset values and returns for shareholder transactions. |
| (b) | Includes earnings credits and interest expense, if applicable, each of which is less than 0.01% unless otherwise noted. |
| (c) | Does not include expenses of Underlying Funds. |
| (d) | Net investment income (loss) is affected by timing of distributions from Underlying Funds. |
| (e) | Portfolio turnover is calculated by dividing the lesser of total purchases or sales of portfolio securities for the reporting period by the monthly average value of portfolio securities owned during the reporting period. Excluded from both the numerator and denominator are amounts relating to derivatives and securities whose maturities or expiration dates at the time of acquisition were one year or less. |
| (f) | Calculated based upon average shares outstanding. |
SEE NOTES TO FINANCIAL STATEMENTS.
| 24 | J.P. MORGAN INVESTOR FUNDS | JUNE 30, 2013 | ||||
Table of Contents
| Ratios/Supplemental data | |||||||||||||||||||||||||
| Ratios to average net assets | ||||||||||||||||||||||||||
| Net asset value, end of period | Total return (excludes sales charge) (a) | Net assets, end of period (000's) | Net expenses (b)(c) | Net | Expenses without waivers, reimbursements and earnings credits (c) | Portfolio turnover rate (e) | ||||||||||||||||||||
| $ | 16.25 | 18.28 | % | $ | 1,344,928 | 0.49 | % | 0.89 | % | 0.76 | % | 15 | % | |||||||||||||
| 13.88 | (1.03 | ) | 1,100,639 | 0.50 | 0.72 | 0.75 | 6 | |||||||||||||||||||
| 14.14 | 26.86 | 1,089,221 | 0.50 | 0.71 | 0.76 | 15 | ||||||||||||||||||||
| 11.22 | 13.67 | 769,574 | 0.50 | 0.81 | 0.79 | 15 | ||||||||||||||||||||
| 9.94 | (22.41 | ) | 573,470 | 0.50 | 1.45 | 0.88 | 23 | |||||||||||||||||||
| 15.88 | 17.63 | 111,593 | 1.04 | 0.34 | 1.26 | 15 | ||||||||||||||||||||
| 13.58 | (1.55 | ) | 147,256 | 1.05 | 0.16 | 1.25 | 6 | |||||||||||||||||||
| 13.85 | 26.20 | 213,785 | 1.06 | 0.12 | 1.26 | 15 | ||||||||||||||||||||
| 11.00 | 12.85 | 232,624 | 1.10 | 0.20 | 1.30 | 15 | ||||||||||||||||||||
| 9.79 | (22.85 | ) | 281,372 | 1.11 | 0.80 | 1.37 | 23 | |||||||||||||||||||
| 15.60 | 17.69 | 157,546 | 1.04 | 0.34 | 1.25 | 15 | ||||||||||||||||||||
| 13.34 | (1.57 | ) | 125,391 | 1.05 | 0.17 | 1.25 | 6 | |||||||||||||||||||
| 13.61 | 26.11 | 128,944 | 1.06 | 0.15 | 1.26 | 15 | ||||||||||||||||||||
| 10.82 | 12.99 | 82,981 | 1.09 | 0.22 | 1.29 | 15 | ||||||||||||||||||||
| 9.62 | (22.89 | ) | 60,098 | 1.11 | 0.80 | 1.37 | 23 | |||||||||||||||||||
| 16.51 | 18.64 | 123,906 | 0.24 | 1.13 | 0.51 | 15 | ||||||||||||||||||||
| 14.09 | (0.77 | ) | 108,189 | 0.25 | 0.99 | 0.50 | 6 | |||||||||||||||||||
| 14.35 | 27.11 | 123,051 | 0.25 | 0.96 | 0.51 | 15 | ||||||||||||||||||||
| 11.39 | 13.87 | 77,338 | 0.25 | 1.08 | 0.54 | 15 | ||||||||||||||||||||
| 10.09 | (22.20 | ) | 55,890 | 0.25 | 1.62 | 0.63 | 23 | |||||||||||||||||||
SEE NOTES TO FINANCIAL STATEMENTS.
| JUNE 30, 2013 | J.P. MORGAN INVESTOR FUNDS | 25 | ||||||
Table of Contents
FINANCIAL HIGHLIGHTS
FOR THE PERIODS INDICATED (continued)
| Per share operating performance | |||||||||||||||||||||||||||
| Investment operations | Distributions | |||||||||||||||||||||||||||
| Net asset value, beginning of period | Net investment income (loss) | Net realized and unrealized gains (losses) on investments | Total from investment operations | Net investment income | Net realized gain | Total distributions | ||||||||||||||||||||||
Investor Growth & Income Fund | ||||||||||||||||||||||||||||
Class A | ||||||||||||||||||||||||||||
Year Ended June 30, 2013 | $ | 13.17 | $ | 0.18 | (f) | $ | 1.64 | $ | 1.82 | $ | (0.21 | ) | $ | — | $ | (0.21 | ) | |||||||||||
Year Ended June 30, 2012 | 13.28 | 0.17 | (f) | (0.10 | ) | 0.07 | (0.18 | ) | — | (0.18 | ) | |||||||||||||||||
Year Ended June 30, 2011 | 11.05 | 0.18 | (f) | 2.23 | 2.41 | (0.18 | ) | — | (0.18 | ) | ||||||||||||||||||
Year Ended June 30, 2010 | 9.90 | 0.20 | (f) | 1.15 | 1.35 | (0.20 | ) | — | (0.20 | ) | ||||||||||||||||||
Year Ended June 30, 2009 | 13.06 | 0.24 | (2.52 | ) | (2.28 | ) | (0.24 | ) | (0.64 | ) | (0.88 | ) | ||||||||||||||||
Class B | ||||||||||||||||||||||||||||
Year Ended June 30, 2013 | 13.11 | 0.11 | (f) | 1.63 | 1.74 | (0.13 | ) | — | (0.13 | ) | ||||||||||||||||||
Year Ended June 30, 2012 | 13.22 | 0.10 | (f) | (0.10 | ) | — | (g) | (0.11 | ) | — | (0.11 | ) | ||||||||||||||||
Year Ended June 30, 2011 | 11.00 | 0.11 | (f) | 2.22 | 2.33 | (0.11 | ) | — | (0.11 | ) | ||||||||||||||||||
Year Ended June 30, 2010 | 9.85 | 0.13 | (f) | 1.15 | 1.28 | (0.13 | ) | — | (0.13 | ) | ||||||||||||||||||
Year Ended June 30, 2009 | 13.00 | 0.18 | (2.51 | ) | (2.33 | ) | (0.18 | ) | (0.64 | ) | (0.82 | ) | ||||||||||||||||
Class C | ||||||||||||||||||||||||||||
Year Ended June 30, 2013 | 12.89 | 0.10 | (f) | 1.61 | 1.71 | (0.14 | ) | — | (0.14 | ) | ||||||||||||||||||
Year Ended June 30, 2012 | 13.01 | 0.10 | (f) | (0.11 | ) | (0.01 | ) | (0.11 | ) | — | (0.11 | ) | ||||||||||||||||
Year Ended June 30, 2011 | 10.83 | 0.11 | (f) | 2.19 | 2.30 | (0.12 | ) | — | (0.12 | ) | ||||||||||||||||||
Year Ended June 30, 2010 | 9.71 | 0.13 | (f) | 1.12 | 1.25 | (0.13 | ) | — | (0.13 | ) | ||||||||||||||||||
Year Ended June 30, 2009 | 12.83 | 0.17 | (2.46 | ) | (2.29 | ) | (0.19 | ) | (0.64 | ) | (0.83 | ) | ||||||||||||||||
Select Class | ||||||||||||||||||||||||||||
Year Ended June 30, 2013 | 13.00 | 0.21 | (f) | 1.63 | 1.84 | (0.25 | ) | — | (0.25 | ) | ||||||||||||||||||
Year Ended June 30, 2012 | 13.12 | 0.20 | (f) | (0.11 | ) | 0.09 | (0.21 | ) | — | (0.21 | ) | |||||||||||||||||
Year Ended June 30, 2011 | 10.92 | 0.21 | (f) | 2.20 | 2.41 | (0.21 | ) | — | (0.21 | ) | ||||||||||||||||||
Year Ended June 30, 2010 | 9.78 | 0.22 | (f) | 1.14 | 1.36 | (0.22 | ) | — | (0.22 | ) | ||||||||||||||||||
Year Ended June 30, 2009 | 12.92 | 0.26 | (2.49 | ) | (2.23 | ) | (0.27 | ) | (0.64 | ) | (0.91 | ) | ||||||||||||||||
| (a) | Includes adjustments in accordance with accounting principles generally accepted in the United States of America and as such, the net asset values for financial reporting purposes and the returns based upon those net asset values may differ from the net asset values and returns for shareholder transactions. |
| (b) | Includes earnings credits and interest expense, if applicable, each of which is less than 0.01% unless otherwise noted. |
| (c) | Does not include expenses of Underlying Funds. |
| (d) | Net investment income (loss) is affected by timing of distributions from Underlying Funds. |
| (e) | Portfolio turnover is calculated by dividing the lesser of total purchases or sales of portfolio securities for the reporting period by the monthly average value of portfolio securities owned during the reporting period. Excluded from both the numerator and denominator are amounts relating to derivatives and securities whose maturities or expiration dates at the time of acquisition were one year or less. |
| (f) | Calculated based upon average shares outstanding. |
| (g) | Amount rounds to less than $0.01. |
| (h) | Amount rounds to less than 0.01%. |
SEE NOTES TO FINANCIAL STATEMENTS.
| 26 | J.P. MORGAN INVESTOR FUNDS | JUNE 30, 2013 | ||||
Table of Contents
| Ratios/Supplemental data | |||||||||||||||||||||||||
| Ratios to average net assets | ||||||||||||||||||||||||||
| Net asset value, end of period | Total return (excludes sales charge) (a) | Net assets, end of period (000's) | Net expenses (b)(c) | Net | Expenses without waivers, reimbursements and earnings credits (c) | Portfolio turnover rate (e) | ||||||||||||||||||||
| $ | 14.78 | 13.91 | % | $ | 1,812,603 | 0.49 | % | 1.29 | % | 0.72 | % | 20 | % | |||||||||||||
| 13.17 | 0.60 | 1,485,151 | 0.50 | 1.33 | 0.71 | 11 | ||||||||||||||||||||
| 13.28 | 21.91 | 1,443,240 | 0.50 | 1.45 | 0.71 | 9 | ||||||||||||||||||||
| 11.05 | 13.52 | 1,008,109 | 0.50 | 1.72 | 0.73 | 14 | ||||||||||||||||||||
| 9.90 | (16.79 | ) | 737,763 | 0.50 | 2.33 | 0.79 | 24 | |||||||||||||||||||
| 14.72 | 13.35 | 124,521 | 1.02 | 0.77 | 1.22 | 20 | ||||||||||||||||||||
| 13.11 | 0.03 | 185,106 | 1.03 | 0.79 | 1.22 | 11 | ||||||||||||||||||||
| 13.22 | 21.23 | 270,833 | 1.04 | 0.88 | 1.22 | 9 | ||||||||||||||||||||
| 11.00 | 12.92 | 315,944 | 1.08 | 1.13 | 1.23 | 14 | ||||||||||||||||||||
| 9.85 | (17.30 | ) | 376,179 | 1.09 | 1.72 | 1.29 | 24 | |||||||||||||||||||
| 14.46 | 13.34 | 225,157 | 1.02 | 0.76 | 1.21 | 20 | ||||||||||||||||||||
| 12.89 | — | (h) | 179,336 | 1.03 | 0.80 | 1.21 | 11 | |||||||||||||||||||
| 13.01 | 21.28 | 186,625 | 1.04 | 0.91 | 1.21 | 9 | ||||||||||||||||||||
| 10.83 | 12.87 | 119,332 | 1.07 | 1.16 | 1.23 | 14 | ||||||||||||||||||||
| 9.71 | (17.28 | ) | 79,996 | 1.09 | 1.72 | 1.29 | 24 | |||||||||||||||||||
| 14.59 | 14.22 | 156,714 | 0.24 | 1.53 | 0.47 | 20 | ||||||||||||||||||||
| 13.00 | 0.79 | 127,295 | 0.25 | 1.59 | 0.46 | 11 | ||||||||||||||||||||
| 13.12 | 22.19 | 146,524 | 0.25 | 1.69 | 0.46 | 9 | ||||||||||||||||||||
| 10.92 | 13.87 | 104,501 | 0.25 | 1.94 | 0.48 | 14 | ||||||||||||||||||||
| 9.78 | (16.61 | ) | 107,048 | 0.25 | 2.57 | 0.54 | 24 | |||||||||||||||||||
SEE NOTES TO FINANCIAL STATEMENTS.
| JUNE 30, 2013 | J.P. MORGAN INVESTOR FUNDS | 27 | ||||||
Table of Contents
AS OF JUNE 30, 2013
1. Organization
JPMorgan Trust II (“JPM II” or the “Trust”) was formed on November 12, 2004, as a Delaware statutory trust, pursuant to a Declaration of Trust dated November 5, 2004 and is registered under the Investment Company Act of 1940, as amended (the “1940 Act”), as an open-end management investment company.
The following are 4 separate funds of the Trust (collectively, the “Funds”) covered by this report:
| Classes Offered | Diversified/Non-Diversified | |||
| Investor Balanced Fund | Class A, Class B, Class C and Select Class | Diversified | ||
| Investor Conservative Growth Fund | Class A, Class B, Class C and Select Class | Diversified | ||
| Investor Growth Fund | Class A, Class B, Class C and Select Class | Diversified | ||
| Investor Growth & Income Fund | Class A, Class B, Class C and Select Class | Diversified |
The investment objective of the Investor Balanced Fund is to seek high total return consistent with the preservation of capital by investing primarily in a diversified group of mutual funds within the same group of investment companies that invest primarily in equity and fixed income securities.
The investment objective of the Investor Conservative Growth Fund is to seek income and capital appreciation by investing primarily in a diversified group of mutual funds within the same group of investment companies that invest primarily in fixed income and equity securities.
The investment objective of the Investor Growth Fund is to seek long-term capital appreciation by investing primarily in a diversified group of mutual funds within the same group of investment companies that invest primarily in equity securities.
The investment objective of the Investor Growth & Income Fund is to seek long-term capital appreciation and growth of income by investing primarily in a diversified group of mutual funds within the same group of investment companies that invest primarily in equity securities.
Effective November 1, 2009, Class B Shares of the Funds may not be purchased or acquired by new or existing shareholders, except through exchanges from Class B Shares of another J.P. Morgan Fund and dividend reinvestments. Shareholders who have invested in Class B Shares prior to November 1, 2009 may continue to hold their Class B Shares until they automatically convert to Class A Shares.
Class A Shares generally provide for a front-end sales charge while Class B and Class C Shares provide for a contingent deferred sales charge (“CDSC”). Class B Shares automatically convert to Class A Shares after eight years. No sales charges are assessed with respect to Select Class Shares. All classes of shares have equal rights as to earnings, assets and voting privileges, except that each class may bear different distribution and shareholder servicing fees and each class has exclusive voting rights with respect to its distribution plan and shareholder servicing agreements. Certain Class A Shares, for which front-end sales charges have been waived, may be subject to a CDSC as described in the Funds’ prospectus.
2. Significant Accounting Policies
The following is a summary of significant accounting policies followed by the Funds in the preparation of their financial statements. The policies are in accordance with accounting principles generally accepted in the United States of America (“GAAP”). The preparation of financial statements requires management to make estimates and assumptions that affect the reported amounts and disclosures in the financial statements. Actual results could differ from those estimates.
A. Valuation of Investments — Investments in J.P. Morgan Funds (the “Underlying Funds”) are valued at each fund’s net asset value per share (“NAV”) as of the report date.
The various inputs that are used in determining the fair value of the Funds’ investments are summarized into the three broad levels listed below.
| Ÿ | Level 1 — quoted prices in active markets for identical securities |
| Ÿ | Level 2 — other significant observable inputs (including quoted prices for similar securities, interest rates, prepayment speeds, credit risk, etc.) |
| Ÿ | Level 3 — significant unobservable inputs (including the Funds’ own assumptions in determining the fair value of investments) |
A financial instrument’s level within the fair value hierarchy is based on the lowest level of any input, both individually and in the aggregate, that is significant to the fair value measurement. The inputs or methodology used for valuing securities are not necessarily an indication of the risk associated with investing in those securities.
| 28 | J.P. MORGAN INVESTOR FUNDS | JUNE 30, 2013 | ||||
Table of Contents
The following tables represent each valuation input as presented on the Schedules of Portfolio Investments (“SOIs”) (amounts in thousands):
Level 1 Quoted prices | Level 2 Other significant observable inputs | Level 3 Significant unobservable inputs | Total | |||||||||||||
Investor Balanced Fund | ||||||||||||||||
Total Investments in Securities (a) | $ | 3,756,548 | $ | — | $ | — | $ | 3,756,548 | ||||||||
|
|
|
|
|
|
|
| |||||||||
Investor Conservative Growth Fund | ||||||||||||||||
Total Investments in Securities (a) | $ | 3,525,060 | $ | — | $ | — | $ | 3,525,060 | ||||||||
|
|
|
|
|
|
|
| |||||||||
Investor Growth Fund | ||||||||||||||||
Total Investments in Securities (a) | $ | 1,736,162 | $ | — | $ | — | $ | 1,736,162 | ||||||||
|
|
|
|
|
|
|
| |||||||||
Investor Growth & Income Fund | ||||||||||||||||
Total Investments in Securities (a) | $ | 2,314,352 | $ | — | $ | — | $ | 2,314,352 | ||||||||
|
|
|
|
|
|
|
| |||||||||
| (a) | All portfolio holdings designated as Level 1 are disclosed individually on the SOIs. Please refer to the SOIs for the asset class specifics of portfolio holdings. |
There were no transfers between any levels during the year ended June 30, 2013.
B. Investment Transactions with Affiliates — The Funds invest in Underlying Funds advised by J.P. Morgan Investment Management Inc. (“JPMIM” or the “Advisor”) or its affiliates pursuant to Section 12(d)(1)(G) of the 1940 Act. An issuer which is under common control with a fund may be considered an affiliate. For the purposes of the financial statements, the Funds assume the following to be affiliated issuers. Included in the Realized Gain (Loss) amounts in the tables below are distributions of realized gains, if any, by the Underlying Funds (amounts in thousands):
| For the year ended June 30, 2013 | ||||||||||||||||||||||||||||
| Affiliate | Value at June 30, 2012 | Purchase Cost | Sales Proceeds | Realized Gain/ Loss | Dividend Income | Shares at June 30, 2013 | Value at June 30, 2013 | |||||||||||||||||||||
Investor Balanced Fund | ||||||||||||||||||||||||||||
Highbridge Dynamic Commodities Strategy Fund, Select Class Shares | $ | 25,060 | $ | 7,800 | $ | 13,999 | $ | (6,830 | ) | $ | — | 960 | $ | 11,475 | ||||||||||||||
JPMorgan Commodities Strategy Fund, Select Class Shares | — | 13,000 | — | — | — | 935 | 12,337 | |||||||||||||||||||||
JPMorgan Core Bond Fund, Select Class Shares | 326,897 | 18,399 | 30,000 | 854 | 8,537 | 26,317 | 307,123 | |||||||||||||||||||||
JPMorgan Core Plus Bond Fund, Select Class Shares | 414,860 | 13,542 | — | 242 | 15,474 | 50,993 | 420,179 | |||||||||||||||||||||
JPMorgan Credit Opportunities Fund, Select Class Shares | 35,589 | — | — | — | 1,225 | 3,479 | 35,554 | |||||||||||||||||||||
JPMorgan Dynamic Growth Fund, Select Class Shares | 16,217 | 37,500 | 6,100 | 331 | — | 2,710 | 52,031 | |||||||||||||||||||||
JPMorgan Emerging Economies Fund, Select Class Shares | 23,866 | 28,700 | 3,600 | (715 | ) | 510 | 3,747 | 46,497 | ||||||||||||||||||||
JPMorgan Emerging Markets Debt Fund, Select Class Shares | 53,975 | 3,500 | 39,600 | 2,689 | 1,876 | 2,403 | 19,824 | |||||||||||||||||||||
JPMorgan Emerging Markets Equity Fund, Select Class Shares | 24,824 | 28,400 | 3,900 | (291 | ) | 250 | 2,197 | 48,121 | ||||||||||||||||||||
JPMorgan Emerging Markets Local Currency Debt Fund, Select Class Shares | — | 23,500 | — | — | 119 | 2,249 | 21,343 | |||||||||||||||||||||
JPMorgan Equity Income Fund, Select Class Shares | 17,726 | 22,552 | — | 152 | 676 | 3,825 | 45,023 | |||||||||||||||||||||
JPMorgan Floating Rate Income Fund, Select Class Shares | 3,566 | 116,321 | — | 21 | 1,994 | 11,874 | 118,385 | |||||||||||||||||||||
JPMorgan Global Natural Resources Fund, Select Class Shares | 10,536 | 3,000 | 2,001 | (1,487 | ) | 258 | 1,070 | 8,529 | ||||||||||||||||||||
JPMorgan Global Research Enhanced Index Fund, Select Class Shares | — | 110,100 | 2,000 | (145 | ) | — | 6,869 | 106,533 | ||||||||||||||||||||
JPMorgan Government Bond Fund, Select Class Shares | 107,339 | 17,900 | 34,000 | 492 | 2,513 | 7,847 | 87,651 | |||||||||||||||||||||
JPMorgan High Yield Fund, Select Class Shares | 226,001 | 1,319 | 120,500 | 2,131 | 11,731 | 14,214 | 114,141 | |||||||||||||||||||||
JPMorgan Inflation Managed Bond Fund, Select Class Shares | 52,308 | 71,335 | 4,500 | 560 | 1,153 | 11,054 | 115,072 | |||||||||||||||||||||
JPMorgan International Equity Index Fund, Select Class Shares | 94,713 | 12,000 | 66,700 | 6,076 | 2,328 | 2,916 | 53,602 | |||||||||||||||||||||
| JUNE 30, 2013 | J.P. MORGAN INVESTOR FUNDS | 29 | ||||||
Table of Contents
NOTES TO FINANCIAL STATEMENTS
AS OF JUNE 30, 2013 (continued)
| For the year ended June 30, 2013 | ||||||||||||||||||||||||||||
| Affiliate | Value at June 30, 2012 | Purchase Cost | Sales Proceeds | Realized Gain/ Loss | Dividend Income | Shares at June 30, 2013 | Value at June 30, 2013 | |||||||||||||||||||||
Investor Balanced Fund (continued) | ||||||||||||||||||||||||||||
JPMorgan Intrepid America Fund, Select Class Shares | $ | 239,105 | $ | 36,100 | $ | 38,900 | $ | 2,491 | $ | 4,335 | 9,483 | $ | 284,486 | |||||||||||||||
JPMorgan Intrepid Growth Fund, Select Class Shares | 124,750 | 16,500 | 23,300 | 1,435 | 1,197 | 4,722 | 139,380 | |||||||||||||||||||||
JPMorgan Intrepid Mid Cap Fund, Select Class Shares | 92,259 | 21,500 | 17,000 | 936 | 973 | 6,141 | 119,507 | |||||||||||||||||||||
JPMorgan Large Cap Growth Fund, Select Class Shares | 40,430 | 8,300 | 8,900 | 212 | 188 | 1,699 | 44,075 | |||||||||||||||||||||
JPMorgan Large Cap Value Fund, Select Class Shares | 147,233 | 6,500 | 32,499 | (319 | ) | 1,889 | 11,365 | 157,065 | ||||||||||||||||||||
JPMorgan Latin America Fund, Select Class Shares | 16,080 | 3,300 | 3,200 | (481 | ) | 49 | 909 | 16,101 | ||||||||||||||||||||
JPMorgan Limited Duration Bond Fund, Select Class Shares | 64,002 | 42,800 | 18,000 | 403 | 993 | 9,224 | 90,860 | |||||||||||||||||||||
JPMorgan Liquid Assets Money Market Fund, Institutional Class Shares | 24,491 | 481,830 | 359,029 | — | 38 | 147,292 | 147,292 | |||||||||||||||||||||
JPMorgan Market Expansion Index Fund, Select Class Shares | 123,679 | 23,651 | 20,100 | 7,031 | 1,618 | 12,278 | 150,279 | |||||||||||||||||||||
JPMorgan Multi-Cap Market Neutral Fund, Select Class Shares | 167,460 | 6,600 | 66,000 | (2,450 | ) | — | 11,011 | 109,449 | ||||||||||||||||||||
JPMorgan Research Market Neutral Fund, Select Class Shares | 60,434 | 22,700 | 4,500 | (405 | ) | — | 5,408 | 81,333 | ||||||||||||||||||||
JPMorgan Short Duration Bond Fund, Select Class Shares | 55,644 | 19,515 | 13,499 | 31 | 672 | 5,617 | 61,220 | |||||||||||||||||||||
JPMorgan Strategic Income Opportunities Fund, Select Class Shares | — | 73,303 | — | 3 | 625 | 6,136 | 72,708 | |||||||||||||||||||||
JPMorgan U.S. Dynamic Plus Fund, Select Class Shares | 39,462 | 3,425 | 12,400 | 337 | 691 | 2,287 | 35,500 | |||||||||||||||||||||
JPMorgan U.S. Equity Fund, Select Class Shares | 326,360 | 39,019 | 30,400 | 8,546 | 4,460 | 31,229 | 399,419 | |||||||||||||||||||||
JPMorgan U.S. Large Cap Core Plus Fund, Select Class Shares | 147,070 | 6,732 | 5,000 | 7,638 | 1,209 | 6,964 | 177,727 | |||||||||||||||||||||
JPMorgan Value Advantage Fund, Select Class Shares | 12,862 | 28,083 | — | 83 | 216 | 1,890 | 46,727 | |||||||||||||||||||||
|
|
|
|
|
|
|
| |||||||||||||||||||||
Total | $ | 3,114,798 | $ | 29,571 | $ | 67,797 | $ | 3,756,548 | ||||||||||||||||||||
|
|
|
|
|
|
|
| |||||||||||||||||||||
| For the year ended June 30, 2013 | ||||||||||||||||||||||||||||
| Affiliate | Value at June 30, 2012 | Purchase Cost | Sales Proceeds | Realized Gain/ Loss | Dividend Income | Shares at June 30, 2013 | Value at June 30, 2013 | |||||||||||||||||||||
Investor Conservative Growth Fund | ||||||||||||||||||||||||||||
Highbridge Dynamic Commodities Strategy Fund, Select Class Shares | $ | 22,647 | $ | 6,500 | $ | 12,499 | $ | (5,776 | ) | $ | — | 869 | $ | 10,382 | ||||||||||||||
JPMorgan Commodities Strategy Fund, Select Class Shares | — | 11,000 | — | — | — | 791 | 10,439 | |||||||||||||||||||||
JPMorgan Core Bond Fund, Select Class Shares | 354,838 | 22,467 | 26,000 | 353 | 9,501 | 29,291 | 341,824 | |||||||||||||||||||||
JPMorgan Core Plus Bond Fund, Select Class Shares | 489,284 | 13,183 | — | 283 | 18,142 | 59,809 | 492,830 | |||||||||||||||||||||
JPMorgan Credit Opportunities Fund, Select Class Shares | 43,845 | — | — | — | 1,509 | 4,286 | 43,802 | |||||||||||||||||||||
JPMorgan Dynamic Growth Fund, Select Class Shares | — | 10,000 | — | — | — | 541 | 10,382 | |||||||||||||||||||||
JPMorgan Emerging Economies Fund, Select Class Shares | 19,804 | 14,900 | 7,301 | (1,310 | ) | 283 | 2,116 | 26,260 | ||||||||||||||||||||
JPMorgan Emerging Markets Debt Fund, Select Class Shares | 46,905 | 10,000 | 36,800 | 2,386 | 1,705 | 2,573 | 21,227 | |||||||||||||||||||||
| 30 | J.P. MORGAN INVESTOR FUNDS | JUNE 30, 2013 | ||||
Table of Contents
| For the year ended June 30, 2013 | ||||||||||||||||||||||||||||
| Affiliate | Value at June 30, 2012 | Purchase Cost | Sales Proceeds | Realized Gain/ Loss | Dividend Income | Shares at June 30, 2013 | Value at June 30, 2013 | |||||||||||||||||||||
Investor Conservative Growth Fund (continued) | ||||||||||||||||||||||||||||
JPMorgan Emerging Markets Equity Fund, Select Class Shares | $ | 19,917 | $ | 16,600 | $ | 9,100 | $ | 65 | $ | 138 | 1,233 | $ | 27,004 | |||||||||||||||
JPMorgan Emerging Markets Local Currency Debt Fund, Select Class Shares | — | 27,500 | 3,500 | (225 | ) | 137 | 2,271 | 21,554 | ||||||||||||||||||||
JPMorgan Equity Income Fund, Select Class Shares | 28,741 | 21,851 | — | 251 | 1,015 | 4,908 | 57,765 | |||||||||||||||||||||
JPMorgan Floating Rate Income Fund, Select Class Shares | 13,150 | 123,728 | — | 28 | 2,130 | 13,564 | 135,238 | |||||||||||||||||||||
JPMorgan Global Natural Resources Fund, Select Class Shares | 6,006 | 6,000 | 1,500 | (586 | ) | 214 | 992 | 7,904 | ||||||||||||||||||||
JPMorgan Global Research Enhanced Index Fund, Select Class Shares | — | 34,500 | — | — | — | 2,232 | 34,623 | |||||||||||||||||||||
JPMorgan Government Bond Fund, Select Class Shares | 243,209 | 32,900 | 4,500 | (23 | ) | 7,136 | 23,308 | 260,347 | ||||||||||||||||||||
JPMorgan High Yield Fund, Select Class Shares | 140,758 | 6,817 | 74,900 | 1,594 | 7,350 | 9,575 | 76,884 | |||||||||||||||||||||
JPMorgan Inflation Managed Bond Fund, Select Class Shares | 86,384 | 72,216 | 11,500 | 667 | 1,413 | 13,702 | 142,634 | |||||||||||||||||||||
JPMorgan International Equity Index Fund, Select Class Shares | 43,805 | 10,000 | 32,600 | 430 | 1,201 | 1,515 | 27,846 | |||||||||||||||||||||
JPMorgan Intrepid America Fund, Select Class Shares | 200,446 | 33,300 | 32,100 | 3,152 | 3,836 | 8,137 | 244,103 | |||||||||||||||||||||
JPMorgan Intrepid Growth Fund, Select Class Shares | 83,037 | 22,800 | 17,900 | 1,122 | 888 | 3,528 | 104,151 | |||||||||||||||||||||
JPMorgan Intrepid Mid Cap Fund, Select Class Shares | 39,122 | 21,600 | 10,400 | 357 | 457 | 3,115 | 60,619 | |||||||||||||||||||||
JPMorgan Large Cap Value Fund, Select Class Shares | 63,869 | 6,800 | 28,701 | 1,171 | 617 | 3,931 | 54,322 | |||||||||||||||||||||
JPMorgan Latin America Fund, Select Class Shares | 12,558 | 6,900 | 4,000 | (427 | ) | 45 | 872 | 15,447 | ||||||||||||||||||||
JPMorgan Limited Duration Bond Fund, Select Class Shares | 147,755 | 45,100 | 10,500 | (251 | ) | 2,188 | 19,017 | 187,313 | ||||||||||||||||||||
JPMorgan Liquid Assets Money Market Fund, Institutional Class Shares | 19,185 | 554,483 | 371,521 | — | 49 | 202,147 | 202,147 | |||||||||||||||||||||
JPMorgan Market Expansion Index Fund, Select Class Shares | 37,713 | 26,433 | 13,700 | 1,889 | 562 | 4,749 | 58,133 | |||||||||||||||||||||
JPMorgan Mid Cap Growth Fund, Select Class Shares | 14,424 | 9,924 | 5,800 | 962 | — | 867 | 21,694 | |||||||||||||||||||||
JPMorgan Multi-Cap Market Neutral Fund, Select Class Shares | 144,666 | 4,600 | 46,500 | (1,566 | ) | — | 10,452 | 103,889 | ||||||||||||||||||||
JPMorgan Research Market Neutral Fund, Select Class Shares | 76,329 | 15,700 | 2,499 | (225 | ) | — | 6,180 | 92,947 | ||||||||||||||||||||
JPMorgan Short Duration Bond Fund, Select Class Shares | 163,682 | 19,037 | 16,500 | 2 | 1,676 | 15,141 | 165,040 | |||||||||||||||||||||
JPMorgan Strategic Income Opportunities Fund, Select Class Shares | — | 78,902 | — | 2 | 646 | 6,610 | 78,333 | |||||||||||||||||||||
JPMorgan U.S. Dynamic Plus Fund, Select Class Shares | 32,281 | 4,343 | 7,000 | 714 | 629 | 2,205 | 34,214 | |||||||||||||||||||||
JPMorgan U.S. Equity Fund, Select Class Shares | 158,210 | 41,744 | 25,501 | 5,389 | 2,206 | 16,177 | 206,904 | |||||||||||||||||||||
JPMorgan U.S. Large Cap Core Plus Fund, Select Class Shares | 87,389 | 4,000 | 3,000 | 4,647 | 718 | 4,142 | 105,706 | |||||||||||||||||||||
JPMorgan Value Advantage Fund, Select Class Shares | 27,484 | 6,232 | — | 132 | 340 | 1,665 | 41,153 | |||||||||||||||||||||
|
|
|
|
|
|
|
| |||||||||||||||||||||
Total | $ | 2,867,443 | $ | 15,207 | $ | 66,731 | $ | 3,525,060 | ||||||||||||||||||||
|
|
|
|
|
|
|
| |||||||||||||||||||||
| JUNE 30, 2013 | J.P. MORGAN INVESTOR FUNDS | 31 | ||||||
Table of Contents
NOTES TO FINANCIAL STATEMENTS
AS OF JUNE 30, 2013 (continued)
| For the year ended June 30, 2013 | ||||||||||||||||||||||||||||
| Affiliate | Value at June 30, 2012 | Purchase Cost | Sales Proceeds | Realized Gain/ Loss | Dividend Income | Shares at June 30, 2013 | Value at June 30, 2013 | |||||||||||||||||||||
Investor Growth Fund | ||||||||||||||||||||||||||||
Highbridge Dynamic Commodities Strategy Fund, Select Class Shares | $ | 12,829 | $ | 2,500 | $ | 6,000 | $ | (2,860 | ) | $ | — | 486 | $ | 5,813 | ||||||||||||||
JPMorgan Commodities Strategy Fund, Select Class Shares | — | 6,000 | — | — | — | 431 | 5,694 | |||||||||||||||||||||
JPMorgan Core Plus Bond Fund, Select Class Shares | 4,259 | 10,008 | — | 8 | 517 | 1,695 | 13,971 | |||||||||||||||||||||
JPMorgan Credit Opportunities Fund, Select Class Shares | 6,754 | — | — | — | 232 | 660 | 6,747 | |||||||||||||||||||||
JPMorgan Dynamic Growth Fund, Select Class Shares | 7,730 | — | — | — | — | 481 | 9,236 | |||||||||||||||||||||
JPMorgan Emerging Economies Fund, Select Class Shares | 8,603 | 20,500 | 500 | (78 | ) | 292 | 2,177 | 27,016 | ||||||||||||||||||||
JPMorgan Emerging Markets Debt Fund, Select Class Shares | 27,896 | — | 19,800 | 1,511 | 872 | 1,110 | 9,155 | |||||||||||||||||||||
JPMorgan Emerging Markets Equity Fund, Select Class Shares | 9,669 | 20,500 | 500 | 13 | 150 | 1,316 | 28,830 | |||||||||||||||||||||
JPMorgan Emerging Markets Local Currency Debt Fund, Select Class Shares | — | 10,800 | — | — | 54 | 1,032 | 9,795 | |||||||||||||||||||||
JPMorgan Equity Income Fund, Select Class Shares | 6,191 | 8,789 | — | 89 | 335 | 1,472 | 17,330 | |||||||||||||||||||||
JPMorgan Floating Rate Income Fund, Select Class Shares | 1,834 | 15,010 | — | 10 | 439 | 1,679 | 16,740 | |||||||||||||||||||||
JPMorgan Global Natural Resources Fund, Select Class Shares | 3,927 | 1,501 | — | — | 111 | 515 | 4,108 | |||||||||||||||||||||
JPMorgan Global Research Enhanced Index Fund, Select Class Shares | — | 42,000 | — | — | — | 2,742 | 42,522 | |||||||||||||||||||||
JPMorgan Government Bond Fund, Select Class Shares | 435 | 6,000 | 5,500 | 2 | 45 | 80 | 897 | |||||||||||||||||||||
JPMorgan High Yield Fund, Select Class Shares | 34,588 | 168 | 18,000 | 1,130 | 1,726 | 2,221 | 17,832 | |||||||||||||||||||||
JPMorgan Inflation Managed Bond Fund, Select Class Shares | 19,929 | 23,565 | 8,000 | 247 | 389 | 3,299 | 34,339 | |||||||||||||||||||||
JPMorgan International Equity Fund, Select Class Shares | 24,427 | 15,000 | 14,900 | 2,789 | 432 | 1,930 | 27,638 | |||||||||||||||||||||
JPMorgan International Equity Index Fund, Select Class Shares | 66,021 | 4,000 | 40,600 | 6,230 | 1,787 | 2,118 | 38,922 | |||||||||||||||||||||
JPMorgan Intrepid America Fund, Select Class Shares | 204,945 | 2,000 | 21,200 | 1,773 | 3,709 | 7,499 | 224,977 | |||||||||||||||||||||
JPMorgan Intrepid Growth Fund, Select Class Shares | 96,921 | 7,000 | 9,500 | 1,193 | 905 | 3,738 | 110,338 | |||||||||||||||||||||
JPMorgan Intrepid Mid Cap Fund, Select Class Shares | 60,223 | — | 3,300 | (141 | ) | 620 | 3,675 | 71,524 | ||||||||||||||||||||
JPMorgan Large Cap Growth Fund, Select Class Shares | 145,814 | — | 8,700 | 2,812 | 639 | 5,814 | 150,807 | |||||||||||||||||||||
JPMorgan Large Cap Value Fund, Select Class Shares | 189,970 | — | 25,900 | (5,335 | ) | 2,491 | 15,259 | 210,886 | ||||||||||||||||||||
JPMorgan Latin America Fund, Select Class Shares | 4,366 | 3,000 | 1,000 | (121 | ) | 19 | 360 | 6,368 | ||||||||||||||||||||
JPMorgan Limited Duration Bond Fund, Select Class Shares | 1,755 | 1,000 | 500 | 71 | 24 | 234 | 2,306 | |||||||||||||||||||||
JPMorgan Liquid Assets Money Market Fund, Institutional Class Shares | 13,037 | 168,643 | 156,961 | — | 12 | 24,719 | 24,719 | |||||||||||||||||||||
JPMorgan Market Expansion Index Fund, Select Class Shares | 93,202 | 5,129 | 4,400 | 5,138 | 1,216 | 9,086 | 111,210 | |||||||||||||||||||||
JPMorgan Mid Cap Growth Fund, Select Class Shares | 8,265 | 387 | — | 386 | — | 409 | 10,229 | |||||||||||||||||||||
JPMorgan Multi-Cap Market Neutral Fund, Select Class Shares | 27,882 | 7,400 | 18,500 | (151 | ) | — | 1,727 | 17,167 | ||||||||||||||||||||
JPMorgan Research Market Neutral Fund, Select Class Shares | 12,559 | 8,200 | 12,000 | (676 | ) | — | 608 | 9,144 | ||||||||||||||||||||
JPMorgan Small Cap Value Fund, Select Class Shares | 48,700 | — | 4,599 | 728 | 619 | 2,271 | 56,428 | |||||||||||||||||||||
JPMorgan Strategic Income Opportunities Fund, Select Class Shares | — | 13,502 | — | 1 | 171 | 1,133 | 13,423 | |||||||||||||||||||||
JPMorgan U.S. Dynamic Plus Fund, Select Class Shares | 19,733 | 437 | 4,899 | 560 | 326 | 1,142 | 17,723 | |||||||||||||||||||||
JPMorgan U.S. Equity Fund, Select Class Shares | 235,205 | 7,940 | 15,200 | 5,152 | 3,113 | 21,291 | 272,318 | |||||||||||||||||||||
| 32 | J.P. MORGAN INVESTOR FUNDS | JUNE 30, 2013 | ||||
Table of Contents
| For the year ended June 30, 2013 | ||||||||||||||||||||||||||||
| Affiliate | Value at June 30, 2012 | Purchase Cost | Sales Proceeds | Realized Gain/ Loss | Dividend Income | Shares at June 30, 2013 | Value at June 30, 2013 | |||||||||||||||||||||
Investor Growth Fund (continued) | ||||||||||||||||||||||||||||
JPMorgan U.S. Large Cap Core Plus Fund, Select Class Shares | $ | 73,497 | $ | 3,364 | $ | — | $ | 3,364 | $ | 604 | 3,580 | $ | 91,373 | |||||||||||||||
JPMorgan Value Advantage Fund, Select Class Shares | 9,046 | 6,065 | — | 65 | 168 | 754 | 18,637 | |||||||||||||||||||||
|
|
|
|
|
|
|
| |||||||||||||||||||||
Total | $ | 1,480,212 | $ | 23,910 | $ | 22,017 | $ | 1,736,162 | ||||||||||||||||||||
|
|
|
|
|
|
|
| |||||||||||||||||||||
| For the year ended June 30, 2013 | ||||||||||||||||||||||||||||
| Affiliate | Value at June 30, 2012 | Purchase Cost | Sales Proceeds | Realized Gain/ Loss | Dividend Income | Shares at June 30, 2013 | Value at June 30, 2013 | |||||||||||||||||||||
Investor Growth & Income Fund | ||||||||||||||||||||||||||||
Highbridge Dynamic Commodities Strategy Fund, Select Class Shares | $ | 16,206 | $ | 3,500 | $ | 7,500 | $ | (3,548 | ) | $ | — | 644 | $ | 7,693 | ||||||||||||||
JPMorgan Commodities Strategy Fund, Select Class Shares | — | 7,500 | — | — | — | 539 | 7,117 | |||||||||||||||||||||
JPMorgan Core Bond Fund, Select Class Shares | 108,228 | 21,515 | 36,999 | 578 | 2,625 | 7,757 | 90,521 | |||||||||||||||||||||
JPMorgan Core Plus Bond Fund, Select Class Shares | 151,050 | 10,790 | 1 | 90 | 5,798 | 19,261 | 158,709 | |||||||||||||||||||||
JPMorgan Credit Opportunities Fund, Select Class Shares | 19,977 | — | 1 | — | 687 | 1,953 | 19,957 | |||||||||||||||||||||
JPMorgan Dynamic Growth Fund, Select Class Shares | 10,021 | 9,000 | 2,800 | 235 | — | 958 | 18,391 | |||||||||||||||||||||
JPMorgan Emerging Economies Fund, Select Class Shares | 18,663 | 17,500 | 1,600 | (301 | ) | 407 | 2,678 | 33,236 | ||||||||||||||||||||
JPMorgan Emerging Markets Debt Fund, Select Class Shares | 34,945 | — | 24,600 | 1,683 | 1,082 | 1,406 | 11,603 | |||||||||||||||||||||
JPMorgan Emerging Markets Equity Fund, Select Class Shares | 20,116 | 16,800 | 3,000 | (276 | ) | 196 | 1,532 | 33,550 | ||||||||||||||||||||
JPMorgan Emerging Markets Local Currency Debt Fund, Select Class Shares | — | 15,000 | — | — | 75 | 1,432 | 13,586 | |||||||||||||||||||||
JPMorgan Equity Income Fund, Select Class Shares | 17,537 | 7,366 | — | 165 | 594 | 2,468 | 29,045 | |||||||||||||||||||||
JPMorgan Floating Rate Income Fund, Select Class Shares | 2,343 | 72,811 | — | 11 | 1,240 | 7,442 | 74,201 | |||||||||||||||||||||
JPMorgan Global Natural Resources Fund, Select Class Shares | 5,760 | 1,500 | — | — | 148 | 688 | 5,481 | |||||||||||||||||||||
JPMorgan Global Research Enhanced Index Fund, Select Class Shares | — | 72,400 | 2,000 | (145 | ) | — | 4,493 | 69,686 | ||||||||||||||||||||
JPMorgan High Yield Fund, Select Class Shares | 141,317 | 862 | 73,000 | 2,740 | 7,588 | 9,191 | 73,801 | |||||||||||||||||||||
JPMorgan Inflation Managed Bond Fund, Select Class Shares | 27,315 | 47,377 | 8,499 | 341 | 609 | 6,146 | 63,977 | |||||||||||||||||||||
JPMorgan International Equity Fund, Select Class Shares | 19,648 | 13,500 | 15,501 | 2,247 | 330 | 1,413 | 20,236 | |||||||||||||||||||||
JPMorgan International Equity Index Fund, Select Class Shares | 64,888 | 1,500 | 40,600 | 6,282 | 1,798 | 1,927 | 35,412 | |||||||||||||||||||||
JPMorgan Intrepid America Fund, Select Class Shares | 233,745 | 8,000 | 26,801 | 3,139 | 4,385 | 8,723 | 261,676 | |||||||||||||||||||||
JPMorgan Intrepid Growth Fund, Select Class Shares | 84,024 | 4,600 | 9,600 | 964 | 811 | 3,158 | 93,224 | |||||||||||||||||||||
JPMorgan Intrepid Mid Cap Fund, Select Class Shares | 34,027 | 4,500 | 3,600 | 280 | 371 | 2,242 | 43,623 | |||||||||||||||||||||
JPMorgan Large Cap Growth Fund, Select Class Shares | 115,577 | 8,200 | 9,800 | 2,405 | 515 | 4,832 | 125,346 | |||||||||||||||||||||
JPMorgan Large Cap Value Fund, Select Class Shares | 157,070 | 1,000 | 35,100 | (1,653 | ) | 1,980 | 11,625 | 160,651 | ||||||||||||||||||||
JPMorgan Latin America Fund, Select Class Shares | 10,150 | 1,500 | 4,900 | (873 | ) | 30 | 381 | 6,752 | ||||||||||||||||||||
JPMorgan Liquid Assets Money Market Fund, Institutional Class Shares | 19,679 | 257,708 | 185,655 | — | 19 | 91,732 | 91,732 | |||||||||||||||||||||
JPMorgan Market Expansion Index Fund, Select Class Shares | 96,358 | 9,682 | 10,200 | 6,209 | 1,284 | 9,312 | 113,977 | |||||||||||||||||||||
JPMorgan Mid Cap Growth Fund, Select Class Shares | 9,638 | 1,498 | 1,000 | 608 | — | 484 | 12,113 | |||||||||||||||||||||
JPMorgan Multi-Cap Market Neutral Fund, Select Class Shares | 111,151 | 8,000 | 46,501 | (1,434 | ) | — | 7,416 | 73,718 | ||||||||||||||||||||
| JUNE 30, 2013 | J.P. MORGAN INVESTOR FUNDS | 33 | ||||||
Table of Contents
NOTES TO FINANCIAL STATEMENTS
AS OF JUNE 30, 2013 (continued)
| For the year ended June 30, 2013 | ||||||||||||||||||||||||||||
| Affiliate | Value at June 30, 2012 | Purchase Cost | Sales Proceeds | Realized Gain/ Loss | Dividend Income | Shares at June 30, 2013 | Value at June 30, 2013 | |||||||||||||||||||||
Investor Growth & Income Fund (continued) | ||||||||||||||||||||||||||||
JPMorgan Research Market Neutral Fund, Select Class Shares | $ | 41,383 | $ | 21,500 | $ | 10,500 | $ | (782 | ) | $ | — | 3,606 | $ | 54,236 | ||||||||||||||
JPMorgan Small Cap Value Fund, Select Class Shares | 37,231 | 4,500 | 9,300 | 906 | 469 | 1,686 | 41,894 | |||||||||||||||||||||
JPMorgan Strategic Income Opportunities Fund, Select Class Shares | — | 48,302 | — | 2 | 364 | 4,041 | 47,889 | |||||||||||||||||||||
JPMorgan U.S. Dynamic Plus Fund, Select Class Shares | 22,598 | 578 | 4,300 | 585 | 432 | 1,413 | 21,925 | |||||||||||||||||||||
JPMorgan U.S. Equity Fund, Select Class Shares | 233,828 | 13,423 | 28,601 | 7,906 | 3,089 | 20,609 | 263,588 | |||||||||||||||||||||
JPMorgan U.S. Large Cap Core Plus Fund, Select Class Shares | 94,698 | 4,335 | 6,000 | 5,456 | 778 | 4,375 | 111,638 | |||||||||||||||||||||
JPMorgan Value Advantage Fund, Select Class Shares | 16,009 | 3,584 | — | 84 | 218 | 978 | 24,168 | |||||||||||||||||||||
|
|
|
|
|
|
|
| |||||||||||||||||||||
Total | $ | 1,975,180 | $ | 33,904 | $ | 37,922 | $ | 2,314,352 | ||||||||||||||||||||
|
|
|
|
|
|
|
| |||||||||||||||||||||
C. Security Transactions and Investment Income — Investment transactions are accounted for on the trade date (the date the order to buy or sell is executed). Securities gains and losses are calculated on a specifically identified cost basis. Dividend income and distributions of net investment income and realized gains from the Underlying Funds, if any, are recorded on the ex-dividend date.
D. Allocation of Income and Expenses — Expenses directly attributable to a fund are charged directly to that fund, while the expenses attributable to more than one fund of the Trust are allocated among the respective funds. In calculating the NAV of each class, investment income, realized and unrealized gains and losses and expenses, other than class specific expenses, are allocated daily to each class of shares based upon the proportion of net assets of each class at the beginning of each day.
The Funds invest in other J.P. Morgan Funds and, as a result, bear a portion of the expenses incurred by the Underlying Funds. These expenses are not reflected in the expenses shown in the Statements of Operations and are not included in the ratios to average net assets shown in the Financial Highlights.
E. Federal Income Taxes — Each Fund is treated as a separate taxable entity for Federal income tax purposes. Each Fund’s policy is to comply with the provisions of the Internal Revenue Code of 1986, as amended (the “Code”), applicable to regulated investment companies and to distribute to shareholders all of its distributable net investment income and net realized gain on investments. Accordingly, no provision for Federal income tax is necessary. Management has reviewed the Funds’ tax positions for all open tax years and has determined that as of June 30, 2013, no liability for income tax is required in the Funds’ financial statements for net unrecognized tax benefits. However, management’s conclusions may be subject to future review based on changes in, or the interpretation of, the accounting standards or tax laws and regulations. Each of the Fund’s Federal tax returns for the prior three fiscal years remain subject to examination by the Internal Revenue Service.
F. Distributions to Shareholders — Distributions from net investment income are generally declared and paid quarterly, except for distributions from the Investor Conservative Growth Fund, which are generally declared and paid monthly. Distributions are declared separately for each class. No class has preferential dividend rights; differences in per share rates are due to differences in separate class expenses. Net realized capital gains, if any, are distributed by each Fund at least annually. The amount of distributions from net investment income and net realized capital gains is determined in accordance with Federal income tax regulations, which may differ from GAAP. To the extent these “book/tax” differences are permanent in nature (i.e., that they result from other than timing of recognition — “temporary differences”), such amounts are reclassified within the capital accounts based on their Federal tax-basis treatment.
The following amounts were reclassified within the capital accounts (amounts in thousands):
| Paid-in-Capital | Accumulated undistributed (distributions net investment income | Accumulated net realized gains (losses) | ||||||||||
Investor Balanced Fund | $ | — | $ | 3,276 | $ | (3,276 | ) | |||||
Investor Conservative Growth Fund | (661 | ) | 2,715 | (2,054 | ) | |||||||
Investor Growth Fund | — | (a) | 1,524 | (1,524 | ) | |||||||
Investor Growth & Income Fund | — | (a) | 2,172 | (2,172 | ) | |||||||
| (a) | Amount rounds to less than $1,000. |
The reclassifications for the Funds relate primarily to taxable overdistributions (Investor Conservative Growth Fund) and investments in regulated investment companies.
| 34 | J.P. MORGAN INVESTOR FUNDS | JUNE 30, 2013 | ||||
Table of Contents
3. Fees and Other Transactions with Affiliates
A. Investment Advisory Fee — Pursuant to the Investment Advisory Agreement, JPMIM acts as the investment advisor to the Funds. JPMIM is a wholly-owned subsidiary of JPMorgan Asset Management Holdings Inc., which is a wholly-owned subsidiary of JPMorgan Chase & Co. (“JPMorgan”). JPMIM supervises the investments of each Fund and for such services is paid a fee. The fee is accrued daily and paid monthly at an annual rate of 0.05% of each Fund’s average daily net assets.
The Advisor waived Investment Advisory fees and/or reimbursed expenses as outlined in Note 3.F.
B. Administration Fee — Pursuant to an Administration Agreement, JPMorgan Funds Management, Inc. (the “Administrator”), an indirect, wholly-owned subsidiary of JPMorgan, provides certain administration services to the Funds. In consideration of these services, the Administrator receives a fee accrued daily and paid monthly at an annual rate of 0.10% of the first $500 million of the average daily net assets, 0.075% of the average daily net assets between $500 million and $1 billion of such funds and 0.05% of the average daily net assets in excess of $1 billion of such funds. For the year ended June 30, 2013, the annual effective rate of each Fund’s average daily net assets, notwithstanding any fee waivers and/or expense reimbursements, was as follows:
Investor Balanced Fund | 0.06 | % | ||
Investor Conservative Growth Fund | 0.06 | |||
Investor Growth Fund | 0.07 | |||
Investor Growth & Income Fund | 0.07 |
The Administrator waived Administration fees as outlined in Note 3.F.
JPMorgan Chase Bank, N.A. (“JPMCB”), a wholly-owned subsidiary of JPMorgan, serves as the Funds’ sub-administrator (the “Sub-administrator”). For its services as Sub-administrator, JPMCB receives a portion of the fees payable to the Administrator.
C. Distribution Fees — Pursuant to a Distribution Agreement, JPMorgan Distribution Services, Inc. (the “Distributor”), a wholly-owned subsidiary of JPMorgan, serves as the Trust’s exclusive underwriter and promotes and arranges for the sale of each Fund’s shares.
The Board of Trustees has adopted a Distribution Plan (the “Distribution Plan”) for Class A, Class B and Class C Shares of the Funds in accordance with Rule 12b-1 under the 1940 Act. The Distribution Plan provides that each Fund shall pay distribution fees, including payments to the Distributor, at annual rates of the average daily net assets as shown in the table below:
| Class A | Class B | Class C | ||||||||
| 0.25% | 0.75 | % | 0.75 | % | ||||||
In addition, the Distributor is entitled to receive the front-end sales charges from purchases of Class A Shares and the CDSC from redemptions of Class B and Class C Shares and certain Class A Shares for which front-end sales charges have been waived. For the year ended June 30, 2013, the Distributor retained the following amounts (in thousands):
| Front-End Sales Charge | CDSC | |||||||
Investor Balanced Fund | $ | 2,398 | $ | 13 | ||||
Investor Conservative Growth Fund | 2,189 | 11 | ||||||
Investor Growth Fund | 726 | 17 | ||||||
Investor Growth & Income Fund | 1,211 | 16 | ||||||
D. Shareholder Servicing Fees — The Trust, on behalf of the Funds, has entered into a Shareholder Servicing Agreement with the Distributor under which the Distributor provides certain support services to the shareholders. For performing these services, the Distributor receives a fee that is accrued daily and paid monthly at an annual rate of 0.25% of the Funds’ average daily net assets.
The Distributor has entered into shareholder services contracts with affiliated and unaffiliated financial intermediaries who provide shareholder services and other related services to their clients or customers who invest in the Funds under which the Distributor will pay all or a portion of such fees earned to financial intermediaries for performing such services.
The Distributor waived Shareholder Servicing fees as outlined in Note 3.F.
E. Custodian and Accounting Fees — JPMCB provides portfolio custody and accounting services to the Funds. The amounts paid directly to JPMCB by the Funds for custody and accounting services are included in Custodian and accounting fees in the Statements of Operations. Payments to the custodian may be reduced by credits earned by each Fund, based on uninvested cash balances held by the custodian. Such earnings credits, if any, are presented separately in the Statements of Operations.
Interest income, if any, earned on cash balances at the custodian, is included in Interest income from affiliates in the Statements of Operations.
Interest expense, if any, paid to the custodian related to cash overdrafts is included in Interest expense to affiliates in the Statements of Operations.
| JUNE 30, 2013 | J.P. MORGAN INVESTOR FUNDS | 35 | ||||||
Table of Contents
NOTES TO FINANCIAL STATEMENTS
AS OF JUNE 30, 2013 (continued)
F. Waivers and Reimbursements — The Advisor, Administrator and Distributor have contractually agreed to waive fees and/or reimburse the Funds to the extent that total annual operating expenses (excluding acquired fund fees and expenses, dividend expenses related to short sales, interest, taxes, expenses related to litigation and potential litigation, extraordinary expenses and expenses related to the Board of Trustees’ deferred compensation plan) exceed the percentages of the Funds’ respective average daily net assets as shown in the table below:
| Class A | Class B | Class C | Select Class | |||||||||||||
Investor Balanced Fund | 0.50 | % | 1.25 | % | 1.25 | % | 0.25 | % | ||||||||
Investor Conservative Growth Fund | 0.50 | 1.25 | 1.25 | 0.25 | ||||||||||||
Investor Growth Fund | 0.50 | 1.25 | 1.25 | 0.25 | ||||||||||||
Investor Growth & Income Fund | 0.50 | 1.25 | 1.25 | 0.25 | ||||||||||||
The expense limitation agreements were in effect for the year ended June 30, 2013. The contractual expense limitation percentages in the table above are in place until at least October 31, 2013. In addition, the Funds’ service providers have voluntarily waived fees during the year ended June 30, 2013. However, the Funds’ service providers are under no obligation to do so and may discontinue such voluntary waivers at any time.
For the year ended June 30, 2013, the Funds’ service providers waived fees and/or reimbursed expenses for each of the Funds as follows (amounts in thousands). None of these parties expect the Funds to repay any such waived fees and reimbursed expenses in future years.
| Contractual Waivers | ||||||||||||||||
Investment Advisory | Administration | Shareholder Servicing | Total | |||||||||||||
Investor Balanced Fund | $ | 33 | $ | 15 | $ | 5,369 | $ | 5,417 | ||||||||
Investor Conservative Growth Fund | 28 | — | 3,933 | 3,961 | ||||||||||||
Investor Growth Fund | 26 | 241 | 3,183 | 3,450 | ||||||||||||
Investor Growth & Income Fund | 21 | 60 | 3,781 | 3,862 | ||||||||||||
| Voluntary Waivers | ||||||||||||||||
Investment Advisory | Administration | Shareholder Servicing | Total | |||||||||||||
Investor Balanced Fund | $ | 21 | $ | — | $ | 1,163 | $ | 1,184 | ||||||||
Investor Conservative Growth Fund | 14 | — | 1,795 | 1,809 | ||||||||||||
Investor Growth Fund | 19 | 28 | 585 | 632 | ||||||||||||
Investor Growth & Income Fund | 24 | — | 752 | 776 | ||||||||||||
The Underlying Funds may impose separate advisory and shareholder servicing fees. The Funds’ Distributor has agreed to waive the Funds’ fees in the weighted average pro-rata amount of the shareholder servicing fees charged by the Underlying Funds. These waivers will be in addition to any waivers required to meet the Funds’ contractual expense limitations, but will not exceed the Funds’ shareholder servicing fee up to 0.25% of the Funds’ net assets.
G. Other — Certain officers of the Trust are affiliated with the Advisor, the Administrator and the Distributor. Such officers, with the exception of the Chief Compliance Officer, receive no compensation from the Funds for serving in their respective roles.
The Board of Trustees appointed a Chief Compliance Officer to the Funds in accordance with Federal securities regulations. Each Fund, along with other affiliated funds, makes reimbursement payments, on a pro-rata basis, to the Administrator for a portion of the fees associated with the Office of the Chief Compliance Officer. Such fees are included in Trustees’ and Chief Compliance Officer’s fees in the Statements of Operations.
The Trust adopted a Trustee Deferred Compensation Plan (the “Plan”) which allows the Independent Trustees to defer the receipt of all or a portion of compensation related to performance of their duties as Trustees. The deferred fees are invested in various J.P. Morgan Funds until distribution in accordance with the Plan.
4. Investment Transactions
During the year ended June 30, 2013, purchases and sales of investments (excluding short-term investments) were as follows (amounts in thousands):
| Purchases (excluding U.S. Government) | Sales Government) | |||||||
Investor Balanced Fund | $ | 886,897 | $ | 620,600 | ||||
Investor Conservative Growth Fund | 787,577 | 444,300 | ||||||
Investor Growth Fund | 251,763 | 243,500 | ||||||
Investor Growth & Income Fund | 462,123 | 422,300 | ||||||
During the year ended June 30, 2013, there were no purchases or sales of U.S. Government securities.
| 36 | J.P. MORGAN INVESTOR FUNDS | JUNE 30, 2013 | ||||
Table of Contents
5. Federal Income Tax Matters
For Federal income tax purposes, the cost and unrealized appreciation (depreciation) in value of investment securities held at June 30, 2013 were as follows (amounts in thousands):
| Aggregate Cost | Gross Unrealized Appreciation | Gross Unrealized Depreciation | Net Unrealized Appreciation (Depreciation) | |||||||||||||
Investor Balanced Fund | $ | 3,309,389 | $ | 472,390 | $ | 25,231 | $ | 447,159 | ||||||||
Investor Conservative Growth Fund | 3,236,390 | 309,390 | 20,720 | 288,670 | ||||||||||||
Investor Growth Fund | 1,387,520 | 359,552 | 10,910 | 348,642 | ||||||||||||
Investor Growth & Income Fund | 1,971,619 | 357,919 | 15,186 | 342,733 | ||||||||||||
The difference between book and tax basis appreciation (depreciation) on investments is primarily attributed to wash sale loss deferrals.
The tax character of distributions paid during the fiscal year ended June 30, 2013 was as follows (amounts in thousands):
Ordinary Income | Total Distributions Paid | |||||||
Investor Balanced Fund | $ | 57,255 | $ | 57,255 | ||||
Investor Conservative Growth Fund | 53,342 | 53,342 | ||||||
Investor Growth Fund | 15,236 | 15,236 | ||||||
Investor Growth & Income Fund | 30,289 | 30,289 | ||||||
The tax character of distributions paid during the fiscal year ended June 30, 2012 was as follows (amounts in thousands):
Ordinary Income | Total Distributions Paid | |||||||
Investor Balanced Fund | $ | 51,109 | $ | 51,109 | ||||
Investor Conservative Growth Fund | 50,712 | 50,712 | ||||||
Investor Growth Fund | 10,811 | 10,811 | ||||||
Investor Growth & Income Fund | 25,335 | 25,335 | ||||||
As of June 30, 2013, the components of net assets (excluding paid-in-capital) on a tax basis were as follows (amounts in thousands):
Current Distributable Ordinary Income | Current Distributable Long-Term Capital Gain or (Tax Basis Capital Loss Carryover) | Unrealized Appreciation (Depreciation) | ||||||||||
Investor Balanced Fund | $ | 273 | $ | 7,775 | $ | 447,159 | ||||||
Investor Conservative Growth Fund | — | (8,343 | ) | 288,670 | ||||||||
Investor Growth Fund | 8 | (21,417 | ) | 348,642 | ||||||||
Investor Growth & Income Fund | 32 | (8,374 | ) | 342,733 | ||||||||
For the Funds, the cumulative timing differences primarily consist of post-October loss deferral (Investor Balanced Fund and Investor Growth Fund), trustee deferred compensation, distributions payable and wash sale loss deferrals.
Under the Regulated Investment Company Modernization Act of 2010 (the “Act”), net capital losses recognized by the Funds after June 30, 2011 are carried forward indefinitely, and retain their character as short-term and/or long-term losses. Prior to the Act, net capital losses incurred by the Funds were carried forward for eight years and treated as short-term losses. The Act requires that post-enactment net capital losses be used before pre-enactment net capital losses.
As of June 30, 2013, the Funds did not have any post-enactment net capital loss carryforwards.
As of June 30, 2013, the Funds had pre-enactment net capital loss carryforwards, expiring during the year indicated, which are available to offset future realized gains (amounts in thousands):
| 2017 | 2018 | 2019 | Total | |||||||||||||
Investor Conservative Growth Fund | $ | — | $ | 4,347 | $ | 3,996 | $ | 8,343 | ||||||||
Investor Growth Fund | — | — | 21,417 | 21,417 | ||||||||||||
Investor Growth & Income Fund | — | — | 8,374 | 8,374 | ||||||||||||
| JUNE 30, 2013 | J.P. MORGAN INVESTOR FUNDS | 37 | ||||||
Table of Contents
NOTES TO FINANCIAL STATEMENTS
AS OF JUNE 30, 2013 (continued)
During the year ended June 30, 2013, the Funds utilized capital loss carryforwards as follows (amounts in thousands):
| Total | ||||
Investor Balanced Fund | $ | 12,946 | ||
Investor Conservative Growth Fund | 9,913 | |||
Investor Growth Fund | 19,275 | |||
Investor Growth & Income Fund | 26,036 | |||
Net capital losses and late year ordinary losses incurred after October 31 and within the taxable year are deemed to arise on the first business day of the Funds’ next taxable year. For the year ended June 30, 2013, the following Funds deferred to July 1, 2013 post-October capital losses of (amounts in thousands):
| Late Year Ordinary Loss Deferral | Post-October Capital Loss Character | |||||||||||
| Short-Term | Long-Term | |||||||||||
Investor Balanced Fund | $ | — | $ | 16 | $ | — | ||||||
Investor Growth Fund | — | 337 | — | |||||||||
6. Borrowings
The Funds rely upon an exemptive order granted by the Securities and Exchange Commission (the “Order”) permitting the establishment and operation of an Interfund Lending Facility (the “Facility”). The Facility allows the Funds to directly lend and borrow money to or from any other fund relying upon the Order at rates beneficial to both the borrowing and lending funds. Advances under the Facility are taken primarily for temporary or emergency purposes, including the meeting of redemption requests that otherwise might require the untimely disposition of securities, and are subject to each Fund’s borrowing restrictions. The Interfund loan rate is determined, as specified in the Order, by averaging the current repurchase agreement rate and the current bank loan rate. The Order was granted to JPM II and may be relied upon by the Funds because they are investment companies in the same “group of investment companies” (as defined in Section 12(d)(1)(G) of the 1940 Act).
In addition, the Trust and JPMCB have entered into a financing arrangement. Under this arrangement, JPMCB provides an unsecured, uncommitted credit facility in the aggregate amount of $100 million to certain of the J.P. Morgan Funds, including the Funds. Advances under the arrangement are taken primarily for temporary or emergency purposes, including the meeting of redemption requests that otherwise might require the untimely disposition of securities, and are subject to each Fund’s borrowing restrictions. Interest on borrowings is payable at a rate determined by JPMCB at the time of borrowing. This agreement has been extended until November 11, 2013.
The Funds had no borrowings outstanding from another fund or from the unsecured, uncommitted credit facility at June 30, 2013, or at any time during the year then ended.
Interest expense paid, if any, as a result of borrowings from another fund or from the unsecured, uncommitted credit facility is included in Interest expense to affiliates in the Statements of Operations.
7. Risks, Concentrations and Indemnifications
In the normal course of business, the Funds enter into contracts that contain a variety of representations which provide general indemnifications. Each Fund’s maximum exposure under these arrangements is unknown. The amount of exposure would depend on future claims that may be made against each Fund that have not yet occurred. However, based on experience, the Funds expect the risk of loss to be remote.
Because of the Funds’ investments in Underlying Funds, the Funds indirectly pay a portion of the expenses incurred by the Underlying Funds. As a result, the cost of investing in the Funds may be higher than the cost of investing in a mutual fund that invests directly in individual securities and financial instruments. The Funds are also subject to certain risks related to Underlying Funds’ investments in securities and financial instruments such as fixed income securities including high yield, asset-backed and mortgage-related securities; equity securities; foreign and emerging markets securities; commodities; and real estate securities. These securities are subject to risks specific to their structure, sector or market.
In addition, the Underlying Funds may use derivative instruments in connection with their individual investment strategies including futures, forward foreign currency exchange contracts, options, swaps and other derivatives, which are also subject to specific risks related to their structure, sector or market and may be riskier than investments in other types of securities. Specific risks and concentrations present in the Underlying Funds are disclosed within their individual financial statements and registration statements, as appropriate.
| 38 | J.P. MORGAN INVESTOR FUNDS | JUNE 30, 2013 | ||||
Table of Contents
The Funds own in the aggregate, more than 10% of the net assets of the following Underlying Funds:
| % of Net Assets | ||||
JPMorgan Credit Opportunities Fund | 97 | % | ||
JPMorgan Global Natural Resources Fund | 89 | |||
JPMorgan Multi-Cap Market Neutral Fund | 89 | |||
JPMorgan Dynamic Growth Fund | 88 | |||
JPMorgan Large Cap Value Fund | 84 | |||
JPMorgan Intrepid Growth Fund | 63 | |||
JPMorgan U.S. Dynamic Plus Fund | 63 | |||
JPMorgan Intrepid Mid Cap Fund | 57 | |||
JPMorgan Limited Duration Bond Fund | 49 | |||
JPMorgan Intrepid America Fund | 46 | |||
JPMorgan Latin America Fund | 42 | |||
JPMorgan International Equity Index Fund | 40 | |||
JPMorgan Core Plus Bond Fund | 40 | |||
JPMorgan Commodities Strategy Fund | 39 | |||
JPMorgan Research Market Neutral Fund | 33 | |||
JPMorgan Emerging Markets Local Currency Debt Fund | 32 | |||
JPMorgan Market Expansion Enhanced Index Fund | 31 | |||
JPMorgan Inflation Managed Bond Fund | 24 | |||
JPMorgan Government Bond Fund | 20 | |||
JPMorgan Emerging Economies Fund | 18 | |||
JPMorgan Global Research Enhanced Index Fund | 17 | |||
JPMorgan U.S. Equity Fund | 14 | |||
JPMorgan Floating Rate Income Fund | 12 | |||
JPMorgan Small Cap Value Fund | 11 | |||
In addition, the Funds each have a shareholder, which is an account maintained by a financial intermediary on behalf of its clients, that owns a significant portion of the Funds’ outstanding shares. Significant shareholder transactions by these shareholders, if any, may impact the Funds’ performance.
| JUNE 30, 2013 | J.P. MORGAN INVESTOR FUNDS | 39 | ||||||
Table of Contents
REPORT OF INDEPENDENT REGISTERED PUBLIC ACCOUNTING FIRM
To the Board of Trustees of JPMorgan Trust II and the Shareholders of JPMorgan Investor Balanced Fund, JPMorgan Investor Conservative Growth Fund, JPMorgan Investor Growth Fund and JPMorgan Investor Growth & Income Fund:
In our opinion, the accompanying statements of assets and liabilities, including the schedules of portfolio investments, and the related statements of operations and of changes in net assets and the financial highlights present fairly, in all material respects, the financial position of JPMorgan Investor Balanced Fund, JPMorgan Investor Conservative Growth Fund, JPMorgan Investor Growth Fund and JPMorgan Investor Growth & Income Fund (each a separate fund of JPMorgan Trust II) (hereafter collectively referred to as the “Funds”) at June 30, 2013, the results of each of their operations for the year then ended, the changes in each of their net assets for each of the two years in the period then ended and the financial highlights for each of the five years in the period then ended, in conformity with accounting principles generally accepted in the United States of America. These financial statements and financial highlights (hereafter referred to as “financial statements”) are the responsibility of the Funds’ management. Our responsibility is to express an opinion on these financial statements based on our audits. We conducted our audits of these financial statements in accordance with the standards of the Public Company Accounting Oversight Board (United States). Those standards require that we plan and perform the audit to obtain reasonable assurance about whether the financial statements are free of material misstatement. An audit includes examining, on a test basis, evidence supporting the amounts and disclosures in the financial statements, assessing the accounting principles used and significant estimates made by management, and evaluating the overall financial statement presentation. We believe that our audits, which included confirmation of securities at June 30, 2013 by correspondence with the transfer agent and custodian, provide a reasonable basis for our opinion.
PricewaterhouseCoopers LLP
New York, New York
August 28, 2013
| 40 | J.P. MORGAN INVESTOR FUNDS | JUNE 30, 2013 | ||||
Table of Contents
(Unaudited)
The Funds’ Statement of Additional Information includes additional information about the Funds’ Trustees and is available, without charge, upon request by calling 1-800-480-4111 or on the J.P. Morgan Funds’ website at www.jpmorganfunds.com.
Name (Year of Birth); Positions With the Funds (1) | Principal Occupations During Past 5 Years | Number of Portfolios in Fund Complex Overseen by Trustee (2) | Other Directorships Held Outside Fund Complex During Past 5 Years | |||
Independent Trustees | ||||||
| John F. Finn (1947); Trustee of Trust since 2005; Trustee of heritage One Group Mutual Funds since 1998. | Chairman (1985-present), President and Chief Executive Officer, Gardner, Inc. (supply chain management company serving industrial and consumer markets) (1974-present). | 172 | Director, Cardinal Health, Inc. (CAH) (1994-present); Director, Greif, Inc. (GEF) (industrial package products and services) (2007-present). | |||
| Dr. Matthew Goldstein (1941); Chairman since 2013; Trustee of Trust since 2005; Trustee of heritage J.P. Morgan Funds since 2003. | Professor, City University of New York (effective 7/1/13); Chancellor, City University of New York (1999-2013); President, Adelphi University (New York) (1998-1999). | 172 | Director, Bronx-Lebanon Hospital Center; Director, United Way of New York City (2002-present); Trustee, Museum of Jewish Heritage (2011-present). | |||
| Robert J. Higgins (1945); Trustee of Trust since 2005; Trustee of heritage J.P. Morgan Funds since 2002. | Retired; Director of Administration of the State of Rhode Island (2003-2004); President — Consumer Banking and Investment Services, Fleet Boston Financial (1971-2001). | 172 | None | |||
| Peter C. Marshall (1942); Trustee of Trust since 2005; Trustee of heritage One Group Mutual Funds since 1985. | Self-employed business consultant (2002-present). | 172 | Director, Center for Communication, Hearing and Deafness (1990-present). | |||
| Mary E. Martinez (1960); Trustee of Trust since 2013. | Associate, Special Properties, a Christie’s International Real Estate Affiliate (2010-Present); Managing Director, Bank of America (Asset Management) (2007-2008); Chief Operating Officer, U.S. Trust Asset Management; U.S. Trust Company (asset management) (2003-2007); President, Excelsior Funds (registered investment companies) (2004-2005). | 172 | Member, New York City Center Advisory Council (oversees public performing arts facilities) (2006-present) | |||
| Marilyn McCoy* (1948); Trustee of Trust since 2005; Trustee of heritage One Group Mutual Funds since 1999. | Vice President of Administration and Planning, Northwestern University (1985-present). | 172 | Trustee, Carleton College (2003-present). | |||
| Mitchell M. Merin (1953); Trustee of Trust since 2013. | Retired (2005-Present); President and Chief Operating Officer, Morgan Stanley Investment Management, Member Morgan Stanley & Co. Management Committee (registered investment adviser) (1998-2005). | 172 | Director, Sun Life Financial (SLF) (2007 to Present) (financial services and insurance); Trustee, Trinity College, Hartford, CT (2002-2010). | |||
| William G. Morton, Jr. (1937); Trustee of Trust since 2005; Trustee of heritage J.P. Morgan Funds since 2003. | Retired; Chairman Emeritus (2001-2002), and Chairman and Chief Executive Officer, Boston Stock Exchange (1985-2001). | 172 | Director, Radio Shack Corp. (1987-2008); Trustee, Stratton Mountain School (2001-present). | |||
| Dr. Robert A. Oden, Jr. (1946); Trustee of Trust since 2005; Trustee of heritage One Group Mutual Funds since 1997. | Retired; President, Carleton College (2002-2010); President, Kenyon College (1995-2002). | 172 | Trustee, American University in Cairo (1999-present); Chairman, Dartmouth-Hitchcock Medical Center (2013-present); Trustee, Dartmouth-Hitchcock Medical Center (2011-present); Trustee, American Schools of Oriental Research (2011-present); Trustee, Carleton College (2002-2010). | |||
| JUNE 30, 2013 | J.P. MORGAN INVESTOR FUNDS | 41 | ||||||
Table of Contents
Name (Year of Birth); Positions With the Funds (1) | Principal Occupations During Past 5 Years | Number of Complex Overseen by Trustee (2) | Other Directorships Held Outside Fund Complex During Past 5 Years | |||
Independent Trustees (continued) | ||||||
| Marian U. Pardo** (1946); Trustee of Trust since 2013. | Managing Director and Founder, Virtual Capital Management LLC (Investment Consulting) (2007-present); Managing Director, Credit Suisse Asset Management (portfolio manager) (2003-2006). | 172 | Member, Board of Governors, Columbus Citizens Foundation (not-for-profit supporting philanthropic and cultural programs) (2006-present). | |||
| Frederick W. Ruebeck (1939); Trustee of Trust since 2005; Trustee of heritage One Group Mutual Funds since 1994. | Consultant (2000-present); Advisor, JP Greene & Associates, LLC (broker-dealer) (2000-2009); Chief Investment Officer, Wabash College (2004-present); Director of Investments, Eli Lilly and Company (pharmaceuticals) (1988-1999). | 172 | Trustee, Wabash College (1988-present); Chairman, Indianapolis Symphony Orchestra Foundation (1994-present). | |||
| James J. Schonbachler (1943); Trustee of Trust since 2005; Trustee of heritage J.P. Morgan Funds since 2001. | Retired; Managing Director of Bankers Trust Company (financial services) (1968-1998). | 172 | None | |||
Interested Trustee Not Affiliated With the Adviser | ||||||
| Frankie D. Hughes*** (1952), Trustee of Trust since 2008. | President and Chief Investment Officer, Hughes Capital Management, Inc. (fixed income asset management) (1993-present). | 172 | Trustee, The Victory Portfolios (2000-2008). | |||
| (1) | The Trustees serve for an indefinite term, subject to the Trust’s current retirement policy, which is age 75 for all Trustees, except that the Board has determined Mr. Morton should continue to serve until December 31, 2014. In order to fill the vacancies created by the retirement of the Fergus Reid, III, William J. Armstrong, and Leonard J. Spalding Jr., effective December 31, 2012, the Board appointed Ms. Martinez and Mr. Merin to serve as Trustees effective January 1, 2013 and Ms. Pardo to serve as Trustee effective February 1, 2013. |
| (2) | A Fund Complex means two or more registered investment companies that hold themselves out to investors as related companies for purposes of investment and investor services or have a common investment advisor or have an investment advisor that is an affiliated person of the investment advisor of any of the other registered investment companies. The J.P. Morgan Funds Complex for which the Board of Trustees serves currently includes eleven registered investment companies (172 funds), including JPMorgan Mutual Fund Group which liquidated November 29, 2012 and is in the process of winding up its affairs. |
| * | Ms. McCoy has served as Vice President of Administration and Planning for Northwestern University since 1985. William M. Daley was the Head of Corporate Responsibility for JPMorgan Chase & Co. prior to January 2011 and served as a member of the Board of Trustees of Northwestern University from 2005 through 2010. JPMIM, the Funds’ investment advisor, is a wholly-owned subsidiary of JPMorgan Chase & Co. Five other members of the Board of Trustees of Northwestern University are executive officers of registered investment advisors (not affiliated with JPMorgan) that are under common control with subadvisors to certain J.P. Morgan Funds. |
| ** | In connection with prior employment with JPMorgan Chase, Ms. Pardo is the recipient of non-qualified pension plan payments from JPMorgan Chase in the amount of approximately $2,055 per month, which she irrevocably waived effective January 1, 2013, and deferred compensation payments from JPMorgan Chase in the amount of approximately $7,294 per year, which ended in January 2013. In addition, Ms. Pardo receives payments from a fully funded qualified plan, which is not an obligation of JPMorgan Chase. |
| *** | Ms. Hughes is treated as an “interested person” based on the portfolio holdings of clients of Hughes Capital Management, Inc. |
The contact address for each of the Trustees is 270 Park Avenue, New York, NY 10017.
| 42 | J.P. MORGAN INVESTOR FUNDS | JUNE 30, 2013 | ||||
Table of Contents
(Unaudited)
Name (Year of Birth), Positions Held with the Trust (Since) | Principal Occupations During Past 5 Years | |
Patricia A. Maleski (1960), | Managing Director, J.P. Morgan Investment Management Inc. and Chief Administrative Officer, J.P. Morgan Funds and Institutional Pooled Vehicles since 2010; previously, Treasurer and Principal Financial Officer of the Trusts from 2008 to 2010; previously, Head of Funds Administration and Board Liaison, J.P. Morgan Funds prior to 2010. Ms. Maleski has been with JPMorgan Chase & Co. since 2001. | |
| Joy C. Dowd (1972), Treasurer and Principal Financial Officer (2010) | Assistant Treasurer of the Trusts from 2009 to 2010; Executive Director, JPMorgan Funds Management, Inc. from February 2011; Vice President, JPMorgan Funds Management, Inc. from December 2008 to February 2011; prior to joining JPMorgan Chase, Ms. Dowd worked in MetLife’s investments audit group from 2005 through 2008. | |
| Frank J. Nasta (1964), Secretary (2008) | Managing Director and Associate General Counsel, JPMorgan Chase since 2008; Previously, Director, Managing Director, General Counsel and Corporate Secretary, J. & W. Seligman & Co. Incorporated; Secretary of each of the investment companies of the Seligman Group of Funds and Seligman Data Corp.; Director and Corporate Secretary, Seligman Advisors, Inc. and Seligman Services, Inc. | |
| Stephen M. Ungerman (1953), Chief Compliance Officer (2005) | Managing Director, JPMorgan Chase & Co.; Mr. Ungerman has been with JPMorgan Chase & Co. since 2000. | |
Kathryn A. Jackson (1962), | Vice President and AML Compliance Manager for JPMorgan Asset Management Compliance since 2011; Senior On-Boarding Specialist for JPMorgan Distribution Services, Inc. in Global Liquidity from 2008 to 2011; prior to joining JPMorgan, Ms. Jackson was a Financial Services Analyst responsible for on-boarding, compliance and training with Nationwide Securities LLC and 1717 Capital Management Company, both registered broker-dealers, from 2005 until 2008. | |
Elizabeth A. Davin (1964), Assistant Secretary (2005)** | Executive Director and Assistant General Counsel, JPMorgan Chase since February 2012; formerly Vice President and Assistant General Counsel, JPMorgan Chase from 2005 until February 2012; Senior Counsel, JPMorgan Chase (formerly Bank One Corporation) from 2004 to 2005. | |
| Jessica K. Ditullio (1962), Assistant Secretary (2005)** | Executive Director and Assistant General Counsel, JPMorgan Chase since February 2011; Ms. Ditullio has served as an attorney with various titles for JPMorgan Chase (formerly Bank One Corporation) since 1990. | |
| John T. Fitzgerald (1975), Assistant Secretary (2008) | Executive Director and Assistant General Counsel, JPMorgan Chase since February 2011; formerly, Vice President and Assistant General Counsel, JPMorgan Chase from 2005 until February 2011. | |
| Carmine Lekstutis (1980), Assistant Secretary (2011) | Vice President and Assistant General Counsel, JPMorgan Chase since 2011; Associate, Skadden, Arps, Slate, Meagher & Flom LLP (law firm) from 2006 to 2011. | |
| Gregory S. Samuels (1980), Assistant Secretary (2010) | Vice President and Assistant General Counsel, JPMorgan Chase since 2010; Associate, Ropes & Gray (law firm) from 2008 to 2010; Associate, Clifford Chance LLP (law firm) from 2005 to 2008. | |
| Pamela L. Woodley (1971), Assistant Secretary (2012) | Vice President and Assistant General Counsel, JPMorgan Chase since November 2004. | |
Michael M. D’Ambrosio (1969), Assistant Treasurer (2012) | Executive Director, JPMorgan Funds Management, Inc. from July 2012; prior to joining JPMorgan Chase, Mr. D’Ambrosio was a Tax Director at PricewaterhouseCoopers LLP since 2006. | |
| Joseph Parascondola (1963), Assistant Treasurer (2011) | Vice President, JPMorgan Funds Management, Inc. since August 2006. | |
| Matthew J. Plastina (1970), Assistant Treasurer (2011) | Vice President, JPMorgan Funds Management, Inc. since August 2010; prior to August 2010, Vice President and Controller, Legg Mason Global Asset Management. | |
Julie A. Roach (1971), Assistant Treasurer (2012)** | Vice President, JPMorgan Funds Management, Inc. from August 2012; prior to joining JPMorgan Chase, Ms. Roach was a Senior Manager with Deloitte since 2001. | |
Gillian I. Sands (1969), Assistant Treasurer (2012) | Vice President, JPMorgan Funds Management, Inc. from September 2012; Assistant Treasurer, Wells Fargo Funds Management (2007-2009). | |
The contact address for each of the officers, unless otherwise noted, is 270 Park Avenue, New York, NY 10017.
| * | The contact address for the officer is 500 Stanton Christiana Road, Ops 1, Floor 02, Newark, DE 19173-2107. |
| ** | The contact address for the officer is 460 Polaris Parkway, Westerville, OH 43082. |
| JUNE 30, 2013 | J.P. MORGAN INVESTOR FUNDS | 43 | ||||||
Table of Contents
SCHEDULE OF SHAREHOLDER EXPENSES
(Unaudited)
Hypothetical $1,000 Investment
As a shareholder of the Funds, you incur two types of costs: (1) transaction costs, including sales charges (loads) on purchase payments and redemption fees and (2) ongoing costs, including investment advisory fees, administration fees, distribution fees and other Fund expenses. The examples below are intended to help you understand your ongoing costs (in dollars) of investing in the Funds (not including expenses of the Underlying Funds) and to compare these ongoing costs with the ongoing costs of investing in other mutual funds. The examples assume that you had a $1,000 investment in each Class at the beginning of the reporting period, January 1, 2013 and continued to hold your shares at the end of the reporting period, June 30, 2013.
Actual Expenses
For each Class of each Fund in the table below, the first line provides information about actual account values and actual expenses. You may use the information in this line, together with the amount you invested, to estimate the expenses that you paid over the period. Simply divide your account value by $1,000 (for example, an $8,600 account value divided by $1,000 = 8.6), then multiply the result by the number in the first line of each Class under the heading entitled “Expenses Paid During the Period” to estimate the expenses you paid on your account during this period.
Hypothetical Example for Comparison Purposes
The second line of each Class in the table below provides information about hypothetical account values and hypothetical expenses based on the Class’ actual expense ratio and an assumed rate of return of 5% per year before expenses, which is not the Class’ actual return. The hypothetical account values and expenses may not be used to estimate the actual ending account balance or expenses you paid for the period. You may use this information to compare the ongoing costs of investing in the Class of the Funds and other funds. To do so, compare this 5% hypothetical example with the 5% hypothetical examples that appear in the shareholder reports of the other funds. Please note that the expenses shown in the table are meant to highlight your ongoing costs only and do not reflect any transaction costs, such as sales charges (loads) or redemption fees, and expenses of the Underlying Funds. Therefore, the second line for each Class in the table is useful in comparing ongoing costs only, and will not help you determine the relative total costs of owning different funds. In addition, if these transaction costs were included, your costs would have been higher. The examples also assume all dividends and distributions have been reinvested.
| Beginning Account Value, January 1, 2013 | Ending Account Value, June 30, 2013 | Expenses Paid During the Period* | Annualized Expense Ratio | |||||||||||||
Investor Balanced Fund | ||||||||||||||||
Class A | ||||||||||||||||
Actual | $ | 1,000.00 | $ | 1,050.90 | $ | 2.49 | 0.49 | % | ||||||||
Hypothetical | 1,000.00 | 1,022.36 | 2.46 | 0.49 | ||||||||||||
Class B | ||||||||||||||||
Actual | 1,000.00 | 1,047.20 | 5.18 | 1.02 | ||||||||||||
Hypothetical | 1,000.00 | 1,019.74 | 5.11 | 1.02 | ||||||||||||
Class C | ||||||||||||||||
Actual | 1,000.00 | 1,047.50 | 5.13 | 1.01 | ||||||||||||
Hypothetical | 1,000.00 | 1,019.79 | 5.06 | 1.01 | ||||||||||||
Select Class | ||||||||||||||||
Actual | 1,000.00 | 1,051.30 | 1.22 | 0.24 | ||||||||||||
Hypothetical | 1,000.00 | 1,023.60 | 1.20 | 0.24 | ||||||||||||
Investor Conservative Growth Fund | ||||||||||||||||
Class A | ||||||||||||||||
Actual | 1,000.00 | 1,027.20 | 2.51 | 0.50 | ||||||||||||
Hypothetical | 1,000.00 | 1,022.32 | 2.51 | 0.50 | ||||||||||||
Class B | ||||||||||||||||
Actual | 1,000.00 | 1,024.30 | 5.12 | 1.02 | ||||||||||||
Hypothetical | 1,000.00 | 1,019.74 | 5.11 | 1.02 | ||||||||||||
Class C | ||||||||||||||||
Actual | 1,000.00 | 1,024.70 | 5.12 | 1.02 | ||||||||||||
Hypothetical | 1,000.00 | 1,019.74 | 5.11 | 1.02 | ||||||||||||
Select Class | ||||||||||||||||
Actual | 1,000.00 | 1,028.20 | 1.26 | 0.25 | ||||||||||||
Hypothetical | 1,000.00 | 1,023.55 | 1.25 | 0.25 | ||||||||||||
| 44 | J.P. MORGAN INVESTOR FUNDS | JUNE 30, 2013 | ||||
Table of Contents
SCHEDULE OF SHAREHOLDER EXPENSES
(Unaudited) (continued)
Hypothetical $1,000 Investment
| Beginning Account Value, January 1, 2013 | Ending Account Value, June 30, 2013 | Expenses Paid During the Period* | Annualized Expense Ratio | |||||||||||||
Investor Growth Fund | ||||||||||||||||
Class A | ||||||||||||||||
Actual | $ | 1,000.00 | $ | 1,104.10 | $ | 2.56 | 0.49 | % | ||||||||
Hypothetical | 1,000.00 | 1,022.36 | 2.46 | 0.49 | ||||||||||||
Class B | ||||||||||||||||
Actual | 1,000.00 | 1,101.30 | 5.42 | 1.04 | ||||||||||||
Hypothetical | 1,000.00 | 1,019.64 | 5.21 | 1.04 | ||||||||||||
Class C | ||||||||||||||||
Actual | 1,000.00 | 1,101.20 | 5.37 | 1.03 | ||||||||||||
Hypothetical | 1,000.00 | 1,019.69 | 5.16 | 1.03 | ||||||||||||
Select Class | ||||||||||||||||
Actual | 1,000.00 | 1,105.80 | 1.25 | 0.24 | ||||||||||||
Hypothetical | 1,000.00 | 1,023.60 | 1.20 | 0.24 | ||||||||||||
Investor Growth & Income Fund | ||||||||||||||||
Class A | ||||||||||||||||
Actual | 1,000.00 | 1,072.90 | 2.52 | 0.49 | ||||||||||||
Hypothetical | 1,000.00 | 1,022.36 | 2.46 | 0.49 | ||||||||||||
Class B | ||||||||||||||||
Actual | 1,000.00 | 1,071.00 | 5.24 | 1.02 | ||||||||||||
Hypothetical | 1,000.00 | 1,019.74 | 5.11 | 1.02 | ||||||||||||
Class C | ||||||||||||||||
Actual | 1,000.00 | 1,070.40 | 5.24 | 1.02 | ||||||||||||
Hypothetical | 1,000.00 | 1,019.74 | 5.11 | 1.02 | ||||||||||||
Select Class | ||||||||||||||||
Actual | 1,000.00 | 1,074.40 | 1.23 | 0.24 | ||||||||||||
Hypothetical | 1,000.00 | 1,023.60 | 1.20 | 0.24 | ||||||||||||
| * | Expenses are equal to each Class’ respective annualized expense ratio, multiplied by the average account value over the period, multiplied by 181/365 (to reflect the one-half year period). |
| JUNE 30, 2013 | J.P. MORGAN INVESTOR FUNDS | 45 | ||||||
Table of Contents
(Unaudited)
Certain tax information for the J.P. Morgan Funds is required to be provided to shareholders based upon the Funds’ income and distributions for the taxable year ended June 30, 2013. The information and distributions reported in this letter may differ from the information and taxable distributions reported to the shareholders for the calendar year ending December 31, 2013. The information necessary to complete your income tax returns for the calendar year ending December 31, 2013 will be provided under separate cover.
Dividends Received Deductions (DRD)
Each Fund hereby designates the following percentage or the maximum allowable percentage as ordinary income distributions eligible for the 70% dividends received deduction for corporate rate shareholders for the fiscal year ended June 30, 2013:
| Dividends Received Deduction | ||||
Investor Balanced Fund | 33.69 | % | ||
Investor Conservative Growth Fund | 24.94 | |||
Investor Growth Fund | 98.93 | |||
Investor Growth & Income Fund | 52.46 | |||
Qualified Dividend Income (QDI)
For the fiscal year ended June 30, 2013 certain dividends paid by the Funds may be subject to a maximum tax rate of 20%.
Each Fund hereby designates the following amount or maximum allowable amount of ordinary income distributions as qualified dividends (amounts in thousands):
| Qualified Dividend Income | ||||
Investor Balanced Fund | $ | 57,255 | ||
Investor Conservative Growth Fund | 53,342 | |||
Investor Growth Fund | 15,236 | |||
Investor Growth & Income Fund | 30,289 | |||
Foreign Source Income and Foreign Tax Credit Pass Through
For the fiscal year ended June 30, 2013, the Funds intend to elect to pass through to shareholders the income tax credit for taxes paid to foreign countries. Foreign gross income and foreign tax expenses are as follows or amounts as finally determined (amounts in thousands):
| Gross Income | Foreign Tax Pass Through | |||||||
| Investor Balanced Fund | $ | 3,323 | $ | 442 | ||||
| Investor Conservative Growth Fund | 1,834 | 236 | ||||||
| Investor Growth Fund | 2,390 | 317 | ||||||
| Investor Growth & Income Fund | 2,592 | 350 | ||||||
The pass-through of the foreign tax credit will only affect those persons who are shareholders on the dividend record dates. These shareholders should refer to their 2012 Form 1099-DIV for the foreign tax paid.
| 46 | J.P. MORGAN INVESTOR FUNDS | JUNE 30, 2013 | ||||
Table of Contents

Rev. January 2011
| FACTS | WHAT DOES J.P. MORGAN FUNDS DO WITH YOUR PERSONAL INFORMATION? |
| Why? | Financial companies choose how they share your personal information. Federal law gives consumers the right to limit some but not all sharing. Federal law also requires us to tell you how we collect, share, and protect your personal information. Please read this notice carefully to understand what we do. |
| What? | The types of personal information we collect and share depend on the product or service you have with us. This information can include:
¡Social Security number and account balances
¡transaction history and account transactions
¡checking account information and wire transfer instructions
When you are no longer our customer, we continue to share your information as described in this notice. |
| How? | All financial companies need to share customers’ personal information to run their everyday business. In the section below, we list the reasons financial companies can share their customers’ personal information; the reasons J.P. Morgan Funds chooses to share; and whether you can limit this sharing. |
| Reasons we can share your personal information | Does J.P. Morgan Funds share? | Can you limit this sharing? | ||
For our everyday business purposes — such as to process your transactions, maintain your account(s), respond to court orders and legal investigations, or report to credit bureaus | Yes | No | ||
For marketing purposes — to offer our products and services to you | Yes | No | ||
| For joint marketing with other financial companies | No | We don’t share | ||
For our affiliates’ everyday business purposes — information about your transactions and experiences | No | We don’t share | ||
For our affiliates’ everyday business purposes — information about your creditworthiness | No | We don’t share | ||
| For nonaffiliates to market to you | No | We don’t share |
| Questions? | Call 1-800-480-4111 or go to www.jpmorganfunds.com | |

Table of Contents
Page 2 |
| Who we are | ||
| Who is providing this notice? | J.P. Morgan Funds | |
| What we do | ||
| How does J.P. Morgan Funds protect my personal information? | To protect your personal information from unauthorized access and use, we use security measures that comply with federal law. These measures include computer safeguards and secured files and buildings. We authorize our employees to access your information only when they need it to do their work and we require companies that work for us to protect your information. | |
How does J.P. Morgan Funds collect my personal information? | We collect your personal information, for example, when you:
¡open an account or provide contact information
¡give us your account information or pay us by check
¡make a wire transfer
We also collect your personal information from others, such as credit bureaus, affiliates and other companies. | |
| Why can’t I limit all sharing? | Federal law gives you the right to limit only
¡sharing for affiliates’ everyday business purposes – information about your creditworthiness
¡affiliates from using your information to market to you
¡sharing for nonaffiliates to market to you
State laws and individual companies may give you additional rights to limit sharing. | |
| Definitions | ||
| Affiliates | Companies related by common ownership or control. They can be financial and nonfinancial companies.
¡J.P. Morgan Funds does not share with our affiliates. | |
| Nonaffiliates | Companies not related by common ownership or control. They can be financial and nonfinancial companies.
¡J.P. Morgan Funds does not share with nonaffiliates so they can market to you. | |
| Joint Marketing | A formal agreement between nonaffiliated financial companies that together market financial products or services to you.
¡J.P. Morgan Funds doesn’t jointly market. | |
Table of Contents
J.P. Morgan Funds are distributed by JPMorgan Distribution Services, Inc., which is an affiliate of JPMorgan Chase & Co. Affiliates of JPMorgan Chase & Co. receive fees for providing various services to the funds.
Contact JPMorgan Distribution Services, Inc. at 1-800-480-4111 for a fund prospectus. You can also visit us at www.jpmorganfunds.com. Investors should carefully consider the investment objectives and risk as well as charges and expenses of the mutual fund before investing. The prospectus contains this and other information about the mutual fund. Read the prospectus carefully before investing.
Investors may obtain information about the Securities Investor Protection Corporation (SIPC), including the SIPC brochure by visiting www.sipc.org or by calling SIPC at 202-371-8300.
Each Fund files a complete schedule of its fund holdings for the first and third quarters of its fiscal year with the SEC on Form N-Q. The Funds’ Forms N-Q are available on the SEC’s website at http://www.sec.gov and may be reviewed and copied at the SEC’s Public Reference Room in Washington, DC. Information on the operation of the SEC’s Public Reference Room may be obtained by calling 1-800-SEC-0330. Shareholders may request the Form N-Q without charge by calling 1-800-480-4111 or by visiting the J.P. Morgan Funds’ website at www.jpmorganfunds.com.
A description of each Fund’s policies and procedures with respect to the disclosure of each Fund’s holdings is available in the prospectus and Statement of Additional Information.
A copy of proxy policies and procedures is available without charge upon request by calling 1-800-480-4111 and on the Funds’ website at www.jpmorganfunds.com. A description of such policies and procedures is on the SEC’s website at www.sec.gov. The Trustees have delegated the authority to vote proxies for securities owned by the Funds to the Advisor. A copy of the Funds’ voting record for the most recent 12-month period ended June 30 is available on the SEC’s website at www.sec.gov or at the Funds’ website at www.jpmorganfunds.com no later than August 31 of each year. The Funds’ proxy voting record will include, among other things, a brief description of the matter voted on for each fund security, and will state how each vote was cast, for example, for or against the proposal.
Table of Contents

J.P. Morgan Asset Management is the marketing name for the asset management business of JPMorgan Chase & Co. Those businesses include, but are not limited to, J.P. Morgan Investment Management Inc., Security Capital Research & Management Incorporated and J.P. Morgan Alternative Asset Management, Inc.
| © JPMorgan Chase & Co., 2013. All rights reserved. June 2013. | AN-INV-613 |
Table of Contents
Annual Report
J.P. Morgan Intrepid Funds
June 30, 2013
JPMorgan Intrepid Advantage Fund (formerly JPMorgan Intrepid Multi Cap Fund)
JPMorgan Intrepid America Fund
JPMorgan Intrepid Growth Fund
JPMorgan Intrepid Mid Cap Fund
JPMorgan Intrepid Value Fund
 |
Table of Contents
Investments in a Fund are not bank deposits or obligations of, or guaranteed or endorsed by, any bank and are not insured or guaranteed by the FDIC, the Federal Reserve Board or any other government agency. You could lose money if you sell when the Fund’s share price is lower than when you invested.
Past performance is no guarantee of future performance. The general market views expressed in this report are opinions based on market and other conditions through the end of the reporting period and are subject to change without notice. These views are not intended to predict the future performance of a Fund or the securities markets. References to specific securities and their issuers are for illustrative purposes only and are not intended to be, and should not be interpreted as, recommendations to purchase or sell such securities. Such views are not meant as investment advice and may not be relied on as an indication of trading intent on behalf of any Fund.
Prospective investors should refer to the Funds’ prospectus for a discussion of the Funds’ investment objectives, strategies and risks. Call J.P. Morgan Funds Service Center at 1–800–480–4111 for a prospectus containing more complete information about a Fund, including management fees and other expenses. Please read it carefully before investing.
Table of Contents
JULY 26, 2013 (Unaudited)
Dear Shareholder:
While somewhat overshadowed by increased volatility at the end of the reporting period, global equities in aggregate posted strong returns for the twelve months ended June 30, 2013. For much of the period, stocks were supported by solid corporate earnings and robust demand from investors looking to generate higher returns in the low interest rate environment. Despite signaling a potential policy shift in June 2013, the U.S. Federal Reserve (“Fed”) continued to pursue its highly accommodative policies in an attempt to lower unemployment and spur the economy. Central banks overseas also did their part to support their economies. The European Central Bank (“ECB”) remained committed to preserving the euro, as it cut rates and introduced new programs designed to aid struggling euro zone members. Elsewhere, the Bank of Japan embarked on a major asset purchase program as a new pro-growth government came into power late in 2012.
 |
“We are encouraged by the stock market’s resiliency in the face of recent volatility.” |
Positive investor sentiment was temporarily interrupted, however, in May 2013 when Fed Chairman Bernanke indicated that the central bank may begin to “taper” its asset purchase program later this year. This triggered a sharp decline in global equities, although they quickly regained their footing and have continued to rally in July. All told, both U.S. and international developed stocks rose sharply during the twelve months ended June 30, 2013. Emerging market equities produced only modest gains given concerns regarding China’s economy and falling commodity prices.
U.S. Treasury Yields Rise Sharply
Talk of Fed tapering negatively impacted the fixed income markets. While U.S. Treasury security yields continued to be low from a historical perspective, they ended the period
sharply higher than when the reporting period began. The yield for 10-year U.S. Treasury securities ended June 30, 2013 at 2.52%, while the yields for 2- and 30-year U.S. Treasury securities finished the reporting period at 0.36% and 3.52%, respectively. Amid the rising interest rate environment, the overall U.S. fixed income market posted a modest decline for the reporting period. In contrast, high yield bonds (also known as junk bonds) posted a strong return and emerging market debt securities also moved higher, albeit to a lesser extent.
Positive Signs for Stocks
Although the global economy is far from robust, it is still on a growth path. The expansion in the U.S. certainly appears to be sustainable and, while Europe remains in a recession, there are indications that its economy may be bottoming. Elsewhere, pro-growth initiatives in Japan have thus far yielded positive results. While growth in China has moderated, we believe the government has the tools at its disposal to avoid a “hard landing.”
We are encouraged by the stock market’s resiliency in the face of recent volatility. In addition, there have been signs that equity market correlations are decreasing, which could create a more favorable environment for active managers. In addition, given the recent sell-off in the bond market, valuations in a number of fixed income sectors have become more attractive.
On behalf of everyone at J.P. Morgan Asset Management, thank you for your continued support. We look forward to managing your investment needs for years to come. Should you have any questions, please visit www.jpmorganfunds.com or contact the J.P. Morgan Funds Service Center at 1-800-480-4111.
Sincerely yours,

George C.W. Gatch
CEO, Global Funds Management
J.P. Morgan Asset Management
JUNE 30, 2013 | J.P. MORGAN INTREPID FUNDS | 1 | ||||||
Table of Contents
JPMorgan Intrepid Funds
TWELVE MONTHS ENDED JUNE 30, 2013 (Unaudited)
Despite periods of heightened volatility and several setbacks, the overall U.S. equity market generated strong results during the twelve months ended June 30, 2013. Supporting the market were overall solid corporate profits, continued economic growth and generally robust investor demand. From an economic perspective, the U.S. housing market showed signs of rebounding and there was some improvement in the labor market. Investor enthusiasm was interrupted late in the reporting period when the U.S. Federal Reserve Board ("Fed") announced in June 2013 that it might begin tapering its asset purchases later in the year. This triggered a rapid sell-off in the overall stock market. However, U.S. equities again rallied in late June, as concerns regarding Fed tapering abated somewhat. The Russell 1000 Index returned 21.24% for the twelve months ended June 30, 2013, while the Russell 3000 Index returned 21.46% for the same period.
U.S. large-cap value stocks outperformed U.S. large-cap growth stocks, as the Russell 1000 Value Index returned 25.32% versus a 17.07% return for the Russell 1000 Growth Index for the twelve months ended June 30, 2013. U.S. mid-cap stocks outperformed U.S. large-cap stocks as the Russell Midcap Index returned 25.41%.
Intrepid Investment Philosophy and Process
The JPMorgan Intrepid Investment Team (the “Team”) employs a philosophy that is rooted in behavioral finance, a field of study that emphasizes the importance of human psychology in financial markets. Behavioral finance examines how investor behavior can be affected by emotional biases and reactions. The field theorizes that inefficiencies arise in the stock market because investors are consistently irrational in making many investment decisions.
The Team aims to capitalize on these market inefficiencies by targeting attractively valued stocks that they believe possess strong fundamentals and momentum characteristics, and looking to sell these stocks when they no longer exhibit these criteria. A disciplined quantitative ranking methodology is utilized to identify attractive stocks in each sector, a process that is combined with qualitative research and value-added trading. Portfolios are constructed with limited sector bets so that stock selection is typically the primary driver of relative performance.
During the reporting period, each of the Funds was managed and positioned in accordance with this investment philosophy and process.
| 2 | J.P. MORGAN INTREPID FUNDS | JUNE 30, 2013 | ||||
Table of Contents
JPMorgan Intrepid Advantage Fund
TWELVE MONTHS ENDED JUNE 30, 2013 (Unaudited)
| REPORTING PERIOD RETURN: | ||||
| Fund (Select Class Shares)* | 22.46% | |||
| Russell 3000 Index | 21.46% | |||
| Net Assets as of 6/30/2013 (In Thousands) | $12,575 | |||
INVESTMENT OBJECTIVE**
The JPMorgan Intrepid Advantage Fund (the “Fund”) seeks to provide long-term capital appreciation.
WHAT WERE THE MAIN DRIVERS OF THE FUND’S PERFORMANCE?
The Fund (Select Class Shares) outperformed the Russell 3000 Index (the “Benchmark”) for the twelve months ended June 30, 2013. The Fund’s stock selection in the consumer staples and consumer discretionary sectors was the main contributor to relative performance. The Fund’s stock selection in the information technology and telecommunications services sectors detracted from relative performance.
Individual contributors to relative performance included the Fund’s positions in Constellation Brands, Inc., Cisco Systems, Inc. and Tyson Foods, Inc. Shares of Constellation Brands, Inc., a global manufacturer and distributor of liquor, rallied as the company reached an agreement to acquire the remaining interest in Crown Imports. The market feels this transaction has the potential to be a significant driver of Constellation Brands’ long-term growth. Shares of Cisco Systems, Inc., a manufacturer of networking equipment, rallied due to higher-than- expected earnings during the company’s fiscal third quarter. Tyson Foods, Inc., a leading processor and marketer of chicken, beef and pork, benefited from lower commodity costs and continued expansion into fast-growing markets abroad.
Individual detractors to relative performance included UnitedHealth Group, Inc., Apple, Inc. and Google, Inc. Shares of insurer UnitedHealth Group, Inc. underperformed the Benchmark due, in part, to uncertainty surrounding federal health care reform. Shares in Apple, Inc. fell amid intense competition with rivals and an outlook that fell short of analyst expectations. Shares of Google, Inc., an internet search and technology company, benefited from investors’ optimism surrounding increased spending on internet search advertising. As such, the Fund’s underweight in the stock, relative to the Benchmark, detracted.
| TOP TEN EQUITY HOLDINGS OF THE PORTFOLIO*** | ||||||||
| 1. | Exxon Mobil Corp. | 3.3 | % | |||||
| 2. | Pfizer, Inc. | 2.7 | ||||||
| 3. | Chevron Corp. | 2.6 | ||||||
| 4. | Microsoft Corp. | 2.5 | ||||||
| 5. | Gap, Inc. (The) | 2.2 | ||||||
| 6. | Cisco Systems, Inc. | 2.1 | ||||||
| 7. | Home Depot, Inc. (The) | 2.0 | ||||||
| 8. | Wells Fargo & Co. | 1.8 | ||||||
| 9. | CVS Caremark Corp. | 1.8 | ||||||
| 10. | Apple, Inc. | 1.7 | ||||||
PORTFOLIO COMPOSITION BY SECTOR*** | ||||
| Financials | 17.1 | % | ||
| Consumer Discretionary | 16.6 | |||
| Information Technology | 16.0 | |||
| Health Care | 13.9 | |||
| Energy | 10.2 | |||
| Industrials | 9.3 | |||
| Consumer Staples | 8.7 | |||
| Materials | 2.8 | |||
| Utilities | 2.5 | |||
| Telecommunication Services | 2.4 | |||
| Short-Term Investment | 0.5 | |||
| * | The return shown is based on net asset values calculated for shareholder transactions and may differ from the return shown in the financial highlights, which reflects adjustments made to the net asset values in accordance with accounting principles generally accepted in the United States of America. |
| ** | The advisor seeks to achieve the Fund’s objective. There can be no guarantee it will be achieved. |
| *** | Percentages indicated are based on total investments as of June 30, 2013. The Fund’s portfolio composition is subject to change. |
| JUNE 30, 2013 | J.P. MORGAN INTREPID FUNDS | 3 | ||||||
Table of Contents
JPMorgan Intrepid Advantage Fund
FUND COMMENTARY
TWELVE MONTHS ENDED JUNE 30, 2013 (Unaudited) (continued)
AVERAGE ANNUAL TOTAL RETURNS AS OF JUNE 30, 2013 | ||||||||||||||||
| INCEPTION DATE OF CLASS | 1 YEAR | 5 YEAR | 10 YEAR | |||||||||||||
CLASS A SHARES | 2/19/05 | |||||||||||||||
Without Sales Charge | 22.21 | % | 6.00 | % | 7.35 | % | ||||||||||
With Sales Charge* | 15.80 | 4.87 | 6.77 | |||||||||||||
CLASS C SHARES | 2/19/05 | |||||||||||||||
Without CDSC | 21.61 | 5.48 | 6.90 | |||||||||||||
With CDSC** | 20.61 | 5.48 | 6.90 | |||||||||||||
SELECT CLASS SHARES | 2/28/03 | 22.46 | 6.27 | 7.57 | ||||||||||||
| * | Sales Charge for Class A Shares is 5.25%. |
| ** | Assumes a 1% CDSC (contingent deferred sales charge) for the one year period and 0% CDSC thereafter. |
TEN YEAR PERFORMANCE (6/30/03 TO 6/30/13)
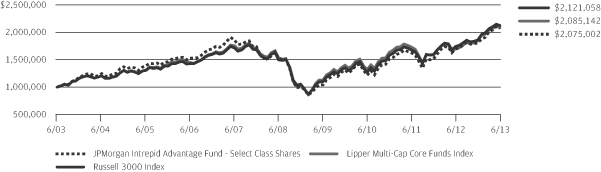
The performance quoted is past performance and is not a guarantee of future results. Mutual funds are subject to certain market risks. Investment returns and principal value of an investment will fluctuate so that an investor’s shares, when redeemed, may be worth more or less than their original cost. Current performance may be higher or lower than the performance data shown. For up-to-date month-end performance information please call 1-800-480-4111.
Returns for Class A and Class C Shares prior to their inception date are based on the performance of the Select Class Shares. The actual returns for Class A and Class C Shares would have been lower than shown because Class A and Class C Shares have higher expenses than Select Class Shares.
The graph illustrates comparative performance for $1,000,000 invested in Select Class Shares of the JPMorgan Intrepid Multi Cap Fund, the Russell 3000 Index, and the Lipper Multi-Cap Core Funds Index from June 30, 2003 to June 30, 2013. The performance of the Fund assumes reinvestment of all dividends and capital gain distributions, if any, and does not include a sales charge. The performance of the Russell 3000 Index does not reflect the deduction of expenses or a sales charge associated with a mutual fund and has been adjusted to reflect reinvestment of all dividends and capital gain distributions of the securities included in the benchmark, if applicable. The performance of the Lipper Multi-Cap Core Funds Index includes expenses associated with a mutual fund, such as investment management fees. These expenses are not identical to the expenses incurred by the Fund. The Russell 3000 Index is an unmanaged index which measures the performance of the 3,000 largest U.S. companies based on total market capitalization, which represents approximately 98% of
the investable U.S. equity market. The Lipper Multi-Cap Core Funds Index is an index based on the total returns of certain mutual funds within the Fund’s designated category as determined by Lipper, Inc. Investors cannot invest directly in an index.
Select Class Shares have a $1,000,000 minimum initial investment.
Fund performance may reflect the waiver of the Fund’s fees and reimbursement of expenses for certain periods since the inception date. Without these waivers and reimbursements, performance would have been lower. Also, performance shown in this section does not reflect the deduction of taxes that a shareholder would pay on Fund distributions or redemption of Fund shares.
Subsequent to the inception of the Fund through October 1, 2003, the Fund did not experience any shareholder purchase and sale activity. If such shareholder activity had occurred, the Fund’s performance may have been impacted.
Effective April 10, 2006, the Fund changed its investment policies. Although past performance is not necessarily an indication of how the Fund will perform in the future, in view of these changes, the Fund’s performance record prior to this period might be less relevant for investors considering whether to purchase shares of the Fund.
The returns shown are based on net asset values calculated for shareholder transactions and may differ from the returns shown in the financial highlights, which reflect adjustments made to the net asset values in accordance with accounting principles generally accepted in the United States of America.
| 4 | J.P. MORGAN INTREPID FUNDS | JUNE 30, 2013 | ||||
Table of Contents
JPMorgan Intrepid America Fund
FUND COMMENTARY
TWELVE MONTHS ENDED JUNE 30, 2013 (Unaudited)
| REPORTING PERIOD RETURN: | ||||
| Fund (Select Class Shares)* | 22.83% | |||
| Russell 1000 Index | 21.24% | |||
| Net Assets as of 6/30/2013 (In Thousands) | $ | 2,197,794 | ||
INVESTMENT OBJECTIVE**
The JPMorgan Intrepid America Fund (the “Fund”) seeks to provide long-term capital growth.
WHAT WERE THE MAIN DRIVERS OF THE FUND’S PERFORMANCE?
The Fund (Select Class Shares) outperformed the Russell 1000 Index (the “Benchmark”) for the twelve months ended June 30, 2013. The Fund’s stock selection in the consumer discretionary and materials sectors was the primary contributor to relative performance. The Fund’s stock selection in the information technology and energy sectors detracted from relative performance.
Individual contributors to relative performance included the Fund’s positions in Gilead Sciences, Inc., Visa, Inc. and LyondellBasell Industries N.V. Shares of Gilead Sciences, Inc., a biotechnology company that discovers, develops and commercializes therapeutics, rose sharply on solid earnings and profit reports and positive clinical results for several of its drugs. Visa, Inc., the financial services giant, reported solid results as it benefits from the global consumer shift from cash to plastic payments. Shares of LyondellBasell Industries N.V. benefited as the chemical manufacturing company posted strong quarterly earnings.
Individual detractors from relative performance included Google, Inc., Apple, Inc. and Eli Lilly & Co. Shares of Google, Inc., an internet search and technology company, benefited from investors’ optimism surrounding increased spending in internet search advertising. Not having a position in the stock detracted from the Fund's relative performance. Shares in Apple, Inc. fell sharply amid intense competition with rivals and an outlook that fell short of analyst expectations. While the Fund eliminated its position in Apple, Inc. during the reporting period, it was still among its largest detractors from performance. Not having a position in Eli Lilly & Co., a global pharmaceutical company, was a negative for relative performance as its shares outperformed the Benchmark for the reporting period.
| TOP TEN EQUITY HOLDINGS OF THE PORTFOLIO*** | ||||||||
| 1. | Chevron Corp. | 2.7 | % | |||||
| 2. | Pfizer, Inc. | 2.6 | ||||||
| 3. | Microsoft Corp. | 2.4 | ||||||
| 4. | Cisco Systems, Inc. | 2.3 | ||||||
| 5. | Exxon Mobil Corp. | 2.3 | ||||||
| 6. | Wells Fargo & Co. | 2.2 | ||||||
| 7. | Honeywell International, Inc. | 2.0 | ||||||
| 8. | Amgen, Inc. | 1.9 | ||||||
| 9. | Oracle Corp. | 1.8 | ||||||
| 10. | Home Depot, Inc. (The) | 1.7 | ||||||
PORTFOLIO COMPOSITION BY SECTOR*** | ||||
| Information Technology | 19.4 | % | ||
| Financials | 14.5 | |||
| Consumer Discretionary | 12.5 | |||
| Health Care | 12.3 | |||
| Industrials | 10.1 | |||
| Energy | 9.3 | |||
| Consumer Staples | 8.8 | |||
| Materials | 4.0 | |||
| Utilities | 3.0 | |||
| Telecommunication Services | 2.5 | |||
| Short-Term Investment | 3.6 | |||
| * | The return shown is based on net asset values calculated for shareholder transactions and may differ from the return shown in the financial highlights, which reflects adjustments made to the net asset values in accordance with accounting principles generally accepted in the United States of America. |
| ** | The advisor seeks to achieve the Fund’s objective. There can be no guarantee it will be achieved. |
| *** | Percentages indicated are based on total investments as of June 30, 2013. The Fund’s portfolio composition is subject to change. |
| JUNE 30, 2013 | J.P. MORGAN INTREPID FUNDS | 5 | ||||||
Table of Contents
JPMorgan Intrepid America Fund
FUND COMMENTARY
TWELVE MONTHS ENDED JUNE 30, 2013 (Unaudited) (continued)
AVERAGE ANNUAL TOTAL RETURNS AS OF JUNE 30, 2013 | ||||||||||||||||
| INCEPTION DATE OF CLASS | 1 YEAR | 5 YEAR | 10 YEAR | |||||||||||||
CLASS A SHARES | 2/19/05 | |||||||||||||||
Without Sales Charge | 22.48 | % | 6.07 | % | 7.74 | % | ||||||||||
With Sales Charge* | 16.04 | 4.93 | 7.16 | |||||||||||||
CLASS C SHARES | 2/19/05 | |||||||||||||||
Without CDSC | 21.90 | 5.54 | 7.28 | |||||||||||||
With CDSC** | 20.90 | 5.54 | 7.28 | |||||||||||||
CLASS R2 SHARES | 11/3/08 | 22.20 | 5.83 | 7.62 | ||||||||||||
CLASS R5 SHARES | 5/15/06 | 23.05 | 6.56 | 8.12 | ||||||||||||
SELECT CLASS SHARES | 2/28/03 | 22.83 | 6.34 | 7.96 | ||||||||||||
| * | Sales Charge for Class A Shares is 5.25%. |
| ** | Assumes a 1% CDSC (contingent deferred sales charge) for the one year period and 0% CDSC thereafter. |
TEN YEAR PERFORMANCE (6/30/03 TO 6/30/13)
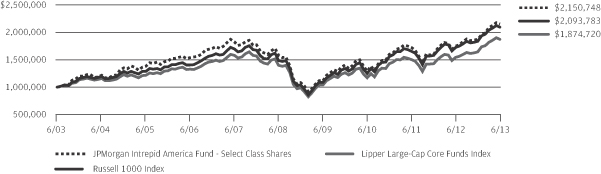
The performance quoted is past performance and is not a guarantee of future results. Mutual funds are subject to certain market risks. Investment returns and principal value of an investment will fluctuate so that an investor’s shares, when redeemed, may be worth more or less than their original cost. Current performance may be higher or lower than the performance data shown. For up-to-date month-end performance information please call 1-800-480-4111.
Returns for Class A, Class C, Class R2 and Class R5 Shares prior to their inception date are based on the performance of the Select Class Shares. The actual returns for Class A, Class C and Class R2 Shares would have been lower than shown because Class A, Class C and Class R2 Shares have higher expenses than Select Class Shares. The actual returns of Class R5 Shares would have been different than those shown because Class R5 Shares have different expenses than Select Class Shares.
The graph illustrates comparative performance for $1,000,000 invested in Select Class Shares of the JPMorgan Intrepid America Fund, the Russell 1000 Index, and the Lipper Large-Cap Core Funds Index from June 30, 2003 to June 30, 2013. The performance of the Fund assumes reinvestment of all dividends and capital gain distributions, if any, and does not include a sales charge. The performance of the Russell 1000 Index does not reflect the deduction of expenses or a sales charge associated with a mutual fund and has been adjusted to reflect reinvestment of all dividends and capital gain distributions of the securities included in the benchmark, if applicable. The performance of
the Lipper Large-Cap Core Funds Index includes expenses associated with a mutual fund, such as investment management fees. These expenses are not identical to the expenses incurred by the Fund. The Russell 1000 Index is an unmanaged index which measures the performance of the 1,000 largest companies (on the basis of capitalization) in the Russell 3000 Index. The Lipper Large-Cap Core Funds Index is an index based on total returns of certain mutual funds within the Fund’s designated category as determined by Lipper, Inc. Investors cannot invest directly in an index.
Select Class Shares have a $1,000,000 minimum initial investment.
Fund performance may reflect the waiver of the Fund’s fees and reimbursement of expenses for certain periods since the inception date. Without these waivers and reimbursements, performance would have been lower. Also, performance shown in this section does not reflect the deduction of taxes that a shareholder would pay on Fund distributions or redemption of Fund shares.
Subsequent to the inception of the Fund through October 1, 2003, the Fund did not experience any shareholder purchase and sale activity. If such shareholder activity had occurred, the Fund’s performance may have been impacted.
The returns shown are based on net asset values calculated for shareholder transactions and may differ from the returns shown in the financial highlights, which reflect adjustments made to the net asset values in accordance with accounting principles generally accepted in the United States of America.
| 6 | J.P. MORGAN INTREPID FUNDS | JUNE 30, 2013 | ||||
Table of Contents
FUND COMMENTARY
TWELVE MONTHS ENDED JUNE 30, 2013 (Unaudited)
| REPORTING PERIOD RETURN: | ||||
| Fund (Select Class Shares)* | 18.52% | |||
| Russell 1000 Growth Index | 17.07% | |||
| Net Assets as of 6/30/2013 (In Thousands) | $ | 693,864 | ||
INVESTMENT OBJECTIVE**
The JPMorgan Intrepid Growth Fund (the “Fund”) seeks to provide long-term capital growth.
WHAT WERE THE MAIN DRIVERS OF THE FUND’S PERFORMANCE?
The Fund (Select Class Shares) outperformed the Russell 1000 Growth Index (the “Benchmark”) for the twelve months ended June 30, 2013. The Fund’s stock selection in the consumer discretionary and health care sectors contributed to relative performance. The Fund’s stock selection in the telecommunication services and energy sectors detracted from relative performance.
Individual contributors to relative performance included Gilead Sciences, Inc., LyondellBasell Industries, N.V. and Honeywell International, Inc. Shares of Gilead Sciences, Inc., a biotechnology company that discovers, develops and commercializes therapeutics, rose sharply on solid earnings and profit reports and positive clinical results for several of its drugs. LyondellBasell Industries N.V., a chemical manufacturing company, posted strong earnings during the reporting period. Honeywell International, Inc. is a multinational conglomerate that produces a variety of commercial and consumer products, engineering services and aerospace systems. It reported higher margins for many of its products and raised its fiscal year forecasts for revenue and earnings.
Individual detractors to relative performance included Google, Inc., Apple, Inc. and Eli Lilly & Co. Shares of Google, Inc., an internet search and technology company, benefited from investors’ optimism surrounding increased spending in internet search advertising. As such, the Fund’s underweight in the stock, relative to the Benchmark, detracted. Shares in Apple, Inc. fell sharply amid intense competition with rivals and an outlook that fell short of analyst expectations. Shares of Eli Lilly & Co., a global pharmaceutical company, outperformed the Benchmark for the reporting period. However, share value declined during the time that the Fund held the position.
| TOP TEN EQUITY HOLDINGS OF THE PORTFOLIO*** | ||||||||
| 1. | Microsoft Corp. | 4.7 | % | |||||
| 2. | Home Depot, Inc. (The) | 2.9 | ||||||
| 3. | Oracle Corp. | 2.6 | ||||||
| 4. | Gilead Sciences, Inc. | 2.5 | ||||||
| 5. | Amgen, Inc. | 2.3 | ||||||
| 6. | Honeywell International, Inc. | 2.2 | ||||||
| 7. | Visa, Inc., Class A | 2.1 | ||||||
| 8. | Google, Inc., Class A | 1.8 | ||||||
| 9. | Altria Group, Inc. | 1.8 | ||||||
| 10. | Ingersoll-Rand plc | 1.8 | ||||||
PORTFOLIO COMPOSITION BY SECTOR*** | ||||
| Information Technology | 27.2 | % | ||
| Consumer Discretionary | 17.7 | |||
| Consumer Staples | 12.4 | |||
| Health Care | 12.4 | |||
| Industrials | 12.1 | |||
| Financials | 4.9 | |||
| Energy | 4.5 | |||
| Materials | 4.0 | |||
| Telecommunication Services | 1.9 | |||
| Utilities | 0.4 | |||
| Short-Term Investment | 2.5 | |||
| * | The return shown is based on net asset values calculated for shareholder transactions and may differ from the return shown in the financial highlights, which reflects adjustments made to the net asset values in accordance with accounting principles generally accepted in the United States of America. |
| ** | The advisor seeks to achieve the Fund’s objective. There can be no guarantee it will be achieved. |
| *** | Percentages indicated are based on total investments as of June 30, 2013. The Fund’s portfolio composition is subject to change. |
| JUNE 30, 2013 | J.P. MORGAN INTREPID FUNDS | 7 | ||||||
Table of Contents
JPMorgan Intrepid Growth Fund
FUND COMMENTARY
TWELVE MONTHS ENDED JUNE 30, 2013 (Unaudited) (continued)
AVERAGE ANNUAL TOTAL RETURNS AS OF JUNE 30, 2013 | ||||||||||||||||
| INCEPTION DATE OF CLASS | 1 YEAR | 5 YEAR | 10 YEAR | |||||||||||||
CLASS A SHARES | 2/19/05 | |||||||||||||||
Without Sales Charge | 18.27 | % | 6.52 | % | 7.86 | % | ||||||||||
With Sales Charge* | 12.04 | 5.38 | 7.28 | |||||||||||||
CLASS C SHARES | 2/19/05 | |||||||||||||||
Without CDSC | 17.66 | 6.00 | 7.41 | |||||||||||||
With CDSC** | 16.66 | 6.00 | 7.41 | |||||||||||||
CLASS R2 SHARES | 11/3/08 | 17.94 | 6.27 | 7.73 | ||||||||||||
CLASS R5 SHARES | 5/15/06 | 18.79 | 7.01 | 8.23 | ||||||||||||
SELECT CLASS SHARES | 2/28/03 | 18.52 | 6.79 | 8.08 | ||||||||||||
| * | Sales Charge for Class A Shares is 5.25%. |
| ** | Assumes a 1% CDSC (contingent deferred sales charge) for the one year period and 0% CDSC thereafter. |
TEN YEAR PERFORMANCE (6/30/03 TO 6/30/13)
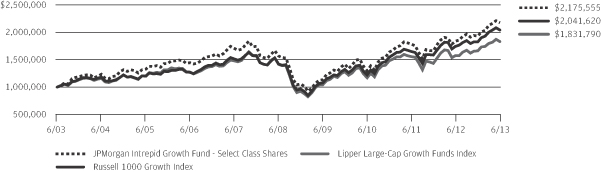
The performance quoted is past performance and is not a guarantee of future results. Mutual funds are subject to certain market risks. Investment returns and principal value of an investment will fluctuate so that an investor’s shares, when redeemed, may be worth more or less than their original cost. Current performance may be higher or lower than the performance data shown. For up-to-date month-end performance information please call 1-800-480-4111.
Returns for Class A, Class C, Class R2 and Class R5 Shares prior to their inception date are based on the performance of the Select Class Shares. The actual returns for Class A, Class C and Class R2 Shares would have been lower than shown because Class A, Class C and Class R2 Shares have higher expenses than Select Class Shares. The actual returns of Class R5 Shares would have been different than those shown because Class R5 Shares have different expenses than Select Class Shares.
The graph illustrates comparative performance for $1,000,000 invested in Select Class Shares of the JPMorgan Intrepid Growth Fund, the Russell 1000 Growth Index, and the Lipper Large-Cap Growth Funds Index from June 30, 2003 to June 30, 2013. The performance of the Fund assumes reinvestment of all dividends and capital gain distributions, if any, and does not include a sales charge. The performance of the Russell 1000 Growth Index does not reflect the deduction of expenses or a sales charge associated with a mutual fund and has been adjusted to reflect reinvestment of all dividends and capital gain distributions of the securities included in the benchmark, if applicable. The performance of the Lipper Large-Cap
Growth Funds Index includes expenses associated with a mutual fund, such as investment management fees. These expenses are not identical to the expenses incurred by the Fund. The Russell 1000 Growth Index is an unmanaged index which measures the performance of those Russell 1000 companies with higher price-to-book ratios and higher forecasted growth values. The Lipper Large-Cap Growth Funds Index is an index based on total returns of certain mutual funds within the Fund’s designated category as determined by Lipper, Inc. Investors cannot invest directly in an index.
Select Class Shares have a $1,000,000 minimum initial investment.
Fund performance may reflect the waiver of the Fund’s fees and reimbursement of expenses for certain periods since the inception date. Without these waivers and reimbursement, performance would have been lower. Also, performance shown in this section does not reflect the deduction of taxes that a shareholder would pay on Fund distributions or redemption of Fund shares.
Subsequent to the inception of the Fund through October 1, 2003, the Fund did not experience any shareholder purchase and sale activity. If such shareholder activity had occurred, the Fund’s performance may have been impacted.
The returns shown are based on net asset values calculated for shareholder transactions and may differ from the returns shown in the financial highlights, which reflect adjustments made to the net asset values in accordance with accounting principles generally accepted in the United States of America.
| 8 | J.P. MORGAN INTREPID FUNDS | JUNE 30, 2013 | ||||
Table of Contents
JPMorgan Intrepid Mid Cap Fund
FUND COMMENTARY
TWELVE MONTHS ENDED JUNE 30, 2013 (Unaudited)
| REPORTING PERIOD RETURN: | ||||
| Fund (Select Class Shares)* | 26.67% | |||
| Russell Midcap Index | 25.41% | |||
| Net Assets as of 6/30/2013 (In Thousands) | $ | 515,763 | ||
INVESTMENT OBJECTIVE**
The JPMorgan Intrepid Mid Cap Fund (the “Fund”) seeks long-term capital growth by investing primarily in equity securities of companies with intermediate capitalizations.
WHAT WERE THE MAIN DRIVERS OF THE FUND’S PERFORMANCE?
The Fund (Select Class Shares) outperformed the Russell Midcap Index (the “Benchmark”) for the twelve months ended June 30, 2013. The Fund’s stock selection in the software and services sector and the health services and systems sector was the primary contributor to relative performance. The Fund’s stock selection in the telecommunications and media sectors was the primary detractor.
Individual contributors to relative performance included the Fund’s positions in Constellation Brands, Inc., Western Digital Corp. and LinkedIn Corp. Shares of Constellation Brands, Inc., a global manufacturer and distributor of liquor, rallied as the company reached an agreement to acquire the remaining interest in Crown Imports. The market feels this transaction has the potential to be a significant driver of Constellation Brands’ long-term growth. The Fund was significantly overweight versus the Benchmark in Western Digital Corp., a hard disk drive manufacturer. Its shares reached an all-time high as demand grew for high capacity disk drive and cloud computing solutions. The Fund was also overweight LinkedIn Corp., a networking website for people in professional occupations. The company reported strong revenue and earnings growth during the reporting period.
Individual detractors from relative performance included Frontier Communications Corp., Lorillard Inc. and IAC Interactive Network, Inc. The Fund was overweight Frontier Communications Corp., a communications company providing services primarily to rural areas and small and medium-sized towns and cities in the U.S. Its shares underperformed the Benchmark as the firm reported flat earnings growth during the reporting period. Shares of Lorillard Inc., a cigarette manufacturer, also lagged the Benchmark due to modest revenue and earnings growth. Shares of IAC Interactive Network, Inc., an Internet company with over 50 brands, performed poorly due to increased competition for advertising dollars.
| TOP TEN EQUITY HOLDINGS OF THE PORTFOLIO*** | ||||||||
| 1. | Lorillard, Inc. | 1.7 | % | |||||
| 2. | Discover Financial Services | 1.7 | ||||||
| 3. | Macy’s, Inc. | 1.7 | ||||||
| 4. | Alliance Data Systems Corp. | 1.5 | ||||||
| 5. | Campbell Soup Co. | 1.4 | ||||||
| 6. | Western Digital Corp. | 1.3 | ||||||
| 7. | PulteGroup, Inc. | 1.3 | ||||||
| 8. | KAR Auction Services, Inc. | 1.3 | ||||||
| 9. | Activision Blizzard, Inc. | 1.3 | ||||||
| 10. | AmerisourceBergen Corp. | 1.3 | ||||||
PORTFOLIO COMPOSITION BY SECTOR*** | ||||
| Financials | 18.4 | % | ||
| Information Technology | 16.3 | |||
| Consumer Discretionary | 14.1 | |||
| Industrials | 13.8 | |||
| Health Care | 10.7 | |||
| Consumer Staples | 6.7 | |||
| Utilities | 6.3 | |||
| Energy | 6.2 | |||
| Materials | 4.7 | |||
| Telecommunication Services | 1.7 | |||
| U.S. Treasury Obligations | 0.2 | |||
| Short-Term Investment | 0.9 | |||
| * | The return shown is based on net asset values calculated for shareholder transactions and may differ from the return shown in the financial highlights, which reflects adjustments made to the net asset values in accordance with accounting principles generally accepted in the United States of America. |
| ** | The advisor seeks to achieve the Fund’s objective. There can be no guarantee it will be achieved. |
| *** | Percentages indicated are based on total investments as of June 30, 2013. The Fund’s portfolio composition is subject to change. |
| JUNE 30, 2013 | J.P. MORGAN INTREPID FUNDS | 9 | ||||||
Table of Contents
JPMorgan Intrepid Mid Cap Fund
FUND COMMENTARY
TWELVE MONTHS ENDED JUNE 30, 2013 (Unaudited) (continued)
AVERAGE ANNUAL TOTAL RETURNS AS OF JUNE 30, 2013 | ||||||||||||||||
| INCEPTION DATE OF CLASS | 1 YEAR | 5 YEAR | 10 YEAR | |||||||||||||
CLASS A SHARES | 5/1/92 | |||||||||||||||
Without Sales Charge | 26.30 | % | 6.91 | % | 9.05 | % | ||||||||||
With Sales Charge* | 19.67 | 5.75 | 8.47 | |||||||||||||
CLASS B SHARES | 9/23/96 | |||||||||||||||
Without CDSC | 25.51 | 6.21 | 8.49 | |||||||||||||
With CDSC** | 20.51 | 5.89 | 8.49 | |||||||||||||
CLASS C SHARES | 3/22/99 | |||||||||||||||
Without CDSC | 25.51 | 6.22 | 8.35 | |||||||||||||
With CDSC*** | 24.51 | 6.22 | 8.35 | |||||||||||||
SELECT CLASS SHARES | 6/1/91 | 26.67 | 7.17 | 9.33 | ||||||||||||
| * | Sales Charge for Class A Shares is 5.25%. |
| ** | Assumes a 5% CDSC (contingent deferred sales charge) for the one year period, 2% CDSC for the five year period and 0% CDSC thereafter. |
| *** | Assumes a 1% CDSC for the one year period and 0% CDSC thereafter. |
TEN YEAR PERFORMANCE (6/30/03 TO 6/30/13)
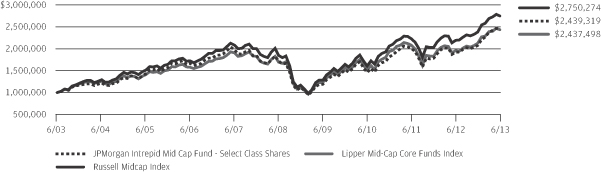
The performance quoted is past performance and is not a guarantee of future results. Mutual funds are subject to certain market risks. Investment returns and principal value of an investment will fluctuate so that an investor’s shares, when redeemed, may be worth more or less than their original cost. Current performance may be higher or lower than the performance data shown. For up-to-date month-end performance information please call 1-800-480-4111.
The graph illustrates comparative performance for $1,000,000 invested in Select Class Shares of the JPMorgan Intrepid Mid Cap Fund, the Russell Midcap Index and the Lipper Mid-Cap Core Funds Index from June 30, 2003 to June 30, 2013. The performance of the Fund assumes reinvestment of all dividends and capital gain distributions, if any, and does not include a sales charge. The performance of the Russell Midcap Index does not reflect the deduction of expenses or a sales charge associated with a mutual fund and has been adjusted to reflect reinvestment of all dividends and capital gain distributions of the securities included in the benchmark, if applicable. The performance of the Lipper Mid-Cap Core Funds Index includes expenses associated with a mutual fund, such as investment management fees. These expenses are not identical to the expenses incurred by the Fund. The Russell Midcap Index is an unmanaged
index which measures the performance of the 800 smallest companies of the Russell 1000 Index. The Lipper Mid-Cap Core Funds Index is an index based on the total returns of certain mutual funds within the Fund’s designated category as determined by Lipper, Inc. Investors cannot invest directly in an index.
Select Class Shares have a $1,000,000 minimum initial investment.
Fund performance may reflect the waiver of the Fund’s fees and reimbursement of expenses for certain periods since the inception date. Without these waivers and reimbursements, performance would have been lower. Also, performance shown in this section does not reflect the deduction of taxes that a shareholder would pay on Fund distributions or redemption of Fund shares.
Because Class B Shares automatically convert to Class A Shares after eight years, the 10 year average annual total return shown above for Class B reflects Class A performance for the period after conversion.
The returns shown are based on net asset values calculated for shareholder transactions and may differ from the returns shown in the financial highlights, which reflect adjustments made to the net asset values in accordance with accounting principles generally accepted in the United States of America.
| 10 | J.P. MORGAN INTREPID FUNDS | JUNE 30, 2013 | ||||
Table of Contents
FUND COMMENTARY
TWELVE MONTHS ENDED JUNE 30, 2013 (Unaudited)
| REPORTING PERIOD RETURN: | ||||
| Fund (Select Class Shares)* | 26.30% | |||
| Russell 1000 Value Index | 25.32% | |||
| Net Assets as of 6/30/2013 (In Thousands) | $ | 1,098,120 | ||
INVESTMENT OBJECTIVE**
The JPMorgan Intrepid Value Fund (the “Fund”) seeks to provide long-term capital appreciation.
WHAT WERE THE MAIN DRIVERS OF THE FUND’S PERFORMANCE?
The Fund (Select Class Shares) outperformed the Russell 1000 Value Index for the twelve months ended June 30, 2013. The Fund’s stock selection in the materials and consumer discretionary sectors was the main contributor to relative performance. The Fund’s stock selection in the information technology and telecommunications services sectors detracted from relative performance.
Individual contributors to relative performance included the Fund’s positions in LyondellBasell Industries N.V., Citigroup, Inc. and Marathon Oil, Inc. Shares of LyondellBasell Industries N.V. rallied as the chemical manufacturing company posted strong quarterly earnings during the reporting period. Shares of Citigroup, Inc., a leading global financial holding company, rose amid, among other things, improving business results. Investors also reacted positively to the company’s proposed restructuring plan. Shares of Marathon Oil Corp., a global oil and natural gas producer, moved higher given solid revenue and earnings growth.
Individual detractors to relative performance included Apple, Inc., CF Industries Holdings, Inc. and Best Buy Co., Inc. Shares in Apple, Inc. fell amid intense competition with rivals and an outlook that fell short of analyst expectations. CF Industries Holdings, Inc., a manufacturer and distributor of nitrogen and phosphate fertilizer products, underperformed the Benchmark amid concerns over falling revenues and earnings. Investor sentiment for consumer electronics retailer Best Buy Co., Inc. improved given its restructuring efforts, and its shares rallied as the company reported earnings and sales that exceeded expectations. As such, not having a position in the stock detracted from the Fund's relative performance.
| TOP TEN EQUITY HOLDINGS OF THE PORTFOLIO*** | ||||||||
| 1. | Exxon Mobil Corp. | 5.2 | % | |||||
| 2. | Pfizer, Inc. | 3.7 | ||||||
| 3. | Wells Fargo & Co. | 3.6 | ||||||
| 4. | Chevron Corp. | 3.2 | ||||||
| 5. | Citigroup, Inc. | 3.0 | ||||||
| 6. | Cisco Systems, Inc. | 2.9 | ||||||
| 7. | Bank of America Corp. | 2.4 | ||||||
| 8. | ConocoPhillips | 2.3 | ||||||
| 9. | AT&T, Inc. | 2.2 | ||||||
| 10. | Allstate Corp. (The) | 1.8 | ||||||
PORTFOLIO COMPOSITION BY SECTOR*** | ||||
| Financials | 27.0 | % | ||
| Energy | 14.3 | |||
| Health Care | 11.8 | |||
| Information Technology | 9.2 | |||
| Industrials | 8.6 | |||
| Consumer Discretionary | 7.8 | |||
| Consumer Staples | 6.3 | |||
| Utilities | 5.8 | |||
| Materials | 3.2 | |||
| Telecommunication Services | 2.6 | |||
| Short-Term Investment | 3.4 | |||
| * | The return shown is based on net asset values calculated for shareholder transactions and may differ from the return shown in the financial highlights, which reflects adjustments made to the net asset values in accordance with accounting principles generally accepted in the United States of America. |
| ** | The advisor seeks to achieve the Fund’s objective. There can be no guarantee it will be achieved. |
| *** | Percentages indicated are based on total investments as of June 30, 2013. The Fund’s portfolio composition is subject to change. |
| JUNE 30, 2013 | J.P. MORGAN INTREPID FUNDS | 11 | ||||||
Table of Contents
JPMorgan Intrepid Value Fund
FUND COMMENTARY
TWELVE MONTHS ENDED JUNE 30, 2013 (Unaudited) (continued)
AVERAGE ANNUAL TOTAL RETURNS AS OF JUNE 30, 2013 | ||||||||||||||||
| INCEPTION DATE OF CLASS | 1 YEAR | 5 YEAR | 10 YEAR | |||||||||||||
CLASS A SHARES | 2/19/05 | |||||||||||||||
Without Sales Charge | 26.07 | % | 6.44 | % | 8.42 | % | ||||||||||
With Sales Charge* | 19.45 | 5.30 | 7.84 | |||||||||||||
CLASS C SHARES | 2/19/05 | |||||||||||||||
Without CDSC | 25.48 | 5.92 | 7.97 | |||||||||||||
With CDSC** | 24.48 | 5.92 | 7.97 | |||||||||||||
CLASS R2 SHARES | 11/3/08 | 25.79 | 6.20 | 8.30 | ||||||||||||
CLASS R5 SHARES | 5/15/06 | 26.53 | 6.87 | 8.78 | ||||||||||||
CLASS R6 SHARES | 11/30/10 | 26.59 | 6.89 | 8.79 | ||||||||||||
SELECT CLASS SHARES | 2/28/03 | 26.30 | 6.66 | 8.62 | ||||||||||||
| * | Sales Charge for Class A Shares is 5.25%. |
| ** | Assumes a 1% CDSC (contingent deferred sales charge) for the one year period and 0% CDSC thereafter. |
TEN YEAR PERFORMANCE (6/30/03 TO 6/30/13)
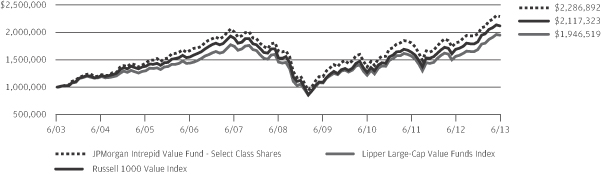
The performance quoted is past performance and is not a guarantee of future results. Mutual funds are subject to certain market risks. Investment returns and principal value of an investment will fluctuate so that an investor’s shares, when redeemed, may be worth more or less than their original cost. Current performance may be higher or lower than the performance data shown. For up-to-date month-end performance information please call 1-800-480-4111.
Returns for Class A, Class C, Class R2, Class R5 and Class R6 Shares prior to their inception date are based on the performance of the Select Class Shares. The actual returns for Class A, Class C and Class R2 Shares would have been lower than shown because Class A, Class C and Class R2 Shares have higher expenses than Select Class Shares. The actual returns of Class R5 and Class R6 Shares would have been different than those shown because Class R5 and Class R6 Shares have different expenses than Select Class Shares.
The graph illustrates comparative performance for $1,000,000 invested in Select Class Shares of the JPMorgan Intrepid Value Fund, the Russell 1000 Value Index, and the Lipper Large-Cap Value Funds Index from June 30, 2003 to June 30, 2013. The performance of the Fund assumes reinvestment of all dividends and capital gain distributions, if any, and does not include a sales charge. The performance of the Russell 1000 Value Index does not reflect the deduction of expenses or a sales charge associated with a mutual fund and has been adjusted to reflect reinvestment of all dividends and capital gain distributions of the securities included in the benchmark, if applicable. The performance of the Lipper
Large-Cap Value Funds Index includes expenses associated with a mutual fund, such as investment management fees. These expenses are not identical to the expenses incurred by the Fund. The Russell 1000 Value Index is an unmanaged index which measures the performance of those Russell 1000 companies with lower price-to-book ratios and lower forecasted growth values. The Lipper Large-Cap Value Funds Index is an index based on the total returns of certain mutual funds within the Fund’s designated category as determined by Lipper, Inc. Investors cannot invest directly in an index.
Select Class Shares have a $1,000,000 minimum initial investment.
Fund performance may reflect the waiver of the Fund’s fees and reimbursement of expenses for certain periods since the inception date. Without these waivers and reimbursements, performance would have been lower. Also, performance shown in this section does not reflect the deduction of taxes that a shareholder would pay on Fund distributions or redemption of Fund shares.
Subsequent to the inception of the Fund through October 1, 2003, the Fund did not experience any shareholder purchase and sale activity. If such shareholder activity had occurred, the Fund’s performance may have been impacted.
The returns shown are based on net asset values calculated for shareholder transactions and may differ from the returns shown in the financial highlights, which reflect adjustments made to the net asset values in accordance with accounting principles generally accepted in the United States of America.
| 12 | J.P. MORGAN INTREPID FUNDS | JUNE 30, 2013 | ||||
Table of Contents
JPMorgan Intrepid Advantage Fund
SCHEDULE OF PORTFOLIO INVESTMENTS
AS OF JUNE 30, 2013
(Amounts in thousands)
| SHARES | SECURITY DESCRIPTION | VALUE($) | ||||||
| Common Stocks — 99.7% | |||||||
Consumer Discretionary — 16.7% | ||||||||
Auto Components — 0.9% | ||||||||
| 2 | Delphi Automotive plc, (United Kingdom) | 115 | ||||||
|
| |||||||
Automobiles — 2.9% | ||||||||
| 13 | Ford Motor Co. | 202 | ||||||
| 5 | General Motors Co. (a) | 160 | ||||||
|
| |||||||
| 362 | ||||||||
|
| |||||||
Hotels, Restaurants & Leisure — 1.0% | ||||||||
| 1 | Brinker International, Inc. | 58 | ||||||
| 1 | Wynn Resorts Ltd. | 64 | ||||||
|
| |||||||
| 122 | ||||||||
|
| |||||||
Household Durables — 0.5% | ||||||||
| 2 | Taylor Morrison Home Corp., Class A (a) | 59 | ||||||
|
| |||||||
Internet & Catalog Retail — 0.9% | ||||||||
| 2 | Expedia, Inc. | 108 | ||||||
|
| |||||||
Media — 4.5% | ||||||||
| 4 | Comcast Corp., Class A | 187 | ||||||
| 3 | Time Warner, Inc. | 195 | ||||||
| 3 | Viacom, Inc., Class B | 184 | ||||||
|
| |||||||
| 566 | ||||||||
|
| |||||||
Specialty Retail — 5.5% | ||||||||
| 6 | Best Buy Co., Inc. | 165 | ||||||
| 7 | Gap, Inc. (The) | 276 | ||||||
| 3 | Home Depot, Inc. (The) | 258 | ||||||
|
| |||||||
| 699 | ||||||||
|
| |||||||
Textiles, Apparel & Luxury Goods — 0.5% | ||||||||
| 1 | Hanesbrands, Inc. | 64 | ||||||
|
| |||||||
Total Consumer Discretionary | 2,095 | |||||||
|
| |||||||
Consumer Staples — 8.7% | ||||||||
Beverages — 1.0% | ||||||||
| 1 | Constellation Brands, Inc., Class A (a) | 68 | ||||||
| 1 | Molson Coors Brewing Co., Class B | 58 | ||||||
|
| |||||||
| 126 | ||||||||
|
| |||||||
Food & Staples Retailing — 3.6% | ||||||||
| 4 | CVS Caremark Corp. | 229 | ||||||
| 3 | Walgreen Co. | 129 | ||||||
| 1 | Wal-Mart Stores, Inc. | 101 | ||||||
|
| |||||||
| 459 | ||||||||
|
| |||||||
| SHARES | SECURITY DESCRIPTION | VALUE($) | ||||||
Food Products — 3.0% | ||||||||
| 1 | Ingredion, Inc. | 60 | ||||||
| 1 | JM Smucker Co. (The) | 124 | ||||||
| 8 | Tyson Foods, Inc., Class A | 196 | ||||||
|
| |||||||
| 380 | ||||||||
|
| |||||||
Household Products — 1.1% | ||||||||
| 1 | Energizer Holdings, Inc. | 136 | ||||||
|
| |||||||
Total Consumer Staples | 1,101 | |||||||
|
| |||||||
Energy — 10.2% | ||||||||
Energy Equipment & Services — 0.6% | ||||||||
| 1 | National Oilwell Varco, Inc. | 76 | ||||||
|
| |||||||
Oil, Gas & Consumable Fuels — 9.6% | ||||||||
| 1 | Apache Corp. | 80 | ||||||
| 3 | Chevron Corp. | 322 | ||||||
| 2 | ConocoPhillips | 119 | ||||||
| 5 | Exxon Mobil Corp. | 420 | ||||||
| 2 | Marathon Oil Corp. | 79 | ||||||
| 1 | Occidental Petroleum Corp. | 125 | ||||||
| 1 | Phillips 66 | 58 | ||||||
|
| |||||||
| 1,203 | ||||||||
|
| |||||||
Total Energy | 1,279 | |||||||
|
| |||||||
Financials — 17.2% | ||||||||
Capital Markets — 2.8% | ||||||||
| 2 | Ameriprise Financial, Inc. | 158 | ||||||
| 1 | Bank of New York Mellon Corp. (The) | 38 | ||||||
| – | (h) | Goldman Sachs Group, Inc. (The) | 60 | |||||
| 4 | Morgan Stanley | 92 | ||||||
|
| |||||||
| 348 | ||||||||
|
| |||||||
Commercial Banks — 2.9% | ||||||||
| 2 | BB&T Corp. | 62 | ||||||
| 7 | KeyCorp. | 77 | ||||||
| 6 | Wells Fargo & Co. | 231 | ||||||
|
| |||||||
| 370 | ||||||||
|
| |||||||
Consumer Finance — 2.9% | ||||||||
| 2 | Capital One Financial Corp. | 156 | ||||||
| 3 | Discover Financial Services | 150 | ||||||
| 2 | Nelnet, Inc., Class A | 54 | ||||||
|
| |||||||
| 360 | ||||||||
|
| |||||||
Diversified Financial Services — 2.2% | ||||||||
| 9 | Bank of America Corp. | 117 | ||||||
| 3 | Citigroup, Inc. | 154 | ||||||
|
| |||||||
| 271 | ||||||||
|
| |||||||
SEE NOTES TO FINANCIAL STATEMENTS.
| JUNE 30, 2013 | J.P. MORGAN INTREPID FUNDS | 13 | ||||||
Table of Contents
JPMorgan Intrepid Advantage Fund
SCHEDULE OF PORTFOLIO INVESTMENTS
AS OF JUNE 30, 2013 (continued)
(Amounts in thousands)
| SHARES | SECURITY DESCRIPTION | VALUE($) | ||||||
| Common Stocks — Continued | |||||||
Insurance — 3.5% | ||||||||
| 1 | Allied World Assurance Co. Holdings AG, (Switzerland) | 112 | ||||||
| 1 | Chubb Corp. (The) | 72 | ||||||
| 5 | CNO Financial Group, Inc. | 60 | ||||||
| 1 | Hartford Financial Services Group, Inc. | 32 | ||||||
| 2 | Prudential Financial, Inc. | 170 | ||||||
|
| |||||||
| 446 | ||||||||
|
| |||||||
Real Estate Investment Trusts (REITs) — 2.1% | ||||||||
| 2 | Extra Space Storage, Inc. | 73 | ||||||
| 6 | RLJ Lodging Trust | 142 | ||||||
| 1 | Sovran Self Storage, Inc. | 49 | ||||||
|
| |||||||
| 264 | ||||||||
|
| |||||||
Thrifts & Mortgage Finance — 0.8% | ||||||||
| 2 | Ocwen Financial Corp. (a) | 101 | ||||||
|
| |||||||
Total Financials | 2,160 | |||||||
|
| |||||||
Health Care — 13.9% | ||||||||
Biotechnology — 3.9% | ||||||||
| 1 | Amgen, Inc. | 131 | ||||||
| 4 | Gilead Sciences, Inc. (a) | 184 | ||||||
| 2 | Quintiles Transnational Holdings, Inc. (a) | 81 | ||||||
| 1 | Vertex Pharmaceuticals, Inc. (a) | 90 | ||||||
|
| |||||||
| 486 | ||||||||
|
| |||||||
Health Care Equipment & Supplies — 3.2% | ||||||||
| 9 | Boston Scientific Corp. (a) | 82 | ||||||
| 2 | CareFusion Corp. (a) | 68 | ||||||
| 2 | Covidien plc, (Ireland) | 154 | ||||||
| 2 | Medtronic, Inc. | 101 | ||||||
|
| |||||||
| 405 | ||||||||
|
| |||||||
Health Care Providers & Services — 1.7% | ||||||||
| 1 | Cigna Corp. | 81 | ||||||
| 2 | Express Scripts Holding Co. (a) | 136 | ||||||
|
| |||||||
| 217 | ||||||||
|
| |||||||
Pharmaceuticals — 5.1% | ||||||||
| 2 | AbbVie, Inc. (m) | 95 | ||||||
| 1 | Johnson & Johnson | 122 | ||||||
| – | (h) | Merck & Co., Inc. | 21 | |||||
| 12 | Pfizer, Inc. | 336 | ||||||
| 2 | Zoetis, Inc. | 63 | ||||||
|
| |||||||
| 637 | ||||||||
|
| |||||||
Total Health Care | 1,745 | |||||||
|
| |||||||
| SHARES | SECURITY DESCRIPTION | VALUE($) | ||||||
Industrials — 9.3% | ||||||||
Aerospace & Defense — 2.1% | ||||||||
| 1 | Boeing Co. (The) | 95 | ||||||
| 1 | Honeywell International, Inc. | 55 | ||||||
| 1 | Northrop Grumman Corp. | 120 | ||||||
|
| |||||||
| 270 | ||||||||
|
| |||||||
Air Freight & Logistics — 0.7% | ||||||||
| 1 | United Parcel Service, Inc., Class B | 93 | ||||||
|
| |||||||
Airlines — 0.7% | ||||||||
| 3 | Delta Air Lines, Inc. (a) | 51 | ||||||
| 1 | United Continental Holdings, Inc. (a) | 31 | ||||||
|
| |||||||
| 82 | ||||||||
|
| |||||||
Construction & Engineering — 2.3% | ||||||||
| 3 | AECOM Technology Corp. (a) | 91 | ||||||
| 2 | Chicago Bridge & Iron Co. N.V., (Netherlands) | 145 | ||||||
| 1 | Fluor Corp. | 49 | ||||||
|
| |||||||
| 285 | ||||||||
�� |
| |||||||
Industrial Conglomerates — 0.6% | ||||||||
| 1 | Danaher Corp. | 76 | ||||||
|
| |||||||
Machinery — 2.3% | ||||||||
| 1 | Crane Co. | 64 | ||||||
| 2 | Ingersoll-Rand plc, (Ireland) | 103 | ||||||
| – | (h) | Parker Hannifin Corp. | 43 | |||||
| 3 | Terex Corp. (a) | 83 | ||||||
|
| |||||||
| 293 | ||||||||
|
| |||||||
Professional Services — 0.6% | ||||||||
| 1 | Towers Watson & Co., Class A | 74 | ||||||
|
| |||||||
Total Industrials | 1,173 | |||||||
|
| |||||||
Information Technology — 16.0% | ||||||||
Communications Equipment — 3.4% | ||||||||
| 11 | Cisco Systems, Inc. | 262 | ||||||
| 1 | Harris Corp. | 42 | ||||||
| 2 | QUALCOMM, Inc. | 128 | ||||||
|
| |||||||
| 432 | ||||||||
|
| |||||||
Computers & Peripherals — 3.0% | ||||||||
| 1 | Apple, Inc. | 214 | ||||||
| 4 | Hewlett-Packard Co. | 87 | ||||||
| 1 | SanDisk Corp. (a) | 75 | ||||||
|
| |||||||
| 376 | ||||||||
|
| |||||||
SEE NOTES TO FINANCIAL STATEMENTS.
| 14 | J.P. MORGAN INTREPID FUNDS | JUNE 30, 2013 | ||||
Table of Contents
| SHARES | SECURITY DESCRIPTION | VALUE($) | ||||||
| Common Stocks — Continued | |||||||
Internet Software & Services — 1.5% | ||||||||
| – | (h) | Google, Inc., Class A (a) | 121 | |||||
| 3 | Yahoo!, Inc. (a) | 63 | ||||||
|
| |||||||
| 184 | ||||||||
|
| |||||||
IT Services — 0.7% | ||||||||
| 3 | CoreLogic, Inc. (a) | 67 | ||||||
| 1 | CSG Systems International, Inc. (a) | 18 | ||||||
|
| |||||||
| 85 | ||||||||
|
| |||||||
Semiconductors & Semiconductor Equipment — 2.9% |
| |||||||
| 2 | Altera Corp. | 71 | ||||||
| 3 | Broadcom Corp., Class A | 90 | ||||||
| 2 | Freescale Semiconductor Ltd. (a) | 24 | ||||||
| 2 | KLA-Tencor Corp. | 123 | ||||||
| 1 | Lam Research Corp. (a) | 62 | ||||||
|
| |||||||
| 370 | ||||||||
|
| |||||||
Software — 4.5% | ||||||||
| 1 | Adobe Systems, Inc. (a) (m) | 38 | ||||||
| 9 | Microsoft Corp. | 314 | ||||||
| 4 | Oracle Corp. | 109 | ||||||
| 3 | Rovi Corp. (a) | 63 | ||||||
| 2 | Symantec Corp. | 48 | ||||||
|
| |||||||
| 572 | ||||||||
|
| |||||||
Total Information Technology | 2,019 | |||||||
|
| |||||||
Materials — 2.8% | ||||||||
Chemicals — 0.9% | ||||||||
| 3 | Axiall Corp. | 117 | ||||||
|
| |||||||
Containers & Packaging — 0.7% | ||||||||
| 2 | Crown Holdings, Inc. (a) | 85 | ||||||
|
| |||||||
Paper & Forest Products — 1.2% | ||||||||
| 2 | International Paper Co. | 89 | ||||||
| 5 | Louisiana-Pacific Corp. (a) | 67 | ||||||
|
| |||||||
| 156 | ||||||||
|
| |||||||
Total Materials | 358 | |||||||
|
| |||||||
Telecommunication Services — 2.4% | ||||||||
Diversified Telecommunication Services — 2.4% |
| |||||||
| 4 | AT&T, Inc. (m) | 140 | ||||||
| 5 | CenturyLink, Inc. | 159 | ||||||
|
| |||||||
Total Telecommunication Services | 299 | |||||||
|
| |||||||
| SHARES | SECURITY DESCRIPTION | VALUE($) | ||||||
Utilities — 2.5% | ||||||||
Electric Utilities — 0.4% | ||||||||
| 1 | Pinnacle West Capital Corp. | 51 | ||||||
|
| |||||||
Gas Utilities — 0.9% | ||||||||
| 3 | UGI Corp. | 111 | ||||||
|
| |||||||
Independent Power Producers & Energy Traders — 0.8% |
| |||||||
| 8 | AES Corp. (m) | 97 | ||||||
|
| |||||||
Water Utilities — 0.4% | ||||||||
| 1 | American Water Works Co., Inc. | 51 | ||||||
|
| |||||||
Total Utilities | 310 | |||||||
|
| |||||||
Total Common Stocks (Cost $10,080) | 12,539 | |||||||
|
| |||||||
| Short-Term Investment — 0.5% | |||||||
Investment Company — 0.5% | ||||||||
| 64 | JPMorgan Prime Money Market Fund, Institutional Class Shares, 0.030% (b) (l) (m) (Cost $64) | 64 | ||||||
|
| |||||||
Total Investments — 100.2% | 12,603 | |||||||
Liabilities in Excess of | (28 | ) | ||||||
|
| |||||||
NET ASSETS — 100.0% | $ | 12,575 | ||||||
|
| |||||||
Percentages indicated are based on net assets.
SEE NOTES TO FINANCIAL STATEMENTS.
| JUNE 30, 2013 | J.P. MORGAN INTREPID FUNDS | 15 | ||||||
Table of Contents
JPMorgan Intrepid America Fund
SCHEDULE OF PORTFOLIO INVESTMENTS
AS OF JUNE 30, 2013
(Amounts in thousands)
| SHARES | SECURITY DESCRIPTION | VALUE($) | ||||||
| Common Stocks — 97.1% | |||||||
Consumer Discretionary — 12.5% | ||||||||
Automobiles — 0.9% | ||||||||
| 1,299 | Ford Motor Co. | 20,096 | ||||||
|
| |||||||
Diversified Consumer Services — 0.9% | ||||||||
| 362 | H&R Block, Inc. | 10,040 | ||||||
| 487 | Service Corp. International | 8,773 | ||||||
|
| |||||||
| 18,813 | ||||||||
|
| |||||||
Hotels, Restaurants & Leisure — 0.8% | ||||||||
| 235 | Brinker International, Inc. | 9,262 | ||||||
| 162 | Wyndham Worldwide Corp. | 9,254 | ||||||
|
| |||||||
| 18,516 | ||||||||
|
| |||||||
Household Durables — 1.0% | ||||||||
| 198 | Jarden Corp. (a) | 8,682 | ||||||
| 309 | PulteGroup, Inc. (a) | 5,862 | ||||||
| 70 | Whirlpool Corp. | 8,017 | ||||||
|
| |||||||
| 22,561 | ||||||||
|
| |||||||
Internet & Catalog Retail — 0.5% | ||||||||
| 132 | Expedia, Inc. | 7,946 | ||||||
| 5 | priceline.com, Inc. (a) | 4,218 | ||||||
|
| |||||||
| 12,164 | ||||||||
|
| |||||||
Media — 3.6% | ||||||||
| 783 | Comcast Corp., Class A | 32,783 | ||||||
| 150 | Time Warner Cable, Inc. | 16,827 | ||||||
| 62 | Time Warner, Inc. | 3,608 | ||||||
| 378 | Viacom, Inc., Class B | 25,730 | ||||||
|
| |||||||
| 78,948 | ||||||||
|
| |||||||
Multiline Retail — 2.0% | ||||||||
| 107 | Dillard’s, Inc., Class A | 8,746 | ||||||
| 722 | Macy’s, Inc. | 34,637 | ||||||
|
| |||||||
| 43,383 | ||||||||
|
| |||||||
Specialty Retail — 2.4% | ||||||||
| 73 | GameStop Corp., Class A | 3,056 | ||||||
| 254 | Gap, Inc. (The) | 10,587 | ||||||
| 496 | Home Depot, Inc. (The) | 38,448 | ||||||
|
| |||||||
| 52,091 | ||||||||
|
| |||||||
Textiles, Apparel & Luxury Goods — 0.4% | ||||||||
| 173 | Hanesbrands, Inc. | 8,885 | ||||||
|
| |||||||
Total Consumer Discretionary | 275,457 | |||||||
|
| |||||||
Consumer Staples — 8.9% | ||||||||
Beverages — 0.4% | ||||||||
| 173 | Molson Coors Brewing Co., Class B | 8,265 | ||||||
|
| |||||||
| SHARES | SECURITY DESCRIPTION | VALUE($) | ||||||
Food & Staples Retailing — 2.4% | ||||||||
| 461 | CVS Caremark Corp. | 26,360 | ||||||
| 621 | Walgreen Co. | 27,426 | ||||||
|
| |||||||
| 53,786 | ||||||||
|
| |||||||
Food Products — 3.4% | ||||||||
| 986 | Archer-Daniels-Midland Co. | 33,422 | ||||||
| 69 | Campbell Soup Co. | 3,086 | ||||||
| 263 | ConAgra Foods, Inc. | 9,197 | ||||||
| 190 | General Mills, Inc. | 9,216 | ||||||
| 117 | Ingredion, Inc. | 7,684 | ||||||
| 85 | JM Smucker Co. (The) | 8,809 | ||||||
| 101 | Tyson Foods, Inc., Class A | 2,581 | ||||||
|
| |||||||
| 73,995 | ||||||||
|
| |||||||
Household Products — 1.3% | ||||||||
| 88 | Energizer Holdings, Inc. | 8,855 | ||||||
| 167 | Kimberly-Clark Corp. | 16,213 | ||||||
| 82 | Spectrum Brands Holdings, Inc. | 4,669 | ||||||
|
| |||||||
| 29,737 | ||||||||
|
| |||||||
Personal Products — 0.4% | ||||||||
| 148 | Nu Skin Enterprises, Inc., Class A | 9,027 | ||||||
|
| |||||||
Tobacco — 1.0% | ||||||||
| 272 | Altria Group, Inc. | 9,517 | ||||||
| 157 | Lorillard, Inc. | 6,862 | ||||||
| 53 | Philip Morris International, Inc. | 4,574 | ||||||
|
| |||||||
| 20,953 | ||||||||
|
| |||||||
Total Consumer Staples | 195,763 | |||||||
|
| |||||||
Energy — 9.3% | ||||||||
Energy Equipment & Services — 0.1% | ||||||||
| 50 | Schlumberger Ltd. | 3,597 | ||||||
|
| |||||||
Oil, Gas & Consumable Fuels — 9.2% | ||||||||
| 352 | Anadarko Petroleum Corp. | 30,205 | ||||||
| 505 | Chevron Corp. | 59,703 | ||||||
| 585 | ConocoPhillips | 35,362 | ||||||
| 561 | Exxon Mobil Corp. | 50,673 | ||||||
| 28 | Marathon Petroleum Corp. | 1,954 | ||||||
| 154 | Phillips 66 | 9,060 | ||||||
| 143 | Tesoro Corp. | 7,503 | ||||||
| 254 | Western Refining, Inc. | 7,124 | ||||||
|
| |||||||
| 201,584 | ||||||||
|
| |||||||
Total Energy | 205,181 | |||||||
|
| |||||||
SEE NOTES TO FINANCIAL STATEMENTS.
| 16 | J.P. MORGAN INTREPID FUNDS | JUNE 30, 2013 | ||||
Table of Contents
| SHARES | SECURITY DESCRIPTION | VALUE($) | ||||||
| Common Stocks — Continued | |||||||
Financials — 14.6% | ||||||||
Capital Markets — 1.8% | ||||||||
| 286 | American Capital Ltd. (a) | 3,627 | ||||||
| 122 | Ameriprise Financial, Inc. | 9,892 | ||||||
| 136 | Goldman Sachs Group, Inc. (The) | 20,572 | ||||||
| 211 | Morgan Stanley | 5,143 | ||||||
|
| |||||||
| 39,234 | ||||||||
|
| |||||||
Commercial Banks — 2.2% | ||||||||
| 1,183 | Wells Fargo & Co. | 48,841 | ||||||
|
| |||||||
Consumer Finance — 1.6% | ||||||||
| 735 | Discover Financial Services | 35,011 | ||||||
|
| |||||||
Diversified Financial Services — 1.7% | ||||||||
| 799 | Citigroup, Inc. | 38,343 | ||||||
|
| |||||||
Insurance — 3.9% | ||||||||
| 59 | ACE Ltd., (Switzerland) | 5,306 | ||||||
| 640 | Allstate Corp. (The) | 30,807 | ||||||
| 566 | CNO Financial Group, Inc. | 7,337 | ||||||
| 71 | Everest Re Group Ltd., (Bermuda) | 9,132 | ||||||
| 301 | Lincoln National Corp. | 10,992 | ||||||
| 97 | RenaissanceRe Holdings Ltd., (Bermuda) | 8,401 | ||||||
| 185 | Travelers Cos., Inc. (The) | 14,769 | ||||||
|
| |||||||
| 86,744 | ||||||||
|
| |||||||
Real Estate Investment Trusts (REITs) — 2.9% |
| |||||||
| 211 | American Tower Corp. | 15,461 | ||||||
| 211 | Extra Space Storage, Inc. | 8,851 | ||||||
| 674 | General Growth Properties, Inc. | 13,388 | ||||||
| 222 | GEO Group, Inc. (The) | 7,544 | ||||||
| 101 | HCP, Inc. | 4,567 | ||||||
| 107 | Hospitality Properties Trust | 2,823 | ||||||
| 151 | Ventas, Inc. | 10,495 | ||||||
|
| |||||||
| 63,129 | ||||||||
|
| |||||||
Thrifts & Mortgage Finance — 0.5% | ||||||||
| 28 | Nationstar Mortgage Holdings, Inc. (a) | 1,041 | ||||||
| 214 | Ocwen Financial Corp. (a) | 8,825 | ||||||
|
| |||||||
| 9,866 | ||||||||
|
| |||||||
Total Financials | 321,168 | |||||||
|
| |||||||
Health Care — 12.4% | ||||||||
Biotechnology — 4.3% | ||||||||
| 436 | Amgen, Inc. | 43,006 | ||||||
| 343 | Gilead Sciences, Inc. (a) | 17,570 | ||||||
| 429 | Vertex Pharmaceuticals, Inc. (a) | 34,296 | ||||||
|
| |||||||
| 94,872 | ||||||||
|
| |||||||
| SHARES | SECURITY DESCRIPTION | VALUE($) | ||||||
Health Care Equipment & Supplies — 1.0% | ||||||||
| 222 | CareFusion Corp. (a) | 8,173 | ||||||
| 284 | Medtronic, Inc. | 14,628 | ||||||
|
| |||||||
| 22,801 | ||||||||
|
| |||||||
Health Care Providers & Services — 2.9% | ||||||||
| 140 | Aetna, Inc. | 8,915 | ||||||
| 154 | AmerisourceBergen Corp. | 8,570 | ||||||
| 172 | Centene Corp. (a) | 9,013 | ||||||
| 212 | Express Scripts Holding Co. (a) | 13,103 | ||||||
| 209 | Omnicare, Inc. | 9,976 | ||||||
| 157 | WellPoint, Inc. | 12,816 | ||||||
|
| |||||||
| 62,393 | ||||||||
|
| |||||||
Pharmaceuticals — 4.2% | ||||||||
| 519 | Eli Lilly & Co. | 25,469 | ||||||
| 2,087 | Pfizer, Inc. | 58,467 | ||||||
| 131 | Salix Pharmaceuticals Ltd. (a) | 8,632 | ||||||
|
| |||||||
| 92,568 | ||||||||
|
| |||||||
Total Health Care | 272,634 | |||||||
|
| |||||||
Industrials — 10.2% | ||||||||
Aerospace & Defense — 3.6% | ||||||||
| 557 | Honeywell International, Inc. | 44,161 | ||||||
| 99 | Huntington Ingalls Industries, Inc. | 5,597 | ||||||
| 358 | Northrop Grumman Corp. | 29,659 | ||||||
|
| |||||||
| 79,417 | ||||||||
|
| |||||||
Air Freight & Logistics — 0.1% | ||||||||
| 18 | United Parcel Service, Inc., Class B | 1,513 | ||||||
|
| |||||||
Airlines — 1.1% | ||||||||
| 162 | Alaska Air Group, Inc. (a) | 8,409 | ||||||
| 119 | Delta Air Lines, Inc. (a) | 2,217 | ||||||
| 625 | Southwest Airlines Co. | 8,056 | ||||||
| 183 | United Continental Holdings, Inc. (a) | 5,723 | ||||||
|
| |||||||
| 24,405 | ||||||||
|
| |||||||
Commercial Services & Supplies — 0.6% | ||||||||
| 148 | Avery Dennison Corp. | 6,329 | ||||||
| 532 | Pitney Bowes, Inc. | 7,811 | ||||||
|
| |||||||
| 14,140 | ||||||||
|
| |||||||
Construction & Engineering — 1.2% | ||||||||
| 314 | AECOM Technology Corp. (a) | 9,992 | ||||||
| 175 | Chicago Bridge & Iron Co. N.V., (Netherlands) | 10,428 | ||||||
| 161 | EMCOR Group, Inc. | 6,541 | ||||||
|
| |||||||
| 26,961 | ||||||||
|
| |||||||
| JUNE 30, 2013 | J.P. MORGAN INTREPID FUNDS | 17 | ||||||
SEE NOTES TO FINANCIAL STATEMENTS.
Table of Contents
JPMorgan Intrepid America Fund
SCHEDULE OF PORTFOLIO INVESTMENTS
AS OF JUNE 30, 2013 (continued)
(Amounts in thousands, except number of contracts)
| SHARES | SECURITY DESCRIPTION | VALUE($) | ||||||
| Common Stocks — Continued | |||||||
Electrical Equipment — 0.1% | ||||||||
| 21 | Roper Industries, Inc. | 2,609 | ||||||
|
| |||||||
Industrial Conglomerates — 0.5% | ||||||||
| 155 | Danaher Corp. | 9,805 | ||||||
|
| |||||||
Machinery — 2.3% | ||||||||
| 139 | Crane Co. | 8,341 | ||||||
| 609 | Ingersoll-Rand plc, (Ireland) | 33,811 | ||||||
| 71 | Oshkosh Corp. (a) | 2,696 | ||||||
| 65 | Stanley Black & Decker, Inc. | 5,009 | ||||||
|
| |||||||
| 49,857 | ||||||||
|
| |||||||
Professional Services — 0.4% | ||||||||
| 86 | Dun & Bradstreet Corp. (The) | 8,361 | ||||||
|
| |||||||
Road & Rail — 0.3% | ||||||||
| 92 | Norfolk Southern Corp. | 6,676 | ||||||
|
| |||||||
Total Industrials | 223,744 | |||||||
|
| |||||||
Information Technology — 19.5% | ||||||||
Communications Equipment — 2.3% | ||||||||
| 2,097 | Cisco Systems, Inc. | 50,988 | ||||||
|
| |||||||
Computers & Peripherals — 2.9% | ||||||||
| 708 | Hewlett-Packard Co. | 17,546 | ||||||
| 818 | Seagate Technology plc, (Ireland) | 36,662 | ||||||
| 149 | Western Digital Corp. | 9,251 | ||||||
|
| |||||||
| 63,459 | ||||||||
|
| |||||||
Internet Software & Services — 1.5% | ||||||||
| 209 | AOL, Inc. (a) (m) | 7,621 | ||||||
| 1,004 | Yahoo!, Inc. (a) | 25,210 | ||||||
|
| |||||||
| 32,831 | ||||||||
|
| |||||||
IT Services — 3.6% | ||||||||
| 48 | Alliance Data Systems Corp. (a) | 8,653 | ||||||
| 224 | Amdocs Ltd. | 8,293 | ||||||
| 192 | Computer Sciences Corp. | 8,417 | ||||||
| 309 | CoreLogic, Inc. (a) | 7,162 | ||||||
| 16 | MasterCard, Inc., Class A | 8,905 | ||||||
| 208 | Visa, Inc., Class A | 37,994 | ||||||
|
| |||||||
| 79,424 | ||||||||
|
| |||||||
Semiconductors & Semiconductor Equipment — 3.2% |
| |||||||
| 492 | Applied Materials, Inc. | 7,339 | ||||||
| 416 | Avago Technologies Ltd., (Singapore) | 15,531 | ||||||
| 196 | Broadcom Corp., Class A | 6,624 | ||||||
| 133 | Freescale Semiconductor Ltd. (a) | 1,802 | ||||||
| 513 | Lam Research Corp. (a) | 22,737 | ||||||
| SHARES | SECURITY DESCRIPTION | VALUE($) | ||||||
Semiconductors & Semiconductor Equipment — Continued |
| |||||||
| 380 | ON Semiconductor Corp. (a) | 3,069 | ||||||
| 327 | Xilinx, Inc. | 12,941 | ||||||
|
| |||||||
| 70,043 | ||||||||
|
| |||||||
Software — 6.0% | ||||||||
| 1,545 | Microsoft Corp. | 53,332 | ||||||
| 1,295 | Oracle Corp. | 39,788 | ||||||
| 335 | Rovi Corp. (a) | 7,656 | ||||||
| 1,399 | Symantec Corp. | 31,442 | ||||||
|
| |||||||
| 132,218 | ||||||||
|
| |||||||
Total Information Technology | 428,963 | |||||||
|
| |||||||
Materials — 4.1% | ||||||||
Chemicals — 3.5% | ||||||||
| 504 | LyondellBasell Industries N.V., (Netherlands), Class A | 33,389 | ||||||
| 106 | Monsanto Co. | 10,423 | ||||||
| 227 | PPG Industries, Inc. | 33,226 | ||||||
|
| |||||||
| 77,038 | ||||||||
|
| |||||||
Containers & Packaging — 0.3% | ||||||||
| 111 | Greif, Inc., Class A | 5,825 | ||||||
|
| |||||||
Paper & Forest Products — 0.3% | ||||||||
| 150 | International Paper Co. | 6,625 | ||||||
|
| |||||||
Total Materials | 89,488 | |||||||
|
| |||||||
Telecommunication Services — 2.5% | ||||||||
Diversified Telecommunication Services — 2.5% |
| |||||||
| 714 | AT&T, Inc. (m) | 25,272 | ||||||
| 191 | CenturyLink, Inc. | 6,767 | ||||||
| 439 | Verizon Communications, Inc. | 22,109 | ||||||
|
| |||||||
Total Telecommunication Services | 54,148 | |||||||
|
| |||||||
Utilities — 3.1% | ||||||||
Electric Utilities — 1.8% | ||||||||
| 711 | American Electric Power Co., Inc. | 31,837 | ||||||
| 144 | Pinnacle West Capital Corp. | 8,004 | ||||||
|
| |||||||
| 39,841 | ||||||||
|
| |||||||
Gas Utilities — 0.5% | ||||||||
| 251 | UGI Corp. | 9,817 | ||||||
|
| |||||||
Independent Power Producers & Energy Traders — 0.8% |
| |||||||
| 735 | AES Corp. (m) | 8,813 | ||||||
| 396 | Calpine Corp. (a) | 8,415 | ||||||
|
| |||||||
| 17,228 | ||||||||
|
| |||||||
Total Utilities | 66,886 | |||||||
|
| |||||||
Total Common Stocks (Cost $1,670,861) | 2,133,432 | |||||||
|
| |||||||
SEE NOTES TO FINANCIAL STATEMENTS.
| 18 | J.P. MORGAN INTREPID FUNDS | JUNE 30, 2013 | ||||
Table of Contents
| SHARES | SECURITY DESCRIPTION | VALUE($) | ||||||
| Short-Term Investment — 3.6% | |||||||
Investment Company — 3.6% | ||||||||
| 79,535 | JPMorgan Prime Money Market Fund, Institutional Class Shares, 0.030% (b) (l) (m) | 79,535 | ||||||
|
| |||||||
Total Investments — 100.7% | 2,212,967 | |||||||
Liabilities in Excess of | (15,173 | ) | ||||||
|
| |||||||
NET ASSETS — 100.0% | $ | 2,197,794 | ||||||
|
| |||||||
Percentages indicated are based on net assets.
Futures Contracts
| NUMBER OF CONTRACTS | DESCRIPTION | EXPIRATION DATE | NOTIONAL 06/30/13 | NET UNREALIZED | ||||||||||||
Long Futures Outstanding | ||||||||||||||||
| 813 | E-mini S&P 500 | 09/20/13 | $ | 65,012 | $ | (192 | ) | |||||||||
|
| |||||||||||||||
| JUNE 30, 2013 | J.P. MORGAN INTREPID FUNDS | 19 | ||||||
SEE NOTES TO FINANCIAL STATEMENTS.
Table of Contents
JPMorgan Intrepid Growth Fund
SCHEDULE OF PORTFOLIO INVESTMENTS
AS OF JUNE 30, 2013
(Amounts in thousands)
| SHARES | SECURITY DESCRIPTION | VALUE($) | ||||||
| Common Stocks — 97.8% |
| ||||||
Consumer Discretionary — 17.8% |
| |||||||
Auto Components — 0.5% |
| |||||||
| 68 | Delphi Automotive plc, (United Kingdom) | 3,432 | ||||||
|
| |||||||
Diversified Consumer Services — 0.8% |
| |||||||
| 100 | H&R Block, Inc. | 2,778 | ||||||
| 141 | Service Corp. International | 2,540 | ||||||
|
| |||||||
| 5,318 | ||||||||
|
| |||||||
Hotels, Restaurants & Leisure — 2.3% |
| |||||||
| 55 | Bally Technologies, Inc. (a) | 3,092 | ||||||
| 84 | Brinker International, Inc. | 3,324 | ||||||
| 75 | Dunkin’ Brands Group, Inc. | 3,199 | ||||||
| 72 | Six Flags Entertainment Corp. | 2,524 | ||||||
| 43 | Wyndham Worldwide Corp. | 2,432 | ||||||
| 10 | Wynn Resorts Ltd. | 1,293 | ||||||
|
| |||||||
| 15,864 | ||||||||
|
| |||||||
Household Durables — 1.2% |
| |||||||
| 61 | Jarden Corp. (a) | 2,660 | ||||||
| 132 | PulteGroup, Inc. (a) | 2,511 | ||||||
| 33 | Tempur-Sealy International, Inc. (a) | 1,449 | ||||||
| 17 | Whirlpool Corp. | 1,967 | ||||||
|
| |||||||
| 8,587 | ||||||||
|
| |||||||
Internet & Catalog Retail — 2.0% |
| |||||||
| 44 | Expedia, Inc. | 2,671 | ||||||
| 66 | Liberty Ventures, Series A (a) | 5,628 | ||||||
| 7 | priceline.com, Inc. (a) | 5,872 | ||||||
|
| |||||||
| 14,171 | ||||||||
|
| |||||||
Media — 4.4% |
| |||||||
| 188 | Comcast Corp., Class A | 7,886 | ||||||
| 115 | DIRECTV (a) | 7,092 | ||||||
| 30 | Scripps Networks Interactive, Inc., Class A | 2,009 | ||||||
| 48 | Time Warner Cable, Inc. | 5,422 | ||||||
| 114 | Viacom, Inc., Class B | 7,765 | ||||||
|
| |||||||
| 30,174 | ||||||||
|
| |||||||
Multiline Retail — 1.7% |
| |||||||
| 34 | Dillard’s, Inc., Class A | 2,778 | ||||||
| 184 | Macy’s, Inc. | 8,837 | ||||||
|
| |||||||
| 11,615 | ||||||||
|
| |||||||
Specialty Retail — 4.5% |
| |||||||
| 195 | Gap, Inc. (The) | 8,142 | ||||||
| 259 | Home Depot, Inc. (The) | 20,057 | ||||||
| 54 | TJX Cos., Inc. | 2,708 | ||||||
|
| |||||||
| 30,907 | ||||||||
|
| |||||||
| SHARES | SECURITY DESCRIPTION | VALUE($) | ||||||
Textiles, Apparel & Luxury Goods — 0.4% |
| |||||||
| 57 | Hanesbrands, Inc. | 2,931 | ||||||
|
| |||||||
Total Consumer Discretionary | 122,999 | |||||||
|
| |||||||
Consumer Staples — 12.5% |
| |||||||
Beverages — 3.8% |
| |||||||
| 268 | Coca-Cola Co. (The) | 10,765 | ||||||
| 89 | Coca-Cola Enterprises, Inc. | 3,115 | ||||||
| 55 | Molson Coors Brewing Co., Class B | 2,647 | ||||||
| 123 | PepsiCo, Inc. | 10,044 | ||||||
|
| |||||||
| 26,571 | ||||||||
|
| |||||||
Food & Staples Retailing — 2.8% |
| |||||||
| 101 | CVS Caremark Corp. | 5,752 | ||||||
| 124 | Kroger Co. (The) | 4,279 | ||||||
| 211 | Walgreen Co. | 9,331 | ||||||
|
| |||||||
| 19,362 | ||||||||
|
| |||||||
Food Products — 2.8% |
| |||||||
| 75 | Campbell Soup Co. | 3,346 | ||||||
| 52 | ConAgra Foods, Inc. | 1,806 | ||||||
| 99 | General Mills, Inc. | 4,785 | ||||||
| 38 | Ingredion, Inc. | 2,513 | ||||||
| 28 | JM Smucker Co. (The) | 2,909 | ||||||
| 48 | Mead Johnson Nutrition Co. | 3,803 | ||||||
|
| |||||||
| 19,162 | ||||||||
|
| |||||||
Household Products — 0.9% |
| |||||||
| 58 | Colgate-Palmolive Co. | 3,329 | ||||||
| 28 | Energizer Holdings, Inc. | 2,824 | ||||||
|
| |||||||
| 6,153 | ||||||||
|
| |||||||
Personal Products — 0.4% |
| |||||||
| 49 | Nu Skin Enterprises, Inc., Class A | 3,013 | ||||||
|
| |||||||
Tobacco — 1.8% |
| |||||||
| 352 | Altria Group, Inc. | 12,310 | ||||||
|
| |||||||
Total Consumer Staples | 86,571 | |||||||
|
| |||||||
Energy — 4.5% |
| |||||||
Energy Equipment & Services — 0.6% |
| |||||||
| 40 | Diamond Offshore Drilling, Inc. | 2,738 | ||||||
| 16 | Schlumberger Ltd. | 1,154 | ||||||
|
| |||||||
| 3,892 | ||||||||
|
| |||||||
Oil, Gas & Consumable Fuels — 3.9% |
| |||||||
| 88 | Anadarko Petroleum Corp. | 7,587 | ||||||
| 39 | Chevron Corp. | 4,565 | ||||||
| 58 | ConocoPhillips | 3,497 | ||||||
| 53 | Exxon Mobil Corp. | 4,816 | ||||||
| 14 | Marathon Petroleum Corp. | 995 | ||||||
SEE NOTES TO FINANCIAL STATEMENTS.
| 20 | J.P. MORGAN INTREPID FUNDS | JUNE 30, 2013 | ||||
Table of Contents
| SHARES | SECURITY DESCRIPTION | VALUE($) | ||||||
| Common Stocks — Continued |
| ||||||
Oil, Gas & Consumable Fuels — Continued |
| |||||||
| 71 | Oasis Petroleum, Inc. (a) | 2,771 | ||||||
| 13 | Phillips 66 | 760 | ||||||
| 86 | Western Refining, Inc. | 2,411 | ||||||
|
| |||||||
| 27,402 | ||||||||
|
| |||||||
Total Energy | 31,294 | |||||||
|
| |||||||
Financials — 4.9% |
| |||||||
Capital Markets — 0.3% |
| |||||||
| 60 | American Capital Ltd. (a) | 763 | ||||||
| 39 | Morgan Stanley | 955 | ||||||
|
| |||||||
| 1,718 | ||||||||
|
| |||||||
Consumer Finance — 1.5% |
| |||||||
| 222 | Discover Financial Services | 10,571 | ||||||
|
| |||||||
Insurance — 0.5% |
| |||||||
| 23 | Prudential Financial, Inc. | 1,695 | ||||||
| 7 | RenaissanceRe Holdings Ltd., (Bermuda) | 642 | ||||||
| 29 | Validus Holdings Ltd., (Bermuda) | 1,033 | ||||||
|
| |||||||
| 3,370 | ||||||||
|
| |||||||
Real Estate Investment Trusts (REITs) — 2.2% |
| |||||||
| 138 | American Tower Corp. | 10,126 | ||||||
| 71 | Extra Space Storage, Inc. | 2,956 | ||||||
| 34 | Ventas, Inc. | 2,348 | ||||||
|
| |||||||
| 15,430 | ||||||||
|
| |||||||
Thrifts & Mortgage Finance — 0.4% |
| |||||||
| 71 | Ocwen Financial Corp. (a) | 2,943 | ||||||
|
| |||||||
Total Financials | 34,032 | |||||||
|
| |||||||
Health Care — 12.4% |
| |||||||
Biotechnology — 6.8% |
| |||||||
| 159 | Amgen, Inc. | 15,726 | ||||||
| 334 | Gilead Sciences, Inc. (a) | 17,120 | ||||||
| 34 | Pharmacyclics, Inc. (a) | 2,686 | ||||||
| 149 | Vertex Pharmaceuticals, Inc. (a) | 11,893 | ||||||
|
| |||||||
| 47,425 | ||||||||
|
| |||||||
Health Care Equipment & Supplies — 0.4% |
| |||||||
| 83 | CareFusion Corp. (a) | 3,058 | ||||||
|
| |||||||
Health Care Providers & Services — 1.7% |
| |||||||
| 51 | AmerisourceBergen Corp. | 2,858 | ||||||
| 41 | Centene Corp. (a) | 2,151 | ||||||
| 71 | Express Scripts Holding Co. (a) | 4,374 | ||||||
| 28 | Omnicare, Inc. | 1,312 | ||||||
| 11 | WellPoint, Inc. | 868 | ||||||
|
| |||||||
| 11,563 | ||||||||
|
| |||||||
| SHARES | SECURITY DESCRIPTION | VALUE($) | ||||||
Pharmaceuticals — 3.5% |
| |||||||
| 71 | AbbVie, Inc. (m) | 2,935 | ||||||
| 212 | Eli Lilly & Co. | 10,433 | ||||||
| 384 | Pfizer, Inc. | 10,742 | ||||||
|
| |||||||
| 24,110 | ||||||||
|
| |||||||
Total Health Care | 86,156 | |||||||
|
| |||||||
Industrials — 12.1% |
| |||||||
Aerospace & Defense — 3.4% |
| |||||||
| 192 | Honeywell International, Inc. | 15,225 | ||||||
| 32 | Huntington Ingalls Industries, Inc. | 1,785 | ||||||
| 82 | Northrop Grumman Corp. | 6,806 | ||||||
|
| |||||||
| 23,816 | ||||||||
|
| |||||||
Air Freight & Logistics — 0.9% |
| |||||||
| 70 | United Parcel Service, Inc., Class B | 6,080 | ||||||
|
| |||||||
Airlines — 0.8% |
| |||||||
| 198 | Delta Air Lines, Inc. (a) | 3,695 | ||||||
| 73 | United Continental Holdings, Inc. (a) | 2,291 | ||||||
|
| |||||||
| 5,986 | ||||||||
|
| |||||||
Commercial Services & Supplies — 0.6% |
| |||||||
| 197 | Pitney Bowes, Inc. | 2,896 | ||||||
| 86 | R.R. Donnelley & Sons Co. | 1,204 | ||||||
|
| |||||||
| 4,100 | ||||||||
|
| |||||||
Construction & Engineering — 0.8% |
| |||||||
| 82 | AECOM Technology Corp. (a) | 2,594 | ||||||
| 47 | Chicago Bridge & Iron Co. N.V., (Netherlands) | 2,780 | ||||||
|
| |||||||
| 5,374 | ||||||||
|
| |||||||
Industrial Conglomerates — 0.8% |
| |||||||
| 86 | Danaher Corp. | 5,444 | ||||||
|
| |||||||
Machinery — 3.8% |
| |||||||
| 221 | Ingersoll-Rand plc, (Ireland) | 12,242 | ||||||
| 19 | Middleby Corp. (a) | 3,283 | ||||||
| 46 | Oshkosh Corp. (a) | 1,731 | ||||||
| 42 | Parker Hannifin Corp. | 4,026 | ||||||
| 57 | Pentair Ltd., (Switzerland) | 3,303 | ||||||
| 21 | Stanley Black & Decker, Inc. | 1,639 | ||||||
|
| |||||||
| 26,224 | ||||||||
|
| |||||||
Professional Services — 0.4% |
| |||||||
| 28 | Dun & Bradstreet Corp. (The) | 2,690 | ||||||
|
| |||||||
Road & Rail — 0.6% | ||||||||
| 29 | Union Pacific Corp. | 4,412 | ||||||
|
| |||||||
Total Industrials | 84,126 | |||||||
|
| |||||||
SEE NOTES TO FINANCIAL STATEMENTS.
| JUNE 30, 2013 | J.P. MORGAN INTREPID FUNDS | 21 | ||||||
Table of Contents
JPMorgan Intrepid Growth Fund
SCHEDULE OF PORTFOLIO INVESTMENTS
AS OF JUNE 30, 2013 (continued)
(Amounts in thousands, except number of contracts)
| SHARES | SECURITY DESCRIPTION | VALUE($) | ||||||
| Common Stocks — Continued |
| ||||||
Information Technology — 27.3% |
| |||||||
Communications Equipment — 1.9% |
| |||||||
| 441 | Cisco Systems, Inc. | 10,716 | ||||||
| 37 | QUALCOMM, Inc. | 2,266 | ||||||
|
| |||||||
| 12,982 | ||||||||
|
| |||||||
Computers & Peripherals — 3.7% |
| |||||||
| 12 | Apple, Inc. | 4,614 | ||||||
| 154 | Hewlett-Packard Co. | 3,822 | ||||||
| 73 | NetApp, Inc. (a) | 2,743 | ||||||
| 260 | Seagate Technology plc, (Ireland) | 11,660 | ||||||
| 47 | Western Digital Corp. | 2,931 | ||||||
|
| |||||||
| 25,770 | ||||||||
|
| |||||||
Internet Software & Services — 3.5% |
| |||||||
| 70 | AOL, Inc. (a) (m) | 2,543 | ||||||
| 14 | Google, Inc., Class A (a) | 12,501 | ||||||
| 372 | Yahoo!, Inc. (a) | 9,346 | ||||||
|
| |||||||
| 24,390 | ||||||||
|
| |||||||
IT Services — 5.0% |
| |||||||
| 18 | Alliance Data Systems Corp. (a) | 3,213 | ||||||
| 62 | Computer Sciences Corp. | 2,692 | ||||||
| 102 | CoreLogic, Inc. (a) | 2,371 | ||||||
| 44 | International Business Machines Corp. | 8,361 | ||||||
| 62 | NeuStar, Inc., Class A (a) | 3,023 | ||||||
| 81 | Visa, Inc., Class A | 14,766 | ||||||
|
| |||||||
| 34,426 | ||||||||
|
| |||||||
Semiconductors & Semiconductor Equipment — 3.2% |
| |||||||
| 157 | Applied Materials, Inc. | 2,347 | ||||||
| 147 | Avago Technologies Ltd., (Singapore) | 5,506 | ||||||
| 61 | Broadcom Corp., Class A | 2,070 | ||||||
| 41 | Freescale Semiconductor Ltd. (a) | 554 | ||||||
| 145 | Lam Research Corp. (a) | 6,438 | ||||||
| 133 | ON Semiconductor Corp. (a) | 1,072 | ||||||
| 109 | Xilinx, Inc. | 4,325 | ||||||
|
| |||||||
| 22,312 | ||||||||
|
| |||||||
Software — 10.0% |
| |||||||
| 77 | Adobe Systems, Inc. (a) (m) | 3,499 | ||||||
| 93 | Aspen Technology, Inc. (a) | 2,683 | ||||||
| 958 | Microsoft Corp. | 33,068 | ||||||
| 598 | Oracle Corp. | 18,355 | ||||||
| 113 | Rovi Corp. (a) | 2,590 | ||||||
| 422 | Symantec Corp. | 9,480 | ||||||
|
| |||||||
| 69,675 | ||||||||
|
| |||||||
Total Information Technology | 189,555 | |||||||
|
| |||||||
| SHARES | SECURITY DESCRIPTION | VALUE($) | ||||||
Materials — 4.0% |
| |||||||
Chemicals — 3.6% |
| |||||||
| 17 | CF Industries Holdings, Inc. | 2,933 | ||||||
| 117 | LyondellBasell Industries N.V., (Netherlands), Class A | 7,779 | ||||||
| 74 | Monsanto Co. | 7,341 | ||||||
| 48 | PPG Industries, Inc. | 7,010 | ||||||
|
| |||||||
| 25,063 | ||||||||
|
| |||||||
Containers & Packaging — 0.4% |
| |||||||
| 61 | Silgan Holdings, Inc. | 2,874 | ||||||
|
| |||||||
Total Materials | 27,937 | |||||||
|
| |||||||
Telecommunication Services — 1.9% | ||||||||
Diversified Telecommunication Services — 1.9% |
| |||||||
| 270 | AT&T, Inc. (m) | 9,548 | ||||||
| 100 | CenturyLink, Inc. | 3,550 | ||||||
|
| |||||||
Total Telecommunication Services | 13,098 | |||||||
|
| |||||||
Utilities — 0.4% |
| |||||||
Gas Utilities — 0.4% | ||||||||
| 75 | UGI Corp. | 2,945 | ||||||
|
| |||||||
Total Common Stocks | 678,713 | |||||||
|
| |||||||
| Short-Term Investment — 2.5% |
| ||||||
Investment Company — 2.5% |
| |||||||
| 17,525 | JPMorgan Prime Money Market Fund, Institutional Class Shares, | 17,525 | ||||||
|
| |||||||
Total Investments — 100.3% | 696,238 | |||||||
Liabilities in Excess of | (2,374 | ) | ||||||
|
| |||||||
NET ASSETS — 100.0% | $ | 693,864 | ||||||
|
| |||||||
Percentages indicated are based on net assets.
SEE NOTES TO FINANCIAL STATEMENTS.
| 22 | J.P. MORGAN INTREPID FUNDS | JUNE 30, 2013 | ||||
Table of Contents
Futures Contracts | ||||||||||||||||
| NUMBER OF CONTRACTS | DESCRIPTION | EXPIRATION DATE | NOTIONAL VALUE AT 06/30/13 | NET UNREALIZED APPRECIATION (DEPRECIATION) | ||||||||||||
Long Futures Outstanding | ||||||||||||||||
| 232 | E-mini S&P 500 | 09/20/2013 | $ | 18,552 | $ | 211 | ||||||||||
|
| |||||||||||||||
SEE NOTES TO FINANCIAL STATEMENTS.
| JUNE 30, 2013 | J.P. MORGAN INTREPID FUNDS | 23 | ||||||
Table of Contents
JPMorgan Intrepid Mid Cap Fund
SCHEDULE OF PORTFOLIO INVESTMENTS
AS OF JUNE 30, 2013
(Amounts in thousands)
| SHARES | SECURITY DESCRIPTION | VALUE($) | ||||||
| Common Stocks — 98.8% | |||||||
Consumer Discretionary — 14.1% | ||||||||
Auto Components — 0.5% | ||||||||
| 37 | Delphi Automotive plc, (United Kingdom) | 1,850 | ||||||
| 14 | TRW Automotive Holdings Corp. (a) | 904 | ||||||
|
| |||||||
| 2,754 | ||||||||
|
| |||||||
Distributors — 0.5% | ||||||||
| 3 | Genuine Parts Co. | 227 | ||||||
| 98 | LKQ Corp. (a) | 2,531 | ||||||
|
| |||||||
| 2,758 | ||||||||
|
| |||||||
Diversified Consumer Services — 0.9% | ||||||||
| 268 | Service Corp. International | 4,834 | ||||||
|
| |||||||
Hotels, Restaurants & Leisure — 1.8% | ||||||||
| 74 | Brinker International, Inc. | 2,934 | ||||||
| 114 | Wyndham Worldwide Corp. | 6,501 | ||||||
|
| |||||||
| 9,435 | ||||||||
|
| |||||||
Household Durables — 2.2% | ||||||||
| 51 | Jarden Corp. (a) | 2,240 | ||||||
| 68 | Leggett & Platt, Inc. | 2,102 | ||||||
| 362 | PulteGroup, Inc. (a) | 6,867 | ||||||
| 4 | Tupperware Brands Corp. | 318 | ||||||
|
| |||||||
| 11,527 | ||||||||
|
| |||||||
Internet & Catalog Retail — 1.8% | ||||||||
| 9 | Expedia, Inc. | 560 | ||||||
| 43 | Groupon, Inc. (a) | 368 | ||||||
| 73 | Liberty Ventures, Series A, (a) | 6,231 | ||||||
| 10 | Netflix, Inc. (a) | 2,005 | ||||||
|
| |||||||
| 9,164 | ||||||||
|
| |||||||
Leisure Equipment & Products — 0.2% | ||||||||
| 17 | Mattel, Inc. | 757 | ||||||
|
| |||||||
Media — 0.3% | ||||||||
| 14 | AMC Networks, Inc., Class A (a) (m) | 903 | ||||||
| 15 | Cinemark Holdings, Inc. | 410 | ||||||
|
| |||||||
| 1,313 | ||||||||
|
| |||||||
Multiline Retail — 2.2% | ||||||||
| 20 | Dillard’s, Inc., Class A | 1,623 | ||||||
| 18 | Dollar Tree, Inc. (a) | 925 | ||||||
| 183 | Macy’s, Inc. | 8,770 | ||||||
|
| |||||||
| 11,318 | ||||||||
|
| |||||||
Specialty Retail — 3.2% | ||||||||
| 6 | CST Brands, Inc. (a) | 194 | ||||||
| 42 | Foot Locker, Inc. | 1,482 | ||||||
| 76 | GameStop Corp., Class A | 3,205 | ||||||
| SHARES | SECURITY DESCRIPTION | VALUE($) | ||||||
Specialty Retail — Continued | ||||||||
| 85 | Gap, Inc. (The) | 3,547 | ||||||
| 24 | O’Reilly Automotive, Inc. (a) | 2,703 | ||||||
| 27 | Ross Stores, Inc. | 1,763 | ||||||
| 39 | TJX Cos., Inc. | 1,937 | ||||||
| 35 | Urban Outfitters, Inc. (a) | 1,404 | ||||||
|
| |||||||
| 16,235 | ||||||||
|
| |||||||
Textiles, Apparel & Luxury Goods — 0.5% | ||||||||
| 6 | Carter’s, Inc. | 422 | ||||||
| 32 | Michael Kors Holdings Ltd., (Hong Kong) (a) | 1,985 | ||||||
|
| |||||||
| 2,407 | ||||||||
|
| |||||||
Total Consumer Discretionary | 72,502 | |||||||
|
| |||||||
Consumer Staples — 6.7% | ||||||||
Beverages — 0.8% | ||||||||
| 79 | Constellation Brands, Inc., Class A (a) | 4,107 | ||||||
|
| |||||||
Food & Staples Retailing — 0.6% | ||||||||
| 93 | Kroger Co. (The) | 3,212 | ||||||
|
| |||||||
Food Products — 3.3% | ||||||||
| 158 | Campbell Soup Co. | 7,086 | ||||||
| 91 | Ingredion, Inc. | 5,952 | ||||||
| 153 | Tyson Foods, Inc., Class A | 3,939 | ||||||
|
| |||||||
| 16,977 | ||||||||
|
| |||||||
Personal Products — 0.2% | ||||||||
| 63 | Coty, Inc., Class A (a) | 1,079 | ||||||
|
| |||||||
Tobacco — 1.8% | ||||||||
| 204 | Lorillard, Inc. | 8,890 | ||||||
|
| |||||||
Total Consumer Staples | 34,265 | |||||||
|
| |||||||
Energy — 6.2% | ||||||||
Energy Equipment & Services — 1.6% | ||||||||
| 8 | Baker Hughes, Inc. | 378 | ||||||
| 14 | Dresser-Rand Group, Inc. (a) | 810 | ||||||
| 17 | National Oilwell Varco, Inc. | 1,151 | ||||||
| 57 | Oil States International, Inc. (a) | 5,276 | ||||||
| 9 | Unit Corp. (a) | 396 | ||||||
|
| |||||||
| 8,011 | ||||||||
|
| |||||||
Oil, Gas & Consumable Fuels — 4.6% | ||||||||
| 22 | Cabot Oil & Gas Corp. | 1,527 | ||||||
| 35 | Cimarex Energy Co. | 2,258 | ||||||
| 10 | Continental Resources, Inc. (a) | 878 | ||||||
| 75 | Energen Corp. | 3,930 | ||||||
| 45 | EQT Corp. | 3,532 | ||||||
| 18 | Marathon Petroleum Corp. | 1,279 | ||||||
| 59 | Murphy Oil Corp. | 3,586 | ||||||
SEE NOTES TO FINANCIAL STATEMENTS.
| 24 | J.P. MORGAN INTREPID FUNDS | JUNE 30, 2013 | ||||
Table of Contents
| SHARES | SECURITY DESCRIPTION | VALUE($) | ||||||
| Common Stocks — Continued |
| ||||||
Oil, Gas & Consumable Fuels— Continued | ||||||||
| 38 | Newfield Exploration Co. (a) | 896 | ||||||
| 36 | Noble Energy, Inc. | 2,156 | ||||||
| 64 | Peabody Energy Corp. | 937 | ||||||
| 34 | Tesoro Corp. | 1,800 | ||||||
| 34 | Valero Energy Corp. | 1,172 | ||||||
|
| |||||||
| 23,951 | ||||||||
|
| |||||||
Total Energy | 31,962 | |||||||
|
| |||||||
Financials — 18.4% | ||||||||
Capital Markets — 1.2% | ||||||||
| 28 | Affiliated Managers Group, Inc. (a) (m) | 4,508 | ||||||
| 138 | American Capital Ltd. (a) | 1,750 | ||||||
|
| |||||||
| 6,258 | ||||||||
|
| |||||||
Commercial Banks — 2.5% | ||||||||
| 12 | BankUnited, Inc. | 307 | ||||||
| 18 | BOK Financial Corp. | 1,146 | ||||||
| 95 | Huntington Bancshares, Inc. | 745 | ||||||
| 202 | KeyCorp | 2,232 | ||||||
| 8 | M&T Bank Corp. | 905 | ||||||
| 122 | Regions Financial Corp. | 1,161 | ||||||
| 30 | Signature Bank (a) | 2,457 | ||||||
| 47 | SVB Financial Group (a) | 3,933 | ||||||
|
| |||||||
| 12,886 | ||||||||
|
| |||||||
Consumer Finance — 1.7% | ||||||||
| 187 | Discover Financial Services | 8,885 | ||||||
|
| |||||||
Diversified Financial Services — 0.3% | ||||||||
| 42 | NASDAQ OMX Group, Inc. (The) | 1,385 | ||||||
|
| |||||||
Insurance — 4.7% | ||||||||
| 25 | Allied World Assurance Co. Holdings AG, (Switzerland) | 2,315 | ||||||
| 70 | American Financial Group, Inc. | 3,419 | ||||||
| 22 | Aon plc, (United Kingdom) | 1,384 | ||||||
| 26 | Arch Capital Group Ltd., (Bermuda) (a) | 1,324 | ||||||
| 24 | Assurant, Inc. | 1,224 | ||||||
| 114 | Assured Guaranty Ltd., (Bermuda) | 2,524 | ||||||
| 16 | Axis Capital Holdings Ltd., (Bermuda) | 742 | ||||||
| 7 | Everest Re Group Ltd., (Bermuda) | 949 | ||||||
| 45 | Hartford Financial Services Group, Inc. | 1,398 | ||||||
| 31 | Lincoln National Corp. | 1,134 | ||||||
| 41 | Principal Financial Group, Inc. | 1,550 | ||||||
| 40 | Protective Life Corp. | 1,536 | ||||||
| 14 | Torchmark Corp. | 915 | ||||||
| SHARES | SECURITY DESCRIPTION | VALUE($) | ||||||
Insurance — Continued | ||||||||
| 96 | Unum Group | 2,814 | ||||||
| 32 | Validus Holdings Ltd., (Bermuda) | 1,152 | ||||||
|
| |||||||
| 24,380 | ||||||||
|
| |||||||
Real Estate Investment Trusts (REITs) — 7.7% | ||||||||
| 15 | American Capital Agency Corp. | 352 | ||||||
| 83 | Annaly Capital Management, Inc. | 1,047 | ||||||
| 76 | Apartment Investment & Management Co., Class A | 2,295 | ||||||
| 3 | AvalonBay Communities, Inc. | 378 | ||||||
| 73 | Brandywine Realty Trust | 992 | ||||||
| 14 | Camden Property Trust | 961 | ||||||
| 24 | Chimera Investment Corp. | 73 | ||||||
| 45 | CommonWealth REIT | 1,037 | ||||||
| 50 | DDR Corp. | 824 | ||||||
| 54 | Digital Realty Trust, Inc. | 3,306 | ||||||
| 43 | Douglas Emmett, Inc. (m) | 1,065 | ||||||
| 282 | Duke Realty Corp. | 4,399 | ||||||
| 20 | Equity Residential | 1,144 | ||||||
| 19 | Extra Space Storage, Inc. | 792 | ||||||
| 41 | Health Care REIT, Inc. | 2,775 | ||||||
| 145 | Hospitality Properties Trust | 3,817 | ||||||
| 97 | Host Hotels & Resorts, Inc. | 1,630 | ||||||
| 25 | Mack-Cali Realty Corp. | 620 | ||||||
| 15 | Mid-America Apartment Communities, Inc. | 996 | ||||||
| 38 | Post Properties, Inc. | 1,886 | ||||||
| 66 | Retail Properties of America, Inc., Class A | 940 | ||||||
| 8 | SL Green Realty Corp. | 679 | ||||||
| 34 | Taubman Centers, Inc. | 2,533 | ||||||
| 37 | Ventas, Inc. | 2,548 | ||||||
| 35 | WP Carey, Inc. | 2,289 | ||||||
|
| |||||||
| 39,378 | ||||||||
|
| |||||||
Real Estate Management & Development — 0.3% |
| |||||||
| 3 | Jones Lang LaSalle, Inc. | 237 | ||||||
| 69 | St. Joe Co. (The) (a) | 1,461 | ||||||
|
| |||||||
| 1,698 | ||||||||
|
| |||||||
Total Financials | 94,870 | |||||||
|
| |||||||
Health Care — 10.7% | ||||||||
Biotechnology — 3.3% | ||||||||
| 36 | Alexion Pharmaceuticals, Inc. (a) | 3,293 | ||||||
| 37 | BioMarin Pharmaceutical, Inc. (a) | 2,042 | ||||||
| 51 | Medivation, Inc. (a) | 2,524 | ||||||
| 23 | Pharmacyclics, Inc. (a) | 1,844 | ||||||
SEE NOTES TO FINANCIAL STATEMENTS.
| JUNE 30, 2013 | J.P. MORGAN INTREPID FUNDS | 25 | ||||||
Table of Contents
JPMorgan Intrepid Mid Cap Fund
SCHEDULE OF PORTFOLIO INVESTMENTS
AS OF JUNE 30, 2013 (continued)
(Amounts in thousands)
| SHARES | SECURITY DESCRIPTION | VALUE($) | ||||||
| Common Stocks — Continued |
| ||||||
Biotechnology — Continued | ||||||||
| 60 | Quintiles Transnational Holdings, Inc. (a) | 2,553 | ||||||
| 62 | Vertex Pharmaceuticals, Inc. (a) | 4,984 | ||||||
|
| |||||||
| 17,240 | ||||||||
|
| |||||||
Health Care Equipment & Supplies — 2.3% | ||||||||
| 204 | Alere, Inc. (a) | 5,001 | ||||||
| 12 | Cooper Cos., Inc. (The) | 1,369 | ||||||
| 95 | Hologic, Inc. (a) | 1,828 | ||||||
| 52 | Zimmer Holdings, Inc. | 3,919 | ||||||
|
| |||||||
| 12,117 | ||||||||
|
| |||||||
Health Care Providers & Services — 3.9% | ||||||||
| 118 | AmerisourceBergen Corp. | 6,571 | ||||||
| 43 | Catamaran Corp. (a) | 2,115 | ||||||
| 75 | Community Health Systems, Inc. | 3,497 | ||||||
| 79 | HCA Holdings, Inc. | 2,860 | ||||||
| 58 | Humana, Inc. | 4,877 | ||||||
|
| |||||||
| 19,920 | ||||||||
|
| |||||||
Life Sciences Tools & Services — 0.7% | ||||||||
| 46 | Life Technologies Corp. (a) | 3,382 | ||||||
|
| |||||||
Pharmaceuticals — 0.5% | ||||||||
| 21 | Perrigo Co. | 2,565 | ||||||
|
| |||||||
Total Health Care | 55,224 | |||||||
|
| |||||||
Industrials — 13.7% | ||||||||
Aerospace & Defense — 1.7% | ||||||||
| 17 | Alliant Techsystems, Inc. | 1,408 | ||||||
| 86 | Huntington Ingalls Industries, Inc. | 4,881 | ||||||
| 28 | L-3 Communications Holdings, Inc. | 2,435 | ||||||
| 3 | Northrop Grumman Corp. | 273 | ||||||
|
| |||||||
| 8,997 | ||||||||
|
| |||||||
Airlines — 0.6% | ||||||||
| 24 | Copa Holdings S.A., (Panama), Class A | 3,173 | ||||||
|
| |||||||
Commercial Services & Supplies — 1.4% | ||||||||
| 291 | KAR Auction Services, Inc. | 6,662 | ||||||
| 43 | R.R. Donnelley & Sons Co. | 600 | ||||||
|
| |||||||
| 7,262 | ||||||||
|
| |||||||
Construction & Engineering — 2.6% | ||||||||
| 194 | AECOM Technology Corp. (a) (m) | 6,180 | ||||||
| 42 | Chicago Bridge & Iron Co. N.V., (Netherlands) | 2,530 | ||||||
| 79 | KBR, Inc. | 2,567 | ||||||
| 45 | URS Corp. | 2,144 | ||||||
|
| |||||||
| 13,421 | ||||||||
|
| |||||||
| SHARES | SECURITY DESCRIPTION | VALUE($) | ||||||
Electrical Equipment — 1.0% | ||||||||
| 30 | Babcock & Wilcox Co. (The) | 901 | ||||||
| 40 | Hubbell, Inc., Class B | 3,980 | ||||||
| 7 | Regal-Beloit Corp. | 467 | ||||||
|
| |||||||
| 5,348 | ||||||||
|
| |||||||
Machinery — 4.5% | ||||||||
| 48 | AGCO Corp. (m) | 2,424 | ||||||
| 10 | Gardner Denver, Inc. | 729 | ||||||
| 80 | Ingersoll-Rand plc, (Ireland) | 4,431 | ||||||
| 31 | Lincoln Electric Holdings, Inc. | 1,758 | ||||||
| 28 | Oshkosh Corp. (a) | 1,075 | ||||||
| 67 | Parker Hannifin Corp. | 6,425 | ||||||
| 73 | Timken Co. | 4,131 | ||||||
| 36 | Toro Co. (The) | 1,617 | ||||||
| 7 | WABCO Holdings, Inc. (a) | 515 | ||||||
|
| |||||||
| 23,105 | ||||||||
|
| |||||||
Marine — 0.3% | ||||||||
| 17 | Kirby Corp. (a) | 1,344 | ||||||
|
| |||||||
Professional Services — 1.0% | ||||||||
| 91 | Manpower, Inc. | 5,003 | ||||||
|
| |||||||
Road & Rail — 0.5% | ||||||||
| 71 | CSX Corp. | 1,645 | ||||||
| 18 | Landstar System, Inc. | 927 | ||||||
|
| |||||||
| 2,572 | ||||||||
|
| |||||||
Trading Companies & Distributors — 0.1% | ||||||||
| 19 | Air Lease Corp. | 519 | ||||||
|
| |||||||
Total Industrials | 70,744 | |||||||
|
| |||||||
Information Technology — 16.3% | ||||||||
Communications Equipment — 0.6% | ||||||||
| 38 | Harris Corp. | 1,864 | ||||||
| 24 | Motorola Solutions, Inc. | 1,397 | ||||||
|
| |||||||
| 3,261 | ||||||||
|
| |||||||
Computers & Peripherals — 1.4% | ||||||||
| 112 | Western Digital Corp. | 6,954 | ||||||
|
| |||||||
Electronic Equipment, Instruments & Components — 1.8% |
| |||||||
| 54 | Arrow Electronics, Inc. (a) | 2,140 | ||||||
| 101 | Avnet, Inc. (a) | 3,407 | ||||||
| 96 | CDW Corp. (a) | 1,790 | ||||||
| 25 | Tech Data Corp. (a) | 1,168 | ||||||
| 60 | Vishay Intertechnology, Inc. (a) | 829 | ||||||
|
| |||||||
| 9,334 | ||||||||
|
| |||||||
SEE NOTES TO FINANCIAL STATEMENTS.
| 26 | J.P. MORGAN INTREPID FUNDS | JUNE 30, 2013 | ||||
Table of Contents
| SHARES | SECURITY DESCRIPTION | VALUE($) | ||||||
| Common Stocks — Continued |
| ||||||
Internet Software & Services — 1.1% | ||||||||
| 31 | LinkedIn Corp., Class A (a) | 5,438 | ||||||
|
| |||||||
IT Services — 4.1% | ||||||||
| 44 | Alliance Data Systems Corp. (a) | 7,956 | ||||||
| 43 | Booz Allen Hamilton Holding Corp. | 744 | ||||||
| 138 | Computer Sciences Corp. | 6,060 | ||||||
| 19 | DST Systems, Inc. | 1,222 | ||||||
| 42 | Fidelity National Information Services, Inc. | 1,803 | ||||||
| 47 | Lender Processing Services, Inc. | 1,520 | ||||||
| 110 | VeriFone Systems, Inc. (a) | 1,841 | ||||||
|
| |||||||
| 21,146 | ||||||||
|
| |||||||
Office Electronics — 0.7% | ||||||||
| 403 | Xerox Corp. | 3,655 | ||||||
|
| |||||||
Semiconductors & Semiconductor Equipment — 2.8% |
| |||||||
| 18 | Analog Devices, Inc. | 811 | ||||||
| 167 | Applied Materials, Inc. | 2,494 | ||||||
| 23 | KLA-Tencor Corp. | 1,276 | ||||||
| 21 | Lam Research Corp. (a) | 918 | ||||||
| 190 | LSI Corp. (a) | 1,357 | ||||||
| 355 | Marvell Technology Group Ltd., (Bermuda) | 4,156 | ||||||
| 149 | NVIDIA Corp. | 2,096 | ||||||
| 86 | Teradyne, Inc. (a) | 1,508 | ||||||
|
| |||||||
| 14,616 | ||||||||
|
| |||||||
Software — 3.8% | ||||||||
| 461 | Activision Blizzard, Inc. (m) | 6,574 | ||||||
| 10 | Autodesk, Inc. (a) | 326 | ||||||
| 209 | CA, Inc. | 5,978 | ||||||
| 28 | Cadence Design Systems, Inc. (a) | 410 | ||||||
| 44 | Rovi Corp. (a) | 998 | ||||||
| 187 | Symantec Corp. | 4,195 | ||||||
| 32 | Synopsys, Inc. (a) | 1,126 | ||||||
|
| |||||||
| 19,607 | ||||||||
|
| |||||||
Total Information Technology | 84,011 | |||||||
|
| |||||||
Materials — 4.7% | ||||||||
Chemicals — 2.3% | ||||||||
| 17 | CF Industries Holdings, Inc. | 2,950 | ||||||
| 33 | Huntsman Corp. | 538 | ||||||
| 41 | PPG Industries, Inc. | 5,996 | ||||||
| 34 | Valspar Corp. (The) | 2,205 | ||||||
|
| |||||||
| 11,689 | ||||||||
|
| |||||||
Containers & Packaging — 0.6% | ||||||||
| 30 | Crown Holdings, Inc. (a) | 1,234 | ||||||
| 7 | Greif, Inc., Class A | 369 | ||||||
| SHARES | SECURITY DESCRIPTION | VALUE($) | ||||||
Containers & Packaging — Continued | ||||||||
| 5 | Rock Tenn Co., Class A | 539 | ||||||
| 48 | Sealed Air Corp. | 1,154 | ||||||
|
| |||||||
| 3,296 | ||||||||
|
| |||||||
Metals & Mining — 0.9% | ||||||||
| 11 | Nucor Corp. | 477 | ||||||
| 56 | Reliance Steel & Aluminum Co. | 3,671 | ||||||
| 48 | Steel Dynamics, Inc. | 714 | ||||||
|
| |||||||
| 4,862 | ||||||||
|
| |||||||
Paper & Forest Products — 0.9% | ||||||||
| 23 | Domtar Corp., (Canada) | 1,550 | ||||||
| 68 | International Paper Co. | 2,995 | ||||||
|
| |||||||
| 4,545 | ||||||||
|
| |||||||
Total Materials | 24,392 | |||||||
|
| |||||||
Telecommunication Services — 1.7% | ||||||||
Diversified Telecommunication Services — 0.9% |
| |||||||
| 1,198 | Frontier Communications Corp. | 4,851 | ||||||
|
| |||||||
Wireless Telecommunication Services — 0.8% |
| |||||||
| 34 | Crown Castle International Corp. (a) | 2,432 | ||||||
| 22 | SBA Communications Corp., Class A (a) | 1,653 | ||||||
|
| |||||||
| 4,085 | ||||||||
|
| |||||||
Total Telecommunication Services | 8,936 | |||||||
|
| |||||||
Utilities — 6.3% | ||||||||
Electric Utilities — 0.2% | ||||||||
| 32 | NV Energy, Inc. | 760 | ||||||
| 7 | Pinnacle West Capital Corp. | 399 | ||||||
|
| |||||||
| 1,159 | ||||||||
|
| |||||||
Gas Utilities — 0.6% | ||||||||
| 75 | UGI Corp. | 2,937 | ||||||
|
| |||||||
Independent Power Producers & Energy Traders — 0.8% |
| |||||||
| 363 | AES Corp. (m) | 4,351 | ||||||
|
| |||||||
Multi-Utilities — 4.7% | ||||||||
| 36 | Alliant Energy Corp. | 1,813 | ||||||
| 51 | Ameren Corp. | 1,756 | ||||||
| 156 | CenterPoint Energy, Inc. | 3,655 | ||||||
| 68 | CMS Energy Corp. | 1,850 | ||||||
| 33 | Consolidated Edison, Inc. | 1,948 | ||||||
| 58 | DTE Energy Co. | 3,866 | ||||||
| 45 | MDU Resources Group, Inc. | 1,156 | ||||||
| 44 | SCANA Corp. | 2,146 | ||||||
SEE NOTES TO FINANCIAL STATEMENTS.
| JUNE 30, 2013 | J.P. MORGAN INTREPID FUNDS | 27 | ||||||
Table of Contents
JPMorgan Intrepid Mid Cap Fund
SCHEDULE OF PORTFOLIO INVESTMENTS
AS OF JUNE 30, 2013 (continued)
(Amounts in thousands, except number of contracts)
| SHARES | SECURITY DESCRIPTION | VALUE($) | ||||||
| Common Stocks — Continued |
| ||||||
Multi-Utilities — Continued | ||||||||
| 53 | Sempra Energy | 4,358 | ||||||
| 96 | TECO Energy, Inc. | 1,644 | ||||||
|
| |||||||
| 24,192 | ||||||||
|
| |||||||
Total Utilities | 32,639 | |||||||
|
| |||||||
Total Common Stocks | 509,545 | |||||||
|
| |||||||
| PRINCIPAL AMOUNT($) | ||||||||
| U.S. Treasury Obligation — 0.1% | |||||||
| 810 | U.S. Treasury Notes, 0.250%, 11/30/13 (k) (Cost $810) | 810 | ||||||
| SHARES | SECURITY DESCRIPTION | VALUE($) | ||||||
| Short-Term Investment — 0.9% | |||||||
Investment Company — 0.9% | ||||||||
| 4,512 | JPMorgan Liquid Assets Money Market Fund, Institutional Class Shares, | 4,512 | ||||||
|
| |||||||
Total Investments — 99.8% | 514,867 | |||||||
Other Assets in Excess of | 896 | |||||||
|
| |||||||
NET ASSETS — 100.0% | $ | 515,763 | ||||||
|
| |||||||
Percentages indicated are based on net assets.
| Futures Contracts | ||||||||||||||||
| NUMBER OF CONTRACTS | DESCRIPTION | EXPIRATION | NOTIONAL 06/30/13 | NET UNREALIZED | ||||||||||||
Long Futures Outstanding | ||||||||||||||||
| 53 | S&P Mid Cap 400 | 09/20/2013 | $ | 6,137 | $ | 31 | ||||||||||
|
| |||||||||||||||
SEE NOTES TO FINANCIAL STATEMENTS.
| 28 | J.P. MORGAN INTREPID FUNDS | JUNE 30, 2013 | ||||
Table of Contents
JPMorgan Intrepid Value Fund
SCHEDULE OF PORTFOLIO INVESTMENTS
AS OF JUNE 30, 2013
(Amounts in thousands)
| SHARES | SECURITY DESCRIPTION | VALUE($) | ||||||
| Common Stocks — 97.0% |
| ||||||
Consumer Discretionary — 7.8% | ||||||||
Auto Components — 0.4% | ||||||||
| 56 | Delphi Automotive plc, (United Kingdom) | 2,823 | ||||||
| 70 | Goodyear Tire & Rubber Co. (The) (a) | 1,066 | ||||||
|
| |||||||
| 3,889 | ||||||||
|
| |||||||
Automobiles — 1.4% | ||||||||
| 973 | Ford Motor Co. | 15,052 | ||||||
|
| |||||||
Diversified Consumer Services — 0.3% | ||||||||
| 121 | H&R Block, Inc. | 3,344 | ||||||
|
| |||||||
Household Durables — 1.1% | ||||||||
| 105 | Jarden Corp. (a) | 4,614 | ||||||
| 176 | PulteGroup, Inc. (a) | 3,333 | ||||||
| 39 | Whirlpool Corp. | 4,460 | ||||||
|
| |||||||
| 12,407 | ||||||||
|
| |||||||
Media — 3.1% | ||||||||
| 232 | CBS Corp. (Non-Voting), Class B | 11,338 | ||||||
| 196 | Gannett Co., Inc. | 4,793 | ||||||
| 67 | Time Warner Cable, Inc. | 7,514 | ||||||
| 20 | Time Warner, Inc. | 1,150 | ||||||
| 145 | Viacom, Inc., Class B | 9,833 | ||||||
|
| |||||||
| 34,628 | ||||||||
|
| |||||||
Multiline Retail — 0.4% | ||||||||
| 51 | Dillard’s, Inc., Class A | 4,172 | ||||||
|
| |||||||
Specialty Retail — 1.1% | ||||||||
| 124 | GameStop Corp., Class A | 5,216 | ||||||
| 171 | Gap, Inc. (The) | 7,136 | ||||||
|
| |||||||
| 12,352 | ||||||||
|
| |||||||
Total Consumer Discretionary | 85,844 | |||||||
|
| |||||||
Consumer Staples — 6.3% | ||||||||
Beverages — 0.4% | ||||||||
| 88 | Molson Coors Brewing Co., Class B | 4,188 | ||||||
|
| |||||||
Food & Staples Retailing — 1.8% | ||||||||
| 255 | CVS Caremark Corp. | 14,558 | ||||||
| 164 | Kroger Co. (The) | 5,654 | ||||||
|
| |||||||
| 20,212 | ||||||||
|
| |||||||
Food Products — 1.7% | ||||||||
| 415 | Archer-Daniels-Midland Co. | 14,066 | ||||||
| 30 | Ingredion, Inc. | 1,975 | ||||||
| 113 | Tyson Foods, Inc., Class A | 2,910 | ||||||
|
| |||||||
| 18,951 | ||||||||
|
| |||||||
| SHARES | SECURITY DESCRIPTION | VALUE($) | ||||||
Household Products — 1.5% | ||||||||
| 53 | Energizer Holdings, Inc. | 5,277 | ||||||
| 35 | Kimberly-Clark Corp. | 3,361 | ||||||
| 94 | Procter & Gamble Co. (The) | 7,229 | ||||||
|
| |||||||
| 15,867 | ||||||||
|
| |||||||
Personal Products — 0.9% | ||||||||
| 108 | Herbalife Ltd., (Cayman Islands) | 4,870 | ||||||
| 88 | Nu Skin Enterprises, Inc., Class A | 5,397 | ||||||
|
| |||||||
| 10,267 | ||||||||
|
| |||||||
Total Consumer Staples | 69,485 | |||||||
|
| |||||||
Energy — 14.3% | ||||||||
Energy Equipment & Services — 0.2% | ||||||||
| 25 | Schlumberger Ltd. | 1,820 | ||||||
|
| |||||||
Oil, Gas & Consumable Fuels — 14.1% | ||||||||
| 298 | Chevron Corp. | 35,260 | ||||||
| 412 | ConocoPhillips | 24,908 | ||||||
| 629 | Exxon Mobil Corp. | 56,821 | ||||||
| 560 | Marathon Oil Corp. | 19,368 | ||||||
| 80 | Marathon Petroleum Corp. | 5,649 | ||||||
| 126 | Phillips 66 | 7,444 | ||||||
| 52 | Tesoro Corp. | 2,731 | ||||||
| 117 | Western Refining, Inc. | 3,276 | ||||||
|
| |||||||
| 155,457 | ||||||||
|
| |||||||
Total Energy | 157,277 | |||||||
|
| |||||||
Financials — 27.1% | ||||||||
Capital Markets — 3.4% | ||||||||
| 334 | American Capital Ltd. (a) | 4,229 | ||||||
| 179 | Ameriprise Financial, Inc. | 14,461 | ||||||
| 108 | Goldman Sachs Group, Inc. (The) | 16,328 | ||||||
| 107 | Morgan Stanley | 2,609 | ||||||
|
| |||||||
| 37,627 | ||||||||
|
| |||||||
Commercial Banks — 5.2% | ||||||||
| 172 | BB&T Corp. | 5,838 | ||||||
| 393 | CapitalSource, Inc. | 3,682 | ||||||
| 321 | Fifth Third Bancorp | 5,799 | ||||||
| 32 | PNC Financial Services Group, Inc. | 2,332 | ||||||
| 951 | Wells Fargo & Co. | 39,266 | ||||||
|
| |||||||
| 56,917 | ||||||||
|
| |||||||
Consumer Finance — 1.8% | ||||||||
| 411 | Discover Financial Services | 19,575 | ||||||
|
| |||||||
SEE NOTES TO FINANCIAL STATEMENTS.
| JUNE 30, 2013 | J.P. MORGAN INTREPID FUNDS | 29 | ||||||
Table of Contents
JPMorgan Intrepid Value Fund
SCHEDULE OF PORTFOLIO INVESTMENTS
AS OF JUNE 30, 2013 (continued)
(Amounts in thousands)
| SHARES | SECURITY DESCRIPTION | VALUE($) | ||||||
| Common Stocks — Continued |
| ||||||
Diversified Financial Services — 5.3% | ||||||||
| 2,025 | Bank of America Corp. | 26,047 | ||||||
| 680 | Citigroup, Inc. | 32,605 | ||||||
|
| |||||||
| 58,652 | ||||||||
|
| |||||||
Insurance — 7.1% | ||||||||
| 54 | Allied World Assurance Co. Holdings AG, (Switzerland) | 4,964 | ||||||
| 415 | Allstate Corp. (The) | 19,951 | ||||||
| 93 | Chubb Corp. (The) | 7,864 | ||||||
| 124 | Lincoln National Corp. | 4,508 | ||||||
| 48 | PartnerRe Ltd., (Bermuda) | 4,383 | ||||||
| 230 | Prudential Financial, Inc. | 16,812 | ||||||
| 49 | RenaissanceRe Holdings Ltd., (Bermuda) | 4,235 | ||||||
| 75 | Torchmark Corp. | 4,859 | ||||||
| 131 | Travelers Cos., Inc. (The) | 10,485 | ||||||
|
| |||||||
| 78,061 | ||||||||
|
| |||||||
Real Estate Investment Trusts (REITs) — 3.9% |
| |||||||
| 205 | Annaly Capital Management, Inc. | 2,574 | ||||||
| 326 | Brandywine Realty Trust | 4,404 | ||||||
| 194 | CBL & Associates Properties, Inc. | 4,160 | ||||||
| 131 | Douglas Emmett, Inc. (m) | 3,261 | ||||||
| 81 | EPR Properties | 4,092 | ||||||
| 121 | Extra Space Storage, Inc. | 5,090 | ||||||
| 165 | Hospitality Properties Trust | 4,344 | ||||||
| 214 | Piedmont Office Realty Trust, Inc., Class A | 3,832 | ||||||
| 62 | Realty Income Corp. | 2,582 | ||||||
| 120 | Ventas, Inc. | 8,314 | ||||||
|
| |||||||
| 42,653 | ||||||||
|
| |||||||
Thrifts & Mortgage Finance — 0.4% | ||||||||
| 106 | Ocwen Financial Corp. (a) | 4,386 | ||||||
|
| |||||||
Total Financials | 297,871 | |||||||
|
| |||||||
Health Care — 11.8% | ||||||||
Biotechnology — 1.4% | ||||||||
| 159 | Amgen, Inc. | 15,687 | ||||||
|
| |||||||
Health Care Equipment & Supplies — 1.4% | ||||||||
| 64 | CareFusion Corp. (a) | 2,373 | ||||||
| 251 | Medtronic, Inc. | 12,924 | ||||||
|
| |||||||
| 15,297 | ||||||||
|
| |||||||
Health Care Providers & Services — 4.5% | ||||||||
| 259 | Aetna, Inc. | 16,451 | ||||||
| 79 | AmerisourceBergen Corp. | 4,427 | ||||||
| 97 | Community Health Systems, Inc. | 4,529 | ||||||
| SHARES | SECURITY DESCRIPTION | VALUE($) | ||||||
Health Care Providers & Services — Continued |
| |||||||
| 96 | Omnicare, Inc. | 4,561 | ||||||
| 241 | WellPoint, Inc. | 19,699 | ||||||
|
| |||||||
| 49,667 | ||||||||
|
| |||||||
Pharmaceuticals — 4.5% | ||||||||
| 113 | Endo Health Solutions, Inc. (a) | 4,164 | ||||||
| 144 | Mylan, Inc. (a) | 4,478 | ||||||
| 1,446 | Pfizer, Inc. | 40,492 | ||||||
|
| |||||||
| 49,134 | ||||||||
|
| |||||||
Total Health Care | 129,785 | |||||||
|
| |||||||
Industrials — 8.7% | ||||||||
Aerospace & Defense — 1.8% | ||||||||
| 193 | General Dynamics Corp. | 15,126 | ||||||
| 57 | Northrop Grumman Corp. | 4,744 | ||||||
|
| |||||||
| 19,870 | ||||||||
|
| |||||||
Airlines — 0.5% | ||||||||
| 62 | Alaska Air Group, Inc. (a) | 3,203 | ||||||
| 78 | Delta Air Lines, Inc. (a) | 1,450 | ||||||
| 38 | United Continental Holdings, Inc. (a) | 1,174 | ||||||
|
| |||||||
| 5,827 | ||||||||
|
| |||||||
Commercial Services & Supplies — 0.8% | ||||||||
| 99 | Avery Dennison Corp. | 4,212 | ||||||
| 271 | Pitney Bowes, Inc. | 3,975 | ||||||
|
| |||||||
| 8,187 | ||||||||
|
| |||||||
Construction & Engineering — 0.4% | ||||||||
| 137 | AECOM Technology Corp. (a) | 4,352 | ||||||
|
| |||||||
Industrial Conglomerates — 0.5% | ||||||||
| 213 | General Electric Co. | 4,932 | ||||||
|
| |||||||
Machinery — 4.5% | ||||||||
| 60 | Crane Co. | 3,611 | ||||||
| 156 | Illinois Tool Works, Inc. | 10,763 | ||||||
| 293 | Ingersoll-Rand plc, (Ireland) | 16,251 | ||||||
| 114 | Oshkosh Corp. (a) | 4,344 | ||||||
| 65 | Parker Hannifin Corp. | 6,163 | ||||||
| 58 | Stanley Black & Decker, Inc. | 4,445 | ||||||
| 157 | Terex Corp. (a) | 4,118 | ||||||
|
| |||||||
| 49,695 | ||||||||
|
| |||||||
Road & Rail — 0.2% | ||||||||
| 17 | Union Pacific Corp. | 2,607 | ||||||
|
| |||||||
Total Industrials | 95,470 | |||||||
|
| |||||||
SEE NOTES TO FINANCIAL STATEMENTS.
| 30 | J.P. MORGAN INTREPID FUNDS | JUNE 30, 2013 | ||||
Table of Contents
| SHARES | SECURITY DESCRIPTION | VALUE($) | ||||||
| Common Stocks — Continued |
| ||||||
Information Technology — 9.3% | ||||||||
Communications Equipment — 2.9% | ||||||||
| 1,319 | Cisco Systems, Inc. | 32,065 | ||||||
|
| |||||||
Computers & Peripherals — 2.0% | ||||||||
| 588 | Hewlett-Packard Co. | 14,570 | ||||||
| 111 | Western Digital Corp. | 6,861 | ||||||
|
| |||||||
| 21,431 | ||||||||
|
| |||||||
Internet Software & Services — 0.4% | ||||||||
| 110 | AOL, Inc. (a) | 4,013 | ||||||
|
| |||||||
IT Services — 0.8% | ||||||||
| 14 | Amdocs Ltd. | 527 | ||||||
| 97 | Computer Sciences Corp. | 4,254 | ||||||
| 155 | CoreLogic, Inc. (a) | 3,598 | ||||||
|
| |||||||
| 8,379 | ||||||||
|
| |||||||
Semiconductors & Semiconductor Equipment — 2.9% |
| |||||||
| 260 | Applied Materials, Inc. | 3,871 | ||||||
| 142 | Avago Technologies Ltd., (Singapore) | 5,289 | ||||||
| 76 | Broadcom Corp., Class A | 2,549 | ||||||
| 72 | Freescale Semiconductor Ltd. (a) | 980 | ||||||
| 114 | Intel Corp. | 2,761 | ||||||
| 215 | Lam Research Corp. (a) | 9,546 | ||||||
| 244 | ON Semiconductor Corp. (a) | 1,971 | ||||||
| 122 | Xilinx, Inc. | 4,848 | ||||||
|
| |||||||
| 31,815 | ||||||||
|
| |||||||
Software — 0.3% | ||||||||
| 167 | Rovi Corp. (a) | 3,807 | ||||||
|
| |||||||
Total Information Technology | 101,510 | |||||||
|
| |||||||
Materials — 3.2% | ||||||||
Chemicals — 1.7% | ||||||||
| 262 | LyondellBasell Industries N.V., (Netherlands), Class A | 17,360 | ||||||
| 9 | PPG Industries, Inc. | 1,347 | ||||||
|
| |||||||
| 18,707 | ||||||||
|
| |||||||
Paper & Forest Products — 1.5% | ||||||||
| 38 | Domtar Corp., (Canada) | 2,554 | ||||||
| 239 | International Paper Co. | 10,577 | ||||||
| 223 | Louisiana-Pacific Corp. (a) | 3,301 | ||||||
|
| |||||||
| 16,432 | ||||||||
|
| |||||||
Total Materials | 35,139 | |||||||
|
| |||||||
| SHARES | SECURITY DESCRIPTION | VALUE($) | ||||||
Telecommunication Services — 2.7% | ||||||||
Diversified Telecommunication Services — 2.7% |
| |||||||
| 695 | AT&T, Inc. | 24,596 | ||||||
| 121 | CenturyLink, Inc. | 4,275 | ||||||
|
| |||||||
Total Telecommunication Services | 28,871 | |||||||
|
| |||||||
Utilities — 5.8% | ||||||||
Electric Utilities — 3.5% | ||||||||
| 382 | American Electric Power Co., Inc. | 17,115 | ||||||
| 80 | Cleco Corp. | 3,714 | ||||||
| 62 | Edison International | 2,996 | ||||||
| 143 | NextEra Energy, Inc. | 11,644 | ||||||
| 49 | Pinnacle West Capital Corp. | 2,690 | ||||||
|
| |||||||
| 38,159 | ||||||||
|
| |||||||
Gas Utilities — 0.4% | ||||||||
| 118 | UGI Corp. | 4,595 | ||||||
|
| |||||||
Independent Power Producers & Energy Traders — 0.4% |
| |||||||
| 399 | AES Corp. (m) | 4,787 | ||||||
|
| |||||||
Multi-Utilities — 1.5% | ||||||||
| 198 | CenterPoint Energy, Inc. | 4,661 | ||||||
| 61 | Consolidated Edison, Inc. | 3,551 | ||||||
| 100 | Sempra Energy | 8,143 | ||||||
|
| |||||||
| 16,355 | ||||||||
|
| |||||||
Total Utilities | 63,896 | |||||||
|
| |||||||
Total Common Stocks | 1,065,148 | |||||||
|
| |||||||
| Short-Term Investment — 3.4% |
| ||||||
Investment Company — 3.4% | ||||||||
| 36,995 | JPMorgan Prime Money Market Fund, Institutional Class Shares, 0.030% (b) (l) (m) | 36,995 | ||||||
|
| |||||||
Total Investments — 100.4% | 1,102,143 | |||||||
Liabilities in Excess of | (4,023 | ) | ||||||
|
| |||||||
NET ASSETS — 100.0% | $ | 1,098,120 | ||||||
|
| |||||||
Percentages indicated are based on net assets.
SEE NOTES TO FINANCIAL STATEMENTS.
| JUNE 30, 2013 | J.P. MORGAN INTREPID FUNDS | 31 | ||||||
Table of Contents
JPMorgan Intrepid Value Fund
SCHEDULE OF PORTFOLIO INVESTMENTS
AS OF JUNE 30, 2013 (continued)
(Amounts in thousands, except number of contracts)
| Futures Contracts | ||||||||||||||||
| NUMBER OF CONTRACTS | DESCRIPTION | EXPIRATION DATE | NOTIONAL VALUE AT 06/30/13 | NET UNREALIZED APPRECIATION (DEPRECIATION) | ||||||||||||
Long Futures Outstanding | ||||||||||||||||
| 397 | E-mini S&P 500 | 09/20/2013 | $ | 31,746 | $ | (25 | ) | |||||||||
|
| |||||||||||||||
SEE NOTES TO FINANCIAL STATEMENTS.
| 32 | J.P. MORGAN INTREPID FUNDS | JUNE 30, 2013 | ||||
Table of Contents
JPMorgan Intrepid Funds
NOTES TO SCHEDULES OF PORTFOLIO INVESTMENTS
AS OF JUNE 30, 2013
| (a) | — Non-income producing security. | |
| (b) | — Investment in affiliate. Money market fund registered under the Investment Company Act of 1940, as amended, and advised by J.P. Morgan Investment Management Inc. | |
| (h) | — Amount rounds to less than one thousand (shares or dollars). | |
| (k) | — All or a portion of this security is deposited with the broker as collateral for futures or with brokers as initial margin for futures contracts. |
| (l) | — The rate shown is the current yield as of June 30, 2013. | |
| (m) | — All or a portion of this security is reserved and/or pledged with the custodian for current or potential holdings of futures, swaps, options, TBAs, when-issued securities, delayed delivery securities, reverse repurchase agreements, unfunded commitments and/or forward foreign currency exchange contracts. |
SEE NOTES TO FINANCIAL STATEMENTS.
| JUNE 30, 2013 | J.P. MORGAN INTREPID FUNDS | 33 | ||||||
Table of Contents
STATEMENTS OF ASSETS AND LIABILITIES
AS OF JUNE 30, 2013
(Amounts in thousands, except per share amounts)
| Intrepid Advantage Fund | Intrepid America Fund | Intrepid Growth Fund | ||||||||||
ASSETS: |
| |||||||||||
Investments in non-affiliates, at value | $ | 12,539 | $ | 2,133,432 | $ | 678,713 | ||||||
Investments in affiliates, at value | 64 | 79,535 | 17,525 | |||||||||
|
|
|
|
|
| |||||||
Total investment securities, at value | 12,603 | 2,212,967 | 696,238 | |||||||||
Deposits at broker for futures contracts | — | 3,700 | 1,115 | |||||||||
Receivables: | ||||||||||||
Investment securities sold | 370 | 96,776 | 45,738 | |||||||||
Fund shares sold | — | (a) | 553 | 306 | ||||||||
Interest and dividends from non-affiliates | 9 | 1,422 | 478 | |||||||||
Dividends from affiliates | — | (a) | 2 | — | (a) | |||||||
|
|
|
|
|
| |||||||
Total Assets | 12,982 | 2,315,420 | 743,875 | |||||||||
|
|
|
|
|
| |||||||
LIABILITIES: | ||||||||||||
Payables: | ||||||||||||
Investment securities purchased | 364 | 100,705 | 32,210 | |||||||||
Fund shares redeemed | — | (a) | 14,707 | 17,042 | ||||||||
Variation margin on futures contracts | — | 373 | 84 | |||||||||
Accrued liabilities: | ||||||||||||
Investment advisory fees | — | 1,183 | 383 | |||||||||
Administration fees | — | 154 | 50 | |||||||||
Shareholder servicing fees | — | 325 | 121 | |||||||||
Distribution fees | 3 | 23 | 17 | |||||||||
Custodian and accounting fees | 7 | 22 | 11 | |||||||||
Trustees’ and Chief Compliance Officer’s fees | — | (a) | 3 | — | (a) | |||||||
Audit Fees | 25 | 25 | 25 | |||||||||
Other | 8 | 106 | 68 | |||||||||
|
|
|
|
|
| |||||||
Total Liabilities | 407 | 117,626 | 50,011 | |||||||||
|
|
|
|
|
| |||||||
Net Assets | $ | 12,575 | $ | 2,197,794 | $ | 693,864 | ||||||
|
|
|
|
|
| |||||||
| (a) | Amount rounds to less than $1,000. |
SEE NOTES TO FINANCIAL STATEMENTS.
| 34 | J.P. MORGAN INTREPID FUNDS | JUNE 30, 2013 | ||||
Table of Contents
| Intrepid Advantage Fund | Intrepid Fund | Intrepid Fund | ||||||||||
NET ASSETS: |
| |||||||||||
Paid-in-Capital | $ | 14,481 | $ | 1,976,240 | $ | 905,685 | ||||||
Accumulated undistributed (distributions in excess of) net investment income | 38 | 12,131 | 2,380 | |||||||||
Accumulated net realized gains (losses) | (4,403 | ) | (252,956 | ) | (358,035 | ) | ||||||
Net unrealized appreciation/depreciation | 2,459 | 462,379 | 143,834 | |||||||||
|
|
|
|
|
| |||||||
Total Net Assets | $ | 12,575 | $ | 2,197,794 | $ | 693,864 | ||||||
|
|
|
|
|
| |||||||
Net Assets: | ||||||||||||
Class A | $ | 8,765 | $ | 87,954 | $ | 33,582 | ||||||
Class C | 2,294 | 7,336 | 15,462 | |||||||||
Class R2 | — | 170 | 603 | |||||||||
Class R5 | — | 710,586 | 105,839 | |||||||||
Select Class | 1,516 | 1,391,748 | 538,378 | |||||||||
|
|
|
|
|
| |||||||
Total | $ | 12,575 | $ | 2,197,794 | $ | 693,864 | ||||||
|
|
|
|
|
| |||||||
Outstanding units of beneficial interest (shares) | ||||||||||||
($0.0001 par value; unlimited number of shares authorized): | ||||||||||||
Class A | 343 | 2,956 | 1,144 | |||||||||
Class C | 92 | 248 | 534 | |||||||||
Class R2 | — | 6 | 21 | |||||||||
Class R5 | — | 23,734 | 3,599 | |||||||||
Select Class | 59 | 46,398 | 18,236 | |||||||||
Net Asset Value (a): | ||||||||||||
Class A — Redemption price per share | $ | 25.54 | $ | 29.76 | $ | 29.36 | ||||||
Class C — Offering price per share (b) | 25.14 | 29.53 | 28.93 | |||||||||
Class R2 — Offering and redemption price per share | — | 29.43 | 28.91 | |||||||||
Class R5 — Offering and redemption price per share | — | 29.94 | 29.41 | |||||||||
Select Class — Offering and redemption price per share | 25.65 | 30.00 | 29.52 | |||||||||
Class A maximum sales charge | 5.25 | % | 5.25 | % | 5.25 | % | ||||||
Class A maximum public offering price per share | $ | 26.96 | $ | 31.41 | $ | 30.99 | ||||||
|
|
|
|
|
| |||||||
Cost of investments in non-affiliates | $ | 10,080 | $ | 1,670,861 | $ | 535,090 | ||||||
Cost of investments in affiliates | 64 | 79,535 | 17,525 | |||||||||
| (a) | Per share amounts may not recalculate due to rounding of net assets and/or shares outstanding. |
| (b) | Redemption price for Class C Shares varies based upon length of time the shares are held. |
SEE NOTES TO FINANCIAL STATEMENTS.
| JUNE 30, 2013 | J.P. MORGAN INTREPID FUNDS | 35 | ||||||
Table of Contents
STATEMENTS OF ASSETS AND LIABILITIES
AS OF JUNE 30, 2013 (continued)
(Amounts in thousands, except per share amounts)
Intrepid Mid Cap | Intrepid Value Fund | |||||||
ASSETS: |
| |||||||
Investments in non-affiliates, at value | $ | 510,355 | $ | 1,065,148 | ||||
Investments in affiliates, at value | 4,512 | 36,995 | ||||||
|
|
|
| |||||
Total investment securities, at value | 514,867 | 1,102,143 | ||||||
Deposits at broker for futures contracts | — | 1,560 | ||||||
Receivables: | ||||||||
Investment securities sold | 24,993 | 35,760 | ||||||
Fund shares sold | 302 | 2,957 | ||||||
Interest and dividends from non-affiliates | 627 | 882 | ||||||
Dividends from affiliates | — | (a) | 1 | |||||
Variation margin on futures contracts | 4 | — | ||||||
|
|
|
| |||||
Total Assets | 540,793 | 1,143,303 | ||||||
|
|
|
| |||||
LIABILITIES: | ||||||||
Payables: | ||||||||
Distributions | 567 | 828 | ||||||
Investment securities purchased | 23,362 | 42,502 | ||||||
Fund shares redeemed | 430 | 790 | ||||||
Variation margin on futures contracts | — | 164 | ||||||
Accrued liabilities: | ||||||||
Investment advisory fees | 277 | 456 | ||||||
Administration fees | 36 | — | ||||||
Shareholder servicing fees | 85 | 205 | ||||||
Distribution fees | 57 | 31 | ||||||
Custodian and accounting fees | 10 | 13 | ||||||
Trustees’ and Chief Compliance Officer’s fees | 1 | — | (a) | |||||
Other | 205 | 194 | ||||||
|
|
|
| |||||
Total Liabilities | 25,030 | 45,183 | ||||||
|
|
|
| |||||
Net Assets | $ | 515,763 | $ | 1,098,120 | ||||
|
|
|
| |||||
| (a) | Amount rounds to less than $1,000. |
SEE NOTES TO FINANCIAL STATEMENTS.
| 36 | J.P. MORGAN INTREPID FUNDS | JUNE 30, 2013 | ||||
Table of Contents
| Intrepid Mid Cap Fund | Intrepid Value Fund | |||||||
NET ASSETS: |
| |||||||
Paid-in-Capital | $ | 405,796 | $ | 948,864 | ||||
Accumulated undistributed (distributions in excess of) net investment income | (487 | ) | (638 | ) | ||||
Accumulated net realized gains (losses) | (30,834 | ) | (72,802 | ) | ||||
Net unrealized appreciation /depreciation | 141,288 | 222,696 | ||||||
|
|
|
| |||||
Total Net Assets | $ | 515,763 | $ | 1,098,120 | ||||
|
|
|
| |||||
Net Assets: | ||||||||
Class A | $ | 144,405 | $ | 71,116 | ||||
Class B | 7,451 | — | ||||||
Class C | 36,073 | 25,538 | ||||||
Class R2 | — | 934 | ||||||
Class R5 | — | 62,685 | ||||||
Class R6 | — | 10,875 | ||||||
Select Class | 327,834 | 926,972 | ||||||
|
|
|
| |||||
Total | $ | 515,763 | $ | 1,098,120 | ||||
|
|
|
| |||||
Outstanding units of beneficial interest (shares) | ||||||||
($0.0001 par value; unlimited number of shares authorized): | ||||||||
Class A | 7,684 | 2,389 | ||||||
Class B | 442 | — | ||||||
Class C | 2,139 | 865 | ||||||
Class R2 | — | 32 | ||||||
Class R5 | — | 2,096 | ||||||
Class R6 | — | 364 | ||||||
Select Class | 16,851 | 31,050 | ||||||
Net Asset Value (a): | ||||||||
Class A — Redemption price per share | $ | 18.79 | $ | 29.76 | ||||
Class B — Offering price per share (b) | 16.86 | — | ||||||
Class C — Offering price per share (b) | 16.87 | 29.52 | ||||||
Class R2 — Offering and redemption price per share | — | 29.69 | ||||||
Class R5 — Offering and redemption price per share | — | 29.91 | ||||||
Class R6 — Offering and redemption price per share | — | 29.91 | ||||||
Select Class — Offering and redemption price per share | 19.45 | 29.85 | ||||||
Class A maximum sales charge | 5.25 | % | 5.25 | % | ||||
Class A maximum public offering price per share | $ | 19.83 | $ | 31.41 | ||||
|
|
|
| |||||
Cost of investments in non-affiliates | $ | 369,098 | $ | 842,427 | ||||
Cost of investments in affiliates | 4,512 | 36,995 | ||||||
| (a) | Per share amounts may not recalculate due to rounding of net assets and/or shares outstanding. |
| (b) | Redemption price for Class B and Class C Shares varies based upon length of time the shares are held. |
SEE NOTES TO FINANCIAL STATEMENTS.
| JUNE 30, 2013 | J.P. MORGAN INTREPID FUNDS | 37 | ||||||
Table of Contents
STATEMENTS OF OPERATIONS
FOR THE YEAR ENDED JUNE 30, 2013
(Amounts in thousands)
| Intrepid Advantage Fund | Intrepid America Fund | Intrepid Growth Fund | ||||||||||
INVESTMENT INCOME: |
| |||||||||||
Dividend income from non-affiliates | $ | 244 | $ | 49,847 | $ | 13,830 | ||||||
Dividend income from affiliates | — | (a) | 49 | 16 | ||||||||
|
|
|
|
|
| |||||||
Total investment income | 244 | 49,896 | 13,846 | |||||||||
|
|
|
|
|
| |||||||
EXPENSES: | ||||||||||||
Investment advisory fees | 73 | 13,042 | 4,479 | |||||||||
Administration fees | 10 | 1,709 | 587 | |||||||||
Distribution fees: | ||||||||||||
Class A | 19 | 184 | 81 | |||||||||
Class C | 16 | 53 | 110 | |||||||||
Class R2 | — | 1 | 3 | |||||||||
Shareholder servicing fees: | ||||||||||||
Class A | 19 | 184 | 81 | |||||||||
Class C | 5 | 18 | 37 | |||||||||
Class R2 | — | — | (a) | 1 | ||||||||
Class R5 | — | 275 | 57 | |||||||||
Select Class | 4 | 3,437 | 1,317 | |||||||||
Custodian and accounting fees | 27 | 83 | 40 | |||||||||
Professional fees | 43 | 64 | 50 | |||||||||
Trustees’ and Chief Compliance Officer’s fees | — | (a) | 21 | 8 | ||||||||
Printing and mailing costs | 3 | 83 | 40 | |||||||||
Registration and filing fees | 35 | 62 | 57 | |||||||||
Transfer agent fees | 17 | 306 | 221 | |||||||||
Other | 6 | 27 | 15 | |||||||||
|
|
|
|
|
| |||||||
Total expenses | 277 | 19,549 | 7,184 | |||||||||
|
|
|
|
|
| |||||||
Less amounts waived | (108 | ) | (460 | ) | (369 | ) | ||||||
Less expense reimbursements | (22 | ) | — | — | ||||||||
|
|
|
|
|
| |||||||
Net expenses | 147 | 19,089 | 6,815 | |||||||||
|
|
|
|
|
| |||||||
Net investment income (loss) | 97 | 30,807 | 7,031 | |||||||||
|
|
|
|
|
| |||||||
REALIZED/UNREALIZED GAINS (LOSSES): | ||||||||||||
Net realized gain (loss) on transactions from: | ||||||||||||
Investments in non-affiliates | 1,542 | 230,121 | 91,650 | |||||||||
Futures | 10 | 5,616 | 3,595 | |||||||||
|
|
|
|
|
| |||||||
Net realized gain (loss) | 1,552 | 235,737 | 95,245 | |||||||||
|
|
|
|
|
| |||||||
Change in net unrealized appreciation/depreciation of: | ||||||||||||
Investments in non-affiliates | 647 | 148,681 | 16,543 | |||||||||
Futures | (2 | ) | (1,588 | ) | (476 | ) | ||||||
|
|
|
|
|
| |||||||
Change in net unrealized appreciation/depreciation | 645 | 147,093 | 16,067 | |||||||||
|
|
|
|
|
| |||||||
Net realized/unrealized gains (losses) | 2,197 | 382,830 | 111,312 | |||||||||
|
|
|
|
|
| |||||||
Change in net assets resulting from operations | $ | 2,294 | $ | 413,637 | $ | 118,343 | ||||||
|
|
|
|
|
| |||||||
| (a) | Amount rounds to less than $1,000. |
SEE NOTES TO FINANCIAL STATEMENTS.
| 38 | J.P. MORGAN INTREPID FUNDS | JUNE 30, 2013 | ||||
Table of Contents
Intrepid Mid Cap | Intrepid Fund | |||||||
INVESTMENT INCOME: |
| |||||||
Interest income from non-affiliates | $ | 2 | $ | — | ||||
Dividend income from non-affiliates | 9,251 | 23,848 | ||||||
Dividend income from affiliates | — | 26 | ||||||
Income from securities lending (net) | 13 | — | (a) | |||||
|
|
|
| |||||
Total investment income | 9,266 | 23,874 | ||||||
|
|
|
| |||||
EXPENSES: | ||||||||
Investment advisory fees | 2,987 | 6,185 | ||||||
Administration fees | 392 | 810 | ||||||
Distribution fees: | ||||||||
Class A | 331 | 160 | ||||||
Class B | 57 | — | ||||||
Class C | 234 | 174 | ||||||
Class R2 | — | 2 | ||||||
Shareholder servicing fees: | ||||||||
Class A | 331 | 160 | ||||||
Class B | 19 | — | ||||||
Class C | 78 | 58 | ||||||
Class R2 | — | 1 | ||||||
Class R5 | — | 29 | ||||||
Select Class | 721 | 1,974 | ||||||
Custodian and accounting fees | 38 | 49 | ||||||
Professional fees | 52 | 52 | ||||||
Trustees’ and Chief Compliance Officer’s fees | 5 | 10 | ||||||
Printing and mailing costs | 70 | 164 | ||||||
Registration and filing fees | 45 | 93 | ||||||
Transfer agent fees | 460 | 956 | ||||||
Other | 15 | 17 | ||||||
|
|
|
| |||||
Total expenses | 5,835 | 10,894 | ||||||
|
|
|
| |||||
Less amounts waived | (630 | ) | (3,250 | ) | ||||
|
|
|
| |||||
Net expenses | 5,205 | 7,644 | ||||||
|
|
|
| |||||
Net investment income (loss) | 4,061 | 16,230 | ||||||
|
|
|
| |||||
REALIZED/UNREALIZED GAINS (LOSSES): | ||||||||
Net realized gain (loss) on transactions from: | ||||||||
Investments in non-affiliates | 33,316 | 66,704 | ||||||
Futures | 3,213 | 3,427 | ||||||
|
|
|
| |||||
Net realized gain (loss) | 36,529 | 70,131 | ||||||
|
|
|
| |||||
Change in net unrealized appreciation/depreciation of: | ||||||||
Investments in non-affiliates | 66,233 | 135,446 | ||||||
Futures | (195 | ) | (452 | ) | ||||
|
|
|
| |||||
Change in net unrealized appreciation/depreciation | 66,038 | 134,994 | ||||||
|
|
|
| |||||
Net realized/unrealized gains (losses) | 102,567 | 205,125 | ||||||
|
|
|
| |||||
Change in net assets resulting from operations | $ | 106,628 | $ | 221,355 | ||||
|
|
|
| |||||
| (a) | Amount rounds to less than $1,000. |
SEE NOTES TO FINANCIAL STATEMENTS.
| JUNE 30, 2013 | J.P. MORGAN INTREPID FUNDS | 39 | ||||||
Table of Contents
STATEMENTS OF CHANGES IN NET ASSETS
FOR THE PERIODS INDICATED
(Amounts in thousands)
| Intrepid Advantage Fund | Intrepid America Fund | |||||||||||||||
| Year Ended 6/30/2013 | Year Ended 6/30/2012 | Year Ended 6/30/2013 | Year Ended 6/30/2012 | |||||||||||||
CHANGE IN NET ASSETS RESULTING FROM OPERATIONS: |
| |||||||||||||||
Net investment income (loss) | $ | 97 | $ | 59 | $ | 30,807 | $ | 18,891 | ||||||||
Net realized gain (loss) | 1,552 | 686 | 235,737 | 19,272 | ||||||||||||
Change in net unrealized appreciation/depreciation | 645 | (792 | ) | 147,093 | (1,415 | ) | ||||||||||
|
|
|
|
|
|
|
| |||||||||
Change in net assets resulting from operations | 2,294 | (47 | ) | 413,637 | 36,748 | |||||||||||
|
|
|
|
|
|
|
| |||||||||
DISTRIBUTIONS TO SHAREHOLDERS: | ||||||||||||||||
Class A | ||||||||||||||||
From net investment income | (86 | ) | (74 | ) | (1,068 | ) | (431 | ) | ||||||||
Class C | ||||||||||||||||
From net investment income | (13 | ) | (10 | ) | (70 | ) | — | |||||||||
Class R2 | ||||||||||||||||
From net investment income | — | — | (1 | ) | — | (a) | ||||||||||
Class R5 | ||||||||||||||||
From net investment income | — | — | (10,815 | ) | (3,672 | ) | ||||||||||
Select Class | ||||||||||||||||
From net investment income | (18 | ) | (15 | ) | (24,714 | ) | (11,474 | ) | ||||||||
|
|
|
|
|
|
|
| |||||||||
Total distributions to shareholders | (117 | ) | (99 | ) | (36,668 | ) | (15,577 | ) | ||||||||
|
|
|
|
|
|
|
| |||||||||
CAPITAL TRANSACTIONS: | ||||||||||||||||
Change in net assets resulting from capital transactions | 158 | (2,420 | ) | (11,315 | ) | 96,366 | ||||||||||
|
|
|
|
|
|
|
| |||||||||
NET ASSETS: | ||||||||||||||||
Change in net assets | 2,335 | (2,566 | ) | 365,654 | 117,537 | |||||||||||
Beginning of period | 10,240 | 12,806 | 1,832,140 | 1,714,603 | ||||||||||||
|
|
|
|
|
|
|
| |||||||||
End of period | $ | 12,575 | $ | 10,240 | $ | 2,197,794 | $ | 1,832,140 | ||||||||
|
|
|
|
|
|
|
| |||||||||
Accumulated undistributed (distributions in excess of) net investment income | $ | 38 | $ | 59 | $ | 12,131 | $ | 18,896 | ||||||||
|
|
|
|
|
|
|
| |||||||||
| (a) | Amount rounds to less than $1,000. |
SEE NOTES TO FINANCIAL STATEMENTS.
| 40 | J.P. MORGAN INTREPID FUNDS | JUNE 30, 2013 | ||||
Table of Contents
| Intrepid Growth Fund | Intrepid Mid Cap Fund | Intrepid Value Fund | ||||||||||||||||||||||
| Year Ended 6/30/2013 | Year Ended 6/30/2012 | Year Ended 6/30/2013 | Year Ended 6/30/2012 | Year Ended 6/30/2013 | Year Ended 6/30/2012 | |||||||||||||||||||
CHANGE IN NET ASSETS RESULTING FROM OPERATIONS: |
| |||||||||||||||||||||||
Net investment income (loss) | $ | 7,031 | $ | 4,333 | $ | 4,061 | $ | 3,324 | $ | 16,230 | $ | 14,221 | ||||||||||||
Net realized gain (loss) | 95,245 | 21,282 | 36,529 | 6,579 | 70,131 | (31,157 | ) | |||||||||||||||||
Change in net unrealized | 16,067 | (6,900 | ) | 66,038 | (31,641 | ) | 134,994 | 3,865 | ||||||||||||||||
|
|
|
|
|
|
|
|
|
|
|
| |||||||||||||
Change in net assets resulting | 118,343 | 18,715 | 106,628 | (21,738 | ) | 221,355 | (13,071 | ) | ||||||||||||||||
|
|
|
|
|
|
|
|
|
|
|
| |||||||||||||
DISTRIBUTIONS TO SHAREHOLDERS: | ||||||||||||||||||||||||
Class A | ||||||||||||||||||||||||
From net investment income | (221 | ) | (87 | ) | (1,006 | ) | (902 | ) | (1,043 | ) | (1,007 | ) | ||||||||||||
Class B | ||||||||||||||||||||||||
From net investment income | — | — | (20 | ) | (29 | ) | — | — | ||||||||||||||||
Class C | ||||||||||||||||||||||||
From net investment income | (29 | ) | — | (86 | ) | (106 | ) | (272 | ) | (264 | ) | |||||||||||||
Class R2 | ||||||||||||||||||||||||
From net investment income | (5 | ) | — | (a) | — | — | (6 | ) | (1 | ) | ||||||||||||||
Class R5 | ||||||||||||||||||||||||
From net investment income | (1,300 | ) | (790 | ) | — | — | (1,138 | ) | (898 | ) | ||||||||||||||
Class R6 | ||||||||||||||||||||||||
From net investment income | — | — | — | — | (316 | ) | (530 | ) | ||||||||||||||||
Select Class | ||||||||||||||||||||||||
From net investment income | (4,926 | ) | (2,710 | ) | (2,755 | ) | (2,535 | ) | (14,178 | ) | (11,743 | ) | ||||||||||||
|
|
|
|
|
|
|
|
|
|
|
| |||||||||||||
Total distributions to shareholders | (6,481 | ) | (3,587 | ) | (3,867 | ) | (3,572 | ) | (16,953 | ) | (14,443 | ) | ||||||||||||
|
|
|
|
|
|
|
|
|
|
|
| |||||||||||||
CAPITAL TRANSACTIONS: | ||||||||||||||||||||||||
Change in net assets resulting from capital transactions | (74,507 | ) | (39,626 | ) | (14,792 | ) | (17,403 | ) | 33,897 | (75,090 | ) | |||||||||||||
|
|
|
|
|
|
|
|
|
|
|
| |||||||||||||
NET ASSETS: | ||||||||||||||||||||||||
Change in net assets | 37,355 | (24,498 | ) | 87,969 | (42,713 | ) | 238,299 | (102,604 | ) | |||||||||||||||
Beginning of period | 656,509 | 681,007 | 427,794 | 470,507 | 859,821 | 962,425 | ||||||||||||||||||
|
|
|
|
|
|
|
|
|
|
|
| |||||||||||||
End of period | $ | 693,864 | $ | 656,509 | $ | 515,763 | $ | 427,794 | $ | 1,098,120 | $ | 859,821 | ||||||||||||
|
|
|
|
|
|
|
|
|
|
|
| |||||||||||||
Accumulated undistributed (distributions in excess of) net investment income | $ | 2,380 | $ | 2,075 | $ | (487 | ) | $ | (560 | ) | $ | (638 | ) | $ | 71 | |||||||||
|
|
|
|
|
|
|
|
|
|
|
| |||||||||||||
| (a) | Amount rounds to less than $1,000. |
SEE NOTES TO FINANCIAL STATEMENTS.
| JUNE 30, 2013 | J.P. MORGAN INTREPID FUNDS | 41 | ||||||
Table of Contents
STATEMENTS OF CHANGES IN NET ASSETS
FOR THE PERIODS INDICATED (continued)
(Amounts in thousands)
| Intrepid Advantage Fund | Intrepid America Fund | |||||||||||||||
| Year Ended 6/30/2013 | Year Ended 6/30/2012 | Year Ended 6/30/2013 | Year Ended 6/30/2012 | |||||||||||||
CAPITAL TRANSACTIONS: | ||||||||||||||||
Class A | ||||||||||||||||
Proceeds from shares issued | $ | 3,021 | $ | 1,923 | $ | 36,878 | $ | 54,229 | ||||||||
Distributions reinvested | 85 | 74 | 1,060 | 428 | ||||||||||||
Cost of shares redeemed | (3,204 | ) | (3,790 | ) | (44,655 | ) | (24,386 | ) | ||||||||
|
|
|
|
|
|
|
| |||||||||
Change in net assets resulting from Class A capital transactions | $ | (98 | ) | $ | (1,793 | ) | $ | (6,717 | ) | $ | 30,271 | |||||
|
|
|
|
|
|
|
| |||||||||
Class C | ||||||||||||||||
Proceeds from shares issued | $ | 603 | $ | 89 | $ | 527 | $ | 277 | ||||||||
Distributions reinvested | 12 | 9 | 65 | — | ||||||||||||
Cost of shares redeemed | (441 | ) | (638 | ) | (1,686 | ) | (2,695 | ) | ||||||||
|
|
|
|
|
|
|
| |||||||||
Change in net assets resulting from Class C capital transactions | $ | 174 | $ | (540 | ) | $ | (1,094 | ) | $ | (2,418 | ) | |||||
|
|
|
|
|
|
|
| |||||||||
Class R2 | ||||||||||||||||
Proceeds from shares issued | $ | — | $ | — | $ | 79 | $ | — | ||||||||
Distributions reinvested | — | — | 1 | — | (a) | |||||||||||
|
|
|
|
|
|
|
| |||||||||
Change in net assets resulting from Class R2 capital transactions | $ | — | $ | — | $ | 80 | $ | — | (a) | |||||||
|
|
|
|
|
|
|
| |||||||||
Class R5 | ||||||||||||||||
Proceeds from shares issued | $ | — | $ | — | $ | 224,786 | $ | 126,573 | ||||||||
Distributions reinvested | — | — | 10,815 | 3,672 | ||||||||||||
Cost of shares redeemed | — | — | (39,949 | ) | (15,017 | ) | ||||||||||
|
|
|
|
|
|
|
| |||||||||
Change in net assets resulting from Class R5 capital transactions | $ | — | $ | — | $ | 195,652 | $ | 115,228 | ||||||||
|
|
|
|
|
|
|
| |||||||||
Select Class | ||||||||||||||||
Proceeds from shares issued | $ | 370 | $ | 115 | $ | 135,367 | $ | 174,790 | ||||||||
Distributions reinvested | 7 | 4 | 922 | 398 | ||||||||||||
Cost of shares redeemed | (295 | ) | (206 | ) | (335,525 | ) | (221,903 | ) | ||||||||
|
|
|
|
|
|
|
| |||||||||
Change in net assets resulting from Select Class capital transactions | $ | 82 | $ | (87 | ) | $ | (199,236 | ) | $ | (46,715 | ) | |||||
|
|
|
|
|
|
|
| |||||||||
Total change in net assets resulting from capital transactions | $ | 158 | $ | (2,420 | ) | $ | (11,315 | ) | $ | 96,366 | ||||||
|
|
|
|
|
|
|
| |||||||||
| (a) | Amount rounds to less than $1,000. |
SEE NOTES TO FINANCIAL STATEMENTS.
| 42 | J.P. MORGAN INTREPID FUNDS | JUNE 30, 2013 | ||||
Table of Contents
| Intrepid Advantage Fund | Intrepid America Fund | |||||||||||||||
| Year Ended 6/30/2013 | Year Ended 6/30/2012 | Year Ended 6/30/2013 | Year Ended 6/30/2012 | |||||||||||||
SHARE TRANSACTIONS: | ||||||||||||||||
Class A | ||||||||||||||||
Issued | 133 | 95 | 1,290 | 2,380 | ||||||||||||
Reinvested | 4 | 4 | 40 | 19 | ||||||||||||
Redeemed | (141 | ) | (203 | ) | (1,662 | ) | (1,041 | ) | ||||||||
|
|
|
|
|
|
|
| |||||||||
Change in Class A Shares | (4 | ) | (104 | ) | (332 | ) | 1,358 | |||||||||
|
|
|
|
|
|
|
| |||||||||
Class C | ||||||||||||||||
Issued | 27 | 5 | 17 | 12 | ||||||||||||
Reinvested | 1 | 1 | 3 | — | ||||||||||||
Redeemed | (20 | ) | (34 | ) | (63 | ) | (115 | ) | ||||||||
|
|
|
|
|
|
|
| |||||||||
Change in Class C Shares | 8 | (28 | ) | (43 | ) | (103 | ) | |||||||||
|
|
|
|
|
|
|
| |||||||||
Class R2 | ||||||||||||||||
Issued | — | — | 3 | — | ||||||||||||
Reinvested | — | — | — | (a) | — | (a) | ||||||||||
|
|
|
|
|
|
|
| |||||||||
Change in Class R2 Shares | — | — | 3 | — | (a) | |||||||||||
|
|
|
|
|
|
|
| |||||||||
Class R5 | ||||||||||||||||
Issued | — | — | 8,207 | 5,382 | ||||||||||||
Reinvested | — | — | 410 | 164 | ||||||||||||
Redeemed | — | — | (1,437 | ) | (636 | ) | ||||||||||
|
|
|
|
|
|
|
| |||||||||
Change in Class R5 Shares | — | — | 7,180 | 4,910 | ||||||||||||
|
|
|
|
|
|
|
| |||||||||
Select Class | ||||||||||||||||
Issued | 16 | 6 | 5,026 | 7,481 | ||||||||||||
Reinvested | — | (a) | — | (a) | 35 | 18 | ||||||||||
Redeemed | (12 | ) | (11 | ) | (12,217 | ) | (9,335 | ) | ||||||||
|
|
|
|
|
|
|
| |||||||||
Change in Select Class Shares | 4 | (5 | ) | (7,156 | ) | (1,836 | ) | |||||||||
|
|
|
|
|
|
|
| |||||||||
| (a) | Amount rounds to less than 1,000 (shares or dollars). |
SEE NOTES TO FINANCIAL STATEMENTS.
| JUNE 30, 2013 | J.P. MORGAN INTREPID FUNDS | 43 | ||||||
Table of Contents
STATEMENTS OF CHANGES IN NET ASSETS
FOR THE PERIODS INDICATED (continued)
(Amounts in thousands)
| Intrepid Growth Fund | Intrepid Mid Cap Fund | |||||||||||||||
| Year Ended 6/30/2013 | Year Ended 6/30/2012 | Year Ended 6/30/2013 | Year Ended 6/30/2012 | |||||||||||||
CAPITAL TRANSACTIONS: | ||||||||||||||||
Class A | ||||||||||||||||
Proceeds from shares issued | $ | 5,774 | $ | 4,240 | $ | 26,948 | $ | 21,079 | ||||||||
Distributions reinvested | 212 | 84 | 985 | 890 | ||||||||||||
Cost of shares redeemed | (9,619 | ) | (14,288 | ) | (35,550 | ) | (30,955 | ) | ||||||||
|
|
|
|
|
|
|
| |||||||||
Change in net assets resulting from Class A capital transactions | $ | (3,633 | ) | $ | (9,964 | ) | $ | (7,617 | ) | $ | (8,986 | ) | ||||
|
|
|
|
|
|
|
| |||||||||
Class B | ||||||||||||||||
Proceeds from shares issued | $ | — | $ | — | $ | 149 | $ | 97 | ||||||||
Distributions reinvested | — | — | 20 | 28 | ||||||||||||
Cost of shares redeemed | — | — | (2,235 | ) | (2,469 | ) | ||||||||||
|
|
|
|
|
|
|
| |||||||||
Change in net assets resulting from Class B capital transactions | $ | — | $ | — | $ | (2,066 | ) | $ | (2,344 | ) | ||||||
|
|
|
|
|
|
|
| |||||||||
Class C | ||||||||||||||||
Proceeds from shares issued | $ | 1,784 | $ | 830 | $ | 8,309 | $ | 6,681 | ||||||||
Distributions reinvested | 24 | — | 81 | 101 | ||||||||||||
Cost of shares redeemed | (2,990 | ) | (4,559 | ) | (7,371 | ) | (7,645 | ) | ||||||||
|
|
|
|
|
|
|
| |||||||||
Change in net assets resulting from Class C capital transactions | $ | (1,182 | ) | $ | (3,729 | ) | $ | 1,019 | $ | (863 | ) | |||||
|
|
|
|
|
|
|
| |||||||||
Class R2 | ||||||||||||||||
Proceeds from shares issued | $ | 263 | $ | 307 | $ | — | $ | — | ||||||||
Distributions reinvested | 4 | — | (a) | — | — | |||||||||||
Cost of shares redeemed | (122 | ) | (9 | ) | — | — | ||||||||||
|
|
|
|
|
|
|
| |||||||||
Change in net assets resulting from Class R2 capital transactions | $ | 145 | $ | 298 | $ | — | $ | — | ||||||||
|
|
|
|
|
|
|
| |||||||||
Class R5 | ||||||||||||||||
Proceeds from shares issued | $ | 14,578 | $ | 18,112 | $ | — | $ | — | ||||||||
Distributions reinvested | 1,300 | 790 | — | — | ||||||||||||
Cost of shares redeemed | (35,556 | ) | (25,313 | ) | — | — | ||||||||||
|
|
|
|
|
|
|
| |||||||||
Change in net assets resulting from Class R5 capital transactions | $ | (19,678 | ) | $ | (6,411 | ) | $ | — | $ | — | ||||||
|
|
|
|
|
|
|
| |||||||||
Select Class | ||||||||||||||||
Proceeds from shares issued | $ | 70,793 | $ | 59,824 | $ | 51,238 | $ | 37,997 | ||||||||
Distributions reinvested | 268 | 149 | 250 | 338 | ||||||||||||
Cost of shares redeemed | (121,220 | ) | (79,793 | ) | (57,616 | ) | (43,545 | ) | ||||||||
|
|
|
|
|
|
|
| |||||||||
Change in net assets resulting from Select Class capital transactions | $ | (50,159 | ) | $ | (19,820 | ) | $ | (6,128 | ) | $ | (5,210 | ) | ||||
|
|
|
|
|
|
|
| |||||||||
Total change in net assets resulting from capital transactions | $ | (74,507 | ) | $ | (39,626 | ) | $ | (14,792 | ) | $ | (17,403 | ) | ||||
|
|
|
|
|
|
|
| |||||||||
| (a) | Amount rounds to less than $1,000. |
SEE NOTES TO FINANCIAL STATEMENTS.
| 44 | J.P. MORGAN INTREPID FUNDS | JUNE 30, 2013 | ||||
Table of Contents
| Intrepid Growth Fund | Intrepid Mid Cap Fund | |||||||||||||||
| Year Ended 6/30/2013 | Year Ended 6/30/2012 | Year Ended 6/30/2013 | Year Ended 6/30/2012 | |||||||||||||
SHARE TRANSACTIONS: | ||||||||||||||||
Class A | ||||||||||||||||
Issued | 211 | 176 | 1,585 | 1,439 | ||||||||||||
Reinvested | 8 | 4 | 58 | 60 | ||||||||||||
Redeemed | (356 | ) | (598 | ) | (2,112 | ) | (2,144 | ) | ||||||||
|
|
|
|
|
|
|
| |||||||||
Change in Class A Shares | (137 | ) | (418 | ) | (469 | ) | (645 | ) | ||||||||
|
|
|
|
|
|
|
| |||||||||
Class B | ||||||||||||||||
Issued | — | — | 10 | 7 | ||||||||||||
Reinvested | — | — | 1 | 2 | ||||||||||||
Redeemed | — | — | (149 | ) | (190 | ) | ||||||||||
|
|
|
|
|
|
|
| |||||||||
Change in Class B Shares | — | — | (138 | ) | (181 | ) | ||||||||||
|
|
|
|
|
|
|
| |||||||||
Class C | ||||||||||||||||
Issued | 65 | 36 | 541 | 506 | ||||||||||||
Reinvested | 1 | — | 6 | 8 | ||||||||||||
Redeemed | (112 | ) | (195 | ) | (491 | ) | (592 | ) | ||||||||
|
|
|
|
|
|
|
| |||||||||
Change in Class C Shares | (46 | ) | (159 | ) | 56 | (78 | ) | |||||||||
|
|
|
|
|
|
|
| |||||||||
Class R2 | ||||||||||||||||
Issued | 11 | 12 | — | — | ||||||||||||
Reinvested | — | (a) | — | (a) | — | — | ||||||||||
Redeemed | (5 | ) | — | (a) | — | — | ||||||||||
|
|
|
|
|
|
|
| |||||||||
Change in Class R2 Shares | 6 | 12 | — | — | ||||||||||||
|
|
|
|
|
|
|
| |||||||||
Class R5 | ||||||||||||||||
Issued | 532 | 752 | — | — | ||||||||||||
Reinvested | 49 | 35 | — | — | ||||||||||||
Redeemed | (1,260 | ) | (1,051 | ) | — | — | ||||||||||
|
|
|
|
|
|
|
| |||||||||
Change in Class R5 Shares | (679 | ) | (264 | ) | — | — | ||||||||||
|
|
|
|
|
|
|
| |||||||||
Select Class | ||||||||||||||||
Issued | 2,600 | 2,516 | 2,855 | 2,568 | ||||||||||||
Reinvested | 10 | 6 | 14 | 22 | ||||||||||||
Redeemed | (4,363 | ) | (3,336 | ) | (3,405 | ) | (2,955 | ) | ||||||||
|
|
|
|
|
|
|
| |||||||||
Change in Select Class Shares | (1,753 | ) | (814 | ) | (536 | ) | (365 | ) | ||||||||
|
|
|
|
|
|
|
| |||||||||
| (a) | Amount rounds to less than 1,000 (shares or dollars). |
SEE NOTES TO FINANCIAL STATEMENTS.
| JUNE 30, 2013 | J.P. MORGAN INTREPID FUNDS | 45 | ||||||
Table of Contents
STATEMENTS OF CHANGES IN NET ASSETS
FOR THE PERIODS INDICATED (continued)
(Amounts in thousands)
| Intrepid Value Fund | ||||||||
| Year Ended 6/30/2013 | Year Ended 6/30/2012 | |||||||
CAPITAL TRANSACTIONS: | ||||||||
Class A | ||||||||
Proceeds from shares issued | $ | 12,723 | $ | 7,225 | ||||
Distributions reinvested | 1,013 | 975 | ||||||
Cost of shares redeemed | (17,470 | ) | (27,020 | ) | ||||
|
|
|
| |||||
Change in net assets resulting from Class A capital transactions | $ | (3,734 | ) | $ | (18,820 | ) | ||
|
|
|
| |||||
Class C | ||||||||
Proceeds from shares issued | $ | 3,716 | $ | 1,276 | ||||
Distributions reinvested | 236 | 212 | ||||||
Cost of shares redeemed | (5,495 | ) | (8,712 | ) | ||||
|
|
|
| |||||
Change in net assets resulting from Class C capital transactions | $ | (1,543 | ) | $ | (7,224 | ) | ||
|
|
|
| |||||
Class R2 | ||||||||
Proceeds from shares issued | $ | 827 | $ | — | ||||
Distributions reinvested | 6 | 1 | ||||||
Cost of shares redeemed | (89 | ) | — | |||||
|
|
|
| |||||
Change in net assets resulting from Class R2 capital transactions | $ | 744 | $ | 1 | ||||
|
|
|
| |||||
Class R5 | ||||||||
Proceeds from shares issued | $ | 5,218 | $ | 11,186 | ||||
Distributions reinvested | 1,138 | 898 | ||||||
Cost of shares redeemed | (8,368 | ) | (9,351 | ) | ||||
|
|
|
| |||||
Change in net assets resulting from Class R5 capital transactions | $ | (2,012 | ) | $ | 2,733 | |||
|
|
|
| |||||
Class R6 | ||||||||
Proceeds from shares issued | $ | 6,617 | $ | 18,438 | ||||
Distributions reinvested | 153 | 362 | ||||||
Cost of shares redeemed | (18,538 | ) | (30,975 | ) | ||||
|
|
|
| |||||
Change in net assets resulting from Class R6 capital transactions | $ | (11,768 | ) | $ | (12,175 | ) | ||
|
|
|
| |||||
Select Class | ||||||||
Proceeds from shares issued | $ | 297,078 | $ | 303,999 | ||||
Distributions reinvested | 10,361 | 7,270 | ||||||
Cost of shares redeemed | (255,229 | ) | (350,874 | ) | ||||
|
|
|
| |||||
Change in net assets resulting from Select Class capital transactions | $ | 52,210 | $ | (39,605 | ) | |||
|
|
|
| |||||
Total change in net assets resulting from capital transactions | $ | 33,897 | $ | (75,090 | ) | |||
|
|
|
| |||||
SEE NOTES TO FINANCIAL STATEMENTS.
| 46 | J.P. MORGAN INTREPID FUNDS | JUNE 30, 2013 | ||||
Table of Contents
| Intrepid Value Fund | ||||||||
| Year Ended 6/30/2013 | Year Ended 6/30/2012 | |||||||
SHARE TRANSACTIONS: | ||||||||
Class A | ||||||||
Issued | 470 | 315 | ||||||
Reinvested | 37 | 43 | ||||||
Redeemed | (664 | ) | (1,229 | ) | ||||
|
|
|
| |||||
Change in Class A Shares | (157 | ) | (871 | ) | ||||
|
|
|
| |||||
Class C | ||||||||
Issued | 136 | 56 | ||||||
Reinvested | 9 | 10 | ||||||
Redeemed | (208 | ) | (387 | ) | ||||
|
|
|
| |||||
Change in Class C Shares | (63 | ) | (321 | ) | ||||
|
|
|
| |||||
Class R2 | ||||||||
Issued | 32 | — | ||||||
Reinvested | — | (a) | — | (a) | ||||
Redeemed | (3 | ) | — | |||||
|
|
|
| |||||
Change in Class R2 Shares | 29 | — | (a) | |||||
|
|
|
| |||||
Class R5 | ||||||||
Issued | 193 | 482 | ||||||
Reinvested | 41 | 39 | ||||||
Redeemed | (303 | ) | (412 | ) | ||||
|
|
|
| |||||
Change in Class R5 Shares | (69 | ) | 109 | |||||
|
|
|
| |||||
Class R6 | ||||||||
Issued | 243 | 756 | ||||||
Reinvested | 6 | 16 | ||||||
Redeemed | (667 | ) | (1,308 | ) | ||||
|
|
|
| |||||
Change in Class R6 Shares | (418 | ) | (536 | ) | ||||
|
|
|
| |||||
Select Class | ||||||||
Issued | 10,906 | 13,182 | ||||||
Reinvested | 376 | 320 | ||||||
Redeemed | (9,557 | ) | (15,567 | ) | ||||
|
|
|
| |||||
Change in Select Class Shares | 1,725 | (2,065 | ) | |||||
|
|
|
| |||||
| (a) | Amount rounds to less than 1,000 (shares or dollars). |
SEE NOTES TO FINANCIAL STATEMENTS.
| JUNE 30, 2013 | J.P. MORGAN INTREPID FUNDS | 47 | ||||||
Table of Contents
FOR THE PERIODS INDICATED
| Per share operating performance | ||||||||||||||||||||
| Investment operations | Distributions | |||||||||||||||||||
| Net asset value, beginning of period | Net investment income (loss) | Net realized and unrealized gains (losses) on investments | Total from investment operations | Net investment income | ||||||||||||||||
Intrepid Advantage Fund | ||||||||||||||||||||
Class A | ||||||||||||||||||||
Year Ended June 30, 2013 | $ | 21.13 | $ | 0.21 | (d)(e) | $ | 4.44 | $ | 4.65 | $ | (0.24 | ) | ||||||||
Year Ended June 30, 2012 | 20.60 | 0.13 | (d) | 0.63 | 0.76 | (0.23 | ) | |||||||||||||
Year Ended June 30, 2011 | 15.44 | 0.17 | (d) | 5.03 | 5.20 | (0.04 | ) | |||||||||||||
Year Ended June 30, 2010 | 13.42 | 0.05 | (d) | 2.16 | 2.21 | (0.19 | ) | |||||||||||||
Year Ended June 30, 2009 | 19.88 | 0.14 | (d) | (6.54 | ) | (6.40 | ) | (0.06 | ) | |||||||||||
Class C | ||||||||||||||||||||
Year Ended June 30, 2013 | 20.81 | 0.10 | (d)(e) | 4.37 | 4.47 | (0.14 | ) | |||||||||||||
Year Ended June 30, 2012 | 20.25 | 0.04 | (d) | 0.62 | 0.66 | (0.10 | ) | |||||||||||||
Year Ended June 30, 2011 | 15.22 | 0.08 | (d) | 4.95 | 5.03 | — | ||||||||||||||
Year Ended June 30, 2010 | 13.27 | (0.03 | )(d) | 2.13 | 2.10 | (0.15 | ) | |||||||||||||
Year Ended June 30, 2009 | 19.65 | 0.07 | (d) | (6.45 | ) | (6.38 | ) | — | ||||||||||||
Select Class | ||||||||||||||||||||
Year Ended June 30, 2013 | 21.21 | 0.28 | (d)(e) | 4.45 | 4.73 | (0.29 | ) | |||||||||||||
Year Ended June 30, 2012 | 20.70 | 0.19 | (d) | 0.62 | 0.81 | (0.30 | ) | |||||||||||||
Year Ended June 30, 2011 | 15.51 | 0.21 | (d) | 5.06 | 5.27 | (0.08 | ) | |||||||||||||
Year Ended June 30, 2010 | 13.46 | 0.09 | (d) | 2.17 | 2.26 | (0.21 | ) | |||||||||||||
Year Ended June 30, 2009 | 19.97 | 0.18 | (d) | (6.58 | ) | (6.40 | ) | (0.11 | ) | |||||||||||
| (a) | Includes adjustments in accordance with accounting principles generally accepted in the United States of America and as such, the net asset values for financial reporting purposes and the returns based upon those net asset values may differ from the net asset values and returns for shareholder transactions. |
| (b) | Includes earnings credits and interest expense, if applicable, each of which is less than 0.01% unless otherwise noted. |
| (c) | Portfolio turnover is calculated by dividing the lesser of total purchases or sales of portfolio securities for the reporting period by the monthly average value of portfolio securities owned during the reporting period. Excluded from both the numerator and denominator are amounts relating to derivatives and securities whose maturities or expiration dates at the time of acquisition were one year or less. |
| (d) | Calculated based upon average shares outstanding. |
| (e) | Reflects a special dividend paid out during the period by one of the Fund’s holdings. Had the Fund not received the special dividend, the net investment income (loss) per share would have been $0.17, $0.06 and $0.23 for Class A, Class C and Select Class Shares, respectively, and the net investment income (loss) ratio would have been 0.73%, 0.24% and 1.00% for Class A, Class C and Select Class Shares, respectively. |
SEE NOTES TO FINANCIAL STATEMENTS.
| 48 | J.P. MORGAN INTREPID FUNDS | JUNE 30, 2013 | ||||
Table of Contents
| Ratios/Supplemental data | |||||||||||||||||||||||||
| Ratios to average net assets | ||||||||||||||||||||||||||
| Net asset value, end of period | Total return (excludes sales charge) (a) | Net assets, end of period (000's) | Net expenses (b) | Net investment income (loss) | Expenses without waivers, reimbursements and earning credits | Portfolio turnover rate (c) | ||||||||||||||||||||
| $ | 25.54 | 22.15 | % | $ | 8,765 | 1.25 | % | 0.92 | %(e) | 2.40 | % | 82 | % | |||||||||||||
| 21.13 | 3.83 | 7,329 | 1.25 | 0.68 | 2.51 | 57 | ||||||||||||||||||||
| 20.60 | 33.71 | 9,291 | 1.25 | 0.91 | 2.44 | 75 | ||||||||||||||||||||
| 15.44 | 16.36 | 7,503 | 1.25 | 0.30 | 2.59 | 145 | ||||||||||||||||||||
| 13.42 | (32.17 | ) | 6,582 | 1.25 | 1.01 | 2.60 | 105 | |||||||||||||||||||
| 25.14 | 21.55 | 2,294 | 1.75 | 0.43 | (e) | 2.91 | 82 | |||||||||||||||||||
| 20.81 | 3.33 | 1,747 | 1.75 | 0.19 | 3.02 | 57 | ||||||||||||||||||||
| 20.25 | 33.05 | 2,266 | 1.75 | 0.43 | 2.94 | 75 | ||||||||||||||||||||
| 15.22 | 15.73 | 2,302 | 1.75 | (0.21 | ) | 3.10 | 145 | |||||||||||||||||||
| 13.27 | (32.47 | ) | 2,384 | 1.75 | 0.49 | 3.07 | 105 | |||||||||||||||||||
| 25.65 | 22.46 | 1,516 | 1.00 | 1.19 | (e) | 2.16 | 82 | |||||||||||||||||||
| 21.21 | 4.09 | 1,164 | 1.00 | 0.94 | 2.28 | 57 | ||||||||||||||||||||
| 20.70 | 34.04 | 1,249 | 1.00 | 1.13 | 2.19 | 75 | ||||||||||||||||||||
| 15.51 | 16.65 | 897 | 1.00 | 0.54 | 2.37 | 145 | ||||||||||||||||||||
| 13.46 | (32.01 | ) | 1,102 | 1.00 | 1.25 | 2.17 | 105 | |||||||||||||||||||
SEE NOTES TO FINANCIAL STATEMENTS.
| JUNE 30, 2013 | J.P. MORGAN INTREPID FUNDS | 49 | ||||||
Table of Contents
FINANCIAL HIGHLIGHTS
FOR THE PERIODS INDICATED (continued)
| Per share operating performance | ||||||||||||||||||||||||||||
| Investment operations | Distributions | |||||||||||||||||||||||||||
| Net asset value, beginning of period | Net investment income (loss) | Net realized and unrealized gains (losses) on investments | Total from investment operations | Net investment income | Net realized gain | Total distributions | ||||||||||||||||||||||
Intrepid America Fund | ||||||||||||||||||||||||||||
Class A | ||||||||||||||||||||||||||||
Year Ended June 30, 2013 | $ | 24.68 | $ | 0.34 | (f)(g) | $ | 5.15 | $ | 5.49 | $ | (0.41 | ) | $ | — | $ | (0.41 | ) | |||||||||||
Year Ended June 30, 2012 | 24.55 | 0.19 | (f) | 0.10 | 0.29 | (0.16 | ) | — | (0.16 | ) | ||||||||||||||||||
Year Ended June 30, 2011 | 18.54 | 0.17 | (f) | 6.01 | 6.18 | (0.17 | ) | — | (0.17 | ) | ||||||||||||||||||
Year Ended June 30, 2010 | 16.41 | 0.13 | (f) | 2.35 | 2.48 | (0.35 | ) | — | (0.35 | ) | ||||||||||||||||||
Year Ended June 30, 2009 | 24.32 | 0.22 | (f) | (7.42 | ) | (7.20 | ) | (0.11 | ) | (0.60 | ) | (0.71 | ) | |||||||||||||||
Class C | ||||||||||||||||||||||||||||
Year Ended June 30, 2013 | 24.48 | 0.20 | (f)(g) | 5.12 | 5.32 | (0.27 | ) | — | (0.27 | ) | ||||||||||||||||||
Year Ended June 30, 2012 | 24.29 | 0.07 | (f) | 0.12 | 0.19 | — | — | — | ||||||||||||||||||||
Year Ended June 30, 2011 | 18.33 | 0.06 | (f) | 5.94 | 6.00 | (0.04 | ) | — | (0.04 | ) | ||||||||||||||||||
Year Ended June 30, 2010 | 16.28 | 0.03 | (f) | 2.34 | 2.37 | (0.32 | ) | — | (0.32 | ) | ||||||||||||||||||
Year Ended June 30, 2009 | 24.09 | 0.13 | (f) | (7.34 | ) | (7.21 | ) | — | (0.60 | ) | (0.60 | ) | ||||||||||||||||
Class R2 | ||||||||||||||||||||||||||||
Year Ended June 30, 2013 | 24.43 | 0.26 | (f)(g) | 5.11 | 5.37 | (0.37 | ) | — | (0.37 | ) | ||||||||||||||||||
Year Ended June 30, 2012 | 24.21 | 0.13 | (f) | 0.12 | 0.25 | (0.03 | ) | — | (0.03 | ) | ||||||||||||||||||
Year Ended June 30, 2011 | 18.36 | 0.13 | (f) | 5.92 | 6.05 | (0.20 | ) | — | (0.20 | ) | ||||||||||||||||||
Year Ended June 30, 2010 | 16.29 | 0.09 | (f) | 2.33 | 2.42 | (0.35 | ) | — | (0.35 | ) | ||||||||||||||||||
November 3, 2008 (h) through June 30, 2009 | 17.58 | 0.13 | (f) | (0.62 | ) | (0.49 | ) | (0.20 | ) | (0.60 | ) | (0.80 | ) | |||||||||||||||
Class R5 | ||||||||||||||||||||||||||||
Year Ended June 30, 2013 | 24.84 | 0.46 | (f)(g) | 5.19 | 5.65 | (0.55 | ) | — | (0.55 | ) | ||||||||||||||||||
Year Ended June 30, 2012 | 24.69 | 0.30 | (f) | 0.10 | 0.40 | (0.25 | ) | — | (0.25 | ) | ||||||||||||||||||
Year Ended June 30, 2011 | 18.65 | 0.26 | (f) | 6.06 | 6.32 | (0.28 | ) | — | (0.28 | ) | ||||||||||||||||||
Year Ended June 30, 2010 | 16.47 | 0.22 | (f) | 2.36 | 2.58 | (0.40 | ) | — | (0.40 | ) | ||||||||||||||||||
Year Ended June 30, 2009 | 24.46 | 0.30 | (f) | (7.48 | ) | (7.18 | ) | (0.21 | ) | (0.60 | ) | (0.81 | ) | |||||||||||||||
Select Class | ||||||||||||||||||||||||||||
Year Ended June 30, 2013 | 24.88 | 0.41 | (f)(g) | 5.20 | 5.61 | (0.49 | ) | — | (0.49 | ) | ||||||||||||||||||
Year Ended June 30, 2012 | 24.73 | 0.25 | (f) | 0.10 | 0.35 | (0.20 | ) | — | (0.20 | ) | ||||||||||||||||||
Year Ended June 30, 2011 | 18.68 | 0.23 | (f) | 6.04 | 6.27 | (0.22 | ) | — | (0.22 | ) | ||||||||||||||||||
Year Ended June 30, 2010 | 16.51 | 0.18 | (f) | 2.37 | 2.55 | (0.38 | ) | — | (0.38 | ) | ||||||||||||||||||
Year Ended June 30, 2009 | 24.47 | 0.27 | (f) | (7.48 | ) | (7.21 | ) | (0.15 | ) | (0.60 | ) | (0.75 | ) | |||||||||||||||
| (a) | Annualized for periods less than one year. |
| (b) | Not annualized for periods less than one year. |
| (c) | Includes adjustments in accordance with accounting principles generally accepted in the United States of America and as such, the net asset values for financial reporting purposes and the returns based upon those net asset values may differ from the net asset values and returns for shareholder transactions. |
| (d) | Includes earnings credits and interest expense, if applicable, each of which is less than 0.01% unless otherwise noted. |
| (e) | Portfolio turnover is calculated by dividing the lesser of total purchases or sales of portfolio securities for the reporting period by the monthly average value of portfolio securities owned during the reporting period. Excluded from both the numerator and denominator are amounts relating to derivatives and securities whose maturities or expiration dates at the time of acquisition were one year or less. |
| (f) | Calculated based upon average shares outstanding. |
| (g) | Reflects a special dividend paid out during the period by one of the Fund’s holdings. Had the Fund not received the special dividend, the net investment income (loss) per share would have been $0.25, $0.11, $0.17, $0.36 and $0.32 for Class A, Class C, Class R2, Class R5 and Select Class Shares, respectively, and the net investment income (loss) ratio would have been 0.91%, 0.41%, 0.61%, 1.31% and 1.16% for Class A, Class C, Class R2, Class R5 and Select Class Shares, respectively. |
| (h) | Commencement of offering of class of shares. |
SEE NOTES TO FINANCIAL STATEMENTS.
| 50 | J.P. MORGAN INTREPID FUNDS | JUNE 30, 2013 | ||||
Table of Contents
| Ratios/Supplemental data | |||||||||||||||||||||||||
| Ratios to average net assets (a) | ||||||||||||||||||||||||||
| Net asset value, end of period | Total return (excludes sales charge) (b)(c) | Net assets, period (000's) | Net expenses (d) | Net investment income (loss) | Expenses without waivers, reimbursements and earning credits | Portfolio turnover rate (b)(e) | ||||||||||||||||||||
| $ | 29.76 | 22.48 | % | $ | 87,954 | 1.24 | % | 1.25 | %(g) | 1.26 | % | 68 | % | |||||||||||||
| 24.68 | 1.26 | 81,139 | 1.25 | 0.82 | 1.27 | 95 | ||||||||||||||||||||
| 24.55 | 33.39 | 47,376 | 1.24 | 0.77 | 1.28 | 102 | ||||||||||||||||||||
| 18.54 | 14.96 | 49,927 | 1.25 | 0.64 | 1.29 | 108 | ||||||||||||||||||||
| 16.41 | (29.40 | ) | 56,213 | 1.25 | 1.25 | 1.32 | 125 | |||||||||||||||||||
| 29.53 | 21.90 | 7,336 | 1.74 | 0.75 | (g) | 1.76 | 68 | |||||||||||||||||||
| 24.48 | 0.78 | 7,117 | 1.75 | 0.31 | 1.78 | 95 | ||||||||||||||||||||
| 24.29 | 32.74 | 9,570 | 1.74 | 0.28 | 1.78 | 102 | ||||||||||||||||||||
| 18.33 | 14.37 | 10,221 | 1.75 | 0.14 | 1.79 | 108 | ||||||||||||||||||||
| 16.28 | (29.78 | ) | 11,270 | 1.75 | 0.73 | 1.81 | 125 | |||||||||||||||||||
| 29.43 | 22.20 | 170 | 1.49 | 0.96 | (g) | 1.51 | 68 | |||||||||||||||||||
| 24.43 | 1.03 | 75 | 1.50 | 0.56 | 1.52 | 95 | ||||||||||||||||||||
| 24.21 | 33.04 | 74 | 1.49 | 0.59 | 1.53 | 102 | ||||||||||||||||||||
| 18.36 | 14.68 | 105 | 1.50 | 0.47 | 1.54 | 108 | ||||||||||||||||||||
| 16.29 | (2.49 | ) | 49 | 1.50 | 1.30 | 1.59 | 125 | |||||||||||||||||||
| 29.94 | 23.05 | 710,586 | 0.79 | 1.66 | (g) | 0.82 | 68 | |||||||||||||||||||
| 24.84 | 1.74 | 411,202 | 0.79 | 1.28 | 0.82 | 95 | ||||||||||||||||||||
| 24.69 | 34.02 | 287,527 | 0.79 | 1.14 | 0.83 | 102 | ||||||||||||||||||||
| 18.65 | 15.49 | 105,092 | 0.80 | 1.12 | 0.84 | 108 | ||||||||||||||||||||
| 16.47 | (29.11 | ) | 84,934 | 0.80 | 1.73 | 0.87 | 125 | |||||||||||||||||||
| 30.00 | 22.83 | 1,391,748 | 0.99 | 1.50 | (g) | 1.02 | 68 | |||||||||||||||||||
| 24.88 | 1.52 | 1,332,607 | 1.00 | 1.07 | 1.02 | 95 | ||||||||||||||||||||
| 24.73 | 33.69 | 1,370,056 | 0.99 | 1.04 | 1.03 | 102 | ||||||||||||||||||||
| 18.68 | 15.28 | 1,259,093 | 1.00 | 0.90 | 1.04 | 108 | ||||||||||||||||||||
| 16.51 | (29.24 | ) | 1,445,890 | 1.00 | 1.47 | 1.06 | 125 | |||||||||||||||||||
SEE NOTES TO FINANCIAL STATEMENTS.
| JUNE 30, 2013 | J.P. MORGAN INTREPID FUNDS | 51 | ||||||
Table of Contents
FINANCIAL HIGHLIGHTS
FOR THE PERIODS INDICATED (continued)
| Per share operating performance | ||||||||||||||||||||||||||||
| Investment operations | Distributions | |||||||||||||||||||||||||||
| Net asset value, beginning of period | Net investment income (loss) | Net realized and unrealized gains (losses) on investments | Total from investment operations | Net investment income | Net asset value, end of period | Total return (excludes sales charge) (b)(c) | ||||||||||||||||||||||
Intrepid Growth Fund | ||||||||||||||||||||||||||||
Class A | ||||||||||||||||||||||||||||
Year Ended June 30, 2013 | $ | 25.00 | $ | 0.21 | (f)(g) | $ | 4.34 | $ | 4.55 | $ | (0.19 | ) | $ | 29.36 | 18.27 | % | ||||||||||||
Year Ended June 30, 2012 | 24.39 | 0.10 | (f) | 0.57 | 0.67 | (0.06 | ) | 25.00 | 2.76 | |||||||||||||||||||
Year Ended June 30, 2011 | 17.93 | 0.12 | (f) | 6.48 | 6.60 | (0.14 | ) | 24.39 | 36.86 | |||||||||||||||||||
Year Ended June 30, 2010 | 15.79 | 0.07 | (f) | 2.20 | 2.27 | (0.13 | ) | 17.93 | 14.32 | |||||||||||||||||||
Year Ended June 30, 2009 | 22.03 | 0.09 | (f) | (6.24 | ) | (6.15 | ) | (0.09 | ) | 15.79 | (27.88 | ) | ||||||||||||||||
Class C | ||||||||||||||||||||||||||||
Year Ended June 30, 2013 | 24.64 | 0.07 | (f)(g) | 4.27 | 4.34 | (0.05 | ) | 28.93 | 17.66 | |||||||||||||||||||
Year Ended June 30, 2012 | 24.09 | (0.02 | )(f) | 0.57 | 0.55 | — | 24.64 | 2.28 | ||||||||||||||||||||
Year Ended June 30, 2011 | 17.70 | 0.01 | (f) | 6.40 | 6.41 | (0.02 | ) | 24.09 | 36.21 | |||||||||||||||||||
Year Ended June 30, 2010 | 15.59 | (0.03 | )(f) | 2.18 | 2.15 | (0.04 | ) | 17.70 | 13.78 | |||||||||||||||||||
Year Ended June 30, 2009 | 21.73 | 0.01 | (f) | (6.15 | ) | (6.14 | ) | — | 15.59 | (28.26 | ) | |||||||||||||||||
Class R2 | ||||||||||||||||||||||||||||
Year Ended June 30, 2013 | 24.72 | 0.13 | (f)(g) | 4.27 | 4.40 | (0.21 | ) | 28.91 | 17.90 | |||||||||||||||||||
Year Ended June 30, 2012 | 24.13 | 0.07 | (f) | 0.54 | 0.61 | (0.02 | ) | 24.72 | 2.53 | |||||||||||||||||||
Year Ended June 30, 2011 | 17.76 | 0.06 | (f) | 6.41 | 6.47 | (0.10 | ) | 24.13 | 36.49 | |||||||||||||||||||
Year Ended June 30, 2010 | 15.65 | 0.02 | (f) | 2.20 | 2.22 | (0.11 | ) | 17.76 | 14.10 | |||||||||||||||||||
November 3, 2008 (h) through June 30, 2009 | 15.84 | 0.08 | (f) | (0.09 | ) | (0.01 | ) | (0.18 | ) | 15.65 | 0.07 | |||||||||||||||||
Class R5 | ||||||||||||||||||||||||||||
Year Ended June 30, 2013 | 25.05 | 0.33 | (f)(g) | 4.34 | 4.67 | (0.31 | ) | 29.41 | 18.79 | |||||||||||||||||||
Year Ended June 30, 2012 | 24.45 | 0.21 | (f) | 0.57 | 0.78 | (0.18 | ) | 25.05 | 3.26 | |||||||||||||||||||
Year Ended June 30, 2011 | 17.98 | 0.21 | (f) | 6.50 | 6.71 | (0.24 | ) | 24.45 | 37.44 | |||||||||||||||||||
Year Ended June 30, 2010 | 15.83 | 0.15 | (f) | 2.22 | 2.37 | (0.22 | ) | 17.98 | 14.86 | |||||||||||||||||||
Year Ended June 30, 2009 | 22.15 | 0.16 | (f) | (6.28 | ) | (6.12 | ) | (0.20 | ) | 15.83 | (27.55 | ) | ||||||||||||||||
Select Class | ||||||||||||||||||||||||||||
Year Ended June 30, 2013 | 25.15 | 0.28 | (f)(g) | 4.35 | 4.63 | (0.26 | ) | 29.52 | 18.52 | |||||||||||||||||||
Year Ended June 30, 2012 | 24.55 | 0.16 | (f) | 0.57 | 0.73 | (0.13 | ) | 25.15 | 3.04 | |||||||||||||||||||
Year Ended June 30, 2011 | 18.04 | 0.17 | (f) | 6.53 | 6.70 | (0.19 | ) | 24.55 | 37.25 | |||||||||||||||||||
Year Ended June 30, 2010 | 15.88 | 0.12 | (f) | 2.22 | 2.34 | (0.18 | ) | 18.04 | 14.64 | |||||||||||||||||||
Year Ended June 30, 2009 | 22.15 | 0.12 | (f) | (6.27 | ) | (6.15 | ) | (0.12 | ) | 15.88 | (27.72 | ) | ||||||||||||||||
| (a) | Annualized for periods less than one year. |
| (b) | Not annualized for periods less than one year. |
| (c) | Includes adjustments in accordance with accounting principles generally accepted in the United States of America and as such, the net asset values for financial reporting purposes and the returns based upon those net asset values may differ from the net asset values and returns for shareholder transactions. |
| (d) | Includes earnings credits and interest expense, if applicable, each of which is less than 0.01% unless otherwise noted. |
| (e) | Portfolio turnover is calculated by dividing the lesser of total purchases or sales of portfolio securities for the reporting period by the monthly average value of portfolio securities owned during the reporting period. Excluded from both the numerator and denominator are amounts relating to derivatives and securities whose maturities or expiration dates at the time of acquisition were one year or less. |
| (f) | Calculated based upon average shares outstanding. |
| (g) | Reflects a special dividend paid out during the period by one of the Fund’s holdings. Had the Fund not received the special dividend, the net investment income (loss) per share would have been $0.14, $0.01, $0.07, $0.26 and $0.21 for Class A, Class C, Class R2, Class R5 and Select Class Shares, respectively, and the net investment income (loss) ratio would have been 0.53%, 0.02%, 0.25%, 0.97% and 0.78% for Class A, Class C, Class R2, Class R5 and Select Class Shares, respectively. |
| (h) | Commencement of offering of class of shares. |
SEE NOTES TO FINANCIAL STATEMENTS.
| 52 | J.P. MORGAN INTREPID FUNDS | JUNE 30, 2013 | ||||
Table of Contents
| Ratios/Supplemental data | |||||||||||||||||
| Ratios to average net assets (a) | ||||||||||||||||||
| Net assets, end of period (000's) | Net expenses (d) | Net investment income (loss) | Expenses without waivers, reimbursements and earning credits | Portfolio turnover rate (b)(e) | ||||||||||||||
| $ | 33,582 | 1.24 | % | 0.76 | %(g) | 1.30 | % | 67 | % | |||||||||
| 32,027 | 1.25 | 0.42 | 1.32 | 110 | ||||||||||||||
| 41,424 | 1.24 | 0.54 | 1.33 | 129 | ||||||||||||||
| 41,167 | 1.25 | 0.36 | 1.34 | 118 | ||||||||||||||
| 49,749 | 1.25 | 0.53 | 1.37 | 121 | ||||||||||||||
| 15,462 | 1.74 | 0.26 | (g) | 1.79 | 67 | |||||||||||||
| 14,298 | 1.75 | (0.09 | ) | 1.82 | 110 | |||||||||||||
| 17,811 | 1.74 | 0.05 | 1.83 | 129 | ||||||||||||||
| 18,827 | 1.75 | (0.14 | ) | 1.84 | 118 | |||||||||||||
| 21,746 | 1.75 | 0.04 | 1.87 | 121 | ||||||||||||||
| 603 | 1.49 | 0.49 | (g) | 1.54 | 67 | |||||||||||||
| 375 | 1.50 | 0.29 | 1.56 | 110 | ||||||||||||||
| 78 | 1.49 | 0.26 | 1.58 | 129 | ||||||||||||||
| 57 | 1.50 | 0.11 | 1.59 | 118 | ||||||||||||||
| 50 | 1.50 | 0.80 | 1.68 | 121 | ||||||||||||||
| 105,839 | 0.79 | 1.21 | (g) | 0.85 | 67 | |||||||||||||
| 107,169 | 0.80 | 0.87 | 0.87 | 110 | ||||||||||||||
| 111,071 | 0.79 | �� | 0.96 | 0.88 | 129 | |||||||||||||
| 86,795 | 0.80 | 0.81 | 0.89 | 118 | ||||||||||||||
| 74,460 | 0.80 | 0.99 | 0.92 | 121 | ||||||||||||||
| 538,378 | 0.99 | 1.02 | (g) | 1.05 | 67 | |||||||||||||
| 502,640 | 1.00 | 0.67 | 1.07 | 110 | ||||||||||||||
| 510,623 | 0.99 | 0.77 | 1.07 | 129 | ||||||||||||||
| 398,110 | 1.00 | 0.61 | 1.09 | 118 | ||||||||||||||
| 495,872 | 1.00 | 0.66 | 1.10 | 121 | ||||||||||||||
SEE NOTES TO FINANCIAL STATEMENTS.
| JUNE 30, 2013 | J.P. MORGAN INTREPID FUNDS | 53 | ||||||
Table of Contents
FINANCIAL HIGHLIGHTS
FOR THE PERIODS INDICATED (continued)
| Per share operating performance | ||||||||||||||||||||||||||||
| Investment operations | Distributions | |||||||||||||||||||||||||||
| Net asset value, beginning of period | Net investment income (loss) | Net realized and unrealized gains (losses) on investments | Total from investment operations | Net investment income | Net realized gain | Total distributions | ||||||||||||||||||||||
Intrepid Mid Cap Fund | ||||||||||||||||||||||||||||
Class A | ||||||||||||||||||||||||||||
Year Ended June 30, 2013 | $ | 14.99 | $ | 0.13 | (d)(e) | $ | 3.80 | $ | 3.93 | $ | (0.13 | ) | $ | — | $ | (0.13 | ) | |||||||||||
Year Ended June 30, 2012 | 15.79 | 0.10 | (d) | (0.79 | ) | (0.69 | ) | (0.11 | ) | — | (0.11 | ) | ||||||||||||||||
Year Ended June 30, 2011 | 11.54 | 0.04 | (d) | 4.26 | 4.30 | (0.05 | ) | — | (0.05 | ) | ||||||||||||||||||
Year Ended June 30, 2010 | 9.53 | 0.07 | (d) | 2.02 | 2.09 | (0.08 | ) | — | (0.08 | ) | ||||||||||||||||||
Year Ended June 30, 2009 | 14.39 | 0.12 | (d) | (4.61 | ) | (4.49 | ) | (0.12 | ) | (0.25 | ) | (0.37 | ) | |||||||||||||||
Class B | ||||||||||||||||||||||||||||
Year Ended June 30, 2013 | 13.47 | 0.02 | (d)(e) | 3.41 | 3.43 | (0.04 | ) | — | (0.04 | ) | ||||||||||||||||||
Year Ended June 30, 2012 | 14.22 | — | (d)(f) | (0.70 | ) | (0.70 | ) | (0.05 | ) | — | (0.05 | ) | ||||||||||||||||
Year Ended June 30, 2011 | 10.44 | (0.04 | )(d) | 3.83 | 3.79 | (0.01 | ) | — | (0.01 | ) | ||||||||||||||||||
Year Ended June 30, 2010 | 8.63 | (0.01 | )(d) | 1.84 | 1.83 | (0.02 | ) | — | (0.02 | ) | ||||||||||||||||||
Year Ended June 30, 2009 | 13.11 | 0.06 | (d) | (4.21 | ) | (4.15 | ) | (0.08 | ) | (0.25 | ) | (0.33 | ) | |||||||||||||||
Class C | ||||||||||||||||||||||||||||
Year Ended June 30, 2013 | 13.48 | 0.02 | (d)(e) | 3.41 | 3.43 | (0.04 | ) | — | (0.04 | ) | ||||||||||||||||||
Year Ended June 30, 2012 | 14.24 | 0.01 | (d) | (0.72 | ) | (0.71 | ) | (0.05 | ) | — | (0.05 | ) | ||||||||||||||||
Year Ended June 30, 2011 | 10.45 | (0.04 | )(d) | 3.85 | 3.81 | (0.02 | ) | — | (0.02 | ) | ||||||||||||||||||
Year Ended June 30, 2010 | 8.64 | (0.01 | )(d) | 1.84 | 1.83 | (0.02 | ) | — | (0.02 | ) | ||||||||||||||||||
Year Ended June 30, 2009 | 13.12 | 0.06 | (d) | (4.21 | ) | (4.15 | ) | (0.08 | ) | (0.25 | ) | (0.33 | ) | |||||||||||||||
Select Class | ||||||||||||||||||||||||||||
Year Ended June 30, 2013 | 15.51 | 0.18 | (d)(e) | 3.93 | 4.11 | (0.17 | ) | — | (0.17 | ) | ||||||||||||||||||
Year Ended June 30, 2012 | 16.33 | 0.14 | (d) | (0.82 | ) | (0.68 | ) | (0.14 | ) | — | (0.14 | ) | ||||||||||||||||
Year Ended June 30, 2011 | 11.92 | 0.08 | (d) | 4.41 | 4.49 | (0.08 | ) | — | (0.08 | ) | ||||||||||||||||||
Year Ended June 30, 2010 | 9.84 | 0.11 | (d) | 2.08 | 2.19 | (0.11 | ) | — | (0.11 | ) | ||||||||||||||||||
Year Ended June 30, 2009 | 14.83 | 0.15 | (d) | (4.75 | ) | (4.60 | ) | (0.14 | ) | (0.25 | ) | (0.39 | ) | |||||||||||||||
| (a) | Includes adjustments in accordance with accounting principles generally accepted in the United States of America and as such, the net asset values for financial reporting purposes and the returns based upon those net asset values may differ from the net asset values and returns for shareholder transactions. |
| (b) | Includes earnings credits and interest expense, if applicable, each of which is less than 0.01% unless otherwise noted. |
| (c) | Portfolio turnover is calculated by dividing the lesser of total purchases or sales of portfolio securities for the reporting period by the monthly average value of portfolio securities owned during the reporting period. Excluded from both the numerator and denominator are amounts relating to derivatives and securities whose maturities or expiration dates at the time of acquisition were one year or less. |
| (d) | Calculated based upon average shares outstanding. |
| (e) | Reflects a special dividend paid out during the period by one of the Fund’s holdings. Had the Fund not received the special dividend, the net investment income (loss) per share would have been $0.08, ($0.02), ($0.03) and $0.13 for Class A, Class B, Class C and Select Class Shares, respectively, and the net investment income (loss) ratio would have been 0.47%, (0.16%), (0.17%), and 0.72% for Class A, Class B, Class C and Select Class Shares, respectively. |
| (f) | Amount rounds to less than $0.01. |
SEE NOTES TO FINANCIAL STATEMENTS.
| 54 | J.P. MORGAN INTREPID FUNDS | JUNE 30, 2013 | ||||
Table of Contents
| Ratios/Supplemental data | |||||||||||||||||||||||||
| Ratios to average net assets | ||||||||||||||||||||||||||
| Net asset value, end of period | Total return (excludes sales charge) (a) | Net assets, end of period (000's) | Net expenses (b) | Net investment income (loss) | Expenses without waivers, reimbursements and earning credits | Portfolio turnover rate (c) | ||||||||||||||||||||
| $ | 18.79 | 26.30 | % | $ | 144,405 | 1.23 | % | 0.78 | %(e) | 1.38 | % | 52 | % | |||||||||||||
| 14.99 | (4.36 | ) | 122,217 | 1.24 | 0.68 | 1.38 | 51 | |||||||||||||||||||
| 15.79 | 37.29 | 138,937 | 1.23 | 0.31 | 1.39 | 47 | ||||||||||||||||||||
| 11.54 | 21.93 | 120,375 | 1.24 | 0.63 | 1.43 | 65 | ||||||||||||||||||||
| 9.53 | (30.94 | ) | 105,702 | 1.24 | 1.22 | 1.55 | 64 | |||||||||||||||||||
| 16.86 | 25.51 | 7,451 | 1.87 | 0.14 | (e) | 1.88 | 52 | |||||||||||||||||||
| 13.47 | (4.94 | ) | 7,805 | 1.88 | 0.03 | 1.88 | 51 | |||||||||||||||||||
| 14.22 | 36.35 | 10,830 | 1.89 | (0.34 | ) | 1.89 | 47 | |||||||||||||||||||
| 10.44 | 21.15 | 10,845 | 1.93 | (0.06 | ) | 1.93 | 65 | |||||||||||||||||||
| 8.63 | (31.38 | ) | 11,745 | 1.85 | 0.60 | 2.04 | 64 | |||||||||||||||||||
| 16.87 | 25.51 | 36,073 | 1.87 | 0.13 | (e) | 1.88 | 52 | |||||||||||||||||||
| 13.48 | (4.97 | ) | 28,079 | 1.88 | 0.04 | 1.88 | 51 | |||||||||||||||||||
| 14.24 | 36.42 | 30,773 | 1.88 | (0.34 | ) | 1.88 | 47 | |||||||||||||||||||
| 10.45 | 21.14 | 22,273 | 1.92 | (0.06 | ) | 1.93 | 65 | |||||||||||||||||||
| 8.64 | (31.35 | ) | 16,706 | 1.85 | 0.61 | 2.05 | 64 | |||||||||||||||||||
| 19.45 | 26.60 | 327,834 | 0.98 | 1.03 | (e) | 1.13 | 52 | |||||||||||||||||||
| 15.51 | (4.11 | ) | 269,693 | 0.99 | 0.94 | 1.13 | 51 | |||||||||||||||||||
| 16.33 | 37.67 | 289,967 | 0.99 | 0.56 | 1.14 | 47 | ||||||||||||||||||||
| 11.92 | 22.23 | 202,190 | 0.99 | 0.88 | 1.18 | 65 | ||||||||||||||||||||
| 9.84 | (30.77 | ) | 224,925 | 0.99 | 1.48 | 1.30 | 64 | |||||||||||||||||||
SEE NOTES TO FINANCIAL STATEMENTS.
| JUNE 30, 2013 | J.P. MORGAN INTREPID FUNDS | 55 | ||||||
Table of Contents
FINANCIAL HIGHLIGHTS
FOR THE PERIODS INDICATED (continued)
| Per share operating performance | ||||||||||||||||||||
| Investment operations | Distributions | |||||||||||||||||||
| Net asset value, beginning of period | Net investment income (loss) | Net realized and unrealized gains (losses) on investments | Total from investment operations | Net investment income | ||||||||||||||||
Intrepid Value Fund | ||||||||||||||||||||
Class A | ||||||||||||||||||||
Year Ended June 30, 2013 | $ | 23.99 | $ | 0.42 | (f) | $ | 5.79 | $ | 6.21 | $ | (0.44 | ) | ||||||||
Year Ended June 30, 2012 | 24.35 | 0.35 | (f) | (0.34 | ) | 0.01 | (0.37 | ) | ||||||||||||
Year Ended June 30, 2011 | 18.64 | 0.30 | (f) | 5.65 | 5.95 | (0.24 | ) | |||||||||||||
Year Ended June 30, 2010 | 16.47 | 0.19 | (f) | 2.17 | 2.36 | (0.19 | ) | |||||||||||||
Year Ended June 30, 2009 | 23.48 | 0.37 | (f) | (7.00 | ) | (6.63 | ) | (0.38 | ) | |||||||||||
Class C | ||||||||||||||||||||
Year Ended June 30, 2013 | 23.80 | 0.29 | (f) | 5.74 | 6.03 | (0.31 | ) | |||||||||||||
Year Ended June 30, 2012 | 24.16 | 0.24 | (f) | (0.35 | ) | (0.11 | ) | (0.25 | ) | |||||||||||
Year Ended June 30, 2011 | 18.53 | 0.19 | (f) | 5.60 | 5.79 | (0.16 | ) | |||||||||||||
Year Ended June 30, 2010 | 16.37 | 0.09 | (f) | 2.16 | 2.25 | (0.09 | ) | |||||||||||||
Year Ended June 30, 2009 | 23.37 | 0.28 | (f) | (6.97 | ) | (6.69 | ) | (0.31 | ) | |||||||||||
Class R2 | ||||||||||||||||||||
Year Ended June 30, 2013 | 23.95 | 0.30 | (f) | 5.83 | 6.13 | (0.39 | ) | |||||||||||||
Year Ended June 30, 2012 | 24.31 | 0.29 | (f) | (0.33 | ) | (0.04 | ) | (0.32 | ) | |||||||||||
Year Ended June 30, 2011 | 18.63 | 0.24 | (f) | 5.64 | 5.88 | (0.20 | ) | |||||||||||||
Year Ended June 30, 2010 | 16.46 | 0.14 | (f) | 2.17 | 2.31 | (0.14 | ) | |||||||||||||
November 3, 2008 (g) through June 30, 2009 | 18.03 | 0.21 | (f) | (1.53 | ) | (1.32 | ) | (0.25 | ) | |||||||||||
Class R5 | ||||||||||||||||||||
Year Ended June 30, 2013 | 24.10 | 0.52 | (f) | 5.82 | 6.34 | (0.53 | ) | |||||||||||||
Year Ended June 30, 2012 | 24.46 | 0.43 | (f) | (0.34 | ) | 0.09 | (0.45 | ) | ||||||||||||
Year Ended June 30, 2011 | 18.71 | 0.37 | (f) | 5.68 | 6.05 | (0.30 | ) | |||||||||||||
Year Ended June 30, 2010 | 16.53 | 0.27 | (f) | 2.19 | 2.46 | (0.28 | ) | |||||||||||||
Year Ended June 30, 2009 | 23.54 | 0.45 | (f) | (7.02 | ) | (6.57 | ) | (0.44 | ) | |||||||||||
Class R6 | ||||||||||||||||||||
Year Ended June 30, 2013 | 24.10 | 0.53 | (f) | 5.83 | 6.36 | (0.55 | ) | |||||||||||||
Year Ended June 30, 2012 | 24.46 | 0.43 | (f) | (0.33 | ) | 0.10 | (0.46 | ) | ||||||||||||
November 30, 2010 (g) through June 30, 2011 | 21.27 | 0.21 | (f) | 3.18 | 3.39 | (0.20 | ) | |||||||||||||
Select Class | ||||||||||||||||||||
Year Ended June 30, 2013 | 24.06 | 0.46 | (f) | 5.81 | 6.27 | (0.48 | ) | |||||||||||||
Year Ended June 30, 2012 | 24.42 | 0.39 | (f) | (0.35 | ) | 0.04 | (0.40 | ) | ||||||||||||
Year Ended June 30, 2011 | 18.70 | 0.33 | (f) | 5.67 | 6.00 | (0.28 | ) | |||||||||||||
Year Ended June 30, 2010 | 16.51 | 0.24 | (f) | 2.19 | 2.43 | (0.24 | ) | |||||||||||||
Year Ended June 30, 2009 | 23.54 | 0.41 | (f) | (7.03 | ) | (6.62 | ) | (0.41 | ) | |||||||||||
| (a) | Annualized for periods less than one year. |
| (b) | Not annualized for periods less than one year. |
| (c) | Includes adjustments in accordance with accounting principles generally accepted in the United States of America and as such, the net asset values for financial reporting purposes and the returns based upon those net asset values may differ from the net asset values and returns for shareholder transactions. |
| (d) | Includes earnings credits and interest expense, if applicable, each of which is less than 0.01% unless otherwise noted. |
| (e) | Portfolio turnover is calculated by dividing the lesser of total purchases or sales of portfolio securities for the reporting period by the monthly average value of portfolio securities owned during the reporting period. Excluded from both the numerator and denominator are amounts relating to derivatives and securities whose maturities or expiration dates at the time of acquisition were one year or less. |
| (f) | Calculated based upon average shares outstanding. |
| (g) | Commencement of offering of class of shares. |
SEE NOTES TO FINANCIAL STATEMENTS.
| 56 | J.P. MORGAN INTREPID FUNDS | JUNE 30, 2013 | ||||
Table of Contents
| Ratios/Supplemental data | |||||||||||||||||||||||||
| Ratios to average net assets (a) | ||||||||||||||||||||||||||
| Net asset value, end of period | Total return (excludes sales charge) (b)(c) | Net assets, end of period (000's) | Net expenses (d) | Net investment income (loss) | Expenses without waivers, reimbursements and earning credits | Portfolio turnover rate (b)(e) | ||||||||||||||||||||
| $ | 29.76 | 26.07 | % | $ | 71,116 | 0.94 | % | 1.57 | % | 1.38 | % | 48 | % | |||||||||||||
| 23.99 | 0.14 | 61,097 | 0.95 | 1.54 | 1.47 | 82 | ||||||||||||||||||||
| 24.35 | 32.01 | 83,202 | 0.97 | 1.34 | 1.40 | 72 | ||||||||||||||||||||
| 18.64 | 14.23 | 82,062 | 1.11 | 0.95 | 1.44 | 113 | ||||||||||||||||||||
| 16.47 | (28.20 | ) | 90,931 | 1.25 | 2.06 | 1.54 | 107 | |||||||||||||||||||
| 29.52 | 25.48 | 25,538 | 1.44 | 1.07 | 1.88 | 48 | ||||||||||||||||||||
| 23.80 | (0.37 | ) | 22,086 | 1.45 | 1.04 | 1.96 | 82 | |||||||||||||||||||
| 24.16 | 31.30 | 30,172 | 1.47 | 0.84 | 1.90 | 72 | ||||||||||||||||||||
| 18.53 | 13.70 | 30,368 | 1.61 | 0.45 | 1.94 | 113 | ||||||||||||||||||||
| 16.37 | (28.57 | ) | 31,875 | 1.75 | 1.56 | 2.04 | 107 | |||||||||||||||||||
| 29.69 | 25.74 | 934 | 1.19 | 1.06 | 1.56 | 48 | ||||||||||||||||||||
| 23.95 | (0.09 | ) | 70 | 1.20 | 1.29 | 1.73 | 82 | |||||||||||||||||||
| 24.31 | 31.65 | 70 | 1.21 | 1.07 | 1.65 | 72 | ||||||||||||||||||||
| 18.63 | 13.98 | 53 | 1.36 | 0.70 | 1.69 | 113 | ||||||||||||||||||||
| 16.46 | (7.15 | ) | 46 | 1.50 | 2.02 | 1.87 | 107 | |||||||||||||||||||
| 29.91 | 26.53 | 62,685 | 0.59 | 1.92 | 0.93 | 48 | ||||||||||||||||||||
| 24.10 | 0.49 | 52,183 | 0.60 | 1.88 | 1.03 | 82 | ||||||||||||||||||||
| 24.46 | 32.45 | 50,276 | 0.60 | 1.60 | 0.94 | 72 | ||||||||||||||||||||
| 18.71 | 14.75 | 17,566 | 0.66 | 1.37 | 0.99 | 113 | ||||||||||||||||||||
| 16.53 | (27.87 | ) | 7,933 | 0.80 | 2.50 | 1.10 | 107 | |||||||||||||||||||
| 29.91 | 26.59 | 10,875 | 0.54 | 1.99 | 0.91 | 48 | ||||||||||||||||||||
| 24.10 | 0.54 | 18,840 | 0.55 | 1.86 | 0.97 | 82 | ||||||||||||||||||||
| 24.46 | 15.96 | 32,237 | 0.54 | 1.48 | 0.87 | 72 | ||||||||||||||||||||
| 29.85 | 26.26 | 926,972 | 0.79 | 1.71 | 1.12 | 48 | ||||||||||||||||||||
| 24.06 | 0.29 | 705,545 | 0.80 | 1.70 | 1.22 | 82 | ||||||||||||||||||||
| 24.42 | 32.17 | 766,468 | 0.80 | 1.44 | 1.14 | 72 | ||||||||||||||||||||
| 18.70 | 14.61 | 138,337 | 0.86 | 1.20 | 1.19 | 113 | ||||||||||||||||||||
| 16.51 | (28.07 | ) | 92,507 | 1.00 | 2.31 | 1.30 | 107 | |||||||||||||||||||
SEE NOTES TO FINANCIAL STATEMENTS.
| JUNE 30, 2013 | J.P. MORGAN INTREPID FUNDS | 57 | ||||||
Table of Contents
AS OF JUNE 30, 2013
1. Organization
JPMorgan Trust I (“JPM I”) and JPMorgan Trust II (“JPM II”) (the “Trusts”) were formed on November 12, 2004, as Delaware statutory trusts, pursuant to Declarations of Trust dated November 5, 2004 and are registered under the Investment Company Act of 1940, as amended (the “1940 Act”), as open-end management investment companies.
The following are 5 separate funds of the Trusts (collectively, the “Funds”) covered by this report:
| Classes Offered | Trust | Diversified/Non-Diversified | ||||
Intrepid Advantage Fund (formerly Intrepid Multi Cap Fund) | Class A, Class C, and Select Class | JPM I | Diversified | |||
| Intrepid America Fund | Class A, Class C, Class R2, Class R5 and Select Class | JPM I | Diversified | |||
| Intrepid Growth Fund | Class A, Class C, Class R2, Class R5 and Select Class | JPM I | Diversified | |||
| Intrepid Mid Cap Fund | Class A, Class B, Class C and Select Class | JPM II | Diversified | |||
| Intrepid Value Fund | Class A, Class C, Class R2, Class R5, Class R6 and Select Class | JPM I | Diversified |
The Investment objective of both the Intrepid America Fund and the Intrepid Growth Fund is to seek to provide long-term capital growth.
The Investment objective of the Intrepid Mid Cap Fund is to seek long-term capital growth by investing primarily in equity securities of companies with intermediate capitalizations.
The Investment objective of both the Intrepid Advantage Fund and the Intrepid Value Fund is to seek to provide long-term capital appreciation.
Effective February 28, 2013, the Intrepid Advantage Fund changed its name from Intrepid Multi Cap Fund.
Effective November 1, 2009, Class B Shares of Intrepid Mid Cap Fund may not be purchased or acquired by new or existing shareholders, except through exchanges from Class B Shares of another J.P. Morgan Fund and dividend reinvestments. Shareholders who have invested in Class B Shares prior to November 1, 2009 may continue to hold their Class B Shares until they automatically convert to Class A Shares.
Class A Shares generally provide for a front-end sales charge while Class B and Class C Shares provide for a contingent deferred sales charge (“CDSC”). Class B Shares automatically convert to Class A Shares after eight years. No sales charges are assessed with respect to Class R2, Class R5, Class R6 and Select Class Shares. All classes of shares have equal rights as to earnings, assets and voting privileges, except that each class may bear different distribution and shareholder servicing fees and each class has exclusive voting rights with respect to its distribution plan and shareholder servicing agreements. Certain Class A Shares, for which front-end sales charges have been waived, may be subject to a CDSC as described in the Funds’ prospectus.
2. Significant Accounting Policies
The following is a summary of significant accounting policies followed by the Funds in the preparation of their financial statements. The policies are in accordance with accounting principles generally accepted in the United States of America (“GAAP”). The preparation of financial statements requires management to make estimates and assumptions that affect the reported amounts and disclosures in the financial statements. Actual results could differ from those estimates.
A. Valuation of Investments — Equity securities listed on a North American, Central American, South American or Caribbean securities exchange shall generally be valued at the last sale price on the exchange on which the security is principally traded that is reported before the time when the net assets of the Funds are valued. Securities listed on the NASDAQ Stock Market LLC are generally valued at the NASDAQ Official Closing Price. Fixed income securities (other than certain short-term investments maturing in less than 61 days) are valued each day based on prices received from independent or affiliated pricing services approved by the Board of Trustees or third party broker-dealers. The pricing services or broker-dealers use multiple valuation techniques to determine fair value. In instances where sufficient market activity exists, the pricing services or broker-dealers may utilize a market-based approach through which quotes from market makers are used to determine fair value. In instances where sufficient market activity may not exist or is limited, the pricing services or broker-dealers also utilize proprietary valuation models which may consider market transactions in comparable securities and the various relationships between securities in determining fair value and/or market characteristics such as benchmark yield curves, option-adjusted spreads, credit spreads, estimated default rates, coupon rates, anticipated timing of principal repayments, underlying collateral, and other unique security features in order to estimate the relevant cash flows, which are then discounted to calculate the fair values. Generally, short-term investments of sufficient credit quality maturing in less than 61 days are valued at amortized cost, which approximates fair value. Investments in other open-end investment companies are valued at each investment company’s net asset value per share (“NAV”) as of the report date.
Certain investments of the Funds may, depending upon market conditions, trade in relatively thin markets and/or in markets that experience significant volatility. As a result of these conditions, the prices used by the Funds to value these securities may differ from the value that would be realized if these securities were sold, and the differences could be material. Futures and options are generally valued on the basis of available market quotations. Swaps and other derivatives are valued daily, primarily using independent or affiliated pricing services approved by the Board of Trustees. If valuations are not available from such services or values received are deemed not representative of fair value, values will be obtained from a third party broker-dealer or counterparty.
| 58 | J.P. MORGAN INTREPID FUNDS | JUNE 30, 2013 | ||||
Table of Contents
Securities or other assets for which market quotations are not readily available or for which market quotations are deemed to not represent the fair value of the security or asset at the time of pricing (including certain illiquid securities) are fair valued in accordance with procedures established by and under the supervision and responsibility of the Board of Trustees. The Board of Trustees has established an Audit and Valuation Committee to assist with the oversight of the valuation of the Funds’ securities. JPMorgan Funds Management, Inc. (the “Administrator”, or “JPMFM”), an indirect, wholly-owned subsidiary of JPMorgan Chase & Co. (“JPMorgan”), has established a Valuation Committee (“VC”) that is comprised of senior representatives from JPMFM, J.P. Morgan Investment Management Inc. (“JPMIM” or the “Advisor”), a wholly-owned subsidiary of JPMorgan Asset Management Holdings Inc. (“JPMAM”), which is a wholly-owned subsidiary of JPMorgan, JPMorgan’s Legal and Compliance and JPMAM’s Risk Management and the Funds’ Chief Compliance Officer. The VC’s responsibilities include making determinations regarding Level 3 fair value measurements (“Fair Values”) and/or providing recommendations for approval to the Board of Trustees’ Audit and Valuation Committee, in accordance with the Funds’ valuation policies.
The VC or Board of Trustees, as applicable, primarily employs a market-based approach which may use related or comparable assets or liabilities, recent transactions, market multiples, book values, and other relevant information for the investment to determine the fair value of the investment. The VC or Board of Trustees may also use an income-based valuation approach in which the anticipated future cash flows of the investment are discounted to calculate fair value. Discounts may also be applied due to the nature or duration of any restrictions on the disposition of the investments. Valuations may be based upon current market prices of securities that are comparable in coupon, rating, maturity and industry.
It is possible that the estimated values may differ significantly from the values that would have been used had a ready market for the investments existed, and such differences could be material. JPMFM and JPMIM are responsible for monitoring developments that may impact Fair Values and for discussing and assessing Fair Values on an ongoing, and at least a quarterly, basis with the VC and Board of Trustees, as applicable. The appropriateness of Fair Values is assessed based on results of unchanged price review and consideration of macro or security specific events, back testing and broker and vendor due diligence.
Valuations reflected in this report are as of the report date. As a result, changes in valuation due to market events and/or issuer related events after the report date and prior to issuance of the report, are not reflected herein.
The various inputs that are used in determining the fair value of the Funds’ investments are summarized into the three broad levels listed below.
| Ÿ | Level 1 — quoted prices in active markets for identical securities |
| Ÿ | Level 2 — other significant observable inputs (including quoted prices for similar securities, interest rates, prepayment speeds, credit risk, etc.) |
| Ÿ | Level 3 — significant unobservable inputs (including the Funds’ own assumptions in determining the fair value of investments) |
A financial instrument’s level within the fair value hierarchy is based on the lowest level of any input, both individually and in the aggregate, that is significant to the fair value measurement. The inputs or methodology used for valuing securities are not necessarily an indication of the risk associated with investing in those securities.
The following tables represent each valuation input as presented on the Schedules of Portfolio Investments (“SOIs”) (amounts in thousands):
| Level 1 Quoted prices | Level 2 Other significant observable inputs | Level 3 Significant | Total | |||||||||||||
Intrepid Advantage Fund | ||||||||||||||||
Total Investments in Securities (a) | $ | 12,603 | $ | — | $ | — | $ | 12,603 | ||||||||
|
|
|
|
|
|
|
| |||||||||
Intrepid America Fund | ||||||||||||||||
Total Investments in Securities (a) | $ | 2,212,967 | $ | — | $ | — | $ | 2,212,967 | ||||||||
|
|
|
|
|
|
|
| |||||||||
Depreciation in Other Financial Instruments | ||||||||||||||||
Futures Contracts | $ | (192 | ) | $ | — | $ | — | $ | (192 | ) | ||||||
|
|
|
|
|
|
|
| |||||||||
Intrepid Growth Fund | ||||||||||||||||
Total Investments in Securities (a) | $ | 696,238 | $ | — | $ | — | $ | 696,238 | ||||||||
|
|
|
|
|
|
|
| |||||||||
Appreciation in Other Financial Instruments | ||||||||||||||||
Futures Contracts | $ | 211 | $ | — | $ | — | $ | 211 | ||||||||
|
|
|
|
|
|
|
| |||||||||
Intrepid Mid Cap Fund | ||||||||||||||||
Total Investments in Securities (b) | $ | 514,057 | $ | 810 | $ | — | $ | 514,867 | ||||||||
|
|
|
|
|
|
|
| |||||||||
Appreciation in Other Financial Instruments | ||||||||||||||||
Futures Contracts | $ | 31 | $ | — | $ | — | $ | 31 | ||||||||
|
|
|
|
|
|
|
| |||||||||
| JUNE 30, 2013 | J.P. MORGAN INTREPID FUNDS | 59 | ||||||
Table of Contents
NOTES TO FINANCIAL STATEMENTS
AS OF JUNE 30, 2013 (continued)
| Level 1 Quoted prices | Level 2 Other significant observable inputs | Level 3 Significant | Total | |||||||||||||
Intrepid Value Fund | ||||||||||||||||
Total Investments in Securities (a) | $ | 1,102,143 | $ | — | $ | — | $ | 1,102,143 | ||||||||
|
|
|
|
|
|
|
| |||||||||
Depreciation in Other Financial Instruments | ||||||||||||||||
Futures Contracts | $ | (25 | ) | $ | — | $ | — | $ | (25 | ) | ||||||
|
|
|
|
|
|
|
| |||||||||
| (a) | All portfolio holdings designated as Level 1 are disclosed individually on the SOIs. Please refer to the SOIs for industry specifics of portfolio holdings. |
| (b) | All portfolio holdings designated as Level 1 and Level 2 are disclosed individually on the SOIs. Level 2 consists of a U.S. Treasury Note that is held for futures collateral. Please refer to the SOIs for industry specifics of portfolio holdings. |
There were no transfers between any levels during the year ended June 30, 2013.
B. Futures Contracts — The Funds use index futures contracts to gain or reduce exposure to the stock market, maintain liquidity and minimize transaction costs. The Funds also buy futures contracts to immediately invest incoming cash in the market or sell futures in response to cash outflows, thereby simulating an invested position in the underlying index while maintaining a cash balance for liquidity. The use of futures contracts exposes the Funds to equity price risk.
Futures contracts provide for the delayed delivery of the underlying instrument at a fixed price or are settled for a cash amount based on the change in the value of the underlying instrument at a specific date in the future. Upon entering into a futures contract, the Funds are required to deposit with the broker, cash or securities in an amount equal to a certain percentage of the contract amount, which is referred to as the initial margin deposit. Subsequent payments, referred to as variation margin, are made or received by the Funds periodically and are based on changes in the market value of open futures contracts. Changes in the market value of open futures contracts are recorded as unrealized appreciation or depreciation on the Statements of Operations. Realized gains or losses, representing the difference between the value of the contract at the time it was opened and the value at the time it was closed, are reported on the Statements of Operations at the closing or expiration of the futures contract. Securities deposited as initial margin are designated in the SOIs and cash deposited is recorded on the Statements of Assets and Liabilities. A receivable from and/or a payable to brokers for the daily variation margin is also recorded on the Statements of Assets and Liabilities.
The Funds may be subject to the risk that the change in the value of the futures contract may not correlate perfectly with the underlying instrument. Use of long futures contracts subjects the Funds to risk of loss in excess of the amounts shown on the Statements of Assets and Liabilities, up to the notional amount of the futures contracts. Use of short futures contracts subjects the Funds to unlimited risk of loss. The Funds may enter into futures contracts only on exchanges or boards of trade. The exchange or board of trade acts as the counterparty to each futures transaction; therefore, the Funds’ credit risk is limited to failure of the exchange or board of trade. Under some circumstances, futures exchanges may establish daily limits on the amount that the price of a futures contract can vary from the previous day’s settlement price, which could effectively prevent liquidation of positions.
The table below discloses the volume of the Funds’ futures contracts activity during the year ended June 30, 2013 (amounts in thousands):
| Intrepid Advantage Fund | Intrepid America Fund | Intrepid Growth Fund | Intrepid Mid Cap Fund | Intrepid Value Fund | ||||||||||||||||
Futures Contracts: |
| |||||||||||||||||||
Average Notional Balance Long | $ | 195 | $ | 52,127 | $ | 17,972 | $ | 11,439 | $ | 26,406 | ||||||||||
Ending Notional Balance Long | — | 65,012 | 18,552 | 6,137 | 31,746 | |||||||||||||||
C. Securities Lending — Each Fund (except Intrepid Advantage Fund) may lend securities to brokers approved by the Advisor in order to generate additional income. Goldman Sachs Bank USA, doing business as Goldman Sachs Agency Lending (“GSAL”) serves as lending agent for each Fund except Intrepid Advantage Fund pursuant to a Securities Lending Agreement (the “GSAL Securities Lending Agreement”). The Funds receive cash collateral, which is invested in Capital Shares of the JPMorgan Prime Money Market Fund (“Collateral Investments”). Upon termination of a loan, the Funds are required to return to the borrower the posted cash collateral. Loans are subject to termination by the Funds or the borrower at any time.
Securities lending income is comprised of income earned on Collateral Investments, net amount of a rebate received from or paid to borrowers for use of cash collateral and lending agent fees. This amount is recorded as Income from securities lending (net) on the Statements of Operations. The Funds also receive payments from the borrower during the period of the loan, equivalent to dividends and interest earned on the securities loaned, which are recorded as Dividend or Interest income, respectively, on the Statements of Operations.
| 60 | J.P. MORGAN INTREPID FUNDS | JUNE 30, 2013 | ||||
Table of Contents
For the year ended June 30, 2013, the Funds earned the following amounts from the investment of cash collateral, prior to rebates or fees, from an investment in an affiliated fund as described below (amounts in thousands):
Intrepid Mid Cap Fund | $ | — | (a) | |
Intrepid Value Fund | — | (a) |
| (a) | Amounts rounds to less than $1,000 |
At the inception of a loan, securities are exchanged for cash collateral equal to at least 102% of the value of loaned U.S. securities, plus accrued interest. The GSAL Securities Lending Agreement requires that the loaned securities be marked to market on a daily basis and additional cash collateral is requested from borrowers when the cash received from borrowers becomes less than 102% of the value of loaned securities.
The value of the cash collateral received is recorded as a liability on the Statements of Assets and Liabilities and details of Collateral Investments are disclosed in the SOIs. At June 30, 2013, there were no securities out on loan.
The Funds bear the risk of loss associated with the Collateral Investments and are not entitled to additional collateral from the borrower to cover any such losses. To the extent that the value of the Collateral Investments declines below the amount owed to a borrower, a Fund may incur losses that exceed the amount it earned on lending the security. Upon termination of a loan, a Fund may use leverage (borrow money) to repay the borrower for cash collateral posted, if the Advisor does not believe that it is prudent to sell the Collateral Investments to fund the payment of this liability.
Securities lending also involves counterparty risks, including the risk that the loaned securities may not be returned in a timely manner or at all. Subject to certain conditions, GSAL has agreed to indemnify the Funds from losses resulting from a borrower’s failure to return a loaned security.
The Advisor waived fees associated with the following Funds’ investment of collateral in JPMorgan Prime Money Market Fund as follows (amounts in thousands):
Intrepid Mid Cap Fund | $ | — | (a) | |
Intrepid Value Fund | — | (a) |
| (a) | Amount rounds to less than $1,000 |
These amounts offset the administration fees and shareholder servicing fees incurred by JPMorgan Prime Money Market Fund related to the Funds’ investment in such fund. A portion of the waiver is voluntary.
D. Security Transactions and Investment Income — Investment transactions are accounted for on the trade date (the date the order to buy or sell is executed). Securities gains and losses are calculated on a specifically identified cost basis. Interest income is determined on the basis of coupon interest accrued using the effective interest method which adjusts for amortization of premiums and accretion of discounts. Dividend income, net of foreign taxes withheld, if any, is recorded on the ex-dividend date or when a Fund first learns of the dividend.
To the extent such information is publically available, the Funds record distributions received in excess of income earned from underlying investments as a reduction of cost of investments and/or realized gain. Such amounts are based on estimates if actual amounts are not available and actual amounts of income, realized gain and return of capital may differ from the estimated amounts. The Funds adjust the estimated amounts of the components of distributions (and consequently their net investment income) as necessary once the issuers provide information about the actual composition of the distributions.
E. Allocation of Income and Expenses — Expenses directly attributable to a fund are charged directly to that fund, while the expenses attributable to more than one fund of the Trusts are allocated among the respective funds. In calculating the NAV of each class, investment income, realized and unrealized gains and losses and expenses, other than class specific expenses, are allocated daily to each class of shares based upon the proportion of net assets of each class at the beginning of each day.
F. Federal Income Taxes — Each Fund is treated as a separate taxable entity for Federal income tax purposes. Each Fund’s policy is to comply with the provisions of the Internal Revenue Code of 1986, as amended (the “Code”), applicable to regulated investment companies and to distribute to shareholders all of its distributable net investment income and net realized gain on investments. Accordingly, no provision for Federal income tax is necessary. Management has reviewed the Funds’ tax positions for all open tax years and has determined that as of June 30, 2013, no liability for income tax is required in the Funds’ financial statements for net unrecognized tax benefits. However, management’s conclusions may be subject to future review based on changes in, or the interpretation of, the accounting standards or tax laws and regulations. Each of the Fund’s Federal tax returns for the prior three fiscal years remain subject to examination by the Internal Revenue Service.
G. Distributions to Shareholders — Distributions from net investment income are generally declared and paid at least annually, except for the Intrepid Mid Cap Fund and Intrepid Value Fund, which are generally declared and paid at least quarterly. Distributions are declared separately for each class. No class has preferential dividend rights; differences in per share rates are due to differences in separate class expenses. Net realized capital gains, if any, are distributed by each Fund at least annually. The amount of distributions from net investment income and net realized capital
| JUNE 30, 2013 | J.P. MORGAN INTREPID FUNDS | 61 | ||||||
Table of Contents
NOTES TO FINANCIAL STATEMENTS
AS OF JUNE 30, 2013 (continued)
gains is determined in accordance with Federal income tax regulations, which may differ from GAAP. To the extent these “book/tax” differences are permanent in nature (i.e., that they result from other than timing of recognition — “temporary differences”), such amounts are reclassified within the capital accounts based on their Federal tax-basis treatment.
The following amounts were reclassified within the capital accounts (amounts in thousands):
| Paid-in-Capital | Accumulated undistributed (distributions net investment income | Accumulated net realized gains (losses) | ||||||||||
Intrepid Advantage Fund | $ | — | (a) | $ | (1 | ) | $ | 1 | ||||
Intrepid America Fund | — | (a) | (904 | ) | 904 | |||||||
Intrepid Growth Fund | — | (a) | (245 | ) | 245 | |||||||
Intrepid Mid Cap Fund | — | (a) | (121 | ) | 121 | |||||||
Intrepid Value Fund | — | (a) | 14 | (14 | ) | |||||||
| (a) | Amounts rounds to less than $1,000. |
The reclassifications for the Funds relate primarily to non-taxable dividends and differences in the tax treatment of real estate investment trust investments and partnership investments.
3. Fees and Other Transactions with Affiliates
A. Investment Advisory Fee — Pursuant to the Investment Advisory Agreements, the Advisor supervises the investments of each Fund and for such services is paid a fee. The fee is accrued daily and paid monthly at an annual rate of 0.65% of each Fund’s average daily net assets.
The Advisor waived Investment Advisory fees and/or reimbursed expenses as outlined in Note 3.F.
B. Administration Fee — Pursuant to an Administration Agreement, the Administrator provides certain administration services to the Funds. In consideration of these services, the Administrator receives a fee accrued daily and paid monthly at an annual rate of 0.15% of the first $25 billion of the average daily net assets of all funds in the J.P. Morgan Funds Complex (excluding certain funds of funds and money market funds) and 0.075% of the average daily net assets in excess of $25 billion of all such funds. For the year ended June 30, 2013, the annual effective rate was 0.09% of each Fund’s average daily net assets, notwithstanding any fee waivers and/or expense reimbursements.
The Administrator waived Administration fees as outlined in Note 3.F.
JPMorgan Chase Bank, N.A. (“JPMCB”), a wholly-owned subsidiary of JPMorgan, serves as the Funds’ sub-administrator (the “Sub-administrator”). For its services as Sub-administrator, JPMCB receives a portion of the fees payable to the Administrator.
C. Distribution Fees — Pursuant to a Distribution Agreement, JPMorgan Distribution Services, Inc. (the “Distributor”), a wholly-owned subsidiary of JPMorgan, serves as the Trusts’ exclusive underwriter and promotes and arranges for the sale of each Fund’s shares.
The Board of Trustees has adopted a Distribution Plan (the “Distribution Plan”) for Class A, Class B, Class C and Class R2 Shares of the Funds in accordance with Rule 12b-1 under the 1940 Act. The Distribution Plan provides that each Fund shall pay distribution fees, including payments to the Distributor, at annual rates of the average daily net assets as shown in the table below:
| Class A | Class B | Class C | Class R2 | |||||||||||||
Intrepid Advantage Fund | 0.25 | % | n/a | 0.75 | % | n/a | ||||||||||
Intrepid America Fund | 0.25 | n/a | 0.75 | 0.50 | % | |||||||||||
Intrepid Growth Fund | 0.25 | n/a | 0.75 | 0.50 | ||||||||||||
Intrepid Mid Cap Fund | 0.25 | 0.75 | % | 0.75 | n/a | |||||||||||
Intrepid Value Fund | 0.25 | n/a | 0.75 | 0.50 | ||||||||||||
In addition, the Distributor is entitled to receive the front-end sales charges from purchases of Class A Shares and the CDSC from redemptions of Class B and Class C Shares and certain Class A Shares for which front-end sales charges have been waived. For the year ended June 30, 2013, the Distributor retained the following amounts (in thousands):
| Front-End Sales Charge | CDSC | |||||||
Intrepid Advantage Fund | $ | 2 | $ | — | (a) | |||
Intrepid America Fund | 4 | — | (a) | |||||
Intrepid Growth Fund | 6 | — | (a) | |||||
Intrepid Mid Cap Fund | 59 | 2 | ||||||
Intrepid Value Fund | 6 | — | (a) | |||||
| (a) | Amount rounds to less than $1,000 |
| 62 | J.P. MORGAN INTREPID FUNDS | JUNE 30, 2013 | ||||
Table of Contents
D. Shareholder Servicing Fees — The Trusts, on behalf of the Funds, have entered into Shareholder Servicing Agreements with the Distributor under which the Distributor provides certain support services to the shareholders. The Class R6 Shares do not participate in the Shareholder Servicing Agreement. For performing these services, the Distributor receives a fee that is accrued daily and paid monthly equal to a percentage of the average daily net assets as shown in the table below:
| Class A | Class B | Class C | Class R2 | Class R5 | Select Class | |||||||||||||||||||
Intrepid Advantage Fund | 0.25 | % | n/a | 0.25 | % | n/a | n/a | 0.25 | % | |||||||||||||||
Intrepid America Fund | 0.25 | n/a | 0.25 | 0.25 | % | 0.05 | % | 0.25 | ||||||||||||||||
Intrepid Growth Fund | 0.25 | n/a | 0.25 | 0.25 | 0.05 | 0.25 | ||||||||||||||||||
Intrepid Mid Cap Fund | 0.25 | 0.25 | % | 0.25 | n/a | n/a | 0.25 | |||||||||||||||||
Intrepid Value Fund | 0.25 | n/a | 0.25 | 0.25 | 0.05 | 0.25 | ||||||||||||||||||
The Distributor has entered into shareholder services contracts with affiliated and unaffiliated financial intermediaries who provide shareholder services and other related services to their clients or customers who invest in the Funds under which the Distributor will pay all or a portion of such fees earned to financial intermediaries for performing such services.
The Distributor waived Shareholder Servicing fees as outlined in Note 3.F.
E. Custodian and Accounting Fees — JPMCB provides portfolio custody and accounting services to the Funds. The amounts paid directly to JPMCB by the Funds for custody and accounting services are included in Custodian and accounting fees in the Statements of Operations. Payments to the custodian may be reduced by credits earned by each Fund, based on uninvested cash balances held by the custodian. Such earnings credits, if any, are presented separately in the Statements of Operations.
Interest expense, if any, paid to the custodian related to cash overdrafts is included in Interest expense to affiliates in the Statements of Operations.
F. Waivers and Reimbursements — The Advisor, Administrator and Distributor have contractually agreed to waive fees and/or reimburse the Funds to the extent that total annual operating expenses (excluding acquired fund fees and expenses, dividend expenses related to short sales, interest, taxes, expenses related to litigation and potential litigation, extraordinary expenses and expenses related to the Board of Trustees’ deferred compensation plan) exceed the percentages of the Funds’ respective average daily net assets as shown in the table below:
| Class A | Class B | Class C | Class R2 | Class R5 | Class R6 | Select Class | ||||||||||||||||||||||
Intrepid Advantage Fund | 1.25 | % | n/a | 1.75 | % | n/a | n/a | n/a | 1.00 | % | ||||||||||||||||||
Intrepid America Fund | 1.25 | n/a | 1.75 | 1.50 | % | 0.80 | % | n/a | 1.00 | |||||||||||||||||||
Intrepid Growth Fund | 1.25 | n/a | 1.75 | 1.50 | 0.80 | n/a | 1.00 | |||||||||||||||||||||
Intrepid Mid Cap Fund | 1.24 | 1.99 | % | 1.99 | n/a | n/a | n/a | 0.99 | ||||||||||||||||||||
Intrepid Value Fund | 0.95 | n/a | 1.45 | 1.20 | 0.60 | 0.55 | % | 0.80 | ||||||||||||||||||||
The expense limitation agreements were in effect for the year ended June 30, 2013. The contractual expense limitation percentages in the table above are in place until at least October 31, 2013. In addition, the Funds’ service providers have voluntarily waived fees during the year ended June 30, 2013. However, the Funds’ service providers are under no obligation to do so and may discontinue such voluntary waivers at any time.
For the year ended June 30, 2013, the Funds’ service providers waived fees and/or reimbursed expenses for each of the Funds as follows (amounts in thousands). None of these parties expect the Funds to repay any such waived fees and reimbursed expenses in future years.
| Contractual Waivers | ||||||||||||||||||||
| Investment Advisory | Administration | Shareholder Servicing | Total | Contractual Reimbursement | ||||||||||||||||
Intrepid Advantage Fund | $ | 71 | $ | 9 | $ | 28 | $ | 108 | $ | 22 | ||||||||||
Intrepid America Fund | — | — | 348 | 348 | — | |||||||||||||||
Intrepid Growth Fund | — | 33 | 296 | 329 | — | |||||||||||||||
Intrepid Mid Cap Fund | 5 | — | 603 | 608 | — | |||||||||||||||
Intrepid Value Fund | 2,292 | 810 | 88 | 3,190 | — | |||||||||||||||
| Voluntary Waivers | ||||||||||||||||
| Investment Advisory | Administration | Shareholder Servicing | Total | |||||||||||||
Intrepid Mid Cap Fund | $ | — | (a) | $ | — | $ | 1 | $ | 1 | |||||||
(a) Amount rounds to less then $1,000
Additionally, the Funds may invest in one or more money market funds advised by the Advisor or its affiliates. The Advisor, Administrator and the Distributor, as shareholder servicing agent, waive fees in an amount sufficient to offset the respective fees each charges to the affiliated money market fund on the Funds’ investment in such affiliated money market fund. A portion of the waiver is voluntary.
| JUNE 30, 2013 | J.P. MORGAN INTREPID FUNDS | 63 | ||||||
Table of Contents
NOTES TO FINANCIAL STATEMENTS
AS OF JUNE 30, 2013 (continued)
The amount of waivers resulting from investments in these money market funds for the year ended June 30, 2013 was as follows (excluding the waiver disclosed in Note 2.C. regarding cash collateral for securities lending invested in the JPMorgan Prime Money Market Fund) (amounts in thousands):
Intrepid Advantage Fund | $ | — | (a) | |
Intrepid America Fund | 112 | |||
Intrepid Growth Fund | 40 | |||
Intrepid Mid Cap Fund | 21 | |||
Intrepid Value Fund | 60 |
| (a) | Amount rounds to less then $1,000 |
G. Other — Certain officers of the Trusts are affiliated with the Advisor, the Administrator and the Distributor. Such officers, with the exception of the Chief Compliance Officer, receive no compensation from the Funds for serving in their respective roles.
The Board of Trustees appointed a Chief Compliance Officer to the Funds in accordance with Federal securities regulations. Each Fund, along with other affiliated funds, makes reimbursement payments, on a pro-rata basis, to the Administrator for a portion of the fees associated with the Office of the Chief Compliance Officer. Such fees are included in Trustees’ and Chief Compliance Officer’s fees in the Statements of Operations.
The Trusts adopted a Trustee Deferred Compensation Plan (the “Plan”) which allows the Independent Trustees to defer the receipt of all or a portion of compensation related to performance of their duties as Trustees. The deferred fees are invested in various J.P. Morgan Funds until distribution in accordance with the Plan.
During the year ended June 30, 2013, the Funds may have purchased securities from an underwriting syndicate in which the principal underwriter or members of the syndicate are affiliated with the Advisor.
The Funds may use related party broker-dealers. For the year ended June 30, 2013, the Funds did not incur any brokerage commissions with broker-dealers affiliated with the Advisor.
The Securities and Exchange Commission (“SEC”) has granted an exemptive order permitting the Funds to engage in principal transactions with J.P. Morgan Securities, Inc., an affiliated broker, involving taxable money market instruments, subject to certain conditions.
4. Investment Transactions
During the year ended June 30, 2013, purchases and sales of investments (excluding short-term investments) were as follows (amounts in thousands):
| Purchases (excluding U.S. Government) | Sales (excluding | Purchases of U.S. Government | Sales of U.S. Government | |||||||||||||
Intrepid Advantage Fund | $ | 9,474 | $ | 9,087 | $ | — | $ | — | ||||||||
Intrepid America Fund | 1,320,988 | 1,356,572 | — | — | ||||||||||||
Intrepid Growth Fund | 446,529 | 512,153 | — | — | ||||||||||||
Intrepid Mid Cap Fund | 233,337 | 241,949 | 715 | 730 | ||||||||||||
Intrepid Value Fund | 480,177 | 440,776 | — | — | ||||||||||||
5. Federal Income Tax Matters
For Federal income tax purposes, the cost and unrealized appreciation (depreciation) in value of investment securities held at June 30, 2013 were as follows (amounts in thousands):
Aggregate Cost | Gross Unrealized Appreciation | Gross Unrealized Depreciation | Net Unrealized Appreciation (Depreciation) | |||||||||||||
Intrepid Advantage Fund | $ | 10,247 | $ | 2,457 | $ | 101 | $ | 2,356 | ||||||||
Intrepid America Fund | 1,759,406 | 464,784 | 11,223 | 453,561 | ||||||||||||
Intrepid Growth Fund | 554,508 | 146,529 | 4,799 | 141,730 | ||||||||||||
Intrepid Mid Cap Fund | 377,432 | 142,804 | 5,368 | 137,436 | ||||||||||||
Intrepid Value Fund | 911,952 | 197,051 | 6,860 | 190,191 | ||||||||||||
For all of the funds, the difference between book and tax appreciation (depreciation) on investments is primarily attributed to non-taxable dividends, and wash sale deferrals.
| 64 | J.P. MORGAN INTREPID FUNDS | JUNE 30, 2013 | ||||
Table of Contents
The tax character of distributions paid during the fiscal year ended June 30, 2013 was as follows (amounts in thousands):
Ordinary Income | Total Distributions Paid | |||||||
Intrepid Advantage Fund | $ | 117 | $ | 117 | ||||
Intrepid America Fund | 36,668 | 36,668 | ||||||
Intrepid Growth Fund | 6,481 | 6,481 | ||||||
Intrepid Mid Cap Fund | 3,867 | 3,867 | ||||||
Intrepid Value Fund | 16,953 | 16,953 | ||||||
The tax character of distributions paid during the fiscal year ended June 30, 2012 was as follows (amounts in thousands):
Ordinary Income | Total Distributions Paid | |||||||
Intrepid Advantage Fund | $ | 99 | $ | 99 | ||||
Intrepid America Fund | 15,577 | 15,577 | ||||||
Intrepid Growth Fund | 3,587 | 3,587 | ||||||
Intrepid Mid Cap Fund | 3,572 | 3,572 | ||||||
Intrepid Value Fund | 14,443 | 14,443 | ||||||
As of June 30, 2013, the components of net assets (excluding paid-in-capital) on a tax basis were as follows (amounts in thousands):
Current Distributable Ordinary Income | Current Distributable Long-Term Capital Gain or (Tax Basis Capital Loss Carryover) | Unrealized Appreciation (Depreciation) | ||||||||||
Intrepid Advantage Fund | $ | 39 | $ | (4,300 | ) | $ | 2,356 | |||||
Intrepid America Fund | 12,208 | (244,137 | ) | 453,561 | ||||||||
Intrepid Growth Fund | 2,404 | (355,932 | ) | 141,730 | ||||||||
Intrepid Mid Cap Fund | 100 | (26,982 | ) | 137,436 | ||||||||
Intrepid Value Fund | 198 | (40,297 | ) | 190,191 | ||||||||
For the Funds, the cumulative timing differences primarily consist of trustee deferred compensation, wash sale loss deferrals, distributions payable, net mark to market gains (losses) on futures contracts and investment in real estate investment trust investments.
Under the Regulated Investment Company Modernization Act of 2010 (the “Act”), net capital losses recognized by the Funds after June 30, 2011 are carried forward indefinitely, and retain their character as short-term and/or long-term losses. Prior to the Act, net capital losses incurred by the Funds were carried forward for eight years and treated as short-term losses. The Act requires that post-enactment net capital losses be used before pre-enactment net capital losses.
At June 30, 2013, the Funds did not have any post-enactment net capital loss carryforwards.
At June 30, 2013, the Funds had the pre-enactment net capital loss carryforwards, expiring during the year indicated, which are available to offset future realized gains (amounts in thousands):
| 2017 | 2018 | Total | ||||||||||
Intrepid Advantage Fund | $ | 868 | $ | 3,432 | $ | 4,300 | ||||||
Intrepid America Fund | — | 244,137 | 244,137 | |||||||||
Intrepid Growth Fund | 103,442 | 252,490 | 335,932 | |||||||||
Intrepid Mid Cap Fund | — | 26,982 | 26,982 | |||||||||
Intrepid Value Fund | — | 40,297 | 40,297 | |||||||||
During the year ended June 30, 2013, the Funds utilized capital loss carryforwards as follows (amounts in thousands)
Intrepid Advantage Fund | $ | 1,502 | ||
Intrepid America Fund | 228,841 | |||
Intrepid Growth Fund | 92,515 | |||
Intrepid Mid Cap Fund | 32,956 | |||
Intrepid Value | 47,958 |
| JUNE 30, 2013 | J.P. MORGAN INTREPID FUNDS | 65 | ||||||
Table of Contents
NOTES TO FINANCIAL STATEMENTS
AS OF JUNE 30, 2013 (continued)
6. Borrowings
The Funds rely upon an exemptive order granted by the SEC (the “Order”) permitting the establishment and operation of an Interfund Lending Facility (the “Facility”). The Facility allows the Funds to directly lend and borrow money to or from any other fund relying upon the Order at rates beneficial to both the borrowing and lending funds. Advances under the Facility are taken primarily for temporary or emergency purposes, including the meeting of redemption requests that otherwise might require the untimely disposition of securities, and are subject to each Fund’s borrowing restrictions. The Interfund loan rate is determined, as specified in the Order, by averaging the current repurchase agreement rate and the current bank loan rate. The Order was granted to JPM II and may be relied upon by the Funds because they are investment companies in the same “group of investment companies” (as defined in Section 12(d)(1)(G) of the 1940 Act).
In addition, the Trusts and JPMCB have entered into a financing arrangement. Under this arrangement, JPMCB provides an unsecured, uncommitted credit facility in the aggregate amount of $100 million to certain of the J.P. Morgan Funds, including the Funds. Advances under the arrangement are taken primarily for temporary or emergency purposes, including the meeting of redemption requests that otherwise might require the untimely disposition of securities, and are subject to each Fund’s borrowing restrictions. Interest on borrowings is payable at a rate determined by JPMCB at the time of borrowing. This agreement has been extended until November 11, 2013.
The Funds had no borrowings outstanding from another fund or from the unsecured, uncommitted credit facility at June 30, 2013, or at any time during the year then ended.
Interest expense paid, if any, as a result of borrowings from another fund or from the unsecured, uncommitted credit facility is included in Interest expense to affiliates in the Statements of Operations.
7. Risks, Concentrations and Indemnifications
In the normal course of business, the Funds enter into contracts that contain a variety of representations which provide general indemnifications. Each Fund’s maximum exposure under these arrangements is unknown. The amount of exposure would depend on future claims that may be made against each Fund that have not yet occurred. However, based on experience, the Funds expect the risk of loss to be remote.
One or more affiliates of the Advisor have investment discretion with respect to their clients’ holdings in the Funds, which collectively represent a significant portion of the Funds’ assets for each of the Intrepid Advantage Fund, Intrepid America Fund, Intrepid Growth Fund and Intrepid Mid Cap Fund.
In addition, the J.P. Morgan Investor Funds and JPMorgan SmartRetirement Funds, which are affiliated funds of funds, own in the aggregate more than 10% of the net assets of the Funds as follows:
| JPMorgan Investor Funds | JPMorgan SmartRetirement Funds | |||||||
Intrepid America Fund | 46.2 | % | 30.3 | % | ||||
Intrepid Growth Fund | 62.9 | N/A | ||||||
Intrepid Mid Cap Fund | 57.3 | N/A | ||||||
Additionally, Intrepid Advantage Fund, Intrepid Mid Cap Fund and Intrepid Value Fund each have a shareholder which is an account maintained by a financial intermediary on behalf of its clients, that owns a significant portion of that Fund’s outstanding shares.
Significant shareholder transactions by these shareholders, if any, may impact the Funds’ performance.
| 66 | J.P. MORGAN INTREPID FUNDS | JUNE 30, 2013 | ||||
Table of Contents
REPORT OF INDEPENDENT REGISTERED PUBLIC ACCOUNTING FIRM
To the Board of Trustees of JPMorgan Trust I and JPMorgan Trust II and the Shareholders of JPMorgan Intrepid Advantage Fund (formerly known as JPMorgan Intrepid Multi Cap Fund), JPMorgan Intrepid America Fund, JPMorgan Intrepid Growth Fund, JPMorgan Intrepid Mid Cap Fund and JPMorgan Intrepid Value Fund:
In our opinion, the accompanying statements of assets and liabilities, including the schedules of portfolio investments, and the related statements of operations and of changes in net assets and the financial highlights present fairly, in all material respects, the financial position of JPMorgan Intrepid Advantage Fund (formerly known as JPMorgan Intrepid Multi Cap Fund), JPMorgan Intrepid America Fund, JPMorgan Intrepid Growth Fund and JPMorgan Intrepid Value Fund (each a separate fund of JPMorgan Trust I) and JPMorgan Intrepid Mid Cap Fund (a separate fund of JPMorgan Trust II) (hereafter collectively referred to as the “Funds”) at June 30, 2013, the results of each of their operations for the year then ended, the changes in each of their net assets for each of the two years in the period then ended and the financial highlights for each of the five years in the period then ended, in conformity with accounting principles generally accepted in the United States of America. These financial statements and financial highlights (hereafter referred to as “financial statements”) are the responsibility of the Funds’ management. Our responsibility is to express an opinion on these financial statements based on our audits. We conducted our audits of these financial statements in accordance with the standards of the Public Company Accounting Oversight Board (United States). Those standards require that we plan and perform the audit to obtain reasonable assurance about whether the financial statements are free of material misstatement. An audit includes examining, on a test basis, evidence supporting the amounts and disclosures in the financial statements, assessing the accounting principles used and significant estimates made by management, and evaluating the overall financial statement presentation. We believe that our audits, which included confirmation of securities at June 30, 2013 by correspondence with the custodian and brokers, provide a reasonable basis for our opinion.
PricewaterhouseCoopers LLP
New York, New York
August 28, 2013
| JUNE 30, 2013 | J.P. MORGAN INTREPID FUNDS | 67 | ||||||
Table of Contents
(Unaudited)
The Funds’ Statement of Additional Information includes additional information about the Funds’ Trustees and is available, without charge, upon request by calling 1-800-480-4111 or on the J.P. Morgan Funds’ website at www.jpmorganfunds.com.
Name (Year of Birth); Positions With the Funds (1) | Principal Occupations During Past 5 Years | Number of Portfolios in Fund Complex Overseen by Trustee (2) | Other Directorships Held Outside Fund Complex During Past 5 Years | |||
Independent Trustees | ||||||
| John F. Finn (1947); Trustee of Trusts since 2005; Trustee of heritage One Group Mutual Funds since 1998. | Chairman (1985-present), President and Chief Executive Officer, Gardner, Inc. (supply chain management company serving industrial and consumer markets) (1974-present). | 172 | Director, Cardinal Health, Inc. (CAH) (1994-present); Director, Greif, Inc. (GEF) (industrial package products and services) (2007-present). | |||
| Dr. Matthew Goldstein (1941); Chairman since 2013; Trustee of Trusts since 2005; Trustee of heritage J.P. Morgan Funds since 2003. | Professor, City University of New York (effective 7/1/13); Chancellor, City University of New York (1999-2013); President, Adelphi University (New York) (1998-1999). | 172 | Director, Bronx-Lebanon Hospital Center; Director, United Way of New York City (2002-present); Trustee, Museum of Jewish Heritage (2011-present). | |||
| Robert J. Higgins (1945); Trustee of Trusts since 2005; Trustee of heritage J.P. Morgan Funds since 2002. | Retired; Director of Administration of the State of Rhode Island (2003-2004); President — Consumer Banking and Investment Services, Fleet Boston Financial (1971-2001). | 172 | None | |||
| Peter C. Marshall (1942); Trustee of Trusts since 2005; Trustee of heritage One Group Mutual Funds since 1985. | Self-employed business consultant (2002-present). | 172 | Director, Center for Communication, Hearing and Deafness (1990-present). | |||
| Mary E. Martinez (1960); Trustee of Trusts since 2013. | Associate, Special Properties, a Christie’s International Real Estate Affiliate (2010-Present); Managing Director, Bank of America (Asset Management) (2007-2008); Chief Operating Officer, U.S. Trust Asset Management; U.S. Trust Company (asset management) (2003-2007); President, Excelsior Funds (registered investment companies) (2004-2005). | 172 | Member, New York City Center Advisory Council (oversees public performing arts facilities) (2006-present). | |||
| Marilyn McCoy* (1948); Trustee of Trusts since 2005; Trustee of heritage One Group Mutual Funds since 1999. | Vice President of Administration and Planning, Northwestern University (1985-present). | 172 | Trustee, Carleton College (2003-present). | |||
| Mitchell M. Merin (1953); Trustee of Trusts since 2013. | Retired (2005-Present); President and Chief Operating Officer, Morgan Stanley Investment Management, Member Morgan Stanley & Co. Management Committee (registered investment adviser) (1998-2005). | 172 | Director, Sun Life Financial (SLF) (2007 to Present) (financial services and insurance); Trustee, Trinity College, Hartford, CT (2002-2010). | |||
| William G. Morton, Jr. (1937); Trustee of Trusts since 2005; Trustee of heritage J.P. Morgan Funds since 2003. | Retired; Chairman Emeritus (2001-2002), and Chairman and Chief Executive Officer, Boston Stock Exchange (1985-2001). | 172 | Director, Radio Shack Corp. (1987-2008); Trustee, Stratton Mountain School (2001-present). | |||
| Dr. Robert A. Oden, Jr. (1946); Trustee of Trusts since 2005; Trustee of heritage One Group Mutual Funds since 1997. | Retired; President, Carleton College (2002-2010); President, Kenyon College (1995-2002). | 172 | Trustee, American University in Cairo (1999-present); Chairman, Dartmouth-Hitchcock Medical Center (2013-present); Trustee, Dartmouth-Hitchcock Medical Center (2011-present); Trustee, American Schools of Oriental Research (2011-present); Trustee, Carleton College (2002-2010). | |||
| 68 | J.P. MORGAN INTREPID FUNDS | JUNE 30, 2013 | ||||
Table of Contents
Name (Year of Birth); Positions With the Funds (1) | Principal Occupations During Past 5 Years | Number of Complex Overseen by Trustee (2) | Other Directorships Held Outside Fund Complex During Past 5 Years | |||
Independent Trustees (continued) | ||||||
| Marian U. Pardo** (1946); Trustee of Trusts since 2013. | Managing Director and Founder, Virtual Capital Management LLC (Investment Consulting) (2007-present); Managing Director, Credit Suisse Asset Management (portfolio manager) (2003-2006). | 172 | Member, Board of Governors, Columbus Citizens Foundation (not-for-profit supporting philanthropic and cultural programs) (2006-present). | |||
| Frederick W. Ruebeck (1939); Trustee of Trusts since 2005; Trustee of heritage One Group Mutual Funds since 1994. | Consultant (2000-present); Advisor, JP Greene & Associates, LLC (broker-dealer) (2000-2009); Chief Investment Officer, Wabash College (2004-present); Director of Investments, Eli Lilly and Company (pharmaceuticals) (1988-1999). | 172 | Trustee, Wabash College (1988-present); Chairman, Indianapolis Symphony Orchestra Foundation (1994-present). | |||
| James J. Schonbachler (1943); Trustee of Trusts since 2005; Trustee of heritage J.P. Morgan Funds since 2001. | Retired; Managing Director of Bankers Trust Company (financial services) (1968-1998). | 172 | None | |||
Interested Trustee Not Affiliated With the Adviser | ||||||
| Frankie D. Hughes*** (1952), Trustee of Trusts since 2008. | President and Chief Investment Officer, Hughes Capital Management, Inc. (fixed income asset management) (1993-present). | 172 | Trustee, The Victory Portfolios (2000-2008). | |||
| (1) | The Trustees serve for an indefinite term, subject to the Trusts’ current retirement policy, which is age 75 for all Trustees, except that the Board has determined Mr. Morton should continue to serve until December 31, 2014. In order to fill the vacancies created by the retirement of the Fergus Reid, III, William J. Armstrong, and Leonard J. Spalding Jr., effective December 31, 2012, the Board appointed Ms. Martinez and Mr. Merin to serve as Trustees effective January 1, 2013 and Ms. Pardo to serve as Trustee effective February 1, 2013. |
| (2) | A Fund Complex means two or more registered investment companies that hold themselves out to investors as related companies for purposes of investment and investor services or have a common investment advisor or have an investment advisor that is an affiliated person of the investment advisor of any of the other registered investment companies. The J.P. Morgan Funds Complex for which the Board of Trustees serves currently includes eleven registered investment companies (172 funds), including JPMorgan Mutual Fund Group which liquidated November 29, 2012 and is in the process of winding up its affairs. |
| * | Ms. McCoy has served as Vice President of Administration and Planning for Northwestern University since 1985. William M. Daley was the Head of Corporate Responsibility for JPMorgan Chase & Co. prior to January 2011 and served as a member of the Board of Trustees of Northwestern University from 2005 through 2010. JPMIM, the Funds’ investment advisor, is a wholly-owned subsidiary of JPMorgan Chase & Co. Five other members of the Board of Trustees of Northwestern University are executive officers of registered investment advisors (not affiliated with JPMorgan) that are under common control with subadvisors to certain J.P. Morgan Funds. |
| ** | In connection with prior employment with JPMorgan Chase, Ms. Pardo is the recipient of non-qualified pension plan payments from JPMorgan Chase in the amount of approximately $2,055 per month, which she irrevocably waived effective January 1, 2013, and deferred compensation payments from JPMorgan Chase in the amount of approximately $7,294 per year, which ended in January 2013. In addition, Ms. Pardo receives payments from a fully funded qualified plan, which is not an obligation of JPMorgan Chase. |
| *** | Ms. Hughes is treated as an “interested person” based on the portfolio holdings of clients of Hughes Capital Management, Inc. |
The contact address for each of the Trustees is 270 Park Avenue, New York, NY 10017.
| JUNE 30, 2013 | J.P. MORGAN INTREPID FUNDS | 69 | ||||||
Table of Contents
(Unaudited)
Name (Year of Birth), Positions Held with the Trusts (Since) | Principal Occupations During Past 5 Years | |
| Patricia A. Maleski (1960), President and Principal Executive Officer (2010) | Managing Director, J.P. Morgan Investment Management Inc. and Chief Administrative Officer, J.P. Morgan Funds and Institutional Pooled Vehicles since 2010; previously, Treasurer and Principal Financial Officer of the Trusts from 2008 to 2010; previously, Head of Funds Administration and Board Liaison, J.P. Morgan Funds prior to 2010. Ms. Maleski has been with JPMorgan Chase & Co. since 2001. | |
| Joy C. Dowd (1972), Treasurer and Principal Financial Officer (2010) | Assistant Treasurer of the Trusts from 2009 to 2010; Executive Director, JPMorgan Funds Management, Inc. from February 2011; Vice President, JPMorgan Funds Management, Inc. from December 2008 to February 2011; prior to joining JPMorgan Chase, Ms. Dowd worked in MetLife’s investments audit group from 2005 through 2008. | |
| Frank J. Nasta (1964), Secretary (2008) | Managing Director and Associate General Counsel, JPMorgan Chase since 2008; Previously, Director, Managing Director, General Counsel and Corporate Secretary, J. & W. Seligman & Co. Incorporated; Secretary of each of the investment companies of the Seligman Group of Funds and Seligman Data Corp.; Director and Corporate Secretary, Seligman Advisors, Inc. and Seligman Services, Inc. | |
| Stephen M. Ungerman (1953), Chief Compliance Officer (2005) | Managing Director, JPMorgan Chase & Co.; Mr. Ungerman has been with JPMorgan Chase & Co. since 2000. | |
| Kathryn A. Jackson (1962), AML Compliance Officer (2012)* | Vice President and AML Compliance Manager for JPMorgan Asset Management Compliance since 2011; Senior On-Boarding Specialist for JPMorgan Distribution Services, Inc. in Global Liquidity from 2008 to 2011; prior to joining JPMorgan, Ms. Jackson was a Financial Services Analyst responsible for on-boarding, compliance and training with Nationwide Securities LLC and 1717 Capital Management Company, both registered broker-dealers, from 2005 until 2008. | |
Elizabeth A. Davin (1964), Assistant Secretary (2005)** | Executive Director and Assistant General Counsel, JPMorgan Chase since February 2012; formerly Vice President and Assistant General Counsel, JPMorgan Chase from 2005 until February 2012; Senior Counsel, JPMorgan Chase (formerly Bank One Corporation) from 2004 to 2005. | |
| Jessica K. Ditullio (1962), Assistant Secretary (2005)** | Executive Director and Assistant General Counsel, JPMorgan Chase since February 2011; Ms. Ditullio has served as an attorney with various titles for JPMorgan Chase (formerly Bank One Corporation) since 1990. | |
| John T. Fitzgerald (1975), Assistant Secretary (2008) | Executive Director and Assistant General Counsel, JPMorgan chase since February 2011; formerly, Vice President and Assistant General Counsel, JPMorgan Chase from 2005 until February 2011. | |
| Carmine Lekstutis (1980), Assistant Secretary (2011) | Vice President and Assistant General Counsel, JPMorgan Chase since 2011; Associate, Skadden, Arps, Slate, Meagher & Flom LLP (law firm) from 2006 to 2011. | |
| Gregory S. Samuels (1980), Assistant Secretary (2010) | Vice President and Assistant General Counsel, JPMorgan Chase since 2010; Associate, Ropes & Gray (law firm) from 2008 to 2010; Associate, Clifford Chance LLP (law firm) from 2005 to 2008. | |
| Pamela L. Woodley (1971), Assistant Secretary (2012) | Vice President and Assistant General Counsel, JPMorgan Chase since November 2004. | |
Michael M. D’Ambrosio (1969), Assistant Treasurer (2012) | Executive Director, JPMorgan Funds Management, Inc. from July 2012; prior to joining JPMorgan Chase, Mr. D’Ambrosio was a Tax Director at PricewaterhouseCoopers LLP since 2006. | |
| Joseph Parascondola (1963), Assistant Treasurer (2011) | Vice President, JPMorgan Funds Management, Inc. since August 2006. | |
| Matthew J. Plastina (1970), Assistant Treasurer (2011) | Vice President, JPMorgan Funds Management, Inc. since August 2010; prior to August 2010, Vice President and Controller, Legg Mason Global Asset Management. | |
Julie A. Roach (1971), Assistant Treasurer (2012)** | Vice President, JPMorgan Funds Management, Inc. from August 2012; prior to joining JPMorgan Chase, Ms. Roach was a Senior Manager with Deloitte since 2001. | |
Gillian I. Sands (1969), Assistant Treasurer (2012) | Vice President, JPMorgan Funds Management, Inc. from September 2012; Assistant Treasurer, Wells Fargo Funds Management (2007-2009). | |
Timothy J. Stewart (1974), Assistant Treasurer (2012)*** | Executive Director, JPMorgan Funds Management, Inc. from July 2012; Managing Director of Robeco Investment Management, Inc. (2011-2012); Chief Financial Officer (2008-2011) and Director of Operations (2003-2008), Robeco-Sage, a division of Robeco Investment Management, Inc. | |
The contact address for each of the officers, unless otherwise noted, is 270 Park Avenue, New York, NY 10017.
| * | The contact address for the officer is 500 Stanton Christiana Road, Ops 1, Floor 02, Newark, DE 19173-2107. |
| ** | The contact address for the officer is 460 Polaris Parkway, Westerville, OH 43082. |
| *** | Mr. Stewart is the Assistant Treasurer of JPMorgan Trust I only. |
| 70 | J.P. MORGAN INTREPID FUNDS | JUNE 30, 2013 | ||||
Table of Contents
SCHEDULE OF SHAREHOLDER EXPENSES
(Unaudited)
Hypothetical $1,000 Investment
As a shareholder of the Funds, you incur two types of costs: (1) transaction costs, including sales charges (loads) on purchase payments and redemption fees and (2) ongoing costs, including investment advisory fees, administration fees, distribution fees and other Fund expenses. The examples below are intended to help you understand your ongoing costs (in dollars) of investing in the Funds and to compare these ongoing costs with the ongoing costs of investing in other mutual funds. The examples assume that you had a $1,000 investment in each Class at the beginning of the reporting period, January 1, 2013, and continued to hold your shares at the end of the reporting period, June 30, 2013.
Actual Expenses
For each Class of each Fund in the table below, the first line provides information about actual account values and actual expenses. You may use the information in this line, together with the amount you invested, to estimate the expenses that you paid over the period. Simply divide your account value by $1,000 (for example, an $8,600 account value divided by $1,000 = 8.6), then multiply the result by the number in the first line of each Class under the heading entitled “Expenses Paid During the Period” to estimate the expenses you paid on your account during this period.
Hypothetical Example for Comparison Purposes
The second line of each Class in the table below provides information about hypothetical account values and hypothetical expenses based on the Class’ actual expense ratio and an assumed rate of return of 5% per year before expenses, which is not the Class’ actual return. The hypothetical account values and expenses may not be used to estimate the actual ending account balance or expenses you paid for the period. You may use this information to compare the ongoing costs of investing in the Class of the Fund and other funds. To do so, compare this 5% hypothetical example with the 5% hypothetical examples that appear in the shareholder reports of the other funds. Please note that the expenses shown in the table are meant to highlight your ongoing costs only and do not reflect any transaction costs, such as sales charges (loads) or redemption fees. Therefore, the second line for each Class in the table is useful in comparing ongoing costs only, and will not help you determine the relative total costs of owning different funds. In addition, if these transaction costs were included, your costs would have been higher. The examples also assume all dividends and distributions have been reinvested.
| Beginning Account Value, January 1, 2013 | Ending Account Value | Expenses Paid During the Period | Annualized Expense Ratio | |||||||||||||
Intrepid Advantage Fund | ||||||||||||||||
Class A | ||||||||||||||||
Actual | $ | 1,000.00 | $ | 1,147.90 | $ | 6.66 | 1.25 | % | ||||||||
Hypothetical | 1,000.00 | 1,018.60 | 6.26 | 1.25 | ||||||||||||
Class C | ||||||||||||||||
Actual | 1,000.00 | 1,145.30 | 9.31 | 1.75 | ||||||||||||
Hypothetical | 1,000.00 | 1,016.12 | 8.75 | 1.75 | ||||||||||||
Select Class | ||||||||||||||||
Actual | 1,000.00 | 1,149.20 | 5.33 | 1.00 | ||||||||||||
Hypothetical | 1,000.00 | 1,019.84 | 5.01 | 1.00 | ||||||||||||
Intrepid America Fund | ||||||||||||||||
Class A | ||||||||||||||||
Actual | 1,000.00 | 1,148.10 | 6.60 | 1.24 | ||||||||||||
Hypothetical | 1,000.00 | 1,018.65 | 6.21 | 1.24 | ||||||||||||
Class C | ||||||||||||||||
Actual | 1,000.00 | 1,145.50 | 9.26 | 1.74 | ||||||||||||
Hypothetical | 1,000.00 | 1,016.17 | 8.70 | 1.74 | ||||||||||||
Class R2 | ||||||||||||||||
Actual | 1,000.00 | 1,146.90 | 7.93 | 1.49 | ||||||||||||
Hypothetical | 1,000.00 | 1,017.41 | 7.45 | 1.49 | ||||||||||||
Class R5 | ||||||||||||||||
Actual | 1,000.00 | 1,150.70 | 4.21 | 0.79 | ||||||||||||
Hypothetical | 1,000.00 | 1,020.88 | 3.96 | 0.79 | ||||||||||||
Select Class | ||||||||||||||||
Actual | 1,000.00 | 1,149.90 | 5.28 | 0.99 | ||||||||||||
Hypothetical | 1,000.00 | 1,019.89 | 4.96 | 0.99 | ||||||||||||
| JUNE 30, 2013 | J.P. MORGAN INTREPID FUNDS | 71 | ||||||
Table of Contents
SCHEDULE OF SHAREHOLDER EXPENSES
(Unaudited) (continued)
Hypothetical $1,000 Investment
| Beginning Account Value, January 1, 2013 | Ending Account Value | Expenses Paid During the Period | Annualized Expense Ratio | |||||||||||||
Intrepid Growth Fund | ||||||||||||||||
Class A | ||||||||||||||||
Actual | $ | 1,000.00 | $ | 1,126.60 | $ | 6.54 | 1.24 | % | ||||||||
Hypothetical | 1,000.00 | 1,018.65 | 6.21 | 1.24 | ||||||||||||
Class C | ||||||||||||||||
Actual | 1,000.00 | 1,123.90 | 9.16 | 1.74 | ||||||||||||
Hypothetical | 1,000.00 | 1,016.17 | 8.70 | 1.74 | ||||||||||||
Class R2 | ||||||||||||||||
Actual | 1,000.00 | 1,124.50 | 7.85 | 1.49 | ||||||||||||
Hypothetical | 1,000.00 | 1,017.41 | 7.45 | 1.49 | ||||||||||||
Class R5 | ||||||||||||||||
Actual | 1,000.00 | 1,129.00 | 4.17 | 0.79 | ||||||||||||
Hypothetical | 1,000.00 | 1,020.88 | 3.96 | 0.79 | ||||||||||||
Select Class | ||||||||||||||||
Actual | 1,000.00 | 1,127.60 | 5.22 | 0.99 | ||||||||||||
Hypothetical | 1,000.00 | 1,019.89 | 4.96 | 0.99 | ||||||||||||
Intrepid Mid Cap Fund | ||||||||||||||||
Class A | ||||||||||||||||
Actual | 1,000.00 | 1,174.00 | 6.63 | 1.23 | ||||||||||||
Hypothetical | 1,000.00 | 1,018.70 | 6.16 | 1.23 | ||||||||||||
Class B | ||||||||||||||||
Actual | 1,000.00 | 1,170.80 | 10.12 | 1.88 | ||||||||||||
Hypothetical | 1,000.00 | 1,015.47 | 9.39 | 1.88 | ||||||||||||
Class C | ||||||||||||||||
Actual | 1,000.00 | 1,170.00 | 10.12 | 1.88 | ||||||||||||
Hypothetical | 1,000.00 | 1,015.47 | 9.39 | 1.88 | ||||||||||||
Select Class | ||||||||||||||||
Actual | 1,000.00 | 1,175.50 | 5.29 | 0.98 | ||||||||||||
Hypothetical | 1,000.00 | 1,019.93 | 4.91 | 0.98 | ||||||||||||
Intrepid Value Fund | ||||||||||||||||
Class A | ||||||||||||||||
Actual | 1,000.00 | 1,157.40 | 5.03 | 0.94 | ||||||||||||
Hypothetical | 1,000.00 | 1,020.13 | 4.71 | 0.94 | ||||||||||||
Class C | ||||||||||||||||
Actual | 1,000.00 | 1,154.60 | 7.69 | 1.44 | ||||||||||||
Hypothetical | 1,000.00 | 1,017.65 | 7.20 | 1.44 | ||||||||||||
Class R2 | ||||||||||||||||
Actual | 1,000.00 | 1,155.80 | 6.36 | 1.19 | ||||||||||||
Hypothetical | 1,000.00 | 1,018.89 | 5.96 | 1.19 | ||||||||||||
Class R5 | ||||||||||||||||
Actual | 1,000.00 | 1,159.40 | 3.16 | 0.59 | ||||||||||||
Hypothetical | 1,000.00 | 1,021.87 | 2.96 | 0.59 | ||||||||||||
Class R6 | ||||||||||||||||
Actual | 1,000.00 | 1,159.70 | 2.89 | 0.54 | ||||||||||||
Hypothetical | 1,000.00 | 1,022.12 | 2.71 | 0.54 | ||||||||||||
Select Class | ||||||||||||||||
Actual | 1,000.00 | 1,158.60 | 4.23 | 0.79 | ||||||||||||
Hypothetical | 1,000.00 | 1,020.88 | 3.96 | 0.79 | ||||||||||||
| * | Expenses are equal to each Class' respective annualized expense ratio, multiplied by the average account value over the period, multiplied by 181/366 (to reflect the one-half year period). |
| 72 | J.P. MORGAN INTREPID FUNDS | JUNE 30, 2013 | ||||
Table of Contents
(Unaudited)
Certain tax information for the J.P. Morgan Funds is required to be provided to shareholders based upon the Funds’ income and distributions for the taxable year ended June 30, 2013. The information and distributions reported in this letter may differ from the information and taxable distributions reported to the shareholders for the calendar year ending December 31, 2013. The information necessary to complete your income tax returns for the calendar year ending December 31, 2013 will be provided under separate cover.
Dividends Received Deductions (DRD)
Each Fund hereby designates the following percentage or the maximum allowable percentage as ordinary income distributions eligible for the 70% dividends received deduction for corporate rate shareholders for the fiscal year ended June 30, 2013:
Dividends Received Deduction | ||||
Intrepid Advantage Fund | 100.00 | % | ||
Intrepid America Fund | 100.00 | |||
Intrepid Growth Fund | 100.00 | |||
Intrepid Mid Cap Fund | 100.00 | |||
Intrepid Value Fund | 100.00 | |||
Qualified Dividend Income (QDI)
For the fiscal year ended June 30, 2013, certain dividends paid by the Funds may be subject to a maximum tax rate of 20%. Each Fund hereby designates the following amount or the maximum allowable amount of ordinary income distributions as qualified dividends (amounts in thousands):
Qualified Dividend Income | ||||
Intrepid Advantage Fund | $ | 117 | ||
Intrepid America Fund | 36,668 | |||
Intrepid Growth Fund | 6,481 | |||
Intrepid Mid Cap Fund | 3,866 | |||
Intrepid Value Fund | 16,953 | |||
| JUNE 30, 2013 | J.P. MORGAN INTREPID FUNDS | 73 | ||||||
Table of Contents

Rev. January 2011
| FACTS | WHAT DOES J.P. MORGAN FUNDS DO WITH YOUR PERSONAL INFORMATION? |
| Why? | Financial companies choose how they share your personal information. Federal law gives consumers the right to limit some but not all sharing. Federal law also requires us to tell you how we collect, share, and protect your personal information. Please read this notice carefully to understand what we do. |
| What? | The types of personal information we collect and share depend on the product or service you have with us. This information can include:
¡Social Security number and account balances
¡transaction history and account transactions
¡checking account information and wire transfer instructions
When you are no longer our customer, we continue to share your information as described in this notice. |
| How? | All financial companies need to share customers’ personal information to run their everyday business. In the section below, we list the reasons financial companies can share their customers’ personal information; the reasons J.P. Morgan Funds chooses to share; and whether you can limit this sharing. |
| Reasons we can share your personal information | Does J.P. Morgan Funds share? | Can you limit this sharing? | ||
For our everyday business purposes — such as to process your transactions, maintain your account(s), respond to court orders and legal investigations, or report to credit bureaus | Yes | No | ||
For marketing purposes — to offer our products and services to you | Yes | No | ||
| For joint marketing with other financial companies | No | We don’t share | ||
For our affiliates’ everyday business purposes — information about your transactions and experiences | No | We don’t share | ||
For our affiliates’ everyday business purposes — information about your creditworthiness | No | We don’t share | ||
| For nonaffiliates to market to you | No | We don’t share |
| Questions? | Call 1-800-480-4111 or go to www.jpmorganfunds.com | |

Table of Contents
Page 2 |
| Who we are | ||
| Who is providing this notice? | J.P. Morgan Funds | |
| What we do | ||
| How does J.P. Morgan Funds protect my personal information? | To protect your personal information from unauthorized access and use, we use security measures that comply with federal law. These measures include computer safeguards and secured files and buildings. We authorize our employees to access your information only when they need it to do their work and we require companies that work for us to protect your information. | |
How does J.P. Morgan Funds collect my personal information? | We collect your personal information, for example, when you:
¡open an account or provide contact information
¡give us your account information or pay us by check
¡make a wire transfer
We also collect your personal information from others, such as credit bureaus, affiliates and other companies. | |
| Why can’t I limit all sharing? | Federal law gives you the right to limit only
¡sharing for affiliates’ everyday business purposes – information about your creditworthiness
¡affiliates from using your information to market to you
¡sharing for nonaffiliates to market to you
State laws and individual companies may give you additional rights to limit sharing. | |
| Definitions | ||
| Affiliates | Companies related by common ownership or control. They can be financial and nonfinancial companies.
¡J.P. Morgan Funds does not share with our affiliates. | |
| Nonaffiliates | Companies not related by common ownership or control. They can be financial and nonfinancial companies.
¡J.P. Morgan Funds does not share with nonaffiliates so they can market to you. | |
| Joint Marketing | A formal agreement between nonaffiliated financial companies that together market financial products or services to you.
¡J.P. Morgan Funds doesn’t jointly market. | |
Table of Contents
J.P. Morgan Funds are distributed by JPMorgan Distribution Services, Inc., which is an affiliate of JPMorgan Chase & Co. Affiliates of JPMorgan Chase & Co. receive fees for providing various services to the funds.
Contact JPMorgan Distribution Services, Inc. at 1-800-480-4111 for a fund prospectus. You can also visit us at www.jpmorganfunds.com. Investors should carefully consider the investment objectives and risk as well as charges and expenses of the mutual fund before investing. The prospectus contains this and other information about the mutual fund. Read the prospectus carefully before investing.
Investors may obtain information about the Securities Investor Protection Corporation (SIPC), including the SIPC brochure by visiting www.sipc.org or by calling SIPC at 202-371-8300.
Each Fund files a complete schedule of its fund holdings for the first and third quarters of its fiscal year with the SEC on Form N-Q. The Funds’ Forms N-Q are available on the SEC’s website at http://www.sec.gov and may be reviewed and copied at the SEC’s Public Reference Room in Washington, DC. Information on the operation of the SEC’s Public Reference Room may be obtained by calling 1-800-SEC-0330. Shareholders may request the Form N-Q without charge by calling 1-800-480-4111 or by visiting the J.P. Morgan Funds’ website at www.jpmorganfunds.com.
A description of each Fund’s policies and procedures with respect to the disclosure of each Fund’s holdings is available in the prospectus and Statement of Additional Information.
A copy of proxy policies and procedures is available without charge upon request by calling 1-800-480-4111 and on the Funds’ website at www.jpmorganfunds.com. A description of such policies and procedures is on the SEC’s website at www.sec.gov. The Trustees have delegated the authority to vote proxies for securities owned by the Funds to the Advisor. A copy of the Funds’ voting record for the most recent 12-month period ended June 30 is available on the SEC’s website at www.sec.gov or at the Funds’ website at www.jpmorganfunds.com no later than August 31 of each year. The Funds’ proxy voting record will include, among other things, a brief description of the matter voted on for each fund security, and will state how each vote was cast, for example, for or against the proposal.
Table of Contents

J.P. Morgan Asset Management is the marketing name for the asset management business of JPMorgan Chase & Co. Those business include, but are not limited to, J.P. Morgan Investment Management Inc., Security Capital Research & Management Incorporated and J.P. Morgan Alternative Asset Management, Inc.
| © JPMorgan Chase & Co., 2013. All rights reserved. June 2013. | AN-INT-613 |
Table of Contents
ITEM 2. CODE OF ETHICS.
Disclose whether, as of the end of the period covered by the report, the registrant has adopted a code of ethics that applies to the registrant’s principal executive officer, principal financial officer, principal accounting officer or controller, or persons performing similar functions, regardless of whether these individuals are employed by the registrant or a third party. If the registrant has not adopted such a code of ethics, explain why it has not done so.
The registrant must briefly describe the nature of any amendment, during the period covered by the report, to a provision of its code of ethics that applies to the registrant’s principal executive officer, principal financial officer, principal accounting officer or controller, or persons performing similar functions, regardless of whether these individuals are employed by the registrant or a third party, and that relates to any element of the code of ethics definition enumerated in paragraph (b) of this Item. The registrant must file a copy of any such amendment as an exhibit pursuant to Item 12(a)(1), unless the registrant has elected to satisfy paragraph (f) of this Item by positing its code of ethics on its website pursuant to paragraph (f)(2) of this Item, or by undertaking to provide its code of ethics to any person without charge, upon request, pursuant to paragraph (f)(3) of this Item.
If the registrant has, during the period covered by the report, granted a waiver, including an implicit waiver, from a provision of the code of ethics that applies to the registrant’s principal executive officer, principal financial officer, principal accounting officer or controller, or persons performing similar functions, regardless of whether these individuals are employed by the registrant or third party, that relates to one or more items set forth in paragraph (b) of this Item, the registrant must briefly describe the nature of the waiver, the name of the person to whom the waiver was granted, and the date of the waiver.
The Registrant has adopted a code of ethics that applies to the Registrant’s principal executive officer and principal financial officer. There were no amendments to the code of ethics or waivers granted with respect to the code of ethics in the period covered by the report.
ITEM 3. AUDIT COMMITTEE FINANCIAL EXPERT.
(a) (1) Disclose that the registrant’s board of directors has determined that the registrant either:
(i) Has at least one audit committee financial expert serving on its audit committee; or
(ii) Does not have an audit committee financial expert serving on its audit committee.
The Registrant’s Board of Trustees has determined that the Registrant has at least one audit committee financial expert serving on its audit committee. The Securities and Exchange Commission has stated that the designation or identification of a person as an audit committee financial expert pursuant to this Item 3 of Form N-CSR does not impose on such person any duties, obligations or liabilities that are greater than the duties, obligations and liabilities imposed on such person as a member of the Audit Committee and the Board of Trustees in the absence of such designation or identification.
(2) If the registrant provides the disclosure required by paragraph (a)(1)(i) of this Item, it must disclose the name of the audit committee financial expert and whether that person is “independent.” In order to be considered “independent” for purposes of this Item, a member of an audit committee may not, other than in his or her capacity as a member of the audit committee, the board of directors, or any other board committee:
(i) Accept directly or indirectly any consulting, advisory, or other compensatory fee from the issuer; or
(ii) Be an “interested person” of the investment company as defined in Section 2(a)(19) of the Act (15 U.S.C. 80a-2(a)(19)).
The audit committee financial expert is Mitchell Merin. He is not an “interested person” of the Registrant and is also “independent” as defined by the U.S. Securities and Exchange Commission for purposes of audit committee financial expert determinations.
(3) If the registrant provides the disclosure required by paragraph (a)(1)(ii) of this Item, it must explain why it does not have an audit committee financial expert.
Not applicable.
Table of Contents
ITEM 4. PRINCIPAL ACCOUNTANT FEES AND SERVICES.
(a) Disclose, under the caption Audit Fees, the aggregate fees billed for each of the last two fiscal years for professional services rendered by the principal accountant for the audit of the registrant’s annual financial statements or services that are normally provided by the accountant in connection with statutory and regulatory filings or engagements for those fiscal years.
AUDIT FEES
2013 – $368,414
2012 – $357,900
(b) Disclose, under the caption Audit-Related Fees, the aggregate fees billed in each of the last two fiscal years for assurance and related services by the principal accountant that are reasonably related to the performance of the audit of the registrant’s financial statements and are not reported under paragraph (a) of this Item. Registrants shall describe the nature of the services comprising the fees disclosed under this category.
AUDIT-RELATED FEES
2013 – $139,900
2012 – $139,900
Audit-related fees consists of semi-annual financial statement reviews and security count procedures performed as required under Rule 17f-2 of the Investment Company Act of 1940 during the Registrant’s fiscal year.
(c) Disclose, under the caption Tax Fees, the aggregate fees billed in each of the last two fiscal years for professional services rendered by the principal accountant for tax compliance, tax advice, and tax planning. Registrants shall describe the nature of the services comprising the fees disclosed under this category.
TAX FEES
2013 – $107,500
2012 – $108,900
The tax fees consist of fees billed in connection with preparing the federal regulated investment company income tax returns for the Registrant for the tax years ended June 30, 2013 and 2012, respectively.
For the last fiscal year, no tax fees were required to be approved pursuant to paragraph (c)(7)(ii) of Rule 2-01 of Regulation
S-X.
(d) Disclose, under the caption All Other Fees, the aggregate fees billed in each of the last two fiscal years for products and services provided by the principal accountant, other than the services reported in paragraphs (a) through (c) of this Item. Registrants shall describe the nature of the services comprising the fees disclosed under this category.
ALL OTHER FEES
2013 – Not applicable
2012 – Not applicable
(e) (1) Disclose the audit committee’s pre-approval policies and procedures described in paragraph (c)(7) of Rule 2-01 of Regulation S-X.
Pursuant to the Registrant’s Audit Committee Charter and written policies and procedures for the pre-approval of audit and non-audit services (the “Pre-approval Policy”), the Audit Committee pre-approves all audit and non-audit services performed by the Registrant’s independent public registered accounting firm for the Registrant. In addition, the Audit Committee pre-approves the auditor’s engagement for non-audit services with the Registrant’s investment adviser (not including a sub-adviser whose role is primarily portfolio management and is sub-contracted or overseen by another investment adviser) and any Service Affiliate in accordance with paragraph (c)(7)(ii) of Rule 2-01 of Regulation S-X, if the engagement relates directly to the operations and financial reporting of the Registrant. Proposed services may be pre-approved either 1) without consideration of specific case-by-case services or 2) require the specific pre-approval of the Audit Committee. Therefore, initially the Pre-approval Policy listed a number of audit and non-audit services that have been approved by the Audit Committee, or which were not subject to pre-approval under the transition provisions of Sarbanes-Oxley Act of 2002 (the “Pre-approval List”). The Audit Committee annually reviews and pre-approves the
Table of Contents
services included on the Pre-approval List that may be provided by the independent public registered accounting firm without obtaining additional specific pre-approval of individual services from the Audit Committee. The Audit Committee adds to, or subtracts from, the list of general pre-approved services from time to time, based on subsequent determinations. All other audit and non-audit services not on the Pre-approval List must be specifically pre-approved by the Audit Committee.
One or more members of the Audit Committee may be appointed as the Committee’s delegate for the purposes of considering whether to approve such services. Any pre-approvals granted by the delegate will be reported, for informational purposes only, to the Audit Committee at its next scheduled meeting. The Audit Committee’s responsibilities to pre-approve services performed by the independent public registered accounting firm are not delegated to management.
(2) Disclose the percentage of services described in each of paragraphs (b) through (d) of this Item that were approved by the audit committee pursuant to paragraph (c)(7)(i)(C) of Rule 2-01 of Regulation S-X.
2013 – 0.0%
2012 – 0.0%
(f) If greater than 50 percent, disclose the percentage of hours expended on the principal accountant’s engagement to audit the registrant’s financial statements for the most recent fiscal year that were attributed to work performed by persons other than the principal accountant’s full-time, permanent employees.
None.
(g) Disclose the aggregate non-audit fees billed by the registrant’s accountant for services rendered to the registrant, and rendered to the registrant’s investment adviser (not including any sub-adviser whose role is primarily portfolio management and is subcontracted with or overseen by another investment adviser), and any entity controlling, controlled by, or under common control with the adviser that provides ongoing services to the registrant for each of the last two fiscal years of the registrant.
The aggregate non-audit fees billed by the independent registered public accounting firm for services rendered to the Registrant, and rendered to Service Affiliates, for the last two calendar year ends were:
2012 – $31.8 million
2011 – $33.8 million*
* Certain fees for 2011 have been reclassified between Audit and Non Audit to conform with the 2012 presentation.
(h) Disclose whether the registrant’s audit committee of the board of directors has considered whether the provision of non-audit services that were rendered to the registrant’s investment adviser (not including any subadviser whose role is primarily portfolio management and is subcontracted with or overseen by another investment adviser), and any entity controlling, controlled by, or under common control with the investment adviser that provides ongoing services to the registrant that were not pre-approved pursuant to paragraph (c)(7)(ii) of Rule 2-01 of Regulation S-X is compatible with maintaining the principal accountant’s independence.
The Registrant’s Audit Committee has considered whether the provision of the non-audit services that were rendered to Service Affiliates that were not pre-approved (not requiring pre-approval) is compatible with maintaining the independent public registered accounting firm’s independence. All services provided by the independent public registered accounting firm to the Registrant or to Service Affiliates that were required to be pre-approved were pre-approved as required.
ITEM 5. AUDIT COMMITTEE OF LISTED REGISTRANTS.
(a) If the registrant is a listed issuer as defined in Rule 10A-3 under the Exchange Act (17CFR 240.10A-3), state whether or not the registrant has a separately-designated standing audit committee established in accordance with Section 3(a)(58)(A) of the Exchange Act (15 U.S.C. 78c(a)(58)(A)). If the registrant has such a committee, however designated, identify each committee member. If the entire board of directors is acting as the registrant’s audit committee as specified in Section 3(a)(58)(B) of the Exchange Act (15 U.S.C. 78c(a)(58)(B)), so state.
(b) If applicable, provide the disclosure required by Rule 10A-3(d) under the Exchange Act (17CFR 240.10A-3(d)) regarding an exemption from the listing standards for all audit committees.
Table of Contents
Not applicable.
ITEM 6. SCHEDULE OF INVESTMENTS.
File Schedule I – Investments in securities of unaffiliated issuers as of the close of the reporting period as set forth in Section 210.12-12 of Regulation S-X, unless the schedule is included as part of the report to shareholders filed under Item 1 of this Form.
Included in Item 1.
ITEM 7. DISCLOSURE OF PROXY VOTING POLICIES AND PROCEDURES FOR CLOSED-END MANAGEMENT INVESTMENT COMPANIES.
A closed-end management investment company that is filing an annual report on this Form N-CSR must, unless it invests exclusively in non-voting securities, describe the policies and procedures that it uses to determine how to vote proxies relating to portfolio securities, including the procedures that the company uses when a vote presents a conflict between the interests of its shareholders, on the one hand, and those of the company’s investment adviser; principal underwriter; or any affiliated person (as defined in Section 2(a)(3) of the Investment Company Act of 1940 (15 U.S.C. 80a-2(a)(3)) and the rules thereunder) of the company, its investment adviser, or its principal underwriter, on the other. Include any policies and procedures of the company’s investment adviser, or any other third party, that the company uses, or that are used on the company’s behalf, to determine how to vote proxies relating to portfolio securities.
Not applicable.
ITEM 8. PORTFOLIO MANAGERS OF CLOSED-END MANAGEMENT INVESTMENT COMPANIES.
Not applicable.
ITEM 9. PURCHASE OF EQUITY SECURITIES BY CLOSED-END MANAGEMENT INVESTMENT COMPANY AND AFFILIATED PURCHASERS.
(a) If the registrant is a closed-end management investment company, provide the information specified in paragraph (b) of this Item with respect to any purchase made by or on behalf of the registrant or any “affiliated purchaser,” as defined in Rule 10b-18(a)(3) under the Exchange Act (17 CFR 240.10b-18(a)(3)), of shares or other units of any class of the registrant’s equity securities that is registered by the registrant pursuant to Section 12 of the Exchange Act (15 U.S.C. 781).
Not applicable.
ITEM 10. SUBMISSION OF MATTERS TO A VOTE OF SECURITY HOLDERS.
Describe any material changes to the procedures by which shareholders may recommend nominees to the registrant’s board of directors, where those changes were implemented after the registrant last provided disclosure in response to the requirements of Item 7(d)(2)(ii)(G) of Schedule 14A (17 CFR 240.14a-101), or this Item.
No material changes to report.
ITEM 11. CONTROLS AND PROCEDURES.
(a) Disclose the conclusions of the registrant’s principal executive and principal financial officers, or persons performing similar functions, regarding the effectiveness of the registrant’s disclosure controls and procedures (as defined in Rule 30a-3(c) under the Act (17 CFR 270.30a-3(c))) as of a date within 90 days of the filing date of the report that includes the disclosure required by this paragraph, based on the evaluation of these controls and procedures required by Rule 30a-3(b) under the Act (17 CFR 270.30a-3(b)) and Rules 13a-15(b) or 15d-15(b) under the Exchange Act (17 CFR 240.13a-15(b) or 240.15d-15(b)).
Table of Contents
The Registrant’s principal executive and principal financial officers have concluded, based on their evaluation of the Registrant’s disclosure controls and procedures as of a date within 90 days of the filing date of this report, that the Registrant’s disclosure controls and procedures are reasonably designed to ensure that information required to be disclosed by the Registrant on Form N-CSR is recorded, processed, summarized and reported within the required time periods and that information required to be disclosed by the Registrant in the reports that it files or submits on Form N-CSR is accumulated and communicated to the Registrant’s management, including its principal executive and principal financial officers, as appropriate to allow timely decisions regarding required disclosure.
(b) Disclose any change in the registrant’s internal control over financial reporting (as defined in Rule 30a-3(d) under the Act (17 CFR 270.30a-3(d)) that occurred during the registrant’s second fiscal quarter of the period covered by this report that has materially affected, or is reasonably likely to materially affect, the registrant’s internal control over financial reporting.
There were no changes in the Registrant’s internal control over financial reporting that occurred during the last fiscal quarter covered by this report that have materially affected, or are reasonably likely to materially affect, the Registrant’s internal control over financial reporting.
ITEM 12. EXHIBITS.
(a) File the exhibits listed below as part of this Form. Letter or number the exhibits in the sequence indicated.
(a)(1) Any code of ethics, or amendment thereto, that is the subject of the disclosure required by Item 2, to the extent that the registrant intends to satisfy the Item 2 requirements through filing of an exhibit.
Code of Ethics applicable to its Principal Executive and Principal Financial Officers pursuant to Section 406 of the Sarbanes-Oxley Act of 2002 attached hereto.
(a)(2) A separate certification for each principal executive officer and principal financial officer of the registrant as required by Rule 30a-2(a) under the Act (17 CFR 270.30a-2).
Certifications pursuant to Rule 30a-2(a) under the Investment Company Act of 1940 are attached hereto.
(a)(3) Any written solicitation to purchase securities under Rule 23c-1 under the Act (17 CFR 270.23c-1) sent or given during the period covered by the report by or on behalf of the registrant to 10 or more persons.
Not applicable.
(b) A separate or combined certification for each principal executive officer and principal officer of the registrant as required by Rule 30a-2(b) under the Act of 1940.
Certifications pursuant to Rule 30a-2(b) under the Investment Company Act of 1940 are attached hereto.
Table of Contents
SIGNATURES
Pursuant to the requirements of the Securities Exchange Act of 1934 and the Investment Company Act of 1940, the registrant has duly caused this report to be signed on its behalf by the undersigned, thereunto duly authorized.
JPMorgan Trust II
| By: | /s/ Patricia A. Maleski | |
| Patricia A. Maleski | ||
| President and Principal Executive Officer | ||
| August 30, 2013 |
Pursuant to the requirements of the Securities Exchange Act of 1934 and the Investment Company Act of 1940, this report has been signed below by the following persons on behalf of the registrant and in the capacities and on the dates indicated.
| By: | /s/ Patricia A. Maleski | |
| Patricia A. Maleski | ||
| President and Principal Executive Officer | ||
| August 30, 2013 |
| By: | /s/ Joy C. Dowd | |
| Joy C. Dowd | ||
| Treasurer and Principal Financial Officer | ||
| August 30, 2013 |