Table of Contents
UNITED STATES
SECURITIES AND EXCHANGE COMMISSION
Washington, D.C. 20549
FORM N-CSR
CERTIFIED SHAREHOLDER REPORT OF REGISTERED
MANAGEMENT INVESTMENT COMPANIES
Investment Company Act file number: 811-04236
JPMorgan Trust II
(Exact name of registrant as specified in charter)
270 Park Avenue
New York, NY 10017
(Address of principal executive offices) (Zip code)
Frank J. Nasta
270 Park Avenue
New York, NY 10017
(Name and Address of Agent for Service)
Registrant’s telephone number, including area code: (800) 480-4111
Date of fiscal year end: October 31
Date of reporting period: November 1, 2011 through October 31, 2012
Form N-CSR is to be used by management investment companies to file reports with the Commission not later than 10 days after the transmission to stockholders of any report that is required to be transmitted to stockholders under Rule 30e-1 under the Investment Company Act of 1940 (17 CFR 270.30e-1). The Commission may use the information provided on Form N-CSR in its regulatory, disclosure review, inspection, and policymaking roles.
A registrant is required to disclose the information specified by Form N-CSR, and the Commission will make this information public. A registrant is not required to respond to the collection of information contained in Form N-CSR unless the Form displays a currently valid Office of Management and Budget (“OMB”) control number. Please direct comments concerning the accuracy of the information collection burden estimate and any suggestions for reducing the burden to Secretary, Securities and Exchange Commission, 450 Fifth Street, NW, Washington, DC 20549-0609. The OMB has reviewed this collection of information under the clearance requirements of 44 U.S.C. Section 3507.
Table of Contents
ITEM 1. REPORTS TO STOCKHOLDERS.
The following is a copy of the report transmitted to shareholders pursuant to Rule 30e-1 under the Investment Company Act of 1940 (17 CFR 270.30e-1).
Table of Contents
Annual Report
J.P. Morgan International Equity Funds
October 31, 2012
JPMorgan Emerging Economies Fund
JPMorgan Emerging Markets Equity Fund
JPMorgan Global Equity Income Fund
JPMorgan Global Opportunities Fund
(formerly JPMorgan Global Focus Fund)
JPMorgan International Equity Fund
JPMorgan International Equity Index Fund
JPMorgan International Opportunities Fund
JPMorgan International Value Fund
JPMorgan Intrepid International Fund

Table of Contents
| CEO’s Letter | 1 | |||
| Market Overview | 2 | |||
| 3 | ||||
| 6 | ||||
| 9 | ||||
| 12 | ||||
| 15 | ||||
| 18 | ||||
| 20 | ||||
| 24 | ||||
| 28 | ||||
| Schedules of Portfolio Investments | 31 | |||
| Financial Statements | 76 | |||
| Financial Highlights | 100 | |||
| Notes to Financial Statements | 118 | |||
| Report of Independent Registered Public Accounting Firm | 139 | |||
| Trustees | 140 | |||
| Officers | 143 | |||
| Schedule of Shareholder Expenses | 144 | |||
| Board Approval of Investment Advisory Agreement | 148 | |||
| Tax Letter | 152 | |||
Investments in a Fund are not bank deposits or obligations of, or guaranteed or endorsed by, any bank and are not insured or guaranteed by the FDIC, the Federal Reserve Board or any other government agency. You could lose money if you sell when the Fund’s share price is lower than when you invested.
Past performance is no guarantee of future performance. The general market views expressed in this report are opinions based on market and other conditions through the end of the reporting period and are subject to change without notice. These views are not intended to predict the future performance of a Fund or the securities markets. References to specific securities and their issuers are for illustrative purposes only and are not intended to be, and should not be interpreted as, recommendations to purchase or sell such securities. Such views are not meant as investment advice and may not be relied on as an indication of trading intent on behalf of any Fund.
Prospective investors should refer to the Funds’ prospectus for a discussion of the Funds’ investment objectives, strategies and risks. Call J.P. Morgan Funds Service Center at 1-800-480-4111 for a prospectus containing more complete information about a Fund, including management fees and other expenses. Please read it carefully before investing.
Table of Contents
NOVEMBER 26, 2012 (Unaudited)
Dear Shareholder:
Global equity markets continued to seesaw against an uncertain macroeconomic and geopolitical backdrop. In the U.S., improving economic data has been overshadowed by the pending “fiscal cliff.” Concerns about a potential economic “hard landing” in China remain, while escalating tension in the Middle East recently resulted in a conflict between Israel and Hamas, exacerbating fears about the stability of the region. Europe’s debt crisis continues and global equity prices have fluctuated with investors’ changing perception about the viability of corrective actions taken by the European Central Bank.
 |
“The constant change in emerging markets economies creates market volatility that we believe can be dampened by holding a range of emerging market equities and fixed income securities representing different regions and sectors.” |
Despite these sharp swings in market momentum, stocks in most parts of the world posted positive returns for the twelve months ended October 31, 2012. Accommodative monetary policies have been a significant catalyst for the positive returns for stocks during the past year and continue to keep yields at historically low levels. As the low interest rate environment persists, an increasing amount of fixed income investors are turning to asset classes like high yield bonds and emerging markets debt in search of higher yielding securities. Higher demand for these securities as well as positive fundamentals led to positive returns for high yield bonds and emerging markets debt during the 12 months ended October 31, 2012.
U.S. Treasury yields remain low while U.S. stocks outperform
Real yields are negative on many parts of the yield curve, meaning that the payment that investors will receive from these bonds is less than the expected rate of inflation. Holders of these securities are willing to see the purchasing power of their money decline in order to access the perceived safety of U.S. Treasury securities, likely a reflection of the elevated level of uncertainty among investors. The yield for 10-year U.S. Treasury securities ended October 2012 at 1.7%, while the yields for 2- and 30-year U.S. Treasury securities finished the reporting period at 0.3% and 2.9%, respectively.
Stock returns across market capitalizations, countries and investment styles varied during the twelve months ended
October 31, 2012. Buoyed by stronger-than-expected economic data, U.S. stocks finished the twelve-month reporting period ahead of international and emerging markets stocks, which were weighed down by Europe’s ongoing debt crisis and concerns about an economic “hard landing” in China.
Emerging markets: An evolving asset class
While the Chinese economy rightfully commands a large amount of attention from emerging markets investors, the asset class encompasses a wide range of countries with diverse cultural and political standards and evolving industries. Changes to local political administrations and economic policies can alter the investment landscape of an emerging market. For example, recently elected Mexican president Pena Nieto has pledged to focus on energy, labor and tax reforms, which has attracted more foreign investors who welcome the proposed business-friendly changes. On the other side of the spectrum, Russia’s recent presidential election has elevated geopolitical risk and therefore lowered the willingness of investors to invest in local Russian companies.
The constant change in emerging markets economies creates market volatility that we believe can be dampened by holding a range of emerging market equities and fixed income securities representing different regions and sectors. The volatility and differences in emerging markets can also create attractive investment opportunities for active managers with the resources in place to monitor disparate emerging economies and the companies that operate in them.
Emerging markets securities can be a valuable tool for investors as they construct their portfolios. As always, we encourage investors to maintain exposure to a variety of asset classes within fixed income, equity and alternative investments.
On behalf of everyone at J.P. Morgan Asset Management, thank you for your continued support. We look forward to managing your investment needs for years to come. Should you have any questions, please visit www.jpmorganfunds.com or contact the J.P. Morgan Funds Service Center at 1-800-480-4111.
Sincerely yours,

George C.W. Gatch
CEO, Global Funds Management
J.P. Morgan Asset Management
| OCTOBER 31, 2012 | J.P. MORGAN INTERNATIONAL EQUITY FUNDS | 1 | ||||||
Table of Contents
J.P. Morgan International Equity Funds
TWELVE MONTHS ENDED OCTOBER 31, 2012 (Unaudited)
Developed Markets
The debt crisis in Europe continued to be a major source of uncertainty in capital markets. Global equity prices rose and fell with investors’ changing perception about the viability of actions taken by the European Central Bank to curb the crisis. Escalating political and social unrest in the Middle East also weighed on investor sentiment during the reporting period. Despite these concerns, stocks in most parts of the world posted positive returns during the twelve months ended October 31, 2012, bolstered by the accommodative policies of central banks as they continued their efforts to stoke economic growth. International developed stocks underperformed U.S. stocks during the reporting period, as the MSCI Europe, Australasia and Far East (“EAFE”) Index (net of foreign withholding taxes) gained 4.61%.
Emerging Markets
Emerging markets stocks underperformed international developed stocks during the reporting period as the MSCI Emerging Markets Index (net of foreign withholding taxes) gained 2.63%. Fears of an economic “hard landing” in China weighed on the asset class, as did concerns about weaker demand for commodities as a result of slowing global economic growth.
| 2 | J.P. MORGAN INTERNATIONAL EQUITY FUNDS | OCTOBER 31, 2012 | ||||
Table of Contents
JPMorgan Emerging Economies Fund
FUND COMMENTARY
TWELVE MONTHS ENDED OCTOBER 31, 2012 (Unaudited)
| REPORTING PERIOD RETURN: | ||||
| Fund (Select Class Shares)* | 3.34% | |||
| Morgan Stanley Capital International (“MSCI”) Emerging Markets Index (net of foreign withholding taxes) | 2.63% | |||
| Net Assets as of 10/31/2012 (In Thousands) | $ | 445,933 | ||
INVESTMENT OBJECTIVE**
The JPMorgan Emerging Economies Fund (the “Fund”) seeks long-term capital growth.
WHAT WERE THE MAIN DRIVERS OF THE FUND’S PERFORMANCE?
The Fund (Select Class Shares) outperformed the MSCI Emerging Markets Index (net of foreign withholding taxes) (the “Benchmark”) for the twelve months ended October 31, 2012. The Fund’s stock selection in the energy and consumer discretionary sectors contributed to relative performance. The Fund’s stock selection in the consumer staples sector and underweight versus the Benchmark and stock selection in the telecommunications services sector detracted from relative performance.
Individual contributors to relative performance included the Fund’s overweight positions versus the Benchmark in Great Wall Motor Company Ltd., a Chinese auto maker, and Cielo S.A., a Brazilian credit and debit card-payment processor. Both stocks rose after the companies reported better-than-expected first-quarter earnings. The Fund’s overweight position versus the Benchmark in Samsung Electronics Co., Ltd. also contributed to relative performance. Shares of the communications equipment provider benefited from the company’s strong sales for its smart phones.
Individual detractors from relative performance included the Fund’s overweight positions versus the Benchmark in Vale S.A.,
E Ink Holdings, Inc. and Banco do Brasil S.A. Shares of Vale, a Brazilian iron-ore producer, declined due to a dispute over the company’s unpaid tax claims. Shares of E Ink Holdings, Inc., which provides TFT LCD panels for e-reader devices, declined after the company reported a quarterly loss due to excess inventory at Amazon Inc., one of its major clients. Shares of Brazilian bank Banco do Brasil S.A. declined on concerns about the impact that increasing loan defaults would have on the company’s earnings.
HOW WAS THE FUND POSITIONED?
The Fund’s portfolio managers used a combination of top-down and bottom-up research, seeking attractively priced countries, sectors and stocks with positive catalysts. As a result of this process, the Fund’s largest overweight versus the Benchmark was in the consumer discretionary sector and the Fund’s largest underweight versus the Benchmark was in the financials sector.
| * | The return shown is based on net asset values calculated for shareholder transactions and may differ from the return shown in the financial highlights, which reflects adjustments made to the net asset values in accordance with accounting principles generally accepted in the United States of America. |
| ** | The advisor seeks to achieve the Fund’s objective. There can be no guarantee it will be achieved. |
| OCTOBER 31, 2012 | J.P. MORGAN INTERNATIONAL EQUITY FUNDS | 3 | ||||||
Table of Contents
JPMorgan Emerging Economies Fund
FUND COMMENTARY
TWELVE MONTHS ENDED OCTOBER 31, 2012 (Unaudited) (continued)
| TOP TEN EQUITY HOLDINGS OF THE PORTFOLIO* | ||||||||
| 1. | Samsung Electronics Co., Ltd. (South Korea) | 5.3 | % | |||||
| 2. | Taiwan Semiconductor Manufacturing Co., Ltd., ADR (Taiwan) | 3.1 | ||||||
| 3. | China Construction Bank Corp., Class H (China) | 2.3 | ||||||
| 4. | Industrial & Commercial Bank of China Ltd., Class H (China) | 2.1 | ||||||
| 5. | CNOOC Ltd. (China) | 2.1 | ||||||
| 6. | Vale S.A., ADR (Brazil) | 2.0 | ||||||
| 7. | Hyundai Motor Co. (South Korea) | 2.0 | ||||||
| 8. | Lukoil OAO, ADR (Russia) | 1.9 | ||||||
| 9. | PetroChina Co., Ltd., Class H (China) | 1.9 | ||||||
| 10. | Cia de Bebidas das Americas, ADR (Preferred Stock) (Brazil) | 1.8 | ||||||
PORTFOLIO COMPOSITION BY COUNTRY* | ||||
| China | 18.9 | % | ||
| South Korea | 14.5 | |||
| Brazil | 10.4 | |||
| Taiwan | 9.5 | |||
| Russia | 7.1 | |||
| South Africa | 6.7 | |||
| Turkey | 6.3 | |||
| Thailand | 5.4 | |||
| Hong Kong | 5.2 | |||
| India | 5.1 | |||
| United Kingdom | 1.5 | |||
| Poland | 1.2 | |||
| Hungary | 1.0 | |||
| Others (each less than 1.0%) | 4.8 | |||
| Short-Term Investment | 2.4 | |||
| * | Percentages indicated are based upon total investments as of October 31, 2012. The Fund’s portfolio composition is subject to change. |
| 4 | J.P. MORGAN INTERNATIONAL EQUITY FUNDS | OCTOBER 31, 2012 | ||||
Table of Contents
AVERAGE ANNUAL TOTAL RETURNS AS OF OCTOBER 31, 2012 | ||||||||||||||||
| INCEPTION DATE OF CLASS | 1 YEAR | 3 YEAR | SINCE INCEPTION | |||||||||||||
CLASS A SHARES | 2/28/08 | |||||||||||||||
Without Sales Charge | 3.15 | % | 8.54 | % | (1.57 | )% | ||||||||||
With Sales Charge* | (2.26 | ) | 6.61 | (2.70 | ) | |||||||||||
CLASS C SHARES | 2/28/08 | |||||||||||||||
Without CDSC | 2.54 | 7.97 | (2.07 | ) | ||||||||||||
With CDSC** | 1.54 | 7.97 | (2.07 | ) | ||||||||||||
CLASS R5 SHARES | 2/28/08 | 3.53 | 9.01 | (1.14 | ) | |||||||||||
SELECT CLASS SHARES | 2/28/08 | 3.34 | 8.81 | (1.33 | ) | |||||||||||
| * | Sales Charge for Class A Shares is 5.25%. |
| ** | Assumes a 1% CDSC (contingent deferred sales charge) for the one year period and 0% CDSC thereafter. |
LIFE OF FUND PERFORMANCE (2/28/08 TO 10/31/12)
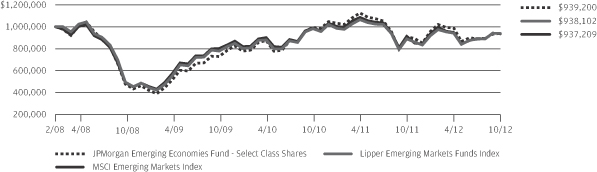
The performance quoted is past performance and is not a guarantee of future results. Mutual funds are subject to certain market risks. Investment returns and principal value of an investment will fluctuate so that an investor’s shares, when redeemed, may be worth more or less than their original cost. Current performance may be higher or lower than the performance data shown. For up-to-date month-end performance information please call 1-800-480-4111.
The Fund commenced operations on February 28, 2008.
The graph illustrates comparative performance for $1,000,000 invested in Select Class Shares of the JPMorgan Emerging Economies Fund, the MSCI Emerging Markets Index and the Lipper Emerging Markets Funds Index from February 28, 2008 to October 31, 2012. The performance of the Fund assumes reinvestment of all dividends and capital gain distributions, if any, and does not include a sales charge. The performance of the MSCI Emerging Markets Index does not reflect the deduction of expenses or a sales charge associated with a mutual fund and approximates the minimum possible dividend reinvestment of the securities included in the benchmark. The dividend is reinvested after deduction of withholding tax, applying the maximum rate to nonresident individual investors who do not benefit from double taxation treaties. The performance of the Lipper Emerging Markets Funds Index includes expenses associated with a mutual fund, such as investment management fees. These expenses are not identical to the expenses incurred by the Fund. The MSCI
Emerging Markets Index is a free float-adjusted market capitalization weighted index that is designed to measure the equity market performance of emerging markets. The Lipper Emerging Markets Funds Index is an index based on total returns of certain mutual funds within the Fund’s designated category as determined by Lipper, Inc. Investors cannot invest directly in an index.
Select Class Shares have a $1,000,000 minimum initial investment.
Fund performance may reflect the waiver of the Fund’s fees and reimbursement of expenses for certain periods since the inception date. Without these waivers and reimbursements, performance would have been lower. Also, performance shown in this section does not reflect the deduction of taxes that a shareholder would pay on Fund distributions or redemption of Fund shares.
International investing involves a greater degree of risk and increased volatility. Changes in currency exchange rates and differences in accounting and taxation policies outside the United States can raise or lower returns. Also, some overseas markets may not be as politically and economically stable as the U.S. and other nations. The Fund is also subject to the additional risk of non-diversified “regional” fund investing.
The returns shown are based on net asset values calculated for shareholder transactions and may differ from the returns shown in the financial highlights, which reflect adjustments made to the net asset values in accordance with accounting principles generally accepted in the United States of America.
| OCTOBER 31, 2012 | J.P. MORGAN INTERNATIONAL EQUITY FUNDS | 5 | ||||||
Table of Contents
JPMorgan Emerging Markets Equity Fund
FUND COMMENTARY
TWELVE MONTHS ENDED OCTOBER 31, 2012 (Unaudited)
| REPORTING PERIOD RETURN: | ||||
| Fund (Institutional Class Shares)* | 4.80% | |||
| Morgan Stanley Capital International (“MSCI”) Emerging Markets Index (net of foreign withholding taxes) | 2.63% | |||
| Net Assets as of 10/31/2012 (In Thousands) | $ | 2,252,486 | ||
INVESTMENT OBJECTIVE**
The JPMorgan Emerging Markets Equity Fund (the “Fund”) seeks to provide high total return from a portfolio of equity securities from emerging markets issuers.
WHAT WERE THE MAIN DRIVERS OF THE FUND’S PERFORMANCE?
The Fund (Institutional Class Shares) outperformed the MSCI Emerging Markets Index (net of foreign withholding taxes) (the “Benchmark”) for the twelve months ended October 31, 2012. The Fund’s stock selection in the industrials, information technology and financials sectors contributed to relative performance. The Fund’s stock selection in the telecommunications services and consumer discretionary sectors and underweight versus the Benchmark in the healthcare sector detracted from relative performance.
Individual contributors to relative performance included the Fund’s overweight positions versus the Benchmark in Grupo Financiero Banorte S.A.B. de C.V., Turkiye Garanti Bankasi A.S. and Samsung Electronics Co., Ltd. Shares of Mexican bank Grupo Financiero Banorte S.A.B. de C.V. benefited from the company’s strong first-quarter earnings, which were boosted by robust growth in bank deposits and loans. Shares of Turkiye Garanti Bankasi A.S. rose after the Turkish bank reported better-than-expected third-quarter earnings. Shares of
communications equipment provider Samsung Electronics Co., Ltd. benefited from the company’s strong sales for its smart phones.
Individual detractors from relative performance included the Fund’s overweight positions versus the Benchmark in Bharti Airtel Ltd., OGX Petroleo e Gas Participacoes S.A. and Infosys Ltd., ADR. Shares of Indian telecommunication provider Bharti Airtel Ltd. declined amid concerns about increasing market competition in India’s telecommunications industry. Shares of Brazilian energy company OGX Petroleo e Gas Participacoes S.A. declined due to investors’ concerns about the company’s announced management change. Shares of Infosys Ltd., ADR decreased after the Indian software and programming company reported disappointing fiscal year-end earnings.
HOW WAS THE FUND POSITIONED?
The Fund employed an active strategy in which portfolio construction was focused on the highest-conviction ideas found at the stock level. The Fund’s portfolio managers used bottom-up fundamental research to determine the Fund’s security weightings against the Benchmark, rigorously researching companies in an attempt to determine their underlying value and potential for future earnings growth. As a result of this process, the Fund’s largest overweight versus the Benchmark was in the consumer staples sector and the Fund’s largest underweight versus the Benchmark was in the materials sector.
| 6 | J.P. MORGAN INTERNATIONAL EQUITY FUNDS | OCTOBER 31, 2012 | ||||
Table of Contents
| TOP TEN EQUITY HOLDINGS OF THE PORTFOLIO*** | ||||||||
| 1. | Samsung Electronics Co., Ltd. (South Korea) | 5.1 | % | |||||
| 2. | Taiwan Semiconductor Manufacturing Co., Ltd., ADR (Taiwan) | 4.2 | ||||||
| 3. | Housing Development Finance Corp., Ltd. (India) | 4.1 | ||||||
| 4. | China Mobile Ltd. (Hong Kong) | 3.2 | ||||||
| 5. | Cia de Bebidas das Americas, ADR (Preferred Stock) (Brazil) | 3.1 | ||||||
| 6. | Turkiye Garanti Bankasi AS (Turkey) | 2.9 | ||||||
| 7. | Hyundai Motor Co. (South Korea) | 2.6 | ||||||
| 8. | CNOOC Ltd. (China) | 2.6 | ||||||
| 9. | Petroleo Brasileiro S.A., ADR (Brazil) | 2.5 | ||||||
| 10. | AIA Group Ltd. (Hong Kong) | 2.4 | ||||||
PORTFOLIO COMPOSITION BY COUNTRY*** | ||||
| Brazil | 14.5 | % | ||
| China | 11.8 | |||
| South Korea | 11.3 | |||
| India | 10.3 | |||
| South Africa | 10.1 | |||
| Hong Kong | 10.0 | |||
| Taiwan | 7.2 | |||
| Indonesia | 4.3 | |||
| Turkey | 3.8 | |||
| Mexico | 3.1 | |||
| Russia | 3.0 | |||
| United Kingdom | 2.6 | |||
| Luxembourg | 1.9 | |||
| Chile | 1.8 | |||
| Malaysia | 1.1 | |||
| Others (each less than 1.0%) | 0.8 | |||
Short-Term Investment | 2.4 | |||
| * | The return shown is based on net asset values calculated for shareholder transactions and may differ from the return shown in the financial highlights, which reflects adjustments made to the net asset values in accordance with accounting principles generally accepted in the United States of America. |
| ** | The advisor seeks to achieve the Fund’s objective. There can be no guarantee it will be achieved. |
| *** | Percentages indicated are based upon total investments as of October 31, 2012. The Fund’s portfolio composition is subject to change. |
| OCTOBER 31, 2012 | J.P. MORGAN INTERNATIONAL EQUITY FUNDS | 7 | ||||||
Table of Contents
JPMorgan Emerging Markets Equity Fund
FUND COMMENTARY
TWELVE MONTHS ENDED OCTOBER 31, 2012 (Unaudited) (continued)
AVERAGE ANNUAL TOTAL RETURNS AS OF OCTOBER 31, 2012 | ||||||||||||||||
| INCEPTION DATE OF CLASS | 1 YEAR | 5 YEAR | 10 YEAR | |||||||||||||
CLASS A SHARES | 9/28/01 | |||||||||||||||
Without Sales Charge | 4.36 | % | (2.89 | )% | 16.15 | % | ||||||||||
With Sales Charge* | (1.12 | ) | (3.93 | ) | 15.52 | |||||||||||
CLASS B SHARES | 9/28/01 | |||||||||||||||
Without CDSC | 3.80 | (3.37 | ) | 15.69 | ||||||||||||
With CDSC** | (1.20 | ) | (3.83 | ) | 15.69 | |||||||||||
CLASS C SHARES | 2/28/06 | |||||||||||||||
Without CDSC | 3.83 | (3.37 | ) | 15.57 | ||||||||||||
With CDSC*** | 2.83 | (3.37 | ) | 15.57 | ||||||||||||
INSTITUTIONAL CLASS SHARES | 11/15/93 | 4.80 | (2.49 | ) | 16.67 | |||||||||||
SELECT CLASS SHARES | 9/10/01 | 4.65 | (2.64 | ) | 16.42 | |||||||||||
| * | Sales Charge for Class A Shares is 5.25%. |
| ** | Assumes a 5% CDSC (contingent deferred sales charge) for the one year period, 2% CDSC for the five year period and 0% CDSC thereafter. |
| *** | Assumes a 1% CDSC for the one year period and 0% CDSC thereafter. |
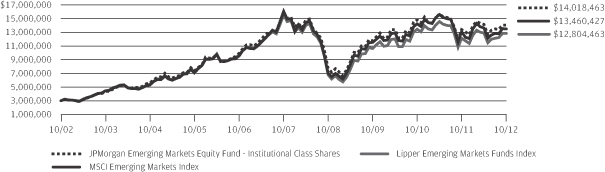
TEN YEAR PERFORMANCE (10/31/02 TO 10/31/12)
The performance quoted is past performance and is not a guarantee of future results. Mutual funds are subject to certain market risks. Investment returns and principal value of an investment will fluctuate so that an investor’s shares, when redeemed, may be worth more or less than their original cost. Current performance may be higher or lower than the performance data shown. For up-to-date month-end performance information please call 1-800-480-4111.
Returns for Class C Shares prior to its inception date were based on the performance of Class B Shares. The actual returns of Class C Shares would have been similar to those shown because Class C Shares have expenses similar to those of Class B Shares.
The graph illustrates comparative performance for $3,000,000 invested in Institutional Class Shares of the JPMorgan Emerging Markets Equity Fund, the MSCI Emerging Markets Index and the Lipper Emerging Markets Funds Index from October 31, 2002 to October 31, 2012. The performance of the Fund assumes reinvestment of all dividends and capital gain distributions, if any, and does not include a sales charge. The performance of the MSCI Emerging Markets Index does not reflect the deduction of expenses or a sales charge associated with a mutual fund and approximates the maximum possible dividend reinvestment of the securities included in the benchmark. The dividend is reinvested after deduction of withholding tax, applying the maximum rate to nonresident individual investors who do not benefit from double taxation treaties. The performance of the Lipper Emerging Markets Funds Index includes expenses associated with a mutual fund, such as investment management fees. These expenses are not identical to the expenses incurred by the Fund. The MSCI Emerging Markets Index is a free float-adjusted market capitalization
weighted index that is designed to measure the equity market performance of emerging markets. The Lipper Emerging Markets Funds Index is an index based on the total returns of the funds in the indicated category, as defined by Lipper, Inc. Investors cannot invest directly in an index.
Institutional Class Shares have a $3,000,000 minimum initial investment.
Fund performance may reflect the waiver of the Fund’s fees and reimbursement of expenses for certain periods since the inception date. Without these waivers and reimbursements, performance would have been lower. Also, performance shown in this section does not reflect the deduction of taxes that a shareholder would pay on Fund distributions or redemption of Fund shares.
International investing involves a greater degree of risk and increased volatility. Changes in currency exchange rates and differences in accounting and taxation policies outside the U.S. can raise or lower returns. Also, some overseas markets may not be as politically and economically stable as the United States and other nations.
Because Class B shares automatically convert to Class A shares after 8 years, the 10 Year average annual total return shown above for Class B reflects Class A performance for the period after conversion.
The returns shown are based on net asset values calculated for shareholder transactions and may differ from the returns shown in the financial highlights, which reflect adjustments made to the net asset values in accordance with accounting principles generally accepted in the United States of America.
| 8 | J.P. MORGAN INTERNATIONAL EQUITY FUNDS | OCTOBER 31, 2012 | ||||
Table of Contents
JPMorgan Global Equity Income Fund
FUND SUMMARY
TWELVE MONTHS ENDED OCTOBER 31, 2012 (Unaudited)
| REPORTING PERIOD RETURN: | ||||
| Fund (Select Class Shares)* | 9.43% | |||
| Morgan Stanley Capital International (“MSCI”) World Index (net of foreign withholding taxes) | 9.45% | |||
| Net Assets as of 10/31/2012 (In Thousands) | $ | 37,867 | ||
INVESTMENT OBJECTIVE**
The JPMorgan Global Equity Income Fund (the “Fund”) seeks to provide both current income and long-term capital appreciation.
WHAT WERE THE MAIN DRIVERS OF THE FUND’S PERFORMANCE?
The Fund (Select Class Shares) underperformed the MSCI World Index (net of foreign withholding taxes) (the “Benchmark”) for the twelve months ended October 31, 2012. The Fund’s stock selection and underweight position versus the Benchmark in the consumer non-durable sector detracted from relative performance. Stock selection in the insurance sector also detracted. The Fund’s stock selection in the banks and finance sector and stock selection and underweight versus the Benchmark in the basic industries sector contributed to relative performance.
Individual detractors from relative performance included the Fund’s overweight positions versus the Benchmark in QBE Insurance Group Ltd., and Canon, Inc. Shares of Australian insurance company QBE Insurance Group Ltd. declined as the company warned that its insurance profit margin might decline in the second half of the year. Shares of the Japanese imaging company Canon, Inc. underperformed, weighed down by concerns about a strong yen, sluggish demand for office equipment, slowing demand in China and a territorial dispute with that same country, which resulted in the Chinese boycotting Japanese goods.
Individual contributors to relative performance included the Fund’s overweight positions versus the Benchmark in Telecom
Corp. of New Zealand Ltd. and Wells Fargo & Co. Shares of Telecom Corp. of New Zealand Ltd., a communications services company, rose as investors were attracted to the stock’s dividend yield. The company has been returning capital to shareholders following the spin off of its Chorus network unit. Shares of U.S. bank Wells Fargo & Co. benefited from investors’ optimism surrounding the bank’s competitive positioning and resulting market share gains.
HOW THE FUND WAS MANAGED
The Fund’s portfolio managers employed a bottom-up fundamental approach to stock selection, rigorously researching companies in an attempt to determine their underlying value and potential for future growth. The Fund’s portfolio managers looked for dividend yielding equity securities that they believed were undervalued and possessed the long-term earnings power and strong cash flow generation that would enable them to grow their dividends.
In addition, the Fund employed futures and currency forwards to help manage cash flows and attempt to keep the Fund’s currency exposure in line with the Benchmark.
| * | The return shown is based on net asset values calculated for shareholder transactions and may differ from the return shown in the financial highlights, which reflects adjustments made to the net asset values in accordance with accounting principles generally accepted in the United States of America. |
| ** | The advisor seeks to achieve the Fund’s objective. There can be no guarantee it will be achieved. |
| OCTOBER 31, 2012 | J.P. MORGAN INTERNATIONAL EQUITY FUNDS | 9 | ||||||
Table of Contents
JPMorgan Global Equity Income Fund
FUND SUMMARY
TWELVE MONTHS ENDED OCTOBER 31, 2012 (Unaudited) (continued)
| TOP TEN EQUITY HOLDINGS OF THE PORTFOLIO* | ||||||||
| 1. | Time Warner, Inc. | 2.8 | % | |||||
| 2. | Royal Dutch Shell plc, Class A (Netherlands) | 2.8 | ||||||
| 3. | Merck & Co., Inc. | 2.7 | ||||||
| 4. | Australia & New Zealand Banking Group Ltd. (Australia) | 2.5 | ||||||
| 5. | Pfizer, Inc. | 2.1 | ||||||
| 6. | Vodafone Group plc (United Kingdom) | 2.1 | ||||||
| 7. | Eni S.p.A. (Italy) | 2.0 | ||||||
| 8. | Telecom Corp. of New Zealand Ltd. (New Zealand) | 2.0 | ||||||
| 9. | Roche Holding AG (Switzerland) | 1.9 | ||||||
| 10. | Verizon Communications, Inc. | 1.9 | ||||||
PORTFOLIO COMPOSITION BY COUNTRY* | ||||
| United States | 30.4 | % | ||
| United Kingdom | 12.1 | |||
| France | 8.3 | |||
| Japan | 8.1 | |||
| Australia | 6.8 | |||
| Germany | 6.2 | |||
| Netherlands | 5.4 | |||
| Switzerland | 5.1 | |||
| China | 2.9 | |||
| Italy | 2.0 | |||
| Sweden | 2.0 | |||
| New Zealand | 2.0 | |||
| Singapore | 1.8 | |||
| Hong Kong | 1.4 | |||
| Indonesia | 1.0 | |||
| Others (each less than 1.0%) | 1.8 | |||
| Short-Term Investment | 2.7 | |||
| * | Percentages indicated are based upon total investments as of October 31, 2012. The Fund’s portfolio composition is subject to change. |
| 10 | J.P. MORGAN INTERNATIONAL EQUITY FUNDS | OCTOBER 31, 2012 | ||||
Table of Contents
AVERAGE ANNUAL TOTAL RETURNS AS OF OCTOBER 31, 2012 | ||||||||||||
| INCEPTION DATE OF CLASS | 1 YEAR | SINCE INCEPTION | ||||||||||
CLASS A SHARES | 2/28/11 | |||||||||||
Without Sales Charge | 9.17 | % | (0.29 | )% | ||||||||
With Sales Charge* | 3.44 | (3.45 | ) | |||||||||
CLASS C SHARES | 2/28/11 | |||||||||||
Without CDSC | 8.74 | (0.75 | ) | |||||||||
With CDSC** | 7.74 | (0.75 | ) | |||||||||
CLASS R2 SHARES | 2/28/11 | 8.96 | (0.53 | ) | ||||||||
CLASS R5 SHARES | 2/28/11 | 9.70 | 0.17 | |||||||||
SELECT CLASS SHARES | 2/28/11 | 9.43 | (0.04 | ) | ||||||||
| * | Sales Charge for Class A Shares is 5.25%. |
| ** | Assumes a 1% CDSC (contingent deferred sales charge) for the one year period and 0% CDSC thereafter. |
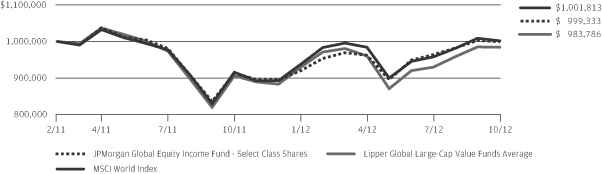
LIFE OF FUND PERFORMANCE (2/28/11 TO 10/31/12)
The performance quoted is past performance and is not a guarantee of future results. Mutual funds are subject to certain market risks. Investment returns and principal value of an investment will fluctuate so that an investor’s shares, when redeemed, may be worth more or less than their original cost. Current performance may be higher or lower than the performance data shown. For up-to-date, month-end performance information please call 1-800-480-4111.
The Fund commenced operations on February 28, 2011.
The graph illustrates comparative performance for $1,000,000 invested in Select Class Shares of the JPMorgan Global Equity Income Fund, the MSCI World Index and the Lipper Global Large-Cap Value Funds Average, from February 28, 2011 to October 31, 2012. The performance of the Fund assumes reinvestment of all dividends and capital gain distributions, if any, and does not include a sales charge. The performance of the MSCI World Index does not reflect the deduction of expenses or a sales charge associated with a mutual fund and approximates the minimum possible dividend reinvestment of the securities included in the benchmark. The dividend is reinvested after deduction of withholding tax, applying the maximum rate to non-resident institutional investors who do not benefit from double taxation treaties. These expenses are not identical to the expenses incurred by the Fund. The performance of the Lipper Global Large-Cap Value Funds Average includes expenses associated with a mutual fund, such as investment management fees. The MSCI World Index is a free float-adjusted market capitalization weighted index that is
designed to measure the equity market performance of developed markets. Investors cannot invest directly in an index. The Lipper Global Large-Cap Value Funds Average is an average based on the total returns of all mutual funds within the Fund’s designated category as determined by Lipper, Inc.
Select Class Shares have a $1,000,000 minimum initial investment.
Fund performance may reflect the waiver of the Fund’s fees and reimbursement of expenses for certain periods since the inception date. Without these waivers and reimbursements, performance would have been lower. Also, performance shown in this section does not reflect the deduction of taxes that a shareholder would pay on Fund distributions or redemption of Fund shares.
International investing involves a greater degree of risk and increased volatility. Changes in currency exchange rates and differences in accounting and taxation policies outside the U.S. can raise or lower returns. Also, some overseas markets may not be as politically and economically stable as the United States and other nations.
The returns shown are based on net asset values calculated for shareholder transactions and may differ from the returns shown in the financial highlights, which reflect adjustments made to the net asset values in accordance with accounting principles generally accepted in the United States of America.
| OCTOBER 31, 2012 | J.P. MORGAN INTERNATIONAL EQUITY FUNDS | 11 | ||||||
Table of Contents
JPMorgan Global Opportunities Fund
FUND COMMENTARY
TWELVE MONTHS ENDED OCTOBER 31, 2012 (Unaudited)
| REPORTING PERIOD RETURN: | ||||
| Fund (Select Class Shares)* | 8.88% | |||
| Morgan Stanley Capital International (“MSCI”) World Index (net of foreign withholding taxes) | 9.45% | |||
| Net Assets as of 10/31/2012 (In Thousands) | $4,623 | |||
INVESTMENT OBJECTIVE**
The JPMorgan Global Opportunities Fund (the “Fund”), previously known as the JPMorgan Global Focus Fund1, seeks to provide long-term capital growth.
WHAT WERE THE MAIN DRIVERS OF THE FUND’S PERFORMANCE?
The Fund (Select Class Shares) underperformed the MSCI World Index (net of foreign withholding taxes) (the “Benchmark”) for the twelve months ended October 31, 2012. The Fund’s stock selection in the energy sector detracted from relative performance. The Fund’s stock selection in the transportation services & consumer cyclicals sectors contributed to relative performance.
Individual detractors from the Fund’s relative performance included the Fund’s overweight positions versus the Benchmark in Humana, Inc., Shire plc. and Kinross Gold Corp. Shares of Humana, Inc. declined after the healthcare company warned of rising cost pressures and lowered its guidance for fiscal 2012 earnings. Shares of Shire plc., an Irish drug company, fell after the FDA approved a generic version of one of its best-selling drugs and the company’s CEO announced he would retire in 2013. Shares of Kinross Gold Corp. declined after the Canadian gold miner took a large goodwill write-down on its Tasiast mine in Africa and warned of project delays. Like many of its peers, the company also struggled with rising cost pressures.
Individual contributors to the Fund’s relative performance included the Fund’s overweight positions versus the Benchmark in Samsung Electronics Co., Ltd., Comcast Corp. and Wells
Fargo & Co. Shares of semiconductor, electronics and communications-equipment provider Samsung Electronics Co., Ltd. benefited as the company’s earnings were bolstered by robust sales for its smart phones and a turnaround in its display business. Shares of Comcast Corp., the U.S. cable TV, phone and internet provider, benefited as the company added more subscribers than expected, returned more capital to shareholders and saw ratings gains at recently-acquired NBC. Shares of U.S. bank Wells Fargo & Co. benefited from investors’ optimism surrounding the bank’s competitive positioning and resulting market share gains.
HOW WAS THE FUND POSITIONED?
The Fund’s portfolio managers employed a bottom-up fundamental approach to stock selection, seeking to identify what they believed to be the most attractive investment opportunities within each sector. The Fund’s portfolio managers sought stocks that they believed possessed an attractive valuation signal (as measured by a proprietary dividend discount model) and a timely catalyst that would enable the stock to realize its inherent value.
In addition, the Fund employed futures and currency forwards to help manage cash flows and attempt to keep the Fund’s currency exposure in line with the Benchmark.
| 1 | The advisor seeks to achieve the Fund’s objective. There can be no guarantee it will be achieved. Effective November 1, 2011, the Fund modified some of its investment strategies and lowered its advisory fee and expense cap. |
| 12 | J.P. MORGAN INTERNATIONAL EQUITY FUNDS | OCTOBER 31, 2012 | ||||
Table of Contents
| TOP TEN EQUITY HOLDINGS OF THE PORTFOLIO*** | ||||||||
| 1. | Apple, Inc. | 2.7 | % | |||||
| 2. | Wells Fargo & Co. | 2.2 | ||||||
| 3. | Royal Dutch Shell plc, Class A (Netherlands) | 2.0 | ||||||
| 4. | Unilever N.V., CVA (Netherlands) | 1.8 | ||||||
| 5. | Merck & Co., Inc. | 1.7 | ||||||
| 6. | Microsoft Corp. | 1.6 | ||||||
| 7. | Citigroup, Inc. | 1.6 | ||||||
| 8. | British American Tobacco plc (United Kingdom) | 1.5 | ||||||
| 9. | Vodafone Group plc (United Kingdom) | 1.5 | ||||||
| 10. | Union Pacific Corp. | 1.5 | ||||||
PORTFOLIO COMPOSITION BY COUNTRY*** | ||||
| United States | 46.5 | % | ||
| United Kingdom | 13.4 | |||
| Japan | 8.6 | |||
| Netherlands | 5.4 | |||
| Germany | 4.9 | |||
| Switzerland | 4.4 | |||
| France | 4.3 | |||
| Ireland | 3.1 | |||
| Hong Kong | 2.4 | |||
| South Korea | 1.0 | |||
| Belgium | 1.0 | |||
| Others (each less than 1.0%) | 5.0 | |||
| * | The return shown is based on net asset values calculated for shareholder transactions and may differ from the return shown in the financial highlights, which reflects adjustments made to the net asset values in accordance with accounting principles generally accepted in the United States of America. |
| ** | The advisor seeks to achieve the Fund’s objective. There can be no guarantee it will be achieved. Effective November 1, 2011, the Fund changed its investment strategy and lowered its advisory fee and expense cap. |
| *** | Percentages indicated are based upon total investments as of October 31, 2012. The Fund’s portfolio composition is subject to change. |
| OCTOBER 31, 2012 | J.P. MORGAN INTERNATIONAL EQUITY FUNDS | 13 | ||||||
Table of Contents
JPMorgan Global Opportunities Fund
FUND COMMENTARY
TWELVE MONTHS ENDED OCTOBER 31, 2012 (Unaudited) (continued)
AVERAGE ANNUAL TOTAL RETURNS AS OF OCTOBER 31, 2012 | ||||||||||||||||
| INCEPTION DATE OF CLASS | 1 YEAR | 5 YEAR | SINCE INCEPTION | |||||||||||||
CLASS A SHARES | 3/30/07 | |||||||||||||||
Without Sales Charge | 8.70 | % | (2.44 | )% | (0.44 | )% | ||||||||||
With Sales Charge* | 2.97 | (3.49 | ) | (1.39 | ) | |||||||||||
CLASS C SHARES | 3/30/07 | |||||||||||||||
Without CDSC | 8.11 | (2.95 | ) | (0.95 | ) | |||||||||||
With CDSC** | 7.11 | (2.95 | ) | (0.95 | ) | |||||||||||
CLASS R2 SHARES | 11/1/11 | 8.42 | (2.49 | ) | (0.48 | ) | ||||||||||
CLASS R5 SHARES | 3/30/07 | 9.15 | (2.01 | ) | 0.01 | |||||||||||
CLASS R6 SHARES | 11/1/11 | 9.16 | (2.01 | ) | 0.01 | |||||||||||
SELECT CLASS SHARES | 3/30/07 | 8.88 | (2.21 | ) | (0.20 | ) | ||||||||||
| * | Sales Charge for Class A Shares is 5.25%. |
| ** | Assumes a 1% CDSC (contingent deferred sales charge) for the one year period and 0% CDSC thereafter. |
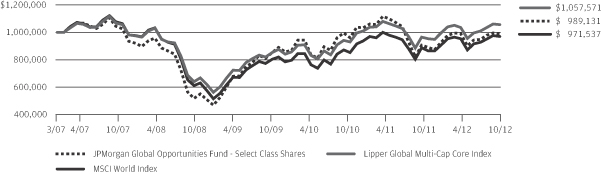
LIFE OF FUND PERFORMANCE (3/30/07 TO 10/31/12)
The performance quoted is past performance and is not a guarantee of future results. Mutual funds are subject to certain market risks. Investment returns and principal value of an investment will fluctuate so that an investor’s shares, when redeemed, may be worth more or less than their original cost. Current performance may be higher or lower than the performance data shown. For up-to-date, month-end performance information please call 1-800-480-4111.
The Fund commenced operations on March 30, 2007.
Effective November 1, 2011, some of the Fund’s investment strategies were modified and performance would have been different if the Fund was managed using its current strategies.
Returns for Class R2 Shares prior to its inception date were based on the performance of Class A Shares. The actual returns of R2 Shares would have been lower than shown because R2 Shares have higher expenses than Class A Shares.
Returns for Class R6 Shares prior to its inception date were based on the performance of Class R5 Shares. The actual returns of Class R6 Shares would have been different than those shown because Class R5 Shares have different expenses than Class R6 Shares.
The graph illustrates comparative performance for $1,000,000 invested in Select Class Shares of the JPMorgan Global Opportunities Fund, the MSCI World Index and the Lipper Global Multi-Cap Core Index from March 30, 2007 to October 31, 2012. The performance of the Fund assumes reinvestment of all dividends and capital gain distributions, if any, and does not include a sales charge. The performance of the MSCI World Index does not reflect the deduction of expenses or a sales charge associated with a mutual fund and approximates the minimum possible dividend reinvestment of the securities included in the benchmark. The dividend is reinvested after deduction of
withholding tax, applying the maximum rate to non-resident institutional investors who do not benefit from double taxation treaties. The performance of the Lipper Global Multi-Cap Core Index includes expenses associated with a mutual fund, such as investment management fees. These expenses are not identical to the expenses incurred by the Fund. The MSCI World Index is a free float-adjusted market capitalization weighted index that is designed to measure the equity market performance of developed markets. The Lipper Global Multi-Cap Core Index is an index based on total returns of certain mutual funds within the Fund’s designated category as determined by Lipper, Inc. Investors cannot invest directly in an index.
From the inception of the Fund through October 31, 2010, the Fund did not experience any shareholder purchase and sale activity. If such shareholder activity had occurred, the Fund’s performance may have been impacted.
Select Class Shares have a $1,000,000 minimum initial investment.
Fund performance may reflect the waiver of the Fund’s fees and reimbursement of expenses for certain periods since the inception date. Without these waivers and reimbursements, performance would have been lower. Also, performance shown in this section does not reflect the deduction of taxes that a shareholder would pay on Fund distributions or redemption of Fund shares.
International investing involves a greater degree of risk and increased volatility. Changes in currency exchange rates and differences in accounting and taxation policies outside the U.S. can raise or lower returns. Also, some overseas markets may not be as politically and economically stable as the United States and other nations.
The returns shown are based on net asset values calculated for shareholder transactions and may differ from the returns shown in the financial highlights, which reflect adjustments made to the net asset values in accordance with accounting principles generally accepted in the United States of America.
| 14 | J.P. MORGAN INTERNATIONAL EQUITY FUNDS | OCTOBER 31, 2012 | ||||
Table of Contents
JPMorgan International Equity Fund
FUND COMMENTARY
TWELVE MONTHS ENDED OCTOBER 31, 2012 (Unaudited)
| REPORTING PERIOD RETURN: | ||||
| Fund (Select Class Shares)* | 7.91% | |||
| Morgan Stanley Capital International (“MSCI”) Europe, Australasia and Far East (“EAFE”) Index (net of foreign withholding taxes) | 4.61% | |||
| Net Assets as of 10/31/2012 (In Thousands) | $ | 1,076,035 | ||
INVESTMENT OBJECTIVE**
The JPMorgan International Equity Fund (the “Fund”) seeks total return from long-term capital growth and income. Total return consists of capital growth and current income.
WHAT WERE THE MAIN DRIVERS OF THE FUND’S PERFORMANCE?
The Fund (Select Class Shares) outperformed the MSCI EAFE Index (net of foreign withholding taxes) (the “Benchmark”) for the twelve months ended October 31, 2012. The Fund’s stock selection, most notably in the information technology sector, contributed to the Fund’s relative performance. The Fund’s stock selection in the financials sector detracted from the Fund’s relative performance.
Individual contributors to the Fund’s relative performance included the Fund’s overweight positions in Samsung Electronics Co., Ltd., WPP plc and Anheuser-Busch InBev N.V. Shares of semiconductor, electronics and communications-equipment provider Samsung Electronics Co., Ltd. benefited as the company’s earnings were bolstered by robust sales for its smart phones and turnaround in its display business. Shares of U.K. advertising company WPP plc advanced due to the company’s better-than-expected 2011 results and expectations that events such as the London Olympics, the European Soccer Championships and the U.S. Presidential elections would support further revenue growth in 2012. Shares of Anheuser-Busch InBev N.V. increased after the beverages company reported strong revenue, boosted by continued growth in emerging markets and a recovery in its U.S. operations.
Individual detractors from the Fund’s relative performance included the Fund’s overweight positions versus the Benchmark in Canon, Inc., Tesco plc, and BG Group plc. Shares of Canon, Inc., the Japanese imaging company, underperformed, weighed down by concerns about a strong yen, sluggish demand for office equipment, slowing demand in China and a territorial dispute with China, which resulted in the Chinese boycotting Japanese goods. Shares of U.K. grocery store operator Tesco plc declined as competitive pressures and a challenging domestic economic environment prompted the company to issue its first profit warning in 20 years. Shares of BG Group plc, which is engaged in the exploration, development and production of natural gas and oil, declined following the company’s announcement that project delays would hold back output growth next year.
HOW WAS THE FUND POSITIONED?
The Fund’s portfolio managers continued to focus on stock selection to build a portfolio of international equities. They
used bottom-up fundamental research to identify what they believed were attractively priced stocks of well-managed companies with the potential to grow their earnings faster than their industry peers.
| TOP TEN EQUITY HOLDINGS OF THE PORTFOLIO*** | ||||||||
| 1. | Royal Dutch Shell plc, Class A (Netherlands) | 2.8 | % | |||||
| 2. | Nestle S.A. (Switzerland) | 2.4 | ||||||
| 3. | HSBC Holdings plc (United Kingdom) | 2.3 | ||||||
| 4. | Total S.A. (France) | 2.2 | ||||||
| 5. | Vodafone Group plc (United Kingdom) | 2.1 | ||||||
| 6. | Standard Chartered plc (United Kingdom) | 2.0 | ||||||
| 7. | BG Group plc (United Kingdom) | 1.9 | ||||||
| 8. | Roche Holding AG (Switzerland) | 1.9 | ||||||
| 9. | SAP AG (Germany) | 1.8 | ||||||
| 10. | Anheuser-Busch InBev N.V. (Belgium) | 1.7 | ||||||
PORTFOLIO COMPOSITION BY COUNTRY*** | ||||
| United Kingdom | 24.1 | % | ||
| Japan | 14.4 | |||
| France | 13.2 | |||
| Switzerland | 12.1 | |||
| Germany | 10.1 | |||
| Netherlands | 4.6 | |||
| China | 4.3 | |||
| Hong Kong | 2.6 | |||
| Australia | 2.1 | |||
| Belgium | 1.7 | |||
| South Korea | 1.4 | |||
| Israel | 1.2 | |||
| Ireland | 1.1 | |||
| Taiwan | 1.1 | |||
| Others (each less than 1.0%) | 2.5 | |||
| Short-Term Investment | 3.5 | |||
| * | The return shown is based on net asset values calculated for shareholder transactions and may differ from the return shown in the financial highlights, which reflects adjustments made to the net asset values in accordance with accounting principles generally accepted in the United States of America. |
| ** | The advisor seeks to achieve the Fund’s objective. There can be no guarantee it will be achieved. |
| *** | Percentages indicated are based upon total investments as of October 31, 2012. The Fund’s portfolio composition is subject to change. |
| OCTOBER 31, 2012 | J.P. MORGAN INTERNATIONAL EQUITY FUNDS | 15 | ||||||
Table of Contents
JPMorgan International Equity Fund
FUND COMMENTARY
TWELVE MONTHS ENDED OCTOBER 31, 2012 (Unaudited) (continued)
AVERAGE ANNUAL TOTAL RETURNS AS OF OCTOBER 31, 2012 | ||||||||||||||||
| INCEPTION DATE OF CLASS | 1 YEAR | 5 YEAR | 10 YEAR | |||||||||||||
CLASS A SHARES | 2/28/02 | |||||||||||||||
Without Sales Charge | 7.70 | % | (4.10 | )% | 7.13 | % | ||||||||||
With Sales Charge* | 2.04 | (5.13 | ) | 6.56 | ||||||||||||
CLASS B SHARES | 2/28/02 | |||||||||||||||
Without CDSC | 7.15 | (4.62 | ) | 6.66 | ||||||||||||
With CDSC** | 2.15 | (5.10 | ) | 6.66 | ||||||||||||
CLASS C SHARES | 1/31/03 | |||||||||||||||
Without CDSC | 7.16 | (4.61 | ) | 6.56 | ||||||||||||
With CDSC*** | 6.16 | (4.61 | ) | 6.56 | ||||||||||||
CLASS R2 SHARES | 11/3/08 | 7.45 | (4.31 | ) | 7.02 | |||||||||||
CLASS R5 SHARES | 5/15/06 | 8.19 | (3.69 | ) | 7.57 | |||||||||||
CLASS R6 SHARES | 11/30/10 | 8.23 | (3.67 | ) | 7.58 | |||||||||||
SELECT CLASS SHARES | 1/1/97 | 7.91 | (3.87 | ) | 7.43 | |||||||||||
| * | Sales Charge for Class A Shares is 5.25%. |
| ** | Assumes a 5% CDSC (contingent deferred sales charge) for the one year period, 2% CDSC for the five year period and 0% CDSC thereafter. |
| *** | Assumes a 1% CDSC for the one year period and 0% CDSC thereafter. |
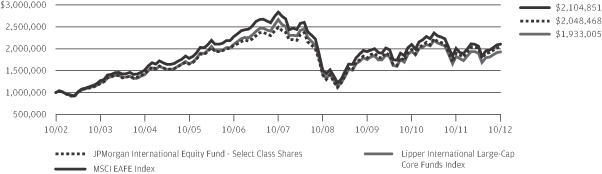
TEN YEAR PERFORMANCE (10/31/02 TO 10/31/12)
The performance quoted is past performance and is not a guarantee of future results. Mutual funds are subject to certain market risks. Investment returns and principal value of an investment will fluctuate so that an investor’s shares, when redeemed, may be worth more or less than their original cost. Current performance may be higher or lower than the performance data shown. For up-to-date month-end performance information please call 1-800-480-4111.
Returns for Class C Shares prior to its inception date were based on the performance of Class B Shares. The actual returns of Class C Shares would have been similar to those shown because Class C Shares have expenses similar to those of Class B Shares.
Returns for Class R5 Shares prior to its inception date were based on the performance of the Select Class Shares. The actual returns of Class R5 Shares would have been different than those shown because Class R5 Shares have different expenses than Select Class Shares.
Returns for Class R2 Shares prior to its inception date were based on the performance of Class A Shares. The actual returns of R2 Shares would have been lower than shown because R2 Shares have higher expenses than Class A Shares.
Returns for Class R6 Shares prior to its inception date were based on the performance of Class R5 Shares. The actual returns of Class R6 Shares would have
been different than those shown because Class R5 Shares have different expenses than Class R6 Shares.
The graph illustrates comparative performance for $1,000,000 invested in Select Class Shares of the JPMorgan International Equity Fund, the MSCI EAFE Index and the Lipper International Large-Cap Core Funds Index from October 31, 2002 to October 31, 2012. The performance of the Fund assumes reinvestment of all dividends and capital gain distributions, if any, and does not include a sales charge. The performance of the MSCI EAFE Index does not reflect the deduction of expenses or a sales charge associated with a mutual fund and approximates the minimum possible dividend reinvestment of the securities included in the benchmark. The dividend is reinvested after deduction of withholding tax, applying the maximum rate to non-resident institutional investors who do not benefit from double taxation treaties. The performance of the Lipper International Large-Cap Core Funds Index includes expenses associated with a mutual fund, such as investment management fees. These expenses are not identical to the expenses incurred by the Fund. The MSCI EAFE Index is a free float-adjusted market capitalization weighted index that is designed to measure the equity market performance of developed markets, excluding the U.S. and Canada. The Lipper International Large-Cap Core Funds Index is based on the total returns of certain mutual funds within the Fund’s designated category, as defined by Lipper, Inc. Investors cannot invest directly in an index.
| 16 | J.P. MORGAN INTERNATIONAL EQUITY FUNDS | OCTOBER 31, 2012 | ||||
Table of Contents
Select Class Shares have a $1,000,000 minimum initial investment.
Fund performance may reflect the waiver of the Fund’s fees and reimbursement of expenses for certain periods since the inception date. Without these waivers and reimbursements, performance would have been lower. Also, performance shown in this section does not reflect the deduction of taxes that a shareholder would pay on Fund distributions or redemption of Fund shares.
International investing involves a greater degree of risk and increased volatility. Changes in currency exchange rates and differences in accounting and taxation policies outside the U.S. can raise or lower returns. Also, some overseas markets may not be as politically and economically stable as the United States and other nations.
Because Class B Shares automatically convert to Class A Shares after 8 years, the 10 year average annual total return shown above for Class B reflects Class A performance for the period after conversion.
The returns shown are based on net asset values calculated for shareholder transactions and may differ from the returns shown in the financial highlights, which reflect adjustments made to the net asset values in accordance with accounting principles generally accepted in the United States of America.
| OCTOBER 31, 2012 | J.P. MORGAN INTERNATIONAL EQUITY FUNDS | 17 | ||||||
Table of Contents
JPMorgan International Equity Index Fund
FUND COMMENTARY
TWELVE MONTHS ENDED OCTOBER 31, 2012 (Unaudited)
| REPORTING PERIOD RETURN: | ||||
| Fund (Select Class Shares)* | 5.40% | |||
| Morgan Stanley Capital International (“MSCI”) Europe, Australasia and Far East (“EAFE”) GDP Index | 3.49% | |||
| Net Assets as of 10/31/2012 (In Thousands) | $ | 585,393 | ||
INVESTMENT OBJECTIVE**
The JPMorgan International Equity Index Fund (the “Fund”) seeks to provide investment results that correspond to the aggregate price and dividend performance of the securities in the MSCI EAFE Gross Domestic Product (“GDP”) Index (the “Benchmark”).
WHAT WERE THE MAIN DRIVERS OF THE FUND’S PERFORMANCE?
The Fund (Select Class Shares) outperformed the Benchmark for the twelve months ended October 31, 2012. The Fund’s exposure to emerging markets stocks, which are not held in the Benchmark, drove the Fund’s relative outperformance as emerging markets stocks outperformed international developed markets stocks during the reporting period.
The Fund’s strategy is not a full replication approach. The Fund seeks to achieve a correlation of 0.90 with the Benchmark, without taking into account the Fund’s expenses. Perfect correlation would be 1.00. The tracking error (a measure of how closely the return of a portfolio follows the return of an index to which it is benchmarked) of this strategy during the reporting period can be attributed to not owning all the names in the Benchmark and the Fund’s exposure to emerging markets stocks.
HOW WAS THE FUND POSITIONED?
The Fund’s portfolio managers constructed the Fund with country weightings based on GDP rather than equity market capitalization. Each country was weighted by GDP, because the Fund’s portfolio managers believed that this measure served as a better indication of each country’s potential earning power than traditional market capitalization. The Fund’s emerging markets exposure at the end of the reporting period was approximately 9.3%.
During the reporting period, the Fund’s portfolio managers used a combination of exchange-traded funds and futures to help manage cash flows. The Fund continued to track the Benchmark, consistent with its investment strategy, and attempted to provide broad international exposure for U.S. investors.
| TOP TEN EQUITY HOLDINGS OF THE PORTFOLIO*** | ||||||||
| 1. | Eni S.p.A. (Italy) | 2.0 | % | |||||
| 2. | Banco Santander S.A. (Spain) | 1.4 | ||||||
| 3. | Siemens AG (Germany) | 1.2 | ||||||
| 4. | BASF SE (Germany) | 1.1 | ||||||
| 5. | Total S.A. (France) | 1.1 | ||||||
| 6. | Sanofi (France) | 1.1 | ||||||
| 7. | Anheuser-Busch InBev N.V. (Belgium) | 1.1 | ||||||
| 8. | Bayer AG (Germany) | 1.1 | ||||||
| 9. | Telefonica S.A. (Spain) | 1.0 | ||||||
| 10. | SAP AG (Germany) | 1.0 | ||||||
PORTFOLIO COMPOSITION BY COUNTRY*** | ||||
| Japan | 18.3 | % | ||
| Germany | 13.0 | |||
| France | 9.5 | |||
| Italy | 7.9 | |||
| United Kingdom | 7.3 | |||
| Spain | 5.7 | |||
| Australia | 5.5 | |||
| Netherlands | 4.1 | |||
| Switzerland | 2.7 | |||
| Belgium | 1.9 | |||
| Sweden | 1.9 | |||
| Norway | 1.6 | |||
| Austria | 1.5 | |||
| Denmark | 1.1 | |||
| Greece | 1.0 | |||
| Hong Kong | 1.0 | |||
| Others (each less than 1.0%) | 15.4 | |||
| Short-Term Investment | 0.6 | |||
| * | The return shown is based on net asset values calculated for shareholder transactions and may differ from the return shown in the financial highlights, which reflects adjustments made to the net asset values in accordance with accounting principles generally accepted in the United States of America. |
| ** | The advisor seeks to achieve the Fund’s objective. There can be no guarantee it will be achieved. |
| *** | Percentages indicated are based upon total investments as of October 31, 2012. The Fund’s portfolio composition is subject to change. |
| 18 | J.P. MORGAN INTERNATIONAL EQUITY FUNDS | OCTOBER 31, 2012 | ||||
Table of Contents
AVERAGE ANNUAL TOTAL RETURNS AS OF OCTOBER 31, 2012 | ||||||||||||||||
| INCEPTION DATE OF CLASS | 1 YEAR | 5 YEAR | 10 YEAR | |||||||||||||
CLASS A SHARES | 4/23/93 | |||||||||||||||
Without Sales Charge | 5.16 | % | (7.14 | )% | 7.72 | % | ||||||||||
With Sales Charge* | (0.35 | ) | (8.13 | ) | 7.15 | |||||||||||
CLASS B SHARES | 1/14/94 | |||||||||||||||
Without CDSC | 4.43 | (7.82 | ) | 7.10 | ||||||||||||
With CDSC** | (0.57 | ) | (8.38 | ) | 7.10 | |||||||||||
CLASS C SHARES | 11/4/97 | |||||||||||||||
Without CDSC | 4.43 | (7.80 | ) | 6.95 | ||||||||||||
With CDSC*** | 3.43 | (7.80 | ) | 6.95 | ||||||||||||
CLASS R2 SHARES | 11/3/08 | 4.94 | (7.38 | ) | 7.45 | |||||||||||
SELECT CLASS SHARES | 10/28/92 | 5.40 | (6.91 | ) | 7.99 | |||||||||||
| * | Sales Charge for Class A Shares is 5.25%. |
| ** | Assumes a 5% CDSC (contingent deferred sales charge) for the one year period, 2% CDSC for the five year period and 0% CDSC thereafter. |
| *** | Assumes a 1% CDSC for the one year period and 0% CDSC thereafter. |
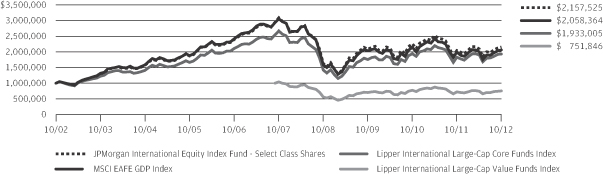
TEN YEAR PERFORMANCE (10/31/02 TO 10/31/12)
The performance quoted is past performance and is not a guarantee of future results. Mutual funds are subject to certain market risks. Investment returns and principal value of an investment will fluctuate so that an investor’s shares, when redeemed, may be worth more or less than their original cost. Current performance may be higher or lower than the performance data shown. For up-to-date month-end performance information please call 1-800-480-4111.
Returns for Class R2 Shares prior to its inception date were based on the performance of the Select Class Shares. Class R2 Shares performance has been adjusted to reflect the difference in expenses between classes.
The graph illustrates comparative performance for $1,000,000 invested in Select Class Shares of the JPMorgan International Equity Index Fund, the MSCI EAFE GDP Index and Lipper International Large-Cap Core Funds Index from October 31, 2002 to October 31, 2012 and Lipper International Large-Cap Value Funds Index from September 30, 2007 (inception of the index) to October 31, 2012. The performance of the Fund assumes reinvestment of all dividends and capital gain distributions, if any, and does not include a sales charge. The performance of the MSCI EAFE GDP Index does not reflect the deduction of expenses or a sales charge associated with a mutual fund and approximates the minimum possible dividend reinvestment of the securities included in the benchmark. The dividend is reinvested after deduction of withholding tax, applying the maximum rate to non-resident institutional investors who do not benefit from double taxation treaties. The performance of the Lipper International Large-Cap Core Funds Index and the Lipper International Large-Cap Value Funds Index include expenses associated with a mutual fund, such as investment management fees. These expenses are not identical to the expenses incurred by the Fund. The MSCI EAFE GDP Index is a country weighted index that is designed
to measure the size of developed market economies, excluding the U.S. & Canada. The Lipper International Large-Cap Core Funds Index and the Lipper International Large-Cap Value Funds Index are based on the total returns of certain mutual funds within the Fund’s designated category as defined by Lipper, Inc. Investors cannot invest directly in an index.
Select Class Shares have a $1,000,000 minimum initial investment.
Fund performance may reflect the waiver of the Fund’s fees and reimbursement of expenses for certain periods since the inception date. Without these waivers and reimbursements, performance would have been lower. Also, performance shown in this section does not reflect the deduction of taxes that a shareholder would pay on fund distributions or redemption of fund shares.
International investing involves a greater degree of risk and increased volatility. Changes in currency exchange rates and differences in accounting and taxation policies outside of the U.S. can raise or lower returns. Also, some overseas markets may not be as politically and economically stable as the United States and other nations.
Because Class B Shares automatically convert to Class A Shares after 8 years, the 10 year average annual total return shown above for Class B reflects Class A performance for the period after conversion.
The returns shown are based on net asset values calculated for shareholder transactions and may differ from the returns shown in the financial highlights, which reflect adjustments made to the net asset values in accordance with accounting principles generally accepted in the United States of America.
| OCTOBER 31, 2012 | J.P. MORGAN INTERNATIONAL EQUITY FUNDS | 19 | ||||||
Table of Contents
JPMorgan International Opportunities Fund
FUND COMMENTARY
TWELVE MONTHS ENDED OCTOBER 31, 2012 (Unaudited)
| REPORTING PERIOD RETURN: | ||||
| Fund (Institutional Class Shares)* | 7.45% | |||
| Morgan Stanley Capital International (“MSCI”) Europe, Australasia and Far East (“EAFE”) Index (net of foreign withholding taxes) | 4.61% | |||
| Net Assets as of 10/31/2012 (In Thousands) | $ | 835,185 | ||
INVESTMENT OBJECTIVE**
The JPMorgan International Opportunities Fund (the “Fund”) seeks to provide high total return from a portfolio of equity securities of foreign companies in developed and, to a lesser extent, emerging markets.
WHAT WERE THE MAIN DRIVERS OF THE FUND’S PERFORMANCE?
The Fund (Institutional Class Shares) outperformed the MSCI EAFE Index (net of foreign withholding taxes) (the “Benchmark”) for the twelve months ended October 31, 2012. The Fund’s stock selection, most notably in the semiconductors and transportation services & consumer cyclicals sectors, contributed to the Fund’s relative performance. The Fund’s stock selection in the autos and consumer non durable sectors detracted from the Fund’s relative performance.
Individual contributors to the Fund’s relative performance included the Fund’s overweight positions versus the Benchmark in Samsung Electronics Co., Ltd., Intercontinental Hotels Group plc and Hon Hai Precision Industry Co., Ltd. Shares of semiconductor, electronics and communications-equipment provider Samsung Electronics Co., Ltd. benefited as the company’s earnings were bolstered by robust sales for its smart phones and a turnaround in its display business. Shares of hotel operator Intercontinental Hotels Group plc benefited as growth in U.S. and China operations bolstered earnings and the company continued to return capital to shareholders. Shares of Hon Hai Precision Industry Co., Ltd., increased as revenues continued to grow, bolstered by strong sales of Apple products. Apple Inc. is the largest client of the Taiwanese consumer electronics contract manufacturer.
Individual detractors from the Fund’s relative performance included the Fund’s overweight positions versus the Benchmark in Nippon Sheet Glass Co., Ltd., Mitsubishi Electric Corp. and BG Group plc. Shares of Japanese glass maker Nippon Sheet Glass Co., Ltd. declined as the slowdown in European auto and construction activity, increased competition from Chinese manufacturers and the resignation of the company’s U.S. head of operations weighed on the stock. Mitsubishi Electric Corp. is a Japanese electronics maker. The stock declined as orders for factory automation equipment slowed and the company was prohibited from bidding on state contracts after the Japanese government accused the company of overcharging. Shares of BG Group plc, which is engaged in the exploration, development and production of natural gas and oil, declined following the company’s announcement that project delays would hold back output growth next year.
HOW WAS THE FUND POSITIONED?
The Fund’s portfolio managers employed a bottom-up fundamental approach to stock selection, seeking to identify what they believed were the most attractive investment opportunities within each sector. The Fund’s portfolio managers looked for stocks that they believed possessed an attractive valuation signal (as measured by a proprietary dividend discount model) and a timely catalyst that would enable the stock to realize its inherent value.
In addition, the Fund employed futures and currency forwards to help manage cash flows and attempt to keep the Fund’s currency exposure in line with that of its Benchmark.
| 20 | J.P. MORGAN INTERNATIONAL EQUITY FUNDS | OCTOBER 31, 2012 | ||||
Table of Contents
| TOP TEN EQUITY HOLDINGS OF THE PORTFOLIO*** | ||||||||
| 1. | Royal Dutch Shell plc, Class A (Netherlands) | 3.3 | % | |||||
| 2. | HSBC Holdings plc (United Kingdom) | 3.0 | ||||||
| 3. | Rio Tinto plc (United Kingdom) | 2.6 | ||||||
| 4. | Unilever N.V., CVA (Netherlands) | 2.4 | ||||||
| 5. | Vodafone Group plc (United Kingdom) | 2.3 | ||||||
| 6. | GlaxoSmithKline plc (United Kingdom) | 2.3 | ||||||
| 7. | British American Tobacco plc (United Kingdom) | 2.1 | ||||||
| 8. | Nestle S.A. (Switzerland) | 1.9 | ||||||
| 9. | BG Group plc (United Kingdom) | 1.8 | ||||||
| 10. | Bayer AG (Germany) | 1.8 | ||||||
PORTFOLIO COMPOSITION BY COUNTRY*** | ||||
| United Kingdom | 25.7 | % | ||
| Japan | 17.4 | |||
| Germany | 10.1 | |||
| Switzerland | 7.3 | |||
| Netherlands | 7.2 | |||
| France | 6.6 | |||
| Hong Kong | 3.4 | |||
| Sweden | 2.8 | |||
| Australia | 2.5 | |||
| China | 2.4 | |||
| Ireland | 2.4 | |||
| South Korea | 2.0 | |||
| Canada | 1.4 | |||
| Belgium | 1.3 | |||
| Taiwan | 1.0 | |||
| Finland | 1.0 | |||
| Others (each less than 1.0%) | 3.1 | |||
| Short-Term Investment | 2.4 | |||
| * | The return shown is based on net asset values calculated for shareholder transactions and may differ from the return shown in the financial highlights, which reflects adjustments made to the net asset values in accordance with accounting principles generally accepted in the United States of America. |
| ** | The advisor seeks to achieve the Fund’s objective. There can be no guarantee it will be achieved. |
| *** | Percentages indicated are based upon total investments as of October 31, 2012. The Fund’s portfolio composition is subject to change. |
| OCTOBER 31, 2012 | J.P. MORGAN INTERNATIONAL EQUITY FUNDS | 21 | ||||||
Table of Contents
JPMorgan International Opportunities Fund
FUND COMMENTARY
TWELVE MONTHS ENDED OCTOBER 31, 2012 (Unaudited) (continued)
AVERAGE ANNUAL TOTAL RETURNS AS OF OCTOBER 31, 2012 | ||||||||||||||||
| INCEPTION DATE OF CLASS | 1 YEAR | 5 YEAR | 10 YEAR | |||||||||||||
CLASS A SHARES | 9/10/01 | |||||||||||||||
Without Sales Charge | 6.95 | % | (5.38 | )% | 7.13 | % | ||||||||||
With Sales Charge* | 1.37 | (6.40 | ) | 6.55 | ||||||||||||
CLASS B SHARES | 9/10/01 | |||||||||||||||
Without CDSC | 6.46 | (5.86 | ) | 6.71 | ||||||||||||
With CDSC** | 1.46 | (6.37 | ) | 6.71 | ||||||||||||
CLASS C SHARES | 7/31/07 | |||||||||||||||
Without CDSC | 6.47 | (5.85 | ) | 6.61 | ||||||||||||
With CDSC*** | 5.47 | (5.85 | ) | 6.61 | ||||||||||||
CLASS R6 SHARES | 11/30/10 | 7.59 | (4.93 | ) | 7.78 | |||||||||||
INSTITUTIONAL CLASS SHARES | 2/26/97 | 7.45 | (4.97 | ) | 7.76 | |||||||||||
SELECT CLASS SHARES | 9/10/01 | 7.28 | (5.15 | ) | 7.53 | |||||||||||
| * | Sales Charge for Class A Shares is 5.25%. |
| ** | Assumes a 5% CDSC (contingent deferred sales charge) for the one year period, 2% CDSC for the five year period and 0% CDSC thereafter. |
| *** | Assumes a 1% CDSC for the one year period and 0% CDSC thereafter. |
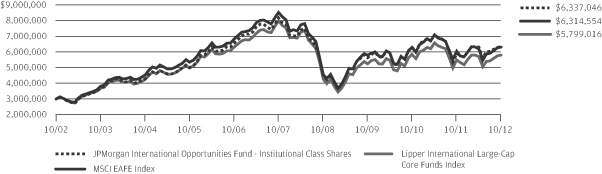
TEN YEAR PERFORMANCE (10/31/02 TO 10/31/12)
The performance quoted is past performance and is not a guarantee of future results. Mutual funds are subject to certain market risks. Investment returns and principal value of an investment will fluctuate so that an investor’s shares, when redeemed, may be worth more or less than their original cost. Current performance may be higher or lower than the performance data shown. For up-to-date month-end performance information please call 1-800-480-4111.
Returns for Class C Shares prior to its inception date were based on the performance of Class B Shares. The actual returns of Class C Shares would have been similar to those shown because Class C Shares have expenses similar to those of Class B Shares.
Returns for Class R6 Shares prior to its inception date were based on the performance of Institutional Class Shares. The actual returns of Class R6 Shares would have been different than those shown because Institutional Class Shares have different expenses than Class R6 Shares.
The graph illustrates comparative performance for $3,000,000 invested in Institutional Class Shares of the JPMorgan International Opportunities Fund, the MSCI EAFE Index and the Lipper International Large-Cap Core Funds Index from October 31, 2002 to October 31, 2012. The performance of the Fund assumes reinvestment of all dividends and capital gain distributions, if any, and does not include a sales charge. The performance of the MSCI EAFE Index does not reflect the deduction of expenses or a sales charge associated with a mutual fund and approximates the minimum possible dividend reinvestment of the
securities included in the benchmark. The dividend is reinvested after deduction of withholding tax, applying the maximum rate to non-resident institutional investors who do not benefit from double taxation treaties. The performance of the Lipper International Large-Cap Core Funds Index includes expenses associated with a mutual fund, such as investment management fees. These expenses are not identical to the expenses incurred by the Fund. The MSCI EAFE Index is a free float-adjusted market capitalization weighted index that is designed to measure the equity market performance of developed markets, excluding the U.S. and Canada. The Lipper International Large-Cap Core Funds Index is based on the total returns of certain mutual funds within the Fund’s designated category, as defined by Lipper, Inc. Investors cannot invest directly in an index.
Institutional Class Shares have a $3,000,000 minimum initial investment.
Fund performance may reflect the waiver of the Fund’s fees and reimbursement of expenses for certain periods since the inception date. Without these waivers and reimbursements, performance would have been lower. Also, performance shown in this section does not reflect the deduction of taxes that a shareholder would pay on Fund distributions or redemption of Fund shares.
International investing involves a greater degree of risk and increased volatility. Changes in currency exchange rates and differences in accounting and taxation policies outside the U.S. can raise or lower returns. Also, some overseas markets may not be as politically and economically stable as the United States and other nations.
| 22 | J.P. MORGAN INTERNATIONAL EQUITY FUNDS | OCTOBER 31, 2012 | ||||
Table of Contents
Because Class B shares automatically convert to Class A shares after 8 years, the 10 Year average annual total return shown above for Class B reflects Class A performance for the period after conversion.
The returns shown are based on net asset values calculated for shareholder transactions and may differ from the returns shown in the financial highlights, which reflect adjustments made to the net asset values in accordance with accounting principles generally accepted in the United States of America.
| OCTOBER 31, 2012 | J.P. MORGAN INTERNATIONAL EQUITY FUNDS | 23 | ||||||
Table of Contents
JPMorgan International Value Fund
FUND COMMENTARY
TWELVE MONTHS ENDED OCTOBER 31, 2012 (Unaudited)
| REPORTING PERIOD RETURN: | ||||
| Fund (Institutional Class Shares)* | 5.00% | |||
| Morgan Stanley Capital International (“MSCI”) Europe, Australasia and Far East (“EAFE”) Value Index (net of foreign withholding taxes) | 4.44% | |||
| Net Assets as of 10/31/2012 (In Thousands) | $ | 2,267,422 | ||
INVESTMENT OBJECTIVE**
The JPMorgan International Value Fund (the “Fund”) seeks to provide high total return from a portfolio of foreign company equity securities.
WHAT WERE THE MAIN DRIVERS OF THE FUND’S PERFORMANCE?
The Fund (Institutional Class Shares) outperformed the MSCI EAFE Value Index (net of foreign withholding taxes) (the “Benchmark”) for the twelve months ended October 31, 2012. The Fund’s stock selection, in aggregate, contributed to relative performance, particularly in the telecommunications, transportation services & consumer cyclicals and semiconductors sectors. The Fund’s sector allocation, notably its underweight positions versus the Benchmark in the banks & finance, capital markets and property sectors detracted from relative performance. The Fund’s stock selection in banks & finance and capital markets also detracted from relative performance.
Individual contributors to the Fund’s relative performance included the Fund’s overweight positions versus the Benchmark in Samsung Electronics Co., Ltd. and Intercontinental Hotels Group plc. Shares of semiconductor, electronics and communications-equipment provider Samsung Electronics Co., Ltd. benefited as the company’s earnings were bolstered by robust sales for its smart phones and a turnaround in its display business. Shares of hotel operator Intercontinental Hotels Group plc benefited as growth in U.S. and China operations bolstered earnings and the company continued to return capital to shareholders.
Not owning shares of Nokia Corp., which was held by the Benchmark, also contributed to the Fund’s relative performance.
Shares of the Finnish communications equipment provider declined as the company continued to struggle, particularly in the high-end segment of the cellular handset market.
Individual detractors from relative performance included the Fund’s overweight positions versus the Benchmark in Repsol YPF S.A. (“Repsol”), Hitachi Ltd. and Mitsubishi Electric Corp. Shares of Spanish oil company Repsol declined after the Argentinean government seized control of Repsol’s Argentine affiliate YPF. Shares of Japanese consumer electronics maker Hitachi Ltd. declined after the company reported disappointing net income due to weakening global demand and restructuring costs. Mitsubishi Electric Corp. is a Japanese electronics maker. The stock declined as orders for factory automation equipment slowed and the company was prohibited from bidding on state contracts after the Japanese government accused the company of overcharging.
HOW WAS THE FUND POSITIONED?
The Fund’s portfolio managers employed a bottom-up fundamental approach to stock selection, seeking to identify what they believed were the most attractive value investment opportunities within each sector. The Fund’s portfolio managers looked for stocks that they believed possessed an attractive valuation signal (as measured by a proprietary dividend discount model) and a timely catalyst that would enable the stock to realize its inherent value.
In addition, the Fund employed futures and currency forwards to help manage cash flows and attempt to keep the Fund’s currency exposure in line with the U.S.-dollar denominated Benchmark.
| 24 | J.P. MORGAN INTERNATIONAL EQUITY FUNDS | OCTOBER 31, 2012 | ||||
Table of Contents
| TOP TEN EQUITY HOLDINGS OF THE PORTFOLIO*** | ||||||||
| 1. | HSBC Holdings plc (United Kingdom) | 3.9 | % | |||||
| 2. | Royal Dutch Shell plc, Class A (Netherlands) | 3.6 | ||||||
| 3. | Vodafone Group plc (United Kingdom) | 3.5 | ||||||
| 4. | Sanofi (France) | 3.4 | ||||||
| 5. | Eni S.p.A. (Italy) | 2.9 | ||||||
| 6. | Sumitomo Mitsui Financial Group, Inc. (Japan) | 2.5 | ||||||
| 7. | Allianz SE (Germany) | 2.3 | ||||||
| 8. | Australia & New Zealand Banking Group Ltd. (Australia) | 2.2 | ||||||
| 9. | BNP Paribas S.A. (France) | 1.9 | ||||||
| 10. | Honda Motor Co., Ltd. (Japan) | 1.9 | ||||||
PORTFOLIO COMPOSITION BY COUNTRY*** | ||||
| United Kingdom | 19.8 | % | ||
| Japan | 18.6 | |||
| France | 11.7 | |||
| Germany | 9.4 | |||
| Netherlands | 7.1 | |||
| Switzerland | 4.3 | |||
| Italy | 3.6 | |||
| China | 3.3 | |||
| Sweden | 3.0 | |||
| Hong Kong | 2.9 | |||
| Australia | 2.5 | |||
| Spain | 2.4 | |||
| Norway | 1.2 | |||
| Belgium | 1.2 | |||
| South Korea | 1.1 | |||
| Others (each less than 1.0%) | 5.0 | |||
| Short-Term Investment | 2.9 | |||
| * | The return shown is based on net asset values calculated for shareholder transactions and may differ from the return shown in the financial highlights, which reflects adjustments made to the net asset values in accordance with accounting principles generally accepted in the United States of America. |
| ** | The advisor seeks to achieve the Fund’s objective. There can be no guarantee it will be achieved. |
| *** | Percentages indicated are based upon total investments as of October 31, 2012. The Fund’s portfolio composition is subject to change. |
| OCTOBER 31, 2012 | J.P. MORGAN INTERNATIONAL EQUITY FUNDS | 25 | ||||||
Table of Contents
JPMorgan International Value Fund
FUND COMMENTARY
TWELVE MONTHS ENDED OCTOBER 31, 2012 (Unaudited) (continued)
AVERAGE ANNUAL TOTAL RETURNS AS OF OCTOBER 31, 2012 | ||||||||||||||||
| INCEPTION DATE OF CLASS | 1 YEAR | 5 YEAR | 10 YEAR | |||||||||||||
CLASS A SHARES | 9/28/01 | |||||||||||||||
Without Sales Charge | 4.55 | % | (6.73 | )% | 8.68 | % | ||||||||||
With Sales Charge* | (0.95 | ) | (7.73 | ) | 8.09 | |||||||||||
CLASS B SHARES | 9/28/01 | |||||||||||||||
Without CDSC | 3.96 | (7.21 | ) | 8.25 | ||||||||||||
With CDSC** | (1.04 | ) | (7.76 | ) | 8.25 | |||||||||||
CLASS C SHARES | 7/11/06 | |||||||||||||||
Without CDSC | 4.04 | (7.20 | ) | 8.14 | ||||||||||||
With CDSC*** | 3.04 | (7.20 | ) | 8.14 | ||||||||||||
CLASS R2 SHARES | 11/3/08 | 4.27 | (6.93 | ) | 8.57 | |||||||||||
CLASS R6 SHARES | 11/30/10 | 5.03 | (6.32 | ) | 9.17 | |||||||||||
INSTITUTIONAL CLASS SHARES | 11/4/93 | 5.00 | (6.35 | ) | 9.16 | |||||||||||
SELECT CLASS SHARES | 9/10/01 | 4.87 | (6.49 | ) | 8.92 | |||||||||||
| * | Sales Charge for Class A Shares is 5.25%. |
| ** | Assumes a 5% CDSC (contingent deferred sales charge) for the one year period, 2% CDSC for the five year period and 0% CDSC thereafter. |
| *** | Assumes a 1% CDSC for the one year period and 0% CDSC thereafter. |
TEN YEAR PERFORMANCE (10/31/02 TO 10/31/12)
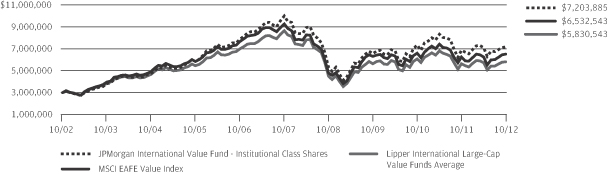
The performance quoted is past performance and is not a guarantee of future results. Mutual funds are subject to certain market risks. Investment returns and principal value of an investment will fluctuate so that an investor’s shares, when redeemed, may be worth more or less than their original cost. Current performance may be higher or lower than the performance data shown. For up-to-date month-end performance information please call 1-800-480-4111.
The performance of Class C Shares prior to its inception date is based on the performance of Class B Shares of the Fund. The actual returns of Class C Shares would have been similar to those shown because Class C Shares have expenses similar to those of Class B Shares.
Returns for Class R2 Shares prior to its inception date were based on the performance of Class A Shares. The actual returns of R2 Shares would have been lower than shown because R2 Shares have higher expenses than Class A Shares.
Returns for Class R6 Shares prior to its inception date were based on the performance of Institutional Class Shares. The actual returns of Class R6 Shares would have been different than those shown because Institutional Class Shares have different expenses than Class R6 Shares.
The graph illustrates comparative performance for $3,000,000 invested in Institutional Class Shares of the JPMorgan International Value Fund, the MSCI EAFE Value Index and the Lipper International Large-Cap Value Funds Average
from October 31, 2002 to October 31, 2012. The performance of the Fund assumes reinvestment of all dividends and capital gain distributions, if any, and does not include a sales charge. The performance of the MSCI EAFE Value Index does not reflect the deduction of expenses or a sales charge associated with a mutual fund and approximates the minimum possible dividend reinvestment of the securities included in the benchmark. The dividend is reinvested after deduction of withholding tax, applying the maximum rate to non-resident institutional investors who do not benefit from double taxation treaties. The performance of the Lipper International Large-Cap Value Funds Average includes expenses associated with a mutual fund, such as investment management fees. These expenses are not identical to the expenses incurred by the Fund. The MSCI EAFE Value Index is a free float-adjusted market capitalization weighted index that is designed to measure the performance of value-oriented stocks in the world’s equity markets, excluding the U.S. and Canada. Investors cannot invest directly in an index. The Lipper International Large-Cap Value Funds Average is an average based on the total returns of all mutual funds within the Fund’s designated category as determined by Lipper, Inc.
Institutional Class Shares have a $3,000,000 minimum initial investment.
Fund performance may reflect the waiver of the Fund’s fees and reimbursement of expenses for certain periods since the inception date. Without these waivers and reimbursements, performance would have been lower. Also, performance shown in this section does not reflect the deduction of taxes that a shareholder would pay on Fund distributions or redemption of Fund shares.
| 26 | J.P. MORGAN INTERNATIONAL EQUITY FUNDS | OCTOBER 31, 2012 | ||||
Table of Contents
International investing involves a greater degree of risk and increased volatility. Changes in currency exchange rates and differences in accounting and taxation policies outside the U.S. can raise or lower returns. Also, some overseas markets may not be as politically and economically stable as the United States and other nations.
Because Class B shares automatically convert to Class A shares after 8 years, the 10 Year average annual total return shown above for Class B reflects Class A performance for the period after conversion.
The returns shown are based on net asset values calculated for shareholder transactions and may differ from the returns shown in the financial highlights, which reflect adjustments made to the net asset values in accordance with accounting principles generally accepted in the United States of America.
| OCTOBER 31, 2012 | J.P. MORGAN INTERNATIONAL EQUITY FUNDS | 27 | ||||||
Table of Contents
JPMorgan Intrepid International Fund
FUND COMMENTARY
TWELVE MONTHS ENDED OCTOBER 31, 2012 (Unaudited)
| REPORTING PERIOD RETURN: | ||||
| Fund (Institutional Class Shares)* | 5.50% | |||
| Morgan Stanley Capital International (“MSCI”) Europe, Australasia and Far East (“EAFE”) Index (net of foreign withholding taxes) | 4.61% | |||
| Net Assets as of 10/31/2012 (In Thousands) | $ | 346,229 | ||
INVESTMENT OBJECTIVE**
The JPMorgan Intrepid International Fund (the “Fund”) seeks to maximize long-term capital growth by investing primarily in equity securities in developed markets outside the U.S.
WHAT WERE THE MAIN DRIVERS OF THE FUND’S PERFORMANCE?
The Fund (Institutional Class Shares) outperformed the MSCI EAFE Index (net of foreign withholding taxes) (the “Benchmark”) for the twelve months ended October 31, 2012. The Fund’s portfolio managers attempted to construct the Fund so that stock selection and style factors (i.e., growth and value characteristics) would be the primary drivers of returns. The Fund’s investments in the consumer discretionary and information technology sectors were the largest contributors to the Fund’s relative performance, while investments in the financials and industrials sectors were the largest detractors from relative performance.
In an attempt to mitigate the impact to performance from individual stocks, the Fund held a range of 200 to 220 stocks across sectors during the reporting period. While their overall impact to the Fund’s return was relatively small, the largest individual contributors to the Fund’s relative performance included the Fund’s overweight positions versus the Benchmark in U.K. real estate and housing companies Taylor Wimpey plc and Persimmon plc. Both stocks benefited from positive trends in the U.K. housing market and rising earnings as they sold more houses built on lower-cost land acquired in the aftermath of the financial crisis. In addition, not owning shares of Benchmark holding Telefonica S.A. contributed to the Fund’s relative
performance. Telefonica S.A. is a Spanish communications services company. The stock declined as the challenging economic environment in Spain undermined earnings, forcing the company to suspend its dividend.
While their overall impact to the Fund’s return was relatively small, individual detractors from the Fund’s relative performance included the Fund’s overweight positions versus the Benchmark in Gree, Inc. and Focus Media Holding Ltd., ADR. Shares of Gree, Inc., a Japanese operator of social games, declined on concerns about an investigation into the company’s sales practices by Japan’s Consumer Affairs Agency. Shares of Chinese media company Focus Media Holding Ltd., ADR declined amid market concerns about the size of its advertising network. The Fund’s underweight position versus the Benchmark in U.K. alcoholic beverages supplier Diageo plc also detracted from relative performance. Despite a difficult economic environment, company earnings have remained strong, due in part to the company’s ability to raise prices.
HOW WAS THE FUND POSITIONED?
The Fund’s strategy is rooted in the notion that investor behavior is influenced by human emotion and this influence gives rise to persistent growth and value anomalies within the market. During the reporting period, the Fund’s portfolio managers sought to exploit these anomalies by utilizing a series of style screens designed to identify stocks with attractive growth and/or value characteristics, targeting names that possessed high earnings momentum, strong price momentum, low price-to-book ratios and low price-to-earnings ratios.
| 28 | J.P. MORGAN INTERNATIONAL EQUITY FUNDS | OCTOBER 31, 2012 | ||||
Table of Contents
| TOP TEN EQUITY HOLDINGS OF THE PORTFOLIO*** | ||||||||
| 1. | Royal Dutch Shell plc, Class A (Netherlands) | 2.2 | % | |||||
| 2. | Nestle S.A. (Switzerland) | 2.1 | ||||||
| 3. | HSBC Holdings plc (United Kingdom) | 1.8 | ||||||
| 4. | Roche Holding AG (Switzerland) | 1.7 | ||||||
| 5. | Vodafone Group plc (United Kingdom) | 1.6 | ||||||
| 6. | Sanofi (France) | 1.6 | ||||||
| 7. | BHP Billiton Ltd. (Australia) | 1.5 | ||||||
| 8. | Novartis AG (Switzerland) | 1.5 | ||||||
| 9. | Total S.A. (France) | 1.3 | ||||||
| 10. | Bayer AG (Germany) | 1.3 | ||||||
PORTFOLIO COMPOSITION BY COUNTRY*** | ||||
| United Kingdom | 21.7 | % | ||
| Japan | 15.7 | |||
| Germany | 10.7 | |||
| Switzerland | 9.6 | |||
| France | 9.5 | |||
| Australia | 5.9 | |||
| Netherlands | 5.9 | |||
| Hong Kong | 2.3 | |||
| Italy | 2.1 | |||
| China | 2.1 | |||
| Spain | 2.1 | |||
| Belgium | 1.4 | |||
| Denmark | 1.2 | |||
| Norway | 1.1 | |||
| Ireland | 1.1 | |||
| Sweden | 1.0 | |||
| Others (each less than 1.0%) | 4.6 | |||
| Short-Term Investment | 2.0 | |||
| * | The return shown is based on net asset values calculated for shareholder transactions and may differ from the return shown in the financial highlights, which reflects adjustments made to the net asset values in accordance with accounting principles generally accepted in the United States of America. |
| ** | The advisor seeks to achieve the Fund’s objective. There can be no guarantee it will be achieved. |
| *** | Percentages indicated are based upon total investments as of October 31, 2012. The Fund’s portfolio composition is subject to change. |
| OCTOBER 31, 2012 | J.P. MORGAN INTERNATIONAL EQUITY FUNDS | 29 | ||||||
Table of Contents
JPMorgan Intrepid International Fund
FUND COMMENTARY
TWELVE MONTHS ENDED OCTOBER 31, 2012 (Unaudited) (continued)
AVERAGE ANNUAL TOTAL RETURNS AS OF OCTOBER 31, 2012 | ||||||||||||||||
| INCEPTION DATE OF CLASS | 1 YEAR | 5 YEAR | 10 YEAR | |||||||||||||
CLASS A SHARES | 4/30/01 | |||||||||||||||
Without Sales Charge | 4.97 | % | (7.55 | )% | 6.03 | % | ||||||||||
With Sales Charge* | (0.55 | ) | (8.54 | ) | 5.46 | |||||||||||
CLASS C SHARES | 2/28/06 | |||||||||||||||
Without CDSC | 4.45 | (8.00 | ) | 5.68 | ||||||||||||
With CDSC** | 3.45 | (8.00 | ) | 5.68 | ||||||||||||
CLASS R2 SHARES | 11/3/08 | 4.64 | (7.74 | ) | 5.92 | |||||||||||
INSTITUTIONAL CLASS SHARES | 4/30/01 | 5.50 | (7.08 | ) | 6.61 | |||||||||||
SELECT CLASS SHARES | 2/28/06 | 5.24 | (7.31 | ) | 6.44 | |||||||||||
| * | Sales Charge for Class A Shares is 5.25%. |
| ** | Assumes a 1% CDSC (contingent deferred sales charge) for the one year period and 0% CDSC thereafter. |
TEN YEAR PERFORMANCE (10/31/02 TO 10/31/12)
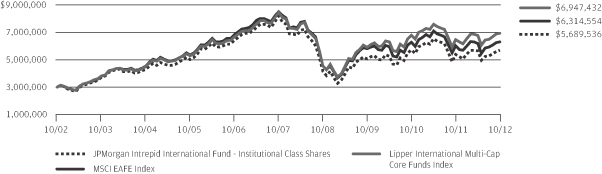
The performance quoted is past performance and is not a guarantee of future results. Mutual funds are subject to certain market risks. Investment returns and principal value of an investment will fluctuate so that an investor’s shares, when redeemed, may be worth more or less than their original cost. Current performance may be higher or lower than the performance data shown. For up-to-date month-end performance information please call 1-800-480-4111.
Returns for Class C and Class R2 Shares prior to their inception date are based on the performance of the Class A Shares. The actual returns for Class C and Class R2 Shares would have been lower than shown because Class C and Class R2 Shares have higher expenses than Class A Shares.
Returns for Select Class Shares prior to its inception date were based on the performance of Institutional Class Shares. The actual returns for Select Class Shares would have been lower than shown because Select Class Shares have higher expenses than Institutional Class Shares.
The graph illustrates comparative performance for $3,000,000 invested in Institutional Class Shares of the JPMorgan Intrepid International Fund, the MSCI EAFE Index and the Lipper International Multi-Cap Core Funds Index from October 31, 2002 to October 31, 2012. The performance of the Fund assumes reinvestment of all dividends and capital gain distributions, if any, and does not include a sales charge. The performance of the MSCI EAFE Index does not reflect the deduction of expenses or a sales charge associated with a mutual fund and approximates the minimum possible dividend reinvestment of the securities included in the benchmark. The dividend is reinvested after deduction of withholding tax, applying the maximum rate to non-resident institutional investors who do not benefit from double taxation treaties. The
performance of the Lipper International Multi-Cap Core Funds Index includes expenses associated with a mutual fund, such as investment management fees. These expenses are not identical to the expenses incurred by the Fund. The MSCI EAFE Index is a free float-adjusted market capitalization weighted index that is designed to measure the equity market performance of developed markets, excluding the U.S. and Canada. The Lipper International Multi-Cap Core Funds Index is based on the total returns of certain mutual funds within the Fund’s designated category, as defined by Lipper, Inc. Investors cannot invest directly in an index.
Institutional Class Shares have a $3,000,000 minimum initial investment.
Fund performance may reflect the waiver of the Fund’s fees and reimbursement of expenses for certain periods since the inception date. Without these waivers and reimbursements, performance would have been lower. Also, performance shown in this section does not reflect the deduction of taxes that a shareholder would pay on Fund distributions or redemption of Fund shares.
International investing involves a greater degree of risk and increased volatility. Changes in currency exchange rates and differences in accounting and taxation policies outside the U.S. can raise or lower returns. Also, some overseas markets may not be as politically and economically stable as the United States and other nations.
The returns shown are based on net asset values calculated for shareholder transactions and may differ from the returns shown in the financial highlights, which reflect adjustments made to the net asset values in accordance with accounting principles generally accepted in the United States of America.
| 30 | J.P. MORGAN INTERNATIONAL EQUITY FUNDS | OCTOBER 31, 2012 | ||||
Table of Contents
JPMorgan Emerging Economies Fund
SCHEDULE OF PORTFOLIO INVESTMENTS
AS OF OCTOBER 31, 2012
(Amounts in thousands)
| SHARES | SECURITY DESCRIPTION | VALUE($) | ||||||
| Common Stocks — 92.6% |
| ||||||
Brazil — 6.4% | ||||||||
| 61 | Cia de Saneamento Basico do Estado de Sao Paulo, ADR (m) | 5,126 | ||||||
| 330 | Cia Energetica de Minas Gerais, ADR (m) | 3,960 | ||||||
| 133 | Ez Tec Empreendimentos e Participacoes S.A. (m) | 1,743 | ||||||
| 67 | M. Dias Branco S.A. (a) (m) | 2,257 | ||||||
| 241 | Obrascon Huarte Lain Brasil S.A. (m) | 2,269 | ||||||
| 207 | Petroleo Brasileiro S.A., ADR (m) | 4,388 | ||||||
| 483 | Vale S.A., ADR (m) | 8,854 | ||||||
|
| |||||||
| 28,597 | ||||||||
|
| |||||||
China — 18.6% | ||||||||
| 13,433 | China Construction Bank Corp., Class H (m) | 10,070 | ||||||
| 1,829 | China Merchants Bank Co., Ltd., Class H (m) | 3,398 | ||||||
| 5,610 | China Minsheng Banking Corp. Ltd., Class H (m) | 5,080 | ||||||
| 3,365 | China Shanshui Cement Group Ltd. (m) | 2,490 | ||||||
| 1,350 | China Shenhua Energy Co., Ltd., Class H (m) | 5,718 | ||||||
| 4,395 | CNOOC Ltd. (m) | 9,045 | ||||||
| 3,540 | Dongfeng Motor Group Co., Ltd., Class H (m) | 4,378 | ||||||
| 3,889 | Dongyue Group (m) | 2,212 | ||||||
| 1,162 | Great Wall Motor Co., Ltd., Class H (m) | 3,169 | ||||||
| 1,732 | Guangzhou R&F Properties Co., Ltd., Class H (m) | 2,117 | ||||||
| 368 | Hengan International Group Co., Ltd. (m) | 3,337 | ||||||
| 13,874 | Industrial & Commercial Bank of China Ltd., | 9,136 | ||||||
| 6,266 | Lenovo Group Ltd. (m) | 5,017 | ||||||
| 69 | NetEase, Inc., ADR (a) (m) | 3,704 | ||||||
| 6,034 | PetroChina Co., Ltd., Class H (m) | 8,188 | ||||||
| 771 | Ping An Insurance Group Co. of China Ltd., | 6,068 | ||||||
|
| |||||||
| 83,127 | ||||||||
|
| |||||||
Cyprus — 0.5% | ||||||||
| 121 | Globaltrans Investment plc, Reg. S, GDR (m) | 2,235 | ||||||
|
| |||||||
Egypt — 0.5% | ||||||||
| 361 | Commercial International Bank Egypt SAE (m) | 2,235 | ||||||
|
| |||||||
Hong Kong — 5.1% | ||||||||
| 2,696 | Chaoda Modern Agriculture Holdings Ltd. (a) (i) (m) | — | ||||||
| 372 | China Mobile Ltd. (m) | 4,126 | ||||||
| 906 | China Overseas Land & Investment Ltd. (m) | 2,359 | ||||||
| 936 | China Resources Power Holdings Co., Ltd. (m) | 2,001 | ||||||
| 1,106 | Digital China Holdings Ltd. (m) | 1,854 | ||||||
| 76 | Jardine Matheson Holdings Ltd. (m) | 4,675 | ||||||
| 2,134 | SJM Holdings Ltd. (m) | 4,625 | ||||||
| 5,746 | Skyworth Digital Holdings Ltd. (m) | 3,089 | ||||||
|
| |||||||
| 22,729 | ||||||||
|
| |||||||
| SHARES | SECURITY DESCRIPTION | VALUE($) | ||||||
Hungary — 1.0% | ||||||||
| 229 | OTP Bank plc (m) | 4,362 | ||||||
|
| |||||||
India — 5.0% | ||||||||
| 504 | Housing Development Finance Corp., Ltd. (m) | 7,113 | ||||||
| 147 | Infosys Ltd., ADR (m) | 6,379 | ||||||
| 772 | Oil & Natural Gas Corp., Ltd. (m) | 3,846 | ||||||
| 207 | Tata Motors Ltd., ADR (m) | 5,001 | ||||||
|
| |||||||
| 22,339 | ||||||||
|
| |||||||
Kazakhstan — 0.7% | ||||||||
| 163 | KazMunaiGas Exploration Production JSC, Reg. S, GDR (m) | 2,888 | ||||||
|
| |||||||
Malaysia — 0.7% | ||||||||
| 1,022 | UMW Holdings Berhad (m) | 3,329 | ||||||
|
| |||||||
Mexico — 0.5% | ||||||||
| 1,542 | Compartamos S.A.B. de C.V. (m) | 2,078 | ||||||
|
| |||||||
Panama — 0.8% | ||||||||
| 39 | Copa Holdings S.A., Class A (m) | 3,639 | ||||||
|
| |||||||
Poland — 1.2% | ||||||||
| 107 | KGHM Polska Miedz S.A. (m) | 5,369 | ||||||
|
| |||||||
Russia — 7.1% | ||||||||
| 136 | Lukoil OAO, ADR (m) | 8,265 | ||||||
| 311 | MMC Norilsk Nickel OJSC, ADR (m) | 4,779 | ||||||
| 317 | Mobile Telesystems OJSC, ADR (m) | 5,430 | ||||||
| 967 | Sberbank of Russia (m) | 2,831 | ||||||
| 403 | Sberbank of Russia, ADR (m) | 4,766 | ||||||
| 139 | Tatneft, ADR (m) | 5,420 | ||||||
|
| |||||||
| 31,491 | ||||||||
|
| |||||||
South Africa — 6.6% | ||||||||
| 623 | African Bank Investments Ltd. (m) | 2,107 | ||||||
| 45 | Assore Ltd. (m) | 1,845 | ||||||
| 455 | AVI Ltd. (m) | 2,998 | ||||||
| 414 | Clicks Group Ltd. (m) | 2,853 | ||||||
| 216 | Exxaro Resources Ltd. (m) | 4,316 | ||||||
| 244 | Imperial Holdings Ltd. (m) | 5,543 | ||||||
| 245 | MTN Group Ltd. (m) | 4,427 | ||||||
| 165 | Tiger Brands Ltd. (m) | 5,232 | ||||||
|
| |||||||
| 29,321 | ||||||||
|
| |||||||
South Korea — 14.3% | ||||||||
| 230 | DGB Financial Group, Inc. (m) | 2,904 | ||||||
| 42 | Hyundai Motor Co. (m) | 8,650 | ||||||
| 105 | Kangwon Land, Inc. (m) | 2,451 | ||||||
| 102 | Kia Motors Corp. (m) | 5,645 | ||||||
| 11 | Korea Zinc Co., Ltd. (m) | 4,301 | ||||||
| 54 | KT&G Corp. (m) | 4,117 | ||||||
SEE NOTES TO FINANCIAL STATEMENTS.
| OCTOBER 31, 2012 | J.P. MORGAN INTERNATIONAL EQUITY FUNDS | 31 | ||||||
Table of Contents
JPMorgan Emerging Economies Fund
SCHEDULE OF PORTFOLIO INVESTMENTS
AS OF OCTOBER 31, 2012 (continued)
(Amounts in thousands)
| SHARES | SECURITY DESCRIPTION | VALUE($) | ||||||
| Common Stocks — Continued |
| ||||||
South Korea — Continued | ||||||||
| 19 | Samsung Electronics Co., Ltd. (m) | 23,353 | ||||||
| 134 | Samsung Heavy Industries Co., Ltd. (m) | 4,081 | ||||||
| 29 | SK Innovation Co., Ltd. (m) | 4,277 | ||||||
| 438 | Woori Finance Holdings Co., Ltd. (m) | 4,138 | ||||||
|
| |||||||
| 63,917 | ||||||||
|
| |||||||
Taiwan — 9.4% | ||||||||
| 427 | Asustek Computer, Inc. (m) | 4,568 | ||||||
| 1,091 | Chipbond Technology Corp. (m) | 1,847 | ||||||
| 616 | Hon Hai Precision Industry Co., Ltd. (m) | 1,867 | ||||||
| 899 | Hon Hai Precision Industry Co., Ltd., Reg. S, GDR (m) | 5,475 | ||||||
| 1,946 | Lite-On Technology Corp. (m) | 2,476 | ||||||
| 2,930 | Pou Chen Corp. (m) | 2,962 | ||||||
| 839 | Radiant Opto-Electronics Corp. (m) | 3,486 | ||||||
| 1,020 | Realtek Semiconductor Corp. (m) | 1,918 | ||||||
| 861 | Taiwan Semiconductor Manufacturing Co., Ltd., ADR (m) | 13,682 | ||||||
| 273 | TPK Holding Co., Ltd. (m) | 3,424 | ||||||
|
| |||||||
| 41,705 | ||||||||
|
| |||||||
Thailand — 5.3% | ||||||||
| 4,358 | Charoen Pokphand Foods PCL, NVDR (m) | 4,999 | ||||||
| 978 | Kasikornbank PCL, NVDR (m) | 5,687 | ||||||
| 5,874 | Krung Thai Bank PCL, NVDR (m) | 3,453 | ||||||
| 602 | PTT PCL (m) | 6,224 | ||||||
| 1,470 | Thai Union Frozen Products PCL, NVDR (m) | 3,446 | ||||||
|
| |||||||
| 23,809 | ||||||||
|
| |||||||
Turkey — 6.3% | ||||||||
| 576 | Arcelik AS (m) | 3,805 | ||||||
| 1,793 | Eregli Demir ve Celik Fabrikalari TAS (m) | 2,131 | ||||||
| 159 | Koza Altin Isletmeleri AS (m) | 3,460 | ||||||
| 1,272 | Turk Hava Yollari (a) (m) | 2,947 | ||||||
| 1,242 | Turkiye Garanti Bankasi AS (m) | 5,933 | ||||||
| 322 | Turkiye Halk Bankasi AS (m) | 2,843 | ||||||
| SHARES | SECURITY DESCRIPTION | VALUE($) | ||||||
Turkey — Continued | ||||||||
| 1,457 | Turkiye Is Bankasi, Class C (m) | 4,961 | ||||||
| 1,261 | Turkiye Sise ve Cam Fabrikalari AS (m) | 1,843 | ||||||
|
| |||||||
| 27,923 | ||||||||
|
| |||||||
Ukraine — 0.2% | ||||||||
| 37 | Kernel Holding S.A. (a) (m) | 783 | ||||||
|
| |||||||
United Arab Emirates — 0.9% | ||||||||
| 461 | Dragon Oil plc (m) | 4,140 | ||||||
|
| |||||||
United Kingdom — 1.5% | ||||||||
| 1,166 | Old Mutual plc (m) | 3,233 | ||||||
| 146 | Standard Chartered plc (m) | 3,473 | ||||||
|
| |||||||
| 6,706 | ||||||||
|
| |||||||
Total Common Stocks | 412,722 | |||||||
|
| |||||||
| Preferred Stocks — 3.8% |
| ||||||
Brazil — 3.8% | ||||||||
| 181 | Banco do Estado do Rio Grande do Sul S.A. (m) | 1,432 | ||||||
| 192 | Cia de Bebidas das Americas, ADR (m) | 7,844 | ||||||
| 541 | Itau Unibanco Holding S.A., ADR (m) | 7,885 | ||||||
|
| |||||||
Total Preferred Stocks | 17,161 | |||||||
|
| |||||||
| Short-Term Investment — 2.4% |
| ||||||
Investment Company — 2.4% | ||||||||
| 10,554 | JPMorgan Prime Money Market Fund, Institutional Class Shares, 0.110% (b) (l) (m) | 10,554 | ||||||
|
| |||||||
Total Investments — 98.8% | 440,437 | |||||||
Other Assets in Excess of | 5,496 | |||||||
|
| |||||||
NET ASSETS — 100.0% | $ | 445,933 | ||||||
|
| |||||||
Percentages indicated are based on net assets.
SEE NOTES TO FINANCIAL STATEMENTS.
| 32 | J.P. MORGAN INTERNATIONAL EQUITY FUNDS | OCTOBER 31, 2012 | ||||
Table of Contents
Summary of Investments by Industry, October 31, 2012
The following table represents the portfolio investments of the Fund by industry classifications as a percentage of total investments:
| INDUSTRY | PERCENTAGE | |||
Commercial Banks | 19.2 | % | ||
Oil, Gas & Consumable Fuels | 15.1 | |||
Semiconductors & Semiconductor Equipment | 10.1 | |||
Metals & Mining | 7.0 | |||
Automobiles | 6.9 | |||
Food Products | 4.5 | |||
Wireless Telecommunication Services | 3.2 | |||
Electronic Equipment, Instruments & Components | 2.9 | |||
Computers & Peripherals | 2.7 | |||
Insurance | 2.1 | |||
Household Durables | 2.0 | |||
| INDUSTRY | PERCENTAGE | |||
Beverages | 1.8 | % | ||
Thrifts & Mortgage Finance | 1.6 | |||
Hotels, Restaurants & Leisure | 1.6 | |||
Airlines | 1.5 | |||
Industrial Conglomerates | 1.5 | |||
IT Services | 1.4 | |||
Distributors | 1.3 | |||
Water Utilities | 1.2 | |||
Real Estate Management & Development | 1.0 | |||
Others (each less than 1.0%) | 9.0 | |||
Short-Term Investment | 2.4 | |||
SEE NOTES TO FINANCIAL STATEMENTS.
| OCTOBER 31, 2012 | J.P. MORGAN INTERNATIONAL EQUITY FUNDS | 33 | ||||||
Table of Contents
JPMorgan Emerging Markets Equity Fund
SCHEDULE OF PORTFOLIO INVESTMENTS
AS OF OCTOBER 31, 2012
(Amounts in thousands)
| SHARES | SECURITY DESCRIPTION | VALUE($) | ||||||
| Common Stocks — 90.6% |
| ||||||
Brazil — 7.8% | ||||||||
| 3,659 | CCR S.A. (m) | 32,174 | ||||||
| 1,632 | Cielo S.A. (m) | 40,365 | ||||||
| 2,700 | Petroleo Brasileiro S.A., ADR (m) | 55,431 | ||||||
| 1,459 | Ultrapar Participacoes S.A. (m) | 30,606 | ||||||
| 1,505 | WEG S.A. (m) | 17,284 | ||||||
|
| |||||||
| 175,860 | ||||||||
|
| |||||||
Chile — 1.8% | ||||||||
| 1,513 | Banco Santander Chile, ADR (m) | 41,132 | ||||||
|
| |||||||
China — 11.8% | ||||||||
| 6,903 | Anhui Conch Cement Co., Ltd., Class H (m) | 23,709 | ||||||
| 22,726 | China Construction Bank Corp., Class H (m) | 17,037 | ||||||
| 15,326 | China Merchants Bank Co., Ltd., Class H (m) | 28,476 | ||||||
| 27,915 | CNOOC Ltd. (m) | 57,448 | ||||||
| 731 | New Oriental Education & Technology Group, ADR (m) | 12,318 | ||||||
| 5,268 | Ping An Insurance Group Co. of China Ltd., | 41,457 | ||||||
| 7,730 | Tingyi Cayman Islands Holding Corp. (m) | 22,901 | ||||||
| 5,268 | Tsingtao Brewery Co., Ltd., Class H (m) | 28,418 | ||||||
| 20,159 | Want Want China Holdings Ltd. (m) | 27,445 | ||||||
| 3,591 | Wumart Stores, Inc., Class H (m) | 6,361 | ||||||
|
| |||||||
| 265,570 | ||||||||
|
| |||||||
Hong Kong — 9.9% | ||||||||
| 13,844 | AIA Group Ltd. (m) | 54,593 | ||||||
| 6,441 | China Mobile Ltd. (m) | 71,442 | ||||||
| 7,844 | Hang Lung Properties Ltd. (m) | 27,160 | ||||||
| 770 | Jardine Matheson Holdings Ltd. (m) | 47,301 | ||||||
| 13,580 | Li & Fung Ltd. (m) | 22,654 | ||||||
|
| |||||||
| 223,150 | ||||||||
|
| |||||||
Hungary — 0.8% | ||||||||
| 945 | OTP Bank plc (m) | 18,011 | ||||||
|
| |||||||
India — 10.2% | ||||||||
| 872 | ACC Ltd. (m) | 22,274 | ||||||
| 2,412 | Ambuja Cements Ltd. (m) | 9,052 | ||||||
| 4,825 | Bharti Airtel Ltd. (m) | 24,119 | ||||||
| 327 | HDFC Bank Ltd., ADR (m) | 12,215 | ||||||
| 6,506 | Housing Development Finance Corp., Ltd. (m) | 91,848 | ||||||
| 173 | Infosys Ltd. (m) | 7,561 | ||||||
| 902 | Infosys Ltd., ADR (m) | 39,174 | ||||||
| 1,479 | Jindal Steel & Power Ltd. (m) | 10,631 | ||||||
| 1,150 | Kotak Mahindra Bank Ltd. (m) | 12,863 | ||||||
|
| |||||||
| 229,737 | ||||||||
|
| |||||||
| SHARES | SECURITY DESCRIPTION | VALUE($) | ||||||
Indonesia — 4.3% | ||||||||
| 62,685 | Astra International Tbk PT (m) | 52,324 | ||||||
| 36,814 | Bank Rakyat Indonesia Persero Tbk PT (m) | 28,211 | ||||||
| 6,068 | Unilever Indonesia Tbk PT (m) | 16,411 | ||||||
|
| |||||||
| 96,946 | ||||||||
|
| |||||||
Luxembourg — 1.9% | ||||||||
| 1,133 | Tenaris S.A., ADR (m) | 42,624 | ||||||
|
| |||||||
Malaysia — 1.1% | ||||||||
| 400 | British American Tobacco Malaysia Bhd (m) | 8,281 | ||||||
| 3,042 | Public Bank Bhd (m) | 15,857 | ||||||
|
| |||||||
| 24,138 | ||||||||
|
| |||||||
Mexico — 3.1% | ||||||||
| 4,334 | Grupo Financiero Banorte S.A.B. de C.V., | 24,094 | ||||||
| 15,299 | Wal-Mart de Mexico S.A.B. de C.V. (m) | 45,018 | ||||||
|
| |||||||
| 69,112 | ||||||||
|
| |||||||
Russia — 3.0% | ||||||||
| 650 | Magnit OJSC, Reg. S, GDR (m) | 23,133 | ||||||
| 10,507 | Sberbank of Russia (m) | 30,759 | ||||||
| 1,094 | Sberbank of Russia, ADR (m) | 12,941 | ||||||
|
| |||||||
| 66,833 | ||||||||
|
| |||||||
South Africa — 10.1% | ||||||||
| 4,560 | African Bank Investments Ltd. (m) | 15,429 | ||||||
| 1,300 | Bidvest Group Ltd. (m) | 31,022 | ||||||
| 10,077 | FirstRand Ltd. (m) | 33,491 | ||||||
| 405 | Kumba Iron Ore Ltd. (m) | 25,306 | ||||||
| 1,000 | Massmart Holdings Ltd. (m) | 20,114 | ||||||
| 701 | Mr Price Group Ltd. (m) | 10,836 | ||||||
| 2,039 | MTN Group Ltd. (m) | 36,839 | ||||||
| 1,602 | Shoprite Holdings Ltd. (m) | 32,949 | ||||||
| 674 | Tiger Brands Ltd. (m) | 21,440 | ||||||
|
| |||||||
| 227,426 | ||||||||
|
| |||||||
South Korea — 11.3% | ||||||||
| 87 | E-Mart Co., Ltd. (m) | 18,856 | ||||||
| 186 | Hyundai Mobis (m) | 47,323 | ||||||
| 280 | Hyundai Motor Co. (m) | 57,581 | ||||||
| 53 | POSCO (m) | 16,521 | ||||||
| 95 | Samsung Electronics Co., Ltd. (m) | 113,968 | ||||||
|
| |||||||
| 254,249 | ||||||||
|
| |||||||
Taiwan — 7.1% |
| |||||||
| 10,955 | Delta Electronics, Inc. (m) | 37,369 | ||||||
| 4,078 | President Chain Store Corp. (m) | 20,154 | ||||||
| 2,732 | Taiwan Semiconductor Manufacturing Co., Ltd. (m) | 8,326 | ||||||
SEE NOTES TO FINANCIAL STATEMENTS.
| 34 | J.P. MORGAN INTERNATIONAL EQUITY FUNDS | OCTOBER 31, 2012 | ||||
Table of Contents
| SHARES | SECURITY DESCRIPTION | VALUE($) | ||||||
| Common Stocks — Continued |
| ||||||
Taiwan — Continued |
| |||||||
| 5,996 | Taiwan Semiconductor Manufacturing Co., Ltd., ADR (m) | 95,329 | ||||||
|
| |||||||
| 161,178 | ||||||||
|
| |||||||
Turkey — 3.8% |
| |||||||
| 4,300 | KOC Holding AS (m) | 20,202 | ||||||
| 13,544 | Turkiye Garanti Bankasi AS (m) | 64,715 | ||||||
|
| |||||||
| 84,917 | ||||||||
|
| |||||||
United Kingdom — 2.6% |
| |||||||
| 535 | SABMiller plc (m) | 22,940 | ||||||
| 1,526 | Standard Chartered plc (m) | 36,137 | ||||||
| 59,077 | ||||||||
|
| |||||||
Total Common Stocks | 2,039,960 | |||||||
|
| |||||||
| Preferred Stocks — 6.6% |
| ||||||
Brazil — 6.6% | ||||||||
| 1,718 | Cia de Bebidas das Americas, ADR (m) | 70,092 | ||||||
| 1,076 | Itau Unibanco Holding S.A. (m) | 15,734 | ||||||
| 1,257 | Itau Unibanco Holding S.A., ADR (m) | 18,327 | ||||||
| 2,532 | Vale S.A., ADR (m) | 45,045 | ||||||
|
| |||||||
Total Preferred Stocks | 149,198 | |||||||
|
| |||||||
| Short-Term Investment — 2.4% |
| ||||||
Investment Company — 2.4% | ||||||||
| 54,151 | JPMorgan Prime Money Market Fund, Institutional Class Shares, 0.110% (b) (l) (m) | 54,151 | ||||||
|
| |||||||
Total Investments — 99.6% | 2,243,309 | |||||||
|
| |||||||
Other Assets in Excess of | 9,177 | |||||||
|
| |||||||
NET ASSETS — 100.0% | $ | 2,252,486 | ||||||
|
| |||||||
Percentages indicated are based on net assets.
Summary of Investments by Industry, October 31, 2012
The following table represents the portfolio investments of the Fund by industry classifications as a percentage of total investments:
| INDUSTRY | PERCENTAGE | |||
Commercial Banks | 16.2 | % | ||
Semiconductors & Semiconductor Equipment | 9.7 | |||
Food & Staples Retailing | 7.4 | |||
Oil, Gas & Consumable Fuels | 6.4 | |||
Wireless Telecommunication Services | 5.9 | |||
Beverages | 5.4 | |||
Automobiles | 4.9 | |||
Industrial Conglomerates | 4.4 | |||
Metals & Mining | 4.3 | |||
Insurance | 4.3 | |||
Thrifts & Mortgage Finance | 4.1 | |||
IT Services | 3.9 | |||
Food Products | 3.2 | |||
Diversified Financial Services | 2.8 | |||
Construction Materials | 2.5 | |||
Auto Components | 2.1 | |||
Energy Equipment & Services | 1.9 | |||
Electronic Equipment, Instruments & Components | 1.7 | |||
Transportation Infrastructure | 1.4 | |||
Real Estate Management & Development | 1.2 | |||
Distributors | 1.0 | |||
Others (each less than 1.0%) | 2.9 | |||
Short-Term Investment | 2.4 | |||
SEE NOTES TO FINANCIAL STATEMENTS.
| OCTOBER 31, 2012 | J.P. MORGAN INTERNATIONAL EQUITY FUNDS | 35 | ||||||
Table of Contents
JPMorgan Global Equity Income Fund
SCHEDULE OF PORTFOLIO INVESTMENTS
AS OF OCTOBER 31, 2012
(Amounts in thousands)
| SHARES | SECURITY DESCRIPTION | VALUE($) | ||||||
| Common Stocks — 96.3% |
| ||||||
Australia — 6.8% | ||||||||
| 46 | Amcor Ltd. (m) | 374 | ||||||
| 36 | Australia & New Zealand Banking Group Ltd. (m) | 939 | ||||||
| 55 | Goodman Group (m) | 254 | ||||||
| 136 | Stockland (m) | 488 | ||||||
| 81 | Transurban Group (m) | 510 | ||||||
|
| |||||||
| 2,565 | ||||||||
|
| |||||||
China — 2.9% | ||||||||
| 762 | China Construction Bank Corp., Class H (m) | 571 | ||||||
| 186 | Wynn Macau Ltd. (m) | 524 | ||||||
|
| |||||||
| 1,095 | ||||||||
|
| |||||||
Finland — 0.9% | ||||||||
| 32 | UPM-Kymmene OYJ (m) | 342 | ||||||
|
| |||||||
France — 8.2% | ||||||||
| 11 | Cie de St-Gobain (m) | 370 | ||||||
| 17 | EDF S.A. (m) | 357 | ||||||
| 6 | Sanofi (m) | 563 | ||||||
| 6 | Schneider Electric S.A. (m) | 389 | ||||||
| 4 | Sodexo (m) | 345 | ||||||
| 12 | Total S.A. (m) | 589 | ||||||
| 2 | Unibail-Rodamco SE (m) | 493 | ||||||
|
| |||||||
| 3,106 | ||||||||
|
| |||||||
Germany — 6.2% | ||||||||
| 5 | Allianz SE (m) | 566 | ||||||
| 7 | BASF SE (m) | 598 | ||||||
| 10 | Deutsche Boerse AG (m) | 520 | ||||||
| 29 | E.ON AG (m) | 654 | ||||||
|
| |||||||
| 2,338 | ||||||||
|
| |||||||
Hong Kong — 1.4% | ||||||||
| 55 | Hutchison Whampoa Ltd. (m) | 539 | ||||||
|
| |||||||
Indonesia — 1.0% | ||||||||
| 766 | Perusahaan Gas Negara Persero Tbk PT (m) | 369 | ||||||
|
| |||||||
Italy — 2.0% | ||||||||
| 32 | Eni S.p.A. (m) | 743 | ||||||
|
| |||||||
Japan — 8.0% | ||||||||
| 17 | Canon, Inc. (m) | 566 | ||||||
| 6 | Daito Trust Construction Co., Ltd. (m) | 585 | ||||||
| 24 | Japan Tobacco, Inc. (m) | 664 | ||||||
| 12 | Nippon Telegraph & Telephone Corp. (m) | 535 | ||||||
| 49 | Sumitomo Corp. (m) | 668 | ||||||
|
| |||||||
| 3,018 | ||||||||
|
| |||||||
Netherlands — 5.3% | ||||||||
| 39 | Koninklijke Ahold N.V. (m) | 492 | ||||||
| SHARES | SECURITY DESCRIPTION | VALUE($) | ||||||
Netherlands — Continued | ||||||||
| 30 | Royal Dutch Shell plc, Class A (m) | 1,035 | ||||||
| 13 | Unilever N.V., CVA (m) | 487 | ||||||
|
| |||||||
| 2,014 | ||||||||
|
| |||||||
New Zealand — 1.9% | ||||||||
| 374 | Telecom Corp. of New Zealand Ltd. (m) | 739 | ||||||
|
| |||||||
Singapore — 1.8% | ||||||||
| 253 | Singapore Telecommunications Ltd. (m) | 666 | ||||||
|
| |||||||
South Africa — 0.0% (g) | ||||||||
| 5 | African Bank Investments Ltd. (m) | 16 | ||||||
|
| |||||||
Sweden — 2.0% | ||||||||
| 20 | Swedbank AB, Class A (m) | 372 | ||||||
| 42 | Telefonaktiebolaget LM Ericsson, Class B (m) | 370 | ||||||
|
| |||||||
| 742 | ||||||||
|
| |||||||
Switzerland — 5.0% | ||||||||
| 8 | Nestle S.A. (m) | 539 | ||||||
| 4 | Roche Holding AG (m) | 726 | ||||||
| 9 | Swiss Re AG (a) (m) | 649 | ||||||
|
| |||||||
| 1,914 | ||||||||
|
| |||||||
Taiwan — 0.9% | ||||||||
| 91 | Novatek Microelectronics Corp. (m) | 342 | ||||||
|
| |||||||
United Kingdom — 12.0% | ||||||||
| 13 | AstraZeneca plc (m) | 588 | ||||||
| 11 | British American Tobacco plc (m) | 539 | ||||||
| 112 | Centrica plc (m) | 588 | ||||||
| 37 | Direct Line Insurance Group plc (a) (m) | 117 | ||||||
| 26 | GlaxoSmithKline plc (m) | 582 | ||||||
| 58 | HSBC Holdings plc (m) | 569 | ||||||
| 23 | Pearson plc (m) | 453 | ||||||
| 7 | SABMiller plc (m) | 308 | ||||||
| 292 | Vodafone Group plc (m) | 792 | ||||||
|
| |||||||
| 4,536 | ||||||||
|
| |||||||
United States — 30.0% | ||||||||
| 1 | Apple, Inc. (m) | 354 | ||||||
| 4 | Chevron Corp. (m) | 478 | ||||||
| 25 | Cisco Systems, Inc. (m) | 433 | ||||||
| 11 | CME Group, Inc. (m) | 616 | ||||||
| 9 | ConocoPhillips (m) | 530 | ||||||
| 11 | E.I. du Pont de Nemours & Co. (m) | 472 | ||||||
| 12 | Emerson Electric Co. (m) | 562 | ||||||
| 10 | Hewlett-Packard Co. (m) | 140 | ||||||
| 7 | Johnson & Johnson (m) | 470 | ||||||
| 12 | Kinder Morgan, Inc. (m) | 405 | ||||||
SEE NOTES TO FINANCIAL STATEMENTS.
| 36 | J.P. MORGAN INTERNATIONAL EQUITY FUNDS | OCTOBER 31, 2012 | ||||
Table of Contents
| SHARES | SECURITY DESCRIPTION | VALUE($) | ||||||
| Common Stocks — Continued |
| ||||||
United States — Continued | ||||||||
| 27 | Masco Corp. (m) | 409 | ||||||
| 9 | Mattel, Inc. (m) | 331 | ||||||
| 22 | Merck & Co., Inc. (m) | 1,024 | ||||||
| 22 | Microsoft Corp. (m) | 637 | ||||||
| 10 | Paychex, Inc. (m) | 326 | ||||||
| 32 | Pfizer, Inc. (m) | 796 | ||||||
| 7 | PG&E Corp. (m) | 284 | ||||||
| 4 | Sempra Energy (m) | 294 | ||||||
| 13 | Sysco Corp. (m) | 398 | ||||||
| 24 | Time Warner, Inc. (m) | 1,049 | ||||||
| 16 | Verizon Communications, Inc. (m) | 706 | ||||||
| 19 | Wells Fargo & Co. (m) | 654 | ||||||
|
| |||||||
| 11,368 | ||||||||
|
| |||||||
Total Common Stocks | 36,452 | |||||||
|
| |||||||
| Short-Term Investment — 2.6% |
| ||||||
Investment Company — 2.6% | ||||||||
| 1,001 | JPMorgan Prime Money Market Fund, Institutional Class Shares, | 1,001 | ||||||
|
| |||||||
Total Investments — 98.9% | 37,453 | |||||||
Other Assets in Excess of | 414 | |||||||
|
| |||||||
NET ASSETS — 100.0% | $ | 37,867 | ||||||
|
| |||||||
Percentages indicated are based on net assets.
Summary of Investments by Industry, October 31, 2012
The following table represents the portfolio investments of the Fund by industry classifications as a percentage of total investments:
| INDUSTRY | PERCENTAGE | |||
Pharmaceuticals | 12.7 | % | ||
Oil, Gas & Consumable Fuels | 10.1 | |||
Commercial Banks | 8.3 | |||
Diversified Telecommunication Services | 7.1 | |||
Multi-Utilities | 4.9 | |||
Media | 4.0 | |||
Insurance | 3.6 | |||
Real Estate Investment Trusts (REITs) | 3.3 | |||
Tobacco | 3.2 | |||
Diversified Financial Services | 3.1 | |||
Chemicals | 2.9 | |||
Food Products | 2.7 | |||
Electrical Equipment | 2.5 | |||
Food & Staples Retailing | 2.4 | |||
Hotels, Restaurants & Leisure | 2.3 | |||
Communications Equipment | 2.1 | |||
Wireless Telecommunication Services | 2.1 | |||
Building Products | 2.1 | |||
Trading Companies & Distributors | 1.8 | |||
Software | 1.7 | |||
Real Estate Management & Development | 1.6 | |||
Office Electronics | 1.5 | |||
Industrial Conglomerates | 1.4 | |||
Transportation Infrastructure | 1.3 | |||
Computers & Peripherals | 1.3 | |||
Containers & Packaging | 1.0 | |||
Gas Utilities | 1.0 | |||
Electric Utilities | 1.0 | |||
Others (each less than 1.0%) | 4.3 | |||
Short-Term Investment | 2.7 | |||
SEE NOTES TO FINANCIAL STATEMENTS.
| OCTOBER 31, 2012 | J.P. MORGAN INTERNATIONAL EQUITY FUNDS | 37 | ||||||
Table of Contents
JPMorgan Global Equity Income Fund
SCHEDULE OF PORTFOLIO INVESTMENTS
AS OF OCTOBER 31, 2012 (continued)
(Amounts in thousands, except number of contracts)
| Forward Foreign Currency Exchange Contracts | ||||||||||||||||||||||
| CONTRACTS TO BUY | CURRENCY | COUNTERPARTY | SETTLEMENT DATE | SETTLEMENT VALUE | VALUE AT 10/31/12 | NET UNREALIZED APPRECIATION (DEPRECIATION) | ||||||||||||||||
| 316,268 | AUD | Credit Suisse International | 12/20/12 | $ | 326 | $ | 327 | $ | 1 | |||||||||||||
| 144,457 | CAD | BNP Paribas | 12/20/12 | 147 | 144 | (3 | ) | |||||||||||||||
| 1,581,281 | CAD | Royal Bank of Canada | 12/20/12 | 1,623 | 1,582 | (41 | ) | |||||||||||||||
| 117,618 | EUR | Credit Suisse International | 12/20/12 | 153 | 153 | — | (h) | |||||||||||||||
| 124,902 | EUR | HSBC Bank, N.A. | 12/20/12 | 161 | 162 | 1 | ||||||||||||||||
| 314,921 | EUR | Royal Bank of Canada | 12/20/12 | 405 | 408 | 3 | ||||||||||||||||
| 248,386 | EUR | Royal Bank of Scotland | 12/20/12 | 320 | 322 | 2 | ||||||||||||||||
| 92,254 | GBP | Royal Bank of Canada | 12/20/12 | 147 | 149 | 2 | ||||||||||||||||
| 5,781,778 | JPY | BNP Paribas | 12/20/12 | 74 | 72 | (2 | ) | |||||||||||||||
| 13,477,544 | JPY | Morgan Stanley | 12/20/12 | 169 | 169 | — | (h) | |||||||||||||||
| 523,427 | NOK | Royal Bank of Scotland | 12/20/12 | 92 | 92 | — | (h) | |||||||||||||||
| 119,820 | NZD | BNP Paribas | 12/20/12 | 98 | 98 | — | (h) | |||||||||||||||
| $ | 3,715 | $ | 3,678 | $ | (37 | ) | ||||||||||||||||
|
| |||||||||||||||||||||
| CONTRACTS TO SELL | CURRENCY | COUNTERPARTY | SETTLEMENT DATE | SETTLEMENT VALUE | VALUE AT 10/31/12 | NET UNREALIZED APPRECIATION (DEPRECIATION) | ||||||||||||||||
| 230,686 | AUD | BNP Paribas | 12/20/12 | $ | 238 | $ | 239 | $ | (1 | ) | ||||||||||||
| 87,529 | AUD | Credit Suisse International | 12/20/12 | 89 | 90 | (1 | ) | |||||||||||||||
| 1,021,474 | AUD | Westpac Banking Corp. | 12/20/12 | 1,065 | 1,056 | 9 | ||||||||||||||||
| 72,378 | CHF | BNP Paribas | 12/20/12 | 77 | 78 | (1 | ) | |||||||||||||||
| 374,458 | CHF | Credit Suisse International | 12/20/12 | 404 | 402 | 2 | ||||||||||||||||
| 78,012 | CHF | Union Bank of Switzerland AG | 12/20/12 | 83 | 84 | (1 | ) | |||||||||||||||
| 87,500 | EUR | BNP Paribas | 12/20/12 | 112 | 113 | (1 | ) | |||||||||||||||
| 191,560 | EUR | Credit Suisse International | 12/20/12 | 250 | 249 | 1 | ||||||||||||||||
| 2,379,328 | EUR | State Street Corp. | 12/20/12 | 3,121 | 3,086 | 35 | ||||||||||||||||
| 387,309 | EUR | Union Bank of Switzerland AG | 12/20/12 | 500 | 502 | (2 | ) | |||||||||||||||
| 140,301 | GBP | BNP Paribas | 12/20/12 | 225 | 227 | (2 | ) | |||||||||||||||
| 1,125,909 | GBP | Citibank, N.A. | 12/20/12 | 1,825 | 1,816 | 9 | ||||||||||||||||
| 2,325,358 | HKD | Credit Suisse International | 12/20/12 | 300 | 300 | — | (h) | |||||||||||||||
| 4,856,549 | HKD | HSBC Bank, N.A. | 12/20/12 | 627 | 627 | — | (h) | |||||||||||||||
| 1,528,500 | HKD | Royal Bank of Canada | 12/20/12 | 197 | 197 | — | (h) | |||||||||||||||
| 14,768,747 | JPY | BNP Paribas | 12/20/12 | 189 | 185 | 4 | ||||||||||||||||
| 101,976 | NZD | Credit Suisse International | 12/20/12 | 84 | 84 | — | (h) | |||||||||||||||
| 832,617 | NZD | Westpac Banking Corp. | 12/20/12 | 685 | 682 | 3 | ||||||||||||||||
| 1,357,387 | SEK | Royal Bank of Scotland | 12/20/12 | 206 | 205 | 1 | ||||||||||||||||
| 277,178 | SGD | Credit Suisse International | 12/20/12 | 227 | 227 | — | (h) | |||||||||||||||
| $ | 10,504 | $ | 10,449 | $ | 55 | |||||||||||||||||
|
| |||||||||||||||||||||
SEE NOTES TO FINANCIAL STATEMENTS.
| 38 | J.P. MORGAN INTERNATIONAL EQUITY FUNDS | OCTOBER 31, 2012 | ||||
Table of Contents
JPMorgan Global Opportunities Fund
SCHEDULE OF PORTFOLIO INVESTMENTS
AS OF OCTOBER 31, 2012
(Amounts in thousands)
| SHARES | SECURITY DESCRIPTION | VALUE($) | ||||||
| Common Stocks — 98.7% |
| ||||||
Belgium — 1.0% |
| |||||||
| — | (h) | Solvay S.A. (m) | 46 | |||||
|
| |||||||
Canada — 0.9% | ||||||||
| 2 | First Quantum Minerals Ltd. (m) | 42 | ||||||
|
| |||||||
China — 0.9% | ||||||||
| 34 | China Construction Bank Corp., Class H (m) | 25 | ||||||
| 10 | China Merchants Bank Co., Ltd., Class H (m) | 18 | ||||||
|
| |||||||
| 43 | ||||||||
|
| |||||||
Denmark — 0.5% |
| |||||||
| — | (h) | Carlsberg A/S, Class B (m) | 21 | |||||
|
| |||||||
Finland — 0.7% | ||||||||
| 3 | Stora Enso OYJ, Class R (m) | 17 | ||||||
| 2 | UPM-Kymmene OYJ (m) | 17 | ||||||
|
| |||||||
| 34 | ||||||||
|
| |||||||
France — 4.3% |
| |||||||
| 1 | GDF Suez (m) | 31 | ||||||
| 1 | Sanofi (m) | 51 | ||||||
| 1 | Schneider Electric S.A. (m) | 46 | ||||||
| 1 | Sodexo (m) | 58 | ||||||
| 1 | Suez Environnement Co. (m) | 12 | ||||||
|
| |||||||
| 198 | ||||||||
|
| |||||||
Germany — 3.8% |
| |||||||
| — | (h) | Allianz SE (m) | 45 | |||||
| 1 | BASF SE (m) | 43 | ||||||
| 1 | Bayer AG (m) | 56 | ||||||
| 1 | E.ON AG (m) | 30 | ||||||
|
| |||||||
| 174 | ||||||||
|
| |||||||
Hong Kong — 2.1% |
| |||||||
| 18 | Belle International Holdings Ltd. (m) | 33 | ||||||
| 14 | China Overseas Land & Investment Ltd. (m) | 37 | ||||||
| 3 | Hutchison Whampoa Ltd. (m) | 29 | ||||||
|
| |||||||
| 99 | ||||||||
|
| |||||||
Ireland — 3.1% |
| |||||||
| 1 | Covidien plc (m) | 47 | ||||||
| 3 | Experian plc (m) | 60 | ||||||
| 1 | Shire plc (m) | 37 | ||||||
|
| |||||||
| 144 | ||||||||
|
| |||||||
Israel — 0.7% |
| |||||||
| 1 | Teva Pharmaceutical Industries Ltd., ADR (m) | 33 | ||||||
|
| |||||||
Japan — 8.6% | ||||||||
| 1 | Canon, Inc. (m) | 23 | ||||||
| — | (h) | Dai-ichi Life Insurance Co., Ltd. (The) (m) | 27 | |||||
| SHARES | SECURITY DESCRIPTION | VALUE($) | ||||||
Japan — Continued | ||||||||
| 8 | Hitachi Ltd. (m) | 42 | ||||||
| 2 | Japan Tobacco, Inc. (m) | 66 | ||||||
| 5 | JX Holdings, Inc. (m) | 28 | ||||||
| 5 | Marubeni Corp. (m) | 32 | ||||||
| 6 | Mitsubishi Electric Corp. (m) | 45 | ||||||
| 2 | Mitsubishi Estate Co., Ltd. (m) | 40 | ||||||
| 5 | Nissan Motor Co., Ltd. (m) | 44 | ||||||
| — | (h) | ORIX Corp. (m) | 36 | |||||
| 1 | Softbank Corp. (m) | 16 | ||||||
|
| |||||||
| 399 | ||||||||
|
| |||||||
Netherlands — 5.4% | ||||||||
| 1 | ASML Holding N.V. (m) | 38 | ||||||
| 1 | European Aeronautic Defence and Space Co. N.V. (m) | 37 | ||||||
| 3 | Royal Dutch Shell plc, Class A (m) | 94 | ||||||
| 2 | Unilever N.V., CVA (m) | 82 | ||||||
|
| |||||||
| 251 | ||||||||
|
| |||||||
South Korea — 1.0% | ||||||||
| — | (h) | Samsung Electronics Co., Ltd. (m) | 47 | |||||
|
| |||||||
Sweden — 0.7% | ||||||||
| 4 | Telefonaktiebolaget LM Ericsson, Class B (m) | 31 | ||||||
|
| |||||||
Switzerland — 4.4% | ||||||||
| 1 | ACE Ltd. (m) | 59 | ||||||
| 1 | Cie Financiere Richemont S.A., Class A (m) | 45 | ||||||
| 1 | Nestle S.A. (m) | 60 | ||||||
| — | (h) | Pentair Ltd. (m) | 19 | |||||
| 1 | Tyco International Ltd. (m) | 18 | ||||||
|
| |||||||
| 201 | ||||||||
|
| |||||||
Taiwan — 0.8% | ||||||||
| 12 | Hon Hai Precision Industry Co., Ltd. (m) | 36 | ||||||
|
| |||||||
United Kingdom — 13.4% | ||||||||
| 3 | BG Group plc (m) | 50 | ||||||
| 1 | British American Tobacco plc (m) | 71 | ||||||
| 8 | Centrica plc (m) | 43 | ||||||
| 2 | Diageo plc (m) | 47 | ||||||
| 3 | GlaxoSmithKline plc (m) | 61 | ||||||
| 6 | HSBC Holdings plc (m) | 62 | ||||||
| 2 | InterContinental Hotels Group plc (m) | 38 | ||||||
| 2 | Pearson plc (m) | 38 | ||||||
| 3 | Prudential plc (m) | 39 | ||||||
| 1 | Rio Tinto plc (m) | 62 | ||||||
| 1 | SABMiller plc (m) | 39 | ||||||
| 26 | Vodafone Group plc (m) | 69 | ||||||
|
| |||||||
| 619 | ||||||||
|
| |||||||
SEE NOTES TO FINANCIAL STATEMENTS.
| OCTOBER 31, 2012 | J.P. MORGAN INTERNATIONAL EQUITY FUNDS | 39 | ||||||
Table of Contents
JPMorgan Global Opportunities Fund
SCHEDULE OF PORTFOLIO INVESTMENTS
AS OF OCTOBER 31, 2012 (continued)
(Amounts in thousands, except number of contracts)
| SHARES | SECURITY DESCRIPTION | VALUE($) | ||||||
| Common Stocks — Continued |
| ||||||
United States — 46.4% | ||||||||
| — | (h) | Adobe Systems, Inc. (a) (m) | 16 | |||||
| — | (h) | Air Products & Chemicals, Inc. (m) | 8 | |||||
| — | (h) | Allergan, Inc. (m) | 40 | |||||
| 1 | Altera Corp. (m) | 29 | ||||||
| — | (h) | Amazon.com, Inc. (a) (m) | 42 | |||||
| 1 | American Express Co. (m) | 44 | ||||||
| — | (h) | Anadarko Petroleum Corp. (m) | 32 | |||||
| — | (h) | Apple, Inc. (m) | 124 | |||||
| — | (h) | AutoZone, Inc. (a) (m) | 36 | |||||
| — | (h) | Biogen Idec, Inc. (a) (m) | 45 | |||||
| 1 | Capital One Financial Corp. (m) | 56 | ||||||
| 1 | CareFusion Corp. (a) (m) | 33 | ||||||
| 1 | Carnival Corp. (m) | 42 | ||||||
| — | (h) | Chevron Corp. (m) | 50 | |||||
| 2 | Cisco Systems, Inc. (m) | 37 | ||||||
| 2 | Citigroup, Inc. (m) | 72 | ||||||
| — | (h) | Coach, Inc. (m) | 23 | |||||
| 1 | Cognizant Technology Solutions Corp., | 40 | ||||||
| 1 | Comcast Corp., Class A (m) | 50 | ||||||
| 1 | E.I. du Pont de Nemours & Co. (m) | 39 | ||||||
| 1 | Fluor Corp. (m) | 50 | ||||||
| — | (h) | Google, Inc., Class A (a) (m) | 51 | |||||
| 1 | Home Depot, Inc. (The) (m) | 64 | ||||||
| — | (h) | Humana, Inc. (m) | 25 | |||||
| 1 | Johnson Controls, Inc. (m) | 36 | ||||||
| 1 | Lam Research Corp. (a) (m) | 35 | ||||||
| — | (h) | LinkedIn Corp., Class A (a) (m) | 28 | |||||
| 2 | Merck & Co., Inc. (m) | 78 | ||||||
| 1 | MetLife, Inc. (m) | 33 | ||||||
| 3 | Microsoft Corp. (m) | 73 | ||||||
| 2 | Morgan Stanley (m) | 32 | ||||||
| 1 | Occidental Petroleum Corp. (m) | 52 | ||||||
| SHARES | SECURITY DESCRIPTION | VALUE($) | ||||||
United States — Continued | ||||||||
| — | (h) | Onyx Pharmaceuticals, Inc. (a) (m) | 25 | |||||
| 1 | Oracle Corp. (m) | 17 | ||||||
| 1 | PACCAR, Inc. (m) | 26 | ||||||
| 2 | Peabody Energy Corp. (m) | 47 | ||||||
| — | (h) | PG&E Corp. (m) | 9 | |||||
| 1 | Schlumberger Ltd. (m) | 63 | ||||||
| — | (h) | Sempra Energy (m) | 30 | |||||
| 1 | SunTrust Banks, Inc. (m) | 36 | ||||||
| 1 | Target Corp. (m) | 43 | ||||||
| — | (h) | Time Warner Cable, Inc. (m) | 22 | |||||
| 1 | Time Warner, Inc. (m) | 58 | ||||||
| 1 | Union Pacific Corp. (m) | 67 | ||||||
| — | (h) | United Technologies Corp. (m) | 35 | |||||
| 1 | UnitedHealth Group, Inc. (m) | 54 | ||||||
| — | (h) | V.F. Corp. (m) | 55 | |||||
| 1 | Valero Energy Corp. (m) | 23 | ||||||
| — | (h) | Vertex Pharmaceuticals, Inc. (a) (m) | 18 | |||||
| 3 | Wells Fargo & Co. (m) | 104 | ||||||
|
| |||||||
| 2,147 | ||||||||
|
| |||||||
Total Common Stocks | 4,565 | |||||||
|
| |||||||
| Preferred Stock — 1.1% |
| ||||||
Germany — 1.1% | ||||||||
| — | (h) | Volkswagen AG (m) | 51 | |||||
|
| |||||||
Total Investments — 99.8% | 4,616 | |||||||
Other Assets in Excess of | 7 | |||||||
|
| |||||||
NET ASSETS — 100.0% | $ | 4,623 | ||||||
|
| |||||||
Percentages indicated are based on net assets.
SEE NOTES TO FINANCIAL STATEMENTS.
| 40 | J.P. MORGAN INTERNATIONAL EQUITY FUNDS | OCTOBER 31, 2012 | ||||
Table of Contents
Summary of Investments by Industry, October 31, 2012
The following table represents the portfolio investments of the Fund by industry classifications as a percentage of total investments:
| INDUSTRY | PERCENTAGE | |||
Oil, Gas & Consumable Fuels | 8.2 | % | ||
Pharmaceuticals | 7.7 | |||
Commercial Banks | 5.3 | |||
Insurance | 4.4 | |||
Media | 3.6 | |||
Multi-Utilities | 3.4 | |||
Semiconductors & Semiconductor Equipment | 3.2 | |||
Food Products | 3.1 | |||
Tobacco | 3.0 | |||
Hotels, Restaurants & Leisure | 3.0 | |||
Chemicals | 2.9 | |||
Specialty Retail | 2.9 | |||
Computers & Peripherals | 2.7 | |||
Textiles, Apparel & Luxury Goods | 2.7 | |||
Diversified Financial Services | 2.3 | |||
Beverages | 2.3 | |||
Software | 2.3 | |||
Metals & Mining | 2.3 | |||
| INDUSTRY | PERCENTAGE | |||
Consumer Finance | 2.2 | % | ||
Automobiles | 2.1 | |||
Electrical Equipment | 2.0 | |||
Biotechnology | 1.9 | |||
Wireless Telecommunication Services | 1.8 | |||
Health Care Equipment & Supplies | 1.7 | |||
Internet Software & Services | 1.7 | |||
Health Care Providers & Services | 1.7 | |||
Electronic Equipment, Instruments & Components | 1.7 | |||
Real Estate Management & Development | 1.6 | |||
Aerospace & Defense | 1.6 | |||
Communications Equipment | 1.5 | |||
Road & Rail | 1.5 | |||
Energy Equipment & Services | 1.4 | |||
Professional Services | 1.3 | |||
Construction & Engineering | 1.1 | |||
Machinery | 1.0 | |||
Others (each less than 1.0%) | 6.9 | |||
| Forward Foreign Currency Exchange Contracts | ||||||||||||||||||||||
| CONTRACTS TO BUY | CURRENCY | COUNTERPARTY | SETTLEMENT DATE | SETTLEMENT VALUE | VALUE AT 10/31/12 | NET UNREALIZED APPRECIATION (DEPRECIATION) | ||||||||||||||||
| 19,945 | EUR | |||||||||||||||||||||
| 2,015,635 | for JPY | BNP Paribas | 12/04/12 | $ | 25 | # | $ | 26 | # | $ | 1 | |||||||||||
| 165,272 | AUD | Barclays Bank plc | 12/04/12 | 169 | 171 | 2 | ||||||||||||||||
| 198,215 | CAD | Barclays Bank plc | 12/04/12 | 199 | 198 | (1 | ) | |||||||||||||||
| 59,082 | CHF | Barclays Bank plc | 12/04/12 | 62 | 63 | 1 | ||||||||||||||||
| 38,291 | EUR | Westpac Banking Corp. | 12/04/12 | 50 | 50 | — | (h) | |||||||||||||||
| 15,712 | GBP | Royal Bank of Canada | 12/04/12 | 25 | 25 | — | (h) | |||||||||||||||
| 150,944 | HKD | Royal Bank of Canada | 12/04/12 | 20 | 20 | — | (h) | |||||||||||||||
| 1,088,540 | JPY | HSBC Bank, N.A. | 12/04/12 | 14 | 14 | — | (h) | |||||||||||||||
| 97,821 | NOK | HSBC Bank, N.A. | 12/04/12 | 17 | 17 | — | (h) | |||||||||||||||
| 149,120 | SEK | HSBC Bank, N.A. | 12/04/12 | 22 | 22 | — | (h) | |||||||||||||||
| 43,461 | SGD | Royal Bank of Scotland | 12/04/12 | 35 | 36 | 1 | ||||||||||||||||
| $ | 638 | $ | 642 | $ | 4 | |||||||||||||||||
|
| |||||||||||||||||||||
SEE NOTES TO FINANCIAL STATEMENTS.
| OCTOBER 31, 2012 | J.P. MORGAN INTERNATIONAL EQUITY FUNDS | 41 | ||||||
Table of Contents
JPMorgan Global Opportunities Fund
SCHEDULE OF PORTFOLIO INVESTMENTS
AS OF OCTOBER 31, 2012 (continued)
(Amounts in thousands, except number of contracts)
| CONTRACTS TO SELL | CURRENCY | COUNTERPARTY | SETTLEMENT DATE | SETTLEMENT VALUE | VALUE AT 10/31/12 | NET UNREALIZED APPRECIATION (DEPRECIATION) | ||||||||||||||||
| 22,996 | EUR | Goldman Sachs International | 12/04/12 | $ | 30 | $ | 30 | $ | — | (h) | ||||||||||||
| 185,090 | EUR | Morgan Stanley | 12/04/12 | 233 | 240 | (7 | ) | |||||||||||||||
| 166,920 | GBP | Morgan Stanley | 12/04/12 | 264 | 270 | (6 | ) | |||||||||||||||
| 29,511 | GBP | State Street Corp. | 12/04/12 | 46 | 47 | (1 | ) | |||||||||||||||
| 209,095 | HKD | HSBC Bank, N.A. | 12/04/12 | 27 | 27 | — | (h) | |||||||||||||||
| 338,558 | HKD | Morgan Stanley | 12/04/12 | 44 | 44 | — | (h) | |||||||||||||||
| 225,424 | HKD | Royal Bank of Canada | 12/04/12 | 29 | 29 | — | (h) | |||||||||||||||
| $ | 673 | $ | 687 | $ | (14 | ) | ||||||||||||||||
|
| |||||||||||||||||||||
| # | For cross-currency exchange contracts, the settlement value is the U.S. dollar market value at 10/31/12 of the currency being sold, and the value at 10/31/12 is the U.S. dollar market value of the currency being purchased. |
SEE NOTES TO FINANCIAL STATEMENTS.
| 42 | J.P. MORGAN INTERNATIONAL EQUITY FUNDS | OCTOBER 31, 2012 | ||||
Table of Contents
JPMorgan International Equity Fund
SCHEDULE OF PORTFOLIO INVESTMENTS
AS OF OCTOBER 31, 2012
(Amounts in thousands)
| SHARES | SECURITY DESCRIPTION | VALUE($) | ||||||
| Common Stocks — 93.9% |
| ||||||
Australia — 2.1% | ||||||||
| 501 | BHP Billiton Ltd. (m) | 17,722 | ||||||
| 87 | Rio Tinto Ltd. (m) | 5,121 | ||||||
|
| |||||||
| 22,843 | ||||||||
|
| |||||||
Belgium — 1.7% | ||||||||
| 218 | Anheuser-Busch InBev N.V. (m) | 18,257 | ||||||
|
| |||||||
China — 4.3% | ||||||||
| 13,715 | China Construction Bank Corp., Class H (m) | 10,282 | ||||||
| 4,094 | CNOOC Ltd. (m) | 8,425 | ||||||
| 19,691 | Industrial & Commercial Bank of China Ltd., Class H (m) | 12,966 | ||||||
| 1,035 | Ping An Insurance Group Co. of China Ltd., Class H (m) | 8,145 | ||||||
| 1,558 | Sands China Ltd. (m) | 5,823 | ||||||
|
| |||||||
| 45,641 | ||||||||
|
| |||||||
France — 13.2% | ||||||||
| 343 | Accor S.A. (m) | 10,729 | ||||||
| 691 | AXA S.A. (m) | 11,015 | ||||||
| 152 | BNP Paribas S.A. (m) | 7,650 | ||||||
| 114 | Imerys S.A. (m) | 6,412 | ||||||
| 203 | Lafarge S.A. (m) | 11,928 | ||||||
| 83 | LVMH Moet Hennessy Louis Vuitton S.A. (m) | 13,468 | ||||||
| 94 | Pernod-Ricard S.A. (m) | 10,106 | ||||||
| 71 | PPR (m) | 12,506 | ||||||
| 166 | Sanofi (m) | 14,611 | ||||||
| 133 | Schneider Electric S.A. (m) | 8,307 | ||||||
| 100 | Technip S.A. (m) | 11,256 | ||||||
| 470 | Total S.A. (m) | 23,650 | ||||||
|
| |||||||
| 141,638 | ||||||||
|
| |||||||
Germany — 7.7% | ||||||||
| 96 | Allianz SE (m) | 11,946 | ||||||
| 179 | Bayer AG (m) | 15,645 | ||||||
| 101 | Fresenius Medical Care AG & Co. KGaA (m) | 7,099 | ||||||
| 60 | Linde AG (m) | 10,161 | ||||||
| 268 | SAP AG (m) | 19,541 | ||||||
| 138 | Siemens AG (m) | 13,915 | ||||||
| 133 | Symrise AG (m) | 4,768 | ||||||
|
| |||||||
| 83,075 | ||||||||
|
| |||||||
Hong Kong — 2.6% | ||||||||
| 2,599 | Belle International Holdings Ltd. (m) | 4,820 | ||||||
| 943 | Cheung Kong Holdings Ltd. (m) | 13,899 | ||||||
| 2,772 | Hang Lung Properties Ltd. (m) | 9,598 | ||||||
|
| |||||||
| 28,317 | ||||||||
|
| |||||||
| SHARES | SECURITY DESCRIPTION | VALUE($) | ||||||
Indonesia — 0.6% | ||||||||
| 8,261 | Astra International Tbk PT (m) | 6,895 | ||||||
|
| |||||||
Ireland — 1.1% | ||||||||
| 945 | WPP plc (m) | 12,221 | ||||||
|
| |||||||
Israel — 1.2% | ||||||||
| 305 | Teva Pharmaceutical Industries Ltd., ADR (m) | 12,315 | ||||||
|
| |||||||
Japan — 14.4% | ||||||||
| 303 | Canon, Inc. (m) | 9,856 | ||||||
| 205 | Daikin Industries Ltd. (m) | 5,666 | ||||||
| 88 | East Japan Railway Co. (m) | 6,013 | ||||||
| 64 | FANUC Corp. (m) | 10,164 | ||||||
| 384 | Honda Motor Co., Ltd. (m) | 11,532 | ||||||
| 375 | Japan Tobacco, Inc. (m) | 10,370 | ||||||
| 553 | Komatsu Ltd. (m) | 11,584 | ||||||
| 1,007 | Kubota Corp. (m) | 10,297 | ||||||
| 245 | Makita Corp. (m) | 9,704 | ||||||
| 565 | Mitsubishi Corp. (m) | 10,085 | ||||||
| 94 | Murata Manufacturing Co., Ltd. (m) | 4,582 | ||||||
| 91 | Nidec Corp. (m) | 6,469 | ||||||
| 141 | Omron Corp. (m) | 2,813 | ||||||
| 189 | Shin-Etsu Chemical Co., Ltd. (m) | 10,660 | ||||||
| 56 | SMC Corp. (m) | 8,860 | ||||||
| 618 | Sumitomo Corp. (m) | 8,421 | ||||||
| 354 | Toyota Motor Corp. (m) | 13,630 | ||||||
| 12 | Yahoo! Japan Corp. (m) | 4,164 | ||||||
|
| |||||||
| 154,870 | ||||||||
|
| |||||||
Mexico — 0.6% | ||||||||
| 256 | America Movil S.A.B. de C.V., ADR (m) | 6,463 | ||||||
|
| |||||||
Netherlands — 4.5% | ||||||||
| 147 | Akzo Nobel N.V. (m) | 8,002 | ||||||
| 1,219 | ING Groep N.V., CVA (a) (m) | 10,845 | ||||||
| 874 | Royal Dutch Shell plc, Class A (m) | 29,975 | ||||||
|
| |||||||
| 48,822 | ||||||||
|
| |||||||
South Korea — 1.4% | ||||||||
| 19 | Hyundai Mobis (m) | 4,778 | ||||||
| 18 | Samsung Electronics Co., Ltd., Reg. S, GDR (m) | 10,510 | ||||||
|
| |||||||
| 15,288 | ||||||||
|
| |||||||
Spain — 0.4% | ||||||||
| 552 | Banco Bilbao Vizcaya Argentaria S.A. (m) | 4,615 | ||||||
|
| |||||||
Sweden — 0.9% | ||||||||
| 397 | Atlas Copco AB, Class A (m) | 9,766 | ||||||
|
| |||||||
Switzerland — 12.1% | ||||||||
| 450 | ABB Ltd. (a) (m) | 8,120 | ||||||
| 154 | Cie Financiere Richemont S.A., Class A (m) | 9,979 | ||||||
SEE NOTES TO FINANCIAL STATEMENTS.
| OCTOBER 31, 2012 | J.P. MORGAN INTERNATIONAL EQUITY FUNDS | 43 | ||||||
Table of Contents
JPMorgan International Equity Fund
SCHEDULE OF PORTFOLIO INVESTMENTS
AS OF OCTOBER 31, 2012 (continued)
(Amounts in thousands)
| SHARES | SECURITY DESCRIPTION | VALUE($) | ||||||
| Common Stocks — Continued |
| ||||||
Switzerland — Continued | ||||||||
| 347 | Credit Suisse Group AG (a) (m) | 8,073 | ||||||
| 127 | Holcim Ltd. (a) (m) | 8,679 | ||||||
| 405 | Nestle S.A. (m) | 25,733 | ||||||
| 271 | Novartis AG (m) | 16,329 | ||||||
| 104 | Roche Holding AG (m) | 20,126 | ||||||
| 4 | SGS S.A. (m) | 7,744 | ||||||
| 713 | Xstrata plc (m) | 11,296 | ||||||
| 57 | Zurich Insurance Group AG (a) (m) | 14,153 | ||||||
|
| |||||||
| 130,232 | ||||||||
|
| |||||||
Taiwan — 1.1% | ||||||||
| 711 | Taiwan Semiconductor Manufacturing Co., Ltd., ADR (m) | 11,304 | ||||||
|
| |||||||
United Kingdom — 24.0% | ||||||||
| 2,671 | Barclays plc (m) | 9,876 | ||||||
| 1,121 | BG Group plc (m) | 20,812 | ||||||
| 275 | BHP Billiton plc (m) | 8,798 | ||||||
| 285 | British American Tobacco plc (m) | 14,145 | ||||||
| 619 | Burberry Group plc (m) | 11,682 | ||||||
| 1,963 | Centrica plc (m) | 10,275 | ||||||
| 668 | GlaxoSmithKline plc (m) | 14,973 | ||||||
| 2,488 | HSBC Holdings plc (m) | 24,512 | ||||||
| 807 | ICAP plc (m) | 4,247 | ||||||
| 324 | Imperial Tobacco Group plc (m) | 12,266 | ||||||
| 1,106 | Man Group plc (m) | 1,406 | ||||||
| 1,234 | Marks & Spencer Group plc (m) | 7,851 | ||||||
| 1,135 | Meggitt plc (m) | 7,078 | ||||||
| 1,265 | Prudential plc (m) | 17,375 | ||||||
| SHARES | SECURITY DESCRIPTION | VALUE($) | ||||||
United Kingdom — Continued | ||||||||
| 256 | Rio Tinto plc (m) | 12,789 | ||||||
| 919 | Standard Chartered plc (m) | 21,770 | ||||||
| 2,089 | Tesco plc (m) | 10,808 | ||||||
| 467 | Tullow Oil plc (m) | 10,600 | ||||||
| 396 | Unilever plc (m) | 14,780 | ||||||
| 8,218 | Vodafone Group plc (m) | 22,316 | ||||||
|
| |||||||
| 258,359 | ||||||||
|
| |||||||
Total Common Stocks | 1,010,921 | |||||||
|
| |||||||
| Preferred Stocks — 2.3% |
| ||||||
Germany — 2.3% | ||||||||
| 120 | Henkel AG & Co. KGaA (m) | 9,588 | ||||||
| 75 | Volkswagen AG (m) | 15,555 | ||||||
|
| |||||||
Total Preferred Stocks | 25,143 | |||||||
|
| |||||||
| Short-Term Investment — 3.5% |
| ||||||
Investment Company — 3.5% | ||||||||
| 37,183 | JPMorgan Prime Money Market Fund, Institutional Class Shares, 0.110% (b) (l) (m) | 37,183 | ||||||
|
| |||||||
Total Investments — 99.7% | 1,073,247 | |||||||
Other Assets in Excess of | 2,788 | |||||||
|
| |||||||
NET ASSETS — 100.0% | $ | 1,076,035 | ||||||
|
| |||||||
Percentages indicated are based on net assets.
SEE NOTES TO FINANCIAL STATEMENTS.
| 44 | J.P. MORGAN INTERNATIONAL EQUITY FUNDS | OCTOBER 31, 2012 | ||||
Table of Contents
Summary of Investments by Industry, October 31, 2012
The following table represents the portfolio investments of the Fund by industry classifications as a percentage of total investments:
| INDUSTRY | PERCENTAGE | |||
Pharmaceuticals | 8.8 | % | ||
Oil, Gas & Consumable Fuels | 8.7 | |||
Commercial Banks | 8.5 | |||
Insurance | 5.8 | |||
Machinery | 5.6 | |||
Metals & Mining | 5.2 | |||
Automobiles | 4.4 | |||
Food Products | 3.8 | |||
Tobacco | 3.4 | |||
Textiles, Apparel & Luxury Goods | 3.3 | |||
Chemicals | 3.1 | |||
Wireless Telecommunication Services | 2.7 | |||
Beverages | 2.6 | |||
Construction Materials | 2.5 | |||
Real Estate Management & Development | 2.2 | |||
Electrical Equipment | 2.1 | |||
| INDUSTRY | PERCENTAGE | |||
Semiconductors & Semiconductor Equipment | 2.0 | % | ||
Multiline Retail | 1.9 | |||
Software | 1.8 | |||
Trading Companies & Distributors | 1.7 | |||
Hotels, Restaurants & Leisure | 1.5 | |||
Industrial Conglomerates | 1.3 | |||
Capital Markets | 1.3 | |||
Media | 1.1 | |||
Energy Equipment & Services | 1.1 | |||
Diversified Financial Services | 1.0 | |||
Food & Staples Retailing | 1.0 | |||
Multi-Utilities | 1.0 | |||
Office Electronics | 1.0 | |||
Others (each less than 1.0%) | 6.1 | |||
Short-Term Investment | 3.5 | |||
SEE NOTES TO FINANCIAL STATEMENTS.
| OCTOBER 31, 2012 | J.P. MORGAN INTERNATIONAL EQUITY FUNDS | 45 | ||||||
Table of Contents
JPMorgan International Equity Index Fund
SCHEDULE OF PORTFOLIO INVESTMENTS
AS OF OCTOBER 31, 2012
(Amounts in thousands)
| SHARES | SECURITY DESCRIPTION | VALUE($) | ||||||
| Common Stocks — 96.4% |
| ||||||
Australia — 5.5% | ||||||||
| 19 | AGL Energy Ltd. (m) | 282 | ||||||
| 12 | ALS Ltd. (m) | 111 | ||||||
| 81 | Alumina Ltd. (m) | 81 | ||||||
| 41 | Amcor Ltd. (m) | 338 | ||||||
| 100 | AMP Ltd. (m) | 478 | ||||||
| 22 | APA Group (m) | 120 | ||||||
| 33 | Asciano Ltd. (m) | 156 | ||||||
| 6 | ASX Ltd. (m) | 183 | ||||||
| 93 | Australia & New Zealand Banking Group Ltd. (m) | 2,450 | ||||||
| 14 | Bendigo and Adelaide Bank Ltd. (m) | 117 | ||||||
| 449 | BGP Holdings plc (a) (i) | — | ||||||
| 112 | BHP Billiton Ltd. (m) | 3,956 | ||||||
| 25 | Boral Ltd. (m) | 94 | ||||||
| 54 | Brambles Ltd. (m) | 405 | ||||||
| 5 | Caltex Australia Ltd. (m) | 81 | ||||||
| 45 | Centro Retail Australia (m) | 100 | ||||||
| 70 | CFS Retail Property Trust Group (m) | 141 | ||||||
| 20 | Coca-Cola Amatil Ltd. (m) | 281 | ||||||
| 2 | Cochlear Ltd. (m) | 143 | ||||||
| 55 | Commonwealth Bank of Australia (m) | 3,295 | ||||||
| 16 | Computershare Ltd. (m) | 143 | ||||||
| 14 | Crown Ltd. (m) | 139 | ||||||
| 18 | CSL Ltd. (m) | 874 | ||||||
| 163 | Dexus Property Group (m) | 167 | ||||||
| 27 | Echo Entertainment Group Ltd. (m) | 97 | ||||||
| 76 | Fairfax Media Ltd. (m) | 31 | ||||||
| 49 | Fortescue Metals Group Ltd. (m) | 209 | ||||||
| 55 | Goodman Group (m) | 251 | ||||||
| 51 | GPT Group (m) | 187 | ||||||
| 18 | Harvey Norman Holdings Ltd. (m) | 36 | ||||||
| 14 | Iluka Resources Ltd. (m) | 143 | ||||||
| 56 | Incitec Pivot Ltd. (m) | 184 | ||||||
| 72 | Insurance Australia Group Ltd. (m) | 341 | ||||||
| 5 | Leighton Holdings Ltd. (m) | 94 | ||||||
| 19 | Lend Lease Group (m) | 168 | ||||||
| 61 | Lynas Corp., Ltd. (a) (m) | 46 | ||||||
| 12 | Macquarie Group Ltd. (m) | 382 | ||||||
| 31 | Metcash Ltd. | 117 | ||||||
| 117 | Mirvac Group (m) | 183 | ||||||
| 78 | National Australia Bank Ltd. (m) | 2,074 | ||||||
| 26 | Newcrest Mining Ltd. (m) | 729 | ||||||
| 13 | Orica Ltd. (m) | 334 | ||||||
| 37 | Origin Energy Ltd. (m) | 438 | ||||||
| 11 | OZ Minerals Ltd. (m) | 93 | ||||||
| 38 | Qantas Airways Ltd. (a) (m) | 52 | ||||||
| SHARES | SECURITY DESCRIPTION | VALUE($) | ||||||
Australia — Continued | ||||||||
| 41 | QBE Insurance Group Ltd. (m) | 560 | ||||||
| 58 | QR National Ltd. (m) | 225 | ||||||
| 4 | Ramsay Health Care Ltd. (m) | 110 | ||||||
| 15 | Rio Tinto Ltd. (m) | 893 | ||||||
| 33 | Santos Ltd. (m) | 397 | ||||||
| 13 | Sonic Healthcare Ltd. (m) | 169 | ||||||
| 60 | SP AusNet (m) | 66 | ||||||
| 77 | Stockland (m) | 278 | ||||||
| 44 | Suncorp Group Ltd. (m) | 431 | ||||||
| 13 | Sydney Airport (m) | 44 | ||||||
| 24 | Tabcorp Holdings Ltd. (m) | 71 | ||||||
| 48 | Tatts Group Ltd. (m) | 139 | ||||||
| 151 | Telstra Corp., Ltd. (m) | 647 | ||||||
| 23 | Toll Holdings Ltd. (m) | 106 | ||||||
| 46 | Transurban Group (m) | 291 | ||||||
| 35 | Wesfarmers Ltd. (m) | 1,258 | ||||||
| 75 | Westfield Group (m) | 829 | ||||||
| 99 | Westfield Retail Trust (m) | 318 | ||||||
| 106 | Westpac Banking Corp. (m) | 2,799 | ||||||
| 16 | Whitehaven Coal Ltd. (m) | 51 | ||||||
| 23 | Woodside Petroleum Ltd. (m) | 814 | ||||||
| 43 | Woolworths Ltd. (m) | 1,301 | ||||||
| 7 | WorleyParsons Ltd. (m) | 185 | ||||||
|
| |||||||
| 32,306 | ||||||||
|
| |||||||
Austria — 1.5% | ||||||||
| 23 | Andritz AG (m) | 1,396 | ||||||
| 69 | Erste Group Bank AG (a) (m) | 1,727 | ||||||
| 249 | IMMOFINANZ AG (a) (m) | 961 | ||||||
| 46 | OMV AG (m) | 1,683 | ||||||
| 15 | Raiffeisen Bank International AG (m) | 611 | ||||||
| 70 | Telekom Austria AG (m) | 441 | ||||||
| 21 | Verbund AG (m) | 497 | ||||||
| 12 | Vienna Insurance Group AG Wiener Versicherung Gruppe (m) | 516 | ||||||
| 34 | Voestalpine AG (m) | 1,074 | ||||||
|
| |||||||
| 8,906 | ||||||||
|
| |||||||
Belgium — 1.9% | ||||||||
| 22 | Ageas (m) | 564 | ||||||
| 75 | Anheuser-Busch InBev N.V. (m) | 6,250 | ||||||
| 14 | Belgacom S.A. (m) | 417 | ||||||
| 7 | Colruyt S.A. (m) | 315 | ||||||
| 10 | Delhaize Group S.A. (m) | 375 | ||||||
| 8 | Groupe Bruxelles Lambert S.A. (m) | 567 | ||||||
| 15 | KBC Groep N.V. (m) | 354 | ||||||
| 3 | Mobistar S.A. (m) | 69 | ||||||
SEE NOTES TO FINANCIAL STATEMENTS.
| 46 | J.P. MORGAN INTERNATIONAL EQUITY FUNDS | OCTOBER 31, 2012 | ||||
Table of Contents
| SHARES | SECURITY DESCRIPTION | VALUE($) | ||||||
| Common Stocks — Continued |
| ||||||
Belgium — Continued | ||||||||
| 6 | Solvay S.A. (m) | 670 | ||||||
| 5 | Telenet Group Holding N.V. (m) | 239 | ||||||
| 10 | UCB S.A. (m) | 592 | ||||||
| 11 | Umicore S.A. (m) | 548 | ||||||
|
| |||||||
| 10,960 | ||||||||
|
| |||||||
Brazil — 0.2% | ||||||||
| 16 | BM&FBovespa S.A. (m) | 100 | ||||||
| 6 | BRF - Brasil Foods S.A. (m) | 111 | ||||||
| 3 | Natura Cosmeticos S.A. (m) | 75 | ||||||
| 44 | Petroleo Brasileiro S.A. (m) | 467 | ||||||
| 25 | Vale S.A. (m) | 457 | ||||||
|
| |||||||
| 1,210 | ||||||||
|
| |||||||
Chile — 0.7% | ||||||||
| 5,450 | Banco Santander Chile (m) | 375 | ||||||
| 10 | CAP S.A. (m) | 354 | ||||||
| 89 | Cencosud S.A. (m) | 487 | ||||||
| 235 | Empresa Nacional de Electricidad S.A. (m) | 377 | ||||||
| 82 | Empresas CMPC S.A. (m) | 313 | ||||||
| 30 | Empresas COPEC S.A. (m) | 436 | ||||||
| 623 | Enersis S.A. (m) | 213 | ||||||
| 19 | Enersis S.A., ADR (m) | 315 | ||||||
| 9 | ENTEL Chile S.A. (m) | 180 | ||||||
| 14 | Latam Airlines Group S.A. (m) | 346 | ||||||
| 41 | S.A.C.I. Falabella (m) | 422 | ||||||
|
| |||||||
| 3,818 | ||||||||
|
| |||||||
China — 0.7% | ||||||||
| 672 | Bank of China Ltd., Class H (m) | 275 | ||||||
| 26 | BBMG Corp., Class H (m) | 22 | ||||||
| 78 | BYD Co., Ltd., Class H (a) (m) | 153 | ||||||
| 468 | China Construction Bank Corp., Class H (m) | 351 | ||||||
| 75 | China Life Insurance Co., Ltd., Class H (m) | 221 | ||||||
| 158 | CNOOC Ltd. (m) | 325 | ||||||
| 410 | Datang International Power Generation Co., Ltd., Class H (m) | 145 | ||||||
| 41 | Foxconn International Holdings Ltd. (a) (m) | 14 | ||||||
| 226 | Huaneng Power International, Inc., Class H (m) | 181 | ||||||
| 601 | Industrial & Commercial Bank of China Ltd., Class H (m) | 396 | ||||||
| 48 | Lenovo Group Ltd. (m) | 38 | ||||||
| 349 | PetroChina Co., Ltd., Class H (m) | 473 | ||||||
| 17 | Ping An Insurance Group Co. of China Ltd., Class H (m) | 130 | ||||||
| 37 | Sands China Ltd. (m) | 138 | ||||||
| 91 | Shui On Land Ltd. (m) | 38 | ||||||
| SHARES | SECURITY DESCRIPTION | VALUE($) | ||||||
China — Continued | ||||||||
| 11 | Tencent Holdings Ltd. (m) | 376 | ||||||
| 74 | Tingyi Cayman Islands Holding Corp. (m) | 219 | ||||||
| 24 | Wynn Macau Ltd. (m) | 66 | ||||||
| 54 | Yangzijiang Shipbuilding Holdings Ltd. (m) | 40 | ||||||
| 151 | Yanzhou Coal Mining Co., Ltd., Class H (m) | 226 | ||||||
| 361 | Zhejiang Expressway Co., Ltd., Class H (m) | 263 | ||||||
|
| |||||||
| 4,090 | ||||||||
|
| |||||||
Denmark — 1.1% | ||||||||
| — | (h) | A.P. Moller - Maersk A/S, Class A (m) | 199 | |||||
| — | (h) | A.P. Moller - Maersk A/S, Class B (m) | 502 | |||||
| 6 | Carlsberg A/S, Class B (m) | 507 | ||||||
| 1 | Coloplast A/S, Class B (m) | 264 | ||||||
| 36 | Danske Bank A/S (a) (m) | 559 | ||||||
| 11 | DSV A/S (m) | 244 | ||||||
| 22 | Novo Nordisk A/S, Class B (m) | 3,573 | ||||||
| 13 | Novozymes A/S, Class B (m) | 368 | ||||||
| 28 | TDC A/S (m) | 196 | ||||||
| 1 | Tryg A/S (m) | 81 | ||||||
| 1 | William Demant Holding A/S (a) (m) | 124 | ||||||
|
| |||||||
| 6,617 | ||||||||
|
| |||||||
Finland — 0.9% | ||||||||
| 9 | Elisa OYJ (m) | 198 | ||||||
| 30 | Fortum OYJ (m) | 547 | ||||||
| 5 | Kesko OYJ, Class B (m) | 142 | ||||||
| 11 | Kone OYJ, Class B (m) | 761 | ||||||
| 8 | Metso OYJ (m) | 290 | ||||||
| 9 | Neste Oil OYJ (m) | 115 | ||||||
| 254 | Nokia OYJ (m) | 683 | ||||||
| 8 | Nokian Renkaat OYJ (m) | 324 | ||||||
| 7 | Orion OYJ, Class B (m) | 171 | ||||||
| 10 | Pohjola Bank plc, Class A (m) | 138 | ||||||
| 28 | Sampo OYJ, Class A (m) | 883 | ||||||
| 37 | Stora Enso OYJ, Class R (m) | 232 | ||||||
| 35 | UPM-Kymmene OYJ (m) | 379 | ||||||
| 12 | Wartsila OYJ (m) | 469 | ||||||
|
| |||||||
| 5,332 | ||||||||
|
| |||||||
France — 9.4% | ||||||||
| 8 | Accor S.A. (m) | 266 | ||||||
| 2 | Aeroports de Paris (m) | 128 | ||||||
| 19 | Air Liquide S.A. (m) | 2,208 | ||||||
| 139 | Alcatel-Lucent (a) (m) | 142 | ||||||
| 12 | Alstom S.A. (m) | 409 | ||||||
| 4 | Arkema S.A. (m) | 342 | ||||||
| 3 | Atos Origin S.A. (m) | 216 | ||||||
SEE NOTES TO FINANCIAL STATEMENTS.
| OCTOBER 31, 2012 | J.P. MORGAN INTERNATIONAL EQUITY FUNDS | 47 | ||||||
Table of Contents
JPMorgan International Equity Index Fund
SCHEDULE OF PORTFOLIO INVESTMENTS
AS OF OCTOBER 31, 2012 (continued)
(Amounts in thousands)
| SHARES | SECURITY DESCRIPTION | VALUE($) | ||||||
| Common Stocks — Continued |
| ||||||
France — Continued | ||||||||
| 106 | AXA S.A. (m) | 1,695 | ||||||
| 58 | BNP Paribas S.A. (m) | 2,918 | ||||||
| 12 | Bouygues S.A. (m) | 284 | ||||||
| 3 | Bureau Veritas S.A. (m) | 344 | ||||||
| 8 | Cap Gemini S.A. (m) | 357 | ||||||
| 34 | Carrefour S.A. (m) | 821 | ||||||
| 3 | Casino Guichard Perrachon S.A. (m) | 288 | ||||||
| 3 | Christian Dior S.A. (m) | 468 | ||||||
| 24 | Cie de St-Gobain (m) | 836 | ||||||
| 9 | Cie Generale de Geophysique-Veritas (a) (m) | 280 | ||||||
| 11 | Cie Generale des Etablissements Michelin, Class B (m) | 931 | ||||||
| 12 | Cie Generale d’Optique Essilor International S.A. (m) | 1,081 | ||||||
| 8 | CNP Assurances (m) | 115 | ||||||
| 60 | Credit Agricole S.A. (a) (m) | 451 | ||||||
| 35 | Danone S.A. (m) | 2,132 | ||||||
| 4 | Dassault Systemes S.A. (m) | 397 | ||||||
| 10 | Edenred (m) | 299 | ||||||
| 14 | EDF S.A. (m) | 294 | ||||||
| 1 | Eurazeo (m) | 66 | ||||||
| 7 | Eutelsat Communications S.A. (m) | 240 | ||||||
| 2 | Fonciere Des Regions (m) | 125 | ||||||
| 112 | France Telecom S.A. (m) | 1,253 | ||||||
| 76 | GDF Suez (m) | 1,754 | ||||||
| 1 | Gecina S.A. (m) | 147 | ||||||
| 34 | Groupe Eurotunnel S.A. (m) | 257 | ||||||
| 1 | ICADE (m) | 114 | ||||||
| 1 | Iliad S.A. (m) | 207 | ||||||
| 2 | Imerys S.A. (m) | 102 | ||||||
| 4 | JCDecaux S.A. (m) | 83 | ||||||
| 6 | Klepierre (m) | 233 | ||||||
| 11 | Lafarge S.A. (m) | 642 | ||||||
| 7 | Lagardere S.C.A (m) | 187 | ||||||
| 14 | Legrand S.A. (m) | 555 | ||||||
| 14 | L’Oreal S.A. (m) | 1,838 | ||||||
| 15 | LVMH Moet Hennessy Louis Vuitton S.A. (m) | 2,480 | ||||||
| 59 | Natixis (m) | 193 | ||||||
| 13 | Pernod-Ricard S.A. (m) | 1,373 | ||||||
| 15 | Peugeot S.A. (a) (m) | 98 | ||||||
| 4 | PPR (m) | 786 | ||||||
| 11 | Publicis Groupe S.A. (m) | 575 | ||||||
| 1 | Remy Cointreau S.A. (m) | 143 | ||||||
| 11 | Renault S.A. (m) | 506 | ||||||
| 6 | Rexel S.A. (m) | 113 | ||||||
| 14 | Safran S.A. (m) | 542 | ||||||
| SHARES | SECURITY DESCRIPTION | VALUE($) | ||||||
France — Continued | ||||||||
| 71 | Sanofi (m) | 6,255 | ||||||
| 31 | Schneider Electric S.A. (m) | 1,956 | ||||||
| 10 | SCOR SE (m) | 268 | ||||||
| 2 | Societe BIC S.A. (m) | 218 | ||||||
| 42 | Societe Generale S.A. (a) (m) | 1,335 | ||||||
| 6 | Sodexo (m) | 447 | ||||||
| 17 | Suez Environnement Co. (m) | 184 | ||||||
| 6 | Technip S.A. (m) | 664 | ||||||
| 5 | Thales S.A. (m) | 181 | ||||||
| 127 | Total S.A. (m) | 6,415 | ||||||
| 5 | Unibail-Rodamco SE (m) | 1,235 | ||||||
| 6 | Vallourec S.A. (m) | 252 | ||||||
| 20 | Veolia Environnement S.A. (m) | 198 | ||||||
| 28 | Vinci S.A. (m) | 1,227 | ||||||
| 77 | Vivendi S.A. (m) | 1,583 | ||||||
| 2 | Wendel S.A. (m) | 176 | ||||||
| 2 | Zodiac Aerospace (m) | 209 | ||||||
|
| |||||||
| 55,117 | ||||||||
|
| |||||||
Germany — 12.0% | ||||||||
| 18 | Adidas AG (m) | 1,516 | ||||||
| 39 | Allianz SE (m) | 4,793 | ||||||
| 4 | Axel Springer AG (m) | 153 | ||||||
| 78 | BASF SE (m) | 6,462 | ||||||
| 70 | Bayer AG (m) | 6,115 | ||||||
| 28 | Bayerische Motoren Werke AG (m) | 2,242 | ||||||
| 9 | Beiersdorf AG (m) | 619 | ||||||
| 4 | Brenntag AG (m) | 559 | ||||||
| 7 | Celesio AG (m) | 136 | ||||||
| 309 | Commerzbank AG (a) (m) | 593 | ||||||
| 7 | Continental AG (m) | 678 | ||||||
| 77 | Daimler AG (m) | 3,602 | ||||||
| 79 | Deutsche Bank AG (m) | 3,592 | ||||||
| 16 | Deutsche Boerse AG (m) | 890 | ||||||
| 21 | Deutsche Lufthansa AG (m) | 316 | ||||||
| 72 | Deutsche Post AG (m) | 1,423 | ||||||
| 238 | Deutsche Telekom AG (m) | 2,718 | ||||||
| 153 | E.ON AG (m) | 3,477 | ||||||
| 3 | Fraport AG Frankfurt Airport Services Worldwide (m) | 192 | ||||||
| 18 | Fresenius Medical Care AG & Co. KGaA (m) | 1,256 | ||||||
| 10 | Fresenius SE & Co. KGaA (m) | 1,193 | ||||||
| 15 | GEA Group AG (m) | 473 | ||||||
| 5 | Hannover Rueckversicherung AG (m) | 357 | ||||||
| 12 | HeidelbergCement AG (m) | 634 | ||||||
| 11 | Henkel AG & Co. KGaA (m) | 706 | ||||||
SEE NOTES TO FINANCIAL STATEMENTS.
| 48 | J.P. MORGAN INTERNATIONAL EQUITY FUNDS | OCTOBER 31, 2012 | ||||
Table of Contents
| SHARES | SECURITY DESCRIPTION | VALUE($) | ||||||
| Common Stocks — Continued |
| ||||||
Germany — Continued | ||||||||
| 3 | Hochtief AG (a) (m) | 138 | ||||||
| 2 | Hugo Boss AG (m) | 212 | ||||||
| 93 | Infineon Technologies AG (m) | 631 | ||||||
| 15 | K+S AG (m) | 693 | ||||||
| 7 | Kabel Deutschland Holding AG (m) | 536 | ||||||
| 7 | Lanxess AG (m) | 585 | ||||||
| 16 | Linde AG (m) | 2,642 | ||||||
| 4 | MAN SE (m) | 367 | ||||||
| 5 | Merck KGaA (m) | 701 | ||||||
| 11 | Metro AG (m) | 310 | ||||||
| 15 | Muenchener Rueckversicherungs AG (m) | 2,441 | ||||||
| 41 | RWE AG (m) | 1,893 | ||||||
| 4 | Salzgitter AG (m) | 153 | ||||||
| 78 | SAP AG (m) | 5,696 | ||||||
| 70 | Siemens AG (m) | 7,031 | ||||||
| 6 | Suedzucker AG (m) | 218 | ||||||
| 33 | ThyssenKrupp AG (m) | 748 | ||||||
| 8 | United Internet AG (m) | 158 | ||||||
| 3 | Volkswagen AG (m) | 494 | ||||||
| 1 | Wacker Chemie AG (m) | 77 | ||||||
|
| |||||||
| 70,419 | ||||||||
|
| |||||||
Greece — 1.0% | ||||||||
| 214 | Coca Cola Hellenic Bottling Co. S.A. (a) (m) | 4,580 | ||||||
| 237 | OPAP S.A. (m) | 1,517 | ||||||
|
| |||||||
| 6,097 | ||||||||
|
| |||||||
Hong Kong — 1.0% | ||||||||
| 159 | AIA Group Ltd. (m) | 626 | ||||||
| 3 | ASM Pacific Technology Ltd. (m) | 31 | ||||||
| 22 | Bank of East Asia Ltd. (m) | 81 | ||||||
| 118 | Belle International Holdings Ltd. (m) | 219 | ||||||
| 58 | BOC Hong Kong Holdings Ltd. (m) | 177 | ||||||
| 15 | Cathay Pacific Airways Ltd. (m) | 27 | ||||||
| 22 | Cheung Kong Holdings Ltd. (m) | 326 | ||||||
| 7 | Cheung Kong Infrastructure Holdings Ltd. (m) | 41 | ||||||
| 53 | China Mobile Ltd. (m) | 587 | ||||||
| 28 | CLP Holdings Ltd. (m) | 237 | ||||||
| 32 | First Pacific Co., Ltd. (m) | 36 | ||||||
| 23 | Galaxy Entertainment Group Ltd. (a) (m) | 79 | ||||||
| 14 | Hang Lung Group Ltd. (m) | 83 | ||||||
| 35 | Hang Lung Properties Ltd. (m) | 121 | ||||||
| 12 | Hang Seng Bank Ltd. (m) | 182 | ||||||
| 14 | Henderson Land Development Co., Ltd. (m) | 97 | ||||||
| 82 | Hong Kong & China Gas Co., Ltd. (m) | 217 | ||||||
| 16 | Hong Kong Exchanges and Clearing Ltd. (m) | 263 | ||||||
| SHARES | SECURITY DESCRIPTION | VALUE($) | ||||||
Hong Kong — Continued | ||||||||
| 10 | Hopewell Holdings Ltd. (m) | 36 | ||||||
| 33 | Hutchison Whampoa Ltd. (m) | 326 | ||||||
| 9 | Hysan Development Co., Ltd. (m) | 40 | ||||||
| 11 | Kerry Properties Ltd. (m) | 52 | ||||||
| 92 | Li & Fung Ltd. (m) | 154 | ||||||
| 7 | Lifestyle International Holdings Ltd. (m) | 14 | ||||||
| 36 | Link REIT (The) (m) | 176 | ||||||
| 16 | MGM China Holdings Ltd. (m) | 28 | ||||||
| 23 | MTR Corp., Ltd. (m) | 90 | ||||||
| 57 | New World Development Co., Ltd. (m) | 87 | ||||||
| 103 | Noble Group Ltd. (m) | 110 | ||||||
| 23 | NWS Holdings Ltd. (m) | 35 | ||||||
| 3 | Orient Overseas International Ltd. (m) | 17 | ||||||
| 54 | PCCW Ltd. (m) | 22 | ||||||
| 21 | Power Assets Holdings Ltd. (m) | 183 | ||||||
| 26 | Shangri-La Asia Ltd. (m) | 50 | ||||||
| 47 | Sino Land Co., Ltd. (m) | 84 | ||||||
| 31 | SJM Holdings Ltd. (m) | 67 | ||||||
| 25 | Sun Hung Kai Properties Ltd. (m) | 339 | ||||||
| 10 | Swire Pacific Ltd., Class A (m) | 123 | ||||||
| 23 | Wharf Holdings Ltd. (m) | 159 | ||||||
| 14 | Wheelock & Co., Ltd. (m) | 61 | ||||||
| 3 | Wing Hang Bank Ltd. (m) | 26 | ||||||
| 10 | Yue Yuen Industrial Holdings Ltd. (m) | 35 | ||||||
|
| |||||||
| 5,744 | ||||||||
|
| |||||||
Hungary — 0.8% | ||||||||
| 186 | Magyar Telekom Telecommunications plc (m) | 345 | ||||||
| 17 | MOL Hungarian Oil and Gas plc (m) | 1,442 | ||||||
| 89 | OTP Bank plc (m) | 1,691 | ||||||
| 6 | Richter Gedeon Nyrt. (m) | 1,032 | ||||||
|
| |||||||
| 4,510 | ||||||||
|
| |||||||
India — 0.7% | ||||||||
| 20 | Bharat Heavy Electricals Ltd. (m) | 81 | ||||||
| 15 | Hindustan Unilever Ltd. (m) | 156 | ||||||
| 31 | Housing Development Finance Corp., Ltd. (m) | 435 | ||||||
| 7 | ICICI Bank Ltd., ADR (m) | 292 | ||||||
| 20 | IDFC Ltd. (m) | 62 | ||||||
| 9 | Infosys Ltd. (m) | 404 | ||||||
| 155 | ITC Ltd., Reg. S, GDR (m) | 816 | ||||||
| 75 | Jaiprakash Associates Ltd. (m) | 121 | ||||||
| 5 | Larsen & Toubro Ltd., Reg. S, GDR (m) | 144 | ||||||
| 9 | Mahindra & Mahindra Ltd. (m) | 140 | ||||||
| 33 | NTPC Ltd. (m) | 102 | ||||||
| 28 | Oil & Natural Gas Corp., Ltd. (m) | 137 | ||||||
SEE NOTES TO FINANCIAL STATEMENTS.
| OCTOBER 31, 2012 | J.P. MORGAN INTERNATIONAL EQUITY FUNDS | 49 | ||||||
Table of Contents
JPMorgan International Equity Index Fund
SCHEDULE OF PORTFOLIO INVESTMENTS
AS OF OCTOBER 31, 2012 (continued)
(Amounts in thousands)
| SHARES | SECURITY DESCRIPTION | VALUE($) | ||||||
| Common Stocks — Continued |
| ||||||
India — Continued | ||||||||
| 12 | Ranbaxy Laboratories Ltd., Reg. S, GDR (a) (m) | 121 | ||||||
| 27 | Reliance Industries Ltd. (m) | 406 | ||||||
| 6 | Reliance Industries Ltd., GDR (e) (m) | 166 | ||||||
| 75 | Sterlite Industries India Ltd. (m) | 137 | ||||||
| 14 | Sun Pharmaceutical Industries Ltd. (m) | 177 | ||||||
| 31 | Tata Motors Ltd. (m) | 148 | ||||||
| 52 | Tata Power Co., Ltd. (m) | 103 | ||||||
| 59 | United Phosphorus Ltd. (m) | 125 | ||||||
|
| |||||||
| 4,273 | ||||||||
|
| |||||||
Ireland — 0.9% | ||||||||
| 102 | CRH plc (m) | 1,905 | ||||||
| 49 | Elan Corp. plc (a) (m) | 533 | ||||||
| 23 | Elan Corp. plc, ADR (a) (m) | 249 | ||||||
| 20 | Experian plc (m) | 342 | ||||||
| 15 | James Hardie Industries SE, CDI (m) | 140 | ||||||
| 21 | Kerry Group plc, Class A (m) | 1,120 | ||||||
| 14 | Ryanair Holdings plc (a) (m) | 84 | ||||||
| 11 | Shire plc (m) | 322 | ||||||
| 25 | WPP plc (m) | 319 | ||||||
|
| |||||||
| 5,014 | ||||||||
|
| |||||||
Israel — 0.8% | ||||||||
| 77 | Bank Hapoalim BM (a) (m) | 303 | ||||||
| 91 | Bank Leumi Le-Israel BM (a) (m) | 295 | ||||||
| 139 | Bezeq Israeli Telecommunication Corp., Ltd. (m) | 169 | ||||||
| — | (h) | Delek Group Ltd. (m) | 63 | |||||
| 32 | Israel Chemicals Ltd. (m) | 406 | ||||||
| — | (h) | Israel Corp., Ltd. (The) (m) | 114 | |||||
| — | (h) | Koor Industries Ltd. (a) (m) | — | (h) | ||||
| 3 | Mellanox Technologies Ltd. (a) (m) | 197 | ||||||
| 9 | Mizrahi Tefahot Bank Ltd. (a) (m) | 82 | ||||||
| 4 | NICE Systems Ltd. (a) (m) | 145 | ||||||
| 49 | Teva Pharmaceutical Industries Ltd. (m) | 1,966 | ||||||
| 20 | Teva Pharmaceutical Industries Ltd., ADR (m) | 810 | ||||||
|
| |||||||
| 4,550 | ||||||||
|
| |||||||
Italy — 7.7% | ||||||||
| 238 | Assicurazioni Generali S.p.A. (m) | 3,872 | ||||||
| 67 | Atlantia S.p.A. (m) | 1,110 | ||||||
| 23 | Autogrill S.p.A. (m) | 240 | ||||||
| 1,296 | Banca Monte dei Paschi di Siena S.p.A. (a) (m) | 358 | ||||||
| 360 | Banco Popolare SC (a) (m) | 575 | ||||||
| 358 | Enel Green Power S.p.A. (m) | 609 | ||||||
| 1,341 | Enel S.p.A. (m) | 5,050 | ||||||
| 518 | Eni S.p.A. (m) | 11,919 | ||||||
| 13 | Exor S.p.A. (m) | 345 | ||||||
| SHARES | SECURITY DESCRIPTION | VALUE($) | ||||||
Italy — Continued | ||||||||
| 175 | Fiat Industrial S.p.A. (m) | 1,898 | ||||||
| 178 | Fiat S.p.A (a) (m) | 872 | ||||||
| 82 | Finmeccanica S.p.A. (a) (m) | 406 | ||||||
| 2,244 | Intesa Sanpaolo S.p.A. (m) | 3,559 | ||||||
| 24 | Luxottica Group S.p.A. (m) | 909 | ||||||
| 137 | Mediaset S.p.A. (m) | 241 | ||||||
| 105 | Mediobanca S.p.A. (m) | 603 | ||||||
| 48 | Pirelli & C. S.p.A. (m) | 559 | ||||||
| 42 | Prysmian S.p.A. (m) | 802 | ||||||
| 54 | Saipem S.p.A. (m) | 2,432 | ||||||
| 345 | Snam S.p.A. (m) | 1,529 | ||||||
| 1,911 | Telecom Italia S.p.A. (m) | 1,763 | ||||||
| 267 | Terna Rete Elettrica Nazionale S.p.A. (m) | 1,004 | ||||||
| 825 | UniCredit S.p.A. (a) (m) | 3,650 | ||||||
| 175 | Unione di Banche Italiane ScpA (m) | 689 | ||||||
|
| |||||||
| 44,994 | ||||||||
|
| |||||||
Japan — 18.3% | ||||||||
| 2 | ABC-Mart, Inc. (m) | 66 | ||||||
| 8 | Advantest Corp. (m) | 104 | ||||||
| 32 | Aeon Co., Ltd. (m) | 350 | ||||||
| 4 | Aeon Credit Service Co., Ltd. (m) | 79 | ||||||
| 4 | Aeon Mall Co., Ltd. (m) | 93 | ||||||
| 8 | Air Water, Inc. (m) | 100 | ||||||
| 10 | Aisin Seiki Co., Ltd. (m) | 295 | ||||||
| 33 | Ajinomoto Co., Inc. (m) | 504 | ||||||
| 2 | Alfresa Holdings Corp. (m) | 95 | ||||||
| 62 | All Nippon Airways Co., Ltd. (m) | 131 | ||||||
| 19 | Amada Co., Ltd. (m) | 97 | ||||||
| 33 | Aozora Bank Ltd. (m) | 93 | ||||||
| 54 | Asahi Glass Co., Ltd. (m) | 370 | ||||||
| 21 | Asahi Group Holdings Ltd. (m) | 471 | ||||||
| 67 | Asahi Kasei Corp. (m) | 371 | ||||||
| 8 | Asics Corp. (m) | 121 | ||||||
| 23 | Astellas Pharma, Inc. (m) | 1,154 | ||||||
| 15 | Bank of Kyoto Ltd. (The) (m) | 129 | ||||||
| 65 | Bank of Yokohama Ltd. (The) (m) | 299 | ||||||
| 4 | Benesse Holdings, Inc. (m) | 177 | ||||||
| 34 | Bridgestone Corp. (m) | 796 | ||||||
| 13 | Brother Industries Ltd. (m) | 123 | ||||||
| 60 | Canon, Inc. (m) | 1,949 | ||||||
| 12 | Casio Computer Co., Ltd. (m) | 89 | ||||||
| 8 | Central Japan Railway Co. (m) | 645 | ||||||
| 41 | Chiba Bank Ltd. (The) (m) | 239 | ||||||
| 8 | Chiyoda Corp. (m) | 129 | ||||||
| 35 | Chubu Electric Power Co., Inc. (m) | 357 | ||||||
SEE NOTES TO FINANCIAL STATEMENTS.
| 50 | J.P. MORGAN INTERNATIONAL EQUITY FUNDS | OCTOBER 31, 2012 | ||||
Table of Contents
| SHARES | SECURITY DESCRIPTION | VALUE($) | ||||||
| Common Stocks — Continued |
| ||||||
Japan — Continued | ||||||||
| 12 | Chugai Pharmaceutical Co., Ltd. (m) | 234 | ||||||
| 9 | Chugoku Bank Ltd. (The) (m) | 124 | ||||||
| 15 | Chugoku Electric Power Co., Inc. (The) (m) | 158 | ||||||
| 13 | Citizen Holdings Co., Ltd. (m) | 68 | ||||||
| 3 | Coca-Cola West Co., Ltd. (m) | 51 | ||||||
| 30 | Cosmo Oil Co., Ltd. (m) | 53 | ||||||
| 9 | Credit Saison Co., Ltd. (m) | 187 | ||||||
| 29 | Dai Nippon Printing Co., Ltd. (m) | 208 | ||||||
| 15 | Daicel Corp. (m) | 92 | ||||||
| 14 | Daido Steel Co., Ltd. (m) | 61 | ||||||
| 10 | Daihatsu Motor Co., Ltd. (m) | 175 | ||||||
| — | (h) | Dai-ichi Life Insurance Co., Ltd. (The) (m) | 526 | |||||
| 35 | Daiichi Sankyo Co., Ltd. (m) | 534 | ||||||
| 12 | Daikin Industries Ltd. (m) | 346 | ||||||
| 8 | Dainippon Sumitomo Pharma Co., Ltd. (m) | 95 | ||||||
| 4 | Daito Trust Construction Co., Ltd. (m) | 388 | ||||||
| 27 | Daiwa House Industry Co., Ltd. (m) | 414 | ||||||
| 88 | Daiwa Securities Group, Inc. (m) | 353 | ||||||
| 6 | Dena Co., Ltd. (m) | 175 | ||||||
| 25 | Denki Kagaku Kogyo KK (m) | 79 | ||||||
| 26 | Denso Corp. (m) | 803 | ||||||
| 10 | Dentsu, Inc. (m) | 227 | ||||||
| 18 | East Japan Railway Co. (m) | 1,229 | ||||||
| 14 | Eisai Co., Ltd. (m) | 605 | ||||||
| 6 | Electric Power Development Co., Ltd. (m) | 164 | ||||||
| 3 | FamilyMart Co., Ltd. (m) | 158 | ||||||
| 10 | FANUC Corp. (m) | 1,601 | ||||||
| 3 | Fast Retailing Co., Ltd. (m) | 629 | ||||||
| 28 | Fuji Electric Co., Ltd. (m) | 57 | ||||||
| 31 | Fuji Heavy Industries Ltd. (m) | 299 | ||||||
| 25 | FUJIFILM Holdings Corp. (m) | 419 | ||||||
| 100 | Fujitsu Ltd. (m) | 386 | ||||||
| 38 | Fukuoka Financial Group, Inc. (m) | 147 | ||||||
| 30 | Furukawa Electric Co., Ltd. (a) (m) | 60 | ||||||
| 5 | Gree, Inc. (m) | 80 | ||||||
| 17 | GS Yuasa Corp. (m) | 66 | ||||||
| 21 | Gunma Bank Ltd. (The) (m) | 100 | ||||||
| 21 | Hachijuni Bank Ltd. (The) (m) | 108 | ||||||
| 1 | Hakuhodo DY Holdings, Inc. (m) | 70 | ||||||
| 4 | Hamamatsu Photonics KK (m) | 128 | ||||||
| 60 | Hankyu Hanshin Holdings, Inc. (m) | 332 | ||||||
| 13 | Hino Motors Ltd. (m) | 100 | ||||||
| 1 | Hirose Electric Co., Ltd. (m) | 157 | ||||||
| 3 | Hisamitsu Pharmaceutical Co., Inc. (m) | 171 | ||||||
| 6 | Hitachi Chemical Co., Ltd. (m) | 78 | ||||||
| SHARES | SECURITY DESCRIPTION | VALUE($) | ||||||
Japan — Continued | ||||||||
| 6 | Hitachi Construction Machinery Co., Ltd. (m) | 97 | ||||||
| 3 | Hitachi High-Technologies Corp. (m) | 68 | ||||||
| 246 | Hitachi Ltd. (m) | 1,305 | ||||||
| 7 | Hitachi Metals Ltd. (m) | 66 | ||||||
| 10 | Hokkaido Electric Power Co., Inc. (m) | 83 | ||||||
| 9 | Hokuriku Electric Power Co. (m) | 86 | ||||||
| 86 | Honda Motor Co., Ltd. (m) | 2,592 | ||||||
| 22 | Hoya Corp. (m) | 454 | ||||||
| 13 | Hulic Co., Ltd. (a) (m) | 107 | ||||||
| 6 | Ibiden Co., Ltd. (m) | 81 | ||||||
| 1 | Idemitsu Kosan Co., Ltd. (m) | 95 | ||||||
| 69 | IHI Corp. (m) | 145 | ||||||
| — | (h) | Inpex Corp. (m) | 661 | |||||
| 18 | Isetan Mitsukoshi Holdings Ltd. (m) | 179 | ||||||
| 64 | Isuzu Motors Ltd. (m) | 339 | ||||||
| 81 | ITOCHU Corp. (m) | 814 | ||||||
| 1 | Itochu Techno-Solutions Corp. (m) | 75 | ||||||
| 13 | Iyo Bank Ltd. (The) (m) | 100 | ||||||
| 26 | J. Front Retailing Co., Ltd. (m) | 136 | ||||||
| 3 | Japan Airlines Co., Ltd. (a) (m) | 143 | ||||||
| 2 | Japan Petroleum Exploration Co. (m) | 64 | ||||||
| — | (h) | Japan Prime Realty Investment Corp. (m) | 130 | |||||
| — | (h) | Japan Real Estate Investment Corp. (m) | 280 | |||||
| — | (h) | Japan Retail Fund Investment Corp. (m) | 208 | |||||
| 16 | Japan Steel Works Ltd. (The) (m) | 95 | ||||||
| 48 | Japan Tobacco, Inc. (m) | 1,319 | ||||||
| 27 | JFE Holdings, Inc. (m) | 379 | ||||||
| 11 | JGC Corp. (m) | 374 | ||||||
| 34 | Joyo Bank Ltd. (The) (m) | 165 | ||||||
| 9 | JSR Corp. (m) | 148 | ||||||
| 12 | JTEKT Corp. (m) | 93 | ||||||
| — | (h) | Jupiter Telecommunications Co., Ltd. (m) | 155 | |||||
| 118 | JX Holdings, Inc. (m) | 627 | ||||||
| 41 | Kajima Corp. (m) | 113 | ||||||
| 12 | Kamigumi Co., Ltd. (m) | 101 | ||||||
| 16 | Kaneka Corp. (m) | 77 | ||||||
| 40 | Kansai Electric Power Co., Inc. (The) (m) | 310 | ||||||
| 11 | Kansai Paint Co., Ltd. (m) | 118 | ||||||
| 28 | Kao Corp. (m) | 778 | ||||||
| 69 | Kawasaki Heavy Industries Ltd. (m) | 142 | ||||||
| 50 | Kawasaki Kisen Kaisha Ltd. (a) (m) | 63 | ||||||
| 14 | KDDI Corp. (m) | 1,103 | ||||||
| 24 | Keikyu Corp. (m) | 228 | ||||||
| 31 | Keio Corp. (m) | 235 | ||||||
| 15 | Keisei Electric Railway Co., Ltd. (m) | 137 | ||||||
SEE NOTES TO FINANCIAL STATEMENTS.
| OCTOBER 31, 2012 | J.P. MORGAN INTERNATIONAL EQUITY FUNDS | 51 | ||||||
Table of Contents
JPMorgan International Equity Index Fund
SCHEDULE OF PORTFOLIO INVESTMENTS
AS OF OCTOBER 31, 2012 (continued)
(Amounts in thousands)
| SHARES | SECURITY DESCRIPTION | VALUE($) | ||||||
| Common Stocks — Continued |
| ||||||
Japan — Continued | ||||||||
| 2 | Keyence Corp. (m) | 637 | ||||||
| 9 | Kikkoman Corp. (m) | 117 | ||||||
| 5 | Kinden Corp. (m) | 32 | ||||||
| 88 | Kintetsu Corp. (m) | 343 | ||||||
| 46 | Kirin Holdings Co., Ltd. (m) | 574 | ||||||
| 133 | Kobe Steel Ltd. (m) | 116 | ||||||
| 5 | Koito Manufacturing Co., Ltd. (m) | 62 | ||||||
| 50 | Komatsu Ltd. (m) | 1,038 | ||||||
| 5 | Konami Corp. (m) | 126 | ||||||
| 23 | Konica Minolta Holdings, Inc. (m) | 156 | ||||||
| 57 | Kubota Corp. (m) | 585 | ||||||
| 17 | Kuraray Co., Ltd. (m) | 198 | ||||||
| 6 | Kurita Water Industries Ltd. (m) | 139 | ||||||
| 8 | Kyocera Corp. (m) | 701 | ||||||
| 13 | Kyowa Hakko Kirin Co., Ltd. (m) | 134 | ||||||
| 23 | Kyushu Electric Power Co., Inc. (m) | 176 | ||||||
| 3 | Lawson, Inc. (m) | 241 | ||||||
| 14 | LIXIL Group Corp. (m) | 314 | ||||||
| 1 | Mabuchi Motor Co., Ltd. (m) | 47 | ||||||
| 6 | Makita Corp. (m) | 224 | ||||||
| 88 | Marubeni Corp. (m) | 569 | ||||||
| 11 | Marui Group Co., Ltd. (m) | 82 | ||||||
| 3 | Maruichi Steel Tube Ltd. (m) | 52 | ||||||
| 142 | Mazda Motor Corp. (a) (m) | 169 | ||||||
| 4 | McDonald’s Holdings Co., Japan Ltd. (m) | 100 | ||||||
| 8 | Medipal Holdings Corp. (m) | 101 | ||||||
| 3 | MEIJI Holdings Co., Ltd. (m) | 145 | ||||||
| 3 | Miraca Holdings, Inc. (m) | 127 | ||||||
| 73 | Mitsubishi Chemical Holdings Corp. (m) | 287 | ||||||
| 74 | Mitsubishi Corp. (m) | 1,316 | ||||||
| 103 | Mitsubishi Electric Corp. (m) | 767 | ||||||
| 66 | Mitsubishi Estate Co., Ltd. (m) | 1,313 | ||||||
| 20 | Mitsubishi Gas Chemical Co., Inc. (m) | 98 | ||||||
| 160 | Mitsubishi Heavy Industries Ltd. (m) | 675 | ||||||
| 7 | Mitsubishi Logistics Corp. (m) | 87 | ||||||
| 56 | Mitsubishi Materials Corp. (m) | 164 | ||||||
| 213 | Mitsubishi Motors Corp. (a) (m) | 184 | ||||||
| 12 | Mitsubishi Tanabe Pharma Corp. (m) | 172 | ||||||
| 676 | Mitsubishi UFJ Financial Group, Inc. (m) | 3,058 | ||||||
| 3 | Mitsubishi UFJ Lease & Finance Co., Ltd. (m) | 139 | ||||||
| 91 | Mitsui & Co., Ltd. (m) | 1,286 | ||||||
| 46 | Mitsui Chemicals, Inc. (m) | 95 | ||||||
| 44 | Mitsui Fudosan Co., Ltd. (m) | 884 | ||||||
| 52 | Mitsui OSK Lines Ltd. (m) | 125 | ||||||
| 1,207 | Mizuho Financial Group, Inc. (m) | 1,889 | ||||||
| SHARES | SECURITY DESCRIPTION | VALUE($) | ||||||
Japan — Continued | ||||||||
| 26 | MS&AD Insurance Group Holdings (m) | 441 | ||||||
| 10 | Murata Manufacturing Co., Ltd. (m) | 506 | ||||||
| 5 | Nabtesco Corp. (m) | 99 | ||||||
| 10 | Namco Bandai Holdings, Inc. (m) | 156 | ||||||
| 131 | NEC Corp. (a) (m) | 251 | ||||||
| 6 | Nexon Co., Ltd. (a) (m) | 67 | ||||||
| 15 | NGK Insulators Ltd. (m) | 163 | ||||||
| 9 | NGK Spark Plug Co., Ltd. (m) | 106 | ||||||
| 9 | NHK Spring Co., Ltd. (m) | 78 | ||||||
| 6 | Nidec Corp. (m) | 410 | ||||||
| 18 | Nikon Corp. (m) | 446 | ||||||
| 6 | Nintendo Co., Ltd. (m) | 715 | ||||||
| — | (h) | Nippon Building Fund, Inc. (m) | 344 | |||||
| 21 | Nippon Electric Glass Co., Ltd. (m) | 107 | ||||||
| 47 | Nippon Express Co., Ltd. (m) | 171 | ||||||
| 9 | Nippon Meat Packers, Inc. (m) | 115 | ||||||
| 5 | Nippon Paper Group, Inc. (m) | 58 | ||||||
| 398 | Nippon Steel Corp. (m) | 878 | ||||||
| 23 | Nippon Telegraph & Telephone Corp. (m) | 1,043 | ||||||
| 85 | Nippon Yusen KK (m) | 162 | ||||||
| 38 | Nishi-Nippon City Bank Ltd. (The) (m) | 87 | ||||||
| 132 | Nissan Motor Co., Ltd. (m) | 1,101 | ||||||
| 11 | Nisshin Seifun Group, Inc. (m) | 131 | ||||||
| 6 | Nisshin Steel Holdings Co. Ltd. (a) (m) | 37 | ||||||
| 3 | Nissin Foods Holdings Co., Ltd. (m) | 117 | ||||||
| 2 | Nitori Holdings Co., Ltd. (m) | 154 | ||||||
| 9 | Nitto Denko Corp. (m) | 402 | ||||||
| 20 | NKSJ Holdings, Inc. (m) | 363 | ||||||
| 5 | NOK Corp. (m) | 86 | ||||||
| 190 | Nomura Holdings, Inc. (m) | 688 | ||||||
| 5 | Nomura Real Estate Holdings, Inc. (m) | 88 | ||||||
| — | (h) | Nomura Real Estate Office Fund, Inc. (m) | 88 | |||||
| 5 | Nomura Research Institute Ltd. (m) | 108 | ||||||
| 23 | NSK Ltd. (m) | 128 | ||||||
| 25 | NTN Corp. (m) | 44 | ||||||
| — | (h) | NTT Data Corp. (m) | 222 | |||||
| 1 | NTT DOCOMO, Inc. (m) | 1,179 | ||||||
| — | (h) | NTT Urban Development Corp. (m) | 45 | |||||
| 35 | Obayashi Corp. (m) | 158 | ||||||
| 32 | Odakyu Electric Railway Co., Ltd. (m) | 340 | ||||||
| 38 | OJI Paper Co., Ltd. (m) | 112 | ||||||
| 12 | Olympus Corp. (a) (m) | 209 | ||||||
| 11 | Omron Corp. (m) | 227 | ||||||
| 4 | Ono Pharmaceutical Co., Ltd. (m) | 266 | ||||||
| 2 | Oracle Corp. Japan (m) | 87 | ||||||
SEE NOTES TO FINANCIAL STATEMENTS.
| 52 | J.P. MORGAN INTERNATIONAL EQUITY FUNDS | OCTOBER 31, 2012 | ||||
Table of Contents
| SHARES | SECURITY DESCRIPTION | VALUE($) | ||||||
| Common Stocks — Continued |
| ||||||
Japan — Continued | ||||||||
| 3 | Oriental Land Co., Ltd. (m) | 362 | ||||||
| 5 | ORIX Corp. (m) | 560 | ||||||
| 96 | Osaka Gas Co., Ltd. (m) | 396 | ||||||
| 1 | Otsuka Corp. (m) | 65 | ||||||
| 19 | Otsuka Holdings Co., Ltd. (m) | 576 | ||||||
| 116 | Panasonic Corp. (m) | 703 | ||||||
| 38 | Rakuten, Inc. (m) | 345 | ||||||
| 101 | Resona Holdings, Inc. (m) | 436 | ||||||
| 33 | Ricoh Co., Ltd. (m) | 277 | ||||||
| 2 | Rinnai Corp. (m) | 116 | ||||||
| 5 | Rohm Co., Ltd. (m) | 152 | ||||||
| 3 | Sankyo Co., Ltd. (m) | 113 | ||||||
| 2 | Sanrio Co., Ltd. (m) | 72 | ||||||
| 4 | Santen Pharmaceutical Co., Ltd. (m) | 180 | ||||||
| 12 | SBI Holdings, Inc. (m) | 82 | ||||||
| 11 | Secom Co., Ltd. (m) | 559 | ||||||
| 10 | Sega Sammy Holdings, Inc. (m) | 198 | ||||||
| 6 | Seiko Epson Corp. (m) | 35 | ||||||
| 23 | Sekisui Chemical Co., Ltd. (m) | 188 | ||||||
| 28 | Sekisui House Ltd. (m) | 290 | ||||||
| 39 | Seven & I Holdings Co., Ltd. (m) | 1,215 | ||||||
| 26 | Seven Bank Ltd. (m) | 75 | ||||||
| 53 | Sharp Corp. (m) | 114 | ||||||
| 8 | Shikoku Electric Power Co., Inc. (m) | 88 | ||||||
| 12 | Shimadzu Corp. (m) | 81 | ||||||
| 1 | Shimamura Co., Ltd. (m) | 125 | ||||||
| 4 | Shimano, Inc. (m) | 252 | ||||||
| 32 | Shimizu Corp. (m) | 106 | ||||||
| 22 | Shin-Etsu Chemical Co., Ltd. (m) | 1,215 | ||||||
| 82 | Shinsei Bank Ltd. (m) | 120 | ||||||
| 15 | Shionogi & Co., Ltd. (m) | 249 | ||||||
| 19 | Shiseido Co., Ltd. (m) | 241 | ||||||
| 27 | Shizuoka Bank Ltd. (The) (m) | 279 | ||||||
| 79 | Showa Denko KK (m) | 121 | ||||||
| 9 | Showa Shell Sekiyu KK (m) | 48 | ||||||
| 3 | SMC Corp. (m) | 441 | ||||||
| 47 | Softbank Corp. (m) | 1,481 | ||||||
| 67 | Sojitz Corp. (m) | 84 | ||||||
| 53 | Sony Corp. (m) | 623 | ||||||
| 9 | Sony Financial Holdings, Inc. (m) | 152 | ||||||
| 4 | Square Enix Holdings Co., Ltd. (m) | 52 | ||||||
| 8 | Stanley Electric Co., Ltd. (m) | 108 | ||||||
| 6 | Sumco Corp. (a) (m) | 42 | ||||||
| 77 | Sumitomo Chemical Co., Ltd. (m) | 216 | ||||||
| 59 | Sumitomo Corp. (m) | 807 | ||||||
| SHARES | SECURITY DESCRIPTION | VALUE($) | ||||||
Japan — Continued | ||||||||
| 39 | Sumitomo Electric Industries Ltd. (m) | 415 | ||||||
| 30 | Sumitomo Heavy Industries Ltd. (m) | 107 | ||||||
| 28 | Sumitomo Metal Mining Co., Ltd. (m) | 370 | ||||||
| 71 | Sumitomo Mitsui Financial Group, Inc. (m) | 2,179 | ||||||
| 161 | Sumitomo Mitsui Trust Holdings, Inc. (m) | 489 | ||||||
| 19 | Sumitomo Realty & Development Co., Ltd. (m) | 533 | ||||||
| 9 | Sumitomo Rubber Industries Ltd. (m) | 110 | ||||||
| 10 | Suruga Bank Ltd. (m) | 118 | ||||||
| 4 | Suzuken Co., Ltd. (m) | 120 | ||||||
| 20 | Suzuki Motor Corp. (m) | 442 | ||||||
| 4 | Sysmex Corp. (m) | 183 | ||||||
| 30 | T&D Holdings, Inc. (m) | 333 | ||||||
| 60 | Taiheiyo Cement Corp. (m) | 128 | ||||||
| 50 | Taisei Corp. (m) | 139 | ||||||
| 2 | Taisho Pharmaceutical Holdings Co., Ltd. (m) | 159 | ||||||
| 13 | Taiyo Nippon Sanso Corp. (m) | 71 | ||||||
| 15 | Takashimaya Co., Ltd. (m) | 99 | ||||||
| 42 | Takeda Pharmaceutical Co., Ltd. (m) | 1,942 | ||||||
| 7 | TDK Corp. (m) | 246 | ||||||
| 53 | Teijin Ltd. (m) | 121 | ||||||
| 8 | Terumo Corp. (m) | 352 | ||||||
| 7 | THK Co., Ltd. (m) | 111 | ||||||
| 55 | Tobu Railway Co., Ltd. (m) | 293 | ||||||
| 6 | Toho Co., Ltd. (m) | 106 | ||||||
| 22 | Toho Gas Co., Ltd. (m) | 133 | ||||||
| 25 | Tohoku Electric Power Co., Inc. (a) (m) | 184 | ||||||
| 38 | Tokio Marine Holdings, Inc. (m) | 1,001 | ||||||
| 80 | Tokyo Electric Power Co., Inc. (a) (m) | 130 | ||||||
| 9 | Tokyo Electron Ltd. (m) | 415 | ||||||
| 129 | Tokyo Gas Co., Ltd. (m) | 683 | ||||||
| 60 | Tokyu Corp. (m) | 306 | ||||||
| 24 | Tokyu Land Corp. (m) | 132 | ||||||
| 15 | TonenGeneral Sekiyu KK (m) | 136 | ||||||
| 29 | Toppan Printing Co., Ltd. (m) | 169 | ||||||
| 78 | Toray Industries, Inc. (m) | 456 | ||||||
| 212 | Toshiba Corp. (m) | 787 | ||||||
| 26 | Tosoh Corp. (m) | 50 | ||||||
| 15 | TOTO Ltd. (m) | 115 | ||||||
| 8 | Toyo Seikan Kaisha Ltd. (m) | 87 | ||||||
| 5 | Toyo Suisan Kaisha Ltd. (m) | 125 | ||||||
| 4 | Toyoda Gosei Co., Ltd. (m) | 76 | ||||||
| 3 | Toyota Boshoku Corp. (m) | 28 | ||||||
| 9 | Toyota Industries Corp. (m) | 252 | ||||||
| 146 | Toyota Motor Corp. (m) | 5,614 | ||||||
| 12 | Toyota Tsusho Corp. (m) | 258 | ||||||
SEE NOTES TO FINANCIAL STATEMENTS.
| OCTOBER 31, 2012 | J.P. MORGAN INTERNATIONAL EQUITY FUNDS | 53 | ||||||
Table of Contents
JPMorgan International Equity Index Fund
SCHEDULE OF PORTFOLIO INVESTMENTS
AS OF OCTOBER 31, 2012 (continued)
(Amounts in thousands)
| SHARES | SECURITY DESCRIPTION | VALUE($) | ||||||
| Common Stocks — Continued |
| ||||||
Japan — Continued | ||||||||
| 6 | Trend Micro, Inc. (m) | 163 | ||||||
| 3 | Tsumura & Co. (m) | 106 | ||||||
| 56 | Ube Industries Ltd. (m) | 128 | ||||||
| 6 | Unicharm Corp. (m) | 330 | ||||||
| 5 | Ushio, Inc. (m) | 47 | ||||||
| 1 | USS Co., Ltd. (m) | 129 | ||||||
| 9 | West Japan Railway Co. (m) | 397 | ||||||
| 1 | Yahoo! Japan Corp. (m) | 261 | ||||||
| 5 | Yakult Honsha Co., Ltd. (m) | 237 | ||||||
| 5 | Yamada Denki Co., Ltd. (m) | 208 | ||||||
| 9 | Yamaguchi Financial Group, Inc. (m) | 75 | ||||||
| 8 | Yamaha Corp. (m) | 69 | ||||||
| 15 | Yamaha Motor Co., Ltd. (m) | 140 | ||||||
| 20 | Yamato Holdings Co., Ltd. (m) | 305 | ||||||
| 2 | Yamato Kogyo Co., Ltd. (m) | 51 | ||||||
| 6 | Yamazaki Baking Co., Ltd. (m) | 68 | ||||||
| 11 | Yaskawa Electric Corp. (m) | 79 | ||||||
| 11 | Yokogawa Electric Corp. (m) | 128 | ||||||
|
| |||||||
| 106,880 | ||||||||
|
| |||||||
Luxembourg — 0.6% | ||||||||
| 56 | ArcelorMittal (m) | 833 | ||||||
| 2 | Millicom International Cellular S.A., SDR (m) | 184 | ||||||
| 19 | SES S.A. FDR (m) | 521 | ||||||
| 96 | Tenaris S.A. (m) | 1,804 | ||||||
|
| |||||||
| 3,342 | ||||||||
|
| |||||||
Mexico — 0.8% | ||||||||
| 105 | Alfa S.A.B. de C.V., Class A (m) | 194 | ||||||
| 1,059 | America Movil S.A.B. de C.V., Series L, (m) | 1,344 | ||||||
| 300 | Cemex S.A.B. de C.V. (a) (m) | 272 | ||||||
| 66 | Fomento Economico Mexicano S.A.B. de C.V. (m) | 597 | ||||||
| 4 | Fresnillo plc (m) | 109 | ||||||
| 80 | Grupo Bimbo S.A.B. de C.V., Series A, (m) | 186 | ||||||
| 18 | Grupo Carso S.A.B. de C.V., Series A1, (m) | 64 | ||||||
| 132 | Grupo Mexico S.A.B. de C.V., Series B, (m) | 425 | ||||||
| 25 | Grupo Modelo S.A.B. de C.V., Series C, (m) | 219 | ||||||
| 83 | Grupo Televisa S.A.B. (m) | 375 | ||||||
| 82 | Kimberly-Clark de Mexico S.A.B. de C.V., Class A (m) | 199 | ||||||
| 18 | Minera Frisco S.A.B. de C.V., Class A1 (a) (m) | 70 | ||||||
| 159 | Wal-Mart de Mexico S.A.B. de C.V., Series V, (m) | 469 | ||||||
|
| |||||||
| 4,523 | ||||||||
|
| |||||||
Netherlands — 4.1% | ||||||||
| 117 | Aegon N.V. (m) | 656 | ||||||
| 16 | Akzo Nobel N.V. (m) | 874 | ||||||
| SHARES | SECURITY DESCRIPTION | VALUE($) | ||||||
Netherlands — Continued | ||||||||
| 29 | ASML Holding N.V. (m) | 1,579 | ||||||
| 4 | Corio N.V. (m) | 191 | ||||||
| 40 | D.E Master Blenders 1753 N.V. (a) (m) | 491 | ||||||
| 10 | Delta Lloyd N.V. (m) | 164 | ||||||
| 25 | European Aeronautic Defence and Space Co., N.V. (m) | 885 | ||||||
| 5 | Fugro N.V., CVA, CVA (m) | 328 | ||||||
| 5 | Gemalto N.V. (m) | 425 | ||||||
| 7 | Heineken Holding N.V. (m) | 347 | ||||||
| 16 | Heineken N.V. (m) | 969 | ||||||
| 262 | ING Groep N.V., CVA (a) (m) | 2,327 | ||||||
| 72 | Koninklijke Ahold N.V. (m) | 917 | ||||||
| 5 | Koninklijke Boskalis Westminster N.V. (m) | 190 | ||||||
| 10 | Koninklijke DSM N.V. (m) | 538 | ||||||
| 69 | Koninklijke KPN N.V. (m) | 438 | ||||||
| 71 | Koninklijke Philips Electronics N.V. (m) | 1,778 | ||||||
| 5 | Koninklijke Vopak N.V. (m) | 330 | ||||||
| 20 | QIAGEN N.V. (a) (m) | 353 | ||||||
| 8 | Randstad Holding N.V. (m) | 269 | ||||||
| 47 | Reed Elsevier N.V. (m) | 637 | ||||||
| 74 | Royal Dutch Shell plc, Class A (m) | 2,546 | ||||||
| 53 | Royal Dutch Shell plc, Class B (m) | 1,875 | ||||||
| 12 | SBM Offshore N.V. (a) (m) | 157 | ||||||
| 22 | TNT Express N.V. (m) | 228 | ||||||
| 111 | Unilever N.V., CVA (m) | 4,087 | ||||||
| 21 | Wolters Kluwer N.V. (m) | 403 | ||||||
|
| |||||||
| 23,982 | ||||||||
|
| |||||||
New Zealand — 0.6% | ||||||||
| 236 | Auckland International Airport Ltd. (m) | 520 | ||||||
| 94 | Contact Energy Ltd. (a) (m) | 426 | ||||||
| 173 | Fletcher Building Ltd. (m) | 1,003 | ||||||
| 147 | SKYCITY Entertainment Group Ltd. (m) | 468 | ||||||
| 482 | Telecom Corp. of New Zealand Ltd. (m) | 953 | ||||||
|
| |||||||
| 3,370 | ||||||||
|
| |||||||
Norway — 1.6% | ||||||||
| 17 | Aker Solutions ASA (m) | 329 | ||||||
| 99 | DnB ASA (m) | 1,239 | ||||||
| 21 | Gjensidige Forsikring ASA (m) | 303 | ||||||
| 93 | Norsk Hydro ASA (m) | 420 | ||||||
| 79 | Orkla ASA (m) | 622 | ||||||
| 36 | Seadrill Ltd. (m) | 1,447 | ||||||
| 113 | Statoil ASA (m) | 2,777 | ||||||
| 73 | Telenor ASA (m) | 1,442 | ||||||
| 19 | Yara International ASA (m) | 896 | ||||||
|
| |||||||
| 9,475 | ||||||||
|
| |||||||
SEE NOTES TO FINANCIAL STATEMENTS.
| 54 | J.P. MORGAN INTERNATIONAL EQUITY FUNDS | OCTOBER 31, 2012 | ||||
Table of Contents
| SHARES | SECURITY DESCRIPTION | VALUE($) | ||||||
| Common Stocks — Continued |
| ||||||
Philippines — 0.8% | ||||||||
| 40 | Ayala Corp. (m) | 424 | ||||||
| 1,041 | Ayala Land, Inc. (m) | 595 | ||||||
| 226 | Bank of the Philippine Islands (m) | 444 | ||||||
| 133 | BDO Unibank, Inc. (a) (m) | 206 | ||||||
| 6 | Globe Telecom, Inc. (m) | 165 | ||||||
| 110 | Jollibee Foods Corp. (m) | 282 | ||||||
| 70 | Manila Electric Co. (m) | 476 | ||||||
| 64 | Metropolitan Bank & Trust Co. (m) | 147 | ||||||
| 9 | Philippine Long Distance Telephone Co. (m) | 558 | ||||||
| 39 | SM Investments Corp. (m) | 762 | ||||||
| 1,538 | SM Prime Holdings, Inc. (m) | 541 | ||||||
|
| |||||||
| 4,600 | ||||||||
|
| |||||||
Portugal — 0.9% | ||||||||
| 584 | Banco Espirito Santo S.A. (a) (m) | 569 | ||||||
| 552 | EDP - Energias de Portugal S.A. (m) | 1,500 | ||||||
| 67 | Galp Energia SGPS S.A., Class B (m) | 1,067 | ||||||
| 64 | Jeronimo Martins SGPS S.A. (m) | 1,112 | ||||||
| 183 | Portugal Telecom SGPS S.A. (m) | 920 | ||||||
|
| |||||||
| 5,168 | ||||||||
|
| |||||||
Singapore — 0.9% | ||||||||
| 52 | Ascendas Real Estate Investment Trust (m) | 100 | ||||||
| 70 | CapitaLand Ltd. (m) | 186 | ||||||
| 64 | CapitaMall Trust (m) | 110 | ||||||
| 35 | CapitaMalls Asia Ltd. (m) | 53 | ||||||
| 13 | City Developments Ltd. (m) | 122 | ||||||
| 54 | ComfortDelgro Corp., Ltd. (m) | 75 | ||||||
| 31 | Cosco Corp. Singapore Ltd. (m) | 22 | ||||||
| 50 | DBS Group Holdings Ltd. (m) | 567 | ||||||
| 25 | Fraser and Neave Ltd. (m) | 187 | ||||||
| 170 | Genting Singapore plc (m) | 185 | ||||||
| 54 | Global Logistic Properties Ltd. (m) | 113 | ||||||
| 177 | Golden Agri-Resources Ltd. (m) | 91 | ||||||
| 141 | Hutchison Port Holdings Trust, Class U (m) | 110 | ||||||
| 3 | Jardine Cycle & Carriage Ltd. (m) | 125 | ||||||
| 39 | Keppel Corp., Ltd. (m) | 342 | ||||||
| 21 | Keppel Land Ltd. (m) | 58 | ||||||
| 28 | Neptune Orient Lines Ltd. (a) (m) | 26 | ||||||
| 43 | Olam International Ltd. (m) | 69 | ||||||
| 71 | Oversea-Chinese Banking Corp., Ltd. (m) | 530 | ||||||
| 26 | SembCorp Industries Ltd. (m) | 115 | ||||||
| 22 | SembCorp Marine Ltd. (m) | 85 | ||||||
| 15 | Singapore Airlines Ltd. (m) | 131 | ||||||
| 24 | Singapore Exchange Ltd. (m) | 132 | ||||||
| 45 | Singapore Press Holdings Ltd. (m) | 150 | ||||||
| SHARES | SECURITY DESCRIPTION | VALUE($) | ||||||
Singapore — Continued | ||||||||
| 40 | Singapore Technologies Engineering Ltd. (m) | 115 | ||||||
| 217 | Singapore Telecommunications Ltd. (m) | 570 | ||||||
| 15 | StarHub Ltd. (m) | 45 | ||||||
| 35 | United Overseas Bank Ltd. (m) | 519 | ||||||
| 13 | UOL Group Ltd. (m) | 59 | ||||||
| 53 | Wilmar International Ltd. (m) | 134 | ||||||
|
| |||||||
| 5,126 | ||||||||
|
| |||||||
South Africa — 0.7% | ||||||||
| 8 | ABSA Group Ltd. (m) | 120 | ||||||
| 1 | Anglo American Platinum Ltd. (m) | 41 | ||||||
| 5 | AngloGold Ashanti Ltd. (m) | 185 | ||||||
| 8 | Bidvest Group Ltd. (m) | 181 | ||||||
| 85 | FirstRand Ltd. (m) | 282 | ||||||
| 17 | Gold Fields Ltd. (m) | 210 | ||||||
| 13 | Impala Platinum Holdings Ltd. (m) | 233 | ||||||
| 35 | MTN Group Ltd. (m) | 636 | ||||||
| 9 | Naspers Ltd., Class N (m) | 588 | ||||||
| 35 | PPC Ltd. (m) | 117 | ||||||
| 56 | Sanlam Ltd. (m) | 249 | ||||||
| 13 | Sasol Ltd. (m) | 535 | ||||||
| 11 | Shoprite Holdings Ltd. (m) | 222 | ||||||
| 23 | Standard Bank Group Ltd. (m) | 288 | ||||||
| 35 | Steinhoff International Holdings Ltd. (a) (m) | 118 | ||||||
| 5 | Tiger Brands Ltd. (m) | 156 | ||||||
|
| |||||||
| 4,161 | ||||||||
|
| |||||||
South Korea — 0.7% | ||||||||
| 2 | Daelim Industrial Co., Ltd. (m) | 124 | ||||||
| 6 | Daewoo Shipbuilding & Marine Engineering Co., Ltd. (m) | 123 | ||||||
| — | (h) | E-Mart Co., Ltd. (m) | 105 | |||||
| 1 | Hyundai Mobis (m) | 366 | ||||||
| 1 | Hyundai Motor Co. (m) | 240 | ||||||
| 3 | KB Financial Group, Inc. (m) | 113 | ||||||
| 1 | LG Chem Ltd. (m) | 347 | ||||||
| 4 | LG Electronics, Inc. (m) | 253 | ||||||
| 1 | POSCO (m) | 409 | ||||||
| 1 | Samsung Electronics Co., Ltd. (m) | 1,360 | ||||||
| 2 | Samsung Fire & Marine Insurance Co., Ltd. (m) | 328 | ||||||
| 5 | Shinhan Financial Group Co., Ltd. (m) | 185 | ||||||
| — | (h) | Shinsegae Co., Ltd. (m) | 30 | |||||
| 8 | SK Hynix, Inc. (a) (m) | 171 | ||||||
| 1 | SK Innovation Co., Ltd. (m) | 97 | ||||||
| 1 | SK Telecom Co., Ltd. (m) | 94 | ||||||
|
| |||||||
| 4,345 | ||||||||
|
| |||||||
SEE NOTES TO FINANCIAL STATEMENTS.
| OCTOBER 31, 2012 | J.P. MORGAN INTERNATIONAL EQUITY FUNDS | 55 | ||||||
Table of Contents
JPMorgan International Equity Index Fund
SCHEDULE OF PORTFOLIO INVESTMENTS
AS OF OCTOBER 31, 2012 (continued)
(Amounts in thousands)
| SHARES | SECURITY DESCRIPTION | VALUE($) | ||||||
| Common Stocks — Continued |
| ||||||
Spain — 5.7% | ||||||||
| 41 | Abertis Infraestructuras S.A. (m) | 613 | ||||||
| 2 | Acciona S.A. (m) | 141 | ||||||
| 11 | Acerinox S.A. (m) | 117 | ||||||
| 16 | ACS Actividades de Construccion y Servicios S.A. (m) | 334 | ||||||
| 34 | Amadeus IT Holding S.A., Class A (m) | 854 | ||||||
| 591 | Banco Bilbao Vizcaya Argentaria S.A. (m) | 4,939 | ||||||
| 311 | Banco de Sabadell S.A. (a) (m) | 759 | ||||||
| 147 | Banco Popular Espanol S.A. (m) | 230 | ||||||
| 1,081 | Banco Santander S.A. (m) | 8,142 | ||||||
| 110 | Bankia S.A. (a) (m) | 166 | ||||||
| 90 | CaixaBank (m) | 343 | ||||||
| 67 | Distribuidora Internacional de Alimentacion S.A. (m) | 403 | ||||||
| 19 | Enagas S.A. (m) | 387 | ||||||
| 44 | Ferrovial S.A. (m) | 625 | ||||||
| 39 | Gas Natural SDG S.A. (m) | 599 | ||||||
| 17 | Grifols S.A. (a) (m) | 576 | ||||||
| 427 | Iberdrola S.A. (m) | 2,209 | ||||||
| 24 | Inditex S.A. (m) | 3,061 | ||||||
| 85 | Mapfre S.A. (m) | 237 | ||||||
| 12 | Red Electrica Corp. S.A. (m) | 552 | ||||||
| 90 | Repsol S.A. (m) | 1,794 | ||||||
| 443 | Telefonica S.A. (m) | 5,846 | ||||||
| 17 | Zardoya Otis S.A. (m) | 211 | ||||||
|
| |||||||
| 33,138 | ||||||||
|
| |||||||
Sweden — 1.8% | ||||||||
| 11 | Alfa Laval AB (m) | 199 | ||||||
| 11 | Assa Abloy AB, Class B (m) | 383 | ||||||
| 23 | Atlas Copco AB, Class A (m) | 561 | ||||||
| 13 | Atlas Copco AB, Class B (m) | 290 | ||||||
| 9 | Boliden AB (m) | 155 | ||||||
| 8 | Electrolux AB, Series B (m) | 209 | ||||||
| 12 | Elekta AB, Class B (m) | 173 | ||||||
| 7 | Getinge AB, Class B (m) | 203 | ||||||
| 32 | Hennes & Mauritz AB, Class B (m) | 1,099 | ||||||
| 8 | Hexagon AB, Class B (m) | 185 | ||||||
| 2 | Holmen AB, Class B (m) | 50 | ||||||
| 12 | Husqvarna AB, Class B (m) | 67 | ||||||
| 3 | Industrivarden AB, Class C (m) | 41 | ||||||
| 7 | Investment AB Kinnevik, Class B (m) | 131 | ||||||
| 16 | Investor AB, Class B (m) | 348 | ||||||
| 7 | Lundin Petroleum AB (a) (m) | 178 | ||||||
| 2 | Modern Times Group AB, Class B (m) | 53 | ||||||
| 89 | Nordea Bank AB (m) | 811 | ||||||
| SHARES | SECURITY DESCRIPTION | VALUE($) | ||||||
Sweden — Continued | ||||||||
| 6 | Ratos AB, Class B (m) | 55 | ||||||
| 35 | Sandvik AB (m) | 481 | ||||||
| 11 | Scania AB, Class B (m) | 204 | ||||||
| 9 | Securitas AB, Class B (m) | 64 | ||||||
| 48 | Skandinaviska Enskilda Banken AB, Class A (m) | 401 | ||||||
| 13 | Skanska AB, Class B (m) | 198 | ||||||
| 13 | SKF AB, Class B (m) | 304 | ||||||
| 5 | SSAB AB, Class A (m) | 32 | ||||||
| 20 | Svenska Cellulosa AB, Class B (m) | 388 | ||||||
| 17 | Svenska Handelsbanken AB, Class A (m) | 584 | ||||||
| 28 | Swedbank AB, Class A (m) | 525 | ||||||
| 7 | Swedish Match AB (m) | 233 | ||||||
| 11 | Tele2 AB, Class B (m) | 176 | ||||||
| 102 | Telefonaktiebolaget LM Ericsson, Class B (m) | 908 | ||||||
| 73 | TeliaSonera AB (m) | 480 | ||||||
| 47 | Volvo AB, Class B (m) | 632 | ||||||
|
| |||||||
| 10,801 | ||||||||
|
| |||||||
Switzerland — 2.7% | ||||||||
| 35 | ABB Ltd. (a) (m) | 630 | ||||||
| 2 | Actelion Ltd. (a) (m) | 77 | ||||||
| 2 | Adecco S.A. (a) (m) | 113 | ||||||
| 1 | Aryzta AG (a) (m) | 57 | ||||||
| 1 | Baloise Holding AG (m) | 61 | ||||||
| — | (h) | Banque Cantonale Vaudoise (m) | 31 | |||||
| — | (h) | Barry Callebaut AG (a) (m) | 29 | |||||
| 8 | Cie Financiere Richemont S.A., Class A (m) | 549 | ||||||
| 20 | Credit Suisse Group AG (a) (m) | 455 | ||||||
| 3 | GAM Holding AG (a) (m) | 39 | ||||||
| 1 | Geberit AG (a) (m) | 114 | ||||||
| — | (h) | Givaudan S.A. (a) (m) | 144 | |||||
| 75 | Glencore International plc (m) | 415 | ||||||
| 4 | Holcim Ltd. (a) (m) | 252 | ||||||
| 4 | Julius Baer Group Ltd. (a) (m) | 129 | ||||||
| 1 | Kuehne & Nagel International AG (m) | 110 | ||||||
| — | (h) | Lindt & Spruengli AG (a) (m) | 114 | |||||
| 1 | Lonza Group AG (a) (m) | 52 | ||||||
| 52 | Nestle S.A. (m) | 3,324 | ||||||
| 37 | Novartis AG (m) | 2,203 | ||||||
| — | (h) | Pargesa Holdings S.A. (m) | 27 | |||||
| — | (h) | Partners Group Holding AG (m) | 49 | |||||
| 11 | Roche Holding AG (m) | 2,150 | ||||||
| 1 | Schindler Holding AG (m) | 134 | ||||||
| — | (h) | SGS S.A. (m) | 172 | |||||
| — | (h) | Sika AG (m) | 67 | |||||
| 1 | Sonova Holding AG (a) (m) | 78 | ||||||
SEE NOTES TO FINANCIAL STATEMENTS.
| 56 | J.P. MORGAN INTERNATIONAL EQUITY FUNDS | OCTOBER 31, 2012 | ||||
Table of Contents
| SHARES | SECURITY DESCRIPTION | VALUE($) | ||||||
| Common Stocks — Continued |
| ||||||
Switzerland — Continued | ||||||||
| 37 | STMicroelectronics N.V. (m) | 218 | ||||||
| — | (h) | Straumann Holding AG (m) | 11 | |||||
| — | (h) | Sulzer AG (m) | 64 | |||||
| 1 | Swatch Group AG (The) (m) | 253 | ||||||
| — | (h) | Swiss Life Holding AG (a) (m) | 57 | |||||
| 1 | Swiss Prime Site AG (a) (m) | 77 | ||||||
| 6 | Swiss Re AG (a) (m) | 395 | ||||||
| — | (h) | Swisscom AG (m) | 141 | |||||
| 2 | Syngenta AG (m) | 586 | ||||||
| 6 | Transocean Ltd. (m) | 253 | ||||||
| 58 | UBS AG (a) (m) | 865 | ||||||
| 6 | Wolseley plc (m) | 255 | ||||||
| 42 | Xstrata plc (m) | 662 | ||||||
| 2 | Zurich Insurance Group AG (a) (m) | 573 | ||||||
|
| |||||||
| 15,985 | ||||||||
|
| |||||||
Taiwan — 0.7% | ||||||||
| 27 | Asustek Computer, Inc. (m) | 284 | ||||||
| 150 | Cathay Financial Holding Co., Ltd. (m) | 150 | ||||||
| 396 | China Steel Corp. (m) | 340 | ||||||
| 183 | Chinatrust Financial Holding Co., Ltd. (m) | 101 | ||||||
| 22 | Chunghwa Telecom Co., Ltd. (m) | 69 | ||||||
| 168 | Far Eastern New Century Corp. (m) | 173 | ||||||
| 78 | Formosa Plastics Corp. (m) | 212 | ||||||
| 197 | Hon Hai Precision Industry Co., Ltd. (m) | 597 | ||||||
| 6 | HTC Corp. (m) | 44 | ||||||
| 25 | MediaTek, Inc. (m) | 278 | ||||||
| 65 | Nan Ya Plastics Corp. (m) | 115 | ||||||
| 105 | Pegatron Corp. (a) (m) | 132 | ||||||
| 103 | Quanta Computer, Inc. (m) | 235 | ||||||
| 557 | Taishin Financial Holding Co., Ltd. (m) | 199 | ||||||
| 91 | Taiwan Cement Corp. (m) | 117 | ||||||
| 63 | Taiwan Mobile Co., Ltd. (m) | 220 | ||||||
| 333 | Taiwan Semiconductor Manufacturing Co., Ltd. (m) | 1,016 | ||||||
| 195 | United Microelectronics Corp. (m) | 72 | ||||||
|
| |||||||
| 4,354 | ||||||||
|
| |||||||
Thailand — 0.7% | ||||||||
| 52 | Advanced Info Service PCL (m) | 337 | ||||||
| 58 | Bangkok Bank PCL (m) | 342 | ||||||
| 12 | Banpu PCL (m) | 156 | ||||||
| 197 | Charoen Pokphand Foods PCL (m) | 226 | ||||||
| 109 | Kasikornbank PCL (m) | 639 | ||||||
| 279 | Krung Thai Bank PCL (m) | 164 | ||||||
| 93 | PTT Exploration & Production PCL (m) | 504 | ||||||
| 97 | PTT Global Chemical PCL (m) | 192 | ||||||
| SHARES | SECURITY DESCRIPTION | VALUE($) | ||||||
Thailand — Continued | ||||||||
| 54 | PTT PCL (m) | 557 | ||||||
| 34 | Siam Cement PCL (m) | 459 | ||||||
| 124 | Siam Commercial Bank PCL (m) | 646 | ||||||
| 35 | Thai Oil PCL (m) | 76 | ||||||
|
| |||||||
| 4,298 | ||||||||
|
| |||||||
Turkey — 0.8% | ||||||||
| 122 | Akbank TAS (m) | 591 | ||||||
| 20 | Anadolu Efes Biracilik Ve Malt Sanayii A.S. (m) | 301 | ||||||
| 8 | BIM Birlesik Magazalar A.S. (m) | 388 | ||||||
| 111 | Eregli Demir ve Celik Fabrikalari TAS (m) | 132 | ||||||
| 69 | Haci Omer Sabanci Holding A.S. (m) | 363 | ||||||
| 49 | KOC Holding A.S. (m) | 231 | ||||||
| 15 | Tupras Turkiye Petrol Rafinerileri A.S. (m) | 365 | ||||||
| 76 | Turkcell Iletisim Hizmet A.S. (a) (m) | 462 | ||||||
| 185 | Turkiye Garanti Bankasi A.S. (m) | 885 | ||||||
| 39 | Turkiye Halk Bankasi A.S. (m) | 341 | ||||||
| 145 | Turkiye Is Bankasi, Class C (m) | 494 | ||||||
| 110 | Yapi ve Kredi Bankasi A.S. (a) (m) | 282 | ||||||
|
| |||||||
| 4,835 | ||||||||
|
| |||||||
United Kingdom — 7.2% | ||||||||
| 20 | 3i Group plc (m) | 71 | ||||||
| 17 | Aberdeen Asset Management plc (m) | 87 | ||||||
| 4 | Admiral Group plc (m) | 78 | ||||||
| 5 | Aggreko plc (m) | 190 | ||||||
| 7 | AMEC plc (m) | 113 | ||||||
| 28 | Anglo American plc (m) | 856 | ||||||
| 8 | Antofagasta plc (m) | 163 | ||||||
| 28 | ARM Holdings plc (m) | 302 | ||||||
| 7 | Associated British Foods plc (m) | 162 | ||||||
| 25 | AstraZeneca plc (m) | 1,177 | ||||||
| 59 | Aviva plc (m) | 318 | ||||||
| 7 | Babcock International Group plc (m) | 112 | ||||||
| 64 | BAE Systems plc (m) | 321 | ||||||
| 12 | Balfour Beatty plc (m) | 60 | ||||||
| 232 | Barclays plc (m) | 859 | ||||||
| 68 | BG Group plc (m) | 1,263 | ||||||
| 42 | BHP Billiton plc (m) | 1,357 | ||||||
| 382 | BP plc (m) | 2,725 | ||||||
| 39 | British American Tobacco plc (m) | 1,948 | ||||||
| 17 | British Land Co. plc (m) | 147 | ||||||
| 22 | British Sky Broadcasting Group plc (m) | 255 | ||||||
| 155 | BT Group plc (m) | 532 | ||||||
| 7 | Bunzl plc (m) | 109 | ||||||
| 9 | Burberry Group plc (m) | 169 | ||||||
| 13 | Capita plc (m) | 156 | ||||||
SEE NOTES TO FINANCIAL STATEMENTS.
| OCTOBER 31, 2012 | J.P. MORGAN INTERNATIONAL EQUITY FUNDS | 57 | ||||||
Table of Contents
JPMorgan International Equity Index Fund
SCHEDULE OF PORTFOLIO INVESTMENTS
AS OF OCTOBER 31, 2012 (continued)
(Amounts in thousands)
| SHARES | SECURITY DESCRIPTION | VALUE($) | ||||||
| Common Stocks — Continued |
| ||||||
United Kingdom — Continued | ||||||||
| 12 | Capital Shopping Centres Group plc (m) | 64 | ||||||
| 4 | Carnival plc (m) | 146 | ||||||
| 103 | Centrica plc (m) | 539 | ||||||
| 21 | Cobham plc (m) | 72 | ||||||
| 37 | Compass Group plc (m) | 407 | ||||||
| 3 | Croda International plc (m) | 95 | ||||||
| 50 | Diageo plc (m) | 1,439 | ||||||
| 5 | Eurasian Natural Resources Corp. plc (m) | 27 | ||||||
| 8 | Evraz plc (m) | 29 | ||||||
| 28 | G4S plc (m) | 119 | ||||||
| 31 | GKN plc (m) | 105 | ||||||
| 101 | GlaxoSmithKline plc (m) | 2,256 | ||||||
| 14 | Hammerson plc (m) | 108 | ||||||
| 364 | HSBC Holdings plc (m) | 3,591 | ||||||
| 12 | ICAP plc (m) | 63 | ||||||
| 6 | IMI plc (m) | 97 | ||||||
| 20 | Imperial Tobacco Group plc (m) | 752 | ||||||
| 9 | Inmarsat plc (m) | 87 | ||||||
| 6 | InterContinental Hotels Group plc (m) | 137 | ||||||
| 102 | International Consolidated Airlines Group S.A. (a) (m) | 268 | ||||||
| 3 | Intertek Group plc (m) | 148 | ||||||
| 17 | Invensys plc (m) | 62 | ||||||
| 10 | Investec plc (m) | 60 | ||||||
| 73 | ITV plc (m) | 102 | ||||||
| 25 | J Sainsbury plc (m) | 141 | ||||||
| 4 | Johnson Matthey plc (m) | 152 | ||||||
| 4 | Kazakhmys plc (m) | 49 | ||||||
| 48 | Kingfisher plc (m) | 226 | ||||||
| 16 | Land Securities Group plc (m) | 207 | ||||||
| 120 | Legal & General Group plc (m) | 259 | ||||||
| 835 | Lloyds Banking Group plc (a) (m) | 550 | ||||||
| 4 | London Stock Exchange Group plc (m) | 60 | ||||||
| 3 | Lonmin plc (m) | 28 | ||||||
| 38 | Man Group plc (m) | 48 | ||||||
| 33 | Marks & Spencer Group plc (m) | 209 | ||||||
| 15 | Meggitt plc (m) | 96 | ||||||
| 25 | Melrose plc (m) | 96 | ||||||
| 71 | National Grid plc (m) | 814 | ||||||
| 3 | Next plc (m) | 195 | ||||||
| 99 | Old Mutual plc (m) | 276 | ||||||
| 16 | Pearson plc (m) | 321 | ||||||
| 5 | Petrofac Ltd. (m) | 135 | ||||||
| 51 | Prudential plc (m) | 698 | ||||||
| 2 | Randgold Resources Ltd. (m) | 213 | ||||||
| 13 | Reckitt Benckiser Group plc (m) | 787 | ||||||
| SHARES | SECURITY DESCRIPTION | VALUE($) | ||||||
United Kingdom — Continued | ||||||||
| 25 | Reed Elsevier plc (m) | 243 | ||||||
| 27 | Resolution Ltd. (m) | 96 | ||||||
| 18 | Rexam plc (m) | 127 | ||||||
| 27 | Rio Tinto plc (m) | 1,341 | ||||||
| 37 | Rolls-Royce Holdings plc (a) (m) | 514 | ||||||
| 42 | Royal Bank of Scotland Group plc (a) (m) | 189 | ||||||
| 72 | RSA Insurance Group plc (m) | 130 | ||||||
| 19 | SABMiller plc (m) | 820 | ||||||
| 26 | Sage Group plc (The) (m) | 130 | ||||||
| 2 | Schroders plc (m) | 56 | ||||||
| 15 | Segro plc (m) | 58 | ||||||
| 10 | Serco Group plc (m) | 89 | ||||||
| 5 | Severn Trent plc (m) | 124 | ||||||
| 18 | Smith & Nephew plc (m) | 193 | ||||||
| 8 | Smiths Group plc (m) | 136 | ||||||
| 19 | SSE plc (m) | 436 | ||||||
| 48 | Standard Chartered plc (m) | 1,133 | ||||||
| 48 | Standard Life plc (m) | 227 | ||||||
| 29 | Subsea 7 S.A. (m) | 629 | ||||||
| 9 | Tate & Lyle plc (m) | 108 | ||||||
| 161 | Tesco plc (m) | 831 | ||||||
| 8 | TUI Travel plc (m) | 34 | ||||||
| 18 | Tullow Oil plc (m) | 419 | ||||||
| 26 | Unilever plc (m) | 960 | ||||||
| 14 | United Utilities Group plc (m) | 152 | ||||||
| 2 | Vedanta Resources plc (m) | 43 | ||||||
| 990 | Vodafone Group plc (m) | 2,690 | ||||||
| 4 | Weir Group plc (The) (m) | 120 | ||||||
| 4 | Whitbread plc (m) | 136 | ||||||
| 48 | WM Morrison Supermarkets plc (m) | 207 | ||||||
|
| |||||||
| 42,234 | ||||||||
|
| |||||||
United States — 0.0% (g) | ||||||||
| 5 | Sims Metal Management Ltd. (m) | 52 | ||||||
|
| |||||||
Total Common Stocks | 564,626 | |||||||
|
| |||||||
| Investment Companies — 0.8% |
| ||||||
United States — 0.8% | ||||||||
| 56 | iShares MSCI EAFE Index Fund (m) | 3,010 | ||||||
| 32 | iShares MSCI Germany Index Fund (m) | 741 | ||||||
| 22 | iShares MSCI Pacific ex-Japan Index Fund (m) | 1,024 | ||||||
|
| |||||||
Total Investment Companies | 4,775 | |||||||
|
| |||||||
| Preferred Stocks — 1.7% |
| ||||||
Brazil — 0.5% | ||||||||
| 27 | Banco Bradesco S.A. (m) | 423 | ||||||
SEE NOTES TO FINANCIAL STATEMENTS.
| 58 | J.P. MORGAN INTERNATIONAL EQUITY FUNDS | OCTOBER 31, 2012 | ||||
Table of Contents
| SHARES | SECURITY DESCRIPTION | VALUE($) | ||||||
| Preferred Stocks — Continued |
| ||||||
Brazil — Continued | ||||||||
| 8 | Cia de Bebidas das Americas (m) | 332 | ||||||
| 7 | Cia Energetica de Minas Gerais (m) | 84 | ||||||
| 67 | Itau Unibanco Holding S.A. (m) | 981 | ||||||
| 54 | Petroleo Brasileiro S.A. (m) | 552 | ||||||
| 37 | Vale S.A., Class A (m) | 667 | ||||||
|
| |||||||
| 3,039 | ||||||||
|
| |||||||
Chile — 0.1% | ||||||||
| 7 | Sociedad Quimica y Minera de Chile S.A., Class B (m) | 424 | ||||||
|
| |||||||
Germany — 0.9% | ||||||||
| 5 | Bayerische Motoren Werke AG (m) | 251 | ||||||
| 15 | Henkel AG & Co. KGaA (m) | 1,215 | ||||||
| 13 | Porsche Automobil Holding SE (m) | 866 | ||||||
| 8 | ProSiebenSat.1 Media AG (m) | 217 | ||||||
| 4 | RWE AG (m) | 145 | ||||||
| 12 | Volkswagen AG (m) | 2,542 | ||||||
|
| |||||||
| 5,236 | ||||||||
|
| |||||||
Italy — 0.2% | ||||||||
| 1,233 | Telecom Italia S.p.A. (m) | 987 | ||||||
|
| |||||||
United Kingdom — 0.0% (g) | ||||||||
| 2,824 | Rolls-Royce Holdings plc (a) (m) | 5 | ||||||
|
| |||||||
Total Preferred Stocks | 9,691 | |||||||
|
| |||||||
| Short-Term Investment — 0.6% |
| ||||||
Investment Company — 0.6% | ||||||||
| 3,425 | JPMorgan Prime Money Market Fund, Institutional Class Shares, | 3,425 | ||||||
|
| |||||||
Total Investments — 99.5% | 582,517 | |||||||
Other Assets in Excess of | 2,876 | |||||||
|
| |||||||
NET ASSETS — 100.0% | $ | 585,393 | ||||||
|
| |||||||
Percentages indicated are based on net assets.
Summary of Investments by Industry, October 31, 2012
The following table represents the portfolio investments of the Fund by industry classifications as a percentage of total investments:
| INDUSTRY | PERCENTAGE | |||
Commercial Banks | 13.3 | % | ||
Oil, Gas & Consumable Fuels | 7.8 | |||
Pharmaceuticals | 6.3 | |||
Insurance | 4.5 | |||
Chemicals | 4.2 | |||
Diversified Telecommunication Services | 4.1 | |||
Automobiles | 4.0 | |||
Metals & Mining | 3.7 | |||
Beverages | 3.3 | |||
Electric Utilities | 2.7 | |||
Machinery | 2.7 | |||
Food Products | 2.7 | |||
Industrial Conglomerates | 2.1 | |||
Food & Staples Retailing | 2.1 | |||
Wireless Telecommunication Services | 2.0 | |||
Multi-Utilities | 1.6 | |||
Energy Equipment & Services | 1.5 | |||
Real Estate Management & Development | 1.5 | |||
Capital Markets | 1.3 | |||
Diversified Financial Services | 1.3 | |||
Software | 1.3 | |||
Media | 1.2 | |||
Textiles, Apparel & Luxury Goods | 1.2 | |||
Semiconductors & Semiconductor Equipment | 1.1 | |||
Real Estate Investment Trusts (REITs) | 1.1 | |||
Electrical Equipment | 1.1 | |||
Trading Companies & Distributors | 1.1 | |||
Electronic Equipment, Instruments & Components | 1.1 | |||
Specialty Retail | 1.0 | |||
Construction Materials | 1.0 | |||
Auto Components | 1.0 | |||
Hotels, Restaurants & Leisure | 1.0 | |||
Others (each less than 1.0%) | 13.5 | |||
Short-Term Investment | 0.6 | |||
SEE NOTES TO FINANCIAL STATEMENTS.
| OCTOBER 31, 2012 | J.P. MORGAN INTERNATIONAL EQUITY FUNDS | 59 | ||||||
Table of Contents
JPMorgan International Equity Index Fund
SCHEDULE OF PORTFOLIO INVESTMENTS
AS OF OCTOBER 31, 2012 (continued)
(Amounts in thousands, except number of contracts)
| Futures Contracts | ||||||||||||||||
| NUMBER OF CONTRACTS | DESCRIPTION | EXPIRATION DATE | NOTIONAL VALUE AT 10/31/12 | UNREALIZED APPRECIATION (DEPRECIATION) | ||||||||||||
Long Futures Outstanding | ||||||||||||||||
| 14 | TOPIX Index | 12/13/12 | $ | 1,299 | $ | 19 | ||||||||||
| 94 | Euro STOXX 50 | 12/21/12 | 3,051 | (5 | ) | |||||||||||
| 7 | FTSE 100 Index | 12/21/12 | 651 | (8 | ) | |||||||||||
|
| |||||||||||||||
| $ | 6 | |||||||||||||||
|
| |||||||||||||||
SEE NOTES TO FINANCIAL STATEMENTS.
| 60 | J.P. MORGAN INTERNATIONAL EQUITY FUNDS | OCTOBER 31, 2012 | ||||
Table of Contents
JPMorgan International Opportunities Fund
SCHEDULE OF PORTFOLIO INVESTMENTS
AS OF OCTOBER 31, 2012
(Amounts in thousands)
| SHARES | SECURITY DESCRIPTION | VALUE($) | ||||||
| Common Stocks — 94.3% |
| ||||||
Australia — 2.4% | ||||||||
| 478 | Australia & New Zealand Banking Group Ltd. (m) | 12,598 | ||||||
| 1,720 | Goodman Group (m) | 7,897 | ||||||
|
| |||||||
| 20,495 | ||||||||
|
| |||||||
Belgium — 1.3% | ||||||||
| 88 | Solvay S.A. (m) | 10,640 | ||||||
|
| |||||||
Canada — 1.4% | ||||||||
| 510 | First Quantum Minerals Ltd. (m) | 11,459 | ||||||
|
| |||||||
China — 2.4% | ||||||||
| 1,863 | China Shenhua Energy Co., Ltd., Class H (m) | 7,894 | ||||||
| 2,992 | CNOOC Ltd. (m) | 6,158 | ||||||
| 1,602 | Sands China Ltd. (m) | 5,988 | ||||||
|
| |||||||
| 20,040 | ||||||||
|
| |||||||
Denmark — 0.5% | ||||||||
| 46 | Carlsberg A/S, Class B (m) | 3,941 | ||||||
|
| |||||||
Finland — 1.0% | ||||||||
| 265 | Ruukki Group OYJ (a) (m) | 171 | ||||||
| 649 | Stora Enso OYJ, Class R (m) | 4,108 | ||||||
| 404 | UPM-Kymmene OYJ (m) | 4,342 | ||||||
|
| |||||||
| 8,621 | ||||||||
|
| |||||||
France — 6.5% | ||||||||
| 186 | Cie de St-Gobain (m) | 6,542 | ||||||
| 283 | GDF Suez (m) | 6,504 | ||||||
| 131 | Sanofi (m) | 11,523 | ||||||
| 207 | Schneider Electric S.A. (m) | 12,970 | ||||||
| 168 | Sodexo (m) | 12,907 | ||||||
| 383 | Suez Environnement Co. (m) | 4,070 | ||||||
|
| |||||||
| 54,516 | ||||||||
|
| |||||||
Germany — 7.5% | ||||||||
| 92 | Allianz SE (m) | 11,402 | ||||||
| 128 | BASF SE (m) | 10,627 | ||||||
| 171 | Bayer AG (m) | 14,927 | ||||||
| 62 | Continental AG (m) | 6,208 | ||||||
| 198 | Deutsche Boerse AG (m) | 10,710 | ||||||
| 380 | E.ON AG (m) | 8,645 | ||||||
|
| |||||||
| 62,519 | ||||||||
|
| |||||||
Hong Kong — 3.3% | ||||||||
| 4,212 | Belle International Holdings Ltd. (m) | 7,811 | ||||||
| 3,870 | China Overseas Land & Investment Ltd. (m) | 10,077 | ||||||
| 1,037 | Hutchison Whampoa Ltd. (m) | 10,159 | ||||||
|
| |||||||
| 28,047 | ||||||||
|
| |||||||
Indonesia — 0.8% | ||||||||
| 13,542 | Perusahaan Gas Negara Persero Tbk PT (m) | 6,531 | ||||||
|
| |||||||
| SHARES | SECURITY DESCRIPTION | VALUE($) | ||||||
Ireland — 2.4% | ||||||||
| 651 | Experian plc (m) | 11,255 | ||||||
| 301 | Shire plc (m) | 8,452 | ||||||
|
| |||||||
| 19,707 | ||||||||
|
| |||||||
Israel — 0.7% | ||||||||
| 141 | Teva Pharmaceutical Industries Ltd., ADR (m) | 5,714 | ||||||
|
| |||||||
Japan — 17.3% | ||||||||
| 286 | Canon, Inc. (m) | 9,285 | ||||||
| 5 | Dai-ichi Life Insurance Co., Ltd. (The) (m) | 5,547 | ||||||
| 1,880 | Fujitsu Ltd. (m) | 7,233 | ||||||
| 2,169 | Hitachi Ltd. (m) | 11,503 | ||||||
| 321 | Honda Motor Co., Ltd. (m) | 9,638 | ||||||
| 147 | Japan Airlines Co., Ltd. (a) (m) | 7,002 | ||||||
| 491 | Japan Tobacco, Inc. (m) | 13,575 | ||||||
| 282 | Komatsu Ltd. (m) | 5,915 | ||||||
| 1,068 | Marubeni Corp. (m) | 6,921 | ||||||
| 1,442 | Mitsubishi Electric Corp. (m) | 10,779 | ||||||
| 466 | Mitsubishi Estate Co., Ltd. (m) | 9,222 | ||||||
| 2,581 | Mitsubishi UFJ Financial Group, Inc. (m) | 11,677 | ||||||
| 487 | Mitsui & Co., Ltd. (m) | 6,857 | ||||||
| 1,265 | Nissan Motor Co., Ltd. (m) | 10,582 | ||||||
| 47 | Nitori Holdings Co., Ltd. (m) | 3,842 | ||||||
| 341 | Sumitomo Mitsui Financial Group, Inc. (m) | 10,420 | ||||||
| 272 | Yamato Holdings Co., Ltd. (m) | 4,147 | ||||||
|
| |||||||
| 144,145 | ||||||||
|
| |||||||
Netherlands — 7.1% | ||||||||
| 223 | ASML Holding N.V. (m) | 12,250 | ||||||
| 792 | Royal Dutch Shell plc, Class A (m) | 27,150 | ||||||
| 551 | Unilever N.V., CVA (m) | 20,250 | ||||||
|
| |||||||
| 59,650 | ||||||||
|
| |||||||
New Zealand — 0.5% | ||||||||
| 2,119 | Telecom Corp. of New Zealand Ltd. (m) | 4,189 | ||||||
|
| |||||||
South Korea — 2.0% | ||||||||
| 23 | LG Chem Ltd. (m) | 6,473 | ||||||
| 8 | Samsung Electronics Co., Ltd. (m) | 9,957 | ||||||
|
| |||||||
| 16,430 | ||||||||
|
| |||||||
Spain — 0.7% | ||||||||
| 45 | Inditex S.A. (m) | 5,735 | ||||||
|
| |||||||
Sweden — 2.8% | ||||||||
| 230 | Electrolux AB (m) | 5,902 | ||||||
| 499 | Swedbank AB, Class A (m) | 9,260 | ||||||
| 915 | Telefonaktiebolaget LM Ericsson, Class B (m) | 8,104 | ||||||
|
| |||||||
| 23,266 | ||||||||
|
| |||||||
SEE NOTES TO FINANCIAL STATEMENTS.
| OCTOBER 31, 2012 | J.P. MORGAN INTERNATIONAL EQUITY FUNDS | 61 | ||||||
Table of Contents
JPMorgan International Opportunities Fund
SCHEDULE OF PORTFOLIO INVESTMENTS
AS OF OCTOBER 31, 2012 (continued)
(Amounts in thousands, except number of contracts)
| SHARES | SECURITY DESCRIPTION | VALUE($) | ||||||
| Common Stocks — Continued |
| ||||||
Switzerland — 7.2% | ||||||||
| 174 | Cie Financiere Richemont S.A., Class A (m) | 11,269 | ||||||
| 418 | Credit Suisse Group AG (a) (m) | 9,725 | ||||||
| 247 | Nestle S.A. (m) | 15,712 | ||||||
| 71 | Roche Holding AG (m) | 13,765 | ||||||
| 140 | Swiss Re AG (a) (m) | 9,675 | ||||||
|
| |||||||
| 60,146 | ||||||||
|
| |||||||
Taiwan — 1.0% | ||||||||
| 1,421 | Hon Hai Precision Industry Co., Ltd., Reg. S, GDR (m) | 8,656 | ||||||
|
| |||||||
United Kingdom — 25.5% | ||||||||
| 808 | BG Group plc (m) | 14,999 | ||||||
| 354 | British American Tobacco plc (m) | 17,546 | ||||||
| 1,961 | BT Group plc (m) | 6,739 | ||||||
| 1,555 | Centrica plc (m) | 8,139 | ||||||
| 839 | GlaxoSmithKline plc (m) | 18,791 | ||||||
| 2,542 | HSBC Holdings plc (m) | 25,062 | ||||||
| 556 | InterContinental Hotels Group plc (m) | 13,746 | ||||||
| 1,825 | Kingfisher plc (m) | 8,546 | ||||||
| 533 | Pearson plc (m) | 10,719 | ||||||
| 236 | Petrofac Ltd. (m) | 6,119 | ||||||
| 862 | Prudential plc (m) | 11,835 | ||||||
| 431 | Rio Tinto plc (m) | 21,512 | ||||||
| 252 | SABMiller plc (m) | 10,823 | ||||||
| SHARES | SECURITY DESCRIPTION | VALUE($) | ||||||
United Kingdom — Continued | ||||||||
| 396 | Standard Chartered plc (m) | 9,380 | ||||||
| 415 | Tullow Oil plc (m) | 9,437 | ||||||
| 7,158 | Vodafone Group plc (m) | 19,438 | ||||||
|
| |||||||
| 212,831 | ||||||||
|
| |||||||
Total Common Stocks | 787,278 | |||||||
|
| |||||||
| Preferred Stocks — 2.5% |
| ||||||
Germany — 2.5% | ||||||||
| 111 | Henkel AG & Co. KGaA (m) | 8,900 | ||||||
| 58 | Volkswagen AG (m) | 12,113 | ||||||
|
| |||||||
Total Preferred Stocks | 21,013 | |||||||
|
| |||||||
| Short-Term Investment — 2.4% |
| ||||||
Investment Company — 2.4% | ||||||||
| 20,262 | JPMorgan Prime Money Market Fund, Institutional Class Shares, 0.110% (b) (l) (m) | 20,262 | ||||||
|
| |||||||
Total Investments — 99.2% | 828,553 | |||||||
Other Assets in Excess of | 6,632 | |||||||
|
| |||||||
NET ASSETS — 100.0% | $ | 835,185 | ||||||
|
| |||||||
Percentages indicated are based on net assets.
SEE NOTES TO FINANCIAL STATEMENTS.
| 62 | J.P. MORGAN INTERNATIONAL EQUITY FUNDS | OCTOBER 31, 2012 | ||||
Table of Contents
Summary of Investments by Industry, October 31, 2012
The following table represents the portfolio investments of the Fund by industry classifications as a percentage of total investments:
| INDUSTRY | PERCENTAGE | |||
Commercial Banks | 9.5 | % | ||
Pharmaceuticals | 8.8 | |||
Oil, Gas & Consumable Fuels | 7.9 | |||
Insurance | 4.6 | |||
Food Products | 4.3 | |||
Metals & Mining | 4.0 | |||
Hotels, Restaurants & Leisure | 3.9 | |||
Automobiles | 3.9 | |||
Tobacco | 3.8 | |||
Chemicals | 3.3 | |||
Multi-Utilities | 3.3 | |||
Specialty Retail | 3.1 | |||
Electrical Equipment | 2.9 | |||
Semiconductors & Semiconductor Equipment | 2.7 | |||
Electronic Equipment, Instruments & Components | 2.4 | |||
Wireless Telecommunication Services | 2.3 | |||
Real Estate Management & Development | 2.3 | |||
| INDUSTRY | PERCENTAGE | |||
Beverages | 1.8 | |||
Trading Companies & Distributors | 1.7 | |||
Textiles, Apparel & Luxury Goods | 1.4 | |||
Professional Services | 1.4 | |||
Diversified Telecommunication Services | 1.3 | |||
Media | 1.3 | |||
Diversified Financial Services | 1.3 | |||
Industrial Conglomerates | 1.2 | |||
Capital Markets | 1.2 | |||
Office Electronics | 1.1 | |||
Household Products | 1.1 | |||
Paper & Forest Products | 1.0 | |||
Communications Equipment | 1.0 | |||
Real Estate Investment Trusts (REITs) | 1.0 | |||
Others (each less than 1.0%) | 6.8 | |||
Short-Term Investment | 2.4 | |||
| Futures Contracts | ||||||||||||||||
| NUMBER OF CONTRACTS | DESCRIPTION | EXPIRATION DATE | NOTIONAL VALUE AT 10/31/12 | UNREALIZED APPRECIATION (DEPRECIATION) | ||||||||||||
Long Futures Outstanding | ||||||||||||||||
| 155 | Dow Jones Euro STOXX 50 Index | 12/21/12 | $ | 5,030 | $ | (22 | ) | |||||||||
| 52 | FTSE 100 Index | 12/21/12 | 4,837 | (18 | ) | |||||||||||
|
| |||||||||||||||
| $ | (40 | ) | ||||||||||||||
|
| |||||||||||||||
| Forward Foreign Currency Exchange Contracts | ||||||||||||||||||||||
| CONTRACTS TO BUY | CURRENCY | COUNTERPARTY | SETTLEMENT DATE | SETTLEMENT VALUE | VALUE AT 10/31/12 | NET UNREALIZED APPRECIATION (DEPRECIATION) | ||||||||||||||||
| 1,545,197 | EUR | |||||||||||||||||||||
| 1,933,406 | for CAD | Credit Suisse International | 11/07/12 | $ | 1,936 | # | $ | 2,003 | # | $ | 67 | |||||||||||
| 1,244,740 | EUR | |||||||||||||||||||||
| 981,543 | for GBP | Barclays Bank plc | 11/07/12 | 1,583 | # | 1,613 | # | 30 | ||||||||||||||
| 1,178,576 | EUR | |||||||||||||||||||||
| 922,928 | for GBP | Credit Suisse International | 11/07/12 | 1,490 | # | 1,528 | # | 38 | ||||||||||||||
| 1,291,005 | EUR | |||||||||||||||||||||
| 1,048,567 | for GBP | Westpac Banking Corp. | 11/07/12 | 1,692 | # | 1,673 | # | (19 | ) | |||||||||||||
| 3,351,456 | EUR | |||||||||||||||||||||
| 33,912,158 | for HKD | Barclays Bank plc | 11/07/12 | 4,376 | # | 4,344 | # | (32 | ) | |||||||||||||
| 1,520,474 | EUR | |||||||||||||||||||||
| 150,304,481 | for JPY | Credit Suisse International | 11/07/12 | 1,883 | # | 1,971 | # | 88 | ||||||||||||||
| 1,439,526 | EUR | |||||||||||||||||||||
| 148,090,633 | for JPY | Westpac Banking Corp. | 11/07/12 | 1,855 | # | 1,866 | # | 11 | ||||||||||||||
SEE NOTES TO FINANCIAL STATEMENTS.
| OCTOBER 31, 2012 | J.P. MORGAN INTERNATIONAL EQUITY FUNDS | 63 | ||||||
Table of Contents
JPMorgan International Opportunities Fund
SCHEDULE OF PORTFOLIO INVESTMENTS
AS OF OCTOBER 31, 2012 (continued)
(Amounts in thousands, except number of contracts)
| CONTRACTS TO BUY | CURRENCY | COUNTERPARTY | SETTLEMENT DATE | SETTLEMENT VALUE | VALUE AT 10/31/12 | NET UNREALIZED APPRECIATION (DEPRECIATION) | ||||||||||||||||
| 954,699 | GBP | |||||||||||||||||||||
| 1,493,730 | for CAD | Barclays Bank plc | 11/07/12 | $ | 1,496 | # | $ | 1,541 | # | $ | 45 | |||||||||||
| 2,560,861 | GBP | |||||||||||||||||||||
| 31,992,602 | for HKD | Westpac Banking Corp. | 11/07/12 | 4,127 | # | 4,132 | # | 5 | ||||||||||||||
| 140,040,606 | JPY | |||||||||||||||||||||
| 1,375,907 | for EUR | Westpac Banking Corp. | 11/07/12 | 1,783 | # | 1,754 | # | (29 | ) | |||||||||||||
| 122,306,706 | JPY | |||||||||||||||||||||
| 972,587 | for GBP | BNP Paribas | 11/07/12 | 1,569 | # | 1,532 | # | (37 | ) | |||||||||||||
| 293,087,418 | JPY | |||||||||||||||||||||
| 28,793,341 | for HKD | Credit Suisse International | 11/07/12 | 3,716 | # | 3,672 | # | (44 | ) | |||||||||||||
| 13,439,612 | SEK | |||||||||||||||||||||
| 1,275,431 | for GBP | Westpac Banking Corp. | 11/07/12 | 2,058 | # | 2,026 | # | (32 | ) | |||||||||||||
Australia and New Zealand Banking | ||||||||||||||||||||||
| 3,249,658 | AUD | Group Limited | 11/07/12 | 3,316 | 3,372 | 56 | ||||||||||||||||
| 2,122,191 | AUD | Barclays Bank plc | 11/07/12 | 2,225 | 2,202 | (23 | ) | |||||||||||||||
| 47,484,330 | AUD | Citibank, N.A. | 11/07/12 | 49,578 | 49,271 | (307 | ) | |||||||||||||||
| 3,428,500 | AUD | Royal Bank of Scotland | 11/07/12 | 3,528 | 3,558 | 30 | ||||||||||||||||
| 2,612,000 | AUD | State Street Corp. | 11/07/12 | 2,693 | 2,710 | 17 | ||||||||||||||||
Australia and New Zealand Banking | ||||||||||||||||||||||
| 2,546,801 | CHF | Group Limited | 11/07/12 | 2,744 | 2,735 | (9 | ) | |||||||||||||||
| 2,224,269 | CHF | Barclays Bank plc | 11/07/12 | 2,296 | 2,388 | 92 | ||||||||||||||||
| 24,107,589 | CHF | TD Bank Financial Group | 11/07/12 | 24,667 | 25,888 | 1,221 | ||||||||||||||||
| 29,609,493 | DKK | State Street Corp. | 11/07/12 | 5,180 | 5,145 | (35 | ) | |||||||||||||||
| 31,547,410 | DKK | Credit Suisse International | 02/07/13 | 5,465 | 5,492 | 27 | ||||||||||||||||
Australia and New Zealand Banking | ||||||||||||||||||||||
| 1,598,357 | EUR | Group Limited | 11/07/12 | 2,087 | 2,072 | (15 | ) | |||||||||||||||
| 4,321,016 | EUR | BNP Paribas | 11/07/12 | 5,404 | 5,601 | 197 | ||||||||||||||||
| 2,937,351 | EUR | Credit Suisse International | 11/07/12 | 3,835 | 3,807 | (28 | ) | |||||||||||||||
| 1,229,194 | EUR | Goldman Sachs International | 11/07/12 | 1,546 | 1,593 | 47 | ||||||||||||||||
| 6,216,294 | EUR | HSBC Bank, N.A. | 11/07/12 | 7,861 | 8,058 | 197 | ||||||||||||||||
| 1,820,331 | EUR | Royal Bank of Scotland | 11/07/12 | 2,361 | 2,360 | (1 | ) | |||||||||||||||
| 5,330,000 | EUR | State Street Corp. | 11/07/12 | 6,891 | 6,909 | 18 | ||||||||||||||||
| 11,594,996 | EUR | Union Bank of Switzerland AG | 11/07/12 | 14,769 | 15,029 | 260 | ||||||||||||||||
| 2,255,238 | EUR | Barclays Bank plc | 02/07/13 | 2,932 | 2,926 | (6 | ) | |||||||||||||||
| 1,050,000 | GBP | BNP Paribas | 11/07/12 | 1,692 | 1,695 | 3 | ||||||||||||||||
| 710,991 | GBP | Credit Suisse International | 11/07/12 | 1,127 | 1,147 | 20 | ||||||||||||||||
| 2,527,222 | GBP | Goldman Sachs International | 11/07/12 | 4,053 | 4,078 | 25 | ||||||||||||||||
| 674,936 | GBP | Royal Bank of Scotland | 11/07/12 | 1,080 | 1,089 | 9 | ||||||||||||||||
| 3,019,797 | GBP | Union Bank of Switzerland AG | 11/07/12 | 4,892 | 4,873 | (19 | ) | |||||||||||||||
| 692,146 | GBP | Westpac Banking Corp. | 11/07/12 | 1,127 | 1,117 | (10 | ) | |||||||||||||||
| 1,035,738 | GBP | Union Bank of Switzerland AG | 02/07/13 | 1,661 | 1,671 | 10 | ||||||||||||||||
| 382,063,499 | JPY | Barclays Bank plc | 11/07/12 | 4,899 | 4,786 | (113 | ) | |||||||||||||||
| 121,169,788 | JPY | Goldman Sachs International | 11/07/12 | 1,547 | 1,518 | (29 | ) | |||||||||||||||
| 492,738,107 | JPY | Royal Bank of Canada | 11/07/12 | 6,275 | 6,173 | (102 | ) | |||||||||||||||
| 933,409,810 | JPY | TD Bank Financial Group | 11/07/12 | 11,950 | 11,693 | (257 | ) | |||||||||||||||
| 125,722,531 | JPY | Union Bank of Switzerland AG | 11/07/12 | 1,607 | 1,575 | (32 | ) | |||||||||||||||
| 132,543,565 | JPY | Credit Suisse International | 02/07/13 | 1,667 | 1,662 | (5 | ) | |||||||||||||||
| 39,518,053 | NOK | TD Bank Financial Group | 11/07/12 | 6,537 | 6,930 | 393 | ||||||||||||||||
| 60,853,498 | SEK | Union Bank of Switzerland AG | 11/07/12 | 8,925 | 9,173 | 248 | ||||||||||||||||
SEE NOTES TO FINANCIAL STATEMENTS.
| 64 | J.P. MORGAN INTERNATIONAL EQUITY FUNDS | OCTOBER 31, 2012 | ||||
Table of Contents
| CONTRACTS TO BUY | CURRENCY | COUNTERPARTY | SETTLEMENT DATE | SETTLEMENT VALUE | VALUE AT 10/31/12 | NET UNREALIZED APPRECIATION (DEPRECIATION) | ||||||||||||||||
| 1,942,003 | SGD | State Street Corp. | 11/07/12 | $ | 1,549 | $ | 1,592 | $ | 43 | |||||||||||||
| 16,621,860 | SGD | Union Bank of Switzerland AG | 11/07/12 | 13,322 | 13,627 | 305 | ||||||||||||||||
| $252,852 | $ | 255,170 | $ | 2,318 | ||||||||||||||||||
|
| |||||||||||||||||||||
| CONTRACTS TO SELL | CURRENCY | COUNTERPARTY | SETTLEMENT DATE | SETTLEMENT VALUE | VALUE AT 10/31/12 | NET UNREALIZED APPRECIATION (DEPRECIATION) | ||||||||||||||||
| 470,246 | AUD | Barclays Bank plc | 11/07/12 | $ | 492 | $ | 488 | $ | 4 | |||||||||||||
| 3,994,943 | AUD | Credit Suisse International | 11/07/12 | 4,105 | 4,145 | (40 | ) | |||||||||||||||
| 1,003,453 | AUD | Union Bank of Switzerland AG | 11/07/12 | 1,022 | 1,041 | (19 | ) | |||||||||||||||
| 6,507,772 | CAD | Citibank, N.A. | 11/07/12 | 6,488 | 6,516 | (28 | ) | |||||||||||||||
| 2,745,000 | CHF | BNP Paribas | 11/07/12 | 2,945 | 2,948 | (3 | ) | |||||||||||||||
| 3,109,000 | CHF | Credit Suisse International | 11/07/12 | 3,312 | 3,338 | (26 | ) | |||||||||||||||
| 1,268,199 | CHF | Royal Bank of Canada | 11/07/12 | 1,328 | 1,362 | (34 | ) | |||||||||||||||
| 5,135,775 | CHF | Royal Bank of Scotland | 11/07/12 | 5,457 | 5,515 | (58 | ) | |||||||||||||||
| 3,158,853 | CHF | State Street Corp. | 11/07/12 | 3,394 | 3,392 | 2 | ||||||||||||||||
| 1,481,400 | CHF | Credit Suisse International | 02/07/13 | 1,583 | 1,594 | (11 | ) | |||||||||||||||
| 2,090,610 | DKK | Royal Bank of Scotland | 11/07/12 | 346 | 364 | (18 | ) | |||||||||||||||
| 1,246,927 | EUR | BNP Paribas | 11/07/12 | 1,613 | 1,616 | (3 | ) | |||||||||||||||
| 3,846,077 | EUR | Citibank, N.A. | 11/07/12 | 4,994 | 4,986 | 8 | ||||||||||||||||
| 2,326,566 | EUR | Goldman Sachs International | 11/07/12 | 3,005 | 3,016 | (11 | ) | |||||||||||||||
| 1,609,397 | EUR | Royal Bank of Canada | 11/07/12 | 2,022 | 2,086 | (64 | ) | |||||||||||||||
| 4,620,331 | EUR | Royal Bank of Scotland | 11/07/12 | 5,680 | 5,989 | (309 | ) | |||||||||||||||
| 961,530 | EUR | State Street Corp. | 11/07/12 | 1,242 | 1,246 | (4 | ) | |||||||||||||||
| 30,897,273 | EUR | Union Bank of Switzerland AG | 11/07/12 | 37,956 | 40,049 | (2,093 | ) | |||||||||||||||
| 2,836,550 | EUR | Credit Suisse International | 02/07/13 | 3,662 | 3,681 | (19 | ) | |||||||||||||||
| 28,754,081 | GBP | Barclays Bank plc | 11/07/12 | 44,687 | 46,400 | (1,713 | ) | |||||||||||||||
| 3,100,000 | GBP | BNP Paribas | 11/07/12 | 4,979 | 5,003 | (24 | ) | |||||||||||||||
| 3,863,331 | GBP | Royal Bank of Scotland | 11/07/12 | 6,022 | 6,234 | (212 | ) | |||||||||||||||
| 1,518,830 | GBP | Union Bank of Switzerland AG | 11/07/12 | 2,411 | 2,451 | (40 | ) | |||||||||||||||
| 2,424,137 | GBP | Westpac Banking Corp. | 11/07/12 | 3,940 | 3,912 | 28 | ||||||||||||||||
| 8,267,236 | HKD | Barclays Bank plc | 11/07/12 | 1,066 | 1,067 | (1 | ) | |||||||||||||||
| 15,341,000 | HKD | Royal Bank of Canada | 11/07/12 | 1,978 | 1,979 | (1 | ) | |||||||||||||||
| 31,944,895 | HKD | Union Bank of Switzerland AG | 11/07/12 | 4,120 | 4,122 | (2 | ) | |||||||||||||||
| 11,388,500 | HKD | Westpac Banking Corp. | 11/07/12 | 1,469 | 1,469 | — | (h) | |||||||||||||||
| 285,762,867 | JPY | Barclays Bank plc | 11/07/12 | 3,657 | 3,580 | 77 | ||||||||||||||||
| 151,442,988 | JPY | Goldman Sachs International | 11/07/12 | 1,948 | 1,897 | 51 | ||||||||||||||||
| 347,385,000 | JPY | Royal Bank of Scotland | 11/07/12 | 4,474 | 4,352 | 122 | ||||||||||||||||
| 769,250,000 | JPY | State Street Corp. | 11/07/12 | 9,633 | 9,636 | (3 | ) | |||||||||||||||
| 322,469,060 | JPY | TD Bank Financial Group | 11/07/12 | 4,103 | 4,039 | 64 | ||||||||||||||||
| 634,871,396 | JPY | Westpac Banking Corp. | 11/07/12 | 8,102 | 7,954 | 148 | ||||||||||||||||
| 1,327,350 | NZD | Barclays Bank plc | 11/07/12 | 1,070 | 1,091 | (21 | ) | |||||||||||||||
| 3,211,474 | NZD | Union Bank of Switzerland AG | 11/07/12 | 2,591 | 2,640 | (49 | ) | |||||||||||||||
| 13,193,843 | SEK | Royal Bank of Canada | 11/07/12 | 1,979 | 1,989 | (10 | ) | |||||||||||||||
| 27,745,000 | SEK | State Street Corp. | 11/07/12 | 4,215 | 4,182 | 33 | ||||||||||||||||
| $203,090 | $ | 207,369 | $ | (4,279 | ) | |||||||||||||||||
|
| |||||||||||||||||||||
| # | For cross-currency exchange contracts, the settlement value is the U.S. Dollar market value at 10/31/12 of the currency being sold, and the value at 10/31/12 is the U.S. dollar market value of the currency being purchased. |
SEE NOTES TO FINANCIAL STATEMENTS.
| OCTOBER 31, 2012 | J.P. MORGAN INTERNATIONAL EQUITY FUNDS | 65 | ||||||
Table of Contents
JPMorgan International Value Fund
SCHEDULE OF PORTFOLIO INVESTMENTS
AS OF OCTOBER 31, 2012
(Amounts in thousands)
| SHARES | SECURITY DESCRIPTION | VALUE($) | ||||||
| Common Stocks — 96.4% |
| ||||||
Australia — 2.5% | ||||||||
| 1,891 | Australia & New Zealand Banking Group Ltd. (m) | 49,880 | ||||||
| 1,654 | Goodman Group (m) | 7,594 | ||||||
|
| |||||||
| 57,474 | ||||||||
|
| |||||||
Belgium — 1.2% | ||||||||
| 231 | Solvay S.A. (m) | 27,822 | ||||||
|
| |||||||
Canada — 0.7% | ||||||||
| 754 | First Quantum Minerals Ltd. (m) | 16,958 | ||||||
|
| |||||||
China — 3.3% | ||||||||
| 33,973 | China Construction Bank Corp., Class H (m) | 25,468 | ||||||
| 5,435 | China Shenhua Energy Co., Ltd., Class H (m) | 23,029 | ||||||
| 13,122 | CNOOC Ltd. (m) | 27,005 | ||||||
|
| |||||||
| 75,502 | ||||||||
|
| |||||||
Finland — 0.9% | ||||||||
| 949 | Ruukki Group OYJ (a) (m) | 615 | ||||||
| 1,791 | UPM-Kymmene OYJ (m) | 19,225 | ||||||
|
| |||||||
| 19,840 | ||||||||
|
| |||||||
France — 11.8% | ||||||||
| 1,122 | AXA S.A. (m) | 17,877 | ||||||
| 880 | BNP Paribas S.A. (m) | 44,400 | ||||||
| 564 | Cie de St-Gobain (m) | 19,858 | ||||||
| 682 | GDF Suez (m) | 15,654 | ||||||
| 299 | Lafarge S.A. (m) | 17,558 | ||||||
| 423 | Renault S.A. (m) | 18,972 | ||||||
| 882 | Sanofi (m) | 77,446 | ||||||
| 329 | Schneider Electric S.A. (m) | 20,576 | ||||||
| 350 | Sodexo (m) | 26,952 | ||||||
| 866 | Suez Environnement Co. (m) | 9,194 | ||||||
|
| |||||||
| 268,487 | ||||||||
|
| |||||||
Germany — 7.9% | ||||||||
| 422 | Allianz SE (m) | 52,399 | ||||||
| 311 | BASF SE (m) | 25,794 | ||||||
| 486 | Bayer AG (m) | 42,344 | ||||||
| 454 | Deutsche Boerse AG (m) | 24,585 | ||||||
| 1,459 | E.ON AG (m) | 33,217 | ||||||
|
| |||||||
| 178,339 | ||||||||
|
| |||||||
Hong Kong — 3.0% | ||||||||
| 4,632 | China Overseas Land & Investment Ltd. (m) | 12,061 | ||||||
| 3,823 | Hutchison Whampoa Ltd. (m) | 37,452 | ||||||
| 10,024 | Sino Land Co., Ltd. (m) | 17,883 | ||||||
|
| |||||||
| 67,396 | ||||||||
|
| |||||||
| SHARES | SECURITY DESCRIPTION | VALUE($) | ||||||
Ireland — 0.8% | ||||||||
| 1,034 | Experian plc (m) | 17,888 | ||||||
|
| |||||||
Israel — 1.0% | ||||||||
| 546 | Teva Pharmaceutical Industries Ltd., ADR (m) | 22,082 | ||||||
|
| |||||||
Italy — 3.7% | ||||||||
| 2,923 | Eni S.p.A. (m) | 67,272 | ||||||
| 9,812 | Intesa Sanpaolo S.p.A. (m) | 15,806 | ||||||
|
| |||||||
| 83,078 | ||||||||
|
| |||||||
Japan — 18.7% | ||||||||
| 673 | Asahi Group Holdings Ltd. (m) | 15,360 | ||||||
| 644 | Bridgestone Corp. (m) | 15,034 | ||||||
| 743 | Canon, Inc. (m) | 24,144 | ||||||
| 173 | East Japan Railway Co. (m) | 11,901 | ||||||
| 3,623 | Fujitsu Ltd. (m) | 13,939 | ||||||
| 7,177 | Hitachi Ltd. (m) | 38,061 | ||||||
| 1,435 | Honda Motor Co., Ltd. (m) | 43,150 | ||||||
| 417 | Japan Airlines Co., Ltd. (a) (m) | 19,840 | ||||||
| 1,003 | Japan Tobacco, Inc. (m) | 27,724 | ||||||
| 1,629 | Kirin Holdings Co., Ltd. (m) | 20,449 | ||||||
| 2,104 | Marubeni Corp. (m) | 13,634 | ||||||
| 1,186 | Mitsui & Co., Ltd. (m) | 16,721 | ||||||
| 573 | Nippon Telegraph & Telephone Corp. (m) | 26,216 | ||||||
| 1,431 | Nissan Motor Co., Ltd. (m) | 11,966 | ||||||
| 208 | ORIX Corp. (m) | 21,376 | ||||||
| 2,417 | Sumitomo Corp. (m) | 32,949 | ||||||
| 1,838 | Sumitomo Mitsui Financial Group, Inc. (m) | 56,149 | ||||||
| 1,043 | Yamato Holdings Co., Ltd. (m) | 15,886 | ||||||
|
| |||||||
| 424,499 | ||||||||
|
| |||||||
Luxembourg — 0.7% | ||||||||
| 1,036 | ArcelorMittal (m) | 15,323 | ||||||
|
| |||||||
Netherlands — 7.2% | ||||||||
| 337 | ASML Holding N.V. (m) | 18,512 | ||||||
| 528 | European Aeronautic Defence and Space Co. N.V. (m) | 18,786 | ||||||
| 2,619 | ING Groep N.V., CVA (a) (m) | 23,301 | ||||||
| 2,371 | Royal Dutch Shell plc, Class A (m) | 81,358 | ||||||
| 581 | Unilever N.V., CVA (m) | 21,349 | ||||||
|
| |||||||
| 163,306 | ||||||||
|
| |||||||
Norway — 1.2% | ||||||||
| 1,422 | Telenor ASA (m) | 27,964 | ||||||
|
| |||||||
Russia — 0.5% | ||||||||
| 938 | Sberbank of Russia, ADR (m) | 11,092 | ||||||
|
| |||||||
South Africa — 0.4% | ||||||||
| 2,364 | African Bank Investments Ltd. (m) | 8,001 | ||||||
|
| |||||||
SEE NOTES TO FINANCIAL STATEMENTS.
| 66 | J.P. MORGAN INTERNATIONAL EQUITY FUNDS | OCTOBER 31, 2012 | ||||
Table of Contents
| SHARES | SECURITY DESCRIPTION | VALUE($) | ||||||
| Common Stocks — Continued |
| ||||||
South Korea — 1.2% | ||||||||
| 22 | Samsung Electronics Co., Ltd. (m) | 26,239 | ||||||
|
| |||||||
Spain — 2.4% | ||||||||
| 1,994 | Banco Bilbao Vizcaya Argentaria S.A. (m) | 16,662 | ||||||
| 4,200 | Iberdrola S.A. (m) | 21,752 | ||||||
| 837 | Repsol S.A. (m) | 16,778 | ||||||
|
| |||||||
| 55,192 | ||||||||
|
| |||||||
Sweden — 3.0% | ||||||||
| 3,528 | Nordea Bank AB (m) | 32,072 | ||||||
| 721 | Swedbank AB, Class A (m) | 13,400 | ||||||
| 2,548 | Telefonaktiebolaget LM Ericsson, Class B (m) | 22,572 | ||||||
|
| |||||||
| 68,044 | ||||||||
|
| |||||||
Switzerland — 4.3% | ||||||||
| 1,211 | Credit Suisse Group AG (a) (m) | 28,173 | ||||||
| 120 | Roche Holding AG (m) | 23,171 | ||||||
| 419 | Swiss Re AG (a) (m) | 28,964 | ||||||
| 72 | Zurich Insurance Group AG (a) (m) | 17,717 | ||||||
|
| |||||||
| 98,025 | ||||||||
|
| |||||||
United Kingdom — 20.0% | ||||||||
| 11,476 | Barclays plc (m) | 42,436 | ||||||
| 349 | British American Tobacco plc (m) | 17,333 | ||||||
| 4,398 | Centrica plc (m) | 23,024 | ||||||
| 1,296 | GlaxoSmithKline plc (m) | 29,035 | ||||||
| 8,997 | HSBC Holdings plc (m) | 88,708 | ||||||
| 1,103 | InterContinental Hotels Group plc (m) | 27,295 | ||||||
| 6,568 | Kingfisher plc (m) | 30,754 | ||||||
| 1,208 | Pearson plc (m) | 24,290 | ||||||
| 2,411 | Prudential plc (m) | 33,108 | ||||||
| 704 | Rio Tinto plc (m) | 35,159 | ||||||
| 490 | SABMiller plc (m) | 21,020 | ||||||
| 29,551 | Vodafone Group plc (m) | 80,250 | ||||||
|
| |||||||
| 452,412 | ||||||||
|
| |||||||
Total Common Stocks | 2,184,963 | |||||||
|
| |||||||
| Preferred Stock — 1.6% |
| ||||||
Germany — 1.6% | ||||||||
| 181 | Volkswagen AG (m) | 37,661 | ||||||
|
| |||||||
| SHARES | SECURITY DESCRIPTION | VALUE($) | ||||||
| Short-Term Investment — 2.9% |
| ||||||
Investment Company — 2.9% | ||||||||
| 65,639 | JPMorgan Prime Money Market Fund, Institutional Class Shares, 0.110% (b) (l) (m) | 65,639 | ||||||
|
| |||||||
Total Investments — 100.9% | 2,288,263 | |||||||
Liabilities in Excess of | (20,841 | ) | ||||||
|
| |||||||
NET ASSETS — 100.0% | $ | 2,267,422 | ||||||
|
| |||||||
Percentages indicated are based on net assets.
Summary of Investments by Industry, October 31, 2012
The following table represents the portfolio investments of the Fund by industry classifications as a percentage of total investments:
| INDUSTRY | PERCENTAGE | |||
Commercial Banks | 17.3 | % | ||
Oil, Gas & Consumable Fuels | 9.4 | |||
Pharmaceuticals | 8.5 | |||
Insurance | 6.6 | |||
Automobiles | 4.9 | |||
Multi-Utilities | 3.5 | |||
Wireless Telecommunication Services | 3.5 | |||
Diversified Financial Services | 3.4 | |||
Metals & Mining | 3.0 | |||
Trading Companies & Distributors | 2.8 | |||
Beverages | 2.5 | |||
Hotels, Restaurants & Leisure | 2.4 | |||
Diversified Telecommunication Services | 2.4 | |||
Chemicals | 2.3 | |||
Tobacco | 2.0 | |||
Semiconductors & Semiconductor Equipment | 2.0 | |||
Electronic Equipment, Instruments & Components | 1.7 | |||
Industrial Conglomerates | 1.6 | |||
Specialty Retail | 1.3 | |||
Real Estate Management & Development | 1.3 | |||
Capital Markets | 1.2 | |||
Media | 1.1 | |||
Office Electronics | 1.1 | |||
Communications Equipment | 1.0 | |||
Electric Utilities | 1.0 | |||
Others (each less than 1.0%) | 9.3 | |||
Short-Term Investment | 2.9 | |||
SEE NOTES TO FINANCIAL STATEMENTS.
| OCTOBER 31, 2012 | J.P. MORGAN INTERNATIONAL EQUITY FUNDS | 67 | ||||||
Table of Contents
JPMorgan International Value Fund
SCHEDULE OF PORTFOLIO INVESTMENTS
AS OF OCTOBER 31, 2012 (continued)
(Amounts in thousands, except number of contracts)
| Futures Contracts | ||||||||||||||||
| NUMBER OF CONTRACTS | DESCRIPTION | EXPIRATION DATE | NOTIONAL VALUE AT 10/31/12 | UNREALIZED APPRECIATION (DEPRECIATION) | ||||||||||||
Long Futures Outstanding | ||||||||||||||||
| 77 | TOPIX Index | 12/13/12 | $ | 7,147 | $ | 95 | ||||||||||
| 352 | Euro STOXX 50 | 12/21/12 | 11,425 | 171 | ||||||||||||
| 118 | FTSE 100 Index | 12/21/12 | 10,976 | 60 | ||||||||||||
|
| |||||||||||||||
| $ | 326 | |||||||||||||||
|
| |||||||||||||||
| Forward Foreign Currency Exchange Contracts | ||||||||||||||||||||||
| CONTRACTS TO BUY | CURRENCY | COUNTERPARTY | SETTLEMENT DATE | SETTLEMENT VALUE | VALUE AT 10/31/12 | NET UNREALIZED APPRECIATION (DEPRECIATION) | ||||||||||||||||
| 4,257,680 | GBP | |||||||||||||||||||||
| 5,292,554 | for EUR | Credit Suisse International | 11/27/12 | $ | 6,861 | # | $ | 6,870 | # | $ | 9 | |||||||||||
| 14,369,232 | GBP | |||||||||||||||||||||
| 179,499,292 | for HKD | Westpac Banking Corp. | 11/27/12 | 23,163 | # | 23,187 | # | 24 | ||||||||||||||
| 359,243,005 | JPY | |||||||||||||||||||||
| 3,557,580 | for EUR | Societe Generale | 11/27/12 | 4,612 | # | 4,501 | # | (111 | ) | |||||||||||||
| 1,019,666,814 | JPY | |||||||||||||||||||||
| 10,354,050 | for EUR | Union Bank of Switzerland AG | 11/27/12 | 13,424 | # | 12,776 | # | (648 | ) | |||||||||||||
| 426,535,180 | JPY | |||||||||||||||||||||
| 3,428,563 | for GBP | Barclays Bank plc | 11/27/12 | 5,532 | # | 5,344 | # | (188 | ) | |||||||||||||
| 1,808,730,833 | JPY | |||||||||||||||||||||
| 177,722,071 | for HKD | Credit Suisse International | 11/27/12 | 22,933 | # | 22,662 | # | (271 | ) | |||||||||||||
| 7,701,193 | CHF | |||||||||||||||||||||
| 5,094,918 | for GBP | Credit Suisse International | 11/27/12 | 8,221 | # | 8,272 | # | 51 | ||||||||||||||
| 17,560,949 | EUR | |||||||||||||||||||||
| 177,722,071 | for HKD | Barclays Bank plc | 11/27/12 | 22,933 | # | 22,767 | # | (166 | ) | |||||||||||||
| 12,867,970 | EUR | |||||||||||||||||||||
| 1,272,370,719 | for JPY | BNP Paribas | 11/27/12 | 15,941 | # | 16,682 | # | 741 | ||||||||||||||
| 144,098,721 | AUD | Credit Suisse International | 11/27/12 | 149,599 | 149,277 | (322 | ) | |||||||||||||||
| 7,840,000 | AUD | Westpac Banking Corp. | 11/27/12 | 8,146 | 8,121 | (25 | ) | |||||||||||||||
| 118,516,811 | CHF | Westpac Banking Corp. | 11/27/12 | 124,101 | 127,308 | 3,207 | ||||||||||||||||
| 14,114,276 | DKK | Westpac Banking Corp. | 11/27/12 | 2,383 | 2,453 | 70 | ||||||||||||||||
| 2,467,451 | EUR | Barclays Bank plc | 11/27/12 | 3,100 | 3,199 | 99 | ||||||||||||||||
| 33,667,022 | EUR | Credit Suisse International | 11/27/12 | 43,692 | 43,647 | (45 | ) | |||||||||||||||
| 4,812,025 | EUR | HSBC Bank, N.A. | 11/27/12 | 6,219 | 6,239 | 20 | ||||||||||||||||
| 6,466,934 | EUR | Merrill Lynch International | 11/27/12 | 8,445 | 8,384 | (61 | ) | |||||||||||||||
| 3,411,267 | EUR | Royal Bank of Canada | 11/27/12 | 4,315 | 4,422 | 107 | ||||||||||||||||
| 2,843,000 | GBP | BNP Paribas | 11/27/12 | 4,583 | 4,588 | 5 | ||||||||||||||||
| 6,531,950 | GBP | Citibank, N.A. | 11/27/12 | 10,615 | 10,540 | (75 | ) | |||||||||||||||
| 20,446,598 | GBP | Credit Suisse International | 11/27/12 | 32,389 | 32,993 | 604 | ||||||||||||||||
| 2,876,760 | GBP | Union Bank of Switzerland AG | 11/27/12 | 4,614 | 4,642 | 28 | ||||||||||||||||
| 6,512,408 | GBP | Westpac Banking Corp. | 11/27/12 | 10,522 | 10,508 | (14 | ) | |||||||||||||||
| 89,140,900 | HKD | Westpac Banking Corp. | 11/27/12 | 11,496 | 11,503 | 7 | ||||||||||||||||
| 337,170,198 | JPY | Barclays Bank plc | 11/27/12 | 4,300 | 4,225 | (75 | ) | |||||||||||||||
| 1,022,687,762 | JPY | BNP Paribas | 11/27/12 | 13,044 | 12,813 | (231 | ) | |||||||||||||||
| 1,615,675,910 | JPY | Credit Suisse International | 11/27/12 | 20,687 | 20,243 | (444 | ) | |||||||||||||||
SEE NOTES TO FINANCIAL STATEMENTS.
| 68 | J.P. MORGAN INTERNATIONAL EQUITY FUNDS | OCTOBER 31, 2012 | ||||
Table of Contents
| CONTRACTS TO BUY | CURRENCY | COUNTERPARTY | SETTLEMENT DATE | SETTLEMENT VALUE | VALUE AT 10/31/12 | NET UNREALIZED APPRECIATION (DEPRECIATION) | ||||||||||||||||
| 742,595,850 | JPY | Royal Bank of Canada | 11/27/12 | $ | 9,499 | $ | 9,304 | $ | (195 | ) | ||||||||||||
| 450,000,000 | JPY | State Street Corp. | 11/27/12 | 5,731 | 5,638 | (93 | ) | |||||||||||||||
| 750,000,000 | JPY | Union Bank of Switzerland AG | 11/27/12 | 9,552 | 9,397 | (155 | ) | |||||||||||||||
| 563,267,914 | JPY | Westpac Banking Corp. | 11/27/12 | 7,187 | 7,057 | (130 | ) | |||||||||||||||
| 5,906,021 | NZD | HSBC Bank, N.A. | 11/27/12 | 4,743 | 4,849 | 106 | ||||||||||||||||
| 3,967,250 | NZD | Morgan Stanley | 11/27/12 | 3,164 | 3,258 | 94 | ||||||||||||||||
| 63,189,943 | SEK | Citibank, N.A. | 11/27/12 | �� | 9,650 | 9,520 | (130 | ) | ||||||||||||||
| 51,831,415 | SGD | Barclays Bank plc | 11/27/12 | 41,580 | 42,491 | 911 | ||||||||||||||||
| $ | 676,976 | $ | 679,680 | $ | 2,704 | |||||||||||||||||
|
| |||||||||||||||||||||
| CONTRACTS TO SELL | CURRENCY | COUNTERPARTY | SETTLEMENT DATE | SETTLEMENT VALUE | VALUE AT 10/31/12 | NET UNREALIZED APPRECIATION (DEPRECIATION) | ||||||||||||||||
| 1,765,500 | AUD | HSBC Bank, N.A. | 11/27/12 | $ | 1,832 | $ | 1,829 | $ | 3 | |||||||||||||
| 11,883,065 | CAD | TD Bank Financial Group | 11/27/12 | 11,985 | 11,892 | 93 | ||||||||||||||||
| 12,572,726 | CHF | Citibank, N.A. | 11/27/12 | 13,409 | 13,505 | (96 | ) | |||||||||||||||
| 24,906,504 | CHF | Credit Suisse International | 11/27/12 | 26,626 | 26,754 | (128 | ) | |||||||||||||||
| 15,005,198 | CHF | Westpac Banking Corp. | 11/27/12 | 16,192 | 16,118 | 74 | ||||||||||||||||
| 63,802,225 | EUR | Barclays Bank plc | 11/27/12 | 80,395 | 82,716 | (2,321 | ) | |||||||||||||||
| 7,112,010 | EUR | Citibank, N.A. | 11/27/12 | 9,227 | 9,221 | 6 | ||||||||||||||||
| 5,275,800 | EUR | Deutsche Bank AG | 11/27/12 | 6,836 | 6,840 | (4 | ) | |||||||||||||||
| 3,525,000 | EUR | HSBC Bank, N.A. | 11/27/12 | 4,585 | 4,570 | 15 | ||||||||||||||||
| 6,248,562 | EUR | Royal Bank of Canada | 11/27/12 | 7,992 | 8,101 | (109 | ) | |||||||||||||||
| 10,759,975 | GBP | BNP Paribas | 11/27/12 | 17,438 | 17,363 | 75 | ||||||||||||||||
| 3,623,566 | GBP | Citibank, N.A. | 11/27/12 | 5,771 | 5,847 | (76 | ) | |||||||||||||||
| 5,500,000 | GBP | Goldman Sachs International | 11/27/12 | 8,849 | 8,875 | (26 | ) | |||||||||||||||
| 73,270,611 | GBP | Royal Bank of Scotland | 11/27/12 | 116,257 | 118,230 | (1,973 | ) | |||||||||||||||
| 66,651,800 | HKD | Westpac Banking Corp. | 11/27/12 | 8,602 | 8,601 | 1 | ||||||||||||||||
| 556,336,814 | JPY | Citibank, N.A. | 11/27/12 | 6,972 | 6,971 | 1 | ||||||||||||||||
| 788,905,606 | JPY | Credit Suisse International | 11/27/12 | 10,167 | 9,884 | 283 | ||||||||||||||||
| 1,366,186,000 | JPY | Deutsche Bank AG | 11/27/12 | 17,479 | 17,117 | 362 | ||||||||||||||||
| 6,337,642,828 | JPY | TD Bank Financial Group | 11/27/12 | 80,748 | 79,405 | 1,343 | ||||||||||||||||
| 670,964,758 | JPY | Westpac Banking Corp. | 11/27/12 | 8,564 | 8,407 | 157 | ||||||||||||||||
| 18,088,500 | NOK | Royal Bank of Canada | 11/27/12 | 3,124 | 3,169 | (45 | ) | |||||||||||||||
| 35,011,219 | NOK | TD Bank Financial Group | 11/27/12 | 5,964 | 6,135 | (171 | ) | |||||||||||||||
| 12,000,000 | NOK | Union Bank of Switzerland AG | 11/27/12 | 2,084 | 2,103 | (19 | ) | |||||||||||||||
| 8,214,500 | NZD | TD Bank Financial Group | 11/27/12 | 6,671 | 6,744 | (73 | ) | |||||||||||||||
| 130,443,074 | SEK | HSBC Bank, N.A. | 11/27/12 | 19,631 | 19,652 | (21 | ) | |||||||||||||||
| $ | 497,400 | $ | 500,049 | $ | (2,649 | ) | ||||||||||||||||
|
| |||||||||||||||||||||
| # | For cross-currency exchange contracts, the settlement value is the U.S. dollar market value at 10/31/12 of the currency being sold, and the value at 10/31/12 is the U.S. dollar market value of the currency being purchased. |
SEE NOTES TO FINANCIAL STATEMENTS.
| OCTOBER 31, 2012 | J.P. MORGAN INTERNATIONAL EQUITY FUNDS | 69 | ||||||
Table of Contents
JPMorgan Intrepid International Fund
SCHEDULE OF PORTFOLIO INVESTMENTS
AS OF OCTOBER 31, 2012
(Amounts in thousands)
| SHARES | SECURITY DESCRIPTION | VALUE($) | ||||||
| Common Stocks — 96.0% |
| ||||||
Australia — 5.9% |
| |||||||
| 134 | Australia & New Zealand Banking Group Ltd. (m) | 3,526 | ||||||
| 147 | BHP Billiton Ltd. (m) | 5,211 | ||||||
| 32 | Commonwealth Bank of Australia (m) | 1,929 | ||||||
| 31 | Flight Centre Ltd. (m) | 858 | ||||||
| 40 | Macquarie Group Ltd. (m) | 1,313 | ||||||
| 118 | Suncorp Group Ltd. (m) | 1,149 | ||||||
| 43 | Wesfarmers Ltd. (m) | 1,533 | ||||||
| 124 | Westfield Group (m) | 1,371 | ||||||
| 135 | Westpac Banking Corp. (m) | 3,564 | ||||||
|
| |||||||
| 20,454 | ||||||||
|
| |||||||
Austria — 0.4% |
| |||||||
| 22 | Andritz AG (m) | 1,355 | ||||||
|
| |||||||
Belgium — 1.4% |
| |||||||
| 32 | Anheuser-Busch InBev N.V. (m) | 2,659 | ||||||
| 12 | Solvay S.A. (m) | 1,395 | ||||||
| 17 | Umicore S.A. (m) | 875 | ||||||
|
| |||||||
| 4,929 | ||||||||
|
| |||||||
Bermuda — 0.3% |
| |||||||
| 20 | Signet Jewelers Ltd. (m) | 1,059 | ||||||
|
| |||||||
Brazil — 0.5% |
| |||||||
| 30 | Cielo S.A. (m) | 732 | ||||||
| 45 | Petroleo Brasileiro S.A., ADR (m) | 963 | ||||||
|
| |||||||
| 1,695 | ||||||||
|
| |||||||
China — 2.1% |
| |||||||
| 9 | Baidu, Inc., ADR (a) (m) | 986 | ||||||
| 2,224 | China Construction Bank Corp., Class H (m) | 1,667 | ||||||
| 248 | China Shenhua Energy Co., Ltd., Class H (m) | 1,049 | ||||||
| 2,622 | Industrial & Commercial Bank of China Ltd., Class H (m) | 1,726 | ||||||
| 118 | Ping An Insurance Group Co. of China Ltd., Class H (m) | 925 | ||||||
| 260 | Sands China Ltd. (m) | 973 | ||||||
|
| |||||||
| 7,326 | ||||||||
|
| |||||||
Denmark — 1.2% |
| |||||||
| 14 | Carlsberg A/S, Class B (m) | 1,216 | ||||||
| 40 | H Lundbeck A/S (m) | 698 | ||||||
| 13 | Novo Nordisk A/S, Class B (m) | 2,114 | ||||||
|
| |||||||
| 4,028 | ||||||||
|
| |||||||
Finland — 0.3% |
| |||||||
| 106 | UPM-Kymmene OYJ (m) | 1,133 | ||||||
|
| |||||||
France — 9.4% |
| |||||||
| 33 | Accor S.A. (m) | 1,044 | ||||||
| 212 | AXA S.A. (m) | 3,379 | ||||||
| SHARES | SECURITY DESCRIPTION | VALUE($) | ||||||
France — Continued |
| |||||||
| 45 | BNP Paribas S.A. (m) | 2,250 | ||||||
| 33 | Cap Gemini S.A. (m) | 1,403 | ||||||
| 9 | Cie Generale des Etablissements Michelin, Class B (m) | 741 | ||||||
| 23 | Lafarge S.A. (m) | 1,321 | ||||||
| 7 | LVMH Moet Hennessy Louis Vuitton S.A. (m) | 1,099 | ||||||
| 10 | Pernod-Ricard S.A. (m) | 1,032 | ||||||
| 9 | PPR (m) | 1,608 | ||||||
| 52 | Rexel S.A. (m) | 944 | ||||||
| 61 | Sanofi (m) | 5,354 | ||||||
| 24 | Schneider Electric S.A. (m) | 1,516 | ||||||
| 54 | Societe Generale S.A. (a) (m) | 1,709 | ||||||
| 11 | Technip S.A. (m) | 1,220 | ||||||
| 92 | Total S.A. (m) | 4,634 | ||||||
| 28 | Vinci S.A. (m) | 1,223 | ||||||
| 56 | Vivendi S.A. (m) | 1,138 | ||||||
| 10 | Zodiac Aerospace (m) | 1,041 | ||||||
|
| |||||||
| 32,656 | ||||||||
|
| |||||||
Germany — 9.4% |
| |||||||
| 27 | Allianz SE (m) | 3,327 | ||||||
| 53 | BASF SE (m) | 4,409 | ||||||
| 51 | Bayer AG (m) | 4,487 | ||||||
| 22 | Bayerische Motoren Werke AG (m) | 1,793 | ||||||
| 13 | Bilfinger Berger SE (m) | 1,309 | ||||||
| 11 | Continental AG (m) | 1,105 | ||||||
| 54 | Deutsche Bank AG (m) | 2,480 | ||||||
| 68 | Deutsche Post AG (m) | 1,341 | ||||||
| 86 | E.ON AG (m) | 1,951 | ||||||
| 51 | Freenet AG (m) | 841 | ||||||
| 13 | Fresenius SE & Co. KGaA (m) | 1,513 | ||||||
| 11 | Linde AG (m) | 1,782 | ||||||
| 47 | SAP AG (m) | 3,446 | ||||||
| 15 | Siemens AG (m) | 1,536 | ||||||
| 28 | Suedzucker AG (m) | 1,090 | ||||||
|
| |||||||
| 32,410 | ||||||||
|
| |||||||
Hong Kong — 2.3% |
| |||||||
| 90 | Cheung Kong Holdings Ltd. (m) | 1,327 | ||||||
| 410 | China Overseas Land & Investment Ltd. (m) | 1,068 | ||||||
| 320 | Hang Lung Properties Ltd. (m) | 1,108 | ||||||
| 125 | Hutchison Whampoa Ltd. (m) | 1,224 | ||||||
| 19 | Jardine Matheson Holdings Ltd. (m) | 1,179 | ||||||
| 86 | Swire Pacific Ltd., Class A (m) | 1,011 | ||||||
| 164 | Wharf Holdings Ltd. (m) | 1,115 | ||||||
|
| |||||||
| 8,032 | ||||||||
|
| |||||||
SEE NOTES TO FINANCIAL STATEMENTS.
| 70 | J.P. MORGAN INTERNATIONAL EQUITY FUNDS | OCTOBER 31, 2012 | ||||
Table of Contents
| SHARES | SECURITY DESCRIPTION | VALUE($) | ||||||
| Common Stocks — Continued |
| ||||||
India — 0.9% |
| |||||||
| 23 | HDFC Bank Ltd., ADR (m) | 867 | ||||||
| 25 | ICICI Bank Ltd., ADR (m) | 969 | ||||||
| 163 | Yes Bank Ltd. (m) | 1,243 | ||||||
|
| |||||||
| 3,079 | ||||||||
|
| |||||||
Indonesia — 0.3% |
| |||||||
| 1,570 | Bank Rakyat Indonesia Persero Tbk PT (m) | 1,203 | ||||||
|
| |||||||
Ireland — 1.1% |
| |||||||
| 139 | Glanbia plc (m) | 1,321 | ||||||
| 23 | Kerry Group plc, Class A (m) | 1,181 | ||||||
| 88 | WPP plc (m) | 1,138 | ||||||
|
| |||||||
| 3,640 | ||||||||
|
| |||||||
Israel — 0.4% |
| |||||||
| 31 | Teva Pharmaceutical Industries Ltd., ADR (m) | 1,235 | ||||||
|
| |||||||
Italy — 1.8% |
| |||||||
| 118 | Eni S.p.A. (m) | 2,709 | ||||||
| 84 | Pirelli & C. S.p.A. (m) | 973 | ||||||
| 80 | Prada S.p.A. (m) | 651 | ||||||
| 234 | Snam S.p.A. (m) | 1,039 | ||||||
| 8 | Tod’s S.p.A. (m) | 921 | ||||||
|
| |||||||
| 6,293 | ||||||||
|
| |||||||
Japan — 15.6% |
| |||||||
| 101 | Anritsu Corp. (m) | 1,271 | ||||||
| 48 | Asahi Group Holdings Ltd. (m) | 1,102 | ||||||
| 22 | Astellas Pharma, Inc. (m) | 1,114 | ||||||
| 17 | Autobacs Seven Co., Ltd. (m) | 714 | ||||||
| 54 | Bridgestone Corp. (m) | 1,250 | ||||||
| 28 | Canon, Inc. (m) | 907 | ||||||
| 43 | Century Tokyo Leasing Corp. (m) | 858 | ||||||
| 134 | Chiba Bank Ltd. (The) (m) | 783 | ||||||
| 63 | Daihatsu Motor Co., Ltd. (m) | 1,103 | ||||||
| 13 | Daito Trust Construction Co., Ltd. (m) | 1,332 | ||||||
| 81 | Daiwa House Industry Co., Ltd. (m) | 1,228 | ||||||
| 28 | Dena Co., Ltd. (m) | 858 | ||||||
| 23 | FamilyMart Co., Ltd. (m) | 1,119 | ||||||
| 8 | FANUC Corp. (m) | 1,306 | ||||||
| 214 | Fukuoka Financial Group, Inc. (m) | 837 | ||||||
| 193 | Hitachi Ltd. (m) | 1,024 | ||||||
| 79 | Honda Motor Co., Ltd. (m) | 2,372 | ||||||
| 250 | Isuzu Motors Ltd. (m) | 1,322 | ||||||
| 122 | ITOCHU Corp. (m) | 1,222 | ||||||
| 20 | Itochu Techno-Solutions Corp. (m) | 1,045 | ||||||
| 41 | Japan Tobacco, Inc. (m) | 1,123 | ||||||
| 220 | JX Holdings, Inc. (m) | 1,170 | ||||||
| 63 | Komatsu Ltd. (m) | 1,310 | ||||||
| SHARES | SECURITY DESCRIPTION | VALUE($) | ||||||
Japan — Continued |
| |||||||
| 28 | Konami Corp. (m) | 650 | ||||||
| 112 | Kubota Corp. (m) | 1,145 | ||||||
| 32 | Makita Corp. (m) | 1,259 | ||||||
| 204 | Marubeni Corp. (m) | 1,322 | ||||||
| 55 | Medipal Holdings Corp. (m) | 704 | ||||||
| 73 | Mitsubishi Corp. (m) | 1,303 | ||||||
| 131 | Mitsubishi Electric Corp. (m) | 979 | ||||||
| 586 | Mitsubishi UFJ Financial Group, Inc. (m) | 2,653 | ||||||
| 54 | Mitsui & Co., Ltd. (m) | 763 | ||||||
| 17 | Murata Manufacturing Co., Ltd. (m) | 817 | ||||||
| 11 | Nidec Corp. (m) | 776 | ||||||
| 24 | Nippon Telegraph & Telephone Corp. (m) | 1,107 | ||||||
| 181 | Nissan Motor Co., Ltd. (m) | 1,513 | ||||||
| 1 | NTT DOCOMO, Inc. (m) | 977 | ||||||
| 12 | ORIX Corp. (m) | 1,193 | ||||||
| 94 | Sekisui Chemical Co., Ltd. (m) | 772 | ||||||
| 27 | Seven & I Holdings Co., Ltd. (m) | 839 | ||||||
| 23 | Shin-Etsu Chemical Co., Ltd. (m) | 1,304 | ||||||
| 36 | Softbank Corp. (m) | 1,150 | ||||||
| 30 | Sugi Holdings Co., Ltd. (m) | 1,095 | ||||||
| 104 | Sumitomo Corp. (m) | 1,416 | ||||||
| 65 | Sumitomo Mitsui Financial Group, Inc. (m) | 1,998 | ||||||
| 53 | Toyota Motor Corp. (m) | 2,028 | ||||||
|
| |||||||
| 54,133 | ||||||||
|
| |||||||
Netherlands — 5.9% |
| |||||||
| 185 | Aegon N.V. (m) | 1,035 | ||||||
| 21 | Akzo Nobel N.V. (m) | 1,125 | ||||||
| 22 | ASML Holding N.V. (m) | 1,197 | ||||||
| 10 | Gemalto N.V. (m) | 899 | ||||||
| 224 | ING Groep N.V., CVA (a) (m) | 1,991 | ||||||
| 17 | Koninklijke DSM N.V. (m) | 891 | ||||||
| 56 | Koninklijke Philips Electronics N.V. (m) | 1,392 | ||||||
| 15 | Nutreco N.V. (m) | 1,153 | ||||||
| 215 | Royal Dutch Shell plc, Class B (m) | 7,594 | ||||||
| 85 | Unilever N.V., CVA (m) | 3,130 | ||||||
|
| |||||||
| 20,407 | ||||||||
|
| |||||||
Norway — 1.1% | ||||||||
| 113 | DnB ASA (m) | 1,412 | ||||||
| 60 | Petroleum Geo-Services ASA (m) | 1,040 | ||||||
| 67 | Telenor ASA (m) | 1,325 | ||||||
|
| |||||||
| 3,777 | ||||||||
|
| |||||||
Singapore — 0.3% | ||||||||
| 122 | Keppel Corp., Ltd. (m) | 1,062 | ||||||
|
| |||||||
SEE NOTES TO FINANCIAL STATEMENTS.
| OCTOBER 31, 2012 | J.P. MORGAN INTERNATIONAL EQUITY FUNDS | 71 | ||||||
Table of Contents
JPMorgan Intrepid International Fund
SCHEDULE OF PORTFOLIO INVESTMENTS
AS OF OCTOBER 31, 2012 (continued)
(Amounts in thousands)
| SHARES | SECURITY DESCRIPTION | VALUE($) | ||||||
| Common Stocks — Continued |
| ||||||
South Africa — 0.3% | ||||||||
| 27 | Tiger Brands Ltd. (m) | 874 | ||||||
|
| |||||||
South Korea — 0.7% | ||||||||
| 5 | Hyundai Motor Co. (m) | 1,035 | ||||||
| 1 | Samsung Electronics Co., Ltd. (m) | 1,274 | ||||||
|
| |||||||
| 2,309 | ||||||||
|
| |||||||
Spain — 2.0% | ||||||||
| 46 | Amadeus IT Holding S.A., Class A (m) | 1,132 | ||||||
| 205 | Banco Bilbao Vizcaya Argentaria S.A. (m) | 1,709 | ||||||
| 44 | Endesa S.A. (m) | 942 | ||||||
| 62 | Ferrovial S.A. (m) | 873 | ||||||
| 53 | Gas Natural SDG S.A. (m) | 821 | ||||||
| 13 | Inditex S.A. (m) | 1,624 | ||||||
|
| |||||||
| 7,101 | ||||||||
|
| |||||||
Sweden — 1.0% | ||||||||
| 36 | Electrolux AB, Series B (m) | 933 | ||||||
| 56 | NCC AB, Class B (m) | 1,046 | ||||||
| 40 | Svenska Handelsbanken AB, Class A (m) | 1,369 | ||||||
|
| |||||||
| 3,348 | ||||||||
|
| |||||||
Switzerland — 9.6% | ||||||||
| 17 | Actelion Ltd. (a) (m) | 816 | ||||||
| 20 | Adecco S.A. (a) (m) | 974 | ||||||
| 28 | Cie Financiere Richemont S.A., Class A (m) | 1,793 | ||||||
| 113 | Credit Suisse Group AG (a) (m) | 2,637 | ||||||
| 2 | Galenica AG (m) | 927 | ||||||
| 17 | Holcim Ltd. (a) (m) | 1,180 | ||||||
| 117 | Nestle S.A. (m) | 7,404 | ||||||
| 86 | Novartis AG (m) | 5,197 | ||||||
| 31 | Roche Holding AG (m) | 5,893 | ||||||
| 3 | Swatch Group AG (The) (m) | 1,050 | ||||||
| 27 | Wolseley plc (m) | 1,188 | ||||||
| 123 | Xstrata plc (m) | 1,943 | ||||||
| 9 | Zurich Insurance Group AG (a) (m) | 2,162 | ||||||
|
| |||||||
| 33,164 | ||||||||
|
| |||||||
Taiwan — 0.2% | ||||||||
| 54 | Taiwan Semiconductor Manufacturing Co., Ltd., ADR (m) | 852 | ||||||
|
| |||||||
United Kingdom — 21.6% | ||||||||
| 130 | Aberdeen Asset Management plc (m) | 681 | ||||||
| 118 | ARM Holdings plc (m) | 1,270 | ||||||
| 48 | Associated British Foods plc (m) | 1,066 | ||||||
| 57 | AstraZeneca plc (m) | 2,661 | ||||||
| 357 | Aviva plc (m) | 1,914 | ||||||
| 228 | Balfour Beatty plc (m) | 1,162 | ||||||
| SHARES | SECURITY DESCRIPTION | VALUE($) | ||||||
United Kingdom — Continued | ||||||||
| 746 | Barclays plc (m) | 2,757 | ||||||
| 150 | BG Group plc (m) | 2,784 | ||||||
| 18 | BHP Billiton plc (m) | 579 | ||||||
| 391 | BP plc (m) | 2,796 | ||||||
| 82 | British American Tobacco plc (m) | 4,073 | ||||||
| 129 | British Land Co. plc (m) | 1,099 | ||||||
| 362 | BT Group plc (m) | 1,244 | ||||||
| 145 | BTG plc (a) (m) | 798 | ||||||
| 50 | Burberry Group plc (m) | 951 | ||||||
| 28 | Carnival plc (m) | 1,114 | ||||||
| 233 | Centrica plc (m) | 1,218 | ||||||
| 108 | Daily Mail & General Trust plc, Class A (m) | 834 | ||||||
| 70 | Diageo plc (m) | 2,003 | ||||||
| 117 | easyJet plc (m) | 1,179 | ||||||
| 195 | GlaxoSmithKline plc (m) | 4,380 | ||||||
| 617 | HSBC Holdings plc (m) | 6,086 | ||||||
| 40 | Imperial Tobacco Group plc (m) | 1,523 | ||||||
| 152 | Inchcape plc (m) | 992 | ||||||
| 40 | InterContinental Hotels Group plc (m) | 982 | ||||||
| 657 | ITV plc (m) | 920 | ||||||
| 211 | J Sainsbury plc (m) | 1,210 | ||||||
| 516 | Legal & General Group plc (m) | 1,119 | ||||||
| 205 | Marks & Spencer Group plc (m) | 1,302 | ||||||
| 187 | Meggitt plc (m) | 1,167 | ||||||
| 89 | Persimmon plc (m) | 1,147 | ||||||
| 37 | Petrofac Ltd. (m) | 951 | ||||||
| 187 | Prudential plc (m) | 2,562 | ||||||
| 27 | Resolution Ltd. (m) | 96 | ||||||
| 84 | Rio Tinto plc (m) | 4,202 | ||||||
| 29 | Spectris plc (m) | 810 | ||||||
| 173 | Standard Chartered plc (m) | 4,095 | ||||||
| 1,287 | Taylor Wimpey plc (m) | 1,272 | ||||||
| 63 | Travis Perkins plc (m) | 1,100 | ||||||
| 45 | Tullow Oil plc (m) | 1,023 | ||||||
| 2,074 | Vodafone Group plc (m) | 5,633 | ||||||
|
| |||||||
| 74,755 | ||||||||
|
| |||||||
Total Common Stocks | 332,309 | |||||||
|
| |||||||
| Preferred Stocks — 1.6% |
| ||||||
Germany — 1.3% | ||||||||
| 16 | Henkel AG & Co. KGaA (m) | 1,240 | ||||||
| 15 | Volkswagen AG (m) | 3,144 | ||||||
|
| |||||||
| 4,384 | ||||||||
|
| |||||||
SEE NOTES TO FINANCIAL STATEMENTS.
| 72 | J.P. MORGAN INTERNATIONAL EQUITY FUNDS | OCTOBER 31, 2012 | ||||
Table of Contents
| SHARES | SECURITY DESCRIPTION | VALUE($) | ||||||
| Preferred Stocks — Continued |
| ||||||
Italy — 0.3% | ||||||||
| 1,386 | Telecom Italia S.p.A. (m) | 1,110 | ||||||
|
| |||||||
Total Preferred Stocks | 5,494 | |||||||
|
| |||||||
| Short-Term Investment — 2.0% |
| ||||||
Investment Company — 2.0% | ||||||||
| 7,030 | JPMorgan Prime Money Market Fund, Institutional Class Shares, | 7,030 | ||||||
|
| |||||||
Total Investments — 99.6% | 344,833 | |||||||
Other Assets in Excess of | 1,396 | |||||||
|
| |||||||
NET ASSETS — 100.0% | $ | 346,229 | ||||||
|
| |||||||
Percentages indicated are based on net assets.
Summary of Investments by Industry, October 31, 2012
The following table represents the portfolio investments of the Fund by industry classifications as a percentage of total investments:
| INDUSTRY | PERCENTAGE | |||
Commercial Banks | 12.9 | % | ||
Pharmaceuticals | 10.1 | |||
Oil, Gas & Consumable Fuels | 7.2 | |||
Insurance | 5.1 | |||
Food Products | 5.0 | |||
Automobiles | 4.1 | |||
Metals & Mining | 3.7 | |||
Chemicals | 3.2 | |||
Trading Companies & Distributors | 2.7 | |||
Wireless Telecommunication Services | 2.5 | |||
Real Estate Management & Development | 2.4 | |||
Beverages | 2.3 | |||
Capital Markets | 2.1 | |||
Tobacco | 1.9 | |||
Textiles, Apparel & Luxury Goods | 1.9 | |||
Industrial Conglomerates | 1.9 | |||
Machinery | 1.8 | |||
Diversified Telecommunication Services | 1.7 | |||
Food & Staples Retailing | 1.7 | |||
Hotels, Restaurants & Leisure | 1.4 | |||
Semiconductors & Semiconductor Equipment | 1.3 | |||
IT Services | 1.3 | |||
Construction & Engineering | 1.2 | |||
Household Durables | 1.2 | |||
Software | 1.2 | |||
Auto Components | 1.2 | |||
Diversified Financial Services | 1.2 | |||
Electronic Equipment, Instruments & Components | 1.1 | |||
Specialty Retail | 1.0 | |||
Others (each less than 1.0%) | 11.7 | |||
Short-Term Investment | 2.0 | |||
SEE NOTES TO FINANCIAL STATEMENTS.
| OCTOBER 31, 2012 | J.P. MORGAN INTERNATIONAL EQUITY FUNDS | 73 | ||||||
Table of Contents
J.P. Morgan International Equity Funds
NOTES TO SCHEDULES OF PORTFOLIO INVESTMENTS
AS OF OCTOBER 31, 2012
| ADR | — American Depositary Receipt | |
| AUD | — Australian Dollar | |
| CAD | — Canadian Dollar | |
| CDI | — CHESS Depositary Interest | |
| CHF | — Swiss Franc | |
| CVA | — Dutch Certification | |
| DKK | — Danish Krone | |
| EAFE | — Europe, Australasia, and Far East | |
| EUR | — Euro | |
| FDR | — Fiduciary Depositary Receipt | |
| GBP | — British Pound | |
| GDR | — Global Depositary Receipt | |
| HKD | — Hong Kong Dollar | |
| JPY | — Japanese Yen | |
| NOK | — Norwegian Krone | |
| NZD | — New Zealand Dollar | |
| NVDR | — Non Voting Depository Receipt | |
| Reg. S | — Security was purchased pursuant to Regulation S under the Securities Act of 1933, which exempts from registration securities offered and sold outside of the United States. Such a security cannot be sold in the United States without either an effective registration statement filed pursuant to the Securities Act of 1933, or pursuant to an exemption from registration. | |
| REIT | — Real Estate Investment Trust | |
| SDR | — Swedish Depositary Receipt | |
| SEK | — Swedish Krona | |
| SGD | — Singapore Dollar | |
| (a) | — Non-income producing security. | |
| (b) | — Investment in affiliate. Money market fund registered under the Investment Company Act of 1940, as amended, and advised by J.P. Morgan Investment Management Inc. | |
| (e) | — Security is exempt from registration under Rule 144A of the Securities Act of 1933, as amended. Unless otherwise indicated, this security has been determined to be liquid under procedures established by the Board of Trustees and may be resold in transactions exempt from registration, normally to qualified institutional buyers. | |
| (g) | — Amount rounds to less than 0.1%. | |||||
| (h) | — Amount rounds to less than one thousand (shares or dollars). | |||||
| (i) | — Security has been deemed illiquid pursuant to procedures approved by the Board of Trustees and may be difficult to sell. | |||||
| (l) | — The rate shown is the current yield as of October 31, 2012. | |||||
| (m) | — All or a portion of this security is reserved and/or pledged with the custodian for current or potential holdings of futures, swaps, options, TBAs, when-issued securities, delayed delivery securities, reverse repurchase agreements, unfunded commitments and forward foreign currency exchange contracts. | |||||
| The value and percentage, based on total investments, of the investments that apply the fair valuation policy for the international investments as described in Note 2.A of the notes to financial statements are as follows (amounts in thousands): | ||||||
| Fund | Value | Percentage | ||||||
| Emerging Economies Fund | $ | 344,212 | 78.2 | % | ||||
| Emerging Markets Equity Fund | 1,552,195 | 69.2 | ||||||
| Global Equity Income Fund | 25,085 | 67.0 | ||||||
| Global Opportunities Fund | 2,252 | 48.8 | ||||||
| International Equity Fund | 995,472 | 92.8 | ||||||
| International Equity Index Fund | 559,890 | 96.1 | ||||||
| International Opportunities Fund | 791,118 | 95.5 | ||||||
| International Value Fund | 2,183,584 | 95.4 | ||||||
| Intrepid International Fund | 331,200 | 96.0 | ||||||
SEE NOTES TO FINANCIAL STATEMENTS.
| 74 | J.P. MORGAN INTERNATIONAL EQUITY FUNDS | OCTOBER 31, 2012 | ||||
Table of Contents
THIS PAGE IS INTENTIONALLY LEFT BLANK
| OCTOBER 31, 2012 | J.P. MORGAN INTERNATIONAL EQUITY FUNDS | 75 | ||||||
Table of Contents
STATEMENTS OF ASSETS AND LIABILITIES
AS OF OCTOBER 31, 2012
(Amounts in thousands, except per share amounts)
| Emerging Economies Fund | Emerging Markets Equity Fund | Global Equity Income Fund | ||||||||||
ASSETS: | ||||||||||||
Investments in non-affiliates, at value | $ | 429,883 | $ | 2,189,158 | $ | 36,452 | ||||||
Investments in affiliates, at value | 10,554 | 54,151 | 1,001 | |||||||||
|
|
|
|
|
| |||||||
Total investment securities, at value | 440,437 | 2,243,309 | 37,453 | |||||||||
Cash | 346 | 297 | 166 | |||||||||
Foreign currency, at value | 2,368 | 8,591 | 25 | |||||||||
Receivables: | ||||||||||||
Investment securities sold | 378 | 10,100 | 104 | |||||||||
Fund shares sold | 2,394 | 4,636 | 295 | |||||||||
Dividends from non-affiliates | 845 | 1,755 | 80 | |||||||||
Dividends from affiliates | 1 | 1 | — | (a) | ||||||||
Tax reclaims | — | — | 26 | |||||||||
Unrealized appreciation on forward foreign currency exchange contracts | — | — | 73 | |||||||||
Prepaid expenses | 18 | — | — | |||||||||
|
|
|
|
|
| |||||||
Total Assets | 446,787 | 2,268,689 | 38,222 | |||||||||
|
|
|
|
|
| |||||||
LIABILITIES: | ||||||||||||
Payables: | ||||||||||||
Dividends | — | — | 1 | |||||||||
Investment securities purchased | 237 | 9,467 | 209 | |||||||||
Fund shares redeemed | 82 | 2,886 | 2 | |||||||||
Unrealized depreciation on forward foreign currency exchange contracts | — | — | 55 | |||||||||
Accrued liabilities: | ||||||||||||
Investment advisory fees | 372 | 1,903 | 6 | |||||||||
Administration fees | 4 | 166 | — | |||||||||
Shareholder servicing fees | 19 | 388 | 6 | |||||||||
Distribution fees | 8 | 91 | 2 | |||||||||
Custodian and accounting fees | 54 | 224 | 16 | |||||||||
Trustees’ and Chief Compliance Officer’s fees | — | (a) | — | (a) | — | (a) | ||||||
Transfer agent fees | 31 | 903 | 2 | |||||||||
Audit fees | 36 | 33 | 36 | |||||||||
Other | 11 | 142 | 20 | |||||||||
|
|
|
|
|
| |||||||
Total Liabilities | 854 | 16,203 | 355 | |||||||||
|
|
|
|
|
| |||||||
Net Assets | $ | 445,933 | $ | 2,252,486 | $ | 37,867 | ||||||
|
|
|
|
|
| |||||||
| (a) | Amount rounds to less than $1,000. |
SEE NOTES TO FINANCIAL STATEMENTS.
| 76 | J.P. MORGAN INTERNATIONAL EQUITY FUNDS | OCTOBER 31, 2012 | ||||
Table of Contents
| Emerging Economies Fund | Emerging Markets Equity Fund | Global Equity Income Fund | ||||||||||
NET ASSETS: | ||||||||||||
Paid-in-Capital | $ | 487,258 | $ | 1,946,142 | $ | 35,969 | ||||||
Accumulated undistributed (distributions in excess of) net investment income | 5,893 | 12,468 | 72 | |||||||||
Accumulated net realized gains (losses) | (59,742 | ) | (95,729 | ) | (651 | ) | ||||||
Net unrealized appreciation (depreciation) | 12,524 | 389,605 | 2,477 | |||||||||
|
|
|
|
|
| |||||||
Total Net Assets | $ | 445,933 | $ | 2,252,486 | $ | 37,867 | ||||||
|
|
|
|
|
| |||||||
Net Assets: | ||||||||||||
Class A | $ | 30,356 | $ | 281,194 | $ | 9,003 | ||||||
Class B | — | 6,100 | — | |||||||||
Class C | 2,088 | 44,643 | 646 | |||||||||
Class R2 | — | — | 461 | |||||||||
Class R5 | 331,032 | — | 465 | |||||||||
Institutional Class | — | 629,223 | — | |||||||||
Select Class | 82,457 | 1,291,326 | 27,292 | |||||||||
|
|
|
|
|
| |||||||
Total | $ | 445,933 | $ | 2,252,486 | $ | 37,867 | ||||||
|
|
|
|
|
| |||||||
Outstanding units of beneficial interest (shares) ($0.0001 par value; unlimited number of shares authorized): | ||||||||||||
Class A | 2,358 | 12,778 | 637 | |||||||||
Class B | — | 282 | — | |||||||||
Class C | 164 | 2,082 | 46 | |||||||||
Class R2 | — | — | 33 | |||||||||
Class R5 | 25,579 | — | 33 | |||||||||
Institutional Class | — | 27,780 | — | |||||||||
Select Class | 6,386 | 57,652 | 1,929 | |||||||||
Net Asset Value (a): | ||||||||||||
Class A — Redemption price per share | $ | 12.88 | $ | 22.01 | $ | 14.12 | ||||||
Class B — Offering price per share (b) | — | 21.59 | — | |||||||||
Class C — Offering price per share (b) | 12.72 | 21.44 | 14.11 | |||||||||
Class R2 — Offering and redemption price per share | — | — | 14.12 | |||||||||
Class R5 — Offering and redemption price per share | 12.94 | — | 14.15 | |||||||||
Institutional Class — Offering and redemption price per share | — | 22.65 | — | |||||||||
Select Class — Offering and redemption price per share | 12.91 | 22.40 | 14.14 | |||||||||
Class A maximum sales charge | 5.25 | % | 5.25 | % | 5.25 | % | ||||||
Class A maximum public offering price per share | $ | 13.59 | $ | 23.23 | $ | 14.90 | ||||||
|
|
|
|
|
| |||||||
Cost of investments in non-affiliates | $ | 417,387 | $ | 1,799,591 | $ | 33,992 | ||||||
Cost of investments in affiliates | 10,554 | 54,151 | 1,001 | |||||||||
Cost of foreign currency | 2,364 | 8,555 | 25 | |||||||||
| (a) | Per share amounts may not recalculate due to rounding of net assets and/or shares outstanding. |
| (b) | Redemption price for Class B and Class C Shares varies based upon length of time the shares are held. |
SEE NOTES TO FINANCIAL STATEMENTS.
| OCTOBER 31, 2012 | J.P. MORGAN INTERNATIONAL EQUITY FUNDS | 77 | ||||||
Table of Contents
STATEMENTS OF ASSETS AND LIABILITIES
AS OF OCTOBER 31, 2012 (continued)
(Amounts in thousands, except per share amounts)
| Global Opportunities Fund | International Equity Fund | International Equity Index Fund | ||||||||||
ASSETS: | ||||||||||||
Investments in non-affiliates, at value | $ | 4,616 | $ | 1,036,064 | $ | 579,092 | ||||||
Investments in affiliates, at value | — | 37,183 | 3,425 | |||||||||
|
|
|
|
|
| |||||||
Total investment securities, at value | 4,616 | 1,073,247 | 582,517 | |||||||||
Cash | 36 | 136 | 575 | |||||||||
Foreign currency, at value | 13 | 19 | 904 | |||||||||
Deposits at broker for futures contracts | — | — | 335 | |||||||||
Receivables: | ||||||||||||
Investment securities sold | 8 | — | — | |||||||||
Fund shares sold | — | 966 | 416 | |||||||||
Dividends from non-affiliates | 6 | 2,120 | 1,235 | |||||||||
Dividends from affiliates | — | 4 | — | (a) | ||||||||
Tax reclaims | 3 | 1,459 | 488 | |||||||||
Variation margin on futures contracts | — | — | 35 | |||||||||
Unrealized appreciation on forward foreign currency exchange contracts | 5 | — | — | |||||||||
Due from Advisor | 16 | — | — | |||||||||
|
|
|
|
|
| |||||||
Total Assets | 4,703 | 1,077,951 | 586,505 | |||||||||
|
|
|
|
|
| |||||||
LIABILITIES: | ||||||||||||
Payables: | ||||||||||||
Investment securities purchased | 10 | — | — | |||||||||
Fund shares redeemed | — | 855 | 461 | |||||||||
Unrealized depreciation on forward foreign currency exchange contracts | 15 | — | — | |||||||||
Accrued liabilities: | ||||||||||||
Investment advisory fees | — | 654 | 273 | |||||||||
Administration fees | — | — | 43 | |||||||||
Shareholder servicing fees | 1 | 72 | 26 | |||||||||
Distribution fees | 1 | 34 | 33 | |||||||||
Custodian and accounting fees | 15 | 47 | 55 | |||||||||
Trustees’ and Chief Compliance Officer’s fees | — | (a) | — | (a) | 2 | |||||||
Transfer agent fees | 3 | 149 | 137 | |||||||||
Audit fees | 34 | 36 | 30 | |||||||||
Other | 1 | 69 | 52 | |||||||||
|
|
|
|
|
| |||||||
Total Liabilities | 80 | 1,916 | 1,112 | |||||||||
|
|
|
|
|
| |||||||
Net Assets | $ | 4,623 | $ | 1,076,035 | $ | 585,393 | ||||||
|
|
|
|
|
| |||||||
| (a) | Amount rounds to less than $1,000. |
SEE NOTES TO FINANCIAL STATEMENTS.
| 78 | J.P. MORGAN INTERNATIONAL EQUITY FUNDS | OCTOBER 31, 2012 | ||||
Table of Contents
| Global Opportunities Fund | International Equity Fund | International Equity Index Fund | ||||||||||
NET ASSETS: | ||||||||||||
Paid-in-Capital | $ | 5,247 | $ | 943,422 | $ | 462,314 | ||||||
Accumulated undistributed (distributions in excess of) net investment income | 93 | 1,414 | 9,952 | |||||||||
Accumulated net realized gains (losses) | (1,128 | ) | (32,514 | ) | (91,484 | ) | ||||||
Net unrealized appreciation (depreciation) | 411 | 163,713 | 204,611 | |||||||||
|
|
|
|
|
| |||||||
Total Net Assets | $ | 4,623 | $ | 1,076,035 | $ | 585,393 | ||||||
|
|
|
|
|
| |||||||
Net Assets: | ||||||||||||
Class A | $ | 1,300 | $ | 98,274 | $ | 96,191 | ||||||
Class B | — | 2,164 | 3,060 | |||||||||
Class C | 415 | 17,873 | 16,291 | |||||||||
Class R2 | 56 | 721 | 786 | |||||||||
Class R5 | 100 | 63,767 | — | |||||||||
Class R6 | 56 | 682,861 | — | |||||||||
Select Class | 2,696 | 210,375 | 469,065 | |||||||||
|
|
|
|
|
| |||||||
Total | $ | 4,623 | $ | 1,076,035 | $ | 585,393 | ||||||
|
|
|
|
|
| |||||||
Outstanding units of beneficial interest (shares) | ||||||||||||
($0.0001 par value; unlimited number of shares authorized): | ||||||||||||
Class A | 97 | 7,355 | 5,580 | |||||||||
Class B | — | 167 | 192 | |||||||||
Class C | 31 | 1,399 | 977 | |||||||||
Class R2 | 4 | 54 | 46 | |||||||||
Class R5 | 7 | 4,716 | — | |||||||||
Class R6 | 4 | 50,520 | — | |||||||||
Select Class | 200 | 15,558 | 27,015 | |||||||||
Net Asset Value (a): | ||||||||||||
Class A — Redemption price per share | $ | 13.48 | $ | 13.36 | $ | 17.24 | ||||||
Class B — Offering price per share (b) | — | 12.93 | 15.91 | |||||||||
Class C — Offering price per share (b) | 13.39 | 12.78 | 16.68 | |||||||||
Class R2 — Offering and redemption price per share | 13.37 | 13.31 | 17.03 | |||||||||
Class R5 — Offering and redemption price per share | 13.51 | 13.52 | — | |||||||||
Class R6 — Offering and redemption price per share | 13.51 | 13.52 | — | |||||||||
Select Class — Offering and redemption price per share | 13.50 | 13.52 | 17.36 | |||||||||
Class A maximum sales charge | 5.25 | % | 5.25 | % | 5.25 | % | ||||||
Class A maximum public offering price per share | $ | 14.23 | $ | 14.10 | $ | 18.20 | ||||||
|
|
|
|
|
| |||||||
Cost of investments in non-affiliates | $ | 4,195 | $ | 872,367 | $ | 374,503 | ||||||
Cost of investments in affiliates | — | 37,183 | 3,425 | |||||||||
Cost of foreign currency | 13 | 18 | 852 | |||||||||
| (a) | Per share amounts may not recalculate due to rounding of net assets and/or shares outstanding. |
| (b) | Redemption price for Class B and Class C Shares varies based upon length of time the shares are held. |
SEE NOTES TO FINANCIAL STATEMENTS.
| OCTOBER 31, 2012 | J.P. MORGAN INTERNATIONAL EQUITY FUNDS | 79 | ||||||
Table of Contents
STATEMENTS OF ASSETS AND LIABILITIES
AS OF OCTOBER 31, 2012 (continued)
(Amounts in thousands, except per share amounts)
| International Opportunities Fund | International Value Fund | Intrepid International Fund | ||||||||||
ASSETS: | ||||||||||||
Investments in non-affiliates, at value | $ | 808,291 | $ | 2,222,624 | $ | 337,803 | ||||||
Investments in affiliates, at value | 20,262 | 65,639 | 7,030 | |||||||||
|
|
|
|
|
| |||||||
Total investment securities, at value | 828,553 | 2,288,263 | 344,833 | |||||||||
Cash | 2,134 | 123 | 732 | |||||||||
Foreign currency, at value | 24 | 1,019 | 116 | |||||||||
Deposits at broker for futures contracts | — | 1,793 | — | |||||||||
Receivables: | ||||||||||||
Investment securities sold | 13,173 | 5,841 | 696 | |||||||||
Fund shares sold | 599 | 6,849 | 214 | |||||||||
Dividends from non-affiliates | 2,000 | 6,950 | 854 | |||||||||
Dividends from affiliates | 2 | 5 | 1 | |||||||||
Tax reclaims | 536 | 2,343 | 260 | |||||||||
Variation margin on futures contracts | — | 116 | — | |||||||||
Unrealized appreciation on forward foreign currency exchange contracts | 4,039 | 8,496 | — | |||||||||
|
|
|
|
|
| |||||||
Total Assets | 851,060 | 2,321,798 | 347,706 | |||||||||
|
|
|
|
|
| |||||||
LIABILITIES: | ||||||||||||
Payables: | ||||||||||||
Investment securities purchased | 8,456 | 16,665 | 954 | |||||||||
Fund shares redeemed | 720 | 26,495 | 117 | |||||||||
Variation margin on futures contracts | 40 | — | — | |||||||||
Unrealized depreciation on forward foreign currency exchange contracts | 6,000 | 8,441 | — | |||||||||
Accrued liabilities: | ||||||||||||
Investment advisory fees | 419 | 1,161 | 246 | |||||||||
Administration fees | 61 | 80 | 11 | |||||||||
Shareholder servicing fees | 25 | 396 | 9 | |||||||||
Distribution fees | 15 | 38 | 7 | |||||||||
Custodian and accounting fees | 42 | 90 | 39 | |||||||||
Trustees’ and Chief Compliance Officer’s fees | 1 | 5 | 1 | |||||||||
Other | 96 | 1,005 | 93 | |||||||||
|
|
|
|
|
| |||||||
Total Liabilities | 15,875 | 54,376 | 1,477 | |||||||||
|
|
|
|
|
| |||||||
Net Assets | $ | 835,185 | $ | 2,267,422 | $ | 346,229 | ||||||
|
|
|
|
|
| |||||||
SEE NOTES TO FINANCIAL STATEMENTS.
| 80 | J.P. MORGAN INTERNATIONAL EQUITY FUNDS | OCTOBER 31, 2012 | ||||
Table of Contents
| International Opportunities Fund | International Value Fund | Intrepid International Fund | ||||||||||
NET ASSETS: | ||||||||||||
Paid-in-Capital | $ | 866,779 | $ | 2,634,238 | $ | 868,841 | ||||||
Accumulated undistributed (distributions in excess of) net investment income | 18,370 | 50,317 | 5,150 | |||||||||
Accumulated net realized gains (losses) | (90,022 | ) | (607,587 | ) | (572,287 | ) | ||||||
Net unrealized appreciation (depreciation) | 40,058 | 190,454 | 44,525 | |||||||||
|
|
|
|
|
| |||||||
Total Net Assets | $ | 835,185 | $ | 2,267,422 | $ | 346,229 | ||||||
|
|
|
|
|
| |||||||
Net Assets: | ||||||||||||
Class A | $ | 67,472 | $ | 124,691 | $ | 32,231 | ||||||
Class B | 462 | 2,932 | — | |||||||||
Class C | 531 | 14,311 | 875 | |||||||||
Class R2 | — | 881 | 81 | |||||||||
Class R6 | 692,117 | 25,945 | — | |||||||||
Institutional Class | 41,574 | 639,798 | 303,575 | |||||||||
Select Class | 33,029 | 1,458,864 | 9,467 | |||||||||
|
|
|
|
|
| |||||||
Total | $ | 835,185 | $ | 2,267,422 | $ | 346,229 | ||||||
|
|
|
|
|
| |||||||
Outstanding units of beneficial interest (shares) | ||||||||||||
($0.0001 par value; unlimited number of shares authorized): | ||||||||||||
Class A | 5,418 | 10,241 | 2,027 | |||||||||
Class B | 37 | 244 | — | |||||||||
Class C | 44 | 1,209 | 55 | |||||||||
Class R2 | — | 73 | 5 | |||||||||
Class R6 | 54,537 | 2,095 | — | |||||||||
Institutional Class | 3,275 | 51,683 | 18,695 | |||||||||
Select Class | 2,613 | 118,558 | 575 | |||||||||
Net Asset Value (a): | ||||||||||||
Class A — Redemption price per share | $ | 12.45 | $ | 12.18 | $ | 15.90 | ||||||
Class B — Offering price per share (b) | 12.46 | 12.03 | — | |||||||||
Class C — Offering price per share (b) | 12.15 | 11.84 | 16.00 | |||||||||
Class R2 — Offering and redemption price per share | — | 11.99 | 15.74 | |||||||||
Class R6 — Offering and redemption price per share | 12.69 | 12.38 | — | |||||||||
Institutional Class — Offering and redemption price per share | 12.69 | 12.38 | 16.24 | |||||||||
Select Class — Offering and redemption price per share | 12.64 | 12.31 | 16.46 | |||||||||
Class A maximum sales charge | 5.25 | % | 5.25 | % | 5.25 | % | ||||||
Class A maximum public offering price per share | $ | 13.14 | $ | 12.85 | $ | 16.78 | ||||||
|
|
|
|
|
| |||||||
Cost of investments in non-affiliates | $ | 766,198 | $ | 2,032,455 | $ | 293,258 | ||||||
Cost of investments in affiliates | 20,262 | 65,639 | 7,030 | |||||||||
Cost of foreign currency | 19 | 1,011 | 116 | |||||||||
| (a) | Per share amounts may not recalculate due to rounding of net assets and/or shares outstanding. |
| (b) | Redemption price for Class B and Class C Shares varies based upon length of time the shares are held. |
SEE NOTES TO FINANCIAL STATEMENTS.
| OCTOBER 31, 2012 | J.P. MORGAN INTERNATIONAL EQUITY FUNDS | 81 | ||||||
Table of Contents
STATEMENTS OF OPERATIONS
FOR THE YEAR ENDED OCTOBER 31, 2012
(Amounts in thousands)
| Emerging Economies Fund | Emerging Markets Equity Fund | Global Equity Income Fund | ||||||||||
INVESTMENT INCOME: | ||||||||||||
Interest income from affiliates | $ | 10 | $ | 5 | $ | — | ||||||
Dividend income from non-affiliates | 12,766 | 50,138 | 1,318 | |||||||||
Dividend income from affiliates | 12 | 64 | 1 | |||||||||
Foreign taxes withheld | (864 | ) | (2,866 | ) | (86 | ) | ||||||
|
|
|
|
|
| |||||||
Total investment income | 11,924 | 47,341 | 1,233 | |||||||||
|
|
|
|
|
| |||||||
EXPENSES: | ||||||||||||
Investment advisory fees | 3,789 | 21,956 | 226 | |||||||||
Administration fees | 330 | 1,916 | 25 | |||||||||
Distribution fees: | ||||||||||||
Class A | 78 | 663 | 5 | |||||||||
Class B | — | 51 | — | |||||||||
Class C | 10 | 325 | 4 | |||||||||
Class R2 | — | — | 2 | |||||||||
Shareholder servicing fees: | ||||||||||||
Class A | 78 | 663 | 5 | |||||||||
Class B | — | 17 | — | |||||||||
Class C | 3 | 109 | 1 | |||||||||
Class R2 | — | — | 1 | |||||||||
Class R5 | 134 | — | — | (a) | ||||||||
Institutional Class | — | 593 | — | |||||||||
Select Class | 195 | 3,217 | 62 | |||||||||
Custodian and accounting fees | 376 | 1,581 | 90 | |||||||||
Professional fees | 69 | 105 | 76 | |||||||||
Interest expense to affiliates | 10 | 10 | — | |||||||||
Trustees’ and Chief Compliance Officer’s fees | 4 | 24 | — | (a) | ||||||||
Printing and mailing costs | 29 | 412 | 8 | |||||||||
Registration and filing fees | 35 | 108 | 71 | |||||||||
Transfer agent fees | 143 | 2,841 | 9 | |||||||||
Offering costs | — | — | 37 | |||||||||
Other | 9 | 11 | 6 | |||||||||
|
|
|
|
|
| |||||||
Total expenses | 5,292 | 34,602 | 628 | |||||||||
|
|
|
|
|
| |||||||
Less amounts waived | (463 | ) | (103 | ) | (256 | ) | ||||||
Less expense reimbursements | — | — | (80 | ) | ||||||||
|
|
|
|
|
| |||||||
Net expenses | 4,829 | 34,499 | 292 | |||||||||
|
|
|
|
|
| |||||||
Net investment income (loss) | 7,095 | 12,842 | 941 | |||||||||
|
|
|
|
|
| |||||||
REALIZED/UNREALIZED GAINS (LOSSES): | ||||||||||||
Net realized gain (loss) on transactions from: | ||||||||||||
Investments in non-affiliates | (40,826 | ) | (85,057 | ) | (502 | ) | ||||||
Futures | — | — | (7 | ) | ||||||||
Foreign currency transactions | (411 | ) | (26 | ) | 70 | |||||||
|
|
|
|
|
| |||||||
Net realized gain (loss) | (41,237 | ) | (85,083 | ) | (439 | ) | ||||||
|
|
|
|
|
| |||||||
Change in net unrealized appreciation/depreciation of: | ||||||||||||
Investments in non-affiliates | 45,941 | 161,675 | 2,639 | |||||||||
Foreign currency translations | 23 | 11 | 22 | |||||||||
|
|
|
|
|
| |||||||
Change in net unrealized appreciation/depreciation | 45,964 | 161,686 | 2,661 | |||||||||
|
|
|
|
|
| |||||||
Net realized/unrealized gains (losses) | 4,727 | 76,603 | 2,222 | |||||||||
|
|
|
|
|
| |||||||
Change in net assets resulting from operations | $ | 11,822 | $ | 89,445 | $ | 3,163 | ||||||
|
|
|
|
|
| |||||||
| (a) | Amount rounds to less than $1,000. |
SEE NOTES TO FINANCIAL STATEMENTS.
| 82 | J.P. MORGAN INTERNATIONAL EQUITY FUNDS | OCTOBER 31, 2012 | ||||
Table of Contents
| Global Opportunities Fund | International Equity Fund | International Equity Index Fund | ||||||||||
INVESTMENT INCOME: | ||||||||||||
Interest income from affiliates | $ | — | $ | — | (a) | $ | — | (a) | ||||
Dividend income from non-affiliates | 127 | 28,514 | 21,117 | |||||||||
Dividend income from affiliates | — | (a) | 42 | 6 | ||||||||
Other income | — | 154 | 293 | |||||||||
Foreign taxes withheld | (6 | ) | (1,966 | ) | (1,992 | ) | ||||||
|
|
|
|
|
| |||||||
Total investment income | 121 | 26,744 | 19,424 | |||||||||
|
|
|
|
|
| |||||||
EXPENSES: | ||||||||||||
Investment advisory fees | 27 | 6,976 | 3,205 | |||||||||
Administration fees | 4 | 760 | 509 | |||||||||
Distribution fees: | ||||||||||||
Class A | 3 | 230 | 233 | |||||||||
Class B | — | 18 | 26 | |||||||||
Class C | 3 | 137 | 115 | |||||||||
Class R2 (b) | — | (a) | 2 | 3 | ||||||||
Shareholder servicing fees: | ||||||||||||
Class A | 3 | 230 | 233 | |||||||||
Class B | — | 6 | 9 | |||||||||
Class C | 1 | 46 | 39 | |||||||||
Class R2 (b) | — | (a) | 1 | 1 | ||||||||
Class R5 | — | (a) | 29 | — | ||||||||
Select Class | 7 | 481 | 1,175 | |||||||||
Custodian and accounting fees | 102 | 268 | 427 | |||||||||
Professional fees | 80 | 80 | 81 | |||||||||
Interest expense to affiliates | — | — | 1 | |||||||||
Trustees’ and Chief Compliance Officer’s fees | — | (a) | 9 | 2 | ||||||||
Printing and mailing costs | 14 | 94 | 85 | |||||||||
Registration and filing fees | 81 | 103 | 62 | |||||||||
Transfer agent fees | 13 | 426 | 354 | |||||||||
Other | 12 | 18 | 12 | |||||||||
|
|
|
|
|
| |||||||
Total expenses | 350 | 9,914 | 6,572 | |||||||||
|
|
|
|
|
| |||||||
Less amounts waived | (31 | ) | (1,727 | ) | (1,385 | ) | ||||||
Less expense reimbursements | (268 | ) | — | — | ||||||||
|
|
|
|
|
| |||||||
Net expenses | 51 | 8,187 | 5,187 | |||||||||
|
|
|
|
|
| |||||||
Net investment income (loss) | 70 | 18,557 | 14,237 | |||||||||
|
|
|
|
|
| |||||||
REALIZED/UNREALIZED GAINS (LOSSES): | ||||||||||||
Net realized gain (loss) on transactions from: | ||||||||||||
Investments in non-affiliates | (202 | ) | (9,003 | ) | (8,736 | ) | ||||||
Futures | 6 | — | 1,331 | |||||||||
Foreign currency transactions | 40 | 185 | 135 | |||||||||
|
|
|
|
|
| |||||||
Net realized gain (loss) | (156 | ) | (8,818 | ) | (7,270 | ) | ||||||
|
|
|
|
|
| |||||||
Change in net unrealized appreciation/depreciation of: | ||||||||||||
Investments in non-affiliates | 464 | 65,491 | 23,626 | (c) | ||||||||
Futures | — | — | (869 | ) | ||||||||
Foreign currency translations | (15 | ) | (136 | ) | (2 | ) | ||||||
|
|
|
|
|
| |||||||
Change in net unrealized appreciation/depreciation | 449 | 65,355 | 22,755 | |||||||||
|
|
|
|
|
| |||||||
Net realized/unrealized gains (losses) | 293 | 56,537 | 15,485 | |||||||||
|
|
|
|
|
| |||||||
Change in net assets resulting from operations | $ | 363 | $ | 75,094 | $ | 29,722 | ||||||
|
|
|
|
|
| |||||||
| (a) | Amount rounds to less than $1,000. |
| (b) | Commencement of offering of class of shares effective November 1, 2011 for Global Opportunities Fund. |
| (c) | Net of change in India capital gains tax of approximately $5,000 for International Equity Index Fund. |
SEE NOTES TO FINANCIAL STATEMENTS.
| OCTOBER 31, 2012 | J.P. MORGAN INTERNATIONAL EQUITY FUNDS | 83 | ||||||
Table of Contents
STATEMENTS OF OPERATIONS
FOR THE YEAR ENDED OCTOBER 31, 2012 (continued)
(Amounts in thousands)
| International Opportunities Fund | International Value Fund | Intrepid International Fund | ||||||||||
INVESTMENT INCOME: | ||||||||||||
Interest income from affiliates | $ | — | $ | 1 | $ | — | ||||||
Dividend income from non-affiliates | 23,142 | 89,493 | 9,544 | |||||||||
Dividend income from affiliates | 21 | 55 | 10 | |||||||||
Other income | 35 | 118 | — | |||||||||
Foreign taxes withheld | (1,553 | ) | (6,167 | ) | (639 | ) | ||||||
|
|
|
|
|
| |||||||
Total investment income | 21,645 | 83,500 | 8,915 | |||||||||
|
|
|
|
|
| |||||||
EXPENSES: | ||||||||||||
Investment advisory fees | 3,874 | 12,530 | 2,400 | |||||||||
Administration fees | 563 | 1,822 | 246 | |||||||||
Distribution fees: | ||||||||||||
Class A | 131 | 289 | 78 | |||||||||
Class B | 4 | 23 | — | |||||||||
Class C | 4 | 114 | 7 | |||||||||
Class R2 | — | 4 | — | (a) | ||||||||
Shareholder servicing fees: | ||||||||||||
Class A | 131 | 289 | 78 | |||||||||
Class B | 1 | 8 | — | |||||||||
Class C | 2 | 38 | 2 | |||||||||
Class R2 | — | 2 | — | (a) | ||||||||
Institutional Class | 39 | 589 | 240 | |||||||||
Select Class | 72 | 3,368 | 26 | |||||||||
Custodian and accounting fees | 278 | 589 | 230 | |||||||||
Professional fees | 79 | 96 | 81 | |||||||||
Interest expense to affiliates | — | 8 | — | |||||||||
Trustees’ and Chief Compliance Officer’s fees | 7 | 22 | 3 | |||||||||
Printing and mailing costs | 53 | 388 | 7 | |||||||||
Registration and filing fees | 61 | 170 | 66 | |||||||||
Transfer agent fees | 212 | 2,583 | 105 | |||||||||
Other | 4 | 9 | 3 | |||||||||
|
|
|
|
|
| |||||||
Total expenses | 5,515 | 22,941 | 3,572 | |||||||||
|
|
|
|
|
| |||||||
Less amounts waived | (35 | ) | (570 | ) | (571 | ) | ||||||
|
|
|
|
|
| |||||||
Net expenses | 5,480 | 22,371 | 3,001 | |||||||||
|
|
|
|
|
| |||||||
Net investment income (loss) | 16,165 | 61,129 | 5,914 | |||||||||
|
|
|
|
|
| |||||||
REALIZED/UNREALIZED GAINS (LOSSES): | ||||||||||||
Net realized gain (loss) on transactions from: | ||||||||||||
Investments in non-affiliates | (18,074 | ) | (144,254 | ) | (13,119 | ) | ||||||
Futures | 88 | 1,586 | — | |||||||||
Foreign currency transactions | 3,207 | 1,205 | (48 | ) | ||||||||
|
|
|
|
|
| |||||||
Net realized gain (loss) | (14,779 | ) | (141,463 | ) | (13,167 | ) | ||||||
|
|
|
|
|
| |||||||
Change in net unrealized appreciation/depreciation of: | ||||||||||||
Investments in non-affiliates | 49,165 | 190,677 | 24,813 | |||||||||
Futures | (40 | ) | 287 | — | ||||||||
Foreign currency translations | (1,675 | ) | (4,635 | ) | (47 | ) | ||||||
|
|
|
|
|
| |||||||
Change in net unrealized appreciation/depreciation | 47,450 | 186,329 | 24,766 | |||||||||
|
|
|
|
|
| |||||||
Net realized/unrealized gains (losses) | 32,671 | 44,866 | 11,599 | |||||||||
|
|
|
|
|
| |||||||
Change in net assets resulting from operations | $ | 48,836 | $ | 105,995 | $ | 17,513 | ||||||
|
|
|
|
|
| |||||||
| (a) | Amount rounds to less than $1,000 |
SEE NOTES TO FINANCIAL STATEMENTS.
| 84 | J.P. MORGAN INTERNATIONAL EQUITY FUNDS | OCTOBER 31, 2012 | ||||
Table of Contents
STATEMENTS OF CHANGES IN NET ASSETS
FOR THE PERIODS INDICATED
(Amounts in thousands)
| Emerging Economies Fund | Emerging Markets Equity Fund | |||||||||||||||
| Year Ended 10/31/2012 | Year Ended 10/31/2011 | Year Ended 10/31/2012 | Year Ended 10/31/2011 | |||||||||||||
CHANGE IN NET ASSETS RESULTING FROM OPERATIONS: | ||||||||||||||||
Net investment income (loss) | $ | 7,095 | $ | 4,223 | $ | 12,842 | $ | 10,581 | ||||||||
Net realized gain (loss) | (41,237 | ) | (16,884 | ) | (85,083 | ) | (16 | ) | ||||||||
Change in net unrealized appreciation/depreciation | 45,964 | (34,905 | ) | 161,686 | (226,329 | ) | ||||||||||
|
|
|
|
|
|
|
| |||||||||
Change in net assets resulting from operations | 11,822 | (47,566 | ) | 89,445 | (215,764 | ) | ||||||||||
|
|
|
|
|
|
|
| |||||||||
DISTRIBUTIONS TO SHAREHOLDERS: | ||||||||||||||||
Class A | ||||||||||||||||
From net investment income | (404 | ) | — | (a) | — | (1,007 | ) | |||||||||
Class C | ||||||||||||||||
From net investment income | (7 | ) | — | — | (39 | ) | ||||||||||
Class R5 | ||||||||||||||||
From net investment income | (3,406 | ) | (248 | ) | — | — | ||||||||||
Institutional Class | ||||||||||||||||
From net investment income | — | — | (1,158 | ) | (3,282 | ) | ||||||||||
Select Class | ||||||||||||||||
From net investment income | (1,054 | ) | (126 | ) | (767 | ) | (5,259 | ) | ||||||||
|
|
|
|
|
|
|
| |||||||||
Total distributions to shareholders | (4,871 | ) | (374 | ) | (1,925 | ) | (9,587 | ) | ||||||||
|
|
|
|
|
|
|
| |||||||||
CAPITAL TRANSACTIONS: | ||||||||||||||||
Change in net assets resulting from capital transactions | 92,749 | 386,712 | 1,200 | 644,976 | ||||||||||||
|
|
|
|
|
|
|
| |||||||||
NET ASSETS: | ||||||||||||||||
Change in net assets | 99,700 | 338,772 | 88,720 | 419,625 | ||||||||||||
Beginning of period | 346,233 | 7,461 | 2,163,766 | 1,744,141 | ||||||||||||
|
|
|
|
|
|
|
| |||||||||
End of period | $ | 445,933 | $ | 346,233 | $ | 2,252,486 | $ | 2,163,766 | ||||||||
|
|
|
|
|
|
|
| |||||||||
Accumulated undistributed (distributions in excess of) net investment income | $ | 5,893 | $ | 3,911 | $ | 12,468 | $ | 1,577 | ||||||||
|
|
|
|
|
|
|
| |||||||||
| (a) | Amount rounds to less than $1,000. |
SEE NOTES TO FINANCIAL STATEMENTS.
| OCTOBER 31, 2012 | J.P. MORGAN INTERNATIONAL EQUITY FUNDS | 85 | ||||||
Table of Contents
STATEMENTS OF CHANGES IN NET ASSETS
FOR THE PERIODS INDICATED (continued)
(Amounts in thousands)
| Global Equity Income Fund | Global Opportunities Fund | |||||||||||||||
| Year Ended 10/31/2012 | Period Ended 10/31/2011(a) | Year Ended 10/31/2012 | Year Ended 10/31/2011 | |||||||||||||
CHANGE IN NET ASSETS RESULTING FROM OPERATIONS: | ||||||||||||||||
Net investment income (loss) | $ | 941 | $ | 75 | $ | 70 | $ | 39 | ||||||||
Net realized gain (loss) | (439 | ) | (146 | ) | (156 | ) | (240 | ) | ||||||||
Change in net unrealized appreciation/depreciation | 2,661 | (184 | ) | 449 | (512 | ) | ||||||||||
|
|
|
|
|
|
|
| |||||||||
Change in net assets resulting from operations | 3,163 | (255 | ) | 363 | (713 | ) | ||||||||||
|
|
|
|
|
|
|
| |||||||||
DISTRIBUTIONS TO SHAREHOLDERS: | ||||||||||||||||
Class A | ||||||||||||||||
From net investment income | (55 | ) | (2 | ) | (14 | ) | (9 | ) | ||||||||
Class C | ||||||||||||||||
From net investment income | (15 | ) | (1 | ) | (4 | ) | (3 | ) | ||||||||
Class R2 (b) | ||||||||||||||||
From net investment income | (13 | ) | (1 | ) | (1 | ) | — | |||||||||
Class R5 | ||||||||||||||||
From net investment income | (16 | ) | (1 | ) | (2 | ) | (2 | ) | ||||||||
Class R6 (b) | ||||||||||||||||
From net investment income | — | — | (1 | ) | — | |||||||||||
Select Class | ||||||||||||||||
From net investment income | (846 | ) | (64 | ) | (41 | ) | (45 | ) | ||||||||
|
|
|
|
|
|
|
| |||||||||
Total distributions to shareholders | (945 | ) | (69 | ) | (63 | ) | (59 | ) | ||||||||
|
|
|
|
|
|
|
| |||||||||
CAPITAL TRANSACTIONS: | ||||||||||||||||
Change in net assets resulting from capital transactions | 32,705 | 3,268 | (216 | ) | 2,168 | |||||||||||
|
|
|
|
|
|
|
| |||||||||
NET ASSETS: | ||||||||||||||||
Change in net assets | 34,923 | 2,944 | 84 | 1,396 | ||||||||||||
Beginning of period | 2,944 | — | 4,539 | 3,143 | ||||||||||||
|
|
|
|
|
|
|
| |||||||||
End of period | $ | 37,867 | $ | 2,944 | $ | 4,623 | $ | 4,539 | ||||||||
|
|
|
|
|
|
|
| |||||||||
Accumulated undistributed (distributions in excess of) net investment income | $ | 72 | $ | 6 | $ | 93 | $ | 46 | ||||||||
|
|
|
|
|
|
|
| |||||||||
| (a) | Commencement of operations was February 28, 2011. |
| (b) | Commencement of offering of class of shares effective November 1, 2011 for Global Opportunities Fund. |
SEE NOTES TO FINANCIAL STATEMENTS.
| 86 | J.P. MORGAN INTERNATIONAL EQUITY FUNDS | OCTOBER 31, 2012 | ||||
Table of Contents
| International Equity Fund | International Equity Index Fund | |||||||||||||||
| Year Ended 10/31/2012 | Year Ended 10/31/2011 | Year Ended 10/31/2012 | Year Ended 10/31/2011 | |||||||||||||
CHANGE IN NET ASSETS RESULTING FROM OPERATIONS: | ||||||||||||||||
Net investment income (loss) | $ | 18,557 | $ | 13,038 | $ | 14,237 | $ | 15,743 | ||||||||
Net realized gain (loss) | (8,818 | ) | (3,838 | ) | (7,270 | ) | 11,150 | |||||||||
Change in net unrealized appreciation/depreciation | 65,355 | (42,482 | ) | 22,755 | (92,735 | ) | ||||||||||
|
|
|
|
|
|
|
| |||||||||
Change in net assets resulting from operations | 75,094 | (33,282 | ) | 29,722 | (65,842 | ) | ||||||||||
|
|
|
|
|
|
|
| |||||||||
DISTRIBUTIONS TO SHAREHOLDERS: | ||||||||||||||||
Class A | ||||||||||||||||
From net investment income | (1,450 | ) | (2,093 | ) | (2,361 | ) | (2,889 | ) | ||||||||
Class B | ||||||||||||||||
From net investment income | (29 | ) | (39 | ) | (68 | ) | (107 | ) | ||||||||
Class C | ||||||||||||||||
From net investment income | (225 | ) | (276 | ) | (261 | ) | (307 | ) | ||||||||
Class R2 | ||||||||||||||||
From net investment income | (4 | ) | (1 | ) | (11 | ) | (5 | ) | ||||||||
Class R5 | ||||||||||||||||
From net investment income | (1,179 | ) | (1,018 | ) | — | — | ||||||||||
Class R6 (a) | ||||||||||||||||
From net investment income | (11,257 | ) | (5,557 | ) | — | — | ||||||||||
Select Class | ||||||||||||||||
From net investment income | (3,509 | ) | (3,854 | ) | (13,654 | ) | (13,161 | ) | ||||||||
|
|
|
|
|
|
|
| |||||||||
Total distributions to shareholders | (17,653 | ) | (12,838 | ) | (16,355 | ) | (16,469 | ) | ||||||||
|
|
|
|
|
|
|
| |||||||||
CAPITAL TRANSACTIONS: | ||||||||||||||||
Change in net assets resulting from capital transactions | 313,506 | 108,846 | (49,829 | ) | 38,549 | |||||||||||
|
|
|
|
|
|
|
| |||||||||
NET ASSETS: | ||||||||||||||||
Change in net assets | 370,947 | 62,726 | (36,462 | ) | (43,762 | ) | ||||||||||
Beginning of period | 705,088 | 642,362 | 621,855 | 665,617 | ||||||||||||
|
|
|
|
|
|
|
| |||||||||
End of period | $ | 1,076,035 | $ | 705,088 | $ | 585,393 | $ | 621,855 | ||||||||
|
|
|
|
|
|
|
| |||||||||
Accumulated undistributed (distributions in excess of) net | $ | 1,414 | $ | 325 | $ | 9,952 | $ | 10,590 | ||||||||
|
|
|
|
|
|
|
| |||||||||
| (a) | Commencement of offering of class of shares effective November 30, 2010 for International Equity Fund. |
SEE NOTES TO FINANCIAL STATEMENTS.
| OCTOBER 31, 2012 | J.P. MORGAN INTERNATIONAL EQUITY FUNDS | 87 | ||||||
Table of Contents
STATEMENTS OF CHANGES IN NET ASSETS
FOR THE PERIODS INDICATED (continued)
(Amounts in thousands)
| International Opportunities Fund | International Value Fund | |||||||||||||||
| Year Ended 10/31/2012 | Year Ended 10/31/2011 | Year Ended 10/31/2012 | Year Ended 10/31/2011 | |||||||||||||
CHANGE IN NET ASSETS RESULTING FROM OPERATIONS: | ||||||||||||||||
Net investment income (loss) | $ | 16,165 | $ | 8,748 | $ | 61,129 | $ | 45,281 | ||||||||
Net realized gain (loss) | (14,779 | ) | (1,059 | ) | (141,463 | ) | 46,593 | |||||||||
Change in net unrealized appreciation/depreciation | 47,450 | (46,324 | ) | 186,329 | (258,093 | ) | ||||||||||
|
|
|
|
|
|
|
| |||||||||
Change in net assets resulting from operations | 48,836 | (38,635 | ) | 105,995 | (166,219 | ) | ||||||||||
|
|
|
|
|
|
|
| |||||||||
DISTRIBUTIONS TO SHAREHOLDERS: | ||||||||||||||||
Class A | ||||||||||||||||
From net investment income | (1,463 | ) | (363 | ) | (3,673 | ) | (4,623 | ) | ||||||||
Class B | ||||||||||||||||
From net investment income | (11 | ) | (16 | ) | (89 | ) | (129 | ) | ||||||||
Class C | ||||||||||||||||
From net investment income | (11 | ) | (19 | ) | (433 | ) | (534 | ) | ||||||||
Class R2 | ||||||||||||||||
From net investment income | — | — | (20 | ) | (37 | ) | ||||||||||
Class R6 (a) | ||||||||||||||||
From net investment income | (12,897 | ) | (1 | ) | (2 | ) | (2 | ) | ||||||||
Institutional Class | ||||||||||||||||
From net investment income | (1,204 | ) | (7,005 | ) | (19,820 | ) | (15,255 | ) | ||||||||
Select Class | ||||||||||||||||
From net investment income | (791 | ) | (794 | ) | (48,068 | ) | (31,789 | ) | ||||||||
|
|
|
|
|
|
|
| |||||||||
Total distributions to shareholders | (16,377 | ) | (8,198 | ) | (72,105 | ) | (52,369 | ) | ||||||||
|
|
|
|
|
|
|
| |||||||||
CAPITAL TRANSACTIONS: | ||||||||||||||||
Change in net assets resulting from capital transactions | 312,142 | 218,691 | 139,907 | 777,579 | ||||||||||||
|
|
|
|
|
|
|
| |||||||||
NET ASSETS: | ||||||||||||||||
Change in net assets | 344,601 | 171,858 | 173,797 | 558,991 | ||||||||||||
Beginning of period | 490,584 | 318,726 | 2,093,625 | 1,534,634 | ||||||||||||
|
|
|
|
|
|
|
| |||||||||
End of period | $ | 835,185 | $ | 490,584 | $ | 2,267,422 | $ | 2,093,625 | ||||||||
|
|
|
|
|
|
|
| |||||||||
Accumulated undistributed (distributions in excess of) net | $ | 18,370 | $ | 15,375 | $ | 50,317 | $ | 60,088 | ||||||||
|
|
|
|
|
|
|
| |||||||||
| (a) | Commencement of offering of class of shares effective November 30, 2010. |
SEE NOTES TO FINANCIAL STATEMENTS.
| 88 | J.P. MORGAN INTERNATIONAL EQUITY FUNDS | OCTOBER 31, 2012 | ||||
Table of Contents
| Intrepid International Fund | ||||||||
| Year Ended 10/31/2012 | Year Ended 10/31/2011 | |||||||
CHANGE IN NET ASSETS RESULTING FROM OPERATIONS: | ||||||||
Net investment income (loss) | $ | 5,914 | $ | 3,656 | ||||
Net realized gain (loss) | (13,167 | ) | 713 | |||||
Change in net unrealized appreciation/depreciation | 24,766 | (17,717 | ) | |||||
|
|
|
| |||||
Change in net assets resulting from operations | 17,513 | (13,348 | ) | |||||
|
|
|
| |||||
DISTRIBUTIONS TO SHAREHOLDERS: | ||||||||
Class A | ||||||||
From net investment income | (328 | ) | (518 | ) | ||||
Class C | ||||||||
From net investment income | (2 | ) | (12 | ) | ||||
Class R2 | ||||||||
From net investment income | (1 | ) | (1 | ) | ||||
Institutional Class | ||||||||
From net investment income | (3,168 | ) | (2,372 | ) | ||||
Select Class | ||||||||
From net investment income | (144 | ) | (152 | ) | ||||
|
|
|
| |||||
Total distributions to shareholders | (3,643 | ) | (3,055 | ) | ||||
|
|
|
| |||||
CAPITAL TRANSACTIONS: | ||||||||
Change in net assets resulting from capital transactions | 108,810 | 88,261 | ||||||
|
|
|
| |||||
NET ASSETS: | ||||||||
Change in net assets | 122,680 | 71,858 | ||||||
Beginning of period | 223,549 | 151,691 | ||||||
|
|
|
| |||||
End of period | $ | 346,229 | $ | 223,549 | ||||
|
|
|
| |||||
Accumulated undistributed (distributions in excess of) net investment income | $ | 5,150 | $ | 2,927 | ||||
|
|
|
| |||||
SEE NOTES TO FINANCIAL STATEMENTS.
| OCTOBER 31, 2012 | J.P. MORGAN INTERNATIONAL EQUITY FUNDS | 89 | ||||||
Table of Contents
STATEMENTS OF CHANGES IN NET ASSETS
FOR THE PERIODS INDICATED (continued)
(Amounts in thousands)
| Emerging Economies Fund | Emerging Markets Equity Fund | |||||||||||||||
| Year Ended 10/31/2012 | Year Ended 10/31/2011 | Year Ended 10/31/2012 | Year Ended 10/31/2011 | |||||||||||||
CAPITAL TRANSACTIONS: | ||||||||||||||||
Class A | ||||||||||||||||
Proceeds from shares issued | $ | 17,345 | $ | 57,936 | $ | 115,445 | $ | 175,609 | ||||||||
Dividends and distributions reinvested | 404 | — | (a) | — | 937 | |||||||||||
Cost of shares redeemed | (31,488 | ) | (7,318 | ) | (110,590 | ) | (133,303 | ) | ||||||||
Redemption fees | — | — | (a) | — | 7 | |||||||||||
|
|
|
|
|
|
|
| |||||||||
Change in net assets resulting from Class A capital transactions | $ | (13,739 | ) | $ | 50,618 | $ | 4,855 | $ | 43,250 | |||||||
|
|
|
|
|
|
|
| |||||||||
Class B | ||||||||||||||||
Proceeds from shares issued | $ | — | $ | — | $ | 212 | $ | 646 | ||||||||
Cost of shares redeemed | — | — | (1,932 | ) | (2,980 | ) | ||||||||||
Redemption fees | — | — | — | — | (a) | |||||||||||
|
|
|
|
|
|
|
| |||||||||
Change in net assets resulting from Class B capital transactions | $ | — | $ | — | $ | (1,720 | ) | $ | (2,334 | ) | ||||||
|
|
|
|
|
|
|
| |||||||||
Class C | ||||||||||||||||
Proceeds from shares issued | $ | 2,046 | $ | 460 | $ | 10,193 | $ | 21,953 | ||||||||
Dividends and distributions reinvested | 7 | — | — | 33 | ||||||||||||
Cost of shares redeemed | (483 | ) | (9 | ) | (10,395 | ) | (14,028 | ) | ||||||||
Redemption fees | — | — | (a) | — | 1 | |||||||||||
|
|
|
|
|
|
|
| |||||||||
Change in net assets resulting from Class C capital transactions | $ | 1,570 | $ | 451 | $ | (202 | ) | $ | 7,959 | |||||||
|
|
|
|
|
|
|
| |||||||||
Class R5 | ||||||||||||||||
Proceeds from shares issued | $ | 175,434 | $ | 261,420 | $ | — | $ | — | ||||||||
Dividends and distributions reinvested | 3,406 | 248 | — | — | ||||||||||||
Cost of shares redeemed | (80,783 | ) | (3,561 | ) | — | — | ||||||||||
Redemption fees | — | 1 | — | — | ||||||||||||
|
|
|
|
|
|
|
| |||||||||
Change in net assets resulting from Class R5 capital transactions | $ | 98,057 | $ | 258,108 | $ | — | $ | — | ||||||||
|
|
|
|
|
|
|
| |||||||||
Institutional Class | ||||||||||||||||
Proceeds from shares issued | $ | — | $ | — | $ | 208,354 | $ | 280,763 | ||||||||
Dividends and distributions reinvested | — | — | 934 | 2,114 | ||||||||||||
Cost of shares redeemed | — | — | (200,452 | ) | (138,088 | ) | ||||||||||
Redemption fees | — | — | — | 15 | ||||||||||||
|
|
|
|
|
|
|
| |||||||||
Change in net assets resulting from Institutional Class capital transactions | $ | — | $ | — | $ | 8,836 | $ | 144,804 | ||||||||
|
|
|
|
|
|
|
| |||||||||
Select Class | ||||||||||||||||
Proceeds from shares issued | $ | 32,183 | $ | 93,995 | $ | 507,533 | $ | 804,392 | ||||||||
Dividends and distributions reinvested | 64 | 55 | 569 | 2,409 | ||||||||||||
Cost of shares redeemed | (25,386 | ) | (16,516 | ) | (518,671 | ) | (355,531 | ) | ||||||||
Redemption fees | — | 1 | — | 27 | ||||||||||||
|
|
|
|
|
|
|
| |||||||||
Change in net assets resulting from Select Class capital transactions | $ | 6,861 | $ | 77,535 | $ | (10,569 | ) | $ | 451,297 | |||||||
|
|
|
|
|
|
|
| |||||||||
Total change in net assets resulting from capital transactions | $ | 92,749 | $ | 386,712 | $ | 1,200 | $ | 644,976 | ||||||||
|
|
|
|
|
|
|
| |||||||||
SEE NOTES TO FINANCIAL STATEMENTS.
| 90 | J.P. MORGAN INTERNATIONAL EQUITY FUNDS | OCTOBER 31, 2012 | ||||
Table of Contents
| Emerging Economies Fund | Emerging Markets Equity Fund | |||||||||||||||
| Year Ended 10/31/2012 | Year Ended 10/31/2011 | Year Ended 10/31/2012 | Year Ended 10/31/2011 | |||||||||||||
SHARE TRANSACTIONS: | ||||||||||||||||
Class A | ||||||||||||||||
Issued | 1,350 | 3,985 | 5,368 | 7,727 | ||||||||||||
Reinvested | 35 | — | (a) | — | 40 | |||||||||||
Redeemed | (2,467 | ) | (549 | ) | (5,178 | ) | (5,970 | ) | ||||||||
|
|
|
|
|
|
|
| |||||||||
Change in Class A Shares | (1,082 | ) | 3,436 | 190 | 1,797 | |||||||||||
|
|
|
|
|
|
|
| |||||||||
Class B | ||||||||||||||||
Issued | — | — | 10 | 28 | ||||||||||||
Redeemed | — | — | (92 | ) | (131 | ) | ||||||||||
|
|
|
|
|
|
|
| |||||||||
Change in Class B Shares | — | — | (82 | ) | (103 | ) | ||||||||||
|
|
|
|
|
|
|
| |||||||||
Class C | ||||||||||||||||
Issued | 160 | 38 | 479 | 960 | ||||||||||||
Reinvested | 1 | — | — | 2 | ||||||||||||
Redeemed | (38 | ) | (1 | ) | (501 | ) | (629 | ) | ||||||||
|
|
|
|
|
|
|
| |||||||||
Change in Class C Shares | 123 | 37 | (22 | ) | 333 | |||||||||||
|
|
|
|
|
|
|
| |||||||||
Class R5 | ||||||||||||||||
Issued | 13,598 | 18,199 | — | — | ||||||||||||
Reinvested | 292 | 17 | — | — | ||||||||||||
Redeemed | (6,289 | ) | (242 | ) | — | — | ||||||||||
|
|
|
|
|
|
|
| |||||||||
Change in Class R5 Shares | 7,601 | 17,974 | — | — | ||||||||||||
|
|
|
|
|
|
|
| |||||||||
Institutional Class | ||||||||||||||||
Issued | — | — | 9,474 | 12,015 | ||||||||||||
Reinvested | — | — | 46 | 88 | ||||||||||||
Redeemed | — | — | (9,257 | ) | (5,960 | ) | ||||||||||
|
|
|
|
|
|
|
| |||||||||
Change in Institutional Class Shares | — | — | 263 | 6,143 | ||||||||||||
|
|
|
|
|
|
|
| |||||||||
Select Class | ||||||||||||||||
Issued | 2,538 | 6,525 | 23,388 | 34,906 | ||||||||||||
Reinvested | 5 | 4 | 28 | 102 | ||||||||||||
Redeemed | (1,977 | ) | (1,234 | ) | (24,162 | ) | (15,495 | ) | ||||||||
|
|
|
|
|
|
|
| |||||||||
Change in Select Class Shares | 566 | 5,295 | (746 | ) | 19,513 | |||||||||||
|
|
|
|
|
|
|
| |||||||||
| (a) | Amount rounds to less than 1,000. |
SEE NOTES TO FINANCIAL STATEMENTS.
| OCTOBER 31, 2012 | J.P. MORGAN INTERNATIONAL EQUITY FUNDS | 91 | ||||||
Table of Contents
STATEMENTS OF CHANGES IN NET ASSETS
FOR THE PERIODS INDICATED (continued)
(Amounts in thousands)
| Global Equity Income Fund | Global Opportunities Fund | |||||||||||||||
| Year Ended 10/31/2012 | Period Ended 10/31/2011 (a) | Year Ended 10/31/2012 | Year Ended 10/31/2011 | |||||||||||||
CAPITAL TRANSACTIONS: | ||||||||||||||||
Class A | ||||||||||||||||
Proceeds from shares issued | $ | 9,224 | $ | 129 | $ | 416 | $ | 2,535 | ||||||||
Dividends and distributions reinvested | 55 | 2 | 15 | 9 | ||||||||||||
Cost of shares redeemed | (450 | ) | — | (b) | (690 | ) | (1,026 | ) | ||||||||
Redemption fees | — | — | — | — | (b) | |||||||||||
|
|
|
|
|
|
|
| |||||||||
Change in net assets resulting from Class A capital transactions | $ | 8,829 | $ | 131 | $ | (259 | ) | $ | 1,518 | |||||||
|
|
|
|
|
|
|
| |||||||||
Class C | ||||||||||||||||
Proceeds from shares issued | $ | 530 | $ | 64 | $ | 67 | $ | 354 | ||||||||
Dividends and distributions reinvested | 14 | 1 | 4 | 3 | ||||||||||||
Cost of shares redeemed | — | (a) | — | (116 | ) | (65 | ) | |||||||||
Redemption fees | — | — | — | — | (b) | |||||||||||
|
|
|
|
|
|
|
| |||||||||
Change in net assets resulting from Class C capital transactions | $ | 544 | $ | 65 | $ | (45 | ) | $ | 292 | |||||||
|
|
|
|
|
|
|
| |||||||||
Class R2 (c) | ||||||||||||||||
Proceeds from shares issued | $ | 367 | $ | 50 | $ | 50 | $ | — | ||||||||
Dividends and distributions reinvested | 13 | 1 | 1 | — | ||||||||||||
|
|
|
|
|
|
|
| |||||||||
Change in net assets resulting from Class R2 capital transactions | $ | 380 | $ | 51 | $ | 51 | $ | — | ||||||||
|
|
|
|
|
|
|
| |||||||||
Class R5 | ||||||||||||||||
Proceeds from shares issued | $ | 367 | $ | 50 | $ | — | $ | — | ||||||||
Dividends and distributions reinvested | 16 | 1 | 2 | 2 | ||||||||||||
Redemption fees | — | — | — | — | (b) | |||||||||||
|
|
|
|
|
|
|
| |||||||||
Change in net assets resulting from Class R5 capital transactions | $ | 383 | $ | 51 | $ | 2 | $ | 2 | ||||||||
|
|
|
|
|
|
|
| |||||||||
Class R6 (c) | ||||||||||||||||
Proceeds from shares issued | $ | — | $ | — | $ | 50 | $ | — | ||||||||
Dividends and distributions reinvested | — | — | 1 | — | ||||||||||||
|
|
|
|
|
|
|
| |||||||||
Change in net assets resulting from Class R6 capital transactions | $ | — | $ | — | $ | 51 | $ | — | ||||||||
|
|
|
|
|
|
|
| |||||||||
Select Class | ||||||||||||||||
Proceeds from shares issued | $ | 21,742 | $ | 2,921 | $ | 78 | $ | 1,504 | ||||||||
Dividends and distributions reinvested | 839 | 64 | 40 | 45 | ||||||||||||
Cost of shares redeemed | (12 | ) | (15 | ) | (134 | ) | (1,193 | ) | ||||||||
Redemption fees | — | — | — | — | (b) | |||||||||||
|
|
|
|
|
|
|
| |||||||||
Change in net assets resulting from Select Class capital transactions | $ | 22,569 | $ | 2,970 | $ | (16 | ) | $ | 356 | |||||||
|
|
|
|
|
|
|
| |||||||||
Total change in net assets resulting from capital transactions | $ | 32,705 | $ | 3,268 | $ | (216 | ) | $ | 2,168 | |||||||
|
|
|
|
|
|
|
| |||||||||
SEE NOTES TO FINANCIAL STATEMENTS.
| 92 | J.P. MORGAN INTERNATIONAL EQUITY FUNDS | OCTOBER 31, 2012 | ||||
Table of Contents
| Global Equity Income Fund | Global Opportunities Fund | |||||||||||||||
| Year Ended 10/31/2012 | Period Ended 10/31/2011 (a) | Year Ended 10/31/2012 | Year Ended 10/31/2011 | |||||||||||||
SHARE TRANSACTIONS: | ||||||||||||||||
Class A | ||||||||||||||||
Issued | 656 | 9 | 32 | 179 | ||||||||||||
Reinvested | 4 | — | (b) | 1 | 1 | |||||||||||
Redeemed | (32 | ) | — | (b) | (54 | ) | (83 | ) | ||||||||
|
|
|
|
|
|
|
| |||||||||
Change in Class A Shares | 628 | 9 | (21 | ) | 97 | |||||||||||
|
|
|
|
|
|
|
| |||||||||
Class C | ||||||||||||||||
Issued | 41 | 4 | 5 | 25 | ||||||||||||
Reinvested | 1 | — | (b) | — | (b) | — | (b) | |||||||||
Redeemed | — | (b) | — | (9 | ) | (5 | ) | |||||||||
|
|
|
|
|
|
|
| |||||||||
Change in Class C Shares | 42 | 4 | (4 | ) | 20 | |||||||||||
|
|
|
|
|
|
|
| |||||||||
Class R2 (c) | ||||||||||||||||
Issued | 29 | 3 | 4 | — | ||||||||||||
Reinvested | 1 | — | (b) | — | (b) | — | ||||||||||
|
|
|
|
|
|
|
| |||||||||
Change in Class R2 Shares | 30 | 3 | 4 | — | ||||||||||||
|
|
|
|
|
|
|
| |||||||||
Class R5 | ||||||||||||||||
Issued | 29 | 3 | — | — | ||||||||||||
Reinvested | 1 | — | (b) | — | (b) | — | (b) | |||||||||
|
|
|
|
|
|
|
| |||||||||
Change in Class R5 Shares | 30 | 3 | — | (b) | — | (b) | ||||||||||
|
|
|
|
|
|
|
| |||||||||
Class R6 (c) | ||||||||||||||||
Issued | — | — | 4 | — | ||||||||||||
Reinvested | — | — | — | (b) | — | |||||||||||
|
|
|
|
|
|
|
| |||||||||
Change in Class R6 Shares | — | — | 4 | — | ||||||||||||
|
|
|
|
|
|
|
| |||||||||
Select Class | ||||||||||||||||
Issued | 1,669 | 195 | 6 | 100 | ||||||||||||
Reinvested | 62 | 5 | 4 | 3 | ||||||||||||
Redeemed | (1 | ) | (1 | ) | (11 | ) | (82 | ) | ||||||||
|
|
|
|
|
|
|
| |||||||||
Change in Select Class Shares | 1,730 | 199 | (1 | ) | 21 | |||||||||||
|
|
|
|
|
|
|
| |||||||||
| (a) | Commencement of operations was February 28, 2011. |
| (b) | Amount rounds to less than 1,000. |
| (c) | Commencement of offering of class of shares effective November 1, 2011 for Global Opportunities Fund. |
SEE NOTES TO FINANCIAL STATEMENTS.
| OCTOBER 31, 2012 | J.P. MORGAN INTERNATIONAL EQUITY FUNDS | 93 | ||||||
Table of Contents
STATEMENTS OF CHANGES IN NET ASSETS
FOR THE PERIODS INDICATED (continued)
(Amounts in thousands)
| International Equity Fund | International Equity Index Fund | |||||||||||||||
| Year Ended 10/31/2012 | Year Ended 10/31/2011 | Year Ended 10/31/2012 | Year Ended 10/31/2011 | |||||||||||||
CAPITAL TRANSACTIONS: | ||||||||||||||||
Class A | ||||||||||||||||
Proceeds from shares issued | $ | 45,000 | $ | 57,126 | $ | 26,703 | $ | 32,815 | ||||||||
Dividends and distributions reinvested | 1,404 | 2,039 | 2,272 | 2,661 | ||||||||||||
Cost of shares redeemed | (57,239 | ) | (77,591 | ) | (33,906 | ) | (46,940 | ) | ||||||||
Redemption fees | — | 2 | — | 2 | ||||||||||||
|
|
|
|
|
|
|
| |||||||||
Change in net assets resulting from Class A capital transactions | $ | (10,835 | ) | $ | (18,424 | ) | $ | (4,931 | ) | $ | (11,462 | ) | ||||
|
|
|
|
|
|
|
| |||||||||
Class B | ||||||||||||||||
Proceeds from shares issued | $ | 50 | $ | 195 | $ | 42 | $ | 150 | ||||||||
Dividends and distributions reinvested | 23 | 29 | 67 | 101 | ||||||||||||
Cost of shares redeemed | (853 | ) | (1,809 | ) | (1,257 | ) | (2,032 | ) | ||||||||
Redemption fees | — | — | (a) | — | — | (a) | ||||||||||
|
|
|
|
|
|
|
| |||||||||
Change in net assets resulting from Class B capital transactions | $ | (780 | ) | $ | (1,585 | ) | $ | (1,148 | ) | $ | (1,781 | ) | ||||
|
|
|
|
|
|
|
| |||||||||
Class C | ||||||||||||||||
Proceeds from shares issued | $ | 2,504 | $ | 4,209 | $ | 4,855 | $ | 7,301 | ||||||||
Dividends and distributions reinvested | 149 | 175 | 245 | 272 | ||||||||||||
Cost of shares redeemed | (5,942 | ) | (6,116 | ) | (4,620 | ) | (8,092 | ) | ||||||||
Redemption fees | — | — | (a) | — | — | (a) | ||||||||||
|
|
|
|
|
|
|
| |||||||||
Change in net assets resulting from Class C capital transactions | $ | (3,289 | ) | $ | (1,732 | ) | $ | 480 | $ | (519 | ) | |||||
|
|
|
|
|
|
|
| |||||||||
Class R2 | ||||||||||||||||
Proceeds from shares issued | $ | 662 | $ | — | $ | 539 | $ | 337 | ||||||||
Dividends and distributions reinvested | 2 | 1 | 3 | 1 | ||||||||||||
Cost of shares redeemed | (57 | ) | — | (243 | ) | (100 | ) | |||||||||
Redemption fees | — | — | (a) | — | — | (a) | ||||||||||
|
|
|
|
|
|
|
| |||||||||
Change in net assets resulting from Class R2 capital transactions | $ | 607 | $ | 1 | $ | 299 | $ | 238 | ||||||||
|
|
|
|
|
|
|
| |||||||||
Class R5 | ||||||||||||||||
Proceeds from shares issued | $ | 22,598 | $ | 51,189 | $ | — | $ | — | ||||||||
Dividends and distributions reinvested | 1,179 | 1,018 | — | — | ||||||||||||
Cost of shares redeemed | (9,719 | ) | (253,227 | ) | — | — | ||||||||||
Redemption fees | — | 1 | — | — | ||||||||||||
|
|
|
|
|
|
|
| |||||||||
Change in net assets resulting from Class R5 capital transactions | $ | 14,058 | $ | (201,019 | ) | $ | — | $ | — | |||||||
|
|
|
|
|
|
|
| |||||||||
Class R6 (b) | ||||||||||||||||
Proceeds from shares issued | $ | 329,320 | $ | 406,486 | $ | — | $ | — | ||||||||
Dividends and distributions reinvested | 11,257 | 5,557 | — | — | ||||||||||||
Cost of shares redeemed | (37,992 | ) | (37,435 | ) | — | — | ||||||||||
Redemption fees | — | 5 | — | — | ||||||||||||
|
|
|
|
|
|
|
| |||||||||
Change in net assets resulting from Class R6 capital transactions | $ | 302,585 | $ | 374,613 | $ | — | $ | — | ||||||||
|
|
|
|
|
|
|
| |||||||||
Select Class | ||||||||||||||||
Proceeds from shares issued | $ | 63,016 | $ | 66,352 | $ | 45,653 | $ | 134,004 | ||||||||
Dividends and distributions reinvested | 2,202 | 2,337 | 1,712 | 2,114 | ||||||||||||
Cost of shares redeemed | (54,058 | ) | (111,701 | ) | (91,894 | ) | (84,055 | ) | ||||||||
Redemption fees | — | 4 | — | 10 | ||||||||||||
|
|
|
|
|
|
|
| |||||||||
Change in net assets resulting from Select Class capital transactions | $ | 11,160 | $ | (43,008 | ) | $ | (44,529 | ) | $ | 52,073 | ||||||
|
|
|
|
|
|
|
| |||||||||
Total change in net assets resulting from capital transactions | $ | 313,506 | $ | 108,846 | $ | (49,829 | ) | $ | 38,549 | |||||||
|
|
|
|
|
|
|
| |||||||||
SEE NOTES TO FINANCIAL STATEMENTS.
| 94 | J.P. MORGAN INTERNATIONAL EQUITY FUNDS | OCTOBER 31, 2012 | ||||
Table of Contents
| International Equity Fund | International Equity Index Fund | |||||||||||||||
| Year Ended 10/31/2012 | Year Ended 10/31/2011 | Year Ended 10/31/2012 | Year Ended 10/31/2011 | |||||||||||||
SHARE TRANSACTIONS: | ||||||||||||||||
Class A | ||||||||||||||||
Issued | 3,527 | 4,149 | 1,627 | 1,752 | ||||||||||||
Reinvested | 111 | 146 | 148 | 144 | ||||||||||||
Redeemed | (4,441 | ) | (5,922 | ) | (2,081 | ) | (2,534 | ) | ||||||||
|
|
|
|
|
|
|
| |||||||||
Change in Class A Shares | (803 | ) | (1,627 | ) | (306 | ) | (638 | ) | ||||||||
|
|
|
|
|
|
|
| |||||||||
Class B | ||||||||||||||||
Issued | 3 | 15 | 2 | 8 | ||||||||||||
Reinvested | 2 | 2 | 5 | 6 | ||||||||||||
Redeemed | (69 | ) | (136 | ) | (83 | ) | (116 | ) | ||||||||
|
|
|
|
|
|
|
| |||||||||
Change in Class B Shares | (64 | ) | (119 | ) | (76 | ) | (102 | ) | ||||||||
|
|
|
|
|
|
|
| |||||||||
Class C | ||||||||||||||||
Issued | 207 | 316 | 304 | 397 | ||||||||||||
Reinvested | 12 | 13 | 16 | 15 | ||||||||||||
Redeemed | (492 | ) | (475 | ) | (291 | ) | (450 | ) | ||||||||
|
|
|
|
|
|
|
| |||||||||
Change in Class C Shares | (273 | ) | (146 | ) | 29 | (38 | ) | |||||||||
|
|
|
|
|
|
|
| |||||||||
Class R2 | ||||||||||||||||
Issued | 53 | — | 33 | 20 | ||||||||||||
Reinvested | — | (a) | — | (a) | — | (a) | — | (a) | ||||||||
Redeemed | (4 | ) | — | (15 | ) | (5 | ) | |||||||||
|
|
|
|
|
|
|
| |||||||||
Change in Class R2 Shares | 49 | — | (a) | 18 | 15 | |||||||||||
|
|
|
|
|
|
|
| |||||||||
Class R5 | ||||||||||||||||
Issued | 1,799 | 3,905 | — | — | ||||||||||||
Reinvested | 92 | 74 | — | — | ||||||||||||
Redeemed | (757 | ) | (18,263 | ) | — | — | ||||||||||
|
|
|
|
|
|
|
| |||||||||
Change in Class R5 Shares | 1,134 | (14,284 | ) | — | — | |||||||||||
|
|
|
|
|
|
|
| |||||||||
Class R6 (b) | ||||||||||||||||
Issued | 25,388 | 29,470 | — | — | ||||||||||||
Reinvested | 881 | 402 | — | — | ||||||||||||
Redeemed | (2,974 | ) | (2,647 | ) | — | — | ||||||||||
|
|
|
|
|
|
|
| |||||||||
Change in Class R6 Shares | 23,295 | 27,225 | — | — | ||||||||||||
|
|
|
|
|
|
|
| |||||||||
Select Class | ||||||||||||||||
Issued | 4,933 | 4,873 | 2,866 | 7,136 | ||||||||||||
Reinvested | 172 | 167 | 111 | 114 | ||||||||||||
Redeemed | (4,163 | ) | (8,211 | ) | (5,614 | ) | (4,537 | ) | ||||||||
|
|
|
|
|
|
|
| |||||||||
Change in Select Class Shares | 942 | (3,171 | ) | (2,637 | ) | 2,713 | ||||||||||
|
|
|
|
|
|
|
| |||||||||
| (a) | Amount rounds to less than 1,000. |
| (b) | Commencement of offering of class of shares effective November 30, 2010 for International Equity Fund. |
SEE NOTES TO FINANCIAL STATEMENTS.
| OCTOBER 31, 2012 | J.P. MORGAN INTERNATIONAL EQUITY FUNDS | 95 | ||||||
Table of Contents
STATEMENTS OF CHANGES IN NET ASSETS
FOR THE PERIODS INDICATED (continued)
(Amounts in thousands)
| International Opportunities Fund | International Value Fund | |||||||||||||||
| Year Ended 10/31/2012 | Year Ended 10/31/2011 | Year Ended 10/31/2012 | Year Ended 10/31/2011 | |||||||||||||
CAPITAL TRANSACTIONS: | ||||||||||||||||
Class A | ||||||||||||||||
Proceeds from shares issued | $ | 37,212 | $ | 55,121 | $ | 49,899 | $ | 75,529 | ||||||||
Dividends and distributions reinvested | 1,455 | 351 | 3,261 | 3,776 | ||||||||||||
Cost of shares redeemed | (21,984 | ) | (14,020 | ) | (44,716 | ) | (97,178 | ) | ||||||||
Redemption fees | — | — | (a) | — | 2 | |||||||||||
|
|
|
|
|
|
|
| |||||||||
Change in net assets resulting from Class A capital transactions | $ | 16,683 | $ | 41,452 | $ | 8,444 | $ | (17,871 | ) | |||||||
|
|
|
|
|
|
|
| |||||||||
Class B | ||||||||||||||||
Proceeds from shares issued | $ | 19 | $ | 341 | $ | 43 | $ | 207 | ||||||||
Dividends and distributions reinvested | 10 | 14 | 75 | 101 | ||||||||||||
Cost of shares redeemed | (289 | ) | (506 | ) | (770 | ) | (1,696 | ) | ||||||||
Redemption fees | — | — | (a) | — | — | (a) | ||||||||||
|
|
|
|
|
|
|
| |||||||||
Change in net assets resulting from Class B capital transactions | $ | (260 | ) | $ | (151 | ) | $ | (652 | ) | $ | (1,388 | ) | ||||
|
|
|
|
|
|
|
| |||||||||
Class C | ||||||||||||||||
Proceeds from shares issued | $ | 87 | $ | 276 | $ | 2,699 | $ | 3,898 | ||||||||
Dividends and distributions reinvested | 9 | 13 | 274 | 302 | ||||||||||||
Cost of shares redeemed | (166 | ) | (478 | ) | (5,245 | ) | (5,488 | ) | ||||||||
Redemption fees | — | — | (a) | — | 1 | |||||||||||
|
|
|
|
|
|
|
| |||||||||
Change in net assets resulting from Class C capital transactions | $ | (70 | ) | $ | (189 | ) | $ | (2,272 | ) | $ | (1,287 | ) | ||||
|
|
|
|
|
|
|
| |||||||||
Class R2 | ||||||||||||||||
Proceeds from shares issued | $ | — | $ | — | $ | 385 | $ | 692 | ||||||||
Dividends and distributions reinvested | — | — | 10 | 11 | ||||||||||||
Cost of shares redeemed | — | — | (222 | ) | (821 | ) | ||||||||||
Redemption fees | — | — | — | — | (a) | |||||||||||
|
|
|
|
|
|
|
| |||||||||
Change in net assets resulting from Class R2 capital transactions | $ | — | $ | — | $ | 173 | $ | (118 | ) | |||||||
|
|
|
|
|
|
|
| |||||||||
Class R6 (b) | ||||||||||||||||
Proceeds from shares issued | $ | 312,227 | $ | 428,154 | $ | 33,126 | $ | 50 | ||||||||
Dividends and distributions reinvested | 12,897 | 1 | 2 | 2 | ||||||||||||
Cost of shares redeemed | (33,425 | ) | (20,282 | ) | (9,200 | ) | — | |||||||||
Redemption fees | — | 1 | — | — | (a) | |||||||||||
|
|
|
|
|
|
|
| |||||||||
Change in net assets resulting from Class R6 capital transactions | $ | 291,699 | $ | 407,874 | $ | 23,928 | $ | 52 | ||||||||
|
|
|
|
|
|
|
| |||||||||
Institutional Class | ||||||||||||||||
Proceeds from shares issued | $ | 9,873 | $ | 36,085 | $ | 256,917 | $ | 308,897 | ||||||||
Dividends and distributions reinvested | 788 | 6,602 | 14,739 | 10,471 | ||||||||||||
Cost of shares redeemed | (10,083 | ) | (274,069 | ) | (190,594 | ) | (138,436 | ) | ||||||||
Redemption fees | — | — | (a) | — | 7 | |||||||||||
|
|
|
|
|
|
|
| |||||||||
Change in net assets resulting from Institutional Class capital transactions | $ | 578 | $ | (231,382 | ) | $ | 81,062 | $ | 180,939 | |||||||
|
|
|
|
|
|
|
| |||||||||
Select Class | ||||||||||||||||
Proceeds from shares issued | $ | 13,694 | $ | 10,527 | $ | 551,695 | $ | 933,257 | ||||||||
Dividends and distributions reinvested | 516 | 474 | 29,315 | 2,710 | ||||||||||||
Cost of shares redeemed | (10,698 | ) | (9,914 | ) | (551,786 | ) | (318,731 | ) | ||||||||
Redemption fees | — | — | (a) | — | 16 | |||||||||||
|
|
|
|
|
|
|
| |||||||||
Change in net assets resulting from Select Class capital transactions | $ | 3,512 | $ | 1,087 | $ | 29,224 | $ | 617,252 | ||||||||
|
|
|
|
|
|
|
| |||||||||
Total change in net assets resulting from capital transactions | $ | 312,142 | $ | 218,691 | $ | 139,907 | $ | 777,579 | ||||||||
|
|
|
|
|
|
|
| |||||||||
SEE NOTES TO FINANCIAL STATEMENTS.
| 96 | J.P. MORGAN INTERNATIONAL EQUITY FUNDS | OCTOBER 31, 2012 | ||||
Table of Contents
| International Opportunities Fund | International Value Fund | |||||||||||||||
| Year Ended 10/31/2012 | Year Ended 10/31/2011 | Year Ended 10/31/2012 | Year Ended 10/31/2011 | |||||||||||||
SHARE TRANSACTIONS: | ||||||||||||||||
Class A | ||||||||||||||||
Issued | 3,125 | 4,021 | 4,264 | 5,652 | ||||||||||||
Reinvested | 132 | 27 | 297 | 290 | ||||||||||||
Redeemed | (1,828 | ) | (1,112 | ) | (3,776 | ) | (7,207 | ) | ||||||||
|
|
|
|
|
|
|
| |||||||||
Change in Class A Shares | 1,429 | 2,936 | 785 | (1,265 | ) | |||||||||||
|
|
|
|
|
|
|
| |||||||||
Class B | ||||||||||||||||
Issued | 1 | 26 | 4 | 15 | ||||||||||||
Reinvested | 1 | 1 | 7 | 8 | ||||||||||||
Redeemed | (24 | ) | (40 | ) | (66 | ) | (129 | ) | ||||||||
|
|
|
|
|
|
|
| |||||||||
Change in Class B Shares | (22 | ) | (13 | ) | (55 | ) | (106 | ) | ||||||||
|
|
|
|
|
|
|
| |||||||||
Class C | ||||||||||||||||
Issued | 8 | 21 | 236 | 299 | ||||||||||||
Reinvested | 1 | 1 | 26 | 24 | ||||||||||||
Redeemed | (14 | ) | (39 | ) | (462 | ) | (424 | ) | ||||||||
|
|
|
|
|
|
|
| |||||||||
Change in Class C Shares | (5 | ) | (17 | ) | (200 | ) | (101 | ) | ||||||||
|
|
|
|
|
|
|
| |||||||||
Class R2 | ||||||||||||||||
Issued | — | — | 33 | 53 | ||||||||||||
Reinvested | — | — | 1 | 1 | ||||||||||||
Redeemed | — | — | (19 | ) | (61 | ) | ||||||||||
|
|
|
|
|
|
|
| |||||||||
Change in Class R2 Shares | — | — | 15 | (7 | ) | |||||||||||
|
|
|
|
|
|
|
| |||||||||
Class R6 (b) | ||||||||||||||||
Issued | 25,578 | 32,025 | 2,821 | 4 | ||||||||||||
Reinvested | 1,153 | — | (a) | — | (a) | — | (a) | |||||||||
Redeemed | (2,807 | ) | (1,412 | ) | (730 | ) | — | |||||||||
|
|
|
|
|
|
|
| |||||||||
Change in Class R6 Shares | 23,924 | 30,613 | 2,091 | 4 | ||||||||||||
|
|
|
|
|
|
|
| |||||||||
Institutional Class | ||||||||||||||||
Issued | 808 | 2,718 | 21,768 | 22,968 | ||||||||||||
Reinvested | 70 | 499 | 1,323 | 793 | ||||||||||||
Redeemed | (828 | ) | (20,291 | ) | (15,861 | ) | (10,335 | ) | ||||||||
|
|
|
|
|
|
|
| |||||||||
Change in Institutional Class Shares | 50 | (17,074 | ) | 7,230 | 13,426 | |||||||||||
|
|
|
|
|
|
|
| |||||||||
Select Class | ||||||||||||||||
Issued | 1,131 | 788 | 46,604 | 70,086 | ||||||||||||
Reinvested | 46 | 36 | 2,644 | 206 | ||||||||||||
Redeemed | (908 | ) | (764 | ) | (46,673 | ) | (24,224 | ) | ||||||||
|
|
|
|
|
|
|
| |||||||||
Change in Select Class Shares | 269 | 60 | 2,575 | 46,068 | ||||||||||||
|
|
|
|
|
|
|
| |||||||||
| (a) | Amount rounds to less than 1,000. |
| (b) | Commencement of offering of class of shares effective November 30, 2010. |
SEE NOTES TO FINANCIAL STATEMENTS.
| OCTOBER 31, 2012 | J.P. MORGAN INTERNATIONAL EQUITY FUNDS | 97 | ||||||
Table of Contents
STATEMENTS OF CHANGES IN NET ASSETS
FOR THE PERIODS INDICATED (continued)
(Amounts in thousands)
| Intrepid International Fund | ||||||||
| Year Ended 10/31/2012 | Year Ended 10/31/2011 | |||||||
CAPITAL TRANSACTIONS: | ||||||||
Class A | ||||||||
Proceeds from shares issued | $ | 8,357 | $ | 32,879 | ||||
Dividends and distributions reinvested | 317 | 490 | ||||||
Cost of shares redeemed | (9,553 | ) | (23,302 | ) | ||||
Redemption fees | — | — | (a) | |||||
|
|
|
| |||||
Change in net assets resulting from Class A capital transactions | $ | (879 | ) | $ | 10,067 | |||
|
|
|
| |||||
Class C | ||||||||
Proceeds from shares issued | $ | 154 | $ | 147 | ||||
Dividends and distributions reinvested | 2 | 10 | ||||||
Cost of shares redeemed | (332 | ) | (534 | ) | ||||
Redemption fees | — | — | (a) | |||||
|
|
|
| |||||
Change in net assets resulting from Class C capital transactions | $ | (176 | ) | $ | (377 | ) | ||
|
|
|
| |||||
Class R2 | ||||||||
Proceeds from shares issued | $ | 2 | $ | 55 | ||||
Dividends and distributions reinvested | 1 | 1 | ||||||
Cost of shares redeemed | (32 | ) | (5 | ) | ||||
Redemption fees | — | — | (a) | |||||
|
|
|
| |||||
Change in net assets resulting from Class R2 capital transactions | $ | (29 | ) | $ | 51 | |||
|
|
|
| |||||
Institutional Class | ||||||||
Proceeds from shares issued | $ | 115,082 | $ | 104,518 | ||||
Dividends and distributions reinvested | 2,649 | 1,682 | ||||||
Cost of shares redeemed | (4,834 | ) | (14,018 | ) | ||||
Redemption fees | — | 1 | ||||||
|
|
|
| |||||
Change in net assets resulting from Institutional Class capital transactions | $ | 112,897 | $ | 92,183 | ||||
|
|
|
| |||||
Select Class | ||||||||
Proceeds from shares issued | $ | 1,207 | $ | 899 | ||||
Dividends and distributions reinvested | 20 | 16 | ||||||
Cost of shares redeemed | (4,230 | ) | (14,578 | ) | ||||
Redemption fees | — | — | (a) | |||||
|
|
|
| |||||
Change in net assets resulting from Select Class capital transactions | $ | (3,003 | ) | $ | (13,663 | ) | ||
|
|
|
| |||||
Total change in net assets resulting from capital transactions | $ | 108,810 | $ | 88,261 | ||||
|
|
|
| |||||
SEE NOTES TO FINANCIAL STATEMENTS.
| 98 | J.P. MORGAN INTERNATIONAL EQUITY FUNDS | OCTOBER 31, 2012 | ||||
Table of Contents
| Intrepid International Fund | ||||||||
| Year Ended 10/31/2012 | Year Ended 10/31/2011 | |||||||
SHARE TRANSACTIONS: | ||||||||
Class A | ||||||||
Issued | 551 | 1,952 | ||||||
Reinvested | 22 | 29 | ||||||
Redeemed | (631 | ) | (1,340 | ) | ||||
|
|
|
| |||||
Change in Class A Shares | (58 | ) | 641 | |||||
|
|
|
| |||||
Class C | ||||||||
Issued | 12 | 7 | ||||||
Reinvested | — | (a) | 1 | |||||
Redeemed | (23 | ) | (32 | ) | ||||
|
|
|
| |||||
Change in Class C Shares | (11 | ) | (24 | ) | ||||
|
|
|
| |||||
Class R2 | ||||||||
Issued | — | (a) | 3 | |||||
Reinvested | — | (a) | — | (a) | ||||
Redeemed | (2 | ) | — | (a) | ||||
|
|
|
| |||||
Change in Class R2 Shares | (2 | ) | 3 | |||||
|
|
|
| |||||
Institutional Class | ||||||||
Issued | 7,445 | 6,221 | ||||||
Reinvested | 184 | 99 | ||||||
Redeemed | (315 | ) | (829 | ) | ||||
|
|
|
| |||||
Change in Institutional Class Shares | 7,314 | 5,491 | ||||||
|
|
|
| |||||
Select Class | ||||||||
Issued | 77 | 52 | ||||||
Reinvested | 1 | 1 | ||||||
Redeemed | (274 | ) | (836 | ) | ||||
|
|
|
| |||||
Change in Select Class Shares | (196 | ) | (783 | ) | ||||
|
|
|
| |||||
| (a) | Amount rounds to less than 1,000. |
SEE NOTES TO FINANCIAL STATEMENTS.
| OCTOBER 31, 2012 | J.P. MORGAN INTERNATIONAL EQUITY FUNDS | 99 | ||||||
Table of Contents
FOR THE PERIODS INDICATED
| Per share operating performance | |||||||||||||||||||||||
| Investment operations | Distributions | |||||||||||||||||||||||
| Net asset value, beginning of period | Net investment income (loss) | Net realized and unrealized gains (losses) on investments | Total from investment operations | Net investment income | Redemption fees | |||||||||||||||||||
Emerging Economies Fund | ||||||||||||||||||||||||
Class A | ||||||||||||||||||||||||
Year Ended October 31, 2012 | $ | 12.65 | $ | 0.17 | (e) | $ | 0.21 | $ | 0.38 | $ | (0.15 | ) | $ | — | ||||||||||
Year Ended October 31, 2011 | 13.91 | 0.20 | (e) | (1.44 | ) | (1.24 | ) | (0.02 | ) | — | (f) | |||||||||||||
Year Ended October 31, 2010 | 10.47 | 0.11 | (e) | 3.60 | 3.71 | (0.27 | ) | — | ||||||||||||||||
Year Ended October 31, 2009 | 7.14 | 0.18 | 3.42 | 3.60 | (0.27 | ) | — | |||||||||||||||||
February 28, 2008 (g) through October 31, 2008 | 15.00 | 0.20 | (8.06 | ) | (7.86 | ) | — | — | ||||||||||||||||
Class C | ||||||||||||||||||||||||
Year Ended October 31, 2012 | 12.58 | 0.15 | (e) | 0.15 | 0.30 | (0.16 | ) | — | ||||||||||||||||
Year Ended October 31, 2011 | 13.87 | 0.08 | (e) | (1.37 | ) | (1.29 | ) | — | — | (f) | ||||||||||||||
Year Ended October 31, 2010 | 10.46 | 0.05 | (e) | 3.59 | 3.64 | (0.23 | ) | — | ||||||||||||||||
Year Ended October 31, 2009 | 7.11 | 0.14 | 3.43 | 3.57 | (0.22 | ) | — | |||||||||||||||||
February 28, 2008 (g) through October 31, 2008 | 15.00 | 0.16 | (8.05 | ) | (7.89 | ) | — | — | ||||||||||||||||
Class R5 | ||||||||||||||||||||||||
Year Ended October 31, 2012 | 12.71 | 0.25 | (e) | 0.18 | 0.43 | (0.20 | ) | — | ||||||||||||||||
Year Ended October 31, 2011 | 13.93 | 0.30 | (e) | (1.47 | ) | (1.17 | ) | (0.05 | ) | — | (f) | |||||||||||||
Year Ended October 31, 2010 | 10.48 | 0.17 | (e) | 3.59 | 3.76 | (0.31 | ) | — | ||||||||||||||||
Year Ended October 31, 2009 | 7.16 | 0.22 | 3.41 | 3.63 | (0.31 | ) | — | |||||||||||||||||
February 28, 2008 (g) through October 31, 2008 | 15.00 | 0.24 | (8.08 | ) | (7.84 | ) | — | — | ||||||||||||||||
Select Class | ||||||||||||||||||||||||
Year Ended October 31, 2012 | 12.68 | 0.22 | (e) | 0.18 | 0.40 | (0.17 | ) | — | ||||||||||||||||
Year Ended October 31, 2011 | 13.92 | 0.25 | (e) | (1.45 | ) | (1.20 | ) | (0.04 | ) | — | (f) | |||||||||||||
Year Ended October 31, 2010 | 10.48 | 0.14 | (e) | 3.59 | 3.73 | (0.29 | ) | — | ||||||||||||||||
Year Ended October 31, 2009 | 7.15 | 0.20 | 3.42 | 3.62 | (0.29 | ) | — | |||||||||||||||||
February 28, 2008 (g) through October 31, 2008 | 15.00 | 0.23 | (8.08 | ) | (7.85 | ) | — | — | ||||||||||||||||
| (a) | Annualized for periods less than one year. |
| (b) | Not annualized for periods less than one year. |
| (c) | Includes adjustments in accordance with accounting principles generally accepted in the United States of America and as such, the net asset values for financial reporting purposes and the returns based upon those net asset values may differ from the net asset values and returns for shareholder transactions. |
| (d) | Includes earnings credits and interest expense, if applicable, each of which is less than 0.01% or unless otherwise noted. |
| (e) | Calculated based upon average shares outstanding. |
| (f) | Amount rounds to less than $0.01. |
| (g) | Commencement of operations. |
| (h) | Includes interest expense of 0.01%. |
| (i) | Ratios are disproportionate between classes due to the size of net assets and fixed expenses. |
| * | Portfolio turnover is calculated by dividing the lesser of total purchases or sales of portfolio securities for the reporting period by the monthly average of portfolio securities owned during the reporting period. Excluded from both the numerator and denominator are amounts relating to derivatives and securities whose maturities or expiration dates at the time of acquisition were one year or less. |
SEE NOTES TO FINANCIAL STATEMENTS.
| 100 | J.P. MORGAN INTERNATIONAL EQUITY FUNDS | OCTOBER 31, 2012 | ||||
Table of Contents
| Ratios/Supplemental data | |||||||||||||||||||||||||
| Ratios to average net assets (a) | ||||||||||||||||||||||||||
Net asset | Total return (excludes sales charge) (b)(c) | Net assets, end of period (000’s) | Net expenses (d) | Net investment income (loss) | Expenses without waivers, reimbursements and earning credits | Portfolio turnover rate* (b) | ||||||||||||||||||||
| $ | 12.88 | 3.15 | % | $ | 30,356 | 1.65 | % | 1.37 | % | 1.76 | % | 72 | % | |||||||||||||
| 12.65 | (8.93 | ) | 43,519 | 1.75 | 1.50 | 1.75 | 84 | |||||||||||||||||||
| 13.91 | 36.12 | 49 | 1.85 | 0.96 | 3.99 | 156 | ||||||||||||||||||||
| 10.47 | 52.59 | 36 | 1.85 | 2.27 | 5.59 | 141 | ||||||||||||||||||||
| 7.14 | (52.40 | ) | 24 | 1.86 | (h) | 2.37 | 5.30 | (i) | 110 | |||||||||||||||||
| 12.72 | 2.54 | 2,088 | 2.12 | 1.21 | 2.27 | 72 | ||||||||||||||||||||
| 12.58 | (9.30 | ) | 516 | 2.28 | 0.57 | 2.32 | 84 | |||||||||||||||||||
| 13.87 | 35.33 | 49 | 2.35 | 0.46 | 4.49 | 156 | ||||||||||||||||||||
| 10.46 | 51.98 | 36 | 2.35 | 1.77 | 6.08 | 141 | ||||||||||||||||||||
| 7.11 | (52.60 | ) | 24 | 2.36 | (h) | 1.86 | 5.81 | (i) | 110 | |||||||||||||||||
| 12.94 | 3.53 | 331,032 | 1.19 | 1.99 | 1.31 | 72 | ||||||||||||||||||||
| 12.71 | (8.45 | ) | 228,411 | 1.31 | 2.14 | 1.32 | 84 | |||||||||||||||||||
| 13.93 | 36.66 | 50 | 1.40 | 1.41 | 3.54 | 156 | ||||||||||||||||||||
| 10.48 | 53.31 | 37 | 1.40 | 2.72 | 5.13 | 141 | ||||||||||||||||||||
| 7.16 | (52.27 | ) | 24 | 1.41 | (h) | 2.82 | 4.86 | (i) | 110 | |||||||||||||||||
| 12.91 | 3.34 | 82,457 | 1.39 | 1.70 | 1.51 | 72 | ||||||||||||||||||||
| 12.68 | (8.65 | ) | 73,787 | 1.52 | 1.76 | 1.55 | 84 | |||||||||||||||||||
| 13.92 | 36.35 | 7,313 | 1.60 | 1.21 | 3.74 | 156 | ||||||||||||||||||||
| 10.48 | 53.07 | 5,360 | 1.60 | 2.52 | 5.33 | 141 | ||||||||||||||||||||
| 7.15 | (52.33 | ) | 3,503 | 1.61 | (h) | 2.62 | 5.05 | (i) | 110 | |||||||||||||||||
SEE NOTES TO FINANCIAL STATEMENTS.
| OCTOBER 31, 2012 | J.P. MORGAN INTERNATIONAL EQUITY FUNDS | 101 | ||||||
Table of Contents
FINANCIAL HIGHLIGHTS
FOR THE PERIODS INDICATED (continued)
| Per share operating performance | |||||||||||||||||||||||
| Investment operations | Distributions | |||||||||||||||||||||||
| Net asset value, beginning of period | Net investment income (loss) | Net realized and unrealized gains (losses) on investments | Total from investment operations | Net investment income | Redemption fees | |||||||||||||||||||
Emerging Markets Equity Fund | ||||||||||||||||||||||||
Class A | ||||||||||||||||||||||||
Year Ended October 31, 2012 | $ | 21.09 | $ | 0.07 | (c) | $ | 0.85 | $ | 0.92 | $ | — | $ | — | |||||||||||
Year Ended October 31, 2011 | 23.45 | 0.06 | (c) | (2.33 | ) | (2.27 | ) | (0.09 | ) | — | (d) | |||||||||||||
Year Ended October 31, 2010 | 18.79 | (0.01 | )(c) | 4.71 | 4.70 | (0.04 | ) | — | (d) | |||||||||||||||
Year Ended October 31, 2009 | 12.66 | 0.07 | (c) | 6.31 | 6.38 | (0.25 | ) | — | (d) | |||||||||||||||
Year Ended October 31, 2008 | 26.19 | 0.27 | (13.78 | ) | (13.51 | ) | (0.02 | ) | — | (d) | ||||||||||||||
Class B | ||||||||||||||||||||||||
Year Ended October 31, 2012 | 20.80 | (0.05 | )(c) | 0.84 | 0.79 | — | — | |||||||||||||||||
Year Ended October 31, 2011 | 23.15 | (0.07 | )(c) | (2.28 | ) | (2.35 | ) | — | — | (d) | ||||||||||||||
Year Ended October 31, 2010 | 18.60 | (0.12 | )(c) | 4.67 | 4.55 | — | — | (d) | ||||||||||||||||
Year Ended October 31, 2009 | 12.46 | — | (c)(d) | 6.25 | 6.25 | (0.11 | ) | — | (d) | |||||||||||||||
Year Ended October 31, 2008 | 25.89 | 0.16 | (13.59 | ) | (13.43 | ) | — | — | (d) | |||||||||||||||
Class C | ||||||||||||||||||||||||
Year Ended October 31, 2012 | 20.65 | (0.04 | )(c) | 0.83 | 0.79 | — | — | |||||||||||||||||
Year Ended October 31, 2011 | 23.01 | (0.05 | )(c) | (2.29 | ) | (2.34 | ) | (0.02 | ) | — | (d) | |||||||||||||
Year Ended October 31, 2010 | 18.49 | (0.11 | )(c) | 4.63 | 4.52 | — | — | (d) | ||||||||||||||||
Year Ended October 31, 2009 | 12.42 | (0.01 | )(c) | 6.23 | 6.22 | (0.15 | ) | — | (d) | |||||||||||||||
Year Ended October 31, 2008 | 25.80 | 0.16 | (13.54 | ) | (13.38 | ) | — | — | (d) | |||||||||||||||
Institutional Class | ||||||||||||||||||||||||
Year Ended October 31, 2012 | 21.66 | 0.16 | (c) | 0.87 | 1.03 | (0.04 | ) | — | ||||||||||||||||
Year Ended October 31, 2011 | 24.04 | 0.16 | (c) | (2.40 | ) | (2.24 | ) | (0.14 | ) | — | (d) | |||||||||||||
Year Ended October 31, 2010 | 19.23 | 0.08 | (c) | 4.82 | 4.90 | (0.09 | ) | — | (d) | |||||||||||||||
Year Ended October 31, 2009 | 12.97 | 0.14 | (c) | 6.45 | 6.59 | (0.33 | ) | — | (d) | |||||||||||||||
Year Ended October 31, 2008 | 26.80 | 0.30 | (14.04 | ) | (13.74 | ) | (0.09 | ) | — | (d) | ||||||||||||||
Select Class | ||||||||||||||||||||||||
Year Ended October 31, 2012 | 21.42 | 0.13 | (c) | 0.86 | 0.99 | (0.01 | ) | — | ||||||||||||||||
Year Ended October 31, 2011 | 23.80 | 0.13 | (c) | (2.38 | ) | (2.25 | ) | (0.13 | ) | — | (d) | |||||||||||||
Year Ended October 31, 2010 | 19.04 | 0.05 | (c) | 4.77 | 4.82 | (0.06 | ) | — | (d) | |||||||||||||||
Year Ended October 31, 2009 | 12.84 | 0.11 | (c) | 6.39 | 6.50 | (0.30 | ) | — | (d) | |||||||||||||||
Year Ended October 31, 2008 | 26.54 | 0.28 | (13.94 | ) | (13.66 | ) | (0.04 | ) | — | (d) | ||||||||||||||
| (a) | Includes adjustments in accordance with accounting principles generally accepted in the United States of America and as such, the net asset values for financial reporting purposes and the returns based upon those net asset values may differ from the net asset values and returns for shareholder transactions. |
| (b) | Includes earnings credits and interest expense, if applicable, each of which is less than 0.01% or unless otherwise noted. |
| (c) | Calculated based upon average shares outstanding. |
| (d) | Amount rounds to less than $0.01. |
| * | Portfolio turnover is calculated by dividing the lesser of total purchases or sales of portfolio securities for the reporting period by the monthly average of portfolio securities owned during the reporting period. Excluded from both the numerator and denominator are amounts relating to derivatives and securities whose maturities or expiration dates at the time of acquisition were one year or less. |
SEE NOTES TO FINANCIAL STATEMENTS.
| 102 | J.P. MORGAN INTERNATIONAL EQUITY FUNDS | OCTOBER 31, 2012 | ||||
Table of Contents
| Ratios/Supplemental data | |||||||||||||||||||||||||
| Ratios to average net assets | ||||||||||||||||||||||||||
| Net asset value, end of period | Total return (excludes sales charge) (a) | Net assets, end of period (000’s) | Net expenses (b) | Net investment income (loss) | Expenses without waivers, reimbursements and earning credits | Portfolio turnover rate* | ||||||||||||||||||||
| $ | 22.01 | 4.36 | % | $ | 281,194 | 1.82 | % | 0.33 | % | 1.82 | % | 20 | % | |||||||||||||
| 21.09 | (9.73 | ) | 265,458 | 1.79 | 0.28 | 1.80 | 9 | |||||||||||||||||||
| 23.45 | 25.08 | 253,037 | 1.82 | (0.03 | ) | 1.83 | 14 | |||||||||||||||||||
| 18.79 | 51.49 | 121,638 | 1.85 | 0.45 | 1.85 | 10 | ||||||||||||||||||||
| 12.66 | (51.62 | ) | 32,192 | 1.82 | 1.17 | 1.82 | 19 | |||||||||||||||||||
| 21.59 | 3.80 | 6,100 | 2.32 | (0.23 | ) | 2.32 | 20 | |||||||||||||||||||
| 20.80 | (10.15 | ) | 7,572 | 2.29 | (0.32 | ) | 2.30 | 9 | ||||||||||||||||||
| 23.15 | 24.46 | 10,812 | 2.31 | (0.58 | ) | 2.32 | 14 | |||||||||||||||||||
| 18.60 | 50.70 | 10,535 | 2.36 | (0.02 | ) | 2.37 | 10 | |||||||||||||||||||
| 12.46 | (51.87 | ) | 7,124 | 2.32 | 0.67 | 2.32 | 19 | |||||||||||||||||||
| 21.44 | 3.83 | 44,643 | 2.32 | (0.17 | ) | 2.32 | 20 | |||||||||||||||||||
| 20.65 | (10.18 | ) | 43,437 | 2.29 | (0.23 | ) | 2.30 | 9 | ||||||||||||||||||
| 23.01 | 24.45 | 40,757 | 2.32 | (0.52 | ) | 2.33 | 14 | |||||||||||||||||||
| 18.49 | 50.72 | 19,803 | 2.35 | (0.06 | ) | 2.35 | 10 | |||||||||||||||||||
| 12.42 | (51.86 | ) | 5,030 | 2.32 | 0.68 | 2.32 | 19 | |||||||||||||||||||
| 22.65 | 4.80 | 629,223 | 1.41 | 0.73 | 1.42 | 20 | ||||||||||||||||||||
| 21.66 | (9.37 | ) | 596,147 | 1.38 | 0.68 | 1.41 | 9 | |||||||||||||||||||
| 24.04 | 25.55 | 513,904 | 1.40 | 0.37 | 1.43 | 14 | ||||||||||||||||||||
| 19.23 | 52.20 | 325,849 | 1.43 | 0.93 | 1.46 | 10 | ||||||||||||||||||||
| 12.97 | (51.44 | ) | 108,836 | 1.42 | 1.52 | 1.42 | 19 | |||||||||||||||||||
| 22.40 | 4.65 | 1,291,326 | 1.57 | 0.60 | 1.57 | 20 | ||||||||||||||||||||
| 21.42 | (9.51 | ) | 1,251,152 | 1.55 | 0.56 | 1.56 | 9 | |||||||||||||||||||
| 23.80 | 25.38 | 925,631 | 1.57 | 0.23 | 1.58 | 14 | ||||||||||||||||||||
| 19.04 | 51.88 | 330,903 | 1.61 | 0.73 | 1.62 | 10 | ||||||||||||||||||||
| 12.84 | (51.53 | ) | 188,893 | 1.57 | 1.43 | 1.57 | 19 | |||||||||||||||||||
SEE NOTES TO FINANCIAL STATEMENTS.
| OCTOBER 31, 2012 | J.P. MORGAN INTERNATIONAL EQUITY FUNDS | 103 | ||||||
Table of Contents
FINANCIAL HIGHLIGHTS
FOR THE PERIODS INDICATED (continued)
| Per share operating performance | |||||||||||||||||||
| Investment operations | Distributions | |||||||||||||||||||
| Net asset value, beginning of period | Net investment income (loss) | Net realized and unrealized gains (losses) on investments | Total from investment operations | Net investment income | ||||||||||||||||
Global Equity Income Fund | ||||||||||||||||||||
Class A | ||||||||||||||||||||
Year Ended October 31, 2012 | $ | 13.37 | $ | 0.31 | (e) | $ | 0.88 | $ | 1.19 | $ | (0.44 | ) | ||||||||
February 28, 2011 (f) through October 31, 2011 | 15.00 | 0.33 | (e) | (1.64 | ) | (1.31 | ) | (0.32 | ) | |||||||||||
Class C | ||||||||||||||||||||
Year Ended October 31, 2012 | 13.35 | 0.36 | (e) | 0.77 | 1.13 | (0.37 | ) | |||||||||||||
February 28, 2011 (f) through October 31, 2011 | 15.00 | 0.30 | (e) | (1.66 | ) | (1.36 | ) | (0.29 | ) | |||||||||||
Class R2 | ||||||||||||||||||||
Year Ended October 31, 2012 | 13.36 | 0.40 | (e) | 0.76 | 1.16 | (0.40 | ) | |||||||||||||
February 28, 2011 (f) through October 31, 2011 | 15.00 | 0.32 | (e) | (1.66 | ) | (1.34 | ) | (0.30 | ) | |||||||||||
Class R5 | ||||||||||||||||||||
Year Ended October 31, 2012 | 13.38 | 0.50 | (e) | 0.76 | 1.26 | (0.49 | ) | |||||||||||||
February 28, 2011 (f) through October 31, 2011 | 15.00 | 0.38 | (e) | (1.65 | ) | (1.27 | ) | (0.35 | ) | |||||||||||
Select Class | ||||||||||||||||||||
Year Ended October 31, 2012 | 13.37 | 0.47 | (e) | 0.76 | 1.23 | (0.46 | ) | |||||||||||||
February 28, 2011 (f) through October 31, 2011 | 15.00 | 0.37 | (e) | (1.66 | ) | (1.29 | ) | (0.34 | ) | |||||||||||
| (a) | Annualized for periods less than one year. |
| (b) | Not annualized for periods less than one year. |
| (c) | Includes adjustments in accordance with accounting principles generally accepted in the United States of America and as such, the net asset values for financial reporting purposes and the returns based upon those net asset values may differ from the net asset values and returns for shareholder transactions. |
| (d) | Includes earnings credits and interest expense, if applicable, each of which is less than 0.01% or unless otherwise noted. |
| (e) | Calculated based upon average shares outstanding. |
| (f) | Commencement of operations. |
| (g) | Ratios are disproportionate between classes due to the size of net assets and fixed expenses. |
| (h) | Certain non-recurring expense incurred by the Fund were not annualized for the period ended October 31, 2011. |
| * | Portfolio turnover is calculated by dividing the lesser of total purchases or sales of portfolio securities for the reporting period by the monthly average of portfolio securities owned during the reporting period. Excluded from both the numerator and denominator are amounts relating to derivatives and securities whose maturities or expiration dates at the time of acquisition were one year or less. |
SEE NOTES TO FINANCIAL STATEMENTS.
| 104 | J.P. MORGAN INTERNATIONAL EQUITY FUNDS | OCTOBER 31, 2012 | ||||
Table of Contents
| Ratios/Supplemental data | |||||||||||||||||||||||||
| Ratios to average net assets (a) | ||||||||||||||||||||||||||
| Net asset value, end of period | Total return (excludes sales charge) (b)(c) | Net assets, end of period (000’s) | Net expenses (d) | Net investment income (loss) | Expenses without waivers, reimbursements and earning credits | Portfolio turnover rate* (b) | ||||||||||||||||||||
| $ | 14.12 | 9.09 | % | $ | 9,003 | 1.25 | % | 2.21 | % | 2.31 | % | 52 | % | |||||||||||||
| 13.37 | (8.77 | ) | 127 | 1.25 | (h) | 3.53 | (h) | 10.16 | (g)(h) | 40 | ||||||||||||||||
| 14.11 | 8.66 | 646 | 1.75 | 2.69 | 2.95 | 52 | ||||||||||||||||||||
| 13.35 | (9.12 | ) | 60 | 1.75 | (h) | 3.17 | (h) | 10.82 | (g)(h) | 40 | ||||||||||||||||
| 14.12 | 8.87 | 461 | 1.50 | 2.95 | 2.70 | 52 | ||||||||||||||||||||
| 13.36 | (8.97 | ) | 45 | 1.50 | (h) | 3.36 | (h) | 10.72 | (g)(h) | 40 | ||||||||||||||||
| 14.15 | 9.62 | 465 | 0.80 | 3.65 | 2.00 | 52 | ||||||||||||||||||||
| 13.38 | (8.52 | ) | 46 | 0.80 | (h) | 4.05 | (h) | 10.05 | (g)(h) | 40 | ||||||||||||||||
| 14.14 | 9.43 | 27,292 | 1.00 | 3.44 | 2.20 | 52 | ||||||||||||||||||||
| 13.37 | (8.68 | ) | 2,666 | 1.00 | (h) | 3.85 | (h) | 10.23 | (g)(h) | 40 | ||||||||||||||||
SEE NOTES TO FINANCIAL STATEMENTS.
| OCTOBER 31, 2012 | J.P. MORGAN INTERNATIONAL EQUITY FUNDS | 105 | ||||||
Table of Contents
FINANCIAL HIGHLIGHTS
FOR THE PERIODS INDICATED (continued)
| Per share operating performance | |||||||||||||||||||||||||||||||
| Investment operations | Distributions | |||||||||||||||||||||||||||||||
| Net asset value, beginning of period | Net investment income (loss) | Net realized and unrealized gains (losses) on investments | Total from investment operations | Net investment income | Net realized gain | Total distributions | Redeption fees | |||||||||||||||||||||||||
Global Opportunities Fund | ||||||||||||||||||||||||||||||||
Class A | ||||||||||||||||||||||||||||||||
Year Ended October 31, 2012 | $ | 12.57 | $ | 0.19 | (e) | $ | 0.88 | $ | 1.07 | $ | (0.16 | ) | $ | — | $ | (0.16 | ) | $ | — | |||||||||||||
Year Ended October 31, 2011 | 14.05 | 0.11 | (e) | (1.34 | ) | (1.23 | ) | (0.25 | ) | — | (0.25 | ) | — | (f) | ||||||||||||||||||
Year Ended October 31, 2010 | 11.59 | 0.06 | 2.51 | 2.57 | (0.11 | ) | — | (0.11 | ) | — | ||||||||||||||||||||||
Year Ended October 31, 2009 | 8.22 | 0.08 | 3.42 | 3.50 | (0.13 | ) | — | (0.13 | ) | — | ||||||||||||||||||||||
Year Ended October 31, 2008 | 16.56 | 0.12 | (8.07 | ) | (7.95 | ) | (0.02 | ) | (0.37 | ) | (0.39 | ) | — | |||||||||||||||||||
Class C | ||||||||||||||||||||||||||||||||
Year Ended October 31, 2012 | 12.51 | 0.12 | (e) | 0.88 | 1.00 | (0.12 | ) | — | (0.12 | ) | — | |||||||||||||||||||||
Year Ended October 31, 2011 | 13.98 | 0.03 | (e) | (1.33 | ) | (1.30 | ) | (0.17 | ) | — | (0.17 | ) | — | (f) | ||||||||||||||||||
Year Ended October 31, 2010 | 11.55 | 0.01 | 2.48 | 2.49 | (0.06 | ) | — | (0.06 | ) | — | ||||||||||||||||||||||
Year Ended October 31, 2009 | 8.17 | 0.04 | 3.41 | 3.45 | (0.07 | ) | — | (0.07 | ) | — | ||||||||||||||||||||||
Year Ended October 31, 2008 | 16.51 | 0.06 | (8.03 | ) | (7.97 | ) | — | (0.37 | ) | (0.37 | ) | — | ||||||||||||||||||||
Class R2 | ||||||||||||||||||||||||||||||||
November 1, 2011 (h) through October 31, 2012 | 12.15 | 0.15 | (e) | 1.30 | 1.45 | (0.23 | ) | — | (0.23 | ) | — | |||||||||||||||||||||
Class R5 | ||||||||||||||||||||||||||||||||
Year Ended October 31, 2012 | 12.63 | 0.24 | (e) | 0.88 | 1.12 | (0.24 | ) | — | (0.24 | ) | — | |||||||||||||||||||||
Year Ended October 31, 2011 | 14.08 | 0.14 | (e) | (1.32 | ) | (1.18 | ) | (0.27 | ) | — | (0.27 | ) | — | (f) | ||||||||||||||||||
Year Ended October 31, 2010 | 11.61 | 0.13 | 2.49 | 2.62 | (0.15 | ) | — | (0.15 | ) | — | ||||||||||||||||||||||
Year Ended October 31, 2009 | 8.25 | 0.12 | 3.42 | 3.54 | (0.18 | ) | — | (0.18 | ) | — | ||||||||||||||||||||||
Year Ended October 31, 2008 | 16.60 | 0.18 | (8.08 | ) | (7.90 | ) | (0.08 | ) | (0.37 | ) | (0.45 | ) | — | |||||||||||||||||||
Class R6 | ||||||||||||||||||||||||||||||||
November 1, 2011 (h) through October 31, 2012 | 12.20 | 0.25 | (e) | 1.30 | 1.55 | (0.24 | ) | — | (0.24 | ) | — | |||||||||||||||||||||
Select Class | ||||||||||||||||||||||||||||||||
Year Ended October 31, 2012 | 12.62 | 0.22 | (e) | 0.87 | 1.09 | (0.21 | ) | — | (0.21 | ) | — | |||||||||||||||||||||
Year Ended October 31, 2011 | 14.07 | 0.12 | (e) | (1.32 | ) | (1.20 | ) | (0.25 | ) | — | (0.25 | ) | — | (f) | ||||||||||||||||||
Year Ended October 31, 2010 | 11.60 | 0.11 | 2.49 | 2.60 | (0.13 | ) | — | (0.13 | ) | — | ||||||||||||||||||||||
Year Ended October 31, 2009 | 8.24 | 0.10 | 3.41 | 3.51 | (0.15 | ) | — | (0.15 | ) | — | ||||||||||||||||||||||
Year Ended October 31, 2008 | 16.58 | 0.16 | (8.08 | ) | (7.92 | ) | (0.05 | ) | (0.37 | ) | (0.42 | ) | — | |||||||||||||||||||
| (a) | Annualized for periods less than one year. |
| (b) | Not annualized for periods less than one year. |
| (c) | Includes adjustments in accordance with accounting principles generally accepted in the United States of America and as such, the net asset values for financial reporting purposes and the returns based upon those net asset values may differ from the net asset values and returns for shareholder transactions. |
| (d) | Includes earnings credits and interest expense, if applicable, each of which is less than 0.01% or unless otherwise noted. |
| (e) | Calculated based upon average shares outstanding. |
| (f) | Amount rounds to less than $0.01. |
| (g) | Ratios are disproportionate between classes due to the size of net assets and fixed expenses. |
| (h) | Commencement of offering of class of shares. |
| * | Portfolio turnover is calculated by dividing the lesser of total purchases or sales of portfolio securities for the reporting period by the monthly average of portfolio securities owned during the reporting period. Excluded from both the numerator and denominator are amounts relating to derivatives and securities whose maturities or expiration dates at the time of acquisition were one year or less. |
SEE NOTES TO FINANCIAL STATEMENTS.
| 106 | J.P. MORGAN INTERNATIONAL EQUITY FUNDS | OCTOBER 31, 2012 | ||||
Table of Contents
| Ratios/Supplemental data | |||||||||||||||||||||||||
| Ratios to average net assets (a) | ||||||||||||||||||||||||||
Net asset | Total return (excludes sales charge) (b)(c) | Net assets, end of period (000’s) | Net expenses (d) | Net investment income (loss) | Expenses without waivers, reimbursements and earning credits | Portfolio turnover rate* (b) | ||||||||||||||||||||
| $ | 13.48 | 8.70 | % | $ | 1,300 | 1.25 | % | 1.45 | % | 7.91 | % | 100 | % | |||||||||||||
| 12.57 | (8.98 | ) | 1,480 | 1.45 | 0.79 | 5.29 | (g) | 120 | ||||||||||||||||||
| 14.05 | 22.26 | 293 | 1.45 | 0.57 | 9.89 | 97 | ||||||||||||||||||||
| 11.59 | 43.34 | 161 | 1.45 | 0.87 | 10.11 | 119 | ||||||||||||||||||||
| 8.22 | (49.02 | ) | 112 | 1.45 | 0.97 | 6.94 | 264 | |||||||||||||||||||
| 13.39 | 8.11 | 415 | 1.75 | 0.95 | 8.43 | 100 | ||||||||||||||||||||
| 12.51 | (9.46 | ) | 432 | 1.95 | 0.19 | 6.17 | (g) | 120 | ||||||||||||||||||
| 13.98 | 21.59 | 214 | 1.95 | 0.09 | 10.10 | 97 | ||||||||||||||||||||
| 11.55 | 42.63 | 159 | 1.95 | 0.37 | 10.61 | 119 | ||||||||||||||||||||
| 8.17 | (49.26 | ) | 112 | 1.95 | 0.47 | 7.44 | 264 | |||||||||||||||||||
| 13.37 | 12.16 | 56 | 1.50 | 1.20 | 8.17 | 100 | ||||||||||||||||||||
| 13.51 | 9.15 | 100 | 0.80 | 1.89 | 7.47 | 100 | ||||||||||||||||||||
| 12.63 | (8.56 | ) | 92 | 1.00 | 1.01 | 5.68 | (g) | 120 | ||||||||||||||||||
| 14.08 | 22.75 | 100 | 1.00 | 1.04 | 9.15 | 97 | ||||||||||||||||||||
| 11.61 | 44.06 | 82 | 1.00 | 1.32 | 9.65 | 119 | ||||||||||||||||||||
| 8.25 | (48.79 | ) | 57 | 1.00 | 1.42 | 6.48 | 264 | |||||||||||||||||||
| 13.51 | 13.01 | 56 | 0.75 | 1.95 | 7.42 | 100 | ||||||||||||||||||||
| 13.50 | 8.88 | 2,696 | 1.00 | 1.69 | 7.67 | 100 | ||||||||||||||||||||
| 12.62 | (8.73 | ) | 2,535 | 1.20 | 0.86 | 5.68 | (g) | 120 | ||||||||||||||||||
| 14.07 | 22.57 | 2,536 | 1.20 | 0.84 | 9.36 | 97 | ||||||||||||||||||||
| 11.60 | 43.67 | 2,030 | 1.20 | 1.12 | 9.86 | 119 | ||||||||||||||||||||
| 8.24 | (48.86 | ) | 1,412 | 1.20 | 1.22 | 6.69 | 264 | |||||||||||||||||||
SEE NOTES TO FINANCIAL STATEMENTS.
| OCTOBER 31, 2012 | J.P. MORGAN INTERNATIONAL EQUITY FUNDS | 107 | ||||||
Table of Contents
FINANCIAL HIGHLIGHTS
FOR THE PERIODS INDICATED (continued)
| Per share operating performance | |||||||||||||||||||||||||||||||
| Investment operations | Distributions | |||||||||||||||||||||||||||||||
| Net asset value, beginning of period | Net investment income (loss) | Net realized and unrealized gains (losses) on investments | Total from investment operations | Net investment income | Net realized gain | Total distributions | Redemption Fees | |||||||||||||||||||||||||
International Equity Fund | ||||||||||||||||||||||||||||||||
Class A | ||||||||||||||||||||||||||||||||
Year Ended October 31, 2012 | $ | 12.61 | $ | 0.22 | (e) | $ | 0.74 | $ | 0.96 | $ | (0.21 | ) | $ | — | $ | (0.21 | ) | $ | — | |||||||||||||
Year Ended October 31, 2011 | 13.40 | 0.22 | (e) | (0.80 | ) | (0.58 | ) | (0.21 | ) | — | (0.21 | ) | — | (f) | ||||||||||||||||||
Year Ended October 31, 2010 | 12.33 | 0.18 | (e) | 1.07 | 1.25 | (0.18 | ) | — | (0.18 | ) | — | (f) | ||||||||||||||||||||
Year Ended October 31, 2009 | 18.28 | 0.20 | (e) | 1.98 | 2.18 | (0.20 | ) | (7.93 | ) | (8.13 | ) | — | (f) | |||||||||||||||||||
Year Ended October 31, 2008 | 42.57 | 0.67 | (e) | (15.42 | ) | (14.75 | ) | (0.79 | ) | (8.75 | ) | (9.54 | ) | — | (f) | |||||||||||||||||
Class B | ||||||||||||||||||||||||||||||||
Year Ended October 31, 2012 | 12.22 | 0.16 | (e) | 0.70 | 0.86 | (0.15 | ) | — | (0.15 | ) | — | |||||||||||||||||||||
Year Ended October 31, 2011 | 13.00 | 0.14 | (e) | (0.77 | ) | (0.63 | ) | (0.15 | ) | — | (0.15 | ) | — | (f) | ||||||||||||||||||
Year Ended October 31, 2010 | 11.97 | 0.11 | (e) | 1.04 | 1.15 | (0.12 | ) | — | (0.12 | ) | — | (f) | ||||||||||||||||||||
Year Ended October 31, 2009 | 18.01 | 0.14 | (e) | 1.92 | 2.06 | (0.17 | ) | (7.93 | ) | (8.10 | ) | — | (f) | |||||||||||||||||||
Year Ended October 31, 2008 | 42.13 | 0.50 | (e) | (15.21 | ) | (14.71 | ) | (0.66 | ) | (8.75 | ) | (9.41 | ) | — | (f) | |||||||||||||||||
Class C | ||||||||||||||||||||||||||||||||
Year Ended October 31, 2012 | 12.08 | 0.16 | (e) | 0.69 | 0.85 | (0.15 | ) | — | (0.15 | ) | — | |||||||||||||||||||||
Year Ended October 31, 2011 | 12.85 | 0.14 | (e) | (0.76 | ) | (0.62 | ) | (0.15 | ) | — | (0.15 | ) | — | (f) | ||||||||||||||||||
Year Ended October 31, 2010 | 11.85 | 0.11 | (e) | 1.01 | 1.12 | (0.12 | ) | — | (0.12 | ) | — | (f) | ||||||||||||||||||||
Year Ended October 31, 2009 | 17.92 | 0.14 | (e) | 1.89 | 2.03 | (0.17 | ) | (7.93 | ) | (8.10 | ) | — | (f) | |||||||||||||||||||
Year Ended October 31, 2008 | 41.95 | 0.50 | (e) | (15.12 | ) | (14.62 | ) | (0.66 | ) | (8.75 | ) | (9.41 | ) | — | (f) | |||||||||||||||||
Class R2 | ||||||||||||||||||||||||||||||||
Year Ended October 31, 2012 | 12.58 | 0.15 | (e) | 0.77 | 0.92 | (0.19 | ) | — | (0.19 | ) | — | |||||||||||||||||||||
Year Ended October 31, 2011 | 13.37 | 0.18 | (e) | (0.79 | ) | (0.61 | ) | (0.18 | ) | — | (0.18 | ) | — | (f) | ||||||||||||||||||
Year Ended October 31, 2010 | 12.31 | 0.15 | (e) | 1.06 | 1.21 | (0.15 | ) | — | (0.15 | ) | — | (f) | ||||||||||||||||||||
November 3, 2008 (h) through October 31, 2009 | 18.29 | 0.18 | (e) | 1.96 | 2.14 | (0.19 | ) | (7.93 | ) | (8.12 | ) | — | (f) | |||||||||||||||||||
Class R5 | ||||||||||||||||||||||||||||||||
Year Ended October 31, 2012 | 12.75 | 0.29 | (e) | 0.74 | 1.03 | (0.26 | ) | — | (0.26 | ) | — | |||||||||||||||||||||
Year Ended October 31, 2011 | 13.55 | 0.23 | (e) | (0.76 | ) | (0.53 | ) | (0.27 | ) | — | (0.27 | ) | — | (f) | ||||||||||||||||||
Year Ended October 31, 2010 | 12.47 | 0.23 | (e) | 1.09 | 1.32 | (0.24 | ) | — | (0.24 | ) | — | (f) | ||||||||||||||||||||
Year Ended October 31, 2009 | 18.38 | 0.25 | (e) | 2.01 | 2.26 | (0.24 | ) | (7.93 | ) | (8.17 | ) | — | (f) | |||||||||||||||||||
Year Ended October 31, 2008 | 42.72 | 0.80 | (e) | (15.49 | ) | (14.69 | ) | (0.90 | ) | (8.75 | ) | (9.65 | ) | — | (f) | |||||||||||||||||
Class R6 | ||||||||||||||||||||||||||||||||
Year Ended October 31, 2012 | 12.75 | 0.29 | (e) | 0.74 | 1.03 | (0.26 | ) | — | (0.26 | ) | — | |||||||||||||||||||||
November 30, 2010 (h) through October 31, 2011 | 12.85 | 0.28 | (e) | (0.10 | ) | 0.18 | (0.28 | ) | — | (0.28 | ) | — | (f) | |||||||||||||||||||
Select Class | ||||||||||||||||||||||||||||||||
Year Ended October 31, 2012 | 12.76 | 0.26 | (e) | 0.74 | 1.00 | (0.24 | ) | — | (0.24 | ) | — | |||||||||||||||||||||
Year Ended October 31, 2011 | 13.56 | 0.24 | (e) | (0.80 | ) | (0.56 | ) | (0.24 | ) | — | (0.24 | ) | — | (f) | ||||||||||||||||||
Year Ended October 31, 2010 | 12.47 | 0.22 | (e) | 1.08 | �� | 1.30 | (0.21 | ) | — | (0.21 | ) | — | (f) | |||||||||||||||||||
Year Ended October 31, 2009 | 18.38 | 0.24 | (e) | 2.00 | 2.24 | (0.22 | ) | (7.93 | ) | (8.15 | ) | — | (f) | |||||||||||||||||||
Year Ended October 31, 2008 | 42.72 | 0.65 | (e) | (15.41 | ) | (14.76 | ) | (0.83 | ) | (8.75 | ) | (9.58 | ) | — | (f) | |||||||||||||||||
| (a) | Annualized for periods less than one year. |
| (b) | Not annualized for periods less than one year. |
| (c) | Includes adjustments in accordance with accounting principles generally accepted in the United States of America and as such, the net asset values for financial reporting purposes and the returns based upon those net asset values may differ from the net asset values and returns for shareholder transactions. |
| (d) | Includes earnings credits and interest expense, if applicable, each of which is less than 0.01% or unless otherwise noted. |
| (e) | Calculated based upon average shares outstanding. |
| (f) | Amount rounds to less than $0.01. |
| (g) | Includes interest expense of 0.04%. |
| (h) | Commencement of offering of class of shares. |
| * | Portfolio turnover is calculated by dividing the lesser of total purchases or sales of portfolio securities for the reporting period by the monthly average of portfolio securities owned during the reporting period. Excluded from both the numerator and denominator are amounts relating to derivatives and securities whose maturities or expiration dates at the time of acquisition were one year or less. |
SEE NOTES TO FINANCIAL STATEMENTS.
| 108 | J.P. MORGAN INTERNATIONAL EQUITY FUNDS | OCTOBER 31, 2012 | ||||
Table of Contents
| Ratios/Supplemental data | |||||||||||||||||||||||||
| Ratios to average net assets (a) | ||||||||||||||||||||||||||
| Net asset value, end of period | Total return (excludes sales charge) (b)(c) | Net assets, end of period (000’s) | Net expenses (d) | Net investment income (loss) | Expenses without waivers, reimbursements and earning credits | Portfolio turnover rate* (b) | ||||||||||||||||||||
| $ | 13.36 | 7.70 | % | $ | 98,274 | 1.30 | % | 1.72 | % | 1.51 | % | 5 | % | |||||||||||||
| 12.61 | (4.49 | ) | 102,866 | 1.31 | 1.63 | 1.52 | 18 | |||||||||||||||||||
| 13.40 | 10.42 | 131,125 | 1.31 | 1.44 | 1.54 | 15 | ||||||||||||||||||||
| 12.33 | 27.39 | 114,557 | 1.31 | 1.90 | 1.62 | 14 | ||||||||||||||||||||
| 18.28 | (43.95 | ) | 87,531 | 1.35 | (g) | 2.33 | 1.64 | 13 | ||||||||||||||||||
| 12.93 | 7.15 | 2,164 | 1.80 | 1.31 | 2.01 | 5 | ||||||||||||||||||||
| 12.22 | (4.99 | ) | 2,817 | 1.81 | 1.08 | 2.02 | 18 | |||||||||||||||||||
| 13.00 | 9.82 | 4,543 | 1.86 | 0.89 | 2.04 | 15 | ||||||||||||||||||||
| 11.97 | 26.72 | 5,303 | 1.87 | 1.44 | 2.12 | 14 | ||||||||||||||||||||
| 18.01 | (44.27 | ) | 5,225 | 1.91 | 1.74 | 2.14 | 13 | |||||||||||||||||||
| 12.78 | 7.16 | 17,873 | 1.80 | 1.31 | 2.01 | 5 | ||||||||||||||||||||
| 12.08 | (4.93 | ) | 20,193 | 1.81 | 1.09 | 2.02 | 18 | |||||||||||||||||||
| 12.85 | 9.69 | 23,370 | 1.86 | 0.88 | 2.04 | 15 | ||||||||||||||||||||
| 11.85 | 26.76 | 22,934 | 1.87 | 1.46 | 2.12 | 14 | ||||||||||||||||||||
| 17.92 | (44.24 | ) | 24,300 | 1.91 | 1.74 | 2.14 | 13 | |||||||||||||||||||
| 13.31 | 7.45 | 721 | 1.55 | 1.16 | 1.74 | 5 | ||||||||||||||||||||
| 12.58 | (4.73 | ) | 67 | 1.56 | 1.33 | 1.77 | 18 | |||||||||||||||||||
| 13.37 | 10.07 | 70 | 1.56 | 1.17 | 1.79 | 15 | ||||||||||||||||||||
| 12.31 | 26.95 | 64 | 1.56 | 1.76 | 1.85 | 14 | ||||||||||||||||||||
| 13.52 | 8.19 | 63,767 | 0.85 | 2.24 | 1.05 | 5 | ||||||||||||||||||||
| 12.75 | (4.07 | ) | 45,680 | 0.86 | 1.69 | 1.08 | 18 | |||||||||||||||||||
| 13.55 | 10.86 | 242,131 | 0.86 | 1.86 | 1.10 | 15 | ||||||||||||||||||||
| 12.47 | 27.92 | 144,494 | 0.86 | 2.39 | 1.16 | 14 | ||||||||||||||||||||
| 18.38 | (43.70 | ) | 86,640 | 0.90 | (g) | 2.86 | 1.19 | 13 | ||||||||||||||||||
| 13.52 | 8.23 | 682,861 | 0.80 | 2.26 | 1.00 | 5 | ||||||||||||||||||||
| 12.75 | 1.20 | 347,040 | 0.81 | 2.23 | 1.01 | 18 | ||||||||||||||||||||
| 13.52 | 7.91 | 210,375 | 1.05 | 2.02 | 1.25 | 5 | ||||||||||||||||||||
| 12.76 | (4.26 | ) | 186,425 | 1.06 | 1.76 | 1.27 | 18 | |||||||||||||||||||
| 13.56 | 10.72 | 241,123 | 1.06 | 1.74 | 1.29 | 15 | ||||||||||||||||||||
| 12.47 | 27.73 | 260,814 | 1.06 | 2.28 | 1.37 | 14 | ||||||||||||||||||||
| 18.38 | (43.82 | ) | 277,313 | 1.10 | (g) | 2.10 | 1.37 | 13 | ||||||||||||||||||
SEE NOTES TO FINANCIAL STATEMENTS.
| OCTOBER 31, 2012 | J.P. MORGAN INTERNATIONAL EQUITY FUNDS | 109 | ||||||
Table of Contents
FINANCIAL HIGHLIGHTS
FOR THE PERIODS INDICATED (continued)
| Per share operating performance | |||||||||||||||||||||||||||||||
| Investment operations | Distributions | |||||||||||||||||||||||||||||||
| Net asset value, beginning of period | Net investment income (loss) | Net realized (losses) on | Total from investment operations | Net investment income | Net realized gain | Total distributions | Redemption fees | |||||||||||||||||||||||||
International Equity Index Fund | ||||||||||||||||||||||||||||||||
Class A | ||||||||||||||||||||||||||||||||
Year Ended October 31, 2012 | $ | 16.83 | $ | 0.37 | (e) | $ | 0.45 | $ | 0.82 | $ | (0.41 | ) | $ | — | $ | (0.41 | ) | $ | — | |||||||||||||
Year Ended October 31, 2011 | 19.03 | 0.40 | (e) | (2.16 | )(g) | (1.76 | ) | (0.44 | ) | — | (0.44 | ) | — | (f) | ||||||||||||||||||
Year Ended October 31, 2010 | 17.89 | 0.33 | (e) | 1.10 | 1.43 | (0.29 | ) | — | (0.29 | ) | — | (f) | ||||||||||||||||||||
Year Ended October 31, 2009 | 16.27 | 0.36 | (e) | 3.52 | 3.88 | (0.70 | ) | (1.56 | ) | (2.26 | ) | — | (f) | |||||||||||||||||||
Year Ended October 31, 2008 | 33.43 | 0.78 | (15.70 | ) | (14.92 | ) | (0.58 | ) | (1.66 | ) | (2.24 | ) | — | (f) | ||||||||||||||||||
Class B | ||||||||||||||||||||||||||||||||
Year Ended October 31, 2012 | 15.52 | 0.23 | (e) | 0.43 | 0.66 | (0.27 | ) | — | (0.27 | ) | — | |||||||||||||||||||||
Year Ended October 31, 2011 | 17.57 | 0.24 | (e) | (1.99 | )(g) | (1.75 | ) | (0.30 | ) | — | (0.30 | ) | — | (f) | ||||||||||||||||||
Year Ended October 31, 2010 | 16.54 | 0.18 | (e) | 1.02 | 1.20 | (0.17 | ) | — | (0.17 | ) | — | (f) | ||||||||||||||||||||
Year Ended October 31, 2009 | 15.13 | 0.24 | (e) | 3.25 | 3.49 | (0.52 | ) | (1.56 | ) | (2.08 | ) | — | (f) | |||||||||||||||||||
Year Ended October 31, 2008 | 31.25 | 0.55 | (14.64 | ) | (14.09 | ) | (0.37 | ) | (1.66 | ) | (2.03 | ) | — | (f) | ||||||||||||||||||
Class C | ||||||||||||||||||||||||||||||||
Year Ended October 31, 2012 | 16.27 | 0.25 | (e) | 0.44 | 0.69 | (0.28 | ) | — | (0.28 | ) | — | |||||||||||||||||||||
Year Ended October 31, 2011 | 18.41 | 0.26 | (e) | (2.09 | )(g) | (1.83 | ) | (0.31 | ) | — | (0.31 | ) | — | (f) | ||||||||||||||||||
Year Ended October 31, 2010 | 17.35 | 0.20 | (e) | 1.06 | 1.26 | (0.20 | ) | — | (0.20 | ) | — | (f) | ||||||||||||||||||||
Year Ended October 31, 2009 | 15.78 | 0.24 | (e) | 3.41 | 3.65 | (0.52 | ) | (1.56 | ) | (2.08 | ) | — | (f) | |||||||||||||||||||
Year Ended October 31, 2008 | 32.52 | 0.57 | (15.24 | ) | (14.67 | ) | (0.41 | ) | (1.66 | ) | (2.07 | ) | — | (f) | ||||||||||||||||||
Class R2 | ||||||||||||||||||||||||||||||||
Year Ended October 31, 2012 | 16.66 | 0.32 | (e) | 0.45 | 0.77 | (0.40 | ) | — | (0.40 | ) | — | |||||||||||||||||||||
Year Ended October 31, 2011 | 18.86 | 0.32 | (e) | (2.12 | )(g) | (1.80 | ) | (0.40 | ) | — | (0.40 | ) | — | (f) | ||||||||||||||||||
Year Ended October 31, 2010 | 17.76 | 0.28 | (e) | 1.10 | 1.38 | (0.28 | ) | — | (0.28 | ) | — | (f) | ||||||||||||||||||||
November 3, 2008 (h) through October 31, 2009 | 16.32 | 0.27 | (e) | 3.48 | 3.75 | (0.75 | ) | (1.56 | ) | (2.31 | ) | — | (f) | |||||||||||||||||||
Select Class | ||||||||||||||||||||||||||||||||
Year Ended October 31, 2012 | 16.96 | 0.41 | (e) | 0.45 | 0.86 | (0.46 | ) | — | (0.46 | ) | — | |||||||||||||||||||||
Year Ended October 31, 2011 | 19.17 | 0.45 | (e) | (2.17 | )(g) | (1.72 | ) | (0.49 | ) | — | (0.49 | ) | — | (f) | ||||||||||||||||||
Year Ended October 31, 2010 | 18.01 | 0.37 | (e) | 1.12 | 1.49 | (0.33 | ) | — | (0.33 | ) | — | (f) | ||||||||||||||||||||
Year Ended October 31, 2009 | 16.39 | 0.42 | (e) | 3.51 | 3.93 | (0.75 | ) | (1.56 | ) | (2.31 | ) | — | (f) | |||||||||||||||||||
Year Ended October 31, 2008 | 33.65 | 0.80 | (15.75 | ) | (14.95 | ) | (0.65 | ) | (1.66 | ) | (2.31 | ) | — | (f) | ||||||||||||||||||
| (a) | Annualized for periods less than one year. |
| (b) | Not annualized for periods less than one year. |
| (c) | Includes adjustments in accordance with accounting principles generally accepted in the United States of America and as such, the net asset values for financial reporting purposes and the returns based upon those net asset values may differ from the net asset values and returns for shareholder transactions. |
| (d) | Includes earnings credits and interest expense, if applicable, each of which is less than 0.01% or unless otherwise noted. |
| (e) | Calculated based upon average shares outstanding. |
| (f) | Amount rounds to less than $0.01. |
| (g) | An affiliate of JPMorgan Chase & Co. reimbursed the Fund for losses incurred from an operational error. The impact was less than $0.01 to the net realized and unrealized gains (losses) on investments per share and less than 0.01% to the total return. |
| (h) | Commencement of offering of class of shares. |
| * | Portfolio turnover is calculated by dividing the lesser of total purchases or sales of portfolio securities for the reporting period by the monthly average of portfolio securities owned during the reporting period. Excluded from both the numerator and denominator are amounts relating to derivatives and securities whose maturities or expiration dates at the time of acquisition were one year or less. |
SEE NOTES TO FINANCIAL STATEMENTS.
| 110 | J.P. MORGAN INTERNATIONAL EQUITY FUNDS | OCTOBER 31, 2012 | ||||
Table of Contents
| Ratios/Supplemental data | |||||||||||||||||||||||||
| Ratios to average net assets (a) | ||||||||||||||||||||||||||
| Net asset value, end of period | Total return (excludes sales charge) (b)(c) | Net assets, end of period (000’s) | Net expenses (d) | Net investment income (loss) | Expenses without waivers, reimbursements and earning credits | Portfolio turnover rate* (b) | ||||||||||||||||||||
| $ | 17.24 | 5.16 | % | $ | 96,191 | 1.07 | % | 2.27 | % | 1.31 | % | 19 | % | |||||||||||||
| 16.83 | (9.45 | )(g) | 99,046 | 1.07 | 2.16 | 1.31 | 40 | |||||||||||||||||||
| 19.03 | 8.09 | 124,178 | 1.07 | 1.89 | 1.34 | 39 | ||||||||||||||||||||
| 17.89 | 27.74 | 109,441 | 1.07 | 2.40 | 1.37 | 37 | ||||||||||||||||||||
| 16.27 | (47.49 | ) | 82,272 | 1.07 | 2.97 | 1.27 | 18 | |||||||||||||||||||
| 15.91 | 4.43 | 3,060 | 1.79 | 1.54 | 1.82 | 19 | ||||||||||||||||||||
| 15.52 | (10.11 | )(g) | 4,154 | 1.78 | 1.41 | 1.81 | 40 | |||||||||||||||||||
| 17.57 | 7.32 | 6,503 | 1.80 | 1.11 | 1.83 | 39 | ||||||||||||||||||||
| 16.54 | 26.78 | 8,179 | 1.80 | 1.72 | 1.87 | 37 | ||||||||||||||||||||
| 15.13 | (47.88 | ) | 8,547 | 1.77 | 2.18 | 1.77 | 18 | |||||||||||||||||||
| 16.68 | 4.43 | 16,291 | 1.79 | 1.57 | 1.81 | 19 | ||||||||||||||||||||
| 16.27 | (10.08 | )(g) | 15,428 | 1.78 | 1.46 | 1.81 | 40 | |||||||||||||||||||
| 18.41 | 7.34 | 18,148 | 1.80 | 1.19 | 1.83 | 39 | ||||||||||||||||||||
| 17.35 | 26.74 | 16,231 | 1.80 | 1.63 | 1.87 | 37 | ||||||||||||||||||||
| 15.78 | (47.85 | ) | 10,639 | 1.77 | 2.16 | 1.77 | 18 | |||||||||||||||||||
| 17.03 | 4.94 | 786 | 1.32 | 1.97 | 1.56 | 19 | ||||||||||||||||||||
| 16.66 | (9.72 | )(g) | 463 | 1.32 | 1.77 | 1.55 | 40 | |||||||||||||||||||
| 18.86 | 7.88 | 251 | 1.32 | 1.62 | 1.59 | 39 | ||||||||||||||||||||
| 17.76 | 26.96 | 234 | 1.32 | 1.77 | 1.62 | 37 | ||||||||||||||||||||
| 17.36 | 5.40 | 469,065 | 0.82 | 2.51 | 1.06 | 19 | ||||||||||||||||||||
| 16.96 | (9.21 | )(g) | 502,764 | 0.82 | 2.40 | 1.05 | 40 | |||||||||||||||||||
| 19.17 | 8.37 | 516,537 | 0.82 | 2.08 | 1.08 | 39 | ||||||||||||||||||||
| 18.01 | 28.02 | 772,784 | 0.82 | 2.76 | 1.12 | 37 | ||||||||||||||||||||
| 16.39 | (47.35 | ) | 714,939 | 0.82 | 3.09 | 1.02 | 18 | |||||||||||||||||||
SEE NOTES TO FINANCIAL STATEMENTS.
| OCTOBER 31, 2012 | J.P. MORGAN INTERNATIONAL EQUITY FUNDS | 111 | ||||||
Table of Contents
FINANCIAL HIGHLIGHTS
FOR THE PERIODS INDICATED (continued)
| Per share operating performance | ||||||||||||||||||||||||
| Investment operations | Distributions | |||||||||||||||||||||||
| Net asset value, beginning of period | Net investment income (loss) | Net realized and unrealized gains (losses) on investments | Total from investment operations | Net investment income | Redemption fees | |||||||||||||||||||
International Opportunities Fund | ||||||||||||||||||||||||
Class A | ||||||||||||||||||||||||
Year Ended October 31, 2012 | $ | 12.00 | $ | 0.23 | (e) | $ | 0.56 | $ | 0.79 | $ | (0.34 | ) | $ | — | ||||||||||
Year Ended October 31, 2011 | 13.20 | 0.19 | (e) | (1.08 | ) | (0.89 | ) | (0.31 | ) | — | (f) | |||||||||||||
Year Ended October 31, 2010 | 12.10 | 0.15 | (e) | 1.24 | 1.39 | (0.29 | ) | — | (f) | |||||||||||||||
Year Ended October 31, 2009 | 9.95 | 0.19 | (e) | 2.16 | 2.35 | (0.20 | ) | — | (f) | |||||||||||||||
Year Ended October 31, 2008 | 18.40 | 0.30 | (e) | (8.48 | ) | (8.18 | ) | (0.27 | ) | — | (f) | |||||||||||||
Class B | ||||||||||||||||||||||||
Year Ended October 31, 2012 | 11.93 | 0.18 | (e) | 0.56 | 0.74 | (0.21 | ) | — | ||||||||||||||||
Year Ended October 31, 2011 | 13.09 | 0.15 | (e) | (1.10 | ) | (0.95 | ) | (0.21 | ) | — | (f) | |||||||||||||
Year Ended October 31, 2010 | 12.03 | 0.08 | (e) | 1.23 | 1.31 | (0.25 | ) | — | (f) | |||||||||||||||
Year Ended October 31, 2009 | 9.83 | 0.14 | (e) | 2.16 | 2.30 | (0.10 | ) | — | (f) | |||||||||||||||
Year Ended October 31, 2008 | 18.20 | 0.23 | (e) | (8.39 | ) | (8.16 | ) | (0.21 | ) | — | (f) | |||||||||||||
Class C | ||||||||||||||||||||||||
Year Ended October 31, 2012 | 11.65 | 0.18 | (e) | 0.55 | 0.73 | (0.23 | ) | — | ||||||||||||||||
Year Ended October 31, 2011 | 12.84 | 0.15 | (e) | (1.07 | ) | (0.92 | ) | (0.27 | ) | — | (f) | |||||||||||||
Year Ended October 31, 2010 | 11.82 | 0.09 | (e) | 1.20 | 1.29 | (0.27 | ) | — | (f) | |||||||||||||||
Year Ended October 31, 2009 | 9.77 | 0.13 | (e) | 2.11 | 2.24 | (0.19 | ) | — | (f) | |||||||||||||||
Year Ended October 31, 2008 | 18.21 | 0.23 | (e) | (8.35 | ) | (8.12 | ) | (0.32 | ) | — | (f) | |||||||||||||
Class R6 | ||||||||||||||||||||||||
Year Ended October 31, 2012 | 12.20 | 0.31 | (e) | 0.56 | 0.87 | (0.38 | ) | — | ||||||||||||||||
November 30, 2010 (g) through October 31, 2011 | 12.78 | 0.27 | (e) | (0.48 | ) | (0.21 | ) | (0.37 | ) | — | (f) | |||||||||||||
Institutional Class | ||||||||||||||||||||||||
Year Ended October 31, 2012 | 12.20 | 0.30 | (e) | 0.56 | 0.86 | (0.37 | ) | — | ||||||||||||||||
Year Ended October 31, 2011 | 13.42 | 0.23 | (e) | (1.09 | ) | (0.86 | ) | (0.36 | ) | — | (f) | |||||||||||||
Year Ended October 31, 2010 | 12.29 | 0.22 | (e) | 1.24 | 1.46 | (0.33 | ) | — | (f) | |||||||||||||||
Year Ended October 31, 2009 | 10.13 | 0.25 | (e) | 2.18 | 2.43 | (0.27 | ) | — | (f) | |||||||||||||||
Year Ended October 31, 2008 | 18.72 | 0.38 | (e) | (8.62 | ) | (8.24 | ) | (0.35 | ) | — | (f) | |||||||||||||
Select Class | ||||||||||||||||||||||||
Year Ended October 31, 2012 | 12.15 | 0.28 | (e) | 0.56 | 0.84 | (0.35 | ) | — | ||||||||||||||||
Year Ended October 31, 2011 | 13.37 | 0.26 | (e) | (1.14 | ) | (0.88 | ) | (0.34 | ) | — | (f) | |||||||||||||
Year Ended October 31, 2010 | 12.24 | 0.19 | (e) | 1.25 | 1.44 | (0.31 | ) | — | (f) | |||||||||||||||
Year Ended October 31, 2009 | 10.07 | 0.22 | (e) | 2.18 | 2.40 | (0.23 | ) | — | (f) | |||||||||||||||
Year Ended October 31, 2008 | 18.60 | 0.34 | (e) | (8.56 | ) | (8.22 | ) | (0.31 | ) | — | (f) | |||||||||||||
| (a) | Annualized for periods less than one year. |
| (b) | Not annualized for periods less than one year. |
| (c) | Includes adjustments in accordance with accounting principles generally accepted in the United States of America and as such, the net asset values for financial reporting purposes and the returns based upon those net asset values may differ from the net asset values and returns for shareholder transactions. |
| (d) | Includes earnings credits and interest expense, if applicable, each of which is less than 0.01% or unless otherwise noted. |
| (e) | Calculated based upon average shares outstanding. |
| (f) | Amount rounds to less than $0.01. |
| (g) | Commencement of offering of class of shares. |
| * | Portfolio turnover is calculated by dividing the lesser of total purchases or sales of portfolio securities for the reporting period by the monthly average of portfolio securities owned during the reporting period. Excluded from both the numerator and denominator are amounts relating to derivatives and securities whose maturities or expiration dates at the time of acquisition were one year or less. |
SEE NOTES TO FINANCIAL STATEMENTS.
| 112 | J.P. MORGAN INTERNATIONAL EQUITY FUNDS | OCTOBER 31, 2012 | ||||
Table of Contents
| Ratios/Supplemental data | |||||||||||||||||||||||||
| Ratios to average net assets (a) | ||||||||||||||||||||||||||
Net asset | Total return (excludes sales charge) (b)(c) | Net assets, end of period (000’s) | Net expenses (d) | Net investment income (loss) | Expenses without waivers, reimbursements and earning credits | Portfolio turnover rate* (b) | ||||||||||||||||||||
| $ | 12.45 | 6.95 | % | $ | 67,472 | 1.29 | % | 1.91 | % | 1.30 | % | 45 | % | |||||||||||||
| 12.00 | (6.91 | ) | 47,855 | 1.28 | 1.45 | 1.28 | 76 | |||||||||||||||||||
| 13.20 | 11.67 | 13,904 | 1.34 | 1.23 | 1.36 | 57 | ||||||||||||||||||||
| 12.10 | 24.17 | 13,773 | 1.41 | 1.84 | 1.42 | 85 | ||||||||||||||||||||
| 9.95 | (45.06 | ) | 6,700 | 1.39 | 1.99 | 1.39 | 70 | |||||||||||||||||||
| 12.46 | 6.46 | 462 | 1.79 | 1.54 | 1.80 | 45 | ||||||||||||||||||||
| 11.93 | (7.40 | ) | 702 | 1.78 | 1.18 | 1.79 | 76 | |||||||||||||||||||
| 13.09 | 11.01 | 949 | 1.85 | 0.65 | 1.86 | 57 | ||||||||||||||||||||
| 12.03 | 23.62 | 1,716 | 1.91 | 1.34 | 1.92 | 85 | ||||||||||||||||||||
| 9.83 | (45.31 | ) | 879 | 1.89 | 1.48 | 1.89 | 70 | |||||||||||||||||||
| 12.15 | 6.47 | 531 | 1.79 | 1.55 | 1.80 | 45 | ||||||||||||||||||||
| 11.65 | (7.37 | ) | 576 | 1.78 | 1.14 | 1.79 | 76 | |||||||||||||||||||
| 12.84 | 11.05 | 849 | 1.85 | 0.77 | 1.86 | 57 | ||||||||||||||||||||
| 11.82 | 23.50 | 636 | 1.91 | 1.20 | 1.92 | 85 | ||||||||||||||||||||
| 9.77 | (45.31 | ) | 87 | 1.89 | 1.58 | 1.89 | 70 | |||||||||||||||||||
| 12.69 | 7.59 | 692,117 | 0.79 | 2.58 | 0.79 | 45 | ||||||||||||||||||||
| 12.20 | (1.85 | ) | 373,613 | 0.78 | 2.27 | 0.78 | 76 | |||||||||||||||||||
| 12.69 | 7.45 | 41,574 | 0.89 | 2.47 | 0.90 | 45 | ||||||||||||||||||||
| 12.20 | (6.59 | ) | 39,362 | 0.89 | 1.73 | 0.90 | 76 | |||||||||||||||||||
| 13.42 | 12.12 | 272,487 | 0.91 | 1.75 | 0.96 | 57 | ||||||||||||||||||||
| 12.29 | 24.70 | 161,023 | 0.92 | 2.41 | 1.02 | 85 | ||||||||||||||||||||
| 10.13 | (44.77 | ) | 126,248 | 0.92 | 2.48 | 0.98 | 70 | |||||||||||||||||||
| 12.64 | 7.28 | 33,029 | 1.04 | 2.35 | 1.05 | 45 | ||||||||||||||||||||
| 12.15 | (6.77 | ) | 28,476 | 1.03 | 1.97 | 1.04 | 76 | |||||||||||||||||||
| 13.37 | 11.93 | 30,537 | 1.09 | 1.56 | 1.11 | 57 | ||||||||||||||||||||
| 12.24 | 24.41 | 28,588 | 1.16 | 2.12 | 1.17 | 85 | ||||||||||||||||||||
| 10.07 | (44.87 | ) | 23,645 | 1.14 | 2.20 | 1.14 | 70 | |||||||||||||||||||
SEE NOTES TO FINANCIAL STATEMENTS.
| OCTOBER 31, 2012 | J.P. MORGAN INTERNATIONAL EQUITY FUNDS | 113 | ||||||
Table of Contents
FINANCIAL HIGHLIGHTS
FOR THE PERIODS INDICATED (continued)
| Per share operating performance | |||||||||||||||||||||||||||||||
| Investment operations | Distributions | |||||||||||||||||||||||||||||||
| Net asset value, beginning of period | Net investment income (loss) | Net realized and unrealized gains (losses) on investments | Total from investment operations | Net investment income | Net realized gain | Total distributions | Redemption fees | |||||||||||||||||||||||||
International Value Fund | ||||||||||||||||||||||||||||||||
Class A | ||||||||||||||||||||||||||||||||
Year Ended October 31, 2012 | $ | 12.05 | $ | 0.31 | (e) | $ | 0.21 | $ | 0.52 | $ | (0.39 | ) | $ | — | $ | (0.39 | ) | $ | — | |||||||||||||
Year Ended October 31, 2011 | 13.36 | 0.28 | (e) | (1.17 | ) | (0.89 | ) | (0.42 | ) | — | (0.42 | ) | — | (f) | ||||||||||||||||||
Year Ended October 31, 2010 | 12.27 | 0.17 | (e) | 1.20 | 1.37 | (0.28 | ) | — | (0.28 | ) | — | (f) | ||||||||||||||||||||
Year Ended October 31, 2009 | 10.32 | 0.23 | (e) | 2.06 | 2.29 | (0.34 | ) | — | (0.34 | ) | — | (f) | ||||||||||||||||||||
Year Ended October 31, 2008 | 20.84 | 0.41 | (e) | (9.73 | ) | (9.32 | ) | (0.22 | ) | (0.98 | ) | (1.20 | ) | — | (f) | |||||||||||||||||
Class B | ||||||||||||||||||||||||||||||||
Year Ended October 31, 2012 | 11.89 | 0.25 | (e) | 0.20 | 0.45 | (0.31 | ) | — | (0.31 | ) | — | |||||||||||||||||||||
Year Ended October 31, 2011 | 13.18 | 0.21 | (e) | (1.16 | ) | (0.95 | ) | (0.34 | ) | — | (0.34 | ) | — | (f) | ||||||||||||||||||
Year Ended October 31, 2010 | 12.10 | 0.11 | (e) | 1.18 | 1.29 | (0.21 | ) | — | (0.21 | ) | — | (f) | ||||||||||||||||||||
Year Ended October 31, 2009 | 10.12 | 0.18 | (e) | 2.03 | 2.21 | (0.23 | ) | — | (0.23 | ) | — | (f) | ||||||||||||||||||||
Year Ended October 31, 2008 | 20.46 | 0.32 | (e) | (9.56 | ) | (9.24 | ) | (0.12 | ) | (0.98 | ) | (1.10 | ) | — | (f) | |||||||||||||||||
Class C | ||||||||||||||||||||||||||||||||
Year Ended October 31, 2012 | 11.72 | 0.25 | (e) | 0.19 | 0.44 | (0.32 | ) | — | (0.32 | ) | — | |||||||||||||||||||||
Year Ended October 31, 2011 | 13.01 | 0.21 | (e) | (1.14 | ) | (0.93 | ) | (0.36 | ) | — | (0.36 | ) | — | (f) | ||||||||||||||||||
Year Ended October 31, 2010 | 11.96 | 0.11 | (e) | 1.17 | 1.28 | (0.23 | ) | — | (0.23 | ) | — | (f) | ||||||||||||||||||||
Year Ended October 31, 2009 | 10.04 | 0.18 | (e) | 2.02 | 2.20 | (0.28 | ) | — | (0.28 | ) | — | (f) | ||||||||||||||||||||
Year Ended October 31, 2008 | 20.36 | 0.33 | (e) | (9.51 | ) | (9.18 | ) | (0.16 | ) | (0.98 | ) | (1.14 | ) | — | (f) | |||||||||||||||||
Class R2 | ||||||||||||||||||||||||||||||||
Year Ended October 31, 2012 | 11.86 | 0.28 | (e) | 0.19 | 0.47 | (0.34 | ) | — | (0.34 | ) | — | |||||||||||||||||||||
Year Ended October 31, 2011 | 13.21 | 0.24 | (e) | (1.15 | ) | (0.91 | ) | (0.44 | ) | — | (0.44 | ) | — | (f) | ||||||||||||||||||
Year Ended October 31, 2010 | 12.19 | 0.11 | (e) | 1.21 | 1.32 | (0.30 | ) | — | (0.30 | ) | — | (f) | ||||||||||||||||||||
November 3, 2008 (g) through October 31, 2009 | 10.33 | 0.09 | (e) | 2.15 | 2.24 | (0.38 | ) | — | (0.38 | ) | — | (f) | ||||||||||||||||||||
Class R6 | ||||||||||||||||||||||||||||||||
Year Ended October 31, 2012 | 12.26 | 0.37 | (e) | 0.21 | 0.58 | (0.46 | ) | — | (0.46 | ) | — | |||||||||||||||||||||
November 30, 2010 (g) through October 31, 2011 | 12.72 | 0.32 | (e) | (0.30 | ) | 0.02 | (0.48 | ) | — | (0.48 | ) | — | (f) | |||||||||||||||||||
Institutional Class | ||||||||||||||||||||||||||||||||
Year Ended October 31, 2012 | 12.26 | 0.36 | (e) | 0.20 | 0.56 | (0.44 | ) | — | (0.44 | ) | — | |||||||||||||||||||||
Year Ended October 31, 2011 | 13.59 | 0.33 | (e) | (1.19 | ) | (0.86 | ) | (0.47 | ) | — | (0.47 | ) | — | (f) | ||||||||||||||||||
Year Ended October 31, 2010 | 12.47 | 0.25 | (e) | 1.19 | 1.44 | (0.32 | ) | — | (0.32 | ) | — | (f) | ||||||||||||||||||||
Year Ended October 31, 2009 | 10.47 | 0.28 | (e) | 2.10 | 2.38 | (0.38 | ) | — | (0.38 | ) | — | (f) | ||||||||||||||||||||
Year Ended October 31, 2008 | 21.11 | 0.50 | (e) | (9.89 | ) | (9.39 | ) | (0.27 | ) | (0.98 | ) | (1.25 | ) | — | (f) | |||||||||||||||||
Select Class | ||||||||||||||||||||||||||||||||
Year Ended October 31, 2012 | 12.19 | 0.34 | (e) | 0.21 | 0.55 | (0.43 | ) | — | (0.43 | ) | — | |||||||||||||||||||||
Year Ended October 31, 2011 | 13.50 | 0.31 | (e) | (1.18 | ) | (0.87 | ) | (0.44 | ) | — | (0.44 | ) | — | (f) | ||||||||||||||||||
Year Ended October 31, 2010 | 12.40 | 0.23 | (e) | 1.18 | 1.41 | (0.31 | ) | — | (0.31 | ) | — | (f) | ||||||||||||||||||||
Year Ended October 31, 2009 | 10.42 | 0.25 | (e) | 2.10 | 2.35 | (0.37 | ) | — | (0.37 | ) | — | (f) | ||||||||||||||||||||
Year Ended October 31, 2008 | 21.01 | 0.47 | (e) | (9.84 | ) | (9.37 | ) | (0.24 | ) | (0.98 | ) | (1.22 | ) | — | (f) | |||||||||||||||||
| (a) | Annualized for periods less than one year. |
| (b) | Not annualized for periods less than one year. |
| (c) | Includes adjustments in accordance with accounting principles generally accepted in the United States of America and as such, the net asset values for financial reporting purposes and the returns based upon those net asset values may differ from the net asset values and returns for shareholder transactions. |
| (d) | Includes earnings credits and interest expense, if applicable, each of which is less than 0.01% or unless otherwise noted. |
| (e) | Calculated based upon average shares outstanding. |
| (f) | Amount rounds to less than $0.01. |
| (g) | Commencement of offering of class of shares. |
| * | Portfolio turnover is calculated by dividing the lesser of total purchases or sales of portfolio securities for the reporting period by the monthly average of portfolio securities owned during the reporting period. Excluded from both the numerator and denominator are amounts relating to derivatives and securities whose maturities or expiration dates at the time of acquisition were one year or less. |
SEE NOTES TO FINANCIAL STATEMENTS.
| 114 | J.P. MORGAN INTERNATIONAL EQUITY FUNDS | OCTOBER 31, 2012 | ||||
Table of Contents
| Ratios/Supplemental data | |||||||||||||||||||||||||
| Ratios to average net assets (a) | ||||||||||||||||||||||||||
Net asset | Total return (excludes sales charge) (b)(c) | Net assets, end of period (000’s) | Net expenses (d) | Net investment income (loss) | Expenses without waivers, reimbursements and earning credits | Portfolio turnover rate* (b) | ||||||||||||||||||||
| $ | 12.18 | 4.64 | % | $ | 124,691 | 1.35 | % | 2.66 | % | 1.37 | % | 62 | % | |||||||||||||
| 12.05 | (6.91 | ) | 113,976 | 1.34 | 2.15 | 1.36 | 60 | |||||||||||||||||||
| 13.36 | 11.35 | 143,259 | 1.34 | 1.41 | 1.35 | 92 | ||||||||||||||||||||
| 12.27 | 23.08 | 134,648 | 1.36 | 2.20 | 1.36 | 98 | ||||||||||||||||||||
| 10.32 | (47.12 | ) | 79,202 | 1.32 | 2.59 | 1.32 | 86 | |||||||||||||||||||
| 12.03 | 4.04 | 2,932 | 1.85 | 2.20 | 1.87 | 62 | ||||||||||||||||||||
| 11.89 | (7.42 | ) | 3,557 | 1.84 | 1.61 | 1.86 | 60 | |||||||||||||||||||
| 13.18 | 10.81 | 5,337 | 1.84 | 0.91 | 1.85 | 92 | ||||||||||||||||||||
| 12.10 | 22.50 | 6,517 | 1.86 | 1.80 | 1.86 | 98 | ||||||||||||||||||||
| 10.12 | (47.40 | ) | 7,321 | 1.82 | 2.03 | 1.82 | 86 | |||||||||||||||||||
| 11.84 | 4.04 | 14,311 | 1.85 | 2.23 | 1.87 | 62 | ||||||||||||||||||||
| 11.72 | (7.38 | ) | 16,510 | 1.84 | 1.60 | 1.86 | 60 | |||||||||||||||||||
| 13.01 | 10.81 | 19,646 | 1.84 | 0.89 | 1.85 | 92 | ||||||||||||||||||||
| 11.96 | 22.60 | 18,081 | 1.86 | 1.77 | 1.86 | 98 | ||||||||||||||||||||
| 10.04 | (47.43 | ) | 12,159 | 1.82 | 2.12 | 1.82 | 86 | |||||||||||||||||||
| 11.99 | 4.27 | 881 | 1.60 | 2.43 | 1.62 | 62 | ||||||||||||||||||||
| 11.86 | (7.12 | ) | 694 | 1.59 | 1.84 | 1.61 | 60 | |||||||||||||||||||
| 13.21 | 11.00 | 856 | 1.60 | 0.90 | 1.61 | 92 | ||||||||||||||||||||
| 12.19 | 22.73 | 423 | 1.60 | 0.76 | 1.60 | 98 | ||||||||||||||||||||
| 12.38 | 5.11 | 25,945 | 0.84 | 3.06 | 0.87 | 62 | ||||||||||||||||||||
| 12.26 | (0.10 | ) | 50 | 0.84 | 2.57 | 0.86 | 60 | |||||||||||||||||||
| 12.38 | 5.00 | 639,798 | 0.94 | �� | 3.03 | 0.97 | 62 | |||||||||||||||||||
| 12.26 | (6.56 | ) | 545,034 | 0.94 | 2.48 | 0.96 | 60 | |||||||||||||||||||
| 13.59 | 11.79 | 421,538 | 0.92 | 2.04 | 0.95 | 92 | ||||||||||||||||||||
| 12.47 | 23.75 | 347,238 | 0.95 | 2.60 | 0.96 | 98 | ||||||||||||||||||||
| 10.47 | (46.94 | ) | 149,326 | 0.92 | 3.09 | 0.92 | 86 | |||||||||||||||||||
| 12.31 | 4.87 | 1,458,864 | 1.10 | 2.92 | 1.12 | 62 | ||||||||||||||||||||
| 12.19 | (6.65 | ) | 1,413,804 | 1.09 | 2.37 | 1.12 | 60 | |||||||||||||||||||
| 13.50 | 11.56 | 943,998 | 1.09 | 1.84 | 1.10 | 92 | ||||||||||||||||||||
| 12.40 | 23.51 | 1,132,171 | 1.11 | 2.42 | 1.11 | 98 | ||||||||||||||||||||
| 10.42 | (47.00 | ) | 564,867 | 1.07 | 2.91 | 1.07 | 86 | |||||||||||||||||||
SEE NOTES TO FINANCIAL STATEMENTS.
| OCTOBER 31, 2012 | J.P. MORGAN INTERNATIONAL EQUITY FUNDS | 115 | ||||||
Table of Contents
FINANCIAL HIGHLIGHTS
FOR THE PERIODS INDICATED (continued)
| Per share operating performance | |||||||||||||||||||||||||||||||
| Investment operations | Distributions | |||||||||||||||||||||||||||||||
| Net asset value, beginning of period | Net investment income (loss) | Net realized and unrealized gains (losses) on investments | Total from investment operations | Net investment income | Net realized gain | Total distributions | Redemption fees | |||||||||||||||||||||||||
Intrepid International Fund | ||||||||||||||||||||||||||||||||
Class A | ||||||||||||||||||||||||||||||||
Year Ended October 31, 2012 | $ | 15.32 | $ | 0.25 | (e) | $ | 0.49 | $ | 0.74 | $ | (0.16 | ) | $ | — | $ | (0.16 | ) | $ | — | |||||||||||||
Year Ended October 31, 2011 | 16.59 | 0.24 | (e) | (1.27 | ) | (1.03 | ) | (0.24 | ) | — | (0.24 | ) | — | (f) | ||||||||||||||||||
Year Ended October 31, 2010 | 14.99 | 0.12 | (e) | 1.73 | 1.85 | (0.25 | ) | — | (0.25 | ) | — | (f) | ||||||||||||||||||||
Year Ended October 31, 2009 | 13.51 | 0.19 | (e) | 2.40 | 2.59 | (1.11 | ) | — | (1.11 | ) | — | (f) | ||||||||||||||||||||
Year Ended October 31, 2008 | 27.57 | 0.49 | (e) | (13.93 | ) | (13.44 | ) | (0.23 | ) | (0.39 | ) | (0.62 | ) | — | (f) | |||||||||||||||||
Class C | ||||||||||||||||||||||||||||||||
Year Ended October 31, 2012 | 15.36 | 0.18 | (e) | 0.50 | 0.68 | (0.04 | ) | — | (0.04 | ) | — | |||||||||||||||||||||
Year Ended October 31, 2011 | 16.61 | 0.15 | (e) | (1.26 | ) | (1.11 | ) | (0.14 | ) | — | (0.14 | ) | — | (f) | ||||||||||||||||||
Year Ended October 31, 2010 | 14.99 | 0.05 | (e) | 1.73 | 1.78 | (0.16 | ) | — | (0.16 | ) | — | (f) | ||||||||||||||||||||
Year Ended October 31, 2009 | 13.37 | 0.13 | (e) | 2.41 | 2.54 | (0.92 | ) | — | (0.92 | ) | — | (f) | ||||||||||||||||||||
Year Ended October 31, 2008 | 27.33 | 0.38 | (e) | (13.80 | ) | (13.42 | ) | (0.15 | ) | (0.39 | ) | (0.54 | ) | — | (f) | |||||||||||||||||
Class R2 | ||||||||||||||||||||||||||||||||
Year Ended October 31, 2012 | 15.21 | 0.19 | (e) | 0.50 | 0.69 | (0.16 | ) | — | (0.16 | ) | — | |||||||||||||||||||||
Year Ended October 31, 2011 | 16.46 | 0.17 | (e) | (1.22 | ) | (1.05 | ) | (0.20 | ) | — | (0.20 | ) | — | (f) | ||||||||||||||||||
Year Ended October 31, 2010 | 14.86 | 0.08 | (e) | 1.72 | 1.80 | (0.20 | ) | — | (0.20 | ) | — | (f) | ||||||||||||||||||||
November 3, 2008 (h) through October 31, 2009 | 13.56 | 0.16 | (e) | 2.32 | 2.48 | (1.18 | ) | — | (1.18 | ) | — | (f) | ||||||||||||||||||||
Institutional Class | ||||||||||||||||||||||||||||||||
Year Ended October 31, 2012 | 15.66 | 0.33 | (e) | 0.50 | 0.83 | (0.25 | ) | — | (0.25 | ) | — | |||||||||||||||||||||
Year Ended October 31, 2011 | 16.94 | 0.32 | (e) | (1.29 | ) | (0.97 | ) | (0.31 | ) | — | (0.31 | ) | — | (f) | ||||||||||||||||||
Year Ended October 31, 2010 | 15.27 | 0.19 | (e) | 1.78 | 1.97 | (0.30 | ) | — | (0.30 | ) | — | (f) | ||||||||||||||||||||
Year Ended October 31, 2009 | 13.76 | 0.25 | (e) | 2.46 | 2.71 | (1.20 | ) | — | (1.20 | ) | — | (f) | ||||||||||||||||||||
Year Ended October 31, 2008 | 28.05 | 0.60 | (e) | (14.17 | ) | (13.57 | ) | (0.33 | ) | (0.39 | ) | (0.72 | ) | — | (f) | |||||||||||||||||
Select Class | ||||||||||||||||||||||||||||||||
Year Ended October 31, 2012 | 15.85 | 0.30 | (e) | 0.51 | 0.81 | (0.20 | ) | — | (0.20 | ) | — | |||||||||||||||||||||
Year Ended October 31, 2011 | 16.99 | 0.26 | (e) | (1.28 | ) | (1.02 | ) | (0.12 | ) | — | (0.12 | ) | — | (f) | ||||||||||||||||||
Year Ended October 31, 2010 | 15.31 | 0.15 | (e) | 1.79 | 1.94 | (0.26 | ) | — | (0.26 | ) | — | (f) | ||||||||||||||||||||
Year Ended October 31, 2009 | 13.72 | 0.23 | (e) | 2.45 | 2.68 | (1.09 | ) | — | (1.09 | ) | — | (f) | ||||||||||||||||||||
Year Ended October 31, 2008 | 27.96 | 0.57 | (e) | (14.14 | ) | (13.57 | ) | (0.28 | ) | (0.39 | ) | (0.67 | ) | — | (f) | |||||||||||||||||
| (a) | Annualized for periods less than one year. |
| (b) | Not annualized for periods less than one year. |
| (c) | Includes adjustments in accordance with accounting principles generally accepted in the United States of America and as such, the net asset values for financial reporting purposes and the returns based upon those net asset values may differ from the net asset values and returns for shareholder transactions. |
| (d) | Includes earnings credits and interest expense, if applicable, each of which is less than 0.01% or unless otherwise noted. |
| (e) | Calculated based upon average shares outstanding. |
| (f) | Amount rounds to less than $0.01. |
| (g) | Includes interest expense of 0.01%. |
| (h) | Commencement of offering of class of shares. |
| * | Portfolio turnover is calculated by dividing the lesser of total purchases or sales of portfolio securities for the reporting period by the monthly average of portfolio securities owned during the reporting period. Excluded from both the numerator and denominator are amounts relating to derivatives and securities whose maturities or expiration dates at the time of acquisition were one year or less. |
SEE NOTES TO FINANCIAL STATEMENTS.
| 116 | J.P. MORGAN INTERNATIONAL EQUITY FUNDS | OCTOBER 31, 2012 | ||||
Table of Contents
| Ratios/Supplemental data | |||||||||||||||||||||||||
| Ratios to average net assets (a) | ||||||||||||||||||||||||||
Net asset | Total return (excludes sales charge) (b)(c) | Net assets, end of period (000’s) | Net expenses (d) | Net investment income (loss) | Expenses without waivers, reimbursements and earning credits | Portfolio turnover rate* (b) | ||||||||||||||||||||
| $ | 15.90 | 4.97 | % | $ | 32,231 | 1.50 | % | 1.65 | % | 1.62 | % | 46 | % | |||||||||||||
| 15.32 | (6.30 | ) | 31,942 | 1.50 | 1.42 | 1.61 | 79 | |||||||||||||||||||
| 16.59 | 12.54 | 23,960 | 1.50 | 0.78 | 1.73 | 92 | ||||||||||||||||||||
| 14.99 | 21.38 | 23,506 | 1.51 | (g) | 1.51 | 1.63 | 95 | |||||||||||||||||||
| 13.51 | (49.72 | ) | 13,027 | 1.51 | 2.25 | 1.53 | 126 | |||||||||||||||||||
| 16.00 | 4.45 | 875 | 2.00 | 1.18 | 2.12 | 46 | ||||||||||||||||||||
| 15.36 | (6.75 | ) | 1,018 | 2.00 | 0.91 | 2.11 | 79 | |||||||||||||||||||
| 16.61 | 12.01 | 1,489 | 2.00 | 0.30 | 2.24 | 92 | ||||||||||||||||||||
| 14.99 | 20.77 | 1,489 | 2.00 | (g) | 1.03 | 2.13 | 95 | |||||||||||||||||||
| 13.37 | (49.97 | ) | 1,773 | 2.01 | (g) | 1.75 | 2.03 | 126 | ||||||||||||||||||
| 15.74 | 4.64 | 81 | 1.75 | 1.29 | 1.87 | 46 | ||||||||||||||||||||
| 15.21 | (6.48 | ) | 106 | 1.75 | 1.04 | 1.85 | 79 | |||||||||||||||||||
| 16.46 | 12.26 | 68 | 1.75 | 0.53 | 1.99 | 92 | ||||||||||||||||||||
| 14.86 | 20.61 | 60 | 1.75 | (g) | 1.29 | 1.87 | 95 | |||||||||||||||||||
| 16.24 | 5.50 | 303,575 | 1.00 | 2.16 | 1.21 | 46 | ||||||||||||||||||||
| 15.66 | (5.85 | ) | 178,258 | 1.00 | 1.88 | 1.20 | 79 | |||||||||||||||||||
| 16.94 | 13.11 | 99,766 | 1.00 | 1.21 | 1.31 | 92 | ||||||||||||||||||||
| 15.27 | 22.05 | 112,905 | 1.01 | (g) | 1.90 | 1.22 | 95 | |||||||||||||||||||
| 13.76 | (49.49 | ) | 108,212 | 1.01 | (g) | 2.68 | 1.13 | 126 | ||||||||||||||||||
| 16.46 | 5.24 | 9,467 | 1.25 | 1.94 | 1.37 | 46 | ||||||||||||||||||||
| 15.85 | (6.08 | ) | 12,225 | 1.25 | 1.51 | 1.37 | 79 | |||||||||||||||||||
| 16.99 | 12.86 | 26,408 | 1.25 | 0.93 | 1.37 | 92 | ||||||||||||||||||||
| 15.31 | 21.65 | 330,843 | 1.25 | (g) | 1.81 | 1.38 | 95 | |||||||||||||||||||
| 13.72 | (49.58 | ) | 530,210 | 1.26 | (g) | 2.56 | 1.28 | 126 | ||||||||||||||||||
SEE NOTES TO FINANCIAL STATEMENTS.
| OCTOBER 31, 2012 | J.P. MORGAN INTERNATIONAL EQUITY FUNDS | 117 | ||||||
Table of Contents
AS OF OCTOBER 31, 2012
1. Organization
JPMorgan Trust I (“JPM I”) and JPMorgan Trust II (��JPM II”) (the “Trusts”) were formed on November 12, 2004, as Delaware statutory trusts, pursuant to Declarations of Trust dated November 5, 2004 and are registered under the Investment Company Act of 1940, as amended (the “1940 Act”), as open-end management investment companies.
The following are 9 separate funds of the Trusts (collectively, the “Funds”) covered by this report:
| Classes Offered | Trust | Diversified/Non-Diversified | ||||
| Emerging Economies Fund | Class A, Class C, Class R5 and Select Class | JPM I | Diversified | |||
| Emerging Markets Equity Fund | Class A, Class B, Class C, Institutional Class and Select Class | JPM I | Diversified | |||
| Global Equity Income Fund | Class A, Class C, Class R2, Class R5 and Select Class | JPM I | Diversified | |||
| Global Opportunities Fund | Class A, Class C, Class R2*, Class R5, Class R6* and Select Class | JPM I | Diversified | |||
| International Equity Fund | Class A, Class B, Class C, Class R2, Class R5, Class R6** and Select Class | JPM I | Diversified | |||
| International Equity Index Fund | Class A, Class B, Class C, Class R2 and Select Class | JPM II | Diversified | |||
| International Opportunities Fund | Class A, Class B, Class C, Class R6**, Institutional Class and Select Class | JPM I | Diversified | |||
| International Value Fund | Class A, Class B, Class C, Class R2, Class R6**, Institutional Class and Select Class | JPM I | Diversified | |||
| Intrepid International Fund | Class A, Class C, Class R2, Institutional Class and Select Class | JPM I | Diversified |
| * | Class R2 and R6 Shares commenced operations on November 1, 2011 for the Global Opportunities Fund. |
| ** | Class R6 shares commenced operations on November 30, 2010 for the International Equity Fund, International Opportunities Fund and International Value Fund. |
Global Equity Income Fund commenced operations on February 28, 2011.
The investment objective of Emerging Economies Fund is to seek long-term capital growth.
The investment objective of Emerging Markets Equity Fund is to seek to provide high total return from a portfolio of equity securities from emerging markets issuers.
The investment objective of Global Equity Income Fund is to seek to provide both current income and long-term capital appreciation.
The investment objective of Global Opportunities Fund is to seek to provide long-term capital growth.
The investment objective of International Equity Fund is to seek total return from long-term capital growth and income. Total return consists of capital growth and current income.
The investment objective of International Equity Index Fund is to seek to provide investment results that correspond to the aggregate price and dividend performance of the securities in the MSCI EAFE Gross Domestic Product (“GDP”) Index.
The investment objective of International Opportunities Fund is to seek to provide high total return from a portfolio of equity securities of foreign companies in developed and, to a lesser extent, emerging markets.
The investment objective of International Value Fund is to seek to provide high total return from a portfolio of foreign company equity securities.
The investment objective of Intrepid International Fund is to seek to maximize long-term capital growth by investing primarily in equity securities in developed markets outside the U.S.
Effective November 1, 2011, Global Focus Fund was renamed Global Opportunities Fund and modified some of its investment strategies, its investment objective and fees pursuant to the approval of the Board of Trustees.
Effective November 1, 2009, Class B Shares of the Emerging Markets Equity Fund, International Equity Fund, International Equity Index Fund, International Opportunities Fund and International Value Fund may not be purchased or acquired by new or existing shareholders, except through exchanges from Class B Shares of another J.P. Morgan Fund and dividend reinvestments. Shareholders who have invested in Class B Shares prior to November 1, 2009 may continue to hold their Class B Shares until they convert automatically to Class A Shares.
Class A Shares generally provide for a front-end sales charge while Class B and Class C Shares provide for a contingent deferred sales charge (“CDSC”). Class B Shares automatically convert to Class A Shares after eight years. No sales charges are assessed with respect to the Class R2, Class R5, Class R6, Select Class and Institutional Class Shares. All classes of shares have equal rights as to earnings, assets and voting privileges except that each class may bear different distribution and shareholder servicing fees and each class has exclusive voting rights with respect to its distribution plan and shareholder servicing agreements. Certain Class A Shares, for which front-end sales charges have been waived, may be subject to a CDSC as described in the Funds’ prospectus.
| 118 | J.P. MORGAN INTERNATIONAL EQUITY FUNDS | OCTOBER 31, 2012 | ||||
Table of Contents
2. Significant Accounting Policies
The following is a summary of significant accounting policies followed by the Funds in the preparation of their financial statements. The policies are in accordance with accounting principles generally accepted in the United States of America. The preparation of financial statements requires management to make estimates and assumptions that affect the reported amounts and disclosures in the financial statements. Actual results could differ from those estimates.
A. Valuation of Investments — Equity securities listed on a North American, Central American, South American or Caribbean securities exchange shall generally be valued at the last sale price on the exchange on which the security is principally traded that is reported before the time when the net assets of the Funds are valued. Securities listed on the NASDAQ Stock Market LLC are generally valued at the NASDAQ Official Closing Price. Fixed income securities (other than certain short-term investments maturing in less than 61 days) are valued each day based on prices received from independent or affiliated pricing services approved by the Board of Trustees or third party broker-dealers. The broker-dealers or pricing services use multiple valuation techniques to determine fair value. In instances where sufficient market activity exists, the broker-dealers or pricing services may utilize a market-based approach through which quotes from market makers are used to determine fair value. In instances where sufficient market activity may not exist or is limited, the broker-dealers or pricing services also utilize proprietary valuation models which may consider market transactions in comparable securities and the various relationships between securities in determining value and/or market characteristics such as benchmark yield curves, option-adjusted spreads, credit spreads, estimated default rates, coupon-rates, anticipated timing of principal repayments, underlying collateral, and other unique security features in order to estimate the relevant cash flows, which are then discounted to calculate the fair values.
Generally, short-term investments of sufficient credit quality maturing in less than 61 days are valued at amortized cost, which approximates market value. Certain investments of the Funds may, depending upon market conditions, trade in relatively thin markets and/or in markets that experience significant volatility. As a result of these conditions, the prices used by the Funds to value securities may differ from the value that would be realized if these securities were sold, and the differences could be material. Futures and options are generally valued on the basis of available market quotations. Swaps and other derivatives are valued daily, primarily using independent or affiliated pricing services approved by the Board of Trustees. If valuations are not available from such services or values received are deemed not representative of market value, values will be obtained from a third party broker-dealer or counterparty. Investments in other open-end investment companies are valued at each investment company’s net asset value per share as of the report date.
Securities or other assets for which market quotations are not readily available or for which market quotations do not represent the fair value of the security or asset at the time of pricing (including certain illiquid securities) are fair valued in accordance with procedures established by and under the supervision and responsibility of the Board of Trustees. The Board of Trustees has established an Audit and Valuation Committee to assist with the oversight of the valuation of the Funds’ securities. JPMorgan Funds Management, Inc. (the “Administrator”, or “JPMFM”), an indirect, wholly-owned subsidiary of JPMorgan Chase & Co. (“JPMorgan”), has established a Valuation Committee (“VC”) that is comprised of senior representatives from JPMFM, J.P. Morgan Investment Management Inc. (“JPMIM” or the “Advisor”), a wholly-owned subsidiary of JPMorgan Asset Management Holdings Inc. (“JPMAM”), which is a wholly-owned subsidiary of JPMorgan, JPMAM’s Legal and Compliance, JPMAM’s Risk Management and the Funds’ Chief Compliance Officer. The VC’s responsibilities include making determinations regarding Level 3 fair value measurements (“Fair Values”) and/or providing recommendations for approval to the Board of Trustees’ Audit and Valuation Committee, in accordance with the Funds’ valuation policies.
The VC or Board of Trustees, as applicable, primarily employ a market-based approach which may use related or comparable assets or liabilities, recent transactions, market multiples, book values, and other relevant information for the investment to determine the fair value of the investment. The VC or Board of Trustees may also use an income-based valuation approach in which the anticipated future cash flows of the investment are discounted to calculate fair value. Discounts may also be applied due to the nature or duration of any restrictions on the disposition of the investments. Valuations may be based upon current market prices of securities that are comparable in coupon, rating, maturity and industry. Trading in securities on most foreign exchanges and over-the-counter markets is normally completed before the close of the domestic market and may also take place on days when the domestic market is closed. In accordance with procedures adopted by the Board of Trustees, the Funds apply fair value pricing on equity securities on a daily basis except for North American, Central American, South American and Caribbean equity securities held in their portfolios by utilizing the quotations of an independent pricing service, unless a Fund’s advisor determines that use of another valuation methodology is appropriate. The pricing service uses statistical analyses and quantitative models to adjust local market prices using factors such as subsequent movement and changes in the prices of indices, securities and exchange rates in other markets, in determining fair value as of the time a Fund calculates its net asset values.
It is possible that the estimated values may differ significantly from the values that would have been used had a ready market for the investments existed, and such differences could be material. JPMFM and JPMIM are responsible for monitoring developments that may impact Fair Values and for discussing and assessing Fair Values on an ongoing and at least a quarterly basis with the VC and Board of Trustees, as applicable. The appropriateness of Fair Values is assessed based on results of unchanged price review and consideration of macro or security specific events, back testing and broker and vendor due diligence.
Valuations reflected in this report are as of the report date. As a result, changes in valuation due to market events and/or issuer related events after the report date and prior to issuance of the report, are not reflected herein.
| OCTOBER 31, 2012 | J.P. MORGAN INTERNATIONAL EQUITY FUNDS | 119 | ||||||
Table of Contents
NOTES TO FINANCIAL STATEMENTS
AS OF OCTOBER 31, 2012 (continued)
The various inputs that are used in determining the fair value of the Funds’ investments are summarized into the three broad levels listed below.
| Ÿ | Level 1 — quoted prices in active markets for identical securities |
| Ÿ | Level 2 — other significant observable inputs (including quoted prices for similar securities, interest rates, prepayment speeds, credit risk, etc.) |
| Ÿ | Level 3 — significant unobservable inputs (including the Funds’ own assumptions in determining the fair value of investments) |
A financial instrument’s level within the fair value hierarchy is based on the lowest level of any input both individually and in the aggregate that is significant to the fair value measurement. The inputs or methodology used for valuing securities are not necessarily an indication of the risk associated with investing in those securities.
The following tables represent each valuation input by country as presented on the Schedules of Portfolio Investments (“SOIs”) (amounts in thousands):
JPMorgan Emerging Economies Fund
| Level 1 Quoted prices | Level 2 Other significant observable inputs | Level 3 Significant unobservable inputs | Total | |||||||||||||
Investments in Securities | ||||||||||||||||
Common Stocks | ||||||||||||||||
Brazil | $ | 6,269 | $ | 22,328 | $ | — | $ | 28,597 | ||||||||
China | 3,704 | 79,423 | — | 83,127 | ||||||||||||
Cyprus | — | 2,235 | — | 2,235 | ||||||||||||
Egypt | — | 2,235 | — | 2,235 | ||||||||||||
Hong Kong | — | 22,729 | — | (a) | 22,729 | |||||||||||
Hungary | — | 4,362 | — | 4,362 | ||||||||||||
India | — | 22,339 | — | 22,339 | ||||||||||||
Kazakhstan | — | 2,888 | — | 2,888 | ||||||||||||
Malaysia | — | 3,329 | — | 3,329 | ||||||||||||
Mexico | 2,078 | — | — | 2,078 | ||||||||||||
Panama | 3,639 | — | — | 3,639 | ||||||||||||
Poland | — | 5,369 | — | 5,369 | ||||||||||||
Russia | — | 31,491 | — | 31,491 | ||||||||||||
South Africa | — | 29,321 | — | 29,321 | ||||||||||||
South Korea | — | 63,917 | — | 63,917 | ||||||||||||
Taiwan | — | 41,705 | — | 41,705 | ||||||||||||
Thailand | — | 23,809 | — | 23,809 | ||||||||||||
Turkey | — | 27,923 | — | 27,923 | ||||||||||||
Ukraine | — | 783 | — | 783 | ||||||||||||
United Arab Emirates | — | 4,140 | — | 4,140 | ||||||||||||
United Kingdom | — | 6,706 | — | 6,706 | ||||||||||||
|
|
|
|
|
|
|
| |||||||||
Total Common Stocks | 15,690 | 397,032 | — | (a) | 412,722 | |||||||||||
|
|
|
|
|
|
|
| |||||||||
Preferred Stocks | ||||||||||||||||
Brazil | 1,432 | 15,729 | — | 17,161 | ||||||||||||
|
|
|
|
|
|
|
| |||||||||
Total Preferred Stocks | 1,432 | 15,729 | — | 17,161 | ||||||||||||
|
|
|
|
|
|
|
| |||||||||
Short-Term Investment | ||||||||||||||||
Investment Company | 10,554 | — | — | 10,554 | ||||||||||||
|
|
|
|
|
|
|
| |||||||||
Total Investments in Securities | $ | 27,676 | $ | 412,761 | $ | — | (a) | $ | 440,437 | |||||||
|
|
|
|
|
|
|
| |||||||||
| 120 | J.P. MORGAN INTERNATIONAL EQUITY FUNDS | OCTOBER 31, 2012 | ||||
Table of Contents
JPMorgan Emerging Markets Equity Fund
| Level 1 Quoted prices | Level 2 Other significant | Level 3 Significant | Total | |||||||||||||
Investments in Securities | ||||||||||||||||
Common Stocks | ||||||||||||||||
Brazil | $ | 120,429 | $ | 55,431 | $ | — | $ | 175,860 | ||||||||
Chile | — | 41,132 | — | 41,132 | ||||||||||||
China | 12,318 | 253,252 | — | 265,570 | ||||||||||||
Hong Kong | — | 223,150 | — | 223,150 | ||||||||||||
Hungary | — | 18,011 | — | 18,011 | ||||||||||||
India | — | 229,737 | — | 229,737 | ||||||||||||
Indonesia | — | 96,946 | — | 96,946 | ||||||||||||
Luxembourg | — | 42,624 | — | 42,624 | ||||||||||||
Malaysia | — | 24,138 | — | 24,138 | ||||||||||||
Mexico | 69,112 | — | — | 69,112 | ||||||||||||
Russia | — | 66,833 | — | 66,833 | ||||||||||||
South Africa | — | 227,426 | — | 227,426 | ||||||||||||
South Korea | — | 254,249 | — | 254,249 | ||||||||||||
Taiwan | — | 161,178 | — | 161,178 | ||||||||||||
Turkey | — | 84,917 | — | 84,917 | ||||||||||||
United Kingdom | — | 59,077 | — | 59,077 | ||||||||||||
|
|
|
|
|
|
|
| |||||||||
Total Common Stocks | 201,859 | 1,838,101 | — | 2,039,960 | ||||||||||||
|
|
|
|
|
|
|
| |||||||||
Preferred Stocks | ||||||||||||||||
Brazil | 15,734 | 133,464 | — | 149,198 | ||||||||||||
Short-Term Investment | ||||||||||||||||
Investment Company | 54,151 | — | — | 54,151 | ||||||||||||
|
|
|
|
|
|
|
| |||||||||
Total Investments in Securities | $ | 271,744 | $ | 1,971,565 | $ | — | $ | 2,243,309 | ||||||||
|
|
|
|
|
|
|
| |||||||||
| Global Equity Income Fund | ||||||||||||||||
| Level 1 Quoted prices | Level 2 Other significant observable inputs | Level 3 Significant unobservable inputs | Total | |||||||||||||
Investments in Securities | ||||||||||||||||
Common Stocks | ||||||||||||||||
Australia | $ | — | $ | 2,565 | $ | — | $ | 2,565 | ||||||||
China | — | 1,095 | — | 1,095 | ||||||||||||
Finland | — | 342 | — | 342 | ||||||||||||
France | — | 3,106 | — | 3,106 | ||||||||||||
Germany | — | 2,338 | — | 2,338 | ||||||||||||
Hong Kong | — | 539 | — | 539 | ||||||||||||
Indonesia | — | 369 | — | 369 | ||||||||||||
Italy | — | 743 | — | 743 | ||||||||||||
Japan | — | 3,018 | — | 3,018 | ||||||||||||
Netherlands | — | 2,014 | — | 2,014 | ||||||||||||
New Zealand | — | 739 | — | 739 | ||||||||||||
Singapore | — | 666 | — | 666 | ||||||||||||
South Africa | — | 16 | — | 16 | ||||||||||||
Sweden | — | 742 | — | 742 | ||||||||||||
Switzerland | — | 1,914 | — | 1,914 | ||||||||||||
Taiwan | — | 342 | — | 342 | ||||||||||||
United Kingdom | — | 4,536 | — | 4,536 | ||||||||||||
United States | 11,368 | — | — | 11,368 | ||||||||||||
|
|
|
|
|
|
|
| |||||||||
Total Common Stocks | 11,368 | 25,084 | — | 36,452 | ||||||||||||
|
|
|
|
|
|
|
| |||||||||
| OCTOBER 31, 2012 | J.P. MORGAN INTERNATIONAL EQUITY FUNDS | 121 | ||||||
Table of Contents
NOTES TO FINANCIAL STATEMENTS
AS OF OCTOBER 31, 2012 (continued)
Global Equity Income Fund (continued)
| Level 1 Quoted prices | Level 2 Other significant observable inputs | Level 3 Significant unobservable inputs | Total | |||||||||||||
Short-Term Investment | ||||||||||||||||
Investment Company | $ | 1,001 | $ | — | $ | — | $ | 1,001 | ||||||||
|
|
|
|
|
|
|
| |||||||||
Total Investments in Securities | $ | 12,369 | $ | 25,084 | $ | — | $ | 37,453 | ||||||||
|
|
|
|
|
|
|
| |||||||||
Appreciation in Other Financial Instruments | ||||||||||||||||
Forward Foreign Currency Exchange Contracts | $ | — | $ | 73 | $ | — | $ | 73 | ||||||||
|
|
|
|
|
|
|
| |||||||||
Depreciation in Other Financial Instruments | ||||||||||||||||
Forward Foreign Currency Exchange Contracts | $ | — | $ | (55 | ) | $ | — | $ | (55 | ) | ||||||
|
|
|
|
|
|
|
| |||||||||
| JPMorgan Global Opportunities Fund | ||||||||||||||||
| Level 1 Quoted prices | Level 2 Other significant observable inputs | Level 3 Significant unobservable inputs | Total | |||||||||||||
Investments in Securities | ||||||||||||||||
Common Stocks | ||||||||||||||||
Belgium | $ | — | $ | 46 | $ | — | $ | 46 | ||||||||
Canada | 42 | — | — | 42 | ||||||||||||
China | — | 43 | — | 43 | ||||||||||||
Denmark | — | 21 | — | 21 | ||||||||||||
Finland | — | 34 | — | 34 | ||||||||||||
France | — | 198 | — | 198 | ||||||||||||
Germany | — | 174 | — | 174 | ||||||||||||
Hong Kong | — | 99 | — | 99 | ||||||||||||
Ireland | 47 | 97 | — | 144 | ||||||||||||
Israel | — | 33 | — | 33 | ||||||||||||
Japan | — | 399 | — | 399 | ||||||||||||
Netherlands | — | 251 | — | 251 | ||||||||||||
South Korea | — | 47 | — | 47 | ||||||||||||
Sweden | — | 31 | — | 31 | ||||||||||||
Switzerland | 96 | 105 | — | 201 | ||||||||||||
Taiwan | — | 36 | — | 36 | ||||||||||||
United Kingdom | — | 619 | — | 619 | ||||||||||||
United States | 2,147 | — | — | 2,147 | ||||||||||||
|
|
|
|
|
|
|
| |||||||||
Total Common Stocks | 2,332 | 2,233 | — | 4,565 | ||||||||||||
|
|
|
|
|
|
|
| |||||||||
Preferred Stocks | ||||||||||||||||
Germany | — | 51 | — | 51 | ||||||||||||
|
|
|
|
|
|
|
| |||||||||
Total Preferred Stocks | — | 51 | — | 51 | ||||||||||||
|
|
|
|
|
|
|
| |||||||||
Total Investments in Securities | $ | 2,332 | $ | 2,284 | $ | — | $ | 4,616 | ||||||||
|
|
|
|
|
|
|
| |||||||||
Appreciation in Other Financial Instruments | ||||||||||||||||
Forward Foreign Currency Exchange Contracts | $ | — | $ | 5 | $ | — | $ | 5 | ||||||||
|
|
|
|
|
|
|
| |||||||||
Depreciation in Other Financial Instruments | ||||||||||||||||
Forward Foreign Currency Exchange Contracts | $ | — | $ | (15 | ) | $ | — | $ | (15 | ) | ||||||
|
|
|
|
|
|
|
| |||||||||
| JPMorgan International Equity Fund | ||||||||||||||||
| Level 1 Quoted prices | Level 2 Other significant observable inputs | Level 3 Significant unobservable inputs | Total | |||||||||||||
Total Investments in Securities (b) | $ | 37,183 | $ | 1,036,064 | $ | — | $ | 1,073,247 | ||||||||
|
|
|
|
|
|
|
| |||||||||
| 122 | J.P. MORGAN INTERNATIONAL EQUITY FUNDS | OCTOBER 31, 2012 | ||||
Table of Contents
International Equity Index
| Level 1 Quoted prices | Level 2 Other significant observable inputs | Level 3 Significant unobservable inputs | Total | |||||||||||||
Investments in Securities | ||||||||||||||||
Common Stocks | ||||||||||||||||
Australia | $ | — | $ | 32,306 | $ | — | (a) | $ | 32,306 | |||||||
Austria | — | 8,906 | — | 8,906 | ||||||||||||
Belgium | — | 10,960 | — | 10,960 | ||||||||||||
Brazil | 1,210 | — | — | 1,210 | ||||||||||||
Chile | 3,503 | 315 | — | 3,818 | ||||||||||||
China | — | 4,090 | — | 4,090 | ||||||||||||
Denmark | — | 6,617 | — | 6,617 | ||||||||||||
Finland | — | 5,332 | — | 5,332 | ||||||||||||
France | — | 55,117 | — | 55,117 | ||||||||||||
Germany | — | 70,419 | — | 70,419 | ||||||||||||
Greece | — | 6,097 | — | 6,097 | ||||||||||||
Hong Kong | — | 5,744 | — | 5,744 | ||||||||||||
Hungary | — | 4,510 | — | 4,510 | ||||||||||||
India | — | 4,273 | — | 4,273 | ||||||||||||
Ireland | — | 5,014 | — | 5,014 | ||||||||||||
Israel | — | 4,550 | — | 4,550 | ||||||||||||
Italy | — | 44,994 | — | 44,994 | ||||||||||||
Japan | — | 106,880 | — | 106,880 | ||||||||||||
Luxembourg | — | 3,342 | — | 3,342 | ||||||||||||
Mexico | 4,414 | 109 | — | 4,523 | ||||||||||||
Netherlands | — | 23,982 | — | 23,982 | ||||||||||||
New Zealand | — | 3,370 | — | 3,370 | ||||||||||||
Norway | — | 9,475 | — | 9,475 | ||||||||||||
Philippines | — | 4,600 | — | 4,600 | ||||||||||||
Portugal | — | 5,168 | — | 5,168 | ||||||||||||
Singapore | — | 5,126 | — | 5,126 | ||||||||||||
South Africa | — | 4,161 | — | 4,161 | ||||||||||||
South Korea | — | 4,345 | — | 4,345 | ||||||||||||
Spain | — | 33,138 | — | 33,138 | ||||||||||||
Sweden | — | 10,801 | — | 10,801 | ||||||||||||
Switzerland | — | 15,985 | — | 15,985 | ||||||||||||
Taiwan | — | 4,354 | — | 4,354 | ||||||||||||
Thailand | — | 4,298 | — | 4,298 | ||||||||||||
Turkey | — | 4,835 | — | 4,835 | ||||||||||||
United Kingdom | — | 42,234 | — | 42,234 | ||||||||||||
United States | — | 52 | — | 52 | ||||||||||||
|
|
|
|
|
|
|
| |||||||||
Total Common Stocks | 9,127 | 555,499 | — | (a) | 564,626 | |||||||||||
|
|
|
|
|
|
|
| |||||||||
Preferred Stocks | ||||||||||||||||
Brazil | 3,039 | — | — | 3,039 | ||||||||||||
Chile | 424 | — | — | 424 | ||||||||||||
Germany | — | 5,236 | — | 5,236 | ||||||||||||
Italy | — | 987 | — | 987 | ||||||||||||
United Kingdom | 5 | — | — | 5 | ||||||||||||
|
|
|
|
|
|
|
| |||||||||
Total Preferred Stocks | 3,468 | 6,223 | — | 9,691 | ||||||||||||
|
|
|
|
|
|
|
| |||||||||
Investment Companies | ||||||||||||||||
United States | 4,775 | — | — | 4,775 | ||||||||||||
|
|
|
|
|
|
|
| |||||||||
Total Investment Companies | 4,775 | — | — | 4,775 | ||||||||||||
|
|
|
|
|
|
|
| |||||||||
Short-Term Investment | ||||||||||||||||
Investment Company | 3,425 | — | — | 3,425 | ||||||||||||
|
|
|
|
|
|
|
| |||||||||
Total Investments in Securities | $ | 20,795 | $ | 561,722 | $ | — | (a) | $ | 582,517 | |||||||
|
|
|
|
|
|
|
| |||||||||
| OCTOBER 31, 2012 | J.P. MORGAN INTERNATIONAL EQUITY FUNDS | 123 | ||||||
Table of Contents
NOTES TO FINANCIAL STATEMENTS
AS OF OCTOBER 31, 2012 (continued)
International Equity Index (continued)
| Level 1 Quoted prices | Level 2 Other significant observable inputs | Level 3 Significant unobservable inputs | Total | |||||||||||||
Appreciation in Other Financial Instruments | ||||||||||||||||
Futures Contracts | $ | 19 | $ | — | $ | — | $ | 19 | ||||||||
|
|
|
|
|
|
|
| |||||||||
Depreciation in Other Financial Instruments | ||||||||||||||||
Futures Contracts | $ | (13 | ) | $ | — | $ | — | $ | (13 | ) | ||||||
|
|
|
|
|
|
|
| |||||||||
| JPMorgan International Opportunities Fund | ||||||||||||||||
| Level 1 Quoted prices | Level 2 Other significant observable inputs | Level 3 Significant | Total | |||||||||||||
Investments in Securities | ||||||||||||||||
Common Stocks | ||||||||||||||||
Australia | $ | — | $ | 20,495 | $ | — | $ | 20,495 | ||||||||
Belgium | — | 10,640 | — | 10,640 | ||||||||||||
Canada | 11,459 | — | — | 11,459 | ||||||||||||
China | — | 20,040 | — | 20,040 | ||||||||||||
Denmark | — | 3,941 | — | 3,941 | ||||||||||||
Finland | — | 8,621 | — | 8,621 | ||||||||||||
France | — | 54,516 | — | 54,516 | ||||||||||||
Germany | — | 62,519 | — | 62,519 | ||||||||||||
Hong Kong | — | 28,047 | — | 28,047 | ||||||||||||
Indonesia | — | 6,531 | — | 6,531 | ||||||||||||
Ireland | — | 19,707 | — | 19,707 | ||||||||||||
Israel | — | 5,714 | — | 5,714 | ||||||||||||
Japan | — | 144,145 | — | 144,145 | ||||||||||||
Netherlands | — | 59,650 | — | 59,650 | ||||||||||||
New Zealand | — | 4,189 | — | 4,189 | ||||||||||||
South Korea | — | 16,430 | — | 16,430 | ||||||||||||
Spain | — | 5,735 | — | 5,735 | ||||||||||||
Sweden | — | 23,266 | — | 23,266 | ||||||||||||
Switzerland | — | 60,146 | — | 60,146 | ||||||||||||
Taiwan | — | 8,656 | — | 8,656 | ||||||||||||
United Kingdom | — | 212,831 | — | 212,831 | ||||||||||||
|
|
|
|
|
|
|
| |||||||||
Total Common Stocks | 11,459 | 775,819 | — | 787,278 | ||||||||||||
|
|
|
|
|
|
|
| |||||||||
Preferred Stocks | ||||||||||||||||
Germany | — | 21,013 | — | 21,013 | ||||||||||||
|
|
|
|
|
|
|
| |||||||||
Short-Term Investment | ||||||||||||||||
Investment Company | 20,262 | — | — | 20,262 | ||||||||||||
|
|
|
|
|
|
|
| |||||||||
Total Investments in Securities | $ | 31,721 | $ | 796,832 | $ | — | $ | 828,553 | ||||||||
|
|
|
|
|
|
|
| |||||||||
Appreciation in Other Financial Instruments | ||||||||||||||||
Forward Foreign Currency Exchange Contracts | $ | — | $ | 4,039 | $ | — | $ | 4,039 | ||||||||
|
|
|
|
|
|
|
| |||||||||
Depreciation in Other Financial Instruments | ||||||||||||||||
Forward Foreign Currency Exchange Contracts | $ | — | $ | (6,000 | ) | $ | — | $ | (6,000 | ) | ||||||
Futures Contracts | (40 | ) | — | — | (40 | ) | ||||||||||
|
|
|
|
|
|
|
| |||||||||
Total Depreciation in Other Financial Instruments | $ | (40 | ) | $ | (6,000 | ) | $ | — | $ | (6,040 | ) | |||||
|
|
|
|
|
|
|
| |||||||||
| 124 | J.P. MORGAN INTERNATIONAL EQUITY FUNDS | OCTOBER 31, 2012 | ||||
Table of Contents
JPMorgan International Value Fund
| Level 1 Quoted prices | Level 2 Other significant | Level 3 Significant | Total | |||||||||||||
Investments in Securities | ||||||||||||||||
Common Stocks | ||||||||||||||||
Australia | $ | — | $ | 57,474 | $ | — | $ | 57,474 | ||||||||
Belgium | — | 27,822 | — | 27,822 | ||||||||||||
Canada | 16,958 | — | — | 16,958 | ||||||||||||
China | — | 75,502 | — | 75,502 | ||||||||||||
Finland | — | 19,840 | — | 19,840 | ||||||||||||
France | — | 268,487 | — | 268,487 | ||||||||||||
Germany | — | 178,339 | — | 178,339 | ||||||||||||
Hong Kong | — | 67,396 | — | 67,396 | ||||||||||||
Ireland | — | 17,888 | — | 17,888 | ||||||||||||
Israel | — | 22,082 | — | 22,082 | ||||||||||||
Italy | — | 83,078 | — | 83,078 | ||||||||||||
Japan | — | 424,499 | — | 424,499 | ||||||||||||
Luxembourg | — | 15,323 | — | 15,323 | ||||||||||||
Netherlands | — | 163,306 | — | 163,306 | ||||||||||||
Norway | — | 27,964 | — | 27,964 | ||||||||||||
Russia | — | 11,092 | — | 11,092 | ||||||||||||
South Africa | — | 8,001 | — | 8,001 | ||||||||||||
South Korea | — | 26,239 | — | 26,239 | ||||||||||||
Spain | — | 55,192 | — | 55,192 | ||||||||||||
Sweden | — | 68,044 | — | 68,044 | ||||||||||||
Switzerland | — | 98,025 | — | 98,025 | ||||||||||||
United Kingdom | — | 452,412 | — | 452,412 | ||||||||||||
|
|
|
|
|
|
|
| |||||||||
Total Common Stocks | 16,958 | 2,168,005 | — | 2,184,963 | ||||||||||||
|
|
|
|
|
|
|
| |||||||||
Preferred Stocks | ||||||||||||||||
Germany | — | 37,661 | — | 37,661 | ||||||||||||
|
|
|
|
|
|
|
| |||||||||
Total Preferred Stocks | — | 37,661 | — | 37,661 | ||||||||||||
|
|
|
|
|
|
|
| |||||||||
Short-Term Investment | ||||||||||||||||
Investment Company | 65,639 | — | — | 65,639 | ||||||||||||
|
|
|
|
|
|
|
| |||||||||
Total Investments in Securities | $ | 82,597 | $ | 2,205,666 | $ | — | $ | 2,288,263 | ||||||||
|
|
|
|
|
|
|
| |||||||||
Appreciation in Other Financial Instruments | ||||||||||||||||
Forward Foreign Currency Exchange Contracts | $ | — | $ | 8,496 | $ | — | $ | 8,496 | ||||||||
Futures Contracts | 326 | — | — | 326 | ||||||||||||
|
|
|
|
|
|
|
| |||||||||
Total Appreciation in Other Financial Instruments | $ | 326 | $ | 8,496 | $ | — | $ | 8,822 | ||||||||
|
|
|
|
|
|
|
| |||||||||
Depreciation in Other Financial Instruments | ||||||||||||||||
Forward Foreign Currency Exchange Contracts | $ | — | $ | (8,441 | ) | $ | — | $ | (8,441 | ) | ||||||
|
|
|
|
|
|
|
| |||||||||
| OCTOBER 31, 2012 | J.P. MORGAN INTERNATIONAL EQUITY FUNDS | 125 | ||||||
Table of Contents
NOTES TO FINANCIAL STATEMENTS
AS OF OCTOBER 31, 2012 (continued)
Intrepid International Fund
| Level 1 Quoted prices | Level 2 Other significant observable inputs | Level 3 Significant unobservable inputs | Total | |||||||||||||
Investments in Securities | ||||||||||||||||
Common Stocks | ||||||||||||||||
Australia | $ | — | $ | 20,454 | $ | — | $ | 20,454 | ||||||||
Austria | — | 1,355 | — | 1,355 | ||||||||||||
Belgium | — | 4,929 | — | 4,929 | ||||||||||||
Bermuda | — | 1,059 | — | 1,059 | ||||||||||||
Brazil | 732 | 963 | — | 1,695 | ||||||||||||
China | 986 | 6,340 | — | 7,326 | ||||||||||||
Denmark | — | 4,028 | — | 4,028 | ||||||||||||
Finland | — | 1,133 | — | 1,133 | ||||||||||||
France | — | 32,656 | — | 32,656 | ||||||||||||
Germany | — | 32,410 | — | 32,410 | ||||||||||||
Hong Kong | — | 8,032 | — | 8,032 | ||||||||||||
India | — | 3,079 | — | 3,079 | ||||||||||||
Indonesia | — | 1,203 | — | 1,203 | ||||||||||||
Ireland | — | 3,640 | — | 3,640 | ||||||||||||
Israel | — | 1,235 | — | 1,235 | ||||||||||||
Italy | — | 6,293 | — | 6,293 | ||||||||||||
Japan | — | 54,133 | — | 54,133 | ||||||||||||
Netherlands | — | 20,407 | — | 20,407 | ||||||||||||
Norway | — | 3,777 | — | 3,777 | ||||||||||||
Singapore | — | 1,062 | — | 1,062 | ||||||||||||
South Africa | — | 874 | — | 874 | ||||||||||||
South Korea | — | 2,309 | — | 2,309 | ||||||||||||
Spain | — | 7,101 | — | 7,101 | ||||||||||||
Sweden | — | 3,348 | — | 3,348 | ||||||||||||
Switzerland | — | 33,164 | — | 33,164 | ||||||||||||
Taiwan | — | 852 | — | 852 | ||||||||||||
United Kingdom | — | 74,755 | — | 74,755 | ||||||||||||
|
|
|
|
|
|
|
| |||||||||
Total Common Stocks | 1,718 | 330,591 | — | 332,309 | ||||||||||||
|
|
|
|
|
|
|
| |||||||||
Preferred Stocks | ||||||||||||||||
Germany | — | 4,384 | — | 4,384 | ||||||||||||
Italy | — | 1,110 | — | 1,110 | ||||||||||||
|
|
|
|
|
|
|
| |||||||||
Total Preferred Stocks | — | 5,494 | — | 5,494 | ||||||||||||
|
|
|
|
|
|
|
| |||||||||
Short-Term Investment | ||||||||||||||||
Investment Company | 7,030 | — | — | 7,030 | ||||||||||||
|
|
|
|
|
|
|
| |||||||||
Total Investments in Securities | $ | 8,748 | $ | 336,085 | $ | — | $ | 344,833 | ||||||||
|
|
|
|
|
|
|
| |||||||||
| (a) | Value is zero. |
| (b) | Portfolio holdings designated as Level 1 and Level 2 are disclosed individually in the SOI. Level 1 consists of a money market mutual fund that is held for daily investments of cash. Please refer to the SOI for country specifics of portfolio holdings. |
There were no transfers between Levels 1 and 2 during the year ended October 31, 2012.
| 126 | J.P. MORGAN INTERNATIONAL EQUITY FUNDS | OCTOBER 31, 2012 | ||||
Table of Contents
The following is a summary of investments for which significant unobservable inputs (Level 3) were used in determining fair value (amounts in thousands):
| Emerging Economies Fund | Balance as of 10/31/11 | Realized gain (loss) | Change in unrealized appreciation (depreciation) | Net accretion (amortization) | Purchases 1 | Sales 2 | Transfers into Level 3 | Transfers out of Level 3 | Balance as of 10/31/12 | |||||||||||||||||||||||||||
Investment in Securities | ||||||||||||||||||||||||||||||||||||
Common Stocks — Hong Kong | $ | — | (a) | $ | — | $ | — | $ | — | $ | — | $ | — | $ | — | $ | — | $ | — | (a) | ||||||||||||||||
|
|
|
|
|
|
|
|
|
|
|
|
|
|
|
|
|
| |||||||||||||||||||
| $ | — | (a) | $ | — | $ | — | $ | — | $ | — | $ | — | $ | — | $ | — | $ | — | (a) | |||||||||||||||||
|
|
|
|
|
|
|
|
|
|
|
|
|
|
|
|
|
| |||||||||||||||||||
| Emerging Markets Equity Fund | Balance as of 10/31/11 | Realized gain (loss) | Change in unrealized appreciation (depreciation) | Net accretion (amortization) | Purchases 1 | Sales 2 | Transfers into Level 3 | Transfers out of Level 3 | Balance as of 10/31/12 | |||||||||||||||||||||||||||
Investments in Securities | ||||||||||||||||||||||||||||||||||||
Common Stocks — China | $ | 34,036 | $ | — | $ | — | $ | — | $ | — | $ | — | $ | — | $ | (34,036 | ) | $ | — | |||||||||||||||||
Common Stocks — Malaysia | 6,016 | — | — | — | — | — | — | (6,016 | ) | — | ||||||||||||||||||||||||||
|
|
|
|
|
|
|
|
|
|
|
|
|
|
|
|
|
| |||||||||||||||||||
| $ | 40,052 | $ | — | $ | — | $ | — | $ | — | $ | — | $ | — | $ | (40,052 | ) | $ | — | ||||||||||||||||||
|
|
|
|
|
|
|
|
|
|
|
|
|
|
|
|
|
| |||||||||||||||||||
| International Equity Index Fund | Balance as of 10/31/11 | Realized gain (loss) | Change in unrealized appreciation (depreciation) | Net accretion (amortization) | Purchases 1 | Sales 2 | Transfers into Level 3 | Transfers out of Level 3 | Balance as of 10/31/12 | |||||||||||||||||||||||||||
Investments in Securities | ||||||||||||||||||||||||||||||||||||
Common Stocks — Australia | $ | — | (a) | $ | — | $ | — | $ | — | $ | — | $ | — | $ | — | $ | — | $ | — | (a) | ||||||||||||||||
Common Stocks — Japan | — | (a) | — | — | — | — | — | (a) | — | — | — | |||||||||||||||||||||||||
|
|
|
|
|
|
|
|
|
|
|
|
|
|
|
|
|
| |||||||||||||||||||
| $ | — | (a) | $ | — | $ | — | $ | — | $ | — | $ | — | (a) | $ | — | $ | — | $ | — | (a) | ||||||||||||||||
|
|
|
|
|
|
|
|
|
|
|
|
|
|
|
|
|
| |||||||||||||||||||
| (a) | Value is zero. |
| 1 | Purchases include all purchases of securities and securities received in corporate actions. |
| 2 | Sales include all sales of securities, maturities, paydowns and securities tendered in corporate actions. |
Transfers into, and out of, Level 3 are valued utilizing values as of the beginning of the year.
Transfers from Level 2 to Level 3 or from Level 3 to Level 2 are due to a decline or an increase in market activity (e.g. frequency of trades), which resulted in a lack of or increase in available market inputs to determine price.
The change in unrealized appreciation (depreciation) attributable to securities owned at October 31, 2012, which were valued using significant unobservable inputs (Level 3) was zero for Emerging Economies Fund and International Equity Index Fund.
B. Restricted and Illiquid Securities — Certain securities held by the Funds may be subject to legal or contractual restrictions on resale and/or are illiquid. Restricted securities generally are resold in transactions exempt from registration under the Securities Act of 1933 (the “Securities Act”). An illiquid security is a security which cannot be disposed of promptly (within seven days) and in the usual course of business at approximately its fair value and includes, but is not limited to, repurchase agreements maturing in excess of seven days, time deposits with a withdrawal penalty, non-negotiable instruments and instruments for which no market exists. Disposal of these securities may involve time-consuming negotiations and expense. Prompt sale at the current valuation may be difficult and could adversely affect the net assets of the Funds. As of October 31, 2012, the Funds had no investments in restricted securities other than securities sold to the Funds under Rule 144A and/or Regulation S under the Securities Act.
The following is the value and percentage of net assets of illiquid securities as of October 31, 2012 (amounts in thousands):
| Value | Percentage | |||||||
Emerging Economies Fund | $ | — | (a) | — | % | |||
International Equity Index Fund | — | (a) | — | |||||
| (a) | Value is zero. |
C. Futures Contracts — The Global Equity Income Fund, Global Opportunities Fund, International Equity Index Fund, International Opportunities Fund and International Value Fund use index futures contracts to gain or reduce exposure to the stock market, maintain liquidity and minimize transaction costs. The Funds also buy futures contracts to immediately invest incoming cash in the market or sell futures in response to cash outflows, thereby simulating an invested position in the underlying index while maintaining a cash balance for liquidity.
Futures contracts provide for the delayed delivery of the underlying instrument at a fixed price or are settled for a cash amount based on the change in the value of the underlying instrument at a specific date in the future. Upon entering into a futures contract, the Funds are required to
| OCTOBER 31, 2012 | J.P. MORGAN INTERNATIONAL EQUITY FUNDS | 127 | ||||||
Table of Contents
NOTES TO FINANCIAL STATEMENTS
AS OF OCTOBER 31, 2012 (continued)
deposit with the broker, cash or securities in an amount equal to a certain percentage of the contract amount, which is referred to as the initial margin deposit. Subsequent payments, referred to as variation margin, are made or received by the Funds periodically and are based on changes in the market value of open futures contracts. Changes in the market value of open futures contracts are recorded as unrealized appreciation (depreciation) in the Statements of Operations. Realized gains or losses, representing the difference between the value of the contract at the time it was opened and the value at the time it was closed, are reported in the Statements of Operations at the closing or expiration of the futures contract. Securities deposited as initial margin are designated in the SOIs and cash deposited is recorded on the Statements of Assets and Liabilities. A receivable from and/or a payable to brokers for the daily variation margin is also recorded on the Statements of Assets and Liabilities.
The Funds may be subject to the risk that the change in the value of the futures contract may not correlate perfectly with the underlying instrument. Use of long futures contracts subjects the Funds to risk of loss in excess of the amounts shown on the Statements of Assets and Liabilities, up to the notional amount of the futures contracts. Use of short futures contracts subjects the Funds to unlimited risk of loss. The Funds may enter into futures contracts only on exchanges or boards of trade. The exchange or board of trade acts as the counterparty to each futures transaction; therefore, the Funds’ credit risk is limited to failure of the exchange or board of trade. Under some circumstances, futures exchanges may establish daily limits on the amount that the price of a futures contract can vary from the previous day’s settlement price, which could effectively prevent liquidation of unfavorable positions.
The table below discloses the volume of the Funds’ futures contracts activity during the year ended October 31, 2012 (amounts in thousands):
Global Equity Income | Global Opportunities | International Equity Index Fund | International Opportunities Fund | International Value Fund | ||||||||||||||||
Futures Contracts: | ||||||||||||||||||||
Average Notional Balance Long | $ | 927 | (a) | $ | 64 | (b) | $ | 8,476 | $ | 1,706 | $ | 11,017 | ||||||||
Ending Notional Balance Long | — | — | 5,001 | 9,867 | 29,548 | |||||||||||||||
| (a) | For the period September 1, 2012 through October 31, 2012. |
| (b) | For the period December 1, 2011 through January 31, 2012. |
D. Forward Foreign Currency Exchange Contracts — The Global Equity Income Fund, Global Opportunities Fund, International Opportunities Fund and International Value Fund may be exposed to foreign currency risks associated with portfolio investments and therefore use forward foreign currency exchange contracts to hedge or manage these exposures. Forward foreign currency exchange contracts represent obligations to purchase or sell foreign currency on a specified future date at a price fixed at the time the contracts are entered into. Non-deliverable forward foreign currency exchange contracts are settled with the counterparty in cash without the delivery of foreign currency.
The values of the forward foreign currency exchange contracts are adjusted daily based on the applicable exchange rate of the underlying currency. Changes in the value of these contracts are recorded as unrealized appreciation or depreciation until the contract settlement date. When the forward foreign currency exchange contract is closed, the Funds record a realized gain or loss equal to the difference between the value at the time the contract was opened and the value at the time it was closed.
The table below discloses the volume of the Funds’ forward foreign currency exchange contracts activity during the year ended
October 31, 2012 (amounts in thousands):
Global Equity Income Fund | Global Opportunities | International Opportunities Fund | International Value Fund | |||||||||||||
Forward Foreign Currency Exchange Contracts: | ||||||||||||||||
Average Settlement Value Purchased | $ | 3,454 | $ | 710 | $ | 179,792 | $ | 471,067 | ||||||||
Average Settlement Value Sold | 7,828 | 791 | 152,248 | 371,768 | ||||||||||||
Ending Settlement Value Purchased | 3,715 | 638 | 252,852 | 676,976 | ||||||||||||
Ending Settlement Value Sold | 10,504 | 673 | 203,090 | 497,400 | ||||||||||||
E. Summary of Derivatives Information — The following tables present the value of derivatives held as of October 31, 2012, by their primary underlying risk exposure and respective location on the Statements of Assets and Liabilities (amounts in thousands):
Global Equity Income Fund
| Derivative Contract | Statement of Assets and Liabilities Location | |||||
| Assets: | Forward Foreign Currency Exchange Contracts | |||||
Foreign Exchange Contracts | Receivables | $ | 73 | |||
|
| |||||
Liabilities: | ||||||
Foreign Currency Contracts | Payables | $ | (55 | ) | ||
|
| |||||
| 128 | J.P. MORGAN INTERNATIONAL EQUITY FUNDS | OCTOBER 31, 2012 | ||||
Table of Contents
Global Opportunities Fund
| Derivative Contract | Statement of Assets and Liabilities Location | |||||
| Assets: | Forward Foreign Currency Exchange Contracts | |||||
Foreign Currency Contracts | Receivables | $ | 5 | |||
|
| |||||
Liabilities: | ||||||
Foreign Currency Contracts | Payables | $ | (15 | ) | ||
|
| |||||
International Equity Index Fund
| Derivative Contract | Statement of Assets and Liabilities Location | |||||
| Assets: | Futures Contracts (a) | |||||
Equity contracts | Receivables, Net Assets — Unrealized Appreciation | $ | 19 | |||
|
| |||||
Liabilities: | ||||||
Equity contracts | Payables, Net Assets — Unrealized Depreciation | $ | (13 | ) | ||
|
| |||||
International Opportunities Fund
| Derivative Contract | Statement of Assets and Liabilities Location | |||||||||
| Assets: | Futures Contracts (a) | Forward Foreign Currency Exchange Contracts | ||||||||
Forward Foreign Currency Exchange Contracts | Receivables | $ | — | $ | 4,039 | |||||
|
|
|
| |||||||
Liabilities: | ||||||||||
Forward Foreign Currency Exchange Contracts | Payables | $ | — | $ | (6,000 | ) | ||||
Equity contracts | Payables, Net Assets — Unrealized Depreciation | (40 | ) | — | ||||||
|
|
|
| |||||||
Total | $ | (40 | ) | $ | (6,000 | ) | ||||
|
|
|
| |||||||
International Value Fund
| Derivative Contract | Statement of Assets and Liabilities Location | |||||||||
| Assets: | Futures Contracts (a) | Forward Foreign Currency Exchange Contracts | ||||||||
Forward Foreign Currency Exchange Contracts | Receivables | $ | — | $ | 8,496 | |||||
Equity contracts | Receivables, Net Assets — Unrealized Appreciation | 326 | — | |||||||
|
|
|
| |||||||
Total | $ | 326 | $ | 8,496 | ||||||
|
|
|
| |||||||
Liabilities: | ||||||||||
Forward Foreign Currency Exchange Contracts | Payables | $ | — | $ | (8,441 | ) | ||||
|
|
|
| |||||||
| (a) | This amount represents the cumulative appreciation/depreciation of futures contracts as reported in the SOIs. The Statements of Assets & Liabilities only reflects the current day variation margin receivable/payable to brokers. |
The following tables present the effect of derivatives on the Statements of Operations for the year ended October 31, 2012, by primary underlying risk exposure (amounts in thousands):
Global Equity Income Fund
| Derivative Contract | Futures Contracts | Forward Foreign Currency Exchange Contracts | Total | |||||||||
Foreign Exchange Contracts | $ | — | $ | 61 | $ | 61 | ||||||
Equity contracts | (7 | ) | — | (7 | ) | |||||||
|
|
|
|
|
| |||||||
Total | $ | (7 | ) | $ | 61 | $ | 54 | |||||
|
|
|
|
|
| |||||||
| OCTOBER 31, 2012 | J.P. MORGAN INTERNATIONAL EQUITY FUNDS | 129 | ||||||
Table of Contents
NOTES TO FINANCIAL STATEMENTS
AS OF OCTOBER 31, 2012 (continued)
| Amount of Change in Unrealized Appreciation (Depreciation) on Derivatives Recognized in Income | ||||
| Derivative Contract | Forward Foreign Currency Exchange Contracts | |||
Foreign Exchange Contracts | $ | 23 | ||
|
| |||
Global Opportunities Fund
| Derivative Contract | Futures Contracts | Forward Foreign Currency Exchange Contracts | Total | |||||||||
Foreign Exchange Contracts | $ | — | $ | 36 | $ | 36 | ||||||
Equity contracts | 6 | — | 6 | |||||||||
|
|
|
|
|
| |||||||
Total | $ | 6 | $ | 36 | $ | 42 | ||||||
|
|
|
|
|
| |||||||
| Amount of Change in Unrealized Appreciation (Depreciation) on Derivatives Recognized in Income | ||||
| Derivative Contract | Forward Foreign Currency Exchange Contracts | |||
Foreign Exchange Contracts | $ | (14 | ) | |
|
| |||
International Equity Index Fund
| Derivative Contract | Futures Contracts | |||
Equity contracts | $ | 1,331 | ||
|
| |||
| Amount of Change in Unrealized Appreciation (Depreciation) on Derivatives Recognized in Income | ||||
| Derivative Contract | Futures Contracts | |||
Equity contracts | $ | (869 | ) | |
|
| |||
International Opportunities Fund
| Amount of Realized Gain (Loss) on Derivatives Recognized in Income | ||||||||||||
| Derivative Contract | Futures Contracts | Forward Foreign Currency Exchange Contracts | Total | |||||||||
Foreign Exchange Contracts | $ | — | $ | 1,564 | $ | 1,564 | ||||||
Equity contracts | 88 | — | 88 | |||||||||
|
|
|
|
|
| |||||||
Total | $ | 88 | $ | 1,564 | $ | 1,652 | ||||||
|
|
|
|
|
| |||||||
| Amount of Change in Unrealized Appreciation (Depreciation) on Derivatives Recognized in Income | ||||||||||||
| Derivative Contract | Futures Contracts | Forward Foreign Currency Exchange Contracts | Total | |||||||||
Foreign Exchange Contracts | $ | — | $ | (1,618 | ) | $ | (1,618 | ) | ||||
Equity contracts | (40 | ) | — | (40 | ) | |||||||
|
|
|
|
|
| |||||||
Total | $ | (40 | ) | $ | (1,618 | ) | $ | (1,658 | ) | |||
|
|
|
|
|
| |||||||
International Value Fund
| Amount of Realized Gain (Loss) on Derivatives Recognized in Income | ||||||||||||
| Derivative Contract | Futures Contracts | Forward Foreign Currency Exchange Contracts | Total | |||||||||
Foreign Exchange Contracts | $ | — | $ | (3,373 | ) | $ | (3,373 | ) | ||||
Equity contracts | 1,586 | — | 1,586 | |||||||||
|
|
|
|
|
| |||||||
Total | $ | 1,586 | $ | (3,373 | ) | $ | (1,787 | ) | ||||
|
|
|
|
|
| |||||||
| 130 | J.P. MORGAN INTERNATIONAL EQUITY FUNDS | OCTOBER 31, 2012 | ||||
Table of Contents
| Amount of Change in Unrealized Appreciation (Depreciation) on Derivatives Recognized in Income | ||||||||||||
| Derivative Contract | Futures Contracts | Forward Foreign Currency Exchange Contracts | Total | |||||||||
Foreign Exchange Contracts | $ | — | $ | (4,588 | ) | $ | (4,588 | ) | ||||
Equity contracts | 287 | — | 287 | |||||||||
|
|
|
|
|
| |||||||
Total | $ | 287 | $ | (4,588 | ) | $ | (4,301 | ) | ||||
|
|
|
|
|
| |||||||
The Funds’ derivatives contracts held at October 31, 2012 are not accounted for as hedging instruments under accounting principles generally accepted in the United States of America.
F. Foreign Currency Translation — The books and records of the Funds are maintained in U.S. dollars. Foreign currency amounts are translated into U.S. dollars at the prevailing exchange rates of such currencies against the U.S. dollar. The market value of investment securities and other assets and liabilities are translated at the exchange rate as of the valuation date. Purchases and sales of investment securities, income and expenses are translated at the exchange rate prevailing on the respective dates of such transactions.
Although the net assets of the Funds are presented at the foreign exchange rates and market values at the close of the period, the Funds do not isolate that portion of the results of operations arising as a result of changes in the foreign exchange rates from the fluctuations arising from changes in the market prices of securities held or sold during the year. Accordingly, such foreign currency gains (losses) are included in the reported net realized and unrealized gains (losses) on investment transactions on the Statements of Operations.
Reported realized foreign currency gains or losses arise from the disposition of foreign currency, purchase of foreign currency in certain countries (such as Brazil) that impose a tax on such purchases, currency gains or losses realized between the trade and settlement dates on securities transactions, and the difference between the amounts of dividends, interest and foreign withholding taxes recorded on each Fund’s books on the transaction date and the U.S. dollar equivalent of the amounts actually received or paid. Unrealized foreign exchange gains and losses arise from changes (due to changes in the exchange rate) in the value of foreign currency and other assets and liabilities denominated in foreign currencies, which are held at period end.
G. Offering and Organizational Costs — Total offering costs of approximately $111,000 paid in connection with the offering of shares of the Global Equity Income Fund were amortized up to 12 months from the date the Fund commenced operations.
H. Security Transactions and Investment Income — Investment transactions are accounted for on the trade date (the date the order to buy or sell is executed). Securities gains and losses are calculated on a specifically identified cost basis. Interest income is determined on the basis of coupon interest accrued using the effective interest method which adjusts for amortization of premiums and accretion of discounts. Dividend income net of foreign taxes withheld, if any, is recorded on the ex-dividend date or when a Fund first learns of the dividend.
I. Allocation of Income and Expenses — Expenses directly attributable to a fund are charged directly to that fund, while the expenses attributable to more than one fund of the Trusts are allocated among the respective funds. In calculating the net asset value per share of each class, investment income, realized and unrealized gains and losses and expenses, other than class specific expenses, are allocated daily to each class of shares based upon the proportion of net assets of each class at the beginning of each day. Each class of shares bears its pro-rata portion of expenses attributable to its fund, except that each class separately bears expenses related specifically to that class.
J. Federal Income Taxes — Each Fund is treated as a separate taxable entity for Federal income tax purposes. Each Fund’s policy is to comply with the provisions of the Internal Revenue Code of 1986, as amended (the “Code”), applicable to regulated investment companies and to distribute to shareholders all of its distributable net investment income and net realized gain on investments. Accordingly, no provision for Federal income tax is necessary. The Funds are not aware of any tax positions for which it is reasonably possible that the total amounts of unrecognized tax benefits or losses will significantly change in the next twelve months. However, the Funds’ conclusions may be subject to future review based on changes in, or the interpretation of, the accounting standards or tax laws and regulations. Each of the Fund’s Federal tax returns for the prior three fiscal years, or since inception if shorter, remain subject to examination by the Internal Revenue Service.
K. Foreign Taxes — The Funds may be subject to foreign taxes on income, gains on investments or currency purchases/repatriation, a portion of which may be recoverable. The Funds will accrue such taxes and recoveries as applicable, based upon their current interpretation of tax rules and regulations that exist in the markets in which they invest. The Funds are subject to a tax imposed on short-term capital gains on securities of issuers domiciled in India. The Funds record an estimated deferred tax liability for securities that have been held for less than one year at the end of the reporting period, assuming those positions were disposed of at the end of the period. Short-term realized capital losses on the sale of securities of issuers domiciled in India can be carried forward for eight years to offset potential future short-term realized capital gains.
India has recently enacted rules imposing a tax on indirect transfer of Indian shares, although additional guidance from the Indian tax authorities is awaited. At present, management does not believe that such tax will be applicable to the Funds. However, the Funds’ conclusion, regarding this and other foreign tax matters, may be subject to future review based on changes in, or the interpretation of, the accounting standards and the tax laws and regulations.
| OCTOBER 31, 2012 | J.P. MORGAN INTERNATIONAL EQUITY FUNDS | 131 | ||||||
Table of Contents
NOTES TO FINANCIAL STATEMENTS
AS OF OCTOBER 31, 2012 (continued)
L. Distributions to Shareholders — Dividends from net investment income are generally declared and paid annually, except for Global Equity Income Fund, which are declared and paid monthly and for International Equity Fund, which are declared and paid quarterly. Dividends are declared separately for each class. No class has preferential dividend rights; differences in per share rates are due to differences in separate class expenses. Net realized capital gains, if any, are distributed by each Fund at least annually. The amount of dividends and distributions from net investment income and net realized capital gains is determined in accordance with Federal income tax regulations, which may differ from accounting principles generally accepted in the United States of America. To the extent these “book/tax” differences are permanent in nature (i.e., that they result from other than timing of recognition — “temporary differences”), such amounts are reclassified within the capital accounts based on their Federal tax-basis treatment.
The following amounts were reclassified within the capital accounts (amounts in thousands):
| Paid-in-Capital | Accumulated undistributed/ (distribution net investment income | Accumulated net realized | ||||||||||
Emerging Economies Fund | $ | — | $ | (242 | ) | $ | 242 | |||||
Emerging Markets Equity Fund | 231 | (26 | ) | (205 | ) | |||||||
Global Equity Income Fund | — | 70 | (70 | ) | ||||||||
Global Opportunities Fund | — | 40 | (40 | ) | ||||||||
International Equity Fund | — | 185 | (185 | ) | ||||||||
International Equity Index Fund | — | 1,480 | (1,480 | ) | ||||||||
International Opportunities Fund | — | 3,207 | (3,207 | ) | ||||||||
International Value Fund | — | 1,205 | (1,205 | ) | ||||||||
Intrepid International Fund | — | (48 | ) | 48 | ||||||||
The reclassifications for the Funds relate primarily to foreign currency gains or losses, non-taxable special dividends (International Equity Index Fund), and passive foreign investment company (PFIC) gains and losses (Emerging Economies Fund, Global Opportunities Fund, International Equity Index Fund and Intrepid International Fund).
N. Redemption Fees — Prior to May 2, 2011, shares of the Funds held for less than 60 days were generally subject to a redemption fee of 2.00%, based on the redeemed share’s market value. Redemption fees were paid directly to the applicable Fund and were credited to paid in capital. Effective May 2, 2011 shares of the Funds are no longer subject to a redemption fee regardless of how long such shares have been held.
3. Fees and Other Transactions with Affiliates
A. Investment Advisory Fee — Pursuant to the Investment Advisory Agreement, JPMIM supervises the investments of each respective Fund and for such services is paid a fee. The fee is accrued daily and paid monthly based on each Fund’s respective average daily net assets.
The annual rate for each Fund is as follows:
Emerging Economies Fund | 1.00 | % | ||
Emerging Markets Equity Fund | 1.00 | |||
Global Equity Income Fund | 0.80 | |||
Global Opportunities Fund | 0.60 | |||
International Equity Fund | 0.80 | |||
International Equity Index Fund | 0.55 | |||
International Opportunities Fund | 0.60 | |||
International Value Fund | 0.60 | |||
Intrepid International Fund | 0.85 |
The Advisor waived Investment Advisory fees and/or reimbursed expenses as outlined in Note 3.F.
B. Administration Fee — Pursuant to an Administration Agreement, the Administrator provides certain administration services to the Funds. In consideration of these services, the Administrator receives a fee accrued daily and paid monthly at an annual rate of 0.15% of the first $25 billion of the average daily net assets of all funds in the J.P. Morgan Funds Complex (excluding certain funds of funds and money market funds) and 0.075% of the average daily net assets in excess of $25 billion of all such funds. For the year ended October 31, 2012, the annual effective rate was 0.09% of each Fund’s average daily net assets, notwithstanding any fee waivers and/or expense reimbursements.
The Administrator waived Administration fees as outlined in Note 3.F.
JPMorgan Chase Bank, N.A. (“JPMCB”), a wholly-owned subsidiary of JPMorgan, and successor in interest to J.P. Morgan Investor Services Co., serves as the Funds’ sub-administrator (the “Sub-administrator”). For its services as Sub-administrator, JPMCB receives a portion of the fees payable to the Administrator.
| 132 | J.P. MORGAN INTERNATIONAL EQUITY FUNDS | OCTOBER 31, 2012 | ||||
Table of Contents
C. Distribution Fees — Pursuant to a Distribution Agreement, JPMorgan Distribution Services, Inc. (the “Distributor”), a wholly-owned subsidiary of JPMorgan, serves as the Trusts’ exclusive underwriter and promotes and arranges for the sale of each Fund’s shares.
The Board of Trustees has adopted a Distribution Plan (the “Distribution Plan”) for Class A, Class B, Class C and Class R2 Shares of the Funds in accordance with Rule 12b-1 under the 1940 Act. The Distribution Plan provides that each Fund shall pay distribution fees, including payments to the Distributor, at annual rates of the average daily net assets as shown in the table below:
| Class A | Class B | Class C | Class R2 | |||||||||||||
Emerging Economies Fund | 0.25 | % | n/a | 0.75 | % | n/a | ||||||||||
Emerging Markets Equity Fund | 0.25 | 0.75 | % | 0.75 | n/a | |||||||||||
Global Equity Income Fund | 0.25 | n/a | 0.75 | 0.50 | % | |||||||||||
Global Opportunities Fund | 0.25 | n/a | 0.75 | 0.50 | ||||||||||||
International Equity Fund | 0.25 | 0.75 | 0.75 | 0.50 | ||||||||||||
International Equity Index Fund | 0.25 | 0.75 | 0.75 | 0.50 | ||||||||||||
International Opportunities Fund | 0.25 | 0.75 | 0.75 | n/a | ||||||||||||
International Value Fund | 0.25 | 0.75 | 0.75 | 0.50 | ||||||||||||
Intrepid International Fund | 0.25 | n/a | 0.75 | 0.50 | ||||||||||||
In addition, the Distributor is entitled to receive the front-end sales charges from purchases of Class A Shares and the CDSC from redemptions of Class B and Class C Shares and certain Class A Shares for which front-end sales charges have been waived. For the year ended October 31, 2012, the Distributor retained the following amounts (in thousands):
| Front-End Sales Charge | CDSC | |||||||
Emerging Economies Fund | $ | 8 | $ | 1 | ||||
Emerging Markets Equity Fund | 37 | 4 | ||||||
Global Equity Income Fund | 1 | — | ||||||
Global Opportunities Fund | — | (a) | — | |||||
International Equity Fund | 11 | 1 | ||||||
International Equity Index Fund | 64 | 1 | ||||||
International Opportunities Fund | 2 | — | (a) | |||||
International Value Fund | 18 | 1 | ||||||
Intrepid International Fund | — | (a) | — | |||||
| (a) | Amount rounds to less than $1,000. |
D. Shareholder Servicing Fees — The Trusts, on behalf of the Funds, have entered into a Shareholder Servicing Agreement with the Distributor under which the Distributor provides certain support services to the shareholders. The Class R6 Shares do not participate in the Shareholder Servicing Agreement. For performing these services, the Distributor receives a fee that is accrued daily and paid monthly equal to a percentage of the average daily net assets as shown in the table below:
| Class A | Class B | Class C | Class R2 | Class R5 | Institutional Class | Select Class | ||||||||||||||||||||||
Emerging Economies Fund | 0.25 | % | n/a | 0.25 | % | n/a | 0.05 | % | n/a | 0.25 | % | |||||||||||||||||
Emerging Markets Equity Fund | 0.25 | 0.25 | % | 0.25 | n/a | n/a | 0.10 | % | 0.25 | |||||||||||||||||||
Global Equity Income Fund | 0.25 | n/a | 0.25 | 0.25 | % | 0.05 | n/a | 0.25 | ||||||||||||||||||||
Global Opportunities Fund | 0.25 | n/a | 0.25 | 0.25 | 0.05 | n/a | 0.25 | |||||||||||||||||||||
International Equity Fund | 0.25 | 0.25 | 0.25 | 0.25 | 0.05 | n/a | 0.25 | |||||||||||||||||||||
International Equity Index Fund | 0.25 | 0.25 | 0.25 | 0.25 | n/a | n/a | 0.25 | |||||||||||||||||||||
International Opportunities Fund | 0.25 | 0.25 | 0.25 | n/a | n/a | 0.10 | 0.25 | |||||||||||||||||||||
International Value Fund | 0.25 | 0.25 | 0.25 | 0.25 | n/a | 0.10 | 0.25 | |||||||||||||||||||||
Intrepid International Fund | 0.25 | n/a | 0.25 | 0.25 | n/a | 0.10 | 0.25 | |||||||||||||||||||||
The Distributor has entered into shareholder services contracts with affiliated and unaffiliated financial intermediaries who provide shareholder services and other related services to their clients or customers who invest in the Funds under which the Distributor will pay all or a portion of such fees earned to financial intermediaries for performing such services.
The Distributor waived Shareholder Servicing fees as outlined in Note 3.F.
E. Custodian and Accounting Fees — JPMCB provides portfolio custody and accounting services to the Funds. The amounts paid directly to JPMCB by the Funds for custody and accounting services are included in Custodian and accounting fees in the Statements of Operations. The Funds earn interest on uninvested cash balances held by the custodian. Interest income, if any, earned on cash balances at the custodian, is included as Interest income from affiliates in the Statements of Operations. Interest expense, if any, paid to the custodian related to cash overdrafts is included in Interest expense to affiliates in the Statements of Operations.
| OCTOBER 31, 2012 | J.P. MORGAN INTERNATIONAL EQUITY FUNDS | 133 | ||||||
Table of Contents
NOTES TO FINANCIAL STATEMENTS
AS OF OCTOBER 31, 2012 (continued)
F. Waivers and Reimbursements — The Advisor, Administrator and Distributor have contractually agreed to waive fees and/or reimburse the Funds to the extent that total annual operating expenses (excluding acquired fund fees and expenses, dividend expenses related to short sales, interest, taxes, expenses related to litigation and potential litigation, extraordinary expenses and expenses related to the Board of Trustees’ deferred compensation plan) exceed the percentages of the Funds’ respective average daily net assets as shown in the table below:
| Class A | Class B | Class C | Class R2 | Class R5 | Class R6 | Institutional Class | Select Class | |||||||||||||||||||||||||
Emerging Economies Fund | 1.60 | %* | n/a | 2.10 | %* | n/a | 1.15 | %* | n/a | n/a | 1.35 | %* | ||||||||||||||||||||
Emerging Markets Equity Fund | 2.00 | 2.50 | % | 2.50 | n/a | n/a | n/a | 1.45 | % | 1.75 | ||||||||||||||||||||||
Global Equity Income Fund | 1.25 | n/a | 1.75 | 1.50 | % | 0.80 | n/a | n/a | 1.00 | |||||||||||||||||||||||
Global Opportunities Fund | 1.25 | n/a | 1.75 | 1.50 | 0.80 | 0.75 | % | n/a | 1.00 | |||||||||||||||||||||||
International Equity Fund | 1.31 | 1.81 | 1.81 | 1.56 | 0.86 | 0.81 | n/a | 1.06 | ||||||||||||||||||||||||
International Equity Index Fund | 1.07 | 1.80 | 1.80 | 1.32 | n/a | n/a | n/a | 0.82 | ||||||||||||||||||||||||
International Opportunities Fund | 1.31 | 1.92 | 1.92 | n/a | n/a | 0.81 | 0.91 | 1.06 | ||||||||||||||||||||||||
International Value Fund | 1.35 | 1.85 | 1.85 | 1.60 | n/a | 0.85 | 0.95 | 1.10 | ||||||||||||||||||||||||
Intrepid International Fund | 1.50 | n/a | 2.00 | 1.75 | n/a | n/a | 1.00 | 1.25 | ||||||||||||||||||||||||
| * | Prior to February 29, 2012, the contractual expense limitations for Emerging Economies Fund were 1.85%, 2.35%, 1.40% and 1.60% for Class A, Class C, Class R5 and Select Class, respectively. |
The expense limitation agreements were in effect for the year ended October 31, 2012. The contractual expense limitation percentages in the table above are in place until at least February 28, 2013. In addition, the Funds’ service providers have voluntarily waived fees during the year ended October 31, 2012. However, the Funds’ service providers are under no obligation to do so and may discontinue such voluntary waivers at any time.
For the year ended October 31, 2012, the Funds’ service providers waived fees and/or reimbursed expenses for each of the Funds as follows (amounts in thousands). None of these parties expect the Funds to repay any such waived fees and/or reimbursed expenses in future years.
| Contractual Waivers | ||||||||||||||||||||
Investment Advisory | Administration | Shareholder Servicing | Total | Contractual Reimbursements | ||||||||||||||||
Emerging Economies Fund | $ | 84 | $ | 227 | $ | 134 | $ | 445 | $ | — | ||||||||||
Emerging Markets Equity Fund | — | — | 9 | 9 | — | |||||||||||||||
Global Equity Income Fund | 217 | 25 | 14 | 256 | 80 | |||||||||||||||
Global Opportunities Fund | 27 | 4 | — | 31 | 268 | |||||||||||||||
International Equity Fund | 1,064 | 601 | — | 1,665 | — | |||||||||||||||
International Equity Index Fund | 96 | — | 1,276 | 1,372 | — | |||||||||||||||
International Opportunities Fund | — | 4 | — | 4 | — | |||||||||||||||
International Value Fund | 186 | 305 | — | 491 | — | |||||||||||||||
Intrepid International Fund | 86 | 231 | 240 | 557 | — | |||||||||||||||
| Voluntary Waivers | ||||||||
| Investment Advisory | Total | |||||||
International Equity Fund | $ | 4 | $ | 4 | ||||
International Equity Index Fund | 3 | 3 | ||||||
Additionally, the Funds may invest in one or more money market funds advised by the Advisor or its affiliates. The Advisor, Administrator and Distributor as shareholder servicing agent waive fees in an amount sufficient to offset the respective fees each charges to the affiliated money market fund on the Funds’ investment in such affiliated money market fund. A portion of the waiver is voluntary.
The amounts of these waivers resulting from investments in these money market funds for the year ended October 31, 2012 were as follows (amounts in thousands):
Emerging Economies Fund | $ | 18 | ||
Emerging Markets Equity Fund | 94 | |||
International Equity Fund | 58 | |||
International Equity Index Fund | 10 | |||
International Opportunities Fund | 31 | |||
International Value Fund | 79 | |||
Intrepid International Fund | 14 |
G. Other — Certain officers of the Trusts are affiliated with the Advisor, the Administrator and the Distributor. Such officers, with the exception of the Chief Compliance Officer, receive no compensation from the Funds for serving in their respective roles.
| 134 | J.P. MORGAN INTERNATIONAL EQUITY FUNDS | OCTOBER 31, 2012 | ||||
Table of Contents
The Board of Trustees appointed a Chief Compliance Officer to the Funds in accordance with federal securities regulations. Each Fund, along with other affiliated funds, makes reimbursement payments, on a pro-rata basis, to the Administrator for a portion of the fees associated with the Office of the Chief Compliance Officer. Such fees are included in Trustees’ and Chief Compliance Officer’s fees in the Statements of Operations.
The Trusts adopted a Trustee Deferred Compensation Plan (the “Plan”) which allows the Independent Trustees to defer the receipt of all or a portion of compensation related to performance of their duties as Trustees. The deferred fees are invested in various J.P. Morgan Funds until distribution in accordance with the Plan.
During the year ended October 31, 2012, certain Funds may have purchased securities from an underwriting syndicate in which the principal underwriter or members of the syndicate are affiliated with the Advisor.
The Funds may use related party broker-dealers. For the year ended October 31, 2012, incurred brokerage commissions with broker-dealers affiliated with the Advisor were as follows (amounts in thousands):
Emerging Economies Fund | $ | — | (a) | |
Emerging Markets Equity Fund | 4 | |||
Global Equity Income Fund | — | (a) | ||
Global Opportunities Fund | — | (a) | ||
International Opportunities Fund | 2 | |||
International Value Fund | 2 | |||
Intrepid International Fund | — | (a) |
| (a) | Amount rounds to less than $1,000. |
The Securities and Exchange Commission (“SEC”) has granted an exemptive order permitting the Funds to engage in principal transactions with J.P. Morgan Securities, Inc., an affiliated broker, involving taxable money market instruments, subject to certain conditions.
4. Investment Transactions
During the year ended October 31, 2012, purchases and sales of investments (excluding short-term investments) were as follows (amounts in thousands):
| Purchases (excluding U.S. Government) | Sales (excluding U.S. Government) | |||||||
Emerging Economies Fund | $ | 353,295 | $ | 261,777 | ||||
Emerging Markets Equity Fund | 422,152 | 439,031 | ||||||
Global Equity Income Fund | 44,954 | 13,519 | ||||||
Global Opportunities Fund | 4,401 | 4,554 | ||||||
International Equity Fund | 327,647 | 44,190 | ||||||
International Equity Index Fund | 110,827 | 158,659 | ||||||
International Opportunities Fund | 579,526 | 281,149 | ||||||
International Value Fund | 1,401,115 | 1,266,022 | ||||||
Intrepid International Fund | 228,241 | 125,645 | ||||||
During the year ended October 31, 2012, there were no purchases or sales of U.S. Government securities.
5. Federal Income Tax Matters
For Federal income tax purposes, the cost and unrealized appreciation (depreciation) in value of investment securities held at October 31, 2012 were as follows (amounts in thousands):
| Aggregate Cost | Gross Unrealized Appreciation | Gross Unrealized Depreciation | Net Unrealized Appreciation (Depreciation) | |||||||||||||
Emerging Economies Fund | $ | 435,456 | $ | 28,664 | $ | 23,683 | $ | 4,981 | ||||||||
Emerging Markets Equity Fund | 1,853,904 | 465,255 | 75,850 | 389,405 | ||||||||||||
Global Equity Income Fund | 35,054 | 2,934 | 535 | 2,399 | ||||||||||||
Global Opportunities Fund | 4,244 | 541 | 169 | 372 | ||||||||||||
International Equity Fund | 914,622 | 190,913 | 32,288 | 158,625 | ||||||||||||
International Equity Index Fund | 404,037 | 208,740 | 30,260 | 178,480 | ||||||||||||
International Opportunities Fund | 789,906 | 69,045 | 30,398 | 38,647 | ||||||||||||
International Value Fund | 2,129,829 | 235,636 | 77,202 | 158,434 | ||||||||||||
Intrepid International Fund | 316,153 | 33,335 | 4,655 | 28,680 | ||||||||||||
| OCTOBER 31, 2012 | J.P. MORGAN INTERNATIONAL EQUITY FUNDS | 135 | ||||||
Table of Contents
NOTES TO FINANCIAL STATEMENTS
AS OF OCTOBER 31, 2012 (continued)
For the Funds, the difference between book and tax basis appreciation (depreciation) on investments is primarily attributed to mark to market of passive foreign investment companies (PFICs) (Emerging Economies Fund, Global Equity Income Fund, Global Opportunities Fund, International Equity Index Fund, International Opportunities Fund, International Value Fund and Intrepid International Fund), non-taxable special dividends (International Equity Index Fund) and wash sale loss deferrals.
The tax character of distributions paid during the fiscal year ended October 31, 2012 was as follows (amounts in thousands):
| Ordinary Income | Total Distributions Paid | |||||||
Emerging Economies Fund | $ | 4,871 | $ | 4,871 | ||||
Emerging Markets Equity Fund | 1,925 | 1,925 | ||||||
Global Equity Income Fund | 945 | 945 | ||||||
Global Opportunities Fund | 63 | 63 | ||||||
International Equity Fund | 17,653 | 17,653 | ||||||
International Equity Index Fund | 16,355 | 16,355 | ||||||
International Opportunities Fund | 16,377 | 16,377 | ||||||
International Value Fund | 72,105 | 72,105 | ||||||
Intrepid International Fund | 3,643 | 3,643 | ||||||
The tax character of distributions paid during the fiscal year ended October 31, 2011 was as follows (amounts in thousands):
Ordinary Income | Total Distributions Paid | |||||||
Emerging Economies Fund | $ | 374 | $ | 374 | ||||
Emerging Markets Equity Fund | 9,587 | 9,587 | ||||||
Global Equity Income Fund | 69 | 69 | ||||||
Global Opportunities Fund | 59 | 59 | ||||||
International Equity Fund | 12,838 | 12,838 | ||||||
International Equity Index Fund | 16,469 | 16,469 | ||||||
International Opportunities Fund | 8,198 | 8,198 | ||||||
International Value Fund | 52,369 | 52,369 | ||||||
Intrepid International Fund | 3,055 | 3,055 | ||||||
As of October 31, 2012, the components of net assets (excluding paid in capital) on a tax basis were as follows (amounts in thousands):
Current Distributable Ordinary Income | Current Distributable Long Term Capital Gain or (Tax Basis Loss Carryover) | Unrealized Appreciation (Depreciation) | ||||||||||
Emerging Economies Fund | $ | 5,957 | $ | (52,288 | ) | $ | 5,009 | |||||
Emerging Markets Equity Fund | 12,492 | (95,568 | ) | 389,443 | ||||||||
Global Equity Income Fund | 127 | (624 | ) | 2,397 | ||||||||
Global Opportunities Fund | 90 | (1,086 | ) | 373 | ||||||||
International Equity Fund | 1,483 | (27,441 | ) | 158,639 | ||||||||
International Equity Index Fund | 13,388 | (68,793 | ) | 178,510 | ||||||||
International Opportunities Fund | 16,738 | (87,159 | ) | 38,837 | ||||||||
International Value Fund | 51,753 | (577,731 | ) | 159,181 | ||||||||
Intrepid International Fund | 5,730 | (556,992 | ) | 28,660 | ||||||||
For the Funds, the cumulative timing differences primarily consist of trustee deferred compensation, distribution payable (Global Equity Income Fund), mark to market of forward foreign currency contracts (Global Equity Income Fund, Global Opportunities Fund, International Equity Index Fund, International Opportunities Fund and International Value Fund), mark to market of futures contracts (International Opportunities Fund and International Value Fund), mark to market of passive foreign investment companies (PFICs) (Emerging Economies Fund, Global Equity Income Fund, Global Opportunities Fund, International Equity Index Fund, International Opportunities Fund, International Value Fund and Intrepid International Fund) and wash sale loss deferrals.
Under the Regulated Investment Company Modernization Act of 2010 (the “Act”), net capital losses recognized by the Funds after October 31, 2011, may get carried forward indefinitely, and retain their character as short-term and/or long-term losses. Prior to the Act, net capital losses incurred by the Funds were carried forward for eight years and treated as short-term losses. The Act requires that post-enactment net capital losses be used before pre-enactment net capital losses.
| 136 | J.P. MORGAN INTERNATIONAL EQUITY FUNDS | OCTOBER 31, 2012 | ||||
Table of Contents
As of October 31, 2012, the Funds had post-enactment net capital loss carryforwards as follows (amounts in thousands):
| Capital Loss Carryforward Character | ||||||||
| Short-Term | Long-Term | |||||||
Emerging Economies Fund | $ | 19,744 | $ | 13,924 | ||||
Emerging Markets Equity Fund | 26,125 | 59,597 | ||||||
Global Equity Income Fund | 418 | 64 | ||||||
Global Opportunities Fund | 222 | — | ||||||
International Equity Fund | — | 9,002 | ||||||
International Equity Index Fund | 4,418 | 10,230 | ||||||
International Opportunities Fund | 8,636 | 10,241 | ||||||
International Value Fund | 75,342 | 77,603 | ||||||
Intrepid International Fund | 11,500 | 805 | ||||||
As of October 31, 2012, the Funds had pre-enactment net capital loss carryforwards, expiring during the year indicated, which are available to offset future realized gains as follows: (amounts in thousands):
| 2016 | 2017 | 2018 | 2019 | Total | ||||||||||||||||
Emerging Economies Fund | $ | — | $ | 1,890 | $ | — | $ | 16,730 | $ | 18,620 | ||||||||||
Emerging Markets Equity Fund | — | 9,846 | — | — | 9,846 | |||||||||||||||
Global Equity Income Fund | — | — | — | 142 | 142 | |||||||||||||||
Global Opportunities Fund | 437 | 264 | — | 163 | 864 | |||||||||||||||
International Equity Fund | — | 7,942 | 7,185 | 3,312 | 18,439 | |||||||||||||||
International Equity Index Fund | — | 54,145 | — | — | 54,145 | |||||||||||||||
International Opportunities Fund | 18,724 | 39,131 | 441 | 9,986 | 68,282 | |||||||||||||||
International Value Fund | 119,474 | 241,545 | 63,767 | — | 424,786 | |||||||||||||||
Intrepid International Fund | 293,716 | 250,971 | — | — | 544,687 | |||||||||||||||
6. Borrowings
The Funds rely upon an exemptive order granted by the SEC (“Order”) permitting the establishment and operation of an Interfund Lending Facility (“Facility”). The Facility allows the Funds to directly lend and borrow money to or from any other fund relying upon the Order at rates beneficial to both the borrowing and lending funds. Advances under the Facility are taken primarily for temporary or emergency purposes, including the meeting of redemption requests that otherwise might require the untimely disposition of securities, and are subject to each Fund’s borrowing restrictions. The Interfund Loan Rate is determined, as specified in the Order, by averaging the current repurchase agreement rate and the current bank loan rate. The Order was granted to JPM II and may be relied upon by the Funds because they are investment companies in the same “group of investment companies” (as defined in Section 12(d)(1)(G) of the 1940 Act).
In addition, the Trusts and JPMCB have entered into a financing arrangement. Under this arrangement, JPMCB provides an unsecured, uncommitted credit facility in the aggregate amount of $100 million to certain of the J.P. Morgan Funds, including the Funds. Advances under the arrangement are taken primarily for temporary or emergency purposes, including the meeting of redemption requests that otherwise might require the untimely disposition of securities, and are subject to each Fund’s borrowing restrictions. Interest on borrowings is payable at a rate determined by JPMCB at the time of borrowing. This agreement has been extended until November 11, 2013.
The Funds had no borrowings outstanding from another fund or from the unsecured, uncommitted credit facility at October 31, 2012, or at any time during the year then ended.
Interest expense paid, if any, as a result of borrowings from another fund or from the unsecured, uncommitted credit facility is included in Interest expense to affiliates in the Statements of Operations.
7. Risks, Concentrations and Indemnifications
In the normal course of business, the Funds enter into contracts that contain a variety of representations which provide general indemnifications. Each Fund’s maximum exposure under these arrangements is unknown. The amount of exposure would depend on future claims that may be made against each Fund that have not yet occurred. However, based on experience, the Funds expect the risk of loss to be remote.
One or more affiliates of the Advisor have investment discretion with respect to their clients’ holdings in the Funds, which collectively represent a significant portion of the Fund’s assets for each of the Emerging Markets Equity Fund, International Equity Index Fund, International Value Fund and Intrepid International Fund.
| OCTOBER 31, 2012 | J.P. MORGAN INTERNATIONAL EQUITY FUNDS | 137 | ||||||
Table of Contents
NOTES TO FINANCIAL STATEMENTS
AS OF OCTOBER 31, 2012 (continued)
In addition, the J.P. Morgan Investor Funds and the JPMorgan SmartRetirement Funds, which are affiliated funds of funds, own, in the aggregate more than 10% of the net assets of certain of the Funds as follows:
J.P. Morgan Investor | JPMorgan SmartRetirement Funds | |||||||
Emerging Economies Fund | 15.9 | % | 60.8 | % | ||||
Emerging Markets Equity Fund | n/a | 15.1 | ||||||
International Equity Fund | n/a | 46.0 | ||||||
International Equity Index Fund | 49.1 | n/a | ||||||
International Opportunities Fund | n/a | 60.2 | ||||||
Intrepid International Fund | n/a | 75.6 | ||||||
Additionally, the Advisor owns a significant portion of the outstanding shares of Global Equity Income Fund and Global Opportunities Fund.
International Value Fund has a shareholder, which is an account maintained by a financial intermediary on behalf of its clients, that owns a significant portion of the Fund’s outstanding shares.
Significant shareholder transactions by these shareholders, if any, may impact the Funds’ performance.
The Funds may have elements of risk not typically associated with investments in the United States of America due to concentrated investments in a limited number of countries or regions, which may vary throughout the year depending on the Fund. Such concentrations may subject the Funds to additional risks resulting from political or economic conditions in such countries or regions and the possible imposition of adverse governmental laws or currency exchange restrictions could cause the securities and their markets to be less liquid and their prices to be more volatile than those of comparable U.S. securities.
As of October 31, 2012, substantially all of the Funds’ net assets consisted of securities that are denominated in foreign currencies. Changes in currency exchange rates will affect the value of, and investment income from, such securities.
As of October 31, 2012, International Equity Fund, International Opportunities Fund and Intrepid International Fund invested 24.1%, 25.7% and 21.7% of their respective total investments in issuers in the United Kingdom. Global Equity Income Fund and Global Opportunities Fund invested 30.4% and 46.5% of their respective total investments in issuers in the United States.
| 138 | J.P. MORGAN INTERNATIONAL EQUITY FUNDS | OCTOBER 31, 2012 | ||||
Table of Contents
REPORT OF INDEPENDENT REGISTERED PUBLIC ACCOUNTING FIRM
To the Board of Trustees of JPMorgan Trust I and JPMorgan Trust II and the Shareholders of JPMorgan Emerging Economies Fund, JPMorgan Emerging Markets Equity Fund, JPMorgan Global Equity Income Fund, JPMorgan Global Opportunities Fund (formerly JPMorgan Global Focus Fund), JPMorgan International Equity Fund, JPMorgan International Equity Index Fund, JPMorgan International Opportunities Fund, JPMorgan International Value Fund and JPMorgan Intrepid International Fund:
In our opinion, the accompanying statements of assets and liabilities, including the schedules of portfolio investments, and the related statements of operations and of changes in net assets and the financial highlights present fairly, in all material respects, the financial position of JPMorgan Emerging Economies Fund, JPMorgan Emerging Markets Equity Fund, JPMorgan Global Opportunities Fund (formerly JPMorgan Global Focus Fund), JPMorgan International Equity Fund, JPMorgan International Opportunities Fund, JPMorgan International Value Fund and JPMorgan Intrepid International Fund (each a separate Fund of JPMorgan Trust I) and JPMorgan International Equity Index Fund (a separate Fund of JPMorgan Trust II) at October 31, 2012, the results of each of their operations for the year then ended, the changes in each of their net assets for each of the two years in the period then ended and the financial highlights for each of the periods presented, and the financial position of JPMorgan Global Equity Income Fund (a separate Fund of JPMorgan Trust I) (hereafter collectively referred to as the “Funds”) at October 31, 2012, the results of its operations for the year then ended, and the changes in its net assets and the financial highlights for the year then ended and for the period February 28, 2011 (commencement of operations) through October 31, 2011, in conformity with accounting principles generally accepted in the United States of America. These financial statements and financial highlights (hereafter referred to as “financial statements”) are the responsibility of the Funds’ management. Our responsibility is to express an opinion on these financial statements based on our audits. We conducted our audits of these financial statements in accordance with the standards of the Public Company Accounting Oversight Board (United States). Those standards require that we plan and perform the audit to obtain reasonable assurance about whether the financial statements are free of material misstatement. An audit includes examining, on a test basis, evidence supporting the amounts and disclosures in the financial statements, assessing the accounting principles used and significant estimates made by management, and evaluating the overall financial statement presentation. We believe that our audits, which included confirmation of securities at October 31, 2012 by correspondence with the custodian and brokers, provide a reasonable basis for our opinion.
PricewaterhouseCoopers LLP
New York, New York
December 21, 2012
| OCTOBER 31, 2012 | J.P. MORGAN INTERNATIONAL EQUITY FUNDS | 139 | ||||||
Table of Contents
(Unaudited)
The Funds’ Statement of Additional Information includes additional information about the Funds’ Trustees and is available, without charge, upon request by calling 1-800-480-4111 or on the J.P. Morgan Funds’ website at www.jpmorganfunds.com.
Name (Year of Birth); Positions With the Funds (1) | Principal Occupations During Past 5 Years | Number of Portfolios in Fund Complex Overseen by Trustee (2) | Other Directorships Held Outside Fund Complex During Past 5 Years | |||
Independent Trustees | ||||||
| William J. Armstrong (1941); Trustee of Trusts since 2005; Trustee of heritage J.P. Morgan Funds since 1987. | Retired; CFO and Consultant, EduNeering, Inc. (internet business education supplier) (2000-2001); Vice President and Treasurer, Ingersoll-Rand Company (manufacturer of industrial equipment) (1972-2000). | 168 | None. | |||
| John F. Finn (1947); Trustee of Trusts since 2005; Trustee of heritage One Group Mutual Funds since 1998. | Chairman (1985-present), President and Chief Executive Officer, Gardner, Inc. (supply chain management company serving industrial and consumer markets) (1974-present). | 168 | Director, Cardinal Health, Inc. (CAH) (1994-present); Director, Greif, Inc. (GEF) (industrial package products and services) (2007-present). | |||
| Dr. Matthew Goldstein (1941); Trustee of Trusts since 2005; Trustee of heritage J.P. Morgan Funds since 2003. | Chancellor, City University of New York (1999-present); President, Adelphi University (New York) (1998-1999). | 168 | Director, New Plan Excel (NXL) (1999-2005); Director, National Financial Partners (NFP) (2003-2005); Director, Bronx-Lebanon Hospital Center; Director, United Way of New York City (2002-present). | |||
| Robert J. Higgins (1945); Trustee of Trusts since 2005; Trustee of heritage J.P. Morgan Funds since 2002. | Retired; Director of Administration of the State of Rhode Island (2003-2004); President — Consumer Banking and Investment Services, Fleet Boston Financial (1971-2001). | 168 | None. | |||
| Peter C. Marshall (1942); Trustee of Trusts since 2005; Trustee of heritage One Group Mutual Funds since 1985. | Self-employed business consultant (2002-present). | 168 | Director, Center for Communication, Hearing, and Deafness (1990-present). | |||
| Marilyn McCoy* (1948); Trustee of Trusts since 2005; Trustee of heritage One Group Mutual Funds since 1999. | Vice President of Administration and Planning, Northwestern University (1985-present). | 168 | Trustee, Carleton College (2003-present). | |||
| William G. Morton, Jr. (1937); Trustee of Trusts since 2005; Trustee of heritage J.P. Morgan Funds since 2003. | Retired; Chairman Emeritus (2001-2002), and Chairman and Chief Executive Officer, Boston Stock Exchange (1985-2001). | 168 | Director, Radio Shack Corp. (1987-2008); Trustee, Stratton Mountain School (2001-present). | |||
| Dr. Robert A. Oden, Jr. (1946); Trustee of Trusts since 2005; Trustee of heritage One Group Mutual Funds since 1997. | Retired; President, Carleton College (2002-2010); President, Kenyon College (1995-2002). | 168 | Trustee, American University in Cairo (1999-present); Trustee, Dartmouth-Hitchcock Medical Center (2011-present); Trustee, American Schools of Oriental Research (2011-present); Trustee, Carleton College (2002-2010). | |||
| Fergus Reid, III (1932); Trustee of Trusts (Chairman) since 2005; Trustee (Chairman) of heritage J.P. Morgan Funds since 1987. | Chairman, Joe Pietryka, Inc. (formerly Lumelite Corporation) (plastics manufacturing) (2003-present); Chairman and Chief Executive Officer, Lumelite Corporation (1985-2002). | 168 | Trustee, Morgan Stanley Funds (107 portfolios) (1992-present). | |||
| 140 | J.P. MORGAN INTERNATIONAL EQUITY FUNDS | OCTOBER 31, 2012 | ||||
Table of Contents
Name (Year of Birth); Positions With the Funds (1) | Principal Occupations During Past 5 Years | Number of Complex Overseen by Trustee (2) | Other Directorships Held Outside Fund Complex During Past 5 Years | |||
Independent Trustees (continued) | ||||||
| Frederick W. Ruebeck (1939); Trustee of Trusts since 2005; Trustee of heritage One Group Mutual Funds since 1994. | Consultant (2000-present); Advisor, JP Greene & Associates, LLC (broker-dealer) (2000-2009); Chief Investment Officer, Wabash College (2004-present); Director of Investments, Eli Lilly and Company (pharmaceuticals) (1988-1999). | 168 | Trustee, Wabash College (1988-present); Chairman, Indianapolis Symphony Orchestra Foundation (1994-present). | |||
| James J. Schonbachler (1943); Trustee of Trusts since 2005; Trustee of heritage J.P. Morgan Funds since 2001. | Retired; Managing Director of Bankers Trust Company (financial services) (1968-1998). | 168 | None. | |||
Interested Trustees | ||||||
| Frankie D. Hughes** (1952), Trustee of Trusts since 2008. | President and Chief Investment Officer, Hughes Capital Management, Inc. (fixed income asset management) (1993-present). | 168 | Trustee, The Victory Portfolios (2000-2008). | |||
| Leonard M. Spalding, Jr.*** (1935); Trustee of Trusts since 2005; Trustee of heritage J.P. Morgan Funds since 1998. | Retired; Chief Executive Officer, Chase Mutual Funds (investment company) (1989-1998); President and Chief Executive Officer, Vista Capital Management (investment management) (1990-1998); Chief Investment Executive, Chase Manhattan Private Bank (investment management) (1990-1998). | 168 | Director, Glenview Trust Company, LLC (2001-present); Trustee, St. Catharine College (1998-present); Trustee, Bellarmine University (2000-present); Director, Springfield-Washington County Economic Development Authority (1997-present). | |||
| (1) | Messrs. Armstrong, Reid, and Spalding are retiring from the Board of Trustees effective December 31, 2012. The other Trustees serve for an indefinite term, subject to the Trusts’ current retirement policy, which is age 75 for all Trustees, except that the Board has determined Mr. Morton should continue to serve until December 31, 2014. |
| (2) | A Fund Complex means two or more registered investment companies that hold themselves out to investors as related companies for purposes of investment and investor services or have a common investment advisor or have an investment advisor that is an affiliated person of the investment advisor of any of the other registered investment companies. The J.P. Morgan Funds Complex for which the Board of Trustees serves currently includes eleven registered investment companies (168 funds). |
| * | Ms. McCoy has served as Vice President of Administration and Planning for Northwestern University since 1985. William M. Daley was the Head of Corporate Responsibility for JPMorgan Chase & Co. prior to January 2011 and served as a member of the Board of Trustees of Northwestern University from 2005 through 2010. JPMIM, the Funds’ investment advisor, is a wholly-owned subsidiary of JPMorgan Chase & Co. Five other members of the Board of Trustees of Northwestern University are executive officers of registered investment advisors (not affiliated with JPMorgan) that are under common control with subadvisors to certain J.P. Morgan Funds. |
| ** | Ms. Hughes is treated as an “interested person” based on the portfolio holdings of clients of Hughes Capital Management, Inc. |
| *** | Mr. Spalding is treated as an “interested person” due to his ownership of JPMorgan Chase stock. |
The contact address for each of the Trustees is 270 Park Avenue, New York, NY 10017.
| OCTOBER 31, 2012 | J.P. MORGAN INTERNATIONAL EQUITY FUNDS | 141 | ||||||
Table of Contents
TRUSTEES
(Unaudited) (continued)
In order to fill the vacancies created by the retirement of Messrs. Reid, Armstrong, and Spalding effective December 31, 2012, the Board appointed Mary E. Martinez and Mitchell M. Merin to serve as Trustees effective January 1, 2013 and Marian U. Pardo to serve as Trustee effective February 1, 2013. Information about Ms. Martinez, Mr. Merin, and Ms. Pardo is set forth below:
| Name (Year of Birth) | Principal Occupation During Past 5 Years | Other Directorships Held During the Past 5 Years | ||||
Mary E. Martinez (1960) | Associate, Special Properties, a Christie’s International Real Estate Affiliate (2010-Present); Managing Director, Bank of America (Asset Management) (2007-2008); Chief Operating Officer, U.S. Trust Asset Management; U.S. Trust Company (asset management) (2003-2007); President, Excelsior Funds (registered investment companies) (2004-2005). | Member, New York City Center Advisory Council (oversees public performing arts facilities) (2006-Present) | ||||
Mitchell M. Merin (1953) | Retired (2005-Present); President and Chief Operating Officer, Morgan Stanley Investment Management, Member Morgan Stanley & Co. Management Committee (registered investment adviser) (1998-2005). | Director, Sun Life Financial (SLF) (2007 to Present) (financial services and insurance); Trustee, Trinity College, Hartford, CT (2002-2010) | ||||
Marian U. Pardo* (1946) | Managing Director and Founder, Virtual Capital Management LLC (Investment Consulting) 2007-present); Managing Director, Credit Suisse Asset Management (portfolio manager) (2003-2006). | Member, Board of Governors, Columbus Citizens Foundation (not-for-profit supporting philanthropic and cultural programs) (2006-Present) | ||||
| * | In connection with prior employment with JPMorgan Chase, Ms. Pardo is the recipient of non-qualified pension plan payments from JPMorgan Chase in the amount of approximately $2,055 per month, which she will irrevocably waive effective January 1, 2013, and deferred compensation payments from JPMorgan Chase in the amount of approximately $7,294 per year, which will end on January 1, 2013. In addition, Ms. Pardo receives payments from a fully funded qualified plan, which is not an obligation of JPMorgan Chase. |
| 142 | J.P. MORGAN INTERNATIONAL EQUITY FUNDS | OCTOBER 31, 2012 | ||||
Table of Contents
(Unaudited)
Name (Year of Birth), Positions Held with the Trusts (Since) | Principal Occupations During Past 5 Years | |
Patricia A. Maleski (1960), | Managing Director, J.P. Morgan Investment Management Inc. and Chief Administrative Officer, J.P. Morgan Funds and Institutional Pooled Vehicles since 2010; previously, Treasurer and Principal Financial Officer of the Trusts from 2008 to 2010; previously, Head of Funds Administration and Board Liaison, J.P. Morgan Funds prior to 2010. Ms. Maleski has been with JPMorgan Chase & Co. since 2001. | |
| Joy C. Dowd (1972), Treasurer and Principal Financial Officer (2010) | Assistant Treasurer of the Trusts from 2009 to 2010; Executive Director, JPMorgan Funds Management, Inc. from February 2011; Vice President, JPMorgan Funds Management, Inc. from December 2008 to February 2011; prior to joining JPMorgan Chase, Ms. Dowd worked in MetLife’s investments audit group from 2005 through 2008. | |
| Frank J. Nasta (1964), Secretary (2008) | Managing Director and Associate General Counsel, JPMorgan Chase since 2008; Previously, Director, Managing Director, General Counsel and Corporate Secretary, J. & W. Seligman & Co. Incorporated; Secretary of each of the investment companies of the Seligman Group of Funds and Seligman Data Corp.; Director and Corporate Secretary, Seligman Advisors, Inc. and Seligman Services, Inc. | |
| Stephen M. Ungerman (1953), Chief Compliance Officer (2005) | Managing Director, JPMorgan Chase & Co.; Mr. Ungerman has been with JPMorgan Chase & Co. since 2000. | |
Kathryn A. Jackson (1962), | Vice President and AML Compliance Manager for JPMorgan Asset Management Compliance since 2011; Senior On-Boarding Specialist for JPMorgan Distribution Services, Inc. in Global Liquidity from 2008 to 2011; prior to joining JPMorgan, Ms. Jackson was a Financial Services Analyst responsible for on-boarding, compliance and training with Nationwide Securities LLC and 1717 Capital Management Company, both registered broker-dealers, from 2005 until 2008. | |
Elizabeth A. Davin (1964), Assistant Secretary (2005)** | Executive Director and Assistant General Counsel, JPMorgan Chase since February 2012; formerly Vice President and Assistant General Counsel, JPMorgan Chase from 2005 until February 2012; Senior Counsel, JPMorgan Chase (formerly Bank One Corporation) from 2004 to 2005. | |
| Jessica K. Ditullio (1962), Assistant Secretary (2005)** | Executive Director and Assistant General Counsel, JPMorgan Chase since February 2011; Ms. Ditullio has served as an attorney with various titles for JPMorgan Chase (formerly Bank One Corporation) since 1990. | |
| John T. Fitzgerald (1975), Assistant Secretary (2008) | Executive Director and Assistant General Counsel, JPMorgan chase since February 2011; formerly, Vice President and Assistant General Counsel, JPMorgan Chase from 2005 until February 2011. | |
| Carmine Lekstutis (1980), Assistant Secretary (2011) | Vice President and Assistant General Counsel, JPMorgan Chase since 2011; Associate, Skadden, Arps, Slate, Meagher & Flom LLP (law firm) from 2006 to 2011. | |
| Gregory S. Samuels (1980), Assistant Secretary (2010) | Vice President and Assistant General Counsel, JPMorgan Chase since 2010; Associate, Ropes & Gray (law firm) from 2008 to 2010; Associate, Clifford Chance LLP (law firm) from 2005 to 2008. | |
| Pamela L. Woodley (1971), Assistant Secretary (2012) | Vice President and Assistant General Counsel, JPMorgan Chase since November 2004. | |
Michael M. D’Ambrosio (1969), Assistant Treasurer (2012) | Executive Director, JPMorgan Funds Management, Inc. from July 2012; prior to joining JPMorgan Chase, Mr. D’Ambrosio was a Tax Director at PricewaterhouseCoopers LLP since 2006. | |
| Jeffrey D. House (1972), Assistant Treasurer (2006)** | Vice President, JPMorgan Funds Management, Inc. since July 2006. | |
| Joseph Parascondola (1963), Assistant Treasurer (2011) | Vice President, JPMorgan Funds Management, Inc. since August 2006. | |
| Matthew J. Plastina (1970), Assistant Treasurer (2011) | Vice President, JPMorgan Funds Management, Inc. since August 2010; prior to August 2010, Vice President and Controller, Legg Mason Global Asset Management. | |
| Jeffery Reedy (1973), Assistant Treasurer (2011)** | Vice President, JPMorgan Funds Management, Inc. since February 2006. | |
Julie A. Roach (1971), Assistant Treasurer (2012)** | Vice President, JPMorgan Funds Management, Inc. from August 2012; prior to joining JPMorgan Chase, Ms. Roach was a Senior Manager with Deloitte since 2001. | |
Timothy J. Stewart (1974), Assistant Treasurer (2012)*** | Executive Director, JPMorgan Funds Management, Inc. from July 2012; Managing Director of Robeco Investment Management, Inc. (2011 – 2012); Chief Financial Officer (2008 – 2011) and Director of Operations (2003 - 2008), Robeco-Sage, a division of Robeco Investment Management, Inc. | |
The contact address for each of the officers, unless otherwise noted, is 270 Park Avenue, New York, NY 10017.
| * | The contact address for the officer is 500 Stanton Christiana Road, Ops 1, Floor 02, Newark, DE 19173-2107. |
| ** | The contact address for the officer is 460 Polaris Parkway, Westerville, OH 43082. |
| *** | Mr. Stewart is the Assistant Treasurer of JPMorgan Trust I only. |
| OCTOBER 31, 2012 | J.P. MORGAN INTERNATIONAL EQUITY FUNDS | 143 | ||||||
Table of Contents
SCHEDULE OF SHAREHOLDER EXPENSES
(Unaudited)
Hypothetical $1,000 Investment
As a shareholder of the Funds, you incur two types of costs: (1) transaction costs, including sales charges (loads) on purchase payments and redemption fees and (2) ongoing costs, including investment advisory fees, administration fees, distribution fees and other Fund expenses. The examples below are intended to help you understand your ongoing costs (in dollars) of investing in the Funds and to compare these ongoing costs with the ongoing costs of investing in other mutual funds. The examples assume that you had a $1,000 investment in each Class at the beginning of the reporting period, May 1, 2012, and continued to hold your shares at the end of the reporting period, October 31, 2012.
Actual Expenses
For each Class of each Fund in the table below, the first line provides information about actual account values and actual expenses. You may use the information in this line, together with the amount you invested, to estimate the expenses that you paid over the period. Simply divide your account value by $1,000 (for example, an $8,600 account value divided by $1,000 = 8.6), then multiply the result by the number in the first line of each Class under the heading entitled “Expenses Paid During the Period” to estimate the expenses you paid on your account during this period.
Hypothetical Example for Comparison Purposes
The second line of each Class in the table below provides information about hypothetical account values and hypothetical expenses based on the Class’ actual expense ratio and an assumed rate of return of 5% per year before expenses, which is not the Class’ actual return. The hypothetical account values and expenses may not be used to estimate the actual ending account balance or expenses you paid for the period. You may use this information to compare the ongoing costs of investing in the Class of the Funds and other funds. To do so, compare this 5% hypothetical example with the 5% hypothetical examples that appear in the shareholder reports of the other funds. Please note that the expenses shown in the table are meant to highlight your ongoing costs only and do not reflect any transaction costs, such as sales charges (loads) or redemption fees. Therefore, the second line for each Class in the table is useful in comparing ongoing costs only, and will not help you determine the relative total costs of owning different funds. In addition, if these transaction costs were included, your costs would have been higher. The examples also assume all dividends and distributions have been reinvested.
| Beginning Account Value, May 1, 2012 | Ending Account Value, October 31, 2012 | Expenses Paid During the Period* | Annualized Expense Ratio | |||||||||||||
Emerging Economies Fund | ||||||||||||||||
Class A | ||||||||||||||||
Actual | $ | 1,000.00 | $ | 949.90 | $ | 7.84 | 1.60 | % | ||||||||
Hypothetical | 1,000.00 | 1,017.09 | 8.11 | 1.60 | ||||||||||||
Class C | ||||||||||||||||
Actual | 1,000.00 | 947.10 | 10.28 | 2.10 | ||||||||||||
Hypothetical | 1,000.00 | 1,014.58 | 10.63 | 2.10 | ||||||||||||
Class R5 | ||||||||||||||||
Actual | 1,000.00 | 952.20 | 5.64 | 1.15 | ||||||||||||
Hypothetical | 1,000.00 | 1,019.36 | 5.84 | 1.15 | ||||||||||||
Select Class | ||||||||||||||||
Actual | 1,000.00 | 950.70 | 6.62 | 1.35 | ||||||||||||
Hypothetical | 1,000.00 | 1,018.35 | 6.85 | 1.35 | ||||||||||||
Emerging Markets Equity Fund | ||||||||||||||||
Class A | ||||||||||||||||
Actual | 1,000.00 | 990.50 | 9.06 | 1.81 | ||||||||||||
Hypothetical | 1,000.00 | 1,016.04 | 9.17 | 1.81 | ||||||||||||
Class B | ||||||||||||||||
Actual | 1,000.00 | 987.60 | 11.54 | 2.31 | ||||||||||||
Hypothetical | 1,000.00 | 1,013.52 | 11.69 | 2.31 | ||||||||||||
Class C | ||||||||||||||||
Actual | 1,000.00 | 988.00 | 11.54 | 2.31 | ||||||||||||
Hypothetical | 1,000.00 | 1,013.52 | 11.69 | 2.31 | ||||||||||||
Institutional Class | ||||||||||||||||
Actual | 1,000.00 | 992.60 | 7.06 | 1.41 | ||||||||||||
Hypothetical | 1,000.00 | 1,018.05 | 7.15 | 1.41 | ||||||||||||
| 144 | J.P. MORGAN INTERNATIONAL EQUITY FUNDS | OCTOBER 31, 2012 | ||||
Table of Contents
| Beginning Account Value, May 1, 2012 | Ending Account Value, October 31, 2012 | Expenses Paid During the Period* | Annualized Expense Ratio | |||||||||||||
Emerging Markets Equity Fund (continued) | ||||||||||||||||
Select Class | ||||||||||||||||
Actual | $ | 1,000.00 | $ | 991.60 | $ | 7.81 | 1.56 | % | ||||||||
Hypothetical | 1,000.00 | 1,017.29 | 7.91 | 1.56 | ||||||||||||
Global Equity Income Fund | ||||||||||||||||
Class A | ||||||||||||||||
Actual | 1,000.00 | 1,037.60 | 6.40 | 1.25 | ||||||||||||
Hypothetical | 1,000.00 | 1,018.85 | 6.34 | 1.25 | ||||||||||||
Class C | ||||||||||||||||
Actual | 1,000.00 | 1,036.10 | 8.96 | 1.75 | ||||||||||||
Hypothetical | 1,000.00 | 1,016.34 | 8.87 | 1.75 | ||||||||||||
Class R2 | ||||||||||||||||
Actual | 1,000.00 | 1,036.50 | 7.68 | 1.50 | ||||||||||||
Hypothetical | 1,000.00 | 1,017.60 | 7.61 | 1.50 | ||||||||||||
Class R5 | ||||||||||||||||
Actual | 1,000.00 | 1,040.00 | 4.10 | 0.80 | ||||||||||||
Hypothetical | 1,000.00 | 1,021.11 | 4.06 | 0.80 | ||||||||||||
Select Class | ||||||||||||||||
Actual | 1,000.00 | 1,039.00 | 5.13 | 1.00 | ||||||||||||
Hypothetical | 1,000.00 | 1,020.11 | 5.08 | 1.00 | ||||||||||||
Global Opportunities Fund | ||||||||||||||||
Class A | ||||||||||||||||
Actual | 1,000.00 | 995.60 | 6.27 | 1.25 | ||||||||||||
Hypothetical | 1,000.00 | 1,018.85 | 6.34 | 1.25 | ||||||||||||
Class C | ||||||||||||||||
Actual | 1,000.00 | 992.60 | 8.77 | 1.75 | ||||||||||||
Hypothetical | 1,000.00 | 1,016.34 | 8.87 | 1.75 | ||||||||||||
Class R2 | ||||||||||||||||
Actual | 1,000.00 | 994.80 | 7.52 | 1.50 | ||||||||||||
Hypothetical | 1,000.00 | 1,017.60 | 7.61 | 1.50 | ||||||||||||
Class R5 | ||||||||||||||||
Actual | 1,000.00 | 997.80 | 4.02 | 0.80 | ||||||||||||
Hypothetical | 1,000.00 | 1,021.11 | 4.06 | 0.80 | ||||||||||||
Class R6 | ||||||||||||||||
Actual | 1,000.00 | 998.50 | 3.77 | 0.75 | ||||||||||||
Hypothetical | 1,000.00 | 1,021.37 | 3.81 | 0.75 | ||||||||||||
Select Class | ||||||||||||||||
Actual | 1,000.00 | 997.00 | 5.02 | 1.00 | ||||||||||||
Hypothetical | 1,000.00 | 1,020.11 | 5.08 | 1.00 | ||||||||||||
International Equity Fund | ||||||||||||||||
Class A | ||||||||||||||||
Actual | 1,000.00 | 1,014.50 | 6.58 | 1.30 | ||||||||||||
Hypothetical | 1,000.00 | 1,018.60 | 6.60 | 1.30 | ||||||||||||
Class B | ||||||||||||||||
Actual | 1,000.00 | 1,011.60 | 9.10 | 1.80 | ||||||||||||
Hypothetical | 1,000.00 | 1,016.09 | 9.12 | 1.80 | ||||||||||||
Class C | ||||||||||||||||
Actual | 1,000.00 | 1,011.80 | 9.10 | 1.80 | ||||||||||||
Hypothetical | 1,000.00 | 1,016.09 | 9.12 | 1.80 | ||||||||||||
Class R2 | ||||||||||||||||
Actual | 1,000.00 | 1,013.10 | 7.84 | 1.55 | ||||||||||||
Hypothetical | 1,000.00 | 1,017.34 | 7.86 | 1.55 | ||||||||||||
Class R5 | ||||||||||||||||
Actual | 1,000.00 | 1,016.40 | 4.31 | 0.85 | ||||||||||||
Hypothetical | 1,000.00 | 1,020.86 | 4.32 | 0.85 | ||||||||||||
| OCTOBER 31, 2012 | J.P. MORGAN INTERNATIONAL EQUITY FUNDS | 145 | ||||||
Table of Contents
SCHEDULE OF SHAREHOLDER EXPENSES
(Unaudited) (continued)
Hypothetical $1,000 Investment
| Beginning Account Value, May 1, 2012 | Ending Account Value, October 31, 2012 | Expenses Paid During the Period* | Annualized Expense Ratio | |||||||||||||
International Equity Fund (continued) | ||||||||||||||||
Class R6 | ||||||||||||||||
Actual | $ | 1,000.00 | $ | 1,016.70 | $ | 4.06 | 0.80 | % | ||||||||
Hypothetical | 1,000.00 | 1,021.11 | 4.06 | 0.80 | ||||||||||||
Select Class | ||||||||||||||||
Actual | 1,000.00 | 1,015.50 | 5.32 | 1.05 | ||||||||||||
Hypothetical | 1,000.00 | 1,019.86 | 5.33 | 1.05 | ||||||||||||
International Equity Index Fund | ||||||||||||||||
Class A | ||||||||||||||||
Actual | 1,000.00 | 1,030.50 | 5.46 | 1.07 | ||||||||||||
Hypothetical | 1,000.00 | 1,019.76 | 5.43 | 1.07 | ||||||||||||
Class B | ||||||||||||||||
Actual | 1,000.00 | 1,027.10 | 9.12 | 1.79 | ||||||||||||
Hypothetical | 1,000.00 | 1,016.14 | 9.07 | 1.79 | ||||||||||||
Class C | ||||||||||||||||
Actual | 1,000.00 | 1,027.10 | 9.12 | 1.79 | ||||||||||||
Hypothetical | 1,000.00 | 1,016.14 | 9.07 | 1.79 | ||||||||||||
Class R2 | ||||||||||||||||
Actual | 1,000.00 | 1,029.00 | 6.73 | 1.32 | ||||||||||||
Hypothetical | 1,000.00 | 1,018.50 | 6.70 | 1.32 | ||||||||||||
Select Class | ||||||||||||||||
Actual | 1,000.00 | 1,031.50 | 4.19 | 0.82 | ||||||||||||
Hypothetical | 1,000.00 | 1,021.01 | 4.17 | 0.82 | ||||||||||||
International Opportunities Fund | ||||||||||||||||
Class A | ||||||||||||||||
Actual | 1,000.00 | 1,001.60 | 6.44 | 1.28 | ||||||||||||
Hypothetical | 1,000.00 | 1,018.70 | 6.50 | 1.28 | ||||||||||||
Class B | ||||||||||||||||
Actual | 1,000.00 | 1,000.00 | 8.95 | 1.78 | ||||||||||||
Hypothetical | 1,000.00 | 1,016.19 | 9.02 | 1.78 | ||||||||||||
Class C | ||||||||||||||||
Actual | 1,000.00 | 999.20 | 8.95 | 1.78 | ||||||||||||
Hypothetical | 1,000.00 | 1,016.19 | 9.02 | 1.78 | ||||||||||||
Class R6 | ||||||||||||||||
Actual | 1,000.00 | 1,004.80 | 3.93 | 0.78 | ||||||||||||
Hypothetical | 1,000.00 | 1,021.22 | 3.96 | 0.78 | ||||||||||||
Institutional Class | ||||||||||||||||
Actual | 1,000.00 | 1,004.00 | 4.43 | 0.88 | ||||||||||||
Hypothetical | 1,000.00 | 1,020.71 | 4.47 | 0.88 | ||||||||||||
Select Class | ||||||||||||||||
Actual | 1,000.00 | 1,003.20 | 5.19 | 1.03 | ||||||||||||
Hypothetical | 1,000.00 | 1,019.96 | 5.23 | 1.03 | ||||||||||||
International Value Fund | ||||||||||||||||
Class A | ||||||||||||||||
Actual | 1,000.00 | 1,009.90 | 6.77 | 1.34 | ||||||||||||
Hypothetical | 1,000.00 | 1,018.40 | 6.80 | 1.34 | ||||||||||||
Class B | ||||||||||||||||
Actual | 1,000.00 | 1,006.70 | 9.28 | 1.84 | ||||||||||||
Hypothetical | 1,000.00 | 1,015.89 | 9.32 | 1.84 | ||||||||||||
Class C | ||||||||||||||||
Actual | 1,000.00 | 1,007.70 | 9.29 | 1.84 | ||||||||||||
Hypothetical | 1,000.00 | 1,015.89 | 9.32 | 1.84 | ||||||||||||
Class R2 | ||||||||||||||||
Actual | 1,000.00 | 1,008.40 | 8.03 | 1.59 | ||||||||||||
Hypothetical | 1,000.00 | 1,017.14 | 8.06 | 1.59 | ||||||||||||
| 146 | J.P. MORGAN INTERNATIONAL EQUITY FUNDS | OCTOBER 31, 2012 | ||||
Table of Contents
| Beginning Account Value, May 1, 2012 | Ending Account Value, October 31, 2012 | Expenses Paid During the Period* | Annualized Expense Ratio | |||||||||||||
International Value Fund (continued) | ||||||||||||||||
Class R6 | ||||||||||||||||
Actual | $ | 1,000.00 | $ | 1,012.30 | $ | 4.25 | 0.84 | % | ||||||||
Hypothetical | 1,000.00 | 1,020.91 | 4.27 | 0.84 | ||||||||||||
Institutional Class | ||||||||||||||||
Actual | 1,000.00 | 1,012.30 | 4.75 | 0.94 | ||||||||||||
Hypothetical | 1,000.00 | 1,020.41 | 4.77 | 0.94 | ||||||||||||
Select Class | ||||||||||||||||
Actual | 1,000.00 | 1,011.50 | 5.51 | 1.09 | ||||||||||||
Hypothetical | 1,000.00 | 1,019.66 | 5.53 | 1.09 | ||||||||||||
Intrepid International Fund | ||||||||||||||||
Class A | ||||||||||||||||
Actual | 1,000.00 | 1,006.30 | 7.51 | 1.49 | ||||||||||||
Hypothetical | 1,000.00 | 1,017.65 | 7.56 | 1.49 | ||||||||||||
Class C | ||||||||||||||||
Actual | 1,000.00 | 1,003.80 | 10.02 | 1.99 | ||||||||||||
Hypothetical | 1,000.00 | 1,015.13 | 10.08 | 1.99 | ||||||||||||
Class R2 | ||||||||||||||||
Actual | 1,000.00 | 1,004.50 | 8.77 | 1.74 | ||||||||||||
Hypothetical | 1,000.00 | 1,016.39 | 8.82 | 1.74 | ||||||||||||
Institutional Class | ||||||||||||||||
Actual | 1,000.00 | 1,008.70 | 5.00 | 0.99 | ||||||||||||
Hypothetical | 1,000.00 | 1,020.16 | 5.03 | 0.99 | ||||||||||||
Select Class | ||||||||||||||||
Actual | 1,000.00 | 1,007.30 | 6.26 | 1.24 | ||||||||||||
Hypothetical | 1,000.00 | 1,018.90 | 6.29 | 1.24 | ||||||||||||
* Expenses are equal to each Class’ respective annualized expense ratio, multiplied by the average account value over the period, multiplied by 184/366 (to reflect the one-half year period).
| OCTOBER 31, 2012 | J.P. MORGAN INTERNATIONAL EQUITY FUNDS | 147 | ||||||
Table of Contents
BOARD APPROVAL OF INVESTMENT ADVISORY AGREEMENT
(Unaudited)
The Board of Trustees meets regularly throughout the year and considers factors that are relevant to its annual consideration of investment advisory agreements at each meeting. The Board of Trustees has established various standing committees, composed of Trustees with diverse backgrounds, to which the Board of Trustees has assigned specific subject matter responsibilities to further enhance the effectiveness of the Board’s oversight and decision making. The Board of Trustees and its investment subcommittees (money market and alternative products, equity, and fixed income) also meet for the specific purpose of considering advisory contract annual renewals. The Board of Trustees held meetings in person in June and August 2012, at which the Trustees considered the continuation of the investment advisory agreements for each of the Funds whose annual report is contained herein (each an “Advisory Agreement” and collectively, the “Advisory Agreements”). At the June meeting, the Board’s investment subcommittees met to review and consider performance, expense and related information for the J.P. Morgan Funds. Each investment subcommittee reported to the full Board, which then considered the investment subcommittee’s preliminary findings. At the August meeting, the Trustees continued their review and consideration. The Trustees, including a majority of the Trustees who are not “interested persons” (as defined in the 1940 Act) of any party to the Advisory Agreements or any of their affiliates, approved the continuation of each Advisory Agreement on August 23, 2012.
The Trustees, as part of their review of the investment advisory arrangements for the J.P. Morgan Funds, considered and reviewed performance and other information received from the Advisor on a regular basis over the course of the year, as well as information specifically prepared for their annual review. This information included the Funds’ performance compared to the performance of the Funds’ peers and benchmarks and analyses by the Advisor of the Funds’ performance. In addition, the Trustees have engaged an independent consultant to report on the performance of certain J.P. Morgan Funds at each of the Trustees’ regular meetings. The Advisor also periodically provides comparative information regarding the Funds’ expense ratios and those of the peer groups. In addition, in preparation for the June and August meetings, the Trustees requested, received and evaluated extensive materials from the Advisor, including, with respect to certain J.P. Morgan Funds, performance and expense information compiled by Lipper Inc. (“Lipper”), an independent provider of investment company data. The independent consultant also provided additional analyses of the performance of certain J.P. Morgan Funds with greater than two years of performance history in connection with the Trustees’ review of the investment advisory arrangements. Prior to voting, the Trustees reviewed the proposed approval of the Advisory Agreements with representatives of the Advisor and with counsels to the Trusts and independent Trustees and received a memorandum from independent
counsel to the Trustees discussing the legal standards for their consideration of the proposed approval. The Trustees also discussed the proposed approvals in executive sessions with counsels to the Trusts and independent Trustees at which no representatives of the Advisor were present. Set forth below is a summary of the material factors evaluated by the Trustees in determining whether to approve each Advisory Agreement.
In their deliberations, there was a comprehensive consideration of the information received by the Trustees. Each Trustee attributed different weights to the various factors and no factor alone was considered determinative. From year to year, the Trustees consider and place emphasis on relevant information in light of changing circumstances in market and economic conditions. The Trustees determined that the compensation to be received by the Advisor from each Fund under the applicable Advisory Agreement was fair and reasonable and that the continuance of the investment advisory contract was in the best interests of each Fund and its shareholders.
The factors summarized below were considered and discussed by the Trustees in reaching their conclusions:
Nature, Extent and Quality of Services Provided by the Advisor
The Trustees received and considered information regarding the nature, extent and quality of the services provided to each Fund under the Advisory Agreement. The Trustees took into account information furnished throughout the year at Trustee meetings, as well as the materials furnished specifically in connection with this annual review process. The Trustees considered the background and experience of the Advisor’s senior management and the expertise of, and the amount of attention given to each Fund by, investment personnel of the Advisor. In addition, the Trustees reviewed the qualifications, backgrounds and responsibilities of the portfolio management team primarily responsible for the day-to-day management of each Fund and the infrastructure supporting the team. The Trustees also considered information provided by the Advisor and JPMorgan Distribution Services, Inc. (“JPMDS”) about the structure and distribution strategy of each Fund. The Trustees also reviewed information relating to the Advisor’s risk governance model and reports showing the Advisor’s compliance structure and ongoing compliance processes. The quality of the administrative services provided by JPMorgan Funds Management, Inc. (“JPMFM”), an affiliate of the Advisor, was also considered.
The Board of Trustees also considered its knowledge of the nature and quality of the services provided by the Advisor to the Funds gained from their experience as Trustees of the Funds. In addition, they considered the overall reputation and capabilities of the Advisor and its affiliates, the commitment of the Advisor to provide high quality service to the Funds, their overall confidence in the Advisor’s integrity and the Advisor’s responsiveness to questions or concerns raised by them, including the Advisor’s willingness to consider and implement
| 148 | J.P. MORGAN INTERNATIONAL EQUITY FUNDS | OCTOBER 31, 2012 | ||||
Table of Contents
organizational and operational changes designed to improve investment results and the services provided to each Fund.
Based on these considerations and other factors, the Trustees concluded that they were satisfied with the nature, extent and quality of the investment advisory services provided to the Funds by the Advisor.
Costs of Services Provided and Profitability to the Advisor and its Affiliates
The Trustees received and considered information regarding the profitability to the Advisor and its affiliates in providing services to each of the Funds. The Trustees reviewed and discussed this data. The Trustees recognized that this data is not audited and represents the Advisor’s determination of its and its affiliates’ revenues from the contractual services provided to the Funds, less expenses of providing such services. Expenses include direct and indirect costs and are calculated using an allocation methodology developed by the Advisor. The Trustees also recognized that it is difficult to make comparisons of profitability from fund investment advisory contracts because comparative information is not generally publicly available and is affected by numerous factors, including the structure of the particular adviser, the types of funds it manages, its business mix, numerous assumptions regarding allocations and the fact that publicly-traded fund managers’ operating profits and net income are net of distribution and marketing expenses. Based on their review, the Trustees concluded that the profitability to the Advisor under each of the Advisory Agreements was not unreasonable in light of the services and benefits provided to each Fund.
Fall-Out Benefits
The Trustees reviewed information regarding potential “fallout” or ancillary benefits received by the Advisor and its affiliates as a result of their relationship with the Funds. The Board considered that the Advisor does not currently use third-party soft dollar arrangements with respect to securities transactions it executes for these Funds.
The Trustees also considered that JPMFM and JPMDS, affiliates of the Advisor, earn fees from the Funds for providing administrative and shareholder services. These fees were shown separately in the profitability analysis presented to the Trustees. The Trustees also considered the payments of Rule 12b-1 fees to JPMDS, which also acts as the Funds’ distributor and that these fees are in turn generally paid to financial intermediaries that sell the Funds, including financial intermediaries that are affiliates of the Advisor. The Trustees also considered the fees paid to JPMorgan Chase Bank, N.A. (“JPMCB”) for custody and fund accounting, securities lending and other related services. The Trustees also considered that the Funds are not currently engaged in securities lending.
Economies of Scale
The Trustees noted that the proposed investment advisory fee schedule for each Fund does not contain breakpoints. The Trustees considered whether it would be appropriate to add advisory fee breakpoints and the Trustees concluded that the current fee structure was reasonable in light of the fee waivers and expense limitations that the Advisor has in place that serve to limit the overall net expense ratio at competitive levels. The Trustees also recognized that the fee schedule for the administrative services provided by JPMFM does include a fee breakpoint, which is tied to the overall level of non-money market fund assets excluding certain funds-of-funds, as applicable, advised by the Advisor, and that the Funds benefit from that breakpoint. The Trustees concluded that shareholders benefited from the lower expense ratios which resulted from these factors.
Independent Written Evaluation of the Funds’ Senior Officer/Chief Compliance Officer
The Trustees noted that, upon their direction, the Senior Officer for the International Equity Fund and International Equity Index Fund had prepared an independent written evaluation in order to assist the Trustees in determining the reasonableness of the proposed management fees. The Trustees considered the Senior Officer’s report in determining whether to continue the Advisory Agreements.
The Trustees noted that, upon their direction, the Chief Compliance Officer for the Emerging Economies Fund, Emerging Markets Equity Fund, Global Equity Income Fund, Global Opportunities Fund, International Opportunities Fund, International Value Fund and Intrepid International Fund had prepared an independent written evaluation in order to assist the Trustees in determining the reasonableness of the proposed management fees. The Trustees considered the written evaluation in determining whether to continue the Advisory Agreements.
Fees Relative to Advisor’s Other Clients
The Trustees received and considered information about the nature and extent of investment advisory services and fee rates offered to other clients of the Advisor for investment management styles substantially similar to that of each Fund. The Trustees also considered the complexity of investment management for the Funds relative to the Advisor’s other clients and the differences in the nature and extent of the services provided to the different clients. The Trustees concluded that the fee rates charged to each Fund in comparison to those charged to the Advisor’s other clients were reasonable.
Investment Performance
The Trustees received and considered absolute and/or relative performance for Funds which had at least one full year of performance at the time of the review in a report prepared by
| OCTOBER 31, 2012 | J.P. MORGAN INTERNATIONAL EQUITY FUNDS | 149 | ||||||
Table of Contents
BOARD APPROVAL OF INVESTMENT ADVISORY AGREEMENT
(Unaudited) (continued)
Lipper. The Trustees considered the total return performance information, which included the ranking of those Funds which had at least one full year of performance a the time of the review within a performance universe made up of funds with the same Lipper investment classification and objective (the “Universe Group”) by total return for applicable one-, three- and five-year periods. The Trustees reviewed a description of Lipper’s methodology for selecting mutual funds in each Fund’s Universe Group. The Lipper materials provided to the Trustees highlighted information with respect to certain representative classes to assist the Trustees in their review. As part of this review, the Trustees also reviewed each Fund’s performance against its benchmark and considered the performance information provided for the Funds at regular Board meetings by the Advisor and the independent consultant and also considered the special analysis prepared by the independent consultant. The Lipper performance data noted by the Trustees as part of their review and the determinations made by the Trustees with respect to each Fund’s performance for certain representative classes are summarized below:
The Trustees noted that the Emerging Economies Fund’s performance was in the third and first quintiles for Class A shares and in the second and first quintiles for Select Class shares for the one- and three-year periods ended December 31, 2011, respectively, and that the independent consultant indicated that the overall performance was attractive. The Trustees discussed the performance and investment strategy of the Fund with the Advisor and, based upon this discussion and other factors, concluded that the performance was reasonable.
The Trustees noted that the Emerging Markets Equity Fund’s performance was in the second, fourth and second quintiles for Class A shares and in the second, third and second quintiles for Select Class shares for the one-, three- and five-year periods ended December 31, 2011, respectively, and that the independent consultant indicated that the overall performance needed enhancement. The Trustees discussed the performance and investment strategy of the Fund with the Advisor and, based upon this discussion and other factors, concluded that the performance was reasonable.
The Trustees noted the performance of the Global Equity Income Fund since its inception on February 28, 2011 as compared with that of its benchmark index through December 31, 2011. The Trustees discussed the performance and investment strategy of the Fund with the Advisor and, based upon this discussion and various other factors, concluded that the performance was reasonable.
The Trustees noted that the Global Opportunities Fund’s performance was in the fifth and first quintiles for both Class A and Select Class shares for the one- and three-year periods ended December 31, 2011, respectively, and that the independent consultant indicated that the overall performance needed enhancement. The Trustees also noted that effective
November 1, 2011, the Fund changed its name, investment objective and investment strategies. The Trustees discussed the performance and investment strategy of the Fund with the Advisor and, based upon this discussion and other factors, concluded that the performance was reasonable.
The Trustees noted that the International Equity Fund’s performance was in the second quintile for both Class A and Select Class shares for each of the one-, three-, and five-year periods ended December 31, 2011, and that the independent consultant indicated that overall performance was attractive. The Trustees discussed the performance and investment strategy of the Fund with the Advisor and, based upon this discussion and other factors, concluded that the performance was reasonable.
The Trustees noted that the International Equity Index Fund’s performance was in the fourth, third and third quintiles for both Class A and Select Class shares for the one-, three- and five-year periods ended December 31, 2011, respectively, and that the independent consultant indicated that the overall performance was satisfactory. The Trustees discussed the performance and investment strategy of the Fund with the Advisor and concluded that they were satisfied with the Advisor’s analysis of the Fund’s performance. They requested, however, that the Fund’s Advisor provide additional Fund performance information to be reviewed with members of the money market and alternative products subcommittee at each of their regular meetings over the course of the next year.
The Trustees noted that the International Opportunities Fund’s performance was in the fourth, third and third quintiles for both Class A and Select Class shares for the one-, three-, and five-year periods ended December 31, 2011, respectively, and that the independent consultant indicated that the overall performance was satisfactory. The Trustees discussed the performance and investment strategy of the Fund with the Advisor and, based upon this discussion and other factors, concluded that the performance was reasonable.
The Trustees noted that the International Value Fund’s performance was in the third, second and second quintiles for both Class A and Select Class shares for the one-, three- and five- year periods ended December 31, 2011, respectively, and that the independent consultant indicated that the overall performance was satisfactory. The Trustees discussed the performance and investment strategy of the Fund with the Advisor and, based upon this discussion and other factors, concluded that the performance was reasonable.
The Trustees noted that the Intrepid International Fund’s performance was in the fourth, fourth and fifth quintiles for Class A shares and in the third, fourth, and fifth quintiles for Select Class shares for the one-, three- and five- year periods ended December 31, 2011, respectively, and that the independent consultant indicated that the overall performance was satisfactory. The Trustees discussed the performance and
| 150 | J.P. MORGAN INTERNATIONAL EQUITY FUNDS | OCTOBER 31, 2012 | ||||
Table of Contents
investment strategy of the Fund with the Advisor and concluded that they were satisfied with the Advisor’s analysis of the Fund’s performance. They requested, however, that the Fund’s Advisor provide additional Fund performance information to be reviewed with members of the equity subcommittee at each of their regular meetings over the course of the next year.
Advisory Fees and Expense Ratios
The Trustees considered the contractual advisory fee rate paid by each Fund to the Advisor and compared that rate to the information prepared by Lipper concerning management fee rates paid by other funds in the same Lipper category as each Fund. The Trustees recognized that Lipper reported each Fund’s management fee rate as the combined contractual advisory fee and administration fee rates. The Trustees also reviewed information about other expenses and the expense ratios for each Fund. The Trustees considered the fee waiver and/or expense reimbursement arrangements currently in place for each Fund and considered the net advisory fee rate after taking into account any waivers and/or reimbursements. The Trustees recognized that it is difficult to make comparisons of advisory fees because there are variations in the services that are included in the fees paid by other funds. The Trustees’ determination as a result of the review of each Fund’s advisory fees and expense ratios for certain representative classes are summarized below:
The Trustees noted that the Emerging Economies Fund’s net advisory fee for both Class A and Select Class shares was in the second quintile, and that the actual total expenses for Class A and Select Class shares were in the second and third quintiles, respectively, of their Universe Group. After considering the factors identified above, in light of this information, the Trustees concluded that the advisory fee was reasonable.
The Trustees noted that the Emerging Markets Equity Fund’s net advisory fee for Class A and Select Class shares was in the third and fourth quintiles, respectively, and that the actual total expenses for both Class A and Select Class shares were in the fourth quintile of their Universe Group. After considering the factors identified above, in light of this information, the Trustees concluded that the advisory fees were reasonable.
The Trustees noted that the Global Equity Income Fund’s net advisory fee for both Class A and Select Class shares was in the first quintile and that the actual total expenses for both Class A and Select Class shares were in the second quintile of their Universe Group. After considering the factors identified above, in light of this information, the Trustees concluded that the advisory fee was reasonable.
The Trustees noted that the Global Opportunities Fund’s net advisory fee for both Class A and Select Class shares was in the
first quintile, and that the actual total expenses for both Class A and Select Class shares were in the second quintile of their Universe Group. The Trustees noted further that, effective November 1, 2011, the contractual advisory fee and expense caps for the Fund were reduced and that Lipper reflected the reduced fees and expense caps in their analysis. After considering the factors identified above, in light of this information, the Trustees concluded that the advisory fee was reasonable.
The Trustees noted that the International Equity Fund’s net advisory fee for Class A and Select Class shares was in the first and second quintiles, respectively, and that actual total expenses for Class A and Select Class shares were in the second and third quintiles, respectively, of their Universe Group. After considering the factors identified above, in light of this information, the Trustees concluded that the advisory fees were reasonable.
The Trustees noted that the International Equity Index Fund’s net advisory fee for Class A and Select Class shares was in the second and fifth quintiles, respectively, and that the actual total expenses for Class A and Select Class shares were in the first and fourth quintiles, respectively, of their Universe Group. After considering the factors identified above, in light of this information, the Trustees concluded that the advisory fees were reasonable.
The Trustees noted that the International Opportunities Fund’s net advisory fee for Class A and Select Class shares was in the first and second quintiles, respectively, and that the actual total expenses for both Class A and Select Class shares were in the second quintile of their Universe Group. After considering the factors identified above, in light of this information, the Trustees concluded that the advisory fees were reasonable.
The Trustees noted that the International Value Fund’s net advisory fee for Class A and Select Class shares was in the first and second quintiles, respectively, and that the actual total expenses for Class A and Select Class shares were in the second and third quintiles, respectively, of their Universe Group. After considering the factors identified above, in light of this information, the Trustees concluded that the advisory fees were reasonable.
The Trustees noted that the Intrepid International Fund’s net advisory fee for Class A and Select Class shares was in the second and third quintiles, respectively, and that the actual total expenses for both Class A and Select Class shares were in the third quintile of their Universe Group. After considering the factors identified above, in light of this information, the Trustees concluded that the advisory fees were reasonable.
| OCTOBER 31, 2012 | J.P. MORGAN INTERNATIONAL EQUITY FUNDS | 151 | ||||||
Table of Contents
(Unaudited)
Certain tax information for the J.P. Morgan Funds is required to be provided to shareholders based upon the Funds’ income and distributions for the taxable year ended October 31, 2012. The information and distributions reported in this letter may differ from the information and taxable distributions reported to the shareholders for the calendar year ending December 31, 2012. The information necessary to complete your income tax returns for the calendar year ending December 31, 2012 will be received under separate cover.
Dividend Received Deductions (DRD)
The following represents the percentage of ordinary income distributions eligible for the 70% dividend received deduction for corporate rate shareholders for the fiscal year ended October 31, 2012:
| Dividend Received Deduction | ||||
Global Equity Income Fund | 32.07 | % | ||
Global Opportunities Fund | 30.46 | |||
Qualified Dividend Income (QDI)
For the fiscal year ended October 31, 2012, certain dividends paid by the Funds may be subject to a maximum tax rate of 15%. The following represents the amount of ordinary income distributions treated as qualified dividends (amounts in thousands):
| Qualified Dividend Income | ||||
Emerging Economies Fund | $ | 4,871 | ||
Emerging Markets Equity Fund | 1,925 | |||
Global Equity Income Fund | 945 | |||
Global Opportunities Fund | 63 | |||
International Equity Fund | 17,653 | |||
International Equity Index Fund | 16,355 | |||
International Opportunities Fund | 16,377 | |||
International Value Fund | 69,589 | |||
Intrepid International Fund | 3,643 | |||
Foreign Source Income and Foreign Tax Credit Pass Through
For the fiscal year ended October 31, 2012, the Funds intend to elect to pass through to shareholders the income tax credit for taxes paid to foreign countries. Gross income and foreign tax expenses are as follows (amounts in thousands):
| Gross Income | Foreign Tax Pass Through | |||||||
Emerging Economies Fund | $ | 11,910 | $ | 864 | ||||
Emerging Markets Equity Fund | 50,078 | 2,866 | ||||||
Global Equity Income Fund | 948 | 82 | ||||||
Global Opportunities Fund | 91 | 6 | ||||||
International Equity Fund | 26,548 | 1,767 | ||||||
International Equity Index Fund | 18,678 | 1,969 | ||||||
International Opportunities Fund | 21,492 | 1,553 | ||||||
International Value Fund | 80,600 | 5,523 | ||||||
Intrepid International Fund | 8,905 | 639 | ||||||
The pass-through of the foreign tax credit will only affect those persons who are shareholders on the dividend record date in December, 2012. These shareholders will receive more detailed information along with their 2012 Form 1099-DIV.
| 152 | J.P. MORGAN INTERNATIONAL EQUITY FUNDS | OCTOBER 31, 2012 | ||||
Table of Contents
Rev. January 2011
| FACTS | WHAT DOES J.P. MORGAN FUNDS DO WITH YOUR PERSONAL INFORMATION? |
| Why? | Financial companies choose how they share your personal information. Federal law gives consumers the right to limit some but not all sharing. Federal law also requires us to tell you how we collect, share, and protect your personal information. Please read this notice carefully to understand what we do. |
| What? | The types of personal information we collect and share depend on the product or service you have with us. This information can include:
¡Social Security number and account balances
¡transaction history and account transactions
¡checking account information and wire transfer instructions
When you are no longer our customer, we continue to share your information as described in this notice. |
| How? | All financial companies need to share customers’ personal information to run their everyday business. In the section below, we list the reasons financial companies can share their customers’ personal information; the reasons J.P. Morgan Funds chooses to share; and whether you can limit this sharing. |
| Reasons we can share your personal information | Does J.P. Morgan Funds share? | Can you limit this sharing? | ||
For our everyday business purposes — such as to process your transactions, maintain your account(s), respond to court orders and legal investigations, or report to credit bureaus | Yes | No | ||
For marketing purposes — to offer our products and services to you | Yes | No | ||
| For joint marketing with other financial companies | No | We don’t share | ||
For our affiliates’ everyday business purposes — information about your transactions and experiences | No | We don’t share | ||
For our affiliates’ everyday business purposes — information about your creditworthiness | No | We don’t share | ||
| For nonaffiliates to market to you | No | We don’t share |
| Questions? | Call 1-800-480-4111 or go to www.jpmorganfunds.com | |

Table of Contents

Page 2 |
| Who we are | ||
| Who is providing this notice? | J.P. Morgan Funds | |
| What we do | ||
| How does J.P. Morgan Funds protect my personal information? | To protect your personal information from unauthorized access and use, we use security measures that comply with federal law. These measures include computer safeguards and secured files and buildings. We authorize our employees to access your information only when they need it to do their work and we require companies that work for us to protect your information. | |
How does J.P. Morgan Funds collect my personal information? | We collect your personal information, for example, when you:
¡open an account or provide contact information
¡give us your account information or pay us by check
¡make a wire transfer
We also collect your personal information from others, such as credit bureaus, affiliates and other companies. | |
| Why can’t I limit all sharing? | Federal law gives you the right to limit only
¡sharing for affiliates’ everyday business purposes – information about your creditworthiness
¡affiliates from using your information to market to you
¡sharing for nonaffiliates to market to you
State laws and individual companies may give you additional rights to limit sharing. | |
| Definitions | ||
| Affiliates | Companies related by common ownership or control. They can be financial and nonfinancial companies.
¡J.P. Morgan Funds does not share with our affiliates. | |
| Nonaffiliates | Companies not related by common ownership or control. They can be financial and nonfinancial companies.
¡J.P. Morgan Funds does not share with nonaffiliates so they can market to you. | |
| Joint Marketing | A formal agreement between nonaffiliated financial companies that together market financial products or services to you.
¡J.P. Morgan Funds doesn’t jointly market. | |
Table of Contents
J.P. Morgan Funds are distributed by JPMorgan Distribution Services, Inc., which is an affiliate of JPMorgan Chase & Co. Affiliates of JPMorgan Chase & Co. receive fees for providing various services to the funds.
Contact JPMorgan Distribution Services, Inc. at 1-800-480-4111 for a fund prospectus. You can also visit us at www.jpmorganfunds.com. Investors should carefully consider the investment objectives and risk as well as charges and expenses of the mutual fund before investing. The prospectus contains this and other information about the mutual fund. Read the prospectus carefully before investing.
Investors may obtain information about the Securities Investor Protection Corporation (SIPC), including the SIPC brochure by visiting www.sipc.org or by calling SIPC at 202-371-8300.
Each Fund files a complete schedule of its fund holdings for the first and third quarters of its fiscal year with the SEC on Form N-Q. The Funds’ Forms N-Q are available on the SEC’s website at http://www.sec.gov and may be reviewed and copied at the SEC’s Public Reference Room in Washington, DC. Information on the operation of the SEC’s Public Reference Room may be obtained by calling 1-800-SEC-0330. Shareholders may request the Form N-Q without charge by calling 1-800-480-4111 or by visiting the J.P. Morgan Funds’ website at www.jpmorganfunds.com.
A description of each Fund’s policies and procedures with respect to the disclosure of each Fund’s holdings is available in the prospectus and Statement of Additional Information.
A copy of proxy policies and procedures is available without charge upon request by calling 1-800-480-4111 and on the Funds’ website at www.jpmorganfunds.com. A description of such policies and procedures is on the SEC’s website at www.sec.gov. The Trustees have delegated the authority to vote proxies for securities owned by the Funds to the Advisor. A copy of the Funds’ voting record for the most recent 12-month period ended June 30 is available on the SEC’s website at www.sec.gov or at the Funds’ website at www.jpmorganfunds.com no later than August 31 of each year. The Funds’ proxy voting record will include, among other things, a brief description of the matter voted on for each fund security, and will state how each vote was cast, for example, for or against the proposal.

Table of Contents

J.P. Morgan Asset Management is the marketing name for the asset management business of JPMorgan Chase & Co. Those businesses include, but are not limited to, J.P. Morgan Investment Management Inc., Security Capital Research & Management Incorporated and J.P. Morgan Alternative Asset Management, Inc.
| © JPMorgan Chase & Co., 2012. All rights reserved. October 2012. | AN-INTEQ-1012 |
Table of Contents
ITEM 2. CODE OF ETHICS.
Disclose whether, as of the end of the period covered by the report, the registrant has adopted a code of ethics that applies to the registrant’s principal executive officer, principal financial officer, principal accounting officer or controller, or persons performing similar functions, regardless of whether these individuals are employed by the registrant or a third party. If the registrant has not adopted such a code of ethics, explain why it has not done so.
The registrant must briefly describe the nature of any amendment, during the period covered by the report, to a provision of its code of ethics that applies to the registrant’s principal executive officer, principal financial officer, principal accounting officer or controller, or persons performing similar functions, regardless of whether these individuals are employed by the registrant or a third party, and that relates to any element of the code of ethics definition enumerated in paragraph (b) of this Item. The registrant must file a copy of any such amendment as an exhibit pursuant to Item 12(a)(1), unless the registrant has elected to satisfy paragraph (f) of this Item by positing its code of ethics on its website pursuant to paragraph (f)(2) of this Item, or by undertaking to provide its code of ethics to any person without charge, upon request, pursuant to paragraph (f)(3) of this Item.
If the registrant has, during the period covered by the report, granted a waiver, including an implicit waiver, from a provision of the code of ethics that applies to the registrant’s principal executive officer, principal financial officer, principal accounting officer or controller, or persons performing similar functions, regardless of whether these individuals are employed by the registrant or third party, that relates to one or more items set forth in paragraph (b) of this Item, the registrant must briefly describe the nature of the waiver, the name of the person to whom the waiver was granted, and the date of the waiver.
The Registrant has adopted a code of ethics that applies to the Registrant’s principal executive officer and principal financial officer. There were no amendments to the code of ethics or waivers granted with respect to the code of ethics in the period covered by the report.
ITEM 3. AUDIT COMMITTEE FINANCIAL EXPERT.
(a) (1) Disclose that the registrant’s board of directors has determined that the registrant either:
(i) Has at least one audit committee financial expert serving on its audit committee; or
(ii) Does not have an audit committee financial expert serving on its audit committee.
The Registrant’s Board of Trustees has determined that the Registrant has at least one audit committee financial expert serving on its audit committee. The Securities and Exchange Commission has stated that the designation or identification of a person as an audit committee financial expert pursuant to this Item 3 of Form N-CSR does not impose on such person any duties, obligations or liabilities that are greater than the duties, obligations and liabilities imposed on such person as a member of the Audit Committee and the Board of Trustees in the absence of such designation or identification.
(2) If the registrant provides the disclosure required by paragraph (a)(1)(i) of this Item, it must disclose the name of the audit committee financial expert and whether that person is “independent.” In order to be considered “independent” for purposes of this Item, a member of an audit committee may not, other than in his or her capacity as a member of the audit committee, the board of directors, or any other board committee:
(i) Accept directly or indirectly any consulting, advisory, or other compensatory fee from the issuer; or
(ii) Be an “interested person” of the investment company as defined in Section 2(a)(19) of the Act (15 U.S.C. 80a-2(a)(19)).
The audit committee financial expert is John F. Finn. He is not an “interested person” of the Registrant and is also “independent” as defined by the U.S. Securities and Exchange Commission for purposes of audit committee financial expert determinations.
(3) If the registrant provides the disclosure required by paragraph (a)(1)(ii) of this Item, it must explain why it does not have an audit committee financial expert.
Not applicable.
Table of Contents
ITEM 4. PRINCIPAL ACCOUNTANT FEES AND SERVICES.
(a) Disclose, under the caption Audit Fees, the aggregate fees billed for each of the last two fiscal years for professional services rendered by the principal accountant for the audit of the registrant’s annual financial statements or services that are normally provided by the accountant in connection with statutory and regulatory filings or engagements for those fiscal years.
| AUDIT FEES | ||||
2012 – $37,500 | ||||
2011 – $37,400 |
(b) Disclose, under the caption Audit-Related Fees, the aggregate fees billed in each of the last two fiscal years for assurance and related services by the principal accountant that are reasonably related to the performance of the audit of the registrant’s financial statements and are not reported under paragraph (a) of this Item. Registrants shall describe the nature of the services comprising the fees disclosed under this category.
AUDIT-RELATED FEES
| 2012 – $18,730 | ||||
2011 – $18,730 |
Audit-related fees consists of semi-annual financial statement reviews and security count procedures performed as required under Rule 17f-2 of the Investment Company Act of 1940 during the Registrant’s fiscal year.
(c) Disclose, under the caption Tax Fees, the aggregate fees billed in each of the last two fiscal years for professional services rendered by the principal accountant for tax compliance, tax advice, and tax planning. Registrants shall describe the nature of the services comprising the fees disclosed under this category.
| TAX FEES | ||||
2012 – $8,650 | ||||
2011 – $8,650 |
The tax fees consist of fees billed in connection with preparing the federal regulated investment company income tax returns for the Registrant for the tax years ended October 31, 2012 and 2011, respectively.
For the last fiscal year, no tax fees were required to be approved pursuant to paragraph (c)(7)(ii) of Rule 2-01 of Regulation S-X.
(d) Disclose, under the caption All Other Fees, the aggregate fees billed in each of the last two fiscal years for products and services provided by the principal accountant, other than the services reported in paragraphs (a) through (c) of this Item. Registrants shall describe the nature of the services comprising the fees disclosed under this category.
ALL OTHER FEES
| 2012 – Not applicable | ||||
2011 – Not applicable |
(e) (1) Disclose the audit committee’s pre-approval policies and procedures described in paragraph (c)(7) of Rule 2-01 of Regulation S-X.
Pursuant to the Registrant’s Audit Committee Charter and written policies and procedures for the pre-approval of audit and non-audit services (the “Pre-approval Policy”), the Audit Committee pre-approves all audit and non-audit services performed by the Registrant’s independent public registered accounting firm for the Registrant. In addition, the Audit Committee pre-approves the auditor’s engagement for non-audit services with the Registrant’s investment adviser (not including a sub-adviser whose role is primarily portfolio management and is sub-contracted or overseen by another investment adviser) and any Service Affiliate in accordance with paragraph (c)(7)(ii) of Rule 2-01 of Regulation S-X, if the engagement relates directly to the operations and financial reporting of the Registrant. Proposed services may be pre-approved either 1) without consideration of specific case-by-case services or 2) require the specific pre-approval of the Audit Committee. Therefore, initially the Pre-approval Policy listed a number of audit and non-audit services that have been approved by the Audit Committee, or which were not subject to pre-approval under the transition provisions of Sarbanes-Oxley Act of 2002 (the “Pre-approval List”). The Audit Committee annually reviews and pre-approves the services included on the Pre-approval List that may be provided by the independent public registered accounting firm
Table of Contents
without obtaining additional specific pre-approval of individual services from the Audit Committee. The Audit Committee adds to, or subtracts from, the list of general pre-approved services from time to time, based on subsequent determinations. All other audit and non-audit services not on the Pre-approval List must be specifically pre-approved by the Audit Committee.
One or more members of the Audit Committee may be appointed as the Committee’s delegate for the purposes of considering whether to approve such services. Any pre-approvals granted by the delegate will be reported, for informational purposes only, to the Audit Committee at its next scheduled meeting. The Audit Committee’s responsibilities to pre-approve services performed by the independent public registered accounting firm are not delegated to management.
(2) Disclose the percentage of services described in each of paragraphs (b) through (d) of this Item that were approved by the audit committee pursuant to paragraph (c)(7)(i)(C) of Rule 2-01 of Regulation S-X.
| 2012 – 0.0% | ||||
2011 – 0.0% |
(f) If greater than 50 percent, disclose the percentage of hours expended on the principal accountant’s engagement to audit the registrant’s financial statements for the most recent fiscal year that were attributed to work performed by persons other than the principal accountant’s full-time, permanent employees.
None.
(g) Disclose the aggregate non-audit fees billed by the registrant’s accountant for services rendered to the registrant, and rendered to the registrant’s investment adviser (not including any sub-adviser whose role is primarily portfolio management and is subcontracted with or overseen by another investment adviser), and any entity controlling, controlled by, or under common control with the adviser that provides ongoing services to the registrant for each of the last two fiscal years of the registrant.
The aggregate non-audit fees billed by the independent registered public accounting firm for services rendered to the Registrant, and rendered to Service Affiliates, for the last two calendar year ends were:
| 2011 - $28.5 million | ||||
2010 - $32.0 million |
These amounts also include the aggregate non audit fees billed by the Independent Registered Public Accounting firm for services rendered to J.P. Morgan Chase & Co. (“JPMC”) and certain related entities.
(h) Disclose whether the registrant’s audit committee of the board of directors has considered whether the provision of non-audit services that were rendered to the registrant’s investment adviser (not including any subadviser whose role is primarily portfolio management and is subcontracted with or overseen by another investment adviser), and any entity controlling, controlled by, or under common control with the investment adviser that provides ongoing services to the registrant that were not pre-approved pursuant to paragraph (c)(7)(ii) of Rule 2-01 of Regulation S-X is compatible with maintaining the principal accountant’s independence.
The Registrant’s Audit Committee has considered whether the provision of the non-audit services that were rendered to Service Affiliates that were not pre-approved (not requiring pre-approval) is compatible with maintaining the independent public registered accounting firm’s independence. All services provided by the independent public registered accounting firm to the Registrant or to Service Affiliates that were required to be pre-approved were pre-approved as required.
ITEM 5. AUDIT COMMITTEE OF LISTED REGISTRANTS.
(a) If the registrant is a listed issuer as defined in Rule 10A-3 under the Exchange Act (17CFR 240.10A-3), state whether or not the registrant has a separately-designated standing audit committee established in accordance with Section 3(a)(58)(A) of the Exchange Act (15 U.S.C. 78c(a)(58)(A)). If the registrant has such a committee, however designated, identify each committee member. If the entire board of directors is acting as the registrant’s audit committee as specified in Section 3(a)(58)(B) of the Exchange Act (15 U.S.C. 78c(a)(58)(B)), so state.
(b) If applicable, provide the disclosure required by Rule 10A-3(d) under the Exchange Act (17CFR 240.10A-3(d)) regarding an exemption from the listing standards for all audit committees.
Table of Contents
Not applicable.
ITEM 6. SCHEDULE OF INVESTMENTS.
File Schedule I – Investments in securities of unaffiliated issuers as of the close of the reporting period as set forth in Section 210.12-12 of Regulation S-X, unless the schedule is included as part of the report to shareholders filed under Item 1 of this Form.
Included in Item 1.
ITEM 7. DISCLOSURE OF PROXY VOTING POLICIES AND PROCEDURES FOR CLOSED-END MANAGEMENT INVESTMENT COMPANIES.
A closed-end management investment company that is filing an annual report on this Form N-CSR must, unless it invests exclusively in non-voting securities, describe the policies and procedures that it uses to determine how to vote proxies relating to portfolio securities, including the procedures that the company uses when a vote presents a conflict between the interests of its shareholders, on the one hand, and those of the company’s investment adviser; principal underwriter; or any affiliated person (as defined in Section 2(a)(3) of the Investment Company Act of 1940 (15 U.S.C. 80a-2(a)(3)) and the rules thereunder) of the company, its investment adviser, or its principal underwriter, on the other. Include any policies and procedures of the company’s investment adviser, or any other third party, that the company uses, or that are used on the company’s behalf, to determine how to vote proxies relating to portfolio securities.
Not applicable.
ITEM 8. PORTFOLIO MANAGERS OF CLOSED-END MANAGEMENT INVESTMENT COMPANIES.
Not applicable.
ITEM 9. PURCHASE OF EQUITY SECURITIES BY CLOSED-END MANAGEMENT INVESTMENT COMPANY AND AFFILIATED PURCHASERS.
(a) If the registrant is a closed-end management investment company, provide the information specified in paragraph (b) of this Item with respect to any purchase made by or on behalf of the registrant or any “affiliated purchaser,” as defined in Rule 10b-18(a)(3) under the Exchange Act (17 CFR 240.10b-18(a)(3)), of shares or other units of any class of the registrant’s equity securities that is registered by the registrant pursuant to Section 12 of the Exchange Act (15 U.S.C. 781).
Not applicable.
ITEM 10. SUBMISSION OF MATTERS TO A VOTE OF SECURITY HOLDERS.
Describe any material changes to the procedures by which shareholders may recommend nominees to the registrant’s board of directors, where those changes were implemented after the registrant last provided disclosure in response to the requirements of Item 7(d)(2)(ii)(G) of Schedule 14A (17 CFR 240.14a-101), or this Item.
No material changes to report.
ITEM 11. CONTROLS AND PROCEDURES.
(a) Disclose the conclusions of the registrant’s principal executive and principal financial officers, or persons performing similar functions, regarding the effectiveness of the registrant’s disclosure controls and procedures (as defined in Rule 30a-3(c) under the Act (17 CFR 270.30a-3(c))) as of a date within 90 days of the filing date of the report that includes the disclosure required by this paragraph, based on the evaluation of these controls and procedures required by Rule 30a-3(b) under the Act (17 CFR 270.30a-3(b)) and Rules 13a-15(b) or 15d-15(b) under the Exchange Act (17 CFR 240.13a-15(b) or 240.15d-15(b)).
Table of Contents
The Registrant’s principal executive and principal financial officers have concluded, based on their evaluation of the Registrant’s disclosure controls and procedures as of a date within 90 days of the filing date of this report, that the Registrant’s disclosure controls and procedures are reasonably designed to ensure that information required to be disclosed by the Registrant on Form N-CSR is recorded, processed, summarized and reported within the required time periods and that information required to be disclosed by the Registrant in the reports that it files or submits on Form N-CSR is accumulated and communicated to the Registrant’s management, including its principal executive and principal financial officers, as appropriate to allow timely decisions regarding required disclosure.
(b) Disclose any change in the registrant’s internal control over financial reporting (as defined in Rule 30a-3(d) under the Act (17 CFR 270.30a-3(d)) that occurred during the registrant’s second fiscal quarter of the period covered by this report that has materially affected, or is reasonably likely to materially affect, the registrant’s internal control over financial reporting.
There were no changes in the Registrant’s internal control over financial reporting that occurred during the last fiscal quarter covered by this report that have materially affected, or are reasonably likely to materially affect, the Registrant’s internal control over financial reporting.
ITEM 12. EXHIBITS.
(a) File the exhibits listed below as part of this Form. Letter or number the exhibits in the sequence indicated.
(a)(1) Any code of ethics, or amendment thereto, that is the subject of the disclosure required by Item 2, to the extent that the registrant intends to satisfy the Item 2 requirements through filing of an exhibit.
Code of Ethics applicable to its Principal Executive and Principal Financial Officers pursuant to Section 406 of the Sarbanes-Oxley Act of 2002 attached hereto.
(a)(2) A separate certification for each principal executive officer and principal financial officer of the registrant as required by Rule 30a-2(a) under the Act (17 CFR 270.30a-2).
Certifications pursuant to Rule 30a-2(a) under the Investment Company Act of 1940 are attached hereto.
(a)(3) Any written solicitation to purchase securities under Rule 23c-1 under the Act (17 CFR 270.23c-1) sent or given during the period covered by the report by or on behalf of the registrant to 10 or more persons.
Not applicable.
(b) A separate or combined certification for each principal executive officer and principal officer of the registrant as required by Rule 30a-2(b) under the Act of 1940.
Certifications pursuant to Rule 30a-2(b) under the Investment Company Act of 1940 are attached hereto.
Table of Contents
SIGNATURES
Pursuant to the requirements of the Securities Exchange Act of 1934 and the Investment Company Act of 1940, the registrant has duly caused this report to be signed on its behalf by the undersigned, thereunto duly authorized.
JPMorgan Trust II
| By: | /s/ Patricia A. Maleski | |
| Patricia A. Maleski | ||
| President and Principal Executive Officer | ||
| January 7, 2013 |
Pursuant to the requirements of the Securities Exchange Act of 1934 and the Investment Company Act of 1940, this report has been signed below by the following persons on behalf of the registrant and in the capacities and on the dates indicated.
| By: | /s/ Patricia A. Maleski | |
| Patricia A. Maleski | ||
| President and Principal Executive Officer | ||
| January 7, 2013 | ||
| By: | /s/ Joy C. Dowd | |
| Joy C. Dowd | ||
| Treasurer and Principal Financial Officer | ||
| January 7, 2013 | ||