Table of Contents
UNITED STATES
SECURITIES AND EXCHANGE COMMISSION
Washington, D.C. 20549
FORM N-CSR
CERTIFIED SHAREHOLDER REPORT OF REGISTERED
MANAGEMENT INVESTMENT COMPANIES
Investment Company Act file number: 811-04236
| JPMorgan Trust II |
(Exact name of registrant as specified in charter)
270 Park Avenue New York, NY 10017 |
(Address of principal executive offices) (Zip code)
Frank J. Nasta 270 Park Avenue New York, NY 10017 |
(Name and Address of Agent for Service)
Registrant’s telephone number, including area code: (800) 480-4111
Date of fiscal year end: December 31
Date of reporting period: January 1, 2011 through December 31, 2011
Form N-CSR is to be used by management investment companies to file reports with the Commission not later than 10 days after the transmission to stockholders of any report that is required to be transmitted to stockholders under Rule 30e-1 under the Investment Company Act of 1940 (17 CFR 270.30e-1). The Commission may use the information provided on Form N-CSR in its regulatory, disclosure review, inspection, and policymaking roles.
A registrant is required to disclose the information specified by Form N-CSR, and the Commission will make this information public. A registrant is not required to respond to the collection of information contained in Form N-CSR unless the Form displays a currently valid Office of Management and Budget (“OMB”) control number. Please direct comments concerning the accuracy of the information collection burden estimate and any suggestions for reducing the burden to Secretary, Securities and Exchange Commission, 450 Fifth Street, NW, Washington, DC 20549-0609. The OMB has reviewed this collection of information under the clearance requirements of 44 U.S.C. Section 3507.
Table of Contents
ITEM 1. REPORTS TO STOCKHOLDERS.
The following is a copy of the report transmitted to shareholders pursuant to Rule 30e-1 under the Investment Company Act of 1940 (17 CFR 270.30e-1).
Table of Contents
Annual Report
J.P. Morgan Specialty Funds
December 31, 2011
Security Capital U.S. Core Real Estate Securities Fund
JPMorgan U.S. Real Estate Fund

Table of Contents
| CEO’s Letter | 1 | |||
Fund Commentaries: | ||||
| 2 | ||||
| 5 | ||||
| Schedules of Portfolio Investments | 8 | |||
| Financial Statements | 12 | |||
| Financial Highlights | 18 | |||
| Notes to Financial Statements | 22 | |||
| Report of Independent Registered Public Accounting Firm | 28 | |||
| Trustees | 29 | |||
| Officers | 31 | |||
| Schedule of Shareholder Expenses | 32 | |||
| Board Approval of Investment Advisory Agreements | 34 | |||
| Tax Letter | 39 | |||
Privacy Policy — Located at the back of this Annual Report | ||||
Investments in a Fund are not bank deposits or obligations of, or guaranteed or endorsed by, any bank and are not insured or guaranteed by the FDIC, the Federal Reserve Board or any other government agency. You could lose money if you sell when the Fund’s share price is lower than when you invested.
Past performance is no guarantee of future performance. The general market views expressed in this report are opinions based on conditions through the end of the reporting period and are subject to change without notice based on market and other conditions. These views are not intended to predict the future performance of a Fund or the securities markets. References to specific securities and their issuers are for illustrative purposes only and are not intended to be, and should not be interpreted as, recommendations to purchase or sell such securities. Such views are not meant as investment advice and may not be relied on as an indication of trading intent on behalf of any Fund.
Prospective investors should refer to the Funds’ prospectus for a discussion of the Funds’ investment objectives, strategies and risks. Call J.P. Morgan Funds Service Center at 1-800-480-4111 for a prospectus containing more complete information about a Fund including management fees and other expenses. Please read it carefully before investing.
Table of Contents
JANUARY 25, 2012 (Unaudited)
Dear Shareholder:
Investors greeted 2011 in much the same way they welcomed 2010: with high hopes that an improving U.S. economy would finally get us back on course to recovery.
This optimism quickly faded as the European debt crisis and a host of other economic and geopolitical concerns cast a dark shadow on the prospects for future growth. The combination of weak global economic data, credit downgrades in the U.S. and in Europe, and escalating fears of contagion all resulted in a level of market volatility not seen since the financial crisis three years ago.
 |
“Investors greeted 2011 in much the same way they welcomed 2010: With high hopes that an improving U.S. economy would finally get us back on course to recovery.” |
Nonetheless, stocks have regained some of their footing, as positive fourth-quarter economic data on auto sales, payroll employment and manufacturing activity all appear to indicate that consumer confidence is improving and economic growth may be accelerating.
We remain cautious, however, since many of the same challenges that we experienced in 2011 — European debt concerns, uncertainty over monetary and fiscal stimulus, and soft economic data — will likely remain in place this year, laying the groundwork for continued market volatility.
Strong fourth quarter surge caps volatile year
The European debt crisis and other geopolitical and economic events created a generally volatile year for equities, culminating in major sell off in the third quarter. A strong fourth quarter comeback did little to reverse the losses, as the Standard & Poor’s 500 Index (“S&P 500 Index”) ended the year with only slight gains. As of December 31, 2011, the Index had reached a level of 1,258, an increase of 2.1% from one year prior.
Large cap growth stocks lead style categories
Large cap stocks outpaced mid- and small-cap stocks over the 12-month period ended December 31, 2011 (the Russell 1000 Index returned 1.5% and the Russell Mid Cap Index returned -1.6%, compared to a return of -4.2% for the Russell 2000 Index). Overall, large-cap growth stocks fared better than large-cap value stocks as the Russell 1000 Growth Index returned 2.6% for the 12-month reporting period, compared to 0.4% for the Russell 1000 Value Index.
Euro zone uncertainty drives flight-to-quality sentiment
Investors’ lack of confidence in global economic growth prompted them to seek safe havens in U.S. Treasury securities, and high-quality corporate bonds. The Barclays Capital U.S. Aggregate Bond Index returned 7.8%. High yield bonds and emerging market debt securities also performed well, as the Barclays Capital High Yield Index returned 5.0%, and the Barclays Capital Emerging Markets Index returned 7.0% for the 12-month period ended December 31, 2011.
Similar economic concerns pushed yields of U.S. Treasury securities maturing in 10 years or more to historic lows throughout the year. As of the end of the 12-month period ended December 31, 2011, the yields on the benchmark 10-year U.S. Treasury bond dropped from 3.3% to 1.9%. In addition, yields on the 30-year U.S. Treasury bond declined from 4.3% to 2.9%, as did the two-year U.S. Treasury note, from 0.6% to 0.3%.
Lesson for 2012: Keep balance in mind in economic uncertainty
Last year offered its share of shocks to investors: geopolitical upheaval, natural disasters, sovereign-debt crises, and credit-rating downgrades were all among the events competing for the market’s attention. Against the backdrop of an election year, it’s likely that we will face continued global surprises — both on the upside and the downside.
As you reassess your investment strategy for the year ahead, it’s important to stick with a plan that focuses on diversification as well as long-term allocation. Trying to “time” market fluctuations can be risky business, especially given the ongoing uncertainty surrounding the direction of economic growth and the euro zone crisis in the months ahead.
On behalf of everyone at J.P. Morgan Asset Management, thank you for your continued confidence. We look forward to managing your investment needs for years to come. Should you have any questions, please visit www.jpmorganfunds.com or contact the J.P. Morgan Funds Service Center at 1-800-480-4111.
Sincerely yours,

George C.W. Gatch
CEO-Investment Management Americas
J.P. Morgan Asset Management
| DECEMBER 31, 2011 | J.P. MORGAN SPECIALTY FUNDS | 1 | ||||||
Table of Contents
Security Capital U.S. Core Real Estate Securities Fund
FUND COMMENTARY
FOR THE PERIOD AUGUST 31, 2011 (Fund inception date) through DECEMBER 31, 2011 (Unaudited)
| REPORTING PERIOD RETURN: | ||||
| Fund (Select Class Shares)* | 0.97% | |||
| Wilshire US Real Estate Securities Index | 2.45% | |||
| Barclays Capital Investment Grade REIT Index | 2.46% | |||
| U.S. Core Real Estate Securities Composite Benchmark | 2.91% | |||
| Net Assets as of 12/31/2011 (In Thousands) | $9,948 | |||
INVESTMENT OBJECTIVE**
The Security Capital U.S. Core Real Estate Securities Fund (the “Fund”) seeks a risk-adjusted total return over the long-term by investing primarily in real estate securities.
HOW DID THE MARKET PERFORM?
Real estate investment trust (“REIT”) common stocks rebounded strongly in the fourth quarter to end 2011 with attractive total returns amidst highly volatile equity markets buffeted by continued signs of stress in U.S. and global economies and the ongoing potential for contagion associated with a crisis in European financial markets. Returns for REIT senior fixed income securities were strong in 2011 aided, among other things, by a historic swoon in U.S. Treasury yields.
There were distinctive performance differences by property type for common equity investors during 2011, with the underlying themes and influences reflecting company-specific factors, earlier performance differentials as well as shifting investor expectations colored by macro-economic trends. But there was an alternative underlying reality driving company performance during the year that appeared to transcend property type. For much of 2011, REIT stock performance highlighted a bifurcated world of haves and have-nots, generally favoring larger capitalization REITs with high-quality infill (supply constrained) or gateway market portfolios and flexible balance sheets. This mirrored asset-level valuation trends in the larger private-direct market, and is consistent with the broader financial market’s perspective on risk in a year where a 30-year U.S. Treasury Bond generated a 34% total return to investors.
By major property type, self-storage, mall and multifamily companies were the relative outperformers during the reporting period, while the lodging, industrial and shopping center companies lagged.
WHAT WERE THE MAIN DRIVERS OF THE FUND’S PERFORMANCE?
This was the initial reporting period for the Fund based on an inception date of August 31, 2011, and considers the fractional period from inception through December 31, 2011. As the Fund invests in equity and fixed income securities, its performance is compared to multiple benchmarks, including broad-based equity and fixed income benchmarks as well as a blended composite benchmark.
While the Fund (Select Shares) posted a positive total return for the reporting period, it underperformed each of its multiple benchmarks. This underperformance reflected the selection and weightings of securities within the common equity portion of the Fund. In particular, the Fund responded to market momentum driving valuations among the highest quality REITs by introducing select investments where the Fund’s portfolio managers’ research highlighted value that they believed was overlooked by the market. The Fund’s portfolio managers believe that, as is often the case, these value investments take some time to season and bear fruit. Among the fixed income investments, the Fund successfully offset the drag on performance from a defensive shorter maturity stance among bonds with strong performance from its perpetual preferred investments.
HOW WAS THE FUND POSITIONED?
The Fund’s portfolio managers utilize a bottom-up process to inform both security selection and security type (common equity, preferred equity or debt). They rely on proprietary cash flow models, extensive field work and internal real estate market research to target attractive long-term investment opportunities, emphasizing quality real estate portfolios, flexible balance sheets and transparent business models.
| 2 | J.P. MORGAN SPECIALTY FUNDS | DECEMBER 31, 2011 | ||||
Table of Contents
| TOP TEN HOLDINGS OF THE PORTFOLIO*** | ||||||||
| 1. | Simon Property Group, Inc. | 5.2 | % | |||||
| 2. | Equity Residential | 4.2 | ||||||
| 3. | ProLogis, Inc. | 3.8 | ||||||
| 4. | HCP, Inc. | 3.8 | ||||||
| 5. | Ventas, Inc. | 3.4 | ||||||
| 6. | Rouse Co. LP / TRC Co-Issuer, Inc., 6.750%, 05/01/13 | 3.1 | ||||||
| 7. | General Growth Properties, Inc. | 3.1 | ||||||
| 8. | CubeSmart, Series A, 7.750%, 11/02/16 | 2.9 | ||||||
| 9. | SL Green Realty Corp. | 2.9 | ||||||
| 10. | Ashford Hospitality Trust, Inc., Series D, 8.450%, 07/18/12 | 2.8 | ||||||
PORTFOLIO COMPOSITION BY SECTOR*** | ||||
| Common Stocks | 60.7 | % | ||
| Preferred Stocks | 19.7 | |||
| Corporate Bonds | 12.9 | |||
| Convertible Bonds | 2.3 | |||
| Short-Term Investment | 4.4 | |||
| * | The return shown is based on net asset value calculated for shareholder transactions and may differ from the return shown in the financial highlights, which reflects adjustments made to the net asset value in accordance with accounting principles generally accepted in the United States of America. |
| ** | The advisor seeks to achieve the Fund’s objective. There can be no guarantee it will be achieved. |
| *** | Percentages indicated are based upon total investments as of December 31, 2011. The Fund’s composition is subject to change. |
GEOGRAPHIC DIVERSIFICATION | ||||||||
Security Capital Real Estate | NCREIF (b) | |||||||
East | 36.6 | % | 32.9 | % | ||||
Northeast | 22.8 | 19.0 | % | |||||
Mideast | 13.8 | 13.9 | % | |||||
West | 25.4 | % | 34.6 | % | ||||
Pacific | 18.2 | 28.8 | % | |||||
Mountain | 7.2 | 5.8 | % | |||||
South | 21.4 | % | 22.0 | % | ||||
Southeast | 14.2 | 11.6 | % | |||||
Southwest | 7.2 | 10.4 | % | |||||
Midwest | 11.8 | % | 10.5 | % | ||||
East North Central | 7.5 | 8.6 | % | |||||
West North Central | 4.3 | 1.9 | % | |||||
Non-U.S. | 4.8 | % | 0.0 | % | ||||
| (a) | Percentages indicated are based upon total investments as of December 31, 2011. The Fund’s composition is subject to change. |
| (b) | Reflects the industry average of institutions belonging to the National Council of Real Estate Investment Fiduciaries. |
| DECEMBER 31, 2011 | J.P. MORGAN SPECIALTY FUNDS | 3 | ||||||
Table of Contents
Security Capital U.S. Core Real Estate Securities Fund
FUND COMMENTARY
FOR THE PERIOD AUGUST 31, 2011 (Fund Inception Date) through DECEMBER 31, 2011 (Unaudited) (continued)
TOTAL RETURNS AS OF DECEMBER 31, 2011 | ||||||||
| INCEPTION DATE OF CLASS | SINCE INCEPTION*** | |||||||
CLASS A SHARES | 8/31/11 | |||||||
Without Sales Charge | 0.83 | % | ||||||
With Sales Charge* | (4.46 | ) | ||||||
CLASS C SHARES | 8/31/11 | |||||||
Without CDSC | 0.69 | |||||||
With CDSC** | (0.31 | ) | ||||||
CLASS R5 SHARES | 8/31/11 | 1.01 | ||||||
CLASS R6 SHARES | 8/31/11 | 1.02 | ||||||
SELECT CLASS SHARES | 8/31/11 | 0.97 | ||||||
| * | Sales Charge for Class A Shares is 5.25%. |
| ** | Assumes a 1% CDSC (contingent deferred sales charge) for the one year period and 0% CDSC thereafter. |
| *** | Not annualized. |
TEN YEAR PERFORMANCE (8/31/11 TO 12/31/11)
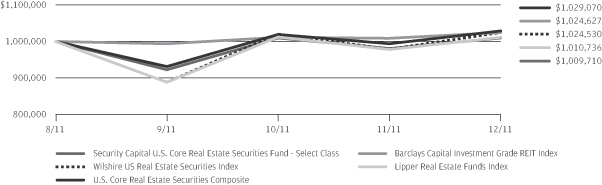
Source: Lipper, Inc. The performance quoted is past performance and is not a guarantee of future results. Mutual funds are subject to certain market risks. Investment returns and principal value of an investment will fluctuate so that an investor’s shares, when redeemed, may be worth more or less than their original cost. Current performance may be higher or lower than the performance data shown. For up-to-date month-end performance information please call 1-800-480-4111.
The Fund commenced operations on August 31, 2011.
The graph illustrates comparative performance for $1,000,000 invested in Select Class Shares of the Security Capital U.S. Core Real Estate Securities Fund, the Wilshire US Real Estate Securities Index, Barclays Capital Investment Grade REIT Index, U.S. Core Real Estate Securities Composite and the Lipper Real Estate Funds Index from August 31, 2011 to December 31, 2011. The performance of the Fund assumes reinvestment of all dividends and capital gains, if any, and does not include a sales charge. The performance of the indices does not reflect the deduction of expenses or a sales charge associated with a mutual fund and has been adjusted to reflect reinvestment of all dividends and capital gains of the securities included in the benchmark. The performance of the Lipper Real Estate Funds Index includes expenses associated with a mutual fund, such as investment management fees. These expenses are not identical to the expenses charged by the Fund. The Wilshire US Real Estate Securities Index is an unmanaged, broad based, float weighted index comprised of publicly traded REITs and real estate operating companies, not including special purpose REITs. It is comprised of major companies engaged in the equity owner-
ship and operation of commercial real estate. The Barclays Capital Investment Grade REIT Index includes publicly issued U.S. corporate and secured notes that meet specified maturity, liquidity, and quality requirements. To qualify, bonds must be SEC-registered or 144A securities with registration rights. The Barclays Capital Investment Grade REIT Index only includes the portion of the Barclays Capital U.S. Corporate Index deemed to be a Real Estate Investment Trust. The U.S. Core Real Estate Securities Composite Benchmark is a composite benchmark comprised of unmanaged indexes that includes 60% Wilshire US Real Estate Securities Index, 10% Wells Fargo Hybrid and Preferred Securities REIT Index and 30% Barclays Capital Investment Grade REIT Index. The Lipper Real Estate Funds Index represents the total returns of the funds in the indicated category as defined by Lipper, Inc. Investors cannot invest directly in an index.
Select Class Shares have a $1,000,000 minimum initial investment and carry no sales charge.
Performance may reflect the waiver of the Fund’s fees and reimbursement of expenses for certain periods since the inception date. Without these waivers and reimbursements performance would have been lower. Also, performance shown in this section does not reflect the deduction of taxes that a shareholder would pay on Fund distributions or redemptions of Fund shares.
The returns shown are based on net asset values calculated for shareholder transactions and may differ from the returns shown in the financial highlights, which reflect adjustments made to the net asset values in accordance with accounting principles generally accepted in the United States of America.
| 4 | J.P. MORGAN SPECIALTY FUNDS | DECEMBER 31, 2011 | ||||
Table of Contents
JPMorgan U.S. Real Estate Fund
FUND COMMENTARY
TWELVE MONTHS ENDED DECEMBER 31, 2011 (Unaudited)
| REPORTING PERIOD RETURN: | ||||
| Fund (Class A Shares, without a sales charge)* | 6.02% | |||
| Wilshire US Real Estate Securities Index | 8.56% | |||
| Net Assets as of 12/31/2011 (In Thousands) | $ | 1,410,918 | ||
INVESTMENT OBJECTIVE**
The JPMorgan U.S. Real Estate Fund (the “Fund”) seeks a high level of current income and long-term capital appreciation primarily through investments in real estate securities.
HOW DID THE MARKET PERFORM?
Real estate investment trust (REIT) common stocks rebounded strongly in the fourth quarter to end 2011 with attractive total returns amidst highly volatile equity markets buffeted by continued signs of stress in U.S. and global economies and the ongoing potential for contagion associated with a crisis in European financial markets.
There were distinctive performance differences by property type for common equity investors during 2011, with the underlying themes and influences reflecting company-specific factors, earlier performance differentials as well as shifting investor expectations colored by macro-economic trends. But there was an alternative underlying reality driving company performance during the year that appeared to transcend property type. For much of 2011, REIT stock performance highlighted a bifurcated world of haves and have-nots, generally favoring larger capitalization REITs with high-quality infill (supply constrained) or gateway market portfolios and flexible balance sheets. This mirrored asset-level valuation trends in the larger private-direct market, and is consistent with the broader financial market’s perspective on risk in a year where a 30-year U.S. Treasury Bond generated a 34% total return to investors.
By major property type, self-storage, mall and multifamily companies were the relative outperformers during the reporting period, while lodging, industrial and shopping center companies lagged.
WHAT WERE THE MAIN DRIVERS OF THE FUND’S PERFORMANCE?
The Fund’s overall level of return was driven by investors’ continued interest in real estate investments as a source of attractive current income. While the Fund (Class A Shares, without a sales charge) posted an attractive absolute return, it underperformed the Wilshire US Real Estate Securities Index during the reporting period.
The Fund’s underperformance was driven by stock selection and weighting among its office investments, with a notable investment in Commonwealth REIT (CWH). While the Fund’s portfolio managers’ research and investments highlighted value in suburban office companies, including Commonwealth, the stock market favored larger capitalization office companies with portfolios located in high-quality infill markets.
Among the Fund’s largest individual contributor to relative performance was its underweight position in the underperforming shopping center companies sector, although the Fund’s targeted investment in Federal Realty Investment Trust (FRT) contributed to relative performance. Among shopping center companies, investors preferred higher quality REITs due to concerns about the margins and health of retailers as well as shifting formats and business models. This preference benefited FRT, which is generally viewed by investors as owning a higher quality niche real estate portfolio, with properties located in markets that have strong demographics, such as population density and income levels.
HOW WAS THE FUND POSITIONED?
The Fund’s portfolio managers utilize a bottom-up process to inform security selection. They rely on proprietary cash flow models, extensive field work and internal real estate market research to target attractive long-term investment opportunities, emphasizing quality real estate portfolios, flexible balance sheets and transparent business models.
| DECEMBER 31, 2011 | J.P. MORGAN SPECIALTY FUNDS | 5 | ||||||
Table of Contents
JPMorgan U.S. Real Estate Fund
FUND COMMENTARY
TWELVE MONTHS ENDED DECEMBER 31, 2011 (Unaudited) (continued)
| TOP TEN EQUITY HOLDINGS OF THE PORTFOLIO*** | ||||||||
| 1. | Equity Residential | 8.4 | % | |||||
| 2. | HCP, Inc. | 7.7 | ||||||
| 3. | Simon Property Group, Inc. | 7.5 | ||||||
| 4. | ProLogis, Inc. | 6.6 | ||||||
| 5. | AvalonBay Communities, Inc. | 5.7 | ||||||
| 6. | Ventas, Inc. | 5.4 | ||||||
| 7. | General Growth Properties, Inc. | 5.3 | ||||||
| 8. | Host Hotels & Resorts, Inc. | 4.4 | ||||||
| 9. | Apartment Investment & Management Co., Class A | 4.4 | ||||||
| 10. | Boston Properties, Inc. | 4.0 | ||||||
PORTFOLIO COMPOSITION BY SECTOR*** | ||||
| Common Stocks | 98.9 | % | ||
| Short-Term Investment | 1.1 | |||
| * | The return shown is based on net asset value calculated for shareholder transactions and may differ from the return shown in the financial highlights, which reflects adjustments made to the net asset value in accordance with accounting principles generally accepted in the United States of America. |
| ** | The advisor seeks to achieve the Fund’s objective. There can be no guarantee it will be achieved. |
| *** | Percentages indicated are based upon total investments as of December 31, 2011. The Fund’s composition is subject to change. |
GEOGRAPHIC DIVERSIFICATION | ||||||||
| JPMorgan U.S. Real Estate Fund (a) | NCREIF (b) | |||||||
East | 36.9 | % | 32.9 | % | ||||
Northeast | 24.4 | 19.0 | % | |||||
Mideast | 12.5 | 13.9 | % | |||||
West | 30.7 | % | 34.6 | % | ||||
Pacific | 22.4 | 28.8 | % | |||||
Mountain | 8.3 | 5.8 | % | |||||
South | 20.2 | % | 22.0 | % | ||||
Southeast | 12.7 | 11.6 | % | |||||
Southwest | 7.5 | 10.4 | % | |||||
Midwest | 8.3 | % | 10.5 | % | ||||
East North Central | 6.1 | 8.6 | % | |||||
West North Central | 2.2 | 1.9 | % | |||||
Non-U.S. | 3.9 | % | 0.0 | % | ||||
| (a) | Percentages indicated are based upon total investments as of December 31, 2011. The Fund’s composition is subject to change. |
| (b) | Reflects the industry average of institutions belonging to the National Council of Real Estate Investment Fiduciaries. |
| 6 | J.P. MORGAN SPECIALTY FUNDS | DECEMBER 31, 2011 | ||||
Table of Contents
AVERAGE ANNUAL TOTAL RETURNS AS OF DECEMBER 31, 2011 | ||||||||||||||||
| INCEPTION DATE OF CLASS | 1 YEAR | 5 YEAR | 10 YEAR | |||||||||||||
CLASS A SHARES | 4/23/97 | |||||||||||||||
Without Sales Charge | 6.02 | % | (3.06 | )% | 9.52 | % | ||||||||||
With Sales Charge* | 0.46 | (4.10 | ) | 8.94 | ||||||||||||
CLASS C SHARES | 2/19/05 | |||||||||||||||
Without CDSC | 5.50 | (3.54 | ) | 9.15 | ||||||||||||
With CDSC** | 4.50 | (3.54 | ) | 9.15 | ||||||||||||
CLASS R2 SHARES | 11/3/08 | 5.81 | (3.21 | ) | 9.44 | |||||||||||
CLASS R5 SHARES | 5/15/06 | 6.46 | (2.63 | ) | 9.84 | |||||||||||
SELECT CLASS SHARES | 1/19/05 | 6.27 | (2.81 | ) | 9.71 | |||||||||||
| * | Sales Charge for Class A Shares is 5.25%. |
| ** | Assumes a 1% CDSC (contingent deferred sales charge) for the one year period and 0% CDSC thereafter. |
TEN YEAR PERFORMANCE (12/31/01 TO 12/31/11)
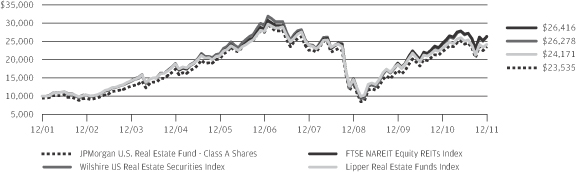
Source: Lipper, Inc. The performance quoted is past performance and is not a guarantee of future results. Mutual funds are subject to certain market risks. Investment returns and principal value of an investment will fluctuate so that an investor’s shares, when redeemed, may be worth more or less than their original cost. Current performance may be higher or lower than the performance data shown. For up-to-date month-end performance information please call 1-800-480-4111.
Returns for the Select Class Shares prior to their inception are based on the performance of the Class A Shares. The actual returns of Select Class Shares would have been different than shown because Select Class Shares have different expenses than Class A Shares.
Returns for the Class C Shares prior to their inception are based on the performance of the Class A Shares. The actual returns of Class C Shares would have been lower than shown because Class C Shares have higher expenses than Class A Shares.
Returns for the Class R5 Shares prior to their inception are based on the performance of the Select Class Shares. The actual returns of Class R5 Shares would have been different than shown because Class R5 Shares have different expenses than Select Class Shares.
Returns for the Class R2 Shares prior to their inception are based on the performance of the Class A Shares. The actual returns of Class R2 Shares would have been lower than shown because Class R2 Shares have higher expenses than Class A Shares.
The graph illustrates comparative performance for $10,000 invested in Class A Shares of the JPMorgan U.S. Real Estate Fund, the Wilshire US Real Estate Securities Index, the FTSE NAREIT Equity REITs Index and the Lipper Real Estate Funds Index from December 31, 2001 to December 31, 2011. The performance of
the Fund assumes reinvestment of all dividends and capital gains, if any, and includes a sales charge. The performance of the indices does not reflect the deduction of expenses or a sales charge associated with a mutual fund and has been adjusted to reflect reinvestment of all dividends and capital gains of the securities included in the benchmark. The performance of the Lipper Real Estate Funds Index includes expenses associated with a mutual fund, such as investment management fees. These expenses are not identical to the expenses charged by the Fund. The Wilshire US Real Estate Securities Index is an unmanaged, broad based, float weighted index comprised of publicly traded REITs and real estate operating companies, not including special purpose REITs. It is comprised of major companies in the companies engaged in the equity ownership and operation of commercial real estate. The FTSE NAREIT Equity REITs Index is a free float adjusted market capitalization weighted index that includes all tax qualified REITs listed in the NYSE, AMEX, and NASDAQ National Market. The Lipper Real Estate Funds Index represents the total returns of the funds in the indicated category as defined by Lipper, Inc. Investors cannot invest directly in an index.
Class A Shares have a $1,000 minimum initial investment and carry a 5.25% sales charge.
Performance may reflect the waiver of the Fund’s fees and reimbursement of expenses for certain periods since the inception date. Without these waivers and reimbursements performance would have been lower. Also, performance shown in this section does not reflect the deduction of taxes that a shareholder would pay on Fund distributions or redemptions of Fund shares.
The returns shown are based on net asset values calculated for shareholder transactions and may differ from the returns shown in the financial highlights, which reflect adjustments made to the net asset values in accordance with accounting principles generally accepted in the United States of America.
| DECEMBER 31, 2011 | J.P. MORGAN SPECIALTY FUNDS | 7 | ||||||
Table of Contents
Security Capital U.S. Core Real Estate Securities Fund
SCHEDULE OF PORTFOLIO INVESTMENTS
AS OF DECEMBER 31, 2011
(Amounts in thousands)
| SHARES | SECURITY DESCRIPTION | VALUE($) | ||||||
| Common Stocks — 59.7% | |||||||
Diversified — 2.7% |
| |||||||
| 6 | Colonial Properties Trust | 125 | ||||||
| 2 | Vornado Realty Trust | 148 | ||||||
|
| |||||||
| 273 | ||||||||
|
| |||||||
Health Care — 8.8% |
| |||||||
| 9 | HCP, Inc. | 374 | ||||||
| 3 | Health Care REIT, Inc. | 175 | ||||||
| 6 | Ventas, Inc. | 331 | ||||||
|
| |||||||
| 880 | ||||||||
|
| |||||||
Hotels — 3.5% |
| |||||||
| 15 | Host Hotels & Resorts, Inc. | 218 | ||||||
| 3 | Hyatt Hotels Corp., Class A (a) | 131 | ||||||
|
| |||||||
| 349 | ||||||||
|
| |||||||
Industrial — 3.8% |
| |||||||
| 13 | ProLogis, Inc. | 375 | ||||||
|
| |||||||
Multifamily — 11.2% |
| |||||||
| 7 | Apartment Investment & Management Co., Class A | 167 | ||||||
| 2 | AvalonBay Communities, Inc. | 201 | ||||||
| 2 | BRE Properties, Inc. | 114 | ||||||
| 2 | Camden Property Trust | 96 | ||||||
| 7 | Equity Residential | 413 | ||||||
| 5 | UDR, Inc. | 119 | ||||||
|
| |||||||
| 1,110 | ||||||||
|
| |||||||
Office — 12.7% |
| |||||||
| 6 | BioMed Realty Trust, Inc. | 112 | ||||||
| 2 | Boston Properties, Inc. | 191 | ||||||
| 13 | Brandywine Realty Trust | 119 | ||||||
| 6 | CommonWealth REIT | 100 | ||||||
| 6 | Corporate Office Properties Trust | 133 | ||||||
| 6 | Mack-Cali Realty Corp. | 160 | ||||||
| 10 | Piedmont Office Realty Trust, Inc., Class A | 169 | ||||||
| 4 | SL Green Realty Corp. | 282 | ||||||
|
| |||||||
| 1,266 | ||||||||
|
| |||||||
Regional Malls — 9.8% |
| |||||||
| 20 | General Growth Properties, Inc. | 300 | ||||||
| 3 | Macerich Co. (The) | 170 | ||||||
| 4 | Simon Property Group, Inc. | 507 | ||||||
|
| |||||||
| 977 | ||||||||
|
| |||||||
Shopping Centers — 3.4% |
| |||||||
| 1 | Federal Realty Investment Trust | 113 | ||||||
| SHARES | SECURITY DESCRIPTION | VALUE($) | ||||||
Shopping Centers — Continued |
| |||||||
| 7 | Kimco Realty Corp. | 117 | ||||||
| 3 | Regency Centers Corp. | 105 | ||||||
|
| |||||||
| 335 | ||||||||
|
| |||||||
Storage — 3.8% |
| |||||||
| 7 | Extra Space Storage, Inc. | 171 | ||||||
| 2 | Public Storage | 206 | ||||||
|
| |||||||
| 377 | ||||||||
|
| |||||||
Total Common Stocks | 5,942 | |||||||
|
| |||||||
| PRINCIPAL AMOUNT($) | ||||||||
| Convertible Bond — 2.3% | |||||||
Financials — 2.3% |
| |||||||
Office — 2.3% |
| |||||||
| 249 | Corporate Office Properties LP, 4.250%, | 229 | ||||||
|
| |||||||
| Corporate Bonds — 12.7% | |||||||
Financials — 12.7% |
| |||||||
Health Care — 1.4% |
| |||||||
| 58 | Health Care REIT, Inc., 6.200%, 06/01/16 | 62 | ||||||
| 80 | Senior Housing Properties Trust, 4.300%, 01/15/16 | 79 | ||||||
|
| |||||||
| 141 | ||||||||
|
| |||||||
Industrial — 1.4% |
| |||||||
ProLogis LP, | ||||||||
| 78 | 4.500%, 08/15/17 | 78 | ||||||
| 60 | 6.625%, 05/15/18 | 65 | ||||||
|
| |||||||
| 143 | ||||||||
|
| |||||||
Office — 3.1% |
| |||||||
CommonWealth REIT, | ||||||||
| 100 | 6.250%, 08/15/16 | 106 | ||||||
| 100 | 6.500%, 01/15/13 | 101 | ||||||
| 100 | Reckson Operating Partnership LP, 6.000%, 03/31/16 | 104 | ||||||
|
| |||||||
| 311 | ||||||||
|
| |||||||
Diversified — 0.8% |
| |||||||
| 71 | Colonial Realty LP, 6.250%, 06/15/14 | 74 | ||||||
|
| |||||||
Regional Malls — 3.1% |
| |||||||
| 300 | Rouse Co. LP/TRC Co-Issuer, Inc., 6.750%, 05/01/13 (e) | 302 | ||||||
|
| |||||||
SEE NOTES TO FINANCIAL STATEMENTS.
| 8 | J.P. MORGAN SPECIALTY FUNDS | DECEMBER 31, 2011 | ||||
Table of Contents
| PRINCIPAL AMOUNT($) | SECURITY DESCRIPTION | VALUE($) | ||||||
| Corporate Bonds — Continued | |||||||
Shopping Centers — 2.9% |
| |||||||
| 200 | DDR Corp., 7.500%, 04/01/17 | 216 | ||||||
| 70 | Equity One, Inc., 6.000%, 09/15/16 | 73 | ||||||
|
| |||||||
| 289 | ||||||||
|
| |||||||
Total Corporate Bonds | 1,260 | |||||||
|
| |||||||
| SHARES | ||||||||
| Preferred Stocks ($25 par value) — 19.3% | |||||||
Financials — 19.3% |
| |||||||
Hotels — 4.7% |
| |||||||
| 12 | Ashford Hospitality Trust, Inc., Series D, 8.450%, 07/18/12 (x) | 269 | ||||||
| 9 | Sunstone Hotel Investors, Inc., Series D, 8.000%, 04/06/16 (x) | 195 | ||||||
|
| |||||||
| 464 | ||||||||
|
| |||||||
Multifamily — 1.6% |
| |||||||
| 4 | Apartment Investment & Management Co., Series U, 7.750%, 02/03/12 (x) | 100 | ||||||
| 3 | Equity Lifestyle Properties, Inc., Series A, 8.034%, 02/03/12 (x) | 63 | ||||||
|
| |||||||
| 163 | ||||||||
|
| |||||||
Office — 6.2% |
| |||||||
| 4 | Corporate Office Properties Trust, Series G, 8.000%, 02/03/12 (x) | 104 | ||||||
| 3 | Hudson Pacific Properties, Inc., Series B, 8.375%, 12/10/15 (x) | 84 | ||||||
| 3 | Kilroy Realty Corp., Series E, 7.800%, 02/03/12 (x) | 64 | ||||||
| 7 | Parkway Properties, Inc., Series D, 8.000%, 02/03/12 (x) | 160 | ||||||
| SHARES | SECURITY DESCRIPTION | VALUE($) | ||||||
Office — Continued |
| |||||||
| 3 | SL Green Realty Corp., Series C, 7.625%, 02/03/12 (x) | 62 | ||||||
| 6 | SL Green Realty Corp., Series D, 7.875%, 02/03/12 (x) | 145 | ||||||
|
| |||||||
| 619 | ||||||||
|
| |||||||
Regional Malls — 3.9% | ||||||||
| 8 | CBL & Associates Properties, Inc., Series C, 7.750%, 02/03/12 (x) | 198 | ||||||
| 8 | Glimcher Realty Trust, Series G, 8.125%, 02/03/12 (x) | 191 | ||||||
|
| |||||||
| 389 | ||||||||
|
| |||||||
Storage — 2.9% |
| |||||||
| 12 | CubeSmart, Series A, 7.750%, 11/02/16 (x) | 288 | ||||||
|
| |||||||
Total Preferred Stocks | 1,923 | |||||||
|
| |||||||
| Short-Term Investment — 4.4% | |||||||
Investment Company — 4.4% |
| |||||||
| 435 | JPMorgan Prime Money Market Fund, Institutional Class Shares, 0.090% (b) (l) | 435 | ||||||
|
| |||||||
Total Investments — 98.4% | 9,789 | |||||||
Other Assets in Excess of | 159 | |||||||
|
| |||||||
NET ASSETS — 100.0% | $ | 9,948 | ||||||
|
| |||||||
Percentages indicated are based on net assets.
SEE NOTES TO FINANCIAL STATEMENTS.
| DECEMBER 31, 2011 | J.P. MORGAN SPECIALTY FUNDS | 9 | ||||||
Table of Contents
JPMorgan U.S. Real Estate Fund
SCHEDULE OF PORTFOLIO INVESTMENTS
AS OF DECEMBER 31, 2011
(Amounts in thousands)
| SHARES | SECURITY DESCRIPTION | VALUE($) | ||||||
| Common Stocks — 98.8% | |||||||
Diversified — 6.7% |
| |||||||
| 2,258 | Colonial Properties Trust | 47,106 | ||||||
| 625 | Vornado Realty Trust | 48,037 | ||||||
|
| |||||||
| 95,143 | ||||||||
|
| |||||||
Health Care — 16.5% |
| |||||||
| 2,631 | HCP, Inc. | 108,998 | ||||||
| 869 | Health Care REIT, Inc. | 47,395 | ||||||
| 1,383 | Ventas, Inc. | 76,217 | ||||||
|
| |||||||
| 232,610 | ||||||||
|
| |||||||
Hotels — 6.2% |
| |||||||
| 4,226 | Host Hotels & Resorts, Inc. | 62,423 | ||||||
| 658 | Hyatt Hotels Corp., Class A (a) | 24,759 | ||||||
|
| |||||||
| 87,182 | ||||||||
|
| |||||||
Industrial — 6.6% |
| |||||||
| 3,249 | ProLogis, Inc. | 92,884 | ||||||
|
| |||||||
Multifamily — 20.4% |
| |||||||
| 2,688 | Apartment Investment & Management Co., Class A | 61,590 | ||||||
| 613 | AvalonBay Communities, Inc. | 80,090 | ||||||
| 583 | BRE Properties, Inc. | 29,445 | ||||||
| 2,065 | Equity Residential | 117,761 | ||||||
|
| |||||||
| 288,886 | ||||||||
|
| |||||||
Office — 16.2% |
| |||||||
| 570 | Boston Properties, Inc. | 56,767 | ||||||
| 2,195 | Brandywine Realty Trust | 20,855 | ||||||
| 1,739 | Corporate Office Properties Trust | 36,979 | ||||||
| 1,442 | Mack-Cali Realty Corp. | 38,484 | ||||||
| 1,589 | Piedmont Office Realty Trust, Inc., Class A | 27,082 | ||||||
| 731 | SL Green Realty Corp. | 48,714 | ||||||
|
| |||||||
| 228,881 | ||||||||
|
| |||||||
Regional Malls — 16.1% |
| |||||||
| 4,976 | General Growth Properties, Inc. | 74,744 | ||||||
| 939 | Macerich Co. (The) | 47,488 | ||||||
| 817 | Simon Property Group, Inc. | 105,309 | ||||||
|
| |||||||
| 227,541 | ||||||||
|
| |||||||
Shopping Centers — 3.8% |
| |||||||
| 196 | Federal Realty Investment Trust | 17,813 | ||||||
| 930 | Regency Centers Corp. | 34,992 | ||||||
|
| |||||||
| 52,805 | ||||||||
|
| |||||||
Storage — 6.3% |
| |||||||
| 1,480 | Extra Space Storage, Inc. | 35,867 | ||||||
| SHARES | SECURITY DESCRIPTION | VALUE($) | ||||||
Storage — Continued | ||||||||
| 394 | Public Storage | 52,956 | ||||||
|
| |||||||
| 88,823 | ||||||||
|
| |||||||
Total Common Stocks | 1,394,755 | |||||||
|
| |||||||
| Short-Term Investment — 1.1% | |||||||
Investment Company — 1.1% | ||||||||
| 15,018 | JPMorgan Prime Money Market Fund, Institutional Class Shares, 0.090% (b) (l) | 15,018 | ||||||
|
| |||||||
Total Investments — 99.9% | 1,409,773 | |||||||
Other Assets in Excess of | 1,145 | |||||||
|
| |||||||
NET ASSETS — 100.0% | $ | 1,410,918 | ||||||
|
| |||||||
Percentages indicated are based on net assets.
SEE NOTES TO FINANCIAL STATEMENTS.
| 10 | J.P. MORGAN SPECIALTY FUNDS | DECEMBER 31, 2011 | ||||
Table of Contents
J.P. Morgan Specialty Funds
NOTES TO SCHEDULES OF PORTFOLIO INVESTMENTS:
AS OF DECEMBER 31, 2011
| REIT | — Real Estate Investment Trust | |
| (a) | — Non-income producing security. | |
| (b) | — Investment in affiliate. Money market fund registered under the Investment Company Act of 1940, as amended, and advised by J.P. Morgan Investment Management Inc. | |
| (e) | — Security is exempt from registration under Rule 144A of the Securities Act of 1933, as amended. Unless otherwise indicated, this security has been determined to be liquid under procedures established by the Board of Trustees and may be resold in transactions exempt from registration, normally to qualified institutional buyers. | |
| (l) | — The rate shown is the current yield as of December 31, 2011. | |
| (x) | — The date shown reflects the first date on which the issuer may redeem the security at par value. The coupon rate for this security is based on par value and is the rate currently in effect as of December 31, 2011. |
SEE NOTES TO FINANCIAL STATEMENTS.
| DECEMBER 31, 2011 | J.P. MORGAN SPECIALTY FUNDS | �� | 11 | |||||
Table of Contents
STATEMENTS OF ASSETS AND LIABILITIES
AS OF DECEMBER 31, 2011
(Amounts in thousands, except per share amounts)
| U.S. Core Real Estate Securities Fund | U.S. Real Estate Fund | |||||||
ASSETS: | ||||||||
Investments in non-affiliates, at value | $ | 9,354 | $ | 1,394,755 | ||||
Investments in affiliates, at value | 435 | 15,018 | ||||||
|
|
|
| |||||
Total investment securities, at value | 9,789 | 1,409,773 | ||||||
Receivables: | ||||||||
Fund shares sold | — | (a) | 2,431 | |||||
Dividends from non-affiliates | 67 | 3,777 | ||||||
Dividends from affiliates | — | (a) | 1 | |||||
Due from Advisor | 62 | — | ||||||
Prepaid expenses and other assets | 100 | — | ||||||
|
|
|
| |||||
Total Assets | 10,018 | 1,415,982 | ||||||
|
|
|
| |||||
LIABILITIES: | ||||||||
Payables: | ||||||||
Dividends | — | (a) | — | |||||
Fund shares redeemed | — | 3,555 | ||||||
Accrued liabilities: | ||||||||
Investment advisory fees | — | 398 | ||||||
Shareholder servicing fees | 2 | 231 | ||||||
Distribution fees | — | (a) | 50 | |||||
Custodian and accounting fees | 9 | 20 | ||||||
Trustees’ and Chief Compliance Officer’s fees | — | (a) | 2 | |||||
Transfer agent fees | 2 | 666 | ||||||
Audit fees | 53 | 35 | ||||||
Other | 4 | 107 | ||||||
|
|
|
| |||||
Total Liabilities | 70 | 5,064 | ||||||
|
|
|
| |||||
Net Assets | $ | 9,948 | $ | 1,410,918 | ||||
|
|
|
| |||||
| (a) | Amount rounds to less than $1,000. |
SEE NOTES TO FINANCIAL STATEMENTS.
| 12 | J.P. MORGAN SPECIALTY FUNDS | DECEMBER 31, 2011 | ||||
Table of Contents
| U.S. Core Real Estate Securities Fund | U.S. Real Estate Fund | |||||||
NET ASSETS: | ||||||||
Paid in capital | $ | 9,718 | $ | 1,111,892 | ||||
Accumulated undistributed net investment income | — | (a) | 199 | |||||
Accumulated net realized gains (losses) | (12 | ) | (100,855 | ) | ||||
Net unrealized appreciation (depreciation) | 242 | 399,682 | ||||||
|
|
|
| |||||
Total Net Assets | $ | 9,948 | $ | 1,410,918 | ||||
|
|
|
| |||||
Net Assets: | ||||||||
Class A | $ | 2,548 | $ | 186,958 | ||||
Class C | 50 | 13,763 | ||||||
Class R2 | — | 5,524 | ||||||
Class R5 | 50 | 15,816 | ||||||
Class R6 | 51 | — | ||||||
Select Class | 7,249 | 1,188,857 | ||||||
|
|
|
| |||||
Total | $ | 9,948 | $ | 1,410,918 | ||||
|
|
|
| |||||
Outstanding units of beneficial interest (shares) ($0.0001 per value; unlimited number of shares authorized): | ||||||||
Class A | 170 | 11,571 | ||||||
Class C | 3 | 861 | ||||||
Class R2 | — | 343 | ||||||
Class R5 | 3 | 975 | ||||||
Class R6 | 3 | — | ||||||
Select Class | 483 | 73,429 | ||||||
Net Asset Value: (b) | ||||||||
Class A — Redemption price per share | $ | 14.98 | $ | 16.16 | ||||
Class C — Offering price per share (c) | 15.00 | 15.99 | ||||||
Class R2 — Offering and redemption price per share | — | 16.10 | ||||||
Class R5 — Offering and redemption price per share | 15.00 | 16.22 | ||||||
Class R6 — Offering and redemption price per share | 15.00 | — | ||||||
Select Class — Offering and redemption price per share | 15.00 | 16.19 | ||||||
Class A maximum sales charge | 5.25 | % | 5.25 | % | ||||
Class A maximum public offering price per share | $ | 15.81 | $ | 17.06 | ||||
|
|
|
| |||||
Cost of investments in non-affiliates | $ | 9,112 | $ | 995,073 | ||||
Cost of investments in affiliates | 435 | 15,018 | ||||||
| (a) | Amount rounds to less than $1,000. |
| (b) | Per share amounts may not recalculate due to rounding of net assets and/or shares outstanding. |
| (c) | Redemption price for Class C Shares varies based upon length of time the shares are held. |
SEE NOTES TO FINANCIAL STATEMENTS.
| DECEMBER 31, 2011 | J.P. MORGAN SPECIALTY FUNDS | 13 | ||||||
Table of Contents
STATEMENTS OF OPERATIONS
FOR THE PERIODS INDICATED
(Amounts in thousands)
| U.S. Core Real Estate Securities Fund Period Ended 12/31/2011 (a) | U.S. Real Estate Fund Year Ended 12/31/2011 | |||||||
INVESTMENT INCOME: | ||||||||
Interest income from non-affiliates | $ | 9 | $ | — | ||||
Dividend income from non-affiliates | 61 | 29,175 | ||||||
Dividend income from affiliates | — | (b) | 35 | |||||
|
|
|
| |||||
Total investment income | 70 | 29,210 | ||||||
|
|
|
| |||||
EXPENSES: | ||||||||
Investment advisory fees | 8 | 9,249 | ||||||
Administration fees | 1 | 1,364 | ||||||
Distribution fees: | ||||||||
Class A | — | (b) | 518 | |||||
Class C | — | (b) | 110 | |||||
Class R2 | — | 17 | ||||||
Shareholder servicing fees: | ||||||||
Class A | — | (b) | 518 | |||||
Class C | — | (b) | 37 | |||||
Class R2 | — | 9 | ||||||
Class R5 | — | (b) | 8 | |||||
Select Class | 3 | 3,248 | ||||||
Custodian and accounting fees | 11 | 83 | ||||||
Interest expense to affiliates | — | — | (b) | |||||
Professional fees | 53 | 77 | ||||||
Trustees’ and Chief Compliance Officer’s fees | — | (b) | 15 | |||||
Printing and mailing costs | 1 | 340 | ||||||
Registration and filing fees | 4 | 118 | ||||||
Transfer agent fees | 3 | 2,132 | ||||||
Offering costs | 50 | — | ||||||
Other | 6 | 22 | ||||||
|
|
|
| |||||
Total expenses | 140 | 17,865 | ||||||
|
|
|
| |||||
Less amounts waived | (1 | ) | (2,069 | ) | ||||
Less earnings credits | — | (b) | — | (b) | ||||
Less expense reimbursements | (126 | ) | (939 | ) | ||||
|
|
|
| |||||
Net expenses | 13 | 14,857 | ||||||
|
|
|
| |||||
Net investment income (loss) | 57 | 14,353 | ||||||
|
|
|
| |||||
REALIZED/UNREALIZED GAINS (LOSSES): | ||||||||
Net realized gain (loss) on transactions from: | ||||||||
Investments in non-affiliates | 1 | 123,924 | ||||||
Change in net unrealized appreciation (depreciation) of: | ||||||||
Investments in non-affiliates | 242 | (36,766 | ) | |||||
|
|
|
| |||||
Net realized/unrealized gains (losses) | 243 | 87,158 | ||||||
|
|
|
| |||||
Change in net assets resulting from operations | $ | 300 | $ | 101,511 | ||||
|
|
|
| |||||
| (a) | Commencement of operations was August 31, 2011. |
| (b) | Amount rounds to less than $1,000. |
SEE NOTES TO FINANCIAL STATEMENTS.
| 14 | J.P. MORGAN SPECIALTY FUNDS | DECEMBER 31, 2011 | ||||
Table of Contents
STATEMENTS OF CHANGES IN NET ASSETS
FOR THE PERIODS INDICATED
(Amounts in thousands)
| U.S. Core Real Estate Securities Fund | U.S. Real Estate Fund | |||||||||||
| Period Ended 12/31/2011 (a) | Year Ended 12/31/2011 | Year Ended 12/31/2010 | ||||||||||
CHANGE IN NET ASSETS RESULTING FROM OPERATIONS: | ||||||||||||
Net investment income (loss) | $ | 57 | $ | 14,353 | $ | 15,791 | ||||||
Net realized gain (loss) | 1 | 123,924 | 69,713 | |||||||||
Change in net unrealized appreciation (depreciation) | 242 | (36,766 | ) | 241,490 | ||||||||
|
|
|
|
|
| |||||||
Change in net assets resulting from operations | 300 | 101,511 | 326,994 | |||||||||
|
|
|
|
|
| |||||||
DISTRIBUTIONS TO SHAREHOLDERS: | ||||||||||||
Class A | ||||||||||||
From net investment income | (16 | ) | (3,957 | ) | (2,301 | ) | ||||||
Return of capital | (2 | ) | — | (3,462 | ) | |||||||
From net realized gains | (1 | ) | — | — | ||||||||
Class C | ||||||||||||
From net investment income | — | (b) | (217 | ) | (61 | ) | ||||||
Return of capital | — | (b) | — | (164 | ) | |||||||
From net realized gains | — | (b) | — | — | ||||||||
Class R2 | ||||||||||||
From net investment income | — | (68 | ) | (6 | ) | |||||||
Return of capital | — | — | (4 | ) | ||||||||
Class R5 | ||||||||||||
From net investment income | (1 | ) | (382 | ) | (202 | ) | ||||||
Return of capital | — | (b) | — | (278 | ) | |||||||
From net realized gains | — | (b) | — | — | ||||||||
Class R6 | ||||||||||||
From net investment income | (1 | ) | — | — | ||||||||
Return of capital | — | (b) | — | — | ||||||||
From net realized gains | — | (b) | — | — | ||||||||
Select Class | ||||||||||||
From net investment income | (49 | ) | (28,779 | ) | (11,619 | ) | ||||||
Return of capital | (8 | ) | — | (12,513 | ) | |||||||
From net realized gains | (2 | ) | — | — | ||||||||
|
|
|
|
|
| |||||||
Total distributions to shareholders | (80 | ) | (33,403 | ) | (30,610 | ) | ||||||
|
|
|
|
|
| |||||||
CAPITAL TRANSACTIONS: | ||||||||||||
Change in net assets from capital transactions | 9,728 | (118,706 | ) | 176,393 | ||||||||
|
|
|
|
|
| |||||||
NET ASSETS: | ||||||||||||
Change in net assets | 9,948 | (50,598 | ) | 472,777 | ||||||||
Beginning of period | — | 1,461,516 | 988,739 | |||||||||
|
|
|
|
|
| |||||||
End of period | $ | 9,948 | $ | 1,410,918 | $ | 1,461,516 | ||||||
|
|
|
|
|
| |||||||
Accumulated undistributed net investment income | $ | — | (b) | $ | 199 | $ | 1,716 | |||||
|
|
|
|
|
| |||||||
| (a) | Commencement of operations was August 31, 2011. |
| (b) | Amount rounds to less than 1,000 |
SEE NOTES TO FINANCIAL STATEMENTS.
| DECEMBER 31, 2011 | J.P. MORGAN SPECIALTY FUNDS | 15 | ||||||
Table of Contents
STATEMENTS OF CHANGES IN NET ASSETS
FOR THE PERIODS INDICATED (continued)
(Amounts in thousands)
| U.S. Core Real Estate Securities Fund | U.S. Real Estate Fund | |||||||||||
| Period Ended 12/31/2011 (a) | Year Ended 12/31/2011 | Year Ended 12/31/2010 | ||||||||||
CAPITAL TRANSACTIONS: | ||||||||||||
Class A | ||||||||||||
Proceeds from shares issued | $ | 2,452 | $ | 56,334 | $ | 213,840 | ||||||
Dividends and distributions reinvested | 19 | 3,672 | 5,422 | |||||||||
Cost of shares redeemed | — | (95,446 | ) | (257,650 | ) | |||||||
|
|
|
|
|
| |||||||
Change in net assets from Class A capital transactions | $ | 2,471 | $ | (35,440 | ) | $ | (38,388 | ) | ||||
|
|
|
|
|
| |||||||
Class C | ||||||||||||
Proceeds from shares issued | $ | 50 | $ | 3,544 | $ | 4,247 | ||||||
Dividends and distributions reinvested | — | (b) | 193 | 197 | ||||||||
Cost of shares redeemed | — | (4,706 | ) | (3,938 | ) | |||||||
|
|
|
|
|
| |||||||
Change in net assets from Class C capital transactions | $ | 50 | $ | (969 | ) | $ | 506 | |||||
|
|
|
|
|
| |||||||
Class R2 | ||||||||||||
Proceeds from shares issued | $ | — | $ | 6,064 | $ | 956 | ||||||
Dividends and distributions reinvested | — | 62 | 9 | |||||||||
Cost of shares redeemed | — | (1,595 | ) | (169 | ) | |||||||
|
|
|
|
|
| |||||||
Change in net assets from Class R2 capital transactions | $ | — | $ | 4,531 | $ | 796 | ||||||
|
|
|
|
|
| |||||||
Class R5 | ||||||||||||
Proceeds from shares issued | $ | 50 | $ | 7,380 | $ | 8,903 | ||||||
Dividends and distributions reinvested | — | (b) | 371 | 403 | ||||||||
Cost of shares redeemed | — | (12,736 | ) | (45,090 | ) | |||||||
|
|
|
|
|
| |||||||
Change in net assets from Class R5 capital transactions | $ | 50 | $ | (4,985 | ) | $ | (35,784 | ) | ||||
|
|
|
|
|
| |||||||
Class R6 | ||||||||||||
Proceeds from shares issued | $ | 50 | $ | — | $ | — | ||||||
Dividends and distributions reinvested | — | (b) | — | — | ||||||||
|
|
|
|
|
| |||||||
Change in net assets from Class R6 capital transactions | $ | 50 | $ | — | $ | — | ||||||
|
|
|
|
|
| |||||||
Select | ||||||||||||
Proceeds from shares issued | $ | 7,048 | $ | 515,242 | $ | 695,732 | ||||||
Dividends and distributions reinvested | 59 | 8,133 | 2,553 | |||||||||
Cost of shares redeemed | — | (605,218 | ) | (449,022 | ) | |||||||
|
|
|
|
|
| |||||||
Change in net assets from Select capital transactions | $ | 7,107 | $ | (81,843 | ) | $ | 249,263 | |||||
|
|
|
|
|
| |||||||
Total change in net assets from capital transactions | $ | 9,728 | $ | (118,706 | ) | $ | 176,393 | |||||
|
|
|
|
|
| |||||||
SEE NOTES TO FINANCIAL STATEMENTS.
| 16 | J.P. MORGAN SPECIALTY FUNDS | DECEMBER 31, 2011 | ||||
Table of Contents
| U.S. Core Real Estate Securities Fund | U.S. Real Estate Fund | |||||||||||
| Period Ended 12/31/2011 (a) | Year Ended 12/31/2011 | Year Ended 12/31/2010 | ||||||||||
SHARE TRANSACTIONS: | ||||||||||||
Class A | ||||||||||||
Issued | 169 | 3,508 | 15,080 | |||||||||
Reinvested | 1 | 234 | 390 | |||||||||
Redeemed | — | (5,985 | ) | (17,830 | ) | |||||||
|
|
|
|
|
| |||||||
Change in Class A Shares | 170 | (2,243 | ) | (2,360 | ) | |||||||
|
|
|
|
|
| |||||||
Class C |
| |||||||||||
Issued | 3 | 221 | 306 | |||||||||
Reinvested | — | (b) | 13 | 14 | ||||||||
Redeemed | — | (298 | ) | (286 | ) | |||||||
|
|
|
|
|
| |||||||
Change in Class C Shares | 3 | (64 | ) | 34 | ||||||||
|
|
|
|
|
| |||||||
Class R2 |
| |||||||||||
Issued | — | 377 | 67 | |||||||||
Reinvested | — | 4 | 1 | |||||||||
Redeemed | — | (99 | ) | (12 | ) | |||||||
|
|
|
|
|
| |||||||
Change in Class R2 Shares | — | 282 | 56 | |||||||||
|
|
|
|
|
| |||||||
Class R5 |
| |||||||||||
Issued | 3 | 454 | 667 | |||||||||
Reinvested | — | (b) | 24 | 28 | ||||||||
Redeemed | — | (784 | ) | (3,839 | ) | |||||||
|
|
|
|
|
| |||||||
Change in Class R5 Shares | 3 | (306 | ) | (3,144 | ) | |||||||
|
|
|
|
|
| |||||||
Class R6 |
| |||||||||||
Issued | 3 | — | — | |||||||||
Reinvested | — | (b) | — | — | ||||||||
|
|
|
|
|
| |||||||
Change in Class R6 Shares | 3 | — | — | |||||||||
|
|
|
|
|
| |||||||
Select |
| |||||||||||
Issued | 479 | 31,954 | 49,314 | |||||||||
Reinvested | 4 | 537 | 182 | |||||||||
Redeemed | — | (36,834 | ) | (31,251 | ) | |||||||
|
|
|
|
|
| |||||||
Change in Select Shares | 483 | (4,343 | ) | 18,245 | ||||||||
|
|
|
|
|
| |||||||
| (a) | Commencement of operations was August 31, 2011. |
| (b) | Amount rounds to less than 1,000. |
SEE NOTES TO FINANCIAL STATEMENTS.
| DECEMBER 31, 2011 | J.P. MORGAN SPECIALTY FUNDS | 17 | ||||||
Table of Contents
FOR THE PERIODS INDICATED
| Per share operating performance | |||||||||||||||||||||||||||||||
| Investment operations | Distributions | |||||||||||||||||||||||||||||||
| Net asset value, beginning of period | Net investment income (loss) | Net realized and unrealized gains (losses) on investments | Total from investment operations | Net investment income | Net realized gain | Return of capital | Total distributions | |||||||||||||||||||||||||
U.S. Core Real Estate Securities Fund |
| |||||||||||||||||||||||||||||||
Class A |
| |||||||||||||||||||||||||||||||
August 31, 2011 (e) through December 31, 2011 | $ | 15.00 | $ | 0.35 | (f) | $ | (0.23 | ) | $ | 0.12 | $ | (0.10 | ) | $ | — | (g) | $ | (0.04 | ) | $ | (0.14 | ) | ||||||||||
Class C | ||||||||||||||||||||||||||||||||
August 31, 2011 (e) through December 31, 2011 | 15.00 | 0.11 | (f) | (0.01 | ) | 0.10 | (0.06 | ) | — | (g) | (0.04 | ) | (0.10 | ) | ||||||||||||||||||
Class R5 | ||||||||||||||||||||||||||||||||
August 31, 2011 (e) through December 31, 2011 | 15.00 | 0.16 | (f) | (0.02 | ) | 0.14 | (0.10 | ) | — | (g) | (0.04 | ) | (0.14 | ) | ||||||||||||||||||
Class R6 | ||||||||||||||||||||||||||||||||
August 31, 2011 (e) through December 31, 2011 | 15.00 | 0.16 | (f) | (0.02 | ) | 0.14 | (0.10 | ) | — | (g) | (0.04 | ) | (0.14 | ) | ||||||||||||||||||
Select Class | ||||||||||||||||||||||||||||||||
August 31, 2011 (e) through December 31, 2011 | 15.00 | 0.19 | (f) | (0.05 | ) | 0.14 | (0.10 | ) | — | (g) | (0.04 | ) | (0.14 | ) | ||||||||||||||||||
| (a) | Annualized for periods less than one year. |
| (b) | Not annualized for periods less than one year. |
| (c) | Includes adjustments in accordance with accounting principles generally accepted in the United States of America and as such, the net asset value for financial reporting purposes and the returns based upon those net asset values may differ from the net asset value and returns for shareholder transactions. |
| (d) | Includes earnings credits and interest expense, each of which is less than 0.01%, if applicable or unless otherwise noted. |
| (e) | Commencement of operations. |
| (f) | Calculated based upon average shares outstanding. |
| (g) | Amount rounds to less than $0.01. |
| (h) | Certain non-recurring expenses incurred by the Fund were not annualized for the period ended December 31, 2011. |
| (i) | The net investment income ratios for Class A and Select Class are disproportionate due to the timing of shareholder capital transactions and when the Fund earned income over the period. |
| (j) | Ratios are disproportionate between classes due to the size of net assets and fixed expenses. |
SEE NOTES TO FINANCIAL STATEMENTS.
| 18 | J.P. MORGAN SPECIALTY FUNDS | DECEMBER 31, 2011 | ||||
Table of Contents
| Ratios/Supplemental data | |||||||||||||||||||||||||
| Ratios to average net assets (a) | ||||||||||||||||||||||||||
| Net asset value, end of period | Total return (excludes sales charge) (b)(c) | Net assets, end of period (000’s) | Net expenses (d) | Net investment income (loss) | Expenses without waivers, reimbursements and earnings credits | Portfolio turnover rate (b) | ||||||||||||||||||||
| $ | 14.98 | 0.83 | % | $ | 2,548 | 1.18 | %(h) | 7.03 | %(h)(i) | 5.74 | % (h)(j) | 8 | % | |||||||||||||
| 15.00 | 0.69 | 50 | 1.68 | (h) | 2.29 | (h) | 11.12 | (h)(j) | 8 | |||||||||||||||||
| 15.00 | 1.01 | 50 | 0.73 | (h) | 3.24 | (h) | 10.27 | (h)(j) | 8 | |||||||||||||||||
| 15.00 | 1.02 | 51 | 0.68 | (h) | 3.29 | (h) | 10.22 | (h)(j) | 8 | |||||||||||||||||
| 15.00 | 0.97 | 7,249 | 0.93 | (h) | 3.82 | (h)(i) | 9.39 | (h)(j) | 8 | |||||||||||||||||
SEE NOTES TO FINANCIAL STATEMENTS.
| DECEMBER 31, 2011 | J.P. MORGAN SPECIALTY FUNDS | 19 | ||||||
Table of Contents
FINANCIAL HIGHLIGHTS
FOR THE PERIODS INDICATED (continued)
| Per share operating performance | |||||||||||||||||||||||||||||||
| Investment operations | Distributions | |||||||||||||||||||||||||||||||
| Net asset value, beginning of period | Net investment income (loss) | Net realized and unrealized gains (losses) on investments | Total from investment operations | Net investment income | Net realized gain | Return of capital | Total distributions | |||||||||||||||||||||||||
U.S. Real Estate Fund |
| |||||||||||||||||||||||||||||||
Class A |
| |||||||||||||||||||||||||||||||
Year Ended December 31, 2011 | $ | 15.55 | $ | 0.12 | (e) | $ | 0.80 | $ | 0.92 | $ | (0.31 | ) | $ | — | $ | — | $ | (0.31 | ) | |||||||||||||
Year Ended December 31, 2010 | 12.19 | 0.15 | (e) | 3.51 | 3.66 | (0.12 | ) | — | (0.18 | ) | (0.30 | ) | ||||||||||||||||||||
Year Ended December 31, 2009 | 10.12 | 0.22 | (e) | 2.11 | 2.33 | (0.22 | ) | — | (0.04 | ) | (0.26 | ) | ||||||||||||||||||||
Year Ended December 31, 2008 | 17.09 | 0.30 | (6.92 | ) | (6.62 | ) | (0.32 | ) | — | (0.03 | ) | (0.35 | ) | |||||||||||||||||||
Year Ended December 31, 2007 | 22.62 | 0.22 | (e) | (4.23 | ) | (4.01 | ) | (0.25 | ) | (1.27 | ) | — | (1.52 | ) | ||||||||||||||||||
Class C | ||||||||||||||||||||||||||||||||
Year Ended December 31, 2011 | 15.39 | 0.04 | (e) | 0.80 | 0.84 | (0.24 | ) | — | — | (0.24 | ) | |||||||||||||||||||||
Year Ended December 31, 2010 | 12.08 | 0.08 | (e) | 3.48 | 3.56 | (0.07 | ) | — | (0.18 | ) | (0.25 | ) | ||||||||||||||||||||
Year Ended December 31, 2009 | 10.04 | 0.17 | (e) | 2.10 | 2.27 | (0.19 | ) | — | (0.04 | ) | (0.23 | ) | ||||||||||||||||||||
Year Ended December 31, 2008 | 16.99 | 0.26 | (6.91 | ) | (6.65 | ) | (0.27 | ) | — | (0.03 | ) | (0.30 | ) | |||||||||||||||||||
Year Ended December 31, 2007 | 22.49 | 0.12 | (e) | (4.21 | ) | (4.09 | ) | (0.14 | ) | (1.27 | ) | — | (1.41 | ) | ||||||||||||||||||
Class R2 | ||||||||||||||||||||||||||||||||
Year Ended December 31, 2011 | 15.50 | 0.09 | (e) | 0.80 | 0.89 | (0.29 | ) | — | — | (0.29 | ) | |||||||||||||||||||||
Year Ended December 31, 2010 | 12.18 | 0.14 | (e) | 3.47 | 3.61 | (0.11 | ) | — | (0.18 | ) | (0.29 | ) | ||||||||||||||||||||
Year Ended December 31, 2009 | 10.12 | 0.20 | (e) | 2.11 | 2.31 | (0.21 | ) | — | (0.04 | ) | (0.25 | ) | ||||||||||||||||||||
November 3, 2008 (g) through December 31, 2008 | 11.11 | 0.13 | (1.12 | ) | (0.99 | ) | — | — | — | — | ||||||||||||||||||||||
Class R5 | ||||||||||||||||||||||||||||||||
Year Ended December 31, 2011 | 15.61 | 0.19 | (e) | 0.80 | 0.99 | (0.38 | ) | — | — | (0.38 | ) | |||||||||||||||||||||
Year Ended December 31, 2010 | 12.23 | 0.18 | (e) | 3.56 | 3.74 | (0.18 | ) | — | (0.18 | ) | (0.36 | ) | ||||||||||||||||||||
Year Ended December 31, 2009 | 10.14 | 0.27 | (e) | 2.11 | 2.38 | (0.25 | ) | — | (0.04 | ) | (0.29 | ) | ||||||||||||||||||||
Year Ended December 31, 2008 | 17.11 | 0.43 | (6.99 | ) | (6.56 | ) | (0.38 | ) | — | (0.03 | ) | (0.41 | ) | |||||||||||||||||||
Year Ended December 31, 2007 | 22.65 | 0.35 | (e) | (4.27 | ) | (3.92 | ) | (0.35 | ) | (1.27 | ) | — | (1.62 | ) | ||||||||||||||||||
Select Class | ||||||||||||||||||||||||||||||||
Year Ended December 31, 2011 | 15.58 | 0.16 | (e) | 0.80 | 0.96 | (0.35 | ) | — | — | (0.35 | ) | |||||||||||||||||||||
Year Ended December 31, 2010 | 12.21 | 0.19 | (e) | 3.52 | 3.71 | (0.16 | ) | — | (0.18 | ) | (0.34 | ) | ||||||||||||||||||||
Year Ended December 31, 2009 | 10.13 | 0.25 | (e) | 2.11 | 2.36 | (0.24 | ) | — | (0.04 | ) | (0.28 | ) | ||||||||||||||||||||
Year Ended December 31, 2008 | 17.10 | 0.38 | (6.97 | ) | (6.59 | ) | (0.35 | ) | — | (0.03 | ) | (0.38 | ) | |||||||||||||||||||
Year Ended December 31, 2007 | 22.64 | 0.28 | (e) | (4.24 | ) | (3.96 | ) | (0.31 | ) | (1.27 | ) | — | (1.58 | ) | ||||||||||||||||||
| (a) | Annualized for periods less than one year. |
| (b) | Not annualized for periods less than one year. |
| (c) | Includes adjustments in accordance with accounting principles generally accepted in the United States of America and as such, the net asset value for financial reporting purposes and the returns based upon those net asset values may differ from the net asset value and returns for shareholder transactions. |
| (d) | Includes earnings credits and interest expense, each of which is less than 0.01%, if applicable or unless otherwise noted. |
| (e) | Calculated based upon average shares outstanding. |
| (f) | Due to ratio being annualized, the ratio may appear disproportionate to other share classes. |
| (g) | Commencement of offering of class of shares. |
SEE NOTES TO FINANCIAL STATEMENTS.
| 20 | J.P. MORGAN SPECIALTY FUNDS | DECEMBER 31, 2011 | ||||
Table of Contents
| Ratios/Supplemental data | |||||||||||||||||||||||||
| Ratios to average net assets (a) | ||||||||||||||||||||||||||
| Net asset value, end of period | Total return (excludes sales charge) (b)(c) | Net assets, end of period (000’s) | Net expenses (d) | Net investment income (loss) | Expenses without waivers, reimbursements and earnings credits | Portfolio turnover rate (b) | ||||||||||||||||||||
| $ | 16.16 | 6.02 | % | $ | 186,958 | 1.17 | % | 0.72 | 1.37 | % | 67 | % | ||||||||||||||
| 15.55 | 30.36 | 214,760 | 1.17 | 1.05 | 1.29 | 71 | ||||||||||||||||||||
| 12.19 | 24.47 | 197,111 | 1.18 | 2.37 | 1.40 | 81 | ||||||||||||||||||||
| 10.12 | (39.55 | ) | 190,173 | 1.18 | 1.91 | 1.29 | 50 | |||||||||||||||||||
| 17.09 | (17.68 | ) | 261,293 | 1.18 | 1.03 | 1.27 | 64 | |||||||||||||||||||
| 15.99 | 5.50 | 13,763 | 1.67 | 0.23 | 1.87 | 67 | ||||||||||||||||||||
| 15.39 | 29.68 | 14,244 | 1.67 | 0.56 | 1.79 | 71 | ||||||||||||||||||||
| 12.08 | 23.90 | 10,763 | 1.68 | 1.86 | 1.89 | 81 | ||||||||||||||||||||
| 10.04 | (39.86 | ) | 8,477 | 1.68 | 1.58 | 1.79 | 50 | |||||||||||||||||||
| 16.99 | (18.08 | ) | 8,161 | 1.68 | 0.55 | 1.77 | 64 | |||||||||||||||||||
| 16.10 | 5.81 | 5,524 | 1.42 | 0.55 | 1.65 | 67 | ||||||||||||||||||||
| 15.50 | 29.95 | 947 | 1.42 | 0.97 | 1.54 | 71 | ||||||||||||||||||||
| 12.18 | 24.16 | 65 | 1.43 | 2.12 | 1.64 | 81 | ||||||||||||||||||||
| 10.12 | (8.91 | ) | 45 | 1.43 | 8.82 | (f) | 1.58 | 50 | ||||||||||||||||||
| 16.22 | 6.46 | 15,816 | 0.72 | 1.17 | 0.92 | 67 | ||||||||||||||||||||
| 15.61 | 30.94 | 19,999 | 0.72 | 1.34 | 0.84 | 71 | ||||||||||||||||||||
| 12.23 | 25.06 | 54,102 | 0.73 | 2.84 | 0.94 | 81 | ||||||||||||||||||||
| 10.14 | (39.30 | ) | 30,576 | 0.73 | 2.75 | 0.84 | 50 | |||||||||||||||||||
| 17.11 | (17.31 | ) | 24,218 | 0.73 | 1.61 | 0.82 | 64 | |||||||||||||||||||
| 16.19 | 6.27 | 1,188,857 | 0.92 | 0.97 | 1.12 | 67 | ||||||||||||||||||||
| 15.58 | 30.69 | 1,211,566 | 0.92 | 1.33 | 1.04 | 71 | ||||||||||||||||||||
| 12.21 | 24.81 | 726,698 | 0.93 | 2.58 | 1.14 | 81 | ||||||||||||||||||||
| 10.13 | (39.41 | ) | 314,364 | 0.93 | 2.40 | 1.04 | 50 | |||||||||||||||||||
| 17.10 | (17.49 | ) | 334,791 | 0.93 | 1.32 | 1.02 | 64 | |||||||||||||||||||
SEE NOTES TO FINANCIAL STATEMENTS.
| DECEMBER 31, 2011 | J.P. MORGAN SPECIALTY FUNDS | 21 | ||||||
Table of Contents
AS OF DECEMBER 31, 2011
1. Organization
JPMorgan Trust I (“JPM I”) and JPMorgan Trust II (“JPM II”) (the “Trusts”) were formed on November 12, 2004, as Delaware statutory trusts, pursuant to Declarations of Trust dated November 5, 2004 and are registered under the Investment Company Act of 1940, as amended (the “1940 Act”), as open-end management investment companies.
The following are 2 separate funds of the Trusts, (collectively, the “Funds”) covered by this report:
| Fund | Classes Offered | Trust | Diversified/Non-Diversified | |||
| Security Capital U.S. Core Real Estate Securities Fund | Class A, Class C, Class R5, Class R6 and Select Class | JPM I | Non-Diversified | |||
| JPMorgan U.S. Real Estate Fund | Class A, Class C, Class R2, Class R5 and Select Class | JPM II | Non-Diversified |
Security Capital U.S. Core Real Estate Securities Fund (“U.S. Core Real Estate Securities Fund”) commenced operations on August 31, 2011.
The investment objective of the U.S. Core Real Estate Securities Fund is to seek to provide a risk-adjusted total return over the long term by investing primarily in real estate securities.
The investment objective of the JPMorgan U.S. Real Estate Fund (“U.S. Real Estate Fund”) is to seek to provide a high level of current income and long term capital appreciation primarily through investments in real estate securities.
Class A Shares generally provide for a front-end sales charge while Class C Shares provide for a contingent deferred sales charge (“CDSC”). No sales charges are assessed with respect to the Class R2, Class R5, Class R6 and Select Class Shares. All classes of shares have equal rights as to earnings, assets and voting privileges except that each class may bear different distribution and shareholder servicing fees and each class has exclusive voting rights with respect to its distribution plan and shareholder servicing agreements. Certain Class A Shares, for which front-end sales charges have been waived, may be subject to a CDSC as described in the Funds’ prospectus.
2. Significant Accounting Policies
The following is a summary of significant accounting policies followed by the Trusts in the preparation of their financial statements. The policies are in accordance with accounting principles generally accepted in the United States of America. The preparation of financial statements requires management to make estimates and assumptions that affect the reported amounts of assets and liabilities at the date of the financial statements and the reported amounts of income and expenses for the period. Actual results could differ from those estimates.
A. Valuation of Investments — Equity securities listed on a North American, Central American, South American or Caribbean securities exchange shall generally be valued at the last sale price on the exchange on which the security is principally traded that is reported before the time when the net assets of the Fund are valued. The value of securities listed on The NASDAQ Stock Market LLC shall generally be the NASDAQ Official Closing Price. Fixed income securities (other than certain short-term investments maturing in less than 61 days) are valued each day based on prices received from independent or affiliated pricing services approved by the Board of Trustees or third party broker-dealers. The broker-dealers or pricing services use multiple valuation techniques to determine fair value. In instances where sufficient market activity exists, the broker-dealers or pricing services may utilize a market-based approach through which quotes from market makers are used to determine fair value. In instances where sufficient market activity may not exist or is limited, the broker-dealers or pricing services also utilize proprietary valuation models which may consider market transactions in comparable securities and the various relationships between securities in determining value and/or market characteristics such as benchmark yield curves, option-adjusted spreads, credit spreads, estimated default rates, coupon rates, anticipated timing of principal repayments, underlying collateral, and other unique security features in order to estimate the relevant cash flows, which are then discounted to calculate the fair values. Generally, short-term investments of sufficient credit quality maturing in less than 61 days are valued at amortized cost, which approximates market value. Certain investments of the Funds may, depending upon market conditions, trade in relatively thin markets and/or in markets that experience significant volatility. As a result of these conditions, the prices used by the Funds to value securities may differ from the value that would be realized if these securities were sold, and the differences could be material. Futures and options shall generally be valued on the basis of available market quotations. Swaps and other derivatives are valued daily, primarily using independent or affiliated pricing services approved by the Board of Trustees. If valuations are not available from such services or values received are deemed not representative of market value, values will be obtained from a third party broker-dealer or counterparty. Investments in other open-end investment companies are valued at such investment company’s net asset value per share as of the report date.
Securities or other assets for which market quotations are not readily available or for which market quotations do not represent the value at the time of pricing (including certain illiquid securities) are fair valued in accordance with procedures established by and under the supervision and responsibility of the Board of Trustees. Under these procedures, the Funds primarily employ a market-based approach which may use related or comparable assets or liabilities, recent transactions, market multiples, book values, and other relevant information for the investment to determine the fair value of the investment. The Funds may also use an income-based valuation approach in which the anticipated future cash flows of the investment are discounted to calculate fair value. Discounts may also be applied due to the nature or duration of any restrictions on the disposition of the investments. Valuations may be based upon current market prices of securities that are comparable in coupon, rating, maturity and industry. It is possible that the estimated values may differ significantly from the values that would have been used had a ready market for the investments existed, and such differences could be material. Trading in securities on most foreign exchanges and over-the-counter markets is normally completed before the close of the domestic market and may also take place on days when the domestic market is closed. In accordance with procedures
| 22 | J.P. MORGAN SPECIALTY FUNDS | DECEMBER 31, 2011 | ||||
Table of Contents
adopted by the Board of Trustees, the Funds apply fair value pricing on equity securities on a daily basis except for North American, Central American, South American and Caribbean equity securities held in their portfolios by utilizing the quotations of an independent pricing service, unless the Funds’ advisor determines that use of another valuation methodology is appropriate. The pricing service uses statistical analyses and quantitative models to adjust local market prices using factors such as subsequent movement and changes in the prices of indices, securities and exchange rates in other markets, in determining fair value as of the time a Fund calculates its net asset values.
Valuations reflected in this report are as of the report date. As a result, changes in valuation due to market events and/or issuer related events after the report date and prior to issuance of the report are not reflected herein.
The various inputs that are used in determining the fair value of the Funds’ investments are summarized into the three broad levels listed below.
| Ÿ | Level 1 — quoted prices in active markets for identical securities |
| Ÿ | Level 2 — other significant observable inputs (including quoted prices for similar securities, interest rates, prepayment speeds, credit risk, etc.) |
| Ÿ | Level 3 — significant unobservable inputs (including the Funds’ own assumptions in determining the fair value of investments) |
A financial instrument’s level within the fair value hierarchy is based on the lowest level of any input both individually and in aggregate that is significant to the fair value measurement. The inputs or methodology used for valuing securities are not necessarily an indication of the risk associated with investing in those securities.
The following tables represent each valuation input as presented on the Schedules of Portfolio Investments (“SOIs”) (amounts in thousands):
U.S. Core Real Estate Securities Fund
Level 1 Quoted Prices | Level 2 Other significant | Level 3 Significant | Total | |||||||||||||
Investments in Securities | ||||||||||||||||
Common Stocks | $ | 5,942 | $ | — | $ | — | $ | 5,942 | ||||||||
|
|
|
|
|
|
|
| |||||||||
Convertible Bond | ||||||||||||||||
Financials | — | 229 | — | 229 | ||||||||||||
|
|
|
|
|
|
|
| |||||||||
Corporate Bonds | ||||||||||||||||
Financials | — | 1,260 | — | 1,260 | ||||||||||||
|
|
|
|
|
|
|
| |||||||||
Preferred Stock | ||||||||||||||||
Financials | — | 1,923 | — | 1,923 | ||||||||||||
|
|
|
|
|
|
|
| |||||||||
Short-Term Investment | ||||||||||||||||
Investment Company | 435 | — | — | 435 | ||||||||||||
|
|
|
|
|
|
|
| |||||||||
Total Investments in Securities | $ | 6,377 | $ | 3,412 | $ | — | $ | 9,789 | ||||||||
|
|
|
|
|
|
|
| |||||||||
U. S. Real Estate Fund
Level 1 Quoted Prices | Level 2 Other significant | Level 3 Significant | Total | |||||||||||||
Total Investments in Securities (a) | $ | 1,409,773 | $ | — | $ | — | $ | 1,409,773 | ||||||||
|
|
|
|
|
|
|
| |||||||||
| (a) | All portfolio holdings designated as Level 1 are disclosed individually in the SOI. Please refer to the SOI for industry specifics of the portfolio holdings. |
There were no transfers between Levels 1 and 2 during the period ended December 31, 2011.
B. Offering and Organization Costs — Total offering costs of approximately $150,000 for the U.S. Core Real Estate Securities Fund paid in connection with the offering of shares of the Fund are amortized up to 12 months from the date the Fund commenced operations. Costs paid in connection with the organization of the Fund, if any, were recorded as an expense at the time it commenced operations and are included as part of Professional fees in the Statement of Operations.
C. Security Transactions and Investment Income — Investment transactions are accounted for on the trade date (the date the order to buy or sell is executed). Securities gains and losses are calculated on a specifically identified cost basis. Interest income is determined on the basis of coupon interest accrued using the effective interest method adjusted for amortization of premiums and accretion of discounts. Dividend income less foreign taxes withheld, if any, is recorded on the ex-dividend date or when a Fund first learns of the dividend.
The Funds record distributions received in excess of income from underlying investments as a reduction of cost of investments and/or realized gain. Such amounts are based on estimates if actual amounts are not available and actual amounts of income, realized gain and return of capital may
| DECEMBER 31, 2011 | J.P. MORGAN SPECIALTY FUNDS | 23 | ||||||
Table of Contents
NOTES TO FINANCIAL STATEMENTS
AS OF DECEMBER 31, 2011 (continued)
differ from the estimated amounts. The Funds adjust the estimated amounts of components of distributions (and consequently their net investment income) as necessary once the issuers provide information about the actual composition of the distributions.
D. Allocation of Income and Expenses — In calculating the net asset value per share of each class, investment income, realized and unrealized gains and losses and expenses other than class specific expenses are allocated daily to each class of shares based upon the proportion of net assets of each class at the beginning of each day. Expenses directly attributable to a fund are charged directly to that fund while the expenses attributable to more than one fund of the Trusts are allocated among the respective funds. Each class of shares bears its pro-rata portion of expenses attributable to its Fund, except that each class separately bears expenses related specifically to that class, such as distribution and shareholder servicing fees.
E. Federal Income Taxes — Each Fund is treated as a separate taxable entity for Federal income tax purposes. Each Fund’s policy is to comply with the provisions of the Internal Revenue Code of 1986, as amended (the “Code”), applicable to regulated investment companies and to distribute to shareholders all of its distributable net investment income and net realized gain on investments. Accordingly, no provision for Federal income tax is necessary. The Funds are not aware of any tax positions for which it is reasonably possible that the total amounts of unrecognized tax benefits or losses will significantly change in the next twelve months. However, the Funds’ conclusions may be subject to future review based on changes in, or the interpretation of, the accounting standards or tax laws and regulations. Each of the Funds’ Federal tax returns for the prior three fiscal years, or since inception if shorter, remains subject to examination by the Internal Revenue Service.
F. Dividends and Distributions to Shareholders — Dividends from net investment income are generally declared and paid quarterly. Dividends are declared separately for each class. No class has preferential dividend rights; differences in per share rates are due to differences in separate class expenses. Net realized capital gains, if any, are distributed at least annually. The amount of dividends and distributions from net investment income and net realized capital gains is determined in accordance with Federal income tax regulations, which may differ from accounting principles generally accepted in the United States of America. To the extent these “book/tax” differences are permanent in nature (i.e., that they result from other than timing of recognition — “temporary differences”), such amounts are reclassified within the capital accounts based on their Federal tax-basis treatment.
The following amounts were reclassified within the capital accounts (amounts in thousands):
| Paid-in-Capital | Accumulated Undistributed/ (Overdistributed) Net Investment Income | Accumulated Net Realized Gain (Loss) on Investments | ||||||||||
U.S. Core Real Estate Securities Fund | $ | — | (a) | 10 | (10 | ) | ||||||
U.S. Real Estate Fund | (17,688 | ) | 17,533 | 155 | ||||||||
| (a) | Amount rounds to less than one thousand. |
The reclassifications for the Funds relate primarily to distributions from investments in real estate investment trusts (U.S. Real Estate Fund), taxable overdistributions (U.S. Real Estate Fund) and distribution reclassifications (U.S. Core Real Estate Securities Fund).
3. Fees and Other Transactions with Affiliates
A. Investment Advisory Fee — Pursuant to the Investment Advisory Agreements, Security Capital Research & Management Incorporated (the “Advisor”) acts as the investment advisor to the Funds. The Advisor is a direct, wholly-owned subsidiary of JPMorgan Asset Management Holdings Inc., which is a wholly-owned subsidiary of JPMorgan Chase & Co. (“JPMorgan”). The Advisor supervises the investments of the Funds and for such services is paid a fee. The fee is accrued daily and paid monthly based on each Fund’s average daily net assets at an annual fee rate of 0.60%.
B. Administration Fee — Pursuant to an Administration Agreement, JPMorgan Funds Management, Inc. (the “Administrator”), an indirect, wholly owned subsidiary of JPMorgan, provides certain administration services to the Funds. In consideration of these services, the Administrator receives a fee computed daily and paid monthly at the annual rate of 0.15% of the first $25 billion of the average daily net assets of all funds in the J.P. Morgan Funds Complex (excluding certain funds of funds and money market funds) and 0.075% of the average daily net assets in excess of $25 billion of all such funds. For the period ended December 31, 2011, the annualized effective rate was 0.09% of each Fund’s average daily net assets.
The Administrator waived Administration fees as outlined in Note 3.F.
JPMorgan Chase Bank, N.A. (“JPMCB”), a wholly-owned subsidiary of JPMorgan, and successor in interest to J.P. Morgan Investor Services, Co. (“JPMIS”), serves as the Funds’ sub-administrator (the “Sub-administrator”). For its services as Sub-administrator, JPMCB receives a portion of the fees payable to the Administrator.
C. Distribution Fees — Pursuant to a Distribution Agreement, JPMorgan Distribution Services, Inc. (the “Distributor”), a wholly-owned subsidiary of JPMorgan, serves as the Trusts’ exclusive underwriter and promotes and arranges for the sale of each Fund’s shares.
The Board of Trustees has adopted a Distribution Plan (the “Distribution Plan”) for Class A, Class C and Class R2 Shares of the Funds in accordance with Rule 12b-1 under the 1940 Act. The Distribution Plan provides that each Fund shall pay distribution fees, including payments to the Distributor, at annual rates of the average daily net assets as shown in the table below:
| Class A | Class C | Class R2 | ||||||||||
U.S. Core Real Estate Securities Fund | 0.25 | % | 0.75 | % | n/a | |||||||
U.S. Real Estate Fund | 0.25 | 0.75 | 0.50 | % | ||||||||
| 24 | J.P. MORGAN SPECIALTY FUNDS | DECEMBER 31, 2011 | ||||
Table of Contents
In addition, the Distributor is entitled to receive the front-end sales charges from purchases of Class A Shares and the CDSC from the redemptions of Class C Shares and certain Class A Shares for which front-end sales charges have been waived. For the period ended December 31, 2011, the Distributor retained the following amounts (in thousands):
| Front-End Sales Charge | CDSC | |||||||
U.S. Real Estate Fund | $ | 29 | $ | 4 | ||||
D. Shareholder Servicing Fees — The Trusts, on behalf of the Funds, have entered into a Shareholder Servicing Agreement with the Distributor under which the Distributor provides certain support services to the shareholders. The Class R6 Shares do not participate in the Shareholder Servicing Agreement. For performing these services, the Distributor receives a fee that is computed daily and paid monthly equal to a percentage of the average daily net assets as shown in the table below:
| Class A | Class C | Class R2 | Class R5 | Select Class | ||||||||||||||||
U.S. Core Real Estate Securities Fund | 0.25 | % | 0.25 | % | n/a | 0.05 | % | 0.25 | % | |||||||||||
U.S. Real Estate Fund | 0.25 | 0.25 | 0.25 | % | 0.05 | 0.25 | ||||||||||||||
The Distributor has entered into shareholder services contracts with affiliated and unaffiliated financial intermediaries who provide shareholder services and other related services to their clients or customers who invest in the Funds under which the Distributor will pay all or a portion of such fees earned to financial intermediaries for performing such services.
The Distributor waived Shareholder Servicing fees as outlined in Note 3.F.
E. Custodian and Accounting Fees — JPMCB provides portfolio custody and accounting services for the Funds. The amounts paid directly to JPMCB by the Funds for custody and accounting services are included in Custodian and accounting fees in the Statement of Operations. The custodian fees may be reduced by credits earned by the Funds, based on uninvested cash balances held by the custodian. Such earnings credits are presented separately in the Statement of Operations.
Interest expense, if any, paid to the custodian related to cash overdrafts is included in Interest expense to affiliates in the Statement of Operations.
F. Waivers and Reimbursements — The Administrator and Distributor as shareholder servicing agent have each contractually agreed to waive fees and/or reimburse the Funds to the extent that total annual operating expenses (excluding acquired fund fees and expenses, dividend expense related to short sales, interest, taxes, extraordinary expenses and expenses related to the Board of Trustees’ deferred compensation plan) exceed the percentages of the Funds’ respective average daily net assets as shown in the table below:
| Class A | Class C | Class R2 | Class R5 | Class R6 | Select Class | |||||||||||||||||||
U.S. Core Real Estate | 1.18 | % | 1.68 | % | n/a | 0.73 | % | 0.68 | % | 0.93 | % | |||||||||||||
U.S. Real Estate Fund | 1.18 | 1.68 | 1.43 | % | 0.73 | n/a | 0.93 | |||||||||||||||||
The contractual expense limitation agreements were in effect for the period ended December 31, 2011. The expense limitation percentages in the table above are in place until at least August 31, 2012 for the U.S. Core Real Estate Securities Fund and April 30, 2012 for the U.S. Real Estate Fund.
For the period ended December 31, 2011, the Funds’ service providers waived fees and/or reimbursed expenses for each of the Funds as follows (amounts in thousands). None of these parties expects the Funds to repay any such waived fees and reimbursed expenses in future years.
| Contractual Waivers | ||||||||||||||||
| Administration | Shareholder Servicing | Total | Contractual Reimbursements | |||||||||||||
U. S. Core Real Estate Securities Fund | $ | 1 | $ | — | $ | 1 | $ | 126 | ||||||||
U.S. Real Estate Fund | 1,256 | 771 | 2,027 | 939 | ||||||||||||
Additionally, the Funds may invest in one or more money market funds advised by the Advisor or its affiliates. The Administrator and Distributor as shareholder servicing agent waive fees in an amount sufficient to offset the respective fees each charges to the affiliated money market fund on the Funds’ investment in such affiliated money market fund. A portion of the waiver is voluntary.
The amount of waivers resulting from investments in the money market funds for the period ended December 31, 2011 was as follows (amounts in thousands):
U.S. Real Estate Fund | $ | 42 |
G. Other — Certain officers of the Trusts are affiliated with the Advisor, the Administrator and the Distributor. Such officers, with the exception of the Chief Compliance Officer, receive no compensation from the Funds for serving in their respective roles.
The Board of Trustees appointed a Chief Compliance Officer to the Funds in accordance with federal securities regulations. Each Fund, along with other affiliated funds, makes reimbursement payments, on a pro-rata basis, to the Administrator for a portion of the fees associated with the Office of the Chief Compliance Officer. Such fees are included in Trustees’ and Chief Compliance Officer’s fees in the Statement of Operations.
| DECEMBER 31, 2011 | J.P. MORGAN SPECIALTY FUNDS | 25 | ||||||
Table of Contents
NOTES TO FINANCIAL STATEMENTS
AS OF DECEMBER 31, 2011 (continued)
The Trust adopted a Trustee Deferred Compensation Plan (the “Plan”) which allows the Independent Trustees to defer the receipt of all or a portion of compensation related to performance of their duties as a Trustee. The deferred fees are invested in various J.P. Morgan Funds until distribution in accordance with the Plan.
During the period ended December 31, 2011, the Funds may have purchased securities from an underwriting syndicate in which the principal underwriter or members of the syndicate are affiliated with the Advisor.
The Fund may use related party broker/dealers. For the period ended December 31, 2011, the Funds did not incur any brokerage commissions with broker/dealers affiliated with the Advisor.
The Securities and Exchange Commission (“SEC”) has granted an exemptive order permitting the Funds to engage in principal transactions with J.P. Morgan Securities, Inc., an affiliated broker, involving taxable money market instruments subject to certain conditions.
4. Investment Transactions
During the period ended December 31, 2011, purchases and sales of investments (excluding short-term investments) were as follows (amounts in thousands):
| Purchases (excluding U.S. Government) | Sales (excluding U.S. Government) | |||||||
U.S. Core Real Estate Securities Fund | $ | 9,474 | $ | 338 | ||||
U.S. Real Estate Fund | 1,023,806 | 1,103,397 | ||||||
During the period ended December 31 2011, there were no purchases or sales of U.S. Government securities.
5. Federal Income Tax Matters
For Federal income tax purposes, the cost and unrealized appreciation (depreciation) in value of the investment securities at December 31, 2011, were as follows (amounts in thousands):
| Aggregate Cost | Gross Unrealized Appreciation | Gross Unrealized Depreciation | Net Unrealized Appreciation (Depreciation) | |||||||||||||
U.S. Core Real Estate Securities Fund | $ | 9,560 | $ | 280 | $ | 51 | $ | 229 | ||||||||
U.S. Real Estate Fund | 1,039,937 | 400,192 | 30,356 | 369,836 | ||||||||||||
The difference between book and tax basis appreciation (depreciation) on investments is primarily attributed to wash sale loss deferrals.
The tax character of distributions paid during the period ended December 31, 2011 were as follows (amounts in thousands):
| Total Distributions Paid From: | ||||||||||||||||
| Ordinary Income | Net Long-Term Capital Gains | Return of Capital | Total Distributions Paid | |||||||||||||
U.S. Core Real Estate Securities Fund | $ | 57 | $ | 13 | $ | 10 | $ | 80 | ||||||||
U.S. Real Estate Fund | 33,403 | — | — | 33,403 | ||||||||||||
The tax character of distributions paid during the fiscal period December 31, 2010 was as follows (amounts in thousands):
| Total Distributions Paid From: | ||||||||||||
Ordinary Income | Return Of Capital | Total Distributions Paid | ||||||||||
U.S. Real Estate Fund | $ | 14,189 | $ | 16,421 | $ | 30,610 | ||||||
At December 31, 2011, the components of net assets (excluding paid-in-capital) on a tax basis were as follows (amounts in thousands):
Current Distributable Income | Current Distributable Long-Term Capital Gain or (Tax Basis Capital Loss Carryover) | Unrealized Appreciation (Depreciation) | ||||||||||
U.S. Core Real Estate Securities Fund | $ | — | $ | — | $ | 229 | ||||||
U.S. Real Estate Fund | — | (59,116 | ) | 369,836 | ||||||||
The cumulative timing differences primarily consist of trustee deferred compensation, distribution payable (U.S. Core Real Estate Securities Fund), deferred dividends from investments in real estate investment trusts, post-October loss deferrals (U.S. Real Estate Fund) and wash sale loss deferrals.
| 26 | J.P. MORGAN SPECIALTY FUNDS | DECEMBER 31, 2011 | ||||
Table of Contents
Under the Regulated Investment Company Modernization Act of 2010 (the “Act”), net capital losses recognized by each Fund after December 31, 2010, may get carried forward indefinitely, and retain their character as short-term and/or long term losses. Prior to the Act, pre-enactment net capital losses incurred by each Fund were carried forward for eight years and treated as short-term losses. The Act requires that post-enactment net capital losses be used before pre-enactment net capital losses.
As of December 31, 2011, the Funds did not have post-enactment net capital loss carryforwards.
As of December 31, 2011, the U.S. Real Estate Fund had pre-enactment net capital loss carryforwards of approximately $59,116,000 expiring during 2017 which are available to offset future realized gains.
During the year ended December 31, 2011, the U.S. Real Estate Fund utilized capital loss carryforwards of approximately $116,564,000.
Net capital losses incurred after October 31 and within the taxable year are deemed to arise on the first business day of the next taxable year. For the year ended December 31, 2011, the U.S. Real Estate Fund deferred to January 1, 2012 post-October short-term capital losses of approximately $4,312,000 and post-October long-term capital losses of approximately $7,581,000.
6. Borrowings
The Funds rely upon an exemptive order (“Order”) permitting the establishment and operation of an Interfund Lending Facility (“Facility”). The Facility allows the Funds to directly lend and borrow money to or from any other fund relying upon the Order at rates beneficial to both the borrowing and lending funds. Advances under the Facility are taken primarily for temporary or emergency purposes, including the meeting of redemption requests that otherwise might require the untimely disposition of securities, and are subject to each Fund’s borrowing restrictions. The Interfund Loan Rate is determined, as specified in the Order, by averaging the current repurchase agreement rate and the current bank loan rate. The Order was granted to JPM II and may be relied upon by the Funds because they are investment companies in the same “group of investment companies” (as defined in Section 12 (d)(1)(G) of the 1940 Act).
In addition, the Trusts and JPMCB have entered into a financing arrangement. Under this arrangement, JPMCB provides an unsecured, uncommitted credit facility in the aggregate amount of $100 million to certain of the J.P. Morgan Funds, including the Funds. Advances under the arrangement are taken primarily for temporary or emergency purposes, including the meeting of redemption requests that otherwise might require the untimely disposition of securities, and are subject to each Fund’s borrowing restrictions. Interest on borrowings is payable at a rate determined by JPMCB at the time of borrowing. This agreement has been extended until November 12, 2012.
The Funds had no borrowings outstanding from another fund or from the unsecured, uncommitted credit facility at December 31, 2011. Average borrowings from the Facility for the year ended December 31, 2011, were as follows (amounts in thousands):
Average Borrowings | Number of Days Outstanding | Interest Paid | ||||||||||
U.S. Real Estate Fund | $ | 22,657 | 1 | — | (a) | |||||||
| (a) | Amount rounds to less than one thousand. |
Interest expense paid, if any, as a result of borrowings from another fund or from the unsecured, uncommitted credit facility is included in Interest expense to affiliates in the Statement of Operations.
7. Risks, Concentrations and Indemnifications
In the normal course of business, the Funds enter into contracts that contain a variety of representations which provide general indemnifications. Each Fund’s maximum exposure under these arrangements is unknown, as this would involve future claims that may be made against each Fund that have not yet occurred. However, based on experience, the Funds expect the risk of loss to be remote.
One or more affiliates of the Advisor have investment discretion with respect to their clients’ holdings in the Funds, which collectively represent a significant portion of the Funds’ assets. Significant shareholder transactions, if any, may impact the Fund’s performance.
In addition, U.S. Real Estate Fund has a shareholder, which is an account maintained by a financial intermediary on behalf of its clients, that owns a significant portion of the Fund’s outstanding shares. Additionally, U.S. Core Real Estate Securities Fund has several shareholders, that own a significant portion of the Fund’s outstanding shares.
Because the Funds may invest a substantial portion of its assets in REITs, the Fund may be subject to certain risks similar to those associated with direct investments in real estate. REITs may be affected by changes in the value of their underlying properties and by defaults by tenants. REITs depend generally on their ability to generate cash flow to make distributions to shareholders, and certain REITs have self-liquidation provisions by which mortgages held may be paid in full and distributions of capital returns may be made at any time.
The U.S. Core Real Estate Securities Fund is subject to interest rate and credit risk. The value of debt securities may decline as interest rates increase. The U.S. Core Real Estate Securities Fund could lose money if the issuer of a fixed income security is unable to pay interest or repay principal when it is due. The ability of the issuers of debt to meet their obligations may be affected by the economic and political developments in a specific industry or region.
| DECEMBER 31, 2011 | J.P. MORGAN SPECIALTY FUNDS | 27 | ||||||
Table of Contents
REPORT OF INDEPENDENT REGISTERED PUBLIC ACCOUNTING FIRM
To the Trustees of JPMorgan Trust I and JPMorgan Trust II and Shareholders of JPMorgan U.S. Real Estate Fund and Security Capital U.S. Core Real Estate Securities Fund:
In our opinion, the accompanying statements of assets and liabilities, including the schedules of portfolio investments, and the related statements of operations and of changes in net assets and the financial highlights present fairly, in all material respects, the financial position of JPMorgan U.S. Real Estate Fund (a separate Fund of JPMorgan Trust II) at December 31, 2011, the results of its operations for the year then ended, the changes in its net assets for each of the two years in the period then ended and the financial highlights for each of the five years in the period then ended, and the financial position of Security Capital U.S. Core Real Estate Securities Fund (a separate Fund of JPMorgan Trust I) (hereafter collectively referred to as the “Funds”) at December 31, 2011, and the results of its operations, the changes in its net assets and the financial highlights for the period August 31, 2011 (commencement of operations) through December 31, 2011 in conformity with accounting principles generally accepted in the United States of America. These financial statements and financial highlights (hereafter referred to as “financial statements”) are the responsibility of the Funds’ management. Our responsibility is to express an opinion on these financial statements based on our audits. We conducted our audits of these financial statements in accordance with the standards of the Public Company Accounting Oversight Board (United States). Those standards require that we plan and perform the audit to obtain reasonable assurance about whether the financial statements are free of material misstatement. An audit includes examining, on a test basis, evidence supporting the amounts and disclosures in the financial statements, assessing the accounting principles used and significant estimates made by management, and evaluating the overall financial statement presentation. We believe that our audits, which included confirmation of securities at December 31, 2011 by correspondence with the custodian, provide a reasonable basis for our opinion.
PricewaterhouseCoopers LLP
New York, New York
February 29, 2012
| 28 | J.P. MORGAN SPECIALTY FUNDS | DECEMBER 31, 2011 | ||||
Table of Contents
(Unaudited)
The Funds’ Statement of Additional Information includes additional information about the Funds’ Trustees and is available, without charge, upon request by calling 1-800-480-4111 or on the J.P. Morgan Funds’ website at www.jpmorganfunds.com.
Name (Year of Birth); Positions With the Funds (1) | Principal Occupations During Past 5 Years | Number of Portfolios in Fund Complex Overseen by Trustee (2) | Other Directorships Held Outside Fund Complex During Past 5 Years | |||
Independent Trustees | ||||||
| William J. Armstrong (1941); Trustee of Trust since 2005; Trustee of heritage J.P. Morgan Funds since 1987. | Retired; CFO and Consultant, EduNeering, Inc. (internet business education supplier) (2000-2001); Vice President and Treasurer, Ingersoll-Rand Company (manufacturer of industrial equipment) (1972-2000). | 154 | None. | |||
| John F. Finn (1947); Trustee of Trust since 2005; Trustee of heritage One Group Mutual Funds since 1998. | Chairman (1985-present), President and Chief Executive Officer, Gardner, Inc. (supply chain management company serving industrial and consumer markets) (1974-present). | 154 | Director, Cardinal Health, Inc. (CAH) (1994-present); Director, Greif, Inc. (GEF) (industrial package products and services) (2007-present). | |||
| Dr. Matthew Goldstein (1941); Trustee of Trust since 2005; Trustee of heritage J.P. Morgan Funds since 2003. | Chancellor, City University of New York (1999-present); President, Adelphi University (New York) (1998-1999). | 154 | Director, New Plan Excel (NXL) (1999-2005); Director, National Financial Partners (NFP) (2003-2005); Director, Bronx-Lebanon Hospital Center; Director, United Way of New York City (2002-present). | |||
| Robert J. Higgins (1945); Trustee of Trust since 2005; Trustee of heritage J.P. Morgan Funds since 2002. | Retired; Director of Administration of the State of Rhode Island (2003-2004); President — Consumer Banking and Investment Services, Fleet Boston Financial (1971-2001). | 154 | None. | |||
| Peter C. Marshall (1942); Trustee of Trust since 2005; Trustee of heritage One Group Mutual Funds since 1985. | Self-employed business consultant (2002-present). | 154 | Director, Center for Communication, Hearing, and Deafness (1990-present). | |||
| Marilyn McCoy* (1948); Trustee of Trust since 2005; Trustee of heritage One Group Mutual Funds since 1999. | Vice President of Administration and Planning, Northwestern University (1985-present). | 154 | Trustee, Carleton College (2003-present). | |||
| William G. Morton, Jr. (1937); Trustee of Trust since 2005; Trustee of heritage J.P. Morgan Funds since 2003. | Retired; Chairman Emeritus (2001-2002), and Chairman and Chief Executive Officer, Boston Stock Exchange (1985-2001). | 154 | Director, Radio Shack Corp. (1987-2008); Trustee, Stratton Mountain School (2001-present). | |||
| Robert A. Oden, Jr. (1946); Trustee of Trust since 2005; Trustee of heritage One Group Mutual Funds since 1997. | Retired; President, Carleton College (2002-2010); President, Kenyon College (1995-2002). | 154 | Trustee, American University in Cairo (1999-present); Trustee, Carleton College (2002-2010). | |||
| Fergus Reid, III (1932); Trustee of Trust (Chairman) since 2005; Trustee (Chairman) of heritage J.P. Morgan Funds since 1987. | Chairman, Joe Pietryka, Inc. (formerly Lumelite Corporation) (plastics manufacturing) (2003-present); Chairman and Chief Executive Officer, Lumelite Corporation (1985-2002). | 154 | Trustee, Morgan Stanley Funds (105 portfolios) (1992-present). | |||
| DECEMBER 31, 2011 | J.P. MORGAN SPECIALTY FUNDS | 29 | ||||||
Table of Contents
TRUSTEES
(Unaudited) (continued)
Name (Year of Birth); Positions With the Funds (1) | Principal Occupations During Past 5 Years | Number of Complex Overseen by Trustee (2) | Other Directorships Held Outside Fund Complex During Past 5 Years | |||
Independent Trustees (continued) | ||||||
| Frederick W. Ruebeck (1939); Trustee of Trust since 2005; Trustee of heritage One Group Mutual Funds since 1994. | Consultant (2000-present); Advisor, JP Greene & Associates, LLC (broker-dealer) (2000-2009); Chief Investment Officer, Wabash College (2004-present); Director of Investments, Eli Lilly and Company (pharmaceuticals) (1988-1999). | 154 | Trustee, Wabash College (1988-present); Chairman, Indianapolis Symphony Orchestra Foundation (1994-present). | |||
| James J. Schonbachler (1943); Trustee of Trust since 2005; Trustee of heritage J.P. Morgan Funds since 2001. | Retired; Managing Director of Bankers Trust Company (financial services) (1968-1998). | 154 | None. | |||
Interested Trustees | ||||||
| Frankie D. Hughes** (1952), Trustee of Trust since 2008. | President and Chief Investment Officer, Hughes Capital Management, Inc. (fixed income asset management) (1993-present). | 154 | Trustee, The Victory Portfolios (2000-2008). | |||
| Leonard M. Spalding, Jr.*** (1935); Trustee of Trust since 2005; Trustee of heritage J.P. Morgan Funds since 1998. | Retired; Chief Executive Officer, Chase Mutual Funds (investment company) (1989-1998); President and Chief Executive Officer, Vista Capital Management (investment management) (1990-1998); Chief Investment Executive, Chase Manhattan Private Bank (investment management) (1990-1998). | 154 | Director, Glenview Trust Company, LLC (2001-present); Trustee, St. Catharine College (1998-present); Trustee, Bellarmine University (2000-present); Director, Springfield-Washington County Economic Development Authority (1997-present); Trustee, Catholic Education Foundation (2005-present). | |||
| (1) | Each Trustee serves for an indefinite term, subject to the Trust’s current retirement policy, which is age 75 for all Trustees, except that the Board has determined Messrs. Reid and Spalding should continue to serve until December 31, 2012. |
| (2) | A Fund Complex means two or more registered investment companies that hold themselves out to investors as related companies for purposes of investment and investor services or have a common investment advisor or have an investment advisor that is an affiliated person of the investment advisor of any of the other registered investment companies. The J.P. Morgan Funds Complex for which the Board of Trustees serves currently includes eleven registered investment companies (154 funds). |
| * | Ms. McCoy has served as Vice President of Administration and Planning for Northwestern University since 1985. William M. Daley was the Head of Corporate Responsibility for JPMorgan Chase & Co. prior to January 2011 and served as a member of the Board of Trustees of Northwestern University from 2005 through 2010. JPMIM, the Funds’ investment advisor, is a wholly-owned subsidiary of JPMorgan Chase & Co. Three other members of the Board of Trustees of Northwestern University are executive officers of registered investment advisors (not affiliated with JPMorgan) that are under common control with subadvisors to certain J.P. Morgan Funds. |
| ** | Ms. Hughes is treated as an “interested person” based on the portfolio holdings of clients of Hughes Capital Management, Inc. |
| *** | Mr. Spalding is treated as an “interested person” due to his ownership of JPMorgan Chase stock. |
The contact address for each of the Trustees is 270 Park Avenue, New York, NY 10017.
| 30 | J.P. MORGAN SPECIALTY FUNDS | DECEMBER 31, 2011 | ||||
Table of Contents
(Unaudited)
Name (Year of Birth), Positions Held with the Trust (Since) | Principal Occupations During Past 5 Years | |
| Patricia A. Maleski (1960), President and Principal Executive Officer (2010) | Managing Director, J.P. Morgan Investment Management Inc. and Chief Administrative Officer, J.P. Morgan Funds and Institutional Pooled Vehicles since 2010; previously, Treasurer and Principal Financial Officer of the Trusts from 2008 to 2010; previously, Head of Funds Administration and Board Liaison, J.P. Morgan Funds prior to 2010. Ms. Maleski has been with JPMorgan Chase & Co. since 2001. | |
| Joy C. Dowd (1972), Treasurer and Principal Financial Officer (2010) | Assistant Treasurer of the Trusts from 2009 to 2010; Executive Director, JPMorgan Funds Management, Inc. from February 2011; Vice President, JPMorgan Funds Management, Inc. from December 2008 to February 2011; prior to joining JPMorgan Chase, Ms. Dowd worked in MetLife’s investments audit group from 2005 through 2008. | |
| Frank J. Nasta (1964), Secretary (2008) | Managing Director and Associate General Counsel, JPMorgan Chase since 2008; Previously, Director, Managing Director, General Counsel and Corporate Secretary, J. & W. Seligman & Co. Incorporated; Secretary of each of the investment companies of the Seligman Group of Funds and Seligman Data Corp.; Director and Corporate Secretary, Seligman Advisors, Inc. and Seligman Services, Inc. | |
| Stephen M. Ungerman (1953), Chief Compliance Officer (2005) | Managing Director, JPMorgan Chase & Co.; Mr. Ungerman has been with JPMorgan Chase & Co. since 2000. | |
| Paul L. Gulinello (1950), AML Compliance Officer (2005) | Vice President and Anti Money Laundering Compliance Officer for JPMorgan Asset Management Americas, additionally responsible for privacy, personal trading and Code of Ethics compliance since 2004. Mr. Gulinello has been with JPMorgan Chase & Co. since 1972. | |
Elizabeth A. Davin (1964), Assistant Secretary (2005)* | Vice President and Assistant General Counsel, JPMorgan Chase since 2005; Senior Counsel, JPMorgan Chase (formerly Bank One Corporation) from 2004 to 2005. | |
| Jessica K. Ditullio (1962), Assistant Secretary (2005)* | Executive Director and Assistant General Counsel, JPMorgan Chase since February 2011; Ms. Ditullio has served as an attorney with various titles for JPMorgan Chase (formerly Bank One Corporation) since 1990. | |
| John T. Fitzgerald (1975), Assistant Secretary (2008) | Executive Director and Assistant General Counsel, JPMorgan Chase since February 2011; formerly, Vice President and Assistant General Counsel, JPMorgan Chase from 2005 until February 2011. | |
| Carmine Lekstutis (1980) Assistant Secretary (2011) | Vice President and Assistant General Counsel, JPMorgan Chase since 2011; Associate, Skadden, Arps, Slate, Meagher & Flom LLP (law firm) from 2006 to 2011. | |
| Gregory S. Samuels (1980) Assistant Secretary (2010) | Vice President and Assistant General Counsel, JPMorgan Chase since 2010; Associate, Ropes & Gray (law firm) from 2008 to 2010; Associate, Clifford Chance LLP (law firm) from 2005 to 2008. | |
| Brian L. Duncan (1965), Assistant Treasurer (2008)* | Vice President, JPMorgan Funds Management, Inc. since June 2007; prior to joining JPMorgan Chase, Mr. Duncan worked for Penn Treaty American Corporation as Vice President and Controller from 2004 through 2007. | |
| Jeffrey D. House (1972), Assistant Treasurer (2006)* | Vice President, JPMorgan Funds Management, Inc. since July 2006. | |
| Laura S. Melman (1966), Assistant Treasurer (2006) | Executive Director, JPMorgan Funds Management, Inc. since February 2011, responsible for Taxation; Vice President, JPMorgan Funds Management, Inc. from August 2006 to February 2011, responsible for Taxation. | |
| Joseph Parascondola (1963), Assistant Treasurer (2011) | Vice President, JPMorgan Funds Management, Inc. since August 2006. | |
| Matthew J. Plastina (1970), Assistant Treasurer (2011) | Vice President, JPMorgan Funds Management, Inc. since August 2010; prior to August 2010, Vice President and Controller, Legg Mason Global Asset Management. | |
| Jeffery Reedy (1973), Assistant Treasurer (2011)* | Vice President, JPMorgan Funds Management, Inc. since February 2006. | |
The contact address for each of the officers, unless otherwise noted, is 270 Park Avenue, New York, NY 10017.
| * | The contact address for the officer is 1111 Polaris Parkway, Columbus, OH 43240. |
| DECEMBER 31, 2011 | J.P. MORGAN SPECIALTY FUNDS | 31 | ||||||
Table of Contents
SCHEDULE OF SHAREHOLDER EXPENSES
(Unaudited)
Hypothetical $1,000 Investment
As a shareholder of the Fund, you incur two types of costs: (1) transaction costs, including sales charges (loads) on purchase payments and redemption fees and (2) ongoing costs, including investment advisory fees, administration fees, distribution fees and other Fund expenses. The examples below are intended to help you understand your ongoing costs (in dollars) of investing in the Fund and to compare these costs with the ongoing costs of investing in other mutual funds. The examples assume that you had a $1,000 investment in the Class at the beginning of the reporting period, July 1, 2011, and continued to hold your shares at the end of the reporting period, December 31, 2011.
Actual Expenses
For each Class of the Fund in the table below, the first line provides information about actual account values and actual expenses. You may use the information in this line, together with the amount you invested, to estimate the expenses that you paid over the period. Simply divide your account value by $1,000 (for example, an $8,600 account value divided by
$1,000 = 8.6), then multiply the result by the number in the first line of each Class under the heading entitled “Expenses Paid During” to estimate the expenses you paid on your account during this period.
Hypothetical Example for Comparison Purposes
The second line of each Class in the table below provides information about hypothetical account values and hypothetical expenses based on the Class’ actual expense ratio and an assumed rate of return of 5% per year before expenses, which is not the Class’ actual return. The hypothetical account values and expenses may not be used to estimate the actual ending account balance or expenses you paid for the period. You may use this information to compare the ongoing costs of investing in the Class of the Fund and other funds. To do so, compare this 5% hypothetical example with the 5% hypothetical examples that appear in the shareholder reports of the other funds. Please note that the expenses shown in the table are meant to highlight your ongoing costs only and do not reflect any transaction costs, such as sales charges (loads) or redemption fees. Therefore, the second line for each Class in the table is useful in comparing ongoing costs only, and will not help you determine the relative total costs of owning different funds. In addition, if these transaction costs were included, your costs would have been higher. The examples also assume all dividends and distributions have been reinvested.
| Beginning Account Value, July 1, 2011 | Ending Account Value December 31, 2011 | Expenses Paid During July 1, 2011 to December 31, 2011 | Annualized Expense Ratio | |||||||||||||
U.S. Core Real Estate Securities Fund | ||||||||||||||||
Class A | ||||||||||||||||
Actual* | $ | 1,000.00 | $ | 1,008.30 | $ | 3.96 | 1.18 | % | ||||||||
Hypothetical** | 1,000.00 | 1,019.26 | 6.01 | 1.18 | ||||||||||||
Class C | ||||||||||||||||
Actual* | 1,000.00 | 1,006.90 | 5.63 | 1.68 | ||||||||||||
Hypothetical** | 1,000.00 | 1,016.74 | 8.54 | 1.68 | ||||||||||||
Class R5 | ||||||||||||||||
Actual* | 1,000.00 | 1,010.10 | 2.45 | 0.73 | ||||||||||||
Hypothetical** | 1,000.00 | 1,021.53 | 3.72 | 0.73 | ||||||||||||
Class R6 | ||||||||||||||||
Actual* | 1,000.00 | 1,010.20 | 2.28 | 0.68 | ||||||||||||
Hypothetical** | 1,000.00 | 1,021.78 | 3.47 | 0.68 | ||||||||||||
Select | ||||||||||||||||
Actual* | 1,000.00 | 1,009.70 | 3.12 | 0.93 | ||||||||||||
Hypothetical** | 1,000.00 | 1,020.52 | 4.74 | 0.93 | ||||||||||||
U.S. Real Estate Fund | ||||||||||||||||
Class A | ||||||||||||||||
Actual** | 1,000.00 | 970.70 | 5.86 | 1.18 | ||||||||||||
Hypothetical** | 1,000.00 | 1,019.26 | 6.01 | 1.18 | ||||||||||||
Class C | ||||||||||||||||
Actual** | 1,000.00 | 968.10 | 8.33 | 1.68 | ||||||||||||
Hypothetical** | 1,000.00 | 1,016.74 | 8.54 | 1.68 | ||||||||||||
Class R2 | ||||||||||||||||
Actual** | 1,000.00 | 969.10 | 7.10 | 1.43 | ||||||||||||
Hypothetical** | 1,000.00 | 1,018.00 | 7.27 | 1.43 | ||||||||||||
| 32 | J.P. MORGAN SPECIALTY FUNDS | DECEMBER 31, 2011 | ||||
Table of Contents
| Beginning Account Value, July 1, 2011 | Ending Account Value December 31, 2011 | Expenses Paid During July 1, 2011 to December 31, 2011 | Annualized Expense Ratio | |||||||||||||
U.S. Real Estate Fund (continued) | ||||||||||||||||
Class R5 | ||||||||||||||||
Actual** | $ | 1,000.00 | $ | 972.40 | $ | 3.63 | 0.73 | % | ||||||||
Hypothetical** | 1,000.00 | 1,021.53 | 3.72 | 0.73 | ||||||||||||
Select | ||||||||||||||||
Actual** | 1,000.00 | 971.40 | 4.62 | 0.93 | ||||||||||||
Hypothetical** | 1,000.00 | 1,020.52 | 4.74 | 0.93 | ||||||||||||
| * | Expenses are equal to the Fund’s annualized expense ratio, multiplied by the average account value over the period, multiplied by 122/365 (to reflect the actual period). Actual expenses reflect a beginning account value as of August 31, 2011 (commencement of operations). |
| ** | Expenses are equal to the Funds’ annualized expense ratios, multiplied by the average account value over the period, multiplied by 184/365 (to reflect the one-half year period). |
| DECEMBER 31, 2011 | J.P. MORGAN SPECIALTY FUNDS | 33 | ||||||
Table of Contents
BOARD APPROVAL OF INVESTMENT ADVISORY AGREEMENTS
(Unaudited)
The Board of Trustees meets regularly throughout the year and considers factors that are relevant to its annual consideration of investment advisory agreements at each meeting. The Board of Trustees has established various standing committees, composed of Trustees with diverse backgrounds, to which the Board of Trustees has assigned specific subject matter responsibilities to further enhance the effectiveness of the Board’s oversight and decision making. The Board of Trustees and its investment subcommittees (money market and alternative products, equity, and fixed income) also meet for the specific purpose of considering approvals of initial advisory agreements for new funds. At their May 2011 in-person meeting, the Trustees, including a majority of the Trustees who are not “interested persons” (as defined in the 1940 Act) of any party to the initial advisory agreement or any of their affiliates (“Independent Trustees”), approved the initial investment advisory agreement (the “New Advisory Agreement”) for the Security Capital U.S. Core Real Estate Securities Fund (the “Fund”).
In connection with the approval of the New Advisory Agreement, the Trustees reviewed written materials prepared by the Advisor and received oral presentations from Advisor personnel. Prior to voting, the Trustees reviewed the proposed approval of the New Advisory Agreement with representatives of the Advisor and with counsels to the Trust and independent Trustees and received a memorandum from independent counsel to the Trustees discussing the legal standards for their consideration of the proposed approvals. The Trustees also discussed the proposed approvals in an executive session with counsels to the Trust and independent Trustees at which no representatives of the Advisor were present. Set forth below is a summary of the material factors evaluated by the Trustees in determining whether to approve the New Advisory Agreement.
In their deliberations, there was a comprehensive consideration of the information received by the Trustees. Each Trustee attributed different weights to the various factors and no factor alone was considered determinative. The Trustees determined that the proposed compensation to be received by the Advisor from the Fund under the New Advisory Agreement was fair and reasonable and that the initial approval of the New Advisory Agreement was in the best interests of the Fund and its potential shareholders.
The factors summarized below were considered and discussed by the Trustees in reaching their conclusions:
Nature, Extent and Quality of Services Provided by the Advisor
In connection with the approval of the New Advisory Agreement, the Trustees considered the materials furnished specifically in connection with these approval items, as well as other relevant information furnished throughout the year and the Trustees’ experience with the Advisor and its services. The Trustees considered the background and experience of the Advisor’s senior management and investment personnel, as
well as the qualifications, backgrounds and responsibilities of the portfolio management team primarily responsible for the day-to-day management of the Fund. The Trustees also considered the investment strategy and investment process for the Fund, and the infrastructure supporting the portfolio management team. In addition, the Trustees considered information about the structure and distribution strategy of the Fund, how it fits within the J.P. Morgan Funds lineup, and how it will be positioned against identified peers.
The Board of Trustees also considered its knowledge of the nature and quality of the services provided by the Advisor to the J.P. Morgan Funds gained from their experience as Trustees of the J.P. Morgan Funds. In addition, they considered the overall reputation and capabilities of the Advisor and its affiliates, the commitment of the Advisor to provide high quality service to the J.P. Morgan Funds, their overall confidence in the Advisor’s integrity and the Advisor’s responsiveness to questions or concerns raised by them, including the Advisor’s willingness to consider and implement organizational and operational changes designed to improve investment results and the services provided to the J.P. Morgan Funds.
Based on these considerations and other factors, the Trustees concluded that they were satisfied with the nature, extent and quality of the investment advisory services to be provided to the Fund by the Advisor.
Fall-Out Benefits
The Trustees reviewed information regarding potential “fallout” or ancillary benefits received by the Advisor and its affiliates as a result of their relationship with the J.P. Morgan Funds. The Board considered that the Advisor does not currently use third-party soft dollar arrangements with respect to securities transactions it executes for the Fund.
The Trustees also considered that JPMorgan Funds Management, Inc. (“JPMFM”) and JPMorgan Distribution Services, Inc. (“JPMDS”), affiliates of the Advisor, will earn fees from the Fund for providing administrative and shareholder services. The Trustees also considered the payments of Rule 12b-1 fees to JPMDS, which also acts as the Fund’s distributor and that these fees are in turn generally paid to financial intermediaries that sell the Fund, including financial intermediaries that are affiliates of the Advisor. The Trustees also considered the fees paid to JPMorgan Chase Bank, N.A. (“JPMCB”) for custody and fund accounting and other related services. The Trustees also considered that any fall-out benefits would be comparable to those related to the other actively managed funds in the complex and were consistent with the process of approving advisory agreements for new funds.
Economies of Scale
The Trustees noted that the proposed investment advisory fee schedule for the Fund does not contain breakpoints. The Trust-
| 34 | J.P. MORGAN SPECIALTY FUNDS | DECEMBER 31, 2011 | ||||
Table of Contents
ees considered whether it would be appropriate to add advisory fee breakpoints and the Trustees concluded that the current fee structure was reasonable in light of the fee waivers and expense limitations that JPMFM and JPMDS have in place that serve to limit the overall net expense ratio at competitive levels. The Trustees also recognized that the fee schedule for the administrative services provided by JPMFM does include a fee breakpoint, which is tied to the overall level of non-money market fund assets excluding certain funds-of-funds, as applicable, advised by the Advisor, and that the Fund would benefit from that breakpoint. In addition, the Trustees found that, with the adoption of a contractual cap on total expenses, shareholders would benefit from expected economies of scale that would be expected to result from the growth of assets before that growth occurred.
Investment Performance
The Trustees considered the Fund’s investment strategy and process, portfolio management team and competitive positioning against identified peer funds, and concluded that the prospects for competitive future performance were acceptable.
Advisory Fees and Expense Ratios
The Trustees considered the contractual advisory fee rate that will be paid by the Fund to the Advisor and compared that rate to the information prepared by Lipper concerning management fee rates paid by other funds in the same Lipper category as the Fund. The Trustees recognized that Lipper reported the Fund’s management fee rate as the combined contractual advisory fee and the administration fee rates. The Trustees also reviewed information about other expenses and the expense ratios for the Fund. The Trustees considered the fee waiver and/or expense reimbursement arrangements proposed for the Fund and considered the net advisory fee rate after taking into account any waivers and/or reimbursements. The Trustees recognized that it is difficult to make comparisons of advisory fees because there are variations in the services that are included in the fees paid by other funds.
The Trustees noted that the Fund’s estimated net advisory fees and total expenses, which were considered on a class-by-class basis, were in line with identified peer funds. After considering the factors identified above, in light of the information, the Trustees concluded that the advisory fees were reasonable.
| DECEMBER 31, 2011 | J.P. MORGAN SPECIALTY FUNDS | 35 | ||||||
Table of Contents
BOARD APPROVAL OF INVESTMENT ADVISORY AGREEMENTS
(Unaudited) (continued)
The Board of Trustees meets regularly throughout the year and considers factors that are relevant to its annual consideration of investment advisory agreements at each meeting. The Board of Trustees has established various standing committees, composed of Trustees with diverse backgrounds, to which the Board of Trustees has assigned specific subject matter responsibilities to further enhance the effectiveness of the Board’s oversight and decision making. The Board of Trustees and its investment subcommittees (money market and alternative products, equity, and fixed income) also meet for the specific purpose of considering advisory contract annual renewals. The Board of Trustees held meetings in person in June and August 2011, at which the Trustees considered the continuation of the investment advisory agreement (the “Advisory Agreement”) for the J.P. Morgan U.S. Real Estate Fund (the “Fund”). At the June meeting, the Board’s investment subcommittees met to review and consider performance, expense and related information for the J.P. Morgan Funds. Each investment subcommittee reported to the full Board, which then considered the investment subcommittee’s preliminary findings. At the August meeting, the Trustees continued their review and consideration. The Trustees, including a majority of the Trustees who are not “interested persons” (as defined in the 1940 Act) of any party to the Advisory Agreement or any of their affiliates, approved the continuation of the Advisory Agreement on August 25, 2011.
The Trustees, as part of their review of the investment advisory arrangements for the J.P. Morgan Funds, considered and reviewed performance and other information received from the Advisor, on a regular basis over the course of the year, as well as information specifically prepared for their annual review. This information included the Fund’s performance compared to the performance of the Fund’s peers and benchmarks and analyses by the Advisor of the Fund’s performance. In addition, the Trustees have engaged an independent consultant to report on the performance of certain J.P. Morgan Funds at each of the Trustees’ regular meetings. The Advisor also periodically provides comparative information regarding the Fund’s expense ratios and those of the peer groups. In addition, in preparation for the June and August meetings, the Trustees requested, received and evaluated extensive materials from the Advisor, including, with respect to certain J.P. Morgan Funds, performance and expense information compiled by Lipper Inc. (“Lipper”), an independent provider of investment company data. The independent consultant also provided additional analyses of the performance of the Fund in connection with the Trustees’ review of the investment advisory arrangements. Prior to voting, the Trustees reviewed the proposed approval of the Advisory Agreement with representatives of the Advisor and with counsels to the Trust and independent Trustees and received a memorandum from independent counsel to the Trustees discussing the legal standards for their consideration
of the proposed approval. The Trustees also discussed the proposed approvals in executive sessions with counsels to the Trust and independent Trustees at which no representatives of the Advisor were present. Set forth below is a summary of the material factors evaluated by the Trustees in determining whether to approve the Advisory Agreement.
In their deliberations, there was a comprehensive consideration of the information received by the Trustees. Each Trustee attributed different weights to the various factors and no factor alone was considered determinative. From year to year, the Trustees consider and place emphasis on relevant information in light of changing circumstances in market and economic conditions. The Trustees determined that the compensation to be received by the Advisor from the Fund under the Advisory Agreement was fair and reasonable and that the continuance of the investment advisory contract was in the best interests of the Fund and its shareholders.
The factors summarized below were considered and discussed by the Trustees in reaching their conclusions:
Nature, Extent and Quality of Services Provided by the Advisor
The Trustees received and considered information regarding the nature, extent and quality of the services provided to the Fund under the Advisory Agreement. The Trustees took into account information furnished throughout the year at Trustee meetings, as well as the materials furnished specifically in connection with this annual review process. The Trustees considered the background and experience of the Advisor’s senior management and the expertise of, and the amount of attention given to the Fund by, investment personnel of the Advisor. In addition, the Trustees reviewed the qualifications, backgrounds and responsibilities of the portfolio management team primarily responsible for the day-to-day management of the Fund and the infrastructure supporting the team. The Trustees also considered information provided by the Advisor and JPMorgan Distribution Services, Inc. (“JPMDS”) about the structure and distribution strategy of the Fund. The Trustees also reviewed information relating to the Advisor’s risk governance model and reports showing the Advisor’s compliance structure and ongoing compliance processes. The quality of the administrative services provided by JPMorgan Funds Management, Inc. (“JPMFM”), an affiliate of the Advisor, was also considered.
The Board of Trustees also considered its knowledge of the nature and quality of the services provided by the Advisor to the Fund gained from their experience as Trustees of the J.P. Morgan Funds. In addition, they considered the overall reputation and capabilities of the Advisor and its affiliates, the commitment of the Advisor to provide high quality service to the Fund, their overall confidence in the Advisor’s integrity and the Advisor’s responsiveness to questions or concerns raised by them, including the Advisor’s willingness to consider and
| 36 | J.P. MORGAN SPECIALTY FUNDS | DECEMBER 31, 2011 | ||||
Table of Contents
implement organizational and operational changes designed to improve investment results and the services provided to the Fund.
Based on these considerations and other factors, the Trustees concluded that they were satisfied with the nature, extent and quality of the investment advisory services provided to the Fund by the Advisor.
Costs of Services Provided and Profitability to the Advisor and its Affiliates
The Trustees received and considered information regarding the profitability to the Advisor and its affiliates in providing services to the Fund. The Trustees reviewed and discussed this data. The Trustees recognized that this data is not audited and represents the Advisor’s determination of its and its affiliates revenues from the contractual services provided to the Fund, less expenses of providing such services. Expenses include direct and indirect costs and are calculated using an allocation methodology developed by the Advisor. The Trustees also recognized that it is difficult to make comparisons of profitability from fund investment advisory contracts because comparative information is not generally publicly available and is affected by numerous factors, including the structure of the particular adviser, the types of funds it manages, its business mix, numerous assumptions regarding allocations and the fact that publicly-traded fund managers’ operating profits and net income are net of distribution and marketing expenses. Based on their review, the Trustees concluded that the profitability to the Advisor under the Advisory Agreement was not unreasonable in light of the services and benefits provided to the Fund.
Fall-Out Benefits
The Trustees reviewed information regarding potential “fallout” or ancillary benefits received by the Advisor and its affiliates as a result of their relationship with the Fund. The Board considered that the Advisor does not currently use third-party soft dollar arrangements with respect to securities transactions it executes for the Fund.
The Trustees also considered that JPMFM and JPMDS, affiliates of the Advisor, earn fees from the Fund for providing administrative and shareholder services. These fees were shown separately in the profitability analysis presented to the Trustees. The Trustees also considered the payments of Rule 12b-1 fees to JPMDS, which also acts as the Fund’s distributor and that these fees are in turn generally paid to financial intermediaries that sell the Fund, including financial intermediaries that are affiliates of the Advisor. The Trustees also considered the fees paid to JPMorgan Chase Bank, N.A. (“JPMCB”) for custody and fund accounting and other related services.
Economies of Scale
The Trustees noted that the proposed investment advisory fee schedule for the Fund does not contain breakpoints. The Trustees considered whether it would be appropriate to add advisory fee breakpoints and the Trustees concluded that the current fee structure was reasonable in light of the fee waivers and expense limitations that JPMFM and JPMDS have in place that serve to limit the overall net expense ratio at competitive levels. The Trustees also recognized that the fee schedule for the administrative services provided by JPMFM does include a fee breakpoint, which is tied to the overall level of non-money market fund assets excluding certain funds-of-funds, as applicable, advised by the Advisor, and that the Fund benefits from that breakpoint. The Trustees concluded that shareholders benefited from the lower expense ratios which resulted from these factors.
Independent Written Evaluation of the Fund’s Chief Compliance Officer
The Trustees noted that, upon their direction, the Chief Compliance Officer for the Fund had prepared an independent written evaluation in order to assist the Trustees in determining the reasonableness of the proposed management fees. The Trustees considered the written evaluation in determining whether to continue the Advisory Agreement.
Fees Relative to Advisor’s Other Clients
The Trustees received and considered information about the nature and extent of investment advisory services and fee rates offered to other clients of the Advisor for investment management styles substantially similar to that of the Fund. The Trustees also considered the complexity of investment management for the Fund relative to the Advisor’s other clients and the differences in the nature and extent of the services provided to the different clients. The Trustees concluded that the fee rates charged to the Fund in comparison to those charged to the Advisor’s other clients were reasonable.
Investment Performance
The Trustees received and considered absolute and/or relative performance for the Fund in a report prepared by Lipper. The Trustees considered the total return performance information, which included the ranking of the Fund within a performance universe made up of funds with the same Lipper investment classification and objective (the “Universe Group”) by total return for applicable one-, three- and five-year periods. The Trustees reviewed a description of Lipper’s methodology for selecting mutual funds in the Fund’s Universe Group. The Lipper materials provided to the Trustees highlighted information with respect to certain representative classes to assist the Trustees in their review. As part of this review, the Trustees
| DECEMBER 31, 2011 | J.P. MORGAN SPECIALTY FUNDS | 37 | ||||||
Table of Contents
BOARD APPROVAL OF INVESTMENT ADVISORY AGREEMENTS
(Unaudited) (continued)
also reviewed the Fund’s performance against its benchmark and considered the performance information provided for the Fund at regular Board meetings by the Advisor and the independent consultant and also considered the special analysis prepared by the independent consultant. The Lipper performance data noted by the Trustees as part of their review and the determinations made by the Trustees with respect to the Fund’s performance for certain representative classes are summarized below:
The Trustees noted that the Fund’s performance was in the first, fourth and fourth quintiles for both Class A and Select class shares for the one-, three-, and five-year periods ended December 31, 2010, respectively, and that the independent consultant indicated that the Fund’s overall performance was satisfactory. The Trustees discussed the performance and investment strategy of the Fund with the Advisor and, based upon this discussion and other factors, concluded that the performance was reasonable. However, they requested that the Advisor provide additional Fund performance information to be reviewed with members of the equity subcommittee at each of their regular meetings over the course of the next year.
Advisory Fees and Expense Ratios
The Trustees considered the contractual advisory fee rate paid by the Fund to the Advisor and compared that rate to the
information prepared by Lipper concerning management fee rates paid by other funds in the same Lipper category as the Fund. The Trustees recognized that Lipper reported the Fund’s management fee rate as the combined contractual advisory fee and the administration fee rates. The Trustees also reviewed information about other expenses and the expense ratios for the Fund. The Trustees considered the fee waiver and/or expense reimbursement arrangements currently in place for the Fund and considered the net advisory fee rate after taking into account any waivers and/or reimbursements. The Trustees recognized that it is difficult to make comparisons of advisory fees because there are variations in the services that are included in the fees paid by other funds. The Trustees’ determinations as a result of the review of the Fund’s advisory fees and expense ratios for certain representative classes are summarized below:
The Trustees noted that the Fund’s net advisory fee for both Class A and Select Class shares was in the second quintile and that the actual total expenses for Class A and Select Class Shares were in the first and second quintiles, respectively, of their Universe Group. After considering the factors identified above, in light of this information, the Trustees concluded that the advisory fee was reasonable.
| 38 | J.P. MORGAN SPECIALTY FUNDS | DECEMBER 31, 2011 | ||||
Table of Contents
(Unaudited)
Certain tax information for the J.P. Morgan Funds is required to be provided to shareholders based upon the Funds’ income and distributions for the taxable year ended December 31, 2011. The information and distributions reported in this letter may differ from the information and taxable distributions reported to the shareholders for the calendar year ending December 31, 2011. The information necessary to complete your income tax returns for the calendar year ending December 31, 2011 will be received under separate cover.
Long Term Capital Gain Designation — 15%
The U.S. Core Real Estate Securities Fund hereby designates approximately $13,000 as long-term capital gain distributions for the purpose of the dividend paid deduction on its respective tax return for the fiscal year ended 2011.
| DECEMBER 31, 2011 | J.P. MORGAN SPECIALTY FUNDS | 39 | ||||||
Table of Contents

Rev. January 2011
| FACTS | WHAT DOES J.P. MORGAN FUNDS DO WITH YOUR PERSONAL INFORMATION? |
| Why? | Financial companies choose how they share your personal information. Federal law gives consumers the right to limit some but not all sharing. Federal law also requires us to tell you how we collect, share, and protect your personal information. Please read this notice carefully to understand what we do. |
| What? | The types of personal information we collect and share depend on the product or service you have with us. This information can include:
¡Social Security number and account balances
¡transaction history and account transactions
¡checking account information and wire transfer instructions
When you are no longer our customer, we continue to share your information as described in this notice. |
| How? | All financial companies need to share customers’ personal information to run their everyday business. In the section below, we list the reasons financial companies can share their customers’ personal information; the reasons J.P. Morgan Funds chooses to share; and whether you can limit this sharing. |
| Reasons we can share your personal information | Does J.P. Morgan Funds share? | Can you limit this sharing? | ||
For our everyday business purposes – such as to process your transactions, maintain your account(s), respond to court orders and legal investigations, or report to credit bureaus | Yes | No | ||
For marketing purposes — to offer our products and services to you | Yes | No | ||
| For joint marketing with other financial companies | No | We don’t share | ||
For our affiliates’ everyday business purposes — information about your transactions and experiences | No | We don’t share | ||
For our affiliates’ everyday business purposes — information about your creditworthiness | No | We don’t share | ||
| For nonaffiliates to market to you | No | We don’t share |
| Questions? | Call 1-800-480-4111 or go to www.jpmorganfunds.com | |

Table of Contents
Page 2 |
| Who we are | ||
| Who is providing this notice? | J.P. Morgan Funds | |
| What we do | ||
| How does J.P. Morgan Funds protect my personal information? | To protect your personal information from unauthorized access and use, we use security measures that comply with federal law. These measures include computer safeguards and secured files and buildings. We authorize our employees to access your information only when they need it to do their work and we require companies that work for us to protect your information. | |
How does J.P. Morgan Funds collect my personal information? | We collect your personal information, for example, when you:
¡open an account or provide contact information
¡give us your account information or pay us by check
¡make a wire transfer
We also collect your personal information from others, such as credit bureaus, affiliates and other companies. | |
| Why can’t I limit all sharing? | Federal law gives you the right to limit only
¡sharing for affiliates’ everyday business purposes – information about your creditworthiness
¡affiliates from using your information to market to you
¡sharing for nonaffiliates to market to you
State laws and individual companies may give you additional rights to limit sharing. | |
| Definitions | ||
| Affiliates | Companies related by common ownership or control. They can be financial and nonfinancial companies.
¡J.P. Morgan Funds does not share with our affiliates. | |
| Nonaffiliates | Companies not related by common ownership or control. They can be financial and nonfinancial companies.
¡J.P. Morgan Funds does not share with nonaffiliates so they can market to you. | |
| Joint Marketing | A formal agreement between nonaffiliated financial companies that together market financial products or services to you.
¡J.P. Morgan Funds doesn’t jointly market. | |
Table of Contents
J.P. Morgan Funds are distributed by JPMorgan Distribution Services, Inc., which is an affiliate of JPMorgan Chase & Co. Affiliates of JPMorgan Chase & Co. receive fees for providing various services to the funds.
Contact JPMorgan Distribution Services, Inc. at 1-800-480-4111 for a fund prospectus. You can also visit us at www.jpmorganfunds.com. Investors should carefully consider the investment objectives and risk as well as charges and expenses of the mutual fund before investing. The prospectus contains this and other information about the mutual fund. Read the prospectus carefully before investing.
Investors may obtain information about the Securities Investor Protection Corporation (SIPC), including the SIPC brochure by visiting www.sipc.org or by calling SIPC at 202-371-8300.
The Fund files a complete schedule of its fund holdings for the first and third quarters of its fiscal year with the SEC on Form N-Q. The Fund’s Forms N-Q are available on the SEC’s website at http://www.sec.gov and may be reviewed and copied at the SEC’s Public Reference Room in Washington, DC. Information on the operation of the SEC’s Public Reference Room may be obtained by calling 1-800-SEC-0330. Shareholders may request the Form N-Q without charge by calling 1-800-480-4111 or by visiting the J.P. Morgan Funds’ website at www.jpmorganfunds.com.
A description of the Fund’s policies and procedures with respect to the disclosure of the Fund’s holdings is available in the prospectus and Statement of Additional Information.
A copy of proxy policies and procedures is available without charge upon request by calling 1-800-480-4111 and a description of such policies and procedures is on the SEC’s website at www.sec.gov. The Trustees have delegated the authority to vote proxies for securities owned by the Fund to the Advisor. A copy of the Fund’s voting record for the most recent 12-month period ended June 30 is available on the SEC’s website at www.sec.gov or at the Fund’s website at www.jpmorganfunds.com no later than August 31 of each year. The Fund’s proxy voting record will include, among other things, a brief description of the matter voted on for each fund security, and will state how each vote was cast, for example, for or against the proposal.

Table of Contents

J.P. Morgan Asset Management is the marketing name for the asset management business of JPMorgan Chase & Co. Those businesses include, but are not limited to, J.P. Morgan Investment Management Inc., Security Capital Research & Management Incorporated and J.P. Morgan Alternative Asset Management, Inc.
| © JPMorgan Chase & Co., 2012. All rights reserved. December 2011. | AN-USRE-1211 |
Table of Contents
ITEM 2. CODE OF ETHICS.
Disclose whether, as of the end of the period covered by the report, the registrant has adopted a code of ethics that applies to the registrant’s principal executive officer, principal financial officer, principal accounting officer or controller, or persons performing similar functions, regardless of whether these individuals are employed by the registrant or a third party. If the registrant has not adopted such a code of ethics, explain why it has not done so.
The registrant must briefly describe the nature of any amendment, during the period covered by the report, to a provision of its code of ethics that applies to the registrant’s principal executive officer, principal financial officer, principal accounting officer or controller, or persons performing similar functions, regardless of whether these individuals are employed by the registrant or a third party, and that relates to any element of the code of ethics definition enumerated in paragraph (b) of this Item. The registrant must file a copy of any such amendment as an exhibit pursuant to Item 12(a)(1), unless the registrant has elected to satisfy paragraph (f) of this Item by positing its code of ethics on its website pursuant to paragraph (f)(2) of this Item, or by undertaking to provide its code of ethics to any person without charge, upon request, pursuant to paragraph (f)(3) of this Item.
If the registrant has, during the period covered by the report, granted a waiver, including an implicit waiver, from a provision of the code of ethics that applies to the registrant’s principal executive officer, principal financial officer, principal accounting officer or controller, or persons performing similar functions, regardless of whether these individuals are employed by the registrant or third party, that relates to one or more items set forth in paragraph (b) of this Item, the registrant must briefly describe the nature of the waiver, the name of the person to whom the waiver was granted, and the date of the waiver.
The Registrant has adopted a code of ethics that applies to the Registrant’s principal executive officer and principal financial officer. There were no amendments to the code of ethics or waivers granted with respect to the code of ethics in the period covered by the report.
ITEM 3. AUDIT COMMITTEE FINANCIAL EXPERT.
(a) (1) Disclose that the registrant’s board of directors has determined that the registrant either:
(i) Has at least one audit committee financial expert serving on its audit committee; or
(ii) Does not have an audit committee financial expert serving on its audit committee.
The Registrant’s Board of Trustees has determined that the Registrant has at least one audit committee financial expert serving on its audit committee. The Securities and Exchange Commission has stated that the designation or identification of a person as an audit committee financial expert pursuant to this Item 3 of Form N-CSR does not impose on such person any duties, obligations or liabilities that are greater than the duties, obligations and liabilities imposed on such person as a member of the Audit Committee and the Board of Trustees in the absence of such designation or identification.
(2) If the registrant provides the disclosure required by paragraph (a)(1)(i) of this Item, it must disclose the name of the audit committee financial expert and whether that person is “independent.” In order to be considered “independent” for purposes of this Item, a member of an audit committee may not, other than in his or her capacity as a member of the audit committee, the board of directors, or any other board committee:
(i) Accept directly or indirectly any consulting, advisory, or other compensatory fee from the issuer; or
(ii) Be an “interested person” of the investment company as defined in Section 2(a)(19) of the Act (15 U.S.C. 80a-2(a)(19)).
The audit committee financial expert is John F. Finn. He is not an “interested person” of the Registrant and is also “independent” as defined by the U.S. Securities and Exchange Commission for purposes of audit committee financial expert determinations.
(3) If the registrant provides the disclosure required by paragraph (a)(1)(ii) of this Item, it must explain why it does not have an audit committee financial expert.
Not applicable.
Table of Contents
ITEM 4. PRINCIPAL ACCOUNTANT FEES AND SERVICES.
(a) Disclose, under the caption Audit Fees, the aggregate fees billed for each of the last two fiscal years for professional services rendered by the principal accountant for the audit of the registrant’s annual financial statements or services that are normally provided by the accountant in connection with statutory and regulatory filings or engagements for those fiscal years.
AUDIT FEES
2011 – $36,600
2010 – $37,100
(b) Disclose, under the caption Audit-Related Fees, the aggregate fees billed in each of the last two fiscal years for assurance and related services by the principal accountant that are reasonably related to the performance of the audit of the registrant’s financial statements and are not reported under paragraph (a) of this Item. Registrants shall describe the nature of the services comprising the fees disclosed under this category.
AUDIT-RELATED FEES
2011 – $11,830
2010 – $11,800
Audit-related fees consists of semi-annual financial statement reviews and security count procedures performed as required under Rule 17f-2 of the Investment Company Act of 1940 during the Registrant’s fiscal year.
(c) Disclose, under the caption Tax Fees, the aggregate fees billed in each of the last two fiscal years for professional services rendered by the principal accountant for tax compliance, tax advice, and tax planning. Registrants shall describe the nature of the services comprising the fees disclosed under this category.
TAX FEES
2011 – $9,350
2010 – $9,400
The tax fees consist of fees billed in connection with preparing the federal regulated investment company income tax returns for the Registrant for the tax years ended December 31, 2011 and 2010, respectively.
For the last fiscal year, no tax fees were required to be approved pursuant to paragraph (c)(7)(ii) of Rule 2-01 of Regulation S-X.
(d) Disclose, under the caption All Other Fees, the aggregate fees billed in each of the last two fiscal years for products and services provided by the principal accountant, other than the services reported in paragraphs (a) through (c) of this Item. Registrants shall describe the nature of the services comprising the fees disclosed under this category.
ALL OTHER FEES
2011 – Not applicable
2010 – Not applicable
(e) (1) Disclose the audit committee’s pre-approval policies and procedures described in paragraph (c)(7) of Rule 2-01 of Regulation S-X.
Pursuant to the Registrant’s Audit Committee Charter and written policies and procedures for the pre-approval of audit and non-audit services (the “Pre-approval Policy”), the Audit Committee pre-approves all audit and non-audit services performed by the Registrant’s independent public registered accounting firm for the Registrant. In addition, the Audit Committee pre-approves the auditor’s engagement for non-audit services with the Registrant’s investment adviser (not including a sub-adviser whose role is primarily portfolio management and is sub-contracted or overseen by another investment adviser) and any Service Affiliate in accordance with paragraph (c)(7)(ii) of Rule 2-01 of Regulation S-X, if the engagement relates directly to the operations and financial reporting of the Registrant. Proposed services may be pre-approved either 1) without consideration of specific case-by-case services or 2) require the specific pre-approval of the Audit Committee. Therefore, initially the Pre-approval Policy listed a number of audit and non-audit services that have been approved by the Audit Committee, or which were not subject to pre-approval under the transition provisions of Sarbanes-Oxley Act of 2002 (the “Pre-approval List”). The Audit Committee annually reviews and pre-approves the
Table of Contents
services included on the Pre-approval List that may be provided by the independent public registered accounting firm without obtaining additional specific pre-approval of individual services from the Audit Committee. The Audit Committee adds to, or subtracts from, the list of general pre-approved services from time to time, based on subsequent determinations. All other audit and non-audit services not on the Pre-approval List must be specifically pre-approved by the Audit Committee.
One or more members of the Audit Committee may be appointed as the Committee’s delegate for the purposes of considering whether to approve such services. Any pre-approvals granted by the delegate will be reported, for informational purposes only, to the Audit Committee at its next scheduled meeting. The Audit Committee’s responsibilities to pre-approve services performed by the independent public registered accounting firm are not delegated to management.
(2) Disclose the percentage of services described in each of paragraphs (b) through (d) of this Item that were approved by the audit committee pursuant to paragraph (c)(7)(i)(C) of Rule 2-01 of Regulation S-X.
2011 – 0.0%
2010 – 0.0%
(f) If greater than 50 percent, disclose the percentage of hours expended on the principal accountant’s engagement to audit the registrant’s financial statements for the most recent fiscal year that were attributed to work performed by persons other than the principal accountant’s full-time, permanent employees.
None.
(g) Disclose the aggregate non-audit fees billed by the registrant’s accountant for services rendered to the registrant, and rendered to the registrant’s investment adviser (not including any sub-adviser whose role is primarily portfolio management and is subcontracted with or overseen by another investment adviser), and any entity controlling, controlled by, or under common control with the adviser that provides ongoing services to the registrant for each of the last two fiscal years of the registrant.
The aggregate non-audit fees billed by the independent registered public accounting firm for services rendered to the Registrant, and rendered to Service Affiliates, for the last two calendar year ends were:
2011 - $28.5 million
2010 - $32.0 million
(h) Disclose whether the registrant’s audit committee of the board of directors has considered whether the provision of non-audit services that were rendered to the registrant’s investment adviser (not including any subadviser whose role is primarily portfolio management and is subcontracted with or overseen by another investment adviser), and any entity controlling, controlled by, or under common control with the investment adviser that provides ongoing services to the registrant that were not pre-approved pursuant to paragraph (c)(7)(ii) of Rule 2-01 of Regulation S-X is compatible with maintaining the principal accountant’s independence.
The Registrant’s Audit Committee has considered whether the provision of the non-audit services that were rendered to Service Affiliates that were not pre-approved (not requiring pre-approval) is compatible with maintaining the independent public registered accounting firm’s independence. All services provided by the independent public registered accounting firm to the Registrant or to Service Affiliates that were required to be pre-approved were pre-approved as required.
ITEM 5. AUDIT COMMITTEE OF LISTED REGISTRANTS.
(a) If the registrant is a listed issuer as defined in Rule 10A-3 under the Exchange Act (17CFR 240.10A-3), state whether or not the registrant has a separately-designated standing audit committee established in accordance with Section 3(a)(58)(A) of the Exchange Act (15 U.S.C. 78c(a)(58)(A)). If the registrant has such a committee, however designated, identify each committee member. If the entire board of directors is acting as the registrant’s audit committee as specified in Section 3(a)(58)(B) of the Exchange Act (15 U.S.C. 78c(a)(58)(B)), so state.
(b) If applicable, provide the disclosure required by Rule 10A-3(d) under the Exchange Act (17CFR 240.10A-3(d)) regarding an exemption from the listing standards for all audit committees.
Not applicable.
Table of Contents
ITEM 6. SCHEDULE OF INVESTMENTS.
File Schedule I – Investments in securities of unaffiliated issuers as of the close of the reporting period as set forth in Section 210.12-12 of Regulation S-X, unless the schedule is included as part of the report to shareholders filed under Item 1 of this Form.
Included in Item 1.
ITEM 7. DISCLOSURE OF PROXY VOTING POLICIES AND PROCEDURES FOR CLOSED-END MANAGEMENT INVESTMENT COMPANIES.
A closed-end management investment company that is filing an annual report on this Form N-CSR must, unless it invests exclusively in non-voting securities, describe the policies and procedures that it uses to determine how to vote proxies relating to portfolio securities, including the procedures that the company uses when a vote presents a conflict between the interests of its shareholders, on the one hand, and those of the company’s investment adviser; principal underwriter; or any affiliated person (as defined in Section 2(a)(3) of the Investment Company Act of 1940 (15 U.S.C. 80a-2(a)(3)) and the rules thereunder) of the company, its investment adviser, or its principal underwriter, on the other. Include any policies and procedures of the company’s investment adviser, or any other third party, that the company uses, or that are used on the company’s behalf, to determine how to vote proxies relating to portfolio securities.
Not applicable.
ITEM 8. PORTFOLIO MANAGERS OF CLOSED-END MANAGEMENT INVESTMENT COMPANIES.
Not applicable.
ITEM 9. PURCHASE OF EQUITY SECURITIES BY CLOSED-END MANAGEMENT INVESTMENT COMPANY AND AFFILIATED PURCHASERS.
(a) If the registrant is a closed-end management investment company, provide the information specified in paragraph (b) of this Item with respect to any purchase made by or on behalf of the registrant or any “affiliated purchaser,” as defined in Rule 10b-18(a)(3) under the Exchange Act (17 CFR 240.10b-18(a)(3)), of shares or other units of any class of the registrant’s equity securities that is registered by the registrant pursuant to Section 12 of the Exchange Act (15 U.S.C. 781).
Not applicable.
ITEM 10. SUBMISSION OF MATTERS TO A VOTE OF SECURITY HOLDERS.
Describe any material changes to the procedures by which shareholders may recommend nominees to the registrant’s board of directors, where those changes were implemented after the registrant last provided disclosure in response to the requirements of Item 7(d)(2)(ii)(G) of Schedule 14A (17 CFR 240.14a-101), or this Item.
No material changes to report.
ITEM 11. CONTROLS AND PROCEDURES.
(a) Disclose the conclusions of the registrant’s principal executive and principal financial officers, or persons performing similar functions, regarding the effectiveness of the registrant’s disclosure controls and procedures (as defined in Rule 30a-3(c) under the Act (17 CFR 270.30a-3(c))) as of a date within 90 days of the filing date of the report that includes the disclosure required by this paragraph, based on the evaluation of these controls and procedures required by Rule 30a-3(b) under the Act (17 CFR 270.30a-3(b)) and Rules 13a-15(b) or 15d-15(b) under the Exchange Act (17 CFR 240.13a-15(b) or 240.15d-15(b)).
The Registrant’s principal executive and principal financial officers have concluded, based on their evaluation of the Registrant’s disclosure controls and procedures as of a date within 90 days of the filing date of this report, that the Registrant’s disclosure controls and procedures are reasonably designed to ensure that information required to be disclosed by the Registrant on Form N-CSR is recorded, processed, summarized and reported within the required time
Table of Contents
periods and that information required to be disclosed by the Registrant in the reports that it files or submits on Form N-CSR is accumulated and communicated to the Registrant’s management, including its principal executive and principal financial officers, as appropriate to allow timely decisions regarding required disclosure.
(b) Disclose any change in the registrant’s internal control over financial reporting (as defined in Rule 30a-3(d) under the Act (17 CFR 270.30a-3(d)) that occurred during the registrant’s second fiscal quarter of the period covered by this report that has materially affected, or is reasonably likely to materially affect, the registrant’s internal control over financial reporting.
There were no changes in the Registrant’s internal control over financial reporting that occurred during the last fiscal quarter covered by this report that have materially affected, or are reasonably likely to materially affect, the Registrant’s internal control over financial reporting.
ITEM 12. EXHIBITS.
(a) File the exhibits listed below as part of this Form. Letter or number the exhibits in the sequence indicated.
(a)(1) Any code of ethics, or amendment thereto, that is the subject of the disclosure required by Item 2, to the extent that the registrant intends to satisfy the Item 2 requirements through filing of an exhibit.
Code of Ethics applicable to its Principal Executive and Principal Financial Officers pursuant to Section 406 of the Sarbanes-Oxley Act of 2002 attached hereto.
(a)(2) A separate certification for each principal executive officer and principal financial officer of the registrant as required by Rule 30a-2(a) under the Act (17 CFR 270.30a-2).
Certifications pursuant to Rule 30a-2(a) under the Investment Company Act of 1940 are attached hereto.
(a)(3) Any written solicitation to purchase securities under Rule 23c-1 under the Act (17 CFR 270.23c-1) sent or given during the period covered by the report by or on behalf of the registrant to 10 or more persons.
Not applicable.
(b) A separate or combined certification for each principal executive officer and principal officer of the registrant as required by Rule 30a-2(b) under the Act of 1940.
Certifications pursuant to Rule 30a-2(b) under the Investment Company Act of 1940 are attached hereto.
Table of Contents
SIGNATURES
Pursuant to the requirements of the Securities Exchange Act of 1934 and the Investment Company Act of 1940, the registrant has duly caused this report to be signed on its behalf by the undersigned, thereunto duly authorized.
JPMorgan Trust II
| By: | /s/ Patricia A. Maleski | |
| Patricia A. Maleski | ||
| President and Principal Executive Officer | ||
| March 9, 2012 |
Pursuant to the requirements of the Securities Exchange Act of 1934 and the Investment Company Act of 1940, this report has been signed below by the following persons on behalf of the registrant and in the capacities and on the dates indicated.
| By: | /s/ Patricia A. Maleski | |
| Patricia A. Maleski | ||
| President and Principal Executive Officer | ||
| March 9, 2012 |
| By: | /s/ Joy C. Dowd | |
| Joy C. Dowd | ||
| Treasurer and Principal Financial Officer | ||
| March 9, 2012 |