UNITED STATES
SECURITIES AND EXCHANGE COMMISSION
Washington, D.C. 20549
FORM N-CSR
CERTIFIED SHAREHOLDER REPORT OF REGISTERED
MANAGEMENT INVESTMENT COMPANIES
Investment Company Act file number: 811-04236
JPMorgan Trust II
(Exact name of registrant as specified in charter)
270 Park Avenue
New York, NY 10017
(Address of principal executive offices) (Zip code)
Frank J. Nasta
270 Park Avenue
New York, NY 10017
(Name and Address of Agent for Service)
Registrant’s telephone number, including area code: (800) 480-4111
Date of fiscal year end: June 30
Date of reporting period: July 1, 2014 through December 31, 2014
Form N-CSR is to be used by management investment companies to file reports with the Commission not later than 10 days after the transmission to stockholders of any report that is required to be transmitted to stockholders under Rule 30e-1 under the Investment Company Act of 1940 (17 CFR 270.30e-1). The Commission may use the information provided on Form N-CSR in its regulatory, disclosure review, inspection, and policymaking roles.
A registrant is required to disclose the information specified by Form N-CSR, and the Commission will make this information public. A registrant is not required to respond to the collection of information contained in Form N-CSR unless the Form displays a currently valid Office of Management and Budget (“OMB”) control number. Please direct comments concerning the accuracy of the information collection burden estimate and any suggestions for reducing the burden to Secretary, Securities and Exchange Commission, 450 Fifth Street, NW, Washington, DC 20549-0609. The OMB has reviewed this collection of information under the clearance requirements of 44 U.S.C. Section 3507.
ITEM 1. REPORTS TO STOCKHOLDERS.
The following is a copy of the report transmitted to shareholders pursuant to Rule 30e-1 under the Investment Company Act of 1940 (17 CFR 270.30e-1).
Semi-Annual Report
J.P. Morgan Small Cap Funds
December 31, 2014 (Unaudited)
JPMorgan Dynamic Small Cap Growth Fund
JPMorgan Small Cap Core Fund
JPMorgan Small Cap Equity Fund
JPMorgan Small Cap Growth Fund
JPMorgan Small Cap Value Fund
JPMorgan U.S. Small Company Fund

CONTENTS
Investments in a Fund are not bank deposits or obligations of, or guaranteed or endorsed by, any bank and are not insured or guaranteed by the FDIC, the Federal Reserve Board or any other government agency. You could lose money if you sell when the Fund’s share price is lower than when you invested.
Past performance is no guarantee of future performance. The general market views expressed in this report are opinions based on market and other conditions through the end of the reporting period and are subject to change without notice. These views are not intended to predict the future performance of a Fund or the securities markets. References to specific securities and their issuers are for illustrative purposes only and are not intended to be, and should not be interpreted as, recommendations to purchase or sell such securities. Such views are not meant as investment advice and may not be relied on as an indication of trading intent on behalf of any Fund.
Prospective investors should refer to the Funds’ prospectus for a discussion of the Funds’ investment objectives, strategies and risks. Call J.P. Morgan Funds Service Center at 1-800-480-4111 for a prospectus containing more complete information about a Fund, including management fees and other expenses. Please read it carefully before investing.
CEO’S LETTER
JANUARY 11, 2015 (Unaudited)
Dear Shareholder,
A growing divergence in the economic trajectories of U.S. and other developed markets and plummeting global energy prices provided a mixed backdrop for the latter half of 2014. The U.S. economy accelerated at a steady pace amid continued strength in corporate earnings, gains in employment and consumer spending and falling oil prices for the six months ended December 31, 2014. Gross domestic product (GDP) in the U.S. climbed by 5.0% in the third quarter of 2014 and unemployment dropped to 5.6% in December, a level not seen since June 2008.
| | |

| | “Amid uncertainty about the global economy recovery, equity markets in the U.S., China and Japan provided investors with solid returns and served to emphasize the prudence of holding a broadly diversified portfolio and a long-term outlook.” |
In response to the continued improvement in the domestic economy, the U.S. Federal Reserve Bank proceeded to taper down its monthly purchases of bonds under its quantitative easing program and finally closed the program in October.
In stark contrast, the European Central Bank (ECB) took unprecedented steps to counter the threat of price deflation in the euro zone and the Bank of Japan stunned markets with a massive stimulus program as Japan’s economy slid into recession.
Another key development in the latter half of 2014 was a precipitous drop in global petroleum prices. A supply glut driven by new production in the U.S. and increased output from other nations, along with decreasing demand from China, Europe and Japan led to a 50% drop in the price of crude oil between July and December.
Amid this backdrop, U.S. equity markets outperformed most other assets classes over the six month period, with large cap stocks providing better returns than small caps and defensive sectors overtaking cyclical sectors. Notably, U.S. equities fell to six-month lows in mid October only to rebound 8.4%, driving the Standard & Poor’s 500 Index (“S&P 500”) to a new closing high of 2,018.05 points on October 31, 2014. In December, the Dow Jones Industrial Average closed above 18,000 points for the first time following the news that third quarter GDP showed the fastest growth in 11 years. The S&P 500 closed at a new high of 2,090.57 points on December 29, 2014, and returned 6.1% for the six months ended December 31, 2014.
Prices for U.S. Treasury securities with longer maturities rose during the six month period as investors sought safe havens amid deteriorating energy prices and geopolitical concerns.
While declining oil prices helped bolster consumer spending in developed nations, energy related sectors came under pressure and yield spreads on high-yield debt — also known as junk bonds — widened. Nations dependent on oil exports experienced volatility in bond yield spreads and currency valuations.
Meanwhile, weak growth in the euro zone raised concerns about the potential for a destructive deflationary spiral. Even after the ECB had cut its deposit rate to negative 0.1% to encourage banks to extend lending by effectively charging them for parking excess cash with the central bank, growth remained tepid and inflation was well below the ECB’s target of just below 2%. The inflation rate averaged 0.4% from July to October and then fell 0.3% in November and was estimated at -0.2% for December. Unemployment across the euro zone remained stubbornly high at 11.5%.
Japan’s economy retreated into recession during the six month period following two quarters of economic contraction, partly attributed to an increase in the national consumption tax earlier in the year. Responding to the crisis, the Bank of Japan surprised global markets on October 31 by unveiling plans to buy 8 trillion to 12 trillion yen ($71 billion to $107 billion) of Japanese government bonds per month, while also tripling its purchases of exchange-traded funds. The announcement drove Tokyo stocks to seven-year highs. For the six months ended December 31, 2014, the MSCI Europe, Australasia and Far East Index returned -9.2%.
Elsewhere, China’s economy continued to grow but at a slower pace for the six month period. At 7.3%, China’s GDP showed the slowest growth in five years, though it was slightly better than economists had expected. The weaker GDP growth was partly attributed to a slowdown in the property sector. However, Chinese equity securities performed well over the six months ended December 31, 2014, amid expectations that policy makers may ease monetary policy to spur growth. Chinese equity markets received an additional boost when regulators increased access to Chinese financial markets by allowing foreign investors in Hong Kong to buy shares in Shanghai.
Russia’s economy, already straining under Western economic sanctions following its annexation of Crimea, began sliding toward recession as prices plummeted for oil and natural gas, its biggest exports. In response, the Russian Central Bank spent heavily from its reserves and raised its key interest rate sharply in a largely unsuccessful effort to halt the ruble’s slide. The MSCI Emerging Markets Index returned -7.7% for the six months ended December 31, 2014.
During the six month period, financial market volatility returned after being largely absent in the first half of 2014. Meanwhile, economic growth outside the U.S. began to falter and the relative strength of the U.S. economy drove the dollar higher against other major currencies. Amid uncertainty about the global economy recovery, equity markets in the U.S., China
| | | | | | | | |
| | | |
| DECEMBER 31, 2014 | | J.P. MORGAN SMALL CAP FUNDS | | | | | 1 | |
CEO’S LETTER
(Unaudited) (continued)
and Japan provided investors with solid returns and served to emphasize the prudence of holding a broadly diversified portfolio and a long-term outlook.
On behalf of everyone at J.P. Morgan Asset Management, thank you for your continued support. We look forward to managing your investment needs for years to come. Should you have any questions, please visit www.jpmorganfunds.com or contact the J.P. Morgan Funds Service Center at 1-800-480-4111.
Sincerely yours,

George C.W. Gatch
CEO, Global Funds Management
J.P. Morgan Asset Management
| | | | | | |
| | | |
| 2 | | | | J.P. MORGAN SMALL CAP FUNDS | | DECEMBER 31, 2014 |
J.P. Morgan Small Cap Funds
MARKET OVERVIEW
SIX MONTHS ENDED DECEMBER 31, 2014 (Unaudited)
U.S equity markets performed strongly during the six month reporting period amid accommodative central bank policies, falling energy prices and steady overall improvement in the U.S. economy. While the second half of 2014 was marked by the return of volatility in financial markets and a sharp sell-off in mid-October, key U.S. equity indexes rebounded to closing highs in the final months of 2014. The Standard & Poor’s 500 Index (“S&P 500”) broke through the 2,000-point closing level for the first time on the final day of October and hit new closing highs in the final weeks of December. Also in late December, the Dow Jones Industrial Average closed above 18,000 points for the first time. U.S. Treasury securities with longer maturities also performed well during the six month reporting period, as geopolitical risks and concerns about weakness in the global economy pushed investors into so-called safe haven bonds.
Overall, U.S. large cap stocks outperformed small cap stocks and growth stocks outperformed value stocks during the reporting period. For the six months ended December 31, 2014, the Russell 2000 Index, a measure of small cap stocks, returned 1.65%, underperforming both the Russell Midcap Index and the Russell 1000 Index, which returned 4.18% and 5.57%, respectively.
| | | | | | | | |
| | | |
| DECEMBER 31, 2014 | | J.P. MORGAN SMALL CAP FUNDS | | | | | 3 | |
JPMorgan Dynamic Small Cap Growth Fund
FUND COMMENTARY
SIX MONTHS ENDED DECEMBER 31, 2014 (Unaudited)
| | | | |
| REPORTING PERIOD RETURN: | |
| Fund (Class A Shares, without a sales charge)* | | | 3.08% | |
| Russell 2000 Growth Index | | | 3.31% | |
| |
| Net Assets as of 12/31/2014 (In Thousands) | | $ | 539,139 | |
INVESTMENT OBJECTIVE**
The JPMorgan Dynamic Small Cap Growth Fund (the “Fund”) seeks capital growth over the long term.
WHAT WERE THE MAIN DRIVERS OF THE FUND’S PERFORMANCE?
The Fund (Class A Shares, without a sales charge) underperformed the Russell 2000 Growth Index (the “Benchmark”) for the six months ended December 31, 2014. The Fund’s security selection in the consumer discretionary sector and its security selection and underweight position in the consumer staples sector were leading detractors from performance relative to the Benchmark, while the Fund’s security selection and overweight position in the health care sector and its security selection in the producer durables sector were leading contributors to relative performance.
Leading individual detractors from relative performance included the Fund’s overweight positions in Laredo Petroleum Holdings Inc., Oasis Petroleum Inc. and Forum Energy Technologies Inc. Shares of Laredo Petroleum, an independent oil and natural gas exploration and production company not held in the Benchmark, fell amid a decline in global oil prices. Shares of Oasis Petroleum, an oil exploration and production company not held in the Benchmark, weakened amid company plans to sharply cut capital spending in the wake of falling oil prices. Shares of Forum Energy, an oilfield services company, fell amid overall weakness in the energy sector due to falling oil prices.
Individual contributors to relative performance included the Fund’s overweight positions in Puma Biotechnology Inc., Receptos Inc. and Trex Inc. Shares of Puma Biotechnology, a development-stage biopharmaceutical company, rose on positive clinical trial results for its lung cancer drug candidate. Shares of Receptos, a biopharmaceutical company, strengthened on the back of positive clinical trial results for its bowel disorder drug candidate. Share of Trex, a maker of plastic/wood composite products for the home improvement market, rose on an improved quarterly revenue forecast.
HOW WAS THE FUND POSITIONED?
The Fund’s portfolio managers utilized a bottom-up approach to stock selection, researching individual companies in an effort to construct portfolios of stocks that have strong fundamentals. The Fund’s portfolio managers preferred to invest in high quality companies with durable franchises that, in their view, possessed the ability to generate strong future earnings growth.
| | | | | | | | |
| TOP TEN EQUITY HOLDINGS OF THE PORTFOLIO*** | |
| | 1. | | | Middleby Corp. (The) | | | 2.2 | % |
| | 2. | | | Acuity Brands, Inc. | | | 2.1 | |
| | 3. | | | Acadia Healthcare Co., Inc. | | | 1.8 | |
| | 4. | | | Trex Co., Inc. | | | 1.7 | |
| | 5. | | | Watsco, Inc. | | | 1.6 | |
| | 6. | | | Wolverine World Wide, Inc. | | | 1.5 | |
| | 7. | | | Insulet Corp. | | | 1.4 | |
| | 8. | | | Lithia Motors, Inc., Class A | | | 1.4 | |
| | 9. | | | Old Dominion Freight Line, Inc. | | | 1.4 | |
| | 10. | | | Monolithic Power Systems, Inc. | | | 1.4 | |
| | | | |
PORTFOLIO COMPOSITION BY SECTOR*** | |
Health Care | | | 25.7 | % |
Information Technology | | | 24.5 | |
Industrials | | | 19.5 | |
Consumer Discretionary | | | 14.4 | |
Financials | | | 8.3 | |
Energy | | | 2.7 | |
Consumer Staples | | | 1.2 | |
Telecommunication Services | | | 1.0 | |
Materials | | | 0.9 | |
| Short-Term Investment | | | 1.8 | |
| * | | The return shown is based on net asset values calculated for shareholder transactions and may differ from the return shown in the financial highlights, which reflects adjustments made to the net asset values in accordance with accounting principles generally accepted in the United States of America. |
| ** | | The adviser seeks to achieve the Fund’s objective. There can be no guarantee it will be achieved. |
| *** | | Percentages indicated are based on total investments as of December 31, 2014. The Fund’s portfolio composition is subject to change. |
| | | | | | |
| | | |
| 4 | | | | J.P. MORGAN SMALL CAP FUNDS | | DECEMBER 31, 2014 |
| | | | | | | | | | | | | | | | | | |
AVERAGE ANNUAL TOTAL RETURNS AS OF DECEMBER 31, 2014 | | | | |
| | | | | |
| | | INCEPTION DATE OF
CLASS | | 6 MONTH* | | | 1 YEAR | | | 5 YEAR | | | 10 YEAR | |
CLASS A SHARES | | May 19, 1997 | | | | | | | | | | | | | | | | |
Without Sales Charge | | | | | 3.08 | % | | | (0.45 | )% | | | 16.03 | % | | | 7.54 | % |
With Sales Charge** | | | | | (2.33 | ) | | | (5.68 | ) | | | 14.79 | | | | 6.97 | |
CLASS B SHARES | | May 19, 1997 | | | | | | | | | | | | | | | | |
Without CDSC | | | | | 2.83 | | | | (0.92 | ) | | | 15.42 | | | | 7.05 | |
With CDSC*** | | | | | (2.17 | ) | | | (5.92 | ) | | | 15.20 | | | | 7.05 | |
CLASS C SHARES | | January 7, 1998 | | | | | | | | | | | | | | | | |
Without CDSC | | | | | 2.78 | | | | (0.97 | ) | | | 15.40 | | | | 6.95 | |
With CDSC**** | | | | | 1.78 | | | | (1.97 | ) | | | 15.40 | | | | 6.95 | |
SELECT CLASS SHARES | | April 5, 1999 | | | 3.19 | | | | (0.17 | ) | | | 16.40 | | | | 7.94 | |
| ** | | Sales Charge for Class A Shares is 5.25%. |
| *** | | Assumes a 5% CDSC (contingent deferred sales charge) for the one year period, 2% CDSC for the five year period and 0% CDSC thereafter. |
| **** | | Assumes a 1% CDSC for the one year period and 0% CDSC thereafter. |
TEN YEAR PERFORMANCE (12/31/04 TO 12/31/14)
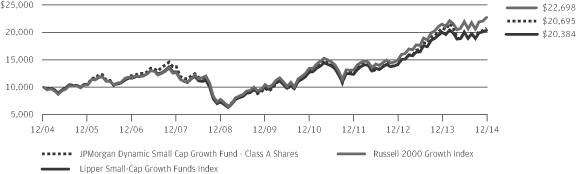
The performance quoted is past performance and is not a guarantee of future results. Mutual funds are subject to certain market risks. Investment returns and principal value of an investment will fluctuate so that an investor’s shares, when redeemed, may be worth more or less than their original cost. Current performance may be higher or lower than the performance data shown. For up-to-date month-end performance information please call 1-800-480-4111.
The graph illustrates comparative performance for $10,000 invested in Class A Shares of the JPMorgan Dynamic Small Cap Growth Fund, the Russell 2000 Growth Index and the Lipper Small-Cap Growth Funds Index from December 31, 2004 to December 31, 2014. The performance of the Fund assumes reinvestment of all dividends and capital gain distributions, if any, and includes a sales charge. The performance of the Russell 2000 Growth Index does not reflect the deduction of expenses or a sales charge associated with a mutual fund and has been adjusted to reflect reinvestment of all dividends and capital gain distributions of the securities included in the benchmark, if applicable. The performance of the Lipper Small-Cap Growth Funds Index includes expenses associated with a mutual fund, such as investment management fees. These expenses are not identical to the expenses incurred by the Fund. The Russell 2000 Growth Index is an unmanaged index which measures the performance of those Russell 2000 companies with higher price-to-book ratios and higher
forecasted growth values. The Lipper Small-Cap Growth Funds Index is an index based on the total returns of certain mutual funds within the Fund’s designated category as determined by Lipper, Inc. Investors cannot invest directly in an index.
Class A Shares have a $1,000 minimum initial investment and carry a 5.25% sales charge.
Fund performance may reflect the waiver of the Fund’s fees and reimbursement of expenses for certain periods since the inception date. Without these waivers and reimbursements, performance would have been lower. Also, performance shown in this section does not reflect the deduction of taxes that a shareholder would pay on Fund distributions or redemption of Fund shares.
Because Class B Shares automatically convert to Class A Shares after eight years, the 10 year average annual total return shown above for Class B reflects Class A performance for the period after conversion.
The returns shown are based on net asset values calculated for shareholder transactions and may differ from the returns shown in the financial highlights, which reflect adjustments made to the net asset values in accordance with accounting principles generally accepted in the United States of America.
| | | | | | | | |
| | | |
| DECEMBER 31, 2014 | | J.P. MORGAN SMALL CAP FUNDS | | | | | 5 | |
JPMorgan Small Cap Core Fund
FUND COMMENTARY
SIX MONTHS ENDED DECEMBER 31, 2014 (Unaudited)
| | | | |
| REPORTING PERIOD RETURN: | |
| Fund (Select Class Shares)* | | | 3.47% | |
| Russell 2000 Index | | | 1.65% | |
| |
| Net Assets as of 12/31/2014 (In Thousands) | | $ | 726,636 | |
INVESTMENT OBJECTIVE**
The JPMorgan Small Cap Core Fund seeks capital growth over the long term.
WHAT WERE THE MAIN DRIVERS OF THE FUND’S PERFORMANCE?
The JPMorgan Small Cap Core Fund (Select Class Shares) outperformed the Russell 2000 Index (the “Benchmark”) for the six months ended December 31, 2014. The Fund’s security selection in the pharmaceutical and energy sectors was a leading contributor to performance relative to the Benchmark, while security selection in the semiconductors and finance sectors was a leading detractor from relative performance.
Individual contributors to relative performance included the Fund’s overweight positions in Hawaiian Holdings Inc., Skyworks Solutions Inc. and Kite Pharma Inc. Shares of Hawaiian Holdings, owner/operator of Hawaiian Airlines, strengthened on expectations that lower fuel prices will bolster earnings. Shares of Skyworks Solutions, a producer of radio frequency semiconductors not held in the Benchmark, rose on increased demand for its products from smartphone makers, particularly Apple Inc. Shares of Kite Pharma, a drug maker focused on cancer immunotherapy, rose on investor expectations for its pipeline of drug candidates.
Individual detractors from relative performance included the Fund’s overweight positions in First Solar Inc., Tower International Inc. and Warren Resources Inc. Shares of First Solar, a maker of solar energy technology not held in the Benchmark, declined amid concerns about demand for the company’s products amid falling global oil prices. Shares of Tower International, a supplier of components to auto makers, fell after the company lowered its revenue forecast and postponed an offering of $250 million in short-term debt. Shares of Warren Resources, an independent oil exploration and production company, fell amid declining global oil prices and the resignation of its chief executive/chairman in early December.
HOW WAS THE FUND POSITIONED?
In accordance with its investment process, the Fund’s portfolio managers take limited sector bets and construct the Fund so that stock selection is typically the primary driver of its relative performance versus the Benchmark. The Fund’s portfolio
managers employ a bottom-up approach to stock selection, using quantitative screening and proprietary analysis to construct a portfolio of companies that they believe are attractively valued and possess strong fundamentals. During the reporting period, the Fund was managed and positioned in accordance with this investment process.
| | | | | | | | |
| TOP TEN EQUITY HOLDINGS OF THE PORTFOLIO*** | |
| | 1. | | | Office Depot, Inc. | | | 1.3 | % |
| | 2. | | | Dynegy, Inc. | | | 1.2 | |
| | 3. | | | NuVasive, Inc. | | | 1.1 | |
| | 4. | | | Unisys Corp. | | | 1.1 | |
| | 5. | | | Hawaiian Holdings, Inc. | | | 1.1 | |
| | 6. | | | Deluxe Corp. | | | 1.0 | |
| | 7. | | | Sanmina Corp. | | | 1.0 | |
| | 8. | | | Inteliquent, Inc. | | | 0.9 | |
| | 9. | | | Skyworks Solutions, Inc. | | | 0.9 | |
| | 10. | | | Take-Two Interactive Software, Inc. | | | 0.9 | |
| | | | |
PORTFOLIO COMPOSITION BY SECTOR*** | |
| Financials | | | 22.7 | % |
| Information Technology | | | 17.3 | |
| Industrials | | | 15.1 | |
| Health Care | | | 14.2 | |
| Consumer Discretionary | | | 13.0 | |
| Consumer Staples | | | 4.2 | |
| Energy | | | 4.0 | |
| Materials | | | 3.3 | |
| Utilities | | | 3.3 | |
| Telecommunication Services | | | 1.4 | |
| Short-Term Investment | | | 1.5 | |
| * | | The return shown is based on net asset values calculated for shareholder transactions and may differ from the return shown in the financial highlights, which reflects adjustments made to the net asset values in accordance with accounting principles generally accepted in the United States of America. |
| ** | | The adviser seeks to achieve the Fund’s objective. There can be no guarantee it will be achieved. |
| *** | | Percentages indicated are based on total investments as of December 31, 2014. The Fund’s portfolio composition is subject to change. |
| | | | | | |
| | | |
| 6 | | | | J.P. MORGAN SMALL CAP FUNDS | | DECEMBER 31, 2014 |
| | | | | | | | | | | | | | | | | | | | |
AVERAGE ANNUAL TOTAL RETURNS AS OF DECEMBER 31, 2014 | |
| | | | | |
| | | INCEPTION DATE OF
CLASS | | | 6 MONTH* | | | 1 YEAR | | | 5 YEAR | | | 10 YEAR | |
SELECT CLASS SHARES | | | January 1, 1997 | | | | 3.47 | % | | | 9.73 | % | | | 17.89 | % | | | 8.05 | % |
TEN YEAR PERFORMANCE (12/31/04 TO 12/31/14)

The performance quoted is past performance and is not a guarantee of future results. Mutual funds are subject to certain market risks. Investment returns and principal value of an investment will fluctuate so that an investor’s shares, when redeemed, may be worth more or less than their original cost. Current performance may be higher or lower than the performance data shown. For up-to-date month-end performance information please call 1-800-480-4111.
The graph illustrates comparative performance for $1,000,000 invested in Select Class Shares of the JPMorgan Small Cap Core Fund, the Russell 2000 Index and the Lipper Small-Cap Core Funds Index from December 31, 2004 to December 31, 2014. The performance of the Fund assumes reinvestment of all dividends and capital gain distributions, if any, and does not include a sales charge. The performance of the Russell 2000 Index does not reflect the deduction of expenses or a sales charge associated with a mutual fund and has been adjusted to reflect reinvestment of all dividends and capital gain distributions of the securities included in the benchmark, if applicable. The performance of the Lipper Small-Cap Core Funds Index includes expenses associated with a mutual fund, such as investment management fees. These expenses are not identical to the expenses incurred by the Fund. The Russell
2000 Index is an unmanaged index which measures the performance of the 2000 smallest stocks (on the basis of capitalization) in the Russell 3000 Index. The Lipper Small-Cap Core Funds Index is an index based on the total returns of certain mutual funds within the Fund’s designated category as determined by Lipper, Inc. Investors cannot invest directly in an index.
Select Class Shares have a $1,000,000 minimum initial investment.
Fund performance may reflect the waiver of the Fund’s fees and reimbursement of expenses for certain periods since the inception date. Without these waivers and reimbursements, performance would have been lower. Also, performance shown in this section does not reflect the deduction of taxes that a shareholder would pay on Fund distributions or redemption of Fund shares.
The returns shown are based on net asset values calculated for shareholder transactions and may differ from the returns shown in the financial highlights, which reflect adjustments made to the net asset values in accordance with accounting principles generally accepted in the United States of America.
| | | | | | | | |
| | | |
| DECEMBER 31, 2014 | | J.P. MORGAN SMALL CAP FUNDS | | | | | 7 | |
JPMorgan Small Cap Equity Fund
FUND COMMENTARY
SIX MONTHS ENDED DECEMBER 31, 2014 (Unaudited)
| | | | |
| REPORTING PERIOD RETURN: | | | |
| Fund (Class A Shares, without a sales charge)* | | | 2.56% | |
| Russell 2000 Index | | | 1.65% | |
| |
| Net Assets as of 12/31/2014 (In Thousands) | | $ | 3,435,206 | |
INVESTMENT OBJECTIVE**
The JPMorgan Small Cap Equity Fund (the “Fund”) seeks capital growth over the long term.
WHAT WERE THE MAIN DRIVERS OF THE FUND’S PERFORMANCE?
The Fund (Class A Shares, without a sales charge) outperformed the Russell 2000 Index (the “Benchmark”) for the six months ended December 31, 2014. The Fund’s security selection in the consumer discretionary and materials & processing sector was a leading contributor to performance relative to the Benchmark, while the Fund’s underweight position in the health care sector and its security selection in the producer durables sector detracted from relative performance.
Individual contributors to relative performance included the Fund’s overweight positions in Jarden Corp., Brinker International Inc. and Imperva Inc. Shares of Jarden, a consumer products company not held in the Benchmark, rose after the company raised its forecast for earnings amid healthy consumer spending the in U.S. Shares of Brinker International, an owner and franchiser of restaurant chains that was not held in the Benchmark, strengthened amid better-than-expected restaurant sales and expectations that falling gasoline prices would boost consumer spending. Shares of Imperva, a data security technology provider, rebounded on positive investor reaction to the company’s new chief executive and management team.
Individual detractors from relative performance included the Fund’s overweight positions in Oasis Petroleum Inc., Laredo Petroleum Holdings Inc. and Resolute Energy Corp. Shares of Oasis Petroleum, an oil exploration and production company, weakened amid company plans to sharply cut capital spending in the wake of falling oil prices. Shares of Laredo Petroleum, an independent oil and natural gas exploration and production company, fell amid a decline in global oil prices. Shares of Resolute Energy, an independent oil and gas exploration and production company, declined on the company’s reduced production forecast and its inability to escalate drilling as expected.
HOW WAS THE FUND POSITIONED?
The Fund’s portfolio managers employed a bottom-up approach to stock selection, constructing portfolios based on
company fundamentals and proprietary analysis. The Fund’s portfolio managers looked for companies that, in their view, had leading competitive advantages, predictable and durable business models, and sustainable free cash flow generation with management teams committed to increasing intrinsic value.
| | | | | | | | |
| TOP TEN EQUITY HOLDINGS OF THE PORTFOLIO*** | |
| | 1. | | | Jarden Corp. | | | 2.8 | % |
| | 2. | | | Waste Connections, Inc. | | | 2.7 | |
| | 3. | | | Brinker International, Inc. | | | 2.1 | |
| | 4. | | | Spectrum Brands Holdings, Inc. | | | 2.0 | |
| | 5. | | | Silgan Holdings, Inc. | | | 1.9 | |
| | 6. | | | AptarGroup, Inc. | | | 1.9 | |
| | 7. | | | Crown Holdings, Inc. | | | 1.8 | |
| | 8. | | | RLJ Lodging Trust | | | 1.8 | |
| | 9. | | | IDEXX Laboratories, Inc. | | | 1.8 | |
| | 10. | | | Toro Co. (The) | | | 1.8 | |
| | | | |
PORTFOLIO COMPOSITION BY SECTOR*** | |
| Financials | | | 21.2 | % |
| Consumer Discretionary | | | 19.2 | |
| Industrials | | | 17.0 | |
| Information Technology | | | 12.4 | |
| Health Care | | | 10.8 | |
| Materials | | | 5.6 | |
| Consumer Staples | | | 3.3 | |
| Energy | | | 3.2 | |
| Utilities | | | 3.0 | |
| Mutual Funds | | | 0.4 | |
| Short-Term Investment | | | 3.9 | |
| * | | The return shown is based on net asset values calculated for shareholder transactions and may differ from the return shown in the financial highlights, which reflects adjustments made to the net asset values in accordance with accounting principles generally accepted in the United States of America. |
| ** | | The adviser seeks to achieve the Fund’s objective. There can be no guarantee it will be achieved. |
| *** | | Percentages indicated are based on total investments as of December 31, 2014. The Fund’s portfolio composition is subject to change. |
| | | | | | |
| | | |
| 8 | | | | J.P. MORGAN SMALL CAP FUNDS | | DECEMBER 31, 2014 |
| | | | | | | | | | | | | | | | | | |
AVERAGE ANNUAL TOTAL RETURNS AS OF DECEMBER 31, 2014 | |
| | | | | |
| | | INCEPTION DATE
OF CLASS | | 6 MONTH* | | | 1 YEAR | | | 5 YEAR | | | 10 YEAR | |
CLASS A SHARES | | December 20, 1994 | | | | | | | | | | | | | | | | |
Without Sales Charge | | | | | 2.56 | % | | | 7.00 | % | | | 17.21 | % | | | 11.30 | % |
With Sales Charge** | | | | | (2.82 | ) | | | 1.38 | | | | 15.94 | | | | 10.70 | |
CLASS B SHARES | | March 28, 1995 | | | | | | | | | | | | | | | | |
Without CDSC | | | | | 2.31 | | | | 6.48 | | | | 16.62 | | | | 10.86 | |
With CDSC*** | | | | | (2.69 | ) | | | 1.48 | | | | 16.41 | | | | 10.86 | |
CLASS C SHARES | | February 19, 2005 | | | | | | | | | | | | | | | | |
Without CDSC | | | | | 2.29 | | | | 6.47 | | | | 16.62 | | | | 10.75 | |
With CDSC**** | | | | | 1.29 | | | | 5.47 | | | | 16.62 | | | | 10.75 | |
CLASS R2 SHARES | | November 3, 2008 | | | 2.44 | | | | 6.73 | | | | 16.91 | | | | 11.13 | |
CLASS R5 SHARES | | May 15, 2006 | | | 2.82 | | | | 7.55 | | | | 17.79 | | | | 11.86 | |
SELECT CLASS SHARES | | May 7, 1996 | | | 2.71 | | | | 7.33 | | | | 17.56 | | | | 11.67 | |
| ** | | Sales Charge for Class A Shares is 5.25%. |
| *** | | Assumes a 5% CDSC (contingent deferred sales charge) for the one year period, 2% CDSC for the five year period and 0% CDSC thereafter. |
| **** | | Assumes a 1% CDSC for the one year period and 0% CDSC thereafter. |
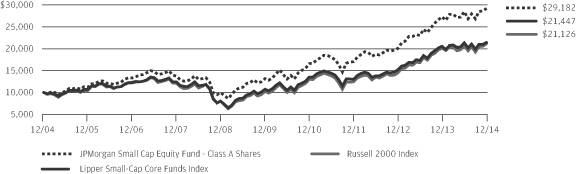
TEN YEAR PERFORMANCE (12/31/04 TO 12/31/14)
The performance quoted is past performance and is not a guarantee of future results. Mutual funds are subject to certain market risks. Investment returns and principal value of an investment will fluctuate so that an investor’s shares, when redeemed, may be worth more or less than their original cost. Current performance may be higher or lower than the performance data shown. For up-to-date month-end performance information please call 1-800-480-4111.
Returns for Class C Shares prior to its inception date are based on the performance of the Class B Shares, whose expenses are substantially similar to those of Class C Shares. Returns for Class R5 Shares prior to its inception date are based on the performance of the Select Class Shares. The actual returns of Class R5 Shares would have been different than those shown because Class R5 Shares have different expenses than Select Class Shares. Returns for Class R2 Shares prior to its inception date are based on the performance of Class A Shares. The actual returns of Class R2 Shares would have been lower than those shown because Class R2 Shares have higher expenses than Class A Shares.
The graph illustrates comparative performance for $10,000 invested in Class A Shares of the JPMorgan Small Cap Equity Fund, the Russell 2000 Index and the Lipper Small-Cap Core Funds Index from December 31, 2004 to December 31, 2014. The performance of the Fund assumes reinvestment of all dividends and capital gain distributions, if any, and includes a sales charge. The performance of the Russell 2000 Index does not reflect the deduction of expenses or a sales charge associated with a mutual fund and has been adjusted to reflect reinvestment of all dividends and capital gain distributions of the securities included in the benchmark, if applicable. The performance of the Lipper Small-Cap Core Funds Index includes
expenses associated with a mutual fund, such as investment management fees. These expenses are not identical to the expenses incurred by the Fund. The Russell 2000 Index is an unmanaged index which measures the performance of the 2000 smallest stocks (on the basis of capitalization) in the Russell 3000 Index. The Lipper Small-Cap Core Funds Index is an index based on the total returns of certain mutual funds within the Fund’s designated category as determined by Lipper, Inc. Investors cannot invest directly in an index.
Class A Shares have a $1,000 minimum initial investment and carry a 5.25% sales charge.
Fund performance may reflect the waiver of the Fund’s fees and reimbursement of expenses for certain periods since the inception date. Without these waivers and reimbursements, performance would have been lower. Also, performance shown in this section does not reflect the deduction of taxes that a shareholder would pay on Fund distributions or redemption of Fund shares.
Because Class B Shares automatically convert to Class A Shares after eight years, the 10 year average annual total return shown above for Class B reflects Class A performance for the period after conversion.
The returns shown are based on net asset values calculated for shareholder transactions and may differ from the returns shown in the financial highlights, which reflect adjustments made to the net asset values in accordance with accounting principles generally accepted in the United States of America.
| | | | | | | | |
| | | |
| DECEMBER 31, 2014 | | J.P. MORGAN SMALL CAP FUNDS | | | | | 9 | |
JPMorgan Small Cap Growth Fund
FUND COMMENTARY
SIX MONTHS ENDED DECEMBER 31, 2014 (Unaudited)
| | | | |
| REPORTING PERIOD RETURN: | | | |
| Fund (Class A Shares, without a sales charge)* | | | 3.14% | |
| Russell 2000 Growth Index | | | 3.31% | |
| |
| Net Assets as of 12/31/2014 (In Thousands) | | $ | 1,160,972 | |
INVESTMENT OBJECTIVE**
The JPMorgan Small Cap Growth Fund (the “Fund”) seeks long-term capital growth primarily by investing in a portfolio of equity securities of small-capitalization and emerging growth companies.
WHAT WERE THE MAIN DRIVERS OF THE FUND’S PERFORMANCE?
The Fund (Class A Shares, without a sales charge) underperformed the Russell 2000 Growth Index (the “Benchmark”) for the six months ended December 31, 2014. The Fund’s security selection in the consumer discretionary sectors and its security selection and underweight position in the consumer staples sector were leading detractors from performance relative to the Benchmark. The Fund’s security selection and overweight position in the health care sector and its security selection in the producer durables sector were leading contributors to relative performance.
Individual detractors from relative performance included the Fund’s overweight positions in Laredo Petroleum Holdings Inc., Oasis Petroleum Inc. and Forum Energy Technologies Inc. Shares of Laredo Petroleum, an oil and natural gas exploration and production company not held in the Benchmark, fell amid a decline in global oil prices. Shares of Oasis Petroleum, an oil exploration and production company not held in the Benchmark, weakened amid company plans to sharply cut capital spending in the wake of falling oil prices. Shares of Forum Energy, an oilfield services company, fell amid overall weakness in the energy sector due to falling oil prices.
Individual contributors to relative performance included the Fund’s overweight positions in Puma Biotechnology Inc., Receptos Inc. and Trex Inc. Shares of Puma Biotechnology, a development-stage biopharmaceutical company, rose on positive clinical trial results for its lung cancer drug candidate. Shares of Receptos, a biopharmaceutical company, strengthened on the back of positive clinical trial results for its bowel disorder drug candidate. Share of Trex, a maker of plastic/wood composite products for the home improvement market, rose on an improved quarterly revenue forecast.
HOW WAS THE FUND POSITIONED?
The Fund’s portfolio managers utilized a bottom-up approach to stock selection, researching individual companies in an effort to construct portfolios of stocks that have strong fundamentals. The Fund’s portfolio managers preferred to invest in high quality companies with durable franchises that, in their view, possessed the ability to generate strong future earnings growth.
| | | | | | | | |
| TOP TEN EQUITY HOLDINGS OF THE PORTFOLIO*** | |
| | 1. | | | Middleby Corp. (The) | | | 2.3 | % |
| | 2. | | | Acuity Brands, Inc. | | | 2.1 | |
| | 3. | | | Acadia Healthcare Co., Inc. | | | 1.9 | |
| | 4. | | | Trex Co., Inc. | | | 1.7 | |
| | 5. | | | Watsco, Inc. | | | 1.6 | |
| | 6. | | | Wolverine World Wide, Inc. | | | 1.5 | |
| | 7. | | | Insulet Corp. | | | 1.5 | |
| | 8. | | | Lithia Motors, Inc., Class A | | | 1.4 | |
| | 9. | | | Old Dominion Freight Line, Inc. | | | 1.4 | |
| | 10. | | | Monolithic Power Systems, Inc. | | | 1.4 | |
| | | | |
PORTFOLIO COMPOSITION BY SECTOR*** | |
Health Care | |
| 26.0
| %
|
Information Technology | |
| 24.7
|
|
Industrials | |
| 19.7
|
|
Consumer Discretionary | |
| 14.6
|
|
Financials | |
| 8.4
|
|
Energy | |
| 2.7
|
|
Consumer Staples | |
| 1.2
|
|
Telecommunication Services | |
| 1.0
|
|
Materials | |
| 0.9
|
|
Short-Term Investment | |
| 0.8
|
|
| * | | The return shown is based on net asset values calculated for shareholder transactions and may differ from the return shown in the financial highlights, which reflects adjustments made to the net asset values in accordance with accounting principles generally accepted in the United States of America. |
| ** | | The adviser seeks to achieve the Fund’s objective. There can be no guarantee it will be achieved. |
| *** | | Percentages indicated are based on total investments as of December 31, 2014. The Fund’s portfolio composition is subject to change. |
| | | | | | |
| | | |
| 10 | | | | J.P. MORGAN SMALL CAP FUNDS | | DECEMBER 31, 2014 |
| | | | | | | | | | | | | | | | | | |
AVERAGE ANNUAL TOTAL RETURNS AS OF DECEMBER 31, 2014 | |
| | | | | |
| | | INCEPTION DATE
OF CLASS | | 6 MONTH* | | | 1 YEAR | | | 5 YEAR | | | 10 YEAR | |
CLASS A SHARES | | July 1, 1991 | | | | | | | | | | | | | | | | |
Without Sales Charge | | | | | 3.14 | % | | | (0.22 | )% | | | 16.40 | % | | | 8.83 | % |
With Sales Charge** | | | | | (2.25 | ) | | | (5.46 | ) | | | 15.16 | | | | 8.25 | |
CLASS B SHARES | | September 12, 1994 | | | | | | | | | | | | | | | | |
Without CDSC | | | | | 2.87 | | | | (0.73 | ) | | | 15.80 | | | | 8.32 | |
With CDSC*** | | | | | (2.13 | ) | | | (5.73 | ) | | | 15.58 | | | | 8.32 | |
CLASS C SHARES | | November 4, 1997 | | | | | | | | | | | | | | | | |
Without CDSC | | | | | 2.88 | | | | (0.79 | ) | | | 15.81 | | | | 8.23 | |
With CDSC**** | | | | | 1.88 | | | | (1.79 | ) | | | 15.81 | | | | 8.23 | |
CLASS R2 SHARES | | November 3, 2008 | | | 2.97 | | | | (0.51 | ) | | | 16.12 | | | | 8.54 | |
CLASS R6 SHARES | | November 30, 2010 | | | 3.41 | | | | 0.25 | | | | 16.97 | | | | 9.30 | |
INSTITUTIONAL CLASS SHARES | | February 19, 2005 | | | 3.36 | | | | 0.19 | | | | 16.88 | | | | 9.26 | |
SELECT CLASS SHARES | | March 26, 1996 | | | 3.28 | | | | 0.05 | | | | 16.71 | | | | 9.11 | |
| ** | | Sales Charge for Class A Shares is 5.25%. |
| *** | | Assumes a 5% CDSC (contingent deferred sales charge) for the one year period, 2% CDSC for the five year period and 0% CDSC thereafter. |
| **** | | Assumes a 1% CDSC for the one year period and 0% CDSC thereafter. |
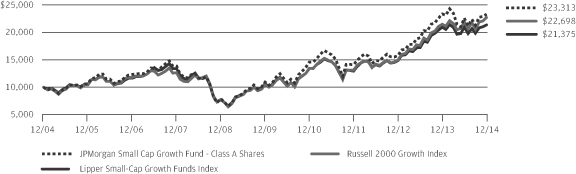
TEN YEAR PERFORMANCE (12/31/04 TO 12/31/14)
The performance quoted is past performance and is not a guarantee of future results. Mutual funds are subject to certain market risks. Investment returns and principal value of an investment will fluctuate so that an investor’s shares, when redeemed, may be worth more or less than their original cost. Current performance may be higher or lower than the performance data shown. For up-to-date month-end performance information please call 1-800-480-4111.
Returns for Institutional Class Shares prior to their inception date are based on the performance of Select Class Shares. Returns for Class R6 Shares prior to their inception date are based on the performance of Institutional Class Shares from February 19, 2005 through inception and on the performance of Select Class Shares prior to February 19, 2005. The actual returns for Institutional Class Shares and Class R6 Shares would have been different than those shown because Institutional Class Shares and Class R6 Shares have different expenses than the class on which the earlier performance is based. Returns for Class R2 Shares prior to its inception date are based on the performance of Class A Shares. All prior class performance for Class R2 Shares has been adjusted to reflect the differences in expenses between classes.
The graph illustrates comparative performance for $10,000 invested in Class A Shares of the JPMorgan Small Cap Growth Fund, the Russell 2000 Growth Index and the Lipper Small-Cap Growth Funds Index from December 31, 2004 to December 31, 2014. The performance of the Fund assumes reinvestment of all dividends and capital gain distributions, if any, and includes a sales charge. The performance of the Russell 2000 Growth Index does not reflect the deduction of expenses or a sales charge associated with a mutual fund and has been adjusted to reflect reinvestment of all dividends and capital gain distributions of
the securities included in the benchmark, if applicable. The performance of the Lipper Small-Cap Growth Funds Index includes expenses associated with a mutual fund, such as investment management fees. These expenses are not identical to the expenses incurred by the Fund. The Russell 2000 Growth Index is an unmanaged index which measures the performance of those Russell 2000 companies with higher price-to-book ratios and higher forecasted growth values. The Lipper Small-Cap Growth Funds Index is an index based on the total returns of certain mutual funds within the Fund’s designated category as determined by Lipper, Inc. Investors cannot invest directly in an index.
Class A Shares have a $1,000 minimum initial investment and carry a 5.25% sales charge.
Fund performance may reflect the waiver of the Fund’s fees and reimbursement of expenses for certain periods since the inception date. Without these waivers and reimbursements, performance would have been lower. Also, performance shown in this section does not reflect the deduction of taxes that a shareholder would pay on Fund distributions or redemption of Fund shares.
Because Class B Shares automatically convert to Class A Shares after eight years, the 10 year average annual total return shown above for Class B reflects Class A performance for the period after conversion.
The returns shown are based on net asset values calculated for shareholder transactions and may differ from the returns shown in the financial highlights, which reflect adjustments made to the net asset values in accordance with accounting principles generally accepted in the United States of America.
| | | | | | | | |
| | | |
| DECEMBER 31, 2014 | | J.P. MORGAN SMALL CAP FUNDS | | | | | 11 | |
JPMorgan Small Cap Value Fund
FUND COMMENTARY
SIX MONTHS ENDED DECEMBER 31, 2014 (Unaudited)
| | | | |
| REPORTING PERIOD RETURN: | |
| Fund (Select Class Shares)* | | | 0.64% | |
| Russell 2000 Value Index | | | 0.01% | |
| |
| Net Assets as of 12/31/2014 (In Thousands) | | $ | 1,623,197 | |
INVESTMENT OBJECTIVE**
The JPMorgan Small Cap Value Fund (the “Fund”) seeks long-term capital growth primarily by investing in equity securities of small-capitalization companies.
WHAT WERE THE MAIN DRIVERS OF THE FUND’S PERFORMANCE?
The Fund (Select Class Shares) outperformed the Russell 2000 Value Index (the “Benchmark”) for the six months ended December 31, 2014. The Fund’s security selection in the industrial cyclical and pharmaceutical sectors was a leading contributor to performance relative to the Benchmark, while security selection in the finance and retail sectors was a leading detractor from relative performance.
Leading individual contributors to relative performance included the Fund’s overweight positions in Spansion Inc., Western Refining Inc. and Helix Energy Solutions Inc. Shares of Spansion, a provider of flash memory technology not held in the Benchmark, rose on news that the company would be acquired by Cypress Semiconductor Corp. Shares of Western Refining, a crude oil refining and marketing company not held in the Benchmark, rose on better-than-expected earnings and revenue. Shares of Helix Energy, an offshore oilfield services company, strengthened after the company raised its earnings forecast.
Individual detractors from relative performance included the Fund’s overweight positions in Ocwen Financial Corp., Cloud Peak Energy Inc. and PhotoMedex Inc. Shares of Ocwen, a mortgage loan servicing and origination company not held in the Benchmark, fell amid the ouster of the company’s influential chairman in a $150 million settlement with the New York State Department of Finance following an investigation of foreclosure and accounting practices. Shares of Cloud Peak, a coal company, weakened on investor concerns about coal demand amid falling global oil prices. Shares of PhotoMedex, a provider of skin care products, fell amid declining sales and purported class action lawsuits related to its key hair removal product.
HOW WAS THE FUND POSITIONED?
In accordance with its investment process, the Fund’s portfolio managers take limited sector bets and construct the Fund so that stock selection is typically the primary driver of its relative
performance versus the Benchmark. The Fund’s portfolio managers use a quantitative ranking methodology to identify stocks in each sector that, in their view, trade at attractive levels. Through bottom-up fundamental research, they seek companies that exhibit high earnings quality and have management teams that make effective capital deployment decisions. During the reporting period, the Fund was managed and positioned in accordance with this investment process.
| | | | | | | | |
| TOP TEN EQUITY HOLDINGS OF THE PORTFOLIO*** | |
| | 1. | | | Portland General Electric Co. | | | 1.2 | % |
| | 2. | | | CYS Investments, Inc. | | | 1.1 | |
| | 3. | | | Rite Aid Corp. | | | 1.1 | |
| | 4. | | | Spansion, Inc., Class A | | | 1.0 | |
| | 5. | | | Dana Holding Corp. | | | 1.0 | |
| | 6. | | | DCT Industrial Trust, Inc. | | | 1.0 | |
| | 7. | | | CNO Financial Group, Inc. | | | 0.9 | |
| | 8. | | | Helix Energy Solutions Group, Inc. | | | 0.9 | |
| | 9. | | | AAR Corp. | | | 0.9 | |
| | 10. | | | Dillard’s, Inc., Class A | | | 0.9 | |
| | | | |
PORTFOLIO COMPOSITION BY SECTOR*** | |
Financials | | | 38.0 | % |
Industrials | | | 14.3 | |
Information Technology | | | 10.6 | |
Consumer Discretionary | | | 9.8 | |
Utilities | | | 6.4 | |
Health Care | | | 5.2 | |
Energy | | | 4.3 | |
Materials | | | 3.8 | |
Consumer Staples | | | 3.8 | |
Telecommunication Services | | | 0.7 | |
Short-Term Investment | | | 3.1 | |
| * | | The return shown is based on net asset values calculated for shareholder transactions and may differ from the return shown in the financial highlights, which reflects adjustments made to the net asset values in accordance with accounting principles generally accepted in the United States of America. |
| ** | | The adviser seeks to achieve the Fund’s objective. There can be no guarantee it will be achieved. |
| *** | | Percentages indicated are based on total investments as of December 31, 2014. The Fund’s portfolio composition is subject to change. |
| | | | | | |
| | | |
| 12 | | | | J.P. MORGAN SMALL CAP FUNDS | | DECEMBER 31, 2014 |
| | | | | | | | | | | | | | | | | | |
AVERAGE ANNUAL TOTAL RETURNS AS OF DECEMBER 31, 2014 | |
| | | | | |
| | | INCEPTION DATE OF
CLASS | | 6 MONTH* | | | 1 YEAR | | | 5 YEAR | | | 10 YEAR | |
CLASS A SHARES | | January 27, 1995 | | | | | | | | | | | | | | | | |
Without Sales Charge | | | | | 0.49 | % | | | 4.00 | % | | | 15.40 | % | | | 7.71 | % |
With Sales Charge** | | | | | (4.79 | ) | | | (1.46 | ) | | | 14.16 | | | | 7.13 | |
CLASS B SHARES | | January 27, 1995 | | | | | | | | | | | | | | | | |
Without CDSC | | | | | 0.22 | | | | 3.40 | | | | 14.71 | | | | 7.18 | |
With CDSC*** | | | | | (4.78 | ) | | | (1.60 | ) | | | 14.48 | | | | 7.18 | |
CLASS C SHARES | | March 22, 1999 | | | | | | | | | | | | | | | | |
Without CDSC | | | | | 0.20 | | | | 3.36 | | | | 14.69 | | | | 7.06 | |
With CDSC**** | | | | | (0.80 | ) | | | 2.36 | | | | 14.69 | | | | 7.06 | |
CLASS R2 SHARES | | November 3, 2008 | | | 0.36 | | | | 3.76 | | | | 15.12 | | | | 7.44 | |
CLASS R5 SHARES | | May 15, 2006 | | | 0.68 | | | | 4.38 | | | | 15.79 | | | | 8.06 | |
CLASS R6 SHARES | | February 22, 2005 | | | 0.71 | | | | 4.43 | | | | 15.84 | | | | 8.13 | |
SELECT CLASS SHARES | | January 27, 1995 | | | 0.64 | | | | 4.29 | | | | 15.70 | | | | 7.98 | |
| ** | | Sales Charge for Class A Shares is 5.25%. |
| *** | | Assumes a 5% CDSC (contingent deferred sales charge) for the one year period, 2% CDSC for the five year period and 0% CDSC thereafter. |
| **** | | Assumes a 1% CDSC for the one year period and 0% CDSC thereafter. |
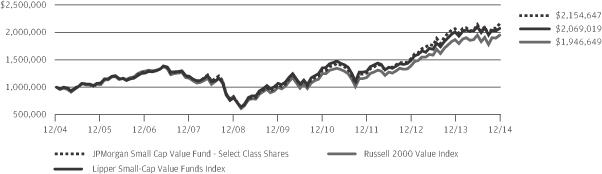
TEN YEAR PERFORMANCE (12/31/04 TO 12/31/14)
The performance quoted is past performance and is not a guarantee of future results. Mutual funds are subject to certain market risks. Investment returns and principal value of an investment will fluctuate so that an investor’s shares, when redeemed, may be worth more or less than their original cost. Current performance may be higher or lower than the performance data shown. For up-to-date month-end performance information please call 1-800-480-4111.
Returns for Class R2, Class R5 and Class R6 Shares prior to their inception dates are based on the performance of the Select Class Shares, the original class offered. All prior class performance for Class R2 Shares has been adjusted to reflect the differences in expenses between classes. The actual returns of Class R5 Shares and Class R6 Shares would have been different than those shown because Class R5 Shares and Class R6 Shares have different expenses than Select Class Shares.
The graph illustrates comparative performance for $1,000,000 invested in Select Class Shares of the JPMorgan Small Cap Value Fund, the Russell 2000 Value Index and the Lipper Small-Cap Value Funds Index from December 31, 2004 to December 31, 2014. The performance of the Fund assumes reinvestment of all dividends and capital gain distributions, if any, and does not include a sales charge. The performance of the Russell 2000 Value Index does not reflect the deduction of expenses or a sales charge associated with a mutual fund and has been adjusted to reflect reinvestment of all dividends and capital gain distributions of the securities included in the benchmark, if applicable.
The performance of the Lipper Small-Cap Value Funds Index includes expenses associated with a mutual fund, such as investment management fees. These expenses are not identical to the expenses incurred by the Fund. The Russell 2000 Value Index is an unmanaged index which measures the performance of those Russell 2000 companies with lower price-to-book ratios and lower forecasted growth values. The Lipper Small-Cap Value Funds Index is an index based on the total returns of certain mutual funds within the Fund’s designated category as determined by Lipper, Inc. Investors cannot invest directly in an index.
Select Class Shares have a $1,000,000 minimum initial investment.
Fund performance may reflect the waiver of the Fund’s fees and reimbursement of expenses for certain periods since the inception date. Without these waivers and reimbursements, performance would have been lower. Also, performance shown in this section does not reflect the deduction of taxes that a shareholder would pay on Fund distributions or redemption of Fund shares.
Because Class B Shares automatically convert to Class A Shares after eight years, the 10 year average annual total return shown above for Class B reflects Class A performance for the period after conversion.
The returns shown are based on net asset values calculated for shareholder transactions and may differ from the returns shown in the financial highlights, which reflect adjustments made to the net asset values in accordance with accounting principles generally accepted in the United States of America.
| | | | | | | | |
| | | |
| DECEMBER 31, 2014 | | J.P. MORGAN SMALL CAP FUNDS | | | | | 13 | |
JPMorgan U.S. Small Company Fund
FUND COMMENTARY
SIX MONTHS ENDED DECEMBER 31, 2014 (Unaudited)
| | | | |
| REPORTING PERIOD RETURN: | |
| Fund (Institutional Class Shares)* | | | 3.65% | |
| Russell 2000 Index | | | 1.65% | |
| |
| Net Assets as of 12/31/2014 (In Thousands) | | $ | 720,604 | |
INVESTMENT OBJECTIVE**
The JPMorgan U.S. Small Company Fund (the “Fund”) seeks to provide high total return from a portfolio of small company stocks.
WHAT WERE THE MAIN DRIVERS OF THE FUND’S PERFORMANCE?
The Fund (Institutional Class Shares) outperformed the Russell 2000 Index (the “Benchmark”) for the six months ended December 31, 2014. The Fund’s security selection and overweight position in the pharmaceuticals sector and security selection in the industrial cyclical sector were leading contributors to performance relative to the Benchmark, while the Fund’s security selection and underweight position in the finance sector and its underweight position in the real estate investment trust sector were leading detractors from relative performance.
Individual contributors to relative performance included the Fund’s overweight positions in Puma Biotechnology Inc., Taser International Inc. and Strayer Education Inc. Shares of Puma Biotechnology, a development stage biopharmaceutical company not held in the Benchmark, rose on positive clinical trial results for its lung cancer drug candidate. Shares of Taser International, maker of Taser brand electronic weapons that was not held in the Benchmark, strengthened on strong demand for its products. Shares of Strayer Education, owner/operator of for-profit Strayer University that was not held in the Benchmark, rose on better-than-expected quarterly earnings.
Individual detractors from relative performance included the Fund’s overweight positions in PhotoMedex Inc., H.H. Gregg Inc. and Ocwen Financial Corp. Shares of PhotoMedex, a provider of skin care products, fell amid declining sales and purported class action lawsuits related to its key hair removal product. Shares of H.H. Gregg, a retailer of housewares and consumer electronics, declined after the company forecast weak sales in stores open more than one year. Shares of Ocwen, a mortgage loan servicing and origination company not held in the Benchmark, fell amid the ouster of the company’s influential chairman in a $150 million settlement with the New York State Department of Finance following an investigation of foreclosure and accounting practices.
HOW WAS THE FUND POSITIONED?
In accordance with its investment process, the Fund’s portfolio managers take limited sector bets and construct the Fund so
that stock selection is typically the primary driver of its relative performance versus the Benchmark. The Fund’s portfolio managers use a quantitative ranking methodology to identify stocks in each sector that, in their view, trade at attractive levels. Through bottom-up fundamental research, they seek companies that exhibit high earnings quality and have management teams that make effective capital deployment decisions. During the reporting period, the Fund was managed and positioned in accordance with this investment process.
| | | | | | | | |
| TOP TEN EQUITY HOLDINGS OF THE PORTFOLIO*** | |
| | 1. | | | Outerwall, Inc. | | | 1.3 | % |
| | 2. | | | Pantry, Inc. (The) | | | 1.2 | |
| | 3. | | | Rite Aid Corp. | | | 1.2 | |
| | 4. | | | Strayer Education, Inc. | | | 1.1 | |
| | 5. | | | Alaska Air Group, Inc. | | | 1.1 | |
| | 6. | | | Dana Holding Corp. | | | 1.0 | |
| | 7. | | | Iconix Brand Group, Inc. | | | 1.0 | |
| | 8. | | | United Stationers, Inc. | | | 1.0 | |
| | 9. | | | Dillard’s, Inc., Class A | | | 1.0 | |
| | 10. | | | AAR Corp. | | | 1.0 | |
| | | | |
PORTFOLIO COMPOSITION BY SECTOR*** | |
| Financials | | | 21.4 | % |
| Information Technology | | | 18.0 | |
| Health Care | | | 14.5 | |
| Consumer Discretionary | | | 13.0 | |
| Industrials | | | 13.0 | |
| Consumer Staples | | | 4.8 | |
| Energy | | | 3.9 | |
| Utilities | | | 3.0 | |
| Materials | | | 2.9 | |
| Telecommunication Services | | | 0.8 | |
| Short-Term Investment | | | 4.7 | |
| * | | The return shown is based on net asset values calculated for shareholder transactions and may differ from the return shown in the financial highlights, which reflects adjustments made to the net asset values in accordance with accounting principles generally accepted in the United States of America. |
| ** | | The adviser seeks to achieve the Fund’s objective. There can be no guarantee it will be achieved. |
| *** | | Percentages indicated are based on total investments as of December 31, 2014. The Fund’s portfolio composition is subject to change. |
| | | | | | |
| | | |
| 14 | | | | J.P. MORGAN SMALL CAP FUNDS | | DECEMBER 31, 2014 |
| | | | | | | | | | | | | | | | | | |
AVERAGE ANNUAL TOTAL RETURNS AS OF DECEMBER 31, 2014 | |
| | | | | |
| | | INCEPTION DATE OF
CLASS | | 6 MONTH* | | | 1 YEAR | | | 5 YEAR | | | 10 YEAR | |
CLASS A SHARES | | November 1, 2007 | | | | | | | | | | | | | | | | |
Without Sales Charge | | | | | 3.39 | % | | | 8.12 | % | | | 17.33 | % | | | 8.20 | % |
With Sales Charge** | | | | | (2.03 | ) | | | 2.45 | | | | 16.08 | | | | 7.62 | |
CLASS C SHARES | | November 1, 2007 | | | | | | | | | | | | | | | | |
Without CDSC | | | | | 3.09 | | | | 7.57 | | | | 16.76 | | | | 7.82 | |
With CDSC*** | | | | | 2.09 | | | | 6.57 | | | | 16.76 | | | | 7.82 | |
CLASS R2 SHARES | | November 1, 2011 | | | 3.23 | | | | 7.85 | | | | 17.17 | | | | 8.13 | |
CLASS R6 SHARES | | November 1, 2011 | | | 3.64 | | | | 8.71 | | | | 17.89 | | | | 8.63 | |
INSTITUTIONAL CLASS SHARES | | November 4, 1993 | | | 3.65 | | | | 8.66 | | | | 17.85 | | | | 8.61 | |
SELECT CLASS SHARES | | September 10, 2001 | | | 3.56 | | | | 8.48 | | | | 17.65 | | | | 8.42 | |
| ** | | Sales Charge for Class A Shares is 5.25%. |
| *** | | Assumes a 1% CDSC (contingent deferred sales charge) for the one year period and 0% CDSC thereafter. |
TEN YEAR PERFORMANCE (12/31/04 TO 12/31/14)
The performance quoted is past performance and is not a guarantee of future results. Mutual funds are subject to certain market risks. Investment returns and principal value of an investment will fluctuate so that an investor’s shares, when redeemed, may be worth more or less than their original cost. Current performance may be higher or lower than the performance data shown. For up-to-date month-end performance information please call 1-800-480-4111.
Returns for Class A and Class C Shares prior to their inception dates are based on the performance of the Select Class Shares. The actual returns for Class A and Class C Shares would have been lower than those shown because Class A and Class C Shares have higher expenses than Select Class Shares.
Returns for Class R2 Shares prior to their inception date are based on the performances of the Class A Shares from November 1, 2007 to October 31, 2011 and the performance of Select Class Shares prior to November 1, 2007. Returns for Class R6 Shares prior to their inception date are based on the performance of the Institutional Class Shares. The actual returns of Class R2 Shares would have been lower than those shown because Class R2 Shares have higher expenses than Class A Shares and Select Class Shares. The actual returns of Class R6 Shares would have been different than these shown because Class R6 Shares have different expenses than Institutional Class Shares.
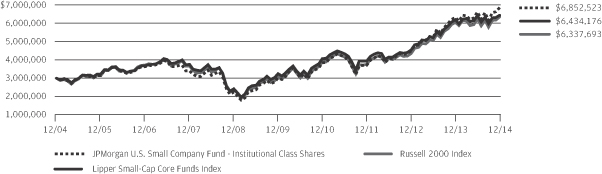
The graph illustrates comparative performance for $3,000,000 invested in Institutional Class Shares of the JPMorgan U.S. Small Company Fund, the Russell 2000 Index and the Lipper Small-Cap Core Funds Index from December 31, 2004 to December 31, 2014. The performance of the Fund
assumes reinvestment of all dividends and capital gain distributions, if any, and does not include a sales charge. The performance of the Russell 2000 Index does not reflect the deduction of expenses associated with a mutual fund and has been adjusted to reflect reinvestment of all dividends and capital gain distributions of the securities included in the benchmark, if applicable. The performance of the Lipper Small-Cap Core Funds Index includes expenses associated with a mutual fund, such as investment management fees. These expenses are not identical to the expenses incurred by the Fund. The Russell 2000 Index is an unmanaged index which measures the performance of the 2000 smallest stocks (on the basis of capitalization) in the Russell 3000 Index. The Lipper Small-Cap Core Funds Index is an index based on the total returns of certain mutual funds within the Fund’s designated category as determined by Lipper, Inc. Investors cannot invest directly in an index.
Institutional Class Shares have a $3,000,000 minimum initial investment.
Fund performance may reflect the waiver of the Fund’s fees and reimbursement of expenses for certain periods since the inception date. Without these waivers and reimbursements, performance would have been lower. Also, performance shown in this section does not reflect the deduction of taxes that a shareholder would pay on Fund distributions or redemptions of Fund shares.
The returns shown are based on net asset values calculated for shareholder transactions and may differ from the returns shown in the financial highlights, which reflect adjustments made to the net asset values in accordance with accounting principles generally accepted in the United States of America.
| | | | | | | | |
| | | |
| DECEMBER 31, 2014 | | J.P. MORGAN SMALL CAP FUNDS | | | | | 15 | |
JPMorgan Dynamic Small Cap Growth Fund
SCHEDULE OF PORTFOLIO INVESTMENTS
AS OF DECEMBER 31, 2014 (Unaudited)
(Amounts in thousands)
| | | | | | | | |
| SHARES | | | SECURITY DESCRIPTION | | VALUE($) | |
| | | | | | | | |
| Common Stocks — 98.3% | |
| | | | Consumer Discretionary — 14.4% | |
| | | | Distributors — 0.5% | |
| | 44 | | | Pool Corp. (m) | | | 2,799 | |
| | | | | | | | |
| | | | Diversified Consumer Services — 1.3% | |
| | 346 | | | 2U, Inc. (a) | | | 6,811 | |
| | | | | | | | |
| | | | Hotels, Restaurants & Leisure — 1.0% | |
| | 165 | | | Boyd Gaming Corp. (a) (m) | | | 2,107 | |
| | 242 | | | Scientific Games Corp., Class A (a) | | | 3,081 | |
| | | | | | | | |
| | | | | | | 5,188 | |
| | | | | | | | |
| | | | Household Durables — 0.5% | |
| | 188 | | | TRI Pointe Homes, Inc. (a) | | | 2,863 | |
| | | | | | | | |
| | | | Internet & Catalog Retail — 2.3% | |
| | 270 | | | Coupons.com, Inc. (a) | | | 4,793 | |
| | 75 | | | HomeAway, Inc. (a) | | | 2,226 | |
| | 186 | | | RetailMeNot, Inc. (a) | | | 2,722 | |
| | 124 | | | Wayfair, Inc., Class A (a) | | | 2,454 | |
| | | | | | | | |
| | | | | | | 12,195 | |
| | | | | | | | |
| | | | Specialty Retail — 5.7% | |
| | 137 | | | Container Store Group, Inc. (The) (a) | | | 2,625 | |
| | 145 | | | Five Below, Inc. (a) | | | 5,931 | |
| | 89 | | | Lithia Motors, Inc., Class A | | | 7,727 | |
| | 112 | | | Men’s Wearhouse, Inc. (The) | | | 4,946 | |
| | 84 | | | Penske Automotive Group, Inc. | | | 4,120 | |
| | 115 | | | Vitamin Shoppe, Inc. (a) | | | 5,603 | |
| | | | | | | | |
| | | | | | | 30,952 | |
| | | | | | | | |
| | | | Textiles, Apparel & Luxury Goods — 3.1% | |
| | 159 | | | Kate Spade & Co. (a) (m) | | | 5,101 | |
| | 180 | | | Vera Bradley, Inc. (a) | | | 3,670 | |
| | 272 | | | Wolverine World Wide, Inc. | | | 8,011 | |
| | | | | | | | |
| | | | | | | 16,782 | |
| | | | | | | | |
| | | | Total Consumer Discretionary | | | 77,590 | |
| | | | | | | | |
| | | | Consumer Staples — 1.2% | |
| | | | Food Products — 1.2% | |
| | 84 | | | Diamond Foods, Inc. (a) | | | 2,376 | |
| | 241 | | | Freshpet, Inc. (a) | | | 4,120 | |
| | | | | | | | |
| | | | Total Consumer Staples | | | 6,496 | |
| | | | | | | | |
| | | | Energy — 2.7% | |
| | | | Energy Equipment & Services — 1.5% | |
| | 53 | | | Dril-Quip, Inc. (a) | | | 4,047 | |
| | 181 | | | Forum Energy Technologies, Inc. (a) | | | 3,749 | |
| | | | | | | | |
| | | | | | | 7,796 | |
| | | | | | | | |
| | | | | | | | |
| SHARES | | | SECURITY DESCRIPTION | | VALUE($) | |
| | | | | | | | |
| | | | | | | | |
| | | | Oil, Gas & Consumable Fuels — 1.2% | |
| | 126 | | | Delek U.S. Holdings, Inc. | | | 3,430 | |
| | 137 | | | Eclipse Resources Corp. (a) | | | 963 | |
| | 216 | | | Laredo Petroleum, Inc. (a) | | | 2,232 | |
| | | | | | | | |
| | | | | | | 6,625 | |
| | | | | | | | |
| | | | Total Energy | | | 14,421 | |
| | | | | | | | |
| | | | Financials — 8.3% | |
| | | | Banks — 1.8% | |
| | 39 | | | Signature Bank (a) | | | 4,901 | |
| | 85 | | | Texas Capital Bancshares, Inc. (a) | | | 4,643 | |
| | | | | | | | |
| | | | | | | 9,544 | |
| | | | | | | | |
| | | | Capital Markets — 2.6% | |
| | 193 | | | Financial Engines, Inc. | | | 7,039 | |
| | 198 | | | FXCM, Inc., Class A | | | 3,282 | |
| | 372 | | | PennantPark Investment Corp. | | | 3,540 | |
| | | | | | | | |
| | | | | | | 13,861 | |
| | | | | | | | |
| | | | Diversified Financial Services — 0.3% | |
| | 80 | | | On Deck Capital, Inc. (a) | | | 1,803 | |
| | | | | | | | |
| | | | Insurance — 0.7% | |
| | 72 | | | AmTrust Financial Services, Inc. | | | 4,047 | |
| | | | | | | | |
| | | | Real Estate Investment Trusts (REITs) — 1.0% | |
| | 40 | | | EastGroup Properties, Inc. (m) | | | 2,562 | |
| | 62 | | | Highwoods Properties, Inc. (m) | | | 2,743 | |
| | | | | | | | |
| | | | | | | 5,305 | |
| | | | | | | | |
| | | | Real Estate Management & Development — 0.7% | |
| | 114 | | | RE/MAX Holdings, Inc., Class A | | | 3,897 | |
| | | | | | | | |
| | | | Thrifts & Mortgage Finance — 1.2% | |
| | 84 | | | BofI Holding, Inc. (a) | | | 6,533 | |
| | | | | | | | |
| | | | Total Financials | | | 44,990 | |
| | | | | | | | |
| | | | Health Care — 25.8% | |
| | | | Biotechnology — 11.3% | |
| | 132 | | | ACADIA Pharmaceuticals, Inc. (a) | | | 4,183 | |
| | 81 | | | Acceleron Pharma, Inc. (a) | | | 3,159 | |
| | 66 | | | Aegerion Pharmaceuticals, Inc. (a) | | | 1,378 | |
| | 237 | | | Arrowhead Research Corp. (a) | | | 1,747 | |
| | 66 | | | Avalanche Biotechnologies, Inc. (a) | | | 3,585 | |
| | 60 | | | Bellicum Pharmaceuticals, Inc. (a) | | | 1,387 | |
| | 98 | | | Chimerix, Inc. (a) | | | 3,957 | |
| | 133 | | | Coherus Biosciences, Inc. (a) | | | 2,173 | |
| | 130 | | | Exact Sciences Corp. (a) | | | 3,555 | |
| | 326 | | | Halozyme Therapeutics, Inc. (a) | | | 3,145 | |
| | 201 | | | Ignyta, Inc. (a) | | | 1,377 | |
| | 215 | | | Insmed, Inc. (a) | | | 3,325 | |
SEE NOTES TO FINANCIAL STATEMENTS.
| | | | | | |
| | | |
| 16 | | | | J.P. MORGAN SMALL CAP FUNDS | | DECEMBER 31, 2014 |
| | | | | | | | |
| SHARES | | | SECURITY DESCRIPTION | | VALUE($) | |
| | | | | | | | |
| Common Stocks — continued | |
| | | | Biotechnology — continued | | | | |
| | 90 | | | Intrexon Corp. (a) | | | 2,474 | |
| | 50 | | | Isis Pharmaceuticals, Inc. (a) | | | 3,108 | |
| | 219 | | | Keryx Biopharmaceuticals, Inc. (a) | | | 3,092 | |
| | 67 | | | Kite Pharma, Inc. (a) | | | 3,843 | |
| | 108 | | | Portola Pharmaceuticals, Inc. (a) | | | 3,069 | |
| | 20 | | | Puma Biotechnology, Inc. (a) | | | 3,720 | |
| | 37 | | | Receptos, Inc. (a) | | | 4,591 | |
| | 24 | | | Synageva BioPharma Corp. (a) | | | 2,231 | |
| | 80 | | | Versartis, Inc. (a) | | | 1,800 | |
| | | | | | | | |
| | | | | | | 60,899 | |
| | | | | | | | |
| | | | Health Care Equipment & Supplies — 6.8% | |
| | 441 | | | GenMark Diagnostics, Inc. (a) | | | 6,008 | |
| | 169 | | | Insulet Corp. (a) | | | 7,799 | |
| | 202 | | | K2M Group Holdings, Inc. (a) | | | 4,224 | |
| | 47 | | | Nevro Corp. (a) | | | 1,806 | |
| | 454 | | | Novadaq Technologies, Inc., (Canada) (a) | | | 7,541 | |
| | 382 | | | Syneron Medical Ltd., (Israel) (a) | | | 3,561 | |
| | 1,742 | | | Unilife Corp. (a) | | | 5,836 | |
| | | | | | | | |
| | | | | | | 36,775 | |
| | | | | | | | |
| | | | Health Care Providers & Services — 3.9% | |
| | 162 | | | Acadia Healthcare Co., Inc. (a) | | | 9,893 | |
| | 129 | | | Surgical Care Affiliates, Inc. (a) | | | 4,343 | |
| | 81 | | | WellCare Health Plans, Inc. (a) | | | 6,635 | |
| | | | | | | | |
| | | | | | | 20,871 | |
| | | | | | | | |
| | | | Health Care Technology — 1.0% | |
| | 207 | | | Veeva Systems, Inc., Class A (a) | | | 5,458 | |
| | | | | | | | |
| | | | Life Sciences Tools & Services — 1.3% | |
| | 206 | | | Fluidigm Corp. (a) | | | 6,955 | |
| | | | | | | | |
| | | | Pharmaceuticals — 1.5% | |
| | 232 | | | Nektar Therapeutics (a) | | | 3,595 | |
| | 89 | | | Revance Therapeutics, Inc. (a) | | | 1,511 | |
| | 114 | | | Sagent Pharmaceuticals, Inc. (a) | | | 2,853 | |
| | | | | | | | |
| | | | | | | 7,959 | |
| | | | | | | | |
| | | | Total Health Care | | | 138,917 | |
| | | | | | | | |
| | | | Industrials — 19.5% | |
| | | | Aerospace & Defense — 1.9% | |
| | 103 | | | HEICO Corp. (m) | | | 6,227 | |
| | 100 | | | Hexcel Corp. (a) | | | 4,132 | |
| | | | | | | | |
| | | | | | | 10,359 | |
| | | | | | | | |
| | | | Air Freight & Logistics — 1.1% | |
| | 141 | | | XPO Logistics, Inc. (a) | | | 5,779 | |
| | | | | | | | |
| | | | | | | | |
| SHARES | | | SECURITY DESCRIPTION | | VALUE($) | |
| | | | | | | | |
| | | | | | | | |
| | | | Airlines — 1.3% | |
| | 92 | | | Spirit Airlines, Inc. (a) | | | 6,975 | |
| | | | | | | | |
| | | | Building Products — 3.7% | |
| | 139 | | | Fortune Brands Home & Security, Inc. | | | 6,285 | |
| | 59 | | | Masonite International Corp. (a) | | | 3,621 | |
| | 46 | | | Norcraft Cos., Inc. (a) | | | 896 | |
| | 215 | | | Trex Co., Inc. (a) | | | 9,152 | |
| | | | | | | | |
| | | | | | | 19,954 | |
| | | | | | | | |
| | | | Electrical Equipment — 2.1% | |
| | 80 | | | Acuity Brands, Inc. | | | 11,273 | |
| | | | | | | | |
| | | | Industrial Conglomerates — 1.1% | |
| | 63 | | | Carlisle Cos., Inc. (m) | | | 5,641 | |
| | | | | | | | |
| | | | Machinery — 2.9% | |
| | 43 | | | Graco, Inc. (m) | | | 3,422 | |
| | 121 | | | Middleby Corp. (The) (a) | | | 12,033 | |
| | | | | | | | |
| | | | | | | 15,455 | |
| | | | | | | | |
| | | | Marine — 0.8% | |
| | 55 | | | Kirby Corp. (a) | | | 4,465 | |
| | | | | | | | |
| | | | Road & Rail — 1.4% | |
| | 99 | | | Old Dominion Freight Line, Inc. (a) | | | 7,684 | |
| | | | | | | | |
| | | | Trading Companies & Distributors — 3.2% | |
| | 96 | | | H&E Equipment Services, Inc. | | | 2,696 | |
| | 200 | | | Rush Enterprises, Inc., Class A (a) | | | 6,401 | |
| | 78 | | | Watsco, Inc. (m) | | | 8,387 | |
| | | | | | | | |
| | | | | | | 17,484 | |
| | | | | | | | |
| | | | Total Industrials | | | 105,069 | |
| | | | | | | | |
| | | | Information Technology — 24.5% | |
| | | | Communications Equipment — 3.2% | |
| | 258 | | | Aruba Networks, Inc. (a) | | | 4,688 | |
| | 221 | | | Ciena Corp. (a) (m) | | | 4,283 | |
| | 140 | | | Infinera Corp. (a) | | | 2,054 | |
| | 23 | | | Palo Alto Networks, Inc. (a) | | | 2,785 | |
| | 272 | | | Ruckus Wireless, Inc. (a) | | | 3,275 | |
| | | | | | | | |
| | | | | | | 17,085 | |
| | | | | | | | |
| | | | Electronic Equipment, Instruments & Components — 0.5% | |
| | 31 | | | FEI Co. (m) | | | 2,830 | |
| | | | | | | | |
| | | | Internet Software & Services — 7.3% | |
| | 99 | | | ChannelAdvisor Corp. (a) | | | 2,135 | |
| | 130 | | | Cornerstone OnDemand, Inc. (a) | | | 4,583 | |
| | 38 | | | CoStar Group, Inc. (a) | | | 6,918 | |
| | 144 | | | Dealertrack Technologies, Inc. (a) | | | 6,369 | |
| | 114 | | | Demandware, Inc. (a) | | | 6,570 | |
| �� | 126 | | | Envestnet, Inc. (a) | | | 6,168 | |
SEE NOTES TO FINANCIAL STATEMENTS.
| | | | | | | | |
| | | |
| DECEMBER 31, 2014 | | J.P. MORGAN SMALL CAP FUNDS | | | | | 17 | |
JPMorgan Dynamic Small Cap Growth Fund
SCHEDULE OF PORTFOLIO INVESTMENTS
AS OF DECEMBER 31, 2014 (Unaudited) (continued)
(Amounts in thousands)
| | | | | | | | |
| SHARES | | | SECURITY DESCRIPTION | | VALUE($) | |
| | | | | | | | |
| Common Stocks — continued | |
| | | | Internet Software & Services — continued | | | | |
| | 138 | | | Marketo, Inc. (a) | | | 4,519 | |
| | 47 | | | Trulia, Inc. (a) | | | 2,142 | |
| | | | | | | | |
| | | | | | | 39,404 | |
| | | | | | | | |
| | | | Semiconductors & Semiconductor Equipment — 5.0% | |
| | 108 | | | Cavium, Inc. (a) | | | 6,651 | |
| | 390 | | | Inphi Corp. (a) | | | 7,208 | |
| | 152 | | | Monolithic Power Systems, Inc. | | | 7,565 | |
| | 194 | | | TriQuint Semiconductor, Inc. (a) | | | 5,336 | |
| | | | | | | | |
| | | | | | | 26,760 | |
| | | | | | | | |
| | | | Software — 7.4% | |
| | 80 | | | CommVault Systems, Inc. (a) | | | 4,158 | |
| | 125 | | | FleetMatics Group plc, (Ireland) (a) | | | 4,426 | |
| | 209 | | | Fortinet, Inc. (a) | | | 6,402 | |
| | 140 | | | Guidewire Software, Inc. (a) | | | 7,089 | |
| | 66 | | | HubSpot, Inc. (a) | | | 2,203 | |
| | 103 | | | Imperva, Inc. (a) | | | 5,073 | |
| | 110 | | | Proofpoint Inc (a) | | | 5,292 | |
| | 64 | | | Tableau Software, Inc., Class A (a) | | | 5,408 | |
| | | | | | | | |
| | | | | | | 40,051 | |
| | | | | | | | |
| | | | Technology Hardware, Storage & Peripherals — 1.1% | |
| | 213 | | | Nimble Storage, Inc. (a) | | | 5,859 | |
| | | | | | | | |
| | | | Total Information Technology | | | 131,989 | |
| | | | | | | | |
| | | | | | | | |
| SHARES | | | SECURITY DESCRIPTION | | VALUE($) | |
| | | | | | | | |
| | | | Materials — 0.9% | |
| | | | Construction Materials — 0.9% | |
| | 65 | | | Eagle Materials, Inc. | | | 4,949 | |
| | | | | | | | |
| | | | Telecommunication Services — 1.0% | |
| | | | Wireless Telecommunication Services — 1.0% | |
| | 311 | | | Boingo Wireless, Inc. (a) | | | 2,384 | |
| | 209 | | | RingCentral, Inc., Class A (a) | | | 3,114 | |
| | | | | | | | |
| | | | Total Telecommunication Services | | | 5,498 | |
| | | | | | | | |
| | | | Total Common Stocks
(Cost $379,260) | | | 529,919 | |
| | | | | | | | |
| Short-Term Investment — 1.8% | |
| | | | Investment Company — 1.8% | |
| | 9,926 | | | JPMorgan Prime Money Market Fund, Institutional Class Shares, 0.020% (b) (l) (m) (Cost $9,926) | | | 9,926 | |
| | | | | | | | |
| | | | Total Investments — 100.1%
(Cost $389,186) | | | 539,845 | |
| | | | Liabilities in Excess of
Other Assets — (0.1)% | | | (706 | ) |
| | | | | | | | |
| | | | NET ASSETS — 100.0% | | $ | 539,139 | |
| | | | | | | | |
Percentages indicated are based on net assets.
SEE NOTES TO FINANCIAL STATEMENTS.
| | | | | | |
| | | |
| 18 | | | | J.P. MORGAN SMALL CAP FUNDS | | DECEMBER 31, 2014 |
JPMorgan Small Cap Core Fund
SCHEDULE OF PORTFOLIO INVESTMENTS
AS OF DECEMBER 31, 2014 (Unaudited)
(Amounts in thousands)
| | | | | | | | |
| SHARES | | | SECURITY DESCRIPTION | | VALUE($) | |
| | | | | | | | |
| Common Stocks — 98.3% | |
| | | | Consumer Discretionary — 13.0% | |
| | | | Auto Components — 1.4% | |
| | 146 | | | Cooper Tire & Rubber Co. | | | 5,063 | |
| | 52 | | | Stoneridge, Inc. (a) | | | 669 | |
| | 178 | | | Tower International, Inc. (a) | | | 4,545 | |
| | | | | | | | |
| | | | | | | 10,277 | |
| | | | | | | | |
| | | | Distributors — 0.3% | |
| | 37 | | | Core-Mark Holding Co., Inc. | | | 2,267 | |
| | 9 | | | VOXX International Corp. (a) | | | 75 | |
| | | | | | | | |
| | | | | | | 2,342 | |
| | | | | | | | |
| | | | Diversified Consumer Services — 0.5% | |
| | 9 | | | Capella Education Co. | | | 669 | |
| | 102 | | | Chegg, Inc. (a) | | | 708 | |
| | 118 | | | LifeLock, Inc. (a) | | | 2,175 | |
| | | | | | | | |
| | | | | | | 3,552 | |
| | | | | | | | |
| | | | Hotels, Restaurants & Leisure — 1.4% | |
| | 71 | | | Bloomin’ Brands, Inc. (a) | | | 1,763 | |
| | 29 | | | Dave & Buster’s Entertainment, Inc. (a) | | | 794 | |
| | 56 | | | Jack in the Box, Inc. | | | 4,486 | |
| | 165 | | | Ruth’s Hospitality Group, Inc. | | | 2,478 | |
| | 33 | | | Sonic Corp. | | | 910 | |
| | | | | | | | |
| | | | | | | 10,431 | |
| | | | | | | | |
| | | | Household Durables — 1.8% | |
| | 88 | | | Helen of Troy Ltd., (Bermuda) (a) | | | 5,693 | |
| | 27 | | | Jarden Corp. (a) | | | 1,300 | |
| | 63 | | | KB Home | | | 1,049 | |
| | 13 | | | Libbey, Inc. (a) | | | 409 | |
| | 20 | | | Lifetime Brands, Inc. | | | 335 | |
| | 9 | | | NACCO Industries, Inc., Class A | | | 540 | |
| | 130 | | | Skullcandy, Inc. (a) | | | 1,191 | |
| | 33 | | | Universal Electronics, Inc. (a) | | | 2,159 | |
| | | | | | | | |
| | | | | | | 12,676 | |
| | | | | | | | |
| | | | Internet & Catalog Retail — 0.4% | |
| | 15 | | | Coupons.com, Inc. (a) | | | 259 | |
| | 45 | | | Lands’ End, Inc. (a) | | | 2,445 | |
| | 13 | �� | | Wayfair, Inc., Class A (a) | | | 258 | |
| | | | | | | | |
| | | | | | | 2,962 | |
| | | | | | | | |
| | | | Leisure Products — 0.0% (g) | |
| | 13 | | | Nautilus, Inc. (a) | | | 200 | |
| | | | | | | | |
| | | | Media — 1.7% | |
| | 15 | | | AMC Entertainment Holdings, Inc., Class A | | | 380 | |
| | 133 | | | Dex Media, Inc. (a) | | | 1,194 | |
| | 225 | | | E.W. Scripps Co. (The), Class A (a) | | | 5,026 | |
| | | | | | | | |
| SHARES | | | SECURITY DESCRIPTION | | VALUE($) | |
| | | | | | | | |
| | | | | | | | |
| | | | Media — continued | | | | |
| | 32 | | | Entercom Communications Corp., Class A (a) | | | 383 | |
| | 80 | | | Journal Communications, Inc., Class A (a) | | | 915 | |
| | 11 | | | Live Nation Entertainment, Inc. (a) | | | 298 | |
| | 43 | | | Nexstar Broadcasting Group, Inc., Class A | | | 2,201 | |
| | 73 | | | Sinclair Broadcast Group, Inc., Class A | | | 2,000 | |
| | | | | | | | |
| | | | | | | 12,397 | |
| | | | | | | | |
| | | | Multiline Retail — 0.4% | |
| | 24 | | | Dillard’s, Inc., Class A | | | 2,979 | |
| | | | | | | | |
| | | | Specialty Retail — 4.2% | |
| | 133 | | | Barnes & Noble, Inc. (a) | | | 3,093 | |
| | 6 | | | Boot Barn Holdings, Inc. (a) | | | 105 | |
| | 99 | | | Brown Shoe Co., Inc. | | | 3,170 | |
| | 64 | | | Cato Corp. (The), Class A | | | 2,687 | |
| | 9 | | | Children’s Place, Inc. (The) | | | 490 | |
| | 43 | | | Citi Trends, Inc. (a) | | | 1,078 | |
| | 190 | | | Express, Inc. (a) | | | 2,797 | |
| | 71 | | | Lithia Motors, Inc., Class A | | | 6,190 | |
| | 1,076 | | | Office Depot, Inc. (a) | | | 9,226 | |
| | 13 | | | Outerwall, Inc. (a) | | | 955 | |
| | 22 | | | Systemax, Inc. (a) | | | 301 | |
| | | | | | | | |
| | | | | | | 30,092 | |
| | | | | | | | |
| | | | Textiles, Apparel & Luxury Goods — 0.9% | |
| | 27 | | | G-III Apparel Group Ltd. (a) | | | 2,748 | |
| | 115 | | | Iconix Brand Group, Inc. (a) | | | 3,889 | |
| | | | | | | | |
| | | | | | | 6,637 | |
| | | | | | | | |
| | | | Total Consumer Discretionary | | | 94,545 | |
| | | | | | | | |
| | | | Consumer Staples — 4.2% | |
| | | | Food & Staples Retailing — 2.1% | |
| | 47 | | | Andersons, Inc. (The) | | | 2,482 | |
| | 673 | | | Rite Aid Corp. (a) | | | 5,064 | |
| | 70 | | | Smart & Final Stores, Inc. (a) | | | 1,104 | |
| | 178 | | | SpartanNash Co. | | | 4,643 | |
| | 181 | | | SUPERVALU, Inc. (a) | | | 1,752 | |
| | | | | | | | |
| | | | | | | 15,045 | |
| | | | | | | | |
| | | | Food Products — 1.7% | |
| | 221 | | | Chiquita Brands International, Inc. (a) | | | 3,193 | |
| | 20 | | | Freshpet, Inc. (a) | | | 340 | |
| | 188 | | | Pilgrim’s Pride Corp. (a) | | | 6,151 | |
| | 49 | | | Pinnacle Foods, Inc. | | | 1,716 | |
| | 16 | | | Sanderson Farms, Inc. | | | 1,311 | |
| | | | | | | | |
| | | | | | | 12,711 | |
| | | | | | | | |
SEE NOTES TO FINANCIAL STATEMENTS.
| | | | | | | | |
| | | |
| DECEMBER 31, 2014 | | J.P. MORGAN SMALL CAP FUNDS | | | | | 19 | |
JPMorgan Small Cap Core Fund
SCHEDULE OF PORTFOLIO INVESTMENTS
AS OF DECEMBER 31, 2014 (Unaudited) (continued)
(Amounts in thousands)
| | | | | | | | |
| SHARES | | | SECURITY DESCRIPTION | | VALUE($) | |
| | | | | | | | |
| Common Stocks — continued | |
| | | | Personal Products — 0.4% | |
| | 26 | | | Revlon, Inc., Class A (a) | | | 874 | |
| | 20 | | | USANA Health Sciences, Inc. (a) | | | 2,062 | |
| | | | | | | | |
| | | | | | | 2,936 | |
| | | | | | | | |
| | | | Total Consumer Staples | | | 30,692 | |
| | | | | | | | |
| | | | Energy — 4.0% | |
| | | | Energy Equipment & Services — 1.1% | |
| | 25 | | | Basic Energy Services, Inc. (a) | | | 174 | |
| | 52 | | | C&J Energy Services, Inc. (a) | | | 691 | |
| | 30 | | | Dawson Geophysical Co. | | | 364 | |
| | 45 | | | FMSA Holdings, Inc. (a) | | | 313 | |
| | 57 | | | Forum Energy Technologies, Inc. (a) | | | 1,188 | |
| | 58 | | | Helix Energy Solutions Group, Inc. (a) | | | 1,261 | |
| | 64 | | | Matrix Service Co. (a) | | | 1,419 | |
| | 16 | | | Pioneer Energy Services Corp. (a) | | | 86 | |
| | 61 | | | Superior Energy Services, Inc. | | | 1,228 | |
| | 113 | | | Tesco Corp. | | | 1,445 | |
| | | | | | | | |
| | | | | | | 8,169 | |
| | | | | | | | |
| | | | Oil, Gas & Consumable Fuels — 2.9% | |
| | 497 | | | Abraxas Petroleum Corp. (a) | | | 1,461 | |
| | 65 | | | Carrizo Oil & Gas, Inc. (a) | | | 2,721 | |
| | 60 | | | Delek U.S. Holdings, Inc. | | | 1,634 | |
| | 28 | | | Energy XXI Bermuda Ltd., (Bermuda) | | | 92 | |
| | 147 | | | Green Plains, Inc. | | | 3,630 | |
| | 44 | | | Jones Energy, Inc., Class A (a) | | | 507 | |
| | 151 | | | Pacific Ethanol, Inc. (a) | | | 1,561 | |
| | 186 | | | Renewable Energy Group, Inc. (a) | | | 1,806 | |
| | 6 | | | REX American Resources Corp. (a) | | | 347 | |
| | 9 | | | SemGroup Corp., Class A | | | 636 | |
| | 45 | | | Stone Energy Corp. (a) | | | 758 | |
| | 18 | | | TransAtlantic Petroleum Ltd. (a) | | | 95 | |
| | 161 | | | VAALCO Energy, Inc. (a) | | | 732 | |
| | 1,030 | | | Warren Resources, Inc. (a) | | | 1,658 | |
| | 64 | | | Western Refining, Inc. | | | 2,403 | |
| | 14 | | | World Fuel Services Corp. | | | 652 | |
| | | | | | | | |
| | | | | | | 20,693 | |
| | | | | | | | |
| | | | Total Energy | | | 28,862 | |
| | | | | | | | |
| | | | Financials — 22.7% | |
| | | | Banks — 8.2% | |
| | 17 | | | Banco Latinoamericano de Comercio Exterior S.A., (Panama), Class E | | | 506 | |
| | 63 | | | BBCN Bancorp, Inc. | | | 912 | |
| | 14 | | | BNC Bancorp | | | 248 | |
| | 7 | | | Bridge Bancorp, Inc. | | | 179 | |
| | 37 | | | Cathay General Bancorp | | | 952 | |
| | | | | | | | |
| SHARES | | | SECURITY DESCRIPTION | | VALUE($) | |
| | | | | | | | |
| | | | | | | | |
| | | | Banks — continued | | | | |
| | 12 | | | Citizens & Northern Corp. | | | 248 | |
| | 8 | | | Community Trust Bancorp, Inc. | | | 301 | |
| | 8 | | | ConnectOne Bancorp, Inc. | | | 145 | |
| | 87 | | | Customers Bancorp, Inc. (a) | | | 1,700 | |
| | 152 | | | East West Bancorp, Inc. | | | 5,875 | |
| | 16 | | | Fidelity Southern Corp. | | | 258 | |
| | 23 | | | Financial Institutions, Inc. | | | 573 | |
| | 291 | | | First BanCorp, (Puerto Rico) (a) | | | 1,708 | |
| | 8 | | | First Business Financial Services, Inc. | | | 383 | |
| | 108 | | | First Commonwealth Financial Corp. | | | 992 | |
| | 28 | | | First Community Bancshares, Inc. | | | 453 | |
| | 25 | | | First Financial Bancorp | | | 472 | |
| | 21 | | | First Merchants Corp. | | | 480 | |
| | 43 | | | First NBC Bank Holding Co. (a) | | | 1,524 | |
| | 161 | | | FirstMerit Corp. | | | 3,034 | |
| | 156 | | | Hanmi Financial Corp. | | | 3,408 | |
| | 64 | | | Hilltop Holdings, Inc. (a) | | | 1,269 | |
| | 623 | | | Huntington Bancshares, Inc. | | | 6,553 | |
| | 5 | | | Iberiabank Corp. | | | 350 | |
| | 20 | | | MainSource Financial Group, Inc. | | | 416 | |
| | 4 | | | National Bankshares, Inc. | | | 134 | |
| | 14 | | | NBT Bancorp, Inc. | | | 375 | |
| | 115 | | | PacWest Bancorp | | | 5,232 | |
| | 46 | | | Pinnacle Financial Partners, Inc. | | | 1,823 | |
| | 187 | | | Popular, Inc., (Puerto Rico) (a) | | | 6,374 | |
| | 36 | | | Preferred Bank | | | 1,015 | |
| | 24 | | | PrivateBancorp, Inc. | | | 792 | |
| | 7 | | | Prosperity Bancshares, Inc. | | | 399 | |
| | 27 | | | Sierra Bancorp | | | 469 | |
| | 68 | | | Southwest Bancorp, Inc. | | | 1,187 | |
| | 54 | | | State Bank Financial Corp. | | | 1,075 | |
| | 65 | | | Susquehanna Bancshares, Inc. | | | 874 | |
| | 7 | | | SVB Financial Group (a) | | | 859 | |
| | 44 | | | TriCo Bancshares | | | 1,087 | |
| | 70 | | | TriState Capital Holdings, Inc. (a) | | | 719 | |
| | 13 | | | WesBanco, Inc. | | | 445 | |
| | 20 | | | West Bancorporation, Inc. | | | 344 | |
| | 307 | | | Wilshire Bancorp, Inc. | | | 3,114 | |
| | 9 | | | Yadkin Financial Corp. (a) | | | 183 | |
| | | | | | | | |
| | | | | | | 59,439 | |
| | | | | | | | |
| | | | Capital Markets — 1.2% | |
| | 16 | | | Arlington Asset Investment Corp., Class A | | | 436 | |
| | 290 | | | BGC Partners, Inc., Class A | | | 2,653 | |
| | 107 | | | Cowen Group, Inc., Class A (a) | | | 513 | |
| | 146 | | | Investment Technology Group, Inc. (a) | | | 3,048 | |
SEE NOTES TO FINANCIAL STATEMENTS.
| | | | | | |
| | | |
| 20 | | | | J.P. MORGAN SMALL CAP FUNDS | | DECEMBER 31, 2014 |
| | | | | | | | |
| SHARES | | | SECURITY DESCRIPTION | | VALUE($) | |
| | | | | | | | |
| Common Stocks — continued | |
| | | | Capital Markets — continued | |
| | 76 | | | Manning & Napier, Inc. | | | 1,049 | |
| | 6 | | | Oppenheimer Holdings, Inc., Class A | | | 128 | |
| | 19 | | | Piper Jaffray Cos. (a) | | | 1,104 | |
| | | | | | | | |
| | | | | | | 8,931 | |
| | | | | | | | |
| | | | Consumer Finance — 1.6% | |
| | 81 | | | Cash America International, Inc. | | | 1,841 | |
| | 45 | | | Encore Capital Group, Inc. (a) | | | 2,002 | |
| | 74 | | | Enova International, Inc. (a) | | | 1,657 | |
| | 271 | | | Green Dot Corp., Class A (a) | | | 5,549 | |
| | 16 | | | Nelnet, Inc., Class A | | | 737 | |
| | | | | | | | |
| | | | | | | 11,786 | |
| | | | | | | | |
| | | | Insurance — 2.6% | |
| | 188 | | | American Equity Investment Life Holding Co. | | | 5,485 | |
| | 35 | | | Aspen Insurance Holdings Ltd., (Bermuda) | | | 1,523 | |
| | 53 | | | Atlas Financial Holdings, Inc. (a) | | | 868 | |
| | 237 | | | CNO Financial Group, Inc. | | | 4,078 | |
| | 13 | | | Crawford & Co., Class B | | | 128 | |
| | 29 | | | HCI Group, Inc. | | | 1,263 | |
| | 8 | | | Horace Mann Educators Corp. | | | 279 | |
| | 131 | | | Maiden Holdings Ltd., (Bermuda) | | | 1,678 | |
| | 7 | | | Montpelier Re Holdings Ltd., (Bermuda) | | | 240 | |
| | 17 | | | Selective Insurance Group, Inc. | | | 467 | |
| | 44 | | | Stewart Information Services Corp. | | | 1,624 | |
| | 31 | | | Symetra Financial Corp. | | | 714 | |
| | 19 | | | United Fire Group, Inc. | | | 562 | |
| | 6 | | | Validus Holdings Ltd., (Bermuda) | | | 240 | |
| | | | | | | | |
| | | | | | | 19,149 | |
| | | | | | | | |
| | | | Real Estate Investment Trusts (REITs) — 8.5% | |
| | 5 | | | Agree Realty Corp. | | | 152 | |
| | 21 | | | American Campus Communities, Inc. | | | 869 | |
| | 449 | | | Anworth Mortgage Asset Corp. | | | 2,359 | |
| | 20 | | | Ashford Hospitality Prime, Inc. | | | 338 | |
| | 469 | | | Ashford Hospitality Trust, Inc. | | | 4,910 | |
| | 329 | | | Capstead Mortgage Corp. | | | 4,036 | |
| | 135 | | | Chambers Street Properties | | | 1,091 | |
| | 43 | | | Chatham Lodging Trust | | | 1,234 | |
| | 37 | | | Chesapeake Lodging Trust | | | 1,377 | |
| | 55 | | | CoreSite Realty Corp. | | | 2,156 | |
| | 122 | | | Cousins Properties, Inc. | | | 1,398 | |
| | 35 | | | DCT Industrial Trust, Inc. | | | 1,234 | |
| | 45 | | | DDR Corp. | | | 834 | |
| | 77 | | | DiamondRock Hospitality Co. | | | 1,141 | |
| | 15 | | | EastGroup Properties, Inc. | | | 969 | |
| | 37 | | | Education Realty Trust, Inc. | | | 1,364 | |
| | | | | | | | |
| SHARES | | | SECURITY DESCRIPTION | | VALUE($) | |
| | | | | | | | |
| | | | | | | | |
| | | | Real Estate Investment Trusts (REITs) — continued | |
| | 201 | | | First Industrial Realty Trust, Inc. | | | 4,139 | |
| | 15 | | | Franklin Street Properties Corp. | | | 188 | |
| | 95 | | | Geo Group, Inc. (The) | | | 3,814 | |
| | 41 | | | Glimcher Realty Trust | | | 569 | |
| | 25 | | | Government Properties Income Trust | | | 582 | |
| | 7 | | | Home Properties, Inc. | | | 485 | |
| | 30 | | | LaSalle Hotel Properties | | | 1,194 | |
| | 19 | | | LTC Properties, Inc. | | | 812 | |
| | 6 | | | Mid-America Apartment Communities, Inc. | | | 428 | |
| | 16 | | | Parkway Properties, Inc. | | | 287 | |
| | 37 | | | Pebblebrook Hotel Trust | | | 1,688 | |
| | 79 | | | Pennsylvania Real Estate Investment Trust | | | 1,844 | |
| | 92 | | | PennyMac Mortgage Investment Trust | | | 1,938 | |
| | 101 | | | Potlatch Corp. | | | 4,237 | |
| | 19 | | | PS Business Parks, Inc. | | | 1,535 | |
| | 78 | | | RAIT Financial Trust | | | 597 | |
| | 14 | | | Ramco-Gershenson Properties Trust | | | 257 | |
| | 96 | | | Redwood Trust, Inc. | | | 1,893 | |
| | 100 | | | RLJ Lodging Trust | | | 3,336 | |
| | 27 | | | Silver Bay Realty Trust Corp. | | | 442 | |
| | 148 | | | Strategic Hotels & Resorts, Inc. (a) | | | 1,957 | |
| | 33 | | | Summit Hotel Properties, Inc. | | | 412 | |
| | 7 | | | Sun Communities, Inc. | | | 411 | |
| | 170 | | | Sunstone Hotel Investors, Inc. | | | 2,808 | |
| | 28 | | | UMH Properties, Inc. | | | 271 | |
| | | | | | | | |
| | | | | | | 61,586 | |
| | | | | | | | |
| | | | Thrifts & Mortgage Finance — 0.6% | |
| | 11 | | | BofI Holding, Inc. (a) | | | 871 | |
| | 95 | | | Flagstar Bancorp, Inc. (a) | | | 1,491 | |
| | 29 | | | HomeStreet, Inc. | | | 500 | |
| | 9 | | | PennyMac Financial Services, Inc., Class A (a) | | | 147 | |
| | 40 | | | Walker & Dunlop, Inc. (a) | | | 707 | |
| | 9 | | | Washington Federal, Inc. | | | 193 | |
| | | | | | | | |
| | | | | | | 3,909 | |
| | | | | | | | |
| | | | Total Financials | | | 164,800 | |
| | | | | | | | |
| | | | Health Care — 14.1% | |
| | | | Biotechnology — 6.3% | |
| | 22 | | | Acceleron Pharma, Inc. (a) | | | 842 | |
| | 143 | | | Achillion Pharmaceuticals, Inc. (a) | | | 1,750 | |
| | 5 | | | Adamas Pharmaceuticals, Inc. (a) | | | 82 | |
| | 3 | | | Agios Pharmaceuticals, Inc. (a) | | | 280 | |
| | 19 | | | Alnylam Pharmaceuticals, Inc. (a) | | | 1,814 | |
| | 32 | | | Applied Genetic Technologies Corp. (a) | | | 671 | |
| | 26 | | | Ardelyx, Inc. (a) | | | 485 | |
SEE NOTES TO FINANCIAL STATEMENTS.
| | | | | | | | |
| | | |
| DECEMBER 31, 2014 | | J.P. MORGAN SMALL CAP FUNDS | | | | | 21 | |
JPMorgan Small Cap Core Fund
SCHEDULE OF PORTFOLIO INVESTMENTS
AS OF DECEMBER 31, 2014 (Unaudited) (continued)
(Amounts in thousands)
| | | | | | | | |
| SHARES | | | SECURITY DESCRIPTION | | VALUE($) | |
| | | | | | | | |
| Common Stocks — continued | |
| | | | Biotechnology — continued | |
| | 188 | | | ARIAD Pharmaceuticals, Inc. (a) | | | 1,294 | |
| | 42 | | | Atara Biotherapeutics, Inc. (a) | | | 1,129 | |
| | 49 | | | Auspex Pharmaceuticals, Inc. (a) | | | 2,566 | |
| | 8 | | | Avalanche Biotechnologies, Inc. (a) | | | 427 | |
| | 36 | | | Bellicum Pharmaceuticals, Inc. (a) | | | 836 | |
| | 36 | | | Bluebird Bio, Inc. (a) | | | 3,256 | |
| | 37 | | | Calithera Biosciences, Inc. (a) | | | 739 | |
| | 29 | | | Cara Therapeutics, Inc. (a) | | | 291 | |
| | 80 | | | Celladon Corp. (a) | | | 1,557 | |
| | 133 | | | Celldex Therapeutics, Inc. (a) | | | 2,427 | |
| | 10 | | | Clovis Oncology, Inc. (a) | | | 571 | |
| | 61 | | | Dicerna Pharmaceuticals, Inc. (a) | | | 1,003 | |
| | 93 | | | Eleven Biotherapeutics, Inc. (a) | | | 1,100 | |
| | 25 | | | FibroGen, Inc. (a) | | | 689 | |
| | 15 | | | Immune Design Corp. (a) | | | 465 | |
| | 76 | | | Insmed, Inc. (a) | | | 1,182 | |
| | 2 | | | Intercept Pharmaceuticals, Inc. (a) | | | 328 | |
| | 22 | | | Isis Pharmaceuticals, Inc. (a) | | | 1,327 | |
| | 6 | | | Karyopharm Therapeutics, Inc. (a) | | | 213 | |
| | 83 | | | Kindred Biosciences, Inc. (a) | | | 619 | |
| | 66 | | | Kite Pharma, Inc. (a) | | | 3,818 | |
| | 16 | | | MacroGenics, Inc. (a) | | | 547 | |
| | 35 | | | NPS Pharmaceuticals, Inc. (a) | | | 1,255 | |
| | 312 | | | Oncothyreon, Inc. (a) | | | 593 | |
| | 6 | | | Ophthotech Corp. (a) | | | 256 | |
| | 222 | | | PDL BioPharma, Inc. | | | 1,709 | |
| | 24 | | | Receptos, Inc. (a) | | | 2,977 | |
| | 5 | | | Sage Therapeutics, Inc. (a) | | | 194 | |
| | 30 | | | Synageva BioPharma Corp. (a) | | | 2,821 | |
| | 316 | | | Threshold Pharmaceuticals, Inc. (a) | | | 1,006 | |
| | 48 | | | Tokai Pharmaceuticals, Inc. (a) | | | 703 | |
| | 23 | | | Ultragenyx Pharmaceutical, Inc. (a) | | | 992 | |
| | 48 | | | Vitae Pharmaceuticals, Inc. (a) | | | 792 | |
| | 11 | | | Zafgen, Inc. (a) | | | 327 | |
| | | | | | | | |
| | | | | | | 45,933 | |
| | | | | | | | |
| | | | Health Care Equipment & Supplies — 3.3% | |
| | 132 | | | Greatbatch, Inc. (a) | | | 6,508 | |
| | 77 | | | Inogen, Inc. (a) | | | 2,425 | |
| | 65 | | | Insulet Corp. (a) | | | 2,998 | |
| | 21 | | | K2M Group Holdings, Inc. (a) | | | 447 | |
| | 32 | | | Nevro Corp. (a) | | | 1,241 | |
| | 173 | | | NuVasive, Inc. (a) | | | 8,145 | |
| | 50 | | | Orthofix International N.V., (Curacao) (a) | | | 1,512 | |
| | 6 | | | PhotoMedex, Inc. (a) | | | 9 | |
| | 29 | | | Roka Bioscience, Inc. (a) | | | 126 | |
| | | | | | | | |
| SHARES | | | SECURITY DESCRIPTION | | VALUE($) | |
| | | | | | | | |
| | | | | | | | |
| | | | Health Care Equipment & Supplies — continued | |
| | 14 | | | Sientra, Inc. (a) | | | 240 | |
| | 52 | | | TransEnterix, Inc. (a) | | | 151 | |
| | 30 | | | TriVascular Technologies, Inc. (a) | | | 373 | |
| | | | | | | | |
| | | | | | | 24,175 | |
| | | | | | | | |
| | | | Health Care Providers & Services — 2.9% | |
| | 64 | | | Amsurg Corp. (a) | | | 3,505 | |
| | 84 | | | Civitas Solutions, Inc. (a) | | | 1,424 | |
| | 344 | | | Cross Country Healthcare, Inc. (a) | | | 4,289 | |
| | 9 | | | HealthEquity, Inc. (a) | | | 234 | |
| | 56 | | | Kindred Healthcare, Inc. | | | 1,011 | |
| | 83 | | | Molina Healthcare, Inc. (a) | | | 4,448 | |
| | 48 | | | Owens & Minor, Inc. | | | 1,668 | |
| | 47 | | | Select Medical Holdings Corp. | | | 678 | |
| | 22 | | | Surgical Care Affiliates, Inc. (a) | | | 730 | |
| | 31 | | | Trupanion, Inc. (a) | | | 216 | |
| | 35 | | | WellCare Health Plans, Inc. (a) | | | 2,897 | |
| | | | | | | | |
| | | | | | | 21,100 | |
| | | | | | | | |
| | | | Health Care Technology — 0.1% | |
| | 16 | | | Castlight Health, Inc., Class B (a) | | | 182 | |
| | 23 | | | Connecture, Inc. (a) | | | 208 | |
| | | | | | | | |
| | | | | | | 390 | |
| | | | | | | | |
| | | | Life Sciences Tools & Services — 0.2% | |
| | 11 | | | INC Research Holdings, Inc., Class A (a) | | | 280 | |
| | 33 | | | PRA Health Sciences, Inc. (a) | | | 794 | |
| | 26 | | | VWR Corp. (a) | | | 678 | |
| | | | | | | | |
| | | | | | | 1,752 | |
| | | | | | | | |
| | | | Pharmaceuticals — 1.3% | |
| | 64 | | | Amphastar Pharmaceuticals, Inc. (a) | | | 738 | |
| | 46 | | | Catalent, Inc. (a) | | | 1,274 | |
| | 68 | | | Egalet Corp. (a) | | | 388 | |
| | 17 | | | Furiex Pharmaceuticals, Inc. (a) (i) | | | 168 | |
| | 83 | | | Impax Laboratories, Inc. (a) | | | 2,620 | |
| | 5 | | | Jazz Pharmaceuticals plc, (Ireland) (a) | | | 753 | |
| | 30 | | | Lannett Co., Inc. (a) | | | 1,295 | |
| | 51 | | | Medicines Co. (The) (a) | | | 1,417 | |
| | 33 | | | Revance Therapeutics, Inc. (a) | | | 556 | |
| | 6 | | | ZS Pharma, Inc. (a) | | | 262 | |
| | | | | | | | |
| | | | | | | 9,471 | |
| | | | | | | | |
| | | | Total Health Care | | | 102,821 | |
| | | | | | | | |
| | | | Industrials — 15.1% | |
| | | | Aerospace & Defense — 1.3% | |
| | 76 | | | AAR Corp. | | | 2,122 | |
| | 6 | | | Curtiss-Wright Corp. | | | 438 | |
SEE NOTES TO FINANCIAL STATEMENTS.
| | | | | | |
| | | |
| 22 | | | | J.P. MORGAN SMALL CAP FUNDS | | DECEMBER 31, 2014 |
| | | | | | | | |
| SHARES | | | SECURITY DESCRIPTION | | VALUE($) | |
| | | | | | | | |
| Common Stocks — continued | |
| | | | Aerospace & Defense — continued | |
| | 134 | | | Engility Holdings, Inc. (a) | | | 5,752 | |
| | 8 | | | Esterline Technologies Corp. (a) | | | 889 | |
| | 3 | | | Triumph Group, Inc. | | | 175 | |
| | | | | | | | |
| | | | | | | 9,376 | |
| | | | | | | | |
| | | | Air Freight & Logistics — 0.3% | |
| | 19 | | | Atlas Air Worldwide Holdings, Inc. (a) | | | 941 | |
| | 18 | | | Park-Ohio Holdings Corp. | | | 1,116 | |
| | | | | | | | |
| | | | | | | 2,057 | |
| | | | | | | | |
| | | | Airlines — 1.8% | |
| | 65 | | | Alaska Air Group, Inc. | | | 3,854 | |
| | 308 | | | Hawaiian Holdings, Inc. (a) | | | 8,022 | |
| | 26 | | | Virgin America, Inc. (a) | | | 1,133 | |
| | | | | | | | |
| | | | | | | 13,009 | |
| | | | | | | | |
| | | | Building Products — 0.7% | |
| | 103 | | | American Woodmark Corp. (a) | | | 4,149 | |
| | 44 | | | Gibraltar Industries, Inc. (a) | | | 711 | |
| | | | | | | | |
| | | | | | | 4,860 | |
| | | | | | | | |
| | | | Commercial Services & Supplies — 4.3% | |
| | 158 | | | ABM Industries, Inc. | | | 4,538 | |
| | 674 | | | ACCO Brands Corp. (a) | | | 6,070 | |
| | 79 | | | ARC Document Solutions, Inc. (a) | | | 807 | |
| | 61 | | | Brady Corp., Class A | | | 1,657 | |
| | 12 | | | Ceco Environmental Corp. | | | 185 | |
| | 407 | | | Cenveo, Inc. (a) | | | 855 | |
| | 120 | | | Deluxe Corp. | | | 7,495 | |
| | 12 | | | Herman Miller, Inc. | | | 365 | |
| | 191 | | | Kimball International, Inc., Class B | | | 1,743 | |
| | 56 | | | Knoll, Inc. | | | 1,185 | |
| | 37 | | | Matthews International Corp., Class A | | | 1,806 | |
| | 12 | | | Quad/Graphics, Inc. | | | 280 | |
| | 139 | | | Steelcase, Inc., Class A | | | 2,490 | |
| | 6 | | | UniFirst Corp. | | | 729 | |
| | 19 | | | United Stationers, Inc. | | | 814 | |
| | 18 | | | Viad Corp. | | | 477 | |
| | | | | | | | |
| | | | | | | 31,496 | |
| | | | | | | | |
| | | | Construction & Engineering — 0.9% | |
| | 70 | | | Argan, Inc. | | | 2,341 | |
| | 52 | | | EMCOR Group, Inc. | | | 2,305 | |
| | 74 | | | Tutor Perini Corp. (a) | | | 1,777 | |
| | | | | | | | |
| | | | | | | 6,423 | |
| | | | | | | | |
| | | | Electrical Equipment — 0.4% | |
| | 34 | | | EnerSys | | | 2,092 | |
| | 16 | | | Regal-Beloit Corp. | | | 1,181 | |
| | | | | | | | |
| | | | | | | 3,273 | |
| | | | | | | | |
| | | | | | | | |
| SHARES | | | SECURITY DESCRIPTION | | VALUE($) | |
| | | | | | | | |
| | | | | | | | |
| | | | Machinery — 2.8% | |
| | 27 | | | Barnes Group, Inc. | | | 1,010 | |
| | 23 | | | Columbus McKinnon Corp. | | | 642 | |
| | 74 | | | Federal Signal Corp. | | | 1,140 | |
| | 55 | | | Global Brass & Copper Holdings, Inc. | | | 724 | |
| | 41 | | | Greenbrier Cos., Inc. (The) | | | 2,219 | |
| | 18 | | | Hyster-Yale Materials Handling, Inc. | | | 1,332 | |
| | 35 | | | Kadant, Inc. | | | 1,486 | |
| | 25 | | | LB Foster Co., Class A | | | 1,234 | |
| | 208 | | | Meritor, Inc. (a) | | | 3,151 | |
| | 38 | | | NN, Inc. | | | 779 | |
| | 5 | | | Standex International Corp. | | | 355 | |
| | 45 | | | TriMas Corp. (a) | | | 1,418 | |
| | 86 | | | Wabash National Corp. (a) | | | 1,068 | |
| | 42 | | | Wabtec Corp. | | | 3,632 | |
| | 6 | | | Watts Water Technologies, Inc., Class A | | | 355 | |
| | | | | | | | |
| | | | | | | 20,545 | |
| | | | | | | | |
| | | | Marine — 0.0% (g) | |
| | 7 | | | Matson, Inc. | | | 255 | |
| | | | | | | | |
| | | | Professional Services — 0.8% | |
| | 77 | | | Barrett Business Services, Inc. | | | 2,096 | |
| | 17 | | | Heidrick & Struggles International, Inc. | | | 387 | |
| | 9 | | | Kelly Services, Inc., Class A | | | 158 | |
| | 19 | | | Paylocity Holding Corp. (a) | | | 499 | |
| | 37 | | | RPX Corp. (a) | | | 503 | |
| | 14 | | | TriNet Group, Inc. (a) | | | 438 | |
| | 31 | | | TrueBlue, Inc. (a) | | | 688 | |
| | 11 | | | VSE Corp. | | | 712 | |
| | | | | | | | |
| | | | | | | 5,481 | |
| | | | | | | | |
| | | | Road & Rail — 1.5% | |
| | 3 | | | AMERCO | | | 767 | |
| | 120 | | | ArcBest Corp. | | | 5,555 | |
| | 12 | | | Avis Budget Group, Inc. (a) | | | 789 | |
| | 11 | | | Quality Distribution, Inc. (a) | | | 112 | |
| | 18 | | | Saia, Inc. (a) | | | 972 | |
| | 72 | | | Swift Transportation Co. (a) | | | 2,067 | |
| | 12 | | | Universal Truckload Services, Inc. | | | 351 | |
| | | | | | | | |
| | | | | | | 10,613 | |
| | | | | | | | |
| | | | Trading Companies & Distributors — 0.3% | |
| | 35 | | | Applied Industrial Technologies, Inc. | | | 1,614 | |
| | 40 | | | General Finance Corp. (a) | | | 396 | |
| | | | | | | | |
| | | | | | | 2,010 | |
| | | | | | | | |
| | | | Total Industrials | | | 109,398 | |
| | | | | | | | |
SEE NOTES TO FINANCIAL STATEMENTS.
| | | | | | | | |
| | | |
| DECEMBER 31, 2014 | | J.P. MORGAN SMALL CAP FUNDS | | | | | 23 | |
JPMorgan Small Cap Core Fund
SCHEDULE OF PORTFOLIO INVESTMENTS
AS OF DECEMBER 31, 2014 (Unaudited) (continued)
(Amounts in thousands, except number of Futures contracts)
| | | | | | | | |
| SHARES | | | SECURITY DESCRIPTION | | VALUE($) | |
| | | | | | | | |
| Common Stocks — continued | |
| | | | Information Technology — 17.2% | |
| | | | Communications Equipment — 1.1% | |
| | 10 | | | Arista Networks, Inc. (a) | | | 626 | |
| | 186 | | | ARRIS Group, Inc. (a) | | | 5,600 | |
| | 130 | | | Extreme Networks, Inc. (a) | | | 459 | |
| | 100 | | | Polycom, Inc. (a) | | | 1,347 | |
| | | | | | | | |
| | | | | | | 8,032 | |
| | | | | | | | |
| | | | Electronic Equipment, Instruments & Components — 2.3% | |
| | 159 | | | Benchmark Electronics, Inc. (a) | | | 4,035 | |
| | 67 | | | Insight Enterprises, Inc. (a) | | | 1,722 | |
| | 143 | | | Kimball Electronics, Inc. (a) | | | 1,723 | |
| | 12 | | | Littelfuse, Inc. | | | 1,141 | |
| | 53 | | | Newport Corp. (a) | | | 1,009 | |
| | 299 | | | Sanmina Corp. (a) | | | 7,035 | |
| | | | | | | | |
| | | | | | | 16,665 | |
| | | | | | | | |
| | | | Internet Software & Services — 2.1% | |
| | 171 | | | Aerohive Networks, Inc. (a) | | | 820 | |
| | 13 | | | Amber Road, Inc. (a) | | | 136 | |
| | 117 | | | Carbonite, Inc. (a) | | | 1,665 | |
| | 70 | | | Cornerstone OnDemand, Inc. (a) | | | 2,447 | |
| | 5 | | | Five9, Inc. (a) | | | 23 | |
| | 51 | | | Hortonworks, Inc. (a) | | | 1,382 | |
| | 31 | | | Intralinks Holdings, Inc. (a) | | | 369 | |
| | 13 | | | New Relic, Inc. (a) | | | 439 | |
| | 15 | | | Q2 Holdings, Inc. (a) | | | 275 | |
| | 134 | | | WebMD Health Corp. (a) | | | 5,281 | |
| | 46 | | | Yelp, Inc. (a) | | | 2,512 | |
| | | | | | | | |
| | | | | | | 15,349 | |
| | | | | | | | |
| | | | IT Services — 2.4% | |
| | 57 | | | CSG Systems International, Inc. | | | 1,439 | |
| | 11 | | | EVERTEC, Inc., (Puerto Rico) | | | 250 | |
| | 331 | | | Global Cash Access Holdings, Inc. (a) | | | 2,365 | |
| | 32 | | | Heartland Payment Systems, Inc. | | | 1,737 | |
| | 53 | | | Science Applications International Corp. | | | 2,625 | |
| | 274 | | | Unisys Corp. (a) | | | 8,063 | |
| | 33 | | | VeriFone Systems, Inc. (a) | | | 1,231 | |
| | | | | | | | |
| | | | | | | 17,710 | |
| | | | | | | | |
| | | | Semiconductors & Semiconductor Equipment — 4.6% | |
| | 36 | | | Alpha & Omega Semiconductor Ltd. (a) | | | 321 | |
| | 116 | | | Amkor Technology, Inc. (a) | | | 824 | |
| | 471 | | | Audience, Inc. (a) | | | 2,073 | |
| | 32 | | | Brooks Automation, Inc. | | | 413 | |
| | 67 | | | First Solar, Inc. (a) | | | 3,006 | |
| | 71 | | | Integrated Silicon Solution, Inc. | | | 1,175 | |
| | 58 | | | Lattice Semiconductor Corp. (a) | | | 400 | |
| | | | | | | | |
| SHARES | | | SECURITY DESCRIPTION | | VALUE($) | |
| | | | | | | | |
| | | | | | | | |
| | | | Semiconductors & Semiconductor Equipment — continued | |
| | 21 | | | Nanometrics, Inc. (a) | | | 360 | |
| | 77 | | | OmniVision Technologies, Inc. (a) | | | 1,999 | |
| | 52 | | | Pericom Semiconductor Corp. (a) | | | 704 | |
| | 29 | | | Photronics, Inc. (a) | | | 242 | |
| | 143 | | | Silicon Image, Inc. (a) | | | 787 | |
| | 92 | | | Skyworks Solutions, Inc. | | | 6,689 | |
| | 186 | | | Spansion, Inc., Class A (a) | | | 6,379 | |
| | 116 | | | SunEdison, Inc. (a) | | | 2,265 | |
| | 34 | | | Synaptics, Inc. (a) | | | 2,368 | |
| | 366 | | | Ultra Clean Holdings, Inc. (a) | | | 3,397 | |
| | | | | | | | |
| | | | | | | 33,402 | |
| | | | | | | | |
| | | | Software — 4.5% | |
| | 8 | | | Aspen Technology, Inc. (a) | | | 288 | |
| | 282 | | | AVG Technologies N.V., (Netherlands) (a) | | | 5,567 | |
| | 12 | | | FireEye, Inc. (a) | | | 366 | |
| | 16 | | | Globant S.A., (Luxembourg) (a) | | | 248 | |
| | 29 | | | HubSpot, Inc. (a) | | | 968 | |
| | 8 | | | Manhattan Associates, Inc. (a) | | | 314 | |
| | 36 | | | Model N, Inc. (a) | | | 379 | |
| | 245 | | | Pegasystems, Inc. | | | 5,078 | |
| | 42 | | | PTC, Inc. (a) | | | 1,536 | |
| | 92 | | | Qlik Technologies, Inc. (a) | | | 2,848 | |
| | 8 | | | Rovi Corp. (a) | | | 169 | |
| | 235 | | | Take-Two Interactive Software, Inc. (a) | | | 6,590 | |
| | 297 | | | TeleCommunication Systems, Inc., Class A (a) | | | 926 | |
| | 48 | | | Telenav, Inc. (a) | | | 319 | |
| | 49 | | | Varonis Systems, Inc. (a) | | | 1,622 | |
| | 63 | | | Verint Systems, Inc. (a) | | | 3,689 | |
| | 15 | | | Yodlee, Inc. (a) | | | 178 | |
| | 61 | | | Zendesk, Inc. (a) | | | 1,477 | |
| | | | | | | | |
| | | | | | | 32,562 | |
| | | | | | | | |
| | | | Technology Hardware, Storage & Peripherals — 0.2% | |
| | 60 | | | Avid Technology, Inc. (a) | | | 846 | |
| | 18 | | | Super Micro Computer, Inc. (a) | | | 624 | |
| | | | | | | | |
| | | | | | | 1,470 | |
| | | | | | | | |
| | | | Total Information Technology | | | 125,190 | |
| | | | | | | | |
| | | | Materials — 3.3% | |
| | | | Chemicals — 1.4% | |
| | 65 | | | A Schulman, Inc. | | | 2,651 | |
| | 47 | | | Axiall Corp. | | | 1,987 | |
| | 4 | | | FutureFuel Corp. | | | 57 | |
| | 6 | | | Innospec, Inc. | | | 235 | |
| | 37 | | | Koppers Holdings, Inc. | | | 948 | |
| | 95 | | | Kronos Worldwide, Inc. | | | 1,236 | |
SEE NOTES TO FINANCIAL STATEMENTS.
| | | | | | |
| | | |
| 24 | | | | J.P. MORGAN SMALL CAP FUNDS | | DECEMBER 31, 2014 |
| | | | | | | | |
| SHARES | | | SECURITY DESCRIPTION | | VALUE($) | |
| | | | | | | | |
| Common Stocks — continued | |
| | | | Chemicals — continued | |
| | 42 | | | Minerals Technologies, Inc. | | | 2,945 | |
| | 67 | | | OMNOVA Solutions, Inc. (a) | | | 545 | |
| | | | | | | | |
| | | | | | | 10,604 | |
| | | | | | | | |
| | | | Containers & Packaging — 1.0% | |
| | 225 | | | Graphic Packaging Holding Co. (a) | | | 3,070 | |
| | 67 | | | Rock-Tenn Co., Class A | | | 4,061 | |
| | | | | | | | |
| | | | | | | 7,131 | |
| | | | | | | | |
| | | | Metals & Mining — 0.6% | |
| | 144 | | | Commercial Metals Co. | | | 2,339 | |
| | 71 | | | Worthington Industries, Inc. | | | 2,140 | |
| | | | | | | | |
| | | | | | | 4,479 | |
| | | | | | | | |
| | | | Paper & Forest Products — 0.3% | |
| | 30 | | | Boise Cascade Co. (a) | | | 1,122 | |
| | 52 | | | Resolute Forest Products, Inc., (Canada) (a) | | | 923 | |
| | | | | | | | |
| | | | | | | 2,045 | |
| | | | | | | | |
| | | | Total Materials | | | 24,259 | |
| | | | | | | | |
| | | | Telecommunication Services — 1.4% | |
| | | | Diversified Telecommunication Services — 1.3% | |
| | 34 | | | IDT Corp., Class B | | | 697 | |
| | 343 | | | Inteliquent, Inc. | | | 6,733 | |
| | 123 | | | magicJack VocalTec Ltd., (Israel) (a) | | | 999 | |
| | 93 | | | Premiere Global Services, Inc. (a) | | | 982 | |
| | | | | | | | |
| | | | | | | 9,411 | |
| | | | | | | | |
| | | | Wireless Telecommunication Services — 0.1% | |
| | 53 | | | RingCentral, Inc., Class A (a) | | | 791 | |
| | | | | | | | |
| | | | Total Telecommunication Services | | | 10,202 | |
| | | | | | | | |
| | | | Utilities — 3.3% | |
| | | | Electric Utilities — 1.4% | |
| | 7 | | | El Paso Electric Co. | | | 268 | |
| | 19 | | | Empire District Electric Co. (The) | | | 571 | |
| | 31 | | | IDACORP, Inc. | | | 2,045 | |
| | 16 | | | MGE Energy, Inc. | | | 744 | |
| | 151 | | | Portland General Electric Co. | | | 5,712 | |
| | 8 | | | Spark Energy, Inc., Class A | | | 108 | |
| | 11 | | | Westar Energy, Inc. | | | 450 | |
| | | | | | | | |
| | | | | | | 9,898 | |
| | | | | | | | |
| | | | | | | | |
| SHARES | | | SECURITY DESCRIPTION | | VALUE($) | |
| | | | | | | | |
| | | | | | | | |
| | | | Gas Utilities — 0.7% | |
| | 2 | | | AGL Resources, Inc. | | | 124 | |
| | 8 | | | Chesapeake Utilities Corp. | | | 390 | |
| | 18 | | | Laclede Group, Inc. (The) | | | 963 | |
| | 31 | | | New Jersey Resources Corp. | | | 1,909 | |
| | 8 | | | Northwest Natural Gas Co. | | | 414 | |
| | 15 | | | Southwest Gas Corp. | | | 940 | |
| | 10 | | | WGL Holdings, Inc. | | | 519 | |
| | | | | | | | |
| | | | | | | 5,259 | |
| | | | | | | | |
| | | | Independent Power & Renewable Electricity Producers — 1.2% | |
| | 285 | | | Dynegy, Inc. (a) | | | 8,656 | |
| | 30 | | | Vivint Solar, Inc. (a) | | | 278 | |
| | | | | | | | |
| | | | | | | 8,934 | |
| | | | | | | | |
| | | | Total Utilities | | | 24,091 | |
| | | | | | | | |
| | | | Total Common Stocks
(Cost $509,442) | | | 714,860 | |
| | | | | | | | |
| | |
NUMBER OF WARRANTS | | | | | | |
| Warrant — 0.0% (g) | |
| | | | Financials — 0.0% (g) | |
| | | | Consumer Finance — 0.0% (g) | |
| | 2 | | | Imperial Holdings, Inc., expiring 10/01/19 (Strike Price $10.75) (a) (i) (Cost $—) | | | — | |
| | | | | | | | |
| SHARES | | | | | | |
| Short-Term Investment — 1.5% | |
| | | | Investment Company — 1.5% | |
| | 10,650 | | | JPMorgan Prime Money Market Fund, Institutional Class Shares, 0.020% (b) (l) (Cost $10,650 ) | | | 10,650 | |
| | | | | | | | |
| | | | Total Investments — 99.8%
(Cost $520,092) | | | 725,510 | |
| | | | Other Assets in Excess of
Liabilities — 0.2% (c) | | | 1,126 | |
| | | | | | | | |
| | | | NET ASSETS — 100.0% | | $ | 726,636 | |
| | | | | | | | |
Percentages indicated are based on net assets.
| | | | | | | | | | | | | | | | |
| Futures Contracts | |
NUMBER OF CONTRACTS | | | DESCRIPTION | | EXPIRATION
DATE | | | NOTIONAL VALUE AT DECEMBER 31, 2014 | | | NET UNREALIZED
APPRECIATION
(DEPRECIATION) | |
| | | | Long Futures Outstanding | | | | | | | | | | | | |
| | 97 | | | E-mini Russell 2000 | | | 03/20/15 | | | $ | 11,647 | | | $ | 442 | |
| | | | | | | | | | | | | | | | |
SEE NOTES TO FINANCIAL STATEMENTS.
| | | | | | | | |
| | | |
| DECEMBER 31, 2014 | | J.P. MORGAN SMALL CAP FUNDS | | | | | 25 | |
JPMorgan Small Cap Equity Fund
SCHEDULE OF PORTFOLIO INVESTMENTS
AS OF DECEMBER 31, 2014 (Unaudited)
(Amounts in thousands)
| | | | | | | | |
| SHARES | | | SECURITY DESCRIPTION | | VALUE($) | |
| | | | | | | | |
| Common Stocks — 96.1% | |
| | | | Consumer Discretionary — 19.3% | |
| | | | Auto Components — 1.6% | |
| | 1,518 | | | Dana Holding Corp. | | | 32,994 | |
| | 428 | | | Drew Industries, Inc. (a) | | | 21,837 | |
| | | | | | | | |
| | | | | | | 54,831 | |
| | | | | | | | |
| | | | Distributors — 1.6% | |
| | 848 | | | Pool Corp. | | | 53,779 | |
| | | | | | | | |
| | | | Diversified Consumer Services — 1.9% | |
| | 660 | | | Ascent Capital Group, Inc., Class A (a) | | | 34,938 | |
| | 1,161 | | | ServiceMaster Global Holdings, Inc. (a) | | | 31,084 | |
| | | | | | | | |
| | | | | | | 66,022 | |
| | | | | | | | |
| | | | Hotels, Restaurants & Leisure — 3.5% | |
| | 1,233 | | | Brinker International, Inc. | | | 72,337 | |
| | 725 | | | Monarch Casino & Resort, Inc. (a) | | | 12,020 | |
| | 583 | | | Papa John’s International, Inc. | | | 32,556 | |
| | 111 | | | Zoe’s Kitchen, Inc. (a) | | | 3,309 | |
| | | | | | | | |
| | | | | | | 120,222 | |
| | | | | | | | |
| | | | Household Durables — 2.8% | |
| | 2,042 | | | Jarden Corp. (a) | | | 97,755 | |
| | | | | | | | |
| | | | Leisure Products — 1.4% | |
| | 561 | | | Brunswick Corp. | | | 28,757 | |
| | 934 | | | Malibu Boats, Inc., Class A (a) | | | 18,003 | |
| | | | | | | | |
| | | | | | | 46,760 | |
| | | | | | | | |
| | | | Media — 3.1% | |
| | 1,370 | | | Cinemark Holdings, Inc. | | | 48,732 | |
| | 959 | | | E.W. Scripps Co. (The), Class A (a) | | | 21,424 | |
| | 493 | | | Morningstar, Inc. | | | 31,872 | |
| | 342 | | | National CineMedia, Inc. | | | 4,921 | |
| | | | | | | | |
| | | | | | | 106,949 | |
| | | | | | | | |
| | | | Specialty Retail — 1.8% | |
| | 1,859 | | | American Eagle Outfitters, Inc. | | | 25,801 | |
| | 2,148 | | | Chico’s FAS, Inc. | | | 34,816 | |
| | | | | | | | |
| | | | | | | 60,617 | |
| | | | | | | | |
| | | | Textiles, Apparel & Luxury Goods — 1.6% | |
| | 2,801 | | | Crocs, Inc. (a) | | | 34,988 | |
| | 596 | | | Iconix Brand Group, Inc. (a) | | | 20,134 | |
| | | | | | | | |
| | | | | | | 55,122 | |
| | | | | | | | |
| | | | Total Consumer Discretionary | | | 662,057 | |
| | | | | | | | |
| | | | Consumer Staples — 3.3% | |
| | | | Food Products — 1.3% | |
| | 406 | | | J&J Snack Foods Corp. | | | 44,161 | |
| | | | | | | | |
| | | | | | | | |
| SHARES | | | SECURITY DESCRIPTION | | VALUE($) | |
| | | | | | | | |
| | | | | | | | |
| | | | Household Products — 2.0% | |
| | 716 | | | Spectrum Brands Holdings, Inc. | | | 68,495 | |
| | | | | | | | |
| | | | Total Consumer Staples | | | 112,656 | |
| | | | | | | | |
| | | | Energy — 3.2% | |
| | | | Energy Equipment & Services — 1.8% | |
| | 268 | | | Dril-Quip, Inc. (a) | | | 20,537 | |
| | 1,364 | | | Patterson-UTI Energy, Inc. | | | 22,633 | |
| | 616 | | | Tidewater, Inc. | | | 19,950 | |
| | | | | | | | |
| | | | | | | 63,120 | |
| | | | | | | | |
| | | | Oil, Gas & Consumable Fuels — 1.4% | |
| | 235 | | | Approach Resources, Inc. (a) | | | 1,499 | |
| | 235 | | | Cimarex Energy Co. | | | 24,874 | |
| | 1,063 | | | Laredo Petroleum, Inc. (a) | | | 11,001 | |
| | 570 | | | Oasis Petroleum, Inc. (a) | | | 9,425 | |
| | | | | | | | |
| | | | | | | 46,799 | |
| | | | | | | | |
| | | | Total Energy | | | 109,919 | |
| | | | | | | | |
| | | | Financials — 21.3% | |
| | | | Banks — 9.1% | |
| | 3,200 | | | Associated Banc-Corp. | | | 59,613 | |
| | 1,160 | | | BankUnited, Inc. | | | 33,608 | |
| | 1,513 | | | First Financial Bancorp | | | 28,128 | |
| | 1,676 | | | First Horizon National Corp. (m) | | | 22,754 | |
| | 604 | | | First Republic Bank | | | 31,487 | |
| | 753 | | | Glacier Bancorp, Inc. | | | 20,921 | |
| | 1,019 | | | Great Western Bancorp, Inc. (a) | | | 23,220 | |
| | 390 | | | Iberiabank Corp. | | | 25,278 | |
| | 1,924 | | | Umpqua Holdings Corp. | | | 32,730 | |
| | 1,220 | | | Western Alliance Bancorp (a) | | | 33,927 | |
| | | | | | | | |
| | | | | | | 311,666 | |
| | | | | | | | |
| | | | Capital Markets — 4.4% | |
| | 688 | | | Eaton Vance Corp. | | | 28,149 | |
| | 557 | | | Greenhill & Co., Inc. | | | 24,293 | |
| | 1,392 | | | HFF, Inc., Class A | | | 50,014 | |
| | 1,419 | | | Janus Capital Group, Inc. | | | 22,883 | |
| | 773 | | | Moelis & Co., Class A | | | 27,002 | |
| | | | | | | | |
| | | | | | | 152,341 | |
| | | | | | | | |
| | | | Insurance — 1.7% | |
| | 1,274 | | | ProAssurance Corp. | | | 57,512 | |
| | | | | | | | |
| | | | Real Estate Investment Trusts (REITs) — 5.2% | |
| | 572 | | | EastGroup Properties, Inc. (m) | | | 36,205 | |
| | 468 | | | Mid-America Apartment Communities, Inc. (m) | | | 34,959 | |
| | 1,172 | | | National Retail Properties, Inc. (m) | | | 46,141 | |
| | 1,838 | | | RLJ Lodging Trust (m) | | | 61,635 | |
| | | | | | | | |
| | | | | | | 178,940 | |
| | | | | | | | |
SEE NOTES TO FINANCIAL STATEMENTS.
| | | | | | |
| | | |
| 26 | | | | J.P. MORGAN SMALL CAP FUNDS | | DECEMBER 31, 2014 |
| | | | | | | | |
| SHARES | | | SECURITY DESCRIPTION | | VALUE($) | |
| | | | | | | | |
| Common Stocks — continued | |
| | | | Real Estate Management & Development — 0.9% | |
| | 85 | | | Marcus & Millichap, Inc. (a) | | | 2,840 | |
| | 644 | | | Realogy Holdings Corp. (a) | | | 28,634 | |
| | | | | | | | |
| | | | | | | 31,474 | |
| | | | | | | | |
| | | | Total Financials | | | 731,933 | |
| | | | | | | | |
| | | | Health Care — 10.9% | |
| | | | Health Care Equipment & Supplies — 3.1% | |
| | 415 | | | IDEXX Laboratories, Inc. (a) | | | 61,578 | |
| | 856 | | | West Pharmaceutical Services, Inc. | | | 45,575 | |
| | | | | | | | |
| | | | | | | 107,153 | |
| | | | | | | | |
| | | | Health Care Providers & Services — 6.1% | |
| | 432 | | | Centene Corp. (a) | | | 44,872 | |
| | 845 | | | Hanger, Inc. (a) | | | 18,505 | |
| | 193 | | | HealthEquity, Inc. (a) | | | 4,922 | |
| | 899 | | | HealthSouth Corp. | | | 34,589 | |
| | 422 | | | Magellan Health, Inc. (a) | | | 25,303 | |
| | 337 | | | MWI Veterinary Supply, Inc. (a) | | | 57,240 | |
| | 312 | | | WellCare Health Plans, Inc. (a) | | | 25,589 | |
| | | | | | | | |
| | | | | | | 211,020 | |
| | | | | | | | |
| | | | Health Care Technology — 0.3% | |
| | 254 | | | Omnicell, Inc. (a) | | | 8,427 | |
| | | | | | | | |
| | | | Pharmaceuticals — 1.4% | |
| | 1,710 | | | Catalent, Inc. (a) | | | 47,680 | |
| | | | | | | | |
| | | | Total Health Care | | | 374,280 | |
| | | | | | | | |
| | | | Industrials — 17.0% | |
| | | | Air Freight & Logistics — 0.7% | |
| | 438 | | | Forward Air Corp. | | | 22,044 | |
| | | | | | | | |
| | | | Building Products — 0.3% | |
| | 824 | | | Ply Gem Holdings, Inc. (a) | | | 11,521 | |
| | | | | | | | |
| | | | Commercial Services & Supplies — 5.1% | |
| | 1,110 | | | Herman Miller, Inc. | | | 32,667 | |
| | 1,150 | | | KAR Auction Services, Inc. | | | 39,850 | |
| | 252 | | | US Ecology, Inc. | | | 10,094 | |
| | 2,130 | | | Waste Connections, Inc. | | | 93,696 | |
| | | | | | | | |
| | | | | | | 176,307 | |
| | | | | | | | |
| | | | Construction & Engineering — 0.7% | |
| | 1,405 | | | Comfort Systems USA, Inc. | | | 24,060 | |
| | | | | | | | |
| | | | Electrical Equipment — 2.0% | |
| | 935 | | | Generac Holdings, Inc. (a) | | | 43,717 | |
| | 304 | | | Regal-Beloit Corp. | | | 22,828 | |
| | | | | | | | |
| | | | | | | 66,545 | |
| | | | | | | | |
| | | | | | | | |
| SHARES | | | SECURITY DESCRIPTION | | VALUE($) | |
| | | | | | | | |
| | | | | | | | |
| | | | Machinery — 6.6% | |
| | 1,150 | | | Allison Transmission Holdings, Inc. | | | 38,988 | |
| | 885 | | | Altra Industrial Motion Corp. | | | 25,111 | |
| | 1,119 | | | Douglas Dynamics, Inc. | | | 23,972 | |
| | 653 | | | RBC Bearings, Inc. | | | 42,155 | |
| | 1,282 | | | Rexnord Corp. (a) | | | 36,178 | |
| | 959 | | | Toro Co. (The) | | | 61,214 | |
| | | | | | | | |
| | | | | | | 227,618 | |
| | | | | | | | |
| | | | Road & Rail — 1.0% | |
| | 1,055 | | | Knight Transportation, Inc. | | | 35,497 | |
| | | | | | | | |
| | | | Trading Companies & Distributors — 0.6% | |
| | 201 | | | Watsco, Inc. | | | 21,557 | |
| | | | | | | | |
| | | | Total Industrials | | | 585,149 | |
| | | | | | | | |
| | | | Information Technology — 12.5% | |
| | | | Electronic Equipment, Instruments & Components — 1.7% | |
| | 263 | | | Anixter International, Inc. (a) | | | 23,306 | |
| | 390 | | | FEI Co. | | | 35,211 | |
| | | | | | | | |
| | | | | | | 58,517 | |
| | | | | | | | |
| | | | Internet Software & Services — 1.5% | |
| | 780 | | | GrubHub, Inc. (a) | | | 28,323 | |
| | 1,249 | | | Q2 Holdings, Inc. (a) | | | 23,536 | |
| | | | | | | | |
| | | | | | | 51,859 | |
| | | | | | | | |
| | | | IT Services — 1.2% | |
| | 1,255 | | | CoreLogic, Inc. (a) | | | 39,651 | |
| | | | | | | | |
| | | | Semiconductors & Semiconductor Equipment — 1.2% | |
| | 1,588 | | | Freescale Semiconductor Ltd. (a) | | | 40,063 | |
| | | | | | | | |
| | | | Software — 6.9% | |
| | 1,153 | | | Advent Software, Inc. | | | 35,331 | |
| | 222 | | | FactSet Research Systems, Inc. | | | 31,262 | |
| | 338 | | | Guidewire Software, Inc. (a) | | | 17,108 | |
| | 597 | | | Imperva, Inc. (a) | | | 29,528 | |
| | 1,533 | | | Monotype Imaging Holdings, Inc. | | | 44,210 | |
| | 185 | | | NetSuite, Inc. (a) | | | 20,201 | |
| | 2,183 | | | Rovi Corp. (a) | | | 49,320 | |
| | 192 | | | Splunk, Inc. (a) | | | 11,344 | |
| | | | | | | | |
| | | | | | | 238,304 | |
| | | | | | | | |
| | | | Total Information Technology | | | 428,394 | |
| | | | | | | | |
| | | | Materials — 5.6% | |
| | | | Containers & Packaging — 5.6% | |
| | 960 | | | AptarGroup, Inc. | | | 64,197 | |
| | 1,220 | | | Crown Holdings, Inc. (a) (m) | | | 62,077 | |
| | 1,223 | | | Silgan Holdings, Inc. | | | 65,550 | |
| | | | | | | | |
| | | | Total Materials | | | 191,824 | |
| | | | | | | | |
SEE NOTES TO FINANCIAL STATEMENTS.
| | | | | | | | |
| | | |
| DECEMBER 31, 2014 | | J.P. MORGAN SMALL CAP FUNDS | | | | | 27 | |
JPMorgan Small Cap Equity Fund
SCHEDULE OF PORTFOLIO INVESTMENTS
AS OF DECEMBER 31, 2014 (Unaudited) (continued)
(Amounts in thousands)
| | | | | | | | |
| SHARES | | | SECURITY DESCRIPTION | | VALUE($) | |
| | | | | | | | |
| Common Stocks — continued | |
| | | | Utilities — 3.0% | |
| | | | Electric Utilities — 1.5% | |
| | 1,414 | | | Portland General Electric Co. | | | 53,507 | |
| | | | | | | | |
| | | | Multi-Utilities — 1.5% | |
| | 895 | | | NorthWestern Corp. | | | 50,624 | |
| | | | | | | | |
| | | | Total Utilities | | | 104,131 | |
| | | | | | | | |
| | | | Total Common Stocks
(Cost $2,110,105) | | | 3,300,343 | |
| | | | | | | | |
| Exchange Traded Fund — 0.4% | |
| | | | U.S. Equity — 0.4% | |
| | 131 | | | iShares Russell 2000 ETF
(Cost $14,909) | | | 15,661 | |
| | | | | | | | |
| Short-Term Investment — 3.9% | |
| | | | Investment Company — 3.9% | |
| | 134,277 | | | JPMorgan Prime Money Market Fund, Institutional Class Shares, 0.020% (b) (l) (m)
(Cost $134,277) | | | 134,277 | |
| | | | | | | | |
| | | | Total Investments — 100.4%
(Cost $2,259,291) | | | 3,450,281 | |
| | | | Liabilities in Excess of
Other Assets — (0.4)% | | | (15,075 | ) |
| | | | | | | | |
| | | | NET ASSETS — 100.0% | | $ | 3,435,206 | |
| | | | | | | | |
Percentages indicated are based on net assets.
SEE NOTES TO FINANCIAL STATEMENTS.
| | | | | | |
| | | |
| 28 | | | | J.P. MORGAN SMALL CAP FUNDS | | DECEMBER 31, 2014 |
JPMorgan Small Cap Growth Fund
SCHEDULE OF PORTFOLIO INVESTMENTS
AS OF DECEMBER 31, 2014 (Unaudited)
(Amounts in thousands)
| | | | | | | | |
| SHARES | | | SECURITY DESCRIPTION | | VALUE($) | |
| | | | | | | | |
| Common Stocks — 99.4% | |
| | | | Consumer Discretionary — 14.6% | |
| | | | Distributors — 0.5% | |
| | 96 | | | Pool Corp. (m) | | | 6,105 | |
| | | | | | | | |
| | | | Diversified Consumer Services — 1.3% | |
| | 754 | | | 2U, Inc. (a) | | | 14,831 | |
| | | | | | | | |
| | | | Hotels, Restaurants & Leisure — 1.0% | |
| | 360 | | | Boyd Gaming Corp. (a) (m) | | | 4,600 | |
| | 528 | | | Scientific Games Corp., Class A (a) | | | 6,718 | |
| | | | | | | | |
| | | | | | | 11,318 | |
| | | | | | | | |
| | | | Household Durables — 0.5% | |
| | 409 | | | TRI Pointe Homes, Inc. (a) | | | 6,243 | |
| | | | | | | | |
| | | | Internet & Catalog Retail — 2.3% | |
| | 588 | | | Coupons.com, Inc. (a) | | | 10,443 | |
| | 163 | | | HomeAway, Inc. (a) | | | 4,859 | |
| | 406 | | | RetailMeNot, Inc. (a) | | | 5,937 | |
| | 270 | | | Wayfair, Inc., Class A (a) | | | 5,351 | |
| | | | | | | | |
| | | | | | | 26,590 | |
| | | | | | | | |
| | | | Specialty Retail — 5.8% | |
| | 299 | | | Container Store Group, Inc. (The) (a) | | | 5,724 | |
| | 316 | | | Five Below, Inc. (a) | | | 12,916 | |
| | 194 | | | Lithia Motors, Inc., Class A | | | 16,823 | |
| | 244 | | | Men’s Wearhouse, Inc. (The) | | | 10,774 | |
| | 183 | | | Penske Automotive Group, Inc. (m) | | | 8,978 | |
| | 251 | | | Vitamin Shoppe, Inc. (a) | | | 12,204 | |
| | | | | | | | |
| | | | | | | 67,419 | |
| | | | | | | | |
| | | | Textiles, Apparel & Luxury Goods — 3.2% | |
| | 347 | | | Kate Spade & Co. (a) (m) | | | 11,111 | |
| | 392 | | | Vera Bradley, Inc. (a) | | | 7,999 | |
| | 592 | | | Wolverine World Wide, Inc. | | | 17,441 | |
| | | | | | | | |
| | | | | | | 36,551 | |
| | | | | | | | |
| | | | Total Consumer Discretionary | | | 169,057 | |
| | | | | | | | |
| | | | Consumer Staples — 1.2% | |
| | | | Food Products — 1.2% | |
| | 184 | | | Diamond Foods, Inc. (a) | | | 5,185 | |
| | 526 | | | Freshpet, Inc. (a) | | | 8,977 | |
| | | | | | | | |
| | | | Total Consumer Staples | | | 14,162 | |
| | | | | | | | |
| | | | Energy — 2.7% | |
| | | | Energy Equipment & Services — 1.5% | |
| | 115 | | | Dril-Quip, Inc. (a) | | | 8,819 | |
| | 394 | | | Forum Energy Technologies, Inc. (a) | | | 8,173 | |
| | | | | | | | |
| | | | | | | 16,992 | |
| | | | | | | | |
| | | | | | | | |
| SHARES | | | SECURITY DESCRIPTION | | VALUE($) | |
| | | | | | | | |
| | | | | | | | |
| | | | Oil, Gas & Consumable Fuels — 1.2% | |
| | 274 | | | Delek U.S. Holdings, Inc. | | | 7,477 | |
| | 300 | | | Eclipse Resources Corp. (a) | | | 2,105 | |
| | 471 | | | Laredo Petroleum, Inc. (a) | | | 4,873 | |
| | | | | | | | |
| | | | | | | 14,455 | |
| | | | | | | | |
| | | | Total Energy | | | 31,447 | |
| | | | | | | | |
| | | | Financials — 8.4% | |
| | | | Banks — 1.8% | |
| | 85 | | | Signature Bank (a) | | | 10,677 | |
| | 186 | | | Texas Capital Bancshares, Inc. (a) | | | 10,115 | |
| | | | | | | | |
| | | | | | | 20,792 | |
| | | | | | | | |
| | | | Capital Markets — 2.6% | |
| | 419 | | | Financial Engines, Inc. | | | 15,327 | |
| | 432 | | | FXCM, Inc., Class A | | | 7,153 | |
| | 810 | | | PennantPark Investment Corp. | | | 7,718 | |
| | | | | | | | |
| | | | | | | 30,198 | |
| | | | | | | | |
| | | | Diversified Financial Services — 0.3% | |
| | 166 | | | On Deck Capital, Inc. (a) | | | 3,712 | |
| | | | | | | | |
| | | | Insurance — 0.8% | |
| | 157 | | | AmTrust Financial Services, Inc. | | | 8,817 | |
| | | | | | | | |
| | | | Real Estate Investment Trusts (REITs) — 1.0% | |
| | 88 | | | EastGroup Properties, Inc. (m) | | | 5,587 | |
| | 135 | | | Highwoods Properties, Inc. (m) | | | 5,983 | |
| | | | | | | | |
| | | | | | | 11,570 | |
| | | | | | | | |
| | | | Real Estate Management & Development — 0.7% | |
| | 248 | | | RE/MAX Holdings, Inc., Class A | | | 8,492 | |
| | | | | | | | |
| | | | Thrifts & Mortgage Finance — 1.2% | |
| | 183 | | | BofI Holding, Inc. (a) | | | 14,224 | |
| | | | | | | | |
| | | | Total Financials | | | 97,805 | |
| | | | | | | | |
| | | | Health Care — 26.0% | |
| | | | Biotechnology — 11.4% | |
| | 287 | | | ACADIA Pharmaceuticals, Inc. (a) | | | 9,114 | |
| | 177 | | | Acceleron Pharma, Inc. (a) | | | 6,886 | |
| | 144 | | | Aegerion Pharmaceuticals, Inc. (a) | | | 3,013 | |
| | 517 | | | Arrowhead Research Corp. (a) | | | 3,818 | |
| | 145 | | | Avalanche Biotechnologies, Inc. (a) | | | 7,814 | |
| | 129 | | | Bellicum Pharmaceuticals, Inc. (a) | | | 2,981 | |
| | 214 | | | Chimerix, Inc. (a) | | | 8,624 | |
| | 291 | | | Coherus Biosciences, Inc. (a) | | | 4,747 | |
| | 282 | | | Exact Sciences Corp. (a) | | | 7,750 | |
| | 711 | | | Halozyme Therapeutics, Inc. (a) | | | 6,858 | |
| | 440 | | | Ignyta, Inc. (a) | | | 3,012 | |
| | 469 | | | Insmed, Inc. (a) | | | 7,249 | |
SEE NOTES TO FINANCIAL STATEMENTS.
| | | | | | | | |
| | | |
| DECEMBER 31, 2014 | | J.P. MORGAN SMALL CAP FUNDS | | | | | 29 | |
JPMorgan Small Cap Growth Fund
SCHEDULE OF PORTFOLIO INVESTMENTS
AS OF DECEMBER 31, 2014 (Unaudited) (continued)
(Amounts in thousands)
| | | | | | | | |
| SHARES | | | SECURITY DESCRIPTION | | VALUE($) | |
| | | | | | | | |
| Common Stocks — continued | |
| | | | Biotechnology — continued | | | | |
| | 196 | | | Intrexon Corp. (a) | | | 5,398 | |
| | 110 | | | Isis Pharmaceuticals, Inc. (a) | | | 6,776 | |
| | 476 | | | Keryx Biopharmaceuticals, Inc. (a) | | | 6,742 | |
| | 145 | | | Kite Pharma, Inc. (a) | | | 8,375 | |
| | 236 | | | Portola Pharmaceuticals, Inc. (a) | | | 6,690 | |
| | 43 | | | Puma Biotechnology, Inc. (a) | | | 8,107 | |
| | 82 | | | Receptos, Inc. (a) | | | 10,000 | |
| | 52 | | | Synageva BioPharma Corp. (a) | | | 4,868 | |
| | 175 | | | Versartis, Inc. (a) | | | 3,932 | |
| | | | | | | | |
| | | | | | | 132,754 | |
| | | | | | | | |
| | | | Health Care Equipment & Supplies — 6.9% | |
| | 961 | | | GenMark Diagnostics, Inc. (a) | | | 13,084 | |
| | 369 | | | Insulet Corp. (a) | | | 16,980 | |
| | 441 | | | K2M Group Holdings, Inc. (a) | | | 9,204 | |
| | 102 | | | Nevro Corp. (a) | | | 3,945 | |
| | 945 | | | Novadaq Technologies, Inc., (Canada) (a) | | | 15,700 | |
| | 832 | | | Syneron Medical Ltd., (Israel) (a) | | | 7,761 | |
| | 3,794 | | | Unilife Corp. (a) | | | 12,710 | |
| | | | | | | | |
| | | | | | | 79,384 | |
| | | | | | | | |
| | | | Health Care Providers & Services — 3.9% | |
| | 352 | | | Acadia Healthcare Co., Inc. (a) | | | 21,533 | |
| | 281 | | | Surgical Care Affiliates, Inc. (a) | | | 9,464 | |
| | 176 | | | WellCare Health Plans, Inc. (a) | | | 14,448 | |
| | | | | | | | |
| | | | | | | 45,445 | |
| | | | | | | | |
| | | | Health Care Technology — 1.0% | |
| | 450 | | | Veeva Systems, Inc., Class A (a) | | | 11,887 | |
| | | | | | | | |
| | | | Life Sciences Tools & Services — 1.3% | |
| | 449 | | | Fluidigm Corp. (a) | | | 15,146 | |
| | | | | | | | |
| | | | Pharmaceuticals — 1.5% | |
| | 505 | | | Nektar Therapeutics (a) | | | 7,835 | |
| | 195 | | | Revance Therapeutics, Inc. (a) | | | 3,304 | |
| | 248 | | | Sagent Pharmaceuticals, Inc. (a) | | | 6,222 | |
| | | | | | | | |
| | | | | | | 17,361 | |
| | | | | | | | |
| | | | Total Health Care | | | 301,977 | |
| | | | | | | | |
| | | | Industrials — 19.7% | |
| | | | Aerospace & Defense — 2.0% | |
| | 225 | | | HEICO Corp. (m) | | | 13,562 | |
| | 217 | | | Hexcel Corp. (a) | | | 9,003 | |
| | | | | | | | |
| | | | | | | 22,565 | |
| | | | | | | | |
| | | | Air Freight & Logistics — 1.1% | |
| | 308 | | | XPO Logistics, Inc. (a) | | | 12,586 | |
| | | | | | | | |
| | | | | | | | |
| SHARES | | | SECURITY DESCRIPTION | | VALUE($) | |
| | | | | | | | |
| | | | | | | | |
| | | | Airlines — 1.3% | |
| | 201 | | | Spirit Airlines, Inc. (a) | | | 15,188 | |
| | | | | | | | |
| | | | Building Products — 3.7% | |
| | 302 | | | Fortune Brands Home & Security, Inc. | | | 13,685 | |
| | 128 | | | Masonite International Corp. (a) | | | 7,892 | |
| | 95 | | | Norcraft Cos., Inc. (a) | | | 1,830 | |
| | 468 | | | Trex Co., Inc. (a) | | | 19,924 | |
| | | | | | | | |
| | | | | | | 43,331 | |
| | | | | | | | |
| | | | Electrical Equipment — 2.1% | |
| | 175 | | | Acuity Brands, Inc. | | | 24,537 | |
| | | | | | | | |
| | | | Industrial Conglomerates — 1.1% | |
| | 136 | | | Carlisle Cos., Inc. (m) | | | 12,285 | |
| | | | | | | | |
| | | | Machinery — 2.9% | |
| | 93 | | | Graco, Inc. (m) | | | 7,459 | |
| | 264 | | | Middleby Corp. (The) (a) | | | 26,190 | |
| | | | | | | | |
| | | | | | | 33,649 | |
| | | | | | | | |
| | | | Marine — 0.8% | |
| | 120 | | | Kirby Corp. (a) | | | 9,725 | |
| | | | | | | | |
| | | | Road & Rail — 1.4% | |
| | 215 | | | Old Dominion Freight Line, Inc. (a) | | | 16,730 | |
| | | | | | | | |
| | | | Trading Companies & Distributors — 3.3% | |
| | 209 | | | H&E Equipment Services, Inc. | | | 5,879 | |
| | 435 | | | Rush Enterprises, Inc., Class A (a) | | | 13,939 | |
| | 171 | | | Watsco, Inc. (m) | | | 18,258 | |
| | | | | | | | |
| | | | | | | 38,076 | |
| | | | | | | | |
| | | | Total Industrials | | | 228,672 | |
| | | | | | | | |
| | | | Information Technology — 24.8% | |
| | | | Communications Equipment — 3.2% | |
| | 562 | | | Aruba Networks, Inc. (a) | | | 10,212 | |
| | 481 | | | Ciena Corp. (a) (m) | | | 9,331 | |
| | 303 | | | Infinera Corp. (a) | | | 4,454 | |
| | 50 | | | Palo Alto Networks, Inc. (a) | | | 6,074 | |
| | 594 | | | Ruckus Wireless, Inc. (a) | | | 7,141 | |
| | | | | | | | |
| | | | | | | 37,212 | |
| | | | | | | | |
| | | | Electronic Equipment, Instruments & Components — 0.6% | |
| | 68 | | | FEI Co. (m) | | | 6,171 | |
| | | | | | | | |
| | | | Internet Software & Services — 7.4% | |
| | 216 | | | ChannelAdvisor Corp. (a) | | | 4,661 | |
| | 284 | | | Cornerstone OnDemand, Inc. (a) | | | 9,984 | |
| | 82 | | | CoStar Group, Inc. (a) | | | 15,065 | |
| | 313 | | | Dealertrack Technologies, Inc. (a) | | | 13,870 | |
| | 249 | | | Demandware, Inc. (a) | | | 14,306 | |
| | 273 | | | Envestnet, Inc. (a) | | | 13,431 | |
SEE NOTES TO FINANCIAL STATEMENTS.
| | | | | | |
| | | |
| 30 | | | | J.P. MORGAN SMALL CAP FUNDS | | DECEMBER 31, 2014 |
| | | | | | | | |
| SHARES | | | SECURITY DESCRIPTION | | VALUE($) | |
| | | | | | | | |
| Common Stocks — continued | |
| | | | Internet Software & Services — continued | | | | |
| | 301 | | | Marketo, Inc. (a) | | | 9,845 | |
| | 102 | | | Trulia, Inc. (a) | | | 4,673 | |
| | | | | | | | |
| | | | | | | 85,835 | |
| | | | | | | | |
| | | | Semiconductors & Semiconductor Equipment — 5.0% | |
| | 234 | | | Cavium, Inc. (a) | | | 14,483 | |
| | 849 | | | Inphi Corp. (a) | | | 15,697 | |
| | 331 | | | Monolithic Power Systems, Inc. | | | 16,470 | |
| | 422 | | | TriQuint Semiconductor, Inc. (a) | | | 11,623 | |
| | | | | | | | |
| | | | | | | 58,273 | |
| | | | | | | | |
| | | | Software — 7.5% | �� |
| | 175 | | | CommVault Systems, Inc. (a) | | | 9,061 | |
| | 272 | | | FleetMatics Group plc, (Ireland) (a) | | | 9,641 | |
| | 455 | | | Fortinet, Inc. (a) | | | 13,941 | |
| | 305 | | | Guidewire Software, Inc. (a) | | | 15,436 | |
| | 143 | | | HubSpot, Inc. (a) | | | 4,808 | |
| | 224 | | | Imperva, Inc. (a) | | | 11,051 | |
| | 239 | | | Proofpoint, Inc. (a) | | | 11,526 | |
| | 139 | | | Tableau Software, Inc., Class A (a) | | | 11,779 | |
| | | | | | | | |
| | | | | | | 87,243 | |
| | | | | | | | |
| | | | Technology Hardware, Storage & Peripherals — 1.1% | |
| | 464 | | | Nimble Storage, Inc. (a) | | | 12,759 | |
| | | | | | | | |
| | | | Total Information Technology | | | 287,493 | |
| | | | | | | | |
| | | | | | | | |
| SHARES | | | SECURITY DESCRIPTION | | VALUE($) | |
| | | | | | | | |
| | | | Materials — 1.0% | |
| | | | Construction Materials — 1.0% | |
| | 142 | | | Eagle Materials, Inc. | | | 10,781 | |
| | | | | | | | |
| | | | Telecommunication Services — 1.0% | |
| | | | Wireless Telecommunication Services — 1.0% | |
| | 647 | | | Boingo Wireless, Inc. (a) | | | 4,963 | |
| | 455 | | | RingCentral, Inc., Class A (a) | | | 6,789 | |
| | | | | | | | |
| | | | Total Telecommunication Services | | | 11,752 | |
| | | | | | | | |
| | | | Total Common Stocks
(Cost $850,048) | | | 1,153,146 | |
| | | | | | | | |
| Short-Term Investment — 0.8% | |
| | | | Investment Company — 0.8% | |
| | 9,864 | | | JPMorgan Liquid Assets Money Market Fund, Institutional Class Shares, 0.030% (b) (l) (m)
(Cost $9,864 ) | | | 9,864 | |
| | | | | | | | |
| | | | Total Investments — 100.2%
(Cost $859,912) | | | 1,163,010 | |
| | | | Liabilities in Excess of
Other Assets — (0.2)% | | | (2,038 | ) |
| | | | | | | | |
| | | | NET ASSETS — 100.0% | | $ | 1,160,972 | |
| | | | | | | | |
Percentages indicated are based on net assets.
SEE NOTES TO FINANCIAL STATEMENTS.
| | | | | | | | |
| | | |
| DECEMBER 31, 2014 | | J.P. MORGAN SMALL CAP FUNDS | | | | | 31 | |
JPMorgan Small Cap Value Fund
SCHEDULE OF PORTFOLIO INVESTMENTS
AS OF DECEMBER 31, 2014 (Unaudited)
(Amounts in thousands)
| | | | | | | | |
| SHARES | | | SECURITY DESCRIPTION | | VALUE($) | |
| | | | | | | | |
| Common Stocks — 96.8% | |
| | | | Consumer Discretionary — 9.8% | |
| | | | Auto Components — 1.2% | |
| | 745 | | | Dana Holding Corp. | | | 16,201 | |
| | 103 | | | Fuel Systems Solutions, Inc. (a) | | | 1,127 | |
| | 61 | | | Spartan Motors, Inc. | | | 323 | |
| | 215 | | | Stoneridge, Inc. (a) | | | 2,762 | |
| | | | | | | | |
| | | | | | | 20,413 | |
| | | | | | | | |
| | | | Distributors — 0.0% (g) | |
| | 82 | | | VOXX International Corp. (a) | | | 721 | |
| | | | | | | | |
| | | | Diversified Consumer Services — 0.9% | |
| | 67 | | | 2U, Inc. (a) | | | 1,321 | |
| | 41 | | | Chegg, Inc. (a) | | | 281 | |
| | 377 | | | K12, Inc. (a) | | | 4,472 | |
| | 479 | | | Regis Corp. (a) | | | 8,033 | |
| | | | | | | | |
| | | | | | | 14,107 | |
| | | | | | | | |
| | | | Hotels, Restaurants & Leisure — 0.5% | |
| | 54 | | | Dave & Buster’s Entertainment, Inc. (a) | | | 1,472 | |
| | 201 | | | Isle of Capri Casinos, Inc. (a) | | | 1,684 | |
| | 18 | | | Jack in the Box, Inc. | | | 1,399 | |
| | 254 | | | Ruth’s Hospitality Group, Inc. | | | 3,805 | |
| | 30 | | | Scientific Games Corp., Class A (a) | | | 383 | |
| | | | | | | | |
| | | | | | | 8,743 | |
| | | | | | | | |
| | | | Household Durables — 0.4% | |
| | 99 | | | CSS Industries, Inc. | | | 2,739 | |
| | 89 | | | Leggett & Platt, Inc. | | | 3,771 | |
| | 94 | | | Skullcandy, Inc. (a) | | | 868 | |
| | | | | | | | |
| | | | | | | 7,378 | |
| | | | | | | | |
| | | | Internet & Catalog Retail — 0.3% | |
| | 38 | | | Coupons.com, Inc. (a) | | | 667 | |
| | 439 | | | Orbitz Worldwide, Inc. (a) | | | 3,616 | |
| | 31 | | | Wayfair, Inc., Class A (a) | | | 606 | |
| | | | | | | | |
| | | | | | | 4,889 | |
| | | | | | | | |
| | | | Leisure Products — 0.2% | |
| | 192 | | | Nautilus, Inc. (a) | | | 2,917 | |
| | | | | | | | |
| | | | Media — 1.1% | |
| | 432 | | | E.W. Scripps Co. (The), Class A (a) | | | 9,655 | |
| | 168 | | | Entercom Communications Corp., Class A (a) | | | 2,045 | |
| | 319 | | | Journal Communications, Inc., Class A (a) | | | 3,643 | |
| | 261 | | | Lee Enterprises, Inc. (a) | | | 961 | |
| | 325 | | | McClatchy Co. (The), Class A (a) | | | 1,079 | |
| | 8 | | | Saga Communications, Inc., Class A | | | 362 | |
| | | | | | | | |
| | | | | | | 17,745 | |
| | | | | | | | |
| | | | | | | | |
| SHARES | | | SECURITY DESCRIPTION | | VALUE($) | |
| | | | | | | | |
| | | | | | | | |
| | | | Multiline Retail — 1.0% | |
| | 149 | | | Bon-Ton Stores, Inc. (The) | | | 1,102 | |
| | 116 | | | Dillard’s, Inc., Class A | | | 14,496 | |
| | | | | | | | |
| | | | | | | 15,598 | |
| | | | | | | | |
| | | | Specialty Retail — 3.0% | |
| | 579 | | | Barnes & Noble, Inc. (a) | | | 13,449 | |
| | 7 | | | Boot Barn Holdings, Inc. (a) | | | 124 | |
| | 286 | | | Brown Shoe Co., Inc. | | | 9,201 | |
| | 252 | | | Children’s Place, Inc. (The) | | | 14,381 | |
| | 203 | | | Guess?, Inc. | | | 4,284 | |
| | 909 | | | hhgregg, Inc. (a) | | | 6,880 | |
| | | | | | | | |
| | | | | | | 48,319 | |
| | | | | | | | |
| | | | Textiles, Apparel & Luxury Goods — 1.2% | |
| | 426 | | | Iconix Brand Group, Inc. (a) | | | 14,408 | |
| | 149 | | | Unifi, Inc. (a) | | | 4,430 | |
| | | | | | | | |
| | | | | | | 18,838 | |
| | | | | | | | |
| | | | Total Consumer Discretionary | | | 159,668 | |
| | | | | | | | |
| | | | Consumer Staples — 3.8% | |
| | | | Food & Staples Retailing — 1.8% | |
| | 181 | | | Pantry, Inc. (The) (a) | | | 6,719 | |
| | 2,302 | | | Rite Aid Corp. (a) | | | 17,312 | |
| | 169 | | | Smart & Final Stores, Inc. (a) | | | 2,655 | |
| | 79 | | | SpartanNash Co. | | | 2,052 | |
| | | | | | | | |
| | | | | | | 28,738 | |
| | | | | | | | |
| | | | Food Products — 1.0% | |
| | 406 | | | Chiquita Brands International, Inc. (a) | | | 5,877 | |
| | 22 | | | Farmer Bros Co. (a) | | | 657 | |
| | 96 | | | Fresh Del Monte Produce, Inc. | | | 3,231 | |
| | 7 | | | John B Sanfilippo & Son, Inc. | | | 323 | |
| | 141 | | | Pinnacle Foods, Inc. | | | 4,963 | |
| | 5 | | | Sanderson Farms, Inc. | | | 420 | |
| | 20 | | | Seneca Foods Corp., Class A (a) | | | 527 | |
| | | | | | | | |
| | | | | | | 15,998 | |
| | | | | | | | |
| | | | Household Products — 0.3% | |
| | 536 | | | Central Garden & Pet Co., Class A (a) | | | 5,117 | |
| | | | | | | | |
| | | | Tobacco — 0.7% | |
| | 174 | | | Alliance One International, Inc. (a) | | | 275 | |
| | 244 | | | Universal Corp. | | | 10,722 | |
| | | | | | | | |
| | | | | | | 10,997 | |
| | | | | | | | |
| | | | Total Consumer Staples | | | 60,850 | |
| | | | | | | | |
| | | | Energy — 4.3% | |
| | | | Energy Equipment & Services — 2.0% | |
| | 31 | | | Dawson Geophysical Co. | | | 381 | |
SEE NOTES TO FINANCIAL STATEMENTS.
| | | | | | |
| | | |
| 32 | | | | J.P. MORGAN SMALL CAP FUNDS | | DECEMBER 31, 2014 |
| | | | | | | | |
| SHARES | | | SECURITY DESCRIPTION | | VALUE($) | |
| | | | | | | | |
| Common Stocks — continued | |
| | | | Energy Equipment & Services — continued | |
| | 143 | | | Exterran Holdings, Inc. | | | 4,662 | |
| | 71 | | | FMSA Holdings, Inc. (a) | | | 490 | |
| | 688 | | | Helix Energy Solutions Group, Inc. (a) | | | 14,919 | |
| | 46 | | | Key Energy Services, Inc. (a) | | | 76 | |
| | 43 | | | Mitcham Industries, Inc. (a) | | | 257 | |
| | 288 | | | Parker Drilling Co. (a) | | | 883 | |
| | 623 | | | Pioneer Energy Services Corp. (a) | | | 3,450 | |
| | 104 | | | SEACOR Holdings, Inc. (a) | | | 7,669 | |
| | | | | | | | |
| | | | | | | 32,787 | |
| | | | | | | | |
| | | | Oil, Gas & Consumable Fuels — 2.3% | |
| | 4 | | | Adams Resources & Energy, Inc. | | | 200 | |
| | 85 | | | Alon USA Energy, Inc. | | | 1,080 | |
| | 725 | | | Cloud Peak Energy, Inc. (a) | | | 6,658 | |
| | 252 | | | Comstock Resources, Inc. | | | 1,715 | |
| | 855 | | | EXCO Resources, Inc. | | | 1,856 | |
| | 198 | | | Frontline Ltd., (Bermuda) (a) | | | 498 | |
| | 421 | | | Midstates Petroleum Co., Inc. (a) | | | 635 | |
| | 32 | | | Pacific Ethanol, Inc. (a) | | | 332 | |
| | 140 | | | REX American Resources Corp. (a) | | | 8,663 | |
| | 67 | | | Stone Energy Corp. (a) | | | 1,126 | |
| | 876 | | | VAALCO Energy, Inc. (a) | | | 3,996 | |
| | 257 | | | W&T Offshore, Inc. | | | 1,884 | |
| | 296 | | | Warren Resources, Inc. (a) | | | 477 | |
| | 206 | | | Western Refining, Inc. | | | 7,798 | |
| | | | | | | | |
| | | | | | | 36,918 | |
| | | | | | | | |
| | | | Total Energy | | | 69,705 | |
| | | | | | | | |
| | | | Financials — 38.0% | |
| | | | Banks — 14.7% | |
| | 91 | | | 1st Source Corp. | | | 3,136 | |
| | 6 | | | American National Bankshares, Inc. | | | 146 | |
| | 66 | | | BancFirst Corp. | | | 4,177 | |
| | 348 | | | BancorpSouth, Inc. | | | 7,836 | |
| | 153 | | | Bank of Hawaii Corp. | | | 9,045 | |
| | 57 | | | Banner Corp. | | | 2,469 | |
| | 329 | | | BBCN Bancorp, Inc. | | | 4,732 | |
| | 18 | | | Bridge Capital Holdings (a) | | | 401 | |
| | 216 | | | Capital Bank Financial Corp., Class A (a) | | | 5,794 | |
| | 77 | | | Cascade Bancorp (a) | | | 402 | |
| | 192 | | | Cathay General Bancorp | | | 4,918 | |
| | 411 | | | Central Pacific Financial Corp. | | | 8,839 | |
| | 8 | | | Century Bancorp, Inc., Class A | | | 304 | |
| | 67 | | | Chemical Financial Corp. | | | 2,065 | |
| | 18 | | | Citizens & Northern Corp. | | | 370 | |
| | 135 | | | City Holding Co. | | | 6,272 | |
| | | | | | | | |
| SHARES | | | SECURITY DESCRIPTION | | VALUE($) | |
| | | | | | | | |
| | | | | | | | |
| | | | Banks — continued | |
| | 91 | | | CoBiz Financial, Inc. | | | 1,195 | |
| | 51 | | | Columbia Banking System, Inc. | | | 1,403 | |
| | 126 | | | Community Bank System, Inc. | | | 4,816 | |
| | 114 | | | Community Trust Bancorp, Inc. | | | 4,168 | |
| | 20 | | | ConnectOne Bancorp, Inc. | | | 371 | |
| | 21 | | | Customers Bancorp, Inc. (a) | | | 415 | |
| | 14 | | | East West Bancorp, Inc. | | | 540 | |
| | 65 | | | Financial Institutions, Inc. | | | 1,632 | |
| | 28 | | | First Bancorp | | | 521 | |
| | 1,190 | | | First BanCorp, (Puerto Rico) (a) | | | 6,984 | |
| | 387 | | | First Busey Corp. | | | 2,517 | |
| | 8 | | | First Citizens BancShares, Inc., Class A | | | 1,947 | |
| | 1,186 | | | First Commonwealth Financial Corp. | | | 10,932 | |
| | 43 | | | First Community Bancshares, Inc. | | | 710 | |
| | 126 | | | First Financial Bancorp | | | 2,340 | |
| | 71 | | | First Financial Bankshares, Inc. | | | 2,107 | |
| | 103 | | | First Interstate BancSystem, Inc. | | | 2,865 | |
| | 170 | | | Flushing Financial Corp. | | | 3,446 | |
| | 434 | | | FNB Corp. | | | 5,776 | |
| | 198 | | | Glacier Bancorp, Inc. | | | 5,490 | |
| | 34 | | | Great Southern Bancorp, Inc. | | | 1,353 | |
| | 24 | | | Guaranty Bancorp | | | 351 | |
| | 310 | | | Hancock Holding Co. | | | 9,517 | |
| | 50 | | | Heartland Financial USA, Inc. | | | 1,366 | |
| | 23 | | | Heritage Financial Corp. | | | 397 | |
| | 65 | | | Hudson Valley Holding Corp. | | | 1,758 | |
| | 57 | | | Lakeland Bancorp, Inc. | | | 672 | |
| | 26 | | | Lakeland Financial Corp. | | | 1,130 | |
| | 172 | | | MainSource Financial Group, Inc. | | | 3,600 | |
| | 112 | | | MB Financial, Inc. | | | 3,667 | |
| | 55 | | | Metro Bancorp, Inc. (a) | | | 1,426 | |
| | 44 | | | National Penn Bancshares, Inc. | | | 459 | |
| | 525 | | | OFG Bancorp, (Puerto Rico) | | | 8,735 | |
| | 73 | | | Pacific Continental Corp. | | | 1,035 | |
| | 145 | | | PacWest Bancorp | | | 6,592 | |
| | 16 | | | Preferred Bank | | | 455 | |
| | 18 | | | Republic Bancorp, Inc., Class A | | | 452 | |
| | 20 | | | S&T Bancorp, Inc. | | | 605 | |
| | 16 | | | Sierra Bancorp | | | 279 | |
| | 70 | | | Simmons First National Corp., Class A | | | 2,854 | |
| | 16 | | | Southside Bancshares, Inc. | | | 452 | |
| | 142 | | | Southwest Bancorp, Inc. | | | 2,456 | |
| | 54 | | | State Bank Financial Corp. | | | 1,071 | |
| | 12 | | | Stock Yards Bancorp, Inc. | | | 390 | |
| | 16 | | | Suffolk Bancorp | | | 366 | |
| | 334 | | | Susquehanna Bancshares, Inc. | | | 4,488 | |
SEE NOTES TO FINANCIAL STATEMENTS.
| | | | | | | | |
| | | |
| DECEMBER 31, 2014 | | J.P. MORGAN SMALL CAP FUNDS | | | | | 33 | |
JPMorgan Small Cap Value Fund
SCHEDULE OF PORTFOLIO INVESTMENTS
AS OF DECEMBER 31, 2014 (Unaudited) (continued)
(Amounts in thousands)
| | | | | | | | |
| SHARES | | | SECURITY DESCRIPTION | | VALUE($) | |
| | | | | | | | |
| Common Stocks — continued | |
| | | | Banks — continued | |
| | 411 | | | TCF Financial Corp. | | | 6,526 | |
| | 37 | | | Tompkins Financial Corp. | | | 2,041 | |
| | 134 | | | Trustmark Corp. | | | 3,288 | |
| | 174 | | | UMB Financial Corp. | | | 9,922 | |
| | 550 | | | Umpqua Holdings Corp. | | | 9,348 | |
| | 392 | | | Union Bankshares Corp. | | | 9,451 | |
| | 70 | | | Valley National Bancorp | | | 684 | |
| | 35 | | | Washington Trust Bancorp, Inc. | | | 1,422 | |
| | 104 | | | Webster Financial Corp. | | | 3,386 | |
| | 39 | | | West Bancorporation, Inc. | | | 657 | |
| | 175 | | | Westamerica Bancorporation | | | 8,564 | |
| | 605 | | | Wilshire Bancorp, Inc. | | | 6,130 | |
| | | | | | | | |
| | | | | | | 238,426 | |
| | | | | | | | |
| | | | Capital Markets — 1.4% | |
| | 96 | | | Arlington Asset Investment Corp., Class A | | | 2,555 | |
| | 673 | | | Cowen Group, Inc., Class A (a) | | | 3,230 | |
| | 32 | | | GAMCO Investors, Inc., Class A | | | 2,846 | |
| | 429 | | | Investment Technology Group, Inc. (a) | | | 8,932 | |
| | 62 | | | Janus Capital Group, Inc. | | | 1,005 | |
| | 52 | | | Oppenheimer Holdings, Inc., Class A | | | 1,211 | |
| | 44 | | | Piper Jaffray Cos. (a) | | | 2,568 | |
| | | | | | | | |
| | | | | | | 22,347 | |
| | | | | | | | |
| | | | Consumer Finance — 1.0% | |
| | 103 | | | Nelnet, Inc., Class A | | | 4,749 | |
| | 137 | | | World Acceptance Corp. (a) | | | 10,869 | |
| | | | | | | | |
| | | | | | | 15,618 | |
| | | | | | | | |
| | | | Diversified Financial Services — 0.1% | |
| | 87 | | | Marlin Business Services Corp. | | | 1,792 | |
| | | | | | | | |
| | | | Insurance — 5.0% | |
| | 357 | | | American Equity Investment Life Holding Co. | | | 10,409 | |
| | 32 | | | Arch Capital Group Ltd., (Bermuda) (a) | | | 1,870 | |
| | 104 | | | Argo Group International Holdings Ltd., (Bermuda) | | | 5,779 | |
| | 886 | | | CNO Financial Group, Inc. | | | 15,257 | |
| | 11 | | | Global Indemnity plc, (Ireland) (a) | | | 303 | |
| | 68 | | | Hallmark Financial Services (a) | | | 822 | |
| | 218 | | | Horace Mann Educators Corp. | | | 7,240 | |
| | 157 | | | Meadowbrook Insurance Group, Inc. | | | 1,330 | |
| | 11 | | | Navigators Group, Inc. (The) (a) | | | 807 | |
| | 192 | | | Platinum Underwriters Holdings Ltd., (Bermuda) | | | 14,111 | |
| | 101 | | | Primerica, Inc. | | | 5,486 | |
| | 163 | | | ProAssurance Corp. | | | 7,368 | |
| | 59 | | | StanCorp Financial Group, Inc. | | | 4,150 | |
| | 294 | | | Symetra Financial Corp. | | | 6,781 | |
| | | | | | | | |
| | | | | | | 81,713 | |
| | | | | | | | |
| | | | | | | | |
| SHARES | | | SECURITY DESCRIPTION | | VALUE($) | |
| | | | | | | | |
| | | | | | | | |
| | | | Real Estate Investment Trusts (REITs) — 13.6% | |
| | 21 | | | American Assets Trust, Inc. | | | 852 | |
| | 2,636 | | | Anworth Mortgage Asset Corp. | | | 13,836 | |
| | 183 | | | Apartment Investment & Management Co., Class A | | | 6,799 | |
| | 122 | | | Ashford Hospitality Prime, Inc. | | | 2,090 | |
| | 609 | | | Ashford Hospitality Trust, Inc. | | | 6,383 | |
| | 1,009 | | | Capstead Mortgage Corp. | | | 12,394 | |
| | 390 | | | CBL & Associates Properties, Inc. | | | 7,576 | |
| | 450 | | | Chambers Street Properties | | | 3,629 | |
| | 310 | | | CoreSite Realty Corp. | | | 12,117 | |
| | 511 | | | CubeSmart | | | 11,280 | |
| | 2,015 | | | CYS Investments, Inc. | | | 17,570 | |
| | 444 | | | DCT Industrial Trust, Inc. | | | 15,816 | |
| | 296 | | | DiamondRock Hospitality Co. | | | 4,400 | |
| | 81 | | | Education Realty Trust, Inc. | | | 2,976 | |
| | 70 | | | EPR Properties | | | 4,028 | |
| | 660 | | | FelCor Lodging Trust, Inc. | | | 7,141 | |
| | 117 | | | First Industrial Realty Trust, Inc. | | | 2,405 | |
| | 454 | | | First Potomac Realty Trust | | | 5,605 | |
| | 151 | | | Franklin Street Properties Corp. | | | 1,847 | |
| | 135 | | | Getty Realty Corp. | | | 2,458 | |
| | 68 | | | Gladstone Commercial Corp. | | | 1,166 | |
| | 28 | | | Glimcher Realty Trust | | | 389 | |
| | 319 | | | Government Properties Income Trust | | | 7,329 | |
| | 54 | | | Highwoods Properties, Inc. | | | 2,400 | |
| | 61 | | | Home Properties, Inc. | | | 4,015 | |
| | 148 | | | Hospitality Properties Trust | | | 4,588 | |
| | 74 | | | LaSalle Hotel Properties | | | 2,979 | |
| | 92 | | | LTC Properties, Inc. | | | 3,954 | |
| | 13 | | | Mid-America Apartment Communities, Inc. | | | 999 | |
| | 140 | | | Parkway Properties, Inc. | | | 2,575 | |
| | 119 | | | Pebblebrook Hotel Trust | | | 5,448 | |
| | 212 | | | Pennsylvania Real Estate Investment Trust | | | 4,981 | |
| | 283 | | | Potlatch Corp. | | | 11,853 | |
| | 33 | | | PS Business Parks, Inc. | | | 2,641 | |
| | 878 | | | RAIT Financial Trust | | | 6,737 | |
| | 4 | | | Saul Centers, Inc. | | | 217 | |
| | 70 | | | Strategic Hotels & Resorts, Inc. (a) | | | 927 | |
| | 402 | | | Sunstone Hotel Investors, Inc. | | | 6,639 | |
| | 13 | | | Taubman Centers, Inc. | | | 970 | |
| | 72 | | | Urstadt Biddle Properties, Inc., Class A | | | 1,582 | |
| | 274 | | | Washington Real Estate Investment Trust | | | 7,571 | |
| | | | | | | | |
| | | | | | | 221,162 | |
| | | | | | | | |
| | | | Real Estate Management & Development — 1.1% | |
| | 190 | | | Alexander & Baldwin, Inc. | | | 7,475 | |
SEE NOTES TO FINANCIAL STATEMENTS.
| | | | | | |
| | | |
| 34 | | | | J.P. MORGAN SMALL CAP FUNDS | | DECEMBER 31, 2014 |
| | | | | | | | |
| SHARES | | | SECURITY DESCRIPTION | | VALUE($) | |
| | | | | | | | |
| Common Stocks — continued | |
| | | | Real Estate Management & Development — continued | |
| | 253 | | | Forestar Group, Inc. (a) | | | 3,890 | |
| | 335 | | | St. Joe Co. (The) (a) | | | 6,152 | |
| | | | | | | | |
| | | | | | | 17,517 | |
| | | | | | | | |
| | | | Thrifts & Mortgage Finance — 1.1% | |
| | 22 | | | BankFinancial Corp. | | | 266 | |
| | 90 | | | Beneficial Mutual Bancorp, Inc. (a) | | | 1,109 | |
| | 302 | | | Charter Financial Corp. | | | 3,458 | |
| | 28 | | | ESB Financial Corp. | | | 532 | |
| | 30 | | | First Financial Northwest, Inc. | | | 360 | |
| | 25 | | | Fox Chase Bancorp, Inc. | | | 417 | |
| | 13 | | | Kearny Financial Corp. (a) | | | 184 | |
| | 459 | | | Northfield Bancorp, Inc. | | | 6,796 | |
| | 52 | | | OceanFirst Financial Corp. | | | 895 | |
| | 15 | | | Territorial Bancorp, Inc. | | | 317 | |
| | 90 | | | United Financial Bancorp, Inc. | | | 1,292 | |
| | 48 | | | Walker & Dunlop, Inc. (a) | | | 840 | |
| | 24 | | | WSFS Financial Corp. | | | 1,815 | |
| | | | | | | | |
| | | | | | | 18,281 | |
| | | | | | | | |
| | | | Total Financials | | | 616,856 | |
| | | | | | | | |
| | | | Health Care — 5.2% | |
| | | | Biotechnology — 1.9% | |
| | 51 | | | Agios Pharmaceuticals, Inc. (a) | | | 5,759 | |
| | 19 | | | Applied Genetic Technologies Corp. (a) | | | 391 | |
| | 64 | | | Ardelyx, Inc. (a) | | | 1,207 | |
| | 89 | | | Auspex Pharmaceuticals, Inc. (a) | | | 4,676 | |
| | 20 | | | Avalanche Biotechnologies, Inc. (a) | | | 1,080 | |
| | 77 | | | Cara Therapeutics, Inc. (a) | | | 771 | |
| | 45 | | | Dicerna Pharmaceuticals, Inc. (a) | | | 741 | |
| | 75 | | | Eleven Biotherapeutics, Inc. (a) | | | 893 | |
| | 33 | | | Epizyme, Inc. (a) | | | 619 | |
| | 18 | | | Foundation Medicine, Inc. (a) | | | 407 | |
| | 38 | | | Immune Design Corp. (a) | | | 1,182 | |
| | 116 | | | Insmed, Inc. (a) | | | 1,788 | |
| | 15 | | | Karyopharm Therapeutics, Inc. (a) | | | 569 | |
| | 28 | | | Kite Pharma, Inc. (a) | | | 1,626 | |
| | 38 | | | MacroGenics, Inc. (a) | | | 1,333 | |
| | 104 | | | Radius Health, Inc. (a) | | | 4,043 | |
| | 13 | | | Sage Therapeutics, Inc. (a) | | | 483 | |
| | 31 | | | Ultragenyx Pharmaceutical, Inc. (a) | | | 1,351 | |
| | 93 | | | Verastem, Inc. (a) | | | 852 | |
| | 27 | | | Zafgen, Inc. (a) | | | 823 | |
| | | | | | | | |
| | | | | | | 30,594 | |
| | | | | | | | |
| | | | Health Care Equipment & Supplies — 1.4% | |
| | 38 | | | Inogen, Inc. (a) | | | 1,176 | |
| | | | | | | | |
| SHARES | | | SECURITY DESCRIPTION | | VALUE($) | |
| | | | | | | | |
| | | | | | | | |
| | | | Health Care Equipment & Supplies — continued | |
| | 83 | | | NuVasive, Inc. (a) | | | 3,928 | |
| | 92 | | | PhotoMedex, Inc. (a) | | | 141 | |
| | 70 | | | Roka Bioscience, Inc. (a) | | | 311 | |
| | 174 | | | SurModics, Inc. (a) | | | 3,845 | |
| | 49 | | | Symmetry Surgical, Inc. (a) | | | 379 | |
| | 367 | | | Thoratec Corp. (a) | | | 11,903 | |
| | 35 | | | TriVascular Technologies, Inc. (a) | | | 440 | |
| | | | | | | | |
| | | | | | | 22,123 | |
| | | | | | | | |
| | | | Health Care Providers & Services — 1.3% | |
| | 58 | | | Centene Corp. (a) | | | 6,065 | |
| | 589 | | | Cross Country Healthcare, Inc. (a) | | | 7,347 | |
| | 23 | | | HealthEquity, Inc. (a) | | | 578 | |
| | 90 | | | LHC Group, Inc. (a) | | | 2,797 | |
| | 25 | | | Surgical Care Affiliates, Inc. (a) | | | 851 | |
| | 105 | | | Triple-S Management Corp., (Puerto Rico), Class B (a) | | | 2,499 | |
| | 77 | | | Trupanion, Inc. (a) | | | 532 | |
| | | | | | | | |
| | | | | | | 20,669 | |
| | | | | | | | |
| | | | Health Care Technology — 0.2% | |
| | 145 | | | MedAssets, Inc. (a) | | | 2,865 | |
| | | | | | | | |
| | | | Life Sciences Tools & Services — 0.2% | |
| | 25 | | | INC Research Holdings, Inc., Class A (a) | | | 645 | |
| | 75 | | | PRA Health Sciences, Inc. (a) | | | 1,826 | |
| | 62 | | | VWR Corp. (a) | | | 1,609 | |
| | | | | | | | |
| | | | | | | 4,080 | |
| | | | | | | | |
| | | | Pharmaceuticals — 0.2% | |
| | 16 | | | Achaogen, Inc. (a) | | | 204 | |
| | 158 | | | Amphastar Pharmaceuticals, Inc. (a) | | | 1,839 | |
| | 41 | | | Egalet Corp. (a) | | | 231 | |
| | 48 | | | Revance Therapeutics, Inc. (a) | | | 810 | |
| | 16 | | | ZS Pharma, Inc. (a) | | | 644 | |
| | | | | | | | |
| | | | | | | 3,728 | |
| | | | | | | | |
| | | | Total Health Care | | | 84,059 | |
| | | | | | | | |
| | | | Industrials — 14.3% | |
| | | | Aerospace & Defense — 1.4% | |
| | 530 | | | AAR Corp. | | | 14,732 | |
| | 201 | | | Engility Holdings, Inc. (a) | | | 8,620 | |
| | | | | | | | |
| | | | | | | 23,352 | |
| | | | | | | | |
| | | | Airlines — 1.0% | |
| | 160 | | | Alaska Air Group, Inc. | | | 9,544 | |
| | 390 | | | SkyWest, Inc. | | | 5,174 | |
| | 20 | | | Virgin America, Inc. (a) | | | 873 | |
| | | | | | | | |
| | | | | | | 15,591 | |
| | | | | | | | |
SEE NOTES TO FINANCIAL STATEMENTS.
| | | | | | | | |
| | | |
| DECEMBER 31, 2014 | | J.P. MORGAN SMALL CAP FUNDS | | | | | 35 | |
JPMorgan Small Cap Value Fund
SCHEDULE OF PORTFOLIO INVESTMENTS
AS OF DECEMBER 31, 2014 (Unaudited) (continued)
(Amounts in thousands)
| | | | | | | | |
| SHARES | | | SECURITY DESCRIPTION | | VALUE($) | |
| | | | | | | | |
| Common Stocks — continued | |
| | | | Building Products — 0.4% | |
| | 374 | | | Gibraltar Industries, Inc. (a) | | | 6,088 | |
| | 19 | | | Trex Co., Inc. (a) | | | 800 | |
| | | | | | | | |
| | | | | | | 6,888 | |
| | | | | | | | |
| | | | Commercial Services & Supplies — 3.4% | |
| | 163 | | | ABM Industries, Inc. | | | 4,678 | |
| | 1,073 | | | ACCO Brands Corp. (a) | | | 9,663 | |
| | 682 | | | ARC Document Solutions, Inc. (a) | | | 6,974 | |
| | 1,706 | | | Cenveo, Inc. (a) | | | 3,583 | |
| | 23 | | | Ennis, Inc. | | | 307 | |
| | 38 | | | G&K Services, Inc., Class A | | | 2,671 | |
| | 110 | | | HNI Corp. | | | 5,601 | |
| | 68 | | | Kimball International, Inc., Class B | | | 622 | |
| | 80 | | | Performant Financial Corp. (a) | | | 533 | |
| | 269 | | | Quad/Graphics, Inc. | | | 6,181 | |
| | 155 | | | R.R. Donnelley & Sons Co. | | | 2,604 | |
| | 42 | | | Steelcase, Inc., Class A | | | 747 | |
| | 256 | | | United Stationers, Inc. | | | 10,806 | |
| | | | | | | | |
| | | | | | | 54,970 | |
| | | | | | | | |
| | | | Construction & Engineering — 1.4% | |
| | 234 | | | Argan, Inc. | | | 7,862 | |
| | 131 | | | Comfort Systems USA, Inc. | | | 2,234 | |
| | 285 | | | EMCOR Group, Inc. | | | 12,657 | |
| | | | | | | | |
| | | | | | | 22,753 | |
| | | | | | | | |
| | | | Electrical Equipment — 0.1% | |
| | 55 | | | GrafTech International Ltd. (a) | | | 279 | |
| | 131 | | | LSI Industries, Inc. | | | 890 | |
| | 17 | | | Polypore International, Inc. (a) | | | 786 | |
| | | | | | | | |
| | | | | | | 1,955 | |
| | | | | | | | |
| | | | Machinery — 2.9% | |
| | 89 | | | AGCO Corp. | | | 4,000 | |
| | 503 | | | Briggs & Stratton Corp. | | | 10,277 | |
| | 346 | | | Douglas Dynamics, Inc. | | | 7,423 | |
| | 186 | | | Federal Signal Corp. | | | 2,867 | |
| | 60 | | | Hurco Cos., Inc. | | | 2,039 | |
| | 64 | | | Hyster-Yale Materials Handling, Inc. | | | 4,692 | |
| | 122 | | | Kadant, Inc. | | | 5,225 | |
| | 274 | | | Mueller Water Products, Inc., Class A | | | 2,804 | |
| | 50 | | | Standex International Corp. | | | 3,832 | |
| | 172 | | | Wabash National Corp. (a) | | | 2,124 | |
| | 19 | | | Watts Water Technologies, Inc., Class A | | | 1,225 | |
| | | | | | | | |
| | | | | | | 46,508 | |
| | | | | | | | |
| | | | Marine — 0.6% | |
| | 54 | | | International Shipholding Corp. | | | 806 | |
| | | | | | | | |
| SHARES | | | SECURITY DESCRIPTION | | VALUE($) | |
| | | | | | | | |
| | | | | | | | |
| | | | Marine — continued | | | | |
| | 242 | | | Matson, Inc. | | | 8,368 | |
| | | | | | | | |
| | | | | | | 9,174 | |
| | | | | | | | |
| | | | Professional Services — 1.7% | |
| | 278 | | | Barrett Business Services, Inc. | | | 7,623 | |
| | 365 | | | FTI Consulting, Inc. (a) | | | 14,115 | |
| | 28 | | | Paylocity Holding Corp. (a) | | | 734 | |
| | 152 | | | RPX Corp. (a) | | | 2,097 | |
| | 54 | | | VSE Corp. | | | 3,572 | |
| | | | | | | | |
| | | | | | | 28,141 | |
| | | | | | | | |
| | | | Road & Rail — 1.1% | |
| | 4 | | | AMERCO | | | 1,222 | |
| | 200 | | | ArcBest Corp. | | | 9,269 | |
| | 46 | | | Celadon Group, Inc. | | | 1,053 | |
| | 23 | | | PAM Transportation Services, Inc. (a) | | | 1,171 | |
| | 209 | | | Quality Distribution, Inc. (a) | | | 2,223 | |
| | 120 | | | USA Truck, Inc. (a) | | | 3,397 | |
| | | | | | | | |
| | | | | | | 18,335 | |
| | | | | | | | |
| | | | Trading Companies & Distributors — 0.3% | |
| | 96 | | | Applied Industrial Technologies, Inc. | | | 4,361 | |
| | | | | | | | |
| | | | Total Industrials | | | 232,028 | |
| | | | | | | | |
| | | | Information Technology — 10.6% | |
| | | | Communications Equipment — 1.5% | |
| | 194 | | | Black Box Corp. | | | 4,629 | |
| | 77 | | | Calix, Inc. (a) | | | 776 | |
| | 140 | | | Comtech Telecommunications Corp. | | | 4,410 | |
| | 651 | | | Emulex Corp. (a) | | | 3,690 | |
| | 357 | | | Harmonic, Inc. (a) | | | 2,503 | |
| | 637 | | | Polycom, Inc. (a) | | | 8,595 | |
| | | | | | | | |
| | | | | | | 24,603 | |
| | | | | | | | |
| | | | Electronic Equipment, Instruments & Components — 1.5% | |
| | 356 | | | Benchmark Electronics, Inc. (a) | | | 9,047 | |
| | 64 | | | Coherent, Inc. (a) | | | 3,866 | |
| | 153 | | | Insight Enterprises, Inc. (a) | | | 3,961 | |
| | 51 | | | Kimball Electronics, Inc. (a) | | | 615 | |
| | 144 | | | Newport Corp. (a) | | | 2,758 | |
| | 84 | | | Sanmina Corp. (a) | | | 1,969 | |
| | 132 | | | Vishay Intertechnology, Inc. | | | 1,862 | |
| | | | | | | | |
| | | | | | | 24,078 | |
| | | | | | | | |
| | | | Internet Software & Services — 0.8% | |
| | 25 | | | Amber Road, Inc. (a) | | | 259 | |
| | 86 | | | Benefitfocus, Inc. (a) | | | 2,808 | |
| | 578 | | | EarthLink Holdings Corp. | | | 2,536 | |
| | 42 | | | Five9, Inc. (a) | | | 189 | |
| | 565 | | | Intralinks Holdings, Inc. (a) | | | 6,728 | |
SEE NOTES TO FINANCIAL STATEMENTS.
| | | | | | |
| | | |
| 36 | | | | J.P. MORGAN SMALL CAP FUNDS | | DECEMBER 31, 2014 |
| | | | | | | | |
| SHARES | | | SECURITY DESCRIPTION | | VALUE($) | |
| | | | | | | | |
| Common Stocks — continued | |
| | | | Internet Software & Services — continued | |
| | 2 | | | OPOWER, Inc. (a) | | | 31 | |
| | 4 | | | Q2 Holdings, Inc. (a) | | | 72 | |
| | | | | | | | |
| | | | | | | 12,623 | |
| | | | | | | | |
| | | | IT Services — 2.0% | |
| | 111 | | | CSG Systems International, Inc. | | | 2,775 | |
| | 32 | | | EVERTEC, Inc., (Puerto Rico) | | | 708 | |
| | 57 | | | Global Cash Access Holdings, Inc. (a) | | | 405 | |
| | 49 | | | Hackett Group, Inc. (The) | | | 428 | |
| | 108 | | | ManTech International Corp., Class A | | | 3,277 | |
| | 459 | | | MoneyGram International, Inc. (a) | | | 4,173 | |
| | 314 | | | NeuStar, Inc., Class A (a) | | | 8,727 | |
| | 116 | | | Sykes Enterprises, Inc. (a) | | | 2,718 | |
| | 315 | | | Unisys Corp. (a) | | | 9,274 | |
| | | | | | | | |
| | | | | | | 32,485 | |
| | | | | | | | |
| | | | Semiconductors & Semiconductor Equipment — 2.9% | |
| | 439 | | | Amkor Technology, Inc. (a) | | | 3,118 | |
| | 261 | | | DSP Group, Inc. (a) | | | 2,838 | |
| | 96 | | | First Solar, Inc. (a) | | | 4,272 | |
| | 62 | | | IXYS Corp. | | | 775 | |
| | 73 | | | Pericom Semiconductor Corp. (a) | | | 984 | |
| | 284 | | | Photronics, Inc. (a) | | | 2,360 | |
| | 531 | | | RF Micro Devices, Inc. (a) | | | 8,809 | |
| | 482 | | | Spansion, Inc., Class A (a) | | | 16,491 | |
| | 126 | | | SunPower Corp. (a) | | | 3,242 | |
| | 117 | | | Ultra Clean Holdings, Inc. (a) | | | 1,087 | |
| | 428 | | | Xcerra Corp. (a) | | | 3,924 | |
| | | | | | | | |
| | | | | | | 47,900 | |
| | | | | | | | |
| | | | Software — 1.5% | |
| | 169 | | | A10 Networks, Inc. (a) | | | 739 | |
| | 129 | | | Actuate Corp. (a) | | | 850 | |
| | 117 | | | Aspen Technology, Inc. (a) | | | 4,104 | |
| | 59 | | | Fair Isaac Corp. | | | 4,295 | |
| | 36 | | | Globant S.A., (Luxembourg) (a) | | | 558 | |
| | 47 | | | Paycom Software, Inc. (a) | | | 1,243 | |
| | 43 | | | Rubicon Project, Inc. (The) (a) | | | 699 | |
| | 388 | | | Take-Two Interactive Software, Inc. (a) | | | 10,864 | |
| | 129 | | | TeleCommunication Systems, Inc., Class A (a) | | | 402 | |
| | 13 | | | Varonis Systems, Inc. (a) | | | 437 | |
| | | | | | | | |
| | | | | | | 24,191 | |
| | | | | | | | |
| | | | Technology Hardware, Storage & Peripherals — 0.4% | |
| | 389 | | | Avid Technology, Inc. (a) | | | 5,531 | |
| | 615 | | | Quantum Corp. (a) | | | 1,082 | |
| | | | | | | | |
| | | | | | | 6,613 | |
| | | | | | | | |
| | | | Total Information Technology | | | 172,493 | |
| | | | | | | | |
| | | | | | | | |
| SHARES | | | SECURITY DESCRIPTION | | VALUE($) | |
| | | | | | | | |
| | | | | | | | |
| | | | Materials — 3.8% | |
| | | | Chemicals — 1.4% | |
| | 185 | | | Minerals Technologies, Inc. | | | 12,876 | |
| | 261 | | | Olin Corp. | | | 5,936 | |
| | 136 | | | Tredegar Corp. | | | 3,050 | |
| | | | | | | | |
| | | | | | | 21,862 | |
| | | | | | | | |
| | | | Containers & Packaging — 0.6% | |
| | 587 | | | Graphic Packaging Holding Co. (a) | | | 7,992 | |
| | 138 | | | Myers Industries, Inc. | | | 2,429 | |
| | | | | | | | |
| | | | | | | 10,421 | |
| | | | | | | | |
| | | | Metals & Mining — 0.8% | |
| | 5 | | | Ampco-Pittsburgh Corp. | | | 103 | |
| | 250 | | | Coeur Mining, Inc. (a) | | | 1,276 | |
| | 144 | | | Commercial Metals Co. | | | 2,339 | |
| | 37 | | | Schnitzer Steel Industries, Inc., Class A | | | 826 | |
| | 291 | | | Worthington Industries, Inc. | | | 8,744 | |
| | | | | | | | |
| | | | | | | 13,288 | |
| | | | | | | | |
| | | | Paper & Forest Products — 1.0% | |
| | 118 | | | Domtar Corp., (Canada) | | | 4,726 | |
| | 35 | | | PH Glatfelter Co. | | | 895 | |
| | 121 | | | Resolute Forest Products, Inc., (Canada) (a) | | | 2,131 | |
| | 203 | | | Schweitzer-Mauduit International, Inc. | | | 8,582 | |
| | | | | | | | |
| | | | | | | 16,334 | |
| | | | | | | | |
| | | | Total Materials | | | 61,905 | |
| | | | | | | | |
| | | | Telecommunication Services — 0.6% | |
| | | | Diversified Telecommunication Services — 0.6% | |
| | 108 | | | FairPoint Communications, Inc. (a) | | | 1,528 | |
| | 255 | | | Inteliquent, Inc. | | | 4,996 | |
| | 43 | | | magicJack VocalTec Ltd., (Israel) (a) | | | 350 | |
| | 951 | | | Vonage Holdings Corp. (a) | | | 3,623 | |
| | | | | | | | |
| | | | Total Telecommunication Services | | | 10,497 | |
| | | | | | | | |
| | | | Utilities — 6.4% | |
| | | | Electric Utilities — 2.3% | |
| | 277 | | | El Paso Electric Co. | | | 11,077 | |
| | 132 | | | PNM Resources, Inc. | | | 3,917 | |
| | 532 | | | Portland General Electric Co. | | | 20,114 | |
| | 48 | | | Unitil Corp. | | | 1,760 | |
| | | | | | | | |
| | | | | | | 36,868 | |
| | | | | | | | |
| | | | Gas Utilities — 1.9% | |
| | 79 | | | AGL Resources, Inc. | | | 4,306 | |
| | 28 | | | Chesapeake Utilities Corp. | | | 1,413 | |
| | 240 | | | Laclede Group, Inc. (The) | | | 12,747 | |
| | 57 | | | Northwest Natural Gas Co. | | | 2,834 | |
SEE NOTES TO FINANCIAL STATEMENTS.
| | | | | | | | |
| | | |
| DECEMBER 31, 2014 | | J.P. MORGAN SMALL CAP FUNDS | | | | | 37 | |
JPMorgan Small Cap Value Fund
SCHEDULE OF PORTFOLIO INVESTMENTS
AS OF DECEMBER 31, 2014 (Unaudited) (continued)
(Amounts in thousands, except number of Futures contracts)
| | | | | | | | |
| SHARES | | | SECURITY DESCRIPTION | | VALUE($) | |
| | | | | | | | |
| Common Stocks — continued | |
| | | | Gas Utilities — continued | |
| | 42 | | | Piedmont Natural Gas Co., Inc. | | | 1,671 | |
| | 140 | | | Southwest Gas Corp. | | | 8,647 | |
| | | | | | | | |
| | | | | | | 31,618 | |
| | | | | | | | |
| | | | Independent Power & Renewable Electricity
Producers — 0.6% | |
| | 1,526 | | | Atlantic Power Corp. | | | 4,136 | |
| | 137 | | | Dynegy, Inc. (a) | | | 4,146 | |
| | 49 | | | Ormat Technologies, Inc. | | | 1,318 | |
| | | | | | | | |
| | | | | | | 9,600 | |
| | | | | | | | |
| | | | Multi-Utilities — 1.4% | |
| | 321 | | | Avista Corp. | | | 11,330 | |
| | 201 | | | NorthWestern Corp. | | | 11,344 | |
| | | | | | | | |
| | | | | | | 22,674 | |
| | | | | | | | |
| | | | Water Utilities — 0.2% | |
| | 104 | | | California Water Service Group | | | 2,547 | |
| | | | | | | | |
| | | | Total Utilities | | | 103,307 | |
| | | | | | | | |
| | | | Total Common Stocks
(Cost $1,262,046) | | | 1,571,368 | |
| | | | | | | | |
| | | | | | | | |
NUMBER OF WARRANTS | | | SECURITY DESCRIPTION | | VALUE($) | |
| | | | | | | | |
| Warrant — 0.0% (g) | |
| | | | Financials — 0.0% (g) | |
| | | | Consumer Finance — 0.0% (g) | |
| | 3 | | | Imperial Holdings, Inc., expiring 10/01/19 (Strike Price $10.75) (a) (i)
(Cost $—) | | | — | |
| | | | | | | | |
| | |
| SHARES | | | | | | |
| Short-Term Investment — 3.1% | |
| | | | Investment Company — 3.1% | |
| | 50,839 | | | JPMorgan Liquid Assets Money Market Fund, Institutional Class Shares, 0.030% (b) (l)
(Cost $50,839) | | | 50,839 | |
| | | | | | | | |
| | | | Total Investments — 99.9%
(Cost $1,312,885) | | | 1,622,207 | |
| | | | Other Assets in Excess of
Liabilities — 0.1% (c) | | | 990 | |
| | | | | | | | |
| | | | NET ASSETS — 100.0% | | $ | 1,623,197 | |
| | | | | | | | |
Percentages indicated are based on net assets.
| | | | | | | | | | | | | | | | |
| Futures Contracts | |
NUMBER OF CONTRACTS | | | DESCRIPTION | | EXPIRATION
DATE | | | NOTIONAL VALUE
AT DECEMBER 31, 2014 | | | NET UNREALIZED
APPRECIATION
(DEPRECIATION) | |
| | | | Long Futures Outstanding | | | | | | | | | | | | |
| | 435 | | | E-mini Russell 2000 | | | 03/20/15 | | | $ | 52,230 | | | $ | 1,462 | |
| | | | | | | | | | | | | | | | |
SEE NOTES TO FINANCIAL STATEMENTS.
| | | | | | |
| | | |
| 38 | | | | J.P. MORGAN SMALL CAP FUNDS | | DECEMBER 31, 2014 |
JPMorgan U.S. Small Company Fund
SCHEDULE OF PORTFOLIO INVESTMENTS
AS OF DECEMBER 31, 2014 (Unaudited)
(Amounts in thousands)
| | | | | | | | |
| SHARES | | | SECURITY DESCRIPTION | | VALUE($) | |
| | | | | | | | |
| Common Stocks — 96.7% | |
| | | | Consumer Discretionary — 13.2% | |
| | | | Auto Components — 2.0% | |
| | 330 | | | Dana Holding Corp. | | | 7,178 | |
| | 401 | | | Stoneridge, Inc. (a) | | | 5,162 | |
| | 75 | | | Tower International, Inc. (a) | | | 1,909 | |
| | | | | | | | |
| | | | | | | 14,249 | |
| | | | | | | | |
| | | | Distributors — 0.1% | |
| | 101 | | | VOXX International Corp. (a) | | | 886 | |
| | | | | | | | |
| | | | Diversified Consumer Services — 1.8% | |
| | 14 | | | Chegg, Inc. (a) | | | 98 | |
| | 286 | | | Regis Corp. (a) | | | 4,785 | |
| | 109 | | | Strayer Education, Inc. (a) | | | 8,059 | |
| | | | | | | | |
| | | | | | | 12,942 | |
| | | | | | | | |
| | | | Hotels, Restaurants & Leisure — 1.5% | |
| | 31 | | | Dave & Buster’s Entertainment, Inc. (a) | | | 835 | |
| | 5 | | | DineEquity, Inc. | | | 498 | |
| | 40 | | | Interval Leisure Group, Inc. | | | 831 | |
| | 14 | | | Jack in the Box, Inc. | | | 1,120 | |
| | 28 | | | Red Robin Gourmet Burgers, Inc. (a) | | | 2,132 | |
| | 205 | | | Sonic Corp. | | | 5,579 | |
| | | | | | | | |
| | | | | | | 10,995 | |
| | | | | | | | |
| | | | Household Durables — 0.4% | |
| | 35 | | | CSS Industries, Inc. | | | 965 | |
| | 46 | | | Leggett & Platt, Inc. | | | 1,951 | |
| | | | | | | | |
| | | | | | | 2,916 | |
| | | | | | | | |
| | | | Internet & Catalog Retail — 0.1% | |
| | 14 | | | Coupons.com, Inc. (a) | | | 254 | |
| | 16 | | | Wayfair, Inc., Class A (a) | | | 310 | |
| | | | | | | | |
| | | | | | | 564 | |
| | | | | | | | |
| | | | Leisure Products — 0.2% | |
| | 82 | | | Nautilus, Inc. (a) | | | 1,243 | |
| | | | | | | | |
| | | | Media — 1.1% | |
| | 34 | | | Entercom Communications Corp., Class A (a) | | | 410 | |
| | 281 | | | Lee Enterprises, Inc. (a) | | | 1,032 | |
| | 41 | | | Nexstar Broadcasting Group, Inc., Class A | | | 2,123 | |
| | 78 | | | Radio One, Inc., Class D (a) | | | 130 | |
| | 151 | | | Sinclair Broadcast Group, Inc., Class A | | | 4,121 | |
| | | | | | | | |
| | | | | | | 7,816 | |
| | | | | | | | |
| | | | Multiline Retail — 1.0% | |
| | 50 | | | Bon-Ton Stores, Inc. (The) | | | 367 | |
| | 57 | | | Dillard’s, Inc., Class A | | | 7,098 | |
| | | | | | | | |
| | | | | | | 7,465 | |
| | | | | | | | |
| | | | | | | | |
| SHARES | | | SECURITY DESCRIPTION | | VALUE($) | |
| | | | | | | | |
| | | | | | | | |
| | | | Specialty Retail — 3.8% | |
| | 19 | | | ANN, Inc. (a) | | | 708 | |
| | 180 | | | Barnes & Noble, Inc. (a) | | | 4,170 | |
| | 5 | | | Boot Barn Holdings, Inc. (a) | | | 88 | |
| | 111 | | | Children’s Place, Inc. (The) | | | 6,321 | |
| | 74 | | | Express, Inc. (a) | | | 1,080 | |
| | 40 | | | Guess?, Inc. | | | 839 | |
| | 573 | | | hhgregg, Inc. (a) | | | 4,339 | |
| | 130 | | | Outerwall, Inc. (a) | | | 9,756 | |
| | 13 | | | Systemax, Inc. (a) | | | 178 | |
| | | | | | | | |
| | | | | | | 27,479 | |
| | | | | | | | |
| | | | Textiles, Apparel & Luxury Goods — 1.2% | |
| | 212 | | | Iconix Brand Group, Inc. (a) | | | 7,170 | |
| | 42 | | | Unifi, Inc. (a) | | | 1,252 | |
| | | | | | | | |
| | | | | | | 8,422 | |
| | | | | | | | |
| | | | Total Consumer Discretionary | | | 94,977 | |
| | | | | | | | |
| | | | Consumer Staples — 4.9% | |
| | | | Food & Staples Retailing — 2.5% | |
| | 231 | | | Pantry, Inc. (The) (a) | | | 8,576 | |
| | 1,139 | | | Rite Aid Corp. (a) | | | 8,565 | |
| | 54 | | | Smart & Final Stores, Inc. (a) | | | 853 | |
| | | | | | | | |
| | | | | | | 17,994 | |
| | | | | | | | |
| | | | Food Products — 1.7% | |
| | 40 | | | B&G Foods, Inc. | | | 1,190 | |
| | 212 | | | Chiquita Brands International, Inc. (a) | | | 3,067 | |
| | 13 | | | Freshpet, Inc. (a) | | | 225 | |
| | 89 | | | Pilgrim’s Pride Corp. (a) | | | 2,922 | |
| | 65 | | | Pinnacle Foods, Inc. | | | 2,298 | |
| | 24 | | | Sanderson Farms, Inc. | | | 2,025 | |
| | 11 | | | Seneca Foods Corp., Class A (a) | | | 292 | |
| | | | | | | | |
| | | | | | | 12,019 | |
| | | | | | | | |
| | | | Personal Products — 0.5% | |
| | 10 | | | Herbalife Ltd. | | | 362 | |
| | 10 | | | Inter Parfums, Inc. | | | 263 | |
| | 7 | | | Medifast, Inc. (a) | | | 242 | |
| | 29 | | | USANA Health Sciences, Inc. (a) | | | 2,985 | |
| | | | | | | | |
| | | | | | | 3,852 | |
| | | | | | | | |
| | | | Tobacco — 0.2% | |
| | 28 | | | Universal Corp. | | | 1,218 | |
| | | | | | | | |
| | | | Total Consumer Staples | | | 35,083 | |
| | | | | | | | |
| | | | Energy — 3.9% | |
| | | | Energy Equipment & Services — 1.5% | |
| | 188 | | | Basic Energy Services, Inc. (a) | | | 1,316 | |
SEE NOTES TO FINANCIAL STATEMENTS.
| | | | | | | | |
| | | |
| DECEMBER 31, 2014 | | J.P. MORGAN SMALL CAP FUNDS | | | | | 39 | |
JPMorgan U.S. Small Company Fund
SCHEDULE OF PORTFOLIO INVESTMENTS
AS OF DECEMBER 31, 2014 (Unaudited) (continued)
(Amounts in thousands)
| | | | | | | | |
| SHARES | | | SECURITY DESCRIPTION | | VALUE($) | |
| | | | | | | | |
| Common Stocks — continued | |
| | | | Energy Equipment & Services — continued | |
| | 134 | | | Exterran Holdings, Inc. | | | 4,359 | |
| | 29 | | | FMSA Holdings, Inc. (a) | | | 201 | |
| | 142 | | | Pioneer Energy Services Corp. (a) | | | 787 | |
| | 58 | | | SEACOR Holdings, Inc. (a) | | | 4,273 | |
| | | | | | | | |
| | | | | | | 10,936 | |
| | | | | | | | |
| | | | Oil, Gas & Consumable Fuels — 2.4% | |
| | 1,117 | | | Abraxas Petroleum Corp. (a) | | | 3,284 | |
| | 10 | | | Adams Resources & Energy, Inc. | | | 479 | |
| | 57 | | | Alon USA Energy, Inc. | | | 717 | |
| | 30 | | | Clayton Williams Energy, Inc. (a) | | | 1,927 | |
| | 181 | | | Cloud Peak Energy, Inc. (a) | | | 1,659 | |
| | 42 | | | Comstock Resources, Inc. | | | 286 | |
| | 12 | | | Contango Oil & Gas Co. (a) | | | 351 | |
| | 3 | | | Isramco, Inc. (a) | | | 348 | |
| | 32 | | | Renewable Energy Group, Inc. (a) | | | 315 | |
| | 83 | | | REX American Resources Corp. (a) | | | 5,137 | |
| | 40 | | | Stone Energy Corp. (a) | | | 668 | |
| | 205 | | | VAALCO Energy, Inc. (a) | | | 933 | |
| | 36 | | | Western Refining, Inc. | | | 1,368 | |
| | | | | | | | |
| | | | | | | 17,472 | |
| | | | | | | | |
| | | | Total Energy | | | 28,408 | |
| | | | | | | | |
| | | | Financials — 21.7% | |
| | | | Banks — 6.8% | |
| | 28 | | | 1st Source Corp. | | | 950 | |
| | 53 | | | BancFirst Corp. | | | 3,366 | |
| | 117 | | | BancorpSouth, Inc. | | | 2,631 | |
| | 28 | | | Banner Corp. | | | 1,192 | |
| | 39 | | | BBCN Bancorp, Inc. | | | 554 | |
| | 121 | | | Capital Bank Financial Corp., Class A (a) | | | 3,229 | |
| | 46 | | | Cathay General Bancorp | | | 1,172 | |
| | 222 | | | Central Pacific Financial Corp. | | | 4,767 | |
| | 18 | | | Chemical Financial Corp. | | | 552 | |
| | 12 | | | Citizens & Northern Corp. | | | 248 | |
| | 29 | | | City Holding Co. | | | 1,354 | |
| | 31 | | | CoBiz Financial, Inc. | | | 410 | |
| | 198 | | | CVB Financial Corp. | | | 3,166 | |
| | 4 | | | East West Bancorp, Inc. | | | 144 | |
| | 316 | | | First Commonwealth Financial Corp. | | | 2,911 | |
| | 7 | | | First Financial Bancorp | | | 128 | |
| | 25 | | | First Interstate BancSystem, Inc. | | | 698 | |
| | 60 | | | Flushing Financial Corp. | | | 1,212 | |
| | 72 | | | FNB Corp. | | | 962 | |
| | 19 | | | Guaranty Bancorp | | | 280 | |
| | 19 | | | MainSource Financial Group, Inc. | | | 406 | |
| | | | | | | | |
| SHARES | | | SECURITY DESCRIPTION | | VALUE($) | |
| | | | | | | | |
| | | | | | | | |
| | | | Banks — continued | | | | |
| | 33 | | | National Penn Bancshares, Inc. | | | 342 | |
| | 127 | | | OFG Bancorp, (Puerto Rico) | | | 2,106 | |
| | 31 | | | PacWest Bancorp | | | 1,427 | |
| | 13 | | | Sierra Bancorp | | | 232 | |
| | 33 | | | Simmons First National Corp., Class A | | | 1,321 | |
| | 8 | | | Southside Bancshares, Inc. | | | 233 | |
| | 41 | | | Southwest Bancorp, Inc. | | | 705 | |
| | 61 | | | Suffolk Bancorp | | | 1,394 | |
| | 66 | | | Susquehanna Bancshares, Inc. | | | 889 | |
| | 118 | | | TCF Financial Corp. | | | 1,875 | |
| | 18 | | | UMB Financial Corp. | | | 1,024 | |
| | 181 | | | Union Bankshares Corp. | | | 4,363 | |
| | 11 | | | Webster Financial Corp. | | | 355 | |
| | 52 | | | West Bancorporation, Inc. | | | 880 | |
| | 14 | | | Westamerica Bancorporation | | | 706 | |
| | 111 | | | Wilshire Bancorp, Inc. | | | 1,122 | |
| | | | | | | | |
| | | | | | | 49,306 | |
| | | | | | | | |
| | | | Capital Markets — 1.2% | |
| | 28 | | | Arlington Asset Investment Corp., Class A | | | 737 | |
| | 236 | | | Cowen Group, Inc., Class A (a) | | | 1,132 | |
| | 33 | | | FBR & Co. (a) | | | 799 | |
| | 17 | | | Federated Investors, Inc., Class B | | | 553 | |
| | 260 | | | Investment Technology Group, Inc. (a) | | | 5,420 | |
| | | | | | | | |
| | | | | | | 8,641 | |
| | | | | | | | |
| | | | Consumer Finance — 1.3% | |
| | 5 | | | Credit Acceptance Corp. (a) | | | 682 | |
| | 49 | | | Nelnet, Inc., Class A | | | 2,289 | |
| | 40 | | | PRA Group, Inc. (a) | | | 2,306 | |
| | 47 | | | World Acceptance Corp. (a) | | | 3,734 | |
| | | | | | | | |
| | | | | | | 9,011 | |
| | | | | | | | |
| | | | Diversified Financial Services — 0.1% | |
| | 36 | | | Marlin Business Services Corp. | | | 741 | |
| | | | | | | | |
| | | | Insurance — 2.5% | |
| | 8 | | | Ambac Financial Group, Inc. (a) | | | 206 | |
| | 130 | | | American Equity Investment Life Holding Co. | | | 3,798 | |
| | 13 | | | Aspen Insurance Holdings Ltd., (Bermuda) | | | 578 | |
| | 223 | | | CNO Financial Group, Inc. | | | 3,838 | |
| | 11 | | | Global Indemnity plc, (Ireland) (a) | | | 306 | |
| | 25 | | | Navigators Group, Inc. (The) (a) | | | 1,855 | |
| | 52 | | | Platinum Underwriters Holdings Ltd., (Bermuda) | | | 3,803 | |
| | 28 | | | Primerica, Inc. | | | 1,503 | |
| | 40 | | | ProAssurance Corp. | | | 1,797 | |
| | 7 | | | Stewart Information Services Corp. | | | 267 | |
| | | | | | | | |
| | | | | | | 17,951 | |
| | | | | | | | |
SEE NOTES TO FINANCIAL STATEMENTS.
| | | | | | |
| | | |
| 40 | | | | J.P. MORGAN SMALL CAP FUNDS | | DECEMBER 31, 2014 |
| | | | | | | | |
| SHARES | | | SECURITY DESCRIPTION | | VALUE($) | |
| | | | | | | | |
| Common Stocks — continued | |
| | | | Real Estate Investment Trusts (REITs) — 7.7% | |
| | 51 | | | American Assets Trust, Inc. | | | 2,014 | |
| | 193 | | | Anworth Mortgage Asset Corp. | | | 1,011 | |
| | 5 | | | Ashford Hospitality Prime, Inc. | | | 89 | |
| | 22 | | | Ashford Hospitality Trust, Inc. | | | 226 | |
| | 11 | | | Associated Estates Realty Corp. | | | 251 | |
| | 28 | | | BioMed Realty Trust, Inc. | | | 597 | |
| | 343 | | | Capstead Mortgage Corp. | | | 4,208 | |
| | 55 | | | CBL & Associates Properties, Inc. | | | 1,076 | |
| | 29 | | | Chambers Street Properties | | | 233 | |
| | 165 | | | CoreSite Realty Corp. | | | 6,451 | |
| | 14 | | | Cousins Properties, Inc. | | | 163 | |
| | 774 | | | CYS Investments, Inc. | | | 6,747 | |
| | 26 | | | DCT Industrial Trust, Inc. | | | 933 | |
| | 54 | | | DiamondRock Hospitality Co. | | | 802 | |
| | 30 | | | EastGroup Properties, Inc. | | | 1,912 | |
| | 33 | | | EPR Properties | | | 1,873 | |
| | 19 | | | Equity LifeStyle Properties, Inc. | | | 1,000 | |
| | 29 | | | FelCor Lodging Trust, Inc. | | | 314 | |
| | 20 | | | First Industrial Realty Trust, Inc. | | | 419 | |
| | 47 | | | Franklin Street Properties Corp. | | | 575 | |
| | 11 | | | Gladstone Commercial Corp. | | | 185 | |
| | 30 | | | Home Properties, Inc. | | | 1,981 | |
| | 55 | | | Hospitality Properties Trust | | | 1,717 | |
| | 87 | | | LTC Properties, Inc. | | | 3,747 | |
| | 21 | | | National Retail Properties, Inc. | | | 807 | |
| | 54 | | | Pennsylvania Real Estate Investment Trust | | | 1,272 | |
| | 29 | | | Post Properties, Inc. | | | 1,698 | |
| | 100 | | | Potlatch Corp. | | | 4,187 | |
| | 10 | | | PS Business Parks, Inc. | | | 772 | |
| | 26 | | | RAIT Financial Trust | | | 202 | |
| | 100 | | | Ramco-Gershenson Properties Trust | | | 1,874 | |
| | 27 | | | Saul Centers, Inc. | | | 1,516 | |
| | 258 | | | Strategic Hotels & Resorts, Inc. (a) | | | 3,412 | |
| | 18 | | | Taubman Centers, Inc. | | | 1,376 | |
| | | | | | | | |
| | | | | | | 55,640 | |
| | | | | | | | |
| | | | Real Estate Management & Development — 0.7% | |
| | 70 | | | Alexander & Baldwin, Inc. | | | 2,744 | |
| | 156 | | | Forestar Group, Inc. (a) | | | 2,401 | |
| | 11 | | | St. Joe Co. (The) (a) | | | 199 | |
| | | | | | | | |
| | | | | | | 5,344 | |
| | | | | | | | |
| | | | Thrifts & Mortgage Finance — 1.4% | |
| | 13 | | | Astoria Financial Corp. | | | 176 | |
| | 10 | | | BankFinancial Corp. | | | 117 | |
| | 34 | | | Beneficial Mutual Bancorp, Inc. (a) | | | 412 | |
| | 11 | | | Capitol Federal Financial, Inc. | | | 138 | |
| | | | | | | | |
| SHARES | | | SECURITY DESCRIPTION | | VALUE($) | |
| | | | | | | | |
| | | | | | | | |
| | | | Thrifts & Mortgage Finance — continued | |
| | 72 | | | Charter Financial Corp. | | | 821 | |
| | 23 | | | MGIC Investment Corp. (a) | | | 212 | |
| | 116 | | | NMI Holdings, Inc., Class A (a) | | | 1,056 | |
| | 385 | | | Northfield Bancorp, Inc. | | | 5,692 | |
| | 36 | | | OceanFirst Financial Corp. | | | 619 | |
| | 41 | | | Walker & Dunlop, Inc. (a) | | | 717 | |
| | | | | | | | |
| | | | | | | 9,960 | |
| | | | | | | | |
| | | | Total Financials | | | 156,594 | |
| | | | | | | | |
| | | | Health Care — 14.7% | |
| | | | Biotechnology — 6.2% | |
| | 124 | | | ACADIA Pharmaceuticals, Inc. (a) | | | 3,921 | |
| | 45 | | | Adamas Pharmaceuticals, Inc. (a) | | | 783 | |
| | 5 | | | Agios Pharmaceuticals, Inc. (a) | | | 515 | |
| | 46 | | | Alnylam Pharmaceuticals, Inc. (a) | | | 4,491 | |
| | 8 | | | Applied Genetic Technologies Corp. (a) | | | 177 | |
| | 27 | | | Ardelyx, Inc. (a) | | | 508 | |
| | 112 | | | Arrowhead Research Corp. (a) | | | 828 | |
| | 45 | | | Atara Biotherapeutics, Inc. (a) | | | 1,207 | |
| | 4 | | | Auspex Pharmaceuticals, Inc. (a) | | | 231 | |
| | 8 | | | Avalanche Biotechnologies, Inc. (a) | | | 416 | |
| | 71 | | | Bellicum Pharmaceuticals, Inc. (a) | | | 1,624 | |
| | 42 | | | Calithera Biosciences, Inc. (a) | | | 844 | |
| | 33 | | | Cara Therapeutics, Inc. (a) | | | 329 | |
| | 77 | | | ChemoCentryx, Inc. (a) | | | 525 | |
| | 40 | | | Chimerix, Inc. (a) | | | 1,594 | |
| | 22 | | | Dicerna Pharmaceuticals, Inc. (a) | | | 361 | |
| | 28 | | | Eleven Biotherapeutics, Inc. (a) | | | 329 | |
| | 28 | | | FibroGen, Inc. (a) | | | 755 | |
| | 11 | | | Foundation Medicine, Inc. (a) | | | 240 | |
| | 75 | | | Immune Design Corp. (a) | | | 2,296 | |
| | 108 | | | Infinity Pharmaceuticals, Inc. (a) | | | 1,823 | |
| | 9 | | | Karyopharm Therapeutics, Inc. (a) | | | 329 | |
| | 11 | | | Kite Pharma, Inc. (a) | | | 611 | |
| | 48 | | | MacroGenics, Inc. (a) | | | 1,694 | |
| | 115 | | | Merrimack Pharmaceuticals, Inc. (a) | | | 1,294 | |
| | 67 | | | Mirati Therapeutics, Inc. (a) | | | 1,245 | |
| | 85 | | | Neurocrine Biosciences, Inc. (a) | | | 1,903 | |
| | 88 | | | NPS Pharmaceuticals, Inc. (a) | | | 3,151 | |
| | 65 | | | Prothena Corp. plc, (Ireland) (a) | | | 1,349 | |
| | 48 | | | PTC Therapeutics, Inc. (a) | | | 2,501 | |
| | 5 | | | Sage Therapeutics, Inc. (a) | | | 183 | |
| | 25 | | | Synageva BioPharma Corp. (a) | | | 2,283 | |
| | 72 | | | Tokai Pharmaceuticals, Inc. (a) | | | 1,055 | |
| | 63 | | | Trius Therapeutics, Inc. (a) (i) | | | — | |
| | 10 | | | Ultragenyx Pharmaceutical, Inc. (a) | | | 435 | |
SEE NOTES TO FINANCIAL STATEMENTS.
| | | | | | | | |
| | | |
| DECEMBER 31, 2014 | | J.P. MORGAN SMALL CAP FUNDS | | | | | 41 | |
JPMorgan U.S. Small Company Fund
SCHEDULE OF PORTFOLIO INVESTMENTS
AS OF DECEMBER 31, 2014 (Unaudited) (continued)
(Amounts in thousands)
| | | | | | | | |
| SHARES | | | SECURITY DESCRIPTION | | VALUE($) | |
| | | | | | | | |
| Common Stocks — continued | |
| | | | Biotechnology — continued | | | | |
| | 56 | | | Versartis, Inc. (a) | | | 1,260 | |
| | 103 | | | Xencor, Inc. (a) | | | 1,652 | |
| | 10 | | | Zafgen, Inc. (a) | | | 302 | |
| | | | | | | | |
| | | | | | | 45,044 | |
| | | | | | | | |
| | | | Health Care Equipment & Supplies — 3.0% | |
| | 190 | | | Accuray, Inc. (a) | | | 1,437 | |
| | 100 | | | CONMED Corp. | | | 4,496 | |
| | 35 | | | Cynosure, Inc., Class A (a) | | | 957 | |
| | 18 | | | Inogen, Inc. (a) | | | 565 | |
| | 31 | | | Nevro Corp. (a) | | | 1,179 | |
| | 57 | | | NuVasive, Inc. (a) | | | 2,674 | |
| | 66 | | | PhotoMedex, Inc. (a) | | | 101 | |
| | 29 | | | Roka Bioscience, Inc. (a) | | | 127 | |
| | 16 | | | Sientra, Inc. (a) | | | 262 | |
| | 216 | | | SurModics, Inc. (a) | | | 4,765 | |
| | 30 | | | Symmetry Surgical, Inc. (a) | | | 236 | |
| | 70 | | | Thoratec Corp. (a) | | | 2,269 | |
| | 98 | | | Wright Medical Group, Inc. (a) | | | 2,622 | |
| | | | | | | | |
| | | | | | | 21,690 | |
| | | | | | | | |
| | | | Health Care Providers & Services — 2.4% | |
| | 52 | | | Centene Corp. (a) | | | 5,379 | |
| | 494 | | | Cross Country Healthcare, Inc. (a) | | | 6,168 | |
| | 8 | | | HealthEquity, Inc. (a) | | | 209 | |
| | 28 | | | HealthSouth Corp. | | | 1,065 | |
| | 23 | | | Molina Healthcare, Inc. (a) | | | 1,221 | |
| | 204 | | | RadNet, Inc. (a) | | | 1,739 | |
| | 35 | | | Surgical Care Affiliates, Inc. (a) | | | 1,174 | |
| | 29 | | | Trupanion, Inc. (a) | | | 200 | |
| | | | | | | | |
| | | | | | | 17,155 | |
| | | | | | | | |
| | | | Health Care Technology — 0.9% | |
| | 128 | | | Castlight Health, Inc., Class B (a) | | | 1,494 | |
| | 23 | | | Connecture, Inc. (a) | | | 205 | |
| | 93 | | | HMS Holdings Corp. (a) | | | 1,960 | |
| | 133 | | | MedAssets, Inc. (a) | | | 2,620 | |
| | 22 | | | Veeva Systems, Inc., Class A (a) | | | 570 | |
| | | | | | | | |
| | | | | | | 6,849 | |
| | | | | | | | |
| | | | Life Sciences Tools & Services — 0.4% | |
| | 34 | | | Affymetrix, Inc. (a) | | | 332 | |
| | 11 | | | INC Research Holdings, Inc., Class A (a) | | | 272 | |
| | 16 | | | PAREXEL International Corp. (a) | | | 872 | |
| | 32 | | | PRA Health Sciences, Inc. (a) | | | 768 | |
| | 30 | | | VWR Corp. (a) | | | 779 | |
| | | | | | | | |
| | | | | | | 3,023 | |
| | | | | | | | |
| | | | | | | | |
| SHARES | | | SECURITY DESCRIPTION | | VALUE($) | |
| | | | | | | | |
| | | | | | | | |
| | | | Pharmaceuticals — 1.8% | |
| | 70 | | | Amphastar Pharmaceuticals, Inc. (a) | | | 812 | |
| | 65 | | | BioDelivery Sciences International, Inc. (a) | | | 780 | |
| | 16 | | | Egalet Corp. (a) | | | 91 | |
| | 16 | | | Lannett Co., Inc. (a) | | | 703 | |
| | 5 | | | Mallinckrodt plc (a) | | | 495 | |
| | 39 | | | Pacira Pharmaceuticals, Inc. (a) | | | 3,422 | |
| | 28 | | | Phibro Animal Health Corp., Class A | | | 871 | |
| | 72 | | | Prestige Brands Holdings, Inc. (a) | | | 2,510 | |
| | 22 | | | Revance Therapeutics, Inc. (a) | | | 373 | |
| | 89 | | | Sagent Pharmaceuticals, Inc. (a) | | | 2,237 | |
| | 9 | | | ZS Pharma, Inc. (a) | | | 366 | |
| | | | | | | | |
| | | | | | | 12,660 | |
| | | | | | | | |
| | | | Total Health Care | | | 106,421 | |
| | | | | | | | |
| | | | Industrials — 13.2% | |
| | | | Aerospace & Defense — 1.9% | |
| | 253 | | | AAR Corp. | | | 7,031 | |
| | 68 | | | Engility Holdings, Inc. (a) | | | 2,889 | |
| | 141 | | | TASER International, Inc. (a) | | | 3,734 | |
| | | | | | | | |
| | | | | | | 13,654 | |
| | | | | | | | |
| | | | Air Freight & Logistics — 0.1% | |
| | 13 | | | Park-Ohio Holdings Corp. | | | 832 | |
| | | | | | | | |
| | | | Airlines — 1.1% | |
| | 131 | | | Alaska Air Group, Inc. | | | 7,847 | |
| | 10 | | | Virgin America, Inc. (a) | | | 415 | |
| | | | | | | | |
| | | | | | | 8,262 | |
| | | | | | | | |
| | | | Building Products — 0.4% | |
| | 130 | | | Gibraltar Industries, Inc. (a) | | | 2,112 | |
| | 11 | | | Trex Co., Inc. (a) | | | 464 | |
| | | | | | | | |
| | | | | | | 2,576 | |
| | | | | | | | |
| | | | Commercial Services & Supplies — 2.0% | |
| | 60 | | | ACCO Brands Corp. (a) | | | 541 | |
| | 57 | | | Deluxe Corp. | | | 3,530 | |
| | 19 | | | G&K Services, Inc., Class A | | | 1,374 | |
| | 34 | | | Quad/Graphics, Inc. | | | 774 | |
| | 25 | | | R.R. Donnelley & Sons Co. | | | 412 | |
| | 24 | | | Steelcase, Inc., Class A | | | 433 | |
| | 170 | | | United Stationers, Inc. | | | 7,167 | |
| | | | | | | | |
| | | | | | | 14,231 | |
| | | | | | | | |
| | | | Construction & Engineering — 1.3% | |
| | 114 | | | Argan, Inc. | | | 3,849 | |
| | 118 | | | EMCOR Group, Inc. | | | 5,254 | |
| | | | | | | | |
| | | | | | | 9,103 | |
| | | | | | | | |
SEE NOTES TO FINANCIAL STATEMENTS.
| | | | | | |
| | | |
| 42 | | | | J.P. MORGAN SMALL CAP FUNDS | | DECEMBER 31, 2014 |
| | | | | | | | |
| SHARES | | | SECURITY DESCRIPTION | | VALUE($) | |
| | | | | | | | |
| Common Stocks — continued | |
| | | | Electrical Equipment — 1.2% | |
| | 27 | | | Acuity Brands, Inc. | | | 3,712 | |
| | 106 | | | Polypore International, Inc. (a) | | | 4,987 | |
| | | | | | | | |
| | | | | | | 8,699 | |
| | | | | | | | |
| | | | Machinery — 2.1% | |
| | 24 | | | Blount International, Inc. | | | 423 | |
| | 174 | | | Briggs & Stratton Corp. | | | 3,545 | |
| | 224 | | | Douglas Dynamics, Inc. | | | 4,805 | |
| | 29 | | | Hurco Cos., Inc. | | | 985 | |
| | 12 | | | Hyster-Yale Materials Handling, Inc. | | | 886 | |
| | 65 | | | Kadant, Inc. | | | 2,779 | |
| | 19 | | | Standex International Corp. | | | 1,463 | |
| | 5 | | | Watts Water Technologies, Inc., Class A | | | 305 | |
| | | | | | | | |
| | | | | | | 15,191 | |
| | | | | | | | |
| | | | Marine — 0.8% | |
| | 169 | | | Matson, Inc. | | | 5,823 | |
| | | | | | | | |
| | | | Professional Services — 1.0% | |
| | 100 | | | Barrett Business Services, Inc. | | | 2,747 | |
| | 19 | | | Paylocity Holding Corp. (a) | | | 507 | |
| | 14 | | | TriNet Group, Inc. (a) | | | 450 | |
| | 51 | | | VSE Corp. | | | 3,374 | |
| | | | | | | | |
| | | | | | | 7,078 | |
| | | | | | | | |
| | | | Road & Rail — 1.1% | |
| | 62 | | | ArcBest Corp. | | | 2,852 | |
| | 18 | | | Celadon Group, Inc. | | | 409 | |
| | – | (h) | | PAM Transportation Services, Inc. (a) | | | 23 | |
| | 65 | | | Swift Transportation Co. (a) | | | 1,864 | |
| | 88 | | | USA Truck, Inc. (a) | | | 2,496 | |
| | | | | | | | |
| | | | | | | 7,644 | |
| | | | | | | | |
| | | | Trading Companies & Distributors — 0.2% | |
| | 40 | | | Applied Industrial Technologies, Inc. | | | 1,814 | |
| | | | | | | | |
| | | | Total Industrials | | | 94,907 | |
| | | | | | | | |
| | | | Information Technology — 18.3% | |
| | | | Communications Equipment — 2.7% | |
| | 11 | | | Arista Networks, Inc. (a) | | | 662 | |
| | 77 | | | Aruba Networks, Inc. (a) | | | 1,400 | |
| | 944 | | | Emulex Corp. (a) | | | 5,351 | |
| | 529 | | | Harmonic, Inc. (a) | | | 3,709 | |
| | 34 | | | InterDigital, Inc. | | | 1,783 | |
| | 260 | | | Polycom, Inc. (a) | | | 3,514 | |
| | 109 | | | Ubiquiti Networks, Inc. | | | 3,216 | |
| | | | | | | | |
| | | | | | | 19,635 | |
| | | | | | | | |
| | | | | | | | |
| SHARES | | | SECURITY DESCRIPTION | | VALUE($) | |
| | | | | | | | |
| | | | | | | | |
| | | | Electronic Equipment, Instruments & Components — 1.6% | |
| | 165 | | | Benchmark Electronics, Inc. (a) | | | 4,200 | |
| | 51 | | | Coherent, Inc. (a) | | | 3,072 | |
| | 18 | | | Insight Enterprises, Inc. (a) | | | 466 | |
| | 83 | | | InvenSense, Inc. (a) | | | 1,351 | |
| | 10 | | | Newport Corp. (a) | | | 182 | |
| | 74 | | | Sanmina Corp. (a) | | | 1,729 | |
| | 52 | | | Vishay Intertechnology, Inc. | | | 732 | |
| | | | | | | | |
| | | | | | | 11,732 | |
| | | | | | | | |
| | | | Internet Software & Services — 2.1% | |
| | 112 | | | Bazaarvoice, Inc. (a) | | | 900 | |
| | 186 | | | Blucora, Inc. (a) | | | 2,569 | |
| | 151 | | | Demand Media, Inc. (a) | | | 921 | |
| | 589 | | | EarthLink Holdings Corp. | | | 2,587 | |
| | 32 | | | Five9, Inc. (a) | | | 145 | |
| | 12 | | | Hortonworks, Inc. (a) | | | 313 | |
| | 199 | | | Intralinks Holdings, Inc. (a) | | | 2,366 | |
| | 389 | | | Marchex, Inc., Class B | | | 1,785 | |
| | 402 | | | Millennial Media, Inc. (a) | | | 643 | |
| | 12 | | | New Relic, Inc. (a) | | | 425 | |
| | 5 | | | OPOWER, Inc. (a) | | | 67 | |
| | 14 | | | Q2 Holdings, Inc. (a) | | | 271 | |
| | 246 | | | Unwired Planet, Inc. (a) | | | 246 | |
| | 36 | | | WebMD Health Corp. (a) | | | 1,432 | |
| | | | | | | | |
| | | | | | | 14,670 | |
| | | | | | | | |
| | | | IT Services — 2.2% | |
| | 18 | | | EVERTEC, Inc., (Puerto Rico) | | | 398 | |
| | 33 | | | Heartland Payment Systems, Inc. | | | 1,754 | |
| | 145 | | | ManTech International Corp., Class A | | | 4,374 | |
| | 61 | | | MoneyGram International, Inc. (a) | | | 558 | |
| | 129 | | | NeuStar, Inc., Class A (a) | | | 3,586 | |
| | 41 | | | Science Applications International Corp. | | | 2,031 | |
| | 78 | | | Unisys Corp. (a) | | | 2,303 | |
| | 29 | | | Vantiv, Inc., Class A (a) | | | 987 | |
| | | | | | | | |
| | | | | | | 15,991 | |
| | | | | | | | |
| | | | Semiconductors & Semiconductor Equipment — 4.1% | |
| | 274 | | | Brooks Automation, Inc. | | | 3,488 | |
| | 48 | | | DSP Group, Inc. (a) | | | 524 | |
| | 168 | | | Fairchild Semiconductor International, Inc. (a) | | | 2,827 | |
| | 40 | | | First Solar, Inc. (a) | | | 1,775 | |
| | 171 | | | Integrated Device Technology, Inc. (a) | | | 3,354 | |
| | 37 | | | Micrel, Inc. | | | 541 | |
| | 29 | | | OmniVision Technologies, Inc. (a) | | | 757 | |
| | 164 | | | Photronics, Inc. (a) | | | 1,361 | |
| | 172 | | | PMC-Sierra, Inc. (a) | | | 1,577 | |
SEE NOTES TO FINANCIAL STATEMENTS.
| | | | | | | | |
| | | |
| DECEMBER 31, 2014 | | J.P. MORGAN SMALL CAP FUNDS | | | | | 43 | |
JPMorgan U.S. Small Company Fund
SCHEDULE OF PORTFOLIO INVESTMENTS
AS OF DECEMBER 31, 2014 (Unaudited) (continued)
(Amounts in thousands, except number of Futures contracts)
| | | | | | | | |
| SHARES | | | SECURITY DESCRIPTION | | VALUE($) | |
| | | | | | | | |
| Common Stocks — continued | |
| | | | Semiconductors & Semiconductor Equipment — continued | |
| | 114 | | | RF Micro Devices, Inc. (a) | | | 1,898 | |
| | 83 | | | SunPower Corp. (a) | | | 2,147 | |
| | 222 | | | TriQuint Semiconductor, Inc. (a) | | | 6,108 | |
| | 336 | | | Ultra Clean Holdings, Inc. (a) | | | 3,119 | |
| | | | | | | | |
| | | | | | | 29,476 | |
| | | | | | | | |
| | | | Software — 4.9% | |
| | 100 | | | ACI Worldwide, Inc. (a) | | | 2,017 | |
| | 186 | | | Aspen Technology, Inc. (a) | | | 6,500 | |
| | 324 | | | AVG Technologies N.V., (Netherlands) (a) | | | 6,400 | |
| | 42 | | | Fair Isaac Corp. | | | 3,051 | |
| | 18 | | | Globant S.A., (Luxembourg) (a) | | | 281 | |
| | 30 | | | HubSpot, Inc. (a) | | | 1,012 | |
| | 55 | | | Manhattan Associates, Inc. (a) | | | 2,256 | |
| | 48 | | | Paycom Software, Inc. (a) | | | 1,269 | |
| | 60 | | | Qualys, Inc. (a) | | | 2,272 | |
| | 126 | | | Rally Software Development Corp. (a) | | | 1,437 | |
| | 18 | | | Rubicon Project, Inc. (The) (a) | | | 290 | |
| | 170 | | | Take-Two Interactive Software, Inc. (a) | | | 4,765 | |
| | 353 | | | TeleCommunication Systems, Inc., Class A (a) | | | 1,101 | |
| | 64 | | | Varonis Systems, Inc. (a) | | | 2,108 | |
| | 16 | | | Yodlee, Inc. (a) | | | 190 | |
| | | | | | | | |
| | | | | | | 34,949 | |
| | | | | | | | |
| | | | Technology Hardware, Storage & Peripherals — 0.7% | |
| | 197 | | | Avid Technology, Inc. (a) | | | 2,792 | |
| | 88 | | | Nimble Storage, Inc. (a) | | | 2,417 | |
| | | | | | | | |
| | | | | | | 5,209 | |
| | | | | | | | |
| | | | Total Information Technology | | | 131,662 | |
| | | | | | | | |
| | | | Materials — 2.9% | |
| | | | Chemicals — 1.0% | |
| | 81 | | | Minerals Technologies, Inc. | | | 5,604 | |
| | 57 | | | OM Group, Inc. | | | 1,690 | |
| | | | | | | | |
| | | | | | | 7,294 | |
| | | | | | | | |
| | | | Containers & Packaging — 1.0% | |
| | 452 | | | Graphic Packaging Holding Co. (a) | | | 6,155 | |
| | 58 | | | Myers Industries, Inc. | | | 1,017 | |
| | | | | | | | |
| | | | | | | 7,172 | |
| | | | | | | | |
| | | | Metals & Mining — 0.6% | |
| | 10 | | | Ampco-Pittsburgh Corp. | | | 185 | |
| | 17 | | | Commercial Metals Co. | | | 274 | |
| | 123 | | | Worthington Industries, Inc. | | | 3,698 | |
| | | | | | | | |
| | | | | | | 4,157 | |
| | | | | | | | |
| | | | | | | | |
| SHARES | | | SECURITY DESCRIPTION | | VALUE($) | |
| | | | | | | | |
| | | | | | | | |
| | | | Paper & Forest Products — 0.3% | |
| | 22 | | | Domtar Corp., (Canada) | | | 869 | |
| | 99 | | | Resolute Forest Products, Inc., (Canada) (a) | | | 1,740 | |
| | | | | | | | |
| | | | | | | 2,609 | |
| | | | | | | | |
| | | | Total Materials | | | 21,232 | |
| | | | | | | | |
| | | | Telecommunication Services — 0.8% | |
| | | | Diversified Telecommunication Services — 0.6% | |
| | 63 | | | Consolidated Communications Holdings, Inc. | | | 1,742 | |
| | 58 | | | FairPoint Communications, Inc. (a) | | | 822 | |
| | 67 | | | magicJack VocalTec Ltd., (Israel) (a) | | | 544 | |
| | 309 | | | Vonage Holdings Corp. (a) | | | 1,176 | |
| | | | | | | | |
| | | | | | | 4,284 | |
| | | | | | | | |
| | | | Wireless Telecommunication Services — 0.2% | |
| | 108 | | | RingCentral, Inc., Class A (a) | | | 1,617 | |
| | | | | | | | |
| | | | Total Telecommunication Services | | | 5,901 | |
| | | | | | | | |
| | | | Utilities — 3.1% | |
| | | | Electric Utilities — 1.1% | |
| | 55 | | | El Paso Electric Co. | | | 2,219 | |
| | 41 | | | PNM Resources, Inc. | | | 1,215 | |
| | 110 | | | Portland General Electric Co. | | | 4,146 | |
| | | | | | | | |
| | | | | | | 7,580 | |
| | | | | | | | |
| | | | Gas Utilities — 0.8% | |
| | 25 | | | AGL Resources, Inc. | | | 1,387 | |
| | 33 | | | Laclede Group, Inc. (The) | | | 1,729 | |
| | 31 | | | Piedmont Natural Gas Co., Inc. | | | 1,238 | |
| | 28 | | | Southwest Gas Corp. | | | 1,712 | |
| | | | | | | | |
| | | | | | | 6,066 | |
| | | | | | | | |
| | | | Independent Power & Renewable Electricity Producers — 0.3% | |
| | 368 | | | Atlantic Power Corp. | | | 998 | |
| | 33 | | | Dynegy, Inc. (a) | | | 986 | |
| | 5 | | | Ormat Technologies, Inc. | | | 128 | |
| | 34 | | | Vivint Solar, Inc. (a) | | | 310 | |
| | | | | | | | |
| | | | | | | 2,422 | |
| | | | | | | | |
| | | | Multi-Utilities — 0.9% | |
| | 110 | | | NorthWestern Corp. | | | 6,200 | |
| | | | | | | | |
| | | | Total Utilities | | | 22,268 | |
| | | | | | | | |
| | | | Total Common Stocks
(Cost $600,919) | | | 697,453 | |
| | | | | | | | |
SEE NOTES TO FINANCIAL STATEMENTS.
| | | | | | |
| | | |
| 44 | | | | J.P. MORGAN SMALL CAP FUNDS | | DECEMBER 31, 2014 |
| | | | | | | | |
NUMBER OF WARRANTS | | | SECURITY DESCRIPTION | | VALUE($) | |
| | | | | | | | |
| Warrant — 0.0% (g) | |
| | | | Financials — 0.0% (g) | |
| | | | Consumer Finance — 0.0% (g) | |
| | — | (h) | | Imperial Holdings, Inc., expiring 10/01/19 (Strike Price $10.75) (a) (i)
(Cost $—) | | | — | |
| | | | | | | | |
| | | | | | | | |
| | |
| SHARES | | | SECURITY DESCRIPTION | | VALUE($) | |
| Short-Term Investment — 4.8% | |
| | | | Investment Company — 4.8% | |
| | 34,245 | | | JPMorgan Prime Money Market Fund, Institutional Class Shares, 0.020% (b) (l) (Cost $34,245) | | | 34,245 | |
| | | | | | | | |
| | | | Total Investments — 101.5%
(Cost $635,164) | | | 731,698 | |
| | | | Liabilities in Excess of
Other Assets — (1.5)% (c) | | | (11,094 | ) |
| | | | | | | | |
| | | | NET ASSETS — 100.0% | | $ | 720,604 | |
| | | | | | | | |
Percentages indicated are based on net assets.
| | | | | | | | | | | | | | | | |
| Futures Contracts | |
NUMBER OF CONTRACTS | | | DESCRIPTION | | EXPIRATION
DATE | | | NOTIONAL VALUE AT DECEMBER 31, 2014 | | | NET
UNREALIZED
APPRECIATION
(DEPRECIATION) | |
| | | | Long Futures Outstanding | | | | | | | | | | | | |
| | 163 | | | E-mini Russell 2000 | �� | | 03/20/15 | | | $ | 19,571 | | | $ | 717 | |
| | | | | | | | | | | | | | | | |
SEE NOTES TO FINANCIAL STATEMENTS.
| | | | | | | | |
| | | |
| DECEMBER 31, 2014 | | J.P. MORGAN SMALL CAP FUNDS | | | | | 45 | |
JPMorgan Small Cap Funds
NOTES TO SCHEDULES OF PORTFOLIO INVESTMENTS
AS OF DECEMBER 31, 2014 (Unaudited)
| | |
| ETF | | — Exchange Traded Fund |
| |
| (a) | | — Non-income producing security. |
| (b) | | — Investment in affiliate. Money market fund registered under the Investment Company Act of 1940, as amended, and advised by J.P. Morgan Investment Management Inc. |
| (c) | | — Included in this amount is cash segregated as collateral for futures contracts. |
| (g) | | — Amount rounds to less than 0.1%. |
| (h) | | — Amount rounds to less than one thousand (shares or dollars). |
| | |
| (i) | | — Security has been deemed illiquid pursuant to procedures approved by the Board of Trustees and may be difficult to sell. |
| (l) | | — The rate shown is the current yield as of December 31, 2014. |
| (m) | | — All or a portion of this security is reserved and/or pledged with the custodian for current or potential holdings of futures, swaps, options, TBAs, when-issued securities, delayed delivery securities, reverse repurchase agreements, unfunded commitments and/or forward foreign currency exchange contracts. |
SEE NOTES TO FINANCIAL STATEMENTS.
| | | | | | |
| | | |
| 46 | | | | J.P. MORGAN SMALL CAP FUNDS | | DECEMBER 31, 2014 |
THIS PAGE IS INTENTIONALLY LEFT BLANK
| | | | | | | | |
| | | |
| DECEMBER 31, 2014 | | J.P. MORGAN SMALL CAP FUNDS | | | | | 47 | |
STATEMENTS OF ASSETS AND LIABILITIES
AS OF DECEMBER 31, 2014 (Unaudited)
(Amounts in thousands, except per share amounts)
| | | | | | | | | | | | |
| | |
Dynamic Small
Cap Growth
Fund | | | Small Cap
Core Fund | | | Small Cap
Equity Fund | |
ASSETS: | | | | | | | | | | | | |
Investments in non-affiliates, at value | | $ | 529,919 | | | $ | 714,860 | | | $ | 3,316,004 | |
Investments in affiliates, at value | | | 9,926 | | | | 10,650 | | | | 134,277 | |
| | | | | | | | | | | | |
Total investment securities, at value | | | 539,845 | | | | 725,510 | | | | 3,450,281 | |
Cash | | | 1 | | | | 1 | | | | — | |
Deposits at broker for futures contracts | | | — | | | | 4,195 | | | | — | |
Receivables: | | | | | | | | | | | | |
Investment securities sold | | | 77 | | | | 2,295 | | | | — | |
Fund shares sold | | | 1,192 | | | | 746 | | | | 3,548 | |
Dividends from non-affiliates | | | 188 | | | | 826 | | | | 7,190 | |
Dividends from affiliates | | | — | (a) | | | — | (a) | | | 5 | |
| | | | | | | | | | | | |
Total Assets | | | 541,303 | | | | 733,573 | | | | 3,461,024 | |
| | | | | | | | | | | | |
| | | |
LIABILITIES: | | | | | | | | | | | | |
Payables: | | | | | | | | | | | | |
Investment securities purchased | | | — | | | | 5,900 | | | | — | |
Fund shares redeemed | | | 1,478 | | | | 263 | | | | 22,195 | |
Variation margin on futures contracts | | | — | | | | 94 | | | | — | |
Accrued liabilities: | | | | | | | | | | | | |
Investment advisory fees | | | 240 | | | | 320 | | | | 1,710 | |
Administration fees | | | 25 | | | | — | | | | 168 | |
Distribution fees | | | 47 | | | | — | | | | 174 | |
Shareholder servicing fees | | | 95 | | | | 83 | | | | 382 | |
Custodian and accounting fees | | | 26 | | | | 19 | | | | 54 | |
Trustees’ and Chief Compliance Officer’s fees | | | — | | | | — | (a) | | | 1 | |
Transfer agent fees | | | 175 | | | | 191 | | | | 974 | |
Other | | | 78 | | | | 67 | | | | 160 | |
| | | | | | | | | | | | |
Total Liabilities | | | 2,164 | | | | 6,937 | | | | 25,818 | |
| | | | | | | | | | | | |
Net Assets | | $ | 539,139 | | | $ | 726,636 | | | $ | 3,435,206 | |
| | | | | | | | | | | | |
| (a) | Amount rounds to less than $1,000. |
SEE NOTES TO FINANCIAL STATEMENTS.
| | | | | | |
| | | |
| 48 | | | | J.P. MORGAN SMALL CAP FUNDS | | DECEMBER 31, 2014 |
| | | | | | | | | | | | |
| | |
Dynamic Small
Cap Growth
Fund | | | Small Cap
Core Fund | | | Small Cap
Equity Fund | |
NET ASSETS: | | | | | | | | | | | | |
Paid-in-Capital | | $ | 393,306 | | | $ | 508,458 | | | $ | 2,242,687 | |
Accumulated undistributed (distributions in excess of) net investment income | | | (4,452 | ) | | | (115 | ) | | | 237 | |
Accumulated net realized gains (losses) | | | (374 | ) | | | 12,433 | | | | 1,292 | |
Net unrealized appreciation (depreciation) | | | 150,659 | | | | 205,860 | | | | 1,190,990 | |
| | | | | | | | | | | | |
Total Net Assets | | $ | 539,139 | | | $ | 726,636 | | | $ | 3,435,206 | |
| | | | | | | | | | | | |
| | | |
Net Assets: | | | | | | | | | | | | |
Class A | | $ | 70,889 | | | $ | — | | | $ | 693,617 | |
Class B | | | 405 | | | | — | | | | 3,455 | |
Class C | | | 50,706 | | | | — | | | | 36,750 | |
Class R2 | | | — | | | | — | | | | 3,580 | |
Class R5 | | | — | | | | — | | | | 1,163,640 | |
Select Class | | | 417,139 | | | | 726,636 | | | | 1,534,164 | |
| | | | | | | | | | | | |
Total | | $ | 539,139 | | | $ | 726,636 | | | $ | 3,435,206 | |
| | | | | | | | | | | | |
| | | |
Outstanding units of beneficial interest (shares) | | | | | | | | | | | | |
($0.0001 par value; unlimited number of shares authorized): | | | | | | | | | | | | |
Class A | | | 2,986 | | | | — | | | | 16,269 | |
Class B | | | 20 | | | | — | | | | 102 | |
Class C | | | 2,524 | | | | — | | | | 1,088 | |
Class R2 | | | — | | | | — | | | | 85 | |
Class R5 | | | — | | | | — | | | | 24,240 | |
Select Class | | | 16,163 | | | | 13,377 | | | | 32,005 | |
| | | |
Net Asset Value (a): | | | | | | | | | | | | |
Class A — Redemption price per share | | $ | 23.74 | | | $ | — | | | $ | 42.63 | |
Class B — Offering price per share (b) | | | 20.14 | | | | — | | | | 33.92 | |
Class C — Offering price per share (b) | | | 20.09 | | | | — | | | | 33.79 | |
Class R2 — Offering and redemption price per share | | | — | | | | — | | | | 42.07 | |
Class R5 — Offering and redemption price per share | | | — | | | | — | | | | 48.00 | |
Select Class — Offering and redemption price per share | | | 25.81 | | | | 54.32 | | | | 47.94 | |
Class A maximum sales charge | | | 5.25 | % | | | — | % | | | 5.25 | % |
Class A maximum public offering price per share
[net asset value per share/(100% — maximum sales charge)] | | $ | 25.06 | | | $ | — | | | $ | 44.99 | |
| | | | | | | | | | | | |
| | | |
Cost of investments in non-affiliates | | $ | 379,260 | | | $ | 509,442 | | | $ | 2,125,014 | |
Cost of investments in affiliates | | | 9,926 | | | | 10,650 | | | | 134,277 | |
| (a) | Per share amounts may not recalculate due to rounding of net assets and/or shares outstanding. |
| (b) | Redemption price for Class B and Class C Shares varies based upon length of time the shares are held. |
SEE NOTES TO FINANCIAL STATEMENTS.
| | | | | | | | |
| | | |
| DECEMBER 31, 2014 | | J.P. MORGAN SMALL CAP FUNDS | | | | | 49 | |
STATEMENTS OF ASSETS AND LIABILITIES
AS OF DECEMBER 31, 2014 (Unaudited) (continued)
(Amounts in thousands, except per share amounts)
| | | | | | | | | | | | |
| | |
Small Cap
Growth Fund | | | Small Cap
Value Fund | | | U.S. Small
Company Fund | |
ASSETS: | | | | | | | | | | | | |
Investments in non-affiliates, at value | | $ | 1,153,146 | | | $ | 1,571,368 | | | $ | 697,453 | |
Investments in affiliates, at value | | | 9,864 | | | | 50,839 | | | | 34,245 | |
| | | | | | | | | | | | |
Total investment securities, at value | | | 1,163,010 | | | | 1,622,207 | | | | 731,698 | |
Cash | | | — | | | | — | (a) | | | 1 | |
Deposits at broker for futures contracts | | | — | | | | 2,242 | | | | 1,515 | |
Receivables: | | | | | | | | | | | | |
Investment securities sold | | | 165 | | | | 5,837 | | | | 1,761 | |
Fund shares sold | | | 1,284 | | | | 1,787 | | | | 5,461 | |
Dividends from non-affiliates | | | 408 | | | | 3,253 | | | | 722 | |
Dividends from affiliates | | | 1 | | | | 2 | | | | 1 | |
Other assets | | | — | | | | — | | | | 26 | |
| | | | | | | | | | | | |
Total Assets | | | 1,164,868 | | | | 1,635,328 | | | | 741,185 | |
| | | | | | | | | | | | |
| | | |
LIABILITIES: | | | | | | | | | | | | |
Payables: | | | | | | | | | | | | |
Investment securities purchased | | | — | | | | 2,878 | | | | 18,064 | |
Fund shares redeemed | | | 2,688 | | | | 7,024 | | | | 1,771 | |
Variation margin on futures contracts | | | — | | | | 422 | | | | 174 | |
Accrued liabilities: | | | | | | | | | | | | |
Investment advisory fees | | | 618 | | | | 869 | | | | 343 | |
Administration fees | | | 75 | | | | 111 | | | | 48 | |
Distribution fees | | | 84 | | | | 159 | | | | 54 | |
Shareholder servicing fees | | | 23 | | | | 57 | | | | 48 | |
Custodian and accounting fees | | | 29 | | | | 60 | | | | 44 | |
Trustees’ and Chief Compliance Officer’s fees | | | 1 | | | | — | | | | — | (a) |
Transfer agent fees | | | 242 | | | | 434 | | | | 11 | |
Other | | | 136 | | | | 117 | | | | 24 | |
| | | | | | | | | | | | |
Total Liabilities | | | 3,896 | | | | 12,131 | | | | 20,581 | |
| | | | | | | | | | | | |
Net Assets | | $ | 1,160,972 | | | $ | 1,623,197 | | | $ | 720,604 | |
| | | | | | | | | | | | |
| (a) | Amount rounds to less than $1,000. |
SEE NOTES TO FINANCIAL STATEMENTS.
| | | | | | |
| | | |
| 50 | | | | J.P. MORGAN SMALL CAP FUNDS | | DECEMBER 31, 2014 |
| | | | | | | | | | | | |
| | |
Small Cap
Growth Fund | | | Small Cap
Value Fund | | | U.S. Small
Company Fund | |
NET ASSETS: | | | | | | | | | | | | |
Paid-in-Capital | | $ | 867,629 | | | $ | 1,310,034 | | | $ | 623,795 | |
Accumulated undistributed (distributions in excess of) net investment income | | | (7,374 | ) | | | (107 | ) | | | (58 | ) |
Accumulated net realized gains (losses) | | | (2,381 | ) | | | 2,486 | | | | (384 | ) |
Net unrealized appreciation (depreciation) | | | 303,098 | | | | 310,784 | | | | 97,251 | |
| | | | | | | | | | | | |
Total Net Assets | | $ | 1,160,972 | | | $ | 1,623,197 | | | $ | 720,604 | |
| | | | | | | | | | | | |
| | | |
Net Assets: | | | | | | | | | | | | |
Class A | | $ | 256,069 | | | $ | 511,291 | | | $ | 160,777 | |
Class B | | | 1,723 | | | | 2,553 | | | | — | |
Class C | | | 25,807 | | | | 49,967 | | | | 27,853 | |
Class R2 | | | 27,702 | | | | 48,050 | | | | 10,895 | |
Class R5 | | | — | | | | 87,607 | | | | — | |
Class R6 | | | 425,988 | | | | 512,599 | | | | 49,853 | |
Institutional Class | | | 276,752 | | | | — | | | | 277,849 | |
Select Class | | | 146,931 | | | | 411,130 | | | | 193,377 | |
| | | | | | | | | | | | |
Total | | $ | 1,160,972 | | | $ | 1,623,197 | | | $ | 720,604 | |
| | | | | | | | | | | | |
| | | |
Outstanding units of beneficial interest (shares) | | | | | | | | | | | | |
($0.0001 par value; unlimited number of shares authorized): | | | | | | | | | | | | |
Class A | | | 19,352 | | | | 19,220 | | | | 9,898 | |
Class B | | | 174 | | | | 111 | | | | — | |
Class C | | | 2,453 | | | | 2,195 | | | | 1,763 | |
Class R2 | | | 2,135 | | | | 1,817 | | | | 677 | |
Class R5 | | | — | | | | 3,135 | | | | — | |
Class R6 | | | 29,221 | | | | 18,325 | | | | 3,019 | |
Institutional Class | | | 19,076 | | | | — | | | | 16,831 | |
Select Class | | | 10,326 | | | | 14,711 | | | | 11,694 | |
| | | |
Net Asset Value (a): | | | | | | | | | | | | |
Class A — Redemption price per share | | $ | 13.23 | | | $ | 26.60 | | | $ | 16.24 | |
Class B — Offering price per share (b) | | | 9.89 | | | | 23.01 | | | | — | |
Class C — Offering price per share (b) | | | 10.52 | | | | 22.76 | | | | 15.80 | |
Class R2 — Offering and redemption price per share | | | 12.98 | | | | 26.44 | | | | 16.08 | |
Class R5 — Offering and redemption price per share | | | — | | | | 27.95 | | | | — | |
Class R6 — Offering and redemption price per share | | | 14.58 | | | | 27.97 | | | | 16.51 | |
Institutional Class — Offering and redemption price per share | | | 14.51 | | | | — | | | | 16.51 | |
Select Class — Offering and redemption price per share | | | 14.23 | | | | 27.95 | | | | 16.54 | |
Class A maximum sales charge | | | 5.25 | % | | | 5.25 | % | | | 5.25 | % |
Class A maximum public offering price per share
[net asset value per share/(100% — maximum sales charge)] | | $ | 13.96 | | | $ | 28.07 | | | $ | 17.14 | |
| | | | | | | | | | | | |
Cost of investments in non-affiliates | | $ | 850,048 | | | $ | 1,262,046 | | | $ | 600,919 | |
Cost of investments in affiliates | | | 9,864 | | | | 50,839 | | | | 34,245 | |
| (a) | Per share amounts may not recalculate due to rounding of net assets and/or shares outstanding. |
| (b) | Redemption price for Class B and Class C Shares varies based upon length of time the shares are held. |
SEE NOTES TO FINANCIAL STATEMENTS.
| | | | | | | | |
| | | |
| DECEMBER 31, 2014 | | J.P. MORGAN SMALL CAP FUNDS | | | | | 51 | |
STATEMENTS OF OPERATIONS
FOR THE SIX MONTHS ENDED DECEMBER 31, 2014 (Unaudited)
(Amounts in thousands)
| | | | | | | | | | | | |
| | |
Dynamic Small
Cap Growth
Fund | | | Small Cap
Core Fund | | | Small Cap
Equity Fund | |
INVESTMENT INCOME: | | | | | | | | | | | | |
Interest income from non-affiliates | | $ | — | | | $ | 1 | | | $ | — | |
Dividend income from non-affiliates | | | 1,041 | | | | 4,015 | | | | 24,625 | |
Dividend income from affiliates | | | 1 | | | | 1 | | | | 15 | |
| | | | | | | | | | | | |
Total investment income | | | 1,042 | | | | 4,017 | | | | 24,640 | |
| | | | | | | | | | | | |
| | | |
EXPENSES: | | | | | | | | | | | | |
Investment advisory fees | | | 1,788 | | | | 2,279 | | | | 10,848 | |
Administration fees | | | 227 | | | | 289 | | | | 1,377 | |
Distribution fees: | | | | | | | | | | | | |
Class A | | | 90 | | | | — | | | | 879 | |
Class B | | | 2 | | | | — | | | | 16 | |
Class C | | | 192 | | | | — | | | | 140 | |
Class R2 | | | — | | | | — | | | | 9 | |
Shareholder servicing fees: | | | | | | | | | | | | |
Class A | | | 90 | | | | — | | | | 879 | |
Class B | | | 1 | | | | — | | | | 5 | |
Class C | | | 64 | | | | — | | | | 47 | |
Class R2 | | | — | | | | — | | | | 5 | |
Class R5 | | | — | | | | — | | | | 286 | |
Select Class | | | 533 | | | | 876 | | | | 1,807 | |
Custodian and accounting fees | | | 24 | | | | 25 | | | | 52 | |
Interest expense to affiliates | | | — | (a) | | | — | | | | — | |
Professional fees | | | 25 | | | | 25 | | | | 28 | |
Trustees’ and Chief Compliance Officer’s fees | | | 2 | | | | 4 | | | | 17 | |
Printing and mailing costs | | | 56 | | | | 40 | | | | 170 | |
Registration and filing fees | | | 45 | | | | 13 | | | | 75 | |
Transfer agent fees | | | 271 | | | | 305 | | | | 1,893 | |
Other | | | 117 | | | | 10 | | | | 246 | |
| | | | | | | | | | | | |
Total expenses | | | 3,527 | | | | 3,866 | | | | 18,779 | |
| | | | | | | | | | | | |
Less fees waived | | | (496 | ) | | | (1,137 | ) | | | (2,135 | ) |
Less expense reimbursements | | | (5 | ) | | | — | | | | — | |
| | | | | | | | | | | | |
Net expenses | | | 3,026 | | | | 2,729 | | | | 16,644 | |
| | | | | | | | | | | | |
Net investment income (loss) | | | (1,984 | ) | | | 1,288 | | | | 7,996 | |
| | | | | | | | | | | | |
| | | |
REALIZED/UNREALIZED GAINS (LOSSES): | | | | | | | | | | | | |
Net realized gain (loss) on transactions from: | | | | | | | | | | | | |
Investments in non-affiliates | | | 16,193 | | | | 31,868 | | | | 79,431 | |
Futures | | | — | | | | (477 | ) | | | — | |
| | | | | | | | | | | | |
Net realized gain (loss) | | | 16,193 | | | | 31,391 | | | | 79,431 | |
| | | | | | | | | | | | |
Change in net unrealized appreciation/depreciation of: | | | | | | | | | | | | |
Investments in non-affiliates | | | 2,014 | | | | (9,815 | ) | | | 2,777 | |
Futures | | | — | | | | 259 | | | | — | |
| | | | | | | | | | | | |
Change in net unrealized appreciation/depreciation | | | 2,014 | | | | (9,556 | ) | | | 2,777 | |
| | | | | | | | | | | | |
Net realized/unrealized gains (losses) | | | 18,207 | | | | 21,835 | | | | 82,208 | |
| | | | | | | | | | | | |
Change in net assets resulting from operations | | $ | 16,223 | | | $ | 23,123 | | | $ | 90,204 | |
| | | | | | | | | | | | |
| (a) | Amount rounds to less than $1,000. |
SEE NOTES TO FINANCIAL STATEMENTS.
| | | | | | |
| | | |
| 52 | | | | J.P. MORGAN SMALL CAP FUNDS | | DECEMBER 31, 2014 |
| | | | | | | | | | | | |
| | |
Small Cap
Growth Fund | | | Small Cap
Value Fund | | | U.S. Small
Company Fund | |
INVESTMENT INCOME: | | | | | | | | | | | | |
Interest income from non-affiliates | | $ | — | | | $ | 2 | | | $ | 1 | |
Dividend income from non-affiliates | | | 2,163 | | | | 15,162 | | | | 3,855 | |
Dividend income from affiliates | | | 3 | | | | 9 | | | | 3 | |
| | | | | | | | | | | | |
Total investment income | | | 2,166 | | | | 15,173 | | | | 3,859 | |
| | | | | | | | | | | | |
| | | |
EXPENSES: | | | | | | | | | | | | |
Investment advisory fees | | | 3,685 | | | | 5,030 | | | | 1,874 | |
Administration fees | | | 468 | | | | 638 | | | | 258 | |
Distribution fees: | | | | | | | | | | | | |
Class A | | | 329 | | | | 621 | | | | 174 | |
Class B | | | 7 | | | | 10 | | | | — | |
Class C | | | 97 | | | | 186 | | | | 91 | |
Class R2 | | | 70 | | | | 116 | | | | 23 | |
Shareholder servicing fees: | | | | | | | | | | | | |
Class A | | | 329 | | | | 621 | | | | 174 | |
Class B | | | 2 | | | | 3 | | | | — | |
Class C | | | 32 | | | | 62 | | | | 30 | |
Class R2 | | | 35 | | | | 58 | | | | 12 | |
Class R5 | | | — | | | | 21 | | | | — | |
Institutional Class | | | 140 | | | | — | | | | 118 | |
Select Class | | | 183 | | | | 495 | | | | 211 | |
Custodian and accounting fees | | | 30 | | | | 59 | | | | 33 | |
Professional fees | | | 26 | | | | 32 | | | | 28 | |
Trustees’ and Chief Compliance Officer’s fees | | | 5 | | | | 6 | | | | 3 | |
Printing and mailing costs | | | 45 | | | | 79 | | | | 20 | |
Registration and filing fees | | | 51 | | | | 77 | | | | 68 | |
Transfer agent fees | | | 594 | | | | 1,012 | | | | 293 | |
Other | | | 14 | | | | 11 | | | | 25 | |
| | | | | | | | | | | | |
Total expenses | | | 6,142 | | | | 9,137 | | | | 3,435 | |
| | | | | | | | | | | | |
Less fees waived | | | (677 | ) | | | (912 | ) | | | (289 | ) |
Less expense reimbursements | | | (5 | ) | | | (4 | ) | | | — | |
| | | | | | | | | | | | |
Net expenses | | | 5,460 | | | | 8,221 | | | | 3,146 | |
| | | | | | | | | | | | |
Net investment income (loss) | | | (3,294 | ) | | | 6,952 | | | | 713 | |
| | | | | | | | | | | | |
| | | |
REALIZED/UNREALIZED GAINS (LOSSES): | | | | | | | | | | | | |
Net realized gain (loss) on transactions from: | | | | | | | | | | | | |
Investments in non-affiliates | | | 34,625 | | | | 32,217 | | | | 14,021 | |
Futures | | | — | | | | (1,907 | ) | | | 151 | |
| | | | | | | | | | | | |
Net realized gain (loss) | | | 34,625 | | | | 30,310 | | | | 14,172 | |
| | | | | | | | | | | | |
Change in net unrealized appreciation/depreciation of: | | | | | | | | | | | | |
Investments in non-affiliates | | | 6,775 | | | | (23,378 | ) | | | 11,798 | |
Futures | | | — | | | | 48 | | | | 205 | |
| | | | | | | | | | | | |
Change in net unrealized appreciation/depreciation | | | 6,775 | | | | (23,330 | ) | | | 12,003 | |
| | | | | | | | | | | | |
Net realized/unrealized gains (losses) | | | 41,400 | | | | 6,980 | | | | 26,175 | |
| | | | | | | | | | | | |
Change in net assets resulting from operations | | $ | 38,106 | | | $ | 13,932 | | | $ | 26,888 | |
| | | | | | | | | | | | |
SEE NOTES TO FINANCIAL STATEMENTS.
| | | | | | | | |
| | | |
| DECEMBER 31, 2014 | | J.P. MORGAN SMALL CAP FUNDS | | | | | 53 | |
STATEMENTS OF CHANGES IN NET ASSETS
FOR THE PERIODS INDICATED
(Amounts in thousands)
| | | | | | | | | | | | | | | | |
| | | Dynamic Small Cap Growth Fund | | | Small Cap Core Fund | |
| | | Six Months Ended
December 31, 2014
(Unaudited) | | | Year Ended
June 30, 2014 | | | Six Months Ended
December 31, 2014
(Unaudited) | | | Year Ended
June 30, 2014 | |
CHANGE IN NET ASSETS RESULTING FROM OPERATIONS: | | | | | | | | | | | | | | | | |
Net investment income (loss) | | $ | (1,984 | ) | | $ | (4,526 | ) | | $ | 1,288 | | | $ | 1,798 | |
Net realized gain (loss) | | | 16,193 | | | | 59,230 | | | | 31,391 | | | | 80,341 | |
Change in net unrealized appreciation/depreciation | | | 2,014 | | | | 39,546 | | | | (9,556 | ) | | | 73,289 | |
| | | | | | | | | | | | | | | | |
Change in net assets resulting from operations | | | 16,223 | | | | 94,250 | | | | 23,123 | | | | 155,428 | |
| | | | | | | | | | | | | | | | |
| | | | |
DISTRIBUTIONS TO SHAREHOLDERS: | | | | | | | | | | | | | | | | |
Class A | | | | | | | | | | | | | | | | |
From net realized gains | | | (5,692 | ) | | | (7,308 | ) | | | — | | | | — | |
Class B | | | | | | | | | | | | | | | | |
From net realized gains | | | (37 | ) | | | (72 | ) | | | — | | | | — | |
Class C | | | | | | | | | | | | | | | | |
From net realized gains | | | (4,687 | ) | | | (5,669 | ) | | | — | | | | — | |
Select Class | | | | | | | | | | | | | | | | |
From net investment income | | | — | | | | — | | | | (1,375 | ) | | | (3,196 | ) |
From net realized gains | | | (32,531 | ) | | | (30,984 | ) | | | (72,101 | ) | | | (30,439 | ) |
| | | | | | | | | | | | | | | | |
Total distributions to shareholders | | | (42,947 | ) | | | (44,033 | ) | | | (73,476 | ) | | | (33,635 | ) |
| | | | | | | | | | | | | | | | |
| | | | |
CAPITAL TRANSACTIONS: | | | | | | | | | | | | | | | | |
Change in net assets resulting from capital transactions | | | 5,839 | | | | (9,967 | ) | | | 73,682 | | | | 59,219 | |
| | | | | | | | | | | | | | | | |
| | | | |
NET ASSETS: | | | | | | | | | | | | | | | | |
Change in net assets | | | (20,885 | ) | | | 40,250 | | | | 23,329 | | | | 181,012 | |
Beginning of period | | | 560,024 | | | | 519,774 | | | | 703,307 | | | | 522,295 | |
| | | | | | | | | | | | | | | | |
End of period | | $ | 539,139 | | | $ | 560,024 | | | $ | 726,636 | | | $ | 703,307 | |
| | | | | | | | | | | | | | | | |
Accumulated undistributed (distributions in excess of) net investment income | | $ | (4,452 | ) | | $ | (2,468 | ) | | $ | (115 | ) | | $ | (28 | ) |
| | | | | | | | | | | | | | | | |
SEE NOTES TO FINANCIAL STATEMENTS.
| | | | | | |
| | | |
| 54 | | | | J.P. MORGAN SMALL CAP FUNDS | | DECEMBER 31, 2014 |
| | | | | | | | | | | | | | | | |
| | | Small Cap Equity Fund | | | Small Cap Growth Fund | |
| | | Six Months Ended
December 31, 2014
(Unaudited) | | | Year Ended
June 30, 2014 | | | Six Months Ended
December 31, 2014
(Unaudited) | | | Year Ended
June 30, 2014 | |
CHANGE IN NET ASSETS RESULTING FROM OPERATIONS: | | | | | | | | | | | | | | | | |
Net investment income (loss) | | $ | 7,996 | | | $ | 16,224 | | | $ | (3,294 | ) | | $ | (6,681 | ) |
Net realized gain (loss) | | | 79,431 | | | | 337,200 | | | | 34,625 | | | | 107,813 | |
Distributions of capital gains received from investment company affiliates | | | — | | | | 1 | | | | — | | | | — | |
Change in net unrealized appreciation/depreciation | | | 2,777 | | | | 297,373 | | | | 6,775 | | | | 79,679 | |
| | | | | | | | | | | | | | | | |
Change in net assets resulting from operations | | | 90,204 | | | | 650,798 | | | | 38,106 | | | | 180,811 | |
| | | | | | | | | | | | | | | | |
| | | | |
DISTRIBUTIONS TO SHAREHOLDERS: | | | | | | | | | | | | | | | | |
Class A | | | | | | | | | | | | | | | | |
From net investment income | | | (1,326 | ) | | | (1,154 | ) | | | — | | | | — | |
From net realized gains | | | (72,144 | ) | | | (39,200 | ) | | | (20,645 | ) | | | (27,816 | ) |
Class B | | | | | | | | | | | | | | | | |
From net realized gains | | | (441 | ) | | | (468 | ) | | | (176 | ) | | | (372 | ) |
Class C | | | | | | | | | | | | | | | | |
From net realized gains | | | (4,673 | ) | | | (2,540 | ) | | | (2,503 | ) | | | (3,356 | ) |
Class R2 | | | | | | | | | | | | | | | | |
From net realized gains | | | (372 | ) | | | (285 | ) | | | (2,202 | ) | | | (3,175 | ) |
Class R5 | | | | | | | | | | | | | | | | |
From net investment income | | | (7,331 | ) | | | (5,697 | ) | | | — | | | | — | |
From net realized gains | | | (107,883 | ) | | | (48,030 | ) | | | — | | | | — | |
Class R6 | | | | | | | | | | | | | | | | |
From net realized gains | | | — | | | | — | | | | (30,237 | ) | | | (27,222 | ) |
Institutional Class | | | | | | | | | | | | | | | | |
From net realized gains | | | — | | | | — | | | | (20,050 | ) | | | (26,893 | ) |
Select Class | | | | | | | | | | | | | | | | |
From net investment income | | | (6,696 | ) | | | (4,998 | ) | | | — | | | | — | |
From net realized gains | | | (140,920 | ) | | | (64,468 | ) | | | (10,568 | ) | | | (13,777 | ) |
| | | | | | | | | | | | | | | | |
Total distributions to shareholders | | | (341,786 | ) | | | (166,840 | ) | | | (86,381 | ) | | | (102,611 | ) |
| | | | | | | | | | | | | | | | |
| | | | |
CAPITAL TRANSACTIONS: | | | | | | | | | | | | | | | | |
Change in net assets resulting from capital transactions | | | 277,343 | | | | 228,662 | | | | 51,933 | | | | 147,196 | |
| | | | | | | | | | | | | | | | |
| | | | |
NET ASSETS: | | | | | | | | | | | | | | | | |
Change in net assets | | | 25,761 | | | | 712,620 | | | | 3,658 | | | | 225,396 | |
Beginning of period | | | 3,409,445 | | | | 2,696,825 | | | | 1,157,314 | | | | 931,918 | |
| | | | | | | | | | | | | | | | |
End of period | | $ | 3,435,206 | | | $ | 3,409,445 | | | $ | 1,160,972 | | | $ | 1,157,314 | |
| | | | | | | | | | | | | | | | |
Accumulated undistributed (distributions in excess of) net investment income | | $ | 237 | | | $ | 7,594 | | | $ | (7,374 | ) | | $ | (4,080 | ) |
| | | | | | | | | | | | | | | | |
SEE NOTES TO FINANCIAL STATEMENTS.
| | | | | | | | |
| | | |
| DECEMBER 31, 2014 | | J.P. MORGAN SMALL CAP FUNDS | | | | | 55 | |
STATEMENTS OF CHANGES IN NET ASSETS
FOR THE PERIODS INDICATED (continued)
(Amounts in thousands)
| | | | | | | | | | | | | | | | |
| | | Small Cap Value Fund | | | U.S. Small Company Fund | |
| | | Six Months Ended
December 31, 2014
(Unaudited) | | | Year Ended
June 30, 2014 | | | Six Months Ended
December 31, 2014
(Unaudited) | | | Year Ended
June 30, 2014 | |
CHANGE IN NET ASSETS RESULTING FROM OPERATIONS: | | | | | | | | | | | | | | | | |
Net investment income (loss) | | $ | 6,952 | | | $ | 8,145 | | | $ | 713 | | | $ | 543 | |
Net realized gain (loss) | | | 30,310 | | | | 93,483 | | | | 14,172 | | | | 16,977 | |
Change in net unrealized appreciation/depreciation | | | (23,330 | ) | | | 129,626 | | | | 12,003 | | | | 56,837 | |
| | | | | | | | | | | | | | | | |
Change in net assets resulting from operations | | | 13,932 | | | | 231,254 | | | | 26,888 | | | | 74,357 | |
| | | | | | | | | | | | | | | | |
| | | | |
DISTRIBUTIONS TO SHAREHOLDERS: | | | | | | | | | | | | | | | | |
Class A | | | | | | | | | | | | | | | | |
From net investment income | | | (1,994 | ) | | | (1,828 | ) | | | — | | | | (72 | ) |
From net realized gains | | | (24,585 | ) | | | (10,944 | ) | | | (5,065 | ) | | | (1,746 | ) |
Class B | | | | | | | | | | | | | | | | |
From net investment income | | | (7 | ) | | | (8 | ) | | | — | | | | — | |
From net realized gains | | | (142 | ) | | | (101 | ) | | | — | | | | — | |
Class C | | | | | | | | | | | | | | | | |
From net investment income | | | (146 | ) | | | (123 | ) | | | — | | | | — | |
From net realized gains | | | (2,788 | ) | | | (1,424 | ) | | | (879 | ) | | | (246 | ) |
Class R2 | | | | | | | | | | | | | | | | |
From net investment income | | | (145 | ) | | | (82 | ) | | | — | | | | (6 | ) |
From net realized gains | | | (2,245 | ) | | | (741 | ) | | | (339 | ) | | | (98 | ) |
Class R5 | | | | | | | | | | | | | | | | |
From net investment income | | | (439 | ) | | | (467 | ) | | | — | | | | — | |
From net realized gains | | | (3,945 | ) | | | (1,547 | ) | | | — | | | | — | |
Class R6 | | | | | | | | | | | | | | | | |
From net investment income | | | (2,693 | ) | | | (2,662 | ) | | | (152 | ) | | | (146 | ) |
From net realized gains | | | (23,274 | ) | | | (8,043 | ) | | | (1,577 | ) | | | (738 | ) |
Institutional Class | | | | | | | | | | | | | | | | |
From net investment income | | | — | | | | — | | | | (689 | ) | | | (275 | ) |
From net realized gains | | | — | | | | — | | | | (8,505 | ) | | | (1,543 | ) |
Select Class | | | | | | | | | | | | | | | | |
From net investment income | | | (1,917 | ) | | | (2,226 | ) | | | (184 | ) | | | (207 | ) |
From net realized gains | | | (19,170 | ) | | | (8,523 | ) | | | (5,885 | ) | | | (2,006 | ) |
| | | | | | | | | | | | | | | | |
Total distributions to shareholders | | | (83,490 | ) | | | (38,719 | ) | | | (23,275 | ) | | | (7,083 | ) |
| | | | | | | | | | | | | | | | |
| | | | |
CAPITAL TRANSACTIONS: | | | | | | | | | | | | | | | | |
Change in net assets resulting from capital transactions | | | 133,601 | | | | 468,137 | | | | 135,228 | | | | 341,780 | |
| | | | | | | | | | | | | | | | |
| | | | |
NET ASSETS: | | | | | | | | | | | | | | | | |
Change in net assets | | | 64,043 | | | | 660,672 | | | | 138,841 | | | | 409,054 | |
Beginning of period | | | 1,559,154 | | | | 898,482 | | | | 581,763 | | | | 172,709 | |
| | | | | | | | | | | | | | | | |
End of period | | $ | 1,623,197 | | | $ | 1,559,154 | | | $ | 720,604 | | | $ | 581,763 | |
| | | | | | | | | | | | | | | | |
Accumulated undistributed (distributions in excess of) net investment income | | $ | (107 | ) | | $ | 282 | | | $ | (58 | ) | | $ | 254 | |
| | | | | | | | | | | | | | | | |
SEE NOTES TO FINANCIAL STATEMENTS.
| | | | | | |
| | | |
| 56 | | | | J.P. MORGAN SMALL CAP FUNDS | | DECEMBER 31, 2014 |
| | | | | | | | | | | | | | | | |
| | | Dynamic Small Cap Growth Fund | | | Small Cap Core Fund | |
| | | Six Months Ended
December 31, 2014
(Unaudited) | | | Year Ended
June 30, 2014 | | | Six Months Ended
December 31, 2014
(Unaudited) | | | Year Ended
June 30, 2014 | |
CAPITAL TRANSACTIONS: | | | | | | | | | | | | | | | | |
Class A | | | | | | | | | | | | | | | | |
Proceeds from shares issued | | $ | 6,274 | | | $ | 23,934 | | | $ | — | | | $ | — | |
Distributions reinvested | | | 4,072 | | | | 5,262 | | | | ��� | | | | — | |
Cost of shares redeemed | | | (22,061 | ) | | | (26,472 | ) | | | — | | | | — | |
| | | | | | | | | | | | | | | | |
Change in net assets resulting from Class A capital transactions | | $ | (11,715 | ) | | $ | 2,724 | | | $ | — | | | $ | — | |
| | | | | | | | | | | | | | | | |
Class B | | | | | | | | | | | | | | | | |
Proceeds from shares issued | | $ | 5 | | | $ | 23 | | | $ | — | | | $ | — | |
Distributions reinvested | | | 33 | | | | 66 | | | | — | | | | — | |
Cost of shares redeemed | | | (124 | ) | | | (427 | ) | | | — | | | | — | |
| | | | | | | | | | | | | | | | |
Change in net assets resulting from Class B capital transactions | | $ | (86 | ) | | $ | (338 | ) | | $ | — | | | $ | — | |
| | | | | | | | | | | | | | | | |
Class C | | | | | | | | | | | | | | | | |
Proceeds from shares issued | | $ | 8,447 | | | $ | 19,447 | | | $ | — | | | $ | — | |
Distributions reinvested | | | 515 | | | | 655 | | | | — | | | | — | |
Cost of shares redeemed | | | (10,176 | ) | | | (22,674 | ) | | | — | | | | — | |
| | | | | | | | | | | | | | | | |
Change in net assets resulting from Class C capital transactions | | $ | (1,214 | ) | | $ | (2,572 | ) | | $ | — | | | $ | — | |
| | | | | | | | | | | | | | | | |
Select Class | | | | | | | | | | | | | | | | |
Proceeds from shares issued | | $ | 73,621 | | | $ | 149,852 | | | $ | 57,084 | | | $ | 99,370 | |
Distributions reinvested | | | 32,251 | | | | 30,591 | | | | 69,335 | | | | 31,856 | |
Cost of shares redeemed | | | (87,018 | ) | | | (190,224 | ) | | | (52,737 | ) | | | (72,007 | ) |
| | | | | | | | | | | | | | | | |
Change in net assets resulting from Select Class capital transactions | | $ | 18,854 | | | $ | (9,781 | ) | | $ | 73,682 | | | $ | 59,219 | |
| | | | | | | | | | | | | | | | |
Total change in net assets resulting from capital transactions | | $ | 5,839 | | | $ | (9,967 | ) | | $ | 73,682 | | | $ | 59,219 | |
| | | | | | | | | | | | | | | | |
SHARE TRANSACTIONS: | | | | | | | | | | | | | | | | |
Class A | | | | | | | | | | | | | | | | |
Issued | | | 265 | | | | 944 | | | | — | | | | — | |
Reinvested | | | 179 | | | | 218 | | | | — | | | | — | |
Redeemed | | | (923 | ) | | | (1,048 | ) | | | — | | | | — | |
| | | | | | | | | | | | | | | | |
Change in Class A Shares | | | (479 | ) | | | 114 | | | | — | | | | — | |
| | | | | | | | | | | | | | | | |
Class B | | | | | | | | | | | | | | | | |
Issued | | | — | (a) | | | 1 | | | | — | | | | — | |
Reinvested | | | 1 | | | | 3 | | | | — | | | | — | |
Redeemed | | | (5 | ) | | | (19 | ) | | | — | | | | — | |
| | | | | | | | | | | | | | | | |
Change in Class B Shares | | | (4 | ) | | | (15 | ) | | | — | | | | — | |
| | | | | | | | | | | | | | | | |
Class C | | | | | | | | | | | | | | | | |
Issued | | | 423 | | | | 893 | | | | — | | | | — | |
Reinvested | | | 27 | | | | 32 | | | | — | | | | — | |
Redeemed | | | (492 | ) | | | (1,034 | ) | | | — | | | | — | |
| | | | | | | | | | | | | | | | |
Change in Class C Shares | | | (42 | ) | | | (109 | ) | | | — | | | | — | |
| | | | | | | | | | | | | | | | |
Select Class | | | | | | | | | | | | | | | | |
Issued | | | 2,848 | | | | 5,539 | | | | 990 | | | | 1,841 | |
Reinvested | | | 1,306 | | | | 1,176 | | | | 1,342 | | | | 602 | |
Redeemed | | | (3,393 | ) | | | (6,999 | ) | | | (936 | ) | | | (1,319 | ) |
| | | | | | | | | | | | | | | | |
Change in Select Class Shares | | | 761 | | | | (284 | ) | | | 1,396 | | | | 1,124 | |
| | | | | | | | | | | | | | | | |
| (a) | Amount rounds to less than 1,000. |
SEE NOTES TO FINANCIAL STATEMENTS.
| | | | | | | | |
| | | |
| DECEMBER 31, 2014 | | J.P. MORGAN SMALL CAP FUNDS | | | | | 57 | |
STATEMENTS OF CHANGES IN NET ASSETS
FOR THE PERIODS INDICATED (continued)
(Amounts in thousands)
| | | | | | | | | | | | | | | | |
| | | Small Cap Equity Fund | | | Small Cap Growth Fund | |
| | | Six Months Ended
December 31, 2014
(Unaudited) | | | Year Ended
June 30, 2014 | | | Six Months Ended
December 31, 2014
(Unaudited) | | | Year Ended
June 30, 2014 | |
CAPITAL TRANSACTIONS: | | | | | | | | | | | | | | | | |
Class A | | | | | | | | | | | | | | | | |
Proceeds from shares issued | | $ | 47,898 | | | $ | 143,105 | | | $ | 20,025 | | | $ | 86,559 | |
Distributions reinvested | | | 66,061 | | | | 36,174 | | | | 19,785 | | | | 26,847 | |
Cost of shares redeemed | | | (102,373 | ) | | | (247,996 | ) | | | (52,749 | ) | | | (100,660 | ) |
| | | | | | | | | | | | | | | | |
Change in net assets resulting from Class A capital transactions | | $ | 11,586 | | | $ | (68,717 | ) | | $ | (12,939 | ) | | $ | 12,746 | |
| | | | | | | | | | | | | | | | |
Class B | | | | | | | | | | | | | | | | |
Proceeds from shares issued | | $ | 54 | | | $ | 109 | | | $ | 12 | | | $ | 108 | |
Distributions reinvested | | | 405 | | | | 440 | | | | 165 | | | | 299 | |
Cost of shares redeemed | | | (2,062 | ) | | | (4,393 | ) | | | (370 | ) | | | (1,534 | ) |
| | | | | | | | | | | | | | | | |
Change in net assets resulting from Class B capital transactions | | $ | (1,603 | ) | | $ | (3,844 | ) | | $ | (193 | ) | | $ | (1,127 | ) |
| | | | | | | | | | | | | | | | |
Class C | | | | | | | | | | | | | | | | |
Proceeds from shares issued | | $ | 1,119 | | | $ | 1,754 | | | $ | 972 | | | $ | 3,615 | |
Distributions reinvested | | | 3,928 | | | | 2,078 | | | | 2,095 | | | | 2,792 | |
Cost of shares redeemed | | | (4,168 | ) | | | (6,514 | ) | | | (3,414 | ) | | | (5,082 | ) |
| | | | | | | | | | | | | | | | |
Change in net assets resulting from Class C capital transactions | | $ | 879 | | | $ | (2,682 | ) | | $ | (347 | ) | | $ | 1,325 | |
| | | | | | | | | | | | | | | | |
Class R2 | | | | | | | | | | | | | | | | |
Proceeds from shares issued | | $ | 431 | | | $ | 1,876 | | | $ | 1,663 | | | $ | 9,894 | |
Distributions reinvested | | | 267 | | | | 169 | | | | 2,147 | | | | 3,015 | |
Cost of shares redeemed | | | (700 | ) | | | (3,854 | ) | | | (5,730 | ) | | | (10,303 | ) |
| | | | | | | | | | | | | | | | |
Change in net assets resulting from Class R2 capital transactions | | $ | (2 | ) | | $ | (1,809 | ) | | $ | (1,920 | ) | | $ | 2,606 | |
| | | | | | | | | | | | | | | | |
Class R5 | | | | | | | | | | | | | | | | |
Proceeds from shares issued | | $ | 89,745 | | | $ | 341,675 | | | $ | — | | | $ | — | |
Distributions reinvested | | | 108,316 | | | | 50,412 | | | | — | | | | — | |
Cost of shares redeemed | | | (128,980 | ) | | | (187,973 | ) | | | — | | | | — | |
| | | | | | | | | | | | | | | | |
Change in net assets resulting from Class R5 capital transactions | | $ | 69,081 | | | $ | 204,114 | | | $ | — | | | $ | — | |
| | | | | | | | | | | | | | | | |
Class R6 | | | | | | | | | | | | | | | | |
Proceeds from shares issued | | $ | — | | | $ | — | | | $ | 76,255 | | | $ | 107,896 | |
Distributions reinvested | | | — | | | | — | | | | 30,237 | | | | 27,222 | |
Cost of shares redeemed | | | — | | | | — | | | | (22,002 | ) | | | (52,030 | ) |
| | | | | | | | | | | | | | | | |
Change in net assets resulting from Class R6 capital transactions | | $ | — | | | $ | — | | | $ | 84,490 | | | $ | 83,088 | |
| | | | | | | | | | | | | | | | |
Institutional Class | | | | | | | | | | | | | | | | |
Proceeds from shares issued | | $ | — | | | $ | — | | | $ | 33,498 | | | $ | 127,596 | |
Distributions reinvested | | | — | | | | — | | | | 18,418 | | | | 24,325 | |
Cost of shares redeemed | | | — | | | | — | | | | (65,719 | ) | | | (97,844 | ) |
| | | | | | | | | | | | | | | | |
Change in net assets resulting from Institutional Class capital transactions | | $ | — | | | $ | — | | | $ | (13,803 | ) | | $ | 54,077 | |
| | | | | | | | | | | | | | | | |
Select Class | | | | | | | | | | | | | | | | |
Proceeds from shares issued | | $ | 205,777 | | | $ | 436,244 | | | $ | 19,099 | | | $ | 51,702 | |
Distributions reinvested | | | 136,721 | | | | 63,813 | | | | 9,680 | | | | 12,567 | |
Cost of shares redeemed | | | (145,096 | ) | | | (398,457 | ) | | | (32,134 | ) | | | (69,788 | ) |
| | | | | | | | | | | | | | | | |
Change in net assets resulting from Select Class capital transactions | | $ | 197,402 | | | $ | 101,600 | | | $ | (3,355 | ) | | $ | (5,519 | ) |
| | | | | | | | | | | | | | | | |
Total change in net assets resulting from capital transactions | | $ | 277,343 | | | $ | 228,662 | | | $ | 51,933 | | | $ | 147,196 | |
| | | | | | | | | | | | | | | | |
SEE NOTES TO FINANCIAL STATEMENTS.
| | | | | | |
| | | |
| 58 | | | | J.P. MORGAN SMALL CAP FUNDS | | DECEMBER 31, 2014 |
| | | | | | | | | | | | | | | | |
| | | Small Cap Equity Fund | | | Small Cap Growth Fund | |
| | | Six Months Ended
December 31, 2014
(Unaudited) | | | Year Ended
June 30, 2014 | | | Six Months Ended
December 31, 2014
(Unaudited) | | | Year Ended
June 30, 2014 | |
SHARE TRANSACTIONS: | | | | | | | | | | | | | | | | |
Class A | | | | | | | | | | | | | | | | |
Issued | | | 1,078 | | | | 3,257 | | | | 1,491 | | | | 6,045 | |
Reinvested | | | 1,602 | | | | 848 | | | | 1,564 | | | | 2,002 | |
Redeemed | | | (2,282 | ) | | | (5,680 | ) | | | (3,933 | ) | | | (7,045 | ) |
| | | | | | | | | | | | | | | | |
Change in Class A Shares | | | 398 | | | | (1,575 | ) | | | (878 | ) | | | 1,002 | |
| | | | | | | | | | | | | | | | |
Class B | | | | | | | | | | | | | | | | |
Issued | | | 2 | | | | 3 | | | | 1 | | | | 11 | |
Reinvested | | | 12 | | | | 13 | | | | 17 | | | | 29 | |
Redeemed | | | (56 | ) | | | (121 | ) | | | (35 | ) | | | (139 | ) |
| | | | | | | | | | | | | | | | |
Change in Class B Shares | | | (42 | ) | | | (105 | ) | | | (17 | ) | | | (99 | ) |
| | | | | | | | | | | | | | | | |
Class C | | | | | | | | | | | | | | | | |
Issued | | | 34 | | | | 49 | | | | 93 | | | | 311 | |
Reinvested | | | 120 | | | | 60 | | | | 208 | | | | 255 | |
Redeemed | | | (115 | ) | | | (180 | ) | | | (316 | ) | | | (437 | ) |
| | | | | | | | | | | | | | | | |
Change in Class C Shares | | | 39 | | | | (71 | ) | | | (15 | ) | | | 129 | |
| | | | | | | | | | | | | | | | |
Class R2 | | | | | | | | | | | | | | | | |
Issued | | | 10 | | | | 44 | | | | 125 | | | | 698 | |
Reinvested | | | 7 | | | | 4 | | | | 173 | | | | 229 | |
Redeemed | | | (16 | ) | | | (88 | ) | | | (430 | ) | | | (729 | ) |
| | | | | | | | | | | | | | | | |
Change in Class R2 Shares | | | 1 | | | | (40 | ) | | | (132 | ) | | | 198 | |
| | | | | | | | | | | | | | | | |
Class R5 | | | | | | | | | | | | | | | | |
Issued | | | 1,798 | | | | 7,041 | | | | — | | | | — | |
Reinvested | | | 2,321 | | | | 1,058 | | | | — | | | | — | |
Redeemed | | | (2,576 | ) | | | (3,834 | ) | | | — | | | | — | |
| | | | | | | | | | | | | | | | |
Change in Class R5 Shares | | | 1,543 | | | | 4,265 | | | | — | | | | — | |
| | | | | | | | | | | | | | | | |
Class R6 | | | | | | | | | | | | | | | | |
Issued | | | — | | | | — | | | | 5,232 | | | | 7,124 | |
Reinvested | | | — | | | | — | | | | 2,169 | | | | 1,867 | |
Redeemed | | | — | | | | — | | | | (1,496 | ) | | | (3,418 | ) |
| | | | | | | | | | | | | | | | |
Change in Class R6 Shares | | | — | | | | — | | | | 5,905 | | | | 5,573 | |
| | | | | | | | | | | | | | | | |
Institutional Class | | | | | | | | | | | | | | | | |
Issued | | | — | | | | — | | | | 2,293 | | | | 8,158 | |
Reinvested | | | — | | | | — | | | | 1,328 | | | | 1,674 | |
Redeemed | | | — | | | | — | | | | (4,463 | ) | | | (6,418 | ) |
| | | | | | | | | | | | | | | | |
Change in Institutional Class Shares | | | — | | | | — | | | | (842 | ) | | | 3,414 | |
| | | | | | | | | | | | | | | | |
Select Class | | | | | | | | | | | | | | | | |
Issued | | | 4,089 | | | | 9,006 | | | | 1,331 | | | | 3,395 | |
Reinvested | | | 2,941 | | | | 1,344 | | | | 711 | | | | 879 | |
Redeemed | | | (2,908 | ) | | | (8,177 | ) | | | (2,220 | ) | | | (4,528 | ) |
| | | | | | | | | | | | | | | | |
Change in Select Class Shares | | | 4,122 | | | | 2,173 | | | | (178 | ) | | | (254 | ) |
| | | | | | | | | | | | | | | | |
SEE NOTES TO FINANCIAL STATEMENTS.
| | | | | | | | |
| | | |
| DECEMBER 31, 2014 | | J.P. MORGAN SMALL CAP FUNDS | | | | | 59 | |
STATEMENTS OF CHANGES IN NET ASSETS
FOR THE PERIODS INDICATED (continued)
(Amounts in thousands)
| | | | | | | | | | | | | | | | |
| | | Small Cap Value Fund | | | U.S. Small Company Fund | |
| | | Six Months Ended
December 31, 2014
(Unaudited) | | | Year Ended
June 30, 2014 | | | Six Months Ended
December 31, 2014
(Unaudited) | | | Year Ended
June 30, 2014 | |
CAPITAL TRANSACTIONS: | | | | | | | | | | | | | | | | |
Class A | | | | | | | | | | | | | | | | |
Proceeds from shares issued | | $ | 79,195 | | | $ | 249,050 | | | $ | 50,906 | | | $ | 95,000 | |
Distributions reinvested | | | 24,983 | | | | 12,217 | | | | 4,623 | | | | 1,637 | |
Cost of shares redeemed | | | (86,061 | ) | | | (142,413 | ) | | | (22,677 | ) | | | (35,876 | ) |
| | | | | | | | | | | | | | | | |
Change in net assets resulting from Class A capital transactions | | $ | 18,117 | | | $ | 118,854 | | | $ | 32,852 | | | $ | 60,761 | |
| | | | | | | | | | | | | | | | |
Class B | | | | | | | | | | | | | | | | |
Proceeds from shares issued | | $ | 34 | | | $ | 11 | | | $ | — | | | $ | — | |
Distributions reinvested | | | 146 | | | | 106 | | | | — | | | | — | |
Cost of shares redeemed | | | (535 | ) | | | (1,364 | ) | | | — | | | | — | |
| | | | | | | | | | | | | | | | |
Change in net assets resulting from Class B capital transactions | | $ | (355 | ) | | $ | (1,247 | ) | | $ | — | | | $ | — | |
| | | | | | | | | | | | | | | | |
Class C | | | | | | | | | | | | | | | | |
Proceeds from shares issued | | $ | 3,179 | | | $ | 13,317 | | | $ | 7,033 | | | $ | 15,087 | |
Distributions reinvested | | | 2,601 | | | | 1,374 | | | | 772 | | | | 203 | |
Cost of shares redeemed | | | (5,762 | ) | | | (10,049 | ) | | | (2,548 | ) | | | (2,232 | ) |
| | | | | | | | | | | | | | | | |
Change in net assets resulting from Class C capital transactions | | $ | 18 | | | $ | 4,642 | | | $ | 5,257 | | | $ | 13,058 | |
| | | | | | | | | | | | | | | | |
Class R2 | | | | | | | | | | | | | | | | |
Proceeds from shares issued | | $ | 8,132 | | | $ | 35,618 | | | $ | 3,120 | | | $ | 7,974 | |
Distributions reinvested | | | 2,200 | | | | 734 | | | | 335 | | | | 104 | |
Cost of shares redeemed | | | (7,998 | ) | | | (8,241 | ) | | | (2,393 | ) | | | (979 | ) |
| | | | | | | | | | | | | | | | |
Change in net assets resulting from Class R2 capital transactions | | $ | 2,334 | | | $ | 28,111 | | | $ | 1,062 | | | $ | 7,099 | |
| | | | | | | | | | | | | | | | |
Class R5 | | | | | | | | | | | | | | | | |
Proceeds from shares issued | | $ | 20,089 | | | $ | 75,057 | | | $ | — | | | $ | — | |
Distributions reinvested | | | 3,921 | | | | 987 | | | | — | | | | — | |
Cost of shares redeemed | | | (12,704 | ) | | | (38,175 | ) | | | — | | | | — | |
| | | | | | | | | | | | | | | | |
Change in net assets resulting from Class R5 capital transactions | | $ | 11,306 | | | $ | 37,869 | | | $ | — | | | $ | — | |
| | | | | | | | | | | | | | | | |
Class R6 | | | | | | | | | | | | | | | | |
Proceeds from shares issued | | $ | 76,226 | | | $ | 220,005 | | | $ | 9,403 | | | $ | 30,227 | |
Distributions reinvested | | | 25,967 | | | | 10,705 | | | | 1,450 | | | | 884 | |
Cost of shares redeemed | | | (23,401 | ) | | | (35,099 | ) | | | (6,732 | ) | | | (9,167 | ) |
| | | | | | | | | | | | | | | | |
Change in net assets resulting from Class R6 capital transactions | | $ | 78,792 | | | $ | 195,611 | | | $ | 4,121 | | | $ | 21,944 | |
| | | | | | | | | | | | | | | | |
Institutional Class | | | | | | | | | | | | | | | | |
Proceeds from shares issued | | $ | — | | | $ | — | | | $ | 72,978 | | | $ | 200,414 | |
Distributions reinvested | | | — | | | | — | | | | 8,769 | | | | 1,623 | |
Cost of shares redeemed | | | — | | | | — | | | | (21,857 | ) | | | (34,113 | ) |
| | | | | | | | | | | | | | | | |
Change in net assets resulting from Institutional Class capital transactions | | $ | — | | | $ | — | | | $ | 59,890 | | | $ | 167,924 | |
| | | | | | | | | | | | | | | | |
Select Class | | | | | | | | | | | | | | | | |
Proceeds from shares issued | | $ | 75,609 | | | $ | 180,916 | | | $ | 43,103 | | | $ | 99,637 | |
Distributions reinvested | | | 18,849 | | | | 9,746 | | | | 5,585 | | | | 1,883 | |
Cost of shares redeemed | | | (71,069 | ) | | | (106,365 | ) | | | (16,642 | ) | | | (30,526 | ) |
| | | | | | | | | | | | | | | | |
Change in net assets resulting from Select Class capital transactions | | $ | 23,389 | | | $ | 84,297 | | | $ | 32,046 | | | $ | 70,994 | |
| | | | | | | | | | | | | | | | |
Total change in net assets resulting from capital transactions | | $ | 133,601 | | | $ | 468,137 | | | $ | 135,228 | | | $ | 341,780 | |
| | | | | | | | | | | | | | | | |
SEE NOTES TO FINANCIAL STATEMENTS.
| | | | | | |
| | | |
| 60 | | | | J.P. MORGAN SMALL CAP FUNDS | | DECEMBER 31, 2014 |
| | | | | | | | | | | | | | | | |
| | | Small Cap Value Fund | | | U.S. Small Company Fund | |
| | | Six Months Ended
December 31, 2014
(Unaudited) | | | Year Ended
June 30, 2014 | | | Six Months Ended
December 31, 2014
(Unaudited) | | | Year Ended
June 30, 2014 | |
SHARE TRANSACTIONS: | | | | | | | | | | | | | | | | |
Class A | | | | | | | | | | | | | | | | |
Issued | | | 2,972 | | | | 9,457 | | | | 3,231 | | | | 6,312 | |
Reinvested | | | 982 | | | | 470 | | | | 298 | | | | 111 | |
Redeemed | | | (3,211 | ) | | | (5,425 | ) | | | (1,437 | ) | | | (2,385 | ) |
| | | | | | | | | | | | | | | | |
Change in Class A Shares | | | 743 | | | | 4,502 | | | | 2,092 | | | | 4,038 | |
| | | | | | | | | | | | | | | | |
Class B | | | | | | | | | | | | | | | | |
Issued | | | 1 | | | | 1 | | | | — | | | | — | |
Reinvested | | | 7 | | | | 5 | | | | — | | | | — | |
Redeemed | | | (23 | ) | | | (60 | ) | | | — | | | | — | |
| | | | | | | | | | | | | | | | |
Change in Class B Shares | | | (15 | ) | | | (54 | ) | | | — | | | | — | |
| | | | | | | | | | | | | | | | |
Class C | | | | | | | | | | | | | | | | |
Issued | | | 139 | | | | 584 | | | | 456 | | | | 1,017 | |
Reinvested | | | 120 | | | | 61 | | | | 51 | | | | 14 | |
Redeemed | | | (251 | ) | | | (441 | ) | | | (165 | ) | | | (150 | ) |
| | | | | | | | | | | | | | | | |
Change in Class C Shares | | | 8 | | | | 204 | | | | 342 | | | | 881 | |
| | | | | | | | | | | | | | | | |
Class R2 | | | | | | | | | | | | | | | | |
Issued | | | 309 | | | | 1,353 | | | | 198 | | | | 532 | |
Reinvested | | | 87 | | | | 28 | | | | 22 | | | | 7 | |
Redeemed | | | (302 | ) | | | (312 | ) | | | (150 | ) | | | (65 | ) |
| | | | | | | | | | | | | | | | |
Change in Class R2 Shares | | | 94 | | | | 1,069 | | | | 70 | | | | 474 | |
| | | | | | | | | | | | | | | | |
Class R5 | | | | | | | | | | | | | | | | |
Issued | | | 719 | | | | 2,744 | | | | — | | | | — | |
Reinvested | | | 147 | | | | 36 | | | | — | | | | — | |
Redeemed | | | (453 | ) | | | (1,358 | ) | | | — | | | | — | |
| | | | | | | | | | | | | | | | |
Change in Class R5 Shares | | | 413 | | | | 1,422 | | | | — | | | | — | |
| | | | | | | | | | | | | | | | |
Class R6 | | | | | | | | | | | | | | | | |
Issued | | | 2,718 | | | | 8,000 | | | | 585 | | | | 2,006 | |
Reinvested | | | 970 | | | | 390 | | | | 92 | | | | 58 | |
Redeemed | | | (831 | ) | | | (1,270 | ) | | | (419 | ) | | | (594 | ) |
| | | | | | | | | | | | | | | | |
Change in Class R6 Shares | | | 2,857 | | | | 7,120 | | | | 258 | | | | 1,470 | |
| | | | | | | | | | | | | | | | |
Institutional Class | | | | | | | | | | | | | | | | |
Issued | | | — | | | | — | | | | 4,520 | | | | 12,964 | |
Reinvested | | | — | | | | — | | | | 554 | | | | 107 | |
Redeemed | | | — | | | | — | | | | (1,366 | ) | | | (2,213 | ) |
| | | | | | | | | | | | | | | | |
Change in Institutional Class Shares | | | — | | | | — | | | | 3,708 | | | | 10,858 | |
| | | | | | | | | | | | | | | | |
Select Class | | | | | | | | | | | | | | | | |
Issued | | | 2,751 | | | | 6,600 | | | | 2,680 | | | | 6,536 | |
Reinvested | | | 705 | | | | 356 | | | | 354 | | | | 125 | |
Redeemed | | | (2,559 | ) | | | (3,845 | ) | | | (1,036 | ) | | | (1,971 | ) |
| | | | | | | | | | | | | | | | |
Change in Select Class Shares | | | 897 | | | | 3,111 | | | | 1,998 | | | | 4,690 | |
| | | | | | | | | | | | | | | | |
SEE NOTES TO FINANCIAL STATEMENTS.
| | | | | | | | |
| | | |
| DECEMBER 31, 2014 | | J.P. MORGAN SMALL CAP FUNDS | | | | | 61 | |
FINANCIAL HIGHLIGHTS
FOR THE PERIODS INDICATED
| | | | | | | | | | | | | | | | | | | | |
| | | | | | Per share operating performance | |
| | | | | | Investment operations | | | Distributions | |
| | | Net asset
value,
beginning
of period | | | Net
investment
income
(loss) | | | Net realized
and unrealized
gains
(losses) on
investments | | | Total from
investment
operations | | | Net
realized
gain | |
Dynamic Small Cap Growth Fund | | | | | | | | | | | | | | | | | | | | |
Class A | | | | | | | | | | | | | | | | | | | | |
Six Months Ended December 31, 2014 (Unaudited) | | $ | 25.11 | | | $ | (0.11 | )(f) | | $ | 0.78 | | | $ | 0.67 | | | $ | (2.04 | ) |
Year Ended June 30, 2014 | | | 23.10 | | | | (0.24 | )(f) | | | 4.44 | | | | 4.20 | | | | (2.19 | ) |
Year Ended June 30, 2013 | | | 18.83 | | | | (0.14 | )(f)(g) | | | 5.17 | | | | 5.03 | | | | (0.76 | ) |
Year Ended June 30, 2012 | | | 20.20 | | | | (0.13 | )(f)(h) | | | (1.24 | ) | | | (1.37 | ) | | | — | |
Year Ended June 30, 2011 | | | 13.80 | | | | (0.16 | )(f) | | | 6.56 | | | | 6.40 | | | | — | |
Year Ended June 30, 2010 | | | 11.89 | | | | (0.13 | )(f) | | | 2.04 | | | | 1.91 | | | | — | |
| | | | | |
Class B | | | | | | | | | | | | | | | | | | | | |
Six Months Ended December 31, 2014 (Unaudited) | | | 21.67 | | | | (0.14 | )(f) | | | 0.65 | | | | 0.51 | | | | (2.04 | ) |
Year Ended June 30, 2014 | | | 20.29 | | | | (0.32 | )(f) | | | 3.89 | | | | 3.57 | | | | (2.19 | ) |
Year Ended June 30, 2013 | | | 16.71 | | | | (0.22 | )(f)(g) | | | 4.56 | | | | 4.34 | | | | (0.76 | ) |
Year Ended June 30, 2012 | | | 18.01 | | | | (0.20 | )(f)(h) | | | (1.10 | ) | | | (1.30 | ) | | | — | |
Year Ended June 30, 2011 | | | 12.37 | | | | (0.23 | )(f) | | | 5.87 | | | | 5.64 | | | | — | |
Year Ended June 30, 2010 | | | 10.73 | | | | (0.19 | )(f) | | | 1.83 | | | | 1.64 | | | | — | |
| | | | | |
Class C | | | | | | | | | | | | | | | | | | | | |
Six Months Ended December 31, 2014 (Unaudited) | | | 21.61 | | | | (0.14 | )(f) | | | 0.66 | | | | 0.52 | | | | (2.04 | ) |
Year Ended June 30, 2014 | | | 20.25 | | | | (0.32 | )(f) | | | 3.87 | | | | 3.55 | | | | (2.19 | ) |
Year Ended June 30, 2013 | | | 16.68 | | | | (0.22 | )(f)(g) | | | 4.55 | | | | 4.33 | | | | (0.76 | ) |
Year Ended June 30, 2012 | | | 17.98 | | | | (0.20 | )(f)(h) | | | (1.10 | ) | | | (1.30 | ) | | | — | |
Year Ended June 30, 2011 | | | 12.35 | | | | (0.23 | )(f) | | | 5.86 | | | | 5.63 | | | | — | |
Year Ended June 30, 2010 | | | 10.71 | | | | (0.19 | )(f) | | | 1.83 | | | | 1.64 | | | | — | |
| | | | | |
Select Class | | | | | | | | | | | | | | | | | | | | |
Six Months Ended December 31, 2014 (Unaudited) | | | 27.08 | | | | (0.08 | )(f) | | | 0.85 | | | | 0.77 | | | | (2.04 | ) |
Year Ended June 30, 2014 | | | 24.70 | | | | (0.19 | )(f) | | | 4.76 | | | | 4.57 | | | | (2.19 | ) |
Year Ended June 30, 2013 | | | 20.02 | | | | (0.07 | )(f)(g) | | | 5.51 | | | | 5.44 | | | | (0.76 | ) |
Year Ended June 30, 2012 | | | 21.39 | | | | (0.06 | )(f)(h) | | | (1.31 | ) | | | (1.37 | ) | | | — | |
Year Ended June 30, 2011 | | | 14.56 | | | | (0.11 | )(f) | | | 6.94 | | | | 6.83 | | | | — | |
Year Ended June 30, 2010 | | | 12.50 | | | | (0.08 | )(f) | | | 2.14 | | | | 2.06 | | | | — | |
| (a) | Annualized for periods less than one year, unless otherwise noted. |
| (b) | Not annualized for periods less than one year. |
| (c) | Includes adjustments in accordance with accounting principles generally accepted in the United States of America and as such, the net asset values for financial reporting purposes and the returns based upon those net asset values may differ from the net asset values and returns for shareholder transactions. |
| (d) | Includes earnings credits and interest expense, if applicable, each of which is less than 0.01% unless otherwise noted. |
| (e) | Portfolio turnover is calculated by dividing the lesser of total purchases or sales of portfolio securities for the reporting period by the monthly average value of portfolio securities owned during the reporting period. Excluded from both the numerator and denominator are amounts relating to derivatives and securities whose maturities or expiration dates at the time of acquisition were one year or less. |
| (f) | Calculated based upon average shares outstanding. |
| (g) | Reflects special dividends paid out during the period by one of the Fund’s holdings. Had the Fund not received the special dividends, the net investment income (loss) per share would have been $(0.20), $(0.27), $(0.27) and $(0.14) for Class A, Class B, Class C and Select Class Shares, respectively, and the net investment income (loss) ratio would have been (1.00)%, (1.53)%, (1.51)% and (0.64)% for Class A, Class B, Class C and Select Class Shares, respectively. |
| (h) | Reflects special dividends paid out during the period by one of the Fund’s holdings. Had the Fund not received the special dividends, the net investment income (loss) per share would have been $(0.17), $(0.23), $(0.23) and $(0.10) for Class A, Class B, Class C and Select Class Shares, respectively, and the net investment income (loss) ratio would have been (0.94)%, (1.43)%, (1.43)% and (0.53)% for Class A, Class B, Class C and Select Class Shares, respectively. |
SEE NOTES TO FINANCIAL STATEMENTS.
| | | | | | |
| | | |
| 62 | | | | J.P. MORGAN SMALL CAP FUNDS | | DECEMBER 31, 2014 |
| | | | | | | | | | | | | | | | | | | | | | | | | | |
| | | Ratios/Supplemental data | |
| | | | | | | | | | Ratios to average net assets (a) | | | | |
Net asset
value,
end of
period | | | Total return
(excludes
sales charge) (b)(c) | | | Net assets,
end of
period
(000’s) | | | Net
expenses (d) | | | Net
investment
income
(loss) | | |
Expenses
without waivers,
reimbursements and
earnings credits | | | Portfolio
turnover
rate (b)(e) | |
| | | | | | | | | | | | | | | | | | | | | | | | | | |
| | | | | | | | | | | | | | | | | | | | | | | | | | |
| $ | 23.74 | | | | 3.04 | % | | $ | 70,889 | | | | 1.25 | % | | | (0.86 | )% | | | 1.46 | % | | | 26 | % |
| | 25.11 | | | | 18.56 | | | | 86,997 | | | | 1.33 | | | | (0.95 | ) | | | 1.38 | | | | 65 | |
| | 23.10 | | | | 27.61 | | | | 77,408 | | | | 1.44 | | | | (0.70 | )(g) | | | 1.44 | | | | 65 | |
| | 18.83 | | | | (6.78 | ) | | | 64,997 | | | | 1.47 | | | | (0.72 | )(h) | | | 1.48 | | | | 63 | |
| | 20.20 | | | | 46.38 | | | | 159,290 | | | | 1.42 | | | | (0.91 | ) | | | 1.50 | | | | 79 | |
| | 13.80 | | | | 16.06 | | | | 72,134 | | | | 1.49 | | | | (0.92 | ) | | | 1.78 | | | | 120 | |
| | | | | | |
| | | | | | | | | | | | | | | | | | | | | | | | | | |
| | 20.14 | | | | 2.78 | | | | 405 | | | | 1.75 | | | | (1.37 | ) | | | 1.95 | | | | 26 | |
| | 21.67 | | | | 18.00 | | | | 521 | | | | 1.84 | | | | (1.46 | ) | | | 1.88 | | | | 65 | |
| | 20.29 | | | | 26.97 | | | | 793 | | | | 1.94 | | | | (1.22 | )(g) | | | 1.95 | | | | 65 | |
| | 16.71 | | | | (7.22 | ) | | | 1,055 | | | | 1.97 | | | | (1.21 | )(h) | | | 1.98 | | | | 63 | |
| | 18.01 | | | | 45.59 | | | | 1,865 | | | | 1.99 | | | | (1.48 | ) | | | 2.04 | | | | 79 | |
| | 12.37 | | | | 15.28 | | | | 2,326 | | | | 2.09 | | | | (1.58 | ) | | | 2.39 | | | | 120 | |
| | | | | | |
| | | | | | | | | | | | | | | | | | | | | | | | | | |
| | 20.09 | | | | 2.84 | | | | 50,706 | | | | 1.75 | | | | (1.36 | ) | | | 2.01 | | | | 26 | |
| | 21.61 | | | | 17.93 | | | | 55,458 | | | | 1.83 | | | | (1.45 | ) | | | 1.88 | | | | 65 | |
| | 20.25 | | | | 26.96 | | | | 54,171 | | | | 1.94 | | | | (1.20 | )(g) | | | 1.94 | | | | 65 | |
| | 16.68 | | | | (7.23 | ) | | | 50,144 | | | | 1.97 | | | | (1.21 | )(h) | | | 1.98 | | | | 63 | |
| | 17.98 | | | | 45.59 | | | | 64,298 | | | | 1.98 | | | | (1.47 | ) | | | 2.02 | | | | 79 | |
| | 12.35 | | | | 15.31 | | | | 45,949 | | | | 2.09 | | | | (1.53 | ) | | | 2.30 | | | | 120 | |
| | | | | | |
| | | | | | | | | | | | | | | | | | | | | | | | | | |
| | 25.81 | | | | 3.19 | | | | 417,139 | | | | 1.00 | | | | (0.61 | ) | | | 1.16 | | | | 26 | |
| | 27.08 | | | | 18.87 | | | | 417,048 | | | | 1.06 | | | | (0.69 | ) | | | 1.13 | | | | 65 | |
| | 24.70 | | | | 28.02 | | | | 387,402 | | | | 1.09 | | | | (0.33 | )(g) | | | 1.19 | | | | 65 | |
| | 20.02 | | | | (6.40 | ) | | | 219,805 | | | | 1.10 | | | | (0.32 | )(h) | | | 1.22 | | | | 63 | |
| | 21.39 | | | | 46.91 | | | | 150,921 | | | | 1.08 | | | | (0.57 | ) | | | 1.24 | | | | 79 | |
| | 14.56 | | | | 16.48 | | | | 51,872 | | | | 1.09 | | | | (0.52 | ) | | | 1.53 | | | | 120 | |
SEE NOTES TO FINANCIAL STATEMENTS.
| | | | | | | | |
| | | |
| DECEMBER 31, 2014 | | J.P. MORGAN SMALL CAP FUNDS | | | | | 63 | |
FINANCIAL HIGHLIGHTS
FOR THE PERIODS INDICATED (continued)
| | | | | | | | | | | | | | | | | | | | | | | | | | | | |
| | | | | | Per share operating performance | |
| | | | | | Investment operations | | | Distributions | |
| | | Net asset
value,
beginning
of period | | | Net
investment
income
(loss) | | | Net realized
and unrealized
gains
(losses) on
investments | | | Total from
investment
operations | | | Net
investment
income | | | Net
realized
gain | | | Total
distributions | |
Small Cap Core Fund | | | | | | | | | | | | | | | | | | | | | | | | | | | | |
Select Class | | | | | | | | | | | | | | | | | | | | | | | | | | | | |
Six Months Ended December 31, 2014 (Unaudited) | | $ | 58.70 | | | $ | 0.10 | | | $ | 1.61 | | | $ | 1.71 | | | $ | (0.10 | ) | | $ | (5.99 | ) | | $ | (6.09 | ) |
Year Ended June 30, 2014 | | | 48.11 | | | | 0.15 | (f) | | | 13.44 | | | | 13.59 | | | | (0.27 | ) | | | (2.73 | ) | | | (3.00 | ) |
Year Ended June 30, 2013 | | | 37.54 | | | | 0.37 | (g) | | | 10.63 | | | | 11.00 | | | | (0.43 | ) | | | — | | | | (0.43 | ) |
Year Ended June 30, 2012 | | | 39.44 | | | | 0.27 | (h) | | | (1.98 | ) | | | (1.71 | ) | | | (0.19 | ) | | | — | | | | (0.19 | ) |
Year Ended June 30, 2011 | | | 28.60 | | | | 0.17 | | | | 10.80 | | | | 10.97 | | | | (0.13 | ) | | | — | | | | (0.13 | ) |
Year Ended June 30, 2010 | | | 23.28 | | | | 0.09 | | | | 5.47 | | | | 5.56 | | | | (0.24 | ) | | | — | | | | (0.24 | ) |
| (a) | Annualized for periods less than one year, unless otherwise noted. |
| (b) | Not annualized for periods less than one year. |
| (c) | Includes adjustments in accordance with accounting principles generally accepted in the United States of America and as such, the net asset values for financial reporting purposes and the returns based upon those net asset values may differ from the net asset values and returns for shareholder transactions. |
| (d) | Includes earnings credits and interest expense, if applicable, each of which is less than 0.01% unless otherwise noted. |
| (e) | Portfolio turnover is calculated by dividing the lesser of total purchases or sales of portfolio securities for the reporting period by the monthly average value of portfolio securities owned during the reporting period. Excluded from both the numerator and denominator are amounts relating to derivatives and securities whose maturities or expiration dates at the time of acquisition were one year or less. |
| (f) | Reflects special dividends paid out during the period by one of the Fund’s holdings. Had the Fund not received the special dividends, the net investment income (loss) per share would have been $0.09 and the net investment income (loss) ratio would have been 0.17% for Select Class Shares. |
| (g) | Reflects special dividends paid out during the period by one of the Fund’s holdings. Had the Fund not received the special dividends, the net investment income (loss) per share would have been $0.19 and the net investment income (loss) ratio would have been 0.44% for Select Class Shares. |
| (h) | Reflects special dividends paid out during the period by one of the Fund’s holdings. Had the Fund not received the special dividends, the net investment income (loss) per share would have been $0.14 and the net investment income (loss) ratio would have been 0.39% for Select Class Shares. |
SEE NOTES TO FINANCIAL STATEMENTS.
| | | | | | |
| | | |
| 64 | | | | J.P. MORGAN SMALL CAP FUNDS | | DECEMBER 31, 2014 |
| | | | | | | | | | | | | | | | | | | | | | | | | | |
| | | Ratios/Supplemental data | |
| | | | | | | | | | Ratios to average net assets (a) | | | | |
Net asset
value,
end of
period | | | Total return
(excludes
sales charge) (b)(c) | | | Net assets,
end of
period
(000’s) | | | Net
expenses (d) | | | Net
investment
income
(loss) | | |
Expenses
without waivers,
reimbursements and
earnings credits | | | Portfolio
turnover
rate (b)(e) | |
| | | | | | | | | | | | | | | | | | | | | | | | | | |
| | | | | | | | | | | | | | | | | | | | | | | | | | |
| $ | 54.32 | | | | 3.47 | % | | $ | 726,636 | | | | 0.78 | % | | | 0.37 | % | | | 1.10 | % | | | 27 | % |
| | 58.70 | | | | 28.95 | | | | 703,307 | | | | 0.79 | | | | 0.28 | (f) | | | 1.12 | | | | 51 | |
| | 48.11 | | | | 29.50 | | | | 522,295 | | | | 0.79 | | | | 0.84 | (g) | | | 1.19 | | | | 55 | |
| | 37.54 | | | | (4.29 | ) | | | 406,590 | | | | 0.80 | | | | 0.64 | (h) | | | 1.02 | | | | 45 | |
| | 39.44 | | | | 38.37 | | | | 549,530 | | | | 0.79 | | | | 0.39 | | | | 1.09 | | | | 38 | |
| | 28.60 | | | | 23.89 | | | | 491,061 | | | | 0.80 | | | | 0.40 | | | | 1.09 | | | | 40 | |
SEE NOTES TO FINANCIAL STATEMENTS.
| | | | | | | | |
| | | |
| DECEMBER 31, 2014 | | J.P. MORGAN SMALL CAP FUNDS | | | | | 65 | |
FINANCIAL HIGHLIGHTS
FOR THE PERIODS INDICATED (continued)
| | | | | | | | | | | | | | | | | | | | | | | | | | | | |
| | | | | | Per share operating performance | |
| | | | | | Investment operations | | | Distributions | |
| | | Net asset
value,
beginning
of period | | | Net
investment
income
(loss) | | | Net realized
and unrealized
gains
(losses) on
investments | | | Total from
investment
operations | | | Net
investment
income | | | Net
realized
gain | | | Total
distributions | |
Small Cap Equity Fund | |
Class A | |
Six Months Ended December 31, 2014 (Unaudited) | | $ | 46.56 | | | $ | 0.04 | (f)(g) | | $ | 0.97 | | | $ | 1.01 | | | $ | (0.08 | ) | | $ | (4.86 | ) | | $ | (4.94 | ) |
Year Ended June 30, 2014 | | | 39.94 | | | | 0.10 | (f)(h) | | | 8.97 | | | | 9.07 | | | | (0.07 | ) | | | (2.38 | ) | | | (2.45 | ) |
Year Ended June 30, 2013 | | | 36.02 | | | | 0.29 | (f)(i) | | | 7.39 | | | | 7.68 | | | | (0.36 | ) | | | (3.40 | ) | | | (3.76 | ) |
Year Ended June 30, 2012 | | | 36.72 | | | | 0.07 | (f) | | | 1.09 | | | | 1.16 | | | | (0.10 | ) | | | (1.76 | ) | | | (1.86 | ) |
Year Ended June 30, 2011 | | | 27.54 | | | | 0.14 | (f) | | | 10.15 | | | | 10.29 | | | | (0.06 | ) | | | (1.05 | ) | | | (1.11 | ) |
Year Ended June 30, 2010 | | | 23.59 | | | | 0.05 | (f) | | | 3.94 | | | | 3.99 | | | | (0.04 | ) | | | — | | | | (0.04 | ) |
| | | | | | | |
Class B | | | | | | | | | | | | | | | | | | | | | | | | | | | | |
Six Months Ended December 31, 2014 (Unaudited) | | | 38.08 | | | | (0.08 | )(f)(g) | | | 0.78 | | | | 0.70 | | | | — | | | | (4.86 | ) | | | (4.86 | ) |
Year Ended June 30, 2014 | | | 33.16 | | | | (0.09 | )(f)(h) | | | 7.39 | | | | 7.30 | | | | — | | | | (2.38 | ) | | | (2.38 | ) |
Year Ended June 30, 2013 | | | 30.51 | | | | 0.09 | (f)(i) | | | 6.17 | | | | 6.26 | | | | (0.21 | ) | | | (3.40 | ) | | | (3.61 | ) |
Year Ended June 30, 2012 | | | 31.46 | | | | (0.09 | )(f) | | | 0.90 | | | | 0.81 | | | | — | | | | (1.76 | ) | | | (1.76 | ) |
Year Ended June 30, 2011 | | | 23.79 | | | | (0.01 | )(f) | | | 8.73 | | | | 8.72 | | | | — | | | | (1.05 | ) | | | (1.05 | ) |
Year Ended June 30, 2010 | | | 20.46 | | | | (0.08 | )(f) | | | 3.41 | | | | 3.33 | | | | — | | | | — | | | | — | |
| | | | | | | |
Class C | | | | | | | | | | | | | | | | | | | | | | | | | | | | |
Six Months Ended December 31, 2014 (Unaudited) | | | 37.96 | | | | (0.06 | )(f)(g) | | | 0.75 | | | | 0.69 | | | | — | | | | (4.86 | ) | | | (4.86 | ) |
Year Ended June 30, 2014 | | | 33.06 | | | | (0.10 | )(f)(h) | | | 7.38 | | | | 7.28 | | | | — | | | | (2.38 | ) | | | (2.38 | ) |
Year Ended June 30, 2013 | | | 30.46 | | | | 0.09 | (f)(i) | | | 6.15 | | | | 6.24 | | | | (0.24 | ) | | | (3.40 | ) | | | (3.64 | ) |
Year Ended June 30, 2012 | | | 31.41 | | | | (0.08 | )(f) | | | 0.89 | | | | 0.81 | | | | — | | | | (1.76 | ) | | | (1.76 | ) |
Year Ended June 30, 2011 | | | 23.75 | | | | (0.02 | )(f) | | | 8.73 | | | | 8.71 | | | | — | | | | (1.05 | ) | | | (1.05 | ) |
Year Ended June 30, 2010 | | | 20.42 | | | | (0.08 | )(f) | | | 3.41 | | | | 3.33 | | | | — | | | | — | | | | — | |
| | | | | | | |
Class R2 | | | | | | | | | | | | | | | | | | | | | | | | | | | | |
Six Months Ended December 31, 2014 (Unaudited) | | | 45.99 | | | | (0.02 | )(f)(g) | | | 0.96 | | | | 0.94 | | | | — | | | | (4.86 | ) | | | (4.86 | ) |
Year Ended June 30, 2014 | | | 39.52 | | | | (0.01 | )(f)(h) | | | 8.86 | | | | 8.85 | | | | — | | | | (2.38 | ) | | | (2.38 | ) |
Year Ended June 30, 2013 | | | 35.67 | | | | 0.20 | (f)(i) | | | 7.31 | | | | 7.51 | | | | (0.26 | ) | | | (3.40 | ) | | | (3.66 | ) |
Year Ended June 30, 2012 | | | 36.41 | | | | (0.01 | )(f) | | | 1.07 | | | | 1.06 | | | | (0.04 | ) | | | (1.76 | ) | | | (1.80 | ) |
Year Ended June 30, 2011 | | | 27.33 | | | | 0.07 | (f) | | | 10.06 | | | | 10.13 | | | | — | | | | (1.05 | ) | | | (1.05 | ) |
Year Ended June 30, 2010 | | | 23.48 | | | | (0.04 | )(f) | | | 3.92 | | | | 3.88 | | | | (0.03 | ) | | | — | | | | (0.03 | ) |
| (a) | Annualized for periods less than one year, unless otherwise noted. |
| (b) | Not annualized for periods less than one year. |
| (c) | Includes adjustments in accordance with accounting principles generally accepted in the United States of America and as such, the net asset values for financial reporting purposes and the returns based upon those net asset values may differ from the net asset values and returns for shareholder transactions. |
| (d) | Includes earnings credits and interest expense, if applicable, each of which is less than 0.01% unless otherwise noted. |
| (e) | Portfolio turnover is calculated by dividing the lesser of total purchases or sales of portfolio securities for the reporting period by the monthly average value of portfolio securities owned during the reporting period. Excluded from both the numerator and denominator are amounts relating to derivatives and securities whose maturities or expiration dates at the time of acquisition were one year or less. |
| (f) | Calculated based upon average shares outstanding. |
| (g) | Reflects special dividends paid out during the period by several of the Fund’s holdings. Had the Fund not received the special dividends, the net investment income (loss) per share would have been $(0.01), $(0.13), $(0.10), $(0.08), $0.11 and $0.07 for Class A, Class B, Class C, Class R2, Class R5 and Select Class Shares, respectively, and the net investment income (loss) ratio would have been (0.06)%, (0.65)%, (0.56)%, (0.32)%, 0.45% and 0.27% for Class A, Class B, Class C, Class R2, Class R5 and Select Class Shares, respectively. |
| (h) | Reflects special dividends paid out during the period by several of the Fund’s holdings. Had the Fund not received the special dividends, the net investment income (loss) per share would have been $(0.04), $(0.21), $(0.21), $(0.15), $0.20 and $0.10 for Class A, Class B, Class C, Class R2, Class R5 and Select Class Shares, respectively, and the net investment income (loss) ratio would have been (0.09)%, (0.58)%, (0.59)%, (0.34)%, 0.41% and 0.21% for Class A, Class B, Class C, Class R2, Class R5 and Select Class Shares, respectively. |
| (i) | Reflects special dividends paid out during the period by several of the Fund’s holdings. Had the Fund not received the special dividends, the net investment income (loss) per share would have been $0.05, $(0.11), $(0.11), $(0.04), $0.26 and $0.18 for Class A, Class B, Class C, Class R2, Class R5 and Select Class Shares, respectively, and the net investment income (loss) ratio would have been 0.14%, (0.35)%, (0.36)%, (0.10)%, 0.62% and 0.44% for Class A, Class B, Class C, Class R2, Class R5 and Select Class Shares, respectively. |
SEE NOTES TO FINANCIAL STATEMENTS.
| | | | | | |
| | | |
| 66 | | | | J.P. MORGAN SMALL CAP FUNDS | | DECEMBER 31, 2014 |
| | | | | | | | | | | | | | | | | | | | | | | | | | |
| | | Ratios/Supplemental data | |
| | | | | | | | | | Ratios to average net assets (a) | | | | |
Net asset
value,
end of
period | | | Total return
(excludes
sales charge) (b)(c) | | | Net assets,
end of period
(000’s) | | | Net
expenses (d) | | | Net
investment
income
(loss) | | |
Expenses
without waivers,
reimbursements and
earnings credits | | | Portfolio
turnover
rate (b)(e) | |
| | | | | | | | | | | | | | | | | | | | | | | | | | |
| | | | | | | | | | | | | | | | | | | | | | | | | | |
| $ | 42.63 | | | | 2.56 | % | | $ | 693,617 | | | | 1.29 | % | | | 0.19 | %(g) | | | 1.39 | % | | | 13 | % |
| | 46.56 | | | | 23.27 | | | | 738,967 | | | | 1.29 | | | | 0.23 | (h) | | | 1.37 | | | | 30 | |
| | 39.94 | | | | 23.11 | | | | 696,784 | | | | 1.29 | | | | 0.78 | (i) | | | 1.39 | | | | 25 | |
| | 36.02 | | | | 3.79 | | | | 618,705 | | | | 1.30 | | | | 0.21 | | | | 1.41 | | | | 27 | |
| | 36.72 | | | | 37.77 | | | | 699,042 | | | | 1.29 | | | | 0.43 | | | | 1.40 | | | | 39 | |
| | 27.54 | | | | 16.91 | | | | 528,676 | | | | 1.29 | | | | 0.16 | | | | 1.38 | | | | 44 | |
| | | | | | |
| | | | | | | | | | | | | | | | | | | | | | | | | | |
| | 33.92 | | | | 2.31 | | | | 3,455 | | | | 1.79 | | | | (0.40 | )(g) | | | 1.89 | | | | 13 | |
| | 38.08 | | | | 22.67 | | | | 5,469 | | | | 1.78 | | | | (0.26 | )(h) | | | 1.87 | | | | 30 | |
| | 33.16 | | | | 22.51 | | | | 8,264 | | | | 1.79 | | | | 0.28 | (i) | | | 1.88 | | | | 25 | |
| | 30.51 | | | | 3.26 | | | | 10,036 | | | | 1.80 | | | | (0.30 | ) | | | 1.91 | | | | 27 | �� |
| | 31.46 | | | | 37.10 | | | | 13,032 | | | | 1.79 | | | | (0.05 | ) | | | 1.90 | | | | 39 | |
| | 23.79 | | | | 16.28 | | | | 12,890 | | | | 1.79 | | | | (0.33 | ) | | | 1.88 | | | | 44 | |
| | | | | | |
| | | | | | | | | | | | | | | | | | | | | | | | | | |
| | 33.79 | | | | 2.29 | | | | 36,750 | | | | 1.79 | | | | (0.31 | )(g) | | | 1.88 | | | | 13 | |
| | 37.96 | | | | 22.67 | | | | 39,824 | | | | 1.79 | | | | (0.26 | )(h) | | | 1.87 | | | | 30 | |
| | 33.06 | | | | 22.50 | | | | 37,039 | | | | 1.79 | | | | 0.28 | (i) | | | 1.88 | | | | 25 | |
| | 30.46 | | | | 3.26 | | | | 34,994 | | | | 1.80 | | | | (0.29 | ) | | | 1.91 | | | | 27 | |
| | 31.41 | | | | 37.13 | | | | 39,403 | | | | 1.79 | | | | (0.06 | ) | | | 1.90 | | | | 39 | |
| | 23.75 | | | | 16.31 | | | | 32,259 | | | | 1.79 | | | | (0.33 | ) | | | 1.88 | | | | 44 | |
| | | | | | |
| | | | | | | | | | | | | | | | | | | | | | | | | | |
| | 42.07 | | | | 2.44 | | | | 3,580 | | | | 1.54 | | | | (0.07 | )(g) | | | 1.69 | | | | 13 | |
| | 45.99 | | | | 22.95 | | | | 3,883 | | | | 1.54 | | | | (0.02 | )(h) | | | 1.62 | | | | 30 | |
| | 39.52 | | | | 22.80 | | | | 4,909 | | | | 1.54 | | | | 0.53 | (i) | | | 1.64 | | | | 25 | |
| | 35.67 | | | | 3.51 | | | | 5,587 | | | | 1.55 | | | | (0.03 | ) | | | 1.66 | | | | 27 | |
| | 36.41 | | | | 37.46 | | | | 5,109 | | | | 1.54 | | | | 0.22 | | | | 1.65 | | | | 39 | |
| | 27.33 | | | | 16.53 | | | | 4,634 | | | | 1.54 | | | | (0.16 | ) | | | 1.63 | | | | 44 | |
SEE NOTES TO FINANCIAL STATEMENTS.
| | | | | | | | |
| | | |
| DECEMBER 31, 2014 | | J.P. MORGAN SMALL CAP FUNDS | | | | | 67 | |
FINANCIAL HIGHLIGHTS
FOR THE PERIODS INDICATED (continued)
| | | | | | | | | | | | | | | | | | | | | | | | | | | | |
| | | | | | Per share operating performance | |
| | | | | | Investment operations | | | Distributions | |
| | | Net asset
value,
beginning
of period | | | Net
investment
income
(loss) | | | Net realized
and unrealized
gains
(losses) on
investments | | | Total from
investment
operations | | | Net
investment
income | | | Net
realized
gain | | | Total
distributions | |
Small Cap Equity Fund (Continued) | |
Class R5 | | | | | | | | | | | | | | | | | | | | | | | | | | | | |
Six Months Ended December 31, 2014 (Unaudited) | | $ | 51.88 | | | $ | 0.17 | (f)(g) | | $ | 1.11 | | | $ | 1.28 | | | $ | (0.30 | ) | | $ | (4.86 | ) | | $ | (5.16 | ) |
Year Ended June 30, 2014 | | | 44.21 | | | | 0.36 | (f)(h) | | | 9.96 | | | | 10.32 | | | | (0.27 | ) | | | (2.38 | ) | | | (2.65 | ) |
Year Ended June 30, 2013 | | | 39.47 | | | | 0.52 | (f)(i) | | | 8.16 | | | | 8.68 | | | | (0.54 | ) | | | (3.40 | ) | | | (3.94 | ) |
Year Ended June 30, 2012 | | | 40.04 | | | | 0.28 | (f) | | | 1.19 | | | | 1.47 | | | | (0.28 | ) | | | (1.76 | ) | | | (2.04 | ) |
Year Ended June 30, 2011 | | | 29.92 | | | | 0.31 | (f) | | | 11.06 | | | | 11.37 | | | | (0.20 | ) | | | (1.05 | ) | | | (1.25 | ) |
Year Ended June 30, 2010 | | | 25.60 | | | | 0.19 | (f) | | | 4.27 | | | | 4.46 | | | | (0.14 | ) | | | — | | | | (0.14 | ) |
| | | | | | | |
Select Class | | | | | | | | | | | | | | | | | | | | | | | | | | | | |
Six Months Ended December 31, 2014 (Unaudited) | | | 51.78 | | | | 0.13 | (f)(g) | | | 1.10 | | | | 1.23 | | | | (0.21 | ) | | | (4.86 | ) | | | (5.07 | ) |
Year Ended June 30, 2014 | | | 44.14 | | | | 0.26 | (f)(h) | | | 9.94 | | | | 10.20 | | | | (0.18 | ) | | | (2.38 | ) | | | (2.56 | ) |
Year Ended June 30, 2013 | | | 39.41 | | | | 0.44 | (f)(i) | | | 8.15 | | | | 8.59 | | | | (0.46 | ) | | | (3.40 | ) | | | (3.86 | ) |
Year Ended June 30, 2012 | | | 39.98 | | | | 0.19 | (f) | | | 1.20 | | | | 1.39 | | | | (0.20 | ) | | | (1.76 | ) | | | (1.96 | ) |
Year Ended June 30, 2011 | | | 29.88 | | | | 0.27 | (f) | | | 11.02 | | | | 11.29 | | | | (0.14 | ) | | | (1.05 | ) | | | (1.19 | ) |
Year Ended June 30, 2010 | | | 25.58 | | | | 0.13 | (f) | | | 4.27 | | | | 4.40 | | | | (0.10 | ) | | | — | | | | (0.10 | ) |
| (a) | Annualized for periods less than one year, unless otherwise noted. |
| (b) | Not annualized for periods less than one year. |
| (c) | Includes adjustments in accordance with accounting principles generally accepted in the United States of America and as such, the net asset values for financial reporting purposes and the returns based upon those net asset values may differ from the net asset values and returns for shareholder transactions. |
| (d) | Includes earnings credits and interest expense, if applicable, each of which is less than 0.01% unless otherwise noted. |
| (e) | Portfolio turnover is calculated by dividing the lesser of total purchases or sales of portfolio securities for the reporting period by the monthly average value of portfolio securities owned during the reporting period. Excluded from both the numerator and denominator are amounts relating to derivatives and securities whose maturities or expiration dates at the time of acquisition were one year or less. |
| (f) | Calculated based upon average shares outstanding. |
| (g) | Reflects special dividends paid out during the period by several of the Fund’s holdings. Had the Fund not received the special dividends, the net investment income (loss) per share would have been $(0.01), $(0.13), $(0.10), $(0.08), $0.11 and $0.07 for Class A, Class B, Class C, Class R2, Class R5 and Select Class Shares, respectively, and the net investment income (loss) ratio would have been (0.06)%, (0.65)%, (0.56)%, (0.32)%, 0.45% and 0.27% for Class A, Class B, Class C, Class R2, Class R5 and Select Class Shares, respectively. |
| (h) | Reflects special dividends paid out during the period by several of the Fund’s holdings. Had the Fund not received the special dividends, the net investment income (loss) per share would have been $(0.04), $(0.21), $(0.21), $(0.15), $0.20 and $0.10 for Class A, Class B, Class C, Class R2, Class R5 and Select Class Shares, respectively, and the net investment income (loss) ratio would have been (0.09)%, (0.58)%, (0.59)%, (0.34)%, 0.41% and 0.21% for Class A, Class B, Class C, Class R2, Class R5 and Select Class Shares, respectively. |
| (i) | Reflects special dividends paid out during the period by several of the Fund’s holdings. Had the Fund not received the special dividends, the net investment income (loss) per share would have been $0.05, $(0.11), $(0.11), $(0.04), $0.26 and $0.18 for Class A, Class B, Class C, Class R2, Class R5 and Select Class Shares, respectively, and the net investment income (loss) ratio would have been 0.14%, (0.35)%, (0.36)%, (0.10)%, 0.62% and 0.44% for Class A, Class B, Class C, Class R2, Class R5 and Select Class Shares, respectively. |
SEE NOTES TO FINANCIAL STATEMENTS.
| | | | | | |
| | | |
| 68 | | | | J.P. MORGAN SMALL CAP FUNDS | | DECEMBER 31, 2014 |
| | | | | | | | | | | | | | | | | | | | | | | | | | |
| | | Ratios/Supplemental data | |
| | | | | | | | | | Ratios to average net assets (a) | | | | |
Net asset
value,
end of
period | | | Total return
(excludes
sales charge) (b)(c) | | | Net assets,
end of period
(000’s) | | | Net
expenses (d) | | | Net
investment
income
(loss) | | |
Expenses
without waivers,
reimbursements and
earnings credits | | | Portfolio
turnover
rate (b)(e) | |
| | | | | | | | | | | | | | | | | | | | | | | | | | |
| | | | | | | | | | | | | | | | | | | | | | | | | | |
| $ | 48.00 | | | | 2.82 | % | | $ | 1,163,640 | | | | 0.79 | % | | | 0.70 | %(g) | | | 0.91 | % | | | 13 | % |
| | 51.88 | | | | 23.90 | | | | 1,177,534 | | | | 0.79 | | | | 0.73 | (h) | | | 0.92 | | | | 30 | |
| | 44.21 | | | | 23.71 | | | | 814,942 | | | | 0.79 | | | | 1.25 | (i) | | | 0.94 | | | | 25 | |
| | 39.47 | | | | 4.31 | | | | 696,200 | | | | 0.79 | | | | 0.73 | | | | 0.96 | | | | 27 | |
| | 40.04 | | | | 38.46 | | | | 567,675 | | | | 0.79 | | | | 0.85 | | | | 0.96 | | | | 39 | |
| | 29.92 | | | | 17.44 | | | | 256,458 | | | | 0.79 | | | | 0.63 | | | | 0.93 | | | | 44 | |
| | | | | | |
| | | | | | | | | | | | | | | | | | | | | | | | | | |
| | 47.94 | | | | 2.73 | | | | 1,534,164 | | | | 0.99 | | | | 0.52 | (g) | | | 1.14 | | | | 13 | |
| | 51.78 | | | | 23.65 | | | | 1,443,768 | | | | 0.99 | | | | 0.53 | (h) | | | 1.12 | | | | 30 | |
| | 44.14 | | | | 23.48 | | | | 1,134,887 | | | | 0.99 | | | | 1.07 | (i) | | | 1.14 | | | | 25 | |
| | 39.41 | | | | 4.09 | | | | 1,076,509 | | | | 1.00 | | | | 0.51 | | | | 1.16 | | | | 27 | |
| | 39.98 | | | | 38.21 | | | | 1,200,332 | | | | 0.99 | | | | 0.75 | | | | 1.15 | | | | 39 | |
| | 29.88 | | | | 17.21 | | | | 935,388 | | | | 0.99 | | | | 0.45 | | | | 1.13 | | | | 44 | |
SEE NOTES TO FINANCIAL STATEMENTS.
| | | | | | | | |
| | | |
| DECEMBER 31, 2014 | | J.P. MORGAN SMALL CAP FUNDS | | | | | 69 | |
FINANCIAL HIGHLIGHTS
FOR THE PERIODS INDICATED (continued)
| | | | | | | | | | | | | | | | | | | | |
| | | | | | Per share operating performance | |
| | | | | | Investment operations | | | Distributions | |
| | | Net asset
value,
beginning
of period | | | Net
investment
income
(loss) | | | Net realized
and unrealized
gains
(losses) on
investments | | | Total from
investment
operations | | | Net
realized
gain | |
Small Cap Growth Fund | |
Class A | |
Six Months Ended December 31, 2014 (Unaudited) | | $ | 13.96 | | | $ | (0.06 | )(f) | | $ | 0.45 | | | $ | 0.39 | | | $ | (1.12 | ) |
Year Ended June 30, 2014 | | | 13.00 | | | | (0.12 | )(f) | | | 2.52 | | | | 2.40 | | | | (1.44 | ) |
Year Ended June 30, 2013 | | | 11.13 | | | | (0.06 | )(f)(g) | | | 2.94 | | | | 2.88 | | | | (1.01 | ) |
Year Ended June 30, 2012 | | | 12.17 | | | | (0.05 | )(f)(h) | | | (0.77 | ) | | | (0.82 | ) | | | (0.22 | ) |
Year Ended June 30, 2011 | | | 8.28 | | | | (0.08 | )(f) | | | 3.97 | | | | 3.89 | | | | — | |
Year Ended June 30, 2010 | | | 6.80 | | | | (0.06 | )(f) | | | 1.54 | | | | 1.48 | | | | — | |
| | | | | |
Class B | | | | | | | | | | | | | | | | | | | | |
Six Months Ended December 31, 2014 (Unaudited) | | | 10.75 | | | | (0.07 | )(f) | | | 0.33 | | | | 0.26 | | | | (1.12 | ) |
Year Ended June 30, 2014 | | | 10.35 | | | | (0.15 | )(f) | | | 1.99 | | | | 1.84 | | | | (1.44 | ) |
Year Ended June 30, 2013 | | | 9.10 | | | | (0.10 | )(f)(g) | | | 2.36 | | | | 2.26 | | | | (1.01 | ) |
Year Ended June 30, 2012 | | | 10.04 | | | | (0.09 | )(f)(h) | | | (0.63 | ) | | | (0.72 | ) | | | (0.22 | ) |
Year Ended June 30, 2011 | | | 6.87 | | | | (0.11 | )(f) | | | 3.28 | | | | 3.17 | | | | — | |
Year Ended June 30, 2010 | | | 5.67 | | | | (0.09 | )(f) | | | 1.29 | | | | 1.20 | | | | — | |
| | | | | |
Class C | | | | | | | | | | | | | | | | | | | | |
Six Months Ended December 31, 2014 (Unaudited) | | | 11.36 | | | | (0.08 | )(f) | | | 0.36 | | | | 0.28 | | | | (1.12 | ) |
Year Ended June 30, 2014 | | | 10.87 | | | | (0.16 | )(f) | | | 2.09 | | | | 1.93 | | | | (1.44 | ) |
Year Ended June 30, 2013 | | | 9.51 | | | | (0.10 | )(f)(g) | | | 2.47 | | | | 2.37 | | | | (1.01 | ) |
Year Ended June 30, 2012 | | | 10.48 | | | | (0.09 | )(f)(h) | | | (0.66 | ) | | | (0.75 | ) | | | (0.22 | ) |
Year Ended June 30, 2011 | | | 7.17 | | | | (0.12 | )(f) | | | 3.43 | | | | 3.31 | | | | — | |
Year Ended June 30, 2010 | | | 5.92 | | | | (0.09 | )(f) | | | 1.34 | | | | 1.25 | | | | — | |
| | | | | |
Class R2 | | | | | | | | | | | | | | | | | | | | |
Six Months Ended December 31, 2014 (Unaudited) | | | 13.73 | | | | (0.07 | )(f) | | | 0.44 | | | | 0.37 | | | | (1.12 | ) |
Year Ended June 30, 2014 | | | 12.84 | | | | (0.16 | )(f) | | | 2.49 | | | | 2.33 | | | | (1.44 | ) |
Year Ended June 30, 2013 | | | 11.03 | | | | (0.09 | )(f)(g) | | | 2.91 | | | | 2.82 | | | | (1.01 | ) |
Year Ended June 30, 2012 | | | 12.09 | | | | (0.08 | )(f)(h) | | | (0.76 | ) | | | (0.84 | ) | | | (0.22 | ) |
Year Ended June 30, 2011 | | | 8.25 | | | | (0.11 | )(f) | | | 3.95 | | | | 3.84 | | | | — | |
Year Ended June 30, 2010 | | | 6.79 | | | | (0.08 | )(f) | | | 1.54 | | | | 1.46 | | | | — | |
| (a) | Annualized for periods less than one year, unless otherwise noted. |
| (b) | Not annualized for periods less than one year. |
| (c) | Includes adjustments in accordance with accounting principles generally accepted in the United States of America and as such, the net asset values for financial reporting purposes and the returns based upon those net asset values may differ from the net asset values and returns for shareholder transactions. |
| (d) | Includes earnings credits and interest expense, if applicable, each of which is less than 0.01% unless otherwise noted. |
| (e) | Portfolio turnover is calculated by dividing the lesser of total purchases or sales of portfolio securities for the reporting period by the monthly average value of portfolio securities owned during the reporting period. Excluded from both the numerator and denominator are amounts relating to derivatives and securities whose maturities or expiration dates at the time of acquisition were one year or less. |
| (f) | Calculated based upon average shares outstanding. |
| (g) | Reflects special dividends paid out during the period by one of the Fund’s holdings. Had the Fund not received the special dividends, the net investment income (loss) per share would have been $(0.09), $(0.12), $(0.13), $(0.12), $(0.04), $(0.05) and $(0.07) for Class A, Class B, Class C, Class R2, Class R6, Institutional Class and Select Class Shares, respectively, and the net investment income (loss) ratio would have been (0.80)%, (1.30)%, (1.30)%, (1.04)%, (0.29)%, (0.40)% and (0.54)% for Class A, Class B, Class C, Class R2, Class R6, Institutional Class and Select Class Shares, respectively. |
| (h) | Reflects special dividends paid out during the period by one of the Fund’s holdings. Had the Fund not received the special dividends, the net investment income (loss) per share would have been $(0.07), $(0.11), $(0.11), $(0.10), $(0.02),(0.27)% and (0.40)% for Class A, Class B, Class C, Class R2, Class R6, Institutional Class and Select Class Shares, respectively, and the net investment income (loss) ratio would have been (0.68)%, (1.18)%, (1.18)%, (0.92)%, (0.19)%, (0.03)% and (0.05)% for Class A, Class B, Class C, Class R2, Class R6, Institutional Class and Select Class Shares, respectively. |
| (i) | Commencement of offering of class of shares. |
| (j) | Amount rounds to less than $0.01. |
| (k) | Amount rounds to less than 0.01% |
SEE NOTES TO FINANCIAL STATEMENTS.
| | | | | | |
| | | |
| 70 | | | | J.P. MORGAN SMALL CAP FUNDS | | DECEMBER 31, 2014 |
| | | | | | | | | | | | | | | | | | | | | | | | | | |
| | | Ratios/Supplemental data | |
| | | | | | | | | | Ratios to average net assets (a) | | | | |
Net asset
value,
end of
period | | | Total return
(excludes
sales charge) (b)(c) | | | Net assets,
end of
period
(000’s) | | | Net
expenses (d) | | | Net
investment
income
(loss) | | |
Expenses
without waivers,
reimbursements and
earnings credits | | | Portfolio
turnover
rate (b)(e) | |
| | | | | | | | | | | | | | | | | | | | | | | | | | |
| | | | | | | | | | | | | | | | | | | | | | | | | | |
| $ | 13.23 | | | | 3.14 | % | | $ | 256,069 | | | | 1.25 | % | | | (0.87 | )% | | | 1.40 | % | | | 26 | % |
| | 13.96 | | | | 18.94 | | | | 282,408 | | | | 1.25 | | | | (0.86 | ) | | | 1.37 | | | | 58 | |
| | 13.00 | | | | 27.94 | | | | 249,986 | | | | 1.24 | | | | (0.50 | )(g) | | | 1.42 | | | | 60 | |
| | 11.13 | | | | (6.59 | ) | | | 219,946 | | | | 1.25 | | | | (0.46 | )(h) | | | 1.44 | | | | 58 | |
| | 12.17 | | | | 46.98 | | | | 271,606 | | | | 1.24 | | | | (0.72 | ) | | | 1.39 | | | | 79 | |
| | 8.28 | | | | 21.76 | | | | 144,214 | | | | 1.25 | | | | (0.71 | ) | | | 1.44 | | | | 83 | |
| | | | | | |
| | | | | | | | | | | | | | | | | | | | | | | | | | |
| | 9.89 | | | | 2.87 | | | | 1,723 | | | | 1.75 | | | | (1.37 | ) | | | 1.89 | | | | 26 | |
| | 10.75 | | | | 18.34 | | | | 2,048 | | | | 1.75 | | | | (1.37 | ) | | | 1.87 | | | | 58 | |
| | 10.35 | | | | 27.32 | | | | 3,005 | | | | 1.74 | | | | (1.01 | )(g) | | | 1.92 | | | | 60 | |
| | 9.10 | | | | (7.00 | ) | | | 3,690 | | | | 1.75 | | | | (0.97 | )(h) | | | 1.94 | | | | 58 | |
| | 10.04 | | | | 46.14 | | | | 6,049 | | | | 1.78 | | | | (1.26 | ) | | | 1.89 | | | | 79 | |
| | 6.87 | | | | 21.16 | | | | 6,318 | | | | 1.85 | | | | (1.33 | ) | | | 1.94 | | | | 83 | |
| | | | | | |
| | | | | | | | | | | | | | | | | | | | | | | | | | |
| | 10.52 | | | | 2.88 | | | | 25,807 | | | | 1.75 | | | | (1.37 | ) | | | 1.88 | | | | 26 | |
| | 11.36 | | | | 18.29 | | | | 28,035 | | | | 1.75 | | | | (1.36 | ) | | | 1.87 | | | | 58 | |
| | 10.87 | | | | 27.30 | | | | 25,415 | | | | 1.74 | | | | (1.00 | )(g) | | | 1.92 | | | | 60 | |
| | 9.51 | | | | (6.99 | ) | | | 23,689 | | | | 1.75 | | | | (0.97 | )(h) | | | 1.94 | | | | 58 | |
| | 10.48 | | | | 46.16 | | | | 31,665 | | | | 1.78 | | | | (1.26 | ) | | | 1.89 | | | | 79 | |
| | 7.17 | | | | 21.11 | | | | 19,472 | | | | 1.85 | | | | (1.31 | ) | | | 1.94 | | | | 83 | |
| | | | | | |
| | | | | | | | | | | | | | | | | | | | | | | | | | |
| | 12.98 | | | | 3.05 | | | | 27,702 | | | | 1.50 | | | | (1.12 | ) | | | 1.70 | | | | 26 | |
| | 13.73 | | | | 18.62 | | | | 31,119 | | | | 1.50 | | | | (1.11 | ) | | | 1.62 | | | | 58 | |
| | 12.84 | | | | 27.64 | | | | 26,561 | | | | 1.49 | | | | (0.75 | )(g) | | | 1.67 | | | | 60 | |
| | 11.03 | | | | (6.80 | ) | | | 22,514 | | | | 1.50 | | | | (0.71 | )(h) | | | 1.69 | | | | 58 | |
| | 12.09 | | | | 46.55 | | | | 16,109 | | | | 1.50 | | | | (0.98 | ) | | | 1.64 | | | | 79 | |
| | 8.25 | | | | 21.50 | | | | 1,561 | | | | 1.50 | | | | (0.89 | ) | | | 1.66 | | | | 83 | |
SEE NOTES TO FINANCIAL STATEMENTS.
| | | | | | | | |
| | | |
| DECEMBER 31, 2014 | | J.P. MORGAN SMALL CAP FUNDS | | | | | 71 | |
FINANCIAL HIGHLIGHTS
FOR THE PERIODS INDICATED (continued)
| | | | | | | | | | | | | | | | | | | | |
| | | | | | Per share operating performance | |
| | | | | | Investment operations | | | Distributions | |
| | | Net asset
value,
beginning
of period | | | Net
investment
income
(loss) | | | Net realized
and unrealized
gains
(losses) on
investments | | | Total from
investment
operations | | | Net
realized
gain | |
Small Cap Growth Fund (Continued) | |
Class R6 | | | | | | | | | | | | | | | | | | | | |
Six Months Ended December 31, 2014 (Unaudited) | | $ | 15.23 | | | $ | (0.03 | )(f) | | $ | 0.50 | | | $ | 0.47 | | | $ | (1.12 | ) |
Year Ended June 30, 2014 | | | 14.00 | | | | (0.06 | )(f) | | | 2.73 | | | | 2.67 | | | | (1.44 | ) |
Year Ended June 30, 2013 | | | 11.85 | | | | — | (f)(g)(j) | | | 3.16 | | | | 3.16 | | | | (1.01 | ) |
Year Ended June 30, 2012 | | | 12.88 | | | | — | (f)(g)(j) | | | (0.81 | ) | | | (0.81 | ) | | | (0.22 | ) |
November 30, 2010 (i) through June 30, 2011 | | | 11.02 | | | | (0.02 | )(f) | | | 1.88 | | | | 1.86 | | | | — | |
| | | | | |
Institutional Class | | | | | | | | | | | | | | | | | | | | |
Six Months Ended December 31, 2014 (Unaudited) | | | 15.17 | | | | (0.03 | )(f) | | | 0.49 | | | | 0.46 | | | | (1.12 | ) |
Year Ended June 30, 2014 | | | 13.96 | | | | (0.07 | )(f) | | | 2.72 | | | | 2.65 | | | | (1.44 | ) |
Year Ended June 30, 2013 | | | 11.84 | | | | (0.01 | )(f)(g) | | | 3.14 | | | | 3.13 | | | | (1.01 | ) |
Year Ended June 30, 2012 | | | 12.87 | | | | (0.01 | )(f)(h) | | | (0.80 | ) | | | (0.81 | ) | | | (0.22 | ) |
Year Ended June 30, 2011 | | | 8.73 | | | | (0.04 | )(f) | | | 4.18 | | | | 4.14 | | | | — | |
Year Ended June 30, 2010 | | | 7.13 | | | | (0.03 | )(f) | | | 1.63 | | | | 1.60 | | | | — | |
| | | | | |
Select Class | | | | | | | | | | | | | | | | | | | | |
Six Months Ended December 31, 2014 (Unaudited) | | | 14.91 | | | | (0.04 | )(f) | | | 0.48 | | | | 0.44 | | | | (1.12 | ) |
Year Ended June 30, 2014 | | | 13.77 | | | | (0.09 | )(f) | | | 2.67 | | | | 2.58 | | | | (1.44 | ) |
Year Ended June 30, 2013 | | | 11.70 | | | | (0.03 | )(f)(g) | | | 3.11 | | | | 3.08 | | | | (1.01 | ) |
Year Ended June 30, 2012 | | | 12.74 | | | | (0.02 | )(f)(h) | | | (0.80 | ) | | | (0.82 | ) | | | (0.22 | ) |
Year Ended June 30, 2011 | | | 8.65 | | | | (0.05 | )(f) | | | 4.14 | | | | 4.09 | | | | — | |
Year Ended June 30, 2010 | | | 7.08 | | | | (0.04 | )(f) | | | 1.61 | | | | 1.57 | | | | — | |
| (a) | Annualized for periods less than one year, unless otherwise noted. |
| (b) | Not annualized for periods less than one year. |
| (c) | Includes adjustments in accordance with accounting principles generally accepted in the United States of America and as such, the net asset values for financial reporting purposes and the returns based upon those net asset values may differ from the net asset values and returns for shareholder transactions. |
| (d) | Includes earnings credits and interest expense, if applicable, each of which is less than 0.01% unless otherwise noted. |
| (e) | Portfolio turnover is calculated by dividing the lesser of total purchases or sales of portfolio securities for the reporting period by the monthly average value of portfolio securities owned during the reporting period. Excluded from both the numerator and denominator are amounts relating to derivatives and securities whose maturities or expiration dates at the time of acquisition were one year or less. |
| (f) | Calculated based upon average shares outstanding. |
| (g) | Reflects special dividends paid out during the period by one of the Fund’s holdings. Had the Fund not received the special dividends, the net investment income (loss) per share would have been $(0.09), $(0.12), $(0.13), $(0.12), $(0.04), $(0.05) and $(0.07) for Class A, Class B, Class C, Class R2, Class R6, Institutional Class and Select Class Shares, respectively, and the net investment income (loss) ratio would have been (0.80)%, (1.30)%, (1.30)%, (1.04)%, (0.29)%, (0.40)% and (0.54)% for Class A, Class B, Class C, Class R2, Class R6, Institutional Class and Select Class Shares, respectively. |
| (h) | Reflects special dividends paid out during the period by one of the Fund’s holdings. Had the Fund not received the special dividends, the net investment income (loss) per share would have been $(0.07), $(0.11), $(0.11), $(0.10), $(0.02),(0.27)% and (0.40)% for Class A, Class B, Class C, Class R2, Class R6, Institutional Class and Select Class Shares, respectively, and the net investment income (loss) ratio would have been (0.68)%, (1.18)%, (1.18)%, (0.92)%, (0.19)%, (0.03)% and (0.05)% for Class A, Class B, Class C, Class R2, Class R6, Institutional Class and Select Class Shares, respectively. |
| (i) | Commencement of offering of class of shares. |
| (j) | Amount rounds to less than $0.01. |
| (k) | Amount rounds to less than 0.01% |
SEE NOTES TO FINANCIAL STATEMENTS.
| | | | | | |
| | | |
| 72 | | | | J.P. MORGAN SMALL CAP FUNDS | | DECEMBER 31, 2014 |
| | | | | | | | | | | | | | | | | | | | | | | | | | |
| | | Ratios/Supplemental data | |
| | | | | | | | | | Ratios to average net assets (a) | | | | |
Net asset
value,
end of
period | | | Total return
(excludes
sales charge) (b)(c) | | | Net assets,
end of
period
(000’s) | | | Net
expenses (d) | | | Net
investment
income
(loss) | | |
Expenses
without waivers,
reimbursements and
earnings credits | | | Portfolio
turnover
rate (b)(e) | |
| | | | | | | | | | | | | | | | | | | | | | | | | | |
| | | | | | | | | | | | | | | | | | | | | | | | | | |
| $ | 14.58 | | | | 3.41 | % | | $ | 425,988 | | | | 0.75 | % | | | (0.36 | )% | | | 0.83 | % | | | 26 | % |
| | 15.23 | | | | 19.55 | | | | 355,032 | | | | 0.75 | | | | (0.36 | ) | | | 0.87 | | | | 58 | |
| | 14.00 | | | | 28.63 | | | | 248,415 | | | | 0.75 | | | | — | (g)(k) | | | 0.92 | | | | 60 | |
| | 11.85 | | | | (6.14 | ) | | | 200,960 | | | | 0.75 | | | | 0.02 | (h) | | | 0.94 | | | | 58 | |
| | 12.88 | | | | 16.88 | | | | 83,457 | | | | 0.74 | (i) | | | (0.24 | )(i) | | | 0.88 | | | | 79 | |
| | | | | | |
| | | | | | | | | | | | | | | | | | | | | | | | | | |
| | 14.51 | | | | 3.36 | | | | 276,752 | | | | 0.85 | | | | (0.47 | ) | | | 0.96 | | | | 26 | |
| | 15.17 | | | | 19.46 | | | | 302,087 | | | | 0.85 | | | | (0.46 | ) | | | 0.97 | | | | 58 | |
| | 13.96 | | | | 28.39 | | | | 230,458 | | | | 0.85 | | | | (0.11 | )(g) | | | 1.02 | | | | 60 | |
| | 11.84 | | | | (6.15 | ) | | | 226,834 | | | | 0.85 | | | | (0.06 | )(h) | | | 1.04 | | | | 58 | |
| | 12.87 | | | | 47.42 | | | | 207,977 | | | | 0.85 | | | | (0.32 | ) | | | 1.00 | | | | 79 | |
| | 8.73 | | | | 22.44 | | | | 146,161 | | | | 0.85 | | | | (0.31 | ) | | | 1.04 | | | | 83 | |
| | | | | | |
| | | | | | | | | | | | | | | | | | | | | | | | | | |
| | 14.23 | | | | 3.28 | | | | 146,931 | | | | 1.00 | | | | (0.62 | ) | | | 1.15 | | | | 26 | |
| | 14.91 | | | | 19.20 | | | | 156,585 | | | | 1.00 | | | | (0.62 | ) | | | 1.12 | | | | 58 | |
| | 13.77 | | | | 28.30 | | | | 148,078 | | | | 1.00 | | | | (0.25 | )(g) | | | 1.17 | | | | 60 | |
| | 11.70 | | | | (6.29 | ) | | | 123,887 | | | | 1.00 | | | | (0.21 | )(h) | | | 1.19 | | | | 58 | |
| | 12.74 | | | | 47.28 | | | | 128,617 | | | | 0.99 | | | | (0.47 | ) | | | 1.14 | | | | 79 | |
| | 8.65 | | | | 22.18 | | | | 100,499 | | | | 1.00 | | | | (0.46 | ) | | | 1.19 | | | | 83 | |
SEE NOTES TO FINANCIAL STATEMENTS.
| | | | | | | | |
| | | |
| DECEMBER 31, 2014 | | J.P. MORGAN SMALL CAP FUNDS | | | | | 73 | |
FINANCIAL HIGHLIGHTS
FOR THE PERIODS INDICATED (continued)
| | | | | | | | | | | | | | | | | | | | | | | | | | | | |
| | | | | | Per share operating performance | |
| | | | | | Investment operations | | | Distributions | |
| | | Net asset
value,
beginning
of period | | | Net
investment
income
(loss) | | | Net realized
and unrealized
gains
(losses) on
investments | | | Total from
investment
operations | | | Net
investment
income | | | Net
realized
gain | | | Total
distributions | |
Small Cap Value Fund | |
Class A | |
Six Months Ended December 31, 2014 (Unaudited) | | $ | 27.98 | | | $ | 0.10 | (f)(g) | | $ | (0.04 | ) | | $ | 0.06 | | | $ | (0.10 | ) | | $ | (1.34 | ) | | $ | (1.44 | ) |
Year Ended June 30, 2014 | | | 23.77 | | | | 0.12 | (f)(h) | | | 4.87 | | | | 4.99 | | | | (0.11 | ) | | | (0.67 | ) | | | (0.78 | ) |
Year Ended June 30, 2013 | | | 18.75 | | | | 0.21 | (f)(i) | | | 5.04 | | | | 5.25 | | | | (0.23 | ) | | | — | | | | (0.23 | ) |
Year Ended June 30, 2012 | | | 18.99 | | | | 0.14 | (f) | | | (0.22 | ) | | | (0.08 | ) | | | (0.16 | ) | | | — | | | | (0.16 | ) |
Year Ended June 30, 2011 | | | 14.53 | | | | 0.12 | (f) | | | 4.46 | | | | 4.58 | | | | (0.12 | ) | | | — | | | | (0.12 | ) |
Year Ended June 30, 2010 | | | 11.46 | | | | 0.09 | (f) | | | 3.06 | | | | 3.15 | | | | (0.08 | ) | | | — | | | | (0.08 | ) |
| | | | | | | |
Class B | | | | | | | | | | | | | | | | | | | | | | | | | | | | |
Six Months Ended December 31, 2014 (Unaudited) | | | 24.43 | | | | 0.01 | (f)(g) | | | (0.03 | ) | | | (0.02 | ) | | | (0.06 | ) | | | (1.34 | ) | | | (1.40 | ) |
Year Ended June 30, 2014 | | | 20.92 | | | | (0.04 | )(f)(h) | | | 4.27 | | | | 4.23 | | | | (0.05 | ) | | | (0.67 | ) | | | (0.72 | ) |
Year Ended June 30, 2013 | | | 16.55 | | | | 0.06 | (f)(i) | | | 4.44 | | | | 4.50 | | | | (0.13 | ) | | | — | | | | (0.13 | ) |
Year Ended June 30, 2012 | | | 16.78 | | | | 0.02 | (f) | | | (0.18 | ) | | | (0.16 | ) | | | (0.07 | ) | | | — | | | | (0.07 | ) |
Year Ended June 30, 2011 | | | 12.88 | | | | 0.01 | (f) | | | 3.95 | | | | 3.96 | | | | (0.06 | ) | | | — | | | | (0.06 | ) |
Year Ended June 30, 2010 | | | 10.17 | | | | — | (f)(j) | | | 2.72 | | | | 2.72 | | | | (0.01 | ) | | | — | | | | (0.01 | ) |
| | | | | | | |
Class C | | | | | | | | | | | | | | | | | | | | | | | | | | | | |
Six Months Ended December 31, 2014 (Unaudited) | | | 24.19 | | | | 0.01 | (f)(g) | | | (0.03 | ) | | | (0.02 | ) | | | (0.07 | ) | | | (1.34 | ) | | | (1.41 | ) |
Year Ended June 30, 2014 | | | 20.73 | | | | (0.03 | )(f)(h) | | | 4.22 | | | | 4.19 | | | | (0.06 | ) | | | (0.67 | ) | | | (0.73 | ) |
Year Ended June 30, 2013 | | | 16.40 | | | | 0.06 | (f)(i) | | | 4.41 | | | | 4.47 | | | | (0.14 | ) | | | — | | | | (0.14 | ) |
Year Ended June 30, 2012 | | | 16.64 | | | | 0.03 | (f) | | | (0.19 | ) | | | (0.16 | ) | | | (0.08 | ) | | | — | | | | (0.08 | ) |
Year Ended June 30, 2011 | | | 12.78 | | | | 0.01 | (f) | | | 3.92 | | | | 3.93 | | | | (0.07 | ) | | | — | | | | (0.07 | ) |
Year Ended June 30, 2010 | | | 10.10 | | | | — | (f)(j) | | | 2.70 | | | | 2.70 | | | | (0.02 | ) | | | — | | | | (0.02 | ) |
| | | | | | | |
Class R2 | | | | | | | | | | | | | | | | | | | | | | | | | | | | |
Six Months Ended December 31, 2014 (Unaudited) | | | 27.83 | | | | 0.06 | (f)(g) | | | (0.03 | ) | | | 0.03 | | | | (0.08 | ) | | | (1.34 | ) | | | (1.42 | ) |
Year Ended June 30, 2014 | | | 23.67 | | | | 0.07 | (f)(h) | | | 4.83 | | | | 4.90 | | | | (0.07 | ) | | | (0.67 | ) | | | (0.74 | ) |
Year Ended June 30, 2013 | | | 18.68 | | | | 0.15 | (f)(i) | | | 5.03 | | | | 5.18 | | | | (0.19 | ) | | | — | | | | (0.19 | ) |
Year Ended June 30, 2012 | | | 18.93 | | | | 0.10 | (f) | | | (0.23 | ) | | | (0.13 | ) | | | (0.12 | ) | | | — | | | | (0.12 | ) |
Year Ended June 30, 2011 | | | 14.51 | | | | 0.08 | (f) | | | 4.45 | | | | 4.53 | | | | (0.11 | ) | | | — | | | | (0.11 | ) |
Year Ended June 30, 2010 | | | 11.45 | | | | 0.06 | (f) | | | 3.06 | | | | 3.12 | | | | (0.06 | ) | | | — | | | | (0.06 | ) |
| (a) | Annualized for periods less than one year, unless otherwise noted. |
| (b) | Not annualized for periods less than one year. |
| (c) | Includes adjustments in accordance with accounting principles generally accepted in the United States of America and as such, the net asset values for financial reporting purposes and the returns based upon those net asset values may differ from the net asset values and returns for shareholder transactions. |
| (d) | Includes earnings credits and interest expense, if applicable, each of which is less than 0.01% unless otherwise noted. |
| (e) | Portfolio turnover is calculated by dividing the lesser of total purchases or sales of portfolio securities for the reporting period by the monthly average value of portfolio securities owned during the reporting period. Excluded from both the numerator and denominator are amounts relating to derivatives and securities whose maturities or expiration dates at the time of acquisition were one year or less. |
| (f) | Calculated based upon average shares outstanding. |
| (g) | Reflects special dividends paid out during the period by one of the Fund’s holdings. Had the Fund not received the special dividends, the net investment income (loss) per share would have been $0.07, $(0.02), $(0.01), $0.04, $0.12, $0.14 and $0.11 for Class A, Class B, Class C, Class R2, Class R5, Class R6 and Select Class Shares, respectively, and the net investment income (loss) ratio would have been 0.52%, (0.14)%, (0.11)%, 0.26%, 0.88%, 0.96% and 0.77% for Class A, Class B, Class C, Class R2, Class R5, Class R6 and Select Class Shares, respectively. |
| (h) | Reflects special dividends paid out during the period by one of the Fund’s holdings. Had the Fund not received the special dividends, the net investment income (loss) per share would have been $0.11, $(0.05), $(0.05), $0.05, $0.22, $0.23 and $0.18 for Class A, Class B, Class C, Class R2, Class R5, Class R6 and Select Class Shares, respectively, and the net investment income (loss) ratio would have been 0.41%, (0.21)%, (0.20)%, 0.20%, 0.79%, 0.82% and 0.66% for Class A, Class B, Class C, Class R2, Class R5, Class R6 and Select Class Shares, respectively. |
| (i) | Reflects special dividends paid out during the period by one of the Fund’s holdings. Had the Fund not received the special dividends, the net investment income (loss) per share would have been $0.12, $(0.01), $(0.01), $0.06, $0.19, $0.20 and $0.17 for Class A, Class B, Class C, Class R2, Class R5, Class R6 and Select Class Shares, respectively, and the net investment income (loss) ratio would have been 0.57%, (0.08)%, (0.08)%, 0.27%, 0.86%, 0.89% and 0.77% for Class A, Class B, Class C, Class R2, Class R5, Class R6 and Select Class Shares, respectively. |
| (j) | Amount rounds to less than $0.01. |
| (k) | Effective November 30, 2010 Ultra Shares were renamed Class R6 Shares. |
SEE NOTES TO FINANCIAL STATEMENTS.
| | | | | | |
| | | |
| 74 | | | | J.P. MORGAN SMALL CAP FUNDS | | DECEMBER 31, 2014 |
| | | | | | | | | | | | | | | | | | | | | | | | | | |
| | | Ratios/Supplemental data | |
| | | | | | | | | | Ratios to average net assets (a) | | | | |
Net asset
value,
end of
period | | | Total return
(excludes
sales charge) (b)(c) | | | Net assets,
end of
period
(000’s) | | | Net
expenses (d) | | | Net
investment
income
(loss) | | |
Expenses
without waivers,
reimbursements and
earnings credits | | | Portfolio
turnover
rate (b)(e) | |
| | | | | | | | | | | | | | | | | | | | | | | | | | |
| | | | | | | | | | | | | | | | | | | | | | | | | | |
| $ | 26.60 | | | | 0.49 | % | | $ | 511,291 | | | | 1.25 | % | | | 0.71 | %(g) | | | 1.42 | % | | | 15 | % |
| | 27.98 | | | | 21.24 | | | | 516,950 | | | | 1.24 | | | | 0.46 | (h) | | | 1.40 | | | | 40 | |
| | 23.77 | | | | 28.08 | | | | 332,177 | | | | 1.24 | | | | 0.98 | (i) | | | 1.39 | | | | 38 | |
| | 18.75 | | | | (0.36 | ) | | | 184,920 | | | | 1.25 | | | | 0.79 | | | | 1.41 | | | | 38 | |
| | 18.99 | | | | 31.56 | | | | 202,094 | | | | 1.25 | | | | 0.68 | | | | 1.43 | | | | 43 | |
| | 14.53 | | | | 27.50 | | | | 150,297 | | | | 1.25 | | | | 0.64 | | | | 1.48 | | | | 50 | |
| | | | | | |
| | | | | | | | | | | | | | | | | | | | | | | | | | |
| | 23.01 | | | | 0.22 | | | | 2,553 | | | | 1.86 | | | | 0.05 | (g) | | | 1.92 | | | | 15 | |
| | 24.43 | | | | 20.50 | | | | 3,071 | | | | 1.83 | | | | (0.15 | )(h) | | | 1.89 | | | | 40 | |
| | 20.92 | | | | 27.27 | | | | 3,762 | | | | 1.85 | | | | 0.34 | (i) | | | 1.89 | | | | 38 | |
| | 16.55 | | | | (0.95 | ) | | | 3,931 | | | | 1.86 | | | | 0.16 | | | | 1.91 | | | | 38 | |
| | 16.78 | | | | 30.75 | | | | 6,611 | | | | 1.85 | | | | 0.06 | | | | 1.93 | | | | 43 | |
| | 12.88 | | | | 26.77 | | | | 7,355 | | | | 1.86 | | | | 0.03 | | | | 1.98 | | | | 50 | |
| | | | | | |
| | | | | | | | | | | | | | | | | | | | | | | | | | |
| | 22.76 | | | | 0.20 | | | | 49,967 | | | | 1.86 | | | | 0.08 | (g) | | | 1.91 | | | | 15 | |
| | 24.19 | | | | 20.45 | | | | 52,909 | | | | 1.84 | | | | (0.15 | )(h) | | | 1.89 | | | | 40 | |
| | 20.73 | | | | 27.35 | | | | 41,108 | | | | 1.85 | | | | 0.34 | (i) | | | 1.89 | | | | 38 | |
| | 16.40 | | | | (0.96 | ) | | | 28,834 | | | | 1.86 | | | | 0.18 | | | | 1.91 | | | | 38 | |
| | 16.64 | | | | 30.72 | | | | 31,602 | | | | 1.85 | | | | 0.07 | | | | 1.93 | | | | 43 | |
| | 12.78 | | | | 26.74 | | | | 23,499 | | | | 1.86 | | | | 0.03 | | | | 1.98 | | | | 50 | |
| | | | | | |
| | | | | | | | | | | | | | | | | | | | | | | | | | |
| | 26.44 | | | | 0.36 | | | | 48,050 | | | | 1.50 | | | | 0.45 | (g) | | | 1.70 | | | | 15 | |
| | 27.83 | | | | 20.95 | | | | 47,939 | | | | 1.49 | | | | 0.25 | (h) | | | 1.66 | | | | 40 | |
| | 23.67 | | | | 27.79 | | | | 15,500 | | | | 1.49 | | | | 0.69 | (i) | | | 1.64 | | | | 38 | |
| | 18.68 | | | | (0.64 | ) | | | 6,758 | | | | 1.50 | | | | 0.55 | | | | 1.66 | | | | 38 | |
| | 18.93 | | | | 31.22 | | | | 6,082 | | | | 1.49 | | | | 0.45 | | | | 1.64 | | | | 43 | |
| | 14.51 | | | | 27.20 | | | | 534 | | | | 1.50 | | | | 0.39 | | | | 1.71 | | | | 50 | |
| | | | | | |
| | | | | | | | | | | | | | | | | | | | | | | | | | |
SEE NOTES TO FINANCIAL STATEMENTS.
| | | | | | | | |
| | | |
| DECEMBER 31, 2014 | | J.P. MORGAN SMALL CAP FUNDS | | | | | 75 | |
FINANCIAL HIGHLIGHTS
FOR THE PERIODS INDICATED (continued)
| | | | | | | | | | | | | | | | | | | | | | | | | | | | |
| | | | | | Per share operating performance | |
| | | | | | Investment operations | | | Distributions | |
| | | Net asset
value,
beginning
of period | | | Net
investment
income
(loss) | | | Net realized
and unrealized
gains
(losses) on
investments | | | Total from
investment
operations | | | Net
investment
income | | | Net
realized
gain | | | Total
distributions | |
Small Cap Value Fund (Continued) | |
Class R5 | |
Six Months Ended December 31, 2014 (Unaudited) | | $ | 29.31 | | | $ | 0.15 | (f)(g) | | $ | (0.03 | ) | | $ | 0.12 | | | $ | (0.14 | ) | | $ | (1.34 | ) | | $ | (1.48 | ) |
Year Ended June 30, 2014 | | | 24.85 | | | | 0.23 | (f)(h) | | | 5.09 | | | | 5.32 | | | | (0.19 | ) | | | (0.67 | ) | | | (0.86 | ) |
Year Ended June 30, 2013 | | | 19.58 | | | | 0.29 | (f)(i) | | | 5.27 | | | | 5.56 | | | | (0.29 | ) | | | — | | | | (0.29 | ) |
Year Ended June 30, 2012 | | | 19.82 | | | | 0.20 | (f) | | | (0.22 | ) | | | (0.02 | ) | | | (0.22 | ) | | | — | | | | (0.22 | ) |
Year Ended June 30, 2011 | | | 15.15 | | | | 0.18 | (f) | | | 4.66 | | | | 4.84 | | | | (0.17 | ) | | | — | | | | (0.17 | ) |
Year Ended June 30, 2010 | | | 11.94 | | | | 0.15 | (f) | | | 3.19 | | | | 3.34 | | | | (0.13 | ) | | | — | | | | (0.13 | ) |
| | | | | | | |
Class R6 (k) | | | | | | | | | | | | | | | | | | | | | | | | | | | | |
Six Months Ended December 31, 2014 (Unaudited) | | | 29.33 | | | | 0.16 | (f)(g) | | | (0.03 | ) | | | 0.13 | | | | (0.15 | ) | | | (1.34 | ) | | | (1.49 | ) |
Year Ended June 30, 2014 | | | 24.87 | | | | 0.24 | (f)(h) | | | 5.09 | | | | 5.33 | | | | (0.20 | ) | | | (0.67 | ) | | | (0.87 | ) |
Year Ended June 30, 2013 | | | 19.59 | | | | 0.29 | (f)(i) | | | 5.29 | | | | 5.58 | | | | (0.30 | ) | | | — | | | | (0.30 | ) |
Year Ended June 30, 2012 | | | 19.83 | | | | 0.22 | (f) | | | (0.23 | ) | | | (0.01 | ) | | | (0.23 | ) | | | — | | | | (0.23 | ) |
Year Ended June 30, 2011 | | | 15.15 | | | | 0.20 | (f) | | | 4.65 | | | | 4.85 | | | | (0.17 | ) | | | — | | | | (0.17 | ) |
Year Ended June 30, 2010 | | | 11.95 | | | | 0.15 | (f) | | | 3.19 | | | | 3.34 | | | | (0.14 | ) | | | — | | | | (0.14 | ) |
| | | | | | | |
Select Class | | | | | | | | | | | | | | | | | | | | | | | | | | | | |
Six Months Ended December 31, 2014 (Unaudited) | | | 29.31 | | | | 0.14 | (f)(g) | | | (0.03 | ) | | | 0.11 | | | | (0.13 | ) | | | (1.34 | ) | | | (1.47 | ) |
Year Ended June 30, 2014 | | | 24.86 | | | | 0.20 | (f)(h) | | | 5.09 | | | | 5.29 | | | | (0.17 | ) | | | (0.67 | ) | | | (0.84 | ) |
Year Ended June 30, 2013 | | | 19.58 | | | | 0.26 | (f)(i) | | | 5.29 | | | | 5.55 | | | | (0.27 | ) | | | — | | | | (0.27 | ) |
Year Ended June 30, 2012 | | | 19.82 | | | | 0.19 | (f) | | | (0.23 | ) | | | (0.04 | ) | | | (0.20 | ) | | | — | | | | (0.20 | ) |
Year Ended June 30, 2011 | | | 15.15 | | | | 0.17 | (f) | | | 4.65 | | | | 4.82 | | | | (0.15 | ) | | | — | | | | (0.15 | ) |
Year Ended June 30, 2010 | | | 11.94 | | | | 0.13 | (f) | | | 3.20 | | | | 3.33 | | | | (0.12 | ) | | | — | | | | (0.12 | ) |
| (a) | Annualized for periods less than one year, unless otherwise noted. |
| (b) | Not annualized for periods less than one year. |
| (c) | Includes adjustments in accordance with accounting principles generally accepted in the United States of America and as such, the net asset values for financial reporting purposes and the returns based upon those net asset values may differ from the net asset values and returns for shareholder transactions. |
| (d) | Includes earnings credits and interest expense, if applicable, each of which is less than 0.01% unless otherwise noted. |
| (e) | Portfolio turnover is calculated by dividing the lesser of total purchases or sales of portfolio securities for the reporting period by the monthly average value of portfolio securities owned during the reporting period. Excluded from both the numerator and denominator are amounts relating to derivatives and securities whose maturities or expiration dates at the time of acquisition were one year or less. |
| (f) | Calculated based upon average shares outstanding. |
| (g) | Reflects special dividends paid out during the period by one of the Fund’s holdings. Had the Fund not received the special dividends, the net investment income (loss) per share would have been $0.07, $(0.02), $(0.01), $0.04, $0.12, $0.14 and $0.11 for Class A, Class B, Class C, Class R2, Class R5, Class R6 and Select Class Shares, respectively, and the net investment income (loss) ratio would have been 0.52%, (0.14)%, (0.11)%, 0.26%, 0.88%, 0.96% and 0.77% for Class A, Class B, Class C, Class R2, Class R5, Class R6 and Select Class Shares, respectively. |
| (h) | Reflects special dividends paid out during the period by one of the Fund’s holdings. Had the Fund not received the special dividends, the net investment income (loss) per share would have been $0.11, $(0.05), $(0.05), $0.05, $0.22, $0.23 and $0.18 for Class A, Class B, Class C, Class R2, Class R5, Class R6 and Select Class Shares, respectively, and the net investment income (loss) ratio would have been 0.41%, (0.21)%, (0.20)%, 0.20%, 0.79%, 0.82% and 0.66% for Class A, Class B, Class C, Class R2, Class R5, Class R6 and Select Class Shares, respectively. |
| (i) | Reflects special dividends paid out during the period by one of the Fund’s holdings. Had the Fund not received the special dividends, the net investment income (loss) per share would have been $0.12, $(0.01), $(0.01), $0.06, $0.19, $0.20 and $0.17 for Class A, Class B, Class C, Class R2, Class R5, Class R6 and Select Class Shares, respectively, and the net investment income (loss) ratio would have been 0.57%, (0.08)%, (0.08)%, 0.27%, 0.86%, 0.89% and 0.77% for Class A, Class B, Class C, Class R2, Class R5, Class R6 and Select Class Shares, respectively. |
| (j) | Amount rounds to less than $0.01. |
| (k) | Effective November 30, 2010 Ultra Shares were renamed Class R6 Shares. |
SEE NOTES TO FINANCIAL STATEMENTS.
| | | | | | |
| | | |
| 76 | | | | J.P. MORGAN SMALL CAP FUNDS | | DECEMBER 31, 2014 |
| | | | | | | | | | | | | | | | | | | | | | | | | | |
| | | Ratios/Supplemental data | |
| | | | | | | | | | Ratios to average net assets (a) | | | | |
Net asset
value,
end of
period | | | Total return
(excludes
sales charge) (b)(c) | | | Net assets,
end of
period
(000’s) | | | Net
expenses (d) | | | Net
investment
income
(loss) | | |
Expenses
without waivers,
reimbursements and
earnings credits | | | Portfolio
turnover
rate (b)(e) | |
| | | | | | | | | | | | | | | | | | | | | | | | | | |
| | | | | | | | | | | | | | | | | | | | | | | | | | |
| $ | 27.95 | | | | 0.68 | % | | $ | 87,607 | | | | 0.91 | % | | | 1.07 | %(g) | | | 0.95 | % | | | 15 | % |
| | 29.31 | | | | 21.67 | | | | 79,792 | | | | 0.90 | | | | 0.85 | (h) | | | 0.95 | | | | 40 | |
| | 24.85 | | | | 28.53 | | | | 32,304 | | | | 0.90 | | | | 1.28 | (i) | | | 0.94 | | | | 38 | |
| | 19.58 | | | | (0.03 | ) | | | 15,668 | | | | 0.91 | | | | 1.09 | | | | 0.95 | | | | 38 | |
| | 19.82 | | | | 31.95 | | | | 31,899 | | | | 0.90 | | | | 1.03 | | | | 1.00 | | | | 43 | |
| | 15.15 | | | | 27.96 | | | | 48,135 | | | | 0.91 | | | | 0.98 | | | | 1.02 | | | | 50 | |
| | | | | | |
| | | | | | | | | | | | | | | | | | | | | | | | | | |
| | 27.97 | | | | 0.71 | | | | 512,599 | | | | 0.83 | | | | 1.15 | (g) | | | 0.86 | | | | 15 | |
| | 29.33 | | | | 21.71 | | | | 453,645 | | | | 0.85 | | | | 0.87 | (h) | | | 0.90 | | | | 40 | |
| | 24.87 | | | | 28.62 | | | | 207,613 | | | | 0.85 | | | | 1.32 | (i) | | | 0.89 | | | | 38 | |
| | 19.59 | | | | 0.02 | | | | 180,853 | | | | 0.86 | | | | 1.21 | | | | 0.91 | | | | 38 | |
| | 19.83 | | | | 32.06 | | | | 103,457 | | | | 0.85 | | | | 1.06 | | | | 0.89 | | | | 43 | |
| | 15.15 | | | | 27.91 | | | | 23,660 | | | | 0.86 | | | | 1.02 | | | | 0.98 | | | | 50 | |
| | | | | | |
| | | | | | | | | | | | | | | | | | | | | | | | | | |
| | 27.95 | | | | 0.64 | | | | 411,130 | | | | 1.00 | | | | 0.96 | (g) | | | 1.16 | | | | 15 | |
| | 29.31 | | | | 21.52 | | | | 404,848 | | | | 0.99 | | | | 0.71 | (h) | | | 1.15 | | | | 40 | |
| | 24.86 | | | | 28.47 | | | | 266,018 | | | | 0.99 | | | | 1.19 | (i) | | | 1.14 | | | | 38 | |
| | 19.58 | | | | (0.11 | ) | | | 196,102 | | | | 1.00 | | | | 1.04 | | | | 1.16 | | | | 38 | |
| | 19.82 | | | | 31.86 | | | | 190,632 | | | | 0.99 | | | | 0.92 | | | | 1.18 | | | | 43 | |
| | 15.15 | | | | 27.83 | | | | 175,578 | | | | 1.00 | | | | 0.90 | | | | 1.23 | | | | 50 | |
SEE NOTES TO FINANCIAL STATEMENTS.
| | | | | | | | |
| | | |
| DECEMBER 31, 2014 | | J.P. MORGAN SMALL CAP FUNDS | | | | | 77 | |
FINANCIAL HIGHLIGHTS
FOR THE PERIODS INDICATED (continued)
| | | | | | | | | | | | | | | | | | | | | | | | | | | | |
| | | | | | Per share operating performance | |
| | | | | | Investment operations | | | Distributions | |
| | | Net asset
value,
beginning
of period | | | Net
investment
income
(loss) | | | Net realized
and unrealized
gains
(losses) on
investments | | | Total from
investment
operations | | | Net
investment
income | | | Net
realized
gain | | | Total
distributions | |
U.S. Small Company Fund | |
Class A | |
Six Months Ended December 31, 2014 (Unaudited) | | $ | 16.25 | | | $ | — | (f)(g)(k) | | $ | 0.53 | | | $ | 0.53 | | | $ | — | | | $ | (0.54 | ) | | $ | (0.54 | ) |
Year Ended June 30, 2014 | | | 13.17 | | | | (0.01 | )(f)(h) | | | 3.39 | | | | 3.38 | | | | (0.01 | ) | | | (0.29 | ) | | | (0.30 | ) |
Year Ended June 30, 2013 | | | 10.31 | | | | 0.04 | (f)(i) | | | 2.89 | | | | 2.93 | | | | (0.07 | ) | | | — | | | | (0.07 | ) |
Year Ended June 30, 2012 | | | 10.62 | | | | 0.02 | (f) | | | (0.33 | )(j) | | | (0.31 | ) | | | — | | | | — | | | | — | |
Year Ended June 30, 2011 | | | 7.79 | | | | — | (f)(k) | | | 2.86 | | | | 2.86 | | | | (0.03 | ) | | | — | | | | (0.03 | ) |
Year Ended June 30, 2010 | | | 6.17 | | | | 0.01 | (f) | | | 1.68 | | | | 1.69 | | | | (0.07 | ) | | | — | | | | (0.07 | ) |
| | | | | | | |
Class C | | | | | | | | | | | | | | | | | | | | | | | | | | | | |
Six Months Ended December 31, 2014 (Unaudited) | | | 15.86 | | | | (0.04 | )(f)(g) | | | 0.52 | | | | 0.48 | | | | — | | | | (0.54 | ) | | | (0.54 | ) |
Year Ended June 30, 2014 | | | 12.91 | | | | (0.08 | )(f)(h) | | | 3.32 | | | | 3.24 | | | | — | | | | (0.29 | ) | | | (0.29 | ) |
Year Ended June 30, 2013 | | | 10.14 | | | | (0.02 | )(f)(i) | | | 2.83 | | | | 2.81 | | | | (0.04 | ) | | | — | | | | (0.04 | ) |
Year Ended June 30, 2012 | | | 10.50 | | | | (0.02 | )(f) | | | (0.34 | )(j) | | | (0.36 | ) | | | — | | | | — | | | | — | |
Year Ended June 30, 2011 | | | 7.71 | | | | (0.05 | )(f) | | | 2.84 | | | | 2.79 | | | | — | | | | — | | | | — | |
Year Ended June 30, 2010 | | | 6.14 | | | | (0.03 | )(f) | | | 1.68 | | | | 1.65 | | | | (0.08 | ) | | | — | | | | (0.08 | ) |
| | | | | | | |
Class R2 | | | | | | | | | | | | | | | | | | | | | | | | | | | | |
Six Months Ended December 31, 2014 (Unaudited) | | | 16.12 | | | | (0.02 | )(f)(g) | | | 0.52 | | | | 0.50 | | | | — | | | | (0.54 | ) | | | (0.54 | ) |
Year Ended June 30, 2014 | | | 13.09 | | | | (0.05 | )(f)(h) | | | 3.38 | | | | 3.33 | | | | (0.01 | ) | | | (0.29 | ) | | | (0.30 | ) |
Year Ended June 30, 2013 | | | 10.25 | | | | (0.02 | )(f)(i) | | | 2.90 | | | | 2.88 | | | | (0.04 | ) | | | — | | | | (0.04 | ) |
November 1, 2011 (l) through June 30, 2012 | | | 9.02 | | | | — | (f)(k) | | | 1.27 | (j) | | | 1.27 | | | | (0.04 | ) | | | — | | | | (0.04 | ) |
| | | | | | | |
Class R6 | | | | | | | | | | | | | | | | | | | | | | | | | | | | |
Six Months Ended December 31, 2014 (Unaudited) | | | 16.52 | | | | 0.04 | (f)(g) | | | 0.54 | | | | 0.58 | | | | (0.05 | ) | | | (0.54 | ) | | | (0.59 | ) |
Year Ended June 30, 2014 | | | 13.35 | | | | 0.06 | (f)(h) | | | 3.46 | | | | 3.52 | | | | (0.06 | ) | | | (0.29 | ) | | | (0.35 | ) |
Year Ended June 30, 2013 | | | 10.43 | | | | 0.11 | (f)(i) | | | 2.91 | | | | 3.02 | | | | (0.10 | ) | | | — | | | | (0.10 | ) |
November 1, 2011(l) through June 30, 2012 | | | 9.13 | | | | 0.05 | (f) | | | 1.29 | | | | 1.34 | | | | (0.04 | ) | | | — | | | | (0.04 | ) |
| (a) | Annualized for periods less than one year, unless otherwise noted. |
| (b) | Not annualized for periods less than one year. |
| (c) | Includes adjustments in accordance with accounting principles generally accepted in the United States of America and as such, the net asset values for financial reporting purposes and the returns based upon those net asset values may differ from the net asset values and returns for shareholder transactions. |
| (d) | Includes earnings credits and interest expense, if applicable, each of which is less than 0.01% unless otherwise noted. |
| (e) | Portfolio turnover is calculated by dividing the lesser of total purchases or sales of portfolio securities for the reporting period by the monthly average value of portfolio securities owned during the reporting period. Excluded from both the numerator and denominator are amounts relating to derivatives and securities whose maturities or expiration dates at the time of acquisition were one year or less. |
| (f) | Calculated based upon average shares outstanding. |
| (g) | Reflects special dividends paid out during the period by one of the Fund’s holdings. Had the Fund not received the special dividends, the net investment income (loss) per share would have been $(0.01), $(0.05), $(0.03), $0.03, $0.03 and $0.01 for Class A, Class C, Class R2, Class R6, Institutional Class and Select Class Shares, respectively, and the net investment income (loss) ratio would have been (0.13)%, (0.63)%, (0.38)%, 0.37%, 0.31% and 0.12% for Class A, Class C, Class R2, Class R6, Institutional Class and Select Class Shares, respectively. |
| (h) | Reflects special dividends paid out during the period by one of the Fund’s holdings. Had the Fund not received the special dividends, the net investment income (loss) per share would have been $(0.02), $(0.09), $(0.05), $0.06, $0.05 and $0.02 for Class A, Class C, Class R2, Class R6, Institutional Class and Select Class Shares, respectively, and the net investment income (loss) ratio would have been (0.12)%, (0.61)%, (0.36)%, 0.38%, 0.34% and 0.13% for Class A, Class C, Class R2, Class R6, Institutional Class and Select Class Shares, respectively. |
| (i) | Reflects special dividends paid out during the period by one of the Fund’s holdings. Had the Fund not received the special dividends, the net investment income (loss) per share would have been $(0.01), $(0.07), $(0.07), $0.07, $0.05 and $0.03 for Class A, Class C, Class R2, Class R6, Institutional Class and Select Class Shares, respectively, and the net investment income (loss) ratio would have been (0.08)%, (0.57)%, (0.58)%, 0.56%, 0.41% and 0.25% for Class A, Class C, Class R2, Class R6, Institutional Class and Select Class Shares, respectively. |
| (j) | An affiliate of JPMorgan made a payment to the Fund for losses incurred from an operational error. Without this payment, the net realized and unrealized gains (losses) on investments per share would have been $(0.34), $(0.35), $1.28 and $(0.34) for Class A, Class C, Class R6 and Select Class Shares, respectively, and the total return would have been (3.01)%, (3.52)%, 14.66% and (2.70)% for Class A, Class C, Class R6 and Select Class Shares, respectively. The impact was less than $0.01 to the net realized and unrealized gains (losses) on investments per share and less than 0.01% to total return for Class R2 and Institutional Class Shares. |
| (k) | Amount rounds to less than $0.01. |
| (l) | Commencement of offering of class of shares. |
SEE NOTES TO FINANCIAL STATEMENTS.
| | | | | | |
| | | |
| 78 | | | | J.P. MORGAN SMALL CAP FUNDS | | DECEMBER 31, 2014 |
| | | | | | | | | | | | | | | | | | | | | | | | | | |
| | | Ratios/Supplemental data | |
| | | | | | | | | | Ratios to average net assets (a) | | | | |
Net asset
value,
end of
period | | | Total return
(excludes
sales charge) (b)(c) | | | Net assets,
end of
period
(000’s) | | | Net
expenses (d) | | | Net
investment
income
(loss) | | |
Expenses
without waivers,
reimbursements and
earnings credits | | | Portfolio
turnover
rate (b)(e) | |
| | | | | | | | | | | | | | | | | | | | | | | | | | |
| | | | | | | | | | | | | | | | | | | | | | | | | | |
| $ | 16.24 | | | | 3.39 | % | | $ | 160,777 | | | | 1.25 | % | | | (0.02 | )%(g) | | | 1.35 | % | | | 22 | % |
| | 16.25 | | | | 25.86 | | | | 126,858 | | | | 1.25 | | | | (0.08 | )(h) | | | 1.34 | | | | 51 | |
| | 13.17 | | | | 28.54 | | | | 49,607 | | | | 1.25 | | | | 0.31 | (i) | | | 1.43 | | | | 54 | |
| | 10.31 | | | | (2.92 | )(j) | | | 8,411 | | | | 1.26 | | | | 0.17 | | | | 1.59 | | | | 74 | |
| | 10.62 | | | | 36.78 | | | | 12,271 | | | | 1.25 | | | | 0.02 | | | | 1.50 | | | | 48 | |
| | 7.79 | | | | 27.48 | | | | 576 | | | | 1.26 | | | | 0.06 | | | | 1.67 | | | | 56 | |
| | | | | | |
| | | | | | | | | | | | | | | | | | | | | | | | | | |
| | 15.80 | | | | 3.16 | | | | 27,853 | | | | 1.75 | | | | (0.52 | )(g) | | | 1.85 | | | | 22 | |
| | 15.86 | | | | 25.27 | | | | 22,539 | | | | 1.75 | | | | (0.57 | )(h) | | | 1.84 | | | | 51 | |
| | 12.91 | | | | 27.83 | | | | 6,972 | | | | 1.75 | | | | (0.18 | )(i) | | | 1.93 | | | | 54 | |
| | 10.14 | | | | (3.43 | )(j) | | | 1,247 | | | | 1.76 | | | | (0.26 | ) | | | 2.10 | | | | 74 | |
| | 10.50 | | | | 36.19 | | | | 1,173 | | | | 1.75 | | | | (0.50 | ) | | | 2.02 | | | | 48 | |
| | 7.71 | | | | 26.81 | | | | 381 | | | | 1.76 | | | | (0.44 | ) | | | 2.18 | | | | 56 | |
| | | | | | |
| | | | | | | | | | | | | | | | | | | | | | | | | | |
| | 16.08 | | | | 3.23 | | | | 10,895 | | | | 1.50 | | | | (0.27 | )(g) | | | 1.61 | | | | 22 | |
| | 16.12 | | | | 25.66 | | | | 9,785 | | | | 1.50 | | | | (0.32 | )(h) | | | 1.59 | | | | 51 | |
| | 13.09 | | | | 28.19 | | | | 1,744 | | | | 1.50 | | | | (0.20 | )(i) | | | 1.65 | | | | 54 | |
| | 10.25 | | | | 14.17 | (j) | | | 57 | | | | 1.51 | | | | 0.02 | | | | 1.91 | | | | 74 | |
| | | | | | |
| | | | | | | | | | | | | | | | | | | | | | | | | | |
| | 16.51 | | | | 3.64 | | | | 49,853 | | | | 0.75 | | | | 0.48 | (g) | | | 0.80 | | | | 22 | |
| | 16.52 | | | | 26.54 | | | | 45,604 | | | | 0.75 | | | | 0.42 | (h) | | | 0.84 | | | | 51 | |
| | 13.35 | | | | 29.17 | | | | 17,232 | | | | 0.75 | | | | 0.95 | (i) | | | 0.97 | | | | 54 | |
| | 10.43 | | | | 14.77 | (j) | | | 12,959 | | | | 0.75 | | | | 0.70 | | | | 1.08 | | | | 74 | |
SEE NOTES TO FINANCIAL STATEMENTS.
| | | | | | | | |
| | | |
| DECEMBER 31, 2014 | | J.P. MORGAN SMALL CAP FUNDS | | | | | 79 | |
FINANCIAL HIGHLIGHTS
FOR THE PERIODS INDICATED (continued)
| | | | | | | | | | | | | | | | | | | | | | | | | | | | |
| | | | | | Per share operating performance | |
| | | | | | Investment operations | | | Distributions | |
| | | Net asset
value,
beginning
of period | | | Net
investment
income
(loss) | | | Net realized
and unrealized
gains
(losses) on
investments | | | Total from
investment
operations | | | Net
investment
income | | | Net
realized
gain | | | Total
distributions | |
U.S. Small Company Fund (continued) | |
Institutional Class | | | | | | | | | | | | | | | | | | | | | | | | | | | | |
Six Months Ended December 31, 2014 (Unaudited) | | $ | 16.51 | | | $ | 0.03 | (f)(g) | | $ | 0.55 | | | $ | 0.58 | | | $ | (0.04 | ) | | $ | (0.54 | ) | | $ | (0.58 | ) |
Year Ended June 30, 2014 | | | 13.35 | | | | 0.06 | (f)(h) | | | 3.44 | | | | 3.50 | | | | (0.05 | ) | | | (0.29 | ) | | | (0.34 | ) |
Year Ended June 30, 2013 | | | 10.43 | | | | 0.10 | (f)(i) | | | 2.92 | | | | 3.02 | | | | (0.10 | ) | | | — | | | | (0.10 | ) |
Year Ended June 30, 2012 | | | 10.75 | | | | 0.06 | (f) | | | (0.34 | )(j) | | | (0.28 | ) | | | (0.04 | ) | | | — | | | | (0.04 | ) |
Year Ended June 30, 2011 | | | 7.84 | | | | 0.04 | (f) | | | 2.90 | | | | 2.94 | | | | (0.03 | ) | | | — | | | | (0.03 | ) |
Year Ended June 30, 2010 | | | 6.20 | | | | 0.04 | (f) | | | 1.68 | | | | 1.72 | | | | (0.08 | ) | | | — | | | | (0.08 | ) |
| | | | | | | |
Select Class | | | | | | | | | | | | | | | | | | | | | | | | | | | | |
Six Months Ended December 31, 2014 (Unaudited) | | | 16.53 | | | | 0.02 | (f)(g) | | | 0.55 | | | | 0.57 | | | | (0.02 | ) | | | (0.54 | ) | | | (0.56 | ) |
Year Ended June 30, 2014 | | | 13.37 | | | | 0.03 | (f)(h) | | | 3.45 | | | | 3.48 | | | | (0.03 | ) | | | (0.29 | ) | | | (0.32 | ) |
Year Ended June 30, 2013 | | | 10.45 | | | | 0.08 | (f)(i) | | | 2.92 | | | | 3.00 | | | | (0.08 | ) | | | — | | | | (0.08 | ) |
Year Ended June 30, 2012 | | | 10.76 | | | | 0.05 | (f) | | | (0.33 | )(j) | | | (0.28 | ) | | | (0.03 | ) | | | — | | | | (0.03 | ) |
Year Ended June 30, 2011 | | | 7.86 | | | | 0.03 | (f) | | | 2.89 | | | | 2.92 | | | | (0.02 | ) | | | — | | | | (0.02 | ) |
Year Ended June 30, 2010 | | | 6.22 | | | | 0.02 | (f) | | | 1.70 | | | | 1.72 | | | | (0.08 | ) | | | — | | | | (0.08 | ) |
| (a) | Annualized for periods less than one year, unless otherwise noted. |
| (b) | Not annualized for periods less than one year. |
| (c) | Includes adjustments in accordance with accounting principles generally accepted in the United States of America and as such, the net asset values for financial reporting purposes and the returns based upon those net asset values may differ from the net asset values and returns for shareholder transactions. |
| (d) | Includes earnings credits and interest expense, if applicable, each of which is less than 0.01% unless otherwise noted. |
| (e) | Portfolio turnover is calculated by dividing the lesser of total purchases or sales of portfolio securities for the reporting period by the monthly average value of portfolio securities owned during the reporting period. Excluded from both the numerator and denominator are amounts relating to derivatives and securities whose maturities or expiration dates at the time of acquisition were one year or less. |
| (f) | Calculated based upon average shares outstanding. |
| (g) | Reflects special dividends paid out during the period by one of the Fund’s holdings. Had the Fund not received the special dividends, the net investment income (loss) per share would have been $(0.01), $(0.05), $(0.03), $0.03, $0.03 and $0.01 for Class A, Class C, Class R2, Class R6, Institutional Class and Select Class Shares, respectively, and the net investment income (loss) ratio would have been (0.13)%, (0.63)%, (0.38)%, 0.37%, 0.31% and 0.12% for Class A, Class C, Class R2, Class R6, Institutional Class and Select Class Shares, respectively. |
| (h) | Reflects special dividends paid out during the period by one of the Fund’s holdings. Had the Fund not received the special dividends, the net investment income (loss) per share would have been $(0.02), $(0.09), $(0.05), $0.06, $0.05 and $0.02 for Class A, Class C, Class R2, Class R6, Institutional Class and Select Class Shares, respectively, and the net investment income (loss) ratio would have been (0.12)%, (0.61)%, (0.36)%, 0.38%, 0.34% and 0.13% for Class A, Class C, Class R2, Class R6, Institutional Class and Select Class Shares, respectively. |
| (i) | Reflects special dividends paid out during the period by one of the Fund’s holdings. Had the Fund not received the special dividends, the net investment income (loss) per share would have been $(0.01), $(0.07), $(0.07), $0.07, $0.05 and $0.03 for Class A, Class C, Class R2, Class R6, Institutional Class and Select Class Shares, respectively, and the net investment income (loss) ratio would have been (0.08)%, (0.57)%, (0.58)%, 0.56%, 0.41% and 0.25% for Class A, Class C, Class R2, Class R6, Institutional Class and Select Class Shares, respectively. |
| (j) | An affiliate of JPMorgan made a payment to the Fund for losses incurred from an operational error. Without this payment, the net realized and unrealized gains (losses) on investments per share would have been $(0.34), $(0.35), $1.28 and $(0.34) for Class A, Class C, Class R6 and Select Class Shares, respectively, and the total return would have been (3.01)%, (3.52)%, 14.66% and (2.70)% for Class A, Class C, Class R6 and Select Class Shares, respectively. The impact was less than $0.01 to the net realized and unrealized gains (losses) on investments per share and less than 0.01% to total return for Class R2 and Institutional Class Shares. |
| (k) | Amount rounds to less than $0.01. |
| (l) | Commencement of offering of class of shares. |
SEE NOTES TO FINANCIAL STATEMENTS.
| | | | | | |
| | | |
| 80 | | | | J.P. MORGAN SMALL CAP FUNDS | | DECEMBER 31, 2014 |
| | | | | | | | | | | | | | | | | | | | | | | | | | |
| | | Ratios/Supplemental data | |
| | | | | | | | | | Ratios to average net assets (a) | | | | |
Net asset
value,
end of
period | | | Total return
(excludes
sales charge) (b)(c) | | | Net assets,
end of
period
(000’s) | | | Net
expenses (d) | | | Net
investment
income
(loss) | | |
Expenses
without waivers,
reimbursements and
earnings credits | | | Portfolio
turnover
rate (b)(e) | |
| | | | | | | | | | | | | | | | | | | | | | | | | | |
| | | | | | | | | | | | | | | | | | | | | | | | | | |
| $ | 16.51 | | | | 3.65 | % | | $ | 277,849 | | | | 0.82 | % | | | 0.42 | %(g) | | | 0.92 | % | | | 22 | % |
| | 16.51 | | | | 26.42 | | | | 216,698 | | | | 0.82 | | | | 0.39 | (h) | | | 0.94 | | | | 51 | |
| | 13.35 | | | | 29.08 | | | | 30,226 | | | | 0.82 | | | | 0.79 | (i) | | | 1.05 | | | | 54 | |
| | 10.43 | | | | (2.59 | )(j) | | | 9,350 | | | | 0.83 | | | | 0.62 | | | | 1.19 | | | | 74 | |
| | 10.75 | | | | 37.58 | | | | 20,763 | | | | 0.82 | | | | 0.42 | | | | 1.13 | | | | 48 | |
| | 7.84 | | | | 27.78 | | | | 10,729 | | | | 0.83 | | | | 0.48 | | | | 1.30 | | | | 56 | |
| | | | | | |
| | | | | | | | | | | | | | | | | | | | | | | | | | |
| | 16.54 | | | | 3.56 | | | | 193,377 | | | | 1.00 | | | | 0.23 | (g) | | | 1.09 | | | | 22 | |
| | 16.53 | | | | 26.21 | | | | 160,279 | | | | 1.00 | | | | 0.17 | (h) | | | 1.09 | | | | 51 | |
| | 13.37 | | | | 28.81 | | | | 66,928 | | | | 1.00 | | | | 0.64 | (i) | | | 1.21 | | | | 54 | |
| | 10.45 | | | | (2.60 | )(j) | | | 37,935 | | | | 1.01 | | | | 0.49 | | | | 1.35 | | | | 74 | |
| | 10.76 | | | | 37.14 | | | | 34,944 | | | | 1.00 | | | | 0.27 | | | | 1.29 | | | | 48 | |
| | 7.86 | | | | 27.61 | | | | 24,229 | | | | 1.01 | | | | 0.30 | | | | 1.45 | | | | 56 | |
SEE NOTES TO FINANCIAL STATEMENTS.
| | | | | | | | |
| | | |
| DECEMBER 31, 2014 | | J.P. MORGAN SMALL CAP FUNDS | | | | | 81 | |
NOTES TO FINANCIAL STATEMENTS
AS OF DECEMBER 31, 2014 (Unaudited)
1. Organization
JPMorgan Trust I (“JPM I”) and JPMorgan Trust II (“JPM II”) (the “Trusts”) were formed on November 12, 2004, as Delaware statutory trusts, pursuant to Declarations of Trust dated November 5, 2004 and are registered under the Investment Company Act of 1940, as amended (the “1940 Act”), as open-end management investment companies.
The following are 6 separate funds of the Trusts (collectively, the “Funds”) covered by this report:
| | | | | | |
| | | Classes Offered | | Trust | | Diversified/Non-Diversified |
| Dynamic Small Cap Growth Fund | | Class A, Class B, Class C and Select Class | | JPM I | | Diversified |
| Small Cap Core Fund | | Select Class | | JPM I | | Diversified |
| Small Cap Equity Fund | | Class A, Class B, Class C, Class R2, Class R5 and Select Class | | JPM I | | Diversified |
| Small Cap Growth Fund | | Class A, Class B, Class C, Class R2, Class R6, Institutional Class and Select Class | | JPM II | | Diversified |
| Small Cap Value Fund | | Class A, Class B, Class C, Class R2, Class R5, Class R6 and Select Class | | JPM II | | Diversified |
| U.S. Small Company Fund | | Class A, Class C, Class R2, Class R6, Institutional Class and Select Class | | JPM I | | Diversified |
The investment objectives of Dynamic Small Cap Growth Fund, Small Cap Core Fund and Small Cap Equity Fund are to seek capital growth over the long term.
The investment objective of Small Cap Growth Fund is to seek long-term capital growth primarily by investing in a portfolio of equity securities of small-capitalization and emerging growth companies.
The investment objective of Small Cap Value Fund is to seek long-term capital growth primarily by investing in equity securities of small-capitalization companies.
The investment objective of U.S. Small Company Fund is to seek to provide high total return from a portfolio of small company stocks.
All share classes of the Dynamic Small Cap Growth Fund, Small Cap Equity Fund and Small Cap Growth Fund are publicly offered only on a limited basis. Investors are not eligible to purchase shares of the Funds unless they meet certain requirements as described in the Classes’ prospectuses.
Effective November 1, 2009, Class B Shares of the Dynamic Small Cap Growth Fund, Small Cap Equity Fund, Small Cap Growth Fund and Small Cap Value Fund may not be purchased or acquired by new or existing shareholders, except through exchanges from Class B Shares of another J.P. Morgan Fund and dividend reinvestments. Shareholders who invested in Class B Shares prior to November 1, 2009 may continue to hold their Class B Shares until they automatically convert to Class A Shares.
Class A Shares generally provide for a front-end sales charge while Class B and Class C Shares provide for a contingent deferred sales charge (“CDSC”). Class B Shares automatically convert to Class A Shares after eight years. No sales charges are assessed with respect to Class R2, Class R5, Class R6, Institutional Class and Select Class Shares. All classes of shares have equal rights as to earnings, assets and voting privileges, except that each class may bear different distribution and shareholder servicing fees and each class has exclusive voting rights with respect to its distribution plan and shareholder servicing agreements. Certain Class A Shares, for which front-end sales charges have been waived, may be subject to a CDSC as described in the Funds’ prospectus.
2. Significant Accounting Policies
The following is a summary of significant accounting policies followed by the Funds in the preparation of their financial statements. The Funds are investment companies and, accordingly, follow the investment company accounting and reporting guidance of the Financial Accounting Standards Board Accounting Standards Codification Topic 946—Investment Companies, which is part of U.S. generally accepted accounting principles (“GAAP”). The preparation of financial statements in conformity with GAAP requires management to make estimates and assumptions that affect the reported amounts of assets and liabilities and disclosure of contingent assets and liabilities at the date of the financial statements and the reported amounts of increases and decreases in net assets from operations during the reporting period. Actual results could differ from those estimates.
A. Valuation of Investments — The valuation of the investments is in accordance with GAAP and the Funds’ valuation policies set forth by and under the supervision and responsibility of the Board of Trustees (the “Board”), which established the following approach to valuation, as described more fully below: (i) investments for which market quotations are readily available shall be valued at such unadjusted quoted prices and (ii) all other investments for which market quotations are not readily available shall be valued at their fair value as determined in good faith by the Board.
JPMorgan Funds Management, Inc. (the “Administrator” or “JPMFM”) has established the J.P. Morgan Asset Management Americas Valuation Committee (“AVC”) to assist the Board with the oversight and monitoring of the valuation of the Funds’ investments. The Administrator implements the valuation policies of the Funds’ investments, as directed by the Board. The AVC oversees and carries out the policies for the valuation of investments held in the Funds. This includes monitoring the appropriateness of fair values based on results of ongoing valuation oversight, including but not limited to consideration of macro or security specific events, market events and pricing vendor and broker due diligence. The Administrator is responsible for discussing and assessing the potential impacts to the fair values on an ongoing basis, and at least on a quarterly basis with the AVC and the Board.
| | | | | | |
| | | |
| 82 | | | | J.P. MORGAN SMALL CAP FUNDS | | DECEMBER 31, 2014 |
A market-based approach is primarily used to value the Funds’ investments. Investments for which market quotations are not readily available are fair valued by approved pricing vendors or third party broker-dealers (collectively referred to as “Pricing Services”) or may be internally fair valued using methods set forth by the valuation policies approved by the Board. This may include related or comparable assets or liabilities, recent transactions, market multiples, book values, and other relevant information for the investment to determine the fair value of the investment. An income-based valuation approach may be used in which the anticipated future cash flows of the investment are discounted to calculate the fair value. Discounts may also be applied due to the nature or duration of any restrictions on the disposition of the investments. Valuations may be based upon current market prices of securities that are comparable in coupon, rating, maturity and industry. It is possible that the estimated values may differ significantly from the values that would have been used, had a ready market for the investments existed, and such differences could be material.
Equities and other exchange-traded instruments are valued at the last sale price or official market closing price on the primary exchange on which the instrument is traded before the net asset values (“NAV”) of the Funds are calculated on a valuation date. Investments in open-end investment companies, including J.P. Morgan Funds, (the “Underlying Funds”) are valued at each investment company’s NAV per share as of the report date.
Fixed income instruments are valued based on prices received from Pricing Services. The Pricing Services use multiple valuation techniques to determine the valuation of fixed income instruments. In instances where sufficient market activity exists, the Pricing Services may utilize a market-based approach through which trades or quotes from market makers are used to determine the valuation of these instruments. In instances where sufficient market activity may not exist, the Pricing Services also utilize proprietary valuation models which may consider market transactions in comparable securities and the various relationships between securities in determining fair value and/or market characteristics in order to estimate the relevant cash flows, which are then discounted to calculate the fair values.
Futures are generally valued on the basis of available market quotations.
Valuations reflected in this report are as of the report date. As a result, changes in valuation due to market events and/or issuer related events after the report date and prior to issuance of the report are not reflected herein.
The various inputs that are used in determining the valuation of the Funds’ investments are summarized into the three broad levels listed below.
| Ÿ | | Level 1 — Unadjusted inputs using quoted prices in active markets for identical investments. |
| Ÿ | | Level 2— Other significant observable inputs including, but are not limited to, quoted prices for similar investments, inputs other than quoted prices that are observable for investments (such as interest rates, prepayment speeds, credit risk, etc.) or other market corroborated inputs. |
| Ÿ | | Level 3 — Significant inputs based on the best information available in the circumstances, to the extent observable inputs are not available (including the Funds’ assumptions in determining the fair value of investments). |
A financial instrument’s level within the fair value hierarchy is based on the lowest level of any input, both individually and in the aggregate, that is significant to the fair value measurement. The inputs or methodology used for valuing instruments are not necessarily an indication of the risk associated with investing in those instruments.
The following tables represent each valuation input as presented on the Schedules of Portfolio Investments (“SOIs”) (amounts in thousands):
Dynamic Small Cap Growth Fund
| | | | | | | | | | | | | | | | |
| | | Level 1
Quoted prices | | | Level 2
Other significant
observable inputs | | | Level 3
Significant
unobservable inputs | | | Total | |
Total Investments in Securities (a) | | $ | 539,845 | | | | $— | | | $ | — | | | $ | 539,845 | |
| | | | | | | | | | | | | | | | |
Small Cap Core Fund | | | | | | | | | | | | | | | | |
Investments in Securities | | | | | | | | | | | | | | | | |
Common Stocks | | | | | | | | | | | | | | | | |
Consumer Discretionary | | $ | 94,545 | | | | $— | | | $ | — | | | $ | 94,545 | |
Consumer Staples | | | 30,692 | | | | — | | | | — | | | | 30,692 | |
Energy | | | 28,862 | | | | — | | | | — | | | | 28,862 | |
Financials | | | 164,800 | | | | — | | | | — | | | | 164,800 | |
Health Care | | | 102,653 | | | | — | | | | 168 | | | | 102,821 | |
Industrials | | | 109,398 | | | | — | | | | — | | | | 109,398 | |
Information Technology | | | 125,190 | | | | — | | | | — | | | | 125,190 | |
Materials | | | 24,259 | | | | — | | | | — | | | | 24,259 | |
Telecommunication Services | | | 10,202 | | | | — | | | | — | | | | 10,202 | |
Utilities | | | 24,091 | | | | — | | | | — | | | | 24,091 | |
| | | | | | | | | | | | | | | | |
Total Common Stocks | | | 714,692 | | | | — | | | | 168 | | | | 714,860 | |
| | | | | | | | | | | | | | | | |
Short-Term Investment | | | | | | | | | | | | | | | | |
Investment Company | | $ | 10,650 | | | | $— | | | $ | — | | | $ | 10,650 | |
| | | | | | | | |
| | | |
| DECEMBER 31, 2014 | | J.P. MORGAN SMALL CAP FUNDS | | | | | 83 | |
NOTES TO FINANCIAL STATEMENTS
AS OF DECEMBER 31, 2014 (Unaudited) (continued)
| | | | | | | | | | | | | | | | |
| | | Level 1
Quoted prices | | | Level 2
Other significant
observable inputs | | | Level 3
Significant
unobservable inputs | | | Total | |
Warrant | | | | | | | | | | | | | | | | |
Financials | | $ | — | | | $ | — | | | $ | — | (b) | | $ | — | (b) |
| | | | | | | | | | | | | | | | |
Total Investments in Securities | | $ | 725,342 | | | $ | — | | | $ | 168 | | | $ | 725,510 | |
| | | | | | | | | | | | | | | | |
Appreciation in Other Financial Instruments | | | | | | | | | | | | | | | | |
Futures Contracts | | $ | 442 | | | $ | — | | | $ | — | | | $ | 442 | |
| | | | | | | | | | | | | | | | |
| | | | |
| Small Cap Equity Fund | | | | | | | | | | | | | | | | |
| | | Level 1
Quoted prices | | | Level 2
Other significant
observable inputs | | | Level 3
Significant
unobservable inputs | | | Total | |
Total Investments in Securities (a) | | $ | 3,450,281 | | | $ | — | | | $ | — | | | $ | 3,450,281 | |
| | | | | | | | | | | | | | | | |
| | | | |
| Small Cap Growth Fund | | | | | | | | | | | | | | | | |
| | | Level 1
Quoted prices | | | Level 2
Other significant
observable inputs | | | Level 3
Significant
unobservable inputs | | | Total | |
Total Investments in Securities (a) | | $ | 1,163,010 | | | $ | — | | | $ | — | | | $ | 1,163,010 | |
| | | | | | | | | | | | | | | | |
| | | | |
| Small Cap Value Fund | | | | | | | | | | | | | | | | |
| | | Level 1
Quoted prices | | | Level 2
Other significant
observable inputs | | | Level 3
Significant
unobservable inputs | | | Total | |
Investments in Securities | | | | | | | | | | | | | | | | |
Common Stocks | | | | | | | | | | | | | | | | |
Consumer Discretionary | | $ | 159,668 | | | $ | — | | | $ | — | | | $ | 159,668 | |
Consumer Staples | | | 60,850 | | | | — | | | | — | | | | 60,850 | |
Energy | | | 69,705 | | | | — | | | | — | | | | 69,705 | |
Financials | | | 616,856 | �� | | | — | | | | — | | | | 616,856 | |
Health Care | | | 84,059 | | | | — | | | | — | | | | 84,059 | |
Industrials | | | 232,028 | | | | — | | | | — | | | | 232,028 | |
Information Technology | | | 172,493 | | | | — | | | | — | | | | 172,493 | |
Materials | | | 61,905 | | | | — | | | | — | | | | 61,905 | |
Telecommunication Services | | | 10,497 | | | | — | | | | — | | | | 10,497 | |
Utilities | | | 103,307 | | | | — | | | | — | | | | 103,307 | |
| | | | | | | | | | | | | | | | |
Total Common Stocks | | | 1,571,368 | | | | — | | | | — | | | | 1,571,368 | |
| | | | | | | | | | | | | | | | |
Short-Term Investment | | | | | | | | | | | | | | | | |
Investment Company | | $ | 50,839 | | | $ | — | | | $ | — | | | $ | 50,839 | |
Warrant | | | | | | | | | | | | | | | | |
Financials | | | — | | | | — | | | | — | (b) | | | — | (b) |
| | | | | | | | | | | | | | | | |
Total Investments in Securities | | $ | 1,622,207 | | | $ | — | | | $ | — | (b) | | $ | 1,622,207 | |
| | | | | | | | | | | | | | | | |
Appreciation in Other Financial Instruments | | | | | | | | | | | | | | | | |
Futures Contracts | | $ | 1,462 | | | $ | — | | | $ | — | | | $ | 1,462 | |
| | | | | | | | | | | | | | | | |
| | | | | | |
| | | |
| 84 | | | | J.P. MORGAN SMALL CAP FUNDS | | DECEMBER 31, 2014 |
| | | | | | | | | | | | | | | | |
| U.S. Small Company Fund | | | | | | | | | | | | | | | | |
| | | Level 1
Quoted prices | | | Level 2
Other significant
observable inputs | | | Level 3
Significant
unobservable inputs | | | Total | |
Investments in Securities | | | | | | | | | | | | | | | | |
Common Stocks | | | | | | | | | | | | | | | | |
Consumer Discretionary | | $ | 94,977 | | | $ | — | | | $ | — | | | $ | 94,977 | |
Consumer Staples | | | 35,083 | | | | — | | | | — | | | | 35,083 | |
Energy | | | 28,408 | | | | — | | | | — | | | | 28,408 | |
Financials | | | 156,594 | | | | — | | | | — | | | | 156,594 | |
Health Care | | | 106,421 | | | | — | | | | — | (b) | | | 106,421 | |
Industrials | | | 94,907 | | | | — | | | | — | | | | 94,907 | |
Information Technology | | | 131,662 | | | | — | | | | — | | | | 131,662 | |
Materials | | | 21,232 | | | | — | | | | — | | | | 21,232 | |
Telecommunication Services | | | 5,901 | | | | — | | | | — | | | | 5,901 | |
Utilities | | | 22,268 | | | | — | | | | — | | | | 22,268 | |
| | | | | | | | | | | | | | | | |
Total Common Stocks | | | 697,453 | | | | — | | | | — | (b) | | | 697,453 | |
| | | | | | | | | | | | | | | | |
Short-Term Investment | | | | | | | | | | | | | | | | |
Investment Company | | $ | 34,245 | | | $ | — | | | $ | — | | | $ | 34,245 | |
Warrant | | | | | | | | | | | | | | | | |
Financials | | | — | | | | — | | | | — | (b) | | | — | (b) |
| | | | | | | | | | | | | | | | |
Total Investments in Securities | | $ | 731,698 | | | $ | — | | | $ | — | (b) | | $ | 731,698 | |
| | | | | | | | | | | | | | | | |
Appreciation in Other Financial Instruments | | | | | | | | | | | | | | | | |
Futures Contracts | | $ | 717 | | | $ | — | | | $ | — | | | $ | 717 | |
| | | | | | | | | | | | | | | | |
| (a) | All portfolio holdings designated as Level 1 are disclosed individually on the SOIs. Please refer to the SOIs for industry specifics of portfolio holdings. |
There were no transfers between Levels 1 and 2 during the six months ended December 31, 2014.
B. Restricted and Illiquid Securities — Certain securities held by the Funds may be subject to legal or contractual restrictions on resale and/or are illiquid. Restricted securities generally are resold in transactions exempt from registration under the Securities Act of 1933 (the “Securities Act”). Illiquid securities are securities which cannot be disposed of promptly (within seven days) and in the usual course of business at approximately their fair value and include, but are not limited to, repurchase agreements maturing in excess of seven days, time deposits with a withdrawal penalty, non-negotiable instruments and instruments for which no market exists. Disposal of these securities may involve time-consuming negotiations and expense. Prompt sale at the current valuation may be difficult and could adversely affect the net assets of the Funds. As of December 31, 2014, the Funds had no investments in restricted securities other than securities sold to the Funds under Rule 144A and/or Regulation S under the Securities Act.
The following are the values and percentages of net assets of illiquid securities as of December 31, 2014 (amounts in thousands):
| | | | | | | | |
| | |
| | | Value | | | Percentage | |
Small Cap Core Fund | | $ | 168 | | | | — | (b) |
Small Cap Value Fund | | | — | (a) | | | — | |
U.S. Small Company Fund | | | — | (a) | | | — | |
| (b) | Amount rounds to less than 0.1%. |
C. Futures Contracts — Small Cap Core Fund, Small Cap Value Fund and U.S. Small Company Fund use index futures contracts to gain or reduce exposure to the stock market, maintain liquidity and minimize transaction costs. The Funds also buy futures contracts to immediately invest incoming cash in the market or sell futures in response to cash outflows, thereby simulating an invested position in the underlying index while maintaining a cash balance for liquidity. The use of futures contracts exposes the Funds to equity price risk.
Futures contracts provide for the delayed delivery of the underlying instrument at a fixed price or are settled for a cash amount based on the change in the value of the underlying instrument at a specific date in the future. Upon entering into a futures contract, the Funds are required to
| | | | | | | | |
| | | |
| DECEMBER 31, 2014 | | J.P. MORGAN SMALL CAP FUNDS | | | | | 85 | |
NOTES TO FINANCIAL STATEMENTS
AS OF DECEMBER 31, 2014 (Unaudited) (continued)
deposit with the broker, cash or securities in an amount equal to a certain percentage of the contract amount, which is referred to as the initial margin deposit. Subsequent payments, referred to as variation margin, are made or received by the Funds periodically and are based on changes in the market value of open futures contracts. Changes in the market value of open futures contracts are recorded as change in net unrealized appreciation/ depreciation in the Statements of Operations. Realized gains or losses, representing the difference between the value of the contract at the time it was opened and the value at the time it was closed, are reported in the Statements of Operations at the closing or expiration of the futures contract. Securities deposited as initial margin are designated in the SOIs and cash deposited is recorded in the Statements of Assets and Liabilities. A receivable from and/or a payable to brokers for the daily variation margin is also recorded in the Statements of Assets and Liabilities.
The Funds may be subject to the risk that the change in the value of the futures contract may not correlate perfectly with the underlying instrument. Use of long futures contracts subjects the Funds to risk of loss in excess of the amounts shown on the Statements of Assets and Liabilities, up to the notional amount of the futures contracts. Use of short futures contracts subjects the Funds to unlimited risk of loss. The Funds may enter into futures contracts only on exchanges or boards of trade. The exchange or board of trade acts as the counterparty to each futures transaction; therefore, the Funds’ credit risk is limited to failure of the exchange or board of trade. Under some circumstances, futures exchanges may establish daily limits on the amount that the price of a futures contract can vary from the previous day’s settlement price, which could effectively prevent liquidation of positions.
The table below discloses the volume of the Funds’ futures contracts activity during the six months ended December 31, 2014 (amounts in thousands):
| | | | | | | | | | | | |
| | | Small Cap
Core Fund | | �� | Small Cap
Value Fund | | | U.S. Small
Company Fund | |
Futures Contracts: | | | | | | | | | | | | |
Average Notional Balance Long | | $ | 12,990 | | | $ | 49,402 | | | $ | 22,590 | |
Ending Notional Balance Long | | | 11,647 | | | | 52,230 | | | | 19,571 | |
The Funds’ futures contracts are not subject to master netting arrangements (the right to close out all transactions traded with a counterparty and net amounts owed or due across transactions).
D. Security Transactions and Investment Income — Investment transactions are accounted for on the trade date (the date the order to buy or sell is executed). Securities gains and losses are calculated on a specifically identified cost basis. Interest income is determined on the basis of coupon interest accrued using the effective interest method which adjusts for amortization of premiums and accretion of discounts. Dividend income net of foreign taxes withheld, if any, is recorded on the ex-dividend date or when a Fund first learns of the dividend.
To the extent such information is publicly available, the Funds record distributions received in excess of income earned from underlying investments as a reduction of cost of investments and/or realized gain. Such amounts are based on estimates if actual amounts are not available and actual amounts of income, realized gain and return of capital may differ from the estimated amounts. The Funds adjust the estimated amounts of the components of distributions (and consequently their net investment income) as necessary once the issuers provide information about the actual composition of the distributions.
E. Allocation of Income and Expenses — Expenses directly attributable to a fund are charged directly to that fund, while the expenses attributable to more than one fund of the Trusts are allocated among the respective funds. In calculating the NAV of each class, investment income, realized and unrealized gains and losses and expenses, other than class specific expenses, are allocated daily to each class of shares based upon the proportion of net assets of each class at the beginning of each day.
F. Federal Income Taxes — Each Fund is treated as a separate taxable entity for Federal income tax purposes. Each Fund’s policy is to comply with the provisions of the Internal Revenue Code of 1986, as amended (the “Code”), applicable to regulated investment companies and to distribute to shareholders all of its distributable net investment income and net realized capital gains on investments. Accordingly, no provision for Federal income tax is necessary. Management has reviewed the Funds’ tax positions for all open tax years and has determined that as of December 31, 2014, no liability for income tax is required in the Funds’ financial statements for net unrecognized tax benefits. However, management’s conclusions may be subject to future review based on changes in, or the interpretation of, the accounting standards or tax laws and regulations. Each of the Fund’s Federal tax returns for the prior three fiscal years remains subject to examination by the Internal Revenue Service.
G. Distributions to Shareholders — Distributions from net investment income are generally declared and paid at least annually, except for Small Cap Value Fund, which are generally declared and paid quarterly. Distributions are declared separately for each class. No class has preferential dividend rights; differences in per share rates are due to differences in separate class expenses. Net realized capital gains, if any, are distributed by each Fund at least annually. The amount of distributions from net investment income and net realized capital gains is determined in accordance with Federal income tax regulations, which may differ from GAAP. To the extent these “book/tax” differences are permanent in nature (i.e., that they result from other than timing of recognition — “temporary differences”), such amounts are reclassified within the capital accounts based on their Federal tax-basis treatment.
| | | | | | |
| | | |
| 86 | | | | J.P. MORGAN SMALL CAP FUNDS | | DECEMBER 31, 2014 |
3. Fees and Other Transactions with Affiliates
A. Investment Advisory Fee — Pursuant to the Investment Advisory Agreements, J.P. Morgan Investment Management, Inc. (the “Adviser” or “JPMIM”), an indirect, wholly-owned subsidiary of JPMorgan Chase & Co. (“JPMorgan”), supervises the investments of each Fund and for such services is paid a fee. The fee is accrued daily and paid monthly based on each Fund’s respective average daily net assets. The annual rate for each Fund is as follows:
| | | | |
Dynamic Small Cap Growth Fund | | | 0.65 | % |
Small Cap Core Fund | | | 0.65 | |
Small Cap Equity Fund | | | 0.65 | |
Small Cap Growth Fund | | | 0.65 | |
Small Cap Value Fund | | | 0.65 | |
U.S. Small Company Fund | | | 0.60 | |
The Adviser waived Investment Advisory fees and/or reimbursed expenses as outlined in Note 3.F.
B. Administration Fee — Pursuant to an Administration Agreement, the Administrator, an indirect, wholly-owned subsidiary of JPMorgan, provides certain administration services to the Funds. In consideration of these services, the Administrator receives a fee accrued daily and paid monthly at an annual rate of 0.15% of the first $25 billion of the average daily net assets of all funds in the J.P. Morgan Funds Complex covered by the Administration Agreement (excluding certain funds of funds and money market funds) and 0.075% of the average daily net assets in excess of $25 billion of all such funds. For the six months ended December 31, 2014, the effective annualized rate was 0.08% of each Fund’s average daily net assets, notwithstanding any fee waivers and/or expense reimbursements.
The Administrator waived Administration fees as outlined in Note 3.F.
JPMorgan Chase Bank, N.A. (“JPMCB”), a wholly-owned subsidiary of JPMorgan, serves as the Funds’ sub-administrator (the “Sub-administrator”). For its services as Sub-administrator, JPMCB receives a portion of the fees payable to the Administrator.
C. Distribution Fees — Pursuant to a Distribution Agreement, JPMorgan Distribution Services, Inc. (the “Distributor”), a wholly-owned subsidiary of JPMorgan, serves as the Trusts’ exclusive underwriter and promotes and arranges for the sale of each Fund’s shares.
The Board has adopted a Distribution Plan (the “Distribution Plan”) for Class A, Class B, Class C and Class R2 Shares of the Funds in accordance with Rule 12b-1 under the 1940 Act. The Distribution Plan provides that each Fund shall pay distribution fees, including payments to the Distributor, at annual rates of the average daily net assets as shown in the table below:
| | | | | | | | | | | | | | | | |
| | | Class A | | | Class B | | | Class C | | | Class R2 | |
Dynamic Small Cap Growth Fund | | | 0.25 | % | | | 0.75 | % | | | 0.75 | % | | | n/a | |
Small Cap Equity Fund | | | 0.25 | | | | 0.75 | | | | 0.75 | | | | 0.50 | % |
Small Cap Growth Fund | | | 0.25 | | | | 0.75 | | | | 0.75 | | | | 0.50 | |
Small Cap Value Fund | | | 0.25 | | | | 0.75 | | | | 0.75 | | | | 0.50 | |
U.S. Small Company Fund | | | 0.25 | | | | n/a | | | | 0.75 | | | | 0.50 | |
In addition, the Distributor is entitled to receive the front-end sales charges from purchases of Class A Shares and the CDSC from redemptions of Class B and Class C Shares and certain Class A Shares for which front-end sales charges have been waived. For the six months ended December 31, 2014, the Distributor retained the following (amounts in thousands):
| | | | | | | | |
| | | Front-End Sales Charge | | | CDSC | |
Dynamic Small Cap Growth Fund | | $ | — | (a) | | $ | — | |
Small Cap Equity Fund | | | 2 | | | | 2 | |
Small Cap Growth Fund | | | 2 | | | | 1 | |
Small Cap Value Fund | | | 12 | | | | — | (a) |
U.S. Small Company Fund | | | 6 | | | | — | (a) |
| (a) | Amount rounds to less than $1,000. |
| | | | | | | | |
| | | |
| DECEMBER 31, 2014 | | J.P. MORGAN SMALL CAP FUNDS | | | | | 87 | |
NOTES TO FINANCIAL STATEMENTS
AS OF DECEMBER 31, 2014 (Unaudited) (continued)
D. Shareholder Servicing Fees — The Trusts, on behalf of the Funds, have entered into Shareholder Servicing Agreements with the Distributor under which the Distributor provides certain support services to the shareholders. The Class R6 Shares do not participate in the Shareholder Servicing Agreement. For performing these services, the Distributor receives a fee that is accrued daily and paid monthly equal to a percentage of the average daily net assets as shown in the table below:
| | | | | | | | | | | | | | | | | | | | | | | | | | | | |
| | | Class A | | | Class B | | | Class C | | | Class R2 | | | Class R5 | | | Institutional Class | | | Select Class | |
Dynamic Small Cap Growth Fund | | | 0.25 | % | | | 0.25 | % | | | 0.25 | % | | | n/a | | | | n/a | | | | n/a | | | | 0.25 | % |
Small Cap Core Fund | | | n/a | | | | n/a | | | | n/a | | | | n/a | | | | n/a | | | | n/a | | | | 0.25 | |
Small Cap Equity Fund | | | 0.25 | | | | 0.25 | | | | 0.25 | | | | 0.25 | % | | | 0.05 | % | | | n/a | | | | 0.25 | |
Small Cap Growth Fund | | | 0.25 | | | | 0.25 | | | | 0.25 | | | | 0.25 | | | | n/a | | | | 0.10 | % | | | 0.25 | |
Small Cap Value Fund | | | 0.25 | | | | 0.25 | | | | 0.25 | | | | 0.25 | | | | 0.05 | | | | n/a | | | | 0.25 | |
U.S. Small Company Fund | | | 0.25 | | | | n/a | | | | 0.25 | | | | 0.25 | | | | n/a | | | | 0.10 | | | | 0.25 | |
The Distributor has entered into shareholder services contracts with affiliated and unaffiliated financial intermediaries who provide shareholder services and other related services to their clients or customers who invest in the Funds under which the Distributor will pay all or a portion of such fees earned to financial intermediaries for performing such services.
The Distributor waived Shareholder Servicing fees as outlined in Note 3.F.
E. Custodian and Accounting Fees — JPMCB provides portfolio custody and accounting services to the Funds. For these services, the Funds pay JPMCB transaction and asset-based fees that vary according to the number of transactions and positions, plus out-of-pocket expenses. The amounts paid directly to JPMCB by the Funds for custody and accounting services are included in Custodian and accounting fees in the Statements of Operations. Payments to the custodian may be reduced by credits earned by each Fund, based on uninvested cash balances held by the custodian. Such earnings credits, if any, are presented separately in the Statements of Operations.
Interest expense paid to the custodian related to cash overdrafts, if any, is included in Interest expense to affiliates in the Statements of Operations.
F. Waivers and Reimbursements — The Adviser, Administrator and Distributor have contractually agreed to waive fees and/or reimburse the Funds to the extent that total annual operating expenses (excluding acquired fund fees and expenses, dividend expenses related to short sales, interest, taxes, expenses related to litigation and potential litigation, extraordinary expenses and expenses related to the Board’s deferred compensation plan) exceed the percentages of the Funds’ respective average daily net assets as shown in the table below:
| | | | | | | | | | | | | | | | | | | | | | | | | | | | | | | | |
| | | Class A | | | Class B | | | Class C | | | Class R2 | | | Class R5 | | | Class R6 | | | Institutional Class | | | Select Class | |
Dynamic Small Cap Growth Fund | | | 1.25 | %* | | | 1.75 | %* | | | 1.75 | %* | | | n/a | | | | n/a | | | | n/a | | | | n/a | | | | 1.00 | %* |
Small Cap Core Fund | | | n/a | | | | n/a | | | | n/a | | | | n/a | | | | n/a | | | | n/a | | | | n/a | | | | 0.80 | |
Small Cap Equity Fund | | | 1.30 | | | | 1.80 | | | | 1.80 | | | | 1.55 | % | | | 0.80 | % | | | n/a | | | | n/a | | | | 1.00 | |
Small Cap Growth Fund | | | 1.25 | | | | 1.75 | | | | 1.75 | | | | 1.50 | | | | n/a | | | | 0.75 | % | | | 0.85 | % | | | 1.00 | |
Small Cap Value Fund | | | 1.25 | | | | 1.86 | | | | 1.86 | | | | 1.50 | | | | 0.91 | | | | 0.86 | | | | n/a | | | | 1.00 | |
U.S. Small Company Fund | | | 1.26 | | | | n/a | | | | 1.76 | | | | 1.51 | | | | n/a | | | | 0.76 | | | | 0.83 | | | | 1.01 | |
| * | Prior to March 1, 2014, the contractual expense limitations for Dynamic Small Cap Growth Fund were 1.50%, 2.10%, 2.10% and 1.10% for Class A, Class B, Class C and Select Class, respectively. |
Except as noted above, the expense limitation agreements were in effect for the six months ended December 31, 2014. The contractual expense limitation percentages in the table above are in place until at least October 31, 2015. In addition, the Funds’ service providers have voluntarily waived fees during the six months ended December 31, 2014. However, the Funds’ service providers are under no obligation to do so and may discontinue such voluntary waivers at any time.
For the six months ended December 31, 2014, the Funds’ service providers waived fees and/or reimbursed expenses for each of the Funds as follows (amounts in thousands). None of these parties expect the Funds to repay any such waived fees and reimbursed expenses in future years.
| | | | | | | | | | | | | | | | | | | | |
| | | Contractual Waivers | | | | |
| | | Investment Advisory | | | Administration | | | Shareholder Servicing | | | Total | | | Contractual
Reimbursements | |
Dynamic Small Cap Growth Fund | | $ | 298 | | | $ | 150 | | | $ | 39 | | | $ | 487 | | | $ | 5 | |
Small Cap Core Fund | | | 699 | | | | 290 | | | | 136 | | | | 1,125 | | | | — | |
Small Cap Equity Fund | | | 790 | | | | 499 | | | | 713 | | | | 2,002 | | | | — | |
Small Cap Growth Fund | | | 284 | | | | 188 | | | | 189 | | | | 661 | | | | 5 | |
Small Cap Value Fund | | | 122 | | | | 79 | | | | 668 | | | | 869 | | | | 4 | |
U.S. Small Company Fund | | | 82 | | | | 51 | | | | 133 | | | | 266 | | | | — | |
| | | | | | |
| | | |
| 88 | | | | J.P. MORGAN SMALL CAP FUNDS | | DECEMBER 31, 2014 |
Additionally, the Funds may invest in one or more money market funds advised by the Adviser or its affiliates. The Adviser, Administrator and Distributor, as shareholder servicing agent, waive fees in an amount sufficient to offset the respective fees each charges to the affiliated money market fund on the Funds’ investment in such affiliated money market fund. A portion of the waiver is voluntary.
The amount of waivers resulting from investments in these money market funds for the six months ended December 31, 2014 was as follows (amounts in thousands):
| | | | |
Dynamic Small Cap Growth Fund | | $ | 9 | |
Small Cap Core Fund | | | 12 | |
Small Cap Equity Fund | | | 133 | |
Small Cap Growth Fund | | | 16 | |
Small Cap Value Fund | | | 43 | |
U.S. Small Company Fund | | | 23 | |
G. Other — Certain officers of the Trusts are affiliated with the Adviser, the Administrator and the Distributor. Such officers, with the exception of the Chief Compliance Officer, receive no compensation from the Funds for serving in their respective roles.
The Board appointed a Chief Compliance Officer to the Funds in accordance with Federal securities regulations. Each Fund, along with other affiliated funds, makes reimbursement payments, on a pro-rata basis, to the Administrator for a portion of the fees associated with the Office of the Chief Compliance Officer. Such fees are included in Trustees’ and Chief Compliance Officer’s fees in the Statements of Operations.
The Trusts adopted a Trustee Deferred Compensation Plan (the “Plan”) which allows the Independent Trustees to defer the receipt of all or a portion of compensation related to performance of their duties as Trustees. The deferred fees are invested in various J.P. Morgan Funds until distribution in accordance with the Plan.
During the six months ended December 31, 2014, the Funds may have purchased securities from an underwriting syndicate in which the principal underwriter or members of the syndicate are affiliated with the Adviser.
The Funds may use related party broker-dealers. For the six months ended December 31, 2014, Small Cap Core Fund and U.S. Small Company Fund incurred less than $1,000 in brokerage commissions with broker-dealers affiliated with the Adviser.
The Securities and Exchange Commission (“SEC”) has granted an exemptive order permitting the Funds to engage in principal transactions with J.P. Morgan Securities, Inc., an affiliated broker, involving taxable money market instruments, subject to certain conditions.
4. Investment Transactions
During the six months ended December 31, 2014, purchases and sales of investments (excluding short-term investments) were as follows (amounts in thousands):
| | | | | | | | | | | | | | | | |
| | | Purchases (excluding
U.S. Government) | | | Sales (excluding U.S. Government) | | | Purchases of U.S. Government | | | Sales of U.S. Government | |
Dynamic Small Cap Growth Fund | | $ | 139,758 | | | $ | 178,607 | | | $ | — | | | $ | — | |
Small Cap Core Fund | | | 183,753 | | | | 183,265 | | | | — | | | | 915 | |
Small Cap Equity Fund | | | 410,705 | | | | 474,608 | | | | — | | | | — | |
Small Cap Growth Fund | | | 290,947 | | | | 314,707 | | | | — | | | | — | |
Small Cap Value Fund | | | 284,210 | | | | 218,940 | | | | — | | | | 1,670 | |
U.S. Small Company Fund | | | 255,888 | | | | 132,889 | | | | — | | | | 610 | |
5. Federal Income Tax Matters
For Federal income tax purposes, the cost and unrealized appreciation (depreciation) in value of investment securities held at December 31, 2014 were as follows (amounts in thousands):
| | | | | | | | | | | | | | | | |
| | | Aggregate
Cost | | | Gross
Unrealized
Appreciation | | | Gross
Unrealized
Depreciation | | | Net Unrealized
Appreciation
(Depreciation) | |
Dynamic Small Cap Growth Fund | | $ | 389,186 | | | $ | 174,736 | | | $ | 24,077 | | | $ | 150,659 | |
Small Cap Core Fund | | | 520,092 | | | | 232,880 | | | | 27,462 | | | | 205,418 | |
Small Cap Equity Fund | | | 2,259,291 | | | | 1,280,070 | | | | 89,080 | | | | 1,190,990 | |
Small Cap Growth Fund | | | 859,912 | | | | 360,760 | | | | 57,662 | | | | 303,098 | |
Small Cap Value Fund | | | 1,312,885 | | | | 376,949 | | | | 67,627 | | | | 309,322 | |
U.S. Small Company Fund | | | 635,164 | | | | 123,629 | | | | 27,095 | | | | 96,534 | |
| | | | | | | | |
| | | |
| DECEMBER 31, 2014 | | J.P. MORGAN SMALL CAP FUNDS | | | | | 89 | |
NOTES TO FINANCIAL STATEMENTS
AS OF DECEMBER 31, 2014 (Unaudited) (continued)
Under the Regulated Investment Company Modernization Act of 2010 (the “Act”), net capital losses recognized by the Funds after June 30, 2011 are carried forward indefinitely, and retain their character as short-term and/or long-term losses. Prior to the Act, net capital losses incurred by the Funds were carried forward for eight years and treated as short-term losses. The Act requires that post-enactment net capital losses be used before pre-enactment net capital losses.
6. Borrowings
The Funds rely upon an exemptive order granted by the SEC (the “Order”) permitting the establishment and operation of an Interfund Lending Facility (the “Facility”). The Facility allows the Funds to directly lend and borrow money to or from any other fund relying upon the Order at rates beneficial to both the borrowing and lending funds. Advances under the Facility are taken primarily for temporary or emergency purposes, including the meeting of redemption requests that otherwise might require the untimely disposition of securities, and are subject to each Fund’s borrowing restrictions. The Interfund loan rate is determined, as specified in the Order, by averaging the current repurchase agreement rate and the current bank loan rate. The Order was granted to JPM II and may be relied upon by the Funds because the Funds and the series of JPM II are all investment companies in the same “group of investment companies” (as defined in Section 12(d)(1)(G) of the 1940 Act).
In addition, the Trusts and JPMCB have entered into a financing arrangement. Under this arrangement, JPMCB provides an unsecured, uncommitted credit facility in the aggregate amount of $100 million to certain of the J.P. Morgan Funds, including the Funds. Advances under the arrangement are taken primarily for temporary or emergency purposes, including the meeting of redemption requests that otherwise might require the untimely disposition of securities, and are subject to each Fund’s borrowing restrictions. Interest on borrowings is payable at a rate determined by JPMCB at the time of borrowing. This agreement has been extended until November 9, 2015.
The Funds had no borrowings outstanding from another fund or from the unsecured, uncommitted credit facility at December 31, 2014 or at any time during the six months then ended.
Interest expense paid, if any, as a result of borrowings from another fund or from the unsecured, uncommitted credit facility is included in Interest expense to affiliates in the Statements of Operations.
7. Risks, Concentrations and Indemnifications
In the normal course of business, the Funds enter into contracts that contain a variety of representations which provide general indemnifications. Each Fund’s maximum exposure under these arrangements is unknown. The amount of exposure would depend on future claims that may be made against each Fund that have not yet occurred. However, based on experience, the Funds expect the risk of loss to be remote.
Dynamic Small Cap Growth Fund and U.S. Small Company Fund each have a shareholder, which is an account maintained by a financial intermediary on behalf of its clients, that owns a significant portion of the Funds’ outstanding shares.
One or more affiliates of the Adviser have investment discretion with respect to their clients’ holdings in the Funds, which collectively represent a significant portion of the Fund’s assets for Small Cap Core Fund and Small Cap Equity Fund.
In addition, the J.P. Morgan Investor Funds and JPMorgan SmartRetirement Funds, which are affiliated funds of funds, own in the aggregate, more than 10% of the net assets of certain Funds as follows:
| | | | |
| | | JPMorgan
SmartRetirement
Funds | |
Small Cap Growth Fund | | | 21.5 | % |
Small Cap Value Fund | | | 14.5 | |
Significant shareholder transactions by these shareholders may impact the Funds’ performance.
Small Cap Equity Fund invests in unaffiliated ETFs. ETFs are pooled investment vehicles whose ownership interests are purchased and sold on a securities exchange. ETFs may be structured as investment companies, depositary receipts or other pooled investment vehicles and may be passively or actively managed. Passively managed ETFs generally seek to track the performance of a particular market index, including broad-based market indexes, as well as indexes relating to particular sectors, markets, regions or industries. Actively managed ETFs do not seek to track the performance of a particular market index. The price movement of an index-based ETF may not track the underlying index and may result in a loss. In addition, ETFs may trade at a price below or above their NAV (also known as a discount or premium, respectively).
The Underlying Funds and ETFs may use derivative instruments in connection with their individual investment strategies including futures, forward foreign currency exchange contracts, options, swaps and other derivatives, which are also subject to specific risks related to their structure, sector or market and may be riskier than investments in other types of securities.
| | | | | | |
| | | |
| 90 | | | | J.P. MORGAN SMALL CAP FUNDS | | DECEMBER 31, 2014 |
SCHEDULE OF SHAREHOLDER EXPENSES
(Unaudited)
Hypothetical $1,000 Investment
As a shareholder of the Funds, you incur two types of costs: (1) transaction costs, including sales charges (loads) on purchase payments and redemption fees and (2) ongoing costs, including investment advisory fees, administration fees, distribution fees and other Fund expenses. The examples below are intended to help you understand your ongoing costs (in dollars) of investing in the Funds and to compare these ongoing costs with the ongoing costs of investing in other mutual funds. The examples assume that you had a $1,000 investment in each Class at the beginning of the reporting period, July 1, 2014, and continued to hold your shares at the end of the reporting period, December 31, 2014.
Actual Expenses
For each Class of each Fund in the table below, the first line provides information about actual account values and actual expenses. You may use the information in this line, together with the amount you invested, to estimate the expenses that you paid over the period. Simply divide your account value by $1,000 (for example, an $8,600 account value divided by $1,000 = 8.6), then multiply the result by the number in the first line of each Class under the heading entitled “Expenses Paid During the period” to estimate the expenses you paid on your account during this period.
Hypothetical Example for Comparison Purposes
The second line of each Class in the table below provides information about hypothetical account values and hypothetical expenses based on the Class’ actual expense ratio and an assumed rate of return of 5% per year before expenses, which is not the Class’ actual return. The hypothetical account values and expenses may not be used to estimate the actual ending account balance or expenses you paid for the period. You may use this information to compare the ongoing costs of investing in the Class of the Funds and other funds. To do so, compare this 5% hypothetical example with the 5% hypothetical examples that appear in the shareholder reports of the other funds. Please note that the expenses shown in the table are meant to highlight your ongoing costs only and do not reflect any transaction costs, such as sales charges (loads) or redemption fees. Therefore, the second line for each Class in the table is useful in comparing ongoing costs only, and will not help you determine the relative total costs of owning different funds. In addition, if these transaction costs were included, your costs would have been higher. The examples also assume all dividends and distributions have been reinvested.
| | | | | | | | | | | | | | | | |
| | | Beginning
Account Value
July 1, 2014 | | | Ending
Account Value
December 31, 2014 | | | Expenses
Paid During
the Period* | | | Annualized
Expense
Ratio | |
Dynamic Small Cap Growth Fund | | | | | | | | | | | | | | | | |
Class A | | | | | | | | | | | | | | | | |
Actual | | $ | 1,000.00 | | | $ | 1,030.40 | | | $ | 6.40 | | | | 1.25 | % |
Hypothetical | | | 1,000.00 | | | | 1,018.90 | | | | 6.36 | | | | 1.25 | |
Class B | | | | | | | | | | | | | | | | |
Actual | | | 1,000.00 | | | | 1,027.80 | | | | 8.94 | | | | 1.75 | |
Hypothetical | | | 1,000.00 | | | | 1,016.38 | | | | 8.89 | | | | 1.75 | |
Class C | | | | | | | | | | | | | | | | |
Actual | | | 1,000.00 | | | | 1,028.40 | | | | 8.95 | | | | 1.75 | |
Hypothetical | | | 1,000.00 | | | | 1,016.38 | | | | 8.89 | | | | 1.75 | |
Select Class | | | | | | | | | | | | | | | | |
Actual | | | 1,000.00 | | | | 1,031.90 | | | | 5.12 | | | | 1.00 | |
Hypothetical | | | 1,000.00 | | | | 1,020.16 | | | | 5.09 | | | | 1.00 | |
| | | | |
Small Cap Core Fund | | | | | | | | | | | | | | | | |
Select Class | | | | | | | | | | | | | | | | |
Actual | | | 1,000.00 | | | | 1,034.70 | | | | 4.00 | | | | 0.78 | |
Hypothetical | | | 1,000.00 | | | | 1,021.27 | | | | 3.97 | | | | 0.78 | |
| | | | |
Small Cap Equity Fund | | | | | | | | | | | | | | | | |
Class A | | | | | | | | | | | | | | | | |
Actual | | | 1,000.00 | | | | 1,025.60 | | | | 6.59 | | | | 1.29 | |
Hypothetical | | | 1,000.00 | | | | 1,018.70 | | | | 6.56 | | | | 1.29 | |
Class B | | | | | | | | | | | | | | | | |
Actual | | | 1,000.00 | | | | 1,023.10 | | | | 9.13 | | | | 1.79 | |
Hypothetical | | | 1,000.00 | | | | 1,016.18 | | | | 9.10 | | | | 1.79 | |
Class C | | | | | | | | | | | | | | | | |
Actual | | | 1,000.00 | | | | 1,022.90 | | | | 9.13 | | | | 1.79 | |
Hypothetical | | | 1,000.00 | | | | 1,016.18 | | | | 9.10 | | | | 1.79 | |
| | | | | | | | |
| | | |
| DECEMBER 31, 2014 | | J.P. MORGAN SMALL CAP FUNDS | | | | | 91 | |
SCHEDULE OF SHAREHOLDER EXPENSES
(Unaudited) (continued)
Hypothetical $1,000 Investment
| | | | | | | | | | | | | | | | |
| | | Beginning
Account Value
July 1, 2014 | | | Ending
Account Value
December 31, 2014 | | | Expenses
Paid During
the Period* | | | Annualized
Expense
Ratio | |
Small Cap Equity Fund (continued) | | | | | | | | | | | | | | | | |
Class R2 | | | | | | | | | | | | | | | | |
Actual | | $ | 1,000.00 | | | $ | 1,024.40 | | | $ | 7.86 | | | | 1.54 | % |
Hypothetical | | | 1,000.00 | | | | 1,017.44 | | | | 7.83 | | | | 1.54 | |
Class R5 | | | | | | | | | | | | | | | | |
Actual | | | 1,000.00 | | | | 1,028.20 | | | | 4.04 | | | | 0.79 | |
Hypothetical | | | 1,000.00 | | | | 1,021.22 | | | | 4.02 | | | | 0.79 | |
Select Class | | | | | | | | | | | | | | | | |
Actual | | | 1,000.00 | | | | 1,027.30 | | | | 5.06 | | | | 0.99 | |
Hypothetical | | | 1,000.00 | | | | 1,020.21 | | | | 5.04 | | | | 0.99 | |
| | | | |
Small Cap Growth Fund | | | | | | | | | | | | | | | | |
Class A | | | | | | | | | | | | | | | | |
Actual | | | 1,000.00 | | | | 1,031.40 | | | | 6.40 | | | | 1.25 | |
Hypothetical | | | 1,000.00 | | | | 1,018.90 | | | | 6.36 | | | | 1.25 | |
Class B | | | | | | | | | | | | | | | | |
Actual | | | 1,000.00 | | | | 1,028.70 | | | | 8.95 | | | | 1.75 | |
Hypothetical | | | 1,000.00 | | | | 1,016.38 | | | | 8.89 | | | | 1.75 | |
Class C | | | | | | | | | | | | | | | | |
Actual | | | 1,000.00 | | | | 1,028.80 | | | | 8.95 | | | | 1.75 | |
Hypothetical | | | 1,000.00 | | | | 1,016.38 | | | | 8.89 | | | | 1.75 | |
Class R2 | | | | | | | | | | | | | | | | |
Actual | | | 1,000.00 | | | | 1,030.50 | | | | 7.68 | | | | 1.50 | |
Hypothetical | | | 1,000.00 | | | | 1,017.64 | | | | 7.63 | | | | 1.50 | |
Class R6 | | | | | | | | | | | | | | | | |
Actual | | | 1,000.00 | | | | 1,034.10 | | | | 3.85 | | | | 0.75 | |
Hypothetical | | | 1,000.00 | | | | 1,021.42 | | | | 3.82 | | | | 0.75 | |
Institutional Class | | | | | | | | | | | | | | | | |
Actual | | | 1,000.00 | | | | 1,033.60 | | | | 4.36 | | | | 0.85 | |
Hypothetical | | | 1,000.00 | | | | 1,020.92 | | | | 4.33 | | | | 0.85 | |
Select Class | | | | | | | | | | | | | | | | |
Actual | | | 1,000.00 | | | | 1,032.80 | | | | 5.12 | | | | 1.00 | |
Hypothetical | | | 1,000.00 | | | | 1,020.16 | | | | 5.09 | | | | 1.00 | |
| | | | |
Small Cap Value Fund | | | | | | | | | | | | | | | | |
Class A | | | | | | | | | | | | | | | | |
Actual | | | 1,000.00 | | | | 1,004.90 | | | | 6.32 | | | | 1.25 | |
Hypothetical | | | 1,000.00 | | | | 1,018.90 | | | | 6.36 | | | | 1.25 | |
Class B | | | | | | | | | | | | | | | | |
Actual | | | 1,000.00 | | | | 1,002.20 | | | | 9.39 | | | | 1.86 | |
Hypothetical | | | 1,000.00 | | | | 1,015.83 | | | | 9.45 | | | | 1.86 | |
Class C | | | | | | | | | | | | | | | | |
Actual | | | 1,000.00 | | | | 1,002.00 | | | | 9.39 | | | | 1.86 | |
Hypothetical | | | 1,000.00 | | | | 1,015.83 | | | | 9.45 | | | | 1.86 | |
Class R2 | | | | | | | | | | | | | | | | |
Actual | | | 1,000.00 | | | | 1,003.60 | | | | 7.58 | | | | 1.50 | |
Hypothetical | | | 1,000.00 | | | | 1,017.64 | | | | 7.63 | | | | 1.50 | |
Class R5 | | | | | | | | | | | | | | | | |
Actual | | | 1,000.00 | | | | 1,006.80 | | | | 4.60 | | | | 0.91 | |
Hypothetical | | | 1,000.00 | | | | 1,020.62 | | | | 4.63 | | | | 0.91 | |
Class R6 | | | | | | | | | | | | | | | | |
Actual | | | 1,000.00 | | | | 1,007.10 | | | | 4.20 | | | | 0.83 | |
Hypothetical | | | 1,000.00 | | | | 1,021.02 | | | | 4.23 | | | | 0.83 | |
Select Class | | | | | | | | | | | | | | | | |
Actual | | | 1,000.00 | | | | 1,006.40 | | | | 5.06 | | | | 1.00 | |
Hypothetical | | | 1,000.00 | | | | 1,020.16 | | | | 5.09 | | | | 1.00 | |
| | | | | | |
| | | |
| 92 | | | | J.P. MORGAN SMALL CAP FUNDS | | DECEMBER 31, 2014 |
| | | | | | | | | | | | | | | | |
| | | Beginning
Account Value
July 1, 2014 | | | Ending
Account Value
December 31, 2014 | | | Expenses
Paid During
the Period* | | | Annualized
Expense
Ratio | |
U.S. Small Company Fund | | | | | | | | | | | | | | | | |
Class A | | | | | | | | | | | | | | | | |
Actual | | $ | 1,000.00 | | | $ | 1,033.90 | | | $ | 6.41 | | | | 1.25 | % |
Hypothetical | | | 1,000.00 | | | | 1,018.90 | | | | 6.36 | | | | 1.25 | |
Class C | | | | | | | | | | | | | | | | |
Actual | | | 1,000.00 | | | | 1,031.60 | | | | 8.96 | | | | 1.75 | |
Hypothetical | | | 1,000.00 | | | | 1,016.38 | | | | 8.89 | | | | 1.75 | |
Class R2 | | | | | | | | | | | | | | | | |
Actual | | | 1,000.00 | | | | 1,032.30 | | | | 7.68 | | | | 1.50 | |
Hypothetical | | | 1,000.00 | | | | 1,017.64 | | | | 7.63 | | | | 1.50 | |
Class R6 | | | | | | | | | | | | | | | | |
Actual | | | 1,000.00 | | | | 1,036.40 | | | | 3.85 | | | | 0.75 | |
Hypothetical | | | 1,000.00 | | | | 1,021.42 | | | | 3.82 | | | | 0.75 | |
Institutional Class | | | | | | | | | | | | | | | | |
Actual | | | 1,000.00 | | | | 1,036.50 | | | | 4.21 | | | | 0.82 | |
Hypothetical | | | 1,000.00 | | | | 1,021.07 | | | | 4.18 | | | | 0.82 | |
Select Class | | | | | | | | | | | | | | | | |
Actual | | | 1,000.00 | | | | 1,035.60 | | | | 5.13 | | | | 1.00 | |
Hypothetical | | | 1,000.00 | | | | 1,020.16 | | | | 5.09 | | | | 1.00 | |
| * | Expenses are equal to each Class’ respective annualized expense ratio, multiplied by the average account value over the period, multiplied by 184/365 (to reflect the one-half year period). |
| | | | | | | | |
| | | |
| DECEMBER 31, 2014 | | J.P. MORGAN SMALL CAP FUNDS | | | | | 93 | |
BOARD APPROVAL OF INVESTMENT ADVISORY AGREEMENT
(Unaudited)
The Board of Trustees has established various standing committees composed of Trustees with diverse backgrounds, to which the Board of Trustees has assigned specific subject matter responsibilities to further enhance the effectiveness of the Board’s oversight and decision making. The Board of Trustees and its investment committees (money market and alternative products, equity, and fixed income) meet regularly throughout the year and consider factors that are relevant to their annual consideration of investment advisory agreements at each meeting. They also meet for the specific purpose of considering investment advisory agreement annual renewals. The Board of Trustees held meetings in person in June and August 2014, at which the Trustees considered the continuation of the investment advisory agreements for each of the Funds whose semi-annual report is contained herein (each an “Advisory Agreement” and collectively, the “Advisory Agreements”). At the June meeting, the Board’s investment committees met to review and consider performance, expense and related information for the J.P. Morgan Funds. Each investment committee reported to the full Board, which then considered the investment committee’s preliminary findings. At the August meeting, the Trustees continued their review and consideration. The Trustees, including a majority of the Trustees who are not “interested persons” (as defined in the 1940 Act) of any party to the Advisory Agreements or any of their affiliates, approved the continuation of each Advisory Agreement on August 20, 2014.
As part of their review of the Advisory Agreements, the Trustees considered and reviewed performance and other information about the Funds received from the Adviser. This information includes the Funds’ performance as compared to the performance of their peers and benchmarks and analyses by the Adviser of the Funds’ performance. In addition, the Trustees have engaged an independent management consulting firm (“independent consultant”) to report on the performance of certain J.P. Morgan Funds at each of the Trustees’ regular meetings. The Adviser also periodically provides comparative information regarding the Funds’ expense ratios and those of their peer groups. In addition, in preparation for the June and August meetings, the Trustees requested, received and evaluated extensive materials from the Adviser, including performance and expense information compiled by Lipper Inc. (“Lipper”), an independent provider of investment company data. The Trustees’ independent consultant also provided additional analyses of the performance of the Funds in connection with the Trustees’ review of the Advisory Agreements. Before voting on the proposed Advisory Agreements, the Trustees reviewed the proposed Advisory Agreements with representatives of the Adviser, counsel to the Trusts and independent legal counsel and received a memorandum from independent legal counsel to the Trustees discussing the legal standards for their consideration of the proposed Advisory Agreements. The Trustees also discussed the proposed Advisory Agreements in
executive sessions with independent legal counsel at which no representatives of the Adviser were present. Set forth below is a summary of the material factors evaluated by the Trustees in determining whether to approve each Advisory Agreement.
The Trustees considered information provided with respect to the Funds over the course of the year. Each Trustee attributed different weights to the various factors and no factor alone was considered determinative. From year to year, the Trustees consider and place emphasis on relevant information in light of changing circumstances in market and economic conditions. The Trustees determined that the compensation to be received by the Adviser from each Fund under the applicable Advisory Agreement was fair and reasonable and that the continuance of each Advisory Agreement was in the best interests of each Fund and its shareholders.
The factors summarized below were considered and discussed by the Trustees in reaching their conclusions:
Nature, Extent and Quality of Services Provided by the Adviser
The Trustees received and considered information regarding the nature, extent and quality of the services provided to each Fund under the Advisory Agreement. The Trustees took into account information furnished throughout the year at Trustee meetings, as well as the materials furnished specifically in connection with this annual review process. The Trustees considered the background and experience of the Adviser’s senior management and the expertise of, and the amount of attention given to each Fund by, investment personnel of the Adviser. In addition, the Trustees reviewed the qualifications, backgrounds and responsibilities of the portfolio management team primarily responsible for the day-to-day management of each Fund and the infrastructure supporting the team. The Trustees also considered information provided by the Adviser and JPMorgan Distribution Services, Inc. (“JPMDS”) about the structure and distribution strategy of each Fund. The Trustees reviewed information relating to the Adviser’s risk governance model and reports showing the Adviser’s compliance structure and ongoing compliance processes. The Trustees also considered the quality of the administrative services provided by JPMorgan Funds Management, Inc. (“JPMFM”), an affiliate of the Adviser.
The Trustees also considered their knowledge of the nature and quality of the services provided by the Adviser and its affiliates to the Funds gained from their experience as Trustees of the Funds. In addition, they considered the overall reputation and capabilities of the Adviser and its affiliates, the commitment of the Adviser to provide high quality service to the Funds, their overall confidence in the Adviser’s integrity and the Adviser’s responsiveness to questions or concerns raised by them, including the Adviser’s willingness to consider and implement organizational and operational changes designed to improve investment results and the services provided to each Fund.
| | | | | | |
| | | |
| 94 | | | | J.P. MORGAN SMALL CAP FUNDS | | DECEMBER 31, 2014 |
Based upon these considerations and other factors, the Trustees concluded that they were satisfied with the nature, extent and quality of the investment advisory services provided to the Funds by the Adviser.
Costs of Services Provided and Profitability to the Adviser and its Affiliates
The Trustees received and considered information regarding the profitability to the Adviser and its affiliates in providing services to each of the Funds. The Trustees reviewed and discussed this data. The Trustees recognized that this data is not audited and represents the Adviser’s determination of its and its affiliates’ revenues from the contractual services provided to the Funds, less expenses of providing such services. Expenses include direct and indirect costs and are calculated using an allocation methodology developed by the Adviser. The Trustees also recognized that it is difficult to make comparisons of profitability from fund investment advisory contracts because comparative information is not generally publicly available and is affected by numerous factors, including the structure of the particular adviser, the types of funds it manages, its business mix, numerous assumptions regarding allocations and the fact that publicly-traded fund managers’ operating profits and net income are net of distribution and marketing expenses. Based on their review, the Trustees concluded that the profitability to the Adviser under each of the Advisory Agreements was not unreasonable in light of the services and benefits provided to each Fund.
Fall-Out Benefits
The Trustees reviewed information regarding potential “fallout” or ancillary benefits received by the Adviser and its affiliates as a result of their relationship with the Funds. The Trustees also reviewed the Adviser’s allocation of fund brokerage for the J.P. Morgan Funds complex, including allocations to brokers who provide research to the Adviser.
The Trustees also considered that JPMFM and JPMDS, affiliates of the Adviser, earn fees from the Funds for providing administrative and shareholder services. These fees were shown separately in the profitability analysis presented to the Trustees. The Trustees also considered the payments of Rule 12b-1 fees to JPMDS, which also acts as the Funds’ distributor and that these fees are in turn generally paid to financial intermediaries that sell the Funds, including financial intermediaries that are affiliates of the Adviser. The Trustees also considered the fees paid to JPMorgan Chase Bank, N.A. (“JPMCB”) for custody and fund accounting, and other related services.
Economies of Scale
The Trustees considered the extent to which the Funds benefit from economies of scale. The Trustees noted that the proposed investment advisory fee schedule for each Fund does not contain breakpoints, but that the fee schedule for the admin-
istrative services provided by JPMFM does include a fee breakpoint, which is tied to the overall level of non-money market fund assets excluding certain funds-of-funds, as applicable, advised by the Adviser, and that the Funds benefit from that breakpoint. The Trustees also noted that the Adviser and its affiliates have implemented fee waivers and expense limitations. The Trustees considered whether it would be appropriate to add advisory fee breakpoints, and the Trustees concluded that the current fee structure was reasonable in light of the fee waivers and expense limitations that the Adviser and its affiliates have in place that serve to limit the overall net expense ratios of the Fund at competitive levels. The Trustees concluded that shareholders of the Funds effectively participated in the economies of scale through these fee waivers and expense limitations and administrative service fee breakpoints.
Independent Written Evaluation of the Funds’ Senior/Chief Compliance Officer
The Trustees noted that, upon their direction, the Senior Officer for the Small Cap Growth Fund and Small Cap Value Fund had prepared an independent written evaluation in order to assist the Trustees in determining the reasonableness of the proposed management fees. In determining whether to continue the Advisory Agreements, the Trustees considered the Senior Officer’s report.
The Trustees noted that, upon their direction, the Chief Compliance Officer for the Dynamic Small Cap Growth Fund, Small Cap Core Fund, Small Cap Equity Fund, and U.S. Small Company Fund had prepared an independent written evaluation in order to assist the Trustees in determining the reasonableness of the proposed management fees. The Trustees considered the written evaluation in determining whether to continue the Advisory Agreements.
Fees Relative to Adviser’s Other Clients
The Trustees received and considered information about the nature and extent of investment advisory services and fee rates offered to other clients of the Adviser for investment management styles substantially similar to that of each Fund. The Trustees also considered the complexity of investment management for the Funds relative to the Adviser’s other clients and the differences in the nature and extent of the services provided to the different clients. The Trustees concluded that the fee rates charged to each Fund in comparison to those charged to the Adviser’s other clients were reasonable.
Investment Performance
The Trustees received and considered absolute and/or relative performance for the Funds in a report prepared by Lipper. The Trustees considered the total return performance information, which included the ranking of the Funds within a performance universe made up of funds with the same Lipper investment classification and objective (the “Universe Group”) by total
| | | | | | | | |
| | | |
| DECEMBER 31, 2014 | | J.P. MORGAN SMALL CAP FUNDS | | | | | 95 | |
BOARD APPROVAL OF INVESTMENT ADVISORY AGREEMENT
(Unaudited) (continued)
return for applicable one-, three- and five-year periods. The Trustees reviewed a description of Lipper’s methodology for selecting mutual funds in each Fund’s Universe Group. The Lipper materials provided to the Trustees highlighted information with respect to certain representative classes to assist the Trustees in their review. As part of this review, the Trustees also reviewed each Fund’s performance against its benchmark and considered the performance information provided for the Funds at regular Board meetings by the Adviser and the Trustees’ independent consultant and also considered the special analysis prepared by the Trustees’ independent consultant. The Lipper performance data noted by the Trustees as part of their review and the determinations made by the Trustees with respect to each Fund’s performance for certain representative classes are summarized below:
The Trustees noted that the Dynamic Small Cap Growth Fund’s performance was in the first, third, and third quintiles for both Class A and Select Class shares for the one-, three-, and five-year periods ended December 31, 2013, respectively, and that the Trustees’ independent consultant indicated that the Fund’s overall performance was satisfactory. The Trustees discussed the performance and investment strategy of the Fund with the Adviser and, based upon this discussion and various other factors, concluded that the performance was reasonable. They requested, however, that the Adviser provide additional Fund performance information to be reviewed with the members of the equity committee at each of their regular meetings over the course of the next year.
The Trustees noted that the Small Cap Core Fund’s performance was in the first, first, and second quintiles for Select Class shares for the one-, three-, and five-year periods ended December 31, 2013, respectively, and that the Trustees’ independent consultant indicated that the Fund’s overall performance was attractive. The Trustees discussed the performance and investment strategy of the Fund with the Adviser and, based upon this discussion and various other factors, concluded that the performance was reasonable.
The Trustees noted that the Small Cap Equity Fund’s performance was in the third, first, and first quintiles for both Class A and Select Class shares for the one-, three-, and five-year periods ended December 31, 2013, respectively, and that the Trustees’ independent consultant indicated that the Fund’s overall performance was attractive. The Trustees discussed the performance and investment strategy of the Fund with the Adviser and, based upon this discussion and various other factors, concluded that the performance was reasonable.
The Trustees noted that the Small Cap Growth Fund’s performance was in the first, third, and second quintiles for Class A shares and in the first, second, and second quintiles for Select Class shares for the one-, three-, and five-year periods ended December 31, 2013, respectively, and that the Trustees’ independent consultant indicated that the Fund’s overall
performance was satisfactory. The Trustees discussed the performance and investment strategy of the Fund with the Adviser and, based upon this discussion and various other factors, concluded that the performance was reasonable. They requested, however, that the Adviser provide additional Fund performance information to be reviewed with the members of the equity committee at each of their regular meetings over the course of the next year.
The Trustees noted that the Small Cap Value Fund’s performance was in the third, second and third quintiles for Class A shares and in the third, first and third quintiles for Select Class shares for the one-, three-, and five-year periods ended December 31, 2013, respectively, and that the Trustees’ independent consultant indicated that the Fund’s overall performance was attractive. The Trustees discussed the performance and investment strategy of the Fund with the Adviser and, based upon this discussion and various other factors, concluded that the performance was reasonable.
The Trustees noted that the U.S. Small Company Fund’s performance was in the second, first, and first quintiles for both Class A and Select Class shares for the one-, three-, and five-year periods ended December 31, 2013, respectively, and that the Trustees’ independent consultant indicated that the Fund’s overall performance was attractive. The Trustees discussed the performance and investment strategy of the Fund with the Adviser and, based upon this discussion and various other factors, concluded that the performance was reasonable.
Advisory Fees and Expense Ratios
The Trustees considered the contractual advisory fee rate paid by each Fund to the Adviser and compared that rate to the information prepared by Lipper concerning management fee rates paid by other funds in the same Lipper category as each Fund. The Trustees recognized that Lipper reported each Fund’s management fee rate as the combined contractual advisory fee and administration fee rates. The Trustees also reviewed information about other expenses and the expense ratios for each Fund. The Trustees considered the fee waiver and/or expense reimbursement arrangements currently in place for each Fund and considered the net advisory fee rate after taking into account any waivers and/or reimbursements. The Trustees recognized that it is difficult to make comparisons of advisory fees because there are variations in the services that are included in the fees paid by other funds. The Trustees’ determinations as a result of the review of each Fund’s advisory fees and expense ratios for certain representative classes are summarized below:
The Trustees noted that the Dynamic Small Cap Growth Fund’s net advisory fee for both Class A and Select Class shares was in the first quintile, and that the actual total expenses for Class A and Select Class shares were in the first and second quintiles, respectively, of the Universe Group. After considering the
| | | | | | |
| | | |
| 96 | | | | J.P. MORGAN SMALL CAP FUNDS | | DECEMBER 31, 2014 |
factors identified above, in light of this information, the Trustees concluded that the advisory fee was reasonable.
The Trustees noted that the Small Cap Core Fund’s net advisory fee and actual total expenses for the Select Class shares were in the first quintile of the Universe Group. After considering the factors identified above, in light of this information, the Trustees concluded that the advisory fee was reasonable.
The Trustees noted that the Small Cap Equity Fund’s net advisory fee and actual total expenses for both Class A and Select Class shares were in the second quintile of the Universe Group. After considering the factors identified above, in light of this information, the Trustees concluded that the advisory fee was reasonable.
The Trustees noted that the Small Cap Growth Fund’s net advisory fee for both Class A and Select Class shares was in the first quintile, and that the actual total expenses for Class A and Select Class shares were in the first and second quintiles, respectively, of the Universe Group. After considering the
factors identified above, in light of this information, the Trustees concluded that the advisory fee was reasonable.
The Trustees noted that the Small Cap Value Fund’s net advisory fee for Class A and Select Class shares was in the first and second quintiles, respectively, and that the actual total expenses for Class A and Select Class shares were in the first and second quintiles, respectively, of the Universe Group. After considering the factors identified above, in light of this information, the Trustees concluded that the advisory fee was reasonable.
The Trustees noted that the U.S. Small Company Fund’s net advisory fee for both Class A and Select Class shares was in the first quintile, and that the actual total expenses for Class A and Select Class shares were in the first and second quintiles, respectively, of the Universe Group. After considering the factors identified above, in light of this information, the Trustees concluded that the advisory fee was reasonable.
| | | | | | | | |
| | | |
| DECEMBER 31, 2014 | | J.P. MORGAN SMALL CAP FUNDS | | | | | 97 | |
J.P. Morgan Funds are distributed by JPMorgan Distribution Services, Inc., which is an affiliate of JPMorgan Chase & Co. Affiliates of JPMorgan Chase & Co. receive fees for providing various services to the funds.
Contact JPMorgan Distribution Services, Inc. at 1-800-480-4111 for a fund prospectus. You can also visit us at www.jpmorganfunds.com. Investors should carefully consider the investment objectives and risk as well as charges and expenses of the mutual fund before investing. The prospectus contains this and other information about the mutual fund. Read the prospectus carefully before investing.
Investors may obtain information about the Securities Investor Protection Corporation (SIPC), including the SIPC brochure by visiting www.sipc.org or by calling SIPC at 202-371-8300.
Each Fund files a complete schedule of its fund holdings for the first and third quarters of its fiscal year with the SEC on Form N-Q. The Funds’ Forms N-Q are available on the SEC’s website at http://www.sec.gov and may be reviewed and copied at the SEC’s Public Reference Room in Washington, DC. Information on the operation of the SEC’s Public Reference Room may be obtained by calling 1-800-SEC-0330. Shareholders may request the Form N-Q without charge by calling 1-800-480-4111 or by visiting the J.P. Morgan Funds’ website at www.jpmorganfunds.com.
A description of each Fund’s policies and procedures with respect to the disclosure of each Fund’s holdings is available in the prospectus and Statement of Additional Information.
A copy of proxy policies and procedures is available without charge upon request by calling 1-800-480-4111 and on the Funds’ website at www.jpmorganfunds.com. A description of such policies and procedures is on the SEC’s website at www.sec.gov. The Trustees have delegated the authority to vote proxies for securities owned by the Funds to the Adviser. A copy of the Funds’ voting record for the most recent 12-month period ended June 30 is available on the SEC’s website at www.sec.gov or at the Funds’ website at www.jpmorganfunds.com no later than August 31 of each year. The Funds’ proxy voting record will include, among other things, a brief description of the matter voted on for each fund security, and will state how each vote was cast, for example, for or against the proposal.


J.P. Morgan Asset Management is the marketing name for the asset management business of JPMorgan Chase & Co. Those businesses include, but are not limited to, J.P. Morgan Investment Management Inc., Security Capital Research & Management Incorporated and J.P. Morgan Alternative Asset Management, Inc.
| | | | |
| | © JPMorgan Chase & Co., 2015. All rights reserved. December 2014. | | SAN-SC-1214 |
Semi-Annual Report
J.P. Morgan Mid Cap/Multi-Cap Funds
December 31, 2014 (Unaudited)
JPMorgan Growth Advantage Fund
JPMorgan Mid Cap Equity Fund
JPMorgan Mid Cap Growth Fund
JPMorgan Mid Cap Value Fund
JPMorgan Multi-Cap Market Neutral Fund
JPMorgan Value Advantage Fund

CONTENTS
Investments in a Fund are not bank deposits or obligations of, or guaranteed or endorsed by, any bank and are not insured or guaranteed by the FDIC, the Federal Reserve Board or any other government agency. You could lose money if you sell when the Fund’s share price is lower than when you invested.
Past performance is no guarantee of future performance. The general market views expressed in this report are opinions based on market and other conditions through the end of the reporting period and are subject to change without notice. These views are not intended to predict the future performance of a Fund or the securities markets. References to specific securities and their issuers are for illustrative purposes only and are not intended to be, and should not be interpreted as, recommendations to purchase or sell such securities. Such views are not meant as investment advice and may not be relied on as an indication of trading intent on behalf of any Fund.
Prospective investors should refer to the Funds’ prospectus for a discussion of the Funds’ investment objectives, strategies and risks. Call J.P. Morgan Funds Service Center at 1-800-480-4111 for a prospectus containing more complete information about a Fund, including management fees and other expenses. Please read it carefully before investing.
CEO’S LETTER
January 11, 2015 (Unaudited)
Dear Shareholder,
A growing divergence in the economic trajectories of U.S. and other developed markets and plummeting global energy prices provided a mixed backdrop for the latter half of 2014. The U.S. economy accelerated at a steady pace amid continued strength in corporate earnings, gains in employment and consumer spending and falling oil prices for the six months ended December 31, 2014. Gross domestic product (GDP) in the U.S. climbed by 5.0% in the third quarter of 2014 and unemployment dropped to 5.6% in December, a level not seen since June 2008.
| | |
 | | “Amid uncertainty about the global economy recovery, equity markets in the U.S., China and Japan provided investors with solid returns and served to emphasize the prudence of holding a broadly diversified portfolio and a long-term outlook.” |
In response to the continued improvement in the domestic economy, the U.S. Federal Reserve Bank proceeded to taper down its monthly purchases of bonds under its quantitative easing program and finally closed the program in October.
In stark contrast, the European Central Bank (ECB) took unprecedented steps to counter the threat of price deflation in the euro zone and the Bank of Japan stunned markets with a massive stimulus program as Japan’s economy slid into recession.
Another key development in the latter half of 2014 was a precipitous drop in global petroleum prices. A supply glut driven by new production in the U.S. and increased output from other nations, along with decreasing demand from China, Europe and Japan led to a 50% drop in the price of crude oil between July and December.
Amid this backdrop, U.S. equity markets outperformed most other assets classes over the six month period, with large cap stocks providing better returns than small caps and defensive sectors overtaking cyclical sectors. Notably, U.S. equities fell to six-month lows in mid October only to rebound 8.4%, driving the Standard & Poor’s 500 (“S&P 500”) Index to a new closing high of 2,018.05 points on October 31, 2014. In December, the Dow Jones Industrial Average closed above 18,000 points for the first time following the news that third quarter GDP showed the fastest growth in 11 years. The S&P 500 closed at a new high of 2,090.57 points on December 29, 2014, and returned 6.1% for the six months ended December 31, 2014.
Prices for U.S. Treasury securities with longer maturities rose during the six month period as investors sought safe havens amid deteriorating energy prices and geopolitical concerns. While declining oil prices helped bolster consumer spending in developed nations, energy related sectors came under pressure and yield spreads on high-yield debt — also known as junk bonds — widened. Nations dependent on oil exports experienced volatility in bond yield spreads and currency valuations.
Meanwhile, weak growth in the euro zone raised concerns about the potential for a destructive deflationary spiral. Even after the ECB had cut its deposit rate to negative 0.1% to encourage banks to extend lending by effectively charging them for parking excess cash with the central bank, growth
remained tepid and inflation was well below the ECB’s target of just below 2%. The inflation rate averaged 0.4% from July to October and then fell 0.3% in November and was estimated at -0.2% for December. Unemployment across the euro zone remained stubbornly high at 11.5%.
Japan’s economy retreated into recession during the six month period following two quarters of economic contraction, partly attributed to an increase in the national consumption tax earlier in the year. Responding to the crisis, the Bank of Japan surprised global markets on October 31 by unveiling plans to buy 8 trillion to 12 trillion yen ($71 billion to $107 billion) of Japanese government bonds per month, while also tripling its purchases of exchange-traded funds. The announcement drove Tokyo stocks to seven-year highs. For the six months ended December 31, 2014, the MSCI Europe, Australasia and Far East Index returned -9.2%.
Elsewhere, China’s economy continued to grow but at a slower pace for the six month period. At 7.3%, China’s GDP showed the slowest growth in five years, though it was slightly better than economists had expected. The weaker GDP growth was partly attributed to a slowdown in the property sector. However, Chinese equity securities performed well over the six months ended December 31, 2014, amid expectations that policy makers may ease monetary policy to spur growth. Chinese equity markets received an additional boost when regulators increased access to Chinese financial markets by allowing foreign investors in Hong Kong to buy shares in Shanghai.
Russia’s economy, already straining under Western economic sanctions following its annexation of Crimea, began sliding toward recession as prices plummeted for oil and natural gas, its biggest exports. In response, the Russian Central Bank spent heavily from its reserves and raised its key interest rate sharply in a largely unsuccessful effort to halt the ruble’s slide. The MSCI Emerging Markets Index returned -7.7% for the six months ended December 31, 2014.
During the six month period, financial market volatility returned after being largely absent in the first half of 2014. Meanwhile, economic growth outside the U.S. began to falter and the relative strength of the U.S. economy drove the dollar higher against other major currencies. Amid uncertainty about the global economy recovery, equity markets in the U.S., China and Japan provided investors with solid returns and served to emphasize the prudence of holding a broadly diversified portfolio and a long-term outlook.
On behalf of everyone at J.P. Morgan Asset Management, thank you for your continued support. We look forward to managing your investment needs for years to come. Should you have any questions, please visit www.jpmorganfunds.com or contact the J.P. Morgan Funds Service Center at 1-800-480-4111.
Sincerely yours,

George C.W. Gatch
CEO, Global Funds Management
J.P. Morgan Asset Management
| | | | | | | | |
| | | |
| DECEMBER 31, 2014 | | J.P. MORGAN MID CAP/MULTI-CAP FUNDS | | | | | 1 | |
J.P. Morgan Mid Cap/Multi-Cap Funds
MARKET OVERVIEW
SIX MONTHS ENDED DECEMBER 31, 2014 (Unaudited)
U.S equity markets performed strongly during the six month reporting period amid accommodative central bank policies, falling energy prices and steady overall improvement in the U.S. economy. While the second half of 2014 was marked by the return of volatility in financial markets and a sharp sell-off in mid-October, key U.S. equity indexes rebounded to closing highs in the final months of 2014. The Standard & Poor’s 500 Index (“S&P 500”) broke through the 2,000-point closing level for the first time on the final day of October and hit new closing highs in the final weeks of December. Also in late December, the Dow Jones Industrial Average closed above 18,000 points for the first time. U.S. Treasury securities with longer maturities also performed well during the six month reporting period, as geopolitical risks and concerns about weakness in the global economy pushed investors into so-called safe haven bonds.
Overall, U.S. large cap stocks outperformed small cap stocks and growth stocks outperformed value stocks during the reporting period. For the six months ended December 31, 2014, mid cap stocks as measured by the Russell Midcap Index returned 4.18%, outperforming the Russell 2000 Index, which returned 1.65%. The S&P 500 Index returned 6.12%.
| | | | | | |
| | | |
| 2 | | | | J.P. MORGAN MID CAP/MULTI-CAP FUNDS | | DECEMBER 31, 2014 |
JPMorgan Growth Advantage Fund
FUND COMMENTARY
SIX MONTHS ENDED DECEMBER 31, 2014 (Unaudited)
| | | | |
| REPORTING PERIOD RETURN: | |
| Fund (Class A Shares, without a sales charge)* | | | 4.69% | |
| Russell 3000 Growth Index | | | 6.10% | |
| |
| Net Assets as of 12/31/2014 (In Thousands) | | $ | 4,168,436 | |
INVESTMENT OBJECTIVE**
The JPMorgan Growth Advantage Fund (the “Fund”) seeks to provide long-term capital growth.
WHAT WERE THE MAIN DRIVERS OF THE FUND’S PERFORMANCE?
The Fund (Class A Shares, without a sales charge) underperformed the Russell 3000 Growth Index (the “Benchmark”) for the six months ended December 31, 2014. The Fund’s security selection in the consumer discretionary and producer durables sectors was a leading detractor from performance relative to the Benchmark, while the Fund’s underweight position in the energy sectors and its overweight position in the health care sector were leading contributors to relative performance.
Individual detractors from relative performance included the Fund’s underweight position in Apple Inc. and its overweight positions in Kirby Corp. and Antero Resources Corp. Shares of Apple, a maker of computers and mobile devices, rose on better-than-expected earnings and revenue, driven by sales of its iPhone and other products. Shares of Kirby, a tank and barge operator, fell after the company lowered its quarterly and full-year forecasts for earnings. Shares of Antero Resources, an independent oil and gas exploration and production company, declined amid falling global oil prices.
Leading individual contributors to relative performance included the Fund’s overweight positions in Regeneron Pharmaceuticals Inc. and Avago Technologies Inc., and its underweight position in Halliburton Co. Shares of Regeneron, a biopharmaceutical company, rose on investor expectations for its eye drug, Eylea, and advances in the company’s pipeline of potential new drugs. Shares of Avago, a Singapore producer of analog semiconductors, strengthened on revenue growth and increased demand for its radio frequency semiconductor chips, which are used by telecom operators upgrading their networks to accommodate so-called 4G smartphones. Shares of Halliburton, an oilfield services company not held by the Fund, declined amid falling global oil prices.
HOW WAS THE FUND POSITIONED?
The Fund’s portfolio managers utilized a bottom-up approach to stock selection, researching individual companies across
market capitalizations in an effort to construct portfolios of stocks that have strong fundamentals. The Fund’s portfolio managers sought to invest in high quality companies with durable franchises that, in their view, possessed the ability to generate strong future earnings growth.
| | | | | | | | |
| TOP TEN EQUITY HOLDINGS OF THE PORTFOLIO*** | |
| | 1. | | | Apple, Inc. | | | 4.0 | % |
| | 2. | | | Facebook, Inc., Class A | | | 3.9 | |
| | 3. | | | Gilead Sciences, Inc. | | | 3.4 | |
| | 4. | | | Google, Inc., Class C | | | 3.1 | |
| | 5. | | | Acuity Brands, Inc. | | | 2.4 | |
| | 6. | | | MasterCard, Inc., Class A | | | 2.3 | |
| | 7. | | | Home Depot, Inc. (The) | | | 2.0 | |
| | 8. | | | CBRE Group, Inc., Class A | | | 2.0 | |
| | 9. | | | Celgene Corp. | | | 1.8 | |
| | 10. | | | Affiliated Managers Group, Inc. | | | 1.7 | |
| | | | |
PORTFOLIO COMPOSITION BY SECTOR*** | |
| Information Technology | | | 29.0 | % |
| Health Care | | | 18.1 | |
| Consumer Discretionary | | | 17.7 | |
| Industrials | | | 13.4 | |
| Financials | | | 9.0 | |
| Materials | | | 4.6 | |
| Energy | | | 3.6 | |
| Consumer Staples | | | 1.2 | |
| Short-Term Investment | | | 3.4 | |
| * | | The return shown is based on net asset values calculated for shareholder transactions and may differ from the return shown in the financial highlights, which reflects adjustments made to the net asset values in accordance with accounting principles generally accepted in the United States of America. |
| ** | | The adviser seeks to achieve the Fund’s objective. There can be no guarantee it will be achieved. |
| *** | | Percentages indicated are based on total investments as of December 31, 2014. The Fund’s portfolio composition is subject to change. |
| | | | | | | | |
| | | |
| DECEMBER 31, 2014 | | J.P. MORGAN MID CAP/MULTI-CAP FUNDS | | | | | 3 | |
JPMorgan Growth Advantage Fund
FUND COMMENTARY
SIX MONTHS ENDED DECEMBER 31, 2014 (Unaudited) (continued)
| | | | | | | | | | | | | | | | | | |
AVERAGE ANNUAL TOTAL RETURNS AS OF DECEMBER 31, 2014 | |
| | | INCEPTION DATE OF
CLASS | | 6 MONTH* | | | 1 YEAR | | | 5 YEAR | | | 10 YEAR | |
CLASS A SHARES | | October 29, 1999 | | | | | | | | | | | | | | | | |
Without Sales Charge | | | | | 4.69 | % | | | 9.54 | % | | | 16.88 | % | | | 10.59 | % |
With Sales Charge** | | | | | (0.81 | ) | | | 3.82 | | | | 15.62 | | | | 9.99 | |
CLASS B SHARES | | October 29, 1999 | | | | | | | | | | | | | | | | |
Without CDSC | | | | | 4.38 | | | | 8.91 | | | | 16.29 | | | | 10.07 | |
With CDSC*** | | | | | (0.62 | ) | | | 3.91 | | | | 16.07 | | | | 10.07 | |
CLASS C SHARES | | May 1, 2006 | | | | | | | | | | | | | | | | |
Without CDSC | | | | | 4.37 | | | | 8.90 | | | | 16.27 | | | | 9.97 | |
With CDSC**** | | | | | 3.37 | | | | 7.90 | | | | 16.27 | | | | 9.97 | |
CLASS R5 SHARES | | January 8, 2009 | | | 4.84 | | | | 9.87 | | | | 17.34 | | | | 10.93 | |
CLASS R6 SHARES | | December 23, 2013 | | | 4.83 | | | | 9.94 | | | | 17.36 | | | | 10.94 | |
SELECT CLASS SHARES | | May 1, 2006 | | | 4.74 | | | | 9.66 | | | | 17.10 | | | | 10.80 | |
| ** | | Sales Charge for Class A Shares is 5.25%. |
| *** | | Assumes 5% CDSC (contingent deferred sales charge) for the one year period, 2% CDSC for the five year period and 0% CDSC thereafter. |
| **** | | Assumes a 1% CDSC for the one year period and 0% CDSC thereafter. |
TEN YEAR PERFORMANCE (12/31/04 TO 12/31/14)
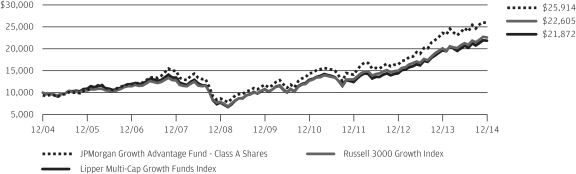
The performance quoted is past performance and is not a guarantee of future results. Mutual funds are subject to certain market risks. Investment returns and principal value of an investment will fluctuate so that an investor’s shares, when redeemed, may be worth more or less than their original cost. Current performance may be higher or lower than the performance data shown. For up-to-date month-end performance information please call 1-800-480-4111.
As of August 17, 2005, the Fund changed its name, investment objective, certain investment policies and benchmark. Prior to that time, the Fund operated as JPMorgan Mid Cap Growth Fund. Although past performance is not necessarily an indication of how the Fund will perform in the future, in view of these changes, the Fund’s performance record prior to August 17, 2005 might be less pertinent for investors considering whether to purchase shares of the Fund. Returns for the Class C Shares prior to its inception date are based on the performance of Class B Shares, whose expenses are substantially similar to those of Class C Shares. Returns for the Select Class Shares prior to its inception date are based on the performance of Class A Shares. During this period, the actual returns of Select Class Shares would have been different than those shown because Select Class Shares have different expenses than Class A Shares. Returns for Class R5 Shares prior to its inception date are based on the performance of Select Class Shares from May 1, 2006 to January 7, 2009 and Class A Shares prior to May 1, 2006. The actual returns of Class R5 Shares would have been different than those shown because Class R5 Shares have different expenses than Select Class and Class A Shares. Returns for Class R6
Shares prior to its inception date are based on the performance of Class R5 Shares from January 8, 2009 to December 23, 2013, Select Class Shares from May 1, 2006 to January 8, 2009 and Class A Shares prior to May 1, 2006. The actual returns of Class R6 Shares would have been different than those shown because Class R6 Shares have different expenses than the other classes.
The graph illustrates comparative performance for $10,000 invested in Class A Shares of the JPMorgan Growth Advantage Fund, the Russell 3000 Growth Index and the Lipper Multi-Cap Growth Funds Index from December 31, 2004 to December 31, 2014. The performance of the Fund assumes reinvestment of all dividends and capital gain distributions, if any, and includes a sales charge. The performance of the Russell 3000 Growth Index does not reflect the deduction of expenses or a sales charge associated with a mutual fund and has been adjusted to reflect reinvestment of all dividends and capital gain distributions of the securities included in the benchmark, if applicable. The performance of the Lipper Multi-Cap Growth Funds Index includes expenses associated with a mutual fund, such as investment management fees. These expenses are not identical to the expenses incurred by the Fund. The Russell 3000 Growth Index is an unmanaged index which measures the performance of those Russell 3000 companies (largest 3000 U.S. companies) with higher price-to-book ratios and higher forecasted growth values. The Lipper Multi-Cap Growth Funds Index is an index based on total returns of certain mutual funds within the Fund’s designated category as determined by Lipper, Inc. Investors cannot invest directly in an index.
| | | | | | |
| | | |
| 4 | | | | J.P. MORGAN MID CAP/MULTI-CAP FUNDS | | DECEMBER 31, 2014 |
Class A Shares have a $1,000 minimum initial investment and carry a 5.25% sales charge.
Fund performance may reflect the waiver of the Fund’s fees and reimbursement of expenses for certain periods since the inception date. Without these waivers and reimbursements, performance would have been lower. Also, performance shown in this section does not reflect the deduction of taxes that a shareholder would pay on Fund distributions or redemption of Fund shares.
Because Class B Shares automatically convert to Class A Shares after 8 years, the 10 year annual average total return shown above for Class B reflects Class A performance for the period after conversion.
The returns shown are based on net asset values calculated for shareholder transactions and may differ from the returns shown in the financial highlights, which reflect adjustments made to the net asset values in accordance with accounting principles generally accepted in the United States of America.
| | | | | | | | |
| | | |
| DECEMBER 31, 2014 | | J.P. MORGAN MID CAP/MULTI-CAP FUNDS | | | | | 5 | |
JPMorgan Mid Cap Equity Fund
FUND COMMENTARY
SIX MONTHS ENDED DECEMBER 31, 2014 (Unaudited)
| | | | |
| REPORTING PERIOD RETURN: | |
| Fund (Select Class Shares)* | | | 4.22% | |
| Russell Midcap Index | | | 4.18% | |
| |
| Net Assets as of 12/31/2014 (In Thousands) | | $ | 3,075,048 | |
INVESTMENT OBJECTIVE**
The JPMorgan Mid Cap Equity Fund (the “Fund”) seeks long-term capital growth.
WHAT WERE THE MAIN DRIVERS OF THE FUND’S PERFORMANCE?
The Fund (Select Class Shares) outperformed the Russell Midcap Index (the “Benchmark”) for the six months ended December 31, 2014. The Fund’s security selection in the materials & processing sector and its underweight position in the energy sector were leading contributors to performance relative to the Benchmark, while the Fund’s security selection in the health care and consumer discretionary sectors detracted from relative performance.
Leading individual contributors to relative performance included the Fund’s overweight positions in Sherwin-Williams Co. and Delta Air Lines Inc. and its underweight position in Noble Energy Inc. Shares of Sherwin Williams, a manufacturer and retailer of paints and coatings, rose after the company increased its forecast for revenue and earnings. Shares of Delta Air Lines rose on overall improvement in the air line industry amid strong consumer spending and falling fuel prices. Shares of Noble Energy, an independent oil and natural exploration and production company not held by the Fund, fell after the company’s earnings fell below analysts’ estimates amid weakening global oil prices.
Leading individual detractors from relative performance included the Fund’s overweight positions in Laredo Petroleum Holdings Inc., Southwestern Energy Co. and Kirby Corp. Shares of Laredo Petroleum, an independent oil and natural gas exploration and production company, fell amid a decline in global oil prices. Shares of Southwestern Energy, an independent oil and natural gas exploration and production company, fell after the company lowered its cash flow forecast amid falling global oil prices. Shares of Kirby, a tank and barge operator, fell after the company lowered its quarter and full-year forecasts for earnings.
HOW WAS THE FUND POSITIONED?
The Fund’s portfolio managers employed a bottom-up approach to stock selection, constructing a portfolio based on
company fundamentals, quantitative screening and proprietary fundamental analysis. The Fund’s portfolio managers sought to identify dominant franchises with predictable business models deemed capable of achieving, in their view, sustained growth, as well as undervalued companies with the potential to grow their intrinsic value per share.
| | | | | | | | |
| TOP TEN EQUITY HOLDINGS OF THE PORTFOLIO*** | |
| | 1. | | | Sherwin-Williams Co. (The) | | | 1.4 | % |
| | 2. | | | Amphenol Corp., Class A | | | 1.4 | |
| | 3. | | | Carlisle Cos., Inc. | | | 1.3 | |
| | 4. | | | Humana, Inc. | | | 1.3 | |
| | 5. | | | Acuity Brands, Inc. | | | 1.2 | |
| | 6. | | | Fortune Brands Home & Security, Inc. | | | 1.1 | |
| | 7. | | | Mohawk Industries, Inc. | | | 1.1 | |
| | 8. | | | CBRE Group, Inc., Class A | | | 1.1 | |
| | 9. | | | Illumina, Inc. | | | 1.1 | |
| | 10. | | | Affiliated Managers Group, Inc. | | | 1.0 | |
| | | | |
PORTFOLIO COMPOSITION BY SECTOR*** | |
| Financials | | | 20.2 | % |
| Consumer Discretionary | | | 19.0 | |
| Information Technology | | | 16.5 | |
| Industrials | | | 13.1 | |
| Health Care | | | 10.7 | |
| Utilities | | | 4.7 | |
| Materials | | | 4.6 | |
| Consumer Staples | | | 4.0 | |
| Energy | | | 4.0 | |
| Short-Term Investment | | | 3.2 | |
| * | | The return shown is based on net asset values calculated for shareholder transactions and may differ from the return shown in the financial highlights, which reflects adjustments made to the net asset values in accordance with accounting principles generally accepted in the United States of America. |
| ** | | The adviser seeks to achieve the Fund’s objective. There can be no guarantee it will be achieved. |
| *** | | Percentages indicated are based on total investments as of December 31, 2014. The Fund’s portfolio composition is subject to change. |
| | | | | | |
| | | |
| 6 | | | | J.P. MORGAN MID CAP/MULTI-CAP FUNDS | | DECEMBER 31, 2014 |
| | | | | | | | | | | | | | | | | | |
AVERAGE ANNUAL TOTAL RETURNS AS OF DECEMBER 31, 2014 | |
| | | INCEPTION DATE OF
CLASS | | 6 MONTH* | | | 1 YEAR | | | 5 YEAR | | | 10 YEAR | |
CLASS A SHARES | | November 2, 2009 | | | | | | | | | | | | | | | | |
Without Sales Charge | | | | | 4.04 | % | | | 12.48 | % | | | 16.89 | % | | | 9.48 | % |
With Sales Charge** | | | | | (1.43 | ) | | | 6.58 | | | | 15.63 | | | | 8.89 | |
CLASS C SHARES | | November 2, 2009 | | | | | | | | | | | | | | | | |
Without CDSC | | | | | 3.77 | | | | 11.92 | | | | 16.31 | | | | 9.20 | |
With CDSC*** | | | | | 2.77 | | | | 10.92 | | | | 16.31 | | | | 9.20 | |
CLASS R2 SHARES | | March 14, 2014 | | | 3.92 | | | | 12.27 | | | | 16.84 | | | | 9.46 | |
CLASS R5 SHARES | | March 14, 2014 | | | 4.27 | | | | 12.96 | | | | 17.31 | | | | 9.68 | |
CLASS R6 SHARES | | March 14, 2014 | | | 4.29 | | | | 12.99 | | | | 17.32 | | | | 9.69 | |
SELECT CLASS SHARES | | January 1, 1997 | | | 4.22 | | | | 12.86 | | | | 17.29 | | | | 9.67 | |
| ** | | Sales Charge for Class A Shares is 5.25%. |
| *** | | Assumes a 1% CDSC (contingent deferred sales charge) for the one year period and 0% CDSC thereafter. |
TEN YEAR PERFORMANCE (12/31/04 TO 12/31/14)
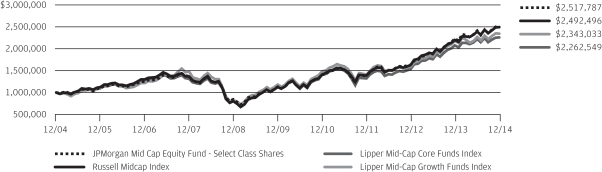
The performance quoted is past performance and is not a guarantee of future results. Mutual funds are subject to certain market risks. Investment returns and principal value of an investment will fluctuate so that an investor’s shares, when redeemed, may be worth more or less than their original cost. Current performance may be higher or lower than the performance data shown. For up-to-date month-end performance information please call 1-800-480-4111.
Returns for Class A and Class C Shares prior to their inception date are based on the performance of Select Class Shares. The actual returns of Class A and Class C Shares would have been lower than those shown because Class A and Class C Shares have higher expenses than Select Class Shares. Returns for Class R2 Shares prior to their inception date are based of Class A Shares from November 2, 2009 to March 13, 2014 and Select Class Shares prior to November 2, 2009. The actual returns of Class R2 Shares would have been lower than those shown because Class R2 Shares have higher expenses than Class A and Select Class Shares. Returns for Class R5 and Class R6 Shares prior to their inception date are based on the performance of Select Class Shares. The actual returns of Class R5 and Class R6 Shares would have been different because Class R5 and Class R6 Shares have different expenses than Select Class Shares.
The graph illustrates comparative performance for $1,000,000 invested in the Select Class Shares of JPMorgan Mid Cap Equity Fund, the Russell Midcap Index Lipper Mid-Cap Core Funds Index and the Lipper Mid-Cap Growth Funds Index from December 31, 2004 to December 31, 2014. The performance of the Fund
assumes reinvestment of all dividends and capital gain distributions, if any, and
does not include a sales charge. The performance of the Russell Midcap Index does not reflect the deduction of expenses or a sales charge associated with a mutual fund and has been adjusted to reflect reinvestment of all dividends and capital gain distributions of the securities included in the benchmark, if applicable. The performance of the Lipper Mid-Cap Core Funds Index and Lipper Mid-Cap Growth Funds Index includes expenses associated with a mutual fund, such as investment management fees. These expenses are not identical to the expenses incurred by the Fund. The Russell Midcap Index is an unmanaged index which measures the performance of the 800 smallest companies in the Russell 1000 Index. The Lipper Mid-Cap Core Funds Index and the Lipper Mid-Cap Growth Funds Index are indices based on total returns of certain mutual funds within the Fund’s designated category as determined by Lipper, Inc. Investors cannot invest directly in an index.
Select Class Shares have a $1,000,000 minimum initial investment.
Fund performance may reflect the waiver of the Fund’s fees and reimbursement of expenses for certain periods since the inception date. Without these waivers and reimbursements, performance would have been lower. Also, performance shown in this section does not reflect the deduction of taxes that a shareholder would pay on Fund distributions or redemption of Fund shares.
The returns shown are based on net asset values calculated for shareholder transactions and may differ from the returns shown in the financial highlights, which reflect adjustments made to the net asset values in accordance with accounting principles generally accepted in the United States of America.
| | | | | | | | |
| | | |
| DECEMBER 31, 2014 | | J.P. MORGAN MID CAP/MULTI-CAP FUNDS | | | | | 7 | |
JPMorgan Mid Cap Growth Fund
FUND COMMENTARY
SIX MONTHS ENDED DECEMBER 31, 2014 (Unaudited)
| | | | |
| REPORTING PERIOD RETURN: | |
| Fund (Select Class Shares)* | | | 2.12% | |
| Russell Midcap Growth Index | | | 5.07% | |
| |
| Net Assets as of 12/31/2014 (In Thousands) | | $ | 2,369,846 | |
INVESTMENT OBJECTIVE**
The JPMorgan Mid Cap Growth Fund (the “Fund”) seeks growth of capital.1
WHAT WERE THE MAIN DRIVERS OF THE FUND’S PERFORMANCE?
The Fund (Select Class Shares) underperformed the Russell Midcap Growth Index (the “Benchmark”) for the six months ended December 31, 2014. The Fund’s security selection in the consumer discretionary and health care sectors was a leading detractor from performance relative to the Benchmark, while security selection in the technology sector and the materials & processing sector was a leading contributor to relative performance.
Leading individual detractors from relative performance included Laredo Petroleum Holdings Inc., Kirby Corp. and Concho Resources Inc. Shares of both Laredo Petroleum and Concho Resoiurces, independent oil and natural gas exploration and production companies, fell amid a decline in global oil prices. Shares of Kirby, a tank and barge operator, fell after the company lowered its quarter and full-year forecasts for earnings.
Leading individual contributors to relative performance included Delta Air Lines Inc., Avago Technologies Ltd. and Ulta Salon, Cosmetics & Fragrances Inc. Shares of Delta Air Lines, which was not held in the Benchmark, benefitted from improvement in the overall outlook for the airline industry, amid strong consumer spending and falling fuel prices. Shares of Avago, a Singapore producer of analog semiconductors, strengthened on revenue growth and increased demand for its radio frequency semiconductor chips, which are used by telecom operators upgrading their networks to accommodate so-called 4G smartphones. Shares of Ulta Salon, a cosmetics retail chain, strengthened after the company raised its forecast for earnings and sales.
HOW WAS THE FUND POSITIONED?
The Fund’s portfolio managers utilized a bottom-up approach to stock selection, researching individual companies in an effort to construct a portfolio of stocks that have strong fundamentals. The Fund’s portfolio managers sought to invest in high
quality companies with durable franchises that, in their view, possessed the ability to generate strong future earnings growth.
| | | | | | | | |
| TOP TEN EQUITY HOLDINGS OF THE PORTFOLIO*** | |
| | 1. | | | Acuity Brands, Inc. | | | 2.5 | % |
| | 2. | | | CBRE Group, Inc., Class A | | | 2.1 | |
| | 3. | | | Illumina, Inc. | | | 2.1 | |
| | 4. | | | Affiliated Managers Group, Inc. | | | 2.1 | |
| | 5. | | | Sherwin-Williams Co. (The) | | | 2.1 | |
| | 6. | | | Delta Air Lines, Inc. | | | 2.0 | |
| | 7. | | | Alliance Data Systems Corp. | | | 1.8 | |
| | 8. | | | Michael Kors Holdings Ltd., (Hong Kong) | | | 1.7 | |
| | 9. | | | Ulta Salon Cosmetics & Fragrance, Inc. | | | 1.7 | |
| | 10. | | | Amphenol Corp., Class A | | | 1.7 | |
| | | | |
PORTFOLIO COMPOSITION BY SECTOR*** | |
| Information Technology | | | 24.3 | % |
| Consumer Discretionary | | | 20.4 | |
| Industrials | | | 16.8 | |
| Health Care | | | 14.8 | |
| Financials | | | 10.8 | |
| Energy | | | 4.2 | |
| Materials | | | 3.0 | |
| Consumer Staples | | | 2.5 | |
Short-Term Investment | | | 3.2 | |
| * | | The return shown is based on net asset values calculated for shareholder transactions and may differ from the return shown in the financial highlights, which reflects adjustments made to the net asset values in accordance with accounting principles generally accepted in the United States of America. |
| ** | | The adviser seeks to achieve the Fund’s objective. There can be no guarantee it will be achieved. |
| *** | | Percentages indicated are based on total investments as of December 31, 2014. The Fund’s portfolio composition is subject to change. |
| 1 | | Effective July 23, 2014, following approval from the Fund’s Board of Trustees, shareholders approved the change to the Fund’s investment objective. The current investment objective is stated above. Prior to July 23, 2014, the Fund’s investment objective was to seek growth of capital and secondarily, current income by investing primarily in equity securities. |
| | | | | | |
| | | |
| 8 | | | | J.P. MORGAN MID CAP/MULTI-CAP FUNDS | | DECEMBER 31, 2014 |
| | | | | | | | | | | | | | | | | | |
AVERAGE ANNUAL TOTAL RETURNS AS OF DECEMBER 31, 2014 | |
| | | INCEPTION DATE OF
CLASS | | 6 MONTH* | | | 1 YEAR | | | 5 YEAR | | | 10 YEAR | |
| | | | | | | | | | | | | | | | | | |
CLASS A SHARES | | February 18, 1992 | | | | | | | | | | | | | | | | |
Without Sales Charge | | | | | 1.95 | % | | | 10.64 | % | | | 16.34 | % | | | 9.38 | % |
With Sales Charge** | | | | | (3.39 | ) | | | 4.85 | | | | 15.10 | | | | 8.79 | |
CLASS B SHARES | | January 14, 1994 | | | | | | | | | | | | | | | | |
Without CDSC | | | | | 1.73 | | | | 10.13 | | | | 15.77 | | | | 8.87 | |
With CDSC*** | | | | | (3.27 | ) | | | 5.13 | | | | 15.55 | | | | 8.87 | |
CLASS C SHARES | | November 4, 1997 | | | | | | | | | | | | | | | | |
Without CDSC | | | | | 1.69 | | | | 10.13 | | | | 15.77 | | | | 8.77 | |
With CDSC**** | | | | | 0.69 | | | | 9.13 | | | | 15.77 | | | | 8.77 | |
CLASS R2 SHARES | | June 19, 2009 | | | 1.88 | | | | 10.48 | | | | 16.17 | | | | 9.21 | |
CLASS R5 SHARES | | November 1, 2011 | | | 2.18 | | | | 11.14 | | | | 16.82 | | | | 9.74 | |
CLASS R6 SHARES | | November 1, 2011 | | | 2.25 | | | | 11.24 | | | | 16.87 | | | | 9.76 | |
SELECT CLASS SHARES | | March 2, 1989 | | | 2.12 | | | | 11.00 | | | | 16.71 | | | | 9.69 | |
| ** | | Sales Charge for Class A Shares is 5.25%. |
| *** | | Assumes a 5% CDSC (contingent deferred sales charge) for the one year period, 2% CDSC for the five year period and 0% CDSC thereafter. |
| **** | | Assumes a 1% CDSC for the one year period and 0% CDSC thereafter. |
TEN YEAR PERFORMANCE (12/31/04 TO 12/31/14)
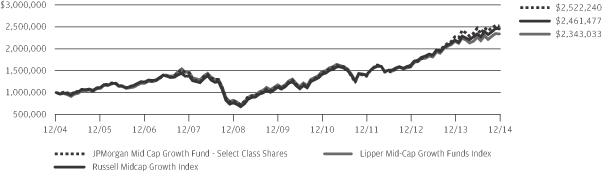
The performance quoted is past performance and is not a guarantee of future results. Mutual funds are subject to certain market risks. Investment returns and principal value of an investment will fluctuate so that an investor’s shares, when redeemed, may be worth more or less than their original cost. Current performance may be higher or lower than the performance data shown. For up-to-date month-end performance information please call 1-800-480-4111.
Returns for the Class R2, Class R5 and Class R6 Shares prior to their inception dates are based on the performance of Select Class Shares. Prior performance for Class R2 Shares has been adjusted to reflect the differences in expenses between classes. The actual returns of Class R5 and Class R6 Shares would have been different than those shown because Class R5 and Class R6 Shares have different expenses than Select Class Shares.
The graph illustrates comparative performance for $1,000,000 invested in Select Class Shares of the JPMorgan Mid Cap Growth Fund, the Russell Midcap Growth Index and the Lipper Mid-Cap Growth Funds Index from December 31, 2004 to December 31, 2014. The performance of the Fund assumes reinvestment of all dividends and capital gain distributions, if any, and does not include a sales charge. The performance of the Russell Midcap Growth Index does not reflect the deduction of expenses or a sales charge associated with a mutual fund and has been adjusted to reflect reinvestment of all dividends and capital gain distributions of the securities included in the benchmark, if applicable. The
performance of the Lipper Mid-Cap Growth Funds Index includes expenses associated with a mutual fund, such as investment management fees. These expenses are not identical to the expenses incurred by the Fund. The Russell Midcap Growth Index is an unmanaged index which measures the performance of those Russell Midcap companies with higher price-to-book ratios and higher forecasted growth values. The Lipper Mid-Cap Growth Funds Index is an index based on total returns of certain mutual funds as determined by Lipper, Inc. Investors cannot invest directly in an index.
Select Class Shares have a $1,000,000 minimum initial investment.
Fund performance may reflect the waiver of the Fund’s fees and reimbursement of expenses for certain periods since the inception date. Without these waivers and reimbursements, performance would have been lower. Also, performance shown in this section does not reflect the deduction of taxes that a shareholder would pay on Fund distributions or redemption of Fund shares.
Because Class B Shares automatically convert to Class A Shares after 8 years, the 10 year average annual total return shown above for Class B reflects Class A performance for the period after conversion.
The returns shown are based on net asset values calculated for shareholder transactions and may differ from the returns shown in the financial highlights, which reflect adjustments made to the net asset values in accordance with accounting principles generally accepted in the United States of America.
| | | | | | | | |
| | | |
| DECEMBER 31, 2014 | | J.P. MORGAN MID CAP/MULTI-CAP FUNDS | | | | | 9 | |
JPMorgan Mid Cap Value Fund
FUND COMMENTARY
SIX MONTHS ENDED DECEMBER 31, 2014 (Unaudited)
| | | | |
| REPORTING PERIOD RETURN: | |
| Fund (Institutional Class Shares)* | | | 6.45% | |
| Russell Midcap Value Index | | | 3.25% | |
| |
| Net Assets as of 12/31/2014 (In Thousands) | | $ | 15,993,084 | |
INVESTMENT OBJECTIVE**
The JPMorgan Mid Cap Value Fund (the “Fund”) seeks growth from capital appreciation.
WHAT WERE THE MAIN DRIVERS OF THE FUND’S PERFORMANCE?
The Fund (Institutional Class Shares) outperformed the Russell Midcap Value Index (the “Benchmark”) for the six months ended December 31, 2014. The Fund’s security selection in the materials sector and its security selection and overweight position in the consumer discretionary sectors were leading contributors to performance relative to the Benchmark, while the Fund’s underweight positions in the telecommunication services (no holdings) and utilities sectors were leading detractors from relative performance.
Leading individual contributors to relative performance included Sigma-Aldrich Corp., Kroger Co. and PBF Energy Co. Shares of Sigma-Aldrich, a U.S. laboratory supply company, rose on the company’s $17 billion acquisition by German drug and chemical company, Merck KGaA. Shares of Kroger, a supermarket chain not held in the Benchmark, rose on better-than-expected earnings and the company’s revised profit forecast, partly due to acquisitions. Shares of PBF Energy, an independent petroleum refiner, rose on the initial public offering for the company’s PBF Logistics LP unit.
Leading individual detractors from relative performance included Albermarle Corp., Gap Inc. and Xilinx Inc. Shares of Albermarle, a specialty chemicals company, declined on the company’s acquisition of Rockwood Holdings Inc. Shares of Gap, a clothing retailer not held in the Benchmark, fell after the company lowered its earnings forecast. Shares of Xilinx, a semiconductor company not held in the Benchmark, fell on a weak outlook for revenue.
HOW WAS THE FUND POSITIONED?
The Fund’s portfolio managers utilized a bottom-up approach to stock selection and sought to identify durable franchises possessing the ability to generate, in their view, sustainable
levels of free cash flow. The Fund continued to have an overweight position in consumer discretionary stocks. The Fund’s largest underweight position was in the telecommunication services sector, where it had no holdings during the reporting period.
| | | | | | | | |
| TOP TEN EQUITY HOLDINGS OF THE PORTFOLIO*** | |
| | 1. | | | Kohl’s Corp. | | | 1.6 | % |
| | 2. | | | Loews Corp. | | | 1.6 | |
| | 3. | | | Expedia, Inc. | | | 1.6 | |
| | 4. | | | Cigna Corp. | | | 1.6 | |
| | 5. | | | Gap, Inc. (The) | | | 1.6 | |
| | 6. | | | Arrow Electronics, Inc. | | | 1.5 | |
| | 7. | | | Jack Henry & Associates, Inc. | | | 1.5 | |
| | 8. | | | Fifth Third Bancorp | | | 1.4 | |
| | 9. | | | Questar Corp. | | | 1.4 | |
| | 10. | | | Ameriprise Financial, Inc. | | | 1.4 | |
| | | | |
PORTFOLIO COMPOSITION BY SECTOR*** | |
| Financials | | | 29.8 | % |
| Consumer Discretionary | | | 17.8 | |
| Industrials | | | 9.4 | |
| Utilities | | | 9.3 | |
| Information Technology | | | 8.8 | |
| Health Care | | | 6.7 | |
| Materials | | | 6.1 | |
| Consumer Staples | | | 5.5 | |
Energy | | | 3.8 | |
Short-Term Investment | | | 2.8 | |
| * | | The return shown is based on net asset values calculated for shareholder transactions and may differ from the return shown in the financial highlights, which reflects adjustments made to the net asset values in accordance with accounting principles generally accepted in the United States of America. |
| ** | | The adviser seeks to achieve the Fund’s objective. There can be no guarantee it will be achieved. |
| *** | | Percentages indicated are based on total investments as of December 31, 2014. The Fund’s portfolio composition is subject to change. |
| | | | | | |
| | | |
| 10 | | | | J.P. MORGAN MID CAP/MULTI-CAP FUNDS | | DECEMBER 31, 2014 |
| | | | | | | | | | | | | | | | | | |
AVERAGE ANNUAL TOTAL RETURNS AS OF DECEMBER 31, 2014 | |
| | | INCEPTION DATE OF
CLASS | | 6 MONTH* | | | 1 YEAR | | | 5 YEAR | | | 10 YEAR | |
CLASS A SHARES | | April 30, 2001 | | | | | | | | | | | | | | | | |
Without Sales Charge | | | | | 6.20 | % | | | 14.60 | % | | | 17.69 | % | | | 9.47 | % |
With Sales Charge** | | | | | 0.63 | | | | 8.59 | | | | 16.43 | | | | 8.88 | |
CLASS B SHARES | | April 30, 2001 | | | | | | | | | | | | | | | | |
Without CDSC | | | | | 5.88 | | | | 13.98 | | | | 17.08 | | | | 9.03 | |
With CDSC*** | | | | | 0.88 | | | | 8.98 | | | | 16.87 | | | | 9.03 | |
CLASS C SHARES | | April 30, 2001 | | | | | | | | | | | | | | | | |
Without CDSC | | | | | 5.92 | | | | 14.02 | | | | 17.09 | | | | 8.92 | |
With CDSC**** | | | | | 4.92 | | | | 13.02 | | | | 17.09 | | | | 8.92 | |
CLASS R2 SHARES | | November 3, 2008 | | | 6.03 | | | | 14.29 | | | | 17.38 | | | | 9.29 | |
INSTITUTIONAL CLASS SHARES | | November 13, 1997 | | | 6.45 | | | | 15.14 | | | | 18.26 | | | | 10.01 | |
SELECT CLASS SHARES | | October 31, 2001 | | | 6.30 | | | | 14.85 | | | | 17.98 | | | | 9.75 | |
| ** | | Sales Charge for Class A Shares is 5.25%. |
| *** | | Assumes a 5% CDSC (contingent deferred sales charge) for the one year period, 2% CDSC for the five year period and 0% CDSC thereafter. |
| **** | | Assumes a 1% CDSC for the one year period and 0% CDSC thereafter. |
TEN YEAR PERFORMANCE (12/31/04 TO 12/31/14)
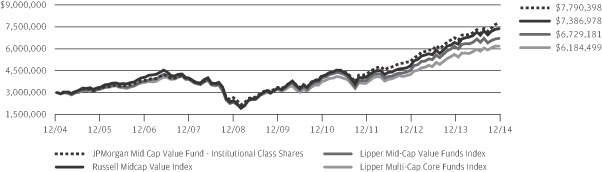
The performance quoted is past performance and is not a guarantee of future results. Mutual funds are subject to certain market risks. Investment returns and principal value of an investment will fluctuate so that an investor’s shares, when redeemed, may be worth more or less than their original cost. Current performance may be higher or lower than the performance data shown. For up-to-date month-end performance information please call 1-800-480-4111.
Returns for Class R2 Shares prior to its inception date are based on the performance of Class A Shares. The actual returns of Class R2 Shares would have been lower than those shown because Class R2 Shares have higher expenses than Class A Shares.
The graph illustrates comparative performance for $3,000,000 invested in Institutional Class Shares of the JPMorgan Mid Cap Value Fund, the Russell Midcap Value Index, the Lipper Mid-Cap Value Funds Index and the Lipper Multi-Cap Core Funds Index from December 31, 2004 to December 31, 2014. The performance of the Fund assumes reinvestment of all dividends and capital gain distributions, if any, and does not include a sales charge. The performance of the Russell Midcap Value Index does not reflect the deduction of expenses or a sales charge associated with a mutual fund and has been adjusted to reflect reinvestment of all dividends and capital gain distributions of the securities included in the benchmark, if applicable. The performance of the Lipper Mid-Cap Value Funds Index and the Lipper Multi-Cap Core Funds Index includes expenses associated with a mutual fund, such as investment management fees.
These expenses are not identical to the expenses incurred by the Fund. The Russell Midcap Value Index is an unmanaged index which measures the performance of those Russell Midcap companies with lower price-to-book ratios and lower forecasted growth values. The Lipper Mid-Cap Value Funds Index and the Lipper Multi-Cap Core Funds Index are indices based on total returns of certain mutual funds within the mid cap and multi cap fund categories, respectively, as determined by Lipper, Inc. Investors cannot invest directly in an index.
Institutional Class Shares have a $3,000,000 minimum initial investment.
Fund performance may reflect the waiver of the Fund’s fees and reimbursement of expenses for certain periods since the inception date. Without these waivers and reimbursements, performance would have been lower. Also, performance shown in this section does not reflect the deduction of taxes that a shareholder would pay on Fund distributions or redemption of Fund shares.
Because Class B Shares automatically convert to Class A Shares after 8 years, the 10 year average annual total return shown above for Class B reflects Class A performance for the period after conversion.
The returns shown are based on net asset values calculated for shareholder transactions and may differ from the returns shown in the financial highlights, which reflect adjustments made to the net asset values in accordance with accounting principles generally accepted in the United States of America.
| | | | | | | | |
| | | |
| DECEMBER 31, 2014 | | J.P. MORGAN MID CAP/MULTI-CAP FUNDS | | | | | 11 | |
JPMorgan Multi-Cap Market Neutral Fund
FUND COMMENTARY
SIX MONTHS ENDED DECEMBER 31, 2014 (Unaudited)
| | | | |
| REPORTING PERIOD RETURN: | |
| Fund (Select Class Shares)* | | | 1.78% | |
| BofA Merrill Lynch 3-Month U.S. Treasury Bill Index | | | 0.01% | |
| |
| Net Assets as of 12/31/14 (In Thousands) | | $ | 321,008 | |
INVESTMENT OBJECTIVE**
The JPMorgan Multi-Cap Market Neutral Fund (the “Fund”) seeks long-term capital preservation and growth by using strategies designed to produce returns which have no correlation with general domestic market performance.
WHAT WERE THE MAIN DRIVERS OF THE FUND’S PERFORMANCE?
The Fund (Select Class Shares) outperformed the BofA Merrill Lynch 3-Month U.S. Treasury Bill Index (the “Benchmark”) for the six months ended December 31, 2014. The Fund’s security selection process produced positive returns in the information technology and health care sectors and negative returns in the energy and telecommunication services sectors.
Individual contributors to Fund returns included short positions in McDermott International Inc. and Transocean Ltd. and a long position in United Therapeutics Corp. Shares of both McDermott International and Transocean, both of which provide engineering and other services to the energy sector, declined amid investor concerns that falling global oil prices will hurt demand for their services. Shares of United Therapeutics, a drug maker, rose following a court ruling that blocked a competitor from selling a generic version of the company’s key hypertension drug.
Individual detractors from Fund returns included its long position in Patterson-UTI Energy Inc. and its short position in Norwegian Cruise Line Holdings Ltd. and Avago Technologies Ltd. Shares of Patterson-UTI, an owner/operator of oil drilling rigs, fell amid a decline in the global price of oil. Shares of Norwegian Cruise Lines, a cruise line operator, rose after the company raised its earnings forecast above analysts’ estimates. Shares of Avago, a Singapore maker of analog semiconductors, strengthened on revenue growth and increased demand for its radio frequency semiconductor chips as telecom operators upgraded their networks for so-called 4G smartphones.
HOW WAS THE FUND POSITIONED?
The Fund’s portfolio managers employed a bottom-up approach to stock selection, constructing a portfolio based on company fundamentals, quantitative screening and proprietary fundamental analysis. The Fund’s portfolio managers sought to identify dominant franchises with predictable business models deemed capable of achieving, in their view, sustained growth, as well as undervalued companies with the potential to grow their intrinsic value per share. Companies that ranked lowest in the above factors were selected by the Fund’s portfolio managers for possible short sales.
| | | | | | | | |
| TOP TEN LONG POSITIONS OF THE PORTFOLIO*** | |
| | 1. | | | Express Scripts Holding Co. | | | 1.2 | % |
| | 2. | | | RLJ Lodging Trust | | | 1.1 | |
| | 3. | | | Western Digital Corp. | | | 1.1 | |
| | 4. | | | Sealed Air Corp. | | | 1.1 | |
| | 5. | | | Stryker Corp. | | | 1.1 | |
| | 6. | | | Kroger Co. (The) | | | 1.1 | |
| | 7. | | | AT&T, Inc. | | | 1.1 | |
| | 8. | | | Pilgrim’s Pride Corp. | | | 1.1 | |
| | 9. | | | Restaurant Brands International, Inc. | | | 1.1 | |
| | 10. | | | Hewlett-Packard Co. | | | 1.1 | |
| | | | | | | | |
| TOP TEN SHORT POSITIONS OF THE PORTFOLIO**** | |
| | 1. | | | CarMax, Inc. | | | 1.2 | % |
| | 2. | | | Praxair, Inc. | | | 1.2 | |
| | 3. | | | Dominion Resources, Inc. | | | 1.2 | |
| | 4. | | | LinkedIn Corp., Class A | | | 1.2 | |
| | 5. | | | Estee Lauder Cos., Inc. (The), Class A | | | 1.2 | |
| | 6. | | | Hain Celestial Group, Inc. (The) | | | 1.1 | |
| | 7. | | | Charter Communications, Inc., Class A | | | 1.1 | |
| | 8. | | | McCormick & Co., Inc. (Non-Voting) | | | 1.1 | |
| | 9. | | | Panera Bread Co., Class A | | | 1.1 | |
| | 10. | | | CoStar Group, Inc. | | | 1.1 | |
| | | | | | |
| | | |
| 12 | | | | J.P. MORGAN MID CAP/MULTI-CAP FUNDS | | DECEMBER 31, 2014 |
| | | | |
LONG POSITION PORTFOLIO COMPOSITION BY SECTOR*** | |
| Information Technology | | | 25.6 | % |
| Consumer Discretionary | | | 16.3 | |
| Industrials | | | 14.0 | |
| Health Care | | | 12.3 | |
| Consumer Staples | | | 7.3 | |
| Financials | | | 4.8 | |
| Materials | | | 4.1 | |
| Utilities | | | 3.5 | |
| Energy | | | 3.0 | |
| Telecommunication Services | | | 2.8 | |
| Short-Term Investment | | | 6.3 | |
| | | | |
SHORT POSITION PORTFOLIO COMPOSITION BY SECTOR**** | |
| Information Technology | | | 24.0 | % |
| Industrials | | | 18.5 | |
| Consumer Discretionary | | | 17.8 | |
| Health Care | | | 12.0 | |
| Consumer Staples | | | 8.3 | |
| Financials | | | 5.5 | |
| Energy | | | 4.9 | |
| Materials | | | 4.2 | |
| Utilities | | | 3.3 | |
| Telecommunication Services | | | 1.5 | |
| * | | The return shown is based on net asset values calculated for shareholder transactions and may differ from the return shown in the financial highlights, which reflects adjustments made to the net asset values in accordance with accounting principles generally accepted in the United States of America. |
| ** | | The adviser seeks to achieve the Fund’s objective. There can be no guarantee it will be achieved. |
| *** | | Percentages indicated are based on total long investments as of December 31, 2014. The Fund’s portfolio composition is subject to change. |
| **** | | Percentages indicated are based on total short investments as of December 31, 2014. The Fund’s portfolio composition is subject to change. |
| | | | | | | | |
| | | |
| DECEMBER 31, 2014 | | J.P. MORGAN MID CAP/MULTI-CAP FUNDS | | | | | 13 | |
JPMorgan Multi-Cap Market Neutral Fund
FUND COMMENTARY
SIX MONTHS ENDED DECEMBER 31, 2014 (Unaudited) (continued)
| | | | | | | | | | | | | | | | | | | | |
AVERAGE ANNUAL TOTAL RETURNS AS OF DECEMBER 31, 2014 | |
| | | | | |
| | | INCEPTION DATE
OF CLASS | | | 6 MONTH* | | | 1 YEAR | | | 5 YEAR | | | 10 YEAR | |
CLASS A SHARES | | | May 23, 2003 | | | | | | | | | | | | | | | | | |
Without Sales Charge | | | | | | | 1.61 | % | | | 1.41 | % | | | 0.06 | % | | | 0.82 | % |
With Sales Charge** | | | | | | | (3.73 | ) | | | (3.91 | ) | | | (1.02 | ) | | | 0.28 | |
CLASS B SHARES | | | May 23, 2003 | | | | | | | | | | | | | | | | | |
Without CDSC | | | | | | | 1.38 | | | | 0.95 | | | | (0.58 | ) | | | 0.22 | |
With CDSC*** | | | | | | | (3.62 | ) | | | (4.05 | ) | | | (0.99 | ) | | | 0.22 | |
CLASS C SHARES | | | May 23, 2003 | | | | | | | | | | | | | | | | | |
Without CDSC | | | | | | | 1.38 | | | | 0.95 | | | | (0.58 | ) | | | 0.12 | |
With CDSC**** | | | | | | | 0.38 | | | | (0.05 | ) | | | (0.58 | ) | | | 0.12 | |
SELECT CLASS SHARES | | | May 23, 2003 | | | | 1.78 | | | | 1.68 | | | | 0.31 | | | | 1.07 | |
| ** | | Sales Charge for Class A Shares is 5.25%. |
| *** | | Assumes a 5% CDSC (contingent deferred sales charge) for the one year period, 2% CDSC for the five year period and 0% CDSC thereafter. |
| **** | | Assumes a 1% CDSC for the one year period and 0% CDSC thereafter. |
TEN YEAR PERFORMANCE (12/31/04 TO 12/31/14)
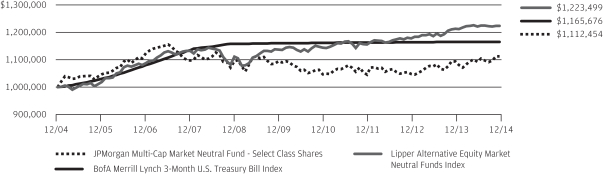
The performance quoted is past performance and is not a guarantee of future results. Mutual funds are subject to certain market risks. Investment returns and principal value of an investment will fluctuate so that an investor’s shares, when redeemed, may be worth more or less than their original cost. Current performance may be higher or lower than the performance data shown. For up-to-date month-end performance information please call 1-800-480-4111.
The graph illustrates comparative performance for $1,000,000 invested in Select Class Shares of the JPMorgan Multi-Cap Market Neutral Fund, the BofA Merrill Lynch 3-Month U.S. Treasury Bill Index and the Lipper Alternative Equity Market Neutral Funds Index from December 31, 2004 to December 31, 2014. The performance of the Fund assumes reinvestment of all dividends and capital gain distributions, if any, and does not include a sales charge. The performance of the indices reflects an initial investment at the end of the month following the Fund’s inception. The performance of the BofA Merrill Lynch 3-Month U.S. Treasury Bill Index does not reflect the deduction of expenses or a sales charge associated with a mutual fund and has been adjusted to reflect reinvestment of all dividends and capital gain distributions of the securities included in the benchmark, if applicable. The performance of the Lipper Alternative Equity Market Neutral Funds Index includes expenses associated with a mutual fund, such as investment management fees. These expenses are not identical to the expenses incurred by the Fund. The BofA Merrill Lynch 3-Month U.S. Treasury Bill Index is
comprised of a single issue purchased at the beginning of the month and held for a full month. Each month the index is rebalanced and the issue selected is the outstanding Treasury Bill that matures closest to, but not beyond, 3 months from the rebalancing date. The Lipper Alternative Equity Market Neutral Funds Index is an index based on total returns of certain mutual funds within the Fund’s designated category as determined by Lipper, Inc. Investors cannot invest directly in an index.
Select Class Shares have a $1,000,000 minimum initial investment.
Fund performance may reflect the waiver of the Fund’s fees and reimbursement of expenses for certain periods since the inception date. Without these waivers and reimbursements, performance would have been lower. Also, performance shown in this section does not reflect the deduction of taxes that a shareholder would pay on Fund distributions or redemption of Fund shares.
Because the Class B Shares automatically convert to Class A Shares after eight years, the since inception average annual total return shown above for Class B reflects Class A performance for the period after conversion.
The returns shown are based on net asset values calculated for shareholder transactions and may differ from the returns shown in the financial highlights, which reflect adjustments made to the net asset values in accordance with accounting principles generally accepted in the United States of America.
| | | | | | |
| | | |
| 14 | | | | J.P. MORGAN MID CAP/MULTI-CAP FUNDS | | DECEMBER 31, 2014 |
JPMorgan Value Advantage Fund
FUND COMMENTARY
SIX MONTHS ENDED DECEMBER 31, 2014 (Unaudited)
| | | | |
| REPORTING PERIOD RETURN: | |
| Fund (Institutional Class Shares)* | | | 5.48% | |
| Russell 3000 Value Index | | | 4.39% | |
| |
| Net Assets as of 12/31/2014 (In Thousands) | | $ | 9,854,695 | |
INVESTMENT OBJECTIVE**
The JPMorgan Value Advantage Fund (the “Fund”) seeks to provide long-term total return from a combination of income and capital gains.
WHAT WERE THE MAIN DRIVERS OF THE FUND’S PERFORMANCE?
The Fund (Institutional Class Shares) outperformed the Russell 3000 Value Index (the “Benchmark”) for the six months ended December 31, 2014. The Fund’s security selection and underweight position in the energy sector and its security selection in the consumer discretionary sector were leading contributors to performance relative to the Benchmark, while the Fund’s security selection in the financials sector and its security selection and underweight position in the health care sector were leading detractors from relative performance.
Leading individual contributors to relative performance included its underweight position in Chevron Corp. and its overweight positions in Bed Bath & Beyond and Home Depot Inc. Shares of Chevron, an integrated energy producer not held in the Fund, declined sharply along with the global price of oil. Shares of Bed Bath & Beyond, an operator of retail chains, rose on better-than-expected quarterly revenue and healthy earnings. Shares of Home Depot, a home improvement retail chain not held in the Benchmark, strengthened on better than expected quarterly sales.
Leading individual detractors from relative performance included The Fund’s overweight positions in Southwestern Energy Co. and Dover Corp and its underweight position in Berkshire Hathaway Inc. Shares of Southwestern Energy, an independent oil and natural gas exploration and production company not held in the Benchmark, fell after the company lowered its forecast of cash flow amid falling global oil prices. Shares of Dover, a manufacturer of pumps and compressors, declined on a lower forecast for quarterly earnings. Shares of Berkshire Hathaway, a financial holding company not held by the Fund, rose on the strength of the company’s core insurance and freight rail businesses.
HOW WAS THE FUND POSITIONED?
The Fund’s portfolio managers utilized a bottom-up approach to stock selection and sought to identify durable franchises possessing the ability to generate, in the portfolio managers’ view, significant levels of free cash flow. The Fund’s largest
overweight position continued to be in the consumer discretionary sector, where the Fund’s portfolio managers found what they believed to be compelling investment opportunities. The Fund’s largest underweight position was in the energy sector. In addition, the Fund’s relative performance was hindered by above-average cash holdings. The cash position accrued because the Fund’s portfolio managers believed valuations were stretched and did not want to invest in overvalued securities.
| | | | | | | | |
| TOP TEN EQUITY HOLDINGS OF THE PORTFOLIO*** | |
| | 1. | | | Wells Fargo & Co. | | | 3.3 | % |
| | 2. | | | Exxon Mobil Corp. | | | 2.6 | |
| | 3. | | | Pfizer, Inc. | | | 2.1 | |
| | 4. | | | Johnson & Johnson | | | 2.0 | |
| | 5. | | | Loews Corp. | | | 1.8 | |
| | 6. | | | Bank of America Corp. | | | 1.7 | |
| | 7. | | | DISH Network Corp., Class A | | | 1.6 | |
| | 8. | | | Capital One Financial Corp. | | | 1.6 | |
| | 9. | | | Merck & Co., Inc. | | | 1.6 | |
| | 10. | | | Kohl’s Corp. | | | 1.5 | |
| | | | |
PORTFOLIO COMPOSITION BY SECTOR*** | |
| Financials | | | 32.2 | % |
| Consumer Discretionary | | | 14.9 | |
| Health Care | | | 8.6 | |
| Industrials | | | 8.3 | |
| Energy | | | 7.1 | |
| Utilities | | | 5.8 | |
| Information Technology | | | 5.5 | |
| Consumer Staples | | | 4.8 | |
| Materials | | | 3.6 | |
| Telecommunication Services | | | 1.1 | |
| Short-Term Investment | | | 8.1 | |
| * | | The return shown is based on net asset values calculated for shareholder transactions and may differ from the return shown in the financial highlights, which reflects adjustments made to the net asset values in accordance with accounting principles generally accepted in the United States of America. |
| ** | | The adviser seeks to achieve the Fund’s objective. There can be no guarantee it will be achieved. |
| *** | | Percentages indicated are based on total investments as of December 31, 2014. The Fund’s portfolio composition is subject to change. |
| | | | | | | | |
| | | |
| DECEMBER 31, 2014 | | J.P. MORGAN MID CAP/MULTI-CAP FUNDS | | | | | 15 | |
JPMorgan Value Advantage Fund
FUND COMMENTARY
SIX MONTHS ENDED DECEMBER 31, 2014 (Unaudited) (continued)
| | | | | | | | | | | | | | | | | | | | |
AVERAGE ANNUAL TOTAL RETURNS AS OF DECEMBER 31, 2014 | |
| | | | | |
| | | INCEPTION DATE
OF CLASS | | | 6 MONTH* | | | 1 YEAR | | | 5 YEAR | | | SINCE
INCEPTION | |
CLASS A SHARES | | | February 28, 2005 | | | | | | | | | | | | | | | | | |
Without Sales Charge | | | | | | | 5.18 | % | | | 13.30 | % | | | 16.48 | % | | | 9.80 | % |
With Sales Charge** | | | | | | | (0.36 | ) | | | 7.35 | | | | 15.23 | | | | 9.20 | |
CLASS C SHARES | | | February 28, 2005 | | | | | | | | | | | | | | | | | |
Without CDSC | | | | | | | 4.91 | | | | 12.70 | | | | 15.90 | | | | 9.26 | |
With CDSC*** | | | | | | | 3.91 | | | | 11.70 | | | | 15.90 | | | | 9.26 | |
INSTITUTIONAL CLASS SHARES | | | February 28, 2005 | | | | 5.48 | | | | 13.87 | | | | 17.05 | | | | 10.30 | |
SELECT CLASS SHARES | | | February 28, 2005 | | | | 5.31 | | | | 13.57 | | | | 16.77 | | | | 10.08 | |
| ** | | Sales Charge for Class A Shares is 5.25%. |
| *** | | Assumes a 1% CDSC (contingent deferred sales charge) for the one year period and 0% CDSC thereafter. |
LIFE OF FUND PERFORMANCE (2/28/05 TO 12/31/14)
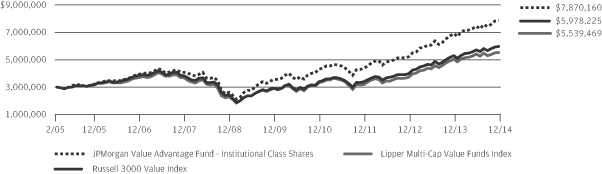
The performance quoted is past performance and is not a guarantee of future results. Mutual funds are subject to certain market risks. Investment returns and principal value of an investment will fluctuate so that an investor’s shares, when redeemed, may be worth more or less than their original cost. Current performance may be higher or lower than the performance data shown. For up-to-date month-end performance information please call 1-800-480-4111.
The Fund commenced operations on February 28, 2005.
The graph illustrates comparative performance for $3,000,000 invested in Institutional Class Shares of the JPMorgan Value Advantage Fund, the Russell 3000 Value Index and the Lipper Multi-Cap Value Funds Index from February 28, 2005 to December 31, 2014. The performance of the Fund assumes reinvestment of all dividends and capital gain distributions, if any, and does not include a sales charge. The performance of the Russell 3000 Value Index does not reflect the deduction of expenses or a sales charge associated with a mutual fund and has been adjusted to reflect reinvestment of all dividends and capital gain distributions of the securities included in the benchmark, if applicable. The performance of the Lipper Multi-Cap Value Funds Index includes expenses associated with a mutual fund, such as investment
management fees. These expenses are not identical to the expenses incurred by the Fund. The Russell 3000 Value Index is an unmanaged index which measures the performance of those Russell 3000 companies (largest 3000 U.S. companies) with lower price-to-book ratios and lower forecasted growth values. The Lipper Multi-Cap Value Funds Index is an index based on total returns of certain mutual funds within the Fund’s designated category as determined by Lipper, Inc. Investors cannot invest directly in an index.
Institutional Class Shares have a $3,000,000 minimum initial investment.
Fund performance may reflect the waiver of the Fund’s fees and reimbursement of expenses for certain periods since the inception date. Without these waivers and reimbursements, performance would have been lower. Also, performance shown in this section does not reflect the deduction of taxes that a shareholder would pay on Fund distributions or redemption of Fund shares.
The returns shown are based on net asset values calculated for shareholder transactions and may differ from the returns shown in the financial highlights, which reflect adjustments made to the net asset values in accordance with accounting principles generally accepted in the United States of America.
| | | | | | |
| | | |
| 16 | | | | J.P. MORGAN MID CAP/MULTI-CAP FUNDS | | DECEMBER 31, 2014 |
JPMorgan Growth Advantage Fund
SCHEDULE OF PORTFOLIO INVESTMENTS
AS OF DECEMBER 31, 2014 (Unaudited)
(Amounts in thousands)
| | | | | | | | |
| SHARES | | | SECURITY DESCRIPTION | | VALUE($) | |
| | | | | | | | |
| Common Stocks — 96.5% | | | | |
| | | | Consumer Discretionary — 17.7% | | | | |
| | | | Auto Components — 0.9% | | | | |
| | 671 | | | BorgWarner, Inc. | | | 36,882 | |
| | | | | | | | |
| | | | Automobiles — 2.0% | |
| | 590 | | | Harley-Davidson, Inc. | | | 38,887 | |
| | 195 | | | Tesla Motors, Inc. (a) | | | 43,281 | |
| | | | | | | | |
| | | | | | | 82,168 | |
| | | | | | | | |
| | | | Hotels, Restaurants & Leisure — 2.2% | |
| | 1,717 | | | Hilton Worldwide Holdings, Inc. (a) | | | 44,786 | |
| | 576 | | | Starbucks Corp. | | | 47,277 | |
| | | | | | | | |
| | | | | | | 92,063 | |
| | | | | | | | |
| | | | Household Durables — 0.9% | |
| | 229 | | | Mohawk Industries, Inc. (a) | | | 35,624 | |
| | | | | | | | |
| | | | Internet & Catalog Retail — 3.5% | |
| | 163 | | | Amazon.com, Inc. (a) | | | 50,680 | |
| | 111 | | | Netflix, Inc. (a) | | | 37,782 | |
| | 51 | | | Priceline Group, Inc. (The) (a) | | | 58,151 | |
| | | | | | | | |
| | | | | | | 146,613 | |
| | | | | | | | |
| | | | Specialty Retail — 6.1% | |
| | 204 | | | Advance Auto Parts, Inc. | | | 32,557 | |
| | 963 | | | GameStop Corp., Class A | | | 32,553 | |
| | 795 | | | Home Depot, Inc. (The) | | | 83,472 | |
| | 475 | | | Ulta Salon Cosmetics & Fragrance, Inc. (a) | | | 60,775 | |
| | 1,339 | | | Urban Outfitters, Inc. (a) | | | 47,036 | |
| | | | | | | | |
| | | | | | | 256,393 | |
| | | | | | | | |
| | | | Textiles, Apparel & Luxury Goods — 2.1% | |
| | 804 | | | Michael Kors Holdings Ltd., (Hong Kong) (a) | | | 60,395 | |
| | 946 | | | Wolverine World Wide, Inc. | | | 27,888 | |
| | | | | | | | |
| | | | | | | 88,283 | |
| | | | | | | | |
| | | | Total Consumer Discretionary | | | 738,026 | |
| | | | | | | | |
| | | | Consumer Staples — 1.2% | |
| | | | Food & Staples Retailing — 1.2% | |
| | 1,423 | | | Sprouts Farmers Market, Inc. (a) | | | 48,364 | |
| | | | | | | | |
| | | | Energy — 3.6% | |
| | | | Energy Equipment & Services — 1.5% | |
| | 260 | | | Dril-Quip, Inc. (a) | | | 19,965 | |
| | 520 | | | Schlumberger Ltd. (m) | | | 44,448 | |
| | | | | | | | |
| | | | | | | 64,413 | |
| | | | | | | | |
| | | | Oil, Gas & Consumable Fuels — 2.1% | |
| | 486 | | | Antero Resources Corp. (a) | | | 19,734 | |
| | 324 | | | Concho Resources, Inc. (a) | | | 32,309 | |
| | | | | | | | |
| SHARES | | | SECURITY DESCRIPTION | | VALUE($) | |
| | | | | | | | |
| | | | | | | | |
| | | | Oil, Gas & Consumable Fuels — continued | |
| | 494 | | | Phillips 66 | | | 35,441 | |
| | | | | | | | |
| | | | | | | 87,484 | |
| | | | | | | | |
| | | | Total Energy | | | 151,897 | |
| | | | | | | | |
| | | | Financials — 9.0% | |
| | | | Banks — 1.8% | |
| | 872 | | | East West Bancorp, Inc. | | | 33,759 | |
| | 336 | | | Signature Bank (a) | | | 42,348 | |
| | | | | | | | |
| | | | | | | 76,107 | |
| | | | | | | | |
| | | | Capital Markets — 3.8% | |
| | 332 | | | Affiliated Managers Group, Inc. (a) | | | 70,485 | |
| | 750 | | | Lazard Ltd., (Bermuda), Class A | | | 37,497 | |
| | 1,368 | | | TD Ameritrade Holding Corp. | | | 48,933 | |
| | | | | | | | |
| | | | | | | 156,915 | |
| | | | | | | | |
| | | | Diversified Financial Services — 0.9% | |
| | 389 | | | Moody’s Corp. | | | 37,308 | |
| | | | | | | | |
| | | | Insurance — 0.5% | |
| | 381 | | | AmTrust Financial Services, Inc. | | | 21,416 | |
| | | | | | | | |
| | | | Real Estate Management & Development — 2.0% | |
| | 2,389 | | | CBRE Group, Inc., Class A (a) | | | 81,834 | |
| | | | | | | | |
| | | | Total Financials | | | 373,580 | |
| | | | | | | | |
| | | | Health Care — 18.1% | |
| | | | Biotechnology — 10.0% | |
| | 235 | | | Alexion Pharmaceuticals, Inc. (a) | | | 43,464 | |
| | 181 | | | Biogen Idec, Inc. (a) | | | 61,542 | |
| | 671 | | | Celgene Corp. (a) | | | 75,092 | |
| | 1,502 | | | Gilead Sciences, Inc. (a) | | | 141,578 | |
| | 149 | | | Regeneron Pharmaceuticals, Inc. (a) | | | 61,127 | |
| | 287 | | | Vertex Pharmaceuticals, Inc. (a) | | | 34,096 | |
| | | | | | | | |
| | | | | | | 416,899 | |
| | | | | | | | |
| | | | Health Care Equipment & Supplies — 0.6% | |
| | 1,566 | | | Novadaq Technologies, Inc., (Canada) (a) | | | 26,032 | |
| | | | | | | | |
| | | | Health Care Providers & Services — 2.6% | |
| | 750 | | | Acadia Healthcare Co., Inc. (a) | | | 45,901 | |
| | 608 | | | UnitedHealth Group, Inc. | | | 61,412 | |
| | | | | | | | |
| | | | | | | 107,313 | |
| | | | | | | | |
| | | | Health Care Technology — 0.6% | |
| | 924 | | | Veeva Systems, Inc., Class A (a) | | | 24,398 | |
| | | | | | | | |
| | | | Life Sciences Tools & Services — 2.2% | |
| | 759 | | | Fluidigm Corp. (a) | | | 25,584 | |
| | 360 | | | Illumina, Inc. (a) | | | 66,357 | |
| | | | | | | | |
| | | | | | | 91,941 | |
| | | | | | | | |
SEE NOTES TO FINANCIAL STATEMENTS.
| | | | | | | | |
| | | |
| DECEMBER 31, 2014 | | J.P. MORGAN MID CAP/MULTI-CAP FUNDS | | | | | 17 | |
JPMorgan Growth Advantage Fund
SCHEDULE OF PORTFOLIO INVESTMENTS
AS OF DECEMBER 31, 2014 (Unaudited) (continued)
(Amounts in thousands)
| | | | | | | | |
| SHARES | | | SECURITY DESCRIPTION | | VALUE($) | |
| | | | | | | | |
| Common Stocks — continued | | | | |
| | | | Pharmaceuticals — 2.1% | |
| | 1,552 | | | Nektar Therapeutics (a) | | | 24,059 | |
| | 451 | | | Valeant Pharmaceuticals International, Inc. (a) | | | 64,571 | |
| | | | | | | | |
| | | | | | | 88,630 | |
| | | | | | | | |
| | | | Total Health Care | | | 755,213 | |
| | | | | | | | |
| | | | Industrials — 13.4% | |
| | | | Airlines — 1.3% | |
| | 1,107 | | | Delta Air Lines, Inc. | | | 54,468 | |
| | | | | | | | |
| | | | Building Products — 2.2% | |
| | 1,264 | | | Fortune Brands Home & Security, Inc. | | | 57,203 | |
| | 768 | | | Trex Co., Inc. (a) | | | 32,706 | |
| | | | | | | | |
| | | | | | | 89,909 | |
| | | | | | | | |
| | | | Electrical Equipment — 2.4% | |
| | 715 | | | Acuity Brands, Inc. | | | 100,122 | |
| | | | | | | | |
| | | | Industrial Conglomerates — 1.5% | |
| | 694 | | | Carlisle Cos., Inc. | | | 62,636 | |
| | | | | | | | |
| | | | Machinery — 1.5% | |
| | 605 | | | Pall Corp. | | | 61,232 | |
| | | | | | | | |
| | | | Marine — 0.7% | |
| | 344 | | | Kirby Corp. (a) | | | 27,783 | |
| | | | | | | | |
| | | | Road & Rail — 1.9% | |
| | 149 | | | Canadian Pacific Railway Ltd., (Canada) | | | 28,740 | |
| | 677 | | | Old Dominion Freight Line, Inc. (a) | | | 52,527 | |
| | | | | | | | |
| | | | | | | 81,267 | |
| | | | | | | | |
| | | | Trading Companies & Distributors — 1.9% | |
| | 2,098 | | | HD Supply Holdings, Inc. (a) | | | 61,855 | |
| | 565 | | | Rush Enterprises, Inc., Class A (a) | | | 18,108 | |
| | | | | | | | |
| | | | | | | 79,963 | |
| | | | | | | | |
| | | | Total Industrials | | | 557,380 | |
| | | | | | | | |
| | | | Information Technology — 28.9% | |
| | | | Communications Equipment — 1.5% | |
| | 1,511 | | | Ciena Corp. (a) | | | 29,327 | |
| | 266 | | | Palo Alto Networks, Inc. (a) | | | 32,640 | |
| | | | | | | | |
| | | | | | | 61,967 | |
| | | | | | | | |
| | | | Electronic Equipment, Instruments & Components — 1.1% | |
| | 838 | | | Amphenol Corp., Class A | | | 45,087 | |
| | | | | | | | |
| | | | Internet Software & Services — 9.1% | |
| | 214 | | | CoStar Group, Inc. (a) | | | 39,260 | |
| | 1,024 | | | Dealertrack Technologies, Inc. (a) | | | 45,391 | |
| | 2,092 | | | Facebook, Inc., Class A (a) | | | 163,249 | |
| | 247 | | | Google, Inc., Class C (a) | | | 130,232 | |
| | | | | | | | |
| | | | | | | 378,132 | |
| | | | | | | | |
| | | | | | | | |
| SHARES | | | SECURITY DESCRIPTION | | VALUE($) | |
| | | | | | | | |
| | | | | | | | |
| | | | IT Services — 3.8% | |
| | 221 | | | Alliance Data Systems Corp. (a) | | | 63,274 | |
| | 1,090 | | | MasterCard, Inc., Class A | | | 93,880 | |
| | | | | | | | |
| | | | | | | 157,154 | |
| | | | | | | | |
| | | | Semiconductors & Semiconductor Equipment — 3.9% | |
| | 458 | | | Avago Technologies Ltd., (Singapore) | | | 46,090 | |
| | 733 | | | Lam Research Corp. | | | 58,117 | |
| | 780 | | | NXP Semiconductors N.V., (Netherlands) (a) | | | 59,615 | |
| | | | | | | | |
| | | | | | | 163,822 | |
| | | | | | | | |
| | | | Software — 5.6% | |
| | 652 | | | Adobe Systems, Inc. (a) | | | 47,364 | |
| | 939 | | | Electronic Arts, Inc. (a) | | | 44,128 | |
| | 643 | | | Guidewire Software, Inc. (a) | | | 32,560 | |
| | 1,331 | | | Microsoft Corp. | | | 61,844 | |
| | 403 | | | ServiceNow, Inc. (a) | | | 27,310 | |
| | 267 | | | Workday, Inc., Class A (a) | | | 21,749 | |
| | | | | | | | |
| | | | | | | 234,955 | |
| | | | | | | | |
| | | | Technology Hardware, Storage & Peripherals — 3.9% | |
| | 1,498 | | | Apple, Inc. (m) | | | 165,310 | |
| | | | | | | | |
| | | | Total Information Technology | | | 1,206,427 | |
| | | | | | | | |
| | | | Materials — 4.6% | |
| | | | Chemicals — 3.9% | |
| | 245 | | | Air Products & Chemicals, Inc. (m) | | | 35,293 | |
| | 294 | | | PPG Industries, Inc. (m) | | | 68,004 | |
| | 216 | | | Sherwin-Williams Co. (The) | | | 56,791 | |
| | | | | | | | |
| | | | | | | 160,088 | |
| | | | | | | | |
| | | | Construction Materials — 0.7% | |
| | 399 | | | Eagle Materials, Inc. | | | 30,305 | |
| | | | | | | | |
| | | | Total Materials | | | 190,393 | |
| | | | | | | | |
| | | | Total Common Stocks
(Cost $2,922,439) | | | 4,021,280 | |
| | | | | | | | |
| Short-Term Investment — 3.4% | |
| | | | Investment Company — 3.4% | |
| | 141,289 | | | JPMorgan Prime Money Market Fund, Institutional Class Shares, 0.020% (b) (l) (m)
(Cost $141,289) | | | 141,289 | |
| | | | | | | | |
| | | | Total Investments — 99.9%
(Cost $3,063,728) | | | 4,162,569 | |
| | | | Other Assets in Excess of Liabilities — 0.1% | | | 5,867 | |
| | | | | | | | |
| | | | NET ASSETS — 100.0% | | $ | 4,168,436 | |
| | | | | | | | |
Percentages indicated are based on net assets.
SEE NOTES TO FINANCIAL STATEMENTS.
| | | | | | |
| | | |
| 18 | | | | J.P. MORGAN MID CAP/MULTI-CAP FUNDS | | DECEMBER 31, 2014 |
JPMorgan Mid Cap Equity Fund
SCHEDULE OF PORTFOLIO INVESTMENTS
AS OF DECEMBER 31, 2014 (Unaudited)
(Amounts in thousands)
| | | | | | | | |
| SHARES | | | SECURITY DESCRIPTION | | VALUE($) | |
| | | | | | | | |
| Common Stocks — 96.7% | |
| | | | Consumer Discretionary — 19.0% | |
| | | | Auto Components — 0.6% | |
| | 324 | | | BorgWarner, Inc. | | | 17,826 | |
| | | | | | | | |
| | | | Automobiles — 1.3% | |
| | 272 | | | Harley-Davidson, Inc. | | | 17,910 | |
| | 97 | | | Tesla Motors, Inc. (a) | | | 21,463 | |
| | | | | | | | |
| | | | | | | 39,373 | |
| | | | | | | | |
| | | | Hotels, Restaurants & Leisure — 2.5% | |
| | 19 | | | Chipotle Mexican Grill, Inc. (a) | | | 13,006 | |
| | 624 | | | Hilton Worldwide Holdings, Inc. (a) | | | 16,272 | |
| | 84 | | | Marriott International, Inc., Class A | | | 6,590 | |
| | 307 | | | Norwegian Cruise Line Holdings Ltd. (a) | | | 14,345 | |
| | 78 | | | Panera Bread Co., Class A (a) | | | 13,547 | |
| | 174 | | | Starwood Hotels & Resorts Worldwide, Inc. | | | 14,097 | |
| | | | | | | | |
| | | | | | | 77,857 | |
| | | | | | | | |
| | | | Household Durables — 2.1% | |
| | 374 | | | Jarden Corp. (a) | | | 17,910 | |
| | 216 | | | Mohawk Industries, Inc. (a) | | | 33,510 | |
| | 347 | | | Toll Brothers, Inc. (a) | | | 11,882 | |
| | | | | | | | |
| | | | | | | 63,302 | |
| | | | | | | | |
| | | | Internet & Catalog Retail — 1.7% | |
| | 293 | | | Expedia, Inc. | | | 24,972 | |
| | 60 | | | Netflix, Inc. (a) | | | 20,360 | |
| | 94 | | | TripAdvisor, Inc. (a) | | | 7,003 | |
| | | | | | | | |
| | | | | | | 52,335 | |
| | | | | | | | |
| | | | Media — 1.5% | |
| | 143 | | | CBS Corp. (Non-Voting), Class B (m) | | | 7,911 | |
| | 336 | | | Clear Channel Outdoor Holdings, Inc., Class A | | | 3,564 | |
| | 224 | | | DISH Network Corp., Class A (a) | | | 16,291 | |
| | 389 | | | Gannett Co., Inc. (m) | | | 12,430 | |
| | 286 | | | Time, Inc. | | | 7,036 | |
| | | | | | | | |
| | | | | | | 47,232 | |
| | | | | | | | |
| | | | Multiline Retail — 1.5% | |
| | 210 | | | Big Lots, Inc. | | | 8,384 | |
| | 413 | | | Kohl’s Corp. | | | 25,238 | |
| | 151 | | | Nordstrom, Inc. | | | 12,025 | |
| | | | | | | | |
| | | | | | | 45,647 | |
| | | | | | | | |
| | | | Specialty Retail — 5.8% | |
| | 108 | | | Advance Auto Parts, Inc. | | | 17,266 | |
| | 26 | | | AutoZone, Inc. (a) | | | 16,048 | |
| | 161 | | | Bed Bath & Beyond, Inc. (a) | | | 12,285 | |
| | 373 | | | Best Buy Co., Inc. | | | 14,527 | |
| | 346 | | | GameStop Corp., Class A | | | 11,685 | |
| | | | | | | | |
| SHARES | | | SECURITY DESCRIPTION | | VALUE($) | |
| | | | | | | | |
| | | | | | | | |
| | | | Specialty Retail — continued | |
| | 571 | | | Gap, Inc. (The) | | | 24,057 | |
| | 240 | | | GNC Holdings, Inc., Class A | | | 11,266 | |
| | 145 | | | Tiffany & Co. | | | 15,461 | |
| | 201 | | | Ulta Salon Cosmetics & Fragrance, Inc. (a) | | | 25,696 | |
| | 519 | | | Urban Outfitters, Inc. (a) | | | 18,216 | |
| | 146 | | | Williams-Sonoma, Inc. | | | 11,070 | |
| | | | | | | | |
| | | | | | | 177,577 | |
| | | | | | | | |
| | | | Textiles, Apparel & Luxury Goods — 2.0% | |
| | 357 | | | Michael Kors Holdings Ltd., (Hong Kong) (a) | | | 26,841 | |
| | 104 | | | PVH Corp. | | | 13,388 | |
| | 79 | | | Ralph Lauren Corp. | | | 14,581 | |
| | 95 | | | V.F. Corp. | | | 7,107 | |
| | | | | | | | |
| | | | | | | 61,917 | |
| | | | | | | | |
| | | | Total Consumer Discretionary | | | 583,066 | |
| | | | | | | | |
| | | | Consumer Staples — 4.0% | |
| | | | Beverages — 1.4% | |
| | 122 | | | Constellation Brands, Inc., Class A (a) | | | 11,961 | |
| | 171 | | | Dr. Pepper Snapple Group, Inc. | | | 12,272 | |
| | 187 | | | Monster Beverage Corp. (a) | | | 20,218 | |
| | | | | | | | |
| | | | | | | 44,451 | |
| | | | | | | | |
| | | | Food & Staples Retailing — 1.7% | |
| | 322 | | | Kroger Co. (The) | | | 20,698 | |
| | 1,838 | | | Rite Aid Corp. (a) | | | 13,822 | |
| | 515 | | | Sprouts Farmers Market, Inc. (a) | | | 17,507 | |
| | | | | | | | |
| | | | | | | 52,027 | |
| | | | | | | | |
| | | | Food Products — 0.5% | |
| | 138 | | | Hershey Co. (The) (m) | | | 14,326 | |
| | | | | | | | |
| | | | Household Products — 0.4% | |
| | 105 | | | Energizer Holdings, Inc. | | | 13,499 | |
| | | | | | | | |
| | | | Total Consumer Staples | | | 124,303 | |
| | | | | | | | |
| | | | Energy — 4.0% | |
| | | | Energy Equipment & Services — 0.3% | |
| | 122 | | | Dril-Quip, Inc. (a) | | | 9,361 | |
| | | | | | | | |
| | | | Oil, Gas & Consumable Fuels — 3.7% | |
| | 174 | | | Antero Resources Corp. (a) | | | 7,077 | |
| | 181 | | | Concho Resources, Inc. (a) | | | 18,075 | |
| | 307 | | | Energen Corp. | | | 19,588 | |
| | 124 | | | EQT Corp. | | | 9,386 | |
| | 523 | | | Laredo Petroleum, Inc. (a) | | | 5,413 | |
| | 270 | | | PBF Energy, Inc., Class A | | | 7,186 | |
| | 252 | | | Plains All American Pipeline LP | | | 12,917 | |
| | 373 | | | QEP Resources, Inc. | | | 7,547 | |
| | 203 | | | Range Resources Corp. | | | 10,834 | |
SEE NOTES TO FINANCIAL STATEMENTS.
| | | | | | | | |
| | | |
| DECEMBER 31, 2014 | | J.P. MORGAN MID CAP/MULTI-CAP FUNDS | | | | | 19 | |
JPMorgan Mid Cap Equity Fund
SCHEDULE OF PORTFOLIO INVESTMENTS
AS OF DECEMBER 31, 2014 (Unaudited) (continued)
(Amounts in thousands)
| | | | | | | | |
| SHARES | | | SECURITY DESCRIPTION | | VALUE($) | |
| | | | | | | | |
| Common Stocks — continued | |
| | | | Oil, Gas & Consumable Fuels — continued | |
| | 540 | | | Southwestern Energy Co. (a) | | | 14,727 | |
| | | | | | | | |
| | | | | | | 112,750 | |
| | | | | | | | |
| | | | Total Energy | | | 122,111 | |
| | | | | | | | |
| | | | Financials — 20.2% | |
| | | | Banks — 4.1% | |
| | 322 | | | Citizens Financial Group, Inc. | | | 7,995 | |
| | 138 | | | City National Corp. | | | 11,175 | |
| | 392 | | | East West Bancorp, Inc. | | | 15,174 | |
| | 1,083 | | | Fifth Third Bancorp | | | 22,074 | |
| | 175 | | | First Republic Bank | | | 9,124 | |
| | 370 | | | Huntington Bancshares, Inc. | | | 3,895 | |
| | 136 | | | M&T Bank Corp. | | | 17,119 | |
| | 138 | | | Signature Bank (a) | | | 17,420 | |
| | 459 | | | SunTrust Banks, Inc. | | | 19,222 | |
| | 149 | | | Zions Bancorporation | | | 4,247 | |
| | | | | | | | |
| | | | | | | 127,445 | |
| | | | | | | | |
| | | | Capital Markets — 4.9% | |
| | 149 | | | Affiliated Managers Group, Inc. (a) | | | 31,666 | |
| | 151 | | | Ameriprise Financial, Inc. | | | 19,946 | |
| | 344 | | | Blackstone Group LP (The) | | | 11,624 | |
| | 381 | | | Invesco Ltd. | | | 15,066 | |
| | 314 | | | Lazard Ltd., (Bermuda), Class A | | | 15,705 | |
| | 169 | | | Legg Mason, Inc. | | | 9,038 | |
| | 139 | | | Northern Trust Corp. | | | 9,356 | |
| | 225 | | | T. Rowe Price Group, Inc. | | | 19,308 | |
| | 572 | | | TD Ameritrade Holding Corp. | | | 20,448 | |
| | | | | | | | |
| | | | | | | 152,157 | |
| | | | | | | | |
| | | | Consumer Finance — 0.4% | |
| | 534 | | | Ally Financial, Inc. (a) | | | 12,607 | |
| | | | | | | | |
| | | | Diversified Financial Services — 0.7% | |
| | 213 | | | Moody’s Corp. | | | 20,369 | |
| | | | | | | | |
| | | | Insurance — 4.4% | |
| | 20 | | | Alleghany Corp. (a) | | | 9,435 | |
| | 124 | | | Chubb Corp. (The) | | | 12,835 | |
| | 406 | | | Hartford Financial Services Group, Inc. (The) | | | 16,943 | |
| | 588 | | | Loews Corp. | | | 24,709 | |
| | 362 | | | Marsh & McLennan Cos., Inc. | | | 20,700 | |
| | 451 | | | Old Republic International Corp. | | | 6,604 | |
| | 251 | | | Progressive Corp. (The) | | | 6,778 | |
| | 364 | | | Unum Group | | | 12,696 | |
| | 198 | | | W.R. Berkley Corp. | | | 10,140 | |
| | 422 | | | XL Group plc, (Ireland) | | | 14,506 | |
| | | | | | | | |
| | | | | | | 135,346 | |
| | | | | | | | |
| | | | | | | | |
| SHARES | | | SECURITY DESCRIPTION | | VALUE($) | |
| | | | | | | | |
| | | | | | | | |
| | | | Real Estate Investment Trusts (REITs) — 4.4% | |
| | 268 | | | American Campus Communities, Inc. (m) | | | 11,087 | |
| | 101 | | | AvalonBay Communities, Inc. (m) | | | 16,472 | |
| | 62 | | | Boston Properties, Inc. (m) | | | 8,037 | |
| | 389 | | | Brixmor Property Group, Inc. (m) | | | 9,657 | |
| | 491 | | | General Growth Properties, Inc. (m) | | | 13,811 | |
| | 639 | | | Kimco Realty Corp. (m) | | | 16,073 | |
| | 221 | | | Outfront Media, Inc. | | | 5,934 | |
| | 310 | | | Rayonier, Inc. (m) | | | 8,668 | |
| | 173 | | | Regency Centers Corp. (m) | | | 11,034 | |
| | 158 | | | Vornado Realty Trust (m) | | | 18,568 | |
| | 415 | | | Weyerhaeuser Co. (m) | | | 14,910 | |
| | | | | | | | |
| | | | | | | 134,251 | |
| | | | | | | | |
| | | | Real Estate Management & Development — 1.1% | |
| | 952 | | | CBRE Group, Inc., Class A (a) | | | 32,589 | |
| | | | | | | | |
| | | | Thrifts & Mortgage Finance — 0.2% | |
| | 622 | | | Hudson City Bancorp, Inc. | | | 6,298 | |
| | | | | | | | |
| | | | Total Financials | | | 621,062 | |
| | | | | | | | |
| | | | Health Care — 10.6% | |
| | | | Biotechnology — 1.3% | |
| | 61 | | | Alexion Pharmaceuticals, Inc. (a) | | | 11,305 | |
| | 74 | | | Receptos, Inc. (a) | | | 9,115 | |
| | 175 | | | Vertex Pharmaceuticals, Inc. (a) | | | 20,755 | |
| | | | | | | | |
| | | | | | | 41,175 | |
| | | | | | | | |
| | | | Health Care Equipment & Supplies — 1.5% | |
| | 296 | | | CareFusion Corp. (a) | | | 17,566 | |
| | 240 | | | Insulet Corp. (a) | | | 11,045 | |
| | 196 | | | Sirona Dental Systems, Inc. (a) | | | 17,151 | |
| | | | | | | | |
| | | | | | | 45,762 | |
| | | | | | | | |
| | | | Health Care Providers & Services — 5.3% | |
| | 194 | | | Acadia Healthcare Co., Inc. (a) | | | 11,881 | |
| | 201 | | | AmerisourceBergen Corp. | | | 18,146 | |
| | 809 | | | Brookdale Senior Living, Inc. (a) | | | 29,673 | |
| | 230 | | | Cigna Corp. (m) | | | 23,637 | |
| | 518 | | | Envision Healthcare Holdings, Inc. (a) | | | 17,955 | |
| | 71 | | | Henry Schein, Inc. (a) | | | 9,675 | |
| | 281 | | | Humana, Inc. (m) | | | 40,325 | |
| | 315 | | | Premier, Inc., Class A (a) | | | 10,569 | |
| | | | | | | | |
| | | | | | | 161,861 | |
| | | | | | | | |
| | | | Health Care Technology — 0.2% | |
| | 261 | | | Veeva Systems, Inc., Class A (a) | | | 6,893 | |
| | | | | | | | |
| | | | Life Sciences Tools & Services — 1.0% | |
| | 176 | | | Illumina, Inc. (a) | | | 32,501 | |
| | | | | | | | |
SEE NOTES TO FINANCIAL STATEMENTS.
| | | | | | |
| | | |
| 20 | | | | J.P. MORGAN MID CAP/MULTI-CAP FUNDS | | DECEMBER 31, 2014 |
| | | | | | | | |
| SHARES | | | SECURITY DESCRIPTION | | VALUE($) | |
| | | | | | | | |
| Common Stocks — continued | |
| | | | Pharmaceuticals — 1.3% | |
| | 73 | | | Jazz Pharmaceuticals plc, (Ireland) (a) | | | 11,985 | |
| | 70 | | | Perrigo Co. plc, (Ireland) | | | 11,718 | |
| | 110 | | | Valeant Pharmaceuticals International, Inc. (a) | | | 15,713 | |
| | | | | | | | |
| | | | | | | 39,416 | |
| | | | | | | | |
| | | | Total Health Care | | | 327,608 | |
| | | | | | | | |
| | | | Industrials — 13.1% | |
| | | | Airlines — 1.0% | |
| | 607 | | | Delta Air Lines, Inc. | | | 29,873 | |
| | | | | | | | |
| | | | Building Products — 1.6% | |
| | 276 | | | A.O. Smith Corp. | | | 15,552 | |
| | 778 | | | Fortune Brands Home & Security, Inc. | | | 35,211 | |
| | | | | | | | |
| | | | | | | 50,763 | |
| | | | | | | | |
| | | | Commercial Services & Supplies — 0.6% | |
| | 139 | | | Stericycle, Inc. (a) | | | 18,227 | |
| | | | | | | | |
| | | | Electrical Equipment — 2.6% | |
| | 273 | | | Acuity Brands, Inc. | | | 38,211 | |
| | 267 | | | AMETEK, Inc. | | | 14,073 | |
| | 125 | | | Hubbell, Inc., Class B | | | 13,385 | |
| | 174 | | | Regal-Beloit Corp. | | | 13,068 | |
| | | | | | | | |
| | | | | | | 78,737 | |
| | | | | | | | |
| | | | Industrial Conglomerates — 1.3% | |
| | 453 | | | Carlisle Cos., Inc. | | | 40,864 | |
| | | | | | | | |
| | | | Machinery — 2.7% | |
| | 219 | | | IDEX Corp. | | | 17,042 | |
| | 164 | | | Middleby Corp. (The) (a) | | | 16,223 | |
| | 249 | | | Pall Corp. | | | 25,193 | |
| | 283 | | | Rexnord Corp. (a) | | | 7,991 | |
| | 113 | | | Snap-on, Inc. | | | 15,502 | |
| | | | | | | | |
| | | | | | | 81,951 | |
| | | | | | | | |
| | | | Marine — 0.4% | |
| | 149 | | | Kirby Corp. (a) | | | 12,014 | |
| | | | | | | | |
| | | | Professional Services — 0.6% | |
| | 237 | | | Equifax, Inc. | | | 19,175 | |
| | | | | | | | |
| | | | Road & Rail — 0.7% | |
| | 55 | | | Canadian Pacific Railway Ltd., (Canada) | | | 10,637 | |
| | 139 | | | Landstar System, Inc. | | | 10,067 | |
| | | | | | | | |
| | | | | | | 20,704 | |
| | | | | | | | |
| | | | Trading Companies & Distributors — 1.6% | |
| | 794 | | | HD Supply Holdings, Inc. (a) | | | 23,427 | |
| | 167 | | | MSC Industrial Direct Co., Inc., Class A | | | 13,592 | |
| | | | | | | | |
| SHARES | | | SECURITY DESCRIPTION | | VALUE($) | |
| | | | | | | | |
| | | | | | | | |
| | | | Trading Companies & Distributors — continued | |
| | 116 | | | Watsco, Inc. | | | 12,428 | |
| | | | | | | | |
| | | | | | | 49,447 | |
| | | | | | | | |
| | | | Total Industrials | | | 401,755 | |
| | | | | | | | |
| | | | Information Technology — 16.5% | |
| | | | Communications Equipment — 1.6% | |
| | 134 | | | Arista Networks, Inc. (a) | | | 8,142 | |
| | 347 | | | Aruba Networks, Inc. (a) | | | 6,303 | |
| | 568 | | | Ciena Corp. (a) | | | 11,032 | |
| | 504 | | | CommScope Holding Co., Inc. (a) | | | 11,516 | |
| | 109 | | | Palo Alto Networks, Inc. (a) | | | 13,348 | |
| | | | | | | | |
| | | | | | | 50,341 | |
| | | | | | | | |
| | | | Electronic Equipment, Instruments & Components — 2.1% | |
| | 772 | | | Amphenol Corp., Class A | | | 41,545 | |
| | 400 | | | Arrow Electronics, Inc. (a) | | | 23,184 | |
| | | | | | | | |
| | | | | | | 64,729 | |
| | | | | | | | |
| | | | Internet Software & Services — 1.6% | |
| | 97 | | | CoStar Group, Inc. (a) | | | 17,849 | |
| | 380 | | | Dealertrack Technologies, Inc. (a) | | | 16,829 | |
| | 360 | | | Twitter, Inc. (a) | | | 12,920 | |
| | | | | | | | |
| | | | | | | 47,598 | |
| | | | | | | | |
| | | | IT Services — 2.7% | |
| | 95 | | | Alliance Data Systems Corp. (a) | | | 27,203 | |
| | 162 | | | Gartner, Inc. (a) | | | 13,659 | |
| | 368 | | | Jack Henry & Associates, Inc. | | | 22,883 | |
| | 525 | | | VeriFone Systems, Inc. (a) | | | 19,523 | |
| | | | | | | | |
| | | | | | | 83,268 | |
| | | | | | | | |
| | | | Semiconductors & Semiconductor Equipment — 4.2% | |
| | 351 | | | Analog Devices, Inc. | | | 19,506 | |
| | 694 | | | Applied Materials, Inc. | | | 17,295 | |
| | 249 | | | Avago Technologies Ltd., (Singapore) | | | 25,077 | |
| | 144 | | | KLA-Tencor Corp. | | | 10,131 | |
| | 232 | | | Lam Research Corp. | | | 18,439 | |
| | 285 | | | NXP Semiconductors N.V., (Netherlands) (a) | | | 21,743 | |
| | 399 | | | Xilinx, Inc. | | | 17,270 | |
| | | | | | | | |
| | | | | | | 129,461 | |
| | | | | | | | |
| | | | Software — 3.8% | |
| | 278 | | | Autodesk, Inc. (a) | | | 16,703 | |
| | 406 | | | Electronic Arts, Inc. (a) | | | 19,083 | |
| | 247 | | | Guidewire Software, Inc. (a) | | | 12,500 | |
| | 176 | | | Mobileye N.V., (Israel) (a) | | | 7,147 | |
| | 92 | | | NetSuite, Inc. (a) | | | 10,055 | |
| | 200 | | | ServiceNow, Inc. (a) | | | 13,597 | |
| | 404 | | | Synopsys, Inc. (a) | | | 17,549 | |
SEE NOTES TO FINANCIAL STATEMENTS.
| | | | | | | | |
| | | |
| DECEMBER 31, 2014 | | J.P. MORGAN MID CAP/MULTI-CAP FUNDS | | | | | 21 | |
JPMorgan Mid Cap Equity Fund
SCHEDULE OF PORTFOLIO INVESTMENTS
AS OF DECEMBER 31, 2014 (Unaudited) (continued)
(Amounts in thousands)
| | | | | | | | |
| SHARES | | | SECURITY DESCRIPTION | | VALUE($) | |
| | | | | | | | |
| Common Stocks — continued | |
| | | | Software — continued | |
| | 125 | | | Tableau Software, Inc., Class A (a) | | | 10,553 | |
| | 130 | | | Workday, Inc., Class A (a) | | | 10,593 | |
| | | | | | | | |
| | | | | | | 117,780 | |
| | | | | | | | |
| | | | Technology Hardware, Storage & Peripherals — 0.5% | |
| | 160 | | | SanDisk Corp. | | | 15,647 | |
| | | | | | | | |
| | | | Total Information Technology | | | 508,824 | |
| | | | | | | | |
| | | | Materials — 4.6% | |
| | | | Chemicals — 2.7% | |
| | 172 | | | Airgas, Inc. | | | 19,844 | |
| | 204 | | | Albemarle Corp. | | | 12,281 | |
| | 167 | | | Sherwin-Williams Co. (The) | | | 43,991 | |
| | 46 | | | Sigma-Aldrich Corp. | | | 6,343 | |
| | | | | | | | |
| | | | | | | 82,459 | |
| | | | | | | | |
| | | | Construction Materials — 0.4% | |
| | 186 | | | Eagle Materials, Inc. | | | 14,141 | |
| | | | | | | | |
| | | | Containers & Packaging — 1.5% | |
| | 256 | | | Ball Corp. | | | 17,431 | |
| | 223 | | | Rock-Tenn Co., Class A | | | 13,619 | |
| | 274 | | | Silgan Holdings, Inc. | | | 14,707 | |
| | | | | | | | |
| | | | | | | 45,757 | |
| | | | | | | | |
| | | | Total Materials | | | 142,357 | |
| | | | | | | | |
| | | | Utilities — 4.7% | |
| | | | Electric Utilities — 1.4% | |
| | 219 | | | Edison International | | | 14,362 | |
| | 359 | | | Westar Energy, Inc. | | | 14,806 | |
| | 391 | | | Xcel Energy, Inc. | | | 14,028 | |
| | | | | | | | |
| | | | | | | 43,196 | |
| | | | | | | | |
| | | | | | | | |
| SHARES | | | SECURITY DESCRIPTION | | VALUE($) | |
| | | | | | | | |
| | | | Gas Utilities — 1.0% | |
| | 146 | | | National Fuel Gas Co. | | | 10,159 | |
| | 850 | | | Questar Corp. | | | 21,482 | |
| | | | | | | | |
| | | | | | | 31,641 | |
| | | | | | | | |
| | | | Multi-Utilities — 2.3% | |
| | 586 | | | CenterPoint Energy, Inc. | | | 13,723 | |
| | 458 | | | CMS Energy Corp. (m) | | | 15,919 | |
| | 151 | | | NiSource, Inc. | | | 6,422 | |
| | 182 | | | Sempra Energy | | | 20,297 | |
| | 239 | | | Wisconsin Energy Corp. | | | 12,587 | |
| | | | | | | | |
| | | | | | | 68,948 | |
| | | | | | | | |
| | | | Total Utilities | | | 143,785 | |
| | | | | | | | |
| | | | Total Common Stocks
(Cost $2,217,318) | | | 2,974,871 | |
| | | | | | | | |
| Short-Term Investment — 3.2% | |
| | | | Investment Company — 3.2% | |
| | 97,564 | | | JPMorgan Prime Money Market Fund, Institutional Class Shares, 0.020% (b) (l) (m)
(Cost $97,564) | | | 97,564 | |
| | | | | | | | |
| | | | Total Investments — 99.9%
(Cost $2,314,882) | | | 3,072,435 | |
| | | | Other Assets in Excess of
Liabilities — 0.1% | | | 2,613 | |
| | | | | | | | |
| | | | NET ASSETS — 100.0% | | $ | 3,075,048 | |
| | | | | | | | |
Percentages indicated are based on net assets.
SEE NOTES TO FINANCIAL STATEMENTS.
| | | | | | |
| | | |
| 22 | | | | J.P. MORGAN MID CAP/MULTI-CAP FUNDS | | DECEMBER 31, 2014 |
JPMorgan Mid Cap Growth Fund
SCHEDULE OF PORTFOLIO INVESTMENTS
AS OF DECEMBER 31, 2014 (Unaudited)
(Amounts in thousands)
| | | | | | | | |
| SHARES | | | SECURITY DESCRIPTION | | VALUE($) | |
| | | | | | | |
| Common Stocks — 96.5% | | | | |
| | | | Consumer Discretionary — 20.3% | | | | |
| | | | Auto Components — 1.2% | | | | |
| | 503 | | | BorgWarner, Inc. | | | 27,662 | |
| | | | | | | | |
| | | | Automobiles — 2.6% | |
| | 422 | | | Harley-Davidson, Inc. | | | 27,794 | |
| | 150 | | | Tesla Motors, Inc. (a) | | | 33,406 | |
| | | | | | | | |
| | | | | | | 61,200 | |
| | | | | | | | |
| | | | Hotels, Restaurants & Leisure — 3.7% | |
| | 30 | | | Chipotle Mexican Grill, Inc. (a) | | | 20,193 | |
| | 968 | | | Hilton Worldwide Holdings, Inc. (a) | | | 25,257 | |
| | 476 | | | Norwegian Cruise Line Holdings Ltd. (a) | | | 22,272 | |
| | 121 | | | Panera Bread Co., Class A (a) | | | 21,081 | |
| | | | | | | | |
| | | | | | | 88,803 | |
| | | | | | | | |
| | | | Household Durables — 1.6% | |
| | 130 | | | Mohawk Industries, Inc. (a) | | | 20,181 | |
| | 538 | | | Toll Brothers, Inc. (a) | | | 18,451 | |
| | | | | | | | |
| | | | | | | 38,632 | |
| | | | | | | | |
| | | | Internet & Catalog Retail — 1.8% | |
| | 93 | | | Netflix, Inc. (a) | | | 31,599 | |
| | 146 | | | TripAdvisor, Inc. (a) | | | 10,878 | |
| | | | | | | | |
| | | | | | | 42,477 | |
| | | | | | | | |
| | | | Multiline Retail — 0.5% | |
| | 326 | | | Big Lots, Inc. | | | 13,027 | |
| | | | | | | | |
| | | | Specialty Retail — 6.2% | |
| | 168 | | | Advance Auto Parts, Inc. | | | 26,807 | |
| | 537 | | | GameStop Corp., Class A | | | 18,140 | |
| | 366 | | | GNC Holdings, Inc., Class A | | | 17,197 | |
| | 310 | | | Ulta Salon Cosmetics & Fragrance, Inc. (a) | | | 39,630 | |
| | 795 | | | Urban Outfitters, Inc. (a) | | | 27,918 | |
| | 227 | | | Williams-Sonoma, Inc. | | | 17,195 | |
| | | | | | | | |
| | | | | | | 146,887 | |
| | | | | | | | |
| | | | Textiles, Apparel & Luxury Goods — 2.7% | |
| | 540 | | | Michael Kors Holdings Ltd., (Hong Kong) (a) | | | 40,531 | |
| | 122 | | | Ralph Lauren Corp. | | | 22,636 | |
| | | | | | | | |
| | | | | | | 63,167 | |
| | | | | | | | |
| | | | Total Consumer Discretionary | | | 481,855 | |
| | | | | | | | |
| | | | Consumer Staples — 2.5% | |
| | | | Beverages — 1.3% | |
| | 290 | | | Monster Beverage Corp. (a) | | | 31,378 | |
| | | | | | | | |
| | | | Food & Staples Retailing — 1.2% | |
| | 800 | | | Sprouts Farmers Market, Inc. (a) | | | 27,167 | |
| | | | | | | | |
| | | | Total Consumer Staples | | | 58,545 | |
| | | | | | | | |
| | | | | | | | |
| SHARES | | | SECURITY DESCRIPTION | | VALUE($) | |
| | | | | | | |
| | | | | | | | |
| | | | Energy — 4.1% | |
| | | | Energy Equipment & Services — 0.6% | |
| | 190 | | | Dril-Quip, Inc. (a) | | | 14,540 | |
| | | | | | | | |
| | | | Oil, Gas & Consumable Fuels — 3.5% | |
| | 271 | | | Antero Resources Corp. (a) | | | 10,993 | |
| | 277 | | | Concho Resources, Inc. (a) | | | 27,671 | |
| | 813 | | | Laredo Petroleum, Inc. (a) | | | 8,419 | |
| | 390 | | | Plains All American Pipeline LP | | | 19,989 | |
| | 310 | | | Range Resources Corp. | | | 16,591 | |
| | | | | | | | |
| | | | | | | 83,663 | |
| | | | | | | | |
| | | | Total Energy | | | 98,203 | |
| | | | | | | | |
| | | | Financials — 10.8% | |
| | | | Banks — 2.1% | |
| | 584 | | | East West Bancorp, Inc. | | | 22,595 | |
| | 215 | | | Signature Bank (a) | | | 27,044 | |
| | | | | | | | |
| | | | | | | 49,639 | |
| | | | | | | | |
| | | | Capital Markets — 5.2% | |
| | 232 | | | Affiliated Managers Group, Inc. (a) | | | 49,133 | |
| | 534 | | | Blackstone Group LP (The) | | | 18,052 | |
| | 486 | | | Lazard Ltd., (Bermuda), Class A | | | 24,294 | |
| | 887 | | | TD Ameritrade Holding Corp. | | | 31,730 | |
| | | | | | | | |
| | | | | | | 123,209 | |
| | | | | | | | |
| | | | Diversified Financial Services — 1.4% | |
| | 330 | | | Moody’s Corp. | | | 31,608 | |
| | | | | | | | |
| | | | Real Estate Management & Development — 2.1% | |
| | 1,476 | | | CBRE Group, Inc., Class A (a) | | | 50,553 | |
| | | | | | | | |
| | | | Total Financials | | | 255,009 | |
| | | | | | | | |
| | | | Health Care — 14.8% | |
| | | | Biotechnology — 2.7% | |
| | 95 | | | Alexion Pharmaceuticals, Inc. (a) | | | 17,559 | |
| | 116 | | | Receptos, Inc. (a) | | | 14,150 | |
| | 271 | | | Vertex Pharmaceuticals, Inc. (a) | | | 32,207 | |
| | | | | | | | |
| | | | | | | 63,916 | |
| | | | | | | | |
| | | | Health Care Equipment & Supplies — 1.8% | |
| | 372 | | | Insulet Corp. (a) | | | 17,153 | |
| | 305 | | | Sirona Dental Systems, Inc. (a) | | | 26,621 | |
| | | | | | | | |
| | | | | | | 43,774 | |
| | | | | | | | |
| | | | Health Care Providers & Services — 5.1% | |
| | 297 | | | Acadia Healthcare Co., Inc. (a) | | | 18,198 | |
| | 675 | | | Brookdale Senior Living, Inc. (a) | | | 24,749 | |
| | 803 | | | Envision Healthcare Holdings, Inc. (a) | | | 27,866 | |
| | 226 | | | Humana, Inc. (m) | | | 32,520 | |
| | 490 | | | Premier, Inc., Class A (a) | | | 16,413 | |
| | | | | | | | |
| | | | | | | 119,746 | |
| | | | | | | | |
SEE NOTES TO FINANCIAL STATEMENTS.
| | | | | | | | |
| | | |
| DECEMBER 31, 2014 | | J.P. MORGAN MID CAP/MULTI-CAP FUNDS | | | | | 23 | |
JPMorgan Mid Cap Growth Fund
SCHEDULE OF PORTFOLIO INVESTMENTS
AS OF DECEMBER 31, 2014 (Unaudited) (continued)
(Amounts in thousands)
| | | | | | | | |
| SHARES | | | SECURITY DESCRIPTION | | VALUE($) | |
| | | | | | | |
| Common Stocks — continued | | | | |
| | | | Health Care Technology — 0.5% | |
| | 406 | | | Veeva Systems, Inc., Class A (a) | | | 10,712 | |
| | | | | | | | |
| | | | Life Sciences Tools & Services — 2.1% | |
| | 273 | | | Illumina, Inc. (a) | | | 50,409 | |
| | | | | | | | |
| | | | Pharmaceuticals — 2.6% | |
| | 114 | | | Jazz Pharmaceuticals plc, (Ireland) (a) | | | 18,583 | |
| | 109 | | | Perrigo Co. plc, (Ireland) | | | 18,187 | |
| | 170 | | | Valeant Pharmaceuticals International, Inc. (a) | | | 24,329 | |
| | | | | | | | |
| | | | | | | 61,099 | |
| | | | | | | | |
| | | | Total Health Care | | | 349,656 | |
| | | | | | | | |
| | | | Industrials — 16.8% | |
| | | | Airlines — 2.0% | |
| | 944 | | | Delta Air Lines, Inc. | | | 46,455 | |
| | | | | | | | |
| | | | Building Products — 2.5% | |
| | 428 | | | A.O. Smith Corp. | | | 24,132 | |
| | 769 | | | Fortune Brands Home & Security, Inc. | | | 34,826 | |
| | | | | | | | |
| | | | | | | 58,958 | |
| | | | | | | | |
| | | | Commercial Services & Supplies — 1.2% | |
| | 216 | | | Stericycle, Inc. (a) | | | 28,283 | |
| | | | | | | | |
| | | | Electrical Equipment — 2.5% | |
| | 423 | | | Acuity Brands, Inc. | | | 59,278 | |
| | | | | | | | |
| | | | Industrial Conglomerates — 1.5% | |
| | 384 | | | Carlisle Cos., Inc. | | | 34,688 | |
| | | | | | | | |
| | | | Machinery — 2.7% | |
| | 254 | | | Middleby Corp. (The) (a) | | | 25,182 | |
| | 386 | | | Pall Corp. (m) | | | 39,087 | |
| | | | | | | | |
| | | | | | | 64,269 | |
| | | | | | | | |
| | | | Marine — 0.8% | |
| | 230 | | | Kirby Corp. (a) | | | 18,578 | |
| | | | | | | | |
| | | | Road & Rail — 1.3% | |
| | 83 | | | Canadian Pacific Railway Ltd., (Canada) | | | 16,071 | |
| | 216 | | | Landstar System, Inc. | | | 15,630 | |
| | | | | | | | |
| | | | | | | 31,701 | |
| | | | | | | | |
| | | | Trading Companies & Distributors — 2.3% | |
| | 1,233 | | | HD Supply Holdings, Inc. (a) | | | 36,347 | |
| | 180 | | | Watsco, Inc. | | | 19,292 | |
| | | | | | | | |
| | | | | | | 55,639 | |
| | | | | | | | |
| | | | Total Industrials | | | 397,849 | |
| | | | | | | | |
| | | | Information Technology — 24.2% | |
| | | | Communications Equipment — 2.5% | |
| | 205 | | | Arista Networks, Inc. (a) | | | 12,480 | |
| | 539 | | | Aruba Networks, Inc. (a) | | | 9,797 | |
| | | | | | | | |
| SHARES | | | SECURITY DESCRIPTION | | VALUE($) | |
| | | | | | | |
| | | | | | | | |
| | | | Communications Equipment — continued | |
| | 883 | | | Ciena Corp. (a) | | | 17,135 | |
| | 169 | | | Palo Alto Networks, Inc. (a) | | | 20,666 | |
| | | | | | | | |
| | | | | | | 60,078 | |
| | | | | | | | |
| | | | Electronic Equipment, Instruments & Components — 1.7% | |
| | 733 | | | Amphenol Corp., Class A | | | 39,443 | |
| | | | | | | | |
| | | | Internet Software & Services — 3.1% | |
| | 151 | | | CoStar Group, Inc. (a) | | | 27,691 | |
| | 586 | | | Dealertrack Technologies, Inc. (a) | | | 25,966 | |
| | 559 | | | Twitter, Inc. (a) | | | 20,055 | |
| | | | | | | | |
| | | | | | | 73,712 | |
| | | | | | | | |
| | | | IT Services — 3.9% | |
| | 147 | | | Alliance Data Systems Corp. (a) | | | 42,135 | |
| | 252 | | | Gartner, Inc. (a) | | | 21,196 | |
| | 814 | | | VeriFone Systems, Inc. (a) | | | 30,292 | |
| | | | | | | | |
| | | | | | | 93,623 | |
| | | | | | | | |
| | | | Semiconductors & Semiconductor Equipment — 5.4% | |
| | 1,074 | | | Applied Materials, Inc. (m) | | | 26,766 | |
| | 384 | | | Avago Technologies Ltd., (Singapore) | | | 38,667 | |
| | 361 | | | Lam Research Corp. (m) | | | 28,618 | |
| | 442 | | | NXP Semiconductors N.V., (Netherlands) (a) | | | 33,746 | |
| | | | | | | | |
| | | | | | | 127,797 | |
| | | | | | | | |
| | | | Software — 6.6% | |
| | 430 | | | Autodesk, Inc. (a) (m) | | | 25,844 | |
| | 630 | | | Electronic Arts, Inc. (a) (m) | | | 29,629 | |
| | 383 | | | Guidewire Software, Inc. (a) | | | 19,412 | |
| | 272 | | | Mobileye N.V., (Israel) (a) | | | 11,028 | |
| | 143 | | | NetSuite, Inc. (a) | | | 15,600 | |
| | 311 | | | ServiceNow, Inc. (a) | | | 21,108 | |
| | 193 | | | Tableau Software, Inc., Class A (a) | | | 16,393 | |
| | 202 | | | Workday, Inc., Class A (a) | | | 16,444 | |
| | | | | | | | |
| | | | | | | 155,458 | |
| | | | | | | | |
| | | | Technology Hardware, Storage & Peripherals — 1.0% | |
| | 248 | | | SanDisk Corp. | | | 24,299 | |
| | | | | | | | |
| | | | Total Information Technology | | | 574,410 | |
| | | | | | | | |
| | | | Materials — 3.0% | |
| | | | Chemicals — 2.1% | |
| | 185 | | | Sherwin-Williams Co. (The) | | | 48,583 | |
| | | | | | | | |
| | | | Construction Materials — 0.9% | |
| | 289 | | | Eagle Materials, Inc. | | | 21,950 | |
| | | | | | | | |
| | | | Total Materials | | | 70,533 | |
| | | | | | | | |
| | | | Total Common Stocks
(Cost $1,654,198) | | | 2,286,060 | |
| | | | | | | | |
SEE NOTES TO FINANCIAL STATEMENTS.
| | | | | | |
| | | |
| 24 | | | | J.P. MORGAN MID CAP/MULTI-CAP FUNDS | | DECEMBER 31, 2014 |
| | | | | | | | |
| SHARES | | | SECURITY DESCRIPTION | | VALUE($) | |
| | | | | | | |
| Short-Term Investment — 3.2% | |
| | | | Investment Company — 3.2% | |
| | 76,415 | | | JPMorgan Liquid Assets Money Market Fund, Institutional Class Shares, 0.030% (b) (l) (m)
(Cost $76,415 ) | | | 76,415 | |
| | | | | | | | |
| | | | Total Investments — 99.7%
(Cost $1,730,613) | | | 2,362,475 | |
| | | | Other Assets in Excess of
Liabilities — 0.3% | | | 7,371 | |
| | | | | | | | |
| | | | NET ASSETS — 100.0% | | $ | 2,369,846 | |
| | | | | | | | |
Percentages indicated are based on net assets.
SEE NOTES TO FINANCIAL STATEMENTS.
| | | | | | | | |
| | | |
| DECEMBER 31, 2014 | | J.P. MORGAN MID CAP/MULTI-CAP FUNDS | | | | | 25 | |
JPMorgan Mid Cap Value Fund
SCHEDULE OF PORTFOLIO INVESTMENTS
AS OF DECEMBER 31, 2014 (Unaudited)
(Amounts in thousands)
| | | | | | | | |
| SHARES | | | SECURITY DESCRIPTION | | VALUE($) | |
| | | | | | | |
| Common Stocks — 97.6% | |
| | | | Consumer Discretionary — 17.9% | | | | |
| | | | Hotels, Restaurants & Leisure — 1.4% | |
| | 978 | | | Marriott International, Inc., Class A | | | 76,299 | |
| | 1,788 | | | Starwood Hotels & Resorts Worldwide, Inc. | | | 144,925 | |
| | | | | | | | |
| | | | | | | 221,224 | |
| | | | | | | | |
| | | | Household Durables — 2.5% | |
| | 3,897 | | | Jarden Corp. (a) | | | 186,612 | |
| | 1,370 | | | Mohawk Industries, Inc. (a) | | | 212,824 | |
| | | | | | | | |
| | | | | | | 399,436 | |
| | | | | | | | |
| | | | Internet & Catalog Retail — 1.6% | |
| | 3,033 | | | Expedia, Inc. | | | 258,875 | |
| | | | | | | | |
| | | | Media — 3.2% | |
| | 1,469 | | | CBS Corp. (Non-Voting), Class B | | | 81,285 | |
| | 3,534 | | | Clear Channel Outdoor Holdings, Inc., Class A | | | 37,422 | |
| | 2,294 | | | DISH Network Corp., Class A (a) | | | 167,230 | |
| | 4,712 | | | Gannett Co., Inc. | | | 150,455 | |
| | 2,957 | | | Time, Inc. | | | 72,773 | |
| | | | | | | | |
| | | | | | | 509,165 | |
| | | | | | | | |
| | | | Multiline Retail — 2.4% | |
| | 4,288 | | | Kohl’s Corp. | | | 261,729 | |
| | 1,573 | | | Nordstrom, Inc. | | | 124,913 | |
| | | | | | | | |
| | | | | | | 386,642 | |
| | | | | | | | |
| | | | Specialty Retail — 5.4% | |
| | 266 | | | AutoZone, Inc. (a) | | | 164,887 | |
| | 1,677 | | | Bed Bath & Beyond, Inc. (a) | | | 127,720 | |
| | 3,920 | | | Best Buy Co., Inc. | | | 152,820 | |
| | 5,979 | | | Gap, Inc. (The) | | | 251,772 | |
| | 1,518 | | | Tiffany & Co. | | | 162,208 | |
| | | | | | | | |
| | | | | | | 859,407 | |
| | | | | | | | |
| | | | Textiles, Apparel & Luxury Goods — 1.4% | |
| | 1,095 | | | PVH Corp. | | | 140,366 | |
| | 1,067 | | | V.F. Corp. | | | 79,946 | |
| | | | | | | | |
| | | | | | | 220,312 | |
| | | | | | | | |
| | | | Total Consumer Discretionary | | | 2,855,061 | |
| | | | | | | | |
| | | | Consumer Staples — 5.5% | |
| | | | Beverages — 1.6% | |
| | 1,268 | | | Constellation Brands, Inc., Class A (a) | | | 124,510 | |
| | 1,886 | | | Dr. Pepper Snapple Group, Inc. | | | 135,214 | |
| | | | | | | | |
| | | | | | | 259,724 | |
| | | | | | | | |
| | | | Food & Staples Retailing — 2.1% | |
| | 3,346 | | | Kroger Co. (The) | | | 214,857 | |
| | 15,560 | | | Rite Aid Corp. (a) | | | 117,011 | |
| | | | | | | | |
| | | | | | | 331,868 | |
| | | | | | | | |
| | | | | | | | |
| SHARES | | | SECURITY DESCRIPTION | | VALUE($) | |
| | | | | | | |
| | | | | | | | |
| | | | Food Products — 0.9% | |
| | 1,448 | | | Hershey Co. (The) | | | 150,460 | |
| | | | | | | | |
| | | | Household Products — 0.9% | |
| | 1,083 | | | Energizer Holdings, Inc. | | | 139,241 | |
| | | | | | | | |
| | | | Total Consumer Staples | | | 881,293 | |
| | | | | | | | |
| | | | Energy — 3.8% | |
| | | | Oil, Gas & Consumable Fuels — 3.8% | |
| | 3,217 | | | Energen Corp. | | | 205,099 | |
| | 1,300 | | | EQT Corp. | | | 98,409 | |
| | 2,651 | | | PBF Energy, Inc., Class A | | | 70,635 | |
| | 3,903 | | | QEP Resources, Inc. | | | 78,915 | |
| | 5,608 | | | Southwestern Energy Co. (a) | | | 153,049 | |
| | | | | | | | |
| | | | Total Energy | | | 606,107 | |
| | | | | | | | |
| | | | Financials — 29.9% | |
| | | | Banks — 6.5% | |
| | 3,344 | | | Citizens Financial Group, Inc. | | | 83,137 | |
| | 1,553 | | | City National Corp. | | | 125,527 | |
| | 11,271 | | | Fifth Third Bancorp | | | 229,650 | |
| | 1,965 | | | First Republic Bank | | | 102,431 | |
| | 3,866 | | | Huntington Bancshares, Inc. | | | 40,668 | |
| | 1,674 | | | M&T Bank Corp. | | | 210,283 | |
| | 4,786 | | | SunTrust Banks, Inc. | | | 200,545 | |
| | 1,631 | | | Zions Bancorporation | | | 46,487 | |
| | | | | | | | |
| | | | | | | 1,038,728 | |
| | | | | | | | |
| | | | Capital Markets — 4.8% | |
| | 1,655 | | | Ameriprise Financial, Inc. | | | 218,872 | |
| | 3,935 | | | Invesco Ltd. | | | 155,523 | |
| | 1,751 | | | Legg Mason, Inc. | | | 93,444 | |
| | 1,450 | | | Northern Trust Corp. | | | 97,752 | |
| | 2,309 | | | T. Rowe Price Group, Inc. | | | 198,290 | |
| | | | | | | | |
| | | | | | | 763,881 | |
| | | | | | | | |
| | | | Consumer Finance — 0.7% | |
| | 4,995 | | | Ally Financial, Inc. (a) | | | 117,987 | |
| | | | | | | | |
| | | | Insurance — 8.8% | |
| | 214 | | | Alleghany Corp. (a) | | | 99,159 | |
| | 1,275 | | | Chubb Corp. (The) | | | 131,878 | |
| | 4,279 | | | Hartford Financial Services Group, Inc. (The) | | | 178,380 | |
| | 6,215 | | | Loews Corp. | | | 261,157 | |
| | 3,701 | | | Marsh & McLennan Cos., Inc. | | | 211,848 | |
| | 4,727 | | | Old Republic International Corp. | | | 69,151 | |
| | 2,582 | | | Progressive Corp. (The) | | | 69,696 | |
| | 3,743 | | | Unum Group | | | 130,544 | |
| | 2,039 | | | W.R. Berkley Corp. | | | 104,502 | |
| | 4,448 | | | XL Group plc, (Ireland) | | | 152,877 | |
| | | | | | | | |
| | | | | | | 1,409,192 | |
| | | | | | | | |
SEE NOTES TO FINANCIAL STATEMENTS.
| | | | | | |
| | | |
| 26 | | | | J.P. MORGAN MID CAP/MULTI-CAP FUNDS | | DECEMBER 31, 2014 |
| | | | | | | | |
| SHARES | | | SECURITY DESCRIPTION | | VALUE($) | |
| | | | | | | |
| Common Stocks — continued | |
| | | | Real Estate Investment Trusts (REITs) — 8.7% | |
| | 2,783 | | | American Campus Communities, Inc. (m) | | | 115,124 | |
| | 1,054 | | | AvalonBay Communities, Inc. (m) | | | 172,202 | |
| | 649 | | | Boston Properties, Inc. (m) | | | 83,508 | |
| | 4,041 | | | Brixmor Property Group, Inc. | | | 100,376 | |
| | 5,105 | | | General Growth Properties, Inc. (m) | | | 143,597 | |
| | 6,696 | | | Kimco Realty Corp. (m) | | | 168,327 | |
| | 2,321 | | | Outfront Media, Inc. | | | 62,287 | |
| | 2,993 | | | Rayonier, Inc. (m) | | | 83,626 | |
| | 1,757 | | | Regency Centers Corp. (m) | | | 112,092 | |
| | 1,636 | | | Vornado Realty Trust (m) | | | 192,540 | |
| | 4,370 | | | Weyerhaeuser Co. (m) | | | 156,848 | |
| | | | | | | | |
| | | | | | | 1,390,527 | |
| | | | | | | | |
| | | | Thrifts & Mortgage Finance — 0.4% | |
| | 6,261 | | | Hudson City Bancorp, Inc. | | | 63,362 | |
| | | | | | | | |
| | | | Total Financials | | | 4,783,677 | |
| | | | | | | | |
| | | | Health Care — 6.7% | |
| | | | Health Care Equipment & Supplies — 1.2% | |
| | 3,133 | | | CareFusion Corp. (a) | | | 185,911 | |
| | | | | | | | |
| | | | Health Care Providers & Services — 5.5% | |
| | 2,159 | | | AmerisourceBergen Corp. | | | 194,670 | |
| | 3,849 | | | Brookdale Senior Living, Inc. (a) | | | 141,145 | |
| | 2,448 | | | Cigna Corp. | | | 251,899 | |
| | 727 | | | Henry Schein, Inc. (a) | | | 99,016 | |
| | 1,404 | | | Humana, Inc. | | | 201,645 | |
| | | | | | | | |
| | | | | | | 888,375 | |
| | | | | | | | |
| | | | Total Health Care | | | 1,074,286 | |
| | | | | | | | |
| | | | Industrials — 9.4% | |
| | | | Building Products — 0.8% | |
| | 2,939 | | | Fortune Brands Home & Security, Inc. | | | 133,045 | |
| | | | | | | | |
| | | | Electrical Equipment — 2.7% | |
| | 2,818 | | | AMETEK, Inc. | | | 148,297 | |
| | 1,299 | | | Hubbell, Inc., Class B | | | 138,792 | |
| | 1,815 | | | Regal-Beloit Corp. | | | 136,508 | |
| | | | | | | | |
| | | | | | | 423,597 | |
| | | | | | | | |
| | | | Industrial Conglomerates — 1.2% | |
| | 2,101 | | | Carlisle Cos., Inc. | | | 189,624 | |
| | | | | | | | |
| | | | Machinery — 2.6% | |
| | 2,297 | | | IDEX Corp. | | | 178,832 | |
| | 2,958 | | | Rexnord Corp. (a) | | | 83,433 | |
| | 1,165 | | | Snap-on, Inc. | | | 159,268 | |
| | | | | | | | |
| | | | | | | 421,533 | |
| | | | | | | | |
| | | | | | | | |
| SHARES | | | SECURITY DESCRIPTION | | VALUE($) | |
| | | | | | | |
| | | | | | | | |
| | | | Professional Services — 1.2% | |
| | 2,462 | | | Equifax, Inc. | | | 199,134 | |
| | | | | | | | |
| | | | Trading Companies & Distributors — 0.9% | |
| | 1,718 | | | MSC Industrial Direct Co., Inc., Class A | | | 139,620 | |
| | | | | | | | |
| | | | Total Industrials | | | 1,506,553 | |
| | | | | | | | |
| | | | Information Technology — 8.9% | |
| | | | Communications Equipment — 0.7% | |
| | 5,188 | | | CommScope Holding Co., Inc. (a) | | | 118,436 | |
| | | | | | | | |
| | | | Electronic Equipment, Instruments & Components — 2.6% | |
| | 3,108 | | | Amphenol Corp., Class A | | | 167,249 | |
| | 4,182 | | | Arrow Electronics, Inc. (a) | | | 242,081 | |
| | | | | | | | |
| | | | | | | 409,330 | |
| | | | | | | | |
| | | | IT Services — 1.5% | |
| | 3,796 | | | Jack Henry & Associates, Inc. | | | 235,912 | |
| | | | | | | | |
| | | | Semiconductors & Semiconductor Equipment — 2.9% | |
| | 3,617 | | | Analog Devices, Inc. | | | 200,826 | |
| | 1,499 | | | KLA-Tencor Corp. | | | 105,401 | |
| | 3,764 | | | Xilinx, Inc. | | | 162,936 | |
| | | | | | | | |
| | | | | | | 469,163 | |
| | | | | | | | |
| | | | Software — 1.2% | |
| | 4,249 | | | Synopsys, Inc. (a) | | | 184,724 | |
| | | | | | | | |
| | | | Total Information Technology | | | 1,417,565 | |
| | | | | | | | |
| | | | Materials — 6.2% | |
| | | | Chemicals — 3.2% | |
| | 1,770 | | | Airgas, Inc. | | | 203,900 | |
| | 1,915 | | | Albemarle Corp. | | | 115,141 | |
| | 505 | | | Sherwin-Williams Co. (The) | | | 132,757 | |
| | 470 | | | Sigma-Aldrich Corp. | | | 64,552 | |
| | | | | | | | |
| | | | | | | 516,350 | |
| | | | | | | | |
| | | | Containers & Packaging — 3.0% | |
| | 2,626 | | | Ball Corp. | | | 179,014 | |
| | 2,298 | | | Rock-Tenn Co., Class A | | | 140,157 | |
| | 2,885 | | | Silgan Holdings, Inc. | | | 154,658 | |
| | | | | | | | |
| | | | | | | 473,829 | |
| | | | | | | | |
| | | | Total Materials | | | 990,179 | |
| | | | | | | | |
| | | | Utilities — 9.3% | |
| | | | Electric Utilities — 2.8% | |
| | 2,314 | | | Edison International | | | 151,537 | |
| | 3,687 | | | Westar Energy, Inc. | | | 152,046 | |
| | 4,011 | | | Xcel Energy, Inc. | | | 144,069 | |
| | | | | | | | |
| | | | | | | 447,652 | |
| | | | | | | | |
SEE NOTES TO FINANCIAL STATEMENTS.
| | | | | | | | |
| | | |
| DECEMBER 31, 2014 | | J.P. MORGAN MID CAP/MULTI-CAP FUNDS | | | | | 27 | |
JPMorgan Mid Cap Value Fund
SCHEDULE OF PORTFOLIO INVESTMENTS
AS OF DECEMBER 31, 2014 (Unaudited) (continued)
(Amounts in thousands)
| | | | | | | | |
| SHARES | | | SECURITY DESCRIPTION | | VALUE($) | |
| | | | | | | |
| Common Stocks — continued | |
| | | | Gas Utilities — 2.0% | |
| | 1,521 | | | National Fuel Gas Co. | | | 105,732 | |
| | 8,856 | | | Questar Corp. | | | 223,889 | |
| | | | | | | | |
| | | | | | | 329,621 | |
| | | | | | | | |
| | | | Multi-Utilities — 4.5% | |
| | 6,132 | | | CenterPoint Energy, Inc. | | | 143,667 | |
| | 4,842 | | | CMS Energy Corp. | | | 168,264 | |
| | 1,585 | | | NiSource, Inc. | | | 67,241 | |
| | 1,885 | | | Sempra Energy | | | 209,915 | |
| | 2,451 | | | Wisconsin Energy Corp. | | | 129,277 | |
| | | | | | | | |
| | | | | | | 718,364 | |
| | | | | | | | |
| | | | Total Utilities | | | 1,495,637 | |
| | | | | | | | |
| | | | Total Common Stocks
(Cost $9,995,548) | | | 15,610,358 | |
| | | | | | | | |
| | | | | | | | |
| SHARES | | | SECURITY DESCRIPTION | | VALUE($) | |
| | | | | | | |
| Short-Term Investment — 2.8% | |
| | | | Investment Company — 2.8% | |
| | 448,474 | | | JPMorgan Prime Money Market Fund, Institutional Class Shares,
0.020% (b) (l) (m)
(Cost $448,474 ) | | | 448,474 | |
| | | | | | | | |
| | | | Total Investments — 100.4%
(Cost $10,444,022 | | | 16,058,832 | |
| | | | Liabilities in Excess of
Other Assets — (0.4)% | | | (65,748 | ) |
| | | | | | | | |
| | | | NET ASSETS — 100.0% | | $ | 15,993,084 | |
| | | | | | | | |
Percentages indicated are based on net assets.
SEE NOTES TO FINANCIAL STATEMENTS.
| | | | | | |
| | | |
| 28 | | | | J.P. MORGAN MID CAP/MULTI-CAP FUNDS | | DECEMBER 31, 2014 |
JPMorgan Multi-Cap Market Neutral Fund
SCHEDULE OF PORTFOLIO INVESTMENTS
AS OF DECEMBER 31, 2014 (Unaudited)
(Amounts in thousands)
| | | | | | | | |
| SHARES | | | SECURITY DESCRIPTION | | VALUE($) | |
| | | | | | | |
| Long Positions — 99.1% (j) | |
| Common Stocks — 92.8% | |
| | | | Consumer Discretionary — 16.2% | |
| | | | Auto Components — 0.4% | |
| | 57 | | | Dana Holding Corp. | | | 1,236 | |
| | | | | | | | |
| | | | Diversified Consumer Services — 1.7% | |
| | 67 | | | Apollo Education Group, Inc. (a) | | | 2,281 | |
| | 63 | | | DeVry Education Group, Inc. | | | 2,979 | |
| | | | | | | | |
| | | | | | | 5,260 | |
| | | | | | | | |
| | | | Hotels, Restaurants & Leisure — 1.9% | |
| | 87 | | | Restaurant Brands International, Inc., (Canada) (a) | | | 3,400 | |
| | 33 | | | Royal Caribbean Cruises Ltd. | | | 2,741 | |
| | | | | | | | |
| | | | | | | 6,141 | |
| | | | | | | | |
| | | | Household Durables — 1.1% | |
| | 1 | | | NVR, Inc. (a) | | | 733 | |
| | 134 | | | PulteGroup, Inc. | | | 2,877 | |
| | | | | | | | |
| | | | | | | 3,610 | |
| | | | | | | | |
| | | | Internet & Catalog Retail — 0.8% | |
| | 15 | | | Expedia, Inc. | | | 1,319 | |
| | 37 | | | Liberty Interactive Corp., Class A (a) | | | 1,096 | |
| | | | | | | | |
| | | | | | | 2,415 | |
| | | | | | | | |
| | | | Media — 1.8% | |
| | 52 | | | Gannett Co., Inc. | | | 1,652 | |
| | 82 | | | Live Nation Entertainment, Inc. (a) | | | 2,133 | |
| | 6 | | | Regal Entertainment Group, Class A | | | 138 | |
| | 20 | | | Time Warner, Inc. | | | 1,749 | |
| | 9 | | | Time, Inc. | | | 210 | |
| | | | | | | | |
| | | | | | | 5,882 | |
| | | | | | | | |
| | | | Multiline Retail — 1.8% | |
| | 51 | | | Big Lots, Inc. | | | 2,046 | |
| | 19 | | | Dillard’s, Inc., Class A | | | 2,380 | |
| | 21 | | | Macy’s, Inc. | | | 1,362 | |
| | | | | | | | |
| | | | | | | 5,788 | |
| | | | | | | | |
| | | | Specialty Retail — 5.1% | |
| | 26 | | | Abercrombie & Fitch Co., Class A | | | 750 | |
| | 86 | | | Best Buy Co., Inc. | | | 3,354 | |
| | 35 | | | Foot Locker, Inc. | | | 1,973 | |
| | 65 | | | GameStop Corp., Class A | | | 2,188 | |
| | 116 | | | Guess?, Inc. | | | 2,436 | |
| | 45 | | | Lowe’s Cos., Inc. | | | 3,105 | |
| | 147 | | | Staples, Inc. | | | 2,656 | |
| | | | | | | | |
| | | | | | | 16,462 | |
| | | | | | | | |
| | | | | | | | |
| SHARES | | | SECURITY DESCRIPTION | | VALUE($) | |
| | | | | | | |
| | | | | | | | |
| | | | | | | | |
| | | | Textiles, Apparel & Luxury Goods — 1.6% | |
| | 31 | | | Deckers Outdoor Corp. (a) | | | 2,832 | |
| | 21 | | | Hanesbrands, Inc. | | | 2,313 | |
| | | | | | | | |
| | | | | | | 5,145 | |
| | | | | | | | |
| | | | Total Consumer Discretionary | | | 51,939 | |
| | | | | | | | |
| | | | Consumer Staples — 7.2% | |
| | | | Beverages — 1.0% | |
| | 42 | | | Molson Coors Brewing Co., Class B | | | 3,097 | |
| | | | | | | | |
| | | | Food & Staples Retailing — 1.6% | |
| | 55 | | | Kroger Co. (The) | | | 3,500 | |
| | 221 | | | Rite Aid Corp. (a) | | | 1,663 | |
| | | | | | | | |
| | | | | | | 5,163 | |
| | | | | | | | |
| | | | Food Products — 2.7% | |
| | 63 | | | Archer-Daniels-Midland Co. | | | 3,299 | |
| | 25 | | | Ingredion, Inc. | | | 2,081 | |
| | 105 | | | Pilgrim’s Pride Corp. (a) | | | 3,438 | |
| | | | | | | | |
| | | | | | | 8,818 | |
| | | | | | | | |
| | | | Household Products — 1.0% | |
| | 26 | | | Energizer Holdings, Inc. | | | 3,291 | |
| | | | | | | | |
| | | | Personal Products — 0.4% | |
| | 34 | | | Herbalife Ltd. | | | 1,286 | |
| | | | | | | | |
| | | | Tobacco — 0.5% | |
| | 25 | | | Lorillard, Inc. | | | 1,549 | |
| | | | | | | | |
| | | | Total Consumer Staples | | | 23,204 | |
| | | | | | | | |
| | | | Energy — 3.0% | |
| | | | Energy Equipment & Services — 0.8% | |
| | 18 | | | Baker Hughes, Inc. | | | 995 | |
| | 81 | | | Superior Energy Services, Inc. | | | 1,636 | |
| | | | | | | | |
| | | | | | | 2,631 | |
| | | | | | | | |
| | | | Oil, Gas & Consumable Fuels — 2.2% | |
| | 19 | | | ConocoPhillips | | | 1,332 | |
| | 53 | | | Kosmos Energy Ltd., (Bermuda) (a) | | | 447 | |
| | 5 | | | Marathon Petroleum Corp. | | | 460 | |
| | 21 | | | Newfield Exploration Co. (a) | | | 571 | |
| | 17 | | | Tesoro Corp. | | | 1,261 | |
| | 33 | | | Valero Energy Corp. | | | 1,625 | |
| | 22 | | | World Fuel Services Corp. | | | 1,026 | |
| | 15 | | | WPX Energy, Inc. (a) | | | 179 | |
| | | | | | | | |
| | | | | | | 6,901 | |
| | | | | | | | |
| | | | Total Energy | | | 9,532 | |
| | | | | | | | |
SEE NOTES TO FINANCIAL STATEMENTS.
| | | | | | | | |
| | | |
| DECEMBER 31, 2014 | | J.P. MORGAN MID CAP/MULTI-CAP FUNDS | | | | | 29 | |
JPMorgan Multi-Cap Market Neutral Fund
SCHEDULE OF PORTFOLIO INVESTMENTS
AS OF DECEMBER 31, 2014 (Unaudited) (continued)
(Amounts in thousands)
| | | | | | | | |
| SHARES | | | SECURITY DESCRIPTION | | VALUE($) | |
| | | | | | | |
| Long Positions — continued | |
| Common Stocks — continued | |
| | | | Financials — 4.7% | |
| | | | Banks — 0.7% | |
| | 78 | | | KeyCorp | | | 1,085 | |
| | 37 | | | Popular, Inc., (Puerto Rico) (a) | | | 1,254 | |
| | | | | | | | |
| | | | | | | 2,339 | |
| | | | | | | | |
| | | | Capital Markets — 1.5% | |
| | 79 | | | E*TRADE Financial Corp. (a) | | | 1,909 | |
| | 56 | | | Lazard Ltd., (Bermuda), Class A | | | 2,807 | |
| | | | | | | | |
| | | | | | | 4,716 | |
| | | | | | | | |
| | | | Consumer Finance — 0.5% | |
| | 28 | | | Discover Financial Services | | | 1,820 | |
| | | | | | | | |
| | | | Insurance — 0.8% | |
| | 14 | | | Aspen Insurance Holdings Ltd., (Bermuda) | | | 595 | |
| | 3 | | | Everest Re Group Ltd., (Bermuda) | | | 453 | |
| | 16 | | | Prudential Financial, Inc. | | | 1,456 | |
| | | | | | | | |
| | | | | | | 2,504 | |
| | | | | | | | |
| | | | Real Estate Investment Trusts (REITs) — 1.2% | |
| | 17 | | | NorthStar Realty Finance Corp. | | | 301 | |
| | 107 | | | RLJ Lodging Trust | | | 3,585 | |
| | | | | | | | |
| | | | | | | 3,886 | |
| | | | | | | | |
| | | | Total Financials | | | 15,265 | |
| | | | | | | | |
| | | | Health Care — 12.2% | |
| | | | Biotechnology — 2.2% | |
| | 10 | | | Amgen, Inc. | | | 1,630 | |
| | 15 | | | Gilead Sciences, Inc. (a) | | | 1,371 | |
| | 12 | | | United Therapeutics Corp. (a) | | | 1,613 | |
| | 21 | | | Vertex Pharmaceuticals, Inc. (a) | | | 2,448 | |
| | | | | | | | |
| | | | | | | 7,062 | |
| | | | | | | | |
| | | | Health Care Equipment & Supplies — 3.1% | |
| | 24 | | | Alere, Inc. (a) | | | 895 | |
| | 11 | | | Becton, Dickinson and Co. | | | 1,568 | |
| | 41 | | | Hologic, Inc. (a) | | | 1,104 | |
| | 39 | | | Medtronic, Inc. | | | 2,826 | |
| | 37 | | | Stryker Corp. | | | 3,504 | |
| | | | | | | | |
| | | | | | | 9,897 | |
| | | | | | | | |
| | | | Health Care Providers & Services — 5.9% | |
| | 20 | | | Aetna, Inc. | | | 1,770 | |
| | 26 | | | Anthem, Inc. | | | 3,208 | |
| | 41 | | | Cardinal Health, Inc. | | | 3,276 | |
| | 12 | | | Cigna Corp. | | | 1,267 | |
| | 45 | | | Express Scripts Holding Co. (a) | | | 3,787 | |
| | 58 | | | Health Net, Inc. (a) | | | 3,111 | |
| | | | | | | | |
| SHARES | | | SECURITY DESCRIPTION | | VALUE($) | |
| | | | | | | |
| | | | | | | | |
| | | | | | | | |
| | | | Health Care Providers & Services — continued | |
| | 3 | | | Laboratory Corp. of America Holdings (a) | | | 337 | |
| | 29 | | | Omnicare, Inc. | | | 2,104 | |
| | | | | | | | |
| | | | | | | 18,860 | |
| | | | | | | | |
| | | | Pharmaceuticals — 1.0% | |
| | 107 | | | Pfizer, Inc. | | | 3,328 | |
| | | | | | | | |
| | | | Total Health Care | | | 39,147 | |
| | | | | | | | |
| | | | Industrials — 13.9% | |
| | | | Aerospace & Defense — 1.4% | |
| | 12 | | | General Dynamics Corp. | | | 1,703 | |
| | 12 | | | Huntington Ingalls Industries, Inc. | | | 1,392 | |
| | 10 | | | Northrop Grumman Corp. | | | 1,438 | |
| | | | | | | | |
| | | | | | | 4,533 | |
| | | | | | | | |
| | | | Air Freight & Logistics — 0.5% | |
| | 9 | | | FedEx Corp. | | | 1,606 | |
| | | | | | | | |
| | | | Airlines — 1.5% | |
| | 17 | | | Alaska Air Group, Inc. | | | 1,003 | |
| | 22 | | | Delta Air Lines, Inc. | | | 1,090 | |
| | 64 | | | Southwest Airlines Co. | | | 2,702 | |
| | | | | | | | |
| | | | | | | 4,795 | |
| | | | | | | | |
| | | | Commercial Services & Supplies — 1.1% | |
| | 128 | | | Pitney Bowes, Inc. | | | 3,126 | |
| | 23 | | | R.R. Donnelley & Sons Co. | | | 387 | |
| | | | | | | | |
| | | | | | | 3,513 | |
| | | | | | | | |
| | | | Construction & Engineering — 1.5% | |
| | 101 | | | AECOM Technology Corp. (a) | | | 3,057 | |
| | 109 | | | KBR, Inc. | | | 1,845 | |
| | | | | | | | |
| | | | | | | 4,902 | |
| | | | | | | | |
| | | | Electrical Equipment — 1.0% | |
| | 43 | | | Regal-Beloit Corp. | | | 3,221 | |
| | | | | | | | |
| | | | Machinery — 5.1% | |
| | 91 | | | Allison Transmission Holdings, Inc. | | | 3,072 | |
| | 42 | | | IDEX Corp. | | | 3,244 | |
| | 32 | | | Illinois Tool Works, Inc. | | | 3,052 | |
| | 24 | | | Joy Global, Inc. | | | 1,123 | |
| | 24 | | | Parker-Hannifin Corp. | | | 3,075 | |
| | 32 | | | SPX Corp. | | | 2,707 | |
| | | | | | | | |
| | | | | | | 16,273 | |
| | | | | | | | |
| | | | Professional Services — 1.2% | |
| | 26 | | | Dun & Bradstreet Corp. (The) | | | 3,085 | |
| | 12 | | | ManpowerGroup, Inc. | | | 816 | |
| | | | | | | | |
| | | | | | | 3,901 | |
| | | | | | | | |
SEE NOTES TO FINANCIAL STATEMENTS.
| | | | | | |
| | | |
| 30 | | | | J.P. MORGAN MID CAP/MULTI-CAP FUNDS | | DECEMBER 31, 2014 |
| | | | | | | | |
| SHARES | | | SECURITY DESCRIPTION | | VALUE($) | |
| | | | | | | |
| Long Positions — continued | |
| Common Stocks — continued | |
| | | | Road & Rail — 0.6% | |
| | 26 | | | Landstar System, Inc. | | | 1,870 | |
| | | | | | | | |
| | | | Total Industrials | | | 44,614 | |
| | | | | | | | |
| | | | Information Technology — 25.4% | |
| | | | Communications Equipment — 2.5% | |
| | 103 | | | ARRIS Group, Inc. (a) | | | 3,112 | |
| | 268 | | | Brocade Communications Systems, Inc. | | | 3,172 | |
| | 5 | | | Harris Corp. | | | 346 | |
| | 109 | | | Polycom, Inc. (a) | | | 1,474 | |
| | | | | | | | |
| | | | | | | 8,104 | |
| | | | | | | | |
| | | | Electronic Equipment, Instruments & Components — 0.4% | |
| | 81 | | | Vishay Intertechnology, Inc. | | | 1,144 | |
| | | | | | | | |
| | | | Internet Software & Services — 2.1% | |
| | 36 | | | eBay, Inc. (a) | | | 2,014 | |
| | 23 | | | LendingClub Corp. (a) | | | 583 | |
| | 23 | | | VeriSign, Inc. (a) | | | 1,288 | |
| | 60 | | | Yahoo!, Inc. (a) | | | 3,018 | |
| | | | | | | | |
| | | | | | | 6,903 | |
| | | | | | | | |
| | | | IT Services — 4.8% | |
| | 63 | | | Amdocs Ltd. | | | 2,916 | |
| | 69 | | | Broadridge Financial Solutions, Inc. | | | 3,207 | |
| | 21 | | | Computer Sciences Corp. | | | 1,350 | |
| | 13 | | | Global Payments, Inc. | | | 1,045 | |
| | 71 | | | Leidos Holdings, Inc. | | | 3,088 | |
| | 16 | | | VeriFone Systems, Inc. (a) | | | 598 | |
| | 174 | | | Western Union Co. (The) | | | 3,117 | |
| | | | | | | | |
| | | | | | | 15,321 | |
| | | | | | | | |
| | | | Semiconductors & Semiconductor Equipment — 1.7% | |
| | 77 | | | Broadcom Corp., Class A | | | 3,315 | |
| | 6 | | | Lam Research Corp. | | | 455 | |
| | 82 | | | NVIDIA Corp. | | | 1,642 | |
| | | | | | | | |
| | | | | | | 5,412 | |
| | | | | | | | |
| | | | Software — 8.9% | |
| | 59 | | | Activision Blizzard, Inc. | | | 1,195 | |
| | 27 | | | Aspen Technology, Inc. (a) | | | 953 | |
| | 104 | | | CA, Inc. | | | 3,162 | |
| | 59 | | | Cadence Design Systems, Inc. (a) | | | 1,112 | |
| | 29 | | | Citrix Systems, Inc. (a) | | | 1,845 | |
| | 70 | | | Electronic Arts, Inc. (a) | | | 3,280 | |
| | 36 | | | Intuit, Inc. | | | 3,333 | |
| | 213 | | | Nuance Communications, Inc. (a) | | | 3,034 | |
| | 70 | | | Oracle Corp. | | | 3,128 | |
| | 59 | | | PTC, Inc. (a) | | | 2,177 | |
| | | | | | | | |
| SHARES | | | SECURITY DESCRIPTION | | VALUE($) | |
| | | | | | | |
| | | | | | | | |
| | | | | | | | |
| | | | Software — continued | |
| | 142 | | | Rovi Corp. (a) | | | 3,197 | |
| | 80 | | | Symantec Corp. | | | 2,056 | |
| | | | | | | | |
| | | | | | | 28,472 | |
| | | | | | | | |
| | | | Technology Hardware, Storage & Peripherals — 5.0% | |
| | 30 | | | Apple, Inc. | | | 3,262 | |
| | 84 | | | Hewlett-Packard Co. | | | 3,370 | |
| | 67 | | | Lexmark International, Inc., Class A | | | 2,772 | |
| | 77 | | | NetApp, Inc. | | | 3,198 | |
| | 32 | | | Western Digital Corp. | | | 3,547 | |
| | | | | | | | |
| | | | | | | 16,149 | |
| | | | | | | | |
| | | | Total Information Technology | | | 81,505 | |
| | | | | | | | |
| | | | Materials — 4.1% | |
| | | | Chemicals — 0.2% | |
| | 9 | | | Scotts Miracle-Gro Co. (The), Class A | | | 544 | |
| | | | | | | | |
| | | | Containers & Packaging — 1.9% | |
| | 20 | | | Ball Corp. | | | 1,366 | |
| | 83 | | | Sealed Air Corp. | | | 3,536 | |
| | 21 | | | Silgan Holdings, Inc. | | | 1,103 | |
| | | | | | | | |
| | | | | | | 6,005 | |
| | | | | | | | |
| | | | Metals & Mining — 1.2% | |
| | 36 | | | Steel Dynamics, Inc. | | | 701 | |
| | 78 | | | United States Steel Corp. | | | 2,090 | |
| | 34 | | | Worthington Industries, Inc. | | | 1,014 | |
| | | | | | | | |
| | | | | | | 3,805 | |
| | | | | | | | |
| | | | Paper & Forest Products — 0.8% | |
| | 68 | | | Domtar Corp., (Canada) | | | 2,750 | |
| | | | | | | | |
| | | | Total Materials | | | 13,104 | |
| | | | | | | | |
| | | | Telecommunication Services — 2.7% | |
| | | | Diversified Telecommunication Services — 2.7% | |
| | 103 | | | AT&T, Inc. | | | 3,456 | |
| | 80 | | | CenturyLink, Inc. | | | 3,174 | |
| | 309 | | | Frontier Communications Corp. | | | 2,063 | |
| | | | | | | | |
| | | | Total Telecommunication Services | | | 8,693 | |
| | | | | | | | |
| | | | Utilities — 3.4% | |
| | | | Gas Utilities — 1.0% | |
| | 85 | | | UGI Corp. | | | 3,234 | |
| | | | | | | | |
| | | | Independent Power & Renewable Electricity Producers — 2.4% | |
| | 243 | | | AES Corp. | | | 3,346 | |
| | 71 | | | Calpine Corp. (a) | | | 1,562 | |
SEE NOTES TO FINANCIAL STATEMENTS.
| | | | | | | | |
| | | |
| DECEMBER 31, 2014 | | J.P. MORGAN MID CAP/MULTI-CAP FUNDS | | | | | 31 | |
JPMorgan Multi-Cap Market Neutral Fund
SCHEDULE OF PORTFOLIO INVESTMENTS
AS OF DECEMBER 31, 2014 (Unaudited) (continued)
(Amounts in thousands)
| | | | | | | | |
| SHARES | | | SECURITY DESCRIPTION | | VALUE($) | |
| | | | | | | |
| Long Positions — continued | |
| Common Stocks — continued | |
| | | | Independent Power & Renewable Electricity Producers — continued | |
| | 95 | | | Dynegy, Inc. (a) | | | 2,871 | |
| | | | | | | | |
| | | | | | | 7,779 | |
| | | | | | | | |
| | | | Total Utilities | | | 11,013 | |
| | | | | | | | |
| | | | Total Common Stocks
(Cost $235,301) | | | 298,016 | |
| | | | | | | | |
| Short-Term Investment — 6.3% | |
| | | | Investment Company— 6.3% | |
| | 20,186 | | | JPMorgan Liquid Assets Money Market Fund, Institutional Class Shares, 0.030% (b) (l)
(Cost $20,186 ) | | | 20,186 | |
| | | | | | | | |
| | | | Total Investments — 99.1%
(Cost $255,487) | | | 318,202 | |
| | | | Other Assets in Excess of
Liabilities — 0.9% (c) | | | 2,806 | |
| | | | | | | | |
| | | | NET ASSETS — 100.0% | | $ | 321,008 | |
| | | | | | | | |
| Short Positions — 92.6% | |
| Common Stocks — 92.6% | |
| | | | Consumer Discretionary — 16.5% | | | | |
| | | | Distributors — 1.0% | |
| | 113 | | | LKQ Corp. (a) | | | 3,186 | |
| | | | | | | | |
| | | | Hotels, Restaurants & Leisure — 3.7% | |
| | 6 | | | McDonald’s Corp. | | | 554 | |
| | 67 | | | Norwegian Cruise Line Holdings Ltd. (a) | | | 3,139 | |
| | 19 | | | Panera Bread Co., Class A (a) | | | 3,286 | |
| | 36 | | | Starbucks Corp. | | | 2,929 | |
| | 14 | | | Wynn Resorts Ltd. | | | 2,083 | |
| | | | | | | | |
| | | | | | | 11,991 | |
| | | | | | | | |
| | | | Household Durables — 1.1% | |
| | 13 | | | Mohawk Industries, Inc. (a) | | | 2,028 | |
| | 41 | | | Toll Brothers, Inc. (a) | | | 1,411 | |
| | | | | | | | |
| | | | | | | 3,439 | |
| | | | | | | | |
| | | | Internet & Catalog Retail — 0.8% | |
| | 3 | | | Amazon.com, Inc. (a) | | | 1,063 | |
| | 176 | | | Groupon, Inc. (a) | | | 1,456 | |
| | | | | | | | |
| | | | | | | 2,519 | |
| | | | | | | | |
| | | | Leisure Products — 0.2% | |
| | 19 | | | Mattel, Inc. | | | 583 | |
| | | | | | | | |
| | | | Media — 3.1% | |
| | 35 | | | AMC Networks, Inc., Class A (a) | | | 2,247 | |
| | 20 | | | Charter Communications, Inc., Class A (a) | | | 3,353 | |
| | 61 | | | DreamWorks Animation SKG, Inc., Class A (a) | | | 1,361 | |
| | 40 | | | Madison Square Garden Co. (The), Class A (a) | | | 3,029 | |
| | | | | | | | |
| | | | | | | 9,990 | |
| | | | | | | | |
| | | | | | | | |
| SHARES | | | SECURITY DESCRIPTION | | VALUE($) | |
| | | | | | | |
| | | | | | | | |
| | | | | | | | |
| | | | Specialty Retail — 5.4% | |
| | 228 | | | American Eagle Outfitters, Inc. | | | 3,166 | |
| | 59 | | | Cabela’s, Inc. (a) | | | 3,109 | |
| | 55 | | | CarMax, Inc. (a) | | | 3,693 | |
| | 11 | | | Restoration Hardware Holdings, Inc. (a) | | | 1,020 | |
| | 24 | | | Signet Jewelers Ltd., (Bermuda) | | | 3,147 | |
| | 39 | | | Tractor Supply Co. | | | 3,065 | |
| | | | | | | | |
| | | | | | | 17,200 | |
| | | | | | | | |
| | | | Textiles, Apparel & Luxury Goods — 1.2% | |
| | 100 | | | Kate Spade & Co. (a) | | | 3,209 | |
| | 12 | | | Under Armour, Inc., Class A (a) | | | 808 | |
| | | | | | | | |
| | | | | | | 4,017 | |
| | | | | | | | |
| | | | Total Consumer Discretionary | | | 52,925 | |
| | | | | | | | |
| | | | Consumer Staples — 7.7% | |
| | | | Beverages — 1.4% | |
| | 4 | | | Boston Beer Co., Inc. (The), Class A (a) | | | 1,231 | |
| | 36 | | | Brown-Forman Corp., Class B | | | 3,152 | |
| | | | | | | | |
| | | | | | | 4,383 | |
| | | | | | | | |
| | | | Food & Staples Retailing — 1.6% | |
| | 55 | | | Fresh Market, Inc. (The) (a) | | | 2,264 | |
| | 38 | | | United Natural Foods, Inc. (a) | | | 2,930 | |
| | | | | | | | |
| | | | | | | 5,194 | |
| | | | | | | | |
| | | | Food Products — 3.2% | |
| | 98 | | | Darling Ingredients, Inc. (a) | | | 1,788 | |
| | 98 | | | Flowers Foods, Inc. | | | 1,889 | |
| | 58 | | | Hain Celestial Group, Inc. (The) (a) | | | 3,390 | |
| | 45 | | | McCormick & Co., Inc. (Non-Voting) | | | 3,322 | |
| | | | | | | | |
| | | | | | | 10,389 | |
| | | | | | | | |
| | | | Household Products — 0.4% | |
| | 12 | | | Procter & Gamble Co. (The) | | | 1,097 | |
| | | | | | | | |
| | | | Personal Products — 1.1% | |
| | 46 | | | Estee Lauder Cos., Inc. (The), Class A | | | 3,475 | |
| | | | | | | | |
| | | | Total Consumer Staples | | | 24,538 | |
| | | | | | | | |
| | | | Energy — 4.5% | |
| | | | Energy Equipment & Services — 1.4% | |
| | 503 | | | McDermott International, Inc. (a) | | | 1,465 | |
| | 56 | | | Noble Corp. plc, (United Kingdom) | | | 931 | |
| | 50 | | | Seadrill Ltd., (Bermuda) | | | 596 | |
| | 74 | | | Transocean Ltd., (Switzerland) | | | 1,358 | |
| | | | | | | | |
| | | | | | | 4,350 | |
| | | | | | | | |
SEE NOTES TO FINANCIAL STATEMENTS.
| | | | | | |
| | | |
| 32 | | | | J.P. MORGAN MID CAP/MULTI-CAP FUNDS | | DECEMBER 31, 2014 |
| | | | | | | | |
| SHARES | | | SECURITY DESCRIPTION | | VALUE($) | |
| | | | | | | |
| Short Positions — continued | |
| Common Stocks — continued | |
| | | | Oil, Gas & Consumable Fuels — 3.1% | |
| | 59 | | | Antero Resources Corp. (a) | | | 2,379 | |
| | 36 | | | Cabot Oil & Gas Corp. | | | 1,051 | |
| | 7 | | | Concho Resources, Inc. (a) | | | 703 | |
| | 80 | | | CONSOL Energy, Inc. | | | 2,696 | |
| | 35 | | | Diamondback Energy, Inc. (a) | | | 2,113 | |
| | 25 | | | Golar LNG Ltd., (Bermuda) | | | 896 | |
| | 8 | | | Whiting Petroleum Corp. (a) | | | 278 | |
| | | | | | | | |
| | | | | | | 10,116 | |
| | | | | | | | |
| | | | Total Energy | | | 14,466 | |
| | | | | | | | |
| | | | Financials — 5.1% | |
| | | | Capital Markets — 1.3% | |
| | 51 | | | Artisan Partners Asset Management, Inc., Class A | | | 2,553 | |
| | 19 | | | T. Rowe Price Group, Inc. | | | 1,654 | |
| | | | | | | | |
| | | | | | | 4,207 | |
| | | | | | | | |
| | | | Diversified Financial Services — 0.2% | |
| | 8 | | | CME Group, Inc. | | | 677 | |
| | | | | | | | |
| | | | Insurance — 1.2% | |
| | 4 | | | Markel Corp. (a) | | | 2,561 | |
| | 132 | | | MBIA, Inc. (a) | | | 1,257 | |
| | | | | | | | |
| | | | | | | 3,818 | |
| | | | | | | | |
| | | | Real Estate Investment Trusts (REITs) — 1.5% | |
| | 20 | | | Crown Castle International Corp. | | | 1,610 | |
| | 15 | | | Lamar Advertising Co., Class A | | | 793 | |
| | 60 | | | Plum Creek Timber Co., Inc. | | | 2,573 | |
| | | | | | | | |
| | | | | | | 4,976 | |
| | | | | | | | |
| | | | Real Estate Management & Development — 0.2% | |
| | 15 | | | Realogy Holdings Corp. (a) | | | 672 | |
| | | | | | | | |
| | | | Thrifts & Mortgage Finance — 0.7% | |
| | 24 | | | Ocwen Financial Corp. (a) | | | 360 | |
| | 117 | | | People’s United Financial, Inc. | | | 1,770 | |
| | | | | | | | |
| | | | | | | 2,130 | |
| | | | | | | | |
| | | | Total Financials | | | 16,480 | |
| | | | | | | | |
| | | | Health Care — 11.1% | |
| | | | Biotechnology — 1.8% | |
| | 8 | | | Alnylam Pharmaceuticals, Inc. (a) | | | 793 | |
| | 60 | | | Cepheid, Inc. (a) | | | 3,251 | |
| | 9 | | | Pharmacyclics, Inc. (a) | | | 1,067 | |
| | 1 | | | Regeneron Pharmaceuticals, Inc. (a) | | | 574 | |
| | | | | | | | |
| | | | | | | 5,685 | |
| | | | | | | | |
| | | | | | | | |
| SHARES | | | SECURITY DESCRIPTION | | VALUE($) | |
| | | | | | | |
| | | | | | | | |
| | | | | | | | |
| | | | Health Care Equipment & Supplies — 1.3% | |
| | 19 | | | Cooper Cos., Inc. (The) | | | 3,007 | |
| | 14 | | | Sirona Dental Systems, Inc. (a) | | | 1,192 | |
| | | | | | | | |
| | | | | | | 4,199 | |
| | | | | | | | |
| | | | Health Care Providers & Services — 3.5% | |
| | 53 | | | Acadia Healthcare Co., Inc. (a) | | | 3,252 | |
| | 5 | | | Henry Schein, Inc. (a) | | | 650 | |
| | 19 | | | Patterson Cos., Inc. | | | 907 | |
| | 57 | | | Team Health Holdings, Inc. (a) | | | 3,257 | |
| | 62 | | | Tenet Healthcare Corp. (a) | | | 3,151 | |
| | | | | | | | |
| | | | | | | 11,217 | |
| | | | | | | | |
| | | | Health Care Technology — 0.7% | |
| | 76 | | | Allscripts Healthcare Solutions, Inc. (a) | | | 968 | |
| | 10 | | | athenahealth, Inc. (a) | | | 1,504 | |
| | | | | | | | |
| | | | | | | 2,472 | |
| | | | | | | | |
| | | | Pharmaceuticals — 3.8% | |
| | 62 | | | Akorn, Inc. (a) | | | 2,241 | |
| | 21 | | | Eli Lilly & Co. | | | 1,430 | |
| | 18 | | | Hospira, Inc. (a) | | | 1,107 | |
| | 18 | | | Perrigo Co. plc, (Ireland) | | | 3,012 | |
| | 11 | | | Salix Pharmaceuticals Ltd. (a) | | | 1,241 | |
| | 72 | | | Zoetis, Inc. | | | 3,106 | |
| | | | | | | | |
| | | | | | | 12,137 | |
| | | | | | | | |
| | | | Total Health Care | | | 35,710 | |
| | | | | | | | |
| | | | Industrials — 17.1% | |
| | | | Aerospace & Defense — 2.9% | |
| | 17 | | | B/E Aerospace, Inc. (a) | | | 991 | |
| | 71 | | | Hexcel Corp. (a) | | | 2,930 | |
| | — | (h) | | KLX, Inc. (a) | | | — | (h) |
| | 11 | | | Precision Castparts Corp. | | | 2,707 | |
| | 39 | | | Triumph Group, Inc. | | | 2,600 | |
| | | | | | | | |
| | | | | | | 9,228 | |
| | | | | | | | |
| | | | Airlines — 0.4% | |
| | 17 | | | Spirit Airlines, Inc. (a) | | | 1,275 | |
| | | | | | | | |
| | | | Building Products — 2.2% | |
| | 59 | | | Armstrong World Industries, Inc. (a) | | | 3,029 | |
| | 45 | | | Fortune Brands Home & Security, Inc. | | | 2,046 | |
| | 53 | | | Owens Corning | | | 1,888 | |
| | | | | | | | |
| | | | | | | 6,963 | |
| | | | | | | | |
| | | | Commercial Services & Supplies — 3.1% | |
| | 86 | | | Copart, Inc. (a) | | | 3,155 | |
SEE NOTES TO FINANCIAL STATEMENTS.
| | | | | | | | |
| | | |
| DECEMBER 31, 2014 | | J.P. MORGAN MID CAP/MULTI-CAP FUNDS | | | | | 33 | |
JPMorgan Multi-Cap Market Neutral Fund
SCHEDULE OF PORTFOLIO INVESTMENTS
AS OF DECEMBER 31, 2014 (Unaudited) (continued)
(Amounts in thousands, except number of Futures contracts)
| | | | | | | | |
| SHARES | | | SECURITY DESCRIPTION | | VALUE($) | |
| | | | | | | |
| Short Positions — continued | |
| Common Stocks — continued | |
| | | | Commercial Services & Supplies — continued | |
| | 51 | | | Republic Services, Inc. | | | 2,045 | |
| | 22 | | | Stericycle, Inc. (a) | | | 2,857 | |
| | 41 | | | Waste Connections, Inc. | | | 1,807 | |
| | | | | | | | |
| | | | | | | 9,864 | |
| | | | | | | | |
| | | | Construction & Engineering — 0.8% | |
| | 94 | | | Quanta Services, Inc. (a) | | | 2,669 | |
| | | | | | | | |
| | | | Electrical Equipment — 0.2% | |
| | 16 | | | SolarCity Corp. (a) | | | 852 | |
| | | | | | | | |
| | | | Machinery — 1.4% | |
| | 22 | | | AGCO Corp. | | | 1,001 | |
| | 40 | | | CLARCOR, Inc. | | | 2,659 | |
| | 16 | | | Colfax Corp. (a) | | | 808 | |
| | | | | | | | |
| | | | | | | 4,468 | |
| | | | | | | | |
| | | | Professional Services — 0.6% | |
| | 29 | | | Verisk Analytics, Inc., Class A (a) | | | 1,864 | |
| | | | | | | | |
| | | | Road & Rail — 2.7% | |
| | 13 | | | Genesee & Wyoming, Inc., Class A (a) | | | 1,179 | |
| | 58 | | | Hertz Global Holdings, Inc. (a) | | | 1,438 | |
| | 20 | | | J.B. Hunt Transport Services, Inc. | | | 1,693 | |
| | 21 | | | Kansas City Southern | | | 2,547 | |
| | 20 | | | Ryder System, Inc. | | | 1,849 | |
| | | | | | | | |
| | | | | | | 8,706 | |
| | | | | | | | |
| | | | Trading Companies & Distributors — 2.8% | |
| | 64 | | | Fastenal Co. | | | 3,049 | |
| | 38 | | | MSC Industrial Direct Co., Inc., Class A | | | 3,110 | |
| | 12 | | | W.W. Grainger, Inc. | | | 2,970 | |
| | | | | | | | |
| | | | | | | 9,129 | |
| | | | | | | | |
| | | | Total Industrials | | | 55,018 | |
| | | | | | | | |
| | | | Information Technology — 22.3% | |
| | | | Communications Equipment — 1.4% | |
| | 41 | | | JDS Uniphase Corp. (a) | | | 566 | |
| | 11 | | | Motorola Solutions, Inc. | | | 750 | |
| | 50 | | | ViaSat, Inc. (a) | | | 3,175 | |
| | | | | | | | |
| | | | | | | 4,491 | |
| | | | | | | | |
| | | | Electronic Equipment, Instruments & Components — 3.8% | |
| | 21 | | | Amphenol Corp., Class A | | | 1,154 | |
| | 25 | | | Arrow Electronics, Inc. (a) | | | 1,429 | |
| | 33 | | | FEI Co. | | | 2,952 | |
| | 91 | | | Ingram Micro, Inc., Class A (a) | | | 2,513 | |
| | 19 | | | IPG Photonics Corp. (a) | | | 1,386 | |
| | 100 | | | Trimble Navigation Ltd. (a) | | | 2,654 | |
| | | | | | | | |
| | | | | | | 12,088 | |
| | | | | | | | |
| | | | | | | | |
| SHARES | | | SECURITY DESCRIPTION | | VALUE($) | |
| | | | | | | |
| | | | | | | | |
| | | | | | | | |
| | | | Internet Software & Services — 3.9% | |
| | 18 | | | CoStar Group, Inc. (a) | | | 3,278 | |
| | 15 | | | LinkedIn Corp., Class A (a) | | | 3,526 | |
| | 124 | | | Pandora Media, Inc. (a) | | | 2,211 | |
| | 12 | | | Rackspace Hosting, Inc. (a) | | | 566 | |
| | 74 | | | Twitter, Inc. (a) | | | 2,672 | |
| | 6 | | | Yelp, Inc. (a) | | | 335 | |
| | | | | | | | |
| | | | | | | 12,588 | |
| | | | | | | | |
| | | | IT Services — 3.8% | |
| | 35 | | | Accenture plc, (Ireland), Class A | | | 3,081 | |
| | 27 | | | Automatic Data Processing, Inc. | | | 2,215 | |
| | 61 | | | CoreLogic, Inc. (a) | | | 1,924 | |
| | 11 | | | FleetCor Technologies, Inc. (a) | | | 1,688 | |
| | 69 | | | Paychex, Inc. | | | 3,184 | |
| | | | | | | | |
| | | | | | | 12,092 | |
| | | | | | | | |
| | | | Semiconductors & Semiconductor Equipment — 1.6% | |
| | 200 | | | Advanced Micro Devices, Inc. (a) | | | 534 | |
| | 22 | | | Analog Devices, Inc. | | | 1,238 | |
| | 30 | | | Avago Technologies Ltd., (Singapore) | | | 3,040 | |
| | 26 | | | SunEdison, Inc. (a) | | | 511 | |
| | | | | | | | |
| | | | | | | 5,323 | |
| | | | | | | | |
| | | | Software — 6.0% | |
| | 61 | | | CommVault Systems, Inc. (a) | | | 3,145 | |
| | 101 | | | FireEye, Inc. (a) | | | 3,175 | |
| | 28 | | | NetSuite, Inc. (a) | | | 3,043 | |
| | 26 | | | ServiceNow, Inc. (a) | | | 1,740 | |
| | 35 | | | Splunk, Inc. (a) | | | 2,037 | |
| | 5 | | | Tableau Software, Inc., Class A (a) | | | 384 | |
| | 22 | | | Ultimate Software Group, Inc. (The) (a) | | | 3,208 | |
| | 931 | | | Zynga, Inc., Class A (a) | | | 2,475 | |
| | | | | | | | |
| | | | | | | 19,207 | |
| | | | | | | | |
| | | | Technology Hardware, Storage & Peripherals — 1.8% | |
| | 108 | | | NCR Corp. (a) | | | 3,136 | |
| | 30 | | | Stratasys Ltd. (a) | | | 2,517 | |
| | | | | | | | |
| | | | | | | 5,653 | |
| | | | | | | | |
| | | | Total Information Technology | | | 71,442 | |
| | | | | | | | |
| | | | Materials — 3.9% | |
| | | | Chemicals — 2.8% | |
| | 18 | | | Air Products & Chemicals, Inc. | | | 2,591 | |
| | 52 | | | FMC Corp. | | | 2,962 | |
| | 28 | | | Praxair, Inc. | | | 3,617 | |
| | | | | | | | |
| | | | | | | 9,170 | |
| | | | | | | | |
SEE NOTES TO FINANCIAL STATEMENTS.
| | | | | | |
| | | |
| 34 | | | | J.P. MORGAN MID CAP/MULTI-CAP FUNDS | | DECEMBER 31, 2014 |
| | | | | | | | |
| SHARES | | | SECURITY DESCRIPTION | | VALUE($) | |
| | | | | | | |
| Short Positions — continued | |
| Common Stocks — continued | |
| | | | Metals & Mining — 1.1% | |
| | 44 | | | Carpenter Technology Corp. | | | 2,184 | |
| | 32 | | | Southern Copper Corp. | | | 894 | |
| | 11 | | | TimkenSteel Corp. | | | 395 | |
| | | | | | | | |
| | | | | | | 3,473 | |
| | | | | | | | |
| | | | Total Materials | | | 12,643 | |
| | | | | | | | |
| | | | Telecommunication Services — 1.4% | |
| | | | Wireless Telecommunication Services — 1.4% | |
| | 376 | | | Sprint Corp. (a) | | | 1,562 | |
| | 84 | | | Telephone & Data Systems, Inc. | | | 2,116 | |
| | 18 | | | United States Cellular Corp. (a) | | | 703 | |
| | | | | | | | |
| | | | Total Telecommunication Services | | | 4,381 | |
| | | | | | | | |
| | | | | | | | |
| SHARES | | | SECURITY DESCRIPTION | | VALUE($) | |
| | | | | | | |
| | | | | | | | |
| | | | | | | | |
| | | | Utilities — 3.0% | |
| | | | Electric Utilities — 1.0% | |
| | 43 | | | Southern Co. (The) | | | 2,114 | |
| | 30 | | | Xcel Energy, Inc. | | | 1,084 | |
| | | | | | | | |
| | | | | | | 3,198 | |
| | | | | | | | |
| | | | Multi-Utilities — 2.0% | |
| | 46 | | | Dominion Resources, Inc. | | | 3,550 | |
| | 69 | | | NiSource, Inc. | | | 2,927 | |
| | | | | | | | |
| | | | | | | 6,477 | |
| | | | | | | | |
| | | | Total Utilities | | | 9,675 | |
| | | | | | | | |
| | | | Total Securities Sold Short
(Proceeds $291,535) | | $ | 297,278 | |
| | | | | | | | |
Percentages indicated are based on net assets.
| | | | | | | | | | | | | | | | |
| Futures Contracts | |
NUMBER OF
CONTRACTS | | | DESCRIPTION | | EXPIRATION
DATE | | | NOTIONAL
VALUE AT
DECEMBER 31, 2014 | | | NET
UNREALIZED
APPRECIATION
(DEPRECIATION) | |
| | | | Short Futures Outstanding | | | | | | | | | | | | |
| | (7 | ) | | S&P Mid Cap 400 | | | 03/20/15 | | | $ | (1,014 | ) | | $ | 12 | |
| | (5 | ) | | E-mini S&P 500 | | | 03/20/15 | | | | (513 | ) | | | 6 | |
| | | | | | | | | | | | | | | | |
| | | | | | | | | | | | | | $ | 18 | |
| | | | | | | | | | | | | | | | |
SEE NOTES TO FINANCIAL STATEMENTS.
| | | | | | | | |
| | | |
| DECEMBER 31, 2014 | | J.P. MORGAN MID CAP/MULTI-CAP FUNDS | | | | | 35 | |
JPMorgan Value Advantage Fund
SCHEDULE OF PORTFOLIO INVESTMENTS
AS OF DECEMBER 31, 2014 (Unaudited)
(Amounts in thousands)
| | | | | | | | |
| SHARES | | | SECURITY DESCRIPTION | | VALUE($) | |
| Common Stocks — 91.6% | | | | |
| | | | Consumer Discretionary — 14.9% | | | | |
| | | | Distributors — 0.4% | | | | |
| | 369 | | | Genuine Parts Co. | | | 39,292 | |
| | | | | | | | |
| | | | Hotels, Restaurants & Leisure — 0.7% | | | | |
| | 1,489 | | | ClubCorp Holdings, Inc. | | | 26,701 | |
| | 2,166 | | | La Quinta Holdings, Inc. (a) | | | 47,773 | |
| | | | | | | | |
| | | | | | | 74,474 | |
| | | | | | | | |
| | | | Household Durables — 0.6% | | | | |
| | 2,281 | | | Brookfield Residential Properties, Inc., (Canada) (a) | | | 54,874 | |
| | | | | | | | |
| | | | Internet & Catalog Retail — 1.3% | | | | |
| | 1,485 | | | Expedia, Inc. | | | 126,726 | |
| | | | | | | | |
| | | | Media — 5.1% | | | | |
| | 623 | | | CBS Corp. (Non-Voting), Class B | | | 34,477 | |
| | 461 | | | DIRECTV (a) | | | 40,003 | |
| | 2,199 | | | DISH Network Corp., Class A (a) | | | 160,278 | |
| | 1,642 | | | Entercom Communications Corp., Class A (a) | | | 19,962 | |
| | 1,275 | | | Gannett Co., Inc. | | | 40,724 | |
| | 933 | | | Omnicom Group, Inc. | | | 72,256 | |
| | 514 | | | Time Warner, Inc. | | | 43,880 | |
| | 1,744 | | | Time, Inc. | | | 42,912 | |
| | 1,287 | | | Twenty-First Century Fox, Inc., Class B | | | 47,463 | |
| | | | | | | | |
| | | | | | | 501,955 | |
| | | | | | | | |
| | | | Multiline Retail — 1.5% | | | | |
| | 2,360 | | | Kohl’s Corp. | | | 144,024 | |
| | | | | | | | |
| | | | Specialty Retail — 4.4% | | | | |
| | 153 | | | AutoZone, Inc. (a) | | | 94,922 | |
| | 1,034 | | | Bed Bath & Beyond, Inc. (a) | | | 78,767 | |
| | 2,673 | | | Best Buy Co., Inc. | | | 104,198 | |
| | 1,835 | | | Gap, Inc. (The) | | | 77,280 | |
| | 749 | | | Home Depot, Inc. (The) | | | 78,582 | |
| | | | | | | | |
| | | | | | | 433,749 | |
| | | | | | | | |
| | | | Textiles, Apparel & Luxury Goods — 0.9% | | | | |
| | 654 | | | Coach, Inc. | | | 24,572 | |
| | 597 | | | Hanesbrands, Inc. | | | 66,659 | |
| | | | | | | | |
| | | | | | | 91,231 | |
| | | | | | | | |
| | | | Total Consumer Discretionary | | | 1,466,325 | |
| | | | | | | | |
| | | | Consumer Staples — 4.7% | | | | |
| | | | Beverages — 0.8% | | | | |
| | 1,055 | | | Dr. Pepper Snapple Group, Inc. | | | 75,592 | |
| | | | | | | | |
| | | | Food & Staples Retailing — 1.5% | | | | |
| | 809 | | | CVS Health Corp. | | | 77,886 | |
| | | | | | | | |
| SHARES | | | SECURITY DESCRIPTION | | VALUE($) | |
| | | | | | | | |
| | | | Food & Staples Retailing — continued | |
| | 1,131 | | | Kroger Co. (The) | | | 72,621 | |
| | | | | | | | |
| | | | | | | 150,507 | |
| | | | | | | | |
| | | | Food Products — 1.0% | |
| | 1,081 | | | Post Holdings, Inc. (a) | | | 45,279 | |
| | 635 | | | TreeHouse Foods, Inc. (a) | | | 54,276 | |
| | | | | | | | |
| | | | | | | 99,555 | |
| | | | | | | | |
| | | | Household Products — 1.4% | |
| | 1,546 | | | Procter & Gamble Co. (The) | | | 140,816 | |
| | | | | | | | |
| | | | Total Consumer Staples | | | 466,470 | |
| | | | | | | | |
| | | | Energy — 7.1% | |
| | | | Oil, Gas & Consumable Fuels — 7.1% | |
| | 2,223 | | | CONSOL Energy, Inc. | | | 75,153 | |
| | 1,205 | | | Devon Energy Corp. | | | 73,752 | |
| | 2,718 | | | Exxon Mobil Corp. | | | 251,297 | |
| | 1,049 | | | Kinder Morgan, Inc. | | | 44,375 | |
| | 1,646 | | | Marathon Oil Corp. | | | 46,571 | |
| | 1,923 | | | PBF Energy, Inc., Class A | | | 51,230 | |
| | 1,444 | | | Phillips 66 | | | 103,549 | |
| | 1,868 | | | Southwestern Energy Co. (a) | | | 50,978 | |
| | | | | | | | |
| | | | Total Energy | | | 696,905 | |
| | | | | | | | |
| | | | Financials — 32.1% | |
| | | | Banks — 11.8% | |
| | 9,141 | | | Bank of America Corp. | | | 163,533 | |
| | 2,322 | | | Citigroup, Inc. | | | 125,635 | |
| | 2,042 | | | Citizens Financial Group, Inc. | | | 50,752 | |
| | 3,593 | | | Fifth Third Bancorp | | | 73,208 | |
| | 861 | | | First Republic Bank | | | 44,879 | |
| | 429 | | | M&T Bank Corp. | | | 53,872 | |
| | 1,154 | | | National Bank Holdings Corp., Class A | | | 22,394 | |
| | 1,088 | | | PNC Financial Services Group, Inc. (The) | | | 99,258 | |
| | 2,302 | | | SunTrust Banks, Inc. | | | 96,433 | |
| | 2,397 | | | U.S. Bancorp | | | 107,732 | |
| | 5,993 | | | Wells Fargo & Co. | | | 328,547 | |
| | | | | | | | |
| | | | | | | 1,166,243 | |
| | | | | | | | |
| | | | Capital Markets — 3.4% | |
| | 454 | | | Ameriprise Financial, Inc. | | | 60,002 | |
| | 1,756 | | | Legg Mason, Inc. | | | 93,692 | |
| | 726 | | | Northern Trust Corp. | | | 48,927 | |
| | 1,549 | | | T. Rowe Price Group, Inc. | | | 133,025 | |
| | | | | | | | |
| | | | | | | 335,646 | |
| | | | | | | | |
| | | | Consumer Finance — 2.6% | |
| | 4,235 | | | Ally Financial, Inc. (a) | | | 100,021 | |
SEE NOTES TO FINANCIAL STATEMENTS.
| | | | | | |
| | | |
| 36 | | | | J.P. MORGAN MID CAP/MULTI-CAP FUNDS | | DECEMBER 31, 2014 |
| | | | | | | | |
| SHARES | | | SECURITY DESCRIPTION | | VALUE($) | |
| Common Stocks — continued | |
| | | | Consumer Finance — continued | |
| | 1,903 | | | Capital One Financial Corp. | | | 157,126 | |
| | | | | | | | |
| | | | | | | 257,147 | |
| | | | | | | | |
| | | | Insurance — 9.5% | |
| | 109 | | | Alleghany Corp. (a) | | | 50,681 | |
| | 1,045 | | | Allied World Assurance Co. Holdings AG, (Switzerland) | | | 39,607 | |
| | 2,368 | | | American International Group, Inc. | | | 132,648 | |
| | 2,365 | | | CNO Financial Group, Inc. | | | 40,729 | |
| | 2,511 | | | Hartford Financial Services Group, Inc. (The) | | | 104,688 | |
| | 4,234 | | | Loews Corp. | | | 177,901 | |
| | 1,106 | | | Marsh & McLennan Cos., Inc. | | | 63,279 | |
| | 1,998 | | | Old Republic International Corp. | | | 29,231 | |
| | 1,091 | | | Prudential Financial, Inc. | | | 98,692 | |
| | 906 | | | Travelers Cos., Inc. (The) | | | 95,858 | |
| | 2,041 | | | Unum Group | | | 71,179 | |
| | 638 | | | W.R. Berkley Corp. | | | 32,709 | |
| | | | | | | | |
| | | | | | | 937,202 | |
| | | | | | | | |
| | | | Real Estate Investment Trusts (REITs) — 3.7% | |
| | 1,910 | | | American Homes 4 Rent, Class A | | | 32,527 | |
| | 1,639 | | | American Residential Properties, Inc. (a) | | | 28,801 | |
| | 2,328 | | | Brixmor Property Group, Inc. | | | 57,832 | |
| | 488 | | | EastGroup Properties, Inc.(m) | | | 30,869 | |
| | 2,245 | | | Excel Trust, Inc. | | | 30,057 | |
| | 2,349 | | | Kimco Realty Corp. (m) | | | 59,044 | |
| | 1,580 | | | Rayonier, Inc. (m) | | | 44,134 | |
| | 2,196 | | | Weyerhaeuser Co. (m) | | | 78,796 | |
| | | | | | | | |
| | | | | | | 362,060 | |
| | | | | | | | |
| | | | Real Estate Management & Development — 0.7% | |
| | 1,260 | | | Brookfield Asset Management, Inc., (Canada), Class A | | | 63,164 | |
| | | | | | | | |
| | | | Thrifts & Mortgage Finance — 0.4% | |
| | 4,049 | | | Hudson City Bancorp, Inc. | | | 40,973 | |
| | | | | | | | |
| | | | Total Financials | | | 3,162,435 | |
| | | | | | | | |
| | | | Health Care — 8.6% | |
| | | | Health Care Providers & Services — 2.3% | |
| | 972 | | | Aetna, Inc. | | | 86,316 | |
| | 480 | | | National Healthcare Corp. | | | 30,136 | |
| | 1,108 | | | UnitedHealth Group, Inc. | | | 112,018 | |
| | | | | | | | |
| | | | | | | 228,470 | |
| | | | | | | | |
| | | | Pharmaceuticals — 6.3% | |
| | 1,900 | | | Johnson & Johnson | | | 198,714 | |
| | 2,732 | | | Merck & Co., Inc. | | | 155,162 | |
| | 6,659 | | | Pfizer, Inc. | | | 207,434 | |
| | | | | | | | |
| SHARES | | | SECURITY DESCRIPTION | | VALUE($) | |
| | | | | | | | |
| | | | Pharmaceuticals — continued | |
| | 390 | | | Valeant Pharmaceuticals International, Inc. (a) | | | 55,842 | |
| | | | | | | | |
| | | | | | | 617,152 | |
| | | | | | | | |
| | | | Total Health Care | | | 845,622 | |
| | | | | | | | |
| | | | Industrials — 8.3% | |
| | | | Aerospace & Defense — 2.1% | |
| | 896 | | | Honeywell International, Inc. | | | 89,548 | |
| | 1,024 | | | United Technologies Corp. | | | 117,737 | |
| | | | | | | | |
| | | | | | | 207,285 | |
| | | | | | | | |
| | | | Airlines — 1.0% | |
| | 1,986 | | | Delta Air Lines, Inc. | | | 97,677 | |
| | | | | | | | |
| | | | Industrial Conglomerates — 0.9% | |
| | 998 | | | Carlisle Cos., Inc. | | | 90,017 | |
| | | | | | | | |
| | | | Machinery — 2.4% | |
| | 537 | | | Crane Co. | | | 31,522 | |
| | 1,512 | | | Dover Corp. | | | 108,412 | |
| | 1,045 | | | Illinois Tool Works, Inc. | | | 98,933 | |
| | | | | | | | |
| | | | | | | 238,867 | |
| | | | | | | | |
| | | | Marine — 0.3% | |
| | 376 | | | Kirby Corp. (a) | | | 30,382 | |
| | | | | | | | |
| | | | Professional Services — 0.9% | |
| | 1,063 | | | Equifax, Inc. | | | 85,997 | |
| | | | | | | | |
| | | | Trading Companies & Distributors — 0.7% | |
| | 261 | | | W.W. Grainger, Inc. | | | 66,450 | |
| | | | | | | | |
| | | | Total Industrials | | | 816,675 | |
| | | | | | | | |
| | | | Information Technology — 5.4% | |
| | | | Communications Equipment — 1.9% | |
| | 4,243 | | | Cisco Systems, Inc. | | | 118,030 | |
| | 896 | | | QUALCOMM, Inc. | | | 66,618 | |
| | | | | | | | |
| | | | | | | 184,648 | |
| | | | | | | | |
| | | | IT Services — 0.5% | |
| | 2,633 | | | Western Union Co. (The) | | | 47,164 | |
| | | | | | | | |
| | | | Semiconductors & Semiconductor Equipment — 1.9% | |
| | 1,016 | | | Analog Devices, Inc. | | | 56,419 | |
| | 577 | | | KLA-Tencor Corp. | | | 40,554 | |
| | 1,799 | | | Texas Instruments, Inc. | | | 96,200 | |
| | | | | | | | |
| | | | | | | 193,173 | |
| | | | | | | | |
| | | | Software — 0.5% | |
| | 1,130 | | | Microsoft Corp. | | | 52,483 | |
| | | | | | | | |
| | | | Technology Hardware, Storage & Peripherals — 0.6% | |
| | 1,516 | | | Hewlett-Packard Co. | | | 60,857 | |
| | | | | | | | |
| | | | Total Information Technology | | | 538,325 | |
| | | | | | | | |
SEE NOTES TO FINANCIAL STATEMENTS.
| | | | | | | | |
| | | |
| DECEMBER 31, 2014 | | J.P. MORGAN MID CAP/MULTI-CAP FUNDS | | | | | 37 | |
JPMorgan Value Advantage Fund
SCHEDULE OF PORTFOLIO INVESTMENTS
AS OF DECEMBER 31, 2014 (Unaudited) (continued)
(Amounts in thousands)
| | | | | | | | |
| SHARES | | | SECURITY DESCRIPTION | | VALUE($) | |
| Common Stocks — continued | |
| | | | Materials — 3.6% | |
| | | | Chemicals — 0.7% | |
| | 1,465 | | | Mosaic Co. (The) | | | 66,882 | |
| | | | | | | | |
| | | | Construction Materials — 1.0% | |
| | 892 | | | Martin Marietta Materials, Inc. | | | 98,445 | |
| | | | | | | | |
| | | | Containers & Packaging — 1.5% | |
| | 989 | | | Ball Corp. | | | 67,420 | |
| | 1,427 | | | Rock-Tenn Co., Class A | | | 87,013 | |
| | | | | | | | |
| | | | | | | 154,433 | |
| | | | | | | | |
| | | | Paper & Forest Products — 0.4% | |
| | 1,303 | | | KapStone Paper & Packaging Corp. | | | 38,188 | |
| | | | | | | | |
| | | | Total Materials | | | 357,948 | |
| | | | | | | | |
| | | | Telecommunication Services — 1.1% | |
| | | | Diversified Telecommunication Services — 1.1% | |
| | 2,385 | | | Verizon Communications, Inc. | | | 111,557 | |
| | | | | | | | |
| | | | Utilities — 5.8% | |
| | | | Electric Utilities — 4.6% | |
| | 1,233 | | | American Electric Power Co., Inc. | | | 74,850 | |
| | 1,049 | | | Duke Energy Corp. | | | 87,650 | |
| | 1,025 | | | Edison International | | | 67,106 | |
| | 851 | | | NextEra Energy, Inc. | | | 90,474 | |
| | 1,013 | | | Northeast Utilities | | | 54,232 | |
| | 2,204 | | | Xcel Energy, Inc. | | | 79,157 | |
| | | | | | | | |
| | | | | | | 453,469 | |
| | | | | | | | |
| | | | | | | | |
| SHARES | | | SECURITY DESCRIPTION | | VALUE($) | |
| | | | | | | | |
| | | | Multi-Utilities — 1.2% | |
| | 560 | | | NiSource, Inc. | | | 23,734 | |
| | 819 | | | Sempra Energy | | | 91,158 | |
| | | | | | | | |
| | | | | | | 114,892 | |
| | | | | | | | |
| | | | Total Utilities | | | 568,361 | |
| | | | | | | | |
| | | | Total Common Stocks
(Cost $7,299,304) | | | 9,030,623 | |
| | | | | | | | |
| Short-Term Investment — 8.1% | |
| | | | Investment Company — 8.1% | | | | |
| | 794,754 | | | JPMorgan Prime Money Market Fund, Institutional Class Shares, 0.020% (b) (l) (m)
(Cost $794,754) | | | 794,754 | |
| | | | | | | | |
| | | | Total Investments — 99.7%
(Cost $8,094,058) | | | 9,825,377 | |
| | | | Other Assets in Excess of
Liabilities — 0.3% | | | 29,318 | |
| | | | | | | | |
| | | | NET ASSETS — 100.0% | | $ | 9,854,695 | |
| | | | | | | | |
Percentages indicated are based on net assets.
SEE NOTES TO FINANCIAL STATEMENTS.
| | | | | | |
| | | |
| 38 | | | | J.P. MORGAN MID CAP/MULTI-CAP FUNDS | | DECEMBER 31, 2014 |
J.P. Morgan Mid Cap/Multi-Cap Funds
NOTES TO SCHEDULES OF PORTFOLIO INVESTMENTS
AS OF DECEMBER 31, 2014 (Unaudited)
| | | | | | |
| (a) | | — Non-income producing security. |
| (b) | | — Investment in affiliate. Money market fund registered under the Investment Company Act of 1940, as amended, and advised by J.P. Morgan Investment Management Inc. |
| (c) | | — Included in this amount is cash segregated as collateral for future contracts. |
| (g) | | — Amount rounds to less than 0.1%. |
| (h) | | — Amount rounds to less than one thousand (shares or dollars). |
| (j) | | — All or a portion of these securities are segregated for short sales. |
| | | | | | |
| (l) | | — The rate shown is the current yield as of December 31, 2014 |
| (m) | | — All or a portion of this security is reserved and/or pledged with the custodian for current or potential holdings of futures, swaps, options, TBAs, when-issued securities, delayed delivery securities, reverse repurchase agreements, unfunded commitments and/or forward foreign currency exchange contracts. |
SEE NOTES TO FINANCIAL STATEMENTS.
| | | | | | | | |
| | | |
| DECEMBER 31, 2014 | | J.P. MORGAN MID CAP/MULTI-CAP FUNDS | | | | | 39 | |
STATEMENTS OF ASSETS AND LIABILITIES
AS OF DECEMBER 31, 2014 (Unaudited)
(Amounts in thousands, except per share amounts)
| | | | | | | | | | | | |
| | | Growth
Advantage Fund | | | Mid Cap
Equity Fund | | | Mid Cap
Growth Fund | |
ASSETS: | | | | | | | | | | | | |
Investments in non-affiliates, at value | | $ | 4,021,280 | | | $ | 2,974,871 | | | $ | 2,286,060 | |
Investments in affiliates, at value | | | 141,289 | | | | 97,564 | | | | 76,415 | |
| | | | | | | | | | | | |
Total investment securities, at value | | | 4,162,569 | | | | 3,072,435 | | | | 2,362,475 | |
Receivables: | | | | | | | | | | | | |
Fund shares sold | | | 10,650 | | | | 3,558 | | | | 13,304 | |
Dividends from non-affiliates | | | 860 | | | | 3,163 | | | | 333 | |
Dividends from affiliates | | | 5 | | | | 3 | | | | 4 | |
Other assets | | | 129 | | | | — | | | | — | |
| | | | | | | | | | | | |
Total Assets | | | 4,174,213 | | | | 3,079,159 | | | | 2,376,116 | |
| | | | | | | | | | | | |
LIABILITIES: | | | | | | | | | | | | |
Payables: | | | | | | | | | | | | |
Investment securities purchased | | | 145 | | | | — | | | | — | |
Fund shares redeemed | | | 2,043 | | | | 1,552 | | | | 3,589 | |
Accrued liabilities: | | | | | | | | | | | | |
Investment advisory fees | | | 2,240 | | | | 1,650 | | | | 1,246 | |
Administration fees | | | 287 | | | | 199 | | | | 149 | |
Distribution fees | | | 304 | | | | 53 | | | | 210 | |
Shareholder servicing fees | | | 356 | | | | 13 | | | | 219 | |
Custodian and accounting fees | | | 43 | | | | 53 | | | | 33 | |
Trustees’ and Chief Compliance Officer’s fees | | | — | (a) | | | 1 | | | | — | (a) |
Transfer agent fees | | | 233 | | | | 556 | | | | 720 | |
Other | | | 126 | | | | 34 | | | | 104 | |
| | | | | | | | | | | | |
Total Liabilities | | | 5,777 | | | | 4,111 | | | | 6,270 | |
| | | | | | | | | | | | |
Net Assets | | $ | 4,168,436 | | | $ | 3,075,048 | | | $ | 2,369,846 | |
| | | | | | | | | | | | |
| (a) | Amount rounds to less than $1,000. |
SEE NOTES TO FINANCIAL STATEMENTS.
| | | | | | |
| | | |
| 40 | | | | J.P. MORGAN MID CAP/MULTI-CAP FUNDS | | DECEMBER 31, 2014 |
| | | | | | | | | | | | |
| | | Growth
Advantage Fund | | | Mid Cap
Equity Fund | | | Mid Cap
Growth Fund | |
NET ASSETS: | |
Paid-in-Capital | | $ | 3,047,492 | | | $ | 2,306,211 | | | $ | 1,727,354 | |
Accumulated undistributed (distributions in excess of) net investment income | | | (15,966 | ) | | | (991 | ) | | | (11,359 | ) |
Accumulated net realized gains (losses) | | | 38,069 | | | | 12,275 | | | | 21,989 | |
Net unrealized appreciation (depreciation) | | | 1,098,841 | | | | 757,553 | | | | 631,862 | |
| | | | | | | | | | | | |
Total Net Assets | | $ | 4,168,436 | | | $ | 3,075,048 | | | $ | 2,369,846 | |
| | | | | | | | | | | | |
| | | |
Net Assets: | | | | | | | | | | | | |
Class A | | $ | 872,880 | | | $ | 185,853 | | | $ | 844,077 | |
Class B | | | 2,295 | | | | — | | | | 4,247 | |
Class C | | | 194,883 | | | | 22,366 | | | | 53,753 | |
Class R2 | | | — | | | | 687 | | | | 4,059 | |
Class R5 | | | 47,921 | | | | 589 | | | | 44,142 | |
Class R6 | | | 1,993,565 | | | | 1,066,585 | | | | 92,712 | |
Select Class | | | 1,056,892 | | | | 1,798,968 | | | | 1,326,856 | |
| | | | | | | | | | | | |
Total | | $ | 4,168,436 | | | $ | 3,075,048 | | | $ | 2,369,846 | |
| | | | | | | | | | | | |
| | | |
Outstanding units of beneficial interest (shares) | | | | | | | | | | | | |
($0.0001 par value; unlimited number of shares authorized): | | | | | | | | | | | | |
Class A | | | 60,917 | | | | 4,170 | | | | 33,570 | |
Class B | | | 177 | | | | — | | | | 252 | |
Class C | | | 15,021 | | | | 511 | | | | 2,577 | |
Class R2 | | | — | | | | 15 | | | | 149 | |
Class R5 | | | 3,246 | | | | 13 | | | | 1,560 | |
Class R6 | | | 134,927 | | | | 23,779 | | | | 3,270 | |
Select Class | | | 72,343 | | | | 40,114 | | | | 47,145 | |
Net Asset Value (a): | | | | | | | | | | | | |
Class A — Redemption price per share | | $ | 14.33 | | | $ | 44.57 | | | $ | 25.14 | |
Class B — Offering price per share (b) | | | 12.96 | | | | — | | | | 16.85 | |
Class C — Offering price per share (b) | | | 12.97 | | | | 43.77 | | | | 20.86 | |
Class R2 — Offering and redemption price per share | | | — | | | | 44.50 | | | | 27.21 | |
Class R5 — Offering and redemption price per share | | | 14.77 | | | | 44.85 | | | | 28.30 | |
Class R6 — Offering and redemption price per share | | | 14.78 | | | | 44.85 | | | | 28.36 | |
Select Class — Offering and redemption price per share | | | 14.61 | | | | 44.85 | | | | 28.14 | |
Class A maximum sales charge | | | 5.25 | % | | | 5.25 | % | | | 5.25 | % |
Class A maximum public offering price per share | | | | | | | | | | | | |
[net asset value per share/(100% — maximum sales charge)] | | $ | 15.12 | | | $ | 47.04 | | | $ | 26.53 | |
| | | | | | | | | | | | |
| | | |
Cost of investments in non-affiliates | | $ | 2,922,439 | | | $ | 2,217,318 | | | $ | 1,654,198 | |
Cost of investments in affiliates | | | 141,289 | | | | 97,564 | | | | 76,415 | |
| (a) | Per share amounts may not recalculate due to rounding of net assets and/or shares outstanding. |
| (b) | Redemption price for Class B and Class C Shares varies based upon length of time the shares are held. |
SEE NOTES TO FINANCIAL STATEMENTS.
| | | | | | | | |
| | | |
| DECEMBER 31, 2014 | | J.P. MORGAN MID CAP/MULTI-CAP FUNDS | | | | | 41 | |
STATEMENTS OF ASSETS AND LIABILITIES
AS OF DECEMBER 31, 2014 (Unaudited) (continued)
(Amounts in thousands, except per share amounts)
| | | | | | | | | | | | |
| | | Mid Cap
Value Fund | | | Multi-Cap
Market
Neutral Fund | | | Value
Advantage Fund | |
ASSETS: | | | | | | | | | | | | |
Investments in non-affiliates, at value | | $ | 15,610,358 | | | $ | 298,016 | | | $ | 9,030,623 | |
Investments in affiliates, at value | | | 448,474 | | | | 20,186 | | | | 794,754 | |
| | | | | | | | | | | | |
Total investment securities, at value | | | 16,058,832 | | | | 318,202 | | | | 9,825,377 | |
Cash | | | — | | | | 123 | | | | — | |
Deposits at broker for futures contracts | | | — | | | | 210 | | | | — | |
Deposits at broker for securities sold short | | | — | | | | 299,435 | | | | — | |
Receivables: | | | | | | | | | | | | |
Investment securities sold | | | — | | | | 5,369 | | | | — | |
Fund shares sold | | | 22,268 | | | | 1 | | | | 34,949 | |
Dividends from non-affiliates | | | 31,078 | | | | 374 | | | | 8,772 | |
Dividends from affiliates | | | 15 | | | | 2 | | | | 24 | |
Variation margin on futures contracts | | | — | | | | 40 | | | | — | |
| | | | | | | | | | | | |
Total Assets | | | 16,112,193 | | | | 623,756 | | | | 9,869,122 | |
| | | | | | | | | | | | |
LIABILITIES: | | | | | | | | | | | | |
Payables: | | | | | | | | | | | | |
Securities sold short, at value | | | — | | | | 297,278 | | | | — | |
Dividend expense to non-affiliates on securities sold short | | | — | | | | 133 | | | | — | |
Investment securities purchased | | | — | | | | 4,876 | | | | — | |
Fund shares redeemed | | | 103,355 | | | | 33 | | | | 6,492 | |
Accrued liabilities: | | | | | | | | | | | | |
Investment advisory fees | | | 8,007 | | | | 273 | | | | 4,966 | |
Administration fees | | | 712 | | | | — | | | | 536 | |
Distribution fees | | | 1,009 | | | | 7 | | | | 787 | |
Shareholder servicing fees | | | 901 | | | | 71 | | | | 986 | |
Custodian and accounting fees | | | 250 | | | | 20 | | | | 89 | |
Trustees’ and Chief Compliance Officer’s fees | | | 2 | | | | — | (a) | | | 2 | |
Other | | | 4,873 | | | | 57 | | | | 569 | |
| | | | | | | | | | | | |
Total Liabilities | | | 119,109 | | | | 302,748 | | | | 14,427 | |
| | | | | | | | | | | | |
Net Assets | | $ | 15,993,084 | | | $ | 321,008 | | | $ | 9,854,695 | |
| | | | | | | | | | | | |
| (a) | Amount rounds to less than $1,000. |
SEE NOTES TO FINANCIAL STATEMENTS.
| | | | | | |
| | | |
| 42 | | | | J.P. MORGAN MID CAP/MULTI-CAP FUNDS | | DECEMBER 31, 2014 |
| | | | | | | | | | | | |
| | | Mid Cap
Value Fund | | | Multi-Cap
Market
Neutral Fund | | | Value
Advantage Fund | |
NET ASSETS: | | | | | | | | | | | | |
Paid-in-Capital | | $ | 10,240,088 | | | $ | 338,991 | | | $ | 8,140,900 | |
Accumulated undistributed (distributions in excess of) net investment income | | | (1,520 | ) | | | (4,446 | ) | | | (808 | ) |
Accumulated net realized gains (losses) | | | 139,706 | | | | (70,527 | ) | | | (16,716 | ) |
Net unrealized appreciation (depreciation) | | | 5,614,810 | | | | 56,990 | | | | 1,731,319 | |
| | | | | | | | | | | | |
Total Net Assets | | $ | 15,993,084 | | | $ | 321,008 | | | $ | 9,854,695 | |
| | | | | | | | | | | | |
| | | |
Net Assets: | | | | | | | | | | | | |
Class A | | $ | 2,700,548 | | | $ | 7,007 | | | $ | 2,151,927 | |
Class B | | | 8,990 | | | | 156 | | | | — | |
Class C | | | 613,455 | | | | 7,655 | | | | 552,738 | |
Class R2 | | | 75,043 | | | | — | | | | — | |
Institutional Class | | | 10,164,312 | | | | — | | | | 4,179,965 | |
Select Class | | | 2,430,736 | | | | 306,190 | | | | 2,970,065 | |
| | | | | | | | | | | | |
Total | | $ | 15,993,084 | | | $ | 321,008 | | | $ | 9,854,695 | |
| | | | | | | | | | | | |
| | | |
Outstanding units of beneficial interest (shares) | | | | | | | | | | | | |
($0.0001 par value; unlimited number of shares authorized): | | | | | | | | | | | | |
Class A | | | 74,051 | | | | 696 | | | | 72,533 | |
Class B | | | 252 | | | | 16 | | | | — | |
Class C | | | 17,335 | | | | 803 | | | | 18,658 | |
Class R2 | | | 2,127 | | | | — | | | | — | |
Institutional Class | | | 273,625 | | | | — | | | | 140,235 | |
Select Class | | | 66,048 | | | | 29,816 | | | | 99,734 | |
| | | |
Net Asset Value (a): | | | | | | | | | | | | |
Class A — Redemption price per share | | $ | 36.47 | | | $ | 10.07 | | | $ | 29.67 | |
Class B — Offering price per share (b) | | | 35.73 | | | | 9.52 | | | | — | |
Class C — Offering price per share (b) | | | 35.39 | | | | 9.53 | | | | 29.62 | |
Class R2 — Offering and redemption price per share | | | 35.29 | | | | — | | | | — | |
Institutional Class — Offering and redemption price per share | | | 37.15 | | | | — | | | | 29.81 | |
Select Class — Offering and redemption price per share | | | 36.80 | | | | 10.27 | | | | 29.78 | |
Class A maximum sales charge | | | 5.25 | % | | | 5.25 | % | | | 5.25 | % |
Class A maximum public offering price per share | | | | | | | | | | | | |
[net asset value per share/(100% — maximum sales charge)] | | $ | 38.49 | | | $ | 10.63 | | | $ | 31.31 | |
| | | | | | | | | | | | |
Cost of investments in non-affiliates | | $ | 9,995,548 | | | $ | 235,301 | | | $ | 7,299,304 | |
Cost of investments in affiliates | | | 448,474 | | | | 20,186 | | | | 794,754 | |
Proceeds from securities sold short | | | — | | | | 291,535 | | | | — | |
| (a) | Per share amounts may not recalculate due to rounding of net assets and/or shares outstanding. |
| (b) | Redemption price for Class B and Class C Shares varies based upon length of time the shares are held. |
SEE NOTES TO FINANCIAL STATEMENTS.
| | | | | | | | |
| | | |
| DECEMBER 31, 2014 | | J.P. MORGAN MID CAP/MULTI-CAP FUNDS | | | | | 43 | |
STATEMENTS OF OPERATIONS
FOR THE SIX MONTHS ENDED DECEMBER 31, 2014 (Unaudited)
(Amounts in thousands)
| | | | | | | | | | | | |
| | | Growth
Advantage Fund | | | Mid Cap
Equity Fund | | | Mid Cap
Growth Fund | |
INVESTMENT INCOME: | | | | | | | | | | | | |
Dividend income from non-affiliates | | $ | 11,034 | | | $ | 19,597 | | | $ | 6,011 | |
Dividend income from affiliates | | | 11 | | | | 10 | | | | 13 | |
| | | | | | | | | | | | |
Total investment income | | | 11,045 | | | | 19,607 | | | | 6,024 | |
| | | | | | | | | | | | |
| | | |
EXPENSES: | | | | | | | | | | | | |
Investment advisory fees | | | 12,463 | | | | 9,517 | | | | 7,204 | |
Administration fees | | | 1,582 | | | | 1,208 | | | | 914 | |
Distribution fees: | | | | | | | | | | | | |
Class A | | | 972 | | | | 210 | | | | 971 | |
Class B | | | 9 | | | | — | | | | 17 | |
Class C | | | 626 | | | | 78 | | | | 178 | |
Class R2 | | | — | | | | 2 | | | | 7 | |
Shareholder servicing fees: | | | | | | | | | | | | |
Class A | | | 972 | | | | 210 | | | | 971 | |
Class B | | | 3 | | | | — | | | | 6 | |
Class C | | | 209 | | | | 26 | | | | 59 | |
Class R2 | | | — | | | | 1 | | | | 4 | |
Class R5 | | | 166 | | | | — | (a) | | | 8 | |
Select Class | | | 1,277 | | | | 2,218 | | | | 1,584 | |
Custodian and accounting fees | | | 54 | | | | 51 | | | | 35 | |
Interest expense to affiliates | | | — | (a) | | | — | | | | — | |
Professional fees | | | 35 | | | | 35 | | | | 30 | |
Trustees’ and Chief Compliance Officer’s fees | | | 18 | | | | 13 | | | | 11 | |
Printing and mailing costs | | | 103 | | | | 157 | | | | 111 | |
Registration and filing fees | | | 133 | | | | 93 | | | | 55 | |
Transfer agent fees | | | 874 | | | | 1,513 | | | | 1,245 | |
Other | | | 178 | | | | 284 | | | | 17 | |
| | | | | | | | | | | | |
Total expenses | | | 19,674 | | | | 15,616 | | | | 13,427 | |
| | | | | | | | | | | | |
Less fees waived | | | (449 | ) | | | (2,847 | ) | | | (1,850 | ) |
Less expense reimbursements | | | — | | | | (19 | ) | | | (2 | ) |
| | | | | | | | | | | | |
Net expenses | | | 19,225 | | | | 12,750 | | | | 11,575 | |
| | | | | | | | | | | | |
Net investment income (loss) | | | (8,180 | ) | | | 6,857 | | | | (5,551 | ) |
| | | | | | | | | | | | |
| | | |
REALIZED/UNREALIZED GAINS (LOSSES): | | | | | | | | | | | | |
Net realized gain (loss) on transactions from investments in non-affiliates | | | 64,047 | | | | 62,348 | | | | 61,706 | |
Change in net unrealized appreciation/depreciation of investments in non-affiliates | | | 129,273 | | | | 59,933 | | | | (5,841 | ) |
| | | | | | | | | | | | |
Net realized/unrealized gains (losses) | | | 193,320 | | | | 122,281 | | | | 55,865 | |
| | | | | | | | | | | | |
Change in net assets resulting from operations | | $ | 185,140 | | | $ | 129,138 | | | $ | 50,314 | |
| | | | | | | | | | | | |
| (a) | Amount rounds to less than $1,000. |
SEE NOTES TO FINANCIAL STATEMENTS.
| | | | | | |
| | | |
| 44 | | | | J.P. MORGAN MID CAP/MULTI-CAP FUNDS | | DECEMBER 31, 2014 |
| | | | | | | | | | | | |
| | | Mid Cap
Value Fund | | | Multi-Cap
Market
Neutral Fund | | | Value
Advantage Fund | |
INVESTMENT INCOME: | | | | | | | | | | | | |
Dividend income from non-affiliates | | $ | 167,159 | | | $ | 2,880 | | | $ | 88,518 | |
Dividend income from affiliates | | | 42 | | | | 9 | | | | 67 | |
| | | | | | | | | | | | |
Total investment income | | | 167,201 | | | | 2,889 | | | | 88,585 | |
| | | | | | | | | | | | |
| | | |
EXPENSES: | | | | | | | | | | | | |
Investment advisory fees | | | 50,926 | | | | 2,609 | | | | 28,378 | |
Administration fees | | | 6,464 | | | | 172 | | | | 3,601 | |
Distribution fees: | | | | | | | | | | | | |
Class A | | | 3,593 | | | | 10 | | | | 2,396 | |
Class B | | | 36 | | | | 1 | | | | — | |
Class C | | | 2,259 | | | | 31 | | | | 1,743 | |
Class R2 | | | 180 | | | | — | | | | — | |
Shareholder servicing fees: | | | | | | | | | | | | |
Class A | | | 3,593 | | | | 10 | | | | 2,396 | |
Class B | | | 12 | | | | — | (a) | | | — | |
Class C | | | 753 | | | | 10 | | | | 581 | |
Class R2 | | | 90 | | | | — | | | | — | |
Institutional Class | | | 4,510 | | | | — | | | | 1,803 | |
Select Class | | | 3,865 | | | | 501 | | | | 3,430 | |
Custodian and accounting fees | | | 235 | | | | 18 | | | | 109 | |
Interest expense to affiliates | | | — | | | | — | (a) | | | — | |
Professional fees | | | 118 | | | | 28 | | | | 48 | |
Trustees’ and Chief Compliance Officer’s fees | | | 76 | | | | 2 | | | | 38 | |
Printing and mailing costs | | | 519 | | | | 4 | | | | 213 | |
Registration and filing fees | | | 157 | | | | 24 | | | | 172 | |
Transfer agent fees | | | 8,328 | | | | 35 | | | | 2,758 | |
Other | | | 723 | | | | 7 | | | | 381 | |
Dividend expense to non-affiliates on securities sold short | | | — | | | | 2,304 | | | | — | |
Interest expense to non-affiliates on securities sold short | | | — | | | | 311 | | | | — | |
| | | | | | | | | | | | |
Total expenses | | | 86,437 | | | | 6,077 | | | | 48,047 | |
| | | | | | | | | | | | |
Less fees waived | | | (13,998 | ) | | | (852 | ) | | | (5,324 | ) |
Less expense reimbursements | | | (19 | ) | | | — | (a) | | | — | |
| | | | | | | | | | | | |
Net expenses | | | 72,420 | | | | 5,225 | | | | 42,723 | |
| | | | | | | | | | | | |
Net investment income (loss) | | | 94,781 | | | | (2,336 | ) | | | 45,862 | |
| | | | | | | | | | | | |
| | | |
REALIZED/UNREALIZED GAINS (LOSSES): | | | | | | | | | | | | |
Net realized gain (loss) on transactions from: | | | | | | | | | | | | |
Investments in non-affiliates | | | 570,998 | | | | 30,678 | | | | 42,577 | |
Futures | | | — | | | | 569 | | | | — | |
Securities sold short | | | — | | | | (40,678 | ) | | | — | |
| | | | | | | | | | | | |
Net realized gain (loss) | | | 570,998 | | | | (9,431 | ) | | | 42,577 | |
| | | | | | | | | | | | |
Change in net unrealized appreciation/depreciation of: | | | | | | | | | | | | |
Investments in non-affiliates | | | 298,211 | | | | (10,409 | ) | | | 402,206 | |
Futures | | | — | | | | 39 | | | | — | |
Securities sold short | | | — | | | | 28,989 | | | | — | |
| | | | | | | | | | | | |
Change in net unrealized appreciation/depreciation | | | 298,211 | | | | 18,619 | | | | 402,206 | |
| | | | | | | | | | | | |
Net realized/unrealized gains (losses) | | | 869,209 | | | | 9,188 | | | | 444,783 | |
| | | | | | | | | | | | |
Change in net assets resulting from operations | | $ | 963,990 | | | $ | 6,852 | | | $ | 490,645 | |
| | | | | | | | | | | | |
| (a) | Amount rounds to less than $1,000. |
SEE NOTES TO FINANCIAL STATEMENTS.
| | | | | | | | |
| | | |
| DECEMBER 31, 2014 | | J.P. MORGAN MID CAP/MULTI-CAP FUNDS | | | | | 45 | |
STATEMENTS OF CHANGES IN NET ASSETS
FOR THE PERIODS INDICATED
(Amounts in thousands)
| | | | | | | | | | | | | | | | |
| | | Growth Advantage Fund | | | Mid Cap Equity Fund | |
| | | Six Months Ended
December 31, 2014 (Unaudited) | | | Year Ended
June 30, 2014 | | | Six Months Ended
December 31, 2014
(Unaudited) | | | Year Ended
June 30, 2014 | |
CHANGE IN NET ASSETS RESULTING FROM OPERATIONS: | | | | | | | | | | | | | | | | |
Net investment income (loss) | | $ | (8,180 | ) | | $ | (7,964 | ) | | $ | 6,857 | | | $ | 4,036 | |
Net realized gain (loss) | | | 64,047 | | | | 223,546 | | | | 62,348 | | | | 135,142 | |
Distributions of capital gains received from investment company affiliates | | | — | | | | 3 | | | | — | | | | 1 | |
Change in net unrealized appreciation/depreciation | | | 129,273 | | | | 492,238 | | | | 59,933 | | | | 222,527 | |
| | | | | | | | | | | | | | | | |
Change in net assets resulting from operations | | | 185,140 | | | | 707,823 | | | | 129,138 | | | | 361,706 | |
| | | | | | | | | | | | | | | | |
| | | | |
DISTRIBUTIONS TO SHAREHOLDERS: | | | | | | | | | | | | | | | | |
Class A | | | | | | | | | | | | | | | | |
From net investment income | | | — | | | | — | | | | (206 | ) | | | (29 | ) |
From net realized gains | | | (32,469 | ) | | | (21,773 | ) | | | (7,964 | ) | | | (4,217 | ) |
Class B | | | | | | | | | | | | | | | | |
From net realized gains | | | (98 | ) | | | (123 | ) | | | — | | | | — | |
Class C | | | | | | | | | | | | | | | | |
From net investment income | | | — | | | | — | | | | (3 | ) | | | — | |
From net realized gains | | | (7,969 | ) | | | (4,242 | ) | | | (987 | ) | | | (1,100 | ) |
Class R2 (a) | | | | | | | | | | | | | | | | |
From net investment income | | | — | | | | — | | | | (1 | ) | | | — | (b) |
From net realized gains | | | — | | | | — | | | | (30 | ) | | | — | |
Class R5 (a) | | | | | | | | | | | | | | | | |
From net investment income | | | — | | | | — | | | | (1 | ) | | | — | (b) |
From net realized gains | | | (1,758 | ) | | | (54,106 | ) | | | (26 | ) | | | — | |
Class R6 (a) | | | | | | | | | | | | | | | | |
From net investment income | | | — | | | | — | | | | (3,034 | ) | | | (913 | ) |
From net realized gains | | | (73,271 | ) | | | — | | | | (46,016 | ) | | | — | |
Select Class | | | | | | | | | | | | | | | | |
From net investment income | | | — | | | | — | | | | (4,068 | ) | | | (3,282 | ) |
From net realized gains | | | (39,626 | ) | | | (49,152 | ) | | | (78,884 | ) | | | (90,616 | ) |
| | | | | | | | | | | | | | | | |
Total distributions to shareholders | | | (155,191 | ) | | | (129,396 | ) | | | (141,220 | ) | | | (100,157 | ) |
| | | | | | | | | | | | | | | | |
| | | | |
CAPITAL TRANSACTIONS: | | | | | | | | | | | | | | | | |
Change in net assets resulting from capital transactions | | | 573,280 | | | | 987,358 | | | | 313,960 | | | | 1,551,394 | |
| | | | | | | | | | | | | | | | |
| | | | |
NET ASSETS: | | | | | | | | | | | | | | | | |
Change in net assets | | | 603,229 | | | | 1,565,785 | | | | 301,878 | | | | 1,812,943 | |
Beginning of period | | | 3,565,207 | | | | 1,999,422 | | | | 2,773,170 | | | | 960,227 | |
| | | | | | | | | | | | | | | | |
End of period | | $ | 4,168,436 | | | $ | 3,565,207 | | | $ | 3,075,048 | | | $ | 2,773,170 | |
| | | | | | | | | | | | | | | | |
Accumulated undistributed (distributions in excess of) net investment income | | $ | (15,966 | ) | | $ | (7,786 | ) | | $ | (991 | ) | | $ | (535 | ) |
| | | | | | | | | | | | | | | | |
| (a) | Commencement of offering of class of shares effective March 14, 2014 for Mid Cap Equity Fund. |
| (b) | Amount rounds to less than $1,000. |
SEE NOTES TO FINANCIAL STATEMENTS.
| | | | | | |
| | | |
| 46 | | | | J.P. MORGAN MID CAP/MULTI-CAP FUNDS | | DECEMBER 31, 2014 |
| | | | | | | | | | | | | | | | |
| | | Mid Cap Growth Fund | | | Mid Cap Value Fund | |
| | | Six Months Ended
December 31, 2014
(Unaudited) | | | Year Ended
June 30, 2014 | | | Six Months Ended
December 31, 2014
(Unaudited) | | | Year Ended
June 30, 2014 | |
CHANGE IN NET ASSETS RESULTING FROM OPERATIONS: | | | | | | | | | | | | | | | | |
Net investment income (loss) | | $ | (5,551 | ) | | $ | (6,054 | ) | | $ | 94,781 | | | $ | 103,278 | |
Net realized gain (loss) | | | 61,706 | | | | 314,124 | | | | 570,998 | | | | 1,068,473 | |
Distributions of capital gains received from investment company affiliates | | | — | | | | — | (a) | | | — | | | | 6 | |
Change in net unrealized appreciation/depreciation | | | (5,841 | ) | | | 225,799 | | | | 298,211 | | | | 1,889,585 | |
| | | | | | | | | | | | | | | | |
Change in net assets resulting from operations | | | 50,314 | | | | 533,869 | | | | 963,990 | | | | 3,061,342 | |
| | | | | | | | | | | | | | | | |
| | | | |
DISTRIBUTIONS TO SHAREHOLDERS: | | | | | | | | | | | | | | | | |
Class A | | | | | | | | | | | | | | | | |
From net investment income | | | — | | | | — | | | | (15,287 | ) | | | (14,338 | ) |
From net realized gains | | | (80,615 | ) | | | (69,231 | ) | | | (197,218 | ) | | | (135,361 | ) |
Class B | | | | | | | | | | | | | | | | |
From net realized gains | | | (608 | ) | | | (943 | ) | | | (668 | ) | | | (524 | ) |
Class C | | | | | | | | | | | | | | | | |
From net investment income | | | — | | | | — | | | | (1,024 | ) | | | (38 | ) |
From net realized gains | | | (6,222 | ) | | | (3,392 | ) | | | (45,175 | ) | | | (24,588 | ) |
Class R2 | | | | | | | | | | | | | | | | |
From net investment income | | | — | | | | — | | | | (331 | ) | | | (201 | ) |
From net realized gains | | | (345 | ) | | | (58 | ) | | | (5,603 | ) | | | (2,784 | ) |
Class R5 | | | | | | | | | | | | | | | | |
From net realized gains | | | (3,427 | ) | | | (2,276 | ) | | | — | | | | — | |
Class R6 | | | | | | | | | | | | | | | | |
From net realized gains | | | (7,943 | ) | | | (5,408 | ) | | | — | | | | — | |
Institutional Class | | | | | | | | | | | | | | | | |
From net investment income | | | — | | | | — | | | | (108,605 | ) | | | (69,637 | ) |
From net realized gains | | | — | | | | — | | | | (711,308 | ) | | | (318,626 | ) |
Select Class | | | | | | | | | | | | | | | | |
From net investment income | | | — | | | | — | | | | (19,269 | ) | | | (17,743 | ) |
From net realized gains | | | (119,065 | ) | | | (99,863 | ) | | | (172,337 | ) | | | (112,976 | ) |
| | | | | | | | | | | | | | | | |
Total distributions to shareholders | | | (218,225 | ) | | | (181,171 | ) | | | (1,276,825 | ) | | | (696,816 | ) |
| | | | | | | | | | | | | | | | |
| | | | |
CAPITAL TRANSACTIONS: | | | | | | | | | | | | | | | | |
Change in net assets resulting from capital transactions | | | 355,953 | | | | 251,309 | | | | 660,334 | | | | 18,077 | |
| | | | | | | | | | | | | | | | |
| | | | |
NET ASSETS: | | | | | | | | | | | | | | | | |
Change in net assets | | | 188,042 | | | | 604,007 | | | | 347,499 | | | | 2,382,603 | |
Beginning of period | | | 2,181,804 | | | | 1,577,797 | | | | 15,645,585 | | | | 13,262,982 | |
| | | | | | | | | | | | | | | | |
End of period | | $ | 2,369,846 | | | $ | 2,181,804 | | | $ | 15,993,084 | | | $ | 15,645,585 | |
| | | | | | | | | | | | | | | | |
Accumulated undistributed (distributions in excess of) net investment income | | $ | (11,359 | ) | | $ | (5,808 | ) | | $ | (1,520 | ) | | $ | 48,215 | |
| | | | | | | | | | | | | | | | |
| (a) | Amount rounds to less than $1,000. |
SEE NOTES TO FINANCIAL STATEMENTS.
| | | | | | | | |
| | | |
| DECEMBER 31, 2014 | | J.P. MORGAN MID CAP/MULTI-CAP FUNDS | | | | | 47 | |
STATEMENTS OF CHANGES IN NET ASSETS
FOR THE PERIODS INDICATED (continued)
(Amounts in thousands)
| | | | | | | | | | | | | | | | |
| | | Multi-Cap Market Neutral Fund | | | Value Advantage Fund | |
| | | Six Months Ended
December 31, 2014
(Unaudited) | | | Year Ended
June 30, 2014 | | | Six Months Ended
December 31, 2014
(Unaudited) | | | Year Ended
June 30, 2014 | |
CHANGE IN NET ASSETS RESULTING FROM OPERATIONS: | | | | | | | | | | | | | | | | |
Net investment income (loss) | | $ | (2,336 | ) | | $ | (4,373 | ) | | $ | 45,862 | | | $ | 83,781 | |
Net realized gain (loss) | | | (9,431 | ) | | | 9,737 | | | | 42,577 | | | | 278,242 | |
Distributions of capital gains received from investment company affiliates | | | — | | | | — | (a) | | | — | | | | 5 | |
Change in net unrealized appreciation/depreciation | | | 18,619 | | | | (136 | ) | | | 402,206 | | | | 747,106 | |
| | | | | | | | | | | | | | | | |
Change in net assets resulting from operations | | | 6,852 | | | | 5,228 | | | | 490,645 | | | | 1,109,134 | |
| | | | | | | | | | | | | | | | |
| | | | |
DISTRIBUTIONS TO SHAREHOLDERS: | | | | | | | | | | | | | | | | |
Class A | | | | | | | | | | | | | | | | |
From net investment income | | | — | | | | — | | | | (18,586 | ) | | | (6,931 | ) |
From net realized gains | | | — | | | | — | | | | (49,085 | ) | | | (30,061 | ) |
Class C | | | | | | | | | | | | | | | | |
From net investment income | | | — | | | | — | | | | (2,882 | ) | | | (562 | ) |
From net realized gains | | | — | | | | — | | | | (12,315 | ) | | | (7,282 | ) |
Institutional Class | | | | | | | | | | | | | | | | |
From net investment income | | | — | | | | — | | | | (51,909 | ) | | | (19,755 | ) |
From net realized gains | | | — | | | | — | | | | (93,724 | ) | | | (54,303 | ) |
Select Class | | | | | | | | | | | | | | | | |
From net investment income | | | — | | | | — | | | | (31,036 | ) | | | (12,951 | ) |
From net realized gains | | | — | | | | — | | | | (67,644 | ) | | | (42,336 | ) |
| | | | | | | | | | | | | | | | |
Total distributions to shareholders | | | — | | | | — | | | | (327,181 | ) | | | (174,181 | ) |
| | | | | | | | | | | | | | | | |
| | | | |
CAPITAL TRANSACTIONS: | | | | | | | | | | | | | | | | |
Change in net assets resulting from capital transactions | | | (136,846 | ) | | | 101,988 | | | | 1,997,787 | | | | 3,061,568 | |
| | | | | | | | | | | | | | | | |
| | | | |
NET ASSETS: | | | | | | | | | | | | | | | | |
Change in net assets | | | (129,994 | ) | | | 107,216 | | | | 2,161,251 | | | | 3,996,521 | |
Beginning of period | | | 451,002 | | | | 343,786 | | | | 7,693,444 | | | | 3,696,923 | |
| | | | | | | | | | | | | | | | |
End of period | | $ | 321,008 | | | $ | 451,002 | | | $ | 9,854,695 | | | $ | 7,693,444 | |
| | | | | | | | | | | | | | | | |
Accumulated undistributed (distributions in excess of) net investment income | | $ | (4,446 | ) | | $ | (2,110 | ) | | $ | (808 | ) | | $ | 57,743 | |
| | | | | | | | | | | | | | | | |
| (a) | Amount rounds to less than $1,000. |
SEE NOTES TO FINANCIAL STATEMENTS.
| | | | | | |
| | | |
| 48 | | | | J.P. MORGAN MID CAP/MULTI-CAP FUNDS | | DECEMBER 31, 2014 |
| | | | | | | | | | | | | | | | |
| | | Growth Advantage Fund | | | Mid Cap Equity Fund | |
| | | Six Months Ended
December 31, 2014
(Unaudited) | | | Year Ended
June 30, 2014 | | | Six Months Ended
December 31, 2014
(Unaudited) | | | Year Ended
June 30, 2014 | |
CAPITAL TRANSACTIONS: | | | | | | | | | | | | | | | | |
Class A | | | | | | | | | | | | | | | | |
Proceeds from shares issued | | $ | 223,391 | | | $ | 463,212 | | | $ | 39,469 | | | $ | 92,281 | |
Net assets acquired in Fund reorganization
(See Note 8) | | | — | | | | — | | | | — | | | | 42,694 | |
Distributions reinvested | | | 31,822 | | | | 21,355 | | | | 8,101 | | | | 4,242 | |
Cost of shares redeemed | | | (104,576 | ) | | | (135,058 | ) | | | (16,733 | ) | | | (16,208 | ) |
| | | | | | | | | | | | | | | | |
Change in net assets resulting from Class A capital transactions | | $ | 150,637 | | | $ | 349,509 | | | $ | 30,837 | | | $ | 123,009 | |
| | | | | | | | | | | | | | | | |
Class B | | | | | | | | | | | | | | | | |
Proceeds from shares issued | | $ | 129 | | | $ | 342 | | | $ | — | | | $ | — | |
Distributions reinvested | | | 94 | | | | 118 | | | | — | | | | — | |
Cost of shares redeemed | | | (344 | ) | | | (599 | ) | | | — | | | | — | |
| | | | | | | | | | | | | | | | |
Change in net assets resulting from Class B capital transactions | | $ | (121 | ) | | $ | (139 | ) | | $ | — | | | $ | — | |
| | | | | | | | | | | | | | | | |
Class C | | | | | | | | | | | | | | | | |
Proceeds from shares issued | | $ | 58,436 | | | $ | 101,473 | | | $ | 2,900 | | | $ | 11,105 | |
Net assets acquired in Fund reorganization
(See Note 8) | | | — | | | | — | | | | — | | | | 1,648 | |
Distributions reinvested | | | 6,954 | | | | 3,500 | | | | 988 | | | | 1,100 | |
Cost of shares redeemed | | | (14,461 | ) | | | (18,573 | ) | | | (1,386 | ) | | | (1,925 | ) |
| | | | | | | | | | | | | | | | |
Change in net assets resulting from Class C capital transactions | | $ | 50,929 | | | $ | 86,400 | | | $ | 2,502 | | | $ | 11,928 | |
| | | | | | | | | | | | | | | | |
Class R2 (a) | | | | | | | | | | | | | | | | |
Proceeds from shares issued | | $ | — | | | $ | — | | | $ | 131 | | | $ | 51 | |
Net assets acquired in Fund reorganization
(See Note 8) | | | — | | | | — | | | | — | | | | 632 | |
Distributions reinvested | | | — | | | | — | | | | 18 | | | | — | (b) |
Cost of shares redeemed | | | — | | | | — | | | | (141 | ) | | | (28 | ) |
| | | | | | | | | | | | | | | | |
Change in net assets resulting from Class R2 capital transactions | | $ | — | | | $ | — | | | $ | 8 | | | $ | 655 | |
| | | | | | | | | | | | | | | | |
Class R5 (a) | | | | | | | | | | | | | | | | |
Proceeds from shares issued | | $ | 63,965 | | | $ | 540,555 | | | $ | 481 | | | $ | 1 | |
Net assets acquired in Fund reorganization
(See Note 8) | | | — | | | | — | | | | — | | | | 87 | |
Distributions reinvested | | | 1,758 | | | | 54,106 | | | | 27 | | | | — | (b) |
Cost of shares redeemed | | | (1,499,170 | ) | | | (225,926 | ) | | | (44 | ) | | | — | |
| | | | | | | | | | | | | | | | |
Change in net assets resulting from Class R5 capital transactions | | $ | (1,433,447 | ) | | $ | 368,735 | | | $ | 464 | | | $ | 88 | |
| | | | | | | | | | | | | | | | |
Class R6 (a) | | | | | | | | | | | | | | | | |
Proceeds from shares issued | | $ | 1,672,189 | | | $ | 276,436 | | | $ | 202,904 | | | $ | 108,850 | |
Net assets acquired in Fund reorganization
(See Note 8) | | | — | | | | — | | | | — | | | | 676,262 | |
Distributions reinvested | | | 70,799 | | | | — | | | | 48,799 | | | | 906 | |
Cost of shares redeemed | | | (11,553 | ) | | | (11,268 | ) | | | (6,760 | ) | | | (751 | ) |
| | | | | | | | | | | | | | | | |
Change in net assets resulting from Class R6 capital transactions | | $ | 1,731,435 | | | $ | 265,168 | | | $ | 244,943 | | | $ | 785,267 | |
| | | | | | | | | | | | | | | | |
Select Class | | | | | | | | | | | | | | | | |
Proceeds from shares issued | | $ | 164,859 | | | $ | 429,743 | | | $ | 160,248 | | | $ | 490,477 | |
Net assets acquired in Fund reorganization
(See Note 8) | | | — | | | | — | | | | — | | | | 390,167 | |
Distributions reinvested | | | 23,846 | | | | 20,345 | | | | 60,283 | | | | 82,318 | |
Cost of shares redeemed | | | (114,858 | ) | | | (532,403 | ) | | | (185,325 | ) | | | (332,515 | ) |
| | | | | | | | | | | | | | | | |
Change in net assets resulting from Select Class capital transactions | | $ | 73,847 | | | $ | (82,315 | ) | | $ | 35,206 | | | $ | 630,447 | |
| | | | | | | | | | | | | | | | |
Total change in net assets resulting from capital transactions | | $ | 573,280 | | | $ | 987,358 | | | $ | 313,960 | | | $ | 1,551,394 | |
| | | | | | | | | | | | | | | | |
| (a) | Commencement of offering of class of shares effective March 14, 2014 for Mid Cap Equity Fund. |
| (b) | Amount rounds to less than 1,000 dollars. |
SEE NOTES TO FINANCIAL STATEMENTS.
| | | | | | | | |
| | | |
| DECEMBER 31, 2014 | | J.P. MORGAN MID CAP/MULTI-CAP FUNDS | | | | | 49 | |
STATEMENTS OF CHANGES IN NET ASSETS
FOR THE PERIODS INDICATED (continued)
(Amounts in thousands)
| | | | | | | | | | | | | | | | |
| | | Growth Advantage Fund | | | Mid Cap Equity Fund | |
| | | Six Months Ended
December 31, 2014
(Unaudited) | | | Year Ended
June 30, 2014 | | | Six Months Ended
December 31, 2014
(Unaudited) | | | Year Ended
June 30, 2014 | |
SHARE TRANSACTIONS: | | | | | | | | | | | | | | | | |
Class A | | | | | | | | | | | | | | | | |
Issued | | | 15,587 | | | | 34,641 | | | | 886 | | | | 2,197 | |
Shares issued in connection with Fund reorganization (See Note 8) | | | — | | | | — | | | | — | | | | 995 | |
Reinvested | | | 2,270 | | | | 1,645 | | | | 188 | | | | 107 | |
Redeemed | | | (7,319 | ) | | | (10,120 | ) | | | (378 | ) | | | (381 | ) |
| | | | | | | | | | | | | | | | |
Change in Class A Shares | | | 10,538 | | | | 26,166 | | | | 696 | | | | 2,918 | |
| | | | | | | | | | | | | | | | |
Class B | | | | | | | | | | | | | | | | |
Issued | | | 10 | | | | 28 | | | | — | | | | — | |
Reinvested | | | 7 | | | | 10 | | | | — | | | | — | |
Redeemed | | | (26 | ) | | | (50 | ) | | | — | | | | — | |
| | | | | | | | | | | | | | | | |
Change in Class B Shares | | | (9 | ) | | | (12 | ) | | | — | | | | — | |
| | | | | | | | | | | | | | | | |
Class C | | | | | | | | | | | | | | | | |
Issued | | | 4,483 | | | | 8,282 | | | | 67 | | | | 269 | |
Shares issued in connection with Fund reorganization (See Note 8) | | | — | | | | — | | | | — | | | | 39 | |
Reinvested | | | 547 | | | | 295 | | | | 23 | | | | 28 | |
Redeemed | | | (1,120 | ) | | | (1,524 | ) | | | (32 | ) | | | (46 | ) |
| | | | | | | | | | | | | | | | |
Change in Class C Shares | | | 3,910 | | | | 7,053 | | | | 58 | | | | 290 | |
| | | | | | | | | | | | | | | | |
Class R2 (a) | | | | | | | | | | | | | | | | |
Issued | | | — | | | | — | | | | 2 | | | | 2 | |
Shares issued in connection with Fund reorganization (See Note 8) | | | — | | | | — | | | | — | | | | 15 | |
Reinvested | | | — | | | | — | | | | 1 | | | | — | (b) |
Redeemed | | | — | | | | — | | | | (4 | ) | | | (1 | ) |
| | | | | | | | | | | | | | | | |
Change in Class R2 Shares | | | — | | | | — | | | | (1 | ) | | | 16 | |
| | | | | | | | | | | | | | | | |
Class R5 (a) | | | | | | | | | | | | | | | | |
Issued | | | 4,356 | | | | 39,731 | | | | 11 | | | | — | (b) |
Shares issued in connection with Fund reorganization (See Note 8) | | | — | | | | — | | | | — | | | | 2 | |
Reinvested | | | 122 | | | | 4,065 | | | | 1 | | | | — | (b) |
Redeemed | | | (100,595 | ) | | | (15,945 | ) | | | (1 | ) | | | — | |
| | | | | | | | | | | | | | | | |
Change in Class R5 Shares | | | (96,117 | ) | | | 27,851 | | | | 11 | | | | 2 | |
| | | | | | | | | | | | | | | | |
Class R6 (a) | | | | | | | | | | | | | | | | |
Issued | | | 112,242 | | | | 19,372 | | | | 4,579 | | | | 2,551 | |
Shares issued in connection with Fund reorganization (See Note 8) | | | — | | | | — | | | | — | | | | 15,676 | |
Reinvested | | | 4,896 | | | | — | | | | 1,121 | | | | 20 | |
Redeemed | | | (792 | ) | | | (791 | ) | | | (150 | ) | | | (18 | ) |
| | | | | | | | | | | | | | | | |
Change in Class R6 Shares | | | 116,346 | | | | 18,581 | | | | 5,550 | | | | 18,229 | |
| | | | | | | | | | | | | | | | |
Select Class | | | | | | | | | | | | | | | | |
Issued | | | 11,313 | | | | 31,913 | | | | 3,586 | | | | 11,736 | |
Shares issued in connection with Fund reorganization (See Note 8) | | | — | | | | — | | | | — | | | | 9,044 | |
Reinvested | | | 1,668 | | | | 1,541 | | | | 1,386 | | | | 2,060 | |
Redeemed | | | (7,901 | ) | | | (38,838 | ) | | | (4,137 | ) | | | (7,967 | ) |
| | | | | | | | | | | | | | | | |
Change in Select Class Shares | | | 5,080 | | | | (5,384 | ) | | | 835 | | | | 14,873 | |
| | | | | | | | | | | | | | | | |
| (a) | Commencement of offering of class of shares effective March 14, 2014 for Mid Cap Equity Fund. |
| (b) | Amount rounds to less than 1,000 shares. |
SEE NOTES TO FINANCIAL STATEMENTS.
| | | | | | |
| | | |
| 50 | | | | J.P. MORGAN MID CAP/MULTI-CAP FUNDS | | DECEMBER 31, 2014 |
| | | | | | | | | | | | | | | | |
| | | Mid Cap Growth Fund | | | Mid Cap Value Fund | |
| | | Six Months Ended
December 31, 2014
(Unaudited) | | | Year Ended
June 30, 2014 | | | Six Months Ended
December 31, 2014
(Unaudited) | | | Year Ended
June 30, 2014 | |
CAPITAL TRANSACTIONS: | | | | | | | | | | | | | | | | |
Class A | | | | | | | | | | | | | | | | |
Proceeds from shares issued | | $ | 154,352 | | | $ | 117,470 | | | $ | 190,442 | | | $ | 455,863 | |
Distributions reinvested | | | 76,908 | | | | 65,053 | | | | 195,292 | | | | 139,350 | |
Cost of shares redeemed | | | (88,838 | ) | | | (127,370 | ) | | | (1,035,632 | ) | | | (880,766 | ) |
| | | | | | | | | | | | | | | | |
Change in net assets resulting from Class A capital transactions | | $ | 142,422 | | | $ | 55,153 | | | $ | (649,898 | ) | | $ | (285,553 | ) |
| | | | | | | | | | | | | | | | |
Class B | | | | | | | | | | | | | | | | |
Proceeds from shares issued | | $ | 22 | | | $ | 60 | | | $ | 16 | | | $ | 98 | |
Distributions reinvested | | | 593 | | | | 905 | | | | 639 | | | | 502 | |
Cost of shares redeemed | | | (1,061 | ) | | | (3,553 | ) | | | (2,136 | ) | | | (7,405 | ) |
| | | | | | | | | | | | | | | | |
Change in net assets resulting from Class B capital transactions | | $ | (446 | ) | | $ | (2,588 | ) | | $ | (1,481 | ) | | $ | (6,805 | ) |
| | | | | | | | | | | | | | | | |
Class C | | | | | | | | | | | | | | | | |
Proceeds from shares issued | | $ | 16,756 | | | $ | 14,903 | | | $ | 17,013 | | | $ | 27,504 | |
Distributions reinvested | | | 5,274 | | | | 2,860 | | | | 36,724 | | | | 19,472 | |
Cost of shares redeemed | | | (4,181 | ) | | | (5,376 | ) | | | (36,801 | ) | | | (66,037 | ) |
| | | | | | | | | | | | | | | | |
Change in net assets resulting from Class C capital transactions | | $ | 17,849 | | | $ | 12,387 | | | $ | 16,936 | | | $ | (19,061 | ) |
| | | | | | | | | | | | | | | | |
Class R2 | | | | | | | | | | | | | | | | |
Proceeds from shares issued | | $ | 2,717 | | | $ | 1,589 | | | $ | 9,372 | | | $ | 21,879 | |
Distributions reinvested | | | 345 | | | | 58 | | | | 5,637 | | | | 2,790 | |
Cost of shares redeemed | | | (599 | ) | | | (276 | ) | | | (10,283 | ) | | | (20,179 | ) |
| | | | | | | | | | | | | | | | |
Change in net assets resulting from Class R2 capital transactions | | $ | 2,463 | | | $ | 1,371 | | | $ | 4,726 | | | $ | 4,490 | |
| | | | | | | | | | | | | | | | |
Class R5 | | | | | | | | | | | | | | | | |
Proceeds from shares issued | | $ | 18,990 | | | $ | 11,177 | | | $ | — | | | $ | — | |
Distributions reinvested | | | 3,427 | | | | 2,276 | | | | — | | | | — | |
Cost of shares redeemed | | | (3,103 | ) | | | (8,354 | ) | | | — | | | | — | |
| | | | | | | | | | | | | | | | |
Change in net assets resulting from Class R5 capital transactions | | $ | 19,314 | | | $ | 5,099 | | | $ | — | | | $ | — | |
| | | | | | | | | | | | | | | | |
Class R6 | | | | | | | | | | | | | | | | |
Proceeds from shares issued | | $ | 20,429 | | | $ | 33,802 | | | $ | — | | | $ | — | |
Distributions reinvested | | | 7,291 | | | | 4,757 | | | | — | | | | — | |
Cost of shares redeemed | | | (15,047 | ) | | | (12,254 | ) | | | — | | | | — | |
| | | | | | | | | | | | | | | | |
Change in net assets resulting from Class R6 capital transactions | | $ | 12,673 | | | $ | 26,305 | | | $ | — | | | $ | — | |
| | | | | | | | | | | | | | | | |
Institutional Class | | | | | | | | | | | | | | | | |
Proceeds from shares issued | | $ | — | | | $ | — | | | $ | 1,906,087 | | | $ | 1,953,853 | |
Distributions reinvested | | | — | | | | — | | | | 686,825 | | | | 315,542 | |
Cost of shares redeemed | | | — | | | | — | | | | (775,800 | ) | | | (1,555,034 | ) |
| | | | | | | | | | | | | | | | |
Change in net assets resulting from Institutional Class capital transactions | | $ | — | | | $ | — | | | $ | 1,817,112 | | | $ | 714,361 | |
| | | | | | | | | | | | | | | | |
Select Class | | | | | | | | | | | | | | | | |
Proceeds from shares issued | | $ | 172,723 | | | $ | 235,397 | | | $ | 874,338 | | | $ | 551,560 | |
Distributions reinvested | | | 103,039 | | | | 84,914 | | | | 174,083 | | | | 120,569 | |
Cost of shares redeemed | | | (114,084 | ) | | | (166,729 | ) | | | (1,575,482 | ) | | | (1,061,484 | ) |
| | | | | | | | | | | | | | | | |
Change in net assets resulting from Select Class capital transactions | | $ | 161,678 | | | $ | 153,582 | | | $ | (527,061 | ) | | $ | (389,355 | ) |
| | | | | | | | | | | | | | | | |
Total change in net assets resulting from capital transactions | | $ | 355,953 | | | $ | 251,309 | | | $ | 660,334 | | | $ | 18,077 | |
| | | | | | | | | | | | | | | | |
SEE NOTES TO FINANCIAL STATEMENTS.
| | | | | | | | |
| | | |
| DECEMBER 31, 2014 | | J.P. MORGAN MID CAP/MULTI-CAP FUNDS | | | | | 51 | |
STATEMENTS OF CHANGES IN NET ASSETS
FOR THE PERIODS INDICATED (continued)
(Amounts in thousands)
| | | | | | | | | | | | | | | | |
| | | Mid Cap Growth Fund | | | Mid Cap Value Fund | |
| | | Six Months Ended
December 31, 2014
(Unaudited) | | | Year Ended
June 30, 2014 | | | Six Months Ended
December 31, 2014
(Unaudited) | | | Year Ended
June 30, 2014 | |
SHARE TRANSACTIONS: | | | | | | | | | | | | | | | | |
Class A | | | | | | | | | | | | | | | | |
Issued | | | 5,901 | | | | 4,546 | | | | 5,152 | | | | 13,275 | |
Reinvested | | | 3,166 | | | | 2,708 | | | | 5,494 | | | | 4,172 | |
Redeemed | | | (3,335 | ) | | | (4,940 | ) | | | (27,993 | ) | | | (25,729 | ) |
| | | | | | | | | | | | | | | | |
Change in Class A Shares | | | 5,732 | | | | 2,314 | | | | (17,347 | ) | | | (8,282 | ) |
| | | | | | | | | | | | | | | | |
Class B | | | | | | | | | | | | | | | | |
Issued | | | 1 | | | | 3 | | | | — | (a) | | | 4 | |
Reinvested | | | 37 | | | | 53 | | | | 18 | | | | 15 | |
Redeemed | | | (56 | ) | | | (193 | ) | | | (57 | ) | | | (223 | ) |
| | | | | | | | | | | | | | | | |
Change in Class B Shares | | | (18 | ) | | | (137 | ) | | | (39 | ) | | | (204 | ) |
| | | | | | | | | | | | | | | | |
Class C | | | | | | | | | | | | | | | | |
Issued | | | 744 | | | | 673 | | | | 483 | | | | 830 | |
Reinvested | | | 262 | | | | 140 | | | | 1,070 | | | | 602 | |
Redeemed | | | (187 | ) | | | (244 | ) | | | (1,025 | ) | | | (1,968 | ) |
| | | | | | | | | | | | | | | | |
Change in Class C Shares | | | 819 | | | | 569 | | | | 528 | | | | (536 | ) |
| | | | | | | | | | | | | | | | |
Class R2 | | | | | | | | | | | | | | | | |
Issued | | | 94 | | | | 58 | | | | 261 | | | | 654 | |
Reinvested | | | 13 | | | | 2 | | | | 164 | | | | 86 | |
Redeemed | | | (21 | ) | | | (10 | ) | | | (289 | ) | | | (599 | ) |
| | | | | | | | | | | | | | | | |
Change in Class R2 Shares | | | 86 | | | | 50 | | | | 136 | | | | 141 | |
| | | | | | | | | | | | | | | | |
Class R5 | | | | | | | | | | | | | | | | |
Issued | | | 639 | | | | 397 | | | | — | | | | — | |
Reinvested | | | 125 | | | | 86 | | | | — | | | | — | |
Redeemed | | | (104 | ) | | | (293 | ) | | | — | | | | — | |
| | | | | | | | | | | | | | | | |
Change in Class R5 Shares | | | 660 | | | | 190 | | | | — | | | | — | |
| | | | | | | | | | | | | | | | |
Class R6 | | | | | | | | | | | | | | | | |
Issued | | | 689 | | | | 1,187 | | | | — | | | | — | |
Reinvested | | | 266 | | | | 179 | | | | — | | | | — | |
Redeemed | | | (503 | ) | | | (432 | ) | | | — | | | | — | |
| | | | | | | | | | | | | | | | |
Change in Class R6 Shares | | | 452 | | | | 934 | | | | — | | | | — | |
| | | | | | | | | | | | | | | | |
Institutional Class | | | | | | | | | | | | | | | | |
Issued | | | — | | | | — | | | | 49,420 | | | | 55,438 | |
Reinvested | | | — | | | | — | | | | 18,860 | | | | 9,240 | |
Redeemed | | | — | | | | — | | | | (20,573 | ) | | | (44,220 | ) |
| | | | | | | | | | | | | | | | |
Change in Institutional Class Shares | | | — | | | | — | | | | 47,707 | | | | 20,458 | |
| | | | | | | | | | | | | | | | |
Select Class | | | | | | | | | | | | | | | | |
Issued | | | 5,934 | | | | 8,322 | | | | 23,375 | | | | 15,917 | |
Reinvested | | | 3,790 | | | | 3,204 | | | | 4,839 | | | | 3,571 | |
Redeemed | | | (3,872 | ) | | | (5,903 | ) | | | (41,079 | ) | | | (30,426 | ) |
| | | | | | | | | | | | | | | | |
Change in Select Class Shares | | | 5,852 | | | | 5,623 | | | | (12,865 | ) | | | (10,938 | ) |
| | | | | | | | | | | | | | | | |
| (a) | Amount rounds to less than 1,000 shares. |
SEE NOTES TO FINANCIAL STATEMENTS.
| | | | | | |
| | | |
| 52 | | | | J.P. MORGAN MID CAP/MULTI-CAP FUNDS | | DECEMBER 31, 2014 |
| | | | | | | | | | | | | | | | |
| | | Multi-Cap Market Neutral Fund | | | Value Advantage Fund | |
| | | Six Months Ended
December 31, 2014
(Unaudited) | | | Year Ended
June 30, 2014 | | | Six Months Ended
December 31, 2014
(Unaudited) | | | Year Ended
June 30, 2014 | |
CAPITAL TRANSACTIONS: | | | | | | | | | | | | | | | | |
Class A | | | | | | | | | | | | | | | | |
Proceeds from shares issued | | $ | 256 | | | $ | 2,563 | | | $ | 615,706 | | | $ | 931,606 | |
Distributions reinvested | | | — | | | | — | | | | 63,610 | | | | 34,685 | |
Cost of shares redeemed | | | (3,682 | ) | | | (6,487 | ) | | | (264,402 | ) | | | (255,314 | ) |
| | | | | | | | | | | | | | | | |
Change in net assets resulting from Class A capital transactions | | $ | (3,426 | ) | | $ | (3,924 | ) | | $ | 414,914 | | | $ | 710,977 | |
| | | | | | | | | | | | | | | | |
Class B | | | | | | | | | | | | | | | | |
Proceeds from shares issued | | $ | — | | | $ | 3 | | | $ | — | | | $ | — | |
Cost of shares redeemed | | | (55 | ) | | | (325 | ) | | | — | | | | — | |
| | | | | | | | | | | | | | | | |
Change in net assets resulting from Class B capital transactions | | $ | (55 | ) | | $ | (322 | ) | | $ | — | | | $ | — | |
| | | | | | | | | | | | | | | | |
Class C | | | | | | | | | | | | | | | | |
Proceeds from shares issued | | $ | 367 | | | $ | 505 | | | $ | 154,592 | | | $ | 164,051 | |
Distributions reinvested | | | — | | | | — | | | | 12,024 | | | | 6,053 | |
Cost of shares redeemed | | | (1,424 | ) | | | (3,141 | ) | | | (26,075 | ) | | | (28,716 | ) |
| | | | | | | | | | | | | | | | |
Change in net assets resulting from Class C capital transactions | | $ | (1,057 | ) | | $ | (2,636 | ) | | $ | 140,541 | | | $ | 141,388 | |
| | | | | | | | | | | | | | | | |
Institutional Class | | | | | | | | | | | | | | | | |
Proceeds from shares issued | | $ | — | | | $ | — | | | $ | 1,108,871 | | | $ | 1,480,427 | |
Distributions reinvested | | | — | | | | — | | | | 134,005 | | | | 69,075 | |
Cost of shares redeemed | | | — | | | | — | | | | (173,103 | ) | | | (330,856 | ) |
| | | | | | | | | | | | | | | | |
Change in net assets resulting from Institutional Class capital transactions | | $ | — | | | $ | — | | | $ | 1,069,773 | | | $ | 1,218,646 | |
| | | | | | | | | | | | | | | | |
Select Class | | | | | | | | | | | | | | | | |
Proceeds from shares issued | | $ | 5,339 | | | $ | 114,928 | | | $ | 398,848 | | | $ | 1,276,857 | |
Distributions reinvested | | | — | | | | — | | | | 87,369 | | | | 49,543 | |
Cost of shares redeemed | | | (137,647 | ) | | | (6,058 | ) | | | (113,658 | ) | | | (335,843 | ) |
| | | | | | | | | | | | | | | | |
Change in net assets resulting from Select Class capital transactions | | $ | (132,308 | ) | | $ | 108,870 | | | $ | 372,559 | | | $ | 990,557 | |
| | | | | | | | | | | | | | | | |
Total change in net assets resulting from capital transactions | | $ | (136,846 | ) | | $ | 101,988 | | | $ | 1,997,787 | | | $ | 3,061,568 | |
| | | | | | | | | | | | | | | | |
SEE NOTES TO FINANCIAL STATEMENTS.
| | | | | | | | |
| | | |
| DECEMBER 31, 2014 | | J.P. MORGAN MID CAP/MULTI-CAP FUNDS | | | | | 53 | |
STATEMENTS OF CHANGES IN NET ASSETS
FOR THE PERIODS INDICATED (continued)
(Amounts in thousands)
| | | | | | | | | | | | | | | | |
| | | Multi-Cap Market Neutral Fund | | | Value Advantage Fund | |
| | | Six Months Ended
December 31, 2014
(Unaudited) | | | Year Ended
June 30, 2014 | | | Six Months Ended
December 31, 2014
(Unaudited) | | | Year Ended
June 30, 2014 | |
SHARE TRANSACTIONS: | | | | | | | | | | | | | | | | |
Class A | | | | | | | | | | | | | | | | |
Issued | | | 25 | | | | 262 | | | | 21,021 | | | | 34,698 | |
Reinvested | | | — | | | | — | | | | 2,177 | | | | 1,320 | |
Redeemed | | | (369 | ) | | | (663 | ) | | | (9,035 | ) | | | (9,483 | ) |
| | | | | | | | | | | | | | | | |
Change in Class A Shares | | | (344 | ) | | | (401 | ) | | | 14,163 | | | | 26,535 | |
| | | | | | | | | | | | | | | | |
Class B | | | | | | | | | | | | | | | | |
Issued | | | — | | | | 1 | | | | — | | | | — | |
Redeemed | | | (6 | ) | | | (36 | ) | | | — | | | | — | |
| | | | | | | | | | | | | | | | |
Change in Class B Shares | | | (6 | ) | | | (35 | ) | | | — | | | | — | |
| | | | | | | | | | | | | | | | |
Class C | | | | | | | | | | | | | | | | |
Issued | | | 39 | | | | 54 | | | | 5,285 | | | | 6,062 | |
Reinvested | | | — | | | | — | | | | 414 | | | | 232 | |
Redeemed | | | (151 | ) | | | (338 | ) | | | (895 | ) | | | (1,062 | ) |
| | | | | | | | | | | | | | | | |
Change in Class C Shares | | | (112 | ) | | | (284 | ) | | | 4,804 | | | | 5,232 | |
| | | | | | | | | | | | | | | | |
Institutional Class | | | | | | | | | | | | | | | | |
Issued | | | — | | | | — | | | | 37,756 | | | | 54,588 | |
Reinvested | | | — | | | | — | | | | 4,545 | | | | 2,610 | |
Redeemed | | | — | | | | — | | | | (5,853 | ) | | | (12,230 | ) |
| | | | | | | | | | | | | | | | |
Change in Institutional Class Shares | | | — | | | | — | | | | 36,448 | | | | 44,968 | |
| | | | | | | | | | | | | | | | |
Select Class | | | | | | | | | | | | | | | | |
Issued | | | 527 | | | | 11,408 | | | | 13,607 | | | | 47,271 | |
Reinvested | | | — | | | | — | | | | 2,972 | | | | 1,877 | |
Redeemed | | | (13,502 | ) | | | (607 | ) | | | (3,865 | ) | | | (12,507 | ) |
| | | | | | | | | | | | | | | | |
Change in Select Class Shares | | | (12,975 | ) | | | 10,801 | | | | 12,714 | | | | 36,641 | |
| | | | | | | | | | | | | | | | |
SEE NOTES TO FINANCIAL STATEMENTS.
| | | | | | |
| | | |
| 54 | | | | J.P. MORGAN MID CAP/MULTI-CAP FUNDS | | DECEMBER 31, 2014 |
THIS PAGE IS INTENTIONALLY LEFT BLANK
| | | | | | | | |
| | | |
| DECEMBER 31, 2014 | | J.P. MORGAN MID CAP/MULTI-CAP FUNDS | | | | | 55 | |
FINANCIAL HIGHLIGHTS
FOR THE PERIODS INDICATED
| | | | | | | | | | | | | | | | | | | | | | | | | | | | |
| | | | | | Per share operating performance | |
| | | | | | Investment operations | | | Distributions | |
| | | Net asset
value,
beginning
of period | | | Net
investment
income
(loss) | | | Net realized
and unrealized
gains
(losses) on
investments | | | Total from
investment
operations | | | Net
investment
income | | | Net
realized
gain | | | Total
distributions | |
Growth Advantage Fund | | | | | | | | | | | | | | | | | | | | | | | | | | | | |
Class A | | | | | | | | | | | | | | | | | | | | | | | | | | | | |
Six Months Ended December 31, 2014 (Unaudited) | | $ | 14.24 | | | $ | (0.05 | )(f) | | $ | 0.71 | | | $ | 0.66 | | | $ | — | | | $ | (0.57 | ) | | $ | (0.57 | ) |
Year Ended June 30, 2014 | | | 11.43 | | | | (0.07 | )(f) | | | 3.52 | | | | 3.45 | | | | — | | | | (0.64 | ) | | | (0.64 | ) |
Year Ended June 30, 2013 | | | 9.49 | | | | 0.01 | (f)(g) | | | 1.97 | | | | 1.98 | | | | (0.01 | ) | | | (0.03 | ) | | | (0.04 | ) |
Year Ended June 30, 2012 | | | 9.28 | | | | (0.03 | )(f)(h) | | | 0.24 | | | | 0.21 | | | | — | | | | — | | | | — | |
Year Ended June 30, 2011 | | | 6.76 | | | | (0.04 | )(f) | | | 2.56 | | | | 2.52 | | | | — | | | | — | | | | — | |
Year Ended June 30, 2010 | | | 5.88 | | | | (0.03 | )(f) | | | 0.91 | | | | 0.88 | | | | — | | | | — | | | | — | |
| | | | | | | |
Class B | | | | | | | | | | | | | | | | | | | | | | | | | | | | |
Six Months Ended December 31, 2014 (Unaudited) | | | 12.97 | | | | (0.08 | )(f) | | | 0.64 | | | | 0.56 | | | | — | | | | (0.57 | ) | | | (0.57 | ) |
Year Ended June 30, 2014 | | | 10.50 | | | | (0.12 | )(f) | | | 3.23 | | | | 3.11 | | | | — | | | | (0.64 | ) | | | (0.64 | ) |
Year Ended June 30, 2013 | | | 8.76 | | | | (0.04 | )(f)(g) | | | 1.81 | | | | 1.77 | | | | — | | | | (0.03 | ) | | | (0.03 | ) |
Year Ended June 30, 2012 | | | 8.61 | | | | (0.07 | )(f)(h) | | | 0.22 | | | | 0.15 | | | | — | | | | — | | | | — | |
Year Ended June 30, 2011 | | | 6.31 | | | | (0.07 | )(f) | | | 2.37 | | | | 2.30 | | | | — | | | | — | | | | — | |
Year Ended June 30, 2010 | | | 5.51 | | | | (0.06 | )(f) | | | 0.86 | | | | 0.80 | | | | — | | | | — | | | | — | |
| | | | | | | |
Class C | | | | | | | | | | | | | | | | | | | | | | | | | | | | |
Six Months Ended December 31, 2014 (Unaudited) | | | 12.98 | | | | (0.08 | )(f) | | | 0.64 | | | | 0.56 | | | | — | | | | (0.57 | ) | | | (0.57 | ) |
Year Ended June 30, 2014 | | | 10.51 | | | | (0.12 | )(f) | | | 3.23 | | | | 3.11 | | | | — | | | | (0.64 | ) | | | (0.64 | ) |
Year Ended June 30, 2013 | | | 8.77 | | | | (0.04 | )(f)(g) | | | 1.81 | | | | 1.77 | | | | — | | | | (0.03 | ) | | | (0.03 | ) |
Year Ended June 30, 2012 | | | 8.61 | | | | (0.07 | )(f)(h) | | | 0.23 | | | | 0.16 | | | | — | | | | — | | | | — | |
Year Ended June 30, 2011 | | | 6.31 | | | | (0.08 | )(f) | | | 2.38 | | | | 2.30 | | | | — | | | | — | | | | — | |
Year Ended June 30, 2010 | | | 5.52 | | | | (0.06 | )(f) | | | 0.85 | | | | 0.79 | | | | — | | | | — | | | | — | |
| | | | | | | |
Class R5 | | | | | | | | | | | | | | | | | | | | | | | | | | | | |
Six Months Ended December 31, 2014 (Unaudited) | | | 14.63 | | | | (0.02 | )(f) | | | 0.73 | | | | 0.71 | | | | — | | | | (0.57 | ) | | | (0.57 | ) |
Year Ended June 30, 2014 | | | 11.68 | | | | (0.02 | )(f) | | | 3.61 | | | | 3.59 | | | | — | | | | (0.64 | ) | | | (0.64 | ) |
Year Ended June 30, 2013 | | | 9.69 | | | | 0.06 | (f)(g) | | | 2.01 | | | | 2.07 | | | | (0.05 | ) | | | (0.03 | ) | | | (0.08 | ) |
Year Ended June 30, 2012 | | | 9.44 | | | | 0.01 | (f)(h) | | | 0.24 | | | | 0.25 | | | | — | | | | — | | | | — | |
Year Ended June 30, 2011 | | | 6.86 | | | | — | (f)(i) | | | 2.58 | | | | 2.58 | | | | — | | | | — | | | | — | |
Year Ended June 30, 2010 | | | 5.93 | | | | — | (f)(i) | | | 0.93 | | | | 0.93 | | | | — | | | | — | | | | — | |
| | | | | | | |
Class R6 | | | | | | | | | | | | | | | | | | | | | | | | | | | | |
Six Months Ended December 31, 2014 (Unaudited) | | | 14.64 | | | | (0.02 | )(f) | | | 0.73 | | | | 0.71 | | | | — | | | | (0.57 | ) | | | (0.57 | ) |
December 23, 2013(j) through June 30, 2014 | | | 13.86 | | | | (0.01 | )(f) | | | 0.79 | | | | 0.78 | | | | — | | | | — | | | | — | |
| | | | | | | |
Select Class | | | | | | | | | | | | | | | | | | | | | | | | | | | | |
Six Months Ended December 31, 2014 (Unaudited) | | | 14.50 | | | | (0.04 | )(f) | | | 0.72 | | | | 0.68 | | | | — | | | | (0.57 | ) | | | (0.57 | ) |
Year Ended June 30, 2014 | | | 11.60 | | | | (0.04 | )(f) | | | 3.58 | | | | 3.54 | | | | — | | | | (0.64 | ) | | | (0.64 | ) |
Year Ended June 30, 2013 | | | 9.63 | | | | 0.04 | (f)(g) | | | 1.98 | | | | 2.02 | | | | (0.02 | ) | | | (0.03 | ) | | | (0.05 | ) |
Year Ended June 30, 2012 | | | 9.39 | | | | (0.02 | )(f)(h) | | | 0.26 | | | | 0.24 | | | | — | | | | — | | | | — | |
Year Ended June 30, 2011 | | | 6.83 | | | | (0.02 | )(f) | | | 2.58 | | | | 2.56 | | | | — | | | | — | | | | — | |
Year Ended June 30, 2010 | | | 5.93 | | | | (0.01 | )(f) | | | 0.91 | | | | 0.90 | | | | — | | | | — | | | | — | |
| (a) | Annualized for periods less than one year, unless otherwise noted. |
| (b) | Not annualized for periods less than one year. |
| (c) | Includes adjustments in accordance with accounting principles generally accepted in the United States of America and as such, the net asset values for financial reporting purposes and the returns based upon those net asset values may differ from the net asset values and returns for shareholder transactions. |
| (d) | Includes earnings credits and interest expense, if applicable, each of which is less than 0.01% unless otherwise noted. |
| (e) | Portfolio turnover is calculated by dividing the lesser of total purchases or sales of portfolio securities for the reporting period by the monthly average value of portfolio securities owned during the reporting period. Excluded from both the numerator and denominator are amounts relating to derivatives and securities whose maturities or expiration dates at the time of acquisition were one year or less. |
| (f) | Calculated based upon average shares outstanding. |
| (g) | Reflects special dividends paid out during the period by several of the Fund’s holdings. Had the Fund not received the special dividends, the net investment income (loss) per share would have been $(0.02), $(0.06), $(0.06), $0.03 and $0.01 for Class A, Class B, Class C, Class R5 and Select Class Shares, respectively, and the net investment income (loss) ratio would have been (0.17)%, (0.66)%, (0.66)%, 0.27% and 0.09% for Class A, Class B, Class C, Class R5 and Select Class Shares, respectively. |
| (h) | Reflects a special dividend paid out during the period by one of the Fund’s holdings. Had the Fund not received the special dividend, the net investment income (loss) per share would have been $(0.05), $(0.09), $(0.09), $(0.01) and $(0.03) for Class A, Class B, Class C, Class R5 and Select Class Shares, respectively, and the net investment income (loss) ratio would have been (0.56)%, (1.08)%, (1.03)%, (0.12)% and (0.37)% for Class A, Class B, Class C, Class R5 and Select Class Shares, respectively. |
| (i) | Amount rounds to less than $0.01. |
| (j) | Commencement of offering of class of shares. |
SEE NOTES TO FINANCIAL STATEMENTS.
| | | | | | |
| | | |
| 56 | | | | J.P. MORGAN MID CAP/MULTI-CAP FUNDS | | DECEMBER 31, 2014 |
| | | | | | | | | | | | | | | | | | | | | | | | | | |
| | | Ratios/Supplemental data | |
| | | | | | | | | | Ratios to average net assets (a) | | | | |
Net asset
value,
end of
period | | | Total return
(excludes
sales charge) (b)(c) | | | Net assets,
end of
period
(000’s) | | | Net
expenses (d) | | | Net
investment income
(loss) | | | Expenses
without waivers,
reimbursements and
earnings credits | | | Portfolio
turnover
rate (b)(e) | |
| | | | | | | | | | | | | | | | | | | | | | | | | | |
| | | | | | | | | | | | | | | | | | | | | | | | | | |
| $ | 14.33 | | | | 4.69 | % | | $ | 872,880 | | | | 1.25 | % | | | (0.67 | )% | | | 1.32 | % | | | 26 | % |
| | 14.24 | | | | 30.69 | | | | 717,564 | | | | 1.24 | | | | (0.51 | ) | | | 1.31 | | | | 62 | |
| | 11.43 | | | | 20.95 | | | | 276,670 | | | | 1.24 | | | | 0.11 | (g) | | | 1.28 | | | | 76 | |
| | 9.49 | | | | 2.26 | | | | 194,911 | | | | 1.25 | | | | (0.37 | )(h) | | | 1.30 | | | | 86 | |
| | 9.28 | | | | 37.28 | | | | 176,492 | | | | 1.25 | | | | (0.45 | ) | | | 1.31 | | | | 96 | |
| | 6.76 | | | | 14.97 | | | | 101,814 | | | | 1.31 | | | | (0.41 | ) | | | 1.31 | | | | 102 | |
| | | | | | |
| | | | | | | | | | | | | | | | | | | | | | | | | | |
| | 12.96 | | | | 4.38 | | | | 2,295 | | | | 1.75 | | | | (1.17 | ) | | | 1.83 | | | | 26 | |
| | 12.97 | | | | 30.15 | | | | 2,417 | | | | 1.74 | | | | (0.99 | ) | | | 1.81 | | | | 62 | |
| | 10.50 | | | | 20.29 | | | | 2,081 | | | | 1.74 | | | | (0.38 | )(g) | | | 1.78 | | | | 76 | |
| | 8.76 | | | | 1.74 | | | | 2,327 | | | | 1.75 | | | | (0.89 | )(h) | | | 1.80 | | | | 86 | |
| | 8.61 | | | | 36.45 | | | | 3,157 | | | | 1.75 | | | | (0.94 | ) | | | 1.81 | | | | 96 | |
| | 6.31 | | | | 14.52 | | | | 3,070 | | | | 1.81 | | | | (0.91 | ) | | | 1.81 | | | | 102 | |
| | | | | | |
| | | | | | | | | | | | | | | | | | | | | | | | | | |
| | 12.97 | | | | 4.37 | | | | 194,883 | | | | 1.75 | | | | (1.17 | ) | | | 1.82 | | | | 26 | |
| | 12.98 | | | | 30.12 | | | | 144,229 | | | | 1.74 | | | | (1.01 | ) | | | 1.81 | | | | 62 | |
| | 10.51 | | | | 20.27 | | | | 42,655 | | | | 1.74 | | | | (0.38 | )(g) | | | 1.78 | | | | 76 | |
| | 8.77 | | | | 1.86 | | | | 27,469 | | | | 1.75 | | | | (0.84 | )(h) | | | 1.80 | | | | 86 | |
| | 8.61 | | | | 36.45 | | | | 20,676 | | | | 1.75 | | | | (0.95 | ) | | | 1.81 | | | | 96 | |
| | 6.31 | | | | 14.31 | | | | 12,811 | | | | 1.81 | | | | (0.91 | ) | | | 1.81 | | | | 102 | |
| | | | | | |
| | | | | | | | | | | | | | | | | | | | | | | | | | |
| | 14.77 | | | | 4.91 | | | | 47,921 | | | | 0.85 | | | | (0.25 | ) | | | 0.86 | | | | 26 | |
| | 14.63 | | | | 31.25 | | | | 1,453,864 | | | | 0.85 | | | | (0.11 | ) | | | 0.86 | | | | 62 | |
| | 11.68 | | | | 21.49 | | | | 835,233 | | | | 0.83 | | | | 0.55 | (g) | | | 0.84 | | | | 76 | |
| | 9.69 | | | | 2.65 | | | | 468,064 | | | | 0.85 | | | | 0.07 | (h) | | | 0.85 | | | | 86 | |
| | 9.44 | | | | 37.61 | | | | 179,677 | | | | 0.86 | | | | (0.05 | ) | | | 0.86 | | | | 96 | |
| | 6.86 | | | | 15.68 | | | | 76,767 | | | | 0.86 | | | | 0.05 | | | | 0.86 | | | | 102 | |
| | | | | | |
| | | | | | | | | | | | | | | | | | | | | | | | | | |
| | 14.78 | | | | 4.96 | | | | 1,993,565 | | | | 0.77 | | | | (0.21 | ) | | | 0.78 | | | | 26 | |
| | 14.64 | | | | 5.63 | | | | 271,958 | | | | 0.80 | | | | (0.15 | ) | | | 0.82 | | | | 62 | |
| | | | | | |
| | | | | | | | | | | | | | | | | | | | | | | | | | |
| | 14.61 | | | | 4.74 | | | | 1,056,892 | | | | 1.06 | | | | (0.49 | ) | | | 1.07 | | | | 26 | |
| | 14.50 | | | | 31.03 | | | | 975,175 | | | | 1.05 | | | | (0.30 | ) | | | 1.06 | | | | 62 | |
| | 11.60 | | | | 21.14 | | | | 842,783 | | | | 1.03 | | | | 0.37 | (g) | | | 1.03 | | | | 76 | |
| | 9.63 | | | | 2.56 | | | | 662,786 | | | | 1.05 | | | | (0.18 | )(h) | | | 1.05 | | | | 86 | |
| | 9.39 | | | | 37.48 | | | | 836,154 | | | | 1.06 | | | | (0.27 | ) | | | 1.06 | | | | 96 | |
| | 6.83 | | | | 15.18 | | | | 604,663 | | | | 1.06 | | | | (0.16 | ) | | | 1.06 | | | | 102 | |
SEE NOTES TO FINANCIAL STATEMENTS.
| | | | | | | | |
| | | |
| DECEMBER 31, 2014 | | J.P. MORGAN MID CAP/MULTI-CAP FUNDS | | | | | 57 | |
FINANCIAL HIGHLIGHTS
FOR THE PERIODS INDICATED (continued)
| | | | | | | | | | | | | | | | | | | | | | | | | | | | |
| | | Per share operating performance | |
| | | | | | Investment operations | | | Distributions | |
| | | Net asset
value,
beginning
of period | | | Net
investment
income
(loss) | | | Net realized
and unrealized
gains
(losses) on
investments | | | Total from
investment
operations | | | Net
investment
income | | | Net
realized
gain | | | Total
distributions | |
Mid Cap Equity Fund | | | | | | | | | | | | | | | | | | | | | | | | | | | | |
Class A | | | | | | | | | | | | | | | | | | | | | | | | | | | | |
Six Months Ended December 31, 2014 (Unaudited) | | $ | 44.91 | | | $ | 0.03 | (f) | | $ | 1.71 | | | $ | 1.74 | | | $ | (0.05 | ) | | $ | (2.03 | ) | | $ | (2.08 | ) |
Year Ended June 30, 2014 | | | 38.10 | | | | (0.04 | )(g) | | | 10.25 | | | | 10.21 | | | | (0.02 | ) | | | (3.38 | ) | | | (3.40 | ) |
Year Ended June 30, 2013 | | | 30.97 | | | | 0.10 | (g)(h) | | | 7.36 | | | | 7.46 | | | | (0.07 | ) | | | (0.26 | ) | | | (0.33 | ) |
Year Ended June 30, 2012 | | | 31.29 | | | | 0.10 | (g)(i) | | | (0.34 | ) | | | (0.24 | ) | | | (0.08 | ) | | | — | | | | (0.08 | ) |
Year Ended June 30, 2011 | | | 22.95 | | | | 0.04 | (g) | | | 8.36 | | | | 8.40 | | | | (0.06 | ) | | | — | | | | (0.06 | ) |
November 2, 2009 (j) through June 30, 2010 | | | 21.55 | | | | 0.05 | | | | 1.41 | | | | 1.46 | | | | (0.06 | ) | | | — | | | | (0.06 | ) |
| | | | | | | |
Class C | | | | | | | | | | | | | | | | | | | | | | | | | | | | |
Six Months Ended December 31, 2014 (Unaudited) | | | 44.21 | | | | (0.06 | )(f) | | | 1.65 | | | | 1.59 | | | | — | (k) | | | (2.03 | ) | | | (2.03 | ) |
Year Ended June 30, 2014 | | | 37.71 | | | | (0.24 | )(g) | | | 10.12 | | | | 9.88 | | | | — | | | | (3.38 | ) | | | (3.38 | ) |
Year Ended June 30, 2013 | | | 30.75 | | | | (0.07 | )(g)(h) | | | 7.29 | | | | 7.22 | | | | — | (k) | | | (0.26 | ) | | | (0.26 | ) |
Year Ended June 30, 2012 | | | 31.16 | | | | (0.05 | )(g)(i) | | | (0.35 | ) | | | (0.40 | ) | | | (0.01 | ) | | | — | | | | (0.01 | ) |
Year Ended June 30, 2011 | | | 22.93 | | | | (0.12 | )(g) | | | 8.37 | | | | 8.25 | | | | (0.02 | ) | | | — | | | | (0.02 | ) |
November 2, 2009 (j) through June 30, 2010 | | | 21.55 | | | | (0.03 | ) | | | 1.41 | | | | 1.38 | | | | — | (k) | | | — | | | | — | (k) |
| | | | | | | |
Class R2 | | | | | | | | | | | | | | | | | | | | | | | | | | | | |
Six Months Ended December 31, 2014 (Unaudited) | | | 44.87 | | | | (0.04 | )(f) | | | 1.72 | | | | 1.68 | | | | (0.02 | ) | | | (2.03 | ) | | | (2.05 | ) |
March 14, 2014 (j) through June 30, 2014 | | | 42.92 | | | | (0.05 | )(g) | | | 2.01 | | | | 1.96 | | | | (0.01 | ) | | | — | | | | (0.01 | ) |
| | | | | | | |
Class R5 | | | | | | | | | | | | | | | | | | | | | | | | | | | | |
Six Months Ended December 31, 2014 (Unaudited) | | | 45.15 | | | | 0.13 | (f) | | | 1.72 | | | | 1.85 | | | | (0.12 | ) | | | (2.03 | ) | | | (2.15 | ) |
March 14, 2014 (j) through June 30, 2014 | | | 43.14 | | | | 0.04 | (g) | | | 2.02 | | | | 2.06 | | | | (0.05 | ) | | | — | | | | (0.05 | ) |
| | | | | | | |
Class R6 | | | | | | | | | | | | | | | | | | | | | | | | | | | | |
Six Months Ended December 31, 2014 (Unaudited) | | | 45.15 | | | | 0.13 | (f) | | | 1.73 | | | | 1.86 | | | | (0.13 | ) | | | (2.03 | ) | | | (2.16 | ) |
March 14, 2014 (j) through June 30, 2014 | | | 43.14 | | | | 0.04 | (g) | | | 2.02 | | | | 2.06 | | | | (0.05 | ) | | | — | | | | (0.05 | ) |
| | | | | | | |
Select Class | | | | | | | | | | | | | | | | | | | | | | | | | | | | |
Six Months Ended December 31, 2014 (Unaudited) | | | 45.15 | | | | 0.10 | (f) | | | 1.73 | | | | 1.83 | | | | (0.10 | ) | | | (2.03 | ) | | | (2.13 | ) |
Year Ended June 30, 2014 | | | 38.22 | | | | 0.11 | (g) | | | 10.30 | | | | 10.41 | | | | (0.10 | ) | | | (3.38 | ) | | | (3.48 | ) |
Year Ended June 30, 2013 | | | 31.05 | | | | 0.20 | (g)(h) | | | 7.40 | | | | 7.60 | | | | (0.17 | ) | | | (0.26 | ) | | | (0.43 | ) |
Year Ended June 30, 2012 | | | 31.36 | | | | 0.19 | (g)(i) | | | (0.33 | ) | | | (0.14 | ) | | | (0.17 | ) | | | — | | | | (0.17 | ) |
Year Ended June 30, 2011 | | | 22.97 | | | | 0.14 | (g) | | | 8.37 | | | | 8.51 | | | | (0.12 | ) | | | — | | | | (0.12 | ) |
Year Ended June 30, 2010 | | | 18.97 | | | | 0.12 | | | | 4.00 | | | | 4.12 | | | | (0.12 | ) | | | — | | | | (0.12 | ) |
| (a) | Annualized for periods less than one year, unless otherwise noted. |
| (b) | Not annualized for periods less than one year. |
| (c) | Includes adjustments in accordance with accounting principles generally accepted in the United States of America and as such, the net asset values for financial reporting purposes and the returns based upon those net asset values may differ from the net asset values and returns for shareholder transactions. |
| (d) | Includes earnings credits and interest expense, if applicable, each of which is less than 0.01% unless otherwise noted. |
| (e) | Portfolio turnover is calculated by dividing the lesser of total purchases or sales of portfolio securities for the reporting period by the monthly average value of portfolio securities owned during the reporting period. Excluded from both the numerator and denominator are amounts relating to derivatives and securities whose maturities or expiration dates at the time of acquisition were one year or less. |
| (f) | Reflects special dividends paid out during the period by several of the Fund’s holdings. Had the Fund not received the special dividends, the net investment income (loss) per share would have been $(0.03), $(0.12), $(0.10), $0.07, $0.07 and $0.04 for Class A, Class C, Class R2, Class R5, Class R6 and Select Class Shares, respectively, and the net investment income (loss) ratio would have been (0.16)%, (0.67)%, (0.43)%, 0.52%, 0.35% and 0.18% for Class A, Class C, Class R2, Class R5, Class R6 and Select Class Shares, respectively. |
| (g) | Calculated based upon average shares outstanding. |
| (h) | Reflects special dividends paid out during the period by several of the Fund’s holdings. Had the Fund not received the special dividends, the net investment income (loss) per share would have been $0.03, $(0.14) and $0.14 for Class A, Class C and Select Class Shares, respectively, and the net investment income (loss) ratio would have been 0.09%, (0.39)% and 0.39% for Class A, Class C and Select Class Shares, respectively. |
| (i) | Reflects a special dividend paid out during the period by one of the Fund’s holdings. Had the Fund not received the special dividend the net investment income (loss) per share would have been $0.05, $(0.10) and $0.14 for Class A, Class C and Select Class Shares, respectively and the net investment income (loss) ratio would have been 0.18%, (0.33)% and 0.48% for Class A, Class C and Select Class Shares, respectively. |
| (j) | Commencement of offering of class of shares. |
| (k) | Amount rounds to less than $0.01. |
SEE NOTES TO FINANCIAL STATEMENTS.
| | | | | | |
| | | |
| 58 | | | | J.P. MORGAN MID CAP/MULTI-CAP FUNDS | | DECEMBER 31, 2014 |
| | | | | | | | | | | | | | | | | | | | | | | | | | |
| | | Ratios/Supplemental data | |
| | | | | | | | | | Ratios to average net assets (a) | | | | |
Net asset
value,
end of
period | | | Total return
(excludes
sales charge) (b)(c) | | | Net assets,
end of
period (000’s) | | | Net
expenses (d) | | | Net
investment income
(loss) | | | Expenses without
waivers,
reimbursements and
earnings credits | | | Portfolio
turnover
rate (b)(e) | |
| | | | | | | | | | | | | | | | | | | | | | | | | | |
| | | | | | | | | | | | | | | | | | | | | | | | | | |
| $ | 44.57 | | | | 4.04 | % | | $ | 185,853 | | | | 1.24 | % | | | 0.10 | %(f) | | | 1.41 | % | | | 18 | % |
| | 44.91 | | | | 27.96 | | | | 156,016 | | | | 1.24 | | | | (0.08 | ) | | | 1.41 | | | | 47 | |
| | 38.10 | | | | 24.23 | | | | 21,171 | | | | 1.24 | | | | 0.27 | (h) | | | 1.49 | | | | 67 | |
| | 30.97 | | | | (0.76 | ) | | | 6,965 | | | | 1.24 | | | | 0.34 | (i) | | | 1.54 | | | | 55 | |
| | 31.29 | | | | 36.60 | | | | 2,918 | | | | 1.24 | | | | 0.14 | | | | 1.53 | | | | 88 | |
| | 22.95 | | | | 6.77 | | | | 1,394 | | | | 1.24 | | | | 0.30 | | | | 1.44 | | | | 56 | |
| | | | | | |
| | | | | | | | | | | | | | | | | | | | | | | | | | |
| | 43.77 | | | | 3.77 | | | | 22,366 | | | | 1.74 | | | | (0.41 | )(f) | | | 1.89 | | | | 18 | |
| | 44.21 | | | | 27.34 | | | | 20,018 | | | | 1.74 | | | | (0.57 | ) | | | 1.93 | | | | 47 | |
| | 37.71 | | | | 23.60 | | | | 6,136 | | | | 1.74 | | | | (0.21 | )(h) | | | 2.00 | | | | 67 | |
| | 30.75 | | | | (1.29 | ) | | | 1,244 | | | | 1.75 | | | | (0.18 | )(i) | | | 2.03 | | | | 55 | |
| | 31.16 | | | | 35.98 | | | | 447 | | | | 1.74 | | | | (0.40 | ) | | | 2.06 | | | | 88 | |
| | 22.93 | | | | 6.40 | | | | 65 | | | | 1.74 | | | | (0.23 | ) | | | 1.92 | | | | 56 | |
| | | | | | |
| | | | | | | | | | | | | | | | | | | | | | | | | | |
| | 44.50 | | | | 3.92 | | | | 687 | | | | 1.49 | | | | (0.17 | )(f) | | | 1.63 | | | | 18 | |
| | 44.87 | | | | 4.56 | | | | 688 | | | | 1.47 | | | | (0.41 | ) | | | 1.60 | | | | 47 | |
| | | | | | |
| | | | | | | | | | | | | | | | | | | | | | | | | | |
| | 44.85 | | | | 4.27 | | | | 589 | | | | 0.79 | | | | 0.83 | (f) | | | 0.85 | | | | 18 | |
| | 45.15 | | | | 4.77 | | | | 91 | | | | 0.78 | | | | 0.27 | | | | 0.91 | | | | 47 | |
| | | | | | |
| | | | | | | | | | | | | | | | | | | | | | | | | | |
| | 44.85 | | | | 4.29 | | | | 1,066,585 | | | | 0.74 | | | | 0.61 | (f) | | | 0.84 | | | | 18 | |
| | 45.15 | | | | 4.78 | | | | 823,036 | | | | 0.73 | | | | 0.34 | | | | 0.86 | | | | 47 | |
| | | | | | |
| | | | | | | | | | | | | | | | | | | | | | | | | | |
| | 44.85 | | | | 4.22 | | | | 1,798,968 | | | | 0.89 | | | | 0.44 | (f) | | | 1.15 | | | | 18 | |
| | 45.15 | | | | 28.45 | | | | 1,773,321 | | | | 0.89 | | | | 0.27 | | | | 1.18 | | | | 47 | |
| | 38.22 | | | | 24.64 | | | | 932,920 | | | | 0.89 | | | | 0.57 | (h) | | | 1.23 | | | | 67 | |
| | 31.05 | | | | (0.42 | ) | | | 813,125 | | | | 0.89 | | | | 0.64 | (i) | | | 1.30 | | | | 55 | |
| | 31.36 | | | | 37.09 | | | | 568,854 | | | | 0.89 | | | | 0.50 | | | | 1.27 | | | | 88 | |
| | 22.97 | | | | 21.72 | | | | 463,478 | | | | 0.89 | | | | 0.55 | | | | 1.17 | | | | 56 | |
SEE NOTES TO FINANCIAL STATEMENTS.
| | | | | | | | |
| | | |
| DECEMBER 31, 2014 | | J.P. MORGAN MID CAP/MULTI-CAP FUNDS | | | | | 59 | |
FINANCIAL HIGHLIGHTS
FOR THE PERIODS INDICATED (continued)
| | | | | | | | | | | | | | | | | | | | | | | | | | | | |
| | | Per share operating performance | |
| | | | | | Investment operations | | | Distributions | |
| | | Net asset
value,
beginning
of period | | | Net
investment
income
(loss) | | | Net realized
and unrealized
gains
(losses) on
investments | | | Total from
investment
operations | | | Net
realized
gain | | | Net asset
value, end
of period | | | Total return
(excludes
sales
charge) (b)(c) | |
Mid Cap Growth Fund | | | | | | | | | | | | | | | | | | | | | | | | | | | | |
Class A | | | | | | | | | | | | | | | | | | | | | | | | | | | | |
Six Months Ended December 31, 2014 (Unaudited) | | $ | 27.49 | | | $ | (0.09 | )(f) | | $ | 0.53 | | | $ | 0.44 | | | $ | (2.79 | ) | | $ | 25.14 | | | | 1.95 | % |
Year Ended June 30, 2014 | | | 22.99 | | | | (0.13 | )(f)(g) | | | 7.42 | | | | 7.29 | | | | (2.79 | ) | | | 27.49 | | | | 33.44 | |
Year Ended June 30, 2013 | | | 19.52 | | | | (0.04 | )(f)(h) | | | 4.50 | | | | 4.46 | | | | (0.99 | ) | | | 22.99 | | | | 23.70 | |
Year Ended June 30, 2012 | | | 23.30 | | | | (0.05 | )(f)(i) | | | (1.72 | ) | | | (1.77 | ) | | | (2.01 | ) | | | 19.52 | | | | (6.61 | ) |
Year Ended June 30, 2011 | | | 16.35 | | | | (0.09 | )(f) | | | 7.04 | | | | 6.95 | | | | — | | | | 23.30 | | | | 42.51 | |
Year Ended June 30, 2010 | | | 13.68 | | | | (0.09 | )(f) | | | 2.76 | | | | 2.67 | | | | — | | | | 16.35 | | | | 19.52 | |
| | | | | | | |
Class B | | | | | | | | | | | | | | | | | | | | | | | | | | | | |
Six Months Ended December 31, 2014 (Unaudited) | | | 19.40 | | | | (0.11 | )(f) | | | 0.35 | | | | 0.24 | | | | (2.79 | ) | | | 16.85 | | | | 1.73 | |
Year Ended June 30, 2014 | | | 17.00 | | | | (0.18 | )(f)(g) | | | 5.37 | | | | 5.19 | | | | (2.79 | ) | | | 19.40 | | | | 32.81 | |
Year Ended June 30, 2013 | | | 14.76 | | | | (0.11 | )(f)(h) | | | 3.34 | | | | 3.23 | | | | (0.99 | ) | | | 17.00 | | | | 22.99 | |
Year Ended June 30, 2012 | | | 18.29 | | | | (0.12 | )(f)(i) | | | (1.40 | ) | | | (1.52 | ) | | | (2.01 | ) | | | 14.76 | | | | (7.08 | ) |
Year Ended June 30, 2011 | | | 12.90 | | | | (0.16 | )(f) | | | 5.55 | | | | 5.39 | | | | — | | | | 18.29 | | | | 41.78 | |
Year Ended June 30, 2010 | | | 10.85 | | | | (0.14 | )(f) | | | 2.19 | | | | 2.05 | | | | — | | | | 12.90 | | | | 18.89 | |
| | | | | | | |
Class C | | | | | | | | | | | | | | | | | | | | | | | | | | | | |
Six Months Ended December 31, 2014 (Unaudited) | | | 23.35 | | | | (0.14 | )(f) | | | 0.44 | | | | 0.30 | | | | (2.79 | ) | | | 20.86 | | | | 1.69 | |
Year Ended June 30, 2014 | | | 19.97 | | | | (0.22 | )(f)(g) | | | 6.39 | | | | 6.17 | | | | (2.79 | ) | | | 23.35 | | | | 32.85 | |
Year Ended June 30, 2013 | | | 17.17 | | | | (0.12 | )(f)(h) | | | 3.91 | | | | 3.79 | | | | (0.99 | ) | | | 19.97 | | | | 23.03 | |
Year Ended June 30, 2012 | | | 20.88 | | | | (0.13 | )(f)(i) | | | (1.57 | ) | | | (1.70 | ) | | | (2.01 | ) | | | 17.17 | | | | (7.06 | ) |
Year Ended June 30, 2011 | | | 14.73 | | | | (0.18 | )(f) | | | 6.33 | | | | 6.15 | | | | — | | | | 20.88 | | | | 41.75 | |
Year Ended June 30, 2010 | | | 12.39 | | | | (0.16 | )(f) | | | 2.50 | | | | 2.34 | | | | — | | | | 14.73 | | | | 18.89 | |
| | | | | | | |
Class R2 | | | | | | | | | | | | | | | | | | | | | | | | | | | | |
Six Months Ended December 31, 2014 (Unaudited) | | | 29.54 | | | | (0.13 | )(f) | | | 0.59 | | | | 0.46 | | | | (2.79 | ) | | | 27.21 | | | | 1.88 | |
Year Ended June 30, 2014 | | | 24.56 | | | | (0.20 | )(f)(g) | | | 7.97 | | | | 7.77 | | | | (2.79 | ) | | | 29.54 | | | | 33.25 | |
Year Ended June 30, 2013 | | | 20.83 | | | | (0.07 | )(f)(h) | | | 4.79 | | | | 4.72 | | | | (0.99 | ) | | | 24.56 | | | | 23.46 | |
Year Ended June 30, 2012 | | | 24.73 | | | | (0.07 | )(f)(i) | | | (1.82 | ) | | | (1.89 | ) | | | (2.01 | ) | | | 20.83 | | | | (6.72 | ) |
Year Ended June 30, 2011 | | | 17.38 | | | | (0.13 | )(f) | | | 7.48 | | | | 7.35 | | | | — | | | | 24.73 | | | | 42.29 | |
Year Ended June 30, 2010 | | | 14.56 | | | | (0.12 | )(f) | | | 2.94 | | | | 2.82 | | | | — | | | | 17.38 | | | | 19.37 | |
| (a) | Annualized for periods less than one year, unless otherwise noted. |
| (b) | Not annualized for periods less than one year. |
| (c) | Includes adjustments in accordance with accounting principles generally accepted in the United States of America and as such, the net asset values for financial reporting purposes and the returns based upon those net asset values may differ from the net asset values and returns for shareholder transactions. |
| (d) | Includes earnings credits and interest expense, if applicable, each of which is less than 0.01% unless otherwise noted. |
| (e) | Portfolio turnover is calculated by dividing the lesser of total purchases or sales of portfolio securities for the reporting period by the monthly average value of portfolio securities owned during the reporting period. Excluded from both the numerator and denominator are amounts relating to derivatives and securities whose maturities or expiration dates at the time of acquisition were one year or less. |
| (f) | Calculated based upon average shares outstanding. |
| (g) | Reflects special dividends paid out during the period by several of the Fund’s holdings. Had the Fund not received the special dividends, the net investment income (loss) per share would have been $(0.14), $(0.19), $(0.23), $(0.20), $(0.02), $(0.01) and $(0.06) for Class A, Class B, Class C, Class R2, Class R5, Class R6 and Select Class Shares, respectively, and the net investment income (loss) ratio would have been (0.53)%, (1.00)%, (1.03)%, (0.73)%, (0.08)%, (0.03)% and (0.22)% for Class A, Class B, Class C, Class R2, Class R5, Class R6 and Select Class Shares, respectively. |
| (h) | Reflects special dividends paid out during the period by several of the Fund’s holdings. Had the Fund not received the special dividends, the net investment income (loss) per share would have been $(0.09), $(0.15), $(0.17), $(0.13), $0.01, $0.02 and $(0.02) for Class A, Class B, Class C, Class R2, Class R5, Class R6 and Select Class Shares, respectively, and the net investment income (loss) ratio would have been (0.42)%, (0.94)%, (0.92)%, (0.57)%, 0.04%, 0.09% and (0.10)% for Class A, Class B, Class C, Class R2, Class R5, Class R6 and Select Class Shares, respectively. |
| (i) | Reflects a special dividend paid out during the period by one of the Fund’s holdings. Had the Fund not received the special dividend, the net investment income (loss) per share would have been $(0.09), $(0.15), $(0.17), $(0.12), less than $0.01, $0.03 and $(0.03) for Class A, Class B, Class C, Class R2, Class R5, Class R6 and Select Class Shares, respectively, and the net investment income (loss) ratio would have been (0.46)%, (0.99)%, (0.97)%, (0.57)%, (0.03)%, 0.24% and (0.14)% for Class A, Class B, Class C, Class R2, Class R5, Class R6 and Select Class Shares, respectively. |
| (j) | Commencement of offering of class of shares. |
SEE NOTES TO FINANCIAL STATEMENTS.
| | | | | | |
| | | |
| 60 | | | | J.P. MORGAN MID CAP/MULTI-CAP FUNDS | | DECEMBER 31, 2014 |
| | | | | | | | | | | | | | | | | | |
| | | Ratios/Supplemental data | |
| | | | Ratios to average net assets (a) | | | | |
Net assets,
end of
period
(000’s) | | | Net
expenses (d) | | | Net
investment income
(loss) | | | Expenses without
waivers,
reimbursements and
earnings credits | | | Portfolio
turnover
rate (b)(e) | |
| | | | | | | | | | | | | | | | | | |
| | | | | | | | | | | | | | | | | | |
| $ | 844,077 | | | | 1.24 | % | | | (0.69 | )% | | | 1.36 | % | | | 26 | % |
| | 765,310 | | | | 1.24 | | | | (0.51 | )(g) | | | 1.37 | | | | 69 | |
| | 586,787 | | | | 1.23 | | | | (0.17 | )(h) | | | 1.45 | | | | 70 | |
| | 538,323 | | | | 1.24 | | | | (0.23 | )(i) | | | 1.38 | | | | 70 | |
| | 696,334 | | | | 1.24 | | | | (0.44 | ) | | | 1.36 | | | | 79 | |
| | 560,054 | | | | 1.24 | | | | (0.53 | ) | | | 1.42 | | | | 82 | |
| | | | |
| | | | | | | | | | | | | | | | | | |
| | 4,247 | | | | 1.74 | | | | (1.19 | ) | | | 1.88 | | | | 26 | |
| | 5,243 | | | | 1.72 | | | | (0.98 | )(g) | | | 1.87 | | | | 69 | |
| | 6,923 | | | | 1.73 | | | | (0.69 | )(h) | | | 1.94 | | | | 70 | |
| | 9,948 | | | | 1.75 | | | | (0.77 | )(i) | | | 1.88 | | | | 70 | |
| | 18,648 | | | | 1.77 | | | | (0.97 | ) | | | 1.86 | | | | 79 | |
| | 20,893 | | | | 1.77 | | | | (1.07 | ) | | | 1.92 | | | | 82 | |
| | | | |
| | | | | | | | | | | | | | | | | | |
| | 53,753 | | | | 1.74 | | | | (1.19 | ) | | | 1.87 | | | | 26 | |
| | 41,047 | | | | 1.73 | | | | (1.01 | )(g) | | | 1.86 | | | | 69 | |
| | 23,745 | | | | 1.73 | | | | (0.67 | )(h) | | | 1.95 | | | | 70 | |
| | 22,190 | | | | 1.75 | | | | (0.75 | )(i) | | | 1.88 | | | | 70 | |
| | 29,187 | | | | 1.77 | | | | (0.97 | ) | | | 1.86 | | | | 79 | |
| | 23,389 | | | | 1.77 | | | | (1.06 | ) | | | 1.92 | | | | 82 | |
| | | | |
| | | | | | | | | | | | | | | | | | |
| | 4,059 | | | | 1.40 | | | | (0.87 | ) | | | 1.64 | | | | 26 | |
| | 1,852 | | | | 1.40 | | | | (0.71 | )(g) | | | 1.59 | | | | 69 | |
| | 320 | | | | 1.39 | | | | (0.32 | )(h) | | | 1.71 | | | | 70 | |
| | 230 | | | | 1.40 | | | | (0.35 | )(i) | | | 1.63 | | | | 70 | |
| | 121 | | | | 1.40 | | | | (0.59 | ) | | | 1.60 | | | | 79 | |
| | 63 | | | | 1.40 | | | | (0.69 | ) | | | 1.67 | | | | 82 | |
SEE NOTES TO FINANCIAL STATEMENTS.
| | | | | | | | |
| | | |
| DECEMBER 31, 2014 | | J.P. MORGAN MID CAP/MULTI-CAP FUNDS | | | | | 61 | |
FINANCIAL HIGHLIGHTS
FOR THE PERIODS INDICATED (continued)
| | | | | | | | | | | | | | | | | | | | | | | | | | | | |
| | | Per share operating performance | |
| | | | | | Investment operations | | | Distributions | |
| | | Net asset
value,
beginning
of period | | | Net
investment
income
(loss) | | | Net realized
and unrealized
gains
(losses) on
investments | | | Total from
investment
operations | | | Net
realized
gain | | | Net asset
value, end
of period | | | Total return
(excludes
sales
charge) (b)(c) | |
Mid Cap Growth Fund (continued) | | | | | | | | | | | | | | | | | | | | | | | | | | | | |
Class R5 | | | | | | | | | | | | | | | | | | | | | | | | | | | | |
Six Months Ended December 31, 2014 (Unaudited) | | $ | 30.52 | | | $ | (0.04 | )(f) | | $ | 0.61 | | | $ | 0.57 | | | $ | (2.79 | ) | | $ | 28.30 | | | | 2.18 | % |
Year Ended June 30, 2014 | | | 25.15 | | | | (0.02 | )(f)(g) | | | 8.18 | | | | 8.16 | | | | (2.79 | ) | | | 30.52 | | | | 34.06 | |
Year Ended June 30, 2013 | | | 21.18 | | | | 0.06 | (f)(h) | | | 4.90 | | | | 4.96 | | | | (0.99 | ) | | | 25.15 | | | | 24.22 | |
November 1, 2011(j) through June 30, 2012 | | | 21.75 | | | | 0.04 | (f)(i) | | | 1.40 | | | | 1.44 | | | | (2.01 | ) | | | 21.18 | | | | 7.71 | |
| | | | | | | |
Class R6 | | | | | | | | | | | | | | | | | | | | | | | | | | | | |
Six Months Ended December 31, 2014 (Unaudited) | | | 30.57 | | | | (0.03 | )(f) | | | 0.61 | | | | 0.58 | | | | (2.79 | ) | | | 28.36 | | | | 2.21 | |
Year Ended June 30, 2014 | | | 25.17 | | | | — | (f)(g)(k) | | | 8.19 | | | | 8.19 | | | | (2.79 | ) | | | 30.57 | | | | 34.16 | |
Year Ended June 30, 2013 | | | 21.19 | | | | 0.08 | (f)(h) | | | 4.89 | | | | 4.97 | | | | (0.99 | ) | | | 25.17 | | | | 24.26 | |
November 1, 2011(j) through June 30, 2012 | | | 21.75 | | | | 0.08 | (f)(i) | | | 1.37 | | | | 1.45 | | | | (2.01 | ) | | | 21.19 | | | | 7.76 | |
| | | | | | | |
Select Class | | | | | | | | | | | | | | | | | | | | | | | | | | | | |
Six Months Ended December 31, 2014 (Unaudited) | | | 30.39 | | | | (0.06 | )(f) | | | 0.60 | | | | 0.54 | | | | (2.79 | ) | | | 28.14 | | | | 2.09 | |
Year Ended June 30, 2014 | | | 25.08 | | | | (0.06 | )(f)(g) | | | 8.16 | | | | 8.10 | | | | (2.79 | ) | | | 30.39 | | | | 33.91 | |
Year Ended June 30, 2013 | | | 21.15 | | | | 0.03 | (f)(h) | | | 4.89 | | | | 4.92 | | | | (0.99 | ) | | | 25.08 | | | | 24.06 | |
Year Ended June 30, 2012 | | | 24.97 | | | | 0.02 | (f)(i) | | | (1.83 | ) | | | (1.81 | ) | | | (2.01 | ) | | | 21.15 | | | | (6.31 | ) |
Year Ended June 30, 2011 | | | 17.47 | | | | (0.03 | )(f) | | | 7.53 | | | | 7.50 | | | | — | | | | 24.97 | | | | 42.93 | |
Year Ended June 30, 2010 | | | 14.57 | | | | (0.04 | )(f) | | | 2.94 | | | | 2.90 | | | | — | | | | 17.47 | | | | 19.90 | |
| (a) | Annualized for periods less than one year, unless otherwise noted. |
| (b) | Not annualized for periods less than one year. |
| (c) | Includes adjustments in accordance with accounting principles generally accepted in the United States of America and as such, the net asset values for financial reporting purposes and the returns based upon those net asset values may differ from the net asset values and returns for shareholder transactions. |
| (d) | Includes earnings credits and interest expense, if applicable, each of which is less than 0.01% unless otherwise noted. |
| (e) | Portfolio turnover is calculated by dividing the lesser of total purchases or sales of portfolio securities for the reporting period by the monthly average value of portfolio securities owned during the reporting period. Excluded from both the numerator and denominator are amounts relating to derivatives and securities whose maturities or expiration dates at the time of acquisition were one year or less. |
| (f) | Calculated based upon average shares outstanding. |
| (g) | Reflects special dividends paid out during the period by several of the Fund’s holdings. Had the Fund not received the special dividends, the net investment income (loss) per share would have been $(0.14), $(0.19), $(0.23), $(0.20), $(0.02), $(0.01) and $(0.06) for Class A, Class B, Class C, Class R2, Class R5, Class R6 and Select Class Shares, respectively, and the net investment income (loss) ratio would have been (0.53)%, (1.00)%, (1.03)%, (0.73)%, (0.08)%, (0.03)% and (0.22)% for Class A, Class B, Class C, Class R2, Class R5, Class R6 and Select Class Shares, respectively. |
| (h) | Reflects special dividends paid out during the period by several of the Fund’s holdings. Had the Fund not received the special dividends, the net investment income (loss) per share would have been $(0.09), $(0.15), $(0.17), $(0.13), $0.01, $0.02 and $(0.02) for Class A, Class B, Class C, Class R2, Class R5, Class R6 and Select Class Shares, respectively, and the net investment income (loss) ratio would have been (0.42)%, (0.94)%, (0.92)%, (0.57)%, 0.04%, 0.09% and (0.10)% for Class A, Class B, Class C, Class R2, Class R5, Class R6 and Select Class Shares, respectively. |
| (i) | Reflects a special dividend paid out during the period by one of the Fund’s holdings. Had the Fund not received the special dividend, the net investment income (loss) per share would have been $(0.09), $(0.15), $(0.17), $(0.12), less than $0.01, $0.03 and $(0.03) for Class A, Class B, Class C, Class R2, Class R5, Class R6 and Select Class Shares, respectively, and the net investment income (loss) ratio would have been (0.46)%, (0.99)%, (0.97)%, (0.57)%, (0.03)%, 0.24% and (0.14)% for Class A, Class B, Class C, Class R2, Class R5, Class R6 and Select Class Shares, respectively. |
| (j) | Commencement of offering of class of shares. |
| (k) | Amount rounds to less than $0.01. |
SEE NOTES TO FINANCIAL STATEMENTS.
| | | | | | |
| | | |
| 62 | | | | J.P. MORGAN MID CAP/MULTI-CAP FUNDS | | DECEMBER 31, 2014 |
| | | | | | | | | | | | | | | | | | |
| | | Ratios/Supplemental data | |
| | | | Ratios to average net assets (a) | | | | |
Net assets,
end of
period
(000’s) | | | Net
expenses (d) | | | Net
investment income
(loss) | | | Expenses without
waivers,
reimbursements and
earnings credits | | | Portfolio
turnover
rate (b)(e) | |
| | | | | | | | | | | | | | | | | | |
| | | | | | | | | | | | | | | | | | |
| $ | 44,142 | | | | 0.79 | % | | | (0.25 | )% | | | 0.92 | % | | | 26 | % |
| | 27,454 | | | | 0.79 | | | | (0.06 | )(g) | | | 0.92 | | | | 69 | |
| | 17,848 | | | | 0.79 | | | | 0.28 | (h) | | | 1.00 | | | | 70 | |
| | 14,837 | | | | 0.78 | | | | 0.31 | (i) | | | 0.92 | | | | 70 | |
| | | | |
| | | | | | | | | | | | | | | | | | |
| | 92,712 | | | | 0.74 | | | | (0.19 | ) | | | 0.84 | | | | 26 | |
| | 86,150 | | | | 0.74 | | | | (0.01 | )(g) | | | 0.86 | | | | 69 | |
| | 47,434 | | | | 0.74 | | | | 0.34 | (h) | | | 0.98 | | | | 70 | |
| | 13,982 | | | | 0.73 | | | | 0.58 | (i) | | | 0.87 | | | | 70 | |
| | | | |
| | | | | | | | | | | | | | | | | | |
| | 1,326,856 | | | | 0.93 | | | | (0.38 | ) | | | 1.13 | | | | 26 | |
| | 1,254,748 | | | | 0.93 | | | | (0.20 | )(g) | | | 1.12 | | | | 69 | |
| | 894,740 | | | | 0.93 | | | | 0.14 | (h) | | | 1.20 | | | | 70 | |
| | 827,306 | | | | 0.93 | | | | 0.09 | (i) | | | 1.13 | | | | 70 | |
| | 1,031,463 | | | | 0.93 | | | | (0.13 | ) | | | 1.10 | | | | 79 | |
| | 685,843 | | | | 0.93 | | | | (0.22 | ) | | | 1.17 | | | | 82 | |
SEE NOTES TO FINANCIAL STATEMENTS.
| | | | | | | | |
| | | |
| DECEMBER 31, 2014 | | J.P. MORGAN MID CAP/MULTI-CAP FUNDS | | | | | 63 | |
FINANCIAL HIGHLIGHTS
FOR THE PERIODS INDICATED (continued)
| | | | | | | | | | | | | | | | | | | | | | | | | | | | |
| | | Per share operating performance | |
| | | | | | Investment operations | | | Distributions | |
| | | Net asset
value,
beginning
of period | | | Net
investment
income
(loss) | | | Net realized
and unrealized
gains
(losses) on
investments | | | Total from
investment
operations | | | Net
investment
income | | | Net
realized
gain | | | Total
distributions | |
Mid Cap Value Fund | | | | | | | | | | | | | | | | | | | | | | | | | | | | |
Class A | | | | | | | | | | | | | | | | | | | | | | | | | | | | |
Six Months Ended December 31, 2014 (Unaudited) | | $ | 37.25 | | | $ | 0.16 | (f)(g) | | $ | 2.05 | | | $ | 2.21 | | | $ | (0.20 | ) | | $ | (2.79 | ) | | $ | (2.99 | ) |
Year Ended June 30, 2014 | | | 31.68 | | | | 0.15 | (f)(h) | | | 7.02 | | | | 7.17 | | | | (0.15 | ) | | | (1.45 | ) | | | (1.60 | ) |
Year Ended June 30, 2013 | | | 25.80 | | | | 0.19 | (f)(i) | | | 6.20 | | | | 6.39 | | | | (0.29 | ) | | | (0.22 | ) | | | (0.51 | ) |
Year Ended June 30, 2012 | | | 24.76 | | | | 0.20 | (f) | | | 1.00 | | | | 1.20 | | | | (0.16 | ) | | | — | | | | (0.16 | ) |
Year Ended June 30, 2011 | | | 18.91 | | | | 0.18 | (f) | | | 5.85 | | | | 6.03 | | | | (0.18 | ) | | | — | | | | (0.18 | ) |
Year Ended June 30, 2010 | | | 15.24 | | | | 0.19 | (f) | | | 3.48 | | | | 3.67 | | | | — | | | | — | | | | — | |
| | | | | | | |
Class B | | | | | | | | | | | | | | | | | | | | | | | | | | | | |
Six Months Ended December 31, 2014 (Unaudited) | | | 36.46 | | | | 0.06 | (f)(g) | | | 2.00 | | | | 2.06 | | | | — | | | | (2.79 | ) | | | (2.79 | ) |
Year Ended June 30, 2014 | | | 31.05 | | | | (0.03 | )(f)(h) | | | 6.89 | | | | 6.86 | | | | — | | | | (1.45 | ) | | | (1.45 | ) |
Year Ended June 30, 2013 | | | 25.16 | | | | 0.03 | (f)(i) | | | 6.08 | | | | 6.11 | | | | — | | | | (0.22 | ) | | | (0.22 | ) |
Year Ended June 30, 2012 | | | 24.10 | | | | 0.07 | (f) | | | 0.99 | | | | 1.06 | | | | — | | | | — | | | | — | |
Year Ended June 30, 2011 | | | 18.38 | | | | 0.07 | (f) | | | 5.69 | | | | 5.76 | | | | (0.04 | ) | | | — | | | | (0.04 | ) |
Year Ended June 30, 2010 | | | 14.89 | | | | 0.10 | (f) | | | 3.39 | | | | 3.49 | | | | — | | | | — | | | | — | |
| | | | | | | |
Class C | | | | | | | | | | | | | | | | | | | | | | | | | | | | |
Six Months Ended December 31, 2014 (Unaudited) | | | 36.19 | | | | 0.07 | (f)(g) | | | 1.98 | | | | 2.05 | | | | (0.06 | ) | | | (2.79 | ) | | | (2.85 | ) |
Year Ended June 30, 2014 | | | 30.84 | | | | (0.03 | )(f)(h) | | | 6.83 | | | | 6.80 | | | | — | (j) | | | (1.45 | ) | | | (1.45 | ) |
Year Ended June 30, 2013 | | | 25.14 | | | | 0.05 | (f)(i) | | | 6.03 | | | | 6.08 | | | | (0.16 | ) | | | (0.22 | ) | | | (0.38 | ) |
Year Ended June 30, 2012 | | | 24.13 | | | | 0.07 | (f) | | | 0.98 | | | | 1.05 | | | | (0.04 | ) | | | — | | | | (0.04 | ) |
Year Ended June 30, 2011 | | | 18.44 | | | | 0.07 | (f) | | | 5.69 | | | | 5.76 | | | | (0.07 | ) | | | — | | | | (0.07 | ) |
Year Ended June 30, 2010 | | | 14.94 | | | | 0.10 | (f) | | | 3.40 | | | | 3.50 | | | | — | | | | — | | | | — | |
| | | | | | | |
Class R2 | | | | | | | | | | | | | | | | | | | | | | | | | | | | |
Six Months Ended December 31, 2014 (Unaudited) | | | 36.14 | | | | 0.12 | (f)(g) | | | 1.97 | | | | 2.09 | | | | (0.15 | ) | | | (2.79 | ) | | | (2.94 | ) |
Year Ended June 30, 2014 | | | 30.81 | | | | 0.06 | (f)(h) | | | 6.82 | | | | 6.88 | | | | (0.10 | ) | | | (1.45 | ) | | | (1.55 | ) |
Year Ended June 30, 2013 | | | 25.18 | | | | 0.12 | (f)(i) | | | 6.03 | | | | 6.15 | | | | (0.30 | ) | | | (0.22 | ) | | | (0.52 | ) |
Year Ended June 30, 2012 | | | 24.27 | | | | 0.14 | (f) | | | 0.97 | | | | 1.11 | | | | (0.20 | ) | | | — | | | | (0.20 | ) |
Year Ended June 30, 2011 | | | 18.63 | | | | 0.12 | (f) | | | 5.76 | | | | 5.88 | | | | (0.24 | ) | | | — | | | | (0.24 | ) |
Year Ended June 30, 2010 | | | 15.06 | | | | 0.15 | (f) | | | 3.42 | | | | 3.57 | | | | — | | | | — | | | | — | |
| (a) | Annualized for periods less than one year, unless otherwise noted. |
| (b) | Not annualized for periods less than one year. |
| (c) | Includes adjustments in accordance with accounting principles generally accepted in the United States of America and as such, the net asset values for financial reporting purposes and the returns based upon those net asset values may differ from the net asset values and returns for shareholder transactions. |
| (d) | Includes earnings credits and interest expense, if applicable, each of which is less than 0.01% unless otherwise noted. |
| (e) | Portfolio turnover is calculated by dividing the lesser of total purchases or sales of portfolio securities for the reporting period by the monthly average value of portfolio securities owned during the reporting period. Excluded from both the numerator and denominator are amounts relating to derivatives and securities whose maturities or expiration dates at the time of acquisition were one year or less. |
| (f) | Calculated based upon average shares outstanding. |
| (g) | Reflects special dividends paid out during the period by several of the Fund’s holdings. Had the Fund not received the special dividends, the net investment income (loss) per share would have been $0.07, $(0.03), $(0.02), $0.03, $0.18 and $0.10 for Class A, Class B, Class C, Class R2, Institutional Class and Select Class Shares, respectively, and the net investment income (loss) ratio would have been 0.34%, (0.14)%, (0.12)%, 0.15%, 0.94% and 0.53% for Class A, Class B, Class C, Class R2, Institutional Class and Select Class Shares, respectively. |
| (h) | Reflects special dividends paid out during the period by several of the Fund’s holdings. Had the Fund not received the special dividends, the net investment income (loss) per share would have been $0.14, $(0.03), $(0.03), $0.05, $0.32 and $0.23 for Class A, Class B, Class C, Class R2, Institutional Class and Select Class Shares, respectively, and the net investment income (loss) ratio would have been 0.41%, (0.10)%, (0.10)%, 0.16%, 0.90% and 0.66% for Class A, Class B, Class C, Class R2, Institutional Class and Select Class Shares, respectively. |
| (i) | Reflects special dividends paid out during the period by several of the Fund’s holdings. Had the Fund not received the special dividends, the net investment income (loss) per share would have been $0.16, $0.00, $0.01, $0.09, $0.31 and $0.23 for Class A, Class B, Class C, Class R2, Institutional Class and Select Class Shares, respectively, and the net investment income (loss) ratio would have been 0.55%, 0.00%, 0.04%, 0.31%, 1.04% and 0.80% for Class A, Class B, Class C, Class R2, Institutional Class and Select Class Shares, respectively. |
| (j) | Amount rounds to less than $0.01. |
SEE NOTES TO FINANCIAL STATEMENTS.
| | | | | | |
| | | |
| 64 | | | | J.P. MORGAN MID CAP/MULTI-CAP FUNDS | | DECEMBER 31, 2014 |
| | | | | | | | | | | | | | | | | | | | | | | | | | |
| | | Ratios/Supplemental data | |
| | | | | | | | | | Ratios to average net assets (a) | | | | |
Net asset
value,
end of
period | | | Total return
(excludes
sales charge) (b)(c) | | | Net assets,
end of
period
(000’s) | | | Net
expenses (d) | | | Net
investment income
(loss) | | | Expenses
without waivers,
reimbursements
and earnings
credits | | | Portfolio
turnover
rate (b)(e) | |
| | | | | | | | | | | | | | | | | | | | | | | | | | |
| | | | | | | | | | | | | | | | | | | | | | | | | | |
| $ | 36.47 | | | | 6.20 | % | | $ | 2,700,548 | | | | 1.23 | % | | | 0.84 | %(g) | | | 1.39 | % | | | 10 | % |
| | 37.25 | | | | 23.25 | | | | 3,404,974 | | | | 1.23 | | | | 0.42 | (h) | | | 1.37 | | | | 25 | |
| | 31.68 | | | | 25.06 | | | | 3,157,503 | | | | 1.23 | | | | 0.67 | (i) | | | 1.38 | | | | 23 | |
| | 25.80 | | | | 4.92 | | | | 1,986,930 | | | | 1.24 | | | | 0.83 | | | | 1.41 | | | | 30 | |
| | 24.76 | | | | 31.96 | | | | 1,979,270 | | | | 1.23 | | | | 0.81 | | | | 1.39 | | | | 41 | |
| | 18.91 | | | | 24.08 | | | | 1,705,572 | | | | 1.23 | | | | 1.04 | | | | 1.40 | | | | 34 | |
| | | | | | |
| | | | | | | | | | | | | | | | | | | | | | | | | | |
| | 35.73 | | | | 5.91 | | | | 8,990 | | | | 1.74 | | | | 0.35 | (g) | | | 1.87 | | | | 10 | |
| | 36.46 | | | | 22.67 | | | | 10,619 | | | | 1.72 | | | | (0.08 | )(h) | | | 1.87 | | | | 25 | |
| | 31.05 | | | | 24.42 | | | | 15,382 | | | | 1.74 | | | | 0.13 | (i) | | | 1.88 | | | | 23 | |
| | 25.16 | | | | 4.40 | | | | 57,100 | | | | 1.75 | | | | 0.30 | | | | 1.91 | | | | 30 | |
| | 24.10 | | | | 31.33 | | | | 90,427 | | | | 1.74 | | | | 0.30 | | | | 1.89 | | | | 41 | |
| | 18.38 | | | | 23.44 | | | | 96,966 | | | | 1.74 | | | | 0.53 | | | | 1.90 | | | | 34 | |
| | | | | | |
| | | | | | | | | | | | | | | | | | | | | | | | | | |
| | 35.39 | | | | 5.92 | | | | 613,455 | | | | 1.74 | | | | 0.38 | (g) | | | 1.90 | | | | 10 | |
| | 36.19 | | | | 22.63 | | | | 608,283 | | | | 1.74 | | | | (0.09 | )(h) | | | 1.87 | | | | 25 | |
| | 30.84 | | | | 24.43 | | | | 534,813 | | | | 1.74 | | | | 0.16 | (i) | | | 1.88 | | | | 23 | |
| | 25.14 | | | | 4.38 | | | | 370,781 | | | | 1.75 | | | | 0.32 | | | | 1.91 | | | | 30 | |
| | 24.13 | | | | 31.29 | | | | 373,415 | | | | 1.74 | | | | 0.30 | | | | 1.89 | | | | 41 | |
| | 18.44 | | | | 23.43 | | | | 309,513 | | | | 1.74 | | | | 0.53 | | | | 1.90 | | | | 34 | |
| | | | | | |
| | | | | | | | | | | | | | | | | | | | | | | | | | |
| | 35.29 | | | | 6.06 | | | | 75,043 | | | | 1.49 | | | | 0.65 | (g) | | | 1.66 | | | | 10 | |
| | 36.14 | | | | 22.94 | | | | 71,958 | | | | 1.49 | | | | 0.17 | (h) | | | 1.62 | | | | 25 | |
| | 30.81 | | | | 24.71 | | | | 57,003 | | | | 1.49 | | | | 0.43 | (i) | | | 1.63 | | | | 23 | |
| | 25.18 | | | | 4.65 | | | | 14,824 | | | | 1.49 | | | | 0.59 | | | | 1.66 | | | | 30 | |
| | 24.27 | | | | 31.66 | | | | 6,500 | | | | 1.49 | | | | 0.50 | | | | 1.65 | | | | 41 | |
| | 18.63 | | | | 23.71 | | | | 1,441 | | | | 1.49 | | | | 0.77 | | | | 1.65 | | | | 34 | |
SEE NOTES TO FINANCIAL STATEMENTS.
| | | | | | | | |
| | | |
| DECEMBER 31, 2014 | | J.P. MORGAN MID CAP/MULTI-CAP FUNDS | | | | | 65 | |
FINANCIAL HIGHLIGHTS
FOR THE PERIODS INDICATED (continued)
| | | | | | | | | | | | | | | | | | | | | | | | | | | | |
| | | Per share operating performance | |
| | | | | | Investment operations | | | Distributions | |
| | | Net asset
value,
beginning
of period | | | Net
investment
income
(loss) | | | Net realized
and unrealized
gains
(losses) on
investments | | | Total from
investment
operations | | | Net
investment
income | | | Net
realized
gain | | | Total
distributions | |
Mid Cap Value Fund (continued) | | | | | | | | | | | | | | | | | | | | | | | | | | | | |
Institutional Class | | | | | | | | | | | | | | | | | | | | | | | | | | | | |
Six Months Ended December 31, 2014 (Unaudited) | | $ | 37.99 | | | $ | 0.28 | (f)(g) | | $ | 2.07 | | | $ | 2.35 | | | $ | (0.40 | ) | | $ | (2.79 | ) | | $ | (3.19 | ) |
Year Ended June 30, 2014 | | | 32.26 | | | | 0.32 | (f)(h) | | | 7.17 | | | | 7.49 | | | | (0.31 | ) | | | (1.45 | ) | | | (1.76 | ) |
Year Ended June 30, 2013 | | | 26.24 | | | | 0.34 | (f)(i) | | | 6.31 | | | | 6.65 | | | | (0.41 | ) | | | (0.22 | ) | | | (0.63 | ) |
Year Ended June 30, 2012 | | | 25.19 | | | | 0.32 | (f) | | | 1.01 | | | | 1.33 | | | | (0.28 | ) | | | — | | | | (0.28 | ) |
Year Ended June 30, 2011 | | | 19.22 | | | | 0.30 | (f)�� | | | 5.95 | | | | 6.25 | | | | (0.28 | ) | | | — | | | | (0.28 | ) |
Year Ended June 30, 2010 | | | 15.43 | | | | 0.29 | (f) | | | 3.52 | | | | 3.81 | | | | (0.02 | ) | | | — | | | | (0.02 | ) |
| | | | | | | |
Select Class | | | | | | | | | | | | | | | | | | | | | | | | | | | | |
Six Months Ended December 31, 2014 (Unaudited) | | | 37.61 | | | | 0.19 | (f)(g) | | | 2.08 | | | | 2.27 | | | | (0.29 | ) | | | (2.79 | ) | | | (3.08 | ) |
Year Ended June 30, 2014 | | | 31.95 | | | | 0.23 | (f)(h) | | | 7.10 | | | | 7.33 | | | | (0.22 | ) | | | (1.45 | ) | | | (1.67 | ) |
Year Ended June 30, 2013 | | | 26.01 | | | | 0.27 | (f)(i) | | | 6.24 | | | | 6.51 | | | | (0.35 | ) | | | (0.22 | ) | | | (0.57 | ) |
Year Ended June 30, 2012 | | | 24.97 | | | | 0.26 | (f) | | | 1.01 | | | | 1.27 | | | | (0.23 | ) | | | — | | | | (0.23 | ) |
Year Ended June 30, 2011 | | | 19.07 | | | | 0.24 | (f) | | | 5.90 | | | | 6.14 | | | | (0.24 | ) | | | — | | | | (0.24 | ) |
Year Ended June 30, 2010 | | | 15.34 | | | | 0.24 | (f) | | | 3.49 | | | | 3.73 | | | | — | (j) | | | — | | | | — | (j) |
| (a) | Annualized for periods less than one year, unless otherwise noted. |
| (b) | Not annualized for periods less than one year. |
| (c) | Includes adjustments in accordance with accounting principles generally accepted in the United States of America and as such, the net asset values for financial reporting purposes and the returns based upon those net asset values may differ from the net asset values and returns for shareholder transactions. |
| (d) | Includes earnings credits and interest expense, if applicable, each of which is less than 0.01% unless otherwise noted. |
| (e) | Portfolio turnover is calculated by dividing the lesser of total purchases or sales of portfolio securities for the reporting period by the monthly average value of portfolio securities owned during the reporting period. Excluded from both the numerator and denominator are amounts relating to derivatives and securities whose maturities or expiration dates at the time of acquisition were one year or less. |
| (f) | Calculated based upon average shares outstanding. |
| (g) | Reflects special dividends paid out during the period by several of the Fund’s holdings. Had the Fund not received the special dividends, the net investment income (loss) per share would have been $0.07, $(0.03), $(0.02), $0.03, $0.18 and $0.10 for Class A, Class B, Class C, Class R2, Institutional Class and Select Class Shares, respectively, and the net investment income (loss) ratio would have been 0.34%, (0.14)%, (0.12)%, 0.15%, 0.94% and 0.53% for Class A, Class B, Class C, Class R2, Institutional Class and Select Class Shares, respectively. |
| (h) | Reflects special dividends paid out during the period by several of the Fund’s holdings. Had the Fund not received the special dividends, the net investment income (loss) per share would have been $0.14, $(0.03), $(0.03), $0.05, $0.32 and $0.23 for Class A, Class B, Class C, Class R2, Institutional Class and Select Class Shares, respectively, and the net investment income (loss) ratio would have been 0.41%, (0.10)%, (0.10)%, 0.16%, 0.90% and 0.66% for Class A, Class B, Class C, Class R2, Institutional Class and Select Class Shares, respectively. |
| (i) | Reflects special dividends paid out during the period by several of the Fund’s holdings. Had the Fund not received the special dividends, the net investment income (loss) per share would have been $0.16, $0.00, $0.01, $0.09, $0.31 and $0.23 for Class A, Class B, Class C, Class R2, Institutional Class and Select Class Shares, respectively, and the net investment income (loss) ratio would have been 0.55%, 0.00%, 0.04%, 0.31%, 1.04% and 0.80% for Class A, Class B, Class C, Class R2, Institutional Class and Select Class Shares, respectively. |
| (j) | Amount rounds to less than $0.01. |
SEE NOTES TO FINANCIAL STATEMENTS.
| | | | | | |
| | | |
| 66 | | | | J.P. MORGAN MID CAP/MULTI-CAP FUNDS | | DECEMBER 31, 2014 |
| | | | | | | | | | | | | | | | | | | | | | | | | | |
| | | Ratios/Supplemental data | |
| | | | | | | | | | Ratios to average net assets (a) | | | | |
Net asset
value,
end of
period | | | Total return
(excludes
sales charge) (b)(c) | | | Net assets,
end of period
(000’s) | | | Net
expenses (d) | | | Net
investment income
(loss) | | | Expenses
without waivers,
reimbursements
and earnings
credits | | | Portfolio
turnover
rate (b)(e) | |
| | | | | | |
| | | | | | | | | | | | | | | | | | | | | | | | | | |
| $ | 37.15 | | | | 6.45 | % | | $ | 10,164,312 | | | | 0.74 | % | | | 1.46 | %(g) | | | 0.95 | % | | | 10 | % |
| | 37.99 | | | | 23.88 | | | | 8,581,992 | | | | 0.74 | | | | 0.92 | (h) | | | 0.97 | | | | 25 | |
| | 32.26 | | | | 25.68 | | | | 6,627,529 | | | | 0.74 | | | | 1.16 | (i) | | | 0.98 | | | | 23 | |
| | 26.24 | | | | 5.43 | | | | 3,543,900 | | | | 0.74 | | | | 1.33 | | | | 1.01 | | | | 30 | |
| | 25.19 | | | | 32.66 | | | | 2,812,296 | | | | 0.74 | | | | 1.29 | | | | 0.99 | | | | 41 | |
| | 19.22 | | | | 24.68 | | | | 1,913,930 | | | | 0.74 | | | | 1.52 | | | | 1.00 | | | | 34 | |
| | | | | | |
| | | | | | | | | | | | | | | | | | | | | | | | | | |
| | 36.80 | | | | 6.30 | | | | 2,430,736 | | | | 0.98 | | | | 1.00 | (g) | | | 1.11 | | | | 10 | |
| | 37.61 | | | | 23.59 | | | | 2,967,759 | | | | 0.98 | | | | 0.67 | (h) | | | 1.12 | | | | 25 | |
| | 31.95 | | | | 25.35 | | | | 2,870,752 | | | | 0.98 | | | | 0.92 | (i) | | | 1.13 | | | | 23 | |
| | 26.01 | | | | 5.20 | | | | 1,836,012 | | | | 0.98 | | | | 1.09 | | | | 1.16 | | | | 30 | |
| | 24.97 | | | | 32.29 | | | | 1,513,926 | | | | 0.98 | | | | 1.05 | | | | 1.14 | | | | 41 | |
| | 19.07 | | | | 24.35 | | | | 1,061,308 | | | | 0.98 | | | | 1.29 | | | | 1.15 | | | | 34 | |
SEE NOTES TO FINANCIAL STATEMENTS.
| | | | | | | | |
| | | |
| DECEMBER 31, 2014 | | J.P. MORGAN MID CAP/MULTI-CAP FUNDS | | | | | 67 | |
FINANCIAL HIGHLIGHTS
FOR THE PERIODS INDICATED (continued)
| | | | | | | | | | | | | | | | | | | | | | | | |
| | | Per share operating performance | |
| | | | | | Investment operations | | | | | | | |
| | |
Net asset
value,
beginning
of period | | | Net
investment
income
(loss) | | | Net realized
and unrealized
gains
(losses) on
investments | | | Total from
investment
operations | | | Net asset
value,
end of
period | | | Total return
(excludes
sales charge) (b)(c) | |
Multi-Cap Market Neutral Fund | | | | | | | | | | | | | | | | | | | | | | | | |
Class A | | | | | | | | | | | | | | | | | | | | | | | | |
Six Months Ended December 31, 2014 (Unaudited) | | $ | 9.91 | | | $ | (0.07 | )(g) | | $ | 0.23 | | | $ | 0.16 | | | $ | 10.07 | | | | 1.61 | % |
Year Ended June 30, 2014 | | | 9.79 | | | | (0.13 | )(g) | | | 0.25 | | | | 0.12 | | | | 9.91 | | | | 1.23 | |
Year Ended June 30, 2013 | | | 9.69 | | | | (0.11 | )(g)(h) | | | 0.21 | | | | 0.10 | | | | 9.79 | | | | 1.03 | |
Year Ended June 30, 2012 | | | 9.81 | | | | (0.14 | )(g) | | | 0.02 | | | | (0.12 | ) | | | 9.69 | | | | (1.22 | ) |
Year Ended June 30, 2011 | | | 9.71 | | | | (0.16 | )(g) | | | 0.26 | | | | 0.10 | | | | 9.81 | | | | 1.03 | |
Year Ended June 30, 2010 | | | 10.21 | | | | (0.17 | )(g) | | | (0.33 | ) | | | (0.50 | ) | | | 9.71 | | | | (4.90 | ) |
| | | | | | |
Class B | | | | | | | | | | | | | | | | | | | | | | | | |
Six Months Ended December 31, 2014 (Unaudited) | | | 9.39 | | | | (0.09 | )(g) | | | 0.22 | | | | 0.13 | | | | 9.52 | | | | 1.38 | |
Year Ended June 30, 2014 | | | 9.31 | | | | (0.17 | )(g) | | | 0.25 | | | | 0.08 | | | | 9.39 | | | | 0.86 | |
Year Ended June 30, 2013 | | | 9.29 | | | | (0.17 | )(g)(h) | | | 0.19 | | | | 0.02 | | | | 9.31 | | | | 0.22 | |
Year Ended June 30, 2012 | | | 9.47 | | | | (0.20 | )(g) | | | 0.02 | | | | (0.18 | ) | | | 9.29 | | | | (1.90 | ) |
Year Ended June 30, 2011 | | | 9.44 | | | | (0.23 | )(g) | | | 0.26 | | | | 0.03 | | | | 9.47 | | | | 0.32 | |
Year Ended June 30, 2010 | | | 10.01 | | | | (0.23 | )(g) | | | (0.34 | ) | | | (0.57 | ) | | | 9.44 | | | | (5.69 | ) |
| | | | | | |
Class C | | | | | | | | | | | | | | | | | | | | | | | | |
Six Months Ended December 31, 2014 (Unaudited) | | | 9.40 | | | | (0.09 | )(g) | | | 0.22 | | | | 0.13 | | | | 9.53 | | | | 1.38 | |
Year Ended June 30, 2014 | | | 9.33 | | | | (0.17 | )(g) | | | 0.24 | | | | 0.07 | | | | 9.40 | | | | 0.75 | |
Year Ended June 30, 2013 | | | 9.30 | | | | (0.17 | )(g)(h) | | | 0.20 | | | | 0.03 | | | | 9.33 | | | | 0.32 | |
Year Ended June 30, 2012 | | | 9.48 | | | | (0.20 | )(g) | | | 0.02 | | | | (0.18 | ) | | | 9.30 | | | | (1.90 | ) |
Year Ended June 30, 2011 | | | 9.46 | | | | (0.23 | )(g) | | | 0.25 | | | | 0.02 | | | | 9.48 | | | | 0.21 | |
Year Ended June 30, 2010 | | | 10.02 | | | | (0.23 | )(g) | | | (0.33 | ) | | | (0.56 | ) | | | 9.46 | | | | (5.59 | ) |
| | | | | | |
Select Class | | | | | | | | | | | | | | | | | | | | | | | | |
Six Months Ended December 31, 2014 (Unaudited) | | | 10.09 | | | | (0.06 | )(g) | | | 0.24 | | | | 0.18 | | | | 10.27 | | | | 1.78 | |
Year Ended June 30, 2014 | | | 9.94 | | | | (0.11 | )(g) | | | 0.26 | | | | 0.15 | | | | 10.09 | | | | 1.51 | |
Year Ended June 30, 2013 | | | 9.82 | | | | (0.09 | )(g)(h) | | | 0.21 | | | | 0.12 | | | | 9.94 | | | | 1.22 | |
Year Ended June 30, 2012 | | | 9.91 | | | | (0.12 | )(g) | | | 0.03 | | | | (0.09 | ) | | | 9.82 | | | | (0.91 | ) |
Year Ended June 30, 2011 | | | 9.79 | | | | (0.14 | )(g) | | | 0.26 | | | | 0.12 | | | | 9.91 | | | | 1.23 | |
Year Ended June 30, 2010 | | | 10.27 | | | | (0.14 | )(g) | | | (0.34 | ) | | | (0.48 | ) | | | 9.79 | | | | (4.67 | ) |
| (a) | Annualized for periods less than one year, unless otherwise noted. |
| (b) | Not annualized for periods less than one year. |
| (c) | Includes adjustments in accordance with accounting principles generally accepted in the United States of America and as such, the net asset values for financial reporting purposes and the returns based upon those net asset values may differ from the net asset values and returns for shareholder transactions. |
| (d) | Includes earnings credits and interest expense, if applicable, each of which is less than 0.01% or unless otherwise noted. |
| (e) | The net expenses and expenses without waivers, reimbursements and earnings credits (excluding dividend expense and interest expense for securities sold short) for Class A are 1.49% and 1.93% for the six months ended December 31, 2014, 1.49% and 1.91% for the year ended June 30, 2014, 1.48% and 1.88% for 2013, 1.48% and 1.94% for 2012, 1.49% and 1.95% for 2011 and 1.49% and 1.94% for 2010; for Class B are 1.99% and 2.46% for the six months ended December 31, 2014, 1.99% and 2.41% for the year ended June 30, 2014, 2.16% and 2.38% for 2013, 2.23% and 2.45% for 2012, 2.24% and 2.45% for 2011 and 2.24% and 2.44% for 2010; for Class C are 1.99% and 2.43% for the six months ended December 31, 2014, 1.99% and 2.40% for the year ended June 30, 2014, 2.15% and 2.38% for 2013, 2.23% and 2.44% for 2012, 2.24% and 2.45% for 2011 and 2.24% and 2.44% for 2010; for Select Class are 1.23% and 1.64% for the six months ended December 31, 2014, 1.23% and 1.65% for the year ended June 30, 2014, 1.23% and 1.63% for 2013, 1.23% and 1.69% for 2012, 1.24% and 1.70% for 2011 and 1.24% and 1.69% for 2010, respectively. |
| (f) | Portfolio turnover is calculated by dividing the lesser of total purchases or sales of portfolio securities for the reporting period by the monthly average value of portfolio securities owned during the reporting period. Excluded from both the numerator and denominator are amounts relating to derivatives and securities whose maturities or expiration dates at the time of acquisition were one year or less. |
| (g) | Calculated based upon average shares outstanding. |
| (h) | Reflects special dividends paid out during the period by several of the Fund’s holdings. Had the Fund not received the special dividends, the net investment income (loss) per share would have been $(0.13),$(0.19),$(0.19) and $(0.11) for Class A,Class B,Class C and Select Class Shares, respectively, and the net investment income (loss) ratio would have been (1.38)%,(2.07)%,(2.06)% and (1.16)% for Class A,Class B,Class C and Select Class Shares, respectively. |
SEE NOTES TO FINANCIAL STATEMENTS.
| | | | | | |
| | | |
| 68 | | | | J.P. MORGAN MID CAP/MULTI-CAP FUNDS | | DECEMBER 31, 2014 |
| | | | | | | | | | | | | | | | | | | | | | |
| | | Ratios/Supplemental data | |
| | | | Ratios to average net assets (a) | | | | | | | |
Net assets,
end of
period
(000’s) | | | Net expenses
(including
dividend and
interest
expense for
securities
sold short)(d)(e) | | | Net
investment income
(loss) | | | Expenses
without waivers,
reimbursements and
earnings credits
(including dividend
and interest expense
for securities sold
short) (e) | | | Portfolio
turnover
rate (b)(f) | | | Portfolio
turnover rate
(including short
sales) (b)(f) | |
| | | | | | | | | | | | | | | | | | | | | | |
| | | | | | | | | | | | | | | | | | | | | | |
| $ | 7,007 | | | | 2.74 | % | | | (1.35 | )% | | | 3.18 | % | | | 43 | % | | | 124 | % |
| | 10,301 | | | | 2.78 | | | | (1.36 | ) | | | 3.20 | | | | 106 | | | | 227 | |
| | 14,101 | | | | 3.04 | | | | (1.13 | )(h) | | | 3.44 | | | | 94 | | | | 251 | |
| | 19,759 | | | | 2.86 | | | | (1.42 | ) | | | 3.32 | | | | 151 | | | | 316 | |
| | 29,216 | | | | 2.92 | | | | (1.65 | ) | | | 3.38 | | | | 145 | | | | 339 | |
| | 94,549 | | | | 2.94 | | | | (1.65 | ) | | | 3.39 | | | | 146 | | | | 348 | |
| | | | | |
| | | | | | | | | | | | | | | | | | | | | | |
| | 156 | | | | 3.24 | | | | (1.83 | ) | | | 3.71 | | | | 43 | | | | 124 | |
| | 209 | | | | 3.28 | | | | (1.88 | ) | | | 3.70 | | | | 106 | | | | 227 | |
| | 530 | | | | 3.70 | | | | (1.82 | )(h) | | | 3.92 | | | | 94 | | | | 251 | |
| | 1,401 | | | | 3.61 | | | | (2.18 | ) | | | 3.83 | | | | 151 | | | | 316 | |
| | 3,484 | | | | 3.67 | | | | (2.47 | ) | | | 3.88 | | | | 145 | | | | 339 | |
| | 7,849 | | | | 3.69 | | | | (2.39 | ) | | | 3.89 | | | | 146 | | | | 348 | |
| | | | | |
| | | | | | | | | | | | | | | | | | | | | | |
| | 7,655 | | | | 3.23 | | | | (1.83 | ) | | | 3.69 | | | | 43 | | | | 124 | |
| | 8,602 | | | | 3.28 | | | | (1.85 | ) | | | 3.70 | | | | 106 | | | | 227 | |
| | 11,181 | | | | 3.69 | | | | (1.81 | )(h) | | | 3.92 | | | | 94 | | | | 251 | |
| | 15,677 | | | | 3.61 | | | | (2.17 | ) | | | 3.82 | | | | 151 | | | | 316 | |
| | 22,094 | | | | 3.67 | | | | (2.46 | ) | | | 3.88 | | | | 145 | | | | 339 | |
| | 39,610 | | | | 3.70 | | | | (2.39 | ) | | | 3.89 | | | | 146 | | | | 348 | |
| | | | | |
| | | | | | | | | | | | | | | | | | | | | | |
| | 306,190 | | | | 2.48 | | | | (1.10 | ) | | | 2.89 | | | | 43 | | | | 124 | |
| | 431,890 | | | | 2.52 | | | | (1.07 | ) | | | 2.94 | | | | 106 | | | | 227 | |
| | 317,974 | | | | 2.78 | | | | (0.90 | )(h) | | | 3.18 | | | | 94 | | | | 251 | |
| | 476,803 | | | | 2.61 | | | | (1.17 | ) | | | 3.07 | | | | 151 | | | | 316 | |
| | 491,653 | | | | 2.67 | | | | (1.39 | ) | | | 3.13 | | | | 145 | | | | 339 | |
| | 433,539 | | | | 2.70 | | | | (1.39 | ) | | | 3.15 | | | | 146 | | | | 348 | |
SEE NOTES TO FINANCIAL STATEMENTS.
| | | | | | | | |
| | | |
| DECEMBER 31, 2014 | | J.P. MORGAN MID CAP/MULTI-CAP FUNDS | | | | | 69 | |
FINANCIAL HIGHLIGHTS
FOR THE PERIODS INDICATED (continued)
| | | | | | | | | | | | | | | | | | | | | | | | | | | | |
| | | Per share operating performance | |
| | | | | | Investment operations | | | Distributions | |
| | | Net asset
value,
beginning
of period | | | Net
investment
income (loss) | | | Net realized
and unrealized
gains
(losses) on
investments | | | Total from
investment
operations | | | Net
investment
income | | | Net
realized
gain | | | Total
distributions | |
Value Advantage Fund | | | | | | | | | | | | | | | | | | | | | | | | | | | | |
Class A | | | | | | | | | | | | | | | | | | | | | | | | | | | | |
Six Months Ended December 31, 2014 (Unaudited) | | $ | 29.15 | | | $ | 0.12 | (f) | | $ | 1.37 | | | $ | 1.49 | | | $ | (0.26 | ) | | $ | (0.71 | ) | | $ | (0.97 | ) |
Year Ended June 30, 2014 | | | 24.64 | | | | 0.34 | (f) | | | 5.03 | | | | 5.37 | | | | (0.16 | ) | | | (0.70 | ) | | | (0.86 | ) |
Year Ended June 30, 2013 | | | 19.96 | | | | 0.22 | (f) | | | 4.75 | | | | 4.97 | | | | (0.20 | ) | | | (0.09 | ) | | | (0.29 | ) |
Year Ended June 30, 2012 | | | 19.07 | | | | 0.25 | (f) | | | 0.84 | | | | 1.09 | | | | (0.20 | ) | | | — | | | | (0.20 | ) |
Year Ended June 30, 2011 | | | 15.22 | | | | 0.23 | (f) | | | 3.79 | | | | 4.02 | | | | (0.17 | ) | | | — | | | | (0.17 | ) |
Year Ended June 30, 2010 | | | 12.01 | | | | 0.23 | (f) | | | 3.17 | | | | 3.40 | | | | (0.19 | ) | | | — | | | | (0.19 | ) |
| | | | | | | |
Class C | | | | | | | | | | | | | | | | | | | | | | | | | | | | |
Six Months Ended December 31, 2014 (Unaudited) | | | 29.08 | | | | 0.04 | (f) | | | 1.37 | | | | 1.41 | | | | (0.16 | ) | | | (0.71 | ) | | | (0.87 | ) |
Year Ended June 30, 2014 | | | 24.61 | | | | 0.20 | (f) | | | 5.02 | | | | 5.22 | | | | (0.05 | ) | | | (0.70 | ) | | | (0.75 | ) |
Year Ended June 30, 2013 | | | 19.91 | | | | 0.11 | (f) | | | 4.74 | | | | 4.85 | | | | (0.06 | ) | | | (0.09 | ) | | | (0.15 | ) |
Year Ended June 30, 2012 | | | 19.01 | | | | 0.16 | (f) | | | 0.84 | | | | 1.00 | | | | (0.10 | ) | | | — | | | | (0.10 | ) |
Year Ended June 30, 2011 | | | 15.17 | | | | 0.14 | (f) | | | 3.77 | | | | 3.91 | | | | (0.07 | ) | | | — | | | | (0.07 | ) |
Year Ended June 30, 2010 | | | 11.97 | | | | 0.15 | (f) | | | 3.17 | | | | 3.32 | | | | (0.12 | ) | | | — | | | | (0.12 | ) |
| | | | | | | |
Institutional Class | | | | | | | | | | | | | | | | | | | | | | | | | | | | |
Six Months Ended December 31, 2014 (Unaudited) | | | 29.31 | | | | 0.19 | (f) | | | 1.40 | | | | 1.59 | | | | (0.38 | ) | | | (0.71 | ) | | | (1.09 | ) |
Year Ended June 30, 2014 | | | 24.74 | | | | 0.48 | (f) | | | 5.04 | | | | 5.52 | | | | (0.25 | ) | | | (0.70 | ) | | | (0.95 | ) |
Year Ended June 30, 2013 | | | 19.99 | | | | 0.34 | (f) | | | 4.75 | | | | 5.09 | | | | (0.25 | ) | | | (0.09 | ) | | | (0.34 | ) |
Year Ended June 30, 2012 | | | 19.11 | | | | 0.35 | (f) | | | 0.83 | | | | 1.18 | | | | (0.30 | ) | | | — | | | | (0.30 | ) |
Year Ended June 30, 2011 | | | 15.24 | | | | 0.32 | (f) | | | 3.79 | | | | 4.11 | | | | (0.24 | ) | | | — | | | | (0.24 | ) |
Year Ended June 30, 2010 | | | 12.01 | | | | 0.31 | (f) | | | 3.18 | | | | 3.49 | | | | (0.26 | ) | | | — | | | | (0.26 | ) |
| | | | | | | |
Select Class | | | | | | | | | | | | | | | | | | | | | | | | | | | | |
Six Months Ended December 31, 2014 (Unaudited) | | | 29.27 | | | | 0.15 | (f) | | | 1.39 | | | | 1.54 | | | | (0.32 | ) | | | (0.71 | ) | | | (1.03 | ) |
Year Ended June 30, 2014 | | | 24.72 | | | | 0.42 | (f) | | | 5.03 | | | | 5.45 | | | | (0.20 | ) | | | (0.70 | ) | | | (0.90 | ) |
Year Ended June 30, 2013 | | | 20.00 | | | | 0.28 | (f) | | | 4.75 | | | | 5.03 | | | | (0.22 | ) | | | (0.09 | ) | | | (0.31 | ) |
Year Ended June 30, 2012 | | | 19.12 | | | | 0.30 | (f) | | | 0.83 | | | | 1.13 | | | | (0.25 | ) | | | — | | | | (0.25 | ) |
Year Ended June 30, 2011 | | | 15.27 | | | | 0.28 | (f) | | | 3.79 | | | | 4.07 | | | | (0.22 | ) | | | — | | | | (0.22 | ) |
Year Ended June 30, 2010 | | | 12.04 | | | | 0.27 | (f) | | | 3.19 | | | | 3.46 | | | | (0.23 | ) | | | — | | | | (0.23 | ) |
| (a) | Annualized for periods less than one year, unless otherwise noted. |
| (b) | Not annualized for periods less than one year. |
| (c) | Includes adjustments in accordance with accounting principles generally accepted in the United States of America and as such, the net asset values for financial reporting purposes and the returns based upon those net asset values may differ from the net asset values and returns for shareholder transactions. |
| (d) | Includes earnings credits and interest expense, if applicable, each of which is less than 0.01% unless otherwise noted. |
| (e) | Portfolio turnover is calculated by dividing the lesser of total purchases or sales of portfolio securities for the reporting period by the monthly average value of portfolio securities owned during the reporting period. Excluded from both the numerator and denominator are amounts relating to derivatives and securities whose maturities or expiration dates at the time of acquisition were one year or less. |
| (f) | Calculated based upon average shares outstanding. |
SEE NOTES TO FINANCIAL STATEMENTS.
| | | | | | |
| | | |
| 70 | | | | J.P. MORGAN MID CAP/MULTI-CAP FUNDS | | DECEMBER 31, 2014 |
| | | | | | | | | | | | | | | | | | | | | | | | | | |
| | | Ratios/Supplemental data | |
| | | | | | | | | | Ratios to average net assets (a) | | | | |
Net asset
value,
end of
period | | | Total return
(excludes
sales charge) (b)(c) | | | Net assets,
end of period (000’s) | | | Net
expenses (d) | | | Net
investment income (loss) | | | Expenses
without waivers,
reimbursements and
earnings credits | | | Portfolio
turnover
rate (b)(e) | |
| | | | | | | | | | | | | | | | | | | | | | | | | | |
| | | | | | | | | | | | | | | | | | | | | | | | | | |
| $ | 29.67 | | | | 5.18 | % | | $ | 2,151,927 | | | | 1.24 | % | | | 0.79 | % | | | 1.36 | % | | | 9 | % |
| | 29.15 | | | | 22.19 | | | | 1,701,250 | | | | 1.24 | | | | 1.26 | | | | 1.33 | | | | 36 | |
| | 24.64 | | | | 25.09 | | | | 784,359 | | | | 1.24 | | | | 0.98 | | | | 1.33 | | | | 22 | |
| | 19.96 | | | | 5.83 | | | | 206,816 | | | | 1.25 | | | | 1.34 | | | | 1.41 | | | | 49 | |
| | 19.07 | | | | 26.45 | | | | 232,103 | | | | 1.24 | | | | 1.28 | | | | 1.34 | | | | 33 | |
| | 15.22 | | | | 28.35 | | | | 150,081 | | | | 1.24 | | | | 1.52 | | | | 1.38 | | | | 45 | |
| | | | | | |
| | | | | | | | | | | | | | | | | | | | | | | | | | |
| | 29.62 | | | | 4.91 | | | | 552,738 | | | | 1.74 | | | | 0.30 | | | | 1.82 | | | | 9 | |
| | 29.08 | | | | 21.58 | | | | 402,880 | | | | 1.74 | | | | 0.74 | | | | 1.83 | | | | 36 | |
| | 24.61 | | | | 24.45 | | | | 212,198 | | | | 1.74 | | | | 0.49 | | | | 1.83 | | | | 22 | |
| | 19.91 | | | | 5.32 | | | | 117,937 | | | | 1.75 | | | | 0.84 | | | | 1.91 | | | | 49 | |
| | 19.01 | | | | 25.82 | | | | 131,743 | | | | 1.74 | | | | 0.78 | | | | 1.84 | | | | 33 | |
| | 15.17 | | | | 27.72 | | | | 108,165 | | | | 1.74 | | | | 1.01 | | | | 1.88 | | | | 45 | |
| | | | | | |
| | | | | | | | | | | | | | | | | | | | | | | | | | |
| | 29.81 | | | | 5.48 | | | | 4,179,965 | | | | 0.74 | | | | 1.30 | | | | 0.90 | | | | 9 | |
| | 29.31 | | | | 22.77 | | | | 3,042,506 | | | | 0.74 | | | | 1.77 | | | | 0.93 | | | | 36 | |
| | 24.74 | | | | 25.73 | | | | 1,455,125 | | | | 0.74 | | | | 1.50 | | | | 0.93 | | | | 22 | |
| | 19.99 | | | | 6.36 | | | | 384,525 | | | | 0.75 | | | | 1.86 | | | | 1.01 | | | | 49 | |
| | 19.11 | | | | 27.06 | | | | 284,433 | | | | 0.74 | | | | 1.79 | | | | 0.94 | | | | 33 | |
| | 15.24 | | | | 29.03 | | | | 156,531 | | | | 0.74 | | | | 2.04 | | | | 0.98 | | | | 45 | |
| | | | | | |
| | | | | | | | | | | | | | | | | | | | | | | | | | |
| | 29.78 | | | | 5.31 | | | | 2,970,065 | | | | 0.99 | | | | 1.03 | | | | 1.06 | | | | 9 | |
| | 29.27 | | | | 22.49 | | | | 2,546,808 | | | | 0.99 | | | | 1.53 | | | | 1.08 | | | | 36 | |
| | 24.72 | | | | 25.38 | | | | 1,245,241 | | | | 0.99 | | | | 1.23 | | | | 1.08 | | | | 22 | |
| | 20.00 | | | | 6.09 | | | | 422,861 | | | | 1.00 | | | | 1.62 | | | | 1.16 | | | | 49 | |
| | 19.12 | | | | 26.75 | | | | 270,562 | | | | 0.99 | | | | 1.53 | | | | 1.09 | | | | 33 | |
| | 15.27 | | | | 28.70 | | | | 71,209 | | | | 0.99 | | | | 1.77 | | | | 1.13 | | | | 45 | |
SEE NOTES TO FINANCIAL STATEMENTS.
| | | | | | | | |
| | | |
| DECEMBER 31, 2014 | | J.P. MORGAN MID CAP/MULTI-CAP FUNDS | | | | | 71 | |
NOTES TO FINANCIAL STATEMENTS
AS OF DECEMBER 31, 2014 (Unaudited)
1. Organization
JPMorgan Trust I (“JPM I”) and JPMorgan Trust II (“JPM II”) were formed on November 12, 2004, as Delaware statutory trusts, pursuant to Declarations of Trust dated November 5, 2004 and are registered under the Investment Company Act of 1940, as amended (the “1940 Act”), as open-end management investment companies.
J.P. Morgan Mutual Fund Investment Trust (“JPMMFIT”), an open-end management investment company, was organized as a Massachusetts business trust on September 23, 1997.
J.P. Morgan Fleming Mutual Fund Group, Inc. (“JPMFMFG”, with JPM I, JPM II and JPMMFIT (the “Trusts”)), an open-end management investment company, was organized as a Maryland corporation on August 19, 1997.
The following are 6 separate funds of the Trusts (collectively, the “Funds”) covered by this report:
| | | | | | |
| | | Classes Offered | | Trust | | Diversified/Non-Diversified |
| Growth Advantage Fund | | Class A, Class B, Class C, Class R5, Class R6* and Select Class | | JPMMFIT | | Diversified |
| Mid Cap Equity Fund | | Class A, Class C, Class R2**, Class R5**, Class R6** and Select Class | | JPM I | | Diversified |
| Mid Cap Growth Fund | | Class A, Class B, Class C, Class R2, Class R5, Class R6 and Select Class | | JPM II | | Diversified |
| Mid Cap Value Fund | | Class A, Class B, Class C, Class R2, Institutional Class and Select Class | | JPMFMFG | | Diversified |
| Multi-Cap Market Neutral Fund | | Class A, Class B, Class C, and Select Class | | JPM II | | Diversified |
| Value Advantage Fund | | Class A, Class C, Institutional Class and Select Class | | JPM I | | Diversified |
| * | Class R6 Shares of Growth Advantage Fund commenced operations on December 23, 2013. |
| ** | Class R2, Class R5 and Class R6 Shares of Mid Cap Equity Fund commenced operations on March 14, 2014. |
The investment objective of Growth Advantage Fund and Mid Cap Equity Fund is to seek to provide long-term capital growth.
The investment objective of Mid Cap Growth Fund is to seek growth of capital.
The investment objective of Mid Cap Value Fund is to seek growth from capital appreciation.
The investment objective of Multi-Cap Market Neutral Fund is to seek long-term capital preservation and growth by using strategies designed to produce returns which have no correlation with general domestic market performance.
The investment objective of Value Advantage Fund is to seek to provide long-term total return from a combination of income and capital gains.
Effective as of the close of business on January 3, 2014, all share classes of the Mid Cap Equity Fund are publicly offered only on a limited basis. Investors are not eligible to purchase shares of the Fund unless they meet certain requirements as described in the Classes’ prospectuses.
Effective as of the close of business on February 22, 2013, all share classes of the Mid Cap Value Fund are publicly offered only on a limited basis. Investors are not eligible to purchase shares of the Fund unless they meet certain requirements as described in the Classes’ prospectuses.
Effective November 1, 2009, Class B Shares of the Growth Advantage Fund, Mid Cap Growth Fund, Mid Cap Value Fund and Multi-Cap Market Neutral Fund may not be purchased or acquired by new or existing shareholders, except through exchanges from Class B Shares of another J.P. Morgan Fund and dividend reinvestments. Shareholders who invested in Class B Shares prior to November 1, 2009 may continue to hold their Class B Shares until they automatically convert to Class A Shares.
Class A Shares generally provide for a front-end sales charge while Class B and Class C Shares provide for a contingent deferred sales charge (“CDSC”). Class B Shares automatically convert to Class A Shares after eight years. No sales charges are assessed with respect to Class R2, Class R5, Class R6, Institutional Class and Select Class Shares. All classes of shares have equal rights as to earnings, assets and voting privileges, except that each class may bear different distribution and shareholder servicing fees and each class has exclusive voting rights with respect to its distribution plan and shareholder servicing agreements. Certain Class A Shares, for which front-end sales charges have been waived, may be subject to a CDSC as described in the Funds’ prospectus.
2. Significant Accounting Policies
The following is a summary of significant accounting policies followed by the Funds in the preparation of their financial statements. The Funds are investment companies and, accordingly, follow the investment company accounting and reporting guidance of the Financial Accounting Standards Board Accounting Standards Codification Topic 946—Investment Companies, which is part of U.S. generally accepted accounting principles (“GAAP”). The preparation of financial statements in conformity with GAAP requires management to make estimates and assumptions that affect the reported amounts of assets and liabilities and disclosure of contingent assets and liabilities at the date of the financial statements and the reported amounts of increases and decreases in net assets from operations during the reporting period. Actual results could differ from those estimates.
A. Valuation of Investments — The valuation of the investments is in accordance with GAAP and the Funds’ valuation policies set forth by and under the supervision and responsibility of the Board of Trustees (the “Board”), which established the following approach to valuation, as described more fully below: (i) investments for which market quotations are readily available shall be valued at such unadjusted quoted prices and (ii) all other investments for which market quotations are not readily available shall be valued at their fair value as determined in good faith by the Board.
| | | | | | |
| | | |
| 72 | | | | J.P. MORGAN MID CAP/MULTI-CAP FUNDS | | DECEMBER 31, 2014 |
JPMorgan Funds Management, Inc. (the “Administrator” or “JPMFM”) has established the J.P. Morgan Asset Management Americas Valuation Committee (“AVC”) to assist the Board with the oversight and monitoring of the valuation of the Funds’ investments. The Administrator implements the valuation policies of the Funds’ investments, as directed by the Board. The AVC oversees and carries out the policies for the valuation of investments held in the Funds. This includes monitoring the appropriateness of fair values based on results of ongoing valuation oversight, including but not limited to consideration of macro or security specific events, market events and pricing vendor and broker due diligence. The Administrator is responsible for discussing and assessing the potential impacts to the fair values on an ongoing basis, and at least on a quarterly basis with the AVC and the Board.
Equities and other exchange-traded instruments are valued at the last sale price or official market closing price on the primary exchange on which the instrument is traded before the net asset values (“NAV”) of the Funds are calculated on a valuation date. Investments in open-end investment companies (the “Underlying Funds”) are valued at each investment company’s NAV per share as of the report date.
Futures are generally valued on the basis of available market quotations.
Valuations reflected in this report are as of the report date. As a result, changes in valuation due to market events and/or issuer related events after the report date and prior to issuance of the report are not reflected herein.
The various inputs that are used in determining the valuation of the Funds’ investments are summarized into the three broad levels listed below.
| Ÿ | | Level 1 — Unadjusted inputs using quoted prices in active markets for identical investments. |
| Ÿ | | Level 2— Other significant observable inputs including, but are not limited to, quoted prices for similar investments, inputs other than quoted prices that are observable for investments (such as interest rates, prepayment speeds, credit risk, etc.) or other market corroborated inputs. |
| Ÿ | | Level 3 — Significant inputs based on the best information available in the circumstances, to the extent observable inputs are not available (including the Funds’ assumptions in determining the fair value of investments). |
A financial instrument’s level within the fair value hierarchy is based on the lowest level of any input, both individually and in the aggregate, that is significant to the fair value measurement. The inputs or methodology used for valuing instruments are not necessarily an indication of the risk associated with investing in those instruments.
The following tables represent each valuation input as presented on the Schedules of Portfolio Investments (“SOIs”) (amounts in thousands):
Growth Advantage Fund
| | | | | | | | | | | | | | | | |
| | | Level 1
Quoted prices | | | Level 2
Other significant
observable inputs | | | Level 3
Significant
unobservable inputs | | | Total | |
Total Investments in Securities (a) | | $ | 4,162,569 | | | $ | — | | | $ | — | | | $ | 4,162,569 | |
| | | | | | | | | | | | | | | | |
| | | | |
Mid Cap Equity Fund | | | | | | | | | | | | | | | | |
| | | Level 1
Quoted prices | | | Level 2
Other significant
observable inputs | | | Level 3
Significant
unobservable inputs | | | Total | |
Total Investments in Securities (a) | | $ | 3,072,435 | | | $ | — | | | $ | — | | | $ | 3,072,435 | |
| | | | | | | | | | | | | | | | |
| | | | |
Mid Cap Growth Fund | | | | | | | | | | | | | | | | |
| | | Level 1
Quoted prices | | | Level 2
Other significant
observable inputs | | | Level 3
Significant
unobservable inputs | | | Total | |
Total Investments in Securities (a) | | $ | 2,362,475 | | | $ | — | | | $ | — | | | $ | 2,362,475 | |
| | | | | | | | | | | | | | | | |
| | | | |
Mid Cap Value Fund | | | | | | | | | | | | | | | | |
| | | Level 1
Quoted prices | | | Level 2
Other significant
observable inputs | | | Level 3
Significant
unobservable inputs | | | Total | |
Total Investments in Securities (a) | | $ | 16,058,832 | | | $ | — | | | $ | — | | | $ | 16,058,832 | |
| | | | | | | | | | | | | | | | |
| | | | | | | | |
| | | |
| DECEMBER 31, 2014 | | J.P. MORGAN MID CAP/MULTI-CAP FUNDS | | | | | 73 | |
NOTES TO FINANCIAL STATEMENTS
AS OF DECEMBER 31, 2014 (Unaudited) (continued)
| | | | | | | | | | | | | | | | |
| | | | |
Multi-Cap Market Neutral Fund | | | | | | | | | | | | | | | | |
| | | Level 1
Quoted prices | | | Level 2
Other significant
observable inputs | | | Level 3
Significant
unobservable inputs | | | Total | |
Total Investments in Securities (a) | | $ | 318,202 | | | $ | — | | | $ | — | | | $ | 318,202 | |
| | | | | | | | | | | | | | | | |
Total Liabilities for Securities Sold Short (a) | | $ | (297,278 | ) | | $ | — | | | $ | — | | | $ | (297,278 | ) |
| | | | | | | | | | | | | | | | |
Appreciation in Other Financial Instruments | | | | | | | | | | | | | | | | |
Futures Contracts | | $ | 18 | | | $ | — | | | $ | — | | | $ | 18 | |
| | | | | | | | | | | | | | | | |
| | | | |
Value Advantage Fund | | | | | | | | | | | | | | | | |
| | | Level 1
Quoted prices | | | Level 2
Other significant
observable inputs | | | Level 3
Significant
unobservable inputs | | | Total | |
Total Investments in Securities (a) | | $ | 9,825,377 | | | $ | — | | | $ | — | | | $ | 9,825,377 | |
| | | | | | | | | | | | | | | | |
| (a) | All portfolio holdings designated as Level 1 are disclosed individually on the SOIs. Please refer to the SOIs for industry specifics of portfolio holdings. |
There were no transfers among any levels during the six months ended December 31, 2014.
B. Short Sales — Multi-Cap Market Neutral Fund engages in short sales as part of its normal investment activities. In a short sale, the Fund sells securities it does not own in anticipation of a decline in the market value of those securities. In order to deliver securities to the purchaser, the Fund borrows securities from a broker. To close out a short position, the Fund delivers the same securities to the broker.
The Fund is required to pledge cash or securities to the broker as collateral for the securities sold short. Collateral requirements are calculated daily based on the current market value of the short positions. Cash collateral deposited with the broker is recorded as an asset on the Statements of Assets and Liabilities. Securities segregated as collateral are denoted in the SOIs. The Fund may receive or pay the net of the following amounts: (i) a portion of the income from the investment of cash collateral; (ii) the broker’s fee on the borrowed securities (calculated daily based upon the market value of each borrowed security and a variable rate that is dependent on availability of the security); and (iii) a financing charge for the difference between the market value of the short position and cash collateral deposited with the broker. The net income or fee is reported as interest income or interest expense, respectively, on securities sold short in the Statements of Operations.
The Fund is obligated to pay the broker dividends declared on short positions when a position is open on the record date. Dividends on short positions are reported on ex-dividend date on the Statements of Operations as dividend expense on securities sold short.
Liabilities for securities sold short are reported at market value on the Statements of Assets and Liabilities and the change in market value is recorded as change in net unrealized appreciation (depreciation) in the Statements of Operations. Short sale transactions may result in unlimited losses as the security’s price increases and the short position loses value. There is no upward limit on the price a borrowed security could attain. The Fund is also subject to risk of loss if the broker were to fail to perform its obligations under the contractual terms.
The Fund will record a realized loss if the price of the borrowed security increases between the date of the short sale and the date on which the Fund replaces the borrowed security. The Fund will record a realized gain if the price of the borrowed security declines between those dates.
As of December 31, 2014, the Fund had outstanding short sales as listed on its SOI.
C. Futures Contracts — Multi-Cap Market Neutral Fund uses index futures contracts to gain or reduce exposure to the stock market, maintain liquidity and minimize transaction costs. The Fund also buys futures contracts to immediately invest incoming cash in the market or sell futures in response to cash outflows, thereby simulating an invested position in the underlying index while maintaining a cash balance for liquidity. The use of futures contracts exposes the Fund to equity price risk.
Futures contracts provide for the delayed delivery of the underlying instrument at a fixed price or are settled for a cash amount based on the change in the value of the underlying instrument at a specific date in the future. Upon entering into a futures contract, the Fund is required to deposit with the broker, cash or securities in an amount equal to a certain percentage of the contract amount, which is referred to as the initial margin deposit. Subsequent payments, referred to as variation margin, are made or received by the Fund periodically and are based on changes in the market value of open futures contracts. Changes in the market value of open futures contracts are recorded as change in net unrealized appreciation/depreciation on the Statements of Operations. Realized gains or losses, representing the difference between the value of the contract at the time it was opened and the value at the time it was closed, are reported in the Statements of Operations at the closing or expiration of the futures contract. Securities deposited as initial margin are designated in the SOIs and cash deposited is recorded on the Statements of Assets and Liabilities. A receivable from and/or a payable to brokers for the daily variation margin is also recorded on the Statements of Assets and Liabilities.
| | | | | | |
| | | |
| 74 | | | | J.P. MORGAN MID CAP/MULTI-CAP FUNDS | | DECEMBER 31, 2014 |
The Fund may be subject to the risk that the change in the value of the futures contract may not correlate perfectly with the underlying instrument. Use of long futures contracts subjects the Fund to risk of loss in excess of the amounts shown on the Statements of Assets and Liabilities, up to the notional amount of the futures contracts. Use of short futures contracts subjects the Fund to unlimited risk of loss. The Fund may enter into futures contracts only on exchanges or boards of trade. The exchange or board of trade acts as the counterparty to each futures transaction; therefore, the Fund’s credit risk is limited to failure of the exchange or board of trade. Under some circumstances, futures exchanges may establish daily limits on the amount that the price of a futures contract can vary from the previous day’s settlement price, which could effectively prevent liquidation of positions.
The table below discloses the volume of the Fund’s futures contracts activity during the six months ended December 31, 2014 (amounts in thousands):
| | | | |
| | | Multi-Cap Market
Neutral Fund | |
Futures Contracts: | | | | |
Average Notional Balance Short | | $ | 3,319 | |
Ending Notional Balance Short | | | 1,527 | |
The Fund’s futures contracts are not subject to master netting arrangements (the right to close out all transactions traded with a counterparty and net amounts owed or due across transactions).
D. Security Transactions and Investment Income — Investment transactions are accounted for on the trade date (the date the order to buy or sell is executed). Securities gains and losses are calculated on a specifically identified cost basis. Interest income is determined on the basis of coupon interest accrued using the effective interest method which adjusts for amortization of premiums and accretion of discounts. Dividend income, net of foreign taxes withheld, if any, and dividend expense on securities sold short, are recorded on the ex-dividend date or when a Fund first learns of the dividend.
To the extent such information is publicly available, the Funds record distributions received in excess of income earned from underlying investments as a reduction of cost of investments and/or realized gain. Such amounts are based on estimates if actual amounts are not available and actual amounts of income, realized gain and return of capital may differ from the estimated amounts. The Funds adjust the estimated amounts of the components of distributions (and consequently their net investment income) as necessary once the issuers provide information about the actual composition of the distributions.
E. Allocation of Income and Expenses — Expenses directly attributable to a fund are charged directly to that fund, while the expenses attributable to more than one fund of the Trusts are allocated among the respective funds. In calculating the NAV of each class, investment income, realized and unrealized gains and losses and expenses, other than class specific expenses, are allocated daily to each class of shares based upon the proportion of net assets of each class at the beginning of each day.
F. Federal Income Taxes — Each Fund is treated as a separate taxable entity for Federal income tax purposes. Each Fund’s policy is to comply with the provisions of the Internal Revenue Code of 1986, as amended (the “Code”), applicable to regulated investment companies and to distribute to shareholders all of its distributable net investment income and net realized capital gains on investments. Accordingly, no provision for Federal income tax is necessary. Management has reviewed the Funds’ tax positions for all open tax years and has determined that as of December 31, 2014, no liability for income tax is required in the Funds’ financial statements for net unrecognized tax benefits. However, management’s conclusions may be subject to future review based on changes in, or the interpretation of, the accounting standards or tax laws and regulations. Each of the Fund’s Federal tax returns for the prior three fiscal years remains subject to examination by the Internal Revenue Service.
G. Distributions to Shareholders — Distributions from net investment income are generally declared and paid at least annually, except for the Mid Cap Equity Fund, Mid Cap Growth Fund and Multi-Cap Market Neutral Fund, for which distributions are generally declared and paid at least quarterly. Distributions are declared separately for each class of each Fund. No class has preferential dividend rights; differences in per share rates are due to differences in separate class expenses. Net realized capital gains, if any, are distributed by each Fund at least annually. The amount of distributions from net investment income and net realized capital gains is determined in accordance with Federal income tax regulations, which may differ from GAAP. To the extent these “book/tax” differences are permanent in nature (i.e., that they result from other than timing of recognition — “temporary differences”), such amounts are reclassified within the capital accounts based on their Federal tax-basis treatment.
| | | | | | | | |
| | | |
| DECEMBER 31, 2014 | | J.P. MORGAN MID CAP/MULTI-CAP FUNDS | | | | | 75 | |
NOTES TO FINANCIAL STATEMENTS
AS OF DECEMBER 31, 2014 (Unaudited) (continued)
3. Fees and Other Transactions with Affiliates
A. Investment Advisory Fee — Pursuant to the Investment Advisory Agreements, J.P. Morgan Investment Management, Inc. (the “Adviser” or “JPMIM”), an indirect, wholly-owned subsidiary of JPMorgan Chase & Co. (“JPMorgan”), supervises the investments of each Fund and for such services is paid a fee. The fee is accrued daily and paid monthly based on each Fund’s respective average daily net assets. The annual rate for each Fund is as follows:
| | | | |
Growth Advantage Fund | | | 0.65 | % |
Mid Cap Equity Fund | | | 0.65 | |
Mid Cap Growth Fund | | | 0.65 | |
Mid Cap Value Fund | | | 0.65 | |
Multi-Cap Market Neutral Fund | | | 1.25 | |
Value Advantage Fund | | | 0.65 | |
The Adviser waived Investment Advisory fees and/or reimbursed expenses as outlined in Note 3.F.
B. Administration Fee — Pursuant to an Administration Agreement, the Administrator, an indirect, wholly-owned subsidiary of JPMorgan, provides certain administration services to the Funds. In consideration of these services, the Administrator receives a fee accrued daily and paid monthly at an annual rate of 0.15% of the first $25 billion of the average daily net assets of all funds in the J.P. Morgan Funds Complex covered by the Administration Agreement (excluding certain funds of funds and money market funds) and 0.075% of the average daily net assets in excess of $25 billion of all such funds. For the six months ended December 31, 2014, the effective annualized rate was 0.08% of each Fund’s average daily net assets, notwithstanding any fee waivers and/or expense reimbursements.
The Administrator waived Administration fees as outlined in Note 3.F.
JPMorgan Chase Bank, N.A. (“JPMCB”), a wholly-owned subsidiary of JPMorgan, serves as the Funds’ sub-administrator (the “Sub-administrator”). For its services as Sub-administrator, JPMCB receives a portion of the fees payable to the Administrator.
C. Distribution Fees — Pursuant to a Distribution Agreement, JPMorgan Distribution Services, Inc. (the “Distributor”), a wholly-owned subsidiary of JPMorgan, serves as the Trusts’ exclusive underwriter and promotes and arranges for the sale of each Fund’s shares.
The Board has adopted a Distribution Plan (the “Distribution Plan”) for Class A, Class B, Class C and Class R2 Shares of the Funds in accordance with Rule 12b-1 under the 1940 Act. The Distribution Plan provides that each Fund shall pay distribution fees, including payments to the Distributor, at annual rates of the average daily net assets as shown in the table below:
| | | | | | | | | | | | | | | | |
| | | Class A | | | Class B | | | Class C | | | Class R2 | |
Growth Advantage Fund | | | 0.25 | % | | | 0.75 | % | | | 0.75 | % | | | n/a | |
Mid Cap Equity Fund | | | 0.25 | | | | n/a | | | | 0.75 | | | | 0.50 | % |
Mid Cap Growth Fund | | | 0.25 | | | | 0.75 | | | | 0.75 | | | | 0.50 | |
Mid Cap Value Fund | | | 0.25 | | | | 0.75 | | | | 0.75 | | | | 0.50 | |
Multi-Cap Market Neutral Fund | | | 0.25 | | | | 0.75 | | | | 0.75 | | | | n/a | |
Value Advantage Fund | | | 0.25 | | | | n/a | | | | 0.75 | | | | n/a | |
In addition, the Distributor is entitled to receive the front-end sales charges from purchases of Class A Shares and the CDSC from redemptions of Class B and Class C Shares and certain Class A Shares for which front-end sales charges have been waived. For the six months ended December 31, 2014, the Distributor retained the following (amounts in thousands):
| | | | | | | | |
| | | Front-End Sales Charge | | | CDSC | |
Growth Advantage Fund | | $ | 299 | | | $ | 1 | |
Mid Cap Equity Fund | | | 89 | | | | — | (a) |
Mid Cap Growth Fund | | | 43 | | | | — | (a) |
Mid Cap Value Fund | | | 17 | | | | 1 | |
Multi-Cap Market Neutral Fund | | | 1 | | | | — | |
Value Advantage Fund | | | 297 | | | | 1 | |
| (a) | Amount rounds to less than $1,000. |
| | | | | | |
| | | |
| 76 | | | | J.P. MORGAN MID CAP/MULTI-CAP FUNDS | | DECEMBER 31, 2014 |
D. Shareholder Servicing Fees — The Trusts, on behalf of the Funds, have entered into Shareholder Servicing Agreements with the Distributor under which the Distributor provides certain support services to the shareholders. The Class R6 Shares do not participate in the Shareholder Servicing Agreement. For performing these services, the Distributor receives a fee that is accrued daily and paid monthly equal to a percentage of the average daily net assets as shown in the table below:
| | | | | | | | | | | | | | | | | | | | | | | | | | | | |
| | | Class A | | | Class B | | | Class C | | | Class R2 | | | Class R5 | | | Institutional Class | | | Select Class | |
Growth Advantage Fund | | | 0.25 | % | | | 0.25 | % | | | 0.25 | % | | | n/a | | | | 0.05 | % | | | n/a | | | | 0.25 | % |
Mid Cap Equity Fund | | | 0.25 | | | | n/a | | | | 0.25 | | | | 0.25 | % | | | 0.05 | | | | n/a | | | | 0.25 | |
Mid Cap Growth Fund | | | 0.25 | | | | 0.25 | | | | 0.25 | | | | 0.25 | | | | 0.05 | | | | n/a | | | | 0.25 | |
Mid Cap Value Fund | | | 0.25 | | | | 0.25 | | | | 0.25 | | | | 0.25 | | | | n/a | | | | 0.10 | % | | | 0.25 | |
Multi-Cap Market Neutral Fund | | | 0.25 | | | | 0.25 | | | | 0.25 | | | | n/a | | | | n/a | | | | n/a | | | | 0.25 | |
Value Advantage Fund | | | 0.25 | | | | n/a | | | | 0.25 | | | | n/a | | | | n/a | | | | 0.10 | | | | 0.25 | |
The Distributor has entered into shareholder services contracts with affiliated and unaffiliated financial intermediaries who provide shareholder services and other related services to their clients or customers who invest in the Funds under which the Distributor will pay all or a portion of such fees earned to financial intermediaries for performing such services.
The Distributor waived Shareholder Servicing fees as outlined in Note 3.F.
E. Custodian and Accounting Fees — JPMCB provides portfolio custody and accounting services to the Funds. For these services, the Funds pay JPMCB transaction and asset-based fees that vary according to the number of transactions and positions, plus out-of-pocket expenses. The amounts paid directly to JPMCB by the Funds for custody and accounting services are included in Custodian and accounting fees in the Statements of Operations. Payments to the custodian may be reduced by credits earned by each Fund, based on uninvested cash balances held by the custodian. Such earnings credits, if any, are presented separately in the Statements of Operations.
Interest expense paid to the custodian related to cash overdrafts, if any, is included in Interest expense to affiliates in the Statements of Operations.
F. Waivers and Reimbursements — The Adviser, Administrator and Distributor have contractually agreed to waive fees and/or reimburse the Funds to the extent that total annual operating expenses (excluding acquired fund fees and expenses, dividend expenses related to short sales, interest, taxes, expenses related to litigation and potential litigation, extraordinary expenses and expenses related to the Board’s deferred compensation plan) exceed the percentages of the Funds’ respective average daily net assets as shown in the table below:
| | | | | | | | | | | | | | | | | | | | | | | | | | | | | | | | |
| | | Class A | | | Class B | | | Class C | | | Class R2 | | | Class R5 | | | Class R6 | | | Institutional Class | | | Select Class | |
Growth Advantage Fund | | | 1.25 | % | | | 1.75 | % | | | 1.75 | % | | | n/a | | | | 0.90 | % | | | 0.80 | % | | | n/a | | | | 1.10 | % |
Mid Cap Equity Fund | | | 1.25 | | | | n/a | | | | 1.75 | | | | 1.50 | % | | | 0.80 | | | | 0.75 | | | | n/a | | | | 0.90 | |
Mid Cap Growth Fund | | | 1.24 | | | | 1.74 | | | | 1.74 | | | | 1.40 | | | | 0.79 | | | | 0.74 | | | | n/a | | | | 0.93 | |
Mid Cap Value Fund | | | 1.24 | | | | 1.75 | | | | 1.75 | | | | 1.50 | | | | n/a | | | | n/a | | | | 0.75 | % | | | 0.99 | |
Multi-Cap Market Neutral Fund | | | 1.50 | | | | 2.00 | | | | 2.00 | | | | n/a | | | | n/a | | | | n/a | | | | n/a | | | | 1.25 | |
Value Advantage Fund | | | 1.25 | | | | n/a | | | | 1.75 | | | | n/a | | | | n/a | | | | n/a | | | | 0.75 | | | | 1.00 | |
The expense limitation agreements were in effect for the six months ended December 31, 2014. The contractual expense limitation percentages in the table above are in place until at least October 31, 2015, except Growth Advantage Fund Class R6 which is in place until December 31, 2014 and Mid Cap Equity Fund which is in place until October 31, 2016. Effective January 1, 2015, the contractual expense limitation for Growth Advantage Fund Class R6 was increased to 0.85% until at least October 31, 2015. In addition, the Funds’ service providers have voluntarily waived fees during the six months ended December 31, 2014. However, the Funds’ service providers are under no obligation to do so and may discontinue such voluntary waivers at any time.
For the six months ended December 31, 2014, the Funds’ service providers waived fees and/or reimbursed expenses for each of the Funds as follows (amounts in thousands). None of these parties expect the Funds to repay any such waived fees and reimbursed expenses in future years.
| | | | | | | | | | | | | | | | | | | | |
| | | Contractual Waivers | |
| | | Investment
Advisory | | | Administration | | | Shareholder
Servicing | | | Total | | | Contractual
Reimbursements | |
Growth Advantage Fund | | $ | 40 | | | $ | 3 | | | $ | 332 | | | $ | 375 | | | $ | — | |
Mid Cap Equity Fund | | | 816 | | | | 545 | | | | 1,396 | | | | 2,757 | | | | 19 | |
Mid Cap Growth Fund | | | 636 | | | | 420 | | | | 743 | | | | 1,799 | | | | 2 | |
Mid Cap Value Fund | | | 5,146 | | | | 3,337 | | | | 5,090 | | | | 13,573 | | | | 19 | |
Multi-Cap Market Neutral Fund | | | 635 | | | | 172 | | | | 3 | | | | 810 | | | | — | (a) |
Value Advantage Fund | | | 1,563 | | | | 1,009 | | | | 2,184 | | | | 4,756 | | | | — | |
| (a) | Amount rounds to less than $1,000. |
Additionally, the Funds may invest in one or more money market funds advised by the Adviser or its affiliates. The Adviser, Administrator and Distributor, as shareholder servicing agent, waive fees in an amount sufficient to offset the respective fees each charges to the affiliated money market fund on the Funds’ investment in such affiliated money market fund. A portion of the waiver is voluntary.
| | | | | | | | |
| | | |
| DECEMBER 31, 2014 | | J.P. MORGAN MID CAP/MULTI-CAP FUNDS | | | | | 77 | |
NOTES TO FINANCIAL STATEMENTS
AS OF DECEMBER 31, 2014 (Unaudited) (continued)
The amount of waivers resulting from investments in these money market funds for the six months ended December 31, 2014 was as follows (amounts in thousands):
| | | | |
Growth Advantage Fund | | $ | 74 | |
Mid Cap Equity Fund | | | 90 | |
Mid Cap Growth Fund | | | 51 | |
Mid Cap Value Fund | | | 425 | |
Multi-Cap Market Neutral Fund | | | 42 | |
Value Advantage Fund | | | 568 | |
G. Other — Certain officers of the Trusts are affiliated with the Adviser, the Administrator and the Distributor. Such officers, with the exception of the Chief Compliance Officer, receive no compensation from the Funds for serving in their respective roles.
The Board appointed a Chief Compliance Officer to the Funds in accordance with Federal securities regulations. Each Fund, along with other affiliated funds, makes reimbursement payments, on a pro-rata basis, to the Administrator for a portion of the fees associated with the Office of the Chief Compliance Officer. Such fees are included in Trustees’ and Chief Compliance Officer’s fees in the Statements of Operations.
The Trusts adopted a Trustee Deferred Compensation Plan (the “Plan”) which allows the Independent Trustees to defer the receipt of all or a portion of compensation related to performance of their duties as Trustees. The deferred fees are invested in various J.P. Morgan Funds until distribution in accordance with the Plan.
During the six months ended December 31, 2014, the Funds may have purchased securities from an underwriting syndicate in which the principal underwriter or members of the syndicate are affiliated with the Adviser.
The Funds may use related party broker-dealers. For the six months ended December 31, 2014, the Funds did not incur any brokerage commissions with broker-dealers affiliated with the Adviser.
The Securities and Exchange Commission (“SEC”) has granted an exemptive order permitting the Funds to engage in principal transactions with J.P. Morgan Securities, Inc., an affiliated broker, involving taxable money market instruments, subject to certain conditions.
4. Investment Transactions
During the six months ended December 31, 2014, purchases and sales of investments (excluding short-term investments) were as follows (amounts in thousands):
| | | | | | | | | | | | | | | | |
| | | Purchases
(excluding U.S. Government) | | | Sales (excluding U.S. Government) | | | Securities
Sold Short | | | Covers on
Securities
Sold Short | |
Growth Advantage Fund | | $ | 1,255,468 | | | $ | 953,897 | | | $ | — | | | $ | — | |
Mid Cap Equity Fund | | | 703,146 | | | | 512,731 | | | | — | | | | — | |
Mid Cap Growth Fund | | | 678,546 | | | | 551,646 | | | | — | | | | — | |
Mid Cap Value Fund | | | 1,550,189 | | | | 1,883,654 | | | | — | | | | — | |
Multi-Cap Market Neutral Fund | | | 157,178 | | | | 273,030 | | | | 188,296 | | | | 291,738 | |
Value Advantage Fund | | | 2,152,827 | | | | 705,819 | | | | — | | | | — | |
During the six months ended December 31, 2014, there were no purchases or sales of U.S. Government securities.
5. Federal Income Tax Matters
For Federal income tax purposes, the cost and unrealized appreciation (depreciation) in value of investment securities held at December 31, 2014 were as follows (amounts in thousands):
| | | | | | | | | | | | | | | | |
| | | Aggregate
Cost | | | Gross
Unrealized
Appreciation | | | Gross
Unrealized
Depreciation | | | Net
Unrealized
Appreciation
(Depreciation) | |
Growth Advantage Fund | | $ | 3,063,728 | | | $ | 1,147,279 | | | $ | 48,438 | | | $ | 1,098,841 | |
Mid Cap Equity Fund | | | 2,314,882 | | | | 775,491 | | | | 17,938 | | | | 757,553 | |
Mid Cap Growth Fund | | | 1,730,613 | | | | 692,528 | | | | 60,666 | | | | 631,862 | |
Mid Cap Value Fund | | | 10,444,022 | | | | 5,738,724 | | | | 123,914 | | | | 5,614,810 | |
Multi-Cap Market Neutral Fund | | | 255,487 | | | | 66,272 | | | | 3,557 | | | | 62,715 | |
Value Advantage Fund | | | 8,094,058 | | | | 1,792,991 | | | | 61,672 | | | | 1,731,319 | |
Under the Regulated Investment Company Modernization Act of 2010 (“the “Act”), net capital losses recognized by the Funds after June 30, 2011 are carried forward indefinitely, and retain their character as short-term and/or long-term losses. Prior to the Act, net capital losses incurred by the Funds were carried forward for eight years and treated as short-term losses. The Act requires that post-enactment net capital losses be used before pre-enactment net capital losses.
| | | | | | |
| | | |
| 78 | | | | J.P. MORGAN MID CAP/MULTI-CAP FUNDS | | DECEMBER 31, 2014 |
At June 30, 2014, the Funds did not have post-enactment capital loss carryforwards.
At June 30, 2014, the following Funds had pre-enactment net capital loss carryforwards, expiring during the years indicated, which are available to offset future realized gains (amounts in thousands):
| | | | | | | | | | | | | | | | |
| | | 2016 | | | 2017 | | | 2018 | | | Total | |
Mid Cap Growth Fund | | $ | — | | | $ | — | | | $ | 13,557 | * | | $ | 13,557 | * |
Mid Cap Value Fund | | | — | | | | — | | | | 34,731 | * | | | 34,731 | * |
Multi-Cap Market Neutral Fund | | | 29,615 | | | | — | | | | — | | | | 29,615 | |
| * | Amount includes capital loss carryforwards from business combinations, which are limited in future years under Internal Revenue Code Sections 381-384. |
6. Borrowings
The Funds rely upon an exemptive order granted by the SEC (the “Order”) permitting the establishment and operation of an Interfund Lending Facility (the “Facility”). The Facility allows the Funds to directly lend and borrow money to or from any other fund relying upon the Order at rates beneficial to both the borrowing and lending funds. Advances under the Facility are taken primarily for temporary or emergency purposes, including the meeting of redemption requests that otherwise might require the untimely disposition of securities, and are subject to each Fund’s borrowing restrictions. The Interfund loan rate is determined, as specified in the Order, by averaging the current repurchase agreement rate and the current bank loan rate. The Order was granted to JPM II and may be relied upon by the Funds because the Funds and the series of JPM II are all investment companies in the same “group of investment companies” (as defined in Section 12(d)(1)(G) of the 1940 Act).
In addition, the Trusts and JPMCB have entered into a financing arrangement. Under this arrangement, JPMCB provides an unsecured, uncommitted credit facility in the aggregate amount of $100 million to certain of the J.P. Morgan Funds, including the Funds. Advances under the arrangement are taken primarily for temporary or emergency purposes, including the meeting of redemption requests that otherwise might require the untimely disposition of securities, and are subject to each Fund’s borrowing restrictions. Interest on borrowings is payable at a rate determined by JPMCB at the time of borrowing. This agreement has been extended until November 9, 2015.
The Funds had no borrowings outstanding from another fund or from the unsecured, uncommitted credit facility at December 31, 2014. Average borrowings from the Facility for the six months ended December 31, 2014, were as follows (amounts in thousands):
| | | | | | | | | | | | | | | | |
| | | Average
Borrowings | | | Average Interest Rate Paid | | | Number
of Days
Outstanding | | | Interest
Paid | |
Multi-Cap Market Neutral Fund | | $ | 21,128 | | | | 0.21 | % | | | 4 | | | $ | — | (a) |
| (a) | Amount rounds to less than $1,000. |
Interest expense paid, if any, as a result of borrowings from another fund or from the unsecured, uncommitted credit facility is included in Interest expense to affiliates in the Statements of Operations.
7. Risks, Concentrations and Indemnifications
In the normal course of business, the Funds enter into contracts that contain a variety of representations which provide general indemnifications. Each Fund’s maximum exposure under these arrangements is unknown. The amount of exposure would depend on future claims that may be made against each Fund that have not yet occurred. However, based on experience, the Funds expect the risk of loss to be remote.
One or more affiliates of the Adviser have investment discretion with respect to their clients’ holdings in the Funds, which collectively represent a significant portion of the Funds’ assets for each of the Growth Advantage Fund, Mid Cap Equity Fund and Mid Cap Growth Fund.
In addition, as of December 31, 2014, the J.P. Morgan Investor Funds and JPMorgan SmartRetirement Funds, which are affiliated funds of funds, own in the aggregate, more than 10% of the net assets of the following Funds as follows:
| | | | | | | | |
| | | J.P. Morgan
Investor Funds | | | JPMorgan
SmartRetirement
Funds | |
Growth Advantage Fund | | | — | | | | 40.6 | % |
Mid Cap Equity Fund | | | — | | | | 30.0 | |
Multi-Cap Market Neutral Fund | | | 89.1 | % | | | — | |
Value Advantage Fund | | | — | | | | 16.7 | |
Additionally, Growth Advantage Fund, Mid Cap Equity Fund, Mid Cap Growth Fund, Mid Cap Value Fund and Value Advantage Fund each have one or more shareholders, each of which is an account maintained by a financial intermediary on behalf of its clients, that owns a significant portion of that Fund’s outstanding shares.
Significant shareholder transactions by these shareholders may impact the Funds’ performance.
| | | | | | | | |
| | | |
| DECEMBER 31, 2014 | | J.P. MORGAN MID CAP/MULTI-CAP FUNDS | | | | | 79 | |
NOTES TO FINANCIAL STATEMENTS
AS OF DECEMBER 31, 2014 (Unaudited) (continued)
As of December 31, 2014, the Multi-Cap Market Neutral Fund pledged substantially all of its assets for securities sold short to Citigroup Global Markets, Inc., who also held 100% of the Multi-Cap Market Neutral Fund’s cash proceeds for securities sold short.
8. Business Combinations
In November 2013, the Board of Trustees of JPM I approved management’s proposal to merge JPMorgan Mid Cap Core Fund (the “Target Fund”) into JPMorgan Mid Cap Equity Fund (the “Acquiring Fund”). The Agreement and Plan of Reorganization with respect to the Target Fund was approved by the Target Fund’s Board of Trustees on November 19-21, 2013. The purpose of the transaction was to combine two portfolios with comparable investment objectives and strategies. The reorganization was effective after the close of business on March 14, 2014. The Acquiring Fund acquired all of the assets and liabilities of the Target Fund as shown in the table below. The transaction was structured to qualify as a tax-free reorganization under the Code. Pursuant to the Agreement and Plan of Reorganization, shareholders of the Target Fund received a number of shares of the corresponding class in the Acquiring Fund, with a value equal to their holdings in the Target Fund as of the close of business on the date of the reorganization. The investment portfolio of the Target Fund, with a fair value of approximately $1,111,228,000 and identified cost of approximately $904,208,000 as of the date of the reorganization, was the principal asset acquired by the Acquiring Fund. For financial statement purposes, assets received and shares issued by the Acquiring Fund were recorded at fair value; however, the cost basis of the investments received from the Target Fund was carried forward to align ongoing reporting of the Acquiring Fund’s realized and unrealized gains and losses with amounts distributable to shareholders for tax purposes.
The following is a summary of Shares Outstanding, Net Assets, NAV and Net Unrealized Appreciation (Depreciation) immediately before and after the reorganization (amounts in thousands, except per share amounts):
| | | | | | | | | | | | | | | | |
| | | Shares
Outstanding | | | Net Assets | | | Net Asset
Value
Per Share | | | Net
Unrealized
Appreciation
(Depreciation) | |
Target Fund | | | | | | | | | | | | | | | | |
Mid Cap Core Fund | | | | | | | | | | | | | | $ | 207,020 | |
Class A | | | 1,967 | | | $ | 42,694 | | | $ | 21.70 | | | | | |
Class C | | | 77 | | | | 1,648 | | | | 21.48 | | | | | |
Class R2 | | | 29 | | | | 632 | | | | 21.60 | | | | | |
Class R5 | | | 4 | | | | 87 | | | | 21.87 | | | | | |
Class R6 | | | 30,932 | | | | 676,262 | | | | 21.86 | | | | | |
Select Class | | | 17,884 | | | | 390,167 | | | | 21.82 | | | | | |
Acquiring Fund | | | | | | | | | | | | | | | | |
Mid Cap Equity Fund | | | | | | | | | | | | | | | 407,160 | |
Class A | | | 1,999 | | | | 85,802 | | | | 42.92 | | | | | |
Class C | | | 386 | | | | 16,354 | | | | 42.32 | | | | | |
Select Class | | | 29,489 | | | | 1,272,165 | | | | 43.14 | | | | | |
| | | | | | | | | | | | | | | | |
| | | Shares
Outstanding | | | Net Assets | | | Net Asset
Value
Per Share | | | Net
Unrealized
Appreciation
(Depreciation) | |
Post Reorganization | | | | | | | | | | | | | | | | |
Mid Cap Equity Fund | | | | | | | | | | | | | | $ | 614,180 | |
Class A | | | 2,994 | | | $ | 128,496 | | | $ | 42.92 | | | | | |
Class C | | | 425 | | | | 18,002 | | | | 42.32 | | | | | |
Class R2 | | | 15 | | | | 632 | | | | 42.92 | | | | | |
Class R5 | | | 2 | | | | 87 | | | | 43.14 | | | | | |
Class R6 | | | 15,676 | | | | 676,262 | | | | 43.14 | | | | | |
Select Class | | | 38,533 | | | | 1,662,333 | | | | 43.14 | | | | | |
Expenses related to reorganization were incurred by the Acquiring Fund. The Adviser, the Administrator and the Distributor waived their fees and/or reimbursed the Fund in an amount sufficient to offset costs incurred by the Fund relating to the reorganization, excluding brokerage fees and brokerage expenses related to the disposition and acquisition of Fund assets associated with the reorganization.
Assuming the reorganization had been completed on July 1, 2013, the beginning of the annual reporting period, the pro forma results of operations for the year ended June 30, 2014, are as follows (amounts in thousands):
| | | | |
Net investment income (loss) | | $ | 7,170 | |
Net realized/unrealized gains (losses) | | | 555,924 | |
| | | | |
Change in net assets resulting from operations | | $ | 563,094 | |
| | | | |
Because the combined investment portfolios have been managed as a single integrated portfolio since the reorganization was completed, it is not practicable to separate the amounts of revenue and earnings of the Target Fund that have been included in the Statements of Operations since March 14, 2014.
| | | | | | |
| | | |
| 80 | | | | J.P. MORGAN MID CAP/MULTI-CAP FUNDS | | DECEMBER 31, 2014 |
SCHEDULE OF SHAREHOLDER EXPENSES
(Unaudited)
Hypothetical $1,000 Investment
As a shareholder of the Funds, you incur two types of costs: (1) transaction costs, including sales charges (loads) on purchase payments and (2) ongoing costs, including investment advisory fees, administration fees, distribution fees and other Fund expenses. The examples below are intended to help you understand your ongoing costs (in dollars) of investing in the Funds and to compare these ongoing costs with the ongoing costs of investing in other mutual funds. The examples assume that you had a $1,000 investment in each Class at the beginning of the reporting period, July 1, 2014, and continued to hold your shares at the end of the reporting period, December 31, 2014.
Actual Expenses
For each Class of each Fund in the table below, the first line provides information about actual account values and actual expenses. You may use the information in this line, together with the amount you invested, to estimate the expenses that you paid over the period. Simply divide your account value by $1,000 (for example, an $8,600 account value divided by $1,000 = 8.6), then multiply the result by the number in the first line of each Class under the heading entitled “Expenses Paid During the Period” to estimate the expenses you paid on your account during this period.
Hypothetical Example for Comparison Purposes
The second line of each Class in the table below provides information about hypothetical account values and hypothetical expenses based on the Class’ actual expense ratio and an assumed rate of return of 5% per year before expenses, which is not the Class’ actual return. The hypothetical account values and expenses may not be used to estimate the actual ending account balance or expenses you paid for the period. You may use this information to compare the ongoing costs of investing in the Class of the Fund and other funds. To do so, compare this 5% hypothetical example with the 5% hypothetical examples that appear in the shareholder reports of the other funds. Please note that the expenses shown in the table are meant to highlight your ongoing costs only and do not reflect any transaction costs, such as sales charges (loads) or redemption fees. Therefore, the second line for each Class in the table is useful in comparing ongoing costs only, and will not help you determine the relative total costs of owning different funds. In addition, if these transaction costs were included, your costs would have been higher. The examples also assume all dividends and distributions have been reinvested.
Expense Example
| | | | | | | | | | | | | | | | |
| | | Beginning
Account Value
July 1, 2014 | | | Ending
Account Value
December 31,
2014 | | | Expenses
Paid During
the Period* | | | Annualized
Expense
Ratio | |
Growth Advantage Fund | | | | | | | | | | | | | | | | |
Class A | | | | | | | | | | | | | | | | |
Actual | | $ | 1,000.00 | | | $ | 1,046.90 | | | $ | 6.45 | | | | 1.25 | % |
Hypothetical | | | 1,000.00 | | | | 1,018.90 | | | | 6.36 | | | | 1.25 | |
Class B | | | | | | | | | | | | | | | | |
Actual | | | 1,000.00 | | | | 1,043.80 | | | | 9.02 | | | | 1.75 | |
Hypothetical | | | 1,000.00 | | | | 1,016.38 | | | | 8.89 | | | | 1.75 | |
Class C | | | | | | | | | | | | | | | | |
Actual | | | 1,000.00 | | | | 1,043.70 | | | | 9.01 | | | | 1.75 | |
Hypothetical | | | 1,000.00 | | | | 1,016.38 | | | | 8.89 | | | | 1.75 | |
Class R5 | | | | | | | | | | | | | | | | |
Actual | | | 1,000.00 | | | | 1,049.10 | | | | 4.39 | | | | 0.85 | |
Hypothetical | | | 1,000.00 | | | | 1,020.92 | | | | 4.33 | | | | 0.85 | |
Class R6 | | | | | | | | | | | | | | | | |
Actual | | | 1,000.00 | | | | 1,049.60 | | | | 3.98 | | | | 0.77 | |
Hypothetical | | | 1,000.00 | | | | 1,021.32 | | | | 3.92 | | | | 0.77 | |
Select Class | | | | | | | | | | | | | | | | |
Actual | | | 1,000.00 | | | | 1,047.40 | | | | 5.47 | | | | 1.06 | |
Hypothetical | | | 1,000.00 | | | | 1,019.86 | | | | 5.40 | | | | 1.06 | |
| | | | |
Mid Cap Equity Fund | | | | | | | | | | | | | | | | |
Class A | | | | | | | | | | | | | | | | |
Actual | | | 1,000.00 | | | | 1,040.40 | | | | 6.38 | | | | 1.24 | |
Hypothetical | | | 1,000.00 | | | | 1,018.95 | | | | 6.31 | | | | 1.24 | |
Class C | | | | | | | | | | | | | | | | |
Actual | | | 1,000.00 | | | | 1,037.70 | | | | 8.94 | | | | 1.74 | |
Hypothetical | | | 1,000.00 | | | | 1,016.43 | | | | 8.84 | | | | 1.74 | |
| | | | | | | | |
| | | |
| DECEMBER 31, 2014 | | J.P. MORGAN MID CAP/MULTI-CAP FUNDS | | | | | 81 | |
SCHEDULE OF SHAREHOLDER EXPENSES
(Unaudited) (continued)
Hypothetical $1,000 Investment
| | | | | | | | | | | | | | | | |
| | | Beginning
Account Value
July 1, 2014 | | | Ending
Account Value
December 31,
2014 | | | Expenses
Paid During
the Period* | | | Annualized
Expense
Ratio | |
Mid Cap Equity Fund (continued) | | | | | | | | | | | | | | | | |
Class R2 | | | | | | | | | | | | | | | | |
Actual | | $ | 1,000.00 | | | $ | 1,039.20 | | | $ | 7.66 | | | | 1.49 | % |
Hypothetical | | | 1,000.00 | | | | 1,017.69 | | | | 7.58 | | | | 1.49 | |
Class R5 | | | | | | | | | | | | | | | | |
Actual | | | 1,000.00 | | | | 1,042.70 | | | | 4.07 | | | | 0.79 | |
Hypothetical | | | 1,000.00 | | | | 1,021.22 | | | | 4.02 | | | | 0.79 | |
Class R6 | | | | | | | | | | | | | | | | |
Actual | | | 1,000.00 | | | | 1,042.90 | | | | 3.81 | | | | 0.74 | |
Hypothetical | | | 1,000.00 | | | | 1,021.48 | | | | 3.77 | | | | 0.74 | |
Select Class | | | | | | | | | | | | | | | | |
Actual | | | 1,000.00 | | | | 1,042.20 | | | | 4.58 | | | | 0.89 | |
Hypothetical | | | 1,000.00 | | | | 1,020.72 | | | | 4.53 | | | | 0.89 | |
| | | | |
Mid Cap Growth Fund | | | | | | | | | | | | | | | | |
Class A | | | | | | | | | | | | | | | | |
Actual | | | 1,000.00 | | | | 1,019.50 | | | | 6.31 | | | | 1.24 | |
Hypothetical | | | 1,000.00 | | | | 1,018.95 | | | | 6.31 | | | | 1.24 | |
Class B | | | | | | | | | | | | | | | | |
Actual | | | 1,000.00 | | | | 1,017.30 | | | | 8.85 | | | | 1.74 | |
Hypothetical | | | 1,000.00 | | | | 1,016.43 | | | | 8.84 | | | | 1.74 | |
Class C | | | | | | | | | | | | | | | | |
Actual | | | 1,000.00 | | | | 1,016.90 | | | | 8.85 | | | | 1.74 | |
Hypothetical | | | 1,000.00 | | | | 1,016.43 | | | | 8.84 | | | | 1.74 | |
Class R2 | | | | | | | | | | | | | | | | |
Actual | | | 1,000.00 | | | | 1,018.80 | | | | 7.12 | | | | 1.40 | |
Hypothetical | | | 1,000.00 | | | | 1,018.15 | | | | 7.12 | | | | 1.40 | |
Class R5 | | | | | | | | | | | | | | | | |
Actual | | | 1,000.00 | | | | 1,021.80 | | | | 4.03 | | | | 0.79 | |
Hypothetical | | | 1,000.00 | | | | 1,021.22 | | | | 4.02 | | | | 0.79 | |
Class R6 | | | | | | | | | | | | | | | | |
Actual | | | 1,000.00 | | | | 1,022.10 | | | | 3.77 | | | | 0.74 | |
Hypothetical | | | 1,000.00 | | | | 1,021.48 | | | | 3.77 | | | | 0.74 | |
Select Class | | | | | | | | | | | | | | | | |
Actual | | | 1,000.00 | | | | 1,020.90 | | | | 4.74 | | | | 0.93 | |
Hypothetical | | | 1,000.00 | | | | 1,020.52 | | | | 4.74 | | | | 0.93 | |
| | | | |
Mid Cap Value Fund | | | | | | | | | | | | | | | | |
Class A | | | | | | | | | | | | | | | | |
Actual | | | 1,000.00 | | | | 1,062.00 | | | | 6.39 | | | | 1.23 | |
Hypothetical | | | 1,000.00 | | | | 1,019.00 | | | | 6.26 | | | | 1.23 | |
Class B | | | | | | | | | | | | | | | | |
Actual | | | 1,000.00 | | | | 1,059.10 | | | | 9.03 | | | | 1.74 | |
Hypothetical | | | 1,000.00 | | | | 1,016.43 | | | | 8.84 | | | | 1.74 | |
Class C | | | | | | | | | | | | | | | | |
Actual | | | 1,000.00 | | | | 1,059.20 | | | | 9.03 | | | | 1.74 | |
Hypothetical | | | 1,000.00 | | | | 1,016.43 | | | | 8.84 | | | | 1.74 | |
Class R2 | | | | | | | | | | | | | | | | |
Actual | | | 1,000.00 | | | | 1,060.60 | | | | 7.74 | | | | 1.49 | |
Hypothetical | | | 1,000.00 | | | | 1,017.69 | | | | 7.58 | | | | 1.49 | |
Institutional Class | | | | | | | | | | | | | | | | |
Actual | | | 1,000.00 | | | | 1,064.50 | | | | 3.85 | | | | 0.74 | |
Hypothetical | | | 1,000.00 | | | | 1,021.48 | | | | 3.77 | | | | 0.74 | |
Select Class | | | | | | | | | | | | | | | | |
Actual | | | 1,000.00 | | | | 1,063.00 | | | | 5.10 | | | | 0.98 | |
Hypothetical | | | 1,000.00 | | | | 1,020.27 | | | | 4.99 | | | | 0.98 | |
| | | | | | |
| | | |
| 82 | | | | J.P. MORGAN MID CAP/MULTI-CAP FUNDS | | DECEMBER 31, 2014 |
| | | | | | | | | | | | | | | | |
| | | Beginning
Account Value
July 1, 2014 | | | Ending
Account Value
December 31,
2014 | | | Expenses
Paid During
the Period* | | | Annualized
Expense
Ratio | |
Multi-Cap Market Neutral Fund | | | | | | | | | | | | | | | | |
Class A | | | | | | | | | | | | | | | | |
Actual | | $ | 1,000.00 | | | $ | 1,016.10 | | | $ | 13.92 | | | | 2.74 | % |
Hypothetical | | | 1,000.00 | | | | 1,011.39 | | | | 13.89 | | | | 2.74 | |
Class B | | | | | | | | | | | | | | | | |
Actual | | | 1,000.00 | | | | 1,013.80 | | | | 16.45 | | | | 3.24 | |
Hypothetical | | | 1,000.00 | | | | 1,008.87 | | | | 16.41 | | | | 3.24 | |
Class C | | | | | | | | | | | | | | | | |
Actual | | | 1,000.00 | | | | 1,013.80 | | | | 16.40 | | | | 3.23 | |
Hypothetical | | | 1,000.00 | | | | 1,008.92 | | | | 16.36 | | | | 3.23 | |
Select Class | | | | | | | | | | | | | | | | |
Actual | | | 1,000.00 | | | | 1,017.80 | | | | 12.61 | | | | 2.48 | |
Hypothetical | | | 1,000.00 | | | | 1,012.70 | | | | 12.58 | | | | 2.48 | |
| | | | |
Value Advantage Fund | | | | | | | | | | | | | | | | |
Class A | | | | | | | | | | | | | | | | |
Actual | | | 1,000.00 | | | | 1,051.80 | | | | 6.41 | | | | 1.24 | |
Hypothetical | | | 1,000.00 | | | | 1,018.95 | | | | 6.31 | | | | 1.24 | |
Class C | | | | | | | | | | | | | | | | |
Actual | | | 1,000.00 | | | | 1,049.10 | | | | 8.99 | | | | 1.74 | |
Hypothetical | | | 1,000.00 | | | | 1,016.43 | | | | 8.84 | | | | 1.74 | |
Institutional Class | | | | | | | | | | | | | | | | |
Actual | | | 1,000.00 | | | | 1,054.80 | | | | 3.83 | | | | 0.74 | |
Hypothetical | | | 1,000.00 | | | | 1,021.48 | | | | 3.77 | | | | 0.74 | |
Select Class | | | | | | | | | | | | | | | | |
Actual | | | 1,000.00 | | | | 1,053.10 | | | | 5.12 | | | | 0.99 | |
Hypothetical | | | 1,000.00 | | | | 1,020.21 | | | | 5.04 | | | | 0.99 | |
| * | Expenses are equal to each Class’ respective annualized expense ratio, multiplied by the average account value over the period, multiplied by 184/365 (to reflect the one-half year period). |
| | | | | | | | |
| | | |
| DECEMBER 31, 2014 | | J.P. MORGAN MID CAP/MULTI-CAP FUNDS | | | | | 83 | |
SPECIAL SHAREHOLDER MEETING RESULTS
(Unaudited)
JPM Trust I
JPM I held a special meeting of shareholders on June 10, 2014, for the purpose of considering and voting upon the election of Trustees.
Trustees were elected by the shareholders of all of the series of JPM I, including Mid Cap Equity Fund and Value Advantage Fund. The results of the voting were as follows:
| | | | |
| | | Votes Received
(Amounts in
thousands) | |
| John F. Finn | | | | |
In Favor | | | 172,130,223 | |
Withheld | | | 1,157,495 | |
| |
| Dr. Matthew Goldstein | | | | |
In Favor | | | 172,109,164 | |
Withheld | | | 1,178,553 | |
| |
| Robert J. Higgins | | | | |
In Favor | | | 158,338,954 | |
Withheld | | | 14,948,763 | |
| |
| Frankie D. Hughes | | | | |
In Favor | | | 172,148,985 | |
Withheld | | | 1,138,733 | |
| |
| Peter C. Marshall | | | | |
In Favor | | | 172,124,473 | |
Withheld | | | 1,163,244 | |
| |
| Mary E. Martinez | | | | |
In Favor | | | 172,132,763 | |
Withheld | | | 1,154,954 | |
| |
| Marilyn McCoy | | | | |
In Favor | | | 172,123,615 | |
Withheld | | | 1,164,102 | |
| | | | |
| | | Votes Received
(Amounts in
thousands) | |
| Mitchell M. Merin | | | | |
In Favor | | | 172,132,812 | |
Withheld | | | 1,154,905 | |
| |
| William G. Morton, Jr. | | | | |
In Favor | | | 172,111,749 | |
Withheld | | | 1,175,968 | |
| |
| Robert A. Oden, Jr. | | | | |
In Favor | | | 172,098,600 | |
Withheld | | | 1,189,117 | |
| |
| Marian U. Pardo | | | | |
In Favor | | | 172,162,159 | |
Withheld | | | 1,125,559 | |
| |
| Frederick W. Ruebeck | | | | |
In Favor | | | 172,051,301 | |
Withheld | | | 1,236,416 | |
| |
| James J. Schonbachler | | | | |
In Favor | | | 172,078,691 | |
Withheld | | | 1,209,026 | |
| | | | | | |
| | | |
| 84 | | | | J.P. MORGAN MID CAP/MULTI-CAP FUNDS | | DECEMBER 31, 2014 |
J.P. Morgan Fleming Mutual Fund Group, Inc.
JPMFMFG held a special meeting of shareholders on June 10, 2014, for the purpose of considering and voting upon the election of Trustees.
Trustees were elected by the shareholders of all of the series of JPMFMFG, including Mid Cap Value Fund. The results of the voting were as follows:
| | | | |
| | | Votes Received
(Amounts in
thousands) | |
| John F. Finn | | | | |
In Favor | | | 248,045 | |
Withheld | | | 2,166 | |
| |
| Dr. Matthew Goldstein | | | | |
In Favor | | | 247,867 | |
Withheld | | | 2,343 | |
| |
| Robert J. Higgins | | | | |
In Favor | | | 193,893 | |
Withheld | | | 56,317 | |
| |
| Frankie D. Hughes | | | | |
In Favor | | | 247,973 | |
Withheld | | | 2,237 | |
| |
| Peter C. Marshall | | | | |
In Favor | | | 247,787 | |
Withheld | | | 2,423 | |
| |
| Mary E. Martinez | | | | |
In Favor | | | 247,969 | |
Withheld | | | 2,241 | |
| |
| Marilyn McCoy | | | | |
In Favor | | | 248,057 | |
Withheld | | | 2,153 | |
| | | | |
| | | Votes Received
(Amounts in
thousands) | |
| Mitchell M. Merin | | | | |
In Favor | | | 248,056 | |
Withheld | | | 2,154 | |
| |
| William G. Morton, Jr. | | | | |
In Favor | | | 247,904 | |
Withheld | | | 2,306 | |
| |
| Robert A. Oden, Jr. | | | | |
In Favor | | | 247,855 | |
Withheld | | | 2,355 | |
| |
| Marian U. Pardo | | | | |
In Favor | | | 248,110 | |
Withheld | | | 2,101 | |
| |
| Frederick W. Ruebeck | | | | |
In Favor | | | 247,773 | |
Withheld | | | 2,437 | |
| |
| James J. Schonbachler | | | | |
In Favor | | | 247,959 | |
Withheld | | | 2,251 | |
| | | | | | | | |
| | | |
| DECEMBER 31, 2014 | | J.P. MORGAN MID CAP/MULTI-CAP FUNDS | | | | | 85 | |
SPECIAL SHAREHOLDER MEETING RESULTS
(Unaudited) (continued)
J.P. Morgan Mutual Fund Investment Trust
JPMMFIT held a special meeting of shareholders on June 10, 2014, for the purpose of considering and voting upon the election of Trustees.
Trustees were elected by the shareholders of all of the series of JPMMFIT, including Growth Advantage Fund. The results of the voting were as follows:
| | | | |
| | | Votes Received
(Amounts in
thousands) | |
| John F. Finn | | | | |
In Favor | | | 215,054 | |
Withheld | | | 617 | |
| |
| Dr. Matthew Goldstein | | | | |
In Favor | | | 215,008 | |
Withheld | | | 662 | |
| |
| Robert J. Higgins | | | | |
In Favor | | | 208,280 | |
Withheld | | | 7,391 | |
| |
| Frankie D. Hughes | | | | |
In Favor | | | 215,086 | |
Withheld | | | 584 | |
| |
| Peter C. Marshall | | | | |
In Favor | | | 215,045 | |
Withheld | | | 625 | |
| |
| Mary E. Martinez | | | | |
In Favor | | | 215,037 | |
Withheld | | | 633 | |
| |
| Marilyn McCoy | | | | |
In Favor | | | 215,057 | |
Withheld | | | 614 | |
| | | | |
| | | Votes Received
(Amounts in
thousands) | |
| Mitchell M. Merin | | | | |
In Favor | | | 215,054 | |
Withheld | | | 616 | |
| |
| William G. Morton, Jr. | | | | |
In Favor | | | 215,030 | |
Withheld | | | 640 | |
| |
| Robert A. Oden, Jr. | | | | |
In Favor | | | 215,047 | |
Withheld | | | 623 | |
| |
| Marian U. Pardo | | | | |
In Favor | | | 215,021 | |
Withheld | | | 649 | |
| |
| Frederick W. Ruebeck | | | | |
In Favor | | | 215,049 | |
Withheld | | | 621 | |
| |
| James J. Schonbachler | | | | |
In Favor | | | 215,049 | |
Withheld | | | 622 | |
| | | | | | |
| | | |
| 86 | | | | J.P. MORGAN MID CAP/MULTI-CAP FUNDS | | DECEMBER 31, 2014 |
JPM Trust II
JPM II held a special meeting of shareholders on June 10, 2014, for the purpose of considering and voting upon the following proposals.
Proposal 1: Election of Trustees
Trustees were elected by the shareholders of all of the series of the JPM II, including Mid Cap Growth Fund and Multi-Cap Market Neutral Fund. The results of the voting were as follows:
| | | | |
| | | Votes Received
(Amounts in
thousands) | |
| John F. Finn | | | | |
In Favor | | | 132,674,822 | |
Withheld | | | 508,692 | |
| |
| Dr. Matthew Goldstein | | | | |
In Favor | | | 132,670,672 | |
Withheld | | | 512,842 | |
| |
| Robert J. Higgins | | | | |
In Favor | | | 124,038,998 | |
Withheld | | | 9,144,516 | |
| |
| Frankie D. Hughes | | | | |
In Favor | | | 132,681,734 | |
Withheld | | | 501,780 | |
| |
| Peter C. Marshall | | | | |
In Favor | | | 132,663,579 | |
Withheld | | | 519,935 | |
| |
| Mary E. Martinez | | | | |
In Favor | | | 132,682,318 | |
Withheld | | | 501,196 | |
| |
| Marilyn McCoy | | | | |
In Favor | | | 132,681,993 | |
Withheld | | | 501,520 | |
| | | | |
| | | Votes Received
(Amounts in
thousands) | |
| Mitchell M. Merin | | | | |
In Favor | | | 132,664,715 | |
Withheld | | | 518,799 | |
| |
| William G. Morton, Jr. | | | | |
In Favor | | | 132,650,698 | |
Withheld | | | 532,816 | |
| Robert A. Oden, Jr. | | | | |
In Favor | | | 132,664,727 | |
Withheld | | | 518,788 | |
| |
| Marian U. Pardo | | | | |
In Favor | | | 132,690,792 | |
Withheld | | | 492,722 | |
| |
| Frederick W. Ruebeck | | | | |
In Favor | | | 132,644,244 | |
Withheld | | | 539,269 | |
| |
| James J. Schonbachler | | | | |
In Favor | | | 132,671,281 | |
Withheld | | | 512,233 | |
Proposal 2: To approve the replacement of the fundamental investment objective for the Mid Cap Growth Fund with a new fundamental investment objective. The special meeting was adjourned because the proposal did not receive enough shareholder votes to pass.
The results of the voting were as follows:
| | | | |
| | | Votes Received
(Amounts in
thousands) | |
For | | | 13,083 | |
Against | | | 326 | |
Abstain | | | 229 | |
Broker Non Votes | | | 15,311 | |
The new fundamental investment objective was approved by shareholders of the Fund when the special meeting reconvened on July 23, 2014.
The results of the voting were as follows:
| | | | |
| | | Votes Received
(Amounts in
thousands) | |
For | | | 39,826 | |
Against | | | 593 | |
Abstain | | | 529 | |
Broker Non Votes | | | 12,639 | |
| | | | | | | | |
| | | |
| DECEMBER 31, 2014 | | J.P. MORGAN MID CAP/MULTI-CAP FUNDS | | | | | 87 | |
BOARD APPROVAL OF INVESTMENT ADVISORY AGREEMENTS
(Unaudited)
The Board of Trustees has established various standing committees, composed of Trustees with diverse backgrounds, to which the Board of Trustees has assigned specific subject matter responsibilities to further enhance the effectiveness of the Board’s oversight and decision making. The Board of Trustees and its investment committees (money market and alternative products, equity, and fixed income) meet regularly throughout the year and consider factors that are relevant to their annual consideration of investment advisory agreements at each meeting. They also meet for the specific purpose of considering investment advisory agreement annual renewals. The Board of Trustees held meetings in person in June and August 2014, at which the Trustees considered the continuation of the investment advisory agreements for each of the Funds whose semi-annual report is contained herein (each an “Advisory Agreement” and collectively, the “Advisory Agreements”). At the June meeting, the Board’s investment committees met to review and consider performance, expense and related information for the J.P. Morgan Funds. Each investment committee reported to the full Board, which then considered the investment committee’s preliminary findings. At the August meeting, the Trustees continued their review and consideration. The Trustees, including a majority of the Trustees who are not “interested persons” (as defined in the 1940 Act) of any party to the Advisory Agreements or any of their affiliates, approved the continuation of each Advisory Agreement on August 20, 2014.
As part of their review of the Advisory Agreements, the Trustees considered and reviewed performance and other information about the Funds received from the Adviser. This information includes the Funds’ performance as compared to the performance of their peers and benchmarks and analyses by the Adviser of the Funds’ performance. In addition, the Trustees have engaged an independent management consulting firm (“independent consultant”) to report on the performance of certain J.P. Morgan Funds at each of the Trustees’ regular meetings. The Adviser also periodically provides comparative information regarding the Funds’ expense ratios and those of their peer groups. In addition, in preparation for the June and August meetings, the Trustees requested, received and evaluated extensive materials from the Adviser, including, performance and expense information compiled by Lipper Inc. (“Lipper”), an independent provider of investment company data. The Trustees’ independent consultant also provided additional analyses of the performance of the Funds in connection with the Trustees’ review of the Advisory Agreements. Before voting on the proposed Advisory Agreements, the Trustees reviewed the proposed Advisory Agreements with representatives of the Adviser, counsel to the Trusts and independent legal counsel and received a memorandum from independent legal counsel to the Trustees discussing the legal standards for their consideration of the proposed Advisory Agreements. The Trustees also discussed the proposed Advisory Agreements in
executive session with independent legal counsel at which no representatives of the Adviser were present. Set forth below is a summary of the material factors evaluated by the Trustees in determining whether to approve each Advisory Agreement.
The Trustees considered information provided with respect to the Funds over the course of the year. Each Trustee attributed different weights to the various factors, and no factor alone was considered determinative. From year to year, the Trustees consider and place emphasis on relevant information in light of changing circumstances in market and economic conditions. The Trustees determined that the compensation to be received by the Adviser from each Fund under the applicable Advisory Agreement was fair and reasonable and that the continuance of each Advisory Agreement was in the best interests of each Fund and its shareholders.
The factors summarized below were considered and discussed by the Trustees in reaching their conclusions:
Nature, Extent and Quality of Services Provided by the Adviser
The Trustees received and considered information regarding the nature, extent and quality of the services provided to each Fund under the Advisory Agreement. The Trustees took into account information furnished throughout the year at Trustee meetings, as well as the materials furnished specifically in connection with this annual review process. The Trustees considered the background and experience of the Adviser’s senior management and the expertise of, and the amount of attention given to each Fund by, investment personnel of the Adviser. In addition, the Trustees reviewed the qualifications, backgrounds and responsibilities of the portfolio management team primarily responsible for the day-to-day management of each Fund and the infrastructure supporting the team. The Trustees also considered information provided by the Adviser and JPMorgan Distribution Services, Inc. (“JPMDS”) about the structure and distribution strategy of each Fund. The Trustees reviewed information relating to the Adviser’s risk governance model and reports showing the Adviser’s compliance structure and ongoing compliance processes. The Trustees also considered the quality of the administrative services provided by JPMorgan Funds Management, Inc. (“JPMFM”), an affiliate of the Adviser.
The Trustees also considered their knowledge of the nature and quality of the services provided by the Adviser and its affiliates to the Funds gained from their experience as Trustees of the J.P. Morgan Funds. In addition, they considered the overall reputation and capabilities of the Adviser and its affiliates, the commitment of the Adviser to provide high quality service to the Funds, their overall confidence in the Adviser’s integrity and the Adviser’s responsiveness to questions or concerns raised by them, including the Adviser’s willingness to consider and implement organizational and operational changes designed to improve investment results and the services provided to each Fund.
| | | | | | |
| | | |
| 88 | | | | J.P. MORGAN MID CAP/MULTI-CAP FUNDS | | DECEMBER 31, 2014 |
Based upon these considerations and other factors, the Trustees concluded that they were satisfied with the nature, extent and quality of the investment advisory services provided to the Funds by the Adviser.
Costs of Services Provided and Profitability to the Adviser and its Affiliates
The Trustees received and considered information regarding the profitability to the Adviser and its affiliates in providing services to each of the Funds. The Trustees reviewed and discussed this data. The Trustees recognized that this data is not audited and represents the Adviser’s determination of its and its affiliates’ revenues from the contractual services provided to the Funds, less expenses of providing such services. Expenses include direct and indirect costs and are calculated using an allocation methodology developed by the Adviser. The Trustees also recognized that it is difficult to make comparisons of profitability from fund investment advisory contracts because comparative information is not generally publicly available and is affected by numerous factors, including the structure of the particular adviser, the types of funds it manages, its business mix, numerous assumptions regarding allocations and the fact that publicly-traded fund managers’ operating profits and net income are net of distribution and marketing expenses. Based on their review, the Trustees concluded that the profitability to the Adviser under each of the Advisory Agreements was not unreasonable in light of the services and benefits provided to each Fund.
Fall-Out Benefits
The Trustees reviewed information regarding potential “fallout” or ancillary benefits received by the Adviser and its affiliates as a result of their relationship with the Funds. The Trustees also reviewed the Adviser’s allocation of fund brokerage for the J.P. Morgan Funds complex, including allocations to brokers who provide research to the Adviser.
The Trustees also considered that JPMFM and JPMDS, affiliates of the Adviser, earn fees from the Funds for providing administrative and shareholder services. These fees were shown separately in the profitability analysis presented to the Trustees. The Trustees also considered the payments of Rule 12b-1 fees to JPMDS, which also acts as the Funds’ distributor and that these fees are in turn generally paid to financial intermediaries that sell the Funds, including financial intermediaries that are affiliates of the Adviser. The Trustees also considered the fees paid to JPMorgan Chase Bank, N.A. (“JPMCB”) for custody and fund accounting, and other related services.
Economies of Scale
The Trustees considered the extent to which the Funds benefit from economies of scale. The Trustees noted that the proposed investment advisory fee schedule for each Fund does not
contain breakpoints, but that the fee schedule for the
administrative services provided by JPMFM does include a fee breakpoint, which is tied to the overall level of non-money market fund assets excluding certain funds-of-funds, as applicable, advised by the Adviser, and that the Funds benefit from that breakpoint. The Trustees also noted that the Adviser and its affiliates have implemented fee waivers and expense limitations. The Trustees considered whether it would be appropriate to add advisory fee breakpoints, and the Trustees concluded that the current fee structure was reasonable in light of the fee waivers and expense limitations that the Adviser and its affiliates have in place that serve to limit the overall net expense ratios of the Fund at competitive levels. The Trustees concluded that shareholders of the Funds effectively participated in the economies of scale through these fee waivers and expense limitations and administrative service fee breakpoints.
Independent Written Evaluation of the Funds’ Senior/Chief Compliance Officer
The Trustees noted that, upon their direction, the Senior Officer for the Mid Cap Growth Fund, Mid Cap Value Fund and Multi-Cap Market Neutral Fund had prepared an independent written evaluation in order to assist the Trustees in determining the reasonableness of the proposed management fees. In determining whether to continue the Advisory Agreements, the Trustees considered the Senior Officer’s report.
The Trustees noted that, upon their direction, the Chief Compliance Officer for the Growth Advantage Fund, Mid Cap Equity Fund, and Value Advantage Fund had prepared an independent written evaluation in order to assist the Trustees in determining the reasonableness of the proposed management fees. The Trustees considered the written evaluation in determining whether to continue the Advisory Agreements.
Fees Relative to Adviser’s Other Clients
The Trustees received and considered information about the nature and extent of investment advisory services and fee rates offered to other clients of the Adviser for investment management styles substantially similar to that of each Fund. The Trustees also considered the complexity of investment management for the Funds relative to the Adviser’s other clients and the differences in the nature and extent of the services provided to the different clients. The Trustees concluded that the fee rates charged to each Fund in comparison to those charged to the Adviser’s other clients were reasonable.
Investment Performance
The Trustees received and considered absolute and/or relative performance for the Funds in a report prepared by Lipper. The Trustees considered the total return performance information, which included the ranking of the Funds within a performance universe made up of funds with the same Lipper investment
| | | | | | | | |
| | | |
| DECEMBER 31, 2014 | | J.P. MORGAN MID CAP/MULTI-CAP FUNDS | | | | | 89 | |
BOARD APPROVAL OF INVESTMENT ADVISORY AGREEMENTS
(Unaudited) (continued)
classification and objective (the “Universe Group”) by total return for applicable one-, three- and five-year periods. The Trustees reviewed a description of Lipper’s methodology for selecting mutual funds in each Fund’s Universe Group. The Lipper materials provided to the Trustees highlighted information with respect to certain representative classes to assist the Trustees in their review. As part of this review, the Trustees also reviewed each Fund’s performance against its benchmark and considered the performance information provided for the Funds at regular Board meetings by the Adviser and the Trustees’ independent consultant and also considered the special analysis prepared by the Trustees’ independent consultant. The Lipper performance data noted by the Trustees as part of their review and the determinations made by the Trustees with respect to each Fund’s performance for certain representative classes are summarized below:
The Trustees noted that the Growth Advantage Fund’s performance was in the first, first, and second quintiles for both Class A and Select Class shares for the one-, three- and five year periods ended December 31, 2013, respectively, and that the Trustees’ independent consultant indicated that the Fund’s overall performance was attractive. The Trustees discussed the performance and investment strategy of the Fund with the Adviser and, based upon this discussion and various other factors, concluded that the performance was reasonable.
The Trustees noted that the Mid Cap Equity Fund’s performance was in the third and first quintiles for Class A shares for the one- and three year periods ended December 31, 2013, respectively and in the second, first and third quintiles for Select Class shares for the one-, three-, and five-year periods ended December 31, 2013, respectively and that the Trustees’ independent consultant indicated that overall performance was attractive. The Trustees discussed the performance and investment strategy of the Fund with the Adviser and, based upon this discussion and various other factors, concluded that the performance was reasonable.
The Trustees noted that the Mid Cap Growth Fund’s performance was in the first, second and second quintiles for both Class A and Select Class shares for the one-, three-, and five-year periods ended December 31, 2013, respectively, and that the Trustees’ independent consultant indicated that overall performance was satisfactory. The Trustees discussed the performance and investment strategy of the Fund with the Adviser and, based upon this discussion and various other factors, concluded that the performance was reasonable.
The Trustees noted that the Mid Cap Value Fund’s performance was in the fourth, first, and second quintiles for Class A shares and in the fourth, first, and first quintiles for Select Class shares for the one-, three-, and five-year periods ended December 31, 2013, respectively and that the Trustees’ independent consultant indicated that the Fund’s overall performance was
attractive. The Trustees discussed the performance and investment strategy of the Fund with the Adviser and, based upon this discussion and various other factors, concluded that they were satisfied with the Adviser’s analysis of the Fund’s performance.
The Trustees noted that the Multi-Cap Market Neutral Fund’s performance was in the second, third and fourth quintiles for both Class A and Select Class shares for the one-, three-, and five-year periods ended December 31, 2013, respectively, and that the Trustees’ independent consultant indicated that the overall performance was satisfactory. The Trustees discussed the performance and investment strategy of the Fund with the Adviser and, based upon this discussion and various other factors, concluded that they were satisfied with the Adviser’s analysis of the Fund’s performance.
The Trustees noted that the Value Advantage Fund’s performance was in the fourth, second, and second quintiles for Class A shares and in the third, first, and first quintiles for Select Class shares for the one-, three-, and five-year periods ended December 31, 2013, respectively and that the Trustees’ independent consultant indicated that overall performance was attractive. The Trustees discussed the performance and investment strategy of the Fund with the Adviser and, based upon this discussion and various other factors, concluded that they were satisfied with the Adviser’s analysis of the Fund’s performance.
Advisory Fees and Expense Ratios
The Trustees considered the contractual advisory fee rate paid by each Fund to the Adviser and compared that rate to the information prepared by Lipper concerning management fee rates paid by other funds in the same Lipper category as each Fund. The Trustees recognized that Lipper reported each Fund’s management fee rate as the combined contractual advisory fee and administration fee rates. The Trustees also reviewed information about other expenses and the expense ratios for each Fund. The Trustees considered the fee waiver and/or expense reimbursement arrangements currently in place for each Fund and considered the net advisory fee rate after taking into account any waivers and/or reimbursements. The Trustees recognized that it is difficult to make comparisons of advisory fees because there are variations in the services that are included in the fees paid by other funds. The Trustees’ determinations as a result of the review of each Fund’s advisory fees and expense ratios for certain representative classes are summarized below:
The Trustees noted that the Growth Advantage Fund’s net advisory fee and actual total expenses for both Class A and Select Class shares were in the third and fourth quintiles, respectively, of the Universe Group After considering the factors identified above, in light of this information, the Trustees concluded that the advisory fees were reasonable.
| | | | | | |
| | | |
| 90 | | | | J.P. MORGAN MID CAP/MULTI-CAP FUNDS | | DECEMBER 31, 2014 |
The Trustees noted that the Mid Cap Equity Fund’s net advisory fee for Class A and Select Class shares was in the first and second quintiles, respectively, and that the actual total expenses for both Class A and Select Class shares were in the second quintile of the Universe Group. After considering the factors identified above, in light of this information, the Trustees concluded that the advisory fees were reasonable.
The Trustees noted that the Mid Cap Growth Fund’s net advisory fee for both Class A and Select Class shares was in the first quintile, and that the actual total expenses for both Class A and Select Class shares were in the second quintile of the Universe Group. After considering the factors identified above, in light of this information, the Trustees concluded that the advisory fee was reasonable.
The Trustees noted that the Mid Cap Value Fund’s net advisory fee and actual total expenses for both Class A and Select Class shares were in the third quintile of the Universe Group. After
considering the factors identified above, in light of this information, the Trustees concluded that the advisory fees were reasonable.
The Trustees noted that the Multi-Cap Market Neutral Fund’s net advisory fee for both Class A and Select Class shares was in the fourth quintile, and that the actual total expenses for Class A and Select Class shares were in the second and third quintile of their Universe Group. After considering the factors identified above, in light of this information, the Trustees concluded that the advisory fee was reasonable.
The Trustees noted that the Value Advantage Fund’s net advisory fee for Class A and Select Class shares was in the third and second quintiles, respectively, and that the actual total expenses for both Class A and Select Class shares were in the third quintile of their Universe Group. After considering the factors identified above, in light of this information, the Trustees concluded that the advisory fees were reasonable.
| | | | | | | | |
| | | |
| DECEMBER 31, 2014 | | J.P. MORGAN MID CAP/MULTI-CAP FUNDS | | | | | 91 | |
J.P. Morgan Funds are distributed by JPMorgan Distribution Services, Inc., which is an affiliate of JPMorgan Chase & Co. Affiliates of JPMorgan Chase & Co. receive fees for providing various services to the funds.
Contact JPMorgan Distribution Services, Inc. at 1-800-480-4111 for a fund prospectus. You can also visit us at www.jpmorganfunds.com. Investors should carefully consider the investment objectives and risk as well as charges and expenses of the mutual fund before investing. The prospectus contains this and other information about the mutual fund. Read the prospectus carefully before investing.
Investors may obtain information about the Securities Investor Protection Corporation (SIPC), including the SIPC brochure by visiting www.sipc.org or by calling SIPC at 202-371-8300.
Each Fund files a complete schedule of its fund holdings for the first and third quarters of its fiscal year with the SEC on Form N-Q. The Funds’ Forms N-Q are available on the SEC’s website at http://www.sec.gov and may be reviewed and copied at the SEC’s Public Reference Room in Washington, DC. Information on the operation of the SEC’s Public Reference Room may be obtained by calling 1-800-SEC-0330. Shareholders may request the Form N-Q without charge by calling 1-800-480-4111 or by visiting the J.P. Morgan Funds’ website at www.jpmorganfunds.com.
A description of each Fund’s policies and procedures with respect to the disclosure of each Fund’s holdings is available in the prospectus and Statement of Additional Information.
A copy of proxy policies and procedures is available without charge upon request by calling 1-800-480-4111 and on the Funds’ website at www.jpmorganfunds.com. A description of such policies and procedures is on the SEC’s website at www.sec.gov. The Trustees have delegated the authority to vote proxies for securities owned by the Funds to the Adviser. A copy of the Funds’ voting record for the most recent 12-month period ended June 30 is available on the SEC’s website at www.sec.gov or at the Funds’ website at www.jpmorganfunds.com no later than August 31 of each year. The Funds’ proxy voting record will include, among other things, a brief description of the matter voted on for each fund security, and will state how each vote was cast, for example, for or against the proposal.

J.P. Morgan Asset Management is the marketing name for the asset management business of JPMorgan Chase & Co. Those businesses include, but are not limited to, J.P. Morgan Investment Management Inc., Security Capital Research & Management Incorporated and J.P. Morgan Alternative Asset Management, Inc.
| | | | |
| | © JPMorgan Chase & Co., 2015. All rights reserved. December 2014. | | SAN-MC-1214 |
Semi-Annual Report
J.P. Morgan Large Cap Funds
December 31, 2014 (Unaudited)
JPMorgan Disciplined Equity Fund
JPMorgan Dynamic Growth Fund
JPMorgan Equity Focus Fund
JPMorgan Equity Income Fund
JPMorgan Growth and Income Fund
JPMorgan Hedged Equity Fund
JPMorgan Large Cap Growth Fund
JPMorgan Large Cap Value Fund
JPMorgan U.S. Equity Fund

CONTENTS
Investments in a Fund are not bank deposits or obligations of, or guaranteed or endorsed by, any bank and are not insured or guaranteed by the FDIC, the Federal Reserve Board or any other government agency. You could lose money if you sell when the Fund’s share price is lower than when you invested.
Past performance is no guarantee of future performance. The general market views expressed in this report are opinions based on market and other conditions through the end of the reporting period and are subject to change without notice. These views are not intended to predict the future performance of a Fund or the securities markets. References to specific securities and their issuers are for illustrative purposes only and are not intended to be, and should not be interpreted as, recommendations to purchase or sell such securities. Such views are not meant as investment advice and may not be relied on as an indication of trading intent on behalf of any Fund.
Prospective investors should refer to the Funds’ prospectus for a discussion of the Funds’ investment objectives, strategies and risks. Call J.P. Morgan Funds Service Center at 1-800-480-4111 for a prospectus containing more complete information about a Fund, including management fees and other expenses. Please read it carefully before investing.
CEO’S LETTER
JANUARY 11, 2015 (Unaudited)
Dear Shareholder,
A growing divergence in the economic trajectories of U.S. and other developed markets and plummeting global energy prices provided a mixed backdrop for the latter half of 2014. The U.S. economy accelerated at a steady pace amid continued strength in corporate earnings, gains in employment and consumer spending and falling oil prices for the six months ended December 31, 2014. Gross domestic product (GDP) in the U.S. climbed by 5.0% in the third quarter of 2014 and unemployment dropped to 5.6% in December, a level not seen since June 2008.
| | |
 | | “Amid uncertainty about the global economy recovery, equity markets in the U.S., China and Japan provided investors with solid returns and served to emphasize the prudence of holding a broadly diversified portfolio and a long-term outlook.” |
In response to the continued improvement in the domestic economy, the U.S. Federal Reserve Bank proceeded to taper down its monthly purchases of bonds under its quantitative easing program and finally closed the program in October.
In stark contrast, the European Central Bank (ECB) took unprecedented steps to counter the threat of price deflation in the euro zone and the Bank of Japan stunned markets with a massive stimulus program as Japan’s economy slid into recession.
Another key development in the latter half of 2014 was a precipitous drop in global petroleum prices. A supply glut driven by new production in the U.S. and increased output from other nations, along with decreasing demand from China, Europe and Japan led to a 50% drop in the price of crude oil between July and December.
Amid this backdrop, U.S. equity markets outperformed most other assets classes over the six month period, with large cap stocks providing better returns than small caps and defensive sectors overtaking cyclical sectors. Notably, U.S. equities fell to six-month lows in mid October only to rebound 8.4%, driving the Standard & Poor’s 500 Index (“S&P 500”) to a new closing high of 2,018.05 points on October 31, 2014. In December, the Dow Jones Industrial Average closed above 18,000 points for the first time following the news that third quarter GDP showed the fastest growth in 11 years. The S&P 500 closed at a new high of 2,090.57 points on December 29, 2014, and returned 6.1% for the six months ended December 31, 2014.
Prices for U.S. Treasury securities with longer maturities rose during the six month period as investors sought safe havens amid deteriorating energy prices and geopolitical concerns. While declining oil prices helped bolster consumer spending in developed nations, energy related sectors came under pressure
and yield spreads on high-yield debt — also known as junk bonds — widened. Nations dependent on oil exports experienced volatility in bond yield spreads and currency valuations.
Meanwhile, weak growth in the euro zone raised concerns about the potential for a destructive deflationary spiral. Even after the ECB had cut its deposit rate to negative 0.1% to encourage banks to extend lending by effectively charging them for parking excess cash with the central bank, growth remained tepid and inflation was well below the ECB’s target of just below 2%. The inflation rate averaged 0.4% from July to October and then fell 0.3% in November and was estimated at -0.2% for December. Unemployment across the euro zone remained stubbornly high at 11.5%.
Japan’s economy retreated into recession during the six month period following two quarters of economic contraction, partly attributed to an increase in the national consumption tax earlier in the year. Responding to the crisis, the Bank of Japan surprised global markets on October 31 by unveiling plans to buy 8 trillion to 12 trillion yen ($71 billion to $107 billion) of Japanese government bonds per month, while also tripling its purchases of exchange-traded funds. The announcement drove Tokyo stocks to seven-year highs. For the six months ended December 31, 2014, the MSCI Europe, Australasia and Far East Index returned -9.2%.
Elsewhere, China’s economy continued to grow but at a slower pace for the six month period. At 7.3%, China’s GDP showed the slowest growth in five years, though it was slightly better than economists had expected. The weaker GDP growth was partly attributed to a slowdown in the property sector. However, Chinese equity securities performed well over the six months ended December 31, 2014, amid expectations that policy makers may ease monetary policy to spur growth. Chinese equity markets received an additional boost when regulators increased access to Chinese financial markets by allowing foreign investors in Hong Kong to buy shares in Shanghai.
Russia’s economy, already straining under Western economic sanctions following its annexation of Crimea, began sliding toward recession as prices plummeted for oil and natural gas, its biggest exports. In response, the Russian Central Bank spent heavily from its reserves and raised its key interest rate sharply in a largely unsuccessful effort to halt the ruble’s slide. The MSCI Emerging Markets Index returned -7.7% for the six months ended December 31, 2014.
During the six month period, financial market volatility returned after being largely absent in the first half of 2014. Meanwhile, economic growth outside the U.S. began to falter and the relative strength of the U.S. economy drove the dollar higher against other major currencies. Amid uncertainty about the global economy recovery, equity markets in the U.S., China and Japan provided investors with solid returns and served to emphasize the prudence of holding a broadly diversified portfolio and a long-term outlook.
| | | | | | | | |
| | | |
| DECEMBER 31, 2014 | | J.P. MORGAN LARGE CAP FUNDS | | | | | 1 | |
CEO’S LETTER
(continued)
On behalf of everyone at J.P. Morgan Asset Management, thank you for your continued support. We look forward to managing your investment needs for years to come. Should you have any questions, please visit www.jpmorganfunds.com or contact the J.P. Morgan Funds Service Center at 1-800-480-4111.
Sincerely yours,

George C.W. Gatch
CEO, Global Funds Management
J.P. Morgan Asset Management
| | | | | | |
| | | |
| 2 | | | | J.P. MORGAN LARGE CAP FUNDS | | DECEMBER 31, 2014 |
J.P. Morgan Large Cap Funds
MARKET OVERVIEW
SIX MONTHS ENDED DECEMBER 31, 2014 (Unaudited)
U.S equity markets performed strongly during the six month reporting period amid accommodative central bank policies, falling energy prices and steady overall improvement in the U.S. economy. While the second half of 2014 was marked by the return of volatility in financial markets and a sharp sell-off in mid-October, key U.S. equity indexes rebounded to closing highs in the final months of 2014. The Standard & Poor’s 500 Index (“S&P 500”) Index broke through the 2,000-point closing level for the first time on the final day of October and hit new closing highs in the final weeks of December. Also in late December, the Dow Jones Industrial Average closed above 18,000 points for the first time.
Overall, U.S. large cap stocks outperformed small cap stocks and growth stocks outperformed value stocks during the reporting period. For the six months ended December 31, 2014, the S&P 500 returned 6.12%, while the Russell 1000 Index returned 5.57%, the Russell 1000 Growth Index returned 6.34% and the Russell 1000 Value Index returned 4.78%.
| | | | | | | | |
| | | |
| DECEMBER 31, 2014 | | J.P. MORGAN LARGE CAP FUNDS | | | | | 3 | |
JPMorgan Disciplined Equity Fund
FUND COMMENTARY
SIX MONTHS ENDED DECEMBER 31, 2014 (Unaudited)
| | | | |
| REPORTING PERIOD RETURN: | |
| Fund (Institutional Class Shares)* | | | 6.89% | |
| S&P 500 Index | | | 6.12% | |
| |
| Net Assets as of 12/31/2014 (In Thousands) | | $ | 5,451,733 | |
INVESTMENT OBJECTIVE**
The JPMorgan Disciplined Equity Fund (the “Fund”) seeks to provide a consistently high total return from a broadly diversified portfolio of equity securities with risk characteristics similar to the Standard and Poor’s 500 Index (the “S&P 500 Index”).
WHAT WERE THE MAIN DRIVERS OF THE FUND’S PERFORMANCE?
The Fund’s Institutional Class Shares outperformed the S&P 500 Index (the “Benchmark”) for the six months ended December 31, 2014. The Fund’s security selection in the consumer cyclical and retail sectors was a leading contributor to performance relative to the Benchmark, while security selection in the energy and pharmaceutical/medical technology sectors was a leading detractor from relative performance.
Leading individual contributors to relative performance included the Fund’s overweight positions in Royal Caribbean Cruises Ltd., Lowe’s Cos. and United Continental Holdings Inc. Shares of Royal Caribbean, a cruise ship operator, rose on solid quarterly earnings amid increased bookings for its Asia and Europe cruises. Share of Lowe’s, a home improvement retail chain, strengthened on better-than-expected quarterly sales. Shares of United Continental, owner/operator of United Airlines, which was not held in the Benchmark, rose on strong fundamentals across the airline sector, including strong consumer spending and falling fuel prices.
Leading individual detractors from relative performance included the Fund’s overweight position in Fluor Corp. and Johnson & Johnson and its underweight position in Gilead Sciences Inc. Shares of Fluor, an engineering and construction services company, fell on expectations of lower earnings. Shares of Johnson & Johnson, a maker of consumer health care products, declined amid investor disappointment with earnings results. Shares of Gilead, a biopharmaceuticals company, rose on the prospects for Sovaldi, the company’s drug for the treatment of Hepatitis C.
HOW WAS THE FUND POSITIONED?
The Fund’s portfolio managers attempted to construct the portfolio so that stock selection was the principal source of
potential excess return. The Fund’s portfolio managers sought investment opportunities in companies that they believed were attractive based on valuation and strong fundamentals.
| | | | | | | | |
| TOP TEN EQUITY HOLDINGS OF THE PORTFOLIO*** | |
| | 1. | | | Apple, Inc. | | | 4.0 | % |
| | 2. | | | Johnson & Johnson | | | 3.4 | |
| | 3. | | | United Technologies Corp. | | | 2.5 | |
| | 4. | | | Morgan Stanley | | | 2.3 | |
| | 5. | | | Microsoft Corp. | | | 2.1 | |
| | 6. | | | Lowe’s Cos., Inc. | | | 2.1 | |
| | 7. | | | Biogen Idec, Inc. | | | 2.0 | |
| | 8. | | | Lam Research Corp. | | | 1.9 | |
| | 9. | | | Invesco Ltd. | | | 1.9 | |
| | 10. | | | Boston Scientific Corp. | | | 1.7 | |
| | | | |
PORTFOLIO COMPOSITION BY SECTOR*** | |
| Information Technology | | | 17.6 | % |
| Financials | | | 16.4 | |
| Consumer Discretionary | | | 15.4 | |
| Health Care | | | 14.9 | |
| Industrials | | | 9.4 | |
| Energy | | | 7.9 | |
| Consumer Staples | | | 5.3 | |
| Materials | | | 4.1 | |
| Utilities | | | 4.0 | |
| Telecommunication Services | | | 1.1 | |
| Short-Term Investments | | | 3.9 | |
| * | | The return shown is based on net asset values calculated for shareholder transactions and may differ from the return shown in the financial highlights, which reflects adjustments made to the net asset values in accordance with accounting principles generally accepted in the United States of America. |
| ** | | The adviser seeks to achieve the Fund’s objective. There can be no guarantee it will be achieved. |
| *** | | Percentages indicated are based on total investments as of December 31, 2014. The Fund’s portfolio composition is subject to change. |
| | | | | | |
| | | |
| 4 | | | | J.P. MORGAN LARGE CAP FUNDS | | DECEMBER 31, 2014 |
| | | | | | | | | | | | | | | | | | |
AVERAGE ANNUAL TOTAL RETURNS AS OF DECEMBER 31, 2014 | |
| | | | | |
| | | INCEPTION DATE OF
CLASS | | 6 MONTH* | | | 1 YEAR | | | 5 YEAR | | | 10 YEAR | |
CLASS A SHARES | | September 28, 2001 | | | | | | | | | | | | | | | | |
Without Sales Charge | | | | | 6.64 | % | | | 15.29 | % | | | 15.77 | % | | | 7.91 | % |
With Sales Charge** | | | | | 1.06 | | | | 9.25 | | | | 14.54 | | | | 7.33 | |
CLASS R6 SHARES | | March 24, 2003 | | | 6.93 | | | | 15.84 | | | | 16.36 | | | | 8.45 | |
INSTITUTIONAL CLASS SHARES | | January 3, 1997 | | | 6.89 | | | | 15.74 | | | | 16.26 | | | | 8.36 | |
SELECT CLASS SHARES | | September 10, 2001 | | | 6.77 | | | | 15.51 | | | | 16.08 | | | | 8.18 | |
| ** | | Sales Charge for Class A Shares is 5.25%. |
TEN YEAR PERFORMANCE (12/31/04 TO 12/31/14)
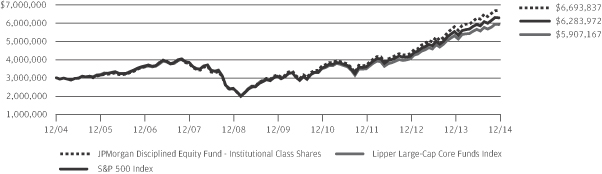
The performance quoted is past performance and is not a guarantee of future results. Mutual funds are subject to certain market risks. Investment returns and principal value of an investment will fluctuate so that an investor’s shares, when redeemed, may be worth more or less than their original cost. Current performance may be higher or lower than the performance data shown. For up-to-date month-end performance information please call 1-800-480-4111.
The graph illustrates comparative performance for $3,000,000 invested in Institutional Class Shares of the JPMorgan Disciplined Equity Fund, the S&P 500 Index and the Lipper Large-Cap Core Funds Index from December 31, 2004 to December 31, 2014. The performance of the Fund assumes reinvestment of all dividends and capital gain distributions, if any, and does not include a sales charge. The performance of the S&P 500 Index does not reflect the deduction of expenses or a sales charge associated with a mutual fund and has been adjusted to reflect reinvestment of all dividends and capital gain distributions of the securities included in the benchmark, if applicable. The performance of the Lipper Large-Cap Core Funds Index includes expenses associated with a mutual
fund, such as investment management fees. These expenses are not identical to the expenses incurred by the Fund. The S&P 500 Index is an unmanaged index generally representative of the performance of large companies in the U.S. stock market. The Lipper Large-Cap Core Funds Index is an index based on the total returns of certain mutual funds within the Fund’s designated category as determined by Lipper, Inc. Investors cannot invest directly in an index.
Institutional Class Shares have a $3,000,000 minimum initial investment.
Fund performance may reflect the waiver of the Fund’s fees and reimbursement of expenses for certain periods since the inception date. Without these waivers and reimbursements, performance would have been lower. Also, performance shown in this section does not reflect the deduction of taxes that a shareholder would pay on Fund distributions or redemption of Fund shares.
The returns shown are based on net asset values calculated for shareholder transactions and may differ from the returns shown in the financial highlights, which reflect adjustments made to the net asset values in accordance with accounting principles generally accepted in the United States of America.
| | | | | | | | |
| | | |
| DECEMBER 31, 2014 | | J.P. MORGAN LARGE CAP FUNDS | | | | | 5 | |
JPMorgan Dynamic Growth Fund
FUND COMMENTARY
SIX MONTHS ENDED DECEMBER 31, 2014 (Unaudited)
| | | | |
| REPORTING PERIOD RETURN: | |
| Fund (Select Class Shares)* | | | 2.25% | |
| Russell 1000 Growth Index | | | 6.34% | |
| |
| Net Assets as of 12/31/2014 (In Thousands) | | $ | 328,456 | |
INVESTMENT OBJECTIVE**
The JPMorgan Dynamic Growth Fund (the “Fund”) seeks long-term capital growth.
WHAT WERE THE MAIN DRIVERS OF THE FUND’S PERFORMANCE?
The Fund (Select Class Shares) underperformed the Russell 1000 Growth Index (the “Benchmark”) for the six months ended December 31, 2014. The Fund’s security selection in the consumer discretionary and technology sectors was a leading detractor from performance relative to the Benchmark, while security selection in the consumer staples and financial services sectors was a leading contributor to relative performance.
Leading individual detractors from relative performance included the Fund’s overweight positions in Schlumberger Ltd. and Salix Pharmaceuticals Inc., and its underweight position in Apple Inc. Shares of Schlumberger, an oilfield services company, declined amid falling global oil prices. Shares of Salix Pharmaceuticals, a drug maker focused on gastrointestinal disorders, fell amid a backup in inventory of its key products. Shares of Apple, a maker of mobile devices and computers, performed strongly on better-than-expected earnings and revenue, driven by sales of its iPhone and other products.
Leading individual contributors to relative performance included the Fund’s overweight positions in CVS Health Corp., Gilead Sciences Inc. and Celgene Corp. Shares of CVS, a pharmacy and retail chain, rose on the strength of its integrated retail/pharmacy benefit operations, as well as its joint venture with Cardinal Health Inc. Shares of Gilead, a biopharmaceuticals company, rose on the sales prospects for Sovaldi, the company’s drug for the treatment of Hepatitis C. Shares of Celgene, a biopharmaceutical company, rose on positive results from clinical trials of its Crohn’s disease treatment.
HOW WAS THE FUND POSITIONED?
The Fund’s portfolio managers utilized a bottom-up approach to stock selection, researching individual companies in an effort
to construct portfolios of stocks that have strong fundamentals and positive price momentum. The Fund’s portfolio managers sought to invest in companies with attractive fundamentals that, in their view, possessed the potential to significantly exceed expectations for a prolonged period of time.
| | | | | | | | |
| TOP TEN EQUITY HOLDINGS OF THE PORTFOLIO*** | |
| | 1. | | | Google, Inc., Class A | | | 5.7 | % |
| | 2. | | | Facebook, Inc., Class A | | | 5.7 | |
| | 3. | | | Kansas City Southern | | | 4.8 | |
| | 4. | | | MasterCard, Inc., Class A | | | 4.7 | |
| | 5. | | | TD Ameritrade Holding Corp. | | | 4.4 | |
| | 6. | | | CVS Health Corp. | | | 4.1 | |
| | 7. | | | Priceline Group, Inc. (The) | | | 4.1 | |
| | 8. | | | Gilead Sciences, Inc. | | | 3.8 | |
| | 9. | | | Alliance Data Systems Corp. | | | 3.2 | |
| | 10. | | | Celgene Corp. | | | 3.0 | |
| | | | |
PORTFOLIO COMPOSITION BY SECTOR*** | |
| Information Technology | | | 35.6 | % |
| Health Care | | | 18.2 | |
| Consumer Discretionary | | | 17.0 | |
| Industrials | | | 7.2 | |
| Financials | | | 7.2 | |
| Energy | | | 4.5 | |
| Consumer Staples | | | 4.1 | |
| Materials | | | 3.0 | |
| Short-Term Investment | | | 3.2 | |
| * | | The return shown is based on net asset values calculated for shareholder transactions and may differ from the return shown in the financial highlights, which reflects adjustments made to the net asset values in accordance with accounting principles generally accepted in the United States of America. |
| ** | | The adviser seeks to achieve the Fund’s objective. There can be no guarantee it will be achieved. |
| *** | | Percentages are based on total investments as of December 31, 2014. The Fund’s portfolio composition is subject to change. |
| | | | | | |
| | | |
| 6 | | | | J.P. MORGAN LARGE CAP FUNDS | | DECEMBER 31, 2014 |
| | | | | | | | | | | | | | | | | | | | |
AVERAGE ANNUAL TOTAL RETURNS AS OF DECEMBER 31, 2014 | |
| | | | | |
| | | INCEPTION DATE OF
CLASS | | | 6 MONTH* | | | 1 YEAR | | | 5 YEAR | | | SINCE
INCEPTION | |
CLASS A SHARES | | | November 30, 2007 | | | | | | | | | | | | | | | | | |
Without Sales Charge | | | | | | | 2.12 | % | | | 1.11 | % | | | 14.42 | % | | | 7.15 | % |
With Sales Charge** | | | | | | | (3.25 | ) | | | (4.20 | ) | | | 13.20 | | | | 6.34 | |
CLASS C SHARES | | | November 30, 2007 | | | | | | | | | | | | | | | | | |
Without CDSC | | | | | | | 1.89 | | | | 0.63 | | | | 13.84 | | | | 6.62 | |
With CDSC*** | | | | | | | 0.89 | | | | (0.37 | ) | | | 13.84 | | | | 6.62 | |
CLASS R5 SHARES | | | November 30, 2007 | | | | 2.38 | | | | 1.56 | | | | 14.92 | | | | 7.63 | |
SELECT CLASS SHARES | | | November 30, 2007 | | | | 2.25 | | | | 1.38 | | | | 14.69 | | | | 7.41 | |
| ** | | Sales Charge for Class A Shares is 5.25%. |
| *** | | Assumes a 1% CDSC (contingent deferred sales charge) for the one year period and 0% CDSC thereafter. |
LIFE OF FUND PERFORMANCE (11/30/07 TO 12/31/14)
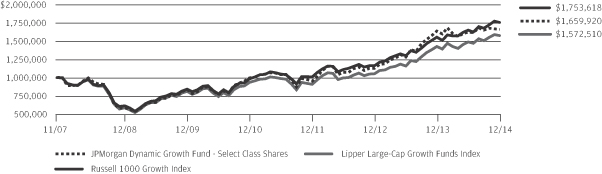
The performance quoted is past performance and is not a guarantee of future results. Mutual funds are subject to certain market risks. Investment returns and principal value of an investment will fluctuate so that an investor’s shares, when redeemed, may be worth more or less than their original cost. Current performance may be higher or lower than the performance data shown. For up-to-date, month-end performance information please call 1-800-480-4111.
The Fund commenced operations on November 30, 2007.
The graph illustrates comparative performance for $1,000,000 invested in Select Class Shares of the JPMorgan Dynamic Growth Fund, the Russell 1000 Growth Index and the Lipper Large-Cap Growth Funds Index from November 30, 2007 to December 31, 2014. The performance of the Fund assumes reinvestment of all dividends and capital gain distributions, if any, and does not include a sales charge. The performance of the Russell 1000 Growth Index does not reflect the deduction of expenses or a sales charge associated with a mutual fund and has been adjusted to reflect reinvestment of all dividends and capital gain distributions of the securities included in the benchmark, if applicable. The performance of the Lipper Large-Cap Growth Funds Index includes expenses associated with a mutual fund, such as investment management fees. These expenses are not identical to the expenses incurred by the
Fund. The Russell 1000 Growth Index is an unmanaged index which measures the performance of those Russell 1000 companies with higher price-to-book ratios and higher forecasted growth values. The Lipper Large-Cap Growth Funds Index is an index based on the total returns of certain mutual funds within the Fund’s designated category as determined by Lipper, Inc. Investors cannot invest directly in an index.
Select Class Shares have a $1,000,000 minimum initial investment.
Subsequent to the inception date of the Fund through August 5, 2010, the Fund did not experience any shareholder activity. If such shareholder activity had occurred, the Fund’s performance may have been impacted.
Fund performance may reflect the waiver of the Fund’s fees and reimbursement of expenses for certain periods since the inception date. Without these waivers and reimbursements, performance would have been lower. Also, performance shown in this section does not reflect the deduction of taxes that a shareholder would pay on Fund distributions or redemption of Fund shares.
The returns shown are based on net asset values calculated for shareholder transactions and may differ from the returns shown in the financial highlights, which reflect adjustments made to the net asset values in accordance with accounting principles generally accepted in the United States of America.
| | | | | | | | |
| | | |
| DECEMBER 31, 2014 | | J.P. MORGAN LARGE CAP FUNDS | | | | | 7 | |
JPMorgan Equity Focus Fund
FUND COMMENTARY
SIX MONTHS ENDED DECEMBER 31, 2014 (Unaudited)
| | | | |
| REPORTING PERIOD RETURN: | |
| Fund (Select Class Shares)* | | | 3.79% | |
| S&P 500 Index | | | 6.12% | |
| |
| Net Assets as of 12/31/2014 (In Thousands) | | $ | 78,864 | |
INVESTMENT OBJECTIVE**
The JPMorgan Equity Focus Fund (the “Fund”) seeks long term capital appreciation.
WHAT WERE THE MAIN DRIVERS OF THE FUND’S PERFORMANCE?
The Fund (Select Class Shares) underperformed the S&P 500 Index (the “Benchmark”) for the six months ended December 31, 2014. The Fund’s security selection in the technology and financial services sectors was a leading detractor from performance relative to the Benchmark, while the Fund’s security selection in the energy and materials & processing sectors was a leading contributor to relative performance.
Leading detractors from relative performance included the Fund’s overweight positions in Google Inc., Salix Pharmaceutical Inc. and Las Vegas Sands Corp. Shares of Google, an Internet search and technology company, fell on weaker-than-expected quarterly results, as well as Mozilla Corp.’s decision to replace Google with Yahoo as its default search engine. Shares of Salix Pharmaceutical, a drug maker focused on gastrointestinal disorders and not held in the Benchmark, declined amid a backup in inventory for its key products. Shares of Las Vegas Sands, a developer of destination resorts and casinos that was not held in the Benchmark, sank amid tighter credit conditions in China and increased regulatory scrutiny, which hurt revenue in the company’s Macau operations.
Leading contributors to relative performance included the Fund’s overweight positions in Gilead Sciences Inc., Kohl’s Corp. and Best Buy Inc. Shares of Gilead, a biopharmaceuticals company, rose on the prospects for Sovaldi, the company’s drug for the treatment of Hepatitis C. Shares of both Kohl’s, a department store chain operator, and Best Buy, a consumer electronics retailer, strengthened on investor expectations for a strong holiday shopping season.
HOW WAS THE FUND POSITIONED?
The Fund’s portfolio managers employed a bottom-up fundamental approach to stock selection. As a result of this approach
to stock selection, the Fund’s largest overweights versus the Benchmark were in the consumer discretionary and financial services sectors. The Fund’s largest underweights versus the Benchmark were in the consumer staples and utilities sectors.
| | | | | | | | |
| TOP TEN EQUITY HOLDINGS OF THE PORTFOLIO*** | |
| | 1. | | | Google, Inc., Class C | | | 5.6 | % |
| | 2. | | | Facebook, Inc., Class A | | | 4.8 | |
| | 3. | | | Kansas City Southern | | | 4.7 | |
| | 4. | | | MasterCard, Inc., Class A | | | 4.2 | |
| | 5. | | | American International Group, Inc. | | | 4.1 | |
| | 6. | | | Wells Fargo & Co. | | | 4.0 | |
| | 7. | | | DISH Network Corp., Class A | | | 4.0 | |
| | 8. | | | Gilead Sciences, Inc. | | | 3.6 | |
| | 9. | | | Priceline Group, Inc. (The) | | | 3.4 | |
| | 10. | | | T. Rowe Price Group, Inc. | | | 3.4 | |
| | | | |
PORTFOLIO COMPOSITION BY SECTOR*** | |
| Financials | | | 23.0 | % |
| Information Technology | | | 18.1 | |
| Consumer Discretionary | | | 17.8 | |
| Health Care | | | 14.0 | |
| Industrials | | | 6.0 | |
| Energy | | | 5.9 | |
| Consumer Staples | | | 4.0 | |
| Materials | | | 3.4 | |
| Utilities | | | 1.5 | |
| Short-Term Investment | | | 6.3 | |
| * | | The return shown is based on net asset values calculated for shareholder transactions and may differ from the return shown in the financial highlights, which reflects adjustments made to the net asset values in accordance with accounting principles generally accepted in the United States of America. |
| ** | | The adviser seeks to achieve the Fund’s objective. There can be no guarantee it will be achieved. |
| *** | | Percentages indicated are based on total investments as of December 31, 2014. The Fund’s portfolio composition is subject to change. |
| | | | | | |
| | | |
| 8 | | | | J.P. MORGAN LARGE CAP FUNDS | | DECEMBER 31, 2014 |
| | | | | | | | | | | | | | | | | | | | |
AVERAGE ANNUAL TOTAL RETURNS AS OF DECEMBER 31, 2014 | |
| | | | | |
| | | INCEPTION DATE OF
CLASS | | | 6 MONTH* | | | 1 YEAR | | | 3 YEAR | | | SINCE
INCEPTION | |
CLASS A SHARES | | | July 29, 2011 | | | | | | | | | | | | | | | | | |
Without Sales Charge | | | | | | | 3.67 | % | | | 7.84 | % | | | 21.08 | % | | | 16.04 | % |
With Sales Charge** | | | | | | | (1.79 | ) | | | 2.15 | | | | 18.92 | | | | 14.23 | |
CLASS C SHARES | | | July 29, 2011 | | | | | | | | | | | | | | | | | |
Without CDSC | | | | | | | 3.36 | | | | 7.28 | | | | 20.45 | | | | 15.45 | |
With CDSC*** | | | | | | | 2.36 | | | | 6.28 | | | | 20.45 | | | | 15.45 | |
SELECT SHARES | | | July 29, 2011 | | | | 3.79 | | | | 8.08 | | | | 21.38 | | | | 16.32 | |
| ** | | Sales Charge for Class A Shares is 5.25%. |
| *** | | Assumes a 1% CDSC (contingent deferred sales charge) for the one year period and 0% CDSC thereafter. |
LIFE OF FUND PERFORMANCE (7/29/11 TO 12/31/14)
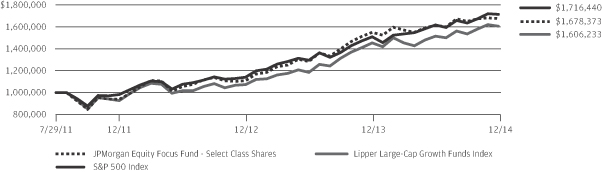
The performance quoted is past performance and is not a guarantee of future results. Mutual funds are subject to certain market risks. Investment returns and principal value of an investment will fluctuate so that an investor’s shares, when redeemed, may be worth more or less than their original cost. Current performance may be higher or lower than the performance data shown. For up-to-date, month-end performance information please call 1-800-480-4111.
The Fund commenced operations on July 29, 2011.
The graph illustrates comparative performance for $1,000,000 invested in Select Class Shares of the JPMorgan Equity Focus Fund, the S&P 500 Index and the Lipper Large-Cap Growth Funds Index from July 29, 2011 to December 31, 2014. The performance of the Fund assumes reinvestment of all dividends and capital gain distributions, if any, and does not include a sales charge. The performance of the S&P 500 Index does not reflect the deduction of expenses or a sales charge associated with a mutual fund and has been adjusted to reflect reinvestment of all dividends and capital gain distributions of securities included in the benchmark, if applicable. The performance of the Lipper Large-Cap Growth Funds Index includes expenses associated with a mutual fund, such as investment management fees. These expenses are not identical to the
expenses incurred by the Fund. The S&P 500 Index is an unmanaged index generally representative of the performance of large companies in the U.S. stock market. The Lipper Large-Cap Growth Funds Index represents the total returns of all mutual funds within the Fund’s designated category as determined by Lipper, Inc. Investors cannot invest directly in an index.
Select Class Shares have a $1,000,000 minimum initial investment.
Subsequent to the inception date of the Fund and through July 30, 2013, the Fund did not experience any shareholder activity. If such shareholder activity had occurred, the Fund’s performance may have been impacted.
Fund performance may reflect the waiver of the Fund’s fees and reimbursement of expenses for certain periods since the inception date. Without these waivers and reimbursements, performance would have been lower. Also, performance shown in this section does not reflect the deduction of taxes that a shareholder would pay on Fund distributions or redemption of Fund shares.
The returns shown are based on net asset values calculated for shareholder transactions and may differ from the returns shown in the financial highlights, which reflect adjustments made to the net asset values in accordance with accounting principles generally accepted in the United States of America.
| | | | | | | | |
| | | |
| DECEMBER 31, 2014 | | J.P. MORGAN LARGE CAP FUNDS | | | | | 9 | |
JPMorgan Equity Income Fund
FUND COMMENTARY
SIX MONTHS ENDED DECEMBER 31, 2014 (Unaudited)
| | | | |
| REPORTING PERIOD RETURN: | |
| Fund (Select Class Shares)* | | | 6.29% | |
| Russell 1000 Value Index | | | 4.78% | |
| |
| Net Assets as of 12/31/2014 (In Thousands) | | $ | 9,064,115 | |
INVESTMENT OBJECTIVE**
The JPMorgan Equity Income Fund (the “Fund”) seeks capital appreciation and current income.1
WHAT WERE THE MAIN DRIVERS OF THE FUND’S PERFORMANCE?
The Fund (Select Class Shares) outperformed the Russell 1000 Value Index (the “Benchmark”) for the six months ended December 31, 2014. The Fund’s security selection and underweight position in the energy sector and its security selection in the producer durables sector were leading contributors to performance relative to the Benchmark, while the Fund’s security selection and underweight positions in the financial services and health care sectors were leading detractors from relative performance.
Individual contributors to the Fund’s relative performance included its overweight positions in L Brands Inc., Apple Inc. and Home Depot Inc. Shares of L Brands, a specialty apparel retailer, rose after the company raised its earnings forecast. Shares of Apple, a maker of computers and mobile devices not held in the Benchmark, strengthened on continued strong demand for its products and services. Shares of Home Depot, a home improvement retail chain not held in the Benchmark, rose on strong sales growth.
Leading individual detractors from the Fund’s relative performance included its overweight positions in ConocoPhillips and Occidental Petroleum Corp. and its underweight position in Berkshire Hathaway Inc. Shares of ConocoPhillips and Occidental Petroleum, both oil and gas producers, declined amid the falling global oil prices. Shares of Berkshire Hathaway, a financial holding company not held by the Fund, rose on the strength of its core insurance and rail freight businesses.
HOW WAS THE FUND POSITIONED?
The Fund’s portfolio managers’ focus remained on stock selection, as they believed that quality companies trading at attractive valuations have the greatest potential to outperform in the long term. As the Fund aimed to purchase stocks with above average dividend yields, the research process was designed to identify companies with predictable and durable business models deemed capable of generating sustainable free cash flow.
| 1 | | Effective July 23, 2014, following approval from the Fund’s Board of Trustees, shareholders approved the a change to the Fund’s investment objective. The current investment objective is stated above. Prior to July 23, 2014, the Fund’s investment objective was to seek current income through regular payment of dividends as well as to achieve capital appreciation by investing primarily in equity securities. |
| | | | | | | | |
| TOP TEN EQUITY HOLDINGS OF THE PORTFOLIO*** | |
| | 1. | | | Wells Fargo & Co. | | | 4.6 | % |
| | 2. | | | Johnson & Johnson | | | 3.8 | |
| | 3. | | | Exxon Mobil Corp. | | | 2.3 | |
| | 4. | | | ConocoPhillips | | | 2.2 | |
| | 5. | | | PNC Financial Services Group, Inc. (The) | | | 2.1 | |
| | 6. | | | Apple, Inc. | | | 2.1 | |
| | 7. | | | Chevron Corp. | | | 2.0 | |
| | 8. | | | Merck & Co., Inc. | | | 2.0 | |
| | 9. | | | BlackRock, Inc. | | | 1.9 | |
| | 10. | | | Pfizer, Inc. | | | 1.9 | |
| | | | |
PORTFOLIO COMPOSITION BY SECTOR*** | |
| Financials | | | 25.5 | % |
| Consumer Discretionary | | | 12.3 | |
| Health Care | | | 11.7 | |
| Industrials | | | 11.3 | |
| Information Technology | | | 9.7 | |
| Energy | | | 9.2 | |
| Consumer Staples | | | 8.9 | |
| Utilities | | | 6.9 | |
| Materials | | | 2.0 | |
| Telecommunication Services | | | 1.5 | |
| Short-Term Investment | | | 1.0 | |
| * | | The return shown is based on net asset values calculated for shareholder transactions and may differ from the return shown in the financial highlights, which reflects adjustments made to the net asset values in accordance with accounting principles generally accepted in the United States of America. |
| ** | | The adviser seeks to achieve the Fund’s objective. There can be no guarantee it will be achieved. |
| *** | | Percentages indicated are based on total investments as of December 31, 2014. The Fund’s portfolio composition is subject to change. |
| | | | | | |
| | | |
| 10 | | | | J.P. MORGAN LARGE CAP FUNDS | | DECEMBER 31, 2014 |
| | | | | | | | | | | | | | | | | | |
AVERAGE ANNUAL TOTAL RETURNS AS OF DECEMBER 31, 2014 | |
| | | | | |
| | | INCEPTION DATE OF
CLASS | | 6 MONTH* | | | 1 YEAR | | | 5 YEAR | | | 10 YEAR | |
CLASS A SHARES | | February 18, 1992 | | | | | | | | | | | | | | | | |
Without Sales Charge | | | | | 6.11 | % | | | 13.46 | % | | | 16.45 | % | | | 8.58 | % |
With Sales Charge** | | | | | 0.52 | | | | 7.53 | | | | 15.20 | | | | 7.99 | |
CLASS B SHARES | | January 14, 1994 | | | | | | | | | | | | | | | | |
Without CDSC | | | | | 5.90 | | | | 12.91 | | | | 15.90 | | | | 8.13 | |
With CDSC*** | | | | | 0.90 | | | | 7.91 | | | | 15.68 | | | | 8.13 | |
CLASS C SHARES | | November 4, 1997 | | | | | | | | | | | | | | | | |
Without CDSC | | | | | 5.88 | | | | 12.87 | | | | 15.88 | | | | 8.02 | |
With CDSC**** | | | | | 4.88 | | | | 11.87 | | | | 15.88 | | | | 8.02 | |
CLASS R2 SHARES | | February 28, 2011 | | | 6.01 | | | | 13.24 | | | | 16.22 | | | | 8.40 | |
CLASS R5 SHARES | | February 28, 2011 | | | 6.39 | | | | 13.97 | | | | 16.96 | | | | 8.96 | |
CLASS R6 SHARES | | January 31, 2012 | | | 6.42 | | | | 14.04 | | | | 16.98 | | | | 8.97 | |
SELECT CLASS SHARES | | July 2, 1987 | | | 6.29 | | | | 13.76 | | | | 16.79 | | | | 8.89 | |
| ** | | Sales Charge for Class A Shares is 5.25%. |
| *** | | Assumes a 5% CDSC (contingent deferred sales charge) for the one year period, 2% CDSC for the five year period and 0% CDSC thereafter. |
| **** | | Assumes a 1% CDSC for the one year period and 0% CDSC thereafter. |
TEN YEAR PERFORMANCE (12/31/04 TO 12/31/14)
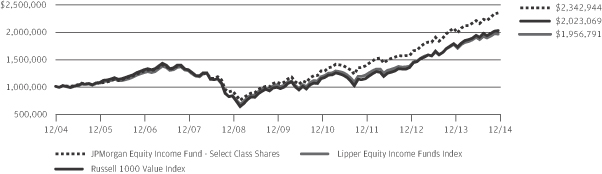
The performance quoted is past performance and is not a guarantee of future results. Mutual funds are subject to certain market risks. Investment returns and principal value of an investment will fluctuate so that an investor’s shares, when redeemed, may be worth more or less than their original cost. Current performance may be higher or lower than the performance data shown. For up-to-date month-end performance information please call 1-800-480-4111.
Returns for Class R2 and Class R5 Shares prior to their inception dates are based on the performance of Select Class Shares. With respect to Class R2 Shares, prior class performance has been adjusted to reflect the differences in expenses between classes. The actual returns for Class R5 Shares would have been different than those shown because Class R5 Shares have different expenses than Select Class Shares.
Returns for Class R6 Shares prior to their inception date are based on the performance of Class R5 Shares and, prior to February 28, 2011, Select Class Shares. The actual returns for Class R6 Shares would have been different than those shown because Class R6 Shares have different expenses than Class R5 and Select Class Shares.
The graph illustrates comparative performance for $1,000,000 invested in Select Class Shares of the JPMorgan Equity Income Fund, the Russell 1000 Value Index and the Lipper Equity Income Funds Index from December 31, 2004 to December 31, 2014. The performance of the Fund assumes reinvestment of all dividends and capital gain distributions, if any, and does not include a sales charge. The performance of the Russell 1000 Value Index does not reflect the deduction of expenses or a sales charge associated with a mutual
fund and has been adjusted to reflect reinvestment of all dividends and capital gain distributions of the securities included in the benchmark, if applicable. The performance of the Lipper Equity Income Funds Index includes expenses associated with a mutual fund, such as investment management fees. These expenses are not identical to the expenses incurred by the Fund. The Russell 1000 Value Index is an unmanaged index which measures the performance of those Russell 1000 companies with lower price-to-book ratios and lower forecasted growth values. The Lipper Equity Income Funds Index is an index based on the total returns of certain mutual funds within the Fund’s designated category as determined by Lipper, Inc. Investors cannot invest directly in an index.
Select Class Shares have a $1,000,000 minimum initial investment.
Fund performance may reflect the waiver of the Fund’s fees and reimbursement of expenses for certain periods since the inception date. Without these waivers and reimbursements, performance would have been lower. Also, performance shown in this section does not reflect the deduction of taxes that a shareholder would pay on Fund distributions or redemption of Fund shares.
Because Class B Shares automatically convert to Class A Shares after eight years, the 10 year average annual total return shown above for Class B reflects Class A performance for the period after conversion.
The returns shown are based on net asset values calculated for shareholder transactions and may differ from the returns shown in the financial highlights, which reflect adjustments made to the net asset values in accordance with accounting principles generally accepted in the United States of America.
| | | | | | | | |
| | | |
| DECEMBER 31, 2014 | | J.P. MORGAN LARGE CAP FUNDS | | | | | 11 | |
JPMorgan Growth and Income Fund
FUND COMMENTARY
SIX MONTHS ENDED DECEMBER 31, 2014 (Unaudited)
| | | | |
| REPORTING PERIOD RETURN: | |
| Fund (Class A Shares, without a sales charge)* | | | 6.15% | |
| Russell 1000 Value Index1 | | | 4.78% | |
| S&P 500/Citigroup Value Index | | | 5.04% | |
| |
| Net Assets as of 12/31/2014 (In Thousands) | | $ | 491,245 | |
INVESTMENT OBJECTIVE**
The JPMorgan Growth and Income Fund (the “Fund”) seeks to provide capital growth over the long term and earn income from dividends.
WHAT WERE THE MAIN DRIVERS OF THE FUND’S PERFORMANCE?
The Fund (Class A Shares, without a sales charge) outperformed both the Russell 1000 Value Index (the “Benchmark”) and its previous benchmark, the S&P500/Citigroup Value Index, for the six months ended December 31, 2014. The Fund’s security selection in the consumer discretionary and energy sectors was a leading contributor to performance relative to the Benchmark, while the Fund’s security selection in the utilities and technology sectors was a leading detractor from relative performance.
Individual contributors to relative performance included the Fund’s overweight positions in DuPont Co., Home Depot Inc. and Kinder Morgan Inc. Shares of DuPont, a chemicals company, rose after the company reaffirmed its earnings forecast and took actions to exit underperforming business lines. Shares of Home Depot, a home improvement retail chain not held in the Benchmark, strengthened on better-than-expected quarterly sales. Shares of Kinder Morgan, an oil and gas pipeline and storage operator, rose on expectations that it will continue to benefit from the boom in U.S. shale oil/gas production.
Leading individual detractors from the Fund’s relative performance included overweight positions in Qualcomm Inc., IBM Corp. and Energen Corp. Shares of Qualcomm, a maker of digital communications technology not held in the Benchmark, declined after the company forecast earnings and revenue below analysts’ expectations. Shares of IBM, an information technology company not held in the Benchmark, weakened after the company posted lower-than-expected quarterly earnings. Shares of Energen, an oil and gas exploration and production company, fell amid the decline in global oil prices.
HOW WAS THE FUND POSITIONED?
The Fund’s portfolio managers focused on stock selection and aimed to invest in undervalued companies with durable franchises, strong management and the ability to grow their intrinsic value per share. The portfolio managers employed a bottom-up approach to security selection, using a combination of quantitative screening and fundamental research. During the reporting period, the Fund was overweight in the consumer discretionary sector, a sector in which the Fund’s portfolio
managers believed they had found many of the qualities they typically seek, such as strong brands, recurring revenue business models and the consistent generation of free cash flow.
| 1 | | On November 1, 2014, the JPMorgan Growth and Income Fund adopted the Russell 1000 Value Index as its primary Benchmark, replacing the S&P 500/Citigroup Value Index. The Fund’s portfolio managers believe the Russell 1000 Value Index is more representative of benchmarks for growth and income funds. |
| | | | | | | | |
| TOP TEN EQUITY HOLDINGS OF THE PORTFOLIO*** | |
| | 1. | | | Wells Fargo & Co. | | | 3.0 | % |
| | 2. | | | Johnson & Johnson | | | 2.9 | |
| | 3. | | | Exxon Mobil Corp. | | | 2.9 | |
| | 4. | | | Microsoft Corp. | | | 2.2 | |
| | 5. | | | Hartford Financial Services Group, Inc. (The) | | | 2.1 | |
| | 6. | | | Occidental Petroleum Corp. | | | 2.1 | |
| | 7. | | | Bank of America Corp. | | | 2.0 | |
| | 8. | | | Berkshire Hathaway, Inc., Class B | | | 2.0 | |
| | 9. | | | Humana, Inc. | | | 1.9 | |
| | 10. | | | Chevron Corp. | | | 1.9 | |
| | | | |
PORTFOLIO COMPOSITION BY SECTOR*** | |
| Financials | | | 33.6 | % |
| Health Care | | | 11.3 | |
| Consumer Discretionary | | | 10.9 | |
| Energy | | | 10.1 | |
| Industrials | | | 8.0 | |
| Information Technology | | | 7.9 | |
| Consumer Staples | | | 7.4 | |
| Utilities | | | 3.8 | |
| Materials | | | 1.9 | |
| Telecommunication Services | | | 1.9 | |
| Short-Term Investment | | | 3.2 | |
| * | | The return shown is based on net asset values calculated for shareholder transactions and may differ from the return shown in the financial highlights, which reflects adjustments made to the net asset values in accordance with accounting principles generally accepted in the United States of America. |
| ** | | The adviser seeks to achieve the Fund’s objective. There can be no guarantee it will be achieved. |
| *** | | Percentages indicated are based on total investments as of December 31, 2014. The Fund’s portfolio composition is subject to change. |
| | | | | | |
| | | |
| 12 | | | | J.P. MORGAN LARGE CAP FUNDS | | DECEMBER 31, 2014 |
| | | | | | | | | | | | | | | | | | |
AVERAGE ANNUAL TOTAL RETURNS AS OF DECEMBER 31, 2014 | |
| | | | | |
| | | INCEPTION DATE OF
CLASS | | 6 MONTH* | | | 1 YEAR | | | 5 YEAR | | | 10 YEAR | |
CLASS A SHARES | | September 23, 1987 | | | | | | | | | | | | | | | | |
Without Sales Charge | | | | | 6.15 | % | | | 14.10 | % | | | 16.08 | % | | | 7.14 | % |
With Sales Charge** | | | | | 0.57 | | | | 8.11 | | | | 14.84 | | | | 6.56 | |
CLASS B SHARES | | November 4, 1993 | | | | | | | | | | | | | | | | |
Without CDSC | | | | | 5.88 | | | | 13.51 | | | | 15.50 | | | | 6.71 | |
With CDSC*** | | | | | 0.88 | | | | 8.51 | | | | 15.27 | | | | 6.71 | |
CLASS C SHARES | | January 2, 1998 | | | | | | | | | | | | | | | | |
Without CDSC | | | | | 5.87 | | | | 13.50 | | | | 15.51 | | | | 6.60 | |
With CDSC**** | | | | | 4.87 | | | | 12.50 | | | | 15.51 | | | | 6.60 | |
SELECT CLASS SHARES | | January 25, 1996 | | | 6.29 | | | | 14.39 | | | | 16.40 | | | | 7.46 | |
| ** | | Sales Charge for Class A Shares is 5.25%. |
| *** | | Assumes a 5% CDSC (contingent deferred sales charge) for the one year period, 2% CDSC for the five year period and 0% CDSC thereafter. |
| **** | | Assumes a 1% CDSC for the one year period and 0% CDSC thereafter. |
TEN YEAR PERFORMANCE (12/31/04 TO 12/31/14)
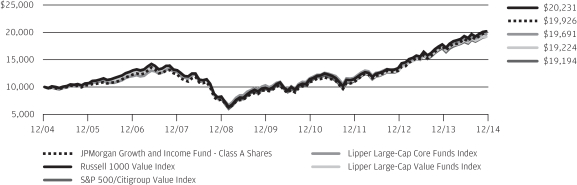
The performance quoted is past performance and is not a guarantee of future results. Mutual funds are subject to certain market risks. Investment returns and principal value of an investment will fluctuate so that an investor’s shares, when redeemed, may be worth more or less than their original cost. Current performance may be higher or lower than the performance data shown. For up-to-date month-end performance information please call 1-800-480-4111.
The graph illustrates comparative performance for $10,000 invested in Class A Shares of the JPMorgan Growth and Income Fund, the Russell 1000 Value Index, the S&P 500/Citigroup Value Index, the Lipper Large-Cap Core Funds Index and the Lipper Large-Cap Value Funds Index from December 31, 2004 to December 31, 2014. The performance of the Fund assumes reinvestment of all dividends and capital gain distributions, if any, and includes a sales charge. The performance of the Russell 1000 Value Index does not reflect the deduction of expenses or a sales charge associated with a mutual fund and has been adjusted to reflect reinvestment of all dividends and capital gain distributions of the securities included in the benchmark, if applicable. The performance of the S&P 500/Citigroup Value Index does not reflect the deduction of expenses or a sales charge associated with a mutual fund and has been adjusted to reflect reinvestment of all dividends and capital gain distributions of the securities included in the benchmark, if applicable. The performance of the Lipper Large-Cap Core Funds Index and the Lipper Large-Cap Value Funds Index includes expenses associated with a mutual fund, such as investment management fees. These expenses are not identical to the expenses incurred by the Fund. The Russell 1000 Value Index is an unmanaged index, which measures the performance of those Russell 1000 companies with lower price-to-book
ratios and lower forecasted growth values. The S&P 500/Citigroup Value Index is an unmanaged index which includes the performance of large U.S. companies with low price-to-book ratios relative to the S&P 500 Index. The Lipper Large-Cap Core Funds Index and the Lipper Large-Cap Value Funds Index are indices based on the total returns of certain groups of mutual funds as determined by Lipper, Inc. Investors cannot invest directly in an index.
Class A Shares have a $1,000 minimum initial investment and carry a 5.25% sales charge.
Fund performance may reflect the waiver of the Fund’s fees and reimbursement of expenses for certain periods since the inception date. Without these waivers and reimbursements, performance would have been lower. Also, performance shown in this section does not reflect the deduction of taxes that a shareholder would pay on Fund distributions or redemption of Fund shares.
Because Class B Shares automatically convert to Class A Shares after eight years, the 10 year average annual total return shown above for Class B reflects Class A performance for the period after conversion.
The returns shown are based on net asset values calculated for shareholder transactions and may differ from the returns shown in the financial highlights, which reflect adjustments made to the net asset values in accordance with accounting principles generally accepted in the United States of America.
On November 1, 2014, the JPMorgan Growth and Income Fund adopted the Russell 1000 Value Index as its primary Benchmark, replacing the S&P 500/Citigroup Value Index. The Fund’s portfolio managers believe the Russell 1000 Value Index is more representative of benchmarks for growth and income funds.
| | | | | | | | |
| | | |
| DECEMBER 31, 2014 | | J.P. MORGAN LARGE CAP FUNDS | | | | | 13 | |
JPMorgan Hedged Equity Fund
FUND COMMENTARY
SIX MONTHS ENDED DECEMBER 31, 2014 (Unaudited)
| | | | |
| REPORTING PERIOD RETURN: | |
| Fund (Select Class Shares)* | | | 4.93% | |
| S&P 500 Index | | | 6.12% | |
| |
| Net Assets as of 12/31/2014 (In Thousands) | | $ | 137,787 | |
INVESTMENT OBJECTIVE**
The JPMorgan Hedged Equity Fund (the “Fund”) seeks to provide capital appreciation.
WHAT WERE THE MAIN DRIVERS OF THE FUND’S PERFORMANCE?
The Fund (Select Class Shares) underperformed the Standard & Poor’s 500 Index (the “Benchmark”) for the six months ended December 31, 2014. The Fund’s security selection in the industrial cyclical and pharmaceutical/medical technology sectors was a leading detractor from performance relative to the Benchmark, while security selection in the consumer cyclical and retail sectors was a leading contributor to relative performance. The Fund’s hedge positioning helped performance by limiting the Fund’s exposure to downside volatility, while positioning it for participation in a subsequent rebound in equity prices.
Leading individual detractors from relative performance included the Fund’s overweight positions in Fluor Corp. and Halliburton Co. and its underweight position in Amgen Inc. Shares of Fluor, an engineering and construction services company, fell on expectations of lower earnings. Shares of Halliburton, an oilfield services company, weakened amid investor concerns that falling global oil prices will curb demand for the company’s services. Shares of Amgen, a drug maker, rose on positive results from clinical trials of some of its key drug candidates.
Leading individual contributors to relative performance included the Fund’s overweight positions in Time Warner Inc., United Continental Holdings Inc. and Royal Caribbean Cruises Ltd. Shares of Time Warner, a media and entertainment company, rose on news of a potential merger with 21st Century Fox Inc. and strong quarterly earnings. Shares of United Continental, owner/operator of United Airlines, which was not held in the Benchmark, rose on solid fundamentals across the airline sector, including strong consumer spending and falling fuel prices. Shares of Royal Caribbean, a cruise ship operator, rose on solid quarterly earnings amid increased bookings for its Asian and European cruises.
HOW WAS THE FUND POSITIONED?
The Fund used an enhanced index strategy that invests primarily in common stocks of large capitalization U.S. companies, while systematically purchasing and selling exchange-traded
index put options and selling exchange-traded index call options. The option overlay is known as a “Put/Spread Collar” strategy. The combination of the diversified portfolio of equity securities, downside protection from index put options and income from index call options was intended to provide the Fund with a portion of the returns associated with equity market investments, while exposing the Fund to less risk than traditional long-only equity strategies.
| | | | | | | | |
| TOP TEN EQUITY HOLDINGS OF THE PORTFOLIO*** | |
| | 1. | | | Apple, Inc. | | | 3.5 | % |
| | 2. | | | Johnson & Johnson | | | 2.4 | |
| | 3. | | | Microsoft Corp. | | | 2.3 | |
| | 4. | | | Wells Fargo & Co. | | | 2.3 | |
| | 5. | | | S&P 500 Index | | | 1.8 | |
| | 6. | | | Exxon Mobil Corp. | | | 1.7 | |
| | 7. | | | Bank of America Corp. | | | 1.6 | |
| | 8. | | | Procter & Gamble Co. (The) | | | 1.6 | |
| | 9. | | | Chevron Corp. | | | 1.5 | |
| | 10. | | | United Technologies Corp. | | | 1.5 | |
| | | | |
PORTFOLIO COMPOSITION BY SECTOR*** | |
| Information Technology | | | 19.0 | % |
| Financials | | | 15.6 | |
| Health Care | | | 13.6 | |
| Consumer Discretionary | | | 12.6 | |
| Industrials | | | 10.6 | |
| Consumer Staples | | | 9.1 | |
| Energy | | | 7.3 | |
| Utilities | | | 3.8 | |
| Materials | | | 2.5 | |
| Options Purchased | | | 1.8 | |
| Telecommunication Services | | | 1.3 | |
| Short-Term Investment | | | 2.8 | |
| * | | The return shown is based on net asset values calculated for shareholder transactions and may differ from the return shown in the financial highlights, which reflects adjustments made to the net asset values in accordance with accounting principles generally accepted in the United States of America. |
| ** | | The adviser seeks to achieve the Fund’s objective. There can be no guarantee it will be achieved. |
| *** | | Percentages indicated are based on total investments as of December 31, 2014. The Fund’s portfolio composition is subject to change. |
| | | | | | |
| | | |
| 14 | | | | J.P. MORGAN LARGE CAP FUNDS | | DECEMBER 31, 2014 |
| | | | | | | | | | | | | | |
AVERAGE ANNUAL TOTAL RETURNS AS OF DECEMBER 31, 2014 | |
| | | | |
| | | INCEPTION DATE OF
CLASS | | 6 MONTH* | | | 1 YEAR | | | SINCE
INCEPTION | |
CLASS A SHARES | | December 13, 2013 | | | | | | | | | | | | |
Without Sales Charge | | | | | 4.77 | % | | | 9.36 | % | | | 10.68 | % |
With Sales Charge** | | | | | (0.72 | ) | | | 3.65 | | | | 5.15 | |
CLASS C SHARES | | December 13, 2013 | | | | | | | | | | | | |
Without CDSC | | | | | 4.54 | | | | 8.82 | | | | 10.15 | |
With CDSC*** | | | | | 3.54 | | | | 7.82 | | | | 10.15 | |
CLASS R5 SHARES | | December 13, 2013 | | | 5.03 | | | | 9.88 | | | | 11.20 | |
CLASS R6 SHARES | | December 13, 2013 | | | 5.04 | | | | 9.91 | | | | 11.24 | |
SELECT CLASS SHARES | | December 13, 2013 | | | 4.93 | | | | 9.62 | | | | 10.95 | |
| ** | | Sales Charge for Class A Shares is 5.25%. |
| *** | | Assumes a 1% CDSC (contingent deferred sales charge) for the one year period and 0% CDSC thereafter. |
LIFE OF FUND PERFORMANCE (12/13/13 TO 12/31/14)

The performance quoted is past performance and is not a guarantee of future results. Mutual funds are subject to certain market risks. Investment returns and principal value of an investment will fluctuate so that an investor’s shares, when redeemed, may be worth more or less than their original cost. Current performance may be higher or lower than the performance data shown. For up-to-date month-end performance information please call 1-800-480-4111.
The Fund commenced operations on December 13, 2013.
The graph illustrates comparative performance for $1,000,000 invested in Select Class Shares of the JPMorgan Hedged Equity Fund, the S&P 500 Index and the BofA Merrill Lynch 3-Month U.S. Treasury Bill Index from December 13, 2013 to December 31, 2014. The performance of the Fund assumes reinvestment of all dividends and capital gain distributions, if any, and does not include a sales charge. The performance of the S&P 500 Index and the BofA Merrill Lynch 3-Month U.S. Treasury Bill Index does not reflect the deduction of expenses or a sales charge associated with a mutual fund and approximates the minimum possible dividend reinvestment of the securities included in the benchmark, if applicable. The S&P 500 Index is an unmanaged index generally representative of the performance of large companies in the U.S. stock market.
The BofA Merrill Lynch 3-Month U.S. Treasury Bill Index is comprised of a single issue purchased at the beginning of the month and held for a full month. Each month the index is rebalanced and the issue selected is the outstanding Treasury Bill that matures closest to, but not beyond, 3 months from the rebalancing date. Investors cannot invest directly in an index.
Select Class Shares have a $1,000,000 minimum initial investment.
Subsequent to the inception date of the Fund and through May 29, 2014, the Fund did not experience any shareholder activity. If such shareholder activity had occurred, the Fund’s performance may have been impacted.
Fund performance may reflect the waiver of the Fund’s fees and reimbursement of expenses for certain periods since the inception date. Without these waivers and reimbursements, performance would have been lower. Also, performance shown in this section does not reflect the deduction of taxes that a shareholder would pay on Fund distributions or redemption of Fund shares.
The returns shown are based on net asset values calculated for shareholder transactions and may differ from the returns shown in the financial highlights, which reflect adjustments made to the net asset values in accordance with accounting principles generally accepted in the United States of America.
| | | | | | | | |
| | | |
| DECEMBER 31, 2014 | | J.P. MORGAN LARGE CAP FUNDS | | | | | 15 | |
JPMorgan Large Cap Growth Fund
FUND COMMENTARY
SIX MONTHS ENDED DECEMBER 31, 2014 (Unaudited)
| | | | |
REPORTING PERIOD RETURN: | |
| Fund (Select Class Shares)* | | | 8.34% | |
| Russell 1000 Growth Index | | | 6.34% | |
| |
| Net Assets as of 12/31/2014 (In Thousands) | | $ | 15,340,279 | |
INVESTMENT OBJECTIVE**
The JPMorgan Large Cap Growth Fund (the “Fund”) seeks long-term capital appreciation.1
WHAT WERE THE MAIN DRIVERS OF THE FUND’S PERFORMANCE?
The Fund (Select Class Shares) outperformed the Russell 1000 Growth Index (the “Benchmark”) for the 6 months ended December 31, 2014. The Fund’s underweight position in the energy sector and its overweight position in the health care sector were leading contributors to performance relative to the Benchmark, while the Fund’s security selection in the consumer discretionary and technology sectors was a leading detractor from relative performance.
Leading individual contributors to relative performance included the Fund’s overweight positions in Home Depot Inc. and Regeneron Pharmaceutical Inc., and its underweight position in Schlumberger Ltd. Shares of Home Depot, a home improvement retail chain, strengthened on the company’s effective strategy execution and better-than-expected sales growth. Shares of Regeneron, a biopharmaceutical company, rose on investors’ heightened expectations for its eye drug, Eylea, and advances in the company’s pipeline of potential new drugs. Shares of Schlumberger, an oilfield services company not held by the Fund, fell on investor concerns that falling global oil prices would reduce demand for the company’s services.
Leading individual detractors from relative performance included the Fund’s underweight position in Apple Inc. and its overweight positions in Pioneer Natural Resources Co. and Michael Kors Holdings Ltd. Shares of Apple, a maker of mobile devices and computers, performed strongly on better-than-expected earnings and revenue, driven by sales of its iPhone and other products. Shares of Pioneer Natural Resources, an independent oil and gas exploration and production company, declined amid falling global oil prices. Shares of Michael Kors Holdings, an apparel and accessories company, fell amid investor concerns about the company’s narrowing profit margins, growing inventory and weaker-than-expected earnings forecast.
HOW WAS THE FUND POSITIONED?
The Fund’s portfolio managers utilized a bottom-up approach to stock selection, rigorously researching individual companies in an effort to construct portfolios of stocks that have strong
fundamentals and positive price momentum. The Fund’s portfolio managers sought to invest in companies with attractive fundamentals that, in their view, possessed the potential to significantly exceed expectations for a prolonged period of time.
| 1 | | Effective July 23, 2014, following approval from the Fund’s Board of Trustees, shareholders approved the change in the investment objective. The current investment objective is stated above. Prior to July 23, 2014, the Fund’s investment objective was to seek long-term capital appreciation and growth of income by investing primarily in equity securities. |
| | | | | | | | |
| TOP TEN EQUITY HOLDINGS OF THE PORTFOLIO*** | |
| | 1. | | | Facebook, Inc., Class A | | | 4.3 | % |
| | 2. | | | Home Depot, Inc. (The) | | | 3.8 | |
| | 3. | | | MasterCard, Inc., Class A | | | 3.7 | |
| | 4. | | | Gilead Sciences, Inc. | | | 3.5 | |
| | 5. | | | Apple, Inc. | | | 3.5 | |
| | 6. | | | Celgene Corp. | | | 3.2 | |
| | 7. | | | Visa, Inc., Class A | | | 2.7 | |
| | 8. | | | Google, Inc., Class C | | | 2.6 | |
| | 9. | | | Comcast Corp., Class A | | | 2.5 | |
| | 10. | | | Regeneron Pharmaceuticals, Inc. | | | 2.3 | |
| | | | |
PORTFOLIO COMPOSITION BY SECTOR*** | |
| Information Technology | | | 28.5 | % |
| Health Care | | | 22.0 | |
| Consumer Discretionary | | | 21.1 | |
| Industrials | | | 9.1 | |
| Materials | | | 6.0 | |
| Consumer Staples | | | 4.3 | |
| Financials | | | 4.1 | |
| Energy | | | 2.5 | |
| Short-Term Investment | | | 2.4 | |
| * | | The return shown is based on net asset values calculated for shareholder transactions and may differ from the return shown in the financial highlights, which reflects adjustments made to the net asset values in accordance with accounting principles generally accepted in the United States of America. |
| ** | | The adviser seeks to achieve the Fund’s objective. There can be no guarantee it will be achieved. |
| *** | | Percentages indicated are based on total investments as of December 31, 2014. The Fund’s portfolio composition is subject to change. |
| | | | | | |
| | | |
| 16 | | | | J.P. MORGAN LARGE CAP FUNDS | | DECEMBER 31, 2014 |
| | | | | | | | | | | | | | | | | | |
AVERAGE ANNUAL TOTAL RETURNS AS OF DECEMBER 31, 2014 | |
| | | | | |
| | | INCEPTION DATE OF
CLASS | | 6 MONTH* | | | 1 YEAR | | | 5 YEAR | | | 10 YEAR | |
CLASS A SHARES | | February 22, 1994 | | | | | | | | | | | | | | | | |
Without Sales Charge | | | | | 8.22 | % | | | 10.64 | % | | | 15.56 | % | | | 8.63 | % |
With Sales Charge** | | | | | 2.54 | | | | 4.84 | | | | 14.32 | | | | 8.04 | |
CLASS B SHARES | | January 14, 1994 | | | | | | | | | | | | | | | | |
Without CDSC | | | | | 7.98 | | | | 10.14 | | | | 15.00 | | | | 8.15 | |
With CDSC*** | | | | | 2.98 | | | | 5.14 | | | | 14.77 | | | | 8.15 | |
CLASS C SHARES | | November 4, 1997 | | | | | | | | | | | | | | | | |
Without CDSC | | | | | 7.95 | | | | 10.13 | | | | 14.98 | | | | 8.06 | |
With CDSC**** | | | | | 6.95 | | | | 9.13 | | | | 14.98 | | | | 8.06 | |
CLASS R2 SHARES | | November 3, 2008 | | | 8.11 | | | | 10.42 | | | | 15.29 | | | | 8.35 | |
CLASS R5 SHARES | | April 14, 2009 | | | 8.43 | | | | 11.08 | | | | 16.02 | | | | 8.98 | |
CLASS R6 SHARES | | November 30, 2010 | | | 8.45 | | | | 11.13 | | | | 16.07 | | | | 9.00 | |
SELECT CLASS SHARES | | February 28, 1992 | | | 8.34 | | | | 10.86 | | | | 15.79 | | | | 8.86 | |
| ** | | Sales Charge for Class A Shares is 5.25%. |
| *** | | Assumes a 5% CDSC (contingent deferred sales charge) for the one year period, 2% CDSC for the five year period and 0% CDSC thereafter. |
| **** | | Assumes a 1% CDSC for the one year period and 0% CDSC thereafter. |
TEN YEAR PERFORMANCE (12/31/04 TO 12/31/14)
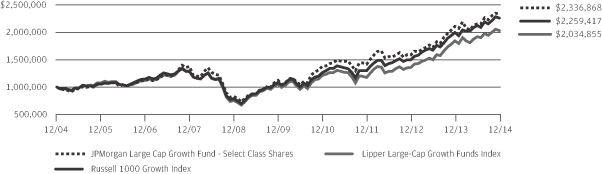
The performance quoted is past performance and is not a guarantee of future results. Mutual funds are subject to certain market risks. Investment returns and principal value of an investment will fluctuate so that an investor’s shares, when redeemed, may be worth more or less than their original cost. Current performance may be higher or lower than the performance data shown. For up-to-date month-end performance information please call 1-800-480-4111.
Returns for Class R2 and Class R5 Shares prior to their inception dates are based on the performance of Select Class Shares. With respect to Class R2 Shares, prior class performance has been adjusted to reflect the differences in expenses between classes. The actual returns for Class R5 Shares would have been different than those shown because Class R5 Shares have different expenses than Select Class Shares.
Returns for Class R6 Shares prior to its inception date are based on the performance of Class R5 Shares and, prior to April 14, 2009, Select Class Shares. The actual returns for Class R6 Shares would have been different than those shown because Class R6 Shares have different expenses than Class R5 and Select Class Shares.
The graph illustrates comparative performance for $1,000,000 invested in Select Class Shares of the JPMorgan Large Cap Growth Fund, the Russell 1000 Growth Index and the Lipper Large-Cap Growth Funds Index from December 31, 2004 to December 31, 2014. The performance of the Fund assumes reinvestment of all dividends and capital gain distributions, if any, and does not include a sales charge. The performance of the Russell 1000 Growth Index does not reflect the deduction of expenses or a sales charge associated with a mutual fund and has
been adjusted to reflect reinvestment of all dividends and capital gain distributions of the securities included in the benchmark, if applicable. The performance of the Lipper Large-Cap Growth Funds Index includes expenses associated with a mutual fund, such as investment management fees. These expenses are not identical to the expenses incurred by the Fund. The Russell 1000 Growth Index is an unmanaged index which measures the performance of those Russell 1000 companies with higher price-to-book ratios and higher forecasted growth values. The Lipper Large-Cap Growth Funds Index is an index based on total returns of certain mutual funds within the Fund’s designated category as determined by Lipper, Inc. Investors cannot invest directly in an index.
Select Class Shares have a $1,000,000 minimum initial investment.
Fund performance may reflect the waiver of the Fund’s fees and reimbursement of expenses for certain periods since the inception date. Without these waivers and reimbursements, performance would have been lower. Also, performance shown in this section does not reflect the deduction of taxes that a shareholder would pay on Fund distributions or redemption of Fund shares.
Because Class B Shares automatically convert to Class A Shares after eight years, the 10 year average annual total return shown above for Class B reflects Class A performance for the period after conversion.
The returns shown are based on net asset values calculated for shareholder transactions and may differ from the returns shown in the financial highlights, which reflect adjustments made to the net asset values in accordance with accounting principles generally accepted in the United States of America.
| | | | | | | | |
| | | |
| DECEMBER 31, 2014 | | J.P. MORGAN LARGE CAP FUNDS | | | | | 17 | |
JPMorgan Large Cap Value Fund
FUND COMMENTARY
SIX MONTHS ENDED DECEMBER 31, 2014 (Unaudited)
| | | | |
| REPORTING PERIOD RETURN: | |
| Fund (Select Class Shares)* | | | 6.33% | |
| Russell 1000 Value Index | | | 4.78% | |
| |
| Net Assets as of 12/31/2014 (In Thousands) | | $ | 818,996 | |
INVESTMENT OBJECTIVE**
The JPMorgan Large Cap Value Fund (the “Fund”) seeks capital appreciation with the incidental goal of achieving current income by investing primarily in equity securities.
WHAT WERE THE MAIN DRIVERS OF THE FUND’S PERFORMANCE?
The Fund (Select Class Shares) outperformed the Russell 1000 Value Index (the “Benchmark”) for the six months ended December 31, 2014. The Fund’s security selection and overweight position in the consumer discretionary sector and its security selection in the financial services sector were leading contributors to performance relative to the Benchmark, while security selection in the consumer staples sector detracted from relative performance.
Individual contributors to performance relative to the Benchmark included the Fund’s overweight positions in UnitedHealth Group Inc., Lowe’s Cos. and Royal Caribbean Cruises Ltd. Shares of UnitedHealth, a diversified health care provider, rose after the company reaffirmed its revenue forecast and raised its earnings forecast. Share of Lowe’s, a home improvement retail chain not held in the Benchmark, strengthened on better-than-expected quarterly sales. Shares of Royal Caribbean, a cruise ship operator, rose on solid quarterly earnings amid increased bookings for its Asia and European cruises.
Individual detractors from relative performance included the Fund’s overweight positions in Fluor Corp. and Halliburton Co. and its underweight position in Berkshire Hathaway Inc. Shares of Fluor, an engineering and construction services company, fell on expectations of lower earnings. Shares of Halliburton, an oilfield services company not held in the Benchmark, weakened amid investor concerns that falling global oil prices will curb demand for the company’s services. Shares of Berkshire Hathaway, a financial holding company, rose on the strength of its core insurance and rail freight businesses.
HOW WAS THE FUND POSITIONED?
The Fund’s portfolio managers combined a bottom-up fundamental approach to security selection with a systematic
valuation process. Overall, the Fund’s portfolio managers looked to take advantage of mispriced stocks that they believed appeared attractive relative to their fair value.
| | | | | | | | |
| TOP TEN EQUITY HOLDINGS OF THE PORTFOLIO*** | |
| | 1. | | | Wells Fargo & Co. | | | 4.1 | % |
| | 2. | | | General Motors Co. | | | 3.9 | |
| | 3. | | | Johnson & Johnson | | | 3.6 | |
| | 4. | | | Bank of America Corp. | | | 3.4 | |
| | 5. | | | Exxon Mobil Corp. | | | 3.2 | |
| | 6. | | | MetLife, Inc. | | | 2.7 | |
| | 7. | | | Occidental Petroleum Corp. | | | 2.5 | |
| | 8. | | | Citigroup, Inc. | | | 2.4 | |
| | 9. | | | UnitedHealth Group, Inc. | | | 2.2 | |
| | 10. | | | Aetna, Inc. | | | 2.1 | |
| | | | |
PORTFOLIO COMPOSITION BY SECTOR*** | |
Financials | | | 31.8 | % |
Health Care | | | 13.8 | |
Industrials | | | 12.8 | |
Consumer Discretionary | | | 11.9 | |
Energy | | | 9.9 | |
Information Technology | | | 7.1 | |
Utilities | | | 4.1 | |
Materials | | | 3.4 | |
Consumer Staples | | | 3.4 | |
Telecommunication Services | | | 0.6 | |
Short-Term Investment | | | 1.2 | |
| * | | The return shown is based on net asset values calculated for shareholder transactions and may differ from the return shown in the financial highlights, which reflects adjustments made to the net asset values in accordance with accounting principles generally accepted in the United States of America. |
| ** | | The adviser seeks to achieve the Fund’s objective. There can be no guarantee it will be achieved. |
| *** | | Percentages indicated are based on total investments as of December 31, 2014. The Fund’s portfolio composition is subject to change. |
| | | | | | |
| | | |
| 18 | | | | J.P. MORGAN LARGE CAP FUNDS | | DECEMBER 31, 2014 |
| | | | | | | | | | | | | | | | | | |
AVERAGE ANNUAL TOTAL RETURNS AS OF DECEMBER 31, 2014 | |
| | | | | |
| | | INCEPTION DATE OF
CLASS | | 6 MONTH* | | | 1 YEAR | | | 5 YEAR | | | 10 YEAR | |
CLASS A SHARES | | February 18, 1992 | | | | | | | | | | | | | | | | |
Without Sales Charge | | | | | 6.24 | % | | | 14.27 | % | | | 13.95 | % | | | 6.64 | % |
With Sales Charge** | | | | | 0.67 | | | | 8.28 | | | | 12.73 | | | | 6.07 | |
CLASS B SHARES | | January 14, 1994 | | | | | | | | | | | | | | | | |
Without CDSC | | | | | 5.96 | | | | 13.74 | | | | 13.40 | | | | 6.20 | |
With CDSC*** | | | | | 0.96 | | | | 8.74 | | | | 13.16 | | | | 6.20 | |
CLASS C SHARES | | March 22, 1999 | | | | | | | | | | | | | | | | |
Without CDSC | | | | | 6.00 | | | | 13.77 | | | | 13.40 | | | | 6.09 | |
With CDSC**** | | | | | 5.00 | | | | 12.77 | | | | 13.40 | | | | 6.09 | |
CLASS R2 SHARES | | November 3, 2008 | | | 6.18 | | | | 14.03 | | | | 13.68 | | | | 6.35 | |
CLASS R5 SHARES | | May 15, 2006 | | | 6.50 | | | | 14.79 | | | | 14.41 | | | | 7.05 | |
CLASS R6 SHARES | | November 30, 2010 | | | 6.48 | | | | 14.75 | | | | 14.44 | | | | 7.07 | |
SELECT CLASS SHARES | | March 1, 1991 | | | 6.33 | | | | 14.47 | | | | 14.16 | | | | 6.86 | |
| ** | | Sales Charge for Class A Shares is 5.25%. |
| *** | | Assumes a 5% CDSC (contingent deferred sales charge) for the one year period, 2% CDSC for the five year period and 0% CDSC thereafter. |
| **** | | Assumes a 1% CDSC for the one year period and 0% CDSC thereafter. |
TEN YEAR PERFORMANCE (12/31/04 TO 12/31/14)
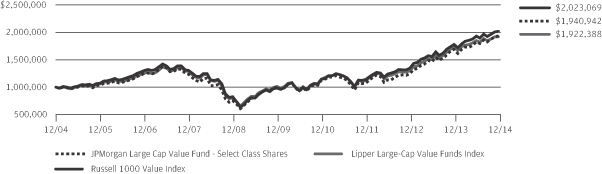
The performance quoted is past performance and is not a guarantee of future results. Mutual funds are subject to certain market risks. Investment returns and principal value of an investment will fluctuate so that an investor’s shares, when redeemed, may be worth more or less than their original cost. Current performance may be higher or lower than the performance data shown. For up-to-date month-end performance information please call 1-800-480-4111.
Returns for Class R2 and Class R5 Shares prior to their inception dates are based on the performance of Select Class Shares. With respect to Class R2 Shares, prior class performance has been adjusted to reflect the differences in expenses between classes. The actual returns for Class R5 Shares would have been different than those shown because Class R5 Shares have different expenses than Select Class Shares.
Returns for Class R6 Shares prior to their inception date are based on the performance of Class R5 Shares and, prior to May 15, 2006, Select Class Shares. The actual returns for Class R6 Shares would have been different than those shown because Class R6 Shares have different expenses than Class R5 and Select Class Shares.
The graph illustrates comparative performance for $1,000,000 invested in Select Class Shares of the JPMorgan Large Cap Value Fund, the Russell 1000 Value Index and the Lipper Large-Cap Value Funds Index from December 31, 2004 to December 31, 2014. The performance of the Fund assumes reinvestment of all dividends and capital gain distributions if any, and does not include a sales charge. The performance of the Russell 1000 Value Index does not reflect the deduction of expenses or a sales charge associated with a mutual
fund and has been adjusted to reflect reinvestment of all dividends and capital gain distributions of the securities included in the benchmark, if applicable. The performance of the Lipper Large-Cap Value Funds Index includes expenses associated with a mutual fund, such as investment management fees. These expenses are not identical to the expenses incurred by the Fund. The Russell 1000 Value Index is an unmanaged index which measures the performance of those Russell 1000 companies with lower price-to-book ratios and lower forecasted growth values. The Lipper Large-Cap Value Funds Index is an index based on the total returns of certain mutual funds within the Fund’s designated category as determined by Lipper, Inc. Investors cannot invest directly in an index.
Select Class Shares have a $1,000,000 minimum initial investment.
Fund performance may reflect the waiver of the Fund’s fees and reimbursement of expenses for certain periods since the inception date. Without these waivers and reimbursements, performance would have been lower. Also, performance shown in this section does not reflect the deduction of taxes that a shareholder would pay on Fund distributions or redemption of Fund shares.
Because Class B Shares automatically convert to Class A Shares after eight years, the 10 year average annual total return shown above for Class B reflects Class A performance for the period after conversion.
The returns shown are based on net asset values calculated for shareholder transactions and may differ from the returns shown in the financial highlights, which reflect adjustments made to the net asset values in accordance with accounting principles generally accepted in the United States of America.
| | | | | | | | |
| | | |
| DECEMBER 31, 2014 | | J.P. MORGAN LARGE CAP FUNDS | | | | | 19 | |
JPMorgan U.S. Equity Fund
FUND COMMENTARY
SIX MONTHS ENDED DECEMBER 31, 2014 (Unaudited)
| | | | |
| REPORTING PERIOD RETURN: | |
| Fund (Institutional Class Shares)* | | | 6.72% | |
| S&P 500 Index | | | 6.12% | |
| |
| Net Assets as of 12/31/2014 (In Thousands) | | $ | 12,522,697 | |
INVESTMENT OBJECTIVE**
The JPMorgan U.S. Equity Fund (the “Fund”) seeks to provide high total return from a portfolio of selected equity securities.
WHAT WERE THE MAIN DRIVERS OF THE FUND’S PERFORMANCE?
The Fund (Institutional Class Shares) outperformed the S&P 500 Index (the “Benchmark”) for the six months ended December 31, 2014. The Fund’s security selection in the semiconductors and auto & transportation sectors was a leading contributor to performance relative to the Benchmark, while security selection in the energy and industrial cyclical sector was a leading detractor from relative performance.
Individual contributors to relative performance included the Fund’s overweight positions in United Continental Holdings Inc., Avago Technologies Ltd. and Time Warner Inc. Shares of United Continental, owner/operator of United Airlines, which was not held in the Benchmark, rose on solid fundamentals across the airline sector, including strong consumer spending and falling fuel prices. Shares of Avago, a Singapore producer of analog semiconductors, strengthened on revenue growth and increased demand for its radio frequency semiconductor chips, which are used by telecom operators upgrading their networks to accommodate so-called 4G smartphones. Shares of Time Warner, a media and entertainment company, rose on the company’s potential merger with 21st Century Fox Inc. and strong quarterly earnings.
Individual detractors from relative performance included the Fund’s overweight positions in Fluor Corp. and Johnson & Johnson and its underweight position in Berkshire Hathaway Inc. Shares of Fluor, an engineering and construction services company, fell on expectations of lower earnings. Shares of Johnson & Johnson, a maker of consumer health care products, declined amid investor disappointment with earnings results. Shares of Berkshire Hathaway, a financial holding company not held by the Fund, rose on the strength of its core insurance and rail freight businesses.
HOW WAS THE FUND POSITIONED?
The Fund’s portfolio managers employed a bottom-up fundamental approach to stock selection, researching companies to determine what they believed to be their underlying value and
potential for future earnings growth. As a result of this approach to stock selection, the Fund was overweight, relative to the Benchmark, in the auto & transportation and the semiconductors sectors. The Fund was underweight, compared with the Benchmark, in the consumer stable sector and the industrial cyclical sector.
| | | | | | | | |
| TOP TEN EQUITY HOLDINGS OF THE PORTFOLIO*** | |
| | 1. | | | Apple, Inc. | | | 3.6 | % |
| | 2. | | | Johnson & Johnson | | | 2.9 | |
| | 3. | | | Wells Fargo & Co. | | | 2.7 | |
| | 4. | | | Microsoft Corp. | | | 2.2 | |
| | 5. | | | Honeywell International, Inc. | | | 1.9 | |
| | 6. | | | Occidental Petroleum Corp. | | | 1.9 | |
| | 7. | | | Bank of America Corp. | | | 1.8 | |
| | 8. | | | Lowe’s Cos., Inc. | | | 1.7 | |
| | 9. | | | Time Warner, Inc. | | | 1.6 | |
| | 10. | | | Morgan Stanley | | | 1.5 | |
| | | | |
PORTFOLIO COMPOSITION BY SECTOR*** | |
| Information Technology | | | 20.6 | % |
| Financials | | | 15.6 | |
| Consumer Discretionary | | | 14.7 | |
| Health Care | | | 14.4 | |
| Industrials | | | 10.7 | |
| Energy | | | 7.5 | |
| Consumer Staples | | | 6.3 | |
| Materials | | | 3.5 | |
| Utilities | | | 2.4 | |
| Telecommunication Services | | | 1.1 | |
| Short-Term Investment | | | 3.2 | |
| * | | The return shown is based on net asset values calculated for shareholder transactions and may differ from the return shown in the financial highlights, which reflects adjustments made to the net asset values in accordance with accounting principles generally accepted in the United States of America. |
| ** | | The adviser seeks to achieve the Fund’s objective. There can be no guarantee it will be achieved. |
| *** | | Percentages indicated are based on total investments as of December 31, 2014. The Fund’s portfolio composition is subject to change. |
| | | | | | |
| | | |
| 20 | | | | J.P. MORGAN LARGE CAP FUNDS | | DECEMBER 31, 2014 |
| | | | | | | | | | | | | | | | | | |
AVERAGE ANNUAL TOTAL RETURNS AS OF DECEMBER 31, 2014 | |
| | | | | |
| | | INCEPTION DATE OF
CLASS | | 6 MONTH* | | | 1 YEAR | | | 5 YEAR | | | 10 YEAR | |
CLASS A SHARES | | September 10, 2001 | | | | | | | | | | | | | | | | |
Without Sales Charge | | | | | 6.59 | % | | | 13.44 | % | | | 15.02 | % | | | 8.62 | % |
With Sales Charge** | | | | | 0.97 | | | | 7.48 | | | | 13.79 | | | | 8.03 | |
CLASS B SHARES | | September 10, 2001 | | | | | | | | | | | | | | | | |
Without CDSC | | | | | 6.32 | | | | 12.87 | | | | 14.44 | | | | 8.18 | |
With CDSC*** | | | | | 1.32 | | | | 7.87 | | | | 14.21 | | | | 8.18 | |
CLASS C SHARES | | September 10, 2001 | | | | | | | | | | | | | | | | |
Without CDSC | | | | | 6.32 | | | | 12.88 | | | | 14.44 | | | | 8.07 | |
With CDSC**** | | | | | 5.32 | | | | 11.88 | | | | 14.44 | | | | 8.07 | |
CLASS R2 SHARES | | November 3, 2008 | | | 6.46 | | | | 13.21 | | | | 14.75 | | | | 8.45 | |
CLASS R5 SHARES | | May 15, 2006 | | | 6.81 | | | | 13.95 | | | | 15.46 | | | | 9.08 | |
CLASS R6 SHARES | | November 30, 2010 | | | 6.82 | | | | 13.98 | | | | 15.53 | | | | 9.12 | |
INSTITUTIONAL CLASS SHARES | | September 17, 1993 | | | 6.72 | | | | 13.83 | | | | 15.42 | | | | 9.04 | |
SELECT CLASS SHARES | | September 10, 2001 | | | 6.67 | | | | 13.69 | | | | 15.25 | | | | 8.87 | |
| ** | | Sales Charge for Class A Shares is 5.25%. |
| *** | | Assumes a 5% CDSC (contingent deferred sales charge) for the one year period, 2% CDSC for the five year period and 0% CDSC thereafter. |
| **** | | Assumes a 1% CDSC for the one year period and 0% CDSC thereafter. |
TEN YEAR PERFORMANCE (12/31/04 TO 12/31/14)
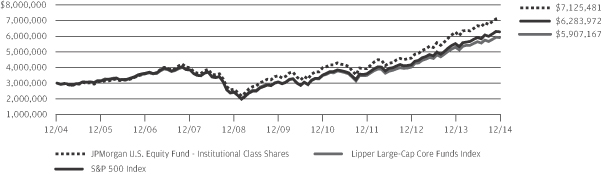
The performance quoted is past performance and is not a guarantee of future results. Mutual funds are subject to certain market risks. Investment returns and principal value of an investment will fluctuate so that an investor’s shares, when redeemed, may be worth more or less than their original cost. Current performance may be higher or lower than the performance data shown. For up-to-date month-end performance information please call 1-800-480-4111.
Returns for Class R2 Shares prior to their inception date are based on the performance of Class A Shares. The actual returns of Class R2 Shares would have been lower than those shown because Class R2 Shares have higher expenses than Class A Shares. Returns for Class R5 Shares prior to its inception date are based on the performance of Institutional Class Shares. The actual returns for Class R5 Shares would have been different than those shown because Class R5 Shares have different expenses than Institutional Class Shares.
Returns for Class R6 Shares prior to their inception date are based on the performance of Class R5 Shares and, prior to May 15, 2006, Institutional Class Shares. The actual returns for Class R6 Shares would have been different than those shown because Class R6 Shares have different expenses than Class R5 and Institutional Class Shares.
The graph illustrates comparative performance for $3,000,000 invested in Institutional Class Shares of the JPMorgan U.S. Equity Fund, the S&P 500 Index and the Lipper Large-Cap Core Funds Index from December 31, 2004 to December 31, 2014. The performance of the Fund assumes reinvestment of all dividends and capital gain distributions, if any, and does not include a sales charge. The performance of the S&P 500 Index does not reflect the deduction
of expenses or a sales charge associated with a mutual fund and has been adjusted to reflect reinvestment of all dividends and capital gain distributions of the securities included in the benchmark, if applicable. The performance of the Lipper Large-Cap Core Funds Index includes expenses associated with a mutual fund, such as investment management fees. These expenses are not identical to the expenses incurred by the Fund. The S&P 500 Index is an unmanaged index generally representative of the performance of large companies in the U.S. stock market. The Lipper Large-Cap Core Funds Index is an index based on the total returns of certain mutual funds within the Fund’s designated category as determined by Lipper, Inc. Investors cannot invest directly in an index.
Institutional Class Shares have a $3,000,000 minimum initial investment.
Fund performance may reflect the waiver of the Fund’s fees and reimbursement of expenses for certain periods since the inception date. Without these waivers and reimbursements, performance would have been lower. Also, performance shown in this section does not reflect the deduction of taxes that a shareholder would pay on Fund distributions or redemption of Fund shares.
Because Class B Shares automatically convert to Class A Shares after eight years, the 10 year average annual total return shown above for Class B reflects Class A performance for the period after conversion.
The returns shown are based on net asset values calculated for shareholder transactions and may differ from the returns shown in the financial highlights, which reflect adjustments made to the net asset values in accordance with accounting principles generally accepted in the United States of America.
| | | | | | | | |
| | | |
| DECEMBER 31, 2014 | | J.P. MORGAN LARGE CAP FUNDS | | | | | 21 | |
JPMorgan Disciplined Equity Fund
SCHEDULE OF PORTFOLIO INVESTMENTS
AS OF DECEMBER 31, 2014 (Unaudited)
(Amounts in thousands)
| | | | | | | | |
| SHARES | | | SECURITY DESCRIPTION | | VALUE($) | |
| | | | | | | | |
| Common Stocks — 99.1% | |
| | | | Consumer Discretionary — 15.9% | |
| | | | Auto Components — 1.2% | |
| | 608 | | | Magna International, Inc., (Canada) | | | 66,040 | |
| | | | | | | | |
| | | | Automobiles — 0.4% | |
| | 598 | | | General Motors Co. | | | 20,873 | |
| | | | | | | | |
| | | | Hotels, Restaurants & Leisure — 1.1% | |
| | 705 | | | Royal Caribbean Cruises Ltd. | | | 58,106 | |
| | | | | | | | |
| | | | Household Durables — 1.2% | |
| | 298 | | | Harman International Industries, Inc. | | | 31,810 | |
| | 26 | | | NVR, Inc. (a) | | | 32,521 | |
| | | | | | | | |
| | | | | | | 64,331 | |
| | | | | | | | |
| | | | Internet & Catalog Retail — 0.3% | |
| | 170 | | | Expedia, Inc. | | | 14,493 | |
| | 1 | | | Priceline Group, Inc. (The) (a) | | | 696 | |
| | | | | | | | |
| | | | | | | 15,189 | |
| | | | | | | | |
| | | | Media — 4.8% | |
| | 641 | | | CBS Corp. (Non-Voting), Class B | | | 35,462 | |
| | 924 | | | Comcast Corp., Class A | | | 53,605 | |
| | 853 | | | DISH Network Corp., Class A��(a) | | | 62,207 | |
| | 1,099 | | | Time Warner, Inc. | | | 93,866 | |
| | 182 | | | Walt Disney Co. (The) | | | 17,124 | |
| | | | | | | | |
| | | | | | | 262,264 | |
| | | | | | | | |
| | | | Multiline Retail — 2.0% | |
| | 953 | | | Dollar General Corp. (a) | | | 67,391 | |
| | 152 | | | Kohl’s Corp. | | | 9,262 | |
| | 513 | | | Macy’s, Inc. | | | 33,710 | |
| | | | | | | | |
| | | | | | | 110,363 | |
| | | | | | | | |
| | | | Specialty Retail — 3.9% | |
| | 786 | | | AutoNation, Inc. (a) | | | 47,464 | |
| | 447 | | | Home Depot, Inc. (The) | | | 46,943 | |
| | 1,685 | | | Lowe’s Cos., Inc. | | | 115,928 | |
| | | | | | | | |
| | | | | | | 210,335 | |
| | | | | | | | |
| | | | Textiles, Apparel & Luxury Goods — 1.0% | |
| | 308 | | | Ralph Lauren Corp. | | | 57,103 | |
| | | | | | | | |
| | | | Total Consumer Discretionary | | | 864,604 | |
| | | | | | | | |
| | | | Consumer Staples — 5.5% | |
| | | | Beverages — 3.8% | |
| | 1,465 | | | Coca-Cola Enterprises, Inc. | | | 64,800 | |
| | 677 | | | Constellation Brands, Inc., Class A (a) | | | 66,481 | |
| | 995 | | | Molson Coors Brewing Co., Class B | | | 74,140 | |
| | | | | | | | |
| | | | | | | 205,421 | |
| | | | | | | | |
| | | | | | | | |
| SHARES | | | SECURITY DESCRIPTION | | VALUE($) | |
| | | | | | | | |
| | | | | | | | |
| | | | Food Products — 1.3% | |
| | 141 | | | Archer-Daniels-Midland Co. | | | 7,348 | |
| | 322 | | | Campbell Soup Co. | | | 14,164 | |
| | 40 | | | Keurig Green Mountain, Inc. | | | 5,309 | |
| | 1,200 | | | Mondelez International, Inc., Class A | | | 43,579 | |
| | | | | | | | |
| | | | | | | 70,400 | |
| | | | | | | | |
| | | | Household Products — 0.4% | |
| | 195 | | | Energizer Holdings, Inc. | | | 25,114 | |
| | | | | | | | |
| | | | Total Consumer Staples | | | 300,935 | |
| | | | | | | | |
| | | | Energy — 8.1% | |
| | | | Energy Equipment & Services — 4.5% | |
| | 1,175 | | | Baker Hughes, Inc. | | | 65,874 | |
| | 299 | | | Cameron International Corp. (a) | | | 14,920 | |
| | 696 | | | Ensco plc, (United Kingdom), Class A | | | 20,833 | |
| | 787 | | | Halliburton Co. | | | 30,941 | |
| | 2,483 | | | Nabors Industries Ltd., (Bermuda) | | | 32,225 | |
| | 268 | | | National Oilwell Varco, Inc. | | | 17,582 | |
| | 327 | | | Noble Corp. plc, (United Kingdom) | | | 5,415 | |
| | 189 | | | Rowan Cos. plc, Class A | | | 4,408 | |
| | 343 | | | Schlumberger Ltd. | | | 29,253 | |
| | 574 | | | Transocean Ltd., (Switzerland) | | | 10,526 | |
| | 1,346 | | | Weatherford International plc, (Switzerland) (a) | | | 15,407 | |
| | | | | | | | |
| | | | | | | 247,384 | |
| | | | | | | | |
| | | | Oil, Gas & Consumable Fuels — 3.6% | |
| | 31 | | | Anadarko Petroleum Corp. | | | 2,525 | |
| | 407 | | | Chevron Corp. | | | 45,603 | |
| | 270 | | | ConocoPhillips | | | 18,619 | |
| | 98 | | | EOG Resources, Inc. | | | 9,004 | |
| | 284 | | | Exxon Mobil Corp. | | | 26,283 | |
| | 233 | | | Hess Corp. | | | 17,207 | |
| | 1,904 | | | Marathon Oil Corp. | | | 53,863 | |
| | 29 | | | Marathon Petroleum Corp. | | | 2,618 | |
| | 253 | | | Tesoro Corp. | | | 18,773 | |
| | | | | | | | |
| | | | | | | 194,495 | |
| | | | | | | | |
| | | | Total Energy | | | 441,879 | |
| | | | | | | | |
| | | | Financials — 16.9% | |
| | | | Banks — 4.6% | |
| | 3,719 | | | Bank of America Corp. | | | 66,541 | |
| | 1,530 | | | Citigroup, Inc. | | | 82,813 | |
| | 219 | | | SVB Financial Group (a) | | | 25,396 | |
| | 1,345 | | | Wells Fargo & Co. | | | 73,709 | |
| | | | | | | | |
| | | | | | | 248,459 | |
| | | | | | | | |
SEE NOTES TO FINANCIAL STATEMENTS.
| | | | | | |
| | | |
| 22 | | | | J.P. MORGAN LARGE CAP FUNDS | | DECEMBER 31, 2014 |
| | | | | | | | |
| SHARES | | | SECURITY DESCRIPTION | | VALUE($) | |
| | | | | | | | |
| Common Stocks — continued | |
| | | | Capital Markets — 7.1% | |
| | 493 | | | Goldman Sachs Group, Inc. (The) | | | 95,539 | |
| | 2,655 | | | Invesco Ltd. | | | 104,932 | |
| | 777 | | | Legg Mason, Inc. | | | 41,488 | |
| | 3,349 | | | Morgan Stanley | | | 129,957 | |
| | 216 | | | State Street Corp. | | | 16,962 | |
| | | | | | | | |
| | | | | | | 388,878 | |
| | | | | | | | |
| | | | Consumer Finance — 0.5% | |
| | 360 | | | Capital One Financial Corp. | | | 29,710 | |
| | | | | | | | |
| | | | Diversified Financial Services — 0.7% | |
| | 249 | | | Berkshire Hathaway, Inc., Class B (a) | | | 37,372 | |
| | | | | | | | |
| | | | Insurance — 3.0% | |
| | 374 | | | ACE Ltd., (Switzerland) | | | 42,910 | |
| | 270 | | | Axis Capital Holdings Ltd., (Bermuda) | | | 13,810 | |
| | 240 | | | Everest Re Group Ltd., (Bermuda) | | | 40,804 | |
| | 1,013 | | | MetLife, Inc. | | | 54,803 | |
| | 40 | | | Prudential Financial, Inc. | | | 3,646 | |
| | 248 | | | XL Group plc, (Ireland) | | | 8,524 | |
| | | | | | | | |
| | | | | | | 164,497 | |
| | | | | | | | |
| | | | Real Estate Investment Trusts (REITs) — 1.0% | |
| | 113 | | | Mid-America Apartment Communities, Inc. | | | 8,446 | |
| | 450 | | | Prologis, Inc. | | | 19,368 | |
| | 150 | | | Simon Property Group, Inc. | | | 27,335 | |
| | | | | | | | |
| | | | | | | 55,149 | |
| | | | | | | | |
| | | | Total Financials | | | 924,065 | |
| | | | | | | | |
| | | | Health Care — 15.4% | |
| | | | Biotechnology — 4.3% | |
| | 195 | | | Alexion Pharmaceuticals, Inc. (a) | | | 36,007 | |
| | 336 | | | Biogen Idec, Inc. (a) | | | 113,987 | |
| | 874 | | | Gilead Sciences, Inc. (a) | | | 82,402 | |
| | | | | | | | |
| | | | | | | 232,396 | |
| | | | | | | | |
| | | | Health Care Equipment & Supplies — 2.4% | |
| | 148 | | | Abbott Laboratories | | | 6,649 | |
| | 179 | | | Becton, Dickinson and Co. | | | 24,910 | |
| | 7,334 | | | Boston Scientific Corp. (a) | | | 97,178 | |
| | | | | | | | |
| | | | | | | 128,737 | |
| | | | | | | | |
| | | | Health Care Providers & Services — 4.4% | |
| | 842 | | | Aetna, Inc. | | | 74,822 | |
| | 647 | | | Cigna Corp. | | | 66,562 | |
| | 21 | | | Humana, Inc. | | | 3,005 | |
| | 20 | | | McKesson Corp. | | | 4,089 | |
| | 937 | | | UnitedHealth Group, Inc. | | | 94,719 | |
| | | | | | | | |
| | | | | | | 243,197 | |
| | | | | | | | |
| | | | | | | | |
| SHARES | | | SECURITY DESCRIPTION | | VALUE($) | |
| | | | | | | | |
| | | | | | | | |
| | | | Pharmaceuticals — 4.3% | |
| | 377 | | | Bristol-Myers Squibb Co. | | | 22,272 | |
| | 1,835 | | | Johnson & Johnson | | | 191,855 | |
| | 361 | | | Merck & Co., Inc. | | | 20,518 | |
| | | | | | | | |
| | | | | | | 234,645 | |
| | | | | | | | |
| | | | Total Health Care | | | 838,975 | |
| | | | | | | | |
| | | | Industrials — 9.7% | |
| | | | Aerospace & Defense — 4.8% | |
| | 51 | | | General Dynamics Corp. | | | 6,963 | |
| | 950 | | | Honeywell International, Inc. | | | 94,928 | |
| | 70 | | | Precision Castparts Corp. | | | 16,741 | |
| | 1,225 | | | United Technologies Corp. | | | 140,930 | |
| | | | | | | | |
| | | | | | | 259,562 | |
| | | | | | | | |
| | | | Airlines — 1.1% | |
| | 606 | | | Delta Air Lines, Inc. | | | 29,789 | |
| | 473 | | | United Continental Holdings, Inc. (a) | | | 31,632 | |
| | | | | | | | |
| | | | | | | 61,421 | |
| | | | | | | | |
| | | | Construction & Engineering — 1.8% | |
| | 1,588 | | | Fluor Corp. | | | 96,290 | |
| | | | | | | | |
| | | | Electrical Equipment — 0.5% | |
| | 434 | | | Emerson Electric Co. | | | 26,797 | |
| | | | | | | | |
| | | | Machinery — 1.0% | |
| | 642 | | | PACCAR, Inc. | | | 43,661 | |
| | 91 | | | Pall Corp. | | | 9,168 | |
| | | | | | | | |
| | | | | | | 52,829 | |
| | | | | | | | |
| | | | Road & Rail — 0.5% | |
| | 351 | | | CSX Corp. | | | 12,732 | |
| | 148 | | | Union Pacific Corp. | | | 17,607 | |
| | | | | | | | |
| | | | | | | 30,339 | |
| | | | | | | | |
| | | | Total Industrials | | | 527,238 | |
| | | | | | | | |
| | | | Information Technology — 18.2% | |
| | | | Communications Equipment — 0.9% | |
| | 673 | | | QUALCOMM, Inc. | | | 50,011 | |
| | | | | | | | |
| | | | Internet Software & Services — 3.0% | |
| | 579 | | | Facebook, Inc., Class A (a) | | | 45,134 | |
| | 121 | | | Google, Inc., Class A (a) | | | 64,364 | |
| | 105 | | | Google, Inc., Class C (a) | | | 55,214 | |
| | | | | | | | |
| | | | | | | 164,712 | |
| | | | | | | | |
| | | | IT Services — 1.3% | |
| | 580 | | | Cognizant Technology Solutions Corp., Class A (a) | | | 30,543 | |
| | 86 | | | Fidelity National Information Services, Inc. | | | 5,374 | |
| | 203 | | | International Business Machines Corp. | | | 32,489 | |
| | | | | | | | |
| | | | | | | 68,406 | |
| | | | | | | | |
SEE NOTES TO FINANCIAL STATEMENTS.
| | | | | | | | |
| | | |
| DECEMBER 31, 2014 | | J.P. MORGAN LARGE CAP FUNDS | | | | | 23 | |
JPMorgan Disciplined Equity Fund
SCHEDULE OF PORTFOLIO INVESTMENTS
AS OF DECEMBER 31, 2014 (Unaudited) (continued)
(Amounts in thousands, except number of Futures contracts)
| | | | | | | | |
| SHARES | | | SECURITY DESCRIPTION | | VALUE($) | |
| | | | | | | | |
| Common Stocks — continued | |
| | | | Semiconductors & Semiconductor Equipment — 4.7% | |
| | 695 | | | Avago Technologies Ltd., (Singapore) | | | 69,860 | |
| | 1,544 | | | Broadcom Corp., Class A | | | 66,880 | |
| | 1,358 | | | Lam Research Corp. | | | 107,719 | |
| | 814 | | | Marvell Technology Group Ltd., (Bermuda) | | | 11,796 | |
| | | | | | | | |
| | | | | | | 256,255 | |
| | | | | | | | |
| | | | Software — 2.7% | |
| | 2,581 | | | Microsoft Corp. | | | 119,907 | |
| | 606 | | | Oracle Corp. | | | 27,250 | |
| | | | | | | | |
| | | | | | | 147,157 | |
| | | | | | | | |
| | | | Technology Hardware, Storage & Peripherals — 5.6% | |
| | 2,039 | | | Apple, Inc. | | | 225,084 | |
| | 2,015 | | | Hewlett-Packard Co. | | | 80,874 | |
| | | | | | | | |
| | | | | | | 305,958 | |
| | | | | | | | |
| | | | Total Information Technology | | | 992,499 | |
| | | | | | | | |
| | | | Materials — 4.2% | |
| | | | Chemicals — 2.2% | |
| | 141 | | | Albemarle Corp. | | | 8,484 | |
| | 980 | | | E.I. du Pont de Nemours & Co. | | | 72,454 | |
| | 913 | | | Mosaic Co. (The) | | | 41,656 | |
| | | | | | | | |
| | | | | | | 122,594 | |
| | | | | | | | |
| | | | Containers & Packaging — 1.2% | |
| | 1,247 | | | Crown Holdings, Inc. (a) | | | 63,487 | |
| | | | | | | | |
| | | | Metals & Mining — 0.8% | |
| | 2,078 | | | Alcoa, Inc. | | | 32,813 | |
| | 369 | | | United States Steel Corp. | | | 9,862 | |
| | | | | | | | |
| | | | | | | 42,675 | |
| | | | | | | | |
| | | | Total Materials | | | 228,756 | |
| | | | | | | | |
| | | | Telecommunication Services — 1.1% | |
| | | | Diversified Telecommunication Services — 1.1% | |
| | 1,306 | | | Verizon Communications, Inc. | | | 61,077 | |
| | | | | | | | |
| | | | Utilities — 4.1% | |
| | | | Electric Utilities — 1.8% | |
| | 74 | | | Edison International | | | 4,852 | |
| | 2,017 | | | Exelon Corp. | | | 74,775 | |
| | | | | | | | |
| SHARES | | | SECURITY DESCRIPTION | | VALUE($) | |
| | | | | | | | |
| | | | | | | | |
| | | | Electric Utilities — continued | | | | |
| | 78 | | | NextEra Energy, Inc. | | | 8,312 | |
| | 227 | | | PPL Corp. | | | 8,251 | |
| | | | | | | | |
| | | | | | | 96,190 | |
| | | | | | | | |
| | | | Gas Utilities — 0.9% | |
| | 746 | | | AGL Resources, Inc. | | | 40,670 | |
| | 458 | | | Questar Corp. | | | 11,578 | |
| | | | | | | | |
| | | | | | | 52,248 | |
| | | | | | | | |
| | | | Multi-Utilities — 1.4% | |
| | 759 | | | CenterPoint Energy, Inc. | | | 17,783 | |
| | 587 | | | NiSource, Inc. | | | 24,911 | |
| | 647 | | | PG&E Corp. | | | 34,468 | |
| | | | | | | | |
| | | | | | | 77,162 | |
| | | | | | | | |
| | | | Total Utilities | | | 225,600 | |
| | | | | | | | |
| | | | Total Common Stocks
(Cost $4,746,297) | | | 5,405,628 | |
| | | | | | | | |
PRINCIPAL AMOUNT($) | | | | | | |
| Short-Term Investments— 4.0% | |
| | | | U.S. Treasury Obligation — 0.2% | |
| | 8,820 | | | U.S. Treasury Bill,
0.057%, 05/28/15 (k) (n) | | | 8,818 | |
| | | | | | | | |
| SHARES | | | | | | |
| | | | Investment Company — 3.8% | | | | |
| | 207,918 | | | JPMorgan Prime Money Market Fund, Institutional Class Shares, 0.020% (b) (l) | | | 207,918 | |
| | | | | | | | |
| | | | Total Short-Term Investments
(Cost $216,736) | | | 216,736 | |
| | | | | | | | |
| | | | Total Investments — 103.1%
(Cost $4,963,033) | | | 5,622,364 | |
| | | | Liabilities in Excess of
Other Assets — (3.1)% | | | (170,631 | ) |
| | | | | | | | |
| | | | NET ASSETS — 100.0% | | $ | 5,451,733 | |
| | | | | | | | |
Percentages indicated are based on net assets.
| | | | | | | | | | | | | | | | |
| Futures Contracts | |
NUMBER OF
CONTRACTS | | | DESCRIPTION | | EXPIRATION
DATE | | | NOTIONAL
VALUE AT
DECEMBER 31, 2014 | | | NET UNREALIZED
APPRECIATION
(DEPRECIATION) | |
| | | | Long Futures Outstanding | | | | | | | | | | | | |
| | 489 | | | E-mini S&P 500 | | | 03/20/15 | | | $ | 50,181 | | | $ | 1,050 | |
| | | | | | | | | | | | | | | | |
SEE NOTES TO FINANCIAL STATEMENTS.
| | | | | | |
| | | |
| 24 | | | | J.P. MORGAN LARGE CAP FUNDS | | DECEMBER 31, 2014 |
JPMorgan Dynamic Growth Fund
SCHEDULE OF PORTFOLIO INVESTMENTS
AS OF DECEMBER 31, 2014 (Unaudited)
(Amounts in thousands)
| | | | | | | | |
| SHARES | | | SECURITY DESCRIPTION | | VALUE($) | |
| | | | | | | | |
| Common Stocks — 96.8% | |
| | | | Consumer Discretionary — 17.0% | |
| | | | Hotels, Restaurants & Leisure — 2.6% | |
| | 104 | | | Starbucks Corp. | | | 8,572 | |
| | | | | | | | |
| | | | Internet & Catalog Retail — 6.8% | |
| | 29 | | | Amazon.com, Inc. (a) | | | 8,919 | |
| | 12 | | | Priceline Group, Inc. (The) (a) | | | 13,301 | |
| | | | | | | | |
| | | | | | | 22,220 | |
| | | | | | | | |
| | | | Media — 2.0% | |
| | 167 | | | Twenty-First Century Fox, Inc., Class A | | | 6,425 | |
| | | | | | | | |
| | | | Specialty Retail — 2.9% | |
| | 92 | | | Home Depot, Inc. (The) | | | 9,642 | |
| | | | | | | | |
| | | | Textiles, Apparel & Luxury Goods — 2.7% | |
| | 119 | | | Michael Kors Holdings Ltd., (Hong Kong) (a) | | | 8,963 | |
| | | | | | | | |
| | | | Total Consumer Discretionary | | | 55,822 | |
| | | | | | | | |
| | | | Consumer Staples — 4.1% | |
| | | | Food & Staples Retailing — 4.1% | |
| | 140 | | | CVS Health Corp. (m) | | | 13,522 | |
| | | | | | | | |
| | | | Energy — 4.5% | |
| | | | Energy Equipment & Services — 1.9% | |
| | 74 | | | Schlumberger Ltd. | | | 6,329 | |
| | | | | | | | |
| | | | Oil, Gas & Consumable Fuels — 2.6% | |
| | 282 | | | Cabot Oil & Gas Corp. | | | 8,353 | |
| | | | | | | | |
| | | | Total Energy | | | 14,682 | |
| | | | | | | | |
| | | | Financials — 7.2% | |
| | | | Capital Markets — 7.2% | |
| | 48 | | | Goldman Sachs Group, Inc. (The) | | | 9,313 | |
| | 404 | | | TD Ameritrade Holding Corp. | | | 14,472 | |
| | | | | | | | |
| | | | Total Financials | | | 23,785 | |
| | | | | | | | |
| | | | Health Care — 18.2% | |
| | | | Biotechnology — 17.1% | |
| | 42 | | | Alexion Pharmaceuticals, Inc. (a) | | | 7,688 | |
| | 28 | | | Biogen Idec, Inc. (a) | | | 9,496 | |
| | 89 | | | Celgene Corp. (a) | | | 10,009 | |
| | 133 | | | Gilead Sciences, Inc. (a) | | | 12,518 | |
| | 17 | | | Regeneron Pharmaceuticals, Inc. (a) | | | 7,107 | |
| | 80 | | | Vertex Pharmaceuticals, Inc. (a) | | | 9,486 | |
| | | | | | | | |
| | | | | | | 56,304 | |
| | | | | | | | |
| | | | Pharmaceuticals — 1.1% | |
| | 32 | | | Salix Pharmaceuticals Ltd. (a) | | | 3,638 | |
| | | | | | | | |
| | | | Total Health Care | | | 59,942 | |
| | | | | | | | |
| | | | Industrials — 7.2% | |
| | | | Aerospace & Defense — 2.4% | |
| | 41 | | | TransDigm Group, Inc. | | | 8,062 | |
| | | | | | | | |
| | | | | | | | |
| SHARES | | | SECURITY DESCRIPTION | | VALUE($) | |
| | | | | | | | |
| | | | Road & Rail — 4.8% | |
| | 129 | | | Kansas City Southern | | | 15,733 | |
| | | | | | | | |
| | | | Total Industrials | | | 23,795 | |
| | | | | | | | |
| | | | Information Technology — 35.6% | |
| | | | Internet Software & Services — 15.4% | |
| | 28 | | | Baidu, Inc., (China), ADR (a) | | | 6,281 | |
| | 239 | | | Facebook, Inc., Class A (a) | | | 18,637 | |
| | 35 | | | Google, Inc., Class A (a) | | | 18,658 | |
| | 30 | | | LinkedIn Corp., Class A (a) | | | 6,908 | |
| | | | | | | | |
| | | | | | | 50,484 | |
| | | | | | | | |
| | | | IT Services — 7.9% | |
| | 36 | | | Alliance Data Systems Corp. (a) | | | 10,398 | |
| | 180 | | | MasterCard, Inc., Class A | | | 15,548 | |
| | | | | | | | |
| | | | | | | 25,946 | |
| | | | | | | | |
| | | | Semiconductors & Semiconductor Equipment — 5.5% | |
| | 76 | | | ARM Holdings plc, (United Kingdom), ADR | | | 3,507 | |
| | 69 | | | Avago Technologies Ltd., (Singapore) | | | 6,903 | |
| | 178 | | | Broadcom Corp., Class A | | | 7,731 | |
| | | | | | | | |
| | | | | | | 18,141 | |
| | | | | | | | |
| | | | Software — 4.0% | |
| | 128 | | | salesforce.com, Inc. (a) | | | 7,584 | |
| | 69 | | | VMware, Inc., Class A (a) | | | 5,659 | |
| | | | | | | | |
| | | | | | | 13,243 | |
| | | | | | | | |
| | | | Technology Hardware, Storage & Peripherals — 2.8% | |
| | 81 | | | Apple, Inc. (m) | | | 8,985 | |
| | | | | | | | |
| | | | Total Information Technology | | | 116,799 | |
| | | | | | | | |
| | | | Materials — 3.0% | |
| | | | Chemicals — 3.0% | |
| | 67 | | | Air Products & Chemicals, Inc. (m) | | | 9,714 | |
| | | | | | | | |
| | | | Total Common Stocks
(Cost $261,717) | | | 318,061 | |
| | | | | | | | |
| Short-Term Investment — 3.2% | |
| | | | Investment Company — 3.2% | |
| | 10,350 | | | JPMorgan Prime Money Market Fund, Institutional Class Shares,
0.02%, (b) (l) (m)
(Cost $10,350) | | | 10,350 | |
| | | | | | | | |
| | | | Total Investments — 100.0%
(Cost $272,067) | | | 328,411 | |
| | | | Other Assets in Excess of
Liabilities — 0.0% (g) | | | 45 | |
| | | | | | | | |
| | | | NET ASSETS — 100.0% | | $ | 328,456 | |
| | | | | | | | |
Percentages indicated are based on net assets.
SEE NOTES TO FINANCIAL STATEMENTS.
| | | | | | | | |
| | | |
| DECEMBER 31, 2014 | | J.P. MORGAN LARGE CAP FUNDS | | | | | 25 | |
JPMorgan Equity Focus Fund
SCHEDULE OF PORTFOLIO INVESTMENTS
AS OF DECEMBER 31, 2014 (Unaudited)
(Amounts in thousands)
| | | | | | | | |
| SHARES | | | SECURITY DESCRIPTION | | VALUE($) | |
| | | | | | | | |
| Common Stocks — 93.7% | |
| | | | Consumer Discretionary — 17.8% | | | | |
| | | | Hotels, Restaurants & Leisure — 2.4% | |
| | 23 | | | Starbucks Corp. | | | 1,880 | |
| | | | | | | | |
| | | | Internet & Catalog Retail — 6.0% | |
| | 7 | | | Amazon.com, Inc. (a) | | | 2,030 | |
| | 2 | | | Priceline Group, Inc. (The) (a) | | | 2,696 | |
| | | | | | | | |
| | | | | | | 4,726 | |
| | | | | | | | |
| | | | Media — 4.0% | |
| | 43 | | | DISH Network Corp., Class A (a) | | | 3,129 | |
| | | | | | | | |
| | | | Multiline Retail — 2.9% | |
| | 38 | | | Kohl’s Corp. | | | 2,332 | |
| | | | | | | | |
| | | | Specialty Retail — 2.5% | |
| | 51 | | | Best Buy Co., Inc. | | | 1,998 | |
| | | | | | | | |
| | | | Total Consumer Discretionary | | | 14,065 | |
| | | | | | | | |
| | | | Consumer Staples — 4.0% | |
| | | | Beverages — 1.5% | |
| | 17 | | | Dr. Pepper Snapple Group, Inc. | | | 1,194 | |
| | | | | | | | |
| | | | Household Products — 2.5% | |
| | 22 | | | Procter & Gamble Co. (The) | | | 1,992 | |
| | | | | | | | |
| | | | Total Consumer Staples | | | 3,186 | |
| | | | | | | | |
| | | | Energy — 5.9% | |
| | | | Energy Equipment & Services — 0.9% | |
| | 8 | | | Schlumberger Ltd. | | | 706 | |
| | | | | | | | |
| | | | Oil, Gas & Consumable Fuels — 5.0% | |
| | 28 | | | Cabot Oil & Gas Corp. | | | 827 | |
| | 24 | | | Exxon Mobil Corp. | | | 2,260 | |
| | 19 | | | Kinder Morgan, Inc. | | | 813 | |
| | | | | | | | |
| | | | | | | 3,900 | |
| | | | | | | | |
| | | | Total Energy | | | 4,606 | |
| | | | | | | | |
| | | | Financials — 23.0% | |
| | | | Banks — 4.0% | |
| | 58 | | | Wells Fargo & Co. | | | 3,164 | |
| | | | | | | | |
| | | | Capital Markets — 3.4% | |
| | 31 | | | T. Rowe Price Group, Inc. | | | 2,690 | |
| | | | | | | | |
| | | | Consumer Finance — 6.4% | |
| | 114 | | | Ally Financial, Inc. (a) | | | 2,681 | |
| | 29 | | | Capital One Financial Corp. | | | 2,383 | |
| | | | | | | | |
| | | | | | | 5,064 | |
| | | | | | | | |
| | | | Diversified Financial Services — 1.1% | |
| | 5 | | | Berkshire Hathaway, Inc., Class B (a) | | | 824 | |
| | | | | | | | |
| | | | | | | | |
| SHARES | | | SECURITY DESCRIPTION | | VALUE($) | |
| | | | | | | | |
| | | | | |
| | | | Insurance — 6.5% | |
| | 58 | | | American International Group, Inc. (m) | | | 3,234 | |
| | 44 | | | Loews Corp. | | | 1,864 | |
| | | | | | | | |
| | | | | | | 5,098 | |
| | | | | | | | |
| | | | Real Estate Investment Trusts (REITs) — 1.6% | |
| | 45 | | | Rayonier, Inc. (m) | | | 1,266 | |
| | | | | | | | |
| | | | Total Financials | | | 18,106 | |
| | | | | | | | |
| | | | Health Care — 14.0% | |
| | | | Biotechnology — 9.4% | |
| | 10 | | | Alexion Pharmaceuticals, Inc. (a) | | | 1,915 | |
| | 8 | | | Biogen Idec, Inc. (a) | | | 2,658 | |
| | 30 | | | Gilead Sciences, Inc. (a) | | | 2,825 | |
| | | | | | | | |
| | | | | | | 7,398 | |
| | | | | | | | |
| | | | Pharmaceuticals — 4.6% | |
| | 19 | | | Johnson & Johnson | | | 1,946 | |
| | 15 | | | Salix Pharmaceuticals Ltd. (a) | | | 1,700 | |
| | | | | | | | |
| | | | | | | 3,646 | |
| | | | | | | | |
| | | | Total Health Care | | | 11,044 | |
| | | | | | | | |
| | | | Industrials — 6.0% | |
| | | | Aerospace & Defense — 1.3% | |
| | 9 | | | United Technologies Corp. | | | 1,054 | |
| | | | | | | | |
| | | | Road & Rail — 4.7% | |
| | 30 | | | Kansas City Southern | | | 3,693 | |
| | | | | | | | |
| | | | Total Industrials | | | 4,747 | |
| | | | | | | | |
| | | | Information Technology — 18.1% | |
| | | | Internet Software & Services — 10.4% | |
| | 49 | | | Facebook, Inc., Class A (a) | | | 3,804 | |
| | 8 | | | Google, Inc., Class C (a) | | | 4,390 | |
| | | | | | | | |
| | | | | | | 8,194 | |
| | | | | | | | |
| | | | IT Services — 4.2% | |
| | 38 | | | MasterCard, Inc., Class A | | | 3,306 | |
| | | | | | | | |
| | | | Software — 3.5% | |
| | 21 | | | salesforce.com, Inc. (a) | | | 1,255 | |
| | 18 | | | VMware, Inc., Class A (a) | | | 1,496 | |
| | | | | | | | |
| | | | | | | 2,751 | |
| | | | | | | | |
| | | | Total Information Technology | | | 14,251 | |
| | | | | | | | |
| | | | Materials — 3.4% | |
| | | | Construction Materials — 1.0% | |
| | 7 | | | Martin Marietta Materials, Inc. | | | 796 | |
| | | | | | | | |
| | | | Containers & Packaging — 2.4% | |
| | 31 | | | Rock-Tenn Co., Class A | | | 1,906 | |
| | | | | | | | |
| | | | Total Materials | | | 2,702 | |
| | | | | | | | |
SEE NOTES TO FINANCIAL STATEMENTS.
| | | | | | |
| | | |
| 26 | | | | J.P. MORGAN LARGE CAP FUNDS | | DECEMBER 31, 2014 |
| | | | | | | | |
| SHARES | | | SECURITY DESCRIPTION | | VALUE($) | |
| | | | | | | | |
| Common Stocks — continued | |
| | | | Utilities — 1.5% | |
| | | | Electric Utilities — 1.5% | |
| | 18 | | | Edison International | | | 1,202 | |
| | | | | | | | |
| | | | Total Common Stocks
(Cost $66,147) | | | 73,909 | |
| | | | | | | | |
| Short-Term Investment — 6.3% | |
| | | | Investment Company— 6.3% | | | | |
| | 4,951 | | | JPMorgan Prime Money Market Fund, Institutional Class Shares,
0.020% (b) (l) (m)
(Cost $4,951) | | | 4,951 | |
| | | | | | | | |
| | | | Total Investments — 100.0%
(Cost $71,098) | | | 78,860 | |
| | | | Other Assets in Excess of
Liabilities — 0.0% (g) | | | 4 | |
| | | | | | | | |
| | | | NET ASSETS — 100.0% | | $ | 78,864 | |
| | | | | | | | |
Percentages indicated are based on net assets.
SEE NOTES TO FINANCIAL STATEMENTS.
| | | | | | | | |
| | | |
| DECEMBER 31, 2014 | | J.P. MORGAN LARGE CAP FUNDS | | | | | 27 | |
JPMorgan Equity Income Fund
SCHEDULE OF PORTFOLIO INVESTMENTS
AS OF DECEMBER 31, 2014 (Unaudited)
(Amounts in thousands)
| | | | | | | | |
| SHARES | | | SECURITY DESCRIPTION | | VALUE($) | |
| | | | | | | | |
| Common Stocks — 98.1% | |
| | | | Consumer Discretionary — 12.2% | | | | |
| | | | Distributors — 0.8% | |
| | 687 | | | Genuine Parts Co. | | | 73,259 | |
| | | | | | | | |
| | | | Hotels, Restaurants & Leisure — 2.2% | |
| | 718 | | | Brinker International, Inc. | | | 42,123 | |
| | 1,966 | | | Dunkin’ Brands Group, Inc. | | | 83,868 | |
| | 866 | | | Wyndham Worldwide Corp. | | | 74,309 | |
| | | | | | | | |
| | | | | | | 200,300 | |
| | | | | | | | |
| | | | Media — 3.7% | |
| | 1,102 | | | Cinemark Holdings, Inc. | | | 39,194 | |
| | 543 | | | Comcast Corp., Class A | | | 31,238 | |
| | 1,062 | | | Omnicom Group, Inc. | | | 82,267 | |
| | 253 | | | Time Warner Cable, Inc. | | | 38,421 | |
| | 1,687 | | | Time Warner, Inc. | | | 144,105 | |
| | | | | | | | |
| | | | | | | 335,225 | |
| | | | | | | | |
| | | | Specialty Retail — 5.0% | |
| | 1,421 | | | Gap, Inc. (The) | | | 59,819 | |
| | 1,544 | | | Home Depot, Inc. (The) | | | 162,123 | |
| | 983 | | | L Brands, Inc. | | | 85,067 | |
| | 847 | | | Tiffany & Co. | | | 90,528 | |
| | 743 | | | Williams-Sonoma, Inc. | | | 56,245 | |
| | | | | | | | |
| | | | | | | 453,782 | |
| | | | | | | | |
| | | | Textiles, Apparel & Luxury Goods — 0.5% | |
| | 579 | | | V.F. Corp. | | | 43,383 | |
| | | | | | | | |
| | | | Total Consumer Discretionary | | | 1,105,949 | |
| | | | | | | | |
| | | | Consumer Staples — 8.8% | |
| | | | Beverages — 0.8% | |
| | 1,790 | | | Coca-Cola Co. (The) (m) | | | 75,562 | |
| | | | | | | | |
| | | | Food Products — 3.5% | |
| | 1,001 | | | Hershey Co. (The) | | | 104,019 | |
| | 471 | | | JM Smucker Co. (The) | | | 47,546 | |
| | 1,074 | | | Kraft Foods Group, Inc. | | | 67,292 | |
| | 2,772 | | | Mondelez International, Inc., Class A | | | 100,681 | |
| | | | | | | | |
| | | | | | | 319,538 | |
| | | | | | | | |
| | | | Household Products — 1.5% | |
| | 1,439 | | | Procter & Gamble Co. (The) | | | 131,060 | |
| | | | | | | | |
| | | | Tobacco — 3.0% | |
| | 3,368 | | | Altria Group, Inc. | | | 165,964 | |
| | 703 | | | Lorillard, Inc. | | | 44,271 | |
| | 737 | | | Philip Morris International, Inc. | | | 60,052 | |
| | | | | | | | |
| | | | | | | 270,287 | |
| | | | | | | | |
| | | | Total Consumer Staples | | | 796,447 | |
| | | | | | | | |
| | | | | | | | |
| SHARES | | | SECURITY DESCRIPTION | | VALUE($) | |
| | | | | | | | |
| | | | | | | | |
| | | | Energy — 9.1% | |
| | | | Oil, Gas & Consumable Fuels — 9.1% | |
| | 1,612 | | | Chevron Corp. | | | 180,862 | |
| | 2,847 | | | ConocoPhillips | | | 196,626 | |
| | 2,230 | | | Exxon Mobil Corp. | | | 206,188 | |
| | 1,085 | | | Kinder Morgan, Inc. | | | 45,888 | |
| | 586 | | | Marathon Petroleum Corp. | | | 52,904 | |
| | 1,738 | | | Occidental Petroleum Corp. | | | 140,114 | |
| | | | | | | | |
| | | | Total Energy | | | 822,582 | |
| | | | | | | | |
| | | | Financials — 25.3% | |
| | | | Banks — 9.7% | |
| | 2,418 | | | BB&T Corp. | | | 94,045 | |
| | 654 | | | Cullen/Frost Bankers, Inc. | | | 46,188 | |
| | 431 | | | M&T Bank Corp. | | | 54,179 | |
| | 2,056 | | | PNC Financial Services Group, Inc. (The) | | | 187,608 | |
| | 1,979 | | | U.S. Bancorp | | | 88,941 | |
| | 7,484 | | | Wells Fargo & Co. | | | 410,252 | |
| | | | | | | | |
| | | | | | | 881,213 | |
| | | | | | | | |
| | | | Capital Markets — 4.6% | |
| | 437 | | | Ameriprise Financial, Inc. | | | 57,761 | |
| | 479 | | | BlackRock, Inc. | | | 171,124 | |
| | 1,161 | | | Northern Trust Corp. | | | 78,274 | |
| | 1,304 | | | T. Rowe Price Group, Inc. | | | 111,993 | |
| | | | | | | | |
| | | | | | | 419,152 | |
| | | | | | | | |
| | | | Diversified Financial Services — 2.5% | |
| | 1,914 | | | CME Group, Inc. | | | 169,692 | |
| | 607 | | | McGraw Hill Financial, Inc. | | | 54,051 | |
| | | | | | | | |
| | | | | | | 223,743 | |
| | | | | | | | |
| | | | Insurance — 6.5% | |
| | 898 | | | Arthur J. Gallagher & Co. | | | 42,300 | |
| | 683 | | | Cincinnati Financial Corp. | | | 35,411 | |
| | 2,038 | | | Hartford Financial Services Group, Inc. (The) | | | 84,980 | |
| | 1,685 | | | MetLife, Inc. | | | 91,117 | |
| | 1,429 | | | Progressive Corp. (The) | | | 38,561 | |
| | 1,252 | | | Prudential Financial, Inc. | | | 113,231 | |
| | 1,558 | | | Travelers Cos., Inc. (The) | | | 164,890 | |
| | 480 | | | Validus Holdings Ltd., (Bermuda) | | | 19,958 | |
| | | | | | | | |
| | | | | | | 590,448 | |
| | | | | | | | |
| | | | Real Estate Investment Trusts (REITs) — 2.0% | |
| | 334 | | | Alexandria Real Estate Equities, Inc. (m) | | | 29,631 | |
| | 386 | | | AvalonBay Communities, Inc. (m) | | | 63,066 | |
| | 478 | | | Simon Property Group, Inc. (m) | | | 87,108 | |
| | | | | | | | |
| | | | | | | 179,805 | |
| | | | | | | | |
| | | | Total Financials | | | 2,294,361 | |
| | | | | | | | |
SEE NOTES TO FINANCIAL STATEMENTS.
| | | | | | |
| | | |
| 28 | | | | J.P. MORGAN LARGE CAP FUNDS | | DECEMBER 31, 2014 |
| | | | | | | | |
| SHARES | | | SECURITY DESCRIPTION | | VALUE($) | |
| | | | | | | | |
| Common Stocks — continued | |
| | | | Health Care — 11.6% | |
| | | | Health Care Equipment & Supplies — 2.2% | |
| | 1,062 | | | Baxter International, Inc. | | | 77,851 | |
| | 830 | | | Becton, Dickinson and Co. (m) | | | 115,445 | |
| | | | | | | | |
| | | | | | | 193,296 | |
| | | | | | | | |
| | | | Pharmaceuticals — 9.4% | |
| | 1,115 | | | AbbVie, Inc. | | | 72,977 | |
| | 1,615 | | | Bristol-Myers Squibb Co. | | | 95,343 | |
| | 3,263 | | | Johnson & Johnson | | | 341,182 | |
| | 3,079 | | | Merck & Co., Inc. | | | 174,866 | |
| | 5,465 | | | Pfizer, Inc. | | | 170,227 | |
| | | | | | | | |
| | | | | | | 854,595 | |
| | | | | | | | |
| | | | Total Health Care | | | 1,047,891 | |
| | | | | | | | |
| | | | Industrials — 11.1% | |
| | | | Aerospace & Defense — 3.0% | |
| | 1,248 | | | Honeywell International, Inc. (m) | | | 124,689 | |
| | 1,279 | | | United Technologies Corp. | | | 147,049 | |
| | | | | | | | |
| | | | | | | 271,738 | |
| | | | | | | | |
| | | | Air Freight & Logistics — 1.1% | |
| | 917 | | | United Parcel Service, Inc., Class B | | | 101,967 | |
| | | | | | | | |
| | | | Electrical Equipment — 1.1% | |
| | 1,592 | | | Emerson Electric Co. | | | 98,296 | |
| | | | | | | | |
| | | | Industrial Conglomerates — 1.0% | |
| | 549 | | | 3M Co. | | | 90,223 | |
| | | | | | | | |
| | | | Machinery — 3.0% | |
| | 1,256 | | | Illinois Tool Works, Inc. | | | 118,991 | |
| | 1,819 | | | PACCAR, Inc. | | | 123,707 | |
| | 211 | | | Snap-on, Inc. | | | 28,852 | |
| | | | | | | | |
| | | | | | | 271,550 | |
| | | | | | | | |
| | | | Road & Rail — 1.4% | |
| | 836 | | | Norfolk Southern Corp. | | | 91,677 | |
| | 306 | | | Union Pacific Corp. | | | 36,500 | |
| | | | | | | | |
| | | | | | | 128,177 | |
| | | | | | | | |
| | | | Trading Companies & Distributors — 0.5% | |
| | 1,021 | | | Fastenal Co. | | | 48,577 | |
| | | | | | | | |
| | | | Total Industrials | | | 1,010,528 | |
| | | | | | | | |
| | | | Information Technology — 9.6% | |
| | | | Communications Equipment — 0.8% | |
| | 1,040 | | | QUALCOMM, Inc. | | | 77,298 | |
| | | | | | | | |
| | | | IT Services — 2.5% | |
| | 937 | | | Accenture plc, (Ireland), Class A | | | 83,653 | |
| | 739 | | | Automatic Data Processing, Inc. | | | 61,641 | |
| | | | | | | | |
| SHARES | | | SECURITY DESCRIPTION | | VALUE($) | |
| | | | | | | | |
| | | | | | | | |
| | | | IT Services — continued | |
| | 1,275 | | | Fidelity National Information Services, Inc. | | | 79,288 | |
| | | | | | | | |
| | | | | | | 224,582 | |
| | | | | | | | |
| | | | Semiconductors & Semiconductor Equipment — 3.1% | |
| | 1,496 | | | Analog Devices, Inc. | | | 83,048 | |
| | 1,156 | | | KLA-Tencor Corp. | | | 81,286 | |
| | 1,583 | | | Texas Instruments, Inc. | | | 84,623 | |
| | 795 | | | Xilinx, Inc. | | | 34,437 | |
| | | | | | | | |
| | | | | | | 283,394 | |
| | | | | | | | |
| | | | Software — 1.1% | |
| | 2,201 | | | Microsoft Corp. | | | 102,256 | |
| | | | | | | | |
| | | | Technology Hardware, Storage & Peripherals — 2.1% | |
| | 1,697 | | | Apple, Inc. (m) | | | 187,353 | |
| | | | | | | | |
| | | | Total Information Technology | | | 874,883 | |
| | | | | | | | |
| | | | Materials — 2.0% | |
| | | | Chemicals — 2.0% | |
| | 478 | | | Airgas, Inc. | | | 55,009 | |
| | 1,027 | | | E.I. du Pont de Nemours & Co. | | | 75,937 | |
| | 219 | | | PPG Industries, Inc. | | | 50,669 | |
| | | | | | | | |
| | | | Total Materials | | | 181,615 | |
| | | | | | | | |
| | | | Telecommunication Services — 1.5% | |
| | | | Diversified Telecommunication Services — 1.5% | |
| | 2,864 | | | Verizon Communications, Inc. (m) | | | 133,956 | |
| | | | | | | | |
| | | | Utilities — 6.9% | |
| | | | Electric Utilities — 2.9% | |
| | 1,665 | | | Edison International | | | 109,029 | |
| | 838 | | | NextEra Energy, Inc. | | | 89,083 | |
| | 1,675 | | | Xcel Energy, Inc. | | | 60,169 | |
| | | | | | | | |
| | | | | | | 258,281 | |
| | | | | | | | |
| | | | Multi-Utilities — 4.0% | |
| | 2,016 | | | CMS Energy Corp. | | | 70,071 | |
| | 600 | | | Dominion Resources, Inc. | | | 46,153 | |
| | 757 | | | DTE Energy Co. | | | 65,341 | |
| | 1,784 | | | NiSource, Inc. | | | 75,692 | |
| | 970 | | | Sempra Energy | | | 107,978 | |
| | | | | | | | |
| | | | | | | 365,235 | |
| | | | | | | | |
| | | | Total Utilities | | | 623,516 | |
| | | | | | | | |
| | | | Total Common Stocks
(Cost $6,935,483) | | | 8,891,728 | |
| | | | | | | | |
SEE NOTES TO FINANCIAL STATEMENTS.
| | | | | | | | |
| | | |
| DECEMBER 31, 2014 | | J.P. MORGAN LARGE CAP FUNDS | | | | | 29 | |
JPMorgan Equity Income Fund
SCHEDULE OF PORTFOLIO INVESTMENTS
AS OF DECEMBER 31, 2014 (Unaudited) (continued)
(Amounts in thousands)
| | | | | | | | |
| SHARES | | | SECURITY DESCRIPTION | | VALUE($) | |
| | | | | | | | |
| Short-Term Investment — 1.0% | |
| | | | Investment Company — 1.0% | |
| | 90,194 | | | JPMorgan Liquid Assets Money Market Fund, Institutional Class Shares, 0.030% (b) (l) (m)
(Cost $90,194) | | | 90,194 | |
| | | | | | | | |
| | | | Total Investments — 99.1%
(Cost $7,025,677) | | | 8,981,922 | |
| | | | Other Assets in Excess of
Liabilities — 0.9% | | | 82,193 | |
| | | | | | | | |
| | | | NET ASSETS — 100.0% | | $ | 9,064,115 | |
| | | | | | | | |
Percentages indicated are based on net assets.
SEE NOTES TO FINANCIAL STATEMENTS.
| | | | | | |
| | | |
| 30 | | | | J.P. MORGAN LARGE CAP FUNDS | | DECEMBER 31, 2014 |
JPMorgan Growth and Income Fund
SCHEDULE OF PORTFOLIO INVESTMENTS
AS OF DECEMBER 31, 2014 (Unaudited)
(Amounts in thousands)
| | | | | | | | |
| SHARES | | | SECURITY DESCRIPTION | | VALUE($) | |
| | | | | | | | |
| Common Stocks — 97.2% | |
| | | | Consumer Discretionary — 11.0% | | | | |
| | | | Hotels, Restaurants & Leisure — 0.8% | |
| | 47 | | | Marriott International, Inc., Class A | | | 3,628 | |
| | | | | | | | |
| | | | Media — 4.8% | |
| | 41 | | | CBS Corp. (Non-Voting), Class B | | | 2,241 | |
| | 63 | | | Comcast Corp., Class A | | | 3,678 | |
| | 111 | | | DISH Network Corp., Class A (a) | | | 8,069 | |
| | 69 | | | Time Warner, Inc. | | | 5,902 | |
| | 41 | | | Walt Disney Co. (The) | | | 3,862 | |
| | | | | | | | |
| | | | | | | 23,752 | |
| | | | | | | | |
| | | | Specialty Retail — 4.8% | |
| | 8 | | | AutoZone, Inc. (a) | | | 4,835 | |
| | 160 | | | Best Buy Co., Inc. | | | 6,249 | |
| | 55 | | | Gap, Inc. (The) | | | 2,316 | |
| | 65 | | | Home Depot, Inc. (The) | | | 6,865 | |
| | 32 | | | Tiffany & Co. | | | 3,462 | |
| | | | | | | | |
| | | | | | | 23,727 | |
| | | | | | | | |
| | | | Textiles, Apparel & Luxury Goods — 0.6% | |
| | 74 | | | Coach, Inc. | | | 2,765 | |
| | | | | | | | |
| | | | Total Consumer Discretionary | | | 53,872 | |
| | | | | | | | |
| | | | Consumer Staples — 7.4% | | | | |
| | | | Beverages — 2.0% | |
| | 55 | | | Dr. Pepper Snapple Group, Inc. | | | 3,949 | |
| | 77 | | | Molson Coors Brewing Co., Class B | | | 5,738 | |
| | | | | | | | |
| | | | | | | 9,687 | |
| | | | | | | | |
| | | | Food & Staples Retailing — 1.7% | |
| | 88 | | | CVS Health Corp. | | | 8,437 | |
| | | | | | | | |
| | | | Food Products — 1.9% | |
| | 79 | | | Campbell Soup Co. | | | 3,489 | |
| | 89 | | | Kraft Foods Group, Inc. | | | 5,596 | |
| | | | | | | | |
| | | | | | | 9,085 | |
| | | | | | | | |
| | | | Household Products — 1.0% | |
| | 55 | | | Procter & Gamble Co. (The) | | | 4,987 | |
| | | | | | | | |
| | | | Tobacco — 0.8% | | | | |
| | 82 | | | Altria Group, Inc. | | | 4,060 | |
| | | | | | | | |
| | | | Total Consumer Staples | | | 36,256 | |
| | | | | | | | |
| | | | Energy — 10.1% | | | | |
| | | | Energy Equipment & Services — 0.8% | |
| | 58 | | | Helmerich & Payne, Inc. | | | 3,904 | |
| | | | | | | | |
| | | | Oil, Gas & Consumable Fuels — 9.3% | |
| | 83 | | | Chevron Corp. | | | 9,261 | |
| | 86 | | | ConocoPhillips | | | 5,972 | |
| | 41 | | | Devon Energy Corp. | | | 2,515 | |
| | | | | | | | |
| SHARES | | | SECURITY DESCRIPTION | | VALUE($) | |
| | | | | | | | |
| | | | | | | | |
| | | | Oil, Gas & Consumable Fuels — continued | |
| | 153 | | | Exxon Mobil Corp. | | | 14,190 | |
| | 128 | | | Occidental Petroleum Corp. | | | 10,278 | |
| | 52 | | | Phillips 66 | | | 3,728 | |
| | | | | | | | |
| | | | | | | 45,944 | |
| | | | | | | | |
| | | | Total Energy | | | 49,848 | |
| | | | | | | | |
| | | | Financials — 33.7% | |
| | | | Banks — 11.5% | |
| | 562 | | | Bank of America Corp. | | | 10,063 | |
| | 125 | | | BB&T Corp. | | | 4,849 | |
| | 140 | | | Citigroup, Inc. | | | 7,573 | |
| | 34 | | | M&T Bank Corp. | | | 4,284 | |
| | 54 | | | PNC Financial Services Group, Inc. (The) | | | 4,881 | |
| | 128 | | | SunTrust Banks, Inc. | | | 5,376 | |
| | 107 | | | U.S. Bancorp | | | 4,828 | |
| | 268 | | | Wells Fargo & Co. | | | 14,692 | |
| | | | | | | | |
| | | | | | | 56,546 | |
| | | | | | | | |
| | | | Capital Markets — 9.6% | |
| | 27 | | | Affiliated Managers Group, Inc. (a) | | | 5,688 | |
| | 38 | | | Ameriprise Financial, Inc. | | | 5,078 | |
| | 17 | | | BlackRock, Inc. | | | 6,222 | |
| | 198 | | | Charles Schwab Corp. (The) | | | 5,975 | |
| | 22 | | | Goldman Sachs Group, Inc. (The) | | | 4,303 | |
| | 208 | | | Invesco Ltd. | | | 8,232 | |
| | 105 | | | Morgan Stanley | | | 4,058 | |
| | 88 | | | T. Rowe Price Group, Inc. | | | 7,513 | |
| | | | | | | | |
| | | | | | | 47,069 | |
| | | | | | | | |
| | | | Consumer Finance — 0.7% | |
| | 41 | | | Capital One Financial Corp. | | | 3,343 | |
| | | | | | | | |
| | | | Diversified Financial Services — 2.7% | |
| | 65 | | | Berkshire Hathaway, Inc., Class B (a) | | | 9,700 | |
| | 17 | | | Intercontinental Exchange, Inc. | | | 3,684 | |
| | | | | | | | |
| | | | | | | 13,384 | |
| | | | | | | | |
| | | | Insurance — 5.5% | |
| | 38 | | | Chubb Corp. (The) | | | 3,963 | |
| | 247 | | | Hartford Financial Services Group, Inc. (The) | | | 10,285 | |
| | 110 | | | Loews Corp. | | | 4,635 | |
| | 92 | | | Prudential Financial, Inc. | | | 8,304 | |
| | | | | | | | |
| | | | | | | 27,187 | |
| | | | | | | | |
| | | | Real Estate Investment Trusts (REITs) — 3.7% | |
| | 15 | | | AvalonBay Communities, Inc. (m) | | | 2,467 | |
| | 40 | | | Regency Centers Corp. (m) | | | 2,519 | |
| | 55 | | | Ventas, Inc. (m) | | | 3,908 | |
SEE NOTES TO FINANCIAL STATEMENTS.
| | | | | | | | |
| | | |
| DECEMBER 31, 2014 | | J.P. MORGAN LARGE CAP FUNDS | | | | | 31 | |
JPMorgan Growth and Income Fund
SCHEDULE OF PORTFOLIO INVESTMENTS
AS OF DECEMBER 31, 2014 (Unaudited) (continued)
(Amounts in thousands)
| | | | | | | | |
| SHARES | | | SECURITY DESCRIPTION | | VALUE($) | |
| | | | | | | | |
| Common Stocks — continued | |
| | | | Real Estate Investment Trusts (REITs) — continued | |
| | 53 | | | Vornado Realty Trust (m) | | | 6,191 | |
| | 84 | | | Weyerhaeuser Co. (m) | | | 3,008 | |
| | | | | | | | |
| | | | | | | 18,093 | |
| | | | | | | | |
| | | | Total Financials | | | 165,622 | |
| | | | | | | | |
| | | | Health Care — 11.4% | |
| | | | Health Care Equipment & Supplies — 1.3% | |
| | 42 | | | Baxter International, Inc. | | | 3,063 | |
| | 24 | | | Becton, Dickinson and Co. | | | 3,340 | |
| | | | | | | | |
| | | | | | | 6,403 | |
| | | | | | | | |
| | | | Health Care Providers & Services — 3.3% | |
| | 65 | | | Humana, Inc. | | | 9,293 | |
| | 66 | | | UnitedHealth Group, Inc. | | | 6,672 | |
| | | | | | | | |
| | | | | | | 15,965 | |
| | | | | | | | |
| | | | Pharmaceuticals — 6.8% | |
| | 85 | | | Bristol-Myers Squibb Co. | | | 5,035 | |
| | 137 | | | Johnson & Johnson | | | 14,347 | |
| | 140 | | | Merck & Co., Inc. | | | 7,932 | |
| | 200 | | | Pfizer, Inc. | | | 6,218 | |
| | | | | | | | |
| | | | | | | 33,532 | |
| | | | | | | | |
| | | | Total Health Care | | | 55,900 | |
| | | | | | | | |
| | | | Industrials — 8.1% | |
| | | | Aerospace & Defense — 2.5% | |
| | 75 | | | Honeywell International, Inc. (m) | | | 7,464 | |
| | 40 | | | United Technologies Corp. | | | 4,600 | |
| | | | | | | | |
| | | | | | | 12,064 | |
| | | | | | | | |
| | | | Construction & Engineering — 1.0% | |
| | 83 | | | Fluor Corp. | | | 5,033 | |
| | | | | | | | |
| | | | Electrical Equipment — 0.8% | |
| | 65 | | | Emerson Electric Co. | | | 4,000 | |
| | | | | | | | |
| | | | Industrial Conglomerates — 1.8% | |
| | 27 | | | 3M Co. | | | 4,453 | |
| | 177 | | | General Electric Co. | | | 4,478 | |
| | | | | | | | |
| | | | | | | 8,931 | |
| | | | | | | | |
| | | | Machinery — 0.4% | |
| | 28 | | | PACCAR, Inc. | | | 1,870 | |
| | | | | | | | |
| | | | Trading Companies & Distributors — 1.6% | |
| | 19 | | | W.W. Grainger, Inc. | | | 4,919 | |
| | 26 | | | Watsco, Inc. | | | 2,825 | |
| | | | | | | | |
| | | | | | | 7,744 | |
| | | | | | | | |
| | | | Total Industrials | | | 39,642 | |
| | | | | | | | |
| | | | | | | | |
| SHARES | | | SECURITY DESCRIPTION | | VALUE($) | |
| | | | | | | | |
| | | | | | | | |
| | | | Information Technology — 7.9% | |
| | | | Communications Equipment — 2.2% | |
| | 214 | | | Cisco Systems, Inc. | | | 5,950 | |
| | 67 | | | QUALCOMM, Inc. | | | 4,980 | |
| | | | | | | | |
| | | | | | | 10,930 | |
| | | | | | | | |
| | | | Semiconductors & Semiconductor Equipment — 1.7% | |
| | 189 | | | Applied Materials, Inc. | | | 4,707 | |
| | 49 | | | KLA-Tencor Corp. | | | 3,425 | |
| | | | | | | | |
| | | | | | | 8,132 | |
| | | | | | | | |
| | | | Software — 2.2% | |
| | 232 | | | Microsoft Corp. | | | 10,781 | |
| | | | | | | | |
| | | | Technology Hardware, Storage & Peripherals — 1.8% | |
| | 80 | | | Apple, Inc. (m) | | | 8,874 | |
| | | | | | | | |
| | | | Total Information Technology | | | 38,717 | |
| | | | | | | | |
| | | | Materials — 1.9% | |
| | | | Chemicals — 1.2% | |
| | 79 | | | E.I. du Pont de Nemours & Co. | | | 5,804 | |
| | | | | | | | |
| | | | Containers & Packaging — 0.7% | |
| | 46 | | | Packaging Corp. of America | | | 3,575 | |
| | | | | | | | |
| | | | Total Materials | | | 9,379 | |
| | | | | | | | |
| | | | Telecommunication Services — 1.9% | |
| | | | Diversified Telecommunication Services — 1.9% | |
| | 195 | | | Verizon Communications, Inc. | | | 9,132 | |
| | | | | | | | |
| | | | Utilities — 3.8% | |
| | | | Electric Utilities — 2.1% | |
| | 74 | | | Edison International | | | 4,813 | |
| | 53 | | | NextEra Energy, Inc. | | | 5,633 | |
| | | | | | | | |
| | | | | | | 10,446 | |
| | | | | | | | |
| | | | Multi-Utilities — 1.7% | |
| | 116 | | | CMS Energy Corp. | | | 4,014 | |
| | 39 | | | Sempra Energy | | | 4,365 | |
| | | | | | | | |
| | | | | | | 8,379 | |
| | | | | | | | |
| | | | Total Utilities | | | 18,825 | |
| | | | | | | | |
| | | | Total Common Stocks
(Cost $305,824) | | | 477,193 | |
| | | | | | | | |
SEE NOTES TO FINANCIAL STATEMENTS.
| | | | | | |
| | | |
| 32 | | | | J.P. MORGAN LARGE CAP FUNDS | | DECEMBER 31, 2014 |
| | | | | | | | |
| SHARES | | | SECURITY DESCRIPTION | | VALUE($) | |
| | | | | | | | |
| Short-Term Investment — 3.2% | |
| | | | Investment Company — 3.2% | | | | |
| | 15,806 | | | JPMorgan Prime Money Market Fund, Institutional Class Shares,
0.020% (b) (l) (m)
(Cost $15,806) | | | 15,806 | |
| | | | | | | | |
| | | | Total Investments — 100.4%
(Cost $321,630) | | | 492,999 | |
| | | | Liabilities in Excess of
Other Assets — (0.4)% | | | (1,754 | ) |
| | | | | | | | |
| | | | NET ASSETS — 100.0% | | $ | 491,245 | |
| | | | | | | | |
Percentages indicated are based on net assets.
SEE NOTES TO FINANCIAL STATEMENTS.
| | | | | | | | |
| | | |
| DECEMBER 31, 2014 | | J.P. MORGAN LARGE CAP FUNDS | | | | | 33 | |
JPMorgan Hedged Equity Fund
SCHEDULE OF PORTFOLIO INVESTMENTS
AS OF DECEMBER 31, 2014 (Unaudited)
(Amounts in thousands)
| | | | | | | | |
| SHARES | | | SECURITY DESCRIPTION | | VALUE($) | |
| | | | | | | | |
| Common Stocks — 98.4% | |
| | | | Consumer Discretionary — 13.0% | | | | |
| | | | Auto Components — 0.1% | |
| | 2 | | | Johnson Controls, Inc. (m) | | | 115 | |
| | | | | | | | |
| | | | Automobiles — 0.6% | |
| | 24 | | | General Motors Co. | | | 826 | |
| | | | | | | | |
| | | | Hotels, Restaurants & Leisure — 1.0% | |
| | — | (h) | | McDonald’s Corp. (m) | | | 33 | |
| | 7 | | | Royal Caribbean Cruises Ltd. | | | 580 | |
| | 7 | | | Starbucks Corp. | | | 608 | |
| | 2 | | | Yum! Brands, Inc. | | | 138 | |
| | | | | | | | |
| | | | | | | 1,359 | |
| | | | | | | | |
| | | | Household Durables — 0.7% | |
| | 5 | | | Harman International Industries, Inc. | | | 546 | |
| | — | (h) | | NVR, Inc. (a) | | | 74 | |
| | 16 | | | PulteGroup, Inc. | | | 349 | |
| | | | | | | | |
| | | | | | | 969 | |
| | | | | | | | |
| | | | Internet & Catalog Retail — 0.9% | |
| | 1 | | | Amazon.com, Inc. (a) | | | 434 | |
| | 2 | | | Expedia, Inc. | | | 129 | |
| | 1 | | | Priceline Group, Inc. (The) (a) | | | 711 | |
| | | | | | | | |
| | | | | | | 1,274 | |
| | | | | | | | |
| | | | Media — 4.6% | |
| | 4 | | | CBS Corp. (Non-Voting), Class B (m) | | | 197 | |
| | 2 | | | Charter Communications, Inc., Class A (a) | | | 281 | |
| | 32 | | | Comcast Corp., Class A | | | 1,869 | |
| | 1 | | | DIRECTV (a) | | | 114 | |
| | 5 | | | DISH Network Corp., Class A (a) | | | 371 | |
| | 2 | | | Time Warner Cable, Inc. | | | 294 | |
| | 21 | | | Time Warner, Inc. | | | 1,817 | |
| | 3 | | | Time, Inc. | | | 69 | |
| | 25 | | | Twenty-First Century Fox, Inc., Class A | | | 955 | |
| | 3 | | | Walt Disney Co. (The) (m) | | | 322 | |
| | | | | | | | |
| | | | | | | 6,289 | |
| | | | | | | | |
| | | | Multiline Retail — 0.3% | |
| | 4 | | | Dollar General Corp. (a) | | | 277 | |
| | 1 | | | Dollar Tree, Inc. (a) | | | 99 | |
| | | | | | | | |
| | | | | | | 376 | |
| | | | | | | | |
| | | | Specialty Retail — 3.7% | |
| | 1 | | | AutoZone, Inc. (a) | | | 731 | |
| | 1 | | | Gap, Inc. (The) | | | 42 | |
| | 18 | | | Home Depot, Inc. (The) | | | 1,898 | |
| | 21 | | | Lowe’s Cos., Inc. | | | 1,464 | |
| | 1 | | | Tiffany & Co. | | | 89 | |
| | | | | | | | |
| SHARES | | | SECURITY DESCRIPTION | | VALUE($) | |
| | | | | | | | |
| | | | | | | | |
| | | | Specialty Retail — continued | |
| | 13 | | | TJX Cos., Inc. (The) | | | 895 | |
| | | | | | | | |
| | | | | | | 5,119 | |
| | | | | | | | |
| | | | Textiles, Apparel & Luxury Goods — 1.1% | |
| | 3 | | | lululemon athletica, Inc., (Canada) (a) | | | 170 | |
| | 3 | | | Ralph Lauren Corp. | | | 485 | |
| | 12 | | | V.F. Corp. | | | 901 | |
| | | | | | | | |
| | | | | | | 1,556 | |
| | | | | | | | |
| | | | Total Consumer Discretionary | | | 17,883 | |
| | | | | | | | |
| | | | Consumer Staples — 9.4% | | | | |
| | | | Beverages — 2.5% | |
| | 37 | | | Coca-Cola Co. (The) (m) | | | 1,561 | |
| | 4 | | | Coca-Cola Enterprises, Inc. | | | 182 | |
| | 8 | | | Constellation Brands, Inc., Class A (a) | | | 777 | |
| | 4 | | | Dr. Pepper Snapple Group, Inc. | | | 290 | |
| | 5 | | | Molson Coors Brewing Co., Class B | | | 397 | |
| | 2 | | | PepsiCo, Inc. | | | 169 | |
| | | | | | | | |
| | | | | | | 3,376 | |
| | | | | | | | |
| | | | Food & Staples Retailing — 1.8% | |
| | 6 | | | Costco Wholesale Corp. | | | 831 | |
| | 12 | | | CVS Health Corp. (m) | | | 1,142 | |
| | 4 | | | Kroger Co. (The) (m) | | | 231 | |
| | 3 | | | Wal-Mart Stores, Inc. | | | 280 | |
| | | | | | | | |
| | | | | | | 2,484 | |
| | | | | | | | |
| | | | Food Products — 1.7% | |
| | 13 | | | Archer-Daniels-Midland Co. (m) | | | 652 | |
| | 2 | | | General Mills, Inc. (m) | | | 96 | |
| | 2 | | | Kellogg Co. (m) | | | 157 | |
| | 39 | | | Mondelez International, Inc., Class A | | | 1,420 | |
| | | | | | | | |
| | | | | | | 2,325 | |
| | | | | | | | |
| | | | Household Products — 2.2% | |
| | 7 | | | Kimberly-Clark Corp. | | | 790 | |
| | 24 | | | Procter & Gamble Co. (The) | | | 2,209 | |
| | | | | | | | |
| | | | | | | 2,999 | |
| | | | | | | | |
| | | | Personal Products — 0.2% | |
| | 4 | | | Estee Lauder Cos., Inc. (The), Class A | | | 325 | |
| | | | | | | | |
| | | | Tobacco — 1.0% | |
| | 18 | | | Philip Morris International, Inc. | | | 1,435 | |
| | | | | | | | |
| | | | Total Consumer Staples | | | 12,944 | |
| | | | | | | | |
| | | | Energy — 7.5% | | | | |
| | | | Energy Equipment & Services — 1.6% | |
| | 7 | | | Baker Hughes, Inc. | | | 397 | |
SEE NOTES TO FINANCIAL STATEMENTS.
| | | | | | |
| | | |
| 34 | | | | J.P. MORGAN LARGE CAP FUNDS | | DECEMBER 31, 2014 |
| | | | | | | | |
| SHARES | | | SECURITY DESCRIPTION | | VALUE($) | |
| | | | | | | | |
| Common Stocks — continued | |
| | | | Energy Equipment & Services — continued | |
| | 3 | | | Ensco plc, (United Kingdom), Class A | | | 86 | |
| | 15 | | | Halliburton Co. (m) | | | 589 | |
| | 13 | | | Schlumberger Ltd. | | | 1,093 | |
| | | | | | | | |
| | | | | | | 2,165 | |
| | | | | | | | |
| | | | Oil, Gas & Consumable Fuels — 5.9% | |
| | 2 | | | Anadarko Petroleum Corp. | | | 175 | |
| | 5 | | | California Resources Corp. (a) | | | 29 | |
| | 3 | | | Cheniere Energy, Inc. (a) | | | 194 | |
| | 19 | | | Chevron Corp. | | | 2,158 | |
| | 6 | | | EOG Resources, Inc. | | | 595 | |
| | 4 | | | EQT Corp. | | | 296 | |
| | 25 | | | Exxon Mobil Corp. (m) | | | 2,351 | |
| | 23 | | | Marathon Oil Corp. | | | 655 | |
| | 14 | | | Occidental Petroleum Corp. | | | 1,096 | |
| | 9 | | | Phillips 66 | | | 637 | |
| | | | | | | | |
| | | | | | | 8,186 | |
| | | | | | | | |
| | | | Total Energy | | | 10,351 | |
| | | | | | | | |
| | | | Financials — 16.1% | | | | |
| | | | Banks — 6.0% | |
| | 128 | | | Bank of America Corp. | | | 2,287 | |
| | 12 | | | BB&T Corp. | | | 472 | |
| | 33 | | | Citigroup, Inc. | | | 1,779 | |
| | 3 | | | PNC Financial Services Group, Inc. (The) | | | 269 | |
| | 13 | | | Regions Financial Corp. | | | 139 | |
| | 1 | | | SVB Financial Group (a) | | | 138 | |
| | 58 | | | Wells Fargo & Co. | | | 3,186 | |
| | | | | | | | |
| | | | | | | 8,270 | |
| | | | | | | | |
| | | | Capital Markets — 3.1% | | | | |
| | 31 | | | Charles Schwab Corp. (The) | | | 932 | |
| | 3 | | | Goldman Sachs Group, Inc. (The) | | | 527 | |
| | 22 | | | Invesco Ltd. | | | 850 | |
| | 34 | | | Morgan Stanley | | | 1,326 | |
| | 8 | | | State Street Corp. | | | 643 | |
| | | | | | | | |
| | | | | | | 4,278 | |
| | | | | | | | |
| | | | Consumer Finance — 0.4% | | | | |
| | 5 | | | Capital One Financial Corp. | | | 436 | |
| | 2 | | | Navient Corp. | | | 39 | |
| | | | | | | | |
| | | | | | | 475 | |
| | | | | | | | |
| | | | Diversified Financial Services — 1.5% | | | | |
| | 10 | | | Berkshire Hathaway, Inc., Class B (a) | | | 1,522 | |
| | 2 | | | Intercontinental Exchange, Inc. | | | 525 | |
| | | | | | | | |
| | | | | | | 2,047 | |
| | | | | | | | |
| | | | | | | | |
| SHARES | | | SECURITY DESCRIPTION | | VALUE($) | |
| | | | | | | | |
| | | | | | | | |
| | | | Insurance — 2.8% | | | | |
| | 11 | | | ACE Ltd., (Switzerland) | | | 1,231 | |
| | 7 | | | American International Group, Inc. (m) | | | 383 | |
| | 4 | | | Axis Capital Holdings Ltd., (Bermuda) | | | 204 | |
| | 4 | | | Hartford Financial Services Group, Inc. (The) | | | 157 | |
| | 7 | | | Marsh & McLennan Cos., Inc. (m) | | | 399 | |
| | 22 | | | MetLife, Inc. | | | 1,166 | |
| | 3 | | | Prudential Financial, Inc. | | | 259 | |
| | 2 | | | Willis Group Holdings plc, (United Kingdom) | | | 70 | |
| | | | | | | | |
| | | | | | | 3,869 | |
| | | | | | | | |
| | | | Real Estate Investment Trusts (REITs) — 2.3% | | | | |
| | 3 | | | AvalonBay Communities, Inc. (m) | | | 522 | |
| | 2 | | | Boston Properties, Inc. (m) | | | 240 | |
| | 8 | | | Brixmor Property Group, Inc. (m) | | | 199 | |
| | 15 | | | DiamondRock Hospitality Co. (m) | | | 220 | |
| | — | (h) | | Essex Property Trust, Inc. (m) | | | 72 | |
| | 1 | | | Extra Space Storage, Inc. (m) | | | 70 | |
| | 4 | | | Highwoods Properties, Inc. (m) | | | 170 | |
| | 8 | | | Host Hotels & Resorts, Inc. (m) | | | 187 | |
| | 6 | | | Liberty Property Trust (m) | | | 238 | |
| | 2 | | | Mid-America Apartment Communities, Inc. (m) | | | 138 | |
| | 2 | | | Omega Healthcare Investors, Inc. (m) | | | 68 | |
| | 9 | | | Prologis, Inc. (m) | | | 376 | |
| | — | (h) | | Public Storage (m) | | | 79 | |
| | 4 | | | Simon Property Group, Inc. (m) | | | 638 | |
| | | | | | | | |
| | | | | | | 3,217 | |
| | | | | | | | |
| | | | Total Financials | | | 22,156 | |
| | | | | | | | |
| | | | Health Care — 14.1% | | | | |
| | | | Biotechnology — 3.2% | |
| | 2 | | | Alexion Pharmaceuticals, Inc. (a) | | | 392 | |
| | — | (h) | | Amgen, Inc. | | | 75 | |
| | 4 | | | Biogen Idec, Inc. (a) | | | 1,371 | |
| | 13 | | | Celgene Corp. (a) | | | 1,500 | |
| | 7 | | | Gilead Sciences, Inc. (a) | | | 686 | |
| | 3 | | | Vertex Pharmaceuticals, Inc. (a) | | | 401 | |
| | | | | | | | |
| | | | | | | 4,425 | |
| | | | | | | | |
| | | | Health Care Equipment & Supplies — 2.6% | | | | |
| | 31 | | | Abbott Laboratories (m) | | | 1,406 | |
| | — | (h) | | Becton, Dickinson and Co. (m) | | | 54 | |
| | 68 | | | Boston Scientific Corp. (a) | | | 902 | |
| | 7 | | | CareFusion Corp. (a) | | | 408 | |
| | 2 | | | Covidien plc, (Ireland) | | | 162 | |
| | 7 | | | Stryker Corp. | | | 655 | |
| | | | | | | | |
| | | | | | | 3,587 | |
| | | | | | | | |
SEE NOTES TO FINANCIAL STATEMENTS.
| | | | | | | | |
| | | |
| DECEMBER 31, 2014 | | J.P. MORGAN LARGE CAP FUNDS | | | | | 35 | |
JPMorgan Hedged Equity Fund
SCHEDULE OF PORTFOLIO INVESTMENTS
AS OF DECEMBER 31, 2014 (Unaudited) (continued)
(Amounts in thousands)
| | | | | | | | |
| SHARES | | | SECURITY DESCRIPTION | | VALUE($) | |
| | | | | | | | |
| Common Stocks — continued | |
| | | | Health Care Providers & Services — 2.4% | | | | |
| | 7 | | | Aetna, Inc. | | | 590 | |
| | 7 | | | Humana, Inc. (m) | | | 963 | |
| | 4 | | | McKesson Corp. | | | 918 | |
| | 8 | | | UnitedHealth Group, Inc. | | | 842 | |
| | | | | | | | |
| | | | | | | 3,313 | |
| | | | | | | | |
| | | | Pharmaceuticals — 5.9% | | | | |
| | 1 | | | Actavis plc (a) | | | 348 | |
| | 2 | | | Allergan, Inc. | | | 462 | |
| | 26 | | | Bristol-Myers Squibb Co. | | | 1,539 | |
| | 33 | | | Johnson & Johnson (m) | | | 3,400 | |
| | 24 | | | Merck & Co., Inc. | | | 1,363 | |
| | 2 | | | Perrigo Co. plc, (Ireland) | | | 312 | |
| | 19 | | | Pfizer, Inc. | | | 604 | |
| | | | | | | | |
| | | | | | | 8,028 | |
| | | | | | | | |
| | | | Total Health Care | | | 19,353 | |
| | | | | | | | |
| | | | Industrials — 10.9% | | | | |
| | | | Aerospace & Defense — 3.2% | |
| | 16 | | | Honeywell International, Inc. (m) | | | 1,570 | |
| | 4 | | | L-3 Communications Holdings, Inc. | | | 470 | |
| | 1 | | | Precision Castparts Corp. | | | 206 | |
| | 19 | | | United Technologies Corp. | | | 2,138 | |
| | | | | | | | |
| | | | | | | 4,384 | |
| | | | | | | | |
| | | | Airlines — 0.7% | |
| | 10 | | | Delta Air Lines, Inc. | | | 498 | |
| | 8 | | | United Continental Holdings, Inc. (a) | | | 546 | |
| | | | | | | | |
| | | | | | | 1,044 | |
| | | | | | | | |
| | | | Building Products — 0.3% | |
| | 2 | | | Fortune Brands Home & Security, Inc. | | | 75 | |
| | 12 | | | Masco Corp. (m) | | | 294 | |
| | | | | | | | |
| | | | | | | 369 | |
| | | | | | | | |
| | | | Commercial Services & Supplies — 0.1% | |
| | 3 | | | Tyco International plc | | | 121 | |
| | | | | | | | |
| | | | Construction & Engineering — 0.7% | |
| | 16 | | | Fluor Corp. (m) | | | 957 | |
| | | | | | | | |
| | | | Electrical Equipment — 1.5% | |
| | 14 | | | Eaton Corp. plc | | | 968 | |
| | 17 | | | Emerson Electric Co. | | | 1,073 | |
| | | | | | | | |
| | | | | | | 2,041 | |
| | | | | | | | |
| | | | Industrial Conglomerates — 0.7% | |
| | 38 | | | General Electric Co. (m) | | | 954 | |
| | | | | | | | |
| | | | Machinery — 1.1% | |
| | — | (h) | | Deere & Co. (m) | | | 29 | |
| | | | | | | | |
| SHARES | | | SECURITY DESCRIPTION | | VALUE($) | |
| | | | | | | | |
| | | | | | | | |
| | | | Machinery — continued | |
| | 18 | | | PACCAR, Inc. | | | 1,247 | |
| | — | (h) | | Pall Corp. | | | 27 | |
| | — | (h) | | Snap-on, Inc. | | | 55 | |
| | 3 | | | SPX Corp. | | | 220 | |
| | | | | | | | |
| | | | | | | 1,578 | |
| | | | | | | | |
| | | | Road & Rail — 2.4% | |
| | 2 | | | Canadian Pacific Railway Ltd., (Canada) | | | 357 | |
| | 24 | | | CSX Corp. (m) | | | 877 | |
| | 17 | | | Union Pacific Corp. | | | 2,042 | |
| | | | | | | | |
| | | | | | | 3,276 | |
| | | | | | | | |
| | | | Trading Companies & Distributors — 0.2% | |
| | 1 | | | W.W. Grainger, Inc. | | | 324 | |
| | | | | | | | |
| | | | Total Industrials | | | 15,048 | |
| | | | | | | | |
| | | | Information Technology — 19.6% | | | | |
| | | | Communications Equipment — 2.1% | |
| | 56 | | | Cisco Systems, Inc. | | | 1,567 | |
| | 18 | | | QUALCOMM, Inc. | | | 1,305 | |
| | | | | | | | |
| | | | | | | 2,872 | |
| | | | | | | | |
| | | | Electronic Equipment, Instruments & Components — 0.3% | |
| | 9 | | | Corning, Inc. | | | 215 | |
| | 4 | | | TE Connectivity Ltd., (Switzerland) | | | 239 | |
| | | | | | | | |
| | | | | | | 454 | |
| | | | | | | | |
| | | | Internet Software & Services — 3.2% | |
| | 1 | | | eBay, Inc. (a) | | | 43 | |
| | 19 | | | Facebook, Inc., Class A (a) | | | 1,511 | |
| | 3 | | | Google, Inc., Class A (a) | | | 1,514 | |
| | 3 | | | Google, Inc., Class C (a) | | | 1,364 | |
| | | | | | | | |
| | | | | | | 4,432 | |
| | | | | | | | |
| | | | IT Services — 3.2% | |
| | 11 | | | Accenture plc, (Ireland), Class A | | | 1,023 | |
| | 1 | | | Alliance Data Systems Corp. (a) | | | 230 | |
| | 13 | | | Cognizant Technology Solutions Corp., Class A (a) | | | 679 | |
| | 5 | | | Fidelity National Information Services, Inc. | | | 308 | |
| | 3 | | | International Business Machines Corp. (m) | | | 417 | |
| | 6 | | | Visa, Inc., Class A | | | 1,665 | |
| | 5 | | | Xerox Corp. | | | 63 | |
| | | | | | | | |
| | | | | | | 4,385 | |
| | | | | | | | |
| | | | Semiconductors & Semiconductor Equipment — 2.5% | |
| | 10 | | | Avago Technologies Ltd., (Singapore) | | | 962 | |
| | 18 | | | Broadcom Corp., Class A | | | 796 | |
| | 9 | | | Freescale Semiconductor Ltd. (a) | | | 221 | |
SEE NOTES TO FINANCIAL STATEMENTS.
| | | | | | |
| | | |
| 36 | | | | J.P. MORGAN LARGE CAP FUNDS | | DECEMBER 31, 2014 |
| | | | | | | | |
| SHARES | | | SECURITY DESCRIPTION | | VALUE($) | |
| | | | | | | | |
| Common Stocks — continued | |
| | | | Semiconductors & Semiconductor Equipment — continued | |
| | 6 | | | KLA-Tencor Corp. | | | 438 | |
| | 14 | | | Lam Research Corp. | | | 1,075 | |
| | | | | | | | |
| | | | | | | 3,492 | |
| | | | | | | | |
| | | | Software — 4.1% | |
| | 14 | | | Adobe Systems, Inc. (a) | | | 986 | |
| | 6 | | | Citrix Systems, Inc. (a) | | | 414 | |
| | 69 | | | Microsoft Corp. | | | 3,196 | |
| | 19 | | | Oracle Corp. | | | 839 | |
| | 2 | | | VMware, Inc., Class A (a) | | | 148 | |
| | | | | | | | |
| | | | | | | 5,583 | |
| | | | | | | | |
| | | | Technology Hardware, Storage & Peripherals — 4.2% | |
| | 46 | | | Apple, Inc. (m) | | | 5,025 | |
| | 2 | | | EMC Corp. | | | 60 | |
| | 17 | | | Hewlett-Packard Co. (m) | | | 682 | |
| | | | | | | | |
| | | | | | | 5,767 | |
| | | | | | | | |
| | | | Total Information Technology | | | 26,985 | |
| | | | | | | | |
| | | | Materials — 2.5% | | | | |
| | | | Chemicals — 1.4% | |
| | 4 | | | Axiall Corp. | | | 176 | |
| | 5 | | | Dow Chemical Co. (The) (m) | | | 250 | |
| | 6 | | | E.I. du Pont de Nemours & Co. (m) | | | 463 | |
| | 2 | | | Monsanto Co. | | | 297 | |
| | 15 | | | Mosaic Co. (The) | | | 668 | |
| | | | | | | | |
| | | | | | | 1,854 | |
| | | | | | | | |
| | | | Construction Materials — 0.1% | |
| | 2 | | | Martin Marietta Materials, Inc. (m) | | | 187 | |
| | | | | | | | |
| | | | Containers & Packaging — 0.3% | |
| | 8 | | | Crown Holdings, Inc. (a) | | | 384 | |
| | 1 | | | Sealed Air Corp. | | | 52 | |
| | | | | | | | |
| | | | | | | 436 | |
| | | | | | | | |
| | | | Metals & Mining — 0.7% | |
| | 45 | | | Alcoa, Inc. (m) | | | 706 | |
| | 12 | | | United States Steel Corp. | | | 313 | |
| | | | | | | | |
| | | | | | | 1,019 | |
| | | | | | | | |
| | | | Total Materials | | | 3,496 | |
| | | | | | | | |
| | | | Telecommunication Services — 1.4% | | | | |
| | | | Diversified Telecommunication Services — 1.4% | |
| | 1 | | | AT&T, Inc. | | | 21 | |
| | 40 | | | Verizon Communications, Inc. (m) | | | 1,891 | |
| | | | | | | | |
| | | | Total Telecommunication Services | | | 1,912 | |
| | | | | | | | |
| | | | | | | | |
| SHARES | | | SECURITY DESCRIPTION | | VALUE($) | |
| | | | | | | | |
| | | | | | | | |
| | | | Utilities — 3.9% | | | | |
| | | | Electric Utilities — 2.3% | |
| | 15 | | | Edison International | | | 1,003 | |
| | 2 | | | Entergy Corp. | | | 151 | |
| | 14 | | | Exelon Corp. | | | 527 | |
| | 9 | | | NextEra Energy, Inc. | | | 1,002 | |
| | 1 | | | Pinnacle West Capital Corp. (m) | | | 69 | |
| | 8 | | | PPL Corp. | | | 274 | |
| | 5 | | | Xcel Energy, Inc. | | | 166 | |
| | | | | | | | |
| | | | | | | 3,192 | |
| | | | | | | | |
| | | | Gas Utilities — 0.2% | |
| | 4 | | | AGL Resources, Inc. | | | 196 | |
| | 5 | | | Questar Corp. | | | 130 | |
| | | | | | | | |
| | | | | | | 326 | |
| | | | | | | | |
| | | | Multi-Utilities — 1.4% | |
| | 13 | | | CenterPoint Energy, Inc. | | | 295 | |
| | 12 | | | CMS Energy Corp. (m) | | | 427 | |
| | 4 | | | Dominion Resources, Inc. | | | 330 | |
| | 12 | | | NiSource, Inc. | | | 513 | |
| | 1 | | | PG&E Corp. | | | 67 | |
| | 3 | | | Public Service Enterprise Group, Inc. | | | 143 | |
| | 1 | | | Sempra Energy | | | 67 | |
| | | | | | | | |
| | | | | | | 1,842 | |
| | | | | | | | |
| | | | Total Utilities | | | 5,360 | |
| | | | | | | | |
| | | | Total Common Stocks
(Cost $127,705) | | | 135,488 | |
| | | | | | | | |
| | |
NUMBER OF
CONTRACTS | | | | | | |
| Option Purchased — 1.8% | |
| | | | Put Option Purchased — 1.8% | |
| | 690 | | | S&P 500 Index, Expiring 03/31/15 at $1,950.000, European Style
(Cost $2,520) | | | 2,484 | |
| | | | | | | | |
| | |
| SHARES | | | | | | |
| Short-Term Investment — 2.8% | | | | |
| | | | Investment Company — 2.8% | |
| | 3,901 | | | JPMorgan Prime Money Market Fund, Institutional Class Shares,
0.020% (b) (l) (m)
(Cost $3,901) | | | 3,901 | |
| | | | | | | | |
| | | | Total Investments — 103.0%
(Cost $134,126) | | | 141,873 | |
| | | | Liabilities in Excess of
Other Assets — (3.0)% (c) | | | (4,086 | ) |
| | | | | | | | |
| | | | NET ASSETS — 100.0% | | $ | 137,787 | |
| | | | | | | | |
Percentages indicated are based on net assets.
SEE NOTES TO FINANCIAL STATEMENTS.
| | | | | | | | |
| | | |
| DECEMBER 31, 2014 | | J.P. MORGAN LARGE CAP FUNDS | | | | | 37 | |
JPMorgan Hedged Equity Fund
SCHEDULE OF PORTFOLIO INVESTMENTS
AS OF DECEMBER 31, 2014 (Unaudited) (continued)
(Amounts in thousands, except number of Futures and Options contracts)
| | | | | | | | | | | | | | | | |
| Futures Contracts | | | | | | | | | |
NUMBER OF
CONTRACTS | | | DESCRIPTION | | EXPIRATION
DATE | | | NOTIONAL
VALUE AT
DECEMBER 31,
2014 | | | NET
UNREALIZED
APPRECIATION
(DEPRECIATION) | |
| | | | Long Futures Outstanding | | | | | | | | | | | | |
| | 17 | | | E-mini S&P 500 | | | 03/20/15 | | | $ | 1,745 | | | $ | 28 | |
| | | | | | | | | | | | | | | | |
OPTIONS WRITTEN
| | | | | | | | | | | | | | | | |
| Call Options Written | | | | | | | | | | | | |
| DESCRIPTION | | EXERCISE
PRICE | | | EXPIRATION
DATE | | | NUMBER OF
CONTRACTS | | | VALUE | |
S&P 500 Index, European Style (Premiums received of $1,941.) | | $ | 2,100.000 | | | | 03/31/15 | | | | 518 | | | $ | (1,919 | ) |
S&P 500 Index, European Style (Premiums received of $120.) | | | 2,200.000 | | | | 03/31/15 | | | | 172 | | | | (118 | ) |
| | | | | | | | | | | | | | | | |
| | | | | | | | | | | | | | $ | (2,037 | ) |
| | | | | | | | | | | | | | | | |
| | | | |
| Put Options Written | | | | | | | | | | | | |
| DESCRIPTION | | EXERCISE
PRICE | | | EXPIRATION
DATE | | | NUMBER OF
CONTRACTS | | | VALUE | |
S&P 500 Index, European Style (Premiums received of $288.) | | $ | 1,650.000 | | | | 03/31/15 | | | | 345 | | | $ | (285 | ) |
S&P 500 Index, European Style (Premiums received of $322.) | | | 1,675.000 | | | | 03/31/15 | | | | 345 | | | | (319 | ) |
| | | | | | | | | | | | | | | | |
| | | | | | | | | | | | | | $ | (604 | ) |
| | | | | | | | | | | | | | | | |
SEE NOTES TO FINANCIAL STATEMENTS.
| | | | | | |
| | | |
| 38 | | | | J.P. MORGAN LARGE CAP FUNDS | | DECEMBER 31, 2014 |
JPMorgan Large Cap Growth Fund
SCHEDULE OF PORTFOLIO INVESTMENTS
AS OF DECEMBER 31, 2014 (Unaudited)
(Amounts in thousands)
| | | | | | | | |
| SHARES | | | SECURITY DESCRIPTION | | VALUE($) | |
| Common Stocks — 98.1% | |
| | | | Consumer Discretionary — 21.2% | |
| | | | Auto Components — 1.1% | |
| | 2,369 | | | Delphi Automotive plc, (United Kingdom) | | | 172,303 | |
| | | | | | | | |
| | | | Automobiles — 1.4% | |
| | 1,000 | | | Tesla Motors, Inc. (a) | | | 222,321 | |
| | | | | | | | |
| | | | Hotels, Restaurants & Leisure — 3.3% | |
| | 270 | | | Chipotle Mexican Grill, Inc. (a) | | | 184,544 | |
| | 1,847 | | | Las Vegas Sands Corp. | | | 107,398 | |
| | 2,699 | | | Starbucks Corp. | | | 221,415 | |
| | | | | | | | |
| | | | | | | 513,357 | |
| | | | | | | | |
| | | | Internet & Catalog Retail — 3.5% | |
| | 577 | | | Amazon.com, Inc. (a) | | | 179,208 | |
| | 257 | | | Netflix, Inc. (a) | | | 87,794 | |
| | 241 | | | Priceline Group, Inc. (The) (a) | | | 275,133 | |
| | | | | | | | |
| | | | | | | 542,135 | |
| | | | | | | | |
| | | | Media — 6.4% | |
| | 6,706 | | | Comcast Corp., Class A | | | 389,033 | |
| | 3,566 | | | Liberty Global plc, (United Kingdom), Series C (a) | | | 172,259 | |
| | 1,930 | | | Time Warner, Inc. | | | 164,835 | |
| | 6,486 | | | Twenty-First Century Fox, Inc., Class A | | | 249,110 | |
| | | | | | | | |
| | | | | | | 975,237 | |
| | | | | | | | |
| | | | Specialty Retail — 3.9% | |
| | 5,641 | | | Home Depot, Inc. (The) | | | 592,157 | |
| | | | | | | | |
| | | | Textiles, Apparel & Luxury Goods — 1.6% | |
| | 3,212 | | | Michael Kors Holdings Ltd., (Hong Kong) (a) | | | 241,223 | |
| | | | | | | | |
| | | | Total Consumer Discretionary | | | 3,258,733 | |
| | | | | | | | |
| | | | Consumer Staples — 4.3% | |
| | | | Food & Staples Retailing — 2.8% | |
| | 1,569 | | | Costco Wholesale Corp. | | | 222,434 | |
| | 2,100 | | | CVS Health Corp. (m) | | | 202,251 | |
| | | | | | | | |
| | | | | | | 424,685 | |
| | | | | | | | |
| | | | Food Products — 0.8% | |
| | 911 | | | Keurig Green Mountain, Inc. | | | 120,665 | |
| | | | | | | | |
| | | | Household Products — 0.7% | |
| | 1,588 | | | Colgate-Palmolive Co. | | | 109,887 | |
| | | | | | | | |
| | | | Total Consumer Staples | | | 655,237 | |
| | | | | | | | |
| | | | Energy — 2.6% | |
| | | | Energy Equipment & Services — 0.2% | |
| | 526 | | | FMC Technologies, Inc. (a) | | | 24,647 | |
| | | | | | | | |
| | | | Oil, Gas & Consumable Fuels — 2.4% | |
| | 5,515 | | | Cabot Oil & Gas Corp. | | | 163,284 | |
| | 784 | | | Marathon Petroleum Corp. | | | 70,755 | |
| | | | | | | | |
| SHARES | | | SECURITY DESCRIPTION | | VALUE($) | |
| | | | | | | | |
| | | | Oil, Gas & Consumable Fuels — continued | |
| | 899 | | | Pioneer Natural Resources Co. | | | 133,787 | |
| | | | | | | | |
| | | | | | | 367,826 | |
| | | | | | | | |
| | | | Total Energy | | | 392,473 | |
| | | | | | | | |
| | | | Financials — 4.1% | |
| | | | Capital Markets — 2.7% | |
| | 522 | | | Affiliated Managers Group, Inc. (a) | | | 110,683 | |
| | 368 | | | BlackRock, Inc. | | | 131,582 | |
| | 4,836 | | | TD Ameritrade Holding Corp. | | | 173,043 | |
| | | | | | | | |
| | | | | | | 415,308 | |
| | | | | | | | |
| | | | Diversified Financial Services — 1.4% | |
| | 2,253 | | | Moody’s Corp. | | | 215,860 | |
| | | | | | | | |
| | | | Total Financials | | | 631,168 | |
| | | | | | | | |
| | | | Health Care — 22.1% | |
| | | | Biotechnology — 15.8% | |
| | 1,941 | | | Alexion Pharmaceuticals, Inc. (a) | | | 359,088 | |
| | 1,009 | | | Biogen Idec, Inc. (a) | | | 342,437 | |
| | 4,463 | | | Celgene Corp. (a) | | | 499,242 | |
| | 5,791 | | | Gilead Sciences, Inc. (a) | | | 545,888 | |
| | 880 | | | Regeneron Pharmaceuticals, Inc. (a) | | | 361,061 | |
| | 2,577 | | | Vertex Pharmaceuticals, Inc. (a) | | | 306,160 | |
| | | | | | | | |
| | | | | | | 2,413,876 | |
| | | | | | | | |
| | | | Health Care Providers & Services — 3.0% | |
| | 2,534 | | | AmerisourceBergen Corp. | | | 228,420 | |
| | 1,137 | | | McKesson Corp. | | | 236,081 | |
| | | | | | | | |
| | | | | | | 464,501 | |
| | | | | | | | |
| | | | Life Sciences Tools & Services — 0.9% | |
| | 759 | | | Illumina, Inc. (a) | | | 140,096 | |
| | | | | | | | |
| | | | Pharmaceuticals — 2.4% | |
| | 380 | | | Salix Pharmaceuticals Ltd. (a) | | | 43,643 | |
| | 2,271 | | | Valeant Pharmaceuticals International, Inc. (a) | | | 324,931 | |
| | | | | | | | |
| | | | | | | 368,574 | |
| | | | | | | | |
| | | | Total Health Care | | | 3,387,047 | |
| | | | | | | | |
| | | | Industrials — 9.1% | |
| | | | Aerospace & Defense — 1.8% | |
| | 2,753 | | | Honeywell International, Inc. (m) | | | 275,100 | |
| | | | | | | | |
| | | | Airlines — 2.1% | |
| | 6,443 | | | Delta Air Lines, Inc. | | | 316,916 | |
| | | | | | | | |
| | | | Building Products — 0.4% | |
| | 1,553 | | | Fortune Brands Home & Security, Inc. | | | 70,291 | |
| | | | | | | | |
| | | | Industrial Conglomerates — 0.5% | |
| | 522 | | | Roper Industries, Inc. | | | 81,630 | |
| | | | | | | | |
SEE NOTES TO FINANCIAL STATEMENTS.
| | | | | | | | |
| | | |
| DECEMBER 31, 2014 | | J.P. MORGAN LARGE CAP FUNDS | | | | | 39 | |
JPMorgan Large Cap Growth Fund
SCHEDULE OF PORTFOLIO INVESTMENTS
AS OF DECEMBER 31, 2014 (Unaudited) (continued)
(Amounts in thousands)
| | | | | | | | |
| SHARES | | | SECURITY DESCRIPTION | | VALUE($) | |
| Common Stocks — continued | |
| | | | Machinery — 0.8% | |
| | 1,949 | | | Flowserve Corp. | | | 116,633 | |
| | | | | | | | |
| | | | Road & Rail — 3.5% | |
| | 1,642 | | | Kansas City Southern | | | 200,337 | |
| | 2,860 | | | Union Pacific Corp. | | | 340,747 | |
| | | | | | | | |
| | | | | | | 541,084 | |
| | | | | | | | |
| | | | Total Industrials | | | 1,401,654 | |
| | | | | | | | |
| | | | Information Technology — 28.6% | |
| | | | Electronic Equipment, Instruments & Components — 1.0% | |
| | 2,792 | | | Amphenol Corp., Class A | | | 150,237 | |
| | | | | | | | |
| | | | Internet Software & Services — 10.2% | |
| | 663 | | | Baidu, Inc., (China), ADR (a) | | | 151,121 | |
| | 8,589 | | | Facebook, Inc., Class A (a) | | | 670,106 | |
| | 326 | | | Google, Inc., Class A (a) | | | 173,141 | |
| | 760 | | | Google, Inc., Class C (a) | | | 400,314 | |
| | 753 | | | LinkedIn Corp., Class A (a) | | | 172,972 | |
| | | | | | | | |
| | | | | | | 1,567,654 | |
| | | | | | | | |
| | | | IT Services — 7.2% | |
| | 409 | | | Alliance Data Systems Corp. (a) | | | 116,851 | |
| | 6,631 | | | MasterCard, Inc., Class A | | | 571,353 | |
| | 1,608 | | | Visa, Inc., Class A | | | 421,723 | |
| | | | | | | | |
| | | | | | | 1,109,927 | |
| | | | | | | | |
| | | | Semiconductors & Semiconductor Equipment — 3.8% | |
| | 1,396 | | | ARM Holdings plc, (United Kingdom), ADR | | | 64,630 | |
| | 2,421 | | | ASML Holding N.V., (Netherlands) | | | 261,022 | |
| | 2,534 | | | Avago Technologies Ltd., (Singapore) | | | 254,865 | |
| | | | | | | | |
| | | | | | | 580,517 | |
| | | | | | | | |
| | | | Software — 2.9% | |
| | 2,915 | | | Adobe Systems, Inc. (a) | | | 211,928 | |
| | 3,366 | | | salesforce.com, Inc. (a) | | | 199,626 | |
| | 570 | | | Splunk, Inc. (a) | | | 33,601 | |
| | | | | | | | |
| | | | | | | 445,155 | |
| | | | | | | | |
| | | | Technology Hardware, Storage & Peripherals — 3.5% | |
| | 4,837 | | | Apple, Inc. (m) | | | 533,940 | |
| | | | | | | | |
| | | | Total Information Technology | | | 4,387,430 | |
| | | | | | | | |
| | | | Materials — 6.1% | |
| | | | Chemicals — 6.1% | |
| | 1,304 | | | Ecolab, Inc. | | | 136,315 | |
| | 2,428 | | | LyondellBasell Industries N.V., Class A | | | 192,791 | |
| | 307 | | | Monsanto Co. | | | 36,689 | |
| | 925 | | | PPG Industries, Inc. (m) | | | 213,814 | |
| | | | | | | | |
| SHARES | | | SECURITY DESCRIPTION | | VALUE($) | |
| | | | | | | | |
| | | | Chemicals — continued | |
| | 1,342 | | | Sherwin-Williams Co. (The) | | | 352,894 | |
| | | | | | | | |
| | | | Total Materials | | | 932,503 | |
| | | | | | | | |
| | | | Total Common Stocks
(Cost $9,979,480) | | | 15,046,245 | |
| | | | | | | | |
| Short-Term Investment — 2.4% | |
| | | | Investment Company — 2.4% | |
| | 369,617 | | | JPMorgan Liquid Assets Money Market Fund, Institutional Class Shares, 0.030% (b) (l) (m)
(Cost $369,617) | | | 369,617 | |
| | | | | | | | |
| | | | Total Investments — 100.5%
(Cost $10,349,097) | | | 15,415,862 | |
| | | | Liabilities in Excess of
Other Assets — (0.5)% | | | (75,583 | ) |
| | | | | | | | |
| | | | NET ASSETS — 100.0% | | $ | 15,340,279 | |
| | | | | | | | |
Percentages indicated are based on net assets.
SEE NOTES TO FINANCIAL STATEMENTS.
| | | | | | |
| | | |
| 40 | | | | J.P. MORGAN LARGE CAP FUNDS | | DECEMBER 31, 2014 |
JPMorgan Large Cap Value Fund
SCHEDULE OF PORTFOLIO INVESTMENTS
AS OF DECEMBER 31, 2014 (Unaudited)
(Amounts in thousands)
| | | | | | | | |
| SHARES | | | SECURITY DESCRIPTION | | VALUE($) | |
| Common Stocks — 98.7% | |
| | | | Consumer Discretionary — 11.9% | |
| | | | Auto Components — 1.0% | |
| | 141 | | | Tenneco, Inc. (a) | | | 7,954 | |
| | | | | | | | |
| | | | Automobiles — 3.9% | |
| | 913 | | | General Motors Co. | | | 31,873 | |
| | | | | | | | |
| | | | Hotels, Restaurants & Leisure — 1.0% | |
| | 102 | | | Royal Caribbean Cruises Ltd. | | | 8,375 | |
| | | | | | | | |
| | | | Household Durables — 2.5% | |
| | 27 | | | Harman International Industries, Inc. | | | 2,849 | |
| | 240 | | | PulteGroup, Inc. | | | 5,142 | |
| | 88 | | | Ryland Group, Inc. (The) | | | 3,374 | |
| | 159 | | | Toll Brothers, Inc. (a) | | | 5,439 | |
| | 21 | | | Whirlpool Corp. | | | 4,010 | |
| | | | | | | | |
| | | | | | | 20,814 | |
| | | | | | | | |
| | | | Media — 0.5% | |
| | 177 | | | Time, Inc. | | | 4,350 | |
| | | | | | | | |
| | | | Multiline Retail — 1.1% | |
| | 37 | | | Dollar General Corp. (a) | | | 2,587 | |
| | 94 | | | Macy’s, Inc. | | | 6,161 | |
| | | | | | | | |
| | | | | | | 8,748 | |
| | | | | | | | |
| | | | Specialty Retail — 1.9% | |
| | 172 | | | Best Buy Co., Inc. | | | 6,713 | |
| | 103 | | | Lowe’s Cos., Inc. | | | 7,059 | |
| | 123 | | | Pier 1 Imports, Inc. | | | 1,894 | |
| | | | | | | | |
| | | | | | | 15,666 | |
| | | | | | | | |
| | | | Total Consumer Discretionary | | | 97,780 | |
| | | | | | | | |
| | | | Consumer Staples — 3.4% | |
| | | | Food & Staples Retailing — 2.9% | |
| | 103 | | | CVS Health Corp. | | | 9,949 | |
| | 157 | | | Wal-Mart Stores, Inc. | | | 13,517 | |
| | | | | | | | |
| | | | | | | 23,466 | |
| | | | | | | | |
| | | | Food Products — 0.5% | |
| | 63 | | | Kellogg Co. | | | 4,143 | |
| | | | | | | | |
| | | | Total Consumer Staples | | | 27,609 | |
| | | | | | | | |
| | | | Energy — 9.8% | |
| | | | Energy Equipment & Services — 1.2% | |
| | 206 | | | Halliburton Co. | | | 8,086 | |
| | 172 | | | Weatherford International plc, (Switzerland) (a) | | | 1,974 | |
| | | | | | | | |
| | | | | | | 10,060 | |
| | | | | | | | |
| | | | Oil, Gas & Consumable Fuels — 8.6% | |
| | 69 | | | Anadarko Petroleum Corp. | | | 5,676 | |
| | | | | | | | |
| SHARES | | | SECURITY DESCRIPTION | | VALUE($) | |
| | | | | | | | |
| | | | Oil, Gas & Consumable Fuels — continued | |
| | 94 | | | California Resources Corp. (a) | | | 517 | |
| | 153 | | | CONSOL Energy, Inc. | | | 5,183 | |
| | 34 | | | EQT Corp. | | | 2,566 | |
| | 281 | | | Exxon Mobil Corp. | | | 25,986 | |
| | 139 | | | Hess Corp. (m) | | | 10,261 | |
| | 254 | | | Occidental Petroleum Corp. | | | 20,443 | |
| | | | | | | | |
| | | | | | | 70,632 | |
| | | | | | | | |
| | | | Total Energy | | | 80,692 | |
| | | | | | | | |
| | | | Financials — 31.8% | |
| | | | Banks — 12.8% | |
| | 1,535 | | | Bank of America Corp. | | | 27,469 | |
| | 219 | | | BB&T Corp. | | | 8,509 | |
| | 369 | | | Citigroup, Inc. | | | 19,963 | |
| | 66 | | | East West Bancorp, Inc. | | | 2,543 | |
| | 100 | | | FirstMerit Corp. | | | 1,885 | |
| | 96 | | | PNC Financial Services Group, Inc. (The) | | | 8,776 | |
| | 21 | | | SVB Financial Group (a) | | | 2,403 | |
| | 610 | | | Wells Fargo & Co. | | | 33,444 | |
| | | | | | | | |
| | | | | | | 104,992 | |
| | | | | | | | |
| | | | Capital Markets — 5.5% | |
| | 199 | | | Invesco Ltd. | | | 7,867 | |
| | 410 | | | Morgan Stanley | | | 15,892 | |
| | 100 | | | Northern Trust Corp. | | | 6,747 | |
| | 182 | | | State Street Corp. | | | 14,290 | |
| | | | | | | | |
| | | | | | | 44,796 | |
| | | | | | | | |
| | | | Consumer Finance — 1.9% | |
| | 236 | | | Ally Financial, Inc. (a) | | | 5,579 | |
| | 118 | | | Capital One Financial Corp. | | | 9,700 | |
| | | | | | | | |
| | | | | | | 15,279 | |
| | | | | | | | |
| | | | Diversified Financial Services — 1.0% | |
| | 53 | | | Berkshire Hathaway, Inc., Class B (a) | | | 8,018 | |
| | | | | | | | |
| | | | Insurance — 8.5% | |
| | 83 | | | ACE Ltd., (Switzerland) | | | 9,552 | |
| | 165 | | | American International Group, Inc. (m) | | | 9,258 | |
| | 236 | | | Hartford Financial Services Group, Inc. (The) | | | 9,856 | |
| | 409 | | | MetLife, Inc. | | | 22,124 | |
| | 134 | | | Prudential Financial, Inc. | | | 12,101 | |
| | 80 | | | Willis Group Holdings plc, (United Kingdom) | | | 3,571 | |
| | 95 | | | XL Group plc, (Ireland) | | | 3,269 | |
| | | | | | | | |
| | | | | | | 69,731 | |
| | | | | | | | |
| | | | Real Estate Investment Trusts (REITs) — 2.1% | |
| | 63 | | | Equity One, Inc. (m) | | | 1,595 | |
SEE NOTES TO FINANCIAL STATEMENTS.
| | | | | | | | |
| | | |
| DECEMBER 31, 2014 | | J.P. MORGAN LARGE CAP FUNDS | | | | | 41 | |
JPMorgan Large Cap Value Fund
SCHEDULE OF PORTFOLIO INVESTMENTS
AS OF DECEMBER 31, 2014 (Unaudited) (continued)
(Amounts in thousands)
| | | | | | | | |
| SHARES | | | SECURITY DESCRIPTION | | VALUE($) | |
| Common Stocks — continued | |
| | | | Real Estate Investment Trusts (REITs) — continued | |
| | 177 | | | Host Hotels & Resorts, Inc. (m) | | | 4,205 | |
| | 171 | | | Liberty Property Trust (m) | | | 6,442 | |
| | 71 | | | Mid-America Apartment Communities, Inc. (m) | | | 5,273 | |
| | | | | | | | |
| | | | | | | 17,515 | |
| | | | | | | | |
| | | | Total Financials | | | 260,331 | |
| | | | | | | | |
| | | | Health Care — 13.8% | |
| | | | Health Care Equipment & Supplies — 2.1% | |
| | 974 | | | Boston Scientific Corp. (a) | | | 12,908 | |
| | 43 | | | Stryker Corp. | | | 4,028 | |
| | | | | | | | |
| | | | | | | 16,936 | |
| | | | | | | | |
| | | | Health Care Providers & Services — 6.1% | |
| | 196 | | | Aetna, Inc. | | | 17,428 | |
| | 42 | | | Cigna Corp. (m) | | | 4,353 | |
| | 75 | | | Humana, Inc. | | | 10,748 | |
| | 177 | | | UnitedHealth Group, Inc. | | | 17,911 | |
| | | | | | | | |
| | | | | | | 50,440 | |
| | | | | | | | |
| | | | Life Sciences Tools & Services — 0.5% | |
| | 33 | | | Thermo Fisher Scientific, Inc. | | | 4,109 | |
| | | | | | | | |
| | | | Pharmaceuticals — 5.1% | |
| | 284 | | | Johnson & Johnson | | | 29,728 | |
| | 133 | | | Merck & Co., Inc. | | | 7,578 | |
| | 146 | | | Pfizer, Inc. | | | 4,557 | |
| | | | | | | | |
| | | | | | | 41,863 | |
| | | | | | | | |
| | | | Total Health Care | | | 113,348 | |
| | | | | | | | |
| | | | Industrials — 12.8% | |
| | | | Aerospace & Defense — 1.7% | |
| | 29 | | | L-3 Communications Holdings, Inc. | | | 3,686 | |
| | 81 | | | Textron, Inc. | | | 3,398 | |
| | 62 | | | United Technologies Corp. | | | 7,176 | |
| | | | | | | | |
| | | | | | | 14,260 | |
| | | | | | | | |
| | | | Airlines — 0.8% | |
| | 138 | | | Delta Air Lines, Inc. | | | 6,778 | |
| | | | | | | | |
| | | | Building Products — 0.4% | |
| | 87 | | | Owens Corning | | | 3,119 | |
| | | | | | | | |
| | | | Construction & Engineering — 1.3% | |
| | 177 | | | Fluor Corp. | | | 10,731 | |
| | | | | | | | |
| | | | Electrical Equipment — 1.7% | |
| | 200 | | | Eaton Corp. plc | | | 13,612 | |
| | | | | | | | |
| | | | Industrial Conglomerates — 1.7% | |
| | 537 | | | General Electric Co. | | | 13,570 | |
| | | | | | | | |
| | | | | | | | |
| SHARES | | | SECURITY DESCRIPTION | | VALUE($) | |
| | | | | | | | |
| | | | Machinery — 3.5% | |
| | 12 | | | Cummins, Inc. | | | 1,658 | |
| | 92 | | | Navistar International Corp. (a) | | | 3,084 | |
| | 74 | | | Oshkosh Corp. | | | 3,605 | |
| | 174 | | | PACCAR, Inc. | | | 11,847 | |
| | 101 | | | SPX Corp. | | | 8,661 | |
| | | | | | | | |
| | | | | | | 28,855 | |
| | | | | | | | |
| | | | Road & Rail — 1.7% | |
| | 375 | | | CSX Corp. (m) | | | 13,590 | |
| | | | | | | | |
| | | | Total Industrials | | | 104,515 | |
| | | | | | | | |
| | | | Information Technology — 7.1% | |
| | | | Communications Equipment — 0.8% | |
| | 236 | | | Cisco Systems, Inc. | | | 6,573 | |
| | | | | | | | |
| | | | Electronic Equipment, Instruments & Components — 0.4% | |
| | 119 | | | Knowles Corp. (a) | | | 2,810 | |
| | | | | | | | |
| | | | IT Services — 0.3% | |
| | 17 | | | International Business Machines Corp. | | | 2,792 | |
| | | | | | | | |
| | | | Semiconductors & Semiconductor Equipment — 2.1% | |
| | 169 | | | Broadcom Corp., Class A | | | 7,310 | |
| | 75 | | | Lam Research Corp. | | | 5,966 | |
| | 215 | | | Teradyne, Inc. | | | 4,249 | |
| | | | | | | | |
| | | | | | | 17,525 | |
| | | | | | | | |
| | | | Software — 1.6% | |
| | 275 | | | Microsoft Corp. | | | 12,792 | |
| | | | | | | | |
| | | | Technology Hardware, Storage & Peripherals — 1.9% | |
| | 37 | | | Apple, Inc. (m) | | | 4,095 | |
| | 170 | | | Hewlett-Packard Co. | | | 6,822 | |
| | 42 | | | Western Digital Corp. | | | 4,616 | |
| | | | | | | | |
| | | | | | | 15,533 | |
| | | | | | | | |
| | | | Total Information Technology | | | 58,025 | |
| | | | | | | | |
| | | | Materials — 3.4% | |
| | | | Chemicals — 2.0% | |
| | 123 | | | Axiall Corp. | | | 5,234 | |
| | 67 | | | Dow Chemical Co. (The) | | | 3,042 | |
| | 62 | | | E.I. du Pont de Nemours & Co. | | | 4,577 | |
| | 37 | | | H.B. Fuller Co. | | | 1,643 | |
| | 35 | | | Mosaic Co. (The) | | | 1,575 | |
| | | | | | | | |
| | | | | | | 16,071 | |
| | | | | | | | |
| | | | Metals & Mining — 1.4% | |
| | 548 | | | Alcoa, Inc. (m) | | | 8,656 | |
| | 112 | | | United States Steel Corp. | | | 3,000 | |
| | | | | | | | |
| | | | | | | 11,656 | |
| | | | | | | | |
| | | | Total Materials | | | 27,727 | |
| | | | | | | | |
SEE NOTES TO FINANCIAL STATEMENTS.
| | | | | | |
| | | |
| 42 | | | | J.P. MORGAN LARGE CAP FUNDS | | DECEMBER 31, 2014 |
| | | | | | | | |
| SHARES | | | SECURITY DESCRIPTION | | VALUE($) | |
| Common Stocks — continued | |
| | | | Telecommunication Services — 0.6% | |
| | | | Diversified Telecommunication Services — 0.6% | |
| | 110 | | | Verizon Communications, Inc. (m) | | | 5,160 | |
| | | | | | | | |
| | | | Utilities — 4.1% | |
| | | | Electric Utilities — 3.4% | |
| | 139 | | | Edison International | | | 9,101 | |
| | 249 | | | Exelon Corp. | | | 9,222 | |
| | 91 | | | NextEra Energy, Inc. | | | 9,704 | |
| | | | | | | | |
| | | | | | | 28,027 | |
| | | | | | | | |
| | | | Multi-Utilities — 0.7% | |
| | 226 | | | CenterPoint Energy, Inc. | | | 5,286 | |
| | | | | | | | |
| | | | Total Utilities | | | 33,313 | |
| | | | | | | | |
| | | | Total Common Stocks
(Cost $660,377) | | | 808,500 | |
| | | | | | | | |
| | |
NUMBER OF
WARRANTS | | | | | | |
| Warrant — 0.0% (g) | |
| | | | Financials — 0.0% (g) | |
| | | | Consumer Finance — 0.0% (g) | |
| | 36 | | | Imperial Holdings, Inc., expiring 10/01/19
(Strike Price $10.75) (a) (i)
(Cost $—) | | | — | |
| | | | | | | | |
| | |
| SHARES | | | | | | |
| Short-Term Investment — 1.2% | |
| | | | Investment Company — 1.2% | |
| | 9,682 | | | JPMorgan Liquid Assets Money Market Fund, Institutional Class Shares,
0.030% (b) (l) (m)
(Cost $9,682) | | | 9,682 | |
| | | | | | | | |
| | | | Total Investments — 99.9%
(Cost $670,059) | | | 818,182 | |
| | | | Other Assets in Excess of
Liabilities — 0.1% | | | 814 | |
| | | | | | | | |
| | | | NET ASSETS — 100.0% | | $ | 818,996 | |
| | | | | | | | |
Percentages indicated are based on net assets.
SEE NOTES TO FINANCIAL STATEMENTS.
| | | | | | | | |
| | | |
| DECEMBER 31, 2014 | | J.P. MORGAN LARGE CAP FUNDS | | | | | 43 | |
JPMorgan U.S. Equity Fund
SCHEDULE OF PORTFOLIO INVESTMENTS
AS OF DECEMBER 31, 2014 (Unaudited)
(Amounts in thousands)
| | | | | | | | |
| SHARES | | | SECURITY DESCRIPTION | | VALUE($) | |
| | | | | | | | |
| Common Stocks — 98.7% | |
| | | | Consumer Discretionary — 15.0% | | | | |
| | | | Auto Components — 0.4% | |
| | 992 | | | Johnson Controls, Inc. | | | 47,974 | |
| | | | | | | | |
| | | | Automobiles — 1.4% | |
| | 5,014 | | | General Motors Co. | | | 175,039 | |
| | | | | | | | |
| | | | Hotels, Restaurants & Leisure — 1.5% | |
| | 235 | | | Carnival Corp. | | | 10,638 | |
| | 122 | | | Dunkin’ Brands Group, Inc. | | | 5,209 | |
| | 694 | | | Royal Caribbean Cruises Ltd. | | | 57,234 | |
| | 1,155 | | | Starbucks Corp. | | | 94,802 | |
| | 303 | | | Yum! Brands, Inc. | | | 22,092 | |
| | | | | | | | |
| | | | | | | 189,975 | |
| | | | | | | | |
| | | | Household Durables — 1.7% | |
| | 1,325 | | | D.R. Horton, Inc. | | | 33,518 | |
| | 971 | | | Harman International Industries, Inc. | | | 103,588 | |
| | 1,441 | | | PulteGroup, Inc. | | | 30,923 | |
| | 663 | | | Toll Brothers, Inc. (a) | | | 22,714 | |
| | 111 | | | Whirlpool Corp. | | | 21,567 | |
| | | | | | | | |
| | | | | | | 212,310 | |
| | | | | | | | |
| | | | Internet & Catalog Retail — 0.6% | |
| | 66 | | | Priceline Group, Inc. (The) (a) | | | 75,784 | |
| | | | | | | | |
| | | | Media — 5.2% | |
| | 635 | | | CBS Corp. (Non-Voting), Class B | | | 35,123 | |
| | 352 | | | Charter Communications, Inc., Class A (a) | | | 58,589 | |
| | 1,565 | | | Comcast Corp., Class A | | | 90,813 | |
| | 886 | | | DISH Network Corp., Class A (a) | | | 64,556 | |
| | 75 | | | Time Warner Cable, Inc. | | | 11,411 | |
| | 2,415 | | | Time Warner, Inc. | | | 206,316 | |
| | 3,670 | | | Twenty-First Century Fox, Inc., Class A | | | 140,965 | |
| | 224 | | | Twenty-First Century Fox, Inc., Class B | | | 8,281 | |
| | 353 | | | Walt Disney Co. (The) | | | 33,265 | |
| | | | | | | | |
| | | | | | | 649,319 | |
| | | | | | | | |
| | | | Multiline Retail — 0.2% | |
| | 475 | | | Dollar Tree, Inc. (a) | | | 33,459 | |
| | | | | | | | |
| | | | Specialty Retail — 3.1% | |
| | 458 | | | Home Depot, Inc. (The) | | | 48,043 | |
| | 3,144 | | | Lowe’s Cos., Inc. | | | 216,319 | |
| | 162 | | | Tiffany & Co. | | | 17,299 | |
| | 1,546 | | | TJX Cos., Inc. (The) | | | 106,039 | |
| | | | | | | | |
| | | | | | | 387,700 | |
| | | | | | | | |
| | | | Textiles, Apparel & Luxury Goods — 0.9% | |
| | 677 | | | lululemon athletica, Inc., (Canada) (a) | | | 37,747 | |
| | 203 | | | PVH Corp. | | | 25,975 | |
| | 210 | | | Ralph Lauren Corp. | | | 38,799 | |
| | | | | | | | |
| SHARES | | | SECURITY DESCRIPTION | | VALUE($) | |
| | | | | | | | |
| | | | | | | | |
| | | | Textiles, Apparel & Luxury Goods — continued | |
| | 111 | | | V.F. Corp. | | | 8,289 | |
| | | | | | | | |
| | | | | | | 110,810 | |
| | | | | | | | |
| | | | Total Consumer Discretionary | | | 1,882,370 | |
| | | | | | | | |
| | | | Consumer Staples — 6.5% | |
| | | | Beverages — 1.6% | |
| | 2,890 | | | Coca-Cola Co. (The) | | | 122,028 | |
| | 788 | | | Constellation Brands, Inc., Class A (a) | | | 77,399 | |
| | 32 | | | Molson Coors Brewing Co., Class B | | | 2,418 | |
| | 45 | | | PepsiCo, Inc. | | | 4,282 | |
| | | | | | | | |
| | | | | | | 206,127 | |
| | | | | | | | |
| | | | Food & Staples Retailing — 1.4% | |
| | 315 | | | Costco Wholesale Corp. | | | 44,629 | |
| | 1,326 | | | CVS Health Corp. | | | 127,754 | |
| | | | | | | | |
| | | | | | | 172,383 | |
| | | | | | | | |
| | | | Food Products — 0.9% | |
| | 687 | | | General Mills, Inc. | | | 36,631 | |
| | 2,113 | | | Mondelez International, Inc., Class A | | | 76,771 | |
| | | | | | | | |
| | | | | | | 113,402 | |
| | | | | | | | |
| | | | Household Products — 1.7% | |
| | 294 | | | Colgate-Palmolive Co. | | | 20,323 | |
| | 2,092 | | | Procter & Gamble Co. (The) | | | 190,564 | |
| | | | | | | | |
| | | | | | | 210,887 | |
| | | | | | | | |
| | | | Personal Products — 0.1% | |
| | 162 | | | Estee Lauder Cos., Inc. (The), Class A | | | 12,333 | |
| | | | | | | | |
| | | | Tobacco — 0.8% | |
| | 1,163 | | | Philip Morris International, Inc. | | | 94,750 | |
| | | | | | | | |
| | | | Total Consumer Staples | | | 809,882 | |
| | | | | | | | |
| | | | Energy — 7.6% | |
| | | | Energy Equipment & Services — 2.3% | |
| | 1,298 | | | Baker Hughes, Inc. | | | 72,769 | |
| | 884 | | | Halliburton Co. | | | 34,787 | |
| | 2,017 | | | Schlumberger Ltd. | | | 172,308 | |
| | 627 | | | Weatherford International plc, (Switzerland) (a) | | | 7,182 | |
| | | | | | | | |
| | | | | | | 287,046 | |
| | | | | | | | |
| | | | Oil, Gas & Consumable Fuels — 5.3% | |
| | 408 | | | Anadarko Petroleum Corp. | | | 33,700 | |
| | 1,093 | | | California Resources Corp. (a) | | | 6,023 | |
| | 18 | | | Cheniere Energy, Inc. (a) | | | 1,302 | |
| | 974 | | | Chevron Corp. | | | 109,285 | |
| | 95 | | | Concho Resources, Inc. (a) | | | 9,510 | |
| | 181 | | | Devon Energy Corp. | | | 11,094 | |
| | 266 | | | EOG Resources, Inc. | | | 24,517 | |
SEE NOTES TO FINANCIAL STATEMENTS.
| | | | | | |
| | | |
| 44 | | | | J.P. MORGAN LARGE CAP FUNDS | | DECEMBER 31, 2014 |
| | | | | | | | |
| SHARES | | | SECURITY DESCRIPTION | | VALUE($) | |
| | | | | | | | |
| Common Stocks — continued | |
| | | | Oil, Gas & Consumable Fuels — continued | |
| | 298 | | | EQT Corp. | | | 22,558 | |
| | 1,201 | | | Exxon Mobil Corp. | | | 111,017 | |
| | 1,507 | | | Marathon Oil Corp. | | | 42,628 | |
| | 125 | | | Marathon Petroleum Corp. | | | 11,304 | |
| | 2,954 | | | Occidental Petroleum Corp. | | | 238,112 | |
| | 442 | | | Phillips 66 | | | 31,661 | |
| | 55 | | | Pioneer Natural Resources Co. | | | 8,157 | |
| | 209 | | | Southwestern Energy Co. (a) | | | 5,712 | |
| | | | | | | | |
| | | | | | | 666,580 | |
| | | | | | | | |
| | | | Total Energy | | | 953,626 | |
| | | | | | | | |
| | | | Financials — 15.9% | |
| | | | Banks — 6.7% | |
| | 12,973 | | | Bank of America Corp. | | | 232,086 | |
| | 727 | | | BB&T Corp. | | | 28,286 | |
| | 3,411 | | | Citigroup, Inc. | | | 184,582 | |
| | 299 | | | East West Bancorp, Inc. | | | 11,590 | |
| | 117 | | | SunTrust Banks, Inc. | | | 4,910 | |
| | 333 | | | SVB Financial Group (a) | | | 38,614 | |
| | 6,241 | | | Wells Fargo & Co. | | | 342,115 | |
| | | | | | | | |
| | | | | | | 842,183 | |
| | | | | | | | |
| | | | Capital Markets — 4.5% | |
| | 69 | | | Affiliated Managers Group, Inc. (a) | | | 14,601 | |
| | 215 | | | Ameriprise Financial, Inc. | | | 28,436 | |
| | 187 | | | BlackRock, Inc. | | | 66,767 | |
| | 2,746 | | | Charles Schwab Corp. (The) | | | 82,896 | |
| | 234 | | | Goldman Sachs Group, Inc. (The) | | | 45,366 | |
| | 1,966 | | | Invesco Ltd. | | | 77,695 | |
| | 5,096 | | | Morgan Stanley | | | 197,725 | |
| | 460 | | | State Street Corp. | | | 36,088 | |
| | 366 | | | TD Ameritrade Holding Corp. | | | 13,085 | |
| | | | | | | | |
| | | | | | | 562,659 | |
| | | | | | | | |
| | | | Consumer Finance — 0.1% | |
| | 335 | | | Santander Consumer USA Holdings, Inc. | | | 6,575 | |
| | | | | | | | |
| | | | Diversified Financial Services — 0.2% | |
| | 130 | | | Intercontinental Exchange, Inc. | | | 28,543 | |
| | | | | | | | |
| | | | Insurance — 3.8% | |
| | 1,605 | | | ACE Ltd., (Switzerland) | | | 184,337 | |
| | 1,251 | | | American International Group, Inc. | | | 70,055 | |
| | 784 | | | Hartford Financial Services Group, Inc. (The) | | | 32,694 | |
| | 1,399 | | | Marsh & McLennan Cos., Inc. | | | 80,072 | |
| | 1,673 | | | MetLife, Inc. | | | 90,499 | |
| | 382 | | | Willis Group Holdings plc, (United Kingdom) | | | 17,105 | |
| | | | | | | | |
| | | | | | | 474,762 | |
| | | | | | | | |
| | | | | | | | |
| SHARES | | | SECURITY DESCRIPTION | | VALUE($) | |
| | | | | | | | |
| | | | | | | | |
| | | | Real Estate Investment Trusts (REITs) — 0.6% | |
| | 45 | | | Boston Properties, Inc. | | | 5,775 | |
| | 928 | | | Prologis, Inc. | | | 39,947 | |
| | 141 | | | Simon Property Group, Inc. | | | 25,605 | |
| | 52 | | | Vornado Realty Trust | | | 6,131 | |
| | | | | | | | |
| | | | | | | 77,458 | |
| | | | | | | | |
| | | | Total Financials | | | 1,992,180 | |
| | | | | | | | |
| | | | Health Care — 14.7% | |
| | | | Biotechnology — 3.8% | |
| | 230 | | | Alexion Pharmaceuticals, Inc. (a) | | | 42,599 | |
| | 473 | | | Biogen Idec, Inc. (a) | | | 160,621 | |
| | 1,138 | | | Celgene Corp. (a) | | | 127,282 | |
| | 672 | | | Gilead Sciences, Inc. (a) | | | 63,344 | |
| | 663 | | | Vertex Pharmaceuticals, Inc. (a) | | | 78,720 | |
| | | | | | | | |
| | | | | | | 472,566 | |
| | | | | | | | |
| | | | Health Care Equipment & Supplies — 1.7% | |
| | 1,474 | | | Abbott Laboratories | | | 66,356 | |
| | 6,301 | | | Boston Scientific Corp. (a) | | | 83,487 | |
| | 211 | | | Covidien plc, (Ireland) | | | 21,563 | |
| | 409 | | | Stryker Corp. | | | 38,616 | |
| | | | | | | | |
| | | | | | | 210,022 | |
| | | | | | | | |
| | | | Health Care Providers & Services — 3.6% | |
| | 139 | | | Aetna, Inc. | | | 12,347 | |
| | 57 | | | Centene Corp. (a) | | | 5,912 | |
| | 100 | | | Cigna Corp. | | | 10,279 | |
| | 834 | | | Humana, Inc. | | | 119,831 | |
| | 547 | | | McKesson Corp. | | | 113,514 | |
| | 1,893 | | | UnitedHealth Group, Inc. | | | 191,383 | |
| | | | | | | | |
| | | | | | | 453,266 | |
| | | | | | | | |
| | | | Pharmaceuticals — 5.6% | |
| | 83 | | | Actavis plc (a) | | | 21,404 | |
| | 51 | | | Allergan, Inc. | | | 10,861 | |
| | 2,447 | | | Bristol-Myers Squibb Co. | | | 144,465 | |
| | 3,537 | | | Johnson & Johnson | | | 369,907 | |
| | 2,454 | | | Merck & Co., Inc. | | | 139,342 | |
| | 82 | | | Perrigo Co. plc, (Ireland) | | | 13,658 | |
| | | | | | | | |
| | | | | | | 699,637 | |
| | | | | | | | |
| | | | Total Health Care | | | 1,835,491 | |
| | | | | | | | |
| | | | Industrials — 11.0% | |
| | | | Aerospace & Defense — 3.6% | |
| | 2,467 | | | Honeywell International, Inc. | | | 246,542 | |
| | 382 | | | L-3 Communications Holdings, Inc. | | | 48,189 | |
| | 1,403 | | | United Technologies Corp. | | | 161,366 | |
| | | | | | | | |
| | | | | | | 456,097 | |
| | | | | | | | |
SEE NOTES TO FINANCIAL STATEMENTS.
| | | | | | | | |
| | | |
| DECEMBER 31, 2014 | | J.P. MORGAN LARGE CAP FUNDS | | | | | 45 | |
JPMorgan U.S. Equity Fund
SCHEDULE OF PORTFOLIO INVESTMENTS
AS OF DECEMBER 31, 2014 (Unaudited) (continued)
(Amounts in thousands, except number of Futures contracts)
| | | | | | | | |
| SHARES | | | SECURITY DESCRIPTION | | VALUE($) | |
| | | | | | | | |
| Common Stocks — continued | |
| | | | Airlines — 1.2% | |
| | 601 | | | Delta Air Lines, Inc. | | | 29,552 | |
| | 1,811 | | | United Continental Holdings, Inc. (a) | | | 121,131 | |
| | | | | | | | |
| | | | | | | 150,683 | |
| | | | | | | | |
| | | | Building Products — 0.8% | |
| | 1,185 | | | Fortune Brands Home & Security, Inc. | | | 53,641 | |
| | 1,601 | | | Masco Corp. | | | 40,346 | |
| | | | | | | | |
| | | | | | | 93,987 | |
| | | | | | | | |
| | | | Construction & Engineering — 0.8% | |
| | 1,615 | | | Fluor Corp. | | | 97,900 | |
| | | | | | | | |
| | | | Electrical Equipment — 1.2% | |
| | 901 | | | Eaton Corp. plc | | | 61,236 | |
| | 1,172 | | | Emerson Electric Co. | | | 72,325 | |
| | 274 | | | Sensata Technologies Holding N.V., (Netherlands) (a) | | | 14,350 | |
| | | | | | | | |
| | | | | | | 147,911 | |
| | | | | | | | |
| | | | Industrial Conglomerates — 0.1% | |
| | 178 | | | Danaher Corp. | | | 15,214 | |
| | | | | | | | |
| | | | Machinery — 1.8% | |
| | 136 | | | Flowserve Corp. | | | 8,153 | |
| | 505 | | | Ingersoll-Rand plc | | | 32,035 | |
| | 2,220 | | | PACCAR, Inc. | | | 150,998 | |
| | 74 | | | Pall Corp. | | | 7,455 | |
| | 7 | | | Pentair plc, (United Kingdom) | | | 483 | |
| | 230 | | | SPX Corp. | | | 19,782 | |
| | 22 | | | WABCO Holdings, Inc. (a) | | | 2,355 | |
| | | | | | | | |
| | | | | | | 221,261 | |
| | | | | | | | |
| | | | Road & Rail — 1.5% | |
| | 170 | | | Canadian Pacific Railway Ltd., (Canada) | | | 32,773 | |
| | 1,522 | | | CSX Corp. | | | 55,134 | |
| | 845 | | | Union Pacific Corp. | | | 100,684 | |
| | | | | | | | |
| | | | | | | 188,591 | |
| | | | | | | | |
| | | | Total Industrials | | | 1,371,644 | |
| | | | | | | | |
| | | | Information Technology — 21.0% | |
| | | | Communications Equipment — 1.0% | |
| | 78 | | | Cisco Systems, Inc. | | | 2,171 | |
| | 1,643 | | | QUALCOMM, Inc. | | | 122,108 | |
| | | | | | | | |
| | | | | | | 124,279 | |
| | | | | | | | |
| | | | Internet Software & Services — 4.0% | |
| | 2,429 | | | Facebook, Inc., Class A (a) | | | 189,485 | |
| | 242 | | | Google, Inc., Class A (a) | | | 128,683 | |
| | 344 | | | Google, Inc., Class C (a) | | | 180,980 | |
| | | | | | | | |
| | | | | | | 499,148 | |
| | | | | | | | |
| | | | | | | | |
| SHARES | | | SECURITY DESCRIPTION | | VALUE($) | |
| | | | | | | | |
| |
| | | | IT Services — 4.0% | |
| | 1,713 | | | Accenture plc, (Ireland), Class A | | | 152,987 | |
| | 176 | | | Alliance Data Systems Corp. (a) | | | 50,363 | |
| | 1,391 | | | Cognizant Technology Solutions Corp., Class A (a) | | | 73,245 | |
| | 887 | | | Fidelity National Information Services, Inc. | | | 55,178 | |
| | 69 | | | International Business Machines Corp. | | | 11,089 | |
| | 609 | | | Visa, Inc., Class A | | | 159,753 | |
| | | | | | | | |
| | | | | | | 502,615 | |
| | | | | | | | |
| | | | Semiconductors & Semiconductor Equipment — 4.1% | |
| | 458 | | | Applied Materials, Inc. | | | 11,417 | |
| | 1,901 | | | Avago Technologies Ltd., (Singapore) | | | 191,215 | |
| | 1,339 | | | Broadcom Corp., Class A | | | 58,023 | |
| | 857 | | | Freescale Semiconductor Ltd. (a) | | | 21,628 | |
| | 1,462 | | | KLA-Tencor Corp. | | | 102,837 | |
| | 1,679 | | | Lam Research Corp. | | | 133,177 | |
| | | | | | | | |
| | | | | | | 518,297 | |
| | | | | | | | |
| | | | Software — 4.1% | |
| | 1,602 | | | Adobe Systems, Inc. (a) | | | 116,486 | |
| | 489 | | | Citrix Systems, Inc. (a) | | | 31,187 | |
| | 6,054 | | | Microsoft Corp. | | | 281,219 | |
| | 1,872 | | | Oracle Corp. | | | 84,187 | |
| | | | | | | | |
| | | | | | | 513,079 | |
| | | | | | | | |
| | | | Technology Hardware, Storage & Peripherals — 3.8% | |
| | 4,213 | | | Apple, Inc. | | | 465,017 | |
| | 27 | | | EMC Corp. | | | 818 | |
| | 306 | | | Hewlett-Packard Co. | | | 12,265 | |
| | | | | | | | |
| | | | | | | 478,100 | |
| | | | | | | | |
| | | | Total Information Technology | | | 2,635,518 | |
| | | | | | | | |
| | | | Materials — 3.5% | |
| | | | Chemicals — 2.0% | |
| | 25 | | | Albemarle Corp. | | | 1,489 | |
| | 409 | | | Axiall Corp. | | | 17,380 | |
| | 964 | | | Dow Chemical Co. (The) | | | 43,986 | |
| | 1,020 | | | E.I. du Pont de Nemours & Co. | | | 75,449 | |
| | 2,390 | | | Mosaic Co. (The) | | | 109,111 | |
| | | | | | | | |
| | | | | | | 247,415 | |
| | | | | | | | |
| | | | Construction Materials — 0.0% (g) | |
| | 41 | | | Martin Marietta Materials, Inc. | | | 4,514 | |
| | | | | | | | |
| | | | Containers & Packaging — 0.3% | |
| | 500 | | | Crown Holdings, Inc. (a) | | | 25,457 | |
| | 322 | | | Sealed Air Corp. | | | 13,664 | |
| | | | | | | | |
| | | | | | | 39,121 | |
| | | | | | | | |
SEE NOTES TO FINANCIAL STATEMENTS.
| | | | | | |
| | | |
| 46 | | | | J.P. MORGAN LARGE CAP FUNDS | | DECEMBER 31, 2014 |
| | | | | | | | |
SHARES | | | SECURITY DESCRIPTION | | VALUE($) | |
| | | | | | | | |
Common Stocks — continued | |
| | | | Metals & Mining — 1.2% | |
| | 7,213 | | | Alcoa, Inc. | | | 113,890 | |
| | 1,421 | | | United States Steel Corp. | | | 38,006 | |
| | | | | | | | |
| | | | | | | 151,896 | |
| | | | | | | | |
| | | | Total Materials | | | 442,946 | |
| | | | | | | | |
| | | | Telecommunication Services — 1.1% | |
| | | | Diversified Telecommunication Services — 1.1% | |
| | 2,979 | | | Verizon Communications, Inc. | | | 139,369 | |
| | | | | | | | |
| | | | Utilities — 2.4% | |
| | | | Electric Utilities — 1.6% | |
| | 568 | | | Edison International | | | 37,175 | |
| | 44 | | | Entergy Corp. | | | 3,862 | |
| | 1,435 | | | Exelon Corp. | | | 53,194 | |
| | 706 | | | NextEra Energy, Inc. | | | 75,065 | |
| | 897 | | | PPL Corp. | | | 32,601 | |
| | | | | | | | |
| | | | | | | 201,897 | |
| | | | | | | | |
| | | | Multi-Utilities — 0.8% | |
| | 1,227 | | | CenterPoint Energy, Inc. | | | 28,744 | |
| | 618 | | | Dominion Resources, Inc. | | | 47,525 | |
| | 505 | | | NiSource, Inc. | | | 21,413 | |
| | 105 | | | PG&E Corp. | | | 5,590 | |
| | | | | | | | |
| | | | | | | 103,272 | |
| | | | | | | | |
| | | | Total Utilities | | | 305,169 | |
| | | | | | | | |
| | | | Total Common Stocks
(Cost $8,923,019) | | | 12,368,195 | |
| | | | | | | | |
| | | | | | | | |
NUMBER OF
WARRANTS | | | SECURITY DESCRIPTION | | VALUE($) | |
| | | | | | | | |
| Warrant — 0.0% (g) | |
| | | | Financials — 0.0% (g) | |
| | | | Consumer Finance — 0.0% (g) | |
| | 24 | | | Imperial Holdings, Inc., expiring 10/01/19 (Strike Price $10.75) (a) (i)
(Cost $—) | | | — | |
| | | | | | | | |
| | |
| SHARES | | | | | | |
| Short-Term Investment — 3.3% | |
| | | | Investment Company — 3.3% | |
| | 408,515 | | | JPMorgan Prime Money Market Fund, Institutional Class Shares,
0.020% (b) (l)
(Cost $408,515) | | | 408,515 | |
| | | | | | | | |
| | | | Total Investments — 102.0%
(Cost $9,331,534) | | | 12,776,710 | |
| | | | Liabilities in Excess of Other Assets — (2.0)% (c) | | | (254,013 | ) |
| | | | | | | | |
| | | | NET ASSETS — 100.0% | | $ | 12,522,697 | |
| | | | | | | | |
Percentages indicated are based on net assets.
| | | | | | | | | | | | | | | | |
| Futures Contracts | | | | | | | | | |
NUMBER OF
CONTRACTS | | | DESCRIPTION | | EXPIRATION
DATE | | | NOTIONAL
VALUE AT
DECEMBER 31, 2014 | | | NET
UNREALIZED
APPRECIATION
(DEPRECIATION) | |
| | | | Long Futures Outstanding | | | | | | | | | | | | |
| | 1,014 | | | E-mini S&P 500 | | | 03/20/15 | | | $ | 104,057 | | | $ | (1,164 | ) |
| | | | | | | | | | | | | | | | |
SEE NOTES TO FINANCIAL STATEMENTS.
| | | | | | | | |
| | | |
| DECEMBER 31, 2014 | | J.P. MORGAN LARGE CAP FUNDS | | | | | 47 | |
J.P. Morgan Large Cap Funds
NOTES TO SCHEDULES OF PORTFOLIO INVESTMENTS
AS OF DECEMBER 31, 2014 (Unaudited)
| | |
| ADR | | — American Depositary Receipt |
| |
| (a) | | — Non-income producing security. |
| (b) | | — Investment in affiliate. Money market fund registered under the Investment Company Act of 1940, as amended, and advised by J.P. Morgan Investment Management Inc. |
| (c) | | — Included in this amount is cash segregated as collateral for futures contracts. |
| (g) | | — Amount rounds to less than 0.1%. |
| (h) | | — Amount rounds to less than one thousand shares or contracts. |
| (i) | | — Security has been deemed illiquid pursuant to procedures approved by the Board of Trustees and may be difficult to sell. |
| | |
| (k) | | — All or a portion of this security is deposited with the broker as collateral for futures or with brokers as initial margin for futures contracts. |
| (l) | | — The rate shown is the current yield as of December 31, 2014. |
| (m) | | — All or a portion of this security is reserved and/or pledged with the custodian for current or potential holdings of futures, swaps, options, TBAs, when-issued securities, delayed delivery securities, reverse repurchase agreements, unfunded commitments and/or forward foreign currency exchange contracts. |
| (n) | | — The rate shown is the effective yield at the date of purchase. |
SEE NOTES TO FINANCIAL STATEMENTS.
| | | | | | |
| | | |
| 48 | | | | J.P. MORGAN LARGE CAP FUNDS | | DECEMBER 31, 2014 |
THIS PAGE IS INTENTIONALLY LEFT BLANK
| | | | | | | | |
| | | |
| DECEMBER 31, 2014 | | J.P. MORGAN LARGE CAP FUNDS | | | | | 49 | |
STATEMENTS OF ASSETS AND LIABILITIES
AS OF DECEMBER 31, 2014 (Unaudited)
(Amounts in thousands, except per share amounts)
| | | | | | | | | | | | |
| | | Disciplined
Equity Fund | | | Dynamic
Growth Fund | | | Equity
Focus Fund | |
ASSETS: | | | | | | | | | | | | |
Investments in non-affiliates, at value | | $ | 5,414,446 | | | $ | 318,061 | | | $ | 73,909 | |
Investments in affiliates, at value | | | 207,918 | | | | 10,350 | | | | 4,951 | |
| | | | | | | | | | | | |
Total investment securities, at value | | | 5,622,364 | | | | 328,411 | | | | 78,860 | |
Cash | | | — | (a) | | | — | | | | — | |
Receivables: | | | | | | | | | | | | |
Investment securities sold | | | 124,841 | | | | — | | | | — | |
Fund shares sold | | | 12,199 | | | | 265 | | | | 83 | |
Dividends from non-affiliates | | | 4,145 | | | | 126 | | | | 26 | |
Dividends from affiliates | | | 4 | | | | 1 | | | | — | (a) |
Other assets | | | — | | | | 9 | | | | — | |
| | | | | | | | | | | | |
Total Assets | | | 5,763,553 | | | | 328,812 | | | | 78,969 | |
| | | | | | | | | | | | |
| | | |
LIABILITIES: | | | | | | | | | | | | |
Payables: | | | | | | | | | | | | |
Investment securities purchased | | | 299,279 | | | | — | | | | — | |
Fund shares redeemed | | | 10,194 | | | | 64 | | | | — | |
Variation margin on futures contracts | | | 595 | | | | — | | | | — | |
Accrued liabilities: | | | | | | | | | | | | |
Investment advisory fees | | | 1,146 | | | | 157 | | | | 38 | |
Administration fees | | | 366 | | | | 16 | | | | 2 | |
Shareholder servicing fees | | | 102 | | | | 64 | | | | 17 | |
Distribution fees | | | 66 | | | | 10 | | | | 1 | |
Custodian and accounting fees | | | 39 | | | | 13 | | | | 13 | |
Trustees’ and Chief Compliance Officer’s fees | | | 7 | | | | — | (a) | | | — | (a) |
Registration Fee | | | — | | | | 7 | | | | 14 | |
Audit fees | | | 13 | | | | 18 | | | | 13 | |
Other | | | 13 | | | | 7 | | | | 7 | |
| | | | | | | | | | | | |
Total Liabilities | | | 311,820 | | | | 356 | | | | 105 | |
| | | | | | | | | | | | |
Net Assets | | $ | 5,451,733 | | | $ | 328,456 | | | $ | 78,864 | |
| | | | | | | | | | | | |
| (a) | Amount rounds to less than $1,000. |
SEE NOTES TO FINANCIAL STATEMENTS.
| | | | | | |
| | | |
| 50 | | | | J.P. MORGAN LARGE CAP FUNDS | | DECEMBER 31, 2014 |
| | | | | | | | | | | | |
| | | Disciplined
Equity Fund | | | Dynamic
Growth Fund | | | Equity
Focus Fund | |
NET ASSETS: | | | | | | | | | | | | |
Paid-in-Capital | | $ | 4,648,039 | | | $ | 276,984 | | | $ | 71,605 | |
Accumulated undistributed (distributions in excess of) net investment income | | | 889 | | | | (1,122 | ) | | | (33 | ) |
Accumulated net realized gains (losses) | | | 142,424 | | | | (3,750 | ) | | | (470 | ) |
Net unrealized appreciation (depreciation) | | | 660,381 | | | | 56,344 | | | | 7,762 | |
| | | | | | | | | | | | |
Total Net Assets | | $ | 5,451,733 | | | $ | 328,456 | | | $ | 78,864 | |
| | | | | | | | | | | | |
| | | |
Net Assets: | | | | | | | | | | | | |
Class A | | $ | 321,069 | | | $ | 27,593 | | | $ | 999 | |
Class C | | | — | | | | 7,465 | | | | 600 | |
Class R5 | | | — | | | | 46 | | | | — | |
Class R6 | | | 4,322,692 | | | | — | | | | — | |
Institutional Class | | | 553,151 | | | | — | | | | — | |
Select Class | | | 254,821 | | | | 293,352 | | | | 77,265 | |
| | | | | | | | | | | | |
Total | | $ | 5,451,733 | | | $ | 328,456 | | | $ | 78,864 | |
| | | | | | | | | | | | |
| | | |
Outstanding units of beneficial interest (shares) | | | | | | | | | | | | |
($0.0001 par value; unlimited number of shares authorized): | | | | | | | | | | | | |
Class A | | | 13,643 | | | | 1,146 | | | | 41 | |
Class C | | | — | | | | 321 | | | | 25 | |
Class R5 | | | — | | | | 2 | | | | — | |
Class R6 | | | 182,476 | | | | — | | | | — | |
Institutional Class | | | 23,355 | | | | — | | | | — | |
Select Class | | | 10,747 | | | | 11,966 | | | | 3,170 | |
| | | |
Net Asset Value (a): | | | | | | | | | | | | |
Class A — Redemption price per share | | $ | 23.53 | | | $ | 24.08 | | | $ | 24.24 | |
Class C — Offering price per share (b) | | | — | | | | 23.24 | | | | 23.87 | |
Class R5 — Offering and redemption price per share | | | — | | | | 24.86 | | | | — | |
Class R6 — Offering and redemption price per share | | | 23.69 | | | | — | | | | — | |
Institutional Class — Offering and redemption price per share | | | 23.68 | | | | — | | | | — | |
Select Class — Offering and redemption price per share | | | 23.71 | | | | 24.51 | | | | 24.37 | |
Class A maximum sales charge | | | 5.25 | % | | | 5.25 | % | | | 5.25 | % |
Class A maximum public offering price per share
[net asset value per share/(100% — maximum sales charge)] | | $ | 24.83 | | | $ | 25.41 | | | $ | 25.58 | |
| | | | | | | | | | | | |
| | | |
Cost of investments in non-affiliates | | $ | 4,755,115 | | | $ | 261,717 | | | $ | 66,147 | |
Cost of investments in affiliates | | | 207,918 | | | | 10,350 | | | | 4,951 | |
| (a) | Per share amounts may not recalculate due to rounding of net assets and/or shares outstanding. |
| (b) | Redemption price for Class C Shares varies based upon length of time the shares are held. |
SEE NOTES TO FINANCIAL STATEMENTS.
| | | | | | | | |
| | | |
| DECEMBER 31, 2014 | | J.P. MORGAN LARGE CAP FUNDS | | | | | 51 | |
STATEMENTS OF ASSETS AND LIABILITIES
AS OF DECEMBER 31, 2014 (Unaudited) (continued)
(Amounts in thousands, except per share amounts)
| | | | | | | | | | | | |
| | | Equity
Income Fund | | | Growth and
Income Fund | | | Hedged
Equity Fund | |
ASSETS: | | | | | | | | | | | | |
Investments in non-affiliates, at value | | $ | 8,891,728 | | | $ | 477,193 | | | $ | 137,972 | |
Investments in affiliates, at value | | | 90,194 | | | | 15,806 | | | | 3,901 | |
| | | | | | | | | | | | |
Total investment securities, at value | | | 8,981,922 | | | | 492,999 | | | | 141,873 | |
Cash | | | — | | | | — | | | | 1 | |
Deposits at broker for futures contracts | | | — | | | | — | | | | 255 | |
Receivables: | | | | | | | | | | | | |
Investment securities sold | | | 1,948 | | | | 174 | | | | 2,671 | |
Fund shares sold | | | 75,345 | | | | 342 | | | | 369 | |
Dividends from non-affiliates | | | 20,015 | | | | 667 | | | | 177 | |
Dividends from affiliates | | | 8 | | | | — | (a) | | | — | (a) |
| | | | | | | | | | | | |
Total Assets | | | 9,079,238 | | | | 494,182 | | | | 145,346 | |
| | | | | | | | | | | | |
| | | |
LIABILITIES: | | | | | | | | | | | | |
Payables: | | | | | | | | | | | | |
Investment securities purchased | | | — | | | | 1,904 | | | | 4,116 | |
Fund shares redeemed | | | 7,775 | | | | 440 | | | | 627 | |
Variation margin on futures contracts | | | — | | | | — | | | | 47 | |
Outstanding options written, at fair value | | | — | | | | — | | | | 2,641 | |
Accrued liabilities: | | | | | | | | | | | | |
Investment advisory fees | | | 2,998 | | | | 163 | | | | 18 | |
Administration fees | | | 620 | | | | 34 | | | | 5 | |
Shareholder servicing fees | | | 1,524 | | | | 103 | | | | 28 | |
Distribution fees | | | 1,218 | | | | 105 | | | | 14 | |
Custodian and accounting fees | | | 104 | | | | 15 | | | | 21 | |
Trustees’ and Chief Compliance Officer’s fees | | | 3 | | | | — | (a) | | | 1 | |
Other | | | 881 | | | | 173 | | | | 41 | |
| | | | | | | | | | | | |
Total Liabilities | | | 15,123 | | | | 2,937 | | | | 7,559 | |
| | | | | | | | | | | | |
Net Assets | | $ | 9,064,115 | | | $ | 491,245 | | | $ | 137,787 | |
| | | | | | | | | | | | |
| (a) | Amount rounds to less than $1,000. |
SEE NOTES TO FINANCIAL STATEMENTS.
| | | | | | |
| | | |
| 52 | | | | J.P. MORGAN LARGE CAP FUNDS | | DECEMBER 31, 2014 |
| | | | | | | | | | | | |
| | | Equity
Income Fund | | | Growth and
Income Fund | | | Hedged
Equity Fund | |
NET ASSETS: | | | | | | | | | | | | |
Paid-in-Capital | | $ | 7,106,458 | | | $ | 314,201 | | | $ | 132,375 | |
Accumulated undistributed (distributions in excess of) net investment income | | | 1,638 | | | | 156 | | | | (10 | ) |
Accumulated net realized gains (losses) | | | (226 | ) | | | 5,519 | | | | (2,383 | ) |
Net unrealized appreciation (depreciation) | | | 1,956,245 | | | | 171,369 | | | | 7,805 | |
| | | | | | | | | | | | |
Total Net Assets | | $ | 9,064,115 | | | $ | 491,245 | | | $ | 137,787 | |
| | | | | | | | | | | | |
| | | |
Net Assets: | | | | | | | | | | | | |
Class A | | $ | 2,765,330 | | | $ | 436,305 | | | $ | 64,641 | |
Class B | | | 3,390 | | | | 2,435 | | | | — | |
Class C | | | 985,499 | | | | 19,435 | | | | 838 | |
Class R2 | | | 42,349 | | | | — | | | | — | |
Class R5 | | | 421,355 | | | | — | | | | 439 | |
Class R6 | | | 719,104 | | | | — | | | | 439 | |
Select Class | | | 4,127,088 | | | | 33,070 | | | | 71,430 | |
| | | | | | | | | | | | |
Total | | $ | 9,064,115 | | | $ | 491,245 | | | $ | 137,787 | |
| | | | | | | | | | | | |
| | | |
Outstanding units of beneficial interest (shares) | | | | | | | | | | | | |
($0.0001 par value; unlimited number of shares authorized): | | | | | | | | | | | | |
Class A | | | 196,611 | | | | 9,462 | | | | 3,932 | |
Class B | | | 243 | | | | 54 | | | | — | |
Class C | | | 70,984 | | | | 458 | | | | 51 | |
Class R2 | | | 3,017 | | | | — | | | | — | |
Class R5 | | | 29,522 | | | | — | | | | 27 | |
Class R6 | | | 50,413 | | | | — | | | | 27 | |
Select Class | | | 289,262 | | | | 687 | | | | 4,337 | |
| | | |
Net Asset Value (a): | | | | | | | | | | | | |
Class A — Redemption price per share | | $ | 14.07 | | | $ | 46.11 | | | $ | 16.44 | |
Class B — Offering price per share (b) | | | 13.96 | | | | 44.98 | | | | — | |
Class C — Offering price per share (b) | | | 13.88 | | | | 42.48 | | | | 16.43 | |
Class R2 — Offering and redemption price per share | | | 14.04 | | | | — | | | | — | |
Class R5 — Offering and redemption price per share | | | 14.27 | | | | — | | | | 16.48 | |
Class R6 — Offering and redemption price per share | | | 14.26 | | | | — | | | | 16.48 | |
Select Class — Offering and redemption price per share | | | 14.27 | | | | 48.12 | | | | 16.47 | |
Class A maximum sales charge | | | 5.25 | % | | | 5.25 | % | | | 5.25 | % |
Class A maximum public offering price per share
[net asset value per share/(100% — maximum sales charge)] | | $ | 14.85 | | | $ | 48.66 | | | $ | 17.35 | |
| | | | | | | | | | | | |
| | | |
Cost of investments in non-affiliates | | $ | 6,935,483 | | | $ | 305,824 | | | $ | 130,225 | |
Cost of investments in affiliates | | | 90,194 | | | | 15,806 | | | | 3,901 | |
Premiums paid from options written | | | — | | | | — | | | | 2,671 | |
| (a) | Per share amounts may not recalculate due to rounding of net assets and/or shares outstanding. |
| (b) | Redemption price for Class B and Class C Shares varies based upon length of time the shares are held. |
SEE NOTES TO FINANCIAL STATEMENTS.
| | | | | | | | |
| | | |
| DECEMBER 31, 2014 | | J.P. MORGAN LARGE CAP FUNDS | | | | | 53 | |
STATEMENTS OF ASSETS AND LIABILITIES
AS OF DECEMBER 31, 2014 (Unaudited) (continued)
(Amounts in thousands, except per share amounts)
| | | | | | | | | | | | |
| | | Large Cap
Growth Fund | | | Large Cap
Value Fund | | | U.S.
Equity Fund | |
ASSETS: | | | | | | | | | | | | |
Investments in non-affiliates, at value | | $ | 15,046,245 | | | $ | 808,500 | | | $ | 12,368,195 | |
Investments in affiliates, at value | | | 369,617 | | | | 9,682 | | | | 408,515 | |
| | | | | | | | | | | | |
Total investment securities, at value | | | 15,415,862 | | | | 818,182 | | | | 12,776,710 | |
Cash | | | — | (a) | | | 1 | | | | 5 | |
Deposits at broker for futures contracts | | | — | | | | — | | | | 1,989 | |
Receivables: | | | | | | | | | | | | |
Investment securities sold | | | — | | | | 2,138 | | | | 11,614 | |
Fund shares sold | | | 19,237 | | | | 128 | | | | 43,655 | |
Dividends from non-affiliates | | | 3,254 | | | | 1,296 | | | | 14,122 | |
Dividends from affiliates | | | 18 | | | | — | (a) | | | 7 | |
| | | | | | | | | | | | |
Total Assets | | | 15,438,371 | | | | 821,745 | | | | 12,848,102 | |
| | | | | | | | | | | | |
| | | |
LIABILITIES: | | | | | | | | | | | | |
Payables: | | | | | | | | | | | | |
Investment securities purchased | | | — | | | | 1,764 | | | | 242,774 | |
Fund shares redeemed | | | 83,669 | | | | 294 | | | | 73,687 | |
Variation margin on futures contracts | | | — | | | | — | | | | 1,315 | |
Accrued liabilities: | | | | | | | | | | | | |
Investment advisory fees | | | 6,479 | | | | 281 | | | | 3,923 | |
Administration fees | | | 1,073 | | | | 58 | | | | 835 | |
Shareholder servicing fees | | | 1,387 | | | | 157 | | | | 845 | |
Distribution fees | | | 1,484 | | | | 29 | | | | 463 | |
Custodian and accounting fees | | | 269 | | | | 24 | | | | 214 | |
Trustees’ and Chief Compliance Officer’s fees | | | 3 | | | | 7 | | | | 3 | |
Other | | | 3,728 | | | | 135 | | | | 1,346 | |
| | | | | | | | | | | | |
Total Liabilities | | | 98,092 | | | | 2,749 | | | | 325,405 | |
| | | | | | | | | | | | |
Net Assets | | $ | 15,340,279 | | | $ | 818,996 | | | $ | 12,522,697 | |
| | | | | | | | | | | | |
| (a) | Amount rounds to less than $1,000. |
SEE NOTES TO FINANCIAL STATEMENTS.
| | | | | | |
| | | |
| 54 | | | | J.P. MORGAN LARGE CAP FUNDS | | DECEMBER 31, 2014 |
| | | | | | | | | | | | |
| | | Large Cap
Growth Fund | | | Large Cap
Value Fund | | | U.S.
Equity Fund | |
NET ASSETS: | | | | | | | | | | | | |
Paid-in-Capital | | $ | 10,105,613 | | | $ | 654,359 | | | $ | 9,215,500 | |
Accumulated undistributed (distributions in excess of) net investment income | | | (36,753 | ) | | | 317 | | | | 3,634 | |
Accumulated net realized gains (losses) | | | 204,654 | | | | 16,197 | | | | (140,449 | ) |
Net unrealized appreciation (depreciation) | | | 5,066,765 | | | | 148,123 | | | | 3,444,012 | |
| | | | | | | | | | | | |
Total Net Assets | | $ | 15,340,279 | | | $ | 818,996 | | | $ | 12,522,697 | |
| | | | | | | | | | | | |
| | | |
Net Assets: | | | | | | | | | | | | |
Class A | | $ | 4,856,933 | | | $ | 93,921 | | | $ | 1,261,541 | |
Class B | | | 6,583 | | | | 1,543 | | | | 4,096 | |
Class C | | | 555,706 | | | | 13,384 | | | | 208,067 | |
Class R2 | | | 238,983 | | | | 612 | | | | 152,134 | |
Class R5 | | | 1,384,375 | | | | 4,426 | | | | 489,662 | |
Class R6 | | | 2,837,976 | | | | 1,553 | | | | 2,663,467 | |
Institutional Class | | | — | | | | — | | | | 4,590,886 | |
Select Class | | | 5,459,723 | | | | 703,557 | | | | 3,152,844 | |
| | | | | | | | | | | | |
Total | | $ | 15,340,279 | | | $ | 818,996 | | | $ | 12,522,697 | |
| | | | | | | | | | | | |
| | | |
Outstanding units of beneficial interest (shares) | | | | | | | | | | | | |
($0.0001 par value; unlimited number of shares authorized): | | | | | | | | | | | | |
Class A | | | 140,646 | | | | 6,289 | | | | 86,921 | |
Class B | | | 218 | | | | 105 | | | | 287 | |
Class C | | | 18,553 | | | | 922 | | | | 14,682 | |
Class R2 | | | 7,021 | | | | 41 | | | | 10,550 | |
Class R5 | | | 39,691 | | | | 298 | | | | 33,631 | |
Class R6 | | | 81,214 | | | | 105 | | | | 182,746 | |
Institutional Class | | | — | | | | — | | | | 315,490 | |
Select Class | | | 157,799 | | | | 47,824 | | | | 216,985 | |
| | | |
Net Asset Value (a): | | | | | | | | | | | | |
Class A — Redemption price per share | | $ | 34.53 | | | $ | 14.93 | | | $ | 14.51 | |
Class B — Offering price per share (b) | | | 30.25 | | | | 14.67 | | | | 14.27 | |
Class C — Offering price per share (b) | | | 29.95 | | | | 14.52 | | | | 14.17 | |
Class R2 — Offering and redemption price per share | | | 34.04 | | | | 14.88 | | | | 14.42 | |
Class R5 — Offering and redemption price per share | | | 34.88 | | | | 14.85 | | | | 14.56 | |
Class R6 — Offering and redemption price per share | | | 34.94 | | | | 14.78 | | | | 14.57 | |
Institutional Class — Offering and redemption price per share | | | — | | | | — | | | | 14.55 | |
Select Class — Offering and redemption price per share | | | 34.60 | | | | 14.71 | | | | 14.53 | |
Class A maximum sales charge | | | 5.25 | % | | | 5.25 | % | | | 5.25 | % |
Class A maximum public offering price per share
[net asset value per share/(100% — maximum sales charge)] | | $ | 36.44 | | | $ | 15.76 | | | $ | 15.31 | |
| | | | | | | | | | | | |
| | | |
Cost of investments in non-affiliates | | $ | 9,979,480 | | | $ | 660,377 | | | $ | 8,923,019 | |
Cost of investments in affiliates | | | 369,617 | | | | 9,682 | | | | 408,515 | |
| (a) | Per share amounts may not recalculate due to rounding of net assets and/or shares outstanding. |
| (b) | Redemption price for Class B and Class C Shares varies based upon length of time the shares are held. |
SEE NOTES TO FINANCIAL STATEMENTS.
| | | | | | | | |
| | | |
| DECEMBER 31, 2014 | | J.P. MORGAN LARGE CAP FUNDS | | | | | 55 | |
STATEMENTS OF OPERATIONS
FOR THE SIX MONTHS ENDED DECEMBER 31, 2014 (Unaudited)
(Amounts in thousands)
| | | | | | | | | | | | |
| | | Disciplined
Equity Fund | | | Dynamic
Growth Fund | | | Equity
Focus Fund | |
INVESTMENT INCOME: | | | | | | | | | | | | |
Interest income from non-affiliates | | $ | 2 | | | $ | — | | | $ | — | |
Dividend income from non-affiliates | | | 42,490 | | | | 871 | | | | 402 | |
Dividend income from affiliates | | | 11 | | | | 1 | | | | — | (a) |
| | | | | | | | | | | | |
Total investment income | | | 42,503 | | | | 872 | | | | 402 | |
| | | | | | | | | | | | |
| | | |
EXPENSES: | | | | | | | | | | | | |
Investment advisory fees | | | 6,130 | | | | 928 | | | | 250 | |
Administration fees | | | 2,023 | | | | 128 | | | | 32 | |
Distribution fees: | | | | | | | | | | | | |
Class A | | | 319 | | | | 28 | | | | 1 | |
Class C | | | — | | | | 23 | | | | 1 | |
Shareholder servicing fees: | | | | | | | | | | | | |
Class A | | | 319 | | | | 28 | | | | 1 | |
Class C | | | — | | | | 8 | | | | — | (a) |
Class R5 | | | — | | | | — | (a) | | | — | |
Institutional Class | | | 230 | | | | — | | | | — | |
Select Class | | | 294 | | | | 351 | | | | 95 | |
Custodian and accounting fees | | | 58 | | | | 16 | | | | 15 | |
Professional fees | | | 49 | | | | 23 | | | | 22 | |
Trustees’ and Chief Compliance Officer’s fees | | | 27 | | | | 1 | | | | — | (a) |
Printing and mailing costs | | | 41 | | | | 8 | | | | 2 | |
Registration and filing fees | | | 93 | | | | 37 | | | | 18 | |
Transfer agent fees | | | 302 | | | | 42 | | | | 5 | |
Other | | | 45 | | | | 6 | | | | 5 | |
| | | | | | | | | | | | |
Total expenses | | | 9,930 | | | | 1,627 | | | | 447 | |
| | | | | | | | | | | | |
Less fees waived | | | (288 | ) | | | (62 | ) | | | (63 | ) |
| | | | | | | | | | | | |
Net expenses | | | 9,642 | | | | 1,565 | | | | 384 | |
| | | | | | | | | | | | |
Net investment income (loss) | | | 32,861 | | | | (693 | ) | | | 18 | |
| | | | | | | | | | | | |
| | | |
REALIZED/UNREALIZED GAINS (LOSSES): | | | | | | | | | | | | |
Net realized gain (loss) on transactions from: | | | | | | | | | | | | |
Investments in non-affiliates | | | 317,136 | | | | (2,580 | ) | | | 190 | |
Futures | | | 3,746 | | | | — | | | | — | |
| | | | | | | | | | | | |
Net realized gain (loss) | | | 320,882 | | | | (2,580 | ) | | | 190 | |
| | | | | | | | | | | | |
Change in net unrealized appreciation/depreciation of: | | | | | | | | | | | | |
Investments in non-affiliates | | | (22,998 | ) | | | 10,932 | | | | 2,611 | |
Futures | | | 697 | | | | — | | | | — | |
| | | | | | | | | | | | |
Change in net unrealized appreciation/depreciation | | | (22,301 | ) | | | 10,932 | | | | 2,611 | |
| | | | | | | | | | | | |
Net realized/unrealized gains (losses) | | | 298,581 | | | | 8,352 | | | | 2,801 | |
| | | | | | | | | | | | |
Change in net assets resulting from operations | | $ | 331,442 | | | $ | 7,659 | | | $ | 2,819 | |
| | | | | | | | | | | | |
| (a) | Amount rounds to less than $1,000. |
SEE NOTES TO FINANCIAL STATEMENTS.
| | | | | | |
| | | |
| 56 | | | | J.P. MORGAN LARGE CAP FUNDS | | DECEMBER 31, 2014 |
| | | | | | | | | | | | |
| | | Equity
Income Fund | | | Growth and
Income Fund | | | Hedged
Equity Fund | |
INVESTMENT INCOME: | | | | | | | | | | | | |
Dividend income from non-affiliates | | $ | 130,644 | | | $ | 6,072 | | | $ | 728 | |
Dividend income from affiliates | | | 33 | | | | 1 | | | | — | (a) |
| | | | | | | | | | | | |
Total investment income | | | 130,677 | | | | 6,073 | | | | 728 | |
| | | | | | | | | | | | |
| | | |
EXPENSES: | | | | | | | | | | | | |
Investment advisory fees | | | 16,378 | | | | 947 | | | | 81 | |
Administration fees | | | 3,378 | | | | 195 | | | | 27 | |
Distribution fees: | | | | | | | | | | | | |
Class A | | | 3,163 | | | | 530 | | | | 36 | |
Class B | | | 14 | | | | 9 | | | | — | |
Class C | | | 3,285 | | | | 63 | | | | 2 | |
Class R2 | | | 88 | | | | — | | | | — | |
Shareholder servicing fees: | | | | | | | | | | | | |
Class A | | | 3,163 | | | | 530 | | | | 36 | |
Class B | | | 5 | | | | 3 | | | | — | |
Class C | | | 1,095 | | | | 21 | | | | — | (a) |
Class R2 | | | 44 | | | | — | | | | — | |
Class R5 | | | 86 | | | | — | | | | — | (a) |
Select Class | | | 4,743 | | | | 38 | | | | 44 | |
Custodian and accounting fees | | | 119 | | | | 16 | | | | 18 | |
Professional fees | | | 65 | | | | 25 | | | | 45 | |
Trustees’ and Chief Compliance Officer’s fees | | | 40 | | | | 3 | | | | 1 | |
Printing and mailing costs | | | 225 | | | | 25 | | | | 2 | |
Registration and filing fees | | | 143 | | | | 32 | | | | 43 | |
Transfer agent fees | | | 2,170 | | | | 231 | | | | 5 | |
Offering costs | | | — | | | | — | | | | 48 | |
Other | | | 38 | | | | 20 | | | | 3 | |
| | | | | | | | | | | | |
Total expenses | | | 38,242 | | | | 2,688 | | | | 391 | |
| | | | | | | | | | | | |
Less fees waived | | | (642 | ) | | | (6 | ) | | | (103 | ) |
Less expense reimbursements | | | (8 | ) | | | — | | | | (58 | ) |
| | | | | | | | | | | | |
Net expenses | | | 37,592 | | | | 2,682 | | | | 230 | |
| | | | | | | | | | | | |
Net investment income (loss) | | | 93,085 | | | | 3,391 | | | | 498 | |
| | | | | | | | | | | | |
| | | |
REALIZED/UNREALIZED GAINS (LOSSES): | | | | | | | | | | | | |
Net realized gain (loss) on transactions from: | | | | | | | | | | | | |
Investments in non-affiliates | | | 87,660 | | | | 20,162 | | | | (2,932 | ) |
Futures | | | — | | | | — | | | | 550 | |
Options written | | | — | | | | — | | | | 121 | |
| | | | | | | | | | | | |
Net realized gain (loss) | | | 87,660 | | | | 20,162 | | | | (2,261 | ) |
| | | | | | | | | | | | |
Change in net unrealized appreciation/depreciation of: | | | | | | | | | | | | |
Investments in non-affiliates | | | 338,075 | | | | 4,602 | | | | 7,448 | |
Futures | | | — | | | | — | | | | 28 | |
Options Written | | | — | | | | — | | | | 30 | |
| | | | | | | | | | | | |
Change in net unrealized appreciation/depreciation | | | 338,075 | | | | 4,602 | | | | 7,506 | |
| | | | | | | | | | | | |
Net realized/unrealized gains (losses) | | | 425,735 | | | | 24,764 | | | | 5,245 | |
| | | | | | | | | | | | |
Change in net assets resulting from operations | | $ | 518,820 | | | $ | 28,155 | | | $ | 5,743 | |
| | | | | | | | | | | | |
| (a) | Amount rounds to less than $1,000. |
SEE NOTES TO FINANCIAL STATEMENTS.
| | | | | | | | |
| | | |
| DECEMBER 31, 2014 | | J.P. MORGAN LARGE CAP FUNDS | | | | | 57 | |
STATEMENTS OF OPERATIONS
FOR THE SIX MONTHS ENDED DECEMBER 31, 2014 (Unaudited) (continued)
(Amounts in thousands)
| | | | | | | | | | | | |
| | | Large Cap
Growth Fund | | | Large Cap
Value Fund | | | U.S.
Equity Fund | |
INVESTMENT INCOME: | | | | | | | | | | | | |
Dividend income from non-affiliates | | $ | 51,092 | | | $ | 8,999 | | | $ | 124,963 | |
Dividend income from affiliates | | | 51 | | | | 2 | | | | 17 | |
| | | | | | | | | | | | |
Total investment income | | | 51,143 | | | | 9,001 | | | | 124,980 | |
| | | | | | | | | | | | |
| | | |
EXPENSES: | | | | | | | | | | | | |
Investment advisory fees | | | 38,006 | | | | 1,683 | | | | 22,813 | |
Administration fees | | | 6,271 | | | | 347 | | | | 4,705 | |
Distribution fees: | | | | | | | | | | | | |
Class A | | | 6,069 | | | | 116 | | | | 1,519 | |
Class B | | | 26 | | | | 6 | | | | 16 | |
Class C | | | 2,025 | | | | 47 | | | | 712 | |
Class R2 | | | 558 | | | | 1 | | | | 349 | |
Shareholder servicing fees: | | | | | | | | | | | | |
Class A | | | 6,069 | | | | 116 | | | | 1,519 | |
Class B | | | 9 | | | | 2 | | | | 5 | |
Class C | | | 675 | | | | 15 | | | | 238 | |
Class R2 | | | 279 | | | | 1 | | | | 174 | |
Class R5 | | | 351 | | | | 1 | | | | 116 | |
Institutional Class | | | — | | | | — | | | | 2,228 | |
Select Class | | | 6,716 | | | | 857 | | | | 3,021 | |
Custodian and accounting fees | | | 259 | | | | 23 | | | | 218 | |
Interest expense to affiliates | | | — | | | | — | (a) | | | — | |
Professional fees | | | 114 | | | | 29 | | | | 72 | |
Trustees’ and Chief Compliance Officer’s fees | | | 67 | | | | — | (a) | | | 51 | |
Printing and mailing costs | | | 537 | | | | 17 | | | | 342 | |
Registration and filing fees | | | 152 | | | | 42 | | | | 145 | |
Transfer agent fees | | | 6,223 | | | | 75 | | | | 2,595 | |
Other | | | 107 | | | | 15 | | | | 484 | |
| | | | | | | | | | | | |
Total expenses | | | 74,513 | | | | 3,393 | | | | 41,322 | |
| | | | | | | | | | | | |
Less fees waived | | | (3,754 | ) | | | (73 | ) | | | (1,956 | ) |
| | | | | | | | | | | | |
Net expenses | | | 70,759 | | | | 3,320 | | | | 39,366 | |
| | | | | | | | | | | | |
Net investment income (loss) | | | (19,616 | ) | | | 5,681 | | | | 85,614 | |
| | | | | | | | | | | | |
| | | |
REALIZED/UNREALIZED GAINS (LOSSES): | | | | | | | | | | | | |
Net realized gain (loss) on transactions from: | | | | | | | | | | | | |
Investments in non-affiliates | | | 422,178 | | | | 59,920 | | | | 520,621 | |
Futures | | | — | | | | — | | | | 11,963 | |
| | | | | | | | | | | | |
Net realized gain (loss) | | | 422,178 | | | | 59,920 | | | | 532,584 | |
| | | | | | | | | | | | |
Change in net unrealized appreciation/depreciation of: | | | | | | | | | | | | |
Investments in non-affiliates | | | 804,442 | | | | (11,747 | ) | | | 141,244 | |
Futures | | | — | | | | — | | | | (1,654 | ) |
| | | | | | | | | | | | |
Change in net unrealized appreciation/depreciation | | | 804,442 | | | | (11,747 | ) | | | 139,590 | |
| | | | | | | | | | | | |
Net realized/unrealized gains (losses) | | | 1,226,620 | | | | 48,173 | | | | 672,174 | |
| | | | | | | | | | | | |
Change in net assets resulting from operations | | $ | 1,207,004 | | | $ | 53,854 | | | $ | 757,788 | |
| | | | | | | | | | | | |
| (a) | Amount rounds to less than $1,000. |
SEE NOTES TO FINANCIAL STATEMENTS.
| | | | | | |
| | | |
| 58 | | | | J.P. MORGAN LARGE CAP FUNDS | | DECEMBER 31, 2014 |
STATEMENTS OF CHANGES IN NET ASSETS
FOR THE PERIODS INDICATED
(Amounts in thousands)
| | | | | | | | | | | | | | | | |
| | | Disciplined Equity Fund | | | Dynamic Growth Fund | |
| | | Six Months Ended
December 31, 2014
(Unaudited) | | | Year Ended
June 30, 2014 | | | Six Months Ended
December 31, 2014
(Unaudited) | | | Year Ended
June 30, 2014 | |
CHANGE IN NET ASSETS RESULTING FROM OPERATIONS: | | | | | | | | | | | | | | | | |
Net investment income (loss) | | $ | 32,861 | | | $ | 46,521 | | | $ | (693 | ) | | $ | (708 | ) |
Net realized gain (loss) | | | 320,882 | | | | 240,349 | | | | (2,580 | ) | | | 7,600 | |
Change in net unrealized appreciation/depreciation | | | (22,301 | ) | | | 433,169 | | | | 10,932 | | | | 30,946 | |
| | �� | | | | | | | | | | | | | | |
Change in net assets resulting from operations | | | 331,442 | | | | 720,039 | | | | 7,659 | | | | 37,838 | |
| | | | | | | | | | | | | | | | |
| | | | |
DISTRIBUTIONS TO SHAREHOLDERS: | | | | | | | | | | | | | | | | |
Class A | | | | | | | | | | | | | | | | |
From net investment income | | | (1,323 | ) | | | (1,624 | ) | | | — | | | | — | |
From net realized gains | | | (19,848 | ) | | | (9,242 | ) | | | (413 | ) | | | — | |
Class C | | | | | | | | | | | | | | | | |
From net realized gains | | | — | | | | — | | | | (111 | ) | | | — | |
Class R5 | | | | | | | | | | | | | | | | |
From net realized gains | | | — | | | | — | | | | (1 | ) | | | — | |
Class R6 | | | | | | | | | | | | | | | | |
From net investment income | | | (27,090 | ) | | | (39,209 | ) | | | — | | | | — | |
From net realized gains | | | (266,822 | ) | | | (139,746 | ) | | | — | | | | — | |
Institutional Class | | | | | | | | | | | | | | | | |
From net investment income | | | (3,037 | ) | | | (4,083 | ) | | | — | | | | — | |
From net realized gains | | | (32,068 | ) | | | (16,849 | ) | | | — | | | | — | |
Select Class | | | | | | | | | | | | | | | | |
From net investment income | | | (1,353 | ) | | | (775 | ) | | | — | | | | — | |
From net realized gains | | | (15,846 | ) | | | (3,550 | ) | | | (4,260 | ) | | | — | |
| | | | | | | | | | | | | | | | |
Total distributions to shareholders | | | (367,387 | ) | | | (215,078 | ) | | | (4,785 | ) | | | — | |
| | | | | | | | | | | | | | | | |
| | | | |
CAPITAL TRANSACTIONS: | | | | | | | | | | | | | | | | |
Change in net assets resulting from capital transactions | | | 1,209,692 | | | | 1,946,173 | | | | 42,817 | | | | 142,647 | |
| | | | | | | | | | | | | | | | |
| | | | |
NET ASSETS: | | | | | | | | | | | | | | | | |
Change in net assets | | | 1,173,747 | | | | 2,451,134 | | | | 45,691 | | | | 180,485 | |
Beginning of period | | | 4,277,986 | | | | 1,826,852 | | | | 282,765 | | | | 102,280 | |
| | | | | | | | | | | | | | | | |
End of period | | $ | 5,451,733 | | | $ | 4,277,986 | | | $ | 328,456 | | | $ | 282,765 | |
| | | | | | | | | | | | | | | | |
Accumulated undistributed (distributions in excess of) net investment income | | $ | 889 | | | $ | 831 | | | $ | (1,122 | ) | | $ | (429 | ) |
| | | | | | | | | | | | | | | | |
SEE NOTES TO FINANCIAL STATEMENTS.
| | | | | | | | |
| | | |
| DECEMBER 31, 2014 | | J.P. MORGAN LARGE CAP FUNDS | | | | | 59 | |
STATEMENTS OF CHANGES IN NET ASSETS
FOR THE PERIODS INDICATED (continued)
(Amounts in thousands)
| | | | | | | | | | | | | | | | |
| | | Equity Focus Fund | | | Equity Income Fund | |
| | | Six Months Ended
December 31, 2014
(Unaudited) | | | Year Ended
June 30, 2014 | | | Six Months Ended
December 31, 2014
(Unaudited) | | | Year Ended
June 30, 2014 | |
CHANGE IN NET ASSETS RESULTING FROM OPERATIONS: | | | | | | | | | | | | | | | | |
Net investment income (loss) | | $ | 18 | | | $ | 62 | | | $ | 93,085 | | | $ | 108,236 | |
Net realized gain (loss) | | | 190 | | | | (77 | ) | | | 87,660 | | | | 125,411 | |
Distributions of capital gains received from investment company affiliates | | | — | | | | — | | | | — | | | | 1 | |
Change in net unrealized appreciation/depreciation | | | 2,611 | | | | 4,489 | | | | 338,075 | | | | 934,953 | |
| | | | | | | | | | | | | | | | |
Change in net assets resulting from operations | | | 2,819 | | | | 4,474 | | | | 518,820 | | | | 1,168,601 | |
| | | | | | | | | | | | | | | | |
| | | | |
DISTRIBUTIONS TO SHAREHOLDERS: | | | | | | | | | | | | | | | | |
Class A | | | | | | | | | | | | | | | | |
From net investment income | | | (1 | ) | | | — | | | | (27,438 | ) | | | (31,236 | ) |
From net realized gains | | | (5 | ) | | | (5 | ) | | | (53,724 | ) | | | (30,026 | ) |
Class B | | | | | | | | | | | | | | | | |
From net investment income | | | — | | | | — | | | | (28 | ) | | | (50 | ) |
From net realized gains | | | — | | | | — | | | | (67 | ) | | | (74 | ) |
Class C | | | | | | | | | | | | | | | | |
From net investment income | | | — | | | | — | | | | (7,777 | ) | | | (7,992 | ) |
From net realized gains | | | (4 | ) | | | (2 | ) | | | (18,697 | ) | | | (10,640 | ) |
Class R2 | | | | | | | | | | | | | | | | |
From net investment income | | | — | | | | — | | | | (365 | ) | | | (317 | ) |
From net realized gains | | | — | | | | — | | | | (817 | ) | | | (336 | ) |
Class R5 | | | | | | | | | | | | | | | | |
From net investment income | | | — | | | | — | | | | (4,485 | ) | | | (5,124 | ) |
From net realized gains | | | — | | | | — | | | | (7,581 | ) | | | (3,803 | ) |
Class R6 | | | | | | | | | | | | | | | | |
From net investment income | | | — | | | | — | | | | (8,002 | ) | | | (9,298 | ) |
From net realized gains | | | — | | | | — | | | | (13,082 | ) | | | (7,928 | ) |
Select Class | | | | | | | | | | | | | | | | |
From net investment income | | | (112 | ) | | | — | (a) | | | (44,891 | ) | | | (54,801 | ) |
From net realized gains | | | (492 | ) | | | (259 | ) | | | (77,081 | ) | | | (46,326 | ) |
| | | | | | | | | | | | | | | | |
Total distributions to shareholders | | | (614 | ) | | | (266 | ) | | | (264,035 | ) | | | (207,951 | ) |
| | | | | | | | | | | | | | | | |
| | | | |
CAPITAL TRANSACTIONS: | | | | | | | | | | | | | | | | |
Change in net assets resulting from capital transactions | | | 4,039 | | | | 64,555 | | | | 1,283,801 | | | | 2,056,118 | |
| | | | | | | | | | | | | | | | |
| | | | |
NET ASSETS: | | | | | | | | | | | | | | | | |
Change in net assets | | | 6,244 | | | | 68,763 | | | | 1,538,586 | | | | 3,016,768 | |
Beginning of period | | | 72,620 | | | | 3,857 | | | | 7,525,529 | | | | 4,508,761 | |
| | | | | | | | | | | | | | | | |
End of period | | $ | 78,864 | | | $ | 72,620 | | | $ | 9,064,115 | | | $ | 7,525,529 | |
| | | | | | | | | | | | | | | | |
Accumulated undistributed (distributions in excess of) net investment income | | $ | (33 | ) | | $ | 62 | | | $ | 1,638 | | | $ | 1,539 | |
| | | | | | | | | | | | | | | | |
| (a) | Amount rounds to less than $1,000. |
SEE NOTES TO FINANCIAL STATEMENTS.
| | | | | | |
| | | |
| 60 | | | | J.P. MORGAN LARGE CAP FUNDS | | DECEMBER 31, 2014 |
| | | | | | | | | | | | | | | | |
| | | Growth and Income Fund | | | Hedged Equity Fund | |
| | | Six Months Ended
December 31, 2014
(Unaudited) | | | Year Ended
June 30, 2014 | | | Six Months Ended
December 31, 2014
(Unaudited) | | | Period Ended
June 30, 2014 (a) | |
CHANGE IN NET ASSETS RESULTING FROM OPERATIONS: | | | | | | | | | | | | | | | | |
Net investment income (loss) | | $ | 3,391 | | | $ | 4,949 | | | $ | 498 | | | $ | 24 | |
Net realized gain (loss) | | | 20,162 | | | | 51,392 | | | | (2,261 | ) | | | (122 | ) |
Distributions of capital gains received from investment company affiliates | | | — | | | | — | (b) | | | — | | | | — | |
Change in net unrealized appreciation/depreciation | | | 4,602 | | | | 34,471 | | | | 7,506 | | | | 299 | |
| | | | | | | | | | | | | | | | |
Change in net assets resulting from operations | | | 28,155 | | | | 90,812 | | | | 5,743 | | | | 201 | |
| | | | | | | | | | | | | | | | |
| | | | |
DISTRIBUTIONS TO SHAREHOLDERS: | | | | | | | | | | | | | | | | |
Class A | | | | | | | | | | | | | | | | |
From net investment income | | | (2,873 | ) | | | (4,431 | ) | | | (229 | ) | | | (4 | ) |
From net realized gains | | | (9,151 | ) | | | — | | | | — | | | | — | |
Return of capital | | | — | | | | — | | | | — | | | | (1 | ) |
Class B | | | | | | | | | | | | | | | | |
From net investment income | | | (11 | ) | | | (18 | ) | | | — | | | | — | |
From net realized gains | | | (53 | ) | | | — | | | | — | | | | — | |
Class C | | | | | | | | | | | | | | | | |
From net investment income | | | (100 | ) | | | (99 | ) | | | (2 | ) | | | — | (b) |
From net realized gains | | | (427 | ) | | | — | | | | — | | | | — | |
Return of capital | | | — | | | | — | | | | — | | | | — | (b) |
Class R5 | | | | | | | | | | | | | | | | |
From net investment income | | | — | | | | — | | | | (2 | ) | | | — | (b) |
Return of capital | | | — | | | | — | | | | — | | | | — | (b) |
Class R6 | | | | | | | | | | | | | | | | |
From net investment income | | | — | | | | — | | | | (2 | ) | | | — | (b) |
Return of capital | | | — | | | | — | | | | — | | | | (1 | ) |
Select Class | | | | | | | | | | | | | | | | |
From net investment income | | | (234 | ) | | | (332 | ) | | | (270 | ) | | | (23 | ) |
From net realized gains | | | (660 | ) | | | — | | | | — | | | | — | |
Return of capital | | | — | | | | — | | | | — | | | | (20 | ) |
| | | | | | | | | | | | | | | | |
Total distributions to shareholders | | | (13,509 | ) | | | (4,880 | ) | | | (505 | ) | | | (49 | ) |
| | | | | | | | | | | | | | | | |
| | | | |
CAPITAL TRANSACTIONS: | | | | | | | | | | | | | | | | |
Change in net assets resulting from capital transactions | | | 12,731 | | | | (17,280 | ) | | | 127,514 | | | | 4,883 | |
| | | | | | | | | | | | | | | | |
| | | | |
NET ASSETS: | | | | | | | | | | | | | | | | |
Change in net assets | | | 27,377 | | | | 68,652 | | | | 132,752 | | | | 5,035 | |
Beginning of period | | | 463,868 | | | | 395,216 | | | | 5,035 | | | | — | |
| | | | | | | | | | | | | | | | |
End of period | | $ | 491,245 | | | $ | 463,868 | | | $ | 137,787 | | | $ | 5,035 | |
| | | | | | | | | | | | | | | | |
Accumulated undistributed (distributions in excess of) net investment income | | $ | 156 | | | $ | (17 | ) | | $ | (10 | ) | | $ | (3 | ) |
| | | | | | | | | | | | | | | | |
| (a) | Commencement of operations was December 13, 2013. |
| (b) | Amount rounds to less than $1,000. |
SEE NOTES TO FINANCIAL STATEMENTS.
| | | | | | | | |
| | | |
| DECEMBER 31, 2014 | | J.P. MORGAN LARGE CAP FUNDS | | | | | 61 | |
STATEMENTS OF CHANGES IN NET ASSETS
FOR THE PERIODS INDICATED (continued)
(Amounts in thousands)
| | | | | | | | | | | | | | | | |
| | | Large Cap Growth Fund | | | Large Cap Value Fund | |
| | | Six Months Ended
December 31, 2014
(Unaudited) | | | Year Ended
June 30, 2014 | | | Six Months Ended
December 31, 2014
(Unaudited) | | | Year Ended
June 30, 2014 | |
CHANGE IN NET ASSETS RESULTING FROM OPERATIONS: | | | | | | | | | | | | | | | | |
Net investment income (loss) | | $ | (19,616 | ) | | $ | (28,833 | ) | | $ | 5,681 | | | $ | 9,568 | |
Net realized gain (loss) | | | 422,178 | | | | 572,824 | | | | 59,920 | | | | 123,935 | |
Distributions of capital gains received from investment company affiliates | | | — | | | | 1 | | | | — | | | | 4 | |
Change in net unrealized appreciation/depreciation | | | 804,442 | | | | 2,563,782 | | | | (11,747 | ) | | | 35,976 | |
| | | | | | | | | | | | | | | | |
Change in net assets resulting from operations | | | 1,207,004 | | | | 3,107,774 | | | | 53,854 | | | | 169,483 | |
| | | | | | | | | | | | | | | | |
| | | | |
DISTRIBUTIONS TO SHAREHOLDERS: | | | | | | | | | | | | | | | | |
Class A | | | | | | | | | | | | | | | | |
From net investment income | | | — | | | | — | | | | (520 | ) | | | (861 | ) |
From net realized gains | | | (85,875 | ) | | | — | | | | (13,856 | ) | | | (1,655 | ) |
Class B | | | | | | | | | | | | | | | | |
From net investment income | | | — | | | | — | | | | (5 | ) | | | (12 | ) |
From net realized gains | | | (133 | ) | | | — | | | | (230 | ) | | | (50 | ) |
Class C | | | | | | | | | | | | | | | | |
From net investment income | | | — | | | | — | | | | (47 | ) | | | (68 | ) |
From net realized gains | | | (11,256 | ) | | | — | | | | (2,003 | ) | | | (233 | ) |
Class R2 | | | | | | | | | | | | | | | | |
From net investment income | | | — | | | | — | | | | (3 | ) | | | (3 | ) |
From net realized gains | | | (3,964 | ) | | | — | | | | (87 | ) | | | (14 | ) |
Class R5 | | | | | | | | | | | | | | | | |
From net investment income | | | — | | | | — | | | | (30 | ) | | | (116 | ) |
From net realized gains | | | (24,104 | ) | | | — | | | | (646 | ) | | | (599 | ) |
Class R6 | | | | | | | | | | | | | | | | |
From net investment income | | | — | | | | — | | | | (319 | ) | | | (724 | ) |
From net realized gains | | | (50,817 | ) | | | — | | | | (6,003 | ) | | | (1,655 | ) |
Select Class | | | | | | | | | | | | | | | | |
From net investment income | | | — | | | | — | | | | (4,384 | ) | | | (8,031 | ) |
From net realized gains | | | (97,149 | ) | | | — | | | | (102,872 | ) | | | (21,436 | ) |
| | | | | | | | | | | | | | | | |
Total distributions to shareholders | | | (273,298 | ) | | | — | | | | (131,005 | ) | | | (35,457 | ) |
| | | | | | | | | | | | | | | | |
| | | | |
CAPITAL TRANSACTIONS: | | | | | | | | | | | | | | | | |
Change in net assets resulting from capital transactions | | | (539,159 | ) | | | 275,053 | | | | 71,700 | | | | (6,000 | ) |
| | | | | | | | | | | | | | | | |
| | | | |
NET ASSETS: | | | | | | | | | | | | | | | | |
Change in net assets | | | 394,547 | | | | 3,382,827 | | | | (5,451 | ) | | | 128,026 | |
Beginning of period | | | 14,945,732 | | | | 11,562,905 | | | | 824,447 | | | | 696,421 | |
| | | | | | | | | | | | | | | | |
End of period | | $ | 15,340,279 | | | $ | 14,945,732 | | | $ | 818,996 | | | $ | 824,447 | |
| | | | | | | | | | | | | | | | |
Accumulated undistributed (distributions in excess of) net investment income | | $ | (36,753 | ) | | $ | (17,137 | ) | | $ | 317 | | | $ | (56 | ) |
| | | | | | | | | | | | | | | | |
SEE NOTES TO FINANCIAL STATEMENTS.
| | | | | | |
| | | |
| 62 | | | | J.P. MORGAN LARGE CAP FUNDS | | DECEMBER 31, 2014 |
| | | | | | | | |
| | | U.S. Equity Fund | |
| | | Six Months Ended
December 31, 2014
(Unaudited) | | | Year Ended
June 30, 2014 | |
CHANGE IN NET ASSETS RESULTING FROM OPERATIONS: | | | | | | | | |
Net investment income (loss) | | $ | 85,614 | | | $ | 96,944 | |
Net realized gain (loss) | | | 532,584 | | | | 736,827 | |
Distributions of capital gains received from investment company affiliates | | | — | | | | 2 | |
Change in net unrealized appreciation/depreciation | | | 139,590 | | | | 1,332,466 | |
| | | | | | | | |
Change in net assets resulting from operations | | | 757,788 | | | | 2,166,239 | |
| | | | | | | | |
| | |
DISTRIBUTIONS TO SHAREHOLDERS: | | | | | | | | |
Class A | | | | | | | | |
From net investment income | | | (7,245 | ) | | | (8,068 | ) |
From net realized gains | | | (101,441 | ) | | | (67,000 | ) |
Class B | | | | | | | | |
From net investment income | | | (15 | ) | | | (13 | ) |
From net realized gains | | | (335 | ) | | | (307 | ) |
Class C | | | | | | | | |
From net investment income | | | (802 | ) | | | (512 | ) |
From net realized gains | | | (16,831 | ) | | | (9,496 | ) |
Class R2 | | | | | | | | |
From net investment income | | | (718 | ) | | | (595 | ) |
From net realized gains | | | (12,128 | ) | | | (6,636 | ) |
Class R5 | | | | | | | | |
From net investment income | | | (3,524 | ) | | | (4,728 | ) |
From net realized gains | | | (39,025 | ) | | | (27,833 | ) |
Class R6 | | | | | | | | |
From net investment income | | | (19,621 | ) | | | (23,536 | ) |
From net realized gains | | | (207,916 | ) | | | (124,852 | ) |
Institutional Class | | | | | | | | |
From net investment income | | | (32,792 | ) | | | (34,846 | ) |
From net realized gains | | | (373,132 | ) | | | (245,150 | ) |
Select Class | | | | | | | | |
From net investment income | | | (17,835 | ) | | | (24,079 | ) |
From net realized gains | | | (194,871 | ) | | | (143,301 | ) |
| | | | | | | | |
Total distributions to shareholders | | | (1,028,231 | ) | | | (720,952 | ) |
| | | | | | | | |
| | |
CAPITAL TRANSACTIONS: | | | | | | | | |
Change in net assets resulting from capital transactions | | | 2,013,496 | | | | 1,347,074 | |
| | | | | | | | |
| | |
NET ASSETS: | | | | | | | | |
Change in net assets | | | 1,743,053 | | | | 2,792,361 | |
Beginning of period | | | 10,779,644 | | | | 7,987,283 | |
| | | | | | | | |
End of period | | $ | 12,522,697 | | | $ | 10,779,644 | |
| | | | | | | | |
Accumulated undistributed (distributions in excess of) net investment income | | $ | 3,634 | | | $ | 572 | |
| | | | | | | | |
SEE NOTES TO FINANCIAL STATEMENTS.
| | | | | | | | |
| | | |
| DECEMBER 31, 2014 | | J.P. MORGAN LARGE CAP FUNDS | | | | | 63 | |
STATEMENTS OF CHANGES IN NET ASSETS
FOR THE PERIODS INDICATED (continued)
(Amounts in thousands)
| | | | | | | | | | | | | | | | |
| | | Disciplined Equity Fund | | | Dynamic Growth Fund | |
| | | Six Months Ended
December 31, 2014
(Unaudited) | | | Year Ended
June 30, 2014 | | | Six Months Ended
December 31, 2014
(Unaudited) | | | Year Ended
June 30, 2014 | |
CAPITAL TRANSACTIONS: | | | | | | | | | | | | | | | | |
Class A | | | | | | | | | | | | | | | | |
Proceeds from shares issued | | $ | 135,497 | | | $ | 110,205 | | | $ | 13,806 | | | $ | 18,137 | |
Distributions reinvested | | | 21,134 | | | | 10,845 | | | | 402 | | | | — | |
Cost of shares redeemed | | | (38,787 | ) | | | (42,738 | ) | | | (3,699 | ) | | | (1,412 | ) |
| | | | | | | | | | | | | | | | |
Change in net assets resulting from Class A capital transactions | | $ | 117,844 | | | $ | 78,312 | | | $ | 10,509 | | | $ | 16,725 | |
| | | | | | | | | | | | | | | | |
Class C | | | | | | | | | | | | | | | | |
Proceeds from shares issued | | $ | — | | | $ | — | | | $ | 3,345 | | | $ | 4,982 | |
Distributions reinvested | | | — | | | | — | | | | 84 | | | | — | |
Cost of shares redeemed | | | — | | | | — | | | | (383 | ) | | | (705 | ) |
| | | | | | | | | | | | | | | | |
Change in net assets resulting from Class C capital transactions | | $ | — | | | $ | — | | | $ | 3,046 | | | $ | 4,277 | |
| | | | | | | | | | | | | | | | |
Class R5 | | | | | | | | | | | | | | | | |
Proceeds from shares issued | | $ | — | | | $ | — | | | $ | — | | | $ | 4 | |
Distributions reinvested | | | — | | | | — | | | | 1 | | | | — | |
Cost of shares redeemed | | | — | | | | — | | | | — | | | | — | (a) |
| | | | | | | | | | | | | | | | |
Change in net assets resulting from Class R5 capital transactions | | $ | — | | | $ | — | | | $ | 1 | | | $ | 4 | |
| | | | | | | | | | | | | | | | |
Class R6 | | | | | | | | | | | | | | | | |
Proceeds from shares issued | | $ | 507,005 | | | $ | 1,799,308 | | | $ | — | | | $ | — | |
Distributions reinvested | | | 293,912 | | | | 178,948 | | | | — | | | | — | |
Cost of shares redeemed | | | (50,565 | ) | | | (264,127 | ) | | | — | | | | — | |
| | | | | | | | | | | | | | | | |
Change in net assets resulting from Class R6 capital transactions | | $ | 750,352 | | | $ | 1,714,129 | | | $ | — | | | $ | — | |
| | | | | | | | | | | | | | | | |
Institutional Class | | | | | | | | | | | | | | | | |
Proceeds from shares issued | | $ | 207,404 | | | $ | 148,282 | | | $ | — | | | $ | — | |
Distributions reinvested | | | 32,075 | | | | 18,575 | | | | — | | | | — | |
Cost of shares redeemed | | | (72,528 | ) | | | (45,570 | ) | | | — | | | | — | |
| | | | | | | | | | | | | | | | |
Change in net assets resulting from Institutional Class capital transactions | | $ | 166,951 | | | $ | 121,287 | | | $ | — | | | $ | — | |
| | | | | | | | | | | | | | | | |
Select Class | | | | | | | | | | | | | | | | |
Proceeds from shares issued | | $ | 195,288 | | | $ | 43,804 | | | $ | 40,380 | | | $ | 133,469 | |
Distributions reinvested | | | 6,618 | | | | 3,427 | | | | 3,771 | | | | — | |
Cost of shares redeemed | | | (27,361 | ) | | | (14,786 | ) | | | (14,890 | ) | | | (11,828 | ) |
| | | | | | | | | | | | | | | | |
Change in net assets resulting from Select Class capital transactions | | $ | 174,545 | | | $ | 32,445 | | | $ | 29,261 | | | $ | 121,641 | |
| | | | | | | | | | | | | | | | |
Total change in net assets resulting from capital transactions | | $ | 1,209,692 | | | $ | 1,946,173 | | | $ | 42,817 | | | $ | 142,647 | |
| | | | | | | | | | | | | | | | |
| (a) | Amount rounds to less than $1,000. |
SEE NOTES TO FINANCIAL STATEMENTS.
| | | | | | |
| | | |
| 64 | | | | J.P. MORGAN LARGE CAP FUNDS | | DECEMBER 31, 2014 |
| | | | | | | | | | | | | | | | |
| | | Disciplined Equity Fund | | | Dynamic Growth Fund | |
| | | Six Months Ended
December 31, 2014
(Unaudited) | | | Year Ended
June 30, 2014 | | | Six Months Ended
December 31, 2014
(Unaudited) | | | Year Ended
June 30, 2014 | |
SHARE TRANSACTIONS: | | | | | | | | | | | | | | | | |
Class A | | | | | | | | | | | | | | | | |
Issued | | | 5,622 | | | | 5,011 | | | | 573 | | | | 763 | |
Reinvested | | | 922 | | | | 507 | | | | 17 | | | | — | |
Redeemed | | | (1,611 | ) | | | (1,927 | ) | | | (154 | ) | | | (60 | ) |
| | | | | | | | | | | | | | | | |
Change in Class A Shares | | | 4,933 | | | | 3,591 | | | | 436 | | | | 703 | |
| | | | | | | | | | | | | | | | |
Class C | | | | | | | | | | | | | | | | |
Issued | | | — | | | | — | | | | 143 | | | | 214 | |
Reinvested | | | — | | | | — | | | | 4 | | | | — | |
Redeemed | | | — | | | | — | | | | (16 | ) | | | (31 | ) |
| | | | | | | | | | | | | | | | |
Change in Class C Shares | | | — | | | | — | | | | 131 | | | | 183 | |
| | | | | | | | | | | | | | | | |
Class R5 | | | | | | | | | | | | | | | | |
Issued | | | — | | | | — | | | | — | | | | — | (a) |
Reinvested | | | — | | | | — | | | | — | (a) | | | — | |
Redeemed | | | — | | | | — | | | | — | | | | — | (a) |
| | | | | | | | | | | | | | | | |
Change in Class R5 Shares | | | — | | | | — | | | | — | (a) | | | — | (a) |
| | | | | | | | | | | | | | | | |
Class R6 | | | | | | | | | | | | | | | | |
Issued | | | 20,996 | | | | 82,159 | | | | — | | | | — | |
Reinvested | | | 12,718 | | | | 8,286 | | | | — | | | | — | |
Redeemed | | | (2,106 | ) | | | (11,337 | ) | | | — | | | | — | |
| | | | | | | | | | | | | | | | |
Change in Class R6 Shares | | | 31,608 | | | | 79,108 | | | | — | | | | — | |
| | | | | | | | | | | | | | | | |
Institutional Class | | | | | | | | | | | | | | | | |
Issued | | | 8,615 | | | | 6,620 | | | | — | | | | — | |
Reinvested | | | 1,388 | | | | 862 | | | | — | | | | — | |
Redeemed | | | (2,978 | ) | | | (2,038 | ) | | | — | | | | — | |
| | | | | | | | | | | | | | | | |
Change in Institutional Class Shares | | | 7,025 | | | | 5,444 | | | | — | | | | — | |
| | | | | | | | | | | | | | | | |
Select Class | | | | | | | | | | | | | | | | |
Issued | | | 8,122 | | | | 1,997 | | | | 1,673 | | | | 5,952 | |
Reinvested | | | 286 | | | | 159 | | | | 156 | | | | — | |
Redeemed | | | (1,132 | ) | | | (673 | ) | | | (600 | ) | | | (526 | ) |
| | | | | | | | | | | | | | | | |
Change in Select Class Shares | | | 7,276 | | | | 1,483 | | | | 1,229 | | | | 5,426 | |
| | | | | | | | | | | | | | | | |
| (a) | Amount rounds to less than 1,000 shares. |
SEE NOTES TO FINANCIAL STATEMENTS.
| | | | | | | | |
| | | |
| DECEMBER 31, 2014 | | J.P. MORGAN LARGE CAP FUNDS | | | | | 65 | |
STATEMENTS OF CHANGES IN NET ASSETS
FOR THE PERIODS INDICATED (continued)
(Amounts in thousands)
| | | | | | | | | | | | | | | | |
| | | Equity Focus Fund | | | Equity Income Fund | |
| | | Six Months Ended
December 31, 2014
(Unaudited) | | | Year Ended
June 30, 2014 | | | Six Months Ended
December 31, 2014
(Unaudited) | | | Year Ended
June 30, 2014 | |
CAPITAL TRANSACTIONS: | | | | | | | | | | | | | | | | |
Class A | | | | | | | | | | | | | | | | |
Proceeds from shares issued | | $ | 602 | | | $ | 490 | | | $ | 722,856 | | | $ | 1,182,529 | |
Distributions reinvested | | | 6 | | | | 5 | | | | 78,069 | | | | 59,065 | |
Cost of shares redeemed | | | (50 | ) | | | (167 | ) | | | (477,818 | ) | | | (454,907 | ) |
| | | | | | | | | | | | | | | | |
Change in net assets resulting from Class A capital transactions | | $ | 558 | | | $ | 328 | | | $ | 323,107 | | | $ | 786,687 | |
| | | | | | | | | | | | | | | | |
Class B | | | | | | | | | | | | | | | | |
Proceeds from shares issued | | $ | — | | | $ | — | | | $ | 161 | | | $ | 1,047 | |
Distributions reinvested | | | — | | | | — | | | | 89 | | | | 112 | |
Cost of shares redeemed | | | — | | | | — | | | | (892 | ) | | | (1,961 | ) |
| | | | | | | | | | | | | | | | |
Change in net assets resulting from Class B capital transactions | | $ | — | | | $ | — | | | $ | (642 | ) | | $ | (802 | ) |
| | | | | | | | | | | | | | | | |
Class C | | | | | | | | | | | | | | | | |
Proceeds from shares issued | | $ | 485 | | | $ | 62 | | | $ | 195,921 | | | $ | 374,473 | |
Distributions reinvested | | | 4 | | | | 2 | | | | 21,952 | | | | 15,425 | |
Cost of shares redeemed | | | (28 | ) | | | (12 | ) | | | (63,683 | ) | | | (89,920 | ) |
| | | | | | | | | | | | | | | | |
Change in net assets resulting from Class C capital transactions | | $ | 461 | | | $ | 52 | | | $ | 154,190 | | | $ | 299,978 | |
| | | | | | | | | | | | | | | | |
Class R2 | | | | | | | | | | | | | | | | |
Proceeds from shares issued | | $ | — | | | $ | — | | | $ | 16,755 | | | $ | 19,772 | |
Distributions reinvested | | | — | | | | — | | | | 1,153 | | | | 652 | |
Cost of shares redeemed | | | — | | | | — | | | | (5,433 | ) | | | (8,361 | ) |
| | | | | | | | | | | | | | | | |
Change in net assets resulting from Class R2 capital transactions | | $ | — | | | $ | — | | | $ | 12,475 | | | $ | 12,063 | |
| | | | | | | | | | | | | | | | |
Class R5 | | | | | | | | | | | | | | | | |
Proceeds from shares issued | | $ | — | | | $ | — | | | $ | 126,872 | | | $ | 133,602 | |
Distributions reinvested | | | — | | | | — | | | | 10,604 | | | | 8,807 | |
Cost of shares redeemed | | | — | | | | — | | | | (34,152 | ) | | | (103,835 | ) |
| | | | | | | | | | | | | | | | |
Change in net assets resulting from Class R5 capital transactions | | $ | — | | | $ | — | | | $ | 103,324 | | | $ | 38,574 | |
| | | | | | | | | | | | | | | | |
Class R6 | | | | | | | | | | | | | | | | |
Proceeds from shares issued | | $ | — | | | $ | — | | | $ | 186,452 | | | $ | 392,844 | |
Distributions reinvested | | | — | | | | — | | | | 18,741 | | | | 14,091 | |
Cost of shares redeemed | | | — | | | | — | | | | (56,453 | ) | | | (150,821 | ) |
| | | | | | | | | | | | | | | | |
Change in net assets resulting from Class R6 capital transactions | | $ | — | | | $ | — | | | $ | 148,740 | | | $ | 256,114 | |
| | | | | | | | | | | | | | | | |
Select Class | | | | | | | | | | | | | | | | |
Proceeds from shares issued | | $ | 9,955 | | | $ | 74,941 | | | $ | 897,911 | | | $ | 1,343,746 | |
Distributions reinvested | | | 41 | | | | 100 | | | | 71,865 | | | | 51,006 | |
Cost of shares redeemed | | | (6,976 | ) | | | (10,866 | ) | | | (427,169 | ) | | | (731,248 | ) |
| | | | | | | | | | | | | | | | |
Change in net assets resulting from Select Class capital transactions | | $ | 3,020 | | | $ | 64,175 | | | $ | 542,607 | | | $ | 663,504 | |
| | | | | | | | | | | | | | | | |
Total change in net assets resulting from capital transactions | | $ | 4,039 | | | $ | 64,555 | | | $ | 1,283,801 | | | $ | 2,056,118 | |
| | | | | | | | | | | | | | | | |
SEE NOTES TO FINANCIAL STATEMENTS.
| | | | | | |
| | | |
| 66 | | | | J.P. MORGAN LARGE CAP FUNDS | | DECEMBER 31, 2014 |
| | | | | | | | | | | | | | | | |
| | | Equity Focus Fund | | | Equity Income Fund | |
| | | Six Months Ended
December 31, 2014
(Unaudited) | | | Year Ended
June 30, 2014 | | | Six Months Ended
December 31, 2014
(Unaudited) | | | Year Ended
June 30, 2014 | |
SHARE TRANSACTIONS: | | | | | | | | | | | | | | | | |
Class A | | | | | | | | | | | | | | | | |
Issued | | | 25 | | | | 22 | | | | 52,740 | | | | 93,449 | |
Reinvested | | | — | (a) | | | — | (a) | | | 5,648 | | | | 4,669 | |
Redeemed | | | (2 | ) | | | (7 | ) | | | (34,608 | ) | | | (35,883 | ) |
| | | | | | | | | | | | | | | | |
Change in Class A Shares | | | 23 | | | | 15 | | | | 23,780 | | | | 62,235 | |
| | | | | | | | | | | | | | | | |
Class B | | | | | | | | | | | | | | | | |
Issued | | | — | | | | — | | | | 12 | | | | 85 | |
Reinvested | | | — | | | | — | | | | 6 | | | | 9 | |
Redeemed | | | — | | | | — | | | | (65 | ) | | | (156 | ) |
| | | | | | | | | | | | | | | | |
Change in Class B Shares | | | — | | | | — | | | | (47 | ) | | | (62 | ) |
| | | | | | | | | | | | | | | | |
Class C | | | | | | | | | | | | | | | | |
Issued | | | 20 | | | | 4 | | | | 14,377 | | | | 30,145 | |
Reinvested | | | — | (a) | | | — | (a) | | | 1,610 | | | | 1,238 | |
Redeemed | | | (1 | ) | | | (1 | ) | | | (4,703 | ) | | | (7,181 | ) |
| | | | | | | | | | | | | | | | |
Change in Class C Shares | | | 19 | | | | 3 | | | | 11,284 | | | | 24,202 | |
| | | | | | | | | | | | | | | | |
Class R2 | | | | | | | | | | | | | | | | |
Issued | | | — | | | | — | | | | 1,221 | | | | 1,554 | |
Reinvested | | | — | | | | — | | | | 84 | | | | 52 | |
Redeemed | | | — | | | | — | | | | (395 | ) | | | (649 | ) |
| | | | | | | | | | | | | | | | |
Change in Class R2 Shares | | | — | | | | — | | | | 910 | | | | 957 | |
| | | | | | | | | | | | | | | | |
Class R5 | | | | | | | | | | | | | | | | |
Issued | | | — | | | | — | | | | 8,987 | | | | 10,246 | |
Reinvested | | | — | | | | — | | | | 756 | | | | 687 | |
Redeemed | | | — | | | | — | | | | (2,435 | ) | | | (8,034 | ) |
| | | | | | | | | | | | | | | | |
Change in Class R5 Shares | | | — | | | | — | | | | 7,308 | | | | 2,899 | |
| | | | | | | | | | | | | | | | |
Class R6 | | | | | | | | | | | | | | | | |
Issued | | | — | | | | — | | | | 13,303 | | | | 30,669 | |
Reinvested | | | — | | | | — | | | | 1,336 | | | | 1,095 | |
Redeemed | | | — | | | | — | | | | (4,056 | ) | | | (11,733 | ) |
| | | | | | | | | | | | | | | | |
Change in Class R6 Shares | | | — | | | | — | | | | 10,583 | | | | 20,031 | |
| | | | | | | | | | | | | | | | |
Select Class | | | | | | | | | | | | | | | | |
Issued | | | 415 | | | | 3,320 | | | | 64,312 | | | | 104,808 | |
Reinvested | | | 2 | | | | 5 | | | | 5,126 | | | | 3,973 | |
Redeemed | | | (291 | ) | | | (475 | ) | | | (30,571 | ) | | | (56,929 | ) |
| | | | | | | | | | | | | | | | |
Change in Select Class Shares | | | 126 | | | | 2,850 | | | | 38,867 | | | | 51,852 | |
| | | | | | | | | | | | | | | | |
| (a) | Amount rounds to less than 1,000 shares. |
SEE NOTES TO FINANCIAL STATEMENTS.
| | | | | | | | |
| | | |
| DECEMBER 31, 2014 | | J.P. MORGAN LARGE CAP FUNDS | | | | | 67 | |
STATEMENTS OF CHANGES IN NET ASSETS
FOR THE PERIODS INDICATED (continued)
(Amounts in thousands)
| | | | | | | | | | | | | | | | |
| | | Growth and Income Fund | | | Hedged Equity Fund | |
| | | Six Months Ended
December 31, 2014
(Unaudited) | | | Year Ended
June 30, 2014 | | | Six Months Ended
December 31, 2014
(Unaudited) | | | Period Ended
June 30, 2014 (a) | |
CAPITAL TRANSACTIONS: | | | | | | | | | | | | | | | | |
Class A | | | | | | | | | | | | | | | | |
Proceeds from shares issued | | $ | 22,387 | | | $ | 31,727 | | | $ | 62,846 | | | $ | 1,573 | |
Distributions reinvested | | | 11,546 | | | | 4,239 | | | | 229 | | | | 4 | |
Cost of shares redeemed | | | (30,188 | ) | | | (50,548 | ) | | | (1,971 | ) | | | (1,009 | ) |
| | | | | | | | | | | | | | | | |
Change in net assets resulting from Class A capital transactions | | $ | 3,745 | | | $ | (14,582 | ) | | $ | 61,104 | | | $ | 568 | |
| | | | | | | | | | | | | | | | |
Class B | | | | | | | | | | | | | | | | |
Proceeds from shares issued | | $ | 75 | | | $ | 86 | | | $ | — | | | $ | — | |
Distributions reinvested | | | 64 | | | | 18 | | | | — | | | | — | |
Cost of shares redeemed | | | (438 | ) | | | (996 | ) | | | — | | | | — | |
| | | | | | | | | | | | | | | | |
Change in net assets resulting from Class B capital transactions | | $ | (299 | ) | | $ | (892 | ) | | $ | — | | | $ | — | |
| | | | | | | | | | | | | | | | |
Class C | | | | | | | | | | | | | | | | |
Proceeds from shares issued | | $ | 5,743 | | | $ | 6,964 | | | $ | 764 | | | $ | 50 | |
Distributions reinvested | | | 472 | | | | 89 | | | | 2 | | | | — | (b) |
Cost of shares redeemed | | | (1,885 | ) | | | (2,395 | ) | | | — | (b) | | | — | |
| | | | | | | | | | | | | | | | |
Change in net assets resulting from Class C capital transactions | | $ | 4,330 | | | $ | 4,658 | | | $ | 766 | | | $ | 50 | |
| | | | | | | | | | | | | | | | |
Class R5 | | | | | | | | | | | | | | | | |
Proceeds from shares issued | | $ | — | | | $ | — | | | $ | 373 | | | $ | 50 | |
Distributions reinvested | | | — | | | | — | | | | 2 | | | | 1 | |
| | | | | | | | | | | | | | | | |
Change in net assets resulting from Class R5 capital transactions | | $ | — | | | $ | — | | | $ | 375 | | | $ | 51 | |
| | | | | | | | | | | | | | | | |
Class R6 | | | | | | | | | | | | | | | | |
Proceeds from shares issued | | $ | — | | | $ | — | | | $ | 374 | | | $ | 50 | |
Distributions reinvested | | | — | | | | — | | | | 2 | | | | 1 | |
| | | | | | | | | | | | | | | | |
Change in net assets resulting from Class R6 capital transactions | | $ | — | | | $ | — | | | $ | 376 | | | $ | 51 | |
| | | | | | | | | | | | | | | | |
Select Class | | | | | | | | | | | | | | | | |
Proceeds from shares issued | | $ | 5,703 | | | $ | 19,582 | | | $ | 67,324 | | | $ | 4,125 | |
Distributions reinvested | | | 767 | | | | 296 | | | | 265 | | | | 38 | |
Cost of shares redeemed | | | (1,515 | ) | | | (26,342 | ) | | | (2,696 | ) | | | — | |
| | | | | | | | | | | | | | | | |
Change in net assets resulting from Select Class capital transactions | | $ | 4,955 | | | $ | (6,464 | ) | | $ | 64,893 | | | $ | 4,163 | |
| | | | | | | | | | | | | | | | |
Total change in net assets resulting from capital transactions | | $ | 12,731 | | | $ | (17,280 | ) | | $ | 127,514 | | | $ | 4,883 | |
| | | | | | | | | | | | | | | | |
| (a) | Commencement of operations was December 13, 2013. |
| (b) | Amount rounds to less than $1,000. |
SEE NOTES TO FINANCIAL STATEMENTS.
| | | | | | |
| | | |
| 68 | | | | J.P. MORGAN LARGE CAP FUNDS | | DECEMBER 31, 2014 |
| | | | | | | | | | | | | | | | |
| | | Growth and Income Fund | | | Hedged Equity Fund | |
| | | Six Months Ended
December 31, 2014
(Unaudited) | | | Year Ended
June 30, 2014 | | | Six Months Ended
December 31, 2014
(Unaudited) | | | Period Ended
June 30, 2014 (a) | |
SHARE TRANSACTIONS: | | | | | | | | | | | | | | | | |
Class A | | | | | | | | | | | | | | | | |
Issued | | | 494 | | | | 791 | | | | 4,004 | | | | 100 | |
Reinvested | | | 257 | | | | 102 | | | | 14 | | | | — | (b) |
Redeemed | | | (674 | ) | | | (1,258 | ) | | | (122 | ) | | | (64 | ) |
| | | | | | | | | | | | | | | | |
Change in Class A Shares | | | 77 | | | | (365 | ) | | | 3,896 | | | | 36 | |
| | | | | | | | | | | | | | | | |
Class B | | | | | | | | | | | | | | | | |
Issued | | | 1 | | | | 2 | | | | — | | | | — | |
Reinvested | | | 2 | | | | — | (b) | | | — | | | | — | |
Redeemed | | | (10 | ) | | | (25 | ) | | | — | | | | — | |
| | | | | | | | | | | | | | | | |
Change in Class B Shares | | | (7 | ) | | | (23 | ) | | | — | | | | — | |
| | | | | | | | | | | | | | | | |
Class C | | | | | | | | | | | | | | | | |
Issued | | | 138 | | | | 187 | | | | 48 | | | | 3 | |
Reinvested | | | 11 | | | | 2 | | | | — | (b) | | | — | (b) |
Redeemed | | | (45 | ) | | | (65 | ) | | | — | (b) | | | — | |
| | | | | | | | | | | | | | | | |
Change in Class C Shares | | | 104 | | | | 124 | | | | 48 | | | | 3 | |
| | | | | | | | | | | | | | | | |
Class R5 | | | | | | | | | | | | | | | | |
Issued | | | — | | | | — | | | | 24 | | | | 3 | |
Reinvested | | | — | | | | — | | | | — | (b) | | | — | (b) |
| | | | | | | | | | | | | | | | |
Change in Class R5 Shares | | | — | | | | — | | | | 24 | | | | 3 | |
| | | | | | | | | | | | | | | | |
Class R6 | | | | | | | | | | | | | | | | |
Issued | | | — | | | | — | | | | 24 | | | | 3 | |
Reinvested | | | — | | | | — | | | | — | (b) | | | — | (b) |
| | | | | | | | | | | | | | | | |
Change in Class R6 Shares | | | — | | | | — | | | | 24 | | | | 3 | |
| | | | | | | | | | | | | | | | |
Select Class | | | | | | | | | | | | | | | | |
Issued | | | 122 | | | | 473 | | | | 4,214 | | | | 270 | |
Reinvested | | | 16 | | | | 7 | | | | 16 | | | | 3 | |
Redeemed | | | (33 | ) | | | (643 | ) | | | (166 | ) | | | — | |
| | | | | | | | | | | | | | | | |
Change in Select Class Shares | | | 105 | | | | (163 | ) | | | 4,064 | | | | 273 | |
| | | | | | | | | | | | | | | | |
| (a) | Commencement of operations was December 13, 2013. |
| (b) | Amount rounds to less than 1,000 shares. |
SEE NOTES TO FINANCIAL STATEMENTS.
| | | | | | | | |
| | | |
| DECEMBER 31, 2014 | | J.P. MORGAN LARGE CAP FUNDS | | | | | 69 | |
STATEMENTS OF CHANGES IN NET ASSETS
FOR THE PERIODS INDICATED (continued)
(Amounts in thousands)
| | | | | | | | | | | | | | | | |
| | | Large Cap Growth Fund | | | Large Cap Value Fund | |
| | | Six Months Ended
December 31, 2014
(Unaudited) | | | Year Ended
June 30, 2014 | | | Six Months Ended
December 31, 2014
(Unaudited) | | | Year Ended
June 30, 2014 | |
CAPITAL TRANSACTIONS: | | | | | | | | | | | | | | | | |
Class A | | | | | | | | | | | | | | | | |
Proceeds from shares issued | | $ | 475,974 | | | $ | 2,726,496 | | | $ | 7,656 | | | $ | 15,561 | |
Net assets acquired in Fund reorganization (See Note 8) | | | — | | | | — | | | | — | | | | 42,595 | |
Distributions reinvested | | | 80,373 | | | | — | | | | 13,856 | | | | 2,439 | |
Cost of shares redeemed | | | (1,040,158 | ) | | | (1,431,629 | ) | | | (10,943 | ) | | | (15,944 | ) |
| | | | | | | | | | | | | | | | |
Change in net assets resulting from Class A capital transactions | | $ | (483,811 | ) | | $ | 1,294,867 | | | $ | 10,569 | | | $ | 44,651 | |
| | | | | | | | | | | | | | | | |
Class B | | | | | | | | | | | | | | | | |
Proceeds from shares issued | | $ | 59 | | | $ | 146 | | | $ | 30 | | | $ | 33 | |
Net assets acquired in Fund reorganization (See Note 8) | | | — | | | | — | | | | — | | | | 1,079 | |
Distributions reinvested | | | 131 | | | | — | | | | 225 | | | | 57 | |
Cost of shares redeemed | | | (1,479 | ) | | | (3,925 | ) | | | (460 | ) | | | (769 | ) |
| | | | | | | | | | | | | | | | |
Change in net assets resulting from Class B capital transactions | | $ | (1,289 | ) | | $ | (3,779 | ) | | $ | (205 | ) | | $ | 400 | |
| | | | | | | | | | | | | | | | |
Class C | | | | | | | | | | | | | | | | |
Proceeds from shares issued | | $ | 46,679 | | | $ | 118,910 | | | $ | 2,240 | | | $ | 3,724 | |
Net assets acquired in Fund reorganization (See Note 8) | | | — | | | | — | | | | — | | | | 3,188 | |
Distributions reinvested | | | 7,502 | | | | — | | | | 1,845 | | | | 268 | |
Cost of shares redeemed | | | (52,296 | ) | | | (90,812 | ) | | | (1,043 | ) | | | (1,946 | ) |
| | | | | | | | | | | | | | | | |
Change in net assets resulting from Class C capital transactions | | $ | 1,885 | | | $ | 28,098 | | | $ | 3,042 | | | $ | 5,234 | |
| | | | | | | | | | | | | | | | |
Class R2 | | | | | | | | | | | | | | | | |
Proceeds from shares issued | | $ | 44,323 | | | $ | 62,282 | | | $ | 181 | | | $ | 194 | |
Distributions reinvested | | | 3,119 | | | | — | | | | 62 | | | | 10 | |
Cost of shares redeemed | | | (43,583 | ) | | | (78,278 | ) | | | (28 | ) | | | (196 | ) |
| | | | | | | | | | | | | | | | |
Change in net assets resulting from Class R2 capital transactions | | $ | 3,859 | | | $ | (15,996 | ) | | $ | 215 | | | $ | 8 | |
| | | | | | | | | | | | | | | | |
Class R5 | | | | | | | | | | | | | | | | |
Proceeds from shares issued | | $ | 159,237 | | | $ | 365,422 | | | $ | 477 | | | $ | 514 | |
Net assets acquired in Fund reorganization (See Note 8) | | | — | | | | — | | | | — | | | | 2,180 | |
Distributions reinvested | | | 22,865 | | | | — | | | | 492 | | | | 690 | |
Cost of shares redeemed | | | (288,518 | ) | | | (413,385 | ) | | | (572 | ) | | | (19,905 | ) |
| | | | | | | | | | | | | | | | |
Change in net assets resulting from Class R5 capital transactions | | $ | (106,416 | ) | | $ | (47,963 | ) | | $ | 397 | | | $ | (16,521 | ) |
| | | | | | | | | | | | | | | | |
Class R6 | | | | | | | | | | | | | | | | |
Proceeds from shares issued | | $ | 308,617 | | | $ | 665,288 | | | $ | 2,025 | | | $ | 4,941 | |
Distributions reinvested | | | 48,411 | | | | — | | | | 6,322 | | | | 2,379 | |
Cost of shares redeemed | | | (405,000 | ) | | | (692,012 | ) | | | (54,453 | ) | | | (8,427 | ) |
| | | | | | | | | | | | | | | | |
Change in net assets resulting from Class R6 capital transactions | | $ | (47,972 | ) | | $ | (26,724 | ) | | $ | (46,106 | ) | | $ | (1,107 | ) |
| | | | | | | | | | | | | | | | |
Select Class | | | | | | | | | | | | | | | | |
Proceeds from shares issued | | $ | 822,111 | | | $ | 1,132,582 | | | $ | 32,903 | | | $ | 29,098 | |
Distributions reinvested | | | 69,462 | | | | — | | | | 106,574 | | | | 27,502 | |
Cost of shares redeemed | | | (796,988 | ) | | | (2,086,032 | ) | | | (35,689 | ) | | | (95,265 | ) |
| | | | | | | | | | | | | | | | |
Change in net assets resulting from Select Class capital transactions | | $ | 94,585 | | | $ | (953,450 | ) | | $ | 103,788 | | | $ | (38,665 | ) |
| | | | | | | | | | | | | | | | |
Total change in net assets resulting from capital transactions | | $ | (539,159 | ) | | $ | 275,053 | | | $ | 71,700 | | | $ | (6,000 | ) |
| | | | | | | | | | | | | | | | |
SEE NOTES TO FINANCIAL STATEMENTS.
| | | | | | |
| | | |
| 70 | | | | J.P. MORGAN LARGE CAP FUNDS | | DECEMBER 31, 2014 |
| | | | | | | | | | | | | | | | |
| | | Large Cap Growth Fund | | | Large Cap Value Fund | |
| | | Six Months Ended
December 31, 2014
(Unaudited) | | | Year Ended
June 30, 2014 | | | Six Months Ended
December 31, 2014
(Unaudited) | | | Year Ended
June 30, 2014 | |
SHARE TRANSACTIONS: | | | | | | | | | | | | | | | | |
Class A | | | | | | | | | | | | | | | | |
Issued | | | 14,117 | | | | 94,359 | | | | 461 | | | | 1,021 | |
Shares issued in connection with Fund reorganization (See Note 8) | | | — | | | | — | | | | — | | | | 2,898 | |
Reinvested | | | 2,374 | | | | — | | | | 958 | | | | 162 | |
Redeemed | | | (31,117 | ) | | | (47,665 | ) | | | (672 | ) | | | (1,042 | ) |
| | | | | | | | | | | | | | | | |
Change in Class A Shares | | | (14,626 | ) | | | 46,694 | | | | 747 | | | | 3,039 | |
| | | | | | | | | | | | | | | | |
Class B | | | | | | | | | | | | | | | | |
Issued | | | 3 | | | | 6 | | | | 2 | | | | 3 | |
Shares issued in connection with Fund reorganization (See Note 8) | | | — | | | | — | | | | — | | | | 74 | |
Reinvested | | | 4 | | | | — | | | | 16 | | | | 4 | |
Redeemed | | | (50 | ) | | | (148 | ) | | | (29 | ) | | | (51 | ) |
| | | | | | | | | | | | | | | | |
Change in Class B Shares | | | (43 | ) | | | (142 | ) | | | (11 | ) | | | 30 | |
| | | | | | | | | | | | | | | | |
Class C | | | | | | | | | | | | | | | | |
Issued | | | 1,588 | | | | 4,514 | | | | 141 | | | | 251 | |
Shares issued in connection with Fund reorganization (See Note 8) | | | — | | | | — | | | | — | | | | 222 | |
Reinvested | | | 255 | | | | — | | | | 131 | | | | 18 | |
Redeemed | | | (1,788 | ) | | | (3,428 | ) | | | (67 | ) | | | (131 | ) |
| | | | | | | | | | | | | | | | |
Change in Class C Shares | | | 55 | | | | 1,086 | | | | 205 | | | | 360 | |
| | | | | | | | | | | | | | | | |
Class R2 | | | | | | | | | | | | | | | | |
Issued | | | 1,318 | | | | 2,078 | | | | 12 | | | | 12 | |
Reinvested | | | 94 | | | | — | | | | 4 | | | | 1 | |
Redeemed | | | (1,327 | ) | | | (2,597 | ) | | | (2 | ) | | | (13 | ) |
| | | | | | | | | | | | | | | | |
Change in Class R2 Shares | | | 85 | | | | (519 | ) | | | 14 | | | | — | (a) |
| | | | | | | | | | | | | | | | |
Class R5 | | | | | | | | | | | | | | | | |
Issued | | | 4,688 | | | | 12,035 | | | | 30 | | | | 34 | |
Shares issued in connection with Fund reorganization (See Note 8) | | | — | | | | — | | | | — | | | | 149 | |
Reinvested | | | 669 | | | | — | | | | 34 | | | | 48 | |
Redeemed | | | (8,424 | ) | | | (13,642 | ) | | | (34 | ) | | | (1,358 | ) |
| | | | | | | | | | | | | | | | |
Change in Class R5 Shares | | | (3,067 | ) | | | (1,607 | ) | | | 30 | | | | (1,127 | ) |
| | | | | | | | | | | | | | | | |
Class R6 | | | | | | | | | | | | | | | | |
Issued | | | 9,027 | | | | 22,243 | | | | 122 | | | | 329 | |
Reinvested | | | 1,413 | | | | — | | | | 441 | | | | 161 | |
Redeemed | | | (11,848 | ) | | | (22,612 | ) | | | (3,548 | ) | | | (557 | ) |
| | | | | | | | | | | | | | | | |
Change in Class R6 Shares | | | (1,408 | ) | | | (369 | ) | | | (2,985 | ) | | | (67 | ) |
| | | | | | | | | | | | | | | | |
Select Class | | | | | | | | | | | | | | | | |
Issued | | | 24,519 | | | | 37,768 | | | | 2,071 | | | | 1,976 | |
Reinvested | | | 2,047 | | | | — | | | | 7,476 | | | | 1,868 | |
Redeemed | | | (23,678 | ) | | | (67,981 | ) | | | (2,107 | ) | | | (6,280 | ) |
| | | | | | | | | | | | | | | | |
Change in Select Class Shares | | | 2,888 | | | | (30,213 | ) | | | 7,440 | | | | (2,436 | ) |
| | | | | | | | | | | | | | | | |
| (a) | Amount rounds to less than 1,000 shares. |
SEE NOTES TO FINANCIAL STATEMENTS.
| | | | | | | | |
| | | |
| DECEMBER 31, 2014 | | J.P. MORGAN LARGE CAP FUNDS | | | | | 71 | |
STATEMENTS OF CHANGES IN NET ASSETS
FOR THE PERIODS INDICATED (continued)
(Amounts in thousands)
| | | | | | | | |
| | | U.S. Equity Fund | |
| | | Six Months Ended
December 31, 2014
(Unaudited) | | | Year Ended
June 30, 2014 | |
CAPITAL TRANSACTIONS: | | | | | | | | |
Class A | | | | | | | | |
Proceeds from shares issued | | $ | 207,431 | | | $ | 383,521 | |
Distributions reinvested | | | 96,062 | | | | 67,082 | |
Cost of shares redeemed | | | (184,443 | ) | | | (308,374 | ) |
| | | | | | | | |
Change in net assets resulting from Class A capital transactions | | $ | 119,050 | | | $ | 142,229 | |
| | | | | | | | |
Class B | | | | | | | | |
Proceeds from shares issued | | $ | 40 | | | $ | 178 | |
Distributions reinvested | | | 331 | | | | 305 | |
Cost of shares redeemed | | | (429 | ) | | | (1,374 | ) |
| | | | | | | | |
Change in net assets resulting from Class B capital transactions | | $ | (58 | ) | | $ | (891 | ) |
| | | | | | | | |
Class C | | | | | | | | |
Proceeds from shares issued | | $ | 39,299 | | | $ | 59,625 | |
Distributions reinvested | | | 16,003 | | | | 9,127 | |
Cost of shares redeemed | | | (16,812 | ) | | | (25,641 | ) |
| | | | | | | | |
Change in net assets resulting from Class C capital transactions | | $ | 38,490 | | | $ | 43,111 | |
| | | | | | | | |
Class R2 | | | | | | | | |
Proceeds from shares issued | | $ | 32,763 | | | $ | 54,604 | |
Distributions reinvested | | | 11,764 | | | | 6,417 | |
Cost of shares redeemed | | | (14,906 | ) | | | (22,308 | ) |
| | | | | | | | |
Change in net assets resulting from Class R2 capital transactions | | $ | 29,621 | | | $ | 38,713 | |
| | | | | | | | |
Class R5 | | | | | | | | |
Proceeds from shares issued | | $ | 77,890 | | | $ | 141,144 | |
Distributions reinvested | | | 35,455 | | | | 28,688 | |
Cost of shares redeemed | | | (54,058 | ) | | | (250,658 | ) |
| | | | | | | | |
Change in net assets resulting from Class R5 capital transactions | | $ | 59,287 | | | $ | (80,826 | ) |
| | | | | | | | |
Class R6 | | | | | | | | |
Proceeds from shares issued | | $ | 382,939 | | | $ | 764,394 | |
Distributions reinvested | | | 223,682 | | | | 140,851 | |
Cost of shares redeemed | | | (277,638 | ) | | | (184,568 | ) |
| | | | | | | | |
Change in net assets resulting from Class R6 capital transactions | | $ | 328,983 | | | $ | 720,677 | |
| | | | | | | | |
Institutional Class | | | | | | | | |
Proceeds from shares issued | | $ | 680,724 | | | $ | 3,312,906 | |
Distributions reinvested | | | 360,252 | | | | 242,236 | |
Cost of shares redeemed | | | (514,876 | ) | | | (874,872 | ) |
| | | | | | | | |
Change in net assets resulting from Institutional Class capital transactions | | $ | 526,100 | | | $ | 2,680,270 | |
| | | | | | | | |
Select Class | | | | | | | | |
Proceeds from shares issued | | $ | 902,954 | | | $ | 703,654 | |
Distributions reinvested | | | 200,535 | | | | 155,534 | |
Cost of shares redeemed | | | (191,466 | ) | | | (3,055,397 | ) |
| | | | | | | | |
Change in net assets resulting from Select Class capital transactions | | $ | 912,023 | | | $ | (2,196,209 | ) |
| | | | | | | | |
Total change in net assets resulting from capital transactions | | $ | 2,013,496 | | | $ | 1,347,074 | |
| | | | | | | | |
SEE NOTES TO FINANCIAL STATEMENTS.
| | | | | | |
| | | |
| 72 | | | | J.P. MORGAN LARGE CAP FUNDS | | DECEMBER 31, 2014 |
| | | | | | | | |
| | | U.S. Equity Fund | |
| | | Six Months Ended
December 31, 2014
(Unaudited) | | | Year Ended
June 30,
2014 | |
SHARE TRANSACTIONS: | | | | | | | | |
Class A | | | | | | | | |
Issued | | | 13,818 | | | | 27,421 | |
Reinvested | | | 6,771 | | | | 4,947 | |
Redeemed | | | (12,250 | ) | | | (22,134 | ) |
| | | | | | | | |
Change in Class A Shares | | | 8,339 | | | | 10,234 | |
| | | | | | | | |
Class B | | | | | | | | |
Issued | | | 2 | | | | 13 | |
Reinvested | | | 24 | | | | 23 | |
Redeemed | | | (28 | ) | | | (101 | ) |
| | | | | | | | |
Change in Class B Shares | | | (2 | ) | | | (65 | ) |
| | | | | | | | |
Class C | | | | | | | | |
Issued | | | 2,677 | | | | 4,349 | |
Reinvested | | | 1,158 | | | | 690 | |
Redeemed | | | (1,147 | ) | | | (1,871 | ) |
| | | | | | | | |
Change in Class C Shares | | | 2,688 | | | | 3,168 | |
| | | | | | | | |
Class R2 | | | | | | | | |
Issued | | | 2,189 | | | | 3,941 | |
Reinvested | | | 835 | | | | 476 | |
Redeemed | | | (1,001 | ) | | | (1,596 | ) |
| | | | | | | | |
Change in Class R2 Shares | | | 2,023 | | | | 2,821 | |
| | | | | | | | |
Class R5 | | | | | | | | |
Issued | | | 5,191 | | | | 9,994 | |
Reinvested | | | 2,489 | | | | 2,106 | |
Redeemed | | | (3,566 | ) | | | (18,145 | ) |
| | | | | | | | |
Change in Class R5 Shares | | | 4,114 | | | | (6,045 | ) |
| | | | | | | | |
Class R6 | | | | | | | | |
Issued | | | 25,503 | | | | 54,986 | |
Reinvested | | | 15,678 | | | | 10,318 | |
Redeemed | | | (18,193 | ) | | | (13,029 | ) |
| | | | | | | | |
Change in Class R6 Shares | | | 22,988 | | | | 52,275 | |
| | | | | | | | |
Institutional Class | | | | | | | | |
Issued | | | 45,077 | | | | 229,320 | |
Reinvested | | | 25,308 | | | | 17,794 | |
Redeemed | | | (34,265 | ) | | | (62,503 | ) |
| | | | | | | | |
Change in Institutional Class Shares | | | 36,120 | | | | 184,611 | |
| | | | | | | | |
Select Class | | | | | | | | |
Issued | | | 62,312 | | | | 51,196 | |
Reinvested | | | 14,107 | | | | 11,454 | |
Redeemed | | | (12,650 | ) | �� | | (212,173 | ) |
| | | | | | | | |
Change in Select Class Shares | | | 63,769 | | | | (149,523 | ) |
| | | | | | | | |
SEE NOTES TO FINANCIAL STATEMENTS.
| | | | | | | | |
| | | |
| DECEMBER 31, 2014 | | J.P. MORGAN LARGE CAP FUNDS | | | | | 73 | |
FINANCIAL HIGHLIGHTS
FOR THE PERIODS INDICATED
| | | | | | | | | | | | | | | | | | | | | | | | | | | | |
| | | | | | Per share operating performance | |
| | | | | | Investment operations | | | Distributions | |
| | | Net asset
value,
beginning
of period | | | Net
investment
income
(loss) | | | Net realized
and unrealized
gains
(losses) on
investments | | | Total from
investment
operations | | | Net
investment
income | | | Net
realized
gain | | | Total
distributions | |
Disciplined Equity Fund | | | | | | | | | | | | | | | | | | | | | | | | | | | | |
Class A | | | | | | | | | | | | | | | | | | | | | | | | | | | | |
Six Months Ended December 31, 2014 (Unaudited) | | $ | 23.73 | | | $ | 0.11 | (f) | | $ | 1.40 | | | $ | 1.51 | | | $ | (0.11 | ) | | $ | (1.60 | ) | | $ | (1.71 | ) |
Year Ended June 30, 2014 | | | 20.27 | | | | 0.23 | (f) | | | 4.79 | | | | 5.02 | | | | (0.21 | ) | | | (1.35 | ) | | | (1.56 | ) |
Year Ended June 30, 2013 | | | 17.42 | | | | 0.20 | (f) | | | 3.56 | | | | 3.76 | | | | (0.23 | ) | | | (0.68 | ) | | | (0.91 | ) |
Year Ended June 30, 2012 | | | 16.80 | | | | 0.21 | (f) | | | 0.61 | | | | 0.82 | | | | (0.20 | ) | | | — | | | | (0.20 | ) |
Year Ended June 30, 2011 | | | 13.07 | | | | 0.17 | (f) | | | 3.72 | | | | 3.89 | | | | (0.16 | ) | | | — | | | | (0.16 | ) |
Year Ended June 30, 2010 | | | 11.52 | | | | 0.18 | (f) | | | 1.54 | | | | 1.72 | | | | (0.17 | ) | | | — | | | | (0.17 | ) |
| | | | | | | |
Class R6 | | | | | | | | | | | | | | | | | | | | | | | | | | | | |
Six Months Ended December 31, 2014 (Unaudited) | | | 23.85 | | | | 0.17 | (f) | | | 1.43 | | | | 1.60 | | | | (0.16 | ) | | | (1.60 | ) | | | (1.76 | ) |
Year Ended June 30, 2014 | | | 20.36 | | | | 0.34 | (f) | | | 4.81 | | | | 5.15 | | | | (0.31 | ) | | | (1.35 | ) | | | (1.66 | ) |
Year Ended June 30, 2013 | | | 17.48 | | | | 0.32 | (f) | | | 3.55 | | | | 3.87 | | | | (0.31 | ) | | | (0.68 | ) | | | (0.99 | ) |
Year Ended June 30, 2012 | | | 16.83 | | | | 0.29 | (f) | | | 0.63 | | | | 0.92 | | | | (0.27 | ) | | | — | | | | (0.27 | ) |
Year Ended June 30, 2011 | | | 13.08 | | | | 0.25 | (f) | | | 3.73 | | | | 3.98 | | | | (0.23 | ) | | | — | | | | (0.23 | ) |
Year Ended June 30, 2010 | | | 11.52 | | | | 0.24 | (f) | | | 1.56 | | | | 1.80 | | | | (0.24 | ) | | | — | | | | (0.24 | ) |
| | | | | | | |
Institutional Class | | | | | | | | | | | | | | | | | | | | | | | | | | | | |
Six Months Ended December 31, 2014 (Unaudited) | | | 23.85 | | | | 0.16 | (f) | | | 1.42 | | | | 1.58 | | | | (0.15 | ) | | | (1.60 | ) | | | (1.75 | ) |
Year Ended June 30, 2014 | | | 20.36 | | | | 0.32 | (f) | | | 4.81 | | | | 5.13 | | | | (0.29 | ) | | | (1.35 | ) | | | (1.64 | ) |
Year Ended June 30, 2013 | | | 17.48 | | | | 0.30 | (f) | | | 3.55 | | | | 3.85 | | | | (0.29 | ) | | | (0.68 | ) | | | (0.97 | ) |
Year Ended June 30, 2012 | | | 16.83 | | | | 0.27 | (f) | | | 0.63 | | | | 0.90 | | | | (0.25 | ) | | | — | | | | (0.25 | ) |
Year Ended June 30, 2011 | | | 13.09 | | | | 0.24 | (f) | | | 3.72 | | | | 3.96 | | | | (0.22 | ) | | | — | | | | (0.22 | ) |
Year Ended June 30, 2010 | | | 11.52 | | | | 0.23 | (f) | | | 1.57 | | | | 1.80 | | | | (0.23 | ) | | | — | | | | (0.23 | ) |
| | | | | | | |
Select Class | | | | | | | | | | | | | | | | | | | | | | | | | | | | |
Six Months Ended December 31, 2014 (Unaudited) | | | 23.88 | | | | 0.14 | (f) | | | 1.42 | | | | 1.56 | | | | (0.13 | ) | | | (1.60 | ) | | | (1.73 | ) |
Year Ended June 30, 2014 | | | 20.39 | | | | 0.28 | (f) | | | 4.82 | | | | 5.10 | | | | (0.26 | ) | | | (1.35 | ) | | | (1.61 | ) |
Year Ended June 30, 2013 | | | 17.51 | | | | 0.27 | (f) | | | 3.56 | | | | 3.83 | | | | (0.27 | ) | | | (0.68 | ) | | | (0.95 | ) |
Year Ended June 30, 2012 | | | 16.86 | | | | 0.25 | (f) | | | 0.63 | | | | 0.88 | | | | (0.23 | ) | | | — | | | | (0.23 | ) |
Year Ended June 30, 2011 | | | 13.11 | | | | 0.21 | (f) | | | 3.73 | | | | 3.94 | | | | (0.19 | ) | | | — | | | | (0.19 | ) |
Year Ended June 30, 2010 | | | 11.54 | | | | 0.21 | (f) | | | 1.56 | | | | 1.77 | | | | (0.20 | ) | | | — | | | | (0.20 | ) |
| (a) | Annualized for periods less than one year, unless otherwise noted. |
| (b) | Not annualized for periods less than one year. |
| (c) | Includes adjustments in accordance with accounting principles generally accepted in the United States of America and as such, the net asset values for financial reporting purposes and the returns based upon those net asset values may differ from the net asset values and returns for shareholder transactions. |
| (d) | Includes earnings credits and interest expense, if applicable, each of which is less than 0.01% unless otherwise noted. |
| (e) | Portfolio turnover is calculated by dividing the lesser of total purchases or sales of portfolio securities for the reporting period by the monthly average value of portfolio securities owned during the reporting period. Excluded from both the numerator and denominator are amounts relating to derivatives and securities whose maturities or expiration dates at the time of acquisition were one year or less. |
| (f) | Calculated based upon average shares outstanding. |
SEE NOTES TO FINANCIAL STATEMENTS.
| | | | | | |
| | | |
| 74 | | | | J.P. MORGAN LARGE CAP FUNDS | | DECEMBER 31, 2014 |
| | | | | | | | | | | | | | | | | | | | | | | | | | |
| | | Ratios/Supplemental data | |
| | | | | | | | | | Ratios to average net assets (a) | | | | |
Net asset
value,
end of
period | | | Total return
(excludes
sales charge) (b)(c) | | |
Net assets,
end of
period
(000’s) | | | Net
expenses (d) | | | Net
investment
income
(loss) | | | Expenses
without waivers,
reimbursements and
earnings credits | | | Portfolio
turnover
rate (b)(e) | |
| | | | | | | | | | | | | | | | | | | | | | | | | | |
| | | | | | | | | | | | | | | | | | | | | | | | | | |
| $ | 23.53 | | | | 6.59 | % | | $ | 321,069 | | | | 0.85 | % | | | 0.90 | % | | | 0.90 | % | | | 71 | % |
| | 23.73 | | | | 25.73 | | | | 206,635 | | | | 0.85 | | | | 1.02 | | | | 0.86 | | | | 113 | |
| | 20.27 | | | | 22.33 | | | | 103,755 | | | | 0.85 | | | | 1.04 | | | | 0.87 | | | | 178 | |
| | 17.42 | | | | 4.98 | | | | 20,831 | | | | 0.85 | | | | 1.21 | | | | 0.88 | | | | 198 | |
| | 16.80 | | | | 29.86 | | | | 3,399 | | | | 0.85 | | | | 1.07 | | | | 0.89 | | | | 169 | |
| | 13.07 | | | | 14.88 | | | | 1,425 | | | | 0.85 | | | | 1.27 | | | | 0.95 | | | | 169 | |
| | | | | | |
| | | | | | | | | | | | | | | | | | | | | | | | | | |
| | 23.69 | | | | 6.93 | | | | 4,322,692 | | | | 0.35 | | | | 1.39 | | | | 0.35 | | | | 71 | |
| | 23.85 | | | | 26.31 | | | | 3,598,945 | | | | 0.35 | | | | 1.52 | | | | 0.36 | | | | 113 | |
| | 20.36 | | | | 22.90 | | | | 1,460,937 | | | | 0.35 | | | | 1.67 | | | | 0.37 | | | | 178 | |
| | 17.48 | | | | 5.57 | | | | 1,024,228 | | | | 0.35 | | | | 1.76 | | | | 0.38 | | | | 198 | |
| | 16.83 | | | | 30.55 | | | | 577,140 | | | | 0.35 | | | | 1.49 | | | | 0.38 | | | | 169 | |
| | 13.08 | | | | 15.51 | | | | 35,855 | | | | 0.35 | | | | 1.76 | | | | 0.45 | | | | 169 | |
| | | | | | |
| | | | | | | | | | | | | | | | | | | | | | | | | | |
| | 23.68 | | | | 6.85 | | | | 553,151 | | | | 0.45 | | | | 1.27 | | | | 0.47 | | | | 71 | |
| | 23.85 | | | | 26.20 | | | | 389,507 | | | | 0.45 | | | | 1.42 | | | | 0.46 | | | | 113 | |
| | 20.36 | | | | 22.79 | | | | 221,638 | | | | 0.45 | | | | 1.57 | | | | 0.47 | | | | 178 | |
| | 17.48 | | | | 5.47 | | | | 171,872 | | | | 0.45 | | | | 1.66 | | | | 0.49 | | | | 198 | |
| | 16.83 | | | | 30.33 | | | | 119,152 | | | | 0.44 | | | | 1.59 | | | | 0.50 | | | | 169 | |
| | 13.09 | | | | 15.49 | | | | 194,273 | | | | 0.45 | | | | 1.68 | | | | 0.55 | | | | 169 | |
| | | | | | |
| | | | | | | | | | | | | | | | | | | | | | | | | | |
| | 23.71 | | | | 6.77 | | | | 254,821 | | | | 0.60 | | | | 1.13 | | | | 0.62 | | | | 71 | |
| | 23.88 | | | | 26.00 | | | | 82,899 | | | | 0.59 | | | | 1.28 | | | | 0.61 | | | | 113 | |
| | 20.39 | | | | 22.61 | | | | 40,522 | | | | 0.60 | | | | 1.40 | | | | 0.62 | | | | 178 | |
| | 17.51 | | | | 5.31 | | | | 15,979 | | | | 0.60 | | | | 1.50 | | | | 0.64 | | | | 198 | |
| | 16.86 | | | | 30.17 | | | | 12,490 | | | | 0.60 | | | | 1.33 | | | | 0.64 | | | | 169 | |
| | 13.11 | | | | 15.28 | | | | 8,983 | | | | 0.60 | | | | 1.55 | | | | 0.70 | | | | 169 | |
SEE NOTES TO FINANCIAL STATEMENTS.
| | | | | | | | |
| | | |
| DECEMBER 31, 2014 | | J.P. MORGAN LARGE CAP FUNDS | | | | | 75 | |
FINANCIAL HIGHLIGHTS
FOR THE PERIODS INDICATED (continued)
| | | | | | | | | | | | | | | | | | | | |
| | | | | | Per share operating performance | |
| | | | | | Investment operations | | | Distributions | |
| | | Net asset
value,
beginning
of period | | | Net
investment
income
(loss) | | | Net realized
and unrealized
gains
(losses) on
investments | | | Total from
investment
operations | | | Net
realized
gain | |
Dynamic Growth Fund | | | | | | | | | | | | | | | | | | | | |
Class A | | | | | | | | | | | | | | | | | | | | |
Six Months Ended December 31, 2014 (Unaudited) | | $ | 23.95 | | | $ | (0.08 | )(f)(g) | | $ | 0.58 | | | $ | 0.50 | | | $ | (0.37 | ) |
Year Ended June 30, 2014 | | | 18.94 | | | | (0.07 | )(f)(h) | | | 5.08 | | | | 5.01 | | | | — | |
Year Ended June 30, 2013 | | | 15.89 | | | | (0.05 | )(f)(i) | | | 3.10 | | | | 3.05 | | | | — | |
Year Ended June 30, 2012 | | | 15.47 | | | | (0.12 | ) | | | 0.54 | | | | 0.42 | | | | — | |
Year Ended June 30, 2011 | | | 11.44 | | | | (0.10 | )(f) | | | 4.13 | | | | 4.03 | | | | — | |
Year Ended June 30, 2010 | | | 9.91 | | | | (0.07 | ) | | | 1.60 | | | | 1.53 | | | | — | |
| | | | | |
Class C | | | | | | | | | | | | | | | | | | | | |
Six Months Ended December 31, 2014 (Unaudited) | | | 23.19 | | | | (0.14 | )(f)(g) | | | 0.56 | | | | 0.42 | | | | (0.37 | ) |
Year Ended June 30, 2014 | | | 18.43 | | | | (0.20 | )(f)(h) | | | 4.96 | | | | 4.76 | | | | — | |
Year Ended June 30, 2013 | | | 15.54 | | | | (0.14 | )(f)(i) | | | 3.03 | | | | 2.89 | | | | — | |
Year Ended June 30, 2012 | | | 15.21 | | | | (0.19 | ) | | | 0.52 | | | | 0.33 | | | | — | |
Year Ended June 30, 2011 | | | 11.29 | | | | (0.17 | )(f) | | | 4.09 | | | | 3.92 | | | | — | |
Year Ended June 30, 2010 | | | 9.84 | | | | (0.13 | ) | | | 1.58 | | | | 1.45 | | | | — | |
| | | | | |
Class R5 | | | | | | | | | | | | | | | | | | | | |
Six Months Ended December 31, 2014 (Unaudited) | | | 24.65 | | | | (0.03 | )(f)(g) | | | 0.61 | | | | 0.58 | | | | (0.37 | ) |
Year Ended June 30, 2014 | | | 19.42 | | | | (0.04 | )(f)(h) | | | 5.27 | | | | 5.23 | | | | — | |
Year Ended June 30, 2013 | | | 16.22 | | | | 0.03 | (f)(i) | | | 3.17 | | | | 3.20 | | | | — | |
Year Ended June 30, 2012 | | | 15.72 | | | | (0.06 | ) | | | 0.56 | | | | 0.50 | | | | — | |
Year Ended June 30, 2011 | | | 11.57 | | | | (0.04 | )(f) | | | 4.19 | | | | 4.15 | | | | — | |
Year Ended June 30, 2010 | | | 9.98 | | | | (0.02 | ) | | | 1.61 | | | | 1.59 | | | | — | |
| | | | | |
Select Class | | | | | | | | | | | | | | | | | | | | |
Six Months Ended December 31, 2014 (Unaudited) | | | 24.34 | | | | (0.05 | )(f)(g) | | | 0.59 | | | | 0.54 | | | | (0.37 | ) |
Year Ended June 30, 2014 | | | 19.20 | | | | (0.08 | )(f)(h) | | | 5.22 | | | | 5.14 | | | | — | |
Year Ended June 30, 2013 | | | 16.07 | | | | (0.03 | )(f)(i) | | | 3.16 | | | | 3.13 | | | | — | |
Year Ended June 30, 2012 | | | 15.61 | | | | (0.09 | ) | | | 0.55 | | | | 0.46 | | | | — | |
Year Ended June 30, 2011 | | | 11.51 | | | | (0.06 | )(f) | | | 4.16 | | | | 4.10 | | | | — | |
Year Ended June 30, 2010 | | | 9.95 | | | | (0.04 | ) | | | 1.60 | | | | 1.56 | | | | — | |
| (a) | Annualized for periods less than one year, unless otherwise noted. |
| (b) | Not annualized for periods less than one year. |
| (c) | Includes adjustments in accordance with accounting principles generally accepted in the United States of America and as such, the net asset values for financial reporting purposes and the returns based upon those net asset values may differ from the net asset values and returns for shareholder transactions. |
| (d) | Includes earnings credits and interest expense, if applicable, each of which is less than 0.01% unless otherwise noted. |
| (e) | Portfolio turnover is calculated by dividing the lesser of total purchases or sales of portfolio securities for the reporting period by the monthly average value of portfolio securities owned during the reporting period. Excluded from both the numerator and denominator are amounts relating to derivatives and securities whose maturities or expiration dates at the time of acquisition were one year or less. |
| (f) | Calculated based upon average shares outstanding. |
| (g) | Net investment income (loss) may appear disproportionate among Classes due to the timing of recognition of income and changes in the relative size of the Classes. |
| (h) | Reflects special dividends paid out during the period by several of the Fund’s holdings. Had the Fund not received the special dividends, the net investment income (loss) per share would have been $(0.08), $(0.21), $(0.05) and $(0.09) for Class A, Class C, Class R5 and Select Class Shares, respectively, and the net investment income (loss) ratio would have been (0.35)%, (0.92)%, (0.23)% and (0.40)% for Class A, Class C, Class R5 and Select Class Shares, respectively. These amounts have been revised to correct a calculation error in the previously issued June 30, 2014 financial highlights’ footnote disclosure. These revisions are not considered material to the previously issued financial statements. |
| (i) | Reflects special dividends paid out during the period by several of the Fund’s holdings. Had the Fund not received the special dividends, the net investment income (loss) per share would have been $(0.10), $(0.19), $(0.03) and $(0.08) for Class A, Class C, Class R5 and Select Class Shares, respectively, and the net investment income (loss) ratio would have been (0.60)%, (1.10)%, (0.15)% and (0.45)% for Class A, Class C, Class R5 and Select Class Shares, respectively. |
SEE NOTES TO FINANCIAL STATEMENTS.
| | | | | | |
| | | |
| 76 | | | | J.P. MORGAN LARGE CAP FUNDS | | DECEMBER 31, 2014 |
| | | | | | | | | | | | | | | | | | | | | | | | | | |
| | | Ratios/Supplemental data | |
| | | | | | | | | | Ratios to average net assets (a) | | | | |
Net asset
value,
end of
period | | | Total return
(excludes
sales charge) (b)(c) | | | Net assets,
end of
period
(000’s) | | | Net
expenses (d) | | | Net
investment
income
(loss) | | |
Expenses
without waivers,
reimbursements and
earnings credits | | | Portfolio
turnover
rate (b)(e) | |
| | | | | | | | | | | | | | | | | | | | | | | | | | |
| | | | | | | | | | | | | | | | | | | | | | | | | | |
| $ | 24.08 | | | | 2.12 | % | | $ | 27,593 | | | | 1.23 | % | | | (0.66 | )%(g) | | | 1.32 | % | | | 38 | % |
| | 23.95 | | | | 26.45 | | | | 16,996 | | | | 1.24 | | | | (0.30 | )(h) | | | 1.25 | | | | 55 | |
| | 18.94 | | | | 19.19 | | | | 126 | | | | 1.25 | | | | (0.30 | )(i) | | | 1.42 | | | | 82 | |
| | 15.89 | | | | 2.71 | | | | 106 | | | | 1.24 | | | | (0.81 | ) | | | 1.44 | | | | 99 | |
| | 15.47 | | | | 35.23 | | | | 103 | | | | 1.23 | | | | (0.71 | ) | | | 3.18 | | | | 97 | |
| | 11.44 | | | | 15.44 | | | | 76 | | | | 1.25 | | | | (0.61 | ) | | | 5.82 | | | | 39 | |
| | | | | | |
| | | | | | | | | | | | | | | | | | | | | | | | | | |
| | 23.24 | | | | 1.84 | | | | 7,465 | | | | 1.73 | | | | (1.16 | )(g) | | | 1.80 | | | | 38 | |
| | 23.19 | | | | 25.83 | | | | 4,416 | | | | 1.74 | | | | (0.86 | )(h) | | | 1.75 | | | | 55 | |
| | 18.43 | | | | 18.60 | | | | 123 | | | | 1.74 | | | | (0.80 | )(i) | | | 1.92 | | | | 82 | |
| | 15.54 | | | | 2.17 | | | | 104 | | | | 1.74 | | | | (1.31 | ) | | | 1.94 | | | | 99 | |
| | 15.21 | | | | 34.72 | | | | 102 | | | | 1.73 | | | | (1.21 | ) | | | 3.68 | | | | 97 | |
| | 11.29 | | | | 14.74 | | | | 75 | | | | 1.75 | | | | (1.11 | ) | | | 6.32 | | | | 39 | |
| | | | | | |
| | | | | | | | | | | | | | | | | | | | | | | | | | |
| | 24.86 | | | | 2.38 | | | | 46 | | | | 0.78 | | | | (0.22 | )(g) | | | 0.81 | | | | 38 | |
| | 24.65 | | | | 26.93 | | | | 45 | | | | 0.80 | | | | (0.17 | )(h) | | | 0.84 | | | | 55 | |
| | 19.42 | | | | 19.73 | | | | 32 | | | | 0.80 | | | | 0.15 | (i) | | | 0.97 | | | | 82 | |
| | 16.22 | | | | 3.18 | | | | 27 | | | | 0.79 | | | | (0.36 | ) | | | 0.99 | | | | 99 | |
| | 15.72 | | | | 35.87 | | | | 26 | | | | 0.78 | | | | (0.26 | ) | | | 2.73 | | | | 97 | |
| | 11.57 | | | | 15.93 | | | | 19 | | | | 0.80 | | | | (0.17 | ) | | | 5.37 | | | | 39 | |
| | | | | | |
| | | | | | | | | | | | | | | | | | | | | | | | | | |
| | 24.51 | | | | 2.25 | | | | 293,352 | | | | 0.98 | | | | (0.42 | )(g) | | | 1.01 | | | | 38 | |
| | 24.34 | | | | 26.77 | | | | 261,308 | | | | 1.00 | | | | (0.35 | )(h) | | | 1.04 | | | | 55 | |
| | 19.20 | | | | 19.48 | | | | 101,999 | | | | 1.00 | | | | (0.16 | )(i) | | | 1.14 | | | | 82 | |
| | 16.07 | | | | 2.95 | | | | 38,953 | | | | 0.99 | | | | (0.56 | ) | | | 1.19 | | | | 99 | |
| | 15.61 | | | | 35.62 | | | | 43,617 | | | | 0.97 | | | | (0.41 | ) | | | 1.59 | | | | 97 | |
| | 11.51 | | | | 15.68 | | | | 2,130 | | | | 1.00 | | | | (0.36 | ) | | | 5.57 | | | | 39 | |
SEE NOTES TO FINANCIAL STATEMENTS.
| | | | | | | | |
| | | |
| DECEMBER 31, 2014 | | J.P. MORGAN LARGE CAP FUNDS | | | | | 77 | |
FINANCIAL HIGHLIGHTS
FOR THE PERIODS INDICATED (continued)
| | | | | | | | | | | | | | | | | | | | | | | | | | | | |
| | | Per share operating performance | |
| | | | | | Investment operations | | | Distributions | |
| | | Net asset
value,
beginning
of period | | | Net
investment
income
(loss) | | | Net realized
and unrealized
gains
(losses) on
investments | | | Total from
investment
operations | | | Net
investment
income | | | Net
realized
gain | | | Total
distributions | |
Equity Focus Fund | | | | | | | | | | | | | | | | | | | | | | | | | | | | |
Class A | | | | | | | | | | | | | | | | | | | | | | | | | | | | |
Six Months Ended December 31, 2014 (Unaudited) | | $ | 23.56 | | | $ | (0.03 | )(g) | | $ | 0.89 | | | $ | 0.86 | | | $ | (0.02 | ) | | $ | (0.16 | ) | | $ | (0.18 | ) |
Year Ended June 30, 2014 | | | 19.18 | | | | (0.02 | )(g) | | | 4.86 | | | | 4.84 | | | | — | | | | (0.46 | ) | | | (0.46 | ) |
Year Ended June 30, 2013 | | | 15.79 | | | | (0.02 | ) | | | 3.41 | | | | 3.39 | | | | — | | | | — | | | | — | |
July 29, 2011(h) through June 30, 2012 | | | 15.00 | | | | 0.01 | | | | 0.79 | | | | 0.80 | | | | (0.01 | ) | | | — | | | | (0.01 | ) |
| | | | | | | |
Class C | | | | | | | | | | | | | | | | | | | | | | | | | | | | |
Six Months Ended December 31, 2014 (Unaudited) | | | 23.24 | | | | (0.09 | )(g) | | | 0.88 | | | | 0.79 | | | | — | | | | (0.16 | ) | | | (0.16 | ) |
Year Ended June 30, 2014 | | | 19.01 | | | | (0.15 | )(g) | | | 4.84 | | | | 4.69 | | | | — | | | | (0.46 | ) | | | (0.46 | ) |
Year Ended June 30, 2013 | | | 15.73 | | | | (0.11 | ) | | | 3.39 | | | | 3.28 | | | | — | | | | — | | | | — | |
July 29, 2011(h) through June 30, 2012 | | | 15.00 | | | | (0.06 | ) | | | 0.79 | | | | 0.73 | | | | — | (i) | | | — | | | | — | |
| | | | | | | |
Select Class | | | | | | | | | | | | | | | | | | | | | | | | | | | | |
Six Months Ended December 31, 2014 (Unaudited) | | | 23.67 | | | | 0.01 | (g) | | | 0.89 | | | | 0.90 | | | | (0.04 | ) | | | (0.16 | ) | | | (0.20 | ) |
Year Ended June 30, 2014 | | | 19.22 | | | | 0.04 | (g) | | | 4.87 | | | | 4.91 | | | | — | (i) | | | (0.46 | ) | | | (0.46 | ) |
Year Ended June 30, 2013 | | | 15.81 | | | | 0.02 | | | | 3.42 | | | | 3.44 | | | | (0.03 | ) | | | — | | | | (0.03 | ) |
July 29, 2011(h) through June 30, 2012 | | | 15.00 | | | | 0.04 | | | | 0.80 | | | | 0.84 | | | | (0.03 | ) | | | — | | | | (0.03 | ) |
| (a) | Annualized for periods less than one year, unless otherwise noted. |
| (b) | Not annualized for periods less than one year. |
| (c) | Includes adjustments in accordance with accounting principles generally accepted in the United States of America and as such, the net asset values for financial reporting purposes and the returns based upon those net asset values may differ from the net asset values and returns for shareholder transactions. |
| (d) | Includes earnings credits and interest expense, if applicable, each of which is less than 0.01% unless otherwise noted. |
| (e) | Certain non-recurring expenses incurred by the Fund were not annualized for the year ended June 30, 2013 and for the period ended June 30, 2012. |
| (f) | Portfolio turnover is calculated by dividing the lesser of total purchases or sales of portfolio securities for the reporting period by the monthly average value of portfolio securities owned during the reporting period. Excluded from both the numerator and denominator are amounts relating to derivatives and securities whose maturities or expiration dates at the time of acquisition were one year or less. |
| (g) | Calculated based upon average shares outstanding. |
| (h) | Commencement of operations. |
| (i) | Amount rounds to less than $0.01. |
SEE NOTES TO FINANCIAL STATEMENTS.
| | | | | | |
| | | |
| 78 | | | | J.P. MORGAN LARGE CAP FUNDS | | DECEMBER 31, 2014 |
| | | | | | | | | | | | | | | | | | | | | | | | | | |
| | | Ratios/Supplemental data | |
| | | | | | | | | | Ratios to average net assets (a) | | | | |
Net asset
value,
end of
period | | | Total return
(excludes
sales charge) (b)(c) | | | Net assets,
end of
period
(000’s) | | | Net
expenses (d)(e) | | | Net
investment
income
(loss) (e) | | | Expenses
without waivers,
reimbursements and
earnings credits (e) | | | Portfolio
turnover
rate (b)(f) | |
| | | | | | | | | | | | | | | | | | | | | | | | | | |
| | | | | | | | | | | | | | | | | | | | | | | | | | |
| $ | 24.24 | | | | 3.67 | % | | $ | 999 | | | | 1.24 | % | | | (0.21 | )% | | | 1.44 | % | | | 24 | % |
| | 23.56 | | | | 25.43 | | | | 423 | | | | 1.24 | | | | (0.10 | ) | | | 2.11 | | | | 76 | |
| | 19.18 | | | | 21.47 | | | | 64 | | | | 1.25 | | | | (0.13 | ) | | | 3.75 | | | | 61 | |
| | 15.79 | | | | 5.37 | | | | 53 | | | | 1.25 | | | | 0.04 | | | | 5.09 | | | | 71 | |
| | | | | | |
| | | | | | | | | | | | | | | | | | | | | | | | | | |
| | 23.87 | | | | 3.40 | | | | 600 | | | | 1.74 | | | | (0.72 | ) | | | 1.91 | | | | 24 | |
| | 23.24 | | | | 24.86 | | | | 133 | | | | 1.74 | | | | (0.67 | ) | | | 2.82 | | | | 76 | |
| | 19.01 | | | | 20.85 | | | | 63 | | | | 1.75 | | | | (0.63 | ) | | | 4.25 | | | | 61 | |
| | 15.73 | | | | 4.87 | | | | 52 | | | | 1.75 | | | | (0.46 | ) | | | 5.58 | | | | 71 | |
| | | | | | |
| | | | | | | | | | | | | | | | | | | | | | | | | | |
| | 24.37 | | | | 3.79 | | | | 77,265 | | | | 0.99 | | | | 0.05 | | | | 1.16 | | | | 24 | |
| | 23.67 | | | | 25.75 | | | | 72,064 | | | | 0.99 | | | | 0.19 | | | | 1.51 | | | | 76 | |
| | 19.22 | | | | 21.77 | | | | 3,730 | | | | 1.00 | | | | 0.12 | | | | 3.51 | | | | 61 | |
| | 15.81 | | | | 5.61 | | | | 3,063 | | | | 1.00 | | | | 0.29 | | | | 4.84 | | | | 71 | |
SEE NOTES TO FINANCIAL STATEMENTS.
| | | | | | | | |
| | | |
| DECEMBER 31, 2014 | | J.P. MORGAN LARGE CAP FUNDS | | | | | 79 | |
FINANCIAL HIGHLIGHTS
FOR THE PERIODS INDICATED (continued)
| | | | | | | | | | | | | | | | | | | | | | | | | | | | |
| | | Per share operating performance | |
| | | | | | Investment operations | | | Distributions | |
| | | Net asset
value,
beginning
of period | | | Net
investment
income
(loss) | | | Net realized
and unrealized
gains
(losses) on
investments | | | Total from
investment
operations | | | Net
investment
income | | | Net
realized
gain | | | Total
distributions | |
Equity Income Fund | | | | | | | | | | | | | | | | | | | | | | | | | | | | |
Class A | | | | | | | | | | | | | | | | | | | | | | | | | | | | |
Six Months Ended December 31, 2014 (Unaudited) | | $ | 13.66 | | | $ | 0.15 | (f)(g) | | $ | 0.69 | | | $ | 0.84 | | | $ | (0.15 | ) | | $ | (0.28 | ) | | $ | (0.43 | ) |
Year Ended June 30, 2014 | | | 11.62 | | | | 0.21 | (f) | | | 2.26 | | | | 2.47 | | | | (0.21 | ) | | | (0.22 | ) | | | (0.43 | ) |
Year Ended June 30, 2013 | | | 9.84 | | | | 0.24 | (f)(h) | | | 1.84 | | | | 2.08 | | | | (0.23 | ) | | | (0.07 | ) | | | (0.30 | ) |
Year Ended June 30, 2012 | | | 9.38 | | | | 0.21 | (f) | | | 0.46 | | | | 0.67 | | | | (0.17 | ) | | | (0.04 | ) | | | (0.21 | ) |
Year Ended June 30, 2011 | | | 7.26 | | | | 0.19 | (f) | | | 2.12 | | | | 2.31 | | | | (0.19 | ) | | | — | | | | (0.19 | ) |
Year Ended June 30, 2010 | | | 6.35 | | | | 0.17 | (f) | | | 0.91 | | | | 1.08 | | | | (0.17 | ) | | | — | | | | (0.17 | ) |
Class B | | | | | | | | | | | | | | | | | | | | | | | | | | | | |
Six Months Ended December 31, 2014 (Unaudited) | | | 13.56 | | | | 0.11 | (f)(g) | | | 0.68 | | | | 0.79 | | | | (0.11 | ) | | | (0.28 | ) | | | (0.39 | ) |
Year Ended June 30, 2014 | | | 11.54 | | | | 0.15 | (f) | | | 2.24 | | | | 2.39 | | | | (0.15 | ) | | | (0.22 | ) | | | (0.37 | ) |
Year Ended June 30, 2013 | | | 9.78 | | | | 0.18 | (f)(h) | | | 1.83 | | | | 2.01 | | | | (0.18 | ) | | | (0.07 | ) | | | (0.25 | ) |
Year Ended June 30, 2012 | | | 9.33 | | | | 0.15 | (f) | | | 0.47 | | | | 0.62 | | | | (0.13 | ) | | | (0.04 | ) | | | (0.17 | ) |
Year Ended June 30, 2011 | | | 7.22 | | | | 0.14 | (f) | | | 2.12 | | | | 2.26 | | | | (0.15 | ) | | | — | | | | (0.15 | ) |
Year Ended June 30, 2010 | | | 6.30 | | | | 0.13 | (f) | | | 0.92 | | | | 1.05 | | | | (0.13 | ) | | | — | | | | (0.13 | ) |
Class C | | | | | | | | | | | | | | | | | | | | | | | | | | | | |
Six Months Ended December 31, 2014 (Unaudited) | | | 13.49 | | | | 0.11 | (f)(g) | | | 0.68 | | | | 0.79 | | | | (0.12 | ) | | | (0.28 | ) | | | (0.40 | ) |
Year Ended June 30, 2014 | | | 11.49 | | | | 0.15 | (f) | | | 2.23 | | | | 2.38 | | | | (0.16 | ) | | | (0.22 | ) | | | (0.38 | ) |
Year Ended June 30, 2013 | | | 9.74 | | | | 0.18 | (f)(h) | | | 1.83 | | | | 2.01 | | | | (0.19 | ) | | | (0.07 | ) | | | (0.26 | ) |
Year Ended June 30, 2012 | | | 9.30 | | | | 0.16 | (f) | | | 0.45 | | | | 0.61 | | | | (0.13 | ) | | | (0.04 | ) | | | (0.17 | ) |
Year Ended June 30, 2011 | | | 7.20 | | | | 0.15 | (f) | | | 2.11 | | | | 2.26 | | | | (0.16 | ) | | | — | | | | (0.16 | ) |
Year Ended June 30, 2010 | | | 6.30 | | | | 0.13 | (f) | | | 0.90 | | | | 1.03 | | | | (0.13 | ) | | | — | | | | (0.13 | ) |
Class R2 | | | | | | | | | | | | | | | | | | | | | | | | | | | | |
Six Months Ended December 31, 2014 (Unaudited) | | | 13.64 | | | | 0.14 | (f)(g) | | | 0.67 | | | | 0.81 | | | | (0.13 | ) | | | (0.28 | ) | | | (0.41 | ) |
Year Ended June 30, 2014 | | | 11.61 | | | | 0.18 | (f) | | | 2.25 | | | | 2.43 | | | | (0.18 | ) | | | (0.22 | ) | | | (0.40 | ) |
Year Ended June 30, 2013 | | | 9.84 | | | | 0.21 | (f)(h) | | | 1.84 | | | | 2.05 | | | | (0.21 | ) | | | (0.07 | ) | | | (0.28 | ) |
Year Ended June 30, 2012 | | | 9.38 | | | | 0.19 | (f) | | | 0.46 | | | | 0.65 | | | | (0.15 | ) | | | (0.04 | ) | | | (0.19 | ) |
February 28, 2011 (i) through June 30, 2011 | | | 9.20 | | | | 0.06 | (f) | | | 0.17 | | | | 0.23 | | | | (0.05 | ) | | | — | | | | (0.05 | ) |
Class R5 | | | | | | | | | | | | | | | | | | | | | | | | | | | | |
Six Months Ended December 31, 2014 (Unaudited) | | | 13.85 | | | | 0.19 | (f)(g) | | | 0.68 | | | | 0.87 | | | | (0.17 | ) | | | (0.28 | ) | | | (0.45 | ) |
Year Ended June 30, 2014 | | | 11.78 | | | | 0.27 | (f) | | | 2.29 | | | | 2.56 | | | | (0.27 | ) | | | (0.22 | ) | | | (0.49 | ) |
Year Ended June 30, 2013 | | | 9.96 | | | | 0.29 | (f)(h) | | | 1.87 | | | | 2.16 | | | | (0.27 | ) | | | (0.07 | ) | | | (0.34 | ) |
Year Ended June 30, 2012 | | | 9.49 | | | | 0.26 | (f) | | | 0.46 | | | | 0.72 | | | | (0.21 | ) | | | (0.04 | ) | | | (0.25 | ) |
February 28, 2011 (i) through June 30, 2011 | | | 9.31 | | | | 0.10 | (f) | | | 0.16 | | | | 0.26 | | | | (0.08 | ) | | | — | | | | (0.08 | ) |
Class R6 | | | | | | | | | | | | | | | | | | | | | | | | | | | | |
Six Months Ended December 31, 2014 (Unaudited) | | | 13.84 | | | | 0.19 | (f)(g) | | | 0.69 | | | | 0.88 | | | | (0.18 | ) | | | (0.28 | ) | | | (0.46 | ) |
Year Ended June 30, 2014 | | | 11.77 | | | | 0.28 | (f) | | | 2.28 | | | | 2.56 | | | | (0.27 | ) | | | (0.22 | ) | | | (0.49 | ) |
Year Ended June 30, 2013 | | | 9.96 | | | | 0.29 | (f)(h) | | | 1.87 | | | | 2.16 | | | | (0.28 | ) | | | (0.07 | ) | | | (0.35 | ) |
January 31, 2012 (i) through June 30, 2012 | | | 9.64 | | | | 0.13 | (f) | | | 0.30 | | | | 0.43 | | | | (0.11 | ) | | | — | | | | (0.11 | ) |
Select Class | | | | | | | | | | | | | | | | | | | | | | | | | | | | |
Six Months Ended December 31, 2014 (Unaudited) | | | 13.85 | | | | 0.17 | (f)(g) | | | 0.69 | | | | 0.86 | | | | (0.16 | ) | | | (0.28 | ) | | | (0.44 | ) |
Year Ended June 30, 2014 | | | 11.77 | | | | 0.25 | (f) | | | 2.29 | | | | 2.54 | | | | (0.24 | ) | | | (0.22 | ) | | | (0.46 | ) |
Year Ended June 30, 2013 | | | 9.96 | | | | 0.27 | (f)(h) | | | 1.86 | | | | 2.13 | | | | (0.25 | ) | | | (0.07 | ) | | | (0.32 | ) |
Year Ended June 30, 2012 | | | 9.50 | | | | 0.24 | (f) | | | 0.45 | | | | 0.69 | | | | (0.19 | ) | | | (0.04 | ) | | | (0.23 | ) |
Year Ended June 30, 2011 | | | 7.35 | | | | 0.22 | (f) | | | 2.14 | | | | 2.36 | | | | (0.21 | ) | | | — | | | | (0.21 | ) |
Year Ended June 30, 2010 | | | 6.42 | | | | 0.20 | (f) | | | 0.92 | | | | 1.12 | | | | (0.19 | ) | | | — | | | | (0.19 | ) |
| (a) | Annualized for periods less than one year, unless otherwise noted. |
| (b) | Not annualized for periods less than one year. |
| (c) | Includes adjustments in accordance with accounting principles generally accepted in the United States of America and as such, the net asset values for financial reporting purposes and the returns based upon those net asset values may differ from the net asset values and returns for shareholder transactions. |
| (d) | Includes earnings credits and interest expense, if applicable, each of which is less than 0.01% unless otherwise noted. |
| (e) | Portfolio turnover is calculated by dividing the lesser of total purchases or sales of portfolio securities for the reporting period by the monthly average value of portfolio securities owned during the reporting period. Excluded from both the numerator and denominator are amounts relating to derivatives and securities whose maturities or expiration dates at the time of acquisition were one year or less. |
| (f) | Calculated based upon average shares outstanding. |
SEE NOTES TO FINANCIAL STATEMENTS.
| | | | | | |
| | | |
| 80 | | | | J.P. MORGAN LARGE CAP FUNDS | | DECEMBER 31, 2014 |
| | | | | | | | | | | | | | | | | | | | | | | | | | |
| | | Ratios/Supplemental data | |
| | | | | | | | | | Ratios to average net assets (a) | | | | |
Net asset
value,
end of
period | | | Total return
(excludes
sales charge) (b)(c) | | |
Net assets,
end of
period
(000’s) | | | Net
expenses (d) | | | Net
investment
income
(loss) | | | Expenses
without waivers,
reimbursements and
earnings credits | | | Portfolio
turnover
rate (b)(e) | |
| | | | | | | | | | | | | | | | | | | | | | | | | | |
| | | | | | | | | | | | | | | | | | | | | | | | | | |
| $ | 14.07 | | | | 6.18 | % | | $ | 2,765,330 | | | | 1.04 | % | | | 2.16 | %(g) | | | 1.07 | % | | | 10 | % |
| | 13.66 | | | | 21.60 | | | | 2,360,750 | | | | 1.04 | | | | 1.68 | | | | 1.06 | | | | 20 | |
| | 11.62 | | | | 21.53 | | | | 1,285,400 | | | | 1.03 | | | | 2.22 | (h) | | | 1.08 | | | | 34 | |
| | 9.84 | | | | 7.30 | | | | 580,848 | | | | 1.04 | | | | 2.22 | | | | 1.08 | | | | 44 | |
| | 9.38 | | | | 32.06 | | | | 217,462 | | | | 1.05 | | | | 2.16 | | | | 1.14 | | | | 37 | |
| | 7.26 | | | | 16.94 | | | | 79,236 | | | | 1.20 | | | | 2.29 | | | | 1.22 | | | | 43 | |
| | | | | | | | | | | | | | | | | | | | | | | | | | |
| | 13.96 | | | | 5.90 | | | | 3,390 | | | | 1.54 | | | | 1.57 | (g) | | | 1.57 | | | | 10 | |
| | 13.56 | | | | 20.99 | | | | 3,932 | | | | 1.52 | | | | 1.17 | | | | 1.56 | | | | 20 | |
| | 11.54 | | | | 20.90 | | | | 4,062 | | | | 1.52 | | | | 1.75 | (h) | | | 1.58 | | | | 34 | |
| | 9.78 | | | | 6.75 | | | | 4,353 | | | | 1.54 | | | | 1.64 | | | | 1.59 | | | | 44 | |
| | 9.33 | | | | 31.44 | | | | 5,962 | | | | 1.56 | | | | 1.66 | | | | 1.65 | | | | 37 | |
| | 7.22 | | | | 16.63 | | | | 6,563 | | | | 1.72 | | | | 1.77 | | | | 1.72 | | | | 43 | |
| | | | | | | | | | | | | | | | | | | | | | | | | | |
| | 13.88 | | | | 5.88 | | | | 985,499 | | | | 1.54 | | | | 1.66 | (g) | | | 1.55 | | | | 10 | |
| | 13.49 | | | | 20.95 | | | | 805,494 | | | | 1.54 | | | | 1.19 | | | | 1.56 | | | | 20 | |
| | 11.49 | | | | 20.94 | | | | 407,911 | | | | 1.53 | | | | 1.71 | (h) | | | 1.58 | | | | 34 | |
| | 9.74 | | | | 6.72 | | | | 130,366 | | | | 1.54 | | | | 1.74 | | | | 1.58 | | | | 44 | |
| | 9.30 | | | | 31.52 | | | | 28,947 | | | | 1.55 | | | | 1.69 | | | | 1.63 | | | | 37 | |
| | 7.20 | | | | 16.34 | | | | 5,549 | | | | 1.71 | | | | 1.79 | | | | 1.72 | | | | 43 | |
| | | | | | | | | | | | | | | | | | | | | | | | | | |
| | 14.04 | | | | 6.01 | | | | 42,349 | | | | 1.29 | | | | 1.97 | (g) | | | 1.34 | | | | 10 | |
| | 13.64 | | | | 21.27 | | | | 28,733 | | | | 1.29 | | | | 1.44 | | | | 1.31 | | | | 20 | |
| | 11.61 | | | | 21.21 | | | | 13,347 | | | | 1.28 | | | | 1.92 | (h) | | | 1.34 | | | | 34 | |
| | 9.84 | | | | 7.13 | | | | 1,682 | | | | 1.29 | | | | 1.94 | | | | 1.32 | | | | 44 | |
| | 9.38 | | | | 2.54 | | | | 51 | | | | 1.28 | | | | 1.80 | | | | 1.36 | | | | 37 | |
| | | | | | | | | | | | | | | | | | | | | | | | | | |
| | 14.27 | | | | 6.39 | | | | 421,355 | | | | 0.59 | | | | 2.63 | (g) | | | 0.60 | | | | 10 | |
| | 13.85 | | | | 22.06 | | | | 307,700 | | | | 0.59 | | | | 2.11 | | | | 0.61 | | | | 20 | |
| | 11.78 | | | | 22.17 | | | | 227,442 | | | | 0.58 | | | | 2.69 | (h) | | | 0.63 | | | | 34 | |
| | 9.96 | | | | 7.78 | | | | 111,647 | | | | 0.58 | | | | 2.77 | | | | 0.63 | | | | 44 | |
| | 9.49 | | | | 2.77 | | | | 2,925 | | | | 0.58 | | | | 3.21 | | | | 0.66 | | | | 37 | |
| | | | | | | | | | | | | | | | | | | | | | | | | | |
| | 14.26 | | | | 6.42 | | | | 719,104 | | | | 0.52 | | | | 2.68 | (g) | | | 0.53 | | | | 10 | |
| | 13.84 | | | | 22.14 | | | | 551,378 | | | | 0.54 | | | | 2.20 | | | | 0.56 | | | | 20 | |
| | 11.77 | | | | 22.12 | | | | 233,034 | | | | 0.53 | | | | 2.63 | (h) | | | 0.59 | | | | 34 | |
| | 9.96 | | | | 4.47 | | | | 70,589 | | | | 0.53 | | | | 3.28 | | | | 0.58 | | | | 44 | |
| | | | | | | | | | | | | | | | | | | | | | | | | | |
| | 14.27 | | | | 6.29 | | | | 4,127,088 | | | | 0.79 | | | | 2.40 | (g) | | | 0.79 | | | | 10 | |
| | 13.85 | | | | 21.94 | | | | 3,467,542 | | | | 0.79 | | | | 1.92 | | | | 0.81 | | | | 20 | |
| | 11.77 | | | | 21.84 | | | | 2,337,565 | | | | 0.78 | | | | 2.48 | (h) | | | 0.83 | | | | 34 | |
| | 9.96 | | | | 7.48 | | | | 1,313,214 | | | | 0.78 | | | | 2.48 | | | | 0.83 | | | | 44 | |
| | 9.50 | | | | 32.42 | | | | 204,331 | | | | 0.80 | | | | 2.45 | | | | 0.89 | | | | 37 | |
| | 7.35 | | | | 17.45 | | | | 89,156 | | | | 0.86 | | | | 2.64 | | | | 0.97 | | | | 43 | |
| (g) | Reflects special dividends paid out during the period by several of the Fund’s holdings. Had the Fund not received the special dividends, the net investment income (loss) per share would have been $0.11, $0.07, $0.07, $0.09, $0.14, $0.15 and $0.13 for Class A, Class B, Class C, Class R2, Class R5, Class R6 and Select Class Shares, respectively, and the net investment income (loss) ratio would have been 1.55%, 0.96%, 1.05%, 1.36%, 2.02%, 2.07% and 1.79% for Class A, Class B, Class C, Class R2, Class R5, Class R6 and Select Class Shares, respectively. |
| (h) | Reflects special dividends paid out during the period by several of the Fund’s holdings. Had the Fund not received the special dividends, the net investment income (loss) per share would have been $0.21, $0.16, $0.16, $0.18, $0.27, $0.26 and $0.24 for Class A, Class B, Class C, Class R2, Class R5, Class R6 and Select Class Shares, respectively, and the net investment income (loss) ratio would have been 1.97%, 1.49%, 1.46%, 1.67%, 2.44%, 2.38% and 2.23% for Class A, Class B, Class C, Class R2, Class R5, Class R6 and Select Class Shares, respectively. |
| (i) | Commencement of offering of class of shares. |
SEE NOTES TO FINANCIAL STATEMENTS.
| | | | | | | | |
| | | |
| DECEMBER 31, 2014 | | J.P. MORGAN LARGE CAP FUNDS | | | | | 81 | |
FINANCIAL HIGHLIGHTS
FOR THE PERIODS INDICATED (continued)
| | | | | | | | | | | | | | | | | | | | | | | | | | | | |
| | | | | | Per share operating performance | |
| | | | | | Investment operations | | | Distributions | |
| | | Net asset
value,
beginning
of period | | | Net
investment
income
(loss) | | | Net realized
and unrealized
gains
(losses) on
investments | | | Total from
investment
operations | | | Net
investment
income | | | Net
realized
gain | | | Total
distributions | |
Growth and Income Fund | | | | | | | | | | | | | | | | | | | | | | | | | | | | |
Class A | | | | | | | | | | | | | | | | | | | | | | | | | | | | |
Six Months Ended December 31, 2014 (Unaudited) | | $ | 44.70 | | | $ | 0.33 | (f)(g) | | $ | 2.38 | | | $ | 2.71 | | | $ | (0.31 | ) | | $ | (0.99 | ) | | $ | (1.30 | ) |
Year Ended June 30, 2014 | | | 36.53 | | | | 0.47 | (f) | | | 8.17 | | | | 8.64 | | | | (0.47 | ) | | | — | | | | (0.47 | ) |
Year Ended June 30, 2013 | | | 29.43 | | | | 0.40 | (f) | | | 7.11 | | | | 7.51 | | | | (0.41 | ) | | | — | | | | (0.41 | ) |
Year Ended June 30, 2012 | | | 28.26 | | | | 0.35 | (f) | | | 1.16 | | | | 1.51 | | | | (0.34 | ) | | | — | | | | (0.34 | ) |
Year Ended June 30, 2011 | | | 22.30 | | | | 0.28 | (f) | | | 5.96 | | | | 6.24 | | | | (0.28 | ) | | | — | | | | (0.28 | ) |
Year Ended June 30, 2010 | | | 19.46 | | | | 0.35 | (f) | | | 2.83 | | | | 3.18 | | | | (0.34 | ) | | | — | | | | (0.34 | ) |
| | | | | | | |
Class B | | | | | | | | | | | | | | | | | | | | | | | | | | | | |
Six Months Ended December 31, 2014 (Unaudited) | | | 43.65 | | | | 0.20 | (f)(g) | | | 2.33 | | | | 2.53 | | | | (0.21 | ) | | | (0.99 | ) | | | (1.20 | ) |
Year Ended June 30, 2014 | | | 35.68 | | | | 0.25 | (f) | | | 7.99 | | | | 8.24 | | | | (0.27 | ) | | | — | | | | (0.27 | ) |
Year Ended June 30, 2013 | | | 28.76 | | | | 0.23 | (f) | | | 6.94 | | | | 7.17 | | | | (0.25 | ) | | | — | | | | (0.25 | ) |
Year Ended June 30, 2012 | | | 27.62 | | | | 0.21 | (f) | | | 1.14 | | | | 1.35 | | | | (0.21 | ) | | | — | | | | (0.21 | ) |
Year Ended June 30, 2011 | | | 21.80 | | | | 0.15 | (f) | | | 5.82 | | | | 5.97 | | | | (0.15 | ) | | | — | | | | (0.15 | ) |
Year Ended June 30, 2010 | | | 19.03 | | | | 0.23 | (f) | | | 2.76 | | | | 2.99 | | | | (0.22 | ) | | | — | | | | (0.22 | ) |
| | | | | | | |
Class C | | | | | | | | | | | | | | | | | | | | | | | | | | | | |
Six Months Ended December 31, 2014 (Unaudited) | | | 41.31 | | | | 0.20 | (f)(g) | | | 2.19 | | | | 2.39 | | | | (0.23 | ) | | | (0.99 | ) | | | (1.22 | ) |
Year Ended June 30, 2014 | | | 33.83 | | | | 0.25 | (f) | | | 7.55 | | | | 7.80 | | | | (0.32 | ) | | | — | | | | (0.32 | ) |
Year Ended June 30, 2013 | | | 27.32 | | | | 0.22 | (f) | | | 6.59 | | | | 6.81 | | | | (0.30 | ) | | | — | | | | (0.30 | ) |
Year Ended June 30, 2012 | | | 26.27 | | | | 0.20 | (f) | | | 1.08 | | | | 1.28 | | | | (0.23 | ) | | | — | | | | (0.23 | ) |
Year Ended June 30, 2011 | | | 20.77 | | | | 0.14 | (f) | | | 5.53 | | | | 5.67 | | | | (0.17 | ) | | | — | | | | (0.17 | ) |
Year Ended June 30, 2010 | | | 18.15 | | | | 0.21 | (f) | | | 2.66 | | | | 2.87 | | | | (0.25 | ) | | | — | | | | (0.25 | ) |
| | | | | | | |
Select Class | | | | | | | | | | | | | | | | | | | | | | | | | | | | |
Six Months Ended December 31, 2014 (Unaudited) | | | 46.58 | | | | 0.41 | (f)(g) | | | 2.47 | | | | 2.88 | | | | (0.35 | ) | | | (0.99 | ) | | | (1.34 | ) |
Year Ended June 30, 2014 | | | 38.03 | | | | 0.58 | (f) | | | 8.52 | | | | 9.10 | | | | (0.55 | ) | | | — | | | | (0.55 | ) |
Year Ended June 30, 2013 | | | 30.63 | | | | 0.51 | (f) | | | 7.40 | | | | 7.91 | | | | (0.51 | ) | | | — | | | | (0.51 | ) |
Year Ended June 30, 2012 | | | 29.39 | | | | 0.45 | (f) | | | 1.21 | | | | 1.66 | | | | (0.42 | ) | | | — | | | | (0.42 | ) |
Year Ended June 30, 2011 | | | 23.18 | | | | 0.37 | (f) | | | 6.20 | | | | 6.57 | | | | (0.36 | ) | | | — | | | | (0.36 | ) |
Year Ended June 30, 2010 | | | 20.21 | | | | 0.43 | (f) | | | 2.95 | | | | 3.38 | | | | (0.41 | ) | | | — | | | | (0.41 | ) |
| (a) | Annualized for periods less than one year, unless otherwise noted. |
| (b) | Not annualized for periods less than one year. |
| (c) | Includes adjustments in accordance with accounting principles generally accepted in the United States of America and as such, the net asset values for financial reporting purposes and the returns based upon those net asset values may differ from the net asset values and returns for shareholder transactions. |
| (d) | Includes earnings credits and interest expense, if applicable, each of which is less than 0.01% unless otherwise noted. |
| (e) | Portfolio turnover is calculated by dividing the lesser of total purchases or sales of portfolio securities for the reporting period by the monthly average value of portfolio securities owned during the reporting period. Excluded from both the numerator and denominator are amounts relating to derivatives and securities whose maturities or expiration dates at the time of acquisition were one year or less. |
| (f) | Calculated based upon average shares outstanding. |
| (g) | Reflects special dividends paid out during the period by several of the Fund’s holdings. Had the Fund not received the special dividends, the net investment income (loss) per share would have been $0.24, $0.12, $0.13 and $0.32 for Class A, Class B, Class C and Select Class Shares, respectively, and the net investment income (loss) ratio would have been 1.08%, 0.55%, 0.60% and 1.34% for Class A, Class B, Class C and Select Class Shares, respectively. |
SEE NOTES TO FINANCIAL STATEMENTS.
| | | | | | |
| | | |
| 82 | | | | J.P. MORGAN LARGE CAP FUNDS | | DECEMBER 31, 2014 |
| | | | | | | | | | | | | | | | | | | | | | | | | | |
| | | Ratios/Supplemental data | |
| | | | | | | | | | Ratios to average net assets (a) | | | | |
Net asset
value,
end of
period | | | Total return
(excludes
sales charge) (b)(c) | | | Net assets,
end of
period
(000’s) | | | Net
expenses (d) | | | Net
investment
income
(loss) | | | Expenses
without waivers,
reimbursements and
earnings credits | | | Portfolio
turnover
rate (b)(e) | |
| | | | | | | | | | | | | | | | | | | | | | | | | | |
| | | | | | | | | | | | | | | | | | | | | | | | | | |
| $ | 46.11 | | | | 6.15 | % | | $ | 436,305 | | | | 1.13 | % | | | 1.44 | %(g) | | | 1.13 | % | | | 21 | % |
| | 44.70 | | | | 23.74 | | | | 419,465 | | | | 1.13 | | | | 1.16 | | | | 1.15 | | | | 42 | |
| | 36.53 | | | | 25.65 | | | | 356,127 | | | | 1.15 | | | | 1.23 | | | | 1.16 | | | | 35 | |
| | 29.43 | | | | 5.45 | | | | 293,520 | | | | 1.19 | | | | 1.28 | | | | 1.19 | | | | 28 | |
| | 28.26 | | | | 28.03 | | | | 306,850 | | | | 1.19 | | | | 1.07 | | | | 1.19 | | | | 23 | |
| | 22.30 | | | | 16.25 | | | | 266,587 | | | | 1.21 | | | | 1.49 | | | | 1.21 | | | | 41 | |
| | | | | | |
| | | | | | | | | | | | | | | | | | | | | | | | | | |
| | 44.98 | | | | 5.88 | | | | 2,435 | | | | 1.64 | | | | 0.91 | (g) | | | 1.64 | | | | 21 | |
| | 43.65 | | | | 23.14 | | | | 2,660 | | | | 1.63 | | | | 0.64 | | | | 1.65 | | | | 42 | |
| | 35.68 | | | | 25.01 | | | | 2,981 | | | | 1.66 | | | | 0.73 | | | | 1.66 | | | | 35 | |
| | 28.76 | | | | 4.93 | | | | 3,286 | | | | 1.69 | | | | 0.77 | | | | 1.70 | | | | 28 | |
| | 27.62 | | | | 27.40 | | | | 4,439 | | | | 1.69 | | | | 0.57 | | | | 1.69 | | | | 23 | |
| | 21.80 | | | | 15.66 | | | | 4,959 | | | | 1.71 | | | | 1.01 | | | | 1.72 | | | | 41 | |
| | | | | | |
| | | | | | | | | | | | | | | | | | | | | | | | | | |
| | 42.48 | | | | 5.90 | | | | 19,435 | | | | 1.64 | | | | 0.96 | (g) | | | 1.64 | | | | 21 | |
| | 41.31 | | | | 23.12 | | | | 14,619 | | | | 1.64 | | | | 0.66 | | | | 1.65 | | | | 42 | |
| | 33.83 | | | | 25.02 | | | | 7,769 | | | | 1.65 | | | | 0.72 | | | | 1.65 | | | | 35 | |
| | 27.32 | | | | 4.94 | | | | 4,137 | | | | 1.69 | | | | 0.79 | | | | 1.69 | | | | 28 | |
| | 26.27 | | | | 27.35 | | | | 3,837 | | | | 1.69 | | | | 0.56 | | | | 1.69 | | | | 23 | |
| | 20.77 | | | | 15.72 | | | | 2,797 | | | | 1.70 | | | | 0.97 | | | | 1.71 | | | | 41 | |
| | | | | | |
| | | | | | | | | | | | | | | | | | | | | | | | | | |
| | 48.12 | | | | 6.29 | | | | 33,070 | | | | 0.89 | | | | 1.70 | (g) | | | 0.89 | | | | 21 | |
| | 46.58 | | | | 24.05 | | | | 27,124 | | | | 0.89 | | | | 1.39 | | | | 0.90 | | | | 42 | |
| | 38.03 | | | | 25.97 | | | | 28,339 | | | | 0.88 | | | | 1.45 | | | | 0.90 | | | | 35 | |
| | 30.63 | | | | 5.78 | | | | 7,474 | | | | 0.89 | | | | 1.58 | | | | 0.94 | | | | 28 | |
| | 29.39 | | | | 28.41 | | | | 5,733 | | | | 0.90 | | | | 1.32 | | | | 0.95 | | | | 23 | |
| | 23.18 | | | | 16.63 | | | | 1,646 | | | | 0.89 | | | | 1.80 | | | | 0.97 | | | | 41 | |
SEE NOTES TO FINANCIAL STATEMENTS.
| | | | | | | | |
| | | |
| DECEMBER 31, 2014 | | J.P. MORGAN LARGE CAP FUNDS | | | | | 83 | |
FINANCIAL HIGHLIGHTS
FOR THE PERIODS INDICATED (continued)
| | | | | | | | | | | | | | | | | | | | | | | | | | | | |
| | | | | | Per share operating performance | |
| | | | | | Investment operations | | | Distributions | |
| | | Net asset
value,
beginning
of period | | | Net
investment
income
(loss) | | | Net realized
and unrealized
gains
(losses) on
investments | | | Total from
investment
operations | | | Net
investment
income | | | Return of
capital | | | Total
distributions | |
Hedged Equity Fund | | | | | | | | | | | | | | | | | | | | | | | | | | | | |
Class A | | | | | | | | | | | | | | | | | | | | | | | | | | | | |
Six Months Ended December 31, 2014 (Unaudited) | | $ | 15.74 | | | $ | 0.12 | (g)(h) | | $ | 0.64 | | | $ | 0.76 | | | $ | (0.06 | ) | | $ | — | | | $ | (0.06 | ) |
December 13, 2013(i) through June 30, 2014 | | | 15.00 | | | | 0.07 | | | | 0.84 | | | | 0.91 | | | | (0.07 | ) | | | (0.10 | ) | | | (0.17 | ) |
| | | | | | | |
Class C | | | | | | | | | | | | | | | | | | | | | | | | | | | | |
Six Months Ended December 31, 2014 (Unaudited) | | | 15.76 | | | | 0.07 | (g)(h) | | | 0.65 | | | | 0.72 | | | | (0.05 | ) | | | — | | | | (0.05 | ) |
December 13, 2013(i) through June 30, 2014 | | | 15.00 | | | | 0.05 | | | | 0.83 | | | | 0.88 | | | | (0.02 | ) | | | (0.10 | ) | | | (0.12 | ) |
| | | | | | | |
Class R5 | | | | | | | | | | | | | | | | | | | | | | | | | | | | |
Six Months Ended December 31, 2014 (Unaudited) | | | 15.76 | | | | 0.14 | (g)(h) | | | 0.65 | | | | 0.79 | | | | (0.07 | ) | | | — | | | | (0.07 | ) |
December 13, 2013(i) through June 30, 2014 | | | 15.00 | | | | 0.13 | | | | 0.82 | | | | 0.95 | | | | (0.09 | ) | | | (0.10 | ) | | | (0.19 | ) |
| | | | | | | |
Class R6 | | | | | | | | | | | | | | | | | | | | | | | | | | | | |
Six Months Ended December 31, 2014 (Unaudited) | | | 15.76 | | | | 0.15 | (g)(h) | | | 0.64 | | | | 0.79 | | | | (0.07 | ) | | | — | | | | (0.07 | ) |
December 13, 2013(i) through June 30, 2014 | | | 15.00 | | | | 0.13 | | | | 0.83 | | | | 0.96 | | | | (0.10 | ) | | | (0.10 | ) | | | (0.20 | ) |
| | | | | | | |
Select Class | | | | | | | | | | | | | | | | | | | | | | | | | | | | |
Six Months Ended December 31, 2014 (Unaudited) | | | 15.76 | | | | 0.13 | (g)(h) | | | 0.65 | | | | 0.78 | | | | (0.07 | ) | | | — | | | | (0.07 | ) |
December 13, 2013(i) through June 30, 2014 | | | 15.00 | | | | 0.10 | | | | 0.84 | | | | 0.94 | | | | (0.08 | ) | | | (0.10 | ) | | | (0.18 | ) |
| (a) | Annualized for periods less than one year, unless otherwise noted. |
| (b) | Not annualized for periods less than one year. |
| (c) | Includes adjustments in accordance with accounting principles generally accepted in the United States of America and as such, the net asset values for financial reporting purposes and the returns based upon those net asset values may differ from the net asset values and returns for shareholder transactions. |
| (d) | Includes earnings credits and interest expense, if applicable, each of which is less than 0.01% unless otherwise noted. |
| (e) | Certain non-recurring expenses incurred by the Fund were not annualized for the six months ended December 31, 2014 and the period ended June 30, 2014. |
| (f) | Portfolio turnover is calculated by dividing the lesser of total purchases or sales of portfolio securities for the reporting period by the monthly average value of portfolio securities owned during the reporting period. Excluded from both the numerator and denominator are amounts relating to derivatives and securities whose maturities or expiration dates at the time of acquisition were one year or less. |
| (g) | Calculated based upon average shares outstanding. |
| (h) | Reflects special dividends paid out during the period by several of the Fund’s holdings. Had the Fund not received the special dividends, the net investment income (loss) per share would have been $0.08, $0.03, $0.11, $0.11 and $0.10 for Class A, Class C, Class R5, Class R6 and Select Class Shares, respectively, and the net investment income (loss) ratio would have been 1.04%, 0.43%, 1.35%, 1.40% and 1.24% for Class A, Class C, Class R5, Class R6 and Select Class Shares, respectively. |
| (i) | Commencement of operations. |
SEE NOTES TO FINANCIAL STATEMENTS.
| | | | | | |
| | | |
| 84 | | | | J.P. MORGAN LARGE CAP FUNDS | | DECEMBER 31, 2014 |
| | | | | | | | | | | | | | | | | | | | | | | | | | |
| | | Ratios/Supplemental data | |
| | | | | | | | | | Ratios to average net assets (a) | | | | |
Net asset
value,
end of
period | | | Total return
(excludes
sales charge) (b)(c) | | | Net assets,
end of
period
(000’s) | | | Net
expenses (d)(e) | | | Net
investment
income
(loss) (e) | | |
Expenses
without waivers,
reimbursements and
earnings credits (e) | | | Portfolio
turnover
rate (b)(f) | |
| | | | | | | | | | | | | | | | | | | | | | | | | | |
| | | | | | | | | | | | | | | | | | | | | | | | | | |
| $ | 16.44 | | | | 4.83 | % | | $ | 64,641 | | | | 0.85 | % | | | 1.43 | %(h) | | | 1.18 | % | | | 13 | % |
| | 15.74 | | | | 6.11 | | | | 569 | | | | 0.85 | | | | 0.96 | | | | 16.65 | | | | 36 | |
| | | | | | |
| | | | | | | | | | | | | | | | | | | | | | | | | | |
| | 16.43 | | | | 4.54 | | | | 838 | | | | 1.35 | | | | 0.82 | (h) | | | 1.98 | | | | 13 | |
| | 15.76 | | | | 5.87 | | | | 53 | | | | 1.35 | | | | 0.56 | | | | 10.04 | | | | 36 | |
| | | | | | |
| | | | | | | | | | | | | | | | | | | | | | | | | | |
| | 16.48 | | | | 5.03 | | | | 439 | | | | 0.40 | | | | 1.74 | (h) | | | 1.21 | | | | 13 | |
| | 15.76 | | | | 6.37 | | | | 53 | | | | 0.40 | | | | 1.51 | | | | 9.10 | | | | 36 | |
| | | | | | |
| | | | | | | | | | | | | | | | | | | | | | | | | | |
| | 16.48 | | | | 5.04 | | | | 439 | | | | 0.35 | | | | 1.79 | (h) | | | 1.16 | | | | 13 | |
| | 15.76 | | | | 6.39 | | | | 53 | | | | 0.35 | | | | 1.56 | | | | 9.05 | | | | 36 | |
| | | | | | |
| | | | | | | | | | | | | | | | | | | | | | | | | | |
| | 16.47 | | | | 4.93 | | | | 71,430 | | | | 0.60 | | | | 1.63 | (h) | | | 1.19 | | | | 13 | |
| | 15.76 | | | | 6.28 | | | | 4,307 | | | | 0.60 | | | | 1.30 | | | | 9.91 | | | | 36 | |
SEE NOTES TO FINANCIAL STATEMENTS.
| | | | | | | | |
| | | |
| DECEMBER 31, 2014 | | J.P. MORGAN LARGE CAP FUNDS | | | | | 85 | |
FINANCIAL HIGHLIGHTS
FOR THE PERIODS INDICATED (continued)
| | | | | | | | | | | | | | | | | | | | | | | | | | | | |
| | | | | | Per share operating performance | |
| | | | | | Investment operations | | | Distributions | |
| | | Net asset
value,
beginning
of period | | | Net
investment
income
(loss) | | | Net realized
and unrealized
gains
(losses) on
investments | | | Total from
investment
operations | | | Net
investment
income | | | Net
realized
gain | | | Total
distributions | |
Large Cap Growth Fund | | | | | | | | | | | | | | | | | | | | | | | | | | | | |
Class A | | | | | | | | | | | | | | | | | | | | | | | | | | | | |
Six Months Ended December 31, 2014 (Unaudited) | | $ | 32.49 | | | $ | (0.07 | )(f) | | $ | 2.73 | | | $ | 2.66 | | | $ | — | | | $ | (0.62 | ) | | $ | (0.62 | ) |
Year Ended June 30, 2014 | | | 26.01 | | | | (0.10 | )(f) | | | 6.58 | | | | 6.48 | | | | — | | | | — | | | | — | |
Year Ended June 30, 2013 | | | 23.64 | | | | 0.08 | (f)(g) | | | 2.37 | | | | 2.45 | | | | (0.08 | ) | | | — | | | | (0.08 | ) |
Year Ended June 30, 2012 | | | 22.38 | | | | (0.06 | )(f) | | | 1.32 | | | | 1.26 | | | | — | | | | — | | | | — | |
Year Ended June 30, 2011 | | | 15.86 | | | | (0.04 | )(f) | | | 6.56 | | | | 6.52 | | | | — | | | | — | | | | — | |
Year Ended June 30, 2010 | | | 13.38 | | | | (0.04 | )(f) | | | 2.52 | | | | 2.48 | | | | — | | | | — | | | | — | |
| | | | | | | |
Class B | | | | | | | | | | | | | | | | | | | | | | | | | | | | |
Six Months Ended December 31, 2014 (Unaudited) | | | 28.60 | | | | (0.14 | )(f) | | | 2.41 | | | | 2.27 | | | | — | | | | (0.62 | ) | | | (0.62 | ) |
Year Ended June 30, 2014 | | | 23.01 | | | | (0.22 | )(f) | | | 5.81 | | | | 5.59 | | | | — | | | | — | | | | — | |
Year Ended June 30, 2013 | | | 20.96 | | | | (0.04 | )(f)(g) | | | 2.10 | | | | 2.06 | | | | (0.01 | ) | | | — | | | | (0.01 | ) |
Year Ended June 30, 2012 | | | 19.93 | | | | (0.15 | )(f) | | | 1.18 | | | | 1.03 | | | | — | | | | — | | | | — | |
Year Ended June 30, 2011 | | | 14.20 | | | | (0.13 | )(f) | | | 5.86 | | | | 5.73 | | | | — | | | | — | | | | — | |
Year Ended June 30, 2010 | | | 12.05 | | | | (0.12 | )(f) | | | 2.27 | | | | 2.15 | | | | — | | | | — | | | | — | |
| | | | | | | |
Class C | | | | | | | | | | | | | | | | | | | | | | | | | | | | |
Six Months Ended December 31, 2014 (Unaudited) | | | 28.33 | | | | (0.13 | )(f) | | | 2.37 | | | | 2.24 | | | | — | | | | (0.62 | ) | | | (0.62 | ) |
Year Ended June 30, 2014 | | | 22.79 | | | | (0.22 | )(f) | | | 5.76 | | | | 5.54 | | | | — | | | | — | | | | — | |
Year Ended June 30, 2013 | | | 20.79 | | | | (0.04 | )(f)(g) | | | 2.07 | | | | 2.03 | | | | (0.03 | ) | | | — | | | | (0.03 | ) |
Year Ended June 30, 2012 | | | 19.77 | | | | (0.15 | )(f) | | | 1.17 | | | | 1.02 | | | | — | | | | — | | | | — | |
Year Ended June 30, 2011 | | | 14.09 | | | | (0.13 | )(f) | | | 5.81 | | | | 5.68 | | | | — | | | | — | | | | — | |
Year Ended June 30, 2010 | | | 11.95 | | | | (0.12 | )(f) | | | 2.26 | | | | 2.14 | | | | — | | | | — | | | | — | |
| | | | | | | |
Class R2 | | | | | | | | | | | | | | | | | | | | | | | | | | | | |
Six Months Ended December 31, 2014 (Unaudited) | | | 32.07 | | | | (0.11 | )(f) | | | 2.70 | | | | 2.59 | | | | — | | | | (0.62 | ) | | | (0.62 | ) |
Year Ended June 30, 2014 | | | 25.74 | | | | (0.18 | )(f) | | | 6.51 | | | | 6.33 | | | | — | | | | — | | | | — | |
Year Ended June 30, 2013 | | | 23.44 | | | | 0.01 | (f)(g) | | | 2.36 | | | | 2.37 | | | | (0.07 | ) | | | — | | | | (0.07 | ) |
Year Ended June 30, 2012 | | | 22.24 | | | | (0.12 | )(f) | | | 1.32 | | | | 1.20 | | | | — | (h) | | | — | | | | — | (h) |
Year Ended June 30, 2011 | | | 15.81 | | | | (0.11 | )(f) | | | 6.54 | | | | 6.43 | | | | — | | | | — | | | | — | |
Year Ended June 30, 2010 | | | 13.37 | | | | (0.08 | )(f) | | | 2.52 | | | | 2.44 | | | | — | | | | — | | | | — | |
| | | | | | | |
Class R5 | | | | | | | | | | | | | | | | | | | | | | | | | | | | |
Six Months Ended December 31, 2014 (Unaudited) | | | 32.75 | | | | (0.01 | )(f) | | | 2.76 | | | | 2.75 | | | | — | | | | (0.62 | ) | | | (0.62 | ) |
Year Ended June 30, 2014 | | | 26.12 | | | | 0.01 | (f) | | | 6.62 | | | | 6.63 | | | | — | | | | — | | | | — | |
Year Ended June 30, 2013 | | | 23.74 | | | | 0.17 | (f)(g) | | | 2.38 | | | | 2.55 | | | | (0.17 | ) | | | — | | | | (0.17 | ) |
Year Ended June 30, 2012 | | | 22.39 | | | | 0.04 | (f) | | | 1.32 | | | | 1.36 | | | | (0.01 | ) | | | — | | | | (0.01 | ) |
Year Ended June 30, 2011 | | | 15.81 | | | | 0.04 | (f) | | | 6.54 | | | | 6.58 | | | | — | | | | — | | | | — | |
Year Ended June 30, 2010 | | | 13.28 | | | | 0.03 | (f) | | | 2.50 | | | | 2.53 | | | | — | | | | — | | | | — | |
| (a) | Annualized for periods less than one year, unless otherwise noted. |
| (b) | Not annualized for periods less than one year. |
| (c) | Includes adjustments in accordance with accounting principles generally accepted in the United States of America and as such, the net asset values for financial reporting purposes and the returns based upon those net asset values may differ from the net asset values and returns for shareholder transactions. |
| (d) | Includes earnings credits and interest expense, if applicable, each of which is less than 0.01% unless otherwise noted. |
| (e) | Portfolio turnover is calculated by dividing the lesser of total purchases or sales of portfolio securities for the reporting period by the monthly average value of portfolio securities owned during the reporting period. Excluded from both the numerator and denominator are amounts relating to derivatives and securities whose maturities or expiration dates at the time of acquisition were one year or less. |
| (f) | Calculated based upon average shares outstanding. |
| (g) | Reflects special dividends paid out during the period by several of the Fund’s holdings. Had the Fund not received the special dividends, the net investment income (loss) per share would have been $0.02, $(0.09), $(0.09), $(0.04), $0.12, $0.13 and $0.07 for Class A, Clas B, Class C, Class R2, Class R5, Class R6 and Select Class Shares, respectively, and the net investment income (loss) ratio would have been 0.08%, (0.41)%, (0.42)%, (0.17)%, 0.47%, 0.50% and 0.28% for Class A, Class B, Class C, Class R2, Class R5, Class R6 and Select Class Shares, respectively. |
| (h) | Amount rounds to less than $0.01. |
SEE NOTES TO FINANCIAL STATEMENTS.
| | | | | | |
| | | |
| 86 | | | | J.P. MORGAN LARGE CAP FUNDS | | DECEMBER 31, 2014 |
| | | | | | | | | | | | | | | | | | | | | | | | | | |
| | | Ratios/Supplemental data | |
| | | | | | | | | | Ratios to average net assets (a) | | | | |
Net asset
value,
end of
period | | | Total return
(excludes
sales charge) (b)(c) | | | Net assets,
end of
period
(000’s) | | | Net
expenses (d) | | | Net
investment
income
(loss) | | |
Expenses
without waivers,
reimbursements and
earnings credits | | | Portfolio
turnover
rate (b)(e) | |
| | | | | | | | | | | | | | | | | | | | | | | | | | |
| | | | | | | | | | | | | | | | | | | | | | | | | | |
| $ | 34.53 | | | | 8.22 | % | | $ | 4,856,933 | | | | 1.08 | % | | | (0.41 | )% | | | 1.20 | % | | | 9 | % |
| | 32.49 | | | | 24.91 | | | | 5,044,428 | | | | 1.10 | | | | (0.34 | ) | | | 1.19 | | | | 39 | |
| | 26.01 | | | | 10.40 | | | | 2,824,115 | | | | 1.09 | | | | 0.30 | (g) | | | 1.19 | | | | 47 | |
| | 23.64 | | | | 5.63 | | | | 1,660,335 | | | | 1.09 | | | | (0.25 | ) | | | 1.15 | | | | 28 | |
| | 22.38 | | | | 41.11 | | | | 328,012 | | | | 1.11 | | | | (0.19 | ) | | | 1.23 | | | | 84 | |
| | 15.86 | | | | 18.54 | | | | 174,585 | | | | 1.24 | | | | (0.27 | ) | | | 1.31 | | | | 61 | |
| | | | | | |
| | | | | | | | | | | | | | | | | | | | | | | | | | |
| | 30.25 | | | | 7.98 | | | | 6,583 | | | | 1.58 | | | | (0.91 | ) | | | 1.69 | | | | 9 | |
| | 28.60 | | | | 24.29 | | | | 7,472 | | | | 1.58 | | | | (0.84 | ) | | | 1.68 | | | | 39 | |
| | 23.01 | | | | 9.81 | | | | 9,278 | | | | 1.59 | | | | (0.19 | )(g) | | | 1.68 | | | | 47 | |
| | 20.96 | | | | 5.17 | | | | 12,170 | | | | 1.59 | | | | (0.75 | ) | | | 1.65 | | | | 28 | |
| | 19.93 | | | | 40.35 | | | | 18,374 | | | | 1.62 | | | | (0.70 | ) | | | 1.74 | | | | 84 | |
| | 14.20 | | | | 17.84 | | | | 20,842 | | | | 1.77 | | | | (0.80 | ) | | | 1.82 | | | | 61 | |
| | | | | | |
| | | | | | | | | | | | | | | | | | | | | | | | | | |
| | 29.95 | | | | 7.95 | | | | 555,706 | | | | 1.58 | | | | (0.91 | ) | | | 1.68 | | | | 9 | |
| | 28.33 | | | | 24.31 | | | | 523,972 | | | | 1.59 | | | | (0.85 | ) | | | 1.69 | | | | 39 | |
| | 22.79 | | | | 9.80 | | | | 396,862 | | | | 1.59 | | | | (0.20 | )(g) | | | 1.69 | | | | 47 | |
| | 20.79 | | | | 5.16 | | | | 205,723 | | | | 1.59 | | | | (0.75 | ) | | | 1.65 | | | | 28 | |
| | 19.77 | | | | 40.31 | | | | 31,181 | | | | 1.60 | | | | (0.68 | ) | | | 1.71 | | | | 84 | |
| | 14.09 | | | | 17.91 | | | | 6,588 | | | | 1.77 | | | | (0.80 | ) | | | 1.81 | | | | 61 | |
| | | | | | |
| | | | | | | | | | | | | | | | | | | | | | | | | | |
| | 34.04 | | | | 8.11 | | | | 238,983 | | | | 1.33 | | | | (0.66 | ) | | | 1.46 | | | | 9 | |
| | 32.07 | | | | 24.59 | | | | 222,421 | | | | 1.35 | | | | (0.60 | ) | | | 1.44 | | | | 39 | |
| | 25.74 | | | | 10.12 | | | | 191,876 | | | | 1.34 | | | | 0.05 | (g) | | | 1.45 | | | | 47 | |
| | 23.44 | | | | 5.41 | | | | 85,913 | | | | 1.34 | | | | (0.50 | ) | | | 1.39 | | | | 28 | |
| | 22.24 | | | | 40.67 | | | | 626 | | | | 1.34 | | | | (0.50 | ) | | | 1.42 | | | | 84 | |
| | 15.81 | | | | 18.25 | | | | 58 | | | | 1.48 | | | | (0.52 | ) | | | 1.56 | | | | 61 | |
| | | | | | |
| | | | | | | | | | | | | | | | | | | | | | | | | | |
| | 34.88 | | | | 8.43 | | | | 1,384,375 | | | | 0.72 | | | | (0.04 | ) | | | 0.73 | | | | 9 | |
| | 32.75 | | | | 25.38 | | | | 1,400,112 | | | | 0.73 | | | | 0.02 | | | | 0.74 | | | | 39 | |
| | 26.12 | | | | 10.78 | | | | 1,158,856 | | | | 0.71 | | | | 0.69 | (g) | | | 0.75 | | | | 47 | |
| | 23.74 | | | | 6.10 | | | | 584,866 | | | | 0.69 | | | | 0.16 | | | | 0.70 | | | | 28 | |
| | 22.39 | | | | 41.62 | | | | 53,668 | | | | 0.71 | | | | 0.22 | | | | 0.76 | | | | 84 | |
| | 15.81 | | | | 19.05 | | | | 10,618 | | | | 0.78 | | | | 0.20 | | | | 0.85 | | | | 61 | |
| | | | | | | | | | | | | | | | | | | | | | | | | | |
SEE NOTES TO FINANCIAL STATEMENTS.
| | | | | | | | |
| | | |
| DECEMBER 31, 2014 | | J.P. MORGAN LARGE CAP FUNDS | | | | | 87 | |
FINANCIAL HIGHLIGHTS
FOR THE PERIODS INDICATED (continued)
| | | | | | | | | | | | | | | | | | | | | | | | | | | | |
| | | | | | Per share operating performance | |
| | | | | | Investment operations | | | Distributions | |
| | | Net asset
value,
beginning
of period | | | Net
investment
income
(loss) | | | Net realized
and unrealized
gains
(losses) on
investments | | | Total from
investment
operations | | | Net
investment
income | | | Net
realized
gain | | | Total
distributions | |
Large Cap Growth Fund (continued) | | | | | | | | | | | | | | | | | | | | | | | | | | | | |
Class R6 | | | | | | | | | | | | | | | | | | | | | | | | | | | | |
Six Months Ended December 31, 2014 (Unaudited) | | $ | 32.80 | | | $ | — | (f)(h) | | $ | 2.76 | | | $ | 2.76 | | | $ | — | | | $ | (0.62 | ) | | $ | (0.62 | ) |
Year Ended June 30, 2014 | | | 26.15 | | | | 0.02 | (f) | | | 6.63 | | | | 6.65 | | | | — | | | | — | | | | — | |
Year Ended June 30, 2013 | | | 23.76 | | | | 0.18 | (f)(g) | | | 2.39 | | | | 2.57 | | | | (0.18 | ) | | | — | | | | (0.18 | ) |
Year Ended June 30, 2012 | | | 22.40 | | | | 0.05 | (f) | | | 1.33 | | | | 1.38 | | | | (0.02 | ) | | | — | | | | (0.02 | ) |
November 30, 2010 (i) through June 30, 2011 | | | 19.94 | | | | 0.03 | (f) | | | 2.43 | | | | 2.46 | | | | — | | | | — | | | | — | |
| | | | | | | |
Select Class | | | | | | | | | | | | | | | | | | | | | | | | | | | | |
Six Months Ended December 31, 2014 (Unaudited) | | | 32.52 | | | | (0.04 | )(f) | | | 2.74 | | | | 2.70 | | | | — | | | | (0.62 | ) | | | (0.62 | ) |
Year Ended June 30, 2014 | | | 25.99 | | | | (0.05 | )(f) | | | 6.58 | | | | 6.53 | | | | — | | | | — | | | | — | |
Year Ended June 30, 2013 | | | 23.61 | | | | 0.12 | (f)(g) | | | 2.37 | | | | 2.49 | | | | (0.11 | ) | | | — | | | | (0.11 | ) |
Year Ended June 30, 2012 | | | 22.31 | | | | (0.01 | )(f) | | | 1.31 | | | | 1.30 | | | | — | (h) | | | — | | | | — | (h) |
Year Ended June 30, 2011 | | | 15.79 | | | | — | (f)(h) | | | 6.52 | | | | 6.52 | | | | — | | | | — | | | | — | |
Year Ended June 30, 2010 | | | 13.28 | | | | — | (f)(h) | | | 2.51 | | | | 2.51 | | | | — | | | | — | | | | — | |
| (a) | Annualized for periods less than one year, unless otherwise noted. |
| (b) | Not annualized for periods less than one year. |
| (c) | Includes adjustments in accordance with accounting principles generally accepted in the United States of America and as such, the net asset values for financial reporting purposes and the returns based upon those net asset values may differ from the net asset values and returns for shareholder transactions. |
| (d) | Includes earnings credits and interest expense, if applicable, each of which is less than 0.01% unless otherwise noted. |
| (e) | Portfolio turnover is calculated by dividing the lesser of total purchases or sales of portfolio securities for the reporting period by the monthly average value of portfolio securities owned during the reporting period. Excluded from both the numerator and denominator are amounts relating to derivatives and securities whose maturities or expiration dates at the time of acquisition were one year or less. |
| (f) | Calculated based upon average shares outstanding. |
| (g) | Reflects special dividends paid out during the period by several of the Fund’s holdings. Had the Fund not received the special dividends, the net investment income (loss) per share would have been $0.02, $(0.09), $(0.09), $(0.04), $0.12, $0.13 and $0.07 for Class A, Clas B, Class C, Class R2, Class R5, Class R6 and Select Class Shares, respectively, and the net investment income (loss) ratio would have been 0.08%, (0.41)%, (0.42)%, (0.17)%, 0.47%, 0.50% and 0.28% for Class A, Class B, Class C, Class R2, Class R5, Class R6 and Select Class Shares, respectively. |
| (h) | Amount rounds to less than $0.01. |
| (i) | Commencement of offering of class of shares. |
SEE NOTES TO FINANCIAL STATEMENTS.
| | | | | | |
| | | |
| 88 | | | | J.P. MORGAN LARGE CAP FUNDS | | DECEMBER 31, 2014 |
| | | | | | | | | | | | | | | | | | | | | | | | | | |
| | | Ratios/Supplemental data | |
| | | | | | | | | | Ratios to average net assets (a) | | | | |
Net asset
value,
end of
period | | | Total return
(excludes
sales charge) (b)(c) | | | Net assets,
end of
period
(000’s) | | | Net
expenses (d) | | | Net
investment
income
(loss) | | |
Expenses
without waivers,
reimbursements and
earnings credits | | | Portfolio
turnover
rate (b)(e) | |
| | | | | | | | | | | | | | | | | | | | | | | | | | |
| | | | | | | | | | | | | | | | | | | | | | | | | | |
| $ | 34.94 | | | | 8.45 | % | | $ | 2,837,976 | | | | 0.65 | % | | | 0.03 | % | | | 0.65 | % | | | 9 | % |
| | 32.80 | | | | 25.43 | | | | 2,709,590 | | | | 0.68 | | | | 0.07 | | | | 0.69 | | | | 39 | |
| | 26.15 | | | | 10.87 | | | | 2,170,011 | | | | 0.67 | | | | 0.72 | (g) | | | 0.70 | | | | 47 | |
| | 23.76 | | | | 6.15 | | | | 1,047,184 | | | | 0.63 | | | | 0.20 | | | | 0.64 | | | | 28 | |
| | 22.40 | | | | 12.34 | | | | 30,386 | | | | 0.63 | | | | 0.25 | | | | 0.65 | | | | 84 | |
| | | | | | |
| | | | | | | | | | | | | | | | | | | | | | | | | | |
| | 34.60 | | | | 8.34 | | | | 5,459,723 | | | | 0.92 | | | | (0.24 | ) | | | 0.93 | | | | 9 | |
| | 32.52 | | | | 25.13 | | | | 5,037,737 | | | | 0.93 | | | | (0.18 | ) | | | 0.94 | | | | 39 | |
| | 25.99 | | | | 10.58 | | | | 4,811,907 | | | | 0.91 | | | | 0.50 | (g) | | | 0.94 | | | | 47 | |
| | 23.61 | | | | 5.85 | | | | 3,320,683 | | | | 0.89 | | | | (0.04 | ) | | | 0.90 | | | | 28 | |
| | 22.31 | | | | 41.29 | | | | 1,463,752 | | | | 0.91 | | | | (0.01 | ) | | | 0.95 | | | | 84 | |
| | 15.79 | | | | 18.90 | | | | 300,304 | | | | 0.99 | | | | (0.02 | ) | | | 1.07 | | | | 61 | |
SEE NOTES TO FINANCIAL STATEMENTS.
| | | | | | | | |
| | | |
| DECEMBER 31, 2014 | | J.P. MORGAN LARGE CAP FUNDS | | | | | 89 | |
FINANCIAL HIGHLIGHTS
FOR THE PERIODS INDICATED (continued)
| | | | | | | | | | | | | | | | | | | | | | | | | | | | |
| | | | | | Per share operating performance | |
| | | | | | Investment operations | | | Distributions | |
| | | Net asset
value,
beginning
of period | | | Net
investment
income
(loss) | | | Net realized
and unrealized
gains
(losses) on
investments | | | Total from
investment
operations | | | Net
investment
income | | | Net
realized
gain | | | Total
distributions | |
Large Cap Value Fund | | | | | | | | | | | | | | | | | | | | | | | | | | | | |
Class A | | | | | | | | | | | | | | | | | | | | | | | | | | | | |
Six Months Ended December 31, 2014 (Unaudited) | | $ | 16.63 | | | $ | 0.10 | (f) | | $ | 0.84 | | | $ | 0.94 | | | $ | (0.09 | ) | | $ | (2.55 | ) | | $ | (2.64 | ) |
Year Ended June 30, 2014 | | | 13.99 | | | | 0.17 | (f) | | | 3.16 | | | | 3.33 | | | | (0.18 | ) | | | (0.51 | ) | | | (0.69 | ) |
Year Ended June 30, 2013 | | | 11.02 | | | | 0.14 | (f) | | | 2.97 | | | | 3.11 | | | | (0.14 | ) | | | — | | | | (0.14 | ) |
Year Ended June 30, 2012 | | | 11.45 | | | | 0.11 | (f) | | | (0.43 | ) | | | (0.32 | ) | | | (0.11 | ) | | | — | | | | (0.11 | ) |
Year Ended June 30, 2011 | | | 9.15 | | | | 0.12 | (f) | | | 2.29 | | | | 2.41 | | | | (0.11 | ) | | | — | | | | (0.11 | ) |
Year Ended June 30, 2010 | | | 8.09 | | | | 0.09 | (f) | | | 1.04 | | | | 1.13 | | | | (0.07 | ) | | | — | | | | (0.07 | ) |
| | | | | | | |
Class B | | | | | | | | | | | | | | | | | | | | | | | | | | | | |
Six Months Ended December 31, 2014 (Unaudited) | | | 16.39 | | | | 0.05 | (f) | | | 0.83 | | | | 0.88 | | | | (0.05 | ) | | | (2.55 | ) | | | (2.60 | ) |
Year Ended June 30, 2014 | | | 13.80 | | | | 0.09 | (f) | | | 3.11 | | | | 3.20 | | | | (0.10 | ) | | | (0.51 | ) | | | (0.61 | ) |
Year Ended June 30, 2013 | | | 10.86 | | | | 0.07 | (f) | | | 2.95 | | | | 3.02 | | | | (0.08 | ) | | | — | | | | (0.08 | ) |
Year Ended June 30, 2012 | | | 11.28 | | | | 0.05 | (f) | | | (0.42 | ) | | | (0.37 | ) | | | (0.05 | ) | | | — | | | | (0.05 | ) |
Year Ended June 30, 2011 | | | 9.02 | | | | 0.06 | (f) | | | 2.26 | | | | 2.32 | | | | (0.06 | ) | | | — | | | | (0.06 | ) |
Year Ended June 30, 2010 | | | 7.99 | | | | 0.04 | (f) | | | 1.02 | | | | 1.06 | | | | (0.03 | ) | | | — | | | | (0.03 | ) |
| | | | | | | |
Class C | | | | | | | | | | | | | | | | | | | | | | | | | | | | |
Six Months Ended December 31, 2014 (Unaudited) | | | 16.25 | | | | 0.06 | (f) | | | 0.82 | | | | 0.88 | | | | (0.06 | ) | | | (2.55 | ) | | | (2.61 | ) |
Year Ended June 30, 2014 | | | 13.70 | | | | 0.09 | (f) | | | 3.08 | | | | 3.17 | | | | (0.11 | ) | | | (0.51 | ) | | | (0.62 | ) |
Year Ended June 30, 2013 | | | 10.80 | | | | 0.08 | (f) | | | 2.91 | | | | 2.99 | | | | (0.09 | ) | | | — | | | | (0.09 | ) |
Year Ended June 30, 2012 | | | 11.22 | | | | 0.05 | (f) | | | (0.41 | ) | | | (0.36 | ) | | | (0.06 | ) | | | — | | | | (0.06 | ) |
Year Ended June 30, 2011 | | | 8.97 | | | | 0.06 | (f) | | | 2.25 | | | | 2.31 | | | | (0.06 | ) | | | — | | | | (0.06 | ) |
Year Ended June 30, 2010 | | | 7.95 | | | | 0.04 | (f) | | | 1.01 | | | | 1.05 | | | | (0.03 | ) | | | — | | | | (0.03 | ) |
| | | | | | | |
Class R2 | | | | | | | | | | | | | | | | | | | | | | | | | | | | |
Six Months Ended December 31, 2014 (Unaudited) | | | 16.58 | | | | 0.08 | (f) | | | 0.84 | | | | 0.92 | | | | (0.07 | ) | | | (2.55 | ) | | | (2.62 | ) |
Year Ended June 30, 2014 | | | 13.95 | | | | 0.13 | (f) | | | 3.14 | | | | 3.27 | | | | (0.13 | ) | | | (0.51 | ) | | | (0.64 | ) |
Year Ended June 30, 2013 | | | 10.99 | | | | 0.11 | (f) | | | 2.96 | | | | 3.07 | | | | (0.11 | ) | | | — | | | | (0.11 | ) |
Year Ended June 30, 2012 | | | 11.42 | | | | 0.08 | (f) | | | (0.42 | ) | | | (0.34 | ) | | | (0.09 | ) | | | — | | | | (0.09 | ) |
Year Ended June 30, 2011 | | | 9.13 | | | | 0.09 | (f) | | | 2.29 | | | | 2.38 | | | | (0.09 | ) | | | — | | | | (0.09 | ) |
Year Ended June 30, 2010 | | | 8.08 | | | | 0.07 | (f) | | | 1.03 | | | | 1.10 | | | | (0.05 | ) | | | — | | | | (0.05 | ) |
| (a) | Annualized for periods less than one year, unless otherwise noted. |
| (b) | Not annualized for periods less than one year. |
| (c) | Includes adjustments in accordance with accounting principles generally accepted in the United States of America and as such, the net asset values for financial reporting purposes and the returns based upon those net asset values may differ from the net asset values and returns for shareholder transactions. |
| (d) | Includes earnings credits and interest expense, if applicable, each of which is less than 0.01% unless otherwise noted. |
| (e) | Portfolio turnover is calculated by dividing the lesser of total purchases or sales of portfolio securities for the reporting period by the monthly average value of portfolio securities owned during the reporting period. Excluded from both the numerator and denominator are amounts relating to derivatives and securities whose maturities or expiration dates at the time of acquisition were one year or less. |
| (f) | Calculated based upon average shares outstanding. |
| (g) | Commencement of offering of class of shares. |
SEE NOTES TO FINANCIAL STATEMENTS.
| | | | | | |
| | | |
| 90 | | | | J.P. MORGAN LARGE CAP FUNDS | | DECEMBER 31, 2014 |
| | | | | | | | | | | | | | | | | | | | | | | | | | |
| | | Ratios/Supplemental data | |
| | | | | | | | | | Ratios to average net assets (a) | | | | |
Net asset
value,
end of
period | | | Total return
(excludes
sales charge) (b)(c) | | | Net assets,
end of
period
(000’s) | | | Net
expenses (d) | | | Net
investment
income
(loss) | | | Expenses
without waivers,
reimbursements and
earnings credits | | | Portfolio
turnover
rate (b)(e) | |
| | | | | | | | | | | | | | | | | | | | | | | | | | |
| | | | | | | | | | | | | | | | | | | | | | | | | | |
| $ | 14.93 | | | | 6.24 | % | | $ | 93,921 | | | | 0.93 | % | | | 1.21 | % | | | 1.04 | % | | | 72 | % |
| | 16.63 | | | | 24.46 | | | | 92,161 | | | | 0.93 | | | | 1.11 | | | | 1.06 | | | | 168 | |
| | 13.99 | | | | 28.38 | | | | 35,030 | | | | 0.94 | | | | 1.11 | | | | 1.04 | | | | 119 | |
| | 11.02 | | | | (2.75 | ) | | | 25,789 | | | | 0.95 | | | | 1.00 | | | | 1.06 | | | | 144 | |
| | 11.45 | | | | 26.42 | | | | 25,668 | | | | 0.97 | | | | 1.09 | | | | 1.08 | | | | 65 | |
| | 9.15 | | | | 13.86 | | | | 22,273 | | | | 1.10 | | | | 0.95 | | | | 1.10 | | | | 86 | |
| | | | | | |
| | | | | | | | | | | | | | | | | | | | | | | | | | |
| | 14.67 | | | | 5.96 | | | | 1,543 | | | | 1.45 | | | | 0.67 | | | | 1.57 | | | | 72 | |
| | 16.39 | | | | 23.81 | | | | 1,893 | | | | 1.44 | | | | 0.60 | | | | 1.55 | | | | 168 | |
| | 13.80 | | | | 27.88 | | | | 1,183 | | | | 1.43 | | | | 0.60 | | | | 1.55 | | | | 119 | |
| | 10.86 | | | | (3.22 | ) | | | 1,442 | | | | 1.45 | | | | 0.51 | | | | 1.57 | | | | 144 | |
| | 11.28 | | | | 25.71 | | | | 2,336 | | | | 1.47 | | | | 0.58 | | | | 1.58 | | | | 65 | |
| | 9.02 | | | | 13.19 | | | | 2,891 | | | | 1.60 | | | | 0.45 | | | | 1.60 | | | | 86 | |
| | | | | | |
| | | | | | | | | | | | | | | | | | | | | | | | | | |
| | 14.52 | | | | 6.00 | | | | 13,384 | | | | 1.45 | | | | 0.71 | | | | 1.55 | | | | 72 | |
| | 16.25 | | | | 23.78 | | | | 11,646 | | | | 1.44 | | | | 0.59 | | | | 1.56 | | | | 168 | |
| | 13.70 | | | | 27.77 | | | | 4,890 | | | | 1.44 | | | | 0.62 | | | | 1.54 | | | | 119 | |
| | 10.80 | | | | (3.17 | ) | | | 3,215 | | | | 1.45 | | | | 0.50 | | | | 1.56 | | | | 144 | |
| | 11.22 | | | | 25.76 | | | | 3,186 | | | | 1.47 | | | | 0.58 | | | | 1.58 | | | | 65 | |
| | 8.97 | | | | 13.22 | | | | 3,473 | | | | 1.59 | | | | 0.45 | | | | 1.60 | | | | 86 | |
| | | | | | |
| | | | | | | | | | | | | | | | | | | | | | | | | | |
| | 14.88 | | | | 6.18 | | | | 612 | | | | 1.20 | | | | 0.95 | | | | 1.37 | | | | 72 | |
| | 16.58 | | | | 24.07 | | | | 455 | | | | 1.20 | | | | 0.83 | | | | 1.30 | | | | 168 | |
| | 13.95 | | | | 28.10 | | | | 378 | | | | 1.20 | | | | 0.87 | | | | 1.29 | | | | 119 | |
| | 10.99 | | | | (2.97 | ) | | | 142 | | | | 1.20 | | | | 0.76 | | | | 1.31 | | | | 144 | |
| | 11.42 | | | | 26.15 | | | | 123 | | | | 1.21 | | | | 0.84 | | | | 1.32 | | | | 65 | |
| | 9.13 | | | | 13.54 | | | | 58 | | | | 1.35 | | | | 0.70 | | | | 1.35 | | | | 86 | |
SEE NOTES TO FINANCIAL STATEMENTS.
| | | | | | | | |
| | | |
| DECEMBER 31, 2014 | | J.P. MORGAN LARGE CAP FUNDS | | | | | 91 | |
FINANCIAL HIGHLIGHTS
FOR THE PERIODS INDICATED (continued)
| | | | | | | | | | | | | | | | | | | | | | | | | | | | |
| | | | | | Per share operating performance | |
| | | | | | Investment operations | | | Distributions | |
| | | Net asset
value,
beginning
of period | | | Net
investment
income
(loss) | | | Net realized
and unrealized
gains
(losses) on
investments | | | Total from
investment
operations | | | Net
investment
income | | | Net
realized
gain | | | Total
distributions | |
Large Cap Value Fund (continued) | | | | | | | | | | | | | | | | | | | | | | | | | | | | |
Class R5 | | | | | | | | | | | | | | | | | | | | | | | | | | | | |
Six Months Ended December 31, 2014 (Unaudited) | | $ | 16.54 | | | $ | 0.13 | (f) | | $ | 0.84 | | | $ | 0.97 | | | $ | (0.11 | ) | | $ | (2.55 | ) | | $ | (2.66 | ) |
Year Ended June 30, 2014 | | | 13.92 | | | | 0.19 | (f) | | | 3.16 | | | | 3.35 | | | | (0.22 | ) | | | (0.51 | ) | | | (0.73 | ) |
Year Ended June 30, 2013 | | | 10.92 | | | | 0.17 | (f) | | | 2.98 | | | | 3.15 | | | | (0.15 | ) | | | — | | | | (0.15 | ) |
Year Ended June 30, 2012 | | | 11.34 | | | | 0.14 | (f) | | | (0.41 | ) | | | (0.27 | ) | | | (0.15 | ) | | | — | | | | (0.15 | ) |
Year Ended June 30, 2011 | | | 9.07 | | | | 0.16 | (f) | | | 2.26 | | | | 2.42 | | | | (0.15 | ) | | | — | | | | (0.15 | ) |
Year Ended June 30, 2010 | | | 8.01 | | | | 0.14 | (f) | | | 1.02 | | | | 1.16 | | | | (0.10 | ) | | | — | | | | (0.10 | ) |
| | | | | | | |
Class R6 | | | | | | | | | | | | | | | | | | | | | | | | | | | | |
Six Months Ended December 31, 2014 (Unaudited) | | | 16.48 | | | | 0.13 | (f) | | | 0.84 | | | | 0.97 | | | | (0.12 | ) | | | (2.55 | ) | | | (2.67 | ) |
Year Ended June 30, 2014 | | | 13.87 | | | | 0.22 | (f) | | | 3.13 | | | | 3.35 | | | | (0.23 | ) | | | (0.51 | ) | | | (0.74 | ) |
Year Ended June 30, 2013 | | | 10.92 | | | | 0.20 | (f) | | | 2.94 | | | | 3.14 | | | | (0.19 | ) | | | — | | | | (0.19 | ) |
Year Ended June 30, 2012 | | | 11.34 | | | | 0.15 | (f) | | | (0.42 | ) | | | (0.27 | ) | | | (0.15 | ) | | | — | | | | (0.15 | ) |
November 30, 2010 (g) through June 30, 2011 | | | 10.19 | | | | 0.10 | (f) | | | 1.17 | | | | 1.27 | | | | (0.12 | ) | | | — | | | | (0.12 | ) |
| | | | | | | |
Select Class | | | | | | | | | | | | | | | | | | | | | | | | | | | | |
Six Months Ended December 31, 2014 (Unaudited) | | | 16.42 | | | | 0.11 | (f) | | | 0.83 | | | | 0.94 | | | | (0.10 | ) | | | (2.55 | ) | | | (2.65 | ) |
Year Ended June 30, 2014 | | | 13.82 | | | | 0.19 | (f) | | | 3.11 | | | | 3.30 | | | | (0.19 | ) | | | (0.51 | ) | | | (0.70 | ) |
Year Ended June 30, 2013 | | | 10.88 | | | | 0.16 | (f) | | | 2.94 | | | | 3.10 | | | | (0.16 | ) | | | — | | | | (0.16 | ) |
Year Ended June 30, 2012 | | | 11.30 | | | | 0.12 | (f) | | | (0.41 | ) | | | (0.29 | ) | | | (0.13 | ) | | | — | | | | (0.13 | ) |
Year Ended June 30, 2011 | | | 9.04 | | | | 0.13 | (f) | | | 2.26 | | | | 2.39 | | | | (0.13 | ) | | | — | | | | (0.13 | ) |
Year Ended June 30, 2010 | | | 7.99 | | | | 0.12 | (f) | | | 1.01 | | | | 1.13 | | | | (0.08 | ) | | | — | | | | (0.08 | ) |
| (a) | Annualized for periods less than one year, unless otherwise noted. |
| (b) | Not annualized for periods less than one year. |
| (c) | Includes adjustments in accordance with accounting principles generally accepted in the United States of America and as such, the net asset values for financial reporting purposes and the returns based upon those net asset values may differ from the net asset values and returns for shareholder transactions. |
| (d) | Includes earnings credits and interest expense, if applicable, each of which is less than 0.01% unless otherwise noted. |
| (e) | Portfolio turnover is calculated by dividing the lesser of total purchases or sales of portfolio securities for the reporting period by the monthly average value of portfolio securities owned during the reporting period. Excluded from both the numerator and denominator are amounts relating to derivatives and securities whose maturities or expiration dates at the time of acquisition were one year or less. |
| (f) | Calculated based upon average shares outstanding. |
| (g) | Commencement of offering of class of shares. |
SEE NOTES TO FINANCIAL STATEMENTS.
| | | | | | |
| | | |
| 92 | | | | J.P. MORGAN LARGE CAP FUNDS | | DECEMBER 31, 2014 |
| | | | | | | | | | | | | | | | | | | | | | | | | | |
| | | Ratios/Supplemental data | |
| | | | | | | | | | Ratios to average net assets (a) | | | | |
Net asset
value,
end of
period | | | Total return
(excludes
sales charge) (b)(c) | | | Net assets,
end of
period
(000’s) | | | Net
expenses (d) | | | Net
investment
income
(loss) | | | Expenses
without waivers,
reimbursements and
earnings credits | | | Portfolio
turnover
rate (b)(e) | |
| | | | | | | | | | | | | | | | | | | | | | | | | | |
| | | | | | | | | | | | | | | | | | | | | | | | | | |
| $ | 14.85 | | | | 6.50 | % | | $ | 4,426 | | | | 0.59 | % | | | 1.57 | % | | | 0.59 | % | | | 72 | % |
| | 16.54 | | | | 24.81 | | | | 4,433 | | | | 0.57 | | | | 1.30 | | | | 0.59 | | | | 168 | |
| | 13.92 | | | | 28.96 | | | | 19,410 | | | | 0.59 | | | | 1.48 | | | | 0.60 | | | | 119 | |
| | 10.92 | | | | (2.34 | ) | | | 25,965 | | | | 0.59 | | | | 1.36 | | | | 0.61 | | | | 144 | |
| | 11.34 | | | | 26.78 | | | | 28,479 | | | | 0.60 | | | | 1.48 | | | | 0.63 | | | | 65 | |
| | 9.07 | | | | 14.39 | | | | 9,930 | | | | 0.64 | | | | 1.43 | | | | 0.64 | | | | 86 | |
| | | | | | |
| | | | | | | | | | | | | | | | | | | | | | | | | | |
| | 14.78 | | | | 6.48 | | | | 1,553 | | | | 0.53 | | | | 1.61 | | | | 0.53 | | | | 72 | |
| | 16.48 | | | | 24.89 | | | | 50,923 | | | | 0.54 | | | | 1.48 | | | | 0.55 | | | | 168 | |
| | 13.87 | | | | 28.94 | | | | 43,781 | | | | 0.53 | | | | 1.52 | | | | 0.54 | | | | 119 | |
| | 10.92 | | | | (2.30 | ) | | | 11,269 | | | | 0.54 | | | | 1.41 | | | | 0.56 | | | | 144 | |
| | 11.34 | | | | 12.50 | | | | 11,006 | | | | 0.54 | | | | 1.48 | | | | 0.55 | | | | 65 | |
| | | | | | |
| | | | | | | | | | | | | | | | | | | | | | | | | | |
| | 14.71 | | | | 6.33 | | | | 703,557 | | | | 0.78 | | | | 1.37 | | | | 0.78 | | | | 72 | |
| | 16.42 | | | | 24.62 | | | | 662,936 | | | | 0.79 | | | | 1.24 | | | | 0.80 | | | | 168 | |
| | 13.82 | | | | 28.65 | | | | 591,749 | | | | 0.78 | | | | 1.27 | | | | 0.79 | | | | 119 | |
| | 10.88 | | | | (2.54 | ) | | | 567,551 | | | | 0.79 | | | | 1.16 | | | | 0.81 | | | | 144 | |
| | 11.30 | | | | 26.52 | | | | 597,026 | | | | 0.80 | | | | 1.26 | | | | 0.83 | | | | 65 | |
| | 9.04 | | | | 14.13 | | | | 418,647 | | | | 0.85 | | | | 1.20 | | | | 0.85 | | | | 86 | |
SEE NOTES TO FINANCIAL STATEMENTS.
| | | | | | | | |
| | | |
| DECEMBER 31, 2014 | | J.P. MORGAN LARGE CAP FUNDS | | | | | 93 | |
FINANCIAL HIGHLIGHTS
FOR THE PERIODS INDICATED (continued)
| | | | | | | | | | | | | | | | | | | | | | | | | | | | |
| | | Per share operating performance | |
| | | | | | Investment operations | | | Distributions | |
| | | Net asset
value,
beginning
of period | | | Net
investment
income
(loss) | | | Net realized
and unrealized
gains
(losses) on
investments | | | Total from
investment
operations | | | Net
investment
income | | | Net
realized
gain | | | Total
distributions | |
U.S. Equity Fund | | | | | | | | | | | | | | | | | | | | | | | | | | | | |
Class A | | | | | | | | | | | | | | | | | | | | | | | | | | | | |
Six Months Ended December 31, 2014 (Unaudited) | | $ | 14.92 | | | $ | 0.09 | (f)(g) | | $ | 0.86 | | | $ | 0.95 | | | $ | (0.09 | ) | | $ | (1.27 | ) | | $ | (1.36 | ) |
Year Ended June 30, 2014 | | | 12.80 | | | | 0.11 | (f) | | | 3.09 | | | | 3.20 | | | | (0.11 | ) | | | (0.97 | ) | | | (1.08 | ) |
Year Ended June 30, 2013 | | | 10.73 | | | | 0.13 | (f) | | | 2.31 | | | | 2.44 | | | | (0.13 | ) | | | (0.24 | ) | | | (0.37 | ) |
Year Ended June 30, 2012 | | | 10.65 | | | | 0.10 | (f) | | | 0.13 | | | | 0.23 | | | | (0.09 | ) | | | (0.06 | ) | | | (0.15 | ) |
Year Ended June 30, 2011 | | | 8.30 | | | | 0.08 | (f) | | | 2.35 | | | | 2.43 | | | | (0.08 | ) | | | — | | | | (0.08 | ) |
Year Ended June 30, 2010 | | | 7.35 | | | | 0.07 | (f) | | | 0.95 | | | | 1.02 | | | | (0.07 | ) | | | — | | | | (0.07 | ) |
Class B | | | | | | | | | | | | | | | | | | | | | | | | | | | | |
Six Months Ended December 31, 2014 (Unaudited) | | | 14.70 | | | | 0.05 | (f)(g) | | | 0.84 | | | | 0.89 | | | | (0.05 | ) | | | (1.27 | ) | | | (1.32 | ) |
Year Ended June 30, 2014 | | | 12.62 | | | | 0.04 | (f) | | | 3.05 | | | | 3.09 | | | | (0.04 | ) | | | (0.97 | ) | | | (1.01 | ) |
Year Ended June 30, 2013 | | | 10.59 | | | | 0.07 | (f) | | | 2.27 | | | | 2.34 | | | | (0.07 | ) | | | (0.24 | ) | | | (0.31 | ) |
Year Ended June 30, 2012 | | | 10.51 | | | | 0.04 | (f) | | | 0.14 | | | | 0.18 | | | | (0.04 | ) | | | (0.06 | ) | | | (0.10 | ) |
Year Ended June 30, 2011 | | | 8.20 | | | | 0.03 | (f) | | | 2.32 | | | | 2.35 | | | | (0.04 | ) | | | — | | | | (0.04 | ) |
Year Ended June 30, 2010 | | | 7.26 | | | | 0.03 | (f) | | | 0.93 | | | | 0.96 | | | | (0.02 | ) | | | — | | | | (0.02 | ) |
Class C | | | | | | | | | | | | | | | | | | | | | | | | | | | | |
Six Months Ended December 31, 2014 (Unaudited) | | | 14.61 | | | | 0.06 | (f)(g) | | | 0.83 | | | | 0.89 | | | | (0.06 | ) | | | (1.27 | ) | | | (1.33 | ) |
Year Ended June 30, 2014 | | | 12.56 | | | | 0.04 | (f) | | | 3.03 | | | | 3.07 | | | | (0.05 | ) | | | (0.97 | ) | | | (1.02 | ) |
Year Ended June 30, 2013 | | | 10.55 | | | | 0.06 | (f) | | | 2.26 | | | | 2.32 | | | | (0.07 | ) | | | (0.24 | ) | | | (0.31 | ) |
Year Ended June 30, 2012 | | | 10.47 | | | | 0.04 | (f) | | | 0.15 | | | | 0.19 | | | | (0.05 | ) | | | (0.06 | ) | | | (0.11 | ) |
Year Ended June 30, 2011 | | | 8.18 | | | | 0.03 | (f) | | | 2.31 | | | | 2.34 | | | | (0.05 | ) | | | — | | | | (0.05 | ) |
Year Ended June 30, 2010 | | | 7.25 | | | | 0.03 | (f) | | | 0.93 | | | | 0.96 | | | | (0.03 | ) | | | — | | | | (0.03 | ) |
Class R2 | | | | | | | | | | | | | | | | | | | | | | | | | | | | |
Six Months Ended December 31, 2014 (Unaudited) | | | 14.84 | | | | 0.08 | (f)(g) | | | 0.84 | | | | 0.92 | | | | (0.07 | ) | | | (1.27 | ) | | | (1.34 | ) |
Year Ended June 30, 2014 | | | 12.74 | | | | 0.07 | (f) | | | 3.08 | | | | 3.15 | | | | (0.08 | ) | | | (0.97 | ) | | | (1.05 | ) |
Year Ended June 30, 2013 | | | 10.69 | | | | 0.10 | (f) | | | 2.29 | | | | 2.39 | | | | (0.10 | ) | | | (0.24 | ) | | | (0.34 | ) |
Year Ended June 30, 2012 | | | 10.62 | | | | 0.07 | (f) | | | 0.13 | | | | 0.20 | | | | (0.07 | ) | | | (0.06 | ) | | | (0.13 | ) |
Year Ended June 30, 2011 | | | 8.29 | | | | 0.05 | (f) | | | 2.35 | | | | 2.40 | | | | (0.07 | ) | | | — | | | | (0.07 | ) |
Year Ended June 30, 2010 | | | 7.35 | | | | 0.05 | (f) | | | 0.95 | | | | 1.00 | | | | (0.06 | ) | | | — | | | | (0.06 | ) |
Class R5 | | | | | | | | | | | | | | | | | | | | | | | | | | | | |
Six Months Ended December 31, 2014 (Unaudited) | | | 14.96 | | | | 0.12 | (f)(g) | | | 0.86 | | | | 0.98 | | | | (0.11 | ) | | | (1.27 | ) | | | (1.38 | ) |
Year Ended June 30, 2014 | | | 12.82 | | | | 0.16 | (f) | | | 3.11 | | | | 3.27 | | | | (0.16 | ) | | | (0.97 | ) | | | (1.13 | ) |
Year Ended June 30, 2013 | | | 10.75 | | | | 0.17 | (f) | | | 2.31 | | | | 2.48 | | | | (0.17 | ) | | | (0.24 | ) | | | (0.41 | ) |
Year Ended June 30, 2012 | | | 10.66 | | | | 0.14 | (f) | | | 0.14 | | | | 0.28 | | | | (0.13 | ) | | | (0.06 | ) | | | (0.19 | ) |
Year Ended June 30, 2011 | | | 8.31 | | | | 0.12 | (f) | | | 2.34 | | | | 2.46 | | | | (0.11 | ) | | | — | | | | (0.11 | ) |
Year Ended June 30, 2010 | | | 7.36 | | | | 0.12 | (f) | | | 0.94 | | | | 1.06 | | | | (0.11 | ) | | | — | | | | (0.11 | ) |
| (a) | Annualized for periods less than one year, unless otherwise noted. |
| (b) | Not annualized for periods less than one year. |
| (c) | Includes adjustments in accordance with accounting principles generally accepted in the United States of America and as such, the net asset values for financial reporting purposes and the returns based upon those net asset values may differ from the net asset values and returns for shareholder transactions. |
| (d) | Includes earnings credits and interest expense, if applicable, each of which is less than 0.01% unless otherwise noted. |
| (e) | Portfolio turnover is calculated by dividing the lesser of total purchases or sales of portfolio securities for the reporting period by the monthly average value of portfolio securities owned during the reporting period. Excluded from both the numerator and denominator are amounts relating to derivatives and securities whose maturities or expiration dates at the time of acquisition were one year or less. |
| (f) | Calculated based upon average shares outstanding. |
| (g) | Reflects special dividends paid out during the period by several of the Fund’s holdings. Had the Fund not received the special dividends, the net investment income (loss) per share would have been $0.06, $0.02, $0.02, $0.04, $0.09, $0.09, $0.08 and $0.07 for Class A, Class B, Class C, Class R2, Class R5, Class R6, Institutional Class and Select Class Shares, respectively, and the net investment income (loss) ratio would have been 0.77%, 0.24%, 0.29%, 0.54%, 1.16%, 1.20%, 1.10% and 0.92% for Class A, Class B, Class C, Class R2, Class R5, Class R6, Institutional Class and Select Class Shares, respectively. |
| (h) | Commencement of offering of class of shares. |
SEE NOTES TO FINANCIAL STATEMENTS.
| | | | | | |
| | | |
| 94 | | | | J.P. MORGAN LARGE CAP FUNDS | | DECEMBER 31, 2014 |
| | | | | | | | | | | | | | | | | | | | | | | | | | |
| | | Ratios/Supplemental data | |
| | | | | | | | | | Ratios to average net assets (a) | | | | |
Net asset
value,
end of
period | | | Total return
(excludes
sales charge) (b)(c) | | |
Net assets,
end of
period
(000’s) | | | Net
expenses (d) | | | Net
investment
income
(loss) | | | Expenses
without waivers,
reimbursements and
earnings credits | | | Portfolio
turnover
rate (b)(e) | |
| | | | | | | | | | | | | | | | | | | | | | | | | | |
| | | | | | | | | | | | | | | | | | | | | | | | | | |
| $ | 14.51 | | | | 6.59 | % | | $ | 1,261,541 | | | | 0.96 | % | | | 1.24 | %(g) | | | 1.08 | % | | | 42 | % |
| | 14.92 | | | | 25.90 | | | | 1,172,752 | | | | 0.97 | | | | 0.77 | | | | 1.05 | | | | 73 | |
| | 12.80 | | | | 23.14 | | | | 874,571 | | | | 0.97 | | | | 1.06 | | | | 1.06 | | | | 88 | |
| | 10.73 | | | | 2.27 | | | | 662,367 | | | | 0.97 | | | | 0.93 | | | | 1.08 | | | | 83 | |
| | 10.65 | | | | 29.29 | | | | 426,536 | | | | 0.97 | | | | 0.81 | | | | 1.07 | | | | 69 | |
| | 8.30 | | | | 13.83 | | | | 184,862 | | | | 1.05 | | | | 0.84 | | | | 1.08 | | | | 84 | |
| | | | | | | | | | | | | | | | | | | | | | | | | | |
| | 14.27 | | | | 6.32 | | | | 4,096 | | | | 1.46 | | | | 0.71 | (g) | | | 1.57 | | | | 42 | |
| | 14.70 | | | | 25.35 | | | | 4,250 | | | | 1.45 | | | | 0.28 | | | | 1.55 | | | | 73 | |
| | 12.62 | | | | 22.45 | | | | 4,466 | | | | 1.46 | | | | 0.57 | | | | 1.56 | | | | 88 | |
| | 10.59 | | | | 1.74 | | | | 4,979 | | | | 1.47 | | | | 0.43 | | | | 1.58 | | | | 83 | |
| | 10.51 | | | | 28.66 | | | | 7,113 | | | | 1.48 | | | | 0.31 | | | | 1.56 | | | | 69 | |
| | 8.20 | | | | 13.25 | | | | 8,190 | | | | 1.57 | | | | 0.33 | | | | 1.58 | | | | 84 | |
| | | | | | | | | | | | | | | | | | | | | | | | | | |
| | 14.17 | | | | 6.32 | | | | 208,067 | | | | 1.46 | | | | 0.76 | (g) | | | 1.56 | | | | 42 | |
| | 14.61 | | | | 25.30 | | | | 175,265 | | | | 1.47 | | | | 0.28 | | | | 1.55 | | | | 73 | |
| | 12.56 | | | | 22.43 | | | | 110,837 | | | | 1.46 | | | | 0.56 | | | | 1.56 | | | | 88 | |
| | 10.55 | | | | 1.83 | | | | 75,962 | | | | 1.47 | | | | 0.43 | | | | 1.58 | | | | 83 | |
| | 10.47 | | | | 28.56 | | | | 57,089 | | | | 1.48 | | | | 0.30 | | | | 1.57 | | | | 69 | |
| | 8.18 | | | | 13.26 | | | | 27,838 | | | | 1.57 | | | | 0.32 | | | | 1.58 | | | | 84 | |
| | | | | | | | | | | | | | | | | | | | | | | | | | |
| | 14.42 | | | | 6.46 | | | | 152,134 | | | | 1.21 | | | | 1.01 | (g) | | | 1.36 | | | | 42 | |
| | 14.84 | | | | 25.61 | | | | 126,549 | | | | 1.22 | | | | 0.53 | | | | 1.30 | | | | 73 | |
| | 12.74 | | | | 22.81 | | | | 72,664 | | | | 1.22 | | | | 0.81 | | | | 1.31 | | | | 88 | |
| | 10.69 | | | | 2.00 | | | | 31,686 | | | | 1.22 | | | | 0.68 | | | | 1.32 | | | | 83 | |
| | 10.62 | | | | 28.96 | | | | 8,533 | | | | 1.22 | | | | 0.51 | | | | 1.32 | | | | 69 | |
| | 8.29 | | | | 13.56 | | | | 492 | | | | 1.30 | | | | 0.57 | | | | 1.33 | | | | 84 | |
| | | | | | | | | | | | | | | | | | | | | | | | | | |
| | 14.56 | | | | 6.81 | | | | 489,662 | | | | 0.58 | | | | 1.63 | (g) | | | 0.61 | | | | 42 | |
| | 14.96 | | | | 26.45 | | | | 441,628 | | | | 0.59 | | | | 1.16 | | | | 0.60 | | | | 73 | |
| | 12.82 | | | | 23.52 | | | | 455,939 | | | | 0.59 | | | | 1.45 | | | | 0.61 | | | | 88 | |
| | 10.75 | | | | 2.72 | | | | 335,220 | | | | 0.59 | | | | 1.32 | | | | 0.63 | | | | 83 | |
| | 10.66 | | | | 29.66 | | | | 153,501 | | | | 0.59 | | | | 1.27 | | | | 0.61 | | | | 69 | |
| | 8.31 | | | | 14.30 | | | | 209,619 | | | | 0.59 | | | | 1.39 | | | | 0.63 | | | | 84 | |
SEE NOTES TO FINANCIAL STATEMENTS.
| | | | | | | | |
| | | |
| DECEMBER 31, 2014 | | J.P. MORGAN LARGE CAP FUNDS | | | | | 95 | |
FINANCIAL HIGHLIGHTS
FOR THE PERIODS INDICATED (continued)
| | | | | | | | | | | | | | | | | | | | | | | | | | | | |
| | | Per share operating performance | |
| | | | | | Investment operations | | | Distributions | |
| | | Net asset
value,
beginning
of period | | | Net
investment
income
(loss) | | | Net realized
and unrealized
gains
(losses) on
investments | | | Total from
investment
operations | | | Net
investment
income | | | Net
realized
gain | | | Total
distributions | |
U.S. Equity Fund (continued) | | | | | | | | | | | | | | | | | | | | | | | | | | | | |
Class R6 | | | | | | | | | | | | | | | | | | | | | | | | | | | | |
Six Months Ended December 31, 2014 (Unaudited) | | $ | 14.98 | | | $ | 0.13 | (f)(g) | | $ | 0.84 | | | $ | 0.97 | | | $ | (0.11 | ) | | $ | (1.27 | ) | | $ | (1.38 | ) |
Year Ended June 30, 2014 | | | 12.83 | | | | 0.17 | (f) | | | 3.11 | | | | 3.28 | | | | (0.16 | ) | | | (0.97 | ) | | | (1.13 | ) |
Year Ended June 30, 2013 | | | 10.76 | | | | 0.17 | (f) | | | 2.31 | | | | 2.48 | | | | (0.17 | ) | | | (0.24 | ) | | | (0.41 | ) |
Year Ended June 30, 2012 | | | 10.67 | | | | 0.14 | (f) | | | 0.14 | | | | 0.28 | | | | (0.13 | ) | | | (0.06 | ) | | | (0.19 | ) |
November 30, 2010 (h) through June 30, 2011 | | | 9.59 | | | | 0.07 | (f) | | | 1.10 | | | | 1.17 | | | | (0.09 | ) | | | — | | | | (0.09 | ) |
Institutional Class | | | | | | | | | | | | | | | | | | | | | | | | | | | | |
Six Months Ended December 31, 2014 (Unaudited) | | | 14.96 | | | | 0.12 | (f)(g) | | | 0.85 | | | | 0.97 | | | | (0.11 | ) | | | (1.27 | ) | | | (1.38 | ) |
Year Ended June 30, 2014 | | | 12.82 | | | | 0.16 | (f) | | | 3.10 | | | | 3.26 | | | | (0.15 | ) | | | (0.97 | ) | | | (1.12 | ) |
Year Ended June 30, 2013 | | | 10.75 | | | | 0.16 | (f) | | | 2.31 | | | | 2.47 | | | | (0.16 | ) | | | (0.24 | ) | | | (0.40 | ) |
Year Ended June 30, 2012 | | | 10.66 | | | | 0.13 | (f) | | | 0.14 | | | | 0.27 | | | | (0.12 | ) | | | (0.06 | ) | | | (0.18 | ) |
Year Ended June 30, 2011 | | | 8.31 | | | | 0.11 | (f) | | | 2.35 | | | | 2.46 | | | | (0.11 | ) | | | — | | | | (0.11 | ) |
Year Ended June 30, 2010 | | | 7.35 | | | | 0.11 | (f) | | | 0.95 | | | | 1.06 | | | | (0.10 | ) | | | — | | | | (0.10 | ) |
Select Class | | | | | | | | | | | | | | | | | | | | | | | | | | | | |
Six Months Ended December 31, 2014 (Unaudited) | | | 14.94 | | | | 0.11 | (f)(g) | | | 0.85 | | | | 0.96 | | | | (0.10 | ) | | | (1.27 | ) | | | (1.37 | ) |
Year Ended June 30, 2014 | | | 12.80 | | | | 0.13 | (f) | | | 3.10 | | | | 3.23 | | | | (0.12 | ) | | | (0.97 | ) | | | (1.09 | ) |
Year Ended June 30, 2013 | | | 10.74 | | | | 0.15 | (f) | | | 2.30 | | | | 2.45 | | | | (0.15 | ) | | | (0.24 | ) | | | (0.39 | ) |
Year Ended June 30, 2012 | | | 10.65 | | | | 0.12 | (f) | | | 0.14 | | | | 0.26 | | | | (0.11 | ) | | | (0.06 | ) | | | (0.17 | ) |
Year Ended June 30, 2011 | | | 8.30 | | | | 0.10 | (f) | | | 2.34 | | | | 2.44 | | | | (0.09 | ) | | | — | | | | (0.09 | ) |
Year Ended June 30, 2010 | | | 7.35 | | | | 0.10 | (f) | | | 0.94 | | | | 1.04 | | | | (0.09 | ) | | | — | | | | (0.09 | ) |
| (a) | Annualized for periods less than one year, unless otherwise noted. |
| (b) | Not annualized for periods less than one year. |
| (c) | Includes adjustments in accordance with accounting principles generally accepted in the United States of America and as such, the net asset values for financial reporting purposes and the returns based upon those net asset values may differ from the net asset values and returns for shareholder transactions. |
| (d) | Includes earnings credits and interest expense, if applicable, each of which is less than 0.01% unless otherwise noted. |
| (e) | Portfolio turnover is calculated by dividing the lesser of total purchases or sales of portfolio securities for the reporting period by the monthly average value of portfolio securities owned during the reporting period. Excluded from both the numerator and denominator are amounts relating to derivatives and securities whose maturities or expiration dates at the time of acquisition were one year or less. |
| (f) | Calculated based upon average shares outstanding. |
| (g) | Reflects special dividends paid out during the period by several of the Fund’s holdings. Had the Fund not received the special dividends, the net investment income (loss) per share would have been $0.06, $0.02, $0.02, $0.04, $0.09, $0.09, $0.08 and $0.07 for Class A, Class B, Class C, Class R2, Class R5, Class R6, Institutional Class and Select Class Shares, respectively, and the net investment income (loss) ratio would have been 0.77%, 0.24%, 0.29%, 0.54%, 1.16%, 1.20%, 1.10% and 0.92% for Class A, Class B, Class C, Class R2, Class R5, Class R6, Institutional Class and Select Class Shares, respectively. |
| (h) | Commencement of offering of class of shares. |
SEE NOTES TO FINANCIAL STATEMENTS.
| | | | | | |
| | | |
| 96 | | | | J.P. MORGAN LARGE CAP FUNDS | | DECEMBER 31, 2014 |
| | | | | | | | | | | | | | | | | | | | | | | | | | |
| | | Ratios/Supplemental data | |
| | | | | | | | | | Ratios to average net assets (a) | | | | |
Net asset
value,
end of
period | | | Total return
(excludes
sales charge) (b)(c) | | |
Net assets,
end of
period
(000’s) | | | Net
expenses (d) | | | Net
investment
income
(loss) | | | Expenses
without waivers,
reimbursements and
earnings credits | | | Portfolio
turnover
rate (b)(e) | |
| | | | | | | | | | | | | | | | | | | | | | | | | | |
| | | | | | | | | | | | | | | | | | | | | | | | | | |
| $ | 14.57 | | | | 6.75 | % | | $ | 2,663,467 | | | | 0.52 | % | | | 1.67 | (g)% | | | 0.54 | % | | | 42 | % |
| | 14.98 | | | | 26.57 | | | | 2,392,416 | | | | 0.54 | | | | 1.21 | | | | 0.55 | | | | 73 | |
| | 12.83 | | | | 23.56 | | | | 1,379,173 | | | | 0.54 | | | | 1.47 | | | | 0.56 | | | | 88 | |
| | 10.76 | | | | 2.76 | | | | 1,114,492 | | | | 0.54 | | | | 1.38 | | | | 0.57 | | | | 83 | |
| | 10.67 | | | | 12.17 | | | | 549,478 | | | | 0.54 | | | | 1.15 | | | | 0.57 | | | | 69 | |
| | | | | | | | | | | | | | | | | | | | | | | | | | |
| | 14.55 | | | | 6.72 | | | | 4,590,886 | | | | 0.63 | | | | 1.57 | (g) | | | 0.65 | | | | 42 | |
| | 14.96 | | | | 26.41 | | | | 4,178,050 | | | | 0.64 | | | | 1.12 | | | | 0.65 | | | | 73 | |
| | 12.82 | | | | 23.48 | | | | 1,214,707 | | | | 0.64 | | | | 1.36 | | | | 0.67 | | | | 88 | |
| | 10.75 | | | | 2.67 | | | | 610,670 | | | | 0.64 | | | | 1.25 | | | | 0.68 | | | | 83 | |
| | 10.66 | �� | | | 29.60 | | | | 500,991 | | | | 0.64 | | | | 1.16 | | | | 0.66 | | | | 69 | |
| | 8.31 | | | | 14.40 | | | | 441,540 | | | | 0.64 | | | | 1.25 | | | | 0.68 | | | | 84 | |
| | | | | | | | | | | | | | | | | | | | | | | | | | |
| | 14.53 | | | | 6.67 | | | | 3,152,844 | | | | 0.78 | | | | 1.39 | (g) | | | 0.80 | | | | 42 | |
| | 14.94 | | | | 26.21 | | | | 2,288,734 | | | | 0.79 | | | | 0.94 | | | | 0.80 | | | | 73 | |
| | 12.80 | | | | 23.22 | | | | 3,874,926 | | | | 0.79 | | | | 1.24 | | | | 0.81 | | | | 88 | |
| | 10.74 | | | | 2.52 | | | | 3,617,633 | | | | 0.79 | | | | 1.12 | | | | 0.83 | | | | 83 | |
| | 10.65 | | | | 29.47 | | | | 3,129,167 | | | | 0.79 | | | | 1.00 | | | | 0.82 | | | | 69 | |
| | 8.30 | | | | 14.10 | | | | 1,741,650 | | | | 0.79 | | | | 1.10 | | | | 0.83 | | | | 84 | |
SEE NOTES TO FINANCIAL STATEMENTS.
| | | | | | | | |
| | | |
| DECEMBER 31, 2014 | | J.P. MORGAN LARGE CAP FUNDS | | | | | 97 | |
NOTES TO FINANCIAL STATEMENTS
AS OF DECEMBER 31, 2014 (Unaudited)
1. Organization
JPMorgan Trust I (“JPM I”) and JPMorgan Trust II (“JPM II”) (the “Trusts”) were formed on November 12, 2004, as Delaware statutory trusts, pursuant to Declarations of Trust dated November 5, 2004 and are registered under the Investment Company Act of 1940, as amended (the “1940 Act”), as open-end management investment companies.
The following are 9 separate funds of the Trusts (collectively, the “Funds”) covered by this report:
| | | | | | |
| | | Classes Offered | | Trust | | Diversified/Non-Diversified |
| Disciplined Equity Fund | | Class A, Class R6, Institutional Class and Select Class | | JPM I | | Diversified |
| Dynamic Growth Fund | | Class A, Class C, Class R5 and Select Class | | JPM I | | Non-Diversified |
| Equity Focus Fund | | Class A, Class C and Select Class | | JPM I | | Non-Diversified |
| Equity Income Fund | | Class A, Class B, Class C, Class R2, Class R5, Class R6 and Select Class | | JPM II | | Diversified |
| Growth and Income Fund | | Class A, Class B, Class C and Select Class | | JPM I | | Diversified |
| Hedged Equity Fund | | Class A, Class C, Class R5, Class R6 and Select Class | | JPM I | | Diversified |
| Large Cap Growth Fund | | Class A, Class B, Class C, Class R2, Class R5, Class R6 and Select Class | | JPM II | | Diversified |
| Large Cap Value Fund | | Class A, Class B, Class C, Class R2, Class R5, Class R6 and Select Class | | JPM II | | Diversified |
| U.S. Equity Fund | | Class A, Class B, Class C, Class R2, Class R5, Class R6, Institutional Class and Select Class | | JPM I | | Diversified |
Prior to July 17, 2013, Class A, Class C and Class R5 Shares and prior to August 6, 2010, Select Class Shares of the Dynamic Growth Fund were not publicly offered for investment.
Prior to July 31, 2013, the Equity Focus Fund was not publicly offered for investment.
Hedged Equity Fund commenced operations on December 13, 2013. Prior to May 30, 2014, the Fund was not publicly offered for investment.
The investment objective of the Disciplined Equity Fund is to seek to provide a consistently high total return from a broadly diversified portfolio of equity securities with risk characteristics similar to the Standard and Poor’s 500 Composite Stock Price Index.
The investment objective of the Dynamic Growth Fund is to seek long-term capital growth.
The investment objective of the Equity Focus Fund is to seek long-term capital appreciation.
The investment objective of the Equity Income Fund is to seek capital appreciation and current income. Prior to July 23, 2014, the Fund’s investment objective was to seek current income through regular payment of dividends with the secondary goal of achieving capital appreciation by investing primarily in equity securities.
The investment objective of the Growth and Income Fund is to seek to provide capital growth over the long-term and to earn income from dividends.
The investment objective of the Hedged Equity Fund is to seek to provide capital appreciation.
The investment objective of the Large Cap Growth Fund is to seek long-term capital appreciation. Prior to July 23, 2014 the Fund’s investment objective was to seek long-term capital appreciation and growth of income by investing primarily in equity securities.
The investment objective of the Large Cap Value Fund is to seek capital appreciation with the incidental goal of achieving current income by investing primarily in equity securities.
The investment objective of the U.S. Equity Fund is to seek to provide high total return from a portfolio of selected equity securities.
Effective November 1, 2009, Class B Shares of the Equity Income Fund, Growth and Income Fund, Large Cap Growth Fund, Large Cap Value Fund and U.S. Equity Fund may not be purchased or acquired by new or existing shareholders, except through exchanges from Class B Shares of another J.P. Morgan Fund and dividend reinvestments. Shareholders who invested in Class B Shares prior to November 1, 2009 may continue to hold their Class B Shares until they automatically convert to Class A Shares.
Large Cap Value Fund acquired all of the assets and liabilities of the JPMorgan Value Opportunities Fund, Inc. in a reorganization on October 18, 2013. Please refer to footnote 8 discussing the merger.
Class A Shares generally provide for a front-end sales charge while Class B and Class C Shares provide for a contingent deferred sales charge (“CDSC”). Class B Shares automatically convert to Class A Shares after eight years. No sales charges are assessed with respect to Class R2, Class R5, Class R6, Institutional Class and Select Class Shares. All classes of shares have equal rights as to earnings, assets and voting privileges, except that each class may bear different distribution and shareholder servicing fees and each class has exclusive voting rights with respect to its distribution plan and shareholder servicing agreements. Certain Class A Shares, for which front-end sales charges have been waived, may be subject to a CDSC as described in the Funds’ prospectus.
2. Significant Accounting Policies
The following is a summary of significant accounting policies followed by the Funds in the preparation of their financial statements. The Funds are investment companies and, accordingly, follow the investment company accounting and reporting guidance of the Financial Accounting Standards
| | | | | | |
| | | |
| 98 | | | | J.P. MORGAN LARGE CAP FUNDS | | DECEMBER 31, 2014 |
Board Accounting Standards Codification Topic 946—Investment Companies, which is part of U.S. generally accepted accounting principles (“GAAP”). The preparation of financial statements in conformity with GAAP requires management to make estimates and assumptions that affect the reported amounts of assets and liabilities and disclosure of contingent assets and liabilities at the date of the financial statements and the reported amounts of increases and decreases in net assets from operations during the reporting period. Actual results could differ from those estimates.
A. Valuation of Investments — The valuation of the investments is in accordance with GAAP and the Funds’ valuation policies set forth by and under the supervision and responsibility of the Board of Trustees (the “Board”), which established the following approach to valuation, as described more fully below: (i) investments for which market quotations are readily available shall be valued at such unadjusted quoted prices and (ii) all other investments for which market quotations are not readily available shall be valued at their fair value as determined in good faith by the Board.
JPMorgan Funds Management, Inc. (the “Administrator” or “JPMFM”) has established the J.P. Morgan Asset Management Americas Valuation Committee (“AVC”) to assist the Board with the oversight and monitoring of the valuation of the Funds’ investments. The Administrator implements the valuation policies of the Funds’ investments, as directed by the Board. The AVC oversees and carries out the policies for the valuation of investments held in the Funds. This includes monitoring the appropriateness of fair values based on results of ongoing valuation oversight, including but not limited to consideration of macro or security specific events, market events and pricing vendor and broker due diligence. The Administrator is responsible for discussing and assessing the potential impacts to the fair values on an ongoing basis, and at least on a quarterly basis with the AVC and the Board.
A market-based approach is primarily used to value the Funds’ investments. Investments for which market quotations are not readily available are fair valued by approved pricing vendors or third party broker-dealers (collectively referred to as “Pricing Services”) or may be internally fair valued using methods set forth by the valuation policies approved by the Board. This may include related or comparable assets or liabilities, recent transactions, market multiples, book values, and other relevant information for the investment to determine the fair value of the investment. An income-based valuation approach may be used in which the anticipated future cash flows of the investment are discounted to calculate the fair value. Discounts may also be applied due to the nature or duration of any restrictions on the disposition of the investments. Valuations may be based upon current market prices of securities that are comparable in coupon, rating, maturity and industry. It is possible that the estimated values may differ significantly from the values that would have been used, had a ready market for the investments existed, and such differences could be material.
Equities and other exchange-traded instruments are valued at the last sale price or official market closing price on the primary exchange on which the instrument is traded before the net asset values (“NAV”) of the Funds are calculated on a valuation date. Investments in open-end investment companies (the “Underlying Funds”) are valued at each investment company’s NAV per share as of the report date.
Fixed income instruments are valued based on prices received from Pricing Services. The Pricing Services use multiple valuation techniques to determine the valuation of fixed income instruments. In instances where sufficient market activity exists, the Pricing Services may utilize a market-based approach through which trades or quotes from market makers are used to determine the valuation of these instruments. In instances where sufficient market activity may not exist, the Pricing Services also utilize proprietary valuation models which may consider market transactions in comparable securities and the various relationships between securities in determining fair value and/or market characteristics in order to estimate the relevant cash flows, which are then discounted to calculate the fair values.
Futures and options are generally valued on the basis of available market quotations.
Valuations reflected in this report are as of the report date. As a result, changes in valuation due to market events and/or issuer related events after the report date and prior to issuance of the report are not reflected herein.
The various inputs that are used in determining the valuation of the Funds’ investments are summarized into the three broad levels listed below.
| Ÿ | | Level 1 — Unadjusted inputs using quoted prices in active markets for identical investments. |
| Ÿ | | Level 2— Other significant observable inputs including, but are not limited to, quoted prices for similar investments, inputs other than quoted prices that are observable for investments (such as interest rates, prepayment speeds, credit risk, etc.) or other market corroborated inputs. |
| Ÿ | | Level 3 — Significant inputs based on the best information available in the circumstances, to the extent observable inputs are not available (including the Funds’ assumptions in determining the fair value of investments). |
A financial instrument’s level within the fair value hierarchy is based on the lowest level of any input, both individually and in the aggregate, that is significant to the fair value measurement. The inputs or methodology used for valuing instruments are not necessarily an indication of the risk associated with investing in those instruments.
The following tables represent each valuation input as presented on the Schedules of Portfolio Investments (“SOIs”) (amounts in thousands):
Disciplined Equity Fund
| | | | | | | | | | | | | | | | |
| | | Level 1
Quoted prices | | | Level 2
Other significant
observable inputs | | | Level 3
Significant
unobservable inputs | | | Total | |
Total Investments in Securities (a) | | $ | 5,613,546 | | | $ | 8,818 | | | $ | — | | | $ | 5,622,364 | |
| | | | | | | | | | | | | | | | |
Appreciation in Other Financial Instruments | | | | | | | | | | | | | | | | |
Futures Contracts | | $ | 1,050 | | | $ | — | | | $ | — | | | $ | 1,050 | |
| | | | | | | | | | | | | | | | |
| | | | | | | | |
| | | |
| DECEMBER 31, 2014 | | J.P. MORGAN LARGE CAP FUNDS | | | | | 99 | |
NOTES TO FINANCIAL STATEMENTS
AS OF DECEMBER 31, 2014 (Unaudited) (continued)
| | | | | | | | | | | | | | | | |
| Dynamic Growth Fund | | | | | | | | | | | | | | | | |
| | | Level 1
Quoted prices | | | Level 2
Other significant
observable inputs | | | Level 3
Significant
unobservable inputs | | | Total | |
Total Investments in Securities (b) | | $ | 328,411 | | | $ | — | | | $ | — | | | $ | 328,411 | |
| | | | | | | | | | | | | | | | |
| | | | |
| Equity Focus Fund | | | | | | | | | | | | | | | | |
| | | Level 1
Quoted prices | | | Level 2
Other significant
observable inputs | | | Level 3
Significant
unobservable inputs | | | Total | |
Total Investments in Securities (b) | | $ | 78,860 | | | $ | — | | | $ | — | | | $ | 78,860 | |
| | | | | | | | | | | | | | | | |
| | | | |
| Equity Income Fund | | | | | | | | | | | | | | | | |
| | | Level 1
Quoted prices | | | Level 2
Other significant
observable inputs | | | Level 3
Significant
unobservable inputs | | | Total | |
Total Investments in Securities (b) | | $ | 8,981,922 | | | $ | — | | | $ | — | | | $ | 8,981,922 | |
| | | | | | | | | | | | | | | | |
| | | | |
| Growth and Income Fund | | | | | | | | | | | | | | | | |
| | | Level 1
Quoted prices | | | Level 2
Other significant
observable inputs | | | Level 3
Significant
unobservable inputs | | | Total | |
Total Investments in Securities (b) | | $ | 492,999 | | | $ | — | | | $ | — | | | $ | 492,999 | |
| | | | | | | | | | | | | | | | |
| | | | |
| Hedged Equity Fund | | | | | | | | | | | | | | | | |
| | | Level 1
Quoted prices | | | Level 2
Other significant
observable inputs | | | Level 3
Significant
unobservable inputs | | | Total | |
Total Investments in Securities (b) | | $ | 141,873 | | | $ | — | | | $ | — | | | $ | 141,873 | |
| | | | | | | | | | | | | | | | |
Liabilities | | | | | | | | | | | | | | | | |
Options Written | | | | | | | | | | | | | | | | |
Call Options Written | | $ | (2,037 | ) | | $ | — | | | $ | — | | | $ | (2,037 | ) |
Put Options Written | | | (604 | ) | | | — | | | | — | | | | (604 | ) |
| | | | | | | | | | | | | | | | |
Total Liabilities | | $ | (2641 | ) | | $ | — | | | $ | — | | | $ | (2,641 | ) |
| | | | | | | | | | | | | | | | |
Appreciation in Other Financial Instruments | | | | | | | | | | | | | | | | |
Futures Contracts | | $ | 28 | | | $ | — | | | $ | — | | | $ | 28 | |
| | | | | | | | | | | | | | | | |
| | | | |
| Large Cap Growth Fund | | | | | | | | | | | | | | | | |
| | | Level 1
Quoted prices | | | Level 2
Other significant
observable inputs | | | Level 3
Significant
unobservable inputs | | | Total | |
Total Investments in Securities (b) | | $ | 15,415,862 | | | $ | — | | | $ | — | | | $ | 15,415,862 | |
| | | | | | | | | | | | | | | | |
| | | | |
| Large Cap Value Fund | | | | | | | | | | | | | | | | |
| | | Level 1
Quoted prices | | | Level 2
Other significant
observable inputs | | | Level 3
Significant
unobservable inputs | | | Total | |
Investments in Securities | | | | | | | | | | | | | | | | |
Common Stocks | | | | | | | | | | | | | | | | |
Consumer Discretionary | | $ | 97,780 | | | $ | — | | | $ | — | | | $ | 97,780 | |
Consumer Staples | | | 27,609 | | | | — | | | | — | | | | 27,609 | |
Energy | | | 80,692 | | | | — | | | | — | | | | 80,692 | |
Financials | | | 260,331 | | | | — | | | | — | | | | 260,331 | |
Health Care | | | 113,348 | | | | — | | | | — | | | | 113,348 | |
| | | | | | |
| | | |
| 100 | | | | J.P. MORGAN LARGE CAP FUNDS | | DECEMBER 31, 2014 |
| | | | | | | | | | | | | | | | |
| Large Cap Value Fund (continued) | | | | | | | | | | | | | | | | |
| | | Level 1
Quoted prices | | | Level 2
Other significant
observable inputs | | | Level 3
Significant
unobservable inputs | | | Total | |
Industrials | | $ | 104,515 | | | $ | — | | | $ | — | | | $ | 104,515 | |
Information Technology | | | 58,025 | | | | — | | | | — | | | | 58,025 | |
Materials | | | 27,727 | | | | — | | | | — | | | | 27,727 | |
Telecommunication Services | | | 5,160 | | | | — | | | | — | | | | 5,160 | |
Utilities | | | 33,313 | | | | — | | | | — | | | | 33,313 | |
| | | | | | | | | | | | | | | | |
Total Common Stocks | | | 808,500 | | | | — | | | | — | | | | 808,500 | |
| | | | | | | | | | | | | | | | |
Warrant | | | | | | | | | | | | | | | | |
Financials | | | — | | | | — | | | | — | (c) | | | — | (c) |
Short-Term Investment | | | | | | | | | | | | | | | | |
Investment Company | | | 9,682 | | | | — | | | | — | | | | 9,682 | |
| | | | | | | | | | | | | | | | |
Total Investments in Securities | | $ | 818,182 | | | $ | — | | | $ | — | (c) | | $ | 818,182 | |
| | | | | | | | | | | | | | | | |
| | | | |
| U.S. Equity Fund | | | | | | | | | | | | | | | | |
| | | Level 1
Quoted prices | | | Level 2
Other significant
observable inputs | | | Level 3
Significant
unobservable inputs | | | Total | |
Investments in Securities | | | | | | | | | |
Common Stocks | | | | | | | | | | | | | | | | |
Consumer Discretionary | | $ | 1,882,370 | | | $ | — | | | $ | — | | | $ | 1,882,370 | |
Consumer Staples | | | 809,882 | | | | — | | | | — | | | | 809,882 | |
Energy | | | 953,626 | | | | — | | | | — | | | | 953,626 | |
Financials | | | 1,992,180 | | | | — | | | | — | | | | 1,992,180 | |
Health Care | | | 1,835,491 | | | | — | | | | — | | | | 1,835,491 | |
Industrials | | | 1,371,644 | | | | — | | | | — | | | | 1,371,644 | |
Information Technology | | | 2,635,518 | | | | — | | | | — | | | | 2,635,518 | |
Materials | | | 442,946 | | | | — | | | | — | | | | 442,946 | |
Telecommunication Services | | | 139,369 | | | | — | | | | — | | | | 139,369 | |
Utilities | | | 305,169 | | | | — | | | | — | | | | 305,169 | |
| | | | | | | | | | | | | | | | |
Total Common Stocks | | | 12,368,195 | | | | — | | | | — | | | | 12,368,195 | |
| | | | | | | | | | | | | | | | |
Warrant | | | | | | | | | | | | | | | | |
Financials | | | — | | | | — | | | | — | (c) | | | — | (c) |
Short-Term Investment | | | | | | | | | | | | | | | | |
Investment Company | | | 408,515 | | | | — | | | | — | | | | 408,515 | |
| | | | | | | | | | | | | | | | |
Total Investments in Securities | | $ | 12,776,710 | | | $ | — | | | $ | — | (c) | | $ | 12,776,710 | |
| | | | | | | | | | | | | | | | |
Depreciation in Other Financial Instruments | | | | | | | | | | | | | | | | |
Futures Contracts | | $ | (1,164 | ) | | $ | — | | | $ | — | | | $ | (1,164 | ) |
| | | | | | | | | | | | | | | | |
| (a) | All portfolio holdings designated as Level 1 and Level 2 are disclosed individually on the SOI. Level 2 consists of a U.S. Treasury Bill that is held for futures collateral. Please refer to the SOI for industry specifics of portfolio holdings. |
| (b) | All portfolio holdings designated as Level 1 are disclosed individually on the SOIs. Please refer to the SOIs for industry specifics of portfolio holdings. |
There were no transfers among any levels during the six months ended December 31, 2014.
B. Restricted and Illiquid Securities — Certain securities held by the Funds may be subject to legal or contractual restrictions on resale and/or are illiquid. Restricted securities generally are resold in transactions exempt from registration under the Securities Act of 1933 (the “Securities Act”). Illiquid securities are securities which cannot be disposed of promptly (within seven days) and in the usual course of business at approximately their fair value and include, but are not limited to, repurchase agreements maturing in excess of seven days, time deposits with a withdrawal penalty, non-negotiable instruments and instruments for which no market exists. Disposal of these securities may involve time-consuming negotiations and expense. Prompt sale at the current valuation may be difficult and could adversely affect the net assets of the Funds. As of December 31, 2014, the Funds had no investments in restricted securities other than securities sold to the Funds under Rule 144A and/or Regulation S under the Securities Act.
| | | | | | | | |
| | | |
| DECEMBER 31, 2014 | | J.P. MORGAN LARGE CAP FUNDS | | | | | 101 | |
NOTES TO FINANCIAL STATEMENTS
AS OF DECEMBER 31, 2014 (Unaudited) (continued)
The following are the values and percentages of net assets of illiquid securities as of December 31, 2014 (amounts in thousands):
| | | | | | | | |
| | | Value | | | Percentage | |
Large Cap Value Fund | | $ | — | (a) | | | — | % |
U.S. Equity Fund | | | — | (a) | | | — | |
C. Futures Contracts — Disciplined Equity Fund, Hedged Equity Fund and U.S. Equity Fund use index futures contracts to gain or reduce exposure to the stock market, maintain liquidity and minimize transaction costs. The Funds also buy futures contracts to immediately invest incoming cash in the market or sell futures in response to cash outflows, thereby simulating an invested position in the underlying index while maintaining a cash balance for liquidity. The use of futures contracts exposes the Funds to equity price risk.
Futures contracts provide for the delayed delivery of the underlying instrument at a fixed price or are settled for a cash amount based on the change in the value of the underlying instrument at a specific date in the future. Upon entering into a futures contract, the Funds are required to deposit with the broker, cash or securities in an amount equal to a certain percentage of the contract amount, which is referred to as the initial margin deposit. Subsequent payments, referred to as variation margin, are made or received by the Funds periodically and are based on changes in the market value of open futures contracts. Changes in the market value of open futures contracts are recorded as change in net unrealized appreciation/ depreciation in the Statements of Operations. Realized gains or losses, representing the difference between the value of the contract at the time it was opened and the value at the time it was closed, are reported in the Statements of Operations at the closing or expiration of the futures contract. Securities deposited as initial margin are designated in the SOIs and cash deposited is recorded on the Statements of Assets and Liabilities. A receivable from and/or a payable to brokers for the daily variation margin is also recorded on the Statements of Assets and Liabilities.
The Funds may be subject to the risk that the change in the value of the futures contract may not correlate perfectly with the underlying instrument. Use of long futures contracts subjects the Funds to risk of loss in excess of the amounts shown on the Statements of Assets and Liabilities, up to the notional amount of the futures contracts. Use of short futures contracts subjects the Funds to unlimited risk of loss. The Funds may enter into futures contracts only on exchanges or boards of trade. The exchange or board of trade acts as the counterparty to each futures transaction; therefore, the Funds’ credit risk is limited to failure of the exchange or board of trade. Under some circumstances, futures exchanges may establish daily limits on the amount that the price of a futures contract can vary from the previous day’s settlement price, which could effectively prevent liquidation of positions.
The table below discloses the volume of the Funds’ futures contracts activity during the six months ended December 31, 2014 (amounts in thousands):
| | | | | | | | | | | | |
| | | Disciplined Equity
Fund | | | Hedged Equity
Fund | | | U.S. Equity
Fund | |
Futures Contracts: | | | | | | | | | | | | |
Average Notional Balance Long | | $ | 64,900 | | | $ | 1,754 | | | $ | 76,653 | |
Ending Notional Balance Long | | | 50,181 | | | | 1,745 | | | | 104,057 | |
The Funds’ futures contracts are not subject to master netting arrangements (the right to close out all transactions traded with a counterparty and net amounts owed or due across transactions).
D. Options — Hedged Equity Fund purchases and sells (“writes”) put and call options on indices and exchange-traded funds (ETFs) to manage and hedge equity risk within its portfolio. A purchaser of a put option has the right, but not the obligation, to sell the underlying instrument at an agreed upon price (“strike price”) to the option seller. A purchaser of a call option has the right, but not the obligation, to purchase the underlying instrument at the strike price from the option seller.
Options Purchased — Premiums paid by the Fund for options purchased are included in the Statement of Assets and Liabilities as an investment. The option is adjusted daily to reflect the current market value of the option and the change is recorded as Change in net unrealized appreciation/depreciation of Investments in non-affiliates on the Statements of Operations. If the option is allowed to expire, the Fund will lose the entire premium it paid and record a loss for the premium amount. Premiums paid for options purchased which are exercised or closed are added to the amounts paid or offset against the proceeds on the underlying investment transaction to determine the realized gain (loss) or cost basis of the security.
Options Written — Premiums received by the Fund for options written are included in the Statement of Assets and Liabilities as a liability. The amount of the liability is adjusted daily to reflect the current market value of the option written and the change in market value is recorded as change in net unrealized appreciation/depreciation. Premiums received from options written that expire are treated as realized gains. If a written option is closed, the Fund records a realized gain or loss on options written based on whether the cost of the closing transaction exceeds the premium received. If a call option is exercised by the option buyer, the premium received by the Fund is added to the proceeds from the sale of the underlying security to the option buyer and compared to the cost of the closing transaction to determine whether there has been a realized gain or loss. If a put option is exercised by an option buyer, the premium received by the option seller reduces the cost basis of the purchased security.
Written uncovered call options subject the Fund to unlimited risk of loss. Written covered call options limit the upside potential of a security above the strike price. Written put options subject the Fund to risk of loss if the value of the security declines below the exercise price minus the put premium.
| | | | | | |
| | | |
| 102 | | | | J.P. MORGAN LARGE CAP FUNDS | | DECEMBER 31, 2014 |
The Fund is not subject to credit risk on options written as the counterparty has already performed its obligation by paying the premium at the inception of the contract.
The Fund’s exchange traded options contracts are not subject to master netting arrangements (the right to close out all transactions traded with a counterparty and net amounts owed or due across transactions).
Transactions in options written during the six months ended December 31, 2014 were as follows (amounts in thousands except for number of contracts):
| | | | | | | | |
| | | Options | |
| | | Number of
Contracts | | | Premiums
Received | |
Options outstanding at June 30, 2014 | | | 50 | | | $ | 37 | |
Options written | | | 2,987 | | | | 4,354 | |
Options expired | | | — | | | | — | |
Options closed | | | (1,657 | ) | | | (1,720 | ) |
| | | | | | | | |
Options outstanding at December 31, 2014 | | | 1,380 | | | $ | 2,671 | |
| | | | | | | | |
The table below discloses the volume of the Fund’s options contracts activity during the six months ended December 31, 2014:
| | | | |
| | |
Exchange-Traded Options: | | | | |
Average Number of Contracts Purchased | | | 334 | |
Average Number of Contracts Written | | | 669 | |
Ending Number of Contracts Purchased | | | 690 | |
Ending Number of Contracts Written | | | 1,380 | |
The Fund’s exchange traded options contracts are not subject to master netting arrangements (the right to close out all transactions traded with a counterparty and net amounts owed or due across transactions).
E. Offering and Organization Costs — Total offering costs of $105,370 incurred in connection with the offering of shares of Hedged Equity Fund are amortized on a straight line basis over 12 months from the date the Fund commenced operations. Costs paid in connection with the organization of the Fund, if any, were recorded as an expense at the time it commenced operations.
F. Security Transactions and Investment Income — Investment transactions are accounted for on the trade date (the date the order to buy or sell is executed). Securities gains and losses are calculated on a specifically identified cost basis. Interest income is determined on the basis of coupon interest accrued using the effective interest method which adjusts for amortization of premiums and accretion of discounts. Dividend income net of foreign taxes withheld, if any, is recorded on the ex-dividend date or when a Fund first learns of the dividend.
To the extent such information is publicly available, the Funds record distributions received in excess of income earned from underlying investments as a reduction of cost of investments and/or realized gain. Such amounts are based on estimates if actual amounts are not available and actual amounts of income, realized gain and return of capital may differ from the estimated amounts. The Funds adjust the estimated amounts of the components of distributions (and consequently their net investment income) as necessary once the issuers provide information about the actual composition of the distributions.
G. Allocation of Income and Expenses — Expenses directly attributable to the Fund are charged directly to the Fund, while the expenses attributable to more than one fund of the Trusts are allocated among the respective funds. In calculating the NAV of each class, investment income, realized and unrealized gains and losses and expenses, other than class specific expenses, are allocated daily to each class of shares based upon the proportion of net assets of each class at the beginning of each day.
H. Federal Income Taxes — Each Fund is treated as a separate taxable entity for Federal income tax purposes. Each Fund’s policy is to comply with the provisions of the Internal Revenue Code of 1986, as amended (the “Code”), applicable to regulated investment companies and to distribute to shareholders all of its distributable net investment income and net realized capital gains on investments. Accordingly, no provision for Federal income tax is necessary. Management has reviewed the Funds’ tax positions for all open tax years and has determined that as of December 31, 2014, no liability for income tax is required in the Funds’ financial statements for net unrecognized tax benefits. However, management’s conclusions may be subject to future review based on changes in, or the interpretation of, the accounting standards or tax laws and regulations. Each of the Fund’s Federal tax returns for the prior three fiscal years remains subject to examination by the Internal Revenue Service.
G. Foreign Taxes — The Funds may be subject to foreign taxes on income, gains on investments or currency purchases/repatriation, a portion of which may be recoverable. The Funds will accrue such taxes and recoveries as applicable, based upon their current interpretation of tax rules and regulations that exist in the markets in which they invest.
H. Distributions to Shareholders — Distributions from net investment income are generally declared and paid quarterly, except for the Dynamic Growth Fund and Equity Focus Fund, for which distributions are generally declared and paid annually, and the Equity Income Fund, for which distributions are generally declared and paid monthly. Distributions are declared separately for each class. No class has preferential dividend rights;
| | | | | | | | |
| | | |
| DECEMBER 31, 2014 | | J.P. MORGAN LARGE CAP FUNDS | | | | | 103 | |
NOTES TO FINANCIAL STATEMENTS
AS OF DECEMBER 31, 2014 (Unaudited) (continued)
differences in per share rates are due to differences in separate class expenses. Net realized capital gains, if any, are distributed by each Fund at least annually. The amount of distributions from net investment income and net realized capital gains is determined in accordance with Federal income tax regulations, which may differ from GAAP. To the extent these “book/tax” differences are permanent in nature (i.e., that they result from other than timing of recognition — “temporary differences”), such amounts are reclassified within the capital accounts based on their Federal tax-basis treatment.
3. Fees and Other Transactions with Affiliates
A. Investment Advisory Fee — Pursuant to the Investment Advisory Agreements, J.P. Morgan Investment Management, Inc. (the “Adviser” or “JPMIM”), an indirect, wholly-owned subsidiary of JPMorgan Chase & Co. (“JPMorgan”), supervises the investments of each Fund and for such services is paid a fee. The fee is accrued daily and paid monthly based on each Fund’s average daily net assets. The annual rate for each Fund is as follows:
| | | | |
Disciplined Equity Fund | | | 0.25 | % |
Dynamic Growth Fund | | | 0.60 | |
Equity Focus Fund | | | 0.65 | |
Equity Income Fund | | | 0.40 | |
Growth and Income Fund | | | 0.40 | |
Hedged Equity Fund | | | 0.25 | |
Large Cap Growth Fund | | | 0.50 | |
Large Cap Value Fund | | | 0.40 | |
U.S. Equity Fund | | | 0.40 | |
The Adviser waived Investment Advisory fees and/or reimbursed expenses as outlined in Note 3.F.
Administration Fee — Pursuant to an Administration Agreements, the Administrator, an indirect, wholly-owned subsidiary of JPMorgan, provides certain administration services to the Funds. In consideration of these services, the Administrator receives a fee accrued daily and paid monthly at an annual rate of 0.15% of the first $25 billion of the average daily net assets of all funds in the J.P. Morgan Funds Complex covered by the Administration Agreements (excluding certain funds of funds and money market funds) and 0.075% of the average daily net assets in excess of $25 billion of all such funds. For the six months ended December 31, 2014, the effective annualized rate was 0.08% of each Fund’s average daily net assets, notwithstanding any fee waivers and/or expense reimbursements.
The Administrator waived Administration fees as outlined in Note 3.F.
JPMorgan Chase Bank, N.A. (“JPMCB”), a wholly-owned subsidiary of JPMorgan, serves as the Funds’ sub-administrator (the “Sub-administrator”). For its services as Sub-administrator, JPMCB receives a portion of the fees payable to the Administrator.
C. Distribution Fees — Pursuant to a Distribution Agreement, JPMorgan Distribution Services, Inc. (the “Distributor”), a wholly-owned subsidiary of JPMorgan, serves as the Trusts’ exclusive underwriter and promotes and arranges for the sale of each Fund’s shares.
The Board has adopted a Distribution Plan (the “Distribution Plan”) for Class A, Class B, Class C and Class R2 Shares of the Funds in accordance with Rule 12b-1 under the 1940 Act. The Distribution Plan provides that each Fund shall pay distribution fees, including payments to the Distributor, at annual rates of the average daily net assets as shown in the table below:
| | | | | | | | | | | | | | | | |
| | | Class A | | | Class B | | | Class C | | | Class R2 | |
Disciplined Equity Fund | | | 0.25 | % | | | n/a | | | | n/a | | | | n/a | |
Dynamic Growth Fund | | | 0.25 | | | | n/a | | | | 0.75 | % | | | n/a | |
Equity Focus Fund | | | 0.25 | | | | n/a | | | | 0.75 | | | | n/a | |
Equity Income Fund | | | 0.25 | | | | 0.75 | % | | | 0.75 | | | | 0.50 | % |
Growth and Income Fund | | | 0.25 | | | | 0.75 | | | | 0.75 | | | | n/a | |
Hedged Equity Fund | | | 0.25 | | | | n/a | | | | 0.75 | | | | n/a | |
Large Cap Growth Fund | | | 0.25 | | | | 0.75 | | | | 0.75 | | | | 0.50 | |
Large Cap Value Fund | | | 0.25 | | | | 0.75 | | | | 0.75 | | | | 0.50 | |
U.S. Equity Fund | | | 0.25 | | | | 0.75 | | | | 0.75 | | | | 0.50 | |
In addition, the Distributor is entitled to receive the front-end sales charges from purchases of Class A Shares and the CDSC from redemptions of Class B and Class C Shares and certain Class A Shares for which front-end sales charges have been waived. For the six months ended December 31, 2014, the Distributor retained the following amounts (in thousands):
| | | | | | | | |
| | | Front-End Sales Charge | | | CDSC | |
Disciplined Equity Fund | | $ | 17 | | | $ | — | (a) |
Dynamic Growth Fund | | | 38 | | | | 10 | |
Equity Focus Fund | | | 1 | | | | — | |
Equity Income Fund | | | 513 | | | | 3 | |
| | | | | | |
| | | |
| 104 | | | | J.P. MORGAN LARGE CAP FUNDS | | DECEMBER 31, 2014 |
| | | | | | | | |
| | | Front-End Sales Charge | | | CDSC | |
Growth and Income Fund | | $ | 26 | | | $ | — | (a) |
Hedged Equity Fund | | | 1 | | | | — | |
Large Cap Growth Fund | | | 123 | | | | 1 | |
Large Cap Value Fund | | | 6 | | | | — | |
U.S. Equity Fund | | | 104 | | | | — | (a) |
| (a) | Amount rounds to less than $1,000. |
D. Shareholder Servicing Fees — The Trusts, on behalf of the Funds, have entered into Shareholder Servicing Agreements with the Distributor under which the Distributor provides certain support services to the shareholders. The Class R6 Shares do not participate in the Shareholder Servicing Agreement. For performing these services, the Distributor receives a fee that is accrued daily and paid monthly equal to a percentage of the average daily net assets as shown in the table below:
| | | | | | | | | | | | | | | | | | | | | | | | | | | | |
| | | Class A | | | Class B | | | Class C | | | Class R2 | | | Class R5 | | | Institutional
Class | | | Select Class | |
Disciplined Equity Fund | | | 0.25 | % | | | n/a | | | | n/a | | | | n/a | | | | n/a | | | | 0.10 | % | | | 0.25 | % |
Dynamic Growth Fund | | | 0.25 | | | | n/a | | | | 0.25 | % | | | n/a | | | | 0.05 | % | | | n/a | | | | 0.25 | |
Equity Focus Fund | | | 0.25 | | | | n/a | | | | 0.25 | | | | n/a | | | | n/a | | | | n/a | | | | 0.25 | |
Equity Income Fund | | | 0.25 | | | | 0.25 | % | | | 0.25 | | | | 0.25 | % | | | 0.05 | | | | n/a | | | | 0.25 | |
Growth and Income Fund | | | 0.25 | | | | 0.25 | | | | 0.25 | | | | n/a | | | | n/a | | | | n/a | | | | 0.25 | |
Hedged Equity Fund | | | 0.25 | | | | n/a | | | | 0.25 | | | | n/a | | | | 0.05 | | | | n/a | | | | 0.25 | |
Large Cap Growth Fund | | | 0.25 | | | | 0.25 | | | | 0.25 | | | | 0.25 | | | | 0.05 | | | | n/a | | | | 0.25 | |
Large Cap Value Fund | | | 0.25 | | | | 0.25 | | | | 0.25 | | | | 0.25 | | | | 0.05 | | | | n/a | | | | 0.25 | |
U.S. Equity Fund | | | 0.25 | | | | 0.25 | | | | 0.25 | | | | 0.25 | | | | 0.05 | | | | 0.10 | | | | 0.25 | |
The Distributor has entered into shareholder services contracts with affiliated and unaffiliated financial intermediaries who provide shareholder services and other related services to their clients or customers who invest in the Funds under which the Distributor will pay all or a portion of such fees earned to financial intermediaries for performing such services.
The Distributor waived Shareholder Servicing fees as outlined in Note 3.F.
E. Custodian and Accounting Fees — JPMCB provides portfolio custody and accounting services to the Funds. For these services, the Funds pay JPMCB transaction and asset-based fees that vary according to the number of transactions and positions, plus out-of-pocket expenses. The amounts paid directly to JPMCB by the Funds for custody and accounting services are included in Custodian and accounting fees in the Statements of Operations. Payments to the custodian may be reduced by credits earned by each Fund, based on uninvested cash balances held by the custodian. Such earnings credits, if any, are presented separately in the Statements of Operations.
Interest expense paid to the custodian related to cash overdrafts, if any, is included in Interest expense to affiliates in the Statements of Operations.
F. Waivers and Reimbursements — The Adviser, Administrator and Distributor have contractually agreed to waive fees and/or reimburse the Funds to the extent that total annual operating expenses (excluding acquired fund fees and expenses, dividend expenses related to short sales, interest, taxes, expenses related to litigation and potential litigation, extraordinary expenses and expenses related to the Board’s deferred compensation plan) exceed the percentages of the Funds’ respective average daily net assets as shown in the table below:
| | | | | | | | | | | | | | | | | | | | | | | | | | | | | | | | |
| | | Class A | | | Class B | | | Class C | | | Class R2 | | | Class R5 | | | Class R6 | | | Institutional Class | | | Select Class | |
Disciplined Equity Fund | | | 0.85 | % | | | n/a | | | | n/a | | | | n/a | | | | n/a | | | | 0.35 | % | | | 0.45 | % | | | 0.60 | % |
Dynamic Growth Fund | | | 1.19 | * | | | n/a | | | | 1.69 | %* | | | n/a | | | | 0.74 | %* | | | n/a | | | | n/a | | | | 0.94 | * |
Equity Focus Fund | | | 1.25 | | | | n/a | | | | 1.75 | | | | n/a | | | | n/a | | | | n/a | | | | n/a | | | | 1.00 | |
Equity Income Fund | | | 1.04 | | | | 1.54 | % | | | 1.54 | | | | 1.29 | % | | | 0.59 | | | | 0.54 | | | | n/a | | | | 0.79 | |
Growth and Income Fund | | | 1.30 | | | | 1.80 | | | | 1.80 | | | | n/a | | | | n/a | | | | n/a | | | | n/a | | | | 0.90 | |
Hedged Equity Fund | | | 0.85 | | | | n/a | | | | 1.35 | | | | n/a | | | | 0.40 | | | | 0.35 | | | | n/a | | | | 0.60 | |
Large Cap Growth Fund | | | 1.05 | ** | | | 1.55 | ** | | | 1.55 | ** | | | 1.30 | ** | | | 0.70 | ** | | | 0.65 | ** | | | n/a | | | | 0.90 | ** |
Large Cap Value Fund | | | 0.93 | | | | 1.45 | | | | 1.45 | | | | 1.20 | | | | 0.60 | | | | 0.55 | | | | n/a | | | | 0.80 | |
U.S. Equity Fund | | | 0.94 | + | | | 1.44 | + | | | 1.44 | + | | | 1.19 | + | | | 0.56 | + | | | 0.51 | + | | | 0.61 | + | | | 0.76 | + |
| * | Prior to October 31, 2014, the expense limitation for Dynamic Growth Fund Class A, Class C, Class R5 and Select Class Shares was 1.25%, 1.75%, 0.80% and 1.00%, respectively. |
| ** | Prior to October 31, 2014, the expense limitation for Large Cap Growth Fund Class A , Class B, Class C, Class R2, Class R5, Class R6 and Select Class Shares was 1.10%, 1.60%, 1.60%, 1.35%, 0.75%, 0.70% and 0.95%, respectively. |
| + | Prior to October 31, 2014, the expense limitation for U.S. Equity Fund Class A, Class B, Class C, Class R2, Class R5, Class R6, Institutional Class and Select Class Shares was 0.97%, 1.47%, 1.47%, 1.22%, 0.59%, 0.54%, 0.64% and 0.79%, respectively. |
| | | | | | | | |
| | | |
| DECEMBER 31, 2014 | | J.P. MORGAN LARGE CAP FUNDS | | | | | 105 | |
NOTES TO FINANCIAL STATEMENTS
AS OF DECEMBER 31, 2014 (Unaudited) (continued)
Except as noted above, the expense limitation agreements were in effect for the six months ended December 31, 2014. The contractual expense limitation percentages in the table above are in place until at least October 31, 2015. In addition, the Funds’ service providers have voluntarily waived fees during the six months ended October 31, 2014. However, the Funds’ service providers are under no obligation to do so and may discontinue such voluntary waivers at any time.
For the six months ended December 31, 2014, the Funds’ service providers waived fees and/or reimbursed expenses for each of the Funds as follows (amounts in thousands). None of these parties expect the Funds to repay any such waived fees and reimbursed expenses in future years.
| | | | | | | | | | | | | | | | | | | | |
| | | Contractual Waivers | | | | |
| | | Investment
Advisory | | | Administration | | | Shareholder Servicing | | | Total | | | Contractual
Reimbursements | |
Disciplined Equity Fund | | $ | 38 | | | $ | 52 | | | $ | 115 | | | $ | 205 | | | $ | — | |
Dynamic Growth Fund | | | 31 | | | | 22 | | | | 9 | | | | 62 | | | | — | |
Equity Focus Fund | | | 36 | | | | 24 | | | | — | (a) | | | 60 | | | | — | |
Equity Income Fund | | | 109 | | | | 59 | | | | 329 | | | | 497 | | | | 8 | |
Growth and Income Fund | | | — | | | | — | | | | — | (a) | | | — | (a) | | | — | |
Hedged Equity Fund | | | 81 | | | | 21 | | | | 1 | | | | 103 | | | | 58 | |
Large Cap Growth Fund | | | 39 | | | | — | | | | 3,546 | | | | 3,585 | | | | — | |
Large Cap Value Fund | | | 2 | | | | — | | | | 60 | | | | 62 | | | | — | |
U.S. Equity Fund | | | 377 | | | | 152 | | | | 1,277 | | | | 1,806 | | | | — | |
| (a) | Amount rounds to less than $1,000. |
Additionally, the Funds may invest in one or more money market funds advised by the Adviser or its affiliates. The Adviser, Administrator and Distributor, as shareholder servicing agent, waive fees in an amount sufficient to offset the respective fees each charges to the affiliated money market fund on the Funds’ investment in such affiliated money market fund. A portion of the waiver is voluntary.
The amounts of waivers resulting from investments in these money market funds for the six months ended December 31, 2014 were as follows (amounts in thousands):
| | | | |
Disciplined Equity Fund | | $ | 83 | |
Equity Focus | | | 3 | |
Equity Income Fund | | | 145 | |
Growth and Income Fund | | | 6 | |
Large Cap Growth Fund | | | 169 | |
Large Cap Value Fund | | | 11 | |
U.S. Equity Fund | | | 150 | |
G. Other — Certain officers of the Trusts are affiliated with the Adviser, the Administrator and the Distributor. Such officers, with the exception of the Chief Compliance Officer, receive no compensation from the Funds for serving in their respective roles.
The Board appointed a Chief Compliance Officer to the Funds in accordance with Federal securities regulations. Each Fund, along with other affiliated funds, makes reimbursement payments, on a pro-rata basis, to the Administrator for a portion of the fees associated with the Office of the Chief Compliance Officer. Such fees are included in Trustees’ and Chief Compliance Officer’s fees in the Statements of Operations.
The Trusts adopted a Trustee Deferred Compensation Plan (the “Plan”) which allows the Independent Trustees to defer the receipt of all or a portion of compensation related to performance of their duties as Trustees. The deferred fees are invested in various J.P. Morgan Funds until distribution in accordance with the Plan.
During the six months ended December 31, 2014, the Funds may have purchased securities from an underwriting syndicate in which the principal underwriter or members of the syndicate are affiliated with the Adviser.
The Funds may use related party broker-dealers. For the six months ended December 31, 2014, the Funds did not incur any brokerage commissions with broker-dealers affiliated with the Adviser.
The Securities and Exchange Commission (“SEC”) has granted an exemptive order permitting the Funds to engage in principal transactions with J.P. Morgan Securities, Inc., an affiliated broker, involving taxable money market instruments, subject to certain conditions.
| | | | | | |
| | | |
| 106 | | | | J.P. MORGAN LARGE CAP FUNDS | | DECEMBER 31, 2014 |
4. Investment Transactions
During the six months ended December 31, 2014, purchases and sales of investments (excluding short-term investments) were as follows (amounts in thousands):
| | | | | | | | |
| | | Purchases
(excluding U.S.
Government) | | | Sales
(excluding U.S.
Government) | |
Disciplined Equity Fund | | $ | 4,259,032 | | | $ | 3,394,179 | |
Dynamic Growth Fund | | | 150,213 | | | | 112,371 | |
Equity Focus Fund | | | 18,290 | | | | 17,945 | |
Equity Income Fund | | | 1,838,652 | | | | 779,966 | |
Growth and Income Fund | | | 99,019 | | | | 104,541 | |
Hedged Equity Fund | | | 131,571 | | | | 8,385 | |
Large Cap Growth Fund | | | 1,322,796 | | | | 2,415,617 | |
Large Cap Value Fund | | | 594,443 | | | | 651,732 | |
U.S. Equity Fund | | | 5,795,668 | | | | 4,741,691 | |
During the six months ended December 31, 2014, there were no purchases or sales of U.S. Government securities.
5. Federal Income Tax Matters
For Federal income tax purposes, the cost and unrealized appreciation (depreciation) in value of investment securities held at December 31, 2014 were as follows (amounts in thousands):
| | | | | | | | | | | | | | | | |
| | | Aggregate
Cost | | | Gross
Unrealized
Appreciation | | | Gross
Unrealized
Depreciation | | | Net Unrealized
Appreciation
(Depreciation) | |
Disciplined Equity Fund | | $ | 4,963,033 | | | $ | 759,773 | | | $ | 100,442 | | | $ | 659,331 | |
Dynamic Growth Fund | | | 272,067 | | | | 60,357 | | | | 4,013 | | | | 56,344 | |
Equity Focus Fund | | | 71,098 | | | | 9,195 | | | | 1,433 | | | | 7,762 | |
Equity Income Fund | | | 7,025,677 | | | | 1,964,381 | | | | 8,136 | | | | 1,956,245 | |
Growth and Income Fund | | | 321,630 | | | | 172,580 | | | | 1,211 | | | | 171,369 | |
Hedged Equity Fund | | | 134,126 | | | | 9,720 | | | | 1,973 | | | | 7,747 | |
Large Cap Growth Fund | | | 10,349,097 | | | | 5,214,011 | | | | 147,246 | | | | 5,066,765 | |
Large Cap Value Fund | | | 670,059 | | | | 156,223 | | | | 8,100 | | | | 148,123 | |
U.S. Equity Fund | | | 9,331,534 | | | | 3,499,083 | | | | 53,907 | | | | 3,445,176 | |
Under the Regulated Investment Company Modernization Act of 2010 (the “Act”), net capital losses recognized by the Funds after June 30, 2011 are carried forward indefinitely, and retain their character as short-term and/or long-term losses. Prior to the Act, net capital losses incurred by the Funds were carried forward for eight years and treated as short-term losses. The Act requires that post-enactment net capital losses be used before pre-enactment net capital losses.
At June 30, 2014, the Funds had pre-enactment net capital loss carryforwards of (amounts in thousands):
| | | | | | | | | | | | |
| | | 2017 | | | 2018 | | | Total | |
Growth and Income Fund | | $ | — | | | $ | 1,897 | | | $ | 1,897 | |
Large Cap Value Fund | | | 4,912 | | | | — | | | | 4,912 | * |
| * | This amount does not include $1,637 of capital loss carryforwards not available due to Internal Revenue Code merger limitations. |
6. Borrowings
The Funds rely upon an exemptive order granted by the SEC (the “Order”) permitting the establishment and operation of an Interfund Lending Facility (the “Facility”). The Facility allows the Funds to directly lend and borrow money to or from any other fund relying upon the Order at rates beneficial to both the borrowing and lending funds. Advances under the Facility are taken primarily for temporary or emergency purposes, including the meeting of redemption requests that otherwise might require the untimely disposition of securities, and are subject to each Fund’s borrowing restrictions. The Interfund loan rate is determined, as specified in the Order, by averaging the current repurchase agreement rate and the current bank loan rate. The Order was granted to JPM II and may be relied upon by the Funds because the Funds and the series of JPM II are all investment companies in the same “group of investment companies” (as defined in Section 12(d)(1)(G) of the 1940 Act).
In addition, the Trusts and JPMCB have entered into a financing arrangement. Under this arrangement, JPMCB provides an unsecured, uncommitted credit facility in the aggregate amount of $100 million to certain of the J.P. Morgan Funds, including the Funds. Advances under the arrangement are taken primarily for temporary or emergency purposes, including the meeting of redemption requests that otherwise might require the untimely disposition of securities, and are subject to each Fund’s borrowing restrictions. Interest on borrowings is payable at a rate determined by JPMCB at the time of borrowing. This agreement has been extended until November 9, 2015.
| | | | | | | | |
| | | |
| DECEMBER 31, 2014 | | J.P. MORGAN LARGE CAP FUNDS | | | | | 107 | |
NOTES TO FINANCIAL STATEMENTS
AS OF DECEMBER 31, 2014 (Unaudited) (continued)
The Funds had no borrowings outstanding from another fund or from the unsecured, uncommitted credit facility at December 31, 2014.
Interest expense paid, if any, as a result of borrowings from another fund or from the unsecured, uncommitted credit facility is included in Interest expense to affiliates in the Statements of Operations.
7. Risks, Concentrations and Indemnifications
In the normal course of business, the Funds enter into contracts that contain a variety of representations which provide general indemnifications. Each Fund’s maximum exposure under these arrangements is unknown. The amount of exposure would depend on future claims that may be made against each Fund that have not yet occurred. However, based on experience, the Funds expect the risk of loss to be remote.
One or more affiliates of the Adviser have investment discretion with respect to their clients’ holdings in the Funds, which collectively represent a significant portion of the Funds’ assets for each of the Equity Focus Fund, Equity Income Fund, Growth and Income Fund and U.S. Equity Fund.
In addition, as of December 31, 2014 the J.P. Morgan Investor Funds and JPMorgan SmartRetirement Funds, which are affiliated funds of funds, own in the aggregate, more than 10% of the net assets of certain Funds as follows:
| | | | | | | | |
| | | J.P. Morgan
Investor Funds | | | JPMorgan
SmartRetirement
Funds | |
Disciplined Equity Fund | | | n/a | | | | 69.3 | % |
Dynamic Growth Fund | | | 68.9 | % | | | n/a | |
Large Cap Value Fund | | | 83.9 | | | | n/a | |
Additionally, Dynamic Growth Fund, Large Cap Growth Fund and U.S. Equity Fund have a shareholder, which is an account maintained by a financial intermediary on behalf of its clients, that owns a significant portion of each Fund’s outstanding shares.
Significant shareholder transactions by these shareholders may impact the Funds’ performance.
8. Business Combinations
In March 2013, the Board of Directors of JPMorgan Value Opportunities Fund, Inc. and the Board of JPM II approved management’s proposal to merge JPMorgan Value Opportunities Fund, Inc. (the “Target Fund”) into JPMorgan Large Cap Value Fund (the “Acquiring Fund”). The Agreement and Plan of Reorganization with respect to the Target Fund was approved by the Target Fund’s shareholders at a special meeting of shareholders held on October 10, 2013. The purpose of the transaction was to combine two portfolios with comparable investment objectives and strategies. The reorganization was effective after the close of business on October 18, 2013. The Acquiring Fund acquired all of the assets and liabilities of the Target Fund as shown in the table below. The transaction was structured to qualify as a tax-free reorganization under the Code. Pursuant to the Agreement and Plan of Reorganization, Class A, Class B and Class C shareholders of the Target Fund received a number of shares of the corresponding class in the Acquiring Fund, and Institutional Class shareholders of the Target Fund received shares of Class R5 in the Acquiring Fund, with a value equal to their holdings in the Target Fund as of the close of business on the date of the reorganization. The investment portfolio of the Target Fund, with a fair value of approximately $48,185,000 and identified cost of approximately $43,339,000 as of the date of the reorganization, was the principal asset acquired by the Acquiring Fund. For financial statement purposes, assets received and shares issued by the Acquiring Fund were recorded at fair value; however, the cost basis of the investments received from the Target Fund was carried forward to align ongoing reporting of the Acquiring Fund’s realized and unrealized gains and losses with amounts distributable to shareholders for tax purposes. As of October 18th, 2013 the Target Fund had pre-enactment net capital loss carryforwards of approximately $7,694,000.
The following is a summary of Shares Outstanding, Net Assets, Net Asset Value Per Share and Net Unrealized Appreciation (Depreciation) immediately before and after the reorganization (amounts in thousands, except per share amounts):
| | | | | | | | | | | | | | | | |
| | | Shares
Outstanding | | | Net
Assets | | | Net Asset
Value
Per Share | | | Net Unrealized
Appreciation
(Depreciation) | |
Target Fund | | | | | | | | | | | | | | | | |
Value Opportunities Fund | | | | | | | | | | | | | | $ | 4,846 | |
Class A | | | 2,219 | | | $ | 42,595 | | | $ | 19.19 | | | | | |
Class B | | | 57 | | | | 1,079 | | | | 19.02 | | | | | |
Class C | | | 168 | | | | 3,188 | | | | 18.99 | | | | | |
Institutional Class | | | 114 | | | | 2,180 | | | | 19.16 | | | | | |
| | | | | | |
| | | |
| 108 | | | | J.P. MORGAN LARGE CAP FUNDS | | DECEMBER 31, 2014 |
| | | | | | | | | | | | | | | | |
| | | Shares
Outstanding | | | Net Assets | | | Net Asset
Value
Per Share | | | Net Unrealized
Appreciation
(Depreciation) | |
Acquiring Fund | | | | | | | | | | | | | | | | |
Large Cap Value Fund | | | | | | | | | | | | | | $ | 149,358 | |
Class A | | | 2,698 | | | $ | 39,656 | | | $ | 14.70 | | | | | |
Class B | | | 85 | | | | 1,229 | | | | 14.48 | | | | | |
Class C | | | 405 | | | | 5,821 | | | | 14.37 | | | | | |
Class R2 | | | 29 | | | | 430 | | | | 14.65 | | | | | |
Class R5 | | | 1,440 | | | | 21,053 | | | | 14.62 | | | | | |
Class R6 | | | 3,305 | | | | 48,139 | | | | 14.57 | | | | | |
Select Class | | | 42,660 | | | | 619,072 | | | | 14.51 | | | | | |
| | | | |
Post Reorganization | | | | | | | | | | | | | | | | |
Large Cap Value Fund | | | | | | | | | | | | | | | 154,204 | |
Class A | | | 5,596 | | | | 82,251 | | | | 14.70 | | | | | |
Class B | | | 159 | | | | 2,308 | | | | 14.48 | | | | | |
Class C | | | 627 | | | | 9,009 | | | | 14.37 | | | | | |
Class R2 | | | 29 | | | | 430 | | | | 14.65 | | | | | |
Class R5 | | | 1,589 | | | | 23,233 | | | | 14.62 | | | | | |
Class R6 | | | 3,305 | | | | 48,139 | | | | 14.57 | | | | | |
Select Class | | | 42,660 | | | | 619,072 | | | | 14.51 | | | | | |
Expenses related to reorganization were incurred by the Acquiring Fund. The Adviser, the Administrator and the Distributor waived their fees and/or reimbursed the Acquiring Fund in an amount sufficient to offset costs incurred by the Acquiring Fund relating to the reorganization, excluding brokerage fees and brokerage expenses related to the disposition and acquisition of Target Fund assets associated with the reorganization.
Assuming the reorganization had been completed on July 1, 2013, the beginning of the annual reporting period, the pro forma results of operations for the year ended June 30, 2014, are as follows (amounts in thousands):
| | | | |
Net investment income (loss) | | $ | 9,707 | |
Net realized/unrealized gains (losses) | | | 164,493 | |
| | | | |
Change in net assets resulting from operations | | $ | 174,200 | |
| | | | |
Because the combined investment portfolios have been managed as a single integrated portfolio since the reorganization was completed, it is not practicable to separate the amounts of revenue and earnings of the Target Fund that have been included in the Statements of Operations since October 18, 2013.
| | | | | | | | |
| | | |
| DECEMBER 31, 2014 | | J.P. MORGAN LARGE CAP FUNDS | | | | | 109 | |
SCHEDULE OF SHAREHOLDER EXPENSES
(Unaudited)
Hypothetical $1,000 Investment
As a shareholder of the Funds, you incur two types of costs: (1) transaction costs, including sales charges (loads) on purchase payments and redemption fees and (2) ongoing costs, including investment advisory fees, administration fees, distribution fees and other Fund expenses. The examples below are intended to help you understand your ongoing costs (in dollars) of investing in the Funds and to compare these ongoing costs with the ongoing costs of investing in other mutual funds. The examples assume that you had a $1,000 investment in each Class at the beginning of the reporting period, July 1, 2014 and continued to hold your shares at the end of the reporting period, December 31, 2014.
Actual Expenses
For each Class of each Fund in the table below, the first line provides information about actual account values and actual expenses. You may use the information in this line, together with the amount you invested, to estimate the expenses that you paid over the period. Simply divide your account value by $1,000 (for example, an $8,600 account value divided by $1,000 = 8.6), then multiply the result by the number in the first line of each Class under the heading entitled “Expenses Paid During the Period” to estimate the expenses you paid on your account during this period.
Hypothetical Example for Comparison Purposes
The second line of each Class in the table below provides information about hypothetical account values and hypothetical expenses based on the Class’ actual expense ratio and an assumed rate of return of 5% per year before expenses, which is not the Class’ actual return. The hypothetical account values and expenses may not be used to estimate the actual ending account balance or expenses you paid for the period. You may use this information to compare the ongoing costs of investing in the Class of the Fund and other funds. To do so, compare this 5% hypothetical example with the 5% hypothetical examples that appear in the shareholder reports of the other funds. Please note that the expenses shown in the table are meant to highlight your ongoing costs only and do not reflect any transaction costs, such as sales charges (loads) or redemption fees. Therefore, the second line for each Class in the table is useful in comparing ongoing costs only, and will not help you determine the relative total costs of owning different funds. In addition, if these transaction costs were included, your costs would have been higher. The examples also assume all dividends and distributions have been reinvested.
| | | | | | | | | | | | | | | | |
| | | Beginning Account Value July 1, 2014 | | | Ending Account Value December 31, 2014 | | | Expenses Paid During
the Period* | | | Annualized Expense Ratio | |
Disciplined Equity Fund | | | | | | | | | | | | | | | | |
Class A | | | | | | | | | | | | | | | | |
Actual | | $ | 1,000.00 | | | $ | 1,066.40 | | | $ | 4.43 | | | | 0.85 | % |
Hypothetical | | | 1,000.00 | | | | 1,020.92 | | | | 4.33 | | | | 0.85 | |
Class R6 | | | | | | | | | | | | | | | | |
Actual | | | 1,000.00 | | | | 1,069.30 | | | | 1.83 | | | | 0.35 | |
Hypothetical | | | 1,000.00 | | | | 1,023.44 | | | | 1.79 | | | | 0.35 | |
Institutional Class | | | | | | | | | | | | | | | | |
Actual | | | 1,000.00 | | | | 1,068.90 | | | | 2.35 | | | | 0.45 | |
Hypothetical | | | 1,000.00 | | | | 1,022.94 | | | | 2.29 | | | | 0.45 | |
Select Class | | | | | | | | | | | | | | | | |
Actual | | | 1,000.00 | | | | 1,067.70 | | | | 3.13 | | | | 0.60 | |
Hypothetical | | | 1,000.00 | | | | 1,022.18 | | | | 3.06 | | | | 0.60 | |
| | | | |
Dynamic Growth Fund | | | | | | | | | | | | | | | | |
Class A | | | | | | | | | | | | | | | | |
Actual | | | 1,000.00 | | | | 1,021.20 | | | | 6.27 | | | | 1.23 | |
Hypothetical | | | 1,000.00 | | | | 1,019.00 | | | | 6.26 | | | | 1.23 | |
Class C | | | | | | | | | | | | | | | | |
Actual | | | 1,000.00 | | | | 1,018.90 | | | | 8.80 | | | | 1.73 | |
Hypothetical | | | 1,000.00 | | | | 1,016.48 | | | | 8.79 | | | | 1.73 | |
Class R5 | | | | | | | | | | | | | | | | |
Actual | | | 1,000.00 | | | | 1,023.80 | | | | 3.98 | | | | 0.78 | |
Hypothetical | | | 1,000.00 | | | | 1,021.27 | | | | 3.97 | | | | 0.78 | |
Select Class | | | | | | | | | | | | | | | | |
Actual | | | 1,000.00 | | | | 1,022.50 | | | | 5.00 | | | | 0.98 | |
Hypothetical | | | 1,000.00 | | | | 1,020.27 | | | | 4.99 | | | | 0.98 | |
| | | | | | |
| | | |
| 110 | | | | J.P. MORGAN LARGE CAP FUNDS | | DECEMBER 31, 2014 |
| | | | | | | | | | | | | | | | |
| | | Beginning Account Value July 1, 2014 | | | Ending Account Value December 31, 2014 | | | Expenses Paid During
the Period* | | | Annualized Expense Ratio | |
Equity Focus Fund | | | | | | | | | | | | | | | | |
Class A | | | | | | | | | | | | | | | | |
Actual | | $ | 1,000.00 | | | $ | 1,036.70 | | | $ | 6.37 | | | | 1.24 | % |
Hypothetical | | | 1,000.00 | | | | 1,018.95 | | | | 6.31 | | | | 1.24 | |
Class C | | | | | | | | | | | | | | | | |
Actual | | | 1,000.00 | | | | 1,033.60 | | | | 8.92 | | | | 1.74 | |
Hypothetical | | | 1,000.00 | | | | 1,016.43 | | | | 8.84 | | | | 1.74 | |
Select Class | | | | | | | | | | | | | | | | |
Actual | | | 1,000.00 | | | | 1,037.90 | | | | 5.09 | | | | 0.99 | |
Hypothetical | | | 1,000.00 | | | | 1,020.21 | | | | 5.04 | | | | 0.99 | |
| | | | |
Equity Income Fund | | | | | | | | | | | | | | | | |
Class A | | | | | | | | | | | | | | | | |
Actual | | | 1,000.00 | | | | 1,061.10 | | | | 5.40 | | | | 1.04 | |
Hypothetical | | | 1,000.00 | | | | 1,019.96 | | | | 5.30 | | | | 1.04 | |
Class B | | | | | | | | | | | | | | | | |
Actual | | | 1,000.00 | | | | 1,059.00 | | | | 7.99 | | | | 1.54 | |
Hypothetical | | | 1,000.00 | | | | 1,017.44 | | | | 7.83 | | | | 1.54 | |
Class C | | | | | | | | | | | | | | | | |
Actual | | | 1,000.00 | | | | 1,058.80 | | | | 7.99 | | | | 1.54 | |
Hypothetical | | | 1,000.00 | | | | 1,017.44 | | | | 7.83 | | | | 1.54 | |
Class R2 | | | | | | | | | | | | | | | | |
Actual | | | 1,000.00 | | | | 1,060.10 | | | | 6.70 | | | | 1.29 | |
Hypothetical | | | 1,000.00 | | | | 1,018.70 | | | | 6.56 | | | | 1.29 | |
Class R5 | | | | | | | | | | | | | | | | |
Actual | | | 1,000.00 | | | | 1,063.90 | | | | 3.07 | | | | 0.59 | |
Hypothetical | | | 1,000.00 | | | | 1,022.23 | | | | 3.01 | | | | 0.59 | |
Class R6 | | | | | | | | | | | | | | | | |
Actual | | | 1,000.00 | | | | 1,064.20 | | | | 2.71 | | | | 0.52 | |
Hypothetical | | | 1,000.00 | | | | 1,022.58 | | | | 2.65 | | | | 0.52 | |
Select Class | | | | | | | | | | | | | | | | |
Actual | | | 1,000.00 | | | | 1,062.90 | | | | 4.11 | | | | 0.79 | |
Hypothetical | | | 1,000.00 | | | | 1,021.22 | | | | 4.02 | | | | 0.79 | |
| | | | |
Growth and Income Fund | | | | | | | | | | | | | | | | |
Class A | | | | | | | | | | | | | | | | |
Actual | | | 1,000.00 | | | | 1,061.50 | | | | 5.87 | | | | 1.13 | |
Hypothetical | | | 1,000.00 | | | | 1,019.51 | | | | 5.75 | | | | 1.13 | |
Class B | | | | | | | | | | | | | | | | |
Actual | | | 1,000.00 | | | | 1,058.80 | | | | 8.51 | | | | 1.64 | |
Hypothetical | | | 1,000.00 | | | | 1,016.94 | | | | 8.34 | | | | 1.64 | |
Class C | | | | | | | | | | | | | | | | |
Actual | | | 1,000.00 | | | | 1,058.70 | | | | 8.51 | | | | 1.64 | |
Hypothetical | | | 1,000.00 | | | | 1,016.94 | | | | 8.34 | | | | 1.64 | |
Select Class | | | | | | | | | | | | | | | | |
Actual | | | 1,000.00 | | | | 1,062.90 | | | | 4.63 | | | | 0.89 | |
Hypothetical | | | 1,000.00 | | | | 1,020.72 | | | | 4.53 | | | | 0.89 | |
| | | | | | | | |
| | | |
| DECEMBER 31, 2014 | | J.P. MORGAN LARGE CAP FUNDS | | | | | 111 | |
SCHEDULE OF SHAREHOLDER EXPENSES
(Unaudited) (continued)
Hypothetical $1,000 Investment
| | | | | | | | | | | | | | | | |
| | | Beginning Account Value July 1, 2014 | | | Ending Account Value December 31, 2014 | | | Expenses Paid During
the Period* | | | Annualized Expense Ratio | |
Hedged Equity Fund | | | | | | | | | | | | | | | | |
Class A | | | | | | | | | | | | | | | | |
Actual | | $ | 1,000.00 | | | $ | 1,047.70 | | | $ | 4.39 | | | | 0.85 | % |
Hypothetical | | | 1,000.00 | | | | 1,020.92 | | | | 4.33 | | | | 0.85 | |
Class C | | | | | | | | | | | | | | | | |
Actual | | | 1,000.00 | | | | 1,045.40 | | | | 6.96 | | | | 1.35 | |
Hypothetical | | | 1,000.00 | | | | 1,018.40 | | | | 6.87 | | | | 1.35 | |
Class R5 | | | | | | | | | | | | | | | | |
Actual | | | 1,000.00 | | | | 1,050.30 | | | | 2.07 | | | | 0.40 | |
Hypothetical | | | 1,000.00 | | | | 1,023.19 | | | | 2.04 | | | | 0.40 | |
Class R6 | | | | | | | | | | | | | | | | |
Actual | | | 1,000.00 | | | | 1,050.40 | | | | 1.81 | | | | 0.35 | |
Hypothetical | | | 1,000.00 | | | | 1,023.44 | | | | 1.79 | | | | 0.35 | |
Select Class | | | | | | | | | | | | | | | | |
Actual | | | 1,000.00 | | | | 1,049.30 | | | | 3.10 | | | | 0.60 | |
Hypothetical | | | 1,000.00 | | | | 1,022.18 | | | | 3.06 | | | | 0.60 | |
| | | | |
Large Cap Growth Fund | | | | | | | | | | | | | | | | |
Class A | | | | | | | | | | | | | | | | |
Actual | | | 1,000.00 | | | | 1,082.20 | | | | 5.67 | | | | 1.08 | |
Hypothetical | | | 1,000.00 | | | | 1,019.76 | | | | 5.50 | | | | 1.08 | |
Class B | | | | | | | | | | | | | | | | |
Actual | | | 1,000.00 | | | | 1,079.80 | | | | 8.28 | | | | 1.58 | |
Hypothetical | | | 1,000.00 | | | | 1,017.24 | | | | 8.03 | | | | 1.58 | |
Class C | | | | | | | | | | | | | | | | |
Actual | | | 1,000.00 | | | | 1,079.50 | | | | 8.28 | | | | 1.58 | |
Hypothetical | | | 1,000.00 | | | | 1,017.24 | | | | 8.03 | | | | 1.58 | |
Class R2 | | | | | | | | | | | | | | | | |
Actual | | | 1,000.00 | | | | 1,081.10 | | | | 6.98 | | | | 1.33 | |
Hypothetical | | | 1,000.00 | | | | 1,018.50 | | | | 6.77 | | | | 1.33 | |
Class R5 | | | | | | | | | | | | | | | | |
Actual | | | 1,000.00 | | | | 1,084.30 | | | | 3.78 | | | | 0.72 | |
Hypothetical | | | 1,000.00 | | | | 1,021.58 | | | | 3.67 | | | | 0.72 | |
Class R6 | | | | | | | | | | | | | | | | |
Actual | | | 1,000.00 | | | | 1,084.50 | | | | 3.42 | | | | 0.65 | |
Hypothetical | | | 1,000.00 | | | | 1,021.93 | | | | 3.31 | | | | 0.65 | |
Select Class | | | | | | | | | | | | | | | | |
Actual | | | 1,000.00 | | | | 1,083.40 | | | | 4.83 | | | | 0.92 | |
Hypothetical | | | 1,000.00 | | | | 1,020.57 | | | | 4.69 | | | | 0.92 | |
| | | | |
Large Cap Value Fund | | | | | | | | | | | | | | | | |
Class A | | | | | | | | | | | | | | | | |
Actual | | | 1,000.00 | | | | 1,062.40 | | | | 4.83 | | | | 0.93 | |
Hypothetical | | | 1,000.00 | | | | 1,020.52 | | | | 4.74 | | | | 0.93 | |
Class B | | | | | | | | | | | | | | | | |
Actual | | | 1,000.00 | | | | 1,059.60 | | | | 7.53 | | | | 1.45 | |
Hypothetical | | | 1,000.00 | | | | 1,017.90 | | | | 7.38 | | | | 1.45 | |
Class C | | | | | | | | | | | | | | | | |
Actual | | | 1,000.00 | | | | 1,060.00 | | | | 7.53 | | | | 1.45 | |
Hypothetical | | | 1,000.00 | | | | 1,017.90 | | | | 7.38 | | | | 1.45 | |
Class R2 | | | | | | | | | | | | | | | | |
Actual | | | 1,000.00 | | | | 1,061.80 | | | | 6.24 | | | | 1.20 | |
Hypothetical | | | 1,000.00 | | | | 1,019.16 | | | | 6.11 | | | | 1.20 | |
Class R5 | | | | | | | | | | | | | | | | |
Actual | | | 1,000.00 | | | | 1,065.00 | | | | 3.07 | | | | 0.59 | |
Hypothetical | | | 1,000.00 | | | | 1,022.23 | | | | 3.01 | | | | 0.59 | |
| | | | | | |
| | | |
| 112 | | | | J.P. MORGAN LARGE CAP FUNDS | | DECEMBER 31, 2014 |
| | | | | | | | | | | | | | | | |
| | | Beginning Account Value July 1, 2014 | | | Ending Account Value December 31, 2014 | | | Expenses Paid During
the Period* | | | Annualized Expense Ratio | |
Large Cap Value Fund (continued) | | | | | | | | | | | | | | | | |
Class R6 | | | | | | | | | | | | | | | | |
Actual | | $ | 1,000.00 | | | $ | 1,064.80 | | | $ | 2.76 | | | | 0.53 | % |
Hypothetical | | | 1,000.00 | | | | 1,022.53 | | | | 2.70 | | | | 0.53 | |
Select Class | | | | | | | | | | | | | | | | |
Actual | | | 1,000.00 | | | | 1,063.30 | | | | 4.06 | | | | 0.78 | |
Hypothetical | | | 1,000.00 | | | | 1,021.27 | | | | 3.97 | | | | 0.78 | |
| | | | |
U.S. Equity Fund | | | | | | | | | | | | | | | | |
Class A | | | | | | | | | | | | | | | | |
Actual | | | 1,000.00 | | | | 1,065.90 | | | | 5.00 | | | | 0.96 | |
Hypothetical | | | 1,000.00 | | | | 1,020.37 | | | | 4.89 | | | | 0.96 | |
Class B | | | | | | | | | | | | | | | | |
Actual | | | 1,000.00 | | | | 1,063.20 | | | | 7.59 | | | | 1.46 | |
Hypothetical | | | 1,000.00 | | | | 1,017.85 | | | | 7.43 | | | | 1.46 | |
Class C | | | | | | | | | | | | | | | | |
Actual | | | 1,000.00 | | | | 1,063.20 | | | | 7.59 | | | | 1.46 | |
Hypothetical | | | 1,000.00 | | | | 1,017.85 | | | | 7.43 | | | | 1.46 | |
Class R2 | | | | | | | | | | | | | | | | |
Actual | | | 1,000.00 | | | | 1,064.60 | | | | 6.30 | | | | 1.21 | |
Hypothetical | | | 1,000.00 | | | | 1,019.11 | | | | 6.16 | | | | 1.21 | |
Class R5 | | | | | | | | | | | | | | | | |
Actual | | | 1,000.00 | | | | 1,068.10 | | | | 3.02 | | | | 0.58 | |
Hypothetical | | | 1,000.00 | | | | 1,022.28 | | | | 2.96 | | | | 0.58 | |
Class R6 | | | | | | | | | | | | | | | | |
Actual | | | 1,000.00 | | | | 1,067.50 | | | | 2.71 | | | | 0.52 | |
Hypothetical | | | 1,000.00 | | | | 1,022.58 | | | | 2.65 | | | | 0.52 | |
Institutional Class | | | | | | | | | | | | | | | | |
Actual | | | 1,000.00 | | | | 1,067.20 | | | | 3.28 | | | | 0.63 | |
Hypothetical | | | 1,000.00 | | | | 1,022.03 | | | | 3.21 | | | | 0.63 | |
Select Class | | | | | | | | | | | | | | | | |
Actual | | | 1,000.00 | | | | 1,066.70 | | | | 4.06 | | | | 0.78 | |
Hypothetical | | | 1,000.00 | | | | 1,021.27 | | | | 3.97 | | | | 0.78 | |
| * | Expenses are equal to each Class’ respective annualized expense ratio, multiplied by the average account value over the period, multiplied by 184/365 (to reflect the one-half year period). |
| | | | | | | | |
| | | |
| DECEMBER 31, 2014 | | J.P. MORGAN LARGE CAP FUNDS | | | | | 113 | |
SPECIAL SHAREHOLDER MEETING RESULTS
(Unaudited)
JPM Trust I
JPM I held a special meeting of shareholders on June 10, 2014, for the purpose of considering and voting upon the election of Trustees.
Trustees were elected by the shareholders of all of the series of the JPM I, including Disciplined Equity Fund, Dynamic Growth Fund, Equity Focus Fund, Growth and Income Fund, Hedged Equity Fund and U.S. Equity Fund. The results of the voting were as follows:
��
| | | | |
| | | Votes Received
(Amounts in
thousands) | |
| John F. Finn | | | | |
In Favor | | | 172,130,223 | |
Withheld | | | 1,157,495 | |
| |
| Dr. Matthew Goldstein | | | | |
In Favor | | | 172,109,164 | |
Withheld | | | 1,178,553 | |
| |
| Robert J. Higgins | | | | |
In Favor | | | 158,338,954 | |
Withheld | | | 14,948,763 | |
| |
| Frankie D. Hughes | | | | |
In Favor | | | 172,148,985 | |
Withheld | | | 1,138,733 | |
| |
| Peter C. Marshall | | | | |
In Favor | | | 172,124,473 | |
Withheld | | | 1,163,244 | |
| |
| Mary E. Martinez | | | | |
In Favor | | | 172,132,763 | |
Withheld | | | 1,154,954 | |
| |
| Marilyn McCoy | | | | |
In Favor | | | 172,123,615 | |
Withheld | | | 1,164,102 | |
| |
| Mitchell M. Merin | | | | |
In Favor | | | 172,132,812 | |
Withheld | | | 1,154,905 | |
| |
| William G. Morton, Jr. | | | | |
In Favor | | | 172,111,749 | |
Withheld | | | 1,175,968 | |
| |
| Robert A. Oden, Jr. | | | | |
In Favor | | | 172,098,600 | |
Withheld | | | 1,189,117 | |
| |
| Marian U. Pardo | | | | |
In Favor | | | 172,162,159 | |
Withheld | | | 1,125,559 | |
| |
| Frederick W. Ruebeck | | | | |
In Favor | | | 172,051,301 | |
Withheld | | | 1,236,416 | |
| |
| James J. Schonbachler | | | | |
In Favor | | | 172,078,691 | |
Withheld | | | 1,209,026 | |
JPM Trust II
JPM II held a special meeting of shareholders on June 10, 2014, for the purpose of considering and voting upon the following proposals:
Proposal 1: Election of Trustees
Trustees were elected by the shareholders of all of the series of the JPM II, including Equity Income Fund, Large Cap Growth Fund and Large Cap Value Fund. The results of the voting were as follows:
| | | | |
| | | Votes Received
(Amounts in
thousands) | |
| John F. Finn | | | | |
In Favor | | | 132,674,822 | |
Withheld | | | 508,692 | |
| |
| Dr. Matthew Goldstein | | | | |
In Favor | | | 132,670,672 | |
Withheld | | | 512,842 | |
| |
| Robert J. Higgins | | | | |
In Favor | | | 124,038,998 | |
Withheld | | | 9,144,516 | |
| |
| Frankie D. Hughes | | | | |
In Favor | | | 132,681,734 | |
Withheld | | | 501,780 | |
| |
| Peter C. Marshall | | | | |
In Favor | | | 132,663,579 | |
Withheld | | | 519,935 | |
| |
| Mary E. Martinez | | | | |
In Favor | | | 132,682,318 | |
Withheld | | | 501,196 | |
| |
| Marilyn McCoy | | | | |
In Favor | | | 132,681,993 | |
Withheld | | | 501,520 | |
| |
| Mitchell M. Merin | | | | |
In Favor | | | 132,664,715 | |
Withheld | | | 518,799 | |
| |
| William G. Morton, Jr. | | | | |
In Favor | | | 132,650,698 | |
Withheld | | | 532,816 | |
| |
| Robert A. Oden, Jr. | | | | |
In Favor | | | 132,664,727 | |
Withheld | | | 518,788 | |
| |
| Marian U. Pardo | | | | |
In Favor | | | 132,690,792 | |
Withheld | | | 492,722 | |
| |
| Frederick W. Ruebeck | | | | |
In Favor | | | 132,644,244 | |
Withheld | | | 539,269 | |
| |
| James J. Schonbachler | | | | |
In Favor | | | 132,671,281 | |
Withheld | | | 512,233 | |
| | | | | | |
| | | |
| 114 | | | | J.P. MORGAN LARGE CAP FUNDS | | DECEMBER 31, 2014 |
Proposal 2: To approve the replacement of the fundamental investment objective for the Large Cap Growth Fund with a new fundamental investment objective. The special meeting was adjourned because the proposal did not receive enough shareholder votes to pass.
The results of the voting were as follows:
| | | | |
| | | Votes Received
(Amounts in
thousands) | |
For | | | 125,187 | |
Against | | | 1,481 | |
Abstain | | | 939 | |
Broker Non Votes | | | 144,718 | |
The new fundamental investment objective was approved by shareholders of the Fund when the special meeting reconvened on July 23, 2014.
The results of the voting were as follows:
| | | | |
| | | Votes Received
(Amounts in
thousands) | |
For | | | 183,396 | |
Against | | | 3,938 | |
Abstain | | | 2,575 | |
Broker Non Votes | | | 71,772 | |
Proposal 3: To approve the replacement of the fundamental investment objective for the Equity Income Fund with a new fundamental investment objective. The special meeting was adjourned because the proposal did not receive enough shareholder votes to pass.
The results of the voting were as follows:
| | | | |
| | | Votes Received
(Amounts in
thousands) | |
For | | | 146,241 | |
Against | | | 2,050 | |
Abstain | | | 1,740 | |
Broker Non Votes | | | 184,249 | |
The new fundamental investment objective was approved by shareholders of the Fund when the special meeting reconvened on July 23, 2014.
The results of the voting were as follows:
| | | | |
| | | Votes Received
(Amounts in
thousands) | |
For | | | 201,763 | |
Against | | | 4,939 | |
Abstain | | | 4,099 | |
Broker Non Votes | | | 75,735 | |
| | | | | | | | |
| | | |
| DECEMBER 31, 2014 | | J.P. MORGAN LARGE CAP FUNDS | | | | | 115 | |
BOARD APPROVAL OF INVESTMENT ADVISORY AGREEMENT
(Unaudited)
The Board of Trustees has established various standing committees, composed of Trustees with diverse backgrounds, to which the Board of Trustees has assigned specific subject matter responsibilities to further enhance the effectiveness of the Board’s oversight and decision making. The Board of Trustees and its investment committees (money market and alternative products, equity, and fixed income) meet regularly throughout the year and consider factors that are relevant to their annual consideration of investment advisory agreements at each meeting. They also meet for the specific purpose of considering investment advisory agreement annual renewals. The Board of Trustees held meetings in person in June and August 2014, at which the Trustees considered the continuation of the investment advisory agreements for each of the Funds whose semi-annual report is contained herein (each an “Advisory Agreement” and collectively, the “Advisory Agreements”). At the June meeting, the Board’s investment committees met to review and consider performance, expense and related information for the J.P. Morgan Funds. Each investment committee reported to the full Board, which then considered the investment committee’s preliminary findings. At the August meeting, the Trustees continued their review and consideration. The Trustees, including a majority of the Trustees who are not “interested persons” (as defined in the 1940 Act) of any party to the Advisory Agreements or any of their affiliates, approved the continuation of each Advisory Agreement on August 20, 2014.
As part of their review of the Advisory Agreements, the Trustees considered and reviewed performance and other information about the Funds received from the Adviser. This information includes the Funds’ performance as compared to the performance of their peers and benchmarks and analyses by the Adviser of the Funds’ performance. In addition, the Trustees have engaged an independent management consulting firm (“independent consultant”) to report on the performance of certain J.P. Morgan Funds at each of the Trustees’ regular meetings. The Adviser also periodically provides comparative information regarding the Funds’ expense ratios and those of their peer groups. In addition, in preparation for the June and August meetings, the Trustees requested, received and evaluated extensive materials from the Adviser, including performance and expense information compiled by Lipper Inc. (“Lipper”), an independent provider of investment company data. The Trustees’ independent consultant also provided additional analyses of the performance of the Funds with greater than two years of performance history in connection with the Trustees’ review of the Advisory Agreements. Before voting on the proposed Advisory Agreements, the Trustees reviewed the proposed Advisory Agreements with representatives of the Adviser, counsel to the Trusts and independent legal counsel and received a memorandum from independent legal counsel discussing the legal standards for their consideration of the proposed Advisory Agreements. The Trustees also discussed
the proposed Advisory Agreements in executive session with independent legal counsel at which no representatives of the Adviser were present. Set forth below is a summary of the material factors evaluated by the Trustees in determining whether to approve each Advisory Agreement.
The Trustees considered information provided with respect to the Funds over the course of the year. Each Trustee attributed different weights to the various factors, and no factor alone was considered determinative. From year to year, the Trustees consider and place emphasis on relevant information in light of changing circumstances in market and economic conditions. The Trustees determined that the compensation to be received by the Adviser from each Fund under the applicable Advisory Agreement was fair and reasonable and that the continuance of each Advisory Agreement was in the best interests of each Fund and its shareholders.
The factors summarized below were considered and discussed by the Trustees in reaching their conclusions:
Nature, Extent and Quality of Services Provided by the Adviser
The Trustees received and considered information regarding the nature, extent and quality of the services provided to each Fund under the Advisory Agreement. The Trustees took into account information furnished throughout the year at Trustee meetings, as well as the materials furnished specifically in connection with this annual review process. The Trustees considered the background and experience of the Adviser’s senior management and the expertise of, and the amount of attention given to each Fund by, investment personnel of the Adviser. In addition, the Trustees reviewed the qualifications, backgrounds and responsibilities of the portfolio management team primarily responsible for the day-to-day management of each Fund and the infrastructure supporting the team. The Trustees also considered information provided by the Adviser and JPMorgan Distribution Services, Inc. (“JPMDS”) about the structure and distribution strategy of each Fund. The Trustees reviewed information relating to the Adviser’s risk governance model and reports showing the Adviser’s compliance structure and ongoing compliance processes. The Trustees also considered quality of the administrative services provided by JPMorgan Funds Management, Inc. (“JPMFM”), an affiliate of the Adviser.
The Trustees also considered their knowledge of the nature and quality of the services provided by the Adviser and its affiliates to the Funds gained from their experience as Trustees of the J.P. Morgan Funds. In addition, they considered the overall reputation and capabilities of the Adviser and its affiliates, the commitment of the Adviser to provide high quality service to the Funds, their overall confidence in the Adviser’s integrity and the Adviser’s responsiveness to questions or concerns raised by them, including the Adviser’s willingness to consider and implement organizational and operational changes designed to improve investment results and the services provided to each Fund.
| | | | | | |
| | | |
| 116 | | | | J.P. MORGAN LARGE CAP FUNDS | | DECEMBER 31, 2014 |
Based upon these considerations and other factors, the Trustees concluded that they were satisfied with the nature, extent and quality of the investment advisory services provided to the Funds by the Adviser.
Costs of Services Provided and Profitability to the Adviser and its Affiliates
The Trustees received and considered information regarding the profitability to the Adviser and its affiliates in providing services to each of the Funds. The Trustees reviewed and discussed this data. The Trustees recognized that this data is not audited and represents the Adviser’s determination of its and its affiliates’ revenues from the contractual services provided to the Funds, less expenses of providing such services. Expenses include direct and indirect costs and are calculated using an allocation methodology developed by the Adviser. The Trustees also recognized that it is difficult to make comparisons of profitability from fund investment advisory contracts because comparative information is not generally publicly available and is affected by numerous factors, including the structure of the particular adviser, the types of funds it manages, its business mix, numerous assumptions regarding allocations and the fact that publicly-traded fund managers’ operating profits and net income are net of distribution and marketing expenses. Based on their review, the Trustees concluded that the profitability to the Adviser under each of the Advisory Agreements was not unreasonable in light of the services and benefits provided to each Fund.
Fall-Out Benefits
The Trustees reviewed information regarding potential “fallout” or ancillary benefits received by the Adviser and its affiliates as a result of their relationship with the Funds. The Trustees also reviewed the Adviser’s allocation of fund brokerage for the J.P. Morgan Funds complex, including allocations to brokers who provide research to the Adviser.
The Trustees also considered that JPMFM and JPMDS, affiliates of the Adviser, earn fees from the Funds for providing administrative and shareholder services. These fees were shown separately in the profitability analysis presented to the Trustees. The Trustees also considered the payments of Rule 12b-1 fees to JPMDS, which also acts as the Funds’ distributor and that these fees are in turn generally paid to financial intermediaries that sell the Funds, including financial intermediaries that are affiliates of the Adviser. The Trustees also considered the fees paid to JPMorgan Chase Bank, N.A. (“JPMCB”) for custody and fund accounting, and other related services.
Economies of Scale
The Trustees considered the extent to which the Funds benefit from economies of scale. The Trustees noted that the proposed investment advisory fee schedule for each Fund does not
contain breakpoints, but that the fee schedule for the administrative services provided by JPMFM does include a fee breakpoint, which is tied to the overall level of non-money market fund assets excluding certain funds-of-funds, as applicable, advised by the Adviser, and that the Funds benefit from that breakpoint. The Trustees also noted that the Adviser and its affiliates have implemented fee waivers and expense limitations. The Trustees considered whether it would be appropriate to add advisory fee breakpoints, and the Trustees concluded that the current fee structure was reasonable in light of the fee waivers and expense limitations that the Adviser and its affiliates have in place that serve to limit the overall net expense ratios of the Fund at competitive levels. The Trustees concluded that shareholders of the Funds effectively participated in the economies of scale through these fee waivers and expense limitations and administrative service fee breakpoints.
Independent Written Evaluation of the Funds’ Senior/Chief Compliance Officer
The Trustees noted that, upon their direction, the Senior Officer for the Equity Income Fund, Large Cap Growth Fund, Large Cap Value Fund and U.S. Equity Fund had prepared an independent written evaluation in order to assist the Trustees in determining the reasonableness of the proposed management fees. In determining whether to continue the Advisory Agreements, the Trustees considered the Senior Officer’s report.
The Trustees noted that, upon their direction, the Chief Compliance Officer for the Disciplined Equity Fund, Dynamic Growth Fund, Equity Focus Fund, and Growth and Income Fund had prepared an independent written evaluation in order to assist the Trustees in determining the reasonableness of the proposed management fees. The Trustees considered the written evaluation in determining whether to continue the Advisory Agreements.
Fees Relative to Adviser’s Other Clients
The Trustees received and considered information about the nature and extent of investment advisory services and fee rates offered to other clients of the Adviser for investment management styles substantially similar to that of each Fund. The Trustees also considered the complexity of investment management for the Funds relative to the Adviser’s other clients and the differences in the nature and extent of the services provided to the different clients. The Trustees concluded that the fee rates charged to each Fund in comparison to those charged to the Adviser’s other clients were reasonable.
Investment Performance
The Trustees received and considered absolute and/or relative performance for the Funds in a report prepared by Lipper. The Trustees considered the total return performance information, which included the ranking of the Funds within a performance
| | | | | | | | |
| | | |
| DECEMBER 31, 2014 | | J.P. MORGAN LARGE CAP FUNDS | | | | | 117 | |
BOARD APPROVAL OF INVESTMENT ADVISORY AGREEMENT
(Unaudited) (continued)
universe made up of funds with the same Lipper investment classification and objective (the “Universe Group”) by total return for applicable one-, three- and five-year periods. The Trustees reviewed a description of Lipper’s methodology for selecting mutual funds in each Fund’s Universe Group. The Lipper materials provided to the Trustees highlighted information with respect to certain representative classes to assist the Trustees in their review. As part of this review, the Trustees also reviewed each Fund’s performance against its benchmark and considered the performance information provided for the Funds at regular Board meetings by the Adviser and the Trustees’ independent consultant and also considered the special analysis prepared by the Trustees’ independent consultant. The Lipper performance data noted by the Trustees as part of their review and the determinations made by the Trustees with respect to each Fund’s performance for certain representative classes are summarized below:
The Trustees noted that the Disciplined Equity Fund’s performance was in the second, second and first quintiles for Class A shares and in the second, first and first quintiles for Select Class shares for the one-, three-, and five-year periods ended December 31, 2013, respectively, and that the Trustees’ independent consultant indicated that the Fund’s overall performance was attractive. The Trustees discussed the performance and investment strategy of the Fund with the Adviser and, based upon this discussion and various other factors, concluded that the performance was reasonable.
The Trustees noted that the Dynamic Growth Fund’s performance was in the first quintile for both Class A and Select Class shares for each of the one-, three-, and five-year periods ended December 31, 2013, respectively, and that the Trustees’ independent consultant indicated that the Fund’s overall performance was attractive. The Trustees discussed the performance and investment strategy of the Fund with the Adviser and, based upon this discussion and various other factors, concluded that the performance was reasonable.
The Trustees noted that the Equity Focus Fund’s performance was in the first quintile for both Class A and Select Class shares for the one-year period ended December 31, 2013, and that the Trustees’ independent consultant indicated that the Fund’s overall performance was attractive. The Trustees discussed the performance and investment strategy of the Fund with the Adviser and, based upon this discussion and various other factors, concluded that the performance was reasonable.
The Trustees noted that the Equity Income Fund’s performance was in the first quintile for both Class A and Select Class shares for each of the one- , three-, and five-year periods ended December 31, 2013, respectively, and that the Trustees’ independent consultant indicated that the Fund’s overall performance was attractive. The Trustees discussed the performance and investment strategy of the Fund with the Adviser and,
based upon this discussion and various other factors, concluded that the performance was reasonable.
The Trustees noted that the Growth and Income Fund’s performance was in the second, first and second quintiles for both Class A and Select Class shares for the one-, three-, and five-year periods ended December 31, 2013, respectively, and that the Trustees’ independent consultant indicated that the Fund’s overall performance was attractive. The Trustees discussed the performance and investment strategy of the Fund with the Adviser and, based upon this discussion and various other factors, concluded that the performance was reasonable.
The Trustees noted that the Large Cap Growth Fund’s performance was in the fourth, third and second quintiles for Class A shares and in the fourth, third, and first quintiles for Select Class shares for the one-, three-, and five-year periods ended December 31, 2013, respectively, and that the Trustees’ independent consultant indicated that the Fund’s overall performance was satisfactory. The Trustees discussed the performance and investment strategy of the Fund with the Adviser and, based upon this discussion and various other factors, concluded that they were satisfied with the Adviser’s analysis of the Fund’s performance. The Trustees requested, however, that the Fund’s Adviser provide additional Fund performance information to be reviewed with the members of the Equity Committee at each of their regular meetings over the course of next year.
The Trustees noted that the Large Cap Value Fund’s performance was in the first, third and second quintiles for Class A shares and in the first, third and first quintiles for Select Class shares for the one-, three- and five-year periods ended December 31, 2013, respectively, and that the Trustees’ independent consultant indicated that the Fund’s overall performance was satisfactory. The Trustees discussed the performance and investment strategy of the Fund with the Adviser and, based upon this discussion and various other factors, concluded that the performance was reasonable.
The Trustees noted that the U.S. Equity Fund’s performance was in the first, second and first quintiles for both Class A and Select Class shares for the one-, three- and five-year periods ended December 31, 2013, respectively, and that the Trustees’ independent consultant indicated that the Fund’s overall performance was satisfactory. The Trustees discussed the performance and investment strategy of the Fund with the Adviser and, based upon this discussion and various other factors, concluded that the performance was reasonable.
Advisory Fees and Expense Ratios
The Trustees considered the contractual advisory fee rate paid by each Fund to the Adviser and compared that rate to the information prepared by Lipper concerning management fee rates paid by other funds in the same Lipper category as each
| | | | | | |
| | | |
| 118 | | | | J.P. MORGAN LARGE CAP FUNDS | | DECEMBER 31, 2014 |
Fund. The Trustees recognized that Lipper reported each Fund’s management fee rate as the combined contractual advisory fee and administration fee rates. The Trustees also reviewed information about other expenses and the expense ratios for each Fund. The Trustees considered the fee waiver and/or expense reimbursement arrangements currently in place for each Fund and considered the net advisory fee rate after taking into account any waivers and/or reimbursements. The Trustees recognized that it is difficult to make comparisons of advisory fees because there are variations in the services that are included in the fees paid by other funds. The Trustees’ determinations as a result of the review of each Fund’s advisory fees and expense ratios for certain representative classes are summarized below:
The Trustees noted that the Disciplined Equity Fund’s net advisory fee and actual total expenses for both Class A and Select Class shares were in the first quintile of the Universe Group. After considering the factors identified above, in light of this information, the Trustees concluded that the advisory fee was reasonable.
The Trustees noted that the Dynamic Growth Fund’s net advisory fee for both Class A and Select Class shares was in the third quintile, and that the actual total expenses for Class A and Select Class shares were in the third and fourth quintiles, respectively, of the Universe Group. After considering the factors identified above, in light of this information, the Trustees concluded that the advisory fee was reasonable.
The Trustees noted that the Equity Focus Fund’s net advisory fee for both Class A and Select Class shares was in the first quintile, and that the actual total expenses for both Class A and Select Class shares were in the third quintile of the Universe Group. After considering the factors identified above, in light of this information, the Trustees concluded that the advisory fee was reasonable.
The Trustees noted that the Equity Income Fund’s net advisory fee for both Class A and Select Class shares was in the first
quintile, and that the actual total expenses for Class A and Select Class shares were in the first and second quintiles, respectively, of the Universe Group. After considering the factors identified above, in light of this information, the Trustees concluded that the advisory fee was reasonable.
The Trustees noted that the Growth and Income Fund’s net advisory fee for both Class A and Select Class shares was in the second quintile and that the actual total expenses for both Class A and Select shares were in the second and third quintiles, respectively, of the Universe Group. After considering the factors identified above, in light of this information, the Trustees concluded that the advisory fee was reasonable.
The Trustees noted that the Large Cap Growth Fund’s net advisory fee for Class A and Select Class shares was in the first and second quintiles, respectively, and that the actual total expenses for Class A and Select Class shares were in the first and third quintiles, respectively, of the Universe Group. After considering the factors identified above, in light of this information, the Trustees concluded that the advisory fee was reasonable.
The Trustees noted that the Large Cap Value Fund’s net advisory fee for Class A and Select Class shares was in the first and second quintiles, respectively, and that the actual total expenses for Class A and Select Class shares were in the first and second quintiles, respectively, of the Universe Group. After considering the factors identified above, in light of this information, the Trustees concluded that the advisory fees were reasonable.
The Trustees noted that the U.S. Equity Fund’s net advisory fee for Class A and Select Class shares was in the first and second quintiles, respectively, and that the actual total expenses for Class A and Select Class shares were in the first and third quintiles, respectively, of the Universe Group. After considering the factors identified above, in light of this information, the Trustees concluded that the advisory fees were reasonable.
| | | | | | | | |
| | | |
| DECEMBER 31, 2014 | | J.P. MORGAN LARGE CAP FUNDS | | | | | 119 | |
J.P. Morgan Funds are distributed by JPMorgan Distribution Services, Inc., which is an affiliate of JPMorgan Chase & Co. Affiliates of JPMorgan Chase & Co. receive fees for providing various services to the funds.
Contact JPMorgan Distribution Services, Inc. at 1-800-480-4111 for a fund prospectus. You can also visit us at www.jpmorganfunds.com. Investors should carefully consider the investment objectives and risk as well as charges and expenses of the mutual fund before investing. The prospectus contains this and other information about the mutual fund. Read the prospectus carefully before investing.
Investors may obtain information about the Securities Investor Protection Corporation (SIPC), including the SIPC brochure by visiting www.sipc.org or by calling SIPC at 202-371-8300.
Each Fund files a complete schedule of its fund holdings for the first and third quarters of its fiscal year with the SEC on Form N-Q. The Funds’ Forms N-Q are available on the SEC’s website at http://www.sec.gov and may be reviewed and copied at the SEC’s Public Reference Room in Washington, DC. Information on the operation of the SEC’s Public Reference Room may be obtained by calling 1-800-SEC-0330. Shareholders may request the Form N-Q without charge by calling 1-800-480-4111 or by visiting the J.P. Morgan Funds’ website at www.jpmorganfunds.com.
A description of each Fund’s policies and procedures with respect to the disclosure of each Fund’s holdings is available in the prospectus and Statement of Additional Information.
A copy of proxy policies and procedures is available without charge upon request by calling 1-800-480-4111 and on the Funds’ website at www.jpmorganfunds.com. A description of such policies and procedures is on the SEC’s website at www.sec.gov. The Trustees have delegated the authority to vote proxies for securities owned by the Funds to the Adviser. A copy of the Funds’ voting record for the most recent 12-month period ended June 30 is available on the SEC’s website at www.sec.gov or at the Funds’ website at www.jpmorganfunds.com no later than August 31 of each year. The Funds’ proxy voting record will include, among other things, a brief description of the matter voted on for each fund security, and will state how each vote was cast, for example, for or against the proposal.

J.P. Morgan Asset Management is the marketing name for the asset management business of JPMorgan Chase & Co. Those businesses include, but are not limited to, J.P. Morgan Investment Management Inc., Security Capital Research & Management Incorporated and J.P. Morgan Alternative Asset Management, Inc.
| | | | |
| | © JPMorgan Chase & Co., 2015. All rights reserved. December 2014. | | SAN-LCE-1214 |
Semi-Annual Report
J.P. Morgan Equity Funds
December 31, 2014 (Unaudited)
JPMorgan Equity Index Fund
JPMorgan Market Expansion Enhanced Index Fund

CONTENTS
Investments in a Fund are not bank deposits or obligations of, or guaranteed or endorsed by, any bank and are not insured or guaranteed by the FDIC, the Federal Reserve Board or any other government agency. You could lose money if you sell when the Fund’s share price is lower than when you invested.
Past performance is no guarantee of future performance. The general market views expressed in this report are opinions based on market and other conditions through the end of the reporting period and are subject to change without notice. These views are not intended to predict the future performance of a Fund or the securities markets. References to specific securities and their issuers are for illustrative purposes only and are not intended to be, and should not be interpreted as, recommendations to purchase or sell such securities. Such views are not meant as investment advice and may not be relied on as an indication of trading intent on behalf of any Fund.
Prospective investors should refer to the Funds’ prospectus for a discussion of the Funds’ investment objectives, strategies and risks. Call J.P. Morgan Funds Service Center at 1-800-480-4111 for a prospectus containing more complete information about a Fund, including management fees and other expenses. Please read it carefully before investing.
CEO’S LETTER
January 11, 2015 (Unaudited)
Dear Shareholder,
A growing divergence in the economic trajectories of U.S. and other developed markets and plummeting global energy prices provided a mixed backdrop for the latter half of 2014. The U.S. economy accelerated at a steady pace amid continued strength in corporate earnings, gains in employment and consumer spending and falling oil prices for the six months ended December 31, 2014. Gross domestic product (GDP) in the U.S. climbed by 5.0% in the third quarter of 2014 and unemployment dropped to 5.6% in December, a level not seen since June 2008.
| | |
 | | “Amid uncertainty about the global economy recovery, equity markets in the U.S., China and Japan provided investors with solid returns and served to emphasize the prudence of holding a broadly diversified portfolio and a long-term outlook.” |
In response to the continued improvement in the domestic economy, the U.S. Federal Reserve Bank proceeded to taper down its monthly purchases of bonds under its quantitative easing program and finally closed the program in October.
In stark contrast, the European Central Bank (ECB) took unprecedented steps to counter the threat of price deflation in the euro zone and the Bank of Japan stunned markets with a massive stimulus program as Japan’s economy slid into recession.
Another key development in the latter half of 2014 was a precipitous drop in global petroleum prices. A supply glut driven by new production in the U.S. and increased output from other nations, along with decreasing demand from China, Europe and Japan led to a 50% drop in the price of crude oil between July and December.
Amid this backdrop, U.S. equity markets outperformed most other assets classes over the six month period, with large cap stocks providing better returns than small caps and defensive sectors overtaking cyclical sectors. Notably, U.S. equities fell to six-month lows in mid October only to rebound 8.4%, driving the Standard & Poor’s 500 Index (“S&P 500”) to a new closing high of 2,018.05 points on October 31, 2014. In December, the Dow Jones Industrial Average closed above 18,000 points for the first time following the news that third quarter GDP showed the fastest growth in 11 years. The S&P 500 closed at a new high of 2,090.57 points on December 29, 2014, and returned 6.1% for the six months ended December 31, 2014.
Prices for U.S. Treasury securities with longer maturities rose during the six month period as investors sought safe havens amid deteriorating energy prices and geopolitical concerns. While declining oil prices helped bolster consumer spending in developed nations, energy related sectors came under pressure and yield spreads on high-yield debt – also known as junk bonds – widened. Nations dependent on oil exports experienced volatility in bond yield spreads and currency valuations.
Meanwhile, weak growth in the euro zone raised concerns about the potential for a destructive deflationary spiral. Even after the ECB had cut its deposit rate to negative 0.1% to encourage banks to extend lending by effectively charging them for parking excess cash with the central bank, growth remained tepid and inflation was well below the ECB’s target of just below 2%. The inflation rate averaged 0.4% from July to October and then fell 0.3% in November and was estimated at -0.2% for December. Unemployment across the euro zone remained stubbornly high at 11.5%.
Japan’s economy retreated into recession during the six month period following two quarters of economic contraction, partly attributed to an increase in the national consumption tax earlier in the year. Responding to the crisis, the Bank of Japan surprised global markets on October 31 by unveiling plans to buy 8 trillion to 12 trillion yen ($71 billion to $107 billion) of Japanese government bonds per month, while also tripling its purchases of exchange-traded funds. The announcement drove Tokyo stocks to seven-year highs. For the six months ended December 31, 2014, the MSCI Europe, Australasia and Far East Index returned -9.2%.
Elsewhere, China’s economy continued to grow but at a slower pace for the six month period. At 7.3%, China’s GDP showed the slowest growth in five years, though it was slightly better than economists had expected. The weaker GDP growth was partly attributed to a slowdown in the property sector. However, Chinese equity securities performed well over the six months ended December 31, 2014, amid expectations that policy makers may ease monetary policy to spur growth. Chinese equity markets received an additional boost when regulators increased access to Chinese financial markets by allowing foreign investors in Hong Kong to buy shares in Shanghai.
Russia’s economy, already straining under Western economic sanctions following its annexation of Crimea, began sliding toward recession as prices plummeted for oil and natural gas, its biggest exports. In response, the Russian Central Bank spent heavily from its reserves and raised its key interest rate sharply in a largely unsuccessful effort to halt the ruble’s slide. The MSCI Emerging Markets Index returned -7.7% for the six months ended December 31, 2014.
| | | | | | | | |
| | | |
| DECEMBER 31, 2014 | | J.P. MORGAN EQUITY FUNDS | | | | | 1 | |
CEO’S LETTER
January 11, 2015 (Unaudited) (continued)
During the six month period, financial market volatility returned after being largely absent in the first half of 2014. Meanwhile, economic growth outside the U.S. began to falter and the relative strength of the U.S. economy drove the dollar higher against other major currencies. Amid uncertainty about the global economy recovery, equity markets in the U.S., China and Japan provided investors with solid returns and served to emphasize the prudence of holding a broadly diversified portfolio and a long-term outlook.
On behalf of everyone at J.P. Morgan Asset Management, thank you for your continued support. We look forward to managing your investment needs for years to come. Should you have any
questions, please visit www.jpmorganfunds.com or contact the J.P. Morgan Funds Service Center at 1-800-480-4111.
Sincerely yours,

George C.W. Gatch
CEO, Global Funds Management
J.P. Morgan Asset Management
| | | | | | |
| | | |
| 2 | | | | J.P. MORGAN EQUITY FUNDS | | DECEMBER 31, 2014 |
JPMorgan Equity Index Fund
FUND COMMENTARY
SIX MONTHS ENDED DECEMBER 31, 2014 (Unaudited)
| | | | |
| REPORTING PERIOD RETURN: | | | |
| Fund (Select Class Shares)* | | | 6.01% | |
| S&P 500 Index | | | 6.12% | |
| |
| Net Assets as of 12/31/2014 (In Thousands) | | $ | 1,966,078 | |
INVESTMENT OBJECTIVE**
The JPMorgan Equity Index Fund (the “Fund”) seeks investment results that correspond to the aggregate price and dividend performance of securities in the Standard & Poor’s 500 Composite Stock Price Index (S&P 500 Index)*** (the “Benchmark”).
WHAT WERE THE MAIN DRIVERS OF THE FUND’S PERFORMANCE?
The Fund (Select Class Shares) performed largely in line with the Benchmark for the six months ended December 31, 2014. This was consistent with its indexing strategy and investment objective, as the Fund looks to generate returns that are comparable to that of the Benchmark.
U.S equity markets performed strongly during the six month reporting period, amid accommodative central bank policies, falling energy prices and steady overall improvement in the U.S. economy. While the second half of 2014 was marked by the return of volatility in financial markets and a sharp sell-off in mid-October, key U.S. equity indexes rebounded to closing highs in the final months of 2014. The S&P 500 Index broke through the 2,000-point closing level for the first time on the final day of October and hit new closing highs in the final weeks of December.
Overall, U.S. large cap stocks outperformed small cap stocks and growth stocks outperformed value stocks during the reporting period. Seven out of 10 sectors within the Benchmark generated positive absolute returns during the reporting period. The information technology and health care sectors were the leading contributors to performance, while the energy sector and the materials sector were leading detractors from Fund performance.
HOW WAS THE FUND POSITIONED?
Regardless of the market outlook, the Fund was managed in strict conformity with a full index replication strategy and aimed to hold the same stocks in nearly the same proportions as those found in the Benchmark.
| | | | | | | | |
| TOP TEN EQUITY HOLDINGS OF THE PORTFOLIO**** | |
| | 1. | | | Apple, Inc. | | | 3.5 | % |
| | 2. | | | Exxon Mobil Corp. | | | 2.1 | |
| | 3. | | | Microsoft Corp. | | | 2.1 | |
| | 4. | | | Johnson & Johnson | | | 1.6 | |
| | 5. | | | Berkshire Hathaway, Inc., Class B | | | 1.5 | |
| | 6. | | | Wells Fargo & Co. | | | 1.4 | |
| | 7. | | | General Electric Co. | | | 1.4 | |
| | 8. | | | Procter & Gamble Co. (The) | | | 1.3 | |
| | 9. | | | JPMorgan Chase & Co. | | | 1.3 | |
| | 10. | | | Chevron Corp. | | | 1.2 | |
| | | | |
PORTFOLIO COMPOSITION BY SECTOR**** | |
| Information Technology | | | 19.5 | % |
| Financials | | | 16.6 | |
| Health Care | | | 14.1 | |
| Consumer Discretionary | | | 12.1 | |
| Industrials | | | 10.4 | |
| Consumer Staples | | | 9.7 | |
| Energy | | | 8.4 | |
| Utilities | | | 3.2 | |
| Materials | | | 3.2 | |
| Telecommunication Services | | | 2.3 | |
| Short-Term Investment | | | 0.5 | |
| * | | The return shown is based on net asset values calculated for shareholder transactions and may differ from the return shown in the financial highlights, which reflects adjustments made to the net asset values in accordance with accounting principles generally accepted in the United States of America. |
| ** | | The adviser seeks to achieve the Fund’s objective. There can be no guarantee it will be achieved. |
| *** | | “S&P 500 Index” is a registered service mark of Standard & Poor’s Corporation, which does not sponsor and is in no way affiliated with the Fund. |
| **** | | Percentages indicated are based on total investments as of December 31, 2014. The Fund’s portfolio composition is subject to change. |
| | | | | | | | |
| | | |
| DECEMBER 31, 2014 | | J.P. MORGAN EQUITY FUNDS | | | | | 3 | |
JPMorgan Equity Index Fund
FUND COMMENTARY
SIX MONTHS ENDED DECEMBER 31, 2014 (Unaudited) (continued)
| | | | | | | | |
AVERAGE ANNUAL TOTAL RETURNS AS OF DECEMBER 31, 2014 |
| | | | | | | | | | | | | | | | | | |
| | | | | |
| | | INCEPTION DATE OF
CLASS | | 6 MONTH* | | | 1 YEAR | | | 5 YEAR | | | 10 YEAR | |
CLASS A SHARES | | February 18, 1992 | | | | | | | | | | | | | | | | |
Without Sales Charge | | | | | 5.88 | % | | | 13.12 | % | | | 14.93 | % | | | 7.22 | % |
With Sales Charge** | | | | | 0.33 | | | | 7.18 | | | | 13.70 | | | | 6.64 | |
CLASS B SHARES | | January 14, 1994 | | | | | | | | | | | | | | | | |
Without CDSC | | | | | 5.46 | | | | 12.25 | | | | 14.06 | | | | 6.58 | |
With CDSC*** | | | | | 0.46 | | | | 7.25 | | | | 13.83 | | | | 6.58 | |
CLASS C SHARES | | November 4, 1997 | | | | | | | | | | | | | | | | |
Without CDSC | | | | | 5.46 | | | | 12.24 | | | | 14.07 | | | | 6.42 | |
With CDSC**** | | | | | 4.46 | | | | 11.24 | | | | 14.07 | | | | 6.42 | |
SELECT CLASS SHARES | | July 2, 1991 | | | 6.01 | | | | 13.40 | | | | 15.21 | | | | 7.49 | |
| ** | | Sales Charge for Class A Shares is 5.25%. |
| *** | | Assumes a 5% CDSC (contingent deferred sales charge) for the one year period, 2% CDSC for the five year period and 0% CDSC thereafter. |
| **** | | Assumes a 1% CDSC for the one year period and 0% CDSC thereafter. |
TEN YEAR PERFORMANCE (12/31/04 TO 12/31/14)
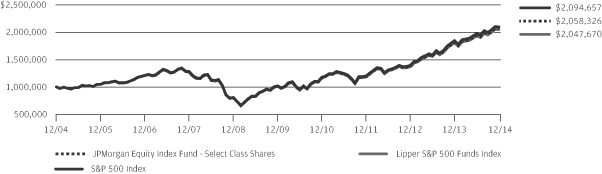
The performance quoted is past performance and is not a guarantee of future results. Mutual funds are subject to certain market risks. Investment returns and principal value of an investment will fluctuate so that an investor’s shares, when redeemed, may be worth more or less than their original cost. Current performance may be higher or lower than the performance data shown. For up-to-date month-end performance information please call 1-800-480-4111.
The graph illustrates comparative performance for $1,000,000 invested in Select Class Shares of the JPMorgan Equity Index Fund, the S&P 500 Index and the Lipper S&P 500 Funds Index from December 31, 2004 to December 31, 2014. The performance of the Fund assumes reinvestment of all dividends and capital gain distributions, if any, and does not include a sales charge. The performance of the S&P 500 Index does not reflect the deduction of expenses or a sales charge associated with a mutual fund and has been adjusted to reflect reinvestment of all dividends and capital gain distributions of the securities included in the benchmark, if applicable. The performance of the Lipper S&P 500 Funds Index includes expenses associated with a mutual fund, such as investment management fees. These expenses are not identical to the expenses incurred by the Fund. The S&P 500 Index is an unmanaged index generally representative of the performance of large companies in the U.S. stock market.
The Lipper S&P 500 Funds Index is an index based on the total returns of certain mutual funds within the Fund’s designated category as determined by Lipper, Inc. Investors cannot invest directly in an index.
Select Class Shares have a $1,000,000 minimum initial investment.
Fund performance may reflect the waiver of the Fund’s fees and reimbursement of expenses for certain periods since the inception date. Without these waivers and reimbursements, performance would have been lower. Also, performance shown in this section does not reflect the deduction of taxes that a shareholder would pay on Fund distributions or redemption of Fund shares.
Because Class B Shares automatically convert to Class A Shares after 8 years, the 10 year average annual total return shown above for Class B reflects Class A performance for the period after conversion.
The returns shown are based on net asset values calculated for shareholder transactions and may differ from the returns shown in the financial highlights, which reflect adjustments made to the net asset values in accordance with accounting principles generally accepted in the United States of America.
| | | | | | |
| | | |
| 4 | | | | J.P. MORGAN EQUITY FUNDS | | DECEMBER 31, 2014 |
JPMorgan Market Expansion Enhanced Index Fund
FUND COMMENTARY
SIX MONTHS ENDED DECEMBER 31, 2014 (Unaudited)
| | | | |
| Reporting Period Return: | |
| Fund (Select Class Shares)* | | | 2.70% | |
| S&P 1000 Index | | | 2.22% | |
| |
| Net Assets as of 12/31/2014 (In Thousands) | | | $1,445,240 | |
INVESTMENT OBJECTIVE**
The JPMorgan Market Expansion Enhanced Index Fund (the “Fund”) seeks to provide investment results that correspond to or incrementally exceed the total return performance of an index that tracks the performance of the small- and mid-capitalization equity markets.
WHAT WERE THE MAIN DRIVERS OF THE FUND’S PERFORMANCE?
The Fund (Select Class Shares) outperformed the Standard & Poor’s 1000 Index*** (the “Benchmark”) for the six months ended December 31, 2014.
U.S equity markets performed strongly during the six month reporting period, amid accommodative central bank policies, falling energy prices and steady overall improvement in the U.S. economy. While the second half of 2014 was marked by the return of volatility in financial markets and a sharp sell-off in mid-October, key U.S. equity indexes rebounded to closing highs in the final months of 2014. Overall, U.S. large cap stocks outperformed both mid cap and small cap stocks and growth stocks outperformed value stocks during the reporting period. Seven out of 10 sectors within the Benchmark generated positive absolute returns during the reporting period and the Benchmark itself closed at a record high near the end of December.
The Fund’s security selection in the semiconductors and consumer cyclical sectors was the leading contributor to performance relative to the Benchmark, while security selection and an overweight position in the energy sector and security selection in the industrials cyclical sectors were leading detractors from relative performance.
Individual contributors to relative performance included the Fund’s overweight positions in Skyworks Solutions Inc., Avid Technology Inc. and its underweight position in GT Advanced
Technologies Inc. Shares of Skyworks, a producer of radio frequency semiconductors, rose on increased demand for its products from smartphone makers, particularly Apple Inc. Shares of Avid Technology, a provider of digital media software, strengthened on the company’s market share gains and its improved forecast of cash flow. Shares of GT Advanced, a diversified technology company not held by the Fund, declined after the company surprised investors by filing for bankruptcy in October.
Individual detractors from relative performance included the Fund’s underweight position in Dresser-Rand Group Inc. and its overweight positions in U.S. Steel Corp. and Salix Pharmaceuticals Ltd. Shares of Dresser-Rand, a provider of industrial equipment not held by the Fund, rose on expectations of a corporate takeover by Siemens Ltd. Shares of U.S. Steel, a maker of steel and related products, declined following a third-quarter loss and falling demand for pipeline amid plummeting global oil prices. Shares of Salix Pharmaceuticals, a drug maker focused on gastrointestinal disorders, weakened amid an inventory issue affecting three of its key drugs.
HOW WAS THE FUND POSITIONED?
The Fund seeks to closely track the sector and industry weights within the Benchmark. Because the Fund uses an enhanced index strategy, not all of the stocks in the Benchmark are held by the Fund, and the Fund’s position in an individual stock may be overweight or underweight as compared to the Benchmark. Looking at valuation and fundamentals, the Fund’s portfolio managers overweighted what they believed were attractively priced stocks with improving fundamentals and underweighted what they believed were expensive stocks with deteriorating fundamentals, based on their bottom-up approach to stock selection. In addition, the Fund may modestly overweight or underweight the sectors and industries within the Benchmark.
| | | | | | | | |
| | | |
| DECEMBER 31, 2014 | | J.P. MORGAN EQUITY FUNDS | | | | | 5 | |
JPMorgan Market Expansion Enhanced Index Fund
FUND COMMENTARY
SIX MONTHS ENDED DECEMBER 31, 2014 (Unaudited) (continued)
| | | | | | | | |
| TOP TEN EQUITY HOLDINGS OF THE PORTFOLIO**** | |
| | 1. | | | Skyworks Solutions, Inc. | | | 1.0 | % |
| | 2. | | | Advance Auto Parts, Inc. | | | 0.8 | |
| | 3. | | | Hanesbrands, Inc. | | | 0.8 | |
| | 4. | | | Community Health Systems, Inc. | | | 0.8 | |
| | 5. | | | Salix Pharmaceuticals Ltd. | | | 0.7 | |
| | 6. | | | Huntington Ingalls Industries, Inc. | | | 0.7 | |
| | 7. | | | Equinix, Inc. | | | 0.7 | |
| | 8. | | | Jarden Corp. | | | 0.7 | |
| | 9. | | | Rock-Tenn Co., Class A | | | 0.7 | |
| | 10. | | | Endo International plc, (Ireland) | | | 0.7 | |
| | | | |
PORTFOLIO COMPOSITION BY SECTOR**** | |
| Financials | | | 22.2 | % |
| Information Technology | | | 17.6 | |
| Industrials | | | 15.6 | |
| Consumer Discretionary | | | 13.0 | |
| Health Care | | | 10.6 | |
| Materials | | | 7.1 | |
| Utilities | | | 4.7 | |
| Energy | | | 3.7 | |
| Consumer Staples | | | 3.2 | |
| Others (each less than 1.0%) | | | 0.1 | |
| Short-Term Investment | | | 2.2 | |
| * | | The return shown is based on net asset values calculated for shareholder transactions and may differ from the return shown in the financial highlights, which reflects adjustments made to the net asset values in accordance with accounting principles generally accepted in the United States of America. |
| ** | | The adviser seeks to achieve the Fund’s objective. There can be no guarantee it will be achieved. |
| *** | | “S&P 1000 Index” is registered service marks of Standard & Poor’s Corporation, which does not sponsor and is in no way affiliated with the Fund. |
| **** | | Percentages indicated are based on total investments as of December 31, 2014. The Fund’s portfolio composition is subject to change. |
| | | | | | |
| | | |
| 6 | | | | J.P. MORGAN EQUITY FUNDS | | DECEMBER 31, 2014 |
| | | | | | | | |
AVERAGE ANNUAL TOTAL RETURNS AS OF DECEMBER 31, 2014 |
| | | | | | | | | | | | | | | | | | |
| | | | | |
| | | INCEPTION DATE OF
CLASS | | 6 MONTH* | | | 1 YEAR | | | 5 YEAR | | | 10 YEAR | |
CLASS A SHARES | | July 31, 1998 | | | | | | | | | | | | | | | | |
Without Sales Charge | | | | | 2.54 | % | | | 9.26 | % | | | 16.21 | % | | | 9.01 | % |
With Sales Charge** | | | | | (2.86 | ) | | | 3.54 | | | | 14.96 | | | | 8.43 | |
CLASS B SHARES | | July 31, 1998 | | | | | | | | | | | | | | | | |
Without CDSC | | | | | 2.18 | | | | 8.52 | | | | 15.41 | | | | 8.39 | |
With CDSC*** | | | | | (2.82 | ) | | | 3.52 | | | | 15.19 | | | | 8.39 | |
CLASS C SHARES | | March 22, 1999 | | | | | | | | | | | | | | | | |
Without CDSC | | | | | 2.29 | | | | 8.56 | | | | 15.43 | | | | 8.25 | |
With CDSC**** | | | | | 1.29 | | | | 7.56 | | | | 15.43 | | | | 8.25 | |
CLASS R2 SHARES | | November 3, 2008 | | | 2.46 | | | | 9.02 | | | | 15.86 | | | | 8.65 | |
SELECT CLASS SHARES | | July 31, 1998 | | | 2.70 | | | | 9.52 | | | | 16.52 | | | | 9.29 | |
| ** | | Sales Charge for Class A Shares is 5.25%. |
| *** | | Assumes 5% CDSC (contingent deferred sales charge) for the one year period, 2% CDSC for the five year period and 0% CDSC thereafter. |
| **** | | Assumes a 1% CDSC for the one year period and 0% CDSC thereafter. |
TEN YEAR PERFORMANCE (12/31/04 TO 12/31/14)
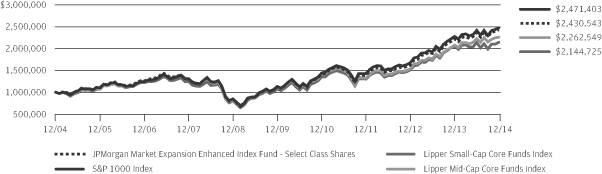
The performance quoted is past performance and is not a guarantee of future results. Mutual funds are subject to certain market risks. Investment returns and principal value of an investment will fluctuate so that an investor’s shares, when redeemed, may be worth more or less than their original cost. Current performance may be higher or lower than the performance data shown. For up-to-date month-end performance information please call 1-800-480-4111.
Returns for Class R2 Shares prior to its inception date are based on the performance of Select Class Shares. All prior class performance for Class R2 Shares has been adjusted to reflect the differences in expenses between classes.
The graph illustrates comparative performance for $1,000,000 invested in Select Class Shares of the JPMorgan Market Expansion Enhanced Index Fund, the S&P 1000 Index, the Lipper Mid-Cap Core Funds Index and the Lipper Small-Cap Core Funds Index from December 31, 2004 to December 31, 2014. The performance of the Fund assumes reinvestment of all dividends and capital gain distributions, if any, and does not include a sales charge. The performance of the S&P 1000 Index does not reflect the deduction of expenses or a sales charge associated with a mutual fund and has been adjusted to reflect reinvestment of all dividends and capital gain distributions of the securities included in the benchmark, if applicable. The performance of the Lipper Small-Cap Core Funds Index and the Lipper Mid-Cap Core Funds Index includes expenses associated with a mutual fund, such as investment management fees. These expenses are not identical to the expenses incurred by the Fund. The S&P 1000 Index is an unmanaged index
generally representative of the performance of the small and mid-size companies in the U.S. stock market. The Lipper Mid-Cap Core Funds Index and the Lipper Small-Cap Core Funds Index are indices based on total returns of certain mutual funds within the mid cap and small cap categories as determined by Lipper, Inc. Investors cannot invest directly in an index.
Select Class Shares have a $1,000,000 minimum initial investment.
Fund performance may reflect the waiver of the Fund’s fees and reimbursement of expenses for certain periods since the inception date. Without these waivers and reimbursements, performance would have been lower. Also, performance shown in this section does not reflect the deduction of taxes that a shareholder would pay on Fund distributions or redemption of Fund shares.
Because Class B Shares automatically convert to Class A Shares after 8 years, the 10 year average annual total return shown above for Class B reflects Class A performance for the period after conversion.
The returns shown are based on net asset values calculated for shareholder transactions and may differ from the returns shown in the financial highlights, which reflect adjustments made to the net asset values in accordance with accounting principles generally accepted in the United States of America.
| | | | | | | | |
| | | |
| DECEMBER 31, 2014 | | J.P. MORGAN EQUITY FUNDS | | | | | 7 | |
JPMorgan Equity Index Fund
SCHEDULE OF PORTFOLIO INVESTMENTS
AS OF DECEMBER 31, 2014 (Unaudited)
(Amounts in thousands)
| | | | | | | | |
| SHARES | | | SECURITY DESCRIPTION | | VALUE($) | |
| Common Stocks — 100.2% | |
| | | | Consumer Discretionary — 12.2% | | | | |
| | | | Auto Components — 0.4% | | | | |
| | 25 | | | BorgWarner, Inc. | | | 1,349 | |
| | 32 | | | Delphi Automotive plc, (United Kingdom) | | | 2,325 | |
| | 30 | | | Goodyear Tire & Rubber Co. (The) | | | 847 | |
| | 72 | | | Johnson Controls, Inc. | | | 3,478 | |
| | | | | | | | |
| | | | | | | 7,999 | |
| | | | | | | | |
| | | | Automobiles — 0.7% | |
| | 416 | | | Ford Motor Co. | | | 6,442 | |
| | 146 | | | General Motors Co. | | | 5,088 | |
| | 23 | | | Harley-Davidson, Inc. | | | 1,525 | |
| | | | | | | | |
| | | | | | | 13,055 | |
| | | | | | | | |
| | | | Distributors — 0.1% | | | | |
| | 17 | | | Genuine Parts Co. | | | 1,759 | |
| | | | | | | | |
| | | | Diversified Consumer Services — 0.0% (g) | | | | |
| | 30 | | | H&R Block, Inc. | | | 1,001 | |
| | | | | | | | |
| | | | Hotels, Restaurants & Leisure — 1.6% | | | | |
| | 49 | | | Carnival Corp. | | | 2,205 | |
| | 3 | | | Chipotle Mexican Grill, Inc. (a) | | | 2,292 | |
| | 14 | | | Darden Restaurants, Inc. | | | 840 | |
| | 23 | | | Marriott International, Inc., Class A | | | 1,791 | |
| | 105 | | | McDonald’s Corp. | | | 9,847 | |
| | 18 | | | Royal Caribbean Cruises Ltd. | | | 1,487 | |
| | 81 | | | Starbucks Corp. | | | 6,630 | |
| | 19 | | | Starwood Hotels & Resorts Worldwide, Inc. | | | 1,563 | |
| | 13 | | | Wyndham Worldwide Corp. | | | 1,142 | |
| | 9 | | | Wynn Resorts Ltd. | | | 1,301 | |
| | 47 | | | Yum! Brands, Inc. | | | 3,442 | |
| | | | | | | | |
| | | �� | | | | 32,540 | |
| | | | | | | | |
| | | | Household Durables — 0.4% | | | | |
| | 36 | | | D.R. Horton, Inc. | | | 906 | |
| | 13 | | | Garmin Ltd., (Switzerland) | | | 687 | |
| | 7 | | | Harman International Industries, Inc. | | | 790 | |
| | 15 | | | Leggett & Platt, Inc. | | | 633 | |
| | 19 | | | Lennar Corp., Class A | | | 864 | |
| | 7 | | | Mohawk Industries, Inc. (a) | | | 1,040 | |
| | 29 | | | Newell Rubbermaid, Inc. | | | 1,115 | |
| | 36 | | | PulteGroup, Inc. | | | 773 | |
| | 8 | | | Whirlpool Corp. | | | 1,629 | |
| | | | | | | | |
| | | | | | | 8,437 | |
| | | | | | | | |
| | | | Internet & Catalog Retail — 1.2% | | | | |
| | 41 | | | Amazon.com, Inc. (a) | | | 12,724 | |
| | 11 | | | Expedia, Inc. | | | 910 | |
| | 7 | | | Netflix, Inc. (a) | | | 2,222 | |
| | | | | | | | |
| SHARES | | | SECURITY DESCRIPTION | | VALUE($) | |
| | | | | | | | |
| | | | Internet & Catalog Retail — continued | |
| | 6 | | | Priceline Group, Inc. (The) (a) | | | 6,447 | |
| | 12 | | | TripAdvisor, Inc. (a) | | | 899 | |
| | | | | | | | |
| | | | | | | 23,202 | |
| | | | | | | | |
| | | | Leisure Products — 0.1% | | | | |
| | 12 | | | Hasbro, Inc. | | | 672 | |
| | 37 | | | Mattel, Inc. | | | 1,132 | |
| | | | | | | | |
| | | | | | | 1,804 | |
| | | | | | | | |
| | | | Media — 3.6% | | | | |
| | 24 | | | Cablevision Systems Corp., Class A | | | 488 | |
| | 51 | | | CBS Corp. (Non-Voting), Class B | | | 2,850 | |
| | 278 | | | Comcast Corp., Class A | | | 16,139 | |
| | 54 | | | DIRECTV (a) | | | 4,702 | |
| | 16 | | | Discovery Communications, Inc., Class A (a) | | | 552 | |
| | 30 | | | Discovery Communications, Inc., Class C (a) | | | 995 | |
| | 24 | | | Gannett Co., Inc. | | | 774 | |
| | 45 | | | Interpublic Group of Cos., Inc. (The) | | | 938 | |
| | 54 | | | News Corp., Class A (a) | | | 845 | |
| | 27 | | | Omnicom Group, Inc. | | | 2,076 | |
| | 11 | | | Scripps Networks Interactive, Inc., Class A | | | 825 | |
| | 30 | | | Time Warner Cable, Inc. | | | 4,606 | |
| | 91 | | | Time Warner, Inc. | | | 7,734 | |
| | 200 | | | Twenty-First Century Fox, Inc., Class A | | | 7,690 | |
| | 40 | | | Viacom, Inc., Class B | | | 3,002 | |
| | 168 | | | Walt Disney Co. (The) | | | 15,868 | |
| | | | | | | | |
| | | | | | | 70,084 | |
| | | | | | | | |
| | | | Multiline Retail — 0.8% | | | | |
| | 33 | | | Dollar General Corp. (a) | | | 2,316 | |
| | 22 | | | Dollar Tree, Inc. (a) | | | 1,563 | |
| | 10 | | | Family Dollar Stores, Inc. | | | 822 | |
| | 22 | | | Kohl’s Corp. | | | 1,332 | |
| | 37 | | | Macy’s, Inc. | | | 2,452 | |
| | 15 | | | Nordstrom, Inc. | | | 1,207 | |
| | 69 | | | Target Corp. | | | 5,221 | |
| | | | | | | | |
| | | | | | | 14,913 | |
| | | | | | | | |
| | | | Specialty Retail — 2.4% | | | | |
| | 8 | | | AutoNation, Inc. (a) | | | 487 | |
| | 3 | | | AutoZone, Inc. (a) | | | 2,142 | |
| | 20 | | | Bed Bath & Beyond, Inc. (a) | | | 1,524 | |
| | 31 | | | Best Buy Co., Inc. | | | 1,225 | |
| | 23 | | | CarMax, Inc. (a) | | | 1,549 | |
| | 12 | | | GameStop Corp., Class A | | | 396 | |
| | 29 | | | Gap, Inc. (The) | | | 1,213 | |
| | 142 | | | Home Depot, Inc. (The) | | | 14,938 | |
| | 27 | | | L Brands, Inc. | | | 2,298 | |
SEE NOTES TO FINANCIAL STATEMENTS.
| | | | | | |
| | | |
| 8 | | | | J.P. MORGAN EQUITY FUNDS | | DECEMBER 31, 2014 |
| | | | | | | | |
| SHARES | | | SECURITY DESCRIPTION | | VALUE($) | |
| Common Stocks — continued | |
| | | | Specialty Retail — continued | |
| | 105 | | | Lowe’s Cos., Inc. | | | 7,228 | |
| | 11 | | | O’Reilly Automotive, Inc. (a) | | | 2,110 | |
| | 11 | | | PetSmart, Inc. | | | 873 | |
| | 23 | | | Ross Stores, Inc. | | | 2,136 | |
| | 69 | | | Staples, Inc. | | | 1,252 | |
| | 12 | | | Tiffany & Co. | | | 1,299 | |
| | 74 | | | TJX Cos., Inc. (The) | | | 5,102 | |
| | 15 | | | Tractor Supply Co. | | | 1,157 | |
| | 11 | | | Urban Outfitters, Inc. (a) | | | 380 | |
| | | | | | | | |
| | | | | | | 47,309 | |
| | | | | | | | |
| | | | Textiles, Apparel & Luxury Goods — 0.9% | | | | |
| | 30 | | | Coach, Inc. | | | 1,118 | |
| | 5 | | | Fossil Group, Inc. (a) | | | 538 | |
| | 22 | | | Michael Kors Holdings Ltd., (Hong Kong) (a) | | | 1,670 | |
| | 75 | | | NIKE, Inc., Class B | | | 7,246 | |
| | 9 | | | PVH Corp. | | | 1,140 | |
| | 7 | | | Ralph Lauren Corp. | | | 1,210 | |
| | 18 | | | Under Armour, Inc., Class A (a) | | | 1,222 | |
| | 37 | | | V.F. Corp. | | | 2,794 | |
| | | | | | | | |
| | | | | | | 16,938 | |
| | | | | | | | |
| | | | Total Consumer Discretionary | | | 239,041 | |
| | | | | | | | |
| | | | Consumer Staples — 9.8% | | | | |
| | | | Beverages — 2.1% | | | | |
| | 17 | | | Brown-Forman Corp., Class B | | | 1,484 | |
| | 426 | | | Coca-Cola Co. (The) | | | 17,973 | |
| | 24 | | | Coca-Cola Enterprises, Inc. | | | 1,062 | |
| | 18 | | | Constellation Brands, Inc., Class A (a) | | | 1,779 | |
| | 21 | | | Dr. Pepper Snapple Group, Inc. | | | 1,505 | |
| | 17 | | | Molson Coors Brewing Co., Class B | | | 1,282 | |
| | 16 | | | Monster Beverage Corp. (a) | | | 1,687 | |
| | 162 | | | PepsiCo, Inc. | | | 15,282 | |
| | | | | | | | |
| | | | | | | 42,054 | |
| | | | | | | | |
| | | | Food & Staples Retailing — 2.5% | | | | |
| | 47 | | | Costco Wholesale Corp. | | | 6,701 | |
| | 124 | | | CVS Health Corp. | | | 11,922 | |
| | 53 | | | Kroger Co. (The) | | | 3,405 | |
| | 25 | | | Safeway, Inc. | | | 874 | |
| | 63 | | | Sysco Corp. | | | 2,520 | |
| | 94 | | | Walgreens Boots Alliance, Inc. | | | 7,158 | |
| | 171 | | | Wal-Mart Stores, Inc. | | | 14,647 | |
| | 39 | | | Whole Foods Market, Inc. | | | 1,959 | |
| | | | | | | | |
| | | | | | | 49,186 | |
| | | | | | | | |
| | | | | | | | |
| SHARES | | | SECURITY DESCRIPTION | | VALUE($) | |
| | | | | | | | |
| | | | Food Products — 1.6% | | | | |
| | 70 | | | Archer-Daniels-Midland Co. | | | 3,615 | |
| | 19 | | | Campbell Soup Co. | | | 851 | |
| | 46 | | | ConAgra Foods, Inc. | | | 1,665 | |
| | 65 | | | General Mills, Inc. | | | 3,477 | |
| | 16 | | | Hershey Co. (The) | | | 1,661 | |
| | 15 | | | Hormel Foods Corp. | | | 756 | |
| | 11 | | | JM Smucker Co. (The) | | | 1,110 | |
| | 27 | | | Kellogg Co. | | | 1,781 | |
| | 13 | | | Keurig Green Mountain, Inc. | | | 1,737 | |
| | 64 | | | Kraft Foods Group, Inc. | | | 3,984 | |
| | 14 | | | McCormick & Co., Inc. (Non-Voting) | | | 1,036 | |
| | 22 | | | Mead Johnson Nutrition Co. | | | 2,194 | |
| | 181 | | | Mondelez International, Inc., Class A | | | 6,590 | |
| | 32 | | | Tyson Foods, Inc., Class A | | | 1,269 | |
| | | | | | | | |
| | | | | | | 31,726 | |
| | | | | | | | |
| | | | Household Products — 2.0% | | | | |
| | 14 | | | Clorox Co. (The) | | | 1,456 | |
| | 93 | | | Colgate-Palmolive Co. | | | 6,401 | |
| | 40 | | | Kimberly-Clark Corp. | | | 4,647 | |
| | 292 | | | Procter & Gamble Co. (The) | | | 26,580 | |
| | | | | | | | |
| | | | | | | 39,084 | |
| | | | | | | | |
| | | | Personal Products — 0.1% | | | | |
| | 47 | | | Avon Products, Inc. | | | 441 | |
| | 24 | | | Estee Lauder Cos., Inc. (The), Class A | | | 1,843 | |
| | | | | | | | |
| | | | | | | 2,284 | |
| | | | | | | | |
| | | | Tobacco — 1.5% | | | | |
| | 213 | | | Altria Group, Inc. | | | 10,516 | |
| | 39 | | | Lorillard, Inc. | | | 2,447 | |
| | 168 | | | Philip Morris International, Inc. | | | 13,666 | |
| | 33 | | | Reynolds American, Inc. | | | 2,138 | |
| | | | | | | | |
| | | | | | | 28,767 | |
| | | | | | | | |
| | | | Total Consumer Staples | | | 193,101 | |
| | | | | | | | |
| | | | Energy — 8.5% | | | | |
| | | | Energy Equipment & Services — 1.4% | | | | |
| | 47 | | | Baker Hughes, Inc. | | | 2,620 | |
| | 21 | | | Cameron International Corp. (a) | | | 1,065 | |
| | 7 | | | Diamond Offshore Drilling, Inc. | | | 266 | |
| | 25 | | | Ensco plc, (United Kingdom), Class A | | | 758 | |
| | 25 | | | FMC Technologies, Inc. (a) | | | 1,183 | |
| | 92 | | | Halliburton Co. | | | 3,599 | |
| | 12 | | | Helmerich & Payne, Inc. | | | 788 | |
| | 31 | | | Nabors Industries Ltd., (Bermuda) | | | 406 | |
| | 46 | | | National Oilwell Varco, Inc. | | | 3,047 | |
SEE NOTES TO FINANCIAL STATEMENTS.
| | | | | | | | |
| | | |
| DECEMBER 31, 2014 | | J.P. MORGAN EQUITY FUNDS | | | | | 9 | |
JPMorgan Equity Index Fund
SCHEDULE OF PORTFOLIO INVESTMENTS
AS OF DECEMBER 31, 2014 (Unaudited) (continued)
(Amounts in thousands)
| | | | | | | | |
| SHARES | | | SECURITY DESCRIPTION | | VALUE($) | |
| Common Stocks — continued | |
| | | | Energy Equipment & Services — continued | |
| | 27 | | | Noble Corp. plc, (United Kingdom) | | | 451 | |
| | 139 | | | Schlumberger Ltd. | | | 11,868 | |
| | 37 | | | Transocean Ltd., (Switzerland) | | | 674 | |
| | | | | | | | |
| | | | | | | 26,725 | |
| | | | | | | | |
| | | | Oil, Gas & Consumable Fuels — 7.1% | | | | |
| | 55 | | | Anadarko Petroleum Corp. | | | 4,512 | |
| | 41 | | | Apache Corp. | | | 2,548 | |
| | 45 | | | Cabot Oil & Gas Corp. | | | 1,321 | |
| | 56 | | | Chesapeake Energy Corp. | | | 1,096 | |
| | 204 | | | Chevron Corp. | | | 22,901 | |
| | 9 | | | Cimarex Energy Co. | | | 999 | |
| | 133 | | | ConocoPhillips | | | 9,180 | |
| | 25 | | | CONSOL Energy, Inc. | | | 840 | |
| | 38 | | | Denbury Resources, Inc. | | | 309 | |
| | 42 | | | Devon Energy Corp. | | | 2,542 | |
| | 59 | | | EOG Resources, Inc. | | | 5,449 | |
| | 16 | | | EQT Corp. | | | 1,238 | |
| | 457 | | | Exxon Mobil Corp. | | | 42,275 | |
| | 27 | | | Hess Corp. | | | 2,026 | |
| | 183 | | | Kinder Morgan, Inc. | | | 7,763 | |
| | 73 | | | Marathon Oil Corp. | | | 2,062 | |
| | 30 | | | Marathon Petroleum Corp. | | | 2,731 | |
| | 18 | | | Murphy Oil Corp. | | | 910 | |
| | 15 | | | Newfield Exploration Co. (a) | | | 402 | |
| | 39 | | | Noble Energy, Inc. | | | 1,846 | |
| | 84 | | | Occidental Petroleum Corp. | | | 6,750 | |
| | 22 | | | ONEOK, Inc. | | | 1,119 | |
| | 60 | | | Phillips 66 | | | 4,286 | |
| | 16 | | | Pioneer Natural Resources Co. | | | 2,393 | |
| | 18 | | | QEP Resources, Inc. | | | 362 | |
| | 18 | | | Range Resources Corp. | | | 974 | |
| | 38 | | | Southwestern Energy Co. (a) | | | 1,041 | |
| | 72 | | | Spectra Energy Corp. | | | 2,630 | |
| | 14 | | | Tesoro Corp. | | | 1,014 | |
| | 56 | | | Valero Energy Corp. | | | 2,786 | |
| | 73 | | | Williams Cos., Inc. (The) | | | 3,265 | |
| | | | | | | | |
| | | | | | | 139,570 | |
| | | | | | | | |
| | | | Total Energy | | | 166,295 | |
| | | | | | | | |
| | | | Financials — 16.7% | |
| | | | Banks — 6.1% | |
| | 1,136 | | | Bank of America Corp. | | | 20,317 | |
| | 78 | | | BB&T Corp. | | | 3,025 | |
| | 327 | | | Citigroup, Inc. | | | 17,702 | |
| | 19 | | | Comerica, Inc. | | | 909 | |
| | | | | | | | |
| SHARES | | | SECURITY DESCRIPTION | | VALUE($) | |
| | | | | | | | |
| | | | Banks — continued | |
| | 89 | | | Fifth Third Bancorp | | | 1,813 | |
| | 88 | | | Huntington Bancshares, Inc. | | | 925 | |
| | 404 | | | JPMorgan Chase & Co. (q) | | | 25,262 | |
| | 94 | | | KeyCorp | | | 1,300 | |
| | 14 | | | M&T Bank Corp. | | | 1,781 | |
| | 57 | | | PNC Financial Services Group, Inc. (The) | | | 5,184 | |
| | 149 | | | Regions Financial Corp. | | | 1,570 | |
| | 56 | | | SunTrust Banks, Inc. | | | 2,360 | |
| | 193 | | | U.S. Bancorp | | | 8,686 | |
| | 510 | | | Wells Fargo & Co. | | | 27,946 | |
| | 22 | | | Zions Bancorporation | | | 625 | |
| | | | | | | | |
| | | | | | | 119,405 | |
| | | | | | | | |
| | | | Capital Markets — 2.3% | | | | |
| | 6 | | | Affiliated Managers Group, Inc. (a) | | | 1,274 | |
| | 20 | | | Ameriprise Financial, Inc. | | | 2,635 | |
| | 122 | | | Bank of New York Mellon Corp. (The) | | | 4,932 | |
| | 14 | | | BlackRock, Inc. | | | 4,919 | |
| | 124 | | | Charles Schwab Corp. (The) | | | 3,746 | |
| | 31 | | | E*TRADE Financial Corp. (a) | | | 757 | |
| | 42 | | | Franklin Resources, Inc. | | | 2,344 | |
| | 44 | | | Goldman Sachs Group, Inc. (The) | | | 8,478 | |
| | 47 | | | Invesco Ltd. | | | 1,839 | |
| | 11 | | | Legg Mason, Inc. | | | 579 | |
| | 165 | | | Morgan Stanley | | | 6,397 | |
| | 24 | | | Northern Trust Corp. | | | 1,611 | |
| | 45 | | | State Street Corp. | | | 3,539 | |
| | 28 | | | T. Rowe Price Group, Inc. | | | 2,405 | |
| | | | | | | | |
| | | | | | | 45,455 | |
| | | | | | | | |
| | | | Consumer Finance — 0.9% | | | | |
| | 96 | | | American Express Co. | | | 8,940 | |
| | 60 | | | Capital One Financial Corp. | | | 4,956 | |
| | 49 | | | Discover Financial Services | | | 3,207 | |
| | 44 | | | Navient Corp. | | | 958 | |
| | | | | | | | |
| | | | | | | 18,061 | |
| | | | | | | | |
| | | | Diversified Financial Services — 2.1% | | | | |
| | 197 | | | Berkshire Hathaway, Inc., Class B (a) | | | 29,568 | |
| | 34 | | | CME Group, Inc. | | | 3,031 | |
| | 12 | | | Intercontinental Exchange, Inc. | | | 2,669 | |
| | 34 | | | Leucadia National Corp. | | | 767 | |
| | 29 | | | McGraw Hill Financial, Inc. | | | 2,609 | |
| | 20 | | | Moody’s Corp. | | | 1,899 | |
| | 13 | | | NASDAQ OMX Group, Inc. (The) | | | 608 | |
| | | | | | | | |
| | | | | | | 41,151 | |
| | | | | | | | |
SEE NOTES TO FINANCIAL STATEMENTS.
| | | | | | |
| | | |
| 10 | | | | J.P. MORGAN EQUITY FUNDS | | DECEMBER 31, 2014 |
| | | | | | | | |
| SHARES | | | SECURITY DESCRIPTION | | VALUE($) | |
| Common Stocks — continued | |
| | | | Insurance — 2.8% | | | | |
| | 36 | | | ACE Ltd., (Switzerland) | | | 4,115 | |
| | 49 | | | Aflac, Inc. | | | 2,972 | |
| | 45 | | | Allstate Corp. (The) | | | 3,182 | |
| | 151 | | | American International Group, Inc. | | | 8,467 | |
| | 31 | | | Aon plc, (United Kingdom) | | | 2,920 | |
| | 8 | | | Assurant, Inc. | | | 519 | |
| | 25 | | | Chubb Corp. (The) | | | 2,635 | |
| | 16 | | | Cincinnati Financial Corp. | | | 824 | |
| | 54 | | | Genworth Financial, Inc., Class A (a) | | | 456 | |
| | 47 | | | Hartford Financial Services Group, Inc. (The) | | | 1,943 | |
| | 28 | | | Lincoln National Corp. | | | 1,618 | |
| | 32 | | | Loews Corp. | | | 1,358 | |
| | 58 | | | Marsh & McLennan Cos., Inc. | | | 3,343 | |
| | 123 | | | MetLife, Inc. | | | 6,636 | |
| | 29 | | | Principal Financial Group, Inc. | | | 1,532 | |
| | 58 | | | Progressive Corp. (The) | | | 1,559 | |
| | 49 | | | Prudential Financial, Inc. | | | 4,474 | |
| | 14 | | | Torchmark Corp. | | | 752 | |
| | 36 | | | Travelers Cos., Inc. (The) | | | 3,788 | |
| | 27 | | | Unum Group | | | 949 | |
| | 28 | | | XL Group plc, (Ireland) | | | 958 | |
| | | | | | | | |
| | | | | | | 55,000 | |
| | | | | | | | |
| | | | Real Estate Investment Trusts (REITs) — 2.4% | |
| | 43 | | | American Tower Corp. | | | 4,232 | |
| | 16 | | | Apartment Investment & Management Co., Class A | | | 587 | |
| | 14 | | | AvalonBay Communities, Inc. | | | 2,329 | |
| | 17 | | | Boston Properties, Inc. | | | 2,128 | |
| | 36 | | | Crown Castle International Corp. | | | 2,837 | |
| | 39 | | | Equity Residential | | | 2,811 | |
| | 7 | | | Essex Property Trust, Inc. | | | 1,427 | |
| | 68 | | | General Growth Properties, Inc. | | | 1,906 | |
| | 50 | | | HCP, Inc. | | | 2,184 | |
| | 35 | | | Health Care REIT, Inc. | | | 2,678 | |
| | 82 | | | Host Hotels & Resorts, Inc. | | | 1,944 | |
| | 20 | | | Iron Mountain, Inc. | | | 778 | |
| | 44 | | | Kimco Realty Corp. | | | 1,117 | |
| | 15 | | | Macerich Co. (The) | | | 1,267 | |
| | 19 | | | Plum Creek Timber Co., Inc. | | | 813 | |
| | 54 | | | Prologis, Inc. | | | 2,323 | |
| | 16 | | | Public Storage | | | 2,896 | |
| | 34 | | | Simon Property Group, Inc. | | | 6,112 | |
| | 32 | | | Ventas, Inc. | | | 2,279 | |
| | 19 | | | Vornado Realty Trust | | | 2,219 | |
| | 57 | | | Weyerhaeuser Co. | | | 2,032 | |
| | | | | | | | |
| | | | | | | 46,899 | |
| | | | | | | | |
| | | | | | | | |
| SHARES | | | SECURITY DESCRIPTION | | VALUE($) | |
| | |
| | | | Real Estate Management & Development — 0.1% | |
| | 30 | | | CBRE Group, Inc., Class A (a) | | | 1,034 | |
| | | | | | | | |
| | | | Thrifts & Mortgage Finance — 0.0% (g) | |
| | 52 | | | Hudson City Bancorp, Inc. | | | 526 | |
| | 33 | | | People’s United Financial, Inc. | | | 505 | |
| | | | | | | | |
| | | | | | | 1,031 | |
| | | | | | | | |
| | | | Total Financials | | | 328,036 | |
| | | | | | | | |
| | | | Health Care — 14.2% | |
| | | | Biotechnology — 2.9% | |
| | 21 | | | Alexion Pharmaceuticals, Inc. (a) | | | 3,962 | |
| | 82 | | | Amgen, Inc. | | | 13,084 | |
| | 26 | | | Biogen Idec, Inc. (a) | | | 8,657 | |
| | 86 | | | Celgene Corp. (a) | | | 9,648 | |
| | 163 | | | Gilead Sciences, Inc. (a) | | | 15,357 | |
| | 8 | | | Regeneron Pharmaceuticals, Inc. (a) | | | 3,288 | |
| | 26 | | | Vertex Pharmaceuticals, Inc. (a) | | | 3,085 | |
| | | | | | | | |
| | | | | | | 57,081 | |
| | | | | | | | |
| | | | Health Care Equipment & Supplies — 2.2% | |
| | 163 | | | Abbott Laboratories | | | 7,321 | |
| | 59 | | | Baxter International, Inc. | | | 4,289 | |
| | 21 | | | Becton, Dickinson and Co. | | | 2,885 | |
| | 143 | | | Boston Scientific Corp. (a) | | | 1,898 | |
| | 8 | | | C.R. Bard, Inc. | | | 1,348 | |
| | 22 | | | CareFusion Corp. (a) | | | 1,307 | |
| | 49 | | | Covidien plc, (Ireland) | | | 5,001 | |
| | 15 | | | DENTSPLY International, Inc. | | | 814 | |
| | 12 | | | Edwards Lifesciences Corp. (a) | | | 1,471 | |
| | 4 | | | Intuitive Surgical, Inc. (a) | | | 2,071 | |
| | 106 | | | Medtronic, Inc. | | | 7,674 | |
| | 31 | | | St. Jude Medical, Inc. | | | 2,008 | |
| | 32 | | | Stryker Corp. | | | 3,045 | |
| | 11 | | | Varian Medical Systems, Inc. (a) | | | 934 | |
| | 18 | | | Zimmer Holdings, Inc. | | | 2,074 | |
| | | | | | | | |
| | | | | | | 44,140 | |
| | | | | | | | |
| | | | Health Care Providers & Services — 2.3% | |
| | 38 | | | Aetna, Inc. | | | 3,374 | |
| | 22 | | | AmerisourceBergen Corp. | | | 2,023 | |
| | 29 | | | Anthem, Inc. | | | 3,663 | |
| | 36 | | | Cardinal Health, Inc. | | | 2,885 | |
| | 28 | | | Cigna Corp. | | | 2,907 | |
| | 19 | | | DaVita HealthCare Partners, Inc. (a) | | | 1,406 | |
| | 79 | | | Express Scripts Holding Co. (a) | | | 6,710 | |
| | 17 | | | Humana, Inc. | | | 2,378 | |
| | 9 | | | Laboratory Corp. of America Holdings (a) | | | 985 | |
SEE NOTES TO FINANCIAL STATEMENTS.
| | | | | | | | |
| | | |
| DECEMBER 31, 2014 | | J.P. MORGAN EQUITY FUNDS | | | | | 11 | |
JPMorgan Equity Index Fund
SCHEDULE OF PORTFOLIO INVESTMENTS
AS OF DECEMBER 31, 2014 (Unaudited) (continued)
(Amounts in thousands)
| | | | | | | | |
| SHARES | | | SECURITY DESCRIPTION | | VALUE($) | |
| Common Stocks — continued | |
| | | | Health Care Providers & Services — continued | |
| | 25 | | | McKesson Corp. | | | 5,198 | |
| | 9 | | | Patterson Cos., Inc. | | | 444 | |
| | 16 | | | Quest Diagnostics, Inc. | | | 1,047 | |
| | 11 | | | Tenet Healthcare Corp. (a) | | | 538 | |
| | 104 | | | UnitedHealth Group, Inc. | | | 10,478 | |
| | 10 | | | Universal Health Services, Inc., Class B | | | 1,094 | |
| | | | | | | | |
| | | | | | | 45,130 | |
| | | | | | | | |
| | | | Health Care Technology — 0.1% | |
| | 33 | | | Cerner Corp. (a) | | | 2,122 | |
| | | | | | | | |
| | | | Life Sciences Tools & Services — 0.4% | |
| | 36 | | | Agilent Technologies, Inc. | | | 1,475 | |
| | 12 | | | PerkinElmer, Inc. | | | 533 | |
| | 43 | | | Thermo Fisher Scientific, Inc. | | | 5,412 | |
| | 9 | | | Waters Corp. (a) | | | 1,014 | |
| | | | | | | | |
| | | | | | | 8,434 | |
| | | | | | | | |
| | | | Pharmaceuticals — 6.3% | |
| | 172 | | | AbbVie, Inc. | | | 11,259 | |
| | 29 | | | Actavis plc (a) | | | 7,368 | |
| | 32 | | | Allergan, Inc. | | | 6,839 | |
| | 179 | | | Bristol-Myers Squibb Co. | | | 10,574 | |
| | 106 | | | Eli Lilly & Co. | | | 7,300 | |
| | 18 | | | Hospira, Inc. (a) | | | 1,119 | |
| | 302 | | | Johnson & Johnson | | | 31,608 | |
| | 13 | | | Mallinckrodt plc (a) | | | 1,244 | |
| | 308 | | | Merck & Co., Inc. | | | 17,483 | |
| | 40 | | | Mylan, Inc. (a) | | | 2,278 | |
| | 15 | | | Perrigo Co. plc, (Ireland) | | | 2,541 | |
| | 680 | | | Pfizer, Inc. | | | 21,194 | |
| | 54 | | | Zoetis, Inc. | | | 2,330 | |
| | | | | | | | |
| | | | | | | 123,137 | |
| | | | | | | | |
| | | | Total Health Care | | | 280,044 | |
| | | | | | | | |
| | | | Industrials — 10.4% | |
| | | | Aerospace & Defense — 2.7% | |
| | 72 | | | Boeing Co. (The) | | | 9,306 | |
| | 34 | | | General Dynamics Corp. | | | 4,679 | |
| | 85 | | | Honeywell International, Inc. | | | 8,447 | |
| | 9 | | | L-3 Communications Holdings, Inc. | | | 1,160 | |
| | 29 | | | Lockheed Martin Corp. | | | 5,584 | |
| | 22 | | | Northrop Grumman Corp. | | | 3,215 | |
| | 15 | | | Precision Castparts Corp. | | | 3,708 | |
| | 33 | | | Raytheon Co. | | | 3,602 | |
| | 14 | | | Rockwell Collins, Inc. | | | 1,213 | |
| | 30 | | | Textron, Inc. | | | 1,255 | |
| | 92 | | | United Technologies Corp. | | | 10,529 | |
| | | | | | | | |
| | | | | | | 52,698 | |
| | | | | | | | |
| | | | | | | | |
| SHARES | | | SECURITY DESCRIPTION | | VALUE($) | |
| | |
| | | | Air Freight & Logistics — 0.8% | |
| | 16 | | | C.H. Robinson Worldwide, Inc. | | | 1,183 | |
| | 21 | | | Expeditors International of Washington, Inc. | | | 930 | |
| | 28 | | | FedEx Corp. | | | 4,940 | |
| | 75 | | | United Parcel Service, Inc., Class B | | | 8,368 | |
| | | | | | | | |
| | | | | | | 15,421 | |
| | | | | | | | |
| | | | Airlines — 0.4% | |
| | 90 | | | Delta Air Lines, Inc. | | | 4,446 | |
| | 73 | | | Southwest Airlines Co. | | | 3,102 | |
| | | | | | | | |
| | | | | | | 7,548 | |
| | | | | | | | |
| | | | Building Products — 0.1% | |
| | 10 | | | Allegion plc, (Ireland) | | | 573 | |
| | 38 | | | Masco Corp. | | | 970 | |
| | | | | | | | |
| | | | | | | 1,543 | |
| | | | | | | | |
| | | | Commercial Services & Supplies — 0.4% | |
| | 19 | | | ADT Corp. (The) | | | 683 | |
| | 10 | | | Cintas Corp. | | | 823 | |
| | 22 | | | Pitney Bowes, Inc. | | | 529 | |
| | 27 | | | Republic Services, Inc. | | | 1,097 | |
| | 9 | | | Stericycle, Inc. (a) | | | 1,202 | |
| | 45 | | | Tyco International plc | | | 1,982 | |
| | 46 | | | Waste Management, Inc. | | | 2,360 | |
| | | | | | | | |
| | | | | | | 8,676 | |
| | | | | | | | |
| | | | Construction & Engineering — 0.1% | |
| | 17 | | | Fluor Corp. | | | 1,023 | |
| | 14 | | | Jacobs Engineering Group, Inc. (a) | | | 630 | |
| | 24 | | | Quanta Services, Inc. (a) | | | 667 | |
| | | | | | | | |
| | | | | | | 2,320 | |
| | | | | | | | |
| | | | Electrical Equipment — 0.6% | |
| | 27 | | | AMETEK, Inc. | | | 1,398 | |
| | 51 | | | Eaton Corp. plc | | | 3,483 | |
| | 75 | | | Emerson Electric Co. | | | 4,624 | |
| | 15 | | | Rockwell Automation, Inc. | | | 1,630 | |
| | | | | | | | |
| | | | | | | 11,135 | |
| | | | | | | | |
| | | | Industrial Conglomerates — 2.3% | |
| | 69 | | | 3M Co. | | | 11,371 | |
| | 66 | | | Danaher Corp. | | | 5,658 | |
| | 1,084 | | | General Electric Co. (k) | | | 27,404 | |
| | 11 | | | Roper Industries, Inc. | | | 1,691 | |
| | | | | | | | |
| | | | | | | 46,124 | |
| | | | | | | | |
| | | | Machinery — 1.5% | |
| | 65 | | | Caterpillar, Inc. | | | 5,984 | |
| | 18 | | | Cummins, Inc. | | | 2,645 | |
SEE NOTES TO FINANCIAL STATEMENTS.
| | | | | | |
| | | |
| 12 | | | | J.P. MORGAN EQUITY FUNDS | | DECEMBER 31, 2014 |
| | | | | | | | |
| SHARES | | | SECURITY DESCRIPTION | | VALUE($) | |
| Common Stocks — continued | |
| | | | Machinery — continued | |
| | 39 | | | Deere & Co. | | | 3,424 | |
| | 18 | | | Dover Corp. | | | 1,281 | |
| | 15 | | | Flowserve Corp. | | | 881 | |
| | 39 | | | Illinois Tool Works, Inc. | | | 3,678 | |
| | 29 | | | Ingersoll-Rand plc | | | 1,817 | |
| | 11 | | | Joy Global, Inc. | | | 493 | |
| | 38 | | | PACCAR, Inc. | | | 2,601 | |
| | 12 | | | Pall Corp. | | | 1,164 | |
| | 16 | | | Parker-Hannifin Corp. | | | 2,070 | |
| | 20 | | | Pentair plc, (United Kingdom) | | | 1,340 | |
| | 6 | | | Snap-on, Inc. | | | 858 | |
| | 17 | | | Stanley Black & Decker, Inc. | | | 1,625 | |
| | 20 | | | Xylem, Inc. | | | 748 | |
| | | | | | | | |
| | | | | | | 30,609 | |
| | | | | | | | |
| | | | Professional Services — 0.2% | |
| | 4 | | | Dun & Bradstreet Corp. (The) | | | 469 | |
| | 13 | | | Equifax, Inc. | | | 1,053 | |
| | 35 | | | Nielsen N.V. | | | 1,565 | |
| | 15 | | | Robert Half International, Inc. | | | 857 | |
| | | | | | | | |
| | | | | | | 3,944 | |
| | | | | | | | |
| | | | Road & Rail — 1.1% | |
| | 107 | | | CSX Corp. | | | 3,894 | |
| | 12 | | | Kansas City Southern | | | 1,454 | |
| | 33 | | | Norfolk Southern Corp. | | | 3,663 | |
| | 6 | | | Ryder System, Inc. | | | 532 | |
| | 96 | | | Union Pacific Corp. | | | 11,438 | |
| | | | | | | | |
| | | | | | | 20,981 | |
| | | | | | | | |
| | | | Trading Companies & Distributors — 0.2% | |
| | 29 | | | Fastenal Co. | | | 1,401 | |
| | 11 | | | United Rentals, Inc. (a) | | | 1,099 | |
| | 7 | | | W.W. Grainger, Inc. | | | 1,670 | |
| | | | | | | | |
| | | | | | | 4,170 | |
| | | | | | | | |
| | | | Total Industrials | | | 205,169 | |
| | | | | | | | |
| | | | Information Technology — 19.7% | |
| | | | Communications Equipment — 1.7% | |
| | 552 | | | Cisco Systems, Inc. | | | 15,360 | |
| | 8 | | | F5 Networks, Inc. (a) | | | 1,040 | |
| | 11 | | | Harris Corp. | | | 811 | |
| | 42 | | | Juniper Networks, Inc. | | | 928 | |
| | 23 | | | Motorola Solutions, Inc. | | | 1,534 | |
| | 180 | | | QUALCOMM, Inc. | | | 13,345 | |
| | | | | | | | |
| | | | | | | 33,018 | |
| | | | | | | | |
| | | | | | | | |
| SHARES | | | SECURITY DESCRIPTION | | VALUE($) | |
| | |
| | | | Electronic Equipment, Instruments & Components — 0.4% | |
| | 33 | | | Amphenol Corp., Class A | | | 1,798 | |
| | 138 | | | Corning, Inc. | | | 3,174 | |
| | 15 | | | FLIR Systems, Inc. | | | 492 | |
| | 44 | | | TE Connectivity Ltd., (Switzerland) | | | 2,778 | |
| | | | | | | | |
| | | | | | | 8,242 | |
| | | | | | | | |
| | | | Internet Software & Services — 3.2% | |
| | 19 | | | Akamai Technologies, Inc. (a) | | | 1,210 | |
| | 122 | | | eBay, Inc. (a) | | | 6,851 | |
| | 226 | | | Facebook, Inc., Class A (a) | | | 17,616 | |
| | 31 | | | Google, Inc., Class A (a) | | | 16,335 | |
| | 31 | | | Google, Inc., Class C (a) | | | 16,188 | |
| | 12 | | | VeriSign, Inc. (a) | | | 671 | |
| | 95 | | | Yahoo!, Inc. (a) | | | 4,806 | |
| | | | | | | | |
| | | | | | | 63,677 | |
| | | | | | | | |
| | | | IT Services — 3.3% | |
| | 68 | | | Accenture plc, (Ireland), Class A | | | 6,052 | |
| | 7 | | | Alliance Data Systems Corp. (a) | | | 1,975 | |
| | 52 | | | Automatic Data Processing, Inc. | | | 4,340 | |
| | 66 | | | Cognizant Technology Solutions Corp., Class A (a) | | | 3,463 | |
| | 15 | | | Computer Sciences Corp. | | | 956 | |
| | 31 | | | Fidelity National Information Services, Inc. | | | 1,906 | |
| | 26 | | | Fiserv, Inc. (a) | | | 1,870 | |
| | 99 | | | International Business Machines Corp. | | | 15,946 | |
| | 106 | | | MasterCard, Inc., Class A | | | 9,117 | |
| | 35 | | | Paychex, Inc. | | | 1,628 | |
| | 17 | | | Teradata Corp. (a) | | | 722 | |
| | 18 | | | Total System Services, Inc. | | | 607 | |
| | 53 | | | Visa, Inc., Class A | | | 13,829 | |
| | 56 | | | Western Union Co. (The) | | | 1,011 | |
| | 116 | | | Xerox Corp. | | | 1,606 | |
| | | | | | | | |
| | | | | | | 65,028 | |
| | | | | | | | |
| | | | Semiconductors & Semiconductor Equipment — 2.5% | |
| | 33 | | | Altera Corp. | | | 1,216 | |
| | 34 | | | Analog Devices, Inc. | | | 1,866 | |
| | 132 | | | Applied Materials, Inc. | | | 3,279 | |
| | 27 | | | Avago Technologies Ltd., (Singapore) | | | 2,747 | |
| | 58 | | | Broadcom Corp., Class A | | | 2,521 | |
| | 8 | | | First Solar, Inc. (a) | | | 362 | |
| | 522 | | | Intel Corp. | | | 18,948 | |
| | 18 | | | KLA-Tencor Corp. | | | 1,249 | |
| | 17 | | | Lam Research Corp. | | | 1,362 | |
| | 26 | | | Linear Technology Corp. | | | 1,174 | |
| | 22 | | | Microchip Technology, Inc. | | | 979 | |
SEE NOTES TO FINANCIAL STATEMENTS.
| | | | | | | | |
| | | |
| DECEMBER 31, 2014 | | J.P. MORGAN EQUITY FUNDS | | | | | 13 | |
JPMorgan Equity Index Fund
SCHEDULE OF PORTFOLIO INVESTMENTS
AS OF DECEMBER 31, 2014 (Unaudited) (continued)
(Amounts in thousands, except number of Futures contracts)
| | | | | | | | |
| SHARES | | | SECURITY DESCRIPTION | | VALUE($) | |
| Common Stocks — continued | |
| | | | Semiconductors & Semiconductor Equipment — continued | |
| | 116 | | | Micron Technology, Inc. (a) | | | 4,058 | |
| | 56 | | | NVIDIA Corp. | | | 1,118 | |
| | 114 | | | Texas Instruments, Inc. | | | 6,099 | |
| | 29 | | | Xilinx, Inc. | | | 1,236 | |
| | | | | | | | |
| | | | | | | 48,214 | |
| | | | | | | | |
| | | | Software — 3.9% | |
| | 51 | | | Adobe Systems, Inc. (a) | | | 3,720 | |
| | 25 | | | Autodesk, Inc. (a) | | | 1,476 | |
| | 35 | | | CA, Inc. | | | 1,053 | |
| | 17 | | | Citrix Systems, Inc. (a) | | | 1,109 | |
| | 34 | | | Electronic Arts, Inc. (a) | | | 1,579 | |
| | 31 | | | Intuit, Inc. | | | 2,842 | |
| | 890 | | | Microsoft Corp. | | | 41,347 | |
| | 349 | | | Oracle Corp. | | | 15,709 | |
| | 20 | | | Red Hat, Inc. (a) | | | 1,402 | |
| | 63 | | | salesforce.com, Inc. (a) | | | 3,759 | |
| | 75 | | | Symantec Corp. | | | 1,912 | |
| | | | | | | | |
| | | | | | | 75,908 | |
| | | | | | | | |
| | | | Technology Hardware, Storage & Peripherals — 4.7% | |
| | 633 | | | Apple, Inc. | | | 69,907 | |
| | 220 | | | EMC Corp. | | | 6,535 | |
| | 202 | | | Hewlett-Packard Co. | | | 8,088 | |
| | 34 | | | NetApp, Inc. | | | 1,395 | |
| | 24 | | | SanDisk Corp. | | | 2,335 | |
| | 35 | | | Seagate Technology plc | | | 2,350 | |
| | 24 | | | Western Digital Corp. | | | 2,609 | |
| | | | | | | | |
| | | | | | | 93,219 | |
| | | | | | | | |
| | | | Total Information Technology | | | 387,306 | |
| | | | | | | | |
| | | | Materials — 3.2% | |
| | | | Chemicals — 2.4% | |
| | 21 | | | Air Products & Chemicals, Inc. | | | 2,996 | |
| | 7 | | | Airgas, Inc. | | | 836 | |
| | 5 | | | CF Industries Holdings, Inc. | | | 1,464 | |
| | 120 | | | Dow Chemical Co. (The) | | | 5,456 | |
| | 98 | | | E.I. du Pont de Nemours & Co. | | | 7,234 | |
| | 16 | | | Eastman Chemical Co. | | | 1,217 | |
| | 29 | | | Ecolab, Inc. | | | 3,049 | |
| | 14 | | | FMC Corp. | | | 821 | |
| | 9 | | | International Flavors & Fragrances, Inc. | | | 886 | |
| | 45 | | | LyondellBasell Industries N.V., Class A | | | 3,563 | |
| | 52 | | | Monsanto Co. | | | 6,245 | |
| | 34 | | | Mosaic Co. (The) | | | 1,556 | |
| | 15 | | | PPG Industries, Inc. | | | 3,426 | |
| | 31 | | | Praxair, Inc. | | | 4,076 | |
| | | | | | | | |
| SHARES | | | SECURITY DESCRIPTION | | VALUE($) | |
| | |
| | | | Chemicals — continued | |
| | 9 | | | Sherwin-Williams Co. (The) | | | 2,318 | |
| | 13 | | | Sigma-Aldrich Corp. | | | 1,765 | |
| | | | | | | | |
| | | | | | | 46,908 | |
| | | | | | | | |
| | | | Construction Materials — 0.1% | |
| | 7 | | | Martin Marietta Materials, Inc. | | | 737 | |
| | 14 | | | Vulcan Materials Co. | | | 935 | |
| | | | | | | | |
| | | | | | | 1,672 | |
| | | | | | | | |
| | | | Containers & Packaging — 0.2% | |
| | 10 | | | Avery Dennison Corp. | | | 510 | |
| | 15 | | | Ball Corp. | | | 1,008 | |
| | 18 | | | MeadWestvaco Corp. | | | 799 | |
| | 18 | | | Owens-Illinois, Inc. (a) | | | 481 | |
| | 23 | | | Sealed Air Corp. | | | 968 | |
| | | | | | | | |
| | | | | | | 3,766 | |
| | | | | | | | |
| | | | Metals & Mining — 0.4% | | | | |
| | 127 | | | Alcoa, Inc. | | | 2,010 | |
| | 12 | | | Allegheny Technologies, Inc. | | | 408 | |
| | 112 | | | Freeport-McMoRan, Inc. | | | 2,621 | |
| | 54 | | | Newmont Mining Corp. | | | 1,018 | |
| | 34 | | | Nucor Corp. | | | 1,690 | |
| | | | | | | | |
| | | | | | | 7,747 | |
| | | | | | | | |
| | | | Paper & Forest Products — 0.1% | |
| | 46 | | | International Paper Co. | | | 2,451 | |
| | | | | | | | |
| | | | Total Materials | | | 62,544 | |
| | | | | | | | |
| | | | Telecommunication Services — 2.3% | | | | |
| | | | Diversified Telecommunication Services — 2.3% | |
| | 560 | | | AT&T, Inc. | | | 18,815 | |
| | 62 | | | CenturyLink, Inc. | | | 2,439 | |
| | 108 | | | Frontier Communications Corp. | | | 722 | |
| | 30 | | | Level 3 Communications, Inc. (a) | | | 1,487 | |
| | 448 | | | Verizon Communications, Inc. | | | 20,963 | |
| | 65 | | | Windstream Holdings, Inc. | | | 536 | |
| | | | | | | | |
| | | | Total Telecommunication Services | | | 44,962 | |
| | | | | | | | |
| | | | Utilities — 3.2% | | | | |
| | | | Electric Utilities — 1.9% | | | | |
| | 53 | | | American Electric Power Co., Inc. | | | 3,208 | |
| | 76 | | | Duke Energy Corp. | | | 6,381 | |
| | 35 | | | Edison International | | | 2,304 | |
| | 19 | | | Entergy Corp. | | | 1,705 | |
| | 93 | | | Exelon Corp. | | | 3,441 | |
| | 45 | | | FirstEnergy Corp. | | | 1,772 | |
| | 47 | | | NextEra Energy, Inc. | | | 5,010 | |
SEE NOTES TO FINANCIAL STATEMENTS.
| | | | | | |
| | | |
| 14 | | | | J.P. MORGAN EQUITY FUNDS | | DECEMBER 31, 2014 |
| | | | | | | | |
| SHARES | | | SECURITY DESCRIPTION | | VALUE($) | |
| Common Stocks — continued | |
| | | | Electric Utilities — continued | | | | |
| | 34 | | | Northeast Utilities | | | 1,831 | |
| | 27 | | | Pepco Holdings, Inc. | | | 733 | |
| | 12 | | | Pinnacle West Capital Corp. | | | 815 | |
| | 72 | | | PPL Corp. | | | 2,609 | |
| | 97 | | | Southern Co. (The) | | | 4,772 | |
| | 55 | | | Xcel Energy, Inc. | | | 1,961 | |
| | | | | | | | |
| | | | | | | 36,542 | |
| | | | | | | | |
| | | | Gas Utilities — 0.0% (g) | | | | |
| | 13 | | | AGL Resources, Inc. | | | 704 | |
| | | | | | | | |
| | | | Independent Power & Renewable Electricity Producers — 0.1% | | | | |
| | 71 | | | AES Corp. | | | 975 | |
| | 37 | | | NRG Energy, Inc. | | | 984 | |
| | | | | | | | |
| | | | | | | 1,959 | |
| | | | | | | | |
| | | | Multi-Utilities — 1.2% | | | | |
| | 26 | | | Ameren Corp. | | | 1,209 | |
| | 46 | | | CenterPoint Energy, Inc. | | | 1,088 | |
| | 30 | | | CMS Energy Corp. | | | 1,032 | |
| | 32 | | | Consolidated Edison, Inc. | | | 2,088 | |
| | 63 | | | Dominion Resources, Inc. | | | 4,849 | |
| | 19 | | | DTE Energy Co. | | | 1,651 | |
| | 9 | | | Integrys Energy Group, Inc. | | | 672 | |
| | | | | | | | |
| SHARES | | | SECURITY DESCRIPTION | | VALUE($) | |
| | |
| | | | Multi-Utilities — continued | | | | |
| | 34 | | | NiSource, Inc. | | | 1,446 | |
| | 51 | | | PG&E Corp. | | | 2,731 | |
| | 55 | | | Public Service Enterprise Group, Inc. | | | 2,263 | |
| | 15 | | | SCANA Corp. | | | 930 | |
| | 25 | | | Sempra Energy | | | 2,780 | |
| | 25 | | | TECO Energy, Inc. | | | 519 | |
| | 24 | | | Wisconsin Energy Corp. | | | 1,285 | |
| | | | | | | | |
| | | | | | | 24,543 | |
| | | | | | | | |
| | | | Total Utilities | | | 63,748 | |
| | | | | | | | |
| | | | Total Common Stocks
(Cost $623,995) | | | 1,970,246 | |
| | | | | | | | |
| Short-Term Investment — 0.5% | |
| | | | Investment Company — 0.5% | |
| | 10,097 | | | JPMorgan Liquid Assets Money Market Fund, Institutional Class Shares, 0.030% (b) (l) (Cost $10,097) | | | 10,097 | |
| | | | | | | | |
| | | | Total Investments — 100.7%
(Cost $634,092) | | | 1,980,343 | |
| | | | Liabilities in Excess of
Other Assets — (0.7)% | | | (14,265 | ) |
| | | | | | | | |
| | | | NET ASSETS — 100.0% | | $ | 1,966,078 | |
| | | | | | | | |
Percentages indicated are based on net assets.
| | | | | | | | | | | | | | | | |
| Futures Contracts | |
NUMBER OF
CONTRACTS | | | DESCRIPTION | | EXPIRATION
DATE | | | NOTIONAL
VALUE AT
DECEMBER 31, 2014 | | | NET
UNREALIZED
APPRECIATION
(DEPRECIATION) | |
| | | | Long Futures Outstanding | | | | | | | | | | | | |
| | 100 | | | E-mini S&P 500 | | | 03/20/15 | | | $ | 10,262 | | | $ | 124 | |
| | | | | | | | | | | | | | | | |
SEE NOTES TO FINANCIAL STATEMENTS.
| | | | | | | | |
| | | |
| DECEMBER 31, 2014 | | J.P. MORGAN EQUITY FUNDS | | | | | 15 | |
JPMorgan Market Expansion Enhanced Index Fund
SCHEDULE OF PORTFOLIO INVESTMENTS
AS OF DECEMBER 31, 2014 (Unaudited)
(Amounts in thousands)
| | | | | | | | |
| SHARES | | | SECURITY DESCRIPTION | | VALUE($) | |
| Common Stocks — 97.8% | |
| | | | Consumer Discretionary — 13.0% | |
| | | | Auto Components — 0.3% | |
| | 137 | | | Gentex Corp. | | | 4,953 | |
| | | | | | | | |
| | | | Automobiles — 0.1% | |
| | 28 | | | Thor Industries, Inc. | | | 1,566 | |
| | 18 | | | Winnebago Industries, Inc. | | | 399 | |
| | | | | | | | |
| | | | | | | 1,965 | |
| | | | | | | | |
| | | | Distributors — 0.4% | |
| | 181 | | | LKQ Corp. (a) | | | 5,095 | |
| | 98 | | | VOXX International Corp. (a) | | | 858 | |
| | | | | | | | |
| | | | | | | 5,953 | |
| | | | | | | | |
| | | | Diversified Consumer Services — 0.5% | |
| | 13 | | | American Public Education, Inc. (a) | | | 469 | |
| | 69 | | | Apollo Education Group, Inc. (a) | | | 2,367 | |
| | 10 | | | Capella Education Co. | | | 759 | |
| | 35 | | | DeVry Education Group, Inc. | | | 1,647 | |
| | 26 | | | Regis Corp. (a) | | | 428 | |
| | 26 | | | Strayer Education, Inc. (a) | | | 1,909 | |
| | 26 | | | Universal Technical Institute, Inc. | | | 253 | |
| | | | | | | | |
| | | | | | | 7,832 | |
| | | | | | | | |
| | | | Hotels, Restaurants & Leisure — 1.4% | |
| | 55 | | | Boyd Gaming Corp. (a) | | | 705 | |
| | 45 | | | Brinker International, Inc. | | | 2,645 | |
| | 19 | | | Cheesecake Factory, Inc. (The) | | | 946 | |
| | 19 | | | Cracker Barrel Old Country Store, Inc. | | | 2,678 | |
| | 1 | | | DineEquity, Inc. | | | 137 | |
| | 9 | | | Domino’s Pizza, Inc. | | | 838 | |
| | 92 | | | Jack in the Box, Inc. | | | 7,340 | |
| | 18 | | | Marriott Vacations Worldwide Corp. | | | 1,337 | |
| | 110 | | | Ruth’s Hospitality Group, Inc. | | | 1,652 | |
| | 45 | | | Scientific Games Corp., Class A (a) | | | 569 | |
| | 1 | | | Sonic Corp. | | | 25 | |
| | 39 | | | Texas Roadhouse, Inc. | | | 1,305 | |
| | 2 | | | Wendy’s Co. (The) | | | 14 | |
| | | | | | | | |
| | | | | | | 20,191 | |
| | | | | | | | |
| | | | Household Durables — 2.1% | |
| | 16 | | | Ethan Allen Interiors, Inc. | | | 508 | |
| | 20 | | | Helen of Troy Ltd., (Bermuda) (a) | | | 1,320 | |
| | 17 | | | iRobot Corp. (a) | | | 585 | |
| | 203 | | | Jarden Corp. (a) | | | 9,708 | |
| | 55 | | | KB Home | | | 904 | |
| | 33 | | | La-Z-Boy, Inc. | | | 883 | |
| | 6 | | | NVR, Inc. (a) | | | 7,383 | |
| | 28 | | | Ryland Group, Inc. (The) | | | 1,092 | |
| | | | | | | | |
| SHARES | | | SECURITY DESCRIPTION | | VALUE($) | |
| | | | | | | | |
| | | | Household Durables — continued | |
| | 38 | | | Tempur Sealy International, Inc. (a) | | | 2,076 | |
| | 28 | | | Tupperware Brands Corp. | | | 1,786 | |
| | 57 | | | Universal Electronics, Inc. (a) | | | 3,701 | |
| | | | | | | | |
| | | | | | | 29,946 | |
| | | | | | | | |
| | | | Internet & Catalog Retail — 0.2% | |
| | 9 | | | Blue Nile, Inc. (a) | | | 311 | |
| | 20 | | | HSN, Inc. | | | 1,520 | |
| | 15 | | | Nutrisystem, Inc. | | | 295 | |
| | | | | | | | |
| | | | | | | 2,126 | |
| | | | | | | | |
| | | | Leisure Products — 0.7% | |
| | 8 | | | Arctic Cat, Inc. | | | 287 | |
| | 59 | | | Brunswick Corp. | | | 3,035 | |
| | 40 | | | Polaris Industries, Inc. | | | 6,122 | |
| | | | | | | | |
| | | | | | | 9,444 | |
| | | | | | | | |
| | | | Media — 0.8% | |
| | 63 | | | Cinemark Holdings, Inc. | | | 2,231 | |
| | 171 | | | E.W. Scripps Co. (The), Class A (a) | | | 3,813 | |
| | 137 | | | Harte-Hanks, Inc. | | | 1,062 | |
| | 29 | | | John Wiley & Sons, Inc., Class A | | | 1,734 | |
| | 88 | | | Live Nation Entertainment, Inc. (a) | | | 2,286 | |
| | 8 | | | Meredith Corp. | | | 421 | |
| | | | | | | | |
| | | | | | | 11,547 | |
| | | | | | | | |
| | | | Multiline Retail — 0.2% | |
| | 37 | | | Big Lots, Inc. | | | 1,486 | |
| | 175 | | | J.C. Penney Co., Inc. (a) | | | 1,133 | |
| | | | | | | | |
| | | | | | | 2,619 | |
| | | | | | | | |
| | | | Specialty Retail — 5.0% | |
| | 38 | | | Aaron’s, Inc. | | | 1,160 | |
| | 42 | | | Abercrombie & Fitch Co., Class A | | | 1,203 | |
| | 74 | | | Advance Auto Parts, Inc. | | | 11,847 | |
| | 8 | | | Aeropostale, Inc. (a) | | | 18 | |
| | 107 | | | American Eagle Outfitters, Inc. | | | 1,491 | |
| | 26 | | | ANN, Inc. (a) | | | 942 | |
| | 66 | | | Ascena Retail Group, Inc. (a) | | | 829 | |
| | 26 | | | Barnes & Noble, Inc. (a) | | | 600 | |
| | 27 | | | Brown Shoe Co., Inc. | | | 878 | |
| | 109 | | | Cato Corp. (The), Class A | | | 4,609 | |
| | 171 | | | Chico’s FAS, Inc. | | | 2,767 | |
| | 78 | | | Children’s Place, Inc. (The) | | | 4,459 | |
| | 136 | | | CST Brands, Inc. | | | 5,909 | |
| | 52 | | | Dick’s Sporting Goods, Inc. | | | 2,563 | |
| | 33 | | | Finish Line, Inc. (The), Class A | | | 800 | |
| | 87 | | | Foot Locker, Inc. | | | 4,880 | |
SEE NOTES TO FINANCIAL STATEMENTS.
| | | | | | |
| | | |
| 16 | | | | J.P. MORGAN EQUITY FUNDS | | DECEMBER 31, 2014 |
| | | | | | | | |
| SHARES | | | SECURITY DESCRIPTION | | VALUE($) | |
| Common Stocks — continued | |
| | | | Specialty Retail — continued | |
| | 16 | | | Genesco, Inc. (a) | | | 1,216 | |
| | 15 | | | Group 1 Automotive, Inc. | | | 1,331 | |
| | 58 | | | Guess?, Inc. | | | 1,212 | |
| | 11 | | | Haverty Furniture Cos., Inc. | | | 245 | |
| | 9 | | | Kirkland’s, Inc. (a) | | | 209 | |
| | 14 | | | Lithia Motors, Inc., Class A | | | 1,181 | |
| | 14 | | | MarineMax, Inc. (a) | | | 272 | |
| | 44 | | | Murphy USA, Inc. (a) | | | 3,044 | |
| | 755 | | | Office Depot, Inc. (a) | | | 6,475 | |
| | 44 | | | Outerwall, Inc. (a) | | | 3,323 | |
| | 33 | | | Select Comfort Corp. (a) | | | 889 | |
| | 16 | | | Signet Jewelers Ltd., (Bermuda) | | | 2,158 | |
| | 20 | | | Stein Mart, Inc. | | | 297 | |
| | 11 | | | Vitamin Shoppe, Inc. (a) | | | 511 | |
| | 52 | | | Williams-Sonoma, Inc. | | | 3,935 | |
| | 14 | | | Zumiez, Inc. (a) | | | 529 | |
| | | | | | | | |
| | | | | | | 71,782 | |
| | | | | | | | |
| | | | Textiles, Apparel & Luxury Goods — 1.3% | |
| | 23 | | | Deckers Outdoor Corp. (a) | | | 2,112 | |
| | 104 | | | Hanesbrands, Inc. | | | 11,571 | |
| | 16 | | | Iconix Brand Group, Inc. (a) | | | 532 | |
| | 11 | | | Movado Group, Inc. | | | 315 | |
| | 65 | | | Perry Ellis International, Inc. (a) | | | 1,675 | |
| | 25 | | | Skechers U.S.A., Inc., Class A (a) | | | 1,377 | |
| | 51 | | | Steven Madden Ltd. (a) | | | 1,612 | |
| | | | | | | | |
| | | | | | | 19,194 | |
| | | | | | | | |
| | | | Total Consumer Discretionary | | | 187,552 | |
| | | | | | | | |
| | | | Consumer Staples — 3.2% | |
| | | | Food & Staples Retailing — 0.7% | |
| | 55 | | | Andersons, Inc. (The) | | | 2,924 | |
| | 25 | | | Casey’s General Stores, Inc. | | | 2,272 | |
| | 48 | | | SpartanNash Co. | | | 1,267 | |
| | 327 | | | SUPERVALU, Inc. (a) | | | 3,176 | |
| | | | | | | | |
| | | | | | | 9,639 | |
| | | | | | | | |
| | | | Food Products — 1.6% | |
| | 7 | | | B&G Foods, Inc. | | | 217 | |
| | 7 | | | Calavo Growers, Inc. | | | 346 | |
| | 18 | | | Cal-Maine Foods, Inc. | | | 706 | |
| | 80 | | | Flowers Foods, Inc. | | | 1,539 | |
| | 45 | | | Hain Celestial Group, Inc. (The) (a) | | | 2,616 | |
| | 91 | | | Ingredion, Inc. | | | 7,726 | |
| | 9 | | | J&J Snack Foods Corp. | | | 968 | |
| | 57 | | | Sanderson Farms, Inc. | | | 4,816 | |
| | 20 | | | Seneca Foods Corp., Class A (a) | | | 542 | |
| | | | | | | | |
| SHARES | | | SECURITY DESCRIPTION | | VALUE($) | |
| | | | | | | | |
| | | | Food Products — continued | |
| | 120 | | | WhiteWave Foods Co. (The) (a) | | | 4,206 | |
| | | | | | | | |
| | | | | | | 23,682 | |
| | | | | | | | |
| | | | Household Products — 0.9% | |
| | 133 | | | Central Garden & Pet Co., Class A (a) | | | 1,269 | |
| | 77 | | | Church & Dwight Co., Inc. | | | 6,099 | |
| | 40 | | | Energizer Holdings, Inc. | | | 5,173 | |
| | | | | | | | |
| | | | | | | 12,541 | |
| | | | | | | | |
| | | | Personal Products — 0.0% (g) | |
| | 9 | | | Medifast, Inc. (a) | | | 290 | |
| | | | | | | | |
| | | | Total Consumer Staples | | | 46,152 | |
| | | | | | | | |
| | | | Energy — 3.7% | |
| | | | Energy Equipment & Services — 2.1% | |
| | 26 | | | Atwood Oceanics, Inc. (a) | | | 745 | |
| | 20 | | | Basic Energy Services, Inc. (a) | | | 138 | |
| | 23 | | | Bristow Group, Inc. | | | 1,501 | |
| | 28 | | | C&J Energy Services, Inc. (a) | | | 376 | |
| | 14 | | | Dril-Quip, Inc. (a) | | | 1,052 | |
| | 10 | | | Exterran Holdings, Inc. | | | 318 | |
| | 72 | | | Gulf Island Fabrication, Inc. | | | 1,400 | |
| | 96 | | | Helix Energy Solutions Group, Inc. (a) | | | 2,091 | |
| | 696 | | | ION Geophysical Corp. (a) | | | 1,914 | |
| | 82 | | | Matrix Service Co. (a) | | | 1,834 | |
| | 59 | | | Oceaneering International, Inc. | | | 3,486 | |
| | 74 | | | Oil States International, Inc. (a) | | | 3,641 | |
| | 195 | | | Patterson-UTI Energy, Inc. | | | 3,236 | |
| | 38 | | | Pioneer Energy Services Corp. (a) | | | 208 | |
| | 222 | | | Superior Energy Services, Inc. | | | 4,471 | |
| | 157 | | | Tesco Corp. | | | 2,015 | |
| | 33 | | | Tidewater, Inc. | | | 1,060 | |
| | 27 | | | Unit Corp. (a) | | | 911 | |
| | | | | | | | |
| | | | | | | 30,397 | |
| | | | | | | | |
| | | | Oil, Gas & Consumable Fuels — 1.6% | |
| | 28 | | | Bill Barrett Corp. (a) | | | 324 | |
| | 23 | | | Carrizo Oil & Gas, Inc. (a) | | | 962 | |
| | 31 | | | Comstock Resources, Inc. | | | 208 | |
| | 9 | | | Contango Oil & Gas Co. (a) | | | 251 | |
| | 34 | | | Energen Corp. | | | 2,187 | |
| | 71 | | | Green Plains, Inc. | | | 1,747 | |
| | 12 | | | Gulfport Energy Corp. (a) | | | 501 | |
| | 205 | | | HollyFrontier Corp. | | | 7,701 | |
| | 36 | | | PetroQuest Energy, Inc. (a) | | | 133 | |
| | 41 | | | Rosetta Resources, Inc. (a) | | | 909 | |
| | 44 | | | SM Energy Co. | | | 1,679 | |
SEE NOTES TO FINANCIAL STATEMENTS.
| | | | | | | | |
| | | |
| DECEMBER 31, 2014 | | J.P. MORGAN EQUITY FUNDS | | | | | 17 | |
JPMorgan Market Expansion Enhanced Index Fund
SCHEDULE OF PORTFOLIO INVESTMENTS
AS OF DECEMBER 31, 2014 (Unaudited) (continued)
(Amounts in thousands)
| | | | | | | | |
| SHARES | | | SECURITY DESCRIPTION | | VALUE($) | |
| Common Stocks — continued | |
| | | | Oil, Gas & Consumable Fuels — continued | |
| | 80 | | | Stone Energy Corp. (a) | | | 1,350 | |
| | 48 | | | World Fuel Services Corp. | | | 2,256 | |
| | 227 | | | WPX Energy, Inc. (a) | | | 2,642 | |
| | | | | | | | |
| | | | | | | 22,850 | |
| | | | | | | | |
| | | | Total Energy | | | 53,247 | |
| | | | | | | | |
| | | | Financials — 22.2% | |
| | | | Banks — 6.1% | |
| | 209 | | | Associated Banc-Corp. | | | 3,888 | |
| | 70 | | | BancorpSouth, Inc. | | | 1,581 | |
| | 43 | | | Bank of Hawaii Corp. | | | 2,523 | |
| | 36 | | | Bank of the Ozarks, Inc. | | | 1,351 | |
| | 11 | | | Banner Corp. | | | 470 | |
| | 50 | | | BBCN Bancorp, Inc. | | | 714 | |
| | 50 | | | Boston Private Financial Holdings, Inc. | | | 674 | |
| | 52 | | | Cathay General Bancorp | | | 1,329 | |
| | 10 | | | City Holding Co. | | | 444 | |
| | 23 | | | City National Corp. | | | 1,823 | |
| | 25 | | | Columbia Banking System, Inc. | | | 697 | |
| | 3 | | | Commerce Bancshares, Inc. | | | 121 | |
| | 27 | | | Community Bank System, Inc. | | | 1,028 | |
| | 77 | | | Cullen/Frost Bankers, Inc. | | | 5,474 | |
| | 55 | | | CVB Financial Corp. | | | 887 | |
| | 208 | | | East West Bancorp, Inc. | | | 8,034 | |
| | 238 | | | First BanCorp, (Puerto Rico) (a) | | | 1,395 | |
| | 34 | | | First Financial Bancorp | | | 636 | |
| | 47 | | | First Midwest Bancorp, Inc. | | | 801 | |
| | 305 | | | First Niagara Financial Group, Inc. | | | 2,572 | |
| | 272 | | | FirstMerit Corp. | | | 5,133 | |
| | 38 | | | FNB Corp. | | | 508 | |
| | 405 | | | Fulton Financial Corp. | | | 5,010 | |
| | 45 | | | Glacier Bancorp, Inc. | | | 1,252 | |
| | 51 | | | Hancock Holding Co. | | | 1,578 | |
| | 20 | | | Hanmi Financial Corp. | | | 427 | |
| | 27 | | | Home BancShares, Inc. | | | 877 | |
| | 13 | | | Independent Bank Corp. | | | 569 | |
| | 35 | | | MB Financial, Inc. | | | 1,155 | |
| | 23 | | | NBT Bancorp, Inc. | | | 594 | |
| | 13 | | | Old National Bancorp | | | 194 | |
| | 151 | | | PacWest Bancorp | | | 6,860 | |
| | 22 | | | Pinnacle Financial Partners, Inc. | | | 868 | |
| | 41 | | | PrivateBancorp, Inc. | | | 1,382 | |
| | 28 | | | Prosperity Bancshares, Inc. | | | 1,560 | |
| | 24 | | | Simmons First National Corp., Class A | | | 955 | |
| | 48 | | | SVB Financial Group (a) | | | 5,571 | |
| | 83 | | | Synovus Financial Corp. | | | 2,235 | |
| | | | | | | | |
| SHARES | | | SECURITY DESCRIPTION | | VALUE($) | |
| | | | | | | | |
| | | | Banks — continued | |
| | 105 | | | TCF Financial Corp. | | | 1,672 | |
| | 7 | | | Tompkins Financial Corp. | | | 389 | |
| | 51 | | | Trustmark Corp. | | | 1,254 | |
| | 73 | | | UMB Financial Corp. | | | 4,142 | |
| | 195 | | | Umpqua Holdings Corp. | | | 3,311 | |
| | 27 | | | United Community Banks, Inc. | | | 511 | |
| | 55 | | | Webster Financial Corp. | | | 1,791 | |
| | 37 | | | Wilshire Bancorp, Inc. | | | 372 | |
| | 30 | | | Wintrust Financial Corp. | | | 1,385 | |
| | | | | | | | |
| | | | | | | 87,997 | |
| | | | | | | | |
| | | | Capital Markets — 1.8% | |
| | 33 | | | Eaton Vance Corp. | | | 1,346 | |
| | 26 | | | Evercore Partners, Inc., Class A | | | 1,377 | |
| | 19 | | | HFF, Inc., Class A | | | 689 | |
| | 26 | | | Investment Technology Group, Inc. (a) | | | 536 | |
| | 10 | | | Piper Jaffray Cos. (a) | | | 552 | |
| | 149 | | | Raymond James Financial, Inc. | | | 8,540 | |
| | 194 | | | SEI Investments Co. | | | 7,782 | |
| | 38 | | | Stifel Financial Corp. (a) | | | 1,920 | |
| | 5 | | | Virtus Investment Partners, Inc. | | | 818 | |
| | 53 | | | Waddell & Reed Financial, Inc., Class A | | | 2,617 | |
| | | | | | | | |
| | | | | | | 26,177 | |
| | | | | | | | |
| | | | Consumer Finance — 0.4% | |
| | 35 | | | Cash America International, Inc. | | | 791 | |
| | 13 | | | Encore Capital Group, Inc. (a) | | | 599 | |
| | 32 | | | Enova International, Inc. (a) | | | 709 | |
| | 35 | | | Ezcorp, Inc., Class A (a) | | | 414 | |
| | 5 | | | First Cash Financial Services, Inc. (a) | | | 285 | |
| | 12 | | | Green Dot Corp., Class A (a) | | | 250 | |
| | 255 | | | SLM Corp. | | | 2,597 | |
| | 9 | | | World Acceptance Corp. (a) | | | 728 | |
| | | | | | | | |
| | | | | | | 6,373 | |
| | | | | | | | |
| | | | Diversified Financial Services — 0.2% | |
| | 52 | | | CBOE Holdings, Inc. | | | 3,288 | |
| | | | | | | | |
| | | | Insurance — 3.9% | |
| | 7 | | | Alleghany Corp. (a) | | | 3,088 | |
| | 55 | | | American Financial Group, Inc. | | | 3,362 | |
| | 11 | | | AMERISAFE, Inc. | | | 479 | |
| | 103 | | | Aspen Insurance Holdings Ltd., (Bermuda) | | | 4,514 | |
| | 57 | | | Brown & Brown, Inc. | | | 1,883 | |
| | 55 | | | Everest Re Group Ltd., (Bermuda) | | | 9,412 | |
| | 86 | | | Hanover Insurance Group, Inc. (The) | | | 6,143 | |
| | 110 | | | HCC Insurance Holdings, Inc. | | | 5,894 | |
| | 24 | | | Mercury General Corp. | | | 1,332 | |
SEE NOTES TO FINANCIAL STATEMENTS.
| | | | | | |
| | | |
| 18 | | | | J.P. MORGAN EQUITY FUNDS | | DECEMBER 31, 2014 |
| | | | | | | | |
| SHARES | | | SECURITY DESCRIPTION | | VALUE($) | |
| Common Stocks — continued | |
| | | | Insurance — continued | |
| | 8 | | | Navigators Group, Inc. (The) (a) | | | 575 | |
| | 184 | | | Old Republic International Corp. | | | 2,698 | |
| | 119 | | | Protective Life Corp. | | | 8,315 | |
| | 39 | | | Reinsurance Group of America, Inc. | | | 3,373 | |
| | 9 | | | Safety Insurance Group, Inc. | | | 607 | |
| | 35 | | | Selective Insurance Group, Inc. | | | 948 | |
| | 6 | | | StanCorp Financial Group, Inc. | | | 427 | |
| | 12 | | | Stewart Information Services Corp. | | | 450 | |
| | 58 | | | W.R. Berkley Corp. | | | 2,951 | |
| | | | | | | | |
| | | | | | | 56,451 | |
| | | | | | | | |
| | | | Real Estate Investment Trusts (REITs) — 8.9% | |
| | 28 | | | Acadia Realty Trust | | | 895 | |
| | 40 | | | Alexandria Real Estate Equities, Inc. | | | 3,509 | |
| | 65 | | | American Campus Communities, Inc. | | | 2,703 | |
| | 34 | | | Associated Estates Realty Corp. | | | 787 | |
| | 98 | | | BioMed Realty Trust, Inc. | | | 2,110 | |
| | 51 | | | Camden Property Trust | | | 3,755 | |
| | 14 | | | CareTrust REIT, Inc. | | | 168 | |
| | 45 | | | Cedar Realty Trust, Inc. | | | 328 | |
| | 23 | | | CoreSite Realty Corp. | | | 898 | |
| | 46 | | | Corporate Office Properties Trust | | | 1,315 | |
| | 82 | | | Corrections Corp. of America | | | 2,970 | |
| | 171 | | | Cousins Properties, Inc. | | | 1,948 | |
| | 438 | | | DiamondRock Hospitality Co. | | | 6,516 | |
| | 199 | | | Duke Realty Corp. | | | 4,026 | |
| | 18 | | | EastGroup Properties, Inc. | | | 1,130 | |
| | 30 | | | EPR Properties | | | 1,718 | |
| | 38 | | | Equity One, Inc. | | | 976 | |
| | 66 | | | Extra Space Storage, Inc. | | | 3,869 | |
| | 13 | | | Federal Realty Investment Trust | | | 1,686 | |
| | 46 | | | Franklin Street Properties Corp. | | | 562 | |
| | 137 | | | Geo Group, Inc. (The) | | | 5,526 | |
| | 17 | | | Getty Realty Corp. | | | 302 | |
| | 24 | | | Government Properties Income Trust | | | 563 | |
| | 49 | | | Healthcare Realty Trust, Inc. | | | 1,333 | |
| | 83 | | | Highwoods Properties, Inc. | | | 3,667 | |
| | 31 | | | Home Properties, Inc. | | | 2,057 | |
| | 78 | | | Hospitality Properties Trust | | | 2,429 | |
| | 49 | | | Inland Real Estate Corp. | | | 538 | |
| | 47 | | | Kilroy Realty Corp. | | | 3,216 | |
| | 190 | | | Kite Realty Group Trust | | | 5,461 | |
| | 184 | | | LaSalle Hotel Properties | | | 7,427 | |
| | 72 | | | Liberty Property Trust | | | 2,717 | |
| | 19 | | | LTC Properties, Inc. | | | 836 | |
| | 56 | | | Mack-Cali Realty Corp. | | | 1,061 | |
| | | | | | | | |
| SHARES | | | SECURITY DESCRIPTION | | VALUE($) | |
| | | | | | | | |
| | | | Real Estate Investment Trusts (REITs) — continued | |
| | 86 | | | Medical Properties Trust, Inc. | | | 1,186 | |
| | 50 | | | Mid-America Apartment Communities, Inc. | | | 3,766 | |
| | 14 | | | Parkway Properties, Inc. | | | 250 | |
| | 34 | | | Post Properties, Inc. | | | 2,004 | |
| | 90 | | | Potlatch Corp. | | | 3,752 | |
| | 12 | | | PS Business Parks, Inc. | | | 927 | |
| | 70 | | | Realty Income Corp. | | | 3,360 | |
| | 57 | | | Regency Centers Corp. | | | 3,632 | |
| | 7 | | | Saul Centers, Inc. | | | 428 | |
| | 118 | | | Senior Housing Properties Trust | | | 2,613 | |
| | 57 | | | SL Green Realty Corp. | | | 6,794 | |
| | 19 | | | Sovran Self Storage, Inc. | | | 1,681 | |
| | 59 | | | Tanger Factory Outlet Centers, Inc. | | | 2,177 | |
| | 85 | | | Taubman Centers, Inc. | | | 6,472 | |
| | 159 | | | UDR, Inc. | | | 4,899 | |
| | 8 | | | Universal Health Realty Income Trust | | | 373 | |
| | 15 | | | Urstadt Biddle Properties, Inc., Class A | | | 324 | |
| | 102 | | | Washington Prime Group, Inc. | | | 1,748 | |
| | 77 | | | Weingarten Realty Investors | | | 2,691 | |
| | | | | | | | |
| | | | | | | 128,079 | |
| | | | | | | | |
| | | | Real Estate Management & Development — 0.8% | |
| | 59 | | | Alexander & Baldwin, Inc. | | | 2,310 | |
| | 22 | | | Forestar Group, Inc. (a) | | | 334 | |
| | 59 | | | Jones Lang LaSalle, Inc. | | | 8,791 | |
| | | | | | | | |
| | | | | | | 11,435 | |
| | | | | | | | |
| | | | Thrifts & Mortgage Finance — 0.1% | |
| | 27 | | | Bank Mutual Corp. | | | 186 | |
| | 54 | | | New York Community Bancorp, Inc. | | | 865 | |
| | 34 | | | Provident Financial Services, Inc. | | | 614 | |
| | 57 | | | TrustCo Bank Corp. | | | 416 | |
| | | | | | | | |
| | | | | | | 2,081 | |
| | | | | | | | |
| | | | Total Financials | | | 321,881 | |
| | | | | | | | |
| | | | Health Care — 10.6% | |
| | | | Biotechnology — 0.5% | |
| | 24 | | | Acorda Therapeutics, Inc. (a) | | | 989 | |
| | 17 | | | Emergent Biosolutions, Inc. (a) | | | 468 | |
| | 49 | | | United Therapeutics Corp. (a) | | | 6,329 | |
| | | | | | | | |
| | | | | | | 7,786 | |
| | | | | | | | |
| | | | Health Care Equipment & Supplies — 2.4% | |
| | 91 | | | Align Technology, Inc. (a) | | | 5,110 | |
| | 17 | | | CONMED Corp. | | | 781 | |
| | 11 | | | Cooper Cos., Inc. (The) | | | 1,859 | |
| | 85 | | | CryoLife, Inc. | | | 961 | |
SEE NOTES TO FINANCIAL STATEMENTS.
| | | | | | | | |
| | | |
| DECEMBER 31, 2014 | | J.P. MORGAN EQUITY FUNDS | | | | | 19 | |
JPMorgan Market Expansion Enhanced Index Fund
SCHEDULE OF PORTFOLIO INVESTMENTS
AS OF DECEMBER 31, 2014 (Unaudited) (continued)
(Amounts in thousands)
| | | | | | | | |
| SHARES | | | SECURITY DESCRIPTION | | VALUE($) | |
| Common Stocks — continued | |
| | | | Health Care Equipment & Supplies — continued | |
| | 17 | | | Cyberonics, Inc. (a) | | | 941 | |
| | 26 | | | Cynosure, Inc., Class A (a) | | | 724 | |
| | 14 | | | Greatbatch, Inc. (a) | | | 707 | |
| | 102 | | | Hill-Rom Holdings, Inc. | | | 4,649 | |
| | 340 | | | Hologic, Inc. (a) | | | 9,084 | |
| | 8 | | | ICU Medical, Inc. (a) | | | 645 | |
| | 9 | | | IDEXX Laboratories, Inc. (a) | | | 1,380 | |
| | 12 | | | Masimo Corp. (a) | | | 323 | |
| | 16 | | | Natus Medical, Inc. (a) | | | 590 | |
| | 31 | | | NuVasive, Inc. (a) | | | 1,454 | |
| | 78 | | | ResMed, Inc. | | | 4,369 | |
| | 6 | | | Symmetry Surgical, Inc., (a) | | | 47 | |
| | 39 | | | Thoratec Corp. (a) | | | 1,255 | |
| | | | | | | | |
| | | | | | | 34,879 | |
| | | | | | | | |
| | | | Health Care Providers & Services — 4.7% | |
| | 25 | | | AMN Healthcare Services, Inc. (a) | | | 485 | |
| | 20 | | | Amsurg Corp. (a) | | | 1,108 | |
| | 89 | | | Centene Corp. (a) | | | 9,262 | |
| | 210 | | | Community Health Systems, Inc. (a) | | | 11,302 | |
| | 271 | | | Cross Country Healthcare, Inc. (a) | | | 3,382 | |
| | 10 | | | Ensign Group, Inc. (The) | | | 452 | |
| | 129 | | | Gentiva Health Services, Inc. (a) | | | 2,449 | |
| | 74 | | | Health Net, Inc. (a) | | | 3,986 | |
| | 56 | | | Henry Schein, Inc. (a) | | | 7,649 | |
| | 33 | | | Kindred Healthcare, Inc. | | | 598 | |
| | 74 | | | LifePoint Hospitals, Inc. (a) | | | 5,343 | |
| | 17 | | | Magellan Health, Inc. (a) | | | 1,030 | |
| | 49 | | | MEDNAX, Inc. (a) | | | 3,212 | |
| | 21 | | | Molina Healthcare, Inc. (a) | | | 1,140 | |
| | 8 | | | MWI Veterinary Supply, Inc. (a) | | | 1,371 | |
| | 67 | | | Omnicare, Inc. | | | 4,892 | |
| | 134 | | | Owens & Minor, Inc. | | | 4,721 | |
| | 57 | | | VCA, Inc. (a) | | | 2,798 | |
| | 38 | | | WellCare Health Plans, Inc. (a) | | | 3,110 | |
| | | | | | | | |
| | | | | | | 68,290 | |
| | | | | | | | |
| | | | Health Care Technology — 0.1% | |
| | 9 | | | Medidata Solutions, Inc. (a) | | | 409 | |
| | 21 | | | Omnicell, Inc. (a) | | | 681 | |
| | | | | | | | |
| | | | | | | 1,090 | |
| | | | | | | | |
| | | | Life Sciences Tools & Services — 1.2% | |
| | 323 | | | Affymetrix, Inc. (a) | | | 3,187 | |
| | 159 | | | Cambrex Corp. (a) | | | 3,437 | |
| | 31 | | | Charles River Laboratories International, Inc. (a) | | | 1,960 | |
| | | | | | | | |
| SHARES | | | SECURITY DESCRIPTION | | VALUE($) | |
| | | | | | | | |
| | | | Life Sciences Tools & Services — continued | |
| | 22 | | | Covance, Inc. (a) | | | 2,308 | |
| | 23 | | | Luminex Corp. (a) | | | 428 | |
| | 12 | | | Mettler-Toledo International, Inc. (a) | | | 3,651 | |
| | 37 | | | PAREXEL International Corp. (a) | | | 2,030 | |
| | | | | | | | |
| | | | | | | 17,001 | |
| | | | | | | | |
| | | | Pharmaceuticals — 1.7% | |
| | 133 | | | Endo International plc, (Ireland) (a) | | | 9,613 | |
| | 43 | | | Impax Laboratories, Inc. (a) | | | 1,359 | |
| | 50 | | | Medicines Co. (The) (a) | | | 1,383 | |
| | 32 | | | Prestige Brands Holdings, Inc. (a) | | | 1,107 | |
| | 90 | | | Salix Pharmaceuticals Ltd. (a) | | | 10,369 | |
| | | | | | | | |
| | | | | | | 23,831 | |
| | | | | | | | |
| | | | Total Health Care | | | 152,877 | |
| | | | | | | | |
| | | | Industrials — 15.6% | |
| | | | Aerospace & Defense — 2.0% | |
| | 25 | | | AAR Corp. | | | 691 | |
| | 49 | | | Alliant Techsystems, Inc. | | | 5,680 | |
| | 5 | | | B/E Aerospace, Inc. (a) | | | 275 | |
| | 77 | | | Engility Holdings, Inc. (a) | | | 3,289 | |
| | 248 | | | Exelis, Inc. | | | 4,356 | |
| | 91 | | | Huntington Ingalls Industries, Inc. | | | 10,195 | |
| | 8 | | | KLX, Inc. (a) | | | 350 | |
| | 20 | | | Moog, Inc., Class A (a) | | | 1,501 | |
| | 20 | | | Orbital Sciences Corp. (a) | | | 547 | |
| | 23 | | | Triumph Group, Inc. | | | 1,552 | |
| | | | | | | | |
| | | | | | | 28,436 | |
| | | | | | | | |
| | | | Air Freight & Logistics — 0.1% | |
| | 22 | | | Hub Group, Inc., Class A (a) | | | 836 | |
| | | | | | | | |
| | | | Airlines — 0.7% | |
| | 97 | | | Alaska Air Group, Inc. | | | 5,769 | |
| | 277 | | | JetBlue Airways Corp. (a) | | | 4,400 | |
| | | | | | | | |
| | | | | | | 10,169 | |
| | | | | | | | |
| | | | Building Products — 1.3% | |
| | 124 | | | A.O. Smith Corp. | | | 7,007 | |
| | 78 | | | American Woodmark Corp. (a) | | | 3,154 | |
| | 67 | | | Fortune Brands Home & Security, Inc. | | | 3,038 | |
| | 99 | | | Griffon Corp. | | | 1,311 | |
| | 34 | | | Lennox International, Inc. | | | 3,228 | |
| | 12 | | | Universal Forest Products, Inc. | | | 643 | |
| | | | | | | | |
| | | | | | | 18,381 | |
| | | | | | | | |
| | | | Commercial Services & Supplies — 1.8% | |
| | 159 | | | ABM Industries, Inc. | | | 4,566 | |
| | 34 | | | Deluxe Corp. | | | 2,131 | |
SEE NOTES TO FINANCIAL STATEMENTS.
| | | | | | |
| | | |
| 20 | | | | J.P. MORGAN EQUITY FUNDS | | DECEMBER 31, 2014 |
| | | | | | | | |
| SHARES | | | SECURITY DESCRIPTION | | VALUE($) | |
| Common Stocks — continued | |
| | | | Commercial Services & Supplies — continued | |
| | 11 | | | Herman Miller, Inc. | | | 323 | |
| | 27 | | | HNI Corp. | | | 1,372 | |
| | 100 | | | Matthews International Corp., Class A | | | 4,880 | |
| | 377 | | | R.R. Donnelley & Sons Co. | | | 6,333 | |
| | 169 | | | Tetra Tech, Inc. | | | 4,525 | |
| | 10 | | | UniFirst Corp. | | | 1,219 | |
| | 21 | | | United Stationers, Inc. | | | 901 | |
| | 12 | | | Viad Corp. | | | 326 | |
| | | | | | | | |
| | | | | | | 26,576 | |
| | | | | | | | |
| | | | Construction & Engineering — 0.9% | |
| | 200 | | | AECOM Technology Corp. (a) | | | 6,082 | |
| | 25 | | | Aegion Corp. (a) | | | 462 | |
| | 23 | | | Comfort Systems USA, Inc. | | | 395 | |
| | 89 | | | EMCOR Group, Inc. | | | 3,980 | |
| | 93 | | | KBR, Inc. | | | 1,570 | |
| | | | | | | | |
| | | | | | | 12,489 | |
| | | | | | | | |
| | | | Electrical Equipment — 1.0% | |
| | 16 | | | AZZ, Inc. | | | 732 | |
| | 62 | | | EnerSys | | | 3,797 | |
| | 131 | | | General Cable Corp. | | | 1,956 | |
| | 28 | | | Hubbell, Inc., Class B | | | 2,968 | |
| | 76 | | | Regal-Beloit Corp. | | | 5,689 | |
| | | | | | | | |
| | | | | | | 15,142 | |
| | | | | | | | |
| | | | Industrial Conglomerates — 0.5% | |
| | 85 | | | Carlisle Cos., Inc. | | | 7,664 | |
| | | | | | | | |
| | | | Machinery — 3.7% | |
| | 43 | | | Actuant Corp., Class A | | | 1,178 | |
| | 53 | | | AGCO Corp. | | | 2,374 | |
| | 17 | | | Albany International Corp., Class A | | | 658 | |
| | 26 | | | Barnes Group, Inc. | | | 944 | |
| | 32 | | | Briggs & Stratton Corp. | | | 647 | |
| | 71 | | | Crane Co. | | | 4,163 | |
| | 39 | | | Federal Signal Corp. | | | 596 | |
| | 45 | | | Hillenbrand, Inc. | | | 1,541 | |
| | 40 | | | IDEX Corp. | | | 3,129 | |
| | 132 | | | ITT Corp. | | | 5,357 | |
| | 17 | | | John Bean Technologies Corp. | | | 575 | |
| | 49 | | | Kennametal, Inc. | | | 1,764 | |
| | 49 | | | Lincoln Electric Holdings, Inc. | | | 3,379 | |
| | 10 | | | Lydall, Inc. (a) | | | 332 | |
| | 26 | | | Nordson Corp. | | | 2,014 | |
| | 66 | | | Oshkosh Corp. | | | 3,218 | |
| | 65 | | | SPX Corp. | | | 5,593 | |
| | 8 | | | Standex International Corp. | | | 618 | |
| | | | | | | | |
| SHARES | | | SECURITY DESCRIPTION | | VALUE($) | |
| | | | | | | | |
| | | | Machinery — continued | |
| | 12 | | | Tennant Co. | | | 862 | |
| | 119 | | | Terex Corp. | | | 3,320 | |
| | 50 | | | Timken Co. | | | 2,145 | |
| | 105 | | | Trinity Industries, Inc. | | | 2,955 | |
| | 64 | | | Wabtec Corp. | | | 5,537 | |
| | 7 | | | Watts Water Technologies, Inc., Class A | | | 431 | |
| | | | | | | | |
| | | | | | | 53,330 | |
| | | | | | | | |
| | | | Marine — 0.6% | |
| | 36 | | | Kirby Corp. (a) | | | 2,923 | |
| | 161 | | | Matson, Inc. | | | 5,551 | |
| | | | | | | | |
| | | | | | | 8,474 | |
| | | | | | | | |
| | | | Professional Services — 1.5% | |
| | 8 | | | CDI Corp. | | | 137 | |
| | 20 | | | Corporate Executive Board Co. (The) | | | 1,441 | |
| | 23 | | | FTI Consulting, Inc. (a) | | | 891 | |
| | 117 | | | Heidrick & Struggles International, Inc. | | | 2,703 | |
| | 13 | | | Insperity, Inc. | | | 437 | |
| | 30 | | | Korn/Ferry International (a) | | | 875 | |
| | 106 | | | Manpowergroup, Inc. | | | 7,252 | |
| | 26 | | | On Assignment, Inc. (a) | | | 873 | |
| | 120 | | | Resources Connection, Inc. | | | 1,981 | |
| | 41 | | | Towers Watson & Co., Class A | | | 4,597 | |
| | 26 | | | TrueBlue, Inc. (a) | | | 571 | |
| | | | | | | | |
| | | | | | | 21,758 | |
| | | | | | | | |
| | | | Road & Rail — 1.1% | |
| | 81 | | | ArcBest Corp. | | | 3,770 | |
| | 125 | | | Con-way, Inc. | | | 6,162 | |
| | 12 | | | J.B. Hunt Transport Services, Inc. | | | 1,025 | |
| | 28 | | | Landstar System, Inc. | | | 2,021 | |
| | 35 | | | Old Dominion Freight Line, Inc. (a) | | | 2,686 | |
| | | | | | | | |
| | | | | | | 15,664 | |
| | | | | | | | |
| | | | Trading Companies & Distributors — 0.4% | |
| | 27 | | | Applied Industrial Technologies, Inc. | | | 1,208 | |
| | 11 | | | GATX Corp. | | | 627 | |
| | 4 | | | MSC Industrial Direct Co., Inc., Class A | | | 301 | |
| | 70 | | | NOW, Inc. (a) | | | 1,788 | |
| | 13 | | | Veritiv Corp. (a) | | | 669 | |
| | 16 | | | Watsco, Inc. | | | 1,734 | |
| | | | | | | | |
| | | | | | | 6,327 | |
| | | | | | | | |
| | | | Total Industrials | | | 225,246 | |
| | | | | | | | |
SEE NOTES TO FINANCIAL STATEMENTS.
| | | | | | | | |
| | | |
| DECEMBER 31, 2014 | | J.P. MORGAN EQUITY FUNDS | | | | | 21 | |
JPMorgan Market Expansion Enhanced Index Fund
SCHEDULE OF PORTFOLIO INVESTMENTS
AS OF DECEMBER 31, 2014 (Unaudited) (continued)
(Amounts in thousands)
| | | | | | | | |
| SHARES | | | SECURITY DESCRIPTION | | VALUE($) | |
| Common Stocks — continued | |
| | | | Information Technology — 17.6% | |
| | | | Communications Equipment — 0.8% | |
| | 128 | | | ARRIS Group, Inc. (a) | | | 3,870 | |
| | 34 | | | Bel Fuse, Inc., Class B | | | 922 | |
| | 150 | | | JDS Uniphase Corp. (a) | | | 2,051 | |
| | 4 | | | NETGEAR, Inc. (a) | | | 140 | |
| | 336 | | | Polycom, Inc. (a) | | | 4,536 | |
| | | | | | | | |
| | | | | | | 11,519 | |
| | | | | | | | |
| | | | Electronic Equipment, Instruments & Components — 4.0% | |
| | 18 | | | Anixter International, Inc. (a) | | | 1,628 | |
| | 151 | | | Arrow Electronics, Inc. (a) | | | 8,761 | |
| | 188 | | | Avnet, Inc. | | | 8,090 | |
| | 21 | | | Belden, Inc. | | | 1,649 | |
| | 207 | | | Benchmark Electronics, Inc. (a) | | | 5,272 | |
| | 15 | | | Coherent, Inc. (a) | | | 917 | |
| | 9 | | | DTS, Inc. (a) | | | 264 | |
| | 16 | | | Electro Scientific Industries, Inc. | | | 123 | |
| | 24 | | | FEI Co. | | | 2,206 | |
| | 18 | | | Gerber Scientific, Inc. (a) (i) | | | — | (h) |
| | 9 | | | II-VI, Inc. (a) | | | 127 | |
| | 190 | | | Ingram Micro, Inc., Class A (a) | | | 5,259 | |
| | 29 | | | Insight Enterprises, Inc. (a) | | | 756 | |
| | 26 | | | Itron, Inc. (a) | | | 1,078 | |
| | 14 | | | Littelfuse, Inc. | | | 1,335 | |
| | 23 | | | Methode Electronics, Inc. | | | 827 | |
| | 26 | | | Newport Corp. (a) | | | 491 | |
| | 12 | | | OSI Systems, Inc. (a) | | | 863 | |
| | 98 | | | Plexus Corp. (a) | | | 4,051 | |
| | 18 | | | Rofin-Sinar Technologies, Inc. (a) | | | 516 | |
| | 10 | | | Rogers Corp. (a) | | | 815 | |
| | 99 | | | Sanmina Corp. (a) | | | 2,327 | |
| | 18 | | | ScanSource, Inc. (a) | | | 735 | |
| | 89 | | | Tech Data Corp. (a) | | | 5,642 | |
| | 132 | | | Trimble Navigation Ltd. (a) | | | 3,515 | |
| | 89 | | | Vishay Intertechnology, Inc. | | | 1,262 | |
| | | | | | | | |
| | | | | | | 58,509 | |
| | | | | | | | |
| | | | Internet Software & Services — 1.6% | |
| | 63 | | | AOL, Inc. (a) | | | 2,931 | |
| | 20 | | | Blucora, Inc. (a) | | | 273 | |
| | 20 | | | comScore, Inc. (a) | | | 910 | |
| | 14 | | | Dealertrack Technologies, Inc. (a) | | | 616 | |
| | 26 | | | Dice Holdings, Inc. (a) | | | 257 | |
| | 23 | | | Digital River, Inc. (a) | | | 570 | |
| | 44 | | | Equinix, Inc. | | | 10,011 | |
| | 20 | | | j2 Global, Inc. | | | 1,243 | |
| | 150 | | | Liquidity Services, Inc. (a) | | | 1,229 | |
| | | | | | | | |
| SHARES | | | SECURITY DESCRIPTION | | VALUE($) | |
| | | | | | | | |
| | | | Internet Software & Services — continued | |
| | 13 | | | LogMeIn, Inc. (a) | | | 655 | |
| | 20 | | | Perficient, Inc. (a) | | | 373 | |
| | 131 | | | QuinStreet, Inc. (a) | | | 793 | |
| | 74 | | | Rackspace Hosting, Inc. (a) | | | 3,472 | |
| | | | | | | | |
| | | | | | | 23,333 | |
| | | | | | | | |
| | | | IT Services — 3.6% | |
| | 50 | | | Acxiom Corp. (a) | | | 1,008 | |
| | 169 | | | Broadridge Financial Solutions, Inc. | | | 7,791 | |
| | 15 | | | CACI International, Inc., Class A (a) | | | 1,302 | |
| | 9 | | | Cardtronics, Inc. (a) | | | 335 | |
| | 61 | | | Convergys Corp. | | | 1,248 | |
| | 16 | | | CSG Systems International, Inc. | | | 397 | |
| | 64 | | | DST Systems, Inc. | | | 5,996 | |
| | 62 | | | ExlService Holdings, Inc. (a) | | | 1,773 | |
| | 8 | | | Forrester Research, Inc. | | | 319 | |
| | 55 | | | Gartner, Inc. (a) | | | 4,601 | |
| | 100 | | | Global Payments, Inc. | | | 8,066 | |
| | 36 | | | Heartland Payment Systems, Inc. | | | 1,924 | |
| | 42 | | | Jack Henry & Associates, Inc. | | | 2,620 | |
| | 39 | | | Leidos Holdings, Inc. | | | 1,689 | |
| | 15 | | | ManTech International Corp., Class A | | | 447 | |
| | 11 | | | MAXIMUS, Inc. | | | 577 | |
| | 28 | | | Science Applications International Corp. | | | 1,367 | |
| | 133 | | | Sykes Enterprises, Inc. (a) | | | 3,130 | |
| | 39 | | | TeleTech Holdings, Inc. (a) | | | 920 | |
| | 144 | | | VeriFone Systems, Inc. (a) | | | 5,369 | |
| | 15 | | | Virtusa Corp. (a) | | | 629 | |
| | | | | | | | |
| | | | | | | 51,508 | |
| | | | | | | | |
| | | | Semiconductors & Semiconductor Equipment — 3.4% | |
| | 28 | | | Advanced Energy Industries, Inc. (a) | | | 656 | |
| | 289 | | | Atmel Corp. (a) | | | 2,428 | |
| | 15 | | | Cabot Microelectronics Corp. (a) | | | 698 | |
| | 40 | | | Cirrus Logic, Inc. (a) | | | 948 | |
| | 77 | | | Cree, Inc. (a) | | | 2,466 | |
| | 11 | | | Diodes, Inc. (a) | | | 304 | |
| | 117 | | | DSP Group, Inc. (a) | | | 1,270 | |
| | 68 | | | Entropic Communications, Inc. (a) | | | 171 | |
| | 77 | | | Fairchild Semiconductor International, Inc. (a) | | | 1,303 | |
| | 88 | | | Integrated Device Technology, Inc. (a) | | | 1,726 | |
| | 48 | | | International Rectifier Corp. (a) | | | 1,903 | |
| | 39 | | | Kopin Corp. (a) | | | 141 | |
| | 340 | | | Kulicke & Soffa Industries, Inc., (Singapore) (a) | | | 4,920 | |
| | 86 | | | Microsemi Corp. (a) | | | 2,438 | |
| | 39 | | | MKS Instruments, Inc. | | | 1,445 | |
| | 11 | | | Nanometrics, Inc. (a) | | | 180 | |
SEE NOTES TO FINANCIAL STATEMENTS.
| | | | | | |
| | | |
| 22 | | | | J.P. MORGAN EQUITY FUNDS | | DECEMBER 31, 2014 |
| | | | | | | | |
| SHARES | | | SECURITY DESCRIPTION | | VALUE($) | |
| Common Stocks — continued | |
| | | | Semiconductors & Semiconductor Equipment — continued | |
| | 127 | | | Pericom Semiconductor Corp. (a) | | | 1,714 | |
| | 4 | | | Power Integrations, Inc. | | | 219 | |
| | 313 | | | RF Micro Devices, Inc. (a) | | | 5,200 | |
| | 198 | | | Skyworks Solutions, Inc. | | | 14,430 | |
| | 20 | | | SunEdison, Inc. (a) | | | 390 | |
| | 23 | | | Synaptics, Inc. (a) | | | 1,590 | |
| | 127 | | | Teradyne, Inc. | | | 2,515 | |
| | 17 | | | Ultratech, Inc. (a) | | | 308 | |
| | | | | | | | |
| | | | | | | 49,363 | |
| | | | | | | | |
| | | | Software — 3.6% | |
| | 80 | | | ANSYS, Inc. (a) | | | 6,543 | |
| | 179 | | | Cadence Design Systems, Inc. (a) | | | 3,398 | |
| | 27 | | | CommVault Systems, Inc. (a) | | | 1,370 | |
| | 22 | | | Fair Isaac Corp. | | | 1,595 | |
| | 84 | | | Fortinet, Inc. (a) | | | 2,579 | |
| | 55 | | | Informatica Corp. (a) | | | 2,085 | |
| | 31 | | | Mentor Graphics Corp. | | | 679 | |
| | 5 | | | MicroStrategy, Inc., Class A (a) | | | 821 | |
| | 165 | | | Progress Software Corp. (a) | | | 4,466 | |
| | 153 | | | PTC, Inc. (a) | | | 5,615 | |
| | 226 | | | Rovi Corp. (a) | | | 5,112 | |
| | 41 | | | SolarWinds, Inc. (a) | | | 2,042 | |
| | 44 | | | Solera Holdings, Inc. | | | 2,226 | |
| | 197 | | | Synopsys, Inc. (a) | | | 8,560 | |
| | 180 | | | Take-Two Interactive Software, Inc. (a) | | | 5,050 | |
| | | | | | | | |
| | | | | | | 52,141 | |
| | | | | | | | |
| | | | Technology Hardware, Storage & Peripherals — 0.6% | |
| | 34 | | | 3D Systems Corp. (a) | | | 1,110 | |
| | 274 | | | Avid Technology, Inc. (a) | | | 3,893 | |
| | 34 | | | Diebold, Inc. | | | 1,166 | |
| | 39 | | | Lexmark International, Inc., Class A | | | 1,615 | |
| | 54 | | | QLogic Corp. (a) | | | 719 | |
| | | | | | | | |
| | | | | | | 8,503 | |
| | | | | | | | |
| | | | Total Information Technology | | | 254,876 | |
| | | | | | | | |
| | | | Materials — 7.1% | |
| | | | Chemicals — 2.9% | |
| | 20 | | | A Schulman, Inc. | | | 810 | |
| | 24 | | | Albemarle Corp. | | | 1,462 | |
| | 74 | | | Ashland, Inc. | | | 8,883 | |
| | 101 | | | Cabot Corp. | | | 4,436 | |
| | 37 | | | Calgon Carbon Corp. (a) | | | 772 | |
| | 47 | | | Cytec Industries, Inc. | | | 2,150 | |
| | 74 | | | FutureFuel Corp. | | | 963 | |
| | 16 | | | Minerals Technologies, Inc. | | | 1,135 | |
| | | | | | | | |
| SHARES | | | SECURITY DESCRIPTION | | VALUE($) | |
| | | | | | | | |
| | | | Chemicals — continued | |
| | 51 | | | Olin Corp. | | | 1,167 | |
| | 18 | | | OM Group, Inc. | | | 527 | |
| | 8 | | | Quaker Chemical Corp. | | | 728 | |
| | 26 | | | Rayonier Advanced Materials, Inc. | | | 574 | |
| | 142 | | | RPM International, Inc. | | | 7,221 | |
| | 86 | | | Scotts Miracle-Gro Co. (The), Class A | | | 5,335 | |
| | 12 | | | Stepan Co. | | | 468 | |
| | 62 | | | Valspar Corp. (The) | | | 5,324 | |
| | 13 | | | Zep, Inc. | | | 201 | |
| | | | | | | | |
| | | | | | | 42,156 | |
| | | | | | | | |
| | | | Construction Materials — 0.1% | |
| | 38 | | | Headwaters, Inc. (a) | | | 570 | |
| | | | | | | | |
| | | | Containers & Packaging — 1.3% | |
| | 70 | | | Packaging Corp. of America | | | 5,459 | |
| | 158 | | | Rock-Tenn Co., Class A | | | 9,658 | |
| | 41 | | | Silgan Holdings, Inc. | | | 2,194 | |
| | 39 | | | Sonoco Products Co. | | | 1,726 | |
| | | | | | | | |
| | | | | | | 19,037 | |
| | | | | | | | |
| | | | Metals & Mining — 2.1% | |
| | 162 | | | AK Steel Holding Corp. (a) | | | 961 | |
| | 31 | | | Century Aluminum Co. (a) | | | 764 | |
| | 202 | | | Commercial Metals Co. | | | 3,296 | |
| | 41 | | | Compass Minerals International, Inc. | | | 3,534 | |
| | 43 | | | Globe Specialty Metals, Inc. | | | 737 | |
| | 17 | | | Kaiser Aluminum Corp. | | | 1,211 | |
| | 82 | | | Reliance Steel & Aluminum Co. | | | 5,036 | |
| | 15 | | | Royal Gold, Inc. | | | 915 | |
| | 183 | | | Steel Dynamics, Inc. | | | 3,606 | |
| | 25 | | | TimkenSteel Corp. | | | 934 | |
| | 33 | | | U.S. Silica Holdings, Inc. | | | 845 | |
| | 165 | | | United States Steel Corp. | | | 4,407 | |
| | 135 | | | Worthington Industries, Inc. | | | 4,072 | |
| | | | | | | | |
| | | | | | | 30,318 | |
| | | | | | | | |
| | | | Paper & Forest Products — 0.7% | |
| | 79 | | | Boise Cascade Co. (a) | | | 2,950 | |
| | 40 | | | Domtar Corp., (Canada) | | | 1,612 | |
| | 50 | | | KapStone Paper & Packaging Corp. | | | 1,451 | |
| | 12 | | | Neenah Paper, Inc. | | | 699 | |
| | 27 | | | PH Glatfelter Co. | | | 693 | |
| | 68 | | | Schweitzer-Mauduit International, Inc. | | | 2,861 | |
| | | | | | | | |
| | | | | | | 10,266 | |
| | | | | | | | |
| | | | Total Materials | | | 102,347 | |
| | | | | | | | |
SEE NOTES TO FINANCIAL STATEMENTS.
| | | | | | | | |
| | | |
| DECEMBER 31, 2014 | | J.P. MORGAN EQUITY FUNDS | | | | | 23 | |
JPMorgan Market Expansion Enhanced Index Fund
SCHEDULE OF PORTFOLIO INVESTMENTS
AS OF DECEMBER 31, 2014 (Unaudited) (continued)
(Amounts in thousands, except number of Futures contracts)
| | | | | | | | |
| SHARES | | | SECURITY DESCRIPTION | | VALUE($) | |
| Common Stocks — continued | |
| | | | Telecommunication Services — 0.1% | |
| | | | Diversified Telecommunication Services — 0.1% | |
| | 23 | | | Atlantic Tele-Network, Inc. | | | 1,583 | |
| | | | | | | | |
| | | | Wireless Telecommunication Services — 0.0% (g) | |
| | 10 | | | NTELOS Holdings Corp. | | | 41 | |
| | | | | | | | |
| | | | Total Telecommunication Services | | | 1,624 | |
| | | | | | | | |
| | | | Utilities — 4.7% | |
| | | | Electric Utilities — 1.3% | |
| | 53 | | | El Paso Electric Co. | | | 2,143 | |
| | 191 | | | Great Plains Energy, Inc. | | | 5,417 | |
| | 125 | | | Hawaiian Electric Industries, Inc. | | | 4,188 | |
| | 56 | | | IDACORP, Inc. | | | 3,738 | |
| | 87 | | | OGE Energy Corp. | | | 3,084 | |
| | | | | | | | |
| | | | | | | 18,570 | |
| | | | | | | | |
| | | | Gas Utilities — 2.0% | |
| | 131 | | | Atmos Energy Corp. | | | 7,311 | |
| | 8 | | | Laclede Group, Inc. (The) | | | 434 | |
| | 20 | | | National Fuel Gas Co. | | | 1,414 | |
| | 84 | | | New Jersey Resources Corp. | | | 5,120 | |
| | 6 | | | Northwest Natural Gas Co. | | | 290 | |
| | 108 | | | Questar Corp. | | | 2,733 | |
| | 33 | | | Southwest Gas Corp. | | | 2,031 | |
| | 239 | | | UGI Corp. | | | 9,091 | |
| | 6 | | | WGL Holdings, Inc. | | | 317 | |
| | | | | | | | |
| | | | | | | 28,741 | |
| | | | | | | | |
| | | | | | | | |
| SHARES | | | SECURITY DESCRIPTION | | VALUE($) | |
| | | | | | | | |
| | | | Multi-Utilities — 1.3% | |
| | 70 | | | Alliant Energy Corp. | | | 4,633 | |
| | 57 | | | Avista Corp. | | | 2,026 | |
| | 58 | | | Black Hills Corp. | | | 3,084 | |
| | 116 | | | MDU Resources Group, Inc. | | | 2,726 | |
| | 25 | | | NorthWestern Corp. | | | 1,388 | |
| | 121 | | | Vectren Corp. | | | 5,575 | |
| | | | | | | | |
| | | | | | | 19,432 | |
| | | | | | | | |
| | | | Water Utilities — 0.1% | |
| | 25 | | | American States Water Co. | | | 924 | |
| | | | | | | | |
| | | | Total Utilities | | | 67,667 | |
| | | | | | | | |
| | | | Total Common Stocks
(Cost $964,129) | | | 1,413,469 | |
| | | | | | | | |
| Short-Term Investment — 2.2% | |
| | | | Investment Company — 2.2% | |
| | 31,936 | | | JPMorgan Liquid Assets Money Market Fund, Institutional Class Shares, 0.030% (b) (l)
(Cost $31,936 ) | | | 31,936 | |
| | | | | | | | |
| | | | Total Investments — 100.0%
(Cost $996,065) | | | 1,445,405 | |
| | | | Liabilities in Excess of
Other Assets — 0.0% (c) | | | (165 | ) |
| | | | | | | | |
| | | | NET ASSETS — 100.0% | | $ | 1,445,240 | |
| | | | | | | | |
Percentages indicated are based on net assets.
| | | | | | | | | | | | | | | | |
| Futures Contracts | |
NUMBER OF
CONTRACTS | | | DESCRIPTION | | EXPIRATION
DATE | | | NOTIONAL
VALUE AT
DECEMBER 31, 2014 | | | NET
UNREALIZED
APPRECIATION
(DEPRECIATION) | |
| | | | Long Futures Outstanding | |
| | 74 | | | E-mini Russell 2000 | | | 03/20/15 | | | $ | 8,885 | | | $ | 172 | |
| | 183 | | | S&P Mid Cap 400 | | | 03/20/15 | | | | 26,510 | | | | 334 | |
| | | | | | | | | | | | | | | | |
| | | | $ | 506 | |
| | | | | | | | | | | | | | | | |
SEE NOTES TO FINANCIAL STATEMENTS.
| | | | | | |
| | | |
| 24 | | | | J.P. MORGAN EQUITY FUNDS | | DECEMBER 31, 2014 |
J.P. Morgan Equity Funds
NOTES TO SCHEDULES OF PORTFOLIO INVESTMENTS
AS OF DECEMBER 31, 2014 (Unaudited)
| | |
| (a) | | — Non-income producing security. |
| (b) | | — Investment in affiliate. Money market fund registered under the Investment Company Act of 1940, as amended, and advised by J.P. Morgan Investment Management Inc. |
| (c) | | — Included in this amount is cash segregated as collateral for futures contracts. |
| (g) | | — Amount rounds to less than 0.1%. |
| (h) | | — Amount rounds to less than one thousand (shares or dollars). |
| | |
| (i) | | — Security has been deemed illiquid pursuant to procedures approved by the Board of Trustees and may be difficult to sell. |
| (k) | | — All or a portion of this security is deposited with the broker as collateral for futures or with brokers as initial margin for futures contracts. |
| (l) | | — The rate shown is the current yield as of December 31, 2014. |
| (q) | | — Investment in affiliate which is a security in the Fund’s index. |
SEE NOTES TO FINANCIAL STATEMENTS.
| | | | | | | | |
| | | |
| DECEMBER 31, 2014 | | J.P. MORGAN EQUITY FUNDS | | | | | 25 | |
STATEMENTS OF ASSETS AND LIABILITIES
AS OF DECEMBER 31, 2014 (Unaudited)
(Amounts in thousands, except per share amounts)
| | | | | | | | |
| | | Equity Index
Fund | | | Market
Expansion
Enhanced Index
Fund | |
ASSETS: | | | | | | | | |
Investments in non-affiliates, at value | | $ | 1,944,984 | | | $ | 1,413,469 | |
Investments in affiliates, at value | | | 35,359 | | | | 31,936 | |
| | | | | | | | |
Total investment securities, at value | | | 1,980,343 | | | | 1,445,405 | |
Cash | | | 2 | | | | 38 | |
Deposits at broker for futures contracts | | | — | | | | 1,670 | |
Receivables: | | | | | | | | |
Investment securities sold | | | — | | | | 1,716 | |
Fund shares sold | | | 2,392 | | | | 559 | |
Dividends from non-affiliates | | | 2,660 | | | | 1,357 | |
Dividends from affiliates | | | — | (a) | | | 1 | |
| | | | | | | | |
Total Assets | | | 1,985,397 | | | | 1,450,746 | |
| | | | | | | | |
| | |
LIABILITIES: | | | | | | | | |
Payables: | | | | | | | | |
Investment securities purchased | | | — | | | | 381 | |
Fund shares redeemed | | | 18,286 | | | | 4,039 | |
Variation margin on futures contracts | | | 169 | | | | 414 | |
Accrued liabilities: | | | | | | | | |
Investment advisory fees | | | 194 | | | | 250 | |
Administration fees | | | — | | | | 64 | |
Distribution fees | | | 217 | | | | 42 | |
Shareholder servicing fees | | | 38 | | | | 189 | |
Custodian and accounting fees | | | 35 | | | | 26 | |
Trustees’ and Chief Compliance Officer’s fees | | | — | (a) | | | — | (a) |
Transfer Agent | | | 306 | | | | 54 | |
Other | | | 74 | | | | 47 | |
| | | | | | | | |
Total Liabilities | | | 19,319 | | | | 5,506 | |
| | | | | | | | |
Net Assets | | $ | 1,966,078 | | | $ | 1,445,240 | |
| | | | | | | | |
| (a) | Amount rounds to less than $1,000. |
SEE NOTES TO FINANCIAL STATEMENTS.
| | | | | | |
| | | |
| 26 | | | | J.P. MORGAN EQUITY FUNDS | | DECEMBER 31, 2014 |
| | | | | | | | |
| | | Equity Index
Fund | | | Market
Expansion
Enhanced Index
Fund | |
NET ASSETS: | | | | | | | | |
Paid-in-Capital | | $ | 652,681 | | | $ | 962,782 | |
Accumulated undistributed (distributions in excess of) net investment income | | | 481 | | | | (631 | ) |
Accumulated net realized gains (losses) | | | (33,459 | ) | | | 33,243 | |
Net unrealized appreciation (depreciation) | | | 1,346,375 | | | | 449,846 | |
| | | | | | | | |
Total Net Assets | | $ | 1,966,078 | | | $ | 1,445,240 | |
| | | | | | | | |
| | |
Net Assets: | | | | | | | | |
Class A | | $ | 713,860 | | | $ | 107,468 | |
Class B | | | 8,239 | | | | 991 | |
Class C | | | 88,591 | | | | 23,487 | |
Class R2 | | | — | | | | 9,100 | |
Select Class | | | 1,155,388 | | | | 1,304,194 | |
| | | | | | | | |
Total | | $ | 1,966,078 | | | $ | 1,445,240 | |
| | | | | | | | |
| | |
Outstanding units of beneficial interest (shares) | | | | | | | | |
($0.0001 par value; unlimited number of shares authorized): | | | | | | | | |
Class A | | | 17,403 | | | | 8,602 | |
Class B | | | 202 | | | | 83 | |
Class C | | | 2,174 | | | | 2,100 | |
Class R2 | | | — | | | | 735 | |
Select Class | | | 28,147 | | | | 103,578 | |
| | |
Net Asset Value (a): | | | | | | | | |
Class A — Redemption price per share | | $ | 41.02 | | | $ | 12.49 | |
Class B — Offering price per share (b) | | | 40.86 | | | | 11.87 | |
Class C — Offering price per share (b) | | | 40.75 | | | | 11.19 | |
Class R2 — Offering and redemption price per share | | | — | | | | 12.38 | |
Select Class — Offering and redemption price per share | | | 41.05 | | | | 12.59 | |
Class A maximum sales charge | | | 5.25 | % | | | 5.25 | % |
Class A maximum public offering price per share
[net asset value per share/(100% — maximum sales charge)] | | $ | 43.29 | | | $ | 13.18 | |
| | | | | | | | |
| | |
Cost of investments in non-affiliates | | $ | 614,766 | | | $ | 964,129 | |
Cost of investments in affiliates | | | 19,326 | | | | 31,936 | |
| (a) | Per share amounts may not recalculate due to rounding of net assets and/or shares outstanding. |
| (b) | Redemption price for Class B and Class C shares vary based upon length of time the shares are held. |
SEE NOTES TO FINANCIAL STATEMENTS.
| | | | | | | | |
| | | |
| DECEMBER 31, 2014 | | J.P. MORGAN EQUITY FUNDS | | | | | 27 | |
STATEMENTS OF OPERATIONS
FOR THE SIX MONTHS ENDED DECEMBER 31, 2014 (Unaudited)
(Amounts in thousands)
| | | | | | | | |
| | | Equity Index
Fund | | | Market
Expansion
Enhanced Index
Fund | |
INVESTMENT INCOME: | | | | | | | | |
Interest income from non-affiliates | | $ | — | | | $ | 2 | |
Dividend income from non-affiliates | | | 19,989 | | | | 10,929 | |
Dividend income from affiliates | | | 332 | | | | 8 | |
| | | | | | | | |
Total investment income | | | 20,321 | | | | 10,939 | |
| | | | | | | | |
| | |
EXPENSES: | | | | | | | | |
Investment advisory fees | | | 2,451 | | | | 1,914 | |
Administration fees | | | 809 | | | | 632 | |
Distribution fees: | | | | | | | | |
Class A | | | 908 | | | | 140 | |
Class B | | | 34 | | | | 4 | |
Class C | | | 308 | | | | 86 | |
Class R2 | | | — | | | | 22 | |
Shareholder servicing fees: | | | | | | | | |
Class A | | | 908 | | | | 140 | |
Class B | | | 11 | | | | 1 | |
Class C | | | 103 | | | | 29 | |
Class R2 | | | — | | | | 11 | |
Select Class | | | 1,429 | | | | 1,734 | |
Custodian and accounting fees | | | 39 | | | | 28 | |
Interest expense to affiliates | | | — | (a) | | | — | (a) |
Professional fees | | | 26 | | | | 26 | |
Trustees’ and Chief Compliance Officer’s fees | | | 8 | | | | 7 | |
Printing and mailing costs | | | 70 | | | | 38 | |
Registration and filing fees | | | 39 | | | | 31 | |
Transfer agent fees | | | 637 | | | | 151 | |
Other | | | 11 | | | | 11 | |
| | | | | | | | |
Total expenses | | | 7,791 | | | | 5,005 | |
| | | | | | | | |
Less fees waived | | | (4,481 | ) | | | (1,404 | ) |
| | | | | | | | |
Net expenses | | | 3,310 | | | | 3,601 | |
| | | | | | | | |
Net investment income (loss) | | | 17,011 | | | | 7,338 | |
| | | | | | | | |
| | |
REALIZED/UNREALIZED GAINS (LOSSES): | | | | | | | | |
Net realized gain (loss) on transactions from: | | | | | | | | |
Investments in non-affiliates | | | 25,175 | | | | 104,219 | |
Investment in affiliates | | | 242 | | | | — | |
Futures | | | 860 | | | | 725 | |
| | | | | | | | |
Net realized gain (loss) | | | 26,277 | | | | 104,944 | |
| | | | | | | | |
Change in net unrealized appreciation/depreciation of: | | | | | | | | |
Investments in non-affiliates | | | 67,888 | | | | (71,086 | ) |
Investments in affiliates | | | 1,786 | | | | — | |
Futures | | | 87 | | | | (435 | ) |
| | | | | | | | |
Change in net unrealized appreciation/depreciation | | | 69,761 | | | | (71,521 | ) |
| | | | | | | | |
Net realized/unrealized gains (losses) | | | 96,038 | | | | 33,423 | |
| | | | | | | | |
Change in net assets resulting from operations | | $ | 113,049 | | | $ | 40,761 | |
| | | | | | | | |
| (a) | Amount rounds to less than $1,000. |
SEE NOTES TO FINANCIAL STATEMENTS.
| | | | | | |
| | | |
| 28 | | | | J.P. MORGAN EQUITY FUNDS | | DECEMBER 31, 2014 |
STATEMENTS OF CHANGES IN NET ASSETS
FOR THE PERIODS INDICATED
(Amounts in thousands)
| | | | | | | | | | | | | | | | |
| | | Equity Index Fund | | | Market Expansion Enhanced Index Fund | |
| | | Six Months Ended
December 31, 2014
(Unaudited) | | | Year Ended
June 30, 2014 | | | Six Months Ended
December 31, 2014
(Unaudited) | | | Year Ended
June 30, 2014 | |
CHANGE IN NET ASSETS RESULTING FROM OPERATIONS: | | | | | | | | | |
Net investment income (loss) | | $ | 17,011 | | | $ | 33,192 | | | $ | 7,338 | | | $ | 13,502 | |
Net realized gain (loss) | | | 26,277 | | | | 154,245 | | | | 104,944 | | | | 156,424 | |
Change in net unrealized appreciation/depreciation | | | 69,761 | | | | 218,557 | | | | (71,521 | ) | | | 168,319 | |
| | | | | | | | | | | | | | | | |
Change in net assets resulting from operations | | | 113,049 | | | | 405,994 | | | | 40,761 | | | | 338,245 | |
| | | | | | | | | | | | | | | | |
| | | | |
DISTRIBUTIONS TO SHAREHOLDERS: | | | | | | | | | | | | | | | | |
Class A | | | | | | | | | | | | | | | | |
From net investment income | | | (6,003 | ) | | | (10,480 | ) | | | (487 | ) | | | (655 | ) |
From net realized gains | | | (50,028 | ) | | | (36,634 | ) | | | (12,480 | ) | | | (8,467 | ) |
Class B | | | | | | | | | | | | | | | | |
From net investment income | | | (40 | ) | | | (93 | ) | | | (1 | ) | | | (1 | ) |
From net realized gains | | | (558 | ) | | | (660 | ) | | | (117 | ) | | | (157 | ) |
Class C | | | | | | | | | | | | | | | | |
From net investment income | | | (429 | ) | | | (632 | ) | | | (49 | ) | | | (36 | ) |
From net realized gains | | | (5,873 | ) | | | (3,829 | ) | | | (2,944 | ) | | | (2,140 | ) |
Class R2 | | | | | | | | | | | | | | | | |
From net investment income | | | — | | | | — | | | | (31 | ) | | | (34 | ) |
From net realized gains | | | — | | | | — | | | | (1,023 | ) | | | (695 | ) |
Select Class | | | | | | | | | | | | | | | | |
From net investment income | | | (10,590 | ) | | | (20,849 | ) | | | (7,242 | ) | | | (11,470 | ) |
From net realized gains | | | (78,050 | ) | | | (67,445 | ) | | | (154,236 | ) | | | (116,316 | ) |
| | | | | | | | | | | | | | | | |
Total distributions to shareholders | | | (151,571 | ) | | | (140,622 | ) | | | (178,610 | ) | | | (139,971 | ) |
| | | | | | | | | | | | | | | | |
| | | | |
CAPITAL TRANSACTIONS: | | | | | | | | | | | | | | | | |
Change in net assets resulting from capital transactions | | | 101,862 | | | | (107,430 | ) | | | 19,061 | | | | (40,847 | ) |
| | | | | | | | | | | | | | | | |
| | | | |
NET ASSETS: | | | | | | | | | | | | | | | | |
Change in net assets | | | 63,340 | | | | 157,942 | | | | (118,788 | ) | | | 157,427 | |
Beginning of period | | | 1,902,738 | | | | 1,744,796 | | | | 1,564,028 | | | | 1,406,601 | |
| | | | | | | | | | | | | | | | |
End of period | | $ | 1,966,078 | | | $ | 1,902,738 | | | $ | 1,445,240 | | | $ | 1,564,028 | |
| | | | | | | | | | | | | | | | |
Accumulated undistributed (distributions in excess of) net investment income | | $ | 481 | | | $ | 532 | | | $ | (631 | ) | | $ | (159 | ) |
| | | | | | | | | | | | | | | | |
SEE NOTES TO FINANCIAL STATEMENTS.
| | | | | | | | |
| | | |
| DECEMBER 31, 2014 | | J.P. MORGAN EQUITY FUNDS | | | | | 29 | |
STATEMENTS OF CHANGES IN NET ASSETS
FOR THE PERIODS INDICATED (continued)
(Amounts in thousands)
| | | | | | | | | | | | | | | | |
| | | Equity Index Fund | | | Market Expansion Enhanced Index Fund | |
| | | Six Months Ended
December 31, 2014
(Unaudited) | | | Year Ended
June 30, 2014 | | | Six Months Ended
December 31, 2014
(Unaudited) | | | Year Ended
June 30, 2014 | |
CAPITAL TRANSACTIONS: | | | | | | | | | | | | | | | | |
Class A | | | | | | | | | | | | | | | | |
Proceeds from shares issued | | $ | 94,326 | | | $ | 157,276 | | | $ | 13,867 | | | $ | 38,319 | |
Distributions reinvested | | | 55,666 | | | | 46,773 | | | | 11,208 | | | | 7,941 | |
Cost of shares redeemed | | | (116,623 | ) | | | (186,244 | ) | | | (24,004 | ) | | | (26,950 | ) |
| | | | | | | | | | | | | | | | |
Change in net assets resulting from Class A capital transactions | | $ | 33,369 | | | $ | 17,805 | | | $ | 1,071 | | | $ | 19,310 | |
| | | | | | | | | | | | | | | | |
Class B | | | | | | | | | | | | | | | | |
Proceeds from shares issued | | $ | 13 | | | $ | 167 | | | $ | 7 | | | $ | 49 | |
Distributions reinvested | | | 588 | | | | 727 | | | | 111 | | | | 147 | |
Cost of shares redeemed | | | (2,169 | ) | | | (4,693 | ) | | | (322 | ) | | | (1,208 | ) |
| | | | | | | | | | | | | | | | |
Change in net assets resulting from Class B capital transactions | | $ | (1,568 | ) | | $ | (3,799 | ) | | $ | (204 | ) | | $ | (1,012 | ) |
| | | | | | | | | | | | | | | | |
Class C | | | | | | | | | | | | | | | | |
Proceeds from shares issued | | $ | 14,617 | | | $ | 17,522 | | | $ | 2,308 | | | $ | 9,602 | |
Distributions reinvested | | | 4,736 | | | | 3,292 | | | | 2,471 | | | | 1,832 | |
Cost of shares redeemed | | | (6,569 | ) | | | (11,596 | ) | | | (2,070 | ) | | | (7,080 | ) |
| | | | | | | | | | | | | | | | |
Change in net assets resulting from Class C capital transactions | | $ | 12,784 | | | $ | 9,218 | | | $ | 2,709 | | | $ | 4,354 | |
| | | | | | | | | | | | | | | | |
Class R2 | | | | | | | | | | | | | | | | |
Proceeds from shares issued | | $ | — | | | $ | — | | | $ | 1,830 | | | $ | 3,276 | |
Distributions reinvested | | | — | | | | — | | | | 795 | | | | 432 | |
Cost of shares redeemed | | | — | | | | — | | | | (1,514 | ) | | | (2,914 | ) |
| | | | | | | | | | | | | | | | |
Change in net assets resulting from Class R2 capital transactions | | $ | — | | | $ | — | | | $ | 1,111 | | | $ | 794 | |
| | | | | | | | | | | | | | | | |
Select Class | | | | | | | | | | | | | | | | |
Proceeds from shares issued | | $ | 113,464 | | | $ | 265,208 | | | $ | 93,193 | | | $ | 138,770 | |
Distributions reinvested | | | 73,418 | | | | 75,199 | | | | 82,855 | | | | 57,709 | |
Cost of shares redeemed | | | (129,605 | ) | | | (471,061 | ) | | | (161,674 | ) | | | (260,772 | ) |
| | | | | | | | | | | | | | | | |
Change in net assets resulting from Select Class capital transactions | | $ | 57,277 | | | $ | (130,654 | ) | | $ | 14,374 | | | $ | (64,293 | ) |
| | | | | | | | | | | | | | | | |
Total change in net assets resulting from capital transactions | | $ | 101,862 | | | $ | (107,430 | ) | | $ | 19,061 | | | $ | (40,847 | ) |
| | | | | | | | | | | | | | | | |
SEE NOTES TO FINANCIAL STATEMENTS.
| | | | | | |
| | | |
| 30 | | | | J.P. MORGAN EQUITY FUNDS | | DECEMBER 31, 2014 |
| | | | | | | | | | | | | | | | |
| | | Equity Index Fund | | | Market Expansion Enhanced Index Fund | |
| | | Six Months Ended
December 31, 2014
(Unaudited) | | | Year Ended
June 30, 2014 | | | Six Months Ended
December 31, 2014
(Unaudited) | | | Year Ended
June 30, 2014 | |
SHARE TRANSACTIONS: | | | | | | | | | | | | | | | | |
Class A | | | | | | | | | | | | | | | | |
Issued | | | 2,227 | | | | 3,983 | | | | 1,050 | | | | 2,921 | |
Reinvested | | | 1,384 | | | | 1,215 | | | | 928 | | | | 633 | |
Redeemed | | | (2,778 | ) | | | (4,712 | ) | | | (1,807 | ) | | | (2,049 | ) |
| | | | | | | | | | | | | | | | |
Change in Class A Shares | | | 833 | | | | 486 | | | | 171 | | | | 1,505 | |
| | | | | | | | | | | | | | | | |
Class B | | | | | | | | | | | | | | | | |
Issued | | | — | (a) | | | 5 | | | | 1 | | | | 4 | |
Reinvested | | | 15 | | | | 19 | | | | 9 | | | | 12 | |
Redeemed | | | (51 | ) | | | (120 | ) | | | (25 | ) | | | (96 | ) |
| | | | | | | | | | | | | | | | |
Change in Class B Shares | | | (36 | ) | | | (96 | ) | | | (15 | ) | | | (80 | ) |
| | | | | | | | | | | | | | | | |
Class C | | | | | | | | | | | | | | | | |
Issued | | | 351 | | | | 448 | | | | 195 | | | | 793 | |
Reinvested | | | 119 | | | | 86 | | | | 229 | | | | 161 | |
Redeemed | | | (157 | ) | | | (295 | ) | | | (172 | ) | | | (594 | ) |
| | | | | | | | | | | | | | | | |
Change in Class C Shares | | | 313 | | | | 239 | | | | 252 | | | | 360 | |
| | | | | | | | | | | | | | | | |
Class R2 | | | | | | | | | | | | | | | | |
Issued | | | — | | | | — | | | | 139 | | | | 252 | |
Reinvested | | | — | | | | — | | | | 66 | | | | 35 | |
Redeemed | | | — | | | | — | | | | (112 | ) | | | (223 | ) |
| | | | | | | | | | | | | | | | |
Change in Class R2 Shares | | | — | | | | — | | | | 93 | | | | 64 | |
| | | | | | | | | | | | | | | | |
Select Class | | | | | | | | | | | | | | | | |
Issued | | | 2,688 | | | | 6,769 | | | | 7,150 | | | | 10,623 | |
Reinvested | | | 1,823 | | | | 1,953 | | | | 6,798 | | | | 4,568 | |
Redeemed | | | (3,060 | ) | | | (11,881 | ) | | | (11,820 | ) | | | (19,655 | ) |
| | | | | | | | | | | | | | | | |
Change in Select Class Shares | | | 1,451 | | | | (3,159 | ) | | | 2,128 | | | | (4,464 | ) |
| | | | | | | | | | | | | | | | |
| (a) | Amount rounds to less than 1,000 shares. |
SEE NOTES TO FINANCIAL STATEMENTS.
| | | | | | | | |
| | | |
| DECEMBER 31, 2014 | | J.P. MORGAN EQUITY FUNDS | | | | | 31 | |
FINANCIAL HIGHLIGHTS
FOR THE PERIODS INDICATED
| | | | | | | | | | | | | | | | | | | | | | | | | | | | |
| | | | | | Per share operating performance | |
| | | | | | Investment operations | | | Distributions | |
| | | Net asset
value,
beginning
of period | | | Net
investment
income
(loss) | | | Net realized
and unrealized
gains
(losses) on
investments | | | Total from
investment
operations | | | Net
investment
income | | | Net
realized
gain | | | Total
distributions | |
Equity Index Fund | | | | | | | | | | | | | | | | | | | | | | | | | | | | |
Class A | | | | | | | | | | | | | | | | | | | | | | | | | | | | |
Six Months Ended December 31, 2014 (Unaudited) | | $ | 41.94 | | | $ | 0.35 | (f) | | $ | 2.02 | | | $ | 2.37 | | | $ | (0.34 | ) | | $ | (2.95 | ) | | $ | (3.29 | ) |
Year Ended June 30, 2014 | | | 36.43 | | | | 0.64 | (f) | | | 7.78 | | | | 8.42 | | | | (0.63 | ) | | | (2.28 | ) | | | (2.91 | ) |
Year Ended June 30, 2013 | | | 30.92 | | | | 0.63 | (f) | | | 5.52 | | | | 6.15 | | | | (0.64 | ) | | | — | | | | (0.64 | ) |
Year Ended June 30, 2012 | | | 29.96 | | | | 0.51 | (f) | | | 0.96 | | | | 1.47 | | | | (0.51 | ) | | | — | | | | (0.51 | ) |
Year Ended June 30, 2011 | | | 23.40 | | | | 0.45 | (f) | | | 6.56 | | | | 7.01 | | | | (0.45 | ) | | | — | | | | (0.45 | ) |
Year Ended June 30, 2010 | | | 20.90 | | | | 0.45 | (f) | | | 2.49 | | | | 2.94 | | | | (0.44 | ) | | | — | | | | (0.44 | ) |
| | | | | | | |
Class B | | | | | | | | | | | | | | | | | | | | | | | | | | | | |
Six Months Ended December 31, 2014 (Unaudited) | | | 41.81 | | | | 0.18 | (f) | | | 2.01 | | | | 2.19 | | | | (0.19 | ) | | | (2.95 | ) | | | (3.14 | ) |
Year Ended June 30, 2014 | | | 36.33 | | | | 0.35 | (f) | | | 7.74 | | | | 8.09 | | | | (0.33 | ) | | | (2.28 | ) | | | (2.61 | ) |
Year Ended June 30, 2013 | | | 30.83 | | | | 0.37 | (f) | | | 5.51 | | | | 5.88 | | | | (0.38 | ) | | | — | | | | (0.38 | ) |
Year Ended June 30, 2012 | | | 29.88 | | | | 0.29 | (f) | | | 0.94 | | | | 1.23 | | | | (0.28 | ) | | | — | | | | (0.28 | ) |
Year Ended June 30, 2011 | | | 23.34 | | | | 0.24 | (f) | | | 6.54 | | | | 6.78 | | | | (0.24 | ) | | | — | | | | (0.24 | ) |
Year Ended June 30, 2010 | | | 20.84 | | | | 0.26 | (f) | | | 2.49 | | | | 2.75 | | | | (0.25 | ) | | | — | | | | (0.25 | ) |
| | | | | | | |
Class C | | | | | | | | | | | | | | | | | | | | | | | | | | | | |
Six Months Ended December 31, 2014 (Unaudited) | | | 41.72 | | | | 0.19 | (f) | | | 2.00 | | | | 2.19 | | | | (0.21 | ) | | | (2.95 | ) | | | (3.16 | ) |
Year Ended June 30, 2014 | | | 36.28 | | | | 0.35 | (f) | | | 7.73 | | | | 8.08 | | | | (0.36 | ) | | | (2.28 | ) | | | (2.64 | ) |
Year Ended June 30, 2013 | | | 30.81 | | | | 0.37 | (f) | | | 5.50 | | | | 5.87 | | | | (0.40 | ) | | | — | | | | (0.40 | ) |
Year Ended June 30, 2012 | | | 29.87 | | | | 0.29 | (f) | | | 0.94 | | | | 1.23 | | | | (0.29 | ) | | | — | | | | (0.29 | ) |
Year Ended June 30, 2011 | | | 23.34 | | | | 0.24 | (f) | | | 6.54 | | | | 6.78 | | | | (0.25 | ) | | | — | | | | (0.25 | ) |
Year Ended June 30, 2010 | | | 20.84 | | | | 0.26 | (f) | | | 2.49 | | | | 2.75 | | | | (0.25 | ) | | | — | | | | (0.25 | ) |
| | | | | | | |
Select Class | | | | | | | | | | | | | | | | | | | | | | | | | | | | |
Six Months Ended December 31, 2014 (Unaudited) | | | 41.96 | | | | 0.40 | (f) | | | 2.03 | | | | 2.43 | | | | (0.39 | ) | | | (2.95 | ) | | | (3.34 | ) |
Year Ended June 30, 2014 | | | 36.44 | | | | 0.74 | (f) | | | 7.79 | | | | 8.53 | | | | (0.73 | ) | | | (2.28 | ) | | | (3.01 | ) |
Year Ended June 30, 2013 | | | 30.92 | | | | 0.71 | (f) | | | 5.53 | | | | 6.24 | | | | (0.72 | ) | | | — | | | | (0.72 | ) |
Year Ended June 30, 2012 | | | 29.97 | | | | 0.58 | (f) | | | 0.95 | | | | 1.53 | | | | (0.58 | ) | | | — | | | | (0.58 | ) |
Year Ended June 30, 2011 | | | 23.40 | | | | 0.52 | (f) | | | 6.57 | | | | 7.09 | | | | (0.52 | ) | | | — | | | | (0.52 | ) |
Year Ended June 30, 2010 | | | 20.90 | | | | 0.51 | (f) | | | 2.49 | | | | 3.00 | | | | (0.50 | ) | | | — | | | | (0.50 | ) |
| (a) | Annualized for periods less than one year, unless otherwise noted. |
| (b) | Not annualized for periods less than one year. |
| (c) | Includes adjustments in accordance with accounting principles generally accepted in the United States of America and as such, the net asset values for financial reporting purposes and the returns based upon those net asset values may differ from the net asset values and returns for shareholder transactions. |
| (d) | Includes earnings credits and interest expense, if applicable, each of which is less than 0.01% unless otherwise noted. |
| (e) | Portfolio turnover is calculated by dividing the lesser of total purchases or sales of portfolio securities for the reporting period by the monthly average value of portfolio securities owned during the reporting period. Excluded from both the numerator and denominator are amounts relating to derivatives and securities whose maturities or expiration dates at the time of acquisition were one year or less. |
| (f) | Calculated based upon average shares outstanding. |
SEE NOTES TO FINANCIAL STATEMENTS.
| | | | | | |
| | | |
| 32 | | | | J.P. MORGAN EQUITY FUNDS | | DECEMBER 31, 2014 |
| | | | | | | | | | | | | | | | | | | | | | | | | | |
| | | Ratios/Supplemental data | |
| | | | | | | | | | Ratios to average net assets (a) | | | | |
Net asset
value,
end of
period | | | Total return
(excludes
sales charge) (b)(c) | | | Net assets,
end of
period
(000’s) | | | Net
expenses (d) | | |
Net
investment
income
(loss) | | | Expenses
without waivers,
reimbursements and
earnings credits | | | Portfolio
turnover
rate (b)(e) | |
| | | | | | | | | | | | | | | | | | | | | | | | | | |
| | | | | | | | | | | | | | | | | | | | | | | | | | |
| $ | 41.02 | | | | 5.88 | % | | $ | 713,860 | | | | 0.45 | % | | | 1.62 | % | | | 0.92 | % | | | 2 | % |
| | 41.94 | | | | 23.95 | | | | 694,974 | | | | 0.45 | | | | 1.63 | | | | 0.91 | | | | 5 | |
| | 36.43 | | | | 20.04 | | | | 585,946 | | | | 0.45 | | | | 1.86 | | | | 0.94 | | | | 4 | |
| | 30.92 | | | | 5.03 | | | | 520,294 | | | | 0.45 | | | | 1.74 | | | | 0.94 | | | | 7 | |
| | 29.96 | | | | 30.09 | | | | 540,743 | | | | 0.45 | | | | 1.63 | | | | 0.94 | | | | 7 | |
| | 23.40 | | | | 13.96 | | | | 491,906 | | | | 0.45 | | | | 1.80 | | | | 0.96 | | | | 8 | |
| | | | | | |
| | | | | | | | | | | | | | | | | | | | | | | | | | |
| | 40.86 | | | | 5.46 | | | | 8,239 | | | | 1.20 | | | | 0.86 | | | | 1.45 | | | | 2 | |
| | 41.81 | | | | 23.01 | | | | 9,943 | | | | 1.20 | | | | 0.88 | | | | 1.41 | | | | 5 | |
| | 36.33 | | | | 19.17 | | | | 12,142 | | | | 1.20 | | | | 1.11 | | | | 1.44 | | | | 4 | |
| | 30.83 | | | | 4.20 | | | | 15,380 | | | | 1.20 | | | | 0.99 | | | | 1.44 | | | | 7 | |
| | 29.88 | | | | 29.10 | | | | 21,922 | | | | 1.20 | | | | 0.88 | | | | 1.44 | | | | 7 | |
| | 23.34 | | | | 13.12 | | | | 27,677 | | | | 1.20 | | | | 1.07 | | | | 1.46 | | | | 8 | |
| | | | | | |
| | | | | | | | | | | | | | | | | | | | | | | | | | |
| | 40.75 | | | | 5.46 | | | | 88,591 | | | | 1.20 | | | | 0.88 | | | | 1.42 | | | | 2 | |
| | 41.72 | | | | 23.01 | | | | 77,644 | | | | 1.20 | | | | 0.88 | | | | 1.41 | | | | 5 | |
| | 36.28 | | | | 19.16 | | | | 58,831 | | | | 1.20 | | | | 1.10 | | | | 1.45 | | | | 4 | |
| | 30.81 | | | | 4.21 | | | | 45,854 | | | | 1.20 | | | | 0.99 | | | | 1.44 | | | | 7 | |
| | 29.87 | | | | 29.11 | | | | 49,126 | | | | 1.20 | | | | 0.88 | | | | 1.44 | | | | 7 | |
| | 23.34 | | | | 13.14 | | | | 42,819 | | | | 1.20 | | | | 1.06 | | | | 1.46 | | | | 8 | |
| | | | | | |
| | | | | | | | | | | | | | | | | | | | | | | | | | |
| | 41.05 | | | | 6.01 | | | | 1,155,388 | | | | 0.20 | | | | 1.87 | | | | 0.67 | | | | 2 | |
| | 41.96 | | | | 24.27 | | | | 1,120,177 | | | | 0.20 | | | | 1.89 | | | | 0.66 | | | | 5 | |
| | 36.44 | | | | 20.35 | | | | 1,087,877 | | | | 0.20 | | | | 2.11 | | | | 0.69 | | | | 4 | |
| | 30.92 | | | | 5.26 | | | | 1,188,683 | | | | 0.20 | | | | 1.99 | | | | 0.69 | | | | 7 | |
| | 29.97 | | | | 30.45 | | | | 1,281,370 | | | | 0.20 | | | | 1.87 | | | | 0.69 | | | | 7 | |
| | 23.40 | | | | 14.24 | | | | 1,001,783 | | | | 0.20 | | | | 2.05 | | | | 0.71 | | | | 8 | |
SEE NOTES TO FINANCIAL STATEMENTS.
| | | | | | | | |
| | | |
| DECEMBER 31, 2014 | | J.P. MORGAN EQUITY FUNDS | | | | | 33 | |
FINANCIAL HIGHLIGHTS
FOR THE PERIODS INDICATED (continued)
| | | | | | | | | | | | | | | | | | | | | | | | | | | | |
| | | Per share operating performance | |
| | | | | | Investment operations | | | Distributions | |
| | | Net asset
value, beginning
of period | | | Net
investment
income
(loss) | | | Net realized
and unrealized
gains
(losses) on
investments | | | Total from
investment
operations | | | Net
investment
income | | | Net
realized
gain | | | Total
distributions | |
Market Expansion Enhanced Index Fund | | | | | | | | | | | | | | | | | | | | | |
Class A | | | | | | | | | | | | | | | | | | | | | | | | | | | | |
Six Months Ended December 31, 2014 (Unaudited) | | $ | 13.85 | | | $ | 0.05 | (f)(g) | | $ | 0.24 | | | $ | 0.29 | | | $ | (0.06 | ) | | $ | (1.59 | ) | | $ | (1.65 | ) |
Year Ended June 30, 2014 | | | 12.17 | | | | 0.09 | (f)(h) | | | 2.81 | | | | 2.90 | | | | (0.08 | ) | | | (1.14 | ) | | | (1.22 | ) |
Year Ended June 30, 2013 | | | 10.32 | | | | 0.11 | (f)(i) | | | 2.45 | | | | 2.56 | | | | (0.11 | ) | | | (0.60 | ) | | | (0.71 | ) |
Year Ended June 30, 2012 | | | 11.52 | | | | 0.07 | (f) | | | (0.42 | ) | | | (0.35 | ) | | | (0.07 | ) | | | (0.78 | ) | | | (0.85 | ) |
Year Ended June 30, 2011 | | | 8.42 | | | | 0.05 | (f) | | | 3.11 | | | | 3.16 | | | | (0.06 | ) | | | — | | | | (0.06 | ) |
Year Ended June 30, 2010 | | | 6.88 | | | | 0.06 | (f) | | | 1.55 | | | | 1.61 | | | | (0.07 | ) | | | — | | | | (0.07 | ) |
| | | | | | | |
Class B | | | | | | | | | | | | | | | | | | | | | | | | | | | | |
Six Months Ended December 31, 2014 (Unaudited) | | | 13.25 | | | | — | (f)(g)(j) | | | 0.23 | | | | 0.23 | | | | (0.02 | ) | | | (1.59 | ) | | | (1.61 | ) |
Year Ended June 30, 2014 | | | 11.70 | | | | — | (f)(h)(j) | | | 2.70 | | | | 2.70 | | | | (0.01 | ) | | | (1.14 | ) | | | (1.15 | ) |
Year Ended June 30, 2013 | | | 9.95 | | | | 0.03 | (f)(i) | | | 2.36 | | | | 2.39 | | | | (0.04 | ) | | | (0.60 | ) | | | (0.64 | ) |
Year Ended June 30, 2012 | | | 11.16 | | | | (0.01 | )(f) | | | (0.41 | ) | | | (0.42 | ) | | | (0.01 | ) | | | (0.78 | ) | | | (0.79 | ) |
Year Ended June 30, 2011 | | | 8.18 | | | | (0.02 | )(f) | | | 3.02 | | | | 3.00 | | | | (0.02 | ) | | | — | | | | (0.02 | ) |
Year Ended June 30, 2010 | | | 6.70 | | | | — | (f)(j) | | | 1.49 | | | | 1.49 | | | | (0.01 | ) | | | — | | | | (0.01 | ) |
| | | | | | | |
Class C | | | | | | | | | | | | | | | | | | | | | | | | | | | | |
Six Months Ended December 31, 2014 (Unaudited) | | | 12.58 | | | | — | (f)(g)(j) | | | 0.22 | | | | 0.22 | | | | (0.02 | ) | | | (1.59 | ) | | | (1.61 | ) |
Year Ended June 30, 2014 | | | 11.18 | | | | — | (f)(h)(j) | | | 2.56 | | | | 2.56 | | | | (0.02 | ) | | | (1.14 | ) | | | (1.16 | ) |
Year Ended June 30, 2013 | | | 9.55 | | | | 0.03 | (f)(i) | | | 2.25 | | | | 2.28 | | | | (0.05 | ) | | | (0.60 | ) | | | (0.65 | ) |
Year Ended June 30, 2012 | | | 10.74 | | | | (0.01 | )(f) | | | (0.39 | ) | | | (0.40 | ) | | | (0.01 | ) | | | (0.78 | ) | | | (0.79 | ) |
Year Ended June 30, 2011 | | | 7.88 | | | | (0.02 | )(f) | | | 2.90 | | | | 2.88 | | | | (0.02 | ) | | | — | | | | (0.02 | ) |
Year Ended June 30, 2010 | | | 6.45 | | | | — | (f)(j) | | | 1.44 | | | | 1.44 | | | | (0.01 | ) | | | — | | | | (0.01 | ) |
| | | | | | | |
Class R2 | | | | | | | | | | | | | | | | | | | | | | | | | | | | |
Six Months Ended December 31, 2014 (Unaudited) | | | 13.74 | | | | 0.04 | (f)(g) | | | 0.23 | | | | 0.27 | | | | (0.04 | ) | | | (1.59 | ) | | | (1.63 | ) |
Year Ended June 30, 2014 | | | 12.09 | | | | 0.06 | (f)(h) | | | 2.78 | | | | 2.84 | | | | (0.05 | ) | | | (1.14 | ) | | | (1.19 | ) |
Year Ended June 30, 2013 | | | 10.25 | | | | 0.08 | (f)(i) | | | 2.44 | | | | 2.52 | | | | (0.08 | ) | | | (0.60 | ) | | | (0.68 | ) |
Year Ended June 30, 2012 | | | 11.46 | | | | 0.03 | (f) | | | (0.42 | ) | | | (0.39 | ) | | | (0.04 | ) | | | (0.78 | ) | | | (0.82 | ) |
Year Ended June 30, 2011 | | | 8.39 | | | | 0.01 | (f) | | | 3.09 | | | | 3.10 | | | | (0.03 | ) | | | — | | | | (0.03 | ) |
Year Ended June 30, 2010 | | | 6.87 | | | | 0.02 | (f) | | | 1.55 | | | | 1.57 | | | | (0.05 | ) | | | — | | | | (0.05 | ) |
| | | | | | | |
Select Class | | | | | | | | | | | | | | | | | | | | | | | | | | | | |
Six Months Ended December 31, 2014 (Unaudited) | | | 13.94 | | | | 0.07 | (f)(g) | | | 0.24 | | | | 0.31 | | | | (0.07 | ) | | | (1.59 | ) | | | (1.66 | ) |
Year Ended June 30, 2014 | | | 12.24 | | | | 0.12 | (f)(h) | | | 2.83 | | | | 2.95 | | | | (0.11 | ) | | | (1.14 | ) | | | (1.25 | ) |
Year Ended June 30, 2013 | | | 10.37 | | | | 0.14 | (f)(i) | | | 2.46 | | | | 2.60 | | | | (0.13 | ) | | | (0.60 | ) | | | (0.73 | ) |
Year Ended June 30, 2012 | | | 11.57 | | | | 0.09 | (f) | | | (0.42 | ) | | | (0.33 | ) | | | (0.09 | ) | | | (0.78 | ) | | | (0.87 | ) |
Year Ended June 30, 2011 | | | 8.45 | | | | 0.08 | (f) | | | 3.11 | | | | 3.19 | | | | (0.07 | ) | | | — | | | | (0.07 | ) |
Year Ended June 30, 2010 | | | 6.91 | | | | 0.09 | (f) | | | 1.54 | | | | 1.63 | | | | (0.09 | ) | | | — | | | | (0.09 | ) |
| (a) | Annualized for periods less than one year, unless otherwise noted. |
| (b) | Not annualized for periods less than one year. |
| (c) | Includes adjustments in accordance with accounting principles generally accepted in the United States of America and as such, the net asset values for financial reporting purposes and the returns based upon those net asset values may differ from the net asset values and returns for shareholder transactions. |
| (d) | Includes earnings credits and interest expense, if applicable, each of which is less than 0.01% unless otherwise noted. |
| (e) | Portfolio turnover is calculated by dividing the lesser of total purchases or sales of portfolio securities for the reporting period by the monthly average value of portfolio securities owned during the reporting period. Excluded from both the numerator and denominator are amounts relating to derivatives and securities whose maturities or expiration dates at the time of acquisition were one year or less. |
| (f) | Calculated based upon average shares outstanding. |
| (g) | Reflects special dividends paid out during the period by several of the Fund’s holdings. Had the Fund not received the special dividends, the net investment income (loss) per share would have remained the same for Class A, Class B and Class C and would have been $0.03 and $0.06 for Class R2 and Select Class Shares, respectively, and the net investment income (loss) ratio would have been 0.67%, (0.03)%, 0.00%, 0.46% and 0.93% for Class A, Class B, Class C, Class R2 and Select Class Shares, respectively. |
| (h) | Reflects special dividends paid out during the period by several of the Fund’s holdings. Had the Fund not received the special dividends, the net investment income (loss) per share remained the same for Class A, Class B, Class C, Class R2 and Select Class Shares and the net investment income (loss) ratio would have been 0.65%, (0.03)%, (0.03)%, 0.42% and 0.90% for Class A, Class B, Class C, Class R2 and Select Class Shares, respectively. |
| (i) | Reflects special dividends paid out during the period by several of the Fund’s holdings. Had the Fund not received the special dividends, the net investment income (loss) per share would have been $0.09, $0.02, $0.01, $0.06 and $0.12 for Class A, Class B, Class C, Class R2 and Select Class Shares, respectively, and the net investment income (loss) ratio would have been 0.82%, 0.15%, 0.13%, 0.58% and 1.07% for Class A, Class B, Class C, Class R2 and Select Class Shares, respectively. |
| (j) | Amount rounds to less than $0.01. |
| (k) | Amount rounds to less than 0.01%. |
SEE NOTES TO FINANCIAL STATEMENTS.
| | | | | | |
| | | |
| 34 | | | | J.P. MORGAN EQUITY FUNDS | | DECEMBER 31, 2014 |
| | | | | | | | | | | | | | | | | | | | | | | | | | |
| | | Ratios/Supplemental data | |
| | | | | | | | | | Ratios to average net assets (a) | | | | |
Net asset
value,
end of period | | | Total return
(excludes
sales charge) (b)(c) | | | Net assets,
end of
period
(000’s) | | | Net
expenses (d) | | | Net
investment
income
(loss) | | | Expenses
without waivers,
reimbursements and
earnings credits | | | Portfolio
turnover
rate) (b)(e) | |
| | | | | | | | | | | | | | | | | | | | | | | | | | |
| | | | | | | | | | | | | | | | | | | | | | | | | | |
| $ | 12.49 | | | | 2.54 | % | | $ | 107,468 | | | | 0.69 | % | | | 0.74 | %(g) | | | 0.89 | % | | | 18 | % |
| | 13.85 | | | | 24.96 | | | | 116,727 | | | | 0.69 | | | | 0.68 | (h) | | | 0.87 | | | | 25 | |
| | 12.17 | | | | 25.91 | | | | 84,296 | | | | 0.69 | | | | 0.95 | (i) | | | 0.88 | | | | 51 | |
| | 10.32 | | | | (2.22 | ) | | | 62,820 | | | | 0.69 | | | | 0.64 | | | | 0.89 | | | | 77 | |
| | 11.52 | | | | 37.50 | | | | 77,638 | | | | 0.69 | | | | 0.50 | | | | 0.89 | | | | 78 | |
| | 8.42 | | | | 23.30 | | | | 57,906 | | | | 0.69 | | | | 0.75 | | | | 0.91 | | | | 61 | |
| | | | | | |
| | | | | | | | | | | | | | | | | | | | | | | | | | |
| | 11.87 | | | | 2.18 | | | | 991 | | | | 1.37 | | | | 0.03 | (g) | | | 1.41 | | | | 18 | |
| | 13.25 | | | | 24.18 | | | | 1,295 | | | | 1.35 | | | | — | (h)(k) | | | 1.37 | | | | 25 | |
| | 11.70 | | | | 25.11 | | | | 2,082 | | | | 1.36 | | | | 0.28 | (i) | | | 1.38 | | | | 51 | |
| | 9.95 | | | | (2.98 | ) | | | 3,613 | | | | 1.39 | | | | (0.08 | ) | | | 1.39 | | | | 77 | |
| | 11.16 | | | | 36.63 | | | | 5,839 | | | | 1.39 | | | | (0.20 | ) | | | 1.39 | | | | 78 | |
| | 8.18 | | | | 22.21 | | | | 7,104 | | | | 1.41 | | | | 0.03 | | | | 1.41 | | | | 61 | |
| | | | | | |
| | | | | | | | | | | | | | | | | | | | | | | | | | |
| | 11.19 | | | | 2.29 | | | | 23,487 | | | | 1.37 | | | | 0.06 | (g) | | | 1.41 | | | | 18 | |
| | 12.58 | | | | 24.03 | | | | 23,248 | | | | 1.37 | | | | — | (h)(k) | | | 1.37 | | | | 25 | |
| | 11.18 | | | | 25.07 | | | | 16,636 | | | | 1.37 | | | | 0.27 | (i) | | | 1.38 | | | | 51 | |
| | 9.55 | | | | (2.85 | ) | | | 12,330 | | | | 1.39 | | | | (0.07 | ) | | | 1.39 | | | | 77 | |
| | 10.74 | | | | 36.53 | | | | 13,613 | | | | 1.39 | | | | (0.21 | ) | | | 1.39 | | | | 78 | |
| | 7.88 | | | | 22.34 | | | | 9,919 | | | | 1.41 | | | | 0.03 | | | | 1.41 | | | | 61 | |
| | | | | | |
| | | | | | | | | | | | | | | | | | | | | | | | | | |
| | 12.38 | | | | 2.46 | | | | 9,100 | | | | 0.92 | | | | 0.52 | (g) | | | 1.16 | | | | 18 | |
| | 13.74 | | | | 24.60 | | | | 8,821 | | | | 0.92 | | | | 0.45 | (h) | | | 1.12 | | | | 25 | |
| | 12.09 | | | | 25.72 | | | | 6,985 | | | | 0.93 | | | | 0.72 | (i) | | | 1.13 | | | | 51 | |
| | 10.25 | | | | (2.64 | ) | | | 4,477 | | | | 1.07 | | | | 0.27 | | | | 1.14 | | | | 77 | |
| | 11.46 | | | | 36.97 | | | | 3,309 | | | | 1.07 | | | | 0.10 | | | | 1.14 | | | | 78 | |
| | 8.39 | | | | 22.83 | | | | 1,527 | | | | 1.07 | | | | 0.24 | | | | 1.16 | | | | 61 | |
| | | | | | |
| | | | | | | | | | | | | | | | | | | | | | | | | | |
| | 12.59 | | | | 2.70 | | | | 1,304,194 | | | | 0.44 | | | | 0.99 | (g) | | | 0.62 | | | | 18 | |
| | 13.94 | | | | 25.26 | | | | 1,413,937 | | | | 0.44 | | | | 0.92 | (h) | | | 0.62 | | | | 25 | |
| | 12.24 | | | | 26.26 | | | | 1,296,602 | | | | 0.44 | | | | 1.21 | (i) | | | 0.63 | | | | 51 | |
| | 10.37 | | | | (1.96 | ) | | | 1,100,332 | | | | 0.44 | | | | 0.89 | | | | 0.64 | | | | 77 | |
| | 11.57 | | | | 37.84 | | | | 1,145,121 | | | | 0.44 | | | | 0.75 | | | | 0.64 | | | | 78 | |
| | 8.45 | | | | 23.49 | | | | 774,830 | | | | 0.44 | | | | 1.00 | | | | 0.66 | | | | 61 | |
SEE NOTES TO FINANCIAL STATEMENTS.
| | | | | | | | |
| | | |
| DECEMBER 31, 2014 | | J.P. MORGAN EQUITY FUNDS | | | | | 35 | |
NOTES TO FINANCIAL STATEMENTS
AS OF DECEMBER 31, 2014 (Unaudited)
1. Organization
JPMorgan Trust II (“JPM II” or the “Trust”) was formed on November 12, 2004, as a Delaware statutory trust, pursuant to a Declaration of Trust dated November 5, 2004 and is registered under the Investment Company Act of 1940, as amended (the “1940 Act”), as an open-end management investment company.
The following are 2 separate funds of the Trust (collectively, the “Funds”) covered by this report:
| | | | |
| | | Classes Offered | | Diversified/Non-Diversified |
| Equity Index Fund | | Class A, Class B, Class C and Select Class | | Diversified |
| Market Expansion Enhanced Index Fund | | Class A, Class B, Class C, Class R2 and Select Class | | Diversified |
The investment objective of the Equity Index Fund is to seek investment results that correspond to the aggregate price and dividend performance of securities in the Standard & Poor’s 500 Composite Stock Price Index (“S&P 500 Index”).
The investment objective of the Market Expansion Enhanced Index Fund is to seek to provide investment results that correspond to or incrementally exceed the total return performance of an index that tracks the performance of the small- and mid-capitalization equity markets.
Effective November 1, 2009, Class B Shares of the Funds may not be purchased or acquired by new or existing shareholders, except through exchanges from Class B Shares of another J.P. Morgan Fund and dividend reinvestments. Shareholders who invested in Class B Shares prior to November 1, 2009 may continue to hold their Class B Shares until they automatically convert to Class A Shares.
Class A Shares generally provide for a front-end sales charge while Class B and Class C Shares provide for a contingent deferred sales charge (“CDSC”). Class B Shares automatically convert to Class A Shares after eight years. No sales charges are assessed with respect to Class R2 and Select Class Shares. All classes of shares have equal rights as to earnings, assets and voting privileges, except that each class may bear different distribution and shareholder servicing fees and each class has exclusive voting rights with respect to its distribution plan and shareholder servicing agreements. Certain Class A Shares, for which front-end sales charges have been waived, may be subject to a CDSC as described in the Funds’ prospectus.
2. Significant Accounting Policies
The following is a summary of significant accounting policies followed by the Funds in the preparation of their financial statements. The Funds are investment companies and, accordingly, follow the investment company accounting and reporting guidance of the Financial Accounting Standards Board Accounting Standards Codification Topic 946—Investment Companies, which is part of U.S. generally accepted accounting principles (“GAAP”). The preparation of financial statements in conformity with GAAP requires management to make estimates and assumptions that affect the reported amounts of assets and liabilities and disclosure of contingent assets and liabilities at the date of the financial statements and the reported amounts of increases and decreases in net assets from operations during the reporting period. Actual results could differ from those estimates.
A. Valuation of Investments — The valuation of the investments is in accordance with GAAP and the Funds’ valuation policies set forth by and under the supervision and responsibility of the Board of Trustees (the “Board”), which established the following approach to valuation, as described more fully below: (i) investments for which market quotations are readily available shall be valued at such unadjusted quoted prices and (ii) all other investments for which market quotations are not readily available shall be valued at their fair value as determined in good faith by the Board.
JPMorgan Funds Management, Inc. (the “Administrator” or “JPMFM”) has established the J.P. Morgan Asset Management Americas Valuation Committee (“AVC”) to assist the Board with the oversight and monitoring of the valuation of the Funds’ investments. The Administrator implements the valuation policies of the Funds’ investments, as directed by the Board. The AVC oversees and carries out the policies for the valuation of investments held in the Funds. This includes monitoring the appropriateness of fair values based on results of ongoing valuation oversight, including but not limited to consideration of macro or security specific events, market events and pricing vendor and broker due diligence. The Administrator is responsible for discussing and assessing the potential impacts to the fair values on an ongoing basis, and at least on a quarterly basis with the AVC and the Board.
A market-based approach is primarily used to value the Funds’ investments. Investments for which market quotations are not readily available are fair valued by approved pricing vendors or third party broker-dealers (collectively referred to as “Pricing Services”) or may be internally fair valued using methods set forth by the valuation policies approved by the Board. This may include related or comparable assets or liabilities, recent transactions, market multiples, book values, and other relevant information for the investment to determine the fair value of the investment. An income-based valuation approach may be used in which the anticipated future cash flows of the investment are discounted to calculate the fair value. Discounts may also be applied due to the nature or duration of any restrictions on the disposition of the investments. Valuations may be based upon current market prices of securities that are comparable in coupon, rating, maturity and industry. It is possible that the estimated values may differ significantly from the values that would have been used, had a ready market for the investments existed, and such differences could be material.
Fixed income instruments are valued based on prices received from Pricing Services. The Pricing Services use multiple valuation techniques to determine the valuation of fixed income instruments. In instances where sufficient market activity exists, the Pricing Services may utilize a market-based approach through which trades or quotes from market makers are used to determine the valuation of these instruments. In instances where sufficient market activity may not exist, the Pricing Services also utilize proprietary valuation models which may consider market transactions in comparable securities and the various relationships between securities in determining fair value and/or market characteristics in order to estimate the relevant cash flows, which are then discounted to calculate the fair values.
| | | | | | |
| | | |
| 36 | | | | J.P. MORGAN EQUITY FUNDS | | DECEMBER 31, 2014 |
Equities and other exchange-traded instruments are valued at the last sale price or official market closing price on the primary exchange on which the instrument is traded before the net asset values (“NAV”) of the Funds are calculated on a valuation date. Investments in open-end investment companies (the “Underlying Funds”) are valued at each investment company’s NAV per share as of the report date.
Futures are generally valued on the basis of available market quotations.
Valuations reflected in this report are as of the report date. As a result, changes in valuation due to market events and/or issuer related events after the report date and prior to issuance of the report are not reflected herein.
The various inputs that are used in determining the valuation of the Funds’ investments are summarized into the three broad levels listed below.
| Ÿ | | Level 1 — Unadjusted inputs using quoted prices in active markets for identical investments. |
| Ÿ | | Level 2 — Other significant observable inputs including, but are not limited to, quoted prices for similar investments, inputs other than quoted prices that are observable for investments (such as interest rates, prepayment speeds, credit risk, etc.) or other market corroborated inputs. |
| Ÿ | | Level 3 — Significant inputs based on the best information available in the circumstances, to the extent observable inputs are not available (including the Funds’ assumptions in determining the fair value of investments). |
A financial instrument’s level within the fair value hierarchy is based on the lowest level of any input, both individually and in the aggregate, that is significant to the fair value measurement. The inputs or methodology used for valuing instruments are not necessarily an indication of the risk associated with investing in those instruments.
The following tables represent each valuation input as presented on the Schedules of Portfolio Investments (“SOIs”) (amounts in thousands):
Equity Index Fund
| | | | | | | | | | | | | | | | |
| | | Level 1
Quoted prices | | | Level 2
Other significant
observable inputs | | | Level 3
Significant
unobservable inputs | | | Total | |
Total Investments in Securities (a) | | $ | 1,980,343 | | | $ | — | | | $ | — | | | $ | 1,980,343 | |
| | | | | | | | | | | | | | | | |
Appreciation in Other Financial Instruments | | | | | | | | | | | | | | | | |
Futures Contracts | | $ | 124 | | | $ | — | | | $ | — | | | $ | 124 | |
| | | | | | | | | | | | | | | | |
Market Expansion Enhanced Index Fund
| | | | | | | | | | | | | | | | |
| | | Level 1
Quoted prices | | | Level 2
Other significant
observable inputs | | | Level 3
Significant
unobservable inputs | | | Total | |
Investments in Securities | | | | | |
Common Stocks | | | | | | | | | | | | | | | | |
Consumer Discretionary | | $ | 187,552 | | | $ | — | | | $ | — | | | $ | 187,552 | |
Consumer Staples | | | 46,152 | | | | — | | | | — | | | | 46,152 | |
Energy | | | 53,247 | | | | — | | | | — | | | | 53,247 | |
Financials | | | 321,881 | | | | — | | | | — | | | | 321,881 | |
Health Care | | | 152,877 | | | | — | | | | — | | | | 152,877 | |
Industrials | | | 225,246 | | | | — | | | | — | | | | 225,246 | |
Information Technology | | | 254,876 | | | | — | | | | — | (b) | | | 254,876 | |
Materials | | | 102,347 | | | | — | | | | — | | | | 102,347 | |
Telecommunication Services | | | 1,624 | | | | — | | | | — | | | | 1,624 | |
Utilities | | | 67,667 | | | | — | | | | — | | | | 67,667 | |
| | | | | | | | | | | | | | | | |
Total Common Stocks | | | 1,413,469 | | | | — | | | | — | (b) | | | 1,413,469 | |
| | | | | | | | | | | | | | | | |
Short-Term Investment | | | | | | | | | | | | | | | | |
Investment Company | | | 31,936 | | | | — | | | | — | | | | 31,936 | |
| | | | | | | | | | | | | | | | |
Total Investments in Securities | | $ | 1,445,405 | | | $ | — | | | $ | — | (b) | | $ | 1,445,405 | |
| | | | | | | | | | | | | | | | |
Appreciation in Other Financial Instruments | | | | | | | | | | | | | | | | |
Futures Contracts | | $ | 506 | | | $ | — | | | $ | — | | | $ | 506 | |
| | | | | | | | | | | | | | | | |
| (a) | All portfolio holdings designated as Level 1 are disclosed individually on the SOI. Please refer to the SOI for industry specifics of portfolio holdings. |
| | | | | | | | |
| | | |
| DECEMBER 31, 2014 | | J.P. MORGAN EQUITY FUNDS | | | | | 37 | |
NOTES TO FINANCIAL STATEMENTS
AS OF DECEMBER 31, 2014 (Unaudited) (continued)
There were no transfers among any levels during the six months ended December 31, 2014.
B. Restricted and Illiquid Securities — Certain securities held by the Funds may be subject to legal or contractual restrictions on resale and/or are illiquid. Restricted securities generally are resold in transactions exempt from registration under the Securities Act of 1933. Illiquid securities are securities which cannot be disposed of promptly (within seven days) and in the usual course of business at approximately their fair value and include, but are not limited to, repurchase agreements maturing in excess of seven days, time deposits with a withdrawal penalty, non-negotiable instruments and instruments for which no market exists. Disposal of these securities may involve time-consuming negotiations and expense. Prompt sale at the current valuation may be difficult and could adversely affect the net assets of the Funds. As of December 31, 2014, the Funds had no investments in restricted securities.
The following is the value and percentage of net assets of illiquid securities as of December 31, 2014 (amounts in thousands):
| | | | | | | | |
| | | Value | | | Percentage | |
Market Expansion Enhanced Index Fund | | $ | — | (a) | | | — | % |
C. Futures Contracts — The Funds use index futures contracts to gain or reduce exposure to their respective indices, maintain liquidity and minimize transaction costs. The Funds also buy futures contracts to immediately invest incoming cash in the market or sell futures in response to cash outflows, thereby simulating an invested position in the underlying index while maintaining a cash balance for liquidity. The use of futures contracts exposes the Funds to equity price risk.
Futures contracts provide for the delayed delivery of the underlying instrument at a fixed price or are settled for a cash amount based on the change in the value of the underlying instrument at a specific date in the future. Upon entering into a futures contract, the Funds are required to deposit with the broker, cash or securities in an amount equal to a certain percentage of the contract amount, which is referred to as the initial margin deposit. Subsequent payments, referred to as variation margin, are made or received by the Funds periodically and are based on changes in the market value of open futures contracts. Changes in the market value of open futures contracts are recorded as change in net unrealized appreciation/depreciation in the Statements of Operations. Realized gains or losses, representing the difference between the value of the contract at the time it was opened and the value at the time it was closed, are reported in the Statements of Operations at the closing or expiration of the futures contract. Securities deposited as initial margin are designated in the SOIs and cash deposited is recorded on the Statements of Assets and Liabilities. A receivable from and/or a payable to brokers for the daily variation margin is also recorded on the Statements of Assets and Liabilities.
The Funds may be subject to the risk that the change in the value of the futures contract may not correlate perfectly with the underlying instrument. Use of long futures contracts subjects the Funds to risk of loss in excess of the amounts shown on the Statements of Assets and Liabilities, up to the notional amount of the futures contracts. Use of short futures contracts subjects the Funds to unlimited risk of loss. The Funds may enter into futures contracts only on exchanges or boards of trade. The exchange or board of trade acts as the counterparty to each futures transaction; therefore, the Funds’ credit risk is limited to failure of the exchange or board of trade. Under some circumstances, futures exchanges may establish daily limits on the amount that the price of a futures contract can vary from the previous day’s settlement price, which could effectively prevent liquidation of positions.
The table below discloses the volume of the Funds’ futures contracts activity during the six months ended December 31, 2014 (amounts in thousands):
| | | | | | | | |
| | | Equity Index
Fund | | | Market Expansion
Enhanced Index Fund | |
Futures Contracts: | | | | | | | | |
Average Notional Balance Long | | $ | 14,745 | | | $ | 45,823 | |
Ending Notional Balance Long | | | 10,262 | | | | 35,395 | |
The Funds’ futures contracts are not subject to master netting arrangements (the right to close out all transactions traded with a counterparty and net amounts owed or due across transactions).
| | | | | | |
| | | |
| 38 | | | | J.P. MORGAN EQUITY FUNDS | | DECEMBER 31, 2014 |
D. Investment Transactions with Affiliates — An issuer which is under common control with a fund may be considered an affiliate. For the purposes of the financial statements, the Funds assume the following to be affiliated issuers (amounts in thousands):
| | | | | | | | | | | | | | | | | | | | | | | | | | | | |
| | | For the six months ended December 31, 2014 | |
| Affiliate | | Value at
June 30,
2014 | | | Purchase
Cost | | | Sales
Proceeds | | | Realized
Gain
(Loss) | | | Dividend
Income | | | Shares at
December 31,
2014 | | | Value at
December 31,
2014 | |
Equity Index Fund | | | | | | | | | | | | | | | | | | | | | | | | | | | | |
JPMorgan Chase & Co. (common stock)* | | $ | 23,682 | | | $ | — | | | $ | 448 | | | $ | 242 | | | $ | 329 | | | | 404 | | | $ | 25,262 | |
JPMorgan Liquid Assets Money Market Fund, Institutional Class Shares | | | 17,665 | | | | 79,075 | | | | 86,643 | | | | — | | | | 3 | | | | 10,097 | | | | 10,097 | |
| | | | | | | | | | | | | | | | | | | | | | | | | | | | |
Total | | $ | 41,347 | | | | | | | | | | | $ | 242 | | | $ | 332 | | | | | | | $ | 35,359 | |
| | | | | | | | | | | | | | | | | | | | | | | | | | | | |
| |
| | | For the six months ended December 31, 2014 | |
| Affiliate | | Value at
June 30,
2014 | | | Purchase
Cost | | | Sales
Proceeds | | | Realized
Gain
(Loss) | | | Dividend
Income | | | Shares at
December 31,
2014 | | | Value at
December 31,
2014 | |
Market Expansion Enhanced Index Fund | | | | | | | | | | | | | | | | | | | | | | | | | | | | |
JPMorgan Liquid Assets Money Market Fund, Institutional Class Shares | | $ | 46,170 | | | $ | 214,287 | | | $ | 228,521 | | | $ | — | | | $ | 8 | | | | 31,936 | | | $ | 31,936 | |
| | | | | | | | | | | | | | | | | | | | | | | | | | | | |
Total | | $ | 46,170 | | | | | | | | | | | $ | — | | | $ | 8 | | | | | | | $ | 31,936 | |
| | | | | | | | | | | | | | | | | | | | | | | | | | | | |
| * | Investment in affiliate which is a security in the Fund’s Index. |
E. Security Transactions and Investment Income — Investment transactions are accounted for on the trade date (the date the order to buy or sell is executed). Securities gains and losses are calculated on a specifically identified cost basis. Interest income is determined on the basis of coupon interest accrued using the effective interest method which adjusts for amortization of premiums and accretion of discounts. Dividend income, net of foreign taxes withheld, if any, less dividend expense on securities sold short, is recorded on the ex-dividend date or when a Fund first learns of the dividend.
To the extent such information is publicly available, the Funds record distributions received in excess of income earned from underlying investments as a reduction of cost of investments and/or realized gain. Such amounts are based on estimates if actual amounts are not available and actual amounts of income, realized gain and return of capital may differ from the estimated amounts. The Funds adjust the estimated amounts of the components of distributions (and consequently their net investment income) as necessary once the issuers provide information about the actual composition of the distributions.
F. Allocation of Income and Expenses — Expenses directly attributable to a fund are charged directly to that fund, while the expenses attributable to more than one fund of the Trust are allocated among the respective funds. In calculating the NAV of each class, investment income, realized and unrealized gains and losses and expenses, other than class specific expenses, are allocated daily to each class of shares based upon the proportion of net assets of each class at the beginning of each day.
G. Federal Income Taxes — Each Fund is treated as a separate taxable entity for Federal income tax purposes. Each Fund’s policy is to comply with the provisions of the Internal Revenue Code of 1986, as amended (the “Code”), applicable to regulated investment companies and to distribute to shareholders all of its distributable net investment income and net realized capital gains on investments. Accordingly, no provision for Federal income tax is necessary. Management has reviewed the Funds’ tax positions for all open tax years and has determined that as of December 31, 2014, no liability for income tax is required in the Funds’ financial statements for net unrecognized tax benefits. However, management’s conclusions may be subject to future review based on changes in, or the interpretation of, the accounting standards or tax laws and regulations. Each of the Fund’s Federal tax returns for the prior three fiscal years remain subject to examination by the Internal Revenue Service.
H. Distributions to Shareholders — Distributions from net investment income are generally declared and paid quarterly and are declared separately for each class. No class has preferential dividend rights; differences in per share rates are due to differences in separate class expenses. Net realized capital gains, if any, are distributed by each Fund at least annually. The amount of distributions from net investment income and net realized capital gains is determined in accordance with Federal income tax regulations, which may differ from GAAP. To the extent these “book/tax” differences are permanent in nature (i.e., that they result from other than timing of recognition — “temporary differences”), such amounts are reclassified within the capital accounts based on their Federal tax-basis treatment.
3. Fees and Other Transactions with Affiliates
A. Investment Advisory Fee — Pursuant to the Investment Advisory Agreement, J.P. Morgan Investment Management, Inc. (the “Adviser” or “JPMIM”), an indirect, wholly-owned subsidiary of JPMorgan Chase & Co. (“JPMorgan”), supervises the investments of each Fund and for such services is paid a fee. The fee is accrued daily and paid monthly at an annual rate of 0.25% of each Fund’s average daily net assets.
| | | | | | | | |
| | | |
| DECEMBER 31, 2014 | | J.P. MORGAN EQUITY FUNDS | | | | | 39 | |
NOTES TO FINANCIAL STATEMENTS
AS OF DECEMBER 31, 2014 (Unaudited) (continued)
The Adviser waived Investment Advisory fees and/or reimbursed expenses as outlined in Note 3.F.
B. Administration Fee — Pursuant to an Administration Agreement, the Administrator, an indirect, wholly-owned subsidiary of JPMorgan, provides certain administration services to the Funds. In consideration of these services, the Administrator receives a fee accrued daily and paid monthly at an annual rate of 0.15% of the first $25 billion of the average daily net assets of all funds in the J.P. Morgan Funds Complex covered by the Administration Agreement (excluding certain funds of funds and money market funds) and 0.075% of the average daily net assets in excess of $25 billion of all such funds. For the six months ended December 31, 2014, the effective annualized rate was 0.08% of each Fund’s average daily net assets, notwithstanding any fee waivers and/or expense reimbursements.
The Administrator waived Administration fees as outlined in Note 3.F.
JPMorgan Chase Bank, N.A. (“JPMCB”), a wholly-owned subsidiary of JPMorgan, serves as the Funds’ sub-administrator (the “Sub-administrator”). For its services as Sub-administrator, JPMCB receives a portion of the fees payable to the Administrator.
C. Distribution Fees — Pursuant to a Distribution Agreement, JPMorgan Distribution Services, Inc. (the “Distributor”), a wholly-owned subsidiary of JPMorgan, serves as the Trust’s exclusive underwriter and promotes and arranges for the sale of each Fund’s shares.
The Board has adopted a Distribution Plan (the “Distribution Plan”) for Class A, Class B, Class C and Class R2 Shares of the Funds in accordance with Rule 12b-1 under the 1940 Act. The Distribution Plan provides that each Fund shall pay distribution fees, including payments to the Distributor, at annual rates of the average daily net assets as shown in the table below:
| | | | | | | | | | | | | | | | |
| | | Class A | | | Class B | | | Class C | | | Class R2 | |
Equity Index Fund | | | 0.25 | % | | | 0.75 | % | | | 0.75 | % | | | n/a | |
Market Expansion Enhanced Index Fund | | | 0.25 | | | | 0.75 | | | | 0.75 | | | | 0.50 | % |
In addition, the Distributor is entitled to receive the front-end sales charges from purchases of Class A Shares and the CDSC from redemptions of Class B and Class C Shares and certain Class A Shares for which front-end sales charges have been waived. For the six months ended December 31, 2014, the Distributor retained the following amounts (in thousands):
| | | | | | | | |
| | | Front-End Sales Charge | | | CDSC | |
Equity Index Fund | | $ | 17 | | | $ | — | (a) |
Market Expansion Enhanced Index Fund | | | 5 | | | | — | (a) |
| (a) | Amount rounds to less than $1,000. |
D. Shareholder Servicing Fees — The Trust, on behalf of the Funds, has entered into Shareholder Servicing Agreements with the Distributor under which the Distributor provides certain support services to the shareholders. For performing these services, the Distributor receives a fee that is accrued daily and paid monthly equal to an annual rate of 0.25% of the average daily net assets of each share class.
The Distributor has entered into shareholder services contracts with affiliated and unaffiliated financial intermediaries who provide shareholder services and other related services to their clients or customers who invest in the Funds under which the Distributor will pay all or a portion of such fees earned to financial intermediaries for performing such services.
The Distributor waived Shareholder Servicing fees as outlined in Note 3.F.
E. Custodian and Accounting Fees — JPMCB provides portfolio custody and accounting services to the Funds. For these services, the Funds pay JPMCB transaction and asset-based fees that vary according to the number of transactions and positions, plus out-of-pocket expenses. The amounts paid directly to JPMCB by the Funds for custody and accounting services are included in Custodian and accounting fees in the Statements of Operations. Payments to the custodian may be reduced by credits earned by each Fund, based on uninvested cash balances held by the custodian. Such earnings credits, if any, are presented separately in the Statements of Operations.
Interest expense paid to the custodian related to cash overdrafts, if any, is included in Interest expense to affiliates in the Statements of Operations.
F. Waivers and Reimbursements — The Adviser, Administrator and Distributor have contractually agreed to waive fees and/or reimburse the Funds to the extent that total annual operating expenses (excluding acquired fund fees and expenses, dividend expenses related to short sales, interest, taxes, expenses related to litigation and potential litigation, extraordinary expenses and expenses related to the Board’s deferred compensation plan) exceed the percentages of the Funds’ respective average daily net assets as shown in the table below:
| | | | | | | | | | | | | | | | | | | | |
| | | Class A | | | Class B | | | Class C | | | Class R2 | | | Select Class | |
Equity Index Fund | | | 0.45 | % | | | 1.20 | % | | | 1.20 | % | | | n/a | | | | 0.20 | % |
Market Expansion Enhanced Index Fund | | | 0.69 | | | | 1.39 | | | | 1.39 | | | | 0.92 | % | | | 0.44 | |
The expense limitation agreements were in effect for the six months ended December 31, 2014. The contractual expense limitation percentages in the table above are in place until at least October 31, 2015. In addition, the Funds’ service providers have voluntarily waived fees during the six months ended December 31, 2014. However, the Funds’ service providers are under no obligation to do so and may discontinue such voluntary waivers at any time.
| | | | | | |
| | | |
| 40 | | | | J.P. MORGAN EQUITY FUNDS | | DECEMBER 31, 2014 |
For the six months ended December 31, 2014, the Funds’ service providers waived fees and/or reimbursed expenses for each of the Funds as follows (amounts in thousands). None of these parties expect the Funds to repay any such waived fees and reimbursed expenses in future years.
| | | | | | | | | | | | | | | | |
| | | Contractual Waivers | |
| | | Investment
Advisory | | | Administration | | | Shareholder
Servicing | | | Total | |
Equity Index Fund | | $ | 1,360 | | | $ | 809 | | | $ | 2,298 | | | $ | 4,467 | |
Market Expansion Enhanced Index Fund | | | 121 | | | | 78 | | | | 1,162 | | | | 1,361 | |
Additionally, the Funds may invest in one or more money market funds advised by the Adviser or its affiliates. The Adviser, Administrator and the Distributor, as shareholder servicing agent, waive fees in an amount sufficient to offset the respective fees each charges to the affiliated money market fund on the Funds’ investment in such affiliated money market fund. A portion of the waiver is voluntary.
The amount of waivers resulting from investments in these money market funds for the six months ended December 31, 2014 was as follows (amounts in thousands):
| | | | |
Equity Index Fund | | $ | 14 | |
Market Expansion Enhanced Index Fund | | | 43 | |
G. Other — Certain officers of the Trust are affiliated with the Adviser, the Administrator and the Distributor. Such officers, with the exception of the Chief Compliance Officer, receive no compensation from the Funds for serving in their respective roles.
The Board appointed a Chief Compliance Officer to the Funds in accordance with Federal securities regulations. Each Fund, along with other affiliated funds, makes reimbursement payments, on a pro-rata basis, to the Administrator for a portion of the fees associated with the Office of the Chief Compliance Officer. Such fees are included in Trustees’ and Chief Compliance Officer’s fees in the Statements of Operations.
The Trust adopted a Trustee Deferred Compensation Plan (the “Plan”) which allows the Independent Trustees to defer the receipt of all or a portion of compensation related to performance of their duties as Trustees. The deferred fees are invested in various J. P. Morgan Funds until distribution in accordance with the Plan.
During the six months ended December 31, 2014, the Funds may have purchased securities from an underwriting syndicate in which the principal underwriter or members of the syndicate are affiliated with the Adviser.
The Funds may use related party broker-dealers. For the six months ended December 31, 2014, the Funds did not incur any brokerage commissions with broker-dealers affiliated with the Adviser.
The Securities and Exchange Commission (“SEC”) has granted an exemptive order permitting the Funds to engage in principal transactions with J.P. Morgan Securities, Inc., an affiliated broker, involving taxable money market instruments, subject to certain conditions.
4. Investment Transactions
During the six months ended December 31, 2014, purchases and sales of investments (excluding short-term investments) were as follows (amounts in thousands):
| | | | | | | | | | | | | | | | |
| | | Purchases
(excluding
U.S. Government) | | | Sales
(excluding
U.S. Government) | | | Purchases of
U.S. Government | | | Sales of
U.S. Government | |
Equity Index Fund | | $ | 38,209 | | | $ | 53,970 | | | $ | — | | | $ | — | |
Market Expansion Enhanced Index Fund | | | 272,145 | | | | 410,944 | | | | — | | | | 1,740 | |
5. Federal Income Tax Matters
For Federal income tax purposes, the cost and unrealized appreciation (depreciation) in value of investment securities held at December 31, 2014 were as follows (amounts in thousands):
| | | | | | | | | | | | | | | | |
| | | Aggregate
Cost | | | Gross
Unrealized
Appreciation | | | Gross
Unrealized
Depreciation | | | Net Unrealized
Appreciation
(Depreciation) | |
Equity Index Fund | | $ | 634,092 | | | $ | 1,358,241 | | | $ | 11,990 | | | $ | 1,346,251 | |
Market Expansion Enhanced Index Fund | | | 996,065 | | | | 478,528 | | | | 29,188 | | | | 449,340 | |
At June 30, 2014, the Funds did not have any net capital loss carryforwards.
6. Borrowings
The Funds rely upon an exemptive order granted by the SEC (the “Order”) permitting the establishment and operation of an Interfund Lending Facility (the “Facility”). The Facility allows the Funds to directly lend and borrow money to or from any other fund relying upon the Order at rates beneficial to both the borrowing and lending funds. Advances under the Facility are taken primarily for temporary or emergency purposes, including
| | | | | | | | |
| | | |
| DECEMBER 31, 2014 | | J.P. MORGAN EQUITY FUNDS | | | | | 41 | |
NOTES TO FINANCIAL STATEMENTS
AS OF DECEMBER 31, 2014 (Unaudited) (continued)
the meeting of redemption requests that otherwise might require the untimely disposition of securities, and are subject to each Fund’s borrowing restrictions. The Interfund loan rate is determined, as specified in the Order, by averaging the current repurchase agreement rate and the current bank loan rate. The Order was granted to JPM II and may be relied upon by the Funds because the Funds and the series of JPMorgan Trust II are all investment companies in the same “group of investment companies” (as defined in Section 12(d)(1)(G) of the 1940 Act).
In addition, the Trust and JPMCB have entered into a financing arrangement. Under this arrangement, JPMCB provides an unsecured, uncommitted credit facility in the aggregate amount of $100 million to certain of the J.P. Morgan Funds, including the Funds. Advances under the arrangement are taken primarily for temporary or emergency purposes, including the meeting of redemption requests that otherwise might require the untimely disposition of securities, and are subject to each Fund’s borrowing restrictions. Interest on borrowings is payable at a rate determined by JPMCB at the time of borrowing. This agreement has been extended until November 9, 2015.
The Funds had no borrowings outstanding from another fund or from the unsecured, uncommitted credit facility at December 31, 2014, or at any time during the six months then ended.
Interest expense paid, if any, as a result of borrowings from another fund or from the unsecured, uncommitted credit facility is included in Interest expense to affiliates in the Statements of Operations.
7. Risks, Concentrations and Indemnifications
In the normal course of business, the Funds enter into contracts that contain a variety of representations which provide general indemnifications. Each Fund’s maximum exposure under these arrangements is unknown. The amount of exposure would depend on future claims that may be made against each Fund that have not yet occurred. However, based on experience, the Funds expect the risk of loss to be remote.
One or more affiliates of the Adviser have investment discretion with respect to their clients’ holdings in the Funds, which collectively represent a significant portion of the Fund’s assets for the Market Expansion Enhanced Index Fund.
In addition, as of December 31, 2014, the J.P. Morgan Investor Funds, which are affiliated funds of funds, own in the aggregate approximately 38.3% of the net assets of Market Expansion Enhanced Index Fund.
Significant shareholder transactions by these shareholders may impact the Fund’s performance.
| | | | | | |
| | | |
| 42 | | | | J.P. MORGAN EQUITY FUNDS | | DECEMBER 31, 2014 |
SCHEDULE OF SHAREHOLDER EXPENSES
(Unaudited)
Hypothetical $1,000 Investment
As a shareholder of the Funds, you incur two types of costs: (1) transaction costs, including sales charges (loads) on purchase payments and (2) ongoing costs, including investment advisory fees, administration fees, distribution fees and other Fund expenses. The examples below are intended to help you understand your ongoing costs (in dollars) of investing in the Funds and to compare these ongoing costs with the ongoing costs of investing in other mutual funds. The examples assume that you had a $1,000 investment in each Class at the beginning of the reporting period, July 1, 2014, and continued to hold your shares at the end of the reporting period, December 31, 2014.
Actual Expenses
For each Class of each Fund in the table below, the first line provides information about actual account values and actual expenses. You may use the information in this line, together with the amount you invested, to estimate the expenses that you paid over the period. Simply divide your account value by $1,000 (for example, an $8,600 account value divided by $1,000 = 8.6), then multiply the result by the number in the first line of each Class under the heading entitled “Expenses Paid During the Period” to estimate the expenses you paid on your account during this period.
Hypothetical Example for Comparison Purposes
The second line of each Class in the table below provides information about hypothetical account values and hypothetical expenses based on the Class’ actual expense ratio and an assumed rate of return of 5% per year before expenses, which is not the Class’ actual return. The hypothetical account values and expenses may not be used to estimate the actual ending account balance or expenses you paid for the period. You may use this information to compare the ongoing costs of investing in the Class of the Funds and other funds. To do so, compare this 5% hypothetical example with the 5% hypothetical examples that appear in the shareholder reports of the other funds. Please note that the expenses shown in the table are meant to highlight your ongoing costs only and do not reflect any transaction costs, such as sales charges (loads) or redemption fees. Therefore, the second line for each Class in the table is useful in comparing ongoing costs only, and will not help you determine the relative total costs of owning different funds. In addition, if these transaction costs were included, your costs would have been higher. The examples also assume all dividends and distributions have been reinvested.
| | | | | | | | | | | | | | | | |
| | | Beginning
Account Value
July 1, 2014 | | | Ending
Account Value
December 31, 2014 | | | Expenses
Paid During
the Period* | | | Annualized
Expense
Ratio | |
Equity Index Fund | | | | | | | | | | | | | | | | |
Class A | | | | | | | | | | | | | | | | |
Actual | | $ | 1,000.00 | | | $ | 1,058.80 | | | $ | 2.34 | | | | 0.45 | % |
Hypothetical | | | 1,000.00 | | | | 1,022.94 | | | | 2.29 | | | | 0.45 | |
Class B | | | | | | | | | | | | | | | | |
Actual | | | 1,000.00 | | | | 1,054.60 | | | | 6.21 | | | | 1.20 | |
Hypothetical | | | 1,000.00 | | | | 1,019.16 | | | | 6.11 | | | | 1.20 | |
Class C | | | | | | | | | | | | | | | | |
Actual | | | 1,000.00 | | | | 1,054.60 | | | | 6.21 | | | | 1.20 | |
Hypothetical | | | 1,000.00 | | | | 1,019.16 | | | | 6.11 | | | | 1.20 | |
Select Class | | | | | | | | | | | | | | | | |
Actual | | | 1,000.00 | | | | 1,060.10 | | | | 1.04 | | | | 0.20 | |
Hypothetical | | | 1,000.00 | | | | 1,024.20 | | | | 1.02 | | | | 0.20 | |
| | | | |
Market Expansion Enhanced Index Fund | | | | | | | | | | | | | | | | |
Class A | | | | | | | | | | | | | | | | |
Actual | | | 1,000.00 | | | | 1,025.40 | | | | 3.52 | | | | 0.69 | |
Hypothetical | | | 1,000.00 | | | | 1,021.73 | | | | 3.52 | | | | 0.69 | |
Class B | | | | | | | | | | | | | | | | |
Actual | | | 1,000.00 | | | | 1,021.80 | | | | 6.98 | | | | 1.37 | |
Hypothetical | | | 1,000.00 | | | | 1,018.30 | | | | 6.97 | | | | 1.37 | |
Class C | | | | | | | | | | | | | | | | |
Actual | | | 1,000.00 | | | | 1,022.90 | | | | 6.99 | | | | 1.37 | |
Hypothetical | | | 1,000.00 | | | | 1,018.30 | | | | 6.97 | | | | 1.37 | |
Class R2 | | | | | | | | | | | | | | | | |
Actual | | | 1,000.00 | | | | 1,024.60 | | | | 4.69 | | | | 0.92 | |
Hypothetical | | | 1,000.00 | | | | 1,020.57 | | | | 4.69 | | | | 0.92 | |
Select Class | | | | | | | | | | | | | | | | |
Actual | | | 1,000.00 | | | | 1,027.00 | | | | 2.25 | | | | 0.44 | |
Hypothetical | | | 1,000.00 | | | | 1,022.99 | | | | 2.24 | | | | 0.44 | |
| * | Expenses are equal to each Class’ respective annualized expense ratio, multiplied by the average account value over the period, multiplied by 184/365 (to reflect the one-half year period). |
| | | | | | | | |
| | | |
| DECEMBER 31, 2014 | | J.P. MORGAN EQUITY FUNDS | | | | | 43 | |
BOARD APPROVAL OF INVESTMENT ADVISORY AGREEMENT
(Unaudited)
The Board of Trustees has established various standing committees, composed of Trustees with diverse backgrounds, to which the Board of Trustees has assigned specific subject matter responsibilities to further enhance the effectiveness of the Board’s oversight and decision making. The Board of Trustees and its investment committees (money market and alternative products, equity, and fixed income) meet regularly throughout the year and consider factors that are relevant to their annual consideration of investment advisory agreements at each meeting. They also meet for the specific purpose of considering investment advisory agreement annual renewals. The Board of Trustees held meetings in person in June and August 2014, at which the Trustees considered the continuation of the investment advisory agreement for each of the Funds whose semi-annual report is contained herein (each an “Advisory Agreement” and collectively, the “Advisory Agreements”). At the June meeting, the Board’s investment committees met to review and consider performance, expense and related information for the J.P. Morgan Funds. Each investment committee reported to the full Board, which then considered the investment committee’s preliminary findings. At the August meeting, the Trustees continued their review and consideration. The Trustees, including a majority of the Trustees who are not “interested persons” (as defined in the 1940 Act) of any party to the Advisory Agreements or any of their affiliates, approved the continuation of each Advisory Agreement on August 20, 2014.
As part of their review of the Advisory Agreements, the Trustees considered and reviewed performance and other information about the Funds received from the Adviser. This information includes the Funds’ performance as compared to the performance of their peers and benchmarks and analyses by the Adviser of the Funds’ performance. In addition, the Trustees have engaged an independent management consulting firm (“independent consultant”) to report on the performance of certain J.P. Morgan Funds at each of the Trustees’ regular meetings. The Adviser also periodically provides comparative information regarding the Funds’ expense ratios and those of their peer groups. In addition, in preparation for the June and August meetings, the Trustees requested, received and evaluated extensive materials from the Adviser, including performance and expense information compiled by Lipper Inc. (“Lipper”), an independent provider of investment company data. The Trustees’ independent consultant also provided additional analyses of the performance of the Funds in connection with the Trustees’ review of the Advisory Agreements. Before voting on the proposed Advisory Agreements, the Trustees reviewed the proposed Advisory Agreements with representatives of the Adviser, counsel to the Trust and independent legal counsel, and received a memorandum from independent legal counsel to the Trustees discussing the legal standards for their consideration of the proposed Advisory Agreements. The Trustees also discussed the proposed Advisory Agreements in
executive session with independent legal counsel at which no representatives of the Adviser were present. Set forth below is a summary of the material factors evaluated by the Trustees in determining whether to approve each Advisory Agreement.
The Trustees considered information provided with respect to the Funds over the course of the year. Each Trustee attributed different weights to the various factors, and no factor alone was considered determinative. From year to year, the Trustees consider and place emphasis on relevant information in light of changing circumstances in market and economic conditions. The Trustees determined that the compensation to be received by the Adviser from each Fund under the applicable Advisory Agreement was fair and reasonable and that the continuance of each Advisory Agreement was in the best interests of each Fund and its shareholders.
The factors summarized below were considered and discussed by the Trustees in reaching their conclusions:
Nature, Extent and Quality of Services Provided by the Adviser
The Trustees received and considered information regarding the nature, extent and quality of the services provided to each Fund under the Advisory Agreement. The Trustees took into account information furnished throughout the year at Trustee meetings, as well as the materials furnished specifically in connection with this annual review process. The Trustees considered the background and experience of the Adviser’s senior management and the expertise of, and the amount of attention given to each Fund by, investment personnel of the Adviser. In addition, the Trustees reviewed the qualifications, backgrounds and responsibilities of the portfolio management team primarily responsible for the day-to-day management of each Fund and the infrastructure supporting the team. The Trustees also considered information provided by the Adviser and JPMorgan Distribution Services, Inc. (“JPMDS”) about the structure and distribution strategy of each Fund. The Trustees reviewed information relating to the Adviser’s risk governance model and reports showing the Adviser’s compliance structure and ongoing compliance processes. The Trustees also considered the quality of the administrative services provided by JPMorgan Funds Management, Inc. (“JPMFM”), an affiliate of the Adviser.
The Trustees also considered their knowledge of the nature and quality of the services provided by the Adviser and its affiliates to the Funds gained from their experience as Trustees of the J.P. Morgan Funds. In addition, they considered the overall reputation and capabilities of the Adviser and its affiliates, the commitment of the Adviser to provide high quality service to the Funds, their overall confidence in the Adviser’s integrity and the Adviser’s responsiveness to questions or concerns raised by them, including the Adviser’s willingness to consider and implement organizational and operational changes designed to improve investment results and the services provided to each Fund.
| | | | | | |
| | | |
| 44 | | | | J.P. MORGAN EQUITY FUNDS | | DECEMBER 31, 2014 |
Based upon these considerations and other factors, the Trustees concluded that they were satisfied with the nature, extent and quality of the investment advisory services provided to the Funds by the Adviser.
Costs of Services Provided and Profitability to the Adviser and its Affiliates
The Trustees received and considered information regarding the profitability to the Adviser and its affiliates in providing services to each of the Funds. The Trustees reviewed and discussed this data. The Trustees recognized that this data is not audited and represents the Adviser’s determination of its and its affiliates’ revenues from the contractual services provided to the Funds, less expenses of providing such services. Expenses include direct and indirect costs and are calculated using an allocation methodology developed by the Adviser. The Trustees also recognized that it is difficult to make comparisons of profitability from fund investment advisory contracts because comparative information is not generally publicly available and is affected by numerous factors, including the structure of the particular adviser, the types of funds it manages, its business mix, numerous assumptions regarding allocations and the fact that publicly-traded fund managers’ operating profits and net income are net of distribution and marketing expenses. Based on their review, the Trustees concluded that the profitability to the Adviser under each of the Advisory Agreements was not unreasonable in light of the services and benefits provided to each Fund.
Fall-Out Benefits
The Trustees reviewed information regarding potential “fallout” or ancillary benefits received by the Adviser and its affiliates as a result of their relationship with the Funds. The Trustees also reviewed the Adviser’s allocation of fund brokerage for the J.P. Morgan Funds complex, including allocations to brokers who provide research to the Adviser.
The Trustees also considered that JPMFM and JPMDS, affiliates of the Adviser, earn fees from the Funds for providing administrative and shareholder services. These fees were shown separately in the profitability analysis presented to the Trustees. The Trustees also considered the payments of Rule 12b-1 fees to JPMDS, which also acts as the Funds’ distributor and that these fees are in turn generally paid to financial intermediaries that sell the Funds, including financial intermediaries that are affiliates of the Adviser. The Trustees also considered the fees paid to JPMorgan Chase Bank, N.A. (“JPMCB”) for custody and fund accounting, and other related services.
Economies of Scale
The Trustees considered the extent to which the Funds benefit from economies of scale. The Trustees noted that the proposed investment advisory fee schedule for each Fund does not con-
tain breakpoints, but that the fee schedule for the administrative services provided by JPMFM does include a fee breakpoint, which is tied to the overall level of non-money market fund assets excluding certain funds-of-funds, as applicable, advised by the Adviser, and that the Funds benefit from that breakpoint. The Trustees also noted that the Adviser and its affiliates have implemented fee waivers and expense limitations. The Trustees considered whether it would be appropriate to add advisory fee breakpoints, and the Trustees concluded that the current fee structure was reasonable in light of the fee waivers and expense limitations that the Adviser and its affiliates have in place that serve to limit the overall net expense ratios of the Fund at competitive levels. The Trustees concluded that shareholders of the Funds effectively participated in the economies of scale through these fee waivers and expense limitations and administrative service fee breakpoints.
Independent Written Evaluation of the Funds’ Senior Officer
The Trustees noted that, upon their direction, the Senior Officer for the Funds had prepared an independent written evaluation in order to assist the Trustees in determining the reasonableness of the proposed management fees. In determining whether to continue the Advisory Agreements, the Trustees considered the Senior Officer’s report.
Fees Relative to Adviser’s Other Clients
The Trustees received and considered information about the nature and extent of investment advisory services and fee rates offered to other clients of the Adviser for investment management styles substantially similar to that of each Fund. The Trustees also considered the complexity of investment management for the Funds relative to the Adviser’s other clients and the differences in the nature and extent of the services provided to the different clients. The Trustees concluded that the fee rates charged to each Fund in comparison to those charged to the Adviser’s other clients were reasonable.
Investment Performance
The Trustees received and considered absolute and/or relative performance for the Funds in a report prepared by Lipper. The Trustees considered the total return performance information, which included the ranking of the Funds within a performance universe made up of funds with the same Lipper investment classification and objective (the “Universe Group”) by total return for applicable one-, three- and five-year periods. The Trustees reviewed a description of Lipper’s methodology for selecting mutual funds in each Fund’s Universe Group. The Lipper materials provided to the Trustees highlighted information with respect to certain representative classes to assist the Trustees in their review. As part of this review, the Trustees also reviewed each Fund’s performance against its benchmark and considered the performance information provided for the Funds at regular Board meetings by the Adviser
| | | | | | | | |
| | | |
| DECEMBER 31, 2014 | | J.P. MORGAN EQUITY FUNDS | | | | | 45 | |
BOARD APPROVAL OF INVESTMENT ADVISORY AGREEMENT
(Unaudited) (continued)
and the Trustees’ independent consultant and also considered the special analysis prepared by the Trustees’ independent consultant. The Lipper performance data noted by the Trustees as part of their review and the determinations made by the Trustees with respect to each Fund’s performance for certain representative classes are summarized below:
The Trustees noted that the Equity Index Fund’s performance was in the third quintile for Class A shares, and in the second quintile for the Select Class shares for the one-, three-, and five-year periods ended December 31, 2013, respectively, and that the Trustees’ independent consultant indicated that the Fund’s overall performance was satisfactory. The Trustees discussed the performance and investment strategy of the Fund with the Adviser and, based upon this discussion and various other factors, concluded that the performance was reasonable.
The Trustees noted that the Market Expansion Enhanced Index Fund’s performance was in the third, second, and second quintiles for both Class A and Select Class shares for the one-, three-, and five-year periods ended December 31, 2013, respectively, and that the Trustees’ independent consultant indicated that the Fund’s overall performance was satisfactory. The Trustees also noted that effective February 28, 2013, the Fund changed portfolio managers, and effective April 30, 2013, the Fund changed its name and 80% investment policy, and other investment strategies. The Trustees discussed the performance and investment strategy of the Fund with the Adviser and, based upon this discussion and various other factors, concluded that the performance was reasonable.
Advisory Fees and Expense Ratios
The Trustees considered the contractual advisory fee rate paid by each Fund to the Adviser and compared that rate to the
information prepared by Lipper concerning management fee rates paid by other funds in the same Lipper category as each Fund. The Trustees recognized that Lipper reported each Fund’s management fee rate as the combined contractual advisory fee and administration fee rates. The Trustees also reviewed information about other expenses and the expense ratios for each Fund. The Trustees considered the fee waiver and/or expense reimbursement arrangements currently in place for each Fund and considered the net advisory fee rate after taking into account any waivers and/or reimbursements. The Trustees recognized that it is difficult to make comparisons of advisory fees because there are variations in the services that are included in the fees paid by other funds. The Trustees’ determinations as a result of the review of each Fund’s advisory fees and expense ratios for certain representative classes are summarized below:
The Trustees noted that the Equity Index Fund’s net advisory fee and actual total expenses for both Class A and Select Class shares were in the first quintile of the Universe Group. After considering the factors identified above, in light of this information, the Trustees concluded that the advisory fees were reasonable.
The Trustees noted that the Market Expansion Enhanced Index Fund’s net advisory fee for Select Class shares was in the fourth quintile and that the actual total expenses for Select Class shares were in the first quintile of the Universe Group. After considering the factors identified above, in light of this information, the Trustees concluded that the advisory fees were reasonable.
| | | | | | |
| | | |
| 46 | | | | J.P. MORGAN EQUITY FUNDS | | DECEMBER 31, 2014 |
J.P. Morgan Funds are distributed by JPMorgan Distribution Services, Inc., which is an affiliate of JPMorgan Chase & Co. Affiliates of JPMorgan Chase & Co. receive fees for providing various services to the funds.
Contact JPMorgan Distribution Services, Inc. at 1-800-480-4111 for a fund prospectus. You can also visit us at www.jpmorganfunds.com. Investors should carefully consider the investment objectives and risk as well as charges and expenses of the mutual fund before investing. The prospectus contains this and other information about the mutual fund. Read the prospectus carefully before investing.
Investors may obtain information about the Securities Investor Protection Corporation (SIPC), including the SIPC brochure by visiting www.sipc.org or by calling SIPC at 202-371-8300.
Each Fund files a complete schedule of its fund holdings for the first and third quarters of its fiscal year with the SEC on Form N-Q. The Funds’ Forms N-Q are available on the SEC’s website at http://www.sec.gov and may be reviewed and copied at the SEC’s Public Reference Room in Washington, DC. Information on the operation of the SEC’s Public Reference Room may be obtained by calling 1-800-SEC-0330. Shareholders may request the Form N-Q without charge by calling 1-800-480-4111 or by visiting the J.P. Morgan Funds’ website at www.jpmorganfunds.com.
A description of each Fund’s policies and procedures with respect to the disclosure of each Fund’s holdings is available in the prospectus and Statement of Additional Information.
A copy of proxy policies and procedures is available without charge upon request by calling 1-800-480-4111 and on the Funds’ website at www.jpmorganfunds.com. A description of such policies and procedures is on the SEC’s website at www.sec.gov. The Trustees have delegated the authority to vote proxies for securities owned by the Funds to the Adviser. A copy of the Funds’ voting record for the most recent 12-month period ended June 30 is available on the SEC’s website at www.sec.gov or at the Funds’ website at www.jpmorganfunds.com no later than August 31 of each year. The Funds’ proxy voting record will include, among other things, a brief description of the matter voted on for each fund security, and will state how each vote was cast, for example, for or against the proposal.

J.P. Morgan Asset Management is the marketing name for the asset management business of JPMorgan Chase & Co. Those business include, but are not limited to, J.P. Morgan Investment Management Inc., Security Capital Research & Management incorporated and J.P. Morgan Alternative Asset Management, Inc.
| | | | |
| | © JPMorgan Chase & Co., 2015. All rights reserved. December 2014. | | SAN-INDEX-1214 |
Semi-Annual Report
J.P. Morgan Investor Funds
December 31, 2014 (Unaudited)
JPMorgan Investor Balanced Fund
JPMorgan Investor Conservative Growth Fund
JPMorgan Investor Growth Fund
JPMorgan Investor Growth & Income Fund

CONTENTS
Investments in a Fund are not bank deposits or obligations of, or guaranteed or endorsed by, any bank and are not insured or guaranteed by the FDIC, the Federal Reserve Board or any other government agency. You could lose money if you sell when the Fund’s share price is lower than when you invested.
Past performance is no guarantee of future performance. The general market views expressed in this report are opinions based on market and other conditions through the end of the reporting period and are subject to change without notice. These views are not intended to predict the future performance of a Fund or the securities markets. References to specific securities and their issuers are for illustrative purposes only and are not intended to be, and should not be interpreted as, recommendations to purchase or sell such securities. Such views are not meant as investment advice and may not be relied on as an indication of trading intent on behalf of any Fund.
Prospective investors should refer to the Funds’ prospectus for a discussion of the Funds’ investment objectives, strategies and risks. Call J.P. Morgan Funds Service Center at 1-800-480-4111 for a prospectus containing more complete information about a Fund, including management fees and other expenses. Please read it carefully before investing.
CEO’S LETTER
January 11, 2015 (Unaudited)
Dear Shareholder,
A growing divergence in the economic trajectories of U.S. and other developed markets and plummeting global energy prices provided a mixed backdrop for the latter half of 2014. The U.S. economy accelerated at a steady pace amid continued strength in corporate earnings, gains in employment and consumer spending and falling oil prices for the six months ended December 31, 2014. Gross domestic product (GDP) in the U.S. climbed by 5.0% in the third quarter of 2014 and unemployment dropped to 5.6% in December, a level not seen since June 2008.
| | |
 | | “Amid uncertainty about the global economy recovery, equity markets in the U.S., China and Japan provided investors with solid returns and served to emphasize the prudence of holding a broadly diversified portfolio and a long-term outlook.” |
In response to the continued improvement in the domestic economy, the U.S. Federal Reserve Bank proceeded to taper down its monthly purchases of bonds under its quantitative easing program and finally closed the program in October.
In stark contrast, the European Central Bank (ECB) took unprecedented steps to counter the threat of price deflation in the euro zone and the Bank of Japan stunned markets with a massive stimulus program as Japan’s economy slid into recession.
Another key development in the latter half of 2014 was a precipitous drop in global petroleum prices. A supply glut driven by new production in the U.S. and increased output from other nations, along with decreasing demand from China, Europe and Japan led to a 50% drop in the price of crude oil between July and December.
Amid this backdrop, U.S. equity markets outperformed most other assets classes over the six month period, with large cap stocks providing better returns than small caps and defensive sectors overtaking cyclical sectors. Notably, U.S. equities fell to six-month lows in mid October only to rebound 8.4%, driving the Standard & Poor’s 500 Index (“S&P 500”) to a new closing high of 2,018.05 points on October 31, 2014. In December, the Dow Jones Industrial Average closed above 18,000 points for the first time following the news that third quarter GDP showed the fastest growth in 11 years. The S&P 500 closed at a new high of 2,090.57 points on December 29, 2014, and returned 6.1% for the six months ended December 31, 2014.
Prices for U.S. Treasury securities with longer maturities rose during the six month period as investors sought safe havens amid deteriorating energy prices and geopolitical concerns. While declining oil prices helped bolster consumer spending in developed nations, energy related sectors came under pressure and yield spreads on high-yield debt — also known as junk bonds — widened. Nations dependent on oil exports experienced volatility in bond yield spreads and currency valuations.
Meanwhile, weak growth in the euro zone raised concerns about the potential for a destructive deflationary spiral. Even after the ECB had cut its deposit rate to negative 0.1% to encourage banks to extend lending by effectively charging them for parking excess cash with the central bank, growth
remained tepid and inflation was well below the ECB’s target of just below 2%. The inflation rate averaged 0.4% from July to October and then fell 0.3% in November and was estimated at -0.2% for December. Unemployment across the euro zone remained stubbornly high at 11.5%.
Japan’s economy retreated into recession during the six month period following two quarters of economic contraction, partly attributed to an increase in the national consumption tax earlier in the year. Responding to the crisis, the Bank of Japan surprised global markets on October 31 by unveiling plans to buy 8 trillion to 12 trillion yen ($71 billion to $107 billion) of Japanese government bonds per month, while also tripling its purchases of exchange-traded funds. The announcement drove Tokyo stocks to seven-year highs. For the six months ended December 31, 2014, the MSCI Europe, Australasia and Far East Index returned -9.2%.
Elsewhere, China’s economy continued to grow but at a slower pace for the six month period. At 7.3%, China’s GDP showed the slowest growth in five years, though it was slightly better than economists had expected. The weaker GDP growth was partly attributed to a slowdown in the property sector. However, Chinese equity securities performed well over the six months ended December 31, 2014, amid expectations that policy makers may ease monetary policy to spur growth. Chinese equity markets received an additional boost when regulators increased access to Chinese financial markets by allowing foreign investors in Hong Kong to buy shares in Shanghai.
Russia’s economy, already straining under Western economic sanctions following its annexation of Crimea, began sliding toward recession as prices plummeted for oil and natural gas, its biggest exports. In response, the Russian Central Bank spent heavily from its reserves and raised its key interest rate sharply in a largely unsuccessful effort to halt the ruble’s slide. The MSCI Emerging Markets Index returned -7.7% for the six months ended December 31, 2014.
During the six month period, financial market volatility returned after being largely absent in the first half of 2014. Meanwhile, economic growth outside the U.S. began to falter and the relative strength of the U.S. economy drove the dollar higher against other major currencies. Amid uncertainty about the global economy recovery, equity markets in the U.S., China and Japan provided investors with solid returns and served to emphasize the prudence of holding a broadly diversified portfolio and a long-term outlook.
On behalf of everyone at J.P. Morgan Asset Management, thank you for your continued support. We look forward to managing your investment needs for years to come. Should you have any questions, please visit www.jpmorganfunds.com or contact the J.P. Morgan Funds Service Center at 1-800-480-4111.
Sincerely yours,

George C.W. Gatch
CEO, Global Funds Management
J.P. Morgan Asset Management
| | | | | | | | |
| | | |
| DECEMBER 31, 2014 | | J.P. MORGAN INVESTOR FUNDS | | | | | 1 | |
J.P. Morgan Investor Funds
FUND FACTS
SIX MONTHS ENDED DECEMBER 31, 2014 (Unaudited)
| | | | | | | | | | | | | | | | | | | | |
Fund | | Fund
Return* | | | Barclays U.S. Intermediate
Aggregate Index Return
(Broad Based Fixed Income Benchmark) | | | Russell 3000
Index Return (Broad-
Based Equity Benchmark) | | | Composite
Benchmark Return | | | Fund Net
Assets as of
December 31, 2014
(in thousands) | |
| JPMorgan Investor Balanced Fund, Class A (No sales charge) | | | 1.65% | | | | 1.24% | | | | 5.25% | | | | 3.26% | ** | | $ | 5,360,161 | |
| | | | | |
| JPMorgan Investor Conservative Growth Fund, Class A (No sales charge) | | | 1.09% | | | | 1.24% | | | | 5.25% | | | | 2.45% | *** | | | 4,430,854 | |
| | | | | |
| JPMorgan Investor Growth Fund, Class A (No sales charge) | | | 3.17% | | | | 1.24% | | | | 5.25% | | | | 4.85% | **** | | | 2,389,542 | |
| | | | | |
| JPMorgan Investor Growth & Income Fund, Class A (No sales charge) | | | 1.94% | | | | 1.24% | | | | 5.25% | | | | 4.06% | ***** | | | 3,216,445 | |
Portfolio Composition by Asset Class******
| | | | |
Investor Balanced Fund | |
| U.S. Equity | | | 41.5 | % |
| Fixed Income | | | 36.6 | |
| International Equity | | | 11.1 | |
| Alternative Assets | | | 6.3 | |
| Money Market | | | 4.5 | |
|
Investor Conservative Growth Fund | |
| Fixed Income | | | 55.6 | % |
| U.S. Equity | | | 26.5 | |
| Alternative Assets | | | 7.0 | |
| International Equity | | | 6.8 | |
| Money Market | | | 4.1 | |
|
Investor Growth Fund | |
| U.S. Equity | | | 75.1 | % |
| International Equity | | | 14.0 | |
| Fixed Income | | | 6.8 | |
| Alternative Assets | | | 2.4 | |
| Money Market | | | 1.7 | |
|
Investor Growth & Income Fund | |
| U.S. Equity | | | 54.1 | % |
| Fixed Income | | | 22.8 | |
| International Equity | | | 14.5 | |
| Alternative Assets | | | 5.8 | |
| Money Market | | | 2.8 | |
| * | | The return shown is based on net asset values calculated for shareholder transactions and may differ from the return shown in the financial highlights, which reflects adjustments made to the net asset values in accordance with accounting principles generally accepted in the United States of America. |
| ** | | The Composite Benchmark is comprised of unmanaged indices that correspond to the Investor Balanced Fund’s model allocation and consists of the Barclays U.S. Intermediate Aggregate Index (50%) and the Russell 3000 Index (50%). |
| *** | | The Composite Benchmark is comprised of unmanaged indices that correspond to the Investor Conservative Growth Fund’s model allocation and consists of the Barclays U.S. Intermediate Aggregate Index (70%) and the Russell 3000 Index (30%). |
| **** | | The Composite Benchmark is comprised of unmanaged indices that correspond to the Investor Growth Fund’s model allocation and consists of the Russell 3000 Index (90%) and the Barclays U.S. Intermediate Aggregate Index (10%). |
| ***** | | The Composite Benchmark is comprised of unmanaged indices that correspond to the Investor Growth & Income Fund’s model allocation and consists of the Russell 3000 Index (70%) and the Barclays U.S. Intermediate Aggregate Index (30%). |
| ****** | | Percentages indicated are based on total investments as of December 31, 2014. The Funds’ portfolio composition is subject to change. |
| | | | | | |
| | | |
| 2 | | | | J.P. MORGAN INVESTOR FUNDS | | DECEMBER 31, 2014 |
J.P. Morgan Investor Funds
FUNDS COMMENTARY
SIX MONTHS ENDED DECEMBER 31, 2014 (Unaudited)
INVESTMENT OBJECTIVES*
The JPMorgan Investor Balanced Fund seeks high total return consistent with the preservation of capital by investing primarily in a diversified group of mutual funds within the same group of investment companies that invest primarily in equity and fixed income securities.
The JPMorgan Investor Conservative Growth Fund seeks income and capital appreciation by investing primarily in a diversified group of mutual funds within the same group of investment companies that invest primarily in fixed income and equity securities.
The JPMorgan Investor Growth Fund seeks long-term capital appreciation by investing primarily in a diversified group of mutual funds within the same group of investment companies that invest primarily in equity securities.
The JPMorgan Investor Growth & Income Fund seeks long-term capital appreciation and growth of income by investing primarily in a diversified group of mutual funds within the same group of investment companies that invest primarily in equity securities.
HOW DID THE MARKET PERFORM?
U.S equity markets performed strongly during the six month reporting period, amid accommodative central bank policies, falling energy prices and steady overall improvement in the U.S. economy. While the second half of 2014 was marked by the return of volatility in financial markets and a sharp sell-off in mid-October, key U.S. equity indexes rebounded to closing highs in the final months of 2014. The Standard & Poor’s 500 Index broke through the 2,000-point closing level for the first time on the final day of October and hit new closing highs in the final weeks of December. Also in late December, the Dow Jones Industrial Average closed above 18,000 points for the first time.
Bond markets were mixed over the six month reporting period. U.S. Treasury securities benefitted from falling oil prices, a slow down in economic growth outside the U.S. and geopolitical risks, which drove investors to investments that provided both a safe haven and good liquidity. A sharp decline in government bond yields in the U.K., European Union and Japan also made U.S. Treasury securities more attractive. Yields generally move in the opposite direction of prices. In aggregate, U.S. Treasury securities returned 2.28% for 2014. Meanwhile, the Barclays U.S. Aggregate Index returned 1.96% for the six months ended December 31, 2014, while the Barclays U.S. High Yield Corporate Index returned -2.85%.
WHAT WERE THE MAIN DRIVERS OF THE FUNDS’ PERFORMANCE?
In accordance with their model allocations, each of the JPMorgan Investor Funds (the “Investor Funds”) allocated its assets among fixed income, equity and alternative investments. For the six months ended December 31, 2014, three of the four Investor Funds outperformed the Barclays U.S. Intermediate Aggregate Index, their broad based fixed income benchmark. In contrast, each of the Investor Funds underperformed the Russell 3000 Index, the Investor Funds’ broad based equity benchmark. This was due to the Funds’ allocation to fixed income securities, which underperformed equity securities during the reporting period.
Each Investor Fund’s performance is also compared to composite benchmarks, which are constructed of different percentages of the Investor Funds’ broad based fixed income and equity benchmarks. These composite benchmarks correspond to each Investor Fund’s model allocation. All four Investor Funds underperformed their respective composite benchmarks, mainly due the Funds’ exposure to both developed market and emerging market equities that were not held in the composite benchmarks.
HOW WERE THE FUNDS POSITIONED?
Each Investor Fund invested in underlying JPMorgan Funds (“underlying funds”). The underlying funds invest in fixed income securities, equities and other alternative fixed income and equity strategies, such as below investment-grade, high-yield bonds, commodities, equity long/short and market-neutral strategies. Among equities, the underlying funds in which the Investor Funds invested were allocated among large-cap, mid-cap, small-cap, and international stocks. The Investor Funds’ portfolio managers made investments for each Investor Fund based on an evaluation of three components: underlying fund selection, tactical asset allocation and strategic asset allocation. They determined the strategic weight for each asset class in the Investor Funds by making investments that they believed would perform well over the long term, and maintained a level of volatility similar to that of each Investor Fund’s composite benchmark.
During the reporting period, the Investor Funds — through their investments in underlying funds — benefited from an overweight position relative to their composite benchmarks in equities and relative underweight position in fixed income securities. While the Funds remained overweight to equities relative to their composite benchmarks, the Funds’ managers began to gradually increase the investments in fixed income. Throughout the six month reporting period, the Funds’ managers added to core fixed income, accumulated a higher than normal cash balance invested in a J.P. Morgan money
| | | | | | | | |
| | | |
| DECEMBER 31, 2014 | | J.P. MORGAN INVESTOR FUNDS | | | | | 3 | |
market fund, and introduced a new position in the J.P. Morgan Systematic Alpha Fund, which invests in a diversified mix of alternative strategies. The Funds’ gradual repositioning reflected the managers’ assessment that various segments of the financial markets are more fairly valued compared with
other segments. The Funds’ managers view their decision to gradually increase fixed income investments in the Investor Funds portfolios as a normal rebalancing of the asset mix following several years of strong equity market performance.
| * | | The adviser seeks to achieve each Fund’s objective. There can be no guarantee it will be achieved. |
| | | | | | |
| | | |
| 4 | | | | J.P. MORGAN INVESTOR FUNDS | | DECEMBER 31, 2014 |
JPMorgan Investor Balanced Fund
FUND COMMENTARY
SIX MONTHS ENDED DECEMBER 31, 2014 (Unaudited)
| | | | | | | | | | | | | | | | | | |
AVERAGE ANNUAL TOTAL RETURNS AS OF DECEMBER 31, 2014 | |
| | | | | |
| | | INCEPTION DATE OF
CLASS | | 6 MONTH* | | | 1 YEAR | | | 5 YEAR | | | 10 YEAR | |
CLASS A SHARES | | December 10, 1996 | | | | | | | | | | | | | | | | |
Without Sales Charge | | | | | 1.65 | % | | | 6.26 | % | | | 8.24 | % | | | 6.05 | % |
With Sales Charge** | | | | | (2.93 | ) | | | 1.48 | | | | 7.25 | | | | 5.56 | |
CLASS B SHARES | | December 10, 1996 | | | | | | | | | | | | | | | | |
Without CDSC | | | | | 1.47 | | | | 5.75 | | | | 7.69 | | | | 5.57 | |
With CDSC*** | | | | | (3.53 | ) | | | 0.75 | | | | 7.39 | | | | 5.57 | |
CLASS C SHARES | | July 1, 1997 | | | | | | | | | | | | | | | | |
Without CDSC | | | | | 1.48 | | | | 5.79 | | | | 7.68 | | | | 5.47 | |
With CDSC**** | | | | | 0.48 | | | | 4.79 | | | | 7.68 | | | | 5.47 | |
SELECT CLASS SHARES | | December 10, 1996 | | | 1.78 | | | | 6.50 | | | | 8.50 | | | | 6.31 | |
| | ** | | Sales Charge for Class A Shares is 4.50%. |
| | *** | | Assumes a 5% CDSC (contingent deferred sales charge) for the one year period, 2% CDSC for the five year period and 0% CDSC thereafter. |
| **** | | Assumes a 1% CDSC for the one year period and 0% CDSC thereafter. |
TEN YEAR PERFORMANCE (12/31/04 TO 12/31/14)
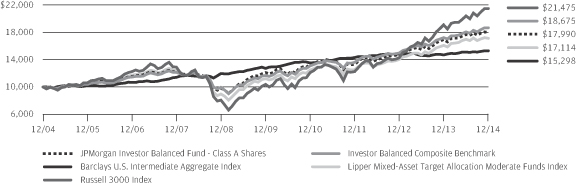
The performance quoted is past performance and is not a guarantee of future results. Mutual funds are subject to certain market risks. Investment returns and principal value of an investment will fluctuate so that an investor’s shares, when redeemed, may be worth more or less than their original cost. Current performance may be higher or lower than the performance data shown. For up-to-date month-end performance information please call 1-800-480-4111.
The graph illustrates comparative performance for $10,000 invested in Class A Shares of the JPMorgan Investor Balanced Fund, the Barclays U.S. Intermediate Aggregate Index, the Russell 3000 Index, the Investor Balanced Composite Benchmark and the Lipper Mixed-Asset Target Allocation Moderate Funds Index from December 31, 2004 to December 31, 2014. The performance of the Fund assumes reinvestment of all dividends and capital gain distributions, if any, and includes a sales charge. The performance of the broad-based securities indices and the Investor Balanced Composite Benchmark does not reflect the deduction of expenses or a sales charge associated with a mutual fund and has been adjusted to reflect reinvestment of all dividends and capital gain distributions of the securities included in the benchmark, if applicable. The performance of the Lipper Mixed-Asset Target Allocation Moderate Funds Index, which is not a broad-based securities index, includes expenses associated with a mutual fund, such as investment management fees. These expenses are not identical to the expenses incurred by the Fund. The Barclays U.S. Intermediate Aggregate Index is an unmanaged index comprised of U.S. Government, mortgage, corporate, and asset-backed securities with maturities of one to 10 years. The Russell 3000 Index is an unmanaged index which measures the performance of the
3,000 largest U.S. companies based on total market capitalization, which represents approximately 98% of the investable U.S. equity market. The Investor Balanced Composite Benchmark is comprised of unmanaged indices that correspond to the Fund’s model allocation and consists of the Barclays U.S. Intermediate Aggregate Index (50%) and the Russell 3000 Index (50%). The Lipper Mixed-Asset Target Allocation Moderate Funds Index consists of funds that by portfolio practice maintain a mix of between 40% to 60% equity securities, with the remainder invested in bonds, cash and cash equivalents. Investors cannot invest directly in an index.
Class A Shares have a $500 minimum initial investment and carry a 4.50% sales charge.
Fund performance may reflect the waiver of the Fund’s fees and reimbursement of expenses for certain periods since the inception date. Without these waivers and reimbursements, performance would have been lower. Also, performance shown in this section does not reflect the deduction of taxes that a shareholder would pay on Fund distributions or redemption of Fund shares.
Because Class B Shares automatically convert to Class A Shares after 8 years, the 10 year average annual total return shown above for Class B reflects Class A performance for the period after conversion.
The returns shown are based on net asset values calculated for shareholder transactions and may differ from the returns shown in the financial highlights, which reflect adjustments made to the net asset values in accordance with accounting principles generally accepted in the United States of America.
| | | | | | | | |
| | | |
| DECEMBER 31, 2014 | | J.P. MORGAN INVESTOR FUNDS | | | | | 5 | |
JPMorgan Investor Conservative Growth Fund
FUND COMMENTARY
SIX MONTHS ENDED DECEMBER 31, 2014 (Unaudited)
| | | | | | | | | | | | | | | | | | |
AVERAGE ANNUAL TOTAL RETURNS AS OF DECEMBER 31, 2014 | |
| | | | | |
| | | INCEPTION DATE OF
CLASS | | 6 MONTH* | | | 1 YEAR | | | 5 YEAR | | | 10 YEAR | |
CLASS A SHARES | | December 10, 1996 | | | | | | | | | | | | | | | | |
Without Sales Charge | | | | | 1.09 | % | | | 5.00 | % | | | 6.39 | % | | | 5.18 | % |
With Sales Charge** | | | | | (3.44 | ) | | | 0.30 | | | | 5.41 | | | | 4.70 | |
CLASS B SHARES | | December 10, 1996 | | | | | | | | | | | | | | | | |
Without CDSC | | | | | 0.92 | | | | 4.53 | | | | 5.86 | | | | 4.72 | |
With CDSC*** | | | | | (4.08 | ) | | | (0.47 | ) | | | 5.54 | | | | 4.72 | |
CLASS C SHARES | | July 1, 1997 | | | | | | | | | | | | | | | | |
Without CDSC | | | | | 0.91 | | | | 4.56 | | | | 5.85 | | | | 4.61 | |
With CDSC**** | | | | | (0.09 | ) | | | 3.56 | | | | 5.85 | | | | 4.61 | |
SELECT CLASS SHARES | | December 10, 1996 | | | 1.27 | | | | 5.36 | | | | 6.68 | | | | 5.45 | |
| | ** | | Sales Charge for Class A Shares is 4.50%. |
| | *** | | Assumes a 5% CDSC (contingent deferred sales charge) for the one year period, 2% CDSC for the five year period and 0% CDSC thereafter. |
| **** | | Assumes a 1% CDSC for the one year period and 0% CDSC thereafter. |
TEN YEAR PERFORMANCE (12/31/04 TO 12/31/14)
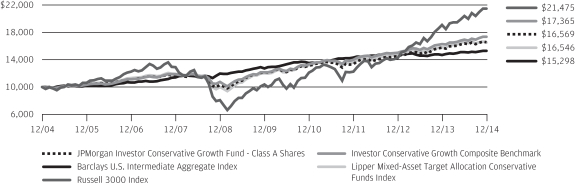
The performance quoted is past performance and is not a guarantee of future results. Mutual funds are subject to certain market risks. Investment returns and principal value of an investment will fluctuate so that an investor’s shares, when redeemed, may be worth more or less than their original cost. Current performance may be higher or lower than the performance data shown. For up-to-date month-end performance information please call 1-800-480-4111.
The graph illustrates comparative performance for $10,000 invested in Class A Shares of the JPMorgan Investor Conservative Growth Fund, the Barclays U.S. Intermediate Aggregate Index, the Russell 3000 Index, the Investor Conservative Growth Composite Benchmark, and the Lipper Mixed-Asset Target Allocation Conservative Funds Index from December 31, 2004 to December 31, 2014. The performance of the Fund assumes reinvestment of all dividends and capital gain distributions, if any, and includes a sales charge. The performance of the broad-based securities indices and the Investor Conservative Growth Composite Benchmark does not reflect the deduction of expenses or a sales charge associated with a mutual fund and has been adjusted to reflect reinvestment of all dividends and capital gain distributions of the securities included in the benchmark, if applicable. The performance of the Lipper Mixed-Asset Target Allocation Conservative Funds Index, which is not a broad-based securities index, includes expenses associated with a mutual fund, such as investment management fees. These expenses are not identical to the expenses incurred by the Fund. The Barclays U.S. Intermediate Aggregate Index is an unmanaged index comprised of U.S. Government, mortgage, corporate, and asset-backed securities with maturities of one to 10 years. The Russell 3000 Index is an unmanaged index
which measures the performance of the 3,000 largest U.S. companies based on total market capitalization, which represents approximately 98% of the investable U.S. equity market. The Investor Conservative Growth Composite Benchmark is comprised of unmanaged indices that correspond to the Fund’s model allocation and consists of the Barclays U.S. Intermediate Aggregate Index (70%) and the Russell 3000 Index (30%). The Lipper Mixed-Asset Target Allocation Conservative Funds Index consists of funds that by portfolio practice maintain a mix of between 20% to 40% equity securities, with the remainder invested in bonds, cash and cash equivalents. Investors cannot invest directly in an index.
Class A Shares have a $500 minimum initial investment and carry a 4.50% sales charge.
Fund performance may reflect the waiver of the Fund’s fees and reimbursement of expenses for certain periods since the inception date. Without these waivers and reimbursements, performance would have been lower. Also, performance shown in this section does not reflect the deduction of taxes that a shareholder would pay on Fund distributions or redemption of Fund shares.
Because Class B Shares automatically convert to Class A Shares after 8 years, the 10 year average annual total return shown above for Class B reflects Class A performance for the period after conversion.
The returns shown are based on net asset values calculated for shareholder transactions and may differ from the returns shown in the financial highlights, which reflect adjustments made to the net asset values in accordance with accounting principles generally accepted in the United States of America.
| | | | | | |
| | | |
| 6 | | | | J.P. MORGAN INVESTOR FUNDS | | DECEMBER 31, 2014 |
JPMorgan Investor Growth Fund
FUND COMMENTARY
SIX MONTHS ENDED DECEMBER 31, 2014 (Unaudited)
| | | | | | | | | | | | | | | | | | |
AVERAGE ANNUAL TOTAL RETURNS AS OF DECEMBER 31, 2014 | |
| | | | | |
| | | INCEPTION DATE OF
CLASS | | 6 MONTH* | | | 1 YEAR | | | 5 YEAR | | | 10 YEAR | |
CLASS A SHARES | | December 10, 1996 | | | | | | | | | | | | | | | | |
Without Sales Charge | | | | | 3.17 | % | | | 8.99 | % | | | 11.78 | % | | | 7.01 | % |
With Sales Charge** | | | | | (1.46 | ) | | | 4.06 | | | | 10.75 | | | | 6.52 | |
CLASS B SHARES | | December 10, 1996 | | | | | | | | | | | | | | | | |
Without CDSC | | | | | 2.93 | | | | 8.44 | | | | 11.17 | | | | 6.50 | |
With CDSC*** | | | | | (2.07 | ) | | | 3.44 | | | | 10.91 | | | | 6.50 | |
CLASS C SHARES | | July 1, 1997 | | | | | | | | | | | | | | | | |
Without CDSC | | | | | 2.93 | | | | 8.48 | | | | 11.17 | | | | 6.40 | |
With CDSC**** | | | | | 1.93 | | | | 7.48 | | | | 11.17 | | | | 6.40 | |
SELECT CLASS SHARES | | December 10, 1996 | | | 3.30 | | | | 9.27 | | | | 12.06 | | | | 7.27 | |
| | ** | | Sales Charge for Class A Shares is 4.50%. |
| | *** | | Assumes a 5% CDSC (contingent deferred sales charge) for the one year period, 2% CDSC for the five year period and 0% CDSC thereafter. |
| **** | | Assumes a 1% CDSC for the one year period and 0% CDSC thereafter. |
TEN YEAR PERFORMANCE (12/31/04 TO 12/31/14)
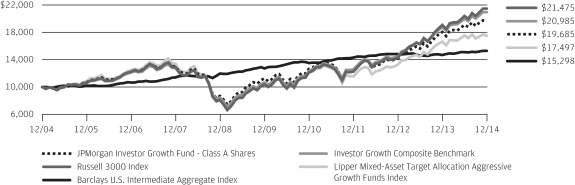
The performance quoted is past performance and is not a guarantee of future results. Mutual funds are subject to certain market risks. Investment returns and principal value of an investment will fluctuate so that an investor’s shares, when redeemed, may be worth more or less than their original cost. Current performance may be higher or lower than the performance data shown. For up-to-date month-end performance information please call 1-800-480-4111.
The graph illustrates comparative performance for $10,000 invested in Class A Shares of the JPMorgan Investor Growth Fund, the Russell 3000 Index, the Barclays U.S. Intermediate Aggregate Index, the Investor Growth Composite Benchmark and the Lipper Mixed-Asset Target Allocation Aggressive Growth Funds Index from December 31, 2004 to December 31, 2014. The performance of the Fund assumes reinvestment of all dividends and capital gain distributions, if any, and includes a sales charge. The performance of the broad-based securities indices and the Investor Growth Composite Benchmark does not reflect the deduction of expenses or a sales charge associated with a mutual fund and has been adjusted to reflect reinvestment of all dividends and capital gain distributions of the securities included in the benchmark, if applicable. The performance of the Lipper Mixed-Asset Target Allocation Aggressive Growth Funds Index, which is not a broad-based securities index, includes expenses associated with a mutual fund, such as investment management fees. These expenses are not identical to the expenses incurred by the Fund. The Russell 3000 Index is an unmanaged index which measures the performance of the 3,000 largest U.S. companies based on total market capitalization, which represents approximately 98% of the investable U.S. equity market. The Barclays U.S. Intermediate Aggregate Index is an unmanaged index comprised
of U.S. Government, mortgage, corporate, and asset-backed securities with maturities of one to 10 years. The Investor Growth Composite Benchmark is comprised of unmanaged indices that correspond to the Fund’s model allocation and consists of the Russell 3000 Index (90%) and the Barclays U.S. Intermediate Aggregate Index (10%). The Lipper Mixed-Asset Target Allocation Aggressive Growth Funds Index consists of funds that invest in a variety of market capitalization ranges without concentrating 75% of their equity assets in any one market capitalization range over an extended period of time. Investors cannot invest directly in an index.
Class A Shares have a $500 minimum initial investment and carry a 4.50% sales charge.
Fund performance may reflect the waiver of the Fund’s fees and reimbursement of expenses for certain periods since the inception date. Without these waivers and reimbursements, performance would have been lower. Also, performance shown in this section does not reflect the deduction of taxes that a shareholder would pay on Fund distributions or redemption of Fund shares.
Because Class B Shares automatically convert to Class A Shares after 8 years, the 10 year average annual total return shown above for Class B reflects Class A performance for the period after conversion.
The returns shown are based on net asset values calculated for shareholder transactions and may differ from the returns shown in the financial highlights, which reflect adjustments made to the net asset values in accordance with accounting principles generally accepted in the United States of America.
| | | | | | | | |
| | | |
| DECEMBER 31, 2014 | | J.P. MORGAN INVESTOR FUNDS | | | | | 7 | |
JPMorgan Investor Growth & Income Fund
FUND COMMENTARY
SIX MONTHS ENDED DECEMBER 31, 2014 (Unaudited)
| | | | | | | | | | | | | | | | | | |
AVERAGE ANNUAL TOTAL RETURNS AS OF DECEMBER 31, 2014 | |
| | | | | |
| | | INCEPTION DATE OF
CLASS | | 6 MONTH* | | | 1 YEAR | | | 5 YEAR | | | 10 YEAR | |
CLASS A SHARES | | December 10, 1996 | | | | | | | | | | | | | | | | |
Without Sales Charge | | | | | 1.94 | % | | | 6.90 | % | | | 9.86 | % | | | 6.44 | % |
With Sales Charge** | | | | | (2.67 | ) | | | 2.09 | | | | 8.84 | | | | 5.95 | |
CLASS B SHARES | | December 10, 1996 | | | | | | | | | | | | | | | | |
Without CDSC | | | | | 1.75 | | | | 6.41 | | | | 9.30 | | | | 5.95 | |
With CDSC*** | | | | | (3.25 | ) | | | 1.41 | | | | 9.02 | | | | 5.95 | |
CLASS C SHARES | | July 1, 1997 | | | | | | | | | | | | | | | | |
Without CDSC | | | | | 1.78 | | | | 6.38 | | | | 9.30 | | | | 5.86 | |
With CDSC**** | | | | | 0.78 | | | | 5.38 | | | | 9.30 | | | | 5.86 | |
SELECT CLASS SHARES | | December 10, 1996 | | | 2.09 | | | | 7.19 | | | | 10.13 | | | | 6.71 | |
| | ** | | Sales Charge for Class A Shares is 4.50%. |
| | *** | | Assumes a 5% CDSC (contingent deferred sales charge) for the one year period, 2% CDSC for the five year period and 0% CDSC thereafter. |
| **** | | Assumes a 1% CDSC for the one year period and 0% CDSC thereafter. |
TEN YEAR PERFORMANCE (12/31/04 TO 12/31/14)
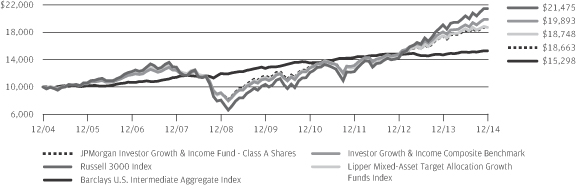
The performance quoted is past performance and is not a guarantee of future results. Mutual funds are subject to certain market risks. Investment returns and principal value of an investment will fluctuate so that an investor’s shares, when redeemed, may be worth more or less than their original cost. Current performance may be higher or lower than the performance data shown. For up-to-date month-end performance information please call 1-800-480-4111.
The graph illustrates comparative performance for $10,000 invested in Class A Shares of the JPMorgan Investor Growth & Income Fund, the Russell 3000 Index, the Barclays U.S. Intermediate Aggregate Index, the Investor Growth & Income Composite Benchmark and the Lipper Mixed-Asset Target Allocation Growth Funds Index from December 31, 2004 to December 31, 2014. The performance of the Fund assumes reinvestment of all dividends and capital gain distributions, if any, and includes a sales charge. The performance of the broad-based securities indices and the Investor Growth & Income Composite Benchmark does not reflect the deduction of expenses or a sales charge associated with a mutual fund and has been adjusted to reflect reinvestment of all dividends and capital gain distributions of the securities included in the benchmark, if applicable. The performance of the Lipper Mixed-Asset Target Allocation Growth Funds Index, which is not a broad-based securities index, includes expenses associated with a mutual fund, such as investment management fees. These expenses are not identical to the expenses incurred by the Fund. The Russell 3000 Index is an unmanaged index which measures the performance of the 3,000 largest U.S. companies based on total market capitalization, which represents approximately 98% of the investable U.S. equity market. The Barclays U.S. Intermediate Aggregate Index is an unmanaged index comprised of U.S. Government,
mortgage, corporate, and asset-backed securities with maturities of one to 10 years. The Investor Growth & Income Composite Benchmark is comprised of unmanaged indices that correspond to the Fund’s model allocation and consists of the Russell 3000 Index (70%) and the Barclays U.S. Intermediate Aggregate Index (30%). The Lipper Mixed-Asset Target Allocation Growth Funds Index consists of funds that by portfolio practice maintain a mix of between 60% to 80% equity securities, with the remainder invested in bonds, cash and cash equivalents. Investors cannot invest directly in an index.
Class A Shares have a $500 minimum initial investment and carry a 4.50% sales charge.
Fund performance may reflect the waiver of the Fund’s fees and reimbursement of expenses for certain periods since the inception date. Without these waivers and reimbursements, performance would have been lower. Also, performance shown in this section does not reflect the deduction of taxes that a shareholder would pay on Fund distributions or redemption of Fund shares.
Because Class B Shares automatically convert to Class A Shares after 8 years, the 10 year average annual total return shown above for Class B reflects Class A performance for the period after conversion.
The returns shown are based on net asset values calculated for shareholder transactions and may differ from the returns shown in the financial highlights, which reflect adjustments made to the net asset values in accordance with accounting principles generally accepted in the United States of America.
| | | | | | |
| | | |
| 8 | | | | J.P. MORGAN INVESTOR FUNDS | | DECEMBER 31, 2014 |
JPMorgan Investor Balanced Fund
SCHEDULE OF PORTFOLIO INVESTMENTS
AS OF DECEMBER 31, 2014 (Unaudited)
(Amounts in thousands)
| | | | | | | | |
| SHARES | | | SECURITY DESCRIPTION | | VALUE($) | |
| | | | | | | | |
| Investment Companies — 100.0% (b) | | | | |
| | | | Alternative Assets — 6.3% | | | | |
| | 1,910 | | | JPMorgan Commodities Strategy Fund, Select Class Shares (a) | | | 20,914 | |
| | 1,340 | | | JPMorgan Global Natural Resources Fund, Select Class Shares | | | 10,173 | |
| | 11,377 | | | JPMorgan Multi-Cap Market Neutral Fund, Select Class Shares (a) | | | 116,844 | |
| | 7,109 | | | JPMorgan Research Market Neutral Fund, Select Class Shares | | | 108,846 | |
| | 5,304 | | | JPMorgan Systematic Alpha Fund, Select Class Shares | | | 79,773 | |
| | | | | | | | |
| | | | Total Alternative Assets | | | 336,550 | |
| | | | | | | | |
| | | | Fixed Income — 36.6% | | | | |
| | 63,753 | | | JPMorgan Core Bond Fund, Select Class Shares | | | 749,100 | |
| | 56,447 | | | JPMorgan Core Plus Bond Fund, Select Class Shares | | | 469,077 | |
| | 4,230 | | | JPMorgan Emerging Markets Debt Fund, Select Class Shares | | | 34,137 | |
| | 4,370 | | | JPMorgan Emerging Markets Local Currency Debt Fund, Select Class Shares | | | 37,979 | |
| | 13,205 | | | JPMorgan Floating Rate Income Fund, Select Class Shares | | | 128,348 | |
| | 1,090 | | | JPMorgan Government Bond Fund, Select Class Shares | | | 11,917 | |
| | 15,072 | | | JPMorgan High Yield Fund, Select Class Shares | | | 114,397 | |
| | 13,912 | | | JPMorgan Inflation Managed Bond Fund, Select Class Shares | | | 142,461 | |
| | 13,210 | | | JPMorgan Limited Duration Bond Fund, Select Class Shares | | | 132,101 | |
| | 10,219 | | | JPMorgan Strategic Income Opportunities Fund, Select Class Shares | | | 119,764 | |
| | 2,305 | | | JPMorgan Unconstrained Debt Fund, Select Class Shares | | | 23,114 | |
| | | | | | | | |
| | | | Total Fixed Income | | | 1,962,395 | |
| | | | | | | | |
| | | | International Equity — 11.1% | | | | |
| | 5,910 | | | JPMorgan Emerging Economies Fund, Select Class Shares | | | 72,039 | |
| | 3,153 | | | JPMorgan Emerging Markets Equity Fund, Select Class Shares | | | 70,553 | |
| | 9,686 | | | JPMorgan Global Research Enhanced Index Fund, Select Class Shares | | | 177,343 | |
| | 4,063 | | | JPMorgan International Equity Fund, Select Class Shares | | | 61,024 | |
| | 9,109 | | | JPMorgan International Research Enhanced Equity Fund, Select Class Shares | | | 147,388 | |
| | 1,826 | | | JPMorgan Intrepid European Fund, Select Class Shares | | | 43,327 | |
| | | | | | | | |
| SHARES | | | SECURITY DESCRIPTION | | VALUE($) | |
| | | | | | | | |
| | | | | | | | |
| | | | International Equity — continued | | | | |
| | 1,484 | | | JPMorgan Latin America Fund, Select Class Shares | | | 22,967 | |
| | | | | | | | |
| | | | Total International Equity | | | 594,641 | |
| | | | | | | | |
| | | | Money Market — 4.5% | | | | |
| | 241,924 | | | JPMorgan Liquid Assets Money Market Fund, Institutional Class Shares, 0.030% (l) | | | 241,924 | |
| | | | | | | | |
| | | | U.S. Equity — 41.5% | | | | |
| | 4,719 | | | JPMorgan Dynamic Growth Fund, Select Class Shares | | | 115,672 | |
| | 6,102 | | | JPMorgan Equity Income Fund, Select Class Shares | | | 87,074 | |
| | 9,862 | | | JPMorgan Intrepid America Fund, Select Class Shares | | | 375,530 | |
| | 4,520 | | | JPMorgan Intrepid Growth Fund, Select Class Shares | | | 182,718 | |
| | 4,902 | | | JPMorgan Intrepid Mid Cap Fund, Select Class Shares | | | 112,402 | |
| | 1,725 | | | JPMorgan Large Cap Growth Fund, Select Class Shares | | | 59,678 | |
| | 13,075 | | | JPMorgan Large Cap Value Fund, Select Class Shares | | | 192,339 | |
| | 15,984 | | | JPMorgan Market Expansion Enhanced Index Fund, Select Class Shares | | | 201,238 | |
| | 3,377 | | | JPMorgan U.S. Dynamic Plus Fund, Select Class Shares | | | 61,876 | |
| | 34,459 | | | JPMorgan U.S. Equity Fund, Select Class Shares | | | 500,692 | |
| | 8,383 | | | JPMorgan U.S. Large Cap Core Plus Fund, Select Class Shares | | | 246,464 | |
| | 2,973 | | | JPMorgan Value Advantage Fund, Select Class Shares | | | 88,532 | |
| | | | | | | | |
| | | | Total U.S. Equity | | | 2,224,215 | |
| | | | | | | | |
| | | | Total Investments — 100.0% (Cost $4,558,858) | | | 5,359,725 | |
| | | | Other Assets in Excess of
Liabilities — 0.0% (g) | | | 436 | |
| | | | | | | | |
| | | | NET ASSETS — 100.0% | | $ | 5,360,161 | |
| | | | | | | | |
Percentages indicated are based on net assets.
SEE NOTES TO FINANCIAL STATEMENTS.
| | | | | | | | |
| | | |
| DECEMBER 31, 2014 | | J.P. MORGAN INVESTOR FUNDS | | | | | 9 | |
JPMorgan Investor Conservative Growth Fund
SCHEDULE OF PORTFOLIO INVESTMENTS
AS OF DECEMBER 31, 2014 (Unaudited)
(Amounts in thousands)
| | | | | | | | |
| SHARES | | | SECURITY DESCRIPTION | | VALUE($) | |
| | | | | | | | |
| Investment Companies — 100.0% (b) | |
| | | | Alternative Assets — 7.0% | | | | |
| | 1,687 | | | JPMorgan Commodities Strategy Fund, Select Class Shares (a) | | | 18,469 | |
| | 1,139 | | | JPMorgan Global Natural Resources Fund, Select Class Shares | | | 8,642 | |
| | 8,561 | | | JPMorgan Multi-Cap Market Neutral Fund, Select Class Shares (a) | | | 87,919 | |
| | 7,412 | | | JPMorgan Research Market Neutral Fund, Select Class Shares | | | 113,476 | |
| | 5,325 | | | JPMorgan Systematic Alpha Fund, Select Class Shares | | | 80,092 | |
| | | | | | | | |
| | | | Total Alternative Assets | | | 308,598 | |
| | | | | | | | |
| | | | Fixed Income — 55.6% | | | | |
| | 79,567 | | | JPMorgan Core Bond Fund, Select Class Shares | | | 934,913 | |
| | 66,143 | | | JPMorgan Core Plus Bond Fund, Select Class Shares | | | 549,646 | |
| | 2,703 | | | JPMorgan Emerging Markets Debt Fund, Select Class Shares | | | 21,815 | |
| | 6,079 | | | JPMorgan Emerging Markets Local Currency Debt Fund, Select Class Shares | | | 52,827 | |
| | 15,980 | | | JPMorgan Floating Rate Income Fund, Select Class Shares | | | 155,329 | |
| | 3,019 | | | JPMorgan Government Bond Fund, Select Class Shares | | | 33,001 | |
| | 11,418 | | | JPMorgan High Yield Fund, Select Class Shares | | | 86,662 | |
| | 17,109 | | | JPMorgan Inflation Managed Bond Fund, Select Class Shares | | | 175,195 | |
| | 29,090 | | | JPMorgan Limited Duration Bond Fund, Select Class Shares | | | 290,901 | |
| | 12,156 | | | JPMorgan Strategic Income Opportunities Fund, Select Class Shares | | | 142,470 | |
| | 1,903 | | | JPMorgan Unconstrained Debt Fund, Select Class Shares | | | 19,089 | |
| | | | | | | | |
| | | | Total Fixed Income | | | 2,461,848 | |
| | | | | | | | |
| | | | International Equity — 6.8% | | | | |
| | 3,193 | | | JPMorgan Emerging Economies Fund, Select Class Shares | | | 38,926 | |
| | 1,727 | | | JPMorgan Emerging Markets Equity Fund, Select Class Shares | | | 38,650 | |
| | 2,747 | | | JPMorgan Global Research Enhanced Index Fund, Select Class Shares | | | 50,289 | |
| | 2,153 | | | JPMorgan International Equity Fund, Select Class Shares | | | 32,337 | |
| | 6,240 | | | JPMorgan International Research Enhanced Equity Fund, Select Class Shares | | | 100,958 | |
| | 1,032 | | | JPMorgan Intrepid European Fund, Select Class Shares | | | 24,481 | |
| | | | | | | | |
| SHARES | | | SECURITY DESCRIPTION | | VALUE($) | |
| | | | | | | | |
| | | | | | | | |
| | | | International Equity — continued | | | | |
| | 1,003 | | | JPMorgan Latin America Fund, Select Class Shares | | | 15,526 | |
| | | | | | | | |
| | | | Total International Equity | | | 301,167 | |
| | | | | | | | |
| | | | Money Market — 4.1% | | | | |
| | 181,184 | | | JPMorgan Liquid Assets Money Market Fund, Institutional Class Shares, 0.030% (l) | | | 181,184 | |
| | | | | | | | |
| | | | U.S. Equity — 26.5% | | | | |
| | 1,639 | | | JPMorgan Dynamic Growth Fund, Select Class Shares | | | 40,162 | |
| | 5,691 | | | JPMorgan Equity Income Fund, Select Class Shares | | | 81,214 | |
| | 6,739 | | | JPMorgan Intrepid America Fund, Select Class Shares | | | 256,639 | |
| | 2,743 | | | JPMorgan Intrepid Growth Fund, Select Class Shares | | | 110,891 | |
| | 1,894 | | | JPMorgan Intrepid Mid Cap Fund, Select Class Shares | | | 43,434 | |
| | 2,961 | | | JPMorgan Large Cap Value Fund, Select Class Shares | | | 43,557 | |
| | 5,690 | | | JPMorgan Market Expansion Enhanced Index Fund, Select Class Shares | | | 71,637 | |
| | 936 | | | JPMorgan Mid Cap Growth Fund, Select Class Shares | | | 26,345 | |
| | 2,473 | | | JPMorgan U.S. Dynamic Plus Fund, Select Class Shares | | | 45,304 | |
| | 17,521 | | | JPMorgan U.S. Equity Fund, Select Class Shares | | | 254,576 | |
| | 4,868 | | | JPMorgan U.S. Large Cap Core Plus Fund, Select Class Shares | | | 143,125 | |
| | 1,999 | | | JPMorgan Value Advantage Fund, Select Class Shares | | | 59,519 | |
| | | | | | | | |
| | | | Total U.S. Equity | | | 1,176,403 | |
| | | | | | | | |
| | | | Total Investments — 100.0% (Cost $3,987,764) | | | 4,429,200 | |
| | | | Other Assets in Excess of
Liabilities — 0.0% (g) | | | 1,654 | |
| | | | | | | | |
| | | | NET ASSETS — 100.0% | | $ | 4,430,854 | |
| | | | | | | | |
Percentages indicated are based on net assets.
SEE NOTES TO FINANCIAL STATEMENTS.
| | | | | | |
| | | |
| 10 | | | | J.P. MORGAN INVESTOR FUNDS | | DECEMBER 31, 2014 |
JPMorgan Investor Growth Fund
SCHEDULE OF PORTFOLIO INVESTMENTS
AS OF DECEMBER 31, 2014 (Unaudited)
(Amounts in thousands)
| | | | | | | | |
| SHARES | | | SECURITY DESCRIPTION | | VALUE($) | |
| | | | | | | | |
| Investment Companies — 100.0% (b) | |
| | | | Alternative Assets — 2.4% | |
| | 907 | | | JPMorgan Commodities Strategy Fund, Select Class Shares (a) | | | 9,929 | |
| | 674 | | | JPMorgan Global Natural Resources Fund, Select Class Shares | | | 5,117 | |
| | 1,478 | | | JPMorgan Multi-Cap Market Neutral Fund, Select Class Shares (a) | | | 15,184 | |
| | 890 | | | JPMorgan Research Market Neutral Fund, Select Class Shares | | | 13,619 | |
| | 950 | | | JPMorgan Systematic Alpha Fund, Select Class Shares | | | 14,287 | |
| | | | | | | | |
| | | | Total Alternative Assets | | | 58,136 | |
| | | | | | | | |
| | | | Fixed Income — 6.8% | |
| | 4,703 | | | JPMorgan Core Bond Fund, Select Class Shares | | | 55,257 | |
| | 1,586 | | | JPMorgan Core Plus Bond Fund, Select Class Shares | | | 13,176 | |
| | 911 | | | JPMorgan Emerging Markets Debt Fund, Select Class Shares | | | 7,350 | |
| | 1,033 | | | JPMorgan Emerging Markets Local Currency Debt Fund, Select Class Shares | | | 8,976 | |
| | 1,387 | | | JPMorgan Floating Rate Income Fund, Select Class Shares | | | 13,482 | |
| | 1,750 | | | JPMorgan High Yield Fund, Select Class Shares | | | 13,285 | |
| | 2,972 | | | JPMorgan Inflation Managed Bond Fund, Select Class Shares | | | 30,434 | |
| | 429 | | | JPMorgan Limited Duration Bond Fund, Select Class Shares | | | 4,285 | |
| | 950 | | | JPMorgan Strategic Income Opportunities Fund, Select Class Shares | | | 11,136 | |
| | 501 | | | JPMorgan Unconstrained Debt Fund, Select Class Shares | | | 5,021 | |
| | | | | | | | |
| | | | Total Fixed Income | | | 162,402 | |
| | | | | | | | |
| | | | International Equity — 14.0% | |
| | 3,190 | | | JPMorgan Emerging Economies Fund, Select Class Shares | | | 38,886 | |
| | 1,768 | | | JPMorgan Emerging Markets Equity Fund, Select Class Shares | | | 39,564 | |
| | 3,524 | | | JPMorgan Global Research Enhanced Index Fund, Select Class Shares | | | 64,518 | |
| | 5,061 | | | JPMorgan International Equity Fund, Select Class Shares | | | 76,021 | |
| | 4,975 | | | JPMorgan International Research Enhanced Equity Fund, Select Class Shares | | | 80,498 | |
| | 1,097 | | | JPMorgan Intrepid European Fund, Select Class Shares | | | 26,035 | |
| | 538 | | | JPMorgan Latin America Fund, Select Class Shares | | | 8,329 | |
| | | | | | | | |
| | | | Total International Equity | | | 333,851 | |
| | | | | | | | |
| | | | | | | | |
| SHARES | | | SECURITY DESCRIPTION | | VALUE($) | |
| | | | | | | | |
| | | | | | | | |
| | | | Money Market — 1.7% | |
| | 41,477 | | | JPMorgan Liquid Assets Money Market Fund, Institutional Class Shares, 0.030% (l) | | | 41,477 | |
| | | | | | | | |
| | | | U.S. Equity — 75.1% | |
| | 991 | | | JPMorgan Dynamic Growth Fund, Select Class Shares | | | 24,301 | |
| | 2,468 | | | JPMorgan Equity Income Fund, Select Class Shares | | | 35,221 | |
| | 7,784 | | | JPMorgan Intrepid America Fund, Select Class Shares | | | 296,414 | |
| | 3,649 | | | JPMorgan Intrepid Growth Fund, Select Class Shares | | | 147,481 | |
| | 3,923 | | | JPMorgan Intrepid Mid Cap Fund, Select Class Shares | | | 89,944 | |
| | 5,682 | | | JPMorgan Large Cap Growth Fund, Select Class Shares | | | 196,603 | |
| | 17,266 | | | JPMorgan Large Cap Value Fund, Select Class Shares | | | 253,983 | |
| | 11,346 | | | JPMorgan Market Expansion Enhanced Index Fund, Select Class Shares | | | 142,851 | |
| | 558 | | | JPMorgan Mid Cap Growth Fund, Select Class Shares | | | 15,694 | |
| | 2,329 | | | JPMorgan Small Cap Value Fund, Select Class Shares | | | 65,089 | |
| | 1,941 | | | JPMorgan U.S. Dynamic Plus Fund, Select Class Shares | | | 35,555 | |
| | 23,489 | | | JPMorgan U.S. Equity Fund, Select Class Shares | | | 341,302 | |
| | 3,776 | | | JPMorgan U.S. Large Cap Core Plus Fund, Select Class Shares | | | 111,006 | |
| | 1,273 | | | JPMorgan Value Advantage Fund, Select Class Shares | | | 37,901 | |
| | | | | | | | |
| | | | Total U.S. Equity | | | 1,793,345 | |
| | | | | | | | |
| | | | Total Investments — 100.0% (Cost $1,744,608) | | | 2,389,211 | |
| | | | Other Assets in Excess of
Liabilities — 0.0% (g) | | | 331 | |
| | | | | | | | |
| | | | NET ASSETS — 100.0% | | $ | 2,389,542 | |
| | | | | | | | |
Percentages indicated are based on net assets.
SEE NOTES TO FINANCIAL STATEMENTS.
| | | | | | | | |
| | | |
| DECEMBER 31, 2014 | | J.P. MORGAN INVESTOR FUNDS | | | | | 11 | |
JPMorgan Investor Growth & Income Fund
SCHEDULE OF PORTFOLIO INVESTMENTS
AS OF DECEMBER 31, 2014 (Unaudited)
(Amounts in thousands)
| | | | | | | | |
| SHARES | | | SECURITY DESCRIPTION | | VALUE($) | |
| | | | | | | | |
| Investment Companies �� 100.0% (b) | | | | |
| | | | Alternative Assets — 5.8% | |
| | 1,308 | | | JPMorgan Commodities Strategy Fund, Select Class Shares (a) | | | 14,321 | |
| | 985 | | | JPMorgan Global Natural Resources Fund, Select Class Shares | | | 7,476 | |
| | 6,422 | | | JPMorgan Multi-Cap Market Neutral Fund, Select Class Shares (a) | | | 65,954 | |
| | 3,818 | | | JPMorgan Research Market Neutral Fund, Select Class Shares | | | 58,460 | |
| | 2,704 | | | JPMorgan Systematic Alpha Fund, Select Class Shares | | | 40,662 | |
| | | | | | | | |
| | | | Total Alternative Assets | | | 186,873 | |
| | | | | | | | |
| | | | Fixed Income — 22.8% | |
| | 21,147 | | | JPMorgan Core Bond Fund, Select Class Shares | | | 248,473 | |
| | 20,409 | | | JPMorgan Core Plus Bond Fund, Select Class Shares | | | 169,596 | |
| | 1,091 | | | JPMorgan Emerging Markets Debt Fund, Select Class Shares | | | 8,805 | |
| | 2,011 | | | JPMorgan Emerging Markets Local Currency Debt Fund, Select Class Shares | | | 17,478 | |
| | 7,930 | | | JPMorgan Floating Rate Income Fund, Select Class Shares | | | 77,084 | |
| | 1,005 | | | JPMorgan Government Bond Fund, Select Class Shares | | | 10,987 | |
| | 8,392 | | | JPMorgan High Yield Fund, Select Class Shares | | | 63,695 | |
| | 7,144 | | | JPMorgan Inflation Managed Bond Fund, Select Class Shares | | | 73,150 | |
| | 4,040 | | | JPMorgan Strategic Income Opportunities Fund, Select Class Shares | | | 47,352 | |
| | 1,504 | | | JPMorgan Unconstrained Debt Fund, Select Class Shares | | | 15,083 | |
| | | | | | | | |
| | | | Total Fixed Income | | | 731,703 | |
| | | | | | | | |
| | | | International Equity — 14.5% | |
| | 4,039 | | | JPMorgan Emerging Economies Fund, Select Class Shares | | | 49,237 | |
| | 2,223 | | | JPMorgan Emerging Markets Equity Fund, Select Class Shares | | | 49,751 | |
| | 6,267 | | | JPMorgan Global Research Enhanced Index Fund, Select Class Shares | | | 114,753 | |
| | 6,282 | | | JPMorgan International Equity Fund, Select Class Shares | | | 94,351 | |
| | 5,997 | | | JPMorgan International Research Enhanced Equity Fund, Select Class Shares | | | 97,034 | |
| | 2,120 | | | JPMorgan Intrepid European Fund, Select Class Shares | | | 50,303 | |
| | 663 | | | JPMorgan Latin America Fund, Select Class Shares | | | 10,269 | |
| | | | | | | | |
| | | | Total International Equity | | | 465,698 | |
| | | | | | | | |
| | | | | | | | |
| SHARES | | | SECURITY DESCRIPTION | | VALUE($) | |
| | | | | | | | |
| | | | | | | | |
| | | | Money Market — 2.8% | |
| | 91,316 | | | JPMorgan Liquid Assets Money Market Fund, Institutional Class Shares, 0.030% (l) | | | 91,316 | |
| | | | | | | | |
| | | | U.S. Equity — 54.1% | |
| | 1,874 | | | JPMorgan Dynamic Growth Fund, Select Class Shares | | | 45,926 | |
| | 3,815 | | | JPMorgan Equity Income Fund, Select Class Shares | | | 54,438 | |
| | 8,898 | | | JPMorgan Intrepid America Fund, Select Class Shares | | | 338,839 | |
| | 2,786 | | | JPMorgan Intrepid Growth Fund, Select Class Shares | | | 112,593 | |
| | 2,065 | | | JPMorgan Intrepid Mid Cap Fund, Select Class Shares | | | 47,349 | |
| | 4,742 | | | JPMorgan Large Cap Growth Fund, Select Class Shares | | | 164,086 | |
| | 13,415 | | | JPMorgan Large Cap Value Fund, Select Class Shares | | | 197,340 | |
| | 11,058 | | | JPMorgan Market Expansion Enhanced Index Fund, Select Class Shares | | | 139,216 | |
| | 682 | | | JPMorgan Mid Cap Growth Fund, Select Class Shares | | | 19,186 | |
| | 1,840 | | | JPMorgan Small Cap Value Fund, Select Class Shares | | | 51,416 | |
| | 2,736 | | | JPMorgan U.S. Dynamic Plus Fund, Select Class Shares | | | 50,124 | |
| | 22,718 | | | JPMorgan U.S. Equity Fund, Select Class Shares | | | 330,092 | |
| | 4,838 | | | JPMorgan U.S. Large Cap Core Plus Fund, Select Class Shares | | | 142,223 | |
| | 1,618 | | | JPMorgan Value Advantage Fund, Select Class Shares | | | 48,170 | |
| | | | | | | | |
| | | | Total U.S. Equity | | | 1,740,998 | |
| | | | | | | | |
| | | | Total Investments — 100.0% (Cost $2,564,541) | | | 3,216,588 | |
| | | | Liabilities in Excess of
Other Assets — 0.0% (g) | | | (143 | ) |
| | | | | | | | |
| | | | NET ASSETS — 100.0% | | $ | 3,216,445 | |
| | | | | | | | |
Percentages indicated are based on net assets.
SEE NOTES TO FINANCIAL STATEMENTS.
| | | | | | |
| | | |
| 12 | | | | J.P. MORGAN INVESTOR FUNDS | | DECEMBER 31, 2014 |
J.P. Morgan Investor Funds
NOTES TO SCHEDULE OF PORTFOLIO INVESTMENTS
AS OF DECEMBER 31, 2014 (Unaudited)
| | |
| (a) | | — Non-income producing security. |
| (b) | | — Investment in affiliate. Fund is registered under the Investment Company Act of 1940, as amended, and advised by J.P. Morgan Investment Management Inc. |
| (g) | | — Amount rounds to less than 0.1%. |
| (l) | | — The rate shown is the current yield as of December 31, 2014. |
Detailed information about investment portfolios of the underlying funds can be found in shareholder reports filed with the Securities and Exchange Commission (SEC) by each such underlying fund semi-annually on Form N-CSR and in certified portfolio holdings filed quarterly on Form N-Q, and are available for download from both the SEC’s as well as each respective underlying fund’s website. Detailed information about underlying J.P. Morgan Funds can also be found at www.jpmorganfunds.com or by calling 1-800-480-4111.
SEE NOTES TO FINANCIAL STATEMENTS.
| | | | | | | | |
| | | |
| DECEMBER 31, 2014 | | J.P. MORGAN INVESTOR FUNDS | | | | | 13 | |
STATEMENTS OF ASSETS AND LIABILITIES
AS OF DECEMBER 31, 2014 (Unaudited)
(Amounts in thousands, except per share amounts)
| | | | | | | | | | | | | | | | |
| | | Investor
Balanced
Fund | | | Investor
Conservative
Growth Fund | | | Investor
Growth Fund | | | Investor
Growth &
Income Fund | |
ASSETS: | | | | | | | | | | | | | | | | |
Investments in affiliates, at value | | $ | 5,359,725 | | | $ | 4,429,200 | | | $ | 2,389,211 | | | $ | 3,216,588 | |
Receivables: | | | | | | | | | | | | | | | | |
Fund shares sold | | | 11,686 | | | | 9,398 | | | | 6,963 | | | | 6,629 | |
Dividends from affiliates | | | 11 | | | | 9 | | | | 2 | | | | 4 | |
Due from Adviser | | | 41 | | | | 61 | | | | 5 | | | | 12 | |
| | | | | | | | | | | | | | | | |
Total Assets | | | 5,371,463 | | | | 4,438,668 | | | | 2,396,181 | | | | 3,223,233 | |
| | | | | | | | | | | | | | | | |
| | | | |
LIABILITIES: | | | | | | | | | | | | | | | | |
Payables: | | | | | | | | | | | | | | | | |
Distributions | | | 3,191 | | | | 598 | | | | 3,228 | | | | 2,363 | |
Fund shares redeemed | | | 5,590 | | | | 4,814 | | | | 2,243 | | | | 2,975 | |
Accrued liabilities: | | | | | | | | | | | | | | | | |
Administration fees | | | — | | | | — | | | | 14 | | | | 5 | |
Distribution fees | | | 1,558 | | | | 1,654 | | | | 597 | | | | 831 | |
Shareholder servicing fees | | | 224 | | | | 235 | | | | 56 | | | | 108 | |
Custodian and accounting fees | | | — | (a) | | | 1 | | | | 11 | | | | 9 | |
Trustees’ and Chief Compliance Officer’s fees | | | 1 | | | | 1 | | | | 1 | | | | 1 | |
Transfer agent fees | | | 493 | | | | 313 | | | | 351 | | | | 336 | |
Other | | | 245 | | | | 198 | | | | 138 | | | | 160 | |
| | | | | | | | | | | | | | | | |
Total Liabilities | | | 11,302 | | | | 7,814 | | | | 6,639 | | | | 6,788 | |
| | | | | | | | | | | | | | | | |
Net Assets | | $ | 5,360,161 | | | $ | 4,430,854 | | | $ | 2,389,542 | | | $ | 3,216,445 | |
| | | | | | | | | | | | | | | | |
SEE NOTES TO FINANCIAL STATEMENTS.
| | | | | | |
| | | |
| 14 | | | | J.P. MORGAN INVESTOR FUNDS | | DECEMBER 31, 2014 |
| | | | | | | | | | | | | | | | |
| | | Investor
Balanced
Fund | | | Investor
Conservative
Growth Fund | | | Investor
Growth Fund | | | Investor
Growth &
Income Fund | |
NET ASSETS: | | | | | | | | | | | | | | | | |
Paid-in-Capital | | $ | 4,486,006 | | | $ | 3,926,598 | | | $ | 1,700,158 | | | $ | 2,553,746 | |
Accumulated undistributed (distributions in excess of) net investment income | | | (33,147 | ) | | | (12,969 | ) | | | (30,509 | ) | | | (27,134 | ) |
Accumulated net realized gains (losses) | | | 106,435 | | | | 75,789 | | | | 75,290 | | | | 37,786 | |
Net unrealized appreciation (depreciation) | | | 800,867 | | | | 441,436 | | | | 644,603 | | | | 652,047 | |
| | | | | | | | | | | | | | | | |
Total Net Assets | | $ | 5,360,161 | | | $ | 4,430,854 | | | $ | 2,389,542 | | | $ | 3,216,445 | |
| | | | | | | | | | | | | | | | |
| | | | |
Net Assets: | | | | | | | | | | | | | | | | |
Class A | | $ | 3,877,995 | | | $ | 2,556,514 | | | $ | 1,863,534 | | | $ | 2,523,392 | |
Class B | | | 77,628 | | | | 40,417 | | | | 75,546 | | | | 80,165 | |
Class C | | | 1,086,404 | | | | 1,711,843 | | | | 243,040 | | | | 387,269 | |
Select Class | | | 318,134 | | | | 122,080 | | | | 207,422 | | | | 225,619 | |
| | | | | | | | | | | | | | | | |
Total | | $ | 5,360,161 | | | $ | 4,430,854 | | | $ | 2,389,542 | | | $ | 3,216,445 | |
| | | | | | | | | | | | | | | | |
| | | | |
Outstanding units of beneficial interest (shares) | | | | | | | | | | | | | | | | |
($0.0001 par value; unlimited number of shares authorized): | | | | | | | | | | | | | | | | |
Class A | | | 258,528 | | | | 200,454 | | | | 95,429 | | | | 150,435 | |
Class B | | | 5,174 | | | | 3,167 | | | | 3,978 | | | | 4,800 | |
Class C | | | 73,421 | | | | 134,818 | | | | 13,040 | | | | 23,642 | |
Select Class | | | 21,177 | | | | 9,526 | | | | 10,445 | | | | 13,631 | |
| | | | |
Net Asset Value (a): | | | | | | | | | | | | | | | | |
Class A — Redemption price per share | | $ | 15.00 | | | $ | 12.75 | | | $ | 19.53 | | | $ | 16.77 | |
Class B — Offering price per share (b) | | | 15.00 | | | | 12.76 | | | | 18.99 | | | | 16.70 | |
Class C — Offering price per share (b) | | | 14.80 | | | | 12.70 | | | | 18.64 | | | | 16.38 | |
Select Class — Offering and redemption price per share | | | 15.02 | | | | 12.82 | | | | 19.86 | | | | 16.55 | |
Class A maximum sales charge | | | 4.50 | % | | | 4.50 | % | | | 4.50 | % | | | 4.50 | % |
Class A maximum public offering price per share | | | — | | | | — | | | | — | | | | — | |
[net asset value per share/(100% – maximum sales charge)] | | $ | 15.71 | | | $ | 13.35 | | | $ | 20.45 | | | $ | 17.56 | |
| | | | | | | | | | | | | | | | |
Cost of investments in affiliates | | | 4,558,858 | | | | 3,987,764 | | | | 1,744,608 | | | | 2,564,541 | |
| (a) | Per share amounts may not recalculate due to rounding of net assets and/or shares outstanding. |
| (b) | Redemption price for Class B and Class C Shares varies based upon length of time the shares are held. |
SEE NOTES TO FINANCIAL STATEMENTS.
| | | | | | | | |
| | | |
| DECEMBER 31, 2014 | | J.P. MORGAN INVESTOR FUNDS | | | | | 15 | |
STATEMENTS OF OPERATIONS
FOR THE SIX MONTHS ENDED DECEMBER 31, 2014 (Unaudited)
(Amounts in thousands)
| | | | | | | | | | | | | | | | |
| | | Investor
Balanced
Fund | | | Investor
Conservative
Growth Fund | | | Investor
Growth Fund | | | Investor
Growth &
Income Fund | |
INVESTMENT INCOME: | | | | | | | | | | | | | | | | |
Dividend income from affiliates | | $ | 53,519 | | | $ | 46,942 | | | $ | 18,934 | | | $ | 30,691 | |
| | | | | | | | | | | | | | | | |
| | | | |
EXPENSES: | | | | | | | | | | | | | | | | |
Investment advisory fees | | | 1,324 | | | | 1,097 | | | | 585 | | | | 792 | |
Administration fees | | | 1,510 | | | | 1,294 | | | | 784 | | | | 982 | |
Distribution fees: | | | | | | | | | | | | | | | | |
Class A | | | 4,793 | | | | 3,199 | | | | 2,286 | | | | 3,111 | |
Class B | | | 313 | | | | 163 | | | | 306 | | | | 327 | |
Class C | | | 3,929 | | | | 6,223 | | | | 878 | | | | 1,402 | |
Shareholder servicing fees: | | | | | | | | | | | | | | | | |
Class A | | | 4,793 | | | | 3,199 | | | | 2,286 | | | | 3,111 | |
Class B | | | 104 | | | | 54 | | | | 102 | | | | 109 | |
Class C | | | 1,310 | | | | 2,075 | | | | 293 | | | | 467 | |
Select Class | | | 414 | | | | 155 | | | | 244 | | | | 272 | |
Custodian and accounting fees | | | 4 | | | | 7 | | | | 12 | | | | 11 | |
Professional fees | | | 31 | | | | 28 | | | | 17 | | | | 24 | |
Trustees’ and Chief Compliance Officer’s fees | | | 23 | | | | 17 | | | | 11 | | | | 14 | |
Printing and mailing costs | | | 239 | | | | 190 | | | | 158 | | | | 172 | |
Registration and filing fees | | | 106 | | | | 110 | | | | 51 | | | | 63 | |
Transfer agent fees | | | 997 | | | | 702 | | | | 785 | | | | 773 | |
Other | | | 39 | | | | 31 | | | | 14 | | | | 22 | |
| | | | | | | | | | | | | | | | |
Total expenses | | | 19,929 | | | | 18,544 | | | | 8,812 | | | | 11,652 | |
| | | | | | | | | | | | | | | | |
Less fees waived | | | (7,734 | ) | | | (6,357 | ) | | | (3,785 | ) | | | (4,880 | ) |
Less expense reimbursements | | | (1,436 | ) | | | (1,685 | ) | | | (106 | ) | | | (530 | ) |
| | | | | | | | | | | | | | | | |
Net expenses | | | 10,759 | | | | 10,502 | | | | 4,921 | | | | 6,242 | |
| | | | | | | | | | | | | | | | |
Net investment income (loss) | | | 42,760 | | | | 36,440 | | | | 14,013 | | | | 24,449 | |
| | | | | | | | | | | | | | | | |
| | | | |
REALIZED/UNREALIZED GAINS (LOSSES): | | | | | | | | | | | | | | | | |
Net realized gain (loss) on investments in affiliates | | | 10,393 | | | | 12,410 | | | | 4,256 | | | | 5,498 | |
Distributions of capital gains received from investment company affiliates | | | 184,343 | | | | 97,095 | | | | 139,252 | | | | 136,053 | |
Change in net unrealized appreciation/depreciation of investments in affiliates | | | (152,376 | ) | | | (101,029 | ) | | | (85,459 | ) | | | (104,752 | ) |
| | | | | | | | | | | | | | | | |
Net realized/unrealized gains (losses) | | | 42,360 | | | | 8,476 | | | | 58,049 | | | | 36,799 | |
| | | | | | | | | | | | | | | | |
Change in net assets resulting from operations | | $ | 85,120 | | | $ | 44,916 | | | $ | 72,062 | | | $ | 61,248 | |
| | | | | | | | | | | | | | | | |
SEE NOTES TO FINANCIAL STATEMENTS.
| | | | | | |
| | | |
| 16 | | | | J.P. MORGAN INVESTOR FUNDS | | DECEMBER 31, 2014 |
STATEMENTS OF CHANGES IN NET ASSETS
FOR THE PERIODS INDICATED
(Amounts in thousands)
| | | | | | | | | | | | | | | | |
| | | Investor Balanced Fund | | | Investor Conservative Growth Fund | |
| | | Six Months Ended
December 31, 2014
(Unaudited) | | | Year Ended
June 30, 2014 | | | Six Months Ended
December 31, 2014
(Unaudited) | | | Year Ended
June 30, 2014 | |
CHANGE IN NET ASSETS RESULTING FROM OPERATIONS: | | | | | | �� | | | | | | | |
Net investment income (loss) | | $ | 42,760 | | | $ | 48,464 | | | $ | 36,440 | | | $ | 47,923 | |
Net realized gain (loss) on investments in affiliates | | | 10,393 | | | | 34,632 | | | | 12,410 | | | | 45,322 | |
Distributions of capital gains received from investment company affiliates | | | 184,343 | | | | 85,847 | | | | 97,095 | | | | 50,096 | |
Change in net unrealized appreciation/depreciation of investments in affiliates | | | (152,376 | ) | | | 418,642 | | | | (101,029 | ) | | | 223,346 | |
| | | | | | | | | | | | | | | | |
Change in net assets resulting from operations | | | 85,120 | | | | 587,585 | | | | 44,916 | | | | 366,687 | |
| | | | | | | | | | | | | | | | |
| | | | |
DISTRIBUTIONS TO SHAREHOLDERS: | | | | | | | | | | | | | | | | |
Class A | | | | | | | | | | | | | | | | |
From net investment income | | | (55,728 | ) | | | (51,978 | ) | | | (30,229 | ) | | | (39,648 | ) |
From net realized gains | | | (69,634 | ) | | | (10,000 | ) | | | (46,254 | ) | | | — | |
Class B | | | | | | | | | | | | | | | | |
From net investment income | | | (982 | ) | | | (993 | ) | | | (418 | ) | | | (581 | ) |
From net realized gains | | | (1,403 | ) | | | (318 | ) | | | (733 | ) | | | — | |
Class C | | | | | | | | | | | | | | | | |
From net investment income | | | (13,778 | ) | | | (8,742 | ) | | | (17,030 | ) | | | (15,776 | ) |
From net realized gains | | | (19,719 | ) | | | (2,481 | ) | | | (31,039 | ) | | | — | |
Select Class | | | | | | | | | | | | | | | | |
From net investment income | | | (5,011 | ) | | | (5,665 | ) | | | (1,569 | ) | | | (2,173 | ) |
From net realized gains | | | (5,776 | ) | | | (937 | ) | | | (2,228 | ) | | | — | |
| | | | | | | | | | | | | | | | |
Total distributions to shareholders | | | (172,031 | ) | | | (81,114 | ) | | | (129,500 | ) | | | (58,178 | ) |
| | | | | | | | | | | | | | | | |
| | | | |
CAPITAL TRANSACTIONS: | | | | | | | | | | | | | | | | |
Change in net assets resulting from capital transactions | | | 282,003 | | | | 890,046 | | | | 252,900 | | | | 418,368 | |
| | | | | | | | | | | | | | | | |
| | | | |
NET ASSETS: | | | | | | | | | | | | | | | | |
Change in net assets | | | 195,092 | | | | 1,396,517 | | | | 168,316 | | | | 726,877 | |
Beginning of period | | | 5,165,069 | | | | 3,768,552 | | | | 4,262,538 | | | | 3,535,661 | |
| | | | | | | | | | | | | | | | |
End of period | | $ | 5,360,161 | | | $ | 5,165,069 | | | $ | 4,430,854 | | | $ | 4,262,538 | |
| | | | | | | | | | | | | | | | |
Accumulated undistributed (distributions in excess of) net investment income | | $ | (33,147 | ) | | $ | (408 | ) | | $ | (12,969 | ) | | $ | (163 | ) |
| | | | | | | | | | | | | | | | |
SEE NOTES TO FINANCIAL STATEMENTS.
| | | | | | | | |
| | | |
| DECEMBER 31, 2014 | | J.P. MORGAN INVESTOR FUNDS | | | | | 17 | |
STATEMENTS OF CHANGES IN NET ASSETS
FOR THE PERIODS INDICATED (continued)
(Amounts in thousands)
| | | | | | | | | | | | | | | | |
| | | Investor Growth Fund | | | Investor Growth & Income Fund | |
| | | Six Months Ended
December 31, 2014
(Unaudited) | | | Year Ended
June 30, 2014 | | | Six Months Ended
December 31, 2014
(Unaudited) | | | Year Ended
June 30, 2014 | |
CHANGE IN NET ASSETS RESULTING FROM OPERATIONS: | | | | | | | | | | | | | | | | |
Net investment income (loss) | | $ | 14,013 | | | $ | 10,805 | | | $ | 24,449 | | | $ | 24,590 | |
Net realized gain (loss) on investments in affiliates | | | 4,256 | | | | 17,333 | | | | 5,498 | | | | 32,103 | |
Distributions of capital gains received from investment company affiliates | | | 139,252 | | | | 54,238 | | | | 136,053 | | | | 60,812 | |
Change in net unrealized appreciation/depreciation of investments in affiliates | | | (85,459 | ) | | | 312,477 | | | | (104,752 | ) | | | 311,079 | |
| | | | | | | | | | | | | | | | |
Change in net assets resulting from operations | | | 72,062 | | | | 394,853 | | | | 61,248 | | | | 428,584 | |
| | | | | | | | | | | | | | | | |
| | | | |
DISTRIBUTIONS TO SHAREHOLDERS: | | | | | | | | | | | | | | | | |
Class A | | | | | | | | | | | | | | | | |
From net investment income | | | (34,534 | ) | | | (18,801 | ) | | | (40,601 | ) | | | (30,868 | ) |
From net realized gains | | | (28,153 | ) | | | — | | | | (56,378 | ) | | | — | |
Class B | | | | | | | | | | | | | | | | |
From net investment income | | | (1,355 | ) | | | (972 | ) | | | (1,146 | ) | | | (989 | ) |
From net realized gains | | | (1,177 | ) | | | — | | | | (1,807 | ) | | | — | |
Class C | | | | | | | | | | | | | | | | |
From net investment income | | | (4,447 | ) | | | (1,772 | ) | | | (5,635 | ) | | | (2,857 | ) |
From net realized gains | | | (3,829 | ) | | | — | | | | (8,812 | ) | | | — | |
Select Class | | | | | | | | | | | | | | | | |
From net investment income | | | (4,011 | ) | | | (2,198 | ) | | | (3,954 | ) | | | (3,225 | ) |
From net realized gains | | | (3,065 | ) | | | — | | | | (5,055 | ) | | | — | |
| | | | | | | | | | | | | | | | |
Total distributions to shareholders | | | (80,571 | ) | | | (23,743 | ) | | | (123,388 | ) | | | (37,939 | ) |
| | | | | | | | | | | | | | | | |
| | | | |
CAPITAL TRANSACTIONS: | | | | | | | | | | | | | | | | |
Change in net assets resulting from capital transactions | | | 109,669 | | | | 179,299 | | | | 183,787 | | | | 385,158 | |
| | | | | | | | | | | | | | | | |
| | | | |
NET ASSETS: | | | | | | | | | | | | | | | | |
Change in net assets | | | 101,160 | | | | 550,409 | | | | 121,647 | | | | 775,803 | |
Beginning of period | | | 2,288,382 | | | | 1,737,973 | | | | 3,094,798 | | | | 2,318,995 | |
| | | | | | | | | | | | | | | | |
End of period | | $ | 2,389,542 | | | $ | 2,288,382 | | | $ | 3,216,445 | | | $ | 3,094,798 | |
| | | | | | | | | | | | | | | | |
Accumulated undistributed (distributions in excess of) net investment income | | $ | (30,509 | ) | | $ | (175 | ) | | $ | (27,134 | ) | | $ | (247 | ) |
| | | | | | | | | | | | | | | | |
SEE NOTES TO FINANCIAL STATEMENTS.
| | | | | | |
| | | |
| 18 | | | | J.P. MORGAN INVESTOR FUNDS | | DECEMBER 31, 2014 |
| | | | | | | | | | | | | | | | |
| | | Investor Balanced Fund | | | Investor Conservative Growth Fund | |
| | | Six Months Ended
December 31, 2014
(Unaudited) | | | Year Ended
June 30, 2014 | | | Six Months Ended
December 31, 2014
(Unaudited) | | | Year Ended
June 30, 2014 | |
CAPITAL TRANSACTIONS: | | | | | | | | | | | | | | | | |
Class A | | | | | | | | | | | | | | | | |
Proceeds from shares issued | | $ | 395,094 | | | $ | 1,172,802 | | | $ | 274,321 | | | $ | 663,475 | |
Distributions reinvested | | | 125,065 | | | | 61,815 | | | | 76,301 | | | | 39,567 | |
Cost of shares redeemed | | | (329,381 | ) | | | (653,336 | ) | | | (261,747 | ) | | | (595,012 | ) |
| | | | | | | | | | | | | | | | |
Change in net assets resulting from Class A capital transactions | | $ | 190,778 | | | $ | 581,281 | | | $ | 88,875 | | | $ | 108,030 | |
| | | | | | | | | | | | | | | | |
Class B | | | | | | | | | | | | | | | | |
Proceeds from shares issued | | $ | 739 | | | $ | 4,133 | | | $ | 406 | | | $ | 2,287 | |
Distributions reinvested | | | 2,376 | | | | 1,307 | | | | 1,147 | | | | 579 | |
Cost of shares redeemed | | | (14,376 | ) | | | (39,779 | ) | | | (6,557 | ) | | | (20,067 | ) |
| | | | | | | | | | | | | | | | |
Change in net assets resulting from Class B capital transactions | | $ | (11,261 | ) | | $ | (34,339 | ) | | $ | (5,004 | ) | | $ | (17,201 | ) |
| | | | | | | | | | | | | | | | |
Class C | | | | | | | | | | | | | | | | |
Proceeds from shares issued | | $ | 173,808 | | | $ | 483,355 | | | $ | 278,672 | | | $ | 648,610 | |
Distributions reinvested | | | 33,245 | | | | 11,113 | | | | 47,900 | | | | 15,718 | |
Cost of shares redeemed | | | (98,079 | ) | | | (151,120 | ) | | | (162,265 | ) | | | (334,441 | ) |
| | | | | | | | | | | | | | | | |
Change in net assets resulting from Class C capital transactions | | $ | 108,974 | | | $ | 343,348 | | | $ | 164,307 | | | $ | 329,887 | |
| | | | | | | | | | | | | | | | |
Select Class | | | | | | | | | | | | | | | | |
Proceeds from shares issued | | $ | 34,723 | | | $ | 81,681 | | | $ | 15,541 | | | $ | 21,226 | |
Distributions reinvested | | | 3,158 | | | | 2,581 | | | | 1,699 | | | | 990 | |
Cost of shares redeemed | | | (44,369 | ) | | | (84,506 | ) | | | (12,518 | ) | | | (24,564 | ) |
| | | | | | | | | | | | | | | | |
Change in net assets resulting from Select Class capital transactions | | $ | (6,488 | ) | | $ | (244 | ) | | $ | 4,722 | | | $ | (2,348 | ) |
| | | | | | | | | | | | | | | | |
Total change in net assets resulting from capital transactions | | $ | 282,003 | | | $ | 890,046 | | | $ | 252,900 | | | $ | 418,368 | |
| | | | | | | | | | | | | | | | |
| | | | |
SHARE TRANSACTIONS: | | | | | | | | | | | | | | | | |
Class A | | | | | | | | | | | | | | | | |
Issued | | | 25,895 | | | | 81,074 | | | | 21,125 | | | | 53,123 | |
Reinvested | | | 8,337 | | | | 4,211 | | | | 5,972 | | | | 3,145 | |
Redeemed | | | (21,605 | ) | | | (45,013 | ) | | | (20,174 | ) | | | (47,622 | ) |
| | | | | | | | | | | | | | | | |
Change in Class A Shares | | | 12,627 | | | | 40,272 | | | | 6,923 | | | | 8,646 | |
| | | | | | | | | | | | | | | | |
Class B | | | | | | | | | | | | | | | | |
Issued | | | 48 | | | | 287 | | | | 30 | | | | 183 | |
Reinvested | | | 158 | | | | 90 | | | | 90 | | | | 46 | |
Redeemed | | | (941 | ) | | | (2,752 | ) | | | (504 | ) | | | (1,605 | ) |
| | | | | | | | | | | | | | | | |
Change in Class B Shares | | | (735 | ) | | | (2,375 | ) | | | (384 | ) | | | (1,376 | ) |
| | | | | | | | | | | | | | | | |
Class C | | | | | | | | | | | | | | | | |
Issued | | | 11,541 | | | | 33,955 | | | | 21,558 | | | | 52,180 | |
Reinvested | | | 2,248 | | | | 768 | | | | 3,770 | | | | 1,253 | |
Redeemed | | | (6,544 | ) | | | (10,540 | ) | | | (12,571 | ) | | | (26,885 | ) |
| | | | | | | | | | | | | | | | |
Change in Class C Shares | | | 7,245 | | | | 24,183 | | | | 12,757 | | | | 26,548 | |
| | | | | | | | | | | | | | | | |
Select Class | | | | | | | | | | | | | | | | |
Issued | | | 2,279 | | | | 5,619 | | | | 1,193 | | | | 1,687 | |
Reinvested | | | 210 | | | | 176 | | | | 132 | | | | 78 | |
Redeemed | | | (2,893 | ) | | | (5,778 | ) | | | (962 | ) | | | (1,958 | ) |
| | | | | | | | | | | | | | | | |
Change in Select Class Shares | | | (404 | ) | | | 17 | | | | 363 | | | | (193 | ) |
| | | | | | | | | | | | | | | | |
SEE NOTES TO FINANCIAL STATEMENTS.
| | | | | | | | |
| | | |
| DECEMBER 31, 2014 | | J.P. MORGAN INVESTOR FUNDS | | | | | 19 | |
STATEMENTS OF CHANGES IN NET ASSETS
FOR THE PERIODS INDICATED (continued)
(Amounts in thousands)
| | | | | | | | | | | | | | | | |
| | | Investor Growth Fund | | | Investor Growth & Income Fund | |
| | | Six Months Ended
December 31, 2014
(Unaudited) | | | Year Ended
June 30, 2014 | | | Six Months Ended
December 31, 2014
(Unaudited) | | | Year Ended
June 30, 2014 | |
CAPITAL TRANSACTIONS: | | | | | | | | | | | | | | | | |
Class A | | | | | | | | | | | | | | | | |
Proceeds from shares issued | | $ | 132,843 | | | $ | 364,251 | | | $ | 224,521 | | | $ | 611,629 | |
Distributions reinvested | | | 62,384 | | | | 18,699 | | | | 96,654 | | | | 30,757 | |
Cost of shares redeemed | | | (116,692 | ) | | | (226,201 | ) | | | (181,482 | ) | | | (328,489 | ) |
| | | | | | | | | | | | | | | | |
Change in net assets resulting from Class A capital transactions | | $ | 78,535 | | | $ | 156,749 | | | $ | 139,693 | | | $ | 313,897 | |
| | | | | | | | | | | | | | | | |
Class B | | | | | | | | | | | | | | | | |
Proceeds from shares issued | | $ | 149 | | | $ | 1,237 | | | $ | 308 | | | $ | 1,832 | |
Distributions reinvested | | | 2,520 | | | | 967 | | | | 2,944 | | | | 986 | |
Cost of shares redeemed | | | (15,183 | ) | | | (44,584 | ) | | | (16,982 | ) | | | (48,540 | ) |
| | | | | | | | | | | | | | | | |
Change in net assets resulting from Class B capital transactions | | $ | (12,514 | ) | | $ | (42,380 | ) | | $ | (13,730 | ) | | $ | (45,722 | ) |
| | | | | | | | | | | | | | | | |
Class C | | | | | | | | | | | | | | | | |
Proceeds from shares issued | | $ | 28,319 | | | $ | 67,519 | | | $ | 53,943 | | | $ | 140,280 | |
Distributions reinvested | | | 7,842 | | | | 1,683 | | | | 13,873 | | | | 2,713 | |
Cost of shares redeemed | | | (18,034 | ) | | | (34,707 | ) | | | (31,187 | ) | | | (51,230 | ) |
| | | | | | | | | | | | | | | | |
Change in net assets resulting from Class C capital transactions | | $ | 18,127 | | | $ | 34,495 | | | $ | 36,629 | | | $ | 91,763 | |
| | | | | | | | | | | | | | | | |
Select Class | | | | | | | | | | | | | | | | |
Proceeds from shares issued | | $ | 34,252 | | | $ | 52,249 | | | $ | 31,124 | | | $ | 57,090 | |
Distributions reinvested | | | 1,898 | | | | 595 | | | | 3,910 | | | | 1,699 | |
Cost of shares redeemed | | | (10,629 | ) | | | (22,409 | ) | | | (13,839 | ) | | | (33,569 | ) |
| | | | | | | | | | | | | | | | |
Change in net assets resulting from Select Class capital transactions | | $ | 25,521 | | | $ | 30,435 | | | $ | 21,195 | | | $ | 25,220 | |
| | | | | | | | | | | | | | | | |
Total change in net assets resulting from capital transactions | | $ | 109,669 | | | $ | 179,299 | | | $ | 183,787 | | | $ | 385,158 | |
| | | | | | | | | | | | | | | | |
| | | | |
SHARE TRANSACTIONS: | | | | | | | | | | | | | | | | |
Class A | | | | | | | | | | | | | | | | |
Issued | | | 6,747 | | | | 20,101 | | | | 13,116 | | | | 38,067 | |
Reinvested | | | 3,198 | | | | 1,002 | | | | 5,767 | | | | 1,874 | |
Redeemed | | | (5,933 | ) | | | (12,465 | ) | | | (10,605 | ) | | | (20,413 | ) |
| | | | | | | | | | | | | | | | |
Change in Class A Shares | | | 4,012 | | | | 8,638 | | | | 8,278 | | | | 19,528 | |
| | | | | | | | | | | | | | | | |
Class B | | | | | | | | | | | | | | | | |
Issued | | | 8 | | | | 71 | | | | 18 | | | | 116 | |
Reinvested | | | 133 | | | | 53 | | | | 177 | | | | 61 | |
Redeemed | | | (790 | ) | | | (2,526 | ) | | | (994 | ) | | | (3,040 | ) |
| | | | | | | | | | | | | | | | |
Change in Class B Shares | | | (649 | ) | | | (2,402 | ) | | | (799 | ) | | | (2,863 | ) |
| | | | | | | | | | | | | | | | |
Class C | | | | | | | | | | | | | | | | |
Issued | | | 1,503 | | | | 3,884 | | | | 3,224 | | | | 8,949 | |
Reinvested | | | 421 | | | | 95 | | | | 848 | | | | 169 | |
Redeemed | | | (960 | ) | | | (2,004 | ) | | | (1,869 | ) | | | (3,248 | ) |
| | | | | | | | | | | | | | | | |
Change in Class C Shares | | | 964 | | | | 1,975 | | | | 2,203 | | | | 5,870 | |
| | | | | | | | | | | | | | | | |
Select Class | | | | | | | | | | | | | | | | |
Issued | | | 1,718 | | | | 2,823 | | | | 1,852 | | | | 3,613 | |
Reinvested | | | 96 | | | | 31 | | | | 236 | | | | 105 | |
Redeemed | | | (529 | ) | | | (1,200 | ) | | | (821 | ) | | | (2,092 | ) |
| | | | | | | | | | | | | | | | |
Change in Select Class Shares | | | 1,285 | | | | 1,654 | | | | 1,267 | | | | 1,626 | |
| | | | | | | | | | | | | | | | |
SEE NOTES TO FINANCIAL STATEMENTS.
| | | | | | |
| | | |
| 20 | | | | J.P. MORGAN INVESTOR FUNDS | | DECEMBER 31, 2014 |
THIS PAGE IS INTENTIONALLY LEFT BLANK
| | | | | | | | |
| | | |
| DECEMBER 31, 2014 | | J.P. MORGAN INVESTOR FUNDS | | | | | 21 | |
FINANCIAL HIGHLIGHTS
FOR THE PERIODS INDICATED
| | | | | | | | | | | | | | | | | | | | | | | | | | | | |
| | | Per share operating performance | |
| | | | | | Investment operations | | | Distributions | |
| | | Net asset
value,
beginning
of period | | | Net
investment
income
(loss) (b) | | | Net realized
and unrealized
gains
(losses) on
investments | | | Total from
investment
operations | | | Net
investment
income | | | Net
realized
gain | | | Total
distributions | |
Investor Balanced Fund | | | | | | | | | | | | | | | | | | | | | | | | | | | | |
Class A | | | | | | | | | | | | | | | | | | | | | | | | | | | | |
Six Months Ended December 31, 2014 (Unaudited) | | $ | 15.25 | | | $ | 0.13 | (h)(i) | | $ | 0.12 | | | $ | 0.25 | | | $ | (0.22 | ) | | $ | (0.28 | ) | | $ | (0.50 | ) |
Year Ended June 30, 2014 | | | 13.61 | | | | 0.17 | (h) | | | 1.74 | | | | 1.91 | | | | (0.23 | ) | | | (0.04 | ) | | | (0.27 | ) |
Year Ended June 30, 2013 | | | 12.53 | | | | 0.20 | (h) | | | 1.11 | | | | 1.31 | | | | (0.23 | ) | | | — | | | | (0.23 | ) |
Year Ended June 30, 2012 | | | 12.58 | | | | 0.22 | (h) | | | (0.05 | ) | | | 0.17 | | | | (0.22 | ) | | | — | | | | (0.22 | ) |
Year Ended June 30, 2011 | | | 11.00 | | | | 0.23 | | | | 1.58 | | | | 1.81 | | | | (0.23 | ) | | | — | | | | (0.23 | ) |
Year Ended June 30, 2010 | | | 10.03 | | | | 0.26 | | | | 0.97 | | | | 1.23 | | | | (0.26 | ) | | | — | | | | (0.26 | ) |
| | | | | | | |
Class B | | | | | | | | | | | | | | | | | | | | | | | | | | | | |
Six Months Ended December 31, 2014 (Unaudited) | | | 15.25 | | | | 0.10 | (h)(i) | | | 0.12 | | | | 0.22 | | | | (0.19 | ) | | | (0.28 | ) | | | (0.47 | ) |
Year Ended June 30, 2014 | | | 13.60 | | | | 0.08 | (h) | | | 1.75 | | | | 1.83 | | | | (0.14 | ) | | | (0.04 | ) | | | (0.18 | ) |
Year Ended June 30, 2013 | | | 12.53 | | | | 0.13 | (h) | | | 1.10 | | | | 1.23 | | | | (0.16 | ) | | | — | | | | (0.16 | ) |
Year Ended June 30, 2012 | | | 12.57 | | | | 0.15 | (h) | | | (0.03 | ) | | | 0.12 | | | | (0.16 | ) | | | — | | | | (0.16 | ) |
Year Ended June 30, 2011 | | | 10.99 | | | | 0.17 | | | | 1.57 | | | | 1.74 | | | | (0.16 | ) | | | — | | | | (0.16 | ) |
Year Ended June 30, 2010 | | | 10.01 | | | | 0.20 | | | | 0.97 | | | | 1.17 | | | | (0.19 | ) | | | — | | | | (0.19 | ) |
| | | | | | | |
Class C | | | | | | | | | | | | | | | | | | | | | | | | | | | | |
Six Months Ended December 31, 2014 (Unaudited) | | | 15.05 | | | | 0.10 | (h)(i) | | | 0.12 | | | | 0.22 | | | | (0.19 | ) | | | (0.28 | ) | | | (0.47 | ) |
Year Ended June 30, 2014 | | | 13.44 | | | | 0.09 | (h) | | | 1.71 | | | | 1.80 | | | | (0.15 | ) | | | (0.04 | ) | | | (0.19 | ) |
Year Ended June 30, 2013 | | | 12.39 | | | | 0.13 | (h) | | | 1.09 | | | | 1.22 | | | | (0.17 | ) | | | — | | | | (0.17 | ) |
Year Ended June 30, 2012 | | | 12.44 | | | | 0.15 | (h) | | | (0.04 | ) | | | 0.11 | | | | (0.16 | ) | | | — | | | | (0.16 | ) |
Year Ended June 30, 2011 | | | 10.88 | | | | 0.17 | | | | 1.56 | | | | 1.73 | | | | (0.17 | ) | | | — | | | | (0.17 | ) |
Year Ended June 30, 2010 | | | 9.93 | | | | 0.20 | | | | 0.95 | | | | 1.15 | | | | (0.20 | ) | | | — | | | | (0.20 | ) |
| | | | | | | |
Select Class | | | | | | | | | | | | | | | | | | | | | | | | | | | | |
Six Months Ended December 31, 2014 (Unaudited) | | | 15.27 | | | | 0.15 | (h)(i) | | | 0.12 | | | | 0.27 | | | | (0.24 | ) | | | (0.28 | ) | | | (0.52 | ) |
Year Ended June 30, 2014 | | | 13.62 | | | | 0.20 | (h) | | | 1.75 | | | | 1.95 | | | | (0.26 | ) | | | (0.04 | ) | | | (0.30 | ) |
Year Ended June 30, 2013 | | | 12.55 | | | | 0.23 | (h) | | | 1.10 | | | | 1.33 | | | | (0.26 | ) | | | — | | | | (0.26 | ) |
Year Ended June 30, 2012 | | | 12.60 | | | | 0.25 | (h) | | | (0.05 | ) | | | 0.20 | | | | (0.25 | ) | | | — | | | | (0.25 | ) |
Year Ended June 30, 2011 | | | 11.01 | | | | 0.26 | | | | 1.59 | | | | 1.85 | | | | (0.26 | ) | | | — | | | | (0.26 | ) |
Year Ended June 30, 2010 | | | 10.04 | | | | 0.28 | | | | 0.97 | | | | 1.25 | | | | (0.28 | ) | | | — | | | | (0.28 | ) |
| (a) | Annualized for periods less than one year, unless otherwise noted. |
| (b) | Net investment income (loss) is affected by timing of distributions from Underlying Funds. |
| (c) | Not annualized for periods less than one year. |
| (d) | Includes adjustments in accordance with accounting principles generally accepted in the United States of America and as such, the net asset values for financial reporting purposes and the returns based upon those net asset values may differ from the net asset values and returns for shareholder transactions. |
| (e) | Does not include expenses of Underlying Funds. |
| (f) | Includes earnings credits and interest expense, if applicable, each of which is less than 0.01% unless otherwise noted. |
| (g) | Portfolio turnover is calculated by dividing the lesser of total purchases or sales of portfolio securities for the reporting period by the monthly average value of portfolio securities owned during the reporting period. Excluded from both the numerator and denominator are amounts relating to derivatives and securities whose maturities or expiration dates at the time of acquisition were one year or less. |
| (h) | Calculated based upon average shares outstanding. |
| (i) | Net investment income (loss) may appear disproportionate among classes due the timing of recognition of income and changes in the relative size of the classes. |
| (j) | Certain non-recurring expenses incurred by the Fund were not annualized for the six months ended December 31, 2014. |
SEE NOTES TO FINANCIAL STATEMENTS.
| | | | | | |
| | | |
| 22 | | | | J.P. MORGAN INVESTOR FUNDS | | DECEMBER 31, 2014 |
| | | | | | | | | | | | | | | | | | | | | | | | | | |
| | | Ratios/Supplemental data | |
| | | | | | | | | | Ratios to average net assets (a) | | | | |
Net asset
value,
end of
period | | | Total return
(excludes
sales charge) (c)(d) | | | Net assets,
end of
period
(000’s) | | | Net
expenses (e)(f) | | | Net
investment
income
(loss) (b) | | |
Expenses
without waivers,
reimbursements and
earnings credits (e) | | | Portfolio
turnover
rate (c)(g) | |
| | | | | | | | | | | | | | | | | | | | | | | | | | |
| | | | | | | | | | | | | | | | | | | | | | | | | | |
| $ | 15.00 | | | | 1.65 | % | | $ | 3,877,995 | | | | 0.34 | %(j) | | | 1.68 | %(i)(j) | | | 0.66 | % | | | 5 | % |
| | 15.25 | | | | 14.12 | | | | 3,749,519 | | | | 0.41 | | | | 1.16 | | | | 0.67 | | | | 12 | |
| | 13.61 | | | | 10.54 | | | | 2,797,749 | | | | 0.50 | | | | 1.51 | | | | 0.69 | | | | 19 | |
| | 12.53 | | | | 1.45 | | | | 2,287,495 | | | | 0.50 | | | | 1.79 | | | | 0.69 | | | | 9 | |
| | 12.58 | | | | 16.53 | | | | 2,104,717 | | | | 0.50 | | | | 1.92 | | | | 0.69 | | | | 5 | |
| | 11.00 | | | | 12.19 | | | | 1,410,998 | | | | 0.50 | | | | 2.34 | | | | 0.71 | | | | 12 | |
| | | | | | |
| | | | | | | | | | | | | | | | | | | | | | | | | | |
| | 15.00 | | | | 1.47 | | | | 77,628 | | | | 0.78 | (j) | | | 1.16 | (i)(j) | | | 1.17 | | | | 5 | |
| | 15.25 | | | | 13.54 | | | | 90,106 | | | | 0.97 | | | | 0.58 | | | | 1.17 | | | | 12 | |
| | 13.60 | | | | 9.86 | | | | 112,689 | | | | 1.01 | | | | 1.00 | | | | 1.19 | | | | 19 | |
| | 12.53 | | | | 0.97 | | | | 167,057 | | | | 1.02 | | | | 1.26 | | | | 1.19 | | | | 9 | |
| | 12.57 | | | | 15.91 | | | | 235,961 | | | | 1.02 | | | | 1.37 | | | | 1.19 | | | | 5 | |
| | 10.99 | | | | 11.66 | | | | 287,519 | | | | 1.05 | | | | 1.75 | | | | 1.21 | | | | 12 | |
| | | | | | |
| | | | | | | | | | | | | | | | | | | | | | | | | | |
| | 14.80 | | | | 1.48 | | | | 1,086,404 | | | | 0.79 | (j) | | | 1.25 | (i)(j) | | | 1.16 | | | | 5 | |
| | 15.05 | | | | 13.50 | | | | 995,919 | | | | 0.97 | | | | 0.61 | | | | 1.17 | | | | 12 | |
| | 13.44 | | | | 9.89 | | | | 564,358 | | | | 1.01 | | | | 0.99 | | | | 1.19 | | | | 19 | |
| | 12.39 | | | | 0.94 | | | | 413,805 | | | | 1.02 | | | | 1.27 | | | | 1.19 | | | | 9 | |
| | 12.44 | | | | 15.98 | | | | 415,301 | | | | 1.02 | | | | 1.40 | | | | 1.19 | | | | 5 | |
| | 10.88 | | | | 11.55 | | | | 216,667 | | | | 1.05 | | | | 1.80 | | | | 1.21 | | | | 12 | |
| | | | | | |
| | | | | | | | | | | | | | | | | | | | | | | | | | |
| | 15.02 | | | | 1.78 | | | | 318,134 | | | | 0.09 | (j) | | | 1.89 | (i)(j) | | | 0.41 | | | | 5 | |
| | 15.27 | | | | 14.45 | | | | 329,525 | | | | 0.16 | | | | 1.39 | | | | 0.42 | | | | 12 | |
| | 13.62 | | | | 10.71 | | | | 293,756 | | | | 0.25 | | | | 1.75 | | | | 0.44 | | | | 19 | |
| | 12.55 | | | | 1.70 | | | | 250,089 | | | | 0.25 | | | | 2.03 | | | | 0.44 | | | | 9 | |
| | 12.60 | | | | 16.88 | | | | 231,620 | | | | 0.25 | | | | 2.15 | | | | 0.44 | | | | 5 | |
| | 11.01 | | | | 12.44 | | | | 160,959 | | | | 0.25 | | | | 2.60 | | | | 0.46 | | | | 12 | |
SEE NOTES TO FINANCIAL STATEMENTS.
| | | | | | | | |
| | | |
| DECEMBER 31, 2014 | | J.P. MORGAN INVESTOR FUNDS | | | | | 23 | |
FINANCIAL HIGHLIGHTS
FOR THE PERIODS INDICATED (continued)
| | | | | | | | | | | | | | | | | | | | | | | | | | | | |
| | | Per share operating performance | |
| | | | | | Investment operations | | | Distributions | |
| | | Net asset
value,
beginning
of period | | | Net
investment
income
(loss) (b) | | | Net realized
and unrealized
gains
(losses) on
investments | | | Total from
investment
operations | | | Net
investment
income | | | Net
realized
gain | | | Total
distributions | |
Investor Conservative Growth Fund | | | | | | | | | | | | | | | | | | | | | | | | | | | | |
Class A | | | | | | | | | | | | | | | | | | | | | | | | | | | | |
Six Months Ended December 31, 2014 (Unaudited) | | $ | 13.00 | | | $ | 0.12 | (h)(i) | | $ | 0.02 | | | $ | 0.14 | | | $ | (0.15 | ) | | $ | (0.24 | ) | | $ | (0.39 | ) |
Year Ended June 30, 2014 | | | 12.01 | | | | 0.18 | (h) | | | 1.02 | | | | 1.20 | | | | (0.21 | ) | | | — | | | | (0.21 | ) |
Year Ended June 30, 2013 | | | 11.46 | | | | 0.19 | (h) | | | 0.58 | | | | 0.77 | | | | (0.22 | ) | | | — | | | | (0.22 | ) |
Year Ended June 30, 2012 | | | 11.40 | | | | 0.23 | (h) | | | 0.06 | | | | 0.29 | | | | (0.23 | ) | | | — | | | | (0.23 | ) |
Year Ended June 30, 2011 | | | 10.47 | | | | 0.25 | | | | 0.93 | | | | 1.18 | | | | (0.25 | ) | | | — | | | | (0.25 | ) |
Year Ended June 30, 2010 | | | 9.67 | | | | 0.29 | | | | 0.80 | | | | 1.09 | | | | (0.29 | ) | | | — | | | | (0.29 | ) |
| | | | | | | |
Class B | | | | | | | | | | | | | | | | | | | | | | | | | | | | |
Six Months Ended December 31, 2014 (Unaudited) | | | 13.01 | | | | 0.09 | (h)(i) | | | 0.03 | | | | 0.12 | | | | (0.13 | ) | | | (0.24 | ) | | | (0.37 | ) |
Year Ended June 30, 2014 | | | 12.02 | | | | 0.11 | (h) | | | 1.02 | | | | 1.13 | | | | (0.14 | ) | | | — | | | | (0.14 | ) |
Year Ended June 30, 2013 | | | 11.47 | | | | 0.13 | (h) | | | 0.58 | | | | 0.71 | | | | (0.16 | ) | | | — | | | | (0.16 | ) |
Year Ended June 30, 2012 | | | 11.40 | | | | 0.17 | (h) | | | 0.07 | | | | 0.24 | | | | (0.17 | ) | | | — | | | | (0.17 | ) |
Year Ended June 30, 2011 | | | 10.48 | | | | 0.18 | | | | 0.93 | | | | 1.11 | | | | (0.19 | ) | | | — | | | | (0.19 | ) |
Year Ended June 30, 2010 | | | 9.67 | | | | 0.23 | | | | 0.81 | | | | 1.04 | | | | (0.23 | ) | | | — | | | | (0.23 | ) |
| | | | | | | |
Class C | | | | | | | | | | | | | | | | | | | | | | | | | | | | |
Six Months Ended December 31, 2014 (Unaudited) | | | 12.95 | | | | 0.09 | (h)(i) | | | 0.03 | | | | 0.12 | | | | (0.13 | ) | | | (0.24 | ) | | | (0.37 | ) |
Year Ended June 30, 2014 | | | 11.97 | | | | 0.11 | (h) | | | 1.01 | | | | 1.12 | | | | (0.14 | ) | | | — | | | | (0.14 | ) |
Year Ended June 30, 2013 | | | 11.42 | | | | 0.13 | (h) | | | 0.58 | | | | 0.71 | | | | (0.16 | ) | | | — | | | | (0.16 | ) |
Year Ended June 30, 2012 | | | 11.36 | | | | 0.17 | (h) | | | 0.06 | | | | 0.23 | | | | (0.17 | ) | | | — | | | | (0.17 | ) |
Year Ended June 30, 2011 | | | 10.44 | | | | 0.19 | | | | 0.92 | | | | 1.11 | | | | (0.19 | ) | | | — | | | | (0.19 | ) |
Year Ended June 30, 2010 | | | 9.64 | | | | 0.23 | | | | 0.81 | | | | 1.04 | | | | (0.24 | ) | | | — | | | | (0.24 | ) |
| | | | | | | |
Select Class | | | | | | | | | | | | | | | | | | | | | | | | | | | | |
Six Months Ended December 31, 2014 (Unaudited) | | | 13.06 | | | | 0.13 | (h)(i) | | | 0.04 | | | | 0.17 | | | | (0.17 | ) | | | (0.24 | ) | | | (0.41 | ) |
Year Ended June 30, 2014 | | | 12.06 | | | | 0.21 | (h) | | | 1.03 | | | | 1.24 | | | | (0.24 | ) | | | — | | | | (0.24 | ) |
Year Ended June 30, 2013 | | | 11.51 | | | | 0.22 | (h) | | | 0.58 | | | | 0.80 | | | | (0.25 | ) | | | — | | | | (0.25 | ) |
Year Ended June 30, 2012 | | | 11.44 | | | | 0.26 | (h) | | | 0.07 | | | | 0.33 | | | | (0.26 | ) | | | — | | | | (0.26 | ) |
Year Ended June 30, 2011 | | | 10.51 | | | | 0.27 | | | | 0.94 | | | | 1.21 | | | | (0.28 | ) | | | — | | | | (0.28 | ) |
Year Ended June 30, 2010 | | | 9.70 | | | | 0.30 | | | | 0.83 | | | | 1.13 | | | | (0.32 | ) | | | — | | | | (0.32 | ) |
| (a) | Annualized for periods less than one year, unless otherwise noted. |
| (b) | Net investment income (loss) is affected by timing of distributions from Underlying Funds. |
| (c) | Not annualized for periods less than one year. |
| (d) | Includes adjustments in accordance with accounting principles generally accepted in the United States of America and as such, the net asset values for financial reporting purposes and the returns based upon those net asset values may differ from the net asset values and returns for shareholder transactions. |
| (e) | Does not include expenses of Underlying Funds. |
| (f) | Includes earnings credits and interest expense, if applicable, each of which is less than 0.01% unless otherwise noted. |
| (g) | Portfolio turnover is calculated by dividing the lesser of total purchases or sales of portfolio securities for the reporting period by the monthly average value of portfolio securities owned during the reporting period. Excluded from both the numerator and denominator are amounts relating to derivatives and securities whose maturities or expiration dates at the time of acquisition were one year or less. |
| (h) | Calculated based upon average shares outstanding. |
| (i) | Net investment income (loss) may appear disproportionate among classes due the timing of recognition of income and changes in the relative size of the classes. |
| (j) | Certain non-recurring expenses incurred by the Fund were not annualized for the six months ended December 31, 2014. |
SEE NOTES TO FINANCIAL STATEMENTS.
| | | | | | |
| | | |
| 24 | | | | J.P. MORGAN INVESTOR FUNDS | | DECEMBER 31, 2014 |
| | | | | | | | | | | | | | | | | | | | | | | | | | |
| | | Ratios/Supplemental data | |
| | | | | | | | | | Ratios to average net assets (a) | | | | |
Net asset
value,
end of
period | | | Total return
(excludes
sales charge) (c)(d) | | | Net assets,
end of
period
(000’s) | | | Net
expenses (e)(f) | | |
Net
investment
income
(loss) (b) | | | Expenses
without waivers,
reimbursements and
earnings credits (e) | | | Portfolio
turnover
rate (c)(g) | |
| | | | | | | | | | | | | | | | | | | | | | | | | | |
| | | | | | | | | | | | | | | | | | | | | | | | | | |
| $ | 12.75 | | | | 1.09 | % | | $ | 2,556,514 | | | | 0.34 | %(j) | | | 1.79 | %(i)(j) | | | 0.66 | % | | | 5 | % |
| | 13.00 | | | | 10.05 | | | | 2,516,247 | | | | 0.41 | | | | 1.41 | | | | 0.66 | | | | 20 | |
| | 12.01 | | | | 6.76 | | | | 2,220,725 | | | | 0.50 | | | | 1.63 | | | | 0.68 | | | | 14 | |
| | 11.46 | | | | 2.60 | | | | 1,847,352 | | | | 0.50 | | | | 2.03 | | | | 0.68 | | | | 9 | |
| | 11.40 | | | | 11.36 | | | | 1,589,494 | | | | 0.50 | | | | 2.26 | | | | 0.68 | | | | 3 | |
| | 10.47 | | | | 11.32 | | | | 927,164 | | | | 0.50 | | | | 2.78 | | | | 0.72 | | | | 11 | |
| | | | | | |
| | | | | | | | | | | | | | | | | | | | | | | | | | |
| | 12.76 | | | | 0.92 | | | | 40,417 | | | | 0.78 | (j) | | | 1.30 | (i)(j) | | | 1.17 | | | | 5 | |
| | 13.01 | | | | 9.43 | | | | 46,180 | | | | 0.97 | | | | 0.84 | | | | 1.16 | | | | 20 | |
| | 12.02 | | | | 6.22 | | | | 59,190 | | | | 1.00 | | | | 1.12 | | | | 1.18 | | | | 14 | |
| | 11.47 | | | | 2.16 | | | | 87,831 | | | | 1.01 | | | | 1.50 | | | | 1.18 | | | | 9 | |
| | 11.40 | | | | 10.64 | | | | 116,375 | | | | 1.02 | | | | 1.69 | | | | 1.18 | | | | 3 | |
| | 10.48 | | | | 10.80 | | | | 145,639 | | | | 1.06 | | | | 2.17 | | | | 1.22 | | | | 11 | |
| | | | | | |
| | | | | | | | | | | | | | | | | | | | | | | | | | |
| | 12.70 | | | | 0.91 | | | | 1,711,843 | | | | 0.79 | (j) | | | 1.37 | (i)(j) | | | 1.16 | | | | 5 | |
| | 12.95 | | | | 9.42 | | | | 1,580,447 | | | | 0.97 | | | | 0.87 | | | | 1.16 | | | | 20 | |
| | 11.97 | | | | 6.27 | | | | 1,142,903 | | | | 1.01 | | | | 1.12 | | | | 1.18 | | | | 14 | |
| | 11.42 | | | | 2.09 | | | | 841,332 | | | | 1.01 | | | | 1.50 | | | | 1.18 | | | | 9 | |
| | 11.36 | | | | 10.73 | | | | 843,076 | | | | 1.01 | | | | 1.76 | | | | 1.18 | | | | 3 | |
| | 10.44 | | | | 10.78 | | | | 341,942 | | | | 1.06 | | | | 2.25 | | | | 1.22 | | | | 11 | |
| | | | | | |
| | | | | | | | | | | | | | | | | | | | | | | | | | |
| | 12.82 | | | | 1.27 | | | | 122,080 | | | | 0.09 | (j) | | | 2.04 | (i)(j) | | | 0.41 | | | | 5 | |
| | 13.06 | | | | 10.35 | | | | 119,664 | | | | 0.16 | | | | 1.66 | | | | 0.41 | | | | 20 | |
| | 12.06 | | | | 6.97 | | | | 112,843 | | | | 0.25 | | | | 1.87 | | | | 0.43 | | | | 14 | |
| | 11.51 | | | | 2.92 | | | | 95,175 | | | | 0.25 | | | | 2.27 | | | | 0.43 | | | | 9 | |
| | 11.44 | | | | 11.57 | | | | 89,120 | | | | 0.25 | | | | 2.48 | | | | 0.43 | | | | 3 | |
| | 10.51 | | | | 11.66 | | | | 60,791 | | | | 0.25 | | | | 3.03 | | | | 0.47 | | | | 11 | |
SEE NOTES TO FINANCIAL STATEMENTS.
| | | | | | | | |
| | | |
| DECEMBER 31, 2014 | | J.P. MORGAN INVESTOR FUNDS | | | | | 25 | |
FINANCIAL HIGHLIGHTS
FOR THE PERIODS INDICATED (continued)
| | | | | | | | | | | | | | | | | | | | | | | | | | | | |
| | | Per share operating performance | |
| | | | | | Investment operations | | | Distributions | |
| | | Net asset
value,
beginning
of period | | | Net
investment
income
(loss) (b) | | | Net realized
and unrealized
gains
(losses) on
investments | | | Total from
investment
operations | | | Net
investment
income | | | Net
realized
gain | | | Total
distributions | |
Investor Growth Fund | | | | | | | | | | | | | | | | | | | | | | | | | | | | |
Class A | | | | | | | | | | | | | | | | | | | | | | | | | | | | |
Six Months Ended December 31, 2014 (Unaudited) | | $ | 19.59 | | | $ | 0.12 | (h)(i) | | $ | 0.50 | | | $ | 0.62 | | | $ | (0.37 | ) | | $ | (0.31 | ) | | $ | (0.68 | ) |
Year Ended June 30, 2014 | | | 16.25 | | | | 0.11 | (h) | | | 3.45 | | | | 3.56 | | | | (0.22 | ) | | | — | | | | (0.22 | ) |
Year Ended June 30, 2013 | | | 13.88 | | | | 0.14 | (h) | | | 2.38 | | | | 2.52 | | | | (0.15 | ) | | | — | | | | (0.15 | ) |
Year Ended June 30, 2012 | | | 14.14 | | | | 0.10 | (h) | | | (0.25 | ) | | | (0.15 | ) | | | (0.11 | ) | | | — | | | | (0.11 | ) |
Year Ended June 30, 2011 | | | 11.22 | | | | 0.09 | (h) | | | 2.92 | | | | 3.01 | | | | (0.09 | ) | | | — | | | | (0.09 | ) |
Year Ended June 30, 2010 | | | 9.94 | | | | 0.10 | (h) | | | 1.26 | | | | 1.36 | | | | (0.08 | ) | | | — | | | | (0.08 | ) |
| | | | | | | |
Class B | | | | | | | | | | | | | | | | | | | | | | | | | | | | |
Six Months Ended December 31, 2014 (Unaudited) | | | 19.09 | | | | 0.07 | (h)(i) | | | 0.49 | | | | 0.56 | | | | (0.35 | ) | | | (0.31 | ) | | | (0.66 | ) |
Year Ended June 30, 2014 | | | 15.88 | | | | — | (h)(k) | | | 3.37 | | | | 3.37 | | | | (0.16 | ) | | | — | | | | (0.16 | ) |
Year Ended June 30, 2013 | | | 13.58 | | | | 0.05 | (h) | | | 2.34 | | | | 2.39 | | | | (0.09 | ) | | | — | | | | (0.09 | ) |
Year Ended June 30, 2012 | | | 13.85 | | | | 0.02 | (h) | | | (0.24 | ) | | | (0.22 | ) | | | (0.05 | ) | | | — | | | | (0.05 | ) |
Year Ended June 30, 2011 | | | 11.00 | | | | 0.02 | (h) | | | 2.86 | | | | 2.88 | | | | (0.03 | ) | | | — | | | | (0.03 | ) |
Year Ended June 30, 2010 | | | 9.79 | | | | 0.02 | (h) | | | 1.24 | | | | 1.26 | | | | (0.05 | ) | | | — | | | | (0.05 | ) |
| | | | | | | |
Class C | | | | | | | | | | | | | | | | | | | | | | | | | | | | |
Six Months Ended December 31, 2014 (Unaudited) | | | 18.75 | | | | 0.08 | (h)(i) | | | 0.47 | | | | 0.55 | | | | (0.35 | ) | | | (0.31 | ) | | | (0.66 | ) |
Year Ended June 30, 2014 | | | 15.60 | | | | 0.01 | (h) | | | 3.30 | | | | 3.31 | | | | (0.16 | ) | | | — | | | | (0.16 | ) |
Year Ended June 30, 2013 | | | 13.34 | | | | 0.05 | (h) | | | 2.30 | | | | 2.35 | | | | (0.09 | ) | | | — | | | | (0.09 | ) |
Year Ended June 30, 2012 | | | 13.61 | | | | 0.02 | (h) | | | (0.24 | ) | | | (0.22 | ) | | | (0.05 | ) | | | — | | | | (0.05 | ) |
Year Ended June 30, 2011 | | | 10.82 | | | | 0.02 | (h) | | | 2.80 | | | | 2.82 | | | | (0.03 | ) | | | — | | | | (0.03 | ) |
Year Ended June 30, 2010 | | | 9.62 | | | | 0.03 | (h) | | | 1.22 | | | | 1.25 | | | | (0.05 | ) | | | — | | | | (0.05 | ) |
| | | | | | | |
Select Class | | | | | | | | | | | | | | | | | | | | | | | | | | | | |
Six Months Ended December 31, 2014 (Unaudited) | | | 19.91 | | | | 0.16 | (h)(i) | | | 0.49 | | | | 0.65 | | | | (0.39 | ) | | | (0.31 | ) | | | (0.70 | ) |
Year Ended June 30, 2014 | | | 16.51 | | | | 0.16 | (h) | | | 3.50 | | | | 3.66 | | | | (0.26 | ) | | | — | | | | (0.26 | ) |
Year Ended June 30, 2013 | | | 14.09 | | | | 0.17 | (h) | | | 2.44 | | | | 2.61 | | | | (0.19 | ) | | | — | | | | (0.19 | ) |
Year Ended June 30, 2012 | | | 14.35 | | | | 0.14 | (h) | | | (0.26 | ) | | | (0.12 | ) | | | (0.14 | ) | | | — | | | | (0.14 | ) |
Year Ended June 30, 2011 | | | 11.39 | | | | 0.13 | (h) | | | 2.95 | | | | 3.08 | | | | (0.12 | ) | | | — | | | | (0.12 | ) |
Year Ended June 30, 2010 | | | 10.09 | | | | 0.13 | (h) | | | 1.28 | | | | 1.41 | | | | (0.11 | ) | | | — | | | | (0.11 | ) |
| (a) | Annualized for periods less than one year, unless otherwise noted. |
| (b) | Net investment income (loss) is affected by timing of distributions from Underlying Funds. |
| (c) | Not annualized for periods less than one year. |
| (d) | Includes adjustments in accordance with accounting principles generally accepted in the United States of America and as such, the net asset values for financial reporting purposes and the returns based upon those net asset values may differ from the net asset values and returns for shareholder transactions. |
| (e) | Does not include expenses of Underlying Funds. |
| (f) | Includes earnings credits and interest expense, if applicable, each of which is less than 0.01% unless otherwise noted. |
| (g) | Portfolio turnover is calculated by dividing the lesser of total purchases or sales of portfolio securities for the reporting period by the monthly average value of portfolio securities owned during the reporting period. Excluded from both the numerator and denominator are amounts relating to derivatives and securities whose maturities or expiration dates at the time of acquisition were one year or less. |
| (h) | Calculated based upon average shares outstanding. |
| (i) | Net investment income (loss) may appear disproportionate among classes due the timing of recognition of income and changes in the relative size of the classes. |
| (j) | Certain non-recurring expenses incurred by the Fund were not annualized for the six months ended December 31, 2014. |
| (k) | Amount rounds to less than $0.01. |
SEE NOTES TO FINANCIAL STATEMENTS.
| | | | | | |
| | | |
| 26 | | | | J.P. MORGAN INVESTOR FUNDS | | DECEMBER 31, 2014 |
| | | | | | | | | | | | | | | | | | | | | | | | | | |
| | | Ratios/Supplemental data | |
| | | | | | | | | | Ratios to average net assets (a) | | | | |
Net asset
value,
end of
period | | | Total return
(excludes
sales charge) (c)(d) | | | Net assets,
end of
period
(000’s) | | | Net
expenses (e)(f) | | | Net
investment
income
(loss) (b) | | | Expenses
without waivers,
reimbursements and
earnings credits (e) | | | Portfolio
turnover
rate (c)(g) | |
| | | | | | | | | | | | | | | | | | | | | | | | | | |
| | | | | | | | | | | | | | | | | | | | | | | | | | |
| $ | 19.53 | | | | 3.17 | % | | $ | 1,863,534 | | | | 0.38 | %(j) | | | 1.23 | %(i)(j) | | | 0.71 | % | | | 3 | % |
| | 19.59 | | | | 21.95 | | | | 1,791,194 | | | | 0.41 | | | | 0.59 | | | | 0.71 | | | | 8 | |
| | 16.25 | | | | 18.28 | | | | 1,344,928 | | | | 0.49 | | | | 0.89 | | | | 0.76 | | | | 15 | |
| | 13.88 | | | | (1.03 | ) | | | 1,100,639 | | | | 0.50 | | | | 0.72 | | | | 0.75 | | | | 6 | |
| | 14.14 | | | | 26.86 | | | | 1,089,221 | | | | 0.50 | | | | 0.71 | | | | 0.76 | | | | 15 | |
| | 11.22 | | | | 13.67 | | | | 769,574 | | | | 0.50 | | | | 0.81 | | | | 0.79 | | | | 15 | |
| | | | | | |
| | | | | | | | | | | | | | | | | | | | | | | | | | |
| | 18.99 | | | | 2.93 | | | | 75,546 | | | | 0.85 | (j) | | | 0.66 | (i)(j) | | | 1.22 | | | | 3 | |
| | 19.09 | | | | 21.28 | | | | 88,345 | | | | 0.95 | | | | 0.02 | | | | 1.21 | | | | 8 | |
| | 15.88 | | | | 17.63 | | | | 111,593 | | | | 1.04 | | | | 0.34 | | | | 1.26 | | | | 15 | |
| | 13.58 | | | | (1.55 | ) | | | 147,256 | | | | 1.05 | | | | 0.16 | | | | 1.25 | | | | 6 | |
| | 13.85 | | | | 26.20 | | | | 213,785 | | | | 1.06 | | | | 0.12 | | | | 1.26 | | | | 15 | |
| | 11.00 | | | | 12.85 | | | | 232,624 | | | | 1.10 | | | | 0.20 | | | | 1.30 | | | | 15 | |
| | | | | | |
| | | | | | | | | | | | | | | | | | | | | | | | | | |
| | 18.64 | | | | 2.93 | | | | 243,040 | | | | 0.85 | (j) | | | 0.79 | (i)(j) | | | 1.21 | | | | 3 | |
| | 18.75 | | | | 21.30 | | | | 226,430 | | | | 0.95 | | | | 0.05 | | | | 1.21 | | | | 8 | |
| | 15.60 | | | | 17.69 | | | | 157,546 | | | | 1.04 | | | | 0.34 | | | | 1.25 | | | | 15 | |
| | 13.34 | | | | (1.57 | ) | | | 125,391 | | | | 1.05 | | | | 0.17 | | | | 1.25 | | | | 6 | |
| | 13.61 | | | | 26.11 | | | | 128,944 | | | | 1.06 | | | | 0.15 | | | | 1.26 | | | | 15 | |
| | 10.82 | | | | 12.99 | | | | 82,981 | | | | 1.09 | | | | 0.22 | | | | 1.29 | | | | 15 | |
| | | | | | |
| | | | | | | | | | | | | | | | | | | | | | | | | | |
| | 19.86 | | | | 3.30 | | | | 207,422 | | | | 0.12 | (j) | | | 1.54 | (i)(j) | | | 0.44 | | | | 3 | |
| | 19.91 | | | | 22.25 | | | | 182,413 | | | | 0.16 | | | | 0.85 | | | | 0.46 | | | | 8 | |
| | 16.51 | | | | 18.64 | | | | 123,906 | | | | 0.24 | | | | 1.13 | | | | 0.51 | | | | 15 | |
| | 14.09 | | | | (0.77 | ) | | | 108,189 | | | | 0.25 | | | | 0.99 | | | | 0.50 | | | | 6 | |
| | 14.35 | | | | 27.11 | | | | 123,051 | | | | 0.25 | | | | 0.96 | | | | 0.51 | | | | 15 | |
| | 11.39 | | | | 13.87 | | | | 77,338 | | | | 0.25 | | | | 1.08 | | | | 0.54 | | | | 15 | |
SEE NOTES TO FINANCIAL STATEMENTS.
| | | | | | | | |
| | | |
| DECEMBER 31, 2014 | | J.P. MORGAN INVESTOR FUNDS | | | | | 27 | |
FINANCIAL HIGHLIGHTS
FOR THE PERIODS INDICATED (continued)
| | | | | | | | | | | | | | | | | | | | | | | | | | | | |
| | | Per share operating performance | |
| | | | | | Investment operations | | | Distributions | |
| | | Net asset
value,
beginning
of period | | | Net
investment
income
(loss) (b) | | | Net realized
and unrealized
gains
(losses) on
investments | | | Total from
investment
operations | | | Net
investment
income | | | Net
realized
gain | | | Total
distributions | |
Investor Growth & Income Fund | | | | | | | | | | | | | | | | | | | | | | | | | | | | |
Class A | | | | | | | | | | | | | | | | | | | | | | | | | | | | |
Six Months Ended December 31, 2014 (Unaudited) | | $ | 17.11 | | | $ | 0.14 | (h)(i) | | $ | 0.18 | | | $ | 0.32 | | | $ | (0.27 | ) | | $ | (0.39 | ) | | $ | (0.66 | ) |
Year Ended June 30, 2014 | | | 14.78 | | | | 0.16 | (h) | | | 2.40 | | | | 2.56 | | | | (0.23 | ) | | | — | | | | (0.23 | ) |
Year Ended June 30, 2013 | | | 13.17 | | | | 0.18 | (h) | | | 1.64 | | | | 1.82 | | | | (0.21 | ) | | | — | | | | (0.21 | ) |
Year Ended June 30, 2012 | | | 13.28 | | | | 0.17 | (h) | | | (0.10 | ) | | | 0.07 | | | | (0.18 | ) | | | — | | | | (0.18 | ) |
Year Ended June 30, 2011 | | | 11.05 | | | | 0.18 | (h) | | | 2.23 | | | | 2.41 | | | | (0.18 | ) | | | — | | | | (0.18 | ) |
Year Ended June 30, 2010 | | | 9.90 | | | | 0.20 | (h) | | | 1.15 | | | | 1.35 | | | | (0.20 | ) | | | — | | | | (0.20 | ) |
| | | | | | | |
Class B | | | | | | | | | | | | | | | | | | | | | | | | | | | | |
Six Months Ended December 31, 2014 (Unaudited) | | | 17.04 | | | | 0.09 | (h)(i) | | | 0.20 | | | | 0.29 | | | | (0.24 | ) | | | (0.39 | ) | | | (0.63 | ) |
Year Ended June 30, 2014 | | | 14.72 | | | | 0.06 | (h) | | | 2.40 | | | | 2.46 | | | | (0.14 | ) | | | — | | | | (0.14 | ) |
Year Ended June 30, 2013 | | | 13.11 | | | | 0.11 | (h) | | | 1.63 | | | | 1.74 | | | | (0.13 | ) | | | — | | | | (0.13 | ) |
Year Ended June 30, 2012 | | | 13.22 | | | | 0.10 | (h) | | | (0.10 | ) | | | — | (k) | | | (0.11 | ) | | | — | | | | (0.11 | ) |
Year Ended June 30, 2011 | | | 11.00 | | | | 0.11 | (h) | | | 2.22 | | | | 2.33 | | | | (0.11 | ) | | | — | | | | (0.11 | ) |
Year Ended June 30, 2010 | | | 9.85 | | | | 0.13 | (h) | | | 1.15 | | | | 1.28 | | | | (0.13 | ) | | | — | | | | (0.13 | ) |
| | | | | | | |
Class C | | | | | | | | | | | | | | | | | | | | | | | | | | | | |
Six Months Ended December 31, 2014 (Unaudited) | | | 16.72 | | | | 0.10 | (h)(i) | | | 0.19 | | | | 0.29 | | | | (0.24 | ) | | | (0.39 | ) | | | (0.63 | ) |
Year Ended June 30, 2014 | | | 14.46 | | | | 0.07 | (h) | | | 2.34 | | | | 2.41 | | | | (0.15 | ) | | | — | | | | (0.15 | ) |
Year Ended June 30, 2013 | | | 12.89 | | | | 0.10 | (h) | | | 1.61 | | | | 1.71 | | | | (0.14 | ) | | | — | | | | (0.14 | ) |
Year Ended June 30, 2012 | | | 13.01 | | | | 0.10 | (h) | | | (0.11 | ) | | | (0.01 | ) | | | (0.11 | ) | | | — | | | | (0.11 | ) |
Year Ended June 30, 2011 | | | 10.83 | | | | 0.11 | (h) | | | 2.19 | | | | 2.30 | | | | (0.12 | ) | | | — | | | | (0.12 | ) |
Year Ended June 30, 2010 | | | 9.71 | | | | 0.13 | (h) | | | 1.12 | | | | 1.25 | | | | (0.13 | ) | | | — | | | | (0.13 | ) |
| | | | | | | |
Select Class | | | | | | | | | | | | | | | | | | | | | | | | | | | | |
Six Months Ended December 31, 2014 (Unaudited) | | | 16.89 | | | | 0.16 | (h)(i) | | | 0.19 | | | | 0.35 | | | | (0.30 | ) | | | (0.39 | ) | | | (0.69 | ) |
Year Ended June 30, 2014 | | | 14.59 | | | | 0.19 | (h) | | | 2.38 | | | | 2.57 | | | | (0.27 | ) | | | — | | | | (0.27 | ) |
Year Ended June 30, 2013 | | | 13.00 | | | | 0.21 | (h) | | | 1.63 | | | | 1.84 | | | | (0.25 | ) | | | — | | | | (0.25 | ) |
Year Ended June 30, 2012 | | | 13.12 | | | | 0.20 | (h) | | | (0.11 | ) | | | 0.09 | | | | (0.21 | ) | | | — | | | | (0.21 | ) |
Year Ended June 30, 2011 | | | 10.92 | | | | 0.21 | (h) | | | 2.20 | | | | 2.41 | | | | (0.21 | ) | | | — | | | | (0.21 | ) |
Year Ended June 30, 2010 | | | 9.78 | | | | 0.22 | (h) | | | 1.14 | | | | 1.36 | | | | (0.22 | ) | | | — | | | | (0.22 | ) |
| (a) | Annualized for periods less than one year, unless otherwise noted. |
| (b) | Net investment income (loss) is affected by timing of distributions from Underlying Funds. |
| (c) | Not annualized for periods less than one year. |
| (d) | Includes adjustments in accordance with accounting principles generally accepted in the United States of America and as such, the net asset values for financial reporting purposes and the returns based upon those net asset values may differ from the net asset values and returns for shareholder transactions. |
| (e) | Does not include expenses of Underlying Funds. |
| (f) | Includes earnings credits and interest expense, if applicable, each of which is less than 0.01% unless otherwise noted. |
| (g) | Portfolio turnover is calculated by dividing the lesser of total purchases or sales of portfolio securities for the reporting period by the monthly average value of portfolio securities owned during the reporting period. Excluded from both the numerator and denominator are amounts relating to derivatives and securities whose maturities or expiration dates at the time of acquisition were one year or less. |
| (h) | Calculated based upon average shares outstanding. |
| (i) | Net investment income (loss) may appear disproportionate among classes due the timing of recognition of income and changes in the relative size of the classes. |
| (j) | Certain non-recurring expenses incurred by the Fund were not annualized for the six months ended December 31, 2014. |
| (k) | Amount rounds to less than $0.01. |
| (l) | Amount rounds to less than 0.01%. |
SEE NOTES TO FINANCIAL STATEMENTS.
| | | | | | |
| | | |
| 28 | | | | J.P. MORGAN INVESTOR FUNDS | | DECEMBER 31, 2014 |
| | | | | | | | | | | | | | | | | | | | | | | | | | |
| | | Ratios/Supplemental data | |
| | | | | | | | | | Ratios to average net assets (a) | | | | |
Net asset
value,
end of
period | | | Total return
(excludes
sales charge) (c)(d) | | | Net assets,
end of
period
(000’s) | | | Net
expenses (e)(f) | | |
Net
investment
income
(loss) (b) | | | Expenses
without waivers,
reimbursements and
earnings credits (e) | | | Portfolio
turnover
rate (c)(g) | |
| | | | | | | | | | | | | | | | | | | | | | | | | | |
| | | | | | | | | | | | | | | | | | | | | | | | | | |
| $ | 16.77 | | | | 1.94 | % | | $ | 2,523,392 | | | | 0.35 | %(j) | | | 1.58 | %(i)(j) | | | 0.68 | % | | | 4 | % |
| | 17.11 | | | | 17.40 | | | | 2,432,024 | | | | 0.41 | | | | 0.96 | | | | 0.68 | | | | 10 | |
| | 14.78 | | | | 13.91 | | | | 1,812,603 | | | | 0.49 | | | | 1.29 | | | | 0.72 | | | | 20 | |
| | 13.17 | | | | 0.60 | | | | 1,485,151 | | | | 0.50 | | | | 1.33 | | | | 0.71 | | | | 11 | |
| | 13.28 | | | | 21.91 | | | | 1,443,240 | | | | 0.50 | | | | 1.45 | | | | 0.71 | | | | 9 | |
| | 11.05 | | | | 13.52 | | | | 1,008,109 | | | | 0.50 | | | | 1.72 | | | | 0.73 | | | | 14 | |
| | | | | | |
| | | | | | | | | | | | | | | | | | | | | | | | | | |
| | 16.70 | | | | 1.75 | | | | 80,165 | | | | 0.80 | (j) | | | 1.03 | (i)(j) | | | 1.19 | | | | 4 | |
| | 17.04 | | | | 16.74 | | | | 95,394 | | | | 0.96 | | | | 0.39 | | | | 1.19 | | | | 10 | |
| | 14.72 | | | | 13.35 | | | | 124,521 | | | | 1.02 | | | | 0.77 | | | | 1.22 | | | | 20 | |
| | 13.11 | | | | 0.03 | | | | 185,106 | | | | 1.03 | | | | 0.79 | | | | 1.22 | | | | 11 | |
| | 13.22 | | | | 21.23 | | | | 270,833 | | | | 1.04 | | | | 0.88 | | | | 1.22 | | | | 9 | |
| | 11.00 | | | | 12.92 | | | | 315,944 | | | | 1.08 | | | | 1.13 | | | | 1.23 | | | | 14 | |
| | | | | | |
| | | | | | | | | | | | | | | | | | | | | | | | | | |
| | 16.38 | | | | 1.78 | | | | 387,269 | | | | 0.81 | (j) | | | 1.15 | (i)(j) | | | 1.18 | | | | 4 | |
| | 16.72 | | | | 16.72 | | | | 358,544 | | | | 0.96 | | | | 0.42 | | | | 1.18 | | | | 10 | |
| | 14.46 | | | | 13.34 | | | | 225,157 | | | | 1.02 | | | | 0.76 | | | | 1.21 | | | | 20 | |
| | 12.89 | | | | 0.00 | (l) | | | 179,336 | | | | 1.03 | | | | 0.80 | | | | 1.21 | | | | 11 | |
| | 13.01 | | | | 21.28 | | | | 186,625 | | | | 1.04 | | | | 0.91 | | | | 1.21 | | | | 9 | |
| | 10.83 | | | | 12.87 | | | | 119,332 | | | | 1.07 | | | | 1.16 | | | | 1.23 | | | | 14 | |
| | | | | | |
| | | | | | | | | | | | | | | | | | | | | | | | | | |
| | 16.55 | | | | 2.09 | | | | 225,619 | | | | 0.10 | (j) | | | 1.86 | (i)(j) | | | 0.42 | | | | 4 | |
| | 16.89 | | | | 17.71 | | | | 208,836 | | | | 0.16 | | | | 1.21 | | | | 0.44 | | | | 10 | |
| | 14.59 | | | | 14.22 | | | | 156,714 | | | | 0.24 | | | | 1.53 | | | | 0.47 | | | | 20 | |
| | 13.00 | | | | 0.79 | | | | 127,295 | | | | 0.25 | | | | 1.59 | | | | 0.46 | | | | 11 | |
| | 13.12 | | | | 22.19 | | | | 146,524 | | | | 0.25 | | | | 1.69 | | | | 0.46 | | | | 9 | |
| | 10.92 | | | | 13.87 | | | | 104,501 | | | | 0.25 | | | | 1.94 | | | | 0.48 | | | | 14 | |
SEE NOTES TO FINANCIAL STATEMENTS.
| | | | | | | | |
| | | |
| DECEMBER 31, 2014 | | J.P. MORGAN INVESTOR FUNDS | | | | | 29 | |
NOTES TO FINANCIAL STATEMENTS
AS OF DECEMBER 31, 2014 (Unaudited)
1. Organization
JPMorgan Trust II (“JPM II” or the “Trust”) was formed on November 12, 2004, as a Delaware statutory trust, pursuant to a Declaration of Trust dated November 5, 2004 and is registered under the Investment Company Act of 1940, as amended (the “1940 Act”), as an open-end management investment company.
The following are 4 separate funds of the Trust (collectively, the “Funds”) covered by this report:
| | | | |
| | | Classes Offered | | Diversified/Non-Diversified |
| Investor Balanced Fund | | Class A, Class B, Class C and Select Class | | Diversified |
| Investor Conservative Growth Fund | | Class A, Class B, Class C and Select Class | | Diversified |
| Investor Growth Fund | | Class A, Class B, Class C and Select Class | | Diversified |
| Investor Growth & Income Fund | | Class A, Class B, Class C and Select Class | | Diversified |
The investment objective of the Investor Balanced Fund is to seek high total return consistent with the preservation of capital by investing primarily in a diversified group of mutual funds within the same group of investment companies that invest primarily in equity and fixed income securities.
The investment objective of the Investor Conservative Growth Fund is to seek income and capital appreciation by investing primarily in a diversified group of mutual funds within the same group of investment companies that invest primarily in fixed income and equity securities.
The investment objective of the Investor Growth Fund is to seek long-term capital appreciation by investing primarily in a diversified group of mutual funds within the same group of investment companies that invest primarily in equity securities.
The investment objective of the Investor Growth & Income Fund is to seek long-term capital appreciation and growth of income by investing primarily in a diversified group of mutual funds within the same group of investment companies that invest primarily in equity securities.
Effective November 1, 2009, Class B Shares of the Funds may not be purchased or acquired by new or existing shareholders, except through exchanges from Class B Shares of another J.P. Morgan Fund and dividend reinvestments. Shareholders who have invested in Class B Shares prior to November 1, 2009 may continue to hold their Class B Shares until they automatically convert to Class A Shares.
Class A Shares generally provide for a front-end sales charge while Class B and Class C Shares provide for a contingent deferred sales charge (“CDSC”). Class B Shares automatically convert to Class A Shares after eight years. No sales charges are assessed with respect to Select Class Shares. All classes of shares have equal rights as to earnings, assets and voting privileges, except that each class may bear different distribution and shareholder servicing fees and each class has exclusive voting rights with respect to its distribution plan and shareholder servicing agreements. Certain Class A Shares, for which front-end sales charges have been waived, may be subject to a CDSC as described in the Funds’ prospectus.
2. Significant Accounting Policies
The following is a summary of significant accounting policies followed by the Funds in the preparation of their financial statements. The Funds are investment companies and, accordingly, follow the investment company accounting and reporting guidance of the Financial Accounting Standards Board Accounting Standards Codification Topic 946—Investment Companies, which is part of U.S. generally accepted accounting principles (“GAAP”). The preparation of financial statements in conformity with GAAP requires management to make estimates and assumptions that affect the reported amounts of assets and liabilities and disclosure of contingent assets and liabilities at the date of the financial statements and the reported amounts of increases and decreases in net assets from operations during the reporting period. Actual results could differ from those estimates.
A. Valuation of Investments — The valuation of the investments is in accordance with GAAP and the Funds’ valuation policies set forth by and under the supervision and responsibility of the Board of Trustees (the “Board”), which established the following approach to valuation, as described more fully below: (i) investments for which market quotations are readily available shall be valued at such unadjusted quoted prices and (ii) all other investments for which market quotations are not readily available shall be valued at their fair value as determined in good faith by the Board.
JPMorgan Funds Management, Inc. (the “Administrator” or “JPMFM”) has established the J.P. Morgan Asset Management Americas Valuation Committee (“AVC”) to assist the Board with the oversight and monitoring of the valuation of the Funds’ investments. The Administrator implements the valuation policies of the Funds’ investments, as directed by the Board. The AVC oversees and carries out the policies for the valuation of investments held in the Funds. This includes monitoring the appropriateness of fair values based on results of ongoing valuation oversight, including but not limited to consideration of macro or security specific events, market events and pricing vendor and broker due diligence. The Administrator is responsible for discussing and assessing the potential impacts to the fair values on an ongoing basis, and at least on a quarterly basis with the AVC and the Board.
Investments in open-end investment companies (the “Underlying Funds”) are valued at each investment company’s net asset value per share (“NAV”) as of the report date.
Valuations reflected in this report are as of the report date. As a result, changes in valuation due to market events and/or issuer related events after the report date and prior to issuance of the report are not reflected herein.
The various inputs that are used in determining the valuation of the Funds’ investments are summarized into the three broad levels listed below.
| Ÿ | | Level 1 — Unadjusted inputs using quoted prices in active markets for identical investments. |
| | | | | | |
| | | |
| 30 | | | | J.P. MORGAN INVESTOR FUNDS | | DECEMBER 31, 2014 |
| Ÿ | | Level 2 — Other significant observable inputs including, but are not limited to, quoted prices for similar investments, inputs other than quoted prices that are observable for investments (such as interest rates, prepayment speeds, credit risk, etc.) or other market corroborated inputs. |
| Ÿ | | Level 3 — Significant inputs based on the best information available in the circumstances, to the extent observable inputs are not available (including the Funds’ assumptions in determining the fair value of investments). |
A financial instrument’s level within the fair value hierarchy is based on the lowest level of any input, both individually and in the aggregate, that is significant to the fair value measurement. The inputs or methodology used for valuing instruments are not necessarily an indication of the risk associated with investing in those instruments.
The following tables represent each valuation input as presented on the Schedules of Portfolio Investments (“SOIs”) (amounts in thousands):
| | | | | | | | | | | | | | | | |
| | | Level 1
Quoted prices | | | Level 2
Other significant
observable inputs | | | Level 3
Significant
unobservable inputs | | | Total | |
Investor Balanced Fund | | | | | | | | | | | | | | | | |
Total Investments in Securities (a) | | $ | 5,359,725 | | | $ | — | | | $ | — | | | $ | 5,359,725 | |
| | | | | | | | | | | | | | | | |
Investor Conservative Growth Fund | | | | | | | | | | | | | | | | |
Total Investments in Securities (a) | | $ | 4,429,200 | | | $ | — | | | $ | — | | | $ | 4,429,200 | |
| | | | | | | | | | | | | | | | |
Investor Growth Fund | | | | | | | | | | | | | | | | |
Total Investments in Securities (a) | | $ | 2,389,211 | | | $ | — | | | $ | — | | | $ | 2,389,211 | |
| | | | | | | | | | | | | | | | |
Investor Growth & Income Fund | | | | | | | | | | | | | | | | |
Total Investments in Securities (a) | | $ | 3,216,588 | | | $ | — | | | $ | — | | | $ | 3,216,588 | |
| | | | | | | | | | | | | | | | |
| (a) | All portfolio holdings designated as Level 1 are disclosed individually on the SOIs. Please refer to the SOIs for asset class specifics of portfolio holdings. |
There were no transfers among any levels during the six months ended December 31, 2014.
B. Investment Transactions with Affiliates — The Funds invest in Underlying Funds advised by J.P. Morgan Investment Management Inc. (the “Adviser” or “JPMIM” ) or its affiliates pursuant to Section 12(d)(1)(G) of the 1940 Act. An issuer which is under common control with a fund may be considered an affiliate. For the purposes of the financial statements, the Funds assume the following to be affiliated issuers. Included in the realized gain (loss) amounts in the tables below are distributions of realized capital gains, if any, received from the Underlying Funds (amounts in thousands):
| | | | | | | | | | | | | | | | | | | | | | | | | | | | |
| | | | | | For the six months ended December 31, 2014 | | | | | | | |
| Affiliate | | Value at
June 30,
2014 | | | Purchase
Cost | | | Sales
Proceeds | | | Realized
Gain/(Loss) | | | Dividend
Income | | | Shares at
December 31,
2014 | | | Value at
December 31,
2014 | |
Investor Balanced Fund | | | | | | | | | | | | | | | | | | | | | | | | | | | | |
JPMorgan Commodities Strategy Fund, Select Class Shares | | $ | 25,995 | | | $ | 1,000 | | | $ | — | | | $ | — | | | $ | — | | | | 1,910 | | | $ | 20,914 | |
JPMorgan Core Bond Fund, Select Class Shares | | | 613,016 | | | | 139,543 | | | | 6,300 | | | | 882 | | | | 8,803 | | | | 63,753 | | | | 749,100 | |
JPMorgan Core Plus Bond Fund, Select Class Shares | | | 467,919 | | | | 11,326 | | | | 6,300 | | | | 3,303 | | | | 7,999 | | | | 56,447 | | | | 469,077 | |
JPMorgan Dynamic Growth Fund, Select Class Shares | | | 102,706 | | | | 13,427 | | | | 1,500 | | | | 1,762 | | | | — | | | | 4,719 | | | | 115,672 | |
JPMorgan Emerging Economies Fund, Select Class Shares | | | 78,848 | | | | 3,914 | | | | 2,100 | | | | (126 | ) | | | 1,315 | | | | 5,910 | | | | 72,039 | |
JPMorgan Emerging Markets Debt Fund, Select Class Shares | | | 25,141 | | | | 10,793 | | | | — | | | | — | | | | 793 | | | | 4,230 | | | | 34,137 | |
JPMorgan Emerging Markets Equity Fund, Select Class Shares | | | 80,273 | | | | 2,837 | | | | 6,100 | | | | 125 | | | | 737 | | | | 3,153 | | | | 70,553 | |
JPMorgan Emerging Markets Local Currency Debt Fund, Select Class Shares | | | 42,669 | | | | 27 | | | | — | | | | — | | | | 26 | | | | 4,370 | | | | 37,979 | |
JPMorgan Equity Income Fund, Select Class Shares | | | 78,879 | | | | 5,611 | | | | — | | | | 1,652 | | | | 958 | | | | 6,102 | | | | 87,074 | |
JPMorgan Floating Rate Income Fund, Select Class Shares | | | 142,844 | | | | 3,048 | | | | 12,200 | | | | (254 | ) | | | 3,048 | | | | 13,205 | | | | 128,348 | |
| | | | | | | | |
| | | |
| DECEMBER 31, 2014 | | J.P. MORGAN INVESTOR FUNDS | | | | | 31 | |
NOTES TO FINANCIAL STATEMENTS
AS OF DECEMBER 31, 2014 (Unaudited) (continued)
| | | | | | | | | | | | | | | | | | | | | | | | | | | | |
| | | | | | For the six months ended December 31, 2014 | | | | | | | |
| Affiliate | | Value at
June 30,
2014 | | | Purchase
Cost | | | Sales
Proceeds | | | Realized
Gain/(Loss) | | | Dividend
Income | | | Shares at
December 31,
2014 | | | Value at
December 31,
2014 | |
Investor Balanced Fund (continued) | | | | | | | | | | | | | | | | | | | | | | | | | | | | |
JPMorgan Global Natural Resources Fund, Select Class Shares | | $ | 13,077 | | | $ | 1,049 | | | $ | — | | | $ | — | | | $ | 49 | | | | 1,340 | | | $ | 10,173 | |
JPMorgan Global Research Enhanced Index Fund, Select Class Shares | | | 185,507 | | | | 4,960 | | | | 7,000 | | | | 2,685 | | | | 2,602 | | | | 9,686 | | | | 177,343 | |
JPMorgan Government Bond Fund, Select Class Shares | | | 5,692 | | | | 6,338 | | | | — | | | | 220 | | | | 119 | | | | 1,090 | | | | 11,917 | |
JPMorgan High Yield Fund, Select Class Shares | | | 109,005 | | | | 13,355 | | | | — | | | | 2,337 | | | | 3,018 | | | | 15,072 | | | | 114,397 | |
JPMorgan Inflation Managed Bond Fund, Select Class Shares | | | 143,032 | | | | 12,893 | | | | 8,400 | | | | (324 | ) | | | 892 | | | | 13,912 | | | | 142,461 | |
JPMorgan International Equity Fund, Select Class Shares | | | 60,425 | | | | 10,275 | | | | 4,000 | | | | (293 | ) | | | 174 | | | | 4,063 | | | | 61,024 | |
JPMorgan International Research Enhanced Equity Fund, Select Class Shares | | | 151,569 | | | | 40,041 | | | | — | | | | 24,182 | | | | 3,960 | | | | 9,109 | | | | 147,388 | |
JPMorgan Intrepid America Fund, Select Class Shares | | | 354,247 | | | | 34,724 | | | | 19,500 | | | | 19,365 | | | | 4,195 | | | | 9,862 | | | | 375,530 | |
JPMorgan Intrepid European Fund, Select Class Shares | | | 45,925 | | | | 5,977 | | | | 2,000 | | | | (252 | ) | | | 1,577 | | | | 1,826 | | | | 43,327 | |
JPMorgan Intrepid Growth Fund, Select Class Shares | | | 167,830 | | | | 11,961 | | | | 12,300 | | | | 1,211 | | | | 960 | | | | 4,520 | | | | 182,718 | |
JPMorgan Intrepid Mid Cap Fund, Select Class Shares | | | 111,796 | | | | 15,043 | | | | 6,500 | | | | 16,278 | | | | 427 | | | | 4,902 | | | | 112,402 | |
JPMorgan Large Cap Growth Fund, Select Class Shares | | | 47,170 | | | | 10,850 | | | | 2,000 | | | | 1,133 | | | | — | | | | 1,725 | | | | 59,678 | |
JPMorgan Large Cap Value Fund, Select Class Shares | | | 183,236 | | | | 39,761 | | | | 13,600 | | | | 29,062 | | | | 1,199 | | | | 13,075 | | | | 192,339 | |
JPMorgan Latin America Fund, Select Class Shares | | | 27,512 | | | | 1,224 | | | | 1,000 | | | | (108 | ) | | | 124 | | | | 1,484 | | | | 22,967 | |
JPMorgan Limited Duration Bond Fund, Select Class Shares | | | 135,456 | | | | 710 | | | | 4,200 | | | | 4 | | | | 708 | | | | 13,210 | | | | 132,101 | |
JPMorgan Liquid Assets Money Market Fund, Institutional Class Shares | | | 299,628 | | | | 263,023 | | | | 320,727 | | | | — | | | | 54 | | | | 241,924 | | | | 241,924 | |
JPMorgan Market Expansion Enhanced Index Fund, Select Class Shares | | | 176,596 | | | | 48,981 | | | | 8,000 | | | | 22,728 | | | | 1,057 | | | | 15,984 | | | | 201,238 | |
JPMorgan Multi-Cap Market Neutral Fund, Select Class Shares | | | 162,367 | | | | — | | | | 48,100 | | | | 494 | | | | — | | | | 11,377 | | | | 116,844 | |
JPMorgan Unconstrained Debt Fund, Select Class Shares | | | 23,213 | | | | 712 | | | | — | | | | — | | | | 713 | | | | 2,305 | | | | 23,114 | |
JPMorgan Research Market Neutral Fund, Select Class Shares | | | 107,386 | | | | 2,701 | | | | — | | | | 2,700 | | | | — | | | | 7,109 | | | | 108,846 | |
JPMorgan Strategic Income Opportunities Fund, Select Class Shares | | | 136,817 | | | | 992 | | | | 16,100 | | | | (164 | ) | | | 993 | | | | 10,219 | | | | 119,764 | |
JPMorgan Systematic Alpha Fund, Select Class Shares | | | — | | | | 80,314 | | | | — | | | | 90 | | | | 824 | | | | 5,304 | | | | 79,773 | |
JPMorgan U.S. Dynamic Plus Fund, Select Class Shares | | | 61,730 | | | | 3,396 | | | | 5,000 | | | | 3,598 | | | | 372 | | | | 3,377 | | | | 61,876 | |
JPMorgan U.S. Equity Fund, Select Class Shares | | | 480,791 | | | | 55,232 | | | | 25,000 | | | | 43,130 | | | | 3,297 | | | | 34,459 | | | | 500,692 | |
JPMorgan U.S. Large Cap Core Plus Fund, Select Class Shares | | | 233,848 | | | | 22,637 | | | | 8,100 | | | | 17,285 | | | | 1,598 | | | | 8,383 | | | | 246,464 | |
JPMorgan Value Advantage Fund, Select Class Shares | | | 80,759 | | | | 6,160 | | | | — | | | | 2,031 | | | | 928 | | | | 2,973 | | | | 88,532 | |
| | | | | | | | | | | | | | | | | | | | | | | | | | | | |
| | $ | 5,162,904 | | | | | | | | | | | $ | 194,736 | | | $ | 53,519 | | | | | | | $ | 5,359,725 | |
| | | | | | | | | | | | | | | | | | | | | | | | | | | | |
| | | | | | | | | | | | | | | | | | | | | | | | | | | | |
| | | | | | For the six months ended December 31, 2014 | | | | | | | |
| Affiliate | | Value at
June 30,
2014 | | | Purchase
Cost | | | Sales
Proceeds | | | Realized
Gain/(Loss) | | | Dividend
Income | | | Shares at
December 31,
2014 | | | Value at
December 31,
2014 | |
Investor Conservative Growth Fund | | | | | | | | | | | | | | | | | | | | | | | | | | | | |
JPMorgan Commodities Strategy Fund, Select Class Shares | | $ | 22,833 | | | $ | 1,000 | | | $ | — | | | $ | — | | | $ | — | | | | 1,687 | | | $ | 18,469 | |
JPMorgan Core Bond Fund, Select Class Shares | | | 806,107 | | | | 130,636 | | | | 5,300 | | | | 1,161 | | | | 11,261 | | | | 79,567 | | | | 934,913 | |
JPMorgan Core Plus Bond Fund, Select Class Shares | | | 546,237 | | | | 13,253 | | | | 5,300 | | | | 3,872 | | | | 9,355 | | | | 66,143 | | | | 549,646 | |
JPMorgan Dynamic Growth Fund, Select Class Shares | | | 37,180 | | | | 4,098 | | | | 1,500 | | | | 633 | | | | — | | | | 1,639 | | | | 40,162 | |
JPMorgan Emerging Economies Fund, Select Class Shares | | | 43,093 | | | | 2,711 | | | | 2,200 | | | | (141 | ) | | | 710 | | | | 3,193 | | | | 38,926 | |
| | | | | | |
| | | |
| 32 | | | | J.P. MORGAN INVESTOR FUNDS | | DECEMBER 31, 2014 |
| | | | | | | | | | | | | | | | | | | | | | | | | | | | |
| | | | | | For the six months ended December 31, 2014 | | | | | | | |
| Affiliate | | Value at
June 30,
2014 | | | Purchase
Cost | | | Sales
Proceeds | | | Realized
Gain/(Loss) | | | Dividend
Income | | | Shares at
December 31,
2014 | | | Value at
December 31,
2014 | |
Investor Conservative Growth Fund (continued) | | | | | | | | | | | | | | | | | | | | | | | | | | | | |
JPMorgan Emerging Markets Debt Fund, Select Class Shares | | $ | 17,533 | | | $ | 5,528 | | | $ | — | | | $ | — | | | $ | 528 | | | | 2,703 | | | $ | 21,815 | |
JPMorgan Emerging Markets Equity Fund, Select Class Shares | | | 43,460 | | | | 2,403 | | | | 3,700 | | | | 36 | | | | 404 | | | | 1,727 | | | | 38,650 | |
JPMorgan Emerging Markets Local Currency Debt Fund, Select Class Shares | | | 59,351 | | | | 37 | | | | — | | | | — | | | | 36 | | | | 6,079 | | | | 52,827 | |
JPMorgan Equity Income Fund, Select Class Shares | | | 74,826 | | | | 3,939 | | | | — | | | | 1,541 | | | | 897 | | | | 5,691 | | | | 81,214 | |
JPMorgan Floating Rate Income Fund, Select Class Shares | | | 165,942 | | | | 3,616 | | | | 7,900 | | | | (170 | ) | | | 3,616 | | | | 15,980 | | | | 155,329 | |
JPMorgan Global Natural Resources Fund, Select Class Shares | | | 10,960 | | | | 1,042 | | | | — | | | | — | | | | 42 | | | | 1,139 | | | | 8,642 | |
JPMorgan Global Research Enhanced Index Fund, Select Class Shares | | | 52,639 | | | | 1,406 | | | | 2,000 | | | | 741 | | | | 738 | | | | 2,747 | | | | 50,289 | |
JPMorgan Government Bond Fund, Select Class Shares | | | 19,861 | | | | 13,465 | | | | — | | | | 609 | | | | 356 | | | | 3,019 | | | | 33,001 | |
JPMorgan High Yield Fund, Select Class Shares | | | 75,923 | | | | 16,280 | | | | — | | | | 1,637 | | | | 2,143 | | | | 11,418 | | | | 86,662 | |
JPMorgan Inflation Managed Bond Fund, Select Class Shares | | | 182,755 | | | | 9,137 | | | | 10,200 | | | | (408 | ) | | | 1,136 | | | | 17,109 | | | | 175,195 | |
JPMorgan International Equity Fund, Select Class Shares | | | 31,271 | | | | 7,095 | | | | 3,000 | | | | (200 | ) | | | 94 | | | | 2,153 | | | | 32,337 | |
JPMorgan International Research Enhanced Equity Fund, Select Class Shares | | | 100,956 | | | | 30,976 | | | | 1,000 | | | | 16,505 | | | | 2,712 | | | | 6,240 | | | | 100,958 | |
JPMorgan Intrepid America Fund, Select Class Shares | | | 254,954 | | | | 21,005 | | | | 23,900 | | | | 18,802 | | | | 2,867 | | | | 6,739 | | | | 256,639 | |
JPMorgan Intrepid European Fund, Select Class Shares | | | 26,864 | | | | 4,491 | | | | 3,000 | | | | (378 | ) | | | 891 | | | | 1,032 | | | | 24,481 | |
JPMorgan Intrepid Growth Fund, Select Class Shares | | | 105,706 | | | | 6,582 | | | | 10,900 | | | | 1,947 | | | | 582 | | | | 2,743 | | | | 110,891 | |
JPMorgan Intrepid Mid Cap Fund, Select Class Shares | | | 42,122 | | | | 7,812 | | | | 3,500 | | | | 6,096 | | | | 164 | | | | 1,894 | | | | 43,434 | |
JPMorgan Large Cap Value Fund, Select Class Shares | | | 44,364 | | | | 12,659 | | | | 9,900 | | | | 8,092 | | | | 283 | | | | 2,961 | | | | 43,557 | |
JPMorgan Latin America Fund, Select Class Shares | | | 18,652 | | | | 1,084 | | | | 1,000 | | | | (109 | ) | | | 84 | | | | 1,003 | | | | 15,526 | |
JPMorgan Limited Duration Bond Fund, Select Class Shares | | | 298,940 | | | | 1,561 | | | | 9,900 | | | | 10 | | | | 1,562 | | | | 29,090 | | | | 290,901 | |
JPMorgan Liquid Assets Money Market Fund, Institutional Class Shares | | | 202,784 | | | | 243,206 | | | | 264,806 | | | | — | | | | 39 | | | | 181,184 | | | | 181,184 | |
JPMorgan Market Expansion Enhanced Index Fund, Select Class Shares | | | 57,479 | | | | 23,950 | | | | 4,500 | | | | 8,140 | | | | 367 | | | | 5,690 | | | | 71,637 | |
JPMorgan Mid Cap Growth Fund, Select Class Shares | | | 24,224 | | | | 5,767 | | | | 2,000 | | | | 2,440 | | | | — | | | | 936 | | | | 26,345 | |
JPMorgan Multi-Cap Market Neutral Fund, Select Class Shares | | | 142,186 | | | | — | | | | 56,501 | | | | 959 | | | | — | | | | 8,561 | | | | 87,919 | |
JPMorgan Unconstrained Debt Fund, Select Class Shares | | | 19,170 | | | | 588 | | | | — | | | | — | | | | 589 | | | | 1,903 | | | | 19,089 | |
JPMorgan Research Market Neutral Fund, Select Class Shares | | | 111,954 | | | | 2,816 | | | | — | | | | 2,815 | | | | — | | | | 7,412 | | | | 113,476 | |
JPMorgan Strategic Income Opportunities Fund, Select Class Shares | | | 160,270 | | | | 1,171 | | | | 16,700 | | | | (171 | ) | | | 1,171 | | | | 12,156 | | | | 142,470 | |
JPMorgan Systematic Alpha Fund, Select Class Shares | | | — | | | | 80,715 | | | | — | | | | 88 | | | | 827 | | | | 5,325 | | | | 80,092 | |
JPMorgan U.S. Dynamic Plus Fund, Select Class Shares | | | 42,702 | | | | 3,886 | | | | 2,500 | | | | 2,464 | | | | 273 | | | | 2,473 | | | | 45,304 | |
JPMorgan U.S. Equity Fund, Select Class Shares | | | 232,162 | | | | 48,367 | | | | 21,500 | | | | 21,494 | | | | 1,663 | | | | 17,521 | | | | 254,576 | |
JPMorgan U.S. Large Cap Core Plus Fund, Select Class Shares | | | 133,376 | | | | 11,532 | | | | 500 | | | | 9,634 | | | | 928 | | | | 4,868 | | | | 143,125 | |
JPMorgan Value Advantage Fund, Select Class Shares | | | 53,284 | | | | 5,090 | | | | — | | | | 1,366 | | | | 624 | | | | 1,999 | | | | 59,519 | |
| | | | | | | | | | | | | | | | | | | | | | | | | | | | |
| | $ | 4,262,120 | | | | | | | | | | | $ | 109,505 | | | $ | 46,942 | | | | | | | $ | 4,429,200 | |
| | | | | | | | | | | | | | | | | | | | | | | | | | | | |
| | | | | | | | |
| | | |
| DECEMBER 31, 2014 | | J.P. MORGAN INVESTOR FUNDS | | | | | 33 | |
NOTES TO FINANCIAL STATEMENTS
AS OF DECEMBER 31, 2014 (Unaudited) (continued)
| | | | | | | | | | | | | | | | | | | | | | | | | | | | |
| | | | | | For the six months ended December 31, 2014 | | | | | | | |
| Affiliate | | Value at
June 30,
2014 | | | Purchase
Cost | | | Sales
Proceeds | | | Realized
Gain/(Loss) | | | Dividend
Income | | | Shares at
December 31,
2014 | | | Value at
December 31,
2014 | |
Investor Growth Fund | | | | | | | | | | | | | | | | | | | | | | | | | | | | |
JPMorgan Commodities Strategy Fund, Select Class Shares | | $ | 12,839 | | | $ | — | | | $ | — | | | $ | — | | | $ | — | | | | 907 | | | $ | 9,929 | |
JPMorgan Core Bond Fund, Select Class Shares | | | 24,905 | | | | 33,561 | | | | 3,600 | | | | 141 | | | | 592 | | | | 4,703 | | | | 55,257 | |
JPMorgan Core Plus Bond Fund, Select Class Shares | | | 16,122 | | | | 344 | | | | 3,200 | | | | 96 | | | | 251 | | | | 1,586 | | | | 13,176 | |
JPMorgan Dynamic Growth Fund, Select Class Shares | | | 22,753 | | | | 1,363 | | | | — | | | | 363 | | | | — | | | | 991 | | | | 24,301 | |
JPMorgan Emerging Economies Fund, Select Class Shares | | | 43,035 | | | | 4,110 | | | | 3,400 | | | | (212 | ) | | | 709 | | | | 3,190 | | | | 38,886 | |
JPMorgan Emerging Markets Debt Fund, Select Class Shares | | | 7,684 | | | | 204 | | | | — | | | | — | | | | 204 | | | | 911 | | | | 7,350 | |
JPMorgan Emerging Markets Equity Fund, Select Class Shares | | | 44,305 | | | | 1,813 | | | | 2,900 | | | | (43 | ) | | | 413 | | | | 1,768 | | | | 39,564 | |
JPMorgan Emerging Markets Local Currency Debt Fund, Select Class Shares | | | 10,084 | | | | 7 | | | | — | | | | — | | | | 6 | | | | 1,033 | | | | 8,976 | |
JPMorgan Equity Income Fund, Select Class Shares | | | 32,130 | | | | 2,061 | | | | — | | | | 668 | | | | 392 | | | | 2,468 | | | | 35,221 | |
JPMorgan Floating Rate Income Fund, Select Class Shares | | | 20,942 | | | | 366 | | | | 7,200 | | | | (100 | ) | | | 366 | | | | 1,387 | | | | 13,482 | |
JPMorgan Global Natural Resources Fund, Select Class Shares | | | 7,078 | | | | 25 | | | | — | | | | — | | | | 25 | | | | 674 | | | | 5,117 | |
JPMorgan Global Research Enhanced Index Fund, Select Class Shares | | | 66,944 | | | | 1,804 | | | | 2,000 | | | | 952 | | | | 946 | | | | 3,524 | | | | 64,518 | |
JPMorgan High Yield Fund, Select Class Shares | | | 13,614 | | | | 649 | | | | — | | | | 284 | | | | 365 | | | | 1,750 | | | | 13,285 | |
JPMorgan Inflation Managed Bond Fund, Select Class Shares | | | 39,475 | | | | 230 | | | | 8,000 | | | | (309 | ) | | | 230 | | | | 2,972 | | | | 30,434 | |
JPMorgan International Equity Fund, Select Class Shares | | | 77,578 | | | | 5,513 | | | | — | | | | — | | | | 213 | | | | 5,061 | | | | 76,021 | |
JPMorgan International Research Enhanced Equity Fund, Select Class Shares | | | 81,772 | | | | 23,169 | | | | — | | | | 13,207 | | | | 2,163 | | | | 4,975 | | | | 80,498 | |
JPMorgan Intrepid America Fund, Select Class Shares | | | 274,816 | | | | 21,253 | | | | 3,600 | | | | 13,648 | | | | 3,311 | | | | 7,784 | | | | 296,414 | |
JPMorgan Intrepid European Fund, Select Class Shares | | | 27,037 | | | | 2,847 | | | | — | | | | — | | | | 947 | | | | 1,097 | | | | 26,035 | |
JPMorgan Intrepid Growth Fund, Select Class Shares | | | 135,562 | | | | 2,275 | | | | 2,100 | | | | 371 | | | | 775 | | | | 3,649 | | | | 147,481 | |
JPMorgan Intrepid Mid Cap Fund, Select Class Shares | | | 82,091 | | | | 15,630 | | | | 1,500 | | | | 11,754 | | | | 334 | | | | 3,923 | | | | 89,944 | |
JPMorgan Large Cap Growth Fund, Select Class Shares | | | 185,166 | | | | 4,461 | | | | 5,000 | | | | 5,830 | | | | — | | | | 5,682 | | | | 196,603 | |
JPMorgan Large Cap Value Fund, Select Class Shares | | | 238,463 | | | | 42,563 | | | | 3,600 | | | | 37,331 | | | | 1,576 | | | | 17,266 | | | | 253,983 | |
JPMorgan Latin America Fund, Select Class Shares | | | 10,321 | | | | 245 | | | | 500 | | | | (54 | ) | | | 45 | | | | 538 | | | | 8,329 | |
JPMorgan Limited Duration Bond Fund, Select Class Shares | | | 4,259 | | | | 22 | | | | — | | | | — | | | | 23 | | | | 429 | | | | 4,285 | |
JPMorgan Liquid Assets Money Market Fund, Institutional Class Shares | | | 43,096 | | | | 60,046 | | | | 61,665 | | | | — | | | | 5 | | | | 41,477 | | | | 41,477 | |
JPMorgan Market Expansion Enhanced Index Fund, Select Class Shares | | | 131,552 | | | | 23,771 | | | | — | | | | 15,919 | | | | 753 | | | | 11,346 | | | | 142,851 | |
JPMorgan Mid Cap Growth Fund, Select Class Shares | | | 14,958 | | | | 1,809 | | | | — | | | | 1,410 | | | | — | | | | 558 | | | | 15,694 | |
JPMorgan Multi-Cap Market Neutral Fund, Select Class Shares | | | 22,396 | | | | — | | | | 7,501 | | | | 64 | | | | — | | | | 1,478 | | | | 15,184 | |
JPMorgan Unconstrained Debt Fund, Select Class Shares | | | 5,042 | | | | 155 | | | | — | | | | — | | | | 155 | | | | 501 | | | | 5,021 | |
JPMorgan Research Market Neutral Fund, Select Class Shares | | | 13,436 | | | | 338 | | | | — | | | | 338 | | | | — | | | | 890 | | | | 13,619 | |
JPMorgan Small Cap Value Fund, Select Class Shares | | | 57,414 | | | | 9,857 | | | | — | | | | 2,961 | | | | 297 | | | | 2,329 | | | | 65,089 | |
JPMorgan Strategic Income Opportunities Fund, Select Class Shares | | | 23,621 | | | | 119 | | | | 12,400 | | | | (105 | ) | | | 119 | | | | 950 | | | | 11,136 | |
JPMorgan Systematic Alpha Fund, Select Class Shares | | | — | | | | 14,367 | | | | — | | | | 20 | | | | 148 | | | | 950 | | | | 14,287 | |
JPMorgan U.S. Dynamic Plus Fund, Select Class Shares | | | 32,760 | | | | 1,951 | | | | — | | | | 1,737 | | | | 214 | | | | 1,941 | | | | 35,555 | |
JPMorgan U.S. Equity Fund, Select Class Shares | | | 324,189 | | | | 29,462 | | | | 4,400 | | | | 28,076 | | | | 2,240 | | | | 23,489 | | | | 341,302 | |
JPMorgan U.S. Large Cap Core Plus Fund, Select Class Shares | | | 106,632 | | | | 8,869 | | | | 3,600 | | | | 8,291 | | | | 720 | | | | 3,776 | | | | 111,006 | |
JPMorgan Value Advantage Fund, Select Class Shares | | | 34,980 | | | | 2,267 | | | | — | | | | 870 | | | | 397 | | | | 1,273 | | | | 37,901 | |
| | | | | | | | | | | | | | | | | | | | | | | | | | | | |
| | $ | 2,289,051 | | | | | | | | | | | $ | 143,508 | | | $ | 18,934 | | | | | | | $ | 2,389,211 | |
| | | | | | | | | | | | | | | | | | | | | | | | | | | | |
| | | | | | |
| | | |
| 34 | | | | J.P. MORGAN INVESTOR FUNDS | | DECEMBER 31, 2014 |
| | | | | | | | | | | | | | | | | | | | | | | | | | | | |
| | | | | | For the six months ended December 31, 2014 | | | | | | | |
| Affiliate | | Value at
June 30,
2014 | | | Purchase
Cost | | | Sales
Proceeds | | | Realized
Gain/(Loss) | | | Dividend
Income | | | Shares at
December 31,
2014 | | | Value at
December 31,
2014 | |
Investor Growth & Income Fund | | | | | | | | | | | | | | | | | | | | | | | | | | | | |
JPMorgan Commodities Strategy Fund, Select Class Shares | | $ | 16,443 | | | $ | 1,999 | | | $ | — | | | $ | — | | | $ | — | | | | 1,308 | | | $ | 14,321 | |
JPMorgan Core Bond Fund, Select Class Shares | | | 190,510 | | | | 60,692 | | | | 3,900 | | | | 276 | | | | 2,979 | | | | 21,147 | | | | 248,473 | |
JPMorgan Core Plus Bond Fund, Select Class Shares | | | 170,777 | | | | 4,107 | | | | 3,900 | | | | 1,185 | | | | 2,906 | | | | 20,409 | | | | 169,596 | |
JPMorgan Dynamic Growth Fund, Select Class Shares | | | 44,713 | | | | 885 | | | | — | | | | 685 | | | | — | | | | 1,874 | | | | 45,926 | |
JPMorgan Emerging Economies Fund, Select Class Shares | | | 55,129 | | | | 2,198 | | | | 2,100 | | | | (132 | ) | | | 898 | | | | 4,039 | | | | 49,237 | |
JPMorgan Emerging Markets Debt Fund, Select Class Shares | | | 9,205 | | | | 244 | | | | — | | | | — | | | | 244 | | | | 1,091 | | | | 8,805 | |
JPMorgan Emerging Markets Equity Fund, Select Class Shares | | | 57,802 | | | | 1,820 | | | | 5,300 | | | | 50 | | | | 520 | | | | 2,223 | | | | 49,751 | |
JPMorgan Emerging Markets Local Currency Debt Fund, Select Class Shares | | | 19,637 | | | | 12 | | | | — | | | | — | | | | 12 | | | | 2,011 | | | | 17,478 | |
JPMorgan Equity Income Fund, Select Class Shares | | | 51,217 | | | | 1,638 | | | | — | | | | 1,033 | | | | 606 | | | | 3,815 | | | | 54,438 | |
JPMorgan Floating Rate Income Fund, Select Class Shares | | | 86,767 | | | | 1,840 | | | | 8,300 | | | | (169 | ) | | | 1,840 | | | | 7,930 | | | | 77,084 | |
JPMorgan Global Natural Resources Fund, Select Class Shares | | | 8,373 | | | | 2,036 | | | | — | | | | — | | | | 36 | | | | 985 | | | | 7,476 | |
JPMorgan Global Research Enhanced Index Fund, Select Class Shares | | | 120,521 | | | | 3,211 | | | | 5,000 | | | | 1,753 | | | | 1,683 | | | | 6,267 | | | | 114,753 | |
JPMorgan Government Bond Fund, Select Class Shares | | | — | | | | 11,077 | | | | — | | | | 203 | | | | 74 | | | | 1,005 | | | | 10,987 | |
JPMorgan High Yield Fund, Select Class Shares | | | 63,744 | | | | 4,607 | | | | — | | | | 1,361 | | | | 1,745 | | | | 8,392 | | | | 63,695 | |
JPMorgan Inflation Managed Bond Fund, Select Class Shares | | | 71,085 | | | | 10,442 | | | | 5,900 | | | | (231 | ) | | | 442 | | | | 7,144 | | | | 73,150 | |
JPMorgan International Equity Fund, Select Class Shares | | | 96,715 | | | | 6,364 | | | | — | | | | — | | | | 264 | | | | 6,282 | | | | 94,351 | |
JPMorgan International Research Enhanced Equity Fund, Select Class Shares | | | 100,540 | | | | 25,627 | | | | — | | | | 15,921 | | | | 2,607 | | | | 5,997 | | | | 97,034 | |
JPMorgan Intrepid America Fund, Select Class Shares | | | 319,333 | | | | 26,949 | | | | 12,400 | | | | 17,593 | | | | 3,785 | | | | 8,898 | | | | 338,839 | |
JPMorgan Intrepid European Fund, Select Class Shares | | | 54,454 | | | | 4,431 | | | | 1,000 | | | | (126 | ) | | | 1,831 | | | | 2,120 | | | | 50,303 | |
JPMorgan Intrepid Growth Fund, Select Class Shares | | | 103,175 | | | | 5,092 | | | | 4,900 | | | | 560 | | | | 591 | | | | 2,786 | | | | 112,593 | |
JPMorgan Intrepid Mid Cap Fund, Select Class Shares | | | 40,222 | | | | 11,330 | | | | 1,000 | | | | 6,211 | | | | 174 | | | | 2,065 | | | | 47,349 | |
JPMorgan Large Cap Growth Fund, Select Class Shares | | | 144,132 | | | | 12,988 | | | | 3,000 | | | | 3,037 | | | | — | | | | 4,742 | | | | 164,086 | |
JPMorgan Large Cap Value Fund, Select Class Shares | | | 185,292 | | | | 37,825 | | | | 7,900 | | | | 29,295 | | | | 1,232 | | | | 13,415 | | | | 197,340 | |
JPMorgan Latin America Fund, Select Class Shares | | | 13,825 | | | | 655 | | | | 2,000 | | | | (139 | ) | | | 55 | | | | 663 | | | | 10,269 | |
JPMorgan Liquid Assets Money Market Fund, Institutional Class Shares | | | 117,899 | | | | 136,534 | | | | 163,117 | | | | — | | | | 7 | | | | 91,316 | | | | 91,316 | |
JPMorgan Market Expansion Enhanced Index Fund, Select Class Shares | | | 130,172 | | | | 23,550 | | | | 2,500 | | | | 15,587 | | | | 738 | | | | 11,058 | | | | 139,216 | |
JPMorgan Mid Cap Growth Fund, Select Class Shares | | | 18,793 | | | | 1,724 | | | | — | | | | 1,724 | | | | — | | | | 682 | | | | 19,186 | |
JPMorgan Multi-Cap Market Neutral Fund, Select Class Shares | | | 87,152 | | | | — | | | | 22,500 | | | | 238 | | | | — | | | | 6,422 | | | | 65,954 | |
JPMorgan Unconstrained Debt Fund, Select Class Shares | | | 15,147 | | | | 465 | | | | — | | | | — | | | | 465 | | | | 1,504 | | | | 15,083 | |
JPMorgan Research Market Neutral Fund, Select Class Shares | | | 57,676 | | | | 1,451 | | | | — | | | | 1,450 | | | | — | | | | 3,818 | | | | 58,460 | |
JPMorgan Small Cap Value Fund, Select Class Shares | | | 37,465 | | | | 14,868 | | | | — | | | | 2,339 | | | | 229 | | | | 1,840 | | | | 51,416 | |
JPMorgan Strategic Income Opportunities Fund, Select Class Shares | | | 59,639 | | | | 408 | | | | 11,900 | | | | (114 | ) | | | 408 | | | | 4,040 | | | | 47,352 | |
JPMorgan Systematic Alpha Fund, Select Class Shares | | | — | | | | 40,973 | | | | — | | | | 53 | | | | 420 | | | | 2,704 | | | | 40,662 | |
JPMorgan U.S. Dynamic Plus Fund, Select Class Shares | | | 47,583 | | | | 2,751 | | | | 1,500 | | | | 2,575 | | | | 302 | | | | 2,736 | | | | 50,124 | |
JPMorgan U.S. Equity Fund, Select Class Shares | | | 316,936 | | | | 31,499 | | | | 11,100 | | | | 27,998 | | | | 2,171 | | | | 22,718 | | | | 330,092 | |
JPMorgan U.S. Large Cap Core Plus Fund, Select Class Shares | | | 137,072 | | | | 11,266 | | | | 5,000 | | | | 10,230 | | | | 922 | | | | 4,838 | | | | 142,223 | |
JPMorgan Value Advantage Fund, Select Class Shares | | | 45,741 | | | | 1,611 | | | | — | | | | 1,105 | | | | 505 | | | | 1,618 | | | | 48,170 | |
| | | | | | | | | | | | | | | | | | | | | | | | | | | | |
| | $ | 3,094,886 | | | | | | | | | | | $ | 141,551 | | | $ | 30,691 | | | | | | | $ | 3,216,588 | |
| | | | | | | | | | | | | | | | | | | | | | | | | | | | |
| | | | | | | | |
| | | |
| DECEMBER 31, 2014 | | J.P. MORGAN INVESTOR FUNDS | | | | | 35 | |
NOTES TO FINANCIAL STATEMENTS
AS OF DECEMBER 31, 2014 (Unaudited) (continued)
C. Security Transactions and Investment Income — Investment transactions are accounted for on the trade date (the date the order to buy or sell is executed). Securities gains and losses are calculated on a specifically identified cost basis. Distributions of net investment income and realized capital gains from the Underlying Funds are recorded on the ex-dividend date.
D. Allocation of Income and Expenses — Expenses directly attributable to a fund are charged directly to that fund, while the expenses attributable to more than one fund of the Trust are allocated among the respective funds. In calculating the NAV of each class, investment income, realized and unrealized gains and losses and expenses, other than class specific expenses, are allocated daily to each class of shares based upon the proportion of net assets of each class at the beginning of each day.
The Funds invest in other J.P. Morgan Funds and, as a result, bear a portion of the expenses incurred by the Underlying Funds. These expenses are not reflected in the expenses shown in the Statements of Operations and are not included in the ratios to average net assets shown in the Financial Highlights.
E. Federal Income Taxes — Each Fund is treated as a separate taxable entity for Federal income tax purposes. Each Fund’s policy is to comply with the provisions of the Internal Revenue Code of 1986, as amended (the “Code”), applicable to regulated investment companies and to distribute to shareholders all of its distributable net investment income and net realized capital gains on investments. Accordingly, no provision for Federal income tax is necessary. Management has reviewed the Funds’ tax positions for all open tax years and has determined that as of December 31, 2014, no liability for income tax is required in the Funds’ financial statements for net unrecognized tax benefits. However, management’s conclusions may be subject to future review based on changes in, or the interpretation of, the accounting standards or tax laws and regulations. Each of the Fund’s Federal tax returns for the prior three fiscal years remains subject to examination by the Internal Revenue Service.
F. Distributions to Shareholders — Distributions from net investment income are generally declared and paid quarterly, except for distributions from the Investor Conservative Growth Fund, for which distributions are generally declared and paid monthly. Distributions are declared separately for each class. No class has preferential dividend rights; differences in per share rates are due to differences in separate class expenses. Net realized capital gains, if any, are distributed by each Fund at least annually. The amount of distributions from net investment income and net realized capital gains is determined in accordance with Federal income tax regulations, which may differ from GAAP. To the extent these “book/tax” differences are permanent in nature (i.e., that they result from other than timing of recognition — “temporary differences”), such amounts are reclassified within the capital accounts based on their Federal tax-basis treatment.
3. Fees and Other Transactions with Affiliates
A. Investment Advisory Fee — Pursuant to the Investment Advisory Agreement, the Adviser, an indirect, wholly-owned subsidiary of JPMorgan Asset Management Holdings Inc., which is a wholly-owned subsidiary of JPMorgan Chase & Co. (“JPMorgan”), supervises the investments of each Fund and for such services is paid a fee. The fee is accrued daily and paid monthly at an annual rate of 0.05% of each Fund’s average daily net assets.
The Adviser waived Investment Advisory fees and/or reimbursed expenses as outlined in Note 3.F.
B. Administration Fee — Pursuant to an Administration Agreement, the Administrator, an indirect, wholly-owned subsidiary of JPMorgan, provides certain administration services to the Funds. In consideration of these services, the Administrator receives a fee accrued daily and paid monthly at an annual rate of 0.10% of the first $500 million of the average daily net assets, 0.075% of the average daily net assets between $500 million and $1 billion of such funds and 0.05% of the average daily net assets in excess of $1 billion of such funds. For the six months ended December 31, 2014, the effective annualized rate of each Fund’s average daily net assets, notwithstanding any fee waivers and/or expense reimbursements, was as follows:
| | | | |
Investor Balanced Fund | | | 0.06 | % |
Investor Conservative Growth Fund | | | 0.06 | |
Investor Growth Fund | | | 0.07 | |
Investor Growth & Income Fund | | | 0.06 | |
The Administrator waived Administration fees as outlined in Note 3.F.
JPMorgan Chase Bank, N.A. (“JPMCB”), a wholly-owned subsidiary of JPMorgan, serves as the Funds’ sub-administrator (the “Sub-administrator”). For its services as Sub-administrator, JPMCB receives a portion of the fees payable to the Administrator.
C. Distribution Fees — Pursuant to a Distribution Agreement, JPMorgan Distribution Services, Inc. (the “Distributor”), a wholly-owned subsidiary of JPMorgan, serves as the Trust’s exclusive underwriter and promotes and arranges for the sale of each Fund’s shares.
The Board has adopted a Distribution Plan (the “Distribution Plan”) for Class A, Class B and Class C Shares of the Funds in accordance with Rule 12b-1 under the 1940 Act. The Distribution Plan provides that each Fund shall pay distribution fees, including payments to the Distributor, at annual rates of the average daily net assets as shown in the table below:
| | | | | | | | | | | | |
| | | Class A | | | Class B | | | Class C | |
| | | 0.25 | % | | | 0.75 | % | | | 0.75 | % |
| | | | | | |
| | | |
| 36 | | | | J.P. MORGAN INVESTOR FUNDS | | DECEMBER 31, 2014 |
In addition, the Distributor is entitled to receive the front-end sales charges from purchases of Class A Shares and the CDSC from redemptions of Class B and Class C Shares and certain Class A Shares for which front-end sales charges have been waived. For the six months ended December 31, 2014, the Distributor retained the following amounts (in thousands):
| | | | | | | | |
| | | Front-End Sales Charge | | | CDSC | |
Investor Balanced Fund | | $ | 1,303 | | | $ | 1 | |
Investor Conservative Growth Fund | | | 775 | | | | 3 | |
Investor Growth Fund | | | 393 | | | | 2 | |
Investor Growth & Income Fund | | | 714 | | | | 1 | |
D. Shareholder Servicing Fees — The Trust, on behalf of the Funds, has entered into a Shareholder Servicing Agreement with the Distributor under which the Distributor provides certain support services to the shareholders. For performing these services, the Distributor receives a fee that is accrued daily and paid monthly at an annual rate of 0.25% of the Funds’ average daily net assets.
The Distributor has entered into shareholder services contracts with affiliated and unaffiliated financial intermediaries who provide shareholder services and other related services to their clients or customers who invest in the Funds under which the Distributor will pay all or a portion of such fees earned to financial intermediaries for performing such services.
The Distributor waived Shareholder Servicing fees as outlined in Note 3.F.
E. Custodian and Accounting Fees — JPMCB provides portfolio custody and accounting services to the Funds. For these services, the Funds pay JPMCB transaction and asset-based fees that vary according to the number of transactions and positions, plus out-of-pocket expenses. The amounts paid directly to JPMCB by the Funds for custody and accounting services are included in Custodian and accounting fees in the Statements of Operations. Payments to the custodian may be reduced by credits earned by each Fund, based on uninvested cash balances held by the custodian. Such earnings credits, if any, are presented separately in the Statements of Operations.
Interest expense paid to the custodian related to cash overdrafts, if any, is included in Interest expense to affiliates in the Statements of Operations.
F. Waivers and Reimbursements — The Adviser, Administrator and Distributor have contractually agreed to waive fees and/or reimburse the Funds to the extent that total annual operating expenses (excluding acquired fund fees and expenses, dividend expenses related to short sales, interest, taxes, expenses related to litigation and potential litigation, extraordinary expenses and expenses related to the Board’s deferred compensation plan) exceed the percentages of the Funds’ respective average daily net assets as shown in the table below:
| | | | | | | | | | | | | | | | |
| | | Class A | | | Class B | | | Class C | | | Select Class | |
Investor Balanced Fund | | | 0.39 | % | | | 1.14 | % | | | 1.14 | % | | | 0.14 | % |
Investor Conservative Growth Fund | | | 0.39 | | | | 1.14 | | | | 1.14 | | | | 0.14 | |
Investor Growth Fund | | | 0.39 | | | | 1.14 | | | | 1.14 | | | | 0.14 | |
Investor Growth & Income Fund | | | 0.39 | | | | 1.14 | | | | 1.14 | | | | 0.14 | |
| * | Prior to September 1, 2013, the contractual expense limitations for the Funds were 0.50%, 1.25%, 1.25% and 0.25% for Class A, Class B, Class C and Select Class Shares, respectively. |
Except as noted above, the expense limitation agreements were in effect for the six months ended December 31, 2014 and are in place until at least October 31, 2015.
The Underlying Funds may impose separate advisory and shareholder servicing fees. To avoid charging a shareholder servicing fee at an effective rate above 0.25% of the Funds’ net assets, the Funds’ Distributor may waive shareholder servicing fees with respect to the Funds in an amount equal to the weighted average pro-rata amount of shareholder servicing fees charged by the Underlying Funds. This waiver may be in addition to any waivers required to meet the Funds’ contractual expense limitations, but will not exceed the Funds’ shareholder servicing fees.
For the six months ended December 31, 2014, the Funds’ service providers waived fees and/or reimbursed expenses for each of the Funds as follows (amounts in thousands). None of these parties expect the Funds to repay any such waived fees and reimbursed expenses in future years.
| | | | | | | | | | | | | | | | | | | | |
| | | Contractual Waivers | | | | |
| | | Investment Advisory | | | Administration | | | Shareholder Servicing | | | Total | | | Contractual
Reimbursements | |
Investor Balanced Fund | | $ | 762 | | | $ | 351 | | | $ | 5,471 | | | $ | 6,584 | | | $ | 1,436 | |
Investor Conservative Growth Fund | | | 574 | | | | 300 | | | | 3,826 | | | | 4,700 | | | | 1,685 | |
Investor Growth Fund | | | 585 | | | | 344 | | | | 2,505 | | | | 3,434 | | | | 106 | |
Investor Growth & Income Fund | | | 699 | | | | 222 | | | | 3,468 | | | | 4,389 | | | | 530 | |
| | | | | | | | |
| | | |
| DECEMBER 31, 2014 | | J.P. MORGAN INVESTOR FUNDS | | | | | 37 | |
NOTES TO FINANCIAL STATEMENTS
AS OF DECEMBER 31, 2014 (Unaudited) (continued)
In addition, the Funds’ service providers have voluntarily waived fees during the six months ended December 31, 2014. However, the Funds’ service providers are under no obligation to do so and may discontinue such voluntary waivers at any time.
| | | | |
| | | Voluntary Waivers | |
| | | Shareholder Servicing | |
Investor Balanced Fund | | $ | 1,150 | |
Investor Conservative Growth Fund | | | 1,657 | |
Investor Growth Fund | | | 351 | |
Investor Growth & Income Fund | | | 491 | |
G. Other — Certain officers of the Trust are affiliated with the Adviser, the Administrator and the Distributor. Such officers, with the exception of the Chief Compliance Officer, receive no compensation from the Funds for serving in their respective roles.
The Board appointed a Chief Compliance Officer to the Funds in accordance with Federal securities regulations. Each Fund, along with other affiliated funds, makes reimbursement payments, on a pro-rata basis, to the Administrator for a portion of the fees associated with the Office of the Chief Compliance Officer. Such fees are included in Trustees’ and Chief Compliance Officer’s fees in the Statements of Operations.
The Trust adopted a Trustee Deferred Compensation Plan (the “Plan”) which allows the Independent Trustees to defer the receipt of all or a portion of compensation related to performance of their duties as Trustees. The deferred fees are invested in various J.P. Morgan Funds until distribution in accordance with the Plan.
4. Investment Transactions
During the six months ended December 31, 2014, purchases and sales of investments (excluding short-term investments) were as follows (amounts in thousands):
| | | | | | | | |
| | | Purchases
(excluding U.S.
Government) | | | Sales
(excluding U.S. Government) | |
Investor Balanced Fund | | $ | 621,812 | | | $ | 225,300 | |
Investor Conservative Growth Fund | | | 485,698 | | | | 208,401 | |
Investor Growth Fund | | | 257,480 | | | | 74,501 | |
Investor Growth & Income Fund | | | 368,635 | | | | 121,100 | |
During the six months ended December 31, 2014, there were no purchases or sales of U.S. Government securities.
5. Federal Income Tax Matters
For Federal income tax purposes, the cost and unrealized appreciation (depreciation) in value of investment securities held at December 31, 2014 were as follows (amounts in thousands):
| | | | | | | | | | | | | | | | |
| | | Aggregate
Cost | | | Gross
Unrealized
Appreciation | | | Gross
Unrealized
Depreciation | | | Net Unrealized
Appreciation
(Depreciation) | |
Investor Balanced Fund | | $ | 4,558,858 | | | $ | 861,352 | | | $ | 60,485 | | | $ | 800,867 | |
Investor Conservative Growth Fund | | | 3,987,764 | | | | 495,952 | | | | 54,516 | | | | 441,436 | |
Investor Growth Fund | | | 1,744,608 | | | | 666,530 | | | | 21,927 | | | | 644,603 | |
Investor Growth & Income Fund | | | 2,564,541 | | | | 691,375 | | | | 39,328 | | | | 652,047 | |
At June 30, 2014, the Funds did not have any net capital loss carryforwards.
6. Borrowings
The Funds rely upon an exemptive order granted by the Securities and Exchange Commission (the “Order”) permitting the establishment and operation of an Interfund Lending Facility (the “Facility”). The Facility allows the Funds to directly lend and borrow money to or from any other fund relying upon the Order at rates beneficial to both the borrowing and lending funds. Advances under the Facility are taken primarily for temporary or emergency purposes, including the meeting of redemption requests that otherwise might require the untimely disposition of securities, and are subject to each Fund’s borrowing restrictions. The Interfund loan rate is determined, as specified in the Order, by averaging the current repurchase agreement rate and the current bank loan rate. The Order was granted to JPMorgan Trust II and may be relied upon by the Funds because the Funds and the series of JPMorgan Trust II are all investment companies in the same “group of investment companies” (as defined in Section 12(d)(1)(G) of the 1940 Act).
In addition, the Trust and JPMCB have entered into a financing arrangement. Under this arrangement, JPMCB provides an unsecured, uncommitted credit facility in the aggregate amount of $100 million to certain of the J.P. Morgan Funds, including the Funds. Advances under the arrangement are taken primarily for temporary or emergency purposes, including the meeting of redemption requests that otherwise might require the untimely
| | | | | | |
| | | |
| 38 | | | | J.P. MORGAN INVESTOR FUNDS | | DECEMBER 31, 2014 |
disposition of securities, and are subject to each Fund’s borrowing restrictions. Interest on borrowings is payable at a rate determined by JPMCB at the time of borrowing. This agreement has been extended until November 9, 2015.
The Funds had no borrowings outstanding from another fund or from the unsecured, uncommitted credit facility at December 31, 2014, or at any time during the six months then ended.
Interest expense paid, if any, as a result of borrowings from another fund or from the unsecured, uncommitted credit facility is included in Interest expense to affiliates in the Statements of Operations.
7. Risks, Concentrations and Indemnifications
In the normal course of business, the Funds enter into contracts that contain a variety of representations which provide general indemnifications. Each Fund’s maximum exposure under these arrangements is unknown. The amount of exposure would depend on future claims that may be made against each Fund that have not yet occurred. However, based on experience, the Funds expect the risk of loss to be remote.
Because of the Funds’ investments in Underlying Funds, the Funds indirectly pay a portion of the expenses incurred by the Underlying Funds. As a result, the cost of investing in the Funds may be higher than the cost of investing in a mutual fund that invests directly in individual securities and financial instruments. The Funds are also subject to certain risks related to the Underlying Funds’ investments in securities and financial instruments such as fixed income securities, including high yield, asset-backed and mortgage-related securities, equity securities, foreign and emerging markets securities, commodities and real estate securities. These securities are subject to risks specific to their structure, sector or market.
In addition, the Underlying Funds may use derivative instruments in connection with their individual investment strategies including futures, forward foreign currency exchange contracts, options, swaps and other derivatives, which are also subject to specific risks related to their structure, sector or market and may be riskier than investments in other types of securities. Specific risks and concentrations present in the Underlying Funds are disclosed within their individual financial statements and registration statements, as appropriate.
The Funds own in the aggregate, more than 10% of the net assets of the following Underlying Funds:
| | | | |
| | | % of Net Assets | |
JPMorgan Multi-Cap Market Neutral Fund | | | 89 | % |
JPMorgan Large Cap Value Fund | | | 84 | |
JPMorgan Global Natural Resources Fund | | | 75 | |
JPMorgan Commodities Strategy Fund | | | 74 | |
JPMorgan Systematic Alpha Fund | | | 73 | |
JPMorgan Dynamic Growth Fund | | | 69 | |
JPMorgan International Research Enhanced Equity Fund | | | 66 | |
JPMorgan Latin America Fund | | | 62 | |
JPMorgan U.S. Dynamic Plus Fund | | | 62 | |
JPMorgan Intrepid Growth Fund | | | 60 | |
JPMorgan Limited Duration Bond Fund | | | 46 | |
JPMorgan Research Market Neutral Fund | | | 42 | |
JPMorgan Emerging Markets Local Currency Debt Fund | | | 40 | |
JPMorgan Intrepid Mid Cap Fund | | | 39 | |
JPMorgan Market Expansion Enhanced Index Fund | | | 38 | |
JPMorgan Intrepid America Fund JPMorgan Core Plus Bond Fund | |
| 37
35 |
|
JPMorgan Inflation Managed Bond Fund | | | 24 | |
JPMorgan Emerging Economies Fund JPMorgan Intrepid European Fund | |
| 16
15 |
|
JPMorgan Floating Rate Income Fund | | | 13 | |
JPMorgan U.S. Equity Fund | | | 11 | |
JPMorgan International Equity Fund | | | 11 | |
One or more affiliates of the Adviser have investment discretion with respect to their clients’ holdings in the Funds, which collectively represent a significant portion of the Funds’ net assets .
Significant shareholder transactions by these shareholders may impact the Funds’ performance.
| | | | | | | | |
| | | |
| DECEMBER 31, 2014 | | J.P. MORGAN INVESTOR FUNDS | | | | | 39 | |
SCHEDULE OF SHAREHOLDER EXPENSES
(Unaudited)
Hypothetical $1,000 Investment
As a shareholder of the Funds, you incur two types of costs: (1) transaction costs, including sales charges (loads) on purchase payments and (2) ongoing costs, including investment advisory fees, administration fees, distribution fees and other Fund expenses. The examples below are intended to help you understand your ongoing costs (in dollars) of investing in the Funds (not including expenses of the Underlying Funds) and to compare these ongoing costs with the ongoing costs of investing in other mutual funds. The examples assume that you had a $1,000 investment in each Class at the beginning of the reporting period, July 1, 2014 and continued to hold your shares at the end of the reporting period, December 31, 2014.
Actual Expenses
For each Class of each Fund in the table below, the first line provides information about actual account values and actual expenses. You may use the information in this line, together with the amount you invested, to estimate the expenses that you paid over the period. Simply divide your account value by $1,000 (for example, an $8,600 account value divided by $1,000 = 8.6), then multiply the result by the number in the first line of each Class under the heading entitled “Expenses Paid During the Period” to estimate the expenses you paid on your account during this period.
Hypothetical Example for Comparison Purposes
The second line of each Class in the table below provides information about hypothetical account values and hypothetical expenses based on the Class’ actual expense ratio and an assumed rate of return of 5% per year before expenses, which is not the Class’ actual return. The hypothetical account values and expenses may not be used to estimate the actual ending account balance or expenses you paid for the period. You may use this information to compare the ongoing costs of investing in the Class of the Funds and other funds. To do so, compare this 5% hypothetical example with the 5% hypothetical examples that appear in the shareholder reports of the other funds. Please note that the expenses shown in the table are meant to highlight your ongoing costs only and do not reflect any transaction costs, such as sales charges (loads) or redemption fees, and expenses of the Underlying Funds. Therefore, the second line for each Class in the table is useful in comparing ongoing costs only, and will not help you determine the relative total costs of owning different funds. In addition, if these transaction costs were included, your costs would have been higher. The examples also assume all dividends and distributions have been reinvested.
| | | | | | | | | | | | | | | | |
| | | Beginning
Account Value
July 1, 2014 | | | Ending
Account Value
December 31, 2014 | | | Expenses
Paid During
the Period* | | | Annualized
Expense
Ratio | |
Investor Balanced Fund | | | | | | | | | | | | | | | | |
Class A | | | | | | | | | | | | | | | | |
Actual | | $ | 1,000.00 | | | $ | 1,016.50 | | | $ | 1.73 | | | | 0.34 | % |
Hypothetical | | | 1,000.00 | | | | 1,023.49 | | | | 1.73 | | | | 0.34 | |
Class B | | | | | | | | | | | | | | | | |
Actual | | | 1,000.00 | | | | 1,014.70 | | | | 3.55 | | | | 0.69 | |
Hypothetical | | | 1,000.00 | | | | 1,021.68 | | | | 3.57 | | | | 0.69 | |
Class C | | | | | | | | | | | | | | | | |
Actual | | | 1,000.00 | | | | 1,014.80 | | | | 3.76 | | | | 0.74 | |
Hypothetical | | | 1,000.00 | | | | 1,021.48 | | | | 3.77 | | | | 0.74 | |
Select Class | | | | | | | | | | | | | | | | |
Actual | | | 1,000.00 | | | | 1,017.80 | | | | 0.41 | | | | 0.08 | |
Hypothetical | | | 1,000.00 | | | | 1,024.80 | | | | 0.41 | | | | 0.08 | |
| | | | |
Investor Conservative Growth Fund | | | | | | | | | | | | | | | | |
Class A | | | | | | | | | | | | | | | | |
Actual | | | 1,000.00 | | | | 1,010.90 | | | | 1.67 | | | | 0.33 | |
Hypothetical | | | 1,000.00 | | | | 1,023.54 | | | | 1.68 | | | | 0.33 | |
Class B | | | | | | | | | | | | | | | | |
Actual | | | 1,000.00 | | | | 1,009.20 | | | | 3.49 | | | | 0.69 | |
Hypothetical | | | 1,000.00 | | | | 1,021.73 | | | | 3.52 | | | | 0.69 | |
Class C | | | | | | | | | | | | | | | | |
Actual | | | 1,000.00 | | | | 1,009.10 | | | | 3.70 | | | | 0.73 | |
Hypothetical | | | 1,000.00 | | | | 1,021.53 | | | | 3.72 | | | | 0.73 | |
Select Class | | | | | | | | | | | | | | | | |
Actual | | | 1,000.00 | | | | 1,012.70 | | | | 0.41 | | | | 0.08 | |
Hypothetical | | | 1,000.00 | | | | 1,024.80 | | | | 0.41 | | | | 0.08 | |
| | | | | | |
| | | |
| 40 | | | | J.P. MORGAN INVESTOR FUNDS | | DECEMBER 31, 2014 |
| | | | | | | | | | | | | | | | |
| | | Beginning
Account Value
July 1, 2014 | | | Ending
Account Value
December 31, 2014 | | | Expenses
Paid During
the Period* | | | Annualized
Expense
Ratio | |
Investor Growth Fund | | | | | | | | | | | | | | | | |
Class A | | | | | | | | | | | | | | | | |
Actual | | $ | 1,000.00 | | | $ | 1,031.70 | | | $ | 1.95 | | | | 0.38 | % |
Hypothetical | | | 1,000.00 | | | | 1,023.29 | | | | 1.94 | | | | 0.38 | |
Class B | | | | | | | | | | | | | | | | |
Actual | | | 1,000.00 | | | | 1,029.30 | | | | 4.14 | | | | 0.81 | |
Hypothetical | | | 1,000.00 | | | | 1,021.12 | | | | 4.13 | | | | 0.81 | |
Class C | | | | | | | | | | | | | | | | |
Actual | | | 1,000.00 | | | | 1,029.30 | | | | 4.19 | | | | 0.82 | |
Hypothetical | | | 1,000.00 | | | | 1,021.07 | | | | 4.18 | | | | 0.82 | |
Select Class | | | | | | | | | | | | | | | | |
Actual | | | 1,000.00 | | | | 1,033.00 | | | | 0.61 | | | | 0.12 | |
Hypothetical | | | 1,000.00 | | | | 1,024.60 | | | | 0.61 | | | | 0.12 | |
| | | | |
Investor Growth & Income Fund | | | | | | | | | | | | | | | | |
Class A | | | | | | | | | | | | | | | | |
Actual | | | 1,000.00 | | | | 1,019.40 | | | | 1.78 | | | | 0.35 | |
Hypothetical | | | 1,000.00 | | | | 1,023.44 | | | | 1.79 | | | | 0.35 | |
Class B | | | | | | | | | | | | | | | | |
Actual | | | 1,000.00 | | | | 1,017.50 | | | | 3.71 | | | | 0.73 | |
Hypothetical | | | 1,000.00 | | | | 1,021.53 | | | | 3.72 | | | | 0.73 | |
Class C | | | | | | | | | | | | | | | | |
Actual | | | 1,000.00 | | | | 1,017.80 | | | | 3.92 | | | | 0.77 | |
Hypothetical | | | 1,000.00 | | | | 1,021.32 | | | | 3.92 | | | | 0.77 | |
Select Class | | | | | | | | | | | | | | | | |
Actual | | | 1,000.00 | | | | 1,020.90 | | | | 0.51 | | | | 0.09 | |
Hypothetical | | | 1,000.00 | | | | 1,024.70 | | | | 0.51 | | | | 0.09 | |
| * | Expenses are equal to each Class’ respective annualized expense ratio, multiplied by the average account value over the period, multiplied by 184/365 (to reflect the one-half year period). |
| | | | | | | | |
| | | |
| DECEMBER 31, 2014 | | J.P. MORGAN INVESTOR FUNDS | | | | | 41 | |
TAX LETTER
(Unaudited)
Certain tax information for the J.P. Morgan Funds is required to be provided to shareholders based upon the Funds’ income and distributions for the taxable year ended June 30, 2014. The information and distributions reported in this letter may differ from the information and taxable distributions reported to the shareholders for the calendar year ending December 31, 2014. The information necessary to complete your income tax returns for the calendar year ending December 31, 2014 will be provided under separate cover.
Foreign Source Income and Foreign Tax Credit Pass Through
For the fiscal year ended June 30, 2014, the Funds elected to pass through to shareholders taxes paid to foreign countries. Gross income and foreign tax expenses were as follows or amounts as finally determined (amounts in thousands):
| | | | | | | | |
| | | Total Foreign
Source Income | | | Total Foreign
Tax Credit | |
Investor Balanced Fund | | $ | 6,112 | | | $ | 690 | |
Investor Conservative Growth Fund | | | 3,881 | | | | 430 | |
Investor Growth Fund | | | 4,303 | | | | 449 | |
Investor Growth & Income Fund | | | 5,213 | | | | 549 | |
| | | | | | |
| | | |
| 42 | | | | J.P. MORGAN INVESTOR FUNDS | | DECEMBER 31, 2014 |
BOARD APPROVAL OF INVESTMENT ADVISORY AGREEMENT
(Unaudited)
The Board of Trustees has established various standing committees composed of Trustees with diverse backgrounds, to which the Board of Trustees has assigned specific subject matter responsibilities to further enhance the effectiveness of the Board’s oversight and decision making. The Board of Trustees and its investment committees (money market and alternative products, equity, and fixed income) meet regularly throughout the year and consider factors that are relevant to their annual consideration of investment advisory agreements at each meeting. They also meet for the specific purpose of considering investment advisory agreement annual renewals. The Board of Trustees held meetings in person in June and August 2014, at which the Trustees considered the continuation of the investment advisory agreement for each of the Funds whose semi-annual report is contained herein (each an “Advisory Agreement” and collectively, the “Advisory Agreements”). At the June meeting, the Board’s investment committees met to review and consider performance, expense and related information concerning the Funds and the underlying J.P. Morgan Funds in which each of the Funds invests (the “Underlying Funds”). Each investment committee reported to the full Board, which then considered the investment committee’s preliminary findings. At the August meeting, the Trustees continued their review and consideration. The Trustees, including a majority of the Trustees who are not “interested persons” (as defined in the 1940 Act) of any party to the Advisory Agreements or any of their affiliates, approved the continuation of each Advisory Agreement on August 20, 2014.
As part of their review of the Advisory Agreements, the Trustees considered and reviewed performance and other information about the Funds and Underlying Funds received from the Adviser. This information includes the Funds’ and Underlying Funds’ performance as compared to the performance of the Funds’ and Underlying Funds’ peers and benchmarks and analyses by the Adviser of the Funds’ and the Underlying Funds’ performance. In addition, the Trustees have engaged an independent management consulting firm (“independent consultant”) to report on the performance of certain J.P. Morgan Funds at each of the Trustees’ regular meetings. The Adviser also periodically provides comparative information regarding the Funds’ and Underlying Funds’ expense ratios and those of their peer groups. In addition, in preparation for the June and August meetings, the Trustees requested, received and evaluated extensive materials from the Adviser, including, with respect to the Funds and/or Underlying Funds, performance and expense information compiled by Lipper Inc. (“Lipper”), an independent provider of investment company data. The Trustees’ independent consultant also provided additional analyses of the performance of the Funds in connection with the Trustees’ review of the Advisory Agreements. Before voting on the proposed Advisory Agreements, the Trustees reviewed the proposed Advisory Agreements with representatives of the Adviser, counsel to the Trust and
independent legal counsel and received a memorandum from independent legal counsel to the Trustees discussing the legal standards for their consideration of the proposed Advisory Agreements. The Trustees also discussed the proposed Advisory Agreements in executive sessions with independent legal counsel at which no representatives of the Adviser were present. Set forth below is a summary of the material factors evaluated by the Trustees in determining whether to approve each Advisory Agreement.
The Trustees considered information provided with respect to the Funds and Underlying Funds over the course of the year. Each Trustee attributed different weights to the various factors and no factor alone was considered determinative. From year to year, the Trustees consider and place emphasis on relevant information in light of changing circumstances in market and economic conditions. The Trustees determined that the compensation to be received by the Adviser from each Fund under the applicable Advisory Agreement was fair and reasonable and that the continuance of the Advisory Agreement was in the best interests of each Fund and its shareholders.
The factors summarized below were considered and discussed by the Trustees in reaching their conclusions:
Nature, Extent and Quality of Services Provided by the Adviser
The Trustees received and considered information regarding the nature, extent and quality of the services provided to each Fund under the Advisory Agreement. The Trustees took into account information furnished throughout the year at Trustee meetings, as well as the materials furnished specifically in connection with this annual review process. The Trustees considered the background and experience of the Adviser’s senior management and the expertise of, and the amount of attention given to each Fund by, investment personnel of the Adviser. In addition, the Trustees reviewed the qualifications, backgrounds and responsibilities of the portfolio management team primarily responsible for the day-to-day management of each Fund and the infrastructure supporting the team. The Trustees also considered information provided by the Adviser and JPMorgan Distribution Services, Inc. (“JPMDS”) about the structure and distribution strategy of each Fund. The Trustees also reviewed information relating to the Adviser’s risk governance model and reports showing the Adviser’s compliance structure and ongoing compliance processes. The Trustees also considered the quality of the administrative services provided by JPMorgan Funds Management, Inc. (“JPMFM”), an affiliate of the Adviser.
The Trustees also considered their knowledge of the nature and quality of the services provided by the Adviser and its affiliates to the Funds and Underlying Funds gained from their experience as Trustees of the J.P. Morgan Funds. In addition, they considered the overall reputation and capabilities of the Adviser and its affiliates, the commitment of the Adviser to provide high quality service to the Funds and Underlying Funds,
| | | | | | | | |
| | | |
| DECEMBER 31, 2014 | | J.P. MORGAN INVESTOR FUNDS | | | | | 43 | |
BOARD APPROVAL OF INVESTMENT ADVISORY AGREEMENT
(Unaudited) (continued)
their overall confidence in the Adviser’s integrity and the Adviser’s responsiveness to questions or concerns raised by them, including the Adviser’s willingness to consider and implement organizational and operational changes designed to improve investment results and the services provided to each Fund and Underlying Fund.
Based upon these considerations and other factors, the Trustees concluded that they were satisfied with the nature, extent and quality of the investment advisory services provided to the Funds by the Adviser.
Costs of Services Provided and Profitability to the Adviser and its Affiliates
The Trustees received and considered information regarding the profitability to the Adviser and its affiliates in providing services to the Funds and Underlying Funds. The Trustees reviewed and discussed this data. The Trustees recognized that this data is not audited and represents the Adviser’s determination of its and its affiliates’ revenues from the contractual services provided to the Funds and Underlying Funds, less expenses of providing such services. Expenses include direct and indirect costs and are calculated using an allocation methodology developed by the Adviser. The Trustees also recognized that it is difficult to make comparisons of profitability from fund investment advisory contracts because comparative information is not generally publicly available and is affected by numerous factors, including the structure of the particular adviser, the types of funds it manages, its business mix, numerous assumptions regarding allocations and the fact that publicly-traded fund managers’ operating profits and net income are net of distribution and marketing expenses. Based on their review, the Trustees concluded that the profitability to the Adviser under each of the Advisory Agreements was not unreasonable in light of the services and benefits provided to each Fund and Underlying Fund.
Fall-Out Benefits
The Trustees reviewed information regarding potential “fallout” or ancillary benefits received by the Adviser and its affiliates as a result of their relationship with the Funds including the benefits received by the Adviser and its affiliates in connection with the Funds’ investments in the Underlying Funds. The Trustees also reviewed the Adviser’s allocation of fund brokerage for the J.P. Morgan Funds complex, including allocations to brokers who provide research to the Adviser.
The Trustees also considered that JPMFM and JPMDS, affiliates of the Adviser, earn fees from the Funds and/or Underlying Funds for providing administrative and shareholder services. These fees were shown separately in the profitability analysis presented to the Trustees. The Trustees also considered the payments of Rule 12b-1 fees to JPMDS, which also acts as the Funds’ distributor and that these fees are in turn generally paid
to financial intermediaries that sell the Funds, including financial intermediaries that are affiliates of the Adviser. The Trustees also considered the fees paid to JPMorgan Chase Bank, N.A. (“JPMCB”) for custody and fund accounting and other related services.
Economies of Scale
The Trustees considered the extent to which the Funds benefit from economies of scale. The Trustees noted that the proposed investment advisory fee schedule for each Fund does not contain breakpoints, but that the fee schedule for the administrative services provided by JPMFM does include fee breakpoints, which are tied to the overall level of each Fund’s assets advised by the Adviser, and that each Fund benefits from those breakpoints. The Trustees also noted that the Adviser and its affiliates have implemented fee waivers and expense limitations. The Trustees considered whether it would be appropriate to add advisory fee breakpoints, and the Trustees concluded that the current fee structure was reasonable in light of the fee waivers and expense limitations that the Adviser and its affiliates have in place that serve to limit the overall net expense ratios of each Fund at competitive levels. The Trustees concluded that shareholders of the Funds effectively participated in the economies of scale through these fee waivers and expense limitations and administrative service fee breakpoints.
Independent Written Evaluation of the Funds’ Senior Officer
The Trustees noted that, upon their direction, the Senior Officer for the Funds had prepared an independent written evaluation in order to assist the Trustees in determining the reasonableness of the proposed management fees. In determining whether to continue the Advisory Agreements, the Trustees considered the Senior Officer’s report.
Fees Relative to Adviser’s Other Clients
The Trustees received and considered information about the nature and extent of investment advisory services and fee rates offered to other clients of the Adviser for investment management styles substantially similar to that of each Fund. The Trustees also considered the complexity of investment management for the Funds relative to the Adviser’s other clients and the differences in the nature and extent of the services provided to the different clients. The Trustees concluded that the fee rates charged to each Fund in comparison to those charged to the Adviser’s other clients were reasonable.
Investment Performance
The Trustees received and considered absolute and/or relative performance for the Funds in a report prepared by Lipper. The Trustees considered the total return performance information, which included the ranking of the Funds within a performance universe made up of funds with the same Lipper investment classification and objective (the “Universe Group”) by total
| | | | | | |
| | | |
| 44 | | | | J.P. MORGAN INVESTOR FUNDS | | DECEMBER 31, 2014 |
return for applicable one-, three- and five-year periods. The Trustees reviewed a description of Lipper’s methodology for selecting mutual funds in each Fund’s Universe Group. The Lipper materials provided to the Trustees highlighted information with respect to certain representative classes to assist the Trustees in their review. As part of this review, the Trustees also reviewed each Fund’s performance against its benchmark and considered the performance information provided for the Funds at regular Board meetings by the Adviser and the Trustees’ independent consultant and also considered the special analysis prepared by the Trustees’ independent consultant. The Lipper performance data noted by the Trustees as part of their review and the determinations made by the Trustees with respect to each Fund’s performance for certain representative classes are summarized below:
The Trustees noted that the Investor Balanced Fund’s performance was in the third, third and fourth quintiles for Class A shares for the one-, three-, and five-year periods ended December 31, 2013, respectively, and in the third quintile for Select Class shares for each of the one-, three-, and five-year periods ended December 31, 2013, and that the Trustees’ independent consultant indicated that the Fund’s overall performance was satisfactory. The Trustees discussed the performance and investment strategy of the Fund with the Adviser and, based upon this discussion and various other factors, concluded that they were satisfied with the Adviser’s analysis of the Fund’s performance.
The Trustees noted that the Investor Conservative Growth Fund’s performance was in the second, third and fourth quintiles for Class A shares and in the second, third and third quintiles for Select Class shares for the one-, three-, and five-year periods ended December 31, 2013, respectively, and that the Trustees’ independent consultant indicated that the Fund’s overall performance was satisfactory. The Trustees discussed the performance and investment strategy of the Fund with the Adviser and, based upon this discussion and various other factors, concluded that they were satisfied with the Adviser’s analysis of the Fund’s performance.
The Trustees noted that the Investor Growth Fund’s performance was in the fifth, fourth and fourth quintiles for both Class A and Select Class shares for the one-, three-, and five-year periods ended December 31, 2013, respectively, and that the Trustees’ independent consultant indicated that the Fund’s overall performance needed enhancement. The Trustees discussed the performance and investment strategy of the Fund with the Adviser and, based upon this discussion and various other factors, concluded that they were satisfied with the Adviser’s analysis of the Fund’s performance.
The Trustees noted that the Investor Growth & Income Fund’s performance was in the third, second and third quintiles for Class A shares for the one-, three-, and five-year periods ended
December 31, 2013, respectively, and in the second quintile for Select Class shares for each of the one-, three-, and five-year periods ended December 31, 2013, and that the Trustees’ independent consultant indicated that the Fund’s overall performance was satisfactory. The Trustees discussed the performance and investment strategy of the Fund with the Adviser and, based upon this discussion and various other factors, concluded that they were satisfied with the Adviser’s analysis of the Fund’s performance.
Advisory Fees and Expense Ratios
The Trustees considered the contractual advisory fee rate paid by each Fund to the Adviser and compared that rate to the information prepared by Lipper concerning management fee rates paid by other funds in the same Lipper category as each Fund. The Trustees recognized that Lipper reported each Fund’s management fee rate as the combined contractual advisory fee and the administration fee rates. The Trustees also reviewed information about other expenses and the expense ratios for each Fund. The Trustees considered the fee waiver and/or expense reimbursement arrangements currently in place for each Fund and considered the net advisory fee rate after taking into account any waivers and/or reimbursements. The Trustees recognized that it is difficult to make comparisons of advisory fees because there are variations in the services that are included in the fees paid by other funds. The Trustees’ determinations as a result of the review of each Fund’s advisory fees and expense ratios for certain representative classes are summarized below:
The Trustees noted that the Investor Balanced Fund’s net advisory fee for both Class A and Select Class shares was in the third quintile, and that the actual total expenses for Class A and Select Class shares were in the fifth and third quintiles, respectively, of the Universe Group. After considering the factors identified above, in light of the information, the Trustees concluded that the advisory fee was reasonable and that such fees would be for services provided in addition to, rather than duplicative of, services provided under the advisory contract of the Underlying Funds in which the Fund invests.
The Trustees noted that the Investor Conservative Growth Fund’s net advisory fee for Class A and Select Class shares was in the third and second quintiles, and that the actual total expenses for Class A and Select Class shares were in the fourth and third quintiles, respectively, of the Universe Group. After considering the factors identified above, in light of the information, the Trustees concluded that the advisory fees were reasonable and that such fees would be for services provided in addition to, rather than duplicative of, services provided under the advisory contract of the Underlying Funds in which the Fund invests.
The Trustees noted that the Investor Growth Fund’s net advisory fee for both Class A and Select Class shares was in the
| | | | | | | | |
| | | |
| DECEMBER 31, 2014 | | J.P. MORGAN INVESTOR FUNDS | | | | | 45 | |
BOARD APPROVAL OF INVESTMENT ADVISORY AGREEMENT
(Unaudited) (continued)
second quintile, and that the actual total expenses for Class A and Select Class shares were in the second and third quintiles, respectively, of the Universe Group. After considering the factors identified above, in light of the information, the Trustees concluded that the advisory fee was reasonable and that such fees would be for services provided in addition to, rather than duplicative of, services provided under the advisory contract of the Underlying Funds in which the Fund invests.
The Trustees noted that the Investor Growth & Income Fund’s net advisory fee for Class A and Select Class shares was in the third and second quintiles, and that the actual total expenses for Class A and Select Class shares were in the fifth and third quintiles, respectively, of the Universe Group. After considering the factors identified above, in light of the information, the Trustees concluded that the advisory fees were reasonable and that such fees would be for services provided in addition to, rather than duplicative of, services provided under the advisory contract of the Underlying Funds in which the Fund invests.
| | | | | | |
| | | |
| 46 | | | | J.P. MORGAN INVESTOR FUNDS | | DECEMBER 31, 2014 |
J.P. Morgan Funds are distributed by JPMorgan Distribution Services, Inc., which is an affiliate of JPMorgan Chase & Co. Affiliates of JPMorgan Chase & Co. receive fees for providing various services to the funds.
Contact JPMorgan Distribution Services, Inc. at 1-800-480-4111 for a fund prospectus. You can also visit us at www.jpmorganfunds.com. Investors should carefully consider the investment objectives and risk as well as charges and expenses of the mutual fund before investing. The prospectus contains this and other information about the mutual fund. Read the prospectus carefully before investing.
Investors may obtain information about the Securities Investor Protection Corporation (SIPC), including the SIPC brochure by visiting www.sipc.org or by calling SIPC at 202-371-8300.
Each Fund files a complete schedule of its fund holdings for the first and third quarters of its fiscal year with the SEC on Form N-Q. The Funds’ Forms N-Q are available on the SEC’s website at http://www.sec.gov and may be reviewed and copied at the SEC’s Public Reference Room in Washington, DC. Information on the operation of the SEC’s Public Reference Room may be obtained by calling 1-800-SEC-0330. Shareholders may request the Form N-Q without charge by calling 1-800-480-4111 or by visiting the J.P. Morgan Funds’ website at www.jpmorganfunds.com.
A description of each Fund’s policies and procedures with respect to the disclosure of each Fund’s holdings is available in the prospectus and Statement of Additional Information.
A copy of proxy policies and procedures is available without charge upon request by calling 1-800-480-4111 and on the Funds’ website at www.jpmorganfunds.com. A description of such policies and procedures is on the SEC’s website at www.sec.gov. The Trustees have delegated the authority to vote proxies for securities owned by the Funds to the Adviser. A copy of the Funds’ voting record for the most recent 12-month period ended June 30 is available on the SEC’s website at www.sec.gov or at the Funds’ website at www.jpmorganfunds.com no later than August 31 of each year. The Funds’ proxy voting record will include, among other things, a brief description of the matter voted on for each fund security, and will state how each vote was cast, for example, for or against the proposal.

J.P. Morgan Asset Management is the marketing name for the asset management business of JPMorgan Chase & Co. Those businesses include, but are not limited to, J.P. Morgan Investment Management Inc., Security Capital Research & Management Incorporated and J.P. Morgan Alternative Asset Management, Inc.
| | | | |
| | © JPMorgan Chase & Co., 2015. All rights reserved. December 2014. | | SAN-INV-1214 |
Semi-Annual Report
J.P. Morgan Intrepid Funds
December 31, 2014 (Unaudited)
JPMorgan Intrepid Advantage Fund
JPMorgan Intrepid America Fund
JPMorgan Intrepid Growth Fund
JPMorgan Intrepid Mid Cap Fund
JPMorgan Intrepid Value Fund
CONTENTS
Investments in a Fund are not bank deposits or obligations of, or guaranteed or endorsed by, any bank and are not insured or guaranteed by the FDIC, the Federal Reserve Board or any other government agency. You could lose money if you sell when the Fund’s share price is lower than when you invested.
Past performance is no guarantee of future performance. The general market views expressed in this report are opinions based on market and other conditions through the end of the reporting period and are subject to change without notice. These views are not intended to predict the future performance of a Fund or the securities markets. References to specific securities and their issuers are for illustrative purposes only and are not intended to be, and should not be interpreted as, recommendations to purchase or sell such securities. Such views are not meant as investment advice and may not be relied on as an indication of trading intent on behalf of any Fund.
Prospective investors should refer to the Funds’ prospectus for a discussion of the Funds’ investment objectives, strategies and risks. Call J.P. Morgan Funds Service Center at 1–800–480–4111 for a prospectus containing more complete information about a Fund, including management fees and other expenses. Please read it carefully before investing.
CEO’S LETTER
Dear Shareholder,
A growing divergence in the economic trajectories of U.S. and other developed markets and plummeting global energy prices provided a mixed backdrop for the latter half of 2014. The U.S. economy accelerated at a steady pace amid continued strength in corporate earnings, gains in employment and consumer spending and falling oil prices for the six months ended December 31, 2014. Gross domestic product (GDP) in the U.S. climbed by 5.0% in the third quarter of 2014 and unemployment dropped to 5.6% in December, a level not seen since June 2008.
| | |
 | | “Amid uncertainty about the global economy recovery, equity markets in the U.S., China and Japan provided investors with solid returns and served to emphasize the prudence of holding a broadly diversified portfolio and a long-term outlook.” |
In response to the continued improvement in the domestic economy, the U.S. Federal Reserve Bank proceeded to taper down its monthly purchases of bonds under its quantitative easing program and finally closed the program in October.
In stark contrast, the European Central Bank (ECB) took unprecedented steps to counter the threat of price deflation in the euro zone and the Bank of Japan stunned markets with a massive stimulus program as Japan’s economy slid into recession.
Another key development in the latter half of 2014 was a precipitous drop in global petroleum prices. A supply glut driven by new production in the U.S. and increased output from other nations, along with decreasing demand from China, Europe and Japan led to a 50% drop in the price of crude oil between July and December.
Amid this backdrop, U.S. equity markets outperformed most other assets classes over the six month period, with large cap stocks providing better returns than small caps and defensive sectors overtaking cyclical sectors. Notably, U.S. equities fell to six-month lows in mid October only to rebound 8.4%, driving the Standard & Poor’s 500 Index (“S&P 500”) to a new closing high of 2,018.05 points on October 31, 2014. In December, the Dow Jones Industrial Average closed above 18,000 points for the first time following the news that third quarter GDP showed the fastest growth in 11 years. The S&P 500 closed at a new high of 2,090.57 points on December 29, 2014, and returned 6.1% for the six months ended December 31, 2014.
Prices for U.S. Treasury securities with longer maturities rose during the six month period as investors sought safe havens amid deteriorating energy prices and geopolitical concerns. While declining oil prices helped bolster consumer spending in
developed nations, energy related sectors came under pressure and yield spreads on high-yield debt — also known as junk bonds — widened. Nations dependent on oil exports experienced volatility in bond yield spreads and currency valuations.
Meanwhile, weak growth in the euro zone raised concerns about the potential for a destructive deflationary spiral. Even after the ECB had cut its deposit rate to negative 0.1% to encourage banks to extend lending by effectively charging them for parking excess cash with the central bank, growth remained tepid and inflation was well below the ECB’s target of just below 2%. The inflation rate averaged 0.4% from July to October and then fell 0.3% in November and was estimated at -0.2% for December. Unemployment across the euro zone remained stubbornly high at 11.5%.
Japan’s economy retreated into recession during the six month period following two quarters of economic contraction, partly attributed to an increase in the national consumption tax earlier in the year. Responding to the crisis, the Bank of Japan surprised global markets on October 31 by unveiling plans to buy 8 trillion to 12 trillion yen ($71 billion to $107 billion) of Japanese government bonds per month, while also tripling its purchases of exchange-traded funds. The announcement drove Tokyo stocks to seven-year highs. For the six months ended December 31, 2014, the MSCI Europe, Australasia and Far East Index returned -9.2%.
Elsewhere, China’s economy continued to grow but at a slower pace for the six month period. At 7.3%, China’s GDP showed the slowest growth in five years, though it was slightly better than economists had expected. The weaker GDP growth was partly attributed to a slowdown in the property sector. However, Chinese equity securities performed well over the six months ended December 31, 2014, amid expectations that policy makers may ease monetary policy to spur growth. Chinese equity markets received an additional boost when regulators increased access to Chinese financial markets by allowing foreign investors in Hong Kong to buy shares in Shanghai.
Russia’s economy, already straining under Western economic sanctions following its annexation of Crimea, began sliding toward recession as prices plummeted for oil and natural gas, its biggest exports. In response, the Russian Central Bank spent heavily from its reserves and raised its key interest rate sharply in a largely unsuccessful effort to halt the ruble’s slide. The MSCI Emerging Markets Index returned -7.7% for the six months ended December 31, 2014.
During the six month period, financial market volatility returned after being largely absent in the first half of 2014. Meanwhile, economic growth outside the U.S. began to falter and the relative strength of the U.S. economy drove the dollar higher against other major currencies. Amid uncertainty about the global economy recovery, equity markets in the U.S., China and Japan provided investors with solid returns and served to
| | | | | | | | |
| | | |
| DECEMBER 31, 2014 | | J.P. MORGAN INTREPID FUNDS | | | | | 1 | |
CEO’S LETTER
(continued)
emphasize the prudence of holding a broadly diversified portfolio and a long-term outlook.
On behalf of everyone at J.P. Morgan Asset Management, thank you for your continued support. We look forward to managing your investment needs for years to come. Should you have any questions, please visit www.jpmorganfunds.com or contact the J.P. Morgan Funds Service Center at 1-800-480-4111.
Sincerely yours,

George C.W. Gatch
CEO, Global Funds Management
J.P. Morgan Asset Management
| | | | | | |
| | | |
| 2 | | | | J.P. MORGAN INTREPID FUNDS | | DECEMBER 31, 2014 |
JPMorgan Intrepid Funds
MARKET OVERVIEW
SIX MONTHS ENDED DECEMBER 31, 2014 (Unaudited)
U.S equity markets performed strongly during the six month reporting period, amid accommodative central bank policies, falling energy prices and steady overall improvement in the U.S. economy. While the second half of 2014 was marked by the return of volatility in financial markets and a sharp sell-off in mid-October, key U.S. equity indexes rebounded to closing highs in the final months of 2014. The S&P 500 Index broke through the 2,000-point closing level for the first time on the final day of October and hit new closing highs in the final weeks of December. Also in late December, the Dow Jones Industrial Average closed above 18,000 points for the first time. U.S. Treasury securities with longer maturities also performed well during the six month reporting period, as geopolitical risks and concerns about weakness in the global economy pushed investors into so-called safe haven bonds.
Overall, U.S. large cap stocks outperformed small cap stocks and growth stocks outperformed value stocks during the reporting period. For the six months ended December 31, 2014, the S&P 500 Index returned 6.12%, while the Russell 1000 Index returned 5.57%, the Russell 1000 Growth Index 6.34% and the Russell 1000 Value Index returned 4.78%. Mid cap stocks as measured by the Russell Midcap Index returned 4.18%, outperforming the Russell 2000 Index, which returned 1.65%.
Intrepid Investment Philosophy and Process
The JPMorgan Intrepid Investment Team employs a philosophy that is rooted in behavioral finance, a field of study that emphasizes the importance of human psychology in financial markets. Behavioral finance examines how investor behavior can be affected by emotional biases and reactions. The field theorizes that inefficiencies arise in the stock market because investors are consistently irrational in making many investment decisions.
The Team aims to capitalize on these market inefficiencies by targeting attractively valued stocks that they believe possess strong fundamentals and momentum characteristics, and looks to sell these stocks when they no longer exhibit these criteria. A disciplined quantitative ranking methodology is utilized to identify attractive stocks in each sector, a process that is combined with qualitative research and value-added trading.
During the reporting period, each of the Funds was managed and positioned in accordance with this investment philosophy and process.
| | | | | | | | |
| | | |
| DECEMBER 31, 2014 | | J.P. MORGAN INTREPID FUNDS | | | | | 3 | |
JPMorgan Intrepid Advantage Fund
FUND COMMENTARY
SIX MONTHS ENDED DECEMBER 31, 2014 (Unaudited)
| | | | |
REPORTING PERIOD RETURN: | |
Fund (Select Class Shares)* | | | 5.94% | |
Russell 3000 Index | | | 5.25% | |
| |
Net Assets as of 12/31/2014 (In Thousands) | | | $22,586 | |
INVESTMENT OBJECTIVE**
The JPMorgan Intrepid Advantage Fund (the “Fund”) seeks to provide long-term capital appreciation.
WHAT WERE THE MAIN DRIVERS OF THE FUND’S PERFORMANCE?
The Fund (Select Class Shares) outperformed the Russell 3000 Index (the “Benchmark”) for the six months ended December 31, 2014. The Fund’s security selection in the information technology and industrials sectors was the leading contributor to performance relative to the Benchmark, while security selection in the consumer discretionary and consumer staples sectors was the leading detractor from relative performance.
Leading individual contributors to relative performance included the Fund’s overweight positions in Yahoo Inc., Northrop Grumman Corp. and Southwest Airlines Co. Shares of Yahoo, an Internet content provider, rose after the successful initial public offering of Alibaba Group Holding Ltd., in which Yahoo holds a 15% stake. Shares of Northrop Grumman, an aerospace and electronics company, rose on an increase in the company’s military contracts. Shares of Southwest Airlines rose on overall improvement in travel demand and discipline in capacity and utilization.
Leading individual detractors from relative performance included the Fund’s overweight positions in TripAdvisor Inc., Viacom Inc. and Wynn Resorts Ltd. Shares of TripAdvisor, an online travel company, weakened amid weak earnings and a data security breach at one of its subsidiaries. Shares of Viacom, a provider of entertainment content, declined after the company reported lower-than-expected revenue. Shares of Wynn Resorts, an owner/operator of destination casino resorts, fell on expected weakness in the gaming industry in Macau, where Wynn has significant business.
| | | | | | | | |
| TOP TEN EQUITY HOLDINGS OF THE PORTFOLIO*** | |
| | 1. | | | Apple, Inc. | | | 4.9 | % |
| | 2. | | | Microsoft Corp. | | | 3.8 | |
| | 3. | | | Wells Fargo & Co. | | | 2.2 | |
| | 4. | | | Time Warner, Inc. | | | 2.1 | |
| | 5. | | | Chevron Corp. | | | 2.0 | |
| | 6. | | | Northrop Grumman Corp. | | | 1.9 | |
| | 7. | | | Hewlett-Packard Co. | | | 1.9 | |
| | 8. | | | Home Depot, Inc. (The) | | | 1.8 | |
| | 9. | | | Cisco Systems, Inc. | | | 1.7 | |
| | 10. | | | Exxon Mobil Corp. | | | 1.7 | |
| | | | |
PORTFOLIO COMPOSITION BY SECTOR*** | |
| Information Technology | | | 22.6 | % |
| Health Care | | | 16.7 | |
| Financials | | | 14.9 | |
| Consumer Discretionary | | | 13.4 | |
| Consumer Staples | | | 9.0 | |
| Industrials | | | 8.6 | |
| Energy | | | 6.8 | |
| Telecommunication Services | | | 2.1 | |
| Utilities | | | 1.5 | |
| Materials | | | 1.4 | |
| Short-Term Investment | | | 3.0 | |
| * | | The return shown is based on net asset values calculated for shareholder transactions and may differ from the return shown in the financial highlights, which reflects adjustments made to the net asset values in accordance with accounting principles generally accepted in the United States of America. |
| ** | | The adviser seeks to achieve the Fund’s objective. There can be no guarantee it will be achieved. |
| *** | | Percentages indicated are based on total investments as of December 31, 2014. The Fund’s portfolio composition is subject to change. |
| | | | | | |
| | | |
| 4 | | | | J.P. MORGAN INTREPID FUNDS | | DECEMBER 31, 2014 |
| | | | | | | | | | | | | | | | | | |
AVERAGE ANNUAL TOTAL RETURNS AS OF DECEMBER 31, 2014 | |
| | | | | |
| | | INCEPTION DATE OF
CLASS | | 6 MONTH* | | | 1 YEAR | | | 5 YEAR | | | 10 YEAR | |
CLASS A SHARES | | February 19, 2005 | | | | | | | | | | | | | | | | |
Without Sales Charge | | | | | 5.77 | % | | | 13.03 | % | | | 15.86 | % | | | 7.03 | % |
With Sales Charge** | | | | | 0.22 | | | | 7.08 | | | | 14.62 | | | | 6.45 | |
CLASS C SHARES | | February 19, 2005 | | | | | | | | | | | | | | | | |
Without CDSC | | | | | 5.52 | | | | 12.48 | | | | 15.29 | | | | 6.50 | |
With CDSC*** | | | | | 4.52 | | | | 11.48 | | | | 15.29 | | | | 6.50 | |
SELECT CLASS SHARES | | February 28, 2003 | | | 5.94 | | | | 13.33 | | | | 16.15 | | | | 7.29 | |
| ** | | Sales Charge for Class A Shares is 5.25%. |
| *** | | Assumes a 1% CDSC (contingent deferred sales charge) for the one year period and 0% CDSC thereafter. |
TEN YEAR PERFORMANCE (12/31/04 TO 12/31/14)
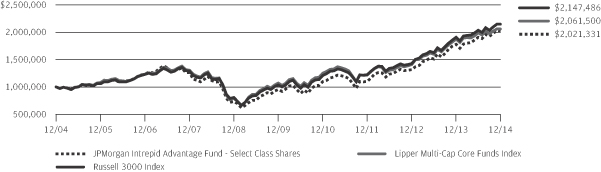
The performance quoted is past performance and is not a guarantee of future results. Mutual funds are subject to certain market risks. Investment returns and principal value of an investment will fluctuate so that an investor’s shares, when redeemed, may be worth more or less than their original cost. Current performance may be higher or lower than the performance data shown. For up-to-date month-end performance information please call 1-800-480-4111.
Returns for Class A and Class C Shares prior to their inception dates are based on the performance of Select Class Shares. The actual returns for Class A and Class C Shares would have been lower than those shown because Class A and Class C Shares have higher expenses than Select Class Shares.
The graph illustrates comparative performance for $1,000,000 invested in Select Class Shares of the JPMorgan Intrepid Advantage Fund, the Russell 3000 Index and the Lipper Multi-Cap Core Funds Index from December 31, 2004 to December 31, 2014. The performance of the Fund assumes reinvestment of all dividends and capital gain distributions, if any, and does not include a sales charge. The performance of the Russell 3000 Index does not reflect the deduction of expenses or a sales charge associated with a mutual fund and has been adjusted to reflect reinvestment of all dividends and capital gain distributions of the securities included in the benchmark, if applicable. The performance of the Lipper Multi-Cap Core Funds Index includes expenses associated with a mutual fund, such as investment management fees. These expenses are not identical to the expenses incurred by the Fund. The
Russell 3000 Index is an unmanaged index which measures the performance of the 3,000 largest U.S. companies based on total market capitalization, which represents approximately 98% of the investable U.S. equity market. The Lipper Multi-Cap Core Funds Index is an index based on the total returns of certain mutual funds within the Fund’s designated category as determined by Lipper, Inc. Investors cannot invest directly in an index.
Select Class Shares have a $1,000,000 minimum initial investment.
Fund performance may reflect the waiver of the Fund’s fees and reimbursement of expenses for certain periods since the inception date. Without these waivers and reimbursements, performance would have been lower. Also, performance shown in this section does not reflect the deduction of taxes that a shareholder would pay on Fund distributions or redemption of Fund shares.
Effective April 10, 2006, the Fund changed its investment policies. Although past performance is not necessarily an indication of how the Fund will perform in the future, in view of these changes, the Fund’s performance record prior to this date might be less relevant for investors considering whether to purchase shares of the Fund.
The returns shown are based on net asset values calculated for shareholder transactions and may differ from the returns shown in the financial highlights, which reflect adjustments made to the net asset values in accordance with accounting principles generally accepted in the United States of America.
| | | | | | | | |
| | | |
| DECEMBER 31, 2014 | | J.P. MORGAN INTREPID FUNDS | | | | | 5 | |
JPMorgan Intrepid America Fund
FUND COMMENTARY
SIX MONTHS ENDED DECEMBER 31, 2014 (Unaudited)
| | | | |
REPORTING PERIOD RETURN: | |
Fund (Select Class Shares)* | | | 7.38% | |
| S&P 500 Index(1) | | | 6.12% | |
Russell 1000 Index | | | 5.57% | |
| |
Net Assets as of 12/31/2014 (In Thousands) | | | $3,466,605 | |
INVESTMENT OBJECTIVE**
The JPMorgan Intrepid America Fund (the “Fund”) seeks to provide long-term capital growth.
WHAT WERE THE MAIN DRIVERS OF THE FUND’S PERFORMANCE?
The Fund (Select Class Shares) outperformed the Standard & Poor’s 500 Index (the “Benchmark”) for the six months ended December 31, 2014. The Fund’s security selection in the industrials and information technology sectors was a leading contributor to performance relative to the Benchmark, while security selection in the financials and utilities sectors was a leading detractor from relative performance.
Leading individual contributors to relative performance included the Fund’s overweight positions in Northrop Grumman Corp., United Therapeutics Corp. and Kroger Co. Shares of Northrop Grumman, an aerospace and electronics company, rose on an increase in the company’s military contracts. Shares of United Therapeutics, a biopharmaceuticals company not held in the Benchmark, strengthened on favorable court rulings related to its patent on the hypertension drug Remodulin. Shares of Kroger, a supermarket chain, rose on increased quarterly earnings and the company’s forecast for profit growth.
Leading individual detractors from relative performance included the Fund’s overweight positions in Patterson-UTI Energy Inc., Viacom Inc. and Herbalife Ltd. Patterson-UTI, an owner/operator of oil drilling rigs, fell amid a decline in the global price of oil. Shares of Viacom, a provider of entertainment content, declined after the company reported lower-than-expected revenue. Shares of Herbalife, a distributor of nutritional supplements through a network of independent sellers, fell on the company’s forecast for lower revenue and earnings.
| | | | | | | | |
| TOP TEN EQUITY HOLDINGS OF THE PORTFOLIO*** | |
| | 1. | | | Apple, Inc. | | | 3.5 | % |
| | 2. | | | Wells Fargo & Co. | | | 3.3 | |
| | 3. | | | Microsoft Corp. | | | 3.2 | |
| | 4. | | | Pfizer, Inc. | | | 2.6 | |
| | 5. | | | Hewlett-Packard Co. | | | 2.5 | |
| | 6. | | | Time Warner, Inc. | | | 2.3 | |
| | 7. | | | Oracle Corp. | | | 2.2 | |
| | 8. | | | Archer-Daniels-Midland Co. | | | 2.1 | |
| | 9. | | | Anthem, Inc. | | | 2.1 | |
| | 10. | | | Northrop Grumman Corp. | | | 2.1 | |
| | | | |
PORTFOLIO COMPOSITION BY SECTOR*** | |
Information Technology | | | 20.4 | % |
Financials | | | 14.4 | |
Health Care | | | 14.3 | |
Consumer Discretionary | | | 11.8 | |
Industrials | | | 10.7 | |
Consumer Staples | | | 9.1 | |
Energy | | | 7.8 | |
Utilities | | | 3.1 | |
Materials | | | 3.0 | |
Telecommunication Services | | | 2.4 | |
Short-Term Investment | | | 3.0 | |
| * | | The return shown is based on net asset values calculated for shareholder transactions and may differ from the return shown in the financial highlights, which reflects adjustments made to the net asset values in accordance with accounting principles generally accepted in the United States of America. |
| ** | | The adviser seeks to achieve the Fund’s objective. There can be no guarantee it will be achieved. |
| *** | | Percentages indicated are based on total investments as of December 31, 2014. The Fund’s portfolio composition is subject to change. |
| (1) | | On November 1, 2014, the JPMorgan Intrepid America Fund adopted the Standard & Poor‘s 500 Index as its primary Benchmark, replacing the Russell 1000 Index, because the portfolio managers believe the S&P 500 Index is a more representative benchmark for large cap funds. |
| | | | | | |
| | | |
| 6 | | | | J.P. MORGAN INTREPID FUNDS | | DECEMBER 31, 2014 |
| | | | | | | | | | | | | | | | | | |
AVERAGE ANNUAL TOTAL RETURNS AS OF DECEMBER 31, 2014 | |
| | | | | |
| | | INCEPTION DATE OF
CLASS | | 6 MONTH* | | | 1 YEAR | | | 5 YEAR | | | 10 YEAR | |
CLASS A SHARES | | February 19, 2005 | | | | | | | | | | | | | | | | |
Without Sales Charge | | | | | 7.25 | % | | | 15.86 | % | | | 15.53 | % | | | 7.77 | % |
With Sales Charge** | | | | | 1.61 | | | | 9.78 | | | | 14.29 | | | | 7.19 | |
CLASS C SHARES | | February 19, 2005 | | | | | | | | | | | | | | | | |
Without CDSC | | | | | 6.98 | | | | 15.27 | | | | 14.95 | | | | 7.24 | |
With CDSC*** | | | | | 5.98 | | | | 14.27 | | | | 14.95 | | | | 7.24 | |
CLASS R2 SHARES | | November 3, 2008 | | | 7.11 | | | | 15.55 | | | | 15.24 | | | | 7.61 | |
CLASS R5 SHARES | | May 15, 2006 | | | 7.49 | | | | 16.38 | | | | 16.05 | | | | 8.23 | |
SELECT CLASS SHARES | | February 28, 2003 | | | 7.38 | | | | 16.15 | | | | 15.82 | | | | 8.03 | |
| ** | | Sales Charge for Class A Shares is 5.25%. |
| *** | | Assumes a 1% CDSC (contingent deferred sales charge) for the one year period and 0% CDSC thereafter. |
TEN YEAR PERFORMANCE (12/31/04 TO 12/31/14)
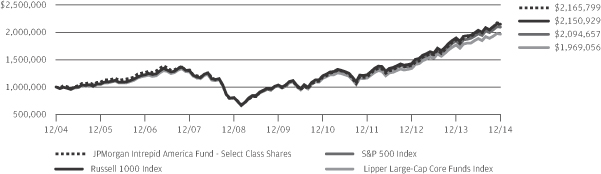
The performance quoted is past performance and is not a guarantee of future results. Mutual funds are subject to certain market risks. Investment returns and principal value of an investment will fluctuate so that an investor’s shares, when redeemed, may be worth more or less than their original cost. Current performance may be higher or lower than the performance data shown. For up-to-date month-end performance information please call 1-800-480-4111.
Returns for Class A, Class C and Class R5 Shares prior to their inception dates are based on the performance of Select Class Shares. The actual returns for Class A and Class C Shares would have been lower than those shown because Class A and Class C Shares have higher expenses than Select Class Shares. The actual returns for Class R5 Shares would have been different than those shown because Class R5 Shares have different expenses than Select Class Shares.
Returns for Class R2 Shares prior to their inception date are based on the performance of Class A Shares from February 19, 2005 to November 2, 2008 and the performance of Select Class Shares prior to February 19, 2005. During these periods, the actual returns for Class R2 Shares would have been lower than those shown because Class R2 Shares have higher expenses than Class A and Select Class Shares.
The graph illustrates comparative performance for $1,000,000 invested in Select Class Shares of the JPMorgan Intrepid America Fund, the S&P 500 Index, the Russell 1000 Index and the Lipper Large-Cap Core Funds Index from December 31, 2004 to December 31, 2014. The performance of the Fund assumes reinvestment of all dividends and capital gain distributions, if any, and does not include a sales charge. The performance of the S&P 500 Index and Russell 1000 Index does not reflect the deduction of expenses or a sales charge associated with a mutual fund and has been adjusted to reflect reinvestment of
all dividends and capital gain distributions of the securities included in the benchmark, if applicable. The performance of the Lipper Large-Cap Core Funds Index includes expenses associated with a mutual fund, such as investment management fees. These expenses are not identical to the expenses incurred by the Fund. The S&P 500 Index is an unmanaged index generally representative of the performance of large companies in the U.S. stock market. The Russell 1000 Index is an unmanaged index which measures the performance of the 1,000 largest companies (on the basis of capitalization) in the Russell 3000 Index. The Lipper Large-Cap Core Funds Index is an index based on total returns of certain mutual funds within the Fund’s designated category as determined by Lipper, Inc. Investors cannot invest directly in an index.
Select Class Shares have a $1,000,000 minimum initial investment.
Fund performance may reflect the waiver of the Fund’s fees and reimbursement of expenses for certain periods since the inception date. Without these waivers and reimbursements, performance would have been lower. Also, performance shown in this section does not reflect the deduction of taxes that a shareholder would pay on Fund distributions or redemption of Fund shares.
The returns shown are based on net asset values calculated for shareholder transactions and may differ from the returns shown in the financial highlights, which reflect adjustments made to the net asset values in accordance with accounting principles generally accepted in the United States of America.
On November 1, 2014, the JPMorgan Intrepid America Fund adopted the Standard & Poor’s 500 Index as its primary Benchmark, replacing the Russell 1000 Index, because the portfolio managers believe the S&P 500 Index is a more representative benchmark for large cap funds.
| | | | | | | | |
| | | |
| DECEMBER 31, 2014 | | J.P. MORGAN INTREPID FUNDS | | | | | 7 | |
JPMorgan Intrepid Growth Fund
FUND COMMENTARY
SIX MONTHS ENDED DECEMBER 31, 2014 (Unaudited)
| | | | |
| REPORTING PERIOD RETURN: | |
Fund (Select Class Shares)* | | | 9.11% | |
Russell 1000 Growth Index | | | 6.34% | |
| |
Net Assets as of 12/31/2014 (In Thousands) | | | $917,259 | |
INVESTMENT OBJECTIVE**
The JPMorgan Intrepid Growth Fund (the “Fund”) seeks to provide long-term capital growth.
WHAT WERE THE MAIN DRIVERS OF THE FUND’S PERFORMANCE?
The Fund (Select Class Shares) outperformed the Russell 1000 Growth Index (the “Benchmark”) for the six months ended December 31, 2014. The Fund’s security selection in the information technology and industrials sectors was the leading contributor to performance relative to the Benchmark, while security selection in the materials and utilities sectors was the leading detractor from relative performance.
Leading individual contributors to relative performance included the Fund’s overweight positions in Yahoo Inc., Delta Air Lines Inc. and Southwest Airlines Co. Shares of Yahoo, a provider of Internet content, rose following the initial public offering of Alibaba Group Holding Ltd., in which Yahoo holds a 15% stake. Shares of both Delta Air Lines and Southwest Airlines rose on overall improvement in the airline sector.
Leading individual detractors from relative performance included the Fund’s overweight positions in Viacom Inc., Herbalife Ltd. and Patterson-UTI Energy Co. Shares of Viacom, a provider of entertainment content, declined after the company reported lower-than-expected revenue. Shares of Herbalife, a distributor of nutritional supplements through a network of independent sellers, fell on the company’s forecast for lower revenue and earnings. Shares of Patterson-UTI, an owner/operator of oil drilling rigs, fell amid a 50% drop in the global price of oil.
| | | | | | | | |
| TOP TEN EQUITY HOLDINGS OF THE PORTFOLIO*** | |
| | 1. | | | Apple, Inc. | | | 6.1 | % |
| | 2. | | | Microsoft Corp. | | | 4.2 | |
| | 3. | | | Oracle Corp. | | | 3.3 | |
| | 4. | | | Gilead Sciences, Inc. | | | 3.0 | |
| | 5. | | | Amgen, Inc. | | | 2.7 | |
| | 6. | | | Home Depot, Inc. (The) | | | 2.6 | |
| | 7. | | | Visa, Inc., Class A | | | 2.3 | |
| | 8. | | | Archer-Daniels-Midland Co. | | | 2.0 | |
| | 9. | | | Time Warner, Inc. | | | 2.0 | |
| | 10. | | | Anthem, Inc. | | | 1.9 | |
| | | | |
PORTFOLIO COMPOSITION BY SECTOR*** | |
Information Technology | | | 28.7 | % |
Consumer Discretionary | | | 17.3 | |
Health Care | | | 14.1 | |
Industrials | | | 11.3 | |
Consumer Staples | | | 9.4 | |
Energy | | | 4.5 | |
Financials | | | 4.4 | |
Materials | | | 3.9 | |
Telecommunication Services | | | 2.3 | |
Utilities | | | 0.5 | |
Short-Term Investment | | | 3.6 | |
| * | | The return shown is based on net asset values calculated for shareholder transactions and may differ from the return shown in the financial highlights, which reflects adjustments made to the net asset values in accordance with accounting principles generally accepted in the United States of America. |
| ** | | The adviser seeks to achieve the Fund’s objective. There can be no guarantee it will be achieved. |
| *** | | Percentages indicated are based on total investments as of December 31, 2014. The Fund’s portfolio composition is subject to change. |
| | | | | | |
| | | |
| 8 | | | | J.P. MORGAN INTREPID FUNDS | | DECEMBER 31, 2014 |
| | | | | | | | | | | | | | | | | | |
AVERAGE ANNUAL TOTAL RETURNS AS OF DECEMBER 31, 2014 | |
| | | | | |
| | | INCEPTION DATE OF
CLASS | | 6 MONTH* | | | 1 YEAR | | | 5 YEAR | | | 10 YEAR | |
CLASS A SHARES | | February 19, 2005 | | | | | | | | | | | | | | | | |
Without Sales Charge | | | | | 8.99 | % | | | 16.14 | % | | | 16.03 | % | | | 8.38 | % |
With Sales Charge** | | | | | 3.28 | | | | 10.03 | | | | 14.79 | | | | 7.79 | |
CLASS C SHARES | | February 19, 2005 | | | | | | | | | | | | | | | | |
Without CDSC | | | | | 8.71 | | | | 15.55 | | | | 15.45 | | | | 7.84 | |
With CDSC*** | | | | | 7.71 | | | | 14.55 | | | | 15.45 | | | | 7.84 | |
CLASS R2 SHARES | | November 3, 2008 | | | 8.84 | | | | 15.82 | | | | 15.74 | | | | 8.21 | |
CLASS R5 SHARES | | May 15, 2006 | | | 9.24 | | | | 16.66 | | | | 16.55 | | | | 8.82 | |
SELECT CLASS SHARES | | February 28, 2003 | | | 9.11 | | | | 16.39 | | | | 16.32 | | | | 8.64 | |
| ** | | Sales Charge for Class A Shares is 5.25%. |
| *** | | Assumes a 1% CDSC (contingent deferred sales charge) for the one year period and 0% CDSC thereafter. |
TEN YEAR PERFORMANCE (12/31/04 TO 12/31/14)
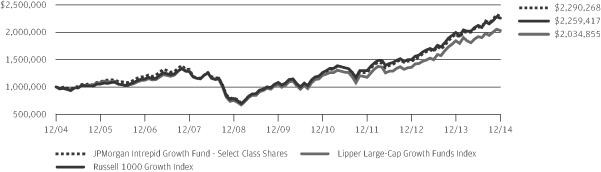
The performance quoted is past performance and is not a guarantee of future results. Mutual funds are subject to certain market risks. Investment returns and principal value of an investment will fluctuate so that an investor’s shares, when redeemed, may be worth more or less than their original cost. Current performance may be higher or lower than the performance data shown. For up-to-date month-end performance information please call 1-800-480-4111.
Returns for Class A, Class C and Class R5 Shares prior to their inception dates are based on the performance of Select Class Shares. The actual returns for Class A and Class C Shares would have been lower than those shown because Class A and Class C Shares have higher expenses than Select Class Shares. The actual returns for Class R5 Shares would have been different than those shown because Class R5 Shares have different expenses than Select Class Shares.
Returns for Class R2 Shares prior to their inception date are based on the performance of Class A Shares from February 19, 2005 to November 2, 2008 and the performance of Select Class Shares prior to February 19, 2005. During these periods, the actual returns for Class R2 Shares would have been lower than those shown because Class R2 Shares have higher expenses than Class A and Select Class Shares.
The graph illustrates comparative performance for $1,000,000 invested in Select Class Shares of the JPMorgan Intrepid Growth Fund, the Russell 1000 Growth Index and the Lipper Large-Cap Growth Funds Index from December 31, 2004 to December 31, 2014. The performance of the Fund assumes reinvestment of all dividends and capital gain distributions, if any, and does not include
a sales charge. The performance of the Russell 1000 Growth Index does not reflect the deduction of expenses or a sales charge associated with a mutual fund and has been adjusted to reflect reinvestment of all dividends and capital gain distributions of the securities included in the benchmark, if applicable. The performance of the Lipper Large-Cap Growth Funds Index includes expenses associated with a mutual fund, such as investment management fees. These expenses are not identical to the expenses incurred by the Fund. The Russell 1000 Growth Index is an unmanaged index which measures the performance of those Russell 1000 companies with higher price-to-book ratios and higher forecasted growth values. The Lipper Large-Cap Growth Funds Index is an index based on total returns of certain mutual funds within the Fund’s designated category as determined by Lipper, Inc. Investors cannot invest directly in an index.
Select Class Shares have a $1,000,000 minimum initial investment.
Fund performance may reflect the waiver of the Fund’s fees and reimbursement of expenses for certain periods since the inception date. Without these waivers and reimbursements, performance would have been lower. Also, performance shown in this section does not reflect the deduction of taxes that a shareholder would pay on Fund distributions or redemption of Fund shares.
The returns shown are based on net asset values calculated for shareholder transactions and may differ from the returns shown in the financial highlights, which reflect adjustments made to the net asset values in accordance with accounting principles generally accepted in the United States of America.
| | | | | | | | |
| | | |
| DECEMBER 31, 2014 | | J.P. MORGAN INTREPID FUNDS | | | | | 9 | |
JPMorgan Intrepid Mid Cap Fund
FUND COMMENTARY
SIX MONTHS ENDED DECEMBER 31, 2014 (Unaudited)
| | | | |
| REPORTING PERIOD RETURN: | |
Fund (Select Class Shares)* | | | 6.56% | |
Russell Midcap Index | | | 4.18% | |
| |
Net Assets as of 12/31/2014 (In Thousands) | | $ | 757,966 | |
INVESTMENT OBJECTIVE**
The JPMorgan Intrepid Mid Cap Fund (the “Fund”) seeks long-term capital growth by investing primarily in equity securities of companies with intermediate capitalizations.
WHAT WERE THE MAIN DRIVERS OF THE FUND’S PERFORMANCE?
The Fund (Select Class Shares) outperformed the Russell Midcap Index (the “Benchmark”) for the six months ended December 31, 2014. The Fund’s security selection in the energy and industrial cyclical sectors was the leading contributor to performance relative to the Benchmark, while security selection in the retail and telecommunications sectors was the leading detractor from relative performance.
Leading individual contributors to relative performance included the Fund’s overweight positions in Southwest Airlines Co., Huntington Ingalls Industries Inc. and Booz Allen Hamilton Holding Corp. Shares of Southwest Airlines rose on overall improvement in travel demand and discipline in capacity and utilization. Shares of Huntington Ingalls, a shipbuilder, climbed higher on expectations of increased military contracts. Shares of Booz Allen, a management and technology consulting company, rose after the company raised its earnings forecast.
Leading individual detractors from relative performance included the Fund’s overweight positions in ManpowerGroup Inc., First Solar Inc. and Rovi Corp. Shares of ManpowerGroup, a provider of employment and personnel services, fell after the company forecast earnings below analysts’ estimates. Shares of First Solar, a maker of photovoltaic solar cells, weakened after the company posted a decline in quarterly earnings and revenue. Shares of Rovi, maker of digital entertainment technology, declined on weakness in earnings.
| | | | | | | | |
| TOP TEN EQUITY HOLDINGS OF THE PORTFOLIO*** | |
| | 1. | | | Bunge Ltd. | | | 2.0 | % |
| | 2. | | | H&R Block, Inc. | | | 2.0 | |
| | 3. | | | Southwest Airlines Co. | | | 1.9 | |
| | 4. | | | Huntington Ingalls Industries, Inc. | | | 1.9 | |
| | 5. | | | Western Digital Corp. | | | 1.8 | |
| | 6. | | | Lear Corp. | | | 1.7 | |
| | 7. | | | CareFusion Corp. | | | 1.6 | |
| | 8. | | | Rite Aid Corp. | | | 1.6 | |
| | 9. | | | Foot Locker, Inc. | | | 1.6 | |
| | 10. | | | Best Buy Co., Inc. | | | 1.5 | |
| | | | |
PORTFOLIO COMPOSITION BY SECTOR*** | |
| Information Technology | | | 17.7 | % |
| Financials | | | 17.4 | |
| Consumer Discretionary | | | 14.0 | |
| Industrials | | | 11.6 | |
| Health Care | | | 11.0 | |
| Consumer Staples | | | 8.3 | |
| Utilities | | | 5.7 | |
| Materials | | | 5.1 | |
| Energy | | | 4.6 | |
| Telecommunication Services | | | 1.1 | |
| Short-Term Investment | | | 3.5 | |
| * | | The return shown is based on net asset values calculated for shareholder transactions and may differ from the return shown in the financial highlights, which reflects adjustments made to the net asset values in accordance with accounting principles generally accepted in the United States of America. |
| ** | | The adviser seeks to achieve the Fund’s objective. There can be no guarantee it will be achieved. |
| *** | | Percentages indicated are based on total investments as of December 31, 2014. The Fund’s portfolio composition is subject to change. |
| | | | | | |
| | | |
| 10 | | | | J.P. MORGAN INTREPID FUNDS | | DECEMBER 31, 2014 |
| | | | | | | | | | | | | | | | | | |
AVERAGE ANNUAL TOTAL RETURNS AS OF DECEMBER 31, 2014 | |
| | | INCEPTION DATE OF
CLASS | | 6 MONTH* | | | 1 YEAR | | | 5 YEAR | | | 10 YEAR | |
CLASS A SHARES | | May 1, 1992 | | | | | | | | | | | | | | | | |
Without Sales Charge | | | | | 6.41 | % | | | 15.36 | % | | | 16.96 | % | | | 9.39 | % |
With Sales Charge** | | | | | 0.81 | | | | 9.32 | | | | 15.70 | | | | 8.81 | |
CLASS B SHARES | | September 23, 1996 | | | | | | | | | | | | | | | | |
Without CDSC | | | | | 6.04 | | | | 14.61 | | | | 16.21 | | | | 8.84 | |
With CDSC*** | | | | | 1.04 | | | | 9.61 | | | | 15.99 | | | | 8.84 | |
CLASS C SHARES | | March 22, 1999 | | | | | | | | | | | | | | | | |
Without CDSC | | | | | 6.07 | | | | 14.60 | | | | 16.21 | | | | 8.72 | |
With CDSC**** | | | | | 5.07 | | | | 13.60 | | | | 16.21 | | | | 8.72 | |
SELECT CLASS SHARES | | June 1, 1991 | | | 6.56 | | | | 15.62 | | | | 17.24 | | | | 9.67 | |
| ** | | Sales Charge for Class A Shares is 5.25%. |
| *** | | Assumes a 5% CDSC (contingent deferred sales charge) for the one year period, 2% CDSC for the five year period and 0% CDSC thereafter. |
| **** | | Assumes a 1% CDSC for the one year period and 0% CDSC thereafter. |
TEN YEAR PERFORMANCE (12/31/04 TO 12/31/14)
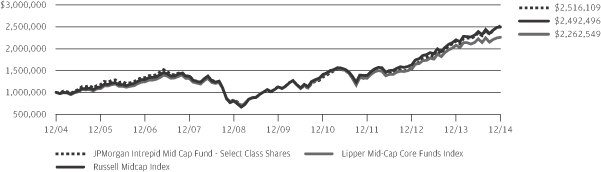
The performance quoted is past performance and is not a guarantee of future results. Mutual funds are subject to certain market risks. Investment returns and principal value of an investment will fluctuate so that an investor’s shares, when redeemed, may be worth more or less than their original cost. Current performance may be higher or lower than the performance data shown. For up-to-date month-end performance information please call 1-800-480-4111.
The graph illustrates comparative performance for $1,000,000 invested in Select Class Shares of the JPMorgan Intrepid Mid Cap Fund, the Russell Midcap Index and the Lipper Mid-Cap Core Funds Index from December 31, 2004 to December 31, 2014. The performance of the Fund assumes reinvestment of all dividends and capital gain distributions, if any, and does not include a sales charge. The performance of the Russell Midcap Index does not reflect the deduction of expenses or a sales charge associated with a mutual fund and has been adjusted to reflect reinvestment of all dividends and capital gain distributions of the securities included in the benchmark, if applicable. The performance of the Lipper Mid-Cap Core Funds Index includes expenses associated with a mutual fund, such as investment management fees. These expenses are not identical to the expenses incurred by the Fund. The Russell Midcap Index is
an unmanaged index which measures the performance of the 800 smallest
companies of the Russell 1000 Index. The Lipper Mid-Cap Core Funds Index is an index based on the total returns of certain mutual funds within the Fund’s designated category as determined by Lipper, Inc. Investors cannot invest directly in an index.
Select Class Shares have a $1,000,000 minimum initial investment.
Fund performance may reflect the waiver of the Fund’s fees and reimbursement of expenses for certain periods since the inception date. Without these waivers and reimbursements, performance would have been lower. Also, performance shown in this section does not reflect the deduction of taxes that a shareholder would pay on Fund distributions or redemption of Fund shares.
Because Class B Shares automatically convert to Class A Shares after eight years, the 10 year average annual total return shown above for Class B reflects Class A performance for the period after conversion.
The returns shown are based on net asset values calculated for shareholder transactions and may differ from the returns shown in the financial highlights, which reflect adjustments made to the net asset values in accordance with accounting principles generally accepted in the United States of America.
| | | | | | | | |
| | | |
| DECEMBER 31, 2014 | | J.P. MORGAN INTREPID FUNDS | | | | | 11 | |
JPMorgan Intrepid Value Fund
FUND COMMENTARY
SIX MONTHS ENDED DECEMBER 31, 2014 (Unaudited)
| | | | |
| REPORTING PERIOD RETURN: | |
Fund (Select Class Shares)* | | | 5.43% | |
Russell 1000 Value Index | | | 4.78% | |
| |
Net Assets as of 12/31/2014 (In Thousands) | | $ | 1,712,519 | |
INVESTMENT OBJECTIVE**
The JPMorgan Intrepid Value Fund (the “Fund”) seeks to provide long-term capital appreciation.
WHAT WERE THE MAIN DRIVERS OF THE FUND’S PERFORMANCE?
The Fund (Select Class Shares) outperformed the Russell 1000 Value Index (the “Benchmark”) for the six months ended December 31, 2014. The Fund’s security selection in the industrials and health care sectors was a leading contributor to performance relative to the Benchmark, while security selection in the materials and consumer discretionary sectors detracted from relative performance.
Leading individual contributors to relative performance included the Fund’s overweight positions in Northrop Grumman Corp., United Therapeutics Inc. and Southwest Airlines Co. Shares of Northrop Grumman, an aerospace and electronics company, rose on an increase in the company’s military contracts. Shares of United Therapeutics, a biopharmaceuticals company, strengthened on favorable court rulings related to its patent on the hypertension drug Remodulin. Shares of Southwest Airlines rose on overall improvement in travel demand and discipline in capacity and utilization.
Leading individual detractors from relative performance included the Fund’s overweight positions in Herbalife Ltd. and Viacom Inc. and its position in Exxon Mobil Corp. Shares of Herbalife, a distributor of nutritional supplements through a network of independent sellers, fell on the company’s forecast for lower revenue and earnings. Shares of Viacom, a provider of entertainment content, declined after the company reported lower-than-expected revenue. Shares of Exxon Mobil, an integrated petrochemical company, weakened along with other oil producers amid a 50% decline in global oil prices.
| | | | | | | | |
| TOP TEN EQUITY HOLDINGS OF THE PORTFOLIO*** | |
| | 1. | | | Wells Fargo & Co. | | | 4.1 | % |
| | 2. | | | Pfizer, Inc. | | | 3.4 | |
| | 3. | | | Hewlett-Packard Co. | | | 2.7 | |
| | 4. | | | Citigroup, Inc. | | | 2.4 | |
| | 5. | | | Chevron Corp. | | | 2.4 | |
| | 6. | | | Anthem, Inc. | | | 2.3 | |
| | 7. | | | Archer-Daniels-Midland Co. | | | 2.2 | |
| | 8. | | | Northrop Grumman Corp. | | | 2.2 | |
| | 9. | | | National Oilwell Varco, Inc. | | | 2.1 | |
| | 10. | | | Discover Financial Services | | | 2.1 | |
| | | | |
PORTFOLIO COMPOSITION BY SECTOR*** | |
Financials | | | 27.8 | % |
Health Care | | | 13.8 | |
Energy | | | 11.1 | |
Industrials | | | 10.4 | |
Information Technology | | | 10.1 | |
Consumer Discretionary | | | 7.0 | |
Consumer Staples | | | 6.7 | |
Utilities | | | 6.3 | |
Materials | | | 2.5 | |
Telecommunication Services | | | 1.9 | |
Short-Term Investment | | | 2.4 | |
| * | | The return shown is based on net asset values calculated for shareholder transactions and may differ from the return shown in the financial highlights, which reflects adjustments made to the net asset values in accordance with accounting principles generally accepted in the United States of America. |
| ** | | The adviser seeks to achieve the Fund’s objective. There can be no guarantee it will be achieved. |
| *** | | Percentages indicated are based on total investments as of December 31, 2014. The Fund’s portfolio composition is subject to change. |
| | | | | | |
| | | |
| 12 | | | | J.P. MORGAN INTREPID FUNDS | | DECEMBER 31, 2014 |
| | | | | | | | | | | | | | | | | | | | |
AVERAGE ANNUAL TOTAL RETURNS AS OF DECEMBER 31, 2014 | |
| | | | | |
| | | INCEPTION DATE OF
CLASS | | | 6 MONTH* | | | 1 YEAR | | | 5 YEAR | | | 10 YEAR | |
CLASS A SHARES | | | February 19, 2005 | | | | | | | | | | | | | | | | | |
Without Sales Charge | | | | | | | 5.33 | % | | | 13.75 | % | | | 15.28 | % | | | 7.93 | % |
With Sales Charge** | | | | | | | (0.21 | ) | | | 7.77 | | | | 14.04 | | | | 7.35 | |
CLASS C SHARES | | | February 19, 2005 | | | | | | | | | | | | | | | | | |
Without CDSC | | | | | | | 5.06 | | | | 13.16 | | | | 14.70 | | | | 7.39 | |
With CDSC*** | | | | | | | 4.06 | | | | 12.16 | | | | 14.70 | | | | 7.39 | |
CLASS R2 SHARES | | | November 3, 2008 | | | | 5.18 | | | | 13.47 | | | | 14.99 | | | | 7.76 | |
CLASS R5 SHARES | | | May 15, 2006 | | | | 5.53 | | | | 14.17 | | | | 15.71 | | | | 8.33 | |
CLASS R6 SHARES | | | November 30, 2010 | | | | 5.55 | | | | 14.22 | | | | 15.75 | | | | 8.35 | |
SELECT CLASS SHARES | | | February 28, 2003 | | | | 5.43 | | | | 13.93 | | | | 15.47 | | | | 8.15 | |
| ** | | Sales Charge for Class A Shares is 5.25%. |
| *** | | Assumes a 1% CDSC (contingent deferred sales charge) for the one year period and 0% CDSC thereafter. |
TEN YEAR PERFORMANCE (12/31/04 TO 12/31/14)
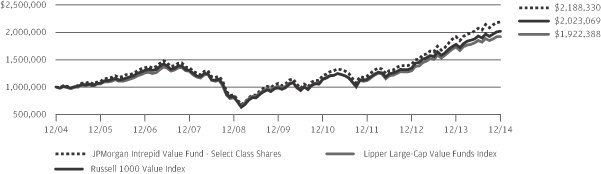
The performance quoted is past performance and is not a guarantee of future results. Mutual funds are subject to certain market risks. Investment returns and principal value of an investment will fluctuate so that an investor’s shares, when redeemed, may be worth more or less than their original cost. Current performance may be higher or lower than the performance data shown. For up-to-date month-end performance information please call 1-800-480-4111.
Returns for Class A, Class C and Class R5 Shares prior to their inception dates are based on the performance of Select Class Shares. The actual returns for Class A and Class C Shares would have been lower than those shown because Class A and Class C Shares have higher expenses than Select Class Shares. The actual returns for Class R5 Shares would have been different than those shown because Class R5 Shares have different expenses than Select Class Shares.
Returns for Class R2 Shares prior to their inception date are based on the performance of Class A Shares from February 19, 2005 to November 2, 2008 and the performance of Select Class Shares prior to February 19, 2005. During these periods, the actual returns for Class R2 Shares would have been lower than those shown because Class R2 Shares have higher expenses than Class A and Select Class Shares.
Returns for Class R6 Shares prior to their inception date are based on the performance of Class R5 Shares from May 15, 2006 to November 29, 2010 and the performance of Select Class Shares prior to May 15, 2006. During these periods, the actual returns for Class R6 Shares would have been different than those shown because Class R6 Shares have different expenses than Class R5 and Select Class Shares.
The graph illustrates comparative performance for $1,000,000 invested in Select Class Shares of the JPMorgan Intrepid Value Fund, the Russell 1000
Value Index and the Lipper Large-Cap Value Funds Index from December 31, 2004 to December 31, 2014. The performance of the Fund assumes reinvestment of all dividends and capital gain distributions, if any, and does not include a sales charge. The performance of the Russell 1000 Value Index does not reflect the deduction of expenses or a sales charge associated with a mutual fund and has been adjusted to reflect reinvestment of all dividends and capital gain distributions of the securities included in the benchmark, if applicable. The performance of the Lipper Large-Cap Value Funds Index includes expenses associated with a mutual fund, such as investment management fees. These expenses are not identical to the expenses incurred by the Fund. The Russell 1000 Value Index is an unmanaged index which measures the performance of those Russell 1000 companies with lower price-to-book ratios and lower forecasted growth values. The Lipper Large-Cap Value Funds Index is an index based on the total returns of certain mutual funds within the Fund’s designated category as determined by Lipper, Inc. Investors cannot invest directly in an index.
Select Class Shares have a $1,000,000 minimum initial investment.
Fund performance may reflect the waiver of the Fund’s fees and reimbursement of expenses for certain periods since the inception date. Without these waivers and reimbursements, performance would have been lower. Also, performance shown in this section does not reflect the deduction of taxes that a shareholder would pay on Fund distributions or redemption of Fund shares.
The returns shown are based on net asset values calculated for shareholder transactions and may differ from the returns shown in the financial highlights, which reflect adjustments made to the net asset values in accordance with accounting principles generally accepted in the United States of America.
| | | | | | | | |
| | | |
| DECEMBER 31, 2014 | | J.P. MORGAN INTREPID FUNDS | | | | | 13 | |
JPMorgan Intrepid Advantage Fund
SCHEDULE OF PORTFOLIO INVESTMENTS
AS OF DECEMBER 31, 2014 (Unaudited)
(Amounts in thousands)
| | | | | | | | |
| SHARES | | | SECURITY DESCRIPTION | | VALUE($) | |
| | | | | | | | |
| Common Stocks — 96.5% | |
| | | | Consumer Discretionary — 13.3% | | | | |
| | | | Auto Components — 1.2% | |
| | 4 | | | Delphi Automotive plc, (United Kingdom) | | | 269 | |
| | | | | | | | |
| | | | Hotels, Restaurants & Leisure — 1.1% | |
| | 6 | | | Hilton Worldwide Holdings, Inc. (a) | | | 162 | |
| | 1 | | | Wynn Resorts Ltd. | | | 93 | |
| | | | | | | | |
| | | | | | | 255 | |
| | | | | | | | |
| | | | Household Durables — 0.6% | |
| | 2 | | | Garmin Ltd., (Switzerland) | | | 129 | |
| | | | | | | | |
| | | | Internet & Catalog Retail — 1.6% | |
| | — | (h) | | Priceline Group, Inc. (The) (a) | | | 177 | |
| | 2 | | | TripAdvisor, Inc. (a) | | | 183 | |
| | | | | | | | |
| | | | | | | 360 | |
| | | | | | | | |
| | | | Media — 3.5% | |
| | 1 | | | Comcast Corp., Class A | | | 81 | |
| | 4 | | | Starz, Series A (a) | | | 118 | |
| | 5 | | | Time Warner, Inc. | | | 468 | |
| | 2 | | | Viacom, Inc., Class B | | | 117 | |
| | | | | | | | |
| | | | | | | 784 | |
| | | | | | | | |
| | | | Multiline Retail — 0.7% | |
| | 3 | | | Kohl’s Corp. | | | 169 | |
| | | | | | | | |
| | | | Specialty Retail — 4.0% | |
| | 9 | | | Best Buy Co., Inc. | | | 340 | |
| | 4 | | | Home Depot, Inc. (The) | | | 399 | |
| | 2 | | | Lowe’s Cos., Inc. | | | 165 | |
| | | | | | | | |
| | | | | | | 904 | |
| | | | | | | | |
| | | | Textiles, Apparel & Luxury Goods — 0.6% | |
| | 1 | | | Hanesbrands, Inc. | | | 137 | |
| | | | | | | | |
| | | | Total Consumer Discretionary | | | 3,007 | |
| | | | | | | | |
| | | | Consumer Staples — 9.0% | |
| | | | Beverages — 2.4% | |
| | 5 | | | Coca-Cola Co. (The) | | | 207 | |
| | 2 | | | Molson Coors Brewing Co., Class B | | | 145 | |
| | 2 | | | PepsiCo, Inc. | | | 196 | |
| | | | | | | | |
| | | | | | | 548 | |
| | | | | | | | |
| | | | Food & Staples Retailing — 1.0% | |
| | 3 | | | Walgreens Boots Alliance, Inc. | | | 217 | |
| | | | | | | | |
| | | | Food Products — 2.5% | |
| | 2 | | | Archer-Daniels-Midland Co. (m) | | | 103 | |
| | 3 | | | Ingredion, Inc. | | | 225 | |
| | 5 | | | Mondelez International, Inc., Class A | | | 165 | |
| | 2 | | | Tyson Foods, Inc., Class A | | | 77 | |
| | | | | | | | |
| | | | | | | 570 | |
| | | | | | | | |
| | | | | | | | |
| SHARES | | | SECURITY DESCRIPTION | | VALUE($) | |
| | | | | | | | |
| | | | | | | | |
| | | | Household Products — 1.2% | |
| | 2 | | | Energizer Holdings, Inc. | | | 270 | |
| | | | | | | | |
| | | | Tobacco — 1.9% | |
| | 3 | | | Lorillard, Inc. | | | 212 | |
| | 3 | | | Philip Morris International, Inc. | | | 204 | |
| | | | | | | | |
| | | | | | | 416 | |
| | | | | | | | |
| | | | Total Consumer Staples | | | 2,021 | |
| | | | | | | | |
| | | | Energy — 6.8% | |
| | | | Oil, Gas & Consumable Fuels — 6.8% | |
| | 1 | | | Anadarko Petroleum Corp. | | | 83 | |
| | 4 | | | Chevron Corp. | | | 460 | |
| | 5 | | | ConocoPhillips | | | 335 | |
| | 1 | | | Devon Energy Corp. | | | 80 | |
| | 4 | | | Exxon Mobil Corp. | | | 381 | |
| | 1 | | | Marathon Petroleum Corp. | | | 83 | |
| | 2 | | | Phillips 66 | | | 117 | |
| | | | | | | | |
| | | | Total Energy | | | 1,539 | |
| | | | | | | | |
| | | | Financials — 14.9% | |
| | | | Banks — 6.8% | |
| | 17 | | | Bank of America Corp. | | | 297 | |
| | 6 | | | Citigroup, Inc. | | | 328 | |
| | 4 | | | Fifth Third Bancorp | | | 90 | |
| | 11 | | | KeyCorp | | | 146 | |
| | 4 | | | SunTrust Banks, Inc. | | | 178 | |
| | 9 | | | Wells Fargo & Co. | | | 499 | |
| | | | | | | | |
| | | | | | | 1,538 | |
| | | | | | | | |
| | | | Capital Markets — 1.1% | |
| | 1 | | | Ameriprise Financial, Inc. | | | 73 | |
| | 5 | | | Morgan Stanley | | | 186 | |
| | | | | | | | |
| | | | | | | 259 | |
| | | | | | | | |
| | | | Consumer Finance — 2.2% | |
| | 3 | | | Capital One Financial Corp. | | | 245 | |
| | 4 | | | Discover Financial Services | | | 259 | |
| | | | | | | | |
| | | | | | | 504 | |
| | | | | | | | |
| | | | Insurance — 3.1% | |
| | 2 | | | American International Group, Inc. (m) | | | 125 | |
| | 5 | | | CNO Financial Group, Inc. | | | 89 | |
| | 5 | | | Hartford Financial Services Group, Inc. (The) | | | 225 | |
| | 3 | | | Prudential Financial, Inc. | | | 251 | |
| | | | | | | | |
| | | | | | | 690 | |
| | | | | | | | |
| | | | Real Estate Investment Trusts (REITs) — 1.2% | |
| | 8 | | | RLJ Lodging Trust (m) | | | 264 | |
| | | | | | | | |
SEE NOTES TO FINANCIAL STATEMENTS.
| | | | | | |
| | | |
| 14 | | | | J.P. MORGAN INTREPID FUNDS | | DECEMBER 31, 2014 |
| | | | | | | | |
| SHARES | | | SECURITY DESCRIPTION | | VALUE($) | |
| | | | | | | | |
| Common Stocks — continued | |
| | | | Real Estate Management & Development — 0.5% | |
| | 3 | | | CBRE Group, Inc., Class A (a) | | | 102 | |
| | | | | | | | |
| | | | Total Financials | | | 3,357 | |
| | | | | | | | |
| | | | Health Care — 16.6% | | | | |
| | | | Biotechnology — 3.3% | | | | |
| | 2 | | | Amgen, Inc. | | | 251 | |
| | 4 | | | Gilead Sciences, Inc. (a) | | | 374 | |
| | 1 | | | Vertex Pharmaceuticals, Inc. (a) | | | 116 | |
| | | | | | | | |
| | | | | | | 741 | |
| | | | | | | | |
| | | | Health Care Equipment & Supplies — 4.7% | | | | |
| | 1 | | | Becton, Dickinson and Co. | | | 111 | |
| | 15 | | | Boston Scientific Corp. (a) | | | 193 | |
| | 3 | | | CareFusion Corp. (a) | | | 191 | |
| | 2 | | | Covidien plc, (Ireland) | | | 179 | |
| | 2 | | | Medtronic, Inc. | | | 172 | |
| | 2 | | | Stryker Corp. | | | 224 | |
| | | | | | | | |
| | | | | | | 1,070 | |
| | | | | | | | |
| | | | Health Care Providers & Services — 5.2% | | | | |
| | 2 | | | Anthem, Inc. | | | 257 | |
| | 2 | | | Cardinal Health, Inc. | | | 194 | |
| | 3 | | | Cigna Corp. | | | 355 | |
| | 1 | | | Humana, Inc. | | | 104 | |
| | 1 | | | McKesson Corp. | | | 268 | |
| | | | | | | | |
| | | | | | | 1,178 | |
| | | | | | | | |
| | | | Life Sciences Tools & Services — 0.6% | | | | |
| | 2 | | | Quintiles Transnational Holdings, Inc. (a) | | | 130 | |
| | | | | | | | |
| | | | Pharmaceuticals — 2.8% | | | | |
| | 2 | | | Bristol-Myers Squibb Co. | | | 125 | |
| | 4 | | | Merck & Co., Inc. | | | 206 | |
| | 10 | | | Pfizer, Inc. | | | 302 | |
| | | | | | | | |
| | | | | | | 633 | |
| | | | | | | | |
| | | | Total Health Care | | | 3,752 | |
| | | | | | | | |
| | | | Industrials — 8.6% | | | | |
| | | | Aerospace & Defense — 3.2% | | | | |
| | 2 | | | General Dynamics Corp. | | | 210 | |
| | 1 | | | Honeywell International, Inc. (m) | | | 77 | |
| | 3 | | | Northrop Grumman Corp. | | | 424 | |
| | | | | | | | |
| | | | | | | 711 | |
| | | | | | | | |
| | | | Airlines — 1.7% | | | | |
| | 2 | | | Delta Air Lines, Inc. | | | 110 | |
| | 5 | | | Southwest Airlines Co. | | | 204 | |
| | 1 | | | United Continental Holdings, Inc. (a) | | | 80 | |
| | | | | | | | |
| | | | | | | 394 | |
| | | | | | | | |
| | | | | | | | |
| SHARES | | | SECURITY DESCRIPTION | | VALUE($) | |
| | | | | | | | |
| | |
| | | | Construction & Engineering — 1.1% | | | | |
| | 6 | | | AECOM Technology Corp. (a) | | | 180 | |
| | 1 | | | Fluor Corp. | | | 64 | |
| | | | | | | | |
| | | | | | | 244 | |
| | | | | | | | |
| | | | Machinery — 2.6% | | | | |
| | 3 | | | Allison Transmission Holdings, Inc. | | | 95 | |
| | 1 | | | Caterpillar, Inc. | | | 87 | |
| | 3 | | | Ingersoll-Rand plc | | | 187 | |
| | 2 | | | Parker-Hannifin Corp. | | | 216 | |
| | | | | | | | |
| | | | | | | 585 | |
| | | | | | | | |
| | | | Total Industrials | | | 1,934 | |
| | | | | | | | |
| | | | Information Technology — 22.4% | | | | |
| | | | Communications Equipment — 3.0% | | | | |
| | 14 | | | Cisco Systems, Inc. | | | 388 | |
| | 1 | | | Harris Corp. | | | 72 | |
| | 3 | | | QUALCOMM, Inc. | | | 229 | |
| | | | | | | | |
| | | | | | | 689 | |
| | | | | | | | |
| | | | Internet Software & Services — 3.2% | | | | |
| | — | (h) | | Google, Inc., Class A (a) | | | 182 | |
| | — | (h) | | Google, Inc., Class C (a) | | | 206 | |
| | 7 | | | Yahoo!, Inc. (a) | | | 332 | |
| | | | | | | | |
| | | | | | | 720 | |
| | | | | | | | |
| | | | IT Services — 0.6% | | | | |
| | 2 | | | MasterCard, Inc., Class A | | | 129 | |
| | | | | | | | |
| | | | Semiconductors & Semiconductor Equipment — 2.4% | |
| | 5 | | | Broadcom Corp., Class A | | | 236 | |
| | 3 | | | KLA-Tencor Corp. | | | 183 | |
| | 2 | | | Lam Research Corp. | | | 133 | |
| | | | | | | | |
| | | | | | | 552 | |
| | | | | | | | |
| | | | Software — 5.8% | | | | |
| | 18 | | | Microsoft Corp. | | | 851 | |
| | 5 | | | Oracle Corp. | | | 242 | |
| | 5 | | | Rovi Corp. (a) | | | 118 | |
| | 4 | | | Symantec Corp. | | | 105 | |
| | | | | | | | |
| | | | | | | 1,316 | |
| | | | | | | | |
| | | | Technology Hardware, Storage & Peripherals — 7.4% | |
| | 10 | | | Apple, Inc. (m) | | | 1,092 | |
| | 11 | | | Hewlett-Packard Co. | | | 421 | |
| | 2 | | | SanDisk Corp. | | | 147 | |
| | | | | | | | |
| | | | | | | 1,660 | |
| | | | | | | | |
| | | | Total Information Technology | | | 5,066 | |
| | | | | | | | |
SEE NOTES TO FINANCIAL STATEMENTS.
| | | | | | | | |
| | | |
| DECEMBER 31, 2014 | | J.P. MORGAN INTREPID FUNDS | | | | | 15 | |
JPMorgan Intrepid Advantage Fund
SCHEDULE OF PORTFOLIO INVESTMENTS
AS OF DECEMBER 31, 2014 (Unaudited) (continued)
(Amounts in thousands)
| | | | | | | | |
| SHARES | | | SECURITY DESCRIPTION | | VALUE($) | |
| | | | | | | | |
| Common Stocks — continued | |
| | | | Materials — 1.3% | | | | |
| | | | Chemicals — 0.4% | | | | |
| | 2 | | | Dow Chemical Co. (The) | | | 104 | |
| | | | | | | | |
| | | | Containers & Packaging — 0.6% | |
| | 3 | | | Crown Holdings, Inc. (a) | | | 132 | |
| | | | | | | | |
| | | | Metals & Mining — 0.3% | |
| | 3 | | | United States Steel Corp. | | | 68 | |
| | | | | | | | |
| | | | Total Materials | | | 304 | |
| | | | | | | | |
| | | | Telecommunication Services — 2.1% | |
| | | | Diversified Telecommunication Services — 2.1% | |
| | 6 | | | AT&T, Inc. | | | 218 | |
| | 6 | | | CenturyLink, Inc. | | | 256 | |
| | | | | | | | |
| | | | Total Telecommunication Services | | | 474 | |
| | | | | | | | |
| | | | Utilities — 1.5% | |
| | | | Gas Utilities — 0.9% | |
| | 5 | | | UGI Corp. | | | 196 | |
| | | | | | | | |
| | | | Independent Power & Renewable Electricity Producers — 0.6% | |
| | 10 | | | AES Corp. | | | 132 | |
| | | | | | | | |
| | | | Total Utilities | | | 328 | |
| | | | | | | | |
| | | | Total Common Stocks
(Cost $16,576) | | | 21,782 | |
| | | | | | | | |
| Short-Term Investment — 3.0% | |
| | | | Investment Company — 3.0% | |
| | 681 | | | JPMorgan Prime Money Market Fund, Institutional Class Shares,
0.020% (b) (l) (m)
(Cost $681) | | | 681 | |
| | | | | | | | |
| | | | Total Investments — 99.5%
(Cost $17,257) | | | 22,463 | |
| | | | Other Assets in Excess of
Liabilities — 0.5% | | | 123 | |
| | | | | | | | |
| | | | NET ASSETS — 100.0% | | $ | 22,586 | |
| | | | | | | | |
Percentages indicated are based on net assets.
SEE NOTES TO FINANCIAL STATEMENTS.
| | | | | | |
| | | |
| 16 | | | | J.P. MORGAN INTREPID FUNDS | | DECEMBER 31, 2014 |
JPMorgan Intrepid America Fund
SCHEDULE OF PORTFOLIO INVESTMENTS
AS OF DECEMBER 31, 2014 (Unaudited)
(Amounts in thousands)
| | | | | | | | |
| SHARES | | | SECURITY DESCRIPTION | | VALUE($) | |
| | | | | | | | |
| Common Stocks — 97.0% | |
| | | | Consumer Discretionary — 11.8% | |
| | | | Auto Components — 0.7% | |
| | 342 | | | Delphi Automotive plc, (United Kingdom) | | | 24,848 | |
| | | | | | | | |
| | | | Diversified Consumer Services — 1.7% | |
| | 768 | | | Apollo Education Group, Inc. (a) | | | 26,210 | |
| | 21 | | | Graham Holdings Co., Class B | | | 18,311 | |
| | 415 | | | H&R Block, Inc. | | | 13,987 | |
| | | | | | | | |
| | | | | | | 58,508 | |
| | | | | | | | |
| | | | Hotels, Restaurants & Leisure — 0.5% | |
| | 426 | | | Restaurant Brands International, Inc., (Canada) (a) | | | 16,639 | |
| | | | | | | | |
| | | | Household Durables — 0.8% | |
| | 341 | | | Jarden Corp. (a) | | | 16,345 | |
| | 488 | | | PulteGroup, Inc. | | | 10,468 | |
| | | | | | | | |
| | | | | | | 26,813 | |
| | | | | | | | |
| | | | Media — 3.1% | |
| | 172 | | | Time Warner Cable, Inc. | | | 26,109 | |
| | 941 | | | Time Warner, Inc. | | | 80,380 | |
| | | | | | | | |
| | | | | | | 106,489 | |
| | | | | | | | |
| | | | Multiline Retail — 2.0% | |
| | 627 | | | Big Lots, Inc. | | | 25,081 | |
| | 208 | | | Dillard’s, Inc., Class A | | | 26,062 | |
| | 80 | | | Kohl’s Corp. | | | 4,902 | |
| | 227 | | | Macy’s, Inc. | | | 14,938 | |
| | | | | | | | |
| | | | | | | 70,983 | |
| | | | | | | | |
| | | | Specialty Retail — 2.5% | |
| | 250 | | | Foot Locker, Inc. | | | 14,028 | |
| | 1,040 | | | Lowe’s Cos., Inc. | | | 71,545 | |
| | | | | | | | |
| | | | | | | 85,573 | |
| | | | | | | | |
| | | | Textiles, Apparel & Luxury Goods — 0.5% | |
| | 160 | | | Hanesbrands, Inc. | | | 17,848 | |
| | | | | | | | |
| | | | Total Consumer Discretionary | | | 407,701 | |
| | | | | | | | |
| | | | Consumer Staples — 9.1% | |
| | | | Beverages — 0.3% | |
| | 115 | | | Molson Coors Brewing Co., Class B | | | 8,600 | |
| | | | | | | | |
| | | | Food & Staples Retailing — 2.3% | |
| | 159 | | | CVS Health Corp. | | | 15,323 | |
| | 997 | | | Kroger Co. (The) | | | 63,998 | |
| | | | | | | | |
| | | | | | | 79,321 | |
| | | | | | | | |
| | | | Food Products — 4.4% | |
| | 1,415 | | | Archer-Daniels-Midland Co. | | | 73,575 | |
| | 280 | | | Bunge Ltd. | | | 25,455 | |
| | | | | | | | |
| SHARES | | | SECURITY DESCRIPTION | | VALUE($) | |
| | | | | | | | |
| | | | | | | | |
| | | | Food Products — continued | |
| | 283 | | | Ingredion, Inc. | | | 24,001 | |
| | 880 | | | Pilgrim’s Pride Corp. (a) | | | 28,852 | |
| | | | | | | | |
| | | | | | | 151,883 | |
| | | | | | | | |
| | | | Household Products — 0.9% | |
| | 202 | | | Energizer Holdings, Inc. | | | 25,956 | |
| | 55 | | | Spectrum Brands Holdings, Inc. | | | 5,224 | |
| | | | | | | | |
| | | | | | | 31,180 | |
| | | | | | | | |
| | | | Personal Products — 0.5% | |
| | 1,013 | | | Avon Products, Inc. | | | 9,511 | |
| | 247 | | | Herbalife Ltd. (a) | | | 9,301 | |
| | | | | | | | |
| | | | | | | 18,812 | |
| | | | | | | | |
| | | | Tobacco — 0.7% | |
| | 409 | | | Lorillard, Inc. | | | 25,717 | |
| | | | | | | | |
| | | | Total Consumer Staples | | | 315,513 | |
| | | | | | | | |
| | | | Energy — 7.8% | |
| | | | Energy Equipment & Services — 3.5% | |
| | 350 | | | Baker Hughes, Inc. | | | 19,641 | |
| | 567 | | | Halliburton Co. | | | 22,292 | |
| | 1,081 | | | National Oilwell Varco, Inc. | | | 70,812 | |
| | 107 | | | Schlumberger Ltd. | | | 9,131 | |
| | | | | | | | |
| | | | | | | 121,876 | |
| | | | | | | | |
| | | | Oil, Gas & Consumable Fuels — 4.3% | |
| | 965 | | | ConocoPhillips | | | 66,671 | |
| | 252 | | | Marathon Petroleum Corp. | | | 22,736 | |
| | 181 | | | Tesoro Corp. | | | 13,472 | |
| | 917 | | | Valero Energy Corp. | | | 45,367 | |
| | | | | | | | |
| | | | | | | 148,246 | |
| | | | | | | | |
| | | | Total Energy | | | 270,122 | |
| | | | | | | | |
| | | | Financials — 14.4% | |
| | | | Banks — 5.6% | |
| | 302 | | | Citigroup, Inc. | | | 16,341 | |
| | 1,061 | | | Fifth Third Bancorp | | | 21,618 | |
| | 385 | | | KeyCorp | | | 5,357 | |
| | 398 | | | PNC Financial Services Group, Inc. (The) | | | 36,346 | |
| | 2,097 | | | Wells Fargo & Co. | | | 114,982 | |
| | | | | | | | |
| | | | | | | 194,644 | |
| | | | | | | | |
| | | | Capital Markets — 0.9% | |
| | 222 | | | Ameriprise Financial, Inc. | | | 29,412 | |
| | | | | | | | |
| | | | Consumer Finance — 1.9% | |
| | 986 | | | Discover Financial Services | | | 64,540 | |
| | | | | | | | |
SEE NOTES TO FINANCIAL STATEMENTS.
| | | | | | | | |
| | | |
| DECEMBER 31, 2014 | | J.P. MORGAN INTREPID FUNDS | | | | | 17 | |
JPMorgan Intrepid America Fund
SCHEDULE OF PORTFOLIO INVESTMENTS
AS OF DECEMBER 31, 2014 (Unaudited) (continued)
(Amounts in thousands, except number of Futures contracts)
| | | | | | | | |
| SHARES | | | SECURITY DESCRIPTION | | VALUE($) | |
| | | | | | | | |
| Common Stocks — continued | |
| | | | Insurance — 3.6% | |
| | 179 | | | Allstate Corp. (The) | | | 12,589 | |
| | 189 | | | Aspen Insurance Holdings Ltd., (Bermuda) | | | 8,268 | |
| | 646 | | | CNO Financial Group, Inc. | | | 11,131 | |
| | 153 | | | Everest Re Group Ltd., (Bermuda) | | | 26,056 | |
| | 260 | | | Lincoln National Corp. | | | 15,006 | |
| | 196 | | | PartnerRe Ltd., (Bermuda) | | | 22,358 | |
| | 63 | | | Prudential Financial, Inc. | | | 5,654 | |
| | 231 | | | Travelers Cos., Inc. (The) | | | 24,398 | |
| | | | | | | | |
| | | | | | | 125,460 | |
| | | | | | | | |
| | | | Real Estate Investment Trusts (REITs) — 2.3% | |
| | 921 | | | American Capital Agency Corp. | | | 20,099 | |
| | 243 | | | American Tower Corp. | | | 23,971 | |
| | 408 | | | Annaly Capital Management, Inc. | | | 4,407 | |
| | 19 | | | Hospitality Properties Trust | | | 592 | |
| | 432 | | | RLJ Lodging Trust | | | 14,472 | |
| | 143 | | | Vornado Realty Trust | | | 16,797 | |
| | | | | | | | |
| | | | | | | 80,338 | |
| | | | | | | | |
| | | | Real Estate Management & Development — 0.1% | |
| | 142 | | | CBRE Group, Inc., Class A (a) | | | 4,874 | |
| | | | | | | | |
| | | | Total Financials | | | 499,268 | |
| | | | | | | | |
| | | | Health Care — 14.3% | |
| | | | Biotechnology — 3.4% | |
| | 448 | | | Amgen, Inc. | | | 71,362 | |
| | 236 | | | Gilead Sciences, Inc. (a) | | | 22,198 | |
| | 220 | | | Vertex Pharmaceuticals, Inc. (a) | | | 26,077 | |
| | | | | | | | |
| | | | | | | 119,637 | |
| | | | | | | | |
| | | | Health Care Equipment & Supplies — 2.4% | |
| | 991 | | | Medtronic, Inc. | | | 71,558 | |
| | 114 | | | Stryker Corp. | | | 10,725 | |
| | | | | | | | |
| | | | | | | 82,283 | |
| | | | | | | | |
| | | | Health Care Providers & Services — 5.5% | |
| | 271 | | | Aetna, Inc. | | | 24,064 | |
| | 573 | | | Anthem, Inc. | | | 71,946 | |
| | 525 | | | Health Net, Inc. (a) | | | 28,124 | |
| | 208 | | | LifePoint Hospitals, Inc. (a) | | | 14,950 | |
| | 241 | | | McKesson Corp. | | | 49,944 | |
| | | | | | | | |
| | | | | | | 189,028 | |
| | | | | | | | |
| | | | Pharmaceuticals — 3.0% | |
| | 253 | | | Merck & Co., Inc. | | | 14,339 | |
| | 2,873 | | | Pfizer, Inc. | | | 89,502 | |
| | | | | | | | |
| | | | | | | 103,841 | |
| | | | | | | | |
| | | | Total Health Care | | | 494,789 | |
| | | | | | | | |
| | | | | | | | |
| SHARES | | | SECURITY DESCRIPTION | | VALUE($) | |
| | | | | | | | |
| | | | | | | | |
| | | | Industrials — 10.7% | |
| | | | Aerospace & Defense — 4.3% | |
| | 192 | | | General Dynamics Corp. | | | 26,464 | |
| | 158 | | | Honeywell International, Inc. | | | 15,747 | |
| | 99 | | | Huntington Ingalls Industries, Inc. | | | 11,134 | |
| | 488 | | | Northrop Grumman Corp. | | | 71,941 | |
| | 220 | | | Raytheon Co. | | | 23,776 | |
| | | | | | | | |
| | | | | | | 149,062 | |
| | | | | | | | |
| | | | Airlines — 2.5% | |
| | 162 | | | Alaska Air Group, Inc. | | | 9,675 | |
| | 1,032 | | | Delta Air Lines, Inc. | | | 50,774 | |
| | 639 | | | Southwest Airlines Co. | | | 27,047 | |
| | | | | | | | |
| | | | | | | 87,496 | |
| | | | | | | | |
| | | | Commercial Services & Supplies — 0.7% | |
| | 1,020 | | | Pitney Bowes, Inc. | | | 24,845 | |
| | | | | | | | |
| | | | Construction & Engineering — 0.4% | |
| | 456 | | | AECOM Technology Corp. (a) | | | 13,846 | |
| | | | | | | | |
| | | | Machinery — 2.8% | |
| | 161 | | | Allison Transmission Holdings, Inc. | | | 5,457 | |
| | 154 | | | IDEX Corp. | | | 11,964 | |
| | 651 | | | Illinois Tool Works, Inc. | | | 61,669 | |
| | 80 | | | Parker-Hannifin Corp. | | | 10,264 | |
| | 77 | | | SPX Corp. | | | 6,607 | |
| | | | | | | | |
| | | | | | | 95,961 | |
| | | | | | | | |
| | | | Total Industrials | | | 371,210 | |
| | | | | | | | |
| | | | Information Technology — 20.4% | |
| | | | Communications Equipment — 0.7% | |
| | 1,909 | | | Brocade Communications Systems, Inc. | | | 22,603 | |
| | | | | | | | |
| | | | Internet Software & Services — 1.3% | |
| | 420 | | | VeriSign, Inc. (a) | | | 23,923 | |
| | 436 | | | Yahoo!, Inc. (a) | | | 22,042 | |
| | | | | | | | |
| | | | | | | 45,965 | |
| | | | | | | | |
| | | | IT Services — 2.5% | |
| | 257 | | | Amdocs Ltd. | | | 11,967 | |
| | 63 | | | Computer Sciences Corp. | | | 3,994 | |
| | 109 | | | MasterCard, Inc., Class A | | | 9,417 | |
| | 239 | | | Visa, Inc., Class A | | | 62,535 | |
| | | | | | | | |
| | | | | | | 87,913 | |
| | | | | | | | |
| | | | Semiconductors & Semiconductor Equipment — 2.0% | |
| | 437 | | | Broadcom Corp., Class A | | | 18,940 | |
| | 329 | | | KLA-Tencor Corp. | | | 23,107 | |
| | 273 | | | Lam Research Corp. | | | 21,636 | |
| | 318 | | | NVIDIA Corp. | | | 6,368 | |
| | | | | | | | |
| | | | | | | 70,051 | |
| | | | | | | | |
SEE NOTES TO FINANCIAL STATEMENTS.
| | | | | | |
| | | |
| 18 | | | | J.P. MORGAN INTREPID FUNDS | | DECEMBER 31, 2014 |
| | | | | | | | |
| SHARES | | | SECURITY DESCRIPTION | | VALUE($) | |
| | | | | | | | |
| Common Stocks — continued | |
| | | | Software — 7.3% | |
| | 1,139 | | | Activision Blizzard, Inc. | | | 22,957 | |
| | 32 | | | Citrix Systems, Inc. (a) | | | 2,048 | |
| | 404 | | | Electronic Arts, Inc. (a) | | | 18,971 | |
| | 165 | | | Intuit, Inc. | | | 15,174 | |
| | 2,381 | | | Microsoft Corp. | | | 110,611 | |
| | 1,687 | | | Oracle Corp. | | | 75,882 | |
| | 329 | | | Rovi Corp. (a) | | | 7,428 | |
| | | | | | | | |
| | | | | | | 253,071 | |
| | | | | | | | |
| | | | Technology Hardware, Storage & Peripherals — 6.6% | |
| | 1,088 | | | Apple, Inc. | | | 120,038 | |
| | 2,146 | | | Hewlett-Packard Co. | | | 86,099 | |
| | 236 | | | SanDisk Corp. | | | 23,094 | |
| | | | | | | | |
| | | | | | | 229,231 | |
| | | | | | | | |
| | | | Total Information Technology | | | 708,834 | |
| | | | | | | | |
| | | | Materials — 3.0% | |
| | | | Chemicals — 1.9% | |
| | 342 | | | LyondellBasell Industries N.V., Class A | | | 27,119 | |
| | 172 | | | PPG Industries, Inc. | | | 39,790 | |
| | | | | | | | |
| | | | | | | 66,909 | |
| | | | | | | | |
| | | | Containers & Packaging — 0.9% | |
| | 694 | | | Sealed Air Corp. | | | 29,459 | |
| | | | | | | | |
| | | | Metals & Mining — 0.2% | |
| | 259 | | | United States Steel Corp. | | | 6,926 | |
| | | | | | | | |
| | | | Total Materials | | | 103,294 | |
| | | | | | | | |
| | | | Telecommunication Services — 2.4% | |
| | | | Diversified Telecommunication Services — 2.4% | |
| | 819 | | | AT&T, Inc. | | | 27,510 | |
| | 589 | | | CenturyLink, Inc. | | | 23,294 | |
| | | | | | | | |
| SHARES | | | SECURITY DESCRIPTION | | VALUE($) | |
| | | | | | | | |
| | | | Diversified Telecommunication Services — continued | |
| | 1,604 | | | Frontier Communications Corp. | | | 10,697 | |
| | 504 | | | Verizon Communications, Inc. | | | 23,568 | |
| | | | | | | | |
| | | | Total Telecommunication Services | | | 85,069 | |
| | | | | | | | |
| | | | Utilities — 3.1% | |
| | | | Electric Utilities — 0.8% | |
| | 330 | | | Entergy Corp. | | | 28,886 | |
| | | | | | | | |
| | | | Gas Utilities — 0.8% | |
| | 681 | | | UGI Corp. | | | 25,872 | |
| | | | | | | | |
| | | | Independent Power & Renewable Electricity Producers — 1.2% | |
| | 608 | | | AES Corp. | | | 8,371 | |
| | 296 | | | Calpine Corp. (a) | | | 6,559 | |
| | 853 | | | Dynegy, Inc. (a) | | | 25,885 | |
| | | | | | | | |
| | | | | | | 40,815 | |
| | | | | | | | |
| | | | Multi-Utilities — 0.3% | |
| | 260 | | | Public Service Enterprise Group, Inc. | | | 10,750 | |
| | | | | | | | |
| | | | Total Utilities | | | 106,323 | |
| | | | | | | | |
| | | | Total Common Stocks
(Cost $2,544,318) | | | 3,362,123 | |
| | | | | | | | |
| Short-Term Investment — 3.0% | |
| | | | Investment Company — 3.0% | |
| | 104,962 | | | JPMorgan Prime Money Market Fund, Institutional Class Shares, 0.020% (b) (l) (Cost $104,962) | | | 104,962 | |
| | | | | | | | |
| | | | Total Investments — 100.0%
(Cost $2,649,280) | | | 3,467,085 | |
| | | | Liabilities in Excess of
Other Assets — 0.0% (c) (g) | | | (480 | ) |
| | | | | | | | |
| | | | NET ASSETS — 100.0% | | $ | 3,466,605 | |
| | | | | | | | |
Percentages indicated are based on net assets.
| | | | | | | | | | | | | | | | |
| Futures Contracts | |
NUMBER OF
CONTRACTS | | | DESCRIPTION | | EXPIRATION
DATE | | | NOTIONAL
VALUE AT
DECEMBER 31, 2014 | | | NET
UNREALIZED
APPRECIATION
(DEPRECIATION) | |
| | | | Long Futures Outstanding | |
| | 962 | | | E-mini S&P 500 | | | 03/20/15 | | | $ | 98,720 | | | $ | 1,491 | |
| | | | | | | | | | | | | | | | |
SEE NOTES TO FINANCIAL STATEMENTS.
| | | | | | | | |
| | | |
| DECEMBER 31, 2014 | | J.P. MORGAN INTREPID FUNDS | | | | | 19 | |
JPMorgan Intrepid Growth Fund
SCHEDULE OF PORTFOLIO INVESTMENTS
AS OF DECEMBER 31, 2014 (Unaudited)
(Amounts in thousands)
| | | | | | | | |
| SHARES | | | SECURITY DESCRIPTION | | VALUE($) | |
| | | | | | | | |
| Common Stocks — 96.1% | |
| | | | Consumer Discretionary — 17.3% | |
| | | | Auto Components — 0.5% | |
| | 68 | | | Delphi Automotive plc, (United Kingdom) | | | 4,909 | |
| | | | | | | | |
| | | | Diversified Consumer Services — 1.9% | |
| | 215 | | | Apollo Education Group, Inc. (a) | | | 7,347 | |
| | 8 | | | Graham Holdings Co., Class B | | | 6,910 | |
| | 100 | | | H&R Block, Inc. | | | 3,351 | |
| | | | | | | | |
| | | | | | | 17,608 | |
| | | | | | | | |
| | | | Hotels, Restaurants & Leisure — 1.2% | |
| | 5 | | | Chipotle Mexican Grill, Inc. (a) | | | 3,217 | |
| | 189 | | | Restaurant Brands International, Inc., (Canada) (a) | | | 7,398 | |
| | | | | | | | |
| | | | | | | 10,615 | |
| | | | | | | | |
| | | | Household Durables — 0.3% | |
| | 9 | | | Harman International Industries, Inc. | | | 982 | |
| | 32 | | | Tempur Sealy International, Inc. (a) | | | 1,768 | |
| | | | | | | | |
| | | | | | | 2,750 | |
| | | | | | | | |
| | | | Internet & Catalog Retail — 0.3% | |
| | 29 | | | Expedia, Inc. | | | 2,492 | |
| | | | | | | | |
| | | | Media — 4.4% | |
| | 115 | | | DIRECTV (a) | | | 9,936 | |
| | 69 | | | DISH Network Corp., Class A (a) | | | 5,030 | |
| | 56 | | | Starz, Series A (a) | | | 1,657 | |
| | 14 | | | Time Warner Cable, Inc. | | | 2,053 | |
| | 210 | | | Time Warner, Inc. | | | 17,921 | |
| | 45 | | | Viacom, Inc., Class B | | | 3,356 | |
| | | | | | | | |
| | | | | | | 39,953 | |
| | | | | | | | |
| | | | Multiline Retail — 2.5% | |
| | 171 | | | Big Lots, Inc. | | | 6,855 | |
| | 57 | | | Dillard’s, Inc., Class A | | | 7,085 | |
| | 28 | | | Kohl’s Corp. | | | 1,679 | |
| | 116 | | | Macy’s, Inc. | | | 7,653 | |
| | | | | | | | |
| | | | | | | 23,272 | |
| | | | | | | | |
| | | | Specialty Retail — 4.6% | |
| | 120 | | | Foot Locker, Inc. | | | 6,747 | |
| | 227 | | | Home Depot, Inc. (The) | | | 23,860 | |
| | 171 | | | Lowe’s Cos., Inc. | | | 11,737 | |
| | | | | | | | |
| | | | | | | 42,344 | |
| | | | | | | | |
| | | | Textiles, Apparel & Luxury Goods — 1.6% | |
| | 63 | | | Deckers Outdoor Corp. (a) | | | 5,772 | |
| | 67 | �� | | Hanesbrands, Inc. | | | 7,512 | |
| | 27 | | | Skechers U.S.A., Inc., Class A (a) | | | 1,486 | |
| | | | | | | | |
| | | | | | | 14,770 | |
| | | | | | | | |
| | | | Total Consumer Discretionary | | | 158,713 | |
| | | | | | | | |
| | | | | | | | |
| SHARES | | | SECURITY DESCRIPTION | | VALUE($) | |
| | | | | | | | |
| | | | | | | | |
| | | | Consumer Staples — 9.3% | |
| | | | Beverages — 1.5% | |
| | 109 | | | Coca-Cola Co. (The) | | | 4,602 | |
| | 99 | | | PepsiCo, Inc. | | | 9,390 | |
| | | | | | | | |
| | | | | | | 13,992 | |
| | | | | | | | |
| | | | Food & Staples Retailing — 1.6% | |
| | 232 | | | Kroger Co. (The) | | | 14,916 | |
| | | | | | | | |
| | | | Food Products — 4.1% | |
| | 359 | | | Archer-Daniels-Midland Co. | | | 18,647 | |
| | 50 | | | Bunge Ltd. | | | 4,509 | |
| | 86 | | | Ingredion, Inc. | | | 7,271 | |
| | 226 | | | Pilgrim’s Pride Corp. (a) | | | 7,424 | |
| | | | | | | | |
| | | | | | | 37,851 | |
| | | | | | | | |
| | | | Household Products — 0.5% | |
| | 35 | | | Energizer Holdings, Inc. | | | 4,461 | |
| | | | | | | | |
| | | | Personal Products — 0.4% | |
| | 102 | | | Herbalife Ltd. (a) | | | 3,849 | |
| | | | | | | | |
| | | | Tobacco — 1.2% | |
| | 169 | | | Altria Group, Inc. | | | 8,346 | |
| | 34 | | | Lorillard, Inc. | | | 2,159 | |
| | | | | | | | |
| | | | | | | 10,505 | |
| | | | | | | | |
| | | | Total Consumer Staples | | | 85,574 | |
| | | | | | | | |
| | | | Energy — 4.5% | |
| | | | Energy Equipment & Services — 2.8% | |
| | 103 | | | Baker Hughes, Inc. | | | 5,758 | |
| | 52 | | | Nabors Industries Ltd., (Bermuda) | | | 674 | |
| | 271 | | | National Oilwell Varco, Inc. | | | 17,739 | |
| | 16 | | | Schlumberger Ltd. | | | 1,375 | |
| | | | | | | | |
| | | | | | | 25,546 | |
| | | | | | | | |
| | | | Oil, Gas & Consumable Fuels — 1.7% | |
| | 39 | | | ConocoPhillips | | | 2,666 | |
| | 26 | | | Marathon Petroleum Corp. | | | 2,356 | |
| | 50 | | | Tesoro Corp. | | | 3,747 | |
| | 145 | | | Valero Energy Corp. | | | 7,162 | |
| | | | | | | | |
| | | | | | | 15,931 | |
| | | | | | | | |
| | | | Total Energy | | | 41,477 | |
| | | | | | | | |
| | | | Financials — 4.4% | |
| | | | Consumer Finance — 1.8% | |
| | 247 | | | Discover Financial Services | | | 16,143 | |
| | | | | | | | |
| | | | Diversified Financial Services — 0.8% | |
| | 73 | | | Moody’s Corp. | | | 6,985 | |
| | | | | | | | |
SEE NOTES TO FINANCIAL STATEMENTS.
| | | | | | |
| | | |
| 20 | | | | J.P. MORGAN INTREPID FUNDS | | DECEMBER 31, 2014 |
| | | | | | | | |
| SHARES | | | SECURITY DESCRIPTION | | VALUE($) | |
| | | | | | | | |
| Common Stocks — continued | |
| | | | Insurance — 0.2% | |
| | 12 | | | Assurant, Inc. | | | 842 | |
| | 28 | | | Validus Holdings Ltd., (Bermuda) | | | 1,176 | |
| | | | | | | | |
| | | | | | | 2,018 | |
| | | | | | | | |
| | | | Real Estate Investment Trusts (REITs) — 1.6% | |
| | 149 | | | American Tower Corp. | | | 14,758 | |
| | | | | | | | |
| | | | Total Financials | | | 39,904 | |
| | | | | | | | |
| | | | Health Care — 14.1% | |
| | | | Biotechnology — 7.0% | |
| | 154 | | | Amgen, Inc. | | | 24,451 | |
| | 293 | | | Gilead Sciences, Inc. (a) | | | 27,628 | |
| | 2 | | | Regeneron Pharmaceuticals, Inc. (a) | | | 861 | |
| | 17 | | | United Therapeutics Corp. (a) | | | 2,137 | |
| | 76 | | | Vertex Pharmaceuticals, Inc. (a) | | | 9,052 | |
| | | | | | | | |
| | | | | | | 64,129 | |
| | | | | | | | |
| | | | Health Care Equipment & Supplies — 1.2% | |
| | 24 | | | C.R. Bard, Inc. | | | 3,982 | |
| | 58 | | | Edwards Lifesciences Corp. (a) | | | 7,439 | |
| | | | | | | | |
| | | | | | | 11,421 | |
| | | | | | | | |
| | | | Health Care Providers & Services — 4.0% | |
| | 141 | | | Anthem, Inc. | | | 17,745 | |
| | 47 | | | Cardinal Health, Inc. | | | 3,802 | |
| | 75 | | | Express Scripts Holding Co. (a) | | | 6,333 | |
| | 124 | | | Health Net, Inc. (a) | | | 6,649 | |
| | 9 | | | McKesson Corp. | | | 1,806 | |
| | | | | | | | |
| | | | | | | 36,335 | |
| | | | | | | | |
| | | | Pharmaceuticals — 1.9% | |
| | 267 | | | AbbVie, Inc. | | | 17,473 | |
| | | | | | | | |
| | | | Total Health Care | | | 129,358 | |
| | | | | | | | |
| | | | Industrials — 11.2% | |
| | | | Aerospace & Defense — 3.8% | |
| | 111 | | | General Dynamics Corp. | | | 15,234 | |
| | 65 | | | Huntington Ingalls Industries, Inc. | | | 7,265 | |
| | 34 | | | Northrop Grumman Corp. | | | 4,982 | |
| | 36 | | | TransDigm Group, Inc. | | | 7,069 | |
| | | | | | | | |
| | | | | | | 34,550 | |
| | | | | | | | |
| | | | Air Freight & Logistics — 0.3% | |
| | 23 | | | United Parcel Service, Inc., Class B | | | 2,546 | |
| | | | | | | | |
| | | | Airlines — 3.4% | |
| | 72 | | | Alaska Air Group, Inc. | | | 4,326 | |
| | 338 | | | Delta Air Lines, Inc. | | | 16,636 | |
| | 250 | | | Southwest Airlines Co. | | | 10,576 | |
| | | | | | | | |
| | | | | | | 31,538 | |
| | | | | | | | |
| | | | | | | | |
| SHARES | | | SECURITY DESCRIPTION | | VALUE($) | |
| | | | | | | | |
| | | | | | | | |
| | | | Commercial Services & Supplies — 0.7% | |
| | 287 | | | Pitney Bowes, Inc. | | | 6,997 | |
| | | | | | | | |
| | | | Construction & Engineering — 0.2% | |
| | 57 | | | AECOM Technology Corp. (a) | | | 1,728 | |
| | | | | | | | |
| | | | Industrial Conglomerates — 0.2% | |
| | 24 | | | Danaher Corp. | | | 2,057 | |
| | | | | | | | |
| | | | Machinery — 2.1% | |
| | 207 | | | Allison Transmission Holdings, Inc. | | | 7,024 | |
| | 13 | | | Caterpillar, Inc. | | | 1,217 | |
| | 45 | | | IDEX Corp. | | | 3,495 | |
| | 14 | | | Illinois Tool Works, Inc. | | | 1,335 | |
| | 40 | | | Parker-Hannifin Corp. | | | 5,145 | |
| | 11 | | | SPX Corp. | | | 938 | |
| | | | | | | | |
| | | | | | | 19,154 | |
| | | | | | | | |
| | | | Trading Companies & Distributors — 0.5% | |
| | 152 | | | HD Supply Holdings, Inc. (a) | | | 4,480 | |
| | | | | | | | |
| | | | Total Industrials | | | 103,050 | |
| | | | | | | | |
| | | | Information Technology — 28.6% | |
| | | | Communications Equipment — 0.2% | |
| | 18 | | | QUALCOMM, Inc. | | | 1,360 | |
| | | | | | | | |
| | | | Internet Software & Services — 4.0% | |
| | 15 | | | Facebook, Inc., Class A (a) | | | 1,147 | |
| | 13 | | | Google, Inc., Class A (a) | | | 6,686 | |
| | 77 | | | IAC/InterActiveCorp | | | 4,669 | |
| | 122 | | | VeriSign, Inc. (a) | | | 6,943 | |
| | 334 | | | Yahoo!, Inc. (a) | | | 16,890 | |
| | | | | | | | |
| | | | | | | 36,335 | |
| | | | | | | | |
| | | | IT Services — 3.0% | |
| | 74 | | | Amdocs Ltd. | | | 3,452 | |
| | 86 | | | Booz Allen Hamilton Holding Corp. | | | 2,276 | |
| | 12 | | | Computer Sciences Corp. | | | 763 | |
| | 80 | | | Visa, Inc., Class A | | | 21,028 | |
| | | | | | | | |
| | | | | | | 27,519 | |
| | | | | | | | |
| | | | Semiconductors & Semiconductor Equipment — 2.3% | |
| | 179 | | | Broadcom Corp., Class A | | | 7,743 | |
| | 87 | | | Lam Research Corp. | | | 6,895 | |
| | 341 | | | NVIDIA Corp. | | | 6,835 | |
| | | | | | | | |
| | | | | | | 21,473 | |
| | | | | | | | |
| | | | Software — 10.6% | |
| | 364 | | | Activision Blizzard, Inc. | | | 7,326 | |
| | 72 | | | Citrix Systems, Inc. (a) | | | 4,562 | |
| | 162 | | | Electronic Arts, Inc. (a) | | | 7,621 | |
| | 828 | | | Microsoft Corp. | | | 38,440 | |
SEE NOTES TO FINANCIAL STATEMENTS.
| | | | | | | | |
| | | |
| DECEMBER 31, 2014 | | J.P. MORGAN INTREPID FUNDS | | | | | 21 | |
JPMorgan Intrepid Growth Fund
SCHEDULE OF PORTFOLIO INVESTMENTS
AS OF DECEMBER 31, 2014 (Unaudited) (continued)
(Amounts in thousands, except number of Futures contracts)
| | | | | | | | |
| SHARES | | | SECURITY DESCRIPTION | | VALUE($) | |
| | | | | | | | |
| Common Stocks — continued | |
| | | | Software — continued | |
| | 677 | | | Oracle Corp. | | | 30,458 | |
| | 75 | | | PTC, Inc. (a) | | | 2,760 | |
| | 74 | | | VMware, Inc., Class A (a) | | | 6,065 | |
| | | | | | | | |
| | | | | | | 97,232 | |
| | | | | | | | |
| | | | Technology Hardware, Storage & Peripherals — 8.5% | |
| | 509 | | | Apple, Inc. | | | 56,233 | |
| | 390 | | | Hewlett-Packard Co. | | | 15,639 | |
| | 65 | | | SanDisk Corp. | | | 6,349 | |
| | | | | | | | |
| | | | | | | 78,221 | |
| | | | | | | | |
| | | | Total Information Technology | | | 262,140 | |
| | | | | | | | |
| | | | Materials — 3.9% | |
| | | | Chemicals — 1.7% | |
| | 143 | | | LyondellBasell Industries N.V., Class A | | | 11,329 | |
| | 19 | | | PPG Industries, Inc. | | | 4,295 | |
| | | | | | | | |
| | | | | | | 15,624 | |
| | | | | | | | |
| | | | Containers & Packaging — 1.6% | |
| | 132 | | | Crown Holdings, Inc. (a) | | | 6,714 | |
| | 194 | | | Sealed Air Corp. | | | 8,223 | |
| | | | | | | | |
| | | | | | | 14,937 | |
| | | | | | | | |
| | | | Metals & Mining — 0.6% | |
| | 186 | | | United States Steel Corp. | | | 4,963 | |
| | | | | | | | |
| | | | Total Materials | | | 35,524 | |
| | | | | | | | |
| | | | | | | | |
| SHARES | | | SECURITY DESCRIPTION | | VALUE($) | |
| | | | | | | | |
| | | | Telecommunication Services — 2.3% | |
| | | | Diversified Telecommunication Services — 2.3% | |
| | 268 | | | AT&T, Inc. | | | 9,012 | |
| | 165 | | | CenturyLink, Inc. | | | 6,532 | |
| | 115 | | | Level 3 Communications, Inc. (a) | | | 5,654 | |
| | | | | | | | |
| | | | Total Telecommunication Services | | | 21,198 | |
| | | | | | | | |
| | | | Utilities — 0.5% | |
| | | | Independent Power & Renewable Electricity Producers — 0.5% | |
| | 142 | | | Dynegy, Inc. (a) | | | 4,304 | |
| | | | | | | | |
| | | | Total Common Stocks
(Cost $650,885) | | | 881,242 | |
| | | | | | | | |
| Short-Term Investment — 3.6% | |
| | | | Investment Company — 3.6% | |
| | 33,378 | | | JPMorgan Prime Money Market Fund, Institutional Class Shares, 0.020% (b) (l) (Cost $33,378) | | | 33,378 | |
| | | | | | | | |
| | | | Total Investments — 99.7%
(Cost $684,263) | | | 914,620 | |
| | | | Other Assets in Excess of
Liabilities — 0.3% (c) | | | 2,639 | |
| | | | | | | | |
| | | | NET ASSETS — 100.0% | | $ | 917,259 | |
| | | | | | | | |
Percentages indicated are based on net assets.
| | | | | | | | | | | | | | | | |
| Futures Contracts | |
NUMBER OF
CONTRACTS | | | DESCRIPTION | | EXPIRATION
DATE | | | NOTIONAL
VALUE AT
DECEMBER 31, 2014 | | | NET
UNREALIZED
APPRECIATION
(DEPRECIATION) | |
| | | | Long Futures Outstanding | |
| | 323 | | | E-mini S&P 500 | | | 03/20/15 | | | $ | 33,146 | | | $ | 448 | |
| | | | | | | | | | | | | | | | |
SEE NOTES TO FINANCIAL STATEMENTS.
| | | | | | |
| | | |
| 22 | | | | J.P. MORGAN INTREPID FUNDS | | DECEMBER 31, 2014 |
JPMorgan Intrepid Mid Cap Fund
SCHEDULE OF PORTFOLIO INVESTMENTS
AS OF DECEMBER 31, 2014 (Unaudited)
(Amounts in thousands)
| | | | | | | | |
| SHARES | | | SECURITY DESCRIPTION | | VALUE($) | |
| | | | | | | | |
| Common Stocks — 96.4% | |
| | | | Consumer Discretionary — 14.0% | |
| | | | Auto Components — 2.1% | |
| | 101 | | | Goodyear Tire & Rubber Co. (The) | | | 2,897 | |
| | 135 | | | Lear Corp. | | | 13,202 | |
| | | | | | | | |
| | | | | | | 16,099 | |
| | | | | | | | |
| | | | Diversified Consumer Services — 2.7% | |
| | 6 | | | Graham Holdings Co., Class B | | | 5,096 | |
| | 452 | | | H&R Block, Inc. | | | 15,233 | |
| | | | | | | | |
| | | | | | | 20,329 | |
| | | | | | | | |
| | | | Hotels, Restaurants & Leisure — 1.6% | |
| | 312 | | | Aramark | | | 9,716 | |
| | 22 | | | Brinker International, Inc. | | | 1,285 | |
| | 1 | | | Chipotle Mexican Grill, Inc. (a) | | | 342 | |
| | 9 | | | Domino’s Pizza, Inc. | | | 810 | |
| | | | | | | | |
| | | | | | | 12,153 | |
| | | | | | | | |
| | | | Household Durables — 0.4% | |
| | 69 | | | Jarden Corp. (a) | | | 3,294 | |
| | | | | | | | |
| | | | Internet & Catalog Retail — 1.1% | |
| | 277 | | | Groupon, Inc. (a) | | | 2,291 | |
| | 36 | | | Liberty TripAdvisor Holdings, Inc., Class A (a) | | | 966 | |
| | 124 | | | Liberty Ventures, Series A (a) | | | 4,689 | |
| | | | | | | | |
| | | | | | | 7,946 | |
| | | | | | | | |
| | | | Media — 0.2% | |
| | 88 | | | Cablevision Systems Corp., Class A | | | 1,812 | |
| | | | | | | | |
| | | | Multiline Retail — 1.2% | |
| | 142 | | | Macy’s, Inc. | | | 9,343 | |
| | | | | | | | |
| | | | Specialty Retail — 4.3% | |
| | 21 | | | Advance Auto Parts, Inc. | | | 3,265 | |
| | 284 | | | Best Buy Co., Inc. | | | 11,063 | |
| | 46 | | | CST Brands, Inc. | | | 2,006 | |
| | 209 | | | Foot Locker, Inc. | | | 11,758 | |
| | 29 | | | Gap, Inc. (The) | | | 1,200 | |
| | 19 | | | Murphy USA, Inc. (a) | | | 1,329 | |
| | 20 | | | PetSmart, Inc. | | | 1,602 | |
| | | | | | | | |
| | | | | | | 32,223 | |
| | | | | | | | |
| | | | Textiles, Apparel & Luxury Goods — 0.4% | |
| | 29 | | | Hanesbrands, Inc. | | | 3,215 | |
| | | | | | | | |
| | | | Total Consumer Discretionary | | | 106,414 | |
| | | | | | | | |
| | | | Consumer Staples — 8.3% | |
| | | | Food & Staples Retailing — 3.2% | |
| | 137 | | | Kroger Co. (The) | | | 8,765 | |
| | 1,565 | | | Rite Aid Corp. (a) | | | 11,770 | |
| | 112 | | | Safeway, Inc. | | | 3,926 | |
| | | | | | | | |
| | | | | | | 24,461 | |
| | | | | | | | |
| | | | | | | | |
| SHARES | | | SECURITY DESCRIPTION | | VALUE($) | |
| | | | | | | | |
| | | | | | | | |
| | | | Food Products — 3.7% | |
| | 169 | | | Bunge Ltd. | | | 15,364 | |
| | 81 | | | Ingredion, Inc. | | | 6,872 | |
| | 137 | | | Tyson Foods, Inc., Class A | | | 5,484 | |
| | | | | | | | |
| | | | | | | 27,720 | |
| | | | | | | | |
| | | | Personal Products — 0.1% | |
| | 27 | | | Herbalife Ltd. | | | 1,003 | |
| | | | | | | | |
| | | | Tobacco — 1.3% | |
| | 150 | | | Lorillard, Inc. | | | 9,441 | |
| | | | | | | | |
| | | | Total Consumer Staples | | | 62,625 | |
| | | | | | | | |
| | | | Energy — 4.6% | |
| | | | Energy Equipment & Services — 0.8% | |
| | 7 | | | Baker Hughes, Inc. | | | 415 | |
| | 40 | | | Cameron International Corp. (a) | | | 2,008 | |
| | 15 | | | National Oilwell Varco, Inc. | | | 984 | |
| | 45 | | | Oil States International, Inc. (a) | | | 2,203 | |
| | 31 | | | Patterson-UTI Energy, Inc. | | | 509 | |
| | | | | | | | |
| | | | | | | 6,119 | |
| | | | | | | | |
| | | | Oil, Gas & Consumable Fuels — 3.8% | |
| | 38 | | | Cabot Oil & Gas Corp. | | | 1,137 | |
| | 31 | | | Cimarex Energy Co. | | | 3,291 | |
| | 18 | | | Continental Resources, Inc. (a) | | | 690 | |
| | 114 | | | EQT Corp. | | | 8,600 | |
| | 16 | | | Marathon Petroleum Corp. | | | 1,444 | |
| | 48 | | | Murphy Oil Corp. | | | 2,410 | |
| | 34 | | | Newfield Exploration Co. (a) | | | 911 | |
| | 7 | | | Noble Energy, Inc. | | | 337 | |
| | 27 | | | Peabody Energy Corp. | | | 206 | |
| | 37 | | | Tesoro Corp. | | | 2,736 | |
| | 30 | | | Valero Energy Corp. | | | 1,485 | |
| | 109 | | | World Fuel Services Corp. | | | 5,129 | |
| | | | | | | | |
| | | | | | | 28,376 | |
| | | | | | | | |
| | | | Total Energy | | | 34,495 | |
| | | | | | | | |
| | | | Financials — 17.4% | |
| | | | Banks — 2.7% | |
| | 70 | | | East West Bancorp, Inc. | | | 2,725 | |
| | 135 | | | Fifth Third Bancorp | | | 2,749 | |
| | 85 | | | Huntington Bancshares, Inc. | | | 890 | |
| | 199 | | | KeyCorp | | | 2,772 | |
| | 72 | | | PacWest Bancorp | | | 3,268 | |
| | 29 | | | Popular, Inc., (Puerto Rico) (a) | | | 998 | |
| | 109 | | | Regions Financial Corp. | | | 1,152 | |
| | 12 | | | Signature Bank (a) | | | 1,461 | |
| | 40 | | | SVB Financial Group (a) | | | 4,631 | |
| | | | | | | | |
| | | | | | | 20,646 | |
| | | | | | | | |
SEE NOTES TO FINANCIAL STATEMENTS.
| | | | | | | | |
| | | |
| DECEMBER 31, 2014 | | J.P. MORGAN INTREPID FUNDS | | | | | 23 | |
JPMorgan Intrepid Mid Cap Fund
SCHEDULE OF PORTFOLIO INVESTMENTS
AS OF DECEMBER 31, 2014 (Unaudited) (continued)
(Amounts in thousands)
| | | | | | | | |
| SHARES | | | SECURITY DESCRIPTION | | VALUE($) | |
| | | | | | | | |
| Common Stocks — continued | |
| | | | Capital Markets — 0.9% | |
| | 17 | | | Affiliated Managers Group, Inc. (a) | | | 3,523 | |
| | 59 | | | Lazard Ltd., (Bermuda), Class A | | | 2,967 | |
| | | | | | | | |
| | | | | | | 6,490 | |
| | | | | | | | |
| | | | Consumer Finance — 1.6% | |
| | 167 | | | Discover Financial Services | | | 10,904 | |
| | 43 | | | Synchrony Financial (a) | | | 1,267 | |
| | | | | | | | |
| | | | | | | 12,171 | |
| | | | | | | | |
| | | | Insurance — 4.2% | |
| | 61 | | | Allied World Assurance Co. Holdings AG, (Switzerland) | | | 2,309 | |
| | 62 | | | American Financial Group, Inc. | | | 3,783 | |
| | 19 | | | Aon plc, (United Kingdom) | | | 1,821 | |
| | 23 | | | Arch Capital Group Ltd., (Bermuda) (a) | | | 1,368 | |
| | 7 | | | Aspen Insurance Holdings Ltd., (Bermuda) | | | 302 | |
| | 30 | | | Assurant, Inc. | | | 2,063 | |
| | 102 | | | Assured Guaranty Ltd., (Bermuda) | | | 2,656 | |
| | 15 | | | Axis Capital Holdings Ltd., (Bermuda) | | | 756 | |
| | 18 | | | Endurance Specialty Holdings Ltd., (Bermuda) | | | 1,071 | |
| | 7 | | | Everest Re Group Ltd., (Bermuda) | | | 1,175 | |
| | 12 | | | FNF Group | | | 418 | |
| | 19 | | | Hanover Insurance Group, Inc. (The) | | | 1,341 | |
| | 41 | | | Hartford Financial Services Group, Inc. (The) | | | 1,689 | |
| | 28 | | | Lincoln National Corp. | | | 1,603 | |
| | 37 | | | Principal Financial Group, Inc. | | | 1,927 | |
| | 36 | | | Protective Life Corp. | | | 2,494 | |
| | 19 | | | Torchmark Corp. | | | 1,020 | |
| | 86 | | | Unum Group | | | 2,982 | |
| | 29 | | | Validus Holdings Ltd., (Bermuda) | | | 1,189 | |
| | | | | | | | |
| | | | | | | 31,967 | |
| | | | | | | | |
| | | | Real Estate Investment Trusts (REITs) — 7.8% | |
| | 14 | | | American Capital Agency Corp. | | | 303 | |
| | 71 | | | Annaly Capital Management, Inc. | | | 762 | |
| | 68 | | | Apartment Investment & Management Co., Class A | | | 2,537 | |
| | 3 | | | AvalonBay Communities, Inc. | | | 425 | |
| | 8 | | | Boston Properties, Inc. | | | 1,004 | |
| | 66 | | | Brandywine Realty Trust | | | 1,051 | |
| | 12 | | | Camden Property Trust | | | 916 | |
| | 22 | | | Chimera Investment Corp. | | | 71 | |
| | 15 | | | Corrections Corp. of America | | | 549 | |
| | 18 | | | Crown Castle International Corp. | | | 1,377 | |
| | 44 | | | DDR Corp. | | | 813 | |
| | 38 | | | Douglas Emmett, Inc. | | | 1,082 | |
| | 252 | | | Duke Realty Corp. | | | 5,090 | |
| | | | | | | | |
| SHARES | | | SECURITY DESCRIPTION | | VALUE($) | |
| | | | | | | | |
| | | | | | | | |
| | | | Real Estate Investment Trusts (REITs) — continued | |
| | 40 | | | Equity Commonwealth | | | 1,026 | |
| | 42 | | | Equity LifeStyle Properties, Inc. | | | 2,150 | |
| | 18 | | | Equity Residential | | | 1,272 | |
| | 17 | | | Extra Space Storage, Inc. | | | 991 | |
| | 37 | | | Health Care REIT, Inc. | | | 2,800 | |
| | 130 | | | Hospitality Properties Trust | | | 4,019 | |
| | 86 | | | Host Hotels & Resorts, Inc. | | | 2,054 | |
| | 13 | | | Mid-America Apartment Communities, Inc. | | | 971 | |
| | 56 | | | NorthStar Realty Finance Corp. | | | 983 | |
| | 34 | | | Post Properties, Inc. | | | 1,998 | |
| | 16 | | | Regency Centers Corp. | | | 995 | |
| | 97 | | | Retail Properties of America, Inc., Class A | | | 1,619 | |
| | 7 | | | SL Green Realty Corp. | | | 833 | |
| | 30 | | | Taubman Centers, Inc. | | | 2,300 | |
| | 33 | | | Ventas, Inc. | | | 2,343 | |
| | 41 | | | Vornado Realty Trust | | | 4,838 | |
| | 275 | | | Weyerhaeuser Co. | | | 9,884 | |
| | 31 | | | WP Carey, Inc. | | | 2,173 | |
| | | | | | | | |
| | | | | | | 59,229 | |
| | | | | | | | |
| | | | Real Estate Management & Development — 0.2% | |
| | 7 | | | Jones Lang LaSalle, Inc. | | | 1,095 | |
| | | | | | | | |
| | | | Total Financials | | | 131,598 | |
| | | | | | | | |
| | | | Health Care — 10.9% | |
| | | | Biotechnology — 2.7% | |
| | 39 | | | Alnylam Pharmaceuticals, Inc. (a) | | | 3,763 | |
| | 39 | | | BioMarin Pharmaceutical, Inc. (a) | | | 3,562 | |
| | 41 | | | Incyte Corp. (a) | | | 3,005 | |
| | 12 | | | Intercept Pharmaceuticals, Inc. (a) | | | 1,919 | |
| | 29 | | | Medivation, Inc. (a) | | | 2,869 | |
| | 44 | | | Vertex Pharmaceuticals, Inc. (a) | | | 5,274 | |
| | | | | | | | |
| | | | | | | 20,392 | |
| | | | | | | | |
| | | | Health Care Equipment & Supplies — 3.1% | |
| | 44 | | | Boston Scientific Corp. (a) | | | 579 | |
| | 206 | | | CareFusion Corp. (a) | | | 12,200 | |
| | 6 | | | Cooper Cos., Inc. (The) | | | 1,038 | |
| | 184 | | | Hologic, Inc. (a) | | | 4,912 | |
| | 47 | | | Zimmer Holdings, Inc. | | | 5,285 | |
| | | | | | | | |
| | | | | | | 24,014 | |
| | | | | | | | |
| | | | Health Care Providers & Services — 4.0% | |
| | 61 | | | Cardinal Health, Inc. | | | 4,917 | |
| | 94 | | | Catamaran Corp. (a) | | | 4,880 | |
| | 47 | | | Community Health Systems, Inc. (a) | | | 2,523 | |
| | 117 | | | HCA Holdings, Inc. (a) | | | 8,565 | |
SEE NOTES TO FINANCIAL STATEMENTS.
| | | | | | |
| | | |
| 24 | | | | J.P. MORGAN INTREPID FUNDS | | DECEMBER 31, 2014 |
| | | | | | | | |
| SHARES | | | SECURITY DESCRIPTION | | VALUE($) | |
| | | | | | | | |
| Common Stocks — continued | |
| | | | Health Care Providers & Services — continued | |
| | 6 | | | Health Net, Inc. (a) | | | 332 | |
| | 64 | | | Humana, Inc. | | | 9,235 | |
| | | | | | | | |
| | | | | | | 30,452 | |
| | | | | | | | |
| | | | Health Care Technology — 0.2% | |
| | 54 | | | Veeva Systems, Inc., Class A (a) | | | 1,429 | |
| | | | | | | | |
| | | | Pharmaceuticals — 0.9% | |
| | 51 | | | Endo International plc, (Ireland) (a) | | | 3,678 | |
| | 18 | | | Perrigo Co. plc, (Ireland) | | | 3,009 | |
| | | | | | | | |
| | | | | | | 6,687 | |
| | | | | | | | |
| | | | Total Health Care | | | 82,974 | |
| | | | | | | | |
| | | | Industrials — 11.6% | |
| | | | Aerospace & Defense — 3.2% | |
| | 15 | | | Alliant Techsystems, Inc. | | | 1,790 | |
| | 126 | | | Huntington Ingalls Industries, Inc. | | | 14,116 | |
| | 38 | | | L-3 Communications Holdings, Inc. | | | 4,821 | |
| | 3 | | | Northrop Grumman Corp. | | | 442 | |
| | 71 | | | Spirit Aerosystems Holdings, Inc., Class A (a) | | | 3,069 | |
| | | | | | | | |
| | | | | | | 24,238 | |
| | | | | | | | |
| | | | Airlines — 2.7% | |
| | 32 | | | Alaska Air Group, Inc. | | | 1,883 | |
| | 96 | | | Delta Air Lines, Inc. | | | 4,717 | |
| | 337 | | | Southwest Airlines Co. | | | 14,266 | |
| | | | | | | | |
| | | | | | | 20,866 | |
| | | | | | | | |
| | | | Commercial Services & Supplies — 0.7% | |
| | 84 | | | KAR Auction Services, Inc. | | | 2,907 | |
| | 69 | | | Pitney Bowes, Inc. | | | 1,672 | |
| | 39 | | | R.R. Donnelley & Sons Co. | | | 647 | |
| | | | | | | | |
| | | | | | | 5,226 | |
| | | | | | | | |
| | | | Construction & Engineering — 1.8% | |
| | 300 | | | AECOM Technology Corp. (a) | | | 9,099 | |
| | 28 | | | Fluor Corp. | | | 1,704 | |
| | 72 | | | Jacobs Engineering Group, Inc. (a) | | | 3,235 | |
| | | | | | | | |
| | | | | | | 14,038 | |
| | | | | | | | |
| | | | Electrical Equipment — 0.2% | |
| | 27 | | | Babcock & Wilcox Co. (The) | | | 812 | |
| | 7 | | | Regal-Beloit Corp. | | | 504 | |
| | | | | | | | |
| | | | | | | 1,316 | |
| | | | | | | | |
| | | | Machinery — 2.6% | |
| | 75 | | | Crane Co. | | | 4,397 | |
| | 71 | | | Ingersoll-Rand plc | | | 4,520 | |
| | 56 | | | Oshkosh Corp. | | | 2,739 | |
| | | | | | | | |
| SHARES | | | SECURITY DESCRIPTION | | VALUE($) | |
| | | | | | | | |
| | | | | | | | |
| | | | Machinery — continued | |
| | 60 | | | Parker-Hannifin Corp. | | | 7,756 | |
| | | | | | | | |
| | | | | | | 19,412 | |
| | | | | | | | |
| | | | Marine — 0.0% (g) | |
| | 4 | | | Kirby Corp. (a) | | | 282 | |
| | | | | | | | |
| | | | Professional Services — 0.1% | |
| | 9 | | | Manpowergroup, Inc. | | | 627 | |
| | | | | | | | |
| | | | Road & Rail — 0.2% | |
| | 16 | | | Landstar System, Inc. | | | 1,160 | |
| | | | | | | | |
| | | | Trading Companies & Distributors — 0.1% | |
| | 57 | | | MRC Global, Inc. (a) | | | 868 | |
| | 4 | | | NOW, Inc. (a) | | | 99 | |
| | 1 | | | Veritiv Corp. (a) | | | 68 | |
| | | | | | | | |
| | | | | | | 1,035 | |
| | | | | | | | |
| | | | Total Industrials | | | 88,200 | |
| | | | | | | | |
| | | | Information Technology — 17.7% | |
| | | | Communications Equipment — 0.7% | |
| | 56 | | | ARRIS Group, Inc. (a) | | | 1,676 | |
| | 23 | | | Harris Corp. | | | 1,627 | |
| | 90 | | | Juniper Networks, Inc. | | | 2,004 | |
| | | | | | | | |
| | | | | | | 5,307 | |
| | | | | | | | |
| | | | Electronic Equipment, Instruments & Components — 0.5% | |
| | 53 | | | Avnet, Inc. | | | 2,284 | |
| | 22 | | | Tech Data Corp. (a) | | | 1,410 | |
| | | | | | | | |
| | | | | | | 3,694 | |
| | | | | | | | |
| | | | Internet Software & Services — 2.0% | |
| | 7 | | | Equinix, Inc. | | | 1,497 | |
| | 61 | | | LendingClub Corp. (a) | | | 1,543 | |
| | 32 | | | LinkedIn Corp., Class A (a) | | | 7,442 | |
| | 124 | | | Twitter, Inc. (a) | | | 4,459 | |
| | | | | | | | |
| | | | | | | 14,941 | |
| | | | | | | | |
| | | | IT Services — 5.7% | |
| | 27 | | | Alliance Data Systems Corp. (a) | | | 7,766 | |
| | 412 | | | Booz Allen Hamilton Holding Corp. | | | 10,933 | |
| | 43 | | | Fidelity National Information Services, Inc. | | | 2,687 | |
| | 46 | | | Global Payments, Inc. | | | 3,689 | |
| | 240 | | | Vantiv, Inc., Class A (a) | | | 8,151 | |
| | 696 | | | Xerox Corp. | | | 9,651 | |
| | | | | | | | |
| | | | | | | 42,877 | |
| | | | | | | | |
| | | | Semiconductors & Semiconductor Equipment — 3.9% | |
| | 266 | | | Advanced Micro Devices, Inc. (a) | | | 710 | |
| | 71 | | | Applied Materials, Inc. | | | 1,757 | |
SEE NOTES TO FINANCIAL STATEMENTS.
| | | | | | | | |
| | | |
| DECEMBER 31, 2014 | | J.P. MORGAN INTREPID FUNDS | | | | | 25 | |
JPMorgan Intrepid Mid Cap Fund
SCHEDULE OF PORTFOLIO INVESTMENTS
AS OF DECEMBER 31, 2014 (Unaudited) (continued)
(Amounts in thousands, except number of Futures contracts)
| | | | | | | | |
| SHARES | | | SECURITY DESCRIPTION | | VALUE($) | |
| | | | | | | | |
| Common Stocks — continued | |
| | | | Semiconductors & Semiconductor Equipment — continued | |
| | 57 | | | First Solar, Inc. (a) | | | 2,528 | |
| | 45 | | | KLA-Tencor Corp. | | | 3,129 | |
| | 39 | | | Lam Research Corp. | | | 3,094 | |
| | 317 | | | Marvell Technology Group Ltd., (Bermuda) | | | 4,594 | |
| | 262 | | | Micron Technology, Inc. (a) | | | 9,173 | |
| | 254 | | | ON Semiconductor Corp. (a) | | | 2,571 | |
| | 31 | | | Skyworks Solutions, Inc. | | | 2,276 | |
| | | | | | | | |
| | | | | | | 29,832 | |
| | | | | | | | |
| | | | Software — 3.2% | |
| | 166 | | | Activision Blizzard, Inc. | | | 3,339 | |
| | 38 | | | Citrix Systems, Inc. (a) | | | 2,437 | |
| | 99 | | | Electronic Arts, Inc. (a) | | | 4,650 | |
| | 46 | | | Mobileye N.V., (Israel) (a) | | | 1,866 | |
| | 348 | | | Rovi Corp. (a) | | | 7,868 | |
| | 46 | | | Synopsys, Inc. (a) | | | 2,000 | |
| | 700 | | | Zynga, Inc., Class A (a) | | | 1,862 | |
| | | | | | | | |
| | | | | | | 24,022 | |
| | | | | | | | |
| | | | Technology Hardware, Storage & Peripherals — 1.7% | |
| | 120 | | | Western Digital Corp. | | | 13,284 | |
| | | | | | | | |
| | | | Total Information Technology | | | 133,957 | |
| | | | | | | | |
| | | | Materials — 5.1% | |
| | | | Chemicals — 2.2% | |
| | 29 | | | Ashland, Inc. | | | 3,461 | |
| | 44 | | | Cabot Corp. | | | 1,943 | |
| | 11 | | | Huntsman Corp. | | | 255 | |
| | 37 | | | PPG Industries, Inc. | | | 8,472 | |
| | 30 | | | Valspar Corp. (The) | | | 2,629 | |
| | | | | | | | |
| | | | | | | 16,760 | |
| | | | | | | | |
| | | | Containers & Packaging — 1.0% | |
| | 10 | | | Avery Dennison Corp. | | | 535 | |
| | 27 | | | Crown Holdings, Inc. (a) | | | 1,364 | |
| | 7 | | | Greif, Inc., Class A | | | 307 | |
| | 53 | | | Rock-Tenn Co., Class A | | | 3,256 | |
| | 43 | | | Sealed Air Corp. | | | 1,833 | |
| | | | | | | | |
| | | | | | | 7,295 | |
| | | | | | | | |
| | | | Metals & Mining — 1.1% | |
| | 61 | | | Alcoa, Inc. | | | 961 | |
| | 4 | | | Compass Minerals International, Inc. | | | 339 | |
| | 8 | | | Nucor Corp. | | | 368 | |
| | 52 | | | Reliance Steel & Aluminum Co. | | | 3,198 | |
| | 43 | | | Steel Dynamics, Inc. | | | 849 | |
| | 106 | | | United States Steel Corp. | | | 2,832 | |
| | | | | | | | |
| | | | | | | 8,547 | |
| | | | | | | | |
| | | | | | | | |
| SHARES | | | SECURITY DESCRIPTION | | VALUE($) | |
| | | | | | | | |
| | | | | | | | |
| | | | Paper & Forest Products — 0.8% | |
| | 42 | | | Domtar Corp., (Canada) | | | 1,673 | |
| | 81 | | | International Paper Co. | | | 4,324 | |
| | | | | | | | |
| | | | | | | 5,997 | |
| | | | | | | | |
| | | | Total Materials | | | 38,599 | |
| | | | | | | | |
| | | | Telecommunication Services — 1.1% | |
| | | | Diversified Telecommunication Services — 0.8% | |
| | 755 | | | Frontier Communications Corp. | | | 5,037 | |
| | 175 | | | Windstream Holdings, Inc. | | | 1,445 | |
| | | | | | | | |
| | | | | | | 6,482 | |
| | | | | | | | |
| | | | Wireless Telecommunication Services — 0.3% | |
| | 20 | | | SBA Communications Corp., Class A (a) | | | 2,215 | |
| | | | | | | | |
| | | | Total Telecommunication Services | | | 8,697 | |
| | | | | | | | |
| | | | Utilities — 5.7% | |
| | | | Electric Utilities — 0.2% | |
| | 7 | | | Entergy Corp. | | | 638 | |
| | 7 | | | Pinnacle West Capital Corp. | | | 458 | |
| | | | | | | | |
| | | | | | | 1,096 | |
| | | | | | | | |
| | | | Gas Utilities — 1.0% | |
| | 203 | | | UGI Corp. | | | 7,716 | |
| | | | | | | | |
| | | | Independent Power & Renewable Electricity Producers — 0.6% | |
| | 324 | | | AES Corp. | | | 4,460 | |
| | | | | | | | |
| | | | Multi-Utilities — 3.9% | |
| | 32 | | | Alliant Energy Corp. | | | 2,135 | |
| | 46 | | | Ameren Corp. | | | 2,104 | |
| | 139 | | | CenterPoint Energy, Inc. | | | 3,257 | |
| | 97 | | | CMS Energy Corp. | | | 3,353 | |
| | 30 | | | Consolidated Edison, Inc. | | | 1,967 | |
| | 52 | | | DTE Energy Co. | | | 4,448 | |
| | 78 | | | Public Service Enterprise Group, Inc. | | | 3,213 | |
| | 39 | | | SCANA Corp. | | | 2,368 | |
| | 48 | | | Sempra Energy | | | 5,301 | |
| | 85 | | | TECO Energy, Inc. | | | 1,751 | |
| | | | | | | | |
| | | | | | | 29,897 | |
| | | | | | | | |
| | | | Total Utilities | | | 43,169 | |
| | | | | | | | |
| | | | Total Common Stocks
(Cost $533,242) | | | 730,728 | |
| | | | | | | | |
SEE NOTES TO FINANCIAL STATEMENTS.
| | | | | | |
| | | |
| 26 | | | | J.P. MORGAN INTREPID FUNDS | | DECEMBER 31, 2014 |
| | | | | | | | |
| SHARES | | | SECURITY DESCRIPTION | | VALUE($) | |
| Short-Term Investment — 3.5% | |
| | | | Investment Company — 3.5% | |
| | 26,716 | | | JPMorgan Liquid Assets Money Market Fund, Institutional Class Shares, 0.030% (b) (l)
(Cost $26,716) | | | 26,716 | |
| | | | | | | | |
| | | | Total Investments — 99.9%
(Cost $559,958) | | | 757,444 | |
| | | | Other Assets in Excess of
Liabilities — 0.1% (c) | | | 522 | |
| | | | | | | | |
| | | | NET ASSETS — 100.0% | | $ | 757,966 | |
| | | | | | | | |
Percentages indicated are based on net assets.
| | | | | | | | | | | | | | | | |
| Futures Contracts | |
NUMBER OF
CONTRACTS | | | DESCRIPTION | | EXPIRATION
DATE | | | NOTIONAL
VALUE AT
DECEMBER 31, 2014 | | | NET
UNREALIZED
APPRECIATION
(DEPRECIATION) | |
| | | | Long Futures Outstanding | |
| | 156 | | | S&P Mid Cap 400 | | | 03/20/15 | | | $ | 22,598 | | | $ | 468 | |
| | | | | | | | | | | | | | | | |
SEE NOTES TO FINANCIAL STATEMENTS.
| | | | | | | | |
| | | |
| DECEMBER 31, 2014 | | J.P. MORGAN INTREPID FUNDS | | | | | 27 | |
JPMorgan Intrepid Value Fund
SCHEDULE OF PORTFOLIO INVESTMENTS
AS OF DECEMBER 31, 2014 (Unaudited)
(Amounts in thousands)
| | | | | | | | |
| SHARES | | | SECURITY DESCRIPTION | | VALUE($) | |
| | | | | | | | |
| Common Stocks — 97.7% | | | | |
| | | | Consumer Discretionary — 7.0% | | | | |
| | | | Automobiles — 1.0% | |
| | 1,073 | | | Ford Motor Co. | | | 16,635 | |
| | | | | | | | |
| | | | Diversified Consumer Services — 0.9% | |
| | 86 | | | Apollo Education Group, Inc. (a) | | | 2,944 | |
| | 281 | | | DeVry Education Group, Inc. | | | 13,315 | |
| | | | | | | | |
| | | | | | | 16,259 | |
| | | | | | | | |
| | | | Household Durables — 0.7% | |
| | 78 | | | Jarden Corp. (a) | | | 3,724 | |
| | 349 | | | PulteGroup, Inc. | | | 7,498 | |
| | | | | | | | |
| | | | | | | 11,222 | |
| | | | | | | | |
| | | | Internet & Catalog Retail — 0.2% | |
| | 37 | | | Expedia, Inc. | | | 3,184 | |
| | | | | | | | |
| | | | Media — 2.5% | |
| | 100 | | | Gannett Co., Inc. | | | 3,198 | |
| | 80 | | | Time Warner Cable, Inc. | | | 12,226 | |
| | 332 | | | Time Warner, Inc. | | | 28,325 | |
| | | | | | | | |
| | | | | | | 43,749 | |
| | | | | | | | |
| | | | Multiline Retail — 1.7% | | | | |
| | 114 | | | Dillard’s, Inc., Class A | | | 14,320 | |
| | 215 | | | Macy’s, Inc. | | | 14,110 | |
| | | | | | | | |
| | | | | | | 28,430 | |
| | | | | | | | |
| | | | Total Consumer Discretionary | | | 119,479 | |
| | | | | | | | |
| | | | Consumer Staples — 6.7% | | | | |
| | | | Food & Staples Retailing — 2.5% | | | | |
| | 105 | | | CVS Caremark Corp. | | | 10,083 | |
| | 506 | | | Kroger Co. (The) | | | 32,497 | |
| | | | | | | | |
| | | | | | | 42,580 | |
| | | | | | | | |
| | | | Food Products — 2.7% | | | | |
| | 719 | | | Archer-Daniels-Midland Co. | | | 37,362 | |
| | 276 | | | Pilgrim’s Pride Corp. (a) | | | 9,044 | |
| | | | | | | | |
| | | | | | | 46,406 | |
| | | | | | | | |
| | | | Household Products — 1.1% | | | | |
| | 112 | | | Energizer Holdings, Inc. | | | 14,373 | |
| | 44 | | | Kimberly-Clark Corp. | | | 5,130 | |
| | | | | | | | |
| | | | | | | 19,503 | |
| | | | | | | | |
| | | | Personal Products — 0.4% | | | | |
| | 182 | | | Herbalife Ltd. | | | 6,861 | |
| | | | | | | | |
| | | | Total Consumer Staples | | | 115,350 | |
| | | | | | | | |
| | | | Energy — 11.1% | | | | |
| | | | Energy Equipment & Services — 2.7% | | | | |
| | 70 | | | Baker Hughes, Inc. | | | 3,942 | |
| | 118 | | | Halliburton Co. | | | 4,645 | |
| | | | | | | | |
| SHARES | | | SECURITY DESCRIPTION | | VALUE($) | |
| | | | | | | | |
| | | | | |
| | | | Energy Equipment & Services — continued | | | | |
| | 559 | | | National Oilwell Varco, Inc. | | | 36,657 | |
| | 28 | | | Oil States International, Inc. (a) | | | 1,379 | |
| | | | | | | | |
| | | | | | | 46,623 | |
| | | | | | | | |
| | | | Oil, Gas & Consumable Fuels — 8.4% | | | | |
| | 359 | | | Chevron Corp. | | | 40,256 | |
| | 496 | | | ConocoPhillips | | | 34,233 | |
| | 196 | | | Exxon Mobil Corp. | | | 18,074 | |
| | 270 | | | Marathon Oil Corp. | | | 7,633 | |
| | 152 | | | Marathon Petroleum Corp. | | | 13,747 | |
| | 582 | | | Valero Energy Corp. | | | 28,789 | |
| | | | | | | | |
| | | | | | | 142,732 | |
| | | | | | | | |
| | | | Total Energy | | | 189,355 | |
| | | | | | | | |
| | | | Financials — 27.9% | | | | |
| | | | Banks — 10.9% | | | | |
| | 1,951 | | | Bank of America Corp. | | | 34,900 | |
| | 769 | | | Citigroup, Inc. | | | 41,599 | |
| | 32 | | | Comerica, Inc. | | | 1,504 | |
| | 602 | | | Fifth Third Bancorp | | | 12,272 | |
| | 804 | | | KeyCorp | | | 11,181 | |
| | 175 | | | PNC Financial Services Group, Inc. (The) | | | 15,972 | |
| | 1,284 | | | Wells Fargo & Co. | | | 70,403 | |
| | | | | | | | |
| | | | | | | 187,831 | |
| | | | | | | | |
| | | | Capital Markets — 2.5% | |
| | 108 | | | Ameriprise Financial, Inc. | | | 14,296 | |
| | 90 | | | Goldman Sachs Group, Inc. (The) | | | 17,493 | |
| | 109 | | | Legg Mason, Inc. | | | 5,823 | |
| | 129 | | | Morgan Stanley | | | 4,986 | |
| | | | | | | | |
| | | | | | | 42,598 | |
| | | | | | | | |
| | | | Consumer Finance — 2.1% | |
| | 543 | | | Discover Financial Services | | | 35,587 | |
| | | | | | | | |
| | | | Insurance — 8.1% | |
| | 428 | | | Allstate Corp. (The) | | | 30,095 | |
| | 55 | | | Aspen Insurance Holdings Ltd., (Bermuda) | | | 2,425 | |
| | 99 | | | Assurant, Inc. | | | 6,795 | |
| | 250 | | | Axis Capital Holdings Ltd., (Bermuda) | | | 12,757 | |
| | 80 | | | Everest Re Group Ltd., (Bermuda) | | | 13,658 | |
| | 384 | | | Hartford Financial Services Group, Inc. (The) | | | 16,009 | |
| | 134 | | | Lincoln National Corp. | | | 7,734 | |
| | 58 | | | PartnerRe Ltd., (Bermuda) | | | 6,620 | |
| | 277 | | | Prudential Financial, Inc. | | | 25,075 | |
| | 30 | | | Travelers Cos., Inc. (The) | | | 3,218 | |
| | 332 | | | Validus Holdings Ltd., (Bermuda) | | | 13,794 | |
| | | | | | | | |
| | | | | | | 138,180 | |
| | | | | | | | |
SEE NOTES TO FINANCIAL STATEMENTS.
| | | | | | |
| | | |
| 28 | | | | J.P. MORGAN INTREPID FUNDS | | DECEMBER 31, 2014 |
| | | | | | | | |
| SHARES | | | SECURITY DESCRIPTION | | VALUE($) | |
| | | | | | | | |
| Common Stocks — continued | | | | |
| | | | Real Estate Investment Trusts (REITs) — 4.0% | |
| | 579 | | | American Capital Agency Corp. | | | 12,646 | |
| | 300 | | | Annaly Capital Management, Inc. | | | 3,240 | |
| | 679 | | | Brandywine Realty Trust | | | 10,857 | |
| | 199 | | | Hospitality Properties Trust | | | 6,169 | |
| | 672 | | | NorthStar Realty Finance Corp. | | | 11,807 | |
| | 258 | | | Piedmont Office Realty Trust, Inc., Class A | | | 4,861 | |
| | 436 | | | RLJ Lodging Trust | | | 14,622 | |
| | 35 | | | Vornado Realty Trust | | | 4,167 | |
| | | | | | | | |
| | | | | | | 68,369 | |
| | | | | | | | |
| | | | Real Estate Management & Development — 0.3% | |
| | 141 | | | CBRE Group, Inc., Class A (a) | | | 4,843 | |
| | | | | | | | |
| | | | Total Financials | | | 477,408 | |
| | | | | | | | |
| | | | Health Care — 13.8% | |
| | | | Biotechnology — 2.0% | |
| | 232 | | | Gilead Sciences, Inc. (a) | | | 21,830 | |
| | 98 | | | United Therapeutics Corp. (a) | | | 12,716 | |
| | | | | | | | |
| | | | | | | 34,546 | |
| | | | | | | | |
| | | | Health Care Equipment & Supplies — 1.2% | |
| | 355 | | | Alere, Inc. (a) | | | 13,490 | |
| | 52 | | | Edwards Lifesciences Corp. (a) | | | 6,560 | |
| | | | | | | | |
| | | | | | | 20,050 | |
| | | | | | | | |
| | | | Health Care Providers & Services — 7.1% | |
| | 278 | | | Aetna, Inc. | | | 24,677 | |
| | 306 | | | Anthem, Inc. | | | 38,505 | |
| | 68 | | | Cardinal Health, Inc. | | | 5,466 | |
| | 305 | | | Express Scripts Holding Co. (a) | | | 25,833 | |
| | 257 | | | Health Net, Inc. (a) | | | 13,757 | |
| | 195 | | | LifePoint Hospitals, Inc. (a) | | | 14,051 | |
| | | | | | | | |
| | | | | | | 122,289 | |
| | | | | | | | |
| | | | Pharmaceuticals — 3.5% | |
| | 1,894 | | | Pfizer, Inc. | | | 58,999 | |
| | | | | | | | |
| | | | Total Health Care | | | 235,884 | |
| | | | | | | | |
| | | | Industrials — 10.4% | |
| | | | Aerospace & Defense — 4.2% | |
| | 248 | | | General Dynamics Corp. | | | 34,116 | |
| | 252 | | | Northrop Grumman Corp. | | | 37,069 | |
| | | | | | | | |
| | | | | | | 71,185 | |
| | | | | | | | |
| | | | Airlines — 2.0% | |
| | 91 | | | Alaska Air Group, Inc. | | | 5,432 | |
| | 298 | | | Delta Air Lines, Inc. | | | 14,673 | |
| | 317 | | | Southwest Airlines Co. | | | 13,399 | |
| | | | | | | | |
| | | | | | | 33,504 | |
| | | | | | | | |
| | | | | | | | |
| SHARES | | | SECURITY DESCRIPTION | | VALUE($) | |
| | | | | | | | |
| | | | | |
| | | | Commercial Services & Supplies — 0.7% | |
| | 531 | | | Pitney Bowes, Inc. | | | 12,933 | |
| | | | | | | | |
| | | | Construction & Engineering — 0.6% | |
| | 356 | | | AECOM Technology Corp. (a) | | | 10,824 | |
| | | | | | | | |
| | | | Machinery — 2.9% | |
| | 41 | | | IDEX Corp. | | | 3,160 | |
| | 315 | | | Illinois Tool Works, Inc. | | | 29,849 | |
| | 51 | | | Parker-Hannifin Corp. | | | 6,538 | |
| | 125 | | | SPX Corp. | | | 10,749 | |
| | | | | | | | |
| | | | | | | 50,296 | |
| | | | | | | | |
| | | | Total Industrials | | | 178,742 | |
| | | | | | | | |
| | | | Information Technology — 10.1% | |
| | | | Communications Equipment — 0.8% | |
| | 1,172 | | | Brocade Communications Systems, Inc. | | | 13,882 | |
| | | | | | | | |
| | | | Electronic Equipment, Instruments & Components — 0.1% | |
| | 118 | | | Vishay Intertechnology, Inc. | | | 1,672 | |
| | | | | | | | |
| | | | Semiconductors & Semiconductor Equipment — 1.3% | |
| | 137 | | | Intel Corp. | | | 4,982 | |
| | 25 | | | KLA-Tencor Corp. | | | 1,723 | |
| | 127 | | | Lam Research Corp. | | | 10,076 | |
| | 152 | | | Micron Technology, Inc. (a) | | | 5,311 | |
| | | | | | | | |
| | | | | | | 22,092 | |
| | | | | | | | |
| | | | Software — 3.1% | |
| | 393 | | | Activision Blizzard, Inc. | | | 7,913 | |
| | 129 | | | CA, Inc. | | | 3,916 | |
| | 623 | | | Oracle Corp. | | | 28,025 | |
| | 606 | | | Rovi Corp. (a) | | | 13,683 | |
| | | | | | | | |
| | | | | | | 53,537 | |
| | | | | | | | |
| | | | Technology Hardware, Storage & Peripherals — 4.8% | |
| | 83 | | | Apple, Inc. | | | 9,106 | |
| | 1,142 | | | Hewlett-Packard Co. | | | 45,841 | |
| | 150 | | | SanDisk Corp. | | | 14,687 | |
| | 111 | | | Western Digital Corp. | | | 12,288 | |
| | | | | | | | |
| | | | | | | 81,922 | |
| | | | | | | | |
| | | | Total Information Technology | | | 173,105 | |
| | | | | | | | |
| | | | Materials — 2.5% | |
| | | | Chemicals — 1.7% | |
| | 370 | | | LyondellBasell Industries N.V., Class A | | | 29,366 | |
| | | | | | | | |
| | | | Metals & Mining — 0.6% | |
| | 400 | | | United States Steel Corp. | | | 10,696 | |
| | | | | | | | |
| | | | Paper & Forest Products — 0.2% | |
| | 84 | | | Domtar Corp., (Canada) | | | 3,363 | |
| | | | | | | | |
| | | | Total Materials | | | 43,425 | |
| | | | | | | | |
SEE NOTES TO FINANCIAL STATEMENTS.
| | | | | | | | |
| | | |
| DECEMBER 31, 2014 | | J.P. MORGAN INTREPID FUNDS | | | | | 29 | |
JPMorgan Intrepid Value Fund
SCHEDULE OF PORTFOLIO INVESTMENTS
AS OF DECEMBER 31, 2014 (Unaudited) (continued)
(Amounts in thousands, except number of Futures contracts)
| | | | | | | | |
| SHARES | | | SECURITY DESCRIPTION | | VALUE($) | |
| | | | | | | | |
| Common Stocks — continued | | | | |
| | | | Telecommunication Services — 1.9% | |
| | | | Diversified Telecommunication Services — 1.9% | |
| | 612 | | | AT&T, Inc. | | | 20,557 | |
| | 146 | | | CenturyLink, Inc. | | | 5,764 | |
| | 960 | | | Frontier Communications Corp. | | | 6,402 | |
| | | | | | | | |
| | | | Total Telecommunication Services | | | 32,723 | |
| | | | | | | | |
| | | | Utilities — 6.3% | |
| | | | Electric Utilities — 3.4% | |
| | 460 | | | American Electric Power Co., Inc. | | | 27,949 | |
| | 158 | | | Entergy Corp. | | | 13,848 | |
| | 151 | | | NextEra Energy, Inc. | | | 16,082 | |
| | | | | | | | |
| | | | | | | 57,879 | |
| | | | | | | | |
| | | | Gas Utilities — 0.8% | |
| | 369 | | | UGI Corp. | | | 14,032 | |
| | | | | | | | |
| | | | Independent Power & Renewable Electricity Producers — 1.7% | |
| | 875 | | | AES Corp. | | | 12,045 | |
| | 278 | | | Calpine Corp. (a) | | | 6,148 | |
| | | | | | | | |
| SHARES | | | SECURITY DESCRIPTION | | VALUE($) | |
| | | | | | | | |
| | | | | | | | |
| | | | Independent Power & Renewable Electricity Producers — continued | |
| | 386 | | | Dynegy, Inc. (a) | | | 11,718 | |
| | | | | | | | |
| | | | | | | 29,911 | |
| | | | | | | | |
| | | | Multi-Utilities — 0.4% | |
| | 163 | | | Public Service Enterprise Group, Inc. | | | 6,766 | |
| | | | | | | | |
| | | | Total Utilities | | | 108,588 | |
| | | | | | | | |
| | | | Total Common Stocks
(Cost $1,288,766) | | | 1,674,059 | |
| | | | | | | | |
| Short-Term Investment — 2.4% | |
| | | | Investment Company — 2.4% | | | | |
| | 40,784 | | | JPMorgan Prime Money Market Fund, Institutional Class Shares, 0.020% (b) (l)
(Cost $40,784) | | | 40,784 | |
| | | | | | | | |
| | | | Total Investments — 100.1%
(Cost $1,329,550) | | | 1,714,843 | |
| | | | Liabilities in Excess of
Other Assets — (0.1)% (c) | | | (2,324 | ) |
| | | | | | | | |
| | | | NET ASSETS — 100.0% | | $ | 1,712,519 | |
| | | | | | | | |
Percentages indicated are based on net assets.
| | | | | | | | | | | | | | | | |
| Futures Contracts | |
NUMBER OF
CONTRACTS | | | DESCRIPTION | | EXPIRATION
DATE | | | NOTIONAL
VALUE AT
DECEMBER 31, 2014 | | | NET
UNREALIZED
APPRECIATION
(DEPRECIATION) | |
| | | | Long Futures Outstanding | |
| | 304 | | | E-mini S&P 500 | | | 03/20/15 | | | $ | 31,196 | | | $ | 728 | |
| | | | | | | | | | | | | | | | |
SEE NOTES TO FINANCIAL STATEMENTS.
| | | | | | |
| | | |
| 30 | | | | J.P. MORGAN INTREPID FUNDS | | DECEMBER 31, 2014 |
JPMorgan Intrepid Funds
NOTES TO SCHEDULES OF PORTFOLIO INVESTMENTS
AS OF DECEMBER 31, 2014 (Unaudited)
| | |
| (a) | | — Non-income producing security. |
| (b) | | — Investment in affiliate. Money market fund registered under the Investment Company Act of 1940, as amended, and advised by J.P. Morgan Investment Management Inc. |
| (c) | | — Included in this amount is cash segregated as collateral for futures contracts. |
| (g) | | — Amount rounds to less than 0.1%. |
| (h) | | — Amount rounds to less than 1,000 shares. |
| | |
| (l) | | — The rate shown is the current yield as of December 31, 2014. |
| (m) | | — All or a portion of this security is reserved and/or pledged with the custodian for current or potential holdings of futures, swaps, options, TBAs, when-issued securities, delayed delivery securities, reverse repurchase agreements, unfunded commitments and/or forward foreign currency exchange contracts. |
SEE NOTES TO FINANCIAL STATEMENTS.
| | | | | | | | |
| | | |
| DECEMBER 31, 2014 | | J.P. MORGAN INTREPID FUNDS | | | | | 31 | |
STATEMENTS OF ASSETS AND LIABILITIES
AS OF DECEMBER 31, 2014 (Unaudited)
(Amounts in thousands, except per share amounts)
| | | | | | | | | | | | |
| | | Intrepid
Advantage
Fund | | | Intrepid
America Fund | | | Intrepid
Growth
Fund | |
ASSETS: | | | | | | | | | | | | |
Investments in non-affiliates, at value | | $ | 21,782 | | | $ | 3,362,123 | | | $ | 881,242 | |
Investments in affiliates, at value | | | 681 | | | | 104,962 | | | | 33,378 | |
| | | | | | | | | | | | |
Total investment securities, at value | | | 22,463 | | | | 3,467,085 | | | | 914,620 | |
Foreign currency, at value | | | — | | | | 35 | | | | 16 | |
Deposits at broker for futures contracts | | | — | | | | 4,625 | | | | 1,380 | |
Receivables: | | | | | | | | | | | | |
Investment securities sold | | | — | | | | 9,948 | | | | 3,132 | |
Fund shares sold | | | 165 | | | | 1,703 | | | | 12,538 | |
Dividends from non-affiliates | | | 23 | | | | 2,735 | | | | 522 | |
Dividends from affiliates | | | — | (a) | | | 3 | | | | 1 | |
| | | | | | | | | | | | |
Total Assets | | | 22,651 | | | | 3,486,134 | | | | 932,209 | |
| | | | | | | | | | | | |
| | | |
LIABILITIES: | | | | | | | | | | | | |
Payables: | | | | | | | | | | | | |
Due to custodian | | | — | | | | 16 | | | | 16 | |
Investment securities purchased | | | — | | | | 14,226 | | | | 3,286 | |
Fund shares redeemed | | | 2 | | | | 2,050 | | | | 10,626 | |
Variation margin on futures contracts | | | — | | | | 1,169 | | | | 360 | |
Accrued liabilities: | | | | | | | | | | | | |
Investment advisory fees | | | 3 | | | | 1,180 | | | | 299 | |
Administration fees | | | — | (a) | | | 239 | | | | 6 | |
Distribution fees | | | 6 | | | | 40 | | | | 35 | |
Shareholder servicing fees | | | 4 | | | | 431 | | | | 159 | |
Custodian and accounting fees | | | 15 | | | | 47 | | | | 19 | |
Trustees’ and Chief Compliance Officer’s fees | | | — | (a) | | | 5 | | | | 1 | |
Audit fees | | | 15 | | | | 7 | | | | 17 | |
Registration Fee | | | 10 | | | | — | | | | 20 | |
Transfer agent fees | | | 6 | | | | 59 | | | | 74 | |
Other | | | 4 | | | | 60 | | | | 32 | |
| | | | | | | | | | | | |
Total Liabilities | | | 65 | | | | 19,529 | | | | 14,950 | |
| | | | | | | | | | | | |
Net Assets | | $ | 22,586 | | | $ | 3,466,605 | | | $ | 917,259 | |
| | | | | | | | | | | | |
| (a) | Amount rounds to less than $1,000. |
SEE NOTES TO FINANCIAL STATEMENTS.
| | | | | | |
| | | |
| 32 | | | | J.P. MORGAN INTREPID FUNDS | | DECEMBER 31, 2014 |
| | | | | | | | | | | | |
| | | Intrepid
Advantage
Fund | | | Intrepid
America Fund | | | Intrepid
Growth Fund | |
NET ASSETS: | | | | | | | | | | | | |
Paid-in-Capital | | $ | 20,346 | | | $ | 2,611,604 | | | $ | 883,004 | |
Accumulated undistributed (distributions in excess of) net investment income | | | 2 | | | | (146 | ) | | | 46 | |
Accumulated net realized gains (losses) | | | (2,968 | ) | | | 35,851 | | | | (196,596 | ) |
Net unrealized appreciation (depreciation) | | | 5,206 | | | | 819,296 | | | | 230,805 | |
| | | | | | | | | | | | |
Total Net Assets | | $ | 22,586 | | | $ | 3,466,605 | | | $ | 917,259 | |
| | | | | | | | | | | | |
| | | |
Net Assets: | | | | | | | | | | | | |
Class A | | $ | 11,750 | | | $ | 156,237 | | | $ | 71,214 | |
Class C | | | 6,495 | | | | 11,344 | | | | 34,109 | |
Class R2 | | | — | | | | 681 | | | | 805 | |
Class R5 | | | — | | | | 1,702,951 | | | | 148,722 | |
Select Class | | | 4,341 | | | | 1,595,392 | | | | 662,409 | |
| | | | | | | | | | | | |
Total | | $ | 22,586 | | | $ | 3,466,605 | | | $ | 917,259 | |
| | | | | | | | | | | | |
| | | |
Outstanding units of beneficial interest (shares) | | | | | | | | | | | | |
($0.0001 par value; unlimited number of shares authorized): | | | | | | | | | | | | |
Class A | | | 350 | | | | 4,142 | | | | 1,771 | |
Class C | | | 197 | | | | 303 | | | | 863 | |
Class R2 | | | — | | | | 18 | | | | 20 | |
Class R5 | | | — | | | | 44,861 | | | | 3,697 | |
Select Class | | | 129 | | | | 41,901 | | | | 16,390 | |
| | | |
Net Asset Value (a): | | | | | | | | | | | | |
Class A — Redemption price per share | | $ | 33.55 | | | $ | 37.72 | | | $ | 40.19 | |
Class C — Offering price per share (b) | | | 32.92 | | | | 37.48 | | | | 39.57 | |
Class R2 — Offering and redemption price per share | | | — | | | | 37.14 | | | | 39.66 | |
Class R5 — Offering and redemption price per share | | | — | | | | 37.96 | | | | 40.23 | |
Select Class — Offering and redemption price per share | | | 33.72 | | | | 38.08 | | | | 40.42 | |
Class A maximum sales charge | | | 5.25 | % | | | 5.25 | % | | | 5.25 | % |
Class A maximum public offering price per share
[net asset value per share/(100% — maximum sales charge)] | | $ | 35.41 | | | $ | 39.81 | | | $ | 42.42 | |
| | | | | | | | | | | | |
| | | |
Cost of investments in non-affiliates | | $ | 16,576 | | | $ | 2,544,318 | | | $ | 650,885 | |
Cost of investments in affiliates | | | 681 | | | | 104,962 | | | | 33,378 | |
Cost of foreign currency | | | — | | | | 35 | | | | 16 | |
| (a) | Per share amounts may not recalculate due to rounding of net assets and/or shares outstanding. |
| (b) | Redemption price for Class C shares varies based upon length of time the shares are held. |
SEE NOTES TO FINANCIAL STATEMENTS.
| | | | | | | | |
| | | |
| DECEMBER 31, 2014 | | J.P. MORGAN INTREPID FUNDS | | | | | 33 | |
STATEMENTS OF ASSETS AND LIABILITIES
AS OF DECEMBER 31, 2014 (Unaudited) (continued)
(Amounts in thousands, except per share amounts)
| | | | | | | | |
| | | Intrepid Mid Cap
Fund | | | Intrepid Value Fund | |
ASSETS: | | | | | | | | |
Investments in non-affiliates, at value | | $ | 730,728 | | | $ | 1,674,059 | |
Investments in affiliates, at value | | | 26,716 | | | | 40,784 | |
| | | | | | | | |
Total investment securities, at value | | | 757,444 | | | | 1,714,843 | |
Deposits at broker for futures contracts | | | 1,060 | | | | 1,890 | |
Receivables: | | | | | | | | |
Investment securities sold | | | 528 | | | | 2,724 | |
Fund shares sold | | | 4,790 | | | | 7,696 | |
Dividends from non-affiliates | | | 857 | | | | 1,525 | |
Dividends from affiliates | | | 2 | | | | 1 | |
| | | | | | | | |
Total Assets | | | 764,681 | | | | 1,728,679 | |
| | | | | | | | |
| | |
LIABILITIES: | | | | | | | | |
Payables: | | | | | | | | |
Investment securities purchased | | | 4,661 | | | | 11,860 | |
Fund shares redeemed | | | 1,048 | | | | 2,588 | |
Variation margin on futures contracts | | | 292 | | | | 449 | |
Accrued liabilities: | | | | | | | | |
Investment advisory fees | | | 352 | | | | 479 | |
Administration fees | | | 24 | | | | 73 | |
Distribution fees | | | 91 | | | | 60 | |
Shareholder servicing fees | | | 121 | | | | 168 | |
Custodian and accounting fees | | | 21 | | | | 28 | |
Trustees’ and Chief Compliance Officer’s fees | | | — | | | | 1 | |
Transfer agent fees | | | 65 | | | | 359 | |
Other | | | 40 | | | | 95 | |
| | | | | | | | |
Total Liabilities | | | 6,715 | | | | 16,160 | |
| | | | | | | | |
Net Assets | | $ | 757,966 | | | $ | 1,712,519 | |
| | | | | | | | |
SEE NOTES TO FINANCIAL STATEMENTS.
| | | | | | |
| | | |
| 34 | | | | J.P. MORGAN INTREPID FUNDS | | DECEMBER 31, 2014 |
| | | | | | | | |
| | | Intrepid Mid Cap
Fund | | | Intrepid Value Fund | |
NET ASSETS: | | | | | | | | |
Paid-in-Capital | | $ | 559,785 | | | $ | 1,325,715 | |
Accumulated undistributed (distributions in excess of) net investment income | | | (227 | ) | | | (135 | ) |
Accumulated net realized gains (losses) | | | 454 | | | | 918 | |
Net unrealized appreciation (depreciation) | | | 197,954 | | | | 386,021 | |
| | | | | | | | |
Total Net Assets | | $ | 757,966 | | | $ | 1,712,519 | |
| | | | | | | | |
| | |
Net Assets: | | | | | | | | |
Class A | | $ | 274,140 | | | $ | 148,364 | |
Class B | | | 4,705 | | | | — | |
Class C | | | 57,743 | | | | 45,363 | |
Class R2 | | | — | | | | 2,202 | |
Class R5 | | | — | | | | 84,277 | |
Class R6 | | | — | | | | 30,831 | |
Select Class | | | 421,378 | | | | 1,401,482 | |
| | | | | | | | |
Total | | $ | 757,966 | | | $ | 1,712,519 | |
| | | | | | | | |
| | |
Outstanding units of beneficial interest (shares) | | | | | | | | |
($0.0001 par value; unlimited number of shares authorized): | | | | | | | | |
Class A | | | 12,463 | | | | 4,130 | |
Class B | | | 245 | | | | — | |
Class C | | | 2,997 | | | | 1,276 | |
Class R2 | | | — | | | | 61 | |
Class R5 | | | — | | | | 2,332 | |
Class R6 | | | — | | | | 853 | |
Select Class | | | 18,378 | | | | 38,870 | |
| | |
Net Asset Value (a): | | | | | | | | |
Class A — Redemption price per share | | $ | 22.00 | | | $ | 35.92 | |
Class B — Offering price per share (b) | | | 19.26 | | | | — | |
Class C — Offering price per share (b) | | | 19.26 | | | | 35.55 | |
Class R2 — Offering and redemption price per share | | | — | | | | 35.79 | |
Class R5 — Offering and redemption price per share | | | — | | | | 36.14 | |
Class R6 — Offering and redemption price per share | | | — | | | | 36.15 | |
Select Class — Offering and redemption price per share | | | 22.93 | | | | 36.06 | |
Class A maximum sales charge | | | 5.25 | % | | | 5.25 | % |
Class A maximum public offering price per share
[net asset value per share/(100% — maximum sales charge)] | | $ | 23.22 | | | $ | 37.91 | |
| | | | | | | | |
| | |
Cost of investments in non-affiliates | | $ | 533,242 | | | $ | 1,288,766 | |
Cost of investments in affiliates | | | 26,716 | | | | 40,784 | |
| (a) | Per share amounts may not recalculate due to rounding of net assets and/or shares outstanding. |
| (b) | Redemption price for Class B and Class C shares varies based upon length of time the shares are held. |
SEE NOTES TO FINANCIAL STATEMENTS.
| | | | | | | | |
| | | |
| DECEMBER 31, 2014 | | J.P. MORGAN INTREPID FUNDS | | | | | 35 | |
STATEMENTS OF OPERATIONS
FOR THE SIX MONTHS ENDED DECEMBER 31, 2014 (Unaudited)
(Amounts in thousands)
| | | | | | | | | | | | |
| | | Intrepid
Advantage
Fund | | | Intrepid
America
Fund | | | Intrepid
Growth
Fund | |
INVESTMENT INCOME: | | | | | | | | | | | | |
Dividend income from non-affiliates | | $ | 219 | | | $ | 35,180 | | | $ | 5,650 | |
Dividend income from affiliates | | | — | (a) | | | 10 | | | | 3 | |
| | | | | | | | | | | | |
Total investment income | | | 219 | | | | 35,190 | | | | 5,653 | |
| | | | | | | | | | | | |
| | | |
EXPENSES: | | | | | | | | | | | | |
Investment advisory fees | | | 63 | | | | 6,517 | | | | 2,099 | |
Administration fees | | | 8 | | | | 1,339 | | | | 346 | |
Distribution fees: | | | | | | | | | | | | |
Class A | | | 13 | | | | 157 | | | | 57 | |
Class C | | | 18 | | | | 36 | | | | 93 | |
Class R2 | | | — | | | | 1 | | | | 2 | |
Shareholder servicing fees: | | | | | | | | | | | | |
Class A | | | 13 | | | | 157 | | | | 57 | |
Class C | | | 6 | | | | 12 | | | | 31 | |
Class R2 | | | — | | | | — | (a) | | | 1 | |
Class R5 | | | — | | | | 384 | | | | 33 | |
Select Class | | | 5 | | | | 1,966 | | | | 796 | |
Custodian and accounting fees | | | 14 | | | | 51 | | | | 21 | |
Professional fees | | | 23 | | | | 32 | | | | 29 | |
Trustees’ and Chief Compliance Officer’s fees | | | — | (a) | | | 16 | | | | 4 | |
Printing and mailing costs | | | 2 | | | | 38 | | | | 17 | |
Registration and filing fees | | | 20 | | | | 46 | | | | 44 | |
Transfer agent fees | | | 9 | | | | 166 | | | | 118 | |
Other | | | 7 | | | | 45 | | | | 17 | |
| | | | | | | | | | | | |
Total expenses | | | 201 | | | | 10,963 | | | | 3,765 | |
| �� | | | | | | | | | | | |
Less fees waived | | | (83 | ) | | | (126 | ) | | | (320 | ) |
Less expense reimbursements | | | — | | | | — | | | | (2 | ) |
| | | | | | | | | | | | |
Net expenses | | | 118 | | | | 10,837 | | | | 3,443 | |
| | | | | | | | | | | | |
Net investment income (loss) | | | 101 | | | | 24,353 | | | | 2,210 | |
| | | | | | | | | | | | |
| | | |
REALIZED/UNREALIZED GAINS (LOSSES): | | | | | | | | | | | | |
Net realized gain (loss) on transactions from: | | | | | | | | | | | | |
Investments in non-affiliates | | | 226 | | | | 109,380 | | | | 57,177 | |
Futures | | | — | | | | (707 | ) | | | 24 | |
Foreign currency transactions | | | — | | | | — | (a) | | | — | (a) |
| | | | | | | | | | | | |
Net realized gain (loss) | | | 226 | | | | 108,673 | | | | 57,201 | |
| | | | | | | | | | | | |
Change in net unrealized appreciation/depreciation of: | | | | | | | | | | | | |
Investments in non-affiliates | | | 811 | | | | 104,154 | | | | 14,463 | |
Futures | | | — | | | | 1,008 | | | | 357 | |
| | | | | | | | | | | | |
Change in net unrealized appreciation/depreciation | | | 811 | | | | 105,162 | | | | 14,820 | |
| | | | | | | | | | | | |
Net realized/unrealized gains (losses) | | | 1,037 | | | | 213,835 | | | | 72,021 | |
| | | | | | | | | | | | |
Change in net assets resulting from operations | | $ | 1,138 | | | $ | 238,188 | | | $ | 74,231 | |
| | | | | | | | | | | | |
| (a) | Amount rounds to less than $1,000. |
SEE NOTES TO FINANCIAL STATEMENTS.
| | | | | | |
| | | |
| 36 | | | | J.P. MORGAN INTREPID FUNDS | | DECEMBER 31, 2014 |
| | | | | | | | |
| | | Intrepid
Mid Cap
Fund | | | Intrepid
Value
Fund | |
INVESTMENT INCOME: | | | | | | | | |
Interest income from non-affiliates | | $ | 1 | | | $ | — | |
Dividend income from non-affiliates | | | 5,575 | | | | 16,462 | |
Dividend income from affiliates | | | 5 | | | | 5 | |
| | | | | | | | |
Total investment income | | | 5,581 | | | | 16,467 | |
| | | | | | | | |
| | |
EXPENSES: | | | | | | | | |
Investment advisory fees | | | 2,102 | | | | 3,170 | |
Administration fees | | | 267 | | | | 654 | |
Distribution fees: | | | | | | | | |
Class A | | | 266 | | | | 160 | |
Class B | | | 19 | | | | — | |
Class C | | | 196 | | | | 149 | |
Class R2 | | | — | | | | 4 | |
Shareholder servicing fees: | | | | | | | | |
Class A | | | 266 | | | | 160 | |
Class B | | | 7 | | | | — | |
Class C | | | 65 | | | | 50 | |
Class R2 | | | — | | | | 2 | |
Class R5 | | | — | | | | 21 | |
Select Class | | | 471 | | | | 1,633 | |
Custodian and accounting fees | | | 20 | | | | 29 | |
Professional fees | | | 26 | | | | 28 | |
Trustees’ and Chief Compliance Officer’s fees | | | 3 | | | | 8 | |
Printing and mailing costs | | | 35 | | | | 74 | |
Registration and filing fees | | | 26 | | | | 67 | |
Transfer agent fees | | | 188 | | | | 877 | |
Other | | | 7 | | | | 122 | |
| | | | | | | | |
Total expenses | | | 3,964 | | | | 7,208 | |
| | | | | | | | |
Less fees waived | | | (548 | ) | | | (1,136 | ) |
Less expense reimbursements | | | — | | | | — | (a) |
| | | | | | | | |
Net expenses | | | 3,416 | | | | 6,072 | |
| | | | | | | | |
Net investment income (loss) | | | 2,165 | | | | 10,395 | |
| | | | | | | | |
| | |
REALIZED/UNREALIZED GAINS (LOSSES): | | | | | | | | |
Net realized gain (loss) on transactions from: | | | | | | | | |
Investments in non-affiliates | | | 18,538 | | | | 80,896 | |
Futures | | | 257 | | | | 2,650 | |
| | | | | | | | |
Net realized gain (loss) | | | 18,795 | | | | 83,546 | |
| | | | | | | | |
Change in net unrealized appreciation/depreciation of: | | | | | | | | |
Investments in non-affiliates | | | 21,865 | | | | (10,001 | ) |
Futures | | | 295 | | | | 444 | |
| | | | | | | | |
Change in net unrealized appreciation/depreciation | | | 22,160 | | | | (9,557 | ) |
| | | | | | | | |
Net realized/unrealized gains (losses) | | | 40,955 | | | | 73,989 | |
| | | | | | | | |
Change in net assets resulting from operations | | $ | 43,120 | | | $ | 84,384 | |
| | | | | | | | |
| (a) | Amount rounds to less than $1,000. |
SEE NOTES TO FINANCIAL STATEMENTS.
| | | | | | | | |
| | | |
| DECEMBER 31, 2014 | | J.P. MORGAN INTREPID FUNDS | | | | | 37 | |
STATEMENTS OF CHANGES IN NET ASSETS
FOR THE PERIODS INDICATED
(Amounts in thousands)
| | | | | | | | | | | | | | | | |
| | | Intrepid Advantage Fund | | | Intrepid America Fund | |
| | | Six Months Ended
December 31, 2014
(Unaudited) | | | Year Ended
June 30, 2014 | | | Six Months Ended
December 31, 2014
(Unaudited) | | | Year Ended
June 30, 2014 | |
CHANGE IN NET ASSETS RESULTING FROM OPERATIONS: | | | | | | | | | | | | | | | | |
Net investment income (loss) | | $ | 101 | | | $ | 91 | | | $ | 24,353 | | | $ | 32,016 | |
Net realized gain (loss) | | | 226 | | | | 1,207 | | | | 108,673 | | | | 336,209 | |
Change in net unrealized appreciation/depreciation | | | 811 | | | | 1,936 | | | | 105,162 | | | | 251,755 | |
| | | | | | | | | | | | | | | | |
Change in net assets resulting from operations | | | 1,138 | | | | 3,234 | | | | 238,188 | | | | 619,980 | |
| | | | | | | | | | | | | | | | |
| | | | |
DISTRIBUTIONS TO SHAREHOLDERS: | | | | | | | | | | | | | | | | |
Class A | | | | | | | | | | | | | | | | |
From net investment income | | | (78 | ) | | | (54 | ) | | | (1,555 | ) | | | (777 | ) |
From net realized gains | | | — | | | | — | | | | (7,056 | ) | | | — | |
Class C | | | | | | | | | | | | | | | | |
From net investment income | | | (37 | ) | | | (7 | ) | | | (59 | ) | | | (22 | ) |
From net realized gains | | | — | | | | — | | | | (488 | ) | | | — | |
Class R2 | | | | | | | | | | | | | | | | |
From net investment income | | | — | | | | — | | | | (7 | ) | | | (1 | ) |
From net realized gains | | | — | | | | — | | | | (20 | ) | | | — | |
Class R5 | | | | | | | | | | | | | | | | |
From net investment income | | | — | | | | — | | | | (22,291 | ) | | | (11,848 | ) |
From net realized gains | | | — | | | | — | | | | (75,877 | ) | | | — | |
Select Class | | | | | | | | | | | | | | | | |
From net investment income | | | (33 | ) | | | (17 | ) | | | (17,845 | ) | | | (13,878 | ) |
From net realized gains | | | — | | | | — | | | | (72,997 | ) | | | — | |
| | | | | | | | | | | | | | | | |
Total distributions to shareholders | | | (148 | ) | | | (78 | ) | | | (198,195 | ) | | | (26,526 | ) |
| | | | | | | | | | | | | | | | |
| | | | |
CAPITAL TRANSACTIONS: | | | | | | | | | | | | | | | | |
Change in net assets resulting from capital transactions | | | 4,983 | | | | 882 | | | | 442,979 | | | | 192,385 | |
| | | | | | | | | | | | | | | | |
| | | | |
NET ASSETS: | | | | | | | | | | | | | | | | |
Change in net assets | | | 5,973 | | | | 4,038 | | | | 482,972 | | | | 785,839 | |
Beginning of period | | | 16,613 | | | | 12,575 | | | | 2,983,633 | | | | 2,197,794 | |
| | | | | | | | | | | | | | | | |
End of period | | $ | 22,586 | | | $ | 16,613 | | | $ | 3,466,605 | | | $ | 2,983,633 | |
| | | | | | | | | | | | | | | | |
Accumulated undistributed (distributions in excess of) net investment income | | $ | 2 | | | $ | 49 | | | $ | (146 | ) | | $ | 17,258 | |
| | | | | | | | | | | | | | | | |
SEE NOTES TO FINANCIAL STATEMENTS.
| | | | | | |
| | | |
| 38 | | | | J.P. MORGAN INTREPID FUNDS | | DECEMBER 31, 2014 |
| | | | | | | | | | | | | | | | |
| | | Intrepid Growth Fund | | | Intrepid Mid Cap Fund | |
| | | Six Months Ended
December 31, 2014
(Unaudited) | | | Year Ended
June 30, 2014 | | | Six Months Ended
December 31, 2014
(Unaudited) | | | Year Ended
June 30, 2014 | |
CHANGE IN NET ASSETS RESULTING FROM OPERATIONS: | | | | | | | | | | | | | | | | |
Net investment income (loss) | | $ | 2,210 | | | $ | 6,041 | | | $ | 2,165 | | | $ | 2,713 | |
Net realized gain (loss) | | | 57,201 | | | | 104,085 | | | | 18,795 | | | | 110,696 | |
Change in net unrealized appreciation/depreciation | | | 14,820 | | | | 72,151 | | | | 22,160 | | | | 34,506 | |
| | | | | | | | | | | | | | | | |
Change in net assets resulting from operations | | | 74,231 | | | | 182,277 | | | | 43,120 | | | | 147,915 | |
| | | | | | | | | | | | | | | | |
| | | | |
DISTRIBUTIONS TO SHAREHOLDERS: | | | | | | | | | | | | | | | | |
Class A | | | | | | | | | | | | | | | | |
From net investment income | | | (320 | ) | | | (112 | ) | | | (714 | ) | | | (505 | ) |
From net realized gains | | | — | | | | — | | | | (33,270 | ) | | | (788 | ) |
Class B | | | | | | | | | | | | | | | | |
From net investment income | | | — | | | | — | | | | (5 | ) | | | — | |
From net realized gains | | | — | | | | — | | | | (722 | ) | | | (33 | ) |
Class C | | | | | | | | | | | | | | | | |
From net investment income | | | (45 | ) | | | (8 | ) | | | (74 | ) | | | — | |
From net realized gains | | | — | | | | — | | | | (8,490 | ) | | | (205 | ) |
Class R2 | | | | | | | | | | | | | | | | |
From net investment income | | | (1 | ) | | | (1 | ) | | | — | | | | — | |
Class R5 | | | | | | | | | | | | | | | | |
From net investment income | | | (995 | ) | | | (1,052 | ) | | | — | | | | — | |
Select Class | | | | | | | | | | | | | | | | |
From net investment income | | | (3,526 | ) | | | (4,372 | ) | | | (1,516 | ) | | | (1,684 | ) |
From net realized gains | | | — | | | | — | | | | (53,175 | ) | | | (1,755 | ) |
| | | | | | | | | | | | | | | | |
Total distributions to shareholders | | | (4,887 | ) | | | (5,545 | ) | | | (97,966 | ) | | | (4,970 | ) |
| | | | | | | | | | | | | | | | |
| | | | |
CAPITAL TRANSACTIONS: | | | | | | | | | | | | | | | | |
Change in net assets resulting from capital transactions | | | 71,733 | | | | (94,414 | ) | | | 215,917 | | | | (61,813 | ) |
| | | | | | | | | | | | | | | | |
| | | | |
NET ASSETS: | | | | | | | | | | | | | | | | |
Change in net assets | | | 141,077 | | | | 82,318 | | | | 161,071 | | | | 81,132 | |
Beginning of period | | | 776,182 | | | | 693,864 | | | | 596,895 | | | | 515,763 | |
| | | | | | | | | | | | | | | | |
End of period | | $ | 917,259 | | | $ | 776,182 | | | $ | 757,966 | | | $ | 596,895 | |
| | | | | | | | | | | | | | | | |
Accumulated undistributed (distributions in excess of) net investment income | | $ | 46 | | | $ | 2,723 | | | $ | (227 | ) | | $ | (83 | ) |
| | | | | | | | | | | | | | | | |
SEE NOTES TO FINANCIAL STATEMENTS.
| | | | | | | | |
| | | |
| DECEMBER 31, 2014 | | J.P. MORGAN INTREPID FUNDS | | | | | 39 | |
STATEMENTS OF CHANGES IN NET ASSETS
FOR THE PERIODS INDICATED (continued)
(Amounts in thousands)
| | | | | | | | |
| | | Intrepid Value Fund | |
| | | Six Months Ended
December 31, 2014
(Unaudited) | | | Year Ended
June 30, 2014 | |
CHANGE IN NET ASSETS RESULTING FROM OPERATIONS: | | | | | | | | |
Net investment income (loss) | | $ | 10,395 | | | $ | 17,585 | |
Net realized gain (loss) | | | 83,546 | | | | 115,586 | |
Change in net unrealized appreciation/depreciation | | | (9,557 | ) | | | 172,882 | |
| | | | | | | | |
Change in net assets resulting from operations | | | 84,384 | | | | 306,053 | |
| | | | | | | | |
| | |
DISTRIBUTIONS TO SHAREHOLDERS: | | | | | | | | |
Class A | | | | | | | | |
From net investment income | | | (783 | ) | | | (1,034 | ) |
From net realized gains | | | (10,740 | ) | | | — | |
Class C | | | | | | | | |
From net investment income | | | (163 | ) | | | (214 | ) |
From net realized gains | | | (3,334 | ) | | | — | |
Class R2 | | | | | | | | |
From net investment income | | | (10 | ) | | | (9 | ) |
From net realized gains | | | (155 | ) | | | — | |
Class R5 | | | | | | | | |
From net investment income | | | (597 | ) | | | (1,055 | ) |
From net realized gains | | | (6,160 | ) | | | — | |
Class R6 | | | | | | | | |
From net investment income | | | (209 | ) | | | (234 | ) |
From net realized gains | | | (2,196 | ) | | | — | |
Select Class | | | | | | | | |
From net investment income | | | (8,627 | ) | | | (14,448 | ) |
From net realized gains | | | (102,921 | ) | | | — | |
| | | | | | | | |
Total distributions to shareholders | | | (135,895 | ) | | | (16,994 | ) |
| | | | | | | | |
| | |
CAPITAL TRANSACTIONS: | | | | | | | | |
Change in net assets resulting from capital transactions | | | 298,417 | | | | 78,434 | |
| | | | | | | | |
| | |
NET ASSETS: | | | | | | | | |
Change in net assets | | | 246,906 | | | | 367,493 | |
Beginning of period | | | 1,465,613 | | | | 1,098,120 | |
| | | | | | | | |
End of period | | $ | 1,712,519 | | | $ | 1,465,613 | |
| | | | | | | | |
Accumulated undistributed (distributions in excess of) net investment income | | $ | (135 | ) | | $ | (141 | ) |
| | | | | | | | |
SEE NOTES TO FINANCIAL STATEMENTS.
| | | | | | |
| | | |
| 40 | | | | J.P. MORGAN INTREPID FUNDS | | DECEMBER 31, 2014 |
| | | | | | | | | | | | | | | | |
| | | Intrepid Advantage Fund | | | Intrepid America Fund | |
| | | Six Months Ended
December 31, 2014
(Unaudited) | | | Year Ended
June 30, 2014 | | | Six Months Ended
December 31, 2014
(Unaudited) | | | Year Ended
June 30, 2014 | |
CAPITAL TRANSACTIONS: | | | | | | | | | | | | | | | | |
Class A | | | | | | | | | | | | | | | | |
Proceeds from shares issued | | $ | 2,383 | | | $ | 1,047 | | | $ | 69,232 | | | $ | 51,201 | |
Distributions reinvested | | | 77 | | | | 54 | | | | 7,997 | | | | 505 | |
Cost of shares redeemed | | | (713 | ) | | | (2,430 | ) | | | (19,373 | ) | | | (64,819 | ) |
| | | | | | | | | | | | | | | | |
Change in net assets resulting from Class A capital transactions | | $ | 1,747 | | | $ | (1,329 | ) | | $ | 57,856 | | | $ | (13,113 | ) |
| | | | | | | | | | | | | | | | |
Class C | | | | | | | | | | | | | | | | |
Proceeds from shares issued | | $ | 2,650 | | | $ | 997 | | | $ | 2,750 | | | $ | 1,022 | |
Distributions reinvested | | | 35 | | | | 7 | | | | 508 | | | | 21 | |
Cost of shares redeemed | | | (164 | ) | | | (218 | ) | | | (803 | ) | | | (1,397 | ) |
| | | | | | | | | | | | | | | | |
Change in net assets resulting from Class C capital transactions | | $ | 2,521 | | | $ | 786 | | | $ | 2,455 | | | $ | (354 | ) |
| | | | | | | | | | | | | | | | |
Class R2 | | | | | | | | | | | | | | | | |
Proceeds from shares issued | | $ | — | | | $ | — | | | $ | 603 | | | $ | 54 | |
Distributions reinvested | | | — | | | | — | | | | 10 | | | | 1 | |
Cost of shares redeemed | | | — | | | | — | | | | (98 | ) | | | (99 | ) |
| | | | | | | | | | | | | | | | |
Change in net assets resulting from Class R2 capital transactions | | $ | — | | | $ | — | | | $ | 515 | | | $ | (44 | ) |
| | | | | | | | | | | | | | | | |
Class R5 | | | | | | | | | | | | | | | | |
Proceeds from shares issued | | $ | — | | | $ | — | | | $ | 229,726 | | | $ | 426,650 | |
Distributions reinvested | | | — | | | | — | | | | 98,125 | | | | 11,848 | |
Cost of shares redeemed | | | — | | | | — | | | | (3,191 | ) | | | (20,847 | ) |
| | | | | | | | | | | | | | | | |
Change in net assets resulting from Class R5 capital transactions | | $ | — | | | $ | — | | | $ | 324,660 | | | $ | 417,651 | |
| | | | | | | | | | | | | | | | |
Select Class | | | | | | | | | | | | | | | | |
Proceeds from shares issued | | $ | 739 | | | $ | 1,514 | | | $ | 80,054 | | | $ | 101,250 | |
Distributions reinvested | | | 22 | | | | 6 | | | | 75,360 | | | | 11,463 | |
Cost of shares redeemed | | | (46 | ) | | | (95 | ) | | | (97,921 | ) | | | (324,468 | ) |
| | | | | | | | | | | | | | | | |
Change in net assets resulting from Select Class capital transactions | | $ | 715 | | | $ | 1,425 | | | $ | 57,493 | | | $ | (211,755 | ) |
| | | | | | | | | | | | | | | | |
Total change in net assets resulting from capital transactions | | $ | 4,983 | | | $ | 882 | | | $ | 442,979 | | | $ | 192,385 | |
| | | | | | | | | | | | | | | | |
SEE NOTES TO FINANCIAL STATEMENTS.
| | | | | | | | |
| | | |
| DECEMBER 31, 2014 | | J.P. MORGAN INTREPID FUNDS | | | | | 41 | |
STATEMENTS OF CHANGES IN NET ASSETS
FOR THE PERIODS INDICATED (continued)
(Amounts in thousands)
| | | | | | | | | | | | | | | | |
| | | Intrepid Advantage Fund | | | Intrepid America Fund | |
| | | Six Months Ended
December 31, 2014
(Unaudited) | | | Year Ended
June 30, 2014 | | | Six Months Ended
December 31, 2014
(Unaudited) | | | Year Ended
June 30, 2014 | |
SHARE TRANSACTIONS: | | | | | | | | | | | | | | | | |
Class A | | | | | | | | | | | | | | | | |
Issued | | | 73 | | | | 37 | | | | 1,824 | | | | 1,526 | |
Reinvested | | | 2 | | | | 2 | | | | 216 | | | | 15 | |
Redeemed | | | (22 | ) | | | (85 | ) | | | (504 | ) | | | (1,891 | ) |
| | | | | | | | | | | | | | | | |
Change in Class A Shares | | | 53 | | | | (46 | ) | | | 1,536 | | | | (350 | ) |
| | | | | | | | | | | | | | | | |
Class C | | | | | | | | | | | | | | | | |
Issued | | | 83 | | | | 34 | | | | 73 | | | | 30 | |
Reinvested | | | 1 | | | | — | (a) | | | 14 | | | | 1 | |
Redeemed | | | (5 | ) | | | (8 | ) | | | (21 | ) | | | (42 | ) |
| | | | | | | | | | | | | | | | |
Change in Class C Shares | | | 79 | | | | 26 | | | | 66 | | | | (11 | ) |
| | | | | | | | | | | | | | | | |
Class R2 | | | | | | | | | | | | | | | | |
Issued | | | — | | | | — | | | | 16 | | | | 2 | |
Reinvested | | | — | | | | — | | | | — | (a) | | | — | (a) |
Redeemed | | | — | | | | — | | | | (3 | ) | | | (3 | ) |
| | | | | | | | | | | | | | | | |
Change in Class R2 Shares | | | — | | | | — | | | | 13 | | | | (1 | ) |
| | | | | | | | | | | | | | | | |
Class R5 | | | | | | | | | | | | | | | | |
Issued | | | — | | | | — | | | | 6,008 | | | | 12,842 | |
Reinvested | | | — | | | | — | | | | 2,615 | | | | 348 | |
Redeemed | | | — | | | | — | | | | (83 | ) | | | (603 | ) |
| | | | | | | | | | | | | | | | |
Change in Class R5 Shares | | | — | | | | — | | | | 8,540 | | | | 12,587 | |
| | | | | | | | | | | | | | | | |
Select Class | | | | | | | | | | | | | | | | |
Issued | | | 22 | | | | 51 | | | | 2,143 | | | | 3,090 | |
Reinvested | | | 1 | | | | — | (a) | | | 2,006 | | | | 335 | |
Redeemed | | | (1 | ) | | | (3 | ) | | | (2,508 | ) | | | (9,563 | ) |
| | | | | | | | | | | | | | | | |
Change in Select Class Shares | | | 22 | | | | 48 | | | | 1,641 | | | | (6,138 | ) |
| | | | | | | | | | | | | | | | |
| (a) | Amount rounds to less than 1,000 shares. |
SEE NOTES TO FINANCIAL STATEMENTS.
| | | | | | |
| | | |
| 42 | | | | J.P. MORGAN INTREPID FUNDS | | DECEMBER 31, 2014 |
| | | | | | | | | | | | | | | | |
| | | Intrepid Growth Fund | | | Intrepid Mid Cap Fund | |
| | | Six Months Ended
December 31, 2014
(Unaudited) | | | Year Ended
June 30, 2014 | | | Six Months Ended
December 31, 2014
(Unaudited) | | | Year Ended
June 30, 2014 | |
CAPITAL TRANSACTIONS: | | | | | | | | | | | | | | | | |
Class A | | | | | | | | | | | | | | | | |
Proceeds from shares issued | | $ | 42,457 | | | $ | 8,517 | | | $ | 92,222 | | | $ | 41,307 | |
Distributions reinvested | | | 307 | | | | 108 | | | | 32,192 | | | | 1,257 | |
Cost of shares redeemed | | | (8,693 | ) | | | (15,891 | ) | | | (23,789 | ) | | | (34,483 | ) |
| | | | | | | | | | | | | | | | |
Change in net assets resulting from Class A capital transactions | | $ | 34,071 | | | $ | (7,266 | ) | | $ | 100,625 | | | $ | 8,081 | |
| | | | | | | | | | | | | | | | |
Class B | | | | | | | | | | | | | | | | |
Proceeds from shares issued | | $ | — | | | $ | — | | | $ | 95 | | | $ | 142 | |
Distributions reinvested | | | — | | | | — | | | | 691 | | | | 32 | |
Cost of shares redeemed | | | — | | | | — | | | | (1,321 | ) | | | (3,652 | ) |
| | | | | | | | | | | | | | | | |
Change in net assets resulting from Class B capital transactions | | $ | — | | | $ | — | | | $ | (535 | ) | | $ | (3,478 | ) |
| | | | | | | | | | | | | | | | |
Class C | | | | | | | | | | | | | | | | |
Proceeds from shares issued | | $ | 14,131 | | | $ | 2,456 | | | $ | 10,120 | | | $ | 11,340 | |
Distributions reinvested | | | 35 | | | | 6 | | | | 7,809 | | | | 192 | |
Cost of shares redeemed | | | (1,755 | ) | | | (2,301 | ) | | | (4,573 | ) | | | (8,150 | ) |
| | | | | | | | | | | | | | | | |
Change in net assets resulting from Class C capital transactions | | $ | 12,411 | | | $ | 161 | | | $ | 13,356 | | | $ | 3,382 | |
| | | | | | | | | | | | | | | | |
Class R2 | | | | | | | | | | | | | | | | |
Proceeds from shares issued | | $ | 322 | | | $ | 79 | | | $ | — | | | $ | — | |
Distributions reinvested | | | 1 | | | | 1 | | | | — | | | | — | |
Cost of shares redeemed | | | (208 | ) | | | (211 | ) | | | — | | | | — | |
| | | | | | | | | | | | | | | | |
Change in net assets resulting from Class R2 capital transactions | | $ | 115 | | | $ | (131 | ) | | $ | — | | | $ | — | |
| | | | | | | | | | | | | | | | |
Class R5 | | | | | | | | | | | | | | | | |
Proceeds from shares issued | | $ | 21,115 | | | $ | 12,500 | | | $ | — | | | $ | — | |
Distributions reinvested | | | 994 | | | | 1,052 | | | | — | | | | — | |
Cost of shares redeemed | | | (8,425 | ) | | | (21,523 | ) | | | — | | | | — | |
| | | | | | | | | | | | | | | | |
Change in net assets resulting from Class R5 capital transactions | | $ | 13,684 | | | $ | (7,971 | ) | | $ | — | | | $ | — | |
| | | | | | | | | | | | | | | | |
Select Class | | | | | | | | | | | | | | | | |
Proceeds from shares issued | | $ | 59,914 | | | $ | 46,041 | | | $ | 84,175 | | | $ | 57,111 | |
Distributions reinvested | | | 3,214 | | | | 3,875 | | | | 49,164 | | | | 3,315 | |
Cost of shares redeemed | | | (51,676 | ) | | | (129,123 | ) | | | (30,868 | ) | | | (130,224 | ) |
| | | | | | | | | | | | | | | | |
Change in net assets resulting from Select Class capital transactions | | $ | 11,452 | | | $ | (79,207 | ) | | $ | 102,471 | | | $ | (69,798 | ) |
| | | | | | | | | | | | | | | | |
Total change in net assets resulting from capital transactions | | $ | 71,733 | | | $ | (94,414 | ) | | $ | 215,917 | | | $ | (61,813 | ) |
| | | | | | | | | | | | | | | | |
SEE NOTES TO FINANCIAL STATEMENTS.
| | | | | | | | |
| | | |
| DECEMBER 31, 2014 | | J.P. MORGAN INTREPID FUNDS | | | | | 43 | |
STATEMENTS OF CHANGES IN NET ASSETS
FOR THE PERIODS INDICATED (continued)
(Amounts in thousands)
| | | | | | | | | | | | | | | | |
| | | Intrepid Growth Fund | | | Intrepid Mid Cap Fund | |
| | | Six Months Ended
December 31, 2014
(Unaudited) | | | Year Ended
June 30, 2014 | | | Six Months Ended
December 31, 2014
(Unaudited) | | | Year Ended
June 30, 2014 | |
SHARE TRANSACTIONS: | | | | | | | | | | | | | | | | |
Class A | | | | | | | | | | | | | | | | |
Issued | | | 1,088 | | | | 250 | | | | 3,939 | | | | 1,876 | |
Reinvested | | | 8 | | | | 3 | | | | 1,514 | | | | 57 | |
Redeemed | | | (231 | ) | | | (491 | ) | | | (1,010 | ) | | | (1,597 | ) |
| | | | | | | | | | | | | | | | |
Change in Class A Shares | | | 865 | | | | (238 | ) | | | 4,443 | | | | 336 | |
| | | | | | | | | | | | | | | | |
Class B | | | | | | | | | | | | | | | | |
Issued | | | — | | | | — | | | | 5 | | | | 8 | |
Reinvested | | | — | | | | — | | | | 37 | | | | 2 | |
Redeemed | | | — | | | | — | | | | (61 | ) | | | (188 | ) |
| | | | | | | | | | | | | | | | |
Change in Class B Shares | | | — | | | | — | | | | (19 | ) | | | (178 | ) |
| | | | | | | | | | | | | | | | |
Class C | | | | | | | | | | | | | | | | |
Issued | | | 370 | | | | 74 | | | | 487 | | | | 581 | |
Reinvested | | | 1 | | | | — | (a) | | | 419 | | | | 10 | |
Redeemed | | | (45 | ) | | | (71 | ) | | | (218 | ) | | | (421 | ) |
| | | | | | | | | | | | | | | | |
Change in Class C Shares | | | 326 | | | | 3 | | | | 688 | | | | 170 | |
| | | | | | | | | | | | | | | | |
Class R2 | | | | | | | | | | | | | | | | |
Issued | | | 9 | | | | 2 | | | | — | | | | — | |
Reinvested | | | — | (a) | | | — | (a) | | | — | | | | — | |
Redeemed | | | (5 | ) | | | (7 | ) | | | — | | | | — | |
| | | | | | | | | | | | | | | | |
Change in Class R2 Shares | | | 4 | | | | (5 | ) | | | — | | | | — | |
| | | | | | | | | | | | | | | | |
Class R5 | | | | | | | | | | | | | | | | |
Issued | | | 535 | | | | 367 | | | | — | | | | — | |
Reinvested | | | 24 | | | | 31 | | | | — | | | | — | |
Redeemed | | | (218 | ) | | | (641 | ) | | | — | | | | — | |
| | | | | | | | | | | | | | | | |
Change in Class R5 Shares | | | 341 | | | | (243 | ) | | | — | | | | — | |
| | | | | | | | | | | | | | | | |
Select Class | | | | | | | | | | | | | | | | |
Issued | | | 1,554 | | | | 1,443 | | | | 3,446 | | | | 2,579 | |
Reinvested | | | 79 | | | | 113 | | | | 2,216 | | | | 144 | |
Redeemed | | | (1,303 | ) | | | (3,732 | ) | | | (1,222 | ) | | | (5,636 | ) |
| | | | | | | | | | | | | | | | |
Change in Select Class Shares | | | 330 | | | | (2,176 | ) | | | 4,440 | | | | (2,913 | ) |
| | | | | | | | | | | | | | | | |
| (a) | Amount rounds to less than 1,000 shares. |
SEE NOTES TO FINANCIAL STATEMENTS.
| | | | | | |
| | | |
| 44 | | | | J.P. MORGAN INTREPID FUNDS | | DECEMBER 31, 2014 |
| | | | | | | | |
| | | Intrepid Value Fund | |
| | | Six Months Ended
December 31, 2014
(Unaudited) | | | Year Ended
June 30, 2014 | |
CAPITAL TRANSACTIONS: | | | | | | | | |
Class A | | | | | | | | |
Proceeds from shares issued | | $ | 45,747 | | | $ | 45,132 | |
Distributions reinvested | | | 11,127 | | | | 1,016 | |
Cost of shares redeemed | | | (18,444 | ) | | | (22,532 | ) |
| | | | | | | | |
Change in net assets resulting from Class A capital transactions | | $ | 38,430 | | | $ | 23,616 | |
| | | | | | | | |
Class C | | | | | | | | |
Proceeds from shares issued | | $ | 10,939 | | | $ | 8,164 | |
Distributions reinvested | | | 3,092 | | | | 193 | |
Cost of shares redeemed | | | (3,175 | ) | | | (4,558 | ) |
| | | | | | | | |
Change in net assets resulting from Class C capital transactions | | $ | 10,856 | | | $ | 3,799 | |
| | | | | | | | |
Class R2 | | | | | | | | |
Proceeds from shares issued | | $ | 1,040 | | | $ | 491 | |
Distributions reinvested | | | 103 | | | | 7 | |
Cost of shares redeemed | | | (214 | ) | | | (289 | ) |
| | | | | | | | |
Change in net assets resulting from Class R2 capital transactions | | $ | 929 | | | $ | 209 | |
| | | | | | | | |
Class R5 | | | | | | | | |
Proceeds from shares issued | | $ | 8,640 | | | $ | 10,240 | |
Distributions reinvested | | | 6,757 | | | | 1,055 | |
Cost of shares redeemed | | | (8,955 | ) | | | (9,584 | ) |
| | | | | | | | |
Change in net assets resulting from Class R5 capital transactions | | $ | 6,442 | | | $ | 1,711 | |
| | | | | | | | |
Class R6 | | | | | | | | |
Proceeds from shares issued | | $ | 12,133 | | | $ | 20,752 | |
Distributions reinvested | | | 2,405 | | | | 234 | |
Cost of shares redeemed | | | (2,160 | ) | | | (15,146 | ) |
| | | | | | | | |
Change in net assets resulting from Class R6 capital transactions | | $ | 12,378 | | | $ | 5,840 | |
| | | | | | | | |
Select Class | | | | | | | | |
Proceeds from shares issued | | $ | 290,370 | | | $ | 447,101 | |
Distributions reinvested | | | 100,231 | | | | 11,704 | |
Cost of shares redeemed | | | (161,219 | ) | | | (415,546 | ) |
| | | | | | | | |
Change in net assets resulting from Select Class capital transactions | | $ | 229,382 | | | $ | 43,259 | |
| | | | | | | | |
Total change in net assets resulting from capital transactions | | $ | 298,417 | | | $ | 78,434 | |
| | | | | | | | |
SEE NOTES TO FINANCIAL STATEMENTS.
| | | | | | | | |
| | | |
| DECEMBER 31, 2014 | | J.P. MORGAN INTREPID FUNDS | | | | | 45 | |
STATEMENTS OF CHANGES IN NET ASSETS
FOR THE PERIODS INDICATED (continued)
(Amounts in thousands)
| | | | | | | | |
| | | Intrepid Value Fund | |
| | | Six Months Ended
December 31, 2014
(Unaudited) | | | Year Ended
June 30, 2014 | |
SHARE TRANSACTIONS: | | | | | | | | |
Class A | | | | | | | | |
Issued | | | 1,235 | | | | 1,328 | |
Reinvested | | | 319 | | | | 29 | |
Redeemed | | | (496 | ) | | | (674 | ) |
| | | | | | | | |
Change in Class A Shares | | | 1,058 | | | | 683 | |
| | | | | | | | |
Class C | | | | | | | | |
Issued | | | 296 | | | | 243 | |
Reinvested | | | 90 | | | | 6 | |
Redeemed | | | (87 | ) | | | (137 | ) |
| | | | | | | | |
Change in Class C Shares | | | 299 | | | | 112 | |
| | | | | | | | |
Class R2 | | | | | | | | |
Issued | | | 28 | | | | 13 | |
Reinvested | | | 3 | | | | — | (a) |
Redeemed | | | (6 | ) | | | (9 | ) |
| | | | | | | | |
Change in Class R2 Shares | | | 25 | | | | 4 | |
| | | | | | | | |
Class R5 | | | | | | | | |
Issued | | | 232 | | | | 305 | |
Reinvested | | | 192 | | | | 30 | |
Redeemed | | | (236 | ) | | | (287 | ) |
| | | | | | | | |
Change in Class R5 Shares | | | 188 | | | | 48 | |
| | | | | | | | |
Class R6 | | | | | | | | |
Issued | | | 320 | | | | 577 | |
Reinvested | | | 69 | | | | 7 | |
Redeemed | | | (58 | ) | | | (426 | ) |
| | | | | | | | |
Change in Class R6 Shares | | | 331 | | | | 158 | |
| | | | | | | | |
Select Class | | | | | | | | |
Issued | | | 7,693 | | | | 13,485 | |
Reinvested | | | 2,862 | | | | 337 | |
Redeemed | | | (4,296 | ) | | | (12,261 | ) |
| | | | | | | | |
Change in Select Class Shares | | | 6,259 | | | | 1,561 | |
| | | | | | | | |
| (a) | Amount rounds to less than 1,000 shares. |
SEE NOTES TO FINANCIAL STATEMENTS.
| | | | | | |
| | | |
| 46 | | | | J.P. MORGAN INTREPID FUNDS | | DECEMBER 31, 2014 |
THIS PAGE IS INTENTIONALLY LEFT BLANK
| | | | | | | | |
| | | |
| DECEMBER 31, 2014 | | J.P. MORGAN INTREPID FUNDS | | | | | 47 | |
FINANCIAL HIGHLIGHTS
FOR THE PERIODS INDICATED
| | | | | | | | | | | | | | | | | | | | |
| | | Per share operating performance | |
| | | | | | Investment operations | | | Distributions | |
| | | Net asset
value,
beginning
of period | | | Net
investment
income
(loss) | | | Net realized
and unrealized
gains
(losses) on
investments | | | Total from
investment
operations | | | Net
investment
income | |
Intrepid Advantage Fund | | | | | | | | | | | | | | | | | | | | |
Class A | | | | | | | | | | | | | | | | | | | | |
Six Months Ended December 31, 2014 (Unaudited) | | $ | 31.93 | | | $ | 0.18 | (f)(g) | | $ | 1.66 | | | $ | 1.84 | | | $ | (0.22 | ) |
Year Ended June 30, 2014 | | | 25.54 | | | | 0.20 | (f) | | | 6.37 | | | | 6.57 | | | | (0.18 | ) |
Year Ended June 30, 2013 | | | 21.13 | | | | 0.21 | (f)(h) | | | 4.44 | | | | 4.65 | | | | (0.24 | ) |
Year Ended June 30, 2012 | | | 20.60 | | | | 0.13 | (f) | | | 0.63 | | | | 0.76 | | | | (0.23 | ) |
Year Ended June 30, 2011 | | | 15.44 | | | | 0.17 | (f) | | | 5.03 | | | | 5.20 | | | | (0.04 | ) |
Year Ended June 30, 2010 | | | 13.42 | | | | 0.05 | (f) | | | 2.16 | | | | 2.21 | | | | (0.19 | ) |
| | | | | |
Class C | | | | | | | | | | | | | | | | | | | | |
Six Months Ended December 31, 2014 (Unaudited) | | | 31.38 | | | | 0.11 | (f)(g) | | | 1.62 | | | | 1.73 | | | | (0.19 | ) |
Year Ended June 30, 2014 | | | 25.14 | | | | 0.05 | (f) | | | 6.26 | | | | 6.31 | | | | (0.07 | ) |
Year Ended June 30, 2013 | | | 20.81 | | | | 0.10 | (f)(h) | | | 4.37 | | | | 4.47 | | | | (0.14 | ) |
Year Ended June 30, 2012 | | | 20.25 | | | | 0.04 | (f) | | | 0.62 | | | | 0.66 | | | | (0.10 | ) |
Year Ended June 30, 2011 | | | 15.22 | | | | 0.08 | (f) | | | 4.95 | | | | 5.03 | | | | — | |
Year Ended June 30, 2010 | | | 13.27 | | | | (0.03 | )(f) | | | 2.13 | | | | 2.10 | | | | (0.15 | ) |
| | | | | |
Select Class | | | | | | | | | | | | | | | | | | | | |
Six Months Ended December 31, 2014 (Unaudited) | | | 32.07 | | | | 0.22 | (f)(g) | | | 1.69 | | | | 1.91 | | | | (0.26 | ) |
Year Ended June 30, 2014 | | | 25.65 | | | | 0.28 | (f) | | | 6.39 | | | | 6.67 | | | | (0.25 | ) |
Year Ended June 30, 2013 | | | 21.21 | | | | 0.28 | (f)(h) | | | 4.45 | | | | 4.73 | | | | (0.29 | ) |
Year Ended June 30, 2012 | | | 20.70 | | | | 0.19 | (f) | | | 0.62 | | | | 0.81 | | | | (0.30 | ) |
Year Ended June 30, 2011 | | | 15.51 | | | | 0.21 | (f) | | | 5.06 | | | | 5.27 | | | | (0.08 | ) |
Year Ended June 30, 2010 | | | 13.46 | | | | 0.09 | (f) | | | 2.17 | | | | 2.26 | | | | (0.21 | ) |
| (a) | Annualized for periods less than one year, unless otherwise noted. |
| (b) | Not annualized for periods less than one year. |
| (c) | Includes adjustments in accordance with accounting principles generally accepted in the United States of America and as such, the net asset values for financial reporting purposes and the returns based upon those net asset values may differ from the net asset values and returns for shareholder transactions. |
| (d) | Includes earnings credits and interest expense, if applicable, each of which is less than 0.01% unless otherwise noted. |
| (e) | Portfolio turnover is calculated by dividing the lesser of total purchases or sales of portfolio securities for the reporting period by the monthly average value of portfolio securities owned during the reporting period. Excluded from both the numerator and denominator are amounts relating to derivatives and securities whose maturities or expiration dates at the time of acquisition were one year or less. |
| (f) | Calculated based upon average shares outstanding. |
| (g) | Reflects special dividends paid out during the period by several of the Fund’s holdings. Had the Fund not received the special dividends, the net investment income (loss) per share would have been $0.11, $0.03 and $0.15 for Class A, Class C and Select Class Shares, respectively, and the net investment income (loss) ratio would have been 0.66%, 0.22% and 0.89% for Class A, Class C and Select Class Shares, respectively. |
| (h) | Reflects special dividends paid out during the period by several of the Fund’s holdings. Had the Fund not received the special dividends, the net investment income (loss) per share would have been $0.17, $0.06 and $0.23 for Class A, Class C and Select Class Shares, respectively, and the net investment income (loss) ratio would have been 0.73%, 0.24% and 1.00% for Class A, Class C and Select Class Shares, respectively. |
SEE NOTES TO FINANCIAL STATEMENTS.
| | | | | | |
| | | |
| 48 | | | | J.P. MORGAN INTREPID FUNDS | | DECEMBER 31, 2014 |
| | | | | | | | | | | | | | | | | | | | | | | | | | |
| | | Ratios/Supplemental data | |
| | | | | | | | | | Ratios to average net assets (a) | | | | |
Net asset
value,
end of
period | | | Total return
(excludes
sales charge) (b)(c) | | | Net assets,
end of
period
(000’s) | | | Net
expenses (d) | | | Net
investment
income
(loss) | | |
Expenses
without waivers,
reimbursements and
earnings credits | | | Portfolio
turnover
rate (b)(e) | |
| | | | | | | | | | | | | | | | | | | | | | | | | | |
| | | | | | | | | | | | | | | | | | | | | | | | | | |
| $ | 33.55 | | | | 5.77 | % | | $ | 11,750 | | | | 1.15 | % | | | 1.11 | %(g) | | | 2.01 | % | | | 9 | % |
| | 31.93 | | | | 25.78 | | | | 9,466 | | | | 1.17 | | | | 0.68 | | | | 2.19 | | | | 49 | |
| | 25.54 | | | | 22.15 | | | | 8,765 | | | | 1.25 | | | | 0.92 | (h) | | | 2.40 | | | | 82 | |
| | 21.13 | | | | 3.83 | | | | 7,329 | | | | 1.25 | | | | 0.68 | | | | 2.51 | | | | 57 | |
| | 20.60 | | | | 33.71 | | | | 9,291 | | | | 1.25 | | | | 0.91 | | | | 2.44 | | | | 75 | |
| | 15.44 | | | | 16.36 | | | | 7,503 | | | | 1.25 | | | | 0.30 | | | | 2.59 | | | | 145 | |
| | | | | | |
| | | | | | | | | | | | | | | | | | | | | | | | | | |
| | 32.92 | | | | 5.52 | | | | 6,495 | | | | 1.65 | | | | 0.67 | (g) | | | 2.51 | | | | 9 | |
| | 31.38 | | | | 25.13 | | | | 3,709 | | | | 1.66 | | | | 0.19 | | | | 2.66 | | | | 49 | |
| | 25.14 | | | | 21.55 | | | | 2,294 | | | | 1.75 | | | | 0.43 | (h) | | | 2.91 | | | | 82 | |
| | 20.81 | | | | 3.33 | | | | 1,747 | | | | 1.75 | | | | 0.19 | | | | 3.02 | | | | 57 | |
| | 20.25 | | | | 33.05 | | | | 2,266 | | | | 1.75 | | | | 0.43 | | | | 2.94 | | | | 75 | |
| | 15.22 | | | | 15.73 | | | | 2,302 | | | | 1.75 | | | | (0.21 | ) | | | 3.10 | | | | 145 | |
| | | | | | |
| | | | | | | | | | | | | | | | | | | | | | | | | | |
| | 33.72 | | | | 5.94 | | | | 4,341 | | | | 0.90 | | | | 1.34 | (g) | | | 1.75 | | | | 9 | |
| | 32.07 | | | | 26.10 | | | | 3,438 | | | | 0.91 | | | | 0.95 | | | | 1.90 | | | | 49 | |
| | 25.65 | | | | 22.46 | | | | 1,516 | | | | 1.00 | | | | 1.19 | (h) | | | 2.16 | | | | 82 | |
| | 21.21 | | | | 4.09 | | | | 1,164 | | | | 1.00 | | | | 0.94 | | | | 2.28 | | | | 57 | |
| | 20.70 | | | | 34.04 | | | | 1,249 | | | | 1.00 | | | | 1.13 | | | | 2.19 | | | | 75 | |
| | 15.51 | | | | 16.65 | | | | 897 | | | | 1.00 | | | | 0.54 | | | | 2.37 | | | | 145 | |
SEE NOTES TO FINANCIAL STATEMENTS.
| | | | | | | | |
| | | |
| DECEMBER 31, 2014 | | J.P. MORGAN INTREPID FUNDS | | | | | 49 | |
FINANCIAL HIGHLIGHTS
FOR THE PERIODS INDICATED (continued)
| | | | | | | | | | | | | | | | | | | | | | | | | | | | |
| | | Per share operating performance | |
| | | | | | Investment operations | | | Distributions | |
| | | Net asset
value,
beginning
of period | | | Net
investment
income
(loss) | | | Net realized
and unrealized
gains
(losses) on
investments | | | Total from
investment
operations | | | Net
investment
income | | | Net
realized
gain | | | Total
distributions | |
Intrepid America Fund | | | | | | | | | | | | | | | | | | | | | | | | | | | | |
Class A | | | | | | | | | | | | | | | | | | | | | | | | | | | | |
Six Months Ended December 31, 2014 (Unaudited) | | $ | 37.28 | | | $ | 0.23 | (f)(g) | | $ | 2.42 | | | $ | 2.65 | | | $ | (0.38 | ) | | $ | (1.83 | ) | | $ | (2.21 | ) |
Year Ended June 30, 2014 | | | 29.76 | | | | 0.30 | (f) | | | 7.49 | | | | 7.79 | | | | (0.27 | ) | | | — | | | | (0.27 | ) |
Year Ended June 30, 2013 | | | 24.68 | | | | 0.34 | (f) | | | 5.15 | | | | 5.49 | | | | (0.41 | ) | | | — | | | | (0.41 | ) |
Year Ended June 30, 2012 | | | 24.55 | | | | 0.19 | (f) | | | 0.10 | | | | 0.29 | | | | (0.16 | ) | | | — | | | | (0.16 | ) |
Year Ended June 30, 2011 | | | 18.54 | | | | 0.17 | (f) | | | 6.01 | | | | 6.18 | | | | (0.17 | ) | | | — | | | | (0.17 | ) |
Year Ended June 30, 2010 | | | 16.41 | | | | 0.13 | (f) | | | 2.35 | | | | 2.48 | | | | (0.35 | ) | | | — | | | | (0.35 | ) |
| | | | | | | |
Class C | | | | | | | | | | | | | | | | | | | | | | | | | | | | |
Six Months Ended December 31, 2014 (Unaudited) | | | 36.99 | | | | 0.12 | (f)(g) | | | 2.41 | | | | 2.53 | | | | (0.21 | ) | | | (1.83 | ) | | | (2.04 | ) |
Year Ended June 30, 2014 | | | 29.53 | | | | 0.13 | (f) | | | 7.42 | | | | 7.55 | | | | (0.09 | ) | | | — | | | | (0.09 | ) |
Year Ended June 30, 2013 | | | 24.48 | | | | 0.20 | (f) | | | 5.12 | | | | 5.32 | | | | (0.27 | ) | | | — | | | | (0.27 | ) |
Year Ended June 30, 2012 | | | 24.29 | | | | 0.07 | (f) | | | 0.12 | | | | 0.19 | | | | — | | | | — | | | | — | |
Year Ended June 30, 2011 | | | 18.33 | | | | 0.06 | (f) | | | 5.94 | | | | 6.00 | | | | (0.04 | ) | | | — | | | | (0.04 | ) |
Year Ended June 30, 2010 | | | 16.28 | | | | 0.03 | (f) | | | 2.34 | | | | 2.37 | | | | (0.32 | ) | | | — | | | | (0.32 | ) |
| | | | | | | |
Class R2 | | | | | | | | | | | | | | | | | | | | | | | | | | | | |
Six Months Ended December 31, 2014 (Unaudited) | | | 36.82 | | | | 0.16 | (f)(g) | | | 2.41 | | | | 2.57 | | | | (0.42 | ) | | | (1.83 | ) | | | (2.25 | ) |
Year Ended June 30, 2014 | | | 29.43 | | | | 0.21 | (f) | | | 7.40 | | | | 7.61 | | | | (0.22 | ) | | | — | | | | (0.22 | ) |
Year Ended June 30, 2013 | | | 24.43 | | | | 0.26 | (f) | | | 5.11 | | | | 5.37 | | | | (0.37 | ) | | | — | | | | (0.37 | ) |
Year Ended June 30, 2012 | | | 24.21 | | | | 0.13 | (f) | | | 0.12 | | | | 0.25 | | | | (0.03 | ) | | | — | | | | (0.03 | ) |
Year Ended June 30, 2011 | | | 18.36 | | | | 0.13 | (f) | | | 5.92 | | | | 6.05 | | | | (0.20 | ) | | | — | | | | (0.20 | ) |
Year Ended June 30, 2010 | | | 16.29 | | | | 0.09 | (f) | | | 2.33 | | | | 2.42 | | | | (0.35 | ) | | | — | | | | (0.35 | ) |
| | | | | | | |
Class R5 | | | | | | | | | | | | | | | | | | | | | | | | | | | | |
Six Months Ended December 31, 2014 (Unaudited) | | | 37.54 | | | | 0.31 | (f)(g) | | | 2.45 | | | | 2.76 | | | | (0.51 | ) | | | (1.83 | ) | | | (2.34 | ) |
Year Ended June 30, 2014 | | | 29.94 | | | | 0.46 | (f) | | | 7.54 | | | | 8.00 | | | | (0.40 | ) | | | — | | | | (0.40 | ) |
Year Ended June 30, 2013 | | | 24.84 | | | | 0.46 | (f) | | | 5.19 | | | | 5.65 | | | | (0.55 | ) | | | — | | | | (0.55 | ) |
Year Ended June 30, 2012 | | | 24.69 | | | | 0.30 | (f) | | | 0.10 | | | | 0.40 | | | | (0.25 | ) | | | — | | | | (0.25 | ) |
Year Ended June 30, 2011 | | | 18.65 | | | | 0.26 | (f) | | | 6.06 | | | | 6.32 | | | | (0.28 | ) | | | — | | | | (0.28 | ) |
Year Ended June 30, 2010 | | | 16.47 | | | | 0.22 | (f) | | | 2.36 | | | | 2.58 | | | | (0.40 | ) | | | — | | | | (0.40 | ) |
| | | | | | | |
Select Class | | | | | | | | | | | | | | | | | | | | | | | | | | | | |
Six Months Ended December 31, 2014 (Unaudited) | | | 37.61 | | | | 0.27 | (f)(g) | | | 2.46 | | | | 2.73 | | | | (0.43 | ) | | | (1.83 | ) | | | (2.26 | ) |
Year Ended June 30, 2014 | | | 30.00 | | | | 0.38 | (f) | | | 7.56 | | | | 7.94 | | | | (0.33 | ) | | | — | | | | (0.33 | ) |
Year Ended June 30, 2013 | | | 24.88 | | | | 0.41 | (f) | | | 5.20 | | | | 5.61 | | | | (0.49 | ) | | | — | | | | (0.49 | ) |
Year Ended June 30, 2012 | | | 24.73 | | | | 0.25 | (f) | | | 0.10 | | | | 0.35 | | | | (0.20 | ) | | | — | | | | (0.20 | ) |
Year Ended June 30, 2011 | | | 18.68 | | | | 0.23 | (f) | | | 6.04 | | | | 6.27 | | | | (0.22 | ) | | | — | | | | (0.22 | ) |
Year Ended June 30, 2010 | | | 16.51 | | | | 0.18 | (f) | | | 2.37 | | | | 2.55 | | | | (0.38 | ) | | | — | | | | (0.38 | ) |
| (a) | Annualized for periods less than one year, unless otherwise noted. |
| (b) | Not annualized for periods less than one year. |
| (c) | Includes adjustments in accordance with accounting principles generally accepted in the United States of America and as such, the net asset values for financial reporting purposes and the returns based upon those net asset values may differ from the net asset values and returns for shareholder transactions. |
| (d) | Includes earnings credits and interest expense, if applicable, each of which is less than 0.01%, if applicable unless otherwise noted. |
| (e) | Portfolio turnover is calculated by dividing the lesser of total purchases or sales of portfolio securities for the reporting period by the monthly average value of portfolio securities owned during the reporting period. Excluded from both the numerator and denominator are amounts relating to derivatives and securities whose maturities or expiration dates at the time of acquisition were one year or less. |
| (f) | Calculated based upon average shares outstanding. |
| (g) | Reflects special dividends paid out during the period by several of the Fund’s holdings. Had the Fund not received the special dividends, the net investment income (loss) per share would have been $0.17, $0.06, $0.09, $0.25 and $0.21 for Class A, Class C, Class R2, Class R5 and Select Class Shares, respectively, and the net investment income (loss) ratio would have been 0.86%, 0.32%, 0.50%, 1.29% and 1.07% for Class A, Class C, Class R2, Class R5 and Select Class Shares, respectively. |
SEE NOTES TO FINANCIAL STATEMENTS.
| | | | | | |
| | | |
| 50 | | | | J.P. MORGAN INTREPID FUNDS | | DECEMBER 31, 2014 |
| | | | | | | | | | | | | | | | | | | | | | | | | | |
| | | Ratios/Supplemental data | |
| | | | | | | | | | Ratios to average net assets (a) | | | | |
Net asset
value,
end of
period | | | Total return
(excludes
sales charge) (b)(c) | | | Net assets,
end of
period
(000’s) | | | Net
expenses (d) | | | Net
investment
income
(loss) | | |
Expenses
without waivers,
reimbursements and
earnings credits | | | Portfolio
turnover
rate (b)(e) | |
| | | | | | | | | | | | | | | | | | | | | | | | | | |
| | | | | | | | | | | | | | | | | | | | | | | | | | |
| $ | 37.72 | | | | 7.25 | % | | $ | 156,237 | | | | 1.02 | % | | | 1.19 | %(g) | | | 1.07 | % | | | 25 | % |
| | 37.28 | | | | 26.26 | | | | 97,155 | | | | 1.04 | | | | 0.90 | | | | 1.05 | | | | 67 | |
| | 29.76 | | | | 22.48 | | | | 87,954 | | | | 1.24 | | | | 1.25 | | | | 1.26 | | | | 68 | |
| | 24.68 | | | | 1.26 | | | | 81,139 | | | | 1.25 | | | | 0.82 | | | | 1.27 | | | | 95 | |
| | 24.55 | | | | 33.39 | | | | 47,376 | | | | 1.24 | | | | 0.77 | | | | 1.28 | | | | 102 | |
| | 18.54 | | | | 14.96 | | | | 49,927 | | | | 1.25 | | | | 0.64 | | | | 1.29 | | | | 108 | |
| | | | | | |
| | | | | | | | | | | | | | | | | | | | | | | | | | |
| | 37.48 | | | | 6.98 | | | | 11,344 | | | | 1.52 | | | | 0.66 | (g) | | | 1.54 | | | | 25 | |
| | 36.99 | | | | 25.62 | | | | 8,774 | | | | 1.54 | | | | 0.39 | | | | 1.55 | | | | 67 | |
| | 29.53 | | | | 21.90 | | | | 7,336 | | | | 1.74 | | | | 0.75 | | | | 1.76 | | | | 68 | |
| | 24.48 | | | | 0.78 | | | | 7,117 | | | | 1.75 | | | | 0.31 | | | | 1.78 | | | | 95 | |
| | 24.29 | | | | 32.74 | | | | 9,570 | | | | 1.74 | | | | 0.28 | | | | 1.78 | | | | 102 | |
| | 18.33 | | | | 14.37 | | | | 10,221 | | | | 1.75 | | | | 0.14 | | | | 1.79 | | | | 108 | |
| | | | | | |
| | | | | | | | | | | | | | | | | | | | | | | | | | |
| | 37.14 | | | | 7.11 | | | | 681 | | | | 1.27 | | | | 0.83 | (g) | | | 1.29 | | | | 25 | |
| | 36.82 | | | | 25.93 | | | | 166 | | | | 1.29 | | | | 0.64 | | | | 1.30 | | | | 67 | |
| | 29.43 | | | | 22.20 | | | | 170 | | | | 1.49 | | | | 0.96 | | | | 1.51 | | | | 68 | |
| | 24.43 | | | | 1.03 | | | | 75 | | | | 1.50 | | | | 0.56 | | | | 1.52 | | | | 95 | |
| | 24.21 | | | | 33.04 | | | | 74 | | | | 1.49 | | | | 0.59 | | | | 1.53 | | | | 102 | |
| | 18.36 | | | | 14.68 | | | | 105 | | | | 1.50 | | | | 0.47 | | | | 1.54 | | | | 108 | |
| | | | | | |
| | | | | | | | | | | | | | | | | | | | | | | | | | |
| | 37.96 | | | | 7.49 | | | | 1,702,951 | | | | 0.55 | | | | 1.63 | (g) | | | 0.56 | | | | 25 | |
| | 37.54 | | | | 26.84 | | | | 1,363,358 | | | | 0.58 | | | | 1.35 | | | | 0.59 | | | | 67 | |
| | 29.94 | | | | 23.05 | | | | 710,586 | | | | 0.79 | | | | 1.66 | | | | 0.82 | | | | 68 | |
| | 24.84 | | | | 1.74 | | | | 411,202 | | | | 0.79 | | | | 1.28 | | | | 0.82 | | | | 95 | |
| | 24.69 | | | | 34.02 | | | | 287,527 | | | | 0.79 | | | | 1.14 | | | | 0.83 | | | | 102 | |
| | 18.65 | | | | 15.49 | | | | 105,092 | | | | 0.80 | | | | 1.12 | | | | 0.84 | | | | 108 | |
| | | | | | |
| | | | | | | | | | | | | | | | | | | | | | | | | | |
| | 38.08 | | | | 7.40 | | | | 1,595,392 | | | | 0.75 | | | | 1.41 | (g) | | | 0.76 | | | | 25 | |
| | 37.61 | | | | 26.56 | | | | 1,514,180 | | | | 0.79 | | | | 1.14 | | | | 0.80 | | | | 67 | |
| | 30.00 | | | | 22.83 | | | | 1,391,748 | | | | 0.99 | | | | 1.50 | | | | 1.02 | | | | 68 | |
| | 24.88 | | | | 1.52 | | | | 1,332,607 | | | | 1.00 | | | | 1.07 | | | | 1.02 | | | | 95 | |
| | 24.73 | | | | 33.69 | | | | 1,370,056 | | | | 0.99 | | | | 1.04 | | | | 1.03 | | | | 102 | |
| | 18.68 | | | | 15.28 | | | | 1,259,093 | | | | 1.00 | | | | 0.90 | | | | 1.04 | | | | 108 | |
SEE NOTES TO FINANCIAL STATEMENTS.
| | | | | | | | |
| | | |
| DECEMBER 31, 2014 | | J.P. MORGAN INTREPID FUNDS | | | | | 51 | |
FINANCIAL HIGHLIGHTS
FOR THE PERIODS INDICATED (continued)
| | | | | | | | | | | | | | | | | | | | |
| | | Per share operating performance | |
| | | | | | Investment operations | | | Distributions | |
| | | Net asset
value,
beginning
of period | | | Net
investment
income
(loss) | | | Net realized
and unrealized
gains
(losses) on
investments | | | Total from
investment
operations | | | Net
investment
income | |
Intrepid Growth Fund | | | | | | | | | | | | | | | | | | | | |
Class A | | | | | | | | | | | | | | | | | | | | |
Six Months Ended December 31, 2014 (Unaudited) | | $ | 37.05 | | | $ | 0.06 | (f) | | $ | 3.27 | | | $ | 3.33 | | | $ | (0.19 | ) |
Year Ended June 30, 2014 | | | 29.36 | | | | 0.18 | (f)(g) | | | 7.64 | | | | 7.82 | | | | (0.13 | ) |
Year Ended June 30, 2013 | | | 25.00 | | | | 0.21 | (f) | | | 4.34 | | | | 4.55 | | | | (0.19 | ) |
Year Ended June 30, 2012 | | | 24.39 | | | | 0.10 | (f) | | | 0.57 | | | | 0.67 | | | | (0.06 | ) |
Year Ended June 30, 2011 | | | 17.93 | | | | 0.12 | (f) | | | 6.48 | | | | 6.60 | | | | (0.14 | ) |
Year Ended June 30, 2010 | | | 15.79 | | | | 0.07 | (f) | | | 2.20 | | | | 2.27 | | | | (0.13 | ) |
| | | | | |
Class C | | | | | | | | | | | | | | | | | | | | |
Six Months Ended December 31, 2014 (Unaudited) | | | 36.45 | | | | (0.04 | )(f) | | | 3.21 | | | | 3.17 | | | | (0.05 | ) |
Year Ended June 30, 2014 | | | 28.93 | | | | 0.01 | (f)(g) | | | 7.52 | | | | 7.53 | | | | (0.01 | ) |
Year Ended June 30, 2013 | | | 24.64 | | | | 0.07 | (f) | | | 4.27 | | | | 4.34 | | | | (0.05 | ) |
Year Ended June 30, 2012 | | | 24.09 | | | | (0.02 | )(f) | | | 0.57 | | | | 0.55 | | | | — | |
Year Ended June 30, 2011 | | | 17.70 | | | | 0.01 | (f) | | | 6.40 | | | | 6.41 | | | | (0.02 | ) |
Year Ended June 30, 2010 | | | 15.59 | | | | (0.03 | )(f) | | | 2.18 | | | | 2.15 | | | | (0.04 | ) |
| | | | | |
Class R2 | | | | | | | | | | | | | | | | | | | | |
Six Months Ended December 31, 2014 (Unaudited) | | | 36.49 | | | | 0.01 | (f) | | | 3.23 | | | | 3.24 | | | | (0.07 | ) |
Year Ended June 30, 2014 | | | 28.91 | | | | 0.09 | (f)(g) | | | 7.54 | | | | 7.63 | | | | (0.05 | ) |
Year Ended June 30, 2013 | | | 24.72 | | | | 0.13 | (f) | | | 4.27 | | | | 4.40 | | | | (0.21 | ) |
Year Ended June 30, 2012 | | | 24.13 | | | | 0.07 | (f) | | | 0.54 | | | | 0.61 | | | | (0.02 | ) |
Year Ended June 30, 2011 | | | 17.76 | | | | 0.06 | (f) | | | 6.41 | | | | 6.47 | | | | (0.10 | ) |
Year Ended June 30, 2010 | | | 15.65 | | | | 0.02 | (f) | | | 2.20 | | | | 2.22 | | | | (0.11 | ) |
| | | | | |
Class R5 | | | | | | | | | | | | | | | | | | | | |
Six Months Ended December 31, 2014 (Unaudited) | | | 37.09 | | | | 0.14 | (f) | | | 3.29 | | | | 3.43 | | | | (0.29 | ) |
Year Ended June 30, 2014 | | | 29.41 | | | | 0.33 | (f)(g) | | | 7.65 | | | | 7.98 | | | | (0.30 | ) |
Year Ended June 30, 2013 | | | 25.05 | | | | 0.33 | (f) | | | 4.34 | | | | 4.67 | | | | (0.31 | ) |
Year Ended June 30, 2012 | | | 24.45 | | | | 0.21 | (f) | | | 0.57 | | | | 0.78 | | | | (0.18 | ) |
Year Ended June 30, 2011 | | | 17.98 | | | | 0.21 | (f) | | | 6.50 | | | | 6.71 | | | | (0.24 | ) |
Year Ended June 30, 2010 | | | 15.83 | | | | 0.15 | (f) | | | 2.22 | | | | 2.37 | | | | (0.22 | ) |
| | | | | |
Select Class | | | | | | | | | | | | | | | | | | | | |
Six Months Ended December 31, 2014 (Unaudited) | | | 37.23 | | | | 0.10 | (f) | | | 3.30 | | | | 3.40 | | | | (0.21 | ) |
Year Ended June 30, 2014 | | | 29.52 | | | | 0.26 | (f)(g) | | | 7.69 | | | | 7.95 | | | | (0.24 | ) |
Year Ended June 30, 2013 | | | 25.15 | | | | 0.28 | (f) | | | 4.35 | | | | 4.63 | | | | (0.26 | ) |
Year Ended June 30, 2012 | | | 24.55 | | | | 0.16 | (f) | | | 0.57 | | | | 0.73 | | | | (0.13 | ) |
Year Ended June 30, 2011 | | | 18.04 | | | | 0.17 | (f) | | | 6.53 | | | | 6.70 | | | | (0.19 | ) |
Year Ended June 30, 2010 | | | 15.88 | | | | 0.12 | (f) | | | 2.22 | | | | 2.34 | | | | (0.18 | ) |
| (a) | Annualized for periods less than one year, unless otherwise noted. |
| (b) | Not annualized for periods less than one year. |
| (c) | Includes adjustments in accordance with accounting principles generally accepted in the United States of America and as such, the net asset values for financial reporting purposes and the returns based upon those net asset values may differ from the net asset values and returns for shareholder transactions. |
| (d) | Includes earnings credits and interest expense, if applicable, each of which is less than 0.01% unless otherwise noted. |
| (e) | Portfolio turnover is calculated by dividing the lesser of total purchases or sales of portfolio securities for the reporting period by the monthly average value of portfolio securities owned during the reporting period. Excluded from both the numerator and denominator are amounts relating to derivatives and securities whose maturities or expiration dates at the time of acquisition were one year or less. |
| (f) | Calculated based upon average shares outstanding. |
| (g) | Reflects special dividends paid out during the period by several of the Fund’s holdings. Had the Fund not received the special dividends, the net investment income (loss) per share would have been $0.17,$0.00,$0.09,$0.32 and $0.26 for Class A,Class C,Class R2,Class R5 and Select Class Shares, respectively, and the net investment income (loss) ratio would have been 0.51%,0.01%,0.26%,0.96% and 0.76% for Class A,Class C,Class R2,Class R5 and Select Class Shares, respectively. |
SEE NOTES TO FINANCIAL STATEMENTS.
| | | | | | |
| | | |
| 52 | | | | J.P. MORGAN INTREPID FUNDS | | DECEMBER 31, 2014 |
| | | | | | | | | | | | | | | | | | | | | | | | | | |
| | | Ratios/Supplemental data | |
| | | | | | | | | | Ratios to average net assets (a) | | | | |
Net asset
value,
end of
period | | | Total return
(excludes
sales charge) (b)(c) | | |
Net assets,
end of
period
(000’s) | | | Net
expenses (d) | | | Net
investment
income
(loss) | | | Expenses
without waivers,
reimbursements and
earnings credits | | | Portfolio
turnover
rate (b)(e) | |
| | | | | | | | | | | | | | | | | | | | | | | | | | |
| | | | | | | | | | | | | | | | | | | | | | | | | | |
| $ | 40.19 | | | | 8.99 | % | | $ | 71,214 | | | | 1.04 | % | | | 0.30 | % | | | 1.16 | % | | | 35 | % |
| | 37.05 | | | | 26.68 | | | | 33,563 | | | | 1.16 | | | | 0.54 | (g) | | | 1.17 | | | | 67 | |
| | 29.36 | | | | 18.27 | | | | 33,582 | | | | 1.24 | | | | 0.76 | | | | 1.30 | | | | 67 | |
| | 25.00 | | | | 2.76 | | | | 32,027 | | | | 1.25 | | | | 0.42 | | | | 1.32 | | | | 110 | |
| | 24.39 | | | | 36.86 | | | | 41,424 | | | | 1.24 | | | | 0.54 | | | | 1.33 | | | | 129 | |
| | 17.93 | | | | 14.32 | | | | 41,167 | | | | 1.25 | | | | 0.36 | | | | 1.34 | | | | 118 | |
| | | | | | |
| | | | | | | | | | | | | | | | | | | | | | | | | | |
| | 39.57 | | | | 8.71 | | | | 34,109 | | | | 1.55 | | | | (0.20 | ) | | | 1.66 | | | | 35 | |
| | 36.45 | | | | 26.05 | | | | 19,566 | | | | 1.65 | | | | 0.03 | (g) | | | 1.67 | | | | 67 | |
| | 28.93 | | | | 17.66 | | | | 15,462 | | | | 1.74 | | | | 0.26 | | | | 1.79 | | | | 67 | |
| | 24.64 | | | | 2.28 | | | | 14,298 | | | | 1.75 | | | | (0.09 | ) | | | 1.82 | | | | 110 | |
| | 24.09 | | | | 36.21 | | | | 17,811 | | | | 1.74 | | | | 0.05 | | | | 1.83 | | | | 129 | |
| | 17.70 | | | | 13.78 | | | | 18,827 | | | | 1.75 | | | | (0.14 | ) | | | 1.84 | | | | 118 | |
| | | | | | |
| | | | | | | | | | | | | | | | | | | | | | | | | | |
| | 39.66 | | | | 8.86 | | | | 805 | | | | 1.30 | | | | 0.07 | | | | 1.41 | | | | 35 | |
| | 36.49 | | | | 26.41 | | | | 601 | | | | 1.41 | | | | 0.28 | (g) | | | 1.42 | | | | 67 | |
| | 28.91 | | | | 17.90 | | | | 603 | | | | 1.49 | | | | 0.49 | | | | 1.54 | | | | 67 | |
| | 24.72 | | | | 2.53 | | | | 375 | | | | 1.50 | | | | 0.29 | | | | 1.56 | | | | 110 | |
| | 24.13 | | | | 36.49 | | | | 78 | | | | 1.49 | | | | 0.26 | | | | 1.58 | | | | 129 | |
| | 17.76 | | | | 14.10 | | | | 57 | | | | 1.50 | | | | 0.11 | | | | 1.59 | | | | 118 | |
| | | | | | |
| | | | | | | | | | | | | | | | | | | | | | | | | | |
| | 40.23 | | | | 9.24 | | | | 148,722 | | | | 0.62 | | | | 0.73 | | | | 0.71 | | | | 35 | |
| | 37.09 | | | | 27.23 | | | | 124,489 | | | | 0.71 | | | | 0.98 | (g) | | | 0.72 | | | | 67 | |
| | 29.41 | | | | 18.79 | | | | 105,839 | | | | 0.79 | | | | 1.21 | | | | 0.85 | | | | 67 | |
| | 25.05 | | | | 3.26 | | | | 107,169 | | | | 0.80 | | | | 0.87 | | | | 0.87 | | | | 110 | |
| | 24.45 | | | | 37.44 | | | | 111,071 | | | | 0.79 | | | | 0.96 | | | | 0.88 | | | | 129 | |
| | 17.98 | | | | 14.86 | | | | 86,795 | | | | 0.80 | | | | 0.81 | | | | 0.89 | | | | 118 | |
| | | | | | |
| | | | | | | | | | | | | | | | | | | | | | | | | | |
| | 40.42 | | | | 9.14 | | | | 662,409 | | | | 0.82 | | | | 0.53 | | | | 0.89 | | | | 35 | |
| | 37.23 | | | | 27.00 | | | | 597,963 | | | | 0.91 | | | | 0.79 | (g) | | | 0.92 | | | | 67 | |
| | 29.52 | | | | 18.52 | | | | 538,378 | | | | 0.99 | | | | 1.02 | | | | 1.05 | | | | 67 | |
| | 25.15 | | | | 3.04 | | | | 502,640 | | | | 1.00 | | | | 0.67 | | | | 1.07 | | | | 110 | |
| | 24.55 | | | | 37.25 | | | | 510,623 | | | | 0.99 | | | | 0.77 | | | | 1.07 | | | | 129 | |
| | 18.04 | | | | 14.64 | | | | 398,110 | | | | 1.00 | | | | 0.61 | | | | 1.09 | | | | 118 | |
SEE NOTES TO FINANCIAL STATEMENTS.
| | | | | | | | |
| | | |
| DECEMBER 31, 2014 | | J.P. MORGAN INTREPID FUNDS | | | | | 53 | |
FINANCIAL HIGHLIGHTS
FOR THE PERIODS INDICATED (continued)
| | | | | | | | | | | | | | | | | | | | | | | | | | | | |
| | | Per share operating performance | |
| | | | | | Investment operations | | | Distributions | |
| | | Net asset
value,
beginning
of period | | | Net
investment
income
(loss) | | | Net realized
and unrealized
gains
(losses) on
investments | | | Total from
investment
operations | | | Net
investment
income | | | Net
realized
gain | | | Total
distributions | |
Intrepid Mid Cap Fund | | | | | | | | | | | | | | | | | | | | | | | | | | | | |
Class A | | | | | | | | | | | | | | | | | | | | | | | | | | | | |
Six Months Ended December 31, 2014 (Unaudited) | | $ | 24.11 | | | $ | 0.07 | (f)(g) | | $ | 1.35 | | | $ | 1.42 | | | $ | (0.07 | ) | | $ | (3.46 | ) | | $ | (3.53 | ) |
Year Ended June 30, 2014 | | | 18.79 | | | | 0.08 | (f)(h) | | | 5.41 | | | | 5.49 | | | | (0.07 | ) | | | (0.10 | ) | | | (0.17 | ) |
Year Ended June 30, 2013 | | | 14.99 | | | | 0.13 | (f)(i) | | | 3.80 | | | | 3.93 | | | | (0.13 | ) | | | — | | | | (0.13 | ) |
Year Ended June 30, 2012 | | | 15.79 | | | | 0.10 | (f) | | | (0.79 | ) | | | (0.69 | ) | | | (0.11 | ) | | | — | | | | (0.11 | ) |
Year Ended June 30, 2011 | | | 11.54 | | | | 0.04 | (f) | | | 4.26 | | | | 4.30 | | | | (0.05 | ) | | | — | | | | (0.05 | ) |
Year Ended June 30, 2010 | | | 9.53 | | | | 0.07 | (f) | | | 2.02 | | | | 2.09 | | | | (0.08 | ) | | | — | | | | (0.08 | ) |
| | | | | | | |
Class B | | | | | | | | | | | | | | | | | | | | | | | | | | | | |
Six Months Ended December 31, 2014 (Unaudited) | | | 21.56 | | | | (0.01 | )(f)(g) | | | 1.19 | | | | 1.18 | | | | (0.02 | ) | | | (3.46 | ) | | | (3.48 | ) |
Year Ended June 30, 2014 | | | 16.86 | | | | (0.05 | )(f)(h) | | | 4.84 | | | | 4.79 | | | | — | | | | (0.09 | ) | | | (0.09 | ) |
Year Ended June 30, 2013 | | | 13.47 | | | | 0.02 | (f)(i) | | | 3.41 | | | | 3.43 | | | | (0.04 | ) | | | — | | | | (0.04 | ) |
Year Ended June 30, 2012 | | | 14.22 | | | | — | (f)(j) | | | (0.70 | ) | | | (0.70 | ) | | | (0.05 | ) | | | — | | | | (0.05 | ) |
Year Ended June 30, 2011 | | | 10.44 | | | | (0.04 | )(f) | | | 3.83 | | | | 3.79 | | | | (0.01 | ) | | | — | | | | (0.01 | ) |
Year Ended June 30, 2010 | | | 8.63 | | | | (0.01 | )(f) | | | 1.84 | | | | 1.83 | | | | (0.02 | ) | | | — | | | | (0.02 | ) |
| | | | | | | |
Class C | | | | | | | | | | | | | | | | | | | | | | | | | | | | |
Six Months Ended December 31, 2014 (Unaudited) | | | 21.56 | | | | (0.01 | )(f)(g) | | | 1.20 | | | | 1.19 | | | | (0.03 | ) | | | (3.46 | ) | | | (3.49 | ) |
Year Ended June 30, 2014 | | | 16.87 | | | | (0.05 | )(f)(h) | | | 4.84 | | | | 4.79 | | | | — | | | | (0.10 | ) | | | (0.10 | ) |
Year Ended June 30, 2013 | | | 13.48 | | | | 0.02 | (f)(i) | | | 3.41 | | | | 3.43 | | | | (0.04 | ) | | | — | | | | (0.04 | ) |
Year Ended June 30, 2012 | | | 14.24 | | | | 0.01 | (f) | | | (0.72 | ) | | | (0.71 | ) | | | (0.05 | ) | | | — | | | | (0.05 | ) |
Year Ended June 30, 2011 | | | 10.45 | | | | (0.04 | )(f) | | | 3.85 | | | | 3.81 | | | | (0.02 | ) | | | — | | | | (0.02 | ) |
Year Ended June 30, 2010 | | | 8.64 | | | | (0.01 | )(f) | | | 1.84 | | | | 1.83 | | | | (0.02 | ) | | | — | | | | (0.02 | ) |
| | | | | | | |
Select Class | | | | | | | | | | | | | | | | | | | | | | | | | | | | |
Six Months Ended December 31, 2014 (Unaudited) | | | 24.97 | | | | 0.10 | (f)(g) | | | 1.41 | | | | 1.51 | | | | (0.09 | ) | | | (3.46 | ) | | | (3.55 | ) |
Year Ended June 30, 2014 | | | 19.45 | | | | 0.14 | (f)(h) | | | 5.60 | | | | 5.74 | | | | (0.12 | ) | | | (0.10 | ) | | | (0.22 | ) |
Year Ended June 30, 2013 | | | 15.51 | | | | 0.18 | (f)(i) | | | 3.93 | | | | 4.11 | | | | (0.17 | ) | | | — | | | | (0.17 | ) |
Year Ended June 30, 2012 | | | 16.33 | | | | 0.14 | (f) | | | (0.82 | ) | | | (0.68 | ) | | | (0.14 | ) | | | — | | | | (0.14 | ) |
Year Ended June 30, 2011 | | | 11.92 | | | | 0.08 | (f) | | | 4.41 | | | | 4.49 | | | | (0.08 | ) | | | — | | | | (0.08 | ) |
Year Ended June 30, 2010 | | | 9.84 | | | | 0.11 | (f) | | | 2.08 | | | | 2.19 | | | | (0.11 | ) | | | — | | | | (0.11 | ) |
| (a) | Annualized for periods less than one year, unless otherwise noted. |
| (b) | Not annualized for periods less than one year. |
| (c) | Includes adjustments in accordance with accounting principles generally accepted in the United States of America and as such, the net asset values for financial reporting purposes and the returns based upon those net asset values may differ from the net asset values and returns for shareholder transactions. |
| (d) | Includes earnings credits and interest expense, if applicable, each of which is less than 0.01% unless otherwise noted. |
| (e) | Portfolio turnover is calculated by dividing the lesser of total purchases or sales of portfolio securities for the reporting period by the monthly average value of portfolio securities owned during the reporting period. Excluded from both the numerator and denominator are amounts relating to derivatives and securities whose maturities or expiration dates at the time of acquisition were one year or less. |
| (f) | Calculated based upon average shares outstanding. |
| (g) | Reflects special dividends paid out during the period by several of the Fund’s holdings. Had the Fund not received the special dividends, the net investment income (loss) per share would have been $0.02, $(0.06), $(0.05) and $0.05 for Class A, Class B, Class C and Select Class Shares, respectively, and the net investment income (loss) ratio would have been 0.18%, (0.53)%, (0.48)% and 0.41% for Class A, Class B, Class C, and Select Class Shares, respectively. |
| (h) | Reflects special dividends paid out during the period by several of the Fund’s holdings. Had the Fund not received the special dividends, the net investment income (loss) per share would have been $0.04, $(0.09), $(0.08) and $0.10 for Class A, Class B, Class C and Select Class Shares, respectively, and the net investment income (loss) ratio would have been 0.20%, (0.45)%, (0.42)% and 0.45% for Class A, Class B, Class C, and Select Class Shares, respectively. |
| (i) | Reflects a special dividend paid out during the period by one of the Fund’s holdings. Had the Fund not received the special dividend, the net investment income (loss) per share would have been $0.08, $(0.02), $(0.03) and $0.13 for Class A, Class B, Class C and Select Class Shares, respectively, and the net investment income (loss) ratio would have been 0.47%, (0.16)%, (0.17)% and 0.72% for Class A, Class B, Class C and Select Class Shares, respectively. |
| (j) | Amount rounds to less than $0.01. |
SEE NOTES TO FINANCIAL STATEMENTS.
| | | | | | |
| | | |
| 54 | | | | J.P. MORGAN INTREPID FUNDS | | DECEMBER 31, 2014 |
| | | | | | | | | | | | | | | | | | | | | | | | | | |
| | | Ratios/Supplemental data | |
| | | | | | | | | | Ratios to average net assets (a) | | | | |
Net asset
value,
end of
period | | | Total return
(excludes
sales charge) (b)(c) | | | Net assets,
end of
period
(000’s) | | | Net
expenses (d) | | | Net
investment
income
(loss) | | | Expenses
without waivers,
reimbursements and
earnings credits | | | Portfolio
turnover
rate (b)(e) | |
| | | | | | | | | | | | | | | | | | | | | | | | | | |
| | | | | | | | | | | | | | | | | | | | | | | | | | |
| $ | 22.00 | | | | 6.41 | % | | $ | 274,140 | | | | 1.15 | % | | | 0.60 | %(g) | | | 1.34 | % | | | 15 | % |
| | 24.11 | | | | 29.30 | | | | 193,342 | | | | 1.16 | | | | 0.38 | (h) | | | 1.32 | | | | 64 | |
| | 18.79 | | | | 26.30 | | | | 144,405 | | | | 1.23 | | | | 0.78 | (i) | | | 1.38 | | | | 52 | |
| | 14.99 | | | | (4.36 | ) | | | 122,217 | | | | 1.24 | | | | 0.68 | | | | 1.38 | | | | 51 | |
| | 15.79 | | | | 37.29 | | | | 138,937 | | | | 1.23 | | | | 0.31 | | | | 1.39 | | | | 47 | |
| | 11.54 | | | | 21.93 | | | | 120,375 | | | | 1.24 | | | | 0.63 | | | | 1.43 | | | | 65 | |
| | | | | | |
| | | | | | | | | | | | | | | | | | | | | | | | | | |
| | 19.26 | | | | 6.04 | | | | 4,705 | | | | 1.79 | | | | (0.12 | )(g) | | | 1.86 | | | | 15 | |
| | 21.56 | | | | 28.47 | | | | 5,680 | | | | 1.78 | | | | (0.28 | )(h) | | | 1.83 | | | | 64 | |
| | 16.86 | | | | 25.51 | | | | 7,451 | | | | 1.87 | | | | 0.14 | (i) | | | 1.88 | | | | 52 | |
| | 13.47 | | | | (4.94 | ) | | | 7,805 | | | | 1.88 | | | | 0.03 | | | | 1.88 | | | | 51 | |
| | 14.22 | | | | 36.35 | | | | 10,830 | | | | 1.89 | | | | (0.34 | ) | | | 1.89 | | | | 47 | |
| | 10.44 | | | | 21.15 | | | | 10,845 | | | | 1.93 | | | | (0.06 | ) | | | 1.93 | | | | 65 | |
| | | | | | |
| | | | | | | | | | | | | | | | | | | | | | | | | | |
| | 19.26 | | | | 6.07 | | | | 57,743 | | | | 1.79 | | | | (0.07 | )(g) | | | 1.86 | | | | 15 | |
| | 21.56 | | | | 28.43 | | | | 49,796 | | | | 1.79 | | | | (0.25 | )(h) | | | 1.82 | | | | 64 | |
| | 16.87 | | | | 25.51 | | | | 36,073 | | | | 1.87 | | | | 0.13 | (i) | | | 1.88 | | | | 52 | |
| | 13.48 | | | | (4.97 | ) | | | 28,079 | | | | 1.88 | | | | 0.04 | | | | 1.88 | | | | 51 | |
| | 14.24 | | | | 36.42 | | | | 30,773 | | | | 1.88 | | | | (0.34 | ) | | | 1.88 | | | | 47 | |
| | 10.45 | | | | 21.14 | | | | 22,273 | | | | 1.92 | | | | (0.06 | ) | | | 1.93 | | | | 65 | |
| | | | | | |
| | | | | | | | | | | | | | | | | | | | | | | | | | |
| | 22.93 | | | | 6.56 | | | | 421,378 | | | | 0.90 | | | | 0.82 | (g) | | | 1.07 | | | | 15 | |
| | 24.97 | | | | 29.61 | | | | 348,077 | | | | 0.91 | | | | 0.62 | (h) | | | 1.08 | | | | 64 | |
| | 19.45 | | | | 26.60 | | | | 327,834 | | | | 0.98 | | | | 1.03 | (i) | | | 1.13 | | | | 52 | |
| | 15.51 | | | | (4.11 | ) | | | 269,693 | | | | 0.99 | | | | 0.94 | | | | 1.13 | | | | 51 | |
| | 16.33 | | | | 37.67 | | | | 289,967 | | | | 0.99 | | | | 0.56 | | | | 1.14 | | | | 47 | |
| | 11.92 | | | | 22.23 | | | | 202,190 | | | | 0.99 | | | | 0.88 | | | | 1.18 | | | | 65 | |
SEE NOTES TO FINANCIAL STATEMENTS.
| | | | | | | | |
| | | |
| DECEMBER 31, 2014 | | J.P. MORGAN INTREPID FUNDS | | | | | 55 | |
FINANCIAL HIGHLIGHTS
FOR THE PERIODS INDICATED (continued)
| | | | | | | | | | | | | | | | | | | | | | | | | | | | |
| | | Per share operating performance | |
| | | | | | Investment operations | | | Distributions | |
| | | Net asset
value,
beginning
of period | | | Net
investment
income
(loss) | | | Net realized
and unrealized
gains
(losses) on
investments | | | Total from
investment
operations | | | Net
investment
income | | | Net
realized
gain | | | Total
distributions | |
Intrepid Value Fund | | | | | | | | | | | | | | | | | | | | | | | | | | | | |
Class A | | | | | | | | | | | | | | | | | | | | | | | | | | | | |
Six Months Ended December 31, 2014 (Unaudited) | | $ | 37.13 | | | $ | 0.22 | (f) | | $ | 1.65 | | | $ | 1.87 | | | $ | (0.21 | ) | | $ | (2.87 | ) | | $ | (3.08 | ) |
Year Ended June 30, 2014 | | | 29.76 | | | | 0.40 | (f) | | | 7.36 | | | | 7.76 | | | | (0.39 | ) | | | — | | | | (0.39 | ) |
Year Ended June 30, 2013 | | | 23.99 | | | | 0.42 | (f) | | | 5.79 | | | | 6.21 | | | | (0.44 | ) | | | — | | | | (0.44 | ) |
Year Ended June 30, 2012 | | | 24.35 | | | | 0.35 | (f) | | | (0.34 | ) | | | 0.01 | | | | (0.37 | ) | | | — | | | | (0.37 | ) |
Year Ended June 30, 2011 | | | 18.64 | | | | 0.30 | (f) | | | 5.65 | | | | 5.95 | | | | (0.24 | ) | | | — | | | | (0.24 | ) |
Year Ended June 30, 2010 | | | 16.47 | | | | 0.19 | (f) | | | 2.17 | | | | 2.36 | | | | (0.19 | ) | | | — | | | | (0.19 | ) |
| | | | | | | |
Class C | | | | | | | | | | | | | | | | | | | | | | | | | | | | |
Six Months Ended December 31, 2014 (Unaudited) | | | 36.80 | | | | 0.13 | (f) | | | 1.63 | | | | 1.76 | | | | (0.14 | ) | | | (2.87 | ) | | | (3.01 | ) |
Year Ended June 30, 2014 | | | 29.52 | | | | 0.23 | (f) | | | 7.28 | | | | 7.51 | | | | (0.23 | ) | | | — | | | | (0.23 | ) |
Year Ended June 30, 2013 | | | 23.80 | | | | 0.29 | (f) | | | 5.74 | | | | 6.03 | | | | (0.31 | ) | | | — | | | | (0.31 | ) |
Year Ended June 30, 2012 | | | 24.16 | | | | 0.24 | (f) | | | (0.35 | ) | | | (0.11 | ) | | | (0.25 | ) | | | — | | | | (0.25 | ) |
Year Ended June 30, 2011 | | | 18.53 | | | | 0.19 | (f) | | | 5.60 | | | | 5.79 | | | | (0.16 | ) | | | — | | | | (0.16 | ) |
Year Ended June 30, 2010 | | | 16.37 | | | | 0.09 | (f) | | | 2.16 | | | | 2.25 | | | | (0.09 | ) | | | — | | | | (0.09 | ) |
| | | | | | | |
Class R2 | | | | | | | | | | | | | | | | | | | | | | | | | | | | |
Six Months Ended December 31, 2014 (Unaudited) | | | 37.02 | | | | 0.18 | (f) | | | 1.64 | | | | 1.82 | | | | (0.18 | ) | | | (2.87 | ) | | | (3.05 | ) |
Year Ended June 30, 2014 | | | 29.69 | | | | 0.31 | (f) | | | 7.33 | | | | 7.64 | | | | (0.31 | ) | | | — | | | | (0.31 | ) |
Year Ended June 30, 2013 | | | 23.95 | | | | 0.30 | (f) | | | 5.83 | | | | 6.13 | | | | (0.39 | ) | | | — | | | | (0.39 | ) |
Year Ended June 30, 2012 | | | 24.31 | | | | 0.29 | (f) | | | (0.33 | ) | | | (0.04 | ) | | | (0.32 | ) | | | — | | | | (0.32 | ) |
Year Ended June 30, 2011 | | | 18.63 | | | | 0.24 | (f) | | | 5.64 | | | | 5.88 | | | | (0.20 | ) | | | — | | | | (0.20 | ) |
Year Ended June 30, 2010 | | | 16.46 | | | | 0.14 | (f) | | | 2.17 | | | | 2.31 | | | | (0.14 | ) | | | — | | | | (0.14 | ) |
| | | | | | | |
Class R5 | | | | | | | | | | | | | | | | | | | | | | | | | | | | |
Six Months Ended December 31, 2014 (Unaudited) | | | 37.33 | | | | 0.29 | (f) | | | 1.65 | | | | 1.94 | | | | (0.26 | ) | | | (2.87 | ) | | | (3.13 | ) |
Year Ended June 30, 2014 | | | 29.91 | | | | 0.52 | (f) | | | 7.40 | | | | 7.92 | | | | (0.50 | ) | | | — | | | | (0.50 | ) |
Year Ended June 30, 2013 | | | 24.10 | | | | 0.52 | (f) | | | 5.82 | | | | 6.34 | | | | (0.53 | ) | | | — | | | | (0.53 | ) |
Year Ended June 30, 2012 | | | 24.46 | | | | 0.43 | (f) | | | (0.34 | ) | | | 0.09 | | | | (0.45 | ) | | | — | | | | (0.45 | ) |
Year Ended June 30, 2011 | | | 18.71 | | | | 0.37 | (f) | | | 5.68 | | | | 6.05 | | | | (0.30 | ) | | | — | | | | (0.30 | ) |
Year Ended June 30, 2010 | | | 16.53 | | | | 0.27 | (f) | | | 2.19 | | | | 2.46 | | | | (0.28 | ) | | | — | | | | (0.28 | ) |
| | | | | | | |
Class R6 | | | | | | | | | | | | | | | | | | | | | | | | | | | | |
Six Months Ended December 31, 2014 (Unaudited) | | | 37.33 | | | | 0.30 | (f) | | | 1.66 | | | | 1.96 | | | | (0.27 | ) | | | (2.87 | ) | | | (3.14 | ) |
Year Ended June 30, 2014 | | | 29.91 | | | | 0.47 | (f) | | | 7.46 | | | | 7.93 | | | | (0.51 | ) | | | — | | | | (0.51 | ) |
Year Ended June 30, 2013 | | | 24.10 | | | | 0.53 | (f) | | | 5.83 | | | | 6.36 | | | | (0.55 | ) | | | — | | | | (0.55 | ) |
Year Ended June 30, 2012 | | | 24.46 | | | | 0.43 | (f) | | | (0.33 | ) | | | 0.10 | | | | (0.46 | ) | | | — | | | | (0.46 | ) |
November 30, 2010 (g) through June 30, 2011 | | | 21.27 | | | | 0.21 | (f) | | | 3.18 | | | | 3.39 | | | | (0.20 | ) | | | — | | | | (0.20 | ) |
| | | | | | | |
Select Class | | | | | | | | | | | | | | | | | | | | | | | | | | | | |
Six Months Ended December 31, 2014 (Unaudited) | | | 37.25 | | | | 0.25 | (f) | | | 1.66 | | | | 1.91 | | | | (0.23 | ) | | | (2.87 | ) | | | (3.10 | ) |
Year Ended June 30, 2014 | | | 29.85 | | | | 0.45 | (f) | | | 7.38 | | | | 7.83 | | | | (0.43 | ) | | | — | | | | (0.43 | ) |
Year Ended June 30, 2013 | | | 24.06 | | | | 0.46 | (f) | | | 5.81 | | | | 6.27 | | | | (0.48 | ) | | | — | | | | (0.48 | ) |
Year Ended June 30, 2012 | | | 24.42 | | | | 0.39 | (f) | | | (0.35 | ) | | | 0.04 | | | | (0.40 | ) | | | — | | | | (0.40 | ) |
Year Ended June 30, 2011 | | | 18.70 | | | | 0.33 | (f) | | | 5.67 | | | | 6.00 | | | | (0.28 | ) | | | — | | | | (0.28 | ) |
Year Ended June 30, 2010 | | | 16.51 | | | | 0.24 | (f) | | | 2.19 | | | | 2.43 | | | | (0.24 | ) | | | — | | | | (0.24 | ) |
| (a) | Annualized for periods less than one year, unless otherwise noted. |
| (b) | Not annualized for periods less than one year. |
| (c) | Includes adjustments in accordance with accounting principles generally accepted in the United States of America and as such, the net asset values for financial reporting purposes and the returns based upon those net asset values may differ from the net asset values and returns for shareholder transactions. |
| (d) | Includes earnings credits and interest expense, if applicable, each of which is less than 0.01% unless otherwise noted. |
| (e) | Portfolio turnover is calculated by dividing the lesser of total purchases or sales of portfolio securities for the reporting period by the monthly average value of portfolio securities owned during the reporting period. Excluded from both the numerator and denominator are amounts relating to derivatives and securities whose maturities or expiration dates at the time of acquisition were one year or less. |
| (f) | Calculated based upon average shares outstanding. |
| (g) | Commencement of offering of class of shares. |
SEE NOTES TO FINANCIAL STATEMENTS.
| | | | | | |
| | | |
| 56 | | | | J.P. MORGAN INTREPID FUNDS | | DECEMBER 31, 2014 |
| | | | | | | | | | | | | | | | | | | | | | | | | | |
| | | Ratios/Supplemental data | |
| | | | | | | | | | Ratios to average net assets | | | | |
Net asset
value,
end of
period | | | Total return
(excludes
sales charge) (b)(c) | | | Net assets,
end of
period
(000’s) | | | Net
expenses (d) | | | Net
investment
income
(loss) | | | Expenses
without waivers,
reimbursements and
earnings credits | | | Portfolio
turnover
rate (b)(e) | |
| | | | | | | | | | | | | | | | | | | | | | | | | | |
| | | | | | | | | | | | | | | | | | | | | | | | | | |
| $ | 35.92 | | | | 5.33 | % | | $ | 148,364 | | | | 0.90 | % | | | 1.18 | % | | | 1.12 | % | | | 28 | % |
| | 37.13 | | | | 26.17 | | | | 114,036 | | | | 0.94 | | | | 1.19 | | | | 1.17 | | | | 49 | |
| | 29.76 | | | | 26.07 | | | | 71,116 | | | | 0.94 | | | | 1.57 | | | | 1.38 | | | | 48 | |
| | 23.99 | | | | 0.14 | | | | 61,097 | | | | 0.95 | | | | 1.54 | | | | 1.47 | | | | 82 | |
| | 24.35 | | | | 32.01 | | | | 83,202 | | | | 0.97 | | | | 1.34 | | | | 1.40 | | | | 72 | |
| | 18.64 | | | | 14.23 | | | | 82,062 | | | | 1.11 | | | | 0.95 | | | | 1.44 | | | | 113 | |
| | | | | | |
| | | | | | | | | | | | | | | | | | | | | | | | | | |
| | 35.55 | | | | 5.06 | | | | 45,363 | | | | 1.40 | | | | 0.68 | | | | 1.63 | | | | 28 | |
| | 36.80 | | | | 25.50 | | | | 35,963 | | | | 1.44 | | | | 0.69 | | | | 1.67 | | | | 49 | |
| | 29.52 | | | | 25.48 | | | | 25,538 | | | | 1.44 | | | | 1.07 | | | | 1.88 | | | | 48 | |
| | 23.80 | | | | (0.37 | ) | | | 22,086 | | | | 1.45 | | | | 1.04 | | | | 1.96 | | | | 82 | |
| | 24.16 | | | | 31.30 | | | | 30,172 | | | | 1.47 | | | | 0.84 | | | | 1.90 | | | | 72 | |
| | 18.53 | | | | 13.70 | | | | 30,368 | | | | 1.61 | | | | 0.45 | | | | 1.94 | | | | 113 | |
| | | | | | |
| | | | | | | | | | | | | | | | | | | | | | | | | | |
| | 35.79 | | | | 5.21 | | | | 2,202 | | | | 1.15 | | | | 0.93 | | | | 1.43 | | | | 28 | |
| | 37.02 | | | | 25.82 | | | | 1,346 | | | | 1.19 | | | | 0.92 | | | | 1.42 | | | | 49 | |
| | 29.69 | | | | 25.74 | | | | 934 | | | | 1.19 | | | | 1.06 | | | | 1.56 | | | | 48 | |
| | 23.95 | | | | (0.09 | ) | | | 70 | | | | 1.20 | | | | 1.29 | | | | 1.73 | | | | 82 | |
| | 24.31 | | | | 31.65 | | | | 70 | | | | 1.21 | | | | 1.07 | | | | 1.65 | | | | 72 | |
| | 18.63 | | | | 13.98 | | | | 53 | | | | 1.36 | | | | 0.70 | | | | 1.69 | | | | 113 | |
| | | | | | |
| | | | | | | | | | | | | | | | | | | | | | | | | | |
| | 36.14 | | | | 5.50 | | | | 84,277 | | | | 0.55 | | | | 1.52 | | | | 0.66 | | | | 28 | |
| | 37.33 | | | | 26.60 | | | | 80,008 | | | | 0.59 | | | | 1.53 | | | | 0.72 | | | | 49 | |
| | 29.91 | | | | 26.53 | | | | 62,685 | | | | 0.59 | | | | 1.92 | | | | 0.93 | | | | 48 | |
| | 24.10 | | | | 0.49 | | | | 52,183 | | | | 0.60 | | | | 1.88 | | | | 1.03 | | | | 82 | |
| | 24.46 | | | | 32.45 | | | | 50,276 | | | | 0.60 | | | | 1.60 | | | | 0.94 | | | | 72 | |
| | 18.71 | | | | 14.75 | | | | 17,566 | | | | 0.66 | | | | 1.37 | | | | 0.99 | | | | 113 | |
| | | | | | |
| | | | | | | | | | | | | | | | | | | | | | | | | | |
| | 36.15 | | | | 5.55 | | | | 30,831 | | | | 0.50 | | | | 1.58 | | | | 0.59 | | | | 28 | |
| | 37.33 | | | | 26.66 | | | | 19,495 | | | | 0.54 | | | | 1.41 | | | | 0.67 | | | | 49 | |
| | 29.91 | | | | 26.59 | | | | 10,875 | | | | 0.54 | | | | 1.99 | | | | 0.91 | | | | 48 | |
| | 24.10 | | | | 0.54 | | | | 18,840 | | | | 0.55 | | | | 1.86 | | | | 0.97 | | | | 82 | |
| | 24.46 | | | | 15.96 | | | | 32,237 | | | | 0.54 | (g) | | | 1.48 | (g) | | | 0.87 | (g) | | | 72 | |
| | | | | | |
| | | | | | | | | | | | | | | | | | | | | | | | | | |
| | 36.06 | | | | 5.43 | | | | 1,401,482 | | | | 0.75 | | | | 1.33 | | | | 0.89 | | | | 28 | |
| | 37.25 | | | | 26.35 | | | | 1,214,765 | | | | 0.79 | | | | 1.34 | | | | 0.92 | | | | 49 | |
| | 29.85 | | | | 26.26 | | | | 926,972 | | | | 0.79 | | | | 1.71 | | | | 1.12 | | | | 48 | |
| | 24.06 | | | | 0.29 | | | | 705,545 | | | | 0.80 | | | | 1.70 | | | | 1.22 | | | | 82 | |
| | 24.42 | | | | 32.17 | | | | 766,468 | | | | 0.80 | | | | 1.44 | | | | 1.14 | | | | 72 | |
| | 18.70 | | | | 14.61 | | | | 138,337 | | | | 0.86 | | | | 1.20 | | | | 1.19 | | | | 113 | |
SEE NOTES TO FINANCIAL STATEMENTS.
| | | | | | | | |
| | | |
| DECEMBER 31, 2014 | | J.P. MORGAN INTREPID FUNDS | | | | | 57 | |
NOTES TO FINANCIAL STATEMENTS
AS OF DECEMBER 31, 2014 (Unaudited)
1. Organization
JPMorgan Trust I (“JPM I”) and JPMorgan Trust II (“JPM II”) (the “Trusts”) were formed on November 12, 2004, as Delaware statutory trusts, pursuant to Declarations of Trust dated November 5, 2004 and are registered under the Investment Company Act of 1940, as amended (the “1940 Act”), as open-end management investment companies.
The following are 5 separate funds of the Trusts (collectively, the “Funds”) covered by this report:
| | | | | | |
| | | Classes Offered | | Trust | | Diversified/Non-Diversified |
| Intrepid Advantage Fund | | Class A, Class C, and Select Class | | JPM I | | Diversified |
| Intrepid America Fund | | Class A, Class C, Class R2, Class R5 and Select Class | | JPM I | | Diversified |
| Intrepid Growth Fund | | Class A, Class C, Class R2, Class R5 and Select Class | | JPM I | | Diversified |
| Intrepid Mid Cap Fund | | Class A, Class B, Class C and Select Class | | JPM II | | Diversified |
| Intrepid Value Fund | | Class A, Class C, Class R2, Class R5, Class R6 and Select Class | | JPM I | | Diversified |
The investment objective of both the Intrepid Advantage Fund and the Intrepid Value Fund is to seek to provide long-term capital appreciation.
The investment objective of both the Intrepid America Fund and the Intrepid Growth Fund is to seek to provide long-term capital growth.
The investment objective of the Intrepid Mid Cap Fund is to seek long-term capital growth by investing primarily in equity securities of companies with intermediate capitalizations.
Effective November 1, 2009, Class B Shares of Intrepid Mid Cap Fund may not be purchased or acquired by new or existing shareholders, except through exchanges from Class B Shares of another J.P. Morgan Fund and dividend reinvestments. Shareholders who invested in Class B Shares prior to November 1, 2009 may continue to hold their Class B Shares until they automatically convert to Class A Shares.
Class A Shares generally provide for a front-end sales charge while Class B and Class C Shares provide for a contingent deferred sales charge (“CDSC”). Class B Shares automatically convert to Class A Shares after eight years. No sales charges are assessed with respect to Class R2, Class R5, Class R6 and Select Class Shares. All classes of shares have equal rights as to earnings, assets and voting privileges, except that each class may bear different distribution and shareholder servicing fees and each class has exclusive voting rights with respect to its distribution plan and shareholder servicing agreements. Certain Class A Shares, for which front-end sales charges have been waived, may be subject to a CDSC as described in the Funds’ prospectus.
2. Significant Accounting Policies
The following is a summary of significant accounting policies followed by the Funds in the preparation of their financial statements. The Funds are investment companies and, accordingly, follow the investment company accounting and reporting guidance of the Financial Accounting Standards Board Accounting Standards Codification Topic 946—Investment Companies, which is part of U.S. generally accepted accounting principles (“GAAP”). The preparation of financial statements in conformity with GAAP requires management to make estimates and assumptions that affect the reported amounts of assets and liabilities and disclosure of contingent assets and liabilities at the date of the financial statements and the reported amounts of increases and decreases in net assets from operations during the reporting period. Actual results could differ from those estimates.
A. Valuation of Investments — The valuation of the investments is in accordance with GAAP and the Funds’ valuation policies set forth by and under the supervision and responsibility of the Board of Trustees (the “Board”), which established the following approach to valuation, as described more fully below: (i) investments for which market quotations are readily available shall be valued at such unadjusted quoted prices and (ii) all other investments for which market quotations are not readily available shall be valued at their fair value as determined in good faith by the Board.
JPMorgan Funds Management, Inc. (the “Administrator” or “JPMFM”) has established the J.P. Morgan Asset Management Americas Valuation Committee (“AVC”) to assist the Board with the oversight and monitoring of the valuation of the Funds’ investments. The Administrator implements the valuation policies of the Funds’ investments, as directed by the Board. The AVC oversees and carries out the policies for the valuation of investments held in the Funds. This includes monitoring the appropriateness of fair values based on results of ongoing valuation oversight, including but not limited to consideration of macro or security specific events, market events and pricing vendor and broker due diligence. The Administrator is responsible for discussing and assessing the potential impacts to the fair values on an ongoing basis, and at least on a quarterly basis with the AVC and the Board.
Equities and other exchange-traded instruments are valued at the last sale price or official market closing price on the primary exchange on which the instrument is traded before the net asset values (“NAV”) of the Funds are calculated on a valuation date. Investments in open-end investment companies (the “Underlying Funds”) are valued at each investment company’s NAV per share as of the report date.
Fixed income instruments are valued based on prices received from approved pricing vendors or third party broker-dealers (collectively referenced to as “Pricing Services”). The Pricing Services use multiple valuation techniques to determine the valuation of fixed income instruments. In instances where sufficient market activity exists, the Pricing Services may utilize a market-based approach through which trades or quotes from market makers are used to determine the valuation of these instruments. In instances where sufficient market activity may not exist, the Pricing Services also utilize proprietary valuation models which may consider market transactions in comparable securities and the various relationships between securities in determining fair value and/or market characteristics in order to estimate the relevant cash flows, which are then discounted to calculate the fair values.
| | | | | | |
| | | |
| 58 | | | | J.P. MORGAN INTREPID FUNDS | | DECEMBER 31, 2014 |
Futures are generally valued on the basis of available market quotations.
Valuations reflected in this report are as of the report date. As a result, changes in valuation due to market events and/or issuer related events after the report date and prior to issuance of the report are not reflected herein.
The various inputs that are used in determining the valuation of the Funds’ investments are summarized into the three broad levels listed below.
| Ÿ | | Level 1 — Unadjusted inputs using quoted prices in active markets for identical investments. |
| Ÿ | | Level 2 — Other significant observable inputs including, but are not limited to, quoted prices for similar investments, inputs other than quoted prices that are observable for investments (such as interest rates, prepayment speeds, credit risk, etc.) or other market corroborated inputs. |
| Ÿ | | Level 3 — Significant inputs based on the best information available in the circumstances, to the extent observable inputs are not available (including the Funds’ assumptions in determining the fair value of investments). |
A financial instrument’s level within the fair value hierarchy is based on the lowest level of any input, both individually and in the aggregate, that is significant to the fair value measurement. The inputs or methodology used for valuing instruments are not necessarily an indication of the risk associated with investing in those instruments.
The following tables represent each valuation input as presented on the Schedules of Portfolio Investments (“SOIs”) (amounts in thousands):
| | | | | | | | | | | | | | | | |
| | | Level 1
Quoted prices | | | Level 2
Other significant
observable inputs | | | Level 3 Significant
unobservable inputs | | | Total | |
Intrepid Advantage Fund | | | | | | | | | | | | | | | | |
Total Investments in Securities (a) | | $ | 22,463 | | | $ | — | | | $ | — | | | $ | 22,463 | |
| | | | | | | | | | | | | | | | |
Intrepid America Fund | | | | | | | | | | | | | | | | |
Total Investments in Securities (a) | | $ | 3,467,085 | | | $ | — | | | $ | — | | | $ | 3,467,085 | |
| | | | | | | | | | | | | | | | |
Appreciation in Other Financial Instruments | | | | | | | | | | | | | | | | |
Futures Contracts | | $ | 1,491 | | | $ | — | | | $ | — | | | $ | 1,491 | |
| | | | | | | | | | | | | | | | |
Intrepid Growth Fund | | | | | | | | | | | | | | | | |
Total Investments in Securities (a) | | $ | 914,620 | | | $ | — | | | $ | — | | | $ | 914,620 | |
| | | | | | | | | | | | | | | | |
Appreciation in Other Financial Instruments | | | | | | | | | | | | | | | | |
Futures Contracts | | $ | 448 | | | $ | — | | | $ | — | | | $ | 448 | |
| | | | | | | | | | | | | | | | |
Intrepid Mid Cap Fund | | | | | | | | | | | | | | | | |
Total Investments in Securities (a) | | $ | 757,444 | | | $ | — | | | $ | — | | | $ | 757,444 | |
| | | | | | | | | | | | | | | | |
Appreciation in Other Financial Instruments | | | | | | | | | | | | | | | | |
Futures Contracts | | $ | 468 | | | $ | — | | | $ | — | | | $ | 468 | |
| | | | | | | | | | | | | | | | |
Intrepid Value Fund | | | | | | | | | | | | | | | | |
Total Investments in Securities (a) | | $ | 1,714,843 | | | $ | — | | | $ | — | | | $ | 1,714,843 | |
| | | | | | | | | | | | | | | | |
Appreciation in Other Financial Instruments | | | | | | | | | | | | | | | | |
Futures Contracts | | $ | 728 | | | $ | — | | | $ | — | | | $ | 728 | |
| | | | | | | | | | | | | | | | |
| (a) | All portfolio holdings designated as Level 1 are disclosed individually on the SOIs. Please refer to the SOIs for industry specifics of portfolio holdings. |
There were no transfers among any levels during the six months ended December 31, 2014.
B. Futures Contracts — The Funds use index futures contracts to gain or reduce exposure to the stock market, maintain liquidity and minimize transaction costs. The Funds also buy futures contracts to immediately invest incoming cash in the market or sell futures in response to cash outflows, thereby simulating an invested position in the underlying index while maintaining a cash balance for liquidity. The use of futures contracts exposes the Funds to equity price risk.
Futures contracts provide for the delayed delivery of the underlying instrument at a fixed price or are settled for a cash amount based on the change in the value of the underlying instrument at a specific date in the future. Upon entering into a futures contract, the Funds are required to deposit with the broker, cash or securities in an amount equal to a certain percentage of the contract amount, which is referred to as the initial margin deposit. Subsequent payments, referred to as variation margin, are made or received by the Funds periodically and are based on changes in the market value of open futures contracts. Changes in the market value of open futures contracts are recorded as change in net unrealized appreciation/depreciation in the Statements of Operations. Realized gains or losses, representing the difference between the value of the contract at the time it was opened and the value at the time it was closed, are reported in the Statements of Operations at the closing or expiration of the futures contract. Securities deposited as initial margin are designated in the SOIs and cash deposited is recorded on the Statements of Assets and Liabilities. A receivable from and/or a payable to brokers for the daily variation margin is also recorded on the Statements of Assets and Liabilities.
| | | | | | | | |
| | | |
| DECEMBER 31, 2014 | | J.P. MORGAN INTREPID FUNDS | | | | | 59 | |
NOTES TO FINANCIAL STATEMENTS
AS OF DECEMBER 31, 2014 (Unaudited) (continued)
The Funds may be subject to the risk that the change in the value of the futures contract may not correlate perfectly with the underlying instrument. Use of long futures contracts subjects the Funds to risk of loss in excess of the amounts shown on the Statements of Assets and Liabilities, up to the notional amount of the futures contracts. Use of short futures contracts subjects the Funds to unlimited risk of loss. The Funds may enter into futures contracts only on exchanges or boards of trade. The exchange or board of trade acts as the counterparty to each futures transaction; therefore, the Funds’ credit risk is limited to failure of the exchange or board of trade. Under some circumstances, futures exchanges may establish daily limits on the amount that the price of a futures contract can vary from the previous day’s settlement price, which could effectively prevent liquidation of positions.
The table below discloses the volume of the Funds’ futures contracts activity during the six months ended December 31, 2014 (amounts in thousands):
| | | | | | | | | | | | | | | | |
| | | Intrepid
America
Fund | | | Intrepid
Growth
Fund | | | Intrepid
Mid Cap
Fund | | | Intrepid
Value
Fund | |
Average Notional Balance Long | | $ | 85,000 | | | $ | 22,966 | | | $ | 19,764 | | | $ | 38,711 | |
Ending Notional Balance Long | | | 98,720 | | | | 33,146 | | | | 22,598 | | | | 31,196 | |
The Funds’ futures contracts are not subject to master netting agreements (the right to close out all transactions traded with a counterparty and net amounts owed or due across transactions).
C. Security Transactions and Investment Income — Investment transactions are accounted for on the trade date (the date the order to buy or sell is executed). Securities gains and losses are calculated on a specifically identified cost basis. Interest income is determined on the basis of coupon interest accrued using the effective interest method which adjusts for amortization of premiums and accretion of discounts. Dividend income, net of foreign taxes withheld, if any, is recorded on the ex-dividend date or when a Fund first learns of the dividend.
To the extent such information is publicly available, the Funds record distributions received in excess of income earned from underlying investments as a reduction of cost of investments and/or realized gain. Such amounts are based on estimates if actual amounts are not available and actual amounts of income, realized gain and return of capital may differ from the estimated amounts. The Funds adjust the estimated amounts of the components of distributions (and consequently their net investment income) as necessary once the issuers provide information about the actual composition of the distributions.
D. Allocation of Income and Expenses — Expenses directly attributable to a fund are charged directly to that fund, while the expenses attributable to more than one fund of the Trusts are allocated among the respective funds. In calculating the NAV of each class, investment income, realized and unrealized gains and losses and expenses, other than class specific expenses, are allocated daily to each class of shares based upon the proportion of net assets of each class at the beginning of each day.
E. Federal Income Taxes — Each Fund is treated as a separate taxable entity for Federal income tax purposes. Each Fund’s policy is to comply with the provisions of the Internal Revenue Code of 1986, as amended (the “Code”), applicable to regulated investment companies and to distribute to shareholders all of its distributable net investment income and net realized capital gains on investments. Accordingly, no provision for Federal income tax is necessary. Management has reviewed the Funds’ tax positions for all open tax years and has determined that as of December 31, 2014, no liability for income tax is required in the Funds’ financial statements for net unrecognized tax benefits. However, management’s conclusions may be subject to future review based on changes in, or the interpretation of, the accounting standards or tax laws and regulations. Each of the Fund’s Federal tax returns for the prior three fiscal years remains subject to examination by the Internal Revenue Service.
F. Distributions to Shareholders — Distributions from net investment income are generally declared and paid at least annually, except for the Intrepid Mid Cap Fund and Intrepid Value Fund, for which distributions are generally declared and paid at least quarterly. Distributions are declared separately for each class. No class has preferential dividend rights; differences in per share rates are due to differences in separate class expenses. Net realized capital gains, if any, are distributed by each Fund at least annually. The amount of distributions from net investment income and net realized capital gains is determined in accordance with Federal income tax regulations, which may differ from GAAP. To the extent these “book/tax” differences are permanent in nature (i.e., that they result from other than timing of recognition — “temporary differences”), such amounts are reclassified within the capital accounts based on their Federal tax-basis treatment.
3. Fees and Other Transactions with Affiliates
A. Investment Advisory Fee — Pursuant to the Investment Advisory Agreements, J.P. Morgan Investment Management, Inc. (the “Adviser” or “JPMIM”), an indirect, wholly-owned subsidiary of JPMorgan Chase & Co. (“JPMorgan”), supervises the investments of each Fund and for such services is paid a fee. The fee is accrued daily and paid monthly based on each Fund’s respective average daily net assets. The annual rate for each Fund is as follows:
| | | | |
Intrepid Advantage Fund | | | 0.65 | % |
Intrepid America Fund | | | 0.40 | |
Intrepid Growth Fund | | | 0.50 | |
Intrepid Mid Cap Fund | | | 0.65 | |
Intrepid Value Fund | | | 0.40 | |
| | | | | | |
| | | |
| 60 | | | | J.P. MORGAN INTREPID FUNDS | | DECEMBER 31, 2014 |
The Adviser waived Investment Advisory fees and/or reimbursed expenses as outlined in Note 3.F.
B. Administration Fee — Pursuant to an Administration Agreement, the Administrator, an indirect, wholly-owned subsidiary of JPMorgan, provides certain administration services to the Funds. In consideration of these services, the Administrator receives a fee accrued daily and paid monthly at an annual rate of 0.15% of the first $25 billion of the average daily net assets of all funds in the J.P. Morgan Funds Complex covered by the Administration Agreement (excluding certain funds of funds and money market funds) and 0.075% of the average daily net assets in excess of $25 billion of all such funds. For the six months ended December 31, 2014, the effective annualized rate was 0.08% of each Fund’s average daily net assets, notwithstanding any fee waivers and/or expense reimbursements.
The Administrator waived Administration fees as outlined in Note 3.F.
JPMorgan Chase Bank, N.A. (“JPMCB”), a wholly-owned subsidiary of JPMorgan, serves as the Funds’ sub-administrator (the “Sub-administrator”). For its services as Sub-administrator, JPMCB receives a portion of the fees payable to the Administrator.
C. Distribution Fees — Pursuant to a Distribution Agreement, JPMorgan Distribution Services, Inc. (the “Distributor”), a wholly-owned subsidiary of JPMorgan, serves as the Trusts’ exclusive underwriter and promotes and arranges for the sale of each Fund’s shares.
The Board has adopted a Distribution Plan (the “Distribution Plan”) for Class A, Class B, Class C and Class R2 Shares of the Funds in accordance with Rule 12b-1 under the 1940 Act. The Distribution Plan provides that each Fund shall pay distribution fees, including payments to the Distributor, at annual rates of the average daily net assets as shown in the table below:
| | | | | | | | | | | | | | | | |
| | | Class A | | | Class B | | | Class C | | | Class R2 | |
Intrepid Advantage Fund | | | 0.25 | % | | | n/a | | | | 0.75 | % | | | n/a | |
Intrepid America Fund | | | 0.25 | | | | n/a | | | | 0.75 | | | | 0.50 | % |
Intrepid Growth Fund | | | 0.25 | | | | n/a | | | | 0.75 | | | | 0.50 | |
Intrepid Mid Cap Fund | | | 0.25 | | | | 0.75 | % | | | 0.75 | | | | n/a | |
Intrepid Value Fund | | | 0.25 | | | | n/a | | | | 0.75 | | | | 0.50 | |
In addition, the Distributor is entitled to receive the front-end sales charges from purchases of Class A Shares and the CDSC from redemptions of Class B and Class C Shares and certain Class A Shares for which front-end sales charges have been waived. For the six months ended December 31, 2014, the Distributor retained the following (amounts in thousands):
| | | | | | | | |
| | | Front-End Sales Charge | | | CDSC | |
Intrepid Advantage Fund | | $ | 2 | | | $ | — | |
Intrepid America Fund | | | 4 | | | | — | (a) |
Intrepid Growth Fund | | | 8 | | | | — | |
Intrepid Mid Cap Fund | | | 22 | | | | 1 | |
Intrepid Value Fund | | | 16 | | | | — | (a) |
| (a) | Amount rounds to less than $1,000. |
D. Shareholder Servicing Fees — The Trusts, on behalf of the Funds, have entered into Shareholder Servicing Agreements with the Distributor under which the Distributor provides certain support services to the shareholders. The Class R6 Shares do not participate in the Shareholder Servicing Agreement. For performing these services, the Distributor receives a fee that is accrued daily and paid monthly equal to a percentage of the average daily net assets as shown in the table below:
| | | | | | | | | | | | | | | | | | | | | | | | |
| | | Class A | | | Class B | | | Class C | | | Class R2 | | | Class R5 | | | Select Class | |
Intrepid Advantage Fund | | | 0.25 | % | | | n/a | | | | 0.25 | % | | | n/a | | | | n/a | | | | 0.25 | % |
Intrepid America Fund | | | 0.25 | | | | n/a | | | | 0.25 | | | | 0.25 | % | | | 0.05 | % | | | 0.25 | |
Intrepid Growth Fund | | | 0.25 | | | | n/a | | | | 0.25 | | | | 0.25 | | | | 0.05 | | | | 0.25 | |
Intrepid Mid Cap Fund | | | 0.25 | | | | 0.25 | % | | | 0.25 | | | | n/a | | | | n/a | | | | 0.25 | |
Intrepid Value Fund | | | 0.25 | | | | n/a | | | | 0.25 | | | | 0.25 | | | | 0.05 | | | | 0.25 | |
The Distributor has entered into shareholder services contracts with affiliated and unaffiliated financial intermediaries who provide shareholder services and other related services to their clients or customers who invest in the Funds under which the Distributor will pay all or a portion of such fees earned to financial intermediaries for performing such services.
The Distributor waived Shareholder Servicing fees as outlined in Note 3.F.
E. Custodian and Accounting Fees — JPMCB provides portfolio custody and accounting services to the Funds. For these services, the Funds pay JPMCB transaction and asset-based fees that vary according to the number of transactions and positions, plus out-of-pocket expenses. The amounts paid directly to JPMCB by the Funds for custody and accounting services are included in Custodian and accounting fees in the Statements of Oper-
| | | | | | | | |
| | | |
| DECEMBER 31, 2014 | | J.P. MORGAN INTREPID FUNDS | | | | | 61 | |
NOTES TO FINANCIAL STATEMENTS
AS OF DECEMBER 31, 2014 (Unaudited) (continued)
ations. Payments to the custodian may be reduced by credits earned by each Fund, based on uninvested cash balances held by the custodian. Such earnings credits, if any, are presented separately in the Statements of Operations.
Interest expense paid to the custodian related to cash overdrafts, if any, is included in Interest expense to affiliates in the Statements of Operations.
F. Waivers and Reimbursements — The Adviser, Administrator and Distributor have contractually agreed to waive fees and/or reimburse the Funds to the extent that total annual operating expenses (excluding acquired fund fees and expenses, dividend expenses related to short sales, interest, taxes, expenses related to litigation and potential litigation, extraordinary expenses and expenses related to the Board’s deferred compensation plan) exceed the percentages of the Funds’ respective average daily net assets as shown in the table below:
| | | | | | | | | | | | | | | | | | | | | | | | | | | | |
| | | Class A | | | Class B | | | Class C | | | Class R2 | | | Class R5 | | | Class R6 | | | Select Class | |
Intrepid Advantage Fund | | | 1.15 | % | | | n/a | | | | 1.65 | % | | | n/a | | | | n/a | | | | n/a | | | | 0.90 | % |
Intrepid America Fund* | | | 1.04 | | | | n/a | | | | 1.54 | | | | 1.29 | % | | | 0.60 | % | | | n/a | | | | 0.80 | |
Intrepid Growth Fund* | | | 0.93 | | | | n/a | | | | 1.42 | | | | 1.17 | | | | 0.48 | | | | n/a | | | | 0.68 | |
Intrepid Mid Cap Fund | | | 1.15 | | | | 1.79 | % | | | 1.79 | | | | n/a | | | | n/a | | | | n/a | | | | 0.90 | |
Intrepid Value Fund** | | | 0.83 | | | | n/a | | | | 1.33 | | | | 1.08 | % | | | 0.48 | % | | | 0.43 | % | | | 0.68 | |
| * | Prior to November 5, 2014 for Intrepid America Fund and prior to October 31, 2014 for Intrepid Growth Fund, there were no contractual expense limitations for Class A, Class C, Class R2, Class R5 and Select Class. |
| ** | Effective November 11, 2014, the contractual expense limitations for all classes of Intrepid Value Fund were reduced by 0.12% from 0.95%, 1.45%, 1.20%, 0.60%, 0.55% and 0.80% for Class A, Class C, Class R2, Class R5,Class R6 and Select Class, respectively. |
Except as noted above, the expense limitation agreements were in effect for the six months ended December 31, 2014. The contractual expense limitation percentages in the table above are in place until at least October 31, 2015 except Intrepid America Fund which is in place until at least November 5, 2015. In addition, the Funds’ service providers have voluntarily waived fees during the six months ended December 31, 2014. However, the Funds’ service providers are under no obligation to do so and may discontinue such voluntary waivers at any time.
For the six months ended December 31, 2014, the Funds’ service providers waived fees and/or reimbursed expenses for each of the Funds as follows (amounts in thousands). None of these parties expect the Funds to repay any such waived fees and reimbursed expenses in future years.
| | | | | | | | | | | | | | | | | | | | |
| | | Contractual Waivers | | | | |
| | | Investment
Advisory | | | Administration | | | Shareholder
Servicing | | | Total | | | Contractual
Reimbursement | |
Intrepid Advantage Fund | | $ | 60 | | | $ | 8 | | | $ | 15 | | | $ | 83 | | | $ | — | |
Intrepid America Fund | | | — | | | | — | | | | 29 | | | | 29 | | | | — | |
Intrepid Growth Fund | | | 165 | | | | 114 | | | | 20 | | | | 299 | | | | 2 | |
Intrepid Mid Cap Fund | | | 127 | | | | 84 | | | | 320 | | | | 531 | | | | — | |
Intrepid Value Fund | | | 429 | | | | 274 | | | | 389 | | | | 1,092 | | | | — | (a) |
Additionally, the Funds may invest in one or more money market funds advised by the Adviser or its affiliates. The Adviser, Administrator and the Distributor, as shareholder servicing agent, waive fees in an amount sufficient to offset the respective fees each charges to the affiliated money market fund on the Funds’ investment in such affiliated money market fund. A portion of the waiver is voluntary.
The amounts of waivers resulting from investments in these money market funds for the six months ended December 31, 2014 were as follows (amounts in thousands):
| | | | |
Intrepid Advantage Fund | | $ | — | (a) |
Intrepid America Fund | | | 97 | |
Intrepid Growth Fund | | | 21 | |
Intrepid Mid Cap Fund | | | 17 | |
Intrepid Value Fund | | | 44 | |
| (a) | Amount rounds to less than $1,000. |
G. Other — Certain officers of the Trusts are affiliated with the Adviser, the Administrator and the Distributor. Such officers, with the exception of the Chief Compliance Officer, receive no compensation from the Funds for serving in their respective roles.
The Board appointed a Chief Compliance Officer to the Funds in accordance with Federal securities regulations. Each Fund, along with other affiliated funds, makes reimbursement payments, on a pro-rata basis, to the Administrator for a portion of the fees associated with the Office of the Chief Compliance Officer. Such fees are included in Trustees’ and Chief Compliance Officer’s fees in the Statements of Operations.
The Trusts adopted a Trustee Deferred Compensation Plan (the “Plan”) which allows the Independent Trustees to defer the receipt of all or a portion of compensation related to performance of their duties as Trustees. The deferred fees are invested in various J.P. Morgan Funds until distribution in accordance with the Plan.
| | | | | | |
| | | |
| 62 | | | | J.P. MORGAN INTREPID FUNDS | | DECEMBER 31, 2014 |
During the six months ended December 31, 2014, the Funds may have purchased securities from an underwriting syndicate in which the principal underwriter or members of the syndicate are affiliated with the Adviser.
The Funds may use related party broker-dealers. For the six months ended December 31, 2014, the Funds did not incur any brokerage commissions with broker-dealers affiliated with the Adviser.
The Securities and Exchange Commission (“SEC”) has granted an exemptive order permitting the Funds to engage in principal transactions with J.P. Morgan Securities, Inc., an affiliated broker, involving taxable money market instruments, subject to certain conditions.
4. Investment Transactions
During the six months ended December 31, 2014, purchases and sales of investments (excluding short-term investments) were as follows (amounts in thousands):
| | | | | | | | | | | | | | | | |
| | | Purchases
(excluding U.S.
Government) | | | Sales
(excluding U.S.
Government) | | | Purchases
of U.S.
Government | | | Sales
of U.S.
Government | |
Intrepid Advantage Fund | | $ | 6,409 | | | $ | 1,707 | | | $ | — | | | $ | — | |
Intrepid America Fund | | | 1,004,246 | | | | 775,461 | | | | — | | | | — | |
Intrepid Growth Fund | | | 326,167 | | | | 283,041 | | | | — | | | | — | |
Intrepid Mid Cap Fund | | | 203,577 | | | | 90,841 | | | | — | | | | 625 | |
Intrepid Value Fund | | | 610,136 | | | | 422,479 | | | | — | | | | — | |
5. Federal Income Tax Matters
For Federal income tax purposes, the cost and unrealized appreciation (depreciation) in value of investment securities held at December 31, 2014 were as follows (amounts in thousands):
| | | | | | | | | | | | | | | | |
| | | Aggregate
Cost | | | Gross
Unrealized
Appreciation | | | Gross
Unrealized
Depreciation | | | Net Unrealized
Appreciation
(Depreciation) | |
Intrepid Advantage Fund | | $ | 17,257 | | | $ | 5,314 | | | $ | 108 | | | $ | 5,206 | |
Intrepid America Fund | | | 2,649,280 | | | | 850,789 | | | | 32,984 | | | | 817,805 | |
Intrepid Growth Fund | | | 684,263 | | | | 244,241 | | | | 13,884 | | | | 230,357 | |
Intrepid Mid Cap Fund | | | 559,958 | | | | 209,822 | | | | 12,336 | | | | 197,486 | |
Intrepid Value Fund | | | 1,329,550 | | | | 405,182 | | | | 19,889 | | | | 385,293 | |
Under the Regulated Investment Company Modernization Act of 2010 (the “Act”), net capital losses recognized by the Funds after June 30, 2011 are carried forward indefinitely, and retain their character as short-term and/or long-term losses. Prior to the Act, net capital losses incurred by the Funds were carried forward for eight years and treated as short-term losses. The Act requires that post-enactment net capital losses be used before pre-enactment net capital losses.
At June 30, 2014, the Funds did not have any post-enactment net capital loss carryforwards.
At June 30, 2014, the Funds had pre-enactment net capital loss carryforwards, expiring during the years indicated, which are available to offset future realized gains (amounts in thousands):
| | | | | | | | | | | | |
| | | 2018 | | | 2019 | | | Total | |
Intrepid Advantage Fund | | $ | — | | | $ | 3,111 | | | $ | 3,111 | |
Intrepid Growth Fund | | | 251,742 | | | | — | | | | 251,742 | |
During the year ended June 30, 2014, the Funds utilized capital loss carryforwards as follows (amounts in thousands):
| | | | |
Intrepid Advantage Fund | | $ | 1,190 | |
Intrepid America Fund | | | 243,921 | |
Intrepid Growth Fund | | | 104,094 | |
Intrepid Mid Cap Fund | | | 26,914 | |
Intrepid Value Fund | | | 40,207 | |
6. Borrowings
The Funds rely upon an exemptive order granted by the SEC (the “Order”) permitting the establishment and operation of an Interfund Lending Facility (the “Facility”). The Facility allows the Funds to directly lend and borrow money to or from any other fund relying upon the Order at rates beneficial to both the borrowing and lending funds. Advances under the Facility are taken primarily for temporary or emergency purposes, including the meeting of redemption requests that otherwise might require the untimely disposition of securities, and are subject to each Fund’s borrowing restrictions. The Interfund loan rate is determined, as specified in the Order, by averaging the current repurchase agreement rate and the current
| | | | | | | | |
| | | |
| DECEMBER 31, 2014 | | J.P. MORGAN INTREPID FUNDS | | | | | 63 | |
NOTES TO FINANCIAL STATEMENTS
AS OF DECEMBER 31, 2014 (Unaudited) (continued)
bank loan rate. The Order was granted to JPM II and may be relied upon by the Funds because the Funds and the series of JPMorgan Trust II are all investment companies in the same “group of investment companies” (as defined in Section 12(d)(1)(G) of the 1940 Act).
In addition, the Trusts and JPMCB have entered into a financing arrangement. Under this arrangement, JPMCB provides an unsecured, uncommitted credit facility in the aggregate amount of $100 million to certain of the J.P. Morgan Funds, including the Funds. Advances under the arrangement are taken primarily for temporary or emergency purposes, including the meeting of redemption requests that otherwise might require the untimely disposition of securities, and are subject to each Fund’s borrowing restrictions. Interest on borrowings is payable at a rate determined by JPMCB at the time of borrowing. This agreement has been extended until November 9, 2015.
The Funds had no borrowings outstanding from another fund or from the unsecured, uncommitted credit facility at December 31, 2014, or at any time during the six months then ended.
Interest expense paid, if any, as a result of borrowings from another fund or from the unsecured, uncommitted credit facility is included in Interest expense to affiliates in the Statements of Operations.
7. Risks, Concentrations and Indemnifications
In the normal course of business, the Funds enter into contracts that contain a variety of representations which provide general indemnifications. Each Fund’s maximum exposure under these arrangements is unknown. The amount of exposure would depend on future claims that may be made against each Fund that have not yet occurred. However, based on experience, the Funds expect the risk of loss to be remote.
One or more affiliates of the Adviser have investment discretion with respect to their clients’ holdings in the Funds, which collectively represent a significant portion of the Funds’ assets for each of the Funds.
In addition, the J.P. Morgan Investor Funds and JPMorgan SmartRetirement Funds, which are affiliated funds of funds, own in the aggregate, more than 10% of the net assets of the Funds as follows:
| | | | | | | | |
| | | J.P. Morgan
Investor Funds | | | JPMorgan
SmartRetirement Funds | |
Intrepid America Fund | | | 36.6 | % | | | 47.8 | % |
Intrepid Growth Fund | | | 60.4 | | | | — | |
Intrepid Mid Cap Fund | | | 38.8 | | | | — | |
Additionally, the Funds each have one or more shareholders, each of which are accounts maintained by a financial intermediary on behalf of its clients, that own a significant portion of that Fund’s outstanding shares.
Significant shareholder transactions by these shareholders may impact the Funds’ performance.
| | | | | | |
| | | |
| 64 | | | | J.P. MORGAN INTREPID FUNDS | | DECEMBER 31, 2014 |
SCHEDULE OF SHAREHOLDER EXPENSES
(Unaudited)
Hypothetical $1,000 Investment
As a shareholder of the Funds, you incur two types of costs: (1) transaction costs, including sales charges (loads) on purchase payments and (2) ongoing costs, including investment advisory fees, administration fees, distribution fees and other Fund expenses. The examples below are intended to help you understand your ongoing costs (in dollars) of investing in the Funds and to compare these ongoing costs with the ongoing costs of investing in other mutual funds. The examples assume that you had a $1,000 investment in each Class at the beginning of the reporting period, July 1, 2014, and continued to hold your shares at the end of the reporting period, December 31, 2014.
Actual Expenses
For each Class of each Fund in the table below, the first line provides information about actual account values and actual expenses. You may use the information in this line, together with the amount you invested, to estimate the expenses that you paid over the period. Simply divide your account value by $1,000 (for example, an $8,600 account value divided by $1,000 = 8.6), then multiply the result by the number in the first line of each Class under the heading entitled “Expenses Paid During the Period” to estimate the expenses you paid on your account during this period.
Hypothetical Example for Comparison Purposes
The second line of each Class in the table below provides information about hypothetical account values and hypothetical expenses based on the Class’ actual expense ratio and an assumed rate of return of 5% per year before expenses, which is not the Class’ actual return. The hypothetical account values and expenses may not be used to estimate the actual ending account balance or expenses you paid for the period. You may use this information to compare the ongoing costs of investing in the Class of the Fund and other funds. To do so, compare this 5% hypothetical example with the 5% hypothetical examples that appear in the shareholder reports of the other funds. Please note that the expenses shown in the table are meant to highlight your ongoing costs only and do not reflect any transaction costs, such as sales charges (loads) or redemption fees. Therefore, the second line for each Class in the table is useful in comparing ongoing costs only, and will not help you determine the relative total costs of owning different funds. In addition, if these transaction costs were included, your costs would have been higher. The examples also assume all dividends and distributions have been reinvested.
| | | | | | | | | | | | | | | | |
| | | Beginning
Account Value
July 1, 2014 | | | Ending
Account Value
December 31, 2014 | | | Expenses
Paid During
the Period* | | | Annualized
Expense
Ratio | |
Intrepid Advantage Fund | | | | | | | | | | | | | | | | |
Class A | | | | | | | | | | | | | | | | |
Actual | | $ | 1,000.00 | | | $ | 1,057.70 | | | $ | 5.96 | | | | 1.15 | % |
Hypothetical | | | 1,000.00 | | | | 1,019.41 | | | | 5.85 | | | | 1.15 | |
Class C | | | | | | | | | | | | | | | | |
Actual | | | 1,000.00 | | | | 1,055.20 | | | | 8.55 | | | | 1.65 | |
Hypothetical | | | 1,000.00 | | | | 1,016.89 | | | | 8.39 | | | | 1.65 | |
Select Class | | | | | | | | | | | | | | | | |
Actual | | | 1,000.00 | | | | 1,059.40 | | | | 4.67 | | | | 0.90 | |
Hypothetical | | | 1,000.00 | | | | 1,020.67 | | | | 4.58 | | | | 0.90 | |
| | | | |
Intrepid America Fund | | | | | | | | | | | | | | | | |
Class A | | | | | | | | | | | | | | | | |
Actual | | | 1,000.00 | | | | 1,072.50 | | | | 5.33 | | | | 1.02 | |
Hypothetical | | | 1,000.00 | | | | 1,020.06 | | | | 5.19 | | | | 1.02 | |
Class C | | | | | | | | | | | | | | | | |
Actual | | | 1,000.00 | | | | 1,069.80 | | | | 7.93 | | | | 1.52 | |
Hypothetical | | | 1,000.00 | | | | 1,017.54 | | | | 7.73 | | | | 1.52 | |
Class R2 | | | | | | | | | | | | | | | | |
Actual | | | 1,000.00 | | | | 1,071.10 | | | | 6.63 | | | | 1.27 | |
Hypothetical | | | 1,000.00 | | | | 1,018.80 | | | | 6.46 | | | | 1.27 | |
Class R5 | | | | | | | | | | | | | | | | |
Actual | | | 1,000.00 | | | | 1,074.90 | | | | 2.88 | | | | 0.55 | |
Hypothetical | | | 1,000.00 | | | | 1,022.43 | | | | 2.80 | | | | 0.55 | |
Select Class | | | | | | | | | | | | | | | | |
Actual | | | 1,000.00 | | | | 1,074.00 | | | | 3.92 | | | | 0.75 | |
Hypothetical | | | 1,000.00 | | | | 1,021.42 | | | | 3.82 | | | | 0.75 | |
| | | | | | | | |
| | | |
| DECEMBER 31, 2014 | | J.P. MORGAN INTREPID FUNDS | | | | | 65 | |
SCHEDULE OF SHAREHOLDER EXPENSES
(Unaudited) (continued)
Hypothetical $1,000 Investment
| | | | | | | | | | | | | | | | |
| | | Beginning
Account Value
July 1, 2014 | | | Ending
Account Value
December 31, 2014 | | | Expenses
Paid During
the Period* | | | Annualized
Expense
Ratio | |
Intrepid Growth Fund | | | | | | | | | | | | | | | | |
Class A | | | | | | | | | | | | | | | | |
Actual | | $ | 1,000.00 | | | $ | 1,089.90 | | | $ | 5.48 | | | | 1.04 | % |
Hypothetical | | | 1,000.00 | | | | 1,019.96 | | | | 5.30 | | | | 1.04 | |
Class C | | | | | | | | | | | | | | | | |
Actual | | | 1,000.00 | | | | 1,087.10 | | | | 8.15 | | | | 1.55 | |
Hypothetical | | | 1,000.00 | | | | 1,017.39 | | | | 7.88 | | | | 1.55 | |
Class R2 | | | | | | | | | | | | | | | | |
Actual | | | 1,000.00 | | | | 1,088.60 | | | | 6.84 | | | | 1.30 | |
Hypothetical | | | 1,000.00 | | | | 1,018.65 | | | | 6.61 | | | | 1.30 | |
Class R5 | | | | | | | | | | | | | | | | |
Actual | | | 1,000.00 | | | | 1,092.40 | | | | 3.27 | | | | 0.62 | |
Hypothetical | | | 1,000.00 | | | | 1,022.08 | | | | 3.16 | | | | 0.62 | |
Select Class | | | | | | | | | | | | | | | | |
Actual | | | 1,000.00 | | | | 1,091.40 | | | | 4.32 | | | | 0.82 | |
Hypothetical | | | 1,000.00 | | | | 1,021.07 | | | | 4.18 | | | | 0.82 | |
| | | | |
Intrepid Mid Cap Fund | | | | | | | | | | | | | | | | |
Class A | | | | | | | | | | | | | | | | |
Actual | | | 1,000.00 | | | | 1,064.10 | | | | 5.98 | | | | 1.15 | |
Hypothetical | | | 1,000.00 | | | | 1,019.41 | | | | 5.85 | | | | 1.15 | |
Class B | | | | | | | | | | | | | | | | |
Actual | | | 1,000.00 | | | | 1,060.40 | | | | 9.30 | | | | 1.79 | |
Hypothetical | | | 1,000.00 | | | | 1,016.18 | | | | 9.10 | | | | 1.79 | |
Class C | | | | | | | | | | | | | | | | |
Actual | | | 1,000.00 | | | | 1,060.70 | | | | 9.30 | | | | 1.79 | |
Hypothetical | | | 1,000.00 | | | | 1,016.18 | | | | 9.10 | | | | 1.79 | |
Select Class | | | | | | | | | | | | | | | | |
Actual | | | 1,000.00 | | | | 1,065.60 | | | | 4.69 | | | | 0.90 | |
Hypothetical | | | 1,000.00 | | | | 1,020.67 | | | | 4.58 | | | | 0.90 | |
| | | | |
Intrepid Value Fund | | | | | | | | | | | | | | | | |
Class A | | | | | | | | | | | | | | | | |
Actual | | | 1,000.00 | | | | 1,053.30 | | | | 4.66 | | | | 0.90 | |
Hypothetical | | | 1,000.00 | | | | 1,020.67 | | | | 4.58 | | | | 0.90 | |
Class C | | | | | | | | | | | | | | | | |
Actual | | | 1,000.00 | | | | 1,050.60 | | | | 7.24 | | | | 1.40 | |
Hypothetical | | | 1,000.00 | | | | 1,018.15 | | | | 7.12 | | | | 1.40 | |
Class R2 | | | | | | | | | | | | | | | | |
Actual | | | 1,000.00 | | | | 1,052.10 | | | | 5.95 | | | | 1.15 | |
Hypothetical | | | 1,000.00 | | | | 1,019.41 | | | | 5.85 | | | | 1.15 | |
Class R5 | | | | | | | | | | | | | | | | |
Actual | | | 1,000.00 | | | | 1,055.00 | | | | 2.85 | | | | 0.55 | |
Hypothetical | | | 1,000.00 | | | | 1,022.43 | | | | 2.80 | | | | 0.55 | |
Class R6 | | | | | | | | | | | | | | | | |
Actual | | | 1,000.00 | | | | 1,055.50 | | | | 2.59 | | | | 0.50 | |
Hypothetical | | | 1,000.00 | | | | 1,022.68 | | | | 2.55 | | | | 0.50 | |
Select Class | | | | | | | | | | | | | | | | |
Actual | | | 1,000.00 | | | | 1,054.30 | | | | 3.88 | | | | 0.75 | |
Hypothetical | | | 1,000.00 | | | | 1,021.42 | | | | 3.82 | | | | 0.75 | |
| * | Expenses are equal to each Class’ respective annualized expense ratio, multiplied by the average account value over the period, multiplied by 184/365 (to reflect the one-half year period). |
| | | | | | |
| | | |
| 66 | | | | J.P. MORGAN INTREPID FUNDS | | DECEMBER 31, 2014 |
BOARD APPROVAL OF INVESTMENT ADVISORY AGREEMENT
(Unaudited)
The Board of Trustees has established various standing committees composed of Trustees with diverse backgrounds, to which the Board of Trustees has assigned specific subject matter responsibilities to further enhance the effectiveness of the Board’s oversight and decision making. The Board of Trustees and its investment committees (money market and alternative products, equity, and fixed income) meet regularly throughout the year and consider factors that are relevant to their annual consideration of investment advisory agreements at each meeting. They also meet for the specific purpose of considering investment advisory agreement annual renewals. The Board of Trustees held meetings in person in June and August 2014, at which the Trustees considered the continuation of the investment advisory agreements for each of the Funds whose semi-annual report is contained herein (each an “Advisory Agreement” and collectively, the “Advisory Agreements”). At the June meeting, the Board’s investment committees met to review and consider performance, expense and related information for the J.P. Morgan Funds. Each investment committee reported to the full Board, which then considered the investment committee’s preliminary findings. At the August meeting, the Trustees continued their review and consideration. The Trustees, including a majority of the Trustees who are not “interested persons” (as defined in the 1940 Act) of any party to the Advisory Agreements or any of their affiliates, approved the continuation of each Advisory Agreement on August 20, 2014.
As part of their review of the Advisory Agreements, the Trustees considered and reviewed performance and other information about the Funds received from the Adviser. This information includes the Funds’ performance as compared to the performance of their peers and benchmarks and analyses by the Adviser of the Funds’ performance. In addition, the Trustees have engaged an independent management consulting firm (“independent consultant”) to report on the performance of certain J.P. Morgan Funds at each of the Trustees’ regular meetings. The Adviser also periodically provides comparative information regarding the Funds’ expense ratios and those of their peer groups. In addition, in preparation for the June and August meetings, the Trustees requested, received and evaluated extensive materials from the Adviser, including performance and expense information compiled by Lipper Inc. (“Lipper”), an independent provider of investment company data. The Trustees’ independent consultant also provided additional analyses of the performance of the Funds in connection with the Trustees’ review of the Advisory Agreements. Before voting on the proposed Advisory Agreements, the Trustees reviewed the proposed Advisory Agreements with representatives of the Adviser, counsel to the Trusts and independent legal counsel and received a memorandum from independent legal counsel to the Trustees discussing the legal standards for their consideration of the proposed Advisory Agreements. The Trustees also discussed the proposed Advisory Agreements in
executive sessions with independent legal counsel at which no representatives of the Adviser were present. Set forth below is a summary of the material factors evaluated by the Trustees in determining whether to approve each Advisory Agreement.
The Trustees considered information provided with respect to the Funds over the course of the year. Each Trustee attributed different weights to the various factors and no factor alone was considered determinative. From year to year, the Trustees consider and place emphasis on relevant information in light of changing circumstances in market and economic conditions. The Trustees determined that the compensation to be received by the Adviser from each Fund under the applicable Advisory Agreement was fair and reasonable and that the continuance of the Advisory Agreements was in the best interests of each Fund and its shareholders.
The factors summarized below were considered and discussed by the Trustees in reaching their conclusions:
Nature, Extent and Quality of Services Provided by the Adviser
The Trustees received and considered information regarding the nature, extent and quality of the services provided to each Fund under the Advisory Agreement. The Trustees took into account information furnished throughout the year at Trustee meetings, as well as the materials furnished specifically in connection with this annual review process. The Trustees considered the background and experience of the Adviser’s senior management and the expertise of, and the amount of attention given to each Fund by, investment personnel of the Adviser. In addition, the Trustees reviewed the qualifications, backgrounds and responsibilities of the portfolio management team primarily responsible for the day-to-day management of each Fund and the infrastructure supporting the team. The Trustees also considered information provided by the Adviser and JPMorgan Distribution Services, Inc. (“JPMDS”) about the structure and distribution strategy of each Fund. The Trustees reviewed information relating to the Adviser’s risk governance model and reports showing the Adviser’s compliance structure and ongoing compliance processes. The Trustees also considered the quality of the administrative services provided by JPMorgan Funds Management, Inc. (“JPMFM”), an affiliate of the Adviser.
The Trustees also considered their knowledge of the nature and quality of the services provided by the Adviser and its affiliates to the Funds gained from their experience as Trustees of the J.P. Morgan Funds. In addition, they considered the overall reputation and capabilities of the Adviser and its affiliates, the commitment of the Adviser to provide high quality service to the Funds, their overall confidence in the Adviser’s integrity and the Adviser’s responsiveness to questions or concerns raised by them, including the Adviser’s willingness to consider and implement organizational and operational changes designed to improve investment results and the services provided to each Fund.
| | | | | | | | |
| | | |
| DECEMBER 31, 2014 | | J.P. MORGAN INTREPID FUNDS | | | | | 67 | |
BOARD APPROVAL OF INVESTMENT ADVISORY AGREEMENT
(Unaudited) (continued)
Based upon these considerations and other factors, the Trustees concluded that they were satisfied with the nature, extent and quality of the investment advisory services provided to the Funds by the Adviser.
Costs of Services Provided and Profitability to the Adviser and its Affiliates
The Trustees received and considered information regarding the profitability to the Adviser and its affiliates in providing services to each of the Funds. The Trustees reviewed and discussed this data. The Trustees recognized that this data is not audited and represents the Adviser’s determination of its and its affiliates’ revenues from the contractual services provided to the Funds, less expenses of providing such services. Expenses include direct and indirect costs and are calculated using an allocation methodology developed by the Adviser. The Trustees also recognized that it is difficult to make comparisons of profitability from fund investment advisory contracts because comparative information is not generally publicly available and is affected by numerous factors, including the structure of the particular adviser, the types of funds it manages, its business mix, numerous assumptions regarding allocations and the fact that publicly-traded fund managers’ operating profits and net income are net of distribution and marketing expenses. Based on their review, the Trustees concluded that the profitability to the Adviser under each of the Advisory Agreements was not unreasonable in light of the services and benefits provided to each Fund.
Fall-Out Benefits
The Trustees reviewed information regarding potential “fallout” or ancillary benefits received by the Adviser and its affiliates as a result of their relationship with the Funds. The Trustees also reviewed the Adviser’s allocation of fund brokerage for the J.P. Morgan Funds complex, including allocations to brokers who provide research to the Adviser.
The Trustees also considered that JPMFM and JPMDS, affiliates of the Adviser, earn fees from the Funds for providing administrative and shareholder services. These fees were shown separately in the profitability analysis presented to the Trustees. The Trustees also considered the payments of Rule 12b-1 fees to JPMDS, which also acts as the Funds’ distributor and that these fees are in turn generally paid to financial intermediaries that sell the Funds, including financial intermediaries that are affiliates of the Adviser. The Trustees also considered the fees paid to JPMorgan Chase Bank, N.A. (“JPMCB”) for custody and fund accounting, and other related services.
Economies of Scale
The Trustees considered the extent to which the Funds benefit from economies of scale. The Trustees noted that the proposed investment advisory fee schedule for each Fund does not contain breakpoints, but that the fee schedule for the administrative
services provided by JPMFM does include a fee breakpoint, which is tied to the overall level of non-money market fund assets excluding certain funds-of-funds, as applicable, advised by the Adviser, and that the Funds benefit from that breakpoint. The Trustees also noted that the Adviser and its affiliates had implemented fee waivers and expense limitations for each Fund except for the Intrepid America and Intrepid Growth Funds for the period beginning November 1, 2013. The Trustees considered whether it would be appropriate to add advisory fee breakpoints, and the Trustees concluded that the current fee structure was reasonable in light of the fee waivers and expense limitations that the Adviser and its affiliates have in place that serve to limit the overall net expense ratios of the Funds at competitive levels. The Trustees concluded that shareholders of the Funds effectively participated in the economies of scale through the applicable fee waivers and expense limitations and administrative service fee breakpoints.
Independent Written Evaluation of the Funds’ Senior/Chief Compliance Officer
The Trustees noted that, upon their direction, the Senior Officer for the Intrepid Mid Cap Fund had prepared an independent written evaluation in order to assist the Trustees in determining the reasonableness of the proposed management fees. In determining whether to continue the Advisory Agreements, the Trustees considered the Senior Officer’s report.
The Trustees noted that, upon their direction, the Chief Compliance Officer for the Intrepid Advantage Fund, Intrepid America Fund, Intrepid Growth Fund, and Intrepid Value Fund had prepared an independent written evaluation in order to assist the Trustees in determining the reasonableness of the proposed management fees. The Trustees considered the written evaluation in determining whether to continue the Advisory Agreements.
Fees Relative to Adviser’s Other Clients
The Trustees received and considered information about the nature and extent of investment advisory services and fee rates offered to other clients of the Adviser for investment management styles substantially similar to that of each Fund. The Trustees also considered the complexity of investment management for the Funds relative to the Adviser’s other clients and the differences in the nature and extent of the services provided to the different clients. The Trustees concluded that the fee rates charged to each Fund in comparison to those charged to the Adviser’s other clients were reasonable.
Investment Performance
The Trustees received and considered absolute and/or relative performance for the Funds in a report prepared by Lipper. The Trustees considered the total return performance information, which included the ranking of the Funds within a performance universe made up of funds with the same Lipper investment
| | | | | | |
| | | |
| 68 | | | | J.P. MORGAN INTREPID FUNDS | | DECEMBER 31, 2014 |
classification and objective (the “Universe Group”) by total return for applicable one-, three- and five-year periods. The Trustees reviewed a description of Lipper’s methodology for selecting mutual funds in each Fund’s Universe Group. The Lipper materials provided to the Trustees highlighted information with respect to certain representative classes to assist the Trustees in their review. As part of this review, the Trustees also reviewed each Fund’s performance against its benchmark and considered the performance information provided for the Funds at regular Board meetings by the Adviser and the Trustees’ independent consultant and also considered the special analysis prepared by the Trustees’ independent consultant. The Lipper performance data noted by the Trustees as part of their review and the determinations made by the Trustees with respect to each Fund’s performance for certain representative classes are summarized below:
The Trustees noted that the Intrepid Advantage Fund’s performance was in the second, first and second quintiles for both Class A and Select Class shares for the one-, three- and five-year periods ended December 31, 2013, respectively, and that the Trustees’ independent consultant indicated that the Fund’s overall performance was attractive. The Trustees discussed the performance and investment strategy of the Fund with the Adviser and, based upon this discussion and various other factors, concluded that the performance was reasonable.
The Trustees noted that the Intrepid America Fund’s performance was in the second quintile for Class A shares for each of the one-, three-, and five-year periods ended December 31, 2013, and in the first, second, and first quintiles for Select Class shares for the one-, three- and five-year periods ended December 31, 2013, respectively, and the Trustees’ independent consultant indicated that the Fund’s overall performance was attractive. The Trustees discussed the performance and investment strategy of the Fund with the Adviser and, based upon this discussion and various other factors, concluded that the performance was reasonable.
The Trustees noted that the Intrepid Growth Fund’s performance was in the third, second and third quintiles for Class A shares and in the third, second, and second quintiles for Select Class shares for the one-, three- and five-year periods ended December 31, 2013, respectively, and that the Trustees’ independent consultant indicated that the Fund’s overall performance was attractive. The Trustees discussed the performance and investment strategy of the Fund with the Adviser and, based upon this discussion and various other factors, concluded that the performance was reasonable.
The Trustees noted that the Intrepid Mid Cap Fund’s performance was in the first, first and second quintiles for both Class A and Select Class shares for the one-, three-, and five-year periods ended December 31, 2013, respectively, and that the Trustees’ independent consultant indicated that overall performance was attractive. The Trustees discussed the performance and
investment strategy of the Fund with the Adviser and, based upon this discussion and various other factors, concluded that the performance was reasonable.
The Trustees noted that the Intrepid Value Fund’s performance was in the second, first, and second quintiles for Class A shares and in the first, first and second quintiles for Select Class shares for the one-, three-, and five-year periods ended December 31, 2013, respectively, and that the Trustees’ independent consultant indicated that the Fund’s overall performance was attractive. The Trustees discussed the performance and investment strategy of the Fund with the Adviser and, based upon this discussion and various other factors, concluded that the performance was reasonable.
Advisory Fees and Expense Ratios
The Trustees considered the contractual advisory fee rate paid by each Fund to the Adviser and compared that rate to the information prepared by Lipper concerning management fee rates paid by other funds in the same Lipper category as each Fund. The Trustees recognized that Lipper reported each Fund’s management fee rate as the combined contractual advisory fee and administration fee rates. The Trustees also reviewed information about other expenses and the expense ratios for each Fund. The Trustees considered the fee waiver and/or expense reimbursement arrangements currently in place for each Fund and considered the net advisory fee rate after taking into account any waivers and/or reimbursements. The Trustees also considered that the Adviser, JPMDS and JPMFM agreed to add fee waivers and/or expense reimbursements for the Intrepid Growth Fund and to increase the fee waivers and/or expense reimbursements for the Intrepid Value Fund effective November 1, 2014. The Trustees recognized that it is difficult to make comparisons of advisory fees because there are variations in the services that are included in the fees paid by other funds. The Trustees’ determinations as a result of the review of each Fund’s advisory fees and expense ratios for certain representative classes are summarized below:
The Trustees noted that the Intrepid Advantage Fund’s net advisory fee for both Class A and Select Class shares was in the first quintile and that the actual total expenses for Class A and Select Class shares were in the second and third quintiles, respectively, of the Universe Group. After considering the factors identified above, in light of this information, the Trustees concluded that the advisory fee was reasonable.
The Trustees noted that the Intrepid America Fund’s net advisory fee for both Class A and Select Class shares was in the second quintile, and that the actual total expenses for Class A and Select Class shares were in the first and second quintiles, respectively, of the Universe Group. After considering the factors identified above, in light of this information, the Trustees concluded that the advisory fee was reasonable.
| | | | | | | | |
| | | |
| DECEMBER 31, 2014 | | J.P. MORGAN INTREPID FUNDS | | | | | 69 | |
BOARD APPROVAL OF INVESTMENT ADVISORY AGREEMENT
(Unaudited) (continued)
The Trustees noted that the Intrepid Growth Fund’s net advisory fee and actual total expenses for both Class A and Select Class shares were in the second quintile of the Universe Group. After considering the factors identified above, including the addition of fee waivers and/or expense reimbursements that would take effect on November 1, 2014, in light of this information, the Trustees concluded that the advisory fee was reasonable.
The Trustees noted that the Intrepid Mid Cap Fund’s net advisory fee for both Class A and Select Class shares was in the third quintile and that the actual total expenses for Class A and Select Class shares were in the first and second quintiles,
respectively, of the Universe Group. After considering the factors identified above, in light of this information, the Trustees concluded that the advisory fee was reasonable.
The Trustees noted that the Intrepid Value Fund’s net advisory fee for both Class A and Select Class shares was in the first quintile and that the actual total expenses for Class A and Select Class shares were in the first and second quintiles, respectively, of the Universe Group. After considering the factors identified above, including the additional fee waivers and/or expense reimbursements that would take effect on November 1, 2014, in light of this information, the Trustees concluded that the advisory fee was reasonable.
| | | | | | |
| | | |
| 70 | | | | J.P. MORGAN INTREPID FUNDS | | DECEMBER 31, 2014 |
J.P. Morgan Funds are distributed by JPMorgan Distribution Services, Inc., which is an affiliate of JPMorgan Chase & Co. Affiliates of JPMorgan Chase & Co. receive fees for providing various services to the funds.
Contact JPMorgan Distribution Services, Inc. at 1-800-480-4111 for a fund prospectus. You can also visit us at www.jpmorganfunds.com. Investors should carefully consider the investment objectives and risk as well as charges and expenses of the mutual fund before investing. The prospectus contains this and other information about the mutual fund. Read the prospectus carefully before investing.
Investors may obtain information about the Securities Investor Protection Corporation (SIPC), including the SIPC brochure by visiting www.sipc.org or by calling SIPC at 202-371-8300.
Each Fund files a complete schedule of its fund holdings for the first and third quarters of its fiscal year with the SEC on Form N-Q. The Funds’ Forms N-Q are available on the SEC’s website at http://www.sec.gov and may be reviewed and copied at the SEC’s Public Reference Room in Washington, DC. Information on the operation of the SEC’s Public Reference Room may be obtained by calling 1-800-SEC-0330. Shareholders may request the Form N-Q without charge by calling 1-800-480-4111 or by visiting the J.P. Morgan Funds’ website at www.jpmorganfunds.com.
A description of each Fund’s policies and procedures with respect to the disclosure of each Fund’s holdings is available in the prospectus and Statement of Additional Information.
A copy of proxy policies and procedures is available without charge upon request by calling 1-800-480-4111 and on the Funds’ website at www.jpmorganfunds.com. A description of such policies and procedures is on the SEC’s website at www.sec.gov. The Trustees have delegated the authority to vote proxies for securities owned by the Funds to the Adviser. A copy of the Funds’ voting record for the most recent 12-month period ended June 30 is available on the SEC’s website at www.sec.gov or at the Funds’ website at www.jpmorganfunds.com no later than August 31 of each year. The Funds’ proxy voting record will include, among other things, a brief description of the matter voted on for each fund security, and will state how each vote was cast, for example, for or against the proposal.

J.P. Morgan Asset Management is the marketing name for the asset management business of JPMorgan Chase & Co. Those business include, but are not limited to, J.P. Morgan Investment Management Inc., Security Capital Research & Management Incorporated and J.P. Morgan Alternative Asset Management, Inc.
| | | | |
| | © JPMorgan Chase & Co., 2015. All rights reserved. December 2014. | | SAN-INT-1214 |
ITEM 2. CODE OF ETHICS.
Disclose whether, as of the end of the period covered by the report, the registrant has adopted a code of ethics that applies to the registrant’s principal executive officer, principal financial officer, principal accounting officer or controller, or persons performing similar functions, regardless of whether these individuals are employed by the registrant or a third party. If the registrant has not adopted such a code of ethics, explain why it has not done so.
The registrant must briefly describe the nature of any amendment, during the period covered by the report, to a provision of its code of ethics that applies to the registrant’s principal executive officer, principal financial officer, principal accounting officer or controller, or persons performing similar functions, regardless of whether these individuals are employed by the registrant or a third party, and that relates to any element of the code of ethics definition enumerated in paragraph (b) of this Item. The registrant must file a copy of any such amendment as an exhibit pursuant to Item 12(a)(1), unless the registrant has elected to satisfy paragraph (f) of this Item by positing its code of ethics on its website pursuant to paragraph (f)(2) of this Item, or by undertaking to provide its code of ethics to any person without charge, upon request, pursuant to paragraph (f)(3) of this Item.
If the registrant has, during the period covered by the report, granted a waiver, including an implicit waiver, from a provision of the code of ethics that applies to the registrant’s principal executive officer, principal financial officer, principal accounting officer or controller, or persons performing similar functions, regardless of whether these individuals are employed by the registrant or third party, that relates to one or more items set forth in paragraph (b) of this Item, the registrant must briefly describe the nature of the waiver, the name of the person to whom the waiver was granted, and the date of the waiver.
Not applicable to a semiannual report.
ITEM 3. AUDIT COMMITTEE FINANCIAL EXPERT.
(a) (1) Disclose that the registrant’s board of directors has determined that the registrant either:
(i) Has at least one audit committee financial expert serving on its audit committee; or
(ii) Does not have an audit committee financial expert serving on its audit committee.
(2) If the registrant provides the disclosure required by paragraph (a)(1)(i) of this Item, it must disclose the name of the audit committee financial expert and whether that person is “independent.” In order to be considered “independent” for purposes of this Item, a member of an audit committee may not, other than in his or her capacity as a member of the audit committee, the board of directors, or any other board committee:
(i) Accept directly or indirectly any consulting, advisory, or other compensatory fee from the issuer; or
(ii) Be an “interested person” of the investment company as defined in Section 2(a)(19) of the Act (15 U.S.C. 80a-2(a)(19)).
(3) If the registrant provides the disclosure required by paragraph (a)(1)(ii) of this Item, it must explain why it does not have an audit committee financial expert.
Not applicable to a semiannual report.
ITEM 4. PRINCIPAL ACCOUNTANT FEES AND SERVICES.
(a) Disclose, under the caption Audit Fees, the aggregate fees billed for each of the last two fiscal years for professional services rendered by the principal accountant for the audit of the registrant’s annual financial statements or services that are normally provided by the accountant in connection with statutory and regulatory filings or engagements for those fiscal years.
(b) Disclose, under the caption Audit-Related Fees, the aggregate fees billed in each of the last two fiscal years for assurance and related services by the principal accountant that are reasonably related to the performance of the audit of the registrant’s financial statements and are not reported under paragraph (a) of this Item. Registrants shall describe the nature of the services comprising the fees disclosed under this category.
(c) Disclose, under the caption Tax Fees, the aggregate fees billed in each of the last two fiscal years for professional services rendered by the principal accountant for tax compliance, tax advice, and tax planning. Registrants shall describe the nature of the services comprising the fees disclosed under this category.
(d) Disclose, under the caption All Other Fees, the aggregate fees billed in each of the last two fiscal years for products and services provided by the principal accountant, other than the services reported in paragraphs (a) through (c) of this Item. Registrants shall describe the nature of the services comprising the fees disclosed under this category.
(e) (1) Disclose the audit committee’s pre-approval policies and procedures described in paragraph (c)(7) of Rule 2-01 of Regulation S-X.
(2) Disclose the percentage of services described in each of paragraphs (b) through (d) of this Item that were approved by the audit committee pursuant to paragraph (c)(7)(i)(C) of Rule 2-01 of Regulation S-X.
(f) If greater than 50 percent, disclose the percentage of hours expended on the principal accountant’s engagement to audit the registrant’s financial statements for the most recent fiscal year that were attributed to work performed by persons other than the principal accountant’s full-time, permanent employees.
(g) Disclose the aggregate non-audit fees billed by the registrant’s accountant for services rendered to the registrant, and rendered to the registrant’s investment adviser (not including any sub-adviser whose role is primarily portfolio management and is subcontracted with or overseen by another investment adviser), and any entity controlling, controlled by, or under common control with the adviser that provides ongoing services to the registrant for each of the last two fiscal years of the registrant.
(h) Disclose whether the registrant’s audit committee of the board of directors has considered whether the provision of non-audit services that were rendered to the registrant’s investment adviser (not including any subadviser whose role is primarily portfolio management and is subcontracted with or overseen by another investment adviser), and any entity controlling, controlled by, or under common control with the investment adviser that provides ongoing services to the registrant that were not pre-approved pursuant to paragraph (c)(7)(ii) of Rule 2-01 of Regulation S-X is compatible with maintaining the principal accountant’s independence.
Not applicable to a semiannual report.
ITEM 5. AUDIT COMMITTEE OF LISTED REGISTRANTS.
(a) If the registrant is a listed issuer as defined in Rule 10A-3 under the Exchange Act (17CFR 240.10A-3), state whether or not the registrant has a separately-designated standing audit committee established in accordance with Section 3(a)(58)(A) of the Exchange Act (15 U.S.C. 78c(a)(58)(A)). If the registrant has such a committee, however designated, identify each committee member. If the entire board of directors is acting as the registrant’s audit committee as specified in Section 3(a)(58)(B) of the Exchange Act (15 U.S.C. 78c(a)(58)(B)), so state.
(b) If applicable, provide the disclosure required by Rule 10A-3(d) under the Exchange Act (17CFR 240.10A-3(d)) regarding an exemption from the listing standards for all audit committees.
Not applicable to a semiannual report.
ITEM 6. SCHEDULE OF INVESTMENTS.
File Schedule I – Investments in securities of unaffiliated issuers as of the close of the reporting period as set forth in Section 210.12-12 of Regulation S-X, unless the schedule is included as part of the report to shareholders filed under Item 1 of this Form.
Included in Item 1.
ITEM 7. DISCLOSURE OF PROXY VOTING POLICIES AND PROCEDURES FOR CLOSED-END MANAGEMENT INVESTMENT COMPANIES.
A closed-end management investment company that is filing an annual report on this Form N-CSR must, unless it invests exclusively in non-voting securities, describe the policies and procedures that it uses to determine how to vote proxies relating to portfolio securities, including the procedures that the company uses when a vote presents a conflict between the interests of its shareholders, on the one hand, and those of the company’s investment adviser; principal underwriter; or any affiliated person (as defined in Section 2(a)(3) of the Investment Company Act of 1940 (15 U.S.C. 80a-2(a)(3)) and the rules thereunder) of the company, its investment adviser, or its principal underwriter, on the other. Include any policies and procedures of the company’s investment adviser, or any other third party, that the company uses, or that are used on the company’s behalf, to determine how to vote proxies relating to portfolio securities.
Not applicable.
ITEM 8. PORTFOLIO MANAGERS OF CLOSED-END MANAGEMENT INVESTMENT COMPANIES.
Not applicable.
ITEM 9. PURCHASE OF EQUITY SECURITIES BY CLOSED-END MANAGEMENT INVESTMENT COMPANY AND AFFILIATED PURCHASERS.
(a) If the registrant is a closed-end management investment company, provide the information specified in paragraph (b) of this Item with respect to any purchase made by or on behalf of the registrant or any “affiliated purchaser,” as defined in Rule 10b-18(a)(3) under the Exchange Act (17 CFR 240.10b-18(a)(3)), of shares or other units of any class of the registrant’s equity securities that is registered by the registrant pursuant to Section 12 of the Exchange Act (15 U.S.C. 781).
Not applicable.
ITEM 10. SUBMISSION OF MATTERS TO A VOTE OF SECURITY HOLDERS.
Describe any material changes to the procedures by which shareholders may recommend nominees to the registrant’s board of directors, where those changes were implemented after the registrant last provided disclosure in response to the requirements of Item 7(d)(2)(ii)(G) of Schedule 14A (17 CFR 240.14a-101), or this Item.
No material changes to report.
ITEM 11. CONTROLS AND PROCEDURES.
(a) Disclose the conclusions of the registrant’s principal executive and principal financial officers, or persons performing similar functions, regarding the effectiveness of the registrant’s disclosure controls and procedures (as defined in Rule 30a-3(c) under the Act (17 CFR 270.30a-3(c))) as of a date within 90 days of the filing date of the report that includes the disclosure required by this paragraph, based on the evaluation of these controls and procedures required by Rule 30a-3(b) under the Act (17 CFR 270.30a-3(b)) and Rules 13a-15(b) or 15d-15(b) under the Exchange Act (17 CFR 240.13a-15(b) or 240.15d-15(b)).
The Registrant’s principal executive and principal financial officers have concluded, based on their evaluation of the Registrant’s disclosure controls and procedures as of a date within 90 days of the filing date of this report, that the
Registrant’s disclosure controls and procedures are reasonably designed to ensure that information required to be disclosed by the Registrant on Form N-CSR is recorded, processed, summarized and reported within the required time periods and that information required to be disclosed by the Registrant in the reports that it files or submits on Form N-CSR is accumulated and communicated to the Registrant’s management, including its principal executive and principal financial officers, as appropriate to allow timely decisions regarding required disclosure.
(b) Disclose any change in the registrant’s internal control over financial reporting (as defined in Rule 30a-3(d) under the Act (17 CFR 270.30a-3(d)) that occurred during the registrant’s second fiscal quarter of the period covered by this report that has materially affected, or is reasonably likely to materially affect, the registrant’s internal control over financial reporting.
There were no changes in the Registrant’s internal control over financial reporting that occurred during the last fiscal quarter covered by this report that have materially affected, or are reasonably likely to materially affect, the Registrant’s internal control over financial reporting.
ITEM 12. EXHIBITS.
(a) File the exhibits listed below as part of this Form. Letter or number the exhibits in the sequence indicated.
(a)(1) Any code of ethics, or amendment thereto, that is the subject of the disclosure required by Item 2, to the extent that the registrant intends to satisfy the Item 2 requirements through filing of an exhibit.
Not applicable.
(a)(2) A separate certification for each principal executive officer and principal financial officer of the registrant as required by Rule 30a-2(a) under the Act (17 CFR 270.30a-2).
Certifications pursuant to Rule 30a-2(a) under the Investment Company Act of 1940 are attached hereto.
(a)(3) Any written solicitation to purchase securities under Rule 23c-1 under the Act (17 CFR 270.23c-1) sent or given during the period covered by the report by or on behalf of the registrant to 10 or more persons.
Not applicable.
(b) A separate or combined certification for each principal executive officer and principal officer of the registrant as required by Rule 30a-2(b) under the Act of 1940.
Certifications pursuant to Rule 30a-2(b) under the Investment Company Act of 1940 are attached hereto.
SIGNATURES
Pursuant to the requirements of the Securities Exchange Act of 1934 and the Investment Company Act of 1940, the registrant has duly caused this report to be signed on its behalf by the undersigned, thereunto duly authorized.
JPMorgan Trust II
| | |
| By: | | /s/ Robert L. Young |
| | Robert L. Young |
| | President and Principal Executive Officer |
| | February 27, 2015 |
Pursuant to the requirements of the Securities Exchange Act of 1934 and the Investment Company Act of 1940, this report has been signed below by the following persons on behalf of the registrant and in the capacities and on the dates indicated.
| | |
| By: | | /s/ Robert L. Young |
| | Robert L. Young |
| | President and Principal Executive Officer |
| | February 27, 2015 |
| |
| By: | | /s/ Laura M. Del Prato |
| | Laura M. Del Prato |
| | Treasurer and Principal Financial Officer |
| | February 27, 2015 |
