UNITED STATES
SECURITIES AND EXCHANGE COMMISSION
Washington, D.C. 20549
FORM N-CSR
CERTIFIED SHAREHOLDER REPORT OF REGISTERED
MANAGEMENT INVESTMENT COMPANIES
Investment Company Act file number: 811-04236
JPMorgan Trust II
(Exact name of registrant as specified in charter)
270 Park Avenue
New York, NY 10017
(Address of principal executive offices) (Zip code)
Frank J. Nasta
270 Park Avenue
New York, NY 10017
(Name and Address of Agent for Service)
Registrant’s telephone number, including area code: (800) 480-4111
Date of fiscal year end: October 31
Date of reporting period: November 1, 2014 through April 30, 2015
Form N-CSR is to be used by management investment companies to file reports with the Commission not later than 10 days after the transmission to stockholders of any report that is required to be transmitted to stockholders under Rule 30e-1 under the Investment Company Act of 1940 (17 CFR 270.30e-1). The Commission may use the information provided on Form N-CSR in its regulatory, disclosure review, inspection, and policymaking roles.
A registrant is required to disclose the information specified by Form N-CSR, and the Commission will make this information public. A registrant is not required to respond to the collection of information contained in Form N-CSR unless the Form displays a currently valid Office of Management and Budget (“OMB”) control number. Please direct comments concerning the accuracy of the information collection burden estimate and any suggestions for reducing the burden to Secretary, Securities and Exchange Commission, 450 Fifth Street, NW, Washington, DC 20549-0609. The OMB has reviewed this collection of information under the clearance requirements of 44 U.S.C. Section 3507.
| ITEM 1. | REPORTS TO STOCKHOLDERS. |
The following is a copy of the report transmitted to shareholders pursuant to Rule 30e-1 under the Investment Company Act of 1940 (17 CFR 270.30e-1).
Semi-Annual Report
J.P. Morgan International Equity Funds
April 30, 2015 (Unaudited)
JPMorgan Emerging Economies Fund
JPMorgan Emerging Markets Equity Fund
JPMorgan Emerging Markets Equity Income Fund
JPMorgan Global Research Enhanced Index Fund
JPMorgan Global Unconstrained Equity Fund
JPMorgan International Equity Fund
JPMorgan International Equity Income Fund
(formerly JPMorgan Global Equity Income Fund)
JPMorgan International Opportunities Fund
JPMorgan International Research Enhanced Equity Fund
JPMorgan International Unconstrained Equity Fund
JPMorgan International Value Fund
JPMorgan Intrepid International Fund

CONTENTS
Investments in a Fund are not bank deposits or obligations of, or guaranteed or endorsed by, any bank and are not insured or guaranteed by the FDIC, the Federal Reserve Board or any other government agency. You could lose money if you sell when the Fund’s share price is lower than when you invested.
Past performance is no guarantee of future performance. The general market views expressed in this report are opinions based on market and other conditions through the end of the reporting period and are subject to change without notice. These views are not intended to predict the future performance of a Fund or the securities markets. References to specific securities and their issuers are for illustrative purposes only and are not intended to be, and should not be interpreted as, recommendations to purchase or sell such securities. Such views are not meant as investment advice and may not be relied on as an indication of trading intent on behalf of any Fund.
Prospective investors should refer to the Funds’ prospectus for a discussion of the Funds’ investment objectives, strategies and risks. Call J.P. Morgan Funds Service Center at 1-800-480-4111 for a prospectus containing more complete information about a Fund, including management fees and other expenses. Please read it carefully before investing.
CEO’S LETTER
May 12, 2015 (Unaudited)
Dear Shareholder,
The sharp divergence between U.S. economic growth and the rest of the world that marked the end of 2014 receded somewhat in 2015 as aggressive actions by central banks and a stunning drop in global oil prices brought improved economic growth and strength in financial markets. Globally, equity markets and bond market aggregate indexes provided positive returns for the six months ended April 30, 2015.
| | |
 | | “The collective, if not concerted, efforts of central bankers helped to drive financial markets higher during the six month period.” |
By the start of November, the U.S. Federal Reserve had ended its multi-billion dollar bond buying program amid substantial and continued improvement in employment. Meanwhile, Japan unleashed a massive economic stimulus to counter two consecutive quarters of economic contraction and the European Central Bank moved decisively to head off the threat of a deflationary spiral. China’s central bank also undertook a series of actions to counter a slowing economy. By the end of February 2015, the nations of India, Australia, Canada, Singapore and Denmark had also enacted monetary policies to counter economic weakness.
The collective, if not concerted, efforts of central bankers helped drive financial markets higher during the six month period. Global mergers and acquisitions activity and generally healthy corporate earnings contributed to strength in equity markets. By mid April, European stock prices, as measured by the FTSEurofirst 300 Index, closed at their highest level since 2000, while China’s Shanghai Composite Index rose to close at a seven year high and Japan’s Nikkei Stock Average 225 closed above the 20,000 point level for the first time in 15 years.
After notching record closing highs in February, March and April, the Standard & Poor’s 500 Index ended the six months through April 30, 2015, with a return of 4.40%. The MSCI Europe, Australasia and Far East Index returned 7.06% and the MSCI Emerging Markets Index returned 4.04% for the same period. Among bond indexes, the Barclays U.S. Aggregate Index returned 2.06% and the Barclays Emerging Markets Aggregate Index returned 1.15% for the same period.
While U.S. financial markets continued to benefit from low interest rates, expanding corporate profits and mergers, the overall U.S. economy — after leading all other developed markets in growth through 2014 — showed signs of weakening in early 2015.
For the first quarter of 2015, U.S. gross domestic product (GDP) actually contracted by 0.7% compared with 2.2% growth for the final quarter of 2014. In hindsight, economists noted two significant drags on the domestic economy in the first three months of 2015: Severe winter weather across the eastern half of the country impeded construction and transportation and a months-long labor dispute created significant backlogs at crucial West Coast ports. The relative strength of the U.S. dollar also made exports more expensive and curbed foreign demand for U.S.-made goods.
Declines in global oil prices, while helping consumer sectors of the economy, forced energy sector companies to curtail new projects and the U.S. dollar’s strength relative to other leading currencies put pressure on the earnings of companies with large overseas operations.
While U.S. unemployment fell to 5.4% in April 2015 from 5.8% in November 2014, the pace of job growth in March was the weakest in 15 months at 85,000 total jobs added. While wage growth in the U.S. showed improvement in April, it remained weak overall, as it has throughout the economic recovery.
Meanwhile, GDP growth in the European Union (EU) rose 0.4% in the final quarter of 2014 and by 0.4% in the first three months of 2015. The euro’s weakness relative to other currencies helped drive export growth and in April 2015, EU consumer prices ended a four-month string of declines and bank lending in March 2015 rose for the first time since 2012. Further, even as the ongoing Greek debt crisis curbed investor confidence in the EU, data from countries ranging from Germany to Spain showed the economic recovery gaining strength.
The changes in the relative strengths and trajectories in the economies of the developed and emerging market nations over the course of the past six months clearly demonstrate the fluid and interconnected nature of the global economy. We believe a well diversified portfolio and a patient, long-term perspective may allow investors to benefit from positive trends while limiting the impact of negative trends.
On behalf of everyone at J.P. Morgan Asset Management, thank you for your continued support. We look forward to managing your investment needs for years to come. Should you have any questions, please visit www.jpmorganfunds.com or contact the J.P. Morgan Funds Service Center at 1-800-480-4111.
Sincerely yours,

George C.W. Gatch
CEO, Global Funds Management
J.P. Morgan Asset Management
| | | | | | | | |
| | | |
| APRIL 30, 2015 | | J.P. MORGAN INTERNATIONAL EQUITY FUNDS | | | | | 1 | |
J.P. Morgan International Equity Funds
MARKET OVERVIEW
SIX MONTHS ENDED APRIL 30, 2015 (Unaudited)
Developed Markets
Increased central bank stimulus in the European Union and the Japanese government’s bulk purchases of equities during the six month period provided support for equity markets outside the U.S. Meanwhile, the U.S. Federal Reserve (the “Fed”) ended its own asset purchasing program but held interest rates at historical lows. U.S. equity prices remained near record highs for much of the period, supported by low interest rates, earnings growth and mergers and acquisitions activity. For the six months ended April 30, 2015, the MSCI Europe, Australasia and Far East Index returned 7.06% and the S&P 500 Index returned 4.40%.
Large bond purchases by the European Central Bank drove up prices for European sovereign debt. Yields, which generally move in the opposite direction of prices, fell on German 10 year bonds to record lows and sent fixed income investors to seek relatively higher yields from U.S. Treasury bonds. Notably, April 2015 brought fresh signs of economic growth and inflation expectations in Europe and led to sharply higher German bond yields at the end of the month.
Commodities prices generally remained under pressure during the six month period amid tepid global demand. Oil and gas prices continued to fall until hitting a bottom in mid-March. While energy prices rose steadily through April, they remained well below levels seen at the start of the six month reporting period.
Emerging Markets
Slowing growth in China drove uncertainty across emerging markets. However, the Chinese central bank took several actions aimed at stabilizing a deceleration of growth to a moderate pace. During the six month period, Chinese equity prices provided positive returns and the Shanghai Composite Index closed at a seven year high in late April.
Falling energy prices for much of the six month period also provided a boost for other emerging market nations, including India, Brazil, South Africa and Turkey. Russia, which is an energy exporting nation, was hurt by low global oil prices as well as continued economic sanctions imposed by the West. For the six month period, the MSCI Emerging Markets Index returned 4.04%.
| | | | | | |
| | | |
| 2 | | | | J.P. MORGAN INTERNATIONAL EQUITY FUNDS | | APRIL 30, 2015 |
JPMorgan Emerging Economies Fund
FUND COMMENTARY
SIX MONTHS ENDED APRIL 30, 2015 (Unaudited)
| | | | |
| REPORTING PERIOD RETURN: | |
| Fund (Select Class Shares)* | | | 3.96% | |
| Morgan Stanley Capital International (“MSCI”) Emerging Markets Index (net of foreign withholding taxes) | | | 3.92% | |
| |
| Net Assets as of 4/30/2015 (In Thousands) | | $ | 843,847 | |
INVESTMENT OBJECTIVE**
The JPMorgan Emerging Economies Fund (the “Fund”) seeks long-term capital growth.
WHAT WERE THE MAIN DRIVERS OF THE FUND’S PERFORMANCE?
The Fund’s Select Class Shares outperformed the MSCI Emerging Markets Index (net of foreign withholding taxes) (the “Benchmark”) for the six months ended April 30, 2015.
The Fund’s security selection and underweight position in the consumer staples sector and its security selection in the health care sector were leading contributors to performance relative to the Benchmark, while the Fund’s security selection in the financials and consumer discretionary sectors were detractors from relative performance.
Leading individual contributors to relative performance included the Fund’s overweight positions in Great Wall Motor Co., Pegatron Corp. and China Merchants Bank Co. Shares of Great Wall Motor, a Chinese automaker, rose on increased sales of its budget-priced sport utility vehicles. Shares of Pegatron, a Taiwanese electronics manufacturer and the main assembler of Apple Inc. products, rose on strong sales and earnings in early 2015. Shares of China Merchants Bank, a Chinese commercial bank, strengthened on solid growth in earnings.
Leading individual detractors from relative performance included the Fund’s overweight position in Kroton Educacional SA and its underweight positions in Tencent Holdings Ltd. and Ping An Insurance Co. Shares of Kroton Educacional, a Brazilian
operator of private schools, fell after the Brazilian government tightened regulations on a college loan program that provides a large portion of Kroton’s revenue. Shares of Tencent Holdings, a provider of Internet and mobile services in China, gained from continued growth in its online advertising businesses. Shares of Ping An Insurance on strong earnings growth. However, the Fund had no position in the stock, which hurt relative performance.
HOW WAS THE FUND POSITIONED?
The Fund’s portfolio managers used a combination of top-down and bottom-up research, seeking what they believed to be attractively priced countries, sectors and securities with positive catalysts. As a result of this process, the Fund’s largest average positions during the six months ended April 30, 2015, were in China, South Korea and Taiwan and its smallest average positions in which the Fund invested were in Egypt, Malaysia and Greece. From a sector perspective, the Fund’s largest average positions were in the information technology, financials and consumer discretionary sectors, while its smallest average positions in which it was invested were in the health care, consumer staples and materials sectors.
| * | | The return shown is based on net asset values calculated for shareholder transactions and may differ from the return shown in the financial highlights, which reflects adjustments made to the net asset values in accordance with accounting principles generally accepted in the United States of America. |
| ** | | The adviser seeks to achieve the Fund’s objective. There can be no guarantee it will be achieved. |
| | | | | | | | |
| | | |
| APRIL 30, 2015 | | J.P. MORGAN INTERNATIONAL EQUITY FUNDS | | | | | 3 | |
JPMorgan Emerging Economies Fund
FUND COMMENTARY
SIX MONTHS ENDED APRIL 30, 2015 (Unaudited) (continued)
| | | | | | | | |
| TOP TEN EQUITY HOLDINGS OF THE PORTFOLIO* | |
| | 1. | | | Bank of China Ltd., Class H (China) | | | 1.9 | % |
| | 2. | | | China Merchants Bank Co., Ltd., Class H (China) | | | 1.6 | |
| | 3. | | | China CITIC Bank Corp., Ltd., Class H (China) | | | 1.4 | |
| | 4. | | | Samsung Electronics Co., Ltd. (South Korea) | | | 1.2 | |
| | 5. | | | China Construction Bank Corp., Class H (China) | | | 1.2 | |
| | 6. | | | Catcher Technology Co., Ltd. (Taiwan) | | | 1.2 | |
| | 7. | | | Lenovo Group Ltd. (China) | | | 1.2 | |
| | 8. | | | CNOOC Ltd. (China) | | | 1.2 | |
| | 9. | | | Fubon Financial Holding Co., Ltd. (Taiwan) | | | 1.2 | |
| | 10. | | | Industrial & Commercial Bank of China Ltd., Class H (China) | | | 1.2 | |
| | | | |
PORTFOLIO COMPOSITION BY COUNTRY* | |
| China | | | 25.0 | % |
| South Korea | | | 19.6 | |
| Taiwan | | | 12.8 | |
| Russia | | | 6.4 | |
| Brazil | | | 6.4 | |
| India | | | 6.3 | |
| Thailand | | | 5.5 | |
| Turkey | | | 5.0 | |
| Hong Kong | | | 4.8 | |
| South Africa | | | 3.7 | |
| Indonesia | | | 1.0 | |
| Others (each less than 1.0%) | | | 2.2 | |
| Short-Term Investment | | | 1.3 | |
| * | | Percentages indicated are based on total investments as of April 30, 2015. The Fund’s portfolio composition is subject to change. |
| | | | | | |
| | | |
| 4 | | | | J.P. MORGAN INTERNATIONAL EQUITY FUNDS | | APRIL 30, 2015 |
| | | | | | | | | | | | | | | | | | |
AVERAGE ANNUAL TOTAL RETURNS AS OF APRIL 30, 2015 | |
| | | | | |
| | | INCEPTION DATE OF
CLASS | | 6 MONTH* | | | 1 YEAR | | | 5 YEAR | | | SINCE
INCEPTION | |
CLASS A SHARES | | February 28, 2008 | | | | | | | | | | | | | | | | |
Without Sales Charge | | | | | 3.83 | % | | | 6.01 | % | | | 2.87 | % | | | 0.03 | % |
With Sales Charge** | | | | | (1.64 | ) | | | 0.46 | | | | 1.76 | | | | (0.72 | ) |
CLASS C SHARES | | February 28, 2008 | | | | | | | | | | | | | | | | |
Without CDSC | | | | | 3.61 | | | | 5.49 | | | | 2.35 | | | | (0.47 | ) |
With CDSC*** | | | | | 2.61 | | | | 4.49 | | | | 2.35 | | | | (0.47 | ) |
CLASS R5 SHARES | | February 28, 2008 | | | 4.10 | | | | 6.51 | | | | 3.34 | | | | 0.49 | |
SELECT CLASS SHARES | | February 28, 2008 | | | 3.96 | | | | 6.31 | | | | 3.13 | | | | 0.28 | |
| ** | | Sales Charge for Class A Shares is 5.25%. |
| *** | | Assumes a 1% CDSC (contingent deferred sales charge) for the one year period and 0% CDSC thereafter. |
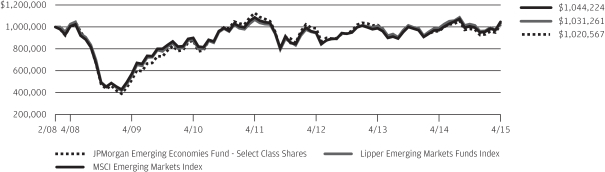
LIFE OF FUND PERFORMANCE (2/28/08 TO 4/30/15)
The performance quoted is past performance and is not a guarantee of future results. Mutual funds are subject to certain market risks. Investment returns and principal value of an investment will fluctuate so that an investor’s shares, when redeemed, may be worth more or less than their original cost. Current performance may be higher or lower than the performance data shown. For up-to-date month-end performance information please call 1-800-480-4111.
The Fund commenced operations on February 28, 2008.
The graph illustrates comparative performance for $1,000,000 invested in Select Class Shares of the JPMorgan Emerging Economies Fund, the MSCI Emerging Markets Index and the Lipper Emerging Markets Funds Index from February 28, 2008 to April 30, 2015. The performance of the Fund assumes reinvestment of all dividends and capital gain distributions, if any, and does not include a sales charge. The performance of the MSCI Emerging Markets Index does not reflect the deduction of expenses or a sales charge associated with a mutual fund and approximates the minimum possible dividend reinvestment of the securities included in the benchmark, if applicable. The dividend is reinvested after deduction of withholding tax, applying the maximum rate to non-resident individual investors who do not benefit from double taxation treaties. The performance of the Lipper Emerging Markets Funds Index includes expenses associated with a mutual fund, such as investment management fees. These expenses are not identical to the expenses incurred by the Fund. The
MSCI Emerging Markets Index is a free float-adjusted market capitalization weighted index that is designed to measure the equity market performance of emerging markets. The Lipper Emerging Markets Funds Index is an index based on the total returns of certain mutual funds within the Fund’s designated category as determined by Lipper, Inc. Investors cannot invest directly in an index.
Select Class Shares have a $1,000,000 minimum initial investment.
Fund performance may reflect the waiver of the Fund’s fees and reimbursement of expenses for certain periods since the inception date. Without these waivers and reimbursements, performance would have been lower. Also, performance shown in this section does not reflect the deduction of taxes that a shareholder would pay on Fund distributions or redemption of Fund shares.
International investing involves a greater degree of risk and increased volatility. Changes in currency exchange rates and differences in accounting and taxation policies outside the United States can raise or lower returns. Also, some overseas markets may not be as politically and economically stable as the U.S. and other nations.
The returns shown are based on net asset values calculated for shareholder transactions and may differ from the returns shown in the financial highlights, which reflect adjustments made to the net asset values in accordance with accounting principles generally accepted in the United States of America.
| | | | | | | | |
| | | |
| APRIL 30, 2015 | | J.P. MORGAN INTERNATIONAL EQUITY FUNDS | | | | | 5 | |
JPMorgan Emerging Markets Equity Fund
FUND COMMENTARY
SIX MONTHS ENDED APRIL 30, 2015 (Unaudited)
| | | | |
| REPORTING PERIOD RETURN: | |
| Fund (Institutional Class Shares)* | | | (2.98)% | |
| Morgan Stanley Capital International (“MSCI”) Emerging Markets Index (net of foreign withholding taxes) | | | 3.92% | |
| |
| Net Assets as of 4/30/2015 (In Thousands) | | $ | 2,088,476 | |
INVESTMENT OBJECTIVE**
The JPMorgan Emerging Markets Equity Fund (the “Fund”) seeks to provide high total return from a portfolio of equity securities from emerging markets issuers.
WHAT WERE THE MAIN DRIVERS OF THE FUND’S PERFORMANCE?
The Fund’s Institutional Class Shares underperformed the MSCI Emerging Markets Index (net of foreign withholding taxes) (the “Benchmark”) for the six months ended April 30, 2015.
The Fund’s security selection in the consumer discretionary and financials sectors was the leading detractor from performance relative to the Benchmark. The Fund’s security selection and underweight position in the energy sector and its underweight position in the utilities sector were leading positive contributors to relative performance.
Leading individual detractors from relative performance included the Fund’s positions in Sands China Ltd., Wynn Macau Ltd. and Baidu Inc., none of which were held in the Benchmark. Shares of Sands China and Wynn Macau, both Macau casino operators, declined as Chinese government efforts to curb corruption reduced casino traffic by wealthy customers. Shares of Baidu, a Chinese Internet portal operator, fell after the company posted revenues below analysts’ estimates.
Leading individual contributors to relative performance included the Fund’s overweight positions in Capitec Bank Holdings Ltd. and AIA Group Ltd., and its underweight position in
Petroleo Brasileiro SA (Petrobras). Shares of Capitec Bank, a South African financial services company, rose on solid earnings and revenue. Shares of AIA Group, a Hong Kong insurer and financial services company, rose on strong growth in new business. Shares of Petrobras, Brazil’s state-controlled energy company, fell amid weak global oil prices and an ongoing corruption scandal.
HOW WAS THE FUND POSITIONED?
The Fund employed an active strategy in which portfolio construction was focused on the highest-conviction ideas found at the security level. The Fund’s portfolio managers used bottom-up fundamental research to determine the Fund’s security weightings, researching companies in an attempt to determine their underlying value and potential for future earnings growth. As a result of this process, at the end of the reporting period the Fund’s largest average sector positions were the financials, information technology and consumer discretionary sectors, while the smallest average sector positions in which the Fund was invested were in the utilities, health care and telecommunication services sectors.
| * | | The return shown is based on net asset values calculated for shareholder transactions and may differ from the return shown in the financial highlights, which reflects adjustments made to the net asset values in accordance with accounting principles generally accepted in the United States of America. |
| ** | | The adviser seeks to achieve the Fund’s objective. There can be no guarantee it will be achieved. |
| | | | | | |
| | | |
| 6 | | | | J.P. MORGAN INTERNATIONAL EQUITY FUNDS | | APRIL 30, 2015 |
| | | | | | | | |
| TOP TEN EQUITY HOLDINGS OF THE PORTFOLIO* | |
| | 1. | | | AIA Group Ltd. (Hong Kong) | | | 3.6 | % |
| | 2. | | | Taiwan Semiconductor Manufacturing Co., Ltd., ADR (Taiwan) | | | 3.1 | |
| | 3. | | | Housing Development Finance Corp., Ltd (India) | | | 2.8 | |
| | 4. | | | Tata Consultancy Services Ltd. (India) | | | 2.8 | |
| | 5. | | | Tencent Holdings Ltd. (China) | | | 2.7 | |
| | 6. | | | Bidvest Group Ltd. (The) (South Africa) | | | 2.2 | |
| | 7. | | | HDFC Bank Ltd., ADR (India) | | | 2.1 | |
| | 8. | | | Remgro Ltd. (South Africa) | | | 2.1 | |
| | 9. | | | MTN Group Ltd. (South Africa) | | | 2.0 | |
| | 10. | | | Baidu, Inc., ADR (China) | | | 1.9 | |
| | | | |
PORTFOLIO COMPOSITION BY COUNTRY* | |
| South Africa | | | 18.0 | % |
| India | | | 16.5 | |
| Brazil | | | 9.4 | |
| China | | | 8.9 | |
| Taiwan | | | 7.9 | |
| Russia | | | 6.9 | |
| Hong Kong | | | 6.3 | |
| Thailand | | | 5.5 | |
| South Korea | | | 4.0 | |
| Indonesia | | | 3.4 | |
| Turkey | | | 2.5 | |
| Mexico | | | 2.3 | |
| United Kingdom | | | 2.2 | |
| Peru | | | 1.5 | |
| Panama | | | 1.4 | |
| Australia | | | 1.2 | |
| Others (each less than 1.0%) | | | 1.0 | |
| Short-Term Investment | | | 1.1 | |
| * | | Percentages indicated are based on total investments as of April 30, 2015. The Fund’s portfolio composition is subject to change. |
| | | | | | | | |
| | | |
| APRIL 30, 2015 | | J.P. MORGAN INTERNATIONAL EQUITY FUNDS | | | | | 7 | |
JPMorgan Emerging Markets Equity Fund
FUND COMMENTARY
SIX MONTHS ENDED APRIL 30, 2015 (Unaudited) (continued)
| | | | | | | | | | | | | | | | | | |
AVERAGE ANNUAL TOTAL RETURNS AS OF APRIL 30, 2015 | |
| | | | | |
| | | INCEPTION DATE OF
CLASS | | 6 MONTH* | | | 1 YEAR | | | 5 YEAR | | | 10 YEAR | |
CLASS A SHARES | | September 28, 2001 | | | | | | | | | | | | | | | | |
Without Sales Charge | | | | | (3.17 | )% | | | 0.82 | % | | | 1.72 | % | | | 8.47 | % |
With Sales Charge** | | | | | (8.24 | ) | | | (4.46 | ) | | | 0.63 | | | | 7.88 | |
CLASS B SHARES | | September 28, 2001 | | | | | | | | | | | | | | | | |
Without CDSC | | | | | (3.42 | ) | | | 0.30 | | | | 1.21 | | | | 8.05 | |
With CDSC*** | | | | | (8.42 | ) | | | (4.70 | ) | | | 0.82 | | | | 8.05 | |
CLASS C SHARES | | February 28, 2006 | | | | | | | | | | | | | | | | |
Without CDSC | | | | | (3.39 | ) | | | 0.31 | | | | 1.21 | | | | 7.93 | |
With CDSC**** | | | | | (4.39 | ) | | | (0.69 | ) | | | 1.21 | | | | 7.93 | |
CLASS R6 SHARES | | December 13, 2013 | | | (2.90 | ) | | | 1.33 | | | | 2.15 | | | | 8.94 | |
INSTITUTIONAL CLASS SHARES | | November 15, 1993 | | | (2.98 | ) | | | 1.25 | | | | 2.13 | | | | 8.92 | |
SELECT CLASS SHARES | | September 10, 2001 | | | (3.03 | ) | | | 1.10 | | | | 1.97 | | | | 8.75 | |
| ** | | Sales Charge for Class A Shares is 5.25%. |
| *** | | Assumes a 5% CDSC (contingent deferred sales charge) for the one year period, 2% CDSC for the five year period and 0% CDSC thereafter. |
| **** | | Assumes a 1% CDSC for the one year period and 0% CDSC thereafter. |
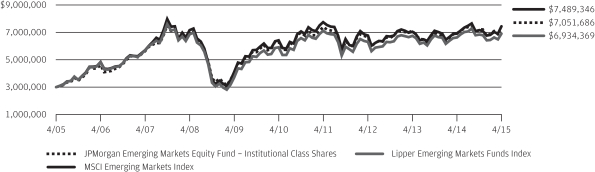
TEN YEAR PERFORMANCE (4/30/05 TO 4/30/15)
The performance quoted is past performance and is not a guarantee of future results. Mutual funds are subject to certain market risks. Investment returns and principal value of an investment will fluctuate so that an investor’s shares, when redeemed, may be worth more or less than their original cost. Current performance may be higher or lower than the performance data shown. For up-to-date month-end performance information please call 1-800-480-4111.
Returns for Class C Shares prior to its inception date are based on the performance of Class B Shares. The actual returns of Class C Shares would have been similar to those shown because Class C Shares have expenses similar to those of Class B Shares.
Returns for Class R6 Shares prior to its inception date are based on the performance of Institutional Class Shares. The actual returns of R6 Shares would have been different than those shown because R6 Shares have different expenses than Institutional Class Shares.
The graph illustrates comparative performance for $3,000,000 invested in Institutional Class Shares of the JPMorgan Emerging Markets Equity Fund, the MSCI Emerging Markets Index and the Lipper Emerging Markets Funds Index from April 30, 2005 to April 30, 2015. The performance of the Fund assumes reinvestment of all dividends and capital gain distributions, if any, and does not include a sales charge. The performance of the MSCI Emerging Markets Index does not reflect the deduction of expenses or a sales charge associated with a mutual fund and approximates the minimum possible dividend reinvestment of the securities included in the benchmark, if applicable. The dividend is reinvested after deduction of withholding tax, applying the maximum rate to non-resident individual investors who do not benefit from double taxation treaties. The performance of the Lipper Emerging Markets Funds Index includes expenses associated with a mutual fund, such as investment management fees. These expenses are not identical to the expenses incurred by the Fund. The MSCI
Emerging Markets Index is a free float-adjusted market capitalization weighted index that is designed to measure the equity market performance of emerging markets. The Lipper Emerging Markets Funds Index is an index based on the total returns of certain mutual funds within the Fund’s designated category, as determined by Lipper, Inc. Investors cannot invest directly in an index.
Institutional Class Shares have a $3,000,000 minimum initial investment.
Fund performance may reflect the waiver of the Fund’s fees and reimbursement of expenses for certain periods since the inception date. Without these waivers and reimbursements, performance would have been lower. Also, performance shown in this section does not reflect the deduction of taxes that a shareholder would pay on Fund distributions or redemption of Fund shares.
International investing involves a greater degree of risk and increased volatility. Changes in currency exchange rates and differences in accounting and taxation policies outside the U.S. can raise or lower returns. Also, some overseas markets may not be as politically and economically stable as the United States and other nations.
Because Class B shares automatically convert to Class A shares after 8 years, the 10 Year average annual total return shown above for Class B reflects Class A performance for the period after conversion. The Board of Trustees of the Fund has approved the automatic conversion of the Fund’s Class B Shares into Class A Shares on June 19, 2015. On June 19, 2015, all Class B Shares of the Fund will automatically convert to Class A Shares of the Fund.
The returns shown are based on net asset values calculated for shareholder transactions and may differ from the returns shown in the financial highlights, which reflect adjustments made to the net asset values in accordance with accounting principles generally accepted in the United States of America.
| | | | | | |
| | | |
| 8 | | | | J.P. MORGAN INTERNATIONAL EQUITY FUNDS | | APRIL 30, 2015 |
JPMorgan Emerging Markets Equity Income Fund
FUND COMMENTARY
FOR THE PERIOD DECEMBER 12, 2014 (FUND INCEPTION DATE) THROUGH APRIL 30, 2015 (Unaudited)
| | | | |
| REPORTING PERIOD RETURN: | |
| Fund (Select Class Shares)* | | | 4.96% | |
| Morgan Stanley Capital International (“MSCI”) Emerging Markets Index (net of foreign withholding taxes) | | | 12.42% | |
| |
| Net Assets as of 4/30/2015 (In Thousands) | | | $3,175 | |
INVESTMENT OBJECTIVE**
The JPMorgan Emerging Markets Equity Income Fund (the “Fund”) seeks to provide both current income and long-term capital appreciation.
WHAT WERE THE MAIN DRIVERS OF THE FUND’S PERFORMANCE?
The Fund’s Select Class Shares underperformed the MSCI Emerging Markets Index (net of foreign withholding taxes) (the “Benchmark”) from its inception on December 12, 2014 to April 30, 2015.
The Fund’s security selection and overweight position in the information technology sector and its security selection in the consumer discretionary sector were leading detractors from relative performance for the reporting period. The Fund’s security selection in the financials and materials sectors was a leading contributor to performance relative to the Benchmark for the reporting period.
Leading individual detractors from relative performance included the Fund’s overweight positions in Wynn Macau Ltd. and Pt. Perusahaan Gas Negara and its underweight position in Tencent Holdings Ltd. Shares of Wynn Macau, an operator of casino resorts, declined as Chinese government efforts to curb corruption reduced casino traffic among wealthy customers. Perusahaan Gas, an Indonesian natural gas producer, declined in line with other energy sector companies amid weakness in oil and gas prices. Shares of Tencent Holdings, a provider of Internet and mobile services in China, gained from continued growth in its online advertising businesses.
Leading individual contributors to relative performance included the Fund’s overweight positions in Lukoil OAO, OTP Bank Nyrt and Mobile Telesystems OAO. Shares of Lukoil, a Russian oil and natural gas company, rose after the company reaffirmed its commitment to start production at the Filanovsky field in the Caspian Sea. Shares of OTP Bank Nyrt, Hungary’s largest bank, rose after the company forecast a profit for 2015. Shares of Mobile Telesystems, a Russian telecommunications services company, strengthened on solid earnings and revenue growth.
HOW THE FUND WAS MANAGED?
The Fund’s portfolio managers employed a bottom-up fundamental approach to security selection, rigorously researching companies in an attempt to determine their underlying value and potential for future growth. The Fund’s portfolio managers looked for dividend yielding equity securities that they believed were undervalued and possessed the long-term earnings power and strong cash flow generation that would enable them to grow their dividends. In addition, the Fund employed futures and currency forwards to help manage cash flows and attempt to manage the Fund’s currency exposure.
| * | | The return shown is based on net asset values calculated for shareholder transactions and may differ from the return shown in the financial highlights, which reflects adjustments made to the net asset values in accordance with accounting principles generally accepted in the United States of America. |
| ** | | The adviser seeks to achieve the Fund’s objective. There can be no guarantee it will be achieved. |
| | | | | | | | |
| | | |
| APRIL 30, 2015 | | J.P. MORGAN INTERNATIONAL EQUITY FUNDS | | | | | 9 | |
JPMorgan Emerging Markets Equity Income Fund
FUND COMMENTARY
FOR THE PERIOD DECEMBER 12, 2014 (FUND INCEPTION DATE) THROUGH APRIL 30, 2015 (Unaudited) (continued)
| | | | | | | | |
| TOP TEN EQUITY HOLDINGS OF THE PORTFOLIO* | |
| | 1. | | | China Construction Bank Corp., Class H (China) | | | 2.5 | % |
| | 2. | | | Taiwan Semiconductor Manufacturing Co., Ltd., ADR (Taiwan) | | | 2.4 | |
| | 3. | | | MTN Group Ltd. (South Africa) | | | 2.4 | |
| | 4. | | | Industrial & Commercial Bank of China Ltd., Class H (China) | | | 2.4 | |
| | 5. | | | China Mobile Ltd. (Hong Kong) | | | 2.4 | |
| | 6. | | | Bank of China Ltd., Class H (China) | | | 2.3 | |
| | 7. | | | Siam Cement PCL (The), NVDR (Thailand) | | | 2.3 | |
| | 8. | | | Siliconware Precision Industries Co., Ltd. (Taiwan) | | | 2.2 | |
| | 9. | | | Bidvest Group Ltd. (The) (South Africa) | | | 2.1 | |
| | 10. | | | MediaTek, Inc. (Taiwan) | | | 2.1 | |
| | | | |
PORTFOLIO COMPOSITION BY COUNTRY* | |
| Taiwan | | | 22.0 | % |
| South Africa | | | 13.0 | |
| China | | | 10.6 | |
| Brazil | | | 10.2 | |
| Hong Kong | | | 8.1 | |
| Russia | | | 6.9 | |
| South Korea | | | 5.8 | |
| Turkey | | | 5.2 | |
| Thailand | | | 4.3 | |
| United States | | | 2.3 | |
| Mexico | | | 2.1 | |
| Chile | | | 1.9 | |
| Poland | | | 1.8 | |
| Indonesia | | | 1.6 | |
| Hungary | | | 1.5 | |
| Singapore | | | 1.4 | |
| United Arab Emirates | | | 1.3 | |
| * | | Percentages indicated are based on total investments as of April 30, 2015. The Fund’s portfolio composition is subject to change. |
| | | | | | |
| | | |
| 10 | | | | J.P. MORGAN INTERNATIONAL EQUITY FUNDS | | APRIL 30, 2015 |
| | | | | | |
TOTAL RETURNS AS OF APRIL 30, 2015 | |
| | |
| | | INCEPTION DATE OF
CLASS | | SINCE
INCEPTION* | |
CLASS A SHARES | | December 12, 2014 | | | | |
Without Sales Charge | | | | | 4.83 | % |
With Sales Charge** | | | | | (0.67 | ) |
CLASS C SHARES | | December 12, 2014 | | | | |
Without CDSC | | | | | 4.62 | |
With CDSC*** | | | | | 3.62 | |
CLASS R5 SHARES | | December 12, 2014 | | | 5.03 | |
CLASS R6 SHARES | | December 12, 2014 | | | 5.03 | |
SELECT CLASS SHARES | | December 12, 2014 | | | 4.96 | |
| ** | | Sales Charge for Class A Shares is 5.25%. |
| *** | | Assumes a 1% CDSC (contingent deferred sales charge) for the one year period and 0% CDSC thereafter. |
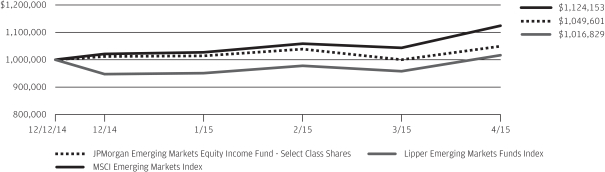
LIFE OF FUND PERFORMANCE (12/12/14 TO 4/30/15)
The performance quoted is past performance and is not a guarantee of future results. Mutual funds are subject to certain market risks. Investment returns and principal value of an investment will fluctuate so that an investor’s shares, when redeemed, may be worth more or less than their original cost. Current performance may be higher or lower than the performance data shown. For up-to-date month-end performance information please call 1-800-480-4111.
The Fund commenced operations on December 12, 2014.
The graph illustrates comparative performance for $1,000,000 invested in Select Class Shares of the JPMorgan Emerging Markets Equity Income Fund, the MSCI Emerging Markets Index and the Lipper Emerging Markets Funds Index from December 12, 2014 to April 30, 2015. The performance of the Fund assumes reinvestment of all dividends and capital gain distributions, if any, and does not include a sales charge. The performance of the MSCI Emerging Markets Index does not reflect the deduction of expenses or a sales charge associated with a mutual fund and approximates the minimum possible dividend reinvestment of the securities included in the benchmark, if applicable. The dividend is reinvested after deduction of withholding tax, applying the maximum rate to non-resident individual investors who do not benefit from double taxation treaties. The performance of the Lipper Emerging Markets Funds Index includes expenses associated with a mutual fund, such as investment management fees. These expenses are not identical to the expenses incurred by the
Fund. The MSCI Emerging Markets Index is a free float-adjusted market capitalization weighted index that is designed to measure the equity market performance of emerging markets. The Lipper Emerging Markets Funds Index is an index based on the total returns of certain mutual funds within the Fund’s designated category, as determined by Lipper, Inc. Investors cannot invest directly in an index.
Select Class Shares have a $1,000,000 minimum initial investment.
Fund performance may reflect the waiver of the Fund’s fees and reimbursement of expenses for certain periods since the inception date. Without these waivers and reimbursements, performance would have been lower. Also, performance shown in this section does not reflect the deduction of taxes that a shareholder would pay on Fund distributions or redemption of Fund shares.
International investing involves a greater degree of risk and increased volatility. Changes in currency exchange rates and differences in accounting and taxation policies outside the U.S. can raise or lower returns. Also, some overseas markets may not be as politically and economically stable as the United States and other nations.
The returns shown are based on net asset values calculated for shareholder transactions and may differ from the returns shown in the financial highlights, which reflect adjustments made to the net asset values in accordance with accounting principles generally accepted in the United States of America.
| | | | | | | | |
| | | |
| APRIL 30, 2015 | | J.P. MORGAN INTERNATIONAL EQUITY FUNDS | | | | | 11 | |
JPMorgan Global Research Enhanced Index Fund
FUND COMMENTARY
SIX MONTHS ENDED APRIL 30, 2015 (Unaudited)
| | | | |
| REPORTING PERIOD RETURN: | |
| Fund (Select Class Shares)* | | | 4.41% | |
| Morgan Stanley Capital International (“MSCI”) World Index (net of foreign withholding taxes)1 | | | 5.09% | |
| |
| Net Assets as of 4/30/2015 (In Thousands) | | | $6,528,573 | |
INVESTMENT OBJECTIVE**
The JPMorgan Global Research Enhanced Index Fund (the “Fund”) seeks to provide long-term capital appreciation.
WHAT WERE THE MAIN DRIVERS OF THE FUND’S PERFORMANCE?
The Fund’s Select Class Shares underperformed the MSCI World Index (net of foreign withholding taxes) (the “Benchmark”) for the six months ended April 30, 2015. The Fund’s security selection in the basic industries and health care sectors detracted from performance relative to the Benchmark for the six month reporting period. The Fund’s security selection in the technology-hardware and autos sectors made a positive contribution to relative performance.
Due to the Fund’s holdings of a relatively large number of securities during the period, the impact of individual holdings on the Fund’s relative performance tended to be small.
HOW WAS THE FUND POSITIONED?
The Fund sought to outperform the Benchmark over time, while seeking to achieve sector, geographic and risk characteristics similar to that of the Benchmark. Using the fundamental equity insights generated by JPMorgan’s team of analysts, the Fund’s portfolio managers implemented an overweight position in securities included within the universe of the Benchmark that they considered undervalued, while underweighting or not holding securities in the Benchmark that they considered overvalued. During the reporting period, the Fund’s portfolio managers used exchange-traded funds and futures to help manage cash flows.
| | | | | | | | |
| TOP TEN EQUITY HOLDINGS OF THE PORTFOLIO*** | |
| | 1. | | | Apple, Inc. (United States) | | | 2.2 | % |
| | 2. | | | Microsoft Corp. (United States) | | | 1.3 | |
| | 3. | | | Wells Fargo & Co. (United States) | | | 1.0 | |
| | 4. | | | Exxon Mobil Corp. (United States) | | | 0.9 | |
| | 5. | | | Johnson & Johnson (United States) | | | 0.9 | |
| | 6. | | | Nestle S.A. (Switzerland) | | | 0.8 | |
| | 7. | | | Roche Holding AG (Switzerland) | | | 0.8 | |
| | 8. | | | Pfizer, Inc. (United States) | | | 0.7 | |
| | 9. | | | Procter & Gamble Co. (The) (United States) | | | 0.7 | |
| | 10. | | | Verizon Communications, Inc. (United States) | | | 0.7 | |
| | | | |
PORTFOLIO COMPOSITION BY COUNTRY*** | |
| United States | | | 53.5 | % |
| Japan | | | 8.4 | |
| United Kingdom | | | 7.3 | |
| Switzerland | | | 4.1 | |
| France | | | 3.9 | |
| Germany | | | 3.7 | |
| Canada | | | 3.6 | |
| Australia | | | 2.5 | |
| Netherlands | | | 1.5 | |
| Spain | | | 1.3 | |
| Hong Kong | | | 1.1 | |
| Ireland | | | 1.0 | |
| Italy | | | 1.0 | |
| Others (each less than 1.0%) | | | 3.6 | |
| Short-Term Investment | | | 3.5 | |
| 1 | | MSCI World Index is a registered service mark of Morgan Stanley Capital International, which does not sponsor and is in no way affiliated with the Fund. |
| * | | The return shown is based on net asset values calculated for shareholder transactions and may differ from the return shown in the financial highlights, which reflects adjustments made to the net asset values in accordance with accounting principles generally accepted in the United States of America. |
| ** | | The adviser seeks to achieve the Fund’s objective. There can be no guarantee it will be achieved. |
| *** | | Percentages indicated are based on total investments as of April 30, 2015. The Fund’s portfolio composition is subject to change. |
| | | | | | |
| | | |
| 12 | | | | J.P. MORGAN INTERNATIONAL EQUITY FUNDS | | APRIL 30, 2015 |
| | | | | | | | | | | | | | |
AVERAGE ANNUAL TOTAL RETURNS AS OF APRIL 30, 2015 | |
| | | | |
| | | INCEPTION DATE OF
CLASS | | 6 MONTH* | | | 1 YEAR | | | SINCE
INCEPTION | |
CLASS A SHARES | | February 28, 2013 | | | | | | | | | | | | |
Without Sales Charge | | | | | 4.34 | % | | | 7.37 | % | | | 13.83 | % |
With Sales Charge** | | | | | (1.14 | ) | | | 1.74 | | | | 11.03 | |
CLASS C SHARES | | February 28, 2013 | | | | | | | | | | | | |
Without CDSC | | | | | 4.01 | | | | 6.81 | | | | 13.24 | |
With CDSC*** | | | | | 3.01 | | | | 5.81 | | | | 13.24 | |
CLASS R2 SHARES | | February 28, 2013 | | | 4.15 | | | | 7.06 | | | | 13.52 | |
SELECT CLASS SHARES | | February 28, 2013 | | | 4.41 | | | | 7.61 | | | | 14.10 | |
| ** | | Sales Charge for Class A Shares is 5.25%. |
| *** | | Assumes a 1% CDSC (contingent deferred sales charge) for the one year period and 0% CDSC thereafter. |
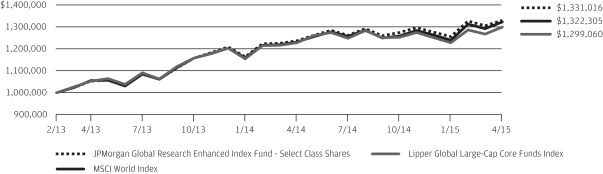
LIFE OF FUND PERFORMANCE (2/28/13 TO 4/30/15)
The performance quoted is past performance and is not a guarantee of future results. Mutual funds are subject to certain market risks. Investment returns and principal value of an investment will fluctuate so that an investor’s shares, when redeemed, may be worth more or less than their original cost. Current performance may be higher or lower than the performance data shown. For up-to-date, month-end performance information please call 1-800-480-4111.
The Fund commenced operations on February 28, 2013.
The graph illustrates comparative performance for $1,000,000 invested in Select Class Shares of the JPMorgan Global Research Enhanced Index Fund, the MSCI World Index and the Lipper Global Large-Cap Core Funds Index from February 28, 2013 to April 30, 2015. The performance of the Fund assumes reinvestment of all dividends and capital gain distributions, if any, and does not include a sales charge. The performance of the MSCI World Index does not reflect the deduction of expenses or a sales charge associated with a mutual fund and has been adjusted to reflect reinvestment of all dividends and capital gain distributions of the securities included in the benchmark, if applicable. The performance of the Lipper Global Large-Cap Core Funds Index includes expenses associated with a mutual fund, such as investment management fees. These expenses are not identical to the expenses incurred by the Fund. The MSCI World Index is a free float-adjusted market capitalization weighted index that is designed to measure the equity market performance of developed markets. The Lipper Global Large-Cap Core Funds Index is an index based on the total returns of certain mutuals funds within the Fund’s designated category, as determined by Lipper, Inc. Investors cannot invest directly in an index.
Select Class Shares have a $1,000,000 minimum initial investment.
Fund performance may reflect the waiver of the Fund’s fees and reimbursement of expenses for certain periods since the inception date. Without these waivers and reimbursements, performance would have been lower. Also,
performance shown in this section does not reflect the deduction of taxes that a shareholder would pay on Fund distributions or redemption of Fund shares.
International investing involves a greater degree of risk and increased volatility. Changes in currency exchange rates and differences in accounting and taxation policies outside the U.S. can raise or lower returns. Also, some overseas markets may not be as politically and economically stable as the United States and other nations.
The returns shown are based on net asset values calculated for shareholder transactions and may differ from the returns shown in the financial highlights, which reflect adjustments made to the net asset values in accordance with accounting principles generally accepted in the United States of America.
The MSCI information may only be used for your internal use, may not be reproduced or redisseminated in any form and may not be used as a basis for or a component of any financial instruments or products or indices. None of the MSCI information is intended to constitute investment advice or a recommendation to make (or refrain from making) any kind of investment decision and may not be relied on as such. Historical data and analysis should not be taken as an indication or guarantee of any future performance analysis, forecast or prediction. The MSCI information is provided on an “as is” basis and the user of this information assumes the entire risk of any use made of this information. MSCI, each of its affiliates and each other person involved in or related to compiling, computing or creating any MSCI information (collectively, the “MSCI Parties”) expressly disclaims all warranties (including, without limitation, any warranties of originality, accuracy, completeness, timeliness, non-infringement, merchantability and fitness for a particular purpose) with respect to this information. Without limiting any of the foregoing, in no event shall any MSCI Party have any liability for any direct, indirect, special, incidental, punitive, consequential (including, without limitation, lost profits) or any other damages. (www.msci.com)
| | | | | | | | |
| | | |
| APRIL 30, 2015 | | J.P. MORGAN INTERNATIONAL EQUITY FUNDS | | | | | 13 | |
JPMorgan Global Unconstrained Equity Fund
FUND COMMENTARY
SIX MONTHS ENDED APRIL 30, 2015 (Unaudited)
| | | | |
| REPORTING PERIOD RETURN: | |
| Fund (Select Class Shares)* | | | 7.39% | |
| Morgan Stanley Capital International (“MSCI”) All Country World Index (net of foreign withholding taxes) | | | 4.97% | |
| |
| Net Assets as of 4/30/2015 (In Thousands) | | | $4,947 | |
INVESTMENT OBJECTIVE**
The JPMorgan Global Unconstrained Equity Fund (the “Fund”) seeks to provide long-term capital appreciation.
WHAT WERE THE MAIN DRIVERS OF THE FUND’S PERFORMANCE?
The Fund’s Select Class Shares outperformed the MSCI All Country World Index (net of foreign withholding taxes) (the “Benchmark”) for the six months ended April 30, 2015.
The Fund’s security selection in the financials and industrials sectors was a leading contributor to performance relative to the Benchmark for the six month reporting period. The Fund’s security selection in the consumer discretionary sector and the information technology sector was a leading detractor from relative performance. By region, the Fund’s security selection in emerging markets and Continental Europe was a leading contributor to relative performance, while the Fund’s security selection in the Pacific region, excluding Japan, and its underweight position in Japan were leading detractors from relative performance.
Leading individual contributors to the Fund’s relative performance included overweight positions in Boston Scientific Corp., China Merchants Bank Co. and Industrial and Commercial Bank of China Ltd. Shares of Boston Scientific, a U.S. medical device manufacturer, rose after the company settled a long-running legal dispute with Johnson & Johnson and continued to deliver strong earnings. Shares of both China Merchants Bank and Industrial and Commercial Bank of China strengthened as China’s government took steps to counter slowing economic growth.
Leading individual detractors from the Fund’s relative performance included overweight positions in Sand China Ltd., MEG Energy Corp and Baidu Inc. Shares of Sands China, a Macau casino operator, fell as the Chinese government’s effort to curb corruption reduced casino traffic among wealthy customers. Shares of MEG Energy, a Canadian energy company focused on the Alberta oils sands region, declined on global weakness in oil prices. Shares of Baidu, a Chinese Internet portal operator not held in the Benchmark, fell after the company reported lower-than-expected earnings and a weak forecast for 2015.
HOW WAS THE FUND POSITIONED?
The Fund’s portfolio managers combined a contrarian approach with bottom-up fundamental research to construct a global portfolio of what they believed were undervalued companies,
characterized by sustainability of earnings, strong free cash flow and the ability to increase earnings faster than their sector peers.
| | | | | | | | |
| TOP TEN EQUITY HOLDINGS OF THE PORTFOLIO*** | |
| | 1. | | | Citigroup, Inc. (United States) | | | 3.2 | % |
| | 2. | | | Google, Inc., Class C (United States) | | | 3.1 | |
| | 3. | | | Twenty-First Century Fox, Inc., Class A (United States) | | | 2.9 | |
| | 4. | | | Baidu, Inc., ADR (China) | | | 2.8 | |
| | 5. | | | Johnson & Johnson (United States) | | | 2.8 | |
| | 6. | | | BG Group plc (United Kingdom) | | | 2.8 | |
| | 7. | | | Barclays plc (United Kingdom) | | | 2.7 | |
| | 8. | | | Sanofi (France) | | | 2.4 | |
| | 9. | | | MetLife, Inc. (United States) | | | 2.4 | |
| | 10. | | | Novartis AG (Switzerland) | | | 2.4 | |
| | | | |
PORTFOLIO COMPOSITION BY COUNTRY*** | |
| United States | | | 49.1 | % |
| United Kingdom | | | 8.1 | |
| France | | | 7.3 | |
| China | | | 7.2 | |
| Switzerland | | | 5.5 | |
| Canada | | | 2.5 | |
| South Korea | | | 2.4 | |
| Spain | | | 2.2 | |
| Israel | | | 2.0 | |
| Japan | | | 1.9 | |
| Germany | | | 1.6 | |
| Netherlands | | | 1.2 | |
| Hong Kong | | | 1.2 | |
| Ireland | | | 1.0 | |
| Others (each less than 1.0%) | | | 3.5 | |
| Short-Term Investment | | | 3.3 | |
| * | | The return shown is based on net asset values calculated for shareholder transactions and may differ from the return shown in the financial highlights, which reflects adjustments made to the net asset values in accordance with accounting principles generally accepted in the United States of America. |
| ** | | The adviser seeks to achieve the Fund’s objective. There can be no guarantee it will be achieved. |
| *** | | Percentages indicated are based on total investments as of April 30, 2015. The Fund’s portfolio composition is subject to change. |
| | | | | | |
| | | |
| 14 | | | | J.P. MORGAN INTERNATIONAL EQUITY FUNDS | | APRIL 30, 2015 |
| | | | | | | | | | | | | | | | | | |
AVERAGE ANNUAL TOTAL RETURNS AS OF APRIL 30, 2015 | |
| | | | | |
| | | INCEPTION DATE OF
CLASS | | 6 MONTH* | | | 1 YEAR | | | 3 YEAR | | | SINCE
INCEPTION | |
CLASS A SHARES | | November 30, 2011 | | | | | | | | | | | | | | | | |
Without Sales Charge | | | | | 7.15 | % | | | 9.27 | % | | | 13.39 | % | | | 14.91 | % |
With Sales Charge** | | | | | 1.54 | | | | 3.55 | | | | 11.36 | | | | 13.11 | |
CLASS C SHARES | | November 30, 2011 | | | | | | | | | | | | | | | | |
Without CDSC | | | | | 6.91 | | | | 8.76 | | | | 12.82 | | | | 14.34 | |
With CDSC*** | | | | | 5.91 | | | | 7.76 | | | | 12.82 | | | | 14.34 | |
CLASS R2 SHARES | | November 30, 2011 | | | 7.03 | | | | 8.99 | | | | 13.09 | | | | 14.62 | |
CLASS R5 SHARES | | November 30, 2011 | | | 7.40 | | | | 9.80 | | | | 13.91 | | | | 15.43 | |
CLASS R6 SHARES | | November 30, 2011 | | | 7.45 | | | | 9.85 | | | | 13.96 | | | | 15.49 | |
SELECT CLASS SHARES | | November 30, 2011 | | | 7.39 | | | | 9.63 | | | | 13.71 | | | | 15.22 | |
| ** | | Sales Charge for Class A Shares is 5.25%. |
| *** | | Assumes a 1% CDSC (contingent deferred sales charge) for the one year period and 0% CDSC thereafter. |
LIFE OF FUND PERFORMANCE (11/30/11 TO 4/30/15)
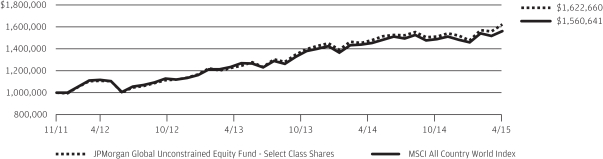
The performance quoted is past performance and is not a guarantee of future results. Mutual funds are subject to certain market risks. Investment returns and principal value of an investment will fluctuate so that an investor’s shares, when redeemed, may be worth more or less than their original cost. Current performance may be higher or lower than the performance data shown. For up-to-date month-end performance information please call 1-800-480-4111.
The Fund commenced operations on November 30, 2011.
The graph illustrates comparative performance for $1,000,000 invested in Select Class Shares of the JPMorgan Global Unconstrained Equity Fund and the MSCI All Country World Index from November 30, 2011 to April 30, 2015. The performance of the Fund assumes reinvestment of all dividends and capital gain distributions, if any, and does not include a sales charge. The performance of the MSCI All Country World Index does not reflect the deduction of expenses or a sales charge associated with a mutual fund and approximates the minimum possible dividend reinvestment of the securities included in the benchmark, if applicable. The dividend is reinvested after deduction of withholding tax, applying the maximum rate to non-resident institutional investors who do not benefit from double taxation treaties. The MSCI All Country World Index is a free float-adjusted market capitalization weighted index that is designed to measure the equity market performance of developed and emerging markets. Investors cannot invest directly in an index.
Select Class Shares have a $1,000,000 minimum initial investment.
Subsequent to the inception date of the Fund and through January 5, 2015, the Fund did not experience any shareholder activity. If such shareholder activity had occurred, the Fund’s performance may have been impacted.
Fund performance may reflect the waiver of the Fund’s fees and reimbursement of expenses for certain periods since the inception date. Without these waivers and reimbursements, performance would have been lower. Also, performance shown in this section does not reflect the deduction of taxes that a shareholder would pay on Fund distributions or redemption of Fund shares.
International investing involves a greater degree of risk and increased volatility. Changes in currency exchange rates and differences in accounting and taxation policies outside the U.S. can raise or lower returns. Also, some overseas markets may not be as politically and economically stable as the U.S. and other nations.
The returns shown are based on net asset values calculated for shareholder transactions and may differ from the returns shown in the financial highlights, which reflect adjustments made to the net asset values in accordance with accounting principles generally accepted in the United States of America.
| | | | | | | | |
| | | |
| APRIL 30, 2015 | | J.P. MORGAN INTERNATIONAL EQUITY FUNDS | | | | | 15 | |
JPMorgan International Equity Fund
FUND COMMENTARY
SIX MONTHS ENDED APRIL 30, 2015 (Unaudited)
| | | | |
| REPORTING PERIOD RETURN: | | | |
| Fund (Select Class Shares)* | | | 7.36% | |
| Morgan Stanley Capital International (“MSCI”) Europe, Australasia and Far East (“EAFE”) Index (net of foreign withholding taxes) | | | 6.81% | |
| |
| Net Assets as of 4/30/2015 (In Thousands) | | | $2,809,702 | |
INVESTMENT OBJECTIVE**
The JPMorgan International Equity Fund (the “Fund”) seeks total return from long-term capital growth and income. Total return consists of capital growth and current income.
WHAT WERE THE MAIN DRIVERS OF THE FUND’S PERFORMANCE?
The Fund’s Select Class Shares outperformed the MSCI EAFE Index (net of foreign withholding taxes) (the “Benchmark”) for the six months ended April 30, 2015.
The Fund’s security selection in the financials and energy sectors was a leading contributor to performance relative to the Benchmark during the six month reporting period. The Fund’s security selection in the consumer discretionary and industrials sectors was a leading detractor from relative performance.
Leading individual contributors to the Fund’s relative performance included the Fund’s overweight positions in Ping An Insurance Group Co., Cheung Kong Holdings Ltd. and China Overseas Land & Investment Ltd. Shares of Ping An Insurance Group Co., a Chinese insurer, and China Overseas Land, a Chinese real estate and investment company, rose amid China’s efforts to counter slowing economic growth. Shares of Cheung Kong, a Hong Kong property developer and conglomerate, rose on news that the company, along with its Hutchison Whampoa affiliate, was revamping its organizational structure to separate Chinese real estate activities from the rest of the business.
Leading individual detractors from the Fund’s relative performance included its overweight positions in Sands China Ltd., Wynn Macau Ltd. and Komatsu Ltd. Shares of Sands China and Wynn Macau, both resort casino operators in Macau, came under pressure as the Chinese government’s effort to curb corruption reduced casino traffic among wealth customers. Shares of Komatsu, a Japanese construction equipment maker, declined as a pullback in mining company equipment purchases resulted in earnings weakness.
HOW WAS THE FUND POSITIONED?
The Fund’s portfolio managers continued to focus on security selection to build a portfolio of international equities. They used bottom-up fundamental research to identify what they
believed were attractively priced securities of well-managed companies with the potential to grow their earnings faster than their industry peers.
| | | | | | | | |
| TOP TEN EQUITY HOLDINGS OF THE PORTFOLIO*** | |
| | 1. | | | BG Group plc (United Kingdom) | | | 2.6 | % |
| | 2. | | | Novartis AG (Switzerland) | | | 2.5 | |
| | 3. | | | HSBC Holdings plc (United Kingdom) | | | 2.3 | |
| | 4. | | | Vodafone Group plc (United Kingdom) | | | 2.2 | |
| | 5. | | | Toyota Motor Corp. (Japan) | | | 2.2 | |
| | 6. | | | Roche Holding AG (Switzerland) | | | 2.1 | |
| | 7. | | | Sumitomo Mitsui Financial Group, Inc. (Japan) | | | 2.0 | |
| | 8. | | | CK Hutchison Holdings Ltd. (Hong Kong) | | | 2.0 | |
| | 9. | | | Nestle S.A. (Switzerland) | | | 1.9 | |
| | 10. | | | Japan Tobacco, Inc. (Japan) | | | 1.9 | |
| | | | |
PORTFOLIO COMPOSITION BY COUNTRY*** | |
| United Kingdom | | | 21.8 | % |
| Japan | | | 19.4 | |
| Switzerland | | | 14.8 | |
| France | | | 11.6 | |
| Germany | | | 8.7 | |
| Netherlands | | | 4.9 | |
| Hong Kong | | | 4.4 | |
| China | | | 3.0 | |
| South Korea | | | 1.9 | |
| Australia | | | 1.6 | |
| Belgium | | | 1.5 | |
| Israel | | | 1.0 | |
| Others (each less than 1.0%) | | | 3.7 | |
| Short-Term Investment | | | 1.7 | |
| * | | The return shown is based on net asset values calculated for shareholder transactions and may differ from the return shown in the financial highlights, which reflects adjustments made to the net asset values in accordance with accounting principles generally accepted in the United States of America. |
| ** | | The adviser seeks to achieve the Fund’s objective. There can be no guarantee it will be achieved. |
| *** | | Percentages indicated are based on total investments as of April 30, 2015. The Fund’s portfolio composition is subject to change. |
| | | | | | |
| | | |
| 16 | | | | J.P. MORGAN INTERNATIONAL EQUITY FUNDS | | APRIL 30, 2015 |
| | | | | | | | | | | | | | | | | | |
AVERAGE ANNUAL TOTAL RETURNS AS OF APRIL 30, 2015 | |
| | | | | |
| | | INCEPTION DATE OF
CLASS | | 6 MONTH* | | | 1 YEAR | | | 5 YEAR | | | 10 YEAR | |
CLASS A SHARES | | February 28, 2002 | | | | | | | | | | | | | | | | |
Without Sales Charge | | | | | 7.23 | % | | | 2.58 | % | | | 6.97 | % | | | 5.20 | % |
With Sales Charge** | | | | | 1.63 | | | | (2.81 | ) | | | 5.82 | | | | 4.64 | |
CLASS B SHARES | | February 28, 2002 | | | | | | | | | | | | | | | | |
Without CDSC | | | | | 6.98 | | | | 2.02 | | | | 6.43 | | | | 4.73 | |
With CDSC*** | | | | | 1.98 | | | | (2.98 | ) | | | 6.12 | | | | 4.73 | |
CLASS C SHARES | | January 31, 2003 | | | | | | | | | | | | | | | | |
Without CDSC | | | | | 6.98 | | | | 2.06 | | | | 6.43 | | | | 4.63 | |
With CDSC**** | | | | | 5.98 | | | | 1.06 | | | | 6.43 | | | | 4.63 | |
CLASS R2 SHARES | | November 3, 2008 | | | 7.08 | | | | 2.31 | | | | 6.68 | | | | 5.02 | |
CLASS R5 SHARES | | May 15, 2006 | | | 7.49 | | | | 3.00 | | | | 7.45 | | | | 5.64 | |
CLASS R6 SHARES | | November 3, 2010 | | | 7.51 | | | | 3.11 | | | | 7.49 | | | | 5.67 | |
SELECT CLASS SHARES | | January 1, 1997 | | | 7.36 | | | | 2.78 | | | | 7.22 | | | | 5.46 | |
| ** | | Sales Charge for Class A Shares is 5.25%. |
| *** | | Assumes a 5% CDSC (contingent deferred sales charge) for the one year period, 2% CDSC for the five year period and 0% CDSC thereafter. |
| **** | | Assumes a 1% CDSC for the one year period and 0% CDSC thereafter. |
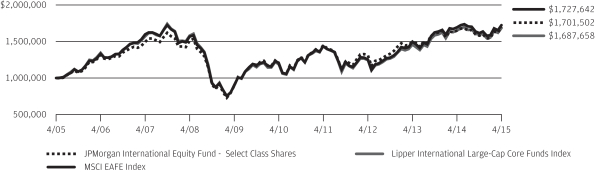
TEN YEAR PERFORMANCE (4/30/05 TO 4/30/15)
The performance quoted is past performance and is not a guarantee of future results. Mutual funds are subject to certain market risks. Investment returns and principal value of an investment will fluctuate so that an investor’s shares, when redeemed, may be worth more or less than their original cost. Current performance may be higher or lower than the performance data shown. For up-to-date month-end performance information please call 1-800-480-4111.
Returns for Class R2 Shares prior to its inception date are based on the performance of Class A Shares. The actual returns of R2 Shares would have been lower than those shown because R2 Shares have higher expenses than Class A Shares.
Returns for Class R5 Shares prior to its inception date are based on the performance of Select Class Shares. The actual returns of Class R5 Shares would have been different than those shown because Class R5 Shares have different expenses than Select Class Shares.
Returns for Class R6 Shares prior to its inception date are based on the performance of Class R5 Shares. The actual returns of Class R6 Shares would have been different than those shown because Class R6 Shares have different expenses than Class R5 Shares.
The graph illustrates comparative performance for $1,000,000 invested in Select Class Shares of the JPMorgan International Equity Fund, the MSCI EAFE Index and the Lipper International Large-Cap Core Funds Index from April 30, 2005 to April 30, 2015. The performance of the Fund assumes reinvestment of all dividends and capital gain distributions, if any, and does not include a sales charge. The performance of the MSCI EAFE Index does not reflect the deduction of expenses or a sales charge associated with a mutual fund and approximates the minimum possible dividend reinvestment of the securities included in the benchmark, if applicable. The dividend is reinvested after deduction of withholding tax, applying the maximum rate to non-resident institutional investors who do not benefit from double taxation treaties. The performance of the Lipper International Large-Cap Core Funds Index includes expenses associated with a mutual fund, such as investment management fees. These expenses are not identical to the expenses incurred by the Fund. The MSCI EAFE Index is a free float-adjusted market capitalization weighted index that is designed to measure the equity market performance of developed markets, excluding the U.S. and Canada. The Lipper International Large-Cap Core Funds Index is an index based on the total returns of certain mutual funds within the Fund’s designated category, as determined by Lipper, Inc. Investors cannot invest directly in an index.
Select Class Shares have a $1,000,000 minimum initial investment.
| | | | | | | | |
| | | |
| APRIL 30, 2015 | | J.P. MORGAN INTERNATIONAL EQUITY FUNDS | | | | | 17 | |
JPMorgan International Equity Fund
FUND COMMENTARY
SIX MONTHS ENDED APRIL 30, 2015 (Unaudited) (continued)
Fund performance may reflect the waiver of the Fund’s fees and reimbursement of expenses for certain periods since the inception date. Without these waivers and reimbursements, performance would have been lower. Also, performance shown in this section does not reflect the deduction of taxes that a shareholder would pay on Fund distributions or redemption of Fund shares.
International investing involves a greater degree of risk and increased volatility. Changes in currency exchange rates and differences in accounting and taxation policies outside the U.S. can raise or lower returns. Also, some overseas markets may not be as politically and economically stable as the United States and other nations.
Because Class B Shares automatically convert to Class A Shares after 8 years, the 10 year average annual total return shown above for Class B reflects Class A performance for the period after conversion. The Board of Trustees of the Fund has approved the automatic conversion of the Fund’s Class B Shares into
Class A Shares on June 19, 2015. On June 19, 2015, all Class B Shares of the Fund will automatically convert to Class A Shares of the Fund.
The returns shown are based on net asset values calculated for shareholder transactions and may differ from the returns shown in the financial highlights, which reflect adjustments made to the net asset values in accordance with accounting principles generally accepted in the United States of America.
| | | | | | |
| | | |
| 18 | | | | J.P. MORGAN INTERNATIONAL EQUITY FUNDS | | APRIL 30, 2015 |
JPMorgan International Equity Income Fund1
(formerly JPMorgan Global Equity Income Fund)
FUND COMMENTARY
SIX MONTHS ENDED APRIL 30, 2015 (Unaudited)
| | | | |
| REPORTING PERIOD RETURN: | |
| Fund (Select Class Shares)* | | | 6.18% | |
| Morgan Stanley Capital International (“MSCI”) Europe, Australasia and Far East (“EAFE”) Index (net of foreign withholding taxes)2 | | | 6.81% | |
| Morgan Stanley Capital International (“MSCI”) All County World Index (net of foreign withholding taxes) | | | 4.97% | |
| |
| Net Assets as of 4/30/2015 (In Thousands) | | | $98,925 | |
INVESTMENT OBJECTIVE**
The JPMorgan International Equity Income Fund (the “Fund”) seeks to provide current income and long-term capital appreciation.
WHAT WERE THE MAIN DRIVERS OF THE FUND’S PERFORMANCE?
The Fund’s Select Class Shares underperformed the MSCI EAFE Index (net of foreign withholding taxes) (the “Benchmark”) for the six months ended April 30, 2015.
The Fund’s security selection in the health care and insurance sectors was a leading detractor from performance relative to the Benchmark for the six month reporting period. The Fund’s security selection and underweight positions in the consumer non-durables and banks sectors was a leading positive contributor to relative performance.
Leading individual detractors from relative performance included the Fund’s overweight positions in Suncorp Group Ltd., Johnson & Johnson and Microsoft Corp. Shares of Suncorp Group, an Australian banking and insurance company, declined on investor worries about the company’s exposure to damage from cyclone Marcia. Shares of Johnson & Johnson, a U.S. diversified health care products company, weakened on investor concerns about increased competition for a number of its best selling products and the negative impact of a strong U.S. dollar relative to other companies. Shares of Microsoft, a U.S. provider of computer software and services, fell after the company reported disappointing sales for its Windows operating system and issued a cautious earnings forecast.
Leading individual contributors to relative performance included the Fund’s overweight positions in Man Group PLC, Japan Tobacco Inc. and Mitsubishi UFJ Financial Group. Shares of Man Group, a U.K. asset management company, rose on
investor expectations that the strong performance of its flagship investment fund would lead to an increase in assets under management. Shares of Japan Tobacco strengthened on investor expectations of an increased dividend payment. Shares of Mitsubishi UFJ Financial, a Japanese banking company, rose amid signs of improvement in the Japanese economy and the company’s plan to repurchase shares and increase its dividend payment.
HOW THE FUND WAS MANAGED?
The Fund’s portfolio managers employed a bottom-up fundamental approach to security selection, rigorously researching companies in an attempt to determine their underlying value and potential for future growth. The Fund’s portfolio managers looked for dividend yielding equity securities that they believed were undervalued and possessed the long-term earnings power and strong cash flow generation that would enable them to grow their dividends. In addition, the Fund employed futures and currency forwards to help manage cash flows and attempt to manage the Fund’s currency exposure.
| 1 | | Effective January 30, 2015, the Fund’s name was changed from “JPMorgan Global Equity Income Fund” and the Fund’s investment strategy was changed. |
| 2 | | Effective January 30, 2015, the Fund’s primary benchmark changed from the MSCI All Country World Index (net of foreign withholding taxes) to the MSCI EAFE Index (net of foreign withholding taxes) to more closely align the Fund’s primary benchmark with its investment strategies. |
| * | | The return shown is based on net asset values calculated for shareholder transactions and may differ from the return shown in the financial highlights, which reflects adjustments made to the net asset values in accordance with accounting principles generally accepted in the United States of America. |
| ** | | The adviser seeks to achieve the Fund’s objective. There can be no guarantee it will be achieved. |
| | | | | | | | |
| | | |
| APRIL 30, 2015 | | J.P. MORGAN INTERNATIONAL EQUITY FUNDS | | | | | 19 | |
JPMorgan International Equity Income Fund
(formerly JPMorgan Global Equity Income Fund)
FUND COMMENTARY
SIX MONTHS ENDED APRIL 30, 2015 (Unaudited) (continued)
| | | | | | | | |
| TOP TEN EQUITY HOLDINGS OF THE PORTFOLIO* | |
| | 1. | | | Japan Tobacco, Inc. (Japan) | | | 3.2 | % |
| | 2. | | | DNB ASA (Norway) | | | 2.9 | |
| | 3. | | | Toyota Motor Corp. (Japan) | | | 2.8 | |
| | 4. | | | Mitsubishi UFJ Financial Group, Inc. (Japan) | | | 2.6 | |
| | 5. | | | Nippon Telegraph & Telephone Corp. (Japan) | | | 2.2 | |
| | 6. | | | Accor S.A. (France) | | | 2.0 | |
| | 7. | | | ING Groep N.V., CVA (Netherlands) | | | 2.0 | |
| | 8. | | | Hitachi Ltd. (Japan) | | | 1.9 | |
| | 9. | | | Seven & I Holdings Co., Ltd. (Japan) | | | 1.8 | |
| | 10. | | | Telefonica S.A. (Spain) | | | 1.8 | |
| | | | |
PORTFOLIO COMPOSITION BY COUNTRY* | |
| United Kingdom | | | 22.3 | % |
| Japan | | | 20.4 | |
| Germany | | | 7.3 | |
| Switzerland | | | 6.6 | |
| Australia | | | 5.7 | |
| France | | | 5.6 | |
| Netherlands | | | 5.6 | |
| Israel | | | 3.3 | |
| Norway | | | 2.9 | |
| Spain | | | 2.7 | |
| Finland | | | 2.3 | |
| Taiwan | | | 2.0 | |
| China | | | 1.8 | |
| Sweden | | | 1.8 | |
| Hong Kong | | | 1.7 | |
| South Africa | | | 1.2 | |
| South Korea | | | 1.1 | |
| Italy | | | 1.1 | |
| Others (each less than 1.0%) | | | 1.7 | |
| Short-Term Investment | | | 2.9 | |
| * | | Percentages indicated are based on total investments as of April 30, 2015. The Fund’s portfolio composition is subject to change. |
| | | | | | |
| | | |
| 20 | | | | J.P. MORGAN INTERNATIONAL EQUITY FUNDS | | APRIL 30, 2015 |
| | | | | | | | | | | | | | | | | | |
AVERAGE ANNUAL TOTAL RETURNS AS OF APRIL 30, 2015 | |
| | | | | |
| | | INCEPTION DATE OF
CLASS | | 6 MONTH* | | | 1 YEAR | | | 3 YEAR | | | SINCE
INCEPTION | |
CLASS A SHARES | | February 28, 2011 | | | | | | | | | | | | | | | | |
Without Sales Charge | | | | | 6.00 | % | | | 5.25 | % | | | 11.27 | % | | | 6.92 | % |
With Sales Charge** | | | | | 0.43 | | | | (0.26 | ) | | | 9.28 | | | | 5.54 | |
CLASS C SHARES | | February 28, 2011 | | | | | | | | | | | | | | | | |
Without CDSC | | | | | 5.69 | | | | 4.75 | | | | 10.72 | | | | 6.38 | |
With CDSC*** | | | | | 4.69 | | | | 3.75 | | | | 10.72 | | | | 6.38 | |
CLASS R2 SHARES | | February 28, 2011 | | | 5.86 | | | | 4.97 | | | | 10.97 | | | | 6.63 | |
CLASS R5 SHARES | | February 28, 2011 | | | 6.24 | | | | 5.73 | | | | 11.76 | | | | 7.39 | |
CLASS R6 SHARES | | January 30, 2015 | | | 6.13 | | | | 5.61 | | | | 11.72 | | | | 7.36 | |
SELECT CLASS SHARES | | February 28, 2011 | | | 6.18 | | | | 5.55 | | | | 11.56 | | | | 7.19 | |
| ** | | Sales Charge for Class A Shares is 5.25%. |
| *** | | Assumes a 1% CDSC (contingent deferred sales charge) for the one year period and 0% CDSC thereafter. |
LIFE OF FUND PERFORMANCE (2/28/11 TO 4/30/15)
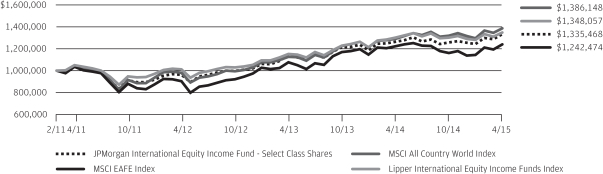
The performance quoted is past performance and is not a guarantee of future results. Mutual funds are subject to certain market risks. Investment returns and principal value of an investment will fluctuate so that an investor’s shares, when redeemed, may be worth more or less than their original cost. Current performance may be higher or lower than the performance data shown. For up-to-date, month-end performance information please call 1-800-480-4111.
The Fund commenced operations on February 28, 2011.
Returns for Class R6 Shares prior to its inception date are based on the performance of Class R5 Shares. The actual returns for Class R6 Shares would have been different than those shown because Class R6 Shares have different expenses than Class R5 Shares.
The graph illustrates comparative performance for $1,000,000 invested in Select Class Shares of the JPMorgan International Equity Income Fund, the MSCI EAFE Index, the MSCI All Country World Index and the Lipper International Equity Income Funds Index from February 28, 2011 to April 30, 2015. The performance of the Fund assumes reinvestment of all dividends and capital gain distributions, if any, and does not include a sales charge. The performance of the MSCI EAFE Index and the MSCI All Country World Index does not reflect the deduction of expenses or a sales charge associated with a mutual fund and approximates the minimum possible dividend reinvestment of the securities included in the benchmarks, if applicable. The dividend is reinvested after deduction of withholding tax, applying the maximum rate to non-resident institutional investors who do not benefit from double taxation treaties. The performance of the Lipper International Equity Income Funds Index includes expenses associated with a mutual fund, such as investment management fees. These expenses are not identical to the expenses incurred by the Fund. The
MSCI EAFE Index is a free float-adjusted market capitalization weighted index that is designed to measure the equity market performance of developed markets, excluding the U.S. and Canada.
The MSCI All Country World Index is a free float-adjusted market capitalization weighted index that is designed to measure the equity market performance of developed and emerging markets. The Lipper International Equity Income Funds Index is an index based on the total returns of certain mutual funds within the Fund’s designated category as determined by Lipper, Inc. Investors cannot invest directly in an index.
Select Class Shares have a $1,000,000 minimum initial investment.
Fund performance may reflect the waiver of the Fund’s fees and reimbursement of expenses for certain periods since the inception date. Without these waivers and reimbursements, performance would have been lower. Also, performance shown in this section does not reflect the deduction of taxes that a shareholder would pay on Fund distributions or redemption of Fund shares.
International investing involves a greater degree of risk and increased volatility. Changes in currency exchange rates and differences in accounting and taxation policies outside the United States can raise or lower returns. Also, some overseas markets may not be as politically and economically stable as the United States and other nations.
The returns shown are based on net asset values calculated for shareholder transactions and may differ from the returns shown in the financial highlights, which reflect adjustments made to the net asset values in accordance with accounting principles generally accepted in the United States of America.
| | | | | | | | |
| | | |
| APRIL 30, 2015 | | J.P. MORGAN INTERNATIONAL EQUITY FUNDS | | | | | 21 | |
JPMorgan International Equity Income Fund
(formerly JPMorgan Global Equity Income Fund)
FUND COMMENTARY
SIX MONTHS ENDED APRIL 30, 2015 (Unaudited) (continued)
The MSCI information may only be used for your internal use, may not be reproduced or redisseminated in any form and may not be used as a basis for or a component of any financial instruments or products or indices. None of the MSCI information is intended to constitute investment advice or a recommendation to make (or refrain from making) any kind of investment decision and may not be relied on as such. Historical data and analysis should not be taken as an indication or guarantee of any future performance analysis, forecast or prediction. The MSCI information is provided on an “as is” basis and the user of this information assumes the entire risk of any use made of this
information. MSCI, each of its affiliates and each other person involved in or related to compiling, computing or creating any MSCI information (collectively, the “MSCI Parties”) expressly disclaims all warranties (including, without limitation, any warranties of originality, accuracy, completeness, timeliness, non-infringement, merchantability and fitness for a particular purpose) with respect to this information. Without limiting any of the foregoing, in no event shall any MSCI Party have any liability for any direct, indirect, special, incidental, punitive, consequential (including, without limitation, lost profits) or any other damages. (www.msci.com)
| | | | | | |
| | | |
| 22 | | | | J.P. MORGAN INTERNATIONAL EQUITY FUNDS | | APRIL 30, 2015 |
JPMorgan International Opportunities Fund
FUND COMMENTARY
SIX MONTHS ENDED APRIL 30, 2015 (Unaudited)
| | | | |
| REPORTING PERIOD RETURN: | |
| Fund (Institutional Class Shares)* | | | 5.63% | |
| Morgan Stanley Capital International (“MSCI”) Europe, Australasia and Far East (“EAFE”) Index (net of foreign withholding taxes) | | | 6.81% | |
| |
| Net Assets as of 4/30/2015 (In Thousands) | | | $1,956,583 | |
INVESTMENT OBJECTIVE**
The JPMorgan International Opportunities Fund (the “Fund”) seeks to provide high total return from a portfolio of equity securities of foreign companies in developed and, to a lesser extent, emerging markets.
WHAT WERE THE MAIN DRIVERS OF THE FUND’S PERFORMANCE?
The Fund’s Institutional Class Shares underperformed the MSCI EAFE Index (net of foreign withholding taxes) (the “Benchmark”) for the six months ended April 30, 2015.
By sector, the Fund’s security selection in the health care and transportation services & construction cyclical sectors was a leading detractor from performance relative to the Benchmark for the six month reporting period. The Fund’s security selection in the industrial cyclical and banks sectors was a leading contributor to relative performance.
By region, the Fund’s security selection in North America detracted from relative performance, while security selection in Europe (excluding the U.K.) and emerging markets was a leading contributor to relative performance. Emerging markets are not represented in the Benchmark.
Leading individual detractors from the Fund’s relative performance included its overweight positions in Sands China Ltd., Mazda Motor Corp. and First Quantum Minerals Ltd. Shares of Sands China, a Macau casino resort operator, declined as a Chinese government effort to curb corruptions reduced casino traffic among wealthy customers. Shares of Mazda, a Japanese automaker, declined on disappointing earnings. Shares of First Quantum, a Canadian mining company not held in the Benchmark, declined on weakness in global commodities prices.
Leading individual contributors to relative performance included the Fund’s overweight positions in Mitsubishi UFJ Financial Group Ltd., China Overseas Land & Investment Ltd. and DMG Mori Seiki Co. Shares of Mitsubishi UFJ Financial, a Japanese banking company, rose amid signs of an improving economy in Japan and the company’s plans to repurchase shares and increase its dividend. Shares of China Overseas Land, a Chinese real estate and investment company rose on Chinese government efforts to counter slowing growth. Shares of DMG Mori Seiki, a Japanese machinery manufacturer not held in the Benchmark, rose amid the corporate capital expenditure/replacement cycle in Japan and investor expectations that DMG’s acquisition of its German partner would generate significant benefits.
HOW WAS THE FUND POSITIONED?
The Fund’s portfolio managers employed a bottom-up fundamental approach to security selection, seeking to identify what they believed were the most attractive investment opportunities within each sector. The Fund’s portfolio managers looked for securities that they believed possessed an attractive valuation signal (as measured by a proprietary dividend discount model) and a timely catalyst that would enable the security to realize its inherent value. In addition, the Fund employed futures and currency forwards to help manage cash flows and the Fund’s currency exposure.
| * | | The return shown is based on net asset values calculated for shareholder transactions and may differ from the return shown in the financial highlights, which reflects adjustments made to the net asset values in accordance with accounting principles generally accepted in the United States of America. |
| ** | | The adviser seeks to achieve the Fund’s objective. There can be no guarantee it will be achieved. |
| | | | | | | | |
| | | |
| APRIL 30, 2015 | | J.P. MORGAN INTERNATIONAL EQUITY FUNDS | | | | | 23 | |
JPMorgan International Opportunities Fund
FUND COMMENTARY
SIX MONTHS ENDED APRIL 30, 2015 (Unaudited) (continued)
| | | | | | | | |
| TOP TEN EQUITY HOLDINGS OF THE PORTFOLIO* | |
| | 1. | | | Novartis AG (Switzerland) | | | 3.2 | % |
| | 2. | | | Nestle S.A. (Switzerland) | | | 3.0 | |
| | 3. | | | Roche Holding AG (Switzerland) | | | 2.9 | |
| | 4. | | | Mitsubishi UFJ Financial Group, Inc. (Japan) | | | 2.3 | |
| | 5. | | | HSBC Holdings plc (United Kingdom) | | | 2.2 | |
| | 6. | | | Vodafone Group plc (United Kingdom) | | | 2.1 | |
| | 7. | | | Bayer AG (Germany) | | | 2.0 | |
| | 8. | | | Daimler AG (Germany) | | | 1.8 | |
| | 9. | | | Prudential plc (United Kingdom) | | | 1.7 | |
| | 10. | | | BG Group plc (United Kingdom) | | | 1.7 | |
| | | | |
PORTFOLIO COMPOSITION BY COUNTRY* | |
| Japan | | | 23.2 | % |
| United Kingdom | | | 22.2 | |
| Switzerland | | | 13.5 | |
| France | | | 8.4 | |
| Germany | | | 7.9 | |
| Netherlands | | | 4.4 | |
| Australia | | | 4.0 | |
| Hong Kong | | | 3.1 | |
| Italy | | | 1.8 | |
| Norway | | | 1.6 | |
| China | | | 1.4 | |
| Ireland | | | 1.2 | |
| Sweden | | | 1.1 | |
| Finland | | | 1.1 | |
| South Korea | | | 1.0 | |
| Others (each less than 1.0%) | | | 0.9 | |
| Short-Term Investment | | | 3.2 | |
| * | | Percentages indicated are based on total investments as of April 30, 2015. The Fund’s portfolio composition is subject to change. |
| | | | | | |
| | | |
| 24 | | | | J.P. MORGAN INTERNATIONAL EQUITY FUNDS | | APRIL 30, 2015 |
| | | | | | | | | | | | | | | | | | |
AVERAGE ANNUAL TOTAL RETURNS AS OF APRIL 30, 2015 | |
| | | | | |
| | | INCEPTION DATE OF
CLASS | | 6 MONTH* | | | 1 YEAR | | | 5 YEAR | | | 10 YEAR | |
CLASS A SHARES | | September 10, 2001 | | | | | | | | | | | | | | | | |
Without Sales Charge | | | | | 5.36 | % | | | 0.54 | % | | | 6.39 | % | | | 5.55 | % |
With Sales Charge** | | | | | (0.17 | ) | | | (4.74 | ) | | | 5.25 | | | | 4.98 | |
CLASS B SHARES | | September 10, 2001 | | | | | | | | | | | | | | | | |
Without CDSC | | | | | 5.08 | | | | (0.02 | ) | | | 5.86 | | | | 5.13 | |
With CDSC*** | | | | | 0.08 | | | | (5.02 | ) | | | 5.54 | | | | 5.13 | |
CLASS C SHARES | | July 31, 2007 | | | | | | | | | | | | | | | | |
Without CDSC | | | | | 5.10 | | | | 0.04 | | | | 5.87 | | | | 5.02 | |
With CDSC**** | | | | | 4.10 | | | | (0.96 | ) | | | 5.87 | | | | 5.02 | |
CLASS R6 SHARES | | November 30, 2010 | | | 5.65 | | | | 1.04 | | | | 6.92 | | | | 6.06 | |
INSTITUTIONAL CLASS SHARES | | February 26, 1997 | | | 5.63 | | | | 0.96 | | | | 6.84 | | | | 6.02 | |
SELECT CLASS SHARES | | September 10, 2001 | | | 5.52 | | | | 0.83 | | | | 6.66 | | | | 5.81 | |
| ** | | Sales Charge for Class A Shares is 5.25%. |
| *** | | Assumes a 5% CDSC (contingent deferred sales charge) for the one year period, 2% CDSC for the five year period and 0% CDSC thereafter. |
| **** | | Assumes a 1% CDSC for the one year period and 0% CDSC thereafter. |
TEN YEAR PERFORMANCE (4/30/05 TO 4/30/15)
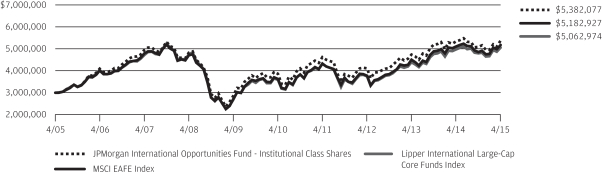
The performance quoted is past performance and is not a guarantee of future results. Mutual funds are subject to certain market risks. Investment returns and principal value of an investment will fluctuate so that an investor’s shares, when redeemed, may be worth more or less than their original cost. Current performance may be higher or lower than the performance data shown. For up-to-date month-end performance information please call 1-800-480-4111.
Returns for Class C Shares prior to its inception date are based on the performance of Class B Shares. The actual returns of Class C Shares would have been similar to those shown because Class C Shares have expenses similar to those of Class B Shares.
Returns for Class R6 Shares prior to its inception date are based on the performance of Institutional Class Shares. The actual returns of Class R6 Shares would have been different than those shown because Class R6 Shares have different expenses than Institutional Class Shares.
The graph illustrates comparative performance for $3,000,000 invested in Institutional Class Shares of the JPMorgan International Opportunities Fund, the MSCI EAFE Index and the Lipper International Large-Cap Core Funds Index from April 30, 2005 to April 30, 2015. The performance of the Fund assumes reinvestment of all dividends and capital gain distributions, if any, and does not
include a sales charge. The performance of the MSCI EAFE Index does not reflect the deduction of expenses or a sales charge associated with a mutual fund and approximates the minimum possible dividend reinvestment of the securities included in the benchmark, if applicable. The dividend is reinvested after deduction of withholding tax, applying the maximum rate to non-resident institutional investors who do not benefit from double taxation treaties. The performance of the Lipper International Large-Cap Core Funds Index includes expenses associated with a mutual fund, such as investment management fees. These expenses are not identical to the expenses incurred by the Fund. The MSCI EAFE Index is a free float-adjusted market capitalization weighted index that is designed to measure the equity market performance of developed markets, excluding the U.S. and Canada. The Lipper International Large-Cap Core Funds Index is an index based on the total returns of certain mutual funds within the Fund’s designated category, as determined by Lipper, Inc. Investors cannot invest directly in an index.
Institutional Class Shares have a $3,000,000 minimum initial investment.
Fund performance may reflect the waiver of the Fund’s fees and reimbursement of expenses for certain periods since the inception date. Without these waivers and reimbursements, performance would have been lower. Also, performance shown in this section does not reflect the deduction of taxes that a shareholder would pay on Fund distributions or redemption of Fund shares.
| | | | | | | | |
| | | |
| APRIL 30, 2015 | | J.P. MORGAN INTERNATIONAL EQUITY FUNDS | | | | | 25 | |
JPMorgan International Opportunities Fund
FUND COMMENTARY
SIX MONTHS ENDED APRIL 30, 2015 (Unaudited) (continued)
International investing involves a greater degree of risk and increased volatility. Changes in currency exchange rates and differences in accounting and taxation policies outside the U.S. can raise or lower returns. Also, some overseas markets may not be as politically and economically stable as the United States and other nations.
Because Class B shares automatically convert to Class A shares after 8 years, the 10 Year average annual total return shown above for Class B reflects Class A performance for the period after conversion. The Board of Trustees of
the Fund has approved the automatic conversion of the Fund’s Class B Shares into Class A Shares on June 19, 2015. On June 19, 2015, all Class B Shares of the Fund will automatically convert to Class A Shares of the Fund.
The returns shown are based on net asset values calculated for shareholder transactions and may differ from the returns shown in the financial highlights, which reflect adjustments made to the net asset values in accordance with accounting principles generally accepted in the United States of America.
| | | | | | |
| | | |
| 26 | | | | J.P. MORGAN INTERNATIONAL EQUITY FUNDS | | APRIL 30, 2015 |
JPMorgan International Research Enhanced Equity Fund
FUND COMMENTARY
SIX MONTHS ENDED APRIL 30, 2015 (Unaudited)
| | | | |
| REPORTING PERIOD RETURN: | |
| Fund (Select Class Shares)* | | | 6.23% | |
| Morgan Stanley Capital International (“MSCI”) Europe, Australasia and Far East (“EAFE”) Index (net of foreign withholding taxes) | | | 6.81% | |
| |
| Net Assets as of 4/30/2015 (In Thousands) | | | $810,771 | |
INVESTMENT OBJECTIVE**
The JPMorgan International Research Enhanced Equity Fund (the “Fund”) seeks to provide long-term appreciation.
WHAT WERE THE MAIN DRIVERS OF THE FUND’S PERFORMANCE?
The Fund’s Select Class Shares underperformed the MSCI EAFE Index (net of foreign withholdings) (the “Benchmark”) for the six months ended April 30, 2015.
By sector, the Fund’s security selection in the utilities and basic industries sectors was a leading detractor from performance relative to the Benchmark for the six month reporting period. The Fund’s security selection in the industrial cyclical and property sectors was a leading contributor to relative performance. By region, the Fund’s security selection in Japan and Europe was the largest contributor to relative performance. Due to the relatively large number of securities held by the Fund during the period, the impact of individual holdings on performance relative to the Benchmark tended to be small.
HOW WAS THE FUND POSITIONED?
Using the fundamental research conducted by JPMorgan’s team of analysts, the Fund’s managers implemented modestly overweight or underweight positions in, or did not hold, individual components of the Benchmark in an attempt to generate returns that modestly exceeded those of the Benchmark, while maintaining sector, geographic and risk characteristics similar to the Benchmark.
| | | | | | | | |
| TOP TEN EQUITY HOLDINGS OF THE PORTFOLIO*** | |
| | 1. | | | Nestle S.A. (Switzerland) | | | 2.2 | % |
| | 2. | | | Toyota Motor Corp. (Japan) | | | 1.9 | |
| | 3. | | | Novartis AG (Switzerland) | | | 1.6 | |
| | 4. | | | Bayer AG (Germany) | | | 1.4 | |
| | 5. | | | Sanofi (France) | | | 1.3 | |
| | 6. | | | Roche Holding AG (Switzerland) | | | 1.3 | |
| | 7. | | | British American Tobacco plc (United Kingdom) | | | 1.3 | |
| | 8. | | | Novo Nordisk A/S, Class B (Denmark) | | | 1.2 | |
| | 9. | | | Royal Dutch Shell plc, Class A (Netherlands) | | | 1.2 | |
| | 10. | | | HSBC Holdings plc (United Kingdom) | | | 1.1 | |
| | | | |
PORTFOLIO COMPOSITION BY COUNTRY*** | |
| Japan | | | 22.3 | % |
| United Kingdom | | | 19.1 | |
| France | | | 10.9 | |
| Germany | | | 9.5 | |
| Switzerland | | | 8.2 | |
| Australia | | | 5.6 | |
| Netherlands | | | 4.1 | |
| Spain | | | 2.8 | |
| Hong Kong | | | 2.7 | |
| Italy | | | 2.2 | |
| Denmark | | | 2.2 | |
| Sweden | | | 1.8 | |
| Finland | | | 1.6 | |
| Ireland | | | 1.2 | |
| Others (each less than 1.0%) | | | 3.6 | |
| Short-Term Investment | | | 2.2 | |
| * | | The return shown is based on net asset values calculated for shareholder transactions and may differ from the return shown in the financial highlights, which reflects adjustments made to the net asset values in accordance with accounting principles generally accepted in the United States of America. |
| ** | | The adviser seeks to achieve the Fund’s objective. There can be no guarantee it will be achieved. |
| *** | | Percentages indicated are based on total investments as of April 30, 2015. The Fund’s portfolio composition is subject to change. |
| | | | | | | | |
| | | |
| APRIL 30, 2015 | | J.P. MORGAN INTERNATIONAL EQUITY FUNDS | | | | | 27 | |
JPMorgan International Research Enhanced Equity Fund
FUND COMMENTARY
SIX MONTHS ENDED APRIL 30, 2015 (Unaudited) (continued)
| | | | | | | | | | | | | | | | | | |
AVERAGE ANNUAL TOTAL RETURNS AS OF APRIL 30, 2015 | |
| | | | | |
| | | INCEPTION DATE OF
CLASS | | 6 MONTH* | | | 1 YEAR | | | 5 YEAR | | | 10 YEAR | |
CLASS A SHARES | | April 23, 1993 | | | | | | | | | | | | | | | | |
Without Sales Charge | | | | | 6.10 | % | | | 0.90 | % | | | 6.21 | % | | | 5.19 | % |
With Sales Charge** | | | | | 0.53 | | | | (4.41 | ) | | | 5.07 | | | | 4.62 | |
CLASS B SHARES | | January 14, 1994 | | | | | | | | | | | | | | | | |
Without CDSC | | | | | 5.87 | | | | 0.36 | | | | 5.56 | | | | 4.59 | |
With CDSC*** | | | | | 0.87 | | | | (4.64 | ) | | | 5.23 | | | | 4.59 | |
CLASS C SHARES | | November 4, 1997 | | | | | | | | | | | | | | | | |
Without CDSC | | | | | 5.87 | | | | 0.36 | | | | 5.55 | | | | 4.49 | |
With CDSC**** | | | | | 4.87 | | | | (0.64 | ) | | | 5.55 | | | | 4.49 | |
CLASS R2 SHARES | | November 3, 2008 | | | 6.01 | | | | 0.64 | | | | 5.95 | | | | 4.93 | |
SELECT CLASS SHARES | | October 28, 1992 | | | 6.23 | | | | 1.11 | | | | 6.47 | | | | 5.45 | |
| ** | | Sales Charge for Class A Shares is 5.25%. |
| *** | | Assumes a 5% CDSC (contingent deferred sales charge) for the one year period, 2% CDSC for the five year period and 0% CDSC thereafter. |
| **** | | Assumes a 1% CDSC for the one year period and 0% CDSC thereafter. |
TEN YEAR PERFORMANCE (4/30/05 TO 4/30/15)
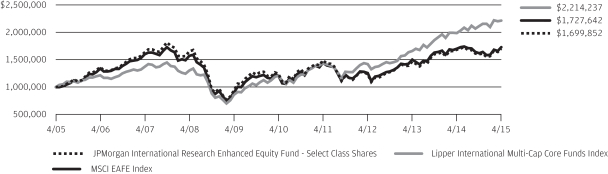
The performance quoted is past performance and is not a guarantee of future results. Mutual funds are subject to certain market risks. Investment returns and principal value of an investment will fluctuate so that an investor’s shares, when redeemed, may be worth more or less than their original cost. Current performance may be higher or lower than the performance data shown. For up-to-date month-end performance information please call 1-800-480-4111.
Returns for Class R2 Shares prior to its inception date are based on the performance of Select Class Shares. Class R2 Shares performance has been adjusted to reflect the difference in expenses between classes.
The graph illustrates comparative performance for $1,000,000 invested in Select Class Shares of the JPMorgan International Research Enhanced Equity Fund, the MSCI EAFE Index and the Lipper International Multi-Cap Core Funds Index from April 30, 2005 to April 30, 2015. The performance of the Fund assumes reinvestment of all dividends and capital gain distributions, if any, and does not include a sales charge. The performance of the MSCI EAFE Index does not reflect the deduction of expenses or a sales charge associated with a mutual fund and approximates the minimum possible dividend reinvestment of the securities included in the benchmark, if applicable. The dividend is reinvested after deduction of withholding tax, applying the maximum rate to non-resident institutional investors who do not benefit from double taxation
treaties. The performance of the Lipper International Multi-Cap Core Funds Index includes expenses associated with a mutual fund, such as investment management fees. These expenses are not identical to the expenses incurred by the Fund. The MSCI EAFE Index is a free float-adjusted market capitalization weighted index that is designed to measure the equity market performance of developed markets, excluding the U.S. and Canada. The Lipper International Multi-Cap Core Funds Index is an index based on the total returns of certain mutual funds within the Fund’s designated category as determined by Lipper, Inc. Investors cannot invest directly in an index.
Select Class Shares have a $1,000,000 minimum initial investment.
Fund performance may reflect the waiver of the Fund’s fees and reimbursement of expenses for certain periods since the inception date. Without these waivers and reimbursements, performance would have been lower. Also, performance shown in this section does not reflect the deduction of taxes that a shareholder would pay on Fund distributions or redemption of Fund shares.
International investing involves a greater degree of risk and increased volatility. Changes in currency exchange rates and differences in accounting and taxation policies outside of the U.S. can raise or lower returns. Also, some overseas markets may not be as politically and economically stable as the United States and other nations.
| | | | | | |
| | | |
| 28 | | | | J.P. MORGAN INTERNATIONAL EQUITY FUNDS | | APRIL 30, 2015 |
Because Class B Shares automatically convert to Class A Shares after 8 years, the 10 year average annual total return shown above for Class B reflects Class A performance for the period after conversion. The Board of Trustees of the Fund has approved the automatic conversion of the Fund’s Class B Shares into
Class A Shares on June 19, 2015. On June 19, 2015, all Class B Shares of the Fund will automatically convert to Class A Shares of the Fund.
The returns shown are based on net asset values calculated for shareholder transactions and may differ from the returns shown in the financial highlights, which reflect adjustments made to the net asset values in accordance with accounting principles generally accepted in the United States of America.
The MSCI information may only be used for your internal use, may not be reproduced or redisseminated in any form and may not be used as a basis for or a component of any financial instruments or products or indices. None of the MSCI information is intended to constitute investment advice or a
recommendation to make (or refrain from making) any kind of investment decision and may not be relied on as such. Historical data and analysis should not be taken as an indication or guarantee of any future performance analysis, forecast or prediction. The MSCI information is provided on an “as is” basis and the user of this information assumes the entire risk of any use made of this information. MSCI, each of its affiliates and each other person involved in or related to compiling, computing or creating any MSCI information (collectively, the “MSCI Parties”) expressly disclaims all warranties (including, without limitation, any warranties of originality, accuracy, completeness, timeliness, non-infringement, merchantability and fitness for a particular purpose) with respect to this information. Without limiting any of the foregoing, in no event shall any MSCI Party have any liability for any direct, indirect, special, incidental, punitive, consequential (including, without limitation, lost profits) or any other damages. (www.msci.com)
| | | | | | | | |
| | | |
| APRIL 30, 2015 | | J.P. MORGAN INTERNATIONAL EQUITY FUNDS | | | | | 29 | |
JPMorgan International Unconstrained Equity Fund
FUND COMMENTARY
SIX MONTHS ENDED APRIL 30, 2015 (Unaudited)
| | | | |
| REPORTING PERIOD RETURN: | | | |
| Fund (Select Class Shares)* | |
| 9.71%
|
|
Morgan Stanley Capital International (“MSCI”) All Country World Index, Ex-U.S. (net of foreign withholding taxes) | | | 5.56% | |
| |
| Net Assets as of 4/30/2015 (In Thousands) | | | $22,053 | |
INVESTMENT OBJECTIVE**
The JPMorgan International Unconstrained Equity Fund (the “Fund”) seeks to provide long-term capital appreciation.
WHAT WERE THE MAIN DRIVERS OF THE FUND’S PERFORMANCE?
The Fund’s Select Class Shares outperformed the MSCI All Country World Index, ex-U.S. (net of foreign withholding taxes) (the “Benchmark”) for the six months ended April 30, 2015.
By sector, the Fund’s security selection in the financials and materials sectors was a leading contributor to performance relative to the Benchmark for the six months reporting period. The Fund’s security selection in the industrials and information technology sectors was a leading detractor from relative performance.
By region, the Fund’s security selection in emerging markets and Continental Europe was a leading contributor to relative performance, while the Fund’s security selection in Canada and its underweight position in Japan were leading detractors from relative performance.
Leading individual contributors to the Fund’s relative performance included its overweight positions in Ping An Insurance Group Co., Accor SA and Cheung Kong Holdings Ltd. Shares of Ping An Insurance Group Co., a Chinese insurer, rose in line with other Chinese financial sector companies amid Chinese government efforts to counter slowing economic growth. Shares of Accor, a French hotel operator that derives the bulk of its revenue from Europe, rose on expectations that the company would benefit from European Central Bank efforts to stimulate economic growth along with the company’s own
efforts to increase revenue. Shares of Cheung Kong, a Hong Kong property developer and conglomerate, rose on news that the company, along with its Hutchison Whampoa affiliate, was revamping its organizational structure to separate Chinese real estate activities from the rest of the business.
Leading individual detractors from the Fund’s relative performance included its overweight positions in Baidu Inc., Sands China Ltd. and MEG Energy Corp. Shares of Baidu, a Chinese Internet portal operator, fell after the company reported earnings and an earnings forecast below analysts’ estimates. Shares of Sands China, a developer-operator of resort casinos in Macau, fell as Chinese government efforts to quell corruption reduced casino traffic among wealthy customers. Shares of MEG Energy, a Canadian energy company focused on the Alberta oil sands region, fell on weakness in global oil prices.
HOW WAS THE FUND POSITIONED?
The Fund’s portfolio managers continued to focus on stock selection to build a portfolio of international equities. They used bottom-up fundamental research to identify what they believed were attractively priced stocks of well-managed companies with the potential to grow their earnings faster than their industry peers.
| * | | The return shown is based on net asset values calculated for shareholder transactions and may differ from the return shown in the financial highlights, which reflects adjustments made to the net asset values in accordance with accounting principles generally accepted in the United States of America. |
| ** | | The adviser seeks to achieve the Fund’s objective. There can be no guarantee it will be achieved. |
| | | | | | |
| | | |
| 30 | | | | J.P. MORGAN INTERNATIONAL EQUITY FUNDS | | APRIL 30, 2015 |
| | | | | | | | |
| TOP TEN EQUITY HOLDINGS OF THE PORTFOLIO* | |
| | 1. | | | Baidu, Inc., ADR (China) | | | 3.6 | % |
| | 2. | | | CK Hutchison Holdings Ltd. (Hong Kong) | | | 3.0 | |
| | 3. | | | Toronto-Dominion Bank (The) (Canada) | | | 3.0 | |
| | 4. | | | Barclays plc (United Kingdom) | | | 3.0 | |
| | 5. | | | Roche Holding AG (Switzerland) | | | 2.9 | |
| | 6. | | | Ping An Insurance Group Co. of China Ltd., Class H (China) | | | 2.9 | |
| | 7. | | | Accor S.A. (France) | | | 2.9 | |
| | 8. | | | Orange S.A. (France) | | | 2.9 | |
| | 9. | | | Akzo Nobel N.V. (Netherlands) | | | 2.8 | |
| | 10. | | | Japan Tobacco, Inc. (Japan) | | | 2.7 | |
| | | | |
PORTFOLIO COMPOSITION BY COUNTRY* | |
| United Kingdom | | | 16.4 | % |
| France | | | 12.5 | |
| Japan | | | 12.3 | |
| Switzerland | | | 12.1 | |
| Canada | | | 6.9 | |
| China | | | 6.6 | |
| Netherlands | | | 4.8 | |
| India | | | 4.0 | |
| Germany | | | 3.3 | |
| Hong Kong | | | 3.0 | |
| South Korea | | | 2.5 | |
| Italy | | | 2.2 | |
| South Africa | | | 2.0 | |
| Taiwan | | | 1.9 | |
| Ireland | | | 1.9 | |
| Short-Term Investment | | | 7.6 | |
| * | | Percentages indicated are based on total investments as of April 30, 2015. The Fund’s portfolio composition is subject to change. |
| | | | | | | | |
| | | |
| APRIL 30, 2015 | | J.P. MORGAN INTERNATIONAL EQUITY FUNDS | | | | | 31 | |
JPMorgan International Unconstrained Equity Fund
FUND COMMENTARY
SIX MONTHS ENDED APRIL 30, 2015 (Unaudited) (continued)
| | | | | | | | | | | | | | | | | | | | |
AVERAGE ANNUAL TOTAL RETURNS AS OF APRIL 30, 2015 | |
| | | | | |
| | | INCEPTION DATE OF
CLASS | | | 6 MONTH* | | | 1 YEAR | | | 3 YEAR | | | SINCE
INCEPTION | |
CLASS A SHARES | | | November 30, 2011 | | | | | | | | | | | | | | | | | |
Without Sales Charge | | | | | | | 9.59 | % | | | 7.06 | % | | | 10.05 | % | | | 12.71 | % |
With Sales Charge** | | | | | | | 3.84 | | | | 1.46 | | | | 8.08 | | | | 10.95 | |
CLASS C SHARES | | | November 30, 2011 | | | | | | | | | | | | | | | | | |
Without CDSC | | | | | | | 9.20 | | | | 6.48 | | | | 9.48 | | | | 12.12 | |
With CDSC*** | | | | | | | 8.20 | | | | 5.48 | | | | 9.48 | | | | 12.12 | |
CLASS R2 SHARES | | | November 30, 2011 | | | | 9.39 | | | | 6.80 | | | | 9.76 | | | | 12.42 | |
CLASS R5 SHARES | | | November 30, 2011 | | | | 9.78 | | | | 7.54 | | | | 10.53 | | | | 13.21 | |
CLASS R6 SHARES | | | November 30, 2011 | | | | 9.83 | | | | 7.59 | | | | 10.60 | | | | 13.27 | |
SELECT CLASS SHARES | | | November 30, 2011 | | | | 9.71 | | | | 7.35 | | | | 10.31 | | | | 12.99 | |
| ** | | Sales Charge for Class A Shares is 5.25%. |
| *** | | Assumes a 1% CDSC (contingent deferred sales charge) for the one year period and 0% CDSC thereafter. |
LIFE OF FUND PERFORMANCE (11/30/11 To 4/30/15)
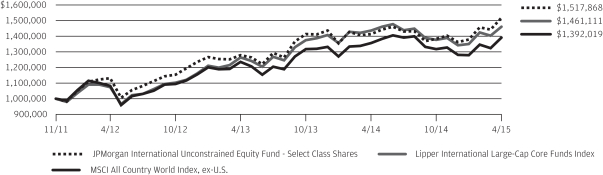
The performance quoted is past performance and is not a guarantee of future results. Mutual funds are subject to certain market risks. Investment returns and principal value of an investment will fluctuate so that an investor’s shares, when redeemed, may be worth more or less than their original cost. Current performance may be higher or lower than the performance data shown. For up-to-date, month-end performance information please call 1-800-480-4111.
The Fund commenced operations on November 30, 2011.
The graph illustrates comparative performance for $1,000,000 invested in Select Class Shares of the JPMorgan International Unconstrained Equity Fund, the MSCI All Country World Index, ex-U.S., and the Lipper International Large-Cap Core Funds Index from November 30, 2011 to April 30, 2015. The performance of the Fund assumes reinvestment of all dividends and capital gain distributions, if any, and does not include a sales charge. The performance of the MSCI All Country World Index, ex-U.S. does not reflect the deduction of expenses or a sales charge associated with a mutual fund and approximates the minimum possible dividend reinvestment of the securities included in the benchmark, if applicable. The dividend is reinvested after deduction of withholding tax, applying the maximum rate to non-resident institutional investors who do not benefit from double taxation treaties. The performance of the Lipper International Large-Cap Core Funds Index includes expenses associated with a mutual fund, such as investment management fees. These expenses are not identical to the expenses incurred by the Fund. The MSCI All Country World Index, ex-U.S. is a free float-adjusted market capitalization weighted index that is designed to measure the equity market performance of developed and
emerging markets, excluding the United States. The Lipper International Large-Cap Core Funds Index is an index based on the total returns of certain mutual funds within the Fund’s designated category, as determined by Lipper, Inc. Investors cannot invest directly in an index.
Select Class Shares have a $1,000,000 minimum initial investment.
Subsequent to the inception date of the Fund and through May 30, 2013, the Fund did not experience any shareholder activity. If such shareholder activity had occurred, the Fund’s performance may have been impacted.
Fund performance may reflect the waiver of the Fund’s fees and reimbursement of expenses for certain periods since the inception date. Without these waivers and reimbursements, performance would have been lower. Also, performance shown in this section does not reflect the deduction of taxes that a shareholder would pay on Fund distributions or redemption of Fund shares.
International investing involves a greater degree of risk and increased volatility. Changes in currency exchange rates and differences in accounting and taxation policies outside the U.S. can raise or lower returns. Also, some overseas markets may not be as politically and economically stable as the United States and other nations.
The returns shown are based on net asset values calculated for shareholder transactions and may differ from the returns shown in the financial highlights, which reflect adjustments made to the net asset values in accordance with accounting principles generally accepted in the United States of America.
| | | | | | |
| | | |
| 32 | | | | J.P. MORGAN INTERNATIONAL EQUITY FUNDS | | APRIL 30, 2015 |
JPMorgan International Value Fund
FUND COMMENTARY
SIX MONTHS ENDED APRIL 30, 2015 (Unaudited)
| | | | |
| REPORTING PERIOD RETURN: | |
| Fund (Institutional Class Shares)* | | | 3.70% | |
| Morgan Stanley Capital International (“MSCI”) Europe, Australasia and Far East (“EAFE”) Value Index (net of foreign withholding taxes) | | | 5.35% | |
| |
| Net Assets as of 4/30/2015 (In Thousands) | | | $2,530,219 | |
INVESTMENT OBJECTIVE**
The JPMorgan International Value Fund (the “Fund”) seeks to provide high total return from a portfolio of foreign company equity securities.
WHAT WERE THE MAIN DRIVERS OF THE FUND’S PERFORMANCE?
The Fund’s Institutional Class Shares underperformed the MSCI EAFE Value Index (net of foreign withholding taxes) (the “Benchmark”) for the six months ended April 30, 2015.
By sector, the Fund’s security selection in the basic industries and the health care sectors was a leading detractor from performance relative to the Benchmark for the six month reporting period. The Fund’s security selection in the banks sector and its underweight position and security selection in the energy sector were leading positive contributors to relative performance.
By region, the Fund’s security selection in Japan and Canada detracted from performance relative to the Benchmark, while the Fund’s security selection in Continental Europe and emerging markets made positive contributions to relative performance. Emerging markets were not represented in the Benchmark.
Leading individual detractors from relative performance included the Fund’s overweight positions in Hitachi Ltd., Mazda Motor Corp. and Sands China Ltd. Shares of both Hitachi, a Japanese diversified manufacturer of electronic equipment and infrastructure, and Mazda, a Japanese automaker not held in the Benchmark, came under pressure from disappointing earnings. Shares of Sands China, a Macau casino resort operator not held in the Benchmark, declined as a Chinese government effort to curb corruption reduced casino traffic among wealthy customers.
Leading individual contributors to the Fund’s relative performance included the Fund’s positions in Sony Corp., Mitsubishi UFJ Financial Group Inc. and Industrial and Commercial Bank of China Ltd. Shares of Sony, a Japanese entertainment and consumer electronics conglomerate not held in the Benchmark, rose on the company’s forecast of rising profit, driven by cost cutting and a shift away from consumer electronics into gaming, entertainment and sensors used in smart phones. Shares of Mitsubishi UFJ Financial, a Japanese banking company, rose amid signs of economic growth in Japan, and the company’s plans for share repurchases and an increase in its dividend. Shares of Industrial and Commercial Bank of China, which was not held in the Benchmark, strengthened amid China’s efforts to counter slowing economic growth.
HOW WAS THE FUND POSITIONED?
The Fund’s portfolio managers employed a bottom-up fundamental approach to security selection, seeking to identify what they believed were the most attractive value investment opportunities within each sector. The Fund’s portfolio managers looked for securities that they believed possessed an attractive valuation signal (as measured by a proprietary dividend discount model) and a timely catalyst that would enable the securities to realize its inherent value. In addition, the Fund employed futures and currency forwards to help manage cash flows and currency exposure.
| * | | The return shown is based on net asset values calculated for shareholder transactions and may differ from the return shown in the financial highlights, which reflects adjustments made to the net asset values in accordance with accounting principles generally accepted in the United States of America. |
| ** | | The adviser seeks to achieve the Fund’s objective. There can be no guarantee it will be achieved. |
| | | | | | | | |
| | | |
| APRIL 30, 2015 | | J.P. MORGAN INTERNATIONAL EQUITY FUNDS | | | | | 33 | |
JPMorgan International Value Fund
FUND COMMENTARY
SIX MONTHS ENDED APRIL 30, 2015 (Unaudited) (continued)
| | | | | | | | |
| TOP TEN HOLDINGS OF THE PORTFOLIO* | |
| | 1. | | | Toyota Motor Corp. (Japan) | | | 3.6 | % |
| | 2. | | | Mitsubishi UFJ Financial Group, Inc. (Japan) | | | 3.4 | |
| | 3. | | | Vodafone Group plc (United Kingdom) | | | 2.9 | |
| | 4. | | | TOTAL S.A. (France) | | | 2.3 | |
| | 5. | | | AXA S.A. (France) | | | 2.1 | |
| | 6. | | | BNP Paribas S.A. (France) | | | 1.9 | |
| | 7. | | | Australia & New Zealand Banking Group Ltd (Australia) | | | 1.9 | |
| | 8. | | | Prudential plc (United Kingdom) | | | 1.9 | |
| | 9. | | | Roche Holding AG (Switzerland) | | | 1.8 | |
| | 10. | | | Barclays plc (United Kingdom) | | | 1.8 | |
| | | | |
PORTFOLIO COMPOSITION BY COUNTRY* | |
| Japan | | | 23.3 | % |
| United Kingdom | | | 16.7 | |
| France | | | 13.8 | |
| Germany | | | 8.2 | |
| Switzerland | | | 6.0 | |
| Italy | | | 5.3 | |
| Netherlands | | | 5.0 | |
| Australia | | | 3.4 | |
| Spain | | | 3.4 | |
| Belgium | | | 2.1 | |
| Norway | | | 1.9 | |
| Ireland | | | 1.8 | |
| South Korea | | | 1.6 | |
| Sweden | | | 1.3 | |
| China | | | 1.0 | |
| Luxembourg | | | 1.0 | |
| Hong Kong | | | 1.0 | |
| Others (each less than 1.0%) | | | 3.0 | |
| Short-Term Investment | | | 0.2 | |
| * | | Percentages indicated are based on total investments as of April 30, 2015. The Fund’s portfolio composition is subject to change. |
| | | | | | |
| | | |
| 34 | | | | J.P. MORGAN INTERNATIONAL EQUITY FUNDS | | APRIL 30, 2015 |
| | | | | | | | | | | | | | | | | | |
AVERAGE ANNUAL TOTAL RETURNS AS OF APRIL 30, 2015 | |
| | | | | |
| | | INCEPTION DATE OF
CLASS | | 6 MONTH* | | | 1 YEAR | | | 5 YEAR | | | 10 YEAR | |
CLASS A SHARES | | September 28, 2001 | | | | | | | | | | | | | | | | |
Without Sales Charge | | | | | 3.50 | % | | | (2.63 | )% | | | 5.58 | % | | | 5.31 | % |
With Sales Charge** | | | | | (1.91 | ) | | | (7.72 | ) | | | 4.44 | | | | 4.75 | |
CLASS B SHARES | | September 28, 2001 | | | | | | | | | | | | | | | | |
Without CDSC | | | | | 3.26 | | | | (3.10 | ) | | | 5.05 | | | | 4.89 | |
With CDSC*** | | | | | (1.74 | ) | | | (8.10 | ) | | | 4.72 | | | | 4.89 | |
CLASS C SHARES | | July 11, 2006 | | | | | | | | | | | | | | | | |
Without CDSC | | | | | 3.25 | | | | (3.17 | ) | | | 5.05 | | | | 4.79 | |
With CDSC**** | | | | | 2.25 | | | | (4.17 | ) | | | 5.05 | | | | 4.79 | |
CLASS R2 SHARES | | November 3, 2008 | | | 3.32 | | | | (2.95 | ) | | | 5.30 | | | | 5.13 | |
CLASS R6 SHARES | | November 30, 2010 | | | 3.82 | | | | (2.08 | ) | | | 6.11 | | | | 5.81 | |
INSTITUTIONAL CLASS SHARES | | November 4, 1993 | | | 3.70 | | | | (2.27 | ) | | | 6.00 | | | | 5.75 | |
SELECT CLASS SHARES | | September 10, 2001 | | | 3.67 | | | | (2.40 | ) | | | 5.83 | | | | 5.58 | |
| ** | | Sales Charge for Class A Shares is 5.25%. |
| *** | | Assumes a 5% CDSC (contingent deferred sales charge) for the one year period, 2% CDSC for the five year period and 0% CDSC thereafter. |
| **** | | Assumes a 1% CDSC for the one year period and 0% CDSC thereafter. |
TEN YEAR PERFORMANCE (4/30/05 To 4/30/15)
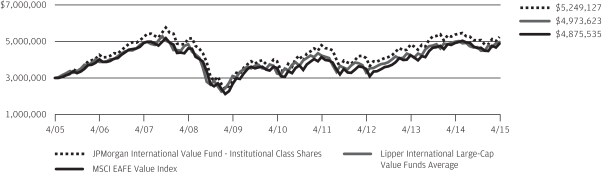
The performance quoted is past performance and is not a guarantee of future results. Mutual funds are subject to certain market risks. Investment returns and principal value of an investment will fluctuate so that an investor’s shares, when redeemed, may be worth more or less than their original cost. Current performance may be higher or lower than the performance data shown. For up-to-date month-end performance information please call 1-800-480-4111.
Returns for Class C Shares prior to its inception date are based on the performance of Class B Shares. The actual returns of Class C Shares would have been similar to those shown because Class C Shares have expenses similar to those of Class B Shares.
Returns for Class R2 Shares prior to its inception date are based on the performance of Class A Shares. The actual returns of R2 Shares would have been lower than those shown because R2 Shares have higher expenses than Class A Shares.
Returns for Class R6 Shares prior to its inception date are based on the performance of Institutional Class Shares. The actual returns of Class R6 Shares would have been different than those shown because Class R6 Shares have different expenses than Institutional Class Shares.
The graph illustrates comparative performance for $3,000,000 invested in Institutional Class Shares of the JPMorgan International Value Fund, the MSCI EAFE Value Index and the Lipper International Large-Cap Value Funds Average from April 30, 2005 to April 30, 2015. The performance of the Fund assumes reinvestment of all dividends and capital gain distributions, if any, and does not include a sales charge. The performance of the MSCI EAFE Value Index does not reflect the deduction of expenses or a sales charge associated with a mutual fund and approximates the minimum possible dividend reinvestment of the securities included in the benchmark, if applicable. The dividend is reinvested after deduction of withholding tax, applying the maximum rate to non-resident institutional investors who do not benefit from double taxation treaties. The performance of the Lipper International Large-Cap Value Funds Average includes expenses associated with a mutual fund, such as investment management fees. These expenses are not identical to the expenses incurred by the Fund. The MSCI EAFE Value Index is a free float-adjusted market capitalization weighted index that is designed to measure the performance of value-oriented stocks in the world’s equity markets, excluding the U.S. and Canada. Investors cannot invest directly in an index. The Lipper International Large-Cap Value Funds Average is an average based on the total returns of all mutual funds within the Fund’s designated category as determined by Lipper, Inc.
| | | | | | | | |
| | | |
| APRIL 30, 2015 | | J.P. MORGAN INTERNATIONAL EQUITY FUNDS | | | | | 35 | |
JPMorgan International Value Fund
FUND COMMENTARY
SIX MONTHS ENDED APRIL 30, 2015 (Unaudited) (continued)
Institutional Class Shares have a $3,000,000 minimum initial investment.
Fund performance may reflect the waiver of the Fund’s fees and reimbursement of expenses for certain periods since the inception date. Without these waivers and reimbursements, performance would have been lower. Also, performance shown in this section does not reflect the deduction of taxes that a shareholder would pay on Fund distributions or redemption of Fund shares.
International investing involves a greater degree of risk and increased volatility. Changes in currency exchange rates and differences in accounting and taxation policies outside the U.S. can raise or lower returns. Also, some overseas markets may not be as politically and economically stable as the United States and other nations.
Because Class B shares automatically convert to Class A shares after 8 years, the 10 Year average annual total return shown above for Class B reflects Class A performance for the period after conversion. The Board of Trustees of the Fund has approved the automatic conversion of the Fund’s Class B Shares into Class A Shares on June 19, 2015. On June 19, 2015, all Class B Shares of the Fund will automatically convert to Class A Shares of the Fund.
The returns shown are based on net asset values calculated for shareholder transactions and may differ from the returns shown in the financial highlights, which reflect adjustments made to the net asset values in accordance with accounting principles generally accepted in the United States of America.
| | | | | | |
| | | |
| 36 | | | | J.P. MORGAN INTERNATIONAL EQUITY FUNDS | | APRIL 30, 2015 |
JPMorgan Intrepid International Fund
FUND COMMENTARY
SIX MONTHS ENDED APRIL 30, 2015 (Unaudited)
| | | | |
| REPORTING PERIOD RETURN: | |
| Fund (Institutional Class Shares)* | | | 6.58% | |
| Morgan Stanley Capital International (“MSCI”) Europe, Australasia and Far East (“EAFE”) Index (net of foreign withholding taxes) | | | 6.81% | |
| |
| Net Assets as of 4/30/2015 (In Thousands) | | | $1,945,178 | |
INVESTMENT OBJECTIVE**
The JPMorgan Intrepid International Fund (the “Fund”) seeks to maximize long-term capital growth by investing primarily in equity securities in developed markets outside the U.S.
WHAT WERE THE MAIN DRIVERS OF THE FUND’S PERFORMANCE?
The Fund’s Institutional Class Shares underperformed the MSCI EAFE Index (net of foreign withholding taxes) (the “Benchmark”) for the six months ended April 30, 2015.
The Fund’s portfolio managers attempted to construct the Fund so that security selection and style factors (i.e., growth and value characteristics) would be the primary drivers of returns.
During the reporting period, securities exhibiting the growth characteristics targeted by the Fund (high earnings momentum and high medium-term price momentum) generally outperformed the broader market. The Fund’s value analysis yielded mixed results. During the six month reporting period, securities with low price-to-earnings ratios slightly outperformed the broader equity market but securities with low price-to-book ratios underperformed the broader market. Price-to-earnings ratio is the price of a share divided by per share earnings for a 12-month period. Price-to-book ratio is the current closing price of a share divided by the book value per share for the most recent quarter.
The Fund’s security selection in the information technology and health care sectors was a leading detractor from performance
relative to the Benchmark for the six month reporting period. The Fund’s security selection in the consumer discretionary and financials sectors was a leading contributor to relative performance.
The Fund targeted collections of companies that exhibited specific growth and/or value characteristics during the period. The Fund held a range of 150 to 250 securities during the period. Consequently, the impact of any individual security on the Fund’s overall performance tended to be small.
HOW WAS THE FUND POSITIONED?
The Fund’s strategy was rooted in the notion that investor behavior is influenced by human emotion and this influence gives rise to persistent growth and value anomalies within the market. During the reporting period, the Fund’s portfolio managers sought to exploit these anomalies by utilizing a series of style screens designed to identify securities with attractive growth and/or value characteristics, targeting names that they believed possessed high earnings momentum, strong price momentum, low price-to-book ratios and low price-to-earnings ratios.
| * | | The return shown is based on net asset values calculated for shareholder transactions and may differ from the return shown in the financial highlights, which reflects adjustments made to the net asset values in accordance with accounting principles generally accepted in the United States of America. |
| ** | | The adviser seeks to achieve the Fund’s objective. There can be no guarantee it will be achieved. |
| | | | | | | | |
| | | |
| APRIL 30, 2015 | | J.P. MORGAN INTERNATIONAL EQUITY FUNDS | | | | | 37 | |
JPMorgan Intrepid International Fund
FUND COMMENTARY
SIX MONTHS ENDED APRIL 30, 2015 (Unaudited) (continued)
| | | | | | | | |
| TOP TEN EQUITY HOLDINGS OF THE PORTFOLIO* | |
| | 1. | | | Novartis AG (Switzerland) | | | 2.1 | % |
| | 2. | | | Royal Dutch Shell plc, Class B (Netherlands) | | | 1.9 | |
| | 3. | | | Toyota Motor Corp. (Japan) | | | 1.7 | |
| | 4. | | | Nestle S.A. (Switzerland) | | | 1.4 | |
| | 5. | | | BP plc (United Kingdom) | | | 1.3 | |
| | 6. | | | Sanofi (France) | | | 1.3 | |
| | 7. | | | Roche Holding AG (Switzerland) | | | 1.3 | |
| | 8. | | | Bayer AG (Germany) | | | 1.2 | |
| | 9. | | | TOTAL S.A. (France) | | | 1.2 | |
| | 10. | | | Anheuser-Busch InBev N.V. (Belgium) | | | 1.1 | |
| | | | |
PORTFOLIO COMPOSITION BY COUNTRY* | |
| Japan | | | 22.4 | % |
| United Kingdom | | | 18.2 | |
| France | | | 10.3 | |
| Germany | | | 8.8 | |
| Switzerland | | | 8.1 | |
| Australia | | | 6.6 | |
| Netherlands | | | 3.7 | |
| Spain | | | 3.2 | |
| Sweden | | | 2.2 | |
| Belgium | | | 2.0 | |
| Hong Kong | | | 2.0 | |
| Ireland | | | 2.0 | |
| Italy | | | 1.6 | |
| Denmark | | | 1.5 | |
| Others (each less than 1.0%) | | | 5.7 | |
| Short-Term Investment | | | 1.7 | |
| * | | Percentages indicated are based on total investments as of April 30, 2015. The Fund’s portfolio composition is subject to change. |
| | | | | | |
| | | |
| 38 | | | | J.P. MORGAN INTERNATIONAL EQUITY FUNDS | | APRIL 30, 2015 |
| | | | | | | | | | | | | | | | | | |
AVERAGE ANNUAL TOTAL RETURNS AS OF APRIL 30, 2015 | |
| | | | | |
| | | INCEPTION DATE OF
CLASS | | 6 MONTH* | | | 1 YEAR | | | 5 YEAR | | | 10 YEAR | |
CLASS A SHARES | | April 30, 2001 | | | | | | | | | | | | | | | | |
Without Sales Charge | | | | | 6.32 | % | | | 1.77 | % | | | 7.42 | % | | | 4.76 | % |
With Sales Charge** | | | | | 0.73 | | | | (3.58 | ) | | | 6.26 | | | | 4.20 | |
CLASS C SHARES | | February 28, 2006 | | | | | | | | | | | | | | | | |
Without CDSC | | | | | 6.05 | | | | 1.20 | | | | 6.87 | | | | 4.28 | |
With CDSC*** | | | | | 5.05 | | | | 0.20 | | | | 6.87 | | | | 4.28 | |
CLASS R2 SHARES | | November 3, 2008 | | | 6.18 | | | | 1.46 | | | | 7.15 | | | | 4.59 | |
INSTITUTIONAL CLASS SHARES | | April 30, 2001 | | | 6.58 | | | | 2.27 | | | | 7.96 | | | | 5.29 | |
SELECT CLASS SHARES | | February 28, 2006 | | | 6.46 | | | | 1.97 | | | | 7.68 | | | | 5.05 | |
| ** | | Sales Charge for Class A Shares is 5.25%. |
| *** | | Assumes a 1% CDSC (contingent deferred sales charge) for the one year period and 0% CDSC thereafter. |
TEN YEAR PERFORMANCE (4/30/05 TO 4/30/15)
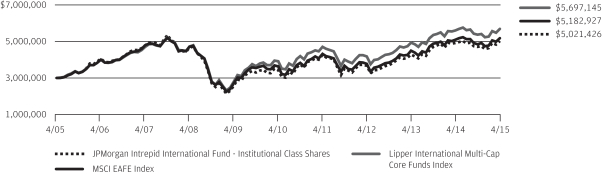
The performance quoted is past performance and is not a guarantee of future results. Mutual funds are subject to certain market risks. Investment returns and principal value of an investment will fluctuate so that an investor’s shares, when redeemed, may be worth more or less than their original cost. Current performance may be higher or lower than the performance data shown. For up-to-date month-end performance information please call 1-800-480-4111.
Returns for Class C and Class R2 Shares prior to their inception date are based on the performance of Class A Shares. The actual returns for Class C and Class R2 Shares would have been lower than those shown because Class C and Class R2 Shares have higher expenses than Class A Shares.
Returns for Select Class Shares prior to its inception date are based on the performance of Institutional Class Shares. The actual returns for Select Class Shares would have been lower than those shown because Select Class Shares have higher expenses than Institutional Class Shares.
The graph illustrates comparative performance for $3,000,000 invested in Institutional Class Shares of the JPMorgan Intrepid International Fund, the MSCI EAFE Index and the Lipper International Multi-Cap Core Funds Index from April 30, 2005 to April 30, 2015. The performance of the Fund assumes reinvestment of all dividends and capital gain distributions, if any, and does not include a sales charge. The performance of the MSCI EAFE Index does not reflect the deduction of expenses or a sales charge associated with a mutual fund and approximates the minimum possible dividend reinvestment of the securities included in the benchmark, if applicable. The dividend is reinvested after deduction of withholding tax, applying the maximum rate to non-resident institutional investors who do not benefit from double taxation treaties. The
performance of the Lipper International Multi-Cap Core Funds Index includes expenses associated with a mutual fund, such as investment management fees. These expenses are not identical to the expenses incurred by the Fund. The MSCI EAFE Index is a free float-adjusted market capitalization weighted index that is designed to measure the equity market performance of developed markets, excluding the U.S. and Canada. The Lipper International Multi-Cap Core Funds Index is an index based on the total returns of certain mutual funds within the Fund’s designated category, as determined by Lipper, Inc. Investors cannot invest directly in an index.
Institutional Class Shares have a $3,000,000 minimum initial investment.
Fund performance may reflect the waiver of the Fund’s fees and reimbursement of expenses for certain periods since the inception date. Without these waivers and reimbursements, performance would have been lower. Also, performance shown in this section does not reflect the deduction of taxes that a shareholder would pay on Fund distributions or redemption of Fund shares.
International investing involves a greater degree of risk and increased volatility. Changes in currency exchange rates and differences in accounting and taxation policies outside the U.S. can raise or lower returns. Also, some overseas markets may not be as politically and economically stable as the United States and other nations.
The returns shown are based on net asset values calculated for shareholder transactions and may differ from the returns shown in the financial highlights, which reflect adjustments made to the net asset values in accordance with accounting principles generally accepted in the United States of America.
| | | | | | | | |
| | | |
| APRIL 30, 2015 | | J.P. MORGAN INTERNATIONAL EQUITY FUNDS | | | | | 39 | |
JPMorgan Emerging Economies Fund
SCHEDULE OF PORTFOLIO INVESTMENTS
AS OF APRIL 30, 2015 (Unaudited)
(Amounts in thousands)
| | | | | | | | |
| SHARES | | | SECURITY DESCRIPTION | | VALUE($) | |
| | | | | | | | |
| Common Stocks — 97.7% | |
| | | | Brazil — 6.2% | |
| | 836 | | | Banco Bradesco S.A., ADR | | | 8,938 | |
| | 1,087 | | | Banco do Brasil S.A. | | | 9,447 | |
| | 959 | | | Cia Energetica de Minas Gerais, ADR | | | 4,720 | |
| | 828 | | | Embraer S.A. | | | 6,466 | |
| | 679 | | | Itau Unibanco Holding S.A. (Preference Shares), ADR | | | 8,702 | |
| | 787 | | | JBS S.A. | | | 4,012 | |
| | 1,684 | | | Kroton Educacional S.A. | | | 6,183 | |
| | 228 | | | Smiles S.A. | | | 3,921 | |
| | | | | | | | |
| | | | | | | 52,389 | |
| | | | | | | | |
| | | | China — 24.9% | | | | |
| | 658 | | | AAC Technologies Holdings, Inc. | | | 3,471 | |
| | 2,036 | | | Air China Ltd., Class H | | | 2,456 | |
| | 1,600 | | | ANTA Sports Products Ltd. | | | 3,526 | |
| | 18 | | | Baidu, Inc., ADR (a) | | | 3,669 | |
| | 22,919 | | | Bank of China Ltd., Class H | | | 15,704 | |
| | 1,913 | | | BYD Electronic International Co., Ltd. | | | 2,881 | |
| | 12,829 | | | China CITIC Bank Corp., Ltd., Class H | | | 11,634 | |
| | 10,468 | | | China Construction Bank Corp., Class H | | | 10,162 | |
| | 13,840 | | | China Everbright Bank Co., Ltd., Class H | | | 9,377 | |
| | 4,445 | | | China Merchants Bank Co., Ltd., Class H | | | 13,343 | |
| | 5,138 | | | China Minsheng Banking Corp., Ltd., Class H | | | 7,502 | |
| | 2,646 | | | China Southern Airlines Co., Ltd., Class H | | | 2,600 | |
| | 12,552 | | | China Telecom Corp., Ltd., Class H | | | 9,298 | |
| | 5,844 | | | CNOOC Ltd. | | | 9,965 | |
| | 8,420 | | | Geely Automobile Holdings Ltd. | | | 4,737 | |
| | 15,216 | | | GOME Electrical Appliances Holdings Ltd. | | | 3,898 | |
| | 1,272 | | | Great Wall Motor Co., Ltd., Class H | | | 9,647 | |
| | 7,026 | | | Huadian Power International Corp., Ltd., Class H | | | 7,779 | |
| | 5,432 | | | Huaneng Power International, Inc., Class H | | | 7,704 | |
| | 11,138 | | | Industrial & Commercial Bank of China Ltd., Class H | | | 9,662 | |
| | 5,739 | | | Jintian Pharmaceutical Group Ltd. | | | 3,054 | |
| | 5,880 | | | Lenovo Group Ltd. | | | 10,111 | |
| | 74 | | | NetEase, Inc., ADR | | | 9,528 | |
| | 3,474 | | | Shanghai Electric Group Co., Ltd., Class H | | | 3,542 | |
| | 3,194 | | | Shenzhen Expressway Co., Ltd., Class H | | | 3,047 | |
| | 1,532 | | | Sinopharm Group Co., Ltd., Class H | | | 7,277 | |
| | 3,857 | | | Sinotrans Ltd., Class H | | | 2,952 | |
| | 1,185 | | | Sunny Optical Technology Group Co., Ltd. | | | 2,637 | |
| | 2,110 | | | TCL Communication Technology Holdings Ltd. | | | 2,246 | |
| | 377 | | | Tencent Holdings Ltd. | | | 7,785 | |
| | 1,514 | | | Weichai Power Co., Ltd., Class H | | | 5,999 | |
| | 1,840 | | | Zhejiang Expressway Co., Ltd., Class H | | | 2,922 | |
| | | | | | | | |
| | | | | | | 210,115 | |
| | | | | | | | |
| | | | | | | | |
| SHARES | | | SECURITY DESCRIPTION | | VALUE($) | |
| | | | | | | | |
| | | | | | | | |
| | | | Egypt — 0.3% | |
| | 342 | | | Commercial International Bank Egypt SAE, GDR | | | 2,358 | |
| | | | | | | | |
| | | | Hong Kong — 4.7% | |
| | 6,533 | | | Belle International Holdings Ltd. | | | 8,385 | |
| | 576 | | | China Mobile Ltd. | | | 8,220 | |
| | 1,127 | | | China Singyes Solar Technologies Holdings Ltd. (a) | | | 1,846 | |
| | 7,042 | | | China Travel International Investment Hong Kong Ltd. | | | 3,137 | |
| | 3,574 | | | China Unicom Hong Kong Ltd. (a) | | | 6,712 | |
| | 34,875 | | | REXLot Holdings Ltd. | | | 2,597 | |
| | 1,767 | | | Shenzhen International Holdings Ltd. | | | 3,321 | |
| | 4,384 | | | Skyworth Digital Holdings Ltd. | | | 3,906 | |
| | 3,714 | | | Truly International Holdings Ltd. | | | 1,754 | |
| | | | | | | | |
| | | | | | | 39,878 | |
| | | | | | | | |
| | | | India — 6.3% | |
| | 1,144 | | | Apollo Tyres Ltd. | | | 3,116 | |
| | 189 | | | Bharat Petroleum Corp., Ltd. | | | 2,273 | |
| | 670 | | | Canara Bank | | | 3,983 | |
| | 495 | | | HCL Technologies Ltd. | | | 6,856 | |
| | 475 | | | Hexaware Technologies Ltd. | | | 2,101 | |
| | 378 | | | Hindustan Petroleum Corp., Ltd. | | | 3,712 | |
| | 348 | | | Housing Development Finance Corp., Ltd. (m) | | | 6,407 | |
| | 666 | | | IRB Infrastructure Developers Ltd. | | | 2,444 | |
| | 853 | | | Power Finance Corp., Ltd. | | | 3,559 | |
| | 714 | | | Rural Electrification Corp., Ltd. | | | 3,499 | |
| | 1,278 | | | Sintex Industries Ltd. | | | 2,225 | |
| | 193 | | | Tata Motors Ltd., ADR | | | 7,935 | |
| | 230 | | | Tech Mahindra Ltd. | | | 2,254 | |
| | 132 | | | Wockhardt Ltd. | | | 2,652 | |
| | | | | | | | |
| | | | | | | 53,016 | |
| | | | | | | | |
| | | | Indonesia — 1.0% | |
| | 9,047 | | | Bank Negara Indonesia Persero Tbk PT | | | 4,465 | |
| | 18,786 | | | Telekomunikasi Indonesia Persero Tbk PT (m) | | | 3,778 | |
| | | | | | | | |
| | | | | | | 8,243 | |
| | | | | | | | |
| | | | Netherlands — 0.1% | |
| | 200 | | | VimpelCom Ltd., ADR | | | 1,132 | |
| | | | | | | | |
| | | | Poland — 0.8% | |
| | 377 | | | Energa S.A. | | | 2,614 | |
| | 745 | | | PGE Polska Grupa Energetyczna S.A. | | | 4,285 | |
| | | | | | | | |
| | | | | | | 6,899 | |
| | | | | | | | |
| | | | Qatar — 0.2% | |
| | 78 | | | Gulf International Services QSC | | | 1,901 | |
| | | | | | | | |
SEE NOTES TO FINANCIAL STATEMENTS.
| | | | | | |
| | | |
| 40 | | | | J.P. MORGAN INTERNATIONAL EQUITY FUNDS | | APRIL 30, 2015 |
| | | | | | | | |
| SHARES | | | SECURITY DESCRIPTION | | VALUE($) | |
| | | | | | | | |
| Common Stocks — continued | |
| | | | Russia — 5.9% | |
| | 2,124 | | | Alrosa AO | | | 2,823 | |
| | 215 | | | CTC Media, Inc. | | | 750 | |
| | 163 | | | Lukoil OAO, ADR | | | 8,353 | |
| | 272 | | | MegaFon OAO, Reg. S, GDR | | | 4,632 | |
| | 99 | | | MMC Norilsk Nickel OJSC, ADR | | | 1,831 | |
| | 360 | | | MMC Norilsk Nickel OJSC, ADR | | | 6,778 | |
| | 531 | | | Mobile TeleSystems OJSC, ADR | | | 6,409 | |
| | 794 | | | Moscow Exchange MICEX-RTS OAO | | | 1,184 | |
| | 1,309 | | | Sberbank of Russia, ADR | | | 7,771 | |
| | 218 | | | Severstal PAO, Reg. S, GDR | | | 2,411 | |
| | 10 | | | Tatneft OAO, ADR | | | 343 | �� |
| | 198 | | | Tatneft OAO, ADR | | | 6,789 | |
| | | | | | | | |
| | | | | | | 50,074 | |
| | | | | | | | |
| | | | South Africa — 3.7% | |
| | 211 | | | Bidvest Group Ltd. (The) | | | 5,725 | |
| | 211 | | | Mr Price Group Ltd. | | | 4,502 | |
| | 1,979 | | | Netcare Ltd. | | | 6,923 | |
| | 1,486 | | | Steinhoff International Holdings Ltd. | | | 9,429 | |
| | 648 | | | Telkom S.A. SOC Ltd. (a) | | | 4,452 | |
| | | | | | | | |
| | | | | | | 31,031 | |
| | | | | | | | |
| | | | South Korea — 19.6% | |
| | 5 | | | AMOREPACIFIC Group (i) (m) | | | 7,162 | |
| | 265 | | | BNK Financial Group, Inc. | | | 3,954 | |
| | 8 | | | CJ CheilJedang Corp. | | | 2,991 | |
| | 25 | | | Com2uSCorp (a) | | | 4,236 | |
| | 82 | | | Coway Co., Ltd. | | | 6,925 | |
| | 53 | | | Daesang Corp. | | | 2,306 | |
| | 222 | | | DGB Financial Group, Inc. | | | 2,501 | |
| | 15 | | | GS Home Shopping, Inc. | | | 3,370 | |
| | 71 | | | Halla Visteon Climate Control Corp. | | | 2,661 | |
| | 125 | | | Hankook Tire Co., Ltd. | | | 5,249 | |
| | 44 | | | Hansae Co., Ltd. | | | 1,679 | |
| | 68 | | | Hyundai Development Co-Engineering & Construction | | | 3,593 | |
| | 36 | | | Hyundai Mobis Co., Ltd. (m) | | | 7,977 | |
| | 475 | | | Industrial Bank of Korea | | | 6,530 | |
| | 35 | | | KEPCO Plant Service & Engineering Co., Ltd. | | | 3,221 | |
| | 91 | | | KH Vatec Co., Ltd. | | | 1,842 | |
| | 154 | | | Kia Motors Corp. | | | 7,091 | |
| | 182 | | | Korea Electric Power Corp. (m) | | | 7,919 | |
| | 16 | | | Korea Zinc Co., Ltd. | | | 7,072 | |
| | 106 | | | KT&G Corp. | | | 9,437 | |
| | 15 | | | LG Hausys Ltd. | | | 2,324 | |
| | 48 | | | LG Innotek Co., Ltd. | | | 4,501 | |
| | 54 | | | LS Corp. | | | 2,713 | |
| | | | | | | | |
| SHARES | | | SECURITY DESCRIPTION | | VALUE($) | |
| | | | | | | | |
| | | | | | | | |
| | | | South Korea — continued | |
| | 25 | | | Mando Corp. | | | 3,503 | |
| | 34 | | | Naturalendo Tech Co., Ltd. (a) | | | 1,088 | |
| | 23 | | | NCSoft Corp. | | | 4,374 | |
| | 147 | | | Partron Co., Ltd. | | | 1,539 | |
| | 8 | | | Samsung Electronics Co., Ltd. (m) | | | 10,476 | |
| | 72 | | | Seah Besteel Corp. | | | 2,457 | |
| | 31 | | | SK C&C Co., Ltd. | | | 7,311 | |
| | 43 | | | SK Holdings Co., Ltd. (m) | | | 7,401 | |
| | 198 | | | SK Hynix, Inc. | | | 8,475 | |
| | 33 | | | SK Telecom Co., Ltd. (m) | | | 8,784 | |
| | 195 | | | Wonik IPS Co., Ltd. (a) | | | 2,181 | |
| | | | | | | | |
| | | | | | | 164,843 | |
| | | | | | | | |
| | | | Taiwan — 12.7% | |
| | 6,111 | | | Advanced Semiconductor Engineering, Inc. | | | 8,666 | |
| | 614 | | | Asustek Computer, Inc. | | | 6,505 | |
| | 868 | | | Catcher Technology Co., Ltd. | | | 10,157 | |
| | 1,020 | | | Chicony Electronics Co., Ltd. | | | 2,932 | |
| | 1,281 | | | Chipbond Technology Corp. | | | 2,768 | |
| | 5,769 | | | Compeq Manufacturing Co., Ltd. | | | 3,652 | |
| | 4,522 | | | Fubon Financial Holding Co., Ltd. | | | 9,725 | |
| | 2,602 | | | Hon Hai Precision Industry Co., Ltd. | | | 7,797 | |
| | 7,946 | | | Innolux Corp. | | | 4,099 | |
| | 4,610 | | | Inotera Memories, Inc. (a) | | | 5,294 | |
| | 2,748 | | | Pegatron Corp. | | | 8,141 | |
| | 1,946 | | | Pou Chen Corp. | | | 2,727 | |
| | 1,433 | | | Radiant Opto-Electronics Corp. | | | 4,712 | |
| | 1,184 | | | Realtek Semiconductor Corp. | | | 3,687 | |
| | 1,833 | | | Taiwan Paiho Ltd. | | | 4,977 | |
| | 391 | | | Taiwan Semiconductor Manufacturing Co., Ltd., ADR | | | 9,547 | |
| | 2,611 | | | Vanguard International Semiconductor Corp. | | | 4,010 | |
| | 3,538 | | | Wan Hai Lines Ltd. | | | 3,923 | |
| | 1,180 | | | Zhen Ding Technology Holding Ltd. | | | 4,108 | |
| | | | | | | | |
| | | | | | | 107,427 | |
| | | | | | | | |
| | | | Thailand — 5.5% | |
| | 264 | | | Airports of Thailand PCL, NVDR | | | 2,315 | |
| | 1,128 | | | Kasikornbank PCL, NVDR | | | 7,157 | |
| | 11,676 | | | Krung Thai Bank PCL, NVDR | | | 7,065 | |
| | 2,450 | | | Pruksa Real Estate PCL, NVDR | | | 2,036 | |
| | 755 | | | PTT PCL, NVDR | | | 8,138 | |
| | 22,524 | | | Quality Houses PCL, NVDR | | | 2,111 | |
| | 3,743 | | | Samart Corp. PCL, NVDR | | | 3,389 | |
| | 1,377 | | | Siam Commercial Bank PCL (The) | | | 6,625 | |
| | 42 | | | Siam Commercial Bank PCL (The), NVDR | | | 203 | |
| | 3,363 | | | Supalai PCL, NVDR | | | 2,032 | |
SEE NOTES TO FINANCIAL STATEMENTS.
| | | | | | | | |
| | | |
| APRIL 30, 2015 | | J.P. MORGAN INTERNATIONAL EQUITY FUNDS | | | | | 41 | |
JPMorgan Emerging Economies Fund
SCHEDULE OF PORTFOLIO INVESTMENTS
AS OF APRIL 30, 2015 (Unaudited) (continued)
(Amounts in thousands)
| | | | | | | | |
| SHARES | | | SECURITY DESCRIPTION | | VALUE($) | |
| | | | | | | | |
| Common Stocks — continued | |
| | | | Thailand — continued | | | | |
| | 8,736 | | | Thai Union Frozen Products PCL, NVDR | | | 5,407 | |
| | | | | | | | |
| | | | | | | 46,478 | |
| | | | | | | | |
| | | | Turkey — 5.0% | |
| | 3,912 | | | Eregli Demir ve Celik Fabrikalari TAS | | | 6,601 | |
| | 1,671 | | | KOC Holding A.S. (m) | | | 7,904 | |
| | 342 | | | TAV Havalimanlari Holding A.S. (a) | | | 3,007 | |
| | 480 | | | Tofas Turk Otomobil Fabrikasi A.S. | | | 2,944 | |
| | 2,085 | | | Trakya Cam Sanayi A.S. | | | 2,510 | |
| | 195 | | | Tupras Turkiye Petrol Rafinerileri A.S. (a) | | | 4,725 | |
| | 1,782 | | | Turk Hava Yollari AO (a) (m) | | | 5,912 | |
| | 806 | | | Turkiye Halk Bankasi A.S. | | | 4,084 | |
| | 1,766 | | | Turkiye Is Bankasi, Class C | | | 3,971 | |
| | | | | | | | |
| | | | | | | 41,658 | |
| | | | | | | | |
| | | | United Arab Emirates — 0.8% | |
| | 6,953 | | | Air Arabia PJSC | | | 3,086 | |
| | 1,992 | | | Dubai Islamic Bank PJSC | | | 3,737 | |
| | | | | | | | |
| | | | | | | 6,823 | |
| | | | | | | | |
| | | | Total Common Stocks
(Cost $713,601) | | | 824,265 | |
| | | | | | | | |
| Preferred Stocks — 0.6%
|
|
| | | | Brazil — 0.2% | | | | |
| | 319 | | | Banco do Estado do Rio Grande do Sul S.A., Class B | | | 1,202 | |
| | | | | | | | |
| | | | Russia — 0.4% | | | | |
| | 4,855 | | | Surgutneftegas OAO | | | 3,660 | |
| | | | | | | | |
| | | | Total Preferred Stocks
(Cost $6,199) | | | 4,862 | |
| | | | | | | | |
| Short-Term Investment — 1.2% | |
| | | | Investment Company — 1.2% | |
| | 10,500 | | | JPMorgan Prime Money Market Fund, Institutional Class Shares, 0.050% (b) (l) (m) (Cost $10,500) | | | 10,500 | |
| | | | | | | | |
| | | | Total Investments — 99.5%
(Cost $730,300) | | | 839,627 | |
| | | | Other Assets in Excess of
Liabilities — 0.5% | | | 4,220 | |
| | | | | | | | |
| | | | NET ASSETS — 100.0% | | $ | 843,847 | |
| | | | | | | | |
Percentages indicated are based on net assets.
Summary of Investments by Industry, April 30, 2015
The following table represents the portfolio investments of the Fund by industry classifications as a percentage of total investments:
| | | | |
| INDUSTRY | | PERCENTAGE | |
Banks | | | 20.3 | % |
Technology Hardware, Storage & Peripherals | | | 6.0 | |
Semiconductors & Semiconductor Equipment | | | 5.9 | |
Oil, Gas & Consumable Fuels | | | 5.7 | |
Electronic Equipment, Instruments & Components | | | 4.6 | |
Automobiles | | | 3.9 | |
Metals & Mining | | | 3.6 | |
Wireless Telecommunication Services | | | 3.5 | |
Diversified Telecommunication Services | | | 2.9 | |
Auto Components | | | 2.7 | |
Textiles, Apparel & Luxury Goods | | | 2.5 | |
Industrial Conglomerates | | | 2.5 | |
Internet Software & Services | | | 2.5 | |
Household Durables | | | 2.4 | |
Electric Utilities | | | 2.3 | |
IT Services | | | 2.2 | |
Diversified Financial Services | | | 2.1 | |
Health Care Providers & Services | | | 2.1 | |
Independent Power & Renewable Electricity Producers | | | 1.8 | |
Food Products | | | 1.8 | |
Transportation Infrastructure | | | 1.7 | |
Airlines | | | 1.7 | |
Tobacco | | | 1.1 | |
Software | | | 1.0 | |
Specialty Retail | | | 1.0 | |
Others (each less than 1.0%) | | | 10.9 | |
Short-Term Investment | | | 1.3 | |
SEE NOTES TO FINANCIAL STATEMENTS.
| | | | | | |
| | | |
| 42 | | | | J.P. MORGAN INTERNATIONAL EQUITY FUNDS | | APRIL 30, 2015 |
JPMorgan Emerging Markets Equity Fund
SCHEDULE OF PORTFOLIO INVESTMENTS
AS OF APRIL 30, 2015 (Unaudited)
(Amounts in thousands)
| | | | | | | | |
| SHARES | | | SECURITY DESCRIPTION | | VALUE($) | |
| | | | | | | | |
| Common Stocks — 98.7% | | | | |
| | | | Australia — 1.3% | | | | |
| | 4,133 | | | Oil Search Ltd. | | | 26,236 | |
| | | | | | | | |
| | | | Brazil — 8.6% | | | | |
| | 3,352 | | | AMBEV S.A., ADR | | | 21,220 | |
| | 2,732 | | | BB Seguridade Participacoes S.A. | | | 31,498 | |
| | 5,859 | | | CCR S.A. | | | 32,183 | |
| | 1,053 | | | Cielo S.A. | | | 14,490 | |
| | 1,394 | | | Itau Unibanco Holding S.A. (Preference Shares), ADR | | | 17,869 | |
| | 685 | | | Lojas Renner S.A. | | | 23,926 | |
| | 845 | | | Marcopolo S.A. | | | 643 | |
| | 1,201 | | | Ultrapar Participacoes S.A. | | | 27,491 | |
| | 1,890 | | | WEG S.A. | | | 10,113 | |
| | | | | | | | |
| | | | | | | 179,433 | |
| | | | | | | | |
| | | | China — 9.0% | | | | |
| | 119 | | | Alibaba Group Holding Ltd., ADR (a) | | | 9,673 | |
| | 203 | | | Baidu, Inc., ADR (a) | | | 40,691 | |
| | 11,666 | | | CNOOC Ltd. | | | 19,893 | |
| | 25,470 | | | Geely Automobile Holdings Ltd. | | | 14,328 | |
| | 641 | | | JD.com, Inc., ADR (a) | | | 21,522 | |
| | 17,106 | | | Sun Art Retail Group Ltd. | | | 17,634 | |
| | 2,710 | | | Tencent Holdings Ltd. | | | 55,938 | |
| | 1,198 | | | Tsingtao Brewery Co., Ltd., Class H | | | 7,611 | |
| | | | | | | | |
| | | | | | | 187,290 | |
| | | | | | | | |
| | | | Cyprus — 0.3% | | | | |
| | 1,183 | | | Globaltrans Investment plc, Reg. S, GDR (a) | | | 5,856 | |
| | | | | | | | |
| | | | Hong Kong — 6.3% | | | | |
| | 11,311 | | | AIA Group Ltd. | | | 75,225 | |
| | 3 | | | Jardine Matheson Holdings Ltd. | | | 197 | |
| | 351 | | | Jardine Matheson Holdings Ltd. | | | 21,698 | |
| | 8,504 | | | Sands China Ltd. | | | 34,664 | |
| | | | | | | | |
| | | | | | | 131,784 | |
| | | | | | | | |
| | | | India — 16.6% | | | | |
| | 276 | | | ACC Ltd. | | | 6,221 | |
| | 1,630 | | | Ambuja Cements Ltd. | | | 5,954 | |
| | 986 | | | Asian Paints Ltd. | | | 11,831 | |
| | 780 | | | HDFC Bank Ltd., ADR | | | 44,361 | |
| | 3,252 | | | Housing Development Finance Corp., Ltd | | | 59,822 | |
| | 1,143 | | | Infosys Ltd., ADR | | | 35,398 | |
| | 7,766 | | | ITC Ltd. | | | 39,413 | |
| | 1,024 | | | Kotak Mahindra Bank Ltd. | | | 21,454 | |
| | 1,090 | | | Lupin Ltd. | | | 30,379 | |
| | 717 | | | Mahindra & Mahindra Ltd. | | | 12,902 | |
| | 1,493 | | | Tata Consultancy Services Ltd. | | | 57,918 | |
| | 516 | | | Tata Motors Ltd., ADR | | | 21,270 | |
| | | | | | | | |
| | | | | | | 346,923 | |
| | | | | | | | |
| | | | | | | | |
| SHARES | | | SECURITY DESCRIPTION | | VALUE($) | |
| | | | | | | | |
| | | | | | | | |
| | | | Indonesia — 3.4% | | | | |
| | 49,071 | | | Astra International Tbk PT | | | 25,823 | |
| | 16,427 | | | Bank Central Asia Tbk PT | | | 17,008 | |
| | 32,473 | | | Bank Rakyat Indonesia Persero Tbk PT | | | 28,992 | |
| | | | | | | | |
| | | | | | | 71,823 | |
| | | | | | | | |
| | | | Mexico — 2.3% | | | | |
| | 8,786 | | | Fibra Uno Administracion S.A. de C.V. | | | 21,921 | |
| | 2,516 | | | Infraestructura Energetica Nova S.A.B. de C.V. | | | 14,642 | |
| | 4,149 | | | Mexichem S.A.B. de C.V. | | | 11,884 | |
| | | | | | | | |
| | | | | | | 48,447 | |
| | | | | | | | |
| | | | Panama — 1.4% | | | | |
| | 262 | | | Copa Holdings S.A., Class A | | | 29,097 | |
| | | | | | | | |
| | | | Peru — 1.5% | | | | |
| | 202 | | | Credicorp Ltd. | | | 30,762 | |
| | | | | | | | |
| | | | Russia — 6.9% | | | | |
| | 666 | | | Lukoil OAO, ADR | | | 34,094 | |
| | 111 | | | Magnit PJSC | | | 24,343 | |
| | 333 | | | Magnit PJSC, Reg. S, GDR | | | 18,277 | |
| | 543 | | | Mail.ru Group Ltd., Reg. S, GDR (a) | | | 12,945 | |
| | 4,269 | | | Mobile Telesystems OJSC | | | 21,859 | |
| | 22,305 | | | Sberbank of Russia | | | 33,219 | |
| | | | | | | | |
| | | | | | | 144,737 | |
| | | | | | | | |
| | | | South Africa — 18.1% | | | | |
| | 803 | | | Aspen Pharmacare Holdings Ltd. (a) | | | 24,420 | |
| | 1,700 | | | Bidvest Group Ltd. (The) | | | 46,064 | |
| | 353 | | | Capitec Bank Holdings Ltd. | | | 16,614 | |
| | 6,887 | | | FirstRand Ltd. | | | 32,898 | |
| | 600 | | | Imperial Holdings Ltd. | | | 10,045 | |
| | 7,046 | | | Life Healthcare Group Holdings Ltd. | | | 24,198 | |
| | 1,268 | | | Mr Price Group Ltd. | | | 27,077 | |
| | 2,091 | | | MTN Group Ltd. | | | 41,989 | |
| | 145 | | | Naspers Ltd., Class N | | | 22,789 | |
| | 1,977 | | | Remgro Ltd. | | | 43,921 | |
| | 4,016 | | | Sanlam Ltd. | | | 25,973 | |
| | 1,565 | | | Shoprite Holdings Ltd. | | | 22,397 | |
| | 5,288 | | | Woolworths Holdings Ltd. | | | 39,783 | |
| | | | | | | | |
| | | | | | | 378,168 | |
| | | | | | | | |
| | | | South Korea — 4.0% | | | | |
| | 149 | | | Hyundai Motor Co. | | | 23,371 | |
| | 612 | | | Kia Motors Corp. | | | 28,190 | |
| | 25 | | | Samsung Electronics Co., Ltd. | | | 32,488 | |
| | | | | | | | |
| | | | | | | 84,049 | |
| | | | | | | | |
| | | | Switzerland — 0.8% | | | | |
| | 303 | | | Luxoft Holding, Inc. (a) | | | 15,727 | |
| | | | | | | | |
SEE NOTES TO FINANCIAL STATEMENTS.
| | | | | | | | |
| | | |
| APRIL 30, 2015 | | J.P. MORGAN INTERNATIONAL EQUITY FUNDS | | | | | 43 | |
JPMorgan Emerging Markets Equity Fund
SCHEDULE OF PORTFOLIO INVESTMENTS
AS OF APRIL 30, 2015 (Unaudited) (continued)
(Amounts in thousands)
| | | | | | | | |
| SHARES | | | SECURITY DESCRIPTION | | VALUE($) | |
| | | | | | | | |
| Common Stocks — continued | |
| | | | Taiwan — 8.0% | | | | |
| | 4,586 | | | Delta Electronics, Inc. | | | 27,596 | |
| | 1,617 | | | MediaTek, Inc. | | | 20,785 | |
| | 3,483 | | | President Chain Store Corp. | | | 25,775 | |
| | 16,173 | | | Siliconware Precision Industries Co., Ltd. | | | 26,569 | |
| | 2,703 | | | Taiwan Semiconductor Manufacturing Co., Ltd., ADR | | | 66,070 | |
| | | | | | | | |
| | | | | | | 166,795 | |
| | | | | | | | |
| | | | Thailand — 5.5% | | | | |
| | 3,145 | | | Advanced Info Service PCL, NVDR | | | 22,825 | |
| | 3,647 | | | Kasikornbank PCL, NVDR | | | 23,139 | |
| | 1,575 | | | Siam Cement PCL (The), NVDR | | | 25,631 | |
| | 4,255 | | | Siam Commercial Bank PCL (The) | | | 20,476 | |
| | 8,677 | | | Total Access Communication PCL, NVDR | | | 22,793 | |
| | | | | | | | |
| | | | | | | 114,864 | |
| | | | | | | | |
| | | | Turkey — 2.5% | | | | |
| | 771 | | | Ford Otomotiv Sanayi A.S. | | | 9,532 | |
| | 5,036 | | | KOC Holding A.S. | | | 23,820 | |
| | 6,242 | | | Turkiye Garanti Bankasi A.S. | | | 19,862 | |
| | | | | | | | |
| | | | | | | 53,214 | |
| | | | | | | | |
| | | | United Kingdom — 2.2% | | | | |
| | 776 | | | Anglo American plc | | | 13,143 | |
| | 617 | | | SABMiller plc | | | 32,686 | |
| | | | | | | | |
| | | | | | | 45,829 | |
| | | | | | | | |
| | | | Total Common Stocks
(Cost $1,741,316) | | | 2,061,034 | |
| | | | | | | | |
| Preferred Stocks — 0.8%
|
|
| | | | Brazil — 0.8% | | | | |
| | 954 | | | Itau Unibanco Holding S.A. | | | 12,216 | |
| | 5,960 | | | Marcopolo S.A. | | | 5,460 | |
| | | | | | | | |
| | | | Total Preferred Stocks
(Cost $18,230) | | | 17,676 | |
| | | | | | | | |
| Short-Term Investment — 1.1% | |
| | | | Investment Company — 1.1% | | | | |
| | 22,701 | | | JPMorgan Prime Money Market Fund, Institutional Class Shares,
0.050% (b) (l) (m)
(Cost $22,701) | | | 22,701 | |
| | | | | | | | |
| | | | Total Investments — 100.6%
(Cost $1,782,247) | | | 2,101,411 | |
| | | | Liabilities in Excess of
Other Assets — (0.6)% | | | (12,935 | ) |
| | | | | | | | |
| | | | NET ASSETS — 100.0% | | $ | 2,088,476 | |
| | | | | | | | |
Percentages indicated are based on net assets.
Summary of Investments by Industry, April 30, 2015
The following table represents the portfolio investments of the Fund by industry classifications as a percentage of total investments:
| | | | |
| INDUSTRY | | PERCENTAGE | |
Banks | | | 13.6 | % |
Automobiles | | | 6.4 | |
Insurance | | | 6.3 | |
IT Services | | | 5.9 | |
Internet Software & Services | | | 5.7 | |
Semiconductors & Semiconductor Equipment | | | 5.4 | |
Wireless Telecommunication Services | | | 5.2 | |
Food & Staples Retailing | | | 5.2 | |
Oil, Gas & Consumable Fuels | | | 5.1 | |
Industrial Conglomerates | | | 4.4 | |
Diversified Financial Services | | | 3.7 | |
Multiline Retail | | | 3.0 | |
Beverages | | | 2.9 | |
Thrifts & Mortgage Finance | | | 2.8 | |
Pharmaceuticals | | | 2.6 | |
Tobacco | | | 1.9 | |
Construction Materials | | | 1.8 | |
Hotels, Restaurants & Leisure | | | 1.6 | |
Technology Hardware, Storage & Peripherals | | | 1.5 | |
Transportation Infrastructure | | | 1.5 | |
Airlines | | | 1.4 | |
Electronic Equipment, Instruments & Components | | | 1.3 | |
Specialty Retail | | | 1.3 | |
Health Care Providers & Services | | | 1.2 | |
Chemicals | | | 1.1 | |
Media | | | 1.1 | |
Real Estate Investment Trusts (REITs) | | | 1.0 | |
Internet & Catalog Retail | | | 1.0 | |
Others (each less than 1.0%) | | | 3.0 | |
Short-Term Investment | | | 1.1 | |
SEE NOTES TO FINANCIAL STATEMENTS.
| | | | | | |
| | | |
| 44 | | | | J.P. MORGAN INTERNATIONAL EQUITY FUNDS | | APRIL 30, 2015 |
JPMorgan Emerging Markets Equity Income Fund
SCHEDULE OF PORTFOLIO INVESTMENTS
AS OF APRIL 30, 2015 (Unaudited)
(Amounts in thousands)
| | | | | | | | |
| SHARES | | | SECURITY DESCRIPTION | | VALUE($) | |
| | | | | | | | |
| Common Stocks — 93.4% | | | | |
| | | | Brazil — 9.8% | | | | |
| | 9 | | | AMBEV S.A., ADR | | | 60 | |
| | 4 | | | Banco Bradesco S.A., ADR | | | 43 | |
| | 6 | | | Banco do Brasil S.A. | | | 51 | |
| | 8 | | | CCR S.A. | | | 46 | |
| | 6 | | | Cia Energetica de Minas Gerais, ADR | | | 30 | |
| | 1 | | | Embraer S.A., ADR | | | 36 | |
| | 4 | | | Tractebel Energia S.A. | | | 44 | |
| | | | | | | | |
| | | | | | | 310 | |
| | | | | | | | |
| | | | Chile — 1.8% | | | | |
| | 3 | | | Banco Santander Chile, ADR | | | 59 | |
| | | | | | | | |
| | | | China — 10.1% | | | | |
| | 101 | | | Bank of China Ltd., Class H | | | 69 | |
| | 78 | | | China Construction Bank Corp., Class H | | | 76 | |
| | 20 | | | China Shenhua Energy Co., Ltd., Class H | | | 52 | |
| | 83 | | | Industrial & Commercial Bank of China Ltd., Class H | | | 72 | |
| | 14 | | | MGM China Holdings Ltd. | | | 26 | |
| | 13 | | | Wynn Macau Ltd. | | | 27 | |
| | | | | | | | |
| | | | | | | 322 | |
| | | | | | | | |
| | | | Hong Kong — 7.8% | | | | |
| | 5 | | | China Mobile Ltd. | | | 72 | |
| | 18 | | | China Resources Power Holdings Co., Ltd. | | | 54 | |
| | 3 | | | Hang Seng Bank Ltd. (m) | | | 49 | |
| | 12 | | | Sands China Ltd. | | | 47 | |
| | 2 | | | VTech Holdings Ltd. | | | 25 | |
| | | | | | | | |
| | | | | | | 247 | |
| | | | | | | | |
| | | | Hungary — 1.4% | | | | |
| | 2 | | | OTP Bank plc | | | 45 | |
| | | | | | | | |
| | | | Indonesia — 1.6% | | | | |
| | 9 | | | Indo Tambangraya Megah Tbk PT | | | 9 | |
| | 202 | | | Telekomunikasi Indonesia Persero Tbk PT | | | 41 | |
| | | | | | | | |
| | | | | | | 50 | |
| | | | | | | | |
| | | | Mexico — 2.0% | | | | |
| | 28 | | | Kimberly-Clark de Mexico S.A.B. de C.V., Class A (m) | | | 63 | |
| | | | | | | | |
| | | | Poland — 1.7% | | | | |
| | — | (h) | | Powszechny Zaklad Ubezpieczen S.A. | | | 53 | |
| | | | | | | | |
| | | | Russia — 6.6% | | | | |
| | 1 | | | Lukoil OAO, ADR | | | 63 | |
| | 1 | | | MegaFon OAO, Reg. S, GDR | | | 25 | |
| | 3 | | | MMC Norilsk Nickel OJSC, ADR | | | 55 | |
| | 3 | | | Mobile Telesystems OJSC, ADR | | | 40 | |
| | 2 | | | Severstal PAO, Reg. S, GDR | | | 25 | |
| | | | | | | | |
| | | | | | | 208 | |
| | | | | | | | |
| | | | | | | | |
| SHARES | | | SECURITY DESCRIPTION | | VALUE($) | |
| | | | | | | | |
| | | | | | | | |
| | | | Singapore — 1.4% | | | | |
| | 64 | | | Hutchison Port Holdings Trust, Class U | | | 43 | |
| | | | | | | | |
| | | | South Africa — 12.5% | | | | |
| | 7 | | | AVI Ltd. | | | 45 | |
| | 4 | | | Barclays Africa Group Ltd. (m) | | | 62 | |
| | 2 | | | Bidvest Group Ltd. (The) | | | 65 | |
| | 4 | | | Imperial Holdings Ltd. | | | 59 | |
| | 18 | | | Life Healthcare Group Holdings Ltd. | | | 61 | |
| | 11 | | | MMI Holdings Ltd. | | | 32 | |
| | 4 | | | MTN Group Ltd. | | | 72 | |
| | | | | | | | |
| | | | | | | 396 | |
| | | | | | | | |
| | | | South Korea — 5.5% | | | | |
| | 2 | | | Kangwon Land, Inc. | | | 55 | |
| | 1 | | | KT&G Corp. | | | 62 | |
| | 2 | | | SK Telecom Co., Ltd., ADR | | | 57 | |
| | | | | | | | |
| | | | | | | 174 | |
| | | | | | | | |
| | | | Taiwan — 21.0% | | | | |
| | 4 | | | Asustek Computer, Inc. | | | 42 | |
| | 21 | | | Cheng Shin Rubber Industry Co., Ltd. | | | 50 | |
| | 6 | | | Chicony Electronics Co., Ltd. | | | 17 | |
| | 10 | | | Delta Electronics, Inc. | | | 60 | |
| | 10 | | | Far EasTone Telecommunications Co., Ltd. | | | 24 | |
| | 5 | | | MediaTek, Inc. | | | 64 | |
| | 4 | | | Novatek Microelectronics Corp. | | | 21 | |
| | 6 | | | President Chain Store Corp. | | | 44 | |
| | 19 | | | Quanta Computer, Inc. | | | 48 | |
| | 11 | | | Radiant Opto-Electronics Corp. | | | 36 | |
| | 40 | | | Siliconware Precision Industries Co., Ltd. (m) | | | 66 | |
| | 4 | | | Simplo Technology Co., Ltd. | | | 20 | |
| | 16 | | | Taiwan Mobile Co., Ltd. | | | 56 | |
| | 3 | | | Taiwan Semiconductor Manufacturing Co., Ltd., ADR | | | 73 | |
| | 8 | | | Tripod Technology Corp. | | | 16 | |
| | 20 | | | Vanguard International Semiconductor Corp. | | | 31 | |
| | | | | | | | |
| | | | | | | 668 | |
| | | | | | | | |
| | | | Thailand — 4.1% | | | | |
| | 9 | | | Advanced Info Service PCL | | | 62 | |
| | 4 | | | Siam Cement PCL (The), NVDR | | | 68 | |
| | | | | | | | |
| | | | | | | 130 | |
| | | | | | | | |
| | | | Turkey — 4.9% | | | | |
| | 6 | | | Arcelik A.S. | | | 30 | |
| | 12 | | | Eregli Demir ve Celik Fabrikalari TAS | | | 21 | |
| | 6 | | | Tofas Turk Otomobil Fabrikasi A.S. | | | 39 | |
| | 15 | | | Turk Telekomunikasyon A.S. | | | 41 | |
| | 6 | | | Turkcell Iletisim Hizmetleri A.S. | | | 26 | |
| | | | | | | | |
| | | | | | | 157 | |
| | | | | | | | |
SEE NOTES TO FINANCIAL STATEMENTS.
| | | | | | | | |
| | | |
| APRIL 30, 2015 | | J.P. MORGAN INTERNATIONAL EQUITY FUNDS | | | | | 45 | |
JPMorgan Emerging Markets Equity Income Fund
SCHEDULE OF PORTFOLIO INVESTMENTS
AS OF APRIL 30, 2015 (Unaudited) (continued)
(Amounts in thousands)
| | | | | | | | |
| SHARES | | | SECURITY DESCRIPTION | | VALUE($) | |
| Common Stocks — continued | |
| | | | United Arab Emirates — 1.2% | | | | |
| | 9 | | | First Gulf Bank PJSC | | | 39 | |
| | | | | | | | |
| | | | Total Common Stocks
(Cost $2,837) | | | 2,964 | |
| | | | | | | | |
| | |
NUMBER OF
WARRANTS | | | | | | |
| Warrants — 2.2%
|
|
| | | | Saudi Arabia — 2.2% | | | | |
| | 3 | | | Al Rajhi Bank, expiring 08/22/16
(Strike Price $1.00) (a) | | | 51 | |
| | 1 | | | Yanbu National Petrochemical,
expiring 07/31/17 (Strike Price $1.00) (a) | | | 19 | |
| | | | | | | | |
| | | | Total Warrants
(Cost $57) | | | 70 | |
| | | | | | | | |
| | | | Total Investments — 95.6%
(Cost $2,894) | | | 3,034 | |
| | | | Other Assets in Excess of
Liabilities — 4.4% | | | 141 | |
| | | | | | | | |
| | | | NET ASSETS — 100.0% | | $ | 3,175 | |
| | | | | | | | |
Percentages indicated are based on net assets.
Summary of Investments by Industry, April 30, 2015
The following table represents the portfolio investments of the Fund by industry classifications as a percentage of total investments:
| | | | |
| INDUSTRY | | PERCENTAGE | |
Banks | | | 20.2 | % |
Wireless Telecommunication Services | | | 14.3 | |
Semiconductors & Semiconductor Equipment | | | 9.6 | |
Hotels, Restaurants & Leisure | | | 5.1 | |
Oil, Gas & Consumable Fuels | | | 4.1 | |
Technology Hardware, Storage & Peripherals | | | 3.5 | |
Metals & Mining | | | 3.3 | |
Independent Power & Renewable Electricity Producers | | | 3.2 | |
Electronic Equipment, Instruments & Components | | | 3.2 | |
Transportation Infrastructure | | | 3.0 | |
Construction Materials | | | 2.9 | |
Insurance | | | 2.8 | |
Diversified Telecommunication Services | | | 2.7 | |
Industrial Conglomerates | | | 2.1 | |
Household Products | | | 2.1 | |
Tobacco | | | 2.0 | |
Health Care Providers & Services | | | 2.0 | |
Beverages | | | 2.0 | |
Distributors | | | 1.9 | |
Auto Components | | | 1.7 | |
Food Products | | | 1.5 | |
Food & Staples Retailing | | | 1.5 | |
Automobiles | | | 1.3 | |
Aerospace & Defense | | | 1.2 | |
Electric Utilities | | | 1.0 | |
Household Durables | | | 1.0 | |
Others (each less than 1.0%) | | | 0.8 | |
SEE NOTES TO FINANCIAL STATEMENTS.
| | | | | | |
| | | |
| 46 | | | | J.P. MORGAN INTERNATIONAL EQUITY FUNDS | | APRIL 30, 2015 |
JPMorgan Global Research Enhanced Index Fund
SCHEDULE OF PORTFOLIO INVESTMENTS
AS OF APRIL 30, 2015 (Unaudited)
(Amounts in thousands)
| | | | | | | | |
| SHARES | | | SECURITY DESCRIPTION | | VALUE($) | |
| | | | | | | | |
| Common Stocks — 95.8% | | | | |
| | | | Australia — 2.5% | | | | |
| | 212 | | | AGL Energy Ltd. | | | 2,548 | |
| | 1,054 | | | Alumina Ltd. | | | 1,278 | |
| | 305 | | | Amcor Ltd. | | | 3,244 | |
| | 351 | | | AMP Ltd. | | | 1,780 | |
| | 410 | | | Asciano Ltd. | | | 2,128 | |
| | 385 | | | Aurizon Holdings Ltd. | | | 1,469 | |
| | 476 | | | Australia & New Zealand Banking Group Ltd. | | | 12,746 | |
| | 102 | | | Bank of Queensland Ltd. | | | 1,047 | |
| | 510 | | | BHP Billiton Ltd. | | | 13,023 | |
| | 526 | | | BHP Billiton plc | | | 12,643 | |
| | 116 | | | Brambles Ltd. | | | 986 | |
| | 17 | | | Caltex Australia Ltd. | | | 480 | |
| | 143 | | | Coca-Cola Amatil Ltd. | | | 1,158 | |
| | 16 | | | Cochlear Ltd. | | | 1,051 | |
| | 246 | | | Commonwealth Bank of Australia | | | 17,243 | |
| | 137 | | | Computershare Ltd. | | | 1,331 | |
| | 8 | | | Crown Resorts Ltd. | | | 77 | |
| | 92 | | | CSL Ltd. | | | 6,579 | |
| | 350 | | | Dexus Property Group | | | 2,031 | |
| | 838 | | | Federation Centres Ltd. | | | 1,948 | |
| | 478 | | | Goodman Group | | | 2,345 | |
| | 436 | | | Insurance Australia Group Ltd. | | | 2,000 | |
| | 155 | | | Lend Lease Group | | | 1,964 | |
| | 57 | | | Macquarie Group Ltd. | | | 3,477 | |
| | 1,556 | | | Mirvac Group | | | 2,465 | |
| | 340 | | | National Australia Bank Ltd. | | | 9,857 | |
| | 147 | | | Newcrest Mining Ltd. (a) | | | 1,644 | |
| | 81 | | | Orica Ltd. | | | 1,281 | |
| | 193 | | | Origin Energy Ltd. | | | 1,925 | |
| | 486 | | | Qantas Airways Ltd. (a) | | | 1,300 | |
| | 208 | | | QBE Insurance Group Ltd. | | | 2,240 | |
| | 40 | | | Ramsay Health Care Ltd. | | | 1,993 | |
| | 18 | | | REA Group Ltd. | | | 657 | |
| | 144 | | | Santos Ltd. | | | 937 | |
| | 633 | | | Scentre Group | | | 1,865 | |
| | 7 | | | Seek Ltd. | | | 90 | |
| | 146 | | | Stockland | | | 512 | |
| | 325 | | | Suncorp Group Ltd. | | | 3,365 | |
| | 122 | | | Sydney Airport | | | 517 | |
| | 472 | | | Tabcorp Holdings Ltd. | | | 1,814 | |
| | 669 | | | Telstra Corp., Ltd. | | | 3,289 | |
| | 110 | | | Toll Holdings Ltd. | | | 777 | |
| | 459 | | | Transurban Group | | | 3,588 | |
| | 133 | | | Wesfarmers Ltd. | | | 4,571 | |
| | 192 | | | Westfield Corp. | | | 1,427 | |
| | | | | | | | |
| SHARES | | | SECURITY DESCRIPTION | | VALUE($) | |
| | | | | | | | |
| | | | | | | | |
| | | | Australia — continued | | | | |
| | 515 | | | Westpac Banking Corp. | | | 14,809 | |
| | 125 | | | Woodside Petroleum Ltd. | | | 3,460 | |
| | 257 | | | Woolworths Ltd. | | | 5,967 | |
| | | | | | | | |
| | | | | | | 164,926 | |
| | | | | | | | |
| | | | Austria — 0.0% (g) | | | | |
| | — | (h) | | Telekom Austria AG | | | — | (h) |
| | | | | | | | |
| | | | Belgium — 0.7% | | | | |
| | 111 | | | Anheuser-Busch InBev N.V. | | | 13,543 | |
| | 154 | | | Delhaize Group S.A. | | | 12,434 | |
| | 115 | | | KBC Groep N.V. (a) | | | 7,552 | |
| | 78 | | | Solvay S.A. | | | 11,534 | |
| | | | | | | | |
| | | | | | | 45,063 | |
| | | | | | | | |
| | | | Canada — 3.6% | | | | |
| | 35 | | | Agnico-Eagle Mines Ltd. | | | 1,071 | |
| | 33 | | | Agrium, Inc. | | | 3,434 | |
| | 82 | | | Alimentation Couche-Tard, Inc., Class B | | | 3,128 | |
| | 61 | | | ARC Resources Ltd. | | | 1,241 | |
| | 134 | | | Bank of Montreal | | | 8,723 | |
| | 238 | | | Bank of Nova Scotia (The) | | | 13,149 | |
| | 215 | | | Barrick Gold Corp. | | | 2,794 | |
| | 52 | | | BCE, Inc. | | | 2,304 | |
| | 254 | | | Bombardier, Inc., Class B | | | 513 | |
| | 115 | | | Brookfield Asset Management, Inc., Class A | | | 6,192 | |
| | 83 | | | Cameco Corp. | | | 1,460 | |
| | 84 | | | Canadian Imperial Bank of Commerce | | | 6,783 | |
| | 179 | | | Canadian National Railway Co. | | | 11,584 | |
| | 226 | | | Canadian Natural Resources Ltd. | | | 7,522 | |
| | 98 | | | Canadian Oil Sands Ltd. | | | 1,061 | |
| | 44 | | | Canadian Pacific Railway Ltd. | | | 8,283 | |
| | 74 | | | Canadian Pacific Railway Ltd. | | | 14,158 | |
| | 157 | | | Cenovus Energy, Inc. | | | 2,963 | |
| | 73 | | | Crescent Point Energy Corp. | | | 1,894 | |
| | 144 | | | Eldorado Gold Corp. | | | 717 | |
| | 155 | | | Enbridge, Inc. | | | 8,122 | |
| | 152 | | | Encana Corp. | | | 2,162 | |
| | 75 | | | First Quantum Minerals Ltd. | | | 1,152 | |
| | 39 | | | Fortis, Inc. | | | 1,257 | |
| | 31 | | | Franco-Nevada Corp. | | | 1,591 | |
| | 172 | | | Goldcorp, Inc. | | | 3,241 | |
| | 59 | | | Great-West Lifeco, Inc. | | | 1,804 | |
| | 69 | | | Husky Energy, Inc. | | | 1,548 | |
| | 63 | | | Imperial Oil Ltd. | | | 2,762 | |
| | 27 | | | Intact Financial Corp. | | | 2,090 | |
| | 207 | | | Kinross Gold Corp. (a) | | | 503 | |
SEE NOTES TO FINANCIAL STATEMENTS.
| | | | | | | | |
| | | |
| APRIL 30, 2015 | | J.P. MORGAN INTERNATIONAL EQUITY FUNDS | | | | | 47 | |
JPMorgan Global Research Enhanced Index Fund
SCHEDULE OF PORTFOLIO INVESTMENTS
AS OF APRIL 30, 2015 (Unaudited) (continued)
(Amounts in thousands)
| | | | | | | | |
| SHARES | | | SECURITY DESCRIPTION | �� | VALUE($) | |
| | | | | | | | |
| Common Stocks — continued | |
| | | | Canada — continued | | | | |
| | 55 | | | Loblaw Cos. Ltd. | | | 2,790 | |
| | 48 | | | lululemon athletica, Inc. (a) | | | 3,028 | |
| | 54 | | | Magna International, Inc. | | | 2,705 | |
| | 91 | | | Magna International, Inc. | | | 4,584 | |
| | 374 | | | Manulife Financial Corp. | | | 6,812 | |
| | 60 | | | Metro, Inc. | | | 1,747 | |
| | 68 | | | National Bank of Canada | | | 2,734 | |
| | 61 | | | Pembina Pipeline Corp. | | | 2,115 | |
| | 176 | | | Potash Corp. of Saskatchewan, Inc. | | | 5,737 | |
| | 71 | | | Power Corp. of Canada | | | 1,958 | |
| | 50 | | | Power Financial Corp. | | | 1,558 | |
| | 79 | | | Rogers Communications, Inc., Class B | | | 2,832 | |
| | 303 | | | Royal Bank of Canada | | | 20,104 | |
| | 54 | | | Saputo, Inc. | | | 1,602 | |
| | 78 | | | Shaw Communications, Inc., Class B | | | 1,784 | |
| | 74 | | | Silver Wheaton Corp. | | | 1,467 | |
| | 32 | | | SNC-Lavalin Group, Inc. | | | 1,150 | |
| | 124 | | | Sun Life Financial, Inc. | | | 3,965 | |
| | 328 | | | Suncor Energy, Inc. | | | 10,681 | |
| | 220 | | | Talisman Energy, Inc. | | | 1,760 | |
| | 120 | | | Teck Resources Ltd., Class B | | | 1,819 | |
| | 382 | | | Toronto-Dominion Bank (The) | | | 17,618 | |
| | 145 | | | TransCanada Corp. | | | 6,748 | |
| | 140 | | | Yamana Gold, Inc. | | | 534 | |
| | | | | | | | |
| | | | | | | 233,038 | |
| | | | | | | | |
| | | | China — 0.0% (g) | | | | |
| | 1,053 | | | Yangzijiang Shipbuilding Holdings Ltd. | | | 1,163 | |
| | | | | | | | |
| | | | Colombia — 0.0% (g) | | | | |
| | — | (h) | | Pacific Rubiales Energy Corp. | | | — | (h) |
| | | | | | | | |
| | | | Denmark — 0.6% | | | | |
| | 5 | | | AP Moeller — Maersk A/S, Class B | | | 9,837 | |
| | 410 | | | Danske Bank A/S | | | 11,642 | |
| | 346 | | | Novo Nordisk A/S, Class B | | | 19,405 | |
| | | | | | | | |
| | | | | | | 40,884 | |
| | | | | | | | |
| | | | Finland — 0.4% | | | | |
| | 834 | | | Nokia OYJ | | | 5,630 | |
| | — | (h) | | Nokian Renkaat OYJ | | | — | (h) |
| | 640 | | | UPM-Kymmene OYJ | | | 11,579 | |
| | 177 | | | Wartsila OYJ Abp | | | 8,132 | |
| | | | | | | | |
| | | | | | | 25,341 | |
| | | | | | | | |
| | | | France — 3.9% | | | | |
| | 131 | | | Air Liquide S.A. | | | 17,086 | |
| | 263 | | | Airbus Group N.V. | | | 18,217 | |
| | | | | | | | |
| SHARES | | | SECURITY DESCRIPTION | | VALUE($) | |
| | | | | | | | |
| | | | | | | | |
| | | | France — continued | | | | |
| | 1,275 | | | Alcatel-Lucent (a) | | | 4,425 | |
| | 685 | �� | | AXA S.A. | | | 17,313 | |
| | 307 | | | BNP Paribas S.A. | | | 19,392 | |
| | 100 | | | Bouygues S.A. | | | 4,140 | |
| | 87 | | | Cap Gemini S.A. | | | 7,735 | |
| | 76 | | | Cie de Saint-Gobain | | | 3,439 | |
| | 47 | | | Danone S.A. | | | 3,386 | |
| | 374 | | | GDF Suez | | | 7,602 | |
| | 46 | | | L’Oreal S.A. (a) | | | 8,782 | |
| | 13 | | | LVMH Moet Hennessy Louis Vuitton SE | | | 2,279 | |
| | 723 | | | Natixis S.A. | | | 5,986 | |
| | 168 | | | Orange S.A. | | | 2,770 | |
| | 134 | | | Publicis Groupe S.A. | | | 11,227 | |
| | 155 | | | Renault S.A. | | | 16,295 | |
| | 326 | | | Sanofi | | | 33,186 | |
| | 214 | | | Schneider Electric SE | | | 15,987 | |
| | 172 | | | Societe Generale S.A. | | | 8,590 | |
| | 94 | | | Sodexo S.A. | | | 9,526 | |
| | 164 | | | Suez Environnement Co. | | | 3,345 | |
| | 191 | | | Thales S.A. | | | 11,614 | |
| | 390 | | | TOTAL S.A. | | | 21,121 | |
| | 12 | | | Unibail-Rodamco SE | | | 3,357 | |
| | | | | | | | |
| | | | | | | 256,800 | |
| | | | | | | | |
| | | | Germany — 3.2% | | | | |
| | 123 | | | Allianz SE | | | 20,896 | |
| | 105 | | | BASF SE | | | 10,410 | |
| | 183 | | | Bayer AG (a) | | | 26,287 | |
| | 139 | | | Bayerische Motoren Werke AG | | | 16,455 | |
| | 160 | | | Brenntag AG | | | 9,626 | |
| | 44 | | | Continental AG (a) | | | 10,257 | |
| | 173 | | | Daimler AG | | | 16,669 | |
| | 93 | | | Deutsche Bank AG | | | 2,978 | |
| | 400 | | | Deutsche Post AG | | | 13,160 | |
| | 953 | | | Deutsche Telekom AG | | | 17,518 | |
| | 859 | | | E.ON SE | | | 13,367 | |
| | 183 | | | HeidelbergCement AG | | | 14,071 | |
| | 15 | | | Linde AG | | | 2,927 | |
| | 5 | | | Muenchener Rueckversicherungs- Gesellschaft AG | | | 984 | |
| | 246 | | | SAP SE | | | 18,614 | |
| | 84 | | | Siemens AG | | | 9,171 | |
| | 1,342 | | | Telefonica Deutschland Holding AG (a) | | | 8,318 | |
| | | | | | | | |
| | | | | | | 211,708 | |
| | | | | | | | |
| | | | Hong Kong — 1.1% | | | | |
| | 1,901 | | | AIA Group Ltd. | | | 12,645 | |
SEE NOTES TO FINANCIAL STATEMENTS.
| | | | | | |
| | | |
| 48 | | | | J.P. MORGAN INTERNATIONAL EQUITY FUNDS | | APRIL 30, 2015 |
| | | | | | | | |
| SHARES | | | SECURITY DESCRIPTION | | VALUE($) | |
| | | | | | | | |
| Common Stocks — continued | |
| | | | Hong Kong — continued | | | | |
| | 877 | | | BOC Hong Kong Holdings Ltd. | | | 3,402 | |
| | 533 | | | Cathay Pacific Airways Ltd. | | | 1,372 | |
| | 251 | | | Cheung Kong Infrastructure Holdings Ltd. | | | 2,126 | |
| | 284 | | | CK Hutchison Holdings Ltd. | | | 6,161 | |
| | 173 | | | CLP Holdings Ltd. | | | 1,510 | |
| | 329 | | | Galaxy Entertainment Group Ltd. | | | 1,581 | |
| | 681 | | | Hang Lung Properties Ltd. | | | 2,302 | |
| | 180 | | | Hang Seng Bank Ltd. | | | 3,509 | |
| | 324 | | | Henderson Land Development Co., Ltd. | | | 2,598 | |
| | 1,015 | | | HKT Trust & HKT Ltd. | | | 1,357 | |
| | 866 | | | Hong Kong & China Gas Co., Ltd. | | | 2,062 | |
| | 148 | | | Hong Kong Exchanges and Clearing Ltd. | | | 5,649 | |
| | 431 | | | Hutchison Whampoa Ltd. | | | 6,351 | |
| | 363 | | | Kerry Properties Ltd. | | | 1,479 | |
| | 1,462 | | | Li & Fung Ltd. | | | 1,489 | |
| | 298 | | | Link REIT (The) | | | 1,848 | |
| | 491 | | | MTR Corp., Ltd. | | | 2,411 | |
| | 183 | | | NWS Holdings Ltd. | | | 311 | |
| | 180 | | | Power Assets Holdings Ltd. | | | 1,812 | |
| | 558 | | | Sands China Ltd. | | | 2,275 | |
| | 1,260 | | | Sino Land Co., Ltd. | | | 2,217 | |
| | 227 | | | Sun Hung Kai Properties Ltd. | | | 3,770 | |
| | 41 | | | Swire Pacific Ltd., Class A | | | 553 | |
| | 97 | | | Wharf Holdings Ltd. (The) | | | 699 | |
| | 97 | | | Wheelock & Co., Ltd. | | | 546 | |
| | 140 | | | Yue Yuen Industrial Holdings Ltd. | | | 532 | |
| | | | | | | | |
| | | | | | | 72,567 | |
| | | | | | | | |
| | | | Ireland — 1.0% | | | | |
| | 278 | | | Accenture plc, Class A | | | 25,745 | |
| | 26 | | | Allegion plc | | | 1,593 | |
| | 124 | | | James Hardie Industries plc | | | 1,420 | |
| | 79 | | | Medtronic plc | | | 5,858 | |
| | 24 | | | Perrigo Co. plc | | | 4,470 | |
| | 202 | | | Shire plc | | | 16,431 | |
| | 245 | | | XL Group plc | | | 9,093 | |
| | | | | | | | |
| | | | | | | 64,610 | |
| | | | | | | | |
| | | | Israel — 0.1% | | | | |
| | 155 | | | Teva Pharmaceutical Industries Ltd., ADR | | | 9,351 | |
| | | | | | | | |
| | | | Italy — 1.0% | | | | |
| | 488 | | | Assicurazioni Generali S.p.A. | | | 9,545 | |
| | 1,945 | | | Enel Green Power S.p.A. | | | 3,778 | |
| | 2,070 | | | Enel S.p.A. | | | 9,812 | |
| | 166 | | | Eni S.p.A. | | | 3,187 | |
| | 4,043 | | | Intesa Sanpaolo S.p.A. | | | 13,583 | |
| | | | | | | | |
| SHARES | | | SECURITY DESCRIPTION | | VALUE($) | |
| | | | | | | | |
| | | | | | | | |
| | | | Italy — continued | | | | |
| | 99 | | | Luxottica Group S.p.A. | | | 6,513 | |
| | 5,962 | | | Telecom Italia S.p.A. (a) | | | 7,037 | |
| | 1,224 | | | UniCredit S.p.A. | | | 8,783 | |
| | | | | | | | |
| | | | | | | 62,238 | |
| | | | | | | | |
| | | | Japan — 8.4% | | | | |
| | 148 | | | Advantest Corp. | | | 1,747 | |
| | 241 | | | Ajinomoto Co., Inc. | | | 5,344 | |
| | 4 | | | Alfresa Holdings Corp. | | | 60 | |
| | 527 | | | Amada Holdings Co., Ltd. | | | 5,315 | |
| | 450 | | | ANA Holdings, Inc. | | | 1,244 | |
| | 27 | | | Asahi Group Holdings Ltd. | | | 881 | |
| | 569 | | | Asahi Kasei Corp. | | | 5,358 | |
| | 671 | | | Astellas Pharma, Inc. | | | 10,442 | |
| | 196 | | | Bandai Namco Holdings, Inc. | | | 4,016 | |
| | 334 | | | Bank of Yokohama Ltd. (The) | | | 2,120 | |
| | 151 | | | Bridgestone Corp. | | | 6,303 | |
| | 180 | | | Canon, Inc. | | | 6,407 | |
| | 44 | | | Central Japan Railway Co. | | | 7,894 | |
| | 723 | | | Chiba Bank Ltd. (The) | | | 5,942 | |
| | 62 | | | Chubu Electric Power Co., Inc. | | | 820 | |
| | 61 | | | Chugai Pharmaceutical Co., Ltd. | | | 1,840 | |
| | 354 | | | Citizen Holdings Co., Ltd. | | | 2,801 | |
| | 84 | | | COLOPL, Inc. | | | 1,714 | |
| | 180 | | | Daicel Corp. | | | 2,169 | |
| | 276 | | | Dai-ichi Life Insurance Co., Ltd. (The) | | | 4,535 | |
| | 75 | | | Daikin Industries Ltd. | | | 5,080 | |
| | 111 | | | Daiwa House Industry Co., Ltd. | | | 2,467 | |
| | 62 | | | Dentsu, Inc. | | | 2,895 | |
| | 113 | | | East Japan Railway Co. | | | 9,988 | |
| | 31 | | | Eisai Co., Ltd. | | | 2,093 | |
| | 20 | | | Electric Power Development Co., Ltd. | | | 658 | |
| | 27 | | | FANUC Corp. | | | 5,939 | |
| | 18 | | | Fast Retailing Co., Ltd. | | | 7,129 | |
| | 160 | | | Fuji Heavy Industries Ltd. | | | 5,334 | |
| | 88 | | | FUJIFILM Holdings Corp. | | | 3,296 | |
| | 603 | | | Fujitsu Ltd. | | | 3,997 | |
| | 24 | | | Fukuoka Financial Group, Inc. | | | 138 | |
| | 485 | | | Furukawa Electric Co., Ltd. | | | 889 | |
| | 131 | | | Hakuhodo DY Holdings, Inc. | | | 1,402 | |
| | 11 | | | Hirose Electric Co., Ltd. | | | 1,521 | |
| | 1,105 | | | Hitachi Ltd. | | | 7,539 | |
| | 699 | | | Hokuhoku Financial Group, Inc. | | | 1,672 | |
| | 358 | | | Honda Motor Co., Ltd. | | | 11,999 | |
| | 57 | | | Hoya Corp. | | | 2,193 | |
| | 127 | | | Ibiden Co., Ltd. | | | 2,212 | |
SEE NOTES TO FINANCIAL STATEMENTS.
| | | | | | | | |
| | | |
| APRIL 30, 2015 | | J.P. MORGAN INTERNATIONAL EQUITY FUNDS | | | | | 49 | |
JPMorgan Global Research Enhanced Index Fund
SCHEDULE OF PORTFOLIO INVESTMENTS
AS OF APRIL 30, 2015 (Unaudited) (continued)
(Amounts in thousands)
| | | | | | | | |
| SHARES | | | SECURITY DESCRIPTION | | VALUE($) | |
| | | | | | | | |
| Common Stocks — continued | |
| | | | Japan — continued | | | | |
| | 279 | | | Inpex Corp. | | | 3,495 | |
| | 15 | | | Isetan Mitsukoshi Holdings Ltd. | | | 248 | |
| | 2 | | | Japan Retail Fund Investment Corp. | | | 3,651 | |
| | 259 | | | Japan Tobacco, Inc. | | | 9,031 | |
| | 51 | | | JFE Holdings, Inc. | | | 1,160 | |
| | 645 | | | JX Holdings, Inc. | | | 2,808 | |
| | 512 | | | Kansai Electric Power Co., Inc. (The) (a) | | | 5,144 | |
| | 54 | | | Kao Corp. | | | 2,586 | |
| | 1,025 | | | Kawasaki Heavy Industries Ltd. | | | 5,283 | |
| | 487 | | | KDDI Corp. | | | 11,528 | |
| | 14 | | | Keyence Corp. | | | 7,207 | |
| | 63 | | | Kirin Holdings Co., Ltd. | | | 838 | |
| | 1,465 | | | Kobe Steel Ltd. | | | 2,663 | |
| | 40 | | | Komatsu Ltd. | | | 799 | |
| | 128 | | | Kubota Corp. | | | 2,003 | |
| | 33 | | | Kyocera Corp. | | | 1,744 | |
| | 238 | | | Kyushu Electric Power Co., Inc. (a) | | | 2,533 | |
| | 54 | | | Mabuchi Motor Co., Ltd. | | | 3,227 | |
| | 339 | | | Marubeni Corp. | | | 2,100 | |
| | 177 | | | Marui Group Co., Ltd. | | | 1,935 | |
| | 113 | | | Mazda Motor Corp. | | | 2,209 | |
| | 317 | | | Medipal Holdings Corp. | | | 4,321 | |
| | 16 | | | MEIJI Holdings Co., Ltd. | | | 1,884 | |
| | 241 | | | Minebea Co., Ltd. | | | 3,695 | |
| | 259 | | | Mitsubishi Corp. | | | 5,584 | |
| | 620 | | | Mitsubishi Electric Corp. | | | 8,097 | |
| | 164 | | | Mitsubishi Estate Co., Ltd. | | | 3,860 | |
| | 714 | | | Mitsubishi Heavy Industries Ltd. | | | 3,956 | |
| | 7 | | | Mitsubishi Motors Corp. | | | 67 | |
| | 63 | | | Mitsubishi Tanabe Pharma Corp. | | | 1,065 | |
| | 2,691 | | | Mitsubishi UFJ Financial Group, Inc. | | | 19,116 | |
| | 534 | | | Mitsui & Co., Ltd. | | | 7,462 | |
| | 1,505 | | | Mitsui Chemicals, Inc. | | | 4,976 | |
| | 294 | | | Mitsui Fudosan Co., Ltd. | | | 8,715 | |
| | 149 | | | Mitsui OSK Lines Ltd. | | | 526 | |
| | 3,288 | | | Mizuho Financial Group, Inc. | | | 6,268 | |
| | 24 | | | Murata Manufacturing Co., Ltd. | | | 3,396 | |
| | 385 | | | NEC Corp. | | | 1,281 | |
| | 132 | | | NGK Spark Plug Co., Ltd. | | | 3,705 | |
| | 181 | | | NH Foods Ltd. | | | 3,955 | |
| | 16 | | | Nintendo Co., Ltd. | | | 2,703 | |
| | 429 | | | Nippon Express Co., Ltd. | | | 2,463 | |
| | — | (h) | | Nippon Prologis REIT, Inc. | | | 325 | |
| | 2,496 | | | Nippon Steel & Sumitomo Metal Corp. | | | 6,493 | |
| | 114 | | | Nippon Telegraph & Telephone Corp. | | | 7,718 | |
| | 870 | | | Nissan Motor Co., Ltd. | | | 9,034 | |
| | | | | | | | |
| SHARES | | | SECURITY DESCRIPTION | | VALUE($) | |
| | | | | | | | |
| | | | | | | | |
| | | | Japan — continued | | | | |
| | 31 | | | Nitori Holdings Co., Ltd. | | | 2,369 | |
| | 60 | | | Nitto Denko Corp. | | | 3,871 | |
| | 1,071 | | | Nomura Holdings, Inc. | | | 6,948 | |
| | 42 | | | Nomura Real Estate Holdings, Inc. | | | 850 | |
| | 13 | | | Nomura Research Institute Ltd. | | | 505 | |
| | 301 | | | NSK Ltd. | | | 4,701 | |
| | 135 | | | NTT DOCOMO, Inc. | | | 2,398 | |
| | 75 | | | Omron Corp. | | | 3,448 | |
| | 21 | | | Oriental Land Co., Ltd. | | | 1,435 | |
| | 258 | | | ORIX Corp. | | | 3,963 | |
| | 96 | | | Otsuka Holdings Co., Ltd. | | | 3,018 | |
| | 336 | | | Panasonic Corp. | | | 4,807 | |
| | 853 | | | Resona Holdings, Inc. | | | 4,548 | |
| | 96 | | | Ricoh Co., Ltd. | | | 992 | |
| | 23 | | | Rinnai Corp. | | | 1,753 | |
| | 9 | | | Santen Pharmaceutical Co., Ltd. | | | 112 | |
| | 129 | | | Sanwa Holdings Corp. | | | 970 | |
| | 23 | | | Secom Co., Ltd. | | | 1,637 | |
| | 134 | | | Seiko Epson Corp. | | | 2,335 | |
| | 331 | | | Sekisui Chemical Co., Ltd. | | | 4,414 | |
| | 85 | | | Seven & I Holdings Co., Ltd. | | | 3,671 | |
| | 338 | | | Shimizu Corp. | | | 2,431 | |
| | 113 | | | Shin-Etsu Chemical Co., Ltd. | | | 6,926 | |
| | 3 | | | SMC Corp. | | | 842 | |
| | 135 | | | SoftBank Corp. | | | 8,451 | |
| | 124 | | | Sompo Japan Nipponkoa Holdings, Inc. | | | 4,038 | |
| | 238 | | | Sony Corp. (a) | | | 7,195 | |
| | 135 | | | Sumitomo Corp. | | | 1,596 | |
| | — | (h) | | Sumitomo Forestry Co., Ltd. | | | 1 | |
| | 281 | | | Sumitomo Mitsui Financial Group, Inc. | | | 12,287 | |
| | 53 | | | Sumitomo Realty & Development Co., Ltd. | | | 2,046 | |
| | — | (h) | | Sundrug Co., Ltd. | | | 20 | |
| | 70 | | | Suntory Beverage & Food Ltd. | | | 2,960 | |
| | 87 | | | Suzuken Co., Ltd. | | | 2,726 | |
| | 32 | | | Suzuki Motor Corp. | | | 1,044 | |
| | 83 | | | Sysmex Corp. | | | 4,598 | |
| | 98 | | | T&D Holdings, Inc. | | | 1,408 | |
| | 17 | | | Taisho Pharmaceutical Holdings Co., Ltd. | | | 1,174 | |
| | 271 | | | Takashimaya Co., Ltd. | | | 2,529 | |
| | 62 | | | Takeda Pharmaceutical Co., Ltd. | | | 3,157 | |
| | 140 | | | Terumo Corp. | | | 3,588 | |
| | 184 | | | Tokio Marine Holdings, Inc. | | | 7,480 | |
| | 782 | | | Tokyo Gas Co., Ltd. | | | 4,513 | |
| | 71 | | | Tokyu Corp. | | | 472 | |
| | 496 | | | Toshiba Corp. | | | 1,987 | |
SEE NOTES TO FINANCIAL STATEMENTS.
| | | | | | |
| | | |
| 50 | | | | J.P. MORGAN INTERNATIONAL EQUITY FUNDS | | APRIL 30, 2015 |
| | | | | | | | |
| SHARES | | | SECURITY DESCRIPTION | | VALUE($) | |
| | | | | | | | |
| Common Stocks — continued | |
| | | | Japan — continued | | | | |
| | 553 | | | Toyota Motor Corp. | | | 38,473 | |
| | 239 | | | Unicharm Corp. | | | 6,011 | |
| | 1 | | | United Urban Investment Corp. | | | 1,019 | |
| | 391 | | | Yamada Denki Co., Ltd. | | | 1,598 | |
| | 190 | | | Yamaha Motor Co., Ltd. | | | 4,462 | |
| | 178 | | | Yamato Holdings Co., Ltd. | | | 3,977 | |
| | | | | | | | |
| | | | | | | 546,004 | |
| | | | | | | | |
| | | | Luxembourg — 0.1% | | | | |
| | 751 | | | ArcelorMittal | | | 7,995 | |
| | | | | | | | |
| | | | Netherlands — 1.5% | | | | |
| | 72 | | | ASML Holding N.V. | | | 7,781 | |
| | 112 | | | Heineken Holding N.V. | | | 7,803 | |
| | 907 | | | ING Groep N.V., CVA (a) | | | 13,921 | |
| | 1,043 | | | Koninklijke KPN N.V. | | | 3,868 | |
| | 198 | | | NN Group N.V. (a) | | | 5,760 | |
| | 36 | | | NXP Semiconductors N.V. (a) | | | 3,467 | |
| | 1,133 | | | Royal Dutch Shell plc, Class A | | | 35,733 | |
| | 515 | | | Royal Dutch Shell plc, Class B | | | 16,490 | |
| | | | | | | | |
| | | | | | | 94,823 | |
| | | | | | | | |
| | | | New Zealand — 0.0% (g) | | | | |
| | 135 | | | Contact Energy Ltd. | | | 584 | |
| | 357 | | | Meridian Energy Ltd. | | | 685 | |
| | 72 | | | Ryman Healthcare Ltd. | | | 445 | |
| | 576 | | | Spark New Zealand Ltd. | | | 1,304 | |
| | | | | | | | |
| | | | | | | 3,018 | |
| | | | | | | | |
| | | | Norway — 0.3% | | | | |
| | 623 | | | DNB ASA | | | 11,069 | |
| | 330 | | | Telenor ASA | | | 7,461 | |
| | | | | | | | |
| | | | | | | 18,530 | |
| | | | | | | | |
| | | | Singapore — 0.8% | | | | |
| | 198 | | | Avago Technologies Ltd. | | | 23,190 | |
| | 847 | | | CapitaCommercial Trust | | | 1,083 | |
| | 339 | | | DBS Group Holdings Ltd. | | | 5,380 | |
| | 695 | | | Global Logistic Properties Ltd. | | | 1,441 | |
| | 1,563 | | | Hutchison Port Holdings Trust, Class U | | | 1,053 | |
| | 364 | | | Keppel Corp., Ltd. | | | 2,389 | |
| | 569 | | | Oversea-Chinese Banking Corp., Ltd. | | | 4,579 | |
| | 1,409 | | | Singapore Telecommunications Ltd. | | | 4,707 | |
| | 230 | | | United Overseas Bank Ltd. | | | 4,251 | |
| | 527 | | | Wilmar International Ltd. | | | 1,295 | |
| | | | | | | | |
| | | | | | | 49,368 | |
| | | | | | | | |
| | | | | | | | |
| SHARES | | | SECURITY DESCRIPTION | | VALUE($) | |
| | | | | | | | |
| | | | | | | | |
| | | | Spain — 1.3% | | | | |
| | 99 | | | Amadeus IT Holding S.A., Class A | | | 4,513 | |
| | 598 | | | Banco Bilbao Vizcaya Argentaria S.A. | | | 6,009 | |
| | 2,299 | | | Banco Santander S.A. | | | 17,384 | |
| | 3,235 | | | Bankia S.A. (a) | | | 4,518 | |
| | 1,647 | | | Distribuidora Internacional de Alimentacion S.A. | | | 13,189 | |
| | 1,430 | | | Iberdrola S.A. | | | 9,568 | |
| | 145 | | | Inditex S.A. | | | 4,659 | |
| | 513 | | | Repsol S.A. | | | 10,580 | |
| | 1,106 | | | Telefonica S.A. | | | 16,830 | |
| | | | | | | | |
| | | | | | | 87,250 | |
| | | | | | | | |
| | | | Sweden — 0.6% | | | | |
| | 184 | | | Assa Abloy AB, Class B | | | 10,684 | |
| | 284 | | | Electrolux AB, Series B | | | 8,492 | |
| | 245 | | | Nordea Bank AB | | | 3,114 | |
| | 277 | | | Swedbank AB, Class A | | | 6,437 | |
| | 428 | | | Tele2 AB, Class B | | | 5,709 | |
| | 314 | | | Telefonaktiebolaget LM Ericsson, Class B | | | 3,433 | |
| | | | | | | | |
| | | | | | | 37,869 | |
| | | | | | | | |
| | | | Switzerland — 4.1% | | | | |
| | 264 | | | ABB Ltd. (a) | | | 5,783 | |
| | 220 | | | ACE Ltd. | | | 23,505 | |
| | 190 | | | Cie Financiere Richemont S.A. | | | 16,964 | |
| | 277 | | | Credit Suisse Group AG (a) | | | 7,336 | |
| | 1,066 | | | Glencore plc | | | 5,064 | |
| | 92 | | | Holcim Ltd. (a) | | | 7,364 | |
| | 711 | | | Nestle S.A. | | | 55,179 | |
| | 406 | | | Novartis AG | | | 41,435 | |
| | 171 | | | Roche Holding AG | | | 49,000 | |
| | 117 | | | Swiss Re AG (a) | | | 10,404 | |
| | 6 | | | Syngenta AG | | | 1,990 | |
| | 169 | | | TE Connectivity Ltd. | | | 11,230 | |
| | 941 | | | UBS Group AG (a) | | | 18,789 | |
| | 217 | | | Wolseley plc | | | 12,850 | |
| | 1 | | | Zurich Insurance Group AG (a) | | | 245 | |
| | | | | | | | |
| | | | | | | 267,138 | |
| | | | | | | | |
| | | | United Kingdom — 7.3% | | | | |
| | 1,697 | | | 3i Group plc | | | 13,147 | |
| | 82 | | | Anglo American plc | | | 1,393 | |
| | 233 | | | ARM Holdings plc | | | 3,965 | |
| | 196 | | | Associated British Foods plc | | | 8,538 | |
| | 275 | | | AstraZeneca plc | | | 18,841 | |
| | 1,113 | | | Aviva plc | | | 8,956 | |
| | 1,208 | | | BAE Systems plc | | | 9,357 | |
| | 5,066 | | | Barclays plc | | | 19,820 | |
SEE NOTES TO FINANCIAL STATEMENTS.
| | | | | | | | |
| | | |
| APRIL 30, 2015 | | J.P. MORGAN INTERNATIONAL EQUITY FUNDS | | | | | 51 | |
JPMorgan Global Research Enhanced Index Fund
SCHEDULE OF PORTFOLIO INVESTMENTS
AS OF APRIL 30, 2015 (Unaudited) (continued)
(Amounts in thousands)
| | | | | | | | |
| SHARES | | | SECURITY DESCRIPTION | | VALUE($) | |
| | | | | | | | |
| Common Stocks — continued | |
| | | | United Kingdom — continued | | | | |
| | 885 | | | BG Group plc | | | 16,035 | |
| | 3,107 | | | BP plc | | | 22,406 | |
| | 552 | | | British American Tobacco plc | | | 30,333 | |
| | 834 | | | BT Group plc | | | 5,814 | |
| | 94 | | | Bunzl plc | | | 2,638 | |
| | 1,588 | | | Cobham plc | | | 7,202 | |
| | 284 | | | Compass Group plc | | | 5,029 | |
| | 100 | | | Diageo plc | | | 2,774 | |
| | 1,074 | | | Dixons Carphone plc | | | 6,973 | |
| | 816 | | | GlaxoSmithKline plc | | | 18,846 | |
| | 211 | | | Hammerson plc | | | 2,163 | |
| | 3,561 | | | HSBC Holdings plc | | | 35,571 | |
| | 237 | | | Imperial Tobacco Group plc | | | 11,585 | |
| | 189 | | | Indivior plc (a) | | | 579 | |
| | 2,236 | | | ITV plc | | | 8,681 | |
| | 28 | | | Liberty Global plc, Class A (a) | | | 1,445 | |
| | 79 | | | Liberty Global plc, Series C (a) | | | 3,971 | |
| | 7,715 | | | Lloyds Banking Group plc | | | 9,136 | |
| | 285 | | | Marks & Spencer Group plc | | | 2,410 | |
| | 688 | | | National Grid plc | | | 9,259 | |
| | 95 | | | Next plc | | | 10,694 | |
| | 104 | | | Pearson plc | | | 2,104 | |
| | 1 | | | Pentair plc | | | 68 | |
| | 435 | | | Persimmon plc (a) | | | 11,299 | |
| | 859 | | | Prudential plc | | | 21,385 | |
| | 67 | | | Randgold Resources Ltd. | | | 5,088 | |
| | 234 | | | Reckitt Benckiser Group plc | | | 20,814 | |
| | 81 | | | Rio Tinto Ltd. | | | 3,666 | |
| | 240 | | | Rio Tinto plc | | | 10,761 | |
| | 350 | | | SABMiller plc | | | 18,534 | |
| | 510 | | | Smith & Nephew plc | | | 8,683 | |
| | 390 | | | SSE plc | | | 9,236 | |
| | 291 | | | Standard Chartered plc | | | 4,767 | |
| | 745 | | | Tesco plc | | | 2,512 | |
| | 368 | | | Unilever N.V., CVA | | | 16,044 | |
| | 6,769 | | | Vodafone Group plc | | | 23,848 | |
| | 126 | | | Whitbread plc | | | 10,092 | |
| | 31 | | | Willis Group Holdings plc | | | 1,510 | |
| | 318 | | | WPP plc | | | 7,410 | |
| | | | | | | | |
| | | | | | | 475,382 | |
| | | | | | | | |
| | | | United States — 53.3% | | | | |
| | 11 | | | 3M Co. | | | 1,691 | |
| | 572 | | | Abbott Laboratories | | | 26,552 | |
| | 94 | | | AbbVie, Inc. | | | 6,059 | |
| | 69 | | | Actavis plc (a) | | | 19,447 | |
| | | | | | | | |
| SHARES | | | SECURITY DESCRIPTION | | VALUE($) | |
| | | | | | | | |
| | | | | | | | |
| | | | United States — continued | | | | |
| | 286 | | | Adobe Systems, Inc. (a) | | | 21,733 | |
| | 163 | | | Aetna, Inc. | | | 17,413 | |
| | 94 | | | AGL Resources, Inc. | | | 4,727 | |
| | 686 | | | Alcoa, Inc. | | | 9,213 | |
| | 77 | | | Alexion Pharmaceuticals, Inc. (a) | | | 13,014 | |
| | 35 | | | Alliance Data Systems Corp. (a) | | | 10,447 | |
| | 13 | | | Altria Group, Inc. | | | 638 | |
| | 73 | | | Amazon.com, Inc. (a) | | | 30,678 | |
| | 381 | | | American International Group, Inc. | | | 21,440 | |
| | 95 | | | American Tower Corp. | | | 8,951 | |
| | 71 | | | Amgen, Inc. | | | 11,237 | |
| | 69 | | | Amphenol Corp., Class A | | | 3,793 | |
| | 162 | | | Anadarko Petroleum Corp. | | | 15,256 | |
| | 1,168 | | | Apple, Inc. | | | 146,115 | |
| | 416 | | | Applied Materials, Inc. | | | 8,223 | |
| | 238 | | | Archer-Daniels-Midland Co. | | | 11,636 | |
| | 18 | | | Arrow Electronics, Inc. (a) | | | 1,059 | |
| | 418 | | | AT&T, Inc. | | | 14,477 | |
| | 25 | | | AutoZone, Inc. (a) | | | 17,012 | |
| | 71 | | | AvalonBay Communities, Inc. | | | 11,586 | |
| | 24 | | | Avnet, Inc. | | | 1,016 | |
| | 74 | | | Axiall Corp. | | | 3,010 | |
| | 211 | | | Baker Hughes, Inc. | | | 14,440 | |
| | 2,780 | | | Bank of America Corp. | | | 44,289 | |
| | 83 | | | Bank of New York Mellon Corp. (The) | | | 3,512 | |
| | 394 | | | BB&T Corp. | | | 15,077 | |
| | 74 | | | Becton, Dickinson and Co. | | | 10,413 | |
| | 209 | | | Berkshire Hathaway, Inc., Class B (a) | | | 29,541 | |
| | 166 | | | Best Buy Co., Inc. | | | 5,766 | |
| | 83 | | | Biogen, Inc. (a) | | | 31,090 | |
| | 30 | | | BlackRock, Inc. | | | 10,951 | |
| | 77 | | | Boston Properties, Inc. | | | 10,127 | |
| | 1,137 | | | Boston Scientific Corp. (a) | | | 20,259 | |
| | 503 | | | Bristol-Myers Squibb Co. | | | 32,085 | |
| | 211 | | | Brixmor Property Group, Inc. | | | 4,955 | |
| | 429 | | | Broadcom Corp., Class A | | | 18,946 | |
| | 147 | | | Capital One Financial Corp. | | | 11,853 | |
| | — | (h) | | Catamaran Corp. (a) | | | 1 | |
| | 45 | | | Caterpillar, Inc. | | | 3,890 | |
| | 227 | | | CBS Corp. (Non-Voting), Class B | | | 14,107 | |
| | 255 | | | Celgene Corp. (a) | | | 27,559 | |
| | 373 | | | CenterPoint Energy, Inc. | | | 7,813 | |
| | 39 | | | CenturyLink, Inc. | | | 1,395 | |
| | 109 | | | Cerner Corp. (a) | | | 7,845 | |
| | 504 | | | Charles Schwab Corp. (The) | | | 15,362 | |
| | 69 | | | Charter Communications, Inc., Class A (a) | | | 12,902 | |
SEE NOTES TO FINANCIAL STATEMENTS.
| | | | | | |
| | | |
| 52 | | | | J.P. MORGAN INTERNATIONAL EQUITY FUNDS | | APRIL 30, 2015 |
| | | | | | | | |
| SHARES | | | SECURITY DESCRIPTION | | VALUE($) | |
| | | | | | | | |
| Common Stocks — continued | |
| | | | United States — continued | |
| | 55 | | | Cheniere Energy, Inc. (a) | | | 4,214 | |
| | 367 | | | Chevron Corp. | | | 40,730 | |
| | 28 | | | Cigna Corp. | | | 3,545 | |
| | 18 | | | Cintas Corp. | | | 1,417 | |
| | 786 | | | Cisco Systems, Inc. | | | 22,661 | |
| | 848 | | | Citigroup, Inc. | | | 45,200 | |
| | 28 | | | Citrix Systems, Inc. (a) | | | 1,873 | |
| | 316 | | | CMS Energy Corp. | | | 10,728 | |
| | 511 | | | Coca-Cola Co. (The) | | | 20,744 | |
| | 114 | | | Coca-Cola Enterprises, Inc. | | | 5,074 | |
| | 313 | | | Cognizant Technology Solutions Corp., Class A (a) | | | 18,344 | |
| | 115 | | | Colgate-Palmolive Co. | | | 7,726 | |
| | 78 | | | Comcast Corp., Class A | | | 4,521 | |
| | 563 | | | Comcast Corp., Class A | | | 32,518 | |
| | 33 | | | Concho Resources, Inc. (a) | | | 4,213 | |
| | 66 | | | ConocoPhillips | | | 4,480 | |
| | 43 | | | CONSOL Energy, Inc. | | | 1,404 | |
| | 158 | | | Constellation Brands, Inc., Class A (a) | | | 18,261 | |
| | 15 | | | Continental Resources, Inc. (a) | | | 787 | |
| | 249 | | | Corning, Inc. | | | 5,221 | |
| | 154 | | | Costco Wholesale Corp. | | | 21,975 | |
| | 234 | | | Crown Holdings, Inc. (a) | | | 12,699 | |
| | 447 | | | CSX Corp. | | | 16,123 | |
| | 26 | | | Cullen/Frost Bankers, Inc. | | | 1,875 | |
| | 101 | | | Cummins, Inc. | | | 13,916 | |
| | 205 | | | CVS Health Corp. | | | 20,335 | |
| | 189 | | | Delta Air Lines, Inc. | | | 8,435 | |
| | 27 | | | DENTSPLY International, Inc. | | | 1,385 | |
| | 46 | | | Devon Energy Corp. | | | 3,166 | |
| | 37 | | | DIRECTV (a) | | | 3,373 | |
| | 194 | | | DISH Network Corp., Class A (a) | | | 13,099 | |
| | 165 | | | Dollar General Corp. | | | 12,006 | |
| | 21 | | | Dollar Tree, Inc. (a) | | | 1,630 | |
| | 179 | | | Douglas Emmett, Inc. | | | 5,096 | |
| | 399 | | | Dow Chemical Co. (The) | | | 20,333 | |
| | 90 | | | Dr. Pepper Snapple Group, Inc. | | | 6,730 | |
| | 8 | | | Dun & Bradstreet Corp. (The) | | | 991 | |
| | 126 | | | Dunkin’ Brands Group, Inc. | | | 6,559 | |
| | 321 | | | E.I. du Pont de Nemours & Co. | | | 23,504 | |
| | 343 | | | Eaton Corp. plc | | | 23,591 | |
| | 20 | | | eBay, Inc. (a) | | | 1,147 | |
| | 240 | | | Edison International | | | 14,618 | |
| | 186 | | | Eli Lilly & Co. | | | 13,390 | |
| | 213 | | | EMC Corp. | | | 5,730 | |
| | 11 | | | Emerson Electric Co. | | | 650 | |
| | | | | | | | |
| SHARES | | | SECURITY DESCRIPTION | | VALUE($) | |
| | | | | | | | |
| | | | | | | | |
| | | | United States — continued | | | | |
| | 195 | | | EOG Resources, Inc. | | | 19,304 | |
| | 96 | | | EQT Corp. | | | 8,615 | |
| | 13 | | | Essex Property Trust, Inc. | | | 2,841 | |
| | 95 | | | Estee Lauder Cos., Inc. (The), Class A | | | 7,696 | |
| | 453 | | | Exelon Corp. | | | 15,402 | |
| | 79 | | | Extra Space Storage, Inc. | | | 5,214 | |
| | 675 | | | Exxon Mobil Corp. | | | 58,942 | |
| | 12 | | | F5 Networks, Inc. (a) | | | 1,487 | |
| | 548 | | | Facebook, Inc., Class A (a) | | | 43,203 | |
| | 49 | | | FedEx Corp. | | | 8,255 | |
| | 202 | | | Fidelity National Information Services, Inc. | | | 12,606 | |
| | 27 | | | Flowserve Corp. | | | 1,587 | |
| | 262 | | | Fluor Corp. | | | 15,730 | |
| | 27 | | | Foot Locker, Inc. | | | 1,615 | |
| | 54 | | | General Dynamics Corp. | | | 7,381 | |
| | 1,207 | | | General Electric Co. | | | 32,681 | |
| | 99 | | | General Growth Properties, Inc. | | | 2,718 | |
| | 498 | | | General Motors Co. | | | 17,476 | |
| | 186 | | | Gilead Sciences, Inc. (a) | | | 18,690 | |
| | 98 | | | Goldman Sachs Group, Inc. (The) | | | 19,229 | |
| | 59 | | | Google, Inc., Class A (a) | | | 32,327 | |
| | 69 | | | Google, Inc., Class C (a) | | | 36,832 | |
| | 42 | | | H&R Block, Inc. | | | 1,257 | |
| | 208 | | | Halliburton Co. | | | 10,193 | |
| | 73 | | | Harman International Industries, Inc. | | | 9,467 | |
| | 275 | | | Hartford Financial Services Group, Inc. (The) | | | 11,225 | |
| | 121 | | | Hershey Co. (The) | | | 11,160 | |
| | 421 | | | Hewlett-Packard Co. | | | 13,890 | |
| | 78 | | | Highwoods Properties, Inc. | | | 3,351 | |
| | 35 | | | HollyFrontier Corp. | | | 1,354 | |
| | 35 | | | Hologic, Inc. (a) | | | 1,197 | |
| | 337 | | | Home Depot, Inc. (The) | | | 36,074 | |
| | 309 | | | Honeywell International, Inc. | | | 31,183 | |
| | 8 | | | Host Hotels & Resorts, Inc. | | | 160 | |
| | 127 | | | Humana, Inc. | | | 21,061 | |
| | 13 | | | Illumina, Inc. | | | 2,347 | |
| | 143 | | | Ingersoll-Rand plc | | | 9,398 | |
| | 401 | | | Intel Corp. | | | 13,039 | |
| | 58 | | | Intercontinental Exchange, Inc. | | | 13,102 | |
| | 75 | | | International Business Machines Corp. | | | 12,892 | |
| | 348 | | | Invesco Ltd. | | | 14,433 | |
| | 11 | | | Jack Henry & Associates, Inc. | | | 738 | |
| | 558 | | | Johnson & Johnson | | | 55,307 | |
| | 252 | | | Johnson Controls, Inc. | | | 12,711 | |
| | 22 | | | Keurig Green Mountain, Inc. | | | 2,546 | |
| | 411 | | | KeyCorp | | | 5,943 | |
SEE NOTES TO FINANCIAL STATEMENTS.
| | | | | | | | |
| | | |
| APRIL 30, 2015 | | J.P. MORGAN INTERNATIONAL EQUITY FUNDS | | | | | 53 | |
JPMorgan Global Research Enhanced Index Fund
SCHEDULE OF PORTFOLIO INVESTMENTS
AS OF APRIL 30, 2015 (Unaudited) (continued)
(Amounts in thousands)
| | | | | | | | |
| SHARES | | | SECURITY DESCRIPTION | | VALUE($) | |
| | | | | | | | |
| Common Stocks — continued | |
| | | | United States — continued | | | | |
| | 99 | | | Kilroy Realty Corp. | | | 7,063 | |
| | 136 | | | Kimberly-Clark Corp. | | | 14,880 | |
| | 133 | | | Kinder Morgan, Inc. | | | 5,713 | |
| | 113 | | | KLA-Tencor Corp. | | | 6,638 | |
| | 104 | | | L-3 Communications Holdings, Inc. | | | 11,921 | |
| | 241 | | | Lam Research Corp. | | | 18,247 | |
| | 137 | | | Liberty Property Trust | | | 4,767 | |
| | 42 | | | Lincoln National Corp. | | | 2,381 | |
| | 43 | | | Loews Corp. | | | 1,800 | |
| | 418 | | | Lowe’s Cos., Inc. | | | 28,749 | |
| | 94 | | | Macy’s, Inc. | | | 6,102 | |
| | 19 | | | Mallinckrodt plc (a) | | | 2,196 | |
| | 14 | | | ManpowerGroup, Inc. | | | 1,182 | |
| | 416 | | | Marathon Oil Corp. | | | 12,922 | |
| | 83 | | | Marathon Petroleum Corp. | | | 8,147 | |
| | 27 | | | Marriott International, Inc., Class A | | | 2,130 | |
| | 149 | | | Marsh & McLennan Cos., Inc. | | | 8,377 | |
| | 55 | | | Martin Marietta Materials, Inc. | | | 7,879 | |
| | 283 | | | Masco Corp. | | | 7,497 | |
| | 50 | | | MasterCard, Inc., Class A | | | 4,552 | |
| | 31 | | | McDonald’s Corp. | | | 3,032 | |
| | 17 | | | McGraw Hill Financial, Inc. | | | 1,792 | |
| | 121 | | | McKesson Corp. | | | 27,123 | |
| | 550 | | | Merck & Co., Inc. | | | 32,747 | |
| | 447 | | | MetLife, Inc. | | | 22,924 | |
| | 137 | | | Micron Technology, Inc. (a) | | | 3,846 | |
| | 1,705 | | | Microsoft Corp. | | | 82,911 | |
| | 86 | | | Mid-America Apartment Communities, Inc. | | | 6,442 | |
| | 126 | | | Molson Coors Brewing Co., Class B | | | 9,274 | |
| | 738 | | | Mondelez International, Inc., Class A | | | 28,335 | |
| | 57 | | | Monsanto Co. | | | 6,456 | |
| | 18 | | | Moody’s Corp. | | | 1,967 | |
| | 741 | | | Morgan Stanley | | | 27,632 | |
| | 350 | | | Mosaic Co. (The) | | | 15,414 | |
| | 75 | | | Mylan N.V. (a) | | | 5,388 | |
| | 36 | | | Newell Rubbermaid, Inc. | | | 1,373 | |
| | 215 | | | NextEra Energy, Inc. | | | 21,724 | |
| | 273 | | | NiSource, Inc. | | | 11,859 | |
| | 15 | | | Norfolk Southern Corp. | | | 1,509 | |
| | 276 | | | Occidental Petroleum Corp. | | | 22,134 | |
| | 726 | | | Oracle Corp. | | | 31,671 | |
| | 295 | | | PACCAR, Inc. | | | 19,289 | |
| | 86 | | | Pall Corp. | | | 8,358 | |
| | 104 | | | Parker-Hannifin Corp. | | | 12,403 | |
| | 367 | | | PepsiCo, Inc. | | | 34,890 | |
| | 1,427 | | | Pfizer, Inc. | | | 48,418 | |
| | | | | | | | |
| SHARES | | | SECURITY DESCRIPTION | | VALUE($) | |
| | | | | | | | |
| | | | | | | | |
| | | | United States — continued | | | | |
| | 226 | | | PG&E Corp. | | | 11,963 | |
| | 372 | | | Philip Morris International, Inc. | | | 31,029 | |
| | 76 | | | Phillips 66 | | | 6,044 | |
| | 86 | | | Pinnacle West Capital Corp. | | | 5,260 | |
| | 38 | | | Pioneer Natural Resources Co. | | �� | 6,510 | |
| | 63 | | | PNC Financial Services Group, Inc. (The) | | | 5,769 | |
| | 9 | | | Precision Castparts Corp. | | | 1,922 | |
| | 12 | | | Priceline Group, Inc. (The) (a) | | | 14,557 | |
| | 596 | | | Procter & Gamble Co. (The) | | | 47,407 | |
| | 280 | | | Prologis, Inc. | | | 11,259 | |
| | 78 | | | Prudential Financial, Inc. | | | 6,388 | |
| | 103 | | | Public Service Enterprise Group, Inc. | | | 4,271 | |
| | 423 | | | PulteGroup, Inc. | | | 8,166 | |
| | 11 | | | PVH Corp. | | | 1,123 | |
| | 234 | | | QUALCOMM, Inc. | | | 15,879 | |
| | 21 | | | Quest Diagnostics, Inc. | | | 1,465 | |
| | 187 | | | Questar Corp. | | | 4,375 | |
| | 11 | | | Quintiles Transnational Holdings, Inc. (a) | | | 731 | |
| | 59 | | | Ralph Lauren Corp. | | | 7,898 | |
| | 27 | | | Regency Centers Corp. | | | 1,670 | |
| | 24 | | | Robert Half International, Inc. | | | 1,321 | |
| | 23 | | | Rock-Tenn Co., Class A | | | 1,447 | |
| | 148 | | | Royal Caribbean Cruises Ltd. | | | 10,050 | |
| | 13 | | | SanDisk Corp. | | | 879 | |
| | 304 | | | Schlumberger Ltd. | | | 28,762 | |
| | 68 | | | Sempra Energy | | | 7,171 | |
| | 31 | | | Sherwin-Williams Co. (The) | | | 8,510 | |
| | 62 | | | Simon Property Group, Inc. | | | 11,169 | |
| | 466 | | | Sirius XM Holdings, Inc. (a) | | | 1,840 | |
| | 17 | | | SL Green Realty Corp. | | | 2,080 | |
| | 16 | | | Snap-on, Inc. | | | 2,320 | |
| | 40 | | | Southwestern Energy Co. (a) | | | 1,118 | |
| | 79 | | | SPX Corp. | | | 6,082 | |
| | 30 | | | Stanley Black & Decker, Inc. | | | 2,915 | |
| | 546 | | | Starbucks Corp. | | | 27,058 | |
| | 179 | | | State Street Corp. | | | 13,808 | |
| | 189 | | | Stryker Corp. | | | 17,441 | |
| | 135 | | | SunTrust Banks, Inc. | | | 5,583 | |
| | 32 | | | SVB Financial Group (a) | | | 4,287 | |
| | 57 | | | Symantec Corp. | | | 1,409 | |
| | 32 | | | Synopsys, Inc. (a) | | | 1,507 | |
| | 107 | | | Target Corp. | | | 8,406 | |
| | 101 | | | TD Ameritrade Holding Corp. | | | 3,648 | |
| | 188 | | | Texas Instruments, Inc. | | | 10,169 | |
| | 100 | | | Thermo Fisher Scientific, Inc. | | | 12,613 | |
| | 77 | | | Thomson Reuters Corp. | | | 3,184 | |
SEE NOTES TO FINANCIAL STATEMENTS.
| | | | | | |
| | | |
| 54 | | | | J.P. MORGAN INTERNATIONAL EQUITY FUNDS | | APRIL 30, 2015 |
| | | | | | | | |
| SHARES | | | SECURITY DESCRIPTION | | VALUE($) | |
| | | | | | | | |
| Common Stocks — continued | |
| | | | United States — continued | | | | |
| | 22 | | | Tiffany & Co. | | | 1,897 | |
| | 51 | | | Time Warner Cable, Inc. | | | 7,963 | |
| | 318 | | | Time Warner, Inc. | | | 26,820 | |
| | 329 | | | TJX Cos., Inc. (The) | | | 21,261 | |
| | 47 | | | T-Mobile USA, Inc. (a) | | | 1,603 | |
| | 163 | | | Toll Brothers, Inc. (a) | | | 5,792 | |
| | 662 | | | Twenty-First Century Fox, Inc., Class A | | | 22,551 | |
| | 80 | | | Twenty-First Century Fox, Inc., Class B | | | 2,681 | |
| | 82 | | | Tyco International plc | | | 3,245 | |
| | 161 | | | U.S. Bancorp | | | 6,922 | |
| | 325 | | | Union Pacific Corp. | | | 34,575 | |
| | 151 | | | United Continental Holdings, Inc. (a) | | | 9,025 | |
| | 15 | | | United Rentals, Inc. (a) | | | 1,445 | |
| | 277 | | | United States Steel Corp. | | | 6,648 | |
| | 309 | | | United Technologies Corp. | | | 35,161 | |
| | 279 | | | UnitedHealth Group, Inc. | | | 31,072 | |
| | 207 | | | V.F. Corp. | | | 14,973 | |
| | 59 | | | Valeant Pharmaceuticals International, Inc. (a) | | | 12,822 | |
| | 145 | | | Valero Energy Corp. | | | 8,223 | |
| | 23 | | | VeriSign, Inc. (a) | | | 1,478 | |
| | — | (h) | | Veritiv Corp. (a) | | | — | (h) |
| | 905 | | | Verizon Communications, Inc. | | | 45,652 | |
| | 79 | | | Vertex Pharmaceuticals, Inc. (a) | | | 9,782 | |
| | 531 | | | Visa, Inc., Class A | | | 35,086 | |
| | 85 | | | Walgreens Boots Alliance, Inc. | | | 7,030 | |
| | 145 | | | Wal-Mart Stores, Inc. | | | 11,305 | |
| | 266 | | | Walt Disney Co. (The) | | | 28,954 | |
| | 33 | | | Waste Management, Inc. | | | 1,647 | |
| | 1,209 | | | Wells Fargo & Co. | | | 66,639 | |
| | 10 | | | Western Digital Corp. | | | 975 | |
| | 67 | | | Western Union Co. (The) | | | 1,362 | |
| | 7 | | | Whirlpool Corp. | | | 1,168 | |
| | 265 | | | Xcel Energy, Inc. | | | 9,002 | |
| | 204 | | | Xerox Corp. | | | 2,342 | |
| | | | | | | | |
| | | | | | | 3,478,095 | |
| | | | | | | | |
| | | | Total Common Stocks
(Cost $5,677,205) | | | 6,253,161 | |
| | | | | | | | |
| Preferred Stocks — 0.4% | |
| | | | Germany — 0.4% | | | | |
| | 162 | | | Henkel AG & Co. KGaA | | | 18,786 | |
| | 33 | | | Volkswagen AG | | | 8,400 | |
| | | | | | | | |
| | | | Total Preferred Stocks
(Cost $24,537) | | | 27,186 | |
| | | | | | | | |
| | | | | | | | |
| SHARES | | | SECURITY DESCRIPTION | | VALUE($) | |
| | | | | | | | |
| Short-Term Investment — 3.5% | |
| | | | Investment Company — 3.5% | | | | |
| | 225,787 | | | JPMorgan Prime Money Market Fund, Institutional Class Shares, 0.050% (b) (l)
(Cost $225,787) | | | 225,787 | |
| | | | | | | | |
| | | | Total Investments — 99.7%
(Cost $5,927,529) | | | 6,506,134 | |
| | | | Other Assets in Excess of
Liabilities — 0.3% (c) | | | 22,439 | |
| | | | | | | | |
| | | | NET ASSETS — 100.0% | | $ | 6,528,573 | |
| | | | | | | | |
Percentages indicated are based on net assets.
Summary of Investments by Industry, April 30, 2015
The following table represents the portfolio investments of the Fund by industry classifications as a percentage of total investments:
| | | | |
| INDUSTRY | | PERCENTAGE | |
Banks | | | 9.3 | % |
Pharmaceuticals | | | 7.5 | |
Oil, Gas & Consumable Fuels | | | 6.5 | |
Insurance | | | 4.0 | |
Media | | | 3.3 | |
Technology Hardware, Storage & Peripherals | | | 2.8 | |
Software | | | 2.5 | |
Capital Markets | | | 2.5 | |
Chemicals | | | 2.4 | |
Diversified Telecommunication Services | | | 2.3 | |
Food Products | | | 2.3 | |
Automobiles | | | 2.3 | |
Beverages | | | 2.2 | |
IT Services | | | 2.2 | |
Specialty Retail | | | 2.1 | |
Aerospace & Defense | | | 2.1 | |
Real Estate Investment Trusts (REITs) | | | 1.9 | |
Machinery | | | 1.9 | |
Semiconductors & Semiconductor Equipment | | | 1.8 | |
Biotechnology | | | 1.8 | |
Household Products | | | 1.8 | |
Internet Software & Services | | | 1.8 | |
Road & Rail | | | 1.7 | |
Health Care Providers & Services | | | 1.7 | |
Food & Staples Retailing | | | 1.7 | |
Electric Utilities | | | 1.7 | |
Metals & Mining | | | 1.6 | |
Health Care Equipment & Supplies | | | 1.6 | |
Multi-Utilities | | | 1.4 | |
SEE NOTES TO FINANCIAL STATEMENTS.
| | | | | | | | |
| | | |
| APRIL 30, 2015 | | J.P. MORGAN INTERNATIONAL EQUITY FUNDS | | | | | 55 | |
JPMorgan Global Research Enhanced Index Fund
SCHEDULE OF PORTFOLIO INVESTMENTS
AS OF APRIL 30, 2015 (Unaudited) (continued)
(Amounts in thousands)
| | | | |
| INDUSTRY | | PERCENTAGE | |
Tobacco | | | 1.3 | % |
Hotels, Restaurants & Leisure | | | 1.2 | |
Household Durables | | | 1.0 | |
Others (each less than 1.0%) | | | 14.3 | |
Short-Term Investment | | | 3.5 | |
| | | | | | | | | | | | | | | | |
| Futures Contracts | |
NUMBER OF
CONTRACTS | | | DESCRIPTION | | EXPIRATION
DATE | | | NOTIONAL
VALUE AT
APRIL 30, 2015 | | | NET
UNREALIZED
APPRECIATION
(DEPRECIATION) | |
| | | | Long Futures Outstanding | | | | | | | | | | | | |
| | 146 | | | TOPIX Index | | | 06/11/15 | | | $ | 19,424 | | | $ | (27 | ) |
| | 481 | | | Dow Jones Euro STOXX 50 Index | | | 06/19/15 | | | | 19,271 | | | | (947 | ) |
| | 1,377 | | | E-mini S&P 500 | | | 06/19/15 | | | | 143,132 | | | | 1,424 | |
| | | | | | | | | | | | | | | | |
| | | | | | | | | | | | | | $ | 450 | |
| | | | | | | | | | | | | | | | |
SEE NOTES TO FINANCIAL STATEMENTS.
| | | | | | |
| | | |
| 56 | | | | J.P. MORGAN INTERNATIONAL EQUITY FUNDS | | APRIL 30, 2015 |
JPMorgan Global Unconstrained Equity Fund
SCHEDULE OF PORTFOLIO INVESTMENTS
AS OF APRIL 30, 2015 (Unaudited)
(Amounts in thousands)
| | | | | | | | |
| SHARES | | | SECURITY DESCRIPTION | | VALUE($) | |
| | | | | | | | |
| Common Stocks — 95.0% | | | | |
| | | | Australia — 0.9% | | | | |
| | 4 | | | QBE Insurance Group Ltd. | | | 44 | |
| | | | | | | | |
| | | | Brazil — 0.5% | | | | |
| | 2 | | | Itau Unibanco Holding S.A. (Preference Shares), ADR | | | 26 | |
| | | | | | | | |
| | | | Canada — 2.5% | | | | |
| | 2 | | | MEG Energy Corp. (a) | | | 44 | |
| | 2 | | | Toronto-Dominion Bank (The) | | | 79 | |
| | | | | | | | |
| | | | | | | 123 | |
| | | | | | | | |
| | | | China — 7.1% | | | | |
| | 1 | | | Baidu, Inc., ADR (a) | | | 138 | |
| | 44 | | | China Lesso Group Holdings Ltd. | | | 32 | |
| | 110 | | | Industrial & Commercial Bank of China Ltd., Class H | | | 95 | |
| | 26 | | | KWG Property Holding Ltd. | | | 26 | |
| | 4 | | | Phoenix New Media Ltd., ADR (a) | | | 32 | |
| | 1 | | | SINA Corp. (a) | | | 29 | |
| | | | | | | | |
| | | | | | | 352 | |
| | | | | | | | |
| | | | Finland — 0.6% | | | | |
| | 5 | | | Outokumpu OYJ (a) | | | 29 | |
| | | | | | | | |
| | | | France — 7.1% | | | | |
| | 1 | | | Airbus Group N.V. | | | 42 | |
| | 4 | | | AXA S.A. | | | 106 | |
| | 2 | | | IPSOS | | | 56 | |
| | 1 | | | Sanofi | | | 118 | |
| | — | (h) | | Sopra Steria Group | | | 31 | |
| | | | | | | | |
| | | | | | | 353 | |
| | | | | | | | |
| | | | Germany — 1.6% | | | | |
| | 1 | | | SAP SE, ADR | | | 79 | |
| | | | | | | | |
| | | | Hong Kong — 1.2% | | | | |
| | 14 | | | Sands China Ltd. | | | 57 | |
| | | | | | | | |
| | | | India — 0.8% | | | | |
| | 3 | | | ICICI Bank Ltd., ADR | | | 37 | |
| | | | | | | | |
| | | | Ireland — 0.9% | | | | |
| | — | (h) | | Shire plc, ADR | | | 46 | |
| | | | | | | | |
| | | | Israel — 2.0% | | | | |
| | 2 | | | Teva Pharmaceutical Industries Ltd., ADR | | | 98 | |
| | | | | | | | |
| | | | Japan — 1.8% | | | | |
| | 2 | | | Sumitomo Mitsui Financial Group, Inc. | | | 92 | |
| | | | | | | | |
| | | | Luxembourg — 0.7% | | | | |
| | 2 | | | Globant S.A. (a) | | | 34 | |
| | | | | | | | |
| | | | Netherlands — 1.2% | | | | |
| | 1 | | | NXP Semiconductors N.V. (a) | | | 58 | |
| | | | | | | | |
| | | | | | | | |
| SHARES | | | SECURITY DESCRIPTION | | VALUE($) | |
| | | | | | | | |
| | | | | | | | |
| | | | South Korea — 2.3% | | | | |
| | — | (h) | | Hyundai Motor Co. | | | 50 | |
| | — | (h) | | Samsung Electronics Co., Ltd. | | | 66 | |
| | | | | | | | |
| | | | | | | 116 | |
| | | | | | | | |
| | | | Spain — 2.1% | | | | |
| | 3 | | | Grifols S.A., ADR | | | 106 | |
| | | | | | | | |
| | | | Switzerland — 5.4% | | | | |
| | 1 | | | ACE Ltd. | | | 58 | |
| | 1 | | | Novartis AG | | | 115 | |
| | — | (h) | | Roche Holding AG | | | 51 | |
| | 2 | | | UBS Group AG (a) | | | 44 | |
| | | | | | | | |
| | | | | | | 268 | |
| | | | | | | | |
| | | | United Kingdom — 8.0% | | | | |
| | 34 | | | Barclays plc | | | 132 | |
| | 7 | | | BG Group plc | | | 134 | |
| | 2 | | | Standard Chartered plc | | | 39 | |
| | 25 | | | Vodafone Group plc | | | 89 | |
| | | | | | | | |
| | | | | | | 394 | |
| | | | | | | | |
| | | | United States — 48.3% | | | | |
| | 1 | | | Albemarle Corp. | | | 37 | |
| | — | (h) | | Amazon.com, Inc. (a) | | | 78 | |
| | 1 | | | American Express Co. | | | 49 | |
| | 1 | | | Anadarko Petroleum Corp. | | | 49 | |
| | 1 | | | Apple, Inc. (m) | | | 73 | |
| | 6 | | | Bank of America Corp. | | | 98 | |
| | 4 | | | Boston Scientific Corp. (a) | | | 79 | |
| | 1 | | | Cabot Oil & Gas Corp. | | | 39 | |
| | 3 | | | Citigroup, Inc. | | | 158 | |
| | 1 | | | Comcast Corp., Class A | | | 75 | |
| | 3 | | | Fairchild Semiconductor International, Inc. (a) | | | 54 | |
| | 2 | | | Fluor Corp. (m) | | | 113 | |
| | — | (h) | | Google, Inc., Class A (a) | | | 69 | |
| | — | (h) | | Google, Inc., Class C (a) | | | 153 | |
| | 1 | | | Hartford Financial Services Group, Inc. (The) | | | 46 | |
| | — | (h) | | Humana, Inc. (m) | | | 57 | |
| | 1 | | | Johnson & Johnson (m) | | | 136 | |
| | 1 | | | Lam Research Corp. | | | 78 | |
| | 1 | | | Las Vegas Sands Corp. | | | 54 | |
| | 2 | | | MetLife, Inc. | | | 118 | |
| | 2 | | | Microsoft Corp. | | | 90 | |
| | 2 | | | Mosaic Co. (The) | | | 73 | |
| | 2 | | | Owens Corning | | | 78 | |
| | 3 | | | Pfizer, Inc. | | | 89 | |
| | 1 | | | QUALCOMM, Inc. | | | 84 | |
| | 3 | | | Teradyne, Inc. | | | 49 | |
SEE NOTES TO FINANCIAL STATEMENTS.
| | | | | | | | |
| | | |
| APRIL 30, 2015 | | J.P. MORGAN INTERNATIONAL EQUITY FUNDS | | | | | 57 | |
JPMorgan Global Unconstrained Equity Fund
SCHEDULE OF PORTFOLIO INVESTMENTS
AS OF APRIL 30, 2015 (Unaudited) (continued)
(Amounts in thousands)
| | | | | | | | |
| SHARES | | | SECURITY DESCRIPTION | | VALUE($) | |
| | | | | | | | |
| Common Stocks — continued | |
| | | | United States — continued | | | | |
| | 4 | | | Time, Inc. | | | 101 | |
| | 4 | | | Twenty-First Century Fox, Inc., Class A | | | 139 | |
| | 1 | | | United Continental Holdings, Inc. (a) | | | 72 | |
| | | | | | | | |
| | | | | | | 2,388 | |
| | | | | | | | |
| | | | Total Common Stocks
(Cost $4,056) | | | 4,700 | |
| | | | | | | | |
| Short-Term Investment — 3.3% | | | | |
| | | | Investment Company — 3.3% | | | | |
| | 162 | | | JPMorgan Prime Money Market Fund, Institutional Class Shares, 0.050% (b) (l) (m) (Cost $162) | | | 162 | |
| | | | | | | | |
| | | | Total Investments — 98.3%
(Cost $4,218) | | | 4,862 | |
| | | | Other Assets in Excess of
Liabilities — 1.7% | | | 85 | |
| | | | | | | | |
| | | | NET ASSETS — 100.0% | | $ | 4,947 | |
| | | | | | | | |
Percentages indicated are based on net assets.
Summary of Investments by Industry, April 30, 2015
The following table represents the portfolio investments of the Fund by industry classifications as a percentage of total investments:
| | | | |
| INDUSTRY | | PERCENTAGE | |
Banks | | | 15.6 | % |
Pharmaceuticals | | | 13.4 | |
Internet Software & Services | | | 8.6 | |
Insurance | | | 7.7 | |
Media | | | 7.6 | |
Oil, Gas & Consumable Fuels | | | 5.5 | |
Semiconductors & Semiconductor Equipment | | | 4.9 | |
Software | | | 4.2 | |
Technology Hardware, Storage & Peripherals | | | 2.8 | |
Construction & Engineering | | | 2.3 | |
Hotels, Restaurants & Leisure | | | 2.3 | |
Building Products | | | 2.3 | |
Chemicals | | | 2.3 | |
Biotechnology | | | 2.2 | |
Wireless Telecommunication Services | | | 1.8 | |
Communications Equipment | | | 1.7 | |
Health Care Equipment & Supplies | | | 1.6 | |
Internet & Catalog Retail | | | 1.6 | |
Airlines | | | 1.5 | |
Health Care Providers & Services | | | 1.2 | |
Automobiles | | | 1.0 | |
Consumer Finance | | | 1.0 | |
Others (each less than 1.0%) | | | 3.6 | |
Short-Term Investment | | | 3.3 | |
SEE NOTES TO FINANCIAL STATEMENTS.
| | | | | | |
| | | |
| 58 | | | | J.P. MORGAN INTERNATIONAL EQUITY FUNDS | | APRIL 30, 2015 |
JPMorgan International Equity Fund
SCHEDULE OF PORTFOLIO INVESTMENTS
AS OF APRIL 30, 2015 (Unaudited)
(Amounts in thousands)
| | | | | | | | |
| SHARES | | | SECURITY DESCRIPTION | | VALUE($) | |
| | | | | | | | |
| Common Stocks — 95.8% | | | | |
| | | | Australia — 1.6% | | | | |
| | 1,155 | | | BHP Billiton Ltd. | | | 29,504 | |
| | 639 | | | BHP Billiton plc | | | 15,347 | |
| | | | | | | | |
| | | | | | | 44,851 | |
| | | | | | | | |
| | | | Belgium — 1.5% | | | | |
| | 354 | | | Anheuser-Busch InBev N.V. | | | 43,086 | |
| | | | | | | | |
| | | | China — 3.0% | | | | |
| | 15,252 | | | China Construction Bank Corp., Class H | | | 14,806 | |
| | 14,783 | | | CNOOC Ltd. | | | 25,208 | |
| | 17,435 | | | Industrial & Commercial Bank of China Ltd., Class H | | | 15,124 | |
| | 1,369 | | | Ping An Insurance Group Co. of China Ltd., Class H | | | 19,571 | |
| | 4,736 | | | Wynn Macau Ltd. | | | 9,587 | |
| | | | | | | | |
| | | | | | | 84,296 | |
| | | | | | | | |
| | | | Denmark — 0.8% | | | | |
| | 384 | | | Novo Nordisk A/S, Class B | | | 21,573 | |
| | | | | | | | |
| | | | France — 11.6% | | | | |
| | 510 | | | Accor S.A. | | | 27,973 | |
| | 1,341 | | | AXA S.A. | | | 33,904 | |
| | 533 | | | BNP Paribas S.A. | | | 33,662 | |
| | 171 | | | Essilor International S.A. | | | 20,826 | |
| | 8 | | | Hermes International | | | 3,150 | |
| | 198 | | | Imerys S.A. | | | 15,090 | |
| | 64 | | | Kering | | | 11,890 | |
| | 306 | | | Lafarge S.A. | | | 22,315 | |
| | 174 | | | LVMH Moet Hennessy Louis Vuitton SE | | | 30,463 | |
| | 177 | | | Pernod Ricard S.A. | | | 22,030 | |
| | 494 | | | Sanofi | | | 50,333 | |
| | 394 | | | Schneider Electric SE | | | 29,428 | |
| | 358 | | | Technip S.A. | | | 24,407 | |
| | | | | | | | |
| | | | | | | 325,471 | |
| | | | | | | | |
| | | | Germany — 6.2% | | | | |
| | 256 | | | Allianz SE | | | 43,635 | |
| | 271 | | | Bayer AG (a) | | | 39,003 | |
| | 330 | | | Fresenius Medical Care AG & Co. KGaA | | | 27,712 | |
| | 71 | | | Linde AG | | | 13,951 | |
| | 652 | | | SAP SE | | | 49,301 | |
| | | | | | | | |
| | | | | | | 173,602 | |
| | | | | | | | |
| | | | Hong Kong — 4.4% | | | | |
| | 6,372 | | | China Overseas Land & Investment Ltd. | | | 26,542 | |
| | 2,532 | | | CK Hutchison Holdings Ltd. | | | 54,914 | |
| | 6,606 | | | Hang Lung Properties Ltd. | | | 22,332 | |
| | 4,660 | | | Sands China Ltd. | | | 18,994 | |
| | | | | | | | |
| | | | | | | 122,782 | |
| | | | | | | | |
| | | | | | | | |
| SHARES | | | SECURITY DESCRIPTION | | VALUE($) | |
| | | | | | | | |
| | | | | | | | |
| | | | India — 0.8% | | | | |
| | 386 | | | HDFC Bank Ltd., ADR | | | 21,963 | |
| | | | | | | | |
| | | | Indonesia — 0.4% | | | | |
| | 23,843 | | | Astra International Tbk PT | | | 12,547 | |
| | | | | | | | |
| | | | Israel — 1.0% | | | | |
| | 457 | | | Teva Pharmaceutical Industries Ltd., ADR | | | 27,586 | |
| | | | | | | | |
| | | | Japan — 19.4% | | | | |
| | 1,902 | | | Astellas Pharma, Inc. | | | 29,620 | |
| | 347 | | | Daikin Industries Ltd. | | | 23,343 | |
| | 255 | | | East Japan Railway Co. | | | 22,521 | |
| | 133 | | | FANUC Corp. | | | 29,233 | |
| | 1,287 | | | Honda Motor Co., Ltd. | | | 43,154 | |
| | 1,145 | | | Inpex Corp. | | | 14,364 | |
| | 1,515 | | | Japan Tobacco, Inc. | | | 52,888 | |
| | 583 | | | KDDI Corp. | | | 13,793 | |
| | 1,346 | | | Komatsu Ltd. | | | 27,070 | |
| | 2,267 | | | Kubota Corp. | | | 35,481 | |
| | 471 | | | Makita Corp. | | | 23,495 | |
| | 714 | | | Mitsui Fudosan Co., Ltd. | | | 21,166 | |
| | 257 | | | Nidec Corp. | | | 19,195 | |
| | 323 | | | Nitto Denko Corp. | | | 20,725 | |
| | 260 | | | Shin-Etsu Chemical Co., Ltd. | | | 15,918 | |
| | 113 | | | SMC Corp. | | | 34,113 | |
| | 1,316 | | | Sumitomo Mitsui Financial Group, Inc. | | | 57,476 | |
| | 869 | | | Toyota Motor Corp. | | | 60,476 | |
| | | | | | | | |
| | | | | | | 544,031 | |
| | | | | | | | |
| | | | Netherlands — 4.9% | | | | |
| | 536 | | | Akzo Nobel N.V. | | | 41,046 | |
| | 258 | | | ASML Holding N.V. | | | 27,791 | |
| | 2,963 | | | ING Groep N.V., CVA (a) | | | 45,450 | |
| | 774 | | | Royal Dutch Shell plc, Class A | | | 24,548 | |
| | | | | | | | |
| | | | | | | 138,835 | |
| | | | | | | | |
| | | | South Africa — 0.8% | | | | |
| | 144 | | | Naspers Ltd., Class N | | | 22,618 | |
| | | | | | | | |
| | | | South Korea — 1.9% | | | | |
| | 57 | | | Hyundai Mobis Co., Ltd. | | | 12,500 | |
| | 63 | | | Samsung Electronics Co., Ltd., Reg. S, GDR | | | 41,492 | |
| | | | | | | | |
| | | | | | | 53,992 | |
| | | | | | | | |
| | | | Switzerland — 14.8% | | | | |
| | 1,110 | | | ABB Ltd. (a) | | | 24,332 | |
| | 319 | | | Cie Financiere Richemont S.A. | | | 28,460 | |
| | 1,376 | | | Credit Suisse Group AG (a) | | | 36,415 | |
| | 6,679 | | | Glencore plc (a) | | | 31,728 | |
| | 245 | | | Holcim Ltd. (a) | | | 19,643 | |
SEE NOTES TO FINANCIAL STATEMENTS.
| | | | | | | | |
| | | |
| APRIL 30, 2015 | | J.P. MORGAN INTERNATIONAL EQUITY FUNDS | | | | | 59 | |
JPMorgan International Equity Fund
SCHEDULE OF PORTFOLIO INVESTMENTS
AS OF APRIL 30, 2015 (Unaudited) (continued)
(Amounts in thousands)
| | | | | | | | |
| SHARES | | | SECURITY DESCRIPTION | | VALUE($) | |
| | | | | | | | |
| Common Stocks — continued | |
| | | | Switzerland — continued | | | | |
| | 693 | | | Nestle S.A. | | | 53,731 | |
| | 679 | | | Novartis AG | | | 69,282 | |
| | 211 | | | Roche Holding AG | | | 60,312 | |
| | 2,445 | | | UBS Group AG (a) | | | 48,835 | |
| | 137 | | | Zurich Insurance Group AG (a) | | | 42,333 | |
| | | | | | | | |
| | | | | | | 415,071 | |
| | | | | | | | |
| | | | Taiwan — 0.9% | | | | |
| | 1,068 | | | Taiwan Semiconductor Manufacturing Co., Ltd., ADR | | | 26,101 | |
| | | | | | | | |
| | | | United Kingdom — 21.8% | | | | |
| | 537 | | | Aggreko plc | | | 13,535 | |
| | 1,842 | | | ARM Holdings plc | | | 31,302 | |
| | 10,631 | | | Barclays plc | | | 41,592 | |
| | 3,994 | | | BG Group plc | | | 72,337 | |
| | 632 | | | British American Tobacco plc | | | 34,729 | |
| | 1,051 | | | Burberry Group plc | | | 28,013 | |
| | 2,804 | | | Centrica plc | | | 10,950 | |
| | 6,493 | | | HSBC Holdings plc | | | 64,627 | |
| | 620 | | | Imperial Tobacco Group plc | | | 30,255 | |
| | 2,712 | | | Meggitt plc | | | 21,919 | |
| | 2,115 | | | Prudential plc | | | 52,658 | |
| | 362 | | | Rio Tinto Ltd. | | | 16,331 | |
| | 436 | | | Rio Tinto plc | | | 19,514 | |
| | 2,339 | | | Standard Chartered plc | | | 38,300 | |
| | 796 | | | Tullow Oil plc | | | 5,051 | |
| | 578 | | | Unilever plc | | | 25,322 | |
| | 17,847 | | | Vodafone Group plc | | | 62,880 | |
| | 1,912 | | | WPP plc | | | 44,590 | |
| | | | | | | | |
| | | | | | | 613,905 | |
| | | | | | | | |
| | | | Total Common Stocks
(Cost $2,248,475) | | | 2,692,310 | |
| | | | | | | | |
| Preferred Stocks — 2.6% | | | | |
| | | | Germany — 2.6% | | | | |
| | 226 | | | Henkel AG & Co. KGaA | | | 26,278 | |
| | 177 | | | Volkswagen AG | | | 45,667 | |
| | | | | | | | |
| | | | Total Preferred Stocks
(Cost $51,659) | | | 71,945 | |
| | | | | | | | |
| | | | | | | | |
| SHARES | | | SECURITY DESCRIPTION | | VALUE($) | |
| | | | | | | | |
| Short-Term Investment — 1.7% | |
| | | | Investment Company — 1.7% | | | | |
| | 47,731 | | | JPMorgan Prime Money Market Fund, Institutional Class Shares, 0.050% (b) (l) (m)
(Cost $47,731) | | | 47,731 | |
| | | | | | | | |
| | | | Total Investments — 100.1%
(Cost $2,347,865) | | | 2,811,986 | |
| | | | Liabilities in Excess of
Other Assets — (0.1)% | | | (2,284 | ) |
| | | | | | | | |
| | | | NET ASSETS — 100.0% | | $ | 2,809,702 | |
| | | | | | | | |
Percentages indicated are based on net assets.
Summary of Investments by Industry, April 30, 2015
The following table represents the portfolio investments of the Fund by industry classifications as a percentage of total investments:
| | | | |
| INDUSTRY | | PERCENTAGE | |
Banks | | | 11.8 | % |
Pharmaceuticals | | | 10.6 | |
Insurance | | | 6.8 | |
Automobiles | | | 5.8 | |
Machinery | | | 5.3 | |
Oil, Gas & Consumable Fuels | | | 5.0 | |
Real Estate Management & Development | | | 4.4 | |
Tobacco | | | 4.2 | |
Metals & Mining | | | 4.0 | |
Textiles, Apparel & Luxury Goods | | | 3.6 | |
Chemicals | | | 3.3 | |
Capital Markets | | | 3.0 | |
Semiconductors & Semiconductor Equipment | | | 3.0 | |
Food Products | | | 2.8 | |
Wireless Telecommunication Services | | | 2.7 | |
Electrical Equipment | | | 2.6 | |
Media | | | 2.4 | |
Beverages | | | 2.3 | |
Construction Materials | | | 2.0 | |
Hotels, Restaurants & Leisure | | | 2.0 | |
Software | | | 1.8 | |
Technology Hardware, Storage & Peripherals | | | 1.5 | |
Health Care Providers & Services | | | 1.0 | |
Others (each less than 1.0%) | | | 6.4 | |
Short-Term Investment | | | 1.7 | |
| | | | | | | | | | | | | | | | | | | | | | |
| Forward Foreign Currency Exchange Contracts | | | | | | | | | | | | |
CONTRACTS
TO BUY | | | CURRENCY | | COUNTERPARTY | | SETTLEMENT
DATE | | | SETTLEMENT
VALUE | | | VALUE AT
APRIL 30, 2015 | | | NET
UNREALIZED
APPRECIATION
(DEPRECIATION) | |
| | 505,316 | | | JPY | | Citibank, N.A. | | | 05/07/15 | | | $ | 4,252 | | | $ | 4,232 | | | $ | (20 | ) |
SEE NOTES TO FINANCIAL STATEMENTS.
| | | | | | |
| | | |
| 60 | | | | J.P. MORGAN INTERNATIONAL EQUITY FUNDS | | APRIL 30, 2015 |
JPMorgan International Equity Income Fund
SCHEDULE OF PORTFOLIO INVESTMENTS
AS OF APRIL 30, 2015 (Unaudited)
(Amounts in thousands)
| | | | | | | | |
| SHARES | | | SECURITY DESCRIPTION | | VALUE($) | |
| | | | | | | | |
| Common Stocks — 96.1% | |
| | | | Australia — 5.7% | | | | |
| | 69 | | | BHP Billiton plc | | | 1,655 | |
| | 283 | | | Goodman Group (m) | | | 1,390 | |
| | 156 | | | Transurban Group | | | 1,220 | |
| | 182 | | | Westfield Corp. (m) | | | 1,350 | |
| | | | | | | | |
| | | | | | | 5,615 | |
| | | | | | | | |
| | | | China — 1.8% | | | | |
| | 2,025 | | | Industrial & Commercial Bank of China Ltd., Class H | | | 1,757 | |
| | | | | | | | |
| | | | Finland — 2.3% | | | | |
| | 197 | | | Nokia OYJ | | | 1,332 | |
| | 53 | | | UPM-Kymmene OYJ | | | 958 | |
| | | | | | | | |
| | | | | | | 2,290 | |
| | | | | | | | |
| | | | France — 5.6% | | | | |
| | 36 | | | Accor S.A. | | | 1,950 | |
| | 54 | | | Groupe Eurotunnel SE | | | 869 | |
| | 33 | | | Klepierre (m) | | | 1,591 | |
| | 18 | | | Thales S.A. | | | 1,111 | |
| | | | | | | | |
| | | | | | | 5,521 | |
| | | | | | | | |
| | | | Germany — 7.3% | | | | |
| | 6 | | | Allianz SE | | | 1,005 | |
| | 8 | | | Bayer AG (a) | | | 1,182 | |
| | 5 | | | Continental AG (a) | | | 1,224 | |
| | 15 | | | Deutsche Boerse AG | | | 1,244 | |
| | 31 | | | Deutsche Wohnen AG | | | 824 | |
| | 91 | | | TUI AG | | | 1,695 | |
| | | | | | | | |
| | | | | | | 7,174 | |
| | | | | | | | |
| | | | Hong Kong — 1.7% | | | | |
| | 113 | | | Hutchison Whampoa Ltd. | | | 1,665 | |
| | | | | | | | |
| | | | Ireland — 0.8% | | | | |
| | 10 | | | Shire plc | | | 812 | |
| | | | | | | | |
| | | | Israel — 3.3% | | | | |
| | 911 | | | Bezeq The Israeli Telecommunication Corp., Ltd. | | | 1,725 | |
| | 25 | | | Teva Pharmaceutical Industries Ltd., ADR | | | 1,502 | |
| | | | | | | | |
| | | | | | | 3,227 | |
| | | | | | | | |
| | | | Italy — 1.1% | | | | |
| | 154 | | | UniCredit S.p.A. | | | 1,105 | |
| | | | | | | | |
| | | | Japan — 20.2% | | | | |
| | 44 | | | Canon, Inc. | | | 1,551 | |
| | 54 | | | Daiwa House Industry Co., Ltd. | | | 1,194 | |
| | 274 | | | Hitachi Ltd. | | | 1,870 | |
| | 53 | | | Japan Airlines Co., Ltd. | | | 1,751 | |
| | | | | | | | |
| SHARES | | | SECURITY DESCRIPTION | | VALUE($) | |
| | | | | | | | |
| | | | | | | | |
| | | | Japan — continued | | | | |
| | 89 | | | Japan Tobacco, Inc. | | | 3,122 | |
| | 355 | | | Mitsubishi UFJ Financial Group, Inc. | | | 2,522 | |
| | 32 | | | Nippon Telegraph & Telephone Corp. | | | 2,174 | |
| | 42 | | | Seven & I Holdings Co., Ltd. | | | 1,805 | |
| | 39 | | | Sony Corp. (a) | | | 1,164 | |
| | 40 | | | Toyota Motor Corp. | | | 2,784 | |
| | | | | | | | |
| | | | | | | 19,937 | |
| | | | | | | | |
| | | | Netherlands — 5.5% | | | | |
| | 11 | | | ASML Holding N.V. | | | 1,140 | |
| | 125 | | | ING Groep N.V., CVA (a) | | | 1,922 | |
| | 39 | | | NN Group N.V. (a) | | | 1,130 | |
| | 40 | | | Royal Dutch Shell plc, Class A | | | 1,272 | |
| | | | | | | | |
| | | | | | | 5,464 | |
| | | | | | | | |
| | | | Norway — 2.9% | | | | |
| | 161 | | | DNB ASA | | | 2,867 | |
| | | | | | | | |
| | | | Russia — 0.8% | | | | |
| | 44 | | | MMC Norilsk Nickel OJSC, ADR | | | 832 | |
| | | | | | | | |
| | | | South Africa — 1.1% | | | | |
| | 56 | | | MTN Group Ltd. | | | 1,133 | |
| | | | | | | | |
| | | | South Korea — 1.1% | | | | |
| | 1 | | | Samsung Electronics Co., Ltd. | | | 1,120 | |
| | | | | | | | |
| | | | Spain — 2.6% | | | | |
| | 37 | | | Ferrovial S.A. | | | 833 | |
| | 117 | | | Telefonica S.A. | | | 1,778 | |
| | | | | | | | |
| | | | | | | 2,611 | |
| | | | | | | | |
| | | | Sweden — 1.7% | | | | |
| | 30 | | | Electrolux AB, Series B | | | 908 | |
| | 35 | | | Swedbank AB, Class A | | | 809 | |
| | | | | | | | |
| | | | | | | 1,717 | |
| | | | | | | | |
| | | | Switzerland — 6.5% | | | | |
| | 30 | | | Credit Suisse Group AG (a) | | | 791 | |
| | 9 | | | Novartis AG | | | 962 | |
| | 5 | | | Roche Holding AG | | | 1,543 | |
| | 17 | | | Swiss Re AG (a) | | | 1,488 | |
| | 28 | | | Wolseley plc | | | 1,636 | |
| | | | | | | | |
| | | | | | | 6,420 | |
| | | | | | | | |
| | | | Taiwan — 2.0% | | | | |
| | 137 | | | Siliconware Precision Industries Co., Ltd., ADR | | | 1,107 | |
| | 36 | | | Taiwan Semiconductor Manufacturing Co., Ltd., ADR | | | 871 | |
| | | | | | | | |
| | | | | | | 1,978 | |
| | | | | | | | |
SEE NOTES TO FINANCIAL STATEMENTS.
| | | | | | | | |
| | | |
| APRIL 30, 2015 | | J.P. MORGAN INTERNATIONAL EQUITY FUNDS | | | | | 61 | |
JPMorgan International Equity Income Fund
SCHEDULE OF PORTFOLIO INVESTMENTS
AS OF APRIL 30, 2015 (Unaudited) (continued)
(Amounts in thousands)
| | | | | | | | |
| SHARES | | | SECURITY DESCRIPTION | | VALUE($) | |
| | | | | | | | |
| Common Stocks — continued | |
| | | | United Kingdom — 22.1% | | | | |
| | 169 | | | 3i Group plc | | | 1,311 | |
| | 119 | | | Aberdeen Asset Management plc | | | 865 | |
| | 49 | | | ARM Holdings plc | | | 838 | |
| | 18 | | | AstraZeneca plc | | | 1,214 | |
| | 135 | | | Aviva plc | | | 1,084 | |
| | 208 | | | BAE Systems plc (m) | | | 1,613 | |
| | 330 | | | Centrica plc | | | 1,289 | |
| | 55 | | | Compass Group plc | | | 972 | |
| | 157 | | | Direct Line Insurance Group plc | | | 765 | |
| | 52 | | | GlaxoSmithKline plc | | | 1,206 | |
| | 104 | | | Hammerson plc (m) | | | 1,065 | |
| | 21 | | | InterContinental Hotels Group plc | | | 886 | |
| | 196 | | | Legal & General Group plc | | | 778 | |
| | 271 | | | Man Group plc | | | 798 | |
| | 82 | | | Meggitt plc | | | 664 | |
| | 42 | | | Persimmon plc (a) | | | 1,086 | |
| | 48 | | | Smith & Nephew plc | | | 811 | |
| | 174 | | | SSP Group plc (a) | | | 796 | |
| | 99 | | | UBM plc | | | 852 | |
| | 373 | | | Vodafone Group plc | | | 1,316 | |
| | 71 | | | WPP plc | | | 1,656 | |
| | | | | | | | |
| | | | | | | 21,865 | |
| | | | | | | | |
| | | | Total Common Stocks
(Cost $89,474) | | | 95,110 | |
| | | | | | | | |
| Short-Term Investment — 2.9% | |
| | | | Investment Company — 2.9% | | | | |
| | 2,843 | | | JPMorgan Prime Money Market Fund, Institutional Class Shares, 0.050% (b) (l) (m)
(Cost $2,843) | | | 2,843 | |
| | | | | | | | |
| | | | Total Investments — 99.0%
(Cost $92,317) | | | 97,953 | |
| | | | Other Assets in Excess
of Liabilities — 1.0% | | | 972 | |
| | | | | | | | |
| | | | NET ASSETS — 100.0% | | $ | 98,925 | |
| | | | | | | | |
Percentages indicated are based on net assets.
Summary of Investments by Industry, April 30, 2015
The following table represents the portfolio investments of the Fund by industry classifications as a percentage of total investments:
| | | | |
| INDUSTRY | | PERCENTAGE | |
Banks | | | 11.2 | % |
Pharmaceuticals | | | 8.6 | |
Hotels, Restaurants & Leisure | | | 6.4 | |
Insurance | | | 6.4 | |
Diversified Telecommunication Services | | | 5.8 | |
Real Estate Investment Trusts (REITs) | | | 5.5 | |
Semiconductors & Semiconductor Equipment | | | 4.0 | |
Capital Markets | | | 3.8 | |
Aerospace & Defense | | | 3.5 | |
Household Durables | | | 3.2 | |
Tobacco | | | 3.2 | |
Automobiles | | | 2.8 | |
Technology Hardware, Storage & Peripherals | | | 2.7 | |
Media | | | 2.6 | |
Metals & Mining | | | 2.5 | |
Wireless Telecommunication Services | | | 2.5 | |
Transportation Infrastructure | | | 2.1 | |
Real Estate Management & Development | | | 2.1 | |
Electronic Equipment, Instruments & Components | | | 1.9 | |
Food & Staples Retailing | | | 1.8 | |
Airlines | | | 1.8 | |
Industrial Conglomerates | | | 1.7 | |
Trading Companies & Distributors | | | 1.7 | |
Communications Equipment | | | 1.4 | |
Multi-Utilities | | | 1.3 | |
Oil, Gas & Consumable Fuels | | | 1.3 | |
Diversified Financial Services | | | 1.3 | |
Auto Components | | | 1.3 | |
Paper & Forest Products | | | 1.0 | |
Others (each less than 1.0%) | | | 1.7 | |
Short-Term Investment | | | 2.9 | |
SEE NOTES TO FINANCIAL STATEMENTS.
| | | | | | |
| | | |
| 62 | | | | J.P. MORGAN INTERNATIONAL EQUITY FUNDS | | APRIL 30, 2015 |
JPMorgan International Opportunities Fund
SCHEDULE OF PORTFOLIO INVESTMENTS
AS OF APRIL 30, 2015 (Unaudited)
(Amounts in thousands)
| | | | | | | | |
| SHARES | | | SECURITY DESCRIPTION | | VALUE($) | |
| | | | | | | | |
| Common Stocks — 94.9% | |
| | | | Australia — 4.0% | | | | |
| | 1,141 | | | Australia & New Zealand Banking Group Ltd. | | | 30,535 | |
| | 3,780 | | | Goodman Group | | | 18,548 | |
| | 1,982 | | | Oil Search Ltd. | | | 12,580 | |
| | 2,168 | | | Westfield Corp. | | | 16,117 | |
| | | | | | | | |
| | | | | | | 77,780 | |
| | | | | | | | |
| | | | China — 1.4% | | | | |
| | 2,816 | | | ENN Energy Holdings Ltd. | | | 20,268 | |
| | 7,501 | | | Sun Art Retail Group Ltd. | | | 7,732 | |
| | | | | | | | |
| | | | | | | 28,000 | |
| | | | | | | | |
| | | | Denmark — 0.3% | | | | |
| | 48 | | | Chr Hansen Holding A/S | | | 2,336 | |
| | 136 | | | Danske Bank A/S | | | 3,862 | |
| | | | | | | | |
| | | | | | | 6,198 | |
| | | | | | | | |
| | | | Finland — 1.1% | | | | |
| | 756 | | | Stora Enso OYJ, Class R | | | 7,955 | |
| | 689 | | | UPM-Kymmene OYJ | | | 12,469 | |
| | | | | | | | |
| | | | | | | 20,424 | |
| | | | | | | | |
| | | | France — 8.4% | | | | |
| | 232 | | | Air Liquide S.A. | | | 30,323 | |
| | 349 | | | Airbus Group N.V. | | | 24,169 | |
| | 882 | | | AXA S.A. | | | 22,312 | |
| | 212 | | | Publicis Groupe S.A. | | | 17,776 | |
| | 222 | | | Renault S.A. | | | 23,349 | |
| | 350 | | | Suez Environnement Co. | | | 7,133 | |
| | 175 | | | Thales S.A. | | | 10,651 | |
| | 178 | | | Valeo S.A. | | | 28,564 | |
| | | | | | | | |
| | | | | | | 164,277 | |
| | | | | | | | |
| | | | Germany — 6.5% | | | | |
| | 271 | | | Bayer AG (a) | | | 39,077 | |
| | 53 | | | Continental AG (a) | | | 12,387 | |
| | 374 | | | Daimler AG | | | 35,973 | |
| | 697 | | | E.ON SE | | | 10,848 | |
| | 390 | | | SAP SE | | | 29,471 | |
| | | | | | | | |
| | | | | | | 127,756 | |
| | | | | | | | |
| | | | Hong Kong — 3.1% | | | | |
| | 5,606 | | | China Overseas Land & Investment Ltd. | | | 23,351 | |
| | 1,688 | | | Hutchison Whampoa Ltd. | | | 24,872 | |
| | 3,052 | | | Sands China Ltd. | | | 12,441 | |
| | | | | | | | |
| | | | | | | 60,664 | |
| | | | | | | | |
| | | | Ireland — 1.2% | | | | |
| | 286 | | | Shire plc | | | 23,260 | |
| | | | | | | | |
| | | | Italy — 1.8% | | | | |
| | 3,907 | | | Enel S.p.A. | | | 18,519 | |
| | | | | | | | |
| SHARES | | | SECURITY DESCRIPTION | | VALUE($) | |
| | | | | | | | |
| | | | | | | | |
| | | | Italy — continued | | | | |
| | 4,738 | | | Intesa Sanpaolo S.p.A. | | | 15,917 | |
| | | | | | | | |
| | | | | | | 34,436 | |
| | | | | | | | |
| | | | Japan — 23.0% | | | | |
| | 403 | | | Daikin Industries Ltd. | | | 27,136 | |
| | 1,174 | | | Daiwa House Industry Co., Ltd. | | | 26,214 | |
| | 684 | | | Dentsu, Inc. | | | 31,894 | |
| | 946 | | | DMG Mori Seiki Co., Ltd. | | | 15,427 | |
| | 2,783 | | | Hitachi Ltd. | | | 18,988 | |
| | 640 | | | Japan Airlines Co., Ltd. | | | 21,349 | |
| | 195 | | | Japan Tobacco, Inc. | | | 6,810 | |
| | 3,094 | | | Kajima Corp. | | | 14,780 | |
| | 46 | | | Keyence Corp. | | | 24,557 | |
| | 1,054 | | | Mazda Motor Corp. | | | 20,666 | |
| | 6,321 | | | Mitsubishi UFJ Financial Group, Inc. | | | 44,904 | |
| | 864 | | | Mitsui Fudosan Co., Ltd. | | | 25,613 | |
| | 2,668 | | | Mitsui OSK Lines Ltd. | | | 9,420 | |
| | 550 | | | NH Foods Ltd. | | | 12,017 | |
| | 5,457 | | | Nippon Steel & Sumitomo Metal Corp. | | | 14,195 | |
| | 230 | | | Nippon Telegraph & Telephone Corp. | | | 15,544 | |
| | 1,774 | | | ORIX Corp. | | | 27,280 | |
| | 527 | | | Seven & I Holdings Co., Ltd. | | | 22,648 | |
| | 121 | | | SoftBank Corp. | | | 7,570 | |
| | 566 | | | Sompo Japan Nipponkoa Holdings, Inc. | | | 18,481 | |
| | 464 | | | Sumitomo Mitsui Financial Group, Inc. | | | 20,278 | |
| | 161 | | | Suntory Beverage & Food Ltd. | | | 6,843 | |
| | 805 | | | Yamato Holdings Co., Ltd. | | | 18,010 | |
| | | | | | | | |
| | | | | | | 450,624 | |
| | | | | | | | |
| | | | Netherlands — 4.4% | | | | |
| | 240 | | | ASML Holding N.V. | | | 25,806 | |
| | 2,013 | | | ING Groep N.V., CVA (a) | | | 30,881 | |
| | 936 | | | Royal Dutch Shell plc, Class A | | | 29,673 | |
| | | | | | | | |
| | | | | | | 86,360 | |
| | | | | | | | |
| | | | Norway — 1.5% | | | | |
| | 1,937 | | | Norsk Hydro ASA | | | 9,173 | |
| | 981 | | | Statoil ASA | | | 20,793 | |
| | | | | | | | |
| | | | | | | 29,966 | |
| | | | | | | | |
| | | | South Korea — 1.0% | | | | |
| | 15 | | | Samsung Electronics Co., Ltd. | | | 19,528 | |
| | | | | | | | |
| | | | Spain — 0.6% | | | | |
| | 1,546 | | | Distribuidora Internacional de Alimentacion S.A. | | | 12,379 | |
| | | | | | | | |
| | | | Sweden — 1.1% | | | | |
| | 712 | | | Electrolux AB, Series B | | | 21,315 | |
| | | | | | | | |
| | | | Switzerland — 13.4% | | | | |
| | 116 | | | Cie Financiere Richemont S.A. | | | 10,364 | |
SEE NOTES TO FINANCIAL STATEMENTS.
| | | | | | | | |
| | | |
| APRIL 30, 2015 | | J.P. MORGAN INTERNATIONAL EQUITY FUNDS | | | | | 63 | |
JPMorgan International Opportunities Fund
SCHEDULE OF PORTFOLIO INVESTMENTS
AS OF APRIL 30, 2015 (Unaudited) (continued)
(Amounts in thousands, except number of Futures contracts)
| | | | | | | | |
| SHARES | | | SECURITY DESCRIPTION | | VALUE($) | |
| Common Stocks — continued | |
| | | | Switzerland — continued | | | | |
| | 753 | | | Nestle S.A. | | | 58,442 | |
| | 602 | | | Novartis AG | | | 61,434 | |
| | 194 | | | Roche Holding AG | | | 55,657 | |
| | 201 | | | Swiss Re AG | | | 17,852 | |
| | 1,561 | | | UBS Group AG (a) | | | 31,177 | |
| | 453 | | | Wolseley plc | | | 26,764 | |
| | | | | | | | |
| | | | | | | 261,690 | |
| | | | | | | | |
| | | | United Kingdom — 22.1% | | | | |
| | 932 | | | ARM Holdings plc | | | 15,843 | |
| | 413 | | | AstraZeneca plc | | | 28,314 | |
| | 2,818 | | | Aviva plc | | | 22,673 | |
| | 1,817 | | | BG Group plc | | | 32,915 | |
| | 585 | | | British American Tobacco plc | | | 32,115 | |
| | 1,978 | | | Dixons Carphone plc | | | 12,837 | |
| | 4,358 | | | HSBC Holdings plc | | | 43,539 | |
| | 351 | | | InterContinental Hotels Group plc | | | 15,008 | |
| | 3,097 | | | Kingfisher plc | | | 16,637 | |
| | 1,032 | | | National Grid plc | | | 13,878 | |
| | 624 | | | Pennon Group plc | | | 8,196 | |
| | 1,346 | | | Prudential plc | | | 33,518 | |
| | 314 | | | Reckitt Benckiser Group plc | | | 27,965 | |
| | 651 | | | Rio Tinto plc | | | 29,129 | |
| | 418 | | | SABMiller plc | | | 22,102 | |
| | 1,256 | | | Smith & Nephew plc | | | 21,382 | |
| | 1,737 | | | UBM plc | | | 14,998 | |
| | 11,868 | | | Vodafone Group plc | | | 41,814 | |
| | | | | | | | |
| | | | | | | 432,863 | |
| | | | | | | | |
| | | | Total Common Stocks
(Cost $1,625,136) | | | 1,857,520 | |
| | | | | | | | |
| Preferred Stock — 1.4% | |
| | | | Germany — 1.4% | | | | |
| | 225 | | | Henkel AG & Co. KGaA
(Cost $19,595) | | | 26,171 | |
| | | | | | | | |
| Short-Term Investment — 3.2% | |
| | | | Investment Company — 3.2% | | | | |
| | 62,979 | | | JPMorgan Prime Money Market Fund, Institutional Class Shares,
0.050% (b) (l) (m)
(Cost $62,979) | | | 62,979 | |
| | | | | | | | |
| | | | Total Investments — 99.5%
(Cost $1,707,710) | | | 1,946,670 | |
| | | | Other Assets in Excess
of Liabilities — 0.5% (c) | | | 9,913 | |
| | | | | | | | |
| | | | NET ASSETS — 100.0% | | $ | 1,956,583 | |
| | | | | | | | |
Percentages indicated are based on net assets.
Summary of Investments by Industry, April 30, 2015
The following table represents the portfolio investments of the Fund by industry classifications as a percentage of total investments:
| | | | |
| INDUSTRY | | PERCENTAGE | |
Pharmaceuticals | | | 10.7 | % |
Banks | | | 9.8 | |
Insurance | | | 5.9 | |
Oil, Gas & Consumable Fuels | | | 4.9 | |
Automobiles | | | 4.1 | |
Real Estate Management & Development | | | 3.9 | |
Food Products | | | 3.6 | |
Media | | | 3.3 | |
Household Products | | | 2.8 | |
Metals & Mining | | | 2.7 | |
Wireless Telecommunication Services | | | 2.5 | |
Electronic Equipment, Instruments & Components | | | 2.2 | |
Food & Staples Retailing | | | 2.2 | |
Semiconductors & Semiconductor Equipment | | | 2.1 | |
Auto Components | | | 2.1 | |
Tobacco | | | 2.0 | |
Aerospace & Defense | | | 1.8 | |
Real Estate Investment Trusts (REITs) | | | 1.8 | |
Chemicals | | | 1.7 | |
Multi-Utilities | | | 1.6 | |
Capital Markets | | | 1.6 | |
Specialty Retail | | | 1.5 | |
Software | | | 1.5 | |
Beverages | | | 1.5 | |
Hotels, Restaurants & Leisure | | | 1.4 | |
Diversified Financial Services | | | 1.4 | |
Building Products | | | 1.4 | |
Trading Companies & Distributors | | | 1.4 | |
Industrial Conglomerates | | | 1.3 | |
Health Care Equipment & Supplies | | | 1.1 | |
Airlines | | | 1.1 | |
Household Durables | | | 1.1 | |
Paper & Forest Products | | | 1.0 | |
Gas Utilities | | | 1.0 | |
Technology Hardware, Storage & Peripherals | | | 1.0 | |
Electric Utilities | | | 1.0 | |
Others (each less than 1.0%) | | | 4.8 | |
Short-Term Investment | | | 3.2 | |
SEE NOTES TO FINANCIAL STATEMENTS.
| | | | | | |
| | | |
| 64 | | | | J.P. MORGAN INTERNATIONAL EQUITY FUNDS | | APRIL 30, 2015 |
| | | | | | | | | | | | | | | | |
| Futures Contracts | |
NUMBER OF
CONTRACTS | | | DESCRIPTION | | EXPIRATION
DATE | | | NOTIONAL
VALUE AT
APRIL 30, 2015 | | | NET
UNREALIZED
APPRECIATION
(DEPRECIATION) | |
| | | | Long Futures Outstanding | | | | | | | | | | | | |
| | 49 | | | TOPIX Index | | | 06/11/15 | | | $ | 6,519 | | | $ | (32 | ) |
| | 228 | | | Dow Jones Euro STOXX 50 Index | | | 06/19/15 | | | | 9,135 | | | | (299 | ) |
| | 92 | | | FTSE 100 Index | | | 06/19/15 | | | | 9,785 | | | | (140 | ) |
| | | | | | | | | | | | | | | | |
| | | | | | | | | | | | | | $ | (471 | ) |
| | | | | | | | | | | | | | | | |
| | | | | | | | | | | | | | | | | | | | | | |
| Forward Foreign Currency Exchange Contracts | |
CONTRACTS
TO BUY | | | CURRENCY
| | COUNTERPARTY | | SETTLEMENT DATE | | | SETTLEMENT VALUE | | | VALUE AT
APRIL 30, 2015 | | | NET UNREALIZED APPRECIATION (DEPRECIATION) | |
| | 6,300 | | | EUR | | | | | | | | | | | | | | | | | | |
| | 4,542 | | | for GBP | | State Street Corp. | | | 05/11/15 | | | $ | 6,971 | # | | $ | 7,074 | # | | $ | 103 | |
| | 68,072 | | | HKD | | | | | | | | | | | | | | | | | | |
| | 1,042,251 | | | for JPY | | Westpac Banking Corp. | | | 05/11/15 | | | | 8,730 | # | | | 8,783 | # | | | 53 | |
| | 519,617 | | | JPY | | | | | | | | | | | | | | | | | | |
| | 2,843 | | | for GBP | | Goldman Sachs International | | | 05/11/15 | | | | 4,363 | # | | | 4,352 | # | | | (11 | ) |
| | 71,409 | | | AUD
| | Australia and New Zealand Banking Group Limited | | | 05/11/15 | | | | 54,925 | | | | 56,488 | | | | 1,563 | |
| | 7,068 | | | AUD | | Standard Chartered Bank | | | 05/11/15 | | | | 5,526 | | | | 5,591 | | | | 65 | |
| | 7,173 | | | CAD | | Union Bank of Switzerland AG | | | 05/11/15 | | | | 5,777 | | | | 5,945 | | | | 168 | |
| | 5,889 | | | CHF | | Barclays Bank plc | | | 05/11/15 | | | | 6,081 | | | | 6,314 | | | | 233 | |
| | 6,347 | | | CHF | | Royal Bank of Scotland | | | 05/11/15 | | | | 6,634 | | | | 6,804 | | | | 170 | |
| | 5,812 | | | CHF | | Goldman Sachs International | | | 08/13/15 | | | | 6,218 | | | | 6,254 | | | | 36 | |
| | 28,643 | | | DKK | | BNP Paribas | | | 05/11/15 | | | | 4,205 | | | | 4,309 | | | | 104 | |
| | 110,159 | | | DKK | | HSBC Bank, N.A. | | | 05/11/15 | | | | 16,849 | | | | 16,571 | | | | (278 | ) |
| | 28,077 | | | EUR | | Barclays Bank plc | | | 05/11/15 | | | | 31,878 | | | | 31,529 | | | | (349 | ) |
| | 5,204 | | | EUR | | BNP Paribas | | | 05/11/15 | | | | 5,648 | | | | 5,844 | | | | 196 | |
| | 7,566 | | | EUR | | Citibank, N.A. | | | 05/11/15 | | | | 8,612 | | | | 8,496 | | | | (116 | ) |
| | 16,840 | | | EUR | | Goldman Sachs International | | | 05/11/15 | | | | 18,695 | | | | 18,910 | | | | 215 | |
| | 14,477 | | | EUR | | HSBC Bank, N.A. | | | 05/11/15 | | | | 16,409 | | | | 16,257 | | | | (152 | ) |
| | 9,468 | | | EUR | | National Australia Bank | | | 05/11/15 | | | | 10,116 | | | | 10,632 | | | | 516 | |
| | 42,733 | | | EUR | | Standard Chartered Bank | | | 05/11/15 | | | | 46,361 | | | | 47,987 | | | | 1,626 | |
| | 3,717 | | | EUR | | TD Bank Financial Group | | | 05/11/15 | | | | 4,212 | | | | 4,174 | | | | (38 | ) |
| | 14,827 | | | EUR | | Westpac Banking Corp. | | | 05/11/15 | | | | 16,541 | | | | 16,650 | | | | 109 | |
| | 3,836 | | | EUR | | Citibank, N.A. | | | 08/13/15 | | | | 4,282 | | | | 4,313 | | | | 31 | |
| | 4,520 | | | EUR | | State Street Corp. | | | 08/13/15 | | | | 5,081 | | | | 5,083 | | | | 2 | |
| | 5,367 | | | GBP | | Standard Chartered Bank | | | 05/11/15 | | | | 7,925 | | | | 8,237 | | | | 312 | |
| | 14,075 | | | GBP | | Union Bank of Switzerland AG | | | 05/11/15 | | | | 20,966 | | | | 21,604 | | | | 638 | |
| | 2,464,390 | | | JPY | | Barclays Bank plc | | | 05/11/15 | | | | 20,855 | | | | 20,641 | | | | (214 | ) |
| | 495,043 | | | JPY | | BNP Paribas | | | 05/11/15 | | | | 4,166 | | | | 4,146 | | | | (20 | ) |
| | 1,596,359 | | | JPY | | Standard Chartered Bank | | | 05/11/15 | | | | 13,347 | | | | 13,370 | | | | 23 | |
| | 1,131,366 | | | JPY | | State Street Corp. | | | 05/11/15 | | | | 9,487 | | | | 9,476 | | | | (11 | ) |
| | 1,000,777 | | | JPY | | Union Bank of Switzerland AG | | | 05/11/15 | | | | 8,337 | | | | 8,382 | | | | 45 | |
| | 784,950 | | | JPY | | Goldman Sachs International | | | 08/13/15 | | | | 6,619 | | | | 6,583 | | | | (36 | ) |
| | 225,566 | | | SEK | | Goldman Sachs International | | | 05/11/15 | | | | 27,346 | | | | 27,071 | | | | (275 | ) |
| | 72,159 | | | SEK | | Union Bank of Switzerland AG | | | 05/11/15 | | | | 8,404 | | | | 8,660 | | | | 256 | |
SEE NOTES TO FINANCIAL STATEMENTS.
| | | | | | | | |
| | | |
| APRIL 30, 2015 | | J.P. MORGAN INTERNATIONAL EQUITY FUNDS | | | | | 65 | |
JPMorgan International Opportunities Fund
SCHEDULE OF PORTFOLIO INVESTMENTS
AS OF APRIL 30, 2015 (Unaudited) (continued)
(Amounts in thousands, except number of Futures contracts)
| | | | | | | | | | | | | | | | | | | | | | |
CONTRACTS
TO BUY | | | CURRENCY
| | COUNTERPARTY | | SETTLEMENT DATE | | | SETTLEMENT VALUE | | | VALUE AT
APRIL 30, 2015 | | | NET UNREALIZED APPRECIATION (DEPRECIATION) | |
| | 32,179 | | | SGD | | State Street Corp. | | | 05/11/15 | | | $ | 23,753 | | | $ | 24,315 | | | $ | 562 | |
| | 5,461 | | | SGD | | Union Bank of Switzerland AG | | | 05/11/15 | | | | 4,020 | | | | 4,127 | | | | 107 | |
| | | | | | | | | | | | $ | 449,339 | | | $ | 454,972 | | | $ | 5,633 | |
| | |
CONTRACTS
TO SELL | | | CURRENCY | | COUNTERPARTY | | SETTLEMENT
DATE | | | SETTLEMENT
VALUE | | | VALUE AT
APRIL 30, 2015 | | | NET
UNREALIZED
APPRECIATION
(DEPRECIATION) | |
| | 4,174 | | | CAD | | Citibank, N.A. | | | 05/11/15 | | | $ | 3,348 | | | $ | 3,459 | | | $ | (111 | ) |
| | 2,999 | | | CAD | | Credit Suisse International | | | 05/11/15 | | | | 2,367 | | | | 2,485 | | | | (118 | ) |
| | 6,134 | | | CHF | | HSBC Bank, N.A. | | | 05/11/15 | | | | 6,386 | | | | 6,577 | | | | (191 | ) |
| | 61,518 | | | CHF | | Union Bank of Switzerland AG | | | 05/11/15 | | | | 66,303 | | | | 65,952 | | | | 351 | |
| | 3,079 | | | CHF | | Westpac Banking Corp. | | | 05/11/15 | | | | 3,338 | | | | 3,301 | | | | 37 | |
| | 20,938 | | | DKK | | Morgan Stanley | | | 05/11/15 | | | | 3,178 | | | | 3,149 | | | | 29 | |
| | 3,686 | | | EUR | | BNP Paribas | | | 05/11/15 | | | | 4,175 | | | | 4,139 | | | | 36 | |
| | 4,443 | | | EUR | | Credit Suisse International | | | 05/11/15 | | | | 5,042 | | | | 4,990 | | | | 52 | |
| | 23,256 | | | EUR | | Royal Bank of Canada | | | 05/11/15 | | | | 25,359 | | | | 26,115 | | | | (756 | ) |
| | 16,366 | | | EUR | | Union Bank of Switzerland AG | | | 05/11/15 | | | | 17,671 | | | | 18,377 | | | | (706 | ) |
| | 6,027 | | | GBP | | Barclays Bank plc | | | 05/11/15 | | | | 9,176 | | | | 9,251 | | | | (75 | ) |
| | 30,272 | | | GBP | | Citibank, N.A. | | | 05/11/15 | | | | 45,527 | | | | 46,465 | | | | (938 | ) |
| | 13,620 | | | GBP | | Goldman Sachs International | | | 05/11/15 | | | | 20,223 | | | | 20,905 | | | | (682 | ) |
| | 7,009 | | | GBP | | HSBC Bank, N.A. | | | 05/11/15 | | | | 10,476 | | | | 10,757 | | | | (281 | ) |
| | 3,601 | | | GBP | | Morgan Stanley | | | 05/11/15 | | | | 5,356 | | | | 5,528 | | | | (172 | ) |
| | 8,434 | | | GBP | | Royal Bank of Canada | | | 05/11/15 | | | | 12,512 | | | | 12,946 | | | | (434 | ) |
| | 2,961 | | | GBP | | Westpac Banking Corp. | | | 05/11/15 | | | | 4,343 | | | | 4,545 | | | | (202 | ) |
| | 55,084 | | | HKD | | Citibank, N.A. | | | 05/11/15 | | | | 7,106 | | | | 7,107 | | | | (1 | ) |
| | 147,452 | | | HKD | | Union Bank of Switzerland AG | | | 05/11/15 | | | | 19,020 | | | | 19,025 | | | | (5 | ) |
| | 1,485,670 | | | JPY | | Australia and New Zealand Banking Group Limited | | | 05/11/15 | | | | 12,366 | | | | 12,444 | | | | (78 | ) |
| | 902,494 | | | JPY | | Barclays Bank plc | | | 05/11/15 | | | | 7,599 | | | | 7,559 | | | | 40 | |
| | 708,025 | | | JPY | | Goldman Sachs International | | | 05/11/15 | | | | 6,036 | | | | 5,930 | | | | 106 | |
| | 2,845,288 | | | JPY | | HSBC Bank, N.A. | | | 05/11/15 | | | | 23,817 | | | | 23,831 | | | | (14 | ) |
| | 493,536 | | | JPY | | State Street Corp. | | | 05/11/15 | | | | 4,135 | | | | 4,133 | | | | 2 | |
| | 622,138 | | | JPY | | Union Bank of Switzerland AG | | | 05/11/15 | | | | 5,258 | | | | 5,211 | | | | 47 | |
| | 2,270,890 | | | JPY | | Westpac Banking Corp. | | | 05/11/15 | | | | 19,128 | | | | 19,020 | | | | 108 | |
| | 110,176 | | | NOK | | State Street Corp. | | | 05/11/15 | | | | 14,149 | | | | 14,629 | | | | (480 | ) |
| | | | | | | | | | | | $ | 363,394 | | | $ | 367,830 | | | $ | (4,436 | ) |
| | |
| # | For cross-currency exchange contracts, the settlement value is the U.S. Dollar market value at April 30, 2015 of the currency being sold, and the value at April 30, 2015 is the U.S. dollar market value of the currency being purchased. |
SEE NOTES TO FINANCIAL STATEMENTS.
| | | | | | |
| | | |
| 66 | | | | J.P. MORGAN INTERNATIONAL EQUITY FUNDS | | APRIL 30, 2015 |
JPMorgan International Research Enhanced Equity Fund
SCHEDULE OF PORTFOLIO INVESTMENTS
AS OF APRIL 30, 2015 (Unaudited)
(Amounts in thousands)
| | | | | | | | |
| SHARES | | | SECURITY DESCRIPTION | | VALUE($) | |
| | | | | | | | |
| Common Stocks — 95.8% | | | | |
| | | | Australia — 5.6% | | | | |
| | 515 | | | AMP Ltd. | | | 2,606 | |
| | 288 | | | Australia & New Zealand Banking Group Ltd. | | | 7,713 | |
| | 449 | | | BGP Holdings plc (a) (i) | | | — | (h) |
| | 313 | | | BHP Billiton Ltd. | | | 8,000 | |
| | 41 | | | BHP Billiton plc | | | 977 | |
| | 101 | | | Commonwealth Bank of Australia | | | 7,076 | |
| | 339 | | | Dexus Property Group | | | 1,970 | |
| | 854 | | | Goodman Group | | | 4,190 | |
| | 52 | | | Macquarie Group Ltd. | | | 3,167 | |
| | 40 | | | National Australia Bank Ltd. | | | 1,149 | |
| | 91 | | | Origin Energy Ltd. | | | 909 | |
| | 130 | | | Wesfarmers Ltd. | | | 4,497 | |
| | 104 | | | Westpac Banking Corp. | | | 2,974 | |
| | | | | | | | |
| | | | | | | 45,228 | |
| | | | | | | | |
| | | | Belgium — 0.8% | | | | |
| | 34 | | | Delhaize Group S.A. | | | 2,775 | |
| | 27 | | | Solvay S.A. | | | 3,957 | |
| | | | | | | | |
| | | | | | | 6,732 | |
| | | | | | | | |
| | | | Denmark — 2.2% | | | | |
| | 1 | | | AP Moeller — Maersk A/S, Class B | | | 1,768 | |
| | 47 | | | Chr Hansen Holding A/S | | | 2,295 | |
| | 127 | | | Danske Bank A/S | | | 3,597 | |
| | 176 | | | Novo Nordisk A/S, Class B | | | 9,854 | |
| | | | | | | | |
| | | | | | | 17,514 | |
| | | | | | | | |
| | | | Finland — 1.6% | | | | |
| | 59 | | | Cargotec Oyj | | | 2,397 | |
| | 259 | | | Nokia OYJ | | | 1,747 | |
| | 245 | | | Outokumpu OYJ (a) | | | 1,476 | |
| | 239 | | | UPM-Kymmene OYJ | | | 4,316 | |
| | 66 | | | Wartsila OYJ Abp | | | 3,048 | |
| | | | | | | | |
| | | | | | | 12,984 | |
| | | | | | | | |
| | | | France — 10.8% | | | | |
| | 51 | | | Air Liquide S.A. | | | 6,698 | |
| | 92 | | | Airbus Group N.V. | | | 6,386 | |
| | 670 | | | Alcatel-Lucent (a) | | | 2,325 | |
| | 186 | | | Altran Technologies S.A. | | | 2,026 | |
| | 266 | | | AXA S.A. | | | 6,716 | |
| | 94 | | | BNP Paribas S.A. | | | 5,922 | |
| | 33 | | | Cap Gemini S.A. | | | 2,949 | |
| | 283 | | | GDF Suez | | | 5,763 | |
| | 27 | | | Lafarge S.A. | | | 2,006 | |
| | 8 | | | L’Oreal S.A. (a) | | | 1,487 | |
| | 396 | | | Natixis S.A. | | | 3,279 | |
| | 56 | | | Publicis Groupe S.A. | | | 4,737 | |
| | | | | | | | |
| SHARES | | | SECURITY DESCRIPTION | | VALUE($) | |
| | | | | | | | |
| | | | | | | | |
| | | | France — continued | | | | |
| | 57 | | | Renault S.A. | | | 5,993 | |
| | 103 | | | Sanofi | | | 10,531 | |
| | 86 | | | Schneider Electric SE | | | 6,462 | |
| | 91 | | | Societe Generale S.A. | | | 4,535 | |
| | 42 | | | Thales S.A. | | | 2,581 | |
| | 131 | | | TOTAL S.A. | | | 7,084 | |
| | | | | | | | |
| | | | | | | 87,480 | |
| | | | | | | | |
| | | | Germany — 8.1% | | | | |
| | 45 | | | Allianz SE | | | 7,719 | |
| | 18 | | | BASF SE | | | 1,810 | |
| | 78 | | | Bayer AG (a) | | | 11,256 | |
| | 61 | | | Bayerische Motoren Werke AG | | | 7,249 | |
| | 75 | | | Brenntag AG | | | 4,475 | |
| | 5 | | | Continental AG (a) | | | 1,233 | |
| | 43 | | | Deutsche Bank AG | | | 1,382 | |
| | 120 | | | Deutsche Post AG | | | 3,951 | |
| | 353 | | | Deutsche Telekom AG | | | 6,495 | |
| | 166 | | | E.ON SE | | | 2,577 | |
| | 56 | | | HeidelbergCement AG | | | 4,264 | |
| | 6 | | | Muenchener Rueckversicherungs-Gesellschaft AG | | | 1,212 | |
| | 98 | | | SAP SE | | | 7,423 | |
| | 44 | | | Siemens AG | | | 4,779 | |
| | | | | | | | |
| | | | | | | 65,825 | |
| | | | | | | | |
| | | | Hong Kong — 2.7% | | | | |
| | 262 | | | AIA Group Ltd. | | | 1,744 | |
| | 267 | | | CK Hutchison Holdings Ltd. | | | 5,795 | |
| | 107 | | | Hang Seng Bank Ltd. | | | 2,078 | |
| | 401 | | | Hutchison Whampoa Ltd. | | | 5,912 | |
| | 262 | | | Power Assets Holdings Ltd. | | | 2,649 | |
| | 535 | | | Sands China Ltd. | | | 2,180 | |
| | 185 | | | Wharf Holdings Ltd. (The) | | | 1,335 | |
| | | | | | | | |
| | | | | | | 21,693 | |
| | | | | | | | |
| | | | Ireland — 1.2% | | | | |
| | 50 | | | Ryanair Holdings plc, ADR | | | 3,273 | |
| | 76 | | | Shire plc | | | 6,159 | |
| | | | | | | | |
| | | | | | | 9,432 | |
| | | | | | | | |
| | | | Israel — 0.3% | | | | |
| | 45 | | | Teva Pharmaceutical Industries Ltd., ADR | | | 2,735 | |
| | | | | | | | |
| | | | Italy — 2.2% | | | | |
| | 203 | | | Assicurazioni Generali S.p.A. | | | 3,961 | |
| | 1,079 | | | Enel Green Power S.p.A. | | | 2,095 | |
| | 705 | | | Enel S.p.A. | | | 3,344 | |
| | 3,220 | | | Telecom Italia S.p.A. (a) | | | 3,800 | |
SEE NOTES TO FINANCIAL STATEMENTS.
| | | | | | | | |
| | | |
| APRIL 30, 2015 | | J.P. MORGAN INTERNATIONAL EQUITY FUNDS | | | | | 67 | |
JPMorgan International Research Enhanced Equity Fund
SCHEDULE OF PORTFOLIO INVESTMENTS
AS OF APRIL 30, 2015 (Unaudited) (continued)
(Amounts in thousands, except number of Futures contracts)
| | | | | | | | |
| SHARES | | | SECURITY DESCRIPTION | | VALUE($) | |
| | | | | | | | |
| Common Stocks — continued | |
| | | | Italy — continued | | | | |
| | 676 | | | UniCredit S.p.A. | | | 4,851 | |
| | | | | | | | |
| | | | | | | 18,051 | |
| | | | | | | | |
| | | | Japan — 22.1% | | | | |
| | 249 | | | Amada Holdings Co., Ltd. | | | 2,513 | |
| | 31 | | | Central Japan Railway Co. | | | 5,573 | |
| | 293 | | | Daicel Corp. | | | 3,532 | |
| | 44 | | | Daikin Industries Ltd. | | | 2,977 | |
| | 109 | | | Daiwa House Industry Co., Ltd. | | | 2,425 | |
| | 57 | | | Dentsu, Inc. | | | 2,671 | |
| | 142 | | | DMG Mori Seiki Co., Ltd. | | | 2,322 | |
| | 64 | | | East Japan Railway Co. | | | 5,657 | |
| | 78 | | | Electric Power Development Co., Ltd. | | | 2,619 | |
| | 22 | | | FANUC Corp. | | | 4,729 | |
| | 115 | | | Fuji Heavy Industries Ltd. | | | 3,852 | |
| | 474 | | | Fujitsu Ltd. | | | 3,143 | |
| | 568 | | | Hitachi Ltd. | | | 3,875 | |
| | 78 | | | Honda Motor Co., Ltd. | | | 2,612 | |
| | 51 | | | Japan Tobacco, Inc. | | | 1,767 | |
| | 156 | | | JFE Holdings, Inc. | | | 3,520 | |
| | 531 | | | JX Holdings, Inc. | | | 2,311 | |
| | 669 | | | Kajima Corp. | | | 3,196 | |
| | 151 | | | KDDI Corp. | | | 3,564 | |
| | 8 | | | Keyence Corp. | | | 4,057 | |
| | 271 | | | Kirin Holdings Co., Ltd. | | | 3,584 | |
| | 103 | | | LIXIL Group Corp. | | | 2,143 | |
| | 39 | | | Mabuchi Motor Co., Ltd. | | | 2,341 | |
| | 136 | | | Mazda Motor Corp. | | | 2,670 | |
| | 144 | | | Medipal Holdings Corp. | | | 1,958 | |
| | 1,239 | | | Mitsubishi UFJ Financial Group, Inc. | | | 8,802 | |
| | 94 | | | Mitsui & Co., Ltd. | | | 1,321 | |
| | 146 | | | Mitsui Fudosan Co., Ltd. | | | 4,320 | |
| | 135 | | | MS&AD Insurance Group Holdings, Inc. | | | 3,869 | |
| | 48 | | | NGK Spark Plug Co., Ltd. | | | 1,332 | |
| | 1,244 | | | Nippon Steel & Sumitomo Metal Corp. | | | 3,236 | |
| | 83 | | | Nippon Telegraph & Telephone Corp. | | | 5,598 | |
| | 688 | | | Nishi-Nippon City Bank Ltd. (The) | | | 2,192 | |
| | 38 | | | Nitori Holdings Co., Ltd. | | | 2,960 | |
| | 199 | | | ORIX Corp. | | | 3,066 | |
| | 95 | | | Otsuka Holdings Co., Ltd. | | | 3,008 | |
| | 228 | | | Ricoh Co., Ltd. | | | 2,354 | |
| | 99 | | | Seiko Epson Corp. | | | 1,737 | |
| | 124 | | | Seven & I Holdings Co., Ltd. | | | 5,330 | |
| | 189 | | | Sony Corp. (a) | | | 5,710 | |
| | 611 | | | Sumitomo Bakelite Co., Ltd. | | | 2,786 | |
| | 59 | | | Sumitomo Corp. | | | 699 | |
| | | | | | | | |
| SHARES | | | SECURITY DESCRIPTION | | VALUE($) | |
| | | | | | | | |
| | | | | | | | |
| | | | Japan — continued | | | | |
| | 159 | | | Sumitomo Mitsui Financial Group, Inc. | | | 6,960 | |
| | 72 | | | Suntory Beverage & Food Ltd. | | | 3,054 | |
| | 77 | | | Suzuken Co., Ltd. | | | 2,422 | |
| | 50 | | | Sysmex Corp. | | | 2,767 | |
| | 295 | | | Takashimaya Co., Ltd. | | | 2,753 | |
| | 610 | | | Tokyo Gas Co., Ltd. | | | 3,519 | |
| | 216 | | | Toyota Motor Corp. | | | 15,064 | |
| | 113 | | | Yamato Holdings Co., Ltd. | | | 2,518 | |
| | 149 | | | Yamazaki Baking Co., Ltd. | | | 2,637 | |
| | | | | | | | |
| | | | | | | 179,625 | |
| | | | | | | | |
| | | | Luxembourg — 0.3% | | | | |
| | 230 | | | ArcelorMittal | | | 2,450 | |
| | | | | | | | |
| | | | Netherlands — 4.1% | | | | |
| | 386 | | | Aegon N.V. | | | 3,047 | |
| | 28 | | | ASML Holding N.V. | | | 2,970 | |
| | 54 | | | Heineken N.V. | | | 4,246 | |
| | 304 | | | ING Groep N.V., CVA (a) | | | 4,657 | |
| | 60 | | | NN Group N.V. (a) | | | 1,750 | |
| | 309 | | | Royal Dutch Shell plc, Class A | | | 9,736 | |
| | 214 | | | Royal Dutch Shell plc, Class B | | | 6,856 | |
| | | | | | | | |
| | | | | | | 33,262 | |
| | | | | | | | |
| | | | New Zealand — 0.4% | | | | |
| | 1,298 | | | Spark New Zealand Ltd. | | | 2,937 | |
| | | | | | | | |
| | | | Norway — 0.6% | | | | |
| | 148 | | | DNB ASA | | | 2,624 | |
| | 96 | | | Telenor ASA | | | 2,164 | |
| | | | | | | | |
| | | | | | | 4,788 | |
| | | | | | | | |
| | | | Portugal — 0.2% | | | | |
| | 444 | | | EDP — Energias de Portugal S.A. | | | 1,774 | |
| | | | | | | | |
| | | | Singapore — 0.9% | | | | |
| | 339 | | | DBS Group Holdings Ltd. | | | 5,382 | |
| | 259 | | | Singapore Exchange Ltd. | | | 1,665 | |
| | | | | | | | |
| | | | | | | 7,047 | |
| | | | | | | | |
| | | | Spain — 2.8% | | | | |
| | 113 | | | Banco Bilbao Vizcaya Argentaria S.A. | | | 1,137 | |
| | 603 | | | Banco Santander S.A. (a) | | | 4,558 | |
| | 1,723 | | | Bankia S.A. (a) | | | 2,406 | |
| | 429 | | | Distribuidora Internacional de Alimentacion S.A. | | | 3,433 | |
| | 173 | | | Repsol S.A. | | | 3,556 | |
| | 492 | | | Telefonica S.A. | | | 7,496 | |
| | | | | | | | |
| | | | | | | 22,586 | |
| | | | | | | | |
SEE NOTES TO FINANCIAL STATEMENTS.
| | | | | | |
| | | |
| 68 | | | | J.P. MORGAN INTERNATIONAL EQUITY FUNDS | | APRIL 30, 2015 |
| | | | | | | | |
| SHARES | | | SECURITY DESCRIPTION | | VALUE($) | |
| | | | | | | | |
| Common Stocks — continued | |
| | | | Sweden — 1.8% | | | | |
| | 57 | | | Assa Abloy AB, Class B | | | 3,297 | |
| | 121 | | | Electrolux AB, Series B | | | 3,610 | |
| | 25 | | | Hennes & Mauritz AB, Class B | | | 989 | |
| | 380 | | | Nordea Bank AB | | | 4,824 | |
| | 164 | | | Telefonaktiebolaget LM Ericsson, Class B | | | 1,792 | |
| | | | | | | | |
| | | | | | | 14,512 | |
| | | | | | | | |
| | | | Switzerland — 8.1% | | | | |
| | 46 | | | Cie Financiere Richemont S.A. | | | 4,064 | |
| | 45 | | | Credit Suisse Group AG (a) | | | 1,196 | |
| | 122 | | | Logitech International S.A. | | | 1,832 | |
| | 233 | | | Nestle S.A. | | | 18,096 | |
| | 125 | | | Novartis AG | | | 12,808 | |
| | 37 | | | Roche Holding AG | | | 10,479 | |
| | 37 | | | Swiss Re AG | | | 3,274 | |
| | 484 | | | UBS Group AG (a) | | | 9,665 | |
| | 76 | | | Wolseley plc | | | 4,525 | |
| | | | | | | | |
| | | | | | | 65,939 | |
| | | | | | | | |
| | | | United Kingdom — 19.0% | | | | |
| | 403 | | | 3i Group plc | | | 3,122 | |
| | 67 | | | Anglo American plc | | | 1,127 | |
| | 58 | | | Associated British Foods plc | | | 2,544 | |
| | 124 | | | AstraZeneca plc | | | 8,525 | |
| | 484 | | | Aviva plc | | | 3,897 | |
| | 303 | | | BAE Systems plc | | | 2,350 | |
| | 1,983 | | | Barclays plc | | | 7,759 | |
| | 338 | | | Barratt Developments plc | | | 2,683 | |
| | 364 | | | BG Group plc | | | 6,588 | |
| | 1,072 | | | BP plc | | | 7,729 | |
| | 186 | | | British American Tobacco plc | | | 10,200 | |
| | 141 | | | Burberry Group plc | | | 3,766 | |
| | 1,198 | | | Debenhams plc | | | 1,646 | |
| | 529 | | | Dixons Carphone plc | | | 3,436 | |
| | 265 | | | Domino’s Pizza Group plc | | | 3,215 | |
| | 182 | | | GlaxoSmithKline plc | | | 4,197 | |
| | 180 | | | HSBC Holdings plc | | | 1,788 | |
| | 995 | | | HSBC Holdings plc | | | 9,945 | |
| | 56 | | | Indivior plc (a) | | | 173 | |
| | 96 | | | InterContinental Hotels Group plc | | | 4,095 | |
| | 1,021 | | | ITV plc | | | 3,963 | |
| | 1,733 | | | Lloyds Banking Group plc | | | 2,052 | |
| | 137 | | | Prudential plc | | | 3,417 | |
| | 73 | | | Reckitt Benckiser Group plc | | | 6,510 | |
| | 59 | | | Rio Tinto Ltd. | | | 2,656 | |
| | 53 | | | Rio Tinto plc | | | 2,359 | |
| | 367 | | | RSA Insurance Group plc | | | 2,401 | |
| | | | | | | | |
| SHARES | | | SECURITY DESCRIPTION | | VALUE($) | |
| | | | | | | | |
| | | | | | | | |
| | | | United Kingdom — continued | | | | |
| | 127 | | | SABMiller plc | | | 6,740 | |
| | 693 | | | SIG plc | | | 2,058 | |
| | 211 | | | Smith & Nephew plc | | | 3,590 | |
| | 220 | | | SSE plc | | | 5,214 | |
| | 981 | | | Taylor Wimpey plc | | | 2,491 | |
| | 179 | | | Tesco plc | | | 604 | |
| | 239 | | | UBM plc | | | 2,064 | |
| | 158 | | | Unilever N.V., CVA | | | 6,890 | |
| | 2,745 | | | Vodafone Group plc | | | 9,672 | |
| | 33 | | | Whitbread plc | | | 2,636 | |
| | | | | | | | |
| | | | | | | 154,102 | |
| | | | | | | | |
| | | | Total Common Stocks
(Cost $664,009) | | | 776,696 | |
| | | | | | | | |
| Preferred Stocks — 1.3% | |
| | | | Germany — 1.3% | | | | |
| | 54 | | | Henkel AG & Co. KGaA | | | 6,318 | |
| | 17 | | | Volkswagen AG | | | 4,334 | |
| | | | | | | | |
| | | | Total Preferred Stocks
(Cost $6,900) | | | 10,652 | |
| | | | | | | | |
| Short-Term Investment — 2.2% | | | | |
| | | | Investment Company — 2.2% | | | | |
| | 17,887 | | | JPMorgan Prime Money Market Fund, Institutional Class Shares, 0.050%, (b) (l)
(Cost $17,887) | | | 17,887 | |
| | | | | | | | |
| | | | Total Investments — 99.3%
(Cost $688,796) | | | 805,235 | |
| | | | Other Assets in Excess of
Liabilities — 0.7% (c) | | | 5,536 | |
| | | | | | | | |
| | | | NET ASSETS — 100.0% | | $ | 810,771 | |
| | | | | | | | |
Percentages indicated are based on net assets.
SEE NOTES TO FINANCIAL STATEMENTS.
| | | | | | | | |
| | | |
| APRIL 30, 2015 | | J.P. MORGAN INTERNATIONAL EQUITY FUNDS | | | | | 69 | |
JPMorgan International Research Enhanced Equity Fund
SCHEDULE OF PORTFOLIO INVESTMENTS
AS OF APRIL 30, 2015 (Unaudited) (continued)
(Amounts in thousands, except number of Futures contracts)
Summary of Investments by Industry, April 30, 2015
The following table represents the portfolio investments of the Fund by industry classifications as a percentage of total investments:
| | | | |
| INDUSTRY | | PERCENTAGE | |
Banks | | | 13.4 | % |
Pharmaceuticals | | | 9.9 | |
Insurance | | | 5.7 | |
Oil, Gas & Consumable Fuels | | | 5.6 | |
Automobiles | | | 5.2 | |
Food Products | | | 3.7 | |
Diversified Telecommunication Services | | | 3.5 | |
Metals & Mining | | | 3.2 | |
Chemicals | | | 2.6 | |
Capital Markets | | | 2.3 | |
Beverages | | | 2.2 | |
Food & Staples Retailing | | | 2.1 | |
Machinery | | | 1.9 | |
Household Durables | | | 1.8 | |
Real Estate Management & Development | | | 1.7 | |
Media | | | 1.7 | |
Wireless Telecommunication Services | | | 1.6 | |
| | | | |
| INDUSTRY | | PERCENTAGE | |
Trading Companies & Distributors | | | 1.6 | % |
Electric Utilities | | | 1.6 | |
Household Products | | | 1.6 | |
Hotels, Restaurants & Leisure | | | 1.5 | |
Tobacco | | | 1.5 | |
Aerospace & Defense | | | 1.4 | |
Road & Rail | | | 1.4 | |
Industrial Conglomerates | | | 1.3 | |
Electrical Equipment | | | 1.1 | |
Building Products | | | 1.0 | |
Multi-Utilities | | | 1.0 | |
IT Services | | | 1.0 | |
Electronic Equipment, Instruments & Components | | | 1.0 | |
Textiles, Apparel & Luxury Goods | | | 1.0 | |
Others (each less than 1.0%) | | | 11.7 | |
Short-Term Investment | | | 2.2 | |
| | | | | | | | | | | | | | | | |
| Futures Contracts | |
NUMBER OF
CONTRACTS | | | DESCRIPTION | | EXPIRATION
DATE | | | NOTIONAL
VALUE AT
APRIL 30, 2015 | | | NET
UNREALIZED
APPRECIATION
(DEPRECIATION) | |
| | | | Long Futures Outstanding | | | | | | | | | | | | |
| | 39 | | | TOPIX Index | | | 06/11/15 | | | $ | 5,189 | | | $ | 20 | |
| | 180 | | | Dow Jones Euro STOXX 50 Index | | | 06/19/15 | | | | 7,211 | | | | (61 | ) |
| | 44 | | | FTSE 100 Index | | | 06/19/15 | | | | 4,680 | | | | 102 | |
| | | | | | | | | | | | | | | | |
| | | | | | | | | | | | | | $ | 61 | |
| | | | | | | | | | | | | | | | |
SEE NOTES TO FINANCIAL STATEMENTS.
| | | | | | |
| | | |
| 70 | | | | J.P. MORGAN INTERNATIONAL EQUITY FUNDS | | APRIL 30, 2015 |
JPMorgan International Unconstrained Equity Fund
SCHEDULE OF PORTFOLIO INVESTMENTS
AS OF APRIL 30, 2015 (Unaudited)
(Amounts in thousands)
| | | | | | | | |
| SHARES | | | SECURITY DESCRIPTION | | VALUE($) | |
| | | | | | | | |
| Common Stocks — 88.6% | | | | |
| | | | Canada — 6.6% | | | | |
| | 5 | | | Canadian National Railway Co. | | | 342 | |
| | 12 | | | MEG Energy Corp. (a) | | | 227 | |
| | 8 | | | Suncor Energy, Inc. | | | 267 | |
| | 14 | | | Toronto-Dominion Bank (The) | | | 628 | |
| | | | | | | | |
| | | | | | | 1,464 | |
| | | | | | | | |
| | | | China — 6.3% | | | | |
| | 4 | | | Baidu, Inc., ADR (a) | | | 770 | |
| | 44 | | | Ping An Insurance Group Co. of China Ltd., Class H | | | 622 | |
| | | | | | | | |
| | | | | | | 1,392 | |
| | | | | | | | |
| | | | France — 12.0% | | | | |
| | 11 | | | Accor S.A. | | | 617 | |
| | 19 | | | AXA S.A. | | | 475 | |
| | 37 | | | Orange S.A. | | | 605 | |
| | 5 | | | Sanofi | | | 505 | |
| | 6 | | | Schneider Electric SE | | | 438 | |
| | | | | | | | |
| | | | | | | 2,640 | |
| | | | | | | | |
| | | | Germany — 3.1% | | | | |
| | 4 | | | Fresenius Medical Care AG & Co. KGaA | | | 299 | |
| | 13 | | | Zalando SE (a) (e) | | | 391 | |
| | | | | | | | |
| | | | | | | 690 | |
| | | | | | | | |
| | | | Hong Kong — 2.9% | | | | |
| | 30 | | | CK Hutchison Holdings Ltd. | | | 640 | |
| | | | | | | | |
| | | | India — 3.8% | | | | |
| | 7 | | | HDFC Bank Ltd., ADR | | | 398 | |
| | 40 | | | ICICI Bank Ltd., ADR | | | 440 | |
| | | | | | | | |
| | | | | | | 838 | |
| | | | | | | | |
| | | | Ireland — 1.8% | | | | |
| | 5 | | | Shire plc | | | 394 | |
| | | | | | | | |
| | | | Italy — 2.1% | | | | |
| | 142 | | | Intesa Sanpaolo S.p.A. | | | 477 | |
| | | | | | | | |
| | | | Japan — 11.8% | | | | |
| | 16 | | | Japan Tobacco, Inc. | | | 573 | |
| | 21 | | | KDDI Corp. | | | 492 | |
| | 16 | | | Kubota Corp. | | | 251 | |
| | 8 | | | Makita Corp. | | | 389 | |
| | 11 | | | Sumitomo Mitsui Financial Group, Inc. | | | 493 | |
| | 6 | | | Toyota Motor Corp. | | | 404 | |
| | | | | | | | |
| | | | | | | 2,602 | |
| | | | | | | | |
| | | | Netherlands — 4.6% | | | | |
| | 8 | | | Akzo Nobel N.V. | | | 598 | |
| | 28 | | | ING Groep N.V., CVA (a) | | | 422 | |
| | | | | | | | |
| | | | | | | 1,020 | |
| | | | | | | | |
| | | | | | | | |
| SHARES | | | SECURITY DESCRIPTION | | VALUE($) | |
| | | | | | | | |
| | | | | | | | |
| | | | South Africa — 2.0% | | | | |
| | 3 | | | Naspers Ltd., Class N | | | 435 | |
| | | | | | | | |
| | | | South Korea — 2.4% | | | | |
| | 1 | | | Samsung Electronics Co., Ltd., Reg. S, GDR | | | 526 | |
| | | | | | | | |
| | | | Switzerland — 11.6% | | | | |
| | 2 | | | Actelion Ltd. (a) | | | 217 | |
| | 5 | | | Cie Financiere Richemont S.A. | | | 419 | |
| | 6 | | | Holcim Ltd. (a) | | | 489 | |
| | 4 | | | Novartis AG | | | 398 | |
| | 2 | | | Roche Holding AG | | | 622 | |
| | 21 | | | UBS Group AG (a) | | | 425 | |
| | | | | | | | |
| | | | | | | 2,570 | |
| | | | | | | | |
| | | | Taiwan — 1.8% | | | | |
| | 16 | | | Taiwan Semiconductor Manufacturing Co., Ltd., ADR | | | 395 | |
| | | | | | | | |
| | | | United Kingdom — 15.8% | | | | |
| | 23 | | | ARM Holdings plc | | | 394 | |
| | 160 | | | Barclays plc | | | 628 | |
| | 24 | | | BG Group plc | | | 433 | |
| | 50 | | | Meggitt plc | | | 401 | |
| | 17 | | | Prudential plc | | | 411 | |
| | 23 | | | Smith & Nephew plc | | | 394 | |
| | 119 | | | Vodafone Group plc | | | 420 | |
| | 17 | | | WPP plc | | | 395 | |
| | | | | | | | |
| | | | | | | 3,476 | |
| | | | | | | | |
| | | | Total Common Stocks
(Cost $18,472) | | | 19,559 | |
| | | | | | | | |
| Short-Term Investment — 7.3% | | | | |
| | | | Investment Company — 7.3% | | | | |
| | 1,600 | | | JPMorgan Prime Money Market Fund, Institutional Class Shares, 0.050% (b) (l) (m)
(Cost $1,600) | | | 1,600 | |
| | | | | | | | |
| | | | Total Investments — 95.9%
(Cost $20,072) | | | 21,159 | |
| | | | Other Assets in Excess of
Liabilities — 4.1% | | | 894 | |
| | | | | | | | |
| | | | NET ASSETS — 100.0% | | $ | 22,053 | |
| | | | | | | | |
Percentages indicated are based on net assets.
SEE NOTES TO FINANCIAL STATEMENTS.
| | | | | | | | |
| | | |
| APRIL 30, 2015 | | J.P. MORGAN INTERNATIONAL EQUITY FUNDS | | | | | 71 | |
JPMorgan International Unconstrained Equity Fund
SCHEDULE OF PORTFOLIO INVESTMENTS
AS OF APRIL 30, 2015 (Unaudited) (continued)
(Amounts in thousands)
Summary of Investments by Industry, April 30, 2015
The following table represents the portfolio investments of the Fund by industry classifications as a percentage of total investments:
| | | | |
| INDUSTRY | | PERCENTAGE | |
Banks | | | 16.5 | % |
Pharmaceuticals | | | 9.1 | |
Insurance | | | 7.1 | |
Oil, Gas & Consumable Fuels | | | 4.4 | |
Wireless Telecommunication Services | | | 4.3 | |
Media | | | 3.9 | |
Semiconductors & Semiconductor Equipment | | | 3.7 | |
Internet Software & Services | | | 3.6 | |
Real Estate Management & Development | | | 3.0 | |
Machinery | | | 3.0 | |
Hotels, Restaurants & Leisure | | | 2.9 | |
Diversified Telecommunication Services | | | 2.9 | |
Chemicals | | | 2.8 | |
Tobacco | | | 2.7 | |
| | | | |
| INDUSTRY | | PERCENTAGE | |
Technology Hardware, Storage & Peripherals | | | 2.5 | % |
Construction Materials | | | 2.3 | |
Electrical Equipment | | | 2.1 | |
Capital Markets | | | 2.0 | |
Textiles, Apparel & Luxury Goods | | | 2.0 | |
Automobiles | | | 1.9 | |
Aerospace & Defense | | | 1.9 | |
Health Care Equipment & Supplies | | | 1.9 | |
Internet & Catalog Retail | | | 1.8 | |
Road & Rail | | | 1.6 | |
Health Care Providers & Services | | | 1.4 | |
Biotechnology | | | 1.0 | |
Others (each less than 1.0%) | | | 0.1 | |
Short-Term Investment | | | 7.6 | |
SEE NOTES TO FINANCIAL STATEMENTS.
| | | | | | |
| | | |
| 72 | | | | J.P. MORGAN INTERNATIONAL EQUITY FUNDS | | APRIL 30, 2015 |
JPMorgan International Value Fund
SCHEDULE OF PORTFOLIO INVESTMENTS
AS OF APRIL 30, 2015 (Unaudited)
(Amounts in thousands)
| | | | | | | | |
| SHARES | | | SECURITY DESCRIPTION | | VALUE($) | |
| | | | | | | | |
| Common Stocks — 97.1% | |
| | | | Australia — 3.3% | |
| | 1,722 | | | Australia & New Zealand Banking Group Ltd. | | | 46,075 | |
| | 3,461 | | | Goodman Group (m) | | | 16,983 | |
| | 3,438 | | | Oil Search Ltd. | | | 21,826 | |
| | | | | | | | |
| | | | | | | 84,884 | |
| | | | | | | | |
| | | | Belgium — 2.0% | |
| | 285 | | | KBC Groep N.V. (a) | | | 18,745 | |
| | 221 | | | Solvay S.A. | | | 32,482 | |
| | | | | | | | |
| | | | | | | 51,227 | |
| | | | | | | | |
| | | | Brazil — 0.7% | |
| | 1,401 | | | Itau Unibanco Holding S.A. (Preference Shares), ADR | | | 17,963 | |
| | | | | | | | |
| | | | China — 1.0% | |
| | 29,316 | | | Industrial & Commercial Bank of China Ltd., Class H | | | 25,431 | |
| | | | | | | | |
| | | | Finland — 0.9% | |
| | 1,214 | | | UPM-Kymmene OYJ | | | 21,961 | |
| | | | | | | | |
| | | | France — 13.6% | |
| | 371 | | | Airbus Group N.V. | | | 25,729 | |
| | 2,051 | | | AXA S.A. | | | 51,858 | |
| | 761 | | | BNP Paribas S.A. | | | 48,063 | |
| | 151 | | | Cap Gemini S.A. | | | 13,494 | |
| | 1,716 | | | GDF Suez | | | 34,915 | |
| | 216 | | | Publicis Groupe S.A. | | | 18,144 | |
| | 377 | | | Renault S.A. | | | 39,623 | |
| | 211 | | | Schneider Electric SE | | | 15,759 | |
| | 250 | | | Societe Generale S.A. | | | 12,488 | |
| | 251 | | | Sodexo S.A. | | | 25,413 | |
| | 1,072 | | | TOTAL S.A. | | | 58,075 | |
| | | | | | | | |
| | | | | | | 343,561 | |
| | | | | | | | |
| | | | Germany — 7.1% | |
| | 240 | | | Bayer AG (a) | | | 34,552 | |
| | 347 | | | Brenntag AG | | | 20,797 | |
| | 334 | | | Daimler AG | | | 32,095 | |
| | 1,993 | | | Deutsche Telekom AG | | | 36,640 | |
| | 222 | | | HeidelbergCement AG | | | 17,030 | |
| | 1,225 | | | Infineon Technologies AG | | | 14,407 | |
| | 1,326 | | | TUI AG | | | 24,727 | |
| | | | | | | | |
| | | | | | | 180,248 | |
| | | | | | | | |
| | | | Hong Kong — 1.0% | |
| | 1,699 | | | Hutchison Whampoa Ltd. | | | 25,034 | |
| | | | | | | | |
| | | | India — 0.5% | |
| | 432 | | | Infosys Ltd., ADR | | | 13,372 | |
| | | | | | | | |
| | | | | | | | |
| SHARES | | | SECURITY DESCRIPTION | | VALUE($) | |
| | | | | | | | |
| | | | | | | | |
| | | | Ireland — 1.8% | |
| | 322 | | | Ryanair Holdings plc, ADR | | | 20,890 | |
| | 300 | | | Shire plc | | | 24,382 | |
| | | | | | | | |
| | | | | | | 45,272 | |
| | | | | | | | |
| | | | Italy — 5.2% | |
| | 1,131 | | | Assicurazioni Generali S.p.A. | | | 22,107 | |
| | 8,369 | | | Enel S.p.A. | | | 39,671 | |
| | 8,129 | | | Intesa Sanpaolo S.p.A. | | | 27,309 | |
| | 20,286 | | | Telecom Italia S.p.A. (a) | | | 23,943 | |
| | 2,486 | | | UniCredit S.p.A. | | | 17,843 | |
| | | | | | | | |
| | | | | | | 130,873 | |
| | | | | | | | |
| | | | Japan — 22.9% | |
| | 190 | | | Daikin Industries Ltd. | | | 12,814 | |
| | 1,313 | | | Daiwa House Industry Co., Ltd. | | | 29,311 | |
| | 114 | | | Dentsu, Inc. | | | 5,296 | |
| | 4,004 | | | Hitachi Ltd. | | | 27,319 | |
| | 786 | | | Japan Airlines Co., Ltd. | | | 26,220 | |
| | 376 | | | Japan Tobacco, Inc. | | | 13,116 | |
| | 3,503 | | | Kawasaki Heavy Industries Ltd. | | | 18,054 | |
| | 721 | | | Mazda Motor Corp. (m) | | | 14,127 | |
| | 11,896 | | | Mitsubishi UFJ Financial Group, Inc. | | | 84,516 | |
| | 1,166 | | | Mitsui Fudosan Co., Ltd. | | | 34,565 | |
| | 4,726 | | | Mitsui OSK Lines Ltd. | | | 16,686 | |
| | 622 | | | Nippon Telegraph & Telephone Corp. | | | 41,974 | |
| | 1,312 | | | ORIX Corp. | | | 20,183 | |
| | 791 | | | Seven & I Holdings Co., Ltd. | | | 34,009 | |
| | 759 | | | Sompo Japan Nipponkoa Holdings, Inc. | | | 24,783 | |
| | 1,472 | | | Sony Corp. (a) | | | 44,513 | |
| | 635 | | | Sumitomo Mitsui Financial Group, Inc. | | | 27,736 | |
| | 1,285 | | | Toyota Motor Corp. | | | 89,419 | |
| | 621 | | | Yamaha Motor Co., Ltd. | | | 14,618 | |
| | | | | | | | |
| | | | | | | 579,259 | |
| | | | | | | | |
| | | | Luxembourg — 1.0% | |
| | 2,359 | | | ArcelorMittal | | | 25,103 | |
| | | | | | | | |
| | | | Netherlands — 4.9% | |
| | 2,419 | | | ING Groep N.V., CVA (a) | | | 37,111 | |
| | 7,685 | | | Koninklijke KPN N.V. | | | 28,494 | |
| | 670 | | | NN Group N.V. (a) | | | 19,542 | |
| | 1,215 | | | Royal Dutch Shell plc, Class A | | | 38,315 | |
| | | | | | | | |
| | | | | | | 123,462 | |
| | | | | | | | |
| | | | Norway — 1.9% | |
| | 1,413 | | | DNB ASA | | | 25,105 | |
| | 4,632 | | | Norsk Hydro ASA | | | 21,938 | |
| | | | | | | | |
| | | | | | | 47,043 | |
| | | | | | | | |
SEE NOTES TO FINANCIAL STATEMENTS.
| | | | | | | | |
| | | |
| APRIL 30, 2015 | | J.P. MORGAN INTERNATIONAL EQUITY FUNDS | | | | | 73 | |
JPMorgan International Value Fund
SCHEDULE OF PORTFOLIO INVESTMENTS
AS OF APRIL 30, 2015 (Unaudited) (continued)
(Amounts in thousands)
| | | | | | | | |
| SHARES | | | SECURITY DESCRIPTION | | VALUE($) | |
| | | | | | | | |
| Common Stocks — continued | |
| | | | Singapore — 0.9% | |
| | 1,404 | | | DBS Group Holdings Ltd. | | | 22,305 | |
| | | | | | | | |
| | | | South Korea — 1.6% | |
| | 31 | | | Samsung Electronics Co., Ltd. | | | 40,942 | |
| | | | | | | | |
| | | | Spain — 3.3% | |
| | 2,618 | | | Banco Bilbao Vizcaya Argentaria S.A. | | | 26,305 | |
| | 10,949 | | | Bankia S.A. (a) | | | 15,291 | |
| | 2,038 | | | Repsol S.A. | | | 42,020 | |
| | | | | | | | |
| | | | | | | 83,616 | |
| | | | | | | | |
| | | | Sweden — 1.2% | |
| | 1,043 | | | Electrolux AB, Series B | | | 31,234 | |
| | | | | | | | |
| | | | Switzerland — 5.9% | |
| | 526 | | | Credit Suisse Group AG (a) | | | 13,933 | |
| | 410 | | | Nestle S.A. | | | 31,839 | |
| | 290 | | | Novartis AG | | | 29,554 | |
| | 160 | | | Roche Holding AG | | | 45,734 | |
| | 477 | | | Wolseley plc | | | 28,220 | |
| | | | | | | | |
| | | | | | | 149,280 | |
| | | | | | | | |
| | | | United Kingdom — 16.4% | |
| | 568 | | | AstraZeneca plc | | | 38,997 | |
| | 4,131 | | | Aviva plc | | | 33,232 | |
| | 3,076 | | | BAE Systems plc (m) | | | 23,832 | |
| | 11,657 | | | Barclays plc | | | 45,606 | |
| | 2,380 | | | BG Group plc | | | 43,116 | |
| | 454 | | | British American Tobacco plc | | | 24,959 | |
| | 2,141 | | | Dixons Carphone plc | | | 13,896 | |
| | 567 | | | InterContinental Hotels Group plc | | | 24,239 | |
| | 1,853 | | | National Grid plc | | | 24,932 | |
| | 1,849 | | | Prudential plc | | | 46,041 | |
| | 140 | | | Reckitt Benckiser Group plc | | | 12,466 | |
| | 233 | | | SABMiller plc | | | 12,332 | |
| | 20,228 | | | Vodafone Group plc | | | 71,268 | |
| | | | | | | | |
| | | | | | | 414,916 | |
| | | | | | | | |
| | | | Total Common Stocks
(Cost $2,150,282) | | | 2,456,986 | |
| | | | | | | | |
| Preferred Stock — 0.9% | |
| | | | Germany — 0.9% | |
| | 237 | | | Porsche Automobil Holding SE
(Cost $25,198) | | | 22,485 | |
| | | | | | | | |
| | | | | | | | |
| SHARES | | | SECURITY DESCRIPTION | | VALUE($) | |
| | | | | | | | |
| Short-Term Investment — 0.2% | |
| | | | Investment Company — 0.2% | |
| | 4,663 | | | JPMorgan Prime Money Market Fund, Institutional Class Shares, 0.050% (b) (l) (m)
(Cost $4,663) | | | 4,663 | |
| | | | | | | | |
| | | | Total Investments — 98.2%
(Cost $2,180,143) | | | 2,484,134 | |
| | | | Other Assets in Excess of
Liabilities — 1.8% | | | 46,085 | |
| | | | | | | | |
| | | | NET ASSETS — 100.0% | | $ | 2,530,219 | |
| | | | | | | | |
Percentages indicated are based on net assets.
Summary of Investments by Industry, April 30, 2015
The following table represents the portfolio investments of the Fund by industry classifications as a percentage of total investments:
| | | | |
| INDUSTRY | | PERCENTAGE | |
Banks | | | 20.0 | % |
Automobiles | | | 8.5 | |
Oil, Gas & Consumable Fuels | | | 8.2 | |
Insurance | | | 8.0 | |
Pharmaceuticals | | | 7.0 | |
Diversified Telecommunication Services | | | 5.3 | |
Household Durables | | | 3.0 | |
Hotels, Restaurants & Leisure | | | 3.0 | |
Wireless Telecommunication Services | | | 2.9 | |
Real Estate Management & Development | | | 2.5 | |
Multi-Utilities | | | 2.4 | |
Aerospace & Defense | | | 2.0 | |
Trading Companies & Distributors | | | 2.0 | |
Airlines | | | 1.9 | |
Metals & Mining | | | 1.9 | |
Technology Hardware, Storage & Peripherals | | | 1.6 | |
Electric Utilities | | | 1.6 | |
Tobacco | | | 1.5 | |
Food & Staples Retailing | | | 1.4 | |
Chemicals | | | 1.3 | |
Food Products | | | 1.3 | |
Electronic Equipment, Instruments & Components | | | 1.1 | |
IT Services | | | 1.1 | |
Industrial Conglomerates | | | 1.0 | |
Others (each less than 1.0%) | | | 9.3 | |
Short-Term Investment | | | 0.2 | |
SEE NOTES TO FINANCIAL STATEMENTS.
| | | | | | |
| | | |
| 74 | | | | J.P. MORGAN INTERNATIONAL EQUITY FUNDS | | APRIL 30, 2015 |
| | | | | | | | | | | | | | | | | | | | | | |
| Forward Foreign Currency Exchange Contracts | |
CONTRACTS
TO BUY | | | CURRENCY | | COUNTERPARTY | | SETTLEMENT
DATE | | | SETTLEMENT
VALUE | | | VALUE AT
APRIL 30, 2015 | | | NET
UNREALIZED
APPRECIATION
(DEPRECIATION) | |
| | 8,698 | | | EUR | | | | | | | | | | | | | | | | | | |
| | 12,299 | | | for AUD | | Deutsche Bank AG | | | 05/29/15 | | | $ | 9,719 | # | | $ | 9,770 | # | | $ | 51 | |
| | 8,139 | | | EUR | | | | | | | | | | | | | | | | | | |
| | 8,393 | | | for CHF | | Barclays Bank plc | | | 05/29/15 | | | | 9,005 | # | | | 9,142 | # | | | 137 | |
| | 195,175 | | | AUD | | Australia and New Zealand Banking Group Limited | | | 05/29/15 | | | | 150,530 | | | | 154,233 | | | | 3,703 | |
| | 10,411 | | | AUD | | HSBC Bank, N.A. | | | 05/29/15 | | | | 7,995 | | | | 8,227 | | | | 232 | |
| | 8,664 | | | CHF | | Australia and New Zealand Banking Group Limited | | | 05/29/15 | | | | 9,351 | | | | 9,296 | | | | (55 | ) |
| | 7,472 | | | CHF | | Barclays Bank plc | | | 05/29/15 | | | | 7,840 | | | | 8,016 | | | | 176 | |
| | 6,506 | | | CHF | | BNP Paribas | | | 05/29/15 | | | | 6,844 | | | | 6,979 | | | | 135 | |
| | 11,903 | | | CHF | | Citibank, N.A. | | | 05/29/15 | | | | 12,624 | | | | 12,770 | | | | 146 | |
| | 19,102 | | | CHF | | Deutsche Bank AG | | | 05/29/15 | | | | 19,455 | | | | 20,493 | | | | 1,038 | |
| | 11,305 | | | CHF | | HSBC Bank, N.A. | | | 05/29/15 | | | | 11,512 | | | | 12,128 | | | | 616 | |
| | 17,106 | | | CHF | | Morgan Stanley | | | 05/29/15 | | | | 18,039 | | | | 18,351 | | | | 312 | |
| | 9,799 | | | CHF | | State Street Corp. | | | 05/29/15 | | | | 10,203 | | | | 10,512 | | | | 309 | |
| | 18,647 | | | CHF | | Union Bank of Switzerland AG | | | 05/29/15 | | | | 19,233 | | | | 20,005 | | | | 772 | |
| | 9,585 | | | CHF | | Westpac Banking Corp. | | | 05/29/15 | | | | 10,116 | | | | 10,283 | | | | 167 | |
| | 71,183 | | | DKK | | BNP Paribas | | | 05/29/15 | | | | 10,154 | | | | 10,716 | | | | 562 | |
| | 77,512 | | | DKK | | Citibank, N.A. | | | 05/29/15 | | | | 11,985 | | | | 11,669 | | | | (316 | ) |
| | 49,833 | | | DKK | | Royal Bank of Scotland | | | 05/29/15 | | | | 7,119 | | | | 7,502 | | | | 383 | |
| | 30,093 | | | EUR | | Credit Suisse International | | | 05/29/15 | | | | 32,479 | | | | 33,801 | | | | 1,322 | |
| | 70,001 | | | EUR | | Deutsche Bank AG | | | 05/29/15 | | | | 74,116 | | | | 78,626 | | | | 4,510 | |
| | 58,349 | | | EUR | | Morgan Stanley | | | 05/29/15 | | | | 61,992 | | | | 65,539 | | | | 3,547 | |
| | 34,809 | | | EUR | | Royal Bank of Canada | | | 05/29/15 | | | | 37,809 | | | | 39,098 | | | | 1,289 | |
| | 107,970 | | | EUR | | Union Bank of Switzerland AG | | | 05/29/15 | | | | 116,946 | | | | 121,274 | | | | 4,328 | |
| | 104,352 | | | EUR | | Westpac Banking Corp. | | | 05/29/15 | | | | 112,210 | | | | 117,210 | | | | 5,000 | |
| | 14,480 | | | GBP | | Australia and New Zealand Banking Group Limited | | | 05/29/15 | | | | 21,460 | | | | 22,223 | | | | 763 | |
| | 31,741 | | | GBP | | Deutsche Bank AG | | | 05/29/15 | | | | 46,328 | | | | 48,714 | | | | 2,386 | |
| | 43,744 | | | GBP | | Goldman Sachs International | | | 05/29/15 | | | | 64,816 | | | | 67,134 | | | | 2,318 | |
| | 13,463 | | | GBP | | HSBC Bank, N.A. | | | 05/29/15 | | | | 20,216 | | | | 20,662 | | | | 446 | |
| | 17,807 | | | GBP | | Royal Bank of Canada | | | 05/29/15 | | | | 27,078 | | | | 27,329 | | | | 251 | |
| | 29,295 | | | GBP | | Standard Chartered Bank | | | 05/29/15 | | | | 43,629 | | | | 44,960 | | | | 1,331 | |
| | 64,310 | | | GBP | | Union Bank of Switzerland AG | | | 05/29/15 | | | | 99,211 | | | | 98,698 | | | | (513 | ) |
| | 31,674 | | | GBP | | Westpac Banking Corp. | | | 05/29/15 | | | | 47,089 | | | | 48,610 | | | | 1,521 | |
| | 47,082 | | | HKD | | Barclays Bank plc | | | 05/29/15 | | | | 6,070 | | | | 6,075 | | | | 5 | |
| | 151,729 | | | HKD | | Goldman Sachs International | | | 05/29/15 | | | | 19,576 | | | | 19,577 | | | | 1 | |
| | 91,123 | | | HKD | | HSBC Bank, N.A. | | | 05/29/15 | | | | 11,748 | | | | 11,757 | | | | 9 | |
| | 89,528 | | | HKD | | Westpac Banking Corp. | | | 05/29/15 | | | | 11,540 | | | | 11,551 | | | | 11 | |
| | 737,063 | | | JPY | | BNP Paribas | | | 05/29/15 | | | | 6,182 | | | | 6,174 | | | | (8 | ) |
| | 3,768,583 | | | JPY | | Citibank, N.A. | | | 05/29/15 | | | | 31,666 | | | | 31,570 | | | | (96 | ) |
| | 10,209,048 | | | JPY | | Deutsche Bank AG | | | 05/29/15 | | | | 84,915 | | | | 85,522 | | | | 607 | |
| | 5,375,788 | | | JPY | | Goldman Sachs International | | | 05/29/15 | | | | 44,509 | | | | 45,034 | | | | 525 | |
| | 8,280,357 | | | JPY | | HSBC Bank, N.A. | | | 05/29/15 | | | | 69,173 | | | | 69,366 | | | | 193 | |
| | 1,104,516 | | | JPY | | National Australia Bank | | | 05/29/15 | | | | 9,191 | | | | 9,253 | | | | 62 | |
| | 1,455,922 | | | JPY | | Royal Bank of Scotland | | | 05/29/15 | | | | 12,185 | | | | 12,196 | | | | 11 | |
| | 4,024,288 | | | JPY | | Standard Chartered Bank | | | 05/29/15 | | | | 33,667 | | | | 33,712 | | | | 45 | |
| | 2,891,663 | | | JPY | | Westpac Banking Corp. | | | 05/29/15 | | | | 24,126 | | | | 24,224 | | | | 98 | |
| | 290,174 | | | SEK | | Deutsche Bank AG | | | 05/29/15 | | | | 34,543 | | | | 34,838 | | | | 295 | |
| | 254,437 | | | SEK | | Goldman Sachs International | | | 05/29/15 | | | | 29,944 | | | | 30,548 | | | | 604 | |
| | 42,015 | | | SGD | | Barclays Bank plc | | | 05/29/15 | | | | 30,797 | | | | 31,736 | | | | 939 | |
| | | | | | | | | | | | $ | 1,596,935 | | | $ | 1,637,103 | | | $ | 40,168 | |
| | |
| # | For cross-currency exchange contracts, the settlement value is the U.S. Dollar market value at April 30, 2015 of the currency being sold, and the value at April 30, 2015 is the U.S. dollar market value of the currency being purchased. |
SEE NOTES TO FINANCIAL STATEMENTS.
| | | | | | | | |
| | | |
| APRIL 30, 2015 | | J.P. MORGAN INTERNATIONAL EQUITY FUNDS | | | | | 75 | |
JPMorgan International Value Fund
SCHEDULE OF PORTFOLIO INVESTMENTS
AS OF APRIL 30, 2015 (Unaudited) (continued)
(Amounts in thousands)
| | | | | | | | | | | | | | | | | | | | | | |
CONTRACTS
TO SELL | | | CURRENCY | | COUNTERPARTY | | SETTLEMENT
DATE | | | SETTLEMENT
VALUE | | | VALUE AT
APRIL 30, 2015 | | | NET
UNREALIZED
APPRECIATION
(DEPRECIATION) | |
| | 23,001 | | | AUD | | Citibank, N.A. | | | 05/29/15 | | | $ | 17,723 | | | $ | 18,177 | | | $ | (454 | ) |
| | 24,593 | | | AUD | | Credit Suisse International | | | 05/29/15 | | | | 18,872 | | | | 19,434 | | | | (562 | ) |
| | 20,656 | | | AUD | | National Australia Bank | | | 05/29/15 | | | | 15,809 | | | | 16,323 | | | | (514 | ) |
| | 9,472 | | | CHF | | BNP Paribas | | | 05/29/15 | | | | 9,470 | | | | 10,162 | | | | (692 | ) |
| | 8,716 | | | CHF | | Citibank, N.A. | | | 05/29/15 | | | | 9,151 | | | | 9,351 | | | | (200 | ) |
| | 80,457 | | | CHF | | Deutsche Bank AG | | | 05/29/15 | | | | 85,036 | | | | 86,315 | | | | (1,279 | ) |
| | 7,821 | | | CHF | | Royal Bank of Canada | | | 05/29/15 | | | | 8,203 | | | | 8,391 | | | | (188 | ) |
| | 9,614 | | | CHF | | Royal Bank of Scotland | | | 05/29/15 | | | | 9,597 | | | | 10,313 | | | | (716 | ) |
| | 14,959 | | | CHF | | State Street Corp. | | | 05/29/15 | | | | 15,289 | | | | 16,048 | | | | (759 | ) |
| | 150,701 | | | DKK | | Union Bank of Switzerland AG | | | 05/29/15 | | | | 22,924 | | | | 22,687 | | | | 237 | |
| | 79,750 | | | EUR | | Australia and New Zealand Banking Group Limited | | | 05/29/15 | | | | 86,177 | | | | 89,576 | | | | (3,399 | ) |
| | 90,947 | | | EUR | | Citibank, N.A. | | | 05/29/15 | | | | 97,387 | | | | 102,153 | | | | (4,766 | ) |
| | 122,791 | | | EUR | | Credit Suisse International | | | 05/29/15 | | | | 139,305 | | | | 137,922 | | | | 1,383 | |
| | 87,358 | | | EUR | | Goldman Sachs International | | | 05/29/15 | | | | 95,846 | | | | 98,122 | | | | (2,276 | ) |
| | 5,846 | | | EUR | | HSBC Bank, N.A. | | | 05/29/15 | | | | 6,292 | | | | 6,566 | | | | (274 | ) |
| | 10,147 | | | EUR | | Morgan Stanley | | | 05/29/15 | | | | 11,488 | | | | 11,397 | | | | 91 | |
| | 103,235 | | | EUR | | State Street Corp. | | | 05/29/15 | | | | 110,515 | | | | 115,955 | | | | (5,440 | ) |
| | 14,925 | | | EUR | | TD Bank Financial Group | | | 05/29/15 | | | | 16,902 | | | | 16,763 | | | | 139 | |
| | 7,704 | | | EUR | | Union Bank of Switzerland AG | | | 05/29/15 | | | | 8,511 | | | | 8,654 | | | | (143 | ) |
| | 19,472 | | | EUR | | Westpac Banking Corp. | | | 05/29/15 | | | | 22,160 | | | | 21,871 | | | | 289 | |
| | 23,889 | | | GBP | | Barclays Bank plc | | | 05/29/15 | | | | 35,537 | | | | 36,663 | | | | (1,126 | ) |
| | 25,524 | | | GBP | | Citibank, N.A. | | | 05/29/15 | | | | 38,108 | | | | 39,172 | | | | (1,064 | ) |
| | 10,046 | | | GBP | | Goldman Sachs International | | | 05/29/15 | | | | 15,519 | | | | 15,418 | | | | 101 | |
| | 35,553 | | | GBP | | HSBC Bank, N.A. | | | 05/29/15 | | | | 52,380 | | | | 54,564 | | | | (2,184 | ) |
| | 6,409 | | | GBP | | Morgan Stanley | | | 05/29/15 | | | | 9,530 | | | | 9,836 | | | | (306 | ) |
| | 20,688 | | | GBP | | Royal Bank of Scotland | | | 05/29/15 | | | | 31,523 | | | | 31,751 | | | | (228 | ) |
| | 23,073 | | | GBP | | Societe Generale | | | 05/29/15 | | | | 34,408 | | | | 35,410 | | | | (1,002 | ) |
| | 12,226 | | | GBP | | Standard Chartered Bank | | | 05/29/15 | | | | 18,353 | | | | 18,762 | | | | (409 | ) |
| | 75,612 | | | GBP | | State Street Corp. | | | 05/29/15 | | | | 111,006 | | | | 116,044 | | | | (5,038 | ) |
| | 46,367 | | | HKD | | Goldman Sachs International | | | 05/29/15 | | | | 5,983 | | | | 5,983 | | | | — | (h) |
| | 91,891 | | | HKD | | State Street Corp. | | | 05/29/15 | | | | 11,854 | | | | 11,856 | | | | (2 | ) |
| | 6,850,006 | | | JPY | | Barclays Bank plc | | | 05/29/15 | | | | 57,378 | | | | 57,383 | | | | (5 | ) |
| | 16,513,584 | | | JPY | | Citibank, N.A. | | | 05/29/15 | | | | 137,945 | | | | 138,337 | | | | (392 | ) |
| | 1,130,993 | | | JPY | | Deutsche Bank AG | | | 05/29/15 | | | | 9,454 | | | | 9,474 | | | | (20 | ) |
| | 5,221,384 | | | JPY | | Goldman Sachs International | | | 05/29/15 | | | | 43,409 | | | | 43,740 | | | | (331 | ) |
| | 724,088 | | | JPY | | HSBC Bank, N.A. | | | 05/29/15 | | | | 6,070 | | | | 6,066 | | | | 4 | |
| | 1,877,754 | | | JPY | | Morgan Stanley | | | 05/29/15 | | | | 15,586 | | | | 15,730 | | | | (144 | ) |
| | 4,630,548 | | | JPY | | Standard Chartered Bank | | | 05/29/15 | | | | 38,839 | | | | 38,791 | | | | 48 | |
| | 4,740,435 | | | JPY | | Union Bank of Switzerland AG | | | 05/29/15 | | | | 39,447 | | | | 39,711 | | | | (264 | ) |
| | 126,980 | | | NOK | | State Street Corp. | | | 05/29/15 | | | | 15,742 | | | | 16,851 | | | | (1,109 | ) |
| | 87,074 | | | NOK | | Union Bank of Switzerland AG | | | 05/29/15 | | | | 11,401 | | | | 11,556 | | | | (155 | ) |
| | 71,961 | | | SEK | | Citibank, N.A. | | | 05/29/15 | | | | 8,366 | | | | 8,640 | | | | (274 | ) |
| | 107,029 | | | SEK | | State Street Corp. | | | 05/29/15 | | | | 12,143 | | | | 12,850 | | | | (707 | ) |
| | 16,310 | | | SGD | | Union Bank of Switzerland AG | | | 05/29/15 | | | | 11,926 | | | | 12,320 | | | | (394 | ) |
| | | | | | | | | | | | $ | 1,578,564 | | | $ | 1,613,088 | | | $ | (34,524 | ) |
| | |
SEE NOTES TO FINANCIAL STATEMENTS.
| | | | | | |
| | | |
| 76 | | | | J.P. MORGAN INTERNATIONAL EQUITY FUNDS | | APRIL 30, 2015 |
JPMorgan Intrepid International Fund
SCHEDULE OF PORTFOLIO INVESTMENTS
AS OF APRIL 30, 2015 (Unaudited)
(Amounts in thousands)
| | | | | | | | |
| SHARES | | | SECURITY DESCRIPTION | | VALUE($) | |
| | | | | | | | |
| Common Stocks — 97.5% | |
| | | | Australia — 6.6% | | | | |
| | 1,314 | | | Asciano Ltd. | | | 6,830 | |
| | 554 | | | Australia & New Zealand Banking Group Ltd. | | | 14,828 | |
| | 614 | | | Bank of Queensland Ltd. | | | 6,301 | |
| | 580 | | | Bendigo & Adelaide Bank Ltd. | | | 5,524 | |
| | 812 | | | BHP Billiton Ltd. | | | 20,748 | |
| | 1,675 | | | Echo Entertainment Group Ltd. | | | 5,982 | |
| | 7,587 | | | Fairfax Media Ltd. | | | 6,243 | |
| | 1,636 | | | GPT Group (The) | | | 5,766 | |
| | 1,483 | | | Harvey Norman Holdings Ltd. | | | 5,142 | |
| | 567 | | | Lend Lease Group | | | 7,164 | |
| | 123 | | | Macquarie Group Ltd. | | | 7,524 | |
| | 447 | | | Newcrest Mining Ltd. (a) | | | 5,010 | |
| | 936 | | | Westfield Corp. | | | 6,960 | |
| | 606 | | | Westpac Banking Corp. | | | 17,410 | |
| | 269 | | | Woodside Petroleum Ltd. | | | 7,424 | |
| | | | | | | | |
| | | | | | | 128,856 | |
| | | | | | | | |
| | | | Austria — 0.4% | | | | |
| | 135 | | | ams AG | | | 7,356 | |
| | | | | | | | |
| | | | Belgium — 2.0% | | | | |
| | 176 | | | Anheuser-Busch InBev N.V. | | | 21,464 | |
| | 153 | | | Belgacom S.A. | | | 5,701 | |
| | 209 | | | bpost S.A. | | | 5,995 | |
| | 77 | | | Delhaize Group S.A. | | | 6,223 | |
| | | | | | | | |
| | | | | | | 39,383 | |
| | | | | | | | |
| | | | China — 0.4% | | | | |
| | 7,956 | | | China Construction Bank Corp., Class H | | | 7,723 | |
| | | | | | | | |
| | | | Denmark — 1.5% | | | | |
| | 3 | | | AP Moeller — Maersk A/S, Class B | | | 6,940 | |
| | 252 | | | Danske Bank A/S | | | 7,152 | |
| | 140 | | | Novo Nordisk A/S, Class B | | | 7,884 | |
| | 72 | | | Pandora A/S | | | 7,437 | |
| | | | | | | | |
| | | | | | | 29,413 | |
| | | | | | | | |
| | | | Finland — 0.9% | | | | |
| | 596 | | | Stora Enso OYJ, Class R | | | 6,267 | |
| | 209 | | | Tieto OYJ | | | 5,009 | |
| | 352 | | | UPM-Kymmene OYJ | | | 6,369 | |
| | | | | | | | |
| | | | | | | 17,645 | |
| | | | | | | | |
| | | | France — 10.3% | | | | |
| | 544 | | | Altran Technologies S.A. | | | 5,929 | |
| | 513 | | | AXA S.A. | | | 12,964 | |
| | 230 | | | BNP Paribas S.A. | | | 14,500 | |
| | 89 | | | Cap Gemini S.A. | | | 7,922 | |
| | 528 | | | Credit Agricole S.A. | | | 8,216 | |
| | | | | | | | |
| SHARES | | | SECURITY DESCRIPTION | | VALUE($) | |
| | | | | | | | |
| | | | | | | | |
| | | | France — continued | | | | |
| | 109 | | | Faurecia | | | 5,167 | |
| | 38 | | | Gaztransport Et Technigaz S.A. | | | 2,295 | |
| | 390 | | | GDF Suez | | | 7,936 | |
| | 63 | | | LVMH Moet Hennessy Louis Vuitton SE | | | 11,002 | |
| | 911 | | | Natixis S.A. | | | 7,539 | |
| | 488 | | | Orange S.A. | | | 8,032 | |
| | 69 | | | Pernod Ricard S.A. | | | 8,570 | |
| | 96 | | | Publicis Groupe S.A. | | | 8,054 | |
| | 70 | | | Renault S.A. | | | 7,340 | |
| | 113 | | | Safran S.A. | | | 8,248 | |
| | 244 | | | Sanofi | | | 24,840 | |
| | 188 | | | Societe Generale S.A. | | | 9,380 | |
| | 725 | | | Technicolor S.A. (a) | | | 4,919 | |
| | 98 | | | Teleperformance | | | 7,383 | |
| | 429 | | | TOTAL S.A. | | | 23,236 | |
| | 44 | | | Valeo S.A. | | | 7,016 | |
| | | | | | | | |
| | | | | | | 200,488 | |
| | | | | | | | |
| | | | Germany — 7.9% | | | | |
| | 102 | | | Allianz SE | | | 17,339 | |
| | 101 | | | Aurubis AG | | | 6,397 | |
| | 165 | | | Bayer AG (a) | | | 23,796 | |
| | 82 | | | Bayerische Motoren Werke AG | | | 9,726 | |
| | 33 | | | Continental AG (a) | | | 7,775 | |
| | 197 | | | Daimler AG | | | 18,956 | |
| | 182 | | | Deutsche Annington Immobilien SE | | | 6,094 | |
| | 215 | | | Freenet AG | | | 6,962 | |
| | 91 | | | Fresenius Medical Care AG & Co. KGaA | | | 7,681 | |
| | 118 | | | Fresenius SE & Co. KGaA | | | 7,050 | |
| | 62 | | | Hannover Rueck SE | | | 6,339 | |
| | 92 | | | HeidelbergCement AG | | | 7,081 | |
| | 81 | | | KUKA AG | | | 5,730 | |
| | 78 | | | Merck KGaA | | | 8,383 | |
| | 123 | | | OSRAM Licht AG | | | 6,503 | |
| | 146 | | | ProSiebenSat.1 Media AG | | | 7,473 | |
| | | | | | | | |
| | | | | | | 153,285 | |
| | | | | | | | |
| | | | Hong Kong — 2.0% | | | | |
| | 831 | | | Cheung Kong Infrastructure Holdings Ltd. | | | 7,040 | |
| | 1,350 | | | China Overseas Land & Investment Ltd. | | | 5,623 | |
| | 448 | | | CK Hutchison Holdings Ltd. | | | 9,718 | |
| | 617 | | | Hutchison Whampoa Ltd. | | | 9,091 | |
| | 523 | | | Swire Pacific Ltd., Class A | | | 7,054 | |
| | | | | | | | |
| | | | | | | 38,526 | |
| | | | | | | | |
| | | | India — 0.3% | | | | |
| | 103 | | | HDFC Bank Ltd., ADR | | | 5,827 | |
| | | | | | | | |
SEE NOTES TO FINANCIAL STATEMENTS.
| | | | | | | | |
| | | |
| APRIL 30, 2015 | | J.P. MORGAN INTERNATIONAL EQUITY FUNDS | | | | | 77 | |
JPMorgan Intrepid International Fund
SCHEDULE OF PORTFOLIO INVESTMENTS
AS OF APRIL 30, 2015 (Unaudited) (continued)
(Amounts in thousands)
| | | | | | | | |
| SHARES | | | SECURITY DESCRIPTION | | VALUE($) | |
| | | | | | | | |
| Common Stocks — continued | |
| | | | Ireland — 2.0% | | | | |
| | 104 | | | DCC plc | | | 6,630 | |
| | 1,242 | | | Greencore Group plc | | | 6,740 | |
| | 97 | | | Ryanair Holdings plc, ADR | | | 6,296 | |
| | 139 | | | Shire plc | | | 11,313 | |
| | 77 | | | Smurfit Kappa Group plc | | | 2,369 | |
| | 161 | | | Smurfit Kappa Group plc | | | 4,912 | |
| | | | | | | | |
| | | | | | | 38,260 | |
| | | | | | | | |
| | | | Israel — 0.6% | | | | |
| | 209 | | | Teva Pharmaceutical Industries Ltd., ADR | | | 12,644 | |
| | | | | | | | |
| | | | Italy — 1.6% | | | | |
| | 1,577 | | | Enel S.p.A. | | | 7,477 | |
| | 2,977 | | | Intesa Sanpaolo S.p.A. | | | 10,003 | |
| | 641 | | | Mediobanca S.p.A. | | | 6,218 | |
| | 5,890 | | | Telecom Italia S.p.A. (a) | | | 6,951 | |
| | | | | | | | |
| | | | | | | 30,649 | |
| | | | | | | | |
| | | | Japan — 22.4% | | | | |
| | 202 | | | Asahi Group Holdings Ltd. | | | 6,499 | |
| | 714 | | | Asahi Kasei Corp. | | | 6,724 | |
| | 572 | | | Astellas Pharma, Inc. | | | 8,911 | |
| | 1,112 | | | Bank of Yokohama Ltd. (The) | | | 7,057 | |
| | 222 | | | Bridgestone Corp. | | | 9,307 | |
| | 270 | | | Brother Industries Ltd. | | | 4,296 | |
| | 302 | | | Canon, Inc. | | | 10,775 | |
| | 355 | | | Casio Computer Co., Ltd. | | | 7,184 | |
| | 856 | | | Citizen Holdings Co., Ltd. | | | 6,774 | |
| | 529 | | | Daicel Corp. | | | 6,372 | |
| | 60 | | | Disco Corp. | | | 5,491 | |
| | 133 | | | FamilyMart Co., Ltd. | | | 5,745 | |
| | 1,338 | | | Fuji Electric Co., Ltd. | | | 6,310 | |
| | 191 | | | FUJIFILM Holdings Corp. | | | 7,179 | |
| | 1,164 | | | Fukuoka Financial Group, Inc. | | | 6,688 | |
| | 319 | | | Hitachi Chemical Co., Ltd. | | | 6,165 | |
| | 544 | | | ITOCHU Corp. | | | 6,692 | |
| | 270 | | | Japan Aviation Electronics Industry Ltd. | | | 6,486 | |
| | 252 | | | Japan Tobacco, Inc. | | | 8,786 | |
| | 273 | | | JFE Holdings, Inc. | | | 6,158 | |
| | 1,282 | | | Kawasaki Heavy Industries Ltd. | | | 6,607 | |
| | 2,009 | | | Kawasaki Kisen Kaisha Ltd. | | | 5,190 | |
| | 437 | | | KDDI Corp. | | | 10,331 | |
| | 3,091 | | | Kobe Steel Ltd. | | | 5,618 | |
| | 113 | | | Kose Corp. | | | 7,369 | |
| | 416 | | | Kubota Corp. | | | 6,511 | |
| | 824 | | | Marubeni Corp. | | | 5,099 | |
| | 34 | | | MEIJI Holdings Co., Ltd. | | | 3,860 | |
| | | | | | | | |
| SHARES | | | SECURITY DESCRIPTION | | VALUE($) | |
| | | | | | | | |
| | | | | | | | |
| | | | Japan — continued | | | | |
| | 410 | | | Mitsubishi Corp. | | | 8,847 | |
| | 565 | | | Mitsubishi Electric Corp. | | | 7,379 | |
| | 2,973 | | | Mitsubishi UFJ Financial Group, Inc. | | | 21,123 | |
| | 296 | | | NH Foods Ltd. | | | 6,467 | |
| | 139 | | | Nippon Telegraph & Telephone Corp. | | | 9,379 | |
| | 902 | | | Nissan Motor Co., Ltd. | | | 9,359 | |
| | 79 | | | Nitori Holdings Co., Ltd. | | | 6,099 | |
| | 92 | | | Nitto Denko Corp. | | | 5,909 | |
| | 550 | | | ORIX Corp. | | | 8,464 | |
| | 91 | | | Rohm Co., Ltd. | | | 6,291 | |
| | 538 | | | Sekisui Chemical Co., Ltd. | | | 7,174 | |
| | 499 | | | Sekisui House Ltd. | | | 7,733 | |
| | 202 | | | Sompo Japan Nipponkoa Holdings, Inc. | | | 6,609 | |
| | 311 | | | Sony Corp. (a) | | | 9,414 | |
| | 400 | | | Sumitomo Electric Industries Ltd. | | | 5,651 | |
| | 1,108 | | | Sumitomo Heavy Industries Ltd. | | | 6,884 | |
| | 326 | | | Sumitomo Mitsui Financial Group, Inc. | | | 14,243 | |
| | 1,744 | | | Sumitomo Mitsui Trust Holdings, Inc. | | | 7,677 | |
| | 506 | | | T&D Holdings, Inc. | | | 7,294 | |
| | 1,272 | | | Taisei Corp. | | | 7,369 | |
| | 562 | | | Tohoku Electric Power Co., Inc. | | | 7,066 | |
| | 220 | | | Tokio Marine Holdings, Inc. | | | 8,952 | |
| | 1,085 | | | Tokyo Gas Co., Ltd. | | | 6,261 | |
| | 488 | | | Toyota Motor Corp. | | | 33,969 | |
| | 107 | | | West Japan Railway Co. | | | 5,948 | |
| | 341 | | | Yamaha Corp. | | | 6,191 | |
| | 315 | | | Yamaha Motor Co., Ltd. | | | 7,420 | |
| | | | | | | | |
| | | | | | | 435,356 | |
| | | | | | | | |
| | | | Luxembourg — 0.3% | | | | |
| | 165 | | | APERAM S.A. (a) | | | 6,282 | |
| | | | | | | | |
| | | | Netherlands — 3.7% | | | | |
| | 1,035 | | | Aegon N.V. | | | 8,165 | |
| | 91 | | | Heineken N.V. | | | 7,175 | |
| | 883 | | | ING Groep N.V., CVA (a) | | | 13,552 | |
| | 203 | | | NN Group N.V. (a) | | | 5,930 | |
| | 1,149 | | | Royal Dutch Shell plc, Class B | | | 36,783 | |
| | | | | | | | |
| | | | | | | 71,605 | |
| | | | | | | | |
| | | | Norway — 0.7% | | | | |
| | 409 | | | DNB ASA | | | 7,271 | |
| | 128 | | | Yara International ASA | | | 6,565 | |
| | | | | | | | |
| | | | | | | 13,836 | |
| | | | | | | | |
| | | | Portugal — 0.3% | | | | |
| | 1,495 | | | EDP — Energias de Portugal S.A. | | | 5,979 | |
| | | | | | | | |
SEE NOTES TO FINANCIAL STATEMENTS.
| | | | | | |
| | | |
| 78 | | | | J.P. MORGAN INTERNATIONAL EQUITY FUNDS | | APRIL 30, 2015 |
| | | | | | | | |
| SHARES | | | SECURITY DESCRIPTION | | VALUE($) | |
| | | | | | | | |
| Common Stocks — continued | |
| | | | Singapore — 0.5% | | | | |
| | 559 | | | DBS Group Holdings Ltd. | | | 8,883 | |
| | | | | | | | |
| | | | South Africa — 0.4% | | | | |
| | 779 | | | Investec plc | | | 7,439 | |
| | | | | | | | |
| | | | South Korea — 0.6% | | | | |
| | 26 | | | Hyundai Motor Co. | | | 4,097 | |
| | 6 | | | Samsung Electronics Co., Ltd. | | | 7,323 | |
| | | | | | | | |
| | | | | | | 11,420 | |
| | | | | | | | |
| | | | Spain — 3.2% | | | | |
| | 1,318 | | | Banco Santander S.A. (a) | | | 9,962 | |
| | 300 | | | Ferrovial S.A. | | | 6,813 | |
| | 257 | | | Gas Natural SDG S.A. | | | 6,327 | |
| | 1,339 | | | Iberdrola S.A. | | | 8,959 | |
| | 1,877 | | | Mapfre S.A. | | | 6,977 | |
| | 448 | | | Repsol S.A. | | | 9,231 | |
| | 954 | | | Telefonica S.A. | | | 14,527 | |
| | | | | | | | |
| | | | | | | 62,796 | |
| | | | | | | | |
| | | | Sweden — 2.2% | | | | |
| | 277 | | | Boliden AB | | | 6,021 | |
| | 371 | | | Castellum AB | | | 5,785 | |
| | 130 | | | Electrolux AB, Series B | | | 3,882 | |
| | 413 | | | Securitas AB, Class B | | | 6,175 | |
| | 122 | | | Svenska Handelsbanken AB, Class A | | | 5,623 | |
| | 260 | | | Swedbank AB, Class A | | | 6,053 | |
| | 340 | | | Telefonaktiebolaget LM Ericsson, Class B | | | 3,722 | |
| | 327 | | | Trelleborg AB, Class B, | | | 6,409 | |
| | | | | | | | |
| | | | | | | 43,670 | |
| | | | | | | | |
| | | | Switzerland — 8.1% | | | | |
| | 93 | | | Adecco S.A. (a) | | | 7,581 | |
| | 9 | | | Georg Fischer AG | | | 6,459 | |
| | 48 | | | Lonza Group AG (a) | | | 6,810 | |
| | 351 | | | Nestle S.A. | | | 27,200 | |
| | 394 | | | Novartis AG | | | 40,178 | |
| | 86 | | | Roche Holding AG | | | 24,586 | |
| | 20 | | | Straumann Holding AG | | | 5,559 | |
| | 24 | | | Swiss Life Holding AG (a) | | | 5,766 | |
| | 91 | | | Swiss Re AG (a) | | | 8,065 | |
| | 763 | | | UBS Group AG (a) | | | 15,234 | |
| | 31 | | | Zurich Insurance Group AG (a) | | | 9,629 | |
| | | | | | | | |
| | | | | | | 157,067 | |
| | | | | | | | |
| | | | United Kingdom — 18.3% | | | | |
| | 904 | | | 3i Group plc | | | 7,004 | |
| | 262 | | | Ashtead Group plc | | | 4,496 | |
| | 232 | | | AstraZeneca plc | | | 15,954 | |
| | | | | | | | |
| SHARES | | | SECURITY DESCRIPTION | | VALUE($) | |
| | | | | | | | |
| | | | | | | | |
| | | | United Kingdom — continued | | | | |
| | 947 | | | Aviva plc | | | 7,623 | |
| | 1,055 | | | BAE Systems plc | | | 8,176 | |
| | 3,379 | | | Barclays plc | | | 13,220 | |
| | 799 | | | Barratt Developments plc | | | 6,339 | |
| | 3,548 | | | BP plc | | | 25,587 | |
| | 383 | | | British American Tobacco plc | | | 21,050 | |
| | 559 | | | British Land Co. plc (The) | | | 7,114 | |
| | 1,710 | | | BT Group plc | | | 11,929 | |
| | 1,053 | | | Carillion plc | | | 5,252 | |
| | 1,425 | | | Direct Line Insurance Group plc | | | 6,957 | |
| | 988 | | | Dixons Carphone plc | | | 6,412 | |
| | 131 | | | Hikma Pharmaceuticals plc | | | 4,089 | |
| | 1,986 | | | HSBC Holdings plc | | | 19,841 | |
| | 247 | | | Imperial Tobacco Group plc | | | 12,067 | |
| | 1,567 | | | Indivior plc (a) | | | 4,798 | |
| | 1,830 | | | ITV plc | | | 7,103 | |
| | 532 | | | John Wood Group plc | | | 5,609 | |
| | 11,116 | | | Lloyds Banking Group plc | | | 13,165 | |
| | 852 | | | Marks & Spencer Group plc | | | 7,216 | |
| | 794 | | | Meggitt plc | | | 6,414 | |
| | 389 | | | Northgate plc | | | 3,853 | |
| | 257 | | | Persimmon plc (a) | | | 6,675 | |
| | 528 | | | Playtech plc | | | 6,634 | |
| | 606 | | | Prudential plc | | | 15,077 | |
| | 144 | | | Reckitt Benckiser Group plc | | | 12,822 | |
| | 355 | | | Rio Tinto plc | | | 15,898 | |
| | 2,730 | | | Taylor Wimpey plc | | | 6,932 | |
| | 225 | | | Travis Perkins plc | | | 7,141 | |
| | 559 | | | UBM plc | | | 4,827 | |
| | 438 | | | Unilever N.V., CVA | | | 19,086 | |
| | 5,669 | | | Vodafone Group plc | | | 19,975 | |
| | 383 | | | WPP plc | | | 8,931 | |
| | | | | | | | |
| | | | | | | 355,266 | |
| | | | | | | | |
| | | | United States — 0.3% | | | | |
| | 133 | | | Carnival plc | | | 6,071 | |
| | | | | | | | |
| | | | Total Common Stocks
(Cost $1,716,378) | | | 1,895,725 | |
| | | | | | | | |
| Preferred Stocks — 0.9% | |
| | | | Germany — 0.9% | | | | |
| | 69 | | | Henkel AG & Co. KGaA | | | 7,970 | |
| | 38 | | | Volkswagen AG | | | 9,794 | |
| | | | | | | | |
| | | | Total Preferred Stocks
(Cost $14,406) | | | 17,764 | |
| | | | | | | | |
SEE NOTES TO FINANCIAL STATEMENTS.
| | | | | | | | |
| | | |
| APRIL 30, 2015 | | J.P. MORGAN INTERNATIONAL EQUITY FUNDS | | | | | 79 | |
JPMorgan Intrepid International Fund
SCHEDULE OF PORTFOLIO INVESTMENTS
AS OF APRIL 30, 2015 (Unaudited) (continued)
(Amounts in thousands)
| | | | | | | | |
| SHARES | | | SECURITY DESCRIPTION | | VALUE($) | |
| | | | | | | | |
| Short-Term Investment — 1.7% | |
| | | | Investment Company — 1.7% | | | | |
| | 33,135 | | | JPMorgan Prime Money Market Fund, Institutional Class Shares,
0.050% (b) (l) (m)
(Cost $33,135) | | | 33,135 | |
| | | | | | | | |
| | | | Total Investments — 100.1%
(Cost $1,763,919) | | | 1,946,624 | |
| | | | Liabilities in Excess of
Other Assets — (0.1)% | | | (1,446 | ) |
| | | | | | | | |
| | | | NET ASSETS — 100.0% | | $ | 1,945,178 | |
| | | | | | | | |
Percentages indicated are based on net assets.
Summary of Investments by Industry, April 30, 2015
The following table represents the portfolio investments of the Fund by industry classifications as a percentage of total investments:
| | | | |
| INDUSTRY | | PERCENTAGE | |
Banks | | | 13.8 | % |
Pharmaceuticals | | | 9.6 | |
Insurance | | | 6.9 | |
Oil, Gas & Consumable Fuels | | | 5.4 | |
Automobiles | | | 5.2 | |
Metals & Mining | | | 3.7 | |
Food Products | | | 3.3 | |
Diversified Telecommunication Services | | | 2.9 | |
Household Durables | | | 2.8 | |
Media | | | 2.4 | |
Beverages | | | 2.2 | |
Capital Markets | | | 2.2 | |
Tobacco | | | 2.2 | |
Real Estate Management & Development | | | 2.1 | |
Machinery | | | 2.0 | |
Wireless Telecommunication Services | | | 1.9 | |
Electric Utilities | | | 1.9 | |
Auto Components | | | 1.8 | |
Trading Companies & Distributors | | | 1.7 | |
Chemicals | | | 1.6 | |
Technology Hardware, Storage & Peripherals | | | 1.5 | |
Aerospace & Defense | | | 1.2 | |
Household Products | | | 1.1 | |
Electrical Equipment | | | 1.0 | |
Real Estate Investment Trusts (REITs) | | | 1.0 | |
Construction & Engineering | | | 1.0 | |
Semiconductors & Semiconductor Equipment | | | 1.0 | |
IT Services | | | 1.0 | |
Others (each less than 1.0%) | | | 13.9 | |
Short-Term Investment | | | 1.7 | |
SEE NOTES TO FINANCIAL STATEMENTS.
| | | | | | |
| | | |
| 80 | | | | J.P. MORGAN INTERNATIONAL EQUITY FUNDS | | APRIL 30, 2015 |
J.P. Morgan International Equity Funds
NOTES TO SCHEDULES OF PORTFOLIO INVESTMENTS
AS OF APRIL 30, 2015 (Unaudited)
| | |
| ADR | | — American Depositary Receipt |
| AUD | | — Australian Dollar |
| CAD | | — Canadian Dollar |
| CHF | | — Swiss Franc |
| CVA | | — Dutch Certification |
| DKK | | — Danish Krone |
| EUR | | — Euro |
| GBP | | — British Pound |
| GDR | | — Global Depositary Receipt |
| HKD | | — Hong Kong Dollar |
| JPY | | — Japanese Yen |
| NOK | | — Norwegian Krone |
| NVDR | | — Non Voting Depositary Receipt |
| Reg. S | | — Security was purchased pursuant to Regulation S under the Securities Act of 1933, which exempts from registration securities offered and sold outside of the United States. Such a security cannot be sold in the United States without either an effective registration statement filed pursuant to the Securities Act of 1933, or pursuant to an exemption from registration. |
| REIT | | — Real Estate Investment Trust |
| SEK | | — Swedish Krona |
| SGD | | — Singapore Dollar |
| |
| (a) | | — Non-income producing security. |
| (b) | | — Investment in affiliate. Money market fund registered under the Investment Company Act of 1940, as amended, and advised by J.P. Morgan Investment Management Inc. |
| (c) | | — Included in this amount is cash segregated as collateral for futures contracts. |
| (e) | | — Security is exempt from registration under Rule 144A of the Securities Act of 1933, as amended. Unless otherwise indicated, this security has been determined to be liquid under procedures established by the Board of Trustees and may be resold in transactions exempt from registration normally to qualified institutional buyers. |
| | | | | | |
| (g) | | — Amount rounds to less than 0.1%. |
| (h) | | — Amount rounds to less than one thousand (shares or dollars). |
| (i) | | — Security has been deemed illiquid pursuant to procedures approved by the Board of Trustees and may be difficult to sell. |
| (l) | | — The rate shown is the current yield as of April 30, 2015. |
| (m) | | — All or a portion of this security is reserved and/or pledged with the custodian for current or potential holdings of futures, swaps, options, TBAs, when-issued securities, delayed delivery securities, reverse repurchase agreements, unfunded commitments and forward foreign currency exchange contracts. |
The value and percentage, based on total investments, of the investments that apply the fair valuation policy for the international investments as described in Note 2.A. of the Notes to Financial Statements are as follows (amounts in thousands):
| | | | | | | | |
| Fund | | Value | | | Percentage | |
| Emerging Economies Fund | | $ | 723,223 | | | | 86.1 | % |
| Emerging Markets Equity Fund | | | 1,518,387 | | | | 72.3 | |
| Emerging Markets Equity Income Fund | | | 2,363 | | | | 77.9 | |
| Global Research Enhanced Index Fund | | | 2,044,848 | | | | 37.6 | |
| Global Unconstrained Equity Fund | | | 1,448 | | | | 29.8 | |
| International Equity Fund | | | 2,688,606 | | | | 95.6 | |
| International Equity Income Fund | | | 91,631 | | | | 93.5 | |
International Opportunities Fund | | | 1,883,691 | | | | 96.8 | |
International Research Enhanced Equity Fund | | | 781,244 | | | | 97.0 | |
International Unconstrained Equity Fund | | | 16,092 | | | | 76.1 | |
| International Value Fund | | | 2,427,245 | | | | 97.7 | |
| Intrepid International Fund | | | 1,888,551 | | | | 97.0 | |
SEE NOTES TO FINANCIAL STATEMENTS.
| | | | | | | | |
| | | |
| APRIL 30, 2015 | | J.P. MORGAN INTERNATIONAL EQUITY FUNDS | | | | | 81 | |
STATEMENTS OF ASSETS AND LIABILITIES
AS OF APRIL 30, 2015 (Unaudited)
(Amounts in thousands)
| | | | | | | | | | | | | | | | |
| | | Emerging
Economies
Fund | | | Emerging
Markets
Equity Fund | | | Emerging
Markets
Equity
Income Fund | | | Global
Research
Enhanced
Index Fund | |
ASSETS: | | | | | | | | | | | | | | | | |
Investments in non-affiliates, at value | | $ | 829,127 | | | $ | 2,078,710 | | | $ | 3,034 | | | $ | 6,280,347 | |
Investments in affiliates, at value | | | 10,500 | | | | 22,701 | | | | — | | | | 225,787 | |
| | | | | | | | | | | | | | | | |
Total investment securities, at value | | | 839,627 | | | | 2,101,411 | | | | 3,034 | | | | 6,506,134 | |
Cash | | | 1,191 | | | | 2,044 | | | | 65 | | | | 956 | |
Foreign currency, at value | | | 916 | | | | 1,779 | | | | 7 | | | | 1,247 | |
Deposits at broker for futures contracts | | | — | | | | — | | | | — | | | | 9,008 | |
Receivables: | | | | | | | | | | | | | | | | |
Investment securities sold | | | 2,010 | | | | — | | | | 14 | | | | 39,597 | |
Fund shares sold | | | 1,060 | | | | 3,740 | | | | — | | | | 5,799 | |
Dividends from non-affiliates | | | 992 | | | | 1,085 | | | | 8 | | | | 11,917 | |
Dividends from affiliates | | | — | (a) | | | 1 | | | | — | | | | 7 | |
Tax reclaims | | | — | | | | — | | | | — | | | | 3,131 | |
Due from Adviser | | | — | | | | — | | | | 50 | | | | — | |
Deferred offering costs | | | — | | | | — | | | | 75 | | | | — | |
Other assets | | | — | | | | — | | | | 5 | | | | 112 | |
| | | | | | | | | | | | | | | | |
Total Assets | | | 845,796 | | | | 2,110,060 | | | | 3,258 | | | | 6,577,908 | |
| | | | | | | | | | | | | | | | |
| | | | |
LIABILITIES: | | | | | | | | | | | | | | | | |
Payables: | | | | | | | | | | | | | | | | |
Investment securities purchased | | | 350 | | | | 4,914 | | | | 16 | | | | 43,163 | |
Fund shares redeemed | | | 158 | | | | 12,549 | | | | — | | | | 2,065 | |
Variation margin on futures contracts | | | — | | | | — | | | | — | | | | 2,259 | |
Accrued liabilities: | | | | | | | | | | | | | | | | |
Investment advisory fees | | | 632 | | | | 1,604 | | | | — | | | | 308 | |
Administration fees | | | 31 | | | | 68 | | | | — | | | | — | |
Distribution fees | | | 10 | | | | 95 | | | | — | (a) | | | — | (a) |
Shareholder servicing fees | | | 74 | | | | 122 | | | | 1 | | | | 1,334 | |
Custodian and accounting fees | | | 456 | | | | 1,049 | | | | 29 | | | | 96 | |
Trustees’ and Chief Compliance Officer’s fees | | | — | (a) | | | — | (a) | | | — | (a) | | | 7 | |
Deferred India capital gains tax | | | 167 | | | | 507 | | | | — | | | | — | |
Audit fees | | | 16 | | | | 18 | | | | 35 | | | | 37 | |
Other | | | 55 | | | | 658 | | | | 2 | | | | 66 | |
| | | | | | | | | | | | | | | | |
Total Liabilities | | | 1,949 | | | | 21,584 | | | | 83 | | | | 49,335 | |
| | | | | | | | | | | | | | | | |
Net Assets | | $ | 843,847 | | | $ | 2,088,476 | | | $ | 3,175 | | | $ | 6,528,573 | |
| | | | | | | | | | | | | | | | |
| (a) | Amount rounds to less than $1,000. |
SEE NOTES TO FINANCIAL STATEMENTS.
| | | | | | |
| | | |
| 82 | | | | J.P. MORGAN INTERNATIONAL EQUITY FUNDS | | APRIL 30, 2015 |
| | | | | | | | | | | | | | | | |
| | | Emerging
Economies
Fund | | | Emerging
Markets
Equity Fund | | | Emerging
Markets
Equity
Income Fund | | | Global
Research
Enhanced
Index Fund | |
NET ASSETS: | | | | | | | | | | | | | | | | |
Paid-in-Capital | | $ | 894,422 | | | $ | 1,761,523 | | | $ | 3,048 | | | $ | 5,939,461 | |
Accumulated undistributed (distributions in excess of) net investment income | | | (793 | ) | | | 4,912 | | | | 6 | | | | 40,073 | |
Accumulated net realized gains (losses) | | | (158,958 | ) | | | 3,416 | | | | (19 | ) | | | (29,931 | ) |
Net unrealized appreciation (depreciation) | | | 109,176 | | | | 318,625 | | | | 140 | | | | 578,970 | |
| | | | | | | | | | | | | | | | |
Total Net Assets | | $ | 843,847 | | | $ | 2,088,476 | | | $ | 3,175 | | | $ | 6,528,573 | |
| | | | | | | | | | | | | | | | |
| | | | |
Net Assets: | | | | | | | | | | | | | | | | |
Class A | | $ | 34,723 | | | $ | 285,598 | | | $ | 31 | | | $ | 66 | |
Class B | | | — | | | | 1,884 | | | | — | | | | — | |
Class C | | | 4,861 | | | | 55,560 | | | | 36 | | | | 66 | |
Class R2 | | | — | | | | — | | | | — | | | | 66 | |
Class R5 | | | 533,061 | | | | — | | | | 21 | | | | — | |
Class R6 | | | — | | | | 763,520 | | | | 21 | | | | — | |
Institutional Class | | | — | | | | 404,322 | | | | — | | | | — | |
Select Class | | | 271,202 | | | | 577,592 | | | | 3,066 | | | | 6,528,375 | |
| | | | | | | | | | | | | | | | |
Total | | $ | 843,847 | | | $ | 2,088,476 | | | $ | 3,175 | | | $ | 6,528,573 | |
| | | | | | | | | | | | | | | | |
| | | | |
Outstanding units of beneficial interest (shares) | | | | | | | | | | | | | | | | |
($0.0001 par value; unlimited number of shares authorized): | | | | | | | | | | | | | | | | |
Class A | | | 2,589 | | | | 12,543 | | | | 2 | | | | 3 | |
Class B | | | — | | | | 84 | | | | — | | | | — | |
Class C | | | 367 | | | | 2,507 | | | | 2 | | | | 3 | |
Class R2 | | | — | | | | — | | | | — | | | | 3 | |
Class R5 | | | 39,549 | | | | — | | | | 1 | | | | — | |
Class R6 | | | — | | | | 32,616 | | | | 2 | | | | — | |
Institutional Class | | | — | | | | 17,249 | | | | — | | | | — | |
Select Class | | | 20,179 | | | | 24,835 | | | | 196 | | | | 341,956 | |
| | | | |
Net Asset Value (a): | | | | | | | | | | | | | | | | |
Class A — Redemption price per share | | $ | 13.41 | | | $ | 22.77 | | | $ | 15.61 | | | $ | 19.08 | |
Class B — Offering price per share (b) | | | — | | | | 22.37 | | | | — | | | | — | |
Class C — Offering price per share (b) | | | 13.24 | | | | 22.16 | | | | 15.58 | | | | 19.03 | |
Class R2 — Offering and redemption price per share | | | — | | | | — | | | | — | | | | 19.06 | |
Class R5 — Offering and redemption price per share | | | 13.48 | | | | — | | | | 15.64 | | | | — | |
Class R6 — Offering and redemption price per share | | | — | | | | 23.41 | | | | 15.64 | | | | — | |
Institutional Class — Offering and redemption price per share | | | — | | | | 23.44 | | | | — | | | | — | |
Select Class — Offering and redemption price per share | | | 13.44 | | | | 23.26 | | | | 15.63 | | | | 19.09 | |
Class A maximum sales charge | | | 5.25 | % | | | 5.25 | % | | | 5.25 | % | | | 5.25 | % |
Class A maximum public offering price per share
[net asset value per share/(100% — maximum sales charge)] | | $ | 14.15 | | | $ | 24.03 | | | $ | 16.47 | | | $ | 20.14 | |
| | | | | | | | | | | | | | | | |
| | | | |
Cost of investments in non-affiliates | | $ | 719,800 | | | $ | 1,759,546 | | | $ | 2,894 | | | $ | 5,701,742 | |
Cost of investments in affiliates | | | 10,500 | | | | 22,701 | | | | — | | | | 225,787 | |
Cost of foreign currency | | | 895 | | | | 1,728 | | | | 7 | | | | 1,223 | |
| (a) | Per share amounts may not recalculate due to rounding of net assets and/or shares outstanding. |
| (b) | Redemption price for Class B and Class C Shares varies based upon length of time the shares are held. |
SEE NOTES TO FINANCIAL STATEMENTS.
| | | | | | | | |
| | | |
| APRIL 30, 2015 | | J.P. MORGAN INTERNATIONAL EQUITY FUNDS | | | | | 83 | |
STATEMENTS OF ASSETS AND LIABILITIES
AS OF APRIL 30, 2015 (Unaudited) (continued)
(Amounts in thousands, except per share amounts)
| | | | | | | | | | | | | | | | |
| | | Global
Unconstrained
Equity Fund | | | International
Equity Fund | | | International
Equity
Income Fund | | | International
Opportunities
Fund | |
ASSETS: | | | | | | | | | | | | | | | | |
Investments in non-affiliates, at value | | $ | 4,700 | | | $ | 2,764,255 | | | $ | 95,110 | | | $ | 1,883,691 | |
Investments in affiliates, at value | | | 162 | | | | 47,731 | | | | 2,843 | | | | 62,979 | |
| | | | | | | | | | | | | | | | |
Total investment securities, at value | | | 4,862 | | | | 2,811,986 | | | | 97,953 | | | | 1,946,670 | |
Cash | | | 36 | | | | 49 | | | | 20 | | | | 894 | |
Foreign currency, at value | | | 2 | | | | 1,699 | | | | 132 | | | | — | |
Deposits at broker for futures contracts | | | — | | | | — | | | | — | | | | 1,648 | |
Receivables: | | | | | | | | | | | | | | | | |
Investment securities sold | | | 136 | | | | — | | | | — | | | | 18,649 | |
Fund shares sold | | | 5 | | | | 2,512 | | | | 467 | | | | 1,857 | |
Dividends from non-affiliates | | | 4 | | | | 11,810 | | | | 366 | | | | 7,014 | |
Dividends from affiliates | | | — | (a) | | | 3 | | | | — | (a) | | | 2 | |
Tax reclaims | | | 4 | | | | 4,374 | | | | 85 | | | | 3,172 | |
Unrealized appreciation on forward foreign currency exchange contracts | | | — | | | | — | | | | — | | | | 7,941 | |
Due from Adviser | | | 61 | | | | — | | | | — | | | | — | |
Other assets | | | 47 | | | | — | | | | 17 | | | | — | |
| | | | | | | | | | | | | | | | |
Total Assets | | | 5,157 | | | | 2,832,433 | | | | 99,040 | | | | 1,987,847 | |
| | | | | | | | | | | | | | | | |
| | | | |
LIABILITIES: | | | | | | | | | | | | | | | | |
Payables: | | | | | | | | | | | | | | | | |
Foreign currency due to custodian, at value | | | — | | | | — | | | | — | | | | 167 | |
Investment securities purchased | | | 154 | | | | 5,695 | | | | — | | | | 2,353 | |
Fund shares redeemed | | | — | | | | 14,672 | | | | 7 | | | | 20,198 | |
Variation margin on futures contracts | | | — | | | | — | | | | — | | | | 424 | |
Unrealized depreciation on forward foreign currency exchange contracts | | | — | | | | 20 | | | | — | | | | 6,744 | |
Accrued liabilities: | | | | | | | | | | | | | | | | |
Investment advisory fees | | | — | | | | 1,678 | | | | 23 | | | | 950 | |
Administration fees | | | — | | | | 94 | | | | — | | | | 131 | |
Distribution fees | | | — | (a) | | | 60 | | | | 14 | | | | 29 | |
Shareholder servicing fees | | | 1 | | | | 109 | | | | 9 | | | | 22 | |
Custodian and accounting fees | | | 18 | | | | 200 | | | | 23 | | | | 166 | |
Trustees’ and Chief Compliance Officer’s fees | | | — | | | | 3 | | | | — | (a) | | | 3 | |
Audit fees | | | 34 | | | | — | | | | 27 | | | | 5 | |
Transfer agent fees | | | 3 | | | | 140 | | | | 12 | | | | 61 | |
Other | | | — | (a) | | | 60 | | | | — | | | | 11 | |
| | | | | | | | | | | | | | | | |
Total Liabilities | | | 210 | | | | 22,731 | | | | 115 | | | | 31,264 | |
| | | | | | | | | | | | | | | | |
Net Assets | | $ | 4,947 | | | $ | 2,809,702 | | | $ | 98,925 | | | $ | 1,956,583 | |
| | | | | | | | | | | | | | | | |
| (a) | Amount rounds to less than $1,000. |
SEE NOTES TO FINANCIAL STATEMENTS.
| | | | | | |
| | | |
| 84 | | | | J.P. MORGAN INTERNATIONAL EQUITY FUNDS | | APRIL 30, 2015 |
| | | | | | | | | | | | | | | | |
| | | Global
Unconstrained
Equity Fund | | | International
Equity Fund | | | International
Equity
Income Fund | | | International
Opportunities
Fund | |
NET ASSETS: | | | | | | | | | | | | | | | | |
Paid-in-Capital | | $ | 4,243 | | | $ | 2,349,301 | | | $ | 87,440 | | | $ | 1,748,626 | |
Accumulated undistributed (distributions in excess of) net investment income | | | 9 | | | | 11,423 | | | | (410 | ) | | | 14,669 | |
Accumulated net realized gains (losses) | | | 51 | | | | (15,051 | ) | | | 6,257 | | | | (46,384 | ) |
Net unrealized appreciation (depreciation) | | | 644 | | | | 464,029 | | | | 5,638 | | | | 239,672 | |
| | | | | | | | | | | | | | | | |
Total Net Assets | | $ | 4,947 | | | $ | 2,809,702 | | | $ | 98,925 | | | $ | 1,956,583 | |
| | | | | | | | | | | | | | | | |
| | | | |
Net Assets: | | | | | | | | | | | | | | | | |
Class A | | $ | 85 | | | $ | 207,530 | | | $ | 61,349 | | | $ | 138,392 | |
Class B | | | — | | | | 710 | | | | — | | | | 134 | |
Class C | | | 101 | | | | 28,588 | | | | 4,401 | | | | 1,722 | |
Class R2 | | | 80 | | | | 1,118 | | | | 649 | | | | — | |
Class R5 | | | 82 | | | | 63,086 | | | | 623 | | | | — | |
Class R6 | | | 82 | | | | 1,960,752 | | | | 21 | | | | 1,713,040 | |
Institutional Class | | | — | | | | — | | | | — | | | | 49,401 | |
Select Class | | | 4,517 | | | | 547,918 | | | | 31,882 | | | | 53,894 | |
| | | | | | | | | | | | | | | | |
Total | | $ | 4,947 | | | $ | 2,809,702 | | | $ | 98,925 | | | $ | 1,956,583 | |
| | | | | | | | | | | | | | | | |
| | | | |
Outstanding units of beneficial interest (shares) | | | | | | | | | | | | | | | | |
($0.0001 par value; unlimited number of shares authorized): | | | | | | | | | | | | | | | | |
Class A | | | 5 | | | | 12,741 | | | | 3,652 | | | | 9,056 | |
Class B | | | — | | | | 45 | | | | — | | | | 9 | |
Class C | | | 5 | | | | 1,844 | | | | 263 | | | | 116 | |
Class R2 | | | 4 | | | | 69 | | | | 39 | | | | — | |
Class R5 | | | 4 | | | | 3,817 | | | | 37 | | | | — | |
Class R6 | | | 5 | | | | 118,648 | | | | 1 | | | | 110,360 | |
Institutional Class | | | — | | | | — | | | | — | | | | 3,180 | |
Select Class | | | 248 | | | | 33,182 | | | | 1,893 | | | | 3,484 | |
| | | | |
Net Asset Value (a): | | | | | | | | | | | | | | | | |
Class A — Redemption price per share | | $ | 18.17 | | | $ | 16.29 | | | $ | 16.80 | | | $ | 15.28 | |
Class B — Offering price per share (b) | | | — | | | | 15.72 | | | | — | | | | 15.38 | |
Class C — Offering price per share (b) | | | 18.09 | | | | 15.50 | | | | 16.73 | | | | 14.85 | |
Class R2 — Offering and redemption price per share | | | 18.13 | | | | 16.22 | | | | 16.78 | | | | — | |
Class R5 — Offering and redemption price per share | | | 18.24 | | | | 16.53 | | | | 16.85 | | | | — | |
Class R6 — Offering and redemption price per share | | | 18.25 | | | | 16.53 | | | | 16.83 | | | | 15.52 | |
Institutional Class — Offering and redemption price per share | | | — | | | | — | | | | — | | | | 15.54 | |
Select Class — Offering and redemption price per share | | | 18.21 | | | | 16.51 | | | | 16.84 | | | | 15.47 | |
Class A maximum sales charge | | | 5.25 | % | | | 5.25 | % | | | 5.25 | % | | | 5.25 | % |
Class A maximum public offering price per share
[net asset value per share/(100% — maximum sales charge)] | | $ | 19.18 | | | $ | 17.19 | | | $ | 17.73 | | | $ | 16.13 | |
| | | | | | | | | | | | | | | | |
| | | | |
Cost of investments in non-affiliates | | $ | 4,056 | | | $ | 2,300,134 | | | $ | 89,474 | | | $ | 1,644,731 | |
Cost of investments in affiliates | | | 162 | | | | 47,731 | | | | 2,843 | | | | 62,979 | |
Cost of foreign currency | | | 2 | | | | 1,699 | | | | 129 | | | | — | |
| (a) | Per share amounts may not recalculate due to rounding of net assets and/or shares outstanding. |
| (b) | Redemption price for Class B and Class C Shares varies based upon length of time the shares are held. |
SEE NOTES TO FINANCIAL STATEMENTS.
| | | | | | | | |
| | | |
| APRIL 30, 2015 | | J.P. MORGAN INTERNATIONAL EQUITY FUNDS | | | | | 85 | |
STATEMENTS OF ASSETS AND LIABILITIES
AS OF APRIL 30, 2015 (Unaudited) (continued)
(Amounts in thousands, except per share amounts)
| | | | | | | | | | | | | | | | |
| | | International
Research
Enhanced
Equity Fund | | | International
Unconstrained
Equity Fund | | | International
Value Fund | | | Intrepid
International
Fund | |
ASSETS: | | | | | | | | | | | | | | | | |
Investments in non-affiliates, at value | | $ | 787,348 | | | $ | 19,559 | | | $ | 2,479,471 | | | $ | 1,913,489 | |
Investments in affiliates, at value | | | 17,887 | | | | 1,600 | | | | 4,663 | | | | 33,135 | |
| | | | | | | | | | | | | | | | |
Total investment securities, at value | | | 805,235 | | | | 21,159 | | | | 2,484,134 | | | | 1,946,624 | |
Cash | | | 275 | | | | 50 | | | | 49 | | | | 427 | |
Foreign currency, at value | | | 6,820 | | | | — | (a) | | | 785 | | | | 107 | |
Deposits at broker for futures contracts | | | 1,192 | | | | 264 | | | | 606 | | | | — | |
Due from custodian | | | 2,057 | | | | — | | | | — | | | | — | |
Receivables: | | | | | | | | | | | | | | | | |
Investment securities sold | | | — | | | | 46 | | | | 46,315 | | | | 10,831 | |
Fund shares sold | | | 204 | | | | 1,946 | | | | 8,833 | | | | 1,861 | |
Dividends from non-affiliates | | | 2,950 | | | | 34 | | | | 14,094 | | | | 7,228 | |
Dividends from affiliates | | | 1 | | | | — | (a) | | | 1 | | | | 1 | |
Tax reclaims | | | 1,384 | | | | 9 | | | | 4,614 | | | | 1,714 | |
Unrealized appreciation on forward foreign currency exchange contracts | | | — | | | | — | | | | 43,448 | | | | — | |
Due from Adviser | | | — | | | | 6 | | | | — | | | | — | |
Other assets | | | — | | | | — | | | | — | | | | 75 | |
| | | | | | | | | | | | | | | | |
Total Assets | | | 820,118 | | | | 23,514 | | | | 2,602,879 | | | | 1,968,868 | |
| | | | | | | | | | | | | | | | |
| | | | |
LIABILITIES: | | | | | | | | | | | | | | | | |
Payables: | | | | | | | | | | | | | | | | |
Investment securities purchased | | | 8,247 | | | | 1,418 | | | | 27,661 | | | | 15,368 | |
Fund shares redeemed | | | 405 | | | | 1 | | | | 4,030 | | | | 6,946 | |
Variation margin on futures contracts | | | 308 | | | | — | | | | 164 | | | | — | |
Unrealized depreciation on forward foreign currency exchange contracts | | | — | | | | — | | | | 37,804 | | | | — | |
Accrued liabilities: | | | | | | | | | | | | | | | | |
Investment advisory fees | | | 9 | | | | — | | | | 1,445 | | | | 947 | |
Administration fees | | | 2 | | | | — | | | | 202 | | | | 130 | |
Distribution fees | | | 33 | | | | — | (a) | | | 146 | | | | 28 | |
Shareholder servicing fees | | | 151 | | | | 2 | | | | 164 | | | | 151 | |
Custodian and accounting fees | | | 88 | | | | 15 | | | | 268 | | | | 62 | |
Trustees’ and Chief Compliance Officer’s fees | | | — | (a) | | | — | | | | 6 | | | | 3 | |
Other | | | 104 | | | | 25 | | | | 770 | | | | 55 | |
| | | | | | | | | | | | | | | | |
Total Liabilities | | | 9,347 | | | | 1,461 | | | | 72,660 | | | | 23,690 | |
| | | | | | | | | | | | | | | | |
Net Assets | | $ | 810,771 | | | $ | 22,053 | | | $ | 2,530,219 | | | $ | 1,945,178 | |
| | | | | | | | | | | | | | | | |
| (a) | Amount rounds to less than $1,000. |
SEE NOTES TO FINANCIAL STATEMENTS.
| | | | | | |
| | | |
| 86 | | | | J.P. MORGAN INTERNATIONAL EQUITY FUNDS | | APRIL 30, 2015 |
| | | | | | | | | | | | | | | | |
| | | International
Research
Enhanced
Equity Fund | | | International
Unconstrained
Equity Fund | | | International
Value Fund | | | Intrepid
International
Fund | |
NET ASSETS: | | | | | | | | | | | | | | | | |
Paid-in-Capital | | $ | 682,289 | | | $ | 20,859 | | | $ | 2,563,263 | | | $ | 2,311,278 | |
Accumulated undistributed (distributions in excess of) net investment income | | | 6,136 | | | | 31 | | | | 3,376 | | | | 13,945 | |
Accumulated net realized gains (losses) | | | 6,060 | | | | 76 | | | | (345,866 | ) | | | (562,831 | ) |
Net unrealized appreciation (depreciation) | | | 116,286 | | | | 1,087 | | | | 309,446 | | | | 182,786 | |
| | | | | | | | | | | | | | | | |
Total Net Assets | | $ | 810,771 | | | $ | 22,053 | | | $ | 2,530,219 | | | $ | 1,945,178 | |
| | | | | | | | | | | | | | | | |
| | | | |
Net Assets: | | | | | | | | | | | | | | | | |
Class A | | $ | 92,205 | | | $ | 1,079 | | | $ | 623,800 | | | $ | 132,076 | |
Class B | | | 1,327 | | | | — | | | | 1,189 | | | | — | |
Class C | | | 20,161 | | | | 354 | | | | 31,595 | | | | 1,691 | |
Class R2 | | | 3,080 | | | | 21 | | | | 1,729 | | | | 292 | |
Class R5 | | | — | | | | 21 | | | | — | | | | — | |
Class R6 | | | — | | | | 21 | | | | 7,270 | | | | — | |
Institutional Class | | | — | | | | — | | | | 1,598,600 | | | | 1,793,896 | |
Select Class | | | 693,998 | | | | 20,557 | | | | 266,036 | | | | 17,223 | |
| | | | | | | | | | | | | | | | |
Total | | $ | 810,771 | | | $ | 22,053 | | | $ | 2,530,219 | | | $ | 1,945,178 | |
| | | | | | | | | | | | | | | | |
| | | | |
Outstanding units of beneficial interest (shares) | | | | | | | | | | | | | | | | |
($0.0001 par value; unlimited number of shares authorized): | | | | | | | | | | | | | | | | |
Class A | | | 5,239 | | | | 58 | | | | 44,156 | | | | 6,447 | |
Class B | | | 83 | | | | — | | | | 84 | | | | — | |
Class C | | | 1,192 | | | | 19 | | | | 2,298 | | | | 82 | |
Class R2 | | | 179 | | | | — | (a) | | | 124 | | | | 14 | |
Class R5 | | | — | | | | — | (a) | | | — | | | | — | |
Class R6 | | | — | | | | — | (a) | | | 505 | | | | — | |
Institutional Class | | | — | | | | — | | | | 111,116 | | | | 85,688 | |
Select Class | | | 39,118 | | | | 1,093 | | | | 18,372 | | | | 810 | |
| | | | |
Net Asset Value (b): | | | | | | | | | | | | | | | | |
Class A — Redemption price per share | | $ | 17.60 | | | $ | 18.72 | | | $ | 14.13 | | | $ | 20.49 | |
Class B — Offering price per share (c) | | | 15.97 | | | | — | | | | 14.12 | | | | — | |
Class C — Offering price per share (c) | | | 16.91 | | | | 18.61 | | | | 13.75 | | | | 20.71 | |
Class R2 — Offering and redemption price per share | | | 17.27 | | | | 18.72 | | | | 13.93 | | | | 20.35 | |
Class R5 — Offering and redemption price per share | | | — | | | | 18.84 | | | | — | | | | — | |
Class R6 — Offering and redemption price per share | | | — | | | | 18.84 | | | | 14.40 | | | | — | |
Institutional Class — Offering and redemption price per share | | | — | | | | — | | | | 14.39 | | | | 20.94 | |
Select Class — Offering and redemption price per share | | | 17.74 | | | | 18.81 | | | | 14.48 | | | | 21.26 | |
Class A maximum sales charge | | | 5.25 | % | | | 5.25 | % | | | 5.25 | % | | | 5.25 | % |
Class A maximum public offering price per share
[net asset value per share/(100% — maximum sales charge)] | | $ | 18.58 | | | $ | 19.76 | | | $ | 14.91 | | | $ | 21.63 | |
| | | | | | | | | | | | | | | | |
| | | | |
Cost of investments in non-affiliates | | $ | 670,909 | | | $ | 18,472 | | | $ | 2,175,480 | | | $ | 1,730,784 | |
Cost of investments in affiliates | | | 17,887 | | | | 1,600 | | | | 4,663 | | | | 33,135 | |
Cost of foreign currency | | | 6,932 | | | | — | (c) | | | 770 | | | | 108 | |
| (a) | Amount rounds to less than $1,000. |
| (b) | Per share amounts may not recalculate due to rounding of net assets and/or shares outstanding. |
| (c) | Redemption price for Class B and Class C Shares varies based upon length of time the shares are held. |
SEE NOTES TO FINANCIAL STATEMENTS.
| | | | | | | | |
| | | |
| APRIL 30, 2015 | | J.P. MORGAN INTERNATIONAL EQUITY FUNDS | | | | | 87 | |
STATEMENTS OF OPERATIONS
FOR THE SIX MONTHS ENDED APRIL 30, 2015 (Unaudited)
(Amounts in thousands)
| | | | | | | | | | | | | | | | |
| | | Emerging
Economies
Fund | | | Emerging
Markets
Equity Fund | | | Emerging Markets
Equity Income
Fund (a) | | | Global Research
Enhanced Index
Fund | |
INVESTMENT INCOME: | | | | | | | | | | | | | | | | |
Interest income from affiliates | | $ | 1 | | | $ | 4 | | | $ | — | | | $ | — | |
Dividend income from non-affiliates | | | 11,646 | | | | 21,489 | | | | 48 | | | | 65,815 | |
Dividend income from affiliates | | | 2 | | | | 6 | | | | — | (b) | | | 43 | |
Foreign taxes withheld | | | (1,075 | ) | | | (1,426 | ) | | | (4 | ) | | | (2,892 | ) |
| | | | | | | | | | | | | | | | |
Total investment income | | | 10,574 | | | | 20,073 | | | | 44 | | | | 62,966 | |
| | | | | | | | | | | | | | | | |
| | | | |
EXPENSES: | | | | | | | | | | | | | | | | |
Investment advisory fees | | | 5,216 | | | | 11,471 | | | | 12 | | | | 5,368 | |
Administration fees | | | 429 | | | | 943 | | | | 1 | | | | 2,204 | |
Distribution fees: | | | | | | | | | | | | | | | | |
Class A | | | 77 | | | | 405 | | | | — | (b) | | | — | (b) |
Class B | | | — | | | | 8 | | | | — | | | | — | |
Class C | | | 18 | | | | 204 | | | | — | (b) | | | — | (b) |
Class R2 | | | — | | | | — | | | | — | | | | — | (b) |
Shareholder servicing fees: | | | | | | | | | | | | | | | | |
Class A | | | 77 | | | | 405 | | | | — | (b) | | | — | (b) |
Class B | | | — | | | | 3 | | | | — | | | | — | |
Class C | | | 6 | | | | 68 | | | | — | (b) | | | — | (b) |
Class R2 | | | — | | | | — | | | | — | | | | — | (b) |
Class R5 | | | 177 | | | | — | | | | — | (b) | | | — | |
Institutional Class | | | — | | | | 199 | | | | — | | | | — | |
Select Class | | | 336 | | | | 690 | | | | 3 | | | | 6,710 | |
Custodian and accounting fees | | | 354 | | | | 653 | | | | 29 | | | | 131 | |
Interest expense to affiliates | | | 12 | | | | 11 | | | | — | (b) | | | 2 | |
Professional fees | | | 42 | | | | 57 | | | | 35 | | | | 63 | |
Trustees’ and Chief Compliance Officer’s fees | | | 5 | | | | 10 | | | | — | (b) | | | 26 | |
Printing and mailing costs | | | 18 | | | | 222 | | | | 2 | | | | 44 | |
Registration and filing fees | | | 38 | | | | 110 | | | | — | (b) | | | 160 | |
Transfer agent fees | | | 32 | | | | 61 | | | | 1 | | | | 28 | |
Sub-transfer agent fees (See Note 2.I.) | | | 98 | | | | 671 | | | | — | | | | 3 | |
Offering costs | | | — | | | | — | | | | 45 | | | | — | |
Other | | | 7 | | | | 17 | | | | 5 | | | | 22 | |
| | | | | | | | | | | | | | | | |
Total expenses | | | 6,942 | | | | 16,208 | | | | 133 | | | | 14,761 | |
| | | | | | | | | | | | | | | | |
Less fees waived | | | (482 | ) | | | (1,017 | ) | | | (13 | ) | | | (5,860 | ) |
Less expense reimbursements | | | (13 | ) | | | (68 | ) | | | (104 | ) | | | — | (a) |
| | | | | | | | | | | | | | | | |
Net expenses | | | 6,447 | | | | 15,123 | | | | 16 | | | | 8,901 | |
| | | | | | | | | | | | | | | | |
Net investment income (loss) | | | 4,127 | | | | 4,950 | | | | 28 | | | | 54,065 | |
| | | | | | | | | | | | | | | | |
| | | | |
REALIZED/UNREALIZED GAINS (LOSSES): | | | | | | | | | | | | | | | | |
Net realized gain (loss) on transactions from: | | | | | | | | | | | | | | | | |
Investments in non-affiliates | | | (59,374 | )(c) | | | 18,405 | | | | (19 | ) | | | (15,024 | ) |
Futures | | | — | | | | — | | | | — | | | | (1,943 | ) |
Foreign currency transactions | | | 441 | | | | 1,042 | | | | — | | | | (153 | ) |
| | | | | | | | | | | | | | | | |
Net realized gain (loss) | | | (58,933 | ) | | | 19,447 | | | | (19 | ) | | | (17,120 | ) |
| | | | | | | | | | | | | | | | |
Change in net unrealized appreciation/depreciation of: | | | | | | | | | | | | | | | | |
Investments in non-affiliates | | | 66,901 | (d) | | | (107,684 | )(e) | | | 140 | | | | 256,934 | |
Futures | | | — | | | | — | | | | — | | | | (6,415 | ) |
Foreign currency translations | | | 26 | | | | (41 | ) | | | — | | | | 128 | |
| | | | | | | | | | | | | | | | |
Change in net unrealized appreciation/depreciation | | | 66,927 | | | | (107,725 | ) | | | 140 | | | | 250,647 | |
| | | | | | | | | | | | | | | | |
Net realized/unrealized gains (losses) | | | 7,994 | | | | (88,278 | ) | | | 121 | | | | 233,527 | |
| | | | | | | | | | | | | | | | |
Change in net assets resulting from operations | | $ | 12,121 | | | $ | (83,328 | ) | | $ | 149 | | | $ | 287,592 | |
| | | | | | | | | | | | | | | | |
| (a) | Commencement of operations was December 12, 2014. |
| (b) | Amounts rounds to less than $1,000. |
| (c) | Net of India capital gains tax of approximately $(200,000) for Emerging Economies Fund. |
| (d) | Net of change in India capital gains tax of approximately $459,000 for Emerging Economies Fund. |
| (e) | Net of change in India capital gains tax of approximately $(507,000) for Emerging Markets Equity Fund. |
SEE NOTES TO FINANCIAL STATEMENTS.
| | | | | | |
| | | |
| 88 | | | | J.P. MORGAN INTERNATIONAL EQUITY FUNDS | | APRIL 30, 2015 |
| | | | | | | | | | | | | | | | |
| | | Global
Unconstrained
Equity Fund | | | International
Equity Fund | | | International
Equity
Income Fund | | | International
Opportunities
Fund | |
INVESTMENT INCOME: | | | | | | | | | | | | | | | | |
Interest income from non-affiliates | | $ | — | | | $ | 1 | | | $ | 2 | | | $ | 1 | |
Dividend income from non-affiliates | | | 34 | | | | 36,426 | | | | 1,968 | | | | 24,248 | |
Dividend income from affiliates | | | — | (a) | | | 11 | | | | — | | | | 6 | |
Foreign taxes withheld | | | (1 | ) | | | (2,380 | ) | | | (98 | ) | | | (1,768 | ) |
| | | | | | | | | | | | | | | | |
Total investment income | | | 33 | | | | 34,058 | | | | 1,872 | | | | 22,487 | |
| | | | | | | | | | | | | | | | |
| | | | |
EXPENSES: | | | | | | | | | | | | | | | | |
Investment advisory fees | | | 17 | | | | 10,098 | | | | 348 | | | | 5,164 | |
Administration fees | | | 2 | | | | 1,037 | | | | 40 | | | | 707 | |
Distribution fees: | | | | | | | | | | | | | | | | |
Class A | | | — | (a) | | | 231 | | | | 77 | | | | 105 | |
Class B | | | — | | | | 3 | | | | — | | | | 1 | |
Class C | | | — | (a) | | | 98 | | | | 13 | | | | 5 | |
Class R2 | | | — | (a) | | | 3 | | | | 2 | | | | — | |
Shareholder servicing fees: | | | | | | | | | | | | | | | | |
Class A | | | — | (a) | | | 231 | | | | 77 | | | | 105 | |
Class B | | | — | | | | 1 | | | | — | | | | — | (a) |
Class C | | | — | (a) | �� | | 33 | | | | 4 | | | | 2 | |
Class R2 | | | — | (a) | | | 1 | | | | 1 | | | | — | |
Class R5 | | | — | (a) | | | 20 | | | | — | (a) | | | — | |
Institutional Class | | | — | | | | — | | | | — | | | | 22 | |
Select Class | | | 5 | | | | 592 | | | | 38 | | | | 59 | |
Custodian and accounting fees | | | 21 | | | | 165 | | | | 3 | | | | 142 | |
Interest expense to affiliates | | | — | | | | 1 | | | | 2 | | | | 2 | |
Professional fees | | | 35 | | | | 48 | | | | 50 | | | | 53 | |
Trustees’ and Chief Compliance Officer’s fees | | | — | (a) | | | 14 | | | | 1 | | | | 9 | |
Printing and mailing costs | | | 6 | | | | 80 | | | | 11 | | | | 30 | |
Registration and filing fees | | | 47 | | | | 76 | | | | 53 | | | | 58 | |
Transfer agent fees | | | 3 | | | | 38 | | | | 5 | | | | 19 | |
Sub-transfer agent fees (See Note 2.I.) | | | — | | | | 294 | | | | 28 | | | | 117 | |
Other | | | 4 | | | | 15 | | | | 4 | | | | 12 | |
| | | | | | | | | | | | | | | | |
Total expenses | | | 140 | | | | 13,079 | | | | 757 | | | | 6,612 | |
| | | | | | | | | | | | | | | | |
Less fees waived | | | (20 | ) | | | (1,686 | ) | | | (195 | ) | | | (100 | ) |
Less expense reimbursements | | | (98 | ) | | | (12 | ) | | | — | | | | (2 | ) |
| | | | | | | | | | | | | | | | |
Net expenses | | | 22 | | | | 11,381 | | | | 562 | | | | 6,510 | |
| | | | | | | | | | | | | | | | |
Net investment income (loss) | | | 11 | | | | 22,677 | | | | 1,310 | | | | 15,977 | |
| | | | | | | | | | | | | | | | |
| | | | |
REALIZED/UNREALIZED GAINS (LOSSES): | | | | | | | | | | | | | | | | |
Net realized gain (loss) on transactions from: | | | | | | | | | | | | | | | | |
Investments in non-affiliates | | | 63 | | | | (3,801 | ) | | | 6,473 | | | | (20,858 | ) |
Futures | | | — | | | | — | | | | — | | | | 1,955 | |
Foreign currency transactions | | | (1 | ) | | | 743 | | | | 52 | | | | (15,188 | ) |
| | | | | | | | | | | | | | | | |
Net realized gain (loss) | | | 62 | | | | (3,058 | ) | | | 6,525 | | | | (34,091 | ) |
| | | | | | | | | | | | | | | | |
Change in net unrealized appreciation/depreciation of: | | | | | | | | | | | | | | | | |
Investments in non-affiliates | | | 262 | | | | 172,294 | | | | (3,799 | ) | | | 119,773 | |
Futures | | | — | | | | — | | | | — | | | | (426 | ) |
Foreign currency translations | | | — | (a) | | | 226 | | | | 8 | | | | 3,679 | |
| | | | | | | | | | | | | | | | |
Change in net unrealized appreciation/depreciation | | | 262 | | | | 172,520 | | | | (3,791 | ) | | | 123,026 | |
| | | | | | | | | | | | | | | | |
Net realized/unrealized gains (losses) | | | 324 | | | | 169,462 | | | | 2,734 | | | | 88,935 | |
| | | | | | | | | | | | | | | | |
Change in net assets resulting from operations | | $ | 335 | | | $ | 192,139 | | | $ | 4,044 | | | $ | 104,912 | |
| | | | | | | | | | | | | | | | |
| (a) | Amount rounds to less than $1,000. |
SEE NOTES TO FINANCIAL STATEMENTS.
| | | | | | | | |
| | | |
| APRIL 30, 2015 | | J.P. MORGAN INTERNATIONAL EQUITY FUNDS | | | | | 89 | |
STATEMENTS OF OPERATIONS
FOR THE SIX MONTHS ENDED APRIL 30, 2015 (Unaudited) (continued)
(Amounts in thousands)
| | | | | | | | | | | | | | | | |
| | | International
Research
Enhanced
Equity Fund | | | International
Unconstrained
Equity Fund | | | International
Value Fund | | | Intrepid
International
Fund | |
INVESTMENT INCOME: | | | | | | | | | | | | | | | | |
Dividend income from non-affiliates | | $ | 11,664 | | | $ | 70 | | | $ | 47,740 | | | $ | 28,581 | |
Dividend income from affiliates | | | 4 | | | | — | (a) | | | 4 | | | | 8 | |
Foreign taxes withheld | | | (668 | ) | | | (5 | ) | | | (3,797 | ) | | | (2,045 | ) |
| | | | | | | | | | | | | | | | |
Total investment income | | | 11,000 | | | | 65 | | | | 43,947 | | | | 26,544 | |
| | | | | | | | | | | | | | | | |
| | | | |
EXPENSES: | | | | | | | | | | | | | | | | |
Investment advisory fees | | | 709 | | | | 24 | | | | 10,529 | | | | 6,260 | |
Administration fees | | | 291 | | | | 3 | | | | 1,442 | | | | 707 | |
Distribution fees: | | | | | | | | | | | | | | | | |
Class A | | | 113 | | | | 1 | | | | 679 | | | | 142 | |
Class B | | | 5 | | | | — | | | | 5 | | | | — | |
Class C | | | 74 | | | | 1 | | | | 111 | | | | 5 | |
Class R2 | | | 7 | | | | — | (a) | | | 4 | | | | — | (a) |
Shareholder servicing fees: | | | | | | | | | | | | | | | | |
Class A | | | 113 | | | | 1 | | | | 679 | | | | 142 | |
Class B | | | 2 | | | | — | | | | 2 | | | | — | |
Class C | | | 24 | | | | — | (a) | | | 37 | | | | 2 | |
Class R2 | | | 4 | | | | — | (a) | | | 2 | | | | — | (a) |
Class R5 | | | — | | | | — | (a) | | | — | | | | — | |
Institutional Class | | | — | | | | — | | | | 1,320 | | | | 795 | |
Select Class | | | 743 | | | | 7 | | | | 340 | | | | 20 | |
Custodian and accounting fees | | | 58 | | | | 17 | | | | 223 | | | | 112 | |
Interest expense to affiliates | | | — | (a) | | | — | | | | 8 | | | | — | (a) |
Professional fees | | | 83 | | | | 36 | | | | 82 | | | | 59 | |
Trustees’ and Chief Compliance Officer’s fees | | | 4 | | | | — | (a) | | | 19 | | | | 9 | |
Printing and mailing costs | | | 47 | | | | 2 | | | | 251 | | | | 17 | |
Registration and filing fees | | | 49 | | | | 48 | | | | 158 | | | | 66 | |
Transfer agent fees | | | 38 | | | | 4 | | | | 37 | | | | 9 | |
Sub-transfer agent fees (See Note 2.I.) | | | 98 | | | | — | (a) | | | 2,344 | | | | 116 | |
Other | | | 7 | | | | 4 | | | | 18 | | | | 9 | |
| | | | | | | | | | | | | | | | |
Total expenses | | | 2,469 | | | | 148 | | | | 18,290 | | | | 8,470 | |
| | | | | | | | | | | | | | | | |
Less fees waived | | | (1,048 | ) | | | (30 | ) | | | (344 | ) | | | (725 | ) |
Less expense reimbursements | | | (4 | ) | | | (85 | ) | | | (33 | ) | | | — | (a) |
| | | | | | | | | | | | | | | | |
Net expenses | | | 1,417 | | | | 33 | | | | 17,913 | | | | 7,745 | |
| | | | | | | | | | | | | | | | |
Net investment income (loss) | | | 9,583 | | | | 32 | | | | 26,034 | | | | 18,799 | |
| | | | | | | | | | | | | | | | |
| | | | |
REALIZED/UNREALIZED GAINS (LOSSES): | | | | | | | | | | | | | | | | |
Net realized gain (loss) on transactions from: | | | | | | | | | | | | | | | | |
Investments in non-affiliates | | | 5,820 | (b) | | | 63 | | | | 22,337 | | | | (17,799 | ) |
Investment in affiliates | | | — | | | | — | (a) | | | — | | | | — | |
Futures | | | 3,286 | | | | (9 | ) | | | 4,479 | | | | — | |
Foreign currency transactions | | | (47 | ) | | | 21 | | | | (7,771 | ) | | | (254 | ) |
| | | | | | | | | | | | | | | | |
Net realized gain (loss) | | | 9,059 | | | | 75 | | | | 19,045 | | | | (18,053 | ) |
| | | | | | | | | | | | | | | | |
Change in net unrealized appreciation/depreciation of: | | | | | | | | | | | | | | | | |
Investments in non-affiliates | | | 27,002 | | | | 726 | | | | 66,609 | | | | 118,952 | |
Futures | | | 69 | | | | — | | | | 484 | | | | — | |
Foreign currency translations | | | (46 | ) | | | — | (a) | | | 2,816 | | | | 201 | |
| | | | | | | | | | | | | | | | |
Change in net unrealized appreciation/depreciation | | | 27,025 | | | | 726 | | | | 69,909 | | | | 119,153 | |
| | | | | | | | | | | | | | | | |
Net realized/unrealized gains (losses) | | | 36,084 | | | | 801 | | | | 88,954 | | | | 101,100 | |
| | | | | | | | | | | | | | | | |
Change in net assets resulting from operations | | $ | 45,667 | | | $ | 833 | | | $ | 114,988 | | | $ | 119,899 | |
| | | | | | | | | | | | | | | | |
| (a) | Amounts rounds to less than $1,000. |
| (b) | Net of India capital gains tax of less than $1,000 for International Research Enhanced Equity Fund. |
SEE NOTES TO FINANCIAL STATEMENTS.
| | | | | | |
| | | |
| 90 | | | | J.P. MORGAN INTERNATIONAL EQUITY FUNDS | | APRIL 30, 2015 |
STATEMENTS OF CHANGES IN NET ASSETS
FOR THE PERIODS INDICATED
(Amounts in thousands)
| | | | | | | | | | | | | | | | |
| | | Emerging Economies Fund | | | Emerging Markets Equity Fund | |
| | | Six Months Ended
April 30, 2015
(Unaudited) | | | Year Ended
October 31, 2014 | | | Six Months Ended
April 30, 2015
(Unaudited) | | | Year Ended
October 31, 2014 | |
CHANGE IN NET ASSETS RESULTING FROM OPERATIONS: | | | | | | | | | | | | | | | | |
Net investment income (loss) | | $ | 4,127 | | | $ | 22,372 | | | $ | 4,950 | | | $ | 28,370 | |
Net realized gain (loss) | | | (58,933 | ) | | | (32,703 | ) | | | 19,447 | | | | 80,394 | |
Distributions of capital gains received from investment company affiliates | | | — | | | | — | (a) | | | — | | | | 1 | |
Change in net unrealized appreciation/depreciation | | | 66,927 | | | | (12,476 | ) | | | (107,725 | ) | | | (77,244 | ) |
| | | | | | | | | | | | | | | | |
Change in net assets resulting from operations | | | 12,121 | | | | (22,807 | ) | | | (83,328 | ) | | | 31,521 | |
| | | | | | | | | | | | | | | | |
| | | | |
DISTRIBUTIONS TO SHAREHOLDERS: | | | | | | | | | | | | | | | | |
Class A | | | | | | | | | | | | | | | | |
From net investment income | | | (1,309 | ) | | | (788 | ) | | | (2,876 | ) | | | (1,101 | ) |
Class B | | | | | | | | | | | | | | | | |
From net investment income | | | — | | | | — | | | | (3 | ) | | | — | |
Class C | | | | | | | | | | | | | | | | |
From net investment income | | | (54 | ) | | | (39 | ) | | | (188 | ) | | | — | |
Class R5 | | | | | | | | | | | | | | | | |
From net investment income | | | (17,780 | ) | | | (10,129 | ) | | | — | | | | — | |
Class R6 | | | | | | | | | | | | | | | | |
From net investment income | | | — | | | | — | | | | (14,467 | ) | | | — | |
Institutional Class | | | | | | | | | | | | | | | | |
From net investment income | | | — | | | | — | | | | (4,060 | ) | | | (17,566 | ) |
Select Class | | | | | | | | | | | | | | | | |
From net investment income | | | (4,910 | ) | | | (3,202 | ) | | | (5,672 | ) | | | (1,422 | ) |
| | | | | | | | | | | | | | | | |
Total distributions to shareholders | | | (24,053 | ) | | | (14,158 | ) | | | (27,266 | ) | | | (20,089 | ) |
| | | | | | | | | | | | | | | | |
| | | | |
CAPITAL TRANSACTIONS: | | | | | | | | | | | | | | | | |
Change in net assets resulting from capital transactions | | | (370,894 | ) | | | 234,052 | | | | (335,904 | ) | | | (888,151 | ) |
| | | | | | | | | | | | | | | | |
| | | | |
NET ASSETS: | | | | | | | | | | | | | | | | |
Change in net assets | | | (382,826 | ) | | | 197,087 | | | | (446,498 | ) | | | (876,719 | ) |
Beginning of period | | | 1,226,673 | | | | 1,029,586 | | | | 2,534,974 | | | | 3,411,693 | |
| | | | | | | | | | | | | | | | |
End of period | | $ | 843,847 | | | $ | 1,226,673 | | | $ | 2,088,476 | | | $ | 2,534,974 | |
| | | | | | | | | | | | | | | | |
Accumulated undistributed (distributions in excess of) net investment income | | $ | (793 | ) | | $ | 19,133 | | | $ | 4,912 | | | $ | 27,228 | |
| | | | | | | | | | | | | | | | |
| (a) | Amount rounds to less than $1,000. |
SEE NOTES TO FINANCIAL STATEMENTS.
| | | | | | | | |
| | | |
| APRIL 30, 2015 | | J.P. MORGAN INTERNATIONAL EQUITY FUNDS | | | | | 91 | |
STATEMENTS OF CHANGES IN NET ASSETS
FOR THE PERIODS INDICATED (continued)
(Amounts in thousands)
| | | | | | | | | | | | |
| | | Emerging Markets
Equity Income Fund | | | Global Research
Enhanced Index Fund | |
| | | Period Ended
April 30, 2015
(Unaudited) (a) | | | Six Months Ended
April 30, 2015
(Unaudited) | | | Year Ended
October 31, 2014 | |
CHANGE IN NET ASSETS RESULTING FROM OPERATIONS: | | | | | | | | | | | | |
Net investment income (loss) | | $ | 28 | | | $ | 54,065 | | | $ | 61,329 | |
Net realized gain (loss) | | | (19 | ) | | | (17,120 | ) | | | 41,381 | |
Distributions of capital gains received from investment company affiliates | | | — | | | | — | | | | 1 | |
Change in net unrealized appreciation/depreciation | | | 140 | | | | 250,647 | | | | 166,613 | |
| | | | | | | | | | | | |
Change in net assets resulting from operations | | | 149 | | | | 287,592 | | | | 269,324 | |
| | | | | | | | | | | | |
| | | |
DISTRIBUTIONS TO SHAREHOLDERS: | | | | | | | | | | | | |
Class A | | | | | | | | | | | | |
From net investment income | | | — | (b) | | | (1 | ) | | | (1 | ) |
From net realized gains | | | — | | | | (1 | ) | | | — | (b) |
Class C | | | | | | | | | | | | |
From net investment income | | | — | (b) | | | — | (b) | | | — | (b) |
From net realized gains | | | — | | | | (1 | ) | | | (1 | ) |
Class R2 | | | | | | | | | | | | |
From net investment income | | | — | | | | — | (b) | | | — | (b) |
From net realized gains | | | — | | | | (1 | ) | | | — | (b) |
Class R5 | | | | | | | | | | | | |
From net investment income | | | — | (b) | | | — | | | | — | |
Class R6 | | | | | | | | | | | | |
From net investment income | | | — | (b) | | | — | | | | — | |
Select Class | | | | | | | | | | | | |
From net investment income | | | (22 | ) | | | (71,222 | ) | | | (20,542 | ) |
From net realized gains | | | — | | | | (47,876 | ) | | | (11,342 | ) |
| | | | | | | | | | | | |
Total distributions to shareholders | | | (22 | ) | | | (119,102 | ) | | | (31,886 | ) |
| | | | | | | | | | | | |
| | | |
CAPITAL TRANSACTIONS: | | | | | | | | | | | | |
Change in net assets resulting from capital transactions | | | 3,048 | | | | 2,782,370 | | | | 1,445,076 | |
| | | | | | | | | | | | |
| | | |
NET ASSETS: | | | | | | | | | | | | |
Change in net assets | | | 3,175 | | | | 2,950,860 | | | | 1,682,514 | |
Beginning of period | | | — | | | | 3,577,713 | | | | 1,895,199 | |
| | | | | | | | | | | | |
End of period | | $ | 3,175 | | | $ | 6,528,573 | | | $ | 3,577,713 | |
| | | | | | | | | | | | |
Accumulated undistributed (distributions in excess of) net investment income | | $ | 6 | | | $ | 40,073 | | | $ | 57,231 | |
| | | | | | | | | | | | |
| (a) | Commencement of operations was December 12, 2014. |
| (b) | Amount rounds to less than $1,000. |
SEE NOTES TO FINANCIAL STATEMENTS.
| | | | | | |
| | | |
| 92 | | | | J.P. MORGAN INTERNATIONAL EQUITY FUNDS | | APRIL 30, 2015 |
| | | | | | | | | | | | | | | | |
| | | Global Unconstrained Equity Fund | | | International Equity Fund | |
| | | Six Months Ended
April 30, 2015
(Unaudited) | | | Year Ended
October 31, 2014 | | | Six Months Ended
April 30, 2015
(Unaudited) | | | Year Ended
October 31, 2014 | |
CHANGE IN NET ASSETS RESULTING FROM OPERATIONS: | | | | | | | | | | | | | | | | |
Net investment income (loss) | | $ | 11 | | | $ | 66 | | | $ | 22,677 | | | $ | 62,055 | |
Net realized gain (loss) | | | 62 | | | | 535 | | | | (3,058 | ) | | | 21,283 | |
Distributions of capital gains received from investment company affiliates | | | — | | | | — | (a) | | | — | | | | 1 | |
Change in net unrealized appreciation/depreciation | | | 262 | | | | (261 | ) | | | 172,520 | | | | (123,792 | ) |
| | | | | | | | | | | | | | | | |
Change in net assets resulting from operations | | | 335 | | | | 340 | | | | 192,139 | | | | (40,453 | ) |
| | | | | | | | | | | | | | | | |
| | | | |
DISTRIBUTIONS TO SHAREHOLDERS: | | | | | | | | | | | | | | | | |
Class A | | | | | | | | | | | | | | | | |
From net investment income | | | (1 | ) | | | (1 | ) | | | (747 | ) | | | (4,391 | ) |
From net realized gains | | | (9 | ) | | | (6 | ) | | | — | | | | — | |
Class B | | | | | | | | | | | | | | | | |
From net investment income | | | — | | | | — | | | | (1 | ) | | | (22 | ) |
Class C | | | | | | | | | | | | | | | | |
From net investment income | | | — | (a) | | | — | (a) | | | (59 | ) | | | (530 | ) |
From net realized gains | | | (9 | ) | | | (6 | ) | | | — | | | | — | |
Class R2 | | | | | | | | | | | | | | | | |
From net investment income | | | (1 | ) | | | (1 | ) | | | (3 | ) | | | (28 | ) |
From net realized gains | | | (9 | ) | | | (6 | ) | | | — | | | | — | |
Class R5 | | | | | | | | | | | | | | | | |
From net investment income | | | (1 | ) | | | (1 | ) | | | (461 | ) | | | (2,846 | ) |
From net realized gains | | | (9 | ) | | | (6 | ) | | | — | | | | — | |
Class R6 | | | | | | | | | | | | | | | | |
From net investment income | | | (1 | ) | | | (1 | ) | | | (9,888 | ) | | | (42,018 | ) |
From net realized gains | | | (9 | ) | | | (6 | ) | | | — | | | | — | |
Select Class | | | | | | | | | | | | | | | | |
From net investment income | | | (61 | ) | | | (45 | ) | | | (2,329 | ) | | | (11,524 | ) |
From net realized gains | | | (496 | ) | | | (341 | ) | | | — | | | | — | |
| | | | | | | | | | | | | | | | |
Total distributions to shareholders | | | (606 | ) | | | (420 | ) | | | (13,488 | ) | | | (61,359 | ) |
| | | | | | | | | | | | | | | | |
| | | | |
CAPITAL TRANSACTIONS: | | | | | | | | | | | | | | | | |
Change in net assets resulting from capital transactions | | | 686 | | | | 420 | | | | 144,261 | | | | 583,648 | |
| | | | | | | | | | | | | | | | |
| | | | |
NET ASSETS: | | | | | | | | | | | | | | | | |
Change in net assets | | | 415 | | | | 340 | | | | 322,912 | | | | 481,836 | |
Beginning of period | | | 4,532 | | | | 4,192 | | | | 2,486,790 | | | | 2,004,954 | |
| | | | | | | | | | | | | | | | |
End of period | | $ | 4,947 | | | $ | 4,532 | | | $ | 2,809,702 | | | $ | 2,486,790 | |
| | | | | | | | | | | | | | | | |
Accumulated undistributed (distributions in excess of) net investment income | | $ | 9 | | | $ | 63 | | | $ | 11,423 | | | $ | 2,234 | |
| | | | | | | | | | | | | | | | |
| (a) | Amount rounds to less than $1,000. |
SEE NOTES TO FINANCIAL STATEMENTS.
| | | | | | | | |
| | | |
| APRIL 30, 2015 | | J.P. MORGAN INTERNATIONAL EQUITY FUNDS | | | | | 93 | |
STATEMENTS OF CHANGES IN NET ASSETS
FOR THE PERIODS INDICATED (continued)
(Amounts in thousands)
| | | | | | | | | | | | | | | | |
| | | International Equity Income Fund | | | International Opportunities Fund | |
| | | Six Months Ended
April 30, 2015
(Unaudited) | | | Year Ended
October 31, 2014 | | | Six Months Ended
April 30, 2015
(Unaudited) | | | Year Ended
October 31,
2014 | |
CHANGE IN NET ASSETS RESULTING FROM OPERATIONS: | | | | | | | | | | | | | | | | |
Net investment income (loss) | | $ | 1,310 | | | $ | 6,461 | | | $ | 15,977 | | | $ | 46,795 | |
Net realized gain (loss) | | | 6,525 | | | | 163 | | | | (34,091 | ) | | | 56,651 | |
Distributions of capital gains received from investment company affiliates | | | — | | | | — | (a) | | | — | | | | 1 | |
Change in net unrealized appreciation/depreciation | | | (3,791 | ) | | | (3,023 | ) | | | 123,026 | | | | (130,096 | ) |
| | | | | | | | | | | | | | | | |
Change in net assets resulting from operations | | | 4,044 | | | | 3,601 | | | | 104,912 | | | | (26,649 | ) |
| | | | | | | | | | | | | | | | |
| | | | |
DISTRIBUTIONS TO SHAREHOLDERS: | | | | | | | | | | | | | | | | |
Class A | | | | | | | | | | | | | | | | |
From net investment income | | | (1,825 | ) | | | (2,495 | ) | | | (1,196 | ) | | | (964 | ) |
From net realized gains | | | (747 | ) | | | (419 | ) | | | — | | | | — | |
Class B | | | | | | | | | | | | | | | | |
From net investment income | | | — | | | | — | | | | (3 | ) | | | — | |
Class C | | | | | | | | | | | | | | | | |
From net investment income | | | (79 | ) | | | (109 | ) | | | (26 | ) | | | (6 | ) |
From net realized gains | | | (30 | ) | | | (16 | ) | | | — | | | | — | |
Class R2 | | | | | | | | | | | | | | | | |
From net investment income | | | (14 | ) | | | (21 | ) | | | — | | | | — | |
From net realized gains | | | (5 | ) | | | (4 | ) | | | — | | | | — | |
Class R5 | | | | | | | | | | | | | | | | |
From net investment income | | | (16 | ) | | | (26 | ) | | | — | | | | — | |
From net realized gains | | | (6 | ) | | | (4 | ) | | | — | | | | — | |
Class R6 (b) | | | | | | | | | | | | | | | | |
From net investment income | | | — | (a) | | | — | | | | (43,134 | ) | | | (14,924 | ) |
Institutional Class | | | | | | | | | | | | | | | | |
From net investment income | | | — | | | | — | | | | (1,208 | ) | | | (670 | ) |
Select Class | | | | | | | | | | | | | | | | |
From net investment income | | | (896 | ) | | | (2,019 | ) | | | (1,161 | ) | | | (395 | ) |
From net realized gains | | | (342 | ) | | | (434 | ) | | | — | | | | — | |
| | | | | | | | | | | | | | | | |
Total distributions to shareholders | | | (3,960 | ) | | | (5,547 | ) | | | (46,728 | ) | | | (16,959 | ) |
| | | | | | | | | | | | | | | | |
| | | | |
CAPITAL TRANSACTIONS: | | | | | | | | | | | | | | | | |
Change in net assets resulting from capital transactions | | | (15,221 | ) | | | 8,324 | | | | 142,553 | | | | 361,687 | |
| | | | | | | | | | | | | | | | |
| | | | |
NET ASSETS: | | | | | | | | | | | | | | | | |
Change in net assets | | | (15,137 | ) | | | 6,378 | | | | 200,737 | | | | 318,079 | |
Beginning of period | | | 114,062 | | | | 107,684 | | | | 1,755,846 | | | | 1,437,767 | |
| | | | | | | | | | | | | | | | |
End of period | | $ | 98,925 | | | $ | 114,062 | | | $ | 1,956,583 | | | $ | 1,755,846 | |
| | | | | | | | | | | | | | | | |
Accumulated undistributed (distributions in excess of) net investment income | | $ | (410 | ) | | $ | 1,110 | | | $ | 14,669 | | | $ | 45,420 | |
| | | | | | | | | | | | | | | | |
| (a) | Amount rounds to less than $1,000. |
| (b) | Commencement of offering of class shares effective January 30, 2015 for International Equity Income Fund. |
SEE NOTES TO FINANCIAL STATEMENTS.
| | | | | | |
| | | |
| 94 | | | | J.P. MORGAN INTERNATIONAL EQUITY FUNDS | | APRIL 30, 2015 |
| | | | | | | | | | | | | | | | |
| | | International Research Enhanced
Equity Fund | | | International Unconstrained Equity Fund | |
| | | Six Months Ended
April 30, 2015
(Unaudited) | | | Year Ended
October 31, 2014 | | | Six Months Ended
April 30, 2015
(Unaudited) | | | Year Ended
October 31, 2014 | |
CHANGE IN NET ASSETS RESULTING FROM OPERATIONS: | | | | | | | | | | | | | | | | |
Net investment income (loss) | | $ | 9,583 | | | $ | 15,366 | | | $ | 32 | | | $ | 51 | |
Net realized gain (loss) | | | 9,059 | | | | 118,095 | | | | 75 | | | | 314 | |
Distributions of capital gains received from investment company affiliates | | | — | | | | — | (a) | | | — | | | | — | |
Change in net unrealized appreciation/depreciation | | | 27,025 | | | | (138,448 | ) | | | 726 | | | | (468 | ) |
| | | | | | | | | | | | | | | | |
Change in net assets resulting from operations | | | 45,667 | | | | (4,987 | ) | | | 833 | | | | (103 | ) |
| | | | | | | | | | | | | | | | |
| | | | |
DISTRIBUTIONS TO SHAREHOLDERS: | | | | | | | | | | | | | | | | |
Class A | | | | | | | | | | | | | | | | |
From net investment income | | | (2,144 | ) | | | (2,006 | ) | | | (3 | ) | | | (1 | ) |
From net realized gains | | | (14,822 | ) | | | (1,739 | ) | | | (23 | ) | | | (6 | ) |
Class B | | | | | | | | | | | | | | | | |
From net investment income | | | (30 | ) | | | (38 | ) | | | — | | | | — | |
From net realized gains | | | (279 | ) | | | (46 | ) | | | — | | | | — | |
Class C | | | | | | | | | | | | | | | | |
From net investment income | | | (384 | ) | | | (316 | ) | | | (1 | ) | | | (1 | ) |
From net realized gains | | | (3,366 | ) | | | (361 | ) | | | (9 | ) | | | (5 | ) |
Class R2 | | | | | | | | | | | | | | | | |
From net investment income | | | (65 | ) | | | (31 | ) | | | (1 | ) | | | — | (a) |
From net realized gains | | | (441 | ) | | | (30 | ) | | | (5 | ) | | | (4 | ) |
Class R5 | | | | | | | | | | | | | | | | |
From net investment income | | | — | | | | — | | | | (1 | ) | | | (1 | ) |
From net realized gains | | | — | | | | — | | | | (5 | ) | | | (4 | ) |
Class R6 | | | | | | | | | | | | | | | | |
From net investment income | | | — | | | | — | | | | (1 | ) | | | (1 | ) |
From net realized gains | | | — | | | | — | | | | (5 | ) | | | (5 | ) |
Select Class | | | | | | | | | | | | | | | | |
From net investment income | | | (14,339 | ) | | | (9,519 | ) | | | (44 | ) | | | (40 | ) |
From net realized gains | | | (90,006 | ) | | | (7,401 | ) | | | (267 | ) | | | (251 | ) |
| | | | | | | | | | | | | | | | |
Total distributions to shareholders | | | (125,876 | ) | | | (21,487 | ) | | | (365 | ) | | | (319 | ) |
| | | | | | | | | | | | | | | | |
| | | | |
CAPITAL TRANSACTIONS: | | | | | | | | | | | | | | | | |
Change in net assets resulting from capital transactions | | | 207,476 | | | | 111,002 | | | | 17,021 | | | | 690 | |
| | | | | | | | | | | | | | | | |
| | | | |
NET ASSETS: | | | | | | | | | | | | | | | | |
Change in net assets | | | 127,267 | | | | 84,528 | | | | 17,489 | | | | 268 | |
Beginning of period | | | 683,504 | | | | 598,976 | | | | 4,564 | | | | 4,296 | |
| | | | | | | | | | | | | | | | |
End of period | | $ | 810,771 | | | $ | 683,504 | | | $ | 22,053 | | | $ | 4,564 | |
| | | | | | | | | | | | | | | | |
Accumulated undistributed (distributions in excess of) net investment income | | $ | 6,136 | | | $ | 13,515 | | | $ | 31 | | | $ | 50 | |
| | | | | | | | | | | | | | | | |
| (a) | Amount rounds to less than $1,000. |
SEE NOTES TO FINANCIAL STATEMENTS.
| | | | | | | | |
| | | |
| APRIL 30, 2015 | | J.P. MORGAN INTERNATIONAL EQUITY FUNDS | | | | | 95 | |
STATEMENTS OF CHANGES IN NET ASSETS
FOR THE PERIODS INDICATED (continued)
(Amounts in thousands)
| | | | | | | | | | | | | | | | |
| | | International Value Fund | | | Intrepid International Fund | |
| | | Six Months Ended
April 30, 2015
(Unaudited) | | | Year Ended
October 31, 2014 | | | Six Months Ended
April 30, 2015
(Unaudited) | | | Year Ended
October 31, 2014 | |
CHANGE IN NET ASSETS RESULTING FROM OPERATIONS: | | | | | | | | | | | | | | | | |
Net investment income (loss) | | $ | 26,034 | | | $ | 123,084 | | | $ | 18,799 | | | $ | 22,694 | |
Net realized gain (loss) | | | 19,045 | | | | 129,378 | | | | (18,053 | ) | | | 15,949 | |
Distributions of capital gains received from investment company affiliates | | | — | | | | 1 | | | | — | | | | — | (a) |
Change in net unrealized appreciation/depreciation | | | 69,909 | | | | (403,321 | ) | | | 119,153 | | | | (71,955 | ) |
| | | | | | | | | | | | | | | | |
Change in net assets resulting from operations | | | 114,988 | | | | (150,858 | ) | | | 119,899 | | | | (33,312 | ) |
| | | | | | | | | | | | | | | | |
| | | | |
DISTRIBUTIONS TO SHAREHOLDERS: | | | | | | | | | | | | | | | | |
Class A | | | | | | | | | | | | | | | | |
From net investment income | | | (17,828 | ) | | | (5,106 | ) | | | (1,178 | ) | | | (764 | ) |
Class B | | | | | | | | | | | | | | | | |
From net investment income | | | (34 | ) | | | (26 | ) | | | — | | | | — | |
Class C | | | | | | | | | | | | | | | | |
From net investment income | | | (874 | ) | | | (395 | ) | | | (7 | ) | | | (7 | ) |
Class R2 | | | | | | | | | | | | | | | | |
From net investment income | | | (54 | ) | | | (18 | ) | | | (1 | ) | | | (1 | ) |
Class R6 | | | | | | | | | | | | | | | | |
From net investment income | | | (1,141 | ) | | | (2,279 | ) | | | — | | | | — | |
Institutional Class | | | | | | | | | | | | | | | | |
From net investment income | | | (104,543 | ) | | | (53,459 | ) | | | (23,132 | ) | | | (9,080 | ) |
Select Class | | | | | | | | | | | | | | | | |
From net investment income | | | (10,060 | ) | | | (2,160 | ) | | | (194 | ) | | | (181 | ) |
| | | | | | | | | | | | | | | | |
Total distributions to shareholders | | | (134,534 | ) | | | (63,443 | ) | | | (24,512 | ) | | | (10,033 | ) |
| | | | | | | | | | | | | | | | |
| | | | |
CAPITAL TRANSACTIONS: | | | | | | | | | | | | | | | | |
Change in net assets resulting from capital transactions | | | (1,239,915 | ) | | | 927,458 | | | | 256,428 | | | | 978,829 | |
| | | | | | | | | | | | | | | | |
| | | | |
NET ASSETS: | | | | | | | | | | | | | | | | |
Change in net assets | | | (1,259,461 | ) | | | 713,157 | | | | 351,815 | | | | 935,484 | |
Beginning of period | | | 3,789,680 | | | | 3,076,523 | | | | 1,593,363 | | | | 657,879 | |
| | | | | | | | | | | | | | | | |
End of period | | $ | 2,530,219 | | | $ | 3,789,680 | | | $ | 1,945,178 | | | $ | 1,593,363 | |
| | | | | | | | | | | | | | | | |
Accumulated undistributed (distributions in excess of) net investment income | | $ | 3,376 | | | $ | 111,876 | | | $ | 13,945 | | | $ | 19,658 | |
| | | | | | | | | | | | | | | | |
| (a) | Amount rounds to less than $1,000. |
SEE NOTES TO FINANCIAL STATEMENTS.
| | | | | | |
| | | |
| 96 | | | | J.P. MORGAN INTERNATIONAL EQUITY FUNDS | | APRIL 30, 2015 |
| | | | | | | | | | | | | | | | |
| | | Emerging Economies Fund | | | Emerging Markets Equity Fund | |
| | | Six Months Ended
April 30, 2015
(Unaudited) | | | Year Ended
October 31, 2014 | | | Six Months Ended
April 30, 2015
(Unaudited) | | | Year Ended
October 31, 2014 | |
CAPITAL TRANSACTIONS: | | | | | | | | | | | | | | | | |
Class A | | | | | | | | | | | | | | | | |
Proceeds from shares issued | | $ | 17,863 | | | $ | 47,826 | | | $ | 71,627 | | | $ | 145,167 | |
Distributions reinvested | | | 703 | | | | 486 | | | | 2,387 | | | | 933 | |
Cost of shares redeemed | | | (62,625 | ) | | | (34,401 | ) | | | (124,258 | ) | | | (129,933 | ) |
| | | | | | | | | | | | | | | | |
Change in net assets resulting from Class A capital transactions | | $ | (44,059 | ) | | $ | 13,911 | | | $ | (50,244 | ) | | $ | 16,167 | |
| | | | | | | | | | | | | | | | |
Class B | | | | | | | | | | | | | | | | |
Proceeds from shares issued | | $ | — | | | $ | — | | | $ | 63 | | | $ | 89 | |
Distributions reinvested | | | — | | | | — | | | | 3 | | | | — | |
Cost of shares redeemed | | | — | | | | — | | | | (776 | ) | | | (1,668 | ) |
| | | | | | | | | | | | | | | | |
Change in net assets resulting from Class B capital transactions | | $ | — | | | $ | — | | | $ | (710 | ) | | $ | (1,579 | ) |
| | | | | | | | | | | | | | | | |
Class C | | | | | | | | | | | | | | | | |
Proceeds from shares issued | | $ | 377 | | | $ | 1,870 | | | $ | 6,564 | | | $ | 15,814 | |
Distributions reinvested | | | 54 | | | | 39 | | | | 176 | | | | — | |
Cost of shares redeemed | | | (983 | ) | | | (1,443 | ) | | | (5,724 | ) | | | (16,476 | ) |
| | | | | | | | | | | | | | | | |
Change in net assets resulting from Class C capital transactions | | $ | (552 | ) | | $ | 466 | | | $ | 1,016 | | | $ | (662 | ) |
| | | | | | | | | | | | | | | | |
Class R5 | | | | | | | | | | | | | | | | |
Proceeds from shares issued | | $ | 128,855 | | | $ | 310,191 | | | $ | — | | | $ | — | |
Distributions reinvested | | | 17,780 | | | | 10,129 | | | | — | | | | — | |
Cost of shares redeemed | | | (451,071 | ) | | | (118,184 | ) | | | — | | | | — | |
| | | | | | | | | | | | | | | | |
Change in net assets resulting from Class R5 capital transactions | | $ | (304,436 | ) | | $ | 202,136 | | | $ | — | | | $ | — | |
| | | | | | | | | | | | | | | | |
Class R6 | | | | | | | | | | | | | | | | |
Proceeds from shares issued | | $ | — | | | $ | — | | | $ | 117,392 | | | $ | 1,092,999 | |
Distributions reinvested | | | — | | | | — | | | | 14,467 | | | | — | |
Cost of shares redeemed | | | — | | | | — | | | | (444,612 | ) | | | (58,952 | ) |
| | | | | | | | | | | | | | | | |
Change in net assets resulting from Class R6 capital transactions | | $ | — | | | $ | — | | | $ | (312,753 | ) | | $ | 1,034,047 | |
| | | | | | | | | | | | | | | | |
Institutional Class | | | | | | | | | | | | | | | | |
Proceeds from shares issued | | $ | — | | | $ | — | | | $ | 85,193 | | | $ | 1,560,275 | |
Distributions reinvested | | | — | | | | — | | | | 2,196 | | | | 14,367 | |
Cost of shares redeemed | | | — | | | | — | | | | (78,340 | ) | | | (2,227,333 | ) |
| | | | | | | | | | | | | | | | |
Change in net assets resulting from Institutional Class capital transactions | | $ | — | | | $ | — | | | $ | 9,049 | | | $ | (652,691 | ) |
| | | | | | | | | | | | | | | | |
Select Class | | | | | | | | | | | | | | | | |
Proceeds from shares issued | | $ | 17,648 | | | $ | 70,981 | | | $ | 101,575 | | | $ | 187,126 | |
Distributions reinvested | | | 4,292 | | | | 3,170 | | | | 5,148 | | | | 1,240 | |
Cost of shares redeemed | | | (43,787 | ) | | | (56,612 | ) | | | (88,985 | ) | | | (1,471,799 | ) |
| | | | | | | | | | | | | | | | |
Change in net assets resulting from Select Class capital transactions | | $ | (21,847 | ) | | $ | 17,539 | | | $ | 17,738 | | | $ | (1,283,433 | ) |
| | | | | | | | | | | | | | | | |
Total change in net assets resulting from capital transactions | | $ | (370,894 | ) | | $ | 234,052 | | | $ | (335,904 | ) | | $ | (888,151 | ) |
| | | | | | | | | | | | | | | | |
SEE NOTES TO FINANCIAL STATEMENTS.
| | | | | | | | |
| | | |
| APRIL 30, 2015 | | J.P. MORGAN INTERNATIONAL EQUITY FUNDS | | | | | 97 | |
STATEMENTS OF CHANGES IN NET ASSETS
FOR THE PERIODS INDICATED (continued)
(Amounts in thousands)
| | | | | | | | | | | | | | | | |
| | | Emerging Economies Fund | | | Emerging Markets Equity Fund | |
| | | Six Months Ended
April 30, 2015
(Unaudited) | | | Year Ended
October 31, 2014 | | | Six Months Ended
April 30, 2015
(Unaudited) | | | Year Ended
October 31, 2014 | |
SHARE TRANSACTIONS: | | | | | | | | | | | | | | | | |
Class A | | | | | | | | | | | | | | | | |
Issued | | | 1,421 | | | | 3,659 | | | | 3,160 | | | | 6,380 | |
Reinvested | | | 58 | | | | 37 | | | | 110 | | | | 43 | |
Redeemed | | | (5,045 | ) | | | (2,653 | ) | | | (5,506 | ) | | | (5,838 | ) |
| | | | | | | | | | | | | | | | |
Change in Class A Shares | | | (3,566 | ) | | | 1,043 | | | | (2,236 | ) | | | 585 | |
| | | | | | | | | | | | | | | | |
Class B | | | | | | | | | | | | | | | | |
Issued | | | — | | | | — | | | | 3 | | | | 5 | |
Reinvested | | | — | | | | — | | | | — | (a) | | | — | |
Redeemed | | | — | | | | — | | | | (35 | ) | | | (76 | ) |
| | | | | | | | | | | | | | | | |
Change in Class B Shares | | | — | | | | — | | | | (32 | ) | | | (71 | ) |
| | | | | | | | | | | | | | | | |
Class C | | | | | | | | | | | | | | | | |
Issued | | | 30 | | | | 143 | | | | 297 | | | | 714 | |
Reinvested | | | 5 | | | | 3 | | | | 8 | | | | — | |
Redeemed | | | (80 | ) | | | (113 | ) | | | (262 | ) | | | (755 | ) |
| | | | | | | | | | | | | | | | |
Change in Class C Shares | | | (45 | ) | | | 33 | | | | 43 | | | | (41 | ) |
| | | | | | | | | | | | | | | | |
Class R5 | | | | | | | | | | | | | | | | |
Issued | | | 9,917 | | | | 23,523 | | | | — | | | | — | |
Reinvested | | | 1,470 | | | | 781 | | | | — | | | | — | |
Redeemed | | | (36,335 | ) | | | (9,179 | ) | | | — | | | | — | |
| | | | | | | | | | | | | | | | |
Change in Class R5 Shares | | | (24,948 | ) | | | 15,125 | | | | — | | | | — | |
| | | | | | | | | | | | | | | | |
Class R6 | | | | | | | | | | | | | | | | |
Issued | | | — | | | | — | | | | 4,973 | | | | 48,796 | |
Reinvested | | | — | | | | — | | | | 646 | | | | — | |
Redeemed | | | — | | | | — | | | | (19,250 | ) | | | (2,549 | ) |
| | | | | | | | | | | | | | | | |
Change in Class R6 Shares | | | — | | | | — | | | | (13,631 | ) | | | 46,247 | |
| | | | | | | | | | | | | | | | |
Institutional Class | | | | | | | | | | | | | | | | |
Issued | | | — | | | | — | | | | 3,670 | | | | 68,256 | |
Reinvested | | | — | | | | — | | | | 98 | | | | 642 | |
Redeemed | | | — | | | | — | | | | (3,368 | ) | | | (99,390 | ) |
| | | | | | | | | | | | | | | | |
Change in Institutional Class Shares | | | — | | | | — | | | | 400 | | | | (30,492 | ) |
| | | | | | | | | | | | | | | | |
Select Class | | | | | | | | | | | | | | | | |
Issued | | | 1,417 | | | | 5,554 | | | | 4,401 | | | | 8,139 | |
Reinvested | | | 355 | | | | 245 | | | | 231 | | | | 56 | |
Redeemed | | | (3,469 | ) | | | (4,249 | ) | | | (3,865 | ) | | | (65,118 | ) |
| | | | | | | | | | | | | | | | |
Change in Select Class Shares | | | (1,697 | ) | | | 1,550 | | | | 767 | | | | (56,923 | ) |
| | | | | | | | | | | | | | | | |
| (a) | Amount rounds to less than 1,000 shares. |
SEE NOTES TO FINANCIAL STATEMENTS.
| | | | | | |
| | | |
| 98 | | | | J.P. MORGAN INTERNATIONAL EQUITY FUNDS | | APRIL 30, 2015 |
| | | | | | | | | | | | |
| | | Emerging Markets
Equity Income Fund | | | Global Research Enhanced Index Fund | |
| | | Period Ended
April 30, 2015 (a)
(Unaudited) | | | Six Months Ended
April 30, 2015
(Unaudited) | | | Year Ended
October 31, 2014 | |
CAPITAL TRANSACTIONS: | | | | | | | | | | | | |
Class A | | | | | | | | | | | | |
Proceeds from shares issued | | $ | 30 | | | $ | — | | | $ | — | |
Distributions reinvested | | | — | (b) | | | 2 | | | | 1 | |
| | | | | | | | | | | | |
Change in net assets resulting from Class A capital transactions | | $ | 30 | | | $ | 2 | | | $ | 1 | |
| | | | | | | | | | | | |
Class C | | | | | | | | | | | | |
Proceeds from shares issued | | $ | 34 | | | $ | — | | | $ | — | |
Distributions reinvested | | | — | (b) | | | 1 | | | | 1 | |
| | | | | | | | | | | | |
Change in net assets resulting from Class C capital transactions | | $ | 34 | | | $ | 1 | | | $ | 1 | |
| | | | | | | | | | | | |
Class R2 | | | | | | | | | | | | |
Distributions reinvested | | $ | — | | | $ | 1 | | | $ | — | (b) |
| | | | | | | | | | | | |
Change in net assets resulting from Class R2 capital transactions | | $ | — | | | $ | 1 | | | $ | — | (b) |
| | | | | | | | | | | | |
Class R5 | | | | | | | | | | | | |
Proceeds from shares issued | | $ | 20 | | | $ | — | | | $ | — | |
Distributions reinvested | | | — | (b) | | | — | | | | — | |
| | | | | | | | | | | | |
Change in net assets resulting from Class R5 capital transactions | | $ | 20 | | | $ | — | | | $ | — | |
| | | | | | | | | | | | |
Class R6 | | | | | | | | | | | | |
Proceeds from shares issued | | $ | 20 | | | $ | — | | | $ | — | |
Distributions reinvested | | | — | (b) | | | — | | | | — | |
| | | | | | | | | | | | |
Change in net assets resulting from Class R6 capital transactions | | $ | 20 | | | $ | — | | | $ | — | |
| | | | | | | | | | | | |
Select Class | | | | | | | | | | | | |
Proceeds from shares issued | | $ | 2,922 | | | $ | 3,032,195 | | | $ | 1,641,002 | |
Distributions reinvested | | | 22 | | | | 12,872 | | | | 5,200 | |
Cost of shares redeemed | | | — | | | | (262,701 | ) | | | (201,128 | ) |
| | | | | | | | | | | | |
Change in net assets resulting from Select Class capital transactions | | $ | 2,944 | | | $ | 2,782,366 | | | $ | 1,445,074 | |
| | | | | | | | | | | | |
Total change in net assets resulting from capital transactions | | $ | 3,048 | | | $ | 2,782,370 | | | $ | 1,445,076 | |
| | | | | | | | | | | | |
| (a) | Commencement of operations was December 12, 2014. |
| (b) | Amount rounds to less than $1,000. |
SEE NOTES TO FINANCIAL STATEMENTS.
| | | | | | | | |
| | | |
| APRIL 30, 2015 | | J.P. MORGAN INTERNATIONAL EQUITY FUNDS | | | | | 99 | |
STATEMENTS OF CHANGES IN NET ASSETS
FOR THE PERIODS INDICATED (continued)
(Amounts in thousands)
| | | | | | | | | | | | |
| | | Emerging Markets
Equity Income Fund | | | Global Research Enhanced Index Fund | |
| | | Period Ended
April 30, 2015 (a)
(Unaudited) | | | Six Months Ended
April 30, 2015
(Unaudited) | | | Year Ended
October 31, 2014 | |
SHARE TRANSACTIONS: | | | | | | | | | | | | |
Class A | | | | | | | | | | | | |
Issued | | | 2 | | | | — | | | | — | |
Reinvested | | | — | (b) | | | — | (b) | | | — | (b) |
| | | | | | | | | | | | |
Change in Class A Shares | | | 2 | | | | — | (b) | | | — | (b) |
| | | | | | | | | | | | |
Class C | | | | | | | | | | | | |
Issued | | | 2 | | | | — | | | | — | |
Reinvested | | | — | (b) | | | — | (b) | | | — | (b) |
| | | | | | | | | | | | |
Change in Class C Shares | | | 2 | | | | — | (b) | | | — | (b) |
| | | | | | | | | | | | |
Class R2 | | | | | | | | | | | | |
Reinvested | | | — | | | | — | (b) | | | — | (b) |
| | | | | | | | | | | | |
Change in Class R2 Shares | | | — | | | | — | (b) | | | — | (b) |
| | | | | | | | | | | | |
Class R5 | | | | | | | | | | | | |
Issued | | | 1 | | | | — | | | | — | |
Reinvested | | | — | (b) | | | — | | | | — | |
| | | | | | | | | | | | |
Change in Class R5 Shares | | | 1 | | | | — | | | | — | |
| | | | | | | | | | | | |
Class R6 | | | | | | | | | | | | |
Issued | | | 2 | | | | — | | | | — | |
Reinvested | | | — | (b) | | | — | | | | — | |
| | | | | | | | | | | | |
Change in Class R6 Shares | | | 2 | | | | — | | | | — | |
| | | | | | | | | | | | |
Select Class | | | | | | | | | | | | |
Issued | | | 195 | | | | 165,097 | | | | 91,856 | |
Reinvested | | | 1 | | | | 703 | | | | 299 | |
Redeemed | | | — | | | | (14,041 | ) | | | (11,083 | ) |
| | | | | | | | | | | | |
Change in Select Class Shares | | | 196 | | | | 151,759 | | | | 81,072 | |
| | | | | | | | | | | | |
| (a) | Commencement of operations was December 12, 2014. |
| (b) | Amount rounds to less than 1,000 shares. |
SEE NOTES TO FINANCIAL STATEMENTS.
| | | | | | |
| | | |
| 100 | | | | J.P. MORGAN INTERNATIONAL EQUITY FUNDS | | APRIL 30, 2015 |
| | | | | | | | | | | | | | | | |
| | | Global Unconstrained Equity Fund | | | International Equity Fund | |
| | | Six Months Ended
April 30, 2015
(Unaudited) | | | Year Ended
October 31, 2014 | | | Six Months Ended
April 30, 2015
(Unaudited) | | | Year Ended
October 31, 2014 | |
CAPITAL TRANSACTIONS: | | | | | | | | | | | | | | | | |
Class A | | | | | | | | | | | | | | | | |
Proceeds from shares issued | | $ | 5 | | | $ | — | | | $ | 58,302 | | | $ | 109,712 | |
Distributions reinvested | | | 10 | | | | 7 | | | | 458 | | | | 2,850 | |
Cost of shares redeemed | | | — | | | | — | | | | (49,371 | ) | | | (107,650 | ) |
| | | | | | | | | | | | | | | | |
Change in net assets resulting from Class A capital transactions | | $ | 15 | | | $ | 7 | | | $ | 9,389 | | | $ | 4,912 | |
| | | | | | | | | | | | | | | | |
Class B | | | | | | | | | | | | | | | | |
Proceeds from shares issued | | $ | — | | | $ | — | | | $ | 9 | | | $ | 21 | |
Distributions reinvested | | | — | | | | — | | | | 1 | | | | 18 | |
Cost of shares redeemed | | | — | | | | — | | | | (310 | ) | | | (741 | ) |
| | | | | | | | | | | | | | | | |
Change in net assets resulting from Class B capital transactions | | $ | — | | | $ | — | | | $ | (300 | ) | | $ | (702 | ) |
| | | | | | | | | | | | | | | | |
Class C | | | | | | | | | | | | | | | | |
Proceeds from shares issued | | $ | 21 | | | $ | — | | | $ | 3,235 | | | $ | 8,687 | |
Distributions reinvested | | | 9 | | | | 6 | | | | 46 | | | | 408 | |
Cost of shares redeemed | | | — | | | | — | | | | (2,734 | ) | | | (5,189 | ) |
| | | | | | | | | | | | | | | | |
Change in net assets resulting from Class C capital transactions | | $ | 30 | | | $ | 6 | | | $ | 547 | | | $ | 3,906 | |
| | | | | | | | | | | | | | | | |
Class R2 | | | | | | | | | | | | | | | | |
Proceeds from shares issued | | $ | — | | | $ | — | | | $ | 117 | | | $ | 461 | |
Distributions reinvested | | | 10 | | | | 7 | | | | 3 | | | | 18 | |
Cost of shares redeemed | | | — | | | | — | | | | (476 | ) | | | (237 | ) |
| | | | | | | | | | | | | | | | |
Change in net assets resulting from Class R2 capital transactions | | $ | 10 | | | $ | 7 | | | $ | (356 | ) | | $ | 242 | |
| | | | | | | | | | | | | | | | |
Class R5 | | | | | | | | | | | | | | | | |
Proceeds from shares issued | | $ | — | | | $ | — | | | $ | 5,298 | | | $ | 20,589 | |
Distributions reinvested | | | 10 | | | | 7 | | | | 461 | | | | 2,846 | |
Cost of shares redeemed | | | — | | | | — | | | | (42,671 | ) | | | (30,870 | ) |
| | | | | | | | | | | | | | | | |
Change in net assets resulting from Class R5 capital transactions | | $ | 10 | | | $ | 7 | | | $ | (36,912 | ) | | $ | (7,435 | ) |
| | | | | | | | | | | | | | | | |
Class R6 | | | | | | | | | | | | | | | | |
Proceeds from shares issued | | $ | — | | | $ | — | | | $ | 311,399 | | | $ | 512,142 | |
Distributions reinvested | | | 10 | | | | 7 | | | | 9,888 | | | | 42,018 | |
Cost of shares redeemed | | | — | | | | — | | | | (169,226 | ) | | | (54,301 | ) |
| | | | | | | | | | | | | | | | |
Change in net assets resulting from Class R6 capital transactions | | $ | 10 | | | $ | 7 | | | $ | 152,061 | | | $ | 499,859 | |
| | | | | | | | | | | | | | | | |
Select Class | | | | | | | | | | | | | | | | |
Proceeds from shares issued | | $ | 54 | | | $ | — | | | $ | 113,243 | | | $ | 146,738 | |
Distributions reinvested | | | 557 | | | | 386 | | | | 2,145 | | | | 10,417 | |
Cost of shares redeemed | | | — | | | | — | | | | (95,556 | ) | | | (74,289 | ) |
| | | | | | | | | | | | | | | | |
Change in net assets resulting from Select Class capital transactions | | $ | 611 | | | $ | 386 | | | $ | 19,832 | | | $ | 82,866 | |
| | | | | | | | | | | | | | | | |
Total change in net assets resulting from capital transactions | | $ | 686 | | | $ | 420 | | | $ | 144,261 | | | $ | 583,648 | |
| | | | | | | | | | | | | | | | |
SEE NOTES TO FINANCIAL STATEMENTS.
| | | | | | | | |
| | | |
| APRIL 30, 2015 | | J.P. MORGAN INTERNATIONAL EQUITY FUNDS | | | | | 101 | |
STATEMENTS OF CHANGES IN NET ASSETS
FOR THE PERIODS INDICATED (continued)
(Amounts in thousands)
| | | | | | | | | | | | | | | | |
| | | Global Unconstrained Equity Fund | | | International Equity Fund | |
| | | Six Months Ended
April 30, 2015
(Unaudited) | | | Year Ended
October 31, 2014 | | | Six Months Ended
April 30, 2015
(Unaudited) | | | Year Ended
October 31, 2014 | |
SHARE TRANSACTIONS: | | | | | | | | | | | | | | | | |
Class A | | | | | | | | | | | | | | | | |
Issued | | | — | (a) | | | — | | | | 3,774 | | | | 6,902 | |
Reinvested | | | 1 | | | | — | (a) | | | 30 | | | | 177 | |
Redeemed | | | — | | | | — | | | | (3,275 | ) | | | (6,712 | ) |
| | | | | | | | | | | | | | | | |
Change in Class A Shares | | | 1 | | | | — | (a) | | | 529 | | | | 367 | |
| | | | | | | | | | | | | | | | |
Class B | | | | | | | | | | | | | | | | |
Issued | | | — | | | | — | | | | 1 | | | | 1 | |
Reinvested | | | — | | | | — | | | | — | (a) | | | 1 | |
Redeemed | | | — | | | | — | | | | (21 | ) | | | (48 | ) |
| | | | | | | | | | | | | | | | |
Change in Class B Shares | | | — | | | | — | | | | (20 | ) | | | (46 | ) |
| | | | | | | | | | | | | | | | |
Class C | | | | | | | | | | | | | | | | |
Issued | | | 1 | | | | — | | | | 218 | | | | 572 | |
Reinvested | | | — | (a) | | | — | (a) | | | 3 | | | | 27 | |
Redeemed | | | — | | | | — | | | | (188 | ) | | | (344 | ) |
| | | | | | | | | | | | | | | | |
Change in Class C Shares | | | 1 | | | | — | (a) | | | 33 | | | | 255 | |
| | | | | | | | | | | | | | | | |
Class R2 | | | | | | | | | | | | | | | | |
Issued | | | — | | | | — | | | | 8 | | | | 28 | |
Reinvested | | | 1 | | | | — | (a) | | | — | (a) | | | 1 | |
Redeemed | | | — | | | | — | | | | (31 | ) | | | (15 | ) |
| | | | | | | | | | | | | | | | |
Change in Class R2 Shares | | | 1 | | | | — | (a) | | | (23 | ) | | | 14 | |
| | | | | | | | | | | | | | | | |
Class R5 | | | | | | | | | | | | | | | | |
Issued | | | — | | | | — | | | | 339 | | | | 1,286 | |
Reinvested | | | — | (a) | | | 1 | | | | 29 | | | | 174 | |
Redeemed | | | — | | | | — | | | | (2,742 | ) | | | (1,900 | ) |
| | | | | | | | | | | | | | | | |
Change in Class R5 Shares | | | — | (a) | | | 1 | | | | (2,374 | ) | | | (440 | ) |
| | | | | | | | | | | | | | | | |
Class R6 | | | | | | | | | | | | | | | | |
Issued | | | — | | | | — | | | | 20,264 | | | | 32,114 | |
Reinvested | | | 1 | | | | 1 | | | | 628 | | | | 2,576 | |
Redeemed | | | — | | | | — | | | | (11,020 | ) | | | (3,336 | ) |
| | | | | | | | | | | | | | | | |
Change in Class R6 Shares | | | 1 | | | | 1 | | | | 9,872 | | | | 31,354 | |
| | | | | | | | | | | | | | | | |
Select Class | | | | | | | | | | | | | | | | |
Issued | | | 3 | | | | — | | | | 7,231 | | | | 9,057 | |
Reinvested | | | 33 | | | | 21 | | | | 136 | | | | 638 | |
Redeemed | | | — | | | | — | | | | (6,172 | ) | | | (4,642 | ) |
| | | | | | | | | | | | | | | | |
Change in Select Class Shares | | | 36 | | | | 21 | | | | 1,195 | | | | 5,053 | |
| | | | | | | | | | | | | | | | |
| (a) | Amount rounds to less than 1,000 shares. |
SEE NOTES TO FINANCIAL STATEMENTS.
| | | | | | |
| | | |
| 102 | | | | J.P. MORGAN INTERNATIONAL EQUITY FUNDS | | APRIL 30, 2015 |
| | | | | | | | | | | | | | | | |
| | | International Equity Income Fund | | | International Opportunities Fund | |
| | | Six Months Ended
April 30, 2015
(Unaudited) | | | Year Ended
October 31, 2014 | | | Six Months Ended
April 30, 2015
(Unaudited) | | | Year Ended
October 31, 2014 | |
CAPITAL TRANSACTIONS: | | | | | | | | | | | | | | | | |
Class A | | | | | | | | | | | | | | | | |
Proceeds from shares issued | | $ | 34,416 | | | $ | 46,956 | | | $ | 84,580 | | | $ | 67,670 | |
Distributions reinvested | | | 1,390 | | | | 1,278 | | | | 667 | | | | 470 | |
Cost of shares redeemed | | | (48,904 | ) | | | (21,768 | ) | | | (61,957 | ) | | | (79,052 | ) |
| | | | | | | | | | | | | | | | |
Change in net assets resulting from Class A capital transactions | | $ | (13,098 | ) | | $ | 26,466 | | | $ | 23,290 | | | $ | (10,912 | ) |
| | | | | | | | | | | | | | | | |
Class B | | | | | | | | | | | | | | | | |
Proceeds from shares issued | | $ | — | | | $ | — | | | $ | — | (a) | | $ | 10 | |
Distributions reinvested | | | — | | | | — | | | | 3 | | | | — | |
Cost of shares redeemed | | | — | | | | — | | | | (67 | ) | | | (294 | ) |
| | | | | | | | | | | | | | | | |
Change in net assets resulting from Class B capital transactions | �� | $ | — | | | $ | — | | | $ | (64 | ) | | $ | (284 | ) |
| | | | | | | | | | | | | | | | |
Class C | | | | | | | | | | | | | | | | |
Proceeds from shares issued | | $ | 1,496 | | | $ | 1,873 | | | $ | 386 | | | $ | 830 | |
Distributions reinvested | | | 107 | | | | 122 | | | | 23 | | | | 5 | |
Cost of shares redeemed | | | (825 | ) | | | (360 | ) | | | (177 | ) | | | (449 | ) |
| | | | | | | | | | | | | | | | |
Change in net assets resulting from Class C capital transactions | | $ | 778 | | | $ | 1,635 | | | $ | 232 | | | $ | 386 | |
| | | | | | | | | | | | | | | | |
Class R2 | | | | | | | | | | | | | | | | |
Proceeds from shares issued | | $ | 42 | | | $ | — | | | $ | — | | | $ | — | |
Distributions reinvested | | | 19 | | | | 25 | | | | — | | | | — | |
| | | | | | | | | | | | | | | | |
Change in net assets resulting from Class R2 capital transactions | | $ | 61 | | | $ | 25 | | | $ | — | | | $ | — | |
| | | | | | | | | | | | | | | | |
Class R5 | | | | | | | | | | | | | | | | |
Proceeds from shares issued | | $ | 1 | | | $ | — | | | $ | — | | | $ | — | |
Distributions reinvested | | | 22 | | | | 30 | | | | — | | | | — | |
| | | | | | | | | | | | | | | | |
Change in net assets resulting from Class R5 capital transactions | | $ | 23 | | | $ | 30 | | | $ | — | | | $ | — | |
| | | | | | | | | | | | | | | | |
Class R6 (b) | | | | | | | | | | | | | | | | |
Proceeds from shares issued | | $ | 20 | | | $ | — | | | $ | 172,186 | | | $ | 400,224 | |
Distributions reinvested | | | — | (a) | | | — | | | | 43,134 | | | | 14,924 | |
Cost of shares redeemed | | | — | | | | — | | | | (92,797 | ) | | | (41,399 | ) |
| | | | | | | | | | | | | | | | |
Change in net assets resulting from Class R6 capital transactions | | $ | 20 | | | $ | — | | | $ | 122,523 | | | $ | 373,749 | |
| | | | | | | | | | | | | | | | |
Institutional Class | | | | | | | | | | | | | | | | |
Proceeds from shares issued | | $ | — | | | $ | — | | | $ | 7,324 | | | $ | 16,360 | |
Distributions reinvested | | | — | | | | — | | | | 832 | | | | 435 | |
Cost of shares redeemed | | | — | | | | — | | | | (16,267 | ) | | | (19,108 | ) |
| | | | | | | | | | | | | | | | |
Change in net assets resulting from Institutional Class capital transactions | | $ | — | | | $ | — | | | $ | (8,111 | ) | | $ | (2,313 | ) |
| | | | | | | | | | | | | | | | |
Select Class | | | | | | | | | | | | | | | | |
Proceeds from shares issued | | $ | 13,417 | | | $ | 21,191 | | | $ | 8,847 | | | $ | 17,796 | |
Distributions reinvested | | | 810 | | | | 1,790 | | | | 899 | | | | 325 | |
Cost of shares redeemed | | | (17,232 | ) | | | (42,813 | ) | | | (5,063 | ) | | | (17,060 | ) |
| | | | | | | | | | | | | | | | |
Change in net assets resulting from Select Class capital transactions | | $ | (3,005 | ) | | $ | (19,832 | ) | | $ | 4,683 | | | $ | 1,061 | |
| | | | | | | | | | | | | | | | |
Total change in net assets resulting from capital transactions | | $ | (15,221 | ) | | $ | 8,324 | | | $ | 142,553 | | | $ | 361,687 | |
| | | | | | | | | | | | | | | | |
| (a) | Amount rounds to less than $1,000. |
| (b) | Commencement of offering of class shares effective January 30, 2015 for International Equity Income Fund. |
SEE NOTES TO FINANCIAL STATEMENTS.
| | | | | | | | |
| | | |
| APRIL 30, 2015 | | J.P. MORGAN INTERNATIONAL EQUITY FUNDS | | | | | 103 | |
STATEMENTS OF CHANGES IN NET ASSETS
FOR THE PERIODS INDICATED (continued)
(Amounts in thousands)
| | | | | | | | | | | | | | | | |
| | | International Equity Income Fund | | | International Opportunities Fund | |
| | | Six Months Ended
April 30, 2015
(Unaudited) | | | Year Ended
October 31, 2014 | | | Six Months Ended
April 30, 2015
(Unaudited) | | | Year Ended
October 31, 2014 | |
SHARE TRANSACTIONS: | | | | | | | | | | | | | | | | |
Class A | | | | | | | | | | | | | | | | |
Issued | | | 2,097 | | | | 2,826 | | | | 5,772 | | | | 4,461 | |
Reinvested | | | 87 | | | | 77 | | | | 47 | | | | 31 | |
Redeemed | | | (3,081 | ) | | | (1,300 | ) | | | (4,239 | ) | | | (5,136 | ) |
| | | | | | | | | | | | | | | | |
Change in Class A Shares | | | (897 | ) | | | 1,603 | | | | 1,580 | | | | (644 | ) |
| | | | | | | | | | | | | | | | |
Class B | | | | | | | | | | | | | | | | |
Issued | | | — | | | | — | | | | 1 | | | | — | (a) |
Reinvested | | | — | | | | — | | | | — | (a) | | | — | |
Redeemed | | | — | | | | — | | | | (5 | ) | | | (19 | ) |
| | | | | | | | | | | | | | | | |
Change in Class B Shares | | | — | | | | — | | | | (4 | ) | | | (19 | ) |
| | | | | | | | | | | | | | | | |
Class C | | | | | | | | | | | | | | | | |
Issued | | | 90 | | | | 113 | | | | 26 | | | | 56 | |
Reinvested | | | 7 | | | | 7 | | | | 2 | | | | 1 | |
Redeemed | | | (50 | ) | | | (22 | ) | | | (12 | ) | | | (31 | ) |
| | | | | | | | | | | | | | | | |
Change in Class C Shares | | | 47 | | | | 98 | | | | 16 | | | | 26 | |
| | | | | | | | | | | | | | | | |
Class R2 | | | | | | | | | | | | | | | | |
Issued | | | 3 | | | | — | | | | — | | | | — | |
Reinvested | | | 1 | | | | 2 | | | | — | | | | — | |
| | | | | | | | | | | | | | | | |
Change in Class R2 Shares | | | 4 | | | | 2 | | | | — | | | | — | |
| | | | | | | | | | | | | | | | |
Class R5 | | | | | | | | | | | | | | | | |
Reinvested | | | 1 | | | | 2 | | | | — | | | | — | |
| | | | | | | | | | | | | | | | |
Change in Class R5 Shares | | | 1 | | | | 2 | | | | — | | | | — | |
| | | | | | | | | | | | | | | | |
Class R6 (b) | | | | | | | | | | | | | | | | |
Issued | | | 1 | | | | — | | | | 11,782 | | | | 26,049 | |
Reinvested | | | — | (a) | | | — | | | | 2,979 | | | | 972 | |
Redeemed | | | — | | | | — | | | | (6,169 | ) | | | (2,625 | ) |
| | | | | | | | | | | | | | | | |
Change in Class R6 Shares | | | 1 | | | | — | | | | 8,592 | | | | 24,396 | |
| | | | | | | | | | | | | | | | |
Institutional Class | | | | | | | | | | | | | | | | |
Issued | | | — | | | | — | | | | 485 | | | | 1,053 | |
Reinvested | | | — | | | | — | | | | 57 | | | | 28 | |
Redeemed | | | — | | | | — | | | | (1,087 | ) | | | (1,230 | ) |
| | | | | | | | | | | | | | | | |
Change in Institutional Class Shares | | | — | | | | — | | | | (545 | ) | | | (149 | ) |
| | | | | | | | | | | | | | | | |
Select Class | | | | | | | | | | | | | | | | |
Issued | | | 813 | | | | 1,276 | | | | 605 | | | | 1,159 | |
Reinvested | | | 50 | | | | 107 | | | | 62 | | | | 21 | |
Redeemed | | | (1,080 | ) | | | (2,594 | ) | | | (343 | ) | | | (1,101 | ) |
| | | | | | | | | | | | | | | | |
Change in Select Class Shares | | | (217 | ) | | | (1,211 | ) | | | 324 | | | | 79 | |
| | | | | | | | | | | | | | | | |
| (a) | Amount rounds to less than 1,000 shares. |
| (b) | Commencement of offering of class shares effective January 30, 2015 for International Equity Income Fund. |
SEE NOTES TO FINANCIAL STATEMENTS.
| | | | | | |
| | | |
| 104 | | | | J.P. MORGAN INTERNATIONAL EQUITY FUNDS | | APRIL 30, 2015 |
| | | | | | | | | | | | | | | | |
| | | International Research Enhanced Equity Fund | | | International Unconstrained Equity Fund | |
| | | Six Months Ended
April 30, 2015
(Unaudited) | | | Year Ended
October 31, 2014 | | | Six Months Ended
April 30, 2015
(Unaudited) | | | Year Ended
October 31, 2014 | |
CAPITAL TRANSACTIONS: | | | | | | | | | | | | | | | | |
Class A | | | | | | | | | | | | | | | | |
Proceeds from shares issued | | $ | 6,026 | | | $ | 19,492 | | | $ | 831 | | | $ | 343 | |
Distributions reinvested | | | 16,487 | | | | 3,637 | | | | 26 | | | | 7 | |
Cost of shares redeemed | | | (14,971 | ) | | | (30,904 | ) | | | (184 | ) | | | (66 | ) |
| | | | | | | | | | | | | | | | |
Change in net assets resulting from Class A capital transactions | | $ | 7,542 | | | $ | (7,775 | ) | | $ | 673 | | | $ | 284 | |
| | | | | | | | | | | | | | | | |
Class B | | | | | | | | | | | | | | | | |
Proceeds from shares issued | | $ | — | (a) | | $ | 33 | | | $ | — | | | $ | — | |
Distributions reinvested | | | 305 | | | | 83 | | | | — | | | | — | |
Cost of shares redeemed | | | (499 | ) | | | (1,031 | ) | | | — | | | | — | |
| | | | | | | | | | | | | | | | |
Change in net assets resulting from Class B capital transactions | | $ | (194 | ) | | $ | (915 | ) | | $ | — | | | $ | — | |
| | | | | | | | | | | | | | | | |
Class C | | | | | | | | | | | | | | | | |
Proceeds from shares issued | | $ | 1,540 | | | $ | 4,045 | | | $ | 287 | | | $ | 64 | |
Distributions reinvested | | | 3,601 | | | | 650 | | | | 10 | | | | 5 | |
Cost of shares redeemed | | | (3,046 | ) | | | (4,908 | ) | | | (97 | ) | | | — | (a) |
| | | | | | | | | | | | | | | | |
Change in net assets resulting from Class C capital transactions | | $ | 2,095 | | | $ | (213 | ) | | $ | 200 | | | $ | 69 | |
| | | | | | | | | | | | | | | | |
Class R2 | | | | | | | | | | | | | | | | |
Proceeds from shares issued | | $ | 1,602 | | | $ | 2,020 | | | $ | — | (a) | | $ | — | (a) |
Distributions reinvested | | | 130 | | | | 18 | | | | 6 | | | | 4 | |
Cost of shares redeemed | | | (884 | ) | | | (1,369 | ) | | | (51 | ) | | | — | |
| | | | | | | | | | | | | | | | |
Change in net assets resulting from Class R2 capital transactions | | $ | 848 | | | $ | 669 | | | $ | (45 | ) | | $ | 4 | |
| | | | | | | | | | | | | | | | |
Class R5 | | | | | | | | | | | | | | | | |
Proceeds from shares issued | | $ | — | | | $ | — | | | $ | — | (a) | | $ | — | (a) |
Distributions reinvested | | | — | | | | — | | | | 6 | | | | 5 | |
Cost of shares redeemed | | | — | | | | — | | | | (53 | ) | | | — | |
| | | | | | | | | | | | | | | | |
Change in net assets resulting from Class R5 capital transactions | | $ | — | | | $ | — | | | $ | (47 | ) | | $ | 5 | |
| | | | | | | | | | | | | | | | |
Class R6 | | | | | | | | | | | | | | | | |
Proceeds from shares issued | | $ | — | | | $ | — | | | $ | — | (a) | | $ | — | (a) |
Distributions reinvested | | | — | | | | — | | | | 6 | | | | 6 | |
Cost of shares redeemed | | | — | | | | — | | | | (53 | ) | | | — | |
| | | | | | | | | | | | | | | | |
Change in net assets resulting from Class R6 capital transactions | | $ | — | | | $ | — | | | $ | (47 | ) | | $ | 6 | |
| | | | | | | | | | | | | | | | |
Select Class | | | | | | | | | | | | | | | | |
Proceeds from shares issued | | $ | 145,318 | | | $ | 141,311 | | | $ | 19,974 | | | $ | 53 | |
Distributions reinvested | | | 93,786 | | | | 14,567 | | | | 311 | | | | 290 | |
Cost of shares redeemed | | | (41,919 | ) | | | (36,642 | ) | | | (3,998 | ) | | | (21 | ) |
| | | | | | | | | | | | | | | | |
Change in net assets resulting from Select Class capital transactions | | $ | 197,185 | | | $ | 119,236 | | | $ | 16,287 | | | $ | 322 | |
| | | | | | | | | | | | | | | | |
Total change in net assets resulting from capital transactions | | $ | 207,476 | | | $ | 111,002 | | | $ | 17,021 | | | $ | 690 | |
| | | | | | | | | | | | | | | | |
| (a) | Amount rounds to less than $1,000. |
SEE NOTES TO FINANCIAL STATEMENTS.
| | | | | | | | |
| | | |
| APRIL 30, 2015 | | J.P. MORGAN INTERNATIONAL EQUITY FUNDS | | | | | 105 | |
STATEMENTS OF CHANGES IN NET ASSETS
FOR THE PERIODS INDICATED (continued)
(Amounts in thousands)
| | | | | | | | | | | | | | | | |
| | | International Research Enhanced Equity Fund | | | International Unconstrained Equity Fund | |
| | | Six Months Ended
April 30, 2015
(Unaudited) | | | Year Ended
October 31, 2014 | | | Six Months Ended
April 30, 2015
(Unaudited) | | | Year Ended
October 31, 2014 | |
SHARE TRANSACTIONS: | | | | | | | | | | | | | | | | |
Class A | | | | | | | | | | | | | | | | |
Issued | | | 349 | | | | 926 | | | | 47 | | | | 18 | |
Reinvested | | | 1,007 | | | | 179 | | | | 2 | | | | 1 | |
Redeemed | | | (844 | ) | | | (1,481 | ) | | | (10 | ) | | | (4 | ) |
| | | | | | | | | | | | | | | | |
Change in Class A Shares | | | 512 | | | | (376 | ) | | | 39 | | | | 15 | |
| | | | | | | | | | | | | | | | |
Class B | | | | | | | | | | | | | | | | |
Issued | | | — | (a) | | | 2 | | | | — | | | | — | |
Reinvested | | | 21 | | | | 4 | | | | — | | | | — | |
Redeemed | | | (31 | ) | | | (53 | ) | | | — | | | | — | |
| | | | | | | | | | | | | | | | |
Change in Class B Shares | | | (10 | ) | | | (47 | ) | | | — | | | | — | |
| | | | | | | | | | | | | | | | |
Class C | | | | | | | | | | | | | | | | |
Issued | | | 94 | | | | 199 | | | | 17 | | | | 3 | |
Reinvested | | | 229 | | | | 33 | | | | 1 | | | | — | (a) |
Redeemed | | | (184 | ) | | | (242 | ) | | | (6 | ) | | | — | (a) |
| | | | | | | | | | | | | | | | |
Change in Class C Shares | | | 139 | | | | (10 | ) | | | 12 | | | | 3 | |
| | | | | | | | | | | | | | | | |
Class R2 | | | | | | | | | | | | | | | | |
Issued | | | 97 | | | | 96 | | | | — | | | | — | |
Reinvested | | | 8 | | | | 1 | | | | — | (a) | | | — | (a) |
Redeemed | | | (52 | ) | | | (65 | ) | | | (3 | ) | | | — | |
| | | | | | | | | | | | | | | | |
Change in Class R2 Shares | | | 53 | | | | 32 | | | | (3 | ) | | | — | (a) |
| | | | | | | | | | | | | | | | |
Class R5 | | | | | | | | | | | | | | | | |
Reinvested | | | — | | | | — | | | | — | (a) | | | — | (a) |
Redeemed | | | — | | | | — | | | | (3 | ) | | | — | |
| | | | | | | | | | | | | | | | |
Change in Class R5 Shares | | | — | | | | — | | | | (3 | ) | | | — | (a) |
| | | | | | | | | | | | | | | | |
Class R6 | | | | | | | | | | | | | | | | |
Reinvested | | | — | | | | — | | | | — | (a) | | | — | (a) |
Redeemed | | | — | | | | — | | | | (3 | ) | | | — | |
| | | | | | | | | | | | | | | | |
Change in Class R6 Shares | | | — | | | | — | | | | (3 | ) | | | — | (a) |
| | | | | | | | | | | | | | | | |
Select Class | | | | | | | | | | | | | | | | |
Issued | | | 8,535 | | | | 6,662 | | | | 1,089 | | | | 2 | |
Reinvested | | | 5,675 | | | | 711 | | | | 19 | | | | 16 | |
Redeemed | | | (2,465 | ) | | | (1,734 | ) | | | (222 | ) | | | (1 | ) |
| | | | | | | | | | | | | | | | |
Change in Select Class Shares | | | 11,745 | | | | 5,639 | | | | 886 | | | | 17 | |
| | | | | | | | | | | | | | | | |
| (a) | Amount rounds to less than 1,000 shares. |
SEE NOTES TO FINANCIAL STATEMENTS.
| | | | | | |
| | | |
| 106 | | | | J.P. MORGAN INTERNATIONAL EQUITY FUNDS | | APRIL 30, 2015 |
| | | | | | | | | | | | | | | | |
| | | International Value Fund | | | Intrepid International Fund | |
| | | Six Months Ended
April 30, 2015
(Unaudited) | | | Year Ended
October 31, 2014 | | | Six Months Ended
April 30, 2015
(Unaudited) | | | Year Ended
October 31, 2014 | |
CAPITAL TRANSACTIONS: | | | | | | | | | | | | | | | | |
Class A | | | | | | | | | | | | | | | | |
Proceeds from shares issued | | $ | 175,712 | | | $ | 400,922 | | | $ | 38,152 | | | $ | 90,342 | |
Distributions reinvested | | | 17,402 | | | | 4,863 | | | | 490 | | | | 357 | |
Cost of shares redeemed | | | (65,552 | ) | | | (111,037 | ) | | | (14,300 | ) | | | (46,032 | ) |
| | | | | | | | | | | | | | | | |
Change in net assets resulting from Class A capital transactions | | $ | 127,562 | | | $ | 294,748 | | | $ | 24,342 | | | $ | 44,667 | |
| | | | | | | | | | | | | | | | |
Class B | | | | | | | | | | | | | | | | |
Proceeds from shares issued | | $ | 12 | | | $ | 51 | | | $ | — | | | $ | — | |
Distributions reinvested | | | 30 | | | | 22 | | | | — | | | | — | |
Cost of shares redeemed | | | (454 | ) | | | (842 | ) | | | — | | | | — | |
| | | | | | | | | | | | | | | | |
Change in net assets resulting from Class B capital transactions | | $ | (412 | ) | | $ | (769 | ) | | $ | — | | | $ | — | |
| | | | | | | | | | | | | | | | |
Class C | | | | | | | | | | | | | | | | |
Proceeds from shares issued | | $ | 4,595 | | | $ | 17,441 | | | $ | 403 | | | $ | 346 | |
Distributions reinvested | | | 726 | | | | 310 | | | | 6 | | | | 6 | |
Cost of shares redeemed | | | (4,931 | ) | | | (7,324 | ) | | | (112 | ) | | | (137 | ) |
| | | | | | | | | | | | | | | | |
Change in net assets resulting from Class C capital transactions | | $ | 390 | | | $ | 10,427 | | | $ | 297 | | | $ | 215 | |
| | | | | | | | | | | | | | | | |
Class R2 | | | | | | | | | | | | | | | | |
Proceeds from shares issued | | $ | 286 | | | $ | 1,108 | | | $ | 190 | | | $ | 6 | |
Distributions reinvested | | | 19 | | | | 9 | | | | 1 | | | | 1 | |
Cost of shares redeemed | | | (337 | ) | | | (491 | ) | | | (6 | ) | | | (6 | ) |
| | | | | | | | | | | | | | | | |
Change in net assets resulting from Class R2 capital transactions | | $ | (32 | ) | | $ | 626 | | | $ | 185 | | | $ | 1 | |
| | | | | | | | | | | | | | | | |
Class R6 | | | | | | | | | | | | | | | | |
Proceeds from shares issued | | $ | 1,705 | | | $ | 766 | | | $ | — | | | $ | — | |
Distributions reinvested | | | 36 | | | | 36 | | | | — | | | | — | |
Cost of shares redeemed | | | (24,612 | ) | | | (73,309 | ) | | | — | | | | — | |
| | | | | | | | | | | | | | | | |
Change in net assets resulting from Class R6 capital transactions | | $ | (22,871 | ) | | $ | (72,507 | ) | | $ | — | | | $ | — | |
| | | | | | | | | | | | | | | | |
Institutional Class | | | | | | | | | | | | | | | | |
Proceeds from shares issued | | $ | 387,558 | | | $ | 2,501,197 | | | $ | 226,349 | | | $ | 956,719 | |
Distributions reinvested | | | 74,288 | | | | 35,770 | | | | 22,528 | | | | 8,462 | |
Cost of shares redeemed | | | (1,772,980 | ) | | | (518,984 | ) | | | (17,701 | ) | | | (33,648 | ) |
| | | | | | | | | | | | | | | | |
Change in net assets resulting from Institutional Class capital transactions | | $ | (1,311,134 | ) | | $ | 2,017,983 | | | $ | 231,176 | | | $ | 931,533 | |
| | | | | | | | | | | | | | | | |
Select Class | | | | | | | | | | | | | | | | |
Proceeds from shares issued | | $ | 40,340 | | | $ | 159,987 | | | $ | 3,064 | | | $ | 7,397 | |
Distributions reinvested | | | 4,957 | | | | 992 | | | | 105 | | | | 78 | |
Cost of shares redeemed | | | (78,715 | ) | | | (1,484,029 | ) | | | (2,741 | ) | | | (5,062 | ) |
| | | | | | | | | | | | | | | | |
Change in net assets resulting from Select Class capital transactions | | $ | (33,418 | ) | | $ | (1,323,050 | ) | | $ | 428 | | | $ | 2,413 | |
| | | | | | | | | | | | | | | | |
Total change in net assets resulting from capital transactions | | $ | (1,239,915 | ) | | $ | 927,458 | | | $ | 256,428 | | | $ | 978,829 | |
| | | | | | | | | | | | | | | | |
SEE NOTES TO FINANCIAL STATEMENTS.
| | | | | | | | |
| | | |
| APRIL 30, 2015 | | J.P. MORGAN INTERNATIONAL EQUITY FUNDS | | | | | 107 | |
STATEMENTS OF CHANGES IN NET ASSETS
FOR THE PERIODS INDICATED (continued)
(Amounts in thousands)
| | | | | | | | | | | | | | | | |
| | | International Value Fund | | | Intrepid International Fund | |
| | | Six Months Ended
April 30, 2015
(Unaudited) | | | Year Ended
October 31, 2014 | | | Six Months Ended
April 30, 2015
(Unaudited) | | | Year Ended
October 31, 2014 | |
SHARE TRANSACTIONS: | | | | | | | | | | | | | | | | |
Class A | | | | | | | | | | | | | | | | |
Issued | | | 12,941 | | | | 27,177 | | | | 1,963 | | | | 4,442 | |
Reinvested | | | 1,313 | | | | 330 | | | | 26 | | | | 18 | |
Redeemed | | | (4,823 | ) | | | (7,499 | ) | | | (731 | ) | | | (2,309 | ) |
| | | | | | | | | | | | | | | | |
Change in Class A Shares | | | 9,431 | | | | 20,008 | | | | 1,258 | | | | 2,151 | |
| | | | | | | | | | | | | | | | |
Class B | | | | | | | | | | | | | | | | |
Issued | | | 1 | | | | 4 | | | | — | | | | — | |
Reinvested | | | 2 | | | | 1 | | | | — | | | | — | |
Redeemed | | | (33 | ) | | | (57 | ) | | | — | | | | — | |
| | | | | | | | | | | | | | | | |
Change in Class B Shares | | | (30 | ) | | | (52 | ) | | | — | | | | — | |
| | | | | | | | | | | | | | | | |
Class C | | | | | | | | | | | | | | | | |
Issued | | | 345 | | | | 1,212 | | | | 21 | | | | 17 | |
Reinvested | | | 56 | | | | 22 | | | | — | (a) | | | — | (a) |
Redeemed | | | (375 | ) | | | (515 | ) | | | (6 | ) | | | (7 | ) |
| | | | | | | | | | | | | | | | |
Change in Class C Shares | | | 26 | | | | 719 | | | | 15 | | | | 10 | |
| | | | | | | | | | | | | | | | |
Class R2 | | | | | | | | | | | | | | | | |
Issued | | | 21 | | | | 76 | | | | 10 | | | | — | (a) |
Reinvested | | | 2 | | | | 1 | | | | — | (a) | | | — | (a) |
Redeemed | | | (26 | ) | | | (34 | ) | | | (1 | ) | | | — | (a) |
| | | | | | | | | | | | | | | | |
Change in Class R2 Shares | | | (3 | ) | | | 43 | | | | 9 | | | | — | (a) |
| | | | | | | | | | | | | | | | |
Class R6 | | | | | | | | | | | | | | | | |
Issued | | | 121 | | | | 50 | | | | — | | | | — | |
Reinvested | | | 3 | | | | 2 | | | | — | | | | — | |
Redeemed | | | (1,768 | ) | | | (4,922 | ) | | | — | | | | — | |
| | | | | | | | | | | | | | | | |
Change in Class R6 Shares | | | (1,644 | ) | | | (4,870 | ) | | | — | | | | — | |
| | | | | | | | | | | | | | | | |
Institutional Class | | | | | | | | | | | | | | | | |
Issued | | | 28,106 | | | | 164,839 | | | | 11,490 | | | | 46,348 | |
Reinvested | | | 5,511 | | | | 2,393 | | | | 1,164 | | | | 420 | |
Redeemed | | | (126,023 | ) | | | (34,844 | ) | | | (900 | ) | | | (1,633 | ) |
| | | | | | | | | | | | | | | | |
Change in Institutional Class Shares | | | (92,406 | ) | | | 132,388 | | | | 11,754 | | | | 45,135 | |
| | | | | | | | | | | | | | | | |
Select Class | | | | | | | | | | | | | | | | |
Issued | | | 2,912 | | | | 10,593 | | | | 151 | | | | 353 | |
Reinvested | | | 365 | | | | 66 | | | | 5 | | | | 4 | |
Redeemed | | | (5,669 | ) | | | (97,497 | ) | | | (135 | ) | | | (247 | ) |
| | | | | | | | | | | | | | | | |
Change in Select Class Shares | | | (2,392 | ) | | | (86,838 | ) | | | 21 | | | | 110 | |
| | | | | | | | | | | | | | | | |
| (a) | Amount rounds to less than 1,000 shares. |
SEE NOTES TO FINANCIAL STATEMENTS.
| | | | | | |
| | | |
| 108 | | | | J.P. MORGAN INTERNATIONAL EQUITY FUNDS | | APRIL 30, 2015 |
THIS PAGE IS INTENTIONALLY LEFT BLANK
| | | | | | | | |
| | | |
| APRIL 30, 2015 | | J.P. MORGAN INTERNATIONAL EQUITY FUNDS | | | | | 109 | |
FINANCIAL HIGHLIGHTS
FOR THE PERIODS INDICATED
| | | | | | | | | | | | | | | | | | | | | | | | |
| | | | | | Per share operating performance | |
| | | | | | Investment operations | | | Distributions | | | | |
| | | Net asset
value,
beginning
of period | | | Net
investment
income
(loss) | | | Net realized
and unrealized
gains
(losses) on
investments | | | Total from
investment
operations | | | Net
investment
income | | | Redemption
fees | |
Emerging Economies Fund | | | | | | | | | | | | | | | | | | | | | | | | |
Class A | | | | | | | | | | | | | | | | | | | | | | | | |
Six Months Ended April 30, 2015 (Unaudited) | | $ | 13.13 | | | $ | 0.03 | (f) | | $ | 0.45 | | | $ | 0.48 | | | $ | (0.20 | ) | | $ | — | |
Year Ended October 31, 2014 | | | 13.63 | | | | 0.22 | (f) | | | (0.57 | ) | | | (0.35 | ) | | | (0.15 | ) | | | — | |
Year Ended October 31, 2013 | | | 12.88 | | | | 0.19 | (f) | | | 0.67 | | | | 0.86 | | | | (0.11 | ) | | | — | |
Year Ended October 31, 2012 | | | 12.65 | | | | 0.17 | (f) | | | 0.21 | | | | 0.38 | | | | (0.15 | ) | | | — | |
Year Ended October 31, 2011 | | | 13.91 | | | | 0.20 | (f) | | | (1.44 | ) | | | (1.24 | ) | | | (0.02 | ) | | | — | (g) |
Year Ended October 31, 2010 | | | 10.47 | | | | 0.11 | (f) | | | 3.60 | | | | 3.71 | | | | (0.27 | ) | | | — | |
| | | | | | |
Class C | | | | | | | | | | | | | | | | | | | | | | | | |
Six Months Ended April 30, 2015 (Unaudited) | | | 12.92 | | | | (0.01 | )(f) | | | 0.46 | | | | 0.45 | | | | (0.13 | ) | | | — | |
Year Ended October 31, 2014 | | | 13.44 | | | | 0.15 | (f) | | | (0.57 | ) | | | (0.42 | ) | | | (0.10 | ) | | | — | |
Year Ended October 31, 2013 | | | 12.72 | | | | 0.13 | (f) | | | 0.66 | | | | 0.79 | | | | (0.07 | ) | | | — | |
Year Ended October 31, 2012 | | | 12.58 | | | | 0.15 | (f) | | | 0.15 | | | | 0.30 | | | | (0.16 | ) | | | — | |
Year Ended October 31, 2011 | | | 13.87 | | | | 0.08 | (f) | | | (1.37 | ) | | | (1.29 | ) | | | — | | | | — | (g) |
Year Ended October 31, 2010 | | | 10.46 | | | | 0.05 | (f) | | | 3.59 | | | | 3.64 | | | | (0.23 | ) | | | — | |
| | | | | | |
Class R5 | | | | | | | | | | | | | | | | | | | | | | | | |
Six Months Ended April 30, 2015 (Unaudited) | | | 13.22 | | | | 0.06 | (f) | | | 0.45 | | | | 0.51 | | | | (0.25 | ) | | | — | |
Year Ended October 31, 2014 | | | 13.71 | | | | 0.29 | (f) | | | (0.58 | ) | | | (0.29 | ) | | | (0.20 | ) | | | — | |
Year Ended October 31, 2013 | | | 12.94 | | | | 0.25 | (f) | | | 0.68 | | | | 0.93 | | | | (0.16 | ) | | | — | |
Year Ended October 31, 2012 | | | 12.71 | | | | 0.25 | (f) | | | 0.18 | | | | 0.43 | | | | (0.20 | ) | | | — | |
Year Ended October 31, 2011 | | | 13.93 | | | | 0.30 | (f) | | | (1.47 | ) | | | (1.17 | ) | | | (0.05 | ) | | | — | (g) |
Year Ended October 31, 2010 | | | 10.48 | | | | 0.17 | (f) | | | 3.59 | | | | 3.76 | | | | (0.31 | ) | | | — | |
| | | | | | |
Select Class | | | | | | | | | | | | | | | | | | | | | | | | |
Six Months Ended April 30, 2015 (Unaudited) | | | 13.17 | | | | 0.04 | (f) | | | 0.46 | | | | 0.50 | | | | (0.23 | ) | | | — | |
Year Ended October 31, 2014 | | | 13.67 | | | | 0.26 | (f) | | | (0.58 | ) | | | (0.32 | ) | | | (0.18 | ) | | | — | |
Year Ended October 31, 2013 | | | 12.91 | | | | 0.21 | (f) | | | 0.70 | | | | 0.91 | | | | (0.15 | ) | | | — | |
Year Ended October 31, 2012 | | | 12.68 | | | | 0.22 | (f) | | | 0.18 | | | | 0.40 | | | | (0.17 | ) | | | — | |
Year Ended October 31, 2011 | | | 13.92 | | | | 0.25 | (f) | | | (1.45 | ) | | | (1.20 | ) | | | (0.04 | ) | | | — | (g) |
Year Ended October 31, 2010 | | | 10.48 | | | | 0.14 | (f) | | | 3.59 | | | | 3.73 | | | | (0.29 | ) | | | — | |
| (a) | Annualized for periods less than one year, unless otherwise noted. |
| (b) | Not annualized for periods less than one year. |
| (c) | Includes adjustments in accordance with accounting principles generally accepted in the United States of America and as such, the net asset values for financial reporting purposes and the returns based upon those net asset values may differ from the net asset values and returns for shareholder transactions. |
| (d) | Includes interest expense, if applicable, which is less than 0.01% unless otherwise noted. |
| (e) | Portfolio turnover is calculated by dividing the lesser of total purchases or sales of portfolio securities for the reporting period by the monthly average value of portfolio securities owned during the reporting period. Excluded from both the numerator and denominator are amounts relating to derivatives and securities whose maturities or expiration dates at the time of acquisition were one year or less. |
| (f) | Calculated based upon average shares outstanding. |
| (g) | Amount rounds to less than $0.01. |
SEE NOTES TO FINANCIAL STATEMENTS.
| | | | | | |
| | | |
| 110 | | | | J.P. MORGAN INTERNATIONAL EQUITY FUNDS | | APRIL 30, 2015 |
| | | | | | | | | | | | | | | | | | | | | | | | | | |
| | | Ratios/Supplemental data | |
| | | | | | | | | | Ratios to average net assets (a) | | | | |
Net asset
value,
end of
period | | | Total return
(excludes
sales charge) (b)(c) | | |
Net assets,
end of
period
(000’s) | | | Net
expenses (d) | | | Net
investment
income
(loss) | | | Expenses
without waivers
and reimbursements | | | Portfolio
turnover
rate (b)(e) | |
| | | | | | | | | | | | | | | | | | | | | | | | | | |
| | | | | | | | | | | | | | | | | | | | | | | | | | |
| $ | 13.41 | | | | 3.83 | % | | $ | 34,723 | | | | 1.57 | % | | | 0.49 | % | | | 1.91 | % | | | 40 | % |
| | 13.13 | | | | (2.56 | ) | | | 80,806 | | | | 1.60 | | | | 1.71 | | | | 1.73 | | | | 79 | |
| | 13.63 | | | | 6.67 | | | | 69,690 | | | | 1.60 | | | | 1.45 | | | | 1.72 | | | | 43 | |
| | 12.88 | | | | 3.15 | | | | 30,356 | | | | 1.65 | | | | 1.37 | | | | 1.76 | | | | 72 | |
| | 12.65 | | | | (8.93 | ) | | | 43,519 | | | | 1.75 | | | | 1.50 | | | | 1.75 | | | | 84 | |
| | 13.91 | | | | 36.12 | | | | 49 | | | | 1.85 | | | | 0.96 | | | | 3.99 | | | | 156 | |
| | | | | | |
| | | | | | | | | | | | | | | | | | | | | | | | | | |
| | 13.24 | | | | 3.61 | | | | 4,861 | | | | 2.11 | | | | (0.11 | ) | | | 2.34 | | | | 40 | |
| | 12.92 | | | | (3.12 | ) | | | 5,331 | | | | 2.10 | | | | 1.13 | | | | 2.23 | | | | 79 | |
| | 13.44 | | | | 6.25 | | | | 5,089 | | | | 2.10 | | | | 1.02 | | | | 2.22 | | | | 43 | |
| | 12.72 | | | | 2.54 | | | | 2,088 | | | | 2.12 | | | | 1.21 | | | | 2.27 | | | | 72 | |
| | 12.58 | | | | (9.30 | ) | | | 516 | | | | 2.28 | | | | 0.57 | | | | 2.32 | | | | 84 | |
| | 13.87 | | | | 35.33 | | | | 49 | | | | 2.35 | | | | 0.46 | | | | 4.49 | | | | 156 | |
| | | | | | |
| | | | | | | | | | | | | | | | | | | | | | | | | | |
| | 13.48 | | | | 4.10 | | | | 533,061 | | | | 1.16 | | | | 0.89 | | | | 1.23 | | | | 40 | |
| | 13.22 | | | | (2.12 | ) | | | 852,477 | | | | 1.15 | | | | 2.19 | | | | 1.28 | | | | 79 | |
| | 13.71 | | | | 7.21 | | | | 676,985 | | | | 1.15 | | | | 1.84 | | | | 1.27 | | | | 43 | |
| | 12.94 | | | | 3.53 | | | | 331,032 | | | | 1.19 | | | | 1.99 | | | | 1.31 | | | | 72 | |
| | 12.71 | | | | (8.45 | ) | | | 228,411 | | | | 1.31 | | | | 2.14 | | | | 1.32 | | | | 84 | |
| | 13.93 | | | | 36.66 | | | | 50 | | | | 1.40 | | | | 1.41 | | | | 3.54 | | | | 156 | |
| | | | | | |
| | | | | | | | | | | | | | | | | | | | | | | | | | |
| | 13.44 | | | | 3.96 | | | | 271,202 | | | | 1.36 | | | | 0.62 | | | | 1.44 | | | | 40 | |
| | 13.17 | | | | (2.35 | ) | | | 288,059 | | | | 1.35 | | | | 1.96 | | | | 1.48 | | | | 79 | |
| | 13.67 | | | | 7.04 | | | | 277,822 | | | | 1.35 | | | | 1.61 | | | | 1.47 | | | | 43 | |
| | 12.91 | | | | 3.34 | | | | 82,457 | | | | 1.39 | | | | 1.70 | | | | 1.51 | | | | 72 | |
| | 12.68 | | | | (8.65 | ) | | | 73,787 | | | | 1.52 | | | | 1.76 | | | | 1.55 | | | | 84 | |
| | 13.92 | | | | 36.35 | | | | 7,313 | | | | 1.60 | | | | 1.21 | | | | 3.74 | | | | 156 | |
SEE NOTES TO FINANCIAL STATEMENTS.
| | | | | | | | |
| | | |
| APRIL 30, 2015 | | J.P. MORGAN INTERNATIONAL EQUITY FUNDS | | | | | 111 | |
FINANCIAL HIGHLIGHTS
FOR THE PERIODS INDICATED (continued)
| | | | | | | | | | | | | | | | | | | | | | | | |
| | | | | | Per share operating performance | |
| | | | | | Investment operations | | | Distributions | | | | |
| | | Net asset
value,
beginning
of period | | | Net
investment
income
(loss) | | | Net realized
and unrealized
gains
(losses) on
investments | | | Total from
investment
operations | | | Net
investment
income | | | Redemption
fees | |
Emerging Markets Equity Fund | | | | | | | | | | | | | | | | | | | | | | | | |
Class A | | | | | | | | | | | | | | | | | | | | | | | | |
Six Months Ended April 30, 2015 (Unaudited) | | $ | 23.72 | | | | 0.01 | (f)(g) | | $ | (0.77 | ) | | $ | (0.76 | ) | | $ | (0.19 | ) | | $ | — | |
Year Ended October 31, 2014 | | | 23.05 | | | | 0.16 | (f)(g) | | | 0.59 | | | | 0.75 | | | | (0.08 | ) | | | — | |
Year Ended October 31, 2013 | | | 22.01 | | | | 0.10 | (f) | | | 1.02 | | | | 1.12 | | | | (0.08 | ) | | | — | |
Year Ended October 31, 2012 | | | 21.09 | | | | 0.07 | (f) | | | 0.85 | | | | 0.92 | | | | — | | | | — | |
Year Ended October 31, 2011 | | | 23.45 | | | | 0.06 | (f) | | | (2.33 | ) | | | (2.27 | ) | | | (0.09 | ) | | | — | (h) |
Year Ended October 31, 2010 | | | 18.79 | | | | (0.01 | )(f) | | | 4.71 | | | | 4.70 | | | | (0.04 | ) | | | — | (h) |
| | | | | | |
Class B | | | | | | | | | | | | | | | | | | | | | | | | |
Six Months Ended April 30, 2015 (Unaudited) | | | 23.19 | | | | (0.04 | )(f)(g) | | | (0.75 | ) | | | (0.79 | ) | | | (0.03 | ) | | | — | |
Year Ended October 31, 2014 | | | 22.57 | | | | 0.02 | (f)(g) | | | 0.60 | | | | 0.62 | | | | — | | | | — | |
Year Ended October 31, 2013 | | | 21.59 | | | | (0.04 | )(f) | | | 1.03 | | | | 0.99 | | | | (0.01 | ) | | | — | |
Year Ended October 31, 2012 | | | 20.80 | | | | (0.05 | )(f) | | | 0.84 | | | | 0.79 | | | | — | | | | — | |
Year Ended October 31, 2011 | | | 23.15 | | | | (0.07 | )(f) | | | (2.28 | ) | | | (2.35 | ) | | | — | | | | — | (h) |
Year Ended October 31, 2010 | | | 18.60 | | | | (0.12 | )(f) | | | 4.67 | | | | 4.55 | | | | — | | | | — | (h) |
| | | | | | |
Class C | | | | | | | | | | | | | | | | | | | | | | | | |
Six Months Ended April 30, 2015 (Unaudited) | | | 23.03 | | | | (0.04 | )(f)(g) | | | (0.75 | ) | | | (0.79 | ) | | | (0.08 | ) | | | — | |
Year Ended October 31, 2014 | | | 22.41 | | | | 0.05 | (f)(g) | | | 0.57 | | | | 0.62 | | | | — | | | | — | |
Year Ended October 31, 2013 | | | 21.44 | | | | (0.01 | )(f) | | | 0.99 | | | | 0.98 | | | | (0.01 | ) | | | — | |
Year Ended October 31, 2012 | | | 20.65 | | | | (0.04 | )(f) | | | 0.83 | | | | 0.79 | | | | — | | | | — | |
Year Ended October 31, 2011 | | | 23.01 | | | | (0.05 | )(f) | | | (2.29 | ) | | | (2.34 | ) | | | (0.02 | ) | | | — | (h) |
Year Ended October 31, 2010 | | | 18.49 | | | | (0.11 | )(f) | | | 4.63 | | | | 4.52 | | | | — | | | | — | (h) |
| | | | | | |
Class R6 | | | | | | | | | | | | | | | | | | | | | | | | |
Six Months Ended April 30, 2015 (Unaudited) | | | 24.44 | | | | 0.06 | (f)(g) | | | (0.79 | ) | | | (0.73 | ) | | | (0.30 | ) | | | — | |
December 23, 2013 (i) through October 31, 2014 | | | 22.47 | | | | 0.38 | (f)(g) | | | 1.59 | | | | 1.97 | | | | — | | | | — | |
| | | | | | |
Institutional Class | | | | | | | | | | | | | | | | | | | | | | | | |
Six Months Ended April 30, 2015 (Unaudited) | | | 24.42 | | | | 0.07 | (f)(g) | | | (0.81 | ) | | | (0.74 | ) | | | (0.24 | ) | | | — | |
Year Ended October 31, 2014 | | | 23.73 | | | | 0.17 | (f)(g) | | | 0.70 | | | | 0.87 | | | | (0.18 | ) | | | — | |
Year Ended October 31, 2013 | | | 22.65 | | | | 0.20 | (f) | | | 1.04 | | | | 1.24 | | | | (0.16 | ) | | | — | |
Year Ended October 31, 2012 | | | 21.66 | | | | 0.16 | (f) | | | 0.87 | | | | 1.03 | | | | (0.04 | ) | | | — | |
Year Ended October 31, 2011 | | | 24.04 | | | | 0.16 | (f) | | | (2.40 | ) | | | (2.24 | ) | | | (0.14 | ) | | | — | (h) |
Year Ended October 31, 2010 | | | 19.23 | | | | 0.08 | (f) | | | 4.82 | | | | 4.90 | | | | (0.09 | ) | | | — | (h) |
| | | | | | |
Select Class | | | | | | | | | | | | | | | | | | | | | | | | |
Six Months Ended April 30, 2015 (Unaudited) | | | 24.24 | | | | 0.05 | (f)(g) | | | (0.79 | ) | | | (0.74 | ) | | | (0.24 | ) | | | — | |
Year Ended October 31, 2014 | | | 23.47 | | | | 0.18 | (f)(g) | | | 0.64 | | | | 0.82 | | | | (0.05 | ) | | | — | |
Year Ended October 31, 2013 | | | 22.40 | | | | 0.17 | (f) | | | 1.03 | | | | 1.20 | | | | (0.13 | ) | | | — | |
Year Ended October 31, 2012 | | | 21.42 | | | | 0.13 | (f) | | | 0.86 | | | | 0.99 | | | | (0.01 | ) | | | — | |
Year Ended October 31, 2011 | | | 23.80 | | | | 0.13 | (f) | | | (2.38 | ) | | | (2.25 | ) | | | (0.13 | ) | | | — | (h) |
Year Ended October 31, 2010 | | | 19.04 | | | | 0.05 | (f) | | | 4.77 | | | | 4.82 | | | | (0.06 | ) | | | — | (h) |
| (a) | Annualized for periods less than one year, unless otherwise noted. |
| (b) | Not annualized for periods less than one year. |
| (c) | Includes adjustments in accordance with accounting principles generally accepted in the United States of America and as such, the net asset values for financial reporting purposes and the returns based upon those net asset values may differ from the net asset values and returns for shareholder transactions. |
| (d) | Includes interest expense, if applicable, which is less than 0.01% unless otherwise noted. |
| (e) | Portfolio turnover is calculated by dividing the lesser of total purchases or sales of portfolio securities for the reporting period by the monthly average value of portfolio securities owned during the reporting period. Excluded from both the numerator and denominator are amounts relating to derivatives and securities whose maturities or expiration dates at the time of acquisition were one year or less. |
| (f) | Calculated based upon average shares outstanding. |
| (g) | Net investment income (loss) may appear disproportionate among the classes due to the timing of recognition of income and changes in the relative size of the classes. |
| (h) | Amount rounds to less than $0.01. |
| (i) | Commencement of offering of class of shares. |
SEE NOTES TO FINANCIAL STATEMENTS.
| | | | | | |
| | | |
| 112 | | | | J.P. MORGAN INTERNATIONAL EQUITY FUNDS | | APRIL 30, 2015 |
| | | | | | | | | | | | | | | | | | | | | | | | | | |
| | | Ratios/Supplemental data | |
| | | | | | | | | | Ratios to average net assets (a) | | | | |
Net asset
value,
end of
period | | | Total return
(excludes
sales charge) (b)(c) | | | Net assets,
end of
period
(000’s) | | | Net
expenses (d) | | | Net
investment
income
(loss) | | | Expenses
without waivers
and reimbursements | | | Portfolio
turnover
rate (b)(e) | |
| | | | | | | | | | | | | | | | | | | | | | | | | | |
| | | | | | | | | | | | | | | | | | | | | | | | | | |
| $ | 22.77 | | | | (3.17 | )% | | $ | 285,598 | | | | 1.65 | % | | | 0.12 | (g) | | | 1.85 | % | | | 15 | % |
| | 23.72 | | | | 3.26 | | | | 350,555 | | | | 1.70 | | | | 0.72 | (g) | | | 1.81 | | | | 33 | |
| | 23.05 | | | | 5.08 | | | | 327,090 | | | | 1.76 | | | | 0.46 | | | | 1.79 | | | | 34 | |
| | 22.01 | | | | 4.36 | | | | 281,194 | | | | 1.82 | | | | 0.33 | | | | 1.82 | | | | 20 | |
| | 21.09 | | | | (9.73 | ) | | | 265,458 | | | | 1.79 | | | | 0.28 | | | | 1.80 | | | | 9 | |
| | 23.45 | | | | 25.08 | | | | 253,037 | | | | 1.82 | | | | (0.03 | ) | | | 1.83 | | | | 14 | |
| | | | | | |
| | | | | | | | | | | | | | | | | | | | | | | | | | |
| | 22.37 | | | | (3.42 | ) | | | 1,884 | | | | 2.15 | | | | (0.38 | )(g) | | | 2.39 | | | | 15 | |
| | 23.19 | | | | 2.75 | | | | 2,687 | | | | 2.20 | | | | 0.10 | (g) | | | 2.31 | | | | 33 | |
| | 22.57 | | | | 4.57 | | | | 4,245 | | | | 2.26 | | | | (0.18 | ) | | | 2.29 | | | | 34 | |
| | 21.59 | | | | 3.80 | | | | 6,100 | | | | 2.32 | | | | (0.23 | ) | | | 2.32 | | | | 20 | |
| | 20.80 | | | | (10.15 | ) | | | 7,572 | | | | 2.29 | | | | (0.32 | ) | | | 2.30 | | | | 9 | |
| | 23.15 | | | | 24.46 | | | | 10,812 | | | | 2.31 | | | | (0.58 | ) | | | 2.32 | | | | 14 | |
| | | | | | |
| | | | | | | | | | | | | | | | | | | | | | | | | | |
| | 22.16 | | | | (3.43 | ) | | | 55,560 | | | | 2.15 | | | | (0.32 | )(g) | | | 2.31 | | | | 15 | |
| | 23.03 | | | | 2.77 | | | | 56,732 | | | | 2.20 | | | | 0.22 | (g) | | | 2.31 | | | | 33 | |
| | 22.41 | | | | 4.56 | | | | 56,119 | | | | 2.26 | | | | (0.06 | ) | | | 2.29 | | | | 34 | |
| | 21.44 | | | | 3.83 | | | | 44,643 | | | | 2.32 | | | | (0.17 | ) | | | 2.32 | | | | 20 | |
| | 20.65 | | | | (10.18 | ) | | | 43,437 | | | | 2.29 | | | | (0.23 | ) | | | 2.30 | | | | 9 | |
| | 23.01 | | | | 24.45 | | | | 40,757 | | | | 2.32 | | | | (0.52 | ) | | | 2.33 | | | | 14 | |
| | | | | | |
| | | | | | | | | | | | | | | | | | | | | | | | | | |
| | 23.41 | | | | (2.94 | ) | | | 763,520 | | | | 1.15 | | | | 0.52 | (g) | | | 1.18 | | | | 15 | |
| | 24.44 | | | | 8.77 | | | | 1,130,050 | | | | 1.20 | | | | 1.85 | (g) | | | 1.33 | | | | 33 | |
| | | | | | |
| | | | | | | | | | | | | | | | | | | | | | | | | | |
| | 23.44 | | | | (2.98 | ) | | | 404,322 | | | | 1.25 | | | | 0.60 | (g) | | | 1.37 | | | | 15 | |
| | 24.42 | | | | 3.72 | | | | 411,449 | | | | 1.30 | | | | 0.72 | (g) | | | 1.40 | | | | 33 | |
| | 23.73 | | | | 5.47 | | | | 1,123,600 | | | | 1.36 | | | | 0.88 | | | | 1.39 | | | | 34 | |
| | 22.65 | | | | 4.80 | | | | 629,223 | | | | 1.41 | | | | 0.73 | | | | 1.42 | | | | 20 | |
| | 21.66 | | | | (9.37 | ) | | | 596,147 | | | | 1.38 | | | | 0.68 | | | | 1.41 | | | | 9 | |
| | 24.04 | | | | 25.55 | | | | 513,904 | | | | 1.40 | | | | 0.37 | | | | 1.43 | | | | 14 | |
| | | | | | |
| | | | | | | | | | | | | | | | | | | | | | | | | | |
| | 23.26 | | | | (3.03 | ) | | | 577,592 | | | | 1.40 | | | | 0.42 | (g) | | | 1.50 | | | | 15 | |
| | 24.24 | | | | 3.51 | | | | 583,501 | | | | 1.45 | | | | 0.78 | (g) | | | 1.56 | | | | 33 | |
| | 23.47 | | | | 5.34 | | | | 1,900,639 | | | | 1.51 | | | | 0.74 | | | | 1.54 | | | | 34 | |
| | 22.40 | | | | 4.65 | | | | 1,291,326 | | | | 1.57 | | | | 0.60 | | | | 1.57 | | | | 20 | |
| | 21.42 | | | | (9.51 | ) | | | 1,251,152 | | | | 1.55 | | | | 0.56 | | | | 1.56 | | | | 9 | |
| | 23.80 | | | | 25.38 | | | | 925,631 | | | | 1.57 | | | | 0.23 | | | | 1.58 | | | | 14 | |
SEE NOTES TO FINANCIAL STATEMENTS.
| | | | | | | | |
| | | |
| APRIL 30, 2015 | | J.P. MORGAN INTERNATIONAL EQUITY FUNDS | | | | | 113 | |
FINANCIAL HIGHLIGHTS
FOR THE PERIODS INDICATED (continued)
| | | | | | | | | | | | | | | | | | | | |
| | | | | | Per share operating performance | |
| | | | | | Investment operations | | | Distributions | |
| | | Net asset
value,
beginning
of period | | | Net
investment
income
(loss) | | | Net realized
and unrealized
gains
(losses) on
investments | | | Total from
investment
operations | | | Net
investment
income | |
Emerging Markets Equity Income Fund | | | | | | | | | | | | | | | | | | | | |
Class A | | | | | | | | | | | | | | | | | | | | |
December 12, 2014 (g) through April 30, 2015 (Unaudited) | | $ | 15.00 | | | $ | 0.13 | (h) | | $ | 0.59 | | | $ | 0.72 | | | $ | (0.11 | ) |
| | | | | |
Class C | | | | | | | | | | | | | | | | | | | | |
December 12, 2014 (g) through April 30, 2015 (Unaudited) | | | 15.00 | | | | 0.11 | (h) | | | 0.58 | | | | 0.69 | | | | (0.11 | ) |
| | | | | |
Class R5 | | | | | | | | | | | | | | | | | | | | |
December 12, 2014 (g) through April 30, 2015 (Unaudited) | | | 15.00 | | | | 0.16 | (h) | | | 0.59 | | | | 0.75 | | | | (0.11 | ) |
| | | | | |
Class R6 | | | | | | | | | | | | | | | | | | | | |
December 12, 2014 (g) through April 30, 2015 (Unaudited) | | | 15.00 | | | | 0.16 | (h) | | | 0.59 | | | | 0.75 | | | | (0.11 | ) |
| | | | | |
Select Class | | | | | | | | | | | | | | | | | | | | |
December 12, 2014 (g) through April 30, 2015 (Unaudited) | | | 15.00 | | | | 0.14 | (h)�� | | | 0.60 | | | | 0.74 | | | | (0.11 | ) |
| (a) | Annualized for periods less than one year, unless otherwise noted. |
| (b) | Not annualized for periods less than one year. |
| (c) | Includes adjustments in accordance with accounting principles generally accepted in the United States of America and as such, the net asset values for financial reporting purposes and the returns based upon those net asset values may differ from the net asset values and returns for shareholder transactions. |
| (d) | Includes interest expense, if applicable, which is less than 0.01% unless otherwise noted. |
| (e) | Certain non-recurring expenses incurred by the Fund were not annualized for the period ended April 30, 2015 |
| (f) | Portfolio turnover is calculated by dividing the lesser of total purchases or sales of portfolio securities for the reporting period by the monthly average value of portfolio securities owned during the reporting period. Excluded from both the numerator and denominator are amounts relating to derivatives and securities whose maturities or expiration dates at the time of acquisition were one year or less. |
| (g) | Commencement of operations. |
| (h) | Net investment income (loss) may appear disproportionate among the classes due to the timing of recognition of income and changes in the relative size of the classes. |
SEE NOTES TO FINANCIAL STATEMENTS.
| | | | | | |
| | | |
| 114 | | | | J.P. MORGAN INTERNATIONAL EQUITY FUNDS | | APRIL 30, 2015 |
| | | | | | | | | | | | | | | | | | | | | | | | | | |
| | | Ratios/Supplemental data | |
| | | | | | | | | | Ratios to average net assets (a) | | | | |
Net asset
value,
end of
period | | | Total return
(excludes
sales charge) (b)(c) | | |
Net assets,
end of
period
(000’s) | | | Net
expenses (d)(e) | | | Net
investment
income
(loss) | | | Expenses
without waivers
and reimbursements (e) | | | Portfolio
turnover
rate (b)(f) | |
| | | | | | | | | | | | | | | | | | | | | | | | | | |
| | | | | | | | | | | | | | | | | | | | | | | | | | |
| $ | 15.61 | | | | 4.83 | % | | $ | 31 | | | | 1.60 | % | | | 2.22 | %(h) | | | 12.08 | % | | | 13 | % |
| | | | | | |
| | | | | | | | | | | | | | | | | | | | | | | | | | |
| | 15.58 | | | | 4.62 | | | | 36 | | | | 2.10 | | | | 1.70 | (h) | | | 13.14 | | | | 13 | |
| | | | | | |
| | | | | | | | | | | | | | | | | | | | | | | | | | |
| | 15.64 | | | | 5.03 | | | | 21 | | | | 1.15 | | | | 2.71 | (h) | | | 10.53 | | | | 13 | |
| | | | | | |
| | | | | | | | | | | | | | | | | | | | | | | | | | |
| | 15.64 | | | | 5.03 | | | | 21 | | | | 1.10 | | | | 2.76 | (h) | | | 10.48 | | | | 13 | |
| | | | | | |
| | | | | | | | | | | | | | | | | | | | | | | | | | |
| | 15.63 | | | | 4.96 | | | | 3,066 | | | | 1.35 | | | | 2.52 | (h) | | | 10.72 | | | | 13 | |
SEE NOTES TO FINANCIAL STATEMENTS.
| | | | | | | | |
| | | |
| APRIL 30, 2015 | | J.P. MORGAN INTERNATIONAL EQUITY FUNDS | | | | | 115 | |
FINANCIAL HIGHLIGHTS
FOR THE PERIODS INDICATED (continued)
| | | | | | | | | | | | | | | | | | | | | | | | | | | | |
| | | | | | Per share operating performance | |
| | | | | | Investment operations | | | Distributions | |
| | | Net asset
value,
beginning
of period | | | Net
investment
income
(loss) | | | Net realized
and unrealized
gains
(losses) on
investments | | | Total from
investment
operations | | | Net
investment
income | | | Net
realized
gain | | | Total
distributions | |
Global Research Enhanced Index Fund | | | | | | | | | | | | | | | | | | | | | | | | | | | | |
Class A | | | | | | | | | | | | | | | | | | | | | | | | | | | | |
Six Months Ended April 30, 2015 (Unaudited) | | $ | 18.77 | | | $ | 0.16 | (f) | | $ | 0.62 | | | $ | 0.78 | | | $ | (0.22 | ) | | $ | (0.25 | ) | | $ | (0.47 | ) |
Year Ended October 31, 2014 | | | 17.33 | | | | 0.34 | (f) | | | 1.35 | | | | 1.69 | | | | (0.15 | ) | | | (0.10 | ) | | | (0.25 | ) |
February 28, 2013 (g) through October 31, 2013 | | | 15.00 | | | | 0.19 | (f) | | | 2.14 | | | | 2.33 | | | | — | | | | — | | | | — | |
| | | | | | | |
Class C | | | | | | | | | | | | | | | | | | | | | | | | | | | | |
Six Months Ended April 30, 2015 (Unaudited) | | | 18.68 | | | | 0.12 | (f) | | | 0.61 | | | | 0.73 | | | | (0.13 | ) | | | (0.25 | ) | | | (0.38 | ) |
Year Ended October 31, 2014 | | | 17.28 | | | | 0.25 | (f) | | | 1.33 | | | | 1.58 | | | | (0.08 | ) | | | (0.10 | ) | | | (0.18 | ) |
February 28, 2013 (g) through October 31, 2013 | | | 15.00 | | | | 0.14 | (f) | | | 2.14 | | | | 2.28 | | | | — | | | | — | | | | — | |
| | | | | | | |
Class R2 | | | | | | | | | | | | | | | | | | | | | | | | | | | | |
Six Months Ended April 30, 2015 (Unaudited) | | | 18.72 | | | | 0.14 | (f) | | | 0.62 | | | | 0.76 | | | | (0.17 | ) | | | (0.25 | ) | | | (0.42 | ) |
Year Ended October 31, 2014 | | | 17.30 | | | | 0.29 | (f) | | | 1.35 | | | | 1.64 | | | | (0.12 | ) | | | (0.10 | ) | | | (0.22 | ) |
February 28, 2013 (g) through October 31, 2013 | | | 15.00 | | | | 0.17 | (f) | | | 2.13 | | | | 2.30 | | | | — | | | | — | | | | — | |
| | | | | | | |
Select Class | | | | | | | | | | | | | | | | | | | | | | | | | | | | |
Six Months Ended April 30, 2015 (Unaudited) | | | 18.81 | | | | 0.19 | (f) | | | 0.61 | | | | 0.80 | | | | (0.27 | ) | | | (0.25 | ) | | | (0.52 | ) |
Year Ended October 31, 2014 | | | 17.37 | | | | 0.39 | (f) | | | 1.33 | | | | 1.72 | | | | (0.18 | ) | | | (0.10 | ) | | | (0.28 | ) |
February 28, 2013 (g) through October 31, 2013 | | | 15.00 | | | | 0.19 | (f) | | | 2.18 | | | | 2.37 | | | | — | | | | — | | | | — | |
| (a) | Annualized for periods less than one year, unless otherwise noted. |
| (b) | Not annualized for periods less than one year. |
| (c) | Includes adjustments in accordance with accounting principles generally accepted in the United States of America and as such, the net asset values for financial reporting purposes and the returns based upon those net asset values may differ from the net asset values and returns for shareholder transactions. |
| (d) | Includes interest expense, if applicable, which is less than 0.01% unless otherwise noted. |
| (e) | Portfolio turnover is calculated by dividing the lesser of total purchases or sales of portfolio securities for the reporting period by the monthly average value of portfolio securities owned during the reporting period. Excluded from both the numerator and denominator are amounts relating to derivatives and securities whose maturities or expiration dates at the time of acquisition were one year or less. |
| (f) | Calculated based upon average shares outstanding. |
| (g) | Commencement of operations. |
| (h) | Certain non-recurring expenses incurred by the Fund were not annualized for the period ended October 31, 2013. |
| (i) | Ratios are disproportionate among classes due to the size of net assets and fixed expenses. |
SEE NOTES TO FINANCIAL STATEMENTS.
| | | | | | |
| | | |
| 116 | | | | J.P. MORGAN INTERNATIONAL EQUITY FUNDS | | APRIL 30, 2015 |
| | | | | | | | | | | | | | | | | | | | | | | | | | |
| | | Ratios/Supplemental data | |
| | | | | | | | | | Ratios to average net assets (a) | | | | |
Net asset
value,
end of
period | | | Total return
(excludes
sales charge) (b)(c) | | |
Net assets,
end of
period
(000’s) | | | Net
expenses (d) | | | Net
investment
income
(loss) | | | Expenses
without waivers
and reimbursements | | | Portfolio
turnover
rate (b)(e) | |
| | | | | | | | | | | | | | | | | | | | | | | | | | |
| | | | | | | | | | | | | | | | | | | | | | | | | | |
| $ | 19.08 | | | | 4.28 | % | | $ | 66 | | | | 0.58 | % | | | 1.78 | % | | | 0.81 | % | | | 20 | % |
| | 18.77 | | | | 9.90 | | | | 64 | | | | 0.58 | | | | 1.87 | | | | 0.81 | | | | 40 | |
| | 17.33 | | | | 15.53 | | | | 58 | | | | 0.58 | (h) | | | 1.79 | (h) | | | 1.62 | (h)(i) | | | 25 | |
| | | | | | |
| | | | | | | | | | | | | | | | | | | | | | | | | | |
| | 19.03 | | | | 4.01 | | | | 66 | | | | 1.08 | | | | 1.27 | | | | 1.31 | | | | 20 | |
| | 18.68 | | | | 9.27 | | | | 63 | | | | 1.08 | | | | 1.37 | | | | 1.31 | | | | 40 | |
| | 17.28 | | | | 15.20 | | | | 58 | | | | 1.08 | (h) | | | 1.29 | (h) | | | 2.12 | (h)(i) | | | 25 | |
| | | | | | |
| | | | | | | | | | | | | | | | | | | | | | | | | | |
| | 19.06 | | | | 4.20 | | | | 66 | | | | 0.83 | | | | 1.52 | | | | 1.06 | | | | 20 | |
| | 18.72 | | | | 9.58 | | | | 63 | | | | 0.83 | | | | 1.62 | | | | 1.06 | | | | 40 | |
| | 17.30 | | | | 15.33 | | | | 58 | | | | 0.83 | (h) | | | 1.54 | (h) | | | 1.87 | (h)(i) | | | 25 | |
| | | | | | |
| | | | | | | | | | | | | | | | | | | | | | | | | | |
| | 19.09 | | | | 4.41 | | | | 6,528,375 | | | | 0.33 | | | | 2.01 | | | | 0.55 | | | | 20 | |
| | 18.81 | | | | 10.09 | | | | 3,577,523 | | | | 0.33 | | | | 2.16 | | | | 0.56 | | | | 40 | |
| | 17.37 | | | | 15.80 | | | | 1,895,025 | | | | 0.33 | (h) | | | 1.73 | (h) | | | 0.60 | (h)(i) | | | 25 | |
SEE NOTES TO FINANCIAL STATEMENTS.
| | | | | | | | |
| | | |
| APRIL 30, 2015 | | J.P. MORGAN INTERNATIONAL EQUITY FUNDS | | | | | 117 | |
FINANCIAL HIGHLIGHTS
FOR THE PERIODS INDICATED (continued)
| | | | | | | | | | | | | | | | | | | | | | | | | | | | |
| | | | | | Per share operating performance | |
| | | | | | Investment operations | | | Distributions | |
| | | Net asset
value,
beginning
of period | | | Net
investment
income
(loss) | | | Net realized
and unrealized
gains
(losses) on
investments | | | Total from
investment
operations | | | Net
investment
income | | | Net
realized
gain | | | Total
distributions | |
Global Unconstrained Equity Fund | | | | | | | | | | | | | | | | | | | | | | | | | | | | |
Class A | | | | | | | | | | | | | | | | | | | | | | | | | | | | |
Six Months Ended April 30, 2015 (Unaudited) | | $ | 19.55 | | | $ | (0.02 | )(i) | | $ | 1.19 | | | $ | 1.17 | | | $ | (0.21 | ) | | $ | (2.34 | ) | | $ | (2.55 | ) |
Year Ended October 31, 2014 | | | 20.11 | | | | 0.23 | | | | 1.17 | | | | 1.40 | | | | (0.17 | ) | | | (1.79 | ) | | | (1.96 | ) |
Year Ended October 31, 2013 | | | 16.73 | | | | 0.24 | | | | 3.77 | | | | 4.01 | | | | (0.22 | ) | | | (0.41 | ) | | | (0.63 | ) |
November 30, 2011 (g) through October 31, 2012 | | | 15.00 | | | | 0.17 | | | | 1.56 | | | | 1.73 | | | | — | (h) | | | — | | | | — | (h) |
| | | | | | | |
Class C | | | | | | | | | | | | | | | | | | | | | | | | | | | | |
Six Months Ended April 30, 2015 (Unaudited) | | | 19.43 | | | | (0.08 | )(i) | | | 1.20 | | | | 1.12 | | | | (0.12 | ) | | | (2.34 | ) | | | (2.46 | ) |
Year Ended October 31, 2014 | | | 20.01 | | | | 0.14 | | | | 1.16 | | | | 1.30 | | | | (0.09 | ) | | | (1.79 | ) | | | (1.88 | ) |
Year Ended October 31, 2013 | | | 16.65 | | | | 0.16 | | | | 3.76 | | | | 3.92 | | | | (0.15 | ) | | | (0.41 | ) | | | (0.56 | ) |
November 30, 2011 (g) through October 31, 2012 | | | 15.00 | | | | 0.09 | | | | 1.56 | | | | 1.65 | | | | — | | | | — | | | | — | |
| | | | | | | |
Class R2 | | | | | | | | | | | | | | | | | | | | | | | | | | | | |
Six Months Ended April 30, 2015 (Unaudited) | | | 19.49 | | | | (0.04 | )(i) | | | 1.19 | | | | 1.15 | | | | (0.17 | ) | | | (2.34 | ) | | | (2.51 | ) |
Year Ended October 31, 2014 | | | 20.06 | | | | 0.18 | | | | 1.17 | | | | 1.35 | | | | (0.13 | ) | | | (1.79 | ) | | | (1.92 | ) |
Year Ended October 31, 2013 | | | 16.69 | | | | 0.20 | | | | 3.77 | | | | 3.97 | | | | (0.19 | ) | | | (0.41 | ) | | | (0.60 | ) |
November 30, 2011 (g) through October 31, 2012 | | | 15.00 | | | | 0.13 | | | | 1.56 | | | | 1.69 | | | | — | | | | — | | | | — | |
| | | | | | | |
Class R5 | | | | | | | | | | | | | | | | | | | | | | | | | | | | |
Six Months Ended April 30, 2015 (Unaudited) | | | 19.65 | | | | 0.02 | (i) | | | 1.19 | | | | 1.21 | | | | (0.28 | ) | | | (2.34 | ) | | | (2.62 | ) |
Year Ended October 31, 2014 | | | 20.19 | | | | 0.31 | | | | 1.19 | | | | 1.50 | | | | (0.25 | ) | | | (1.79 | ) | | | (2.04 | ) |
Year Ended October 31, 2013 | | | 16.79 | | | | 0.32 | | | | 3.79 | | | | 4.11 | | | | (0.30 | ) | | | (0.41 | ) | | | (0.71 | ) |
November 30, 2011 (g) through October 31, 2012 | | | 15.00 | | | | 0.23 | | | | 1.57 | | | | 1.80 | | | | (0.01 | ) | | | — | | | | (0.01 | ) |
| | | | | | | |
Class R6 | | | | | | | | | | | | | | | | | | | | | | | | | | | | |
Six Months Ended April 30, 2015 (Unaudited) | | | 19.66 | | | | 0.02 | (i) | | | 1.20 | | | | 1.22 | | | | (0.29 | ) | | | (2.34 | ) | | | (2.63 | ) |
Year Ended October 31, 2014 | | | 20.20 | | | | 0.32 | | | | 1.19 | | | | 1.51 | | | | (0.26 | ) | | | (1.79 | ) | | | (2.05 | ) |
Year Ended October 31, 2013 | | | 16.80 | | | | 0.33 | | | | 3.78 | | | | 4.11 | | | | (0.30 | ) | | | (0.41 | ) | | | (0.71 | ) |
November 30, 2011 (g) through October 31, 2012 | | | 15.00 | | | | 0.24 | | | | 1.57 | | | | 1.81 | | | | (0.01 | ) | | | — | | | | (0.01 | ) |
| | | | | | | |
Select Class | | | | | | | | | | | | | | | | | | | | | | | | | | | | |
Six Months Ended April 30, 2015 (Unaudited) | | | 19.60 | | | | 0.01 | (i) | | | 1.19 | | | | 1.20 | | | | (0.25 | ) | | | (2.34 | ) | | | (2.59 | ) |
Year Ended October 31, 2014 | | | 20.15 | | | | 0.27 | | | | 1.19 | | | | 1.46 | | | | (0.22 | ) | | | (1.79 | ) | | | (2.01 | ) |
Year Ended October 31, 2013 | | | 16.76 | | | | 0.29 | | | | 3.77 | | | | 4.06 | | | | (0.26 | ) | | | (0.41 | ) | | | (0.67 | ) |
November 30, 2011 (g) through October 31, 2012 | | | 15.00 | | | | 0.20 | | | | 1.57 | | | | 1.77 | | | | (0.01 | ) | | | — | | | | (0.01 | ) |
| (a) | Annualized for periods less than one year, unless otherwise noted. |
| (b) | Not annualized for periods less than one year. |
| (c) | Includes adjustments in accordance with accounting principles generally accepted in the United States of America and as such, the net asset values for financial reporting purposes and the returns based upon those net asset values may differ from the net asset values and returns for shareholder transactions. |
| (d) | Includes interest expense, if applicable, which is less than 0.01% unless otherwise noted. |
| (e) | Portfolio turnover is calculated by dividing the lesser of total purchases or sales of portfolio securities for the reporting period by the monthly average value of portfolio securities owned during the reporting period. Excluded from both the numerator and denominator are amounts relating to derivatives and securities whose maturities or expiration dates at the time of acquisition were one year or less. |
| (f) | Certain non-recurring expenses incurred by the Fund were not annualized for the year ended October 31, 2013 and for the period ended October 31, 2012. |
| (g) | Commencement of operations. |
| (h) | Amount rounds to less than $0.01. |
| (i) | Net investment income (loss) may appear disproportionate among the classes due to the timing of recognition of income and changes in the relative size of the classes. |
SEE NOTES TO FINANCIAL STATEMENTS.
| | | | | | |
| | | |
| 118 | | | | J.P. MORGAN INTERNATIONAL EQUITY FUNDS | | APRIL 30, 2015 |
| | | | | | | | | | | | | | | | | | | | | | | | | | |
| | | Ratios/Supplemental data | |
| | | | | | | | | | Ratios to average net assets (a) | | | | |
Net asset
value,
end of
period | | | Total return
(excludes
sales charge) (b)(c) | | |
Net assets,
end of
period
(000’s) | | | Net
expenses (d) | | | Net
investment
income
(loss) | | | Expenses
without waivers
and reimbursements | | | Portfolio
turnover
rate (b)(e) | |
| | | | | | | | | | | | | | | | | | | | | | | | | | |
| | | | | | | | | | | | | | | | | | | | | | | | | | |
| $ | 18.17 | | | | 7.15 | % | | $ | 85 | | | | 1.27 | % | | | 0.17 | %(i) | | | 6.32 | % | | | 48 | % |
| | 19.55 | | | | 7.83 | | | | 75 | | | | 1.35 | | | | 1.27 | | | | 4.32 | | | | 97 | |
| | 20.11 | | | | 24.74 | | | | 70 | | | | 1.35 | (f) | | | 1.37 | (f) | | | 5.36 | (f) | | | 71 | |
| | 16.73 | | | | 11.55 | | | | 56 | | | | 1.35 | (f) | | | 1.14 | (f) | | | 6.89 | (f) | | | 49 | |
| | | | | | |
| | | | | | | | | | | | | | | | | | | | | | | | | | |
| | 18.09 | | | | 6.91 | | | | 101 | | | | 1.76 | | | | (0.29 | )(i) | | | 7.07 | | | | 48 | |
| | 19.43 | | | | 7.28 | | | | 75 | | | | 1.85 | | | | 0.77 | | | | 4.82 | | | | 97 | |
| | 20.01 | | | | 24.16 | | | | 69 | | | | 1.85 | (f) | | | 0.87 | (f) | | | 5.85 | (f) | | | 71 | |
| | 16.65 | | | | 11.00 | | | | 56 | | | | 1.85 | (f) | | | 0.65 | (f) | | | 7.38 | (f) | | | 49 | |
| | | | | | |
| | | | | | | | | | | | | | | | | | | | | | | | | | |
| | 18.13 | | | | 7.03 | | | | 80 | | | | 1.52 | | | | (0.08 | )(i) | | | 6.56 | | | | 48 | |
| | 19.49 | | | | 7.55 | | | | 75 | | | | 1.60 | | | | 1.02 | | | | 4.56 | | | | 97 | |
| | 20.06 | | | | 24.45 | | | | 69 | | | | 1.60 | (f) | | | 1.12 | (f) | | | 5.60 | (f) | | | 71 | |
| | 16.69 | | | | 11.27 | | | | 56 | | | | 1.60 | (f) | | | 0.90 | (f) | | | 7.14 | (f) | | | 49 | |
| | | | | | |
| | | | | | | | | | | | | | | | | | | | | | | | | | |
| | 18.24 | | | | 7.40 | | | | 82 | | | | 0.82 | | | | 0.62 | (i) | | | 5.86 | | | | 48 | |
| | 19.65 | | | | 8.34 | | | | 76 | | | | 0.90 | | | | 1.72 | | | | 3.86 | | | | 97 | |
| | 20.19 | | | | 25.29 | | | | 70 | | | | 0.90 | (f) | | | 1.82 | (f) | | | 4.89 | (f) | | | 71 | |
| | 16.79 | | | | 11.99 | | | | 56 | | | | 0.90 | (f) | | | 1.60 | (f) | | | 6.45 | (f) | | | 49 | |
| | | | | | |
| | | | | | | | | | | | | | | | | | | | | | | | | | |
| | 18.25 | | | | 7.45 | | | | 82 | | | | 0.77 | | | | 0.67 | (i) | | | 5.81 | | | | 48 | |
| | 19.66 | | | | 8.39 | | | | 76 | | | | 0.85 | | | | 1.77 | | | | 3.81 | | | | 97 | |
| | 20.20 | | | | 25.33 | | | | 70 | | | | 0.85 | (f) | | | 1.87 | (f) | | | 4.85 | (f) | | | 71 | |
| | 16.80 | | | | 12.06 | | | | 56 | | | | 0.85 | (f) | | | 1.65 | (f) | | | 6.40 | (f) | | | 49 | |
| | | | | | |
| | | | | | | | | | | | | | | | | | | | | | | | | | |
| | 18.21 | | | | 7.33 | | | | 4,517 | | | | 0.93 | | | | 0.50 | (i) | | | 6.07 | | | | 48 | |
| | 19.60 | | | | 8.11 | | | | 4,156 | | | | 1.10 | | | | 1.52 | | | | 4.06 | | | | 97 | |
| | 20.15 | | | | 25.04 | | | | 3,844 | | | | 1.10 | (f) | | | 1.62 | (f) | | | 5.10 | (f) | | | 71 | |
| | 16.76 | | | | 11.77 | | | | 3,075 | | | | 1.10 | (f) | | | 1.40 | (f) | | | 6.64 | (f) | | | 49 | |
SEE NOTES TO FINANCIAL STATEMENTS.
| | | | | | | | |
| | | |
| APRIL 30, 2015 | | J.P. MORGAN INTERNATIONAL EQUITY FUNDS | | | | | 119 | |
FINANCIAL HIGHLIGHTS
FOR THE PERIODS INDICATED (continued)
| | | | | | | | | | | | | | | | | | | | | | | | |
| | | | | | Per share operating performance | |
| | | | | | Investment operations | | | Distributions | | | | |
| | | Net asset
value,
beginning
of period | | | Net
investment
income
(loss) | | | Net realized
and unrealized
gains
(losses) on
investments | | | Total from
investment
operations | | | Net
investment
income | | | Redemption
fees | |
International Equity Fund | | | | | | | | | | | | | | | | | | | | | | | | |
Class A | | | | | | | | | | | | | | | | | | | | | | | | |
Six Months Ended April 30, 2015 (Unaudited) | | $ | 15.25 | | | $ | 0.10 | (f) | | $ | 1.00 | | | $ | 1.10 | | | $ | (0.06 | ) | | $ | — | |
Year Ended October 31, 2014 | | | 15.92 | | | | 0.37 | (f)(g) | | | (0.68 | ) | | | (0.31 | ) | | | (0.36 | ) | | | — | |
Year Ended October 31, 2013 | | | 13.36 | | | | 0.20 | (f) | | | 2.56 | | | | 2.76 | | | | (0.20 | ) | | | — | |
Year Ended October 31, 2012 | | | 12.61 | | | | 0.22 | (f) | | | 0.74 | | | | 0.96 | | | | (0.21 | ) | | | — | |
Year Ended October 31, 2011 | | | 13.40 | | | | 0.22 | (f) | | | (0.80 | ) | | | (0.58 | ) | | | (0.21 | ) | | | — | (h) |
Year Ended October 31, 2010 | | | 12.33 | | | | 0.18 | (f) | | | 1.07 | | | | 1.25 | | | | (0.18 | ) | | | — | (h) |
| | | | | | |
Class B | | | | | | | | | | | | | | | | | | | | | | | | |
Six Months Ended April 30, 2015 (Unaudited) | | | 14.72 | | | | 0.05 | (f) | | | 0.98 | | | | 1.03 | | | | (0.03 | ) | | | — | |
Year Ended October 31, 2014 | | | 15.39 | | | | 0.25 | (f)(g) | | | (0.63 | ) | | | (0.38 | ) | | | (0.29 | ) | | | — | |
Year Ended October 31, 2013 | | | 12.93 | | | | 0.11 | (f) | | | 2.49 | | | | 2.60 | | | | (0.14 | ) | | | — | |
Year Ended October 31, 2012 | | | 12.22 | | | | 0.16 | (f) | | | 0.70 | | | | 0.86 | | | | (0.15 | ) | | | — | |
Year Ended October 31, 2011 | | | 13.00 | | | | 0.14 | (f) | | | (0.77 | ) | | | (0.63 | ) | | | (0.15 | ) | | | — | (h) |
Year Ended October 31, 2010 | | | 11.97 | | | | 0.11 | (f) | | | 1.04 | | | | 1.15 | | | | (0.12 | ) | | | — | (h) |
| | | | | | |
Class C | | | | | | | | | | | | | | | | | | | | | | | | |
Six Months Ended April 30, 2015 (Unaudited) | | | 14.52 | | | | 0.06 | (f) | | | 0.95 | | | | 1.01 | | | | (0.03 | ) | | | — | |
Year Ended October 31, 2014 | | | 15.20 | | | | 0.26 | (f)(g) | | | (0.64 | ) | | | (0.38 | ) | | | (0.30 | ) | | | — | |
Year Ended October 31, 2013 | | | 12.78 | | | | 0.12 | (f) | | | 2.45 | | | | 2.57 | | | | (0.15 | ) | | | — | |
Year Ended October 31, 2012 | | | 12.08 | | | | 0.16 | (f) | | | 0.69 | | | | 0.85 | | | | (0.15 | ) | | | — | |
Year Ended October 31, 2011 | | | 12.85 | | | | 0.14 | (f) | | | (0.76 | ) | | | (0.62 | ) | | | (0.15 | ) | | | — | (h) |
Year Ended October 31, 2010 | | | 11.85 | | | | 0.11 | (f) | | | 1.01 | | | | 1.12 | | | | (0.12 | ) | | | — | (h) |
| | | | | | |
Class R2 | | | | | | | | | | | | | | | | | | | | | | | | |
Six Months Ended April 30, 2015 (Unaudited) | | | 15.19 | | | | 0.09 | (f) | | | 0.98 | | | | 1.07 | | | | (0.04 | ) | | | — | |
Year Ended October 31, 2014 | | | 15.87 | | | | 0.30 | (f)(g) | | | (0.65 | ) | | | (0.35 | ) | | | (0.33 | ) | | | — | |
Year Ended October 31, 2013 | | | 13.31 | | | | 0.11 | (f) | | | 2.61 | | | | 2.72 | | | | (0.16 | ) | | | — | |
Year Ended October 31, 2012 | | | 12.58 | | | | 0.15 | (f) | | | 0.77 | | | | 0.92 | | | | (0.19 | ) | | | — | |
Year Ended October 31, 2011 | | | 13.37 | | | | 0.18 | (f) | | | (0.79 | ) | | | (0.61 | ) | | | (0.18 | ) | | | — | (h) |
Year Ended October 31, 2010 | | | 12.31 | | | | 0.15 | (f) | | | 1.06 | | | | 1.21 | | | | (0.15 | ) | | | — | (h) |
| | | | | | |
Class R5 | | | | | | | | | | | | | | | | | | | | | | | | |
Six Months Ended April 30, 2015 (Unaudited) | | | 15.46 | | | | 0.13 | (f) | | | 1.02 | | | | 1.15 | | | | (0.08 | ) | | | — | |
Year Ended October 31, 2014 | | | 16.13 | | | | 0.44 | (f)(g) | | | (0.69 | ) | | | (0.25 | ) | | | (0.42 | ) | | | — | |
Year Ended October 31, 2013 | | | 13.52 | | | | 0.27 | (f) | | | 2.60 | | | | 2.87 | | | | (0.26 | ) | | | — | |
Year Ended October 31, 2012 | | | 12.75 | | | | 0.29 | (f) | | | 0.74 | | | | 1.03 | | | | (0.26 | ) | | | — | |
Year Ended October 31, 2011 | | | 13.55 | | | | 0.23 | (f) | | | (0.76 | ) | | | (0.53 | ) | | | (0.27 | ) | | | — | (h) |
Year Ended October 31, 2010 | | | 12.47 | | | | 0.23 | (f) | | | 1.09 | | | | 1.32 | | | | (0.24 | ) | | | — | (h) |
| | | | | | |
Class R6 | | | | | | | | | | | | | | | | | | | | | | | | |
Six Months Ended April 30, 2015 (Unaudited) | | | 15.46 | | | | 0.15 | (f) | | | 1.01 | | | | 1.16 | | | | (0.09 | ) | | | — | |
Year Ended October 31, 2014 | | | 16.13 | | | | 0.45 | (f)(g) | | | (0.69 | ) | | | (0.24 | ) | | | (0.43 | ) | | | — | |
Year Ended October 31, 2013 | | | 13.52 | | | | 0.28 | (f) | | | 2.59 | | | | 2.87 | | | | (0.26 | ) | | | — | |
Year Ended October 31, 2012 | | | 12.75 | | | | 0.29 | (f) | | | 0.74 | | | | 1.03 | | | | (0.26 | ) | | | — | |
November 30, 2010 (j) through October 31, 2011 | | | 12.85 | | | | 0.28 | (f) | | | (0.10 | ) | | | 0.18 | | | | (0.28 | ) | | | — | (h) |
| | | | | | |
Select Class | | | | | | | | | | | | | | | | | | | | | | | | |
Six Months Ended April 30, 2015 (Unaudited) | | | 15.45 | | | | 0.13 | (f) | | | 1.00 | | | | 1.13 | | | | (0.07 | ) | | | — | |
Year Ended October 31, 2014 | | | 16.13 | | | | 0.39 | (f)(g) | | | (0.67 | ) | | | (0.28 | ) | | | (0.40 | ) | | | — | |
Year Ended October 31, 2013 | | | 13.52 | | | | 0.23 | (f) | | | 2.61 | | | | 2.84 | | | | (0.23 | ) | | | — | |
Year Ended October 31, 2012 | | | 12.76 | | | | 0.26 | (f) | | | 0.74 | | | | 1.00 | | | | (0.24 | ) | | | — | |
Year Ended October 31, 2011 | | | 13.56 | | | | 0.24 | (f) | | | (0.80 | ) | | | (0.56 | ) | | | (0.24 | ) | | | — | (h) |
Year Ended October 31, 2010 | | | 12.47 | | | | 0.22 | (f) | | | 1.08 | | | | 1.30 | | | | (0.21 | ) | | | — | (h) |
| (a) | Annualized for periods less than one year, unless otherwise noted. |
| (b) | Not annualized for periods less than one year. |
| (c) | Includes adjustments in accordance with accounting principles generally accepted in the United States of America and as such, the net asset values for financial reporting purposes and the returns based upon those net asset values may differ from the net asset values and returns for shareholder transactions. |
| (d) | Includes interest expense, if applicable, which is less than 0.01% unless otherwise noted. |
| (e) | Portfolio turnover is calculated by dividing the lesser of total purchases or sales of portfolio securities for the reporting period by the monthly average value of portfolio securities owned during the reporting period. Excluded from both the numerator and denominator are amounts relating to derivatives and securities whose maturities or expiration dates at the time of acquisition were one year or less. |
SEE NOTES TO FINANCIAL STATEMENTS.
| | | | | | |
| | | |
| 120 | | | | J.P. MORGAN INTERNATIONAL EQUITY FUNDS | | APRIL 30, 2015 |
| | | | | | | | | | | | | | | | | | | | | | | | | | |
| | | Ratios/Supplemental data | |
| | | | | | | | | | Ratios to average net assets (a) | | | | |
Net asset
value,
end of
period | | | Total return
(excludes
sales charge) (b)(c) | | |
Net assets,
end of
period
(000’s) | | | Net
expenses (d) | | | Net
investment
income
(loss) | | | Expenses
without waivers
and reimbursements | | | Portfolio
turnover
rate (b)(e) | |
| | | | | | | | | | | | | | | | | | | | | | | | | | |
| | | | | | | | | | | | | | | | | | | | | | | | | | |
| $ | 16.29 | | | | 7.23 | % | | $ | 207,530 | | | | 1.30 | % | | | 1.34 | % | | | 1.59 | % | | | 8 | % |
| | 15.25 | | | | (2.06 | ) | | | 186,242 | | | | 1.31 | | | | 2.34 | (g) | | | 1.45 | | | | 6 | |
| | 15.92 | | | | 20.85 | | | | 188,590 | | | | 1.30 | | | | 1.33 | | | | 1.47 | | | | 8 | |
| | 13.36 | | | | 7.70 | | | | 98,274 | | | | 1.30 | | | | 1.72 | | | | 1.51 | | | | 5 | |
| | 12.61 | | | | (4.49 | ) | | | 102,866 | | | | 1.31 | | | | 1.63 | | | | 1.52 | | | | 18 | |
| | 13.40 | | | | 10.42 | | | | 131,125 | | | | 1.31 | | | | 1.44 | | | | 1.54 | | | | 15 | |
| | | | | | |
| | | | | | | | | | | | | | | | | | | | | | | | | | |
| | 15.72 | | | | 6.98 | | | | 710 | | | | 1.80 | | | | 0.67 | | | | 2.20 | | | | 8 | |
| | 14.72 | | | | (2.57 | ) | | | 963 | | | | 1.81 | | | | 1.63 | (g) | | | 1.95 | | | | 6 | |
| | 15.39 | | | | 20.26 | | | | 1,711 | | | | 1.80 | | | | 0.80 | | | | 1.97 | | | | 8 | |
| | 12.93 | | | | 7.15 | | | | 2,164 | | | | 1.80 | | | | 1.31 | | | | 2.01 | | | | 5 | |
| | 12.22 | | | | (4.99 | ) | | | 2,817 | | | | 1.81 | | | | 1.08 | | | | 2.02 | | | | 18 | |
| | 13.00 | | | | 9.82 | | | | 4,543 | | | | 1.86 | | | | 0.89 | | | | 2.04 | | | | 15 | |
| | | | | | |
| | | | | | | | | | | | | | | | | | | | | | | | | | |
| | 15.50 | | | | 6.98 | | | | 28,588 | | | | 1.80 | | | | 0.86 | | | | 2.04 | | | | 8 | |
| | 14.52 | | | | (2.59 | ) | | | 26,299 | | | | 1.81 | | | | 1.73 | (g) | | | 1.95 | | | | 6 | |
| | 15.20 | | | | 20.25 | | | | 23,655 | | | | 1.80 | | | | 0.83 | | | | 1.97 | | | | 8 | |
| | 12.78 | | | | 7.16 | | | | 17,873 | | | | 1.80 | | | | 1.31 | | | | 2.01 | | | | 5 | |
| | 12.08 | | | | (4.93 | ) | | | 20,193 | | | | 1.81 | | | | 1.09 | | | | 2.02 | | | | 18 | |
| | 12.85 | | | | 9.69 | | | | 23,370 | | | | 1.86 | | | | 0.88 | | | | 2.04 | | | | 15 | |
| | | | | | |
| | | | | | | | | | | | | | | | | | | | | | | | | | |
| | 16.22 | | | | 7.08 | | | | 1,118 | | | | 1.55 | | | | 1.12 | | | | 1.92 | | | | 8 | |
| | 15.19 | | | | (2.33 | ) | | | 1,405 | | | | 1.56 | | | | 1.92 | (g) | | | 1.70 | | | | 6 | |
| | 15.87 | | | | 20.58 | | | | 1,230 | | | | 1.55 | | | | 0.78 | | | | 1.72 | | | | 8 | |
| | 13.31 | | | | 7.45 | | | | 721 | | | | 1.55 | | | | 1.16 | | | | 1.74 | | | | 5 | |
| | 12.58 | | | | (4.73 | ) | | | 67 | | | | 1.56 | | | | 1.33 | | | | 1.77 | | | | 18 | |
| | 13.37 | | | | 10.07 | | | | 70 | | | | 1.56 | | | | 1.17 | | | | 1.79 | | | | 15 | |
| | | | | | |
| | | | | | | | | | | | | | | | | | | | | | | | | | |
| | 16.53 | | | | 7.49 | | | | 63,086 | | | | 0.86 | | | | 1.67 | | | | 1.04 | | | | 8 | |
| | 15.46 | | | | (1.65 | ) | | | 95,749 | | | | 0.86 | | | | 2.73 | (g) | | | 1.00 | | | | 6 | |
| | 16.13 | | | | 21.42 | | | | 106,963 | | | | 0.85 | | | | 1.79 | | | | 1.02 | | | | 8 | |
| | 13.52 | | | | 8.19 | | | | 63,767 | | | | 0.85 | | | | 2.24 | | | | 1.05 | | | | 5 | |
| | 12.75 | | | | (4.07 | ) | | | 45,680 | | | | 0.86 | | | | 1.69 | | | | 1.08 | | | | 18 | |
| | 13.55 | | | | 10.86 | | | | 242,131 | | | | 0.86 | | | | 1.86 | | | | 1.10 | | | | 15 | |
| | | | | | |
| | | | | | | | | | | | | | | | | | | | | | | | | | |
| | 16.53 | | | | 7.51 | | | | 1,960,752 | | | | 0.81 | | | | 1.89 | | | | 0.92 | | | | 8 | |
| | 15.46 | | | | (1.60 | ) | | | 1,681,788 | | | | 0.81 | | | | 2.81 | | | | 0.95 | | | | 6 | |
| | 16.13 | | | | 21.47 | | | | 1,248,489 | | | | 0.80 | | | | 1.85 | | | | 0.97 | | | | 8 | |
| | 13.52 | | | | 8.23 | | | | 682,861 | | | | 0.80 | | | | 2.26 | | | | 1.00 | | | | 5 | |
| | 12.75 | | | | 1.20 | | | | 347,040 | | | | 0.81 | | | | 2.23 | | | | 1.01 | | | | 18 | |
| | | | | | |
| | | | | | | | | | | | | | | | | | | | | | | | | | |
| | 16.51 | | | | 7.36 | | | | 547,918 | | | | 1.06 | | | | 1.71 | | | | 1.20 | | | | 8 | |
| | 15.45 | | | | (1.88 | ) | | | 494,344 | | | | 1.06 | | | | 2.41 | (g) | | | 1.20 | | | | 6 | |
| | 16.13 | | | | 21.23 | | | | 434,316 | | | | 1.05 | | | | 1.51 | | | | 1.22 | | | | 8 | |
| | 13.52 | | | | 7.91 | | | | 210,375 | | | | 1.05 | | | | 2.02 | | | | 1.25 | | | | 5 | |
| | 12.76 | | | | (4.26 | ) | | | 186,425 | | | | 1.06 | | | | 1.76 | | | | 1.27 | | | | 18 | |
| | 13.56 | | | | 10.72 | | | | 241,123 | | | | 1.06 | | | | 1.74 | | | | 1.29 | | | | 15 | |
| (f) | Calculated based upon average shares outstanding. |
| (g) | Reflects special dividends paid out during the period by several of the Fund’s holdings. Had the Fund not received the special dividends, the net investment income (loss) per share would have been $0.32, $0.20, $0.21, $0.25, $0.39, $0.40 and $0.34 for Class A, Class B, Class C, Class R2, Class R5, Class R6 and Select Class Shares, respectively, and the net investment income (loss) ratio would have been 2.01%, 1.30%, 1.40%, 1.59%, 2.40%, 2.48% and 2.08% for Class A, Class B, Class C, Class R2, Class R5, Class R6 and Select Class Shares, respectively. |
| (h) | Amount rounds to less than $0.01. |
| (j) | Commencement of offering of class of shares. |
SEE NOTES TO FINANCIAL STATEMENTS.
| | | | | | | | |
| | | |
| APRIL 30, 2015 | | J.P. MORGAN INTERNATIONAL EQUITY FUNDS | | | | | 121 | |
FINANCIAL HIGHLIGHTS
FOR THE PERIODS INDICATED (continued)
| | | | | | | | | | | | | | | | | | | | | | | | | | | | |
| | | | | | Per share operating performance | |
| | | | | | Investment operations | | | Distributions | |
| | | Net asset
value,
beginning
of period | | | Net
investment
income
(loss) | | | Net realized
and unrealized
gains
(losses) on
investments | | | Total from
investment
operations | | | Net
investment
income | | | Net
realized
gain | | | Total
distributions | |
International Equity Income Fund | | | | | | | | | | | | | | | | | | | | | | | | | | | | |
Class A | | | | | | | | | | | | | | | | | | | | | | | | | | | | |
Six Months Ended April 30, 2015 (Unaudited) | | $ | 16.41 | | | $ | 0.19 | (f) | | $ | 0.76 | | | $ | 0.95 | | | $ | (0.43 | ) | | $ | (0.13 | ) | | $ | (0.56 | ) |
Year Ended October 31, 2014 | | | 16.67 | | | | 0.91 | (f)(g) | | | (0.38 | ) | | | 0.53 | | | | (0.66 | ) | | | (0.13 | ) | | | (0.79 | ) |
Year Ended October 31, 2013 | | | 14.12 | | | | 0.43 | (f) | | | 2.55 | | | | 2.98 | | | | (0.41 | ) | | | (0.02 | ) | | | (0.43 | ) |
Year Ended October 31, 2012 | | | 13.37 | | | | 0.31 | (f) | | | 0.88 | | | | 1.19 | | | | (0.44 | ) | | | — | | | | (0.44 | ) |
February 28, 2011 (h) through October 31, 2011 | | | 15.00 | | | | 0.33 | (f) | | | (1.64 | ) | | | (1.31 | ) | | | (0.32 | ) | | | — | | | | (0.32 | ) |
| | | | | | | |
Class C | | | | | | | | | | | | | | | | | | | | | | | | | | | | |
Six Months Ended April 30, 2015 (Unaudited) | | | 16.36 | | | | 0.31 | (f) | | | 0.59 | | | | 0.90 | | | | (0.40 | ) | | | (0.13 | ) | | | (0.53 | ) |
Year Ended October 31, 2014 | | | 16.63 | | | | 0.84 | (f)(g) | | | (0.40 | ) | | | 0.44 | | | | (0.58 | ) | | | (0.13 | ) | | | (0.71 | ) |
Year Ended October 31, 2013 | | | 14.11 | | | | 0.34 | (f) | | | 2.55 | | | | 2.89 | | | | (0.35 | ) | | | (0.02 | ) | | | (0.37 | ) |
Year Ended October 31, 2012 | | | 13.35 | | | | 0.36 | (f) | | | 0.77 | | | | 1.13 | | | | (0.37 | ) | | | — | | | | (0.37 | ) |
February 28, 2011 (h) through October 31, 2011 | | | 15.00 | | | | 0.30 | (f) | | | (1.66 | ) | | | (1.36 | ) | | | (0.29 | ) | | | — | | | | (0.29 | ) |
| | | | | | | |
Class R2 | | | | | | | | | | | | | | | | | | | | | | | | | | | | |
Six Months Ended April 30, 2015 (Unaudited) | | | 16.41 | | | | 0.32 | (f) | | | 0.60 | | | | 0.92 | | | | (0.42 | ) | | | (0.13 | ) | | | (0.55 | ) |
Year Ended October 31, 2014 | | | 16.67 | | | | 0.87 | (f)(g) | | | (0.39 | ) | | | 0.48 | | | | (0.61 | ) | | | (0.13 | ) | | | (0.74 | ) |
Year Ended October 31, 2013 | | | 14.12 | | | | 0.40 | (f) | | | 2.54 | | | | 2.94 | | | | (0.37 | ) | | | (0.02 | ) | | | (0.39 | ) |
Year Ended October 31, 2012 | | | 13.36 | | | | 0.40 | (f) | | | 0.76 | | | | 1.16 | | | | (0.40 | ) | | | — | | | | (0.40 | ) |
February 28, 2011 (h) through October 31, 2011 | | | 15.00 | | | | 0.32 | (f) | | | (1.66 | ) | | | (1.34 | ) | | | (0.30 | ) | | | — | | | | (0.30 | ) |
| | | | | | | |
Class R5 | | | | | | | | | | | | | | | | | | | | | | | | | | | | |
Six Months Ended April 30, 2015 (Unaudited) | | | 16.46 | | | | 0.37 | (f) | | | 0.62 | | | | 0.99 | | | | (0.47 | ) | | | (0.13 | ) | | | (0.60 | ) |
Year Ended October 31, 2014 | | | 16.72 | | | | 0.99 | (f)(g) | | | (0.39 | ) | | | 0.60 | | | | (0.73 | ) | | | (0.13 | ) | | | (0.86 | ) |
Year Ended October 31, 2013 | | | 14.15 | | | | 0.51 | (f) | | | 2.54 | | | | 3.05 | | | | (0.46 | ) | | | (0.02 | ) | | | (0.48 | ) |
Year Ended October 31, 2012 | | | 13.38 | | | | 0.50 | (f) | | | 0.76 | | | | 1.26 | | | | (0.49 | ) | | | — | | | | (0.49 | ) |
February 28, 2011 (h) through October 31, 2011 | | | 15.00 | | | | 0.38 | (f) | | | (1.65 | ) | | | (1.27 | ) | | | (0.35 | ) | | | — | | | | (0.35 | ) |
| | | | | | | |
Class R6 | | | | | | | | | | | | | | | | | | | | | | | | | | | | |
January 30, 2015 (k) through April 30, 2015 (Unaudited) | | | 16.00 | | | | 0.45 | (f) | | | 0.50 | | | | 0.95 | | | | (0.12 | ) | | | — | | | | (0.12 | ) |
| | | | | | | |
Select Class | | | | | | | | | | | | | | | | | | | | | | | | | | | | |
Six Months Ended April 30, 2015 (Unaudited) | | | 16.45 | | | | 0.26 | (f) | | | 0.72 | | | | 0.98 | | | | (0.46 | ) | | | (0.13 | ) | | | (0.59 | ) |
Year Ended October 31, 2014 | | | 16.71 | | | | 0.96 | (f)(g) | | | (0.40 | ) | | | 0.56 | | | | (0.69 | ) | | | (0.13 | ) | | | (0.82 | ) |
Year Ended October 31, 2013 | | | 14.14 | | | | 0.47 | (f) | | | 2.55 | | | | 3.02 | | | | (0.43 | ) | | | (0.02 | ) | | | (0.45 | ) |
Year Ended October 31, 2012 | | | 13.37 | | | | 0.47 | (f) | | | 0.76 | | | | 1.23 | | | | (0.46 | ) | | | — | | | | (0.46 | ) |
February 28, 2011 (h) through October 31, 2011 | | | 15.00 | | | | 0.37 | (f) | | | (1.66 | ) | | | (1.29 | ) | | | (0.34 | ) | | | — | | | | (0.34 | ) |
| (a) | Annualized for periods less than one year, unless otherwise noted. |
| (b) | Not annualized for periods less than one year. |
| (c) | Includes adjustments in accordance with accounting principles generally accepted in the United States of America and as such, the net asset values for financial reporting purposes and the returns based upon those net asset values may differ from the net asset values and returns for shareholder transactions. |
| (d) | Includes interest expense, if applicable, which is less than 0.01% unless otherwise noted. |
| (e) | Portfolio turnover is calculated by dividing the lesser of total purchases or sales of portfolio securities for the reporting period by the monthly average value of portfolio securities owned during the reporting period. Excluded from both the numerator and denominator are amounts relating to derivatives and securities whose maturities or expiration dates at the time of acquisition were one year or less. |
| (f) | Calculated based upon average shares outstanding. |
| (g) | Reflects special dividends paid out during the period by several of the Fund’s holdings. Had the Fund not received the special dividends, the net investment income (loss) per share would have been $0.66, $0.59, $0.62, $0.74 and $0.71 for Class A, Class C, Class R2, Class R5, Class R6 and Select Class Shares, respectively, and the net investment income (loss) ratio would have been 3.94%, 3.53%, 3.74%, 4.44% and 4.25% for Class A, Class C, Class R2, Class R5, Class R6 and Select Class Shares, respectively. |
| (h) | Commencement of operations. |
| (i) | Ratios are disproportionate among classes due to the size of net assets and fixed expenses. |
| (j) | Certain non-recurring expenses incurred by the Fund were not annualized for the period ended October 31, 2011. |
| (k) | Commencement of offering of class of shares. |
SEE NOTES TO FINANCIAL STATEMENTS.
| | | | | | |
| | | |
| 122 | | | | J.P. MORGAN INTERNATIONAL EQUITY FUNDS | | APRIL 30, 2015 |
| | | | | | | | | | | | | | | | | | | | | | | | | | |
| | | Ratios/Supplemental data | |
| | | | | | | | | | Ratios to average net assets (a) | | | | |
Net asset
value,
end of
period | | | Total return
(excludes
sales charge) (b)(c) | | |
Net assets,
end of
period
(000’s) | | | Net
expenses (d) | | | Net
investment
income
(loss) | | | Expenses
without waivers
and reimbursements | | | Portfolio
turnover
rate (b)(e) | |
| | | | | | | | | | | | | | | | | | | | | | | | | | |
| | | | | | | | | | | | | | | | | | | | | | | | | | |
| $ | 16.80 | | | | 6.00 | % | | $ | 61,349 | | | | 1.25 | % | | | 2.36 | % | | | 1.63 | % | | | 133 | % |
| | 16.41 | | | | 3.18 | | | | 74,652 | | | | 1.25 | | | | 5.44 | (g) | | | 1.67 | | | | 138 | |
| | 16.67 | | | | 21.40 | | | | 49,118 | | | | 1.24 | | | | 2.77 | | | | 1.82 | | | | 63 | |
| | 14.12 | | | | 9.09 | | | | 9,003 | | | | 1.25 | | | | 2.21 | | | | 2.31 | | | | 52 | |
| | 13.37 | | | | (8.77 | ) | | | 127 | | | | 1.25 | (i) | | | 3.53 | (i) | | | 10.16 | (i)(j) | | | 40 | |
| | | | | | |
| | | | | | | | | | | | | | | | | | | | | | | | | | |
| | 16.73 | | | | 5.69 | | | | 4,401 | | | | 1.75 | | | | 3.79 | | | | 2.18 | | | | 133 | |
| | 16.36 | | | | 2.67 | | | | 3,530 | | | | 1.75 | | | | 5.03 | (g) | | | 2.17 | | | | 138 | |
| | 16.63 | | | | 20.74 | | | | 1,957 | | | | 1.74 | | | | 2.16 | | | | 2.32 | | | | 63 | |
| | 14.11 | | | | 8.66 | | | | 646 | | | | 1.75 | | | | 2.69 | | | | 2.95 | | | | 52 | |
| | 13.35 | | | | (9.12 | ) | | | 60 | | | | 1.75 | (i) | | | 3.17 | (i) | | | 10.82 | (i)(j) | | | 40 | |
| | | | | | |
| | | | | | | | | | | | | | | | | | | | | | | | | | |
| | 16.78 | | | | 5.79 | | | | 649 | | | | 1.50 | | | | 3.91 | | | | 1.83 | | | | 133 | |
| | 16.41 | | | | 2.90 | | | | 574 | | | | 1.50 | | | | 5.24 | (g) | | | 1.92 | | | | 138 | |
| | 16.67 | | | | 21.12 | | | | 558 | | | | 1.49 | | | | 2.60 | | | | 2.11 | | | | 63 | |
| | 14.12 | | | | 8.87 | | | | 461 | | | | 1.50 | | | | 2.95 | | | | 2.70 | | | | 52 | |
| | 13.36 | | | | (8.97 | ) | | | 45 | | | | 1.50 | (i) | | | 3.36 | (i) | | | 10.72 | (i)(j) | | | 40 | |
| | | | | | |
| | | | | | | | | | | | | | | | | | | | | | | | | | |
| | 16.85 | | | | 6.24 | | | | 623 | | | | 0.80 | | | | 4.58 | | | | 1.13 | | | | 133 | |
| | 16.46 | | | | 3.60 | | | | 587 | | | | 0.80 | | | | 5.94 | (g) | | | 1.22 | | | | 138 | |
| | 16.72 | | | | 21.94 | | | | 566 | | | | 0.79 | | | | 3.31 | | | | 1.41 | | | | 63 | |
| | 14.15 | | | | 9.62 | | | | 465 | | | | 0.80 | | | | 3.65 | | | | 2.00 | | | | 52 | |
| | 13.38 | | | | (8.52 | ) | | | 46 | | | | 0.80 | (i) | | | 4.05 | (i) | | | 10.05 | (i)(j) | | | 40 | |
| | | | | | |
| | | | | | | | | | | | | | | | | | | | | | | | | | |
| | 16.83 | | | | 7.16 | | | | 21 | | | | 0.74 | | | | 11.29 | | | | 1.14 | | | | 133 | |
| | | | | | |
| | | | | | | | | | | | | | | | | | | | | | | | | | |
| | 16.84 | | | | 6.18 | | | | 31,882 | | | | 0.92 | | | | 3.24 | | | | 1.38 | | | | 133 | |
| | 16.45 | | | | 3.39 | | | | 34,719 | | | | 1.00 | | | | 5.75 | (g) | | | 1.42 | | | | 138 | |
| | 16.71 | | | | 21.73 | | | | 55,485 | | | | 0.99 | | | | 3.04 | | | | 1.59 | | | | 63 | |
| | 14.14 | | | | 9.43 | | | | 27,292 | | | | 1.00 | | | | 3.44 | | | | 2.20 | | | | 52 | |
| | 13.37 | | | | (8.68 | ) | | | 2,666 | | | | 1.00 | (i) | | | 3.85 | (i) | | | 10.23 | (i)(j) | | | 40 | |
SEE NOTES TO FINANCIAL STATEMENTS.
| | | | | | | | |
| | | |
| APRIL 30, 2015 | | J.P. MORGAN INTERNATIONAL EQUITY FUNDS | | | | | 123 | |
FINANCIAL HIGHLIGHTS
FOR THE PERIODS INDICATED (continued)
| | | | | | | | | | | | | | | | | | | | | | | | |
| | | | | | Per share operating performance | |
| | | | | | Investment operations | | | Distributions | | | | |
| | | Net asset
value,
beginning
of period | | | Net
investment
income
(loss) | | | Net realized
and unrealized
gains
(losses) on
investments | | | Total from
investment
operations | | | Net
investment
income | | | Redemption
fees | |
International Opportunities Fund | | | | | | | | | | | | | | | | | | | | | | | | |
Class A | | | | | | | | | | | | | | | | | | | | | | | | |
Six Months Ended April 30, 2015 (Unaudited) | | $ | 14.80 | | | $ | 0.13 | (f) | | $ | 0.64 | | | $ | 0.77 | | | $ | (0.29 | ) | | $ | — | |
Year Ended October 31, 2014 | | | 15.25 | | | | 0.36 | (f) | | | (0.69 | ) | | | (0.33 | ) | | | (0.12 | ) | | | — | |
Year Ended October 31, 2013 | | | 12.45 | | | | 0.25 | (f) | | | 2.83 | | | | 3.08 | | | | (0.28 | ) | | | — | |
Year Ended October 31, 2012 | | | 12.00 | | | | 0.23 | (f) | | | 0.56 | | | | 0.79 | | | | (0.34 | ) | | | — | |
Year Ended October 31, 2011 | | | 13.20 | | | | 0.19 | (f) | | | (1.08 | ) | | | (0.89 | ) | | | (0.31 | ) | | | — | (g) |
Year Ended October 31, 2010 | | | 12.10 | | | | 0.15 | (f) | | | 1.24 | | | | 1.39 | | | | (0.29 | ) | | | — | (g) |
| | | | | | |
Class B | | | | | | | | | | | | | | | | | | | | | | | | |
Six Months Ended April 30, 2015 (Unaudited) | | | 14.89 | | | | 0.03 | (f) | | | 0.71 | | | | 0.74 | | | | (0.25 | ) | | | — | |
Year Ended October 31, 2014 | | | 15.29 | | | | 0.26 | (f) | | | (0.66 | ) | | | (0.40 | ) | | | — | | | | — | |
Year Ended October 31, 2013 | | | 12.46 | | | | 0.18 | (f) | | | 2.83 | | | | 3.01 | | | | (0.18 | ) | | | — | |
Year Ended October 31, 2012 | | | 11.93 | | | | 0.18 | (f) | | | 0.56 | | | | 0.74 | | | | (0.21 | ) | | | — | |
Year Ended October 31, 2011 | | | 13.09 | | | | 0.15 | (f) | | | (1.10 | ) | | | (0.95 | ) | | | (0.21 | ) | | | — | (g) |
Year Ended October 31, 2010 | | | 12.03 | | | | 0.08 | (f) | | | 1.23 | | | | 1.31 | | | | (0.25 | ) | | | — | (g) |
| | | | | | |
Class C | | | | | | | | | | | | | | | | | | | | | | | | |
Six Months Ended April 30, 2015 (Unaudited) | | | 14.41 | | | | 0.06 | (f) | | | 0.66 | | | | 0.72 | | | | (0.28 | ) | | | — | |
Year Ended October 31, 2014 | | | 14.88 | | | | 0.27 | (f) | | | (0.66 | ) | | | (0.39 | ) | | | (0.08 | ) | | | — | |
Year Ended October 31, 2013 | | | 12.15 | | | | 0.16 | (f) | | | 2.77 | | | | 2.93 | | | | (0.20 | ) | | | — | |
Year Ended October 31, 2012 | | | 11.65 | | | | 0.18 | (f) | | | 0.55 | | | | 0.73 | | | | (0.23 | ) | | | — | |
Year Ended October 31, 2011 | | | 12.84 | | | | 0.15 | (f) | | | (1.07 | ) | | | (0.92 | ) | | | (0.27 | ) | | | — | (g) |
Year Ended October 31, 2010 | | | 11.82 | | | | 0.09 | (f) | | | 1.20 | | | | 1.29 | | | | (0.27 | ) | | | — | (g) |
| | | | | | |
Class R6 | | | | | | | | | | | | | | | | | | | | | | | | |
Six Months Ended April 30, 2015 (Unaudited) | | | 15.13 | | | | 0.14 | (f) | | | 0.68 | | | | 0.82 | | | | (0.43 | ) | | | — | |
Year Ended October 31, 2014 | | | 15.57 | | | | 0.44 | (f) | | | (0.70 | ) | | | (0.26 | ) | | | (0.18 | ) | | | — | |
Year Ended October 31, 2013 | | | 12.69 | | | | 0.32 | (f) | | | 2.88 | | | | 3.20 | | | | (0.32 | ) | | | — | |
Year Ended October 31, 2012 | | | 12.20 | | | | 0.31 | (f) | | | 0.56 | | | | 0.87 | | | | (0.38 | ) | | | — | |
November 30, 2010 (h) through October 31, 2011 | | | 12.78 | | | | 0.27 | (f) | | | (0.48 | ) | | | (0.21 | ) | | | (0.37 | ) | | | — | (g) |
| | | | | | |
Institutional Class | | | | | | | | | | | | | | | | | | | | | | | | |
Six Months Ended April 30, 2015 (Unaudited) | | | 15.13 | | | | 0.12 | (f) | | | 0.70 | | | | 0.82 | | | | (0.41 | ) | | | — | |
Year Ended October 31, 2014 | | | 15.57 | | | | 0.42 | (f) | | | (0.69 | ) | | | (0.27 | ) | | | (0.17 | ) | | | — | |
Year Ended October 31, 2013 | | | 12.69 | | | | 0.31 | (f) | | | 2.88 | | | | 3.19 | | | | (0.31 | ) | | | — | |
Year Ended October 31, 2012 | | | 12.20 | | | | 0.30 | (f) | | | 0.56 | | | | 0.86 | | | | (0.37 | ) | | | — | |
Year Ended October 31, 2011 | | | 13.42 | | | | 0.23 | (f) | | | (1.09 | ) | | | (0.86 | ) | | | (0.36 | ) | | | — | (g) |
Year Ended October 31, 2010 | | | 12.29 | | | | 0.22 | (f) | | | 1.24 | | | | 1.46 | | | | (0.33 | ) | | | — | (g) |
| | | | | | |
Select Class | | | | | | | | | | | | | | | | | | | | | | | | |
Six Months Ended April 30, 2015 (Unaudited) | | | 15.06 | | | | 0.12 | (f) | | | 0.68 | | | | 0.80 | | | | (0.39 | ) | | | — | |
Year Ended October 31, 2014 | | | 15.50 | | | | 0.40 | (f) | | | (0.69 | ) | | | (0.29 | ) | | | (0.15 | ) | | | — | |
Year Ended October 31, 2013 | | | 12.64 | | | | 0.29 | (f) | | | 2.87 | | | | 3.16 | | | | (0.30 | ) | | | — | |
Year Ended October 31, 2012 | | | 12.15 | | | | 0.28 | (f) | | | 0.56 | | | | 0.84 | | | | (0.35 | ) | | | — | |
Year Ended October 31, 2011 | | | 13.37 | | | | 0.26 | (f) | | | (1.14 | ) | | | (0.88 | ) | | | (0.34 | ) | | | — | (g) |
Year Ended October 31, 2010 | | | 12.24 | | | | 0.19 | (f) | | | 1.25 | | | | 1.44 | | | | (0.31 | ) | | | — | (g) |
| (a) | Annualized for periods less than one year, unless otherwise noted. |
| (b) | Not annualized for periods less than one year. |
| (c) | Includes adjustments in accordance with accounting principles generally accepted in the United States of America and as such, the net asset values for financial reporting purposes and the returns based upon those net asset values may differ from the net asset values and returns for shareholder transactions. |
| (d) | Includes interest expense, if applicable, which is less than 0.01% unless otherwise noted. |
| (e) | Portfolio turnover is calculated by dividing the lesser of total purchases or sales of portfolio securities for the reporting period by the monthly average value of portfolio securities owned during the reporting period. Excluded from both the numerator and denominator are amounts relating to derivatives and securities whose maturities or expiration dates at the time of acquisition were one year or less. |
| (f) | Calculated based upon average shares outstanding. |
| (g) | Amount rounds to less than $0.01. |
| (h) | Commencement of offering of class of shares. |
SEE NOTES TO FINANCIAL STATEMENTS.
| | | | | | |
| | | |
| 124 | | | | J.P. MORGAN INTERNATIONAL EQUITY FUNDS | | APRIL 30, 2015 |
| | | | | | | | | | | | | | | | | | | | | | | | | | |
| | | Ratios/Supplemental data | |
| | | | | | | | | | Ratios to average net assets (a) | | | | |
Net asset
value,
end of
period | | | Total return
(excludes
sales charge) (b)(c) | | |
Net assets,
end of
period
(000’s) | | | Net
expenses (d) | | | Net
investment
income (loss) | | | Expenses
without waivers
and reimbursements | | | Portfolio
turnover
rate (b)(e) | |
| | | | | | | | | | | | | | | | | | | | | | | | | | |
| | | | | | | | | | | | | | | | | | | | | | | | | | |
| $ | 15.28 | | | | 5.36 | % | | $ | 138,392 | | | | 1.31 | % | | | 1.83 | % | | | 1.48 | % | | | 25 | % |
| | 14.80 | | | | (2.18 | ) | | | 110,667 | | | | 1.23 | | | | 2.39 | | | | 1.24 | | | | 55 | |
| | 15.25 | | | | 25.09 | | | | 123,807 | | | | 1.25 | | | | 1.78 | | | | 1.26 | | | | 36 | |
| | 12.45 | | | | 6.95 | | | | 67,472 | | | | 1.29 | | | | 1.91 | | | | 1.30 | | | | 45 | |
| | 12.00 | | | | (6.91 | ) | | | 47,855 | | | | 1.28 | | | | 1.45 | | | | 1.28 | | | | 76 | |
| | 13.20 | | | | 11.67 | | | | 13,904 | | | | 1.34 | | | | 1.23 | | | | 1.36 | | | | 57 | |
| | | | | | |
| | | | | | | | | | | | | | | | | | | | | | | | | | |
| | 15.38 | | | | 5.08 | | | | 134 | | | | 1.92 | | | | 0.42 | | | | 2.05 | | | | 25 | |
| | 14.89 | | | | (2.62 | ) | | | 196 | | | | 1.73 | | | | 1.72 | | | | 1.74 | | | | 55 | |
| | 15.29 | | | | 24.45 | | | | 484 | | | | 1.73 | | | | 1.28 | | | | 1.76 | | | | 36 | |
| | 12.46 | | | | 6.46 | | | | 462 | | | | 1.79 | | | | 1.54 | | | | 1.80 | | | | 45 | |
| | 11.93 | | | | (7.40 | ) | | | 702 | | | | 1.78 | | | | 1.18 | | | | 1.79 | | | | 76 | |
| | 13.09 | | | | 11.01 | | | | 949 | | | | 1.85 | | | | 0.65 | | | | 1.86 | | | | 57 | |
| | | | | | |
| | | | | | | | | | | | | | | | | | | | | | | | | | |
| | 14.85 | | | | 5.10 | | | | 1,722 | | | | 1.82 | | | | 0.85 | | | | 1.82 | | | | 25 | |
| | 14.41 | | | | (2.65 | ) | | | 1,441 | | | | 1.73 | | | | 1.80 | | | | 1.74 | | | | 55 | |
| | 14.88 | | | | 24.41 | | | | 1,109 | | | | 1.75 | | | | 1.19 | | | | 1.76 | | | | 36 | |
| | 12.15 | | | | 6.47 | | | | 531 | | | | 1.79 | | | | 1.55 | | | | 1.80 | | | | 45 | |
| | 11.65 | | | | (7.37 | ) | | | 576 | | | | 1.78 | | | | 1.14 | | | | 1.79 | | | | 76 | |
| | 12.84 | | | | 11.05 | | | | 849 | | | | 1.85 | | | | 0.77 | | | | 1.86 | | | | 57 | |
| | | | | | |
| | | | | | | | | | | | | | | | | | | | | | | | | | |
| | 15.52 | | | | 5.65 | | | | 1,713,040 | | | | 0.72 | | | | 1.87 | | | | 0.72 | | | | 25 | |
| | 15.13 | | | | (1.67 | ) | | | 1,539,613 | | | | 0.73 | | | | 2.82 | | | | 0.74 | | | | 55 | |
| | 15.57 | | | | 25.71 | | | | 1,204,314 | | | | 0.75 | | | | 2.27 | | | | 0.76 | | | | 36 | |
| | 12.69 | | | | 7.59 | | | | 692,117 | | | | 0.79 | | | | 2.58 | | | | 0.79 | | | | 45 | |
| | 12.20 | | | | (1.85 | ) | | | 373,613 | | | | 0.78 | | | | 2.27 | | | | 0.78 | | | | 76 | |
| | | | | | |
| | | | | | | | | | | | | | | | | | | | | | | | | | |
| | 15.54 | | | | 5.63 | | | | 49,401 | | | | 0.83 | | | | 1.68 | | | | 0.83 | | | | 25 | |
| | 15.13 | | | | (1.76 | ) | | | 56,348 | | | | 0.83 | | | | 2.71 | | | | 0.84 | | | | 55 | |
| | 15.57 | | | | 25.60 | | | | 60,310 | | | | 0.85 | | | | 2.18 | | | | 0.86 | | | | 36 | |
| | 12.69 | | | | 7.45 | | | | 41,574 | | | | 0.89 | | | | 2.47 | | | | 0.90 | | | | 45 | |
| | 12.20 | | | | (6.59 | ) | | | 39,362 | | | | 0.89 | | | | 1.73 | | | | 0.90 | | | | 76 | |
| | 13.42 | | | | 12.12 | | | | 272,487 | | | | 0.91 | | | | 1.75 | | | | 0.96 | | | | 57 | |
| | | | | | |
| | | | | | | | | | | | | | | | | | | | | | | | | | |
| | 15.47 | | | | 5.52 | | | | 53,894 | | | | 1.00 | | | | 1.64 | | | | 1.00 | | | | 25 | |
| | 15.06 | | | | (1.91 | ) | | | 47,581 | | | | 0.98 | | | | 2.55 | | | | 0.99 | | | | 55 | |
| | 15.50 | | | | 25.38 | | | | 47,743 | | | | 0.99 | | | | 2.04 | | | | 1.01 | | | | 36 | |
| | 12.64 | | | | 7.28 | | | | 33,029 | | | | 1.04 | | | | 2.35 | | | | 1.05 | | | | 45 | |
| | 12.15 | | | | (6.77 | ) | | | 28,476 | | | | 1.03 | | | | 1.97 | | | | 1.04 | | | | 76 | |
| | 13.37 | | | | 11.93 | | | | 30,537 | | | | 1.09 | | | | 1.56 | | | | 1.11 | | | | 57 | |
SEE NOTES TO FINANCIAL STATEMENTS.
| | | | | | | | |
| | | |
| APRIL 30, 2015 | | J.P. MORGAN INTERNATIONAL EQUITY FUNDS | | | | | 125 | |
FINANCIAL HIGHLIGHTS
FOR THE PERIODS INDICATED (continued)
| | | | | | | | | | | | | | | | | | | | | | | | | | | | | | | | |
| | | | | | Per share operating performance | |
| | | | | | Investment operations | | | Distributions | | | | |
| | | Net asset
value,
beginning
of period | | | Net
investment
income
(loss) | | | Net realized
and unrealized
gains
(losses) on
investments | | | Total from
investment
operations | | | Net
investment
income | | | Net
realized
gain | | | Total
distributions | | | Redemption
fees | |
International Research Enhanced Equity Fund | | | | | | | | | | | | | | | | | | | | | | | | | | | | | | | | |
Class A | | | | | | | | | | | | | | | | | | | | | | | | | | | | | | | | |
Six Months Ended April 30, 2015 (Unaudited) | | $ | 20.38 | | | $ | 0.21 | (f) | | $ | 0.68 | | | $ | 0.89 | | | $ | (0.40 | ) | | $ | (3.27 | ) | | $ | (3.67 | ) | | $ | — | |
Year Ended October 31, 2014 | | | 21.20 | | | | 0.47 | (f) | | | (0.56 | ) | | | (0.09 | ) | | | (0.39 | ) | | | (0.34 | ) | | | (0.73 | ) | | | — | |
Year Ended October 31, 2013 | | | 17.24 | | | | 0.38 | (f) | | | 4.00 | | | | 4.38 | | | | (0.42 | ) | | | — | | | | (0.42 | ) | | | — | |
Year Ended October 31, 2012 | | | 16.83 | | | | 0.37 | (f) | | | 0.45 | | | | 0.82 | | | | (0.41 | ) | | | — | | | | (0.41 | ) | | | — | |
Year Ended October 31, 2011 | | | 19.03 | | | | 0.40 | (f) | | | (2.16 | ) | | | (1.76 | ) | | | (0.44 | ) | | | — | | | | (0.44 | ) | | | — | (g) |
Year Ended October 31, 2010 | | | 17.89 | | | | 0.33 | (f) | | | 1.10 | | | | 1.43 | | | | (0.29 | ) | | | — | | | | (0.29 | ) | | | — | (g) |
| | | | | | | | |
Class B | | | | | | | | | | | | | | | | | | | | | | | | | | | | | | | | |
Six Months Ended April 30, 2015 (Unaudited) | | | 18.77 | | | | 0.15 | (f) | | | 0.61 | | | | 0.76 | | | | (0.29 | ) | | | (3.27 | ) | | | (3.56 | ) | | | — | |
Year Ended October 31, 2014 | | | 19.57 | | | | 0.33 | (f) | | | (0.51 | ) | | | (0.18 | ) | | | (0.28 | ) | | | (0.34 | ) | | | (0.62 | ) | | | — | |
Year Ended October 31, 2013 | | | 15.91 | | | | 0.25 | (f) | | | 3.70 | | | | 3.95 | | | | (0.29 | ) | | | — | | | | (0.29 | ) | | | — | |
Year Ended October 31, 2012 | | | 15.52 | | | | 0.23 | (f) | | | 0.43 | | | | 0.66 | | | | (0.27 | ) | | | — | | | | (0.27 | ) | | | — | |
Year Ended October 31, 2011 | | | 17.57 | | | | 0.24 | (f) | | | (1.99 | ) | | | (1.75 | ) | | | (0.30 | ) | | | — | | | | (0.30 | ) | | | — | (g) |
Year Ended October 31, 2010 | | | 16.54 | | | | 0.18 | (f) | | | 1.02 | | | | 1.20 | | | | (0.17 | ) | | | — | | | | (0.17 | ) | | | — | (g) |
| | | | | | | | |
Class C | | | | | | | | | | | | | | | | | | | | | | | | | | | | | | | | |
Six Months Ended April 30, 2015 (Unaudited) | | | 19.68 | | | | 0.16 | (f) | | | 0.65 | | | | 0.81 | | | | (0.31 | ) | | | (3.27 | ) | | | (3.58 | ) | | | — | |
Year Ended October 31, 2014 | | | 20.51 | | | | 0.36 | (f) | | | (0.56 | ) | | | (0.20 | ) | | | (0.29 | ) | | | (0.34 | ) | | | (0.63 | ) | | | — | |
Year Ended October 31, 2013 | | | 16.68 | | | | 0.27 | (f) | | | 3.86 | | | | 4.13 | | | | (0.30 | ) | | | — | | | | (0.30 | ) | | | — | |
Year Ended October 31, 2012 | | | 16.27 | | | | 0.25 | (f) | | | 0.44 | | | | 0.69 | | | | (0.28 | ) | | | — | | | | (0.28 | ) | | | — | |
Year Ended October 31, 2011 | | | 18.41 | | | | 0.26 | (f) | | | (2.09 | ) | | | (1.83 | ) | | | (0.31 | ) | | | — | | | | (0.31 | ) | | | — | (g) |
Year Ended October 31, 2010 | | | 17.35 | | | | 0.20 | (f) | | | 1.06 | | | | 1.26 | | | | (0.20 | ) | | | — | | | | (0.20 | ) | | | — | (g) |
| | | | | | | | |
Class R2 | | | | | | | | | | | | | | | | | | | | | | | | | | | | | | | | |
Six Months Ended April 30, 2015 (Unaudited) | | | 20.07 | | | | 0.18 | (f) | | | 0.67 | | | | 0.85 | | | | (0.38 | ) | | | (3.27 | ) | | | (3.65 | ) | | | — | |
Year Ended October 31, 2014 | | | 20.91 | | | | 0.40 | (f) | | | (0.54 | ) | | | (0.14 | ) | | | (0.36 | ) | | | (0.34 | ) | | | (0.70 | ) | | | — | |
Year Ended October 31, 2013 | | | 17.03 | | | | 0.35 | (f) | | | 3.92 | | | | 4.27 | | | | (0.39 | ) | | | — | | | | (0.39 | ) | | | — | |
Year Ended October 31, 2012 | | | 16.66 | | | | 0.32 | (f) | | | 0.45 | | | | 0.77 | | | | (0.40 | ) | | | — | | | | (0.40 | ) | | | — | |
Year Ended October 31, 2011 | | | 18.86 | | | | 0.32 | (f) | | | (2.12 | ) | | | (1.80 | ) | | | (0.40 | ) | | | — | | | | (0.40 | ) | | | — | (g) |
Year Ended October 31, 2010 | | | 17.76 | | | | 0.28 | (f) | | | 1.10 | | | | 1.38 | | | | (0.28 | ) | | | — | | | | (0.28 | ) | | | — | (g) |
| | | | | | | | |
Select Class | | | | | | | | | | | | | | | | | | | | | | | | | | | | | | | | |
Six Months Ended April 30, 2015 (Unaudited) | | | 20.54 | | | | 0.24 | (f) | | | 0.68 | | | | 0.92 | | | | (0.45 | ) | | | (3.27 | ) | | | (3.72 | ) | | | — | |
Year Ended October 31, 2014 | | | 21.36 | | | | 0.52 | (f) | | | (0.56 | ) | | | (0.04 | ) | | | (0.44 | ) | | | (0.34 | ) | | | (0.78 | ) | | | — | |
Year Ended October 31, 2013 | | | 17.36 | | | | 0.40 | (f) | | | 4.06 | | | | 4.46 | | | | (0.46 | ) | | | — | | | | (0.46 | ) | | | — | |
Year Ended October 31, 2012 | | | 16.96 | | | | 0.41 | (f) | | | 0.45 | | | | 0.86 | | | | (0.46 | ) | | | — | | | | (0.46 | ) | | | — | |
Year Ended October 31, 2011 | | | 19.17 | | | | 0.45 | (f) | | | (2.17 | ) | | | (1.72 | ) | | | (0.49 | ) | | | — | | | | (0.49 | ) | | | — | (g) |
Year Ended October 31, 2010 | | | 18.01 | | | | 0.37 | (f) | | | 1.12 | | | | 1.49 | | | | (0.33 | ) | | | — | | | | (0.33 | ) | | | — | (g) |
| (a) | Annualized for periods less than one year, unless otherwise noted. |
| (b) | Not annualized for periods less than one year. |
| (c) | Includes adjustments in accordance with accounting principles generally accepted in the United States of America and as such, the net asset values for financial reporting purposes and the returns based upon those net asset values may differ from the net asset values and returns for shareholder transactions. |
| (d) | Includes interest expense, if applicable, which is less than 0.01% unless otherwise noted. |
| (e) | Portfolio turnover is calculated by dividing the lesser of total purchases or sales of portfolio securities for the reporting period by the monthly average value of portfolio securities owned during the reporting period. Excluded from both the numerator and denominator are amounts relating to derivatives and securities whose maturities or expiration dates at the time of acquisition were one year or less. |
| (f) | Calculated based upon average shares outstanding. |
| (g) | Amount rounds to less than $0.01. |
SEE NOTES TO FINANCIAL STATEMENTS.
| | | | | | |
| | | |
| 126 | | | | J.P. MORGAN INTERNATIONAL EQUITY FUNDS | | APRIL 30, 2015 |
| | | | | | | | | | | | | | | | | | | | | | | | | | |
| | | Ratios/Supplemental data | |
| | | | | | | | | | Ratios to average net assets (a) | | | | |
Net asset value,
end of
period | | | Total return
(excludes
sales charge) (b)(c) | | |
Net assets,
end of
period
(000’s) | | | Net
expenses (d) | | | Net
investment
income
(loss) | | | Expenses
without waivers
and reimbursements | | | Portfolio
turnover
rate (b)(e) | |
| | | | | | | | | | | | | | | | | | | | | | | | | | |
| | | | | | | | | | | | | | | | | | | | | | | | | | |
| $ | 17.60 | | | | 6.10 | % | | $ | 92,205 | | | | 0.59 | % | | | 2.40 | % | | | 1.00 | % | | | 19 | % |
| | 20.38 | | | | (0.40 | ) | | | 96,325 | | | | 0.59 | | | | 2.23 | | | | 1.10 | | | | 63 | |
| | 21.20 | | | | 25.84 | | | | 108,193 | | | | 0.75 | | | | 2.04 | | | | 1.35 | | | | 51 | |
| | 17.24 | | | | 5.16 | | | | 96,191 | | | | 1.07 | | | | 2.27 | | | | 1.31 | | | | 19 | |
| | 16.83 | | | | (9.45 | ) | | | 99,046 | | | | 1.07 | | | | 2.16 | | | | 1.31 | | | | 40 | |
| | 19.03 | | | | 8.09 | | | | 124,178 | | | | 1.07 | | | | 1.89 | | | | 1.34 | | | | 39 | |
| | | | | | |
| | | | | | | | | | | | | | | | | | | | | | | | | | |
| | 15.97 | | | | 5.87 | | | | 1,327 | | | | 1.09 | | | | 1.83 | | | | 1.74 | | | | 19 | |
| | 18.77 | | | | (0.91 | ) | | | 1,754 | | | | 1.09 | | | | 1.69 | | | | 1.62 | | | | 63 | |
| | 19.57 | | | | 25.13 | | | | 2,751 | | | | 1.34 | | | | 1.42 | | | | 1.85 | | | | 51 | |
| | 15.91 | | | | 4.43 | | | | 3,060 | | | | 1.79 | | | | 1.54 | | | | 1.82 | | | | 19 | |
| | 15.52 | | | | (10.11 | ) | | | 4,154 | | | | 1.78 | | | | 1.41 | | | | 1.81 | | | | 40 | |
| | 17.57 | | | | 7.32 | | | | 6,503 | | | | 1.80 | | | | 1.11 | | | | 1.83 | | | | 39 | |
| | | | | | |
| | | | | | | | | | | | | | | | | | | | | | | | | | |
| | 16.91 | | | | 5.87 | | | | 20,161 | | | | 1.09 | | | | 1.90 | | | | 1.54 | | | | 19 | |
| | 19.68 | | | | (0.93 | ) | | | 20,724 | | | | 1.09 | | | | 1.75 | | | | 1.60 | | | | 63 | |
| | 20.51 | | | | 25.09 | | | | 21,802 | | | | 1.30 | | | | 1.49 | | | | 1.85 | | | | 51 | |
| | 16.68 | | | | 4.43 | | | | 16,291 | | | | 1.79 | | | | 1.57 | | | | 1.81 | | | | 19 | |
| | 16.27 | | | | (10.08 | ) | | | 15,428 | | | | 1.78 | | | | 1.46 | | | | 1.81 | | | | 40 | |
| | 18.41 | | | | 7.34 | | | | 18,148 | | | | 1.80 | | | | 1.19 | | | | 1.83 | | | | 39 | |
| | | | | | |
| | | | | | | | | | | | | | | | | | | | | | | | | | |
| | 17.27 | | | | 6.01 | | | | 3,080 | | | | 0.84 | | | | 2.12 | | | | 1.56 | | | | 19 | |
| | 20.07 | | | | (0.66 | ) | | | 2,521 | | | | 0.84 | | | | 1.95 | | | | 1.33 | | | | 63 | |
| | 20.91 | | | | 25.52 | | | | 1,957 | | | | 0.95 | | | | 1.88 | | | | 1.61 | | | | 51 | |
| | 17.03 | | | | 4.94 | | | | 786 | | | | 1.32 | | | | 1.97 | | | | 1.56 | | | | 19 | |
| | 16.66 | | | | (9.72 | ) | | | 463 | | | | 1.32 | | | | 1.77 | | | | 1.55 | | | | 40 | |
| | 18.86 | | | | 7.88 | | | | 251 | | | | 1.32 | | | | 1.62 | | | | 1.59 | | | | 39 | |
| | | | | | |
| | | | | | | | | | | | | | | | | | | | | | | | | | |
| | 17.74 | | | | 6.23 | | | | 693,998 | | | | 0.34 | | | | 2.79 | | | | 0.62 | | | | 19 | |
| | 20.54 | | | | (0.16 | ) | | | 562,180 | | | | 0.34 | | | | 2.45 | | | | 0.84 | | | | 63 | |
| | 21.36 | | | | 26.18 | | | | 464,273 | | | | 0.53 | | | | 2.10 | | | | 1.09 | | | | 51 | |
| | 17.36 | | | | 5.40 | | | | 469,065 | | | | 0.82 | | | | 2.51 | | | | 1.06 | | | | 19 | |
| | 16.96 | | | | (9.21 | ) | | | 502,764 | | | | 0.82 | | | | 2.40 | | | | 1.05 | | | | 40 | |
| | 19.17 | | | | 8.37 | | | | 516,537 | | | | 0.82 | | | | 2.08 | | | | 1.08 | | | | 39 | |
SEE NOTES TO FINANCIAL STATEMENTS.
| | | | | | | | |
| | | |
| APRIL 30, 2015 | | J.P. MORGAN INTERNATIONAL EQUITY FUNDS | | | | | 127 | |
FINANCIAL HIGHLIGHTS
FOR THE PERIODS INDICATED (continued)
| | | | | | | | | | | | | | | | | | | | | | | | | | | | |
| | | | | | Per share operating performance | |
| | | | | | Investment operations | | | Distributions | |
| | | Net asset
value,
beginning
of period | | | Net
investment
income
(loss) | | | Net realized
and unrealized
gains
(losses) on
investments | | | Total from
investment
operations | | | Net
investment
income | | | Net
realized
gain | | | Total
distributions | |
International Unconstrained Equity Fund | | | | | | | | | | | | | | | | | | | | | | | | | | | | |
Class A | | | | | | | | | | | | | | | | | | | | | | | | | | | | |
Six Months Ended April 30, 2015 (Unaudited) | | $ | 18.59 | | | $ | 0.09 | (h) | | $ | 1.50 | | | $ | 1.59 | | | $ | (0.17 | ) | | $ | (1.29 | ) | | $ | (1.46 | ) |
Year Ended October 31, 2014 | | | 20.59 | | | | 0.13 | (i) | | | (0.65 | ) | | | (0.52 | ) | | | (0.17 | ) | | | (1.31 | ) | | | (1.48 | ) |
Year Ended October 31, 2013 | | | 17.28 | | | | 0.15 | | | | 3.62 | | | | 3.77 | | | | (0.11 | ) | | | (0.35 | ) | | | (0.46 | ) |
November 30, 2011 (g) through October 31, 2012 | | | 15.00 | | | | 0.17 | | | | 2.11 | | | | 2.28 | | | | — | | | | — | | | | — | |
| | | | | | | |
Class C | | | | | | | | | | | | | | | | | | | | | | | | | | | | |
Six Months Ended April 30, 2015 (Unaudited) | | | 18.44 | | | | 0.04 | (h) | | | 1.49 | | | | 1.53 | | | | (0.07 | ) | | | (1.29 | ) | | | (1.36 | ) |
Year Ended October 31, 2014 | | | 20.47 | | | | 0.09 | (i) | | | (0.69 | ) | | | (0.60 | ) | | | (0.12 | ) | | | (1.31 | ) | | | (1.43 | ) |
Year Ended October 31, 2013 | | | 17.20 | | | | 0.07 | | | | 3.59 | | | | 3.66 | | | | (0.04 | ) | | | (0.35 | ) | | | (0.39 | ) |
November 30, 2011 (g) through October 31, 2012 | | | 15.00 | | | | 0.10 | | | | 2.10 | | | | 2.20 | | | | — | | | | — | | | | — | |
| | | | | | | |
Class R2 | | | | | | | | | | | | | | | | | | | | | | | | | | | | |
Six Months Ended April 30, 2015 (Unaudited) | | | 18.55 | | | | 0.02 | (h) | | | 1.55 | | | | 1.57 | | | | (0.11 | ) | | | (1.29 | ) | | | (1.40 | ) |
Year Ended October 31, 2014 | | | 20.53 | | | | 0.12 | (i) | | | (0.68 | ) | | | (0.56 | ) | | | (0.11 | ) | | | (1.31 | ) | | | (1.42 | ) |
Year Ended October 31, 2013 | | | 17.24 | | | | 0.12 | | | | 3.59 | | | | 3.71 | | | | (0.07 | ) | | | (0.35 | ) | | | (0.42 | ) |
November 30, 2011 (g) through October 31, 2012 | | | 15.00 | | | | 0.14 | | | | 2.10 | | | | 2.24 | | | | — | | | | — | | | | — | |
| | | | | | | |
Class R5 | | | | | | | | | | | | | | | | | | | | | | | | | | | | |
Six Months Ended April 30, 2015 (Unaudited) | | | 18.72 | | | | 0.21 | (h) | | | 1.43 | | | | 1.64 | | | | (0.23 | ) | | | (1.29 | ) | | | (1.52 | ) |
Year Ended October 31, 2014 | | | 20.69 | | | | 0.24 | (i) | | | (0.67 | ) | | | (0.43 | ) | | | (0.23 | ) | | | (1.31 | ) | | | (1.54 | ) |
Year Ended October 31, 2013 | | | 17.35 | | | | 0.25 | | | | 3.61 | | | | 3.86 | | | | (0.17 | ) | | | (0.35 | ) | | | (0.52 | ) |
November 30, 2011 (g) through October 31, 2012 | | | 15.00 | | | | 0.24 | | | | 2.11 | | | | 2.35 | | | | — | | | | — | | | | — | |
| | | | | | | |
Class R6 | | | | | | | | | | | | | | | | | | | | | | | | | | | | |
Six Months Ended April 30, 2015 (Unaudited) | | | 18.73 | | | | 0.22 | (h) | | | 1.42 | | | | 1.64 | | | | (0.24 | ) | | | (1.29 | ) | | | (1.53 | ) |
Year Ended October 31, 2014 | | | 20.70 | | | | 0.25 | (i) | | | (0.67 | ) | | | (0.42 | ) | | | (0.24 | ) | | | (1.31 | ) | | | (1.55 | ) |
Year Ended October 31, 2013 | | | 17.36 | | | | 0.26 | | | | 3.61 | | | | 3.87 | | | | (0.18 | ) | | | (0.35 | ) | | | (0.53 | ) |
November 30, 2011 (g) through October 31, 2012 | | | 15.00 | | | | 0.25 | | | | 2.11 | | | | 2.36 | | | | — | | | | — | | | | — | |
| | | | | | | |
Select Class | | | | | | | | | | | | | | | | | | | | | | | | | | | | |
Six Months Ended April 30, 2015 (Unaudited) | | | 18.67 | | | | — | (h)(j) | | | 1.63 | | | | 1.63 | | | | (0.20 | ) | | | (1.29 | ) | | | (1.49 | ) |
Year Ended October 31, 2014 | | | 20.64 | | | | 0.21 | (i) | | | (0.67 | ) | | | (0.46 | ) | | | (0.20 | ) | | | (1.31 | ) | | | (1.51 | ) |
Year Ended October 31, 2013 | | | 17.32 | | | | 0.21 | | | | 3.60 | | | | 3.81 | | | | (0.14 | ) | | | (0.35 | ) | | | (0.49 | ) |
November 30, 2011 (g) through October 31, 2012 | | | 15.00 | | | | 0.21 | | | | 2.11 | | | | 2.32 | | | | — | | | | — | | | | — | |
| (a) | Annualized for periods less than one year, unless otherwise noted. |
| (b) | Not annualized for periods less than one year. |
| (c) | Includes adjustments in accordance with accounting principles generally accepted in the United States of America and as such, the net asset values for financial reporting purposes and the returns based upon those net asset values may differ from the net asset values and returns for shareholder transactions. |
| (d) | Includes interest expense, if applicable, which is less than 0.01% unless otherwise noted. |
| (e) | Portfolio turnover is calculated by dividing the lesser of total purchases or sales of portfolio securities for the reporting period by the monthly average value of portfolio securities owned during the reporting period. Excluded from both the numerator and denominator are amounts relating to derivatives and securities whose maturities or expiration dates at the time of acquisition were one year or less. |
| (f) | Certain non-recurring expenses incurred by the Fund were not annualized for the year ended October 31, 2013 and for the period ended October 31, 2012. |
| (g) | Commencement of operations. |
| (h) | Net investment income (loss) may appear disproportionate among classes due to the timing of recognition of income and changes in the relative size of the classes. |
| (i) | Reflects special dividends paid out during the period by one of the Fund’s holdings. Had the Fund not received the special dividend, the net investment income (loss) per share would have been $0.10, $0.06, $0.08, $0.20, $0.22 and $0.17 for Class A, Class C, Class R2, Class R5, Class R6 and Select Class Shares, respectively and the net investment income (loss) ratio would have been 0.80%, 0.37%, 0.48%, 1.18%, 1.23% and 0.99% for Class A, Class C, Class R2, Class R5, Class R6 and Select Class Shares, respectively. |
| (j) | Amount rounds to less than $0.01. |
SEE NOTES TO FINANCIAL STATEMENTS.
| | | | | | |
| | | |
| 128 | | | | J.P. MORGAN INTERNATIONAL EQUITY FUNDS | | APRIL 30, 2015 |
| | | | | | | | | | | | | | | | | | | | | | | | | | |
| | | Ratios/Supplemental data | |
| | | | | | | | | | Ratios to average net assets (a) | | | | |
Net asset
value,
end of
period | | | Total return (excludes
sales charge) (b)(c) | | | Net assets,
end of
period
(000’s) | | | Net
expenses (d) | | | Net
investment
income
(loss) | | | Expenses
without waivers
and reimbursements | | | Portfolio
turnover
rate (b)(e) | |
| | | | | | | | | | | | | | | | | | | | | | | | | | |
| | | | | | | | | | | | | | | | | | | | | | | | | | |
| $ | 18.72 | | | | 9.53 | % | | $ | 1,079 | | | | 1.25 | % | | | 0.82 | %(h) | | | 5.00 | % | | | 33 | % |
| | 18.59 | | | | (2.47 | ) | | | 351 | | | | 1.32 | | | | 0.98 | (i) | | | 5.09 | | | | 63 | |
| | 20.59 | | | | 22.23 | | | | 83 | | | | 1.32 | (f) | | | 0.89 | (f) | | | 7.99 | (f) | | | 65 | |
| | 17.28 | | | | 15.20 | | | | 58 | | | | 1.32 | (f) | | | 1.17 | (f) | | | 6.99 | (f) | | | 40 | |
| | | | | | |
| | | | | | | | | | | | | | | | | | | | | | | | | | |
| | 18.61 | | | | 9.20 | | | | 354 | | | | 1.75 | | | | 0.37 | (h) | | | 5.51 | | | | 33 | |
| | 18.44 | | | | (2.91 | ) | | | 137 | | | | 1.82 | | | | 0.55 | (i) | | | 6.19 | | | | 63 | |
| | 20.47 | | | | 21.61 | | | | 76 | | | | 1.82 | (f) | | | 0.40 | (f) | | | 8.35 | (f) | | | 65 | |
| | 17.20 | | | | 14.67 | | | | 57 | | | | 1.82 | (f) | | | 0.67 | (f) | | | 7.47 | (f) | | | 40 | |
| | | | | | |
| | | | | | | | | | | | | | | | | | | | | | | | | | |
| | 18.72 | | | | 9.39 | | | | 21 | | | | 1.50 | | | | 0.05 | (h) | | | 5.82 | | | | 33 | |
| | 18.55 | | | | (2.68 | ) | | | 68 | | | | 1.57 | | | | 0.66 | (i) | | | 6.05 | | | | 63 | |
| | 20.53 | | | | 21.92 | | | | 70 | | | | 1.57 | (f) | | | 0.67 | (f) | | | 8.01 | (f) | | | 65 | |
| | 17.24 | | | | 14.93 | | | | 57 | | | | 1.57 | (f) | | | 0.92 | (f) | | | 7.23 | (f) | | | 40 | |
| | | | | | |
| | | | | | | | | | | | | | | | | | | | | | | | | | |
| | 18.84 | | | | 9.78 | | | | 21 | | | | 0.80 | | | | 0.75 | (h) | | | 5.13 | | | | 33 | |
| | 18.72 | | | | (1.99 | ) | | | 70 | | | | 0.87 | | | | 1.36 | (i) | | | 5.34 | | | | 63 | |
| | 20.69 | | | | 22.76 | | | | 71 | | | | 0.87 | (f) | | | 1.37 | (f) | | | 7.31 | (f) | | | 65 | |
| | 17.35 | | | | 15.67 | | | | 58 | | | | 0.87 | (f) | | | 1.62 | (f) | | | 6.54 | (f) | | | 40 | |
| | | | | | |
| | | | | | | | | | | | | | | | | | | | | | | | | | |
| | 18.84 | | | | 9.78 | | | | 21 | | | | 0.75 | | | | 0.80 | (h) | | | 5.08 | | | | 33 | |
| | 18.73 | | | | (1.95 | ) | | | 70 | | | | 0.82 | | | | 1.41 | (i) | | | 5.29 | | | | 63 | |
| | 20.70 | | | | 22.80 | | | | 71 | | | | 0.82 | (f) | | | 1.42 | (f) | | | 7.26 | (f) | | | 65 | |
| | 17.36 | | | | 15.73 | | | | 58 | | | | 0.82 | (f) | | | 1.67 | (f) | | | 6.49 | (f) | | | 40 | |
| | | | | | |
| | | | | | | | | | | | | | | | | | | | | | | | | | |
| | 18.81 | | | | 9.71 | | | | 20,557 | | | | 0.90 | | | | 0.94 | (h) | | | 4.17 | | | | 33 | |
| | 18.67 | | | | (2.18 | ) | | | 3,868 | | | | 1.07 | | | | 1.17 | (i) | | | 5.55 | | | | 63 | |
| | 20.64 | | | | 22.49 | | | | 3,925 | | | | 1.07 | (f) | | | 1.17 | (f) | | | 7.52 | (f) | | | 65 | |
| | 17.32 | | | | 15.47 | | | | 3,175 | | | | 1.07 | (f) | | | 1.42 | (f) | | | 6.74 | (f) | | | 40 | |
SEE NOTES TO FINANCIAL STATEMENTS.
| | | | | | | | |
| | | |
| APRIL 30, 2015 | | J.P. MORGAN INTERNATIONAL EQUITY FUNDS | | | | | 129 | |
FINANCIAL HIGHLIGHTS
FOR THE PERIODS INDICATED (continued)
| | | | | | | | | | | | | | | | | | | | | | | | |
| | | | | | Per share operating performance | |
| | | | | | Investment operations | | | Distributions | | | | |
| | | Net asset
value,
beginning
of period | | | Net
investment
income
(loss) | | | Net realized
and unrealized
gains
(losses) on
investments | | | Total from
investment
operations | | | Net
investment
income | | | Redemption
fees | |
International Value Fund | | | | | | | | | | | | | | | | | | | | | | | | |
Class A | | | | | | | | | | | | | | | | | | | | | | | | |
Six Months Ended April 30, 2015 (Unaudited) | | $ | 14.14 | | | $ | 0.09 | (f)(g) | | $ | 0.37 | | | $ | 0.46 | | | $ | (0.47 | ) | | $ | — | |
Year Ended October 31, 2014 | | | 15.02 | | | | 0.47 | (f)(g)(h) | | | (1.07 | ) | | | (0.60 | ) | | | (0.28 | ) | | | — | |
Year Ended October 31, 2013 | | | 12.18 | | | | 0.22 | (f) | | | 2.91 | | | | 3.13 | | | | (0.29 | ) | | | — | |
Year Ended October 31, 2012 | | | 12.05 | | | | 0.31 | (f) | | | 0.21 | | | | 0.52 | | | | (0.39 | ) | | | — | |
Year Ended October 31, 2011 | | | 13.36 | | | | 0.28 | (f) | | | (1.17 | ) | | | (0.89 | ) | | | (0.42 | ) | | | — | (i) |
Year Ended October 31, 2010 | | | 12.27 | | | | 0.17 | (f) | | | 1.20 | | | | 1.37 | | | | (0.28 | ) | | | — | (i) |
| | | | | | |
Class B | | | | | | | | | | | | | | | | | | | | | | | | |
Six Months Ended April 30, 2015 (Unaudited) | | | 14.02 | | | | 0.04 | (f)(g) | | | 0.39 | | | | 0.43 | | | | (0.33 | ) | | | — | |
Year Ended October 31, 2014 | | | 14.86 | | | | 0.37 | (f)(g)(h) | | | (1.05 | ) | | | (0.68 | ) | | | (0.16 | ) | | | — | |
Year Ended October 31, 2013 | | | 12.03 | | | | 0.17 | (f) | | | 2.87 | | | | 3.04 | | | | (0.21 | ) | | | — | |
Year Ended October 31, 2012 | | | 11.89 | | | | 0.25 | (f) | | | 0.20 | | | | 0.45 | | | | (0.31 | ) | | | — | |
Year Ended October 31, 2011 | | | 13.18 | | | | 0.21 | (f) | | | (1.16 | ) | | | (0.95 | ) | | | (0.34 | ) | | | — | (i) |
Year Ended October 31, 2010 | | | 12.10 | | | | 0.11 | (f) | | | 1.18 | | | | 1.29 | | | | (0.21 | ) | | | — | (i) |
| | | | | | |
Class C | | | | | | | | | | | | | | | | | | | | | | | | |
Six Months Ended April 30, 2015 (Unaudited) | | | 13.72 | | | | 0.05 | (f)(g) | | | 0.37 | | | | 0.42 | | | | (0.39 | ) | | | — | |
Year Ended October 31, 2014 | | | 14.61 | | | | 0.38 | (f)(g)(h) | | | (1.05 | ) | | | (0.67 | ) | | | (0.22 | ) | | | — | |
Year Ended October 31, 2013 | | | 11.84 | | | | 0.16 | (f) | | | 2.83 | | | | 2.99 | | | | (0.22 | ) | | | — | |
Year Ended October 31, 2012 | | | 11.72 | | | | 0.25 | (f) | | | 0.19 | | | | 0.44 | | | | (0.32 | ) | | | — | |
Year Ended October 31, 2011 | | | 13.01 | | | | 0.21 | (f) | | | (1.14 | ) | | | (0.93 | ) | | | (0.36 | ) | | | — | (i) |
Year Ended October 31, 2010 | | | 11.96 | | | | 0.11 | (f) | | | 1.17 | | | | 1.28 | | | | (0.23 | ) | | | — | (i) |
| | | | | | |
Class R2 | | | | | | | | | | | | | | | | | | | | | | | | |
Six Months Ended April 30, 2015 (Unaudited) | | | 13.93 | | | | 0.06 | (f)(g) | | | 0.37 | | | | 0.43 | | | | (0.43 | ) | | | — | |
Year Ended October 31, 2014 | | | 14.78 | | | | 0.42 | (f)(g)(h) | | | (1.05 | ) | | | (0.63 | ) | | | (0.22 | ) | | | — | |
Year Ended October 31, 2013 | | | 11.99 | | | | 0.18 | (f) | | | 2.88 | | | | 3.06 | | | | (0.27 | ) | | | — | |
Year Ended October 31, 2012 | | | 11.86 | | | | 0.28 | (f) | | | 0.19 | | | | 0.47 | | | | (0.34 | ) | | | — | |
Year Ended October 31, 2011 | | | 13.21 | | | | 0.24 | (f) | | | (1.15 | ) | | | (0.91 | ) | | | (0.44 | ) | | | — | (i) |
Year Ended October 31, 2010 | | | 12.19 | | | | 0.11 | (f) | | | 1.21 | | | | 1.32 | | | | (0.30 | ) | | | — | (i) |
| | | | | | |
Class R6 | | | | | | | | | | | | | | | | | | | | | | | | |
Six Months Ended April 30, 2015 (Unaudited) | | | 14.42 | | | | 0.08 | (f)(g) | | | 0.43 | | | | 0.51 | | | | (0.53 | ) | | | — | |
Year Ended October 31, 2014 | | | 15.29 | | | | 0.54 | (f)(g)(h) | | | (1.09 | ) | | | (0.55 | ) | | | (0.32 | ) | | | — | |
Year Ended October 31, 2013 | | | 12.38 | | | | 0.30 | (f) | | | 2.96 | | | | 3.26 | | | | (0.35 | ) | | | — | |
Year Ended October 31, 2012 | | | 12.26 | | | | 0.37 | (f) | | | 0.21 | | | | 0.58 | | | | (0.46 | ) | | | — | |
November 30, 2010 (j) through October 31, 2011 | | | 12.72 | | | | 0.32 | (f) | | | (0.30 | ) | | | 0.02 | | | | (0.48 | ) | | | — | (i) |
| | | | | | |
Institutional Class | | | | | | | | | | | | | | | | | | | | | | | | |
Six Months Ended April 30, 2015 (Unaudited) | | | 14.41 | | | | 0.11 | (f)(g) | | | 0.39 | | | | 0.50 | | | | (0.52 | ) | | | — | |
Year Ended October 31, 2014 | | | 15.29 | | | | 0.53 | (f)(g)(h) | | | (1.09 | ) | | | (0.56 | ) | | | (0.32 | ) | | | — | |
Year Ended October 31, 2013 | | | 12.38 | | | | 0.29 | (f) | | | 2.95 | | | | 3.24 | | | | (0.33 | ) | | | — | |
Year Ended October 31, 2012 | | | 12.26 | | | | 0.36 | (f) | | | 0.20 | | | | 0.56 | | | | (0.44 | ) | | | — | |
Year Ended October 31, 2011 | | | 13.59 | | | | 0.33 | (f) | | | (1.19 | ) | | | (0.86 | ) | | | (0.47 | ) | | | — | (i) |
Year Ended October 31, 2010 | | | 12.47 | | | | 0.25 | (f) | | | 1.19 | | | | 1.44 | | | | (0.32 | ) | | | — | (i) |
| | | | | | |
Select Class | | | | | | | | | | | | | | | | | | | | | | | | |
Six Months Ended April 30, 2015 (Unaudited) | | | 14.48 | | | | 0.11 | (f)(g) | | | 0.39 | | | | 0.50 | | | | (0.50 | ) | | | — | |
Year Ended October 31, 2014 | | | 15.19 | | | | 0.45 | (f)(g)(h) | | | (1.04 | ) | | | (0.59 | ) | | | (0.12 | ) | | | — | |
Year Ended October 31, 2013 | | | 12.31 | | | | 0.27 | (f) | | | 2.93 | | | | 3.20 | | | | (0.32 | ) | | | — | |
Year Ended October 31, 2012 | | | 12.19 | | | | 0.34 | (f) | | | 0.21 | | | | 0.55 | | | | (0.43 | ) | | | — | |
Year Ended October 31, 2011 | | | 13.50 | | | | 0.31 | (f) | | | (1.18 | ) | | | (0.87 | ) | | | (0.44 | ) | | | — | (i) |
Year Ended October 31, 2010 | | | 12.40 | | | | 0.23 | (f) | | | 1.18 | | | | 1.41 | | | | (0.31 | ) | | | — | (i) |
| (a) | Annualized for periods less than one year, unless otherwise noted. |
| (b) | Not annualized for periods less than one year. |
| (c) | Includes adjustments in accordance with accounting principles generally accepted in the United States of America and as such, the net asset values for financial reporting purposes and the returns based upon those net asset values may differ from the net asset values and returns for shareholder transactions. |
| (d) | Includes interest expense, if applicable, which is less than 0.01% unless otherwise noted. |
| (e) | Portfolio turnover is calculated by dividing the lesser of total purchases or sales of portfolio securities for the reporting period by the monthly average value of portfolio securities owned during the reporting period. Excluded from both the numerator and denominator are amounts relating to derivatives and securities whose maturities or expiration dates at the time of acquisition were one year or less. |
SEE NOTES TO FINANCIAL STATEMENTS.
| | | | | | |
| | | |
| 130 | | | | J.P. MORGAN INTERNATIONAL EQUITY FUNDS | | APRIL 30, 2015 |
| | | | | | | | | | | | | | | | | | | | | | | | | | |
| | | Ratios/Supplemental data | |
| | | | | | | | | | Ratios to average net assets (a) | | | | |
Net asset
value,
end of
period | | | Total return
(excludes
sales charge) (b)(c) | | |
Net assets,
end of
period
(000’s) | | | Net
expenses (d) | | | Net
investment
income
(loss) | | | Expenses
without waivers
and reimbursements | | | Portfolio
turnover
rate (b)(e) | |
| | | | | | | | | | | | | | | | | | | | | | | | | | |
| | | | | | | | | | | | | | | | | | | | | | | | | | |
| $ | 14.13 | | | | 8.11 | % | | $ | 623,800 | | | | 1.35 | % | | | 1.27 | %(g) | | | 1.41 | % | | | 39 | % |
| | 14.14 | | | | (4.09 | ) | | | 491,010 | | | | 1.33 | | | | 3.19 | (g)(h) | | | 1.36 | | | | 59 | |
| | 15.02 | | | | 26.13 | | | | 221,077 | | | | 1.33 | | | | 1.66 | | | | 1.35 | | | | 66 | |
| | 12.18 | | | | 4.64 | | | | 124,691 | | | | 1.35 | | | | 2.66 | | | | 1.37 | | | | 62 | |
| | 12.05 | | | | (6.91 | ) | | | 113,976 | | | | 1.34 | | | | 2.15 | | | | 1.36 | | | | 60 | |
| | 13.36 | | | | 11.35 | | | | 143,259 | | | | 1.34 | | | | 1.41 | | | | 1.35 | | | | 92 | |
| | | | | | |
| | | | | | | | | | | | | | | | | | | | | | | | | | |
| | 14.12 | | | | 7.95 | | | | 1,189 | | | | 1.85 | | | | 0.65 | (g) | | | 1.98 | | | | 39 | |
| | 14.02 | | | | (4.61 | ) | | | 1,602 | | | | 1.83 | | | | 2.54 | (g)(h) | | | 1.85 | | | | 59 | |
| | 14.86 | | | | 25.64 | | | | 2,476 | | | | 1.82 | | | | 1.29 | | | | 1.85 | | | | 66 | |
| | 12.03 | | | | 4.04 | | | | 2,932 | | | | 1.85 | | | | 2.20 | | | | 1.87 | | | | 62 | |
| | 11.89 | | | | (7.42 | ) | | | 3,557 | | | | 1.84 | | | | 1.61 | | | | 1.86 | | | | 60 | |
| | 13.18 | | | | 10.81 | | | | 5,337 | | | | 1.84 | | | | 0.91 | | | | 1.85 | | | | 92 | |
| | | | | | |
| | | | | | | | | | | | | | | | | | | | | | | | | | |
| | 13.75 | | | | 7.93 | | | | 31,595 | | | | 1.85 | | | | 0.71 | (g) | | | 1.89 | | | | 39 | |
| | 13.72 | | | | (4.64 | ) | | | 31,176 | | | | 1.83 | | | | 2.65 | (g)(h) | | | 1.86 | | | | 59 | |
| | 14.61 | | | | 25.58 | | | | 22,682 | | | | 1.83 | | | | 1.19 | | | | 1.85 | | | | 66 | |
| | 11.84 | | | | 4.04 | | | | 14,311 | | | | 1.85 | | | | 2.23 | | | | 1.87 | | | | 62 | |
| | 11.72 | | | | (7.38 | ) | | | 16,510 | | | | 1.84 | | | | 1.60 | | | | 1.86 | | | | 60 | |
| | 13.01 | | | | 10.81 | | | | 19,646 | | | | 1.84 | | | | 0.89 | | | | 1.85 | | | | 92 | |
| | | | | | |
| | | | | | | | | | | | | | | | | | | | | | | | | | |
| | 13.93 | | | | 7.98 | | | | 1,729 | | | | 1.60 | | | | 0.96 | (g) | | | 1.96 | | | | 39 | |
| | 13.93 | | | | (4.33 | ) | | | 1,768 | | | | 1.58 | | | | 2.91 | (g)(h) | | | 1.61 | | | | 59 | |
| | 14.78 | | | | 25.91 | | | | 1,249 | | | | 1.59 | | | | 1.39 | | | | 1.60 | | | | 66 | |
| | 11.99 | | | | 4.27 | | | | 881 | | | | 1.60 | | | | 2.43 | | | | 1.62 | | | | 62 | |
| | 11.86 | | | | (7.12 | ) | | | 694 | | | | 1.59 | | | | 1.84 | | | | 1.61 | | | | 60 | |
| | 13.21 | | | | 11.00 | | | | 856 | | | | 1.60 | | | | 0.90 | | | | 1.61 | | | | 92 | |
| | | | | | |
| | | | | | | | | | | | | | | | | | | | | | | | | | |
| | 14.40 | | | | 8.27 | | | | 7,270 | | | | 0.73 | | | | 1.23 | (g) | | | 0.72 | | | | 39 | |
| | 14.42 | | | | (3.64 | ) | | | 30,992 | | | | 0.83 | | | | 3.58 | (g)(h) | | | 0.84 | | | | 59 | |
| | 15.29 | | | | 26.84 | | | | 107,313 | | | | 0.84 | | | | 2.12 | | | | 0.85 | | | | 66 | |
| | 12.38 | | | | 5.11 | | | | 25,945 | | | | 0.84 | | | | 3.06 | | | | 0.87 | | | | 62 | |
| | 12.26 | | | | (0.10 | ) | | | 50 | | | | 0.84 | | | | 2.57 | | | | 0.86 | | | | 60 | |
| | | | | | |
| | | | | | | | | | | | | | | | | | | | | | | | | | |
| | 14.39 | | | | 8.20 | | | | 1,598,600 | | | | 0.95 | | | | 1.53 | (g) | | | 0.96 | | | | 39 | |
| | 14.41 | | | | (3.75 | ) | | | 2,932,420 | | | | 0.93 | | | | 3.51 | (g)(h) | | | 0.96 | | | | 59 | |
| | 15.29 | | | | 26.72 | | | | 1,087,334 | | | | 0.94 | | | | 2.08 | | | | 0.95 | | | | 66 | |
| | 12.38 | | | | 5.00 | | | | 639,798 | | | | 0.94 | | | | 3.03 | | | | 0.97 | | | | 62 | |
| | 12.26 | | | | (6.56 | ) | | | 545,034 | | | | 0.94 | | | | 2.48 | | | | 0.96 | | | | 60 | |
| | 13.59 | | | | 11.79 | | | | 421,538 | | | | 0.92 | | | | 2.04 | | | | 0.95 | | | | 92 | |
| | | | | | |
| | | | | | | | | | | | | | | | | | | | | | | | | | |
| | 14.48 | | | | 8.14 | | | | 266,036 | | | | 1.02 | | | | 1.52 | (g) | | | 1.02 | | | | 39 | |
| | 14.48 | | | | (3.90 | ) | | | 300,712 | | | | 1.08 | | | | 2.96 | (g)(h) | | | 1.10 | | | | 59 | |
| | 15.19 | | | | 26.46 | | | | 1,634,392 | | | | 1.09 | | | | 1.99 | | | | 1.10 | | | | 66 | |
| | 12.31 | | | | 4.87 | | | | 1,458,864 | | | | 1.10 | | | | 2.92 | | | | 1.12 | | | | 62 | |
| | 12.19 | | | | (6.65 | ) | | | 1,413,804 | | | | 1.09 | | | | 2.37 | | | | 1.12 | | | | 60 | |
| | 13.50 | | | | 11.56 | | | | 943,998 | | | | 1.09 | | | | 1.84 | | | | 1.10 | | | | 92 | |
| (f) | Calculated based upon average shares outstanding. |
| (g) | Net investment income (loss) may appear disproportionate among classes due to the timing of recognition of income and changes in the relative size of the classes. |
| (h) | Reflects special dividends paid out during the period by several of the Fund’s holdings. Had the Fund not received the special dividends, the net investment income (loss) per share would have been $0.39, $0.29, $0.30, $0.34, $0.46, $0.45 and $0.37 for Class A, Class B, Class C, Class R2, Class R6, Institutional Class and Select Class Shares, respectively and the net investment income (loss) ratio would have been 2.67%, 2.02%, 2.13%, 2.39%, 3.06%, 2.99% and 2.44% for Class A, Class B, Class C, Class R2, Class R6, Institutional Class and Select Class Shares, respectively. |
| (i) | Amount rounds to less than $0.01. |
| (j) | Commencement of offering of class of shares. |
SEE NOTES TO FINANCIAL STATEMENTS.
| | | | | | | | |
| | | |
| APRIL 30, 2015 | | J.P. MORGAN INTERNATIONAL EQUITY FUNDS | | | | | 131 | |
FINANCIAL HIGHLIGHTS
FOR THE PERIODS INDICATED (continued)
| | | | | | | | | | | | | | | | | | | | | | | | |
| | | | | | Per share operating performance | |
| | | | | | Investment operations | | | Distributions | | | | |
| | | Net asset
value,
beginning
of period | | | Net
investment
income
(loss) | | | Net realized
and unrealized
gains
(losses) on
investments | | | Total from
investment
operations | | | Net
investment
income | | | Redemption
fees | |
Intrepid International Fund | | | | | | | | | | | | | | | | | | | | | | | | |
Class A | | | | | | | | | | | | | | | | | | | | | | | | |
Six Months Ended April 30, 2015 (Unaudited) | | $ | 19.49 | | | $ | 0.17 | (f)(g) | | $ | 1.04 | | | $ | 1.21 | | | $ | (0.21 | ) | | $ | — | |
Year Ended October 31, 2014 | | | 19.79 | | | | 0.39 | (f)(g) | | | (0.45 | ) | | | (0.06 | ) | | | (0.24 | ) | | | — | |
Year Ended October 31, 2013 | | | 15.90 | | | | 0.25 | (d) | | | 3.88 | | | | 4.13 | | | | (0.24 | ) | | | — | |
Year Ended October 31, 2012 | | | 15.32 | | | | 0.25 | (d) | | | 0.49 | | | | 0.74 | | | | (0.16 | ) | | | — | |
Year Ended October 31, 2011 | | | 16.59 | | | | 0.24 | (d) | | | (1.27 | ) | | | (1.03 | ) | | | (0.24 | ) | | | — | (f) |
Year Ended October 31, 2010 | | | 14.99 | | | | 0.12 | (d) | | | 1.73 | | | | 1.85 | | | | (0.25 | ) | | | — | (f) |
| | | | | | |
Class C | | | | | | | | | | | | | | | | | | | | | | | | |
Six Months Ended April 30, 2015 (Unaudited) | | | 19.63 | | | | 0.12 | (f)(g) | | | 1.06 | | | | 1.18 | | | | (0.10 | ) | | | — | |
Year Ended October 31, 2014 | | | 19.92 | | | | 0.36 | (f)(g) | | | (0.52 | ) | | | (0.16 | ) | | | (0.13 | ) | | | — | |
Year Ended October 31, 2013 | | | 16.00 | | | | 0.17 | (d) | | | 3.90 | | | | 4.07 | | | | (0.15 | ) | | | — | |
Year Ended October 31, 2012 | | | 15.36 | | | | 0.18 | (d) | | | 0.50 | | | | 0.68 | | | | (0.04 | ) | | | — | |
Year Ended October 31, 2011 | | | 16.61 | | | | 0.15 | (d) | | | (1.26 | ) | | | (1.11 | ) | | | (0.14 | ) | | | — | (f) |
Year Ended October 31, 2010 | | | 14.99 | | | | 0.05 | (d) | | | 1.73 | | | | 1.78 | | | | (0.16 | ) | | | — | (f) |
| | | | | | |
Class R2 | | | | | | | | | | | | | | | | | | | | | | | | |
Six Months Ended April 30, 2015 (Unaudited) | | | 19.31 | | | | 0.22 | (f)(g) | | | 0.96 | | | | 1.18 | | | | (0.14 | ) | | | — | |
Year Ended October 31, 2014 | | | 19.61 | | | | 0.40 | (f)(g) | | | (0.53 | ) | | | (0.13 | ) | | | (0.17 | ) | | | — | |
Year Ended October 31, 2013 | | | 15.74 | | | | 0.20 | (d) | | | 3.86 | | | | 4.06 | | | | (0.19 | ) | | | — | |
Year Ended October 31, 2012 | | | 15.21 | | | | 0.19 | (d) | | | 0.50 | | | | 0.69 | | | | (0.16 | ) | | | — | |
Year Ended October 31, 2011 | | | 16.46 | | | | 0.17 | (d) | | | (1.22 | ) | | | (1.05 | ) | | | (0.20 | ) | | | — | (f) |
Year Ended October 31, 2010 | | | 14.86 | | | | 0.08 | (d) | | | 1.72 | | | | 1.80 | | | | (0.20 | ) | | | — | (f) |
| | | | | | |
Institutional Class | | | | | | | | | | | | | | | | | | | | | | | | |
Six Months Ended April 30, 2015 (Unaudited) | | | 19.95 | | | | 0.22 | (f)(g) | | | 1.07 | | | | 1.29 | | | | (0.30 | ) | | | — | |
Year Ended October 31, 2014 | | | 20.23 | | | | 0.49 | (f)(g) | | | (0.46 | ) | | | 0.03 | | | | (0.31 | ) | | | — | |
Year Ended October 31, 2013 | | | 16.24 | | | | 0.34 | (d) | | | 3.97 | | | | 4.31 | | | | (0.32 | ) | | | — | |
Year Ended October 31, 2012 | | | 15.66 | | | | 0.33 | (d) | | | 0.50 | | | | 0.83 | | | | (0.25 | ) | | | — | |
Year Ended October 31, 2011 | | | 16.94 | | | | 0.32 | (d) | | | (1.29 | ) | | | (0.97 | ) | | | (0.31 | ) | | | — | (f) |
Year Ended October 31, 2010 | | | 15.27 | | | | 0.19 | (d) | | | 1.78 | | | | 1.97 | | | | (0.30 | ) | | | — | (f) |
| | | | | | |
Select Class | | | | | | | | | | | | | | | | | | | | | | | | |
Six Months Ended April 30, 2015 (Unaudited) | | | 20.22 | | | | 0.20 | (f)(g) | | | 1.09 | | | | 1.29 | | | | (0.25 | ) | | | — | |
Year Ended October 31, 2014 | | | 20.51 | | | | 0.51 | (f)(g) | | | (0.53 | ) | | | (0.02 | ) | | | (0.27 | ) | | | — | |
Year Ended October 31, 2013 | | | 16.46 | | | | 0.31 | (d) | | | 4.01 | | | | 4.32 | | | | (0.27 | ) | | | — | |
Year Ended October 31, 2012 | | | 15.85 | | | | 0.30 | (d) | | | 0.51 | | | | 0.81 | | | | (0.20 | ) | | | — | |
Year Ended October 31, 2011 | | | 16.99 | | | | 0.26 | (d) | | | (1.28 | ) | | | (1.02 | ) | | | (0.12 | ) | | | — | (f) |
Year Ended October 31, 2010 | | | 15.31 | | | | 0.15 | (d) | | | 1.79 | | | | 1.94 | | | | (0.26 | ) | | | — | (f) |
| (a) | Annualized for periods less than one year, unless otherwise noted. |
| (b) | Not annualized for periods less than one year. |
| (c) | Includes adjustments in accordance with accounting principles generally accepted in the United States of America and as such, the net asset values for financial reporting purposes and the returns based upon those net asset values may differ from the net asset values and returns for shareholder transactions. |
| (d) | Includes interest expense, if applicable, which is less than 0.01% unless otherwise noted. |
| (e) | Portfolio turnover is calculated by dividing the lesser of total purchases or sales of portfolio securities for the reporting period by the monthly average value of portfolio securities owned during the reporting period. Excluded from both the numerator and denominator are amounts relating to derivatives and securities whose maturities or expiration dates at the time of acquisition were one year or less. |
| (f) | Calculated based upon average shares outstanding. |
| (g) | Net investment income (loss) may appear disproportionate among classes due to the timing of recognition of income and changes in the relative size of the classes. |
| (h) | Amount rounds to less than $0.01. |
SEE NOTES TO FINANCIAL STATEMENTS.
| | | | | | |
| | | |
| 132 | | | | J.P. MORGAN INTERNATIONAL EQUITY FUNDS | | APRIL 30, 2015 |
| | | | | | | | | | | | | | | | | | | | | | | | | | |
| | | Ratios/Supplemental data | |
| | | | | | | | | | Ratios to average net assets (a) | | | | |
Net asset
value,
end of
period | | | Total return
(excludes
sales charge) (b)(c) | | |
Net assets,
end of
period
(000’s) | | | Net
expenses (d) | | | Net
investment
income
(loss) | | | Expenses
without waivers
and reimbursements | | | Portfolio
turnover
rate (b)(e) | |
| | | | | | | | | | | | | | | | | | | | | | | | | | |
| | | | | | | | | | | | | | | | | | | | | | | | | | |
| $ | 20.49 | | | | 6.32 | % | | $ | 132,076 | | | | 1.34 | % | | | 1.78 | %(g) | | | 1.53 | % | | | 20 | % |
| | 19.49 | | | | (0.33 | ) | | | 101,114 | | | | 1.39 | | | | 1.96 | (g) | | | 1.46 | | | | 48 | |
| | 19.79 | | | | 26.25 | | | | 60,135 | | | | 1.47 | | | | 1.42 | | | | 1.54 | | | | 49 | |
| | 15.90 | | | | 4.97 | | | | 32,231 | | | | 1.50 | | | | 1.65 | | | | 1.62 | | | | 46 | |
| | 15.32 | | | | (6.30 | ) | | | 31,942 | | | | 1.50 | | | | 1.42 | | | | 1.61 | | | | 79 | |
| | 16.59 | | | | 12.54 | | | | 23,960 | | | | 1.50 | | | | 0.78 | | | | 1.73 | | | | 92 | |
| | | | | | |
| | | | | | | | | | | | | | | | | | | | | | | | | | |
| | 20.71 | | | | 6.05 | | | | 1,691 | | | | 1.84 | | | | 1.27 | (g) | | | 1.98 | | | | 20 | |
| | 19.63 | | | | (0.84 | ) | | | 1,318 | | | | 1.89 | | | | 1.79 | (g) | | | 1.96 | | | | 48 | |
| | 19.92 | | | | 25.60 | | | | 1,131 | | | | 1.98 | | | | 0.94 | | | | 2.04 | | | | 49 | |
| | 16.00 | | | | 4.45 | | | | 875 | | | | 2.00 | | | | 1.18 | | | | 2.12 | | | | 46 | |
| | 15.36 | | | | (6.75 | ) | | | 1,018 | | | | 2.00 | | | | 0.91 | | | | 2.11 | | | | 79 | |
| | 16.61 | | | | 12.01 | | | | 1,489 | | | | 2.00 | | | | 0.30 | | | | 2.24 | | | | 92 | |
| | | | | | |
| | | | | | | | | | | | | | | | | | | | | | | | | | |
| | 20.35 | | | | 6.18 | | | | 292 | | | | 1.56 | | | | 2.24 | (g) | | | 1.64 | | | | 20 | |
| | 19.31 | | | | (0.66 | ) | | | 98 | | | | 1.64 | | | | 2.03 | (g) | | | 1.71 | | | | 48 | |
| | 19.61 | | | | 26.02 | | | | 98 | | | | 1.72 | | | | 1.16 | | | | 1.79 | | | | 49 | |
| | 15.74 | | | | 4.64 | | | | 81 | | | | 1.75 | | | | 1.29 | | | | 1.87 | | | | 46 | |
| | 15.21 | | | | (6.48 | ) | | | 106 | | | | 1.75 | | | | 1.04 | | | | 1.85 | | | | 79 | |
| | 16.46 | | | | 12.26 | | | | 68 | | | | 1.75 | | | | 0.53 | | | | 1.99 | | | | 92 | |
| | | | | | |
| | | | | | | | | | | | | | | | | | | | | | | | | | |
| | 20.94 | | | | 6.58 | | | | 1,793,896 | | | | 0.87 | | | | 2.21 | (g) | | | 0.94 | | | | 20 | |
| | 19.95 | | | | 0.13 | | | | 1,474,870 | | | | 0.89 | | | | 2.39 | (g) | | | 1.05 | | | | 48 | |
| | 20.23 | | | | 26.90 | | | | 582,599 | | | | 0.97 | | | | 1.88 | | | | 1.14 | | | | 49 | |
| | 16.24 | | | | 5.50 | | | | 303,575 | | | | 1.00 | | | | 2.16 | | | | 1.21 | | | | 46 | |
| | 15.66 | | | | (5.85 | ) | | | 178,258 | | | | 1.00 | | | | 1.88 | | | | 1.20 | | | | 79 | |
| | 16.94 | | | | 13.11 | | | | 99,766 | | | | 1.00 | | | | 1.21 | | | | 1.31 | | | | 92 | |
| | | | | | |
| | | | | | | | | | | | | | | | | | | | | | | | | | |
| | 21.26 | | | | 6.46 | | | | 17,223 | | | | 1.06 | | | | 1.99 | (g) | | | 1.17 | | | | 20 | |
| | 20.22 | | | | (0.13 | ) | | | 15,963 | | | | 1.14 | | | | 2.47 | (g) | | | 1.21 | | | | 48 | |
| | 20.51 | | | | 26.56 | | | | 13,916 | | | | 1.23 | | | | 1.68 | | | | 1.29 | | | | 49 | |
| | 16.46 | | | | 5.24 | | | | 9,467 | | | | 1.25 | | | | 1.94 | | | | 1.37 | | | | 46 | |
| | 15.85 | | | | (6.08 | ) | | | 12,225 | | | | 1.25 | | | | 1.51 | | | | 1.37 | | | | 79 | |
| | 16.99 | | | | 12.86 | | | | 26,408 | | | | 1.25 | | | | 0.93 | | | | 1.37 | | | | 92 | |
SEE NOTES TO FINANCIAL STATEMENTS.
| | | | | | | | |
| | | |
| APRIL 30, 2015 | | J.P. MORGAN INTERNATIONAL EQUITY FUNDS | | | | | 133 | |
NOTES TO FINANCIAL STATEMENTS
AS OF APRIL 30, 2015 (Unaudited)
1. Organization
JPMorgan Trust I (“JPM I”) and JPMorgan Trust II (“JPM II”) (collectively, the “Trusts”) were formed on November 12, 2004, as Delaware statutory trusts, pursuant to Declarations of Trust dated November 5, 2004 and are registered under the Investment Company Act of 1940, as amended (the “1940 Act”), as open-end management investment companies.
The following are 12 separate funds of the Trusts (collectively, the “Funds”) covered by this report:
| | | | | | |
| | | Classes Offered | | Trust | | Diversified/Non-Diversified |
| Emerging Economies Fund | | Class A, Class C, Class R5 and Select Class | | JPM I | | Diversified |
| Emerging Markets Equity Fund | | Class A, Class B, Class C, Class R6*, Institutional Class and Select Class | | JPM I | | Diversified |
| Emerging Markets Equity Income Fund | | Class A, Class C, Class R5, Class R6 and Select Class | | JPM I | | Diversified |
| Global Research Enhanced Index Fund | | Class A, Class C, Class R2, and Select Class | | JPM I | | Diversified |
| Global Unconstrained Equity Fund | | Class A, Class C, Class R2, Class R5, Class R6 and Select Class | | JPM I | | Diversified |
| International Equity Fund | | Class A, Class B, Class C, Class R2, Class R5, Class R6 and Select Class | | JPM I | | Diversified |
| International Equity Income Fund | | Class A, Class C, Class R2, Class R5, Class R6** and Select Class | | JPM I | | Diversified |
| International Opportunities Fund | | Class A, Class B, Class C, Class R6, Institutional Class and Select Class | | JPM I | | Diversified |
| International Research Enhanced Equity Fund | | Class A, Class B, Class C, Class R2 and Select Class | | JPM II | | Diversified |
| International Unconstrained Equity Fund | | Class A, Class C, Class R2, Class R5, Class R6 and Select Class | | JPM I | | Diversified |
| International Value Fund | | Class A, Class B, Class C, Class R2, Class R6, Institutional Class and Select Class | | JPM I | | Diversified |
| Intrepid International Fund | | Class A, Class C, Class R2, Class R6***, Institutional Class and Select Class | | JPM I | | Diversified |
Emerging Markets Equity Income Fund commenced operations on December 12, 2014. Prior to March 27, 2015, the Fund was not publicly offered for investment.
As of April 30, 2015, Class A, Class C and Class R2 Shares of Global Research Enhanced Index Fund were not publicly offered for investment.
Prior to January 5, 2015, Class A, Class C, Class R5, Class R6 and Select Class Shares of Global Unconstrained Equity Fund were not publicly offered for investment.
| * | Class R6 Shares commenced operations on December 23, 2013 for Emerging Markets Equity Fund. |
| ** | Class R6 Shares commenced operations on January 30, 2015 for International Equity Income Fund. |
| *** | Class R6 Shares commenced operations on May 29, 2015 for Intrepid International Fund. |
Effective January 30, 2015, Global Equity Income Fund changed its name to International Equity Income Fund.
The investment objective of Emerging Economies Fund is to seek long-term capital growth.
The investment objective of Emerging Markets Equity Fund is to seek to provide high total return from a portfolio of equity securities from emerging markets issuers.
The investment objective of Emerging Markets Equity Income Fund and the International Equity Income Fund is to seek to provide both current income and long-term capital appreciation.
The investment objective of Global Research Enhanced Index Fund, International Research Enhanced Equity Fund and International Unconstrained Equity Fund is to seek to provide long-term capital appreciation.
The investment objective of Global Unconstrained Equity Fund is to seek to provide long-term capital appreciation.
The investment objective of International Equity Fund is to seek total return from long-term capital growth and income. Total return consists of capital growth and current income.
The investment objective of International Opportunities Fund is to seek to provide high total return from a portfolio of equity securities of foreign companies in developed and, to a lesser extent, emerging markets.
The investment objective of International Value Fund is to seek to provide high total return from a portfolio of foreign company equity securities.
The investment objective of Intrepid International Fund is to seek to maximize long-term capital growth by investing primarily in equity securities in developed markets outside the U.S.
Prior to June 30, 2014, the investment objective of International Research Enhanced Equity Fund was to seek to provide investment results that correspond to the aggregate price and dividend performance of the securities in the MSCI EAFE Gross Domestic Product Index.
| | | | | | |
| | | |
| 134 | | | | J.P. MORGAN INTERNATIONAL EQUITY FUNDS | | APRIL 30, 2015 |
Class A Shares generally provide for a front-end sales charge while Class B and Class C Shares provide for a contingent deferred sales charge (“CDSC”). On June 19, 2015, all Class B Shares automatically converted to Class A Shares of the Fund. Prior to June 19, 2015, Class B Shares automatically convert to Class A Shares after eight years. No sales charges are assessed with respect to Class R2, Class R5, Class R6, Institutional Class and Select Class Shares. All classes of shares have equal rights as to earnings, assets and voting privileges, except that each class may bear different distribution and shareholder servicing fees and each class has exclusive voting rights with respect to its distribution plan and shareholder servicing agreements. Certain Class A Shares, for which front-end sales charges have been waived, may be subject to a CDSC as described in the Funds’ prospectus.
2. Significant Accounting Policies
The following is a summary of significant accounting policies followed by the Funds in the preparation of their financial statements. The Funds are investment companies and, accordingly, follow the investment company accounting and reporting guidance of the Financial Accounting Standards Board Accounting Standards Codification Topic 946 — Investment Companies, which is part of U.S. generally accepted accounting principles (“GAAP”). The preparation of financial statements in conformity with GAAP requires management to make estimates and assumptions that affect the reported amounts of assets and liabilities and disclosure of contingent assets and liabilities at the date of the financial statements and the reported amounts of increases and decreases in net assets from operations during the reporting period. Actual results could differ from those estimates.
A. Valuation of Investments — The valuation of the investments is in accordance with GAAP and the Funds’ valuation policies set forth by and under the supervision and responsibility of the Board of Trustees (the “Board”), which established the following approach to valuation, as described more fully below: (i) investments for which market quotations are readily available shall be valued at such unadjusted quoted prices and (ii) all other investments for which market quotations are not readily available shall be valued at their fair value as determined in good faith by the Board.
JPMorgan Funds Management, Inc. (the “Administrator”) has established the J.P. Morgan Asset Management Americas Valuation Committee (“AVC”) to assist the Board with the oversight and monitoring of the valuation of the Funds’ investments. The Administrator implements the valuation policies of the Funds’ investments, as directed by the Board. The AVC oversees and carries out the policies for the valuation of investments held in the Funds. This includes monitoring the appropriateness of fair values based on results of ongoing valuation oversight, including but not limited to consideration of macro or security specific events, market events and pricing vendor and broker due diligence. The Administrator is responsible for discussing and assessing the potential impacts to the fair values on an ongoing basis, and at least on a quarterly basis with the AVC and the Board.
A market-based approach is primarily used to value the Funds’ investments. Investments for which market quotations are not readily available are fair valued by approved pricing vendors or third party broker-dealers (collectively referred to as “Pricing Services”) or may be internally fair valued using methods set forth by the valuation policies approved by the Board. This may include related or comparable assets or liabilities, recent transactions, market multiples, book values, and other relevant information for the investment to determine the fair value of the investment. An income-based valuation approach may be used in which the anticipated future cash flows of the investment are discounted to calculate the fair value. Discounts may also be applied due to the nature or duration of any restrictions on the disposition of the investments. Valuations may be based upon current market prices of securities that are comparable in coupon, rating, maturity and industry. It is possible that the estimated values may differ significantly from the values that would have been used, had a ready market for the investments existed, and such differences could be material.
Equities and other exchange-traded instruments are valued at the last sale price or official market closing price on the primary exchange on which the instrument is traded before the net asset values (“NAV”) of the Funds are calculated on a valuation date. Certain foreign equity instruments shall be valued by applying an international fair value factor provided by an approved Pricing Service. The factors seek to adjust the local closing price for movements of local markets post closing, but prior to the time the NAVs are calculated. Investments in open-end investment companies (the “Underlying Funds”) are valued at each investment company’s NAV per share as of the report date.
Futures are generally valued on the basis of available market quotations. Other derivatives are valued utilizing market quotations from approved Pricing Services.
See the table on “Quantitative Information about Level 3 Fair Value Measurements” for information on the valuation techniques and inputs used to value Level 3 securities held by Emerging Economies Fund at April 30, 2015.
Valuations reflected in this report are as of the report date. As a result, changes in valuation due to market events and/or issuer related events after the report date and prior to issuance of the report are not reflected herein.
The various inputs that are used in determining the valuation of the Funds’ investments are summarized into the three broad levels listed below.
��
| Ÿ | | Level 1 — Unadjusted inputs using quoted prices in active markets for identical investments. |
| Ÿ | | Level 2 — Other significant observable inputs including, but are not limited to, quoted prices for similar investments, inputs other than quoted prices that are observable for investments (such as interest rates, prepayment speeds, credit risk, etc.) or other market corroborated inputs. |
| Ÿ | | Level 3 — Significant inputs based on the best information available in the circumstances, to the extent observable inputs are not available (including the Funds’ assumptions in determining the fair value of investments). |
A financial instrument’s level within the fair value hierarchy is based on the lowest level of any input, both individually and in the aggregate, that is significant to the fair value measurement. The inputs or methodology used for valuing instruments are not necessarily an indication of the risk associated with investing in those instruments.
| | | | | | | | |
| | | |
| APRIL 30, 2015 | | J.P. MORGAN INTERNATIONAL EQUITY FUNDS | | | | | 135 | |
NOTES TO FINANCIAL STATEMENTS
AS OF APRIL 30, 2015 (Unaudited) (continued)
The following tables represent each valuation input as presented on the Schedules of Portfolio Investments (“SOIs”) (amounts in thousands):
Emerging Economies Fund
| | | | | | | | | | | | | | | | |
| | | Level 1
Quoted prices | | | Level 2
Other significant
observable inputs | | | Level 3
Significant
unobservable inputs | | | Total | |
Investments in Securities | | | | | | | | | | | | | | | | |
Common Stocks | | | | | | | | | | | | | | | | |
Brazil | | $ | 52,389 | | | $ | — | | | $ | — | | | $ | 52,389 | |
China | | | 16,723 | | | | 193,392 | | | | — | | | | 210,115 | |
Egypt | | | — | | | | 2,358 | | | | — | | | | 2,358 | |
Hong Kong | | | 1,754 | | | | 38,124 | | | | — | | | | 39,878 | |
India | | | 17,045 | | | | 35,971 | | | | — | | | | 53,016 | |
Indonesia | | | — | | | | 8,243 | | | | — | | | | 8,243 | |
Netherlands | | | 1,132 | | | | — | | | | — | | | | 1,132 | |
Poland | | | — | | | | 6,899 | | | | — | | | | 6,899 | |
Qatar | | | — | | | | 1,901 | | | | — | | | | 1,901 | |
Russia | | | 13,965 | | | | 36,109 | | | | — | | | | 50,074 | |
South Africa | | | — | | | | 31,031 | | | | — | | | | 31,031 | |
South Korea | | | 13,746 | | | | 143,935 | | | | 7,162 | | | | 164,843 | |
Taiwan | | | 9,547 | | | | 97,880 | | | | — | | | | 107,427 | |
Thailand | | | 6,625 | | | | 39,853 | | | | — | | | | 46,478 | |
Turkey | | | — | | | | 41,658 | | | | — | | | | 41,658 | |
United Arab Emirates | | | — | | | | 6,823 | | | | — | | | | 6,823 | |
| | | | | | | | | | | | | | | | |
Total Common Stocks | | | 132,926 | | | | 684,177 | | | | 7,162 | | | | 824,265 | |
| | | | | | | | | | | | | | | | |
Preferred Stocks | | | | | | | | | | | | | | | | |
Brazil | | | 1,202 | | | | — | | | | — | | | | 1,202 | |
Russia | | | — | | | | 3,660 | | | | — | | | | 3,660 | |
| | | | | | | | | | | | | | | | |
Total Preferred Stocks | | | 1,202 | | | | 3,660 | | | | — | | | | 4,862 | |
| | | | | | | | | | | | | | | | |
Short-Term Investment | | | | | | | | | | | | | | | | |
Investment Company | | | 10,500 | | | | — | | | | — | | | | 10,500 | |
| | | | | | | | | | | | | | | | |
Total Investments in Securities | | $ | 144,628 | | | $ | 687,837 | | | $ | 7,162 | * | | $ | 839,627 | |
| | | | | | | | | | | | | | | | |
| * | Level 3 investments are valued by brokers and pricing services. At April 30, 2015, the value of these investments was approximately $7,162,000. The inputs for these investments are not readily available or cannot be reasonably estimated and are generally those inputs described in Note 2.A. |
| | | | | | |
| | | |
| 136 | | | | J.P. MORGAN INTERNATIONAL EQUITY FUNDS | | APRIL 30, 2015 |
Emerging Markets Equity Fund
| | | | | | | | | | | | | | | | |
| | | Level 1
Quoted prices | | | Level 2
Other significant
observable inputs | | | Level 3
Significant
unobservable inputs | | | Total | |
Investments in Securities | | | | | | | | | | | | | | | | |
Common Stocks | | | | | | | | | | | | | | | | |
Australia | | $ | — | | | $ | 26,236 | | | $ | — | | | $ | 26,236 | |
Brazil | | | 179,433 | | | | — | | | | — | | | | 179,433 | |
China | | | 89,520 | | | | 97,770 | | | | — | | | | 187,290 | |
Cyprus | | | — | | | | 5,856 | | | | — | | | | 5,856 | |
Hong Kong | | | 197 | | | | 131,587 | | | | — | | | | 131,784 | |
India | | | 198,360 | | | | 148,563 | | | | — | | | | 346,923 | |
Indonesia | | | — | | | | 71,823 | | | | — | | | | 71,823 | |
Mexico | | | 48,447 | | | | — | | | | — | | | | 48,447 | |
Panama | | | 29,097 | | | | — | | | | — | | | | 29,097 | |
Peru | | | 30,762 | | | | — | | | | — | | | | 30,762 | |
Russia | | | — | | | | 144,737 | | | | — | | | | 144,737 | |
South Africa | | | — | | | | 378,168 | | | | — | | | | 378,168 | |
South Korea | | | — | | | | 84,049 | | | | — | | | | 84,049 | |
Switzerland | | | 15,727 | | | | — | | | | — | | | | 15,727 | |
Taiwan | | | 66,070 | | | | 100,725 | | | | — | | | | 166,795 | |
Thailand | | | 20,476 | | | | 94,388 | | | | — | | | | 114,864 | |
Turkey | | | — | | | | 53,214 | | | | — | | | | 53,214 | |
United Kingdom | | | — | | | | 45,829 | | | | — | | | | 45,829 | |
| | | | | | | | | | | | | �� | | | |
Total Common Stocks | | | 678,089 | | | | 1,382,945 | | | | — | | | | 2,061,034 | |
| | | | | | | | | | | | | | | | |
Preferred Stocks | | | | | | | | | | | | | | | | |
Brazil | | | 17,676 | | | | — | | | | — | | | | 17,676 | |
Short-Term Investment | | | | | | | | | | | | | | | | |
Investment Company | | | 22,701 | | | | — | | | | — | | | | 22,701 | |
| | | | | | | | | | | | | | | | |
Total Investments in Securities | | $ | 718,466 | | | $ | 1,382,945 | | | $ | — | | | $ | 2,101,411 | |
| | | | | | | | | | | | | | | | |
| | | | |
Emerging Markets Equity Income Fund | | | | | | | | | | | | | | | | |
| | | Level 1
Quoted prices | | | Level 2
Other significant
observable inputs | | | Level 3
Significant
unobservable inputs | | | Total | |
Investments in Securities | | | | | | | | | | | | | | | | |
Common Stocks | | | | | | | | | | | | | | | | |
Brazil | | $ | 310 | | | $ | — | | | $ | — | | | $ | 310 | |
Chile | | | 59 | | | | — | | | | — | | | | 59 | |
China | | | — | | | | 322 | | | | — | | | | 322 | |
Hong Kong | | | — | | | | 247 | | | | — | | | | 247 | |
Hungary | | | — | | | | 45 | | | | — | | | | 45 | |
Indonesia | | | — | | | | 50 | | | | — | | | | 50 | |
Mexico | | | 63 | | | | — | | | | — | | | | 63 | |
Poland | | | — | | | | 53 | | | | — | | | | 53 | |
Russia | | | 65 | | | | 143 | | | | — | | | | 208 | |
Singapore | | | — | | | | 43 | | | | — | | | | 43 | |
South Africa | | | 32 | | | | 364 | | | | — | | | | 396 | |
South Korea | | | 119 | | | | 55 | | | | — | | | | 174 | |
Taiwan | | | 73 | | | | 595 | | | | — | | | | 668 | |
Thailand | | | 62 | | | | 68 | | | | — | | | | 130 | |
Turkey | | | — | | | | 157 | | | | — | | | | 157 | |
United Arab Emirates | | | — | | | | 39 | | | | — | | | | 39 | |
| | | | | | | | | | | | | | | | |
Total Common Stocks | | | 783 | | | | 2,181 | | | | — | | | | 2,964 | |
| | | | | | | | | | | | | | | | |
Warrants | | | — | | | | 70 | | | | — | | | | 70 | |
| | | | | | | | | | | | | | | | |
Total Investments in Securities | | $ | 783 | | | $ | 2,251 | | | $ | — | | | $ | 3,034 | |
| | | | | | | | | | | | | | | | |
| | | | | | | | |
| | | |
| APRIL 30, 2015 | | J.P. MORGAN INTERNATIONAL EQUITY FUNDS | | | | | 137 | |
NOTES TO FINANCIAL STATEMENTS
AS OF APRIL 30, 2015 (Unaudited) (continued)
| | | | | | | | | | | | | | | | |
Global Research Enhanced Index Fund | | | | | | | | | | | | | | | | |
| | | Level 1
Quoted prices | | | Level 2
Other significant
observable inputs | | | Level 3
Significant
unobservable inputs | | | Total | |
Investments in Securities | | | | | | | | | | | | | | | | |
Common Stocks | | | | | | | | | | | | | | | | |
Australia | | $ | — | | | $ | 164,926 | | | $ | — | | | $ | 164,926 | |
Austria | | | — | (a) | | | — | | | | — | | | | — | (a) |
Belgium | | | — | | | | 45,063 | | | | — | | | | 45,063 | |
Canada | | | 233,038 | | | | — | | | | — | | | | 233,038 | |
China | | | — | | | | 1,163 | | | | — | | | | 1,163 | |
Colombia | | | — | (a) | | | — | | | | — | | | | — | (a) |
Denmark | | | — | | | | 40,884 | | | | — | | | | 40,884 | |
Finland | | | — | | | | 25,341 | | | | — | | | | 25,341 | |
France | | | — | | | | 256,800 | | | | — | | | | 256,800 | |
Germany | | | — | | | | 211,708 | | | | — | | | | 211,708 | |
Hong Kong | | | 6,351 | | | | 66,216 | | | | — | | | | 72,567 | |
Ireland | | | 46,759 | | | | 17,851 | | | | — | | | | 64,610 | |
Israel | | | 9,351 | | | | — | | | | — | | | | 9,351 | |
Italy | | | — | | | | 62,238 | | | | — | | | | 62,238 | |
Japan | | | — | | | | 546,004 | | | | — | | | | 546,004 | |
Luxembourg | | | — | | | | 7,995 | | | | — | | | | 7,995 | |
Netherlands | | | 3,467 | | | | 91,356 | | | | — | | | | 94,823 | |
New Zealand | | | 685 | | | | 2,333 | | | | — | | | | 3,018 | |
Norway | | | — | | | | 18,530 | | | | — | | | | 18,530 | |
Singapore | | | 23,190 | | | | 26,178 | | | | — | | | | 49,368 | |
Spain | | | — | | | | 87,250 | | | | — | | | | 87,250 | |
Sweden | | | — | | | | 37,869 | | | | — | | | | 37,869 | |
Switzerland | | | 34,735 | | | | 232,403 | | | | — | | | | 267,138 | |
United Kingdom | | | 7,573 | | | | 467,809 | | | | — | | | | 475,382 | |
United States | | | 3,478,095 | | | | — | | | | — | | | | 3,478,095 | |
| | | | | | | | | | | | | | | | |
Total Common Stocks | | | 3,843,244 | | | | 2,409,917 | | | | — | | | | 6,253,161 | |
| | | | | | | | | | | | | | | | |
Preferred Stocks | | | | | | | | | | | | | | | | |
Germany | | | — | | | | 27,186 | | | | — | | | | 27,186 | |
Short-Term Investment | | | | | | | | | | | | | | | | |
Investment Company | | | 225,787 | | | | — | | | | — | | | | 225,787 | |
| | | | | | | | | | | | | | | | |
Total Investments in Securities | | $ | 4,069,031 | | | $ | 2,437,103 | | | $ | — | | | $ | 6,506,134 | |
| | | | | | | | | | | | | | | | |
Appreciation in Other Financial Instruments | | | | | | | | | | | | | | | | |
Futures Contracts | | $ | 1,424 | | | $ | — | | | $ | — | | | $ | 1,424 | |
| | | | | | | | | | | | | | | | |
Depreciation in Other Financial Instruments | | | | | | | | | | | | | | | | |
Futures Contracts | | $ | (974 | ) | | $ | — | | | $ | — | | | $ | (974 | ) |
| | | | | | | | | | | | | | | | |
| | | | | | |
| | | |
| 138 | | | | J.P. MORGAN INTERNATIONAL EQUITY FUNDS | | APRIL 30, 2015 |
| | | | | | | | | | | | | | | | |
| Global Unconstrained Equity Fund | | | | | | | | | | | | | | | | |
| | | Level 1
Quoted prices | | | Level 2
Other significant
observable inputs | | | Level 3
Significant
unobservable inputs | | | Total | |
Investments in Securities | | | | | | | | | | | | | | | | |
Common Stocks | | | | | | | | | | | | | | | | |
Australia | | $ | — | | | $ | 44 | | | $ | — | | | $ | 44 | |
Brazil | | | 26 | | | | — | | | | — | | | | 26 | |
Canada | | | 123 | | | | — | | | | — | | | | 123 | |
China | | | 199 | | | | 153 | | | | — | | | | 352 | |
Finland | | | — | | | | 29 | | | | — | | | | 29 | |
France | | | — | | | | 353 | | | | — | | | | 353 | |
Germany | | | 79 | | | | — | | | | — | | | | 79 | |
Hong Kong | | | — | | | | 57 | | | | — | | | | 57 | |
India | | | 37 | | | | — | | | | — | | | | 37 | |
Ireland | | | 46 | | | | — | | | | — | | | | 46 | |
Israel | | | 98 | | | | — | | | | — | | | | 98 | |
Japan | | | — | | | | 92 | | | | — | | | | 92 | |
Luxembourg | | | 34 | | | | — | | | | — | | | | 34 | |
Netherlands | | | 58 | | | | — | | | | — | | | | 58 | |
South Korea | | | — | | | | 116 | | | | — | | | | 116 | |
Spain | | | 106 | | | | — | | | | — | | | | 106 | |
Switzerland | | | 58 | | | | 210 | | | | — | | | | 268 | |
United Kingdom | | | — | | | | 394 | | | | — | | | | 394 | |
United States | | | 2,388 | | | | — | | | | — | | | | 2,388 | |
| | | | | | | | | | | | | | | | |
Total Common Stocks | | | 3,252 | | | | 1,448 | | | | — | | | | 4,700 | |
| | | | | | | | | | | | | | | | |
Short-Term Investment | | | | | | | | | | | | | | | | |
Investment Company | | | 162 | | | | — | | | | — | | | | 162 | |
| | | | | | | | | | | | | | | | |
Total Investments in Securities | | $ | 3,414 | | | $ | 1,448 | | | $ | — | | | $ | 4,862 | |
| | | | | | | | | | | | | | | | |
| | | | |
| International Equity Fund | | | | | | | | | | | | | | | | |
| | | Level 1
Quoted prices | | | Level 2
Other significant
observable inputs | | | Level 3
Significant
unobservable inputs | | | Total | |
Investments in Securities | | | | | | | | | | | | | | | | |
Common Stocks | | | | | | | | | | | | | | | | |
Australia | | $ | — | | | $ | 44,851 | | | $ | — | | | $ | 44,851 | |
Belgium | | | — | | | | 43,086 | | | | — | | | | 43,086 | |
China | | | — | | | | 84,296 | | | | — | | | | 84,296 | |
Denmark | | | — | | | | 21,573 | | | | — | | | | 21,573 | |
France | | | — | | | | 325,471 | | | | — | | | | 325,471 | |
Germany | | | — | | | | 173,602 | | | | — | | | | 173,602 | |
Hong Kong | | | — | | | | 122,782 | | | | — | | | | 122,782 | |
India | | | 21,963 | | | | — | | | | — | | | | 21,963 | |
Indonesia | | | — | | | | 12,547 | | | | — | | | | 12,547 | |
Israel | | | 27,586 | | | | — | | | | — | | | | 27,586 | |
Japan | | | — | | | | 544,031 | | | | — | | | | 544,031 | |
Netherlands | | | — | | | | 138,835 | | | | — | | | | 138,835 | |
South Africa | | | — | | | | 22,618 | | | | — | | | | 22,618 | |
South Korea | | | — | | | | 53,992 | | | | — | | | | 53,992 | |
Switzerland | | | — | | | | 415,071 | | | | — | | | | 415,071 | |
Taiwan | | | 26,101 | | | | — | | | | — | | | | 26,101 | |
United Kingdom | | | — | | | | 613,905 | | | | — | | | | 613,905 | |
| | | | | | | | | | | | | | | | |
Total Common Stocks | | | 75,650 | | | | 2,616,660 | | | | — | | | | 2,692,310 | |
| | | | | | | | | | | | | | | | |
| | | | | | | | |
| | | |
| APRIL 30, 2015 | | J.P. MORGAN INTERNATIONAL EQUITY FUNDS | | | | | 139 | |
NOTES TO FINANCIAL STATEMENTS
AS OF APRIL 30, 2015 (Unaudited) (continued)
| | | | | | | | | | | | | | | | |
| International Equity Fund (continued) | | | | | | | | | | | | | | | | |
| | | Level 1
Quoted prices | | | Level 2
Other significant
observable inputs | | | Level 3
Significant
unobservable inputs | | | Total | |
Preferred Stocks | | | | | | | | | | | | | | | | |
Germany | | $ | — | | | $ | 71,945 | | | $ | — | | | $ | 71,945 | |
Short-Term Investment | | | | | | | | | | | | | | | | |
Investment Company | | | 47,731 | | | | — | | | | — | | | | 47,731 | |
| | | | | | | | | | | | | | | | |
Total Investments in Securities | | $ | 123,381 | | | $ | 2,688,605 | | | $ | — | | | $ | 2,811,986 | |
| | | | | | | | | | | | | | | | |
Depreciation in Other Financial Instruments | | | | | | | | | | | | | | | | |
Forward Foreign Currency Exchange Contracts | | $ | — | | | $ | (20 | ) | | $ | — | | | $ | (20 | ) |
| | | | | | | | | | | | | | | | |
| | | | |
| International Equity Income Fund | | | | | | | | | | | | | | | | |
| | | Level 1
Quoted prices | | | Level 2
Other significant
observable inputs | | | Level 3
Significant
unobservable inputs | | | Total | |
Investments in Securities | | | | | | | | | | | | | | | | |
Common Stocks | | | | | | | | | | | | | | | | |
Australia | | $ | — | | | $ | 5,615 | | | $ | — | | | $ | 5,615 | |
China | | | — | | | | 1,757 | | | | — | | | | 1,757 | |
Finland | | | — | | | | 2,290 | | | | — | | | | 2,290 | |
France | | | — | | | | 5,521 | | | | — | | | | 5,521 | |
Germany | | | — | | | | 7,174 | | | | — | | | | 7,174 | |
Hong Kong | | | 1,665 | | | | — | | | | — | | | | 1,665 | |
Ireland | | | — | | | | 812 | | | | — | | | | 812 | |
Israel | | | 1,502 | | | | 1,725 | | | | — | | | | 3,227 | |
Italy | | | — | | | | 1,105 | | | | — | | | | 1,105 | |
Japan | | | — | | | | 19,937 | | | | — | | | | 19,937 | |
Netherlands | | | — | | | | 5,464 | | | | — | | | | 5,464 | |
Norway | | | — | | | | 2,867 | | | | — | | | | 2,867 | |
Russia | | | — | | | | 832 | | | | — | | | | 832 | |
South Africa | | | — | | | | 1,133 | | | | — | | | | 1,133 | |
South Korea | | | — | | | | 1,120 | | | | — | | | | 1,120 | |
Spain | | | — | | | | 2,611 | | | | — | | | | 2,611 | |
Sweden | | | — | | | | 1,717 | | | | — | | | | 1,717 | |
Switzerland | | | — | | | | 6,420 | | | | — | | | | 6,420 | |
Taiwan | | | 1,978 | | | | — | | | | — | | | | 1,978 | |
United Kingdom | | | 796 | | | | 21,069 | | | | — | | | | 21,865 | |
| | | | | | | | | | | | | | | | |
Total Common Stocks | | | 5,941 | | | | 89,169 | | | | — | | | | 95,110 | |
| | | | | | | | | | | | | | | | |
Short-Term Investment | | | | | | | | | | | | | | | | |
Investment Company | | | 2,843 | | | | — | | | | — | | | | 2,843 | |
| | | | | | | | | | | | | | | | |
Total Investments in Securities | | $ | 8,784 | | | $ | 89,169 | | | $ | — | | | $ | 97,953 | |
| | | | | | | | | | | | | | | | |
| | | | | | |
| | | |
| 140 | | | | J.P. MORGAN INTERNATIONAL EQUITY FUNDS | | APRIL 30, 2015 |
| | | | | | | | | | | | | | | | |
| International Opportunities Fund | | | | | | | | | | | | | | | | |
| | | Level 1
Quoted prices | | | Level 2
Other significant
observable inputs | | | Level 3
Significant
unobservable inputs | | | Total | |
Investments in Securities | | | | | | | | | | | | | | | | |
Common Stocks | | | | | | | | | | | | | | | | |
Australia | | $ | — | | | $ | 77,780 | | | $ | — | | | $ | 77,780 | |
China | | | 7,732 | | | | 20,268 | | | | — | | | | 28,000 | |
Denmark | | | — | | | | 6,198 | | | | — | | | | 6,198 | |
Finland | | | — | | | | 20,424 | | | | — | | | | 20,424 | |
France | | | — | | | | 164,277 | | | | — | | | | 164,277 | |
Germany | | | — | | | | 127,756 | | | | — | | | | 127,756 | |
Hong Kong | | | 24,872 | | | | 35,792 | | | | — | | | | 60,664 | |
Ireland | | | — | | | | 23,260 | | | | — | | | | 23,260 | |
Italy | | | — | | | | 34,436 | | | | — | | | | 34,436 | |
Japan | | | — | | | | 450,624 | | | | — | | | | 450,624 | |
Netherlands | | | — | | | | 86,360 | | | | — | | | | 86,360 | |
Norway | | | — | | | | 29,966 | | | | — | | | | 29,966 | |
South Korea | | | — | | | | 19,528 | | | | — | | | | 19,528 | |
Spain | | | — | | | | 12,379 | | | | — | | | | 12,379 | |
Sweden | | | — | | | | 21,315 | | | | — | | | | 21,315 | |
Switzerland | | | — | | | | 261,690 | | | | — | | | | 261,690 | |
United Kingdom | | | — | | | | 432,863 | | | | — | | | | 432,863 | |
| | | | | | | | | | | | | | | | |
Total Common Stocks | | | 32,604 | | | | 1,824,916 | | | | — | | | | 1,857,520 | |
| | | | | | | | | | | | | | | | |
Preferred Stocks | | | | | | | | | | | | | | | | |
Germany | | | — | | | | 26,171 | | | | — | | | | 26,171 | |
Short-Term Investment | | | | | | | | | | | | | | | | |
Investment Company | | | 62,979 | | | | — | | | | — | | | | 62,979 | |
| | | | | | | | | | | | | | | | |
Total Investments in Securities | | $ | 95,583 | | | $ | 1,851,087 | | | $ | — | | | $ | 1,946,670 | |
| | | | | | | | | | | | | | | | |
Appreciation in Other Financial Instruments | | | | | | | | | | | | | | | | |
Forward Foreign Currency Exchange Contracts | | $ | — | | | $ | 7,941 | | | $ | — | | | $ | 7,941 | |
| | | | | | | | | | | | | | | | |
Depreciation in Other Financial Instruments | | | | | | | | | | | | | | | | |
Futures Contracts | | $ | (471 | ) | | $ | — | | | $ | — | | | $ | (471 | ) |
Forward Foreign Currency Exchange Contracts | | | — | | | | (6,744 | ) | | | — | | | | (6,744 | ) |
| | | | | | | | | | | | | | | | |
Total Depreciation in Other Financial Instruments | | $ | (471 | ) | | $ | (6,744 | ) | | $ | — | | | $ | (7,215 | ) |
| | | | | | | | | | | | | | | | |
| | | | | | | | |
| | | |
| APRIL 30, 2015 | | J.P. MORGAN INTERNATIONAL EQUITY FUNDS | | | | | 141 | |
NOTES TO FINANCIAL STATEMENTS
AS OF APRIL 30, 2015 (Unaudited) (continued)
| | | | | | | | | | | | | | | | |
| International Research Enhanced Equity Fund | | | | | | | | | | | | | | | | |
| | | Level 1
Quoted prices | | | Level 2
Other significant
observable inputs | | | Level 3
Significant
unobservable inputs | | | Total | |
Investments in Securities | | | | | | | | | | | | | | | | |
Common Stocks | | | | | | | | | | | | | | | | |
Australia | | $ | — | | | $ | 45,228 | | | $ | — | (a) | | $ | 45,228 | |
Belgium | | | — | | | | 6,732 | | | | — | | | | 6,732 | |
Denmark | | | — | | | | 17,514 | | | | — | | | | 17,514 | |
Finland | | | — | | | | 12,984 | | | | — | | | | 12,984 | |
France | | | 2,026 | | | | 85,454 | | | | — | | | | 87,480 | |
Germany | | | — | | | | 65,825 | | | | — | | | | 65,825 | |
Hong Kong | | | 5,912 | | | | 15,781 | | | | — | | | | 21,693 | |
Ireland | | | 3,273 | | | | 6,159 | | | | — | | | | 9,432 | |
Israel | | | 2,735 | | | | — | | | | — | | | | 2,735 | |
Italy | | | — | | | | 18,051 | | | | — | | | | 18,051 | |
Japan | | | — | | | | 179,625 | | | | — | | | | 179,625 | |
Luxembourg | | | — | | | | 2,450 | | | | — | | | | 2,450 | |
Netherlands | | | — | | | | 33,262 | | | | — | | | | 33,262 | |
New Zealand | | | — | | | | 2,937 | | | | — | | | | 2,937 | |
Norway | | | — | | | | 4,788 | | | | — | | | | 4,788 | |
Portugal | | | — | | | | 1,774 | | | | — | | | | 1,774 | |
Singapore | | | — | | | | 7,047 | | | | — | | | | 7,047 | |
Spain | | | — | | | | 22,586 | | | | — | | | | 22,586 | |
Sweden | | | — | | | | 14,512 | | | | — | | | | 14,512 | |
Switzerland | | | — | | | | 65,939 | | | | — | | | | 65,939 | |
United Kingdom | | | 3,388 | | | | 150,714 | | | | — | | | | 154,102 | |
| | | | | | | | | | | | | | | | |
Total Common Stocks | | | 17,334 | | | | 759,362 | | | | — | (a) | | | 776,696 | |
| | | | | | | | | | | | | | | | |
Preferred Stocks | | | | | | | | | | | | | | | | |
Germany | | | — | | | | 10,652 | | | | — | | | | 10,652 | |
Short-Term Investment | | | | | | | | | | | | | | | | |
Investment Company | | | 17,887 | | | | — | | | | — | | | | 17,887 | |
| | | | | | | | | | | | | | | | |
Total Investments in Securities | | $ | 35,221 | | | $ | 770,014 | | | $ | — | (a) | | $ | 805,235 | |
| | | | | | | | | | | | | | | | |
Appreciation in Other Financial Instruments | | | | | | | | | | | | | | | | |
Futures Contracts | | $ | 122 | | | $ | — | | | $ | — | | | $ | 122 | |
| | | | | | | | | | | | | | | | |
Depreciation in Other Financial Instruments | | | | | | | | | | | | | | | | |
Futures Contracts | | $ | (61 | ) | | $ | — | | | $ | — | | | $ | (61 | ) |
| | | | | | | | | | | | | | | | |
International Unconstrained Equity Fund
| | | | | | | | | | | | | | | | |
| | | Level 1
Quoted prices | | | Level 2
Other significant
observable inputs | | | Level 3
Significant
unobservable inputs | | | Total | |
Investments in Securities | | | | | | | | | | | | | | | | |
Common Stocks | | | | | | | | | | | | | | | | |
Canada | | $ | 1,464 | | | $ | — | | | $ | — | | | $ | 1,464 | |
China | | | 770 | | | | 622 | | | | — | | | | 1,392 | |
France | | | — | | | | 2,640 | | | | — | | | | 2,640 | |
Germany | | | 391 | | | | 299 | | | | — | | | | 690 | |
Hong Kong | | | — | | | | 640 | | | | — | | | | 640 | |
India | | | 838 | | | | — | | | | — | | | | 838 | |
Ireland | | | — | | | | 394 | | | | — | | | | 394 | |
Italy | | | — | | | | 477 | | | | — | | | | 477 | |
Japan | | | — | | | | 2,602 | | | | — | | | | 2,602 | |
Netherlands | | | — | | | | 1,020 | | | | — | | | | 1,020 | |
South Africa | | | — | | | | 435 | | | | — | | | | 435 | |
South Korea | | | — | | | | 526 | | | | — | | | | 526 | |
Switzerland | | | — | | | | 2,570 | | | | — | | | | 2,570 | |
Taiwan | | | 395 | | | | — | | | | — | | | | 395 | |
United Kingdom | | | — | | | | 3,476 | | | | — | | | | 3,476 | |
| | | | | | | | | | | | | | | | |
Total Common Stocks | | | 3,858 | | | | 15,701 | | | | — | | | | 19,559 | |
| | | | | | | | | | | | | | | | |
| | | | | | |
| | | |
| 142 | | | | J.P. MORGAN INTERNATIONAL EQUITY FUNDS | | APRIL 30, 2015 |
| | | | | | | | | | | | | | | | |
| International Unconstrained Equity Fund (continued) | | | | | | | | | | | | | |
| | | Level 1
Quoted prices | | | Level 2
Other significant
observable inputs | | | Level 3
Significant
unobservable inputs | | | Total | |
Short-Term Investment | | | | | | | | | | | | | | | | |
Investment Company | | $ | 1,600 | | | $ | — | | | $ | — | | | $ | 1,600 | |
| | | | | | | | | | | | | | | | |
Total Investments in Securities | | $ | 5,458 | | | $ | 15,701 | | | $ | — | | | $ | 21,159 | |
| | | | | | | | | | | | | | | | |
| | | | |
International Value Fund | | | | | | | | | | | | | | | | |
| | | Level 1
Quoted prices | | | Level 2
Other significant
observable inputs | | | Level 3
Significant
unobservable inputs | | | Total | |
Investments in Securities | | | | | | | | | | | | | | | | |
Common Stocks | | | | | | | | | | | | | | | | |
Australia | | $ | — | | | $ | 84,884 | | | $ | — | | | $ | 84,884 | |
Belgium | | | — | | | | 51,227 | | | | — | | | | 51,227 | |
Brazil | | | 17,963 | | | | — | | | | — | | | | 17,963 | |
China | | | — | | | | 25,431 | | | | — | | | | 25,431 | |
Finland | | | — | | | | 21,961 | | | | — | | | | 21,961 | |
France | | | — | | | | 343,561 | | | | — | | | | 343,561 | |
Germany | | | — | | | | 180,248 | | | | — | | | | 180,248 | |
Hong Kong | | | 25,034 | | | | — | | | | — | | | | 25,034 | |
India | | | 13,372 | | | | — | | | | — | | | | 13,372 | |
Ireland | | | 20,890 | | | | 24,382 | | | | — | | | | 45,272 | |
Italy | | | — | | | | 130,873 | | | | — | | | | 130,873 | |
Japan | | | — | | | | 579,259 | | | | — | | | | 579,259 | |
Luxembourg | | | — | | | | 25,103 | | | | — | | | | 25,103 | |
Netherlands | | | — | | | | 123,462 | | | | — | | | | 123,462 | |
Norway | | | — | | | | 47,043 | | | | — | | | | 47,043 | |
Singapore | | | — | | | | 22,305 | | | | — | | | | 22,305 | |
South Korea | | | — | | | | 40,942 | | | | — | | | | 40,942 | |
Spain | | | — | | | | 83,616 | | | | — | | | | 83,616 | |
Sweden | | | — | | | | 31,234 | | | | — | | | | 31,234 | |
Switzerland | | | — | | | | 149,280 | | | | — | | | | 149,280 | |
United Kingdom | | | — | | | | 414,916 | | | | — | | | | 414,916 | |
| | | | | | | | | | | | | | | | |
Total Common Stocks | | | 77,259 | | | | 2,379,727 | | | | — | | | | 2,456,986 | |
| | | | | | | | | | | | | | | | |
Preferred Stocks | | | | | | | | | | | | | | | | |
Germany | | | — | | | | 22,485 | | | | — | | | | 22,485 | |
Short-Term Investment | | | | | | | | | | | | | | | | |
Investment Company | | | 4,663 | | | | — | | | | — | | | | 4,663 | |
| | | | | | | | | | | | | | | | |
Total Investments in Securities | | $ | 81,922 | | | $ | 2,402,212 | | | $ | — | | | $ | 2,484,134 | |
| | | | | | | | | | | | | | | | |
Appreciation in Other Financial Instruments | | | | | | | | | | | | | | | | |
Forward Foreign Currency Exchange Contracts | | $ | — | | | $ | 43,448 | | | $ | — | | | $ | 43,448 | |
| | | | | | | | | | | | | | | | |
Depreciation in Other Financial Instruments | | | | | | | | | | | | | | | | |
Forward Foreign Currency Exchange Contracts | | $ | — | | | $ | (37,804 | ) | | $ | — | | | $ | (37,804 | ) |
| | | | | | | | | | | | | | | | |
| | | | | | | | |
| | | |
| APRIL 30, 2015 | | J.P. MORGAN INTERNATIONAL EQUITY FUNDS | | | | | 143 | |
NOTES TO FINANCIAL STATEMENTS
AS OF APRIL 30, 2015 (Unaudited) (continued)
Intrepid International Fund
| | | | | | | | | | | | | | | | |
| | | Level 1
Quoted prices | | | Level 2
Other significant
observable inputs | | | Level 3
Significant
unobservable inputs | | | Total | |
Investments in Securities | | | | | | | | | | | | | | | | |
Common Stocks | | | | | | | | | | | | | | | | |
Australia | | $ | — | | | $ | 128,856 | | | $ | — | | | $ | 128,856 | |
Austria | | | — | | | | 7,356 | | | | — | | | | 7,356 | |
Belgium | | | — | | | | 39,383 | | | | — | | | | 39,383 | |
China | | | — | | | | 7,723 | | | | — | | | | 7,723 | |
Denmark | | | — | | | | 29,413 | | | | — | | | | 29,413 | |
Finland | | | — | | | | 17,645 | | | | — | | | | 17,645 | |
France | | | 15,607 | | | | 184,881 | | | | — | | | | 200,488 | |
Germany | | | — | | | | 153,285 | | | | — | | | | 153,285 | |
Hong Kong | | | 9,091 | | | | 29,435 | | | | — | | | | 38,526 | |
India | | | 5,827 | | | | — | | | | — | | | | 5,827 | |
Ireland | | | 6,296 | | | | 31,964 | | | | — | | | | 38,260 | |
Israel | | | 12,644 | | | | — | | | | — | | | | 12,644 | |
Italy | | | — | | | | 30,649 | | | | — | | | | 30,649 | |
Japan | | | — | | | | 435,356 | | | | — | | | | 435,356 | |
Luxembourg | | | — | | | | 6,282 | | | | — | | | | 6,282 | |
Netherlands | | | — | | | | 71,605 | | | | — | | | | 71,605 | |
Norway | | | — | | | | 13,836 | | | | — | | | | 13,836 | |
Portugal | | | — | | | | 5,979 | | | | — | | | | 5,979 | |
Singapore | | | — | | | | 8,883 | | | | — | | | | 8,883 | |
South Africa | | | — | | | | 7,439 | | | | — | | | | 7,439 | |
South Korea | | | — | | | | 11,420 | | | | — | | | | 11,420 | |
Spain | | | — | | | | 62,796 | | | | — | | | | 62,796 | |
Sweden | | | — | | | | 43,670 | | | | — | | | | 43,670 | |
Switzerland | | | — | | | | 157,067 | | | | — | | | | 157,067 | |
United Kingdom | | | 8,651 | | | | 346,615 | | | | — | | | | 355,266 | |
United States | | | — | | | | 6,071 | | | | — | | | | 6,071 | |
| | | | | | | | | | | | | | | | |
Total Common Stocks | | | 58,116 | | | | 1,837,609 | | | | — | | | | 1,895,725 | |
| | | | | | | | | | | | | | | | |
Preferred Stocks | | | | | | | | | | | | | | | | |
Germany | | | — | | | | 17,764 | | | | — | | | | 17,764 | |
Short-Term Investment | | | | | | | | | | | | | | | | |
Investment Company | | | 33,135 | | | | — | | | | — | | | | 33,135 | |
| | | | | | | | | | | | | | | | |
Total Investments in Securities | | $ | 91,251 | | | $ | 1,855,373 | | | $ | — | | | $ | 1,946,624 | |
| | | | | | | | | | | | | | | | |
| (a) | Amount rounds to less than $1,000. |
There were no transfers between Levels 1 and 2 during the six months ended April 30, 2015.
The following is a summary of investments for which significant unobservable inputs (Level 3) were used in determining fair value (amounts in thousands):
| | | | | | | | | | | | | | | | | | | | | | | | | | | | | | | | | | | | |
| Emerging Economies Fund | | Balance as
of October 31, 2014 | | | Realized
gain (loss) | | | Change in
unrealized
appreciation
(depreciation) | | | Net
accretion
(amortization) | | | Purchases¹ | | | Sales² | | | Transfers
into Level 3 | | | Transfers
out
of Level 3 | | | Balance as
of April 30, 2015 | |
Investments in Securities | | | | | | | | | | | | | | | | | | | | | | | | | | | | | | | | | | | | |
Common Stocks — Hong Kong | | $ | — | (a) | | $ | (1,762 | ) | | $ | 1,906 | | | $ | — | | | $ | — | | | $ | (144 | ) | | $ | — | | | $ | — | | | $ | — | |
Common Stocks — South Korea | | | — | | | | 62 | | | | 1,892 | | | | — | | | | 612 | | | | (1,655 | ) | | | 6,251 | | | | — | | | | 7,162 | |
| | | | | | | | | | | | | | | | | | | | | | | | | | | | | | | | | | | | |
Total | | $ | — | | | $ | (1,700 | ) | | $ | 3,798 | | | $ | — | | | $ | 612 | | | $ | (1,799 | ) | | $ | 6,251 | | | $ | — | | | $ | 7,162 | |
| | | | | | | | | | | | | | | | | | | | | | | | | | | | | | | | | | | | |
| 1 | Purchases include all purchases of securities and securities received in corporate actions. |
| 2 | Sales include all sales of securities, maturities, paydowns and securities tendered in corporate actions. |
| (a) | Amount rounds to less than $1,000. |
Transfers into, and out of, Level 3 are valued utilizing values as of the beginning of the period.
Transfers from Level 2 to Level 3 or from Level 3 to Level 2 are due to a decline or an increase in market activity (e.g. frequency of trades), respectively, which resulted in a lack of or increase in available market inputs to determine price.
The change in unrealized appreciation (depreciation) attributable to securities owned at April 30, 2015, which were valued using significant unobservable inputs (Level 3), amounted to approximately $1,892,000. This amount is included in Change in net unrealized appreciation/depreciation of investments in non-affiliates on the Statements of Operations.
| | | | | | |
| | | |
| 144 | | | | J.P. MORGAN INTERNATIONAL EQUITY FUNDS | | APRIL 30, 2015 |
B. Restricted and Illiquid Securities — Certain securities held by the Funds may be subject to legal or contractual restrictions on resale and/or are illiquid. Restricted securities generally are resold in transactions exempt from registration under the Securities Act of 1933 (the “Securities Act”). Illiquid securities are securities which cannot be disposed of promptly (within seven days) and in the usual course of business at approximately their fair value and include, but are not limited to, repurchase agreements maturing in excess of seven days, time deposits with a withdrawal penalty, non-negotiable instruments and instruments for which no market exists. Disposal of these securities may involve time-consuming negotiations and expense. Prompt sale at the current valuation may be difficult and could adversely affect the net assets of the Funds. As of April 30, 2015, the Funds had no investments in restricted securities other than securities sold to the Funds under Rule 144A or Regulation S under the Securities Act.
The following are the values and percentages of net assets of illiquid securities as of April 30, 2015 (amounts in thousands):
| | | | | | | | |
| | |
| | | Value | | | Percentage | |
Emerging Economies Fund | | $ | 7,162 | | | | 0.8 | % |
International Research Enhanced Equity Fund | | | — | (a) | | | 0.0 | (b) |
| (a) | Amount rounds to less than $1,000. |
| (b) | Amount rounds to less than 0.1%. |
C. Futures Contracts — Global Research Enhanced Index Fund, International Opportunities Fund, International Research Enhanced Equity Fund and International Value Fund used index futures contracts to gain or reduce exposure to the stock market, maintain liquidity and minimize transaction costs. The Funds also bought futures contracts to immediately invest incoming cash in the market or sold futures in response to cash outflows, thereby simulating an invested position in the underlying index while maintaining a cash balance for liquidity.
Futures contracts provide for the delayed delivery of the underlying instrument at a fixed price or are settled for a cash amount based on the change in the value of the underlying instrument at a specific date in the future. Upon entering into a futures contract, the Funds are required to deposit with the broker, cash or securities in an amount equal to a certain percentage of the contract amount, which is referred to as the initial margin deposit. Subsequent payments, referred to as variation margin, are made or received by the Funds periodically and are based on changes in the market value of open futures contracts. Changes in the market value of open futures contracts are recorded as Change in net unrealized appreciation/depreciation on the Statements of Operations. Realized gains or losses, representing the difference between the value of the contract at the time it was opened and the value at the time it was closed, are reported on the Statements of Operations at the closing or expiration of the futures contract. Securities deposited as initial margin are designated on the SOIs and cash deposited is recorded on the Statements of Assets and Liabilities. A receivable from and/or a payable to brokers for the daily variation margin is also recorded on the Statements of Assets and Liabilities.
The Funds may be subject to the risk that the change in the value of the futures contract may not correlate perfectly with the underlying instrument. Use of long futures contracts subjects the Funds to risk of loss in excess of the amounts shown on the Statements of Assets and Liabilities, up to the notional amount of the futures contracts. Use of short futures contracts subjects the Funds to unlimited risk of loss. The Funds may enter into futures contracts only on exchanges or boards of trade. The exchange or board of trade acts as the counterparty to each futures transaction; therefore, the Funds’ credit risk is limited to failure of the exchange or board of trade. Under some circumstances, futures exchanges may establish daily limits on the amount that the price of a futures contract can vary from the previous day’s settlement price, which could effectively prevent liquidation of positions.
The Funds’ futures contracts are not subject to master netting arrangements (the right to close out all transactions traded with a counterparty and net amounts owed or due across transactions).
The table below discloses the volume of the Funds’ futures contracts activity during the six months ended April 30, 2015 (amounts in thousands):
| | | | | | | | | | | | | | | | |
| | | Global
Research Enhanced
Index Fund | | | International Opportunities Fund | | | International Research Enhanced Equity Fund | | | International
Value Fund | |
Futures Contracts: | | | | | | | | | | | | | | | | |
Average Notional Balance Long | | $ | 185,583 | | | $ | 9,763 | | | $ | 23,005 | | | $ | 15,647 | |
Ending Notional Balance Long | | | 181,827 | | | | 25,439 | | | | 17,080 | | | | — | |
D. Forward Foreign Currency Exchange Contracts — International Equity Fund, International Opportunities Fund and International Value Fund may be exposed to foreign currency risks associated with portfolio investments and therefore, at times, used forward foreign currency exchange contracts to hedge or manage these exposures. The Funds also bought forward currency exchange contracts to gain exposure to currencies. Forward foreign currency exchange contracts represent obligations to purchase or sell foreign currency on a specified future date at a price fixed at the time the contracts are entered into. Non-deliverable forward foreign currency exchange contracts are settled with the counterparty in cash without the delivery of foreign currency.
The values of the forward foreign currency exchange contracts are adjusted daily based on the applicable exchange rate of the underlying currency. Changes in the value of these contracts are recorded as unrealized appreciation or depreciation until the contract settlement date. When the forward foreign currency exchange contract is closed, the Funds record a realized gain or loss equal to the difference between the value at the time the contract was opened and the value at the time it was closed. The Funds also record a realized gain or loss when a forward foreign currency contract offsets another forward foreign currency contract with the same counterparty upon settlement.
| | | | | | | | |
| | | |
| APRIL 30, 2015 | | J.P. MORGAN INTERNATIONAL EQUITY FUNDS | | | | | 145 | |
NOTES TO FINANCIAL STATEMENTS
AS OF APRIL 30, 2015 (Unaudited) (continued)
As of April 30, 2015, the Funds did not receive or post collateral for forward foreign currency exchange contracts.
The table below discloses the volume of the Funds’ forward foreign currency exchange contracts activity during the six months ended April 30, 2015 (amounts in thousands):
| | | | | | | | | | | | |
| | | International
Equity
Fund | | | International
Opportunities
Fund | | | International
Value Fund | |
Forward Foreign Currency Exchange Contracts: | | | | | | | | | | | | |
Average Settlement Value Purchased | | $ | 4,252 | (a) | | $ | 374,582 | | | $ | 727,233 | |
Average Settlement Value Sold | | | — | | | | 330,573 | | | | 645,524 | |
Ending Settlement Value Purchased | | | 4,252 | | | | 449,339 | | | | 1,596,935 | |
Ending Settlement Value Sold | | | — | | | | 363,394 | | | | 1,578,564 | |
| (a) | For the period from April 1, 2015 to April 30, 2015. |
E. Summary of Derivatives Information
The following table presents the value of derivatives held as of April 30, 2015, by their primary underlying risk exposure and respective location on the Statements of Assets and Liabilities (amounts in thousands):
Global Research Enhanced Index Fund
| | | | | | |
| Derivative Contracts | | Statements of Assets and Liabilities Location | | | |
| Gross Assets: | | | | Futures Contracts (a) | |
Equity contracts | | Receivables, Net Assets — Unrealized Appreciation | | $ | 1,424 | |
| | | | | | |
| | |
Gross Liabilities: | | | | | |
Equity contracts | | Payables, Net Assets — Unrealized Depreciation | | $ | (974 | ) |
| | | | | | |
| (a) | This amount represents the cumulative appreciation (depreciation) of futures contracts as reported on the SOIs. The Statements of Assets and Liabilities only reflect the current day variation margin receivable/payable from/to brokers. |
The following table presents the value of derivatives held as of April 30, 2015, by their primary underlying risk exposure and respective location on the Statements of Assets and Liabilities (amounts in thousands):
International Equity Fund
| | | | | | |
| Derivative Contracts | | Statements of Assets and Liabilities Location | | | |
| Gross Liabilities: | | | | Forward Foreign
Currency Exchange
Contracts | |
Foreign exchange contracts | | Payables | | $ | (20 | ) |
| | | | | | |
The following table presents the value of derivatives held as of April 30, 2015, by their primary underlying risk exposure and respective location on the Statements of Assets and Liabilities (amounts in thousands):
International Opportunities Fund
| | | | | | | | | | | | | | |
| Derivative Contracts | | Statements of Assets and Liabilities Location | |
| Gross Assets: | | | | Futures
Contracts (a) | | | Forward Foreign
Currency Exchange
Contracts | | | Total | |
Foreign exchange contracts | | Receivables | | $ | — | | | $ | 7,941 | | | $ | 7,941 | |
| | | | | | | | | | | | | | |
| | | | |
Gross Liabilities: | | | | | | | | | | | |
Equity contracts | | Payables, Net Assets — Unrealized Depreciation | | $ | (471 | ) | | $ | — | | | $ | (471 | ) |
Foreign exchange contracts | | Payables | | | — | | | | (6,744 | ) | | | (6,744 | ) |
| | | | | | | | | | | | | | |
Total | | | | $ | (471 | ) | | $ | (6,744 | ) | | $ | (7,215 | ) |
| | | | | | | | | | | | | | |
| (a) | This amount represents the cumulative appreciation (depreciation) of futures contracts as reported on the SOIs. The Statements of Assets and Liabilities only reflect the current day variation margin receivable/payable from/to brokers. |
| | | | | | |
| | | |
| 146 | | | | J.P. MORGAN INTERNATIONAL EQUITY FUNDS | | APRIL 30, 2015 |
The following table presents the value of derivatives held as of April 30, 2015, by their primary underlying risk exposure and respective location on the Statements of Assets and Liabilities (amounts in thousands):
International Research Enhanced Equity Fund
| | | | | | |
| Derivative Contracts | | Statements of Assets and Liabilities Location | | | |
| Gross Assets: | | | | Futures Contracts (a) | |
Equity contracts | | Receivables, Net Assets — Unrealized Appreciation | | $ | 122 | |
| | | | | | |
| | |
Gross Liabilities: | | | | | |
Equity contracts | | Payables, Net Assets — Unrealized Depreciation | | $ | (61 | ) |
| | | | | | |
| (a) | This amount represents the cumulative appreciation (depreciation) of futures contracts as reported on the SOIs. The Statements of Assets and Liabilities only reflect the current day variation margin receivable/payable from/to brokers. |
The following table presents the value of derivatives held as of April 30, 2015, by their primary underlying risk exposure and respective location on the Statements of Assets and Liabilities (amounts in thousands):
International Value Fund
| | | | | | |
| Derivative Contracts | | Statements of Assets and Liabilities Location | | | |
| Gross Assets: | | | | Forward Foreign
Currency Exchange
Contracts | |
Foreign exchange contracts | | Receivables | | $ | 43,448 | |
| | | | | | |
| | |
Gross Liabilities: | | | | | |
Foreign exchange contracts | | Payables | | $ | (37,804 | ) |
| | | | | | |
The following table presents the Fund’s gross derivative assets and liabilities by counterparty net of amounts available for offset under netting arrangements and any related collateral received or posted by the Fund as of April 30, 2015 (amounts in thousands):
International Value Fund
| | | | | | | | | | | | | | | | |
| Counterparty | | Gross Amount
of Derivative
Assets
Presented in the
Statement of
Assets and
Liabilities (a) | | | Derivatives
Available
for Offset | | | Collateral
Received | | | Net Amount Due From
Counterparty (not
less than zero) | |
Australia and New Zealand Banking Group Limited | | $ | 4,466 | | | $ | (3,454 | ) | | $ | — | | | $ | 1,012 | |
Barclays Bank plc | | | 1,257 | | | | (1,131 | ) | | | — | | | | 126 | |
BNP Paribas | | | 697 | | | | (697 | ) | | | — | | | | — | |
Citibank, N.A. | | | 146 | | | | (146 | ) | | | — | | | | — | |
Credit Suisse International | | | 2,705 | | | | (562 | ) | | | — | | | | 2,143 | |
Deutsche Bank AG | | | 8,887 | | | | (1,299 | ) | | | — | | | | 7,588 | |
Goldman Sachs International | | | 3,549 | | | | (2,607 | ) | | | — | | | | 942 | |
HSBC Bank, N.A. | | | 1,500 | | | | (1,500 | ) | | | — | | | | — | |
Morgan Stanley | | | 3,950 | | | | (450 | ) | | | — | | | | 3,500 | |
National Australia Bank | | | 62 | | | | (62 | ) | | | — | | | | — | |
Royal Bank of Canada | | | 1,540 | | | | (188 | ) | | | — | | | | 1,352 | |
Royal Bank of Scotland | | | 394 | | | | (394 | ) | | | — | | | | — | |
Standard Chartered Bank | | | 1,424 | | | | (409 | ) | | | — | | | | 1,015 | |
State Street Corp. | | | 309 | | | | (309 | ) | | | — | | | | — | |
TD Bank Financial Group | | | 139 | | | | — | | | | — | | | | 139 | |
Union Bank of Switzerland AG | | | 5,337 | | | | (1,469 | ) | | | — | | | | 3,868 | |
Westpac Banking Corp | | | 7,086 | | | | — | | | | — | | | | 7,086 | |
| | | | | | | | | | | | | | | | |
| | $ | 43,448 | | | $ | (14,677 | ) | | $ | — | | | $ | 28,771 | |
| | | | | | | | | | | | | | | | |
| | | | | | | | |
| | | |
| APRIL 30, 2015 | | J.P. MORGAN INTERNATIONAL EQUITY FUNDS | | | | | 147 | |
NOTES TO FINANCIAL STATEMENTS
AS OF APRIL 30, 2015 (Unaudited) (continued)
| | | | | | | | | | | | | | | | |
| Counterparty | | Gross Amount
of Derivative
Liabilities
Presented in the
Statement of
Assets and
Liabilities (a) | | | Derivatives
Available
for Offset | | | Collateral
Posted | | | Net Amount Due To
Counterparty (not
less than zero) | |
Australia and New Zealand Banking Group Limited | | $ | 3,454 | | | $ | (3,454 | ) | | $ | — | | | $ | — | |
Barclays Bank plc | | | 1,131 | | | | (1,131 | ) | | | — | | | | — | |
BNP Paribas | | | 700 | | | | (697 | ) | | | | | | | 3 | |
Citibank, N.A. | | | 7,562 | | | | (146 | ) | | | — | | | | 7,416 | |
Credit Suisse International | | | 562 | | | | (562 | ) | | | — | | | | — | |
Deutsche Bank AG | | | 1,299 | | | | (1,299 | ) | | | — | | | | — | |
Goldman Sachs International | | | 2,607 | | | | (2,607 | ) | | | — | | | | — | |
HSBC Bank, N.A. | | | 2,458 | | | | (1,500 | ) | | | — | | | | 958 | |
Morgan Stanley | | | 450 | | | | (450 | ) | | | — | | | | — | |
National Australia Bank | | | 514 | | | | (62 | ) | | | — | | | | 452 | |
Royal Bank of Canada | | | 188 | | | | (188 | ) | | | — | | | | — | |
Royal Bank of Scotland | | | 944 | | | | (394 | ) | | | — | | | | 550 | |
Societe Generale | | | 1,002 | | | | — | | | | — | | | | 1,002 | |
Standard Chartered Bank | | | 409 | | | | (409 | ) | | | — | | | | — | |
State Street Corp. | | | 13,055 | | | | (309 | ) | | | — | | | | 12,746 | |
Union Bank of Switzerland AG | | | 1,469 | | | | (1,469 | ) | | | — | | | | — | |
| | | | | | | | | | | | | | | | |
| | $ | 37,804 | | | $ | (14,677 | ) | | $ | — | | | $ | 23,127 | |
| | | | | | | | | | | | | | | | |
| (a) | For financial reporting purposes, the Fund does not offset derivative assets and derivative liabilities subject to master netting arrangements on the Statements of Assets and Liabilities. |
The Funds are party to various derivative contracts governed by International Swaps and Derivatives Association master agreements (“ISDA agreements”). The Funds’ ISDA agreements, which are separately negotiated with each dealer counterparty, may contain provisions allowing, absent other considerations, a counterparty to exercise rights, to the extent not otherwise waived, against the Funds in the event the Funds’ net assets decline over time by a pre-determined percentage or fall below a pre-determined floor. The ISDA agreements may also contain provisions allowing, absent other conditions, the Funds to exercise rights, to the extent not otherwise waived, against the counterparty (i.e. decline in a counterparty’s credit rating below a specified level). Such rights for both the counterparty and Funds often include the ability to terminate (i.e. close out) open contracts at prices which may favor the counterparty, which could have an adverse effect on the Funds. The ISDA agreements give the Funds and counterparty the right, upon an event of default, to close out all transactions traded under such agreements and to net amounts owed or due across all transactions and offset such net payable or receivable with collateral posted to a segregated account by one party to the other.
The following tables present the effect of derivatives on the Statements of Operations for the six months ended April 30, 2015, by primary underlying risk exposure (amounts in thousands):
Emerging Economies Fund
| | | | |
| Amount of Realized Gain (Loss) on Derivatives Recognized on Statements of Operations | |
| Derivative Contracts | | Forward Foreign
Currency Exchange
Contracts | |
Foreign exchange contracts | | $ | 192 | |
| | | | |
Emerging Markets Equity Income Fund
| | | | |
| Amount of Realized Gain (Loss) on Derivatives Recognized on Statements of Operations | |
| Derivative Contracts | | Forward Foreign
Currency Exchange
Contracts | |
Foreign exchange contracts | | $ | — | (a) |
| | | | |
| (a) | Amount rounds to less than $1,000. |
| | | | | | |
| | | |
| 148 | | | | J.P. MORGAN INTERNATIONAL EQUITY FUNDS | | APRIL 30, 2015 |
Global Research Enhanced Index Fund
| | | | |
| Amount of Realized Gain (Loss) on Derivatives Recognized on Statements of Operations | |
| Derivative Contracts | | Futures Contracts | |
Equity contracts | | $ | (1,943 | ) |
| | | | |
| | | | |
|
| Amount of Change in Unrealized Appreciation (Depreciation) on Derivatives Recognized on Statements of Operations | |
| Derivative Contracts | | Futures Contracts | |
Equity contracts | | $ | (6,415 | ) |
| | | | |
Global Unconstrained Equity Fund
| | | | |
| Amount of Realized Gain (Loss) on Derivatives Recognized on Statements of Operations | |
| Derivative Contracts | | Forward Foreign
Currency Exchange
Contracts | |
Foreign exchange contracts | | $ | — | (a) |
| | | | |
| (a) | Amount rounds to less than $1,000. |
International Equity Fund
| | | | |
| Amount of Realized Gain (Loss) on Derivatives Recognized on Statements of Operations | |
| Derivative Contracts | | Forward Foreign
Currency Exchange
Contracts | |
Foreign exchange contracts | | $ | 5 | |
| | | | |
| | | | |
|
| Amount of Change in Unrealized Appreciation (Depreciation) on Derivatives Recognized on Statements of Operations | |
| Derivative Contracts | | Forward Foreign
Currency Exchange
Contracts | |
Foreign exchange contracts | | $ | (20 | ) |
| | | | |
International Opportunities Fund
| | | | | | | | | | | | |
| Amount of Realized Gain (Loss) on Derivatives Recognized on Statements of Operations | |
| Derivative Contracts | | Futures Contracts | | | Forward Foreign
Currency Exchange
Contracts | | | Total | |
Equity contracts | | $ | 1,955 | | | $ | — | | | $ | 1,955 | |
Foreign exchange contracts | | | — | | | | (14,540 | ) | | | (14,540 | ) |
| | | | | | | | | | | | |
Total | | $ | 1,955 | | | $ | (14,540 | ) | | $ | (12,585 | ) |
| | | | | | | | | | | | |
| | | | | | | | | | | | |
| Amount of Change in Unrealized Appreciation (Depreciation) on Derivatives Recognized on Statements of Operations | |
| Derivative Contracts | | Futures Contracts | | | Forward Foreign
Currency Exchange
Contracts | | | Total | |
Equity contracts | | $ | (426 | ) | | $ | — | | | $ | (426 | ) |
Foreign exchange contracts | | | — | | | | 3,482 | | | | 3,482 | |
| | | | | | | | | | | | |
Total | | $ | (426 | ) | | $ | 3,482 | | | $ | 3,056 | |
| | | | | | | | | | | | |
International Research Enhanced Equity Fund
| | | | |
| Amount of Realized Gain (Loss) on Derivatives Recognized on Statements of Operations | |
| Derivative Contracts | | Futures Contracts | |
Equity contracts | | $ | 3,286 | |
| | | | |
| | | | | | | | |
| | | |
| APRIL 30, 2015 | | J.P. MORGAN INTERNATIONAL EQUITY FUNDS | | | | | 149 | |
NOTES TO FINANCIAL STATEMENTS
AS OF APRIL 30, 2015 (Unaudited) (continued)
| | | | |
| Amount of Change in Unrealized Appreciation (Depreciation) on Derivatives Recognized on Statements of Operations | |
| Derivative Contracts | | Futures Contracts | |
Equity contracts | | $ | 69 | |
| | | | |
International Unconstrained Equity Fund
| | | | |
| Amount of Realized Gain (Loss) on Derivatives Recognized on Statements of Operations | |
| Derivative Contracts | | Futures Contracts | |
Equity contracts | | $ | (9 | ) |
| | | | |
International Value Fund
| | | | | | | | | | | | |
| Amount of Realized Gain (Loss) on Derivatives Recognized on Statements of Operations | |
| Derivative Contracts | | Futures Contracts | | | Forward Foreign
Currency Exchange
Contracts | | | Total | |
Equity contracts | | $ | 4,479 | | | $ | — | | | $ | 4,479 | |
Foreign exchange contracts | | | — | | | | (5,580 | ) | | | (5,580 | ) |
| | | | | | | | | | | | |
Total | | $ | 4,479 | | | $ | (5,580 | ) | | $ | (1,101 | ) |
| | | | | | | | | | | | |
| | | | | | | | | | | | |
| Amount of Change in Unrealized Appreciation (Depreciation) on Derivatives Recognized on Statements of Operations | |
| Derivative Contracts | | Futures Contracts | | | Forward Foreign
Currency Exchange
Contracts | | | Total | |
Equity contracts | | $ | 484 | | | $ | — | | | $ | 484 | |
Foreign exchange contracts | | | — | | | | 2,450 | | | | 2,450 | |
| | | | | | | | | | | | |
Total | | $ | 484 | | | $ | 2,450 | | | $ | 2,934 | |
| | | | | | | | | | | | |
The Funds’ derivatives contracts held at April 30, 2015 are not accounted for as hedging instruments under GAAP.
F. Foreign Currency Translation — The books and records of the Funds are maintained in U.S. dollars. Foreign currency amounts are translated into U.S. dollars at the prevailing exchange rates of such currencies against the U.S. dollar. The market value of investment securities and other assets and liabilities are translated at the exchange rate as of the valuation date. Purchases and sales of investment securities, income and expenses are translated at the exchange rate prevailing on the respective dates of such transactions.
Although the net assets of the Funds are presented at the foreign exchange rates and market values at the close of the period, the Funds do not isolate that portion of the results of operations arising as a result of changes in the foreign exchange rates from the fluctuations arising from changes in the market prices of securities held. Accordingly, such foreign currency gains (losses) are included in the reported Change in net unrealized appreciation/depreciation on investment transactions on the Statements of Operations.
Reported realized foreign currency gains and losses arise from the disposition of foreign currency, currency gains or losses realized between the trade and settlement dates on securities transactions, and the difference between the amounts of dividends, interest and foreign withholding taxes recorded on each Fund’s books on the transaction date and the U.S. dollar equivalent of the amounts actually received or paid. These reported realized foreign currency gains and losses are included in Net realized gain (loss) on foreign currency transactions on the Statements of Operations. Unrealized foreign currency gains and losses arise from changes (due to changes in exchange rates) in the value of foreign currency and other assets and liabilities denominated in foreign currencies, which are held at period end and are included in Change in net unrealized appreciation/depreciation on foreign currency translations on the Statements of Operations.
G. Offering and Organizational Costs — Total offering costs of approximately $120,000 incurred in connection with the offering of shares of Emerging Markets Equity Income Fund are amortized on a straight line basis over 12 months from the date the Fund commenced operations. Costs paid in connection with the organization of the Fund, if any, were recorded as an expense at the time the Fund commenced operations and are included as part of Professional fees on the Statements of Operations. For the period ended April 30, 2015, total offering costs amortized were approximately $45,000.
H. Security Transactions and Investment Income — Investment transactions are accounted for on the trade date (the date the order to buy or sell is executed). Securities gains and losses are calculated on a specifically identified cost basis. Interest income is determined on the basis of coupon interest accrued using the effective interest method which adjusts for amortization of premiums and accretion of discounts. Dividend income net of foreign taxes withheld, if any, is recorded on the ex-dividend date or when a fund first learns of the dividend.
I. Allocation of Income and Expenses — Expenses directly attributable to a fund are charged directly to that fund, while the expenses attributable to more than one fund of the Trusts are allocated among the respective funds. In calculating the NAV of each class, investment income, realized and
| | | | | | |
| | | |
| 150 | | | | J.P. MORGAN INTERNATIONAL EQUITY FUNDS | | APRIL 30, 2015 |
unrealized gains and losses and expenses, other than class specific expenses, are allocated daily to each class of shares based upon the proportion of net assets of each class at the beginning of each day.
Sub-transfer agent fees are class-specific expenses. The amount of the Sub-transfer agent fees charged to each class of the Funds for the six months ended April 30, 2015 are as follows (amounts in thousands):
| | | | | | | | | | | | | | | | | | | | | | | | | | | | |
| | | Class A | | | Class B | | | Class C | | | Class R2 | | | Class R5 | | | Institutional Class | | | Select Class | |
Emerging Economies Fund | | $ | 81 | | | $ | — | | | $ | 3 | | | $ | — | | | $ | 1 | | | $ | — | | | $ | 13 | |
Emerging Markets Equity Fund | | | 272 | | | | 2 | | | | 33 | | | | — | | | | — | | | | 178 | | | | 186 | |
Global Research Enhanced Index Fund | | | — | | | | — | | | | — | | | | — | | | | — | | | | — | | | | 3 | |
International Equity Fund | | | 158 | | | | 1 | | | | 15 | | | | 1 | | | | 32 | | | | — | | | | 87 | |
International Equity Income Fund | | | 18 | | | | — | | | | 2 | | | | — | | | | — | | | | — | | | | 8 | |
International Opportunities Fund | | | 107 | | | | — | (a) | | | 1 | | | | — | | | | — | | | | 3 | | | | 6 | |
International Research Enhanced Equity Fund | | | 55 | | | | 2 | | | | 17 | | | | 6 | | | | — | | | | — | | | | 18 | |
International Unconstrained Equity Fund | | | — | (a) | | | — | | | | — | (a) | | | — | | | | — | | | | — | | | | — | |
International Value Fund | | | 498 | | | | 1 | | | | 23 | | | | 4 | | | | — | | | | 1,766 | | | | 52 | |
Intrepid International Fund | | | 109 | | | | — | | | | 1 | | | | — | (a) | | | — | | | | — | (a) | | | 6 | |
| (a) | Amount rounds to less than $1,000. |
J. Federal Income Taxes — Each Fund is treated as a separate taxable entity for Federal income tax purposes. Each Fund’s policy is to comply with the provisions of the Internal Revenue Code of 1986, as amended (the “Code”), applicable to regulated investment companies and to distribute to shareholders all of its distributable net investment income and net realized capital gains on investments. Accordingly, no provision for Federal income tax is necessary. Management has reviewed the Funds’ tax positions for all open tax years and has determined that as of April 30, 2015, no liability for income tax is required in the Funds’ financial statements for net unrecognized tax benefits. However, management’s conclusions may be subject to future review based on changes in, or the interpretation of, the accounting standards or tax laws and regulations. Each of the Funds’ Federal tax returns for the prior three fiscal years, or since inception if shorter, remains subject to examination by the Internal Revenue Service.
K. Foreign Taxes — The Funds may be subject to foreign taxes on income, gains on investments or currency purchases/repatriation, a portion of which may be recoverable. The Funds will accrue such taxes and recoveries as applicable, based upon their current interpretation of tax rules and regulations that exist in the markets in which they invest. The Funds are subject to a tax imposed on short-term capital gains on securities of issuers domiciled in India. The Funds record an estimated deferred tax liability for these securities that have been held for less than one year at the end of the reporting period, assuming those positions were disposed of at the end of the period. This amount, if any, is reported as Deferred India capital gains tax in the accompanying Statements of Assets and Liabilities. Short-term realized capital losses on the sale of securities of issuers domiciled in India can be carried forward for eight years to offset potential future short-term realized capital gains.
India has enacted rules imposing a tax on indirect transfers of Indian shares, although additional guidance from the Indian tax authorities is awaited. At present, management does not believe that such tax will be applicable to the Funds. However, management’s conclusion, regarding this and other foreign tax matters, may be subject to future review based on changes in, or the interpretation of, the accounting standards and the tax laws and regulations.
L. Distributions to Shareholders — Distributions from net investment income if any, are generally declared and paid annually, except for International Equity Income Fund, which are declared and paid monthly and for International Equity Fund, which are declared and paid quarterly. Distributions are declared separately for each class. No class has preferential dividend rights; differences in per share rates are due to differences in separate class expenses. Net realized capital gains, if any, are distributed by each Fund at least annually. The amount of distributions from net investment income and net realized capital gains is determined in accordance with Federal income tax regulations, which may differ from GAAP. To the extent these “book/tax” differences are permanent in nature (i.e., that they result from other than timing of recognition — “temporary differences”), such amounts are reclassified within the capital accounts based on their Federal tax-basis treatment.
3. Fees and Other Transactions with Affiliates
A. Investment Advisory Fee — Pursuant to the Investment Advisory Agreements, J.P. Morgan Investment Management Inc. (the “Adviser” or “JPMIM”), an indirect, wholly-owned subsidiary of JPMorgan Chase & Co. (“JPMorgan”), supervises the investments of each Fund and for such services is paid a fee. The fee is accrued daily and paid monthly based on each Fund’s respective average daily net assets.
The annual rate for each Fund is as follows:
| | | | |
Emerging Economies Fund | | | 1.00 | % |
Emerging Markets Equity Fund | | | 1.00 | |
Emerging Markets Equity Income Fund | | | 1.00 | |
Global Research Enhanced Index Fund | | | 0.20 | |
Global Unconstrained Equity Fund | | | 0.70 | (a) |
International Equity Fund | | | 0.80 | |
| | | | | | | | |
| | | |
| APRIL 30, 2015 | | J.P. MORGAN INTERNATIONAL EQUITY FUNDS | | | | | 151 | |
NOTES TO FINANCIAL STATEMENTS
AS OF APRIL 30, 2015 (Unaudited) (continued)
| | | | |
International Equity Income Fund | | | 0.70 | %(a) |
International Opportunities Fund | | | 0.60 | |
International Research Enhanced Equity Fund | | | 0.20 | (b) |
International Unconstrained Equity Fund | | | 0.70 | (a) |
International Value Fund | | | 0.60 | |
Intrepid International Fund | | | 0.60 | (c) |
| (a) | Prior to December 1, 2014, the investment advisory fee was 0.80% for Global Unconstrained Equity Fund, International Equity Income Fund and International Unconstrained Equity Fund. |
| (b) | Prior to May 20, 2014, the investment advisory fee was 0.55% for International Research Enhanced Equity Fund. |
| (c) | Prior to March 1, 2015, the investment advisory fee was 0.80% for Intrepid International Fund. |
The Adviser waived Investment Advisory fees and/or reimbursed expenses as outlined in Note 3.F.
B. Administration Fee — Pursuant to Administration Agreements, the Administrator, an indirect, wholly-owned subsidiary of JPMorgan, provides certain administration services to the Funds. In consideration of these services, the Administrator receives a fee accrued daily and paid monthly at an annual rate of 0.15% of the first $25 billion of the average daily net assets of all funds in the J.P. Morgan Funds Complex covered by the Administration Agreement (excluding certain funds of funds and money market funds) and 0.075% of the average daily net assets in excess of $25 billion of all such funds. For the six months ended April 30, 2015, the effective annualized rate was 0.08% of each Fund’s average daily net assets, notwithstanding any fee waivers and/or expense reimbursements.
The Administrator waived Administration fees as outlined in Note 3.F.
JPMorgan Chase Bank, N.A. (“JPMCB”), a wholly-owned subsidiary of JPMorgan, serves as the Funds’ sub-administrator (the “Sub-administrator”). For its services as Sub-administrator, JPMCB receives a portion of the fees payable to the Administrator.
C. Distribution Fees — Pursuant to Distribution Agreements, JPMorgan Distribution Services, Inc. (the “Distributor”), a wholly-owned subsidiary of JPMorgan, serves as the Trusts’ exclusive underwriter and promotes and arranges for the sale of each Fund’s shares.
The Board has adopted a Distribution Plan (the “Distribution Plan”) for Class A, Class B, Class C and Class R2 Shares of the Funds, as applicable, in accordance with Rule 12b-1 under the 1940 Act. The Distribution Plan provides that each Fund shall pay distribution fees, including payments to the Distributor, at annual rates of the average daily net assets as shown in the table below:
| | | | | | | | | | | | | | | | |
| | | Class A | | | Class B | | | Class C | | | Class R2 | |
Emerging Economies Fund | | | 0.25 | % | | | n/a | | | | 0.75 | % | | | n/a | |
Emerging Markets Equity Fund | | | 0.25 | | | | 0.75 | % | | | 0.75 | | | | n/a | |
Emerging Markets Equity Income Fund | | | 0.25 | | | | n/a | | | | 0.75 | | | | n/a | |
Global Research Enhanced Index Fund | | | 0.25 | | | | n/a | | | | 0.75 | | | | 0.50 | % |
Global Unconstrained Equity Fund | | | 0.25 | | | | n/a | | | | 0.75 | | | | 0.50 | |
International Equity Fund | | | 0.25 | | | | 0.75 | | | | 0.75 | | | | 0.50 | |
International Equity Income Fund | | | 0.25 | | | | n/a | | | | 0.75 | | | | 0.50 | |
International Opportunities Fund | | | 0.25 | | | | 0.75 | | | | 0.75 | | | | n/a | |
International Research Enhanced Equity Fund | | | 0.25 | | | | 0.75 | | | | 0.75 | | | | 0.50 | |
International Unconstrained Equity Fund | | | 0.25 | | | | n/a | | | | 0.75 | | | | 0.50 | |
International Value Fund | | | 0.25 | | | | 0.75 | | | | 0.75 | | | | 0.50 | |
Intrepid International Fund | | | 0.25 | | | | n/a | | | | 0.75 | | | | 0.50 | |
In addition, the Distributor is entitled to receive the front-end sales charges from purchases of Class A Shares and the CDSC from redemptions of Class B and Class C Shares and certain Class A Shares for which front-end sales charges have been waived. For the six months ended April 30, 2015, the Distributor retained the following amounts (in thousands):
| | | | | | | | |
| | | Front-End Sales Charge | | | CDSC | |
Emerging Economies Fund | | $ | 3 | | | $ | — | (a) |
Emerging Markets Equity Fund | | | 38 | | | | — | (a) |
International Equity Fund | | | 11 | | | | — | (a) |
International Equity Income Fund | | | 13 | | | | — | (a) |
International Opportunities Fund | | | 2 | | | | — | |
International Research Enhanced Equity Fund | | | 6 | | | | — | (a) |
International Unconstrained Equity Fund | | | 1 | | | | — | (a) |
International Value Fund | | | 184 | | | | — | (a) |
Intrepid International Fund | | | 1 | | | | — | |
| (a) | Amount rounds to less than $1,000. |
| | | | | | |
| | | |
| 152 | | | | J.P. MORGAN INTERNATIONAL EQUITY FUNDS | | APRIL 30, 2015 |
D. Shareholder Servicing Fees — The Trusts, on behalf of the Funds, have entered into a Shareholder Servicing Agreement with the Distributor under which the Distributor provides certain support services to the shareholders. The Class R6 Shares do not participate in the Shareholder Servicing Agreement. For performing these services, the Distributor receives a fee that is accrued daily and paid monthly equal to a percentage of the average daily net assets as shown in the table below:
| | | | | | | | | | | | | | | | | | | | | | | | | | | | |
| | | Class A | | | Class B | | | Class C | | | Class R2 | | | Class R5 | | | Institutional Class | | | Select Class | |
Emerging Economies Fund | | | 0.25 | % | | | n/a | | | | 0.25 | % | | | n/a | | | | 0.05 | % | | | n/a | | | | 0.25 | % |
Emerging Markets Equity Fund | | | 0.25 | | | | 0.25 | % | | | 0.25 | | | | n/a | | | | n/a | | | | 0.10 | % | | | 0.25 | |
Emerging Markets Equity Income Fund | | | 0.25 | | | | n/a | | | | 0.25 | | | | n/a | | | | 0.05 | | | | n/a | | | | 0.25 | |
Global Research Enhanced Index Fund | | | 0.25 | | | | n/a | | | | 0.25 | | | | 0.25 | % | | | n/a | | | | n/a | | | | 0.25 | |
Global Unconstrained Equity Fund | | | 0.25 | | | | n/a | | | | 0.25 | | | | 0.25 | | | | 0.05 | | | | n/a | | | | 0.25 | |
International Equity Fund | | | 0.25 | | | | 0.25 | | | | 0.25 | | | | 0.25 | | | | 0.05 | | | | n/a | | | | 0.25 | |
International Equity Income Fund | | | 0.25 | | | | n/a | | | | 0.25 | | | | 0.25 | | | | 0.05 | | | | n/a | | | | 0.25 | |
International Opportunities Fund | | | 0.25 | | | | 0.25 | | | | 0.25 | | | | n/a | | | | n/a | | | | 0.10 | | | | 0.25 | |
International Research Enhanced Equity Fund | | | 0.25 | | | | 0.25 | | | | 0.25 | | | | 0.25 | | | | n/a | | | | n/a | | | | 0.25 | |
International Unconstrained Equity Fund | | | 0.25 | | | | n/a | | | | 0.25 | | | | 0.25 | | | | 0.05 | | | | n/a | | | | 0.25 | |
International Value Fund | | | 0.25 | | | | 0.25 | | | | 0.25 | | | | 0.25 | | | | n/a | | | | 0.10 | | | | 0.25 | |
Intrepid International Fund | | | 0.25 | | | | n/a | | | | 0.25 | | | | 0.25 | | | | n/a | | | | 0.10 | | | | 0.25 | |
The Distributor has entered into shareholder services contracts with affiliated and unaffiliated financial intermediaries who provide shareholder services and other related services to their clients or customers who invest in the Funds under which the Distributor will pay all or a portion of such fees earned to financial intermediaries for performing such services.
The Distributor waived Shareholder Servicing fees as outlined in Note 3.F.
E. Custodian and Accounting Fees — JPMCB provides portfolio and accounting services to the Funds. For these services, the Funds pay JPMCB transaction and asset-based fees that vary according to the number of transactions and positions, plus out-of-pocket expenses. The amounts paid directly to JPMCB by the Funds for custody and accounting services are included in Custodian and accounting fees on the Statements of Operations.
Interest income earned on cash balances at the custodian, if any, is included as Interest income from affiliates on the Statements of Operations.
Interest expense paid to the custodian related to cash overdrafts, if any, is included in Interest expense to affiliates on the Statements of Operations.
F. Waivers and Reimbursements — The Adviser, Administrator and Distributor have contractually agreed to waive fees and/or reimburse the Funds to the extent that total annual operating expenses (excluding acquired fund fees and expenses, dividend expenses related to short sales, interest, taxes, expenses related to litigation and potential litigation, extraordinary expenses and expenses related to the Board’s deferred compensation plan) exceed the percentages of the Funds’ respective average daily net assets as shown in the table below:
| | | | | | | | | | | | | | | | | | | | | | | | | | | | | | | | |
| | | Class A | | | Class B | | | Class C | | | Class R2 | | | Class R5 | | | Class R6 | | | Institutional Class | | | Select Class | |
Emerging Economies Fund | | | 1.60 | % | | | n/a | | | | 2.10 | % | | | n/a | | | | 1.15 | % | | | n/a | | | | n/a | | | | 1.35 | % |
Emerging Markets Equity Fund* | | | 1.55 | | | | 2.05 | % | | | 2.05 | | | | n/a | | | | n/a | | | | 1.05 | % | | | 1.15 | % | | | 1.30 | |
Emerging Markets Equity Income Fund | | | 1.60 | | | | n/a | | | | 2.10 | | | | n/a | | | | 1.15 | | | | 1.10 | | | | n/a | | | | 1.35 | |
Global Research Enhanced Index Fund | | | 0.59 | | | | n/a | | | | 1.09 | | | | 0.84 | % | | | n/a | | | | n/a | | | | n/a | | | | 0.34 | |
Global Unconstrained Equity Fund** | | | 1.25 | | | | n/a | | | | 1.75 | | | | 1.50 | | | | 0.80 | | | | 0.75 | | | | n/a | | | | 0.90 | |
International Equity Fund | | | 1.31 | | | | 1.81 | | | | 1.81 | | | | 1.56 | | | | 0.86 | | | | 0.81 | | | | n/a | | | | 1.06 | |
International Equity Income Fund | | | 1.25 | | | | n/a | | | | 1.75 | | | | 1.50 | | | | 0.80 | | | | 0.75 | | | | n/a | | | | 0.90 | *** |
International Opportunities Fund | | | 1.31 | | | | 1.92 | | | | 1.92 | | | | n/a | | | | n/a | | | | 0.81 | | | | 0.91 | | | | 1.06 | |
International Research Enhanced Equity Fund | | | 0.60 | | | | 1.10 | | | | 1.10 | | | | 0.85 | | | | n/a | | | | n/a | | | | n/a | | | | 0.35 | |
International Unconstrained Equity Fund**** | | | 1.25 | | | | n/a | | | | 1.75 | | | | 1.50 | | | | 0.80 | | | | 0.75 | | | | n/a | | | | 0.90 | |
International Value Fund | | | 1.35 | | | | 1.85 | | | | 1.85 | | | | 1.60 | | | | n/a | | | | 0.85 | | | | 0.95 | | | | 1.10 | |
Intrepid International Fund***** | | | 1.25 | | | | n/a | | | | 1.75 | | | | 1.50 | | | | n/a | | | | n/a | | | | 0.85 | | | | 0.90 | |
| * | Prior to March 1, 2015, the contractual expense limitations for Emerging Markets Equity Fund were 1.70%, 2.20%, 2.20%, 1.20%, 1.30% and 1.45% for Class A, Class B, Class C, Class R6, Institutional Class and Select Class Shares, respectively. |
| ** | Prior to December 1, 2014, the contractual expense limitations for Global Unconstrained Equity Fund were 1.35%, 1.85%, 1.60%, 0.90%, 0.85% and 1.10% for Class A, Class C, Class R2, Class R5, Class R6 and Select Class Shares, respectively. |
| *** | Prior to December 1, 2014, the contractual expense limitation for the Select Class Shares of International Equity Income Fund was 1.00%. |
| **** | Prior to December 1, 2014, the contractual expense limitations for International Unconstrained Equity Fund are 1.32%, 1.82%, 1.57%, 0.87%, 0.82% and 1.07% for Class A, Class C, Class R2, Class R5, Class R6 and Select Class Shares, respectively. |
| ***** | Prior to March 1, 2015, the contractual expense limitations for Intrepid International Fund were 1.40%, 1.90%, 1.65%, 0.90% and 1.15% for Class A, Class C, Class R2, Institutional Class and Select Class Shares, respectively. |
| | | | | | | | |
| | | |
| APRIL 30, 2015 | | J.P. MORGAN INTERNATIONAL EQUITY FUNDS | | | | | 153 | |
NOTES TO FINANCIAL STATEMENTS
AS OF APRIL 30, 2015 (Unaudited) (continued)
Except as noted above, the expense limitation agreements were in effect for the six months ended April 30, 2015 and are in place until February 29, 2016.
For the six months ended April 30, 2015, the Funds’ service providers waived fees and/or reimbursed expenses for each of the Funds as follows (amounts in thousands). None of these parties expect the Funds to repay any such waived fees and/or reimbursed expenses in future years.
| | | | | | | | | | | | | | | | | | | | |
| | | Contractual Waivers | | | | |
| | | Investment Advisory | | | Administration | | | Shareholder Servicing | | | Total | | | Contractual Reimbursements | |
Emerging Economies Fund | | $ | 232 | | | $ | 154 | | | $ | 85 | | | $ | 471 | | | $ | 13 | |
Emerging Markets Equity Fund | | | 261 | | | | 174 | | | | 546 | | | | 981 | | | | 68 | |
Emerging Markets Equity Income Fund | | | 12 | | | | 1 | | | | — | | | | 13 | | | | 104 | |
Global Research Enhanced Index Fund | | | 3,428 | | | | 2,204 | | | | 2 | | | | 5,634 | | | | — | (a) |
Global Unconstrained Equity Fund | | | 16 | | | | 2 | | | | 2 | | | | 20 | | | | 98 | |
International Equity Fund | | | 803 | | | | 535 | | | | 290 | | | | 1,628 | | | | 12 | |
International Equity Income Fund | | | 112 | | | | 40 | | | | 40 | | | | 192 | | | | — | |
International Opportunities Fund | | | — | | | | — | | | | 70 | | | | 70 | | | | 2 | |
International Research Enhanced Equity Fund | | | 652 | | | | 291 | | | | 83 | | | | 1,026 | | | | 4 | |
International Unconstrained Equity Fund | | | 24 | | | | 3 | | | | 3 | | | | 30 | | | | 85 | |
International Value Fund | | | — | | | | — | | | | 311 | | | | 311 | | | | 33 | |
Intrepid International Fund | | | 261 | | | | 173 | | | | 245 | | | | 679 | | | | — | (a) |
| (a) | Amount rounds to less than $1,000. |
Additionally, the Funds may invest in one or more money market funds advised by the Adviser or its affiliates. The Adviser, Administrator and Distributor, as shareholder servicing agent, waive fees in an amount sufficient to offset the respective fees each charges to the affiliated money market fund on the Funds’ investment in such affiliated money market fund. A portion of the waiver is voluntary.
The amounts of these waivers resulting from investments in these money market funds for the six months ended April 30, 2015 were as follows (amounts in thousands):
| | | | |
Emerging Economies Fund | | $ | 11 | |
Emerging Markets Equity Fund | | | 36 | |
Global Research Enhanced Index Fund | | | 226 | |
International Equity Fund | | | 58 | |
International Equity Income Fund | | | 3 | |
International Opportunities Fund | | | 30 | |
International Research Enhanced Equity Fund | | | 22 | |
International Value Fund | | | 33 | |
Intrepid International Fund | | | 46 | |
G. Other — Certain officers of the Trusts are affiliated with the Adviser, the Administrator and the Distributor. Such officers, with the exception of the Chief Compliance Officer, receive no compensation from the Funds for serving in their respective roles.
The Board appointed a Chief Compliance Officer to the Funds in accordance with Federal securities regulations. Each Fund, along with other affiliated funds, makes reimbursement payments, on a pro-rata basis, to the Administrator for a portion of the fees associated with the Office of the Chief Compliance Officer. Such fees are included in Trustees’ and Chief Compliance Officer’s fees on the Statements of Operations.
The Trusts adopted a Trustee Deferred Compensation Plan (the “Plan”) which allows the Independent Trustees to defer the receipt of all or a portion of compensation related to performance of their duties as Trustees. The deferred fees are invested in various J.P. Morgan Funds until distribution in accordance with the Plan.
During the six months ended April 30, 2015, the Funds may have purchased securities from an underwriting syndicate in which the principal underwriter or members of the syndicate are affiliated with the Adviser.
The Funds may use related party broker-dealers. For the six months ended April 30, 2015, the Funds incurred brokerage commissions with broker-dealers affiliated with the Adviser as follows (amounts in thousands):
| | | | |
Emerging Economics Fund | | $ | 7 | |
Emerging Markets Equity Fund | | | 14 | |
Emerging Markets Equity Income Fund | | | — | (a) |
Global Research Enhanced Index Fund | | | 21 | |
Global Unconstrained Equity Fund | | | — | (a) |
| | | | | | |
| | | |
| 154 | | | | J.P. MORGAN INTERNATIONAL EQUITY FUNDS | | APRIL 30, 2015 |
| | | | |
International Equity Fund | | $ | 9 | |
International Equity Income Fund | | | 1 | |
International Opportunities Fund | | | 10 | |
International Research Enhanced Equity Fund | | | 2 | |
International Value Fund | | | 38 | |
Intrepid International Fund | | | 15 | |
| (a) | Amount rounds to less than $1,000. |
The Securities and Exchange Commission (“SEC”) has granted an exemptive order permitting the Funds to engage in principal transactions with J.P. Morgan Securities, Inc., an affiliated broker, involving taxable money market instruments, subject to certain conditions.
4. Investment Transactions
During the six months ended April 30, 2015, purchases and sales of investments (excluding short-term investments) were as follows (amounts in thousands):
| | | | | | | | |
| | | Purchases
(excluding U.S.
Government) | | | Sales
(excluding U.S.
Government) | |
Emerging Economies Fund | | $ | 418,141 | | | $ | 806,398 | |
Emerging Markets Equity Fund | | | 350,399 | | | | 667,735 | |
Emerging Markets Equity Income Fund | | | 3,289 | | | | 375 | |
Global Research Enhanced Index Fund | | | 3,727,863 | | | | 1,050,247 | |
Global Unconstrained Equity Fund | | | 2,126 | | | | 2,178 | |
International Equity Fund | | | 452,066 | | | | 201,417 | |
International Equity Income Fund | | | 128,214 | | | | 146,779 | |
International Opportunities Fund | | | 495,037 | | | | 420,781 | |
International Research Enhanced Equity Fund | | | 229,736 | | | | 128,463 | |
International Unconstrained Equity Fund | | | 16,956 | | | | 2,744 | |
International Value Fund | | | 1,342,362 | | | | 2,672,445 | |
Intrepid International Fund | | | 724,472 | | | | 343,492 | |
During the six months ended April 30, 2015, there were no purchases or sales of U.S. Government securities.
5. Federal Income Tax Matters
For Federal income tax purposes, the cost and unrealized appreciation (depreciation) in value of investment securities held at April 30, 2015 were as follows (amounts in thousands):
| | | | | | | | | | | | | | | | |
| | | Aggregate Cost | | | Gross Unrealized Appreciation | | | Gross Unrealized Depreciation | | | Net Unrealized Appreciation (Depreciation) | |
Emerging Economies Fund | | $ | 730,300 | | | $ | 148,461 | | | $ | 39,134 | | | $ | 109,327 | |
Emerging Markets Equity Fund | | | 1,782,247 | | | | 442,618 | | | | 123,454 | | | | 319,164 | |
Emerging Markets Equity Income Fund | | | 2,894 | | | | 235 | | | | 95 | | | | 140 | |
Global Research Enhanced Index Fund | | | 5,927,529 | | | | 639,643 | | | | 61,038 | | | | 578,605 | |
Global Unconstrained Equity Fund | | | 4,218 | | | | 710 | | | | 66 | | | | 644 | |
International Equity Fund | | | 2,347,865 | | | | 538,293 | | | | 74,172 | | | | 464,121 | |
International Equity Income Fund | | | 92,317 | | | | 6,579 | | | | 943 | | | | 5,636 | |
International Opportunities Fund | | | 1,707,710 | | | | 265,504 | | | | 26,544 | | | | 238,960 | |
International Research Enhanced Equity Fund | | | 688,796 | | | | 129,774 | | | | 13,335 | | | | 116,439 | |
International Unconstrained Equity Fund | | | 20,072 | | | | 1,156 | | | | 69 | | | | 1,087 | |
International Value Fund | | | 2,180,143 | | | | 346,717 | | | | 42,726 | | | | 303,991 | |
Intrepid International Fund | | | 1,763,919 | | | | 216,405 | | | | 33,700 | | | | 182,705 | |
Under the Regulated Investment Company Modernization Act of 2010 (the “Act”), net capital losses recognized by the Funds after October 31, 2011, are carried forward indefinitely, and retain their character as short-term and/or long-term losses. Prior to the Act, net capital losses incurred by the Funds were carried forward for eight years and treated as short-term losses. The Act requires that post-enactment net capital losses be used before pre-enactment net capital losses.
| | | | | | | | |
| | | |
| APRIL 30, 2015 | | J.P. MORGAN INTERNATIONAL EQUITY FUNDS | | | | | 155 | |
NOTES TO FINANCIAL STATEMENTS
AS OF APRIL 30, 2015 (Unaudited) (continued)
At October 31, 2014, the following Funds had post-enactment net capital loss carryforwards as follows (amounts in thousands):
| | | | | | | | |
| | | Capital Loss Carryforward Character | |
| | | Short-Term | | | Long-Term | |
Emerging Economies Fund | | $ | 34,954 | | | $ | 35,501 | |
At October 31, 2014, the following Funds had pre-enactment net capital loss carryforwards, expiring during the years indicated, which are available to offset future realized gains as follows (amounts in thousands):
| | | | | | | | | | | | | | | | | | | | |
| | | 2016 | | | 2017 | | | 2018 | | | 2019 | | | Total | |
Emerging Economies Fund | | $ | — | | | $ | 1,890 | | | $ | — | | | $ | 16,730 | | | $ | 18,620 | |
Emerging Markets Equity Fund | | | — | | | | 4,903 | | | | — | | | | — | | | | 4,903 | |
International Equity Fund | | | — | | | | — | | | | 4,532 | | | | 3,312 | | | | 7,844 | |
International Opportunities Fund | | | — | | | | — | | | | — | | | | 5,449 | | | | 5,449 | |
International Value Fund | | | 35,803 | | | | 241,545 | | | | 63,767 | | | | — | | | | 341,115 | |
Intrepid International Fund | | | 281,509 | | | | 250,971 | | | | — | | | | — | | | | 532,480 | |
6. Borrowings
The Funds rely upon an exemptive order granted by the SEC (the “Order”) permitting the establishment and operation of an Interfund Lending Facility (the “Facility”). The Facility allows the Funds to directly lend and borrow money to or from any other fund relying upon the Order at rates beneficial to both the borrowing and lending funds. Advances under the Facility are taken primarily for temporary or emergency purposes, including the meeting of redemption requests that otherwise might require the untimely disposition of securities, and are subject to each Fund’s borrowing restrictions. The Interfund loan rate is determined, as specified in the Order, by averaging the current repurchase agreement rate and the current bank loan rate. The Order was granted to JPM II and may be relied upon by the Funds because the Funds and the series of JPM II are all investment companies in the same “group of investment companies” (as defined in Section 12(d)(1)(G) of the 1940 Act).
In addition, the Trusts and JPMCB have entered into a financing arrangement. Under this arrangement, JPMCB provides an unsecured, uncommitted credit facility in the aggregate amount of $100 million to certain of the J.P. Morgan Funds, including the Funds. Advances under the arrangement are taken primarily for temporary or emergency purposes, including the meeting of redemption requests that otherwise might require the untimely disposition of securities, and are subject to each Fund’s borrowing restrictions. Interest on borrowings is payable at a rate determined by JPMCB at the time of borrowing. This agreement has been extended until November 9, 2015.
The Funds had no borrowings outstanding from another fund or from the unsecured, uncommitted credit facility at April 30, 2015. Average borrowings from the Facility for, or at any time during, the six months ended April 30, 2015, were as follows (amounts in thousands):
| | | | | | | | | | | | | | | | |
| | | Average
Borrowings | | | Average Interest
Rate Paid | | | Number of Days
Outstanding | | | Interest Paid | |
Emerging Economies Fund | | $ | 60,897 | | | | 0.23 | % | | | 27 | | | $ | 10 | |
Emerging Markets Equity Fund | | | 86,600 | | | | 0.23 | | | | 20 | | | | 11 | |
International Equity Income Fund | | | 12,624 | | | | 0.23 | | | | 2 | | | | — | (a) |
International Opportunities Fund | | | 31,722 | | | | 0.21 | | | | 4 | | | | 1 | |
International Value Fund | | | 83,581 | | | | 0.24 | | | | 11 | | | | 6 | |
| (a) | Amount rounds to less than $1,000. |
Interest expense paid as a result of borrowings from another fund or from the unsecured, uncommitted credit facility is included in Interest expense to affiliates on the Statements of Operations.
7. Risks, Concentrations and Indemnifications
In the normal course of business, the Funds enter into contracts that contain a variety of representations which provide general indemnifications. Each Fund’s maximum exposure under these arrangements is unknown. The amount of exposure would depend on future claims that may be made against each Fund that have not yet occurred. However, based on experience, the Funds expect the risk of loss to be remote.
One or more affiliates of the Adviser have investment discretion with respect to their clients’ holdings in the Funds, which collectively represent a significant portion of the Funds’ assets for each of Global Research Enhanced Index Fund and International Value Fund.
| | | | | | |
| | | |
| 156 | | | | J.P. MORGAN INTERNATIONAL EQUITY FUNDS | | APRIL 30, 2015 |
As of April 30, 2015, the J.P. Morgan Investor Funds and the JPMorgan SmartRetirement Funds, which are affiliated funds of funds, own, in the aggregate, more than 10% of the net assets of the Funds as follows:
| | | | | | | | |
| | | J.P. Morgan Investor
Funds | | | JPMorgan SmartRetirement Funds | |
Emerging Economies Fund | | | 24.5 | % | | | 51.8 | % |
Emerging Markets Equity Fund | | | n/a | | | | 29.4 | |
International Equity Fund | | | 13.6 | | | | 59.3 | |
International Opportunities Fund | | | n/a | | | | 72.1 | |
International Research Enhanced Equity Fund | | | 73.8 | | | | n/a | |
International Unconstrained Equity Fund | | | 84.3 | | | | n/a | |
Intrepid International Fund | | | n/a | | | | 84.9 | |
Additionally, the Adviser owns a significant portion of the outstanding shares of Emerging Markets Equity Income Fund and Global Unconstrained Equity Fund.
International Value Fund has shareholders, which are accounts maintained by financial intermediaries on behalf of their clients, that own a significant portion of the Fund’s outstanding shares.
Significant shareholder transactions by these shareholders may impact the Funds’ performance.
The Funds may have elements of risk not typically associated with investments in the United States of America due to concentrated investments in a limited number of countries or regions, which may vary throughout the year depending on the Fund. Such concentrations may subject the Funds to additional risks resulting from political or economic conditions in such countries or regions and the possible imposition of adverse governmental laws or currency exchange restrictions could cause the securities and their markets to be less liquid and their prices to be more volatile than those of comparable U.S. securities.
As of April 30, 2015, a significant portion of each Fund’s net assets consisted of securities that were denominated in foreign currencies. Changes in currency exchange rates will affect the value of, and investment income from, such securities.
As of April 30, 2015, the Funds had the following country allocations representing greater than 10% of total investments:
| | | | | | | | | | | | | | | | | | | | | | | | |
| | | Brazil | | | China | | | France | | | Germany | | | India | | | Japan | |
Emerging Economies Fund | | | — | | | | 25.0 | % | | | — | | | | — | | | | — | | | | — | |
Emerging Markets Equity Fund | | | — | | | | — | | | | — | | | | — | | | | 16.5 | % | | | — | |
Emerging Markets Equity Income Fund | | | 10.2 | % | | | 10.6 | | | | — | | | | — | | | | — | | | | — | |
Global Research Enhanced Index Fund | | | — | | | | — | | | | — | | | | — | | | | — | | | | — | |
Global Unconstrained Equity Fund | | | — | | | | — | | | | — | | | | — | | | | — | | | | — | |
International Equity Fund | | | | | | | | | | | 11.6 | % | | | | | | | | | | | 19.4 | % |
International Equity Income Fund | | | — | | | | | | | | — | | | | — | | | | — | | | | 20.4 | |
International Opportunities Fund | | | — | | | | — | | | | | | | | — | | | | — | | | | 23.2 | |
International Research Enhanced Equity Fund | | | — | | | | — | | | | 10.9 | | | | — | | | | — | | | | 22.3 | |
International Unconstrained Equity Fund | | | — | | | | — | | | | 12.5 | | | | — | | | | — | | | | 12.3 | |
International Value Fund | | | — | | | | — | | | | 13.8 | | | | — | | | | — | | | | 23.3 | |
Intrepid International Fund | | | — | | | | — | | | | 10.3 | | | | — | | | | — | | | | 22.4 | |
| | | | | | |
| | | South
Africa | | | South
Korea | | | Switzerland | | | Taiwan | | | United
Kingdom | | | United
States | |
Emerging Economies Fund | | | — | | | | 19.6 | % | | | — | | | | 12.8 | % | | | — | | | | — | |
Emerging Markets Equity Fund | | | 18.0 | % | | | — | | | | — | | | | — | | | | — | | | | — | |
Emerging Markets Equity Income Fund | | | 13.0 | | | | — | | | | — | | | | 22.0 | | | | — | | | | — | |
Global Research Enhanced Index Fund | | | — | | | | — | | | | — | | | | — | | | | — | | | | 53.5 | % |
Global Unconstrained Equity Fund | | | — | | | | — | | | | — | | | | | | | | — | | | | 49.1 | |
International Equity Fund | | | — | | | | — | | | | 14.8 | % | | | | | | | 21.8 | % | | | — | |
International Equity Income Fund | | | — | | | | — | | | | — | | | | | | | | 22.3 | | | | — | |
International Opportunities Fund | | | — | | | | — | | | | 13.5 | | | | — | | | | 22.2 | | | | — | |
International Research Enhanced Equity Fund | | | — | | | | — | | | | — | | | | — | | | | 19.1 | | | | — | |
International Unconstrained Equity Fund | | | — | | | | — | | | | 12.1 | | | | — | | | | 16.4 | | | | — | |
International Value Fund | | | — | | | | — | | | | — | | | | — | | | | 16.7 | | | | — | |
Intrepid International Fund | | | — | | | | — | | | | | | | | — | | | | 18.2 | | | | — | |
| | | | | | | | |
| | | |
| APRIL 30, 2015 | | J.P. MORGAN INTERNATIONAL EQUITY FUNDS | | | | | 157 | |
SCHEDULE OF SHAREHOLDER EXPENSES
(Unaudited)
Hypothetical $1,000 Investment
As a shareholder of the Funds, you incur two types of costs: (1) transaction costs, including sales charges (loads) on purchase payments and redemption fees and (2) ongoing costs, including investment advisory fees, administration fees, distribution fees and other Fund expenses. The examples below are intended to help you understand your ongoing costs (in dollars) of investing in the Funds and to compare these ongoing costs with the ongoing costs of investing in other mutual funds. The examples assume that you had a $1,000 investment in each Class at the beginning of the reporting period, November 1, 2014, and continued to hold your shares at the end of the reporting period, April 30, 2015.
Actual Expenses
For each Class of each Fund in the table below, the first line provides information about actual account values and actual expenses. You may use the information in this line, together with the amount you invested, to estimate the expenses that you paid over the period. Simply divide your account value by $1,000 (for example, an $8,600 account value divided by $1,000 = 8.6), then multiply the result by the number in the first line of each Class under the heading entitled “Expenses Paid During the Period” to estimate the expenses you paid on your account during this period.
Hypothetical Example for Comparison Purposes
The second line of each Class in the table below provides information about hypothetical account values and hypothetical expenses based on the Class’ actual expense ratio and an assumed rate of return of 5% per year before expenses, which is not the Class’ actual return. The hypothetical account values and expenses may not be used to estimate the actual ending account balance or expenses you paid for the period. You may use this information to compare the ongoing costs of investing in the Class of the Funds and other funds. To do so, compare this 5% hypothetical example with the 5% hypothetical examples that appear in the shareholder reports of the other funds. Please note that the expenses shown in the table are meant to highlight your ongoing costs only and do not reflect any transaction costs, such as sales charges (loads) or redemption fees. Therefore, the second line for each Class in the table is useful in comparing ongoing costs only, and will not help you determine the relative total costs of owning different funds. In addition, if these transaction costs were included, your costs would have been higher. The examples also assume all dividends and distributions have been reinvested.
| | | | | | | | | | | | | | | | |
| | | Beginning
Account Value
November 1, 2014 | | | Ending
Account Value
April 30, 2015 | | | Expenses
Paid During
the Period | | | Annualized
Expense
Ratio | |
Emerging Economies Fund | | | | | | | | | | | | | | | | |
Class A | | | | | | | | | | | | | | | | |
Actual* | | $ | 1,000.00 | | | $ | 1,038.30 | | | $ | 7.93 | | | | 1.57 | % |
Hypothetical* | | | 1,000.00 | | | | 1,017.01 | | | | 7.85 | | | | 1.57 | |
Class C | | | | | | | | | | | | | | | | |
Actual* | | | 1,000.00 | | | | 1,036.10 | | | | 10.65 | | | | 2.11 | |
Hypothetical* | | | 1,000.00 | | | | 1,014.33 | | | | 10.54 | | | | 2.11 | |
Class R5 | | | | | | | | | | | | | | | | |
Actual* | | | 1,000.00 | | | | 1,041.00 | | | | 5.87 | | | | 1.16 | |
Hypothetical* | | | 1,000.00 | | | | 1,019.04 | | | | 5.81 | | | | 1.16 | |
Select Class | | | | | | | | | | | | | | | | |
Actual* | | | 1,000.00 | | | | 1,039.60 | | | | 6.88 | | | | 1.36 | |
Hypothetical* | | | 1,000.00 | | | | 1,018.05 | | | | 6.81 | | | | 1.36 | |
| | | | |
Emerging Markets Equity Fund | | | | | | | | | | | | | | | | |
Class A | | | | | | | | | | | | | | | | |
Actual* | | | 1,000.00 | | | | 968.30 | | | | 8.05 | | | | 1.65 | |
Hypothetical* | | | 1,000.00 | | | | 1,016.61 | | | | 8.25 | | | | 1.65 | |
Class B | | | | | | | | | | | | | | | | |
Actual* | | | 1,000.00 | | | | 965.80 | | | | 10.48 | | | | 2.15 | |
Hypothetical* | | | 1,000.00 | | | | 1,014.13 | | | | 10.74 | | | | 2.15 | |
Class C | | | | | | | | | | | | | | | | |
Actual* | | | 1,000.00 | | | | 965.70 | | | | 10.48 | | | | 2.15 | |
Hypothetical* | | | 1,000.00 | | | | 1,014.13 | | | | 10.74 | | | | 2.15 | |
Class R6 | | | | | | | | | | | | | | | | |
Actual* | | | 1,000.00 | | | | 970.60 | | | | 5.62 | | | | 1.15 | |
Hypothetical* | | | 1,000.00 | | | | 1,019.09 | | | | 5.76 | | | | 1.15 | |
| | | | | | |
| | | |
| 158 | | | | J.P. MORGAN INTERNATIONAL EQUITY FUNDS | | APRIL 30, 2015 |
| | | | | | | | | | | | | | | | |
| | | Beginning
Account Value
November 1, 2014 | | | Ending
Account Value
April 30, 2015 | | | Expenses
Paid During
the Period | | | Annualized
Expense
Ratio | |
Emerging Markets Equity Fund (continued) | | | | | | | | | | | | | | | | |
Institutional Class | | | | | | | | | | | | | | | | |
Actual* | | $ | 1,000.00 | | | $ | 970.20 | | | $ | 6.06 | | | | 1.24 | % |
Hypothetical* | | | 1,000.00 | | | | 1,018.65 | | | | 6.21 | | | | 1.24 | |
Select Class | | | | | | | | | | | | | | | | |
Actual* | | | 1,000.00 | | | | 969.70 | | | | 6.84 | | | | 1.40 | |
Hypothetical* | | | 1,000.00 | | | | 1,017.85 | | | | 7.00 | | | | 1.40 | |
| | | | |
Emerging Markets Equity Income Fund | | | | | | | | | | | | | | | | |
Class A | | | | | | | | | | | | | | | | |
Actual** | | | 1,000.00 | | | | 1,048.30 | | | | 6.24 | | | | 1.60 | |
Hypothetical* | | | 1,000.00 | | | | 1,016.86 | | | | 8.00 | | | | 1.60 | |
Class C | | | | | | | | | | | | | | | | |
Actual** | | | 1,000.00 | | | | 1,046.20 | | | | 8.18 | | | | 2.10 | |
Hypothetical* | | | 1,000.00 | | | | 1,014.38 | | | | 10.49 | | | | 2.10 | |
Class R5 | | | | | | | | | | | | | | | | |
Actual** | | | 1,000.00 | | | | 1,050.30 | | | | 4.49 | | | | 1.15 | |
Hypothetical* | | | 1,000.00 | | | | 1,019.09 | | | | 5.76 | | | | 1.15 | |
Class R6 | | | | | | | | | | | | | | | | |
Actual** | | | 1,000.00 | | | | 1,050.30 | | | | 4.29 | | | | 1.10 | |
Hypothetical* | | | 1,000.00 | | | | 1,019.34 | | | | 5.51 | | | | 1.10 | |
Select Class | | | | | | | | | | | | | | | | |
Actual** | | | 1,000.00 | | | | 1,049.60 | | | | 5.27 | | | | 1.35 | |
Hypothetical* | | | 1,000.00 | | | | 1,018.10 | | | | 6.76 | | | | 1.35 | |
| | | | |
Global Research Enhanced Index Fund | | | | | | | | | | | | | | | | |
Class A | | | | | | | | | | | | | | | | |
Actual* | | | 1,000.00 | | | | 1,042.80 | | | | 2.94 | | | | 0.58 | |
Hypothetical* | | | 1,000.00 | | | | 1,021.92 | | | | 2.91 | | | | 0.58 | |
Class C | | | | | | | | | | | | | | | | |
Actual* | | | 1,000.00 | | | | 1,040.10 | | | | 5.46 | | | | 1.08 | |
Hypothetical* | | | 1,000.00 | | | | 1,019.44 | | | | 5.41 | | | | 1.08 | |
Class R2 | | | | | | | | | | | | | | | | |
Actual* | | | 1,000.00 | | | | 1,042.00 | | | | 4.20 | | | | 0.83 | |
Hypothetical* | | | 1,000.00 | | | | 1,020.68 | | | | 4.16 | | | | 0.83 | |
Select Class | | | | | | | | | | | | | | | | |
Actual* | | | 1,000.00 | | | | 1,044.10 | | | | 1.67 | | | | 0.33 | |
Hypothetical* | | | 1,000.00 | | | | 1,023.16 | | | | 1.66 | | | | 0.33 | |
| | | | |
Global Unconstrained Equity Fund | | | | | | | | | | | | | | | | |
Class A | | | | | | | | | | | | | | | | |
Actual* | | | 1,000.00 | | | | 1,071.50 | | | | 6.52 | | | | 1.27 | |
Hypothetical* | | | 1,000.00 | | | | 1,018.50 | | | | 6.36 | | | | 1.27 | |
Class C | | | | | | | | | | | | | | | | |
Actual* | | | 1,000.00 | | | | 1,069.10 | | | | 9.03 | | | | 1.76 | |
Hypothetical* | | | 1,000.00 | | | | 1,016.07 | | | | 8.80 | | | | 1.76 | |
Class R2 | | | | | | | | | | | | | | | | |
Actual* | | | 1,000.00 | | | | 1,070.30 | | | | 7.80 | | | | 1.52 | |
Hypothetical* | | | 1,000.00 | | | | 1,017.26 | | | | 7.60 | | | | 1.52 | |
Class R5 | | | | | | | | | | | | | | | | |
Actual* | | | 1,000.00 | | | | 1,074.00 | | | | 4.22 | | | | 0.82 | |
Hypothetical* | | | 1,000.00 | | | | 1,020.73 | | | | 4.11 | | | | 0.82 | |
Class R6 | | | | | | | | | | | | | | | | |
Actual* | | | 1,000.00 | | | | 1,074.50 | | | | 3.96 | | | | 0.77 | |
Hypothetical* | | | 1,000.00 | | | | 1,020.98 | | | | 3.86 | | | | 0.77 | |
Select Class | | | | | | | | | | | | | | | | |
Actual* | | | 1,000.00 | | | | 1,073.90 | | | | 4.78 | | | | 0.93 | |
Hypothetical* | | | 1,000.00 | | | | 1,020.18 | | | | 4.66 | | | | 0.93 | |
| | | | | | | | |
| | | |
| APRIL 30, 2015 | | J.P. MORGAN INTERNATIONAL EQUITY FUNDS | | | | | 159 | |
SCHEDULE OF SHAREHOLDER EXPENSES
(Unaudited) (continued)
Hypothetical $1,000 Investment
| | | | | | | | | | | | | | | | |
| | | Beginning
Account Value
November 1, 2014 | | | Ending
Account Value
April 30, 2015 | | | Expenses
Paid During
the Period | | | Annualized
Expense
Ratio | |
International Equity Fund | | | | | | | | | | | | | | | | |
Class A | | | | | | | | | | | | | | | | |
Actual* | | $ | 1,000.00 | | | $ | 1,072.30 | | | $ | 6.68 | | | | 1.30 | % |
Hypothetical* | | | 1,000.00 | | | | 1,018.35 | | | | 6.51 | | | | 1.30 | |
Class B | | | | | | | | | | | | | | | | |
Actual* | �� | | 1,000.00 | | | | 1,069.80 | | | | 9.24 | | | | 1.80 | |
Hypothetical* | | | 1,000.00 | | | | 1,015.87 | | | | 9.00 | | | | 1.80 | |
Class C | | | | | | | | | | | | | | | | |
Actual* | | | 1,000.00 | | | | 1,069.80 | | | | 9.24 | | | | 1.80 | |
Hypothetical* | | | 1,000.00 | | | | 1,015.87 | | | | 9.00 | | | | 1.80 | |
Class R2 | | | | | | | | | | | | | | | | |
Actual* | | | 1,000.00 | | | | 1,070.80 | | | | 8.01 | | | | 1.56 | |
Hypothetical* | | | 1,000.00 | | | | 1,017.06 | | | | 7.80 | | | | 1.56 | |
Class R5 | | | | | | | | | | | | | | | | |
Actual* | | | 1,000.00 | | | | 1,074.90 | | | | 4.42 | | | | 0.86 | |
Hypothetical* | | | 1,000.00 | | | | 1,020.53 | | | | 4.31 | | | | 0.86 | |
Class R6 | | | | | | | | | | | | | | | | |
Actual* | | | 1,000.00 | | | | 1,075.10 | | | | 4.17 | | | | 0.81 | |
Hypothetical* | | | 1,000.00 | | | | 1,020.78 | | | | 4.06 | | | | 0.81 | |
Select Class | | | | | | | | | | | | | | | | |
Actual* | | | 1,000.00 | | | | 1,073.60 | | | | 5.45 | | | | 1.06 | |
Hypothetical* | | | 1,000.00 | | | | 1,019.54 | | | | 5.31 | | | | 1.06 | |
| | | | |
International Equity Income Fund | | | | | | | | | | | | | | | | |
Class A | | | | | | | | | | | | | | | | |
Actual* | | | 1,000.00 | | | | 1,060.00 | | | | 6.38 | | | | 1.25 | |
Hypothetical* | | | 1,000.00 | | | | 1,018.60 | | | | 6.26 | | | | 1.25 | |
Class C | | | | | | | | | | | | | | | | |
Actual* | | | 1,000.00 | | | | 1,056.90 | | | | 8.92 | | | | 1.75 | |
Hypothetical* | | | 1,000.00 | | | | 1,016.12 | | | | 8.75 | | | | 1.75 | |
Class R2 | | | | | | | | | | | | | | | | |
Actual* | | | 1,000.00 | | | | 1,057.90 | | | | 7.65 | | | | 1.50 | |
Hypothetical* | | | 1,000.00 | | | | 1,017.36 | | | | 7.50 | | | | 1.50 | |
Class R5 | | | | | | | | | | | | | | | | |
Actual* | | | 1,000.00 | | | | 1,062.40 | | | | 4.09 | | | | 0.80 | |
Hypothetical* | | | 1,000.00 | | | | 1,020.83 | | | | 4.01 | | | | 0.80 | |
Class R6 | | | | | | | | | | | | | | | | |
Actual*** | | | 1,000.00 | | | | 1,071.60 | | | | 1.92 | | | | 0.75 | |
Hypothetical* | | | 1,000.00 | | | | 1,021.08 | | | | 3.76 | | | | 0.75 | |
Select Class | | | | | | | | | | | | | | | | |
Actual* | | | 1,000.00 | | | | 1,061.80 | | | | 4.70 | | | | 0.92 | |
Hypothetical* | | | 1,000.00 | | | | 1,020.23 | | | | 4.61 | | | | 0.92 | |
| | | | |
International Opportunities Fund | | | | | | | | | | | | | | | | |
Class A | | | | | | | | | | | | | | | | |
Actual* | | | 1,000.00 | | | | 1,053.60 | | | | 6.67 | | | | 1.31 | |
Hypothetical* | | | 1,000.00 | | | | 1,018.30 | | | | 6.56 | | | | 1.31 | |
Class B | | | | | | | | | | | | | | | | |
Actual* | | | 1,000.00 | | | | 1,050.80 | | | | 9.76 | | | | 1.92 | |
Hypothetical* | | | 1,000.00 | | | | 1,015.27 | | | | 9.59 | | | | 1.92 | |
Class C | | | | | | | | | | | | | | | | |
Actual* | | | 1,000.00 | | | | 1,051.00 | | | | 9.26 | | | | 1.82 | |
Hypothetical* | | | 1,000.00 | | | | 1,015.77 | | | | 9.10 | | | | 1.82 | |
Class R6 | | | | | | | | | | | | | | | | |
Actual* | | | 1,000.00 | | | | 1,056.50 | | | | 3.67 | | | | 0.72 | |
Hypothetical* | | | 1,000.00 | | | | 1,021.22 | | | | 3.61 | | | | 0.72 | |
| | | | | | |
| | | |
| 160 | | | | J.P. MORGAN INTERNATIONAL EQUITY FUNDS | | APRIL 30, 2015 |
| | | | | | | | | | | | | | | | |
| | | Beginning
Account Value
November 1, 2014 | | | Ending
Account Value
April 30, 2015 | | | Expenses
Paid During
the Period | | | Annualized
Expense
Ratio | |
International Opportunities Fund (continued) | | | | | | | | | | | | | | | | |
Institutional Class | | | | | | | | | | | | | | | | |
Actual* | | $ | 1,000.00 | | | $ | 1,056.30 | | | $ | 4.23 | | | | 0.83 | % |
Hypothetical* | | | 1,000.00 | | | | 1,020.68 | | | | 4.16 | | | | 0.83 | |
Select Class | | | | | | | | | | | | | | | | |
Actual* | | | 1,000.00 | | | | 1,055.20 | | | | 5.10 | | | | 1.00 | |
Hypothetical* | | | 1,000.00 | | | | 1,019.84 | | | | 5.01 | | | | 1.00 | |
| | | | |
International Research Enhanced Equity Fund | | | | | | | | | | | | | | | | |
Class A | | | | | | | | | | | | | | | | |
Actual* | | | 1,000.00 | | | | 1,061.00 | | | | 3.01 | | | | 0.59 | |
Hypothetical* | | | 1,000.00 | | | | 1,021.87 | | | | 2.96 | | | | 0.59 | |
Class B | | | | | | | | | | | | | | | | |
Actual* | | | 1,000.00 | | | | 1,058.70 | | | | 5.56 | | | | 1.09 | |
Hypothetical* | �� | | 1,000.00 | | | | 1,019.39 | | | | 5.46 | | | | 1.09 | |
Class C | | | | | | | | | | | | | | | | |
Actual* | | | 1,000.00 | | | | 1,058.70 | | | | 5.56 | | | | 1.09 | |
Hypothetical* | | | 1,000.00 | | | | 1,019.39 | | | | 5.46 | | | | 1.09 | |
Class R2 | | | | | | | | | | | | | | | | |
Actual* | | | 1,000.00 | | | | 1,060.10 | | | | 4.29 | | | | 0.84 | |
Hypothetical* | | | 1,000.00 | | | | 1,020.63 | | | | 4.21 | | | | 0.84 | |
Select Class | | | | | | | | | | | | | | | | |
Actual* | | | 1,000.00 | | | | 1,062.30 | | | | 1.74 | | | | 0.34 | |
Hypothetical* | | | 1,000.00 | | | | 1,023.11 | | | | 1.71 | | | | 0.34 | |
| | | | |
International Unconstrained Equity Fund | | | | | | | | | | | | | | | | |
Class A | | | | | | | | | | | | | | | | |
Actual* | | | 1,000.00 | | | | 1,095.30 | | | | 6.55 | | | | 1.26 | |
Hypothetical* | | | 1,000.00 | | | | 1,018.55 | | | | 6.31 | | | | 1.26 | |
Class C | | | | | | | | | | | | | | | | |
Actual* | | | 1,000.00 | | | | 1,092.00 | | | | 9.13 | | | | 1.76 | |
Hypothetical* | | | 1,000.00 | | | | 1,016.07 | | | | 8.80 | | | | 1.76 | |
Class R2 | | | | | | | | | | | | | | | | |
Actual* | | | 1,000.00 | | | | 1,093.90 | | | | 7.84 | | | | 1.51 | |
Hypothetical* | | | 1,000.00 | | | | 1,017.31 | | | | 7.55 | | | | 1.51 | |
Class R5 | | | | | | | | | | | | | | | | |
Actual* | | | 1,000.00 | | | | 1,097.80 | | | | 4.21 | | | | 0.81 | |
Hypothetical* | | | 1,000.00 | | | | 1,020.78 | | | | 4.06 | | | | 0.81 | |
Class R6 | | | | | | | | | | | | | | | | |
Actual* | | | 1,000.00 | | | | 1,097.80 | | | | 3.95 | | | | 0.76 | |
Hypothetical* | | | 1,000.00 | | | | 1,021.03 | | | | 3.81 | | | | 0.76 | |
Select Class | | | | | | | | | | | | | | | | |
Actual* | | | 1,000.00 | | | | 1,097.10 | | | | 4.78 | | | | 0.92 | |
Hypothetical* | | | 1,000.00 | | | | 1,020.23 | | | | 4.61 | | | | 0.92 | |
| | | | |
International Value Fund | | | | | | | | | | | | | | | | |
Class A | | | | | | | | | | | | | | | | |
Actual* | | | 1,000.00 | | | | 1,081.10 | | | | 6.97 | | | | 1.35 | |
Hypothetical* | | | 1,000.00 | | | | 1,018.10 | | | | 6.76 | | | | 1.35 | |
Class B | | | | | | | | | | | | | | | | |
Actual* | | | 1,000.00 | | | | 1,079.50 | | | | 9.54 | | | | 1.85 | |
Hypothetical* | | | 1,000.00 | | | | 1,015.62 | | | | 9.25 | | | | 1.85 | |
Class C | | | | | | | | | | | | | | | | |
Actual* | | | 1,000.00 | | | | 1,079.30 | | | | 9.54 | | | | 1.85 | |
Hypothetical* | | | 1,000.00 | | | | 1,015.62 | | | | 9.25 | | | | 1.85 | |
Class R2 | | | | | | | | | | | | | | | | |
Actual* | | | 1,000.00 | | | | 1,079.80 | | | | 8.25 | | | | 1.60 | |
Hypothetical* | | | 1,000.00 | | | | 1,016.86 | | | | 8.00 | | | | 1.60 | |
| | | | | | | | |
| | | |
| APRIL 30, 2015 | | J.P. MORGAN INTERNATIONAL EQUITY FUNDS | | | | | 161 | |
SCHEDULE OF SHAREHOLDER EXPENSES
(Unaudited) (continued)
Hypothetical $1,000 Investment
| | | | | | | | | | | | | | | | |
| | | Beginning
Account Value
November 1, 2014 | | | Ending
Account Value
April 30, 2015 | | | Expenses
Paid During
the Period | | | Annualized
Expense
Ratio | |
International Value Fund (continued) | | | | | | | | | | | | | | | | |
Class R6 | | | | | | | | | | | | | | | | |
Actual* | | $ | 1,000.00 | | | $ | 1,082.70 | | | $ | 3.77 | | | | 0.73 | % |
Hypothetical* | | | 1,000.00 | | | | 1,021.17 | | | | 3.66 | | | | 0.73 | |
Institutional Class | | | | | | | | | | | | | | | | |
Actual* | | | 1,000.00 | | | | 1,082.00 | | | | 4.90 | | | | 0.95 | |
Hypothetical* | | | 1,000.00 | | | | 1,020.08 | | | | 4.76 | | | | 0.95 | |
Select Class | | | | | | | | | | | | | | | | |
Actual* | | | 1,000.00 | | | | 1,081.40 | | | | 5.26 | | | | 1.02 | |
Hypothetical* | | | 1,000.00 | | | | 1,019.74 | | | | 5.11 | | | | 1.02 | |
| | | | |
Intrepid International Fund | | | | | | | | | | | | | | | | |
Class A | | | | | | | | | | | | | | | | |
Actual* | | | 1,000.00 | | | | 1,063.20 | | | | 6.85 | | | | 1.34 | |
Hypothetical* | | | 1,000.00 | | | | 1,018.15 | | | | 6.71 | | | | 1.34 | |
Class C | | | | | | | | | | | | | | | | |
Actual* | | | 1,000.00 | | | | 1,060.50 | | | | 9.40 | | | | 1.84 | |
Hypothetical* | | | 1,000.00 | | | | 1,015.67 | | | | 9.20 | | | | 1.84 | |
Class R2 | | | | | | | | | | | | | | | | |
Actual* | | | 1,000.00 | | | | 1,061.80 | | | | 7.97 | | | | 1.56 | |
Hypothetical* | | | 1,000.00 | | | | 1,017.06 | | | | 7.80 | | | | 1.56 | |
Institutional Class | | | | | | | | | | | | | | | | |
Actual* | | | 1,000.00 | | | | 1,065.80 | | | | 4.46 | | | | 0.87 | |
Hypothetical* | | | 1,000.00 | | | | 1,020.48 | | | | 4.36 | | | | 0.87 | |
Select Class | | | | | | | | | | | | | | | | |
Actual* | | | 1,000.00 | | | | 1,064.60 | | | | 5.43 | | | | 1.06 | |
Hypothetical* | | | 1,000.00 | | | | 1,019.54 | | | | 5.31 | | | | 1.06 | |
| * | Expenses are equal to each Class’ respective annualized expense ratio, multiplied by the average account value over the period, multiplied by 181/365 (to reflect the one-half year period). |
| ** | Expenses are equal to each Class’ respective annualized expense ratio, multiplied by the average account value over the period, multiplied by 139/365 (to reflect the actual period.) Commencement of operations was December 12, 2014. |
| ** | Expenses are equal to each Class’ respective annualized expense ratio, multiplied by the average account value over the period, multiplied by 90/365 (to reflect the actual period.) Commencement of operations was January 30, 2015. |
| | | | | | |
| | | |
| 162 | | | | J.P. MORGAN INTERNATIONAL EQUITY FUNDS | | APRIL 30, 2015 |
BOARD APPROVAL OF INVESTMENT ADVISORY AGREEMENT
(Unaudited)
For the JPMorgan Emerging Markets Equity Income Fund
The Board of Trustees has established various standing committees composed of Trustees with diverse backgrounds, to which the Board of Trustees has assigned specific subject matter responsibilities to further enhance the effectiveness of the Board’s oversight and decision making. The Board of Trustees and its investment subcommittees (money market and alternative products, equity, and fixed income) meet regularly throughout the year and consider factors that are relevant to their annual consideration of investment advisory agreements at each meeting. They also meet for the specific purpose of considering approvals of initial advisory agreements for new funds. At their August 2013 in-person meeting, the Trustees, including a majority of the Trustees who are not “interested persons” (as defined in the 1940 Act) of any party to the initial advisory agreement or any of their affiliates (“Independent Trustees”), approved the initial investment advisory agreement (the “New Advisory Agreement”) for the Fund whose semi-annual report is contained herein.
In connection with the approval of the New Advisory Agreement, the Trustees reviewed written materials prepared by the Adviser and received oral presentations from Adviser personnel. Before voting on the proposed New Advisory Agreement, the Trustees reviewed the New Advisory Agreement with representatives of the Adviser and with counsel to the Trust and independent legal counsel and received a memorandum from independent legal counsel to the Trustees discussing the legal standards for their consideration of the proposed agreement. The Trustees also discussed the proposed agreement in an executive session with counsel to the Trust and independent legal counsel at which no representatives of the Adviser were present. Set forth below is a summary of the material factors evaluated by the Trustees in determining whether to approve the New Advisory Agreement.
The Trustees considered information provided with respect to the Fund and the approval of the New Advisory Agreement. Each Trustee attributed different weights to the various factors and no factor alone was considered determinative. The Trustees determined that the proposed compensation to be received by the Adviser from the Fund under the New Advisory Agreement was fair and reasonable and that the initial approval of the New Advisory Agreement was in the best interests of the Fund and its potential shareholders.
The factors summarized below were considered and discussed by the Trustees in reaching their conclusions:
Nature, Extent and Quality of Services Provided by the Adviser
In connection with the approval of the New Advisory Agreement, the Trustees considered the materials furnished specifically in connection with the approval of the New Advisory Agreement, as well as other relevant information furnished throughout the year for the J.P. Morgan Funds complex and the Trustees’ experience with the Adviser and its services. The Trustees considered the
background and experience of the Adviser’s senior management and investment personnel, as well as the qualifications, backgrounds and responsibilities of the portfolio management team primarily responsible for the day-to-day management of the Fund. The Trustees also considered the investment strategy and investment process for the Fund, and the infrastructure supporting the portfolio management team. In addition, the Trustees considered information about the structure and distribution strategy of the Fund, how it fits within the J.P. Morgan Funds lineup, and how it will be positioned against identified peers.
The Trustees also considered its knowledge of the nature and quality of the services provided by the Adviser to the J.P. Morgan Funds gained from their experience as Trustees of the J.P. Morgan Funds. In addition, they considered the overall reputation and capabilities of the Adviser and its affiliates, the commitment of the Adviser to provide high quality service to the J.P. Morgan Funds, their overall confidence in the Adviser’s integrity and the Adviser’s responsiveness to questions or concerns raised by them, including the Adviser’s willingness to consider and implement organizational and operational changes designed to improve investment results and the services provided to the J.P. Morgan Funds.
Based upon these considerations and other factors, the Trustees concluded that they were satisfied with the nature, extent and quality of the investment advisory services to be provided to the Fund by the Adviser.
Fall-Out Benefits
The Trustees reviewed information regarding potential “fallout” or ancillary benefits received by the Adviser and its affiliates as a result of their relationship with the J.P. Morgan Funds. The Trustees also considered the Adviser’s allocation of fund brokerage for the J.P. Morgan Funds complex, including allocations to brokers who provide research to the Adviser.
The Trustees also considered that JPMorgan Funds Management, Inc. (“JPMFM”) and JPMorgan Distribution Services, Inc. (“JPMDS”), affiliates of the Adviser, will earn fees from the Fund for providing administrative and shareholder services. The Trustees also considered the payments of Rule 12b-1 fees to JPMDS, which also acts as the Fund’s distributor and that these fees are in turn generally paid to financial intermediaries that sell the Fund, including financial intermediaries that are affiliates of the Adviser. The Trustees also considered the fees paid to JPMorgan Chase Bank, N.A. (“JPMCB”) for custody and fund accounting and other related services. The Trustees also considered that any fall-out benefits would be comparable to those related to the other actively managed funds in the complex and were consistent with the process of approving advisory agreements for new funds.
Economies of Scale
The Trustees considered the extent to which the Fund will benefit from economies of scale. The Trustees noted that the proposed
| | | | | | | | |
| | | |
| APRIL 30, 2015 | | J.P. MORGAN INTERNATIONAL EQUITY FUNDS | | | | | 163 | |
BOARD APPROVAL OF INVESTMENT ADVISORY AGREEMENT
(Unaudited) (continued)
investment advisory fee schedule for the Fund does not contain breakpoints, but that the fee schedule for the administrative services provided by JPMFM does include a fee breakpoint, which is tied to the overall level of non-money market fund assets excluding certain funds-of-funds, as applicable, advised by the Adviser, and that the Fund will benefit from that breakpoint. The Trustees also noted that the Adviser has implemented fee waivers and expense limitations. The Trustees concluded that shareholders of the Fund will generally benefit from the lower expense ratios that resulted from these factors. The Trustees also considered whether it would be appropriate to add advisory fee breakpoints to the New Advisory Agreement and the Trustees concluded that with the adoption of a contractual cap on total expenses, shareholders will benefit from expected economies of scale that would be expected to result from growth of assets before that growth occurred.
Investment Performance
The Trustees considered the Fund’s investment strategy and process, portfolio management team and competitive positioning against identified peer funds, and concluded that the prospects for competitive future performance were acceptable.
Advisory Fees and Expense Ratios
The Trustees considered the contractual advisory fee rate that will be paid by the Fund to the Adviser and compared that rate to the information prepared by Lipper concerning management fee rates paid by other funds in the same Lipper category as the Fund. The Trustees recognized that Lipper reported the Fund’s management fee rate as the combined contractual advisory fee and administration fee rates. The Trustees also reviewed information about other projected expenses and the expense ratios for the Fund. The Trustees considered the projected fee waiver and/or expense reimbursement arrangements proposed for the Fund and considered the net advisory fee rate after taking into account any projected waivers and/or reimbursements. The Trustees recognized that it is difficult to make comparisons of advisory fees because there are variations in the services that are included in the fees paid by other funds.
The Trustees noted that the Fund’s estimated net advisory fees and total expenses, which were considered on a class-by-class basis, were in line with identified peer funds. After considering the factors identified above, in light of the information, the Trustees concluded that the advisory fees were reasonable.
| | | | | | |
| | | |
| 164 | | | | J.P. MORGAN INTERNATIONAL EQUITY FUNDS | | APRIL 30, 2015 |
J.P. Morgan Funds are distributed by JPMorgan Distribution Services, Inc., which is an affiliate of JPMorgan Chase & Co. Affiliates of JPMorgan Chase & Co. receive fees for providing various services to the funds.
Contact JPMorgan Distribution Services, Inc. at 1-800-480-4111 for a fund prospectus. You can also visit us at www.jpmorganfunds.com. Investors should carefully consider the investment objectives and risk as well as charges and expenses of the mutual fund before investing. The prospectus contains this and other information about the mutual fund. Read the prospectus carefully before investing.
Investors may obtain information about the Securities Investor Protection Corporation (SIPC), including the SIPC brochure by visiting www.sipc.org or by calling SIPC at 202-371-8300.
Each Fund files a complete schedule of its fund holdings for the first and third quarters of its fiscal year with the SEC on Form N-Q. The Funds’ Forms N-Q are available on the SEC’s website at http://www.sec.gov and may be reviewed and copied at the SEC’s Public Reference Room in Washington, DC. Information on the operation of the SEC’s Public Reference Room may be obtained by calling 1-800-SEC-0330. Shareholders may request the Form N-Q without charge by calling 1-800-480-4111 or by visiting the J.P. Morgan Funds’ website at www.jpmorganfunds.com.
A description of each Fund’s policies and procedures with respect to the disclosure of each Fund’s holdings is available in the prospectus and Statement of Additional Information.
A copy of proxy policies and procedures is available without charge upon request by calling 1-800-480-4111 and on the Funds’ website at www.jpmorganfunds.com. A description of such policies and procedures is on the SEC’s website at www.sec.gov. The Trustees have delegated the authority to vote proxies for securities owned by the Funds to the Adviser. A copy of the Funds’ voting record for the most recent 12-month period ended June 30 is available on the SEC’s website at www.sec.gov or at the Funds’ website at www.jpmorganfunds.com no later than August 31 of each year. The Funds’ proxy voting record will include, among other things, a brief description of the matter voted on for each fund security, and will state how each vote was cast, for example, for or against the proposal.


J.P. Morgan Asset Management is the marketing name for the asset management business of JPMorgan Chase & Co. Those businesses include, but are not limited to, J.P. Morgan Investment Management Inc., Security Capital Research & Management Incorporated and J.P. Morgan Alternative Asset Management, Inc.
| | | | |
| | © JPMorgan Chase & Co., 2015. All rights reserved. April 2015. | | SAN-INTEQ-415 |
Disclose whether, as of the end of the period covered by the report, the registrant has adopted a code of ethics that applies to the registrant’s principal executive officer, principal financial officer, principal accounting officer or controller, or persons performing similar functions, regardless of whether these individuals are employed by the registrant or a third party. If the registrant has not adopted such a code of ethics, explain why it has not done so.
The registrant must briefly describe the nature of any amendment, during the period covered by the report, to a provision of its code of ethics that applies to the registrant’s principal executive officer, principal financial officer, principal accounting officer or controller, or persons performing similar functions, regardless of whether these individuals are employed by the registrant or a third party, and that relates to any element of the code of ethics definition enumerated in paragraph (b) of this Item. The registrant must file a copy of any such amendment as an exhibit pursuant to Item 12(a)(1), unless the registrant has elected to satisfy paragraph (f) of this Item by positing its code of ethics on its website pursuant to paragraph (f)(2) of this Item, or by undertaking to provide its code of ethics to any person without charge, upon request, pursuant to paragraph (f)(3) of this Item.
If the registrant has, during the period covered by the report, granted a waiver, including an implicit waiver, from a provision of the code of ethics that applies to the registrant’s principal executive officer, principal financial officer, principal accounting officer or controller, or persons performing similar functions, regardless of whether these individuals are employed by the registrant or third party, that relates to one or more items set forth in paragraph (b) of this Item, the registrant must briefly describe the nature of the waiver, the name of the person to whom the waiver was granted, and the date of the waiver.
Not applicable to a semi-annual report.
| ITEM 3. | AUDIT COMMITTEE FINANCIAL EXPERT. |
(a) (1) Disclose that the registrant’s board of directors has determined that the registrant either:
(i) Has at least one audit committee financial expert serving on its audit committee; or
(ii) Does not have an audit committee financial expert serving on its audit committee.
(2) If the registrant provides the disclosure required by paragraph (a)(1)(i) of this Item, it must disclose the name of the audit committee financial expert and whether that person is “independent.” In order to be considered “independent” for purposes of this Item, a member of an audit committee may not, other than in his or her capacity as a member of the audit committee, the board of directors, or any other board committee:
(i) Accept directly or indirectly any consulting, advisory, or other compensatory fee from the issuer; or
(ii) Be an “interested person” of the investment company as defined in Section 2(a)(19) of the Act (15 U.S.C. 80a-2(a)(19)).
(3) If the registrant provides the disclosure required by paragraph (a)(1)(ii) of this Item, it must explain why it does not have an audit committee financial expert.
Not applicable to a semi-annual report.
| ITEM 4. | PRINCIPAL ACCOUNTANT FEES AND SERVICES. |
(a) Disclose, under the caption Audit Fees, the aggregate fees billed for each of the last two fiscal years for professional services rendered by the principal accountant for the audit of the registrant’s annual financial statements or services that are normally provided by the accountant in connection with statutory and regulatory filings or engagements for those fiscal years.
(b) Disclose, under the caption Audit-Related Fees, the aggregate fees billed in each of the last two fiscal years for assurance and related services by the principal accountant that are reasonably related to the performance of the audit of the registrant’s financial statements and are not reported under paragraph (a) of this Item. Registrants shall describe the nature of the services comprising the fees disclosed under this category.
(c) Disclose, under the caption Tax Fees, the aggregate fees billed in each of the last two fiscal years for professional services rendered by the principal accountant for tax compliance, tax advice, and tax planning. Registrants shall describe the nature of the services comprising the fees disclosed under this category.
(d) Disclose, under the caption All Other Fees, the aggregate fees billed in each of the last two fiscal years for products and services provided by the principal accountant, other than the services reported in paragraphs (a) through (c) of this Item. Registrants shall describe the nature of the services comprising the fees disclosed under this category.
(e) (1) Disclose the audit committee’s pre-approval policies and procedures described in paragraph (c)(7) of Rule 2-01 of Regulation S-X.
(2) Disclose the percentage of services described in each of paragraphs (b) through (d) of this Item that were approved by the audit committee pursuant to paragraph (c)(7)(i)(C) of Rule 2-01 of Regulation S-X.
(f) If greater than 50 percent, disclose the percentage of hours expended on the principal accountant’s engagement to audit the registrant’s financial statements for the most recent fiscal year that were attributed to work performed by persons other than the principal accountant’s full-time, permanent employees.
(g) Disclose the aggregate non-audit fees billed by the registrant’s accountant for services rendered to the registrant, and rendered to the registrant’s investment adviser (not including any sub-adviser whose role is primarily portfolio management and is subcontracted with or overseen by another investment adviser), and any entity controlling, controlled by, or under common control with the adviser that provides ongoing services to the registrant for each of the last two fiscal years of the registrant.
(h) Disclose whether the registrant’s audit committee of the board of directors has considered whether the provision of non-audit services that were rendered to the registrant’s investment adviser (not including any subadviser whose role is primarily portfolio management and is subcontracted with or overseen by another investment adviser), and any entity controlling, controlled by, or under common control with the investment adviser that provides ongoing services to the registrant that were not pre-approved pursuant to paragraph (c)(7)(ii) of Rule 2-01 of Regulation S-X is compatible with maintaining the principal accountant’s independence.
Not applicable to a semi-annual report.
| ITEM 5. | AUDIT COMMITTEE OF LISTED REGISTRANTS. |
(a) If the registrant is a listed issuer as defined in Rule 10A-3 under the Exchange Act (17CFR 240.10A-3), state whether or not the registrant has a separately-designated standing audit committee established in accordance with Section 3(a)(58)(A) of the Exchange Act (15 U.S.C. 78c(a)(58)(A)). If the registrant has such a committee, however designated, identify each committee member. If the entire board of directors is acting as the registrant’s audit committee as specified in Section 3(a)(58)(B) of the Exchange Act (15 U.S.C. 78c(a)(58)(B)), so state.
(b) If applicable, provide the disclosure required by Rule 10A-3(d) under the Exchange Act (17CFR 240.10A-3(d)) regarding an exemption from the listing standards for all audit committees.
Not applicable to a semi-annual report.
| ITEM 6. | SCHEDULE OF INVESTMENTS. |
File Schedule I – Investments in securities of unaffiliated issuers as of the close of the reporting period as set forth in Section 210.12-12 of Regulation S-X, unless the schedule is included as part of the report to shareholders filed under Item 1 of this Form.
Included in Item 1.
ITEM 7. DISCLOSURE OF PROXY VOTING POLICIES AND PROCEDURES FOR CLOSED-END MANAGEMENT INVESTMENT COMPANIES.
A closed-end management investment company that is filing an annual report on this Form N-CSR must, unless it invests exclusively in non-voting securities, describe the policies and procedures that it uses to determine how to vote proxies relating to portfolio securities, including the procedures that the company uses when a vote presents a conflict between the interests of its shareholders, on the one hand, and those of the company’s investment adviser; principal underwriter; or any affiliated person (as defined in Section 2(a)(3) of the Investment Company Act of 1940 (15 U.S.C. 80a-2(a)(3)) and the rules thereunder) of the company, its investment adviser, or its principal underwriter, on the other. Include any policies and procedures of the company’s investment adviser, or any other third party, that the company uses, or that are used on the company’s behalf, to determine how to vote proxies relating to portfolio securities.
Not applicable.
| ITEM 8. | PORTFOLIO MANAGERS OF CLOSED-END MANAGEMENT INVESTMENT COMPANIES. |
Not applicable.
ITEM 9. PURCHASE OF EQUITY SECURITIES BY CLOSED-END MANAGEMENT INVESTMENT COMPANY AND AFFILIATED PURCHASERS.
(a) If the registrant is a closed-end management investment company, provide the information specified in paragraph (b) of this Item with respect to any purchase made by or on behalf of the registrant or any “affiliated purchaser,” as defined in Rule 10b-18(a)(3) under the Exchange Act (17 CFR 240.10b-18(a)(3)), of shares or other units of any class of the registrant’s equity securities that is registered by the registrant pursuant to Section 12 of the Exchange Act (15 U.S.C. 781).
Not applicable.
| ITEM 10. | SUBMISSION OF MATTERS TO A VOTE OF SECURITY HOLDERS. |
Describe any material changes to the procedures by which shareholders may recommend nominees to the registrant’s board of directors, where those changes were implemented after the registrant last provided disclosure in response to the requirements of Item 7(d)(2)(ii)(G) of Schedule 14A (17 CFR 240.14a-101), or this Item.
No material changes to report.
| ITEM 11. | CONTROLS AND PROCEDURES. |
(a) Disclose the conclusions of the registrant’s principal executive and principal financial officers, or persons performing similar functions, regarding the effectiveness of the registrant’s disclosure controls and procedures (as defined in Rule 30a-3(c) under the Act (17 CFR 270.30a-3(c))) as of a date within 90 days of the filing date of the report that includes the disclosure required by this paragraph, based on the evaluation of these controls and procedures required by Rule 30a-3(b) under the Act (17 CFR 270.30a-3(b)) and Rules 13a-15(b) or 15d-15(b) under the Exchange Act (17 CFR 240.13a-15(b) or 240.15d-15(b)).
The Registrant’s principal executive and principal financial officers have concluded, based on their evaluation of the Registrant’s disclosure controls and procedures as of a date within 90 days of the filing date of this report, that the
Registrant’s disclosure controls and procedures are reasonably designed to ensure that information required to be disclosed by the Registrant on Form N-CSR is recorded, processed, summarized and reported within the required time periods and that information required to be disclosed by the Registrant in the reports that it files or submits on Form N-CSR is accumulated and communicated to the Registrant’s management, including its principal executive and principal financial officers, as appropriate to allow timely decisions regarding required disclosure.
(b) Disclose any change in the registrant’s internal control over financial reporting (as defined in Rule 30a-3(d) under the Act (17 CFR 270.30a-3(d)) that occurred during the registrant’s second fiscal quarter of the period covered by this report that has materially affected, or is reasonably likely to materially affect, the registrant’s internal control over financial reporting.
There were no changes in the Registrant’s internal control over financial reporting that occurred during the last fiscal quarter covered by this report that have materially affected, or are reasonably likely to materially affect, the Registrant’s internal control over financial reporting.
(a) File the exhibits listed below as part of this Form. Letter or number the exhibits in the sequence indicated.
(a)(1) Any code of ethics, or amendment thereto, that is the subject of the disclosure required by Item 2, to the extent that the registrant intends to satisfy the Item 2 requirements through filing of an exhibit.
Not applicable.
(a)(2) A separate certification for each principal executive officer and principal financial officer of the registrant as required by Rule 30a-2(a) under the Act (17 CFR 270.30a-2).
Certifications pursuant to Rule 30a-2(a) under the Investment Company Act of 1940 are attached hereto.
(a)(3) Any written solicitation to purchase securities under Rule 23c-1 under the Act (17 CFR 270.23c-1) sent or given during the period covered by the report by or on behalf of the registrant to 10 or more persons.
Not applicable.
(b) A separate or combined certification for each principal executive officer and principal officer of the registrant as required by Rule 30a-2(b) under the Act of 1940.
Certifications pursuant to Rule 30a-2(b) under the Investment Company Act of 1940 are attached hereto.
SIGNATURES
Pursuant to the requirements of the Securities Exchange Act of 1934 and the Investment Company Act of 1940, the registrant has duly caused this report to be signed on its behalf by the undersigned, thereunto duly authorized.
JPMorgan Trust II
| | |
| By: | | /s/ Robert L. Young |
| | Robert L. Young |
| | President and Principal Executive Office |
| | July 2, 2015 |
Pursuant to the requirements of the Securities Exchange Act of 1934 and the Investment Company Act of 1940, this report has been signed below by the following persons on behalf of the registrant and in the capacities and on the dates indicated.
| | |
| By: | | /s/ Robert L. Young |
| | Robert L. Young |
| | President and Principal Executive Officer |
| | July 2, 2015 |
| |
| By: | | /s/ Laura M. Del Prato |
| | Laura M. Del Prato |
| | Treasurer and Principal Financial Officer |
| | July 2, 2015 |