UNITED STATES
SECURITIES AND EXCHANGE COMMISSION
Washington, D.C. 20549
FORM N-CSR
CERTIFIED SHAREHOLDER REPORT OF REGISTERED
MANAGEMENT INVESTMENT COMPANIES
Investment Company Act file number: 811-04236
JPMorgan Trust II
(Exact name of registrant as specified in charter)
277 Park Avenue
New York, NY 10172
(Address of principal executive offices) (Zip code)
Gregory S. Samuels
277 Park Avenue
New York, NY 10172
(Name and Address of Agent for Service)
Registrant’s telephone number, including area code: (800) 480-4111
Date of fiscal year end: October 31
Date of reporting period: November 1, 2021 through April 30, 2022
Form N-CSR is to be used by management investment companies to file reports with the Commission not later than 10 days after the transmission to stockholders of any report that is required to be transmitted to stockholders under Rule 30e-1 under the Investment Company Act of 1940 (17 CFR 270.30e-1). The Commission may use the information provided on Form N-CSR in its regulatory, disclosure review, inspection, and policymaking roles.
A registrant is required to disclose the information specified by Form N-CSR, and the Commission will make this information public. A registrant is not required to respond to the collection of information contained in Form N-CSR unless the Form displays a currently valid Office of Management and Budget (“OMB”) control number. Please direct comments concerning the accuracy of the information collection burden estimate and any suggestions for reducing the burden to Secretary, Securities and Exchange Commission, 450 Fifth Street, NW, Washington, DC 20549-0609. The OMB has reviewed this collection of information under the clearance requirements of 44 U.S.C. Section 3507.
ITEM 1. REPORTS TO STOCKHOLDERS.
a.) The following is a copy of the report transmitted to shareholders pursuant to Rule 30e-1 under the Investment Company Act of 1940 (17 CFR 270.30e-1).
b.) A copy of the notice transmitted to shareholders in reliance on Rule 30e-3 under the 1940 Act that contains disclosures specified by paragraph (c)(3) of that rule is included in the Annual Report. Not Applicable. Notices do not incorporate disclosures from the shareholder reports.
| JPMorgan Emerging Markets Equity Fund |
| JPMorgan Emerging Markets Research Enhanced Equity Fund |
| JPMorgan Europe Dynamic Fund |
| JPMorgan International Equity Fund |
| JPMorgan International Focus Fund |
| JPMorgan International Hedged Equity Fund |
| JPMorgan International Research Enhanced Equity Fund |
| JPMorgan International Value Fund |

| 1 | |
| 2 | |
| Fund Commentaries: | |
| 3 | |
| 7 | |
| 10 | |
| 13 | |
| 16 | |
| 19 | |
| 23 | |
| 25 | |
| 28 | |
| 60 | |
| 86 | |
| 110 | |
| 134 | |
| 138 |
 | “The market environment remains challenging; investors should recognize the risks in trying to time market movements, as well as the potential long-term benefits of portfolio diversification.” — Andrea L. Lisher |

Head of Americas, Client
J.P. Morgan Asset Management
| April 30, 2022 | J.P. Morgan International Equity Funds | 1 |
| 2 | J.P. Morgan International Equity Funds | April 30, 2022 |
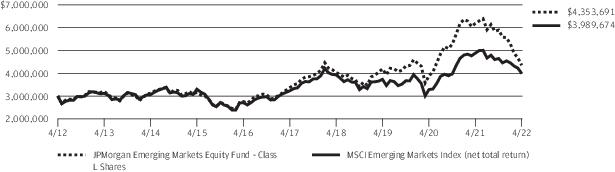
| REPORTING PERIOD RETURN: | |
Fund (Class L Shares) * | (26.17)% |
MSCI Emerging Markets Index (net total return) | (14.15)% |
Net Assets as of 4/30/2022 (In Thousands) | $9,678,228 |
| April 30, 2022 | J.P. Morgan International Equity Funds | 3 |
| TOP TEN POSITIONS OF THE PORTFOLIO AS OF April 30, 2022 | PERCENT OF TOTAL INVESTMENTS | ||
| 1. | Taiwan Semiconductor Manufacturing Co. Ltd., ADR (Taiwan) | 8.0% | |
| 2. | Samsung Electronics Co. Ltd. (South Korea) | 6.4 | |
| 3. | Tencent Holdings Ltd. (China) | 4.8 | |
| 4. | Tata Consultancy Services Ltd. (India) | 3.3 | |
| 5. | MercadoLibre, Inc. (Brazil) | 3.0 | |
| 6. | Housing Development Finance Corp. Ltd. (India) | 3.0 | |
| 7. | Reliance Industries Ltd. (India) | 2.8 | |
| 8. | JD.com, Inc., Class A (China) | 2.6 | |
| 9. | AIA Group Ltd. (Hong Kong) | 2.6 | |
| 10. | NetEase, Inc. (China) | 2.5 | |
| PORTFOLIO COMPOSTION BY COUNTRY AS OF April 30, 2022 | PERCENT OF TOTAL INVESTMENTS | |
China | 30.5% | |
India | 21.9 | |
Taiwan | 11.5 | |
South Korea | 8.1 | |
Brazil | 5.7 | |
Hong Kong | 4.9 | |
Indonesia | 4.4 | |
Mexico | 3.1 | |
United States | 2.0 | |
South Africa | 1.5 | |
United Kingdom | 1.1 | |
Others (each less than 1.0%) | 2.5 | |
Short-Term Investments | 2.8 |
| * | The return shown is based on net asset values calculated for shareholder transactions and may differ from the return shown in the financial highlights, which reflects adjustments made to the net asset values in accordance with accounting principles generally accepted in the United States of America. |
| ** | The adviser seeks to achieve the Fund’s objective. There can be no guarantee it will be achieved. |
| 4 | J.P. Morgan International Equity Funds | April 30, 2022 |
| INCEPTION DATE OF CLASS | 6 MONTH* | 1 YEAR | 5 YEAR | 10 YEAR | |||||
| CLASS A SHARES | September 28, 2001 | ||||||||
| With Sales Charge ** | (30.18)% | (33.58)% | 3.75% | 2.85% | |||||
| Without Sales Charge | (26.30) | (29.90) | 4.87 | 3.40 | |||||
| CLASS C SHARES | February 28, 2006 | ||||||||
| With CDSC *** | (27.47) | (31.25) | 4.36 | 2.99 | |||||
| Without CDSC | (26.47) | (30.25) | 4.36 | 2.99 | |||||
| Class I SHARES | September 10, 2001 | (26.18) | (29.71) | 5.15 | 3.66 | ||||
| Class L SHARES | November 15, 1993 | (26.17) | (29.65) | 5.26 | 3.79 | ||||
| Class R2 SHARES | July 31, 2017 | (26.41) | (30.12) | 4.57 | 3.22 | ||||
| Class R3 SHARES | July 31, 2017 | (26.29) | (29.91) | 4.84 | 3.38 | ||||
| Class R4 SHARES | July 31, 2017 | (26.22) | (29.76) | 5.09 | 3.63 | ||||
| Class R5 SHARES | September 9, 2016 | (26.15) | (29.63) | 5.26 | 3.80 | ||||
| Class R6 SHARES | December 23, 2013 | (26.14) | (29.58) | 5.36 | 3.88 |
| * | Not annualized. |
| ** | Sales Charge for Class A Shares is 5.25%. |
| *** | Assumes a 1% CDSC (contingent deferred sales charge) for the 6 month and one year periods and 0% CDSC thereafter. |
| April 30, 2022 | J.P. Morgan International Equity Funds | 5 |
| 6 | J.P. Morgan International Equity Funds | April 30, 2022 |
| REPORTING PERIOD RETURN: | |
Fund (Class R6 Shares) * | (15.89)% |
MSCI Emerging Markets Index (net total return) | (14.15)% |
Net Assets as of 4/30/2022 (In Thousands) | $2,946,092 |
| April 30, 2022 | J.P. Morgan International Equity Funds | 7 |
| TOP TEN POSITIONS OF THE PORTFOLIO AS OF April 30, 2022 | PERCENT OF TOTAL INVESTMENTS | ||
| 1. | Taiwan Semiconductor Manufacturing Co. Ltd. (Taiwan) | 5.8 % | |
| 2. | Samsung Electronics Co. Ltd. (South Korea) | 4.5 | |
| 3. | Tencent Holdings Ltd. (China) | 4.2 | |
| 4. | Alibaba Group Holding Ltd. (China) | 2.9 | |
| 5. | Reliance Industries Ltd. (India) | 1.8 | |
| 6. | Meituan (China)(a) | 1.4 | |
| 7. | China Construction Bank Corp., Class H (China) | 1.2 | |
| 8. | Infosys Ltd., ADR (India) | 1.2 | |
| 9. | JD.com, Inc., Class A (China) | 1.2 | |
| 10. | Vale SA, ADR (Brazil) | 1.2 | |
| PORTFOLIO COMPOSTION BY COUNTRY AS OF April 30, 2022 | PERCENT OF TOTAL INVESTMENTS | |
China | 30.2% | |
Taiwan | 14.6 | |
South Korea | 13.2 | |
India | 12.7 | |
Brazil | 6.1 | |
Saudi Arabia | 4.2 | |
South Africa | 4.2 | |
Mexico | 2.9 | |
Thailand | 2.1 | |
Indonesia | 1.8 | |
Malaysia | 1.2 | |
Others (each less than 1.0%) | 4.8 | |
Short-Term Investments | 2.0 |
| * | The return shown is based on net asset values calculated for shareholder transactions and may differ from the return shown in the financial highlights, which reflects adjustments made to the net asset values in accordance with accounting principles generally accepted in the United States of America. |
| ** | The adviser seeks to achieve the Fund’s objective. There can be no guarantee it will be achieved. |
| 8 | J.P. Morgan International Equity Funds | April 30, 2022 |
| INCEPTION DATE OF CLASS | 6 MONTH* | 1 YEAR | SINCE INCEPTION | ||||
| Class I SHARES | January 30, 2019 | (15.95)% | (20.37)% | 5.42% | |||
| Class R6 SHARES | December 11, 2018 | (15.89) | (20.26) | 5.54 |
| * | Not annualized. |

| April 30, 2022 | J.P. Morgan International Equity Funds | 9 |
| REPORTING PERIOD RETURN: | |
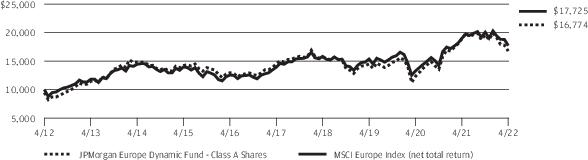
Fund (Class A Shares, without a sales charge) * | (14.34)% |
MSCI Europe Index (net total return) | (11.73)% |
Net Assets as of 4/30/2022 (In Thousands) | $606,542 |
| TOP TEN POSITIONS OF THE PORTFOLIO AS OF April 30, 2022 | PERCENT OF TOTAL INVESTMENTS | ||
| 1. | Nestle SA (Registered) (Switzerland) | 4.7 % | |
| 2. | Novo Nordisk A/S, Class B (Denmark) | 3.7 | |
| 3. | Roche Holding AG (Switzerland) | 3.7 | |
| 4. | TotalEnergies SE (France) | 2.9 | |
| 5. | BP plc (United Kingdom) | 2.8 | |
| 6. | Novartis AG (Registered) (Switzerland) | 2.8 | |
| 7. | LVMH Moet Hennessy Louis Vuitton SE (France) | 2.4 | |
| 8. | Koninklijke Ahold Delhaize NV (Netherlands) | 2.2 | |
| 9. | Allianz SE (Registered) (Germany) | 2.1 | |
| 10. | Diageo plc (United Kingdom) | 2.0 | |
| PORTFOLIO COMPOSTION BY COUNTRY AS OF April 30, 2022 | PERCENT OF TOTAL INVESTMENTS | |
United Kingdom | 18.2% | |
Switzerland | 16.1 | |
France | 15.0 | |
Germany | 14.2 | |
Denmark | 7.2 | |
Netherlands | 5.8 | |
Finland | 3.2 | |
United States | 2.2 | |
Australia | 2.0 | |
Ireland | 1.4 | |
Norway | 1.3 | |
Spain | 1.2 | |
Italy | 1.1 | |
Austria | 1.0 | |
Luxembourg | 0.9 | |
Short-Term Investments | 9.2 |
| * | The return shown is based on net asset values calculated for shareholder transactions and may differ from the return shown in the financial highlights, which reflects adjustments made to the net asset values in accordance with accounting principles generally accepted in the United States of America. |
| 10 | J.P. Morgan International Equity Funds | April 30, 2022 |
| ** | The adviser seeks to achieve the Fund’s objective. There can be no guarantee it will be achieved. |
| April 30, 2022 | J.P. Morgan International Equity Funds | 11 |
| INCEPTION DATE OF CLASS | 6 MONTH* | 1 YEAR | 5 YEAR | 10 YEAR | |||||
| CLASS A SHARES | November 2, 1995 | ||||||||
| With Sales Charge ** | (18.83)% | (15.94)% | 1.75% | 5.31% | |||||
| Without Sales Charge | (14.34) | (11.29) | 2.85 | 5.88 | |||||
| CLASS C SHARES | November 1, 1998 | ||||||||
| With CDSC *** | (15.58) | (12.73) | 2.34 | 5.45 | |||||
| Without CDSC | (14.58) | (11.73) | 2.34 | 5.45 | |||||
| Class I SHARES | September 10, 2001 | (14.22) | (11.03) | 3.12 | 6.16 | ||||
| Class L SHARES | September 10, 2001 | (14.19) | (10.93) | 3.24 | 6.34 | ||||
| Class R6 SHARES | October 1, 2018 | (14.13) | (10.83) | 3.32 | 6.38 |
| * | Not annualized. |
| ** | Sales Charge for Class A Shares is 5.25%. |
| *** | Assumes a 1% CDSC (contingent deferred sales charge) for the 6 month and one year periods and 0% CDSC thereafter. |
| 12 | J.P. Morgan International Equity Funds | April 30, 2022 |
| REPORTING PERIOD RETURN: | |
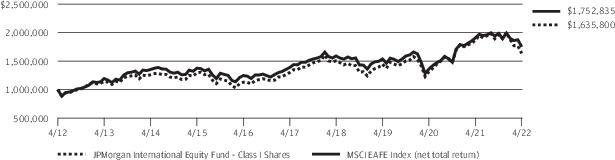
Fund (Class I Shares) * | (16.85)% |
MSCI EAFE Index (net total return) | (11.80)% |
Net Assets as of 4/30/2022 (In Thousands) | $4,483,386 |
| April 30, 2022 | J.P. Morgan International Equity Funds | 13 |
| TOP TEN POSITIONS OF THE PORTFOLIO AS OF April 30, 2022 | PERCENT OF TOTAL INVESTMENTS | ||
| 1. | Nestle SA (Registered) (Switzerland) | 4.0 % | |
| 2. | Roche Holding AG (Switzerland) | 3.3 | |
| 3. | TotalEnergies SE (France) | 3.3 | |
| 4. | Novo Nordisk A/S, Class B (Denmark) | 2.7 | |
| 5. | BHP Group Ltd. (Australia) | 2.5 | |
| 6. | Diageo plc (United Kingdom) | 2.4 | |
| 7. | ASML Holding NV (Netherlands) | 2.3 | |
| 8. | LVMH Moet Hennessy Louis Vuitton SE (France) | 2.2 | |
| 9. | DBS Group Holdings Ltd. (Singapore) | 2.0 | |
| 10. | Shell plc (Netherlands) | 1.9 | |
| PORTFOLIO COMPOSTION BY COUNTRY AS OF April 30, 2022 | PERCENT OF TOTAL INVESTMENTS | |
France | 14.9% | |
Japan | 11.8 | |
Switzerland | 10.1 | |
United Kingdom | 9.9 | |
Germany | 8.3 | |
Denmark | 5.7 | |
Netherlands | 5.6 | |
United States | 4.1 | |
Sweden | 3.6 | |
Hong Kong | 3.4 | |
Australia | 2.5 | |
Spain | 2.0 | |
Singapore | 2.0 | |
South Korea | 1.7 |
| PORTFOLIO COMPOSTION BY COUNTRY AS OF April 30, 2022 | PERCENT OF TOTAL INVESTMENTS | |
South Africa | 1.5% | |
Taiwan | 1.3 | |
Belgium | 1.3 | |
Others (each less than 1.0%) | 3.1 | |
Short-Term Investments | 7.2 |
| * | The return shown is based on net asset values calculated for shareholder transactions and may differ from the return shown in the financial highlights, which reflects adjustments made to the net asset values in accordance with accounting principles generally accepted in the United States of America. |
| ** | The adviser seeks to achieve the Fund’s objective. There can be no guarantee it will be achieved. |
| 14 | J.P. Morgan International Equity Funds | April 30, 2022 |
| INCEPTION DATE OF CLASS | 6 MONTH* | 1 YEAR | 5 YEAR | 10 YEAR | |||||
| CLASS A SHARES | February 28, 2002 | ||||||||
| With Sales Charge ** | (21.34)% | (17.40)% | 3.32% | 4.21% | |||||
| Without Sales Charge | (16.98) | (12.83) | 4.43 | 4.78 | |||||
| CLASS C SHARES | January 31, 2003 | ||||||||
| With CDSC *** | (18.16) | (14.25) | 3.92 | 4.35 | |||||
| Without CDSC | (17.16) | (13.25) | 3.92 | 4.35 | |||||
| Class I SHARES | January 1, 1997 | (16.85) | (12.60) | 4.72 | 5.04 | ||||
| Class R2 SHARES | November 3, 2008 | (17.06) | (13.06) | 4.14 | 4.49 | ||||
| Class R5 SHARES | May 15, 2006 | (16.83) | (12.52) | 4.82 | 5.20 | ||||
| Class R6 SHARES | November 30, 2010 | (16.77) | (12.41) | 4.93 | 5.28 |
| * | Not annualized. |
| ** | Sales Charge for Class A Shares is 5.25%. |
| *** | Assumes a 1% CDSC (contingent deferred sales charge) for the 6 month and one year periods and 0% CDSC thereafter. |
| April 30, 2022 | J.P. Morgan International Equity Funds | 15 |
| REPORTING PERIOD RETURN: | |
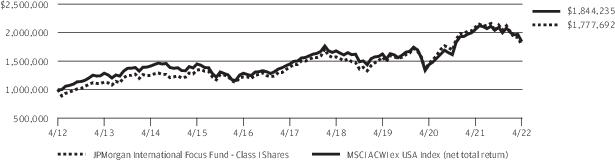
Fund (Class I Shares) * | (16.59)% |
MSCI ACWI ex USA Index (net total return) | (11.87)% |
Net Assets as of 4/30/2022 (In Thousands) | $1,406,947 |
| 16 | J.P. Morgan International Equity Funds | April 30, 2022 |
| TOP TEN POSITIONS OF THE PORTFOLIO AS OF April 30, 2022 | PERCENT OF TOTAL INVESTMENTS | ||
| 1. | Nestle SA (Registered) (Switzerland) | 4.8 % | |
| 2. | Shell plc (Netherlands) | 4.0 | |
| 3. | Novo Nordisk A/S, Class B (Denmark) | 3.9 | |
| 4. | Samsung Electronics Co. Ltd. (South Korea) | 3.8 | |
| 5. | Diageo plc (United Kingdom) | 3.6 | |
| 6. | BHP Group Ltd. (Australia) | 3.5 | |
| 7. | Roche Holding AG (Switzerland) | 3.2 | |
| 8. | Anglo American plc (South Africa) | 3.2 | |
| 9. | Toronto-Dominion Bank (The) (Canada) | 3.1 | |
| 10. | AIA Group Ltd. (Hong Kong) | 2.9 | |
| PORTFOLIO COMPOSTION BY COUNTRY AS OF April 30, 2022 | PERCENT OF TOTAL INVESTMENTS | |
Switzerland | 11.2% | |
United Kingdom | 9.9 | |
France | 9.8 | |
Netherlands | 7.4 | |
Canada | 5.7 | |
Germany | 5.4 | |
Denmark | 5.3 | |
Hong Kong | 4.9 | |
Japan | 4.7 | |
South Korea | 4.5 | |
Australia | 3.5 | |
United States | 3.3 | |
Taiwan | 3.3 | |
South Africa | 3.2 |
| PORTFOLIO COMPOSTION BY COUNTRY AS OF April 30, 2022 | PERCENT OF TOTAL INVESTMENTS | |
Singapore | 2.7% | |
China | 2.4 | |
India | 2.4 | |
Spain | 2.2 | |
Belgium | 2.1 | |
Indonesia | 1.9 | |
Sweden | 1.4 | |
Short-Term Investments | 2.8 |
| * | The return shown is based on net asset values calculated for shareholder transactions and may differ from the return shown in the financial highlights, which reflects adjustments made to the net asset values in accordance with accounting principles generally accepted in the United States of America. |
| ** | The adviser seeks to achieve the Fund’s objective. There can be no guarantee it will be achieved. |
| April 30, 2022 | J.P. Morgan International Equity Funds | 17 |
| INCEPTION DATE OF CLASS | 6 MONTH* | 1 YEAR | 5 YEAR | 10 YEAR | |||||
| CLASS A SHARES | November 30, 2011 | ||||||||
| With Sales Charge ** | (21.10)% | (19.86)% | 3.62% | 5.06% | |||||
| Without Sales Charge | (16.72) | (15.43) | 4.74 | 5.63 | |||||
| CLASS C SHARES | November 30, 2011 | ||||||||
| With CDSC *** | (17.91) | (16.82) | 4.22 | 5.20 | |||||
| Without CDSC | (16.91) | (15.82) | 4.22 | 5.20 | |||||
| Class I SHARES | November 30, 2011 | (16.59) | (15.20) | 5.02 | 5.92 | ||||
| Class R2 SHARES | November 30, 2011 | (16.83) | (15.68) | 4.43 | 5.34 | ||||
| Class R5 SHARES | November 30, 2011 | (16.57) | (15.11) | 5.12 | 6.06 | ||||
| Class R6 SHARES | November 30, 2011 | (16.50) | (15.01) | 5.22 | 6.14 |
| * | Not annualized. |
| ** | Sales Charge for Class A Shares is 5.25%. |
| *** | Assumes a 1% CDSC (contingent deferred sales charge) for the 6 month and one year periods and 0% CDSC thereafter. |
| 18 | J.P. Morgan International Equity Funds | April 30, 2022 |
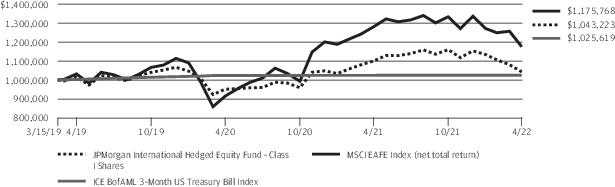
| REPORTING PERIOD RETURN: | |
Fund (Class I Shares) * | (10.08)% |
MSCI EAFE Index (net total return) | (11.80)% |
ICE BofAML 3-Month US Treasury Bill Index | 0.07% |
Net Assets as of 4/30/2022 (In Thousands) | $171,223 |
| April 30, 2022 | J.P. Morgan International Equity Funds | 19 |
| TOP TEN POSITIONS OF THE PORTFOLIO AS OF April 30, 2022 | PERCENT OF TOTAL INVESTMENTS | ||
| 1. | MSCI EAFE E-Mini Index 6/17/2022 at USD 2,015.00, European Style | 3.6 % | |
| 2. | Nestle SA (Registered) (Switzerland) | 2.8 | |
| 3. | Roche Holding AG (Switzerland) | 2.4 | |
| 4. | ASML Holding NV (Netherlands) | 2.0 | |
| 5. | Novo Nordisk A/S, Class B (Denmark) | 1.9 | |
| 6. | LVMH Moet Hennessy Louis Vuitton SE (France) | 1.7 | |
| 7. | Novartis AG (Registered) (Switzerland) | 1.7 | |
| 8. | AstraZeneca plc (United Kingdom) | 1.6 | |
| 9. | Diageo plc (United Kingdom) | 1.4 | |
| 10. | Allianz SE (Registered) (Germany) | 1.3 | |
| PORTFOLIO COMPOSTION BY COUNTRY AS OF April 30, 2022 | PERCENT OF TOTAL INVESTMENTS | |
Japan | 20.9% | |
United Kingdom | 12.8 | |
Switzerland | 10.9 | |
France | 10.7 | |
Germany | 8.7 | |
Australia | 6.1 | |
Netherlands | 5.9 | |
United States | 5.4 | |
Denmark | 3.2 | |
Spain | 2.7 | |
Hong Kong | 2.4 | |
Sweden | 1.9 | |
Others (each less than 1.0%) | 3.9 | |
Short-Term Investments | 4.5 |
| * | The return shown is based on net asset values calculated for shareholder transactions and may differ from the return shown in the financial highlights, which reflects adjustments made to the net asset values in accordance with accounting principles generally accepted in the United States of America. |
| ** | The adviser seeks to achieve the Fund’s objective. There can be no guarantee it will be achieved. |
| 20 | J.P. Morgan International Equity Funds | April 30, 2022 |
| INCEPTION DATE OF CLASS | 6 MONTH* | 1 YEAR | SINCE INCEPTION | ||||
| CLASS A SHARES | March 15, 2019 | ||||||
| With Sales Charge ** | (14.88)% | (10.37)% | (0.61)% | ||||
| Without Sales Charge | (10.15) | (5.40) | 1.11 | ||||
| CLASS C SHARES | March 15, 2019 | ||||||
| With CDSC *** | (11.38) | (6.87) | 0.60 | ||||
| Without CDSC | (10.38) | (5.87) | 0.60 | ||||
| Class I SHARES | March 15, 2019 | (10.08) | (5.18) | 1.36 | |||
| Class R5 SHARES | March 15, 2019 | (9.97) | (5.01) | 1.52 | |||
| Class R6 SHARES | March 15, 2019 | (9.99) | (4.98) | 1.61 |
| * | Not annualized. |
| ** | Sales Charge for Class A Shares is 5.25%. |
| *** | Assumes a 1% CDSC (contingent deferred sales charge) for the 6 month and one year periods and 0% CDSC thereafter. |
| April 30, 2022 | J.P. Morgan International Equity Funds | 21 |
| 22 | J.P. Morgan International Equity Funds | April 30, 2022 |
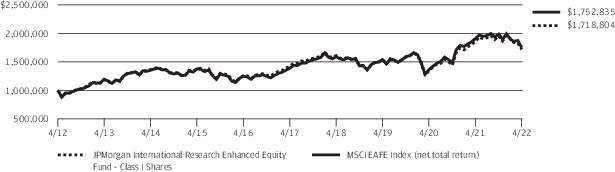
| REPORTING PERIOD RETURN: | |
Fund (Class I Shares) * | (12.16)% |
MSCI EAFE Index (net total return) | (11.80)% |
Net Assets as of 4/30/2022 (In Thousands) | $5,523,040 |
| TOP TEN POSITIONS OF THE PORTFOLIO AS OF April 30, 2022 | PERCENT OF TOTAL INVESTMENTS | ||
| 1. | Nestle SA (Registered) (Switzerland) | 2.9 % | |
| 2. | Roche Holding AG (Switzerland) | 2.5 | |
| 3. | ASML Holding NV (Netherlands) | 2.0 | |
| 4. | Novo Nordisk A/S, Class B (Denmark) | 2.0 | |
| 5. | LVMH Moet Hennessy Louis Vuitton SE (France) | 1.8 | |
| 6. | Novartis AG (Registered) (Switzerland) | 1.7 | |
| 7. | AstraZeneca plc (United Kingdom) | 1.6 | |
| 8. | Diageo plc (United Kingdom) | 1.4 | |
| 9. | BP plc (United Kingdom) | 1.3 | |
| 10. | Allianz SE (Registered) (Germany) | 1.3 | |
| PORTFOLIO COMPOSTION BY COUNTRY AS OF April 30, 2022 | PERCENT OF TOTAL INVESTMENTS | |
Japan | 19.0% | |
United Kingdom | 13.6 | |
Switzerland | 11.4 | |
France | 11.4 | |
Germany | 9.1 | |
Netherlands | 6.3 | |
Australia | 5.8 | |
Denmark | 3.4 | |
Spain | 2.7 | |
Hong Kong | 2.2 | |
Sweden | 1.9 | |
United States | 1.9 | |
Others (each less than 1.0%) | 4.0 | |
Short-Term Investments | 7.3 |
| * | The return shown is based on net asset values calculated for shareholder transactions and may differ from the return shown in the financial highlights, which reflects adjustments made to the net asset values in accordance with accounting principles generally accepted in the United States of America. |
| ** | The adviser seeks to achieve the Fund’s objective. There can be no guarantee it will be achieved. |
| April 30, 2022 | J.P. Morgan International Equity Funds | 23 |
| INCEPTION DATE OF CLASS | 6 MONTH* | 1 YEAR | 5 YEAR | 10 YEAR | |||||
| CLASS A SHARES | April 23, 1993 | ||||||||
| With Sales Charge ** | (16.83)% | (12.46)% | 2.48% | 4.74% | |||||
| Without Sales Charge | (12.21) | (7.61) | 3.60 | 5.31 | |||||
| Class I SHARES | October 28, 1992 | (12.16) | (7.45) | 3.83 | 5.57 | ||||
| Class R6 SHARES | November 1, 2017 | (12.14) | (7.36) | 3.93 | 5.62 |
| * | Not annualized. |
| ** | Sales Charge for Class A Shares is 5.25%. |
| 24 | J.P. Morgan International Equity Funds | April 30, 2022 |
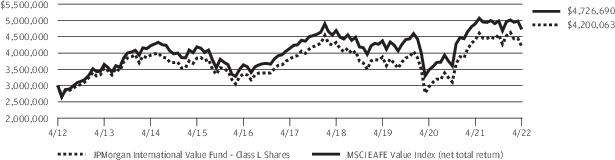
| REPORTING PERIOD RETURN: | |
Fund (Class L Shares) * | (7.92)% |
MSCI EAFE Value Index (net total return) | (5.14)% |
Net Assets as of 4/30/2022 (In Thousands) | $387,700 |
| April 30, 2022 | J.P. Morgan International Equity Funds | 25 |
| TOP TEN POSITIONS OF THE PORTFOLIO AS OF April 30, 2022 | PERCENT OF TOTAL INVESTMENTS | ||
| 1. | Shell plc (Netherlands) | 2.8 % | |
| 2. | Novartis AG (Registered) (Switzerland) | 2.4 | |
| 3. | Toyota Motor Corp. (Japan) | 2.3 | |
| 4. | BHP Group Ltd. (Australia) | 2.2 | |
| 5. | TotalEnergies SE (France) | 1.7 | |
| 6. | HSBC Holdings plc (United Kingdom) | 1.6 | |
| 7. | GlaxoSmithKline plc | 1.5 | |
| 8. | BP plc (United Kingdom) | 1.4 | |
| 9. | Siemens AG (Registered) (Germany) | 1.2 | |
| 10. | Allianz SE (Registered) (Germany) | 1.2 | |
| PORTFOLIO COMPOSTION BY COUNTRY AS OF April 30, 2022 | PERCENT OF TOTAL INVESTMENTS | |
Japan | 20.1% | |
United Kingdom | 13.6 | |
Germany | 9.4 | |
Australia | 8.1 | |
France | 7.7 | |
Switzerland | 5.9 | |
Netherlands | 5.8 | |
Italy | 3.2 | |
Spain | 3.1 | |
Sweden | 2.6 | |
Norway | 2.4 | |
United States | 2.3 | |
Denmark | 1.6 | |
Finland | 1.5 |
| PORTFOLIO COMPOSTION BY COUNTRY AS OF April 30, 2022 | PERCENT OF TOTAL INVESTMENTS | |
Singapore | 1.4% | |
Austria | 1.3 | |
Hong Kong | 1.0 | |
Others (each less than 1.0%) | 2.7 | |
Short-Term Investments | 6.3 |
| * | The return shown is based on net asset values calculated for shareholder transactions and may differ from the return shown in the financial highlights, which reflects adjustments made to the net asset values in accordance with accounting principles generally accepted in the United States of America. |
| ** | The adviser seeks to achieve the Fund’s objective. There can be no guarantee it will be achieved. |
| 26 | J.P. Morgan International Equity Funds | April 30, 2022 |
| INCEPTION DATE OF CLASS | 6 MONTH* | 1 YEAR | 5 YEAR | 10 YEAR | |||||
| CLASS A SHARES | September 28, 2001 | ||||||||
| With Sales Charge ** | (12.90)% | (9.86)% | 0.46% | 2.46% | |||||
| Without Sales Charge | (8.05) | (4.87) | 1.55 | 3.02 | |||||
| CLASS C SHARES | July 11, 2006 | ||||||||
| With CDSC *** | (9.34) | (6.36) | 1.03 | 2.61 | |||||
| Without CDSC | (8.34) | (5.36) | 1.03 | 2.61 | |||||
| Class I SHARES | September 10, 2001 | (7.97) | (4.66) | 1.81 | 3.29 | ||||
| Class L SHARES | November 4, 1993 | (7.92) | (4.53) | 1.92 | 3.42 | ||||
| Class R2 SHARES | November 3, 2008 | (8.22) | (5.13) | 1.25 | 2.74 | ||||
| Class R5 SHARES | September 9, 2016 | (7.85) | (4.50) | 1.92 | 3.42 | ||||
| Class R6 SHARES | November 30, 2010 | (7.93) | (4.44) | 2.02 | 3.53 |
| * | Not annualized. |
| ** | Sales Charge for Class A Shares is 5.25%. |
| *** | Assumes a 1% CDSC (contingent deferred sales charge) for the 6 month and one year periods and 0% CDSC thereafter. |
| April 30, 2022 | J.P. Morgan International Equity Funds | 27 |
| INVESTMENTS | SHARES (000) | VALUE ($000) |
| Common Stocks — 97.3% | ||
| Brazil — 5.7% | ||
| B3 SA - Brasil Bolsa Balcao | 36,160 | 97,275 |
| Magazine Luiza SA * | 35,416 | 35,388 |
| MercadoLibre, Inc. * | 290 | 282,412 |
| Raia Drogasil SA | 12,592 | 53,284 |
| XP, Inc., Class A * | 3,372 | 82,972 |
| 551,331 | ||
| China — 30.5% | ||
| Alibaba Group Holding Ltd. * | 2,185 | 26,658 |
| Beijing Oriental Yuhong Waterproof Technology Co. Ltd., Class A | 14,621 | 99,270 |
| Budweiser Brewing Co. APAC Ltd. (a) | 36,765 | 91,478 |
| Dada Nexus Ltd., ADR * | 3,482 | 26,570 |
| Foshan Haitian Flavouring & Food Co. Ltd., Class A | 10,770 | 131,311 |
| JD.com, Inc., ADR * | 1,020 | 62,922 |
| JD.com, Inc., Class A * | 7,921 | 246,959 |
| Jiangsu Hengli Hydraulic Co. Ltd., Class A | 14,368 | 98,604 |
| KE Holdings, Inc., ADR * | 3,440 | 48,775 |
| Kingdee International Software Group Co. Ltd. * | 33,349 | 68,052 |
| Meituan * (a) | 7,797 | 167,056 |
| Midea Group Co. Ltd., Class A | 3,256 | 27,705 |
| NetEase, Inc. | 12,341 | 236,401 |
| Pharmaron Beijing Co. Ltd., Class A | 5,886 | 110,397 |
| Ping An Bank Co. Ltd., Class A | 24,427 | 55,982 |
| Shenzhen Mindray Bio-Medical Electronics Co. Ltd., Class A | 1,917 | 89,874 |
| Shenzhou International Group Holdings Ltd. | 8,462 | 114,817 |
| Sichuan Swellfun Co. Ltd., Class A | 1,990 | 20,973 |
| Silergy Corp. | 1,455 | 129,542 |
| Sunny Optical Technology Group Co. Ltd. | 6,003 | 87,494 |
| Tencent Holdings Ltd. | 9,578 | 451,358 |
| Wanhua Chemical Group Co. Ltd., Class A | 8,751 | 101,801 |
| Wuliangye Yibin Co. Ltd., Class A | 2,814 | 68,187 |
| Wuxi Biologics Cayman, Inc. * (a) | 19,748 | 145,760 |
| Xinyi Solar Holdings Ltd. | 90,630 | 134,715 |
| Yum China Holdings, Inc. | 2,605 | 108,882 |
| 2,951,543 | ||
| Hong Kong — 4.9% | ||
| AIA Group Ltd. | 24,585 | 241,514 |
| Hong Kong Exchanges & Clearing Ltd. | 1,598 | 67,802 |
| Techtronic Industries Co. Ltd. | 1,220 | 16,254 |
| Techtronic Industries Co. Ltd. | 11,206 | 149,579 |
| 475,149 | ||
| INVESTMENTS | SHARES (000) | VALUE ($000) |
| India — 21.9% | ||
| Apollo Hospitals Enterprise Ltd. | 1,562 | 90,468 |
| Asian Paints Ltd. | 2,104 | 88,691 |
| Britannia Industries Ltd. | 1,516 | 64,701 |
| HDFC Bank Ltd. | 13,065 | 234,234 |
| HDFC Bank Ltd., ADR | 2,799 | 154,522 |
| HDFC Life Insurance Co. Ltd. (a) | 16,679 | 126,468 |
| Hindustan Unilever Ltd. | 5,256 | 152,715 |
| Housing Development Finance Corp. Ltd. | 9,711 | 280,190 |
| Infosys Ltd. | 3,073 | 62,281 |
| Infosys Ltd., ADR | 6,857 | 136,239 |
| Kotak Mahindra Bank Ltd. | 6,895 | 159,883 |
| Reliance Industries Ltd. | 7,350 | 266,303 |
| Tata Consultancy Services Ltd. | 6,652 | 306,584 |
| 2,123,279 | ||
| Indonesia — 4.4% | ||
| Bank Central Asia Tbk. PT | 366,933 | 205,802 |
| Bank Rakyat Indonesia Persero Tbk. PT | 655,689 | 218,467 |
| 424,269 | ||
| Macau — 0.5% | ||
| Sands China Ltd. * | 22,195 | 48,921 |
| Mexico — 3.1% | ||
| Grupo Financiero Banorte SAB de CV, Class O | 17,815 | 117,418 |
| Wal-Mart de Mexico SAB de CV | 52,447 | 185,898 |
| 303,316 | ||
| Panama — 0.7% | ||
| Copa Holdings SA, Class A * | 879 | 66,264 |
| Poland — 0.4% | ||
| Allegro.eu SA * (a) | 6,701 | 34,466 |
| Portugal — 0.9% | ||
| Jeronimo Martins SGPS SA | 4,290 | 89,295 |
| South Africa — 1.5% | ||
| Bid Corp. Ltd. | 3,452 | 72,233 |
| Capitec Bank Holdings Ltd. | 525 | 73,285 |
| 145,518 | ||
| South Korea — 8.2% | ||
| Delivery Hero SE * (a) (b) | 1,063 | 37,355 |
| LG Chem Ltd. | 225 | 92,259 |
| NCSoft Corp. | 162 | 53,683 |
| Samsung Electronics Co. Ltd. | 11,386 | 606,785 |
| 790,082 | ||
| 28 | J.P. Morgan International Equity Funds | April 30, 2022 |
| INVESTMENTS | SHARES (000) | VALUE ($000) |
| Common Stocks — continued | ||
| Taiwan — 11.5% | ||
| Chailease Holding Co. Ltd. | 16,230 | 128,975 |
| Delta Electronics, Inc. | 9,230 | 77,048 |
| Realtek Semiconductor Corp. | 3,104 | 42,120 |
| Taiwan Semiconductor Manufacturing Co. Ltd. | 6,120 | 110,666 |
| Taiwan Semiconductor Manufacturing Co. Ltd., ADR | 8,142 | 756,695 |
| 1,115,504 | ||
| United Kingdom — 1.1% | ||
| Prudential plc | 8,808 | 109,652 |
| United States — 2.0% | ||
| EPAM Systems, Inc. * | 544 | 144,031 |
| JS Global Lifestyle Co. Ltd. (a) | 41,166 | 48,836 |
| 192,867 | ||
| Total Common Stocks (Cost $8,504,575) | 9,421,456 | |
| Short-Term Investments — 2.8% | ||
| Investment Companies — 2.8% | ||
| JPMorgan Prime Money Market Fund Class Institutional Shares, 0.36% (c) (d)(Cost $267,802) | 267,753 | 267,806 |
| Investment of Cash Collateral from Securities Loaned — 0.0% ^ | ||
| JPMorgan Securities Lending Money Market Fund Agency SL Class Shares, 0.37% (c) (d) | 8 | 8 |
| JPMorgan U.S. Government Money Market Fund Class IM Shares, 0.37% (c) (d) | 99 | 99 |
| Total Investment of Cash Collateral from Securities Loaned (Cost $107) | 107 | |
| Total Short-Term Investments (Cost $267,909) | 267,913 | |
| Total Investments — 100.1% (Cost $8,772,484) | 9,689,369 | |
| Liabilities in Excess of Other Assets — (0.1)% | (11,141) | |
| NET ASSETS — 100.0% | 9,678,228 | |
Percentages indicated are based on net assets. | ||
| Abbreviations | |
| ADR | American Depositary Receipt |
| APAC | Asia Pacific |
| PT | Limited liability company |
| SGPS | Holding company |
| ^ | Amount rounds to less than 0.1% of net assets. | |
| * | Non-income producing security. | |
| (a) | Security exempt from registration pursuant to Regulation S under the Securities Act of 1933, as amended. Regulation S applies to securities offerings that are made outside of the United States and do not involve direct selling efforts in the United States and as such may have restrictions on resale. | |
| (b) | The security or a portion of this security is on loan at April 30, 2022. The total value of securities on loan at April 30, 2022 is $106. | |
| (c) | Investment in an affiliated fund, which is registered under the Investment Company Act of 1940, as amended, and is advised by J.P. Morgan Investment Management Inc. | |
| (d) | The rate shown is the current yield as of April 30, 2022. |
| INDUSTRY | PERCENT OF TOTAL INVESTMENTS |
| Banks | 12.7% |
| Semiconductors & Semiconductor Equipment | 12.1 |
| Internet & Direct Marketing Retail | 9.3 |
| IT Services | 6.7 |
| Technology Hardware, Storage & Peripherals | 6.3 |
| Insurance | 4.9 |
| Interactive Media & Services | 4.7 |
| Food & Staples Retailing | 4.0 |
| Entertainment | 2.9 |
| Chemicals | 2.9 |
| Thrifts & Mortgage Finance | 2.9 |
| Oil, Gas & Consumable Fuels | 2.7 |
| Machinery | 2.7 |
| Life Sciences Tools & Services | 2.6 |
| Capital Markets | 2.6 |
| Food Products | 2.1 |
| Beverages | 1.8 |
| Electronic Equipment, Instruments & Components | 1.7 |
| Hotels, Restaurants & Leisure | 1.6 |
| Personal Products | 1.6 |
| Diversified Financial Services | 1.3 |
| Textiles, Apparel & Luxury Goods | 1.2 |
| Construction Materials | 1.0 |
| Others (each less than 1.0%) | 4.9 |
| Short-Term Investments | 2.8 |
| April 30, 2022 | J.P. Morgan International Equity Funds | 29 |
| INVESTMENTS | SHARES (000) | VALUE ($000) |
| Common Stocks — 98.7% | ||
| Brazil — 6.2% | ||
| Atacadao SA | 1,245 | 5,192 |
| B3 SA - Brasil Bolsa Balcao | 1,593 | 4,285 |
| Cia Energetica de Minas Gerais (Preference) | 959 | 2,918 |
| EDP - Energias do Brasil SA | 936 | 4,026 |
| Gerdau SA (Preference) | 2,097 | 11,972 |
| Itau Unibanco Holding SA (Preference) * | 3,198 | 15,485 |
| Itausa SA (Preference) | 6,219 | 11,610 |
| Localiza Rent a Car SA | 436 | 4,701 |
| Lojas Renner SA * | 1,656 | 7,992 |
| Magazine Luiza SA * | 3,785 | 3,782 |
| MercadoLibre, Inc. * | 4 | 4,281 |
| Petroleo Brasileiro SA (Preference) | 4,981 | 30,721 |
| Porto Seguro SA | 470 | 1,950 |
| Raia Drogasil SA | 2,012 | 8,511 |
| Suzano SA | 975 | 9,858 |
| TIM SA, ADR * | 466 | 6,360 |
| Vale SA, ADR | 2,078 | 35,104 |
| WEG SA | 1,854 | 11,365 |
| XP, Inc., Receipts * | 85 | 2,096 |
| 182,209 | ||
| Chile — 0.4% | ||
| Banco Santander Chile, ADR | 383 | 7,452 |
| Cencosud SA | 1,448 | 2,317 |
| Cia Cervecerias Unidas SA, ADR | 118 | 1,578 |
| 11,347 | ||
| China — 30.4% | ||
| Alibaba Group Holding Ltd. * | 7,028 | 85,726 |
| Amoy Diagnostics Co. Ltd., Class A | 204 | 1,393 |
| Anhui Conch Cement Co. Ltd., Class H | 903 | 4,910 |
| Anjoy Foods Group Co. Ltd., Class A | 136 | 2,635 |
| ANTA Sports Products Ltd. | 718 | 8,247 |
| Baidu, Inc., ADR * | 92 | 11,375 |
| Baoshan Iron & Steel Co. Ltd., Class A | 6,679 | 6,444 |
| BeiGene Ltd., ADR * (a) | 17 | 2,677 |
| Beijing Oriental Yuhong Waterproof Technology Co. Ltd., Class A | 589 | 3,999 |
| BOE Technology Group Co. Ltd., Class A | 10,123 | 5,750 |
| BYD Co. Ltd., Class H | 159 | 4,642 |
| Chacha Food Co. Ltd., Class A | 651 | 5,179 |
| China Conch Environment Protection Holdings Ltd. * | 1,321 | 1,131 |
| China Conch Venture Holdings Ltd. | 1,321 | 3,430 |
| China Construction Bank Corp., Class H | 51,389 | 36,609 |
| China International Capital Corp. Ltd., Class H (b) | 3,397 | 6,809 |
| INVESTMENTS | SHARES (000) | VALUE ($000) |
| China — continued | ||
| China Lesso Group Holdings Ltd. | 3,062 | 3,829 |
| China Life Insurance Co. Ltd., Class H | 6,444 | 9,364 |
| China Merchants Bank Co. Ltd., Class H | 3,374 | 20,336 |
| China Molybdenum Co. Ltd., Class H | 12,579 | 6,256 |
| China Oilfield Services Ltd., Class H | 8,198 | 8,393 |
| China Pacific Insurance Group Co. Ltd., Class H | 3,075 | 6,818 |
| China Petroleum & Chemical Corp., Class H | 12,884 | 6,306 |
| China Resources Land Ltd. | 2,594 | 11,585 |
| China Resources Mixc Lifestyle Services Ltd. (b) | 644 | 3,096 |
| China Vanke Co. Ltd., Class H | 4,356 | 10,272 |
| China Yangtze Power Co. Ltd., Class A | 2,446 | 8,336 |
| Chongqing Brewery Co. Ltd., Class A * | 192 | 3,590 |
| Chongqing Fuling Zhacai Group Co. Ltd., Class A | 602 | 3,142 |
| Contemporary Amperex Technology Co. Ltd., Class A | 117 | 7,085 |
| COSCO SHIPPING Holdings Co. Ltd., Class H * | 1,890 | 2,941 |
| Country Garden Services Holdings Co. Ltd. | 1,560 | 6,575 |
| CSPC Pharmaceutical Group Ltd. | 5,804 | 5,934 |
| ENN Energy Holdings Ltd. | 681 | 9,118 |
| Foshan Haitian Flavouring & Food Co. Ltd., Class A | 712 | 8,681 |
| Fuyao Glass Industry Group Co. Ltd., Class H (b) | 965 | 3,942 |
| Ganfeng Lithium Co. Ltd., Class H (b) | 221 | 2,648 |
| Guangzhou Automobile Group Co. Ltd., Class H | 11,024 | 9,347 |
| Guangzhou Kingmed Diagnostics Group Co. Ltd., Class A | 282 | 3,452 |
| Haier Smart Home Co. Ltd., Class H | 3,563 | 12,586 |
| Hangzhou Tigermed Consulting Co. Ltd., Class H (b) | 271 | 2,625 |
| Han's Laser Technology Industry Group Co. Ltd., Class A | 605 | 2,497 |
| Hefei Meiya Optoelectronic Technology, Inc., Class A | 535 | 1,814 |
| Huatai Securities Co. Ltd., Class H (b) | 2,480 | 3,408 |
| Huayu Automotive Systems Co. Ltd., Class A | 978 | 2,861 |
| Huazhu Group Ltd. | 1,647 | 5,183 |
| Hundsun Technologies, Inc., Class A | 327 | 1,862 |
| Hutchmed China Ltd., ADR * (a) | 64 | 972 |
| Industrial & Commercial Bank of China Ltd., Class H | 27,366 | 16,496 |
| Inner Mongolia Yili Industrial Group Co. Ltd., Class A | 1,589 | 9,157 |
| JD.com, Inc., Class A * | 1,127 | 35,144 |
| Jiangsu Hengli Hydraulic Co. Ltd., Class A | 273 | 1,873 |
| Jiangsu Hengrui Medicine Co. Ltd., Class A | 949 | 4,191 |
| Kuaishou Technology * (b) | 315 | 2,576 |
| Kunlun Energy Co. Ltd. | 7,742 | 6,425 |
| Kweichow Moutai Co. Ltd., Class A | 31 | 8,375 |
| Laobaixing Pharmacy Chain JSC, Class A | 670 | 3,232 |
| Lenovo Group Ltd. | 3,448 | 3,348 |
| 30 | J.P. Morgan International Equity Funds | April 30, 2022 |
| INVESTMENTS | SHARES (000) | VALUE ($000) |
| Common Stocks — continued | ||
| China — continued | ||
| Longfor Group Holdings Ltd. (b) | 2,086 | 10,331 |
| Maxscend Microelectronics Co. Ltd., Class A * | 66 | 1,805 |
| Meituan * (b) | 1,866 | 39,984 |
| Minth Group Ltd. | 1,506 | 3,548 |
| NetEase, Inc. | 1,352 | 25,906 |
| NIO, Inc., ADR * (a) | 437 | 7,302 |
| Nongfu Spring Co. Ltd., Class H (b) | 740 | 3,917 |
| Oppein Home Group, Inc., Class A | 348 | 6,074 |
| Pharmaron Beijing Co. Ltd., Class H (b) | 572 | 7,190 |
| PICC Property & Casualty Co. Ltd., Class H | 10,226 | 10,459 |
| Pinduoduo, Inc., ADR * | 222 | 9,573 |
| Ping An Bank Co. Ltd., Class A | 3,403 | 7,798 |
| Ping An Insurance Group Co. of China Ltd., Class H | 3,821 | 24,155 |
| Poly Developments and Holdings Group Co. Ltd., Class A | 1,188 | 3,243 |
| Postal Savings Bank of China Co. Ltd., Class H (b) | 8,595 | 6,517 |
| Qingdao Haier Biomedical Co. Ltd., Class A | 387 | 3,744 |
| Shanghai Baosight Software Co. Ltd., Class A | 513 | 3,641 |
| Shenzhen Mindray Bio-Medical Electronics Co. Ltd., Class A | 128 | 6,009 |
| Silergy Corp. | 77 | 6,856 |
| Skshu Paint Co. Ltd., Class A | 323 | 3,589 |
| Sunny Optical Technology Group Co. Ltd. | 533 | 7,771 |
| Tencent Holdings Ltd. | 2,663 | 125,503 |
| Tongwei Co. Ltd., Class A | 792 | 4,842 |
| Trip.com Group Ltd., ADR * | 152 | 3,606 |
| Wanhua Chemical Group Co. Ltd., Class A | 562 | 6,534 |
| Wuliangye Yibin Co. Ltd., Class A | 101 | 2,437 |
| WuXi AppTec Co. Ltd., Class H (b) | 534 | 7,259 |
| Wuxi Biologics Cayman, Inc. * (b) | 1,988 | 14,677 |
| Xiaomi Corp., Class B * (b) | 3,225 | 4,910 |
| Xinyi Solar Holdings Ltd. | 6,168 | 9,168 |
| XPeng, Inc., Class A * (a) | 485 | 6,024 |
| Yum China Holdings, Inc. | 71 | 2,925 |
| Yum China Holdings, Inc. | 167 | 6,962 |
| Yunnan Energy New Material Co. Ltd. * | 94 | 2,837 |
| Zai Lab Ltd., ADR * | 24 | 966 |
| Zhejiang Dingli Machinery Co. Ltd., Class A | 355 | 1,975 |
| Zhejiang Weixing New Building Materials Co. Ltd., Class A | 1,651 | 4,693 |
| Zhongji Innolight Co. Ltd., Class A | 507 | 2,323 |
| Zijin Mining Group Co. Ltd., Class H | 8,426 | 12,269 |
| 895,949 | ||
| INVESTMENTS | SHARES (000) | VALUE ($000) |
| Colombia — 0.2% | ||
| Ecopetrol SA, ADR (a) | 330 | 5,352 |
| Greece — 0.5% | ||
| Hellenic Telecommunications Organization SA | 384 | 7,388 |
| OPAP SA | 465 | 6,886 |
| 14,274 | ||
| Hong Kong — 0.2% | ||
| Techtronic Industries Co. Ltd. | 418 | 5,579 |
| Hungary — 0.4% | ||
| OTP Bank Nyrt. * | 252 | 7,514 |
| Richter Gedeon Nyrt. | 185 | 3,684 |
| 11,198 | ||
| India — 12.8% | ||
| ACC Ltd. | 153 | 4,626 |
| Apollo Hospitals Enterprise Ltd. | 187 | 10,818 |
| Axis Bank Ltd. * | 994 | 9,375 |
| Bharat Petroleum Corp. Ltd. | 1,760 | 8,285 |
| Biocon Ltd. * | 913 | 4,381 |
| Britannia Industries Ltd. | 233 | 9,936 |
| Dabur India Ltd. | 643 | 4,652 |
| Dr. Reddy's Laboratories Ltd. | 53 | 2,880 |
| Eicher Motors Ltd. | 124 | 4,220 |
| GAIL India Ltd. | 1,461 | 3,020 |
| HDFC Bank Ltd., ADR | 128 | 7,076 |
| HDFC Life Insurance Co. Ltd. (b) | 1,385 | 10,501 |
| Hindalco Industries Ltd. | 1,589 | 9,891 |
| Hindustan Unilever Ltd. | 657 | 19,080 |
| Housing Development Finance Corp. Ltd. | 987 | 28,464 |
| ICICI Bank Ltd. | 3,010 | 28,932 |
| Infosys Ltd., ADR | 1,773 | 35,227 |
| Kotak Mahindra Bank Ltd. | 577 | 13,383 |
| Larsen & Toubro Ltd. | 552 | 12,122 |
| Maruti Suzuki India Ltd. | 135 | 13,556 |
| NTPC Ltd. | 4,763 | 9,668 |
| Oil & Natural Gas Corp. Ltd. | 3,278 | 6,793 |
| Petronet LNG Ltd. | 2,227 | 5,903 |
| Power Grid Corp. of India Ltd. | 2,429 | 7,198 |
| Reliance Industries Ltd. | 1,486 | 53,838 |
| Shriram Transport Finance Co. Ltd. | 446 | 6,927 |
| Tata Consultancy Services Ltd. | 573 | 26,392 |
| Tata Consumer Products Ltd. | 325 | 3,487 |
| Tata Steel Ltd. | 375 | 6,162 |
| April 30, 2022 | J.P. Morgan International Equity Funds | 31 |
| INVESTMENTS | SHARES (000) | VALUE ($000) |
| Common Stocks — continued | ||
| India — continued | ||
| UltraTech Cement Ltd. | 89 | 7,709 |
| Wipro Ltd. | 474 | 3,113 |
| 377,615 | ||
| Indonesia — 1.8% | ||
| Bank Central Asia Tbk. PT | 36,002 | 20,192 |
| Bank Rakyat Indonesia Persero Tbk. PT | 53,968 | 17,982 |
| Telkom Indonesia Persero Tbk. PT | 50,760 | 16,177 |
| 54,351 | ||
| Malaysia — 1.2% | ||
| CIMB Group Holdings Bhd. | 3,823 | 4,557 |
| Malayan Banking Bhd. | 1,818 | 3,781 |
| Petronas Chemicals Group Bhd. | 3,999 | 9,388 |
| Public Bank Bhd. | 11,430 | 12,286 |
| Tenaga Nasional Bhd. | 2,208 | 4,584 |
| 34,596 | ||
| Mexico — 2.9% | ||
| America Movil SAB de CV | 18,099 | 17,650 |
| Fomento Economico Mexicano SAB de CV, ADR | 91 | 6,823 |
| Grupo Aeroportuario del Pacifico SAB de CV, Class B * | 628 | 9,670 |
| Grupo Aeroportuario del Sureste SAB de CV, Class B | 426 | 9,284 |
| Grupo Financiero Banorte SAB de CV, Class O | 1,963 | 12,942 |
| Grupo Mexico SAB de CV | 2,202 | 10,313 |
| Kimberly-Clark de Mexico SAB de CV, Class A | 2,133 | 2,969 |
| Wal-Mart de Mexico SAB de CV | 4,209 | 14,919 |
| 84,570 | ||
| Peru — 0.4% | ||
| Credicorp Ltd. | 80 | 11,094 |
| Philippines — 0.5% | ||
| Ayala Corp. | 253 | 3,554 |
| Ayala Land, Inc. | 5,924 | 3,616 |
| International Container Terminal Services, Inc. | 1,500 | 6,160 |
| 13,330 | ||
| Poland — 0.4% | ||
| Dino Polska SA * (b) | 119 | 7,666 |
| Powszechny Zaklad Ubezpieczen SA | 809 | 5,596 |
| 13,262 | ||
| INVESTMENTS | SHARES (000) | VALUE ($000) |
| Qatar — 0.6% | ||
| Industries Qatar QSC | 1,191 | 6,142 |
| Qatar National Bank QPSC | 1,977 | 12,624 |
| 18,766 | ||
| Russia — 0.0% ^ | ||
| Gazprom PJSC, ADR ‡ | 2,290 | 256 |
| Magnitogorsk Iron & Steel Works PJSC ‡ | 3,146 | 36 |
| MMC Norilsk Nickel PJSC, ADR ‡ | 410 | 197 |
| Novatek PJSC ‡ | 165 | 50 |
| Rosneft Oil Co. PJSC, GDR ‡ (b) | 833 | 78 |
| Sberbank of Russia PJSC, ADR ‡ | 793 | 70 |
| Severstal PAO, GDR ‡ (b) | 329 | 105 |
| TCS Group Holding plc, GDR ‡ * (b) | 69 | 50 |
| X5 Retail Group NV, GDR ‡ (b) | 207 | 50 |
| 892 | ||
| Saudi Arabia — 4.2% | ||
| Al Rajhi Bank | 703 | 32,930 |
| Alinma Bank | 1,338 | 14,673 |
| Almarai Co. JSC | 380 | 5,234 |
| BinDawood Holding Co. | 132 | 3,596 |
| Etihad Etisalat Co. | 368 | 4,249 |
| SABIC Agri-Nutrients Co. | 148 | 6,359 |
| Saudi Arabian Oil Co. (b) | 478 | 5,716 |
| Saudi Basic Industries Corp. | 431 | 14,944 |
| Saudi National Bank (The) | 1,380 | 28,935 |
| Saudi Telecom Co. | 271 | 8,327 |
| 124,963 | ||
| Singapore — 0.1% | ||
| BOC Aviation Ltd. (b) | 347 | 2,718 |
| South Africa — 4.2% | ||
| Bid Corp. Ltd. | 537 | 11,244 |
| Bidvest Group Ltd. (The) | 233 | 3,196 |
| Capitec Bank Holdings Ltd. | 76 | 10,660 |
| Clicks Group Ltd. | 385 | 7,572 |
| FirstRand Ltd. | 4,291 | 18,479 |
| Foschini Group Ltd. (The) | 366 | 3,218 |
| Gold Fields Ltd. | 206 | 2,783 |
| Impala Platinum Holdings Ltd. | 375 | 4,856 |
| MTN Group Ltd. | 359 | 3,809 |
| Naspers Ltd., Class N | 112 | 11,315 |
| Nedbank Group Ltd. | 599 | 8,360 |
| Sanlam Ltd. | 2,676 | 11,085 |
| Sasol Ltd. * | 226 | 5,522 |
| 32 | J.P. Morgan International Equity Funds | April 30, 2022 |
| INVESTMENTS | SHARES (000) | VALUE ($000) |
| Common Stocks — continued | ||
| South Africa — continued | ||
| SPAR Group Ltd. (The) | 620 | 6,500 |
| Standard Bank Group Ltd. | 791 | 8,380 |
| Vodacom Group Ltd. | 644 | 6,201 |
| 123,180 | ||
| South Korea — 13.3% | ||
| BGF retail Co. Ltd. | 18 | 2,506 |
| Hana Financial Group, Inc. | 218 | 8,087 |
| Hankook Tire & Technology Co. Ltd. | 127 | 3,476 |
| Hyundai Glovis Co. Ltd. | 56 | 9,235 |
| Hyundai Mobis Co. Ltd. | 30 | 4,870 |
| Hyundai Motor Co. | 40 | 5,736 |
| JYP Entertainment Corp. | 101 | 4,695 |
| Kakao Corp. | 168 | 11,763 |
| KB Financial Group, Inc. | 370 | 17,204 |
| Kia Corp. | 244 | 16,007 |
| KIWOOM Securities Co. Ltd. | 41 | 3,057 |
| LG Chem Ltd. | 37 | 15,001 |
| LG Household & Health Care Ltd. | 10 | 7,057 |
| Mando Corp. | 73 | 3,119 |
| NAVER Corp. | 81 | 18,023 |
| NCSoft Corp. | 22 | 7,358 |
| POSCO Holdings, Inc. | 63 | 14,461 |
| Samsung Biologics Co. Ltd. * (b) | 11 | 7,480 |
| Samsung Electro-Mechanics Co. Ltd. | 51 | 6,605 |
| Samsung Electronics Co. Ltd. | 2,482 | 132,276 |
| Samsung Fire & Marine Insurance Co. Ltd. | 46 | 7,548 |
| Samsung SDI Co. Ltd. | 12 | 5,813 |
| Shinhan Financial Group Co. Ltd. | 461 | 15,312 |
| SK Hynix, Inc. | 326 | 28,580 |
| SK Innovation Co. Ltd. * | 58 | 9,290 |
| SK Telecom Co. Ltd. | 137 | 6,169 |
| SK, Inc. | 22 | 4,716 |
| SKC Co. Ltd. | 60 | 6,956 |
| S-Oil Corp. | 125 | 10,200 |
| 392,600 | ||
| Taiwan — 14.7% | ||
| Accton Technology Corp. | 686 | 5,351 |
| Advantech Co. Ltd. | 860 | 10,698 |
| ASE Technology Holding Co. Ltd. | 3,092 | 9,865 |
| AU Optronics Corp. | 9,025 | 5,155 |
| Cathay Financial Holding Co. Ltd. | 2,757 | 5,797 |
| Chailease Holding Co. Ltd. | 1,731 | 13,754 |
| CTBC Financial Holding Co. Ltd. | 9,129 | 8,979 |
| INVESTMENTS | SHARES (000) | VALUE ($000) |
| Taiwan — continued | ||
| Delta Electronics, Inc. | 1,908 | 15,927 |
| Eclat Textile Co. Ltd. | 404 | 6,629 |
| Evergreen Marine Corp. Taiwan Ltd. | 786 | 3,778 |
| Fubon Financial Holding Co. Ltd. | 5,983 | 15,022 |
| Giant Manufacturing Co. Ltd. | 457 | 3,821 |
| Hon Hai Precision Industry Co. Ltd. | 3,760 | 12,882 |
| MediaTek, Inc. | 352 | 9,704 |
| Nan Ya Plastics Corp. | 3,282 | 9,589 |
| Nanya Technology Corp. | 3,229 | 7,066 |
| Nien Made Enterprise Co. Ltd. | 368 | 3,876 |
| Novatek Microelectronics Corp. | 744 | 9,842 |
| Powertech Technology, Inc. | 914 | 2,872 |
| Quanta Computer, Inc. | 2,491 | 7,016 |
| Realtek Semiconductor Corp. | 642 | 8,712 |
| Sea Ltd., ADR * | 19 | 1,558 |
| Taiwan Semiconductor Manufacturing Co. Ltd. | 9,455 | 170,970 |
| Taiwan Semiconductor Manufacturing Co. Ltd., ADR | 290 | 26,934 |
| Taiwan Union Technology Corp. | 1,420 | 3,667 |
| Uni-President Enterprises Corp. | 4,552 | 10,531 |
| United Microelectronics Corp. | 2,699 | 4,287 |
| Vanguard International Semiconductor Corp. | 1,277 | 4,493 |
| Wiwynn Corp. | 229 | 7,831 |
| Yageo Corp. | 616 | 8,314 |
| Yang Ming Marine Transport Corp. * | 1,354 | 5,649 |
| Yuanta Financial Holding Co. Ltd. | 13,913 | 12,246 |
| 432,815 | ||
| Thailand — 2.1% | ||
| Airports of Thailand PCL * | 3,921 | 7,578 |
| Airports of Thailand PCL, NVDR * | 104 | 201 |
| Indorama Ventures PCL | 2,247 | 2,942 |
| Minor International PCL * | 5,464 | 5,522 |
| Minor International PCL, NVDR * | 145 | 147 |
| PTT Exploration & Production PCL, NVDR | 85 | 371 |
| PTT Exploration & Production PCL | 2,319 | 10,145 |
| PTT Global Chemical PCL | 4,788 | 6,942 |
| PTT Global Chemical PCL, NVDR | 127 | 185 |
| PTT PCL | 5,171 | 5,621 |
| PTT PCL, NVDR | 138 | 149 |
| SCB X PCL | 2,933 | 9,849 |
| Siam Cement PCL (The), NVDR | 18 | 192 |
| Siam Cement PCL (The) (Registered) | 674 | 7,243 |
| April 30, 2022 | J.P. Morgan International Equity Funds | 33 |
| INVESTMENTS | SHARES (000) | VALUE ($000) |
| Common Stocks — continued | ||
| Thailand — continued | ||
| Thai Oil PCL, NVDR | 76 | 124 |
| Thai Oil PCL | 2,864 | 4,686 |
| 61,897 | ||
| Turkey — 0.2% | ||
| Ford Otomotiv Sanayi A/S | 330 | 6,651 |
| United Arab Emirates — 1.0% | ||
| Dubai Islamic Bank PJSC | 3,613 | 6,320 |
| Emaar Properties PJSC | 4,464 | 7,699 |
| Emirates Telecommunications Group Co. PJSC | 767 | 7,335 |
| First Abu Dhabi Bank PJSC | 1,100 | 6,720 |
| 28,074 | ||
| United States — 0.0% ^ | ||
| JS Global Lifestyle Co. Ltd. (b) | 1,179 | 1,399 |
| Total Common Stocks (Cost $2,859,310) | 2,908,681 | |
| Short-Term Investments — 2.0% | ||
| Investment Companies — 1.5% | ||
| JPMorgan Prime Money Market Fund Class Institutional Shares, 0.36% (c) (d)(Cost $43,823) | 43,814 | 43,823 |
| Investment of Cash Collateral from Securities Loaned — 0.5% | ||
| JPMorgan Securities Lending Money Market Fund Agency SL Class Shares, 0.37% (c) (d) | 6,491 | 6,486 |
| JPMorgan U.S. Government Money Market Fund Class IM Shares, 0.37% (c) (d) | 7,576 | 7,576 |
| Total Investment of Cash Collateral from Securities Loaned (Cost $14,061) | 14,062 | |
| Total Short-Term Investments (Cost $57,884) | 57,885 | |
| Total Investments — 100.7% (Cost $2,917,194) | 2,966,566 | |
| Liabilities in Excess of Other Assets — (0.7)% | (20,474) | |
| NET ASSETS — 100.0% | 2,946,092 | |
Percentages indicated are based on net assets. | ||
| Abbreviations | |
| ADR | American Depositary Receipt |
| GDR | Global Depositary Receipt |
| JSC | Joint Stock Company |
| NVDR | Non-Voting Depositary Receipt |
| PJSC | Public Joint Stock Company |
| Preference | A special type of equity investment that shares in the earnings of the company, has limited voting rights, and may have a dividend preference. Preference shares may also have liquidation preference. |
| PT | Limited liability company |
| ^ | Amount rounds to less than 0.1% of net assets. | |
| ‡ | Value determined using significant unobservable inputs. | |
| * | Non-income producing security. | |
| (a) | The security or a portion of this security is on loan at April 30, 2022. The total value of securities on loan at April 30, 2022 is $13,480. | |
| (b) | Security exempt from registration pursuant to Regulation S under the Securities Act of 1933, as amended. Regulation S applies to securities offerings that are made outside of the United States and do not involve direct selling efforts in the United States and as such may have restrictions on resale. | |
| (c) | Investment in an affiliated fund, which is registered under the Investment Company Act of 1940, as amended, and is advised by J.P. Morgan Investment Management Inc. | |
| (d) | The rate shown is the current yield as of April 30, 2022. | |
| 34 | J.P. Morgan International Equity Funds | April 30, 2022 |
| INDUSTRY | PERCENT OF TOTAL INVESTMENTS |
| Banks | 15.5% |
| Semiconductors & Semiconductor Equipment | 10.1 |
| Internet & Direct Marketing Retail | 6.3 |
| Interactive Media & Services | 5.7 |
| Technology Hardware, Storage & Peripherals | 5.6 |
| Oil, Gas & Consumable Fuels | 5.5 |
| Metals & Mining | 4.2 |
| Insurance | 3.6 |
| Chemicals | 3.1 |
| Electronic Equipment, Instruments & Components | 2.5 |
| Automobiles | 2.5 |
| Food & Staples Retailing | 2.5 |
| IT Services | 2.2 |
| Food Products | 2.1 |
| Real Estate Management & Development | 1.9 |
| Diversified Financial Services | 1.5 |
| Wireless Telecommunication Services | 1.5 |
| Entertainment | 1.3 |
| Life Sciences Tools & Services | 1.3 |
| Diversified Telecommunication Services | 1.3 |
| Transportation Infrastructure | 1.1 |
| Hotels, Restaurants & Leisure | 1.1 |
| Personal Products | 1.0 |
| Construction Materials | 1.0 |
| Thrifts & Mortgage Finance | 1.0 |
| Others (each less than 1.0%) | 12.6 |
| Short-Term Investments | 2.0 |
| DESCRIPTION | NUMBER OF CONTRACTS | EXPIRATION DATE | TRADING CURRENCY | NOTIONAL AMOUNT ($) | VALUE AND UNREALIZED APPRECIATION (DEPRECIATION) ($) |
| Long Contracts | |||||
| MSCI Emerging Markets E-Mini Index | 78 | 06/17/2022 | USD | 4,119 | 77 |
| Abbreviations | |
| MSCI | Morgan Stanley Capital International |
| USD | United States Dollar |
| April 30, 2022 | J.P. Morgan International Equity Funds | 35 |
| INVESTMENTS | SHARES (000) | VALUE ($000) |
| Common Stocks — 97.8% | ||
| Australia — 2.1% | ||
| Glencore plc * | 2,081 | 12,823 |
| Austria — 1.1% | ||
| Erste Group Bank AG | 125 | 3,879 |
| Wienerberger AG | 97 | 2,738 |
| 6,617 | ||
| Denmark — 7.8% | ||
| Carlsberg A/S, Class B | 39 | 4,924 |
| Genmab A/S * | 20 | 7,172 |
| Jyske Bank A/S (Registered) * | 93 | 5,161 |
| Novo Nordisk A/S, Class B | 213 | 24,325 |
| Pandora A/S (a) | 36 | 3,164 |
| Royal Unibrew A/S | 28 | 2,381 |
| 47,127 | ||
| Finland — 3.5% | ||
| Neste OYJ | 105 | 4,527 |
| Nokia OYJ * | 1,783 | 9,038 |
| Nordea Bank Abp | 742 | 7,394 |
| 20,959 | ||
| France — 16.1% | ||
| Airbus SE | 81 | 8,872 |
| Arkema SA | 56 | 6,404 |
| BNP Paribas SA | 136 | 7,066 |
| Capgemini SE | 50 | 10,114 |
| LVMH Moet Hennessy Louis Vuitton SE | 24 | 15,446 |
| Pernod Ricard SA | 43 | 8,818 |
| Teleperformance | 15 | 5,339 |
| Thales SA | 31 | 3,967 |
| TotalEnergies SE (a) | 386 | 18,952 |
| Veolia Environnement SA | 180 | 5,266 |
| Vinci SA (a) | 78 | 7,559 |
| 97,803 | ||
| Germany — 15.2% | ||
| Allianz SE (Registered) | 62 | 13,987 |
| Bayer AG (Registered) * | 106 | 6,974 |
| Brenntag SE | 84 | 6,461 |
| Deutsche Boerse AG | 56 | 9,739 |
| Deutsche Telekom AG (Registered) | 567 | 10,446 |
| DWS Group GmbH & Co. KGaA (b) | 68 | 2,257 |
| Mercedes-Benz Group AG * | 133 | 9,309 |
| Muenchener Rueckversicherungs-Gesellschaft AG (Registered) | 31 | 7,392 |
| INVESTMENTS | SHARES (000) | VALUE ($000) |
| Germany — continued | ||
| RWE AG | 267 | 11,073 |
| Siemens AG (Registered) | 81 | 9,938 |
| Volkswagen AG (Preference) | 31 | 4,809 |
| 92,385 | ||
| Ireland — 1.5% | ||
| AIB Group plc | 1,699 | 3,705 |
| AIB Group plc | 10 | 21 |
| Bank of Ireland Group plc * | 883 | 5,463 |
| Bank of Ireland Group plc * | 14 | 87 |
| 9,276 | ||
| Italy — 1.2% | ||
| UniCredit SpA | 762 | 7,051 |
| Luxembourg — 1.0% | ||
| ArcelorMittal SA | 210 | 6,134 |
| Netherlands — 6.3% | ||
| Adyen NV * (b) | 3 | 4,653 |
| ASM International NV | 20 | 6,075 |
| ASML Holding NV (a) | 8 | 4,670 |
| Koninklijke Ahold Delhaize NV | 496 | 14,618 |
| NN Group NV | 163 | 8,014 |
| 38,030 | ||
| Norway — 1.4% | ||
| Equinor ASA | 257 | 8,688 |
| Spain — 1.3% | ||
| Corp. ACCIONA Energias Renovables SA | 133 | 4,917 |
| Fluidra SA | 105 | 2,836 |
| 7,753 | ||
| Switzerland — 17.3% | ||
| Cie Financiere Richemont SA (Registered) | 73 | 8,448 |
| Nestle SA (Registered) | 236 | 30,416 |
| Novartis AG (Registered) | 206 | 18,206 |
| Roche Holding AG | 65 | 24,249 |
| Schindler Holding AG | 20 | 3,890 |
| Sika AG (Registered) | 23 | 7,124 |
| Zurich Insurance Group AG | 28 | 12,730 |
| 105,063 | ||
| United Kingdom — 19.6% | ||
| 3i Group plc | 304 | 4,973 |
| Ashtead Group plc | 111 | 5,737 |
| Auto Trader Group plc (b) | 643 | 5,075 |
| 36 | J.P. Morgan International Equity Funds | April 30, 2022 |
| INVESTMENTS | SHARES (000) | VALUE ($000) |
| Common Stocks — continued | ||
| United Kingdom — continued | ||
| Barclays plc | 4,715 | 8,666 |
| BP plc | 3,787 | 18,283 |
| Centrica plc * | 6,057 | 6,002 |
| Computacenter plc | 92 | 3,110 |
| Diageo plc | 260 | 12,950 |
| Future plc | 108 | 2,969 |
| Intermediate Capital Group plc | 145 | 2,770 |
| JD Sports Fashion plc | 2,102 | 3,463 |
| Linde plc (a) | 40 | 12,406 |
| Lloyds Banking Group plc | 14,092 | 8,004 |
| Marks & Spencer Group plc * | 2,091 | 3,570 |
| Petershill Partners plc * (b) | 582 | 1,867 |
| RELX plc | 298 | 8,865 |
| Segro plc, REIT | 384 | 6,425 |
| Taylor Wimpey plc | 2,410 | 3,791 |
| 118,926 | ||
| United States — 2.4% | ||
| Schneider Electric SE (a) | 61 | 8,829 |
| Stellantis NV | 413 | 5,552 |
| 14,381 | ||
| Total Common Stocks (Cost $575,629) | 593,016 | |
| Short-Term Investments — 9.9% | ||
| Investment Companies — 2.0% | ||
| JPMorgan Prime Money Market Fund Class Institutional Shares, 0.36% (c) (d)(Cost $12,092) | 12,089 | 12,091 |
| Investment of Cash Collateral from Securities Loaned — 7.9% | ||
| JPMorgan Securities Lending Money Market Fund Agency SL Class Shares, 0.37% (c) (d) | 34,025 | 34,001 |
| JPMorgan U.S. Government Money Market Fund Class IM Shares, 0.37% (c) (d) | 14,177 | 14,177 |
| Total Investment of Cash Collateral from Securities Loaned (Cost $48,178) | 48,178 | |
| Total Short-Term Investments (Cost $60,270) | 60,269 | |
| INVESTMENTS | SHARES (000) | VALUE ($000) |
| Total Investments — 107.7% (Cost $635,899) | 653,285 | |
| Liabilities in Excess of Other Assets — (7.7)% | (46,743) | |
| NET ASSETS — 100.0% | 606,542 | |
Percentages indicated are based on net assets. | ||
| Abbreviations | |
| OYJ | Public Limited Company |
| Preference | A special type of equity investment that shares in the earnings of the company, has limited voting rights, and may have a dividend preference. Preference shares may also have liquidation preference. |
| REIT | Real Estate Investment Trust |
| * | Non-income producing security. |
| (a) | The security or a portion of this security is on loan at April 30, 2022. The total value of securities on loan at April 30, 2022 is $44,177. |
| (b) | Security exempt from registration pursuant to Regulation S under the Securities Act of 1933, as amended. Regulation S applies to securities offerings that are made outside of the United States and do not involve direct selling efforts in the United States and as such may have restrictions on resale. |
| (c) | Investment in an affiliated fund, which is registered under the Investment Company Act of 1940, as amended, and is advised by J.P. Morgan Investment Management Inc. |
| (d) | The rate shown is the current yield as of April 30, 2022. |
| April 30, 2022 | J.P. Morgan International Equity Funds | 37 |
| INDUSTRY | PERCENT OF TOTAL INVESTMENTS |
| Pharmaceuticals | 11.3% |
| Banks | 8.6 |
| Oil, Gas & Consumable Fuels | 7.7 |
| Insurance | 6.4 |
| Food Products | 4.7 |
| Beverages | 4.4 |
| Textiles, Apparel & Luxury Goods | 4.2 |
| Chemicals | 4.0 |
| Multi-Utilities | 3.4 |
| Capital Markets | 3.4 |
| Automobiles | 2.9 |
| Metals & Mining | 2.9 |
| Food & Staples Retailing | 2.8 |
| IT Services | 2.7 |
| Professional Services | 2.2 |
| Aerospace & Defense | 2.0 |
| Trading Companies & Distributors | 1.9 |
| Semiconductors & Semiconductor Equipment | 1.6 |
| Diversified Telecommunication Services | 1.6 |
| Industrial Conglomerates | 1.5 |
| Communications Equipment | 1.4 |
| Electrical Equipment | 1.4 |
| Construction & Engineering | 1.2 |
| Biotechnology | 1.1 |
| Machinery | 1.0 |
| Equity Real Estate Investment Trusts (REITs) | 1.0 |
| Others (each less than 1.0%) | 3.5 |
| Short-Term Investments | 9.2 |
| 38 | J.P. Morgan International Equity Funds | April 30, 2022 |
| DESCRIPTION | NUMBER OF CONTRACTS | EXPIRATION DATE | TRADING CURRENCY | NOTIONAL AMOUNT ($) | VALUE AND UNREALIZED APPRECIATION (DEPRECIATION) ($) |
| Long Contracts | |||||
| EURO STOXX 50 Index | 128 | 06/17/2022 | EUR | 4,971 | (200) |
| FTSE 100 Index | 29 | 06/17/2022 | GBP | 2,704 | (64) |
| (264) |
| Abbreviations | |
| EUR | Euro |
| FTSE | Financial Times and the London Stock Exchange |
| GBP | British Pound |
| April 30, 2022 | J.P. Morgan International Equity Funds | 39 |
| INVESTMENTS | SHARES (000) | VALUE ($000) |
| Common Stocks — 94.4% | ||
| Australia — 2.5% | ||
| BHP Group Ltd. | 1,060 | 35,532 |
| BHP Group Ltd. | 2,303 | 76,945 |
| 112,477 | ||
| Austria — 0.8% | ||
| Erste Group Bank AG | 1,184 | 36,856 |
| Belgium — 1.3% | ||
| KBC Group NV | 877 | 59,685 |
| China — 0.8% | ||
| Tencent Holdings Ltd. | 736 | 34,693 |
| Denmark — 5.8% | ||
| Carlsberg A/S, Class B | 347 | 44,053 |
| Coloplast A/S, Class B | 247 | 33,286 |
| Genmab A/S * | 92 | 32,495 |
| Novo Nordisk A/S, Class B | 1,070 | 122,268 |
| Orsted A/S (a) | 256 | 28,261 |
| 260,363 | ||
| Finland — 0.7% | ||
| Kone OYJ, Class B | 609 | 29,279 |
| France — 15.1% | ||
| AXA SA (b) | 2,268 | 60,007 |
| BNP Paribas SA (b) | 836 | 43,352 |
| Capgemini SE | 288 | 58,640 |
| Kering SA | 87 | 46,403 |
| L'Oreal SA | 202 | 73,510 |
| LVMH Moet Hennessy Louis Vuitton SE | 158 | 101,950 |
| Pernod Ricard SA | 245 | 50,532 |
| Safran SA | 398 | 42,710 |
| TotalEnergies SE | 3,029 | 148,725 |
| Vinci SA (b) | 550 | 53,374 |
| 679,203 | ||
| Germany — 8.4% | ||
| adidas AG | 173 | 34,829 |
| Allianz SE (Registered) | 363 | 81,953 |
| Deutsche Boerse AG | 363 | 63,267 |
| Muenchener Rueckversicherungs-Gesellschaft AG (Registered) | 198 | 47,179 |
| RWE AG | 1,171 | 48,636 |
| Symrise AG | 454 | 53,977 |
| Volkswagen AG (Preference) | 314 | 48,622 |
| 378,463 | ||
| INVESTMENTS | SHARES (000) | VALUE ($000) |
| Hong Kong — 3.5% | ||
| AIA Group Ltd. | 8,860 | 87,043 |
| Hong Kong Exchanges & Clearing Ltd. | 1,054 | 44,705 |
| Techtronic Industries Co. Ltd. | 1,922 | 25,655 |
| 157,403 | ||
| India — 0.9% | ||
| HDFC Bank Ltd., ADR | 745 | 41,122 |
| Japan — 12.0% | ||
| Daikin Industries Ltd. | 270 | 41,200 |
| Hoya Corp. | 490 | 48,589 |
| Keyence Corp. | 174 | 70,109 |
| Kubota Corp. | 2,272 | 38,597 |
| Kyowa Kirin Co. Ltd. | 1,486 | 31,331 |
| Makita Corp. | 962 | 28,425 |
| Nidec Corp. | 514 | 33,262 |
| Recruit Holdings Co. Ltd. | 949 | 34,438 |
| Shin-Etsu Chemical Co. Ltd. | 428 | 58,849 |
| SMC Corp. | 79 | 38,253 |
| Sony Group Corp. | 826 | 71,250 |
| Tokyo Electron Ltd. | 102 | 42,828 |
| 537,131 | ||
| Netherlands — 5.7% | ||
| Adyen NV * (a) | 18 | 30,916 |
| ASML Holding NV | 185 | 104,758 |
| ING Groep NV (b) | 3,197 | 30,290 |
| Shell plc | 3,256 | 87,406 |
| 253,370 | ||
| Singapore — 2.1% | ||
| DBS Group Holdings Ltd. | 3,797 | 92,118 |
| South Africa — 1.5% | ||
| Anglo American plc | 1,554 | 68,826 |
| South Korea — 1.7% | ||
| Delivery Hero SE * (a) (b) | 396 | 13,936 |
| Samsung Electronics Co. Ltd., GDR (a) | 25 | 32,765 |
| Samsung Electronics Co. Ltd., GDR (a) | 23 | 29,669 |
| 76,370 | ||
| Spain — 2.1% | ||
| Iberdrola SA | 6,265 | 71,993 |
| Industria de Diseno Textil SA (b) | 992 | 20,788 |
| 92,781 | ||
| 40 | J.P. Morgan International Equity Funds | April 30, 2022 |
| INVESTMENTS | SHARES (000) | VALUE ($000) |
| Common Stocks — continued | ||
| Sweden — 3.6% | ||
| Assa Abloy AB, Class B | 1,591 | 40,208 |
| Atlas Copco AB, Class A | 930 | 42,144 |
| Svenska Handelsbanken AB, Class A | 5,071 | 51,153 |
| Volvo AB, Class B | 1,854 | 29,581 |
| 163,086 | ||
| Switzerland — 10.3% | ||
| Lonza Group AG (Registered) | 95 | 56,105 |
| Nestle SA (Registered) | 1,420 | 183,305 |
| Roche Holding AG | 412 | 152,801 |
| SGS SA (Registered) | 18 | 45,352 |
| Straumann Holding AG (Registered) | 196 | 23,128 |
| 460,691 | ||
| Taiwan — 1.3% | ||
| Sea Ltd., ADR * | 246 | 20,331 |
| Taiwan Semiconductor Manufacturing Co. Ltd., ADR | 430 | 39,958 |
| 60,289 | ||
| United Kingdom — 10.1% | ||
| Diageo plc | 2,236 | 111,562 |
| Legal & General Group plc | 10,911 | 34,011 |
| Linde plc (b) | 231 | 72,341 |
| London Stock Exchange Group plc | 545 | 53,750 |
| Persimmon plc | 1,277 | 33,264 |
| Prudential plc | 3,233 | 40,249 |
| RELX plc | 2,401 | 71,562 |
| Smith & Nephew plc | 2,147 | 34,799 |
| 451,538 | ||
| United States — 4.2% | ||
| Ferguson plc | 362 | 45,438 |
| GlaxoSmithKline plc | 3,571 | 80,497 |
| Schneider Electric SE (b) | 440 | 63,049 |
| 188,984 | ||
| Total Common Stocks (Cost $3,767,366) | 4,234,728 | |
| Short-Term Investments — 7.4% | ||
| Investment Companies — 2.9% | ||
| JPMorgan Prime Money Market Fund Class Institutional Shares, 0.36% (c) (d)(Cost $127,784) | 127,777 | 127,803 |
| Investment of Cash Collateral from Securities Loaned — 4.5% | ||
| JPMorgan Securities Lending Money Market Fund Agency SL Class Shares, 0.37% (c) (d) | 136,104 | 136,009 |
| INVESTMENTS | SHARES (000) | VALUE ($000) |
| Investment of Cash Collateral from Securities Loaned — continued | ||
| JPMorgan U.S. Government Money Market Fund Class IM Shares, 0.37% (c) (d) | 66,362 | 66,362 |
| Total Investment of Cash Collateral from Securities Loaned (Cost $202,371) | 202,371 | |
| Total Short-Term Investments (Cost $330,155) | 330,174 | |
| Total Investments — 101.8% (Cost $4,097,521) | 4,564,902 | |
| Liabilities in Excess of Other Assets — (1.8)% | (81,516) | |
| NET ASSETS — 100.0% | 4,483,386 | |
Percentages indicated are based on net assets. | ||
| Abbreviations | |
| ADR | American Depositary Receipt |
| GDR | Global Depositary Receipt |
| OYJ | Public Limited Company |
| Preference | A special type of equity investment that shares in the earnings of the company, has limited voting rights, and may have a dividend preference. Preference shares may also have liquidation preference. |
| * | Non-income producing security. |
| (a) | Security exempt from registration pursuant to Regulation S under the Securities Act of 1933, as amended. Regulation S applies to securities offerings that are made outside of the United States and do not involve direct selling efforts in the United States and as such may have restrictions on resale. |
| (b) | The security or a portion of this security is on loan at April 30, 2022. The total value of securities on loan at April 30, 2022 is $169,016. |
| (c) | Investment in an affiliated fund, which is registered under the Investment Company Act of 1940, as amended, and is advised by J.P. Morgan Investment Management Inc. |
| (d) | The rate shown is the current yield as of April 30, 2022. |
| April 30, 2022 | J.P. Morgan International Equity Funds | 41 |
| INDUSTRY | PERCENT OF TOTAL INVESTMENTS |
| Pharmaceuticals | 8.5% |
| Banks | 7.8 |
| Insurance | 7.6 |
| Oil, Gas & Consumable Fuels | 5.2 |
| Machinery | 5.0 |
| Beverages | 4.5 |
| Semiconductors & Semiconductor Equipment | 4.1 |
| Chemicals | 4.1 |
| Food Products | 4.0 |
| Textiles, Apparel & Luxury Goods | 4.0 |
| Metals & Mining | 3.9 |
| Capital Markets | 3.6 |
| Professional Services | 3.4 |
| Health Care Equipment & Supplies | 3.1 |
| Household Durables | 2.3 |
| Electric Utilities | 2.2 |
| Electrical Equipment | 2.1 |
| IT Services | 2.0 |
| Building Products | 1.8 |
| Personal Products | 1.6 |
| Electronic Equipment, Instruments & Components | 1.5 |
| Technology Hardware, Storage & Peripherals | 1.4 |
| Life Sciences Tools & Services | 1.2 |
| Construction & Engineering | 1.2 |
| Multi-Utilities | 1.1 |
| Automobiles | 1.1 |
| Trading Companies & Distributors | 1.0 |
| Others (each less than 1.0%) | 3.5 |
| Short-Term Investments | 7.2 |
| 42 | J.P. Morgan International Equity Funds | April 30, 2022 |
| INVESTMENTS | SHARES (000) | VALUE ($000) |
| Common Stocks — 96.9% | ||
| Australia — 3.5% | ||
| BHP Group Ltd. | 1,474 | 49,409 |
| Belgium — 2.1% | ||
| KBC Group NV | 426 | 28,987 |
| Canada — 5.7% | ||
| Canadian National Railway Co. | 312 | 36,711 |
| Toronto-Dominion Bank (The) | 608 | 43,874 |
| 80,585 | ||
| China — 2.4% | ||
| Tencent Holdings Ltd. | 714 | 33,657 |
| Denmark — 5.3% | ||
| Coloplast A/S, Class B | 147 | 19,794 |
| Novo Nordisk A/S, Class B | 475 | 54,270 |
| 74,064 | ||
| France — 9.8% | ||
| Capgemini SE | 114 | 23,256 |
| L'Oreal SA | 80 | 29,111 |
| LVMH Moet Hennessy Louis Vuitton SE | 55 | 35,515 |
| TotalEnergies SE | 412 | 20,205 |
| Vinci SA | 310 | 30,091 |
| 138,178 | ||
| Germany — 5.4% | ||
| adidas AG | 83 | 16,655 |
| Allianz SE (Registered) | 171 | 38,640 |
| Volkswagen AG (Preference) | 131 | 20,265 |
| 75,560 | ||
| Hong Kong — 4.8% | ||
| AIA Group Ltd. | 4,197 | 41,227 |
| Hong Kong Exchanges & Clearing Ltd. | 638 | 27,063 |
| 68,290 | ||
| India — 2.4% | ||
| HDFC Bank Ltd., ADR | 605 | 33,384 |
| Indonesia — 1.9% | ||
| Bank Central Asia Tbk. PT | 47,320 | 26,541 |
| Japan — 4.7% | ||
| Hoya Corp. | 154 | 15,293 |
| Keyence Corp. | 54 | 21,548 |
| Sony Group Corp. | 337 | 29,066 |
| 65,907 | ||
| INVESTMENTS | SHARES (000) | VALUE ($000) |
| Netherlands — 7.4% | ||
| Adyen NV * (a) | 8 | 14,007 |
| ASML Holding NV | 60 | 34,215 |
| Shell plc | 2,100 | 56,372 |
| 104,594 | ||
| Singapore — 2.6% | ||
| DBS Group Holdings Ltd. | 1,538 | 37,318 |
| South Africa — 3.2% | ||
| Anglo American plc | 1,004 | 44,450 |
| South Korea — 4.5% | ||
| Delivery Hero SE * (a) | 269 | 9,472 |
| Samsung Electronics Co. Ltd. | 1,003 | 53,456 |
| 62,928 | ||
| Spain — 2.1% | ||
| Iberdrola SA | 2,638 | 30,314 |
| Sweden — 1.4% | ||
| Atlas Copco AB, Class A | 439 | 19,881 |
| Switzerland — 11.2% | ||
| Lonza Group AG (Registered) | 39 | 23,191 |
| Nestle SA (Registered) | 519 | 67,010 |
| Roche Holding AG | 123 | 45,449 |
| SGS SA (Registered) | 8 | 21,499 |
| 157,149 | ||
| Taiwan — 3.3% | ||
| Sea Ltd., ADR * | 119 | 9,817 |
| Taiwan Semiconductor Manufacturing Co. Ltd., ADR | 388 | 36,074 |
| 45,891 | ||
| United Kingdom — 9.9% | ||
| Diageo plc | 1,000 | 49,915 |
| Linde plc | 117 | 36,728 |
| Persimmon plc | 641 | 16,686 |
| RELX plc | 1,187 | 35,377 |
| 138,706 | ||
| United States — 3.3% | ||
| Ferguson plc | 189 | 23,702 |
| Schneider Electric SE | 159 | 22,866 |
| 46,568 | ||
| Total Common Stocks (Cost $1,191,605) | 1,362,361 | |
| April 30, 2022 | J.P. Morgan International Equity Funds | 43 |
| INVESTMENTS | SHARES (000) | VALUE ($000) |
| Short-Term Investments — 2.8% | ||
| Investment Companies — 2.8% | ||
| JPMorgan Prime Money Market Fund Class Institutional Shares, 0.36% (b) (c)(Cost $39,692) | 39,681 | 39,689 |
| Total Investments — 99.7% (Cost $1,231,297) | 1,402,050 | |
| Other Assets Less Liabilities — 0.3% | 4,897 | |
| NET ASSETS — 100.0% | 1,406,947 | |
Percentages indicated are based on net assets. | ||
| Abbreviations | |
| ADR | American Depositary Receipt |
| Preference | A special type of equity investment that shares in the earnings of the company, has limited voting rights, and may have a dividend preference. Preference shares may also have liquidation preference. |
| PT | Limited liability company |
| * | Non-income producing security. |
| (a) | Security exempt from registration pursuant to Regulation S under the Securities Act of 1933, as amended. Regulation S applies to securities offerings that are made outside of the United States and do not involve direct selling efforts in the United States and as such may have restrictions on resale. |
| (b) | Investment in an affiliated fund, which is registered under the Investment Company Act of 1940, as amended, and is advised by J.P. Morgan Investment Management Inc. |
| (c) | The rate shown is the current yield as of April 30, 2022. |
| INDUSTRY | PERCENT OF TOTAL INVESTMENTS |
| Banks | 12.2% |
| Pharmaceuticals | 7.1 |
| Metals & Mining | 6.7 |
| Insurance | 5.8 |
| Oil, Gas & Consumable Fuels | 5.4 |
| Semiconductors & Semiconductor Equipment | 5.0 |
| Food Products | 4.8 |
| Professional Services | 4.0 |
| Technology Hardware, Storage & Peripherals | 3.8 |
| Textiles, Apparel & Luxury Goods | 3.7 |
| Beverages | 3.6 |
| Household Durables | 3.3 |
| IT Services | 2.7 |
| Chemicals | 2.6 |
| Road & Rail | 2.6 |
| Health Care Equipment & Supplies | 2.5 |
| Interactive Media & Services | 2.4 |
| Electric Utilities | 2.2 |
| Construction & Engineering | 2.1 |
| Personal Products | 2.1 |
| Capital Markets | 1.9 |
| Trading Companies & Distributors | 1.7 |
| Life Sciences Tools & Services | 1.7 |
| Electrical Equipment | 1.6 |
| Electronic Equipment, Instruments & Components | 1.5 |
| Automobiles | 1.4 |
| Machinery | 1.4 |
| Others (each less than 1.0%) | 1.4 |
| Short-Term Investments | 2.8 |
| 44 | J.P. Morgan International Equity Funds | April 30, 2022 |
| INVESTMENTS | SHARES (000) | VALUE ($000) |
| Common Stocks — 91.2% | ||
| Australia — 6.0% | ||
| Aurizon Holdings Ltd. | 61 | 172 |
| Australia & New Zealand Banking Group Ltd. | 13 | 253 |
| BHP Group Ltd. | 43 | 1,444 |
| Commonwealth Bank of Australia | 12 | 885 |
| CSL Ltd. | 5 | 958 |
| Dexus, REIT | 63 | 490 |
| Goodman Group, REIT | 48 | 800 |
| GPT Group (The), REIT | 41 | 147 |
| Insurance Australia Group Ltd. | 47 | 150 |
| Macquarie Group Ltd. | 3 | 411 |
| Mirvac Group, REIT | 145 | 244 |
| National Australia Bank Ltd. | 19 | 434 |
| Newcrest Mining Ltd. | 8 | 155 |
| Rio Tinto Ltd. | 19 | 1,528 |
| Rio Tinto plc | 9 | 632 |
| Wesfarmers Ltd. | 10 | 360 |
| Westpac Banking Corp. | 55 | 914 |
| Woolworths Group Ltd. | 12 | 327 |
| 10,304 | ||
| Belgium — 0.4% | ||
| KBC Group NV | 10 | 689 |
| China — 0.5% | ||
| BOC Hong Kong Holdings Ltd. | 117 | 423 |
| Prosus NV * | 9 | 406 |
| 829 | ||
| Denmark — 3.2% | ||
| Carlsberg A/S, Class B | 7 | 858 |
| Genmab A/S * | — | 189 |
| Novo Nordisk A/S, Class B | 28 | 3,161 |
| Orsted A/S (a) | 10 | 1,085 |
| Vestas Wind Systems A/S | 7 | 174 |
| 5,467 | ||
| Finland — 0.8% | ||
| Kone OYJ, Class B | 4 | 216 |
| Nokia OYJ * | 60 | 302 |
| Nordea Bank Abp | 77 | 763 |
| 1,281 | ||
| France — 10.7% | ||
| Air Liquide SA | 11 | 1,890 |
| Airbus SE | 4 | 433 |
| Alstom SA | 14 | 316 |
| INVESTMENTS | SHARES (000) | VALUE ($000) |
| France — continued | ||
| AXA SA | 8 | 220 |
| BNP Paribas SA | 28 | 1,474 |
| Capgemini SE | 7 | 1,474 |
| Kering SA | 1 | 633 |
| L'Oreal SA | 6 | 2,116 |
| LVMH Moet Hennessy Louis Vuitton SE | 5 | 2,922 |
| Pernod Ricard SA | 2 | 409 |
| Safran SA | 7 | 708 |
| Sanofi | 5 | 580 |
| Societe Generale SA | 18 | 421 |
| TotalEnergies SE | 42 | 2,055 |
| Veolia Environnement SA | 38 | 1,096 |
| Vinci SA | 15 | 1,488 |
| 18,235 | ||
| Germany — 8.6% | ||
| adidas AG | 4 | 870 |
| Allianz SE (Registered) | 10 | 2,143 |
| BASF SE * | 2 | 86 |
| Bayer AG (Registered) * | 7 | 479 |
| Brenntag SE | 2 | 152 |
| Deutsche Boerse AG | 1 | 153 |
| Deutsche Post AG (Registered) | 23 | 964 |
| Deutsche Telekom AG (Registered) | 92 | 1,686 |
| Infineon Technologies AG | 36 | 1,028 |
| Mercedes-Benz Group AG * | 2 | 163 |
| Merck KGaA | 3 | 518 |
| Muenchener Rueckversicherungs-Gesellschaft AG (Registered) | 4 | 1,014 |
| RWE AG | 34 | 1,417 |
| SAP SE | 11 | 1,124 |
| Siemens AG (Registered) | 8 | 985 |
| Volkswagen AG (Preference) | 5 | 827 |
| Vonovia SE * | 20 | 812 |
| Zalando SE * (a) | 7 | 282 |
| 14,703 | ||
| Hong Kong — 2.4% | ||
| AIA Group Ltd. | 171 | 1,682 |
| CK Asset Holdings Ltd. | 51 | 349 |
| CLP Holdings Ltd. | 20 | 195 |
| Hong Kong Exchanges & Clearing Ltd. | 18 | 742 |
| Link, REIT | 20 | 173 |
| Sun Hung Kai Properties Ltd. | 22 | 253 |
| April 30, 2022 | J.P. Morgan International Equity Funds | 45 |
| INVESTMENTS | SHARES (000) | VALUE ($000) |
| Common Stocks — continued | ||
| Hong Kong — continued | ||
| Techtronic Industries Co. Ltd. | 29 | 387 |
| Xinyi Glass Holdings Ltd. | 143 | 317 |
| 4,098 | ||
| Ireland — 0.5% | ||
| Kingspan Group plc | 3 | 294 |
| Kingspan Group plc | 5 | 467 |
| 761 | ||
| Italy — 0.6% | ||
| Enel SpA | 27 | 174 |
| FinecoBank Banca Fineco SpA | 48 | 672 |
| UniCredit SpA | 26 | 243 |
| 1,089 | ||
| Japan — 20.8% | ||
| AGC, Inc. | 11 | 397 |
| Asahi Group Holdings Ltd. | 23 | 878 |
| Asahi Kasei Corp. | 69 | 566 |
| Bridgestone Corp. | 22 | 817 |
| Capcom Co. Ltd. | 13 | 333 |
| Central Japan Railway Co. | 5 | 655 |
| Daiichi Sankyo Co. Ltd. | 35 | 894 |
| Daikin Industries Ltd. | 3 | 504 |
| Daito Trust Construction Co. Ltd. | 1 | 87 |
| Daiwa House Industry Co. Ltd. | 27 | 661 |
| Dentsu Group, Inc. | 24 | 872 |
| Fast Retailing Co. Ltd. | — | 92 |
| Hitachi Ltd. | 24 | 1,143 |
| Honda Motor Co. Ltd. | 38 | 1,000 |
| Hoya Corp. | 11 | 1,042 |
| ITOCHU Corp. | 29 | 884 |
| Japan Airlines Co. Ltd. * | 12 | 205 |
| Kao Corp. | 11 | 425 |
| Keyence Corp. | 4 | 1,407 |
| Konami Holdings Corp. | 7 | 449 |
| Kubota Corp. | 30 | 517 |
| Kyowa Kirin Co. Ltd. | 18 | 390 |
| Mitsubishi Corp. | 26 | 876 |
| Mitsubishi Electric Corp. | 15 | 159 |
| Mitsubishi UFJ Financial Group, Inc. | 88 | 510 |
| Mitsui Fudosan Co. Ltd. | 24 | 517 |
| Murata Manufacturing Co. Ltd. | 12 | 715 |
| Nidec Corp. | 5 | 304 |
| Nintendo Co. Ltd. | 1 | 320 |
| INVESTMENTS | SHARES (000) | VALUE ($000) |
| Japan — continued | ||
| NIPPON EXPRESS HOLDINGS, Inc. | 7 | 428 |
| Nippon Steel Corp. | 11 | 175 |
| Nippon Telegraph & Telephone Corp. | 33 | 975 |
| Nitori Holdings Co. Ltd. | 4 | 401 |
| Nomura Research Institute Ltd. | 18 | 495 |
| Ono Pharmaceutical Co. Ltd. | 21 | 529 |
| ORIX Corp. | 37 | 673 |
| Otsuka Corp. | 13 | 416 |
| Recruit Holdings Co. Ltd. | 16 | 573 |
| Rohm Co. Ltd. | 6 | 391 |
| Ryohin Keikaku Co. Ltd. | 49 | 440 |
| Seven & i Holdings Co. Ltd. | 13 | 593 |
| Shimadzu Corp. | 2 | 62 |
| Shin-Etsu Chemical Co. Ltd. | 7 | 948 |
| Shionogi & Co. Ltd. | 10 | 528 |
| SoftBank Group Corp. | 10 | 399 |
| Sony Group Corp. | 19 | 1,683 |
| Sumitomo Electric Industries Ltd. | 41 | 441 |
| Sumitomo Metal Mining Co. Ltd. | 12 | 531 |
| Sumitomo Mitsui Financial Group, Inc. | 34 | 1,027 |
| Suzuki Motor Corp. | 12 | 374 |
| T&D Holdings, Inc. | 36 | 464 |
| Takeda Pharmaceutical Co. Ltd. | 10 | 290 |
| Terumo Corp. | 22 | 649 |
| Tokio Marine Holdings, Inc. | 22 | 1,190 |
| Tokyo Electron Ltd. | 3 | 1,266 |
| Toyota Motor Corp. | 111 | 1,898 |
| Yamato Holdings Co. Ltd. | 6 | 107 |
| 35,565 | ||
| Luxembourg — 0.1% | ||
| ArcelorMittal SA | 7 | 216 |
| Netherlands — 5.9% | ||
| Adyen NV * (a) | — | 431 |
| Akzo Nobel NV | 8 | 689 |
| ASML Holding NV | 6 | 3,389 |
| ING Groep NV | 21 | 202 |
| Koninklijke Ahold Delhaize NV | 18 | 516 |
| Koninklijke DSM NV | 4 | 734 |
| Koninklijke KPN NV | 234 | 808 |
| Koninklijke Philips NV | 6 | 149 |
| NN Group NV | 19 | 915 |
| 46 | J.P. Morgan International Equity Funds | April 30, 2022 |
| INVESTMENTS | SHARES (000) | VALUE ($000) |
| Common Stocks — continued | ||
| Netherlands — continued | ||
| Shell plc | 62 | 1,674 |
| Wolters Kluwer NV | 6 | 547 |
| 10,054 | ||
| Singapore — 0.9% | ||
| DBS Group Holdings Ltd. | 45 | 1,087 |
| Oversea-Chinese Banking Corp. Ltd. | 39 | 345 |
| United Overseas Bank Ltd. | 8 | 171 |
| 1,603 | ||
| Spain — 2.6% | ||
| Banco Bilbao Vizcaya Argentaria SA | 239 | 1,256 |
| Banco Santander SA | 72 | 211 |
| Endesa SA | 23 | 486 |
| Iberdrola SA | 179 | 2,051 |
| Industria de Diseno Textil SA | 24 | 507 |
| 4,511 | ||
| Sweden — 1.8% | ||
| Atlas Copco AB, Class A | 19 | 869 |
| Lundin Energy AB | 18 | 754 |
| SKF AB, Class B | 35 | 567 |
| Volvo AB, Class B | 61 | 965 |
| 3,155 | ||
| Switzerland — 10.8% | ||
| Cie Financiere Richemont SA (Registered) | 3 | 344 |
| Givaudan SA (Registered) | — | 1,220 |
| Julius Baer Group Ltd. | 3 | 129 |
| Lonza Group AG (Registered) | 2 | 1,325 |
| Nestle SA (Registered) | 37 | 4,758 |
| Novartis AG (Registered) | 32 | 2,844 |
| Roche Holding AG | 11 | 4,002 |
| SGS SA (Registered) | — | 750 |
| Sika AG (Registered) | 4 | 1,211 |
| UBS Group AG (Registered) | 37 | 630 |
| Zurich Insurance Group AG | 3 | 1,313 |
| 18,526 | ||
| Taiwan — 0.1% | ||
| Sea Ltd., ADR * | 2 | 119 |
| United Kingdom — 12.7% | ||
| 3i Group plc | 79 | 1,288 |
| AstraZeneca plc | 21 | 2,763 |
| Barclays plc | 619 | 1,137 |
| Berkeley Group Holdings plc * | 15 | 759 |
| INVESTMENTS | SHARES (000) | VALUE ($000) |
| United Kingdom — continued | ||
| BP plc | 422 | 2,039 |
| British American Tobacco plc | 16 | 660 |
| CK Hutchison Holdings Ltd. | 17 | 123 |
| DCC plc | 4 | 339 |
| Diageo plc | 47 | 2,340 |
| HSBC Holdings plc | 131 | 819 |
| InterContinental Hotels Group plc | 15 | 955 |
| Intertek Group plc | 2 | 126 |
| Lloyds Banking Group plc | 2,027 | 1,151 |
| London Stock Exchange Group plc | 1 | 131 |
| Prudential plc | 41 | 510 |
| Reckitt Benckiser Group plc | 16 | 1,250 |
| RELX plc | 53 | 1,572 |
| SSE plc | 34 | 785 |
| Standard Chartered plc | 141 | 965 |
| Taylor Wimpey plc | 132 | 208 |
| Tesco plc | 239 | 811 |
| Unilever plc | 23 | 1,069 |
| 21,800 | ||
| United States — 1.8% | ||
| Ferguson plc | 1 | 118 |
| GlaxoSmithKline plc | 17 | 378 |
| Schneider Electric SE | 12 | 1,760 |
| Stellantis NV | 64 | 861 |
| 3,117 | ||
| Total Common Stocks (Cost $147,593) | 156,122 | |
| INVESTMENTS | NO. OF CONTRACTS | |
| Options Purchased — 3.5% | ||
| Put Options Purchased — 3.5% | ||
| United States — 3.5% | ||
| MSCI EAFE E-Mini Index | ||
| 6/17/2022 at USD 2,015.00, European Style | ||
| Notional Amount: USD 166,560 | ||
| Counterparty: Exchange-Traded * (Cost $4,108) | 819 | 6,077 |
| April 30, 2022 | J.P. Morgan International Equity Funds | 47 |
| INVESTMENTS | SHARES (000) | VALUE ($000) |
| Short-Term Investments — 4.5% | ||
| Investment Companies — 4.5% | ||
| JPMorgan U.S. Government Money Market Fund Class Institutional Shares, 0.29% (b) (c)(Cost $7,724) | 7,724 | 7,724 |
| Total Investments — 99.2% (Cost $159,425) | 169,923 | |
| Other Assets Less Liabilities — 0.8% | 1,300 | |
| NET ASSETS — 100.0% | 171,223 | |
Percentages indicated are based on net assets. | ||
Amounts presented as a dash (“-“) represent amounts that round to less than a thousand. | ||
| Abbreviations | |
| ADR | American Depositary Receipt |
| EAFE | Europe, Australasia, and Far East |
| MSCI | Morgan Stanley Capital International |
| OYJ | Public Limited Company |
| Preference | A special type of equity investment that shares in the earnings of the company, has limited voting rights, and may have a dividend preference. Preference shares may also have liquidation preference. |
| REIT | Real Estate Investment Trust |
| USD | United States Dollar |
| * | Non-income producing security. |
| (a) | Security exempt from registration pursuant to Regulation S under the Securities Act of 1933, as amended. Regulation S applies to securities offerings that are made outside of the United States and do not involve direct selling efforts in the United States and as such may have restrictions on resale. |
| (b) | Investment in an affiliated fund, which is registered under the Investment Company Act of 1940, as amended, and is advised by J.P. Morgan Investment Management Inc. |
| (c) | The rate shown is the current yield as of April 30, 2022. |
| INDUSTRY | PERCENT OF TOTAL INVESTMENTS |
| Pharmaceuticals | 10.2% |
| Banks | 9.5 |
| Insurance | 5.6 |
| Chemicals | 4.3 |
| Oil, Gas & Consumable Fuels | 3.8 |
| Index Funds | 3.6 |
| Semiconductors & Semiconductor Equipment | 3.6 |
| Automobiles | 3 |
| Electric Utilities | 2.8 |
| Textiles, Apparel & Luxury Goods | 2.8 |
| Food Products | 2.8 |
| Metals & Mining | 2.7 |
| Beverages | 2.6 |
| Machinery | 2.3 |
| Personal Products | 2.1 |
| Professional Services | 2.1 |
| Capital Markets | 2.1 |
| Diversified Telecommunication Services | 2 |
| IT Services | 1.7 |
| Real Estate Management & Development | 1.6 |
| Household Durables | 1.6 |
| Industrial Conglomerates | 1.5 |
| Multi-Utilities | 1.5 |
| Electrical Equipment | 1.4 |
| Food & Staples Retailing | 1.3 |
| Electronic Equipment, Instruments & Components | 1.3 |
| Trading Companies & Distributors | 1.2 |
| Building Products | 1.2 |
| Equity Real Estate Investment Trusts (REITs) | 1.1 |
| Health Care Equipment & Supplies | 1.1 |
| Others (each less than 1.0%) | 11.1 |
| Short-Term Investments | 4.5 |
| 48 | J.P. Morgan International Equity Funds | April 30, 2022 |
| DESCRIPTION | NUMBER OF CONTRACTS | EXPIRATION DATE | TRADING CURRENCY | NOTIONAL AMOUNT ($) | VALUE AND UNREALIZED APPRECIATION (DEPRECIATION) ($) |
| Long Contracts | |||||
| SPI 200 Index | 27 | 06/16/2022 | AUD | 3,484 | 100 |
| MSCI EAFE E-Mini Index | 52 | 06/17/2022 | USD | 5,188 | (323) |
| (223) |
| Abbreviations | |
| AUD | Australian Dollar |
| EAFE | Europe, Australasia, and Far East |
| MSCI | Morgan Stanley Capital International |
| SPI | Australian Securities Exchange |
| USD | United States Dollar |
| Written Call Options Contracts as of April 30, 2022 (amounts in thousands, except number of contracts): | ||||||
| DESCRIPTION | COUNTERPARTY | NUMBER OF CONTRACTS | NOTIONAL AMOUNT | EXERCISE PRICE | EXPIRATION DATE | VALUE ($) |
| MSCI EAFE E-Mini Index | Exchange-Traded | 819 | USD 166,560 | USD 2,240.00 | 6/17/2022 | (156) |
| Written Put Options Contracts as of April 30, 2022 (amounts in thousands, except number of contracts): | ||||||
| DESCRIPTION | COUNTERPARTY | NUMBER OF CONTRACTS | NOTIONAL AMOUNT | EXERCISE PRICE | EXPIRATION DATE | VALUE ($) |
| MSCI EAFE E-Mini Index | Exchange-Traded | 819 | USD 166,560 | USD 1,700.00 | 6/17/2022 | (880) |
| Total Written Options Contracts (Premiums Received $3,954) | (1,036) | |||||
| Abbreviations | |
| EAFE | Europe, Australasia, and Far East |
| MSCI | Morgan Stanley Capital International |
| USD | United States Dollar |
| April 30, 2022 | J.P. Morgan International Equity Funds | 49 |
| INVESTMENTS | SHARES (000) | VALUE ($000) |
| Common Stocks — 93.0% | ||
| Australia — 5.8% | ||
| Aurizon Holdings Ltd. | 1,806 | 5,100 |
| Australia & New Zealand Banking Group Ltd. | 473 | 8,996 |
| BHP Group Ltd. | 1,252 | 41,822 |
| Commonwealth Bank of Australia (a) | 378 | 27,468 |
| CSL Ltd. (a) | 156 | 29,779 |
| Dexus, REIT | 2,082 | 16,277 |
| Goodman Group, REIT | 1,551 | 25,816 |
| GPT Group (The), REIT | 1,310 | 4,657 |
| Insurance Australia Group Ltd. | 1,434 | 4,579 |
| Macquarie Group Ltd. | 92 | 13,239 |
| Mirvac Group, REIT | 4,262 | 7,203 |
| National Australia Bank Ltd. | 610 | 13,915 |
| Newcrest Mining Ltd. (a) | 254 | 4,775 |
| Rio Tinto Ltd. | 563 | 44,554 |
| Rio Tinto plc | 321 | 22,717 |
| Wesfarmers Ltd. | 322 | 11,149 |
| Westpac Banking Corp. | 1,724 | 28,856 |
| Woolworths Group Ltd. | 370 | 10,019 |
| 320,921 | ||
| Belgium — 0.4% | ||
| KBC Group NV | 345 | 23,440 |
| China — 0.5% | ||
| BOC Hong Kong Holdings Ltd. | 3,436 | 12,438 |
| Prosus NV * | 295 | 14,253 |
| 26,691 | ||
| Denmark — 3.4% | ||
| Carlsberg A/S, Class B | 238 | 30,226 |
| Genmab A/S * | 18 | 6,300 |
| Novo Nordisk A/S, Class B | 947 | 108,177 |
| Orsted A/S (b) | 334 | 36,979 |
| Vestas Wind Systems A/S (a) | 228 | 5,808 |
| 187,490 | ||
| Finland — 0.8% | ||
| Kone OYJ, Class B | 154 | 7,422 |
| Nokia OYJ * | 2,127 | 10,783 |
| Nordea Bank Abp | 2,605 | 25,967 |
| 44,172 | ||
| France — 11.4% | ||
| Air Liquide SA | 376 | 64,981 |
| Airbus SE | 156 | 17,120 |
| Alstom SA | 509 | 11,199 |
| INVESTMENTS | SHARES (000) | VALUE ($000) |
| France — continued | ||
| AXA SA (a) | 322 | 8,524 |
| BNP Paribas SA (a) | 961 | 49,812 |
| Capgemini SE | 253 | 51,500 |
| Kering SA | 42 | 22,324 |
| L'Oreal SA | 195 | 70,811 |
| LVMH Moet Hennessy Louis Vuitton SE | 153 | 98,992 |
| Pernod Ricard SA | 69 | 14,212 |
| Safran SA | 234 | 25,190 |
| Sanofi (a) | 188 | 19,901 |
| Societe Generale SA | 601 | 14,446 |
| TotalEnergies SE (a) | 1,445 | 70,937 |
| Veolia Environnement SA | 1,299 | 37,914 |
| Vinci SA (a) | 537 | 52,073 |
| 629,936 | ||
| Germany — 9.2% | ||
| adidas AG | 150 | 30,244 |
| Allianz SE (Registered) | 315 | 71,064 |
| BASF SE * | 67 | 3,506 |
| Bayer AG (Registered) * | 266 | 17,549 |
| Brenntag SE | 84 | 6,465 |
| Deutsche Boerse AG | 34 | 5,976 |
| Deutsche Post AG (Registered) | 803 | 34,324 |
| Deutsche Telekom AG (Registered) | 3,203 | 59,011 |
| Infineon Technologies AG | 1,184 | 33,593 |
| Mercedes-Benz Group AG * | 76 | 5,298 |
| Merck KGaA | 98 | 18,147 |
| Muenchener Rueckversicherungs-Gesellschaft AG (Registered) | 147 | 34,965 |
| RWE AG | 1,158 | 48,082 |
| SAP SE | 372 | 37,723 |
| Siemens AG (Registered) | 271 | 33,291 |
| Volkswagen AG (Preference) | 191 | 29,548 |
| Vonovia SE * | 708 | 28,201 |
| Zalando SE * (a) (b) | 242 | 9,538 |
| 506,525 | ||
| Hong Kong — 2.2% | ||
| AIA Group Ltd. | 4,937 | 48,498 |
| CK Asset Holdings Ltd. | 1,527 | 10,353 |
| CLP Holdings Ltd. | 589 | 5,748 |
| Hong Kong Exchanges & Clearing Ltd. | 533 | 22,622 |
| Link, REIT | 597 | 5,158 |
| Sun Hung Kai Properties Ltd. | 658 | 7,572 |
| 50 | J.P. Morgan International Equity Funds | April 30, 2022 |
| INVESTMENTS | SHARES (000) | VALUE ($000) |
| Common Stocks — continued | ||
| Hong Kong — continued | ||
| Techtronic Industries Co. Ltd. | 812 | 10,839 |
| Xinyi Glass Holdings Ltd. | 4,214 | 9,325 |
| 120,115 | ||
| Ireland — 0.5% | ||
| Kingspan Group plc | 119 | 10,938 |
| Kingspan Group plc | 163 | 15,188 |
| 26,126 | ||
| Italy — 0.7% | ||
| Enel SpA | 1,060 | 6,894 |
| FinecoBank Banca Fineco SpA | 1,750 | 24,323 |
| UniCredit SpA | 890 | 8,236 |
| 39,453 | ||
| Japan — 19.1% | ||
| AGC, Inc. | 309 | 11,603 |
| Asahi Group Holdings Ltd. | 677 | 25,537 |
| Asahi Kasei Corp. | 2,082 | 17,083 |
| Bridgestone Corp. | 657 | 24,089 |
| Capcom Co. Ltd. | 382 | 10,082 |
| Central Japan Railway Co. | 140 | 17,611 |
| Daiichi Sankyo Co. Ltd. | 1,032 | 25,987 |
| Daikin Industries Ltd. | 89 | 13,613 |
| Daito Trust Construction Co. Ltd. | 21 | 1,974 |
| Daiwa House Industry Co. Ltd. | 831 | 19,973 |
| Dentsu Group, Inc. | 690 | 24,876 |
| Fast Retailing Co. Ltd. | 10 | 4,558 |
| Hitachi Ltd. | 744 | 35,271 |
| Honda Motor Co. Ltd. | 1,113 | 29,270 |
| Hoya Corp. | 297 | 29,524 |
| ITOCHU Corp. | 888 | 26,804 |
| Japan Airlines Co. Ltd. * | 380 | 6,277 |
| Kao Corp. | 331 | 13,266 |
| Keyence Corp. | 87 | 34,934 |
| Konami Holdings Corp. | 219 | 13,436 |
| Kubota Corp. | 928 | 15,762 |
| Kyowa Kirin Co. Ltd. | 560 | 11,797 |
| Mitsubishi Corp. | 782 | 26,263 |
| Mitsubishi Electric Corp. | 459 | 4,808 |
| Mitsubishi UFJ Financial Group, Inc. | 2,758 | 16,033 |
| Mitsui Fudosan Co. Ltd. | 748 | 15,847 |
| Murata Manufacturing Co. Ltd. | 362 | 21,578 |
| Nidec Corp. | 151 | 9,743 |
| Nintendo Co. Ltd. | 22 | 10,086 |
| INVESTMENTS | SHARES (000) | VALUE ($000) |
| Japan — continued | ||
| NIPPON EXPRESS HOLDINGS, Inc. | 217 | 12,723 |
| Nippon Steel Corp. | 289 | 4,597 |
| Nippon Telegraph & Telephone Corp. | 1,259 | 37,093 |
| Nitori Holdings Co. Ltd. | 115 | 11,852 |
| Nomura Research Institute Ltd. | 526 | 14,862 |
| Ono Pharmaceutical Co. Ltd. | 629 | 16,167 |
| ORIX Corp. | 1,122 | 20,460 |
| Otsuka Corp. | 465 | 15,242 |
| Recruit Holdings Co. Ltd. | 455 | 16,504 |
| Rohm Co. Ltd. | 161 | 11,276 |
| Ryohin Keikaku Co. Ltd. | 1,423 | 12,790 |
| Seven & i Holdings Co. Ltd. | 401 | 17,722 |
| Shimadzu Corp. | 88 | 2,864 |
| Shin-Etsu Chemical Co. Ltd. | 205 | 28,119 |
| Shionogi & Co. Ltd. | 271 | 15,063 |
| SoftBank Group Corp. | 278 | 11,438 |
| Sony Group Corp. | 552 | 47,657 |
| Sumitomo Electric Industries Ltd. | 1,231 | 13,232 |
| Sumitomo Metal Mining Co. Ltd. | 355 | 15,565 |
| Sumitomo Mitsui Financial Group, Inc. | 1,008 | 30,447 |
| Suzuki Motor Corp. | 373 | 11,253 |
| T&D Holdings, Inc. | 1,084 | 13,929 |
| Takeda Pharmaceutical Co. Ltd. | 297 | 8,627 |
| Terumo Corp. | 639 | 19,029 |
| Tokio Marine Holdings, Inc. | 650 | 35,161 |
| Tokyo Electron Ltd. | 84 | 35,317 |
| Toyota Motor Corp. | 3,162 | 54,180 |
| Yamato Holdings Co. Ltd. | 160 | 2,990 |
| 1,053,844 | ||
| Luxembourg — 0.1% | ||
| ArcelorMittal SA | 290 | 8,453 |
| Malta — 0.0% ^ | ||
| BGP Holdings plc ‡ * | 449 | 2 |
| Netherlands — 6.3% | ||
| Adyen NV * (b) | 9 | 14,794 |
| Akzo Nobel NV (a) | 273 | 23,721 |
| ASML Holding NV | 199 | 112,793 |
| ING Groep NV (a) | 877 | 8,309 |
| Koninklijke Ahold Delhaize NV | 619 | 18,252 |
| Koninklijke DSM NV | 147 | 24,723 |
| Koninklijke KPN NV | 8,306 | 28,659 |
| Koninklijke Philips NV | 206 | 5,380 |
| April 30, 2022 | J.P. Morgan International Equity Funds | 51 |
| INVESTMENTS | SHARES (000) | VALUE ($000) |
| Common Stocks — continued | ||
| Netherlands — continued | ||
| NN Group NV | 659 | 32,293 |
| Shell plc | 2,241 | 60,167 |
| Wolters Kluwer NV | 189 | 19,088 |
| 348,179 | ||
| Singapore — 0.9% | ||
| DBS Group Holdings Ltd. | 1,397 | 33,884 |
| Oversea-Chinese Banking Corp. Ltd. | 1,225 | 10,880 |
| United Overseas Bank Ltd. | 250 | 5,356 |
| 50,120 | ||
| Spain — 2.8% | ||
| Banco Bilbao Vizcaya Argentaria SA | 8,143 | 42,731 |
| Banco Santander SA (a) | 2,814 | 8,224 |
| Endesa SA | 778 | 16,303 |
| Iberdrola SA | 5,930 | 68,136 |
| Industria de Diseno Textil SA (a) | 814 | 17,073 |
| 152,467 | ||
| Sweden — 1.9% | ||
| Atlas Copco AB, Class A | 669 | 30,337 |
| Lundin Energy AB (a) | 578 | 23,917 |
| SKF AB, Class B | 1,240 | 20,244 |
| Volvo AB, Class B | 2,103 | 33,550 |
| 108,048 | ||
| Switzerland — 11.4% | ||
| Cie Financiere Richemont SA (Registered) | 107 | 12,489 |
| Givaudan SA (Registered) | 10 | 41,518 |
| Julius Baer Group Ltd. | 90 | 4,313 |
| Lonza Group AG (Registered) | 77 | 45,174 |
| Nestle SA (Registered) | 1,260 | 162,612 |
| Novartis AG (Registered) | 1,075 | 94,988 |
| Roche Holding AG | 367 | 136,056 |
| SGS SA (Registered) | 10 | 25,973 |
| Sika AG (Registered) | 133 | 40,771 |
| UBS Group AG (Registered) | 1,302 | 22,099 |
| Zurich Insurance Group AG | 100 | 45,432 |
| 631,425 | ||
| Taiwan — 0.1% | ||
| Sea Ltd., ADR * | 48 | 3,953 |
| United Kingdom — 13.6% | ||
| 3i Group plc | 2,813 | 46,037 |
| AstraZeneca plc | 662 | 88,261 |
| Barclays plc | 21,163 | 38,900 |
| INVESTMENTS | SHARES (000) | VALUE ($000) |
| United Kingdom — continued | ||
| Berkeley Group Holdings plc * | 504 | 25,577 |
| BP plc | 14,904 | 71,951 |
| British American Tobacco plc | 611 | 25,623 |
| CK Hutchison Holdings Ltd. | 535 | 3,752 |
| DCC plc | 149 | 11,282 |
| Diageo plc | 1,581 | 78,866 |
| HSBC Holdings plc | 4,651 | 29,061 |
| InterContinental Hotels Group plc | 517 | 33,011 |
| Intertek Group plc | 71 | 4,443 |
| Lloyds Banking Group plc | 67,039 | 38,076 |
| London Stock Exchange Group plc | 50 | 4,967 |
| Prudential plc | 1,474 | 18,350 |
| Reckitt Benckiser Group plc | 554 | 43,232 |
| RELX plc | 1,858 | 55,359 |
| SSE plc | 1,153 | 26,774 |
| Standard Chartered plc | 5,017 | 34,300 |
| Taylor Wimpey plc | 5,072 | 7,977 |
| Tesco plc | 8,523 | 28,956 |
| Unilever plc | 813 | 37,750 |
| 752,505 | ||
| United States — 1.9% | ||
| Ferguson plc | 42 | 5,303 |
| GlaxoSmithKline plc | 528 | 11,898 |
| Schneider Electric SE (a) | 411 | 59,012 |
| Stellantis NV | 2,140 | 28,726 |
| 104,939 | ||
| Total Common Stocks (Cost $4,625,226) | 5,138,804 | |
| Short-Term Investments — 7.4% | ||
| Investment Companies — 3.7% | ||
| JPMorgan Prime Money Market Fund Class Institutional Shares, 0.36% (c) (d)(Cost $204,860) | 204,821 | 204,862 |
| Investment of Cash Collateral from Securities Loaned — 3.7% | ||
| JPMorgan Securities Lending Money Market Fund Agency SL Class Shares, 0.37% (c) (d) | 127,422 | 127,333 |
| JPMorgan U.S. Government Money Market Fund Class IM Shares, 0.37% (c) (d) | 73,567 | 73,567 |
| Total Investment of Cash Collateral from Securities Loaned (Cost $200,904) | 200,900 | |
| Total Short-Term Investments (Cost $405,764) | 405,762 | |
| 52 | J.P. Morgan International Equity Funds | April 30, 2022 |
| INVESTMENTS | SHARES (000) | VALUE ($000) |
| Total Investments — 100.4% (Cost $5,030,990) | 5,544,566 | |
| Liabilities in Excess of Other Assets — (0.4)% | (21,526) | |
| NET ASSETS — 100.0% | 5,523,040 | |
Percentages indicated are based on net assets. | ||
| Abbreviations | |
| ADR | American Depositary Receipt |
| OYJ | Public Limited Company |
| Preference | A special type of equity investment that shares in the earnings of the company, has limited voting rights, and may have a dividend preference. Preference shares may also have liquidation preference. |
| REIT | Real Estate Investment Trust |
| ^ | Amount rounds to less than 0.1% of net assets. | |
| ‡ | Value determined using significant unobservable inputs. | |
| * | Non-income producing security. | |
| (a) | The security or a portion of this security is on loan at April 30, 2022. The total value of securities on loan at April 30, 2022 is $177,073. | |
| (b) | Security exempt from registration pursuant to Regulation S under the Securities Act of 1933, as amended. Regulation S applies to securities offerings that are made outside of the United States and do not involve direct selling efforts in the United States and as such may have restrictions on resale. | |
| (c) | Investment in an affiliated fund, which is registered under the Investment Company Act of 1940, as amended, and is advised by J.P. Morgan Investment Management Inc. | |
| (d) | The rate shown is the current yield as of April 30, 2022. | |
| INDUSTRY | PERCENT OF TOTAL INVESTMENTS |
| Pharmaceuticals | 10.5% |
| Banks | 9.6 |
| Insurance | 5.6 |
| Chemicals | 4.5 |
| Oil, Gas & Consumable Fuels | 4.1 |
| Semiconductors & Semiconductor Equipment | 3.4 |
| Textiles, Apparel & Luxury Goods | 2.9 |
| Food Products | 2.9 |
| Electric Utilities | 2.9 |
| Automobiles | 2.8 |
| Beverages | 2.7 |
| Metals & Mining | 2.6 |
| Machinery | 2.3 |
| Diversified Telecommunication Services | 2.3 |
| Personal Products | 2.2 |
| Professional Services | 2.2 |
| Capital Markets | 2.1 |
| IT Services | 1.8 |
| Multi-Utilities | 1.6 |
| Real Estate Management & Development | 1.5 |
| Industrial Conglomerates | 1.5 |
| Household Durables | 1.5 |
| Electrical Equipment | 1.5 |
| Food & Staples Retailing | 1.3 |
| Trading Companies & Distributors | 1.2 |
| Building Products | 1.1 |
| Electronic Equipment, Instruments & Components | 1.1 |
| Equity Real Estate Investment Trusts (REITs) | 1.1 |
| Others (each less than 1.0%) | 11.9 |
| Short-Term Investments | 7.3 |
| April 30, 2022 | J.P. Morgan International Equity Funds | 53 |
| DESCRIPTION | NUMBER OF CONTRACTS | EXPIRATION DATE | TRADING CURRENCY | NOTIONAL AMOUNT ($) | VALUE AND UNREALIZED APPRECIATION (DEPRECIATION) ($) |
| Long Contracts | |||||
| SPI 200 Index | 607 | 06/16/2022 | AUD | 78,334 | 2,036 |
| MSCI EAFE E-Mini Index | 826 | 06/17/2022 | USD | 82,402 | (1,379) |
| 657 |
| Abbreviations | |
| AUD | Australian Dollar |
| EAFE | Europe, Australasia, and Far East |
| MSCI | Morgan Stanley Capital International |
| SPI | Australian Securities Exchange |
| USD | United States Dollar |
| 54 | J.P. Morgan International Equity Funds | April 30, 2022 |
| INVESTMENTS | SHARES (000) | VALUE ($000) |
| Common Stocks — 98.2% | ||
| Australia — 8.5% | ||
| Australia & New Zealand Banking Group Ltd. | 177 | 3,371 |
| BHP Group Ltd. | 266 | 8,877 |
| BlueScope Steel Ltd. | 29 | 416 |
| Glencore plc * | 695 | 4,283 |
| Harvey Norman Holdings Ltd. | 141 | 502 |
| JB Hi-Fi Ltd. | 11 | 419 |
| Metcash Ltd. | 136 | 455 |
| National Australia Bank Ltd. | 200 | 4,557 |
| Rio Tinto Ltd. | 24 | 1,923 |
| Rio Tinto plc | 54 | 3,797 |
| South32 Ltd. | 291 | 969 |
| Super Retail Group Ltd. | 62 | 456 |
| Westpac Banking Corp. | 113 | 1,897 |
| Worley Ltd. | 109 | 1,062 |
| 32,984 | ||
| Austria — 1.3% | ||
| ANDRITZ AG | 12 | 520 |
| BAWAG Group AG * (a) | 14 | 680 |
| Erste Group Bank AG | 25 | 768 |
| OMV AG | 32 | 1,608 |
| Telekom Austria AG * | 59 | 419 |
| voestalpine AG | 34 | 886 |
| Wienerberger AG | 13 | 376 |
| 5,257 | ||
| Belgium — 0.5% | ||
| Ageas SA | 18 | 885 |
| Bekaert SA | 19 | 703 |
| Telenet Group Holding NV | 9 | 266 |
| 1,854 | ||
| China — 0.5% | ||
| BOC Hong Kong Holdings Ltd. | 316 | 1,142 |
| Yangzijiang Shipbuilding Holdings Ltd. | 1,259 | 822 |
| 1,964 | ||
| Denmark — 1.7% | ||
| AP Moller - Maersk A/S, Class B | — | 776 |
| D/S Norden A/S | 6 | 210 |
| Drilling Co. of 1972 A/S (The) * | 18 | 910 |
| H+H International A/S, Class B * | 24 | 582 |
| Jyske Bank A/S (Registered) * | 11 | 609 |
| Matas A/S | 38 | 532 |
| Solar A/S, Class B | 9 | 1,043 |
| INVESTMENTS | SHARES (000) | VALUE ($000) |
| Denmark — continued | ||
| Spar Nord Bank A/S | 83 | 1,055 |
| Sydbank A/S | 23 | 784 |
| 6,501 | ||
| Egypt — 0.3% | ||
| Energean plc * | 74 | 1,100 |
| Finland — 1.6% | ||
| Cargotec OYJ, Class B | 12 | 421 |
| Konecranes OYJ | 13 | 374 |
| Nokia OYJ * | 370 | 1,878 |
| Nordea Bank Abp | 202 | 2,007 |
| Outokumpu OYJ (b) | 132 | 647 |
| TietoEVRY OYJ (b) | 10 | 257 |
| Valmet OYJ | 18 | 486 |
| 6,070 | ||
| France — 8.1% | ||
| AXA SA (b) | 117 | 3,096 |
| BNP Paribas SA | 62 | 3,221 |
| Carrefour SA | 81 | 1,723 |
| Cie de Saint-Gobain | 25 | 1,436 |
| Coface SA | 41 | 495 |
| Credit Agricole SA | 91 | 985 |
| Eiffage SA | 11 | 1,131 |
| Eutelsat Communications SA | 84 | 928 |
| IPSOS | 18 | 870 |
| Metropole Television SA | 32 | 594 |
| Orange SA | 177 | 2,102 |
| Publicis Groupe SA | 20 | 1,205 |
| Renault SA * | 35 | 846 |
| Rothschild & Co. | 28 | 1,102 |
| SCOR SE | 18 | 516 |
| Societe Generale SA | 70 | 1,677 |
| Sopra Steria Group SACA | 3 | 496 |
| SPIE SA | 25 | 596 |
| Technip Energies NV * | 79 | 955 |
| Television Francaise 1 (b) | 56 | 473 |
| TotalEnergies SE (b) | 138 | 6,797 |
| 31,244 | ||
| Germany — 9.8% | ||
| Allianz SE (Registered) | 21 | 4,730 |
| Aurubis AG | 7 | 819 |
| Bayer AG (Registered) * | 64 | 4,214 |
| Bayerische Motoren Werke AG | 19 | 1,505 |
| April 30, 2022 | J.P. Morgan International Equity Funds | 55 |
| INVESTMENTS | SHARES (000) | VALUE ($000) |
| Common Stocks — continued | ||
| Germany — continued | ||
| Continental AG * | 7 | 471 |
| Covestro AG (a) | 18 | 786 |
| Daimler Truck Holding AG * | 26 | 684 |
| Deutsche Bank AG (Registered) * | 148 | 1,484 |
| Deutsche Pfandbriefbank AG (a) | 77 | 974 |
| Deutsche Post AG (Registered) | 60 | 2,561 |
| Deutsche Telekom AG (Registered) | 152 | 2,805 |
| DWS Group GmbH & Co. KGaA (a) | 10 | 324 |
| E.ON SE | 127 | 1,324 |
| Freenet AG | 21 | 580 |
| HeidelbergCement AG | 12 | 697 |
| HOCHTIEF AG | 4 | 267 |
| Kloeckner & Co. SE * | 71 | 914 |
| Mercedes-Benz Group AG * | 51 | 3,553 |
| Muenchener Rueckversicherungs-Gesellschaft AG (Registered) | 7 | 1,599 |
| ProSiebenSat.1 Media SE | 27 | 308 |
| Siemens AG (Registered) | 40 | 4,942 |
| Talanx AG | 10 | 405 |
| Volkswagen AG (Preference) | 14 | 2,097 |
| 38,043 | ||
| Hong Kong — 1.0% | ||
| Hongkong Land Holdings Ltd. | 287 | 1,341 |
| Kerry Properties Ltd. | 420 | 1,136 |
| Pacific Basin Shipping Ltd. | 2,195 | 1,007 |
| VTech Holdings Ltd. | 57 | 402 |
| 3,886 | ||
| Italy — 3.4% | ||
| Anima Holding SpA (a) | 104 | 508 |
| Assicurazioni Generali SpA | 84 | 1,593 |
| Azimut Holding SpA | 22 | 460 |
| Credito Emiliano SpA | 68 | 417 |
| Eni SpA | 209 | 2,923 |
| Intesa Sanpaolo SpA | 935 | 1,904 |
| Maire Tecnimont SpA (b) | 252 | 737 |
| Mediobanca Banca di Credito Finanziario SpA | 73 | 735 |
| Pirelli & C SpA (a) | 196 | 971 |
| Poste Italiane SpA (a) | 50 | 488 |
| UniCredit SpA | 137 | 1,267 |
| Unipol Gruppo SpA | 214 | 1,169 |
| 13,172 | ||
| INVESTMENTS | SHARES (000) | VALUE ($000) |
| Japan — 21.0% | ||
| Acom Co. Ltd. | 98 | 251 |
| AGC, Inc. | 26 | 978 |
| Aiful Corp. | 138 | 394 |
| Aozora Bank Ltd. | 23 | 450 |
| Arcs Co. Ltd. | 17 | 269 |
| Bridgestone Corp. | 36 | 1,301 |
| Brother Industries Ltd. | 40 | 690 |
| Chiba Bank Ltd. (The) | 98 | 567 |
| Concordia Financial Group Ltd. | 147 | 537 |
| Cosmo Energy Holdings Co. Ltd. | 58 | 1,438 |
| Credit Saison Co. Ltd. (b) | 92 | 1,034 |
| Dai-ichi Life Holdings, Inc. | 102 | 2,048 |
| Daiwa Securities Group, Inc. | 125 | 613 |
| Fuyo General Lease Co. Ltd. | 16 | 866 |
| Hachijuni Bank Ltd. (The) | 96 | 316 |
| Hitachi Ltd. | 43 | 2,020 |
| Honda Motor Co. Ltd. | 105 | 2,767 |
| Isuzu Motors Ltd. | 115 | 1,340 |
| ITOCHU Corp. | 49 | 1,482 |
| Japan Post Holdings Co. Ltd. | 193 | 1,355 |
| Japan Post Insurance Co. Ltd. | 74 | 1,195 |
| Kamigumi Co. Ltd. | 23 | 389 |
| Kandenko Co. Ltd. | 41 | 261 |
| KDDI Corp. | 105 | 3,474 |
| Kinden Corp. | 22 | 265 |
| Mitsubishi Chemical Holdings Corp. | 137 | 837 |
| Mitsubishi Corp. | 68 | 2,266 |
| Mitsubishi Gas Chemical Co., Inc. | 22 | 314 |
| Mitsubishi UFJ Financial Group, Inc. | 731 | 4,250 |
| Mitsui & Co. Ltd. | 95 | 2,288 |
| Mitsui Fudosan Co. Ltd. | 74 | 1,575 |
| Mizuho Financial Group, Inc. | 178 | 2,159 |
| MS&AD Insurance Group Holdings, Inc. | 44 | 1,319 |
| Nichias Corp. | 14 | 253 |
| Nippon Telegraph & Telephone Corp. | 98 | 2,900 |
| Nippon Television Holdings, Inc. | 33 | 314 |
| Nomura Holdings, Inc. | 274 | 1,055 |
| Nomura Real Estate Holdings, Inc. | 54 | 1,318 |
| ORIX Corp. | 119 | 2,174 |
| Rengo Co. Ltd. | 36 | 215 |
| Resona Holdings, Inc. | 190 | 827 |
| Sanwa Holdings Corp. | 37 | 333 |
| SBI Holdings, Inc. | 23 | 521 |
| Sekisui House Ltd. | 64 | 1,105 |
| 56 | J.P. Morgan International Equity Funds | April 30, 2022 |
| INVESTMENTS | SHARES (000) | VALUE ($000) |
| Common Stocks — continued | ||
| Japan — continued | ||
| Shizuoka Bank Ltd. (The) | 91 | 587 |
| SoftBank Corp. | 211 | 2,452 |
| Sojitz Corp. | 71 | 1,075 |
| Sompo Holdings, Inc. | 23 | 949 |
| Sumitomo Corp. | 94 | 1,486 |
| Sumitomo Forestry Co. Ltd. | 66 | 1,007 |
| Sumitomo Mitsui Financial Group, Inc. | 93 | 2,807 |
| Sumitomo Mitsui Trust Holdings, Inc. | 50 | 1,558 |
| T&D Holdings, Inc. | 92 | 1,182 |
| Takeda Pharmaceutical Co. Ltd. | 115 | 3,349 |
| Tokyo Steel Manufacturing Co. Ltd. | 53 | 551 |
| Tokyo Tatemono Co. Ltd. | 35 | 495 |
| Tosoh Corp. | 38 | 518 |
| Toyota Motor Corp. | 535 | 9,175 |
| Toyota Tsusho Corp. | 19 | 672 |
| UBE Corp. | 16 | 253 |
| Yamaha Motor Co. Ltd. | 55 | 1,144 |
| 81,583 | ||
| Luxembourg — 0.5% | ||
| ArcelorMittal SA | 57 | 1,658 |
| RTL Group SA | 7 | 387 |
| 2,045 | ||
| Malta — 0.1% | ||
| Kindred Group plc, SDR | 57 | 504 |
| Netherlands — 6.1% | ||
| ABN AMRO Bank NV, CVA (a) (b) | 91 | 1,133 |
| Aegon NV | 337 | 1,747 |
| ASR Nederland NV | 27 | 1,218 |
| Flow Traders (a) (b) | 21 | 692 |
| Heijmans NV, CVA | 56 | 764 |
| ING Groep NV | 211 | 2,002 |
| Koninklijke Ahold Delhaize NV | 63 | 1,870 |
| NN Group NV | 26 | 1,288 |
| PostNL NV (b) | 116 | 381 |
| Randstad NV | 13 | 667 |
| Shell plc | 420 | 11,262 |
| Signify NV (a) | 14 | 601 |
| 23,625 | ||
| Norway — 2.5% | ||
| DNB Bank ASA (b) | 70 | 1,354 |
| Elkem ASA (a) | 230 | 953 |
| Equinor ASA | 80 | 2,707 |
| INVESTMENTS | SHARES (000) | VALUE ($000) |
| Norway — continued | ||
| Europris ASA (a) | 59 | 300 |
| Norsk Hydro ASA | 170 | 1,427 |
| Olav Thon Eiendomsselskap ASA | 24 | 493 |
| Selvaag Bolig ASA | 12 | 56 |
| SpareBank 1 Nord Norge | 80 | 854 |
| SpareBank 1 SMN | 42 | 597 |
| SpareBank 1 SR-Bank ASA | 46 | 588 |
| Storebrand ASA | 60 | 518 |
| 9,847 | ||
| Singapore — 1.5% | ||
| DBS Group Holdings Ltd. | 64 | 1,560 |
| Oversea-Chinese Banking Corp. Ltd. | 207 | 1,836 |
| StarHub Ltd. | 378 | 343 |
| United Overseas Bank Ltd. | 68 | 1,449 |
| Yangzijiang Financial Holding Pte. Ltd. * | 1,260 | 497 |
| 5,685 | ||
| South Africa — 0.9% | ||
| Anglo American plc | 76 | 3,373 |
| Spain — 3.3% | ||
| Acerinox SA | 40 | 427 |
| Atresmedia Corp. de Medios de Comunicacion SA | 190 | 726 |
| Banco Bilbao Vizcaya Argentaria SA | 518 | 2,718 |
| Banco Santander SA (b) | 944 | 2,758 |
| CaixaBank SA (b) | 293 | 945 |
| Mediaset Espana Comunicacion SA * | 96 | 431 |
| Repsol SA | 148 | 2,209 |
| Telefonica SA | 401 | 1,950 |
| Unicaja Banco SA (a) | 541 | 510 |
| 12,674 | ||
| Sweden — 2.7% | ||
| Bilia AB, Class A | 24 | 330 |
| Boliden AB (b) | 25 | 1,092 |
| Bonava AB, Class B | 42 | 204 |
| Humana AB * | 52 | 274 |
| Intrum AB * (b) | 24 | 574 |
| Inwido AB | 42 | 573 |
| Loomis AB | 31 | 777 |
| Lundin Energy AB (b) | 27 | 1,124 |
| Mekonomen AB * | 34 | 392 |
| Securitas AB, Class B | 60 | 709 |
| Skandinaviska Enskilda Banken AB, Class A | 125 | 1,402 |
| Skanska AB, Class B | 29 | 544 |
| April 30, 2022 | J.P. Morgan International Equity Funds | 57 |
| INVESTMENTS | SHARES (000) | VALUE ($000) |
| Common Stocks — continued | ||
| Sweden — continued | ||
| SSAB AB, Class B (b) | 189 | 1,110 |
| Svenska Handelsbanken AB, Class A | 105 | 1,061 |
| Volvo AB, Class B | 14 | 230 |
| 10,396 | ||
| Switzerland — 6.2% | ||
| Adecco Group AG (Registered) | 16 | 604 |
| Julius Baer Group Ltd. | 15 | 734 |
| Mobilezone Holding AG (Registered) | 51 | 824 |
| Novartis AG (Registered) | 108 | 9,584 |
| Roche Holding AG | 3 | 1,144 |
| Swiss Life Holding AG (Registered) | 2 | 1,479 |
| Swisscom AG (Registered) (b) | 2 | 1,153 |
| UBS Group AG (Registered) | 237 | 4,024 |
| Vontobel Holding AG (Registered) | 8 | 555 |
| Zurich Insurance Group AG | 9 | 4,063 |
| 24,164 | ||
| United Kingdom — 14.2% | ||
| 3i Group plc | 59 | 969 |
| Aviva plc | 276 | 1,481 |
| Balfour Beatty plc | 249 | 753 |
| Barclays plc | 969 | 1,782 |
| Barratt Developments plc | 139 | 852 |
| Bellway plc | 9 | 267 |
| Berkeley Group Holdings plc * | 10 | 513 |
| BP plc | 1,192 | 5,755 |
| BT Group plc | 575 | 1,276 |
| Centrica plc * | 1,490 | 1,476 |
| CK Hutchison Holdings Ltd. | 276 | 1,937 |
| Crest Nicholson Holdings plc | 84 | 265 |
| Drax Group plc | 122 | 1,237 |
| easyJet plc * | 111 | 766 |
| Halfords Group plc | 239 | 681 |
| HSBC Holdings plc | 1,071 | 6,693 |
| IG Group Holdings plc | 56 | 569 |
| Inchcape plc | 43 | 387 |
| Investec plc | 278 | 1,639 |
| ITV plc | 437 | 404 |
| J Sainsbury plc | 236 | 689 |
| JET2 plc * | 55 | 835 |
| Johnson Matthey plc | 50 | 1,366 |
| Keller Group plc | 44 | 468 |
| Kier Group plc * | 253 | 252 |
| Land Securities Group plc, REIT | 157 | 1,471 |
| INVESTMENTS | SHARES (000) | VALUE ($000) |
| United Kingdom — continued | ||
| Legal & General Group plc | 427 | 1,331 |
| Lloyds Banking Group plc | 4,177 | 2,372 |
| Man Group plc | 271 | 788 |
| Marks & Spencer Group plc * | 530 | 905 |
| Morgan Sindall Group plc | 20 | 531 |
| NatWest Group plc | 399 | 1,071 |
| OSB Group plc | 172 | 1,203 |
| Paragon Banking Group plc | 75 | 462 |
| Premier Foods plc | 451 | 630 |
| Rathbones Group plc | 16 | 412 |
| Reach plc | 208 | 426 |
| Redrow plc | 48 | 314 |
| Royal Mail plc | 263 | 1,125 |
| Standard Chartered plc | 163 | 1,114 |
| Taylor Wimpey plc | 325 | 511 |
| Tesco plc | 599 | 2,034 |
| Vistry Group plc | 77 | 801 |
| Vodafone Group plc | 1,914 | 2,898 |
| WPP plc | 106 | 1,322 |
| 55,033 | ||
| United States — 2.5% | ||
| GlaxoSmithKline plc | 278 | 6,276 |
| Stellantis NV | 97 | 1,303 |
| Stellantis NV | 62 | 836 |
| Tenaris SA | 74 | 1,124 |
| 9,539 | ||
| Total Common Stocks (Cost $361,439) | 380,543 | |
| Short-Term Investments — 6.6% | ||
| Investment Companies — 1.5% | ||
| JPMorgan Prime Money Market Fund Class Institutional Shares, 0.36% (c) (d)(Cost $5,752) | 5,751 | 5,753 |
| Investment of Cash Collateral from Securities Loaned — 5.1% | ||
| JPMorgan Securities Lending Money Market Fund Agency SL Class Shares, 0.37% (c) (d) | 14,709 | 14,699 |
| JPMorgan U.S. Government Money Market Fund Class IM Shares, 0.37% (c) (d) | 5,183 | 5,183 |
| Total Investment of Cash Collateral from Securities Loaned (Cost $19,881) | 19,882 | |
| Total Short-Term Investments (Cost $25,633) | 25,635 | |
| 58 | J.P. Morgan International Equity Funds | April 30, 2022 |
| INVESTMENTS | SHARES (000) | VALUE ($000) |
| Total Investments — 104.8% (Cost $387,072) | 406,178 | |
| Liabilities in Excess of Other Assets — (4.8)% | (18,478) | |
| NET ASSETS — 100.0% | 387,700 | |
Percentages indicated are based on net assets. | ||
Amounts presented as a dash (“-“) represent amounts that round to less than a thousand. | ||
| Abbreviations | |
| CVA | Dutch Certification |
| OYJ | Public Limited Company |
| Preference | A special type of equity investment that shares in the earnings of the company, has limited voting rights, and may have a dividend preference. Preference shares may also have liquidation preference. |
| REIT | Real Estate Investment Trust |
| SDR | Swedish Depositary Receipt |
| * | Non-income producing security. |
| (a) | Security exempt from registration pursuant to Regulation S under the Securities Act of 1933, as amended. Regulation S applies to securities offerings that are made outside of the United States and do not involve direct selling efforts in the United States and as such may have restrictions on resale. |
| (b) | The security or a portion of this security is on loan at April 30, 2022. The total value of securities on loan at April 30, 2022 is $18,772. |
| (c) | Investment in an affiliated fund, which is registered under the Investment Company Act of 1940, as amended, and is advised by J.P. Morgan Investment Management Inc. |
| (d) | The rate shown is the current yield as of April 30, 2022. |
| INDUSTRY | PERCENT OF TOTAL INVESTMENTS |
| Banks | 18.4% |
| Oil, Gas & Consumable Fuels | 9.1 |
| Insurance | 8.9 |
| Metals & Mining | 8.1 |
| Pharmaceuticals | 6 |
| Automobiles | 6 |
| Capital Markets | 4.2 |
| Diversified Telecommunication Services | 3.1 |
| Trading Companies & Distributors | 2.8 |
| Wireless Telecommunication Services | 2.4 |
| Industrial Conglomerates | 2.2 |
| Media | 2.1 |
| Food & Staples Retailing | 2 |
| Real Estate Management & Development | 1.6 |
| Construction & Engineering | 1.5 |
| Household Durables | 1.4 |
| Chemicals | 1.2 |
| Air Freight & Logistics | 1 |
| Energy Equipment & Services | 1 |
| Others (each less than 1.0%) | 10.7 |
| Short-Term Investments | 6.3 |
| April 30, 2022 | J.P. Morgan International Equity Funds | 59 |
| JPMorgan Emerging Markets Equity Fund | JPMorgan Emerging Markets Research Enhanced Equity Fund | JPMorgan Europe Dynamic Fund | |||
| ASSETS: | |||||
| Investments in non-affiliates, at value | $9,421,456 | $2,908,681 | $ 593,016 | ||
| Investments in affiliates, at value | 267,806 | 43,823 | 12,091 | ||
| Investments of cash collateral received from securities loaned, at value (See Note 2.C) | 107 | 14,062 | 48,178 | ||
| Cash | — | 4,238 | 98 | ||
| Foreign currency, at value | 4,775 | 1,131 | — | ||
| Deposits at broker for futures contracts | — | 12,043 | 834 | ||
| Receivables: | |||||
| Investment securities sold | 10,291 | 155,227 | 931 | ||
| Fund shares sold | 131,113 | 137,432 | 59 | ||
| Dividends from non-affiliates | 4,182 | 6,028 | 2,369 | ||
| Dividends from affiliates | 59 | 10 | 2 | ||
| Tax reclaims | 230 | 122 | 3,350 | ||
| Securities lending income (See Note 2.C) | —(a) | 3 | 8 | ||
| Variation margin on futures contracts | — | 3,769 | 34 | ||
| Total Assets | 9,840,019 | 3,286,569 | 660,970 | ||
| LIABILITIES: | |||||
| Payables: | |||||
| Due to custodian | 10,241 | — | — | ||
| Foreign currency due to custodian, at value | — | — | 460 | ||
| Investment securities purchased | — | — | 5,093 | ||
| Collateral received on securities loaned (See Note 2.C) | 107 | 14,063 | 48,178 | ||
| Fund shares redeemed | 94,084 | 317,760 | 250 | ||
| Accrued liabilities: | |||||
| Investment advisory fees | 5,472 | 569 | 312 | ||
| Administration fees | 523 | 140 | 39 | ||
| Distribution fees | 138 | — | 21 | ||
| Service fees | 746 | 19 | 40 | ||
| Custodian and accounting fees | 143 | 180 | 14 | ||
| Trustees’ and Chief Compliance Officer’s fees | — | — | —(a) | ||
| Deferred foreign capital gains tax | 49,934 | 7,716 | — | ||
| Other | 403 | 30 | 21 | ||
| Total Liabilities | 161,791 | 340,477 | 54,428 | ||
| Net Assets | $9,678,228 | $2,946,092 | $ 606,542 (a) Amount rounds to less than one thousand. |
| 60 | J.P. Morgan International Equity Funds | April 30, 2022 |
| JPMorgan Emerging Markets Equity Fund | JPMorgan Emerging Markets Research Enhanced Equity Fund | JPMorgan Europe Dynamic Fund | |||
| NET ASSETS: | |||||
| Paid-in-Capital | $8,828,888 | $3,082,344 | $ 712,608 | ||
| Total distributable earnings (loss) | 849,340 | (136,252) | (106,066) | ||
| Total Net Assets: | $9,678,228 | $2,946,092 | $ 606,542 | ||
| Net Assets: | |||||
| Class A | $ 476,166 | $ — | $ 73,397 | ||
| Class C | 51,142 | — | 7,015 | ||
| Class I | 2,901,502 | 236,318 | 69,744 | ||
| Class L | 1,804,078 | — | 75,636 | ||
| Class R2 | 465 | — | — | ||
| Class R3 | 12,570 | — | — | ||
| Class R4 | 2,908 | — | — | ||
| Class R5 | 15,147 | — | — | ||
| Class R6 | 4,414,250 | 2,709,774 | 380,750 | ||
| Total | $9,678,228 | $2,946,092 | $ 606,542 | ||
| Outstanding units of beneficial interest (shares) ($0.0001 par value; unlimited number of shares authorized): | |||||
| Class A | 16,507 | — | 2,832 | ||
| Class C | 1,848 | — | 307 | ||
| Class I | 98,095 | 14,208 | 2,638 | ||
| Class L | 60,492 | — | 2,823 | ||
| Class R2 | 16 | — | — | ||
| Class R3 | 439 | — | — | ||
| Class R4 | 99 | — | — | ||
| Class R5 | 508 | — | — | ||
| Class R6 | 148,159 | 163,851 | 14,277 | ||
| Net Asset Value (a): | |||||
| Class A — Redemption price per share | $ 28.85 | $ — | $ 25.92 | ||
| Class C — Offering price per share (b) | 27.67 | — | 22.86 | ||
| Class I — Offering and redemption price per share | 29.58 | 16.63 | 26.43 | ||
| Class L — Offering and redemption price per share | 29.82 | — | 26.79 | ||
| Class R2 — Offering and redemption price per share | 28.45 | — | — | ||
| Class R3 — Offering and redemption price per share | 28.64 | — | — | ||
| Class R4 — Offering and redemption price per share | 29.47 | — | — | ||
| Class R5 — Offering and redemption price per share | 29.82 | — | — | ||
| Class R6 — Offering and redemption price per share | 29.79 | 16.54 | 26.67 | ||
| Class A maximum sales charge | 5.25% | —% | 5.25% | ||
| Class A maximum public offering price per share [net asset value per share/(100% – maximum sales charge)] | $ 30.45 | $ — | $ 27.36 | ||
| Cost of investments in non-affiliates | $8,504,575 | $2,859,310 | $ 575,629 | ||
| Cost of investments in affiliates | 267,802 | 43,823 | 12,092 | ||
| Cost of foreign currency | 3,472 | 1,131 | — | ||
| Investment securities on loan, at value (See Note 2.C) | 106 | 13,480 | 44,177 | ||
| Cost of investment of cash collateral (See Note 2.C) | 107 | 14,061 | 48,178 |
| (a) | Per share amounts may not recalculate due to rounding of net assets and/or shares outstanding. |
| (b) | Redemption price for Class C Shares varies based upon length of time the shares are held. |
| April 30, 2022 | J.P. Morgan International Equity Funds | 61 |
| JPMorgan International Equity Fund | JPMorgan International Focus Fund | JPMorgan International Hedged Equity Fund | |||
| ASSETS: | |||||
| Investments in non-affiliates, at value | $4,234,728 | $1,362,361 | $156,122 | ||
| Investments in affiliates, at value | 127,803 | 39,689 | 7,724 | ||
| Investments of cash collateral received from securities loaned, at value (See Note 2.C) | 202,371 | — | — | ||
| Options purchased, at value | — | — | 6,077 | ||
| Cash | 51 | 50 | 751 | ||
| Foreign currency, at value | 2,745 | 967 | 204 | ||
| Deposits at broker for futures contracts | — | — | 642 | ||
| Receivables: | |||||
| Investment securities sold | — | — | 995 | ||
| Fund shares sold | 312,065 | 1,544 | 635 | ||
| Dividends from non-affiliates | 12,176 | 1,739 | 636 | ||
| Dividends from affiliates | 39 | 20 | 1 | ||
| Tax reclaims | 7,971 | 5,603 | 424 | ||
| Securities lending income (See Note 2.C) | 126 | 5 | — | ||
| Other assets | — | 69 | — | ||
| Total Assets | 4,900,075 | 1,412,047 | 174,211 | ||
| LIABILITIES: | |||||
| Payables: | |||||
| Investment securities purchased | 95,972 | 2,937 | 1,215 | ||
| Collateral received on securities loaned (See Note 2.C) | 202,371 | — | — | ||
| Fund shares redeemed | 116,207 | 848 | 615 | ||
| Variation margin on futures contracts | — | — | 39 | ||
| Outstanding options written, at fair value | — | — | 1,036 | ||
| Accrued liabilities: | |||||
| Investment advisory fees | 1,610 | 959 | 16 | ||
| Administration fees | 123 | 9 | — | ||
| Distribution fees | 93 | 71 | 1 | ||
| Service fees | 173 | 161 | 36 | ||
| Custodian and accounting fees | 85 | 73 | 12 | ||
| Trustees’ and Chief Compliance Officer’s fees | — | — | 1 | ||
| Other | 55 | 42 | 17 | ||
| Total Liabilities | 416,689 | 5,100 | 2,988 | ||
| Net Assets | $4,483,386 | $1,406,947 | $171,223 |
| 62 | J.P. Morgan International Equity Funds | April 30, 2022 |
| JPMorgan International Equity Fund | JPMorgan International Focus Fund | JPMorgan International Hedged Equity Fund | |||
| NET ASSETS: | |||||
| Paid-in-Capital | $4,036,997 | $1,118,469 | $179,991 | ||
| Total distributable earnings (loss) | 446,389 | 288,478 | (8,768) | ||
| Total Net Assets: | $4,483,386 | $1,406,947 | $171,223 | ||
| Net Assets: | |||||
| Class A | $ 365,217 | $ 268,558 | $ 5,203 | ||
| Class C | 8,331 | 18,734 | 284 | ||
| Class I | 623,210 | 654,222 | 165,497 | ||
| Class R2 | 20,627 | 1,783 | — | ||
| Class R5 | 9,074 | 2,216 | 21 | ||
| Class R6 | 3,456,927 | 461,434 | 218 | ||
| Total | $4,483,386 | $1,406,947 | $171,223 | ||
| Outstanding units of beneficial interest (shares) ($0.0001 par value; unlimited number of shares authorized): | |||||
| Class A | 21,721 | 11,896 | 354 | ||
| Class C | 526 | 843 | 19 | ||
| Class I | 36,411 | 28,583 | 11,216 | ||
| Class R2 | 1,244 | 79 | — | ||
| Class R5 | 527 | 97 | 2 | ||
| Class R6 | 201,358 | 20,152 | 15 | ||
| Net Asset Value (a): | |||||
| Class A — Redemption price per share | $ 16.81 | $ 22.57 | $ 14.68 | ||
| Class C — Offering price per share (b) | 15.85 | 22.23 | 14.65 | ||
| Class I — Offering and redemption price per share | 17.12 | 22.89 | 14.76 | ||
| Class R2 — Offering and redemption price per share | 16.59 | 22.40 | — | ||
| Class R5 — Offering and redemption price per share | 17.21 | 22.89 | 14.78 | ||
| Class R6 — Offering and redemption price per share | 17.17 | 22.90 | 14.79 | ||
| Class A maximum sales charge | 5.25% | 5.25% | 5.25% | ||
| Class A maximum public offering price per share [net asset value per share/(100% – maximum sales charge)] | $ 17.74 | $ 23.82 | $ 15.49 | ||
| Cost of investments in non-affiliates | $3,767,366 | $1,191,605 | $147,593 | ||
| Cost of investments in affiliates | 127,784 | 39,692 | 7,724 | ||
| Cost of options purchased | — | — | 4,108 | ||
| Cost of foreign currency | 2,748 | 967 | 206 | ||
| Investment securities on loan, at value (See Note 2.C) | 169,016 | — | — | ||
| Cost of investment of cash collateral (See Note 2.C) | 202,371 | — | — | ||
| Premiums received from options written | — | — | 3,954 |
| (a) | Per share amounts may not recalculate due to rounding of net assets and/or shares outstanding. |
| (b) | Redemption price for Class C Shares varies based upon length of time the shares are held. |
| April 30, 2022 | J.P. Morgan International Equity Funds | 63 |
| JPMorgan International Research Enhanced Equity Fund | JPMorgan International Value Fund | ||
| ASSETS: | |||
| Investments in non-affiliates, at value | $5,138,804 | $380,543 | |
| Investments in affiliates, at value | 204,862 | 5,753 | |
| Investments of cash collateral received from securities loaned, at value (See Note 2.C) | 200,900 | 19,882 | |
| Cash | 4,433 | — | |
| Foreign currency, at value | 606 | — | |
| Deposits at broker for futures contracts | 11,765 | — | |
| Receivables: | |||
| Investment securities sold | 29,816 | 658 | |
| Fund shares sold | 567,563 | 818 | |
| Dividends from non-affiliates | 18,416 | 2,851 | |
| Dividends from affiliates | 57 | 3 | |
| Tax reclaims | 10,118 | 2,232 | |
| Securities lending income (See Note 2.C) | 187 | 20 | |
| Total Assets | 6,187,527 | 412,760 | |
| LIABILITIES: | |||
| Payables: | |||
| Due to custodian | — | 266 | |
| Foreign currency due to custodian, at value | — | 289 | |
| Investment securities purchased | 461,303 | 2,647 | |
| Collateral received on securities loaned (See Note 2.C) | 200,899 | 19,882 | |
| Fund shares redeemed | 309 | 587 | |
| Variation margin on futures contracts | 382 | — | |
| Accrued liabilities: | |||
| Investment advisory fees | 714 | 148 | |
| Administration fees | 240 | 3 | |
| Distribution fees | 8 | 40 | |
| Service fees | 27 | 37 | |
| Custodian and accounting fees | 132 | 24 | |
| Trustees’ and Chief Compliance Officer’s fees | —(a) | —(a) | |
| Other | 473 | 1,137 | |
| Total Liabilities | 664,487 | 25,060 | |
| Net Assets | $5,523,040 | $387,700 (a) Amount rounds to less than one thousand. |
| 64 | J.P. Morgan International Equity Funds | April 30, 2022 |
| JPMorgan International Research Enhanced Equity Fund | JPMorgan International Value Fund | ||
| NET ASSETS: | |||
| Paid-in-Capital | $5,318,902 | $451,151 | |
| Total distributable earnings (loss) | 204,138 | (63,451) | |
| Total Net Assets: | $5,523,040 | $387,700 | |
| Net Assets: | |||
| Class A | $ 37,317 | $177,422 | |
| Class C | — | 2,490 | |
| Class I | 313,629 | 37,651 | |
| Class L | — | 6,285 | |
| Class R2 | — | 500 | |
| Class R5 | — | 33 | |
| Class R6 | 5,172,094 | 163,319 | |
| Total | $5,523,040 | $387,700 | |
| Outstanding units of beneficial interest (shares) ($0.0001 par value; unlimited number of shares authorized): | |||
| Class A | 2,080 | 15,053 | |
| Class C | — | 217 | |
| Class I | 17,407 | 3,106 | |
| Class L | — | 521 | |
| Class R2 | — | 43 | |
| Class R5 | — | 3 | |
| Class R6 | 288,141 | 13,630 | |
| Net Asset Value (a): | |||
| Class A — Redemption price per share | $ 17.94 | $ 11.79 | |
| Class C — Offering price per share (b) | — | 11.44 | |
| Class I — Offering and redemption price per share | 18.02 | 12.12 | |
| Class L — Offering and redemption price per share | — | 12.05 | |
| Class R2 — Offering and redemption price per share | — | 11.59 | |
| Class R5 — Offering and redemption price per share | — | 11.97 | |
| Class R6 — Offering and redemption price per share | 17.95 | 11.98 | |
| Class A maximum sales charge | 5.25% | 5.25% | |
| Class A maximum public offering price per share [net asset value per share/(100% – maximum sales charge)] | $ 18.93 | $ 12.44 | |
| Cost of investments in non-affiliates | $4,625,226 | $361,439 | |
| Cost of investments in affiliates | 204,860 | 5,752 | |
| Cost of foreign currency | 631 | — | |
| Investment securities on loan, at value | 177,073 | 18,772 | |
| Cost of investment of cash collateral (See Note 2.C) | 200,904 | 19,881 |
| (a) | Per share amounts may not recalculate due to rounding of net assets and/or shares outstanding. |
| (b) | Redemption price for Class C Shares varies based upon length of time the shares are held. |
| April 30, 2022 | J.P. Morgan International Equity Funds | 65 |
| JPMorgan Emerging Markets Equity Fund | JPMorgan Emerging Markets Research Enhanced Equity Fund | JPMorgan Europe Dynamic Fund | |||
| INVESTMENT INCOME: | |||||
| Interest income from non-affiliates | $ — | $ 3 | $ 1 | ||
| Dividend income from non-affiliates | 49,549 | 46,566 | 11,865 | ||
| Dividend income from affiliates | 90 | 34 | 10 | ||
| Non-cash dividend income from non-affiliates | 13,536 | 4,198 | 2,368 | ||
| Income from securities lending (net) (See Note 2.C) | 85 | 20 | 86 | ||
| Foreign taxes withheld (net) | (5,770) | (3,902) | (1,485) | ||
| Total investment income | 57,490 | 46,919 | 12,845 | ||
| EXPENSES: | |||||
| Investment advisory fees | 40,116 | 4,495 | 2,764 | ||
| Administration fees | 4,115 | 1,348 | 346 | ||
| Distribution fees: | |||||
| Class A | 729 | — | 103 | ||
| Class C | 250 | — | 36 | ||
| Class R2 | 2 | — | — | ||
| Class R3 | 17 | — | — | ||
| Service fees: | |||||
| Class A | 729 | — | 103 | ||
| Class C | 83 | — | 12 | ||
| Class I | 4,859 | 137 | 397 | ||
| Class L | 1,103 | — | 41 | ||
| Class R3 | 17 | — | — | ||
| Class R4 | 4 | — | — | ||
| Class R5 | 9 | — | — | ||
| Custodian and accounting fees | 2,119 | 959 | 76 | ||
| Interest expense to affiliates | 14 | — | 9 | ||
| Professional fees | 143 | 49 | 46 | ||
| Trustees’ and Chief Compliance Officer’s fees | 31 | 18 | 14 | ||
| Printing and mailing costs | 358 | 15 | 30 | ||
| Registration and filing fees | 222 | 46 | 35 | ||
| Transfer agency fees (See Note 2.I) | 130 | 13 | 20 | ||
| Other | 333 | 39 | 27 | ||
| Total expenses | 55,383 | 7,119 | 4,059 | ||
| Less fees waived | (1,804) | (796) | (20) | ||
| Less expense reimbursements | (55) | — | — | ||
| Net expenses | 53,524 | 6,323 | 4,039 | ||
| Net investment income (loss) | $ 3,966 | $ 40,596 | $ 8,806 |
| 66 | J.P. Morgan International Equity Funds | April 30, 2022 |
| JPMorgan Emerging Markets Equity Fund | JPMorgan Emerging Markets Research Enhanced Equity Fund | JPMorgan Europe Dynamic Fund | |||
| REALIZED/UNREALIZED GAINS (LOSSES): | |||||
| Net realized gain (loss) on transactions from: | |||||
| Investments in non-affiliates | $ 58,730(a) | $(144,648)(b) | $ (51,787) | ||
| Investments in affiliates | (21) | (14) | (7) | ||
| Futures contracts | — | (420) | 2,066 | ||
| Foreign currency transactions | (3,457) | (1,113) | (2,159) | ||
| Forward foreign currency exchange contracts | — | — | — | ||
| Net realized gain (loss) | 55,252 | (146,195) | (51,887) | ||
| Distribution of capital gain received from investment company affiliates | — | — | — | ||
| Change in net unrealized appreciation/depreciation on: | |||||
| Investments in non-affiliates | (3,600,687)(c) | (502,838)(d) | (112,693) | ||
| Investments in affiliates | 4 | 1 | (1) | ||
| Futures contracts | — | 77 | (1,615) | ||
| Foreign currency translations | 1,104 | 119 | (314) | ||
| Change in net unrealized appreciation/depreciation | (3,599,579) | (502,641) | (114,623) | ||
| Net realized/unrealized gains (losses) | (3,544,327) | (648,836) | (166,510) | ||
| Change in net assets resulting from operations | $(3,540,361) | $(608,240) | $(157,704) |
| (a) | Net of foreign capital gains tax of $(250). |
| (b) | Net of foreign capital gains tax of $(2,160). |
| (c) | Net of change in foreign capital gains tax of $(89). |
| (d) | Net of change in foreign capital gains tax of $5,322. |
| April 30, 2022 | J.P. Morgan International Equity Funds | 67 |
| JPMorgan International Equity Fund | JPMorgan International Focus Fund | JPMorgan International Hedged Equity Fund | |||
| INVESTMENT INCOME: | |||||
| Interest income from non-affiliates | $ — | $ — | $ — | ||
| Interest income from affiliates | — | —(a) | — | ||
| Dividend income from non-affiliates | 65,897 | 36,677 | 2,708 | ||
| Dividend income from affiliates | 69 | 34 | 2 | ||
| Non-cash dividend income from non-affiliates | — | 3,517 | — | ||
| Income from securities lending (net) (See Note 2.C) | 347 | 84 | — | ||
| Foreign taxes withheld (net) | (6,505) | (3,253) | (270) | ||
| Total investment income | 59,808 | 37,059 | 2,440 | ||
| EXPENSES: | |||||
| Investment advisory fees | 11,777 | 9,993 | 210 | ||
| Administration fees | 1,766 | 1,249 | 63 | ||
| Distribution fees: | |||||
| Class A | 515 | 394 | 6 | ||
| Class C | 37 | 82 | 1 | ||
| Class R2 | 57 | 5 | — | ||
| Service fees: | |||||
| Class A | 515 | 394 | 6 | ||
| Class C | 12 | 28 | — | ||
| Class I | 776 | 970 | 204 | ||
| Class R2 | 28 | 2 | — | ||
| Class R5 | 5 | 1 | — | ||
| Custodian and accounting fees | 307 | 290 | 41 | ||
| Interest expense to affiliates | 8 | 5 | — | ||
| Professional fees | 67 | 52 | 46 | ||
| Trustees’ and Chief Compliance Officer’s fees | 20 | 17 | 13 | ||
| Printing and mailing costs | 60 | 49 | 13 | ||
| Registration and filing fees | 88 | 92 | 55 | ||
| Transfer agency fees (See Note 2.I) | 56 | 33 | 1 | ||
| Other | 62 | 44 | 9 | ||
| Total expenses | 16,156 | 13,700 | 668 | ||
| Less fees waived | (2,706) | (2,941) | (158) | ||
| Less expense reimbursements | — | — | —(a) | ||
| Net expenses | 13,450 | 10,759 | 510 | ||
| Net investment income (loss) | $ 46,358 | $ 26,300 | $ 1,930 (a) Amount rounds to less than one thousand. |
| 68 | J.P. Morgan International Equity Funds | April 30, 2022 |
| JPMorgan International Equity Fund | JPMorgan International Focus Fund | JPMorgan International Hedged Equity Fund | |||
| REALIZED/UNREALIZED GAINS (LOSSES): | |||||
| Net realized gain (loss) on transactions from: | |||||
| Investments in non-affiliates | $ (36,377) | $ 224,853 | $ 879 | ||
| Investments in affiliates | (44) | (5) | — | ||
| Options purchased | — | — | (6,076) | ||
| Futures contracts | — | 71 | (604) | ||
| Foreign currency transactions | (859) | (345) | (40) | ||
| Options written | — | — | 5,505 | ||
| Net realized gain (loss) | (37,280) | 224,574 | (336) | ||
| Change in net unrealized appreciation/depreciation on: | |||||
| Investments in non-affiliates | (884,227) | (803,012) | (24,366) | ||
| Investments in affiliates | 19 | (3) | — | ||
| Options purchased | — | — | 3,612 | ||
| Futures contracts | — | — | (233) | ||
| Foreign currency translations | (1,171) | (384) | (57) | ||
| Options written | — | — | 1,199 | ||
| Change in net unrealized appreciation/depreciation | (885,379) | (803,399) | (19,845) | ||
| Net realized/unrealized gains (losses) | (922,659) | (578,825) | (20,181) | ||
| Change in net assets resulting from operations | $(876,301) | $(552,525) | $(18,251) |
| April 30, 2022 | J.P. Morgan International Equity Funds | 69 |
| JPMorgan International Research Enhanced Equity Fund | JPMorgan International Value Fund | ||
| INVESTMENT INCOME: | |||
| Interest income from non-affiliates | $ 2 | $ — | |
| Interest income from affiliates | —(a) | — | |
| Dividend income from non-affiliates | 80,992 | 8,938 | |
| Dividend income from affiliates | 96 | 5 | |
| Non-cash dividend income from non-affiliates | — | 871 | |
| Income from securities lending (net) (See Note 2.C) | 526 | 48 | |
| Foreign taxes withheld (net) | (7,756) | (805) | |
| Total investment income | 73,860 | 9,057 | |
| EXPENSES: | |||
| Investment advisory fees | 4,904 | 1,088 | |
| Administration fees | 1,839 | 148 | |
| Distribution fees: | |||
| Class A | 53 | 231 | |
| Class C | — | 12 | |
| Class R2 | — | 1 | |
| Service fees: | |||
| Class A | 53 | 231 | |
| Class C | — | 4 | |
| Class I | 453 | 48 | |
| Class L | — | 3 | |
| Class R2 | — | 1 | |
| Custodian and accounting fees | 330 | 49 | |
| Interest expense to affiliates | 36 | 1 | |
| Professional fees | 82 | 49 | |
| Trustees’ and Chief Compliance Officer’s fees | 20 | 13 | |
| Printing and mailing costs | 13 | 8 | |
| Registration and filing fees | 65 | 67 | |
| Transfer agency fees (See Note 2.I) | 33 | 9 | |
| Other | 78 | 25 | |
| Total expenses | 7,959 | 1,988 | |
| Less fees waived | (1,570) | (409) | |
| Less expense reimbursements | — | (1) | |
| Net expenses | 6,389 | 1,578 | |
| Net investment income (loss) | $ 67,471 | $ 7,479 (a) Amount rounds to less than one thousand. |
| 70 | J.P. Morgan International Equity Funds | April 30, 2022 |
| JPMorgan International Research Enhanced Equity Fund | JPMorgan International Value Fund | ||
| REALIZED/UNREALIZED GAINS (LOSSES): | |||
| Net realized gain (loss) on transactions from: | |||
| Investments in non-affiliates | $ 40,943 | $ (76) | |
| Investments in affiliates | (36) | (1) | |
| Futures contracts | (2,412) | (367) | |
| Foreign currency transactions | (1,473) | 109 | |
| Net realized gain (loss) | 37,022 | (335) | |
| Change in net unrealized appreciation/depreciation on: | |||
| Investments in non-affiliates | (745,853) | (40,325) | |
| Investments in affiliates | (3) | 1 | |
| Futures contracts | 501 | (50) | |
| Foreign currency translations | (1,597) | (266) | |
| Change in net unrealized appreciation/depreciation | (746,952) | (40,640) | |
| Net realized/unrealized gains (losses) | (709,930) | (40,975) | |
| Change in net assets resulting from operations | $(642,459) | $(33,496) |
| April 30, 2022 | J.P. Morgan International Equity Funds | 71 |
| JPMorgan Emerging Markets Equity Fund | JPMorgan Emerging Markets Research Enhanced Equity Fund | ||||||
| Six Months Ended April 30, 2022 (Unaudited) | Year Ended October 31, 2021 | Six Months Ended April 30, 2022 (Unaudited) | Year Ended October 31, 2021 | ||||
| CHANGE IN NET ASSETS RESULTING FROM OPERATIONS: | |||||||
| Net investment income (loss) | $ 3,966 | $ (660) | $ 40,596 | $ 70,642 | |||
| Net realized gain (loss) | 55,252 | 570,100 | (146,195) | 184,068 | |||
| Distributions of capital gains received from investment company affiliates | — | — | — | — | |||
| Change in net unrealized appreciation/depreciation | (3,599,579) | 749,583 | (502,641) | 221,738 | |||
| Change in net assets resulting from operations | (3,540,361) | 1,319,023 | (608,240) | 476,448 | |||
| DISTRIBUTIONS TO SHAREHOLDERS: | |||||||
| Class A | (22,535) | — | — | — | |||
| Class C | (2,610) | — | — | — | |||
| Class I | (162,208) | (4,875) | (231) | (1) | |||
| Class L | (91,277) | (3,336) | — | — | |||
| Class R2 | (19) | — | — | — | |||
| Class R3 | (504) | — | — | — | |||
| Class R4 | (135) | (1) | — | — | |||
| Class R5 | (704) | (80) | — | — | |||
| Class R6 | (206,914) | (10,851) | (199,236) | (50,836) | |||
| Total distributions to shareholders | (486,906) | (19,143) | (199,467) | (50,837) | |||
| CAPITAL TRANSACTIONS: | |||||||
| Change in net assets resulting from capital transactions | (130,289) | 1,315,679 | (39,589) | 527,435 | |||
| NET ASSETS: | |||||||
| Change in net assets | (4,157,556) | 2,615,559 | (847,296) | 953,046 | |||
| Beginning of period | 13,835,784 | 11,220,225 | 3,793,388 | 2,840,342 | |||
| End of period | $ 9,678,228 | $13,835,784 | $2,946,092 | $3,793,388 | |||
| 72 | J.P. Morgan International Equity Funds | April 30, 2022 |
| JPMorgan Europe Dynamic Fund | JPMorgan International Equity Fund | ||||||
| Six Months Ended April 30, 2022 (Unaudited) | Year Ended October 31, 2021 | Six Months Ended April 30, 2022 (Unaudited) | Year Ended October 31, 2021 | ||||
| CHANGE IN NET ASSETS RESULTING FROM OPERATIONS: | |||||||
| Net investment income (loss) | $ 8,806 | $ 12,685 | $ 46,358 | $ 80,677 | |||
| Net realized gain (loss) | (51,887) | 65,264 | (37,280) | 332,125 | |||
| Change in net unrealized appreciation/depreciation | (114,623) | 119,032 | (885,379) | 630,933 | |||
| Change in net assets resulting from operations | (157,704) | 196,981 | (876,301) | 1,043,735 | |||
| DISTRIBUTIONS TO SHAREHOLDERS: | |||||||
| Class A | (1,773) | (839) | (27,845) | (3,040) | |||
| Class C | (188) | (80) | (669) | (42) | |||
| Class I | (9,923) | (772) | (38,399) | (4,786) | |||
| Class L | (2,043) | (920) | — | — | |||
| Class R2 | — | — | (1,477) | (292) | |||
| Class R5 | — | — | (678) | (99) | |||
| Class R6 | (11,157) | (4,405) | (256,785) | (33,732) | |||
| Total distributions to shareholders | (25,084) | (7,016) | (325,853) | (41,991) | |||
| CAPITAL TRANSACTIONS: | |||||||
| Change in net assets resulting from capital transactions | (285,188) | 445,725 | 839,823 | 913,051 | |||
| NET ASSETS: | |||||||
| Change in net assets | (467,976) | 635,690 | (362,331) | 1,914,795 | |||
| Beginning of period | 1,074,518 | 438,828 | 4,845,717 | 2,930,922 | |||
| End of period | $ 606,542 | $1,074,518 | $4,483,386 | $4,845,717 | |||
| April 30, 2022 | J.P. Morgan International Equity Funds | 73 |
| International Focus Fund | JPMorgan International Hedged Equity Fund | ||||||
| Six Months Ended April 30, 2022 (Unaudited) | Year Ended October 31, 2021 | Six Months Ended April 30, 2022 (Unaudited) | Year Ended October 31, 2021 | ||||
| CHANGE IN NET ASSETS RESULTING FROM OPERATIONS: | |||||||
| Net investment income (loss) | $ 26,300 | $ 58,536 | $ 1,930 | $ 2,600 | |||
| Net realized gain (loss) | 224,574 | 75,956 | (336) | (5,465) | |||
| Change in net unrealized appreciation/depreciation | (803,399) | 610,179 | (19,845) | 26,744 | |||
| Change in net assets resulting from operations | (552,525) | 744,671 | (18,251) | 23,879 | |||
| DISTRIBUTIONS TO SHAREHOLDERS: | |||||||
| Class A | (5,362) | (1,160) | (77) | (29) | |||
| Class C | (261) | (42) | (6) | (1) | |||
| Class I | (14,693) | (4,486) | (4,049) | (2,175) | |||
| Class R2 | (21) | (9) | — | — | |||
| Class R5 | (56) | (32) | (1) | (1) | |||
| Class R6 | (50,762) | (28,297) | (4) | (1) | |||
| Total distributions to shareholders | (71,155) | (34,026) | (4,137) | (2,207) | |||
| CAPITAL TRANSACTIONS: | |||||||
| Change in net assets resulting from capital transactions | (1,889,661) | 407,973 | 40,835 | (6,164) | |||
| NET ASSETS: | |||||||
| Change in net assets | (2,513,341) | 1,118,618 | 18,447 | 15,508 | |||
| Beginning of period | 3,920,288 | 2,801,670 | 152,776 | 137,268 | |||
| End of period | $ 1,406,947 | $3,920,288 | $171,223 | $152,776 | |||
| 74 | J.P. Morgan International Equity Funds | April 30, 2022 |
| JPMorgan International Research Enhanced Equity Fund | JPMorgan International Value Fund | ||||||
| Six Months Ended April 30, 2022 (Unaudited) | Year Ended October 31, 2021 | Six Months Ended April 30, 2022 (Unaudited) | Year Ended October 31, 2021 | ||||
| CHANGE IN NET ASSETS RESULTING FROM OPERATIONS: | |||||||
| Net investment income (loss) | $ 67,471 | $ 126,966 | $ 7,479 | $ 13,022 | |||
| Net realized gain (loss) | 37,022 | 283,157 | (335) | 4,345 | |||
| Change in net unrealized appreciation/depreciation | (746,952) | 1,196,412 | (40,640) | 104,838 | |||
| Change in net assets resulting from operations | (642,459) | 1,606,535 | (33,496) | 122,205 | |||
| DISTRIBUTIONS TO SHAREHOLDERS: | |||||||
| Class A | (1,695) | (402) | (8,496) | (4,156) | |||
| Class C | — | — | (136) | (106) | |||
| Class I | (15,314) | (10,216) | (1,804) | (914) | |||
| Class L | — | — | (331) | (192) | |||
| Class R2 | — | — | (22) | (11) | |||
| Class R5 | — | — | (2) | (3) | |||
| Class R6 | (182,288) | (95,880) | (7,825) | (3,877) | |||
| Total distributions to shareholders | (199,297) | (106,498) | (18,616) | (9,259) | |||
| CAPITAL TRANSACTIONS: | |||||||
| Change in net assets resulting from capital transactions | 1,368,954 | (1,366,544) | 43,113 | 15,889 | |||
| NET ASSETS: | |||||||
| Change in net assets | 527,198 | 133,493 | (8,999) | 128,835 | |||
| Beginning of period | 4,995,842 | 4,862,349 | 396,699 | 267,864 | |||
| End of period | $5,523,040 | $ 4,995,842 | $387,700 | $396,699 | |||
| April 30, 2022 | J.P. Morgan International Equity Funds | 75 |
| JPMorgan Emerging Markets Equity Fund | JPMorgan Emerging Markets Research Enhanced Equity Fund | ||||||
| Six Months Ended April 30, 2022 (Unaudited) | Year Ended October 31, 2021 | Six Months Ended April 30, 2022 (Unaudited) | Year Ended October 31, 2021 | ||||
| CAPITAL TRANSACTIONS: | |||||||
| Class A | |||||||
| Proceeds from shares issued | $ 72,542 | $ 254,285 | $ — | $ — | |||
| Distributions reinvested | 21,957 | — | — | — | |||
| Cost of shares redeemed | (124,291) | (192,488) | — | — | |||
| Change in net assets resulting from Class A capital transactions | (29,792) | 61,797 | — | — | |||
| Class C | |||||||
| Proceeds from shares issued | 1,419 | 21,002 | — | — | |||
| Distributions reinvested | 2,464 | — | — | — | |||
| Cost of shares redeemed | (12,578) | (18,983) | — | — | |||
| Change in net assets resulting from Class C capital transactions | (8,695) | 2,019 | — | — | |||
| Class I | |||||||
| Proceeds from shares issued | 737,549 | 2,529,253 | 289,005 | 6,294 | |||
| Distributions reinvested | 152,054 | 4,534 | 232 | 1 | |||
| Cost of shares redeemed | (1,413,676) | (2,287,926) | (28,388) | (466) | |||
| Change in net assets resulting from Class I capital transactions | (524,073) | 245,861 | 260,849 | 5,829 | |||
| Class L | |||||||
| Proceeds from shares issued | 375,238 | 1,202,345 | — | — | |||
| Distributions reinvested | 90,633 | 3,299 | — | — | |||
| Cost of shares redeemed | (510,665) | (693,103) | — | — | |||
| Change in net assets resulting from Class L capital transactions | (44,794) | 512,541 | — | — | |||
| Class R2 | |||||||
| Proceeds from shares issued | 80 | 415 | — | — | |||
| Distributions reinvested | 19 | — | — | — | |||
| Cost of shares redeemed | (36) | (288) | — | — | |||
| Change in net assets resulting from Class R2 capital transactions | 63 | 127 | — | — | |||
| Class R3 | |||||||
| Proceeds from shares issued | 3,296 | 13,765 | — | — | |||
| Distributions reinvested | 227 | — | — | — | |||
| Cost of shares redeemed | (1,233) | (5,183) | — | — | |||
| Change in net assets resulting from Class R3 capital transactions | 2,290 | 8,582 | — | — | |||
| Class R4 | |||||||
| Proceeds from shares issued | 574 | 2,383 | — | — | |||
| Distributions reinvested | 135 | 1 | — | — | |||
| Cost of shares redeemed | (464) | (1,833) | — | — | |||
| Change in net assets resulting from Class R4 capital transactions | 245 | 551 | — | — | |||
| 76 | J.P. Morgan International Equity Funds | April 30, 2022 |
| JPMorgan Emerging Markets Equity Fund | JPMorgan Emerging Markets Research Enhanced Equity Fund | ||||||
| Six Months Ended April 30, 2022 (Unaudited) | Year Ended October 31, 2021 | Six Months Ended April 30, 2022 (Unaudited) | Year Ended October 31, 2021 | ||||
| CAPITAL TRANSACTIONS: (continued) | |||||||
| Class R5 | |||||||
| Proceeds from shares issued | $ 2,496 | $ 18,329 | $ — | $ — | |||
| Distributions reinvested | 651 | 79 | — | — | |||
| Cost of shares redeemed | (2,589) | (63,474) | — | — | |||
| Change in net assets resulting from Class R5 capital transactions | 558 | (45,066) | — | — | |||
| Class R6 | |||||||
| Proceeds from shares issued | 1,170,304 | 2,782,507 | 626,445 | 1,383,412 | |||
| Distributions reinvested | 189,279 | 9,925 | 199,236 | 50,835 | |||
| Cost of shares redeemed | (885,674) | (2,263,165) | (1,126,119) | (912,641) | |||
| Change in net assets resulting from Class R6 capital transactions | 473,909 | 529,267 | (300,438) | 521,606 | |||
| Total change in net assets resulting from capital transactions | $ (130,289) | $ 1,315,679 | $ (39,589) | $ 527,435 | |||
| SHARE TRANSACTIONS: | |||||||
| Class A | |||||||
| Issued | 2,151 | 6,043 | — | — | |||
| Reinvested | 591 | — | — | — | |||
| Redeemed | (3,559) | (4,582) | — | — | |||
| Change in Class A Shares | (817) | 1,461 | — | — | |||
| Class C | |||||||
| Issued | 44 | 523 | — | — | |||
| Reinvested | 69 | — | — | — | |||
| Redeemed | (380) | (464) | — | — | |||
| Change in Class C Shares | (267) | 59 | — | — | |||
| Class I | |||||||
| Issued | 20,934 | 58,966 | 15,500 | 281 | |||
| Reinvested | 3,999 | 106 | 12 | — | |||
| Redeemed | (41,117) | (52,366) | (1,565) | (22) | |||
| Change in Class I Shares | (16,184) | 6,706 | 13,947 | 259 | |||
| Class L | |||||||
| Issued | 10,537 | 27,731 | — | — | |||
| Reinvested | 2,366 | 77 | — | — | |||
| Redeemed | (14,334) | (15,762) | — | — | |||
| Change in Class L Shares | (1,431) | 12,046 | — | — | |||
| Class R2 | |||||||
| Issued | 2 | 10 | — | — | |||
| Reinvested | 1 | ��� | — | — | |||
| Redeemed | (1) | (7) | — | — | |||
| Change in Class R2 Shares | 2 | 3 | — | — | |||
| April 30, 2022 | J.P. Morgan International Equity Funds | 77 |
| JPMorgan Emerging Markets Equity Fund | JPMorgan Emerging Markets Research Enhanced Equity Fund | ||||||
| Six Months Ended April 30, 2022 (Unaudited) | Year Ended October 31, 2021 | Six Months Ended April 30, 2022 (Unaudited) | Year Ended October 31, 2021 | ||||
| SHARE TRANSACTIONS: (continued) | |||||||
| Class R3 | |||||||
| Issued | 98 | 334 | — | — | |||
| Reinvested | 6 | — | — | — | |||
| Redeemed | (35) | (124) | — | — | |||
| Change in Class R3 Shares | 69 | 210 | — | — | |||
| Class R4 | |||||||
| Issued | 16 | 54 | — | — | |||
| Reinvested | 4 | — | — | — | |||
| Redeemed | (13) | (42) | — | — | |||
| Change in Class R4 Shares | 7 | 12 | — | — | |||
| Class R5 | |||||||
| Issued | 70 | 416 | — | — | |||
| Reinvested | 17 | 2 | — | — | |||
| Redeemed | (73) | (1,466) | — | — | |||
| Change in Class R5 Shares | 14 | (1,048) | — | — | |||
| Class R6 | |||||||
| Issued | 34,215 | 63,838 | 35,237 | 64,804 | |||
| Reinvested | 4,950 | 232 | 10,435 | 2,474 | |||
| Redeemed | (25,924) | (51,699) | (64,205) | (42,567) | |||
| Change in Class R6 Shares | 13,241 | 12,371 | (18,533) | 24,711 | |||
| 78 | J.P. Morgan International Equity Funds | April 30, 2022 |
| JPMorgan Europe Dynamic Fund | JPMorgan International Equity Fund | ||||||
| Six Months Ended April 30, 2022 (Unaudited) | Year Ended October 31, 2021 | Six Months Ended April 30, 2022 (Unaudited) | Year Ended October 31, 2021 | ||||
| CAPITAL TRANSACTIONS: | |||||||
| Class A | |||||||
| Proceeds from shares issued | $ 3,798 | $ 6,061 | $ 45,611 | $ 128,373 | |||
| Distributions reinvested | 1,698 | 805 | 27,642 | 3,017 | |||
| Cost of shares redeemed | (6,159) | (15,952) | (37,996) | (50,637) | |||
| Change in net assets resulting from Class A capital transactions | (663) | (9,086) | 35,257 | 80,753 | |||
| Class C | |||||||
| Proceeds from shares issued | 65 | 543 | 817 | 2,112 | |||
| Distributions reinvested | 183 | 79 | 669 | 42 | |||
| Cost of shares redeemed | (2,942) | (4,769) | (1,587) | (3,467) | |||
| Change in net assets resulting from Class C capital transactions | (2,694) | (4,147) | (101) | (1,313) | |||
| Class I | |||||||
| Proceeds from shares issued | 51,229 | 412,233 | 265,574 | 217,953 | |||
| Distributions reinvested | 9,021 | 721 | 38,299 | 4,774 | |||
| Cost of shares redeemed | (358,634) | (48,189) | (110,519) | (91,184) | |||
| Change in net assets resulting from Class I capital transactions | (298,384) | 364,765 | 193,354 | 131,543 | |||
| Class L | |||||||
| Proceeds from shares issued | 7,945 | 11,606 | — | — | |||
| Distributions reinvested | 2,037 | 917 | — | — | |||
| Cost of shares redeemed | (5,871) | (6,155) | — | — | |||
| Change in net assets resulting from Class L capital transactions | 4,111 | 6,368 | — | — | |||
| Class R2 | |||||||
| Proceeds from shares issued | — | — | 3,053 | 5,946 | |||
| Distributions reinvested | — | — | 1,474 | 289 | |||
| Cost of shares redeemed | — | — | (2,833) | (9,508) | |||
| Change in net assets resulting from Class R2 capital transactions | — | — | 1,694 | (3,273) | |||
| Class R5 | |||||||
| Proceeds from shares issued | — | — | 1,886 | 4,537 | |||
| Distributions reinvested | — | — | 650 | 95 | |||
| Cost of shares redeemed | — | — | (1,596) | (3,471) | |||
| Change in net assets resulting from Class R5 capital transactions | — | — | 940 | 1,161 | |||
| Class R6 | |||||||
| Proceeds from shares issued | 38,473 | 135,760 | 1,034,724 | 1,637,397 | |||
| Distributions reinvested | 10,393 | 4,405 | 256,061 | 33,605 | |||
| Cost of shares redeemed | (36,424) | (52,340) | (682,106) | (966,822) | |||
| Change in net assets resulting from Class R6 capital transactions | 12,442 | 87,825 | 608,679 | 704,180 | |||
| Total change in net assets resulting from capital transactions | $(285,188) | $445,725 | $ 839,823 | $ 913,051 | |||
| April 30, 2022 | J.P. Morgan International Equity Funds | 79 |
| JPMorgan Europe Dynamic Fund | JPMorgan International Equity Fund | ||||||
| Six Months Ended April 30, 2022 (Unaudited) | Year Ended October 31, 2021 | Six Months Ended April 30, 2022 (Unaudited) | Year Ended October 31, 2021 | ||||
| SHARE TRANSACTIONS: | |||||||
| Class A | |||||||
| Issued | 131 | 204 | 2,323 | 6,338 | |||
| Reinvested | 58 | 31 | 1,370 | 155 | |||
| Redeemed | (215) | (561) | (1,993) | (2,491) | |||
| Change in Class A Shares | (26) | (326) | 1,700 | 4,002 | |||
| Class C | |||||||
| Issued | 2 | 21 | 44 | 108 | |||
| Reinvested | 7 | 3 | 35 | 2 | |||
| Redeemed | (118) | (189) | (87) | (179) | |||
| Change in Class C Shares | (109) | (165) | (8) | (69) | |||
| Class I | |||||||
| Issued | 1,685 | 13,177 | 13,925 | 10,466 | |||
| Reinvested | 301 | 27 | 1,865 | 242 | |||
| Redeemed | (13,380) | (1,563) | (5,912) | (4,423) | |||
| Change in Class I Shares | (11,394) | 11,641 | 9,878 | 6,285 | |||
| Class L | |||||||
| Issued | 264 | 384 | — | — | |||
| Reinvested | 67 | 34 | — | — | |||
| Redeemed | (198) | (212) | — | — | |||
| Change in Class L Shares | 133 | 206 | — | — | |||
| Class R2 | |||||||
| Issued | — | — | 164 | 296 | |||
| Reinvested | — | — | 74 | 15 | |||
| Redeemed | — | — | (148) | (468) | |||
| Change in Class R2 Shares | — | — | 90 | (157) | |||
| Class R5 | |||||||
| Issued | — | — | 101 | 219 | |||
| Reinvested | — | — | 31 | 5 | |||
| Redeemed | — | — | (78) | (165) | |||
| Change in Class R5 Shares | — | — | 54 | 59 | |||
| Class R6 | |||||||
| Issued | 1,288 | 4,263 | 55,539 | 79,648 | |||
| Reinvested | 344 | 163 | 12,433 | 1,702 | |||
| Redeemed | (1,348) | (1,668) | (37,798) | (46,388) | |||
| Change in Class R6 Shares | 284 | 2,758 | 30,174 | 34,962 | |||
| 80 | J.P. Morgan International Equity Funds | April 30, 2022 |
| International Focus Fund | JPMorgan International Hedged Equity Fund | ||||||
| Six Months Ended April 30, 2022 (Unaudited) | Year Ended October 31, 2021 | Six Months Ended April 30, 2022 (Unaudited) | Year Ended October 31, 2021 | ||||
| CAPITAL TRANSACTIONS: | |||||||
| Class A | |||||||
| Proceeds from shares issued | $ 55,948 | $ 195,801 | $ 3,689 | $ 3,079 | |||
| Distributions reinvested | 5,307 | 1,132 | 77 | 29 | |||
| Cost of shares redeemed | (67,045) | (32,379) | (1,511) | (1,473) | |||
| Change in net assets resulting from Class A capital transactions | (5,790) | 164,554 | 2,255 | 1,635 | |||
| Class C | |||||||
| Proceeds from shares issued | 1,461 | 8,415 | 131 | 184 | |||
| Distributions reinvested | 260 | 42 | 6 | 1 | |||
| Cost of shares redeemed | (3,033) | (3,542) | (132) | (7) | |||
| Change in net assets resulting from Class C capital transactions | (1,312) | 4,915 | 5 | 178 | |||
| Class I | |||||||
| Proceeds from shares issued | 190,812 | 534,780 | 89,078 | 57,032 | |||
| Distributions reinvested | 14,119 | 4,249 | 3,842 | 2,032 | |||
| Cost of shares redeemed | (224,640) | (182,797) | (54,423) | (67,180) | |||
| Change in net assets resulting from Class I capital transactions | (19,709) | 356,232 | 38,497 | (8,116) | |||
| Class R2 | |||||||
| Proceeds from shares issued | 417 | 947 | — | — | |||
| Distributions reinvested | 21 | 9 | — | — | |||
| Cost of shares redeemed | (363) | (716) | — | — | |||
| Change in net assets resulting from Class R2 capital transactions | 75 | 240 | — | — | |||
| Class R5 | |||||||
| Proceeds from shares issued | 217 | 424 | — | — | |||
| Distributions reinvested | 56 | 32 | 1 | — | |||
| Cost of shares redeemed | (691) | (749) | — | — | |||
| Change in net assets resulting from Class R5 capital transactions | (418) | (293) | 1 | — | |||
| Class R6 | |||||||
| Proceeds from shares issued | 85,526 | 452,976 | 112 | 151 | |||
| Distributions reinvested | 50,271 | 28,297 | 5 | 1 | |||
| Cost of shares redeemed | (566,706) | (598,948) | (40) | (13) | |||
| Redemptions in-kind | (1,431,598) | — | — | — | |||
| Change in net assets resulting from Class R6 capital transactions | (1,862,507) | (117,675) | 77 | 139 | |||
| Total change in net assets resulting from capital transactions | $(1,889,661) | $ 407,973 | $ 40,835 | $ (6,164) | |||
| SHARE TRANSACTIONS: | |||||||
| Class A | |||||||
| Issued | 2,189 | 7,283 | 232 | 192 | |||
| Reinvested | 205 | 45 | 5 | 2 | |||
| Redeemed | (2,748) | (1,217) | (96) | (92) | |||
| Change in Class A Shares | (354) | 6,111 | 141 | 102 | |||
| April 30, 2022 | J.P. Morgan International Equity Funds | 81 |
| International Focus Fund | JPMorgan International Hedged Equity Fund | ||||||
| Six Months Ended April 30, 2022 (Unaudited) | Year Ended October 31, 2021 | Six Months Ended April 30, 2022 (Unaudited) | Year Ended October 31, 2021 | ||||
| SHARE TRANSACTIONS: (continued) | |||||||
| Class C | |||||||
| Issued | 57 | 316 | 8 | 11 | |||
| Reinvested | 10 | 2 | — | — | |||
| Redeemed | (122) | (134) | (8) | — | |||
| Change in Class C Shares | (55) | 184 | — | 11 | |||
| Class I | |||||||
| Issued | 7,441 | 19,663 | 5,596 | 3,560 | |||
| Reinvested | 538 | 165 | 241 | 135 | |||
| Redeemed | (9,166) | (6,676) | (3,457) | (4,418) | |||
| Change in Class I Shares | (1,187) | 13,152 | 2,380 | (723) | |||
| Class R2 | |||||||
| Issued | 17 | 36 | — | — | |||
| Reinvested | 1 | — | — | — | |||
| Redeemed | (14) | (26) | — | — | |||
| Change in Class R2 Shares | 4 | 10 | — | — | |||
| Class R5 | |||||||
| Issued | 8 | 15 | — | — | |||
| Reinvested | 2 | 1 | — | — | |||
| Redeemed | (27) | (27) | — | — | |||
| Change in Class R5 Shares | (17) | (11) | — | — | |||
| Class R6 | |||||||
| Issued | 3,340 | 16,687 | 7 | 9 | |||
| Reinvested | 1,917 | 1,099 | — | — | |||
| Redeemed | (21,797) | (22,086) | (2) | (1) | |||
| Redemptions in-kind | (60,558) | — | — | — | |||
| Change in Class R6 Shares | (77,098) | (4,300) | 5 | 8 | |||
| 82 | J.P. Morgan International Equity Funds | April 30, 2022 |
| JPMorgan International Research Enhanced Equity Fund | JPMorgan International Value Fund | ||||||
| Six Months Ended April 30, 2022 (Unaudited) | Year Ended October 31, 2021 | Six Months Ended April 30, 2022 (Unaudited) | Year Ended October 31, 2021 | ||||
| CAPITAL TRANSACTIONS: | |||||||
| Class A | |||||||
| Proceeds from shares issued | $ 712 | $ 1,989 | $ 21,599 | $ 39,262 | |||
| Distributions reinvested | 1,642 | 389 | 8,400 | 4,095 | |||
| Cost of shares redeemed | (4,775) | (22,274) | (16,228) | (34,717) | |||
| Change in net assets resulting from Class A capital transactions | (2,421) | (19,896) | 13,771 | 8,640 | |||
| Class C | |||||||
| Proceeds from shares issued | — | — | 127 | 165 | |||
| Distributions reinvested | — | — | 135 | 104 | |||
| Cost of shares redeemed | — | — | (1,309) | (2,175) | |||
| Change in net assets resulting from Class C capital transactions | — | — | (1,047) | (1,906) | |||
| Class I | |||||||
| Proceeds from shares issued | 75,161 | 105,581 | 7,674 | 12,348 | |||
| Distributions reinvested | 15,288 | 10,212 | 1,784 | 829 | |||
| Cost of shares redeemed | (103,229) | (342,012) | (5,847) | (11,848) | |||
| Change in net assets resulting from Class I capital transactions | (12,780) | (226,219) | 3,611 | 1,329 | |||
| Class L | |||||||
| Proceeds from shares issued | — | — | 349 | 2,881 | |||
| Distributions reinvested | — | — | 310 | 179 | |||
| Cost of shares redeemed | — | — | (554) | (3,956) | |||
| Change in net assets resulting from Class L capital transactions | — | — | 105 | (896) | |||
| Class R2 | |||||||
| Proceeds from shares issued | — | — | 32 | 175 | |||
| Distributions reinvested | — | — | 22 | 11 | |||
| Cost of shares redeemed | — | — | (2) | (252) | |||
| Change in net assets resulting from Class R2 capital transactions | — | — | 52 | (66) | |||
| Class R5 | |||||||
| Proceeds from shares issued | — | — | 24 | 21 | |||
| Distributions reinvested | — | — | 2 | 3 | |||
| Cost of shares redeemed | — | — | (52) | (64) | |||
| Change in net assets resulting from Class R5 capital transactions | — | — | (26) | (40) | |||
| Class R6 | |||||||
| Proceeds from shares issued | 1,424,432 | 359,932 | 37,644 | 52,793 | |||
| Distributions reinvested | 181,166 | 95,880 | 7,790 | 3,621 | |||
| Cost of shares redeemed | (221,443) | (1,576,241) | (18,787) | (47,586) | |||
| Change in net assets resulting from Class R6 capital transactions | 1,384,155 | (1,120,429) | 26,647 | 8,828 | |||
| Total change in net assets resulting from capital transactions | $1,368,954 | $(1,366,544) | $ 43,113 | $ 15,889 | |||
| April 30, 2022 | J.P. Morgan International Equity Funds | 83 |
| JPMorgan International Research Enhanced Equity Fund | JPMorgan International Value Fund | ||||||
| Six Months Ended April 30, 2022 (Unaudited) | Year Ended October 31, 2021 | Six Months Ended April 30, 2022 (Unaudited) | Year Ended October 31, 2021 | ||||
| SHARE TRANSACTIONS: | |||||||
| Class A | |||||||
| Issued | 36 | 100 | 1,690 | 3,054 | |||
| Reinvested | 83 | 21 | 685 | 356 | |||
| Redeemed | (238) | (1,211) | (1,270) | (2,757) | |||
| Change in Class A Shares | (119) | (1,090) | 1,105 | 653 | |||
| Class C | |||||||
| Issued | — | — | 10 | 12 | |||
| Reinvested | — | — | 11 | 10 | |||
| Redeemed | — | — | (105) | (181) | |||
| Change in Class C Shares | — | — | (84) | (159) | |||
| Class I | |||||||
| Issued | 3,788 | 5,301 | 582 | 923 | |||
| Reinvested | 765 | 540 | 141 | 70 | |||
| Redeemed | (5,228) | (17,195) | (449) | (921) | |||
| Change in Class I Shares | (675) | (11,354) | 274 | 72 | |||
| Class L | |||||||
| Issued | — | — | 28 | 219 | |||
| Reinvested | — | — | 25 | 15 | |||
| Redeemed | — | — | (43) | (301) | |||
| Change in Class L Shares | — | — | 10 | (67) | |||
| Class R2 | |||||||
| Issued | — | — | 3 | 14 | |||
| Reinvested | — | — | 2 | 1 | |||
| Redeemed | — | — | (—)(a) | (20) | |||
| Change in Class R2 Shares | — | — | 5 | (5) | |||
| Class R5 | |||||||
| Issued | — | — | 2 | 2 | |||
| Redeemed | — | — | (4) | (5) | |||
| Change in Class R5 Shares | — | — | (2) | (3) | |||
| Class R6 | |||||||
| Issued | 76,037 | 17,749 | 2,914 | 4,060 | |||
| Reinvested | 9,108 | 5,089 | 626 | 310 | |||
| Redeemed | (10,933) | (80,049) | (1,451) | (3,744) | |||
| Change in Class R6 Shares | 74,212 | (57,211) | 2,089 | 626 | |||
| (a) | Amount rounds to less than one thousand. |
| 84 | J.P. Morgan International Equity Funds | April 30, 2022 |
| Per share operating performance | ||||||||
| Investment operations | Distributions | |||||||
| Net asset value, beginning of period | Net investment income (loss)(b) | Net realized and unrealized gains (losses) on investments | Total from investment operations | Net investment income | Net realized gain | Total distributions | ||
| JPMorgan Emerging Markets Equity Fund | ||||||||
| Class A | ||||||||
| Six Months Ended April 30, 2022(Unaudited) | $40.54 | $(0.04) | $(10.32) | $(10.36) | $(0.07) | $(1.26) | $(1.33) | |
| Year Ended October 31, 2021 | 36.44 | (0.14) | 4.24 | 4.10 | — | — | — | |
| Year Ended October 31, 2020 | 30.07 | (0.02) | 6.56 | 6.54 | (0.17) | — | (0.17) | |
| Year Ended October 31, 2019 | 23.84 | 0.19 | 6.16 | 6.35 | (0.12) | — | (0.12) | |
| Year Ended October 31, 2018 | 27.58 | 0.14 | (3.84) | (3.70) | (0.04) | — | (0.04) | |
| Year Ended October 31, 2017 | 21.79 | 0.09 | 5.80 | 5.89 | (0.10) | — | (0.10) | |
| Class C | ||||||||
| Six Months Ended April 30, 2022(Unaudited) | 38.96 | (0.13) | (9.90) | (10.03) | — | (1.26) | (1.26) | |
| Year Ended October 31, 2021 | 35.20 | (0.34) | 4.10 | 3.76 | — | — | — | |
| Year Ended October 31, 2020 | 29.07 | (0.18) | 6.35 | 6.17 | (0.04) | — | (0.04) | |
| Year Ended October 31, 2019 | 23.08 | 0.04 | 5.98 | 6.02 | (0.03) | — | (0.03) | |
| Year Ended October 31, 2018 | 26.80 | 0.02 | (3.74) | (3.72) | —(g) | — | — | |
| Year Ended October 31, 2017 | 21.18 | (0.04) | 5.67 | 5.63 | (0.01) | — | (0.01) | |
| Class I | ||||||||
| Six Months Ended April 30, 2022(Unaudited) | 41.60 | (0.01) | (10.58) | (10.59) | (0.17) | (1.26) | (1.43) | |
| Year Ended October 31, 2021 | 37.34 | (0.04) | 4.34 | 4.30 | (0.04) | — | (0.04) | |
| Year Ended October 31, 2020 | 30.79 | 0.05 | 6.75 | 6.80 | (0.25) | — | (0.25) | |
| Year Ended October 31, 2019 | 24.45 | 0.27 | 6.29 | 6.56 | (0.22) | — | (0.22) | |
| Year Ended October 31, 2018 | 28.29 | 0.24 | (3.96) | (3.72) | (0.12) | — | (0.12) | |
| Year Ended October 31, 2017 | 22.33 | 0.16 | 5.94 | 6.10 | (0.14) | — | (0.14) | |
| Class L | ||||||||
| Six Months Ended April 30, 2022(Unaudited) | 41.96 | 0.02 | (10.68) | (10.66) | (0.22) | (1.26) | (1.48) | |
| Year Ended October 31, 2021 | 37.64 | 0.01 | 4.37 | 4.38 | (0.06) | — | (0.06) | |
| Year Ended October 31, 2020 | 31.03 | 0.08 | 6.80 | 6.88 | (0.27) | — | (0.27) | |
| Year Ended October 31, 2019 | 24.63 | 0.29 | 6.35 | 6.64 | (0.24) | — | (0.24) | |
| Year Ended October 31, 2018 | 28.49 | 0.26 | (3.99) | (3.73) | (0.13) | — | (0.13) | |
| Year Ended October 31, 2017 | 22.49 | 0.21 | 5.96 | 6.17 | (0.17) | — | (0.17) | |
| Class R2 | ||||||||
| Six Months Ended April 30, 2022(Unaudited) | 39.99 | (0.09) | (10.19) | (10.28) | — | (1.26) | (1.26) | |
| Year Ended October 31, 2021 | 36.06 | (0.26) | 4.19 | 3.93 | — | — | — | |
| Year Ended October 31, 2020 | 29.78 | (0.13) | 6.52 | 6.39 | (0.11) | — | (0.11) | |
| Year Ended October 31, 2019 | 23.73 | 0.08 | 6.13 | 6.21 | (0.16) | — | (0.16) | |
| Year Ended October 31, 2018 | 27.57 | 0.07 | (3.83) | (3.76) | (0.08) | — | (0.08) | |
| July 31, 2017(h) through October 31, 2017 | 26.40 | (0.01) | 1.18 | 1.17 | — | — | — | |
| Class R3 | ||||||||
| Six Months Ended April 30, 2022(Unaudited) | 40.30 | (0.05) | (10.24) | (10.29) | (0.11) | (1.26) | (1.37) | |
| Year Ended October 31, 2021 | 36.25 | (0.15) | 4.20 | 4.05 | — | — | — | |
| Year Ended October 31, 2020 | 29.96 | (0.05) | 6.55 | 6.50 | (0.21) | — | (0.21) | |
| Year Ended October 31, 2019 | 23.78 | 0.25 | 6.06 | 6.31 | (0.13) | — | (0.13) | |
| Year Ended October 31, 2018 | 27.59 | 0.22 | (3.92) | (3.70) | (0.11) | — | (0.11) | |
| July 31, 2017(h) through October 31, 2017 | 26.40 | 0.01 | 1.18 | 1.19 | — | — | — | |
| 86 | J.P. Morgan International Equity Funds | April 30, 2022 |
| Ratios/Supplemental data | |||||||
| Ratios to average net assets(a) | |||||||
| Net asset value, end of period | Total return (excludes sales charge)(c)(d) | Net assets, end of period (000's) | Net expenses(e) | Net investment income (loss) | Expenses without waivers and reimbursements | Portfolio turnover rate(d) | |
| $28.85 | (26.28)% | $ 476,166 | 1.24(f)% | (0.26)(f)% | 1.31(f)% | 11% | |
| 40.54 | 11.25 | 702,288 | 1.24 | (0.33) | 1.30 | 25 | |
| 36.44 | 21.84 | 578,112 | 1.24 | (0.06) | 1.33 | 15 | |
| 30.07 | 26.77 | 524,357 | 1.24 | 0.69 | 1.47 | 34 | |
| 23.84 | (13.44) | 369,490 | 1.24 | 0.51 | 1.52 | 13 | |
| 27.58 | 27.22 | 525,451 | 1.35 | 0.36 | 1.58 | 22 | |
| 27.67 | (26.47) | 51,142 | 1.74(f) | (0.78)(f) | 1.81(f) | 11 | |
| 38.96 | 10.68 | 82,409 | 1.74 | (0.83) | 1.80 | 25 | |
| 35.20 | 21.24 | 72,364 | 1.74 | (0.58) | 1.83 | 15 | |
| 29.07 | 26.12 | 56,830 | 1.74 | 0.15 | 1.98 | 34 | |
| 23.08 | (13.87) | 43,612 | 1.74 | 0.06 | 2.02 | 13 | |
| 26.80 | 26.58 | 48,497 | 1.85 | (0.15) | 2.09 | 22 | |
| 29.58 | (26.20) | 2,901,502 | 0.99(f) | (0.04)(f) | 1.05(f) | 11 | |
| 41.60 | 11.51 | 4,753,438 | 0.99 | (0.09) | 1.05 | 25 | |
| 37.34 | 22.19 | 4,016,180 | 0.99 | 0.15 | 1.07 | 15 | |
| 30.79 | 27.04 | 1,725,882 | 0.99 | 0.94 | 1.21 | 34 | |
| 24.45 | (13.23) | 773,142 | 0.99 | 0.84 | 1.26 | 13 | |
| 28.29 | 27.54 | 629,451 | 1.10 | 0.62 | 1.30 | 22 | |
| 29.82 | (26.17) | 1,804,078 | 0.89(f) | 0.09(f) | 0.90(f) | 11 | |
| 41.96 | 11.63 | 2,598,326 | 0.89 | 0.02 | 0.90 | 25 | |
| 37.64 | 22.29 | 1,877,489 | 0.89 | 0.25 | 0.92 | 15 | |
| 31.03 | 27.20 | 926,781 | 0.89 | 1.00 | 1.06 | 34 | |
| 24.63 | (13.16) | 475,997 | 0.89 | 0.91 | 1.11 | 13 | |
| 28.49 | 27.72 | 430,860 | 0.95 | 0.84 | 1.14 | 22 | |
| 28.45 | (26.41) | 465 | 1.54(f) | (0.54)(f) | 1.81(f) | 11 | |
| 39.99 | 10.90 | 585 | 1.54 | (0.63) | 1.78 | 25 | |
| 36.06 | 21.51 | 414 | 1.54 | (0.41) | 2.00 | 15 | |
| 29.78 | 26.35 | 145 | 1.54 | 0.31 | 2.26 | 34 | |
| 23.73 | (13.69) | 95 | 1.54 | 0.26 | 2.04 | 13 | |
| 27.57 | 4.43 | 21 | 1.60 | (0.17) | 1.80 | 22 | |
| 28.64 | (26.29) | 12,570 | 1.29(f) | (0.29)(f) | 1.31(f) | 11 | |
| 40.30 | 11.17 | 14,918 | 1.29 | (0.36) | 1.30 | 25 | |
| 36.25 | 21.80 | 5,797 | 1.29 | (0.15) | 1.33 | 15 | |
| 29.96 | 26.67 | 2,151 | 1.29 | 0.90 | 1.49 | 34 | |
| 23.78 | (13.49) | 341 | 1.29 | 0.81 | 1.59 | 13 | |
| 27.59 | 4.51 | 21 | 1.35 | 0.08 | 1.55 | 22 | |
| April 30, 2022 | J.P. Morgan International Equity Funds | 87 |
| Per share operating performance | ||||||||
| Investment operations | Distributions | |||||||
| Net asset value, beginning of period | Net investment income (loss)(b) | Net realized and unrealized gains (losses) on investments | Total from investment operations | Net investment income | Net realized gain | Total distributions | ||
| Class R4 | ||||||||
| Six Months Ended April 30, 2022(Unaudited) | $41.45 | $(0.01) | $(10.55) | $(10.56) | $(0.16) | $(1.26) | $(1.42) | |
| Year Ended October 31, 2021 | 37.20 | (0.05) | 4.32 | 4.27 | (0.02) | — | (0.02) | |
| Year Ended October 31, 2020 | 30.68 | 0.04 | 6.70 | 6.74 | (0.22) | — | (0.22) | |
| Year Ended October 31, 2019 | 24.42 | 0.27 | 6.25 | 6.52 | (0.26) | — | (0.26) | |
| Year Ended October 31, 2018 | 28.28 | 0.18 | (3.91) | (3.73) | (0.13) | — | (0.13) | |
| July 31, 2017(h) through October 31, 2017 | 27.05 | 0.02 | 1.21 | 1.23 | — | — | — | |
| Class R5 | ||||||||
| Six Months Ended April 30, 2022(Unaudited) | 41.88 | 0.02 | (10.67) | (10.65) | (0.15) | (1.26) | (1.41) | |
| Year Ended October 31, 2021 | 37.56 | 0.01 | 4.36 | 4.37 | (0.05) | — | (0.05) | |
| Year Ended October 31, 2020 | 30.96 | 0.08 | 6.78 | 6.86 | (0.26) | — | (0.26) | |
| Year Ended October 31, 2019 | 24.60 | 0.31 | 6.31 | 6.62 | (0.26) | — | (0.26) | |
| Year Ended October 31, 2018 | 28.47 | 0.39 | (4.11) | (3.72) | (0.15) | — | (0.15) | |
| Year Ended October 31, 2017 | 22.49 | 0.15 | 6.01 | 6.16 | (0.18) | — | (0.18) | |
| Class R6 | ||||||||
| Six Months Ended April 30, 2022(Unaudited) | 41.95 | 0.04 | (10.68) | (10.64) | (0.26) | (1.26) | (1.52) | |
| Year Ended October 31, 2021 | 37.61 | 0.05 | 4.37 | 4.42 | (0.08) | — | (0.08) | |
| Year Ended October 31, 2020 | 31.00 | 0.12 | 6.78 | 6.90 | (0.29) | — | (0.29) | |
| Year Ended October 31, 2019 | 24.60 | 0.31 | 6.35 | 6.66 | (0.26) | — | (0.26) | |
| Year Ended October 31, 2018 | 28.46 | 0.29 | (3.99) | (3.70) | (0.16) | — | (0.16) | |
| Year Ended October 31, 2017 | 22.46 | 0.21 | 5.98 | 6.19 | (0.19) | — | (0.19) | |
| (a) | Annualized for periods less than one year, unless otherwise noted. |
| (b) | Calculated based upon average shares outstanding. |
| (c) | Includes adjustments in accordance with accounting principles generally accepted in the United States of America and as such, the net asset values for financial reporting purposes and the returns based upon those net asset values may differ from the net asset values and returns for shareholder transactions. |
| (d) | Not annualized for periods less than one year. |
| (e) | Includes interest expense, if applicable, which is less than 0.005% unless otherwise noted. |
| (f) | Certain non-recurring expenses incurred by the Fund were not annualized for the period indicated. |
| (g) | Amount rounds to less than $0.005. |
| (h) | Commencement of offering of class of shares. |
| 88 | J.P. Morgan International Equity Funds | April 30, 2022 |
| Ratios/Supplemental data | |||||||
| Ratios to average net assets(a) | |||||||
| Net asset value, end of period | Total return (excludes sales charge)(c)(d) | Net assets, end of period (000's) | Net expenses(e) | Net investment income (loss) | Expenses without waivers and reimbursements | Portfolio turnover rate(d) | |
| $29.47 | (26.22)% | $ 2,908 | 1.04(f)% | (0.03)(f)% | 1.06(f)% | 11% | |
| 41.45 | 11.48 | 3,810 | 1.04 | (0.12) | 1.06 | 25 | |
| 37.20 | 22.09 | 2,962 | 1.04 | 0.12 | 1.08 | 15 | |
| 30.68 | 26.98 | 1,300 | 1.04 | 0.94 | 1.23 | 34 | |
| 24.42 | (13.25) | 26 | 1.04 | 0.63 | 1.62 | 13 | |
| 28.28 | 4.55 | 21 | 1.10 | 0.33 | 1.30 | 22 | |
| 29.82 | (26.15) | 15,147 | 0.89(f) | 0.10(f) | 0.92(f) | 11 | |
| 41.88 | 11.64 | 20,676 | 0.89 | 0.02 | 0.91 | 25 | |
| 37.56 | 22.29 | 57,909 | 0.89 | 0.26 | 0.93 | 15 | |
| 30.96 | 27.19 | 41,872 | 0.89 | 1.08 | 1.08 | 34 | |
| 24.60 | (13.14) | 1,672 | 0.89 | 1.37 | 1.11 | 13 | |
| 28.47 | 27.72 | 217 | 0.95 | 0.58 | 3.36 | 22 | |
| 29.79 | (26.14) | 4,414,250 | 0.79(f) | 0.20(f) | 0.80(f) | 11 | |
| 41.95 | 11.75 | 5,659,334 | 0.79 | 0.11 | 0.80 | 25 | |
| 37.61 | 22.39 | 4,608,998 | 0.79 | 0.37 | 0.82 | 15 | |
| 31.00 | 27.36 | 3,034,359 | 0.79 | 1.09 | 0.96 | 34 | |
| 24.60 | (13.08) | 2,936,830 | 0.79 | 1.00 | 1.01 | 13 | |
| 28.46 | 27.87 | 2,813,349 | 0.85 | 0.85 | 1.01 | 22 | |
| April 30, 2022 | J.P. Morgan International Equity Funds | 89 |
| Per share operating performance | ||||||||
| Investment operations | Distributions | |||||||
| Net asset value, beginning of period | Net investment income (loss)(b) | Net realized and unrealized gains (losses) on investments | Total from investment operations | Net investment income | Net realized gain | Total distributions | ||
| JPMorgan Emerging Markets Research Enhanced Equity Fund | ||||||||
| Class I | ||||||||
| Six Months Ended April 30, 2022(Unaudited) | $20.87 | $0.19 | $(3.38) | $(3.19) | $(0.52) | $(0.53) | $(1.05) | |
| Year Ended October 31, 2021 | 18.11 | 0.51 | 2.56 | 3.07 | (0.31) | — | (0.31) | |
| Year Ended October 31, 2020 | 16.78 | 0.33 | 1.04 | 1.37 | — | (0.04) | (0.04) | |
| January 30, 2019(g) through October 31, 2019 | 16.22 | 0.31 | 0.25 | 0.56 | — | — | — | |
| Class R6 | ||||||||
| Six Months Ended April 30, 2022(Unaudited) | 20.77 | 0.21 | (3.37) | (3.16) | (0.54) | (0.53) | (1.07) | |
| Year Ended October 31, 2021 | 18.01 | 0.42 | 2.65 | 3.07 | (0.31) | — | (0.31) | |
| Year Ended October 31, 2020 | 16.80 | 0.31 | 1.07 | 1.38 | (0.13) | (0.04) | (0.17) | |
| December 11, 2018(h) through October 31, 2019 | 15.00 | 0.42 | 1.46 | 1.88 | (0.08) | — | (0.08) | |
| (a) | Annualized for periods less than one year, unless otherwise noted. |
| (b) | Calculated based upon average shares outstanding. |
| (c) | Includes adjustments in accordance with accounting principles generally accepted in the United States of America and as such, the net asset values for financial reporting purposes and the returns based upon those net asset values may differ from the net asset values and returns for shareholder transactions. |
| (d) | Not annualized for periods less than one year. |
| (e) | Includes interest expense, if applicable, which is less than 0.005% unless otherwise noted. |
| (f) | Certain non-recurring expenses incurred by the Fund were not annualized for the period indicated. |
| (g) | Commencement of offering of class of shares. |
| (h) | Commencement of operations. |
| 90 | J.P. Morgan International Equity Funds | April 30, 2022 |
| Ratios/Supplemental data | |||||||
| Ratios to average net assets(a) | |||||||
| Net asset value, end of period | Total return(c)(d) | Net assets, end of period (000's) | Net expenses(e) | Net investment income (loss) | Expenses without waivers | Portfolio turnover rate(d) | |
| $16.63 | (15.90)% | $ 236,318 | 0.45(f)% | 2.21(f)% | 0.64(f)% | 16% | |
| 20.87 | 16.95 | 5,435 | 0.45 | 2.36 | 0.69 | 53 | |
| 18.11 | 8.15 | 33 | 0.45 | 1.98 | 1.39 | 47 | |
| 16.78 | 3.45 | 5 | 0.44(f) | 2.52(f) | 0.70(f) | 28 | |
| 16.54 | (15.84) | 2,709,774 | 0.35(f) | 2.26(f) | 0.39(f) | 16 | |
| 20.77 | 17.09 | 3,787,953 | 0.35 | 1.97 | 0.40 | 53 | |
| 18.01 | 8.22 | 2,840,309 | 0.35 | 1.87 | 0.41 | 47 | |
| 16.80 | 12.60 | 2,090,569 | 0.34(f) | 2.90(f) | 0.46(f) | 28 | |
| April 30, 2022 | J.P. Morgan International Equity Funds | 91 |
| Per share operating performance | ||||||
| Investment operations | Distributions | |||||
| Net asset value, beginning of period | Net investment income (loss)(b) | Net realized and unrealized gains (losses) on investments | Total from investment operations | Net investment income | ||
| JPMorgan Europe Dynamic Fund | ||||||
| Class A | ||||||
| Six Months Ended April 30, 2022(Unaudited) | $30.91 | $0.28 | $(4.65) | $(4.37) | $(0.62) | |
| Year Ended October 31, 2021 | 21.64 | 0.40(g) | 9.14 | 9.54 | (0.27) | |
| Year Ended October 31, 2020 | 24.25 | 0.25 | (2.16) | (1.91) | (0.70) | |
| Year Ended October 31, 2019 | 23.01 | 0.61 | 1.18 | 1.79 | (0.55) | |
| Year Ended October 31, 2018 | 27.04 | 0.42 | (4.08) | (3.66) | (0.37) | |
| Year Ended October 31, 2017 | 21.94 | 0.37 | 5.15 | 5.52 | (0.42) | |
| Class C | ||||||
| Six Months Ended April 30, 2022(Unaudited) | 27.25 | 0.16 | (4.08) | (3.92) | (0.47) | |
| Year Ended October 31, 2021 | 19.10 | 0.22(g) | 8.08 | 8.30 | (0.15) | |
| Year Ended October 31, 2020 | 21.47 | 0.12 | (1.91) | (1.79) | (0.58) | |
| Year Ended October 31, 2019 | 20.39 | 0.44 | 1.06 | 1.50 | (0.42) | |
| Year Ended October 31, 2018 | 24.00 | 0.25 | (3.62) | (3.37) | (0.24) | |
| Year Ended October 31, 2017 | 19.52 | 0.23 | 4.58 | 4.81 | (0.33) | |
| Class I | ||||||
| Six Months Ended April 30, 2022(Unaudited) | 31.57 | 0.16 | (4.57) | (4.41) | (0.73) | |
| Year Ended October 31, 2021 | 22.10 | 0.47(g) | 9.33 | 9.80 | (0.33) | |
| Year Ended October 31, 2020 | 24.75 | 0.31 | (2.19) | (1.88) | (0.77) | |
| Year Ended October 31, 2019 | 23.48 | 0.67 | 1.21 | 1.88 | (0.61) | |
| Year Ended October 31, 2018 | 27.60 | 0.49 | (4.17) | (3.68) | (0.44) | |
| Year Ended October 31, 2017 | 22.37 | 0.46 | 5.25 | 5.71 | (0.48) | |
| Class L | ||||||
| Six Months Ended April 30, 2022(Unaudited) | 31.99 | 0.36 | (4.81) | (4.45) | (0.75) | |
| Year Ended October 31, 2021 | 22.38 | 0.54(g) | 9.44 | 9.98 | (0.37) | |
| Year Ended October 31, 2020 | 25.05 | 0.35 | (2.23) | (1.88) | (0.79) | |
| Year Ended October 31, 2019 | 23.70 | 0.65 | 1.27 | 1.92 | (0.57) | |
| Year Ended October 31, 2018 | 27.85 | 0.51 | (4.18) | (3.67) | (0.48) | |
| Year Ended October 31, 2017 | 22.61 | 0.52 | 5.27 | 5.79 | (0.55) | |
| Class R6 | ||||||
| Six Months Ended April 30, 2022(Unaudited) | 31.86 | 0.36 | (4.77) | (4.41) | (0.78) | |
| Year Ended October 31, 2021 | 22.29 | 0.55(g) | 9.41 | 9.96 | (0.39) | |
| Year Ended October 31, 2020 | 24.96 | 0.37 | (2.22) | (1.85) | (0.82) | |
| Year Ended October 31, 2019 | 23.70 | 0.75 | 1.19 | 1.94 | (0.68) | |
| October 1, 2018(h) through October 31, 2018 | 26.32 | 0.01 | (2.63) | (2.62) | — | |
| (a) | Annualized for periods less than one year, unless otherwise noted. |
| (b) | Calculated based upon average shares outstanding. |
| (c) | Includes adjustments in accordance with accounting principles generally accepted in the United States of America and as such, the net asset values for financial reporting purposes and the returns based upon those net asset values may differ from the net asset values and returns for shareholder transactions. |
| (d) | Not annualized for periods less than one year. |
| (e) | Includes interest expense, if applicable, which is less than 0.005% unless otherwise noted. |
| (f) | Certain non-recurring expenses incurred by the Fund were not annualized for the period indicated. |
| (g) | Reflects income from foreign withholding tax claims, including related interest income. Had the Fund not received these proceeds, the net investment income (loss) per share would have been $0.38, $0.20, $0.45, $0.52 and $0.53 for Class A, Class C, Class I, Class L and Class R6, respectively, and the net investment income (loss) ratios would have been 1.29%, 0.78%, 1.44%, 1.70% and 1.75% for Class A, Class C, Class I, Class L and Class R6, respectively. |
| (h) | Commencement of offering of class of shares. |
| 92 | J.P. Morgan International Equity Funds | April 30, 2022 |
| Ratios/Supplemental data | |||||||
| Ratios to average net assets(a) | |||||||
| Net asset value, end of period | Total return (excludes sales charge)(c)(d) | Net assets, end of period (000's) | Net expenses(e) | Net investment income (loss) | Expenses without waivers | Portfolio turnover rate(d) | |
| $25.92 | (14.36)% | $ 73,397 | 1.24(f)% | 1.98(f)% | 1.24(f)% | 43% | |
| 30.91 | 44.30 | 88,315 | 1.24 | 1.37(g) | 1.26 | 92 | |
| 21.64 | (8.21) | 68,882 | 1.24 | 1.09 | 1.28 | 159 | |
| 24.25 | 8.14 | 98,294 | 1.24 | 2.67 | 1.31 | 83 | |
| 23.01 | (13.72) | 124,681 | 1.24 | 1.58 | 1.29 | 149 | |
| 27.04 | 25.65 | 165,020 | 1.36 | 1.52 | 1.36 | 189 | |
| 22.86 | (14.58) | 7,015 | 1.74(f) | 1.27(f) | 1.75(f) | 43 | |
| 27.25 | 43.56 | 11,313 | 1.74 | 0.86(g) | 1.77 | 92 | |
| 19.10 | (8.68) | 11,082 | 1.74 | 0.59 | 1.77 | 159 | |
| 21.47 | 7.64 | 19,798 | 1.74 | 2.15 | 1.80 | 83 | |
| 20.39 | (14.18) | 31,125 | 1.74 | 1.08 | 1.79 | 149 | |
| 24.00 | 25.02 | 46,615 | 1.85 | 1.07 | 1.86 | 189 | |
| 26.43 | (14.25) | 69,744 | 0.98(f) | 1.07(f) | 0.98(f) | 43 | |
| 31.57 | 44.61 | 443,053 | 0.98 | 1.52(g) | 0.99 | 92 | |
| 22.10 | (7.98) | 52,841 | 0.99 | 1.33 | 1.01 | 159 | |
| 24.75 | 8.44 | 86,582 | 0.99 | 2.86 | 1.05 | 83 | |
| 23.48 | (13.53) | 139,858 | 0.99 | 1.84 | 1.04 | 149 | |
| 27.60 | 26.06 | 187,678 | 1.06 | 1.85 | 1.07 | 189 | |
| 26.79 | (14.19) | 75,636 | 0.82(f) | 2.43(f) | 0.83(f) | 43 | |
| 31.99 | 44.88 | 86,054 | 0.84 | 1.78(g) | 0.85 | 92 | |
| 22.38 | (7.86) | 55,597 | 0.85 | 1.49 | 0.86 | 159 | |
| 25.05 | 8.49 | 65,686 | 0.89 | 2.77 | 0.90 | 83 | |
| 23.70 | (13.41) | 389,665 | 0.88 | 1.88 | 0.89 | 149 | |
| 27.85 | 26.22 | 578,183 | 0.90 | 2.07 | 0.91 | 189 | |
| 26.67 | (14.13) | 380,750 | 0.72(f) | 2.45(f) | 0.73(f) | 43 | |
| 31.86 | 45.01 | 445,783 | 0.74 | 1.83(g) | 0.75 | 92 | |
| 22.29 | (7.79) | 250,426 | 0.75 | 1.61 | 0.76 | 159 | |
| 24.96 | 8.65 | 271,885 | 0.79 | 3.17 | 0.79 | 83 | |
| 23.70 | (9.95) | 18 | 0.82 | 0.67 | 0.83 | 149 | |
| April 30, 2022 | J.P. Morgan International Equity Funds | 93 |
| Per share operating performance | ||||||||
| Investment operations | Distributions | |||||||
| Net asset value, beginning of period | Net investment income (loss)(b) | Net realized and unrealized gains (losses) on investments | Total from investment operations | Net investment income | Net realized gain | Total distributions | ||
| JPMorgan International Equity Fund | ||||||||
| Class A | ||||||||
| Six Months Ended April 30, 2022(Unaudited) | $21.63 | $0.15 | $(3.61) | $(3.46) | $(0.37) | $(0.99) | $(1.36) | |
| Year Ended October 31, 2021 | 16.47 | 0.30(g) | 5.04 | 5.34 | (0.18) | — | (0.18) | |
| Year Ended October 31, 2020 | 17.27 | 0.19 | (0.49) | (0.30) | (0.50) | — | (0.50) | |
| Year Ended October 31, 2019 | 15.56 | 0.33 | 1.89 | 2.22 | (0.33) | (0.18) | (0.51) | |
| Year Ended October 31, 2018 | 17.81 | 0.33 | (2.33) | (2.00) | (0.25) | — | (0.25) | |
| Year Ended October 31, 2017 | 14.24 | 0.22 | 3.39 | 3.61 | (0.04) | — | (0.04) | |
| Class C | ||||||||
| Six Months Ended April 30, 2022(Unaudited) | 20.41 | 0.09 | (3.39) | (3.30) | (0.27) | (0.99) | (1.26) | |
| Year Ended October 31, 2021 | 15.53 | 0.18(g) | 4.77 | 4.95 | (0.07) | — | (0.07) | |
| Year Ended October 31, 2020 | 16.29 | 0.09 | (0.45) | (0.36) | (0.40) | — | (0.40) | |
| Year Ended October 31, 2019 | 14.68 | 0.23 | 1.80 | 2.03 | (0.24) | (0.18) | (0.42) | |
| Year Ended October 31, 2018 | 16.83 | 0.25 | (2.23) | (1.98) | (0.17) | — | (0.17) | |
| Year Ended October 31, 2017 | 13.50 | 0.12 | 3.22 | 3.34 | (0.01) | — | (0.01) | |
| Class I | ||||||||
| Six Months Ended April 30, 2022(Unaudited) | 22.02 | 0.20 | (3.69) | (3.49) | (0.42) | (0.99) | (1.41) | |
| Year Ended October 31, 2021 | 16.76 | 0.36(g) | 5.13 | 5.49 | (0.23) | — | (0.23) | |
| Year Ended October 31, 2020 | 17.56 | 0.21 | (0.47) | (0.26) | (0.54) | — | (0.54) | |
| Year Ended October 31, 2019 | 15.82 | 0.36 | 1.93 | 2.29 | (0.37) | (0.18) | (0.55) | |
| Year Ended October 31, 2018 | 18.09 | 0.41 | (2.40) | (1.99) | (0.28) | — | (0.28) | |
| Year Ended October 31, 2017 | 14.45 | 0.26 | 3.44 | 3.70 | (0.06) | — | (0.06) | |
| Class R2 | ||||||||
| Six Months Ended April 30, 2022(Unaudited) | 21.31 | 0.12 | (3.55) | (3.43) | (0.30) | (0.99) | (1.29) | |
| Year Ended October 31, 2021 | 16.31 | 0.23(g) | 4.99 | 5.22 | (0.22) | — | (0.22) | |
| Year Ended October 31, 2020 | 17.14 | 0.13 | (0.48) | (0.35) | (0.48) | — | (0.48) | |
| Year Ended October 31, 2019 | 15.44 | 0.28 | 1.88 | 2.16 | (0.28) | (0.18) | (0.46) | |
| Year Ended October 31, 2018 | 17.70 | 0.29 | (2.33) | (2.04) | (0.22) | — | (0.22) | |
| Year Ended October 31, 2017 | 14.17 | 0.17 | 3.38 | 3.55 | (0.02) | — | (0.02) | |
| Class R5 | ||||||||
| Six Months Ended April 30, 2022(Unaudited) | 22.14 | 0.19 | (3.69) | (3.50) | (0.44) | (0.99) | (1.43) | |
| Year Ended October 31, 2021 | 16.85 | 0.39(g) | 5.15 | 5.54 | (0.25) | — | (0.25) | |
| Year Ended October 31, 2020 | 17.60 | 0.24 | (0.48) | (0.24) | (0.51) | — | (0.51) | |
| Year Ended October 31, 2019 | 15.85 | 0.38 | 1.94 | 2.32 | (0.39) | (0.18) | (0.57) | |
| Year Ended October 31, 2018 | 18.13 | 0.41 | (2.40) | (1.99) | (0.29) | — | (0.29) | |
| Year Ended October 31, 2017 | 14.47 | 0.21 | 3.52 | 3.73 | (0.07) | — | (0.07) | |
| 94 | J.P. Morgan International Equity Funds | April 30, 2022 |
| Ratios/Supplemental data | |||||||
| Ratios to average net assets(a) | |||||||
| Net asset value, end of period | Total return (excludes sales charge)(c)(d) | Net assets, end of period (000's) | Net expenses(e) | Net investment income (loss) | Expenses without waivers | Portfolio turnover rate(d) | |
| $16.81 | (16.98)% | $365,217 | 0.95(f)% | 1.58(f)% | 1.11(f)% | 18% | |
| 21.63 | 32.56 | 433,033 | 0.95 | 1.47(g) | 1.11 | 35 | |
| 16.47 | (1.88) | 263,791 | 0.95 | 1.17 | 1.12 | 28 | |
| 17.27 | 14.93 | 328,312 | 0.95 | 2.03 | 1.22 | 25 | |
| 15.56 | (11.42) | 240,394 | 0.95 | 1.88 | 1.32 | 33 | |
| 17.81 | 25.43 | 302,130 | 1.23 | 1.39 | 1.35 | 17 | |
| 15.85 | (17.16) | 8,331 | 1.45(f) | 1.02(f) | 1.62(f) | 18 | |
| 20.41 | 31.94 | 10,899 | 1.45 | 0.91(g) | 1.62 | 35 | |
| 15.53 | (2.38) | 9,358 | 1.45 | 0.61 | 1.62 | 28 | |
| 16.29 | 14.39 | 14,549 | 1.45 | 1.51 | 1.74 | 25 | |
| 14.68 | (11.89) | 18,899 | 1.45 | 1.48 | 1.83 | 33 | |
| 16.83 | 24.79 | 24,281 | 1.74 | 0.83 | 1.88 | 17 | |
| 17.12 | (16.85) | 623,210 | 0.70(f) | 2.03(f) | 0.85(f) | 18 | |
| 22.02 | 32.94 | 584,191 | 0.70 | 1.71(g) | 0.86 | 35 | |
| 16.76 | (1.64) | 339,416 | 0.70 | 1.26 | 0.86 | 28 | |
| 17.56 | 15.20 | 190,885 | 0.70 | 2.22 | 0.96 | 25 | |
| 15.82 | (11.20) | 179,831 | 0.70 | 2.30 | 1.06 | 33 | |
| 18.09 | 25.69 | 139,715 | 0.99 | 1.59 | 1.10 | 17 | |
| 16.59 | (17.06) | 20,627 | 1.25(f) | 1.27(f) | 1.46(f) | 18 | |
| 21.31 | 32.18 | 24,598 | 1.25 | 1.13(g) | 1.47 | 35 | |
| 16.31 | (2.21) | 21,379 | 1.25 | 0.79 | 1.37 | 28 | |
| 17.14 | 14.58 | 2,099 | 1.25 | 1.75 | 1.57 | 25 | |
| 15.44 | (11.68) | 1,833 | 1.25 | 1.64 | 1.60 | 33 | |
| 17.70 | 25.12 | 2,096 | 1.49 | 1.07 | 1.71 | 17 | |
| 17.21 | (16.83) | 9,074 | 0.60(f) | 1.97(f) | 0.71(f) | 18 | |
| 22.14 | 33.04 | 10,463 | 0.60 | 1.85(g) | 0.71 | 35 | |
| 16.85 | (1.52) | 6,970 | 0.60 | 1.41 | 0.72 | 28 | |
| 17.60 | 15.38 | 3,778 | 0.60 | 2.31 | 0.83 | 25 | |
| 15.85 | (11.16) | 19,516 | 0.60 | 2.31 | 0.91 | 33 | |
| 18.13 | 25.88 | 21,891 | 0.84 | 1.36 | 0.93 | 17 | |
| April 30, 2022 | J.P. Morgan International Equity Funds | 95 |
| Per share operating performance | ||||||||
| Investment operations | Distributions | |||||||
| Net asset value, beginning of period | Net investment income (loss)(b) | Net realized and unrealized gains (losses) on investments | Total from investment operations | Net investment income | Net realized gain | Total distributions | ||
| Class R6 | ||||||||
| Six Months Ended April 30, 2022(Unaudited) | $22.10 | $0.20 | $(3.68) | $(3.48) | $(0.46) | $(0.99) | $(1.45) | |
| Year Ended October 31, 2021 | 16.81 | 0.42(g) | 5.13 | 5.55 | (0.26) | — | (0.26) | |
| Year Ended October 31, 2020 | 17.61 | 0.26 | (0.49) | (0.23) | (0.57) | — | (0.57) | |
| Year Ended October 31, 2019 | 15.86 | 0.40 | 1.93 | 2.33 | (0.40) | (0.18) | (0.58) | |
| Year Ended October 31, 2018 | 18.13 | 0.43 | (2.39) | (1.96) | (0.31) | — | (0.31) | |
| Year Ended October 31, 2017 | 14.46 | 0.29 | 3.46 | 3.75 | (0.08) | — | (0.08) | |
| (a) | Annualized for periods less than one year, unless otherwise noted. |
| (b) | Calculated based upon average shares outstanding. |
| (c) | Includes adjustments in accordance with accounting principles generally accepted in the United States of America and as such, the net asset values for financial reporting purposes and the returns based upon those net asset values may differ from the net asset values and returns for shareholder transactions. |
| (d) | Not annualized for periods less than one year. |
| (e) | Includes interest expense, if applicable, which is less than 0.005% unless otherwise noted. |
| (f) | Certain non-recurring expenses incurred by the Fund were not annualized for the period indicated. |
| (g) | Reflects income from foreign withholding tax claims. Had the Fund not received these proceeds, the net investment income (loss) per share and the net investment income (loss) ratios for each share class would have remained the same. |
| 96 | J.P. Morgan International Equity Funds | April 30, 2022 |
| Ratios/Supplemental data | |||||||
| Ratios to average net assets(a) | |||||||
| Net asset value, end of period | Total return (excludes sales charge)(c)(d) | Net assets, end of period (000's) | Net expenses(e) | Net investment income (loss) | Expenses without waivers | Portfolio turnover rate(d) | |
| $17.17 | (16.77)% | $3,456,927 | 0.50(f)% | 2.01(f)% | 0.60(f)% | 18% | |
| 22.10 | 33.20 | 3,782,533 | 0.50 | 1.98(g) | 0.60 | 35 | |
| 16.81 | (1.46) | 2,290,008 | 0.50 | 1.56 | 0.61 | 28 | |
| 17.61 | 15.50 | 2,457,383 | 0.50 | 2.46 | 0.72 | 25 | |
| 15.86 | (11.04) | 3,808,621 | 0.50 | 2.42 | 0.81 | 33 | |
| 18.13 | 26.04 | 3,516,978 | 0.74 | 1.84 | 0.81 | 17 | |
| April 30, 2022 | J.P. Morgan International Equity Funds | 97 |
| Per share operating performance | ||||||
| Investment operations | Distributions | |||||
| Net asset value, beginning of period | Net investment income (loss)(b) | Net realized and unrealized gains (losses) on investments | Total from investment operations | Net investment income | ||
| JPMorgan International Focus Fund | ||||||
| Class A | ||||||
| Six Months Ended April 30, 2022(Unaudited) | $27.55 | $0.18 | $(4.73) | $(4.55) | $(0.43) | |
| Year Ended October 31, 2021 | 22.07 | 0.35(g) | 5.32 | 5.67 | (0.19) | |
| Year Ended October 31, 2020 | 21.15 | 0.18 | 0.75 | 0.93 | (0.01) | |
| Year Ended October 31, 2019 | 18.24 | 0.26 | 3.02 | 3.28 | (0.37) | |
| Year Ended October 31, 2018 | 21.14 | 0.36 | (3.13) | (2.77) | (0.13) | |
| Year Ended October 31, 2017 | 17.24 | 0.16 | 4.09 | 4.25 | (0.35) | |
| Class C | ||||||
| Six Months Ended April 30, 2022(Unaudited) | 27.06 | 0.11 | (4.65) | (4.54) | (0.29) | |
| Year Ended October 31, 2021 | 21.68 | 0.20(g) | 5.24 | 5.44 | (0.06) | |
| Year Ended October 31, 2020 | 20.86 | 0.07 | 0.75 | 0.82 | — | |
| Year Ended October 31, 2019 | 17.98 | 0.16 | 2.97 | 3.13 | (0.25) | |
| Year Ended October 31, 2018 | 20.90 | 0.26 | (3.09) | (2.83) | (0.09) | |
| Year Ended October 31, 2017 | 17.04 | 0.05 | 4.06 | 4.11 | (0.25) | |
| Class I | ||||||
| Six Months Ended April 30, 2022(Unaudited) | 27.95 | 0.21 | (4.79) | (4.58) | (0.48) | |
| Year Ended October 31, 2021 | 22.39 | 0.42(g) | 5.39 | 5.81 | (0.25) | |
| Year Ended October 31, 2020 | 21.43 | 0.23 | 0.78 | 1.01 | (0.05) | |
| Year Ended October 31, 2019 | 18.49 | 0.31 | 3.04 | 3.35 | (0.41) | |
| Year Ended October 31, 2018 | 21.41 | 0.44 | (3.19) | (2.75) | (0.17) | |
| Year Ended October 31, 2017 | 17.45 | 0.23 | 4.13 | 4.36 | (0.40) | |
| Class R2 | ||||||
| Six Months Ended April 30, 2022(Unaudited) | 27.25 | 0.14 | (4.69) | (4.55) | (0.30) | |
| Year Ended October 31, 2021 | 21.85 | 0.27(g) | 5.26 | 5.53 | (0.13) | |
| Year Ended October 31, 2020 | 20.99 | 0.13 | 0.73 | 0.86 | — | |
| Year Ended October 31, 2019 | 18.14 | 0.21 | 2.98 | 3.19 | (0.34) | |
| Year Ended October 31, 2018 | 21.11 | 0.35 | (3.17) | (2.82) | (0.15) | |
| Year Ended October 31, 2017 | 17.21 | 0.06 | 4.14 | 4.20 | (0.30) | |
| Class R5 | ||||||
| Six Months Ended April 30, 2022(Unaudited) | 27.96 | 0.22 | (4.79) | (4.57) | (0.50) | |
| Year Ended October 31, 2021 | 22.38 | 0.44(g) | 5.40 | 5.84 | (0.26) | |
| Year Ended October 31, 2020 | 21.42 | 0.25 | 0.78 | 1.03 | (0.07) | |
| Year Ended October 31, 2019 | 18.49 | 0.34 | 3.03 | 3.37 | (0.44) | |
| Year Ended October 31, 2018 | 21.39 | 0.53 | (3.25) | (2.72) | (0.18) | |
| Year Ended October 31, 2017 | 17.44 | 0.20 | 4.17 | 4.37 | (0.42) | |
| 98 | J.P. Morgan International Equity Funds | April 30, 2022 |
| Ratios/Supplemental data | |||||||
| Ratios to average net assets(a) | |||||||
| Net asset value, end of period | Total return (excludes sales charge)(c)(d) | Net assets, end of period (000's) | Net expenses(e) | Net investment income (loss) | Expenses without waivers | Portfolio turnover rate(d) | |
| $22.57 | (16.72)% | $268,558 | 1.00(f)% | 1.39(f)% | 1.21(f)% | 16% | |
| 27.55 | 25.74 | 337,503 | 1.00 | 1.31(g) | 1.21 | 32 | |
| 22.07 | 4.39 | 135,527 | 1.00 | 0.86 | 1.22 | 38 | |
| 21.15 | 18.41 | 114,629 | 1.00 | 1.33 | 1.32 | 34 | |
| 18.24 | (13.20) | 84,325 | 1.00 | 1.75 | 1.38 | 63 | |
| 21.14 | 25.16 | 67,684 | 1.24 | 0.83 | 1.46 | 38 | |
| 22.23 | (16.91) | 18,734 | 1.50(f) | 0.89(f) | 1.73(f) | 16 | |
| 27.06 | 25.11 | 24,272 | 1.50 | 0.77(g) | 1.72 | 32 | |
| 21.68 | 3.93 | 15,463 | 1.50 | 0.32 | 1.73 | 38 | |
| 20.86 | 17.73 | 18,447 | 1.50 | 0.83 | 1.84 | 34 | |
| 17.98 | (13.60) | 22,532 | 1.50 | 1.29 | 1.89 | 63 | |
| 20.90 | 24.51 | 14,534 | 1.74 | 0.27 | 2.00 | 38 | |
| 22.89 | (16.59) | 654,222 | 0.75(f) | 1.63(f) | 0.96(f) | 16 | |
| 27.95 | 26.04 | 832,039 | 0.75 | 1.54(g) | 0.96 | 32 | |
| 22.39 | 4.71 | 372,068 | 0.75 | 1.05 | 0.96 | 38 | |
| 21.43 | 18.62 | 177,764 | 0.75 | 1.57 | 1.08 | 34 | |
| 18.49 | (12.96) | 189,061 | 0.75 | 2.09 | 1.13 | 63 | |
| 21.41 | 25.60 | 131,356 | 0.89 | 1.14 | 1.19 | 38 | |
| 22.40 | (16.83) | 1,783 | 1.30(f) | 1.13(f) | 1.50(f) | 16 | |
| 27.25 | 25.35 | 2,078 | 1.30 | 1.00(g) | 1.48 | 32 | |
| 21.85 | 4.10 | 1,441 | 1.30 | 0.61 | 1.51 | 38 | |
| 20.99 | 18.01 | 1,049 | 1.30 | 1.05 | 1.74 | 34 | |
| 18.14 | (13.46) | 773 | 1.30 | 1.70 | 1.72 | 63 | |
| 21.11 | 24.85 | 97 | 1.49 | 0.31 | 2.79 | 38 | |
| 22.89 | (16.57) | 2,216 | 0.65(f) | 1.69(f) | 0.87(f) | 16 | |
| 27.96 | 26.19 | 3,172 | 0.65 | 1.61(g) | 0.87 | 32 | |
| 22.38 | 4.79 | 2,772 | 0.65 | 1.16 | 0.88 | 38 | |
| 21.42 | 18.76 | 3,082 | 0.65 | 1.71 | 1.04 | 34 | |
| 18.49 | (12.84) | 3,341 | 0.65 | 2.56 | 1.07 | 63 | |
| 21.39 | 25.67 | 90 | 0.79 | 1.01 | 2.44 | 38 | |
| April 30, 2022 | J.P. Morgan International Equity Funds | 99 |
| Per share operating performance | ||||||
| Investment operations | Distributions | |||||
| Net asset value, beginning of period | Net investment income (loss)(b) | Net realized and unrealized gains (losses) on investments | Total from investment operations | Net investment income | ||
| Class R6 | ||||||
| Six Months Ended April 30, 2022(Unaudited) | $27.98 | $0.21 | $(4.76) | $(4.55) | $(0.53) | |
| Year Ended October 31, 2021 | 22.40 | 0.46(g) | 5.40 | 5.86 | (0.28) | |
| Year Ended October 31, 2020 | 21.44 | 0.28 | 0.77 | 1.05 | (0.09) | |
| Year Ended October 31, 2019 | 18.50 | 0.27 | 3.13 | 3.40 | (0.46) | |
| Year Ended October 31, 2018 | 21.40 | 0.44 | (3.16) | (2.72) | (0.18) | |
| Year Ended October 31, 2017 | 17.45 | 0.26 | 4.12 | 4.38 | (0.43) | |
| (a) | Annualized for periods less than one year, unless otherwise noted. |
| (b) | Calculated based upon average shares outstanding. |
| (c) | Includes adjustments in accordance with accounting principles generally accepted in the United States of America and as such, the net asset values for financial reporting purposes and the returns based upon those net asset values may differ from the net asset values and returns for shareholder transactions. |
| (d) | Not annualized for periods less than one year. |
| (e) | Includes interest expense, if applicable, which is less than 0.005% unless otherwise noted. |
| (f) | Certain non-recurring expenses incurred by the Fund were not annualized for the period indicated. |
| (g) | Reflects income from foreign withholding tax claims. Had the Fund not received these proceeds, the net investment income (loss) per share and the net investment income (loss) ratios for each share class would have remained the same. |
| 100 | J.P. Morgan International Equity Funds | April 30, 2022 |
| Ratios/Supplemental data | |||||||
| Ratios to average net assets(a) | |||||||
| Net asset value, end of period | Total return (excludes sales charge)(c)(d) | Net assets, end of period (000's) | Net expenses(e) | Net investment income (loss) | Expenses without waivers | Portfolio turnover rate(d) | |
| $22.90 | (16.50)% | $ 461,434 | 0.55(f)% | 1.60(f)% | 0.71(f)% | 16% | |
| 27.98 | 26.28 | 2,721,224 | 0.55 | 1.68(g) | 0.71 | 32 | |
| 22.40 | 4.89 | 2,274,399 | 0.55 | 1.31 | 0.71 | 38 | |
| 21.44 | 18.95 | 2,284,670 | 0.55 | 1.32 | 0.77 | 34 | |
| 18.50 | (12.81) | 175,198 | 0.55 | 2.12 | 0.87 | 63 | |
| 21.40 | 25.72 | 143,868 | 0.74 | 1.37 | 0.95 | 38 | |
| April 30, 2022 | J.P. Morgan International Equity Funds | 101 |
| Per share operating performance | ||||||
| Investment operations | Distributions | |||||
| Net asset value, beginning of period | Net investment income (loss)(b) | Net realized and unrealized gains (losses) on investments | Total from investment operations | Net investment income | ||
| JPMorgan International Hedged Equity Fund | ||||||
| Class A | ||||||
| Six Months Ended April 30, 2022(Unaudited) | $16.73 | $0.18 | $(1.85) | $(1.67) | $(0.38) | |
| Year Ended October 31, 2021 | 14.12 | 0.30 | 2.58 | 2.88 | (0.27) | |
| Year Ended October 31, 2020 | 15.58 | 0.27 | (1.49) | (1.22) | (0.24) | |
| March 15, 2019(g) through October 31, 2019 | 15.00 | 0.19 | 0.39 | 0.58 | — | |
| Class C | ||||||
| Six Months Ended April 30, 2022(Unaudited) | 16.68 | 0.10 | (1.81) | (1.71) | (0.32) | |
| Year Ended October 31, 2021 | 14.06 | 0.22 | 2.57 | 2.79 | (0.17) | |
| Year Ended October 31, 2020 | 15.53 | 0.20 | (1.50) | (1.30) | (0.17) | |
| March 15, 2019(g) through October 31, 2019 | 15.00 | 0.16 | 0.37 | 0.53 | — | |
| Class I | ||||||
| Six Months Ended April 30, 2022(Unaudited) | 16.83 | 0.18 | (1.84) | (1.66) | (0.41) | |
| Year Ended October 31, 2021 | 14.18 | 0.32 | 2.61 | 2.93 | (0.28) | |
| Year Ended October 31, 2020 | 15.61 | 0.31 | (1.50) | (1.19) | (0.24) | |
| March 15, 2019(g) through October 31, 2019 | 15.00 | 0.32 | 0.29 | 0.61 | — | |
| Class R5 | ||||||
| Six Months Ended April 30, 2022(Unaudited) | 16.86 | 0.19 | (1.84) | (1.65) | (0.43) | |
| Year Ended October 31, 2021 | 14.20 | 0.35 | 2.61 | 2.96 | (0.30) | |
| Year Ended October 31, 2020 | 15.62 | 0.31 | (1.48) | (1.17) | (0.25) | |
| March 15, 2019(g) through October 31, 2019 | 15.00 | 0.34 | 0.28 | 0.62 | — | |
| Class R6 | ||||||
| Six Months Ended April 30, 2022(Unaudited) | 16.88 | 0.21 | (1.85) | (1.64) | (0.45) | |
| Year Ended October 31, 2021 | 14.22 | 0.39 | 2.59 | 2.98 | (0.32) | |
| Year Ended October 31, 2020 | 15.63 | 0.34 | (1.49) | (1.15) | (0.26) | |
| March 15, 2019(g) through October 31, 2019 | 15.00 | 0.35 | 0.28 | 0.63 | — | |
| (a) | Annualized for periods less than one year, unless otherwise noted. |
| (b) | Calculated based upon average shares outstanding. |
| (c) | Includes adjustments in accordance with accounting principles generally accepted in the United States of America and as such, the net asset values for financial reporting purposes and the returns based upon those net asset values may differ from the net asset values and returns for shareholder transactions. |
| (d) | Not annualized for periods less than one year. |
| (e) | Includes interest expense, if applicable, which is less than 0.005% unless otherwise noted. |
| (f) | Certain non-recurring expenses incurred by the Fund were not annualized for the period indicated. |
| (g) | Commencement of offering of class of shares. |
| 102 | J.P. Morgan International Equity Funds | April 30, 2022 |
| Ratios/Supplemental data | |||||||
| Ratios to average net assets(a) | |||||||
| Net asset value, end of period | Total return (excludes sales charge)(c)(d) | Net assets, end of period (000's) | Net expenses(e) | Net investment income (loss) | Expenses without waivers | Portfolio turnover rate(d) | |
| $14.68 | (10.15)% | $ 5,203 | 0.85(f)% | 2.33(f)% | 1.04(f)% | 9% | |
| 16.73 | 20.60 | 3,561 | 0.85 | 1.85 | 1.05 | 50 | |
| 14.12 | (8.02) | 1,573 | 0.85 | 1.84 | 1.30 | 85 | |
| 15.58 | 3.87 | 330 | 0.85(f) | 1.95(f) | 1.31(f) | 9 | |
| 14.65 | (10.38) | 284 | 1.35(f) | 1.33(f) | 1.55(f) | 9 | |
| 16.68 | 19.97 | 320 | 1.35 | 1.35 | 1.55 | 50 | |
| 14.06 | (8.47) | 115 | 1.35 | 1.34 | 1.81 | 85 | |
| 15.53 | 3.53 | 119 | 1.35(f) | 1.73(f) | 1.92(f) | 9 | |
| 14.76 | (10.02) | 165,497 | 0.60(f) | 2.30(f) | 0.79(f) | 9 | |
| 16.83 | 20.90 | 148,703 | 0.60 | 2.02 | 0.79 | 50 | |
| 14.18 | (7.78) | 135,542 | 0.60 | 2.12 | 1.03 | 85 | |
| 15.61 | 4.07 | 59,751 | 0.60(f) | 3.38(f) | 1.19(f) | 9 | |
| 14.78 | (9.97) | 21 | 0.45(f) | 2.35(f) | 0.70(f) | 9 | |
| 16.86 | 21.10 | 23 | 0.45 | 2.19 | 0.71 | 50 | |
| 14.20 | (7.68) | 19 | 0.45 | 2.08 | 1.04 | 85 | |
| 15.62 | 4.13 | 21 | 0.45(f) | 3.59(f) | 1.03(f) | 9 | |
| 14.79 | (9.92) | 218 | 0.35(f) | 2.66(f) | 0.56(f) | 9 | |
| 16.88 | 21.19 | 169 | 0.35 | 2.42 | 0.58 | 50 | |
| 14.22 | (7.53) | 19 | 0.35 | 2.33 | 0.94 | 85 | |
| 15.63 | 4.20 | 21 | 0.35(f) | 3.69(f) | 0.93(f) | 9 | |
| April 30, 2022 | J.P. Morgan International Equity Funds | 103 |
| Per share operating performance | ||||||||
| Investment operations | Distributions | |||||||
| Net asset value, beginning of period | Net investment income (loss)(b) | Net realized and unrealized gains (losses) on investments | Total from investment operations | Net investment income | Net realized gain | Total distributions | ||
| JPMorgan International Research Enhanced Equity Fund | ||||||||
| Class A | ||||||||
| Six Months Ended April 30, 2022(Unaudited) | $21.26 | $0.24 | $(2.78) | $(2.54) | $(0.78) | $ — | $(0.78) | |
| Year Ended October 31, 2021 | 15.84 | 0.43(g) | 5.16 | 5.59 | (0.17) | — | (0.17) | |
| Year Ended October 31, 2020 | 17.93 | 0.36 | (1.96) | (1.60) | (0.49) | — | (0.49) | |
| Year Ended October 31, 2019 | 16.79 | 0.51 | 1.15 | 1.66 | (0.52) | — | (0.52) | |
| Year Ended October 31, 2018 | 18.76 | 0.45 | (2.04) | (1.59) | (0.19) | (0.19) | (0.38) | |
| Year Ended October 31, 2017 | 15.54 | 0.34 | 3.23 | 3.57 | (0.35) | — | (0.35) | |
| Class I | ||||||||
| Six Months Ended April 30, 2022(Unaudited) | 21.39 | 0.25 | (2.79) | (2.54) | (0.83) | — | (0.83) | |
| Year Ended October 31, 2021 | 16.05 | 0.47(g) | 5.23 | 5.70 | (0.36) | — | (0.36) | |
| Year Ended October 31, 2020 | 18.17 | 0.36 | (1.94) | (1.58) | (0.54) | — | (0.54) | |
| Year Ended October 31, 2019 | 17.01 | 0.56 | 1.16 | 1.72 | (0.56) | — | (0.56) | |
| Year Ended October 31, 2018 | 18.92 | 0.35 | (1.91) | (1.56) | (0.16) | (0.19) | (0.35) | |
| Year Ended October 31, 2017 | 15.68 | 0.41 | 3.23 | 3.64 | (0.40) | — | (0.40) | |
| Class R6 | ||||||||
| Six Months Ended April 30, 2022(Unaudited) | 21.33 | 0.27 | (2.80) | (2.53) | (0.85) | — | (0.85) | |
| Year Ended October 31, 2021 | 16.00 | 0.49(g) | 5.21 | 5.70 | (0.37) | — | (0.37) | |
| Year Ended October 31, 2020 | 18.11 | 0.39 | (1.94) | (1.55) | (0.56) | — | (0.56) | |
| Year Ended October 31, 2019 | 16.97 | 0.57 | 1.16 | 1.73 | (0.59) | — | (0.59) | |
| November 1, 2017(h) through October 31, 2018 | 18.98 | 0.56 | (2.16) | (1.60) | (0.22) | (0.19) | (0.41) | |
| (a) | Annualized for periods less than one year, unless otherwise noted. |
| (b) | Calculated based upon average shares outstanding. |
| (c) | Includes adjustments in accordance with accounting principles generally accepted in the United States of America and as such, the net asset values for financial reporting purposes and the returns based upon those net asset values may differ from the net asset values and returns for shareholder transactions. |
| (d) | Not annualized for periods less than one year. |
| (e) | Includes interest expense, if applicable, which is less than 0.005% unless otherwise noted. |
| (f) | Certain non-recurring expenses incurred by the Fund were not annualized for the period indicated. |
| (g) | Reflects income from foreign withholding tax claims, including related interest income. Had the Fund not received these proceeds, the net investment income (loss) per share for each share class would have remained the same and the net investment income (loss) ratios would have been 2.13%, 2.33%, and 2.44% for Class A, Class I and Class R6, respectively. |
| (h) | Commencement of offering of class of shares. |
| 104 | J.P. Morgan International Equity Funds | April 30, 2022 |
| Ratios/Supplemental data | |||||||
| Ratios to average net assets(a) | |||||||
| Net asset value, end of period | Total return (excludes sales charge)(c)(d) | Net assets, end of period (000's) | Net expenses(e) | Net investment income (loss) | Expenses without waivers | Portfolio turnover rate(d) | |
| $17.94 | (12.31)% | $ 37,317 | 0.47(f)% | 2.38(f)% | 0.84(f)% | 9% | |
| 21.26 | 35.44 | 46,779 | 0.60 | 2.15(g) | 0.88 | 20 | |
| 15.84 | (9.26) | 52,118 | 0.60 | 2.21 | 0.83 | 52 | |
| 17.93 | 10.39 | 213,256 | 0.60 | 3.00 | 0.83 | 22 | |
| 16.79 | (8.66) | 203,437 | 0.60 | 2.40 | 0.84 | 42 | |
| 18.76 | 23.41 | 298,112 | 0.59 | 1.98 | 0.90 | 33 | |
| 18.02 | (12.26) | 313,629 | 0.35(f) | 2.48(f) | 0.56(f) | 9 | |
| 21.39 | 35.78 | 386,797 | 0.35 | 2.35(g) | 0.56 | 20 | |
| 16.05 | (9.05) | 472,455 | 0.34 | 2.15 | 0.56 | 52 | |
| 18.17 | 10.65 | 185,680 | 0.35 | 3.28 | 0.56 | 22 | |
| 17.01 | (8.42) | 152,610 | 0.35 | 1.85 | 0.56 | 42 | |
| 18.92 | 23.71 | 4,740,590 | 0.34 | 2.37 | 0.58 | 33 | |
| 17.95 | (12.24) | 5,172,094 | 0.25(f) | 2.78(f) | 0.30(f) | 9 | |
| 21.33 | 35.93 | 4,562,266 | 0.25 | 2.46(g) | 0.31 | 20 | |
| 16.00 | (8.96) | 4,337,776 | 0.24 | 2.35 | 0.30 | 52 | |
| 18.11 | 10.78 | 4,435,538 | 0.25 | 3.37 | 0.31 | 22 | |
| 16.97 | (8.60) | 4,344,571 | 0.25 | 3.00 | 0.32 | 42 | |
| April 30, 2022 | J.P. Morgan International Equity Funds | 105 |
| Per share operating performance | ||||||
| Investment operations | Distributions | |||||
| Net asset value, beginning of period | Net investment income (loss)(b) | Net realized and unrealized gains (losses) on investments | Total from investment operations | Net investment income | ||
| JPMorgan International Value Fund | ||||||
| Class A | ||||||
| Six Months Ended April 30, 2022(Unaudited) | $13.46 | $0.23 | $(1.29) | $(1.06) | $(0.61) | |
| Year Ended October 31, 2021 | 9.46 | 0.43(g) | 3.89 | 4.32 | (0.32) | |
| Year Ended October 31, 2020 | 12.22 | 0.28 | (2.55) | (2.27) | (0.49) | |
| Year Ended October 31, 2019 | 12.44 | 0.44 | (0.20) | 0.24 | (0.46) | |
| Year Ended October 31, 2018 | 14.26 | 0.36 | (1.87) | (1.51) | (0.31) | |
| Year Ended October 31, 2017 | 12.23 | 0.22 | 2.50 | 2.72 | (0.69) | |
| Class C | ||||||
| Six Months Ended April 30, 2022(Unaudited) | 13.02 | 0.17 | (1.23) | (1.06) | (0.52) | |
| Year Ended October 31, 2021 | 9.14 | 0.33(g) | 3.79 | 4.12 | (0.24) | |
| Year Ended October 31, 2020 | 11.81 | 0.21 | (2.47) | (2.26) | (0.41) | |
| Year Ended October 31, 2019 | 12.02 | 0.36 | (0.18) | 0.18 | (0.39) | |
| Year Ended October 31, 2018 | 13.78 | 0.28 | (1.82) | (1.54) | (0.22) | |
| Year Ended October 31, 2017 | 11.88 | 0.15 | 2.42 | 2.57 | (0.67) | |
| Class I | ||||||
| Six Months Ended April 30, 2022(Unaudited) | 13.84 | 0.25 | (1.33) | (1.08) | (0.64) | |
| Year Ended October 31, 2021 | 9.72 | 0.47(g) | 3.99 | 4.46 | (0.34) | |
| Year Ended October 31, 2020 | 12.54 | 0.31 | (2.61) | (2.30) | (0.52) | |
| Year Ended October 31, 2019 | 12.76 | 0.48 | (0.20) | 0.28 | (0.50) | |
| Year Ended October 31, 2018 | 14.62 | 0.41 | (1.92) | (1.51) | (0.35) | |
| Year Ended October 31, 2017 | 12.57 | 0.28 | 2.55 | 2.83 | (0.78) | |
| Class L | ||||||
| Six Months Ended April 30, 2022(Unaudited) | 13.78 | 0.25 | (1.33) | (1.08) | (0.65) | |
| Year Ended October 31, 2021 | 9.66 | 0.47(g) | 3.99 | 4.46 | (0.34) | |
| Year Ended October 31, 2020 | 12.47 | 0.30 | (2.58) | (2.28) | (0.53) | |
| Year Ended October 31, 2019 | 12.70 | 0.46 | (0.17) | 0.29 | (0.52) | |
| Year Ended October 31, 2018 | 14.55 | 0.41 | (1.90) | (1.49) | (0.36) | |
| Year Ended October 31, 2017 | 12.50 | 0.27 | 2.57 | 2.84 | (0.79) | |
| Class R2 | ||||||
| Six Months Ended April 30, 2022(Unaudited) | 13.22 | 0.20 | (1.26) | (1.06) | (0.57) | |
| Year Ended October 31, 2021 | 9.29 | 0.39(g) | 3.82 | 4.21 | (0.28) | |
| Year Ended October 31, 2020 | 11.96 | 0.24 | (2.51) | (2.27) | (0.40) | |
| Year Ended October 31, 2019 | 12.20 | 0.40 | (0.20) | 0.20 | (0.44) | |
| Year Ended October 31, 2018 | 14.01 | 0.31 | (1.84) | (1.53) | (0.28) | |
| Year Ended October 31, 2017 | 12.04 | 0.19 | 2.46 | 2.65 | (0.68) | |
| Class R5 | ||||||
| Six Months Ended April 30, 2022(Unaudited) | 13.67 | 0.28 | (1.34) | (1.06) | (0.64) | |
| Year Ended October 31, 2021 | 9.60 | 0.41(g) | 4.02 | 4.43 | (0.36) | |
| Year Ended October 31, 2020 | 12.40 | 0.33 | (2.59) | (2.26) | (0.54) | |
| Year Ended October 31, 2019 | 12.65 | 0.49 | (0.21) | 0.28 | (0.53) | |
| Year Ended October 31, 2018 | 14.51 | 0.42 | (1.91) | (1.49) | (0.37) | |
| Year Ended October 31, 2017 | 12.51 | 0.23 | 2.59 | 2.82 | (0.82) | |
| 106 | J.P. Morgan International Equity Funds | April 30, 2022 |
| Ratios/Supplemental data | |||||||
| Ratios to average net assets(a) | |||||||
| Net asset value, end of period | Total return (excludes sales charge)(c)(d) | Net assets, end of period (000's) | Net expenses(e) | Net investment income (loss) | Expenses without waivers and reimbursements(f) | Portfolio turnover rate(d) | |
| $11.79 | (8.05)% | $177,422 | 1.00(f)% | 3.55(f)% | 1.23(f)% | 11% | |
| 13.46 | 46.20 | 187,774 | 1.00 | 3.39(g) | 1.24 | 33 | |
| 9.46 | (19.51) | 125,744 | 1.00 | 2.66 | 1.26 | 59 | |
| 12.22 | 2.30 | 181,458 | 1.00 | 3.69 | 1.28 | 61 | |
| 12.44 | (10.88) | 242,231 | 1.00 | 2.59 | 1.27 | 90 | |
| 14.26 | 23.30 | 316,510 | 1.35 | 1.71 | 1.35 | 31 | |
| 11.44 | (8.34) | 2,490 | 1.50(f) | 2.79(f) | 1.76(f) | 11 | |
| 13.02 | 45.54 | 3,923 | 1.50 | 2.70(g) | 1.77 | 33 | |
| 9.14 | (19.94) | 4,202 | 1.50 | 2.07 | 1.78 | 59 | |
| 11.81 | 1.82 | 9,358 | 1.50 | 3.15 | 1.80 | 61 | |
| 12.02 | (11.37) | 14,055 | 1.50 | 2.06 | 1.78 | 90 | |
| 13.78 | 22.67 | 20,997 | 1.85 | 1.21 | 1.87 | 31 | |
| 12.12 | (7.97) | 37,651 | 0.75(f) | 3.86(f) | 0.98(f) | 11 | |
| 13.84 | 46.51 | 39,188 | 0.75 | 3.58(g) | 0.99 | 33 | |
| 9.72 | (19.31) | 26,805 | 0.75 | 2.88 | 1.02 | 59 | |
| 12.54 | 2.56 | 45,503 | 0.75 | 3.91 | 1.03 | 61 | |
| 12.76 | (10.62) | 66,291 | 0.75 | 2.84 | 1.02 | 90 | |
| 14.62 | 23.66 | 144,875 | 1.04 | 2.07 | 1.04 | 31 | |
| 12.05 | (8.00) | 6,285 | 0.66(f) | 3.88(f) | 0.84(f) | 11 | |
| 13.78 | 46.77 | 7,042 | 0.66 | 3.66(g) | 0.84 | 33 | |
| 9.66 | (19.25) | 5,585 | 0.65 | 2.72 | 0.85 | 59 | |
| 12.47 | 2.69 | 30,256 | 0.65 | 3.81 | 0.87 | 61 | |
| 12.70 | (10.57) | 73,651 | 0.65 | 2.84 | 0.87 | 90 | |
| 14.55 | 23.88 | 201,672 | 0.87 | 2.03 | 0.88 | 31 | |
| 11.59 | (8.22) | 500 | 1.30(f) | 3.25(f) | 1.59(f) | 11 | |
| 13.22 | 45.84 | 514 | 1.30 | 3.14(g) | 1.59 | 33 | |
| 9.29 | (19.74) | 412 | 1.30 | 2.27 | 1.61 | 59 | |
| 11.96 | 2.00 | 722 | 1.30 | 3.47 | 1.69 | 61 | |
| 12.20 | (11.19) | 1,025 | 1.30 | 2.27 | 1.59 | 90 | |
| 14.01 | 23.02 | 1,369 | 1.58 | 1.52 | 1.73 | 31 | |
| 11.97 | (7.93) | 33 | 0.65(f) | 4.35(f) | 0.84(f) | 11 | |
| 13.67 | 46.74 | 67 | 0.65 | 3.24(g) | 0.85 | 33 | |
| 9.60 | (19.26) | 77 | 0.65 | 3.13 | 0.86 | 59 | |
| 12.40 | 2.64 | 88 | 0.65 | 4.08 | 0.87 | 61 | |
| 12.65 | (10.58) | 70 | 0.65 | 2.97 | 0.91 | 90 | |
| 14.51 | 23.81 | 62 | 0.93 | 1.69 | 4.00 | 31 | |
| April 30, 2022 | J.P. Morgan International Equity Funds | 107 |
| Per share operating performance | ||||||
| Investment operations | Distributions | |||||
| Net asset value, beginning of period | Net investment income (loss)(b) | Net realized and unrealized gains (losses) on investments | Total from investment operations | Net investment income | ||
| Class R6 | ||||||
| Six Months Ended April 30, 2022(Unaudited) | $13.71 | $0.26 | $(1.32) | $(1.06) | $(0.67) | |
| Year Ended October 31, 2021 | 9.62 | 0.49(g) | 3.97 | 4.46 | (0.37) | |
| Year Ended October 31, 2020 | 12.43 | 0.34 | (2.60) | (2.26) | (0.55) | |
| Year Ended October 31, 2019 | 12.67 | 0.51 | (0.21) | 0.30 | (0.54) | |
| Year Ended October 31, 2018 | 14.53 | 0.43 | (1.91) | (1.48) | (0.38) | |
| Year Ended October 31, 2017 | 12.51 | 0.31 | 2.53 | 2.84 | (0.82) | |
| (a) | Annualized for periods less than one year, unless otherwise noted. |
| (b) | Calculated based upon average shares outstanding. |
| (c) | Includes adjustments in accordance with accounting principles generally accepted in the United States of America and as such, the net asset values for financial reporting purposes and the returns based upon those net asset values may differ from the net asset values and returns for shareholder transactions. |
| (d) | Not annualized for periods less than one year. |
| (e) | Includes interest expense, if applicable, which is less than 0.005% unless otherwise noted. |
| (f) | Certain non-recurring expenses incurred by the Fund were not annualized for the period indicated. |
| (g) | Reflects income from foreign withholding tax claims, including related interest income, less IRS compliance fees. Without these proceeds, the net investment income (loss) per share would have been $0.38, $0.28, $0.42, $0.41, $0.34, $0.35 and $0.44 for Class A, Class C, Class I, Class L, Class R2, Class R5, and Class R6,respectively, and the net investment income (loss) ratios would have been 3.00%, 2.26%, 3.19%, 3.23%, 2.72%, 2.80% and 3.44% for Class A, Class C, Class I, Class L, Class R2, Class R5, and Class R6, respectively. |
| 108 | J.P. Morgan International Equity Funds | April 30, 2022 |
| Ratios/Supplemental data | |||||||
| Ratios to average net assets(a) | |||||||
| Net asset value, end of period | Total return (excludes sales charge)(c)(d) | Net assets, end of period (000's) | Net expenses(e) | Net investment income (loss) | Expenses without waivers and reimbursements(f) | Portfolio turnover rate(d) | |
| $11.98 | (7.93)% | $163,319 | 0.55(f)% | 4.07(f)% | 0.73(f)% | 11% | |
| 13.71 | 46.99 | 158,191 | 0.55 | 3.83(g) | 0.73 | 33 | |
| 9.62 | (19.22) | 105,039 | 0.55 | 3.18 | 0.76 | 59 | |
| 12.43 | 2.83 | 125,887 | 0.55 | 4.22 | 0.77 | 61 | |
| 12.67 | (10.49) | 124,246 | 0.55 | 3.06 | 0.77 | 90 | |
| 14.53 | 23.99 | 108,302 | 0.80 | 2.28 | 0.82 | 31 | |
| April 30, 2022 | J.P. Morgan International Equity Funds | 109 |
| Classes Offered | Trust | Diversification Classification | |
| JPMorgan Emerging Markets Equity Fund | Class A, Class C, Class I, Class L, Class R2, Class R3, Class R4, Class R5 and Class R6 | JPM I | Diversified |
| JPMorgan Emerging Markets Research Enhanced Equity Fund | Class I and Class R6 | JPM IV | Diversified |
| JPMorgan Europe Dynamic Fund | Class A, Class C, Class I, Class L and Class R6 | JPM I | Diversified |
| JPMorgan International Equity Fund | Class A, Class C, Class I, Class R2, Class R5 and Class R6 | JPM I | Diversified |
| JPMorgan International Focus Fund | Class A, Class C, Class I, Class R2, Class R5 and Class R6 | JPM I | Diversified |
| JPMorgan International Hedged Equity Fund | Class A, Class C, Class I, Class R5 and Class R6 | JPM IV | Diversified |
| JPMorgan International Research Enhanced Equity Fund | Class A, Class I and Class R6 | JPM II | Diversified |
| JPMorgan International Value Fund | Class A, Class C, Class I, Class L, Class R2, Class R5 and Class R6 | JPM I | Diversified |
| 110 | J.P. Morgan International Equity Funds | April 30, 2022 |
| • | Level 1 — Unadjusted inputs using quoted prices in active markets for identical investments. |
| • | Level 2 — Other significant observable inputs including, but not limited to, quoted prices for similar investments, inputs other than quoted prices that are observable for investments (such as interest rates, prepayment speeds, credit risk, etc.) or other market corroborated inputs. |
| • | Level 3 — Significant inputs based on the best information available in the circumstances, to the extent observable inputs are not available (including the Funds' assumptions in determining the fair value of investments). |
| April 30, 2022 | J.P. Morgan International Equity Funds | 111 |
| Emerging Markets Equity Fund | |||||||
| Level 1 Quoted prices | Level 2 Other significant observable inputs | Level 3 Significant unobservable inputs | Total | ||||
| Investments in Securities | |||||||
| Common Stocks | |||||||
| Brazil | $ 551,331 | $ — | $— | $ 551,331 | |||
| China | 247,149 | 2,704,394 | — | 2,951,543 | |||
| Hong Kong | — | 475,149 | — | 475,149 | |||
| India | 290,761 | 1,832,518 | — | 2,123,279 | |||
| Indonesia | — | 424,269 | — | 424,269 | |||
| Macau | — | 48,921 | — | 48,921 | |||
| Mexico | 303,316 | — | — | 303,316 | |||
| Panama | 66,264 | — | — | 66,264 | |||
| Poland | — | 34,466 | — | 34,466 | |||
| Portugal | — | 89,295 | — | 89,295 | |||
| South Africa | 72,233 | 73,285 | — | 145,518 | |||
| South Korea | — | 790,082 | — | 790,082 | |||
| Taiwan | 756,695 | 358,809 | — | 1,115,504 | |||
| United Kingdom | — | 109,652 | — | 109,652 | |||
| United States | 144,031 | 48,836 | — | 192,867 | |||
| Total Common Stocks | 2,431,780 | 6,989,676 | — | 9,421,456 | |||
| Short-Term Investments | |||||||
| Investment Companies | 267,806 | — | — | 267,806 | |||
| Investment of Cash Collateral from Securities Loaned | 107 | — | — | 107 | |||
| Total Short-Term Investments | 267,913 | — | — | 267,913 | |||
| Total Investments in Securities | $2,699,693 | $6,989,676 | $— | $9,689,369 | |||
| Emerging Markets Research Enhanced Equity Fund | ||||
| Level 1 Quoted prices | Level 2 Other significant observable inputs | Level 3 Significant unobservable inputs | Total | |
| Investments in Securities | ||||
| Common Stocks | ||||
| Brazil | $182,209 | $ — | $ — | $ 182,209 |
| Chile | 11,347 | — | — | 11,347 |
| China | 48,016 | 847,933 | — | 895,949 |
| Colombia | 5,352 | — | — | 5,352 |
| Greece | — | 14,274 | — | 14,274 |
| Hong Kong | — | 5,579 | — | 5,579 |
| Hungary | — | 11,198 | — | 11,198 |
| India | 42,303 | 335,312 | — | 377,615 |
| Indonesia | 16,177 | 38,174 | — | 54,351 |
| Malaysia | 13,972 | 20,624 | — | 34,596 |
| Mexico | 84,570 | — | — | 84,570 |
| Peru | 11,094 | — | — | 11,094 |
| Philippines | — | 13,330 | — | 13,330 |
| Poland | — | 13,262 | — | 13,262 |
| Qatar | 12,624 | 6,142 | — | 18,766 |
| Russia | — | — | 892 | 892 |
| Saudi Arabia | 4,249 | 120,714 | — | 124,963 |
| Singapore | — | 2,718 | — | 2,718 |
| 112 | J.P. Morgan International Equity Funds | April 30, 2022 |
| Emerging Markets Research Enhanced Equity Fund (continued) | |||||||
| Level 1 Quoted prices | Level 2 Other significant observable inputs | Level 3 Significant unobservable inputs | Total | ||||
| South Africa | $ 34,735 | $ 88,445 | $ — | $ 123,180 | |||
| South Korea | — | 392,600 | — | 392,600 | |||
| Taiwan | 28,492 | 404,323 | — | 432,815 | |||
| Thailand | 54,907 | 6,990 | — | 61,897 | |||
| Turkey | 6,651 | — | — | 6,651 | |||
| United Arab Emirates | 6,720 | 21,354 | — | 28,074 | |||
| United States | — | 1,399 | — | 1,399 | |||
| Total Common Stocks | 563,418 | 2,344,371 | 892 | 2,908,681 | |||
| Short-Term Investments | |||||||
| Investment Companies | 43,823 | — | — | 43,823 | |||
| Investment of Cash Collateral from Securities Loaned | 14,062 | — | — | 14,062 | |||
| Total Short-Term Investments | 57,885 | — | — | 57,885 | |||
| Total Investments in Securities | $621,303 | $2,344,371 | $892 | $2,966,566 | |||
| Appreciation in Other Financial Instruments | |||||||
| Futures Contracts | $ 77 | $ — | $ — | $ 77 | |||
| Europe Dynamic Fund | |||||||
| Level 1 Quoted prices | Level 2 Other significant observable inputs | Level 3 Significant unobservable inputs | Total | ||||
| Investments in Securities | |||||||
| Common Stocks | |||||||
| Australia | $ — | $ 12,823 | $— | $ 12,823 | |||
| Austria | — | 6,617 | — | 6,617 | |||
| Denmark | — | 47,127 | — | 47,127 | |||
| Finland | — | 20,959 | — | 20,959 | |||
| France | — | 97,803 | — | 97,803 | |||
| Germany | — | 92,385 | — | 92,385 | |||
| Ireland | 9,168 | 108 | — | 9,276 | |||
| Italy | — | 7,051 | — | 7,051 | |||
| Luxembourg | — | 6,134 | — | 6,134 | |||
| Netherlands | — | 38,030 | — | 38,030 | |||
| Norway | — | 8,688 | — | 8,688 | |||
| Spain | — | 7,753 | — | 7,753 | |||
| Switzerland | — | 105,063 | — | 105,063 | |||
| United Kingdom | 1,867 | 117,059 | — | 118,926 | |||
| United States | — | 14,381 | — | 14,381 | |||
| Total Common Stocks | 11,035 | 581,981 | — | 593,016 | |||
| Short-Term Investments | |||||||
| Investment Companies | 12,091 | — | — | 12,091 | |||
| Investment of Cash Collateral from Securities Loaned | 48,178 | — | — | 48,178 | |||
| Total Short-Term Investments | 60,269 | — | — | 60,269 | |||
| April 30, 2022 | J.P. Morgan International Equity Funds | 113 |
| Europe Dynamic Fund (continued) | |||||||
| Level 1 Quoted prices | Level 2 Other significant observable inputs | Level 3 Significant unobservable inputs | Total | ||||
| Total Investments in Securities | $71,304 | $581,981 | $— | $653,285 | |||
| Depreciation in Other Financial Instruments | |||||||
| Futures Contracts | $ (264) | $ — | $— | $ (264) | |||
| International Equity Fund | |||||||
| Level 1 Quoted prices | Level 2 Other significant observable inputs | Level 3 Significant unobservable inputs | Total | ||||
| Investments in Securities | |||||||
| Common Stocks | |||||||
| Australia | $ — | $ 112,477 | $— | $ 112,477 | |||
| Austria | — | 36,856 | — | 36,856 | |||
| Belgium | — | 59,685 | — | 59,685 | |||
| China | — | 34,693 | — | 34,693 | |||
| Denmark | — | 260,363 | — | 260,363 | |||
| Finland | — | 29,279 | — | 29,279 | |||
| France | — | 679,203 | — | 679,203 | |||
| Germany | — | 378,463 | — | 378,463 | |||
| Hong Kong | — | 157,403 | — | 157,403 | |||
| India | 41,122 | — | — | 41,122 | |||
| Japan | — | 537,131 | — | 537,131 | |||
| Netherlands | — | 253,370 | — | 253,370 | |||
| Singapore | — | 92,118 | — | 92,118 | |||
| South Africa | — | 68,826 | — | 68,826 | |||
| South Korea | — | 76,370 | — | 76,370 | |||
| Spain | — | 92,781 | — | 92,781 | |||
| Sweden | — | 163,086 | — | 163,086 | |||
| Switzerland | — | 460,691 | — | 460,691 | |||
| Taiwan | 60,289 | — | — | 60,289 | |||
| United Kingdom | — | 451,538 | — | 451,538 | |||
| United States | — | 188,984 | — | 188,984 | |||
| Total Common Stocks | 101,411 | 4,133,317 | — | 4,234,728 | |||
| Short-Term Investments | |||||||
| Investment Companies | 127,803 | — | — | 127,803 | |||
| Investment of Cash Collateral from Securities Loaned | 202,371 | — | — | 202,371 | |||
| Total Short-Term Investments | 330,174 | — | — | 330,174 | |||
| Total Investments in Securities | $431,585 | $4,133,317 | $— | $4,564,902 | |||
| International Focus Fund | ||||
| Level 1 Quoted prices | Level 2 Other significant observable inputs | Level 3 Significant unobservable inputs | Total | |
| Investments in Securities | ||||
| Common Stocks | ||||
| Australia | $ — | $ 49,409 | $— | $ 49,409 |
| Belgium | — | 28,987 | — | 28,987 |
| Canada | 80,585 | — | — | 80,585 |
| 114 | J.P. Morgan International Equity Funds | April 30, 2022 |
| International Focus Fund (continued) | |||||||
| Level 1 Quoted prices | Level 2 Other significant observable inputs | Level 3 Significant unobservable inputs | Total | ||||
| China | $ — | $ 33,657 | $— | $ 33,657 | |||
| Denmark | — | 74,064 | — | 74,064 | |||
| France | — | 138,178 | — | 138,178 | |||
| Germany | — | 75,560 | — | 75,560 | |||
| Hong Kong | — | 68,290 | — | 68,290 | |||
| India | 33,384 | — | — | 33,384 | |||
| Indonesia | — | 26,541 | — | 26,541 | |||
| Japan | — | 65,907 | — | 65,907 | |||
| Netherlands | — | 104,594 | — | 104,594 | |||
| Singapore | — | 37,318 | — | 37,318 | |||
| South Africa | — | 44,450 | — | 44,450 | |||
| South Korea | — | 62,928 | — | 62,928 | |||
| Spain | — | 30,314 | — | 30,314 | |||
| Sweden | — | 19,881 | — | 19,881 | |||
| Switzerland | — | 157,149 | — | 157,149 | |||
| Taiwan | 45,891 | — | — | 45,891 | |||
| United Kingdom | — | 138,706 | — | 138,706 | |||
| United States | — | 46,568 | — | 46,568 | |||
| Total Common Stocks | 159,860 | 1,202,501 | — | 1,362,361 | |||
| Short-Term Investments | |||||||
| Investment Companies | 39,689 | — | — | 39,689 | |||
| Total Investments in Securities | $199,549 | $1,202,501 | $— | $1,402,050 | |||
| International Hedged Equity Fund | ||||
| Level 1 Quoted prices | Level 2 Other significant observable inputs | Level 3 Significant unobservable inputs | Total | |
| Investments in Securities | ||||
| Common Stocks | ||||
| Australia | $ — | $ 10,304 | $— | $ 10,304 |
| Belgium | — | 689 | — | 689 |
| China | — | 829 | — | 829 |
| Denmark | — | 5,467 | — | 5,467 |
| Finland | — | 1,281 | — | 1,281 |
| France | — | 18,235 | — | 18,235 |
| Germany | — | 14,703 | — | 14,703 |
| Hong Kong | — | 4,098 | — | 4,098 |
| Ireland | — | 761 | — | 761 |
| Italy | — | 1,089 | — | 1,089 |
| Japan | — | 35,565 | — | 35,565 |
| Luxembourg | — | 216 | — | 216 |
| Netherlands | — | 10,054 | — | 10,054 |
| Singapore | — | 1,603 | — | 1,603 |
| Spain | — | 4,511 | — | 4,511 |
| Sweden | — | 3,155 | — | 3,155 |
| Switzerland | — | 18,526 | — | 18,526 |
| Taiwan | 119 | — | — | 119 |
| United Kingdom | — | 21,800 | — | 21,800 |
| April 30, 2022 | J.P. Morgan International Equity Funds | 115 |
| International Hedged Equity Fund (continued) | |||||||
| Level 1 Quoted prices | Level 2 Other significant observable inputs | Level 3 Significant unobservable inputs | Total | ||||
| United States | $ — | $ 3,117 | $— | $ 3,117 | |||
| Total Common Stocks | 119 | 156,003 | — | 156,122 | |||
| Options Purchased | |||||||
| Put Options Purchased | 6,077 | — | — | 6,077 | |||
| Short-Term Investments | |||||||
| Investment Companies | 7,724 | — | — | 7,724 | |||
| Total Investments in Securities | $13,920 | $156,003 | $— | $169,923 | |||
| Appreciation in Other Financial Instruments | |||||||
| Futures Contracts | $ 100 | $ — | $— | $ 100 | |||
| Depreciation in Other Financial Instruments | |||||||
| Futures Contracts | (323) | — | — | (323) | |||
| Options Written | |||||||
| Call Options Written | (156) | — | — | (156) | |||
| Put Options Written | (880) | — | — | (880) | |||
| Total Net Appreciation/ Depreciation in Other Financial Instruments | $ (1,259) | $ — | $— | $ (1,259) | |||
| International Research Enhanced Equity Fund | |||||||
| Level 1 Quoted prices | Level 2 Other significant observable inputs | Level 3 Significant unobservable inputs | Total | ||||
| Investments in Securities | |||||||
| Common Stocks | |||||||
| Australia | $ — | $ 320,921 | $— | $ 320,921 | |||
| Belgium | — | 23,440 | — | 23,440 | |||
| China | — | 26,691 | — | 26,691 | |||
| Denmark | — | 187,490 | — | 187,490 | |||
| Finland | — | 44,172 | — | 44,172 | |||
| France | — | 629,936 | — | 629,936 | |||
| Germany | — | 506,525 | — | 506,525 | |||
| Hong Kong | — | 120,115 | — | 120,115 | |||
| Ireland | — | 26,126 | — | 26,126 | |||
| Italy | — | 39,453 | — | 39,453 | |||
| Japan | — | 1,053,844 | — | 1,053,844 | |||
| Luxembourg | — | 8,453 | — | 8,453 | |||
| Malta | — | — | 2 | 2 | |||
| Netherlands | — | 348,179 | — | 348,179 | |||
| Singapore | — | 50,120 | — | 50,120 | |||
| Spain | — | 152,467 | — | 152,467 | |||
| Sweden | — | 108,048 | — | 108,048 | |||
| Switzerland | — | 631,425 | — | 631,425 | |||
| Taiwan | 3,953 | — | — | 3,953 | |||
| United Kingdom | — | 752,505 | — | 752,505 | |||
| United States | — | 104,939 | — | 104,939 | |||
| Total Common Stocks | 3,953 | 5,134,849 | 2 | 5,138,804 | |||
| Short-Term Investments | |||||||
| Investment Companies | 204,862 | — | — | 204,862 | |||
| 116 | J.P. Morgan International Equity Funds | April 30, 2022 |
| International Research Enhanced Equity Fund (continued) | |||||||
| Level 1 Quoted prices | Level 2 Other significant observable inputs | Level 3 Significant unobservable inputs | Total | ||||
| Investment of Cash Collateral from Securities Loaned | $200,900 | $ — | $— | $ 200,900 | |||
| Total Short-Term Investments | 405,762 | — | — | 405,762 | |||
| Total Investments in Securities | $409,715 | $5,134,849 | $ 2 | $5,544,566 | |||
| Appreciation in Other Financial Instruments | |||||||
| Futures Contracts | $ 2,036 | $ — | $— | $ 2,036 | |||
| Depreciation in Other Financial Instruments | |||||||
| Futures Contracts | (1,379) | — | — | (1,379) | |||
| Total Net Appreciation/ Depreciation in Other Financial Instruments | $ 657 | $ — | $— | $ 657 | |||
| International Value Fund | |||||||
| Level 1 Quoted prices | Level 2 Other significant observable inputs | Level 3 Significant unobservable inputs | Total | ||||
| Investments in Securities | |||||||
| Common Stocks | |||||||
| Australia | $ — | $ 32,984 | $— | $ 32,984 | |||
| Austria | — | 5,257 | — | 5,257 | |||
| Belgium | — | 1,854 | — | 1,854 | |||
| China | — | 1,964 | — | 1,964 | |||
| Denmark | 532 | 5,969 | — | 6,501 | |||
| Egypt | 1,100 | — | — | 1,100 | |||
| Finland | — | 6,070 | — | 6,070 | |||
| France | — | 31,244 | — | 31,244 | |||
| Germany | — | 38,043 | — | 38,043 | |||
| Hong Kong | — | 3,886 | — | 3,886 | |||
| Italy | — | 13,172 | — | 13,172 | |||
| Japan | — | 81,583 | — | 81,583 | |||
| Luxembourg | — | 2,045 | — | 2,045 | |||
| Malta | — | 504 | — | 504 | |||
| Netherlands | — | 23,625 | — | 23,625 | |||
| Norway | 1,403 | 8,444 | — | 9,847 | |||
| Singapore | 497 | 5,188 | — | 5,685 | |||
| South Africa | — | 3,373 | — | 3,373 | |||
| Spain | — | 12,674 | — | 12,674 | |||
| Sweden | 274 | 10,122 | — | 10,396 | |||
| Switzerland | — | 24,164 | — | 24,164 | |||
| United Kingdom | 2,401 | 52,632 | — | 55,033 | |||
| United States | — | 9,539 | — | 9,539 | |||
| Total Common Stocks | 6,207 | 374,336 | — | 380,543 | |||
| Short-Term Investments | |||||||
| Investment Companies | 5,753 | — | — | 5,753 | |||
| Investment of Cash Collateral from Securities Loaned | 19,882 | — | — | 19,882 | |||
| Total Short-Term Investments | 25,635 | — | — | 25,635 | |||
| Total Investments in Securities | $31,842 | $374,336 | $— | $406,178 | |||
| April 30, 2022 | J.P. Morgan International Equity Funds | 117 |
| Investment Securities on Loan, at value, Presented on the Statements of Assets and Liabilities | Cash Collateral Posted by Borrower* | Net Amount Due to Counterparty (not less than zero) | |
| Emerging Markets Equity Fund | $ 106 | $ (106) | $— |
| Emerging Markets Research Enhanced Equity Fund | 13,480 | (13,480) | — |
| Europe Dynamic Fund | 44,177 | (44,177) | — |
| International Equity Fund | 169,016 | (169,016) | — |
| International Research Enhanced Equity Fund | 177,073 | (177,073) | — |
| International Value Fund | 18,772 | (18,772) | — |
| * | Collateral posted reflects the value of securities on loan and does not include any additional amounts received from the borrower. |
| 118 | J.P. Morgan International Equity Funds | April 30, 2022 |
| Emerging Markets Equity Fund | $6 |
| Emerging Markets Research Enhanced Equity Fund | 2 |
| Europe Dynamic Fund | 2 |
| International Equity Fund | 8 |
| International Focus Fund | 3 |
| International Research Enhanced Equity Fund | 4 |
| International Value Fund | 1 |
| Emerging Markets Equity Fund | |||||||||||||||
| For the six months ended April 30, 2022 | |||||||||||||||
| Security Description | Value at October 31, 2021 | Purchases at Cost | Proceeds from Sales | Net Realized Gain (Loss) | Change in Unrealized Appreciation/ (Depreciation) | Value at April 30, 2022 | Shares at April 30, 2022 | Dividend Income | Capital Gain Distributions | ||||||
| JPMorgan Prime Money Market Fund Class Institutional Shares, 0.36% (a) (b) | $ 24,800 | $1,675,531 | $1,432,508 | $(21) | $ 4 | $267,806 | 267,753 | $ 90 | $— | ||||||
| JPMorgan Securities Lending Money Market Fund Agency SL Class Shares, 0.37% (a) (b) | 222,040 | 150,500 | 372,500 | (32)* | —(c) | 8 | 8 | 26* | — | ||||||
| JPMorgan U.S. Government Money Market Fund Class IM Shares, 0.37% (a) (b) | 25,886 | 319,665 | 345,452 | — | — | 99 | 99 | 2* | — | ||||||
| Total | $272,726 | $2,145,696 | $2,150,460 | $(53) | $ 4 | $267,913 | $118 | $— | |||||||
| (a) | Investment in an affiliated fund, which is registered under the Investment Company Act of 1940, as amended, and is advised by J.P. Morgan Investment Management Inc. |
| (b) | The rate shown is the current yield as of April 30, 2022. |
| (c) | Amount rounds to less than one thousand. |
| * | Amount is included on the Statements of Operations as Income from securities lending (net) (after payments of rebates and Citibank’s fee). |
| April 30, 2022 | J.P. Morgan International Equity Funds | 119 |
| Emerging Markets Research Enhanced Equity Fund | |||||||||||||||
| For the six months ended April 30, 2022 | |||||||||||||||
| Security Description | Value at October 31, 2021 | Purchases at Cost | Proceeds from Sales | Net Realized Gain (Loss) | Change in Unrealized Appreciation/ (Depreciation) | Value at April 30, 2022 | Shares at April 30, 2022 | Dividend Income | Capital Gain Distributions | ||||||
| JPMorgan Prime Money Market Fund Class Institutional Shares, 0.36% (a) (b) | $ 3,718 | $745,224 | $705,105 | $(14) | $—(c) | $43,823 | 43,814 | $34 | $— | ||||||
| JPMorgan Securities Lending Money Market Fund Agency SL Class Shares, 0.37% (a) (b) | 22,493 | 48,000 | 64,000 | (8)* | 1 | 6,486 | 6,491 | 7* | — | ||||||
| JPMorgan U.S. Government Money Market Fund Class IM Shares, 0.37% (a) (b) | 2,859 | 98,486 | 93,769 | — | — | 7,576 | 7,576 | 2* | — | ||||||
| Total | $29,070 | $891,710 | $862,874 | $(22) | $ 1 | $57,885 | $43 | $— | |||||||
| (a) | Investment in an affiliated fund, which is registered under the Investment Company Act of 1940, as amended, and is advised by J.P. Morgan Investment Management Inc. |
| (b) | The rate shown is the current yield as of April 30, 2022. |
| (c) | Amount rounds to less than one thousand. |
| * | Amount is included on the Statements of Operations as Income from securities lending (net) (after payments of rebates and Citibank’s fee). |
| Europe Dynamic Fund | |||||||||||||||
| For the six months ended April 30, 2022 | |||||||||||||||
| Security Description | Value at October 31, 2021 | Purchases at Cost | Proceeds from Sales | Net Realized Gain (Loss) | Change in Unrealized Appreciation/ (Depreciation) | Value at April 30, 2022 | Shares at April 30, 2022 | Dividend Income | Capital Gain Distributions | ||||||
| JPMorgan Prime Money Market Fund Class Institutional Shares, 0.36% (a) (b) | $46,060 | $253,946 | $287,907 | $(7) | $(1) | $12,091 | 12,089 | $10 | $— | ||||||
| JPMorgan Securities Lending Money Market Fund Agency SL Class Shares, 0.37% (a) (b) | — | 73,000 | 39,000 | 1* | —(c) | 34,001 | 34,025 | 8* | — | ||||||
| JPMorgan U.S. Government Money Market Fund Class IM Shares, 0.37% (a) (b) | 7,173 | 129,488 | 122,484 | — | — | 14,177 | 14,177 | 4* | — | ||||||
| Total | $53,233 | $456,434 | $449,391 | $(6) | $(1) | $60,269 | $22 | $— | |||||||
| (a) | Investment in an affiliated fund, which is registered under the Investment Company Act of 1940, as amended, and is advised by J.P. Morgan Investment Management Inc. |
| (b) | The rate shown is the current yield as of April 30, 2022. |
| (c) | Amount rounds to less than one thousand. |
| * | Amount is included on the Statements of Operations as Income from securities lending (net) (after payments of rebates and Citibank’s fee). |
| 120 | J.P. Morgan International Equity Funds | April 30, 2022 |
| International Equity Fund | |||||||||||||||
| For the six months ended April 30, 2022 | |||||||||||||||
| Security Description | Value at October 31, 2021 | Purchases at Cost | Proceeds from Sales | Net Realized Gain (Loss) | Change in Unrealized Appreciation/ (Depreciation) | Value at April 30, 2022 | Shares at April 30, 2022 | Dividend Income | Capital Gain Distributions | ||||||
| JPMorgan Prime Money Market Fund Class Institutional Shares, 0.36% (a) (b) | $123,785 | $ 968,511 | $ 964,468 | $(44) | $19 | $127,803 | 127,777 | $ 69 | $— | ||||||
| JPMorgan Securities Lending Money Market Fund Agency SL Class Shares, 0.37% (a) (b) | 111,000 | 561,000 | 535,975 | (16)* | —(c) | 136,009 | 136,104 | 59* | — | ||||||
| JPMorgan U.S. Government Money Market Fund Class IM Shares, 0.37% (a) (b) | 13,466 | 609,509 | 556,613 | — | — | 66,362 | 66,362 | 16* | — | ||||||
| Total | $248,251 | $2,139,020 | $2,057,056 | $(60) | $19 | $330,174 | $144 | $— | |||||||
| (a) | Investment in an affiliated fund, which is registered under the Investment Company Act of 1940, as amended, and is advised by J.P. Morgan Investment Management Inc. |
| (b) | The rate shown is the current yield as of April 30, 2022. |
| (c) | Amount rounds to less than one thousand. |
| * | Amount is included on the Statements of Operations as Income from securities lending (net) (after payments of rebates and Citibank’s fee). |
| International Focus Fund | |||||||||||||||
| For the six months ended April 30, 2022 | |||||||||||||||
| Security Description | Value at October 31, 2021 | Purchases at Cost | Proceeds from Sales | Net Realized Gain (Loss) | Change in Unrealized Appreciation/ (Depreciation) | Value at April 30, 2022 | Shares at April 30, 2022 | Dividend Income | Capital Gain Distributions | ||||||
| JPMorgan Prime Money Market Fund Class Institutional Shares, 0.36% (a) (b) | $47,837 | $595,620 | $ 603,760 | $ (5) | $(3) | $39,689 | 39,681 | $34 | $— | ||||||
| JPMorgan Securities Lending Money Market Fund Agency SL Class Shares, 0.37% (a) (b) | 33,000 | 234,000 | 266,986 | (14)* | — | — | — | 8* | — | ||||||
| JPMorgan U.S. Government Money Market Fund Class IM Shares, 0.37% (a) (b) | 3,469 | 160,401 | 163,870 | — | — | — | — | 5* | — | ||||||
| Total | $84,306 | $990,021 | $1,034,616 | $(19) | $(3) | $39,689 | $47 | $— | |||||||
| (a) | Investment in an affiliated fund, which is registered under the Investment Company Act of 1940, as amended, and is advised by J.P. Morgan Investment Management Inc. |
| (b) | The rate shown is the current yield as of April 30, 2022. |
| * | Amount is included on the Statements of Operations as Income from securities lending (net) (after payments of rebates and Citibank’s fee). |
| International Hedged Equity Fund | |||||||||||||||
| For the six months ended April 30, 2022 | |||||||||||||||
| Security Description | Value at October 31, 2021 | Purchases at Cost | Proceeds from Sales | Net Realized Gain (Loss) | Change in Unrealized Appreciation/ (Depreciation) | Value at April 30, 2022 | Shares at April 30, 2022 | Dividend Income | Capital Gain Distributions | ||||||
| JPMorgan U.S. Government Money Market Fund Class Institutional Shares, 0.29% (a) (b) | $3,536 | $54,734 | $50,546 | $— | $— | $7,724 | 7,724 | $2 | $— | ||||||
| (a) | Investment in an affiliated fund, which is registered under the Investment Company Act of 1940, as amended, and is advised by J.P. Morgan Investment Management Inc. |
| (b) | The rate shown is the current yield as of April 30, 2022. |
| April 30, 2022 | J.P. Morgan International Equity Funds | 121 |
| International Research Enhanced Equity Fund | |||||||||||||||
| For the six months ended April 30, 2022 | |||||||||||||||
| Security Description | Value at October 31, 2021 | Purchases at Cost | Proceeds from Sales | Net Realized Gain (Loss) | Change in Unrealized Appreciation/ (Depreciation) | Value at April 30, 2022 | Shares at April 30, 2022 | Dividend Income | Capital Gain Distributions | ||||||
| JPMorgan Prime Money Market Fund Class Institutional Shares, 0.36% (a) (b) | $ 93,239 | $ 936,459 | $ 824,801 | $(36) | $ 1 | $204,862 | 204,821 | $ 96 | $— | ||||||
| JPMorgan Securities Lending Money Market Fund Agency SL Class Shares, 0.37% (a) (b) | 82,347 | 399,000 | 354,000 | (10)* | (4) | 127,333 | 127,422 | 47* | — | ||||||
| JPMorgan U.S. Government Money Market Fund Class IM Shares, 0.37% (a) (b) | 10,123 | 411,295 | 347,851 | — | — | 73,567 | 73,567 | 18* | — | ||||||
| Total | $185,709 | $1,746,754 | $1,526,652 | $(46) | $(3) | $405,762 | $161 | $— | |||||||
| (a) | Investment in an affiliated fund, which is registered under the Investment Company Act of 1940, as amended, and is advised by J.P. Morgan Investment Management Inc. |
| (b) | The rate shown is the current yield as of April 30, 2022. |
| * | Amount is included on the Statements of Operations as Income from securities lending (net) (after payments of rebates and Citibank’s fee). |
| International Value Fund | |||||||||||||||
| For the six months ended April 30, 2022 | |||||||||||||||
| Security Description | Value at October 31, 2021 | Purchases at Cost | Proceeds from Sales | Net Realized Gain (Loss) | Change in Unrealized Appreciation/ (Depreciation) | Value at April 30, 2022 | Shares at April 30, 2022 | Dividend Income | Capital Gain Distributions | ||||||
| JPMorgan Prime Money Market Fund Class Institutional Shares, 0.36% (a) (b) | $2,400 | $ 40,191 | $ 36,838 | $(1) | $ 1 | $ 5,753 | 5,751 | $ 5 | $— | ||||||
| JPMorgan Securities Lending Money Market Fund Agency SL Class Shares, 0.37% (a) (b) | 3,199 | 41,501 | 30,000 | (1)* | — | 14,699 | 14,709 | 6* | — | ||||||
| JPMorgan U.S. Government Money Market Fund Class IM Shares, 0.37% (a) (b) | 945 | 52,091 | 47,853 | — | — | 5,183 | 5,183 | 2* | — | ||||||
| Total | $6,544 | $133,783 | $114,691 | $(2) | $ 1 | $25,635 | $13 | $— | |||||||
| (a) | Investment in an affiliated fund, which is registered under the Investment Company Act of 1940, as amended, and is advised by J.P. Morgan Investment Management Inc. |
| (b) | The rate shown is the current yield as of April 30, 2022. |
| * | Amount is included on the Statements of Operations as Income from securities lending (net) (after payments of rebates and Citibank’s fee). |
| 122 | J.P. Morgan International Equity Funds | April 30, 2022 |
| April 30, 2022 | J.P. Morgan International Equity Funds | 123 |
| Emerging Markets Research Enhanced Equity Fund | Europe Dynamic Fund | International Focus Fund | International Hedged Equity Fund | International Research Enhanced Equity Fund | International Value Fund | |
| Futures Contracts: | ||||||
| Average Notional Balance Long | $82,512 | $20,389 | $ 14,652 | $ 7,409 | $108,795 | $3,581 |
| Average Notional Balance Short | — | — | (14,662) | — | — | — |
| Ending Notional Balance Long | 4,119 | 7,675 | — | 8,672 | 160,736 | — |
| Exchange-Traded Options: | ||||||
| Average Number of Contracts Purchased | — | — | — | 747 | — | — |
| Average Number of Contracts Written | — | — | — | (1,494) | — | — |
| Ending Number of Contracts Purchased | — | — | — | 819 | — | — |
| Ending Number of Contracts Written | — | — | — | (1,638) | — | — |
| Class A | Class C | Class I | Class L | Class R2 | Class R3 | Class R4 | Class R5 | Class R6 | Total | |
| Emerging Markets Equity Fund | ||||||||||
| Transfer agency fees | $ 16 | $ 2 | $42 | $ 12 | $ 1 | $ —(a) | $ —(a) | $ 2 | $55 | $130 |
| Emerging Markets Research Enhanced Equity Fund | ||||||||||
| Transfer agency fees | n/a | n/a | 2 | n/a | n/a | n/a | n/a | n/a | 11 | 13 |
| Europe Dynamic Fund | ||||||||||
| Transfer agency fees | 6 | 1 | 11 | 1 | n/a | n/a | n/a | n/a | 1 | 20 |
| International Equity Fund | ||||||||||
| Transfer agency fees | 11 | 1 | 14 | n/a | 12 | n/a | n/a | —(a) | 18 | 56 |
| International Focus Fund | ||||||||||
| Transfer agency fees | 4 | 2 | 16 | n/a | —(a) | n/a | n/a | 1 | 10 | 33 |
| International Hedged Equity Fund | ||||||||||
| Transfer agency fees | —(a) | —(a) | 1 | n/a | n/a | n/a | n/a | —(a) | —(a) | 1 |
| 124 | J.P. Morgan International Equity Funds | April 30, 2022 |
| Class A | Class C | Class I | Class L | Class R2 | Class R3 | Class R4 | Class R5 | Class R6 | Total | |
| International Research Enhanced Equity Fund | ||||||||||
| Transfer agency fees | $ 9 | n/a | $12 | n/a | n/a | n/a | n/a | n/a | $12 | $ 33 |
| International Value Fund | ||||||||||
| Transfer agency fees | 6 | $ 1 | 1 | $ —(a) | $ —(a) | n/a | n/a | $ —(a) | 1 | 9 |
| (a) | Amount rounds to less than one thousand. |
| Emerging Markets Equity Fund | 0.68% |
| Emerging Markets Research Enhanced Equity Fund | 0.25 |
| Europe Dynamic Fund | 0.60 |
| International Equity Fund | 0.50 |
| International Focus Fund | 0.60 |
| International Hedged Equity Fund | 0.25 |
| International Research Enhanced Equity Fund | 0.20 |
| International Value Fund | 0.55 |
| April 30, 2022 | J.P. Morgan International Equity Funds | 125 |
| Class A | Class C | Class R2 | Class R3 | |
| Emerging Markets Equity Fund | 0.25% | 0.75% | 0.50% | 0.25% |
| Europe Dynamic Fund | 0.25 | 0.75 | n/a | n/a |
| International Equity Fund | 0.25 | 0.75 | 0.50 | n/a |
| International Focus Fund | 0.25 | 0.75 | 0.50 | n/a |
| International Hedged Equity Fund | 0.25 | 0.75 | n/a | n/a |
| International Research Enhanced Equity Fund | 0.25 | n/a | n/a | n/a |
| International Value Fund | 0.25 | 0.75 | 0.50 | n/a |
| Front-End Sales Charge | CDSC | |
| Emerging Markets Equity Fund | $ 7 | $—(a) |
| Europe Dynamic Fund | 1 | — |
| International Equity Fund | 26 | 1 |
| International Focus Fund | 39 | —(a) |
| International Hedged Equity Fund | 1 | — |
| International Research Enhanced Equity Fund | —(a) | — |
| International Value Fund | 19 | — |
| (a) | Amount rounds to less than one thousand. |
| Class A | Class C | Class I | Class L | Class R2 | Class R3 | Class R4 | Class R5 | |
| Emerging Markets Equity Fund | 0.25% | 0.25% | 0.25% | 0.10% | 0.25% | 0.25% | 0.25% | 0.10% |
| Emerging Markets Research Enhanced Equity Fund | n/a | n/a | 0.25 | n/a | n/a | n/a | n/a | n/a |
| Europe Dynamic Fund | 0.25 | 0.25 | 0.25 | 0.10 | n/a | n/a | n/a | n/a |
| International Equity Fund | 0.25 | 0.25 | 0.25 | n/a | 0.25 | n/a | n/a | 0.10 |
| 126 | J.P. Morgan International Equity Funds | April 30, 2022 |
| Class A | Class C | Class I | Class L | Class R2 | Class R3 | Class R4 | Class R5 | |
| International Focus Fund | 0.25% | 0.25% | 0.25% | n/a% | 0.25% | n/a% | n/a% | 0.10% |
| International Hedged Equity Fund | 0.25 | 0.25 | 0.25 | n/a | n/a | n/a | n/a | 0.10 |
| International Research Enhanced Equity Fund | 0.25 | n/a | 0.25 | n/a | n/a | n/a | n/a | n/a |
| International Value Fund | 0.25 | 0.25 | 0.25 | 0.10 | 0.25 | n/a | n/a | 0.10 |
| Class A | Class C | Class I | Class R2 | Class R3 | Class R4 | Class R5 | Class R6 | |
| Emerging Markets Equity Fund | 1.24% | 1.74% | 0.99% | 1.54% | 1.29% | 1.04% | 0.89% | 0.79% |
| Emerging Markets Research Enhanced Equity Fund | n/a | n/a | 0.45 | n/a | n/a | n/a | n/a | 0.35 |
| Europe Dynamic Fund | 1.24 | 1.74 | 0.99 | n/a | n/a | n/a | n/a | n/a |
| International Equity Fund | 0.95 | 1.45 | 0.70 | 1.25 | n/a | n/a | 0.60 | 0.50 |
| International Focus Fund | 1.00 | 1.50 | 0.75 | 1.30 | n/a | n/a | 0.65 | 0.55 |
| International Hedged Equity Fund | 0.85 | 1.35 | 0.60 | n/a | n/a | n/a | 0.45 | 0.35 |
| International Research Enhanced Equity Fund | 0.60 | n/a | 0.35 | n/a | n/a | n/a | n/a | 0.25 |
| International Value Fund | 1.00 | 1.50 | 0.75 | 1.30 | n/a | n/a | 0.65 | 0.55 |
| April 30, 2022 | J.P. Morgan International Equity Funds | 127 |
| Contractual Waivers | Voluntary Waivers | |||||
| Investment Advisory Fees | Administration Fees | Service Fees | Total | Contractual Reimbursements | 12b-1 | |
| Emerging Markets Equity Fund | $ 326 | $ 219 | $1,197 | $1,742 | $55 | $ — |
| Emerging Markets Research Enhanced Equity Fund | 402 | 268 | 84 | 754 | — | — |
| International Equity Fund | 1,412 | 941 | 293 | 2,646 | — | — |
| International Focus Fund | 1,568 | 1,045 | 297 | 2,910 | — | — |
| International Hedged Equity Fund | 95 | 60 | —(a) | 155 | — | — |
| International Research Enhanced Equity Fund | 691 | 459 | 324 | 1,474 | — | 29 |
| International Value Fund | 205 | 137 | 64 | 406 | 1 | — |
| (a) | Amount rounds to less than one thousand. |
| Emerging Markets Equity Fund | $61 |
| Emerging Markets Research Enhanced Equity Fund | 42 |
| Europe Dynamic Fund | 19 |
| International Equity Fund | 59 |
| International Focus Fund | 30 |
| International Hedged Equity Fund | 2 |
| International Research Enhanced Equity Fund | 66 |
| International Value Fund | 3 |
| Emerging Markets Equity Fund | 1 |
| Emerging Markets Research Enhanced Equity Fund | 1 |
| Europe Dynamic Fund | 1 |
| International Equity Fund | 1 |
| International Focus Fund | 1 |
| International Hedged Equity Fund | 1 |
| International Research Enhanced Equity Fund | 1 |
| 128 | J.P. Morgan International Equity Funds | April 30, 2022 |
| Purchases (excluding U.S. Government) | Sales (excluding U.S. Government) | |
| Emerging Markets Equity Fund | $1,308,784 | $2,177,166 |
| Emerging Markets Research Enhanced Equity Fund | 571,098 | 737,155 |
| Europe Dynamic Fund | 385,041 | 642,085 |
| International Equity Fund | 1,248,185 | 836,829 |
| International Focus Fund | 512,049 | 1,301,728 |
| International Hedged Equity Fund | 46,086 | 13,376 |
| International Research Enhanced Equity Fund | 1,412,392 | 422,408 |
| International Value Fund | 69,376 | 44,096 |
| Aggregate Cost | Gross Unrealized Appreciation | Gross Unrealized Depreciation | Net Unrealized Appreciation (Depreciation) | |
| Emerging Markets Equity Fund | $8,772,484 | $2,384,515 | $1,467,630 | $916,885 |
| Emerging Markets Research Enhanced Equity Fund | 2,917,194 | 408,925 | 359,476 | 49,449 |
| Europe Dynamic Fund | 635,899 | 55,515 | 38,393 | 17,122 |
| International Equity Fund | 4,097,521 | 741,897 | 274,516 | 467,381 |
| International Focus Fund | 1,231,297 | 257,687 | 86,934 | 170,753 |
| International Hedged Equity Fund | 155,471 | 23,579 | 10,386 | 13,193 |
| International Research Enhanced Equity Fund | 5,030,990 | 808,857 | 294,624 | 514,233 |
| International Value Fund | 387,072 | 45,483 | 26,377 | 19,106 |
| Capital Loss Carryforward Character | ||
| Short-Term | Long-Term | |
| Europe Dynamic Fund | $ 60,459 | $ — |
| International Focus Fund | 113,809 | — |
| International Hedged Equity Fund | 4,593* | 13,223* |
| International Research Enhanced Equity Fund | — | 285,015 |
| International Value Fund | 48,944 | 31,961 |
| * | Amount includes capital loss carryforwards which are limited in future years under Internal Revenue Code sections 381-384. |
| April 30, 2022 | J.P. Morgan International Equity Funds | 129 |
| Capital Loss Utilized | ||
| Short-Term | Long-Term | |
| Emerging Markets Equity Fund | $ — | $151,019 |
| Emerging Markets Research Enhanced Equity Fund | 64,286 | 18,842 |
| Europe Dynamic Fund | 58,188 | — |
| International Equity Fund | 56,023 | 54,962 |
| International Focus Fund | 51,636 | 21,707 |
| International Research Enhanced Equity Fund | 33,296 | 211,502 |
| International Value Fund | 4,721 | — |
| Average Borrowings | Average Interest Rate paid | Number of Days Outstanding | Interest Paid | |
| Emerging Markets Equity Fund | $45,389 | 0.83% | 20 | $14 |
| Emerging Markets Research Enhanced Equity Fund | 12,242 | 0.81 | 2 | 1 |
| Europe Dynamic Fund | 45,914 | 0.81 | 5 | 5 |
| International Equity Fund | 90,091 | 0.81 | 2 | 4 |
| International Focus Fund | 23,839 | 0.80 | 3 | 2 |
| International Value Fund | 1,651 | 0.82 | 2 | —(a) |
| (a) | Amount rounds to less than one thousand. |
| 130 | J.P. Morgan International Equity Funds | April 30, 2022 |
| Number of Individual Shareholder and/or Affiliated Omnibus Accounts | % of the Fund | Number of Individual Shareholder and/or Non-Affiliated Omnibus Accounts | % of the Fund | |
| Emerging Markets Equity Fund | — | —% | 3 | 43.4% |
| Europe Dynamic Fund | 3 | 45.3 | 1 | 11.6 |
| International Focus Fund | — | — | 2 | 35.5 |
| International Hedged Equity Fund | 1 | 13.9 | 3 | 57.7 |
| International Research Enhanced Equity Fund | 1 | 10.4 | 1 | 10.4 |
| International Value Fund | — | — | 1 | 80.8 |
| J.P. Morgan Investor Funds | JPMorgan SmartRetirement Funds | JPMorgan SmartRetirement Blend Funds | |
| Emerging Markets Research Enhanced Equity Fund | 10.5% | 31.5% | 39.9% |
| Europe Dynamic Fund | 50.5 | — | — |
| International Equity Fund | — | 49.8 | — |
| International Focus Fund | 11.6 | — | — |
| International Research Enhanced Equity Fund | 19.3 | 60.5 | — |
| April 30, 2022 | J.P. Morgan International Equity Funds | 131 |
| Emerging Markets Equity Fund | Emerging Markets Research Enhanced Equity Fund | Europe Dynamic Fund | International Equity Fund | International Focus Fund | International Hedged Equity Fund | International Research Enhanced Equity Fund | International Value Fund | |
| China | 30.5% | 30.3% | —% | —% | —% | —% | —% | —% |
| France | — | — | 16.2 | 15.6 | — | 10.7 | 11.8 | — |
| Germany | — | — | 15.3 | — | — | — | — | — |
| India | 21.9 | 12.8 | — | — | — | — | — | — |
| Japan | — | — | — | 12.3 | — | 20.9 | 19.7 | 21.1 |
| South Korea | — | 13.3 | — | — | — | — | — | — |
| Switzerland | — | — | 17.4 | 10.6 | 11.2 | 10.9 | 11.8 | — |
| Taiwan | 11.5 | 14.7 | — | — | — | — | — | — |
| United Kingdom | — | — | 19.7 | 10.4 | — | 12.8 | 14.1 | 14.2 |
| 132 | J.P. Morgan International Equity Funds | April 30, 2022 |
| Fund | Value | Type |
| International Focus Fund | $1,236,430(a) | Redemption in-kind |
| (a) | This amount includes cash of $99,867 associated with the redemption in-kind. |
| April 30, 2022 | J.P. Morgan International Equity Funds | 133 |
| Beginning Account Value November 1, 2021 | Ending Account Value April 30, 2022 | Expenses Paid During the Period* | Annualized Expense Ratio | |
| JPMorgan Emerging Markets Equity Fund | ||||
| Class A | ||||
| Actual | $1,000.00 | $ 737.20 | $5.34 | 1.24% |
| Hypothetical | 1,000.00 | 1,018.65 | 6.21 | 1.24 |
| Class C | ||||
| Actual | 1,000.00 | 735.30 | 7.49 | 1.74 |
| Hypothetical | 1,000.00 | 1,016.17 | 8.70 | 1.74 |
| Class I | ||||
| Actual | 1,000.00 | 738.00 | 4.27 | 0.99 |
| Hypothetical | 1,000.00 | 1,019.89 | 4.96 | 0.99 |
| Class R2 | ||||
| Actual | 1,000.00 | 735.90 | 6.63 | 1.54 |
| Hypothetical | 1,000.00 | 1,017.16 | 7.70 | 1.54 |
| Class R3 | ||||
| Actual | 1,000.00 | 737.10 | 5.56 | 1.29 |
| Hypothetical | 1,000.00 | 1,018.40 | 6.46 | 1.29 |
| Class R4 | ||||
| Actual | 1,000.00 | 737.80 | 4.48 | 1.04 |
| Hypothetical | 1,000.00 | 1,019.64 | 5.21 | 1.04 |
| Class R5 | ||||
| Actual | 1,000.00 | 738.50 | 3.84 | 0.89 |
| Hypothetical | 1,000.00 | 1,020.38 | 4.46 | 0.89 |
| Class R6 | ||||
| Actual | 1,000.00 | 738.60 | 3.41 | 0.79 |
| Hypothetical | 1,000.00 | 1,020.88 | 3.96 | 0.79 |
| 134 | J.P. Morgan International Equity Funds | April 30, 2022 |
| Beginning Account Value November 1, 2021 | Ending Account Value April 30, 2022 | Expenses Paid During the Period* | Annualized Expense Ratio | |
| JPMorgan Emerging Markets Research Enhanced Equity Fund | ||||
| Class I | ||||
| Actual | $1,000.00 | $ 841.00 | $2.05 | 0.45% |
| Hypothetical | 1,000.00 | 1,022.56 | 2.26 | 0.45 |
| Class R6 | ||||
| Actual | 1,000.00 | 841.60 | 1.60 | 0.35 |
| Hypothetical | 1,000.00 | 1,023.06 | 1.76 | 0.35 |
| JPMorgan Europe Dynamic Fund | ||||
| Class A | ||||
| Actual | 1,000.00 | 856.40 | 5.71 | 1.24 |
| Hypothetical | 1,000.00 | 1,018.65 | 6.21 | 1.24 |
| Class C | ||||
| Actual | 1,000.00 | 854.20 | 8.00 | 1.74 |
| Hypothetical | 1,000.00 | 1,016.17 | 8.70 | 1.74 |
| Class I | ||||
| Actual | 1,000.00 | 857.50 | 4.51 | 0.98 |
| Hypothetical | 1,000.00 | 1,019.94 | 4.91 | 0.98 |
| Class R6 | ||||
| Actual | 1,000.00 | 858.70 | 3.32 | 0.72 |
| Hypothetical | 1,000.00 | 1,021.22 | 3.61 | 0.72 |
| JPMorgan International Equity Fund | ||||
| Class A | ||||
| Actual | 1,000.00 | 830.20 | 4.31 | 0.95 |
| Hypothetical | 1,000.00 | 1,020.08 | 4.76 | 0.95 |
| Class C | ||||
| Actual | 1,000.00 | 828.40 | 6.57 | 1.45 |
| Hypothetical | 1,000.00 | 1,017.60 | 7.25 | 1.45 |
| Class I | ||||
| Actual | 1,000.00 | 831.50 | 3.18 | 0.70 |
| Hypothetical | 1,000.00 | 1,021.32 | 3.51 | 0.70 |
| Class R2 | ||||
| Actual | 1,000.00 | 829.40 | 5.67 | 1.25 |
| Hypothetical | 1,000.00 | 1,018.60 | 6.26 | 1.25 |
| Class R5 | ||||
| Actual | 1,000.00 | 831.70 | 2.72 | 0.60 |
| Hypothetical | 1,000.00 | 1,021.82 | 3.01 | 0.60 |
| Class R6 | ||||
| Actual | 1,000.00 | 832.30 | 2.27 | 0.50 |
| Hypothetical | 1,000.00 | 1,022.32 | 2.51 | 0.50 |
| JPMorgan International Focus Fund | ||||
| Class A | ||||
| Actual | 1,000.00 | 832.80 | 4.54 | 1.00 |
| Hypothetical | 1,000.00 | 1,019.84 | 5.01 | 1.00 |
| Class C | ||||
| Actual | 1,000.00 | 830.90 | 6.81 | 1.50 |
| Hypothetical | 1,000.00 | 1,017.36 | 7.50 | 1.50 |
| Class I | ||||
| Actual | 1,000.00 | 834.10 | 3.41 | 0.75 |
| Hypothetical | 1,000.00 | 1,021.08 | 3.76 | 0.75 |
| Class R2 | ||||
| Actual | 1,000.00 | 831.70 | 5.90 | 1.30 |
| Hypothetical | 1,000.00 | 1,018.35 | 6.51 | 1.30 |
| April 30, 2022 | J.P. Morgan International Equity Funds | 135 |
| Beginning Account Value November 1, 2021 | Ending Account Value April 30, 2022 | Expenses Paid During the Period* | Annualized Expense Ratio | |
| JPMorgan International Focus Fund (continued) | ||||
| Class R5 | ||||
| Actual | $1,000.00 | $ 834.30 | $2.96 | 0.65% |
| Hypothetical | 1,000.00 | 1,021.57 | 3.26 | 0.65 |
| Class R6 | ||||
| Actual | 1,000.00 | 835.00 | 2.50 | 0.55 |
| Hypothetical | 1,000.00 | 1,022.07 | 2.76 | 0.55 |
| JPMorgan International Hedged Equity Fund | ||||
| Class A | ||||
| Actual | 1,000.00 | 898.50 | 4.00 | 0.85 |
| Hypothetical | 1,000.00 | 1,020.58 | 4.26 | 0.85 |
| Class C | ||||
| Actual | 1,000.00 | 896.20 | 6.35 | 1.35 |
| Hypothetical | 1,000.00 | 1,018.10 | 6.76 | 1.35 |
| Class I | ||||
| Actual | 1,000.00 | 899.80 | 2.83 | 0.60 |
| Hypothetical | 1,000.00 | 1,021.82 | 3.01 | 0.60 |
| Class R5 | ||||
| Actual | 1,000.00 | 900.30 | 2.12 | 0.45 |
| Hypothetical | 1,000.00 | 1,022.56 | 2.26 | 0.45 |
| Class R6 | ||||
| Actual | 1,000.00 | 900.80 | 1.65 | 0.35 |
| Hypothetical | 1,000.00 | 1,023.06 | 1.76 | 0.35 |
| JPMorgan International Research Enhanced Equity Fund | ||||
| Class A | ||||
| Actual | 1,000.00 | 876.90 | 2.19 | 0.47 |
| Hypothetical | 1,000.00 | 1,022.46 | 2.36 | 0.47 |
| Class I | ||||
| Actual | 1,000.00 | 877.40 | 1.63 | 0.35 |
| Hypothetical | 1,000.00 | 1,023.06 | 1.76 | 0.35 |
| Class R6 | ||||
| Actual | 1,000.00 | 877.60 | 1.16 | 0.25 |
| Hypothetical | 1,000.00 | 1,023.56 | 1.25 | 0.25 |
| JPMorgan International Value Fund | ||||
| Class A | ||||
| Actual | 1,000.00 | 919.50 | 4.76 | 1.00 |
| Hypothetical | 1,000.00 | 1,019.84 | 5.01 | 1.00 |
| Class C | ||||
| Actual | 1,000.00 | 916.60 | 7.13 | 1.50 |
| Hypothetical | 1,000.00 | 1,017.36 | 7.50 | 1.50 |
| Class I | ||||
| Actual | 1,000.00 | 920.30 | 3.57 | 0.75 |
| Hypothetical | 1,000.00 | 1,021.08 | 3.76 | 0.75 |
| Class R2 | ||||
| Actual | 1,000.00 | 917.80 | 6.18 | 1.30 |
| Hypothetical | 1,000.00 | 1,018.35 | 6.51 | 1.30 |
| Class R5 | ||||
| Actual | 1,000.00 | 920.70 | 3.10 | 0.65 |
| Hypothetical | 1,000.00 | 1,021.57 | 3.26 | 0.65 |
| 136 | J.P. Morgan International Equity Funds | April 30, 2022 |
| Beginning Account Value November 1, 2021 | Ending Account Value April 30, 2022 | Expenses Paid During the Period* | Annualized Expense Ratio | |
| JPMorgan International Value Fund (continued) | ||||
| Class R6 | ||||
| Actual | $1,000.00 | $ 920.70 | $2.62 | 0.55% |
| Hypothetical | 1,000.00 | 1,022.07 | 2.76 | 0.55 |
| * | Expenses are equal to each Class’ respective annualized expense ratio, multiplied by the average account value over the period, multiplied by 181/365 (to reflect the one-half year period). |
| April 30, 2022 | J.P. Morgan International Equity Funds | 137 |
| 138 | J.P. Morgan International Equity Funds | April 30, 2022 |


| © JPMorgan Chase & Co., 2022. All rights reserved. April 2022. | SAN-INTEQ-422 |
ITEM 2. CODE OF ETHICS.
Disclose whether, as of the end of the period covered by the report, the registrant has adopted a code of ethics that applies to the registrant’s principal executive officer, principal financial officer, principal accounting officer or controller, or persons performing similar functions, regardless of whether these individuals are employed by the registrant or a third party. If the registrant has not adopted such a code of ethics, explain why it has not done so.
The registrant must briefly describe the nature of any amendment, during the period covered by the report, to a provision of its code of ethics that applies to the registrant’s principal executive officer, principal financial officer, principal accounting officer or controller, or persons performing similar functions, regardless of whether these individuals are employed by the registrant or a third party, and that relates to any element of the code of ethics definition enumerated in paragraph (b) of this Item. The registrant must file a copy of any such amendment as an exhibit pursuant to Item 13(a)(1), unless the registrant has elected to satisfy paragraph (f) of this Item by positing its code of ethics on its website pursuant to paragraph (f)(2) of this Item, or by undertaking to provide its code of ethics to any person without charge, upon request, pursuant to paragraph (f)(3) of this Item.
If the registrant has, during the period covered by the report, granted a waiver, including an implicit waiver, from a provision of the code of ethics that applies to the registrant’s principal executive officer, principal financial officer, principal accounting officer or controller, or persons performing similar functions, regardless of whether these individuals are employed by the registrant or third party, that relates to one or more items set forth in paragraph (b) of this Item, the registrant must briefly describe the nature of the waiver, the name of the person to whom the waiver was granted, and the date of the waiver.
Not applicable to a semi-annual report.
ITEM 3. AUDIT COMMITTEE FINANCIAL EXPERT.
(a) (1) Disclose that the registrant’s board of directors has determined that the registrant either:
(i) Has at least one audit committee financial expert serving on its audit committee; or
(ii) Does not have an audit committee financial expert serving on its audit committee.
(2) If the registrant provides the disclosure required by paragraph (a)(1)(i) of this Item, it must disclose the name of the audit committee financial expert and whether that person is “independent.” In order to be considered “independent” for purposes of this Item, a member of an audit committee may not, other than in his or her capacity as a member of the audit committee, the board of directors, or any other board committee:
(i) Accept directly or indirectly any consulting, advisory, or other compensatory fee from the issuer; or
(ii) Be an “interested person” of the investment company as defined in Section 2(a)(19) of the Act (15 U.S.C. 80a-2(a)(19)).
(3) If the registrant provides the disclosure required by paragraph (a)(1)(ii) of this Item, it must explain why it does not have an audit committee financial expert.
Not applicable to a semi-annual report.
ITEM 4. PRINCIPAL ACCOUNTANT FEES AND SERVICES.
(a) Disclose, under the caption Audit Fees, the aggregate fees billed for each of the last two fiscal years for professional
services rendered by the principal accountant for the audit of the registrant’s annual financial statements or services that are normally provided by the accountant in connection with statutory and regulatory filings or engagements for those fiscal years.
(b) Disclose, under the caption Audit-Related Fees, the aggregate fees billed in each of the last two fiscal years for assurance and related services by the principal accountant that are reasonably related to the performance of the audit of the registrant’s financial statements and are not reported under paragraph (a) of this Item. Registrants shall describe the nature of the services comprising the fees disclosed under this category.
(c) Disclose, under the caption Tax Fees, the aggregate fees billed in each of the last two fiscal years for professional services rendered by the principal accountant for tax compliance, tax advice, and tax planning. Registrants shall describe the nature of the services comprising the fees disclosed under this category.
(d) Disclose, under the caption All Other Fees, the aggregate fees billed in each of the last two fiscal years for products and services provided by the principal accountant, other than the services reported in paragraphs (a) through (c) of this Item. Registrants shall describe the nature of the services comprising the fees disclosed under this category.
(e) (1) Disclose the audit committee’s pre-approval policies and procedures described in paragraph (c)(7) of Rule 2-01 of Regulation S-X.
(2) Disclose the percentage of services described in each of paragraphs (b) through (d) of this Item that were approved by the audit committee pursuant to paragraph (c)(7)(i)(C) of Rule 2-01 of Regulation S-X.
(f) If greater than 50 percent, disclose the percentage of hours expended on the principal accountant’s engagement to audit the registrant’s financial statements for the most recent fiscal year that were attributed to work performed by persons other than the principal accountant’s full-time, permanent employees.
(g) Disclose the aggregate non-audit fees billed by the registrant’s accountant for services rendered to the registrant, and rendered to the registrant’s investment adviser (not including any sub-adviser whose role is primarily portfolio management and is subcontracted with or overseen by another investment adviser), and any entity controlling, controlled by, or under common control with the adviser that provides ongoing services to the registrant for each of the last two fiscal years of the registrant.
(h) Disclose whether the registrant’s audit committee of the board of directors has considered whether the provision of non-audit services that were rendered to the registrant’s investment adviser (not including any subadviser whose role is primarily portfolio management and is subcontracted with or overseen by another investment adviser), and any entity controlling, controlled by, or under common control with the investment adviser that provides ongoing services to the registrant that were not pre-approved pursuant to paragraph (c)(7)(ii) of Rule 2-01 of Regulation S-X is compatible with maintaining the principal accountant’s independence.
Not applicable to a semi-annual report.
ITEM 5. AUDIT COMMITTEE OF LISTED REGISTRANTS.
(a) If the registrant is a listed issuer as defined in Rule 10A-3 under the Exchange Act (17CFR 240.10A-3), state whether or not the registrant has a separately-designated standing audit committee established in accordance with Section 3(a)(58)(A) of the Exchange Act (15 U.S.C. 78c(a)(58)(A)). If the registrant has such a committee, however designated, identify each committee member. If the entire board of directors is acting as the registrant’s audit committee as specified in Section 3(a)(58)(B) of the Exchange Act (15 U.S.C. 78c(a)(58)(B)), so state.
(b) If applicable, provide the disclosure required by Rule 10A-3(d) under the Exchange Act (17CFR 240.10A-3(d)) regarding an exemption from the listing standards for all audit committees.
Not applicable to a semi-annual report.
ITEM 6. INVESTMENTS.
File Schedule I – Investments in securities of unaffiliated issuers as of the close of the reporting period as set forth in Section 210.12-12 of Regulation S-X, unless the schedule is included as part of the report to shareholders filed under Item 1 of this Form.
Included in Item 1.
ITEM 7. DISCLOSURE OF PROXY VOTING POLICIES AND PROCEDURES FOR CLOSED-END MANAGEMENT INVESTMENT COMPANIES.
Not applicable.
ITEM 8. PORTFOLIO MANAGERS OF CLOSED-END MANAGEMENT INVESTMENT COMPANIES.
Not applicable.
ITEM 9. PURCHASE OF EQUITY SECURITIES BY CLOSED-END MANAGEMENT INVESTMENT COMPANY AND AFFILIATED PURCHASERS.
Not applicable.
ITEM 10. SUBMISSION OF MATTERS TO A VOTE OF SECURITY HOLDERS.
Describe any material changes to the procedures by which shareholders may recommend nominees to the registrant’s board of directors, where those changes were implemented after the registrant last provided disclosure in response to the requirements of Item 7(d)(2)(ii)(G) of Schedule 14A (17 CFR 240.14a-101), or this Item.
No material changes to report.
ITEM 11. CONTROLS AND PROCEDURES.
(a) Disclose the conclusions of the registrant’s principal executive and principal financial officers, or persons performing similar functions, regarding the effectiveness of the registrant’s disclosure controls and procedures (as defined in Rule 30a-3(c) under the Act (17 CFR 270.30a-3(c))) as of a date within 90 days of the filing date of the report that includes the disclosure required by this paragraph, based on the evaluation of these controls and procedures required by Rule 30a-3(b) under the Act (17 CFR 270.30a-3(b)) and Rules 13a-15(b) or 15d-15(b) under the Exchange Act (17 CFR 240.13a-15(b) or 240.15d-15(b)).
The Registrant’s principal executive and principal financial officers have concluded, based on their evaluation of the Registrant’s disclosure controls and procedures as of a date within 90 days of the filing date of this report, that the Registrant’s disclosure controls and procedures are reasonably designed to ensure that information required to be disclosed by the Registrant on Form N-CSR is recorded, processed, summarized and reported within the required time periods and that information required to be disclosed by the Registrant in the reports that it files or submits on Form N-CSR is accumulated and communicated to the Registrant’s management, including its principal executive and principal financial officers, as appropriate to allow timely decisions regarding required disclosure.
(b) Disclose any change in the registrant’s internal control over financial reporting (as defined in Rule 30a-3(d) under the Act (17 CFR 270.30a-3(d)) that occurred during the registrant’s second fiscal quarter of the period covered by this report that has materially affected, or is reasonably likely to materially affect, the registrant’s internal control over financial reporting.
There were no changes in the Registrant’s internal control over financial reporting that occurred during the last fiscal quarter covered by this report that have materially affected, or are reasonably likely to materially affect, the Registrant’s internal control over financial reporting.
ITEM 12. DISCLOSURE OF SECURITIES LENDING ACTIVITIES FOR CLOSED-END MANAGEMENT INVESTMENT COMPANIES.
Not applicable.
ITEM 13. EXHIBITS.
| (a) | File the exhibits listed below as part of this Form. Letter or number the exhibits in the sequence indicated. |
(1) Any code of ethics, or amendment thereto, that is the subject of the disclosure required by Item 2, to the extent that the registrant intends to satisfy the Item 2 requirements through filing of an exhibit.
Not applicable.
(2) A separate certification for each principal executive officer and principal financial officer of the registrant as required by Rule 30a-2(a) under the Act (17 CFR 270.30a-2).
(3) Any written solicitation to purchase securities under Rule 23c-1 under the Act (17 CFR 270.23c-1) sent or given during the period covered by the report by or on behalf of the registrant to 10 or more persons.
Not applicable.
| (b) A | separate or combined certification for each principal executive officer and principal officer of the registrant as required by Rule 30a-2(b) under the Act of 1940. |
SIGNATURES
Pursuant to the requirements of the Securities Exchange Act of 1934 and the Investment Company Act of 1940, the registrant has duly caused this report to be signed on its behalf by the undersigned, thereunto duly authorized.
| JPMorgan Trust II | ||
| By: | /s/ Brian S. Shlissel | |
| Brian S. Shlissel | ||
| President and Principal Executive Officer | ||
| July 5, 2022 | ||
Pursuant to the requirements of the Securities Exchange Act of 1934 and the Investment Company Act of 1940, this report has been signed below by the following persons on behalf of the registrant and in the capacities and on the dates indicated.
| By: | /s/ Brian S. Shlissel | |
| Brian S. Shlissel | ||
| President and Principal Executive Officer | ||
| July 5, 2022 | ||
| By: | /s/ Timothy J. Clemens | |
| Timothy J. Clemens | ||
| Treasurer and Principal Financial Officer | ||
| July 5, 2022 | ||