0000763852 jpmt2:C000173561Member oef:UtilitiesSectorMember 2024-12-31
UNITED STATES
SECURITIES AND EXCHANGE COMMISSION
Washington, D.C. 20549
FORM N-CSR
CERTIFIED SHAREHOLDER REPORT OF REGISTERED MANAGEMENT INVESTMENT COMPANIES
Investment Company Act file number
(Exact name of registrant as specified in charter)
277 Park Avenue
New York, NY 10172
(Address of principal executive offices) (Zip code)
Gregory S. Samuels
277 Park Avenue
New York, NY 10172
(Name and Address of Agent for Service)
Registrant's telephone number, including area code:
Date of reporting period:
Item 1. Report to Stockholders.
a.) The following is a copy of the report transmitted to shareholders pursuant to Rule 30e-1 under the Investment Company Act of 1940 (17 CFR 270.30e-1).
b.) A copy of the notice transmitted to shareholders in reliance on Rule 30e-3 under the 1940 Act that contains disclosures specified by paragraph (c)(3) of that rule is included in the Annual Report. Not Applicable. Notices do not incorporate disclosures from the shareholder reports.
SEMI-ANNUAL SHAREHOLDER REPORT | December 31, 2024 (Unaudited)
JPMorgan Equity Income Fund
Class A Shares/Ticker: OIEIX
SEMI-ANNUAL SHAREHOLDER REPORT
This semi-annual shareholder report contains important information about the JPMorgan Equity Income Fund (the "Fund") for the period of July 1, 2024 to December 31, 2024. You can find additional information about the Fund at www.jpmorganfunds.com/funddocuments. You can also request this information by contacting us at 1-800-480-4111, by sending an e-mail request to Funds.Website.Support@jpmorganfunds.com or by asking any financial intermediary that offers shares of the Fund.
What were the Fund costs for the last six months?
(based on a hypothetical $10,000 investment)
| Fund (Class) | Costs of a
$10,000 investment | Costs paid as a percentage
of a $10,000 investment* |
JPMorgan Equity Income Fund
(Class A Shares) | $49 | 0.95% |
| * | This charge is annualized. |
| Fund net assets (000's) | $44,076,697 | |
| Total number of portfolio holdings | 88 | |
| Portfolio turnover rate | 9 | % |
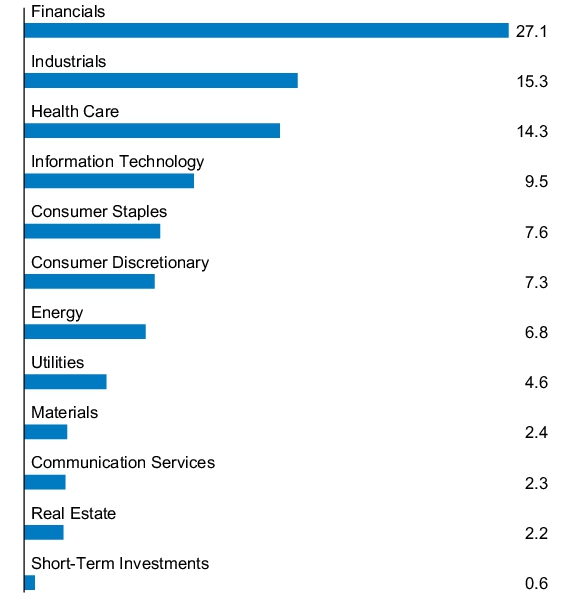
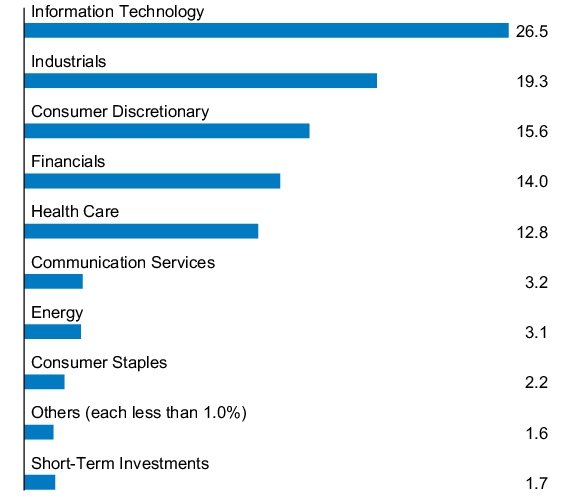
PORTFOLIO COMPOSITION - SECTOR
(% of Total Investments)
Availability of Additional Information
At www.jpmorganfunds.com/funddocuments, you can find additional information about the Fund, including the Fund’s:
Prospectus
Financial information
Fund holdings
Proxy voting information
You can also request this information by contacting us at 1-800-480-4111.
SEMI-ANNUAL SHAREHOLDER REPORT | December 31, 2024 (Unaudited)
JPMorgan Equity Income Fund
Class C Shares/Ticker: OINCX
SEMI-ANNUAL SHAREHOLDER REPORT
This semi-annual shareholder report contains important information about the JPMorgan Equity Income Fund (the "Fund") for the period of July 1, 2024 to December 31, 2024. You can find additional information about the Fund at www.jpmorganfunds.com/funddocuments. You can also request this information by contacting us at 1-800-480-4111, by sending an e-mail request to Funds.Website.Support@jpmorganfunds.com or by asking any financial intermediary that offers shares of the Fund.
What were the Fund costs for the last six months?
(based on a hypothetical $10,000 investment)
| Fund (Class) | Costs of a
$10,000 investment | Costs paid as a percentage
of a $10,000 investment* |
JPMorgan Equity Income Fund
(Class C Shares) | $75 | 1.44% |
| * | This charge is annualized. |
| Fund net assets (000's) | $44,076,697 | |
| Total number of portfolio holdings | 88 | |
| Portfolio turnover rate | 9 | % |
PORTFOLIO COMPOSITION - SECTOR
(% of Total Investments)
Availability of Additional Information
At www.jpmorganfunds.com/funddocuments, you can find additional information about the Fund, including the Fund’s:
Prospectus
Financial information
Fund holdings
Proxy voting information
You can also request this information by contacting us at 1-800-480-4111.
SEMI-ANNUAL SHAREHOLDER REPORT | December 31, 2024 (Unaudited)
JPMorgan Equity Income Fund
Class I Shares/Ticker: HLIEX
SEMI-ANNUAL SHAREHOLDER REPORT
This semi-annual shareholder report contains important information about the JPMorgan Equity Income Fund (the "Fund") for the period of July 1, 2024 to December 31, 2024. You can find additional information about the Fund at www.jpmorganfunds.com/funddocuments. You can also request this information by contacting us at 1-800-480-4111, by sending an e-mail request to Funds.Website.Support@jpmorganfunds.com or by asking any financial intermediary that offers shares of the Fund.
What were the Fund costs for the last six months?
(based on a hypothetical $10,000 investment)
| Fund (Class) | Costs of a
$10,000 investment | Costs paid as a percentage
of a $10,000 investment* |
JPMorgan Equity Income Fund
(Class I Shares) | $36 | 0.69% |
| * | This charge is annualized. |
| Fund net assets (000's) | $44,076,697 | |
| Total number of portfolio holdings | 88 | |
| Portfolio turnover rate | 9 | % |
PORTFOLIO COMPOSITION - SECTOR
(% of Total Investments)
Availability of Additional Information
At www.jpmorganfunds.com/funddocuments, you can find additional information about the Fund, including the Fund’s:
Prospectus
Financial information
Fund holdings
Proxy voting information
You can also request this information by contacting us at 1-800-480-4111.
SEMI-ANNUAL SHAREHOLDER REPORT | December 31, 2024 (Unaudited)
JPMorgan Equity Income Fund
Class R2 Shares/Ticker: OIEFX
SEMI-ANNUAL SHAREHOLDER REPORT
This semi-annual shareholder report contains important information about the JPMorgan Equity Income Fund (the "Fund") for the period of July 1, 2024 to December 31, 2024. You can find additional information about the Fund at www.jpmorganfunds.com/funddocuments. You can also request this information by contacting us at 1-800-480-4111, by sending an e-mail request to Funds.Website.Support@jpmorganfunds.com or by asking any financial intermediary that offers shares of the Fund.
What were the Fund costs for the last six months?
(based on a hypothetical $10,000 investment)
| Fund (Class) | Costs of a
$10,000 investment | Costs paid as a percentage
of a $10,000 investment* |
JPMorgan Equity Income Fund
(Class R2 Shares) | $63 | 1.20% |
| * | This charge is annualized. |
| Fund net assets (000's) | $44,076,697 | |
| Total number of portfolio holdings | 88 | |
| Portfolio turnover rate | 9 | % |
PORTFOLIO COMPOSITION - SECTOR
(% of Total Investments)
Availability of Additional Information
At www.jpmorganfunds.com/funddocuments, you can find additional information about the Fund, including the Fund’s:
Prospectus
Financial information
Fund holdings
Proxy voting information
You can also request this information by contacting us at 1-800-480-4111.
SEMI-ANNUAL SHAREHOLDER REPORT | December 31, 2024 (Unaudited)
JPMorgan Equity Income Fund
Class R3 Shares/Ticker: OIEPX
SEMI-ANNUAL SHAREHOLDER REPORT
This semi-annual shareholder report contains important information about the JPMorgan Equity Income Fund (the "Fund") for the period of July 1, 2024 to December 31, 2024. You can find additional information about the Fund at www.jpmorganfunds.com/funddocuments. You can also request this information by contacting us at 1-800-480-4111, by sending an e-mail request to Funds.Website.Support@jpmorganfunds.com or by asking any financial intermediary that offers shares of the Fund.
What were the Fund costs for the last six months?
(based on a hypothetical $10,000 investment)
| Fund (Class) | Costs of a
$10,000 investment | Costs paid as a percentage
of a $10,000 investment* |
JPMorgan Equity Income Fund
(Class R3 Shares) | $49 | 0.95% |
| * | This charge is annualized. |
| Fund net assets (000's) | $44,076,697 | |
| Total number of portfolio holdings | 88 | |
| Portfolio turnover rate | 9 | % |
PORTFOLIO COMPOSITION - SECTOR
(% of Total Investments)
Availability of Additional Information
At www.jpmorganfunds.com/funddocuments, you can find additional information about the Fund, including the Fund’s:
Prospectus
Financial information
Fund holdings
Proxy voting information
You can also request this information by contacting us at 1-800-480-4111.
SEMI-ANNUAL SHAREHOLDER REPORT | December 31, 2024 (Unaudited)
JPMorgan Equity Income Fund
Class R4 Shares/Ticker: OIEQX
SEMI-ANNUAL SHAREHOLDER REPORT
This semi-annual shareholder report contains important information about the JPMorgan Equity Income Fund (the "Fund") for the period of July 1, 2024 to December 31, 2024. You can find additional information about the Fund at www.jpmorganfunds.com/funddocuments. You can also request this information by contacting us at 1-800-480-4111, by sending an e-mail request to Funds.Website.Support@jpmorganfunds.com or by asking any financial intermediary that offers shares of the Fund.
What were the Fund costs for the last six months?
(based on a hypothetical $10,000 investment)
| Fund (Class) | Costs of a
$10,000 investment | Costs paid as a percentage
of a $10,000 investment* |
JPMorgan Equity Income Fund
(Class R4 Shares) | $36 | 0.69% |
| * | This charge is annualized. |
| Fund net assets (000's) | $44,076,697 | |
| Total number of portfolio holdings | 88 | |
| Portfolio turnover rate | 9 | % |
PORTFOLIO COMPOSITION - SECTOR
(% of Total Investments)
Availability of Additional Information
At www.jpmorganfunds.com/funddocuments, you can find additional information about the Fund, including the Fund’s:
Prospectus
Financial information
Fund holdings
Proxy voting information
You can also request this information by contacting us at 1-800-480-4111.
SEMI-ANNUAL SHAREHOLDER REPORT | December 31, 2024 (Unaudited)
JPMorgan Equity Income Fund
Class R5 Shares/Ticker: OIERX
SEMI-ANNUAL SHAREHOLDER REPORT
This semi-annual shareholder report contains important information about the JPMorgan Equity Income Fund (the "Fund") for the period of July 1, 2024 to December 31, 2024. You can find additional information about the Fund at www.jpmorganfunds.com/funddocuments. You can also request this information by contacting us at 1-800-480-4111, by sending an e-mail request to Funds.Website.Support@jpmorganfunds.com or by asking any financial intermediary that offers shares of the Fund.
What were the Fund costs for the last six months?
(based on a hypothetical $10,000 investment)
| Fund (Class) | Costs of a
$10,000 investment | Costs paid as a percentage
of a $10,000 investment* |
JPMorgan Equity Income Fund
(Class R5 Shares) | $28 | 0.54% |
| * | This charge is annualized. |
| Fund net assets (000's) | $44,076,697 | |
| Total number of portfolio holdings | 88 | |
| Portfolio turnover rate | 9 | % |
PORTFOLIO COMPOSITION - SECTOR
(% of Total Investments)
Availability of Additional Information
At www.jpmorganfunds.com/funddocuments, you can find additional information about the Fund, including the Fund’s:
Prospectus
Financial information
Fund holdings
Proxy voting information
You can also request this information by contacting us at 1-800-480-4111.
SEMI-ANNUAL SHAREHOLDER REPORT | December 31, 2024 (Unaudited)
JPMorgan Equity Income Fund
Class R6 Shares/Ticker: OIEJX
SEMI-ANNUAL SHAREHOLDER REPORT
This semi-annual shareholder report contains important information about the JPMorgan Equity Income Fund (the "Fund") for the period of July 1, 2024 to December 31, 2024. You can find additional information about the Fund at www.jpmorganfunds.com/funddocuments. You can also request this information by contacting us at 1-800-480-4111, by sending an e-mail request to Funds.Website.Support@jpmorganfunds.com or by asking any financial intermediary that offers shares of the Fund.
What were the Fund costs for the last six months?
(based on a hypothetical $10,000 investment)
| Fund (Class) | Costs of a
$10,000 investment | Costs paid as a percentage
of a $10,000 investment* |
JPMorgan Equity Income Fund
(Class R6 Shares) | $23 | 0.44% |
| * | This charge is annualized. |
| Fund net assets (000's) | $44,076,697 | |
| Total number of portfolio holdings | 88 | |
| Portfolio turnover rate | 9 | % |
PORTFOLIO COMPOSITION - SECTOR
(% of Total Investments)
Availability of Additional Information
At www.jpmorganfunds.com/funddocuments, you can find additional information about the Fund, including the Fund’s:
Prospectus
Financial information
Fund holdings
Proxy voting information
You can also request this information by contacting us at 1-800-480-4111.
SEMI-ANNUAL SHAREHOLDER REPORT | December 31, 2024 (Unaudited)
JPMorgan Equity Index Fund
Class A Shares/Ticker: OGEAX
SEMI-ANNUAL SHAREHOLDER REPORT
This semi-annual shareholder report contains important information about the JPMorgan Equity Index Fund (the "Fund") for the period of July 1, 2024 to December 31, 2024. You can find additional information about the Fund at www.jpmorganfunds.com/funddocuments. You can also request this information by contacting us at 1-800-480-4111, by sending an e-mail request to Funds.Website.Support@jpmorganfunds.com or by asking any financial intermediary that offers shares of the Fund.
What were the Fund costs for the last six months?
(based on a hypothetical $10,000 investment)
| Fund (Class) | Costs of a
$10,000 investment | Costs paid as a percentage
of a $10,000 investment* |
JPMorgan Equity Index Fund
(Class A Shares) | $24 | 0.45% |
| * | This charge is annualized. |
| Fund net assets (000's) | $10,750,457 | |
| Total number of portfolio holdings | 507 | |
| Portfolio turnover rate | 5 | % |
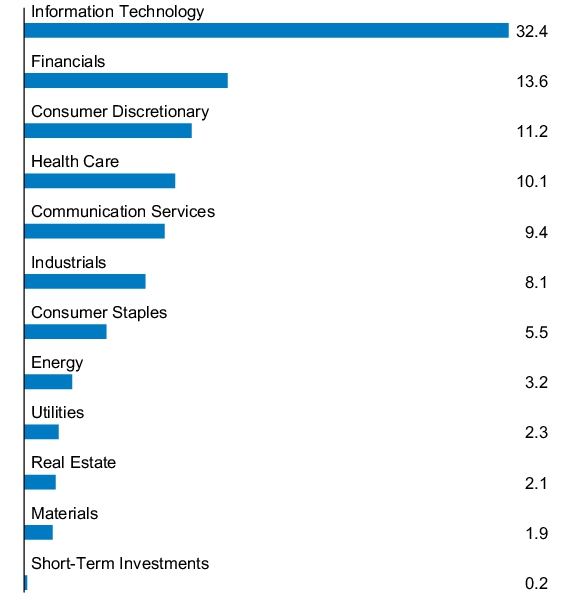
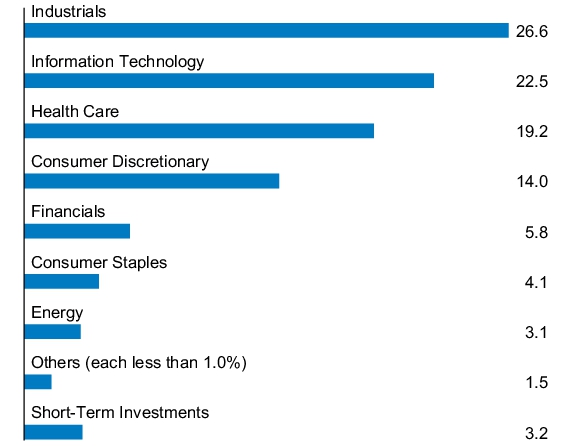
PORTFOLIO COMPOSITION - SECTOR
(% of Total Investments)
Availability of Additional Information
At www.jpmorganfunds.com/funddocuments, you can find additional information about the Fund, including the Fund’s:
Prospectus
Financial information
Fund holdings
Proxy voting information
You can also request this information by contacting us at 1-800-480-4111.
SEMI-ANNUAL SHAREHOLDER REPORT | December 31, 2024 (Unaudited)
JPMorgan Equity Index Fund
Class C Shares/Ticker: OEICX
SEMI-ANNUAL SHAREHOLDER REPORT
This semi-annual shareholder report contains important information about the JPMorgan Equity Index Fund (the "Fund") for the period of July 1, 2024 to December 31, 2024. You can find additional information about the Fund at www.jpmorganfunds.com/funddocuments. You can also request this information by contacting us at 1-800-480-4111, by sending an e-mail request to Funds.Website.Support@jpmorganfunds.com or by asking any financial intermediary that offers shares of the Fund.
What were the Fund costs for the last six months?
(based on a hypothetical $10,000 investment)
| Fund (Class) | Costs of a
$10,000 investment | Costs paid as a percentage
of a $10,000 investment* |
JPMorgan Equity Index Fund
(Class C Shares) | $55 | 1.05% |
| * | This charge is annualized. |
| Fund net assets (000's) | $10,750,457 | |
| Total number of portfolio holdings | 507 | |
| Portfolio turnover rate | 5 | % |
PORTFOLIO COMPOSITION - SECTOR
(% of Total Investments)
Availability of Additional Information
At www.jpmorganfunds.com/funddocuments, you can find additional information about the Fund, including the Fund’s:
Prospectus
Financial information
Fund holdings
Proxy voting information
You can also request this information by contacting us at 1-800-480-4111.
SEMI-ANNUAL SHAREHOLDER REPORT | December 31, 2024 (Unaudited)
JPMorgan Equity Index Fund
Class I Shares/Ticker: HLEIX
SEMI-ANNUAL SHAREHOLDER REPORT
This semi-annual shareholder report contains important information about the JPMorgan Equity Index Fund (the "Fund") for the period of July 1, 2024 to December 31, 2024. You can find additional information about the Fund at www.jpmorganfunds.com/funddocuments. You can also request this information by contacting us at 1-800-480-4111, by sending an e-mail request to Funds.Website.Support@jpmorganfunds.com or by asking any financial intermediary that offers shares of the Fund.
What were the Fund costs for the last six months?
(based on a hypothetical $10,000 investment)
| Fund (Class) | Costs of a
$10,000 investment | Costs paid as a percentage
of a $10,000 investment* |
JPMorgan Equity Index Fund
(Class I Shares) | $10 | 0.20% |
| * | This charge is annualized. |
| Fund net assets (000's) | $10,750,457 | |
| Total number of portfolio holdings | 507 | |
| Portfolio turnover rate | 5 | % |
PORTFOLIO COMPOSITION - SECTOR
(% of Total Investments)
Availability of Additional Information
At www.jpmorganfunds.com/funddocuments, you can find additional information about the Fund, including the Fund’s:
Prospectus
Financial information
Fund holdings
Proxy voting information
You can also request this information by contacting us at 1-800-480-4111.
SEMI-ANNUAL SHAREHOLDER REPORT | December 31, 2024 (Unaudited)
JPMorgan Equity Index Fund
Class R6 Shares/Ticker: OGFAX
SEMI-ANNUAL SHAREHOLDER REPORT
This semi-annual shareholder report contains important information about the JPMorgan Equity Index Fund (the "Fund") for the period of July 1, 2024 to December 31, 2024. You can find additional information about the Fund at www.jpmorganfunds.com/funddocuments. You can also request this information by contacting us at 1-800-480-4111, by sending an e-mail request to Funds.Website.Support@jpmorganfunds.com or by asking any financial intermediary that offers shares of the Fund.
What were the Fund costs for the last six months?
(based on a hypothetical $10,000 investment)
| Fund (Class) | Costs of a
$10,000 investment | Costs paid as a percentage
of a $10,000 investment* |
JPMorgan Equity Index Fund
(Class R6 Shares) | $2 | 0.04% |
| * | This charge is annualized. |
| Fund net assets (000's) | $10,750,457 | |
| Total number of portfolio holdings | 507 | |
| Portfolio turnover rate | 5 | % |
PORTFOLIO COMPOSITION - SECTOR
(% of Total Investments)
Availability of Additional Information
At www.jpmorganfunds.com/funddocuments, you can find additional information about the Fund, including the Fund’s:
Prospectus
Financial information
Fund holdings
Proxy voting information
You can also request this information by contacting us at 1-800-480-4111.
SEMI-ANNUAL SHAREHOLDER REPORT | December 31, 2024 (Unaudited)
JPMorgan Investor Balanced Fund
Class A Shares/Ticker: OGIAX
SEMI-ANNUAL SHAREHOLDER REPORT
This semi-annual shareholder report contains important information about the JPMorgan Investor Balanced Fund (the "Fund") for the period of July 1, 2024 to December 31, 2024. You can find additional information about the Fund at www.jpmorganfunds.com/funddocuments. You can also request this information by contacting us at 1-800-480-4111, by sending an e-mail request to Funds.Website.Support@jpmorganfunds.com or by asking any financial intermediary that offers shares of the Fund.
What were the Fund costs for the last six months?
(based on a hypothetical $10,000 investment)
| Fund (Class) | Costs of a
$10,000 investment | Costs paid as a percentage
of a $10,000 investment* |
JPMorgan Investor Balanced Fund
(Class A Shares) | $29 | 0.56% |
| * | This charge is annualized. |
| Fund net assets (000's) | $5,477,675 | |
| Total number of portfolio holdings | 26 | |
| Portfolio turnover rate | 5 | % |
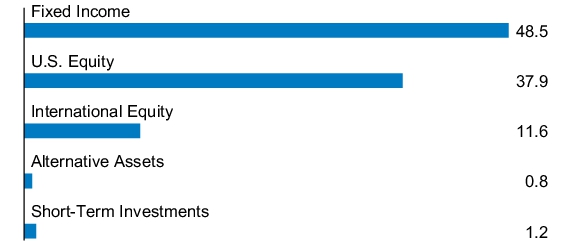
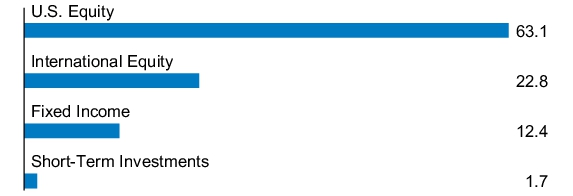
PORTFOLIO COMPOSITION - ASSET CLASS
(% of Total Investments)
Availability of Additional Information
At www.jpmorganfunds.com/funddocuments, you can find additional information about the Fund, including the Fund’s:
Prospectus
Financial information
Fund holdings
Proxy voting information
You can also request this information by contacting us at 1-800-480-4111.
SEMI-ANNUAL SHAREHOLDER REPORT | December 31, 2024 (Unaudited)
JPMorgan Investor Balanced Fund
Class C Shares/Ticker: OGBCX
SEMI-ANNUAL SHAREHOLDER REPORT
This semi-annual shareholder report contains important information about the JPMorgan Investor Balanced Fund (the "Fund") for the period of July 1, 2024 to December 31, 2024. You can find additional information about the Fund at www.jpmorganfunds.com/funddocuments. You can also request this information by contacting us at 1-800-480-4111, by sending an e-mail request to Funds.Website.Support@jpmorganfunds.com or by asking any financial intermediary that offers shares of the Fund.
What were the Fund costs for the last six months?
(based on a hypothetical $10,000 investment)
| Fund (Class) | Costs of a
$10,000 investment | Costs paid as a percentage
of a $10,000 investment* |
JPMorgan Investor Balanced Fund
(Class C Shares) | $54 | 1.06% |
| * | This charge is annualized. |
| Fund net assets (000's) | $5,477,675 | |
| Total number of portfolio holdings | 26 | |
| Portfolio turnover rate | 5 | % |
PORTFOLIO COMPOSITION - ASSET CLASS
(% of Total Investments)
Availability of Additional Information
At www.jpmorganfunds.com/funddocuments, you can find additional information about the Fund, including the Fund’s:
Prospectus
Financial information
Fund holdings
Proxy voting information
You can also request this information by contacting us at 1-800-480-4111.
SEMI-ANNUAL SHAREHOLDER REPORT | December 31, 2024 (Unaudited)
JPMorgan Investor Balanced Fund
Class I Shares/Ticker: OIBFX
SEMI-ANNUAL SHAREHOLDER REPORT
This semi-annual shareholder report contains important information about the JPMorgan Investor Balanced Fund (the "Fund") for the period of July 1, 2024 to December 31, 2024. You can find additional information about the Fund at www.jpmorganfunds.com/funddocuments. You can also request this information by contacting us at 1-800-480-4111, by sending an e-mail request to Funds.Website.Support@jpmorganfunds.com or by asking any financial intermediary that offers shares of the Fund.
What were the Fund costs for the last six months?
(based on a hypothetical $10,000 investment)
| Fund (Class) | Costs of a
$10,000 investment | Costs paid as a percentage
of a $10,000 investment* |
JPMorgan Investor Balanced Fund
(Class I Shares) | $16 | 0.31% |
| * | This charge is annualized. |
| Fund net assets (000's) | $5,477,675 | |
| Total number of portfolio holdings | 26 | |
| Portfolio turnover rate | 5 | % |
PORTFOLIO COMPOSITION - ASSET CLASS
(% of Total Investments)
Availability of Additional Information
At www.jpmorganfunds.com/funddocuments, you can find additional information about the Fund, including the Fund’s:
Prospectus
Financial information
Fund holdings
Proxy voting information
You can also request this information by contacting us at 1-800-480-4111.
SEMI-ANNUAL SHAREHOLDER REPORT | December 31, 2024 (Unaudited)
JPMorgan Investor Balanced Fund
Class R6 Shares/Ticker: JFQUX
SEMI-ANNUAL SHAREHOLDER REPORT
This semi-annual shareholder report contains important information about the JPMorgan Investor Balanced Fund (the "Fund") for the period of July 1, 2024 to December 31, 2024. You can find additional information about the Fund at www.jpmorganfunds.com/funddocuments. You can also request this information by contacting us at 1-800-480-4111, by sending an e-mail request to Funds.Website.Support@jpmorganfunds.com or by asking any financial intermediary that offers shares of the Fund.
What were the Fund costs for the last six months?
(based on a hypothetical $10,000 investment)
| Fund (Class) | Costs of a
$10,000 investment | Costs paid as a percentage
of a $10,000 investment* |
JPMorgan Investor Balanced Fund
(Class R6 Shares) | $3 | 0.06% |
| * | This charge is annualized. |
| Fund net assets (000's) | $5,477,675 | |
| Total number of portfolio holdings | 26 | |
| Portfolio turnover rate | 5 | % |
PORTFOLIO COMPOSITION - ASSET CLASS
(% of Total Investments)
Availability of Additional Information
At www.jpmorganfunds.com/funddocuments, you can find additional information about the Fund, including the Fund’s:
Prospectus
Financial information
Fund holdings
Proxy voting information
You can also request this information by contacting us at 1-800-480-4111.
SEMI-ANNUAL SHAREHOLDER REPORT | December 31, 2024 (Unaudited)
JPMorgan Investor Conservative Growth Fund
Class A Shares/Ticker: OICAX
SEMI-ANNUAL SHAREHOLDER REPORT
This semi-annual shareholder report contains important information about the JPMorgan Investor Conservative Growth Fund (the "Fund") for the period of July 1, 2024 to December 31, 2024. You can find additional information about the Fund at www.jpmorganfunds.com/funddocuments. You can also request this information by contacting us at 1-800-480-4111, by sending an e-mail request to Funds.Website.Support@jpmorganfunds.com or by asking any financial intermediary that offers shares of the Fund.
What were the Fund costs for the last six months?
(based on a hypothetical $10,000 investment)
| Fund (Class) | Costs of a
$10,000 investment | Costs paid as a percentage
of a $10,000 investment* |
JPMorgan Investor Conservative Growth Fund
(Class A Shares) | $29 | 0.56% |
| * | This charge is annualized. |
| Fund net assets (000's) | $3,956,365 | |
| Total number of portfolio holdings | 27 | |
| Portfolio turnover rate | 3 | % |
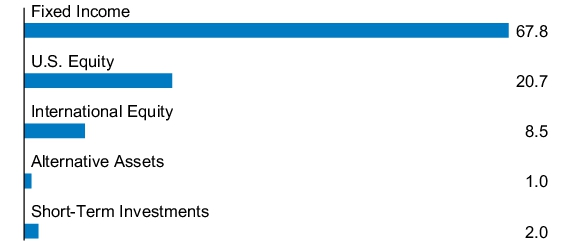
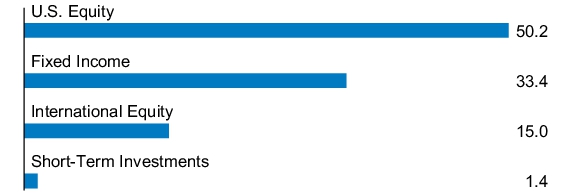
PORTFOLIO COMPOSITION - ASSET CLASS
(% of Total Investments)
Availability of Additional Information
At www.jpmorganfunds.com/funddocuments, you can find additional information about the Fund, including the Fund’s:
Prospectus
Financial information
Fund holdings
Proxy voting information
You can also request this information by contacting us at 1-800-480-4111.
SEMI-ANNUAL SHAREHOLDER REPORT | December 31, 2024 (Unaudited)
JPMorgan Investor Conservative Growth Fund
Class C Shares/Ticker: OCGCX
SEMI-ANNUAL SHAREHOLDER REPORT
This semi-annual shareholder report contains important information about the JPMorgan Investor Conservative Growth Fund (the "Fund") for the period of July 1, 2024 to December 31, 2024. You can find additional information about the Fund at www.jpmorganfunds.com/funddocuments. You can also request this information by contacting us at 1-800-480-4111, by sending an e-mail request to Funds.Website.Support@jpmorganfunds.com or by asking any financial intermediary that offers shares of the Fund.
What were the Fund costs for the last six months?
(based on a hypothetical $10,000 investment)
| Fund (Class) | Costs of a
$10,000 investment | Costs paid as a percentage
of a $10,000 investment* |
JPMorgan Investor Conservative Growth Fund
(Class C Shares) | $54 | 1.06% |
| * | This charge is annualized. |
| Fund net assets (000's) | $3,956,365 | |
| Total number of portfolio holdings | 27 | |
| Portfolio turnover rate | 3 | % |
PORTFOLIO COMPOSITION - ASSET CLASS
(% of Total Investments)
Availability of Additional Information
At www.jpmorganfunds.com/funddocuments, you can find additional information about the Fund, including the Fund’s:
Prospectus
Financial information
Fund holdings
Proxy voting information
You can also request this information by contacting us at 1-800-480-4111.
SEMI-ANNUAL SHAREHOLDER REPORT | December 31, 2024 (Unaudited)
JPMorgan Investor Conservative Growth Fund
Class I Shares/Ticker: ONCFX
SEMI-ANNUAL SHAREHOLDER REPORT
This semi-annual shareholder report contains important information about the JPMorgan Investor Conservative Growth Fund (the "Fund") for the period of July 1, 2024 to December 31, 2024. You can find additional information about the Fund at www.jpmorganfunds.com/funddocuments. You can also request this information by contacting us at 1-800-480-4111, by sending an e-mail request to Funds.Website.Support@jpmorganfunds.com or by asking any financial intermediary that offers shares of the Fund.
What were the Fund costs for the last six months?
(based on a hypothetical $10,000 investment)
| Fund (Class) | Costs of a
$10,000 investment | Costs paid as a percentage
of a $10,000 investment* |
JPMorgan Investor Conservative Growth Fund
(Class I Shares) | $16 | 0.31% |
| * | This charge is annualized. |
| Fund net assets (000's) | $3,956,365 | |
| Total number of portfolio holdings | 27 | |
| Portfolio turnover rate | 3 | % |
PORTFOLIO COMPOSITION - ASSET CLASS
(% of Total Investments)
Availability of Additional Information
At www.jpmorganfunds.com/funddocuments, you can find additional information about the Fund, including the Fund’s:
Prospectus
Financial information
Fund holdings
Proxy voting information
You can also request this information by contacting us at 1-800-480-4111.
SEMI-ANNUAL SHAREHOLDER REPORT | December 31, 2024 (Unaudited)
JPMorgan Investor Conservative Growth Fund
Class R6 Shares/Ticker: JFLJX
SEMI-ANNUAL SHAREHOLDER REPORT
This semi-annual shareholder report contains important information about the JPMorgan Investor Conservative Growth Fund (the "Fund") for the period of July 1, 2024 to December 31, 2024. You can find additional information about the Fund at www.jpmorganfunds.com/funddocuments. You can also request this information by contacting us at 1-800-480-4111, by sending an e-mail request to Funds.Website.Support@jpmorganfunds.com or by asking any financial intermediary that offers shares of the Fund.
What were the Fund costs for the last six months?
(based on a hypothetical $10,000 investment)
| Fund (Class) | Costs of a
$10,000 investment | Costs paid as a percentage
of a $10,000 investment* |
JPMorgan Investor Conservative Growth Fund
(Class R6 Shares) | $3 | 0.06% |
| * | This charge is annualized. |
| Fund net assets (000's) | $3,956,365 | |
| Total number of portfolio holdings | 27 | |
| Portfolio turnover rate | 3 | % |
PORTFOLIO COMPOSITION - ASSET CLASS
(% of Total Investments)
Availability of Additional Information
At www.jpmorganfunds.com/funddocuments, you can find additional information about the Fund, including the Fund’s:
Prospectus
Financial information
Fund holdings
Proxy voting information
You can also request this information by contacting us at 1-800-480-4111.
SEMI-ANNUAL SHAREHOLDER REPORT | December 31, 2024 (Unaudited)
JPMorgan Investor Growth Fund
Class A Shares/Ticker: ONGAX
SEMI-ANNUAL SHAREHOLDER REPORT
This semi-annual shareholder report contains important information about the JPMorgan Investor Growth Fund (the "Fund") for the period of July 1, 2024 to December 31, 2024. You can find additional information about the Fund at www.jpmorganfunds.com/funddocuments. You can also request this information by contacting us at 1-800-480-4111, by sending an e-mail request to Funds.Website.Support@jpmorganfunds.com or by asking any financial intermediary that offers shares of the Fund.
What were the Fund costs for the last six months?
(based on a hypothetical $10,000 investment)
| Fund (Class) | Costs of a
$10,000 investment | Costs paid as a percentage
of a $10,000 investment* |
JPMorgan Investor Growth Fund
(Class A Shares) | $28 | 0.55% |
| * | This charge is annualized. |
| Fund net assets (000's) | $5,603,548 | |
| Total number of portfolio holdings | 24 | |
| Portfolio turnover rate | 1 | % |
PORTFOLIO COMPOSITION - ASSET CLASS
(% of Total Investments)
Availability of Additional Information
At www.jpmorganfunds.com/funddocuments, you can find additional information about the Fund, including the Fund’s:
Prospectus
Financial information
Fund holdings
Proxy voting information
You can also request this information by contacting us at 1-800-480-4111.
SEMI-ANNUAL SHAREHOLDER REPORT | December 31, 2024 (Unaudited)
JPMorgan Investor Growth Fund
Class C Shares/Ticker: OGGCX
SEMI-ANNUAL SHAREHOLDER REPORT
This semi-annual shareholder report contains important information about the JPMorgan Investor Growth Fund (the "Fund") for the period of July 1, 2024 to December 31, 2024. You can find additional information about the Fund at www.jpmorganfunds.com/funddocuments. You can also request this information by contacting us at 1-800-480-4111, by sending an e-mail request to Funds.Website.Support@jpmorganfunds.com or by asking any financial intermediary that offers shares of the Fund.
What were the Fund costs for the last six months?
(based on a hypothetical $10,000 investment)
| Fund (Class) | Costs of a
$10,000 investment | Costs paid as a percentage
of a $10,000 investment* |
JPMorgan Investor Growth Fund
(Class C Shares) | $55 | 1.07% |
| * | This charge is annualized. |
| Fund net assets (000's) | $5,603,548 | |
| Total number of portfolio holdings | 24 | |
| Portfolio turnover rate | 1 | % |
PORTFOLIO COMPOSITION - ASSET CLASS
(% of Total Investments)
Availability of Additional Information
At www.jpmorganfunds.com/funddocuments, you can find additional information about the Fund, including the Fund’s:
Prospectus
Financial information
Fund holdings
Proxy voting information
You can also request this information by contacting us at 1-800-480-4111.
SEMI-ANNUAL SHAREHOLDER REPORT | December 31, 2024 (Unaudited)
JPMorgan Investor Growth Fund
Class I Shares/Ticker: ONIFX
SEMI-ANNUAL SHAREHOLDER REPORT
This semi-annual shareholder report contains important information about the JPMorgan Investor Growth Fund (the "Fund") for the period of July 1, 2024 to December 31, 2024. You can find additional information about the Fund at www.jpmorganfunds.com/funddocuments. You can also request this information by contacting us at 1-800-480-4111, by sending an e-mail request to Funds.Website.Support@jpmorganfunds.com or by asking any financial intermediary that offers shares of the Fund.
What were the Fund costs for the last six months?
(based on a hypothetical $10,000 investment)
| Fund (Class) | Costs of a
$10,000 investment | Costs paid as a percentage
of a $10,000 investment* |
JPMorgan Investor Growth Fund
(Class I Shares) | $16 | 0.31% |
| * | This charge is annualized. |
| Fund net assets (000's) | $5,603,548 | |
| Total number of portfolio holdings | 24 | |
| Portfolio turnover rate | 1 | % |
PORTFOLIO COMPOSITION - ASSET CLASS
(% of Total Investments)
Availability of Additional Information
At www.jpmorganfunds.com/funddocuments, you can find additional information about the Fund, including the Fund’s:
Prospectus
Financial information
Fund holdings
Proxy voting information
You can also request this information by contacting us at 1-800-480-4111.
SEMI-ANNUAL SHAREHOLDER REPORT | December 31, 2024 (Unaudited)
JPMorgan Investor Growth Fund
Class R6 Shares/Ticker: JFTUX
SEMI-ANNUAL SHAREHOLDER REPORT
This semi-annual shareholder report contains important information about the JPMorgan Investor Growth Fund (the "Fund") for the period of July 1, 2024 to December 31, 2024. You can find additional information about the Fund at www.jpmorganfunds.com/funddocuments. You can also request this information by contacting us at 1-800-480-4111, by sending an e-mail request to Funds.Website.Support@jpmorganfunds.com or by asking any financial intermediary that offers shares of the Fund.
What were the Fund costs for the last six months?
(based on a hypothetical $10,000 investment)
| Fund (Class) | Costs of a
$10,000 investment | Costs paid as a percentage
of a $10,000 investment* |
JPMorgan Investor Growth Fund
(Class R6 Shares) | $4 | 0.07% |
| * | This charge is annualized. |
| Fund net assets (000's) | $5,603,548 | |
| Total number of portfolio holdings | 24 | |
| Portfolio turnover rate | 1 | % |
PORTFOLIO COMPOSITION - ASSET CLASS
(% of Total Investments)
Availability of Additional Information
At www.jpmorganfunds.com/funddocuments, you can find additional information about the Fund, including the Fund’s:
Prospectus
Financial information
Fund holdings
Proxy voting information
You can also request this information by contacting us at 1-800-480-4111.
SEMI-ANNUAL SHAREHOLDER REPORT | December 31, 2024 (Unaudited)
JPMorgan Investor Growth & Income Fund
Class A Shares/Ticker: ONGIX
SEMI-ANNUAL SHAREHOLDER REPORT
This semi-annual shareholder report contains important information about the JPMorgan Investor Growth & Income Fund (the "Fund") for the period of July 1, 2024 to December 31, 2024. You can find additional information about the Fund at www.jpmorganfunds.com/funddocuments. You can also request this information by contacting us at 1-800-480-4111, by sending an e-mail request to Funds.Website.Support@jpmorganfunds.com or by asking any financial intermediary that offers shares of the Fund.
What were the Fund costs for the last six months?
(based on a hypothetical $10,000 investment)
| Fund (Class) | Costs of a
$10,000 investment | Costs paid as a percentage
of a $10,000 investment* |
JPMorgan Investor Growth & Income Fund
(Class A Shares) | $28 | 0.55% |
| * | This charge is annualized. |
| Fund net assets (000's) | $4,741,140 | |
| Total number of portfolio holdings | 26 | |
| Portfolio turnover rate | 4 | % |
PORTFOLIO COMPOSITION - ASSET CLASS
(% of Total Investments)
Availability of Additional Information
At www.jpmorganfunds.com/funddocuments, you can find additional information about the Fund, including the Fund’s:
Prospectus
Financial information
Fund holdings
Proxy voting information
You can also request this information by contacting us at 1-800-480-4111.
SEMI-ANNUAL SHAREHOLDER REPORT | December 31, 2024 (Unaudited)
JPMorgan Investor Growth & Income Fund
Class C Shares/Ticker: ONECX
SEMI-ANNUAL SHAREHOLDER REPORT
This semi-annual shareholder report contains important information about the JPMorgan Investor Growth & Income Fund (the "Fund") for the period of July 1, 2024 to December 31, 2024. You can find additional information about the Fund at www.jpmorganfunds.com/funddocuments. You can also request this information by contacting us at 1-800-480-4111, by sending an e-mail request to Funds.Website.Support@jpmorganfunds.com or by asking any financial intermediary that offers shares of the Fund.
What were the Fund costs for the last six months?
(based on a hypothetical $10,000 investment)
| Fund (Class) | Costs of a
$10,000 investment | Costs paid as a percentage
of a $10,000 investment* |
JPMorgan Investor Growth & Income Fund
(Class C Shares) | $55 | 1.07% |
| * | This charge is annualized. |
| Fund net assets (000's) | $4,741,140 | |
| Total number of portfolio holdings | 26 | |
| Portfolio turnover rate | 4 | % |
PORTFOLIO COMPOSITION - ASSET CLASS
(% of Total Investments)
Availability of Additional Information
At www.jpmorganfunds.com/funddocuments, you can find additional information about the Fund, including the Fund’s:
Prospectus
Financial information
Fund holdings
Proxy voting information
You can also request this information by contacting us at 1-800-480-4111.
SEMI-ANNUAL SHAREHOLDER REPORT | December 31, 2024 (Unaudited)
JPMorgan Investor Growth & Income Fund
Class I Shares/Ticker: ONGFX
SEMI-ANNUAL SHAREHOLDER REPORT
This semi-annual shareholder report contains important information about the JPMorgan Investor Growth & Income Fund (the "Fund") for the period of July 1, 2024 to December 31, 2024. You can find additional information about the Fund at www.jpmorganfunds.com/funddocuments. You can also request this information by contacting us at 1-800-480-4111, by sending an e-mail request to Funds.Website.Support@jpmorganfunds.com or by asking any financial intermediary that offers shares of the Fund.
What were the Fund costs for the last six months?
(based on a hypothetical $10,000 investment)
| Fund (Class) | Costs of a
$10,000 investment | Costs paid as a percentage
of a $10,000 investment* |
JPMorgan Investor Growth & Income Fund
(Class I Shares) | $16 | 0.31% |
| * | This charge is annualized. |
| Fund net assets (000's) | $4,741,140 | |
| Total number of portfolio holdings | 26 | |
| Portfolio turnover rate | 4 | % |
PORTFOLIO COMPOSITION - ASSET CLASS
(% of Total Investments)
Availability of Additional Information
At www.jpmorganfunds.com/funddocuments, you can find additional information about the Fund, including the Fund’s:
Prospectus
Financial information
Fund holdings
Proxy voting information
You can also request this information by contacting us at 1-800-480-4111.
SEMI-ANNUAL SHAREHOLDER REPORT | December 31, 2024 (Unaudited)
JPMorgan Investor Growth & Income Fund
Class R6 Shares/Ticker: JFBUX
SEMI-ANNUAL SHAREHOLDER REPORT
This semi-annual shareholder report contains important information about the JPMorgan Investor Growth & Income Fund (the "Fund") for the period of July 1, 2024 to December 31, 2024. You can find additional information about the Fund at www.jpmorganfunds.com/funddocuments. You can also request this information by contacting us at 1-800-480-4111, by sending an e-mail request to Funds.Website.Support@jpmorganfunds.com or by asking any financial intermediary that offers shares of the Fund.
What were the Fund costs for the last six months?
(based on a hypothetical $10,000 investment)
| Fund (Class) | Costs of a
$10,000 investment | Costs paid as a percentage
of a $10,000 investment* |
JPMorgan Investor Growth & Income Fund
(Class R6 Shares) | $3 | 0.06% |
| * | This charge is annualized. |
| Fund net assets (000's) | $4,741,140 | |
| Total number of portfolio holdings | 26 | |
| Portfolio turnover rate | 4 | % |
PORTFOLIO COMPOSITION - ASSET CLASS
(% of Total Investments)
Availability of Additional Information
At www.jpmorganfunds.com/funddocuments, you can find additional information about the Fund, including the Fund’s:
Prospectus
Financial information
Fund holdings
Proxy voting information
You can also request this information by contacting us at 1-800-480-4111.
SEMI-ANNUAL SHAREHOLDER REPORT | December 31, 2024 (Unaudited)
JPMorgan Large Cap Growth Fund
Class A Shares/Ticker: OLGAX
SEMI-ANNUAL SHAREHOLDER REPORT
This semi-annual shareholder report contains important information about the JPMorgan Large Cap Growth Fund (the "Fund") for the period of July 1, 2024 to December 31, 2024. You can find additional information about the Fund at www.jpmorganfunds.com/funddocuments. You can also request this information by contacting us at 1-800-480-4111, by sending an e-mail request to Funds.Website.Support@jpmorganfunds.com or by asking any financial intermediary that offers shares of the Fund.
What were the Fund costs for the last six months?
(based on a hypothetical $10,000 investment)
| Fund (Class) | Costs of a
$10,000 investment | Costs paid as a percentage
of a $10,000 investment* |
JPMorgan Large Cap Growth Fund
(Class A Shares) | $49 | 0.93% |
| * | This charge is annualized. |
| Fund net assets (000's) | $103,997,128 | |
| Total number of portfolio holdings | 73 | |
| Portfolio turnover rate | 18 | % |
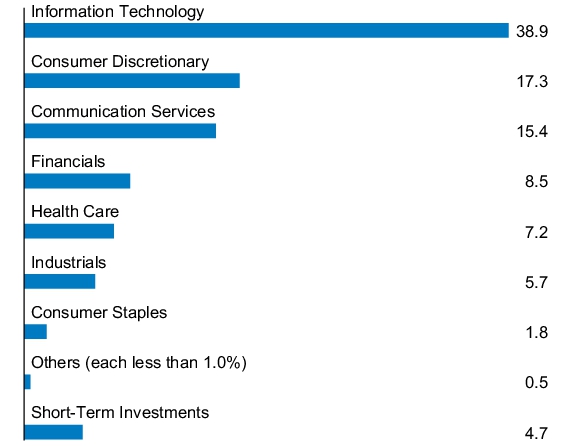
PORTFOLIO COMPOSITION - SECTOR
(% of Total Investments)
Availability of Additional Information
At www.jpmorganfunds.com/funddocuments, you can find additional information about the Fund, including the Fund’s:
Prospectus
Financial information
Fund holdings
Proxy voting information
You can also request this information by contacting us at 1-800-480-4111.
SEMI-ANNUAL SHAREHOLDER REPORT | December 31, 2024 (Unaudited)
JPMorgan Large Cap Growth Fund
Class C Shares/Ticker: OLGCX
SEMI-ANNUAL SHAREHOLDER REPORT
This semi-annual shareholder report contains important information about the JPMorgan Large Cap Growth Fund (the "Fund") for the period of July 1, 2024 to December 31, 2024. You can find additional information about the Fund at www.jpmorganfunds.com/funddocuments. You can also request this information by contacting us at 1-800-480-4111, by sending an e-mail request to Funds.Website.Support@jpmorganfunds.com or by asking any financial intermediary that offers shares of the Fund.
What were the Fund costs for the last six months?
(based on a hypothetical $10,000 investment)
| Fund (Class) | Costs of a
$10,000 investment | Costs paid as a percentage
of a $10,000 investment* |
JPMorgan Large Cap Growth Fund
(Class C Shares) | $75 | 1.43% |
| * | This charge is annualized. |
| Fund net assets (000's) | $103,997,128 | |
| Total number of portfolio holdings | 73 | |
| Portfolio turnover rate | 18 | % |
PORTFOLIO COMPOSITION - SECTOR
(% of Total Investments)
Availability of Additional Information
At www.jpmorganfunds.com/funddocuments, you can find additional information about the Fund, including the Fund’s:
Prospectus
Financial information
Fund holdings
Proxy voting information
You can also request this information by contacting us at 1-800-480-4111.
SEMI-ANNUAL SHAREHOLDER REPORT | December 31, 2024 (Unaudited)
JPMorgan Large Cap Growth Fund
Class I Shares/Ticker: SEEGX
SEMI-ANNUAL SHAREHOLDER REPORT
This semi-annual shareholder report contains important information about the JPMorgan Large Cap Growth Fund (the "Fund") for the period of July 1, 2024 to December 31, 2024. You can find additional information about the Fund at www.jpmorganfunds.com/funddocuments. You can also request this information by contacting us at 1-800-480-4111, by sending an e-mail request to Funds.Website.Support@jpmorganfunds.com or by asking any financial intermediary that offers shares of the Fund.
What were the Fund costs for the last six months?
(based on a hypothetical $10,000 investment)
| Fund (Class) | Costs of a
$10,000 investment | Costs paid as a percentage
of a $10,000 investment* |
JPMorgan Large Cap Growth Fund
(Class I Shares) | $36 | 0.68% |
| * | This charge is annualized. |
| Fund net assets (000's) | $103,997,128 | |
| Total number of portfolio holdings | 73 | |
| Portfolio turnover rate | 18 | % |
PORTFOLIO COMPOSITION - SECTOR
(% of Total Investments)
Availability of Additional Information
At www.jpmorganfunds.com/funddocuments, you can find additional information about the Fund, including the Fund’s:
Prospectus
Financial information
Fund holdings
Proxy voting information
You can also request this information by contacting us at 1-800-480-4111.
SEMI-ANNUAL SHAREHOLDER REPORT | December 31, 2024 (Unaudited)
JPMorgan Large Cap Growth Fund
Class R2 Shares/Ticker: JLGZX
SEMI-ANNUAL SHAREHOLDER REPORT
This semi-annual shareholder report contains important information about the JPMorgan Large Cap Growth Fund (the "Fund") for the period of July 1, 2024 to December 31, 2024. You can find additional information about the Fund at www.jpmorganfunds.com/funddocuments. You can also request this information by contacting us at 1-800-480-4111, by sending an e-mail request to Funds.Website.Support@jpmorganfunds.com or by asking any financial intermediary that offers shares of the Fund.
What were the Fund costs for the last six months?
(based on a hypothetical $10,000 investment)
| Fund (Class) | Costs of a
$10,000 investment | Costs paid as a percentage
of a $10,000 investment* |
JPMorgan Large Cap Growth Fund
(Class R2 Shares) | $62 | 1.18% |
| * | This charge is annualized. |
| Fund net assets (000's) | $103,997,128 | |
| Total number of portfolio holdings | 73 | |
| Portfolio turnover rate | 18 | % |
PORTFOLIO COMPOSITION - SECTOR
(% of Total Investments)
Availability of Additional Information
At www.jpmorganfunds.com/funddocuments, you can find additional information about the Fund, including the Fund’s:
Prospectus
Financial information
Fund holdings
Proxy voting information
You can also request this information by contacting us at 1-800-480-4111.
SEMI-ANNUAL SHAREHOLDER REPORT | December 31, 2024 (Unaudited)
JPMorgan Large Cap Growth Fund
Class R3 Shares/Ticker: JLGPX
SEMI-ANNUAL SHAREHOLDER REPORT
This semi-annual shareholder report contains important information about the JPMorgan Large Cap Growth Fund (the "Fund") for the period of July 1, 2024 to December 31, 2024. You can find additional information about the Fund at www.jpmorganfunds.com/funddocuments. You can also request this information by contacting us at 1-800-480-4111, by sending an e-mail request to Funds.Website.Support@jpmorganfunds.com or by asking any financial intermediary that offers shares of the Fund.
What were the Fund costs for the last six months?
(based on a hypothetical $10,000 investment)
| Fund (Class) | Costs of a
$10,000 investment | Costs paid as a percentage
of a $10,000 investment* |
JPMorgan Large Cap Growth Fund
(Class R3 Shares) | $49 | 0.93% |
| * | This charge is annualized. |
| Fund net assets (000's) | $103,997,128 | |
| Total number of portfolio holdings | 73 | |
| Portfolio turnover rate | 18 | % |
PORTFOLIO COMPOSITION - SECTOR
(% of Total Investments)
Availability of Additional Information
At www.jpmorganfunds.com/funddocuments, you can find additional information about the Fund, including the Fund’s:
Prospectus
Financial information
Fund holdings
Proxy voting information
You can also request this information by contacting us at 1-800-480-4111.
SEMI-ANNUAL SHAREHOLDER REPORT | December 31, 2024 (Unaudited)
JPMorgan Large Cap Growth Fund
Class R4 Shares/Ticker: JLGQX
SEMI-ANNUAL SHAREHOLDER REPORT
This semi-annual shareholder report contains important information about the JPMorgan Large Cap Growth Fund (the "Fund") for the period of July 1, 2024 to December 31, 2024. You can find additional information about the Fund at www.jpmorganfunds.com/funddocuments. You can also request this information by contacting us at 1-800-480-4111, by sending an e-mail request to Funds.Website.Support@jpmorganfunds.com or by asking any financial intermediary that offers shares of the Fund.
What were the Fund costs for the last six months?
(based on a hypothetical $10,000 investment)
| Fund (Class) | Costs of a
$10,000 investment | Costs paid as a percentage
of a $10,000 investment* |
JPMorgan Large Cap Growth Fund
(Class R4 Shares) | $36 | 0.68% |
| * | This charge is annualized. |
| Fund net assets (000's) | $103,997,128 | |
| Total number of portfolio holdings | 73 | |
| Portfolio turnover rate | 18 | % |
PORTFOLIO COMPOSITION - SECTOR
(% of Total Investments)
Availability of Additional Information
At www.jpmorganfunds.com/funddocuments, you can find additional information about the Fund, including the Fund’s:
Prospectus
Financial information
Fund holdings
Proxy voting information
You can also request this information by contacting us at 1-800-480-4111.
SEMI-ANNUAL SHAREHOLDER REPORT | December 31, 2024 (Unaudited)
JPMorgan Large Cap Growth Fund
Class R5 Shares/Ticker: JLGRX
SEMI-ANNUAL SHAREHOLDER REPORT
This semi-annual shareholder report contains important information about the JPMorgan Large Cap Growth Fund (the "Fund") for the period of July 1, 2024 to December 31, 2024. You can find additional information about the Fund at www.jpmorganfunds.com/funddocuments. You can also request this information by contacting us at 1-800-480-4111, by sending an e-mail request to Funds.Website.Support@jpmorganfunds.com or by asking any financial intermediary that offers shares of the Fund.
What were the Fund costs for the last six months?
(based on a hypothetical $10,000 investment)
| Fund (Class) | Costs of a
$10,000 investment | Costs paid as a percentage
of a $10,000 investment* |
JPMorgan Large Cap Growth Fund
(Class R5 Shares) | $28 | 0.53% |
| * | This charge is annualized. |
| Fund net assets (000's) | $103,997,128 | |
| Total number of portfolio holdings | 73 | |
| Portfolio turnover rate | 18 | % |
PORTFOLIO COMPOSITION - SECTOR
(% of Total Investments)
Availability of Additional Information
At www.jpmorganfunds.com/funddocuments, you can find additional information about the Fund, including the Fund’s:
Prospectus
Financial information
Fund holdings
Proxy voting information
You can also request this information by contacting us at 1-800-480-4111.
SEMI-ANNUAL SHAREHOLDER REPORT | December 31, 2024 (Unaudited)
JPMorgan Large Cap Growth Fund
Class R6 Shares/Ticker: JLGMX
SEMI-ANNUAL SHAREHOLDER REPORT
This semi-annual shareholder report contains important information about the JPMorgan Large Cap Growth Fund (the "Fund") for the period of July 1, 2024 to December 31, 2024. You can find additional information about the Fund at www.jpmorganfunds.com/funddocuments. You can also request this information by contacting us at 1-800-480-4111, by sending an e-mail request to Funds.Website.Support@jpmorganfunds.com or by asking any financial intermediary that offers shares of the Fund.
What were the Fund costs for the last six months?
(based on a hypothetical $10,000 investment)
| Fund (Class) | Costs of a
$10,000 investment | Costs paid as a percentage
of a $10,000 investment* |
JPMorgan Large Cap Growth Fund
(Class R6 Shares) | $23 | 0.43% |
| * | This charge is annualized. |
| Fund net assets (000's) | $103,997,128 | |
| Total number of portfolio holdings | 73 | |
| Portfolio turnover rate | 18 | % |
PORTFOLIO COMPOSITION - SECTOR
(% of Total Investments)
Availability of Additional Information
At www.jpmorganfunds.com/funddocuments, you can find additional information about the Fund, including the Fund’s:
Prospectus
Financial information
Fund holdings
Proxy voting information
You can also request this information by contacting us at 1-800-480-4111.
SEMI-ANNUAL SHAREHOLDER REPORT | December 31, 2024 (Unaudited)
JPMorgan Large Cap Value Fund
Class A Shares/Ticker: OLVAX
SEMI-ANNUAL SHAREHOLDER REPORT
This semi-annual shareholder report contains important information about the JPMorgan Large Cap Value Fund (the "Fund") for the period of July 1, 2024 to December 31, 2024. You can find additional information about the Fund at www.jpmorganfunds.com/funddocuments. You can also request this information by contacting us at 1-800-480-4111, by sending an e-mail request to Funds.Website.Support@jpmorganfunds.com or by asking any financial intermediary that offers shares of the Fund.
What were the Fund costs for the last six months?
(based on a hypothetical $10,000 investment)
| Fund (Class) | Costs of a
$10,000 investment | Costs paid as a percentage
of a $10,000 investment* |
JPMorgan Large Cap Value Fund
(Class A Shares) | $49 | 0.93% |
| * | This charge is annualized. |
| Fund net assets (000's) | $4,868,924 | |
| Total number of portfolio holdings | 118 | |
| Portfolio turnover rate | 69 | % |
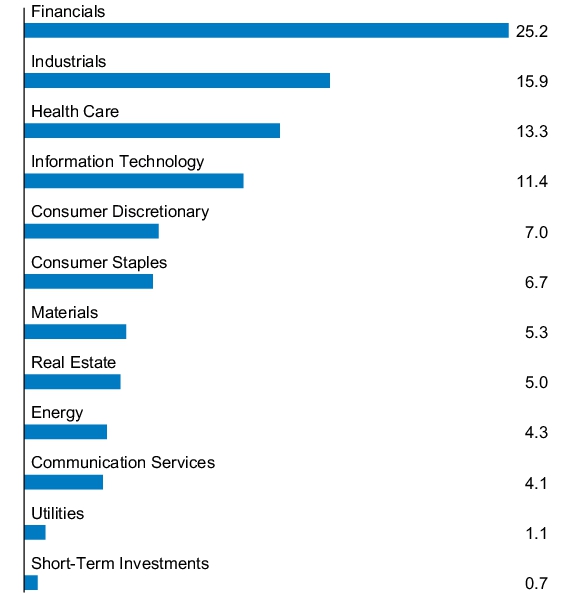
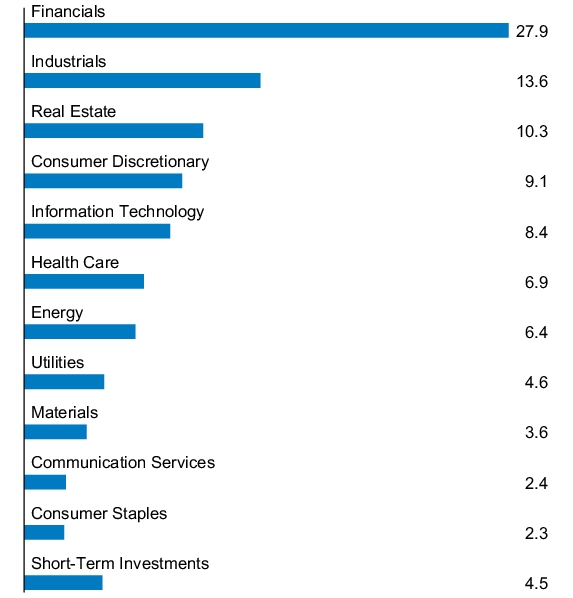
PORTFOLIO COMPOSITION - SECTOR
(% of Total Investments)
Availability of Additional Information
At www.jpmorganfunds.com/funddocuments, you can find additional information about the Fund, including the Fund’s:
Prospectus
Financial information
Fund holdings
Proxy voting information
You can also request this information by contacting us at 1-800-480-4111.
SEMI-ANNUAL SHAREHOLDER REPORT | December 31, 2024 (Unaudited)
JPMorgan Large Cap Value Fund
Class C Shares/Ticker: OLVCX
SEMI-ANNUAL SHAREHOLDER REPORT
This semi-annual shareholder report contains important information about the JPMorgan Large Cap Value Fund (the "Fund") for the period of July 1, 2024 to December 31, 2024. You can find additional information about the Fund at www.jpmorganfunds.com/funddocuments. You can also request this information by contacting us at 1-800-480-4111, by sending an e-mail request to Funds.Website.Support@jpmorganfunds.com or by asking any financial intermediary that offers shares of the Fund.
What were the Fund costs for the last six months?
(based on a hypothetical $10,000 investment)
| Fund (Class) | Costs of a
$10,000 investment | Costs paid as a percentage
of a $10,000 investment* |
JPMorgan Large Cap Value Fund
(Class C Shares) | $75 | 1.43% |
| * | This charge is annualized. |
| Fund net assets (000's) | $4,868,924 | |
| Total number of portfolio holdings | 118 | |
| Portfolio turnover rate | 69 | % |
PORTFOLIO COMPOSITION - SECTOR
(% of Total Investments)
Availability of Additional Information
At www.jpmorganfunds.com/funddocuments, you can find additional information about the Fund, including the Fund’s:
Prospectus
Financial information
Fund holdings
Proxy voting information
You can also request this information by contacting us at 1-800-480-4111.
SEMI-ANNUAL SHAREHOLDER REPORT | December 31, 2024 (Unaudited)
JPMorgan Large Cap Value Fund
Class I Shares/Ticker: HLQVX
SEMI-ANNUAL SHAREHOLDER REPORT
This semi-annual shareholder report contains important information about the JPMorgan Large Cap Value Fund (the "Fund") for the period of July 1, 2024 to December 31, 2024. You can find additional information about the Fund at www.jpmorganfunds.com/funddocuments. You can also request this information by contacting us at 1-800-480-4111, by sending an e-mail request to Funds.Website.Support@jpmorganfunds.com or by asking any financial intermediary that offers shares of the Fund.
What were the Fund costs for the last six months?
(based on a hypothetical $10,000 investment)
| Fund (Class) | Costs of a
$10,000 investment | Costs paid as a percentage
of a $10,000 investment* |
JPMorgan Large Cap Value Fund
(Class I Shares) | $36 | 0.69% |
| * | This charge is annualized. |
| Fund net assets (000's) | $4,868,924 | |
| Total number of portfolio holdings | 118 | |
| Portfolio turnover rate | 69 | % |
PORTFOLIO COMPOSITION - SECTOR
(% of Total Investments)
Availability of Additional Information
At www.jpmorganfunds.com/funddocuments, you can find additional information about the Fund, including the Fund’s:
Prospectus
Financial information
Fund holdings
Proxy voting information
You can also request this information by contacting us at 1-800-480-4111.
SEMI-ANNUAL SHAREHOLDER REPORT | December 31, 2024 (Unaudited)
JPMorgan Large Cap Value Fund
Class R2 Shares/Ticker: JLVZX
SEMI-ANNUAL SHAREHOLDER REPORT
This semi-annual shareholder report contains important information about the JPMorgan Large Cap Value Fund (the "Fund") for the period of July 1, 2024 to December 31, 2024. You can find additional information about the Fund at www.jpmorganfunds.com/funddocuments. You can also request this information by contacting us at 1-800-480-4111, by sending an e-mail request to Funds.Website.Support@jpmorganfunds.com or by asking any financial intermediary that offers shares of the Fund.
What were the Fund costs for the last six months?
(based on a hypothetical $10,000 investment)
| Fund (Class) | Costs of a
$10,000 investment | Costs paid as a percentage
of a $10,000 investment* |
JPMorgan Large Cap Value Fund
(Class R2 Shares) | $62 | 1.18% |
| * | This charge is annualized. |
| Fund net assets (000's) | $4,868,924 | |
| Total number of portfolio holdings | 118 | |
| Portfolio turnover rate | 69 | % |
PORTFOLIO COMPOSITION - SECTOR
(% of Total Investments)
Availability of Additional Information
At www.jpmorganfunds.com/funddocuments, you can find additional information about the Fund, including the Fund’s:
Prospectus
Financial information
Fund holdings
Proxy voting information
You can also request this information by contacting us at 1-800-480-4111.
SEMI-ANNUAL SHAREHOLDER REPORT | December 31, 2024 (Unaudited)
JPMorgan Large Cap Value Fund
Class R3 Shares/Ticker: OLVTX
SEMI-ANNUAL SHAREHOLDER REPORT
This semi-annual shareholder report contains important information about the JPMorgan Large Cap Value Fund (the "Fund") for the period of July 1, 2024 to December 31, 2024. You can find additional information about the Fund at www.jpmorganfunds.com/funddocuments. You can also request this information by contacting us at 1-800-480-4111, by sending an e-mail request to Funds.Website.Support@jpmorganfunds.com or by asking any financial intermediary that offers shares of the Fund.
What were the Fund costs for the last six months?
(based on a hypothetical $10,000 investment)
| Fund (Class) | Costs of a
$10,000 investment | Costs paid as a percentage
of a $10,000 investment* |
JPMorgan Large Cap Value Fund
(Class R3 Shares) | $49 | 0.94% |
| * | This charge is annualized. |
| Fund net assets (000's) | $4,868,924 | |
| Total number of portfolio holdings | 118 | |
| Portfolio turnover rate | 69 | % |
PORTFOLIO COMPOSITION - SECTOR
(% of Total Investments)
Availability of Additional Information
At www.jpmorganfunds.com/funddocuments, you can find additional information about the Fund, including the Fund’s:
Prospectus
Financial information
Fund holdings
Proxy voting information
You can also request this information by contacting us at 1-800-480-4111.
SEMI-ANNUAL SHAREHOLDER REPORT | December 31, 2024 (Unaudited)
JPMorgan Large Cap Value Fund
Class R4 Shares/Ticker: OLVRX
SEMI-ANNUAL SHAREHOLDER REPORT
This semi-annual shareholder report contains important information about the JPMorgan Large Cap Value Fund (the "Fund") for the period of July 1, 2024 to December 31, 2024. You can find additional information about the Fund at www.jpmorganfunds.com/funddocuments. You can also request this information by contacting us at 1-800-480-4111, by sending an e-mail request to Funds.Website.Support@jpmorganfunds.com or by asking any financial intermediary that offers shares of the Fund.
What were the Fund costs for the last six months?
(based on a hypothetical $10,000 investment)
| Fund (Class) | Costs of a
$10,000 investment | Costs paid as a percentage
of a $10,000 investment* |
JPMorgan Large Cap Value Fund
(Class R4 Shares) | $36 | 0.69% |
| * | This charge is annualized. |
| Fund net assets (000's) | $4,868,924 | |
| Total number of portfolio holdings | 118 | |
| Portfolio turnover rate | 69 | % |
PORTFOLIO COMPOSITION - SECTOR
(% of Total Investments)
Availability of Additional Information
At www.jpmorganfunds.com/funddocuments, you can find additional information about the Fund, including the Fund’s:
Prospectus
Financial information
Fund holdings
Proxy voting information
You can also request this information by contacting us at 1-800-480-4111.
SEMI-ANNUAL SHAREHOLDER REPORT | December 31, 2024 (Unaudited)
JPMorgan Large Cap Value Fund
Class R5 Shares/Ticker: JLVRX
SEMI-ANNUAL SHAREHOLDER REPORT
This semi-annual shareholder report contains important information about the JPMorgan Large Cap Value Fund (the "Fund") for the period of July 1, 2024 to December 31, 2024. You can find additional information about the Fund at www.jpmorganfunds.com/funddocuments. You can also request this information by contacting us at 1-800-480-4111, by sending an e-mail request to Funds.Website.Support@jpmorganfunds.com or by asking any financial intermediary that offers shares of the Fund.
What were the Fund costs for the last six months?
(based on a hypothetical $10,000 investment)
| Fund (Class) | Costs of a
$10,000 investment | Costs paid as a percentage
of a $10,000 investment* |
JPMorgan Large Cap Value Fund
(Class R5 Shares) | $28 | 0.54% |
| * | This charge is annualized. |
| Fund net assets (000's) | $4,868,924 | |
| Total number of portfolio holdings | 118 | |
| Portfolio turnover rate | 69 | % |
PORTFOLIO COMPOSITION - SECTOR
(% of Total Investments)
Availability of Additional Information
At www.jpmorganfunds.com/funddocuments, you can find additional information about the Fund, including the Fund’s:
Prospectus
Financial information
Fund holdings
Proxy voting information
You can also request this information by contacting us at 1-800-480-4111.
SEMI-ANNUAL SHAREHOLDER REPORT | December 31, 2024 (Unaudited)
JPMorgan Large Cap Value Fund
Class R6 Shares/Ticker: JLVMX
SEMI-ANNUAL SHAREHOLDER REPORT
This semi-annual shareholder report contains important information about the JPMorgan Large Cap Value Fund (the "Fund") for the period of July 1, 2024 to December 31, 2024. You can find additional information about the Fund at www.jpmorganfunds.com/funddocuments. You can also request this information by contacting us at 1-800-480-4111, by sending an e-mail request to Funds.Website.Support@jpmorganfunds.com or by asking any financial intermediary that offers shares of the Fund.
What were the Fund costs for the last six months?
(based on a hypothetical $10,000 investment)
| Fund (Class) | Costs of a
$10,000 investment | Costs paid as a percentage
of a $10,000 investment* |
JPMorgan Large Cap Value Fund
(Class R6 Shares) | $23 | 0.44% |
| * | This charge is annualized. |
| Fund net assets (000's) | $4,868,924 | |
| Total number of portfolio holdings | 118 | |
| Portfolio turnover rate | 69 | % |
PORTFOLIO COMPOSITION - SECTOR
(% of Total Investments)
Availability of Additional Information
At www.jpmorganfunds.com/funddocuments, you can find additional information about the Fund, including the Fund’s:
Prospectus
Financial information
Fund holdings
Proxy voting information
You can also request this information by contacting us at 1-800-480-4111.
SEMI-ANNUAL SHAREHOLDER REPORT | December 31, 2024 (Unaudited)
JPMorgan Mid Cap Growth Fund
Class A Shares/Ticker: OSGIX
SEMI-ANNUAL SHAREHOLDER REPORT
This semi-annual shareholder report contains important information about the JPMorgan Mid Cap Growth Fund (the "Fund") for the period July 1, 2024 to December 31, 2024. You can find additional information about the Fund at www.jpmorganfunds.com/funddocuments. You can also request this information by contacting us at 1-800-480-4111, by sending an e-mail request to Funds.Website.Support@jpmorganfunds.com or by asking any financial intermediary that offers shares of the Fund.
What were the Fund costs for the last six months?
(based on a hypothetical $10,000 investment)
| Fund (Class) | Costs of a
$10,000 investment | Costs paid as a percentage
of a $10,000 investment* |
JPMorgan Mid Cap Growth Fund
(Class A Shares) | $58 | 1.12% |
| * | This charge is annualized. |
| Fund net assets (000's) | $11,615,217 | |
| Total number of portfolio holdings | 116 | |
| Portfolio turnover rate | 25 | % |
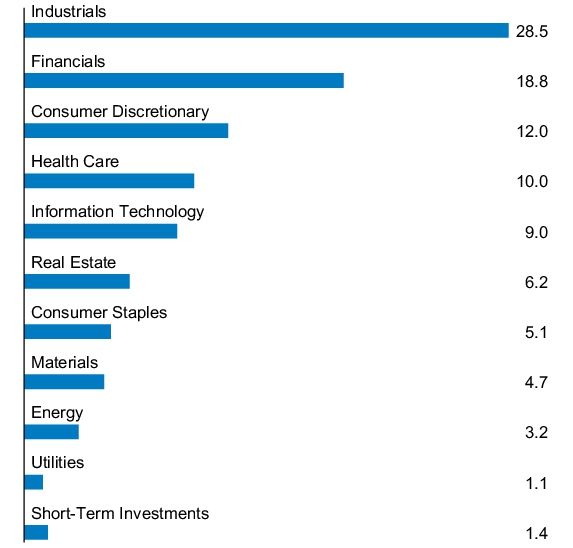
PORTFOLIO COMPOSITION - SECTOR
(% of Total Investments)
Availability of Additional Information
At www.jpmorganfunds.com/funddocuments, you can find additional information about the Fund, including the Fund’s:
Prospectus
Financial information
Fund holdings
Proxy voting information
You can also request this information by contacting us at 1-800-480-4111.
SEMI-ANNUAL SHAREHOLDER REPORT | December 31, 2024 (Unaudited)
JPMorgan Mid Cap Growth Fund
Class C Shares/Ticker: OMGCX
SEMI-ANNUAL SHAREHOLDER REPORT
This semi-annual shareholder report contains important information about the JPMorgan Mid Cap Growth Fund (the "Fund") for the period July 1, 2024 to December 31, 2024. You can find additional information about the Fund at www.jpmorganfunds.com/funddocuments. You can also request this information by contacting us at 1-800-480-4111, by sending an e-mail request to Funds.Website.Support@jpmorganfunds.com or by asking any financial intermediary that offers shares of the Fund.
What were the Fund costs for the last six months?
(based on a hypothetical $10,000 investment)
| Fund (Class) | Costs of a
$10,000 investment | Costs paid as a percentage
of a $10,000 investment* |
JPMorgan Mid Cap Growth Fund
(Class C Shares) | $84 | 1.62% |
| * | This charge is annualized. |
| Fund net assets (000's) | $11,615,217 | |
| Total number of portfolio holdings | 116 | |
| Portfolio turnover rate | 25 | % |
PORTFOLIO COMPOSITION - SECTOR
(% of Total Investments)
Availability of Additional Information
At www.jpmorganfunds.com/funddocuments, you can find additional information about the Fund, including the Fund’s:
Prospectus
Financial information
Fund holdings
Proxy voting information
You can also request this information by contacting us at 1-800-480-4111.
SEMI-ANNUAL SHAREHOLDER REPORT | December 31, 2024 (Unaudited)
JPMorgan Mid Cap Growth Fund
Class I Shares/Ticker: HLGEX
SEMI-ANNUAL SHAREHOLDER REPORT
This semi-annual shareholder report contains important information about the JPMorgan Mid Cap Growth Fund (the "Fund") for the period July 1, 2024 to December 31, 2024. You can find additional information about the Fund at www.jpmorganfunds.com/funddocuments. You can also request this information by contacting us at 1-800-480-4111, by sending an e-mail request to Funds.Website.Support@jpmorganfunds.com or by asking any financial intermediary that offers shares of the Fund.
What were the Fund costs for the last six months?
(based on a hypothetical $10,000 investment)
| Fund (Class) | Costs of a
$10,000 investment | Costs paid as a percentage
of a $10,000 investment* |
JPMorgan Mid Cap Growth Fund
(Class I Shares) | $45 | 0.87% |
| * | This charge is annualized. |
| Fund net assets (000's) | $11,615,217 | |
| Total number of portfolio holdings | 116 | |
| Portfolio turnover rate | 25 | % |
PORTFOLIO COMPOSITION - SECTOR
(% of Total Investments)
Availability of Additional Information
At www.jpmorganfunds.com/funddocuments, you can find additional information about the Fund, including the Fund’s:
Prospectus
Financial information
Fund holdings
Proxy voting information
You can also request this information by contacting us at 1-800-480-4111.
SEMI-ANNUAL SHAREHOLDER REPORT | December 31, 2024 (Unaudited)
JPMorgan Mid Cap Growth Fund
Class R2 Shares/Ticker: JMGZX
SEMI-ANNUAL SHAREHOLDER REPORT
This semi-annual shareholder report contains important information about the JPMorgan Mid Cap Growth Fund (the "Fund") for the period July 1, 2024 to December 31, 2024. You can find additional information about the Fund at www.jpmorganfunds.com/funddocuments. You can also request this information by contacting us at 1-800-480-4111, by sending an e-mail request to Funds.Website.Support@jpmorganfunds.com or by asking any financial intermediary that offers shares of the Fund.
What were the Fund costs for the last six months?
(based on a hypothetical $10,000 investment)
| Fund (Class) | Costs of a
$10,000 investment | Costs paid as a percentage
of a $10,000 investment* |
JPMorgan Mid Cap Growth Fund
(Class R2 Shares) | $75 | 1.43% |
| * | This charge is annualized. |
| Fund net assets (000's) | $11,615,217 | |
| Total number of portfolio holdings | 116 | |
| Portfolio turnover rate | 25 | % |
PORTFOLIO COMPOSITION - SECTOR
(% of Total Investments)
Availability of Additional Information
At www.jpmorganfunds.com/funddocuments, you can find additional information about the Fund, including the Fund’s:
Prospectus
Financial information
Fund holdings
Proxy voting information
You can also request this information by contacting us at 1-800-480-4111.
SEMI-ANNUAL SHAREHOLDER REPORT | December 31, 2024 (Unaudited)
JPMorgan Mid Cap Growth Fund
Class R3 Shares/Ticker: JMGPX
SEMI-ANNUAL SHAREHOLDER REPORT
This semi-annual shareholder report contains important information about the JPMorgan Mid Cap Growth Fund (the "Fund") for the period July 1, 2024 to December 31, 2024. You can find additional information about the Fund at www.jpmorganfunds.com/funddocuments. You can also request this information by contacting us at 1-800-480-4111, by sending an e-mail request to Funds.Website.Support@jpmorganfunds.com or by asking any financial intermediary that offers shares of the Fund.
What were the Fund costs for the last six months?
(based on a hypothetical $10,000 investment)
| Fund (Class) | Costs of a
$10,000 investment | Costs paid as a percentage
of a $10,000 investment* |
JPMorgan Mid Cap Growth Fund
(Class R3 Shares) | $62 | 1.18% |
| * | This charge is annualized. |
| Fund net assets (000's) | $11,615,217 | |
| Total number of portfolio holdings | 116 | |
| Portfolio turnover rate | 25 | % |
PORTFOLIO COMPOSITION - SECTOR
(% of Total Investments)
Availability of Additional Information
At www.jpmorganfunds.com/funddocuments, you can find additional information about the Fund, including the Fund’s:
Prospectus
Financial information
Fund holdings
Proxy voting information
You can also request this information by contacting us at 1-800-480-4111.
SEMI-ANNUAL SHAREHOLDER REPORT | December 31, 2024 (Unaudited)
JPMorgan Mid Cap Growth Fund
Class R4 Shares/Ticker: JMGQX
SEMI-ANNUAL SHAREHOLDER REPORT
This semi-annual shareholder report contains important information about the JPMorgan Mid Cap Growth Fund (the "Fund") for the period July 1, 2024 to December 31, 2024. You can find additional information about the Fund at www.jpmorganfunds.com/funddocuments. You can also request this information by contacting us at 1-800-480-4111, by sending an e-mail request to Funds.Website.Support@jpmorganfunds.com or by asking any financial intermediary that offers shares of the Fund.
What were the Fund costs for the last six months?
(based on a hypothetical $10,000 investment)
| Fund (Class) | Costs of a
$10,000 investment | Costs paid as a percentage
of a $10,000 investment* |
JPMorgan Mid Cap Growth Fund
(Class R4 Shares) | $49 | 0.93% |
| * | This charge is annualized. |
| Fund net assets (000's) | $11,615,217 | |
| Total number of portfolio holdings | 116 | |
| Portfolio turnover rate | 25 | % |
PORTFOLIO COMPOSITION - SECTOR
(% of Total Investments)
Availability of Additional Information
At www.jpmorganfunds.com/funddocuments, you can find additional information about the Fund, including the Fund’s:
Prospectus
Financial information
Fund holdings
Proxy voting information
You can also request this information by contacting us at 1-800-480-4111.
SEMI-ANNUAL SHAREHOLDER REPORT | December 31, 2024 (Unaudited)
JPMorgan Mid Cap Growth Fund
Class R5 Shares/Ticker: JMGFX
SEMI-ANNUAL SHAREHOLDER REPORT
This semi-annual shareholder report contains important information about the JPMorgan Mid Cap Growth Fund (the "Fund") for the period July 1, 2024 to December 31, 2024. You can find additional information about the Fund at www.jpmorganfunds.com/funddocuments. You can also request this information by contacting us at 1-800-480-4111, by sending an e-mail request to Funds.Website.Support@jpmorganfunds.com or by asking any financial intermediary that offers shares of the Fund.
What were the Fund costs for the last six months?
(based on a hypothetical $10,000 investment)
| Fund (Class) | Costs of a
$10,000 investment | Costs paid as a percentage
of a $10,000 investment* |
JPMorgan Mid Cap Growth Fund
(Class R5 Shares) | $40 | 0.77% |
| * | This charge is annualized. |
| Fund net assets (000's) | $11,615,217 | |
| Total number of portfolio holdings | 116 | |
| Portfolio turnover rate | 25 | % |
PORTFOLIO COMPOSITION - SECTOR
(% of Total Investments)
Availability of Additional Information
At www.jpmorganfunds.com/funddocuments, you can find additional information about the Fund, including the Fund’s:
Prospectus
Financial information
Fund holdings
Proxy voting information
You can also request this information by contacting us at 1-800-480-4111.
SEMI-ANNUAL SHAREHOLDER REPORT | December 31, 2024 (Unaudited)
JPMorgan Mid Cap Growth Fund
Class R6 Shares/Ticker: JMGMX
SEMI-ANNUAL SHAREHOLDER REPORT
This semi-annual shareholder report contains important information about the JPMorgan Mid Cap Growth Fund (the "Fund") for the period July 1, 2024 to December 31, 2024. You can find additional information about the Fund at www.jpmorganfunds.com/funddocuments. You can also request this information by contacting us at 1-800-480-4111, by sending an e-mail request to Funds.Website.Support@jpmorganfunds.com or by asking any financial intermediary that offers shares of the Fund.
What were the Fund costs for the last six months?
(based on a hypothetical $10,000 investment)
| Fund (Class) | Costs of a
$10,000 investment | Costs paid as a percentage
of a $10,000 investment* |
JPMorgan Mid Cap Growth Fund
(Class R6 Shares) | $36 | 0.68% |
| * | This charge is annualized. |
| Fund net assets (000's) | $11,615,217 | |
| Total number of portfolio holdings | 116 | |
| Portfolio turnover rate | 25 | % |
PORTFOLIO COMPOSITION - SECTOR
(% of Total Investments)
Availability of Additional Information
At www.jpmorganfunds.com/funddocuments, you can find additional information about the Fund, including the Fund’s:
Prospectus
Financial information
Fund holdings
Proxy voting information
You can also request this information by contacting us at 1-800-480-4111.
SEMI-ANNUAL SHAREHOLDER REPORT | December 31, 2024 (Unaudited)
JPMorgan Small Cap Growth Fund
Class A Shares/Ticker: PGSGX
SEMI-ANNUAL SHAREHOLDER REPORT
This semi-annual shareholder report contains important information about the JPMorgan Small Cap Growth Fund (the "Fund") for the period of July 1, 2024 to December 31, 2024. You can find additional information about the Fund at www.jpmorganfunds.com/funddocuments. You can also request this information by contacting us at 1-800-480-4111, by sending an e-mail request to Funds.Website.Support@jpmorganfunds.com or by asking any financial intermediary that offers shares of the Fund.
What were the Fund costs for the last six months?
(based on a hypothetical $10,000 investment)
| Fund (Class) | Costs of a
$10,000 investment | Costs paid as a percentage
of a $10,000 investment* |
JPMorgan Small Cap Growth Fund
(Class A Shares) | $64 | 1.24% |
| * | This charge is annualized. |
| Fund net assets (000's) | $3,572,264 | |
| Total number of portfolio holdings | 136 | |
| Portfolio turnover rate | 22 | % |
PORTFOLIO COMPOSITION - SECTOR
(% of Total Investments)
Availability of Additional Information
At www.jpmorganfunds.com/funddocuments, you can find additional information about the Fund, including the Fund’s:
Prospectus
Financial information
Fund holdings
Proxy voting information
You can also request this information by contacting us at 1-800-480-4111.
SEMI-ANNUAL SHAREHOLDER REPORT | December 31, 2024 (Unaudited)
JPMorgan Small Cap Growth Fund
Class C Shares/Ticker: OSGCX
SEMI-ANNUAL SHAREHOLDER REPORT
This semi-annual shareholder report contains important information about the JPMorgan Small Cap Growth Fund (the "Fund") for the period of July 1, 2024 to December 31, 2024. You can find additional information about the Fund at www.jpmorganfunds.com/funddocuments. You can also request this information by contacting us at 1-800-480-4111, by sending an e-mail request to Funds.Website.Support@jpmorganfunds.com or by asking any financial intermediary that offers shares of the Fund.
What were the Fund costs for the last six months?
(based on a hypothetical $10,000 investment)
| Fund (Class) | Costs of a
$10,000 investment | Costs paid as a percentage
of a $10,000 investment* |
JPMorgan Small Cap Growth Fund
(Class C Shares) | $90 | 1.73% |
| * | This charge is annualized. |
| Fund net assets (000's) | $3,572,264 | |
| Total number of portfolio holdings | 136 | |
| Portfolio turnover rate | 22 | % |
PORTFOLIO COMPOSITION - SECTOR
(% of Total Investments)
Availability of Additional Information
At www.jpmorganfunds.com/funddocuments, you can find additional information about the Fund, including the Fund’s:
Prospectus
Financial information
Fund holdings
Proxy voting information
You can also request this information by contacting us at 1-800-480-4111.
SEMI-ANNUAL SHAREHOLDER REPORT | December 31, 2024 (Unaudited)
JPMorgan Small Cap Growth Fund
Class I Shares/Ticker: OGGFX
SEMI-ANNUAL SHAREHOLDER REPORT
This semi-annual shareholder report contains important information about the JPMorgan Small Cap Growth Fund (the "Fund") for the period of July 1, 2024 to December 31, 2024. You can find additional information about the Fund at www.jpmorganfunds.com/funddocuments. You can also request this information by contacting us at 1-800-480-4111, by sending an e-mail request to Funds.Website.Support@jpmorganfunds.com or by asking any financial intermediary that offers shares of the Fund.
What were the Fund costs for the last six months?
(based on a hypothetical $10,000 investment)
| Fund (Class) | Costs of a
$10,000 investment | Costs paid as a percentage
of a $10,000 investment* |
JPMorgan Small Cap Growth Fund
(Class I Shares) | $51 | 0.99% |
| * | This charge is annualized. |
| Fund net assets (000's) | $3,572,264 | |
| Total number of portfolio holdings | 136 | |
| Portfolio turnover rate | 22 | % |
PORTFOLIO COMPOSITION - SECTOR
(% of Total Investments)
Availability of Additional Information
At www.jpmorganfunds.com/funddocuments, you can find additional information about the Fund, including the Fund’s:
Prospectus
Financial information
Fund holdings
Proxy voting information
You can also request this information by contacting us at 1-800-480-4111.
SEMI-ANNUAL SHAREHOLDER REPORT | December 31, 2024 (Unaudited)
JPMorgan Small Cap Growth Fund
Class L Shares/Ticker: JISGX
SEMI-ANNUAL SHAREHOLDER REPORT
This semi-annual shareholder report contains important information about the JPMorgan Small Cap Growth Fund (the "Fund") for the period of July 1, 2024 to December 31, 2024. You can find additional information about the Fund at www.jpmorganfunds.com/funddocuments. You can also request this information by contacting us at 1-800-480-4111, by sending an e-mail request to Funds.Website.Support@jpmorganfunds.com or by asking any financial intermediary that offers shares of the Fund.
What were the Fund costs for the last six months?
(based on a hypothetical $10,000 investment)
| Fund (Class) | Costs of a
$10,000 investment | Costs paid as a percentage
of a $10,000 investment* |
JPMorgan Small Cap Growth Fund
(Class L Shares) | $43 | 0.84% |
| * | This charge is annualized. |
| Fund net assets (000's) | $3,572,264 | |
| Total number of portfolio holdings | 136 | |
| Portfolio turnover rate | 22 | % |
PORTFOLIO COMPOSITION - SECTOR
(% of Total Investments)
Availability of Additional Information
At www.jpmorganfunds.com/funddocuments, you can find additional information about the Fund, including the Fund’s:
Prospectus
Financial information
Fund holdings
Proxy voting information
You can also request this information by contacting us at 1-800-480-4111.
SEMI-ANNUAL SHAREHOLDER REPORT | December 31, 2024 (Unaudited)
JPMorgan Small Cap Growth Fund
Class R2 Shares/Ticker: JSGZX
SEMI-ANNUAL SHAREHOLDER REPORT
This semi-annual shareholder report contains important information about the JPMorgan Small Cap Growth Fund (the "Fund") for the period of July 1, 2024 to December 31, 2024. You can find additional information about the Fund at www.jpmorganfunds.com/funddocuments. You can also request this information by contacting us at 1-800-480-4111, by sending an e-mail request to Funds.Website.Support@jpmorganfunds.com or by asking any financial intermediary that offers shares of the Fund.
What were the Fund costs for the last six months?
(based on a hypothetical $10,000 investment)
| Fund (Class) | Costs of a
$10,000 investment | Costs paid as a percentage
of a $10,000 investment* |
JPMorgan Small Cap Growth Fund
(Class R2 Shares) | $77 | 1.48% |
| * | This charge is annualized. |
| Fund net assets (000's) | $3,572,264 | |
| Total number of portfolio holdings | 136 | |
| Portfolio turnover rate | 22 | % |
PORTFOLIO COMPOSITION - SECTOR
(% of Total Investments)
Availability of Additional Information
At www.jpmorganfunds.com/funddocuments, you can find additional information about the Fund, including the Fund’s:
Prospectus
Financial information
Fund holdings
Proxy voting information
You can also request this information by contacting us at 1-800-480-4111.
SEMI-ANNUAL SHAREHOLDER REPORT | December 31, 2024 (Unaudited)
JPMorgan Small Cap Growth Fund
Class R3 Shares/Ticker: JGRQX
SEMI-ANNUAL SHAREHOLDER REPORT
This semi-annual shareholder report contains important information about the JPMorgan Small Cap Growth Fund (the "Fund") for the period of July 1, 2024 to December 31, 2024. You can find additional information about the Fund at www.jpmorganfunds.com/funddocuments. You can also request this information by contacting us at 1-800-480-4111, by sending an e-mail request to Funds.Website.Support@jpmorganfunds.com or by asking any financial intermediary that offers shares of the Fund.
What were the Fund costs for the last six months?
(based on a hypothetical $10,000 investment)
| Fund (Class) | Costs of a
$10,000 investment | Costs paid as a percentage
of a $10,000 investment* |
JPMorgan Small Cap Growth Fund
(Class R3 Shares) | $64 | 1.24% |
| * | This charge is annualized. |
| Fund net assets (000's) | $3,572,264 | |
| Total number of portfolio holdings | 136 | |
| Portfolio turnover rate | 22 | % |
PORTFOLIO COMPOSITION - SECTOR
(% of Total Investments)
Availability of Additional Information
At www.jpmorganfunds.com/funddocuments, you can find additional information about the Fund, including the Fund’s:
Prospectus
Financial information
Fund holdings
Proxy voting information
You can also request this information by contacting us at 1-800-480-4111.
SEMI-ANNUAL SHAREHOLDER REPORT | December 31, 2024 (Unaudited)
JPMorgan Small Cap Growth Fund
Class R4 Shares/Ticker: JGLYX
SEMI-ANNUAL SHAREHOLDER REPORT
This semi-annual shareholder report contains important information about the JPMorgan Small Cap Growth Fund (the "Fund") for the period of July 1, 2024 to December 31, 2024. You can find additional information about the Fund at www.jpmorganfunds.com/funddocuments. You can also request this information by contacting us at 1-800-480-4111, by sending an e-mail request to Funds.Website.Support@jpmorganfunds.com or by asking any financial intermediary that offers shares of the Fund.
What were the Fund costs for the last six months?
(based on a hypothetical $10,000 investment)
| Fund (Class) | Costs of a
$10,000 investment | Costs paid as a percentage
of a $10,000 investment* |
JPMorgan Small Cap Growth Fund
(Class R4 Shares) | $51 | 0.99% |
| * | This charge is annualized. |
| Fund net assets (000's) | $3,572,264 | |
| Total number of portfolio holdings | 136 | |
| Portfolio turnover rate | 22 | % |
PORTFOLIO COMPOSITION - SECTOR
(% of Total Investments)
Availability of Additional Information
At www.jpmorganfunds.com/funddocuments, you can find additional information about the Fund, including the Fund’s:
Prospectus
Financial information
Fund holdings
Proxy voting information
You can also request this information by contacting us at 1-800-480-4111.
SEMI-ANNUAL SHAREHOLDER REPORT | December 31, 2024 (Unaudited)
JPMorgan Small Cap Growth Fund
Class R5 Shares/Ticker: JGSVX
SEMI-ANNUAL SHAREHOLDER REPORT
This semi-annual shareholder report contains important information about the JPMorgan Small Cap Growth Fund (the "Fund") for the period of July 1, 2024 to December 31, 2024. You can find additional information about the Fund at www.jpmorganfunds.com/funddocuments. You can also request this information by contacting us at 1-800-480-4111, by sending an e-mail request to Funds.Website.Support@jpmorganfunds.com or by asking any financial intermediary that offers shares of the Fund.
What were the Fund costs for the last six months?
(based on a hypothetical $10,000 investment)
| Fund (Class) | Costs of a
$10,000 investment | Costs paid as a percentage
of a $10,000 investment* |
JPMorgan Small Cap Growth Fund
(Class R5 Shares) | $43 | 0.84% |
| * | This charge is annualized. |
| Fund net assets (000's) | $3,572,264 | |
| Total number of portfolio holdings | 136 | |
| Portfolio turnover rate | 22 | % |
PORTFOLIO COMPOSITION - SECTOR
(% of Total Investments)
Availability of Additional Information
At www.jpmorganfunds.com/funddocuments, you can find additional information about the Fund, including the Fund’s:
Prospectus
Financial information
Fund holdings
Proxy voting information
You can also request this information by contacting us at 1-800-480-4111.
SEMI-ANNUAL SHAREHOLDER REPORT | December 31, 2024 (Unaudited)
JPMorgan Small Cap Growth Fund
Class R6 Shares/Ticker: JGSMX
SEMI-ANNUAL SHAREHOLDER REPORT
This semi-annual shareholder report contains important information about the JPMorgan Small Cap Growth Fund (the "Fund") for the period of July 1, 2024 to December 31, 2024. You can find additional information about the Fund at www.jpmorganfunds.com/funddocuments. You can also request this information by contacting us at 1-800-480-4111, by sending an e-mail request to Funds.Website.Support@jpmorganfunds.com or by asking any financial intermediary that offers shares of the Fund.
What were the Fund costs for the last six months?
(based on a hypothetical $10,000 investment)
| Fund (Class) | Costs of a
$10,000 investment | Costs paid as a percentage
of a $10,000 investment* |
JPMorgan Small Cap Growth Fund
(Class R6 Shares) | $38 | 0.74% |
| * | This charge is annualized. |
| Fund net assets (000's) | $3,572,264 | |
| Total number of portfolio holdings | 136 | |
| Portfolio turnover rate | 22 | % |
PORTFOLIO COMPOSITION - SECTOR
(% of Total Investments)
Availability of Additional Information
At www.jpmorganfunds.com/funddocuments, you can find additional information about the Fund, including the Fund’s:
Prospectus
Financial information
Fund holdings
Proxy voting information
You can also request this information by contacting us at 1-800-480-4111.
SEMI-ANNUAL SHAREHOLDER REPORT | December 31, 2024 (Unaudited)
JPMorgan Small Cap Value Fund
Class A Shares/Ticker: PSOAX
SEMI-ANNUAL SHAREHOLDER REPORT
This semi-annual shareholder report contains important information about the JPMorgan Small Cap Value Fund (the "Fund") for the period of July 1, 2024 to December 31, 2024. You can find additional information about the Fund at www.jpmorganfunds.com/funddocuments. You can also request this information by contacting us at 1-800-480-4111, by sending an e-mail request to Funds.Website.Support@jpmorganfunds.com or by asking any financial intermediary that offers shares of the Fund.
What were the Fund costs for the last six months?
(based on a hypothetical $10,000 investment)
| Fund (Class) | Costs of a
$10,000 investment | Costs paid as a percentage
of a $10,000 investment* |
JPMorgan Small Cap Value Fund
(Class A Shares) | $62 | 1.18% |
| * | This charge is annualized. |
| Fund net assets (000's) | $1,265,817 | |
| Total number of portfolio holdings | 430 | |
| Portfolio turnover rate | 30 | % |
PORTFOLIO COMPOSITION - SECTOR
(% of Total Investments)
Availability of Additional Information
At www.jpmorganfunds.com/funddocuments, you can find additional information about the Fund, including the Fund’s:
Prospectus
Financial information
Fund holdings
Proxy voting information
You can also request this information by contacting us at 1-800-480-4111.
SEMI-ANNUAL SHAREHOLDER REPORT | December 31, 2024 (Unaudited)
JPMorgan Small Cap Value Fund
Class C Shares/Ticker: OSVCX
SEMI-ANNUAL SHAREHOLDER REPORT
This semi-annual shareholder report contains important information about the JPMorgan Small Cap Value Fund (the "Fund") for the period of July 1, 2024 to December 31, 2024. You can find additional information about the Fund at www.jpmorganfunds.com/funddocuments. You can also request this information by contacting us at 1-800-480-4111, by sending an e-mail request to Funds.Website.Support@jpmorganfunds.com or by asking any financial intermediary that offers shares of the Fund.
What were the Fund costs for the last six months?
(based on a hypothetical $10,000 investment)
| Fund (Class) | Costs of a
$10,000 investment | Costs paid as a percentage
of a $10,000 investment* |
JPMorgan Small Cap Value Fund
(Class C Shares) | $88 | 1.68% |
| * | This charge is annualized. |
| Fund net assets (000's) | $1,265,817 | |
| Total number of portfolio holdings | 430 | |
| Portfolio turnover rate | 30 | % |
PORTFOLIO COMPOSITION - SECTOR
(% of Total Investments)
Availability of Additional Information
At www.jpmorganfunds.com/funddocuments, you can find additional information about the Fund, including the Fund’s:
Prospectus
Financial information
Fund holdings
Proxy voting information
You can also request this information by contacting us at 1-800-480-4111.
SEMI-ANNUAL SHAREHOLDER REPORT | December 31, 2024 (Unaudited)
JPMorgan Small Cap Value Fund
Class I Shares/Ticker: PSOPX
SEMI-ANNUAL SHAREHOLDER REPORT
This semi-annual shareholder report contains important information about the JPMorgan Small Cap Value Fund (the "Fund") for the period of July 1, 2024 to December 31, 2024. You can find additional information about the Fund at www.jpmorganfunds.com/funddocuments. You can also request this information by contacting us at 1-800-480-4111, by sending an e-mail request to Funds.Website.Support@jpmorganfunds.com or by asking any financial intermediary that offers shares of the Fund.
What were the Fund costs for the last six months?
(based on a hypothetical $10,000 investment)
| Fund (Class) | Costs of a
$10,000 investment | Costs paid as a percentage
of a $10,000 investment* |
JPMorgan Small Cap Value Fund
(Class I Shares) | $49 | 0.93% |
| * | This charge is annualized. |
| Fund net assets (000's) | $1,265,817 | |
| Total number of portfolio holdings | 430 | |
| Portfolio turnover rate | 30 | % |
PORTFOLIO COMPOSITION - SECTOR
(% of Total Investments)
Availability of Additional Information
At www.jpmorganfunds.com/funddocuments, you can find additional information about the Fund, including the Fund’s:
Prospectus
Financial information
Fund holdings
Proxy voting information
You can also request this information by contacting us at 1-800-480-4111.
SEMI-ANNUAL SHAREHOLDER REPORT | December 31, 2024 (Unaudited)
JPMorgan Small Cap Value Fund
Class R2 Shares/Ticker: JSVZX
SEMI-ANNUAL SHAREHOLDER REPORT
This semi-annual shareholder report contains important information about the JPMorgan Small Cap Value Fund (the "Fund") for the period of July 1, 2024 to December 31, 2024. You can find additional information about the Fund at www.jpmorganfunds.com/funddocuments. You can also request this information by contacting us at 1-800-480-4111, by sending an e-mail request to Funds.Website.Support@jpmorganfunds.com or by asking any financial intermediary that offers shares of the Fund.
What were the Fund costs for the last six months?
(based on a hypothetical $10,000 investment)
| Fund (Class) | Costs of a
$10,000 investment | Costs paid as a percentage
of a $10,000 investment* |
JPMorgan Small Cap Value Fund
(Class R2 Shares) | $77 | 1.48% |
| * | This charge is annualized. |
| Fund net assets (000's) | $1,265,817 | |
| Total number of portfolio holdings | 430 | |
| Portfolio turnover rate | 30 | % |
PORTFOLIO COMPOSITION - SECTOR
(% of Total Investments)
Availability of Additional Information
At www.jpmorganfunds.com/funddocuments, you can find additional information about the Fund, including the Fund’s:
Prospectus
Financial information
Fund holdings
Proxy voting information
You can also request this information by contacting us at 1-800-480-4111.
SEMI-ANNUAL SHAREHOLDER REPORT | December 31, 2024 (Unaudited)
JPMorgan Small Cap Value Fund
Class R3 Shares/Ticker: JSVPX
SEMI-ANNUAL SHAREHOLDER REPORT
This semi-annual shareholder report contains important information about the JPMorgan Small Cap Value Fund (the "Fund") for the period of July 1, 2024 to December 31, 2024. You can find additional information about the Fund at www.jpmorganfunds.com/funddocuments. You can also request this information by contacting us at 1-800-480-4111, by sending an e-mail request to Funds.Website.Support@jpmorganfunds.com or by asking any financial intermediary that offers shares of the Fund.
What were the Fund costs for the last six months?
(based on a hypothetical $10,000 investment)
| Fund (Class) | Costs of a
$10,000 investment | Costs paid as a percentage
of a $10,000 investment* |
JPMorgan Small Cap Value Fund
(Class R3 Shares) | $64 | 1.23% |
| * | This charge is annualized. |
| Fund net assets (000's) | $1,265,817 | |
| Total number of portfolio holdings | 430 | |
| Portfolio turnover rate | 30 | % |
PORTFOLIO COMPOSITION - SECTOR
(% of Total Investments)
Availability of Additional Information
At www.jpmorganfunds.com/funddocuments, you can find additional information about the Fund, including the Fund’s:
Prospectus
Financial information
Fund holdings
Proxy voting information
You can also request this information by contacting us at 1-800-480-4111.
SEMI-ANNUAL SHAREHOLDER REPORT | December 31, 2024 (Unaudited)
JPMorgan Small Cap Value Fund
Class R4 Shares/Ticker: JSVQX
SEMI-ANNUAL SHAREHOLDER REPORT
This semi-annual shareholder report contains important information about the JPMorgan Small Cap Value Fund (the "Fund") for the period of July 1, 2024 to December 31, 2024. You can find additional information about the Fund at www.jpmorganfunds.com/funddocuments. You can also request this information by contacting us at 1-800-480-4111, by sending an e-mail request to Funds.Website.Support@jpmorganfunds.com or by asking any financial intermediary that offers shares of the Fund.
What were the Fund costs for the last six months?
(based on a hypothetical $10,000 investment)
| Fund (Class) | Costs of a
$10,000 investment | Costs paid as a percentage
of a $10,000 investment* |
JPMorgan Small Cap Value Fund
(Class R4 Shares) | $51 | 0.98% |
| * | This charge is annualized. |
| Fund net assets (000's) | $1,265,817 | |
| Total number of portfolio holdings | 430 | |
| Portfolio turnover rate | 30 | % |
PORTFOLIO COMPOSITION - SECTOR
(% of Total Investments)
Availability of Additional Information
At www.jpmorganfunds.com/funddocuments, you can find additional information about the Fund, including the Fund’s:
Prospectus
Financial information
Fund holdings
Proxy voting information
You can also request this information by contacting us at 1-800-480-4111.
SEMI-ANNUAL SHAREHOLDER REPORT | December 31, 2024 (Unaudited)
JPMorgan Small Cap Value Fund
Class R5 Shares/Ticker: JSVRX
SEMI-ANNUAL SHAREHOLDER REPORT
This semi-annual shareholder report contains important information about the JPMorgan Small Cap Value Fund (the "Fund") for the period of July 1, 2024 to December 31, 2024. You can find additional information about the Fund at www.jpmorganfunds.com/funddocuments. You can also request this information by contacting us at 1-800-480-4111, by sending an e-mail request to Funds.Website.Support@jpmorganfunds.com or by asking any financial intermediary that offers shares of the Fund.
What were the Fund costs for the last six months?
(based on a hypothetical $10,000 investment)
| Fund (Class) | Costs of a
$10,000 investment | Costs paid as a percentage
of a $10,000 investment* |
JPMorgan Small Cap Value Fund
(Class R5 Shares) | $44 | 0.84% |
| * | This charge is annualized. |
| Fund net assets (000's) | $1,265,817 | |
| Total number of portfolio holdings | 430 | |
| Portfolio turnover rate | 30 | % |
PORTFOLIO COMPOSITION - SECTOR
(% of Total Investments)
Availability of Additional Information
At www.jpmorganfunds.com/funddocuments, you can find additional information about the Fund, including the Fund’s:
Prospectus
Financial information
Fund holdings
Proxy voting information
You can also request this information by contacting us at 1-800-480-4111.
SEMI-ANNUAL SHAREHOLDER REPORT | December 31, 2024 (Unaudited)
JPMorgan Small Cap Value Fund
Class R6 Shares/Ticker: JSVUX
SEMI-ANNUAL SHAREHOLDER REPORT
This semi-annual shareholder report contains important information about the JPMorgan Small Cap Value Fund (the "Fund") for the period of July 1, 2024 to December 31, 2024. You can find additional information about the Fund at www.jpmorganfunds.com/funddocuments. You can also request this information by contacting us at 1-800-480-4111, by sending an e-mail request to Funds.Website.Support@jpmorganfunds.com or by asking any financial intermediary that offers shares of the Fund.
What were the Fund costs for the last six months?
(based on a hypothetical $10,000 investment)
| Fund (Class) | Costs of a
$10,000 investment | Costs paid as a percentage
of a $10,000 investment* |
JPMorgan Small Cap Value Fund
(Class R6 Shares) | $38 | 0.74% |
| * | This charge is annualized. |
| Fund net assets (000's) | $1,265,817 | |
| Total number of portfolio holdings | 430 | |
| Portfolio turnover rate | 30 | % |
PORTFOLIO COMPOSITION - SECTOR
(% of Total Investments)
Availability of Additional Information
At www.jpmorganfunds.com/funddocuments, you can find additional information about the Fund, including the Fund’s:
Prospectus
Financial information
Fund holdings
Proxy voting information
You can also request this information by contacting us at 1-800-480-4111.
SEMI-ANNUAL SHAREHOLDER REPORT | December 31, 2024 (Unaudited)
JPMorgan SMID Cap Equity Fund
Class A Shares/Ticker: PECAX
SEMI-ANNUAL SHAREHOLDER REPORT
This semi-annual shareholder report contains important information about the JPMorgan SMID Cap Equity Fund (the "Fund") for the period of July 1, 2024 to December 31, 2024. You can find additional information about the Fund at www.jpmorganfunds.com/funddocuments. You can also request this information by contacting us at 1-800-480-4111, by sending an e-mail request to Funds.Website.Support@jpmorganfunds.com or by asking any financial intermediary that offers shares of the Fund.
What were the Fund costs for the last six months?
(based on a hypothetical $10,000 investment)
| Fund (Class) | Costs of a
$10,000 investment | Costs paid as a percentage
of a $10,000 investment* |
JPMorgan SMID Cap Equity Fund
(Class A Shares) | $57 | 1.08% |
| * | This charge is annualized. |
| Fund net assets (000's) | $422,546 | |
| Total number of portfolio holdings | 103 | |
| Portfolio turnover rate | 20 | % |
PORTFOLIO COMPOSITION - SECTOR
(% of Total Investments)
Availability of Additional Information
At www.jpmorganfunds.com/funddocuments, you can find additional information about the Fund, including the Fund’s:
Prospectus
Financial information
Fund holdings
Proxy voting information
You can also request this information by contacting us at 1-800-480-4111.
SEMI-ANNUAL SHAREHOLDER REPORT | December 31, 2024 (Unaudited)
JPMorgan SMID Cap Equity Fund
Class C Shares/Ticker: ODMCX
SEMI-ANNUAL SHAREHOLDER REPORT
This semi-annual shareholder report contains important information about the JPMorgan SMID Cap Equity Fund (the "Fund") for the period of July 1, 2024 to December 31, 2024. You can find additional information about the Fund at www.jpmorganfunds.com/funddocuments. You can also request this information by contacting us at 1-800-480-4111, by sending an e-mail request to Funds.Website.Support@jpmorganfunds.com or by asking any financial intermediary that offers shares of the Fund.
What were the Fund costs for the last six months?
(based on a hypothetical $10,000 investment)
| Fund (Class) | Costs of a
$10,000 investment | Costs paid as a percentage
of a $10,000 investment* |
JPMorgan SMID Cap Equity Fund
(Class C Shares) | $83 | 1.58% |
| * | This charge is annualized. |
| Fund net assets (000's) | $422,546 | |
| Total number of portfolio holdings | 103 | |
| Portfolio turnover rate | 20 | % |
PORTFOLIO COMPOSITION - SECTOR
(% of Total Investments)
Availability of Additional Information
At www.jpmorganfunds.com/funddocuments, you can find additional information about the Fund, including the Fund’s:
Prospectus
Financial information
Fund holdings
Proxy voting information
You can also request this information by contacting us at 1-800-480-4111.
SEMI-ANNUAL SHAREHOLDER REPORT | December 31, 2024 (Unaudited)
JPMorgan SMID Cap Equity Fund
Class I Shares/Ticker: WOOPX
SEMI-ANNUAL SHAREHOLDER REPORT
This semi-annual shareholder report contains important information about the JPMorgan SMID Cap Equity Fund (the "Fund") for the period of July 1, 2024 to December 31, 2024. You can find additional information about the Fund at www.jpmorganfunds.com/funddocuments. You can also request this information by contacting us at 1-800-480-4111, by sending an e-mail request to Funds.Website.Support@jpmorganfunds.com or by asking any financial intermediary that offers shares of the Fund.
What were the Fund costs for the last six months?
(based on a hypothetical $10,000 investment)
| Fund (Class) | Costs of a
$10,000 investment | Costs paid as a percentage
of a $10,000 investment* |
JPMorgan SMID Cap Equity Fund
(Class I Shares) | $44 | 0.83% |
| * | This charge is annualized. |
| Fund net assets (000's) | $422,546 | |
| Total number of portfolio holdings | 103 | |
| Portfolio turnover rate | 20 | % |
PORTFOLIO COMPOSITION - SECTOR
(% of Total Investments)
Availability of Additional Information
At www.jpmorganfunds.com/funddocuments, you can find additional information about the Fund, including the Fund’s:
Prospectus
Financial information
Fund holdings
Proxy voting information
You can also request this information by contacting us at 1-800-480-4111.
SEMI-ANNUAL SHAREHOLDER REPORT | December 31, 2024 (Unaudited)
JPMorgan SMID Cap Equity Fund
Class R3 Shares/Ticker: WOOOX
SEMI-ANNUAL SHAREHOLDER REPORT
This semi-annual shareholder report contains important information about the JPMorgan SMID Cap Equity Fund (the "Fund") for the period of July 1, 2024 to December 31, 2024. You can find additional information about the Fund at www.jpmorganfunds.com/funddocuments. You can also request this information by contacting us at 1-800-480-4111, by sending an e-mail request to Funds.Website.Support@jpmorganfunds.com or by asking any financial intermediary that offers shares of the Fund.
What were the Fund costs for the last six months?
(based on a hypothetical $10,000 investment)
| Fund (Class) | Costs of a
$10,000 investment | Costs paid as a percentage
of a $10,000 investment* |
JPMorgan SMID Cap Equity Fund
(Class R3 Shares) | $57 | 1.08% |
| * | This charge is annualized. |
| Fund net assets (000's) | $422,546 | |
| Total number of portfolio holdings | 103 | |
| Portfolio turnover rate | 20 | % |
PORTFOLIO COMPOSITION - SECTOR
(% of Total Investments)
Availability of Additional Information
At www.jpmorganfunds.com/funddocuments, you can find additional information about the Fund, including the Fund’s:
Prospectus
Financial information
Fund holdings
Proxy voting information
You can also request this information by contacting us at 1-800-480-4111.
SEMI-ANNUAL SHAREHOLDER REPORT | December 31, 2024 (Unaudited)
JPMorgan SMID Cap Equity Fund
Class R4 Shares/Ticker: WOOQX
SEMI-ANNUAL SHAREHOLDER REPORT
This semi-annual shareholder report contains important information about the JPMorgan SMID Cap Equity Fund (the "Fund") for the period of July 1, 2024 to December 31, 2024. You can find additional information about the Fund at www.jpmorganfunds.com/funddocuments. You can also request this information by contacting us at 1-800-480-4111, by sending an e-mail request to Funds.Website.Support@jpmorganfunds.com or by asking any financial intermediary that offers shares of the Fund.
What were the Fund costs for the last six months?
(based on a hypothetical $10,000 investment)
| Fund (Class) | Costs of a
$10,000 investment | Costs paid as a percentage
of a $10,000 investment* |
JPMorgan SMID Cap Equity Fund
(Class R4 Shares) | $44 | 0.83% |
| * | This charge is annualized. |
| Fund net assets (000's) | $422,546 | |
| Total number of portfolio holdings | 103 | |
| Portfolio turnover rate | 20 | % |
PORTFOLIO COMPOSITION - SECTOR
(% of Total Investments)
Availability of Additional Information
At www.jpmorganfunds.com/funddocuments, you can find additional information about the Fund, including the Fund’s:
Prospectus
Financial information
Fund holdings
Proxy voting information
You can also request this information by contacting us at 1-800-480-4111.
SEMI-ANNUAL SHAREHOLDER REPORT | December 31, 2024 (Unaudited)
JPMorgan SMID Cap Equity Fund
Class R6 Shares/Ticker: WOOSX
SEMI-ANNUAL SHAREHOLDER REPORT
This semi-annual shareholder report contains important information about the JPMorgan SMID Cap Equity Fund (the "Fund") for the period of July 1, 2024 to December 31, 2024. You can find additional information about the Fund at www.jpmorganfunds.com/funddocuments. You can also request this information by contacting us at 1-800-480-4111, by sending an e-mail request to Funds.Website.Support@jpmorganfunds.com or by asking any financial intermediary that offers shares of the Fund.
What were the Fund costs for the last six months?
(based on a hypothetical $10,000 investment)
| Fund (Class) | Costs of a
$10,000 investment | Costs paid as a percentage
of a $10,000 investment* |
JPMorgan SMID Cap Equity Fund
(Class R6 Shares) | $31 | 0.59% |
| * | This charge is annualized. |
| Fund net assets (000's) | $422,546 | |
| Total number of portfolio holdings | 103 | |
| Portfolio turnover rate | 20 | % |
PORTFOLIO COMPOSITION - SECTOR
(% of Total Investments)
Availability of Additional Information
At www.jpmorganfunds.com/funddocuments, you can find additional information about the Fund, including the Fund’s:
Prospectus
Financial information
Fund holdings
Proxy voting information
You can also request this information by contacting us at 1-800-480-4111.
ITEM 2. CODE OF ETHICS.
Not applicable to a semi-annual report.
ITEM 3. AUDIT COMMITTEE FINANCIAL EXPERT.
Not applicable to a semi-annual report.
ITEM 4. PRINCIPAL ACCOUNTANT FEES AND SERVICES.
Not applicable to a semi-annual report.
ITEM 5. AUDIT COMMITTEE OF LISTED REGISTRANTS.
Not applicable to a semi-annual report.
ITEM 6. INVESTMENTS.
File Schedule I – Investments in securities of unaffiliated issuers as of the close of the reporting period as set forth in Section 210.12-12 of Regulation S-X, unless the schedule is included as part of the report to shareholders filed under Item 1 of this Form.
Included in Item 1.
ITEM 7. FINANCIAL STATEMENTS AND FINANCIAL HIGHLIGHTS FOR OPEN-END MANAGEMENT INVESTMENT
COMPANIES.
Semi-Annual Financial Statements
J.P. Morgan Large Cap Funds
December 31, 2024 (Unaudited)
JPMorgan Equity Income Fund |
JPMorgan Equity Index Fund |
JPMorgan Equity Premium Income Fund |
JPMorgan Hedged Equity Fund |
JPMorgan Hedged Equity 2 Fund |
JPMorgan Hedged Equity 3 Fund |
JPMorgan Large Cap Growth Fund |
JPMorgan Large Cap Value Fund |
JPMorgan U.S. Applied Data Science Value Fund |
JPMorgan U.S. Equity Fund |
JPMorgan U.S. GARP Equity Fund |
JPMorgan U.S. Large Cap Core Plus Fund |
JPMorgan U.S. Research Enhanced Equity Fund |
JPMorgan U.S. Sustainable Leaders Fund |
|
CONTENTS
Investments in a Fund are not deposits or obligations of, or guaranteed or endorsed by, any bank and are not insured or guaranteed by the FDIC, the Federal Reserve Board or any other government agency. You could lose money if you sell when a Fund’s share price is lower than when you invested.
Past performance is no guarantee of future performance. The general market views expressed in this report are opinions based on market and other conditions through the end of the reporting period and are subject to change without notice. These views are not intended to predict the future performance of a Fund or the securities markets.
Prospective investors should refer to the Funds’ prospectuses for a discussion of the Funds’ investment objectives, strategies and risks. Call J.P. Morgan Funds Service Center at 1-800-480-4111 for a prospectus containing more complete information about a Fund, including management fees and other expenses. Please read it carefully before investing.
JPMorgan Equity Income Fund
SCHEDULE OF PORTFOLIO INVESTMENTSAS OF December 31, 2024 (Unaudited)
| | |
|
Aerospace & Defense — 3.2% |
| | |
| | |
| | |
| | |
Air Freight & Logistics — 1.5% |
United Parcel Service, Inc., Class B | | |
|
| | |
PNC Financial Services Group, Inc. (The) | | |
| | |
| | |
| | |
|
| | |
| | |
| | |
|
| | |
|
| | |
Bank of New York Mellon Corp. (The) | | |
| | |
| | |
Charles Schwab Corp. (The) | | |
| | |
Goldman Sachs Group, Inc. (The) | | |
| | |
| | |
|
Air Products and Chemicals, Inc. | | |
| | |
| | |
Commercial Services & Supplies — 0.4% |
| | |
|
| | |
Capital One Financial Corp. | | |
| | |
Consumer Staples Distribution & Retail — 1.3% |
| | |
| | |
|
Diversified Telecommunication Services — 0.6% |
Verizon Communications, Inc. | | |
Electric Utilities — 2.1% |
| | |
| | |
| | |
Electrical Equipment — 1.4% |
| | |
Electronic Equipment, Instruments & Components — 0.9% |
| | |
|
| | |
Mondelez International, Inc., Class A | | |
| | |
Ground Transportation — 3.1% |
| | |
| | |
| | |
Health Care Equipment & Supplies — 2.9% |
| | |
| | |
| | |
| | |
Health Care Providers & Services — 5.1% |
| | |
| | |
| | |
| | |
| | |
| | |
|
Alexandria Real Estate Equities, Inc. | | |
| | |
| | |
Hotels, Restaurants & Leisure — 2.2% |
| | |
| | |
| | |
Household Products — 1.5% |
Procter & Gamble Co. (The) | | |
SEE NOTES TO FINANCIAL STATEMENTS.
| J.P. Morgan Large Cap Funds | |
JPMorgan Equity Income Fund
SCHEDULE OF PORTFOLIO INVESTMENTSAS OF December 31, 2024 (Unaudited) (continued)
| | |
Common Stocks — continued |
Industrial Conglomerates — 1.2% |
Honeywell International, Inc. | | |
|
| | |
|
| | |
| | |
Hartford Financial Services Group, Inc. (The) | | |
Marsh & McLennan Cos., Inc. | | |
| | |
| | |
Travelers Cos., Inc. (The) | | |
| | |
|
Accenture plc, Class A (Ireland) | | |
International Business Machines Corp. | | |
| | |
|
| | |
| | |
| | |
| | |
|
| | |
|
| | |
| | |
Public Service Enterprise Group, Inc. | | |
| | |
Oil, Gas & Consumable Fuels — 6.8% |
| | |
| | |
| | |
| | |
| | |
|
| | |
| | |
| | |
| | |
| | |
| | |
|
|
AvalonBay Communities, Inc. | | |
Semiconductors & Semiconductor Equipment — 4.9% |
| | |
| | |
Microchip Technology, Inc. | | |
NXP Semiconductors NV (China) | | |
| | |
| | |
|
| | |
|
| | |
| | |
| | |
| | |
Technology Hardware, Storage & Peripherals — 1.0% |
| | |
Seagate Technology Holdings plc | | |
| | |
Textiles, Apparel & Luxury Goods — 0.1% |
| | |
|
Philip Morris International, Inc. | | |
Total Common Stocks
(Cost $28,013,407) | | |
Short-Term Investments — 0.6% |
Investment Companies — 0.6% |
JPMorgan Prime Money Market Fund Class IM Shares, 4.54% (a) (b)
(Cost $245,668) | | |
Total Investments — 100.1%
(Cost $28,259,075) | | |
Liabilities in Excess of Other Assets — (0.1)% | | |
| | |
Percentages indicated are based on net assets. |
SEE NOTES TO FINANCIAL STATEMENTS.
| J.P. Morgan Large Cap Funds | |
| |
| Real Estate Investment Trust |
| Investment in an affiliated fund, which is registered under the Investment Company Act of 1940, as amended, and is advised by J.P. Morgan Investment Management Inc. |
| The rate shown is the current yield as of December 31, 2024. |
SEE NOTES TO FINANCIAL STATEMENTS.
| J.P. Morgan Large Cap Funds | |
JPMorgan Equity Index Fund
SCHEDULE OF PORTFOLIO INVESTMENTSAS OF December 31, 2024 (Unaudited)
| | |
|
Aerospace & Defense — 1.8% |
| | |
| | |
| | |
| | |
| | |
Huntington Ingalls Industries, Inc. | | |
L3Harris Technologies, Inc. | | |
| | |
| | |
| | |
| | |
| | |
| | |
Air Freight & Logistics — 0.4% |
CH Robinson Worldwide, Inc. | | |
Expeditors International of Washington, Inc. | | |
| | |
United Parcel Service, Inc., Class B | | |
| | |
Automobile Components — 0.0% ^ |
| | |
| | |
| | |
|
| | |
| | |
| | |
| | |
|
| | |
| | |
Citizens Financial Group, Inc. | | |
| | |
Huntington Bancshares, Inc. | | |
| | |
| | |
| | |
PNC Financial Services Group, Inc. (The) | | |
| | |
| | |
| | |
|
|
| | |
| | |
| | |
|
Brown-Forman Corp., Class B | | |
| | |
Constellation Brands, Inc., Class A | | |
| | |
Molson Coors Beverage Co., Class B | | |
| | |
| | |
| | |
|
| | |
| | |
| | |
| | |
| | |
| | |
Regeneron Pharmaceuticals, Inc. * | | |
Vertex Pharmaceuticals, Inc. * | | |
| | |
|
| | |
| | |
| | |
|
| | |
| | |
Builders FirstSource, Inc. * | | |
| | |
Johnson Controls International plc | | |
Lennox International, Inc. | | |
| | |
| | |
| | |
|
Ameriprise Financial, Inc. | | |
Bank of New York Mellon Corp. (The) | | |
| | |
| | |
SEE NOTES TO FINANCIAL STATEMENTS.
| | |
Common Stocks — continued |
Capital Markets — continued |
Cboe Global Markets, Inc. | | |
Charles Schwab Corp. (The) | | |
| | |
FactSet Research Systems, Inc. | | |
| | |
Goldman Sachs Group, Inc. (The) | | |
Intercontinental Exchange, Inc. | | |
| | |
| | |
MarketAxess Holdings, Inc. | | |
| | |
| | |
| | |
| | |
| | |
Raymond James Financial, Inc. | | |
| | |
| | |
T. Rowe Price Group, Inc. | | |
| | |
|
Air Products and Chemicals, Inc. | | |
| | |
| | |
CF Industries Holdings, Inc. | | |
| | |
| | |
| | |
| | |
| | |
| | |
International Flavors & Fragrances, Inc. | | |
| | |
LyondellBasell Industries NV, Class A | | |
| | |
| | |
Sherwin-Williams Co. (The) | | |
| | |
Commercial Services & Supplies — 0.5% |
| | |
| | |
| | |
| | |
| | |
|
Commercial Services & Supplies — continued |
| | |
| | |
| | |
Communications Equipment — 0.9% |
| | |
| | |
| | |
| | |
| | |
| | |
Construction & Engineering — 0.1% |
| | |
Construction Materials — 0.1% |
Martin Marietta Materials, Inc. | | |
| | |
| | |
|
| | |
Capital One Financial Corp. | | |
Discover Financial Services | | |
| | |
| | |
Consumer Staples Distribution & Retail — 2.0% |
| | |
| | |
| | |
| | |
| | |
| | |
Walgreens Boots Alliance, Inc. | | |
| | |
| | |
Containers & Packaging — 0.2% |
| | |
| | |
| | |
| | |
Packaging Corp. of America | | |
| | |
| | |
SEE NOTES TO FINANCIAL STATEMENTS.
JPMorgan Equity Index Fund
SCHEDULE OF PORTFOLIO INVESTMENTSAS OF December 31, 2024 (Unaudited) (continued)
| | |
Common Stocks — continued |
|
| | |
| | |
| | |
| | |
Diversified Telecommunication Services — 0.7% |
| | |
Verizon Communications, Inc. | | |
| | |
Electric Utilities — 1.5% |
| | |
American Electric Power Co., Inc. | | |
Constellation Energy Corp. | | |
| | |
| | |
| | |
| | |
| | |
| | |
| | |
| | |
| | |
| | |
Pinnacle West Capital Corp. | | |
| | |
| | |
| | |
| | |
Electrical Equipment — 0.8% |
| | |
| | |
| | |
| | |
| | |
| | |
Rockwell Automation, Inc. | | |
| | |
Electronic Equipment, Instruments & Components — 0.6% |
| | |
| | |
| | |
| | |
Keysight Technologies, Inc. * | | |
| | |
|
Electronic Equipment, Instruments & Components — continued |
TE Connectivity plc (Switzerland) | | |
Teledyne Technologies, Inc. * | | |
| | |
Zebra Technologies Corp., Class A * | | |
| | |
Energy Equipment & Services — 0.2% |
| | |
| | |
| | |
| | |
|
| | |
Live Nation Entertainment, Inc. * | | |
| | |
Take-Two Interactive Software, Inc. * | | |
| | |
Warner Bros Discovery, Inc. * | | |
| | |
Financial Services — 4.4% |
Apollo Global Management, Inc. | | |
Berkshire Hathaway, Inc., Class B * | | |
| | |
Fidelity National Information Services, Inc. | | |
| | |
| | |
Jack Henry & Associates, Inc. | | |
Mastercard, Inc., Class A | | |
| | |
| | |
| | |
|
Archer-Daniels-Midland Co. | | |
| | |
| | |
| | |
| | |
| | |
| | |
| | |
| | |
Lamb Weston Holdings, Inc. | | |
McCormick & Co., Inc. (Non-Voting) | | |
SEE NOTES TO FINANCIAL STATEMENTS.
| | |
Common Stocks — continued |
Food Products — continued |
Mondelez International, Inc., Class A | | |
| | |
Tyson Foods, Inc., Class A | | |
| | |
|
| | |
Ground Transportation — 0.9% |
| | |
JB Hunt Transport Services, Inc. | | |
| | |
Old Dominion Freight Line, Inc. | | |
Uber Technologies, Inc. * | | |
| | |
| | |
Health Care Equipment & Supplies — 2.3% |
| | |
| | |
Baxter International, Inc. | | |
| | |
Boston Scientific Corp. * | | |
Cooper Cos., Inc. (The) * | | |
| | |
Edwards Lifesciences Corp. * | | |
GE HealthCare Technologies, Inc. | | |
| | |
IDEXX Laboratories, Inc. * | | |
| | |
Intuitive Surgical, Inc. * | | |
| | |
| | |
| | |
| | |
| | |
| | |
Zimmer Biomet Holdings, Inc. | | |
| | |
Health Care Providers & Services — 2.0% |
| | |
| | |
| | |
| | |
| | |
| | |
|
Health Care Providers & Services — continued |
| | |
| | |
| | |
| | |
| | |
| | |
| | |
Molina Healthcare, Inc. * | | |
| | |
| | |
Universal Health Services, Inc., Class B | | |
| | |
|
Alexandria Real Estate Equities, Inc. | | |
Healthpeak Properties, Inc. | | |
| | |
| | |
| | |
Hotel & Resort REITs — 0.0% ^ |
Host Hotels & Resorts, Inc. | | |
Hotels, Restaurants & Leisure — 1.9% |
| | |
| | |
Caesars Entertainment, Inc. * | | |
| | |
Chipotle Mexican Grill, Inc. * | | |
| | |
| | |
| | |
Hilton Worldwide Holdings, Inc. | | |
| | |
Marriott International, Inc., Class A | | |
| | |
MGM Resorts International * | | |
Norwegian Cruise Line Holdings Ltd. * | | |
Royal Caribbean Cruises Ltd. | | |
| | |
| | |
| | |
| | |
Household Durables — 0.3% |
| | |
SEE NOTES TO FINANCIAL STATEMENTS.
JPMorgan Equity Index Fund
SCHEDULE OF PORTFOLIO INVESTMENTSAS OF December 31, 2024 (Unaudited) (continued)
| | |
Common Stocks — continued |
Household Durables — continued |
| | |
| | |
Mohawk Industries, Inc. * | | |
| | |
| | |
| | |
Household Products — 1.1% |
Church & Dwight Co., Inc. | | |
| | |
| | |
| | |
Procter & Gamble Co. (The) | | |
| | |
Independent Power and Renewable Electricity Producers — 0.1% |
| | |
| | |
| | |
Industrial Conglomerates — 0.4% |
| | |
Honeywell International, Inc. | | |
| | |
|
| | |
|
| | |
| | |
American International Group, Inc. | | |
| | |
| | |
| | |
| | |
| | |
| | |
Cincinnati Financial Corp. | | |
Erie Indemnity Co., Class A | | |
| | |
| | |
Hartford Financial Services Group, Inc. (The) | | |
| | |
Marsh & McLennan Cos., Inc. | | |
| | |
| | |
|
|
Principal Financial Group, Inc. | | |
| | |
Prudential Financial, Inc. | | |
Travelers Cos., Inc. (The) | | |
| | |
| | |
| | |
Interactive Media & Services — 6.6% |
| | |
| | |
| | |
Meta Platforms, Inc., Class A | | |
| | |
|
Accenture plc, Class A (Ireland) | | |
Akamai Technologies, Inc. * | | |
Cognizant Technology Solutions Corp., Class A | | |
| | |
| | |
| | |
International Business Machines Corp. | | |
| | |
| | |
Leisure Products — 0.0% ^ |
| | |
Life Sciences Tools & Services — 1.1% |
Agilent Technologies, Inc. | | |
| | |
Charles River Laboratories International, Inc. * | | |
| | |
| | |
Mettler-Toledo International, Inc. * | | |
| | |
Thermo Fisher Scientific, Inc. | | |
| | |
West Pharmaceutical Services, Inc. | | |
| | |
|
| | |
| | |
| | |
SEE NOTES TO FINANCIAL STATEMENTS.
| | |
Common Stocks — continued |
|
| | |
| | |
| | |
Illinois Tool Works, Inc. | | |
| | |
| | |
| | |
| | |
| | |
| | |
| | |
Stanley Black & Decker, Inc. | | |
Westinghouse Air Brake Technologies Corp. | | |
| | |
| | |
|
Charter Communications, Inc., Class A * | | |
| | |
| | |
| | |
Interpublic Group of Cos., Inc. (The) | | |
| | |
| | |
| | |
Paramount Global, Class B (b) | | |
| | |
|
| | |
| | |
| | |
| | |
| | |
|
| | |
| | |
| | |
Consolidated Edison, Inc. | | |
| | |
| | |
| | |
Public Service Enterprise Group, Inc. | | |
| | |
|
Multi-Utilities — continued |
| | |
| | |
| | |
|
| | |
Oil, Gas & Consumable Fuels — 2.9% |
| | |
| | |
| | |
| | |
| | |
| | |
| | |
| | |
| | |
| | |
| | |
| | |
Occidental Petroleum Corp. | | |
| | |
| | |
| | |
| | |
| | |
Williams Cos., Inc. (The) | | |
| | |
Passenger Airlines — 0.2% |
| | |
| | |
United Airlines Holdings, Inc. * | | |
| | |
Personal Care Products — 0.1% |
Estee Lauder Cos., Inc. (The), Class A | | |
| | |
| | |
|
| | |
| | |
| | |
| | |
| | |
SEE NOTES TO FINANCIAL STATEMENTS.
JPMorgan Equity Index Fund
SCHEDULE OF PORTFOLIO INVESTMENTSAS OF December 31, 2024 (Unaudited) (continued)
| | |
Common Stocks — continued |
Pharmaceuticals — continued |
| | |
| | |
| | |
Professional Services — 0.6% |
Automatic Data Processing, Inc. | | |
Broadridge Financial Solutions, Inc. | | |
| | |
| | |
| | |
| | |
| | |
| | |
| | |
| | |
Real Estate Management & Development — 0.1% |
CBRE Group, Inc., Class A * | | |
| | |
| | |
|
AvalonBay Communities, Inc. | | |
| | |
| | |
Essex Property Trust, Inc. | | |
| | |
Mid-America Apartment Communities, Inc. | | |
| | |
| | |
|
Federal Realty Investment Trust | | |
| | |
| | |
| | |
Simon Property Group, Inc. | | |
| | |
Semiconductors & Semiconductor Equipment — 11.4% |
Advanced Micro Devices, Inc. * | | |
| | |
| | |
| | |
| | |
| | |
| | |
|
Semiconductors & Semiconductor Equipment — continued |
| | |
| | |
| | |
Microchip Technology, Inc. | | |
| | |
Monolithic Power Systems, Inc. | | |
| | |
NXP Semiconductors NV (China) | | |
| | |
| | |
| | |
| | |
| | |
| | |
|
| | |
| | |
| | |
Cadence Design Systems, Inc. * | | |
Crowdstrike Holdings, Inc., Class A * | | |
| | |
| | |
| | |
| | |
| | |
| | |
Palantir Technologies, Inc., Class A * | | |
Palo Alto Networks, Inc. * | | |
| | |
| | |
| | |
| | |
| | |
Tyler Technologies, Inc. * | | |
| | |
| | |
|
| | |
| | |
Digital Realty Trust, Inc. | | |
| | |
Extra Space Storage, Inc. | | |
| | |
SEE NOTES TO FINANCIAL STATEMENTS.
| | |
Common Stocks — continued |
Specialized REITs — continued |
| | |
| | |
| | |
| | |
| | |
|
| | |
| | |
| | |
| | |
| | |
O'Reilly Automotive, Inc. * | | |
| | |
| | |
| | |
| | |
| | |
Technology Hardware, Storage & Peripherals — 7.9% |
| | |
Dell Technologies, Inc., Class C | | |
Hewlett Packard Enterprise Co. | | |
| | |
| | |
Seagate Technology Holdings plc | | |
Super Micro Computer, Inc. * (b) | | |
| | |
| | |
Textiles, Apparel & Luxury Goods — 0.4% |
| | |
Lululemon Athletica, Inc. * | | |
| | |
| | |
| | |
| | |
|
| | |
Philip Morris International, Inc. | | |
| | |
Trading Companies & Distributors — 0.3% |
| | |
| | |
|
Trading Companies & Distributors — continued |
| | |
| | |
| | |
|
American Water Works Co., Inc. | | |
Wireless Telecommunication Services — 0.2% |
| | |
Total Common Stocks
(Cost $3,755,325) | | |
| | |
|
Health Care Equipment & Supplies — 0.0% ^ |
ABIOMED, Inc., CVR ‡ *
(Cost $10) | | |
| | |
Short-Term Investments — 0.2% |
Investment Companies — 0.1% |
JPMorgan U.S. Government Money Market Fund Class Institutional Shares, 4.34% (c) (d)
(Cost $16,430) | | |
Investment of Cash Collateral from Securities Loaned — 0.1% |
JPMorgan Securities Lending Money Market Fund Agency SL Class Shares, 4.47% (c) (d)
(Cost $8,707) | | |
Total Short-Term Investments
(Cost $25,137) | | |
Total Investments — 99.9%
(Cost $3,780,472) | | |
Other Assets in Excess of Liabilities — 0.1% | | |
| | |
Percentages indicated are based on net assets. |
| |
| |
| Real Estate Investment Trust |
| Amount rounds to less than 0.1% of net assets. |
| Value determined using significant unobservable inputs. | |
SEE NOTES TO FINANCIAL STATEMENTS.
JPMorgan Equity Index Fund
SCHEDULE OF PORTFOLIO INVESTMENTSAS OF December 31, 2024 (Unaudited) (continued)
| Non-income producing security. | |
| Investment in affiliate. This security is included in an index in which the Fund, as an index fund, tracks. | |
| The security or a portion of this security is on loan at December 31, 2024. The total value of securities on loan at December 31, 2024 is $8,443. | |
| Investment in an affiliated fund, which is registered under the Investment Company Act of 1940, as amended, and is advised by J.P. Morgan Investment Management Inc. | |
| The rate shown is the current yield as of December 31, 2024. | |
Futures contracts outstanding as of December 31, 2024 (amounts in thousands, except number of contracts):
| | | | | VALUE AND
UNREALIZED
APPRECIATION
(DEPRECIATION) ($) |
| | | | | |
| | | | | |
SEE NOTES TO FINANCIAL STATEMENTS.
JPMorgan Equity Premium Income Fund
SCHEDULE OF PORTFOLIO INVESTMENTSAS OF December 31, 2024 (Unaudited)
| | |
|
Aerospace & Defense — 2.0% |
| | |
| | |
| | |
| | |
| | |
| | |
Air Freight & Logistics — 1.2% |
| | |
United Parcel Service, Inc., Class B | | |
| | |
|
| | |
| | |
| | |
|
| | |
| | |
| | |
| | |
|
| | |
Regeneron Pharmaceuticals, Inc. * | | |
Vertex Pharmaceuticals, Inc. * | | |
| | |
|
| | |
|
| | |
| | |
| | |
|
Ameriprise Financial, Inc. | | |
| | |
| | |
|
| | |
| | |
| | |
| | |
|
Communications Equipment — 0.3% |
| | |
|
| | |
Consumer Staples Distribution & Retail — 1.5% |
| | |
| | |
| | |
Electric Utilities — 3.2% |
| | |
| | |
| | |
| | |
| | |
Electrical Equipment — 2.0% |
| | |
| | |
| | |
| | |
Electronic Equipment, Instruments & Components — 0.1% |
Keysight Technologies, Inc. * | | |
Financial Services — 5.6% |
Berkshire Hathaway, Inc., Class B * | | |
| | |
| | |
Jack Henry & Associates, Inc. | | |
Mastercard, Inc., Class A | | |
| | |
| | |
|
Mondelez International, Inc., Class A | | |
Ground Transportation — 1.0% |
| | |
| | |
| | |
Health Care Equipment & Supplies — 3.0% |
| | |
Boston Scientific Corp. * | | |
| | |
| | |
| | |
SEE NOTES TO FINANCIAL STATEMENTS.
| J.P. Morgan Large Cap Funds | |
JPMorgan Equity Premium Income Fund
SCHEDULE OF PORTFOLIO INVESTMENTSAS OF December 31, 2024 (Unaudited) (continued)
| | |
Common Stocks — continued |
Health Care Providers & Services — 1.4% |
| | |
| | |
| | |
|
| | |
Hotels, Restaurants & Leisure — 3.9% |
| | |
Chipotle Mexican Grill, Inc. * | | |
| | |
| | |
| | |
Household Products — 1.7% |
Church & Dwight Co., Inc. | | |
Procter & Gamble Co. (The) | | |
| | |
Industrial Conglomerates — 1.4% |
Honeywell International, Inc. | | |
|
| | |
|
| | |
| | |
| | |
Marsh & McLennan Cos., Inc. | | |
| | |
| | |
Travelers Cos., Inc. (The) | | |
| | |
Interactive Media & Services — 3.1% |
| | |
Meta Platforms, Inc., Class A | | |
| | |
|
Accenture plc, Class A (Ireland) | | |
Cognizant Technology Solutions Corp., Class A | | |
| | |
| | |
|
Life Sciences Tools & Services — 1.6% |
| | |
Thermo Fisher Scientific, Inc. | | |
| | |
|
| | |
| | |
| | |
| | |
| | |
|
| | |
|
| | |
| | |
Public Service Enterprise Group, Inc. | | |
| | |
Oil, Gas & Consumable Fuels — 2.5% |
| | |
| | |
| | |
| | |
Personal Care Products — 0.2% |
| | |
|
| | |
| | |
| | |
| | |
| | |
Professional Services — 0.3% |
| | |
Residential REITs — 0.0% ^ |
Equity LifeStyle Properties, Inc. | | |
Semiconductors & Semiconductor Equipment — 6.4% |
| | |
ASML Holding NV (Registered), NYRS (Netherlands) | | |
| | |
| | |
| | |
SEE NOTES TO FINANCIAL STATEMENTS.
| J.P. Morgan Large Cap Funds | |
| | |
Common Stocks — continued |
Semiconductors & Semiconductor Equipment — continued |
NXP Semiconductors NV (China) | | |
| | |
| | |
|
Cadence Design Systems, Inc. * | | |
| | |
| | |
| | |
| | |
| | |
| | |
|
| | |
| | |
| | |
| | |
|
| | |
Burlington Stores, Inc. * | | |
| | |
| | |
| | |
Technology Hardware, Storage & Peripherals — 1.0% |
| | |
Seagate Technology Holdings plc | | |
| | |
|
| | |
Philip Morris International, Inc. | | |
| | |
Trading Companies & Distributors — 0.3% |
| | |
Total Common Stocks
(Cost $4,264,636) | | |
| | |
Equity-Linked Notes — 13.6% |
Barclays Bank plc, ELN, 41.20%, 2/4/2025, (linked to S&P 500 Index) (United Kingdom) (a) | | |
| | |
|
Barclays Bank plc, ELN, 47.30%, 2/7/2025, (linked to S&P 500 Index) (United Kingdom) (a) | | |
BNP Paribas Issuance BV, ELN, 40.48%, 1/21/2025, (linked to S&P 500 Index) (a) | | |
BNP Paribas, ELN, 42.20%, 1/8/2025, (linked to S&P 500 Index) (a) | | |
BNP Paribas, ELN, 53.51%, 1/31/2025, (linked to S&P 500 Index) (a) | | |
BofA Finance LLC, ELN, 40.45%, 1/17/2025, (linked to S&P 500 Index) (a) | | |
BofA Finance LLC, ELN, 42.48%, 1/7/2025, (linked to S&P 500 Index) (a) | | |
BofA Finance LLC, ELN, 43.08%, 1/24/2025, (linked to S&P 500 Index) (a) | | |
Royal Bank of Canada, ELN, 38.06%, 1/14/2025, (linked to S&P 500 Index) (Canada) (a) | | |
Royal Bank of Canada, ELN, 41.46%, 1/22/2025, (linked to S&P 500 Index) (Canada) (a) | | |
Societe Generale SA, ELN, 55.55%, 1/28/2025, (linked to S&P 500 Index) (a) | | |
UBS AG, ELN, 38.49%, 1/10/2025, (linked to S&P 500 Index) (Switzerland) (a) | | |
UBS AG, ELN, 38.92%, 1/13/2025, (linked to S&P 500 Index) (Switzerland) (a) | | |
UBS AG, ELN, 44.39%, 2/3/2025, (linked to S&P 500 Index) (Switzerland) (a) | | |
Wells Fargo Bank, ELN, 61.94%, 1/27/2025, (linked to S&P 500 Index) | | |
Total Equity-Linked Notes
(Cost $870,953) | | |
| | |
Short-Term Investments — 2.3% |
Investment Companies — 2.3% |
JPMorgan Prime Money Market Fund Class IM Shares, 4.54% (b) (c)
(Cost $143,270) | | |
Total Investments — 100.1%
(Cost $5,278,859) | | |
Liabilities in Excess of Other Assets — (0.1)% | | |
| | |
Percentages indicated are based on net assets. |
SEE NOTES TO FINANCIAL STATEMENTS.
| J.P. Morgan Large Cap Funds | |
JPMorgan Equity Premium Income Fund
SCHEDULE OF PORTFOLIO INVESTMENTSAS OF December 31, 2024 (Unaudited) (continued)
| |
| Real Estate Investment Trust |
| Amount rounds to less than 0.1% of net assets. |
| Non-income producing security. | |
| Securities exempt from registration under Rule 144A or section 4(a)(2), of the Securities Act of 1933, as amended. | |
| Investment in an affiliated fund, which is registered under the Investment Company Act of 1940, as amended, and is advised by J.P. Morgan Investment Management Inc. | |
| The rate shown is the current yield as of December 31, 2024. | |
SEE NOTES TO FINANCIAL STATEMENTS.
| J.P. Morgan Large Cap Funds | |
JPMorgan Hedged Equity Fund
SCHEDULE OF PORTFOLIO INVESTMENTSAS OF December 31, 2024 (Unaudited)
| | |
|
Aerospace & Defense — 1.5% |
| | |
| | |
| | |
| | |
| | |
Air Freight & Logistics — 0.8% |
| | |
United Parcel Service, Inc., Class B | | |
| | |
Automobile Components — 0.1% |
| | |
|
| | |
|
Bank of America Corp. (a) | | |
| | |
| | |
| | |
| | |
| | |
| | |
|
| | |
| | |
| | |
| | |
|
| | |
| | |
Neurocrine Biosciences, Inc. * | | |
Regeneron Pharmaceuticals, Inc. * | | |
Sarepta Therapeutics, Inc. * | | |
Vertex Pharmaceuticals, Inc. * | | |
| | |
|
| | |
|
| | |
| | |
|
Building Products — continued |
| | |
| | |
| | |
|
Ameriprise Financial, Inc. | | |
Charles Schwab Corp. (The) | | |
| | |
Goldman Sachs Group, Inc. (The) | | |
| | |
| | |
|
| | |
| | |
LyondellBasell Industries NV, Class A | | |
| | |
Sherwin-Williams Co. (The) | | |
| | |
Communications Equipment — 0.4% |
| | |
| | |
| | |
Construction Materials — 0.2% |
Martin Marietta Materials, Inc. | | |
|
| | |
Consumer Staples Distribution & Retail — 0.5% |
Costco Wholesale Corp. (a) | | |
|
| | |
Diversified Telecommunication Services — 0.4% |
| | |
Electric Utilities — 2.1% |
| | |
| | |
| | |
| | |
| | |
SEE NOTES TO FINANCIAL STATEMENTS.
| J.P. Morgan Large Cap Funds | |
JPMorgan Hedged Equity Fund
SCHEDULE OF PORTFOLIO INVESTMENTSAS OF December 31, 2024 (Unaudited) (continued)
| | |
Common Stocks — continued |
Electrical Equipment — 0.4% |
| | |
| | |
| | |
Electronic Equipment, Instruments & Components — 0.1% |
TE Connectivity plc (Switzerland) | | |
Energy Equipment & Services — 0.2% |
| | |
|
| | |
Warner Music Group Corp., Class A | | |
| | |
Financial Services — 5.9% |
Berkshire Hathaway, Inc., Class B * (a) | | |
| | |
| | |
Fidelity National Information Services, Inc. | | |
Mastercard, Inc., Class A (a) | | |
| | |
| | |
| | |
|
Mondelez International, Inc., Class A (a) | | |
Ground Transportation — 1.0% |
| | |
Uber Technologies, Inc. * | | |
| | |
| | |
Health Care Equipment & Supplies — 2.0% |
| | |
Baxter International, Inc. | | |
Boston Scientific Corp. * | | |
Edwards Lifesciences Corp. * | | |
| | |
| | |
| | |
Health Care Providers & Services — 2.0% |
| | |
| | |
| | |
| | |
|
Health Care Providers & Services — continued |
| | |
UnitedHealth Group, Inc. (a) | | |
| | |
|
Alexandria Real Estate Equities, Inc. | | |
| | |
| | |
| | |
Hotels, Restaurants & Leisure — 3.6% |
| | |
| | |
Chipotle Mexican Grill, Inc. * | | |
DoorDash, Inc., Class A * | | |
| | |
Hilton Worldwide Holdings, Inc. | | |
| | |
Royal Caribbean Cruises Ltd. | | |
| | |
| | |
Household Durables — 0.1% |
| | |
Household Products — 0.3% |
Church & Dwight Co., Inc. | | |
Independent Power and Renewable Electricity Producers — 0.1% |
| | |
Industrial Conglomerates — 0.7% |
Honeywell International, Inc. | | |
|
| | |
|
| | |
| | |
| | |
Principal Financial Group, Inc. | | |
| | |
| | |
Interactive Media & Services — 6.7% |
Alphabet, Inc., Class A (a) | | |
SEE NOTES TO FINANCIAL STATEMENTS.
| J.P. Morgan Large Cap Funds | |
| | |
Common Stocks — continued |
Interactive Media & Services — continued |
Alphabet, Inc., Class C (a) | | |
Meta Platforms, Inc., Class A (a) | | |
| | |
|
Accenture plc, Class A (Ireland) | | |
Cognizant Technology Solutions Corp., Class A | | |
| | |
Life Sciences Tools & Services — 1.2% |
| | |
Thermo Fisher Scientific, Inc. | | |
| | |
|
| | |
| | |
| | |
| | |
| | |
| | |
|
Charter Communications, Inc., Class A * | | |
| | |
| | |
| | |
|
| | |
|
| | |
Oil, Gas & Consumable Fuels — 2.9% |
| | |
| | |
| | |
| | |
| | |
Passenger Airlines — 0.2% |
| | |
Personal Care Products — 0.3% |
Estee Lauder Cos., Inc. (The), Class A | | |
| | |
| | |
| | |
|
|
Bristol-Myers Squibb Co. (a) | | |
| | |
| | |
| | |
| | |
Professional Services — 0.3% |
| | |
|
Equity LifeStyle Properties, Inc. | | |
Semiconductors & Semiconductor Equipment — 12.2% |
Advanced Micro Devices, Inc. * | | |
| | |
| | |
| | |
| | |
| | |
| | |
NXP Semiconductors NV (China) | | |
Texas Instruments, Inc. (a) | | |
| | |
|
| | |
Cadence Design Systems, Inc. * | | |
| | |
| | |
| | |
| | |
| | |
| | |
| | |
|
Digital Realty Trust, Inc. | | |
| | |
| | |
| | |
|
| | |
| | |
Burlington Stores, Inc. * | | |
SEE NOTES TO FINANCIAL STATEMENTS.
| J.P. Morgan Large Cap Funds | |
JPMorgan Hedged Equity Fund
SCHEDULE OF PORTFOLIO INVESTMENTSAS OF December 31, 2024 (Unaudited) (continued)
| | |
Common Stocks — continued |
Specialty Retail — continued |
| | |
| | |
| | |
Technology Hardware, Storage & Peripherals — 8.0% |
| | |
Hewlett Packard Enterprise Co. | | |
Seagate Technology Holdings plc | | |
| | |
| | |
|
| | |
Philip Morris International, Inc. | | |
| | |
Trading Companies & Distributors — 0.1% |
| | |
Total Common Stocks
(Cost $11,952,717) | | |
| | |
|
Put Options Purchased — 1.2% |
| | |
3/31/2025 at USD 5,565.00, European Style | | |
Notional Amount: USD 21,100,936 | | |
Counterparty: Exchange-Traded *
(Cost $253,033) | | |
| | |
Short-Term Investments — 1.0% |
Investment Companies — 1.0% |
JPMorgan U.S. Government Money Market Fund Class Institutional Shares, 4.34% (b) (c)
(Cost $224,053) | | |
Total Investments — 100.9%
(Cost $12,429,803) | | |
Liabilities in Excess of Other Assets — (0.9)% | | |
| | |
Percentages indicated are based on net assets. |
| |
| Real Estate Investment Trust |
| |
| Amount rounds to less than 0.1% of net assets. |
| Non-income producing security. | |
| All or a portion of the security is segregated for options written. | |
| Investment in an affiliated fund, which is registered under the Investment Company Act of 1940, as amended, and is advised by J.P. Morgan Investment Management Inc. | |
| The rate shown is the current yield as of December 31, 2024. | |
Futures contracts outstanding as of December 31, 2024 (amounts in thousands, except number of contracts):
| | | | | VALUE AND
UNREALIZED
APPRECIATION
(DEPRECIATION) ($) |
| | | | | |
| | | | | |
SEE NOTES TO FINANCIAL STATEMENTS.
| J.P. Morgan Large Cap Funds | |
Written Call Options Contracts as of December 31, 2024 (amounts in thousands, except number of contracts):
|
| | | | | | |
| | | | | | |
Written Put Options Contracts as of December 31, 2024 (amounts in thousands, except number of contracts):
|
| | | | | | |
| | | | | | |
Total Written Options Contracts (Premiums Received $245,535) | |
SEE NOTES TO FINANCIAL STATEMENTS.
| J.P. Morgan Large Cap Funds | |
JPMorgan Hedged Equity 2 Fund
SCHEDULE OF PORTFOLIO INVESTMENTSAS OF December 31, 2024 (Unaudited)
| | |
|
Aerospace & Defense — 1.5% |
| | |
| | |
| | |
| | |
| | |
Air Freight & Logistics — 0.8% |
| | |
United Parcel Service, Inc., Class B | | |
| | |
Automobile Components — 0.1% |
| | |
|
| | |
|
| | |
| | |
| | |
| | |
| | |
| | |
| | |
|
| | |
| | |
| | |
| | |
|
| | |
| | |
Neurocrine Biosciences, Inc. * | | |
Regeneron Pharmaceuticals, Inc. * | | |
Sarepta Therapeutics, Inc. * | | |
Vertex Pharmaceuticals, Inc. * | | |
| | |
|
| | |
|
| | |
| | |
|
Building Products — continued |
| | |
| | |
| | |
|
Ameriprise Financial, Inc. | | |
Charles Schwab Corp. (The) | | |
| | |
Goldman Sachs Group, Inc. (The) | | |
| | |
| | |
|
| | |
| | |
LyondellBasell Industries NV, Class A | | |
| | |
Sherwin-Williams Co. (The) | | |
| | |
Communications Equipment — 0.4% |
| | |
| | |
| | |
Construction Materials — 0.2% |
Martin Marietta Materials, Inc. | | |
|
| | |
Consumer Staples Distribution & Retail — 0.5% |
| | |
|
| | |
Diversified Telecommunication Services — 0.4% |
| | |
Electric Utilities — 2.1% |
| | |
| | |
| | |
| | |
| | |
SEE NOTES TO FINANCIAL STATEMENTS.
| J.P. Morgan Large Cap Funds | |
| | |
Common Stocks — continued |
Electrical Equipment — 0.4% |
| | |
| | |
| | |
Electronic Equipment, Instruments & Components — 0.1% |
TE Connectivity plc (Switzerland) | | |
Energy Equipment & Services — 0.3% |
| | |
|
| | |
Warner Music Group Corp., Class A | | |
| | |
Financial Services — 5.9% |
Berkshire Hathaway, Inc., Class B * | | |
| | |
| | |
Fidelity National Information Services, Inc. | | |
Mastercard, Inc., Class A | | |
| | |
| | |
| | |
|
Mondelez International, Inc., Class A | | |
Ground Transportation — 1.0% |
| | |
Uber Technologies, Inc. * | | |
| | |
| | |
Health Care Equipment & Supplies — 2.0% |
| | |
Baxter International, Inc. | | |
Boston Scientific Corp. * | | |
Edwards Lifesciences Corp. * | | |
| | |
| | |
| | |
Health Care Providers & Services — 2.0% |
| | |
| | |
| | |
| | |
|
Health Care Providers & Services — continued |
| | |
UnitedHealth Group, Inc. (a) | | |
| | |
|
Alexandria Real Estate Equities, Inc. | | |
| | |
| | |
| | |
Hotels, Restaurants & Leisure — 3.6% |
| | |
| | |
Chipotle Mexican Grill, Inc. * | | |
DoorDash, Inc., Class A * | | |
| | |
Hilton Worldwide Holdings, Inc. | | |
| | |
Royal Caribbean Cruises Ltd. | | |
| | |
| | |
Household Durables — 0.1% |
| | |
Household Products — 0.3% |
Church & Dwight Co., Inc. | | |
Independent Power and Renewable Electricity Producers — 0.1% |
| | |
Industrial Conglomerates — 0.7% |
Honeywell International, Inc. | | |
|
| | |
|
| | |
| | |
| | |
Principal Financial Group, Inc. | | |
| | |
| | |
Interactive Media & Services — 6.7% |
| | |
SEE NOTES TO FINANCIAL STATEMENTS.
| J.P. Morgan Large Cap Funds | |
JPMorgan Hedged Equity 2 Fund
SCHEDULE OF PORTFOLIO INVESTMENTSAS OF December 31, 2024 (Unaudited) (continued)
| | |
Common Stocks — continued |
Interactive Media & Services — continued |
| | |
Meta Platforms, Inc., Class A (a) | | |
| | |
|
Accenture plc, Class A (Ireland) | | |
Cognizant Technology Solutions Corp., Class A | | |
| | |
Life Sciences Tools & Services — 1.2% |
| | |
Thermo Fisher Scientific, Inc. | | |
| | |
|
| | |
| | |
| | |
| | |
| | |
| | |
|
Charter Communications, Inc., Class A * | | |
| | |
| | |
| | |
|
| | |
|
| | |
Oil, Gas & Consumable Fuels — 2.9% |
| | |
| | |
| | |
| | |
| | |
Passenger Airlines — 0.2% |
| | |
Personal Care Products — 0.3% |
Estee Lauder Cos., Inc. (The), Class A | | |
| | |
| | |
| | |
|
|
| | |
| | |
| | |
| | |
| | |
Professional Services — 0.3% |
| | |
|
Equity LifeStyle Properties, Inc. | | |
Semiconductors & Semiconductor Equipment — 12.2% |
Advanced Micro Devices, Inc. * | | |
| | |
| | |
| | |
| | |
| | |
| | |
NXP Semiconductors NV (China) | | |
| | |
| | |
|
| | |
Cadence Design Systems, Inc. * | | |
| | |
| | |
| | |
| | |
| | |
| | |
| | |
|
Digital Realty Trust, Inc. | | |
| | |
| | |
| | |
|
| | |
| | |
Burlington Stores, Inc. * | | |
SEE NOTES TO FINANCIAL STATEMENTS.
| J.P. Morgan Large Cap Funds | |
| | |
Common Stocks — continued |
Specialty Retail — continued |
| | |
| | |
| | |
Technology Hardware, Storage & Peripherals — 8.0% |
| | |
Hewlett Packard Enterprise Co. | | |
Seagate Technology Holdings plc | | |
| | |
| | |
|
| | |
Philip Morris International, Inc. | | |
| | |
Trading Companies & Distributors — 0.1% |
| | |
Total Common Stocks
(Cost $3,541,005) | | |
| | |
|
Put Options Purchased — 0.2% |
| | |
1/31/2025 at USD 5,395.00, European Style | | |
Notional Amount: USD 5,240,532 | | |
Counterparty: Exchange-Traded *
(Cost $76,567) | | |
| | |
Short-Term Investments — 1.4% |
Investment Companies — 1.4% |
JPMorgan U.S. Government Money Market Fund Class IM Shares, 4.44% (b) (c)
(Cost $70,122) | | |
Total Investments — 100.6%
(Cost $3,687,694) | | |
Liabilities in Excess of Other Assets — (0.6)% | | |
| | |
Percentages indicated are based on net assets. |
| |
| Real Estate Investment Trust |
| |
| Amount rounds to less than 0.1% of net assets. |
| Non-income producing security. | |
| All or a portion of the security is segregated for options written. | |
| Investment in an affiliated fund, which is registered under the Investment Company Act of 1940, as amended, and is advised by J.P. Morgan Investment Management Inc. | |
| The rate shown is the current yield as of December 31, 2024. | |
Futures contracts outstanding as of December 31, 2024 (amounts in thousands, except number of contracts):
| | | | | VALUE AND
UNREALIZED
APPRECIATION
(DEPRECIATION) ($) |
| | | | | |
| | | | | |
SEE NOTES TO FINANCIAL STATEMENTS.
| J.P. Morgan Large Cap Funds | |
JPMorgan Hedged Equity 2 Fund
SCHEDULE OF PORTFOLIO INVESTMENTSAS OF December 31, 2024 (Unaudited) (continued)
Written Call Options Contracts as of December 31, 2024 (amounts in thousands, except number of contracts):
|
| | | | | | |
| | | | | | |
Written Put Options Contracts as of December 31, 2024 (amounts in thousands, except number of contracts):
|
| | | | | | |
| | | | | | |
Total Written Options Contracts (Premiums Received $83,359) | |
SEE NOTES TO FINANCIAL STATEMENTS.
| J.P. Morgan Large Cap Funds | |
JPMorgan Hedged Equity 3 Fund
SCHEDULE OF PORTFOLIO INVESTMENTSAS OF December 31, 2024 (Unaudited)
| | |
|
Aerospace & Defense — 1.5% |
| | |
| | |
| | |
| | |
| | |
Air Freight & Logistics — 0.8% |
| | |
United Parcel Service, Inc., Class B | | |
| | |
Automobile Components — 0.1% |
| | |
|
| | |
|
| | |
| | |
| | |
| | |
| | |
| | |
| | |
|
| | |
| | |
| | |
| | |
|
| | |
| | |
Neurocrine Biosciences, Inc. * | | |
Regeneron Pharmaceuticals, Inc. * | | |
Sarepta Therapeutics, Inc. * | | |
Vertex Pharmaceuticals, Inc. * | | |
| | |
|
| | |
|
| | |
| | |
|
Building Products — continued |
| | |
| | |
| | |
|
Ameriprise Financial, Inc. | | |
Charles Schwab Corp. (The) | | |
| | |
Goldman Sachs Group, Inc. (The) | | |
| | |
| | |
|
| | |
| | |
LyondellBasell Industries NV, Class A | | |
| | |
Sherwin-Williams Co. (The) | | |
| | |
Communications Equipment — 0.4% |
| | |
| | |
| | |
Construction Materials — 0.2% |
Martin Marietta Materials, Inc. | | |
|
| | |
Consumer Staples Distribution & Retail — 0.5% |
| | |
|
| | |
Diversified Telecommunication Services — 0.3% |
| | |
Electric Utilities — 2.0% |
| | |
| | |
| | |
| | |
| | |
SEE NOTES TO FINANCIAL STATEMENTS.
| J.P. Morgan Large Cap Funds | |
JPMorgan Hedged Equity 3 Fund
SCHEDULE OF PORTFOLIO INVESTMENTSAS OF December 31, 2024 (Unaudited) (continued)
| | |
Common Stocks — continued |
Electrical Equipment — 0.4% |
| | |
| | |
| | |
Electronic Equipment, Instruments & Components — 0.1% |
TE Connectivity plc (Switzerland) | | |
Energy Equipment & Services — 0.2% |
| | |
|
| | |
Warner Music Group Corp., Class A | | |
| | |
Financial Services — 5.7% |
Berkshire Hathaway, Inc., Class B * | | |
| | |
| | |
Fidelity National Information Services, Inc. | | |
Mastercard, Inc., Class A (a) | | |
| | |
| | |
| | |
|
Mondelez International, Inc., Class A | | |
Ground Transportation — 1.0% |
| | |
Uber Technologies, Inc. * | | |
| | |
| | |
Health Care Equipment & Supplies — 1.9% |
| | |
Baxter International, Inc. | | |
Boston Scientific Corp. * | | |
Edwards Lifesciences Corp. * | | |
| | |
| | |
| | |
Health Care Providers & Services — 2.0% |
| | |
| | |
| | |
| | |
|
Health Care Providers & Services — continued |
| | |
| | |
| | |
|
Alexandria Real Estate Equities, Inc. | | |
| | |
| | |
| | |
Hotels, Restaurants & Leisure — 3.5% |
| | |
| | |
Chipotle Mexican Grill, Inc. * | | |
DoorDash, Inc., Class A * | | |
| | |
Hilton Worldwide Holdings, Inc. | | |
| | |
Royal Caribbean Cruises Ltd. | | |
| | |
| | |
Household Durables — 0.1% |
| | |
Household Products — 0.3% |
Church & Dwight Co., Inc. | | |
Independent Power and Renewable Electricity Producers — 0.1% |
| | |
Industrial Conglomerates — 0.7% |
Honeywell International, Inc. | | |
|
| | |
|
| | |
| | |
| | |
Principal Financial Group, Inc. | | |
| | |
| | |
Interactive Media & Services — 6.5% |
| | |
SEE NOTES TO FINANCIAL STATEMENTS.
| J.P. Morgan Large Cap Funds | |
| | |
Common Stocks — continued |
Interactive Media & Services — continued |
| | |
Meta Platforms, Inc., Class A | | |
| | |
|
Accenture plc, Class A (Ireland) | | |
Cognizant Technology Solutions Corp., Class A | | |
| | |
Life Sciences Tools & Services — 1.1% |
| | |
Thermo Fisher Scientific, Inc. | | |
| | |
|
| | |
| | |
| | |
| | |
| | |
| | |
|
Charter Communications, Inc., Class A * | | |
| | |
| | |
| | |
|
| | |
|
| | |
Oil, Gas & Consumable Fuels — 2.8% |
| | |
| | |
| | |
| | |
| | |
Passenger Airlines — 0.2% |
| | |
Personal Care Products — 0.3% |
Estee Lauder Cos., Inc. (The), Class A | | |
| | |
| | |
| | |
|
|
| | |
| | |
| | |
| | |
| | |
Professional Services — 0.3% |
| | |
|
Equity LifeStyle Properties, Inc. | | |
Semiconductors & Semiconductor Equipment — 11.9% |
Advanced Micro Devices, Inc. * | | |
| | |
| | |
| | |
| | |
| | |
| | |
NXP Semiconductors NV (China) | | |
| | |
| | |
|
| | |
Cadence Design Systems, Inc. * | | |
| | |
| | |
| | |
| | |
| | |
| | |
| | |
|
Digital Realty Trust, Inc. | | |
| | |
| | |
| | |
|
| | |
| | |
Burlington Stores, Inc. * | | |
SEE NOTES TO FINANCIAL STATEMENTS.
| J.P. Morgan Large Cap Funds | |
JPMorgan Hedged Equity 3 Fund
SCHEDULE OF PORTFOLIO INVESTMENTSAS OF December 31, 2024 (Unaudited) (continued)
| | |
Common Stocks — continued |
Specialty Retail — continued |
| | |
| | |
| | |
Technology Hardware, Storage & Peripherals — 7.8% |
| | |
Hewlett Packard Enterprise Co. | | |
Seagate Technology Holdings plc | | |
| | |
| | |
|
| | |
Philip Morris International, Inc. | | |
| | |
Trading Companies & Distributors — 0.1% |
| | |
Total Common Stocks
(Cost $2,034,588) | | |
| | |
|
Put Options Purchased — 1.1% |
| | |
2/28/2025 at USD 5,710.00, European Style | | |
Notional Amount: USD 3,086,679 | | |
Counterparty: Exchange-Traded *
(Cost $27,070) | | |
| | |
Short-Term Investments — 3.0% |
Investment Companies — 3.0% |
JPMorgan U.S. Government Money Market Fund Class IM Shares, 4.44% (b) (c)
(Cost $92,702) | | |
Total Investments — 100.4%
(Cost $2,154,360) | | |
Liabilities in Excess of Other Assets — (0.4)% | | |
| | |
Percentages indicated are based on net assets. |
| |
| Real Estate Investment Trust |
| |
| Amount rounds to less than 0.1% of net assets. |
| Non-income producing security. | |
| All or a portion of the security is segregated for options written. | |
| Investment in an affiliated fund, which is registered under the Investment Company Act of 1940, as amended, and is advised by J.P. Morgan Investment Management Inc. | |
| The rate shown is the current yield as of December 31, 2024. | |
Futures contracts outstanding as of December 31, 2024 (amounts in thousands, except number of contracts):
| | | | | VALUE AND
UNREALIZED
APPRECIATION
(DEPRECIATION) ($) |
| | | | | |
| | | | | |
SEE NOTES TO FINANCIAL STATEMENTS.
| J.P. Morgan Large Cap Funds | |
Written Call Options Contracts as of December 31, 2024 (amounts in thousands, except number of contracts):
|
| | | | | | |
| | | | | | |
Written Put Options Contracts as of December 31, 2024 (amounts in thousands, except number of contracts):
|
| | | | | | |
| | | | | | |
Total Written Options Contracts (Premiums Received $26,666) | |
SEE NOTES TO FINANCIAL STATEMENTS.
| J.P. Morgan Large Cap Funds | |
JPMorgan Large Cap Growth Fund
SCHEDULE OF PORTFOLIO INVESTMENTSAS OF December 31, 2024 (Unaudited)
| | |
|
Aerospace & Defense — 1.1% |
| | |
|
| | |
|
| | |
| | |
| | |
| | |
|
| | |
Regeneron Pharmaceuticals, Inc. * | | |
| | |
|
Alibaba Group Holding Ltd., ADR (China) | | |
| | |
MercadoLibre, Inc. (Brazil) * | | |
| | |
|
| | |
|
| | |
Goldman Sachs Group, Inc. (The) | | |
| | |
| | |
Communications Equipment — 1.1% |
| | |
Construction & Engineering — 0.7% |
| | |
Consumer Staples Distribution & Retail — 0.5% |
| | |
Electrical Equipment — 1.1% |
| | |
Vertiv Holdings Co., Class A | | |
| | |
Electronic Equipment, Instruments & Components — 0.6% |
| | |
| | |
|
|
| | |
| | |
| | |
Financial Services — 4.7% |
Berkshire Hathaway, Inc., Class B * | | |
| | |
Mastercard, Inc., Class A | | |
| | |
| | |
Ground Transportation — 0.8% |
Uber Technologies, Inc. * | | |
| | |
| | |
Health Care Equipment & Supplies — 2.6% |
| | |
Edwards Lifesciences Corp. * | | |
Intuitive Surgical, Inc. * | | |
| | |
Health Care Providers & Services — 0.8% |
| | |
Hotels, Restaurants & Leisure — 3.3% |
| | |
| | |
Chipotle Mexican Grill, Inc. * | | |
DoorDash, Inc., Class A * | | |
| | |
| | |
| | |
Household Durables — 1.5% |
| | |
Industrial Conglomerates — 0.8% |
| | |
Interactive Media & Services — 10.6% |
| | |
Meta Platforms, Inc., Class A | | |
| | |
|
International Business Machines Corp. | | |
SEE NOTES TO FINANCIAL STATEMENTS.
| J.P. Morgan Large Cap Funds | |
| | |
Common Stocks — continued |
|
| | |
Shopify, Inc., Class A (Canada) * | | |
| | |
Life Sciences Tools & Services — 0.1% |
Thermo Fisher Scientific, Inc. | | |
|
Trade Desk, Inc. (The), Class A * | | |
|
| | |
Oil, Gas & Consumable Fuels — 0.4% |
| | |
| | |
| | |
|
| | |
| | |
| | |
Semiconductors & Semiconductor Equipment — 13.7% |
ASML Holding NV (Registered), NYRS (Netherlands) | | |
| | |
| | |
| | |
Taiwan Semiconductor Manufacturing Co. Ltd., ADR (Taiwan) | | |
| | |
|
| | |
AppLovin Corp., Class A * | | |
| | |
| | |
| | |
| | |
| | |
Palo Alto Networks, Inc. * | | |
| | |
|
|
| | |
| | |
| | |
| | |
|
| | |
| | |
| | |
Technology Hardware, Storage & Peripherals — 5.4% |
| | |
Trading Companies & Distributors — 0.4% |
| | |
Total Common Stocks
(Cost $54,323,329) | | |
Short-Term Investments — 4.6% |
Investment Companies — 4.6% |
JPMorgan Prime Money Market Fund Class IM Shares, 4.54% (a) (b)
(Cost $4,844,918) | | |
Total Investments — 99.8%
(Cost $59,168,247) | | |
Other Assets in Excess of Liabilities — 0.2% | | |
| | |
Percentages indicated are based on net assets. |
| |
| American Depositary Receipt |
| |
| Non-income producing security. |
| Investment in an affiliated fund, which is registered under the Investment Company Act of 1940, as amended, and is advised by J.P. Morgan Investment Management Inc. |
| The rate shown is the current yield as of December 31, 2024. |
SEE NOTES TO FINANCIAL STATEMENTS.
| J.P. Morgan Large Cap Funds | |
JPMorgan Large Cap Value Fund
SCHEDULE OF PORTFOLIO INVESTMENTSAS OF December 31, 2024 (Unaudited)
| | |
|
Aerospace & Defense — 1.3% |
| | |
Spirit AeroSystems Holdings, Inc., Class A * | | |
| | |
| | |
Air Freight & Logistics — 0.9% |
| | |
Automobile Components — 0.5% |
| | |
|
| | |
| | |
| | |
| | |
First Citizens BancShares, Inc., Class A | | |
| | |
| | |
| | |
| | |
|
| | |
| | |
BioMarin Pharmaceutical, Inc. * | | |
Neurocrine Biosciences, Inc. * | | |
Regeneron Pharmaceuticals, Inc. * | | |
| | |
|
| | |
|
| | |
| | |
| | |
| | |
|
Goldman Sachs Group, Inc. (The) | | |
Raymond James Financial, Inc. | | |
| | |
|
Air Products and Chemicals, Inc. | | |
| | |
|
|
Axalta Coating Systems Ltd. * | | |
| | |
| | |
|
Discover Financial Services | | |
Consumer Staples Distribution & Retail — 4.5% |
BJ's Wholesale Club Holdings, Inc. * | | |
Performance Food Group Co. * | | |
| | |
| | |
Containers & Packaging — 2.2% |
Graphic Packaging Holding Co. | | |
| | |
| | |
| | |
| | |
Diversified Telecommunication Services — 1.6% |
Verizon Communications, Inc. | | |
Electrical Equipment — 2.4% |
| | |
| | |
| | |
| | |
Electronic Equipment, Instruments & Components — 0.5% |
| | |
|
Live Nation Entertainment, Inc. * | | |
| | |
| | |
Financial Services — 8.2% |
| | |
Berkshire Hathaway, Inc., Class B * | | |
| | |
| | |
Fidelity National Information Services, Inc. | | |
| | |
| | |
| | |
|
Lamb Weston Holdings, Inc. | | |
SEE NOTES TO FINANCIAL STATEMENTS.
| J.P. Morgan Large Cap Funds | |
| | |
Common Stocks — continued |
Ground Transportation — 2.2% |
| | |
Knight-Swift Transportation Holdings, Inc. | | |
Uber Technologies, Inc. * | | |
| | |
Health Care Providers & Services — 6.0% |
| | |
| | |
| | |
| | |
| | |
| | |
| | |
| | |
Hotel & Resort REITs — 0.3% |
Host Hotels & Resorts, Inc. | | |
Hotels, Restaurants & Leisure — 2.7% |
| | |
| | |
| | |
Household Durables — 1.0% |
Mohawk Industries, Inc. * | | |
Industrial Conglomerates — 0.8% |
Honeywell International, Inc. | | |
|
Americold Realty Trust, Inc. | | |
| | |
| | |
| | |
|
| | |
| | |
Oscar Health, Inc., Class A * | | |
| | |
Interactive Media & Services — 1.0% |
Pinterest, Inc., Class A * | | |
|
Cognizant Technology Solutions Corp., Class A | | |
|
| | |
| | |
|
|
| | |
Gates Industrial Corp. plc * | | |
| | |
| | |
|
| | |
| | |
| | |
| | |
|
| | |
| | |
| | |
Oil, Gas & Consumable Fuels — 4.3% |
| | |
| | |
| | |
| | |
| | |
| | |
| | |
Passenger Airlines — 2.4% |
American Airlines Group, Inc. * | | |
Copa Holdings SA, Class A (Panama) | | |
| | |
| | |
| | |
|
AstraZeneca plc, ADR (United Kingdom) | | |
| | |
| | |
| | |
Professional Services — 0.5% |
| | |
Real Estate Management & Development — 1.1% |
Zillow Group, Inc., Class C * | | |
Semiconductors & Semiconductor Equipment — 2.0% |
ASML Holding NV (Registered), NYRS (Netherlands) | | |
| | |
| | |
SEE NOTES TO FINANCIAL STATEMENTS.
| J.P. Morgan Large Cap Funds | |
JPMorgan Large Cap Value Fund
SCHEDULE OF PORTFOLIO INVESTMENTSAS OF December 31, 2024 (Unaudited) (continued)
| | |
Common Stocks — continued |
|
| | |
| | |
| | |
| | |
| | |
|
Digital Realty Trust, Inc. | | |
| | |
| | |
| | |
| | |
|
| | |
Technology Hardware, Storage & Peripherals — 5.5% |
Dell Technologies, Inc., Class C | | |
Hewlett Packard Enterprise Co. | | |
Seagate Technology Holdings plc | | |
| | |
| | |
Textiles, Apparel & Luxury Goods — 0.4% |
| | |
|
Philip Morris International, Inc. | | |
Trading Companies & Distributors — 1.2% |
AerCap Holdings NV (Ireland) | | |
WESCO International, Inc. | | |
| | |
Total Common Stocks
(Cost $4,318,777) | | |
| | |
Short-Term Investments — 0.7% |
Investment Companies — 0.6% |
JPMorgan Prime Money Market Fund Class IM Shares, 4.54% (b) (c)
(Cost $27,043) | | |
Investment of Cash Collateral from Securities Loaned — 0.1% |
JPMorgan Securities Lending Money Market Fund Agency SL Class Shares, 4.47% (b) (c)
(Cost $4,824) | | |
Total Short-Term Investments
(Cost $31,867) | | |
Total Investments — 100.3%
(Cost $4,350,644) | | |
Liabilities in Excess of Other Assets — (0.3)% | | |
| | |
Percentages indicated are based on net assets. |
| |
| American Depositary Receipt |
| |
| Real Estate Investment Trust |
| Non-income producing security. |
| The security or a portion of this security is on loan at December 31, 2024. The total value of securities on loan at December 31, 2024 is $4,709. |
| Investment in an affiliated fund, which is registered under the Investment Company Act of 1940, as amended, and is advised by J.P. Morgan Investment Management Inc. |
| The rate shown is the current yield as of December 31, 2024. |
SEE NOTES TO FINANCIAL STATEMENTS.
| J.P. Morgan Large Cap Funds | |
JPMorgan U.S. Applied Data Science Value Fund
SCHEDULE OF PORTFOLIO INVESTMENTSAS OF December 31, 2024 (Unaudited)
| | |
|
Aerospace & Defense — 2.2% |
| | |
| | |
| | |
| | |
Air Freight & Logistics — 0.8% |
United Parcel Service, Inc., Class B | | |
Automobile Components — 0.3% |
| | |
|
| | |
| | |
Citizens Financial Group, Inc. | | |
| | |
PNC Financial Services Group, Inc. (The) | | |
| | |
| | |
|
| | |
|
| | |
Regeneron Pharmaceuticals, Inc. * | | |
Vertex Pharmaceuticals, Inc. * | | |
| | |
|
Fortune Brands Innovations, Inc. | | |
| | |
| | |
|
| | |
Charles Schwab Corp. (The) | | |
| | |
| | |
| | |
|
Axalta Coating Systems Ltd. * | | |
| | |
| | |
| | |
| | |
|
|
| | |
Capital One Financial Corp. | | |
| | |
Consumer Staples Distribution & Retail — 1.6% |
| | |
| | |
| | |
Containers & Packaging — 0.5% |
| | |
Diversified Telecommunication Services — 1.0% |
| | |
Electric Utilities — 3.4% |
| | |
| | |
| | |
| | |
Electrical Equipment — 2.1% |
| | |
Electronic Equipment, Instruments & Components — 0.6% |
Teledyne Technologies, Inc. * | | |
|
Take-Two Interactive Software, Inc. * | | |
Financial Services — 5.1% |
Berkshire Hathaway, Inc., Class B * | | |
| | |
| | |
Fidelity National Information Services, Inc. | | |
| | |
Mastercard, Inc., Class A | | |
| | |
|
Mondelez International, Inc., Class A | | |
Tyson Foods, Inc., Class A | | |
| | |
Ground Transportation — 2.3% |
| | |
| | |
Uber Technologies, Inc. * | | |
| | |
SEE NOTES TO FINANCIAL STATEMENTS.
| J.P. Morgan Large Cap Funds | |
JPMorgan U.S. Applied Data Science Value Fund
SCHEDULE OF PORTFOLIO INVESTMENTSAS OF December 31, 2024 (Unaudited) (continued)
| | |
Common Stocks — continued |
Health Care Equipment & Supplies — 2.6% |
| | |
Boston Scientific Corp. * | | |
| | |
| | |
Health Care Providers & Services — 3.8% |
| | |
| | |
| | |
| | |
| | |
|
| | |
Hotel & Resort REITs — 0.4% |
Host Hotels & Resorts, Inc. | | |
Hotels, Restaurants & Leisure — 2.2% |
| | |
| | |
| | |
| | |
Household Products — 1.4% |
Procter & Gamble Co. (The) | | |
Spectrum Brands Holdings, Inc. | | |
| | |
Industrial Conglomerates — 1.2% |
Honeywell International, Inc. | | |
|
| | |
|
| | |
| | |
Travelers Cos., Inc. (The) | | |
| | |
Interactive Media & Services — 1.0% |
Meta Platforms, Inc., Class A | | |
|
Cognizant Technology Solutions Corp., Class A | | |
Life Sciences Tools & Services — 1.2% |
Thermo Fisher Scientific, Inc. | | |
| | |
|
|
| | |
| | |
| | |
| | |
|
| | |
|
| | |
Public Service Enterprise Group, Inc. | | |
| | |
Oil, Gas & Consumable Fuels — 7.3% |
| | |
| | |
| | |
| | |
| | |
| | |
| | |
Paper & Forest Products — 0.0% ^ |
| | |
Personal Care Products — 0.4% |
| | |
|
| | |
| | |
Jazz Pharmaceuticals plc * | | |
| | |
| | |
Professional Services — 1.0% |
Booz Allen Hamilton Holding Corp. | | |
SS&C Technologies Holdings, Inc. | | |
| | |
Real Estate Management & Development — 1.0% |
CBRE Group, Inc., Class A * | | |
|
American Homes 4 Rent, Class A | | |
|
| | |
SEE NOTES TO FINANCIAL STATEMENTS.
| J.P. Morgan Large Cap Funds | |
| | |
Common Stocks — continued |
Semiconductors & Semiconductor Equipment — 3.8% |
Advanced Micro Devices, Inc. * | | |
| | |
| | |
| | |
NXP Semiconductors NV (China) | | |
| | |
| | |
|
| | |
|
Digital Realty Trust, Inc. | | |
|
| | |
| | |
O'Reilly Automotive, Inc. * | | |
| | |
| | |
Technology Hardware, Storage & Peripherals — 1.1% |
Hewlett Packard Enterprise Co. | | |
Seagate Technology Holdings plc | | |
| | |
|
Philip Morris International, Inc. | | |
Total Common Stocks
(Cost $120,931) | | |
| | |
Short-Term Investments — 1.8% |
Investment Companies — 1.8% |
JPMorgan Prime Money Market Fund Class IM Shares, 4.54% (a) (b)
(Cost $3,007) | | |
Total Investments — 100.0%
(Cost $123,938) | | |
Other Assets in Excess of Liabilities — 0.0% ^ | | |
| | |
Percentages indicated are based on net assets. |
Amounts presented as a dash ("-") represent amounts that round to less than a thousand. |
| |
| Real Estate Investment Trust |
| Amount rounds to less than 0.1% of net assets. |
| Non-income producing security. | |
| Investment in an affiliated fund, which is registered under the Investment Company Act of 1940, as amended, and is advised by J.P. Morgan Investment Management Inc. | |
| The rate shown is the current yield as of December 31, 2024. | |
Futures contracts outstanding as of December 31, 2024 (amounts in thousands, except number of contracts):
| | | | | VALUE AND
UNREALIZED
APPRECIATION
(DEPRECIATION) ($) |
| | | | | |
| | | | | |
SEE NOTES TO FINANCIAL STATEMENTS.
| J.P. Morgan Large Cap Funds | |
JPMorgan U.S. Equity Fund
SCHEDULE OF PORTFOLIO INVESTMENTSAS OF December 31, 2024 (Unaudited)
| | |
|
Aerospace & Defense — 2.7% |
| | |
| | |
| | |
|
| | |
|
| | |
| | |
| | |
|
| | |
Regeneron Pharmaceuticals, Inc. * | | |
Vertex Pharmaceuticals, Inc. * | | |
| | |
|
| | |
|
| | |
| | |
| | |
|
Ameriprise Financial, Inc. | | |
| | |
| | |
Construction Materials — 1.9% |
| | |
|
| | |
Electric Utilities — 3.5% |
| | |
| | |
| | |
| | |
Electrical Equipment — 2.0% |
| | |
Energy Equipment & Services — 2.6% |
| | |
| | |
|
Financial Services — 2.6% |
| | |
Mastercard, Inc., Class A | | |
| | |
|
Mondelez International, Inc., Class A | | |
Ground Transportation — 1.6% |
| | |
Health Care Equipment & Supplies — 3.2% |
Edwards Lifesciences Corp. * | | |
| | |
| | |
| | |
Health Care Providers & Services — 1.9% |
| | |
Hotels, Restaurants & Leisure — 3.8% |
Chipotle Mexican Grill, Inc. * | | |
Marriott International, Inc., Class A | | |
| | |
| | |
|
| | |
|
| | |
Travelers Cos., Inc. (The) | | |
| | |
Interactive Media & Services — 6.3% |
| | |
Meta Platforms, Inc., Class A | | |
| | |
|
| | |
Oil, Gas & Consumable Fuels — 2.2% |
| | |
|
| | |
Semiconductors & Semiconductor Equipment — 14.8% |
| | |
ASML Holding NV (Registered), NYRS (Netherlands) | | |
| | |
SEE NOTES TO FINANCIAL STATEMENTS.
| J.P. Morgan Large Cap Funds | |
| | |
Common Stocks — continued |
Semiconductors & Semiconductor Equipment — continued |
| | |
| | |
| | |
NXP Semiconductors NV (China) | | |
| | |
|
| | |
| | |
| | |
| | |
|
| | |
Technology Hardware, Storage & Peripherals — 8.1% |
| | |
Total Common Stocks
(Cost $18,167,551) | | |
Short-Term Investments — 1.0% |
Investment Companies — 1.0% |
JPMorgan Prime Money Market Fund Class IM Shares, 4.54% (a) (b)
(Cost $327,749) | | |
Total Investments — 100.1%
(Cost $18,495,300) | | |
Liabilities in Excess of Other Assets — (0.1)% | | |
| | |
Percentages indicated are based on net assets. |
| |
| |
| Real Estate Investment Trust |
| Non-income producing security. |
| Investment in an affiliated fund, which is registered under the Investment Company Act of 1940, as amended, and is advised by J.P. Morgan Investment Management Inc. |
| The rate shown is the current yield as of December 31, 2024. |
Futures contracts outstanding as of December 31, 2024 (amounts in thousands, except number of contracts):
| | | | | VALUE AND
UNREALIZED
APPRECIATION
(DEPRECIATION) ($) |
| | | | | |
| | | | | |
SEE NOTES TO FINANCIAL STATEMENTS.
| J.P. Morgan Large Cap Funds | |
JPMorgan U.S. GARP Equity Fund
SCHEDULE OF PORTFOLIO INVESTMENTSAS OF December 31, 2024 (Unaudited)
| | |
|
Aerospace & Defense — 0.9% |
| | |
| | |
| | |
|
| | |
|
| | |
|
| | |
| | |
| | |
|
| | |
Neurocrine Biosciences, Inc. * | | |
Regeneron Pharmaceuticals, Inc. * | | |
Vertex Pharmaceuticals, Inc. * | | |
| | |
|
| | |
|
Builders FirstSource, Inc. * | | |
| | |
| | |
|
Ameriprise Financial, Inc. | | |
Charles Schwab Corp. (The) | | |
Goldman Sachs Group, Inc. (The) | | |
| | |
| | |
| | |
|
| | |
Communications Equipment — 0.9% |
| | |
Construction & Engineering — 0.4% |
| | |
Construction Materials — 0.3% |
Martin Marietta Materials, Inc. | | |
| | |
|
Consumer Staples Distribution & Retail — 1.3% |
| | |
| | |
| | |
Electric Utilities — 0.8% |
| | |
| | |
| | |
| | |
Electrical Equipment — 0.4% |
| | |
Energy Equipment & Services — 0.6% |
| | |
|
| | |
| | |
| | |
Financial Services — 4.2% |
| | |
Mastercard, Inc., Class A | | |
| | |
| | |
Ground Transportation — 1.3% |
| | |
Uber Technologies, Inc. * | | |
| | |
Health Care Equipment & Supplies — 0.8% |
Boston Scientific Corp. * | | |
| | |
| | |
Health Care Providers & Services — 1.1% |
| | |
| | |
| | |
|
| | |
Hotels, Restaurants & Leisure — 3.4% |
| | |
Chipotle Mexican Grill, Inc. * | | |
DoorDash, Inc., Class A * | | |
SEE NOTES TO FINANCIAL STATEMENTS.
| J.P. Morgan Large Cap Funds | |
| | |
Common Stocks — continued |
Hotels, Restaurants & Leisure — continued |
Hilton Worldwide Holdings, Inc. | | |
| | |
| | |
|
| | |
| | |
| | |
Interactive Media & Services — 10.5% |
| | |
| | |
Meta Platforms, Inc., Class A | | |
Pinterest, Inc., Class A * | | |
| | |
Life Sciences Tools & Services — 0.4% |
Thermo Fisher Scientific, Inc. | | |
|
| | |
| | |
| | |
|
Sirius XM Holdings, Inc. (a) | | |
Oil, Gas & Consumable Fuels — 0.3% |
| | |
|
| | |
| | |
| | |
Professional Services — 0.5% |
Booz Allen Hamilton Holding Corp. | | |
Semiconductors & Semiconductor Equipment — 17.3% |
Advanced Micro Devices, Inc. * | | |
| | |
ASML Holding NV (Registered), NYRS (Netherlands) | | |
| | |
| | |
| | |
Microchip Technology, Inc. | | |
| | |
| | |
| | |
|
Semiconductors & Semiconductor Equipment — continued |
NXP Semiconductors NV (China) | | |
Taiwan Semiconductor Manufacturing Co. Ltd., ADR (Taiwan) | | |
| | |
|
| | |
AppLovin Corp., Class A * | | |
Cadence Design Systems, Inc. * | | |
Crowdstrike Holdings, Inc., Class A * | | |
| | |
| | |
| | |
| | |
| | |
|
Digital Realty Trust, Inc. | | |
| | |
| | |
|
Burlington Stores, Inc. * | | |
| | |
| | |
Technology Hardware, Storage & Peripherals — 9.7% |
| | |
Dell Technologies, Inc., Class C | | |
Hewlett Packard Enterprise Co. | | |
Seagate Technology Holdings plc | | |
| | |
Total Common Stocks
(Cost $822,484) | | |
Short-Term Investments — 2.7% |
Investment Companies — 2.6% |
JPMorgan Prime Money Market Fund Class IM Shares, 4.54% (b) (c)
(Cost $44,882) | | |
SEE NOTES TO FINANCIAL STATEMENTS.
| J.P. Morgan Large Cap Funds | |
JPMorgan U.S. GARP Equity Fund
SCHEDULE OF PORTFOLIO INVESTMENTSAS OF December 31, 2024 (Unaudited) (continued)
| | |
Short-Term Investments — continued |
Investment of Cash Collateral from Securities Loaned — 0.1% |
JPMorgan Securities Lending Money Market Fund Agency SL Class Shares, 4.47% (b) (c)
(Cost $1,527) | | |
Total Short-Term Investments
(Cost $46,409) | | |
Total Investments — 101.6%
(Cost $868,893) | | |
Liabilities in Excess of Other Assets — (1.6)% | | |
| | |
Percentages indicated are based on net assets. |
| |
| American Depositary Receipt |
| |
| Real Estate Investment Trust |
| Non-income producing security. |
| The security or a portion of this security is on loan at December 31, 2024. The total value of securities on loan at December 31, 2024 is $1,481. |
| Investment in an affiliated fund, which is registered under the Investment Company Act of 1940, as amended, and is advised by J.P. Morgan Investment Management Inc. |
| The rate shown is the current yield as of December 31, 2024. |
Futures contracts outstanding as of December 31, 2024 (amounts in thousands, except number of contracts):
| | | | | VALUE AND
UNREALIZED
APPRECIATION
(DEPRECIATION) ($) |
| | | | | |
| | | | | |
SEE NOTES TO FINANCIAL STATEMENTS.
| J.P. Morgan Large Cap Funds | |
JPMorgan U.S. Large Cap Core Plus Fund
SCHEDULE OF PORTFOLIO INVESTMENTSAS OF December 31, 2024 (Unaudited)
| | |
|
|
Aerospace & Defense — 3.7% |
| | |
Howmet Aerospace, Inc. (a) | | |
| | |
| | |
| | |
Air Freight & Logistics — 0.3% |
| | |
|
Bank of America Corp. (a) | | |
| | |
| | |
| | |
| | |
|
| | |
| | |
| | |
| | |
| | |
|
| | |
Neurocrine Biosciences, Inc. * | | |
Regeneron Pharmaceuticals, Inc. * | | |
Sarepta Therapeutics, Inc. * | | |
Vertex Pharmaceuticals, Inc. * (a) | | |
| | |
|
| | |
|
| | |
| | |
| | |
|
Ameriprise Financial, Inc. | | |
Charles Schwab Corp. (The) (a) | | |
| | |
Goldman Sachs Group, Inc. (The) (a) | | |
Raymond James Financial, Inc. | | |
| | |
| | |
|
|
|
Air Products and Chemicals, Inc. | | |
| | |
Sherwin-Williams Co. (The) | | |
| | |
Communications Equipment — 0.2% |
| | |
Construction Materials — 0.9% |
Martin Marietta Materials, Inc. | | |
|
Capital One Financial Corp. | | |
Consumer Staples Distribution & Retail — 0.6% |
| | |
| | |
| | |
Diversified Telecommunication Services — 0.4% |
| | |
Electric Utilities — 3.2% |
| | |
| | |
| | |
| | |
| | |
Electrical Equipment — 1.0% |
| | |
| | |
| | |
| | |
Energy Equipment & Services — 0.2% |
| | |
|
Take-Two Interactive Software, Inc. * | | |
Walt Disney Co. (The) (a) | | |
Warner Bros Discovery, Inc. * | | |
Warner Music Group Corp., Class A | | |
| | |
Financial Services — 7.9% |
| | |
Berkshire Hathaway, Inc., Class B * | | |
| | |
SEE NOTES TO FINANCIAL STATEMENTS.
| J.P. Morgan Large Cap Funds | |
JPMorgan U.S. Large Cap Core Plus Fund
SCHEDULE OF PORTFOLIO INVESTMENTSAS OF December 31, 2024 (Unaudited) (continued)
| | |
Long Positions — continued |
Common Stocks — continued |
Financial Services — continued |
| | |
Fidelity National Information Services, Inc. | | |
| | |
Jack Henry & Associates, Inc. | | |
Mastercard, Inc., Class A (a) | | |
| | |
| | |
|
Mondelez International, Inc., Class A (a) | | |
Ground Transportation — 1.7% |
Norfolk Southern Corp. (a) | | |
| | |
| | |
| | |
Health Care Equipment & Supplies — 2.5% |
Boston Scientific Corp. * (a) | | |
Edwards Lifesciences Corp. * | | |
Intuitive Surgical, Inc. * | | |
| | |
| | |
Health Care Providers & Services — 2.5% |
| | |
| | |
| | |
UnitedHealth Group, Inc. (a) | | |
| | |
|
Alexandria Real Estate Equities, Inc. | | |
| | |
| | |
Hotels, Restaurants & Leisure — 5.2% |
| | |
| | |
Chipotle Mexican Grill, Inc. * | | |
| | |
DoorDash, Inc., Class A * | | |
Hilton Worldwide Holdings, Inc. (a) | | |
| | |
|
|
Hotels, Restaurants & Leisure — continued |
| | |
| | |
| | |
Household Durables — 0.1% |
| | |
Household Products — 0.6% |
Church & Dwight Co., Inc. | | |
Procter & Gamble Co. (The) (a) | | |
| | |
Independent Power and Renewable Electricity Producers — 0.1% |
| | |
Industrial Conglomerates — 0.9% |
Honeywell International, Inc. (a) | | |
|
| | |
| | |
| | |
Principal Financial Group, Inc. | | |
Progressive Corp. (The) (a) | | |
Ryan Specialty Holdings, Inc. | | |
Travelers Cos., Inc. (The) | | |
| | |
Interactive Media & Services — 7.2% |
| | |
Alphabet, Inc., Class A (a) | | |
Meta Platforms, Inc., Class A (a) | | |
Pinterest, Inc., Class A * | | |
| | |
|
Cognizant Technology Solutions Corp., Class A | | |
Life Sciences Tools & Services — 1.2% |
Agilent Technologies, Inc. | | |
Thermo Fisher Scientific, Inc. (a) | | |
| | |
|
| | |
| | |
| | |
SEE NOTES TO FINANCIAL STATEMENTS.
| J.P. Morgan Large Cap Funds | |
| | |
Long Positions — continued |
Common Stocks — continued |
|
| | |
|
| | |
| | |
| | |
| | |
| | |
Oil, Gas & Consumable Fuels — 3.9% |
| | |
| | |
| | |
| | |
| | |
| | |
| | |
| | |
| | |
|
Bristol-Myers Squibb Co. (a) | | |
Elanco Animal Health, Inc. * | | |
| | |
| | |
| | |
Professional Services — 0.5% |
Booz Allen Hamilton Holding Corp. | | |
|
American Homes 4 Rent, Class A | | |
Equity LifeStyle Properties, Inc. | | |
| | |
Semiconductors & Semiconductor Equipment — 17.0% |
Advanced Micro Devices, Inc. * | | |
| | |
ASML Holding NV (Registered), NYRS (Netherlands) | | |
| | |
| | |
| | |
Microchip Technology, Inc. | | |
| | |
| | |
NXP Semiconductors NV (China) | | |
| | |
|
|
Semiconductors & Semiconductor Equipment — continued |
| | |
| | |
Taiwan Semiconductor Manufacturing Co. Ltd., ADR (Taiwan) | | |
Texas Instruments, Inc. (a) | | |
| | |
|
Cadence Design Systems, Inc. * | | |
| | |
| | |
| | |
| | |
| | |
| | |
| | |
|
| | |
Digital Realty Trust, Inc. | | |
| | |
| | |
|
| | |
| | |
Burlington Stores, Inc. * | | |
| | |
| | |
| | |
Technology Hardware, Storage & Peripherals — 6.5% |
| | |
Hewlett Packard Enterprise Co. | | |
Seagate Technology Holdings plc | | |
Western Digital Corp. * (a) | | |
| | |
Wireless Telecommunication Services — 0.3% |
| | |
Total Common Stocks
(Cost $2,208,832) | | |
SEE NOTES TO FINANCIAL STATEMENTS.
| J.P. Morgan Large Cap Funds | |
JPMorgan U.S. Large Cap Core Plus Fund
SCHEDULE OF PORTFOLIO INVESTMENTSAS OF December 31, 2024 (Unaudited) (continued)
| | |
Long Positions — continued |
Short-Term Investments — 1.4% |
Investment Companies — 1.4% |
JPMorgan Prime Money Market Fund Class IM Shares, 4.54% (b) (c)(Cost $40,267) | | |
Total Long Positions
(Cost $2,249,099) | | |
Short Positions — (22.4)% |
|
Aerospace & Defense — (0.6)% |
| | |
Huntington Ingalls Industries, Inc. | | |
| | |
| | |
Air Freight & Logistics — (0.2)% |
Expeditors International of Washington, Inc. | | |
|
| | |
|
Citizens Financial Group, Inc. | | |
Huntington Bancshares, Inc. | | |
| | |
|
Constellation Brands, Inc., Class A | | |
Molson Coors Beverage Co., Class B | | |
| | |
|
| | |
Building Products — (0.3)% |
Johnson Controls International plc | | |
|
| | |
Cboe Global Markets, Inc. | | |
FactSet Research Systems, Inc. | | |
| | |
| | |
| | |
| | |
|
| | |
Commercial Services & Supplies — (0.4)% |
| | |
| | |
|
|
Commercial Services & Supplies — continued |
| | |
| | |
| | |
Communications Equipment — (0.2)% |
| | |
Consumer Staples Distribution & Retail — (0.7)% |
| | |
| | |
Walgreens Boots Alliance, Inc. | | |
| | |
Containers & Packaging — (0.1)% |
| | |
Diversified Telecommunication Services — (0.1)% |
Verizon Communications, Inc. | | |
Electric Utilities — (1.8)% |
American Electric Power Co., Inc. | | |
Constellation Energy Corp. | | |
| | |
| | |
| | |
| | |
| | |
Pinnacle West Capital Corp. | | |
| | |
| | |
Electrical Equipment — (0.1)% |
Rockwell Automation, Inc. | | |
Electronic Equipment, Instruments & Components — (0.1)% |
| | |
Energy Equipment & Services — (0.2)% |
| | |
|
| | |
| | |
| | |
Financial Services — (0.7)% |
| | |
SEE NOTES TO FINANCIAL STATEMENTS.
| J.P. Morgan Large Cap Funds | |
| | |
Short Positions — continued |
Common Stocks — continued |
Financial Services — continued |
| | |
| | |
| | |
|
| | |
| | |
| | |
|
| | |
Health Care Equipment & Supplies — (0.2)% |
| | |
Zimmer Biomet Holdings, Inc. | | |
| | |
Health Care Providers & Services — (0.6)% |
| | |
| | |
| | |
Molina Healthcare, Inc. * | | |
| | |
Hotels, Restaurants & Leisure — (0.2)% |
Choice Hotels International, Inc. | | |
| | |
| | |
|
| | |
| | |
American International Group, Inc. | | |
| | |
Hartford Financial Services Group, Inc. (The) | | |
Kinsale Capital Group, Inc. | | |
RenaissanceRe Holdings Ltd. (Bermuda) | | |
| | |
| | |
| | |
|
| | |
International Business Machines Corp. | | |
| | |
| | |
|
|
Life Sciences Tools & Services — (0.4)% |
| | |
| | |
| | |
|
| | |
| | |
Illinois Tool Works, Inc. | | |
Stanley Black & Decker, Inc. | | |
| | |
|
| | |
Interpublic Group of Cos., Inc. (The) | | |
| | |
|
| | |
Consolidated Edison, Inc. | | |
| | |
|
| | |
Oil, Gas & Consumable Fuels — (0.8)% |
| | |
| | |
Occidental Petroleum Corp. | | |
| | |
| | |
| | |
| | |
|
| | |
| | |
| | |
| | |
Professional Services — (0.9)% |
Automatic Data Processing, Inc. | | |
| | |
| | |
| | |
SEE NOTES TO FINANCIAL STATEMENTS.
| J.P. Morgan Large Cap Funds | |
JPMorgan U.S. Large Cap Core Plus Fund
SCHEDULE OF PORTFOLIO INVESTMENTSAS OF December 31, 2024 (Unaudited) (continued)
| | |
Short Positions — continued |
Common Stocks — continued |
Professional Services — continued |
| | |
| | |
| | |
Residential REITs — (0.2)% |
Essex Property Trust, Inc. | | |
Mid-America Apartment Communities, Inc. | | |
| | |
|
| | |
| | |
Simon Property Group, Inc. | | |
| | |
Semiconductors & Semiconductor Equipment — (2.2)% |
| | |
| | |
| | |
Monolithic Power Systems, Inc. | | |
| | |
| | |
| | |
|
| | |
| | |
| | |
| | |
| | |
Specialized REITs — (0.1)% |
Extra Space Storage, Inc. | | |
Specialty Retail — (0.4)% |
| | |
Technology Hardware, Storage & Peripherals — (0.8)% |
| | |
| | |
| | |
| | |
|
|
Textiles, Apparel & Luxury Goods — (0.3)% |
| | |
| | |
| | |
Trading Companies & Distributors — (0.4)% |
| | |
Total Common Stocks
(Proceeds $(658,216)) | | |
Total Short Positions
(Proceeds $(658,216)) | | |
Total Investments — 99.5%
(Cost $1,590,883) | | |
Other Assets Less Liabilities — 0.5% | | |
| | |
Percentages indicated are based on net assets. |
Amounts presented as a dash ("-") represent amounts that round to less than a thousand. |
| |
| American Depositary Receipt |
| |
| Real Estate Investment Trust |
| Amount rounds to less than 0.1% of net assets. |
| Non-income producing security. | |
| All or a portion of this security is segregated as collateral for short sales. The total value of securities segregated as collateral is $867,605. | |
| Investment in an affiliated fund, which is registered under the Investment Company Act of 1940, as amended, and is advised by J.P. Morgan Investment Management Inc. | |
| The rate shown is the current yield as of December 31, 2024. | |
SEE NOTES TO FINANCIAL STATEMENTS.
| J.P. Morgan Large Cap Funds | |
JPMorgan U.S. Research Enhanced Equity Fund
SCHEDULE OF PORTFOLIO INVESTMENTSAS OF December 31, 2024 (Unaudited)
| | |
|
Aerospace & Defense — 1.5% |
| | |
| | |
| | |
| | |
| | |
Air Freight & Logistics — 0.8% |
| | |
United Parcel Service, Inc., Class B | | |
| | |
Automobile Components — 0.1% |
| | |
|
| | |
|
| | |
| | |
| | |
| | |
| | |
| | |
| | |
|
| | |
| | |
| | |
| | |
|
| | |
| | |
Neurocrine Biosciences, Inc. * | | |
Regeneron Pharmaceuticals, Inc. * | | |
Sarepta Therapeutics, Inc. * | | |
Vertex Pharmaceuticals, Inc. * | | |
| | |
|
| | |
|
| | |
| | |
|
Building Products — continued |
| | |
| | |
| | |
|
Ameriprise Financial, Inc. | | |
Charles Schwab Corp. (The) | | |
| | |
Goldman Sachs Group, Inc. (The) | | |
| | |
| | |
|
| | |
| | |
LyondellBasell Industries NV, Class A | | |
| | |
Sherwin-Williams Co. (The) | | |
| | |
Communications Equipment — 0.4% |
| | |
| | |
| | |
Construction Materials — 0.2% |
Martin Marietta Materials, Inc. | | |
|
| | |
Consumer Staples Distribution & Retail — 0.5% |
| | |
|
| | |
Diversified Telecommunication Services — 0.4% |
| | |
Electric Utilities — 2.1% |
| | |
| | |
| | |
| | |
| | |
SEE NOTES TO FINANCIAL STATEMENTS.
| J.P. Morgan Large Cap Funds | |
JPMorgan U.S. Research Enhanced Equity Fund
SCHEDULE OF PORTFOLIO INVESTMENTSAS OF December 31, 2024 (Unaudited) (continued)
| | |
Common Stocks — continued |
Electrical Equipment — 0.4% |
| | |
| | |
| | |
Electronic Equipment, Instruments & Components — 0.1% |
TE Connectivity plc (Switzerland) | | |
Energy Equipment & Services — 0.2% |
| | |
|
| | |
Warner Music Group Corp., Class A | | |
| | |
Financial Services — 5.9% |
Berkshire Hathaway, Inc., Class B * | | |
| | |
| | |
Fidelity National Information Services, Inc. | | |
Mastercard, Inc., Class A | | |
| | |
| | |
| | |
|
Mondelez International, Inc., Class A | | |
Ground Transportation — 1.0% |
| | |
Uber Technologies, Inc. * | | |
| | |
| | |
Health Care Equipment & Supplies — 2.0% |
| | |
Baxter International, Inc. | | |
Boston Scientific Corp. * | | |
Edwards Lifesciences Corp. * | | |
| | |
| | |
| | |
Health Care Providers & Services — 2.0% |
| | |
| | |
| | |
| | |
|
Health Care Providers & Services — continued |
| | |
| | |
| | |
|
Alexandria Real Estate Equities, Inc. | | |
| | |
| | |
| | |
Hotels, Restaurants & Leisure — 3.6% |
| | |
| | |
Chipotle Mexican Grill, Inc. * | | |
DoorDash, Inc., Class A * | | |
| | |
Hilton Worldwide Holdings, Inc. | | |
| | |
Royal Caribbean Cruises Ltd. | | |
| | |
| | |
Household Durables — 0.1% |
| | |
Household Products — 0.3% |
Church & Dwight Co., Inc. | | |
Independent Power and Renewable Electricity Producers — 0.1% |
| | |
Industrial Conglomerates — 0.7% |
Honeywell International, Inc. | | |
|
| | |
|
| | |
| | |
| | |
Principal Financial Group, Inc. | | |
| | |
| | |
Interactive Media & Services — 6.7% |
| | |
SEE NOTES TO FINANCIAL STATEMENTS.
| J.P. Morgan Large Cap Funds | |
| | |
Common Stocks — continued |
Interactive Media & Services — continued |
| | |
Meta Platforms, Inc., Class A | | |
| | |
|
Accenture plc, Class A (Ireland) | | |
Cognizant Technology Solutions Corp., Class A | | |
| | |
Life Sciences Tools & Services — 1.2% |
| | |
Thermo Fisher Scientific, Inc. | | |
| | |
|
| | |
| | |
| | |
| | |
| | |
| | |
|
Charter Communications, Inc., Class A * | | |
| | |
| | |
| | |
|
| | |
|
| | |
Oil, Gas & Consumable Fuels — 2.9% |
| | |
| | |
| | |
| | |
| | |
Passenger Airlines — 0.2% |
| | |
Personal Care Products — 0.3% |
Estee Lauder Cos., Inc. (The), Class A | | |
| | |
| | |
| | |
|
|
| | |
| | |
| | |
| | |
| | |
Professional Services — 0.3% |
| | |
|
Equity LifeStyle Properties, Inc. | | |
Semiconductors & Semiconductor Equipment — 12.2% |
Advanced Micro Devices, Inc. * | | |
| | |
| | |
| | |
| | |
| | |
| | |
NXP Semiconductors NV (China) | | |
| | |
| | |
|
| | |
Cadence Design Systems, Inc. * | | |
| | |
| | |
| | |
| | |
| | |
| | |
| | |
|
Digital Realty Trust, Inc. | | |
| | |
| | |
| | |
|
| | |
| | |
Burlington Stores, Inc. * | | |
SEE NOTES TO FINANCIAL STATEMENTS.
| J.P. Morgan Large Cap Funds | |
JPMorgan U.S. Research Enhanced Equity Fund
SCHEDULE OF PORTFOLIO INVESTMENTSAS OF December 31, 2024 (Unaudited) (continued)
| | |
Common Stocks — continued |
Specialty Retail — continued |
| | |
| | |
| | |
Technology Hardware, Storage & Peripherals — 8.0% |
| | |
Hewlett Packard Enterprise Co. | | |
Seagate Technology Holdings plc | | |
| | |
| | |
|
| | |
Philip Morris International, Inc. | | |
| | |
Trading Companies & Distributors — 0.1% |
| | |
Total Common Stocks
(Cost $5,632,407) | | |
Short-Term Investments — 1.3% |
Investment Companies — 1.3% |
JPMorgan Prime Money Market Fund Class IM Shares, 4.54% (a) (b)
(Cost $134,346) | | |
Total Investments — 100.0%
(Cost $5,766,753) | | |
Other Assets in Excess of Liabilities — 0.0% ^ | | |
| | |
Percentages indicated are based on net assets. |
| |
| Real Estate Investment Trust |
| Amount rounds to less than 0.1% of net assets. |
| Non-income producing security. | |
| Investment in an affiliated fund, which is registered under the Investment Company Act of 1940, as amended, and is advised by J.P. Morgan Investment Management Inc. | |
| The rate shown is the current yield as of December 31, 2024. | |
Futures contracts outstanding as of December 31, 2024 (amounts in thousands, except number of contracts):
| | | | | VALUE AND
UNREALIZED
APPRECIATION
(DEPRECIATION) ($) |
| | | | | |
| | | | | |
SEE NOTES TO FINANCIAL STATEMENTS.
| J.P. Morgan Large Cap Funds | |
JPMorgan U.S. Sustainable Leaders Fund
SCHEDULE OF PORTFOLIO INVESTMENTSAS OF December 31, 2024 (Unaudited)
| | |
|
Aerospace & Defense — 1.4% |
| | |
|
| | |
|
| | |
| | |
| | |
| | |
| | |
|
| | |
Regeneron Pharmaceuticals, Inc. * | | |
Sarepta Therapeutics, Inc. * | | |
Vertex Pharmaceuticals, Inc. * | | |
| | |
|
| | |
|
| | |
|
Charles Schwab Corp. (The) | | |
Goldman Sachs Group, Inc. (The) | | |
| | |
|
| | |
Diversified Telecommunication Services — 1.1% |
| | |
Electric Utilities — 1.7% |
| | |
| | |
| | |
|
| | |
Warner Music Group Corp., Class A | | |
| | |
Financial Services — 7.2% |
| | |
| | |
| | |
|
Financial Services — continued |
Fidelity National Information Services, Inc. | | |
Mastercard, Inc., Class A | | |
| | |
Ground Transportation — 1.2% |
| | |
Health Care Equipment & Supplies — 3.0% |
Boston Scientific Corp. * | | |
Edwards Lifesciences Corp. * | | |
| | |
| | |
Health Care Providers & Services — 2.2% |
| | |
|
Alexandria Real Estate Equities, Inc. | | |
| | |
| | |
Hotels, Restaurants & Leisure — 2.9% |
Chipotle Mexican Grill, Inc. * | | |
| | |
Hilton Worldwide Holdings, Inc. | | |
| | |
Household Products — 1.7% |
Procter & Gamble Co. (The) | | |
|
| | |
| | |
| | |
Travelers Cos., Inc. (The) | | |
| | |
Interactive Media & Services — 3.8% |
| | |
|
Cognizant Technology Solutions Corp., Class A | | |
Life Sciences Tools & Services — 1.7% |
Thermo Fisher Scientific, Inc. | | |
|
| | |
SEE NOTES TO FINANCIAL STATEMENTS.
| J.P. Morgan Large Cap Funds | |
JPMorgan U.S. Sustainable Leaders Fund
SCHEDULE OF PORTFOLIO INVESTMENTSAS OF December 31, 2024 (Unaudited) (continued)
| | |
Common Stocks — continued |
|
| | |
| | |
| | |
|
Charter Communications, Inc., Class A * | | |
|
| | |
Semiconductors & Semiconductor Equipment — 13.7% |
| | |
ASML Holding NV (Registered), NYRS (Netherlands) | | |
| | |
| | |
Microchip Technology, Inc. | | |
| | |
| | |
NXP Semiconductors NV (China) | | |
Taiwan Semiconductor Manufacturing Co. Ltd., ADR (Taiwan) | | |
| | |
|
| | |
| | |
| | |
| | |
| | |
|
Digital Realty Trust, Inc. | | |
|
Burlington Stores, Inc. * | | |
| | |
|
Specialty Retail — continued |
| | |
| | |
| | |
Technology Hardware, Storage & Peripherals — 7.3% |
| | |
| | |
| | |
Total Common Stocks
(Cost $170,311) | | |
Short-Term Investments — 1.7% |
Investment Companies — 1.7% |
JPMorgan Prime Money Market Fund Class IM Shares, 4.54% (a) (b)
(Cost $4,064) | | |
Total Investments — 98.6%
(Cost $174,375) | | |
Other Assets in Excess of Liabilities — 1.4% | | |
| | |
Percentages indicated are based on net assets. |
| |
| American Depositary Receipt |
| |
| Real Estate Investment Trust |
| Non-income producing security. |
| Investment in an affiliated fund, which is registered under the Investment Company Act of 1940, as amended, and is advised by J.P. Morgan Investment Management Inc. |
| The rate shown is the current yield as of December 31, 2024. |
Futures contracts outstanding as of December 31, 2024 (amounts in thousands, except number of contracts):
| | | | | VALUE AND
UNREALIZED
APPRECIATION
(DEPRECIATION) ($) |
| | | | | |
| | | | | |
SEE NOTES TO FINANCIAL STATEMENTS.
| J.P. Morgan Large Cap Funds | |
SCHEDULE OF PORTFOLIO INVESTMENTSAS OF December 31, 2024 (Unaudited)
| | |
|
Aerospace & Defense — 3.3% |
| | |
| | |
| | |
| | |
Air Freight & Logistics — 1.4% |
United Parcel Service, Inc., Class B | | |
|
| | |
First Citizens BancShares, Inc., Class A | | |
| | |
PNC Financial Services Group, Inc. (The) | | |
| | |
| | |
|
| | |
|
| | |
Regeneron Pharmaceuticals, Inc. * | | |
Vertex Pharmaceuticals, Inc. * | | |
| | |
|
| | |
|
| | |
| | |
| | |
Charles Schwab Corp. (The) | | |
Goldman Sachs Group, Inc. (The) | | |
| | |
| | |
|
Air Products and Chemicals, Inc. | | |
Axalta Coating Systems Ltd. * | | |
| | |
Commercial Services & Supplies — 0.4% |
| | |
Construction Materials — 1.3% |
| | |
| | |
|
|
| | |
Capital One Financial Corp. | | |
| | |
Consumer Staples Distribution & Retail — 1.4% |
| | |
Containers & Packaging — 0.6% |
| | |
Electric Utilities — 2.2% |
| | |
| | |
| | |
| | |
Electrical Equipment — 1.6% |
| | |
|
| | |
Financial Services — 3.7% |
Berkshire Hathaway, Inc., Class B * | | |
| | |
| | |
|
Mondelez International, Inc., Class A | | |
Ground Transportation — 3.0% |
| | |
| | |
| | |
Health Care Equipment & Supplies — 2.3% |
| | |
Boston Scientific Corp. * | | |
| | |
| | |
Health Care Providers & Services — 4.4% |
| | |
| | |
| | |
| | |
Universal Health Services, Inc., Class B | | |
| | |
SEE NOTES TO FINANCIAL STATEMENTS.
| J.P. Morgan Large Cap Funds | |
SCHEDULE OF PORTFOLIO INVESTMENTSAS OF December 31, 2024 (Unaudited) (continued)
| | |
Common Stocks — continued |
|
| | |
Hotel & Resort REITs — 0.4% |
Host Hotels & Resorts, Inc. | | |
Hotels, Restaurants & Leisure — 2.2% |
| | |
| | |
| | |
Household Products — 1.2% |
Procter & Gamble Co. (The) | | |
|
| | |
|
| | |
Hartford Financial Services Group, Inc. (The) | | |
Marsh & McLennan Cos., Inc. | | |
| | |
| | |
Interactive Media & Services — 1.6% |
| | |
Meta Platforms, Inc., Class A | | |
| | |
|
International Business Machines Corp. | | |
Life Sciences Tools & Services — 0.6% |
Thermo Fisher Scientific, Inc. | | |
|
| | |
| | |
| | |
| | |
|
| | |
|
| | |
Public Service Enterprise Group, Inc. | | |
| | |
Oil, Gas & Consumable Fuels — 7.0% |
| | |
| | |
| | |
|
Oil, Gas & Consumable Fuels — continued |
| | |
| | |
| | |
|
| | |
| | |
| | |
| | |
| | |
|
AvalonBay Communities, Inc. | | |
Semiconductors & Semiconductor Equipment — 5.3% |
Advanced Micro Devices, Inc. * | | |
| | |
| | |
NXP Semiconductors NV (China) | | |
| | |
| | |
|
| | |
|
| | |
| | |
| | |
O'Reilly Automotive, Inc. * | | |
| | |
| | |
Technology Hardware, Storage & Peripherals — 0.7% |
| | |
|
Philip Morris International, Inc. | | |
Wireless Telecommunication Services — 0.4% |
| | |
Total Common Stocks
(Cost $4,426,987) | | |
SEE NOTES TO FINANCIAL STATEMENTS.
| J.P. Morgan Large Cap Funds | |
| | |
Short-Term Investments — 1.2% |
Investment Companies — 1.2% |
JPMorgan Prime Money Market Fund Class IM Shares, 4.54% (a) (b)
(Cost $71,434) | | |
Total Investments — 100.1%
(Cost $4,498,421) | | |
Liabilities in Excess of Other Assets — (0.1)% | | |
| | |
Percentages indicated are based on net assets. |
| |
| Real Estate Investment Trust |
| Non-income producing security. |
| Investment in an affiliated fund, which is registered under the Investment Company Act of 1940, as amended, and is advised by J.P. Morgan Investment Management Inc. |
| The rate shown is the current yield as of December 31, 2024. |
SEE NOTES TO FINANCIAL STATEMENTS.
| J.P. Morgan Large Cap Funds | |
STATEMENTS OF ASSETS AND LIABILITIESAS OF December 31, 2024 (Unaudited)
(Amounts in thousands, except per share amounts)
| JPMorgan
Equity Income
Fund | | JPMorgan
Equity Premium
Income Fund | |
| | | | |
Investments in non-affiliates, at value | | | | |
Investments in affiliates, at value | | | | |
Investments of cash collateral received from securities loaned, at value (See Note 2.C.) | | | | |
Options purchased, at value | | | | |
| | | | |
Deposits at broker for futures contracts | | | | |
| | | | |
Investment securities sold | | | | |
| | | | |
Interest from non-affiliates | | | | |
Dividends from non-affiliates | | | | |
Dividends from affiliates | | | | |
Securities lending income (See Note 2.C.) | | | | |
| | | | |
| | | | |
| | | | |
| | | | |
| | | | |
Investment securities purchased | | | | |
Collateral received on securities loaned (See Note 2.C.) | | | | |
| | | | |
Variation margin on futures contracts | | | | |
Outstanding options written, at fair value | | | | |
| | | | |
| | | | |
| | | | |
| | | | |
| | | | |
Custodian and accounting fees | | | | |
Trustees’ and Chief Compliance Officer’s fees | | | | |
| | | | |
| | | | |
| | | | |
(a)
Amount rounds to less than one thousand.
SEE NOTES TO FINANCIAL STATEMENTS.
| J.P. Morgan Large Cap Funds | |
| JPMorgan Equity Income Fund | | JPMorgan Equity Premium Income Fund | |
| | | | |
| | | | |
Total distributable earnings (loss) | | | | |
| | | | |
| | | | |
| | | | |
| | | | |
| | | | |
| | | | |
| | | | |
| | | | |
| | | | |
| | | | |
| | | | |
Outstanding units of beneficial interest (shares)
($0.0001 par value; unlimited number of shares authorized): | | | | |
| | | | |
| | | | |
| | | | |
| | | | |
| | | | |
| | | | |
| | | | |
| | | | |
| | | | |
Class A — Redemption price per share | | | | |
Class C — Offering price per share (b) | | | | |
Class I — Offering and redemption price per share | | | | |
Class R2 — Offering and redemption price per share | | | | |
Class R3 — Offering and redemption price per share | | | | |
Class R4 — Offering and redemption price per share | | | | |
Class R5 — Offering and redemption price per share | | | | |
Class R6 — Offering and redemption price per share | | | | |
Class A maximum sales charge | | | | |
Class A maximum public offering price per share
[net asset value per share/(100% – maximum sales charge)] | | | | |
Cost of investments in non-affiliates | | | | |
Cost of investments in affiliates | | | | |
Cost of options purchased | | | | |
Investment securities on loan, at value (See Note 2.C.) | | | | |
Cost of investment of cash collateral (See Note 2.C.) | | | | |
Premiums received from options written | | | | |
(a)
Per share amounts may not recalculate due to rounding of net assets and/or shares outstanding.
(b)
Redemption price for Class C Shares varies based upon length of time the shares are held.
SEE NOTES TO FINANCIAL STATEMENTS.
| J.P. Morgan Large Cap Funds | |
STATEMENTS OF ASSETS AND LIABILITIESAS OF December 31, 2024 (Unaudited) (continued)
(Amounts in thousands, except per share amounts)
| JPMorgan
Hedged
Equity 2 Fund | JPMorgan
Hedged
Equity 3 Fund | JPMorgan
Large Cap
Growth Fund | |
| | | | |
Investments in non-affiliates, at value | | | | |
Investments in affiliates, at value | | | | |
Investments of cash collateral received from securities loaned, at value (See Note 2.C.) | | | | |
Options purchased, at value | | | | |
Restricted cash for exchange-traded options | | | | |
| | | | |
Deposits at broker for futures contracts | | | | |
| | | | |
Investment securities sold | | | | |
| | | | |
Interest from non-affiliates | | | | |
Dividends from non-affiliates | | | | |
Dividends from affiliates | | | | |
Securities lending income (See Note 2.C.) | | | | |
| | | | |
| | | | |
| | | | |
| | | | |
Investment securities purchased | | | | |
Collateral received on securities loaned (See Note 2.C.) | | | | |
| | | | |
Variation margin on futures contracts | | | | |
Outstanding options written, at fair value | | | | |
| | | | |
| | | | |
| | | | |
| | | | |
| | | | |
Custodian and accounting fees | | | | |
Trustees’ and Chief Compliance Officer’s fees | | | | |
| | | | |
| | | | |
| | | | |
(a)
Amount rounds to less than one thousand.
SEE NOTES TO FINANCIAL STATEMENTS.
| J.P. Morgan Large Cap Funds | |
| JPMorgan Hedged Equity 2 Fund | JPMorgan Hedged Equity 3 Fund | JPMorgan Large Cap Growth Fund | |
| | | | |
| | | | |
Total distributable earnings (loss) | | | | |
| | | | |
| | | | |
| | | | |
| | | | |
| | | | |
| | | | |
| | | | |
| | | | |
| | | | |
| | | | |
| | | | |
Outstanding units of beneficial interest (shares)
($0.0001 par value; unlimited number of shares authorized): | | | | |
| | | | |
| | | | |
| | | | |
| | | | |
| | | | |
| | | | |
| | | | |
| | | | |
| | | | |
Class A — Redemption price per share | | | | |
Class C — Offering price per share (b) | | | | |
Class I — Offering and redemption price per share | | | | |
Class R2 — Offering and redemption price per share | | | | |
Class R3 — Offering and redemption price per share | | | | |
Class R4 — Offering and redemption price per share | | | | |
Class R5 — Offering and redemption price per share | | | | |
Class R6 — Offering and redemption price per share | | | | |
Class A maximum sales charge | | | | |
Class A maximum public offering price per share
[net asset value per share/(100% – maximum sales charge)] | | | | |
Cost of investments in non-affiliates | | | | |
Cost of investments in affiliates | | | | |
Cost of options purchased | | | | |
Investment securities on loan, at value (See Note 2.C.) | | | | |
Cost of investment of cash collateral (See Note 2.C.) | | | | |
Premiums received from options written | | | | |
(a)
Per share amounts may not recalculate due to rounding of net assets and/or shares outstanding.
(b)
Redemption price for Class C Shares varies based upon length of time the shares are held.
SEE NOTES TO FINANCIAL STATEMENTS.
| J.P. Morgan Large Cap Funds | |
STATEMENTS OF ASSETS AND LIABILITIESAS OF December 31, 2024 (Unaudited) (continued)
(Amounts in thousands, except per share amounts)
| JPMorgan
U.S. Applied
Data Science
Value Fund | | JPMorgan
U.S. GARP
Equity Fund | JPMorgan
U.S. Large
Cap Core
|
| | | | |
Investments in non-affiliates, at value | | | | |
Investments in affiliates, at value | | | | |
Investments of cash collateral received from securities loaned, at value (See Note 2.C.) | | | | |
| | | | |
Deposits at broker for futures contracts | | | | |
| | | | |
Investment securities sold | | | | |
| | | | |
Dividends from non-affiliates | | | | |
Dividends from affiliates | | | | |
Securities lending income (See Note 2.C.) | | | | |
| | | | |
| | | | |
| | | | |
Securities sold short, at value | | | | |
Dividend expense to non-affiliates on securities sold short | | | | |
Investment securities purchased | | | | |
Interest expense to non-affiliates on securities sold short | | | | |
Collateral received on securities loaned (See Note 2.C.) | | | | |
| | | | |
Variation margin on futures contracts | | | | |
| | | | |
| | | | |
| | | | |
| | | | |
| | | | |
Custodian and accounting fees | | | | |
Trustees’ and Chief Compliance Officer’s fees | | | | |
| | | | |
| | | | |
| | | | |
(a)
Amount rounds to less than one thousand.
SEE NOTES TO FINANCIAL STATEMENTS.
| J.P. Morgan Large Cap Funds | |
| JPMorgan U.S. Applied Data Science Value Fund | | JPMorgan U.S. GARP Equity Fund | JPMorgan U.S. Large Cap Core |
| | | | |
| | | | |
Total distributable earnings (loss) | | | | |
| | | | |
| | | | |
| | | | |
| | | | |
| | | | |
| | | | |
| | | | |
| | | | |
| | | | |
| | | | |
| | | | |
| | | | |
Outstanding units of beneficial interest (shares)
($0.0001 par value; unlimited number of shares authorized): | | | | |
| | | | |
| | | | |
| | | | |
| | | | |
| | | | |
| | | | |
| | | | |
| | | | |
| | | | |
| | | | |
Class A — Redemption price per share | | | | |
Class C — Offering price per share (b) | | | | |
Class I — Offering and redemption price per share | | | | |
Class L — Offering and redemption price per share | | | | |
Class R2 — Offering and redemption price per share | | | | |
Class R3 — Offering and redemption price per share | | | | |
Class R4 — Offering and redemption price per share | | | | |
Class R5 — Offering and redemption price per share | | | | |
Class R6 — Offering and redemption price per share | | | | |
Class A maximum sales charge | | | | |
Class A maximum public offering price per share
[net asset value per share/(100% – maximum sales charge)] | | | | |
Cost of investments in non-affiliates | | | | |
Cost of investments in affiliates | | | | |
Investment securities on loan, at value (See Note 2.C.) | | | | |
Cost of investment of cash collateral (See Note 2.C.) | | | | |
Proceeds from securities sold short | | | | |
(a)
Per share amounts may not recalculate due to rounding of net assets and/or shares outstanding.
(b)
Redemption price for Class C Shares varies based upon length of time the shares are held.
SEE NOTES TO FINANCIAL STATEMENTS.
| J.P. Morgan Large Cap Funds | |
STATEMENTS OF ASSETS AND LIABILITIESAS OF December 31, 2024 (Unaudited) (continued)
(Amounts in thousands, except per share amounts)
| JPMorgan
U.S. Research
Enhanced
Equity Fund | JPMorgan
U.S. Sustainable
Leaders Fund | |
| | | |
Investments in non-affiliates, at value | | | |
Investments in affiliates, at value | | | |
| | | |
Deposits at broker for futures contracts | | | |
| | | |
Investment securities sold | | | |
| | | |
Dividends from non-affiliates | | | |
Dividends from affiliates | | | |
| | | |
| | | |
| | | |
Investment securities purchased | | | |
| | | |
Variation margin on futures contracts | | | |
| | | |
| | | |
| | | |
| | | |
| | | |
Custodian and accounting fees | | | |
Trustees’ and Chief Compliance Officer’s fees | | | |
| | | |
| | | |
| | | |
(a)
Amount rounds to less than one thousand.
SEE NOTES TO FINANCIAL STATEMENTS.
| J.P. Morgan Large Cap Funds | |
| JPMorgan U.S. Research Enhanced Equity Fund | JPMorgan U.S. Sustainable Leaders Fund | |
| | | |
| | | |
Total distributable earnings (loss) | | | |
| | | |
| | | |
| | | |
| | | |
| | | |
| | | |
| | | |
| | | |
| | | |
| | | |
| | | |
Outstanding units of beneficial interest (shares)
($0.0001 par value; unlimited number of shares authorized): | | | |
| | | |
| | | |
| | | |
| | | |
| | | |
| | | |
| | | |
| | | |
| | | |
Class A — Redemption price per share | | | |
Class C — Offering price per share (b) | | | |
Class I — Offering and redemption price per share | | | |
Class R2 — Offering and redemption price per share | | | |
Class R3 — Offering and redemption price per share | | | |
Class R4 — Offering and redemption price per share | | | |
Class R5 — Offering and redemption price per share | | | |
Class R6 — Offering and redemption price per share | | | |
Class A maximum sales charge | | | |
Class A maximum public offering price per share
[net asset value per share/(100% – maximum sales charge)] | | | |
Cost of investments in non-affiliates | | | |
Cost of investments in affiliates | | | |
(a)
Per share amounts may not recalculate due to rounding of net assets and/or shares outstanding.
(b)
Redemption price for Class C Shares varies based upon length of time the shares are held.
SEE NOTES TO FINANCIAL STATEMENTS.
| J.P. Morgan Large Cap Funds | |
STATEMENTS OF OPERATIONSFOR THE SIX MONTHS ENDED December 31, 2024 (Unaudited)
(Amounts in thousands)
| JPMorgan
Equity Income
Fund | | JPMorgan
Equity Premium
Income Fund | |
| | | | |
Interest income from non-affiliates | | | | |
Interest income from affiliates | | | | |
Dividend income from non-affiliates | | | | |
Dividend income from affiliates | | | | |
Income from securities lending (net) (See Note 2.C.) | | | | |
| | | | |
| | | | |
| | | | |
| | | | |
| | | | |
| | | | |
| | | | |
| | | | |
| | | | |
| | | | |
| | | | |
| | | | |
| | | | |
| | | | |
| | | | |
| | | | |
| | | | |
Custodian and accounting fees | | | | |
Interest expense to affiliates | | | | |
| | | | |
Trustees’ and Chief Compliance Officer’s fees | | | | |
Printing and mailing costs | | | | |
Registration and filing fees | | | | |
Transfer agency fees (See Note 2.K.) | | | | |
| | | | |
| | | | |
| | | | |
Less expense reimbursements | | | | |
| | | | |
Net investment income (loss) | | | | |
(a)
Amount rounds to less than one thousand.
SEE NOTES TO FINANCIAL STATEMENTS.
| J.P. Morgan Large Cap Funds | |
| JPMorgan Equity Income Fund | | JPMorgan Equity Premium Income Fund | |
REALIZED/UNREALIZED GAINS (LOSSES): | | | | |
Net realized gain (loss) on transactions from: | | | | |
Investments in non-affiliates | | | | |
Investments in affiliates | | | | |
| | | | |
| | | | |
| | | | |
| | | | |
Change in net unrealized appreciation/depreciation on: | | | | |
Investments in non-affiliates | | | | |
Investments in affiliates | | | | |
| | | | |
| | | | |
| | | | |
Change in net unrealized appreciation/depreciation | | | | |
Net realized/unrealized gains (losses) | | | | |
Change in net assets resulting from operations | | | | |
SEE NOTES TO FINANCIAL STATEMENTS.
| J.P. Morgan Large Cap Funds | |
STATEMENTS OF OPERATIONSFOR THE SIX MONTHS ENDED December 31, 2024 (Unaudited) (continued)
(Amounts in thousands)
| JPMorgan
Hedged
Equity 2 Fund | JPMorgan
Hedged
Equity 3 Fund | JPMorgan
Large Cap
Growth Fund | |
| | | | |
Interest income from non-affiliates | | | | |
Interest income from affiliates | | | | |
Dividend income from non-affiliates | | | | |
Dividend income from affiliates | | | | |
Income from securities lending (net) (See Note 2.C.) | | | | |
| | | | |
| | | | |
| | | | |
| | | | |
| | | | |
| | | | |
| | | | |
| | | | |
| | | | |
| | | | |
| | | | |
| | | | |
| | | | |
| | | | |
| | | | |
| | | | |
| | | | |
Custodian and accounting fees | | | | |
Interest expense to affiliates | | | | |
| | | | |
Trustees’ and Chief Compliance Officer’s fees | | | | |
Printing and mailing costs | | | | |
Registration and filing fees | | | | |
Transfer agency fees (See Note 2.K.) | | | | |
| | | | |
| | | | |
| | | | |
Less expense reimbursements | | | | |
| | | | |
Net investment income (loss) | | | | |
(a)
Amount rounds to less than one thousand.
SEE NOTES TO FINANCIAL STATEMENTS.
| J.P. Morgan Large Cap Funds | |
| JPMorgan Hedged Equity 2 Fund | JPMorgan Hedged Equity 3 Fund | JPMorgan Large Cap Growth Fund | |
REALIZED/UNREALIZED GAINS (LOSSES): | | | | |
Net realized gain (loss) on transactions from: | | | | |
Investments in non-affiliates | | | | |
Investments in affiliates | | | | |
| | | | |
| | | | |
| | | | |
| | | | |
Change in net unrealized appreciation/depreciation on: | | | | |
Investments in non-affiliates | | | | |
Investments in affiliates | | | | |
| | | | |
| | | | |
Foreign currency translations | | | | |
| | | | |
Change in net unrealized appreciation/depreciation | | | | |
Net realized/unrealized gains (losses) | | | | |
Change in net assets resulting from operations | | | | |
SEE NOTES TO FINANCIAL STATEMENTS.
| J.P. Morgan Large Cap Funds | |
STATEMENTS OF OPERATIONSFOR THE SIX MONTHS ENDED December 31, 2024 (Unaudited) (continued)
(Amounts in thousands)
| JPMorgan
U.S. Applied
Data Science
Value Fund | | JPMorgan
U.S. GARP
Equity Fund | JPMorgan
U.S. Large
Cap Core
|
| | | | |
Interest income from non-affiliates | | | | |
Interest income from affiliates | | | | |
Dividend income from non-affiliates | | | | |
Dividend income from affiliates | | | | |
Income from securities lending (net) (See Note 2.C.) | | | | |
| | | | |
| | | | |
| | | | |
| | | | |
| | | | |
| | | | |
| | | | |
| | | | |
| | | | |
| | | | |
| | | | |
| | | | |
| | | | |
| | | | |
| | | | |
| | | | |
| | | | |
| | | | |
Custodian and accounting fees | | | | |
Interest expense to affiliates | | | | |
| | | | |
Trustees’ and Chief Compliance Officer’s fees | | | | |
Printing and mailing costs | | | | |
Registration and filing fees | | | | |
Transfer agency fees (See Note 2.K.) | | | | |
Dividend expense to non-affiliates on securities sold short | | | | |
Interest expense to non-affiliates on securities sold short | | | | |
| | | | |
| | | | |
| | | | |
Less expense reimbursements | | | | |
| | | | |
Net investment income (loss) | | | | |
(a)
Amount rounds to less than one thousand.
SEE NOTES TO FINANCIAL STATEMENTS.
| J.P. Morgan Large Cap Funds | |
| JPMorgan U.S. Applied Data Science Value Fund | | JPMorgan U.S. GARP Equity Fund | JPMorgan U.S. Large Cap Core |
REALIZED/UNREALIZED GAINS (LOSSES): | | | | |
Net realized gain (loss) on transactions from: | | | | |
Investments in non-affiliates | | | | |
Investments in affiliates | | | | |
| | | | |
| | | | |
| | | | |
Change in net unrealized appreciation/depreciation on: | | | | |
Investments in non-affiliates | | | | |
Investments in affiliates | | | | |
| | | | |
| | | | |
Change in net unrealized appreciation/depreciation | | | | |
Net realized/unrealized gains (losses) | | | | |
Change in net assets resulting from operations | | | | |
(a)
Amount rounds to less than one thousand.
SEE NOTES TO FINANCIAL STATEMENTS.
| J.P. Morgan Large Cap Funds | |
STATEMENTS OF OPERATIONSFOR THE SIX MONTHS ENDED December 31, 2024 (Unaudited) (continued)
(Amounts in thousands)
| JPMorgan
U.S. Research
Enhanced
Equity Fund | JPMorgan
U.S. Sustainable
Leaders Fund | |
| | | |
Interest income from non-affiliates | | | |
Interest income from affiliates | | | |
Dividend income from non-affiliates | | | |
Dividend income from affiliates | | | |
Income from securities lending (net) (See Note 2.C.) | | | |
| | | |
| | | |
| | | |
| | | |
| | | |
| | | |
| | | |
| | | |
| | | |
| | | |
| | | |
| | | |
| | | |
| | | |
| | | |
| | | |
| | | |
Custodian and accounting fees | | | |
Interest expense to affiliates | | | |
| | | |
Trustees’ and Chief Compliance Officer’s fees | | | |
Printing and mailing costs | | | |
Registration and filing fees | | | |
Transfer agency fees (See Note 2.K.) | | | |
| | | |
| | | |
| | | |
Less expense reimbursements | | | |
| | | |
Net investment income (loss) | | | |
(a)
Amount rounds to less than one thousand.
SEE NOTES TO FINANCIAL STATEMENTS.
| J.P. Morgan Large Cap Funds | |
| JPMorgan U.S. Research Enhanced Equity Fund | JPMorgan U.S. Sustainable Leaders Fund | |
REALIZED/UNREALIZED GAINS (LOSSES): | | | |
Net realized gain (loss) on transactions from: | | | |
Investments in non-affiliates | | | |
Investments in affiliates | | | |
| | | |
| | | |
Change in net unrealized appreciation/depreciation on: | | | |
Investments in non-affiliates | | | |
Investments in affiliates | | | |
| | | |
Change in net unrealized appreciation/depreciation | | | |
Net realized/unrealized gains (losses) | | | |
Change in net assets resulting from operations | | | |
(a)
Amount rounds to less than one thousand.
SEE NOTES TO FINANCIAL STATEMENTS.
| J.P. Morgan Large Cap Funds | |
STATEMENTS OF CHANGES IN NET ASSETSFOR THE PERIODS INDICATED
(Amounts in thousands)
| JPMorgan Equity Income Fund | JPMorgan Equity Index Fund |
| Six Months Ended
December 31, 2024
(Unaudited) | | Six Months Ended
December 31, 2024
(Unaudited) | |
CHANGE IN NET ASSETS RESULTING FROM OPERATIONS: | | | | |
Net investment income (loss) | | | | |
| | | | |
Change in net unrealized appreciation/depreciation | | | | |
Change in net assets resulting from operations | | | | |
DISTRIBUTIONS TO SHAREHOLDERS: | | | | |
| | | | |
| | | | |
| | | | |
| | | | |
| | | | |
| | | | |
| | | | |
| | | | |
Total distributions to shareholders | | | | |
| | | | |
Change in net assets resulting from capital transactions | | | | |
| | | | |
| | | | |
| | | | |
| | | | |
SEE NOTES TO FINANCIAL STATEMENTS.
| J.P. Morgan Large Cap Funds | |
| JPMorgan Equity Premium
Income Fund | JPMorgan Hedged Equity Fund |
| Six Months Ended
December 31, 2024
(Unaudited) | | Six Months Ended
December 31, 2024
(Unaudited) | |
CHANGE IN NET ASSETS RESULTING FROM OPERATIONS: | | | | |
Net investment income (loss) | | | | |
| | | | |
Change in net unrealized appreciation/depreciation | | | | |
Change in net assets resulting from operations | | | | |
DISTRIBUTIONS TO SHAREHOLDERS: | | | | |
| | | | |
| | | | |
| | | | |
| | | | |
| | | | |
Total distributions to shareholders | | | | |
| | | | |
Change in net assets resulting from capital transactions | | | | |
| | | | |
| | | | |
| | | | |
| | | | |
SEE NOTES TO FINANCIAL STATEMENTS.
| J.P. Morgan Large Cap Funds | |
STATEMENTS OF CHANGES IN NET ASSETSFOR THE PERIODS INDICATED (continued)
(Amounts in thousands)
| JPMorgan Hedged Equity 2 Fund | JPMorgan Hedged Equity 3 Fund |
| Six Months Ended
December 31, 2024
(Unaudited) | | Six Months Ended
December 31, 2024
(Unaudited) | |
CHANGE IN NET ASSETS RESULTING FROM OPERATIONS: | | | | |
Net investment income (loss) | | | | |
| | | | |
Change in net unrealized appreciation/depreciation | | | | |
Change in net assets resulting from operations | | | | |
DISTRIBUTIONS TO SHAREHOLDERS: | | | | |
| | | | |
| | | | |
| | | | |
| | | | |
| | | | |
Total distributions to shareholders | | | | |
| | | | |
Change in net assets resulting from capital transactions | | | | |
| | | | |
| | | | |
| | | | |
| | | | |
(a)
Amount rounds to less than one thousand.
SEE NOTES TO FINANCIAL STATEMENTS.
| J.P. Morgan Large Cap Funds | |
| JPMorgan Large Cap Growth Fund | JPMorgan Large Cap Value Fund |
| Six Months Ended
December 31, 2024
(Unaudited) | | Six Months Ended
December 31, 2024
(Unaudited) | |
CHANGE IN NET ASSETS RESULTING FROM OPERATIONS: | | | | |
Net investment income (loss) | | | | |
| | | | |
Change in net unrealized appreciation/depreciation | | | | |
Change in net assets resulting from operations | | | | |
DISTRIBUTIONS TO SHAREHOLDERS: | | | | |
| | | | |
| | | | |
| | | | |
| | | | |
| | | | |
| | | | |
| | | | |
| | | | |
Total distributions to shareholders | | | | |
| | | | |
Change in net assets resulting from capital transactions | | | | |
| | | | |
| | | | |
| | | | |
| | | | |
SEE NOTES TO FINANCIAL STATEMENTS.
| J.P. Morgan Large Cap Funds | |
STATEMENTS OF CHANGES IN NET ASSETSFOR THE PERIODS INDICATED (continued)
(Amounts in thousands)
| JPMorgan U.S. Applied
Data Science Value Fund | JPMorgan U.S. Equity Fund |
| Six Months Ended
December 31, 2024
(Unaudited) | | Six Months Ended
December 31, 2024
(Unaudited) | |
CHANGE IN NET ASSETS RESULTING FROM OPERATIONS: | | | | |
Net investment income (loss) | | | | |
| | | | |
Change in net unrealized appreciation/depreciation | | | | |
Change in net assets resulting from operations | | | | |
DISTRIBUTIONS TO SHAREHOLDERS: | | | | |
| | | | |
| | | | |
| | | | |
| | | | |
| | | | |
| | | | |
| | | | |
| | | | |
| | | | |
Total distributions to shareholders | | | | |
| | | | |
Change in net assets resulting from capital transactions | | | | |
| | | | |
| | | | |
| | | | |
| | | | |
SEE NOTES TO FINANCIAL STATEMENTS.
| J.P. Morgan Large Cap Funds | |
| JPMorgan U.S. GARP Equity Fund | JPMorgan U.S. Large Cap Core Plus Fund |
| Six Months Ended
December 31, 2024
(Unaudited) | | Six Months Ended
December 31, 2024
(Unaudited) | |
CHANGE IN NET ASSETS RESULTING FROM OPERATIONS: | | | | |
Net investment income (loss) | | | | |
| | | | |
Change in net unrealized appreciation/depreciation | | | | |
Change in net assets resulting from operations | | | | |
DISTRIBUTIONS TO SHAREHOLDERS: | | | | |
| | | | |
| | | | |
| | | | |
| | | | |
| | | | |
| | | | |
Total distributions to shareholders | | | | |
| | | | |
Change in net assets resulting from capital transactions | | | | |
| | | | |
| | | | |
| | | | |
| | | | |
SEE NOTES TO FINANCIAL STATEMENTS.
| J.P. Morgan Large Cap Funds | |
STATEMENTS OF CHANGES IN NET ASSETSFOR THE PERIODS INDICATED (continued)
(Amounts in thousands)
| JPMorgan U.S. Research
Enhanced Equity Fund | JPMorgan U.S. Sustainable Leaders Fund |
| Six Months Ended
December 31, 2024
(Unaudited) | | Six Months Ended
December 31, 2024
(Unaudited) | |
CHANGE IN NET ASSETS RESULTING FROM OPERATIONS: | | | | |
Net investment income (loss) | | | | |
| | | | |
Change in net unrealized appreciation/depreciation | | | | |
Change in net assets resulting from operations | | | | |
DISTRIBUTIONS TO SHAREHOLDERS: | | | | |
| | | | |
| | | | |
| | | | |
| | | | |
Total distributions to shareholders | | | | |
| | | | |
Change in net assets resulting from capital transactions | | | | |
| | | | |
| | | | |
| | | | |
| | | | |
(a)
Amount rounds to less than one thousand.
SEE NOTES TO FINANCIAL STATEMENTS.
| J.P. Morgan Large Cap Funds | |
| |
| Six Months Ended
December 31, 2024
(Unaudited) | |
CHANGE IN NET ASSETS RESULTING FROM OPERATIONS: | | |
Net investment income (loss) | | |
| | |
Change in net unrealized appreciation/depreciation | | |
Change in net assets resulting from operations | | |
DISTRIBUTIONS TO SHAREHOLDERS: | | |
| | |
| | |
| | |
| | |
| | |
| | |
| | |
| | |
Total distributions to shareholders | | |
| | |
Change in net assets resulting from capital transactions | | |
| | |
| | |
| | |
| | |
SEE NOTES TO FINANCIAL STATEMENTS.
| J.P. Morgan Large Cap Funds | |
STATEMENTS OF CHANGES IN NET ASSETSFOR THE PERIODS INDICATED (continued)
(Amounts in thousands)
| JPMorgan Equity Income Fund | JPMorgan Equity Index Fund |
| Six Months Ended December 31, 2024
(Unaudited) | | Six Months Ended December 31, 2024
(Unaudited) | |
| | | | |
| | | | |
Proceeds from shares issued | | | | |
| | | | |
| | | | |
Change in net assets resulting from Class A capital transactions | | | | |
| | | | |
Proceeds from shares issued | | | | |
| | | | |
| | | | |
Change in net assets resulting from Class C capital transactions | | | | |
| | | | |
Proceeds from shares issued | | | | |
| | | | |
| | | | |
Change in net assets resulting from Class I capital transactions | | | | |
| | | | |
Proceeds from shares issued | | | | |
| | | | |
| | | | |
Change in net assets resulting from Class R2 capital transactions | | | | |
| | | | |
Proceeds from shares issued | | | | |
| | | | |
| | | | |
Change in net assets resulting from Class R3 capital transactions | | | | |
| | | | |
Proceeds from shares issued | | | | |
| | | | |
| | | | |
Change in net assets resulting from Class R4 capital transactions | | | | |
| | | | |
Proceeds from shares issued | | | | |
| | | | |
| | | | |
Change in net assets resulting from Class R5 capital transactions | | | | |
SEE NOTES TO FINANCIAL STATEMENTS.
| J.P. Morgan Large Cap Funds | |
| JPMorgan Equity Income Fund | JPMorgan Equity Index Fund |
| Six Months Ended December 31, 2024 (Unaudited) | | Six Months Ended December 31, 2024 (Unaudited) | |
CAPITAL TRANSACTIONS: (continued) | | | | |
| | | | |
Proceeds from shares issued | | | | |
| | | | |
| | | | |
Change in net assets resulting from Class R6 capital transactions | | | | |
Total change in net assets resulting from capital transactions | | | | |
| | | | |
| | | | |
| | | | |
| | | | |
| | | | |
| | | | |
| | | | |
| | | | |
| | | | |
| | | | |
| | | | |
| | | | |
| | | | |
| | | | |
| | | | |
| | | | |
| | | | |
| | | | |
| | | | |
| | | | |
Change in Class R2 Shares | | | | |
| | | | |
| | | | |
| | | | |
| | | | |
Change in Class R3 Shares | | | | |
| | | | |
| | | | |
| | | | |
| | | | |
Change in Class R4 Shares | | | | |
SEE NOTES TO FINANCIAL STATEMENTS.
| J.P. Morgan Large Cap Funds | |
STATEMENTS OF CHANGES IN NET ASSETSFOR THE PERIODS INDICATED (continued)
(Amounts in thousands)
| JPMorgan Equity Income Fund | JPMorgan Equity Index Fund |
| Six Months Ended December 31, 2024 (Unaudited) | | Six Months Ended December 31, 2024 (Unaudited) | |
SHARE TRANSACTIONS: (continued) | | | | |
| | | | |
| | | | |
| | | | |
| | | | |
Change in Class R5 Shares | | | | |
| | | | |
| | | | |
| | | | |
| | | | |
Change in Class R6 Shares | | | | |
SEE NOTES TO FINANCIAL STATEMENTS.
| J.P. Morgan Large Cap Funds | |
| JPMorgan Equity Premium
Income Fund | JPMorgan Hedged Equity Fund |
| Six Months Ended December 31, 2024
(Unaudited) | | Six Months Ended December 31, 2024
(Unaudited) | |
| | | | |
| | | | |
Proceeds from shares issued | | | | |
| | | | |
| | | | |
Change in net assets resulting from Class A capital transactions | | | | |
| | | | |
Proceeds from shares issued | | | | |
| | | | |
| | | | |
Change in net assets resulting from Class C capital transactions | | | | |
| | | | |
Proceeds from shares issued | | | | |
| | | | |
| | | | |
Change in net assets resulting from Class I capital transactions | | | | |
| | | | |
Proceeds from shares issued | | | | |
| | | | |
| | | | |
Change in net assets resulting from Class R5 capital transactions | | | | |
| | | | |
Proceeds from shares issued | | | | |
| | | | |
| | | | |
Change in net assets resulting from Class R6 capital transactions | | | | |
Total change in net assets resulting from capital transactions | | | | |
| | | | |
| | | | |
| | | | |
| | | | |
| | | | |
| | | | |
| | | | |
| | | | |
| | | | |
| | | | |
| | | | |
SEE NOTES TO FINANCIAL STATEMENTS.
| J.P. Morgan Large Cap Funds | |
STATEMENTS OF CHANGES IN NET ASSETSFOR THE PERIODS INDICATED (continued)
(Amounts in thousands)
| JPMorgan Equity Premium Income Fund | JPMorgan Hedged Equity Fund |
| Six Months Ended December 31, 2024 (Unaudited) | | Six Months Ended December 31, 2024 (Unaudited) | |
SHARE TRANSACTIONS: (continued) | | | | |
| | | | |
| | | | |
| | | | |
| | | | |
| | | | |
| | | | |
| | | | |
| | | | |
| | | | |
Change in Class R5 Shares | | | | |
| | | | |
| | | | |
| | | | |
| | | | |
Change in Class R6 Shares | | | | |
(a)
Amount rounds to less than one thousand.
SEE NOTES TO FINANCIAL STATEMENTS.
| J.P. Morgan Large Cap Funds | |
| JPMorgan Hedged Equity 2 Fund | JPMorgan Hedged Equity 3 Fund |
| Six Months Ended December 31, 2024
(Unaudited) | | Six Months Ended December 31, 2024
(Unaudited) | |
| | | | |
| | | | |
Proceeds from shares issued | | | | |
| | | | |
| | | | |
Change in net assets resulting from Class A capital transactions | | | | |
| | | | |
Proceeds from shares issued | | | | |
| | | | |
| | | | |
Change in net assets resulting from Class C capital transactions | | | | |
| | | | |
Proceeds from shares issued | | | | |
| | | | |
| | | | |
Change in net assets resulting from Class I capital transactions | | | | |
| | | | |
Proceeds from shares issued | | | | |
| | | | |
| | | | |
Change in net assets resulting from Class R5 capital transactions | | | | |
| | | | |
Proceeds from shares issued | | | | |
| | | | |
| | | | |
Change in net assets resulting from Class R6 capital transactions | | | | |
Total change in net assets resulting from capital transactions | | | | |
| | | | |
| | | | |
| | | | |
| | | | |
| | | | |
| | | | |
| | | | |
| | | | |
| | | | |
| | | | |
| | | | |
(a)
Amount rounds to less than one thousand.
SEE NOTES TO FINANCIAL STATEMENTS.
| J.P. Morgan Large Cap Funds | |
STATEMENTS OF CHANGES IN NET ASSETSFOR THE PERIODS INDICATED (continued)
(Amounts in thousands)
| JPMorgan Hedged Equity 2 Fund | JPMorgan Hedged Equity 3 Fund |
| Six Months Ended December 31, 2024 (Unaudited) | | Six Months Ended December 31, 2024 (Unaudited) | |
SHARE TRANSACTIONS: (continued) | | | | |
| | | | |
| | | | |
| | | | |
| | | | |
| | | | |
| | | | |
| | | | |
| | | | |
| | | | |
Change in Class R5 Shares | | | | |
| | | | |
| | | | |
| | | | |
| | | | |
Change in Class R6 Shares | | | | |
(a)
Amount rounds to less than one thousand.
SEE NOTES TO FINANCIAL STATEMENTS.
| J.P. Morgan Large Cap Funds | |
| JPMorgan Large Cap Growth Fund | JPMorgan Large Cap Value Fund |
| Six Months Ended December 31, 2024
(Unaudited) | | Six Months Ended December 31, 2024
(Unaudited) | |
| | | | |
| | | | |
Proceeds from shares issued | | | | |
| | | | |
| | | | |
Change in net assets resulting from Class A capital transactions | | | | |
| | | | |
Proceeds from shares issued | | | | |
| | | | |
| | | | |
Change in net assets resulting from Class C capital transactions | | | | |
| | | | |
Proceeds from shares issued | | | | |
| | | | |
| | | | |
Change in net assets resulting from Class I capital transactions | | | | |
| | | | |
Proceeds from shares issued | | | | |
| | | | |
| | | | |
Change in net assets resulting from Class R2 capital transactions | | | | |
| | | | |
Proceeds from shares issued | | | | |
| | | | |
| | | | |
Change in net assets resulting from Class R3 capital transactions | | | | |
| | | | |
Proceeds from shares issued | | | | |
| | | | |
| | | | |
Change in net assets resulting from Class R4 capital transactions | | | | |
| | | | |
Proceeds from shares issued | | | | |
| | | | |
| | | | |
Change in net assets resulting from Class R5 capital transactions | | | | |
SEE NOTES TO FINANCIAL STATEMENTS.
| J.P. Morgan Large Cap Funds | |
STATEMENTS OF CHANGES IN NET ASSETSFOR THE PERIODS INDICATED (continued)
(Amounts in thousands)
| JPMorgan Large Cap Growth Fund | JPMorgan Large Cap Value Fund |
| Six Months Ended December 31, 2024 (Unaudited) | | Six Months Ended December 31, 2024 (Unaudited) | |
CAPITAL TRANSACTIONS: (continued) | | | | |
| | | | |
Proceeds from shares issued | | | | |
| | | | |
| | | | |
Change in net assets resulting from Class R6 capital transactions | | | | |
Total change in net assets resulting from capital transactions | | | | |
| | | | |
| | | | |
| | | | |
| | | | |
| | | | |
| | | | |
| | | | |
| | | | |
| | | | |
| | | | |
| | | | |
| | | | |
| | | | |
| | | | |
| | | | |
| | | | |
| | | | |
| | | | |
| | | | |
| | | | |
Change in Class R2 Shares | | | | |
| | | | |
| | | | |
| | | | |
| | | | |
Change in Class R3 Shares | | | | |
| | | | |
| | | | |
| | | | |
| | | | |
Change in Class R4 Shares | | | | |
SEE NOTES TO FINANCIAL STATEMENTS.
| J.P. Morgan Large Cap Funds | |
| JPMorgan Large Cap Growth Fund | JPMorgan Large Cap Value Fund |
| Six Months Ended December 31, 2024 (Unaudited) | | Six Months Ended December 31, 2024 (Unaudited) | |
SHARE TRANSACTIONS: (continued) | | | | |
| | | | |
| | | | |
| | | | |
| | | | |
Change in Class R5 Shares | | | | |
| | | | |
| | | | |
| | | | |
| | | | |
Change in Class R6 Shares | | | | |
SEE NOTES TO FINANCIAL STATEMENTS.
| J.P. Morgan Large Cap Funds | |
STATEMENTS OF CHANGES IN NET ASSETSFOR THE PERIODS INDICATED (continued)
(Amounts in thousands)
| JPMorgan U.S. Applied
Data Science Value Fund | JPMorgan U.S. Equity Fund |
| Six Months Ended December 31, 2024
(Unaudited) | | Six Months Ended December 31, 2024
(Unaudited) | |
| | | | |
| | | | |
Proceeds from shares issued | | | | |
| | | | |
| | | | |
Change in net assets resulting from Class A capital transactions | | | | |
| | | | |
Proceeds from shares issued | | | | |
| | | | |
| | | | |
Change in net assets resulting from Class C capital transactions | | | | |
| | | | |
Proceeds from shares issued | | | | |
| | | | |
| | | | |
Change in net assets resulting from Class I capital transactions | | | | |
| | | | |
Proceeds from shares issued | | | | |
| | | | |
| | | | |
Change in net assets resulting from Class L capital transactions | | | | |
| | | | |
Proceeds from shares issued | | | | |
| | | | |
| | | | |
Change in net assets resulting from Class R2 capital transactions | | | | |
| | | | |
Proceeds from shares issued | | | | |
| | | | |
| | | | |
Change in net assets resulting from Class R3 capital transactions | | | | |
| | | | |
Proceeds from shares issued | | | | |
| | | | |
| | | | |
Change in net assets resulting from Class R4 capital transactions | | | | |
SEE NOTES TO FINANCIAL STATEMENTS.
| J.P. Morgan Large Cap Funds | |
| JPMorgan U.S. Applied Data Science Value Fund | JPMorgan U.S. Equity Fund |
| Six Months Ended December 31, 2024 (Unaudited) | | Six Months Ended December 31, 2024 (Unaudited) | |
CAPITAL TRANSACTIONS: (continued) | | | | |
| | | | |
Proceeds from shares issued | | | | |
| | | | |
| | | | |
Change in net assets resulting from Class R5 capital transactions | | | | |
| | | | |
Proceeds from shares issued | | | | |
| | | | |
| | | | |
Change in net assets resulting from Class R6 capital transactions | | | | |
Total change in net assets resulting from capital transactions | | | | |
| | | | |
| | | | |
| | | | |
| | | | |
| | | | |
| | | | |
| | | | |
| | | | |
| | | | |
| | | | |
| | | | |
| | | | |
| | | | |
| | | | |
| | | | |
| | | | |
| | | | |
| | | | |
| | | | |
| | | | |
| | | | |
| | | | |
| | | | |
| | | | |
| | | | |
Change in Class R2 Shares | | | | |
SEE NOTES TO FINANCIAL STATEMENTS.
| J.P. Morgan Large Cap Funds | |
STATEMENTS OF CHANGES IN NET ASSETSFOR THE PERIODS INDICATED (continued)
(Amounts in thousands)
| JPMorgan U.S. Applied Data Science Value Fund | JPMorgan U.S. Equity Fund |
| Six Months Ended December 31, 2024 (Unaudited) | | Six Months Ended December 31, 2024 (Unaudited) | |
SHARE TRANSACTIONS: (continued) | | | | |
| | | | |
| | | | |
| | | | |
| | | | |
Change in Class R3 Shares | | | | |
| | | | |
| | | | |
| | | | |
| | | | |
Change in Class R4 Shares | | | | |
| | | | |
| | | | |
| | | | |
| | | | |
Change in Class R5 Shares | | | | |
| | | | |
| | | | |
| | | | |
| | | | |
Change in Class R6 Shares | | | | |
(a)
Amount rounds to less than one thousand.
SEE NOTES TO FINANCIAL STATEMENTS.
| J.P. Morgan Large Cap Funds | |
| JPMorgan U.S. GARP Equity Fund | JPMorgan U.S. Large Cap Core Plus Fund |
| Six Months Ended December 31, 2024
(Unaudited) | | Six Months Ended December 31, 2024
(Unaudited) | |
| | | | |
| | | | |
Proceeds from shares issued | | | | |
| | | | |
| | | | |
Change in net assets resulting from Class A capital transactions | | | | |
| | | | |
Proceeds from shares issued | | | | |
| | | | |
| | | | |
Change in net assets resulting from Class C capital transactions | | | | |
| | | | |
Proceeds from shares issued | | | | |
| | | | |
| | | | |
Change in net assets resulting from Class I capital transactions | | | | |
| | | | |
Proceeds from shares issued | | | | |
| | | | |
| | | | |
Change in net assets resulting from Class R2 capital transactions | | | | |
| | | | |
Proceeds from shares issued | | | | |
| | | | |
| | | | |
Change in net assets resulting from Class R5 capital transactions | | | | |
| | | | |
Proceeds from shares issued | | | | |
| | | | |
| | | | |
Change in net assets resulting from Class R6 capital transactions | | | | |
Total change in net assets resulting from capital transactions | | | | |
| | | | |
| | | | |
| | | | |
| | | | |
| | | | |
| | | | |
SEE NOTES TO FINANCIAL STATEMENTS.
| J.P. Morgan Large Cap Funds | |
STATEMENTS OF CHANGES IN NET ASSETSFOR THE PERIODS INDICATED (continued)
(Amounts in thousands)
| JPMorgan U.S. GARP Equity Fund | JPMorgan U.S. Large Cap Core Plus Fund |
| Six Months Ended December 31, 2024 (Unaudited) | | Six Months Ended December 31, 2024 (Unaudited) | |
SHARE TRANSACTIONS: (continued) | | | | |
| | | | |
| | | | |
| | | | |
| | | | |
| | | | |
| | | | |
| | | | |
| | | | |
| | | | |
| | | | |
| | | | |
| | | | |
| | | | |
| | | | |
Change in Class R2 Shares | | | | |
| | | | |
| | | | |
| | | | |
| | | | |
Change in Class R5 Shares | | | | |
| | | | |
| | | | |
| | | | |
| | | | |
Change in Class R6 Shares | | | | |
SEE NOTES TO FINANCIAL STATEMENTS.
| J.P. Morgan Large Cap Funds | |
| JPMorgan U.S. Research
Enhanced Equity Fund | JPMorgan U.S. Sustainable Leaders Fund |
| Six Months Ended December 31, 2024
(Unaudited) | | Six Months Ended December 31, 2024
(Unaudited) | |
| | | | |
| | | | |
Proceeds from shares issued | | | | |
| | | | |
| | | | |
Change in net assets resulting from Class A capital transactions | | | | |
| | | | |
Proceeds from shares issued | | | | |
| | | | |
| | | | |
Change in net assets resulting from Class C capital transactions | | | | |
| | | | |
Proceeds from shares issued | | | | |
| | | | |
| | | | |
Change in net assets resulting from Class I capital transactions | | | | |
| | | | |
Proceeds from shares issued | | | | |
| | | | |
| | | | |
Change in net assets resulting from Class R6 capital transactions | | | | |
Total change in net assets resulting from capital transactions | | | | |
| | | | |
| | | | |
| | | | |
| | | | |
| | | | |
| | | | |
| | | | |
| | | | |
| | | | |
| | | | |
| | | | |
| | | | |
| | | | |
| | | | |
| | | | |
| | | | |
(a)
Amount rounds to less than one thousand.
SEE NOTES TO FINANCIAL STATEMENTS.
| J.P. Morgan Large Cap Funds | |
STATEMENTS OF CHANGES IN NET ASSETSFOR THE PERIODS INDICATED (continued)
(Amounts in thousands)
| JPMorgan U.S. Research Enhanced Equity Fund | JPMorgan U.S. Sustainable Leaders Fund |
| Six Months Ended December 31, 2024 (Unaudited) | | Six Months Ended December 31, 2024 (Unaudited) | |
SHARE TRANSACTIONS: (continued) | | | | |
| | | | |
| | | | |
| | | | |
| | | | |
Change in Class R6 Shares | | | | |
SEE NOTES TO FINANCIAL STATEMENTS.
| J.P. Morgan Large Cap Funds | |
| |
| Six Months Ended December 31, 2024
(Unaudited) | |
| | |
| | |
Proceeds from shares issued | | |
| | |
| | |
Change in net assets resulting from Class A capital transactions | | |
| | |
Proceeds from shares issued | | |
| | |
| | |
Change in net assets resulting from Class C capital transactions | | |
| | |
Proceeds from shares issued | | |
| | |
| | |
Change in net assets resulting from Class I capital transactions | | |
| | |
Proceeds from shares issued | | |
| | |
| | |
Change in net assets resulting from Class R2 capital transactions | | |
| | |
Proceeds from shares issued | | |
| | |
| | |
Change in net assets resulting from Class R3 capital transactions | | |
| | |
Proceeds from shares issued | | |
| | |
| | |
Change in net assets resulting from Class R4 capital transactions | | |
| | |
Proceeds from shares issued | | |
| | |
| | |
Change in net assets resulting from Class R5 capital transactions | | |
SEE NOTES TO FINANCIAL STATEMENTS.
| J.P. Morgan Large Cap Funds | |
STATEMENTS OF CHANGES IN NET ASSETSFOR THE PERIODS INDICATED (continued)
(Amounts in thousands)
| |
| Six Months Ended December 31, 2024 (Unaudited) | |
CAPITAL TRANSACTIONS: (continued) | | |
| | |
Proceeds from shares issued | | |
| | |
| | |
Change in net assets resulting from Class R6 capital transactions | | |
Total change in net assets resulting from capital transactions | | |
| | |
| | |
| | |
| | |
| | |
| | |
| | |
| | |
| | |
| | |
| | |
| | |
| | |
| | |
| | |
| | |
| | |
| | |
| | |
| | |
Change in Class R2 Shares | | |
| | |
| | |
| | |
| | |
Change in Class R3 Shares | | |
| | |
| | |
| | |
| | |
Change in Class R4 Shares | | |
(a)
Amount rounds to less than one thousand.
SEE NOTES TO FINANCIAL STATEMENTS.
| J.P. Morgan Large Cap Funds | |
| |
| Six Months Ended December 31, 2024 (Unaudited) | |
SHARE TRANSACTIONS: (continued) | | |
| | |
| | |
| | |
| | |
Change in Class R5 Shares | | |
| | |
| | |
| | |
| | |
Change in Class R6 Shares | | |
SEE NOTES TO FINANCIAL STATEMENTS.
| J.P. Morgan Large Cap Funds | |
STATEMENT OF CASH FLOWSFOR THE PERIOD ENDED December 31, 2024
(Amounts in thousands)
| JPMorgan
U.S. Large
Cap Core
Plus Fund |
INCREASE (DECREASE) IN CASH | |
Cash flows provided (used) by operating activities: | |
Net increase in net assets resulting from operations | |
Adjustments to reconcile net increase/decrease in net assets resulting
from operations to net cash provided (used) by operating activities: | |
Purchases of investment securities | |
Proceeds from disposition of investment securities | |
Covers of investment securities sold short | |
Proceeds from investment securities sold short | |
Purchases of short-term investments — affiliates, net | |
Change in unrealized (appreciation)/depreciation on investments in non-affiliates | |
Change in unrealized (appreciation)/depreciation on investments in affiliates | |
Change in unrealized (appreciation)/depreciation on investment securities sold short | |
Net realized (gain)/loss on investments in non-affiliates | |
Net realized (gain)/loss on investments in affiliates | |
Net realized (gain)/loss on securities sold short | |
Decrease in dividends receivable from affiliates | |
Increase in dividends receivable from non-affiliates | |
Increase in dividend expense payable to non-affiliates on securities sold short | |
Increase in interest expense payable to non-affiliates on securities sold short | |
Decrease in variation margin payable | |
Increase in investment advisory fees payable | |
Increase in administration fees payable | |
Increase in distribution fees payable | |
Increase in service fees payable | |
Decrease in custodian and accounting fees payable | |
Increase in Trustees' and Chief Compliance Officer's fees | |
Decrease in other accrued expenses payable | |
Net cash provided (used) by operating activities | |
Cash flows provided (used) by financing activities: | |
Proceeds from shares issued | |
Payment for shares redeemed | |
Cash distributions paid to shareholders (net of reinvestments $165,235) | |
Net cash provided (used) by financing activities | |
| |
Net increase (decrease) in unrestricted and restricted cash and deposits at broker | |
Restricted and unrestricted cash and deposits at broker at beginning of period | |
Restricted and unrestricted cash and deposits at broker at end of period | |
Supplemental disclosure of cash flow information:For the period ended December 31, 2024 the Fund paid approximately $1,836 in interest expense.
For purposes of reporting the Statement of Cash Flows, the Fund considers all cash accounts that are not subject to withdrawal restrictions or penalties to be cash equivalents.
SEE NOTES TO FINANCIAL STATEMENTS.
| J.P. Morgan Large Cap Funds | |
Reconciliation of restricted and unrestricted cash at the end of period to the Statements of Assets and Liabilities:
| JPMorgan
U.S. Large
Cap Core
Plus Fund | JPMorgan
U.S. Large
Cap Core
Plus Fund |
| | |
| | |
| | |
| | |
| | |
| | |
SEE NOTES TO FINANCIAL STATEMENTS.
| J.P. Morgan Large Cap Funds | |
FINANCIAL HIGHLIGHTSFOR THE PERIODS INDICATED
| Per share operating performance |
| | | |
| Net asset
value,
beginning
of period | Net
investment
income
(loss)(b) | Net realized
and unrealized
gains (losses)
on investments | Total from
investment
operations | | | |
JPMorgan Equity Income Fund | | | | | | | |
| | | | | | | |
Six Months Ended December 31, 2024 (Unaudited) | | | | | | | |
| | | | | | | |
| | | | | | | |
| | | | | | | |
| | | | | | | |
| | | | | | | |
| | | | | | | |
Six Months Ended December 31, 2024 (Unaudited) | | | | | | | |
| | | | | | | |
| | | | | | | |
| | | | | | | |
| | | | | | | |
| | | | | | | |
| | | | | | | |
Six Months Ended December 31, 2024 (Unaudited) | | | | | | | |
| | | | | | | |
| | | | | | | |
| | | | | | | |
| | | | | | | |
| | | | | | | |
| | | | | | | |
Six Months Ended December 31, 2024 (Unaudited) | | | | | | | |
| | | | | | | |
| | | | | | | |
| | | | | | | |
| | | | | | | |
| | | | | | | |
| | | | | | | |
Six Months Ended December 31, 2024 (Unaudited) | | | | | | | |
| | | | | | | |
| | | | | | | |
| | | | | | | |
| | | | | | | |
| | | | | | | |
| | | | | | | |
Six Months Ended December 31, 2024 (Unaudited) | | | | | | | |
| | | | | | | |
| | | | | | | |
| | | | | | | |
| | | | | | | |
| | | | | | | |
SEE NOTES TO FINANCIAL STATEMENTS.
| J.P. Morgan Large Cap Funds | |
| |
| | | Ratios to average net assets(a) |
Net asset
value,
end of
period | Total return
(excludes
sales charge)(c)(d) | Net assets,
end of
period
(000's) | | Net
investment
income
(loss) | Expenses without
waivers and
reimbursements | |
| | | | | | |
| | | | | | |
| | | | | | |
| | | | | | |
| | | | | | |
| | | | | | |
| | | | | | |
| | | | | | |
| | | | | | |
| | | | | | |
| | | | | | |
| | | | | | |
| | | | | | |
| | | | | | |
| | | | | | |
| | | | | | |
| | | | | | |
| | | | | | |
| | | | | | |
| | | | | | |
| | | | | | |
| | | | | | |
| | | | | | |
| | | | | | |
| | | | | | |
| | | | | | |
| | | | | | |
| | | | | | |
| | | | | | |
| | | | | | |
| | | | | | |
| | | | | | |
| | | | | | |
| | | | | | |
| | | | | | |
| | | | | | |
| | | | | | |
| | | | | | |
| | | | | | |
| | | | | | |
| | | | | | |
| | | | | | |
| | | | | | |
SEE NOTES TO FINANCIAL STATEMENTS.
| J.P. Morgan Large Cap Funds | |
FINANCIAL HIGHLIGHTSFOR THE PERIODS INDICATED (continued)
| Per share operating performance |
| | | |
| Net asset
value,
beginning
of period | Net
investment
income
(loss)(b) | Net realized
and unrealized
gains (losses)
on investments | Total from
investment
operations | | | |
JPMorgan Equity Income Fund (continued) | | | | | | | |
| | | | | | | |
Six Months Ended December 31, 2024 (Unaudited) | | | | | | | |
| | | | | | | |
| | | | | | | |
| | | | | | | |
| | | | | | | |
| | | | | | | |
| | | | | | | |
Six Months Ended December 31, 2024 (Unaudited) | | | | | | | |
| | | | | | | |
| | | | | | | |
| | | | | | | |
| | | | | | | |
| | | | | | | |
| | | | | | | |
|
| Annualized for periods less than one year, unless otherwise noted. |
| Calculated based upon average shares outstanding. |
| Not annualized for periods less than one year. |
| Includes adjustments in accordance with accounting principles generally accepted in the United States of America and as such, the net asset values for financial reporting purposes and the returns based upon those net asset values may differ from the net asset values and returns for shareholder transactions. |
| Includes interest expense, if applicable, which is less than 0.005% unless otherwise noted. |
SEE NOTES TO FINANCIAL STATEMENTS.
| J.P. Morgan Large Cap Funds | |
| |
| | | Ratios to average net assets(a) |
Net asset
value,
end of
period | Total return
(excludes
sales charge)(c)(d) | Net assets,
end of
period
(000's) | | Net
investment
income
(loss) | Expenses without
waivers and
reimbursements | |
|
| | | | | | |
| | | | | | |
| | | | | | |
| | | | | | |
| | | | | | |
| | | | | | |
| | | | | | |
| | | | | | |
| | | | | | |
| | | | | | |
| | | | | | |
| | | | | | |
| | | | | | |
| | | | | | |
| | | | | | |
SEE NOTES TO FINANCIAL STATEMENTS.
| J.P. Morgan Large Cap Funds | |
FINANCIAL HIGHLIGHTSFOR THE PERIODS INDICATED
| Per share operating performance |
| | | |
| Net asset
value,
beginning
of period | Net
investment
income
(loss)(b) | Net realized
and unrealized
gains (losses)
on investments | Total from
investment
operations | | | |
JPMorgan Equity Index Fund | | | | | | | |
| | | | | | | |
Six Months Ended December 31, 2024 (Unaudited) | | | | | | | |
| | | | | | | |
| | | | | | | |
| | | | | | | |
| | | | | | | |
| | | | | | | |
| | | | | | | |
Six Months Ended December 31, 2024 (Unaudited) | | | | | | | |
| | | | | | | |
| | | | | | | |
| | | | | | | |
| | | | | | | |
| | | | | | | |
| | | | | | | |
Six Months Ended December 31, 2024 (Unaudited) | | | | | | | |
| | | | | | | |
| | | | | | | |
| | | | | | | |
| | | | | | | |
| | | | | | | |
| | | | | | | |
Six Months Ended December 31, 2024 (Unaudited) | | | | | | | |
| | | | | | | |
| | | | | | | |
| | | | | | | |
| | | | | | | |
| | | | | | | |
| | | | | | | |
|
| Annualized for periods less than one year, unless otherwise noted. |
| Calculated based upon average shares outstanding. |
| Not annualized for periods less than one year. |
| Includes adjustments in accordance with accounting principles generally accepted in the United States of America and as such, the net asset values for financial reporting purposes and the returns based upon those net asset values may differ from the net asset values and returns for shareholder transactions. |
| Includes interest expense, if applicable, which is less than 0.005% unless otherwise noted. |
| Net expenses for Class R6 Shares are 0.044% for the six months ended December 31, 2024, 0.044% for the year ended June 30, 2024, 0.045% for the year ended June 30, 2023, 0.045% for the year ended June 30,2022, 0.044% for the year ended June 30, 2021, 0.044% for the year ended June 30, 2020. |
SEE NOTES TO FINANCIAL STATEMENTS.
| J.P. Morgan Large Cap Funds | |
| |
| | | Ratios to average net assets(a) |
Net asset
value,
end of
period | Total return
(excludes
sales charge)(c)(d) | Net assets,
end of
period
(000's) | | Net
investment
income
(loss) | Expenses without
waivers and
reimbursements | |
| | | | | | |
| | | | | | |
| | | | | | |
| | | | | | |
| | | | | | |
| | | | | | |
| | | | | | |
| | | | | | |
| | | | | | |
| | | | | | |
| | | | | | |
| | | | | | |
| | | | | | |
| | | | | | |
| | | | | | |
| | | | | | |
| | | | | | |
| | | | | | |
| | | | | | |
| | | | | | |
| | | | | | |
| | | | | | |
| | | | | | |
| | | | | | |
| | | | | | |
| | | | | | |
| | | | | | |
| | | | | | |
| | | | | | |
| | | | | | |
SEE NOTES TO FINANCIAL STATEMENTS.
| J.P. Morgan Large Cap Funds | |
FINANCIAL HIGHLIGHTSFOR THE PERIODS INDICATED
| Per share operating performance |
| | | |
| Net asset
value,
beginning
of period | Net
investment
income
(loss)(b) | Net realized
and unrealized
gains (losses)
on investments | Total from
investment
operations | | Net asset
value,
end of
period |
JPMorgan Equity Premium Income Fund | | | | | | |
| | | | | | |
Six Months Ended December 31, 2024 (Unaudited) | | | | | | |
| | | | | | |
| | | | | | |
| | | | | | |
| | | | | | |
| | | | | | |
| | | | | | |
Six Months Ended December 31, 2024 (Unaudited) | | | | | | |
| | | | | | |
| | | | | | |
| | | | | | |
| | | | | | |
| | | | | | |
| | | | | | |
Six Months Ended December 31, 2024 (Unaudited) | | | | | | |
| | | | | | |
| | | | | | |
| | | | | | |
| | | | | | |
| | | | | | |
| | | | | | |
Six Months Ended December 31, 2024 (Unaudited) | | | | | | |
| | | | | | |
| | | | | | |
| | | | | | |
| | | | | | |
| | | | | | |
| | | | | | |
Six Months Ended December 31, 2024 (Unaudited) | | | | | | |
| | | | | | |
| | | | | | |
| | | | | | |
| | | | | | |
| | | | | | |
| | | | | | |
|
| Annualized for periods less than one year, unless otherwise noted. |
| Calculated based upon average shares outstanding. |
| Not annualized for periods less than one year. |
| Includes adjustments in accordance with accounting principles generally accepted in the United States of America and as such, the net asset values for financial reporting purposes and the returns based upon those net asset values may differ from the net asset values and returns for shareholder transactions. |
| Includes interest expense, if applicable, which is less than 0.005% unless otherwise noted. |
SEE NOTES TO FINANCIAL STATEMENTS.
| J.P. Morgan Large Cap Funds | |
|
| | Ratios to average net assets(a) |
Total return
(excludes
sales charge)(c)(d) | Net assets,
end of
period
(000's) | | Net
investment
income
(loss) | Expenses without
waivers and
reimbursements | |
| | | | | |
| | | | | |
| | | | | |
| | | | | |
| | | | | |
| | | | | |
| | | | | |
| | | | | |
| | | | | |
| | | | | |
| | | | | |
| | | | | |
| | | | | |
| | | | | |
| | | | | |
| | | | | |
| | | | | |
| | | | | |
| | | | | |
| | | | | |
| | | | | |
| | | | | |
| | | | | |
| | | | | |
| | | | | |
| | | | | |
| | | | | |
| | | | | |
| | | | | |
| | | | | |
| | | | | |
| | | | | |
| | | | | |
| | | | | |
| | | | | |
| | | | | |
| | | | | |
SEE NOTES TO FINANCIAL STATEMENTS.
| J.P. Morgan Large Cap Funds | |
FINANCIAL HIGHLIGHTSFOR THE PERIODS INDICATED
| Per share operating performance |
| | | |
| Net asset
value,
beginning
of period | Net
investment
income
(loss)(b) | Net realized
and unrealized
gains (losses)
on investments | Total from
investment
operations | | Net asset
value,
end of
period |
JPMorgan Hedged Equity Fund | | | | | | |
| | | | | | |
Six Months Ended December 31, 2024 (Unaudited) | | | | | | |
| | | | | | |
| | | | | | |
| | | | | | |
| | | | | | |
| | | | | | |
| | | | | | |
Six Months Ended December 31, 2024 (Unaudited) | | | | | | |
| | | | | | |
| | | | | | |
| | | | | | |
| | | | | | |
| | | | | | |
| | | | | | |
Six Months Ended December 31, 2024 (Unaudited) | | | | | | |
| | | | | | |
| | | | | | |
| | | | | | |
| | | | | | |
| | | | | | |
| | | | | | |
Six Months Ended December 31, 2024 (Unaudited) | | | | | | |
| | | | | | |
| | | | | | |
| | | | | | |
| | | | | | |
| | | | | | |
| | | | | | |
Six Months Ended December 31, 2024 (Unaudited) | | | | | | |
| | | | | | |
| | | | | | |
| | | | | | |
| | | | | | |
| | | | | | |
| | | | | | |
|
| Annualized for periods less than one year, unless otherwise noted. |
| Calculated based upon average shares outstanding. |
| Not annualized for periods less than one year. |
| Includes adjustments in accordance with accounting principles generally accepted in the United States of America and as such, the net asset values for financial reporting purposes and the returns based upon those net asset values may differ from the net asset values and returns for shareholder transactions. |
| Includes interest expense, if applicable, which is less than 0.005% unless otherwise noted. |
SEE NOTES TO FINANCIAL STATEMENTS.
| J.P. Morgan Large Cap Funds | |
|
| | Ratios to average net assets(a) |
Total return
(excludes
sales charge)(c)(d) | Net assets,
end of
period
(000's) | | Net
investment
income
(loss) | Expenses without
waivers and
reimbursements | |
| | | | | |
| | | | | |
| | | | | |
| | | | | |
| | | | | |
| | | | | |
| | | | | |
| | | | | |
| | | | | |
| | | | | |
| | | | | |
| | | | | |
| | | | | |
| | | | | |
| | | | | |
| | | | | |
| | | | | |
| | | | | |
| | | | | |
| | | | | |
| | | | | |
| | | | | |
| | | | | |
| | | | | |
| | | | | |
| | | | | |
| | | | | |
| | | | | |
| | | | | |
| | | | | |
| | | | | |
| | | | | |
| | | | | |
| | | | | |
| | | | | |
| | | | | |
| | | | | |
SEE NOTES TO FINANCIAL STATEMENTS.
| J.P. Morgan Large Cap Funds | |
FINANCIAL HIGHLIGHTSFOR THE PERIODS INDICATED
| Per share operating performance |
| | | |
| Net asset
value,
beginning
of period | Net
investment
income
(loss)(b) | Net realized
and unrealized
gains (losses)
on investments | Total from
investment
operations | | | |
JPMorgan Hedged Equity 2 Fund | | | | | | | |
| | | | | | | |
Six Months Ended December 31, 2024 (Unaudited) | | | | | | | |
| | | | | | | |
| | | | | | | |
| | | | | | | |
February 26, 2021 (f) through June 30, 2021 | | | | | | | |
| | | | | | | |
Six Months Ended December 31, 2024 (Unaudited) | | | | | | | |
| | | | | | | |
| | | | | | | |
| | | | | | | |
February 26, 2021 (f) through June 30, 2021 | | | | | | | |
| | | | | | | |
Six Months Ended December 31, 2024 (Unaudited) | | | | | | | |
| | | | | | | |
| | | | | | | |
| | | | | | | |
February 26, 2021 (f) through June 30, 2021 | | | | | | | |
| | | | | | | |
Six Months Ended December 31, 2024 (Unaudited) | | | | | | | |
| | | | | | | |
| | | | | | | |
| | | | | | | |
February 26, 2021 (f) through June 30, 2021 | | | | | | | |
| | | | | | | |
Six Months Ended December 31, 2024 (Unaudited) | | | | | | | |
| | | | | | | |
| | | | | | | |
| | | | | | | |
February 26, 2021 (f) through June 30, 2021 | | | | | | | |
| | | | | | | |
|
| Annualized for periods less than one year, unless otherwise noted. |
| Calculated based upon average shares outstanding. |
| Not annualized for periods less than one year. |
| Includes adjustments in accordance with accounting principles generally accepted in the United States of America and as such, the net asset values for financial reporting purposes and the returns based upon those net asset values may differ from the net asset values and returns for shareholder transactions. |
| Includes interest expense, if applicable, which is less than 0.005% unless otherwise noted. |
| Commencement of operations. |
| Certain non-recurring expenses incurred by the Fund were not annualized for the period indicated. |
| Amount rounds to less than $0.005. |
| Amount rounds to less than 0.005%. |
SEE NOTES TO FINANCIAL STATEMENTS.
| J.P. Morgan Large Cap Funds | |
| |
| | | Ratios to average net assets(a) |
Net asset
value,
end of
period | Total return
(excludes
sales charge)(c)(d) | Net assets,
end of
period
(000's) | | Net
investment
income
(loss) | Expenses without
waivers and
reimbursements | |
| | | | | | |
| | | | | | |
| | | | | | |
| | | | | | |
| | | | | | |
| | | | | | |
| | | | | | |
| | | | | | |
| | | | | | |
| | | | | | |
| | | | | | |
| | | | | | |
| | | | | | |
| | | | | | |
| | | | | | |
| | | | | | |
| | | | | | |
| | | | | | |
| | | | | | |
| | | | | | |
| | | | | | |
| | | | | | |
| | | | | | |
| | | | | | |
| | | | | | |
| | | | | | |
| | | | | | |
| | | | | | |
| | | | | | |
| | | | | | |
| | | | | | |
| | | | | | |
SEE NOTES TO FINANCIAL STATEMENTS.
| J.P. Morgan Large Cap Funds | |
FINANCIAL HIGHLIGHTSFOR THE PERIODS INDICATED
| Per share operating performance |
| | | |
| Net asset
value,
beginning
of period | Net
investment
income
(loss)(b) | Net realized
and unrealized
gains (losses)
on investments | Total from
investment
operations | | | |
JPMorgan Hedged Equity 3 Fund | | | | | | | |
| | | | | | | |
Six Months Ended December 31, 2024 (Unaudited) | | | | | | | |
| | | | | | | |
| | | | | | | |
| | | | | | | |
February 26, 2021 (f) through June 30, 2021 | | | | | | | |
| | | | | | | |
Six Months Ended December 31, 2024 (Unaudited) | | | | | | | |
| | | | | | | |
| | | | | | | |
| | | | | | | |
February 26, 2021 (f) through June 30, 2021 | | | | | | | |
| | | | | | | |
Six Months Ended December 31, 2024 (Unaudited) | | | | | | | |
| | | | | | | |
| | | | | | | |
| | | | | | | |
February 26, 2021 (f) through June 30, 2021 | | | | | | | |
| | | | | | | |
Six Months Ended December 31, 2024 (Unaudited) | | | | | | | |
| | | | | | | |
| | | | | | | |
| | | | | | | |
February 26, 2021 (f) through June 30, 2021 | | | | | | | |
| | | | | | | |
Six Months Ended December 31, 2024 (Unaudited) | | | | | | | |
| | | | | | | |
| | | | | | | |
| | | | | | | |
February 26, 2021 (f) through June 30, 2021 | | | | | | | |
| | | | | | | |
|
| Annualized for periods less than one year, unless otherwise noted. |
| Calculated based upon average shares outstanding. |
| Not annualized for periods less than one year. |
| Includes adjustments in accordance with accounting principles generally accepted in the United States of America and as such, the net asset values for financial reporting purposes and the returns based upon those net asset values may differ from the net asset values and returns for shareholder transactions. |
| Includes interest expense, if applicable, which is less than 0.005% unless otherwise noted. |
| Commencement of operations. |
| Certain non-recurring expenses incurred by the Fund were not annualized for the period indicated. |
| Amount rounds to less than $0.005. |
SEE NOTES TO FINANCIAL STATEMENTS.
| J.P. Morgan Large Cap Funds | |
| |
| | | Ratios to average net assets(a) |
Net asset
value,
end of
period | Total return
(excludes
sales charge)(c)(d) | Net assets,
end of
period
(000's) | | Net
investment
income
(loss) | Expenses without
waivers and
reimbursements | |
| | | | | | |
| | | | | | |
| | | | | | |
| | | | | | |
| | | | | | |
| | | | | | |
| | | | | | |
| | | | | | |
| | | | | | |
| | | | | | |
| | | | | | |
| | | | | | |
| | | | | | |
| | | | | | |
| | | | | | |
| | | | | | |
| | | | | | |
| | | | | | |
| | | | | | |
| | | | | | |
| | | | | | |
| | | | | | |
| | | | | | |
| | | | | | |
| | | | | | |
| | | | | | |
| | | | | | |
| | | | | | |
| | | | | | |
| | | | | | |
| | | | | | |
| | | | | | |
SEE NOTES TO FINANCIAL STATEMENTS.
| J.P. Morgan Large Cap Funds | |
FINANCIAL HIGHLIGHTSFOR THE PERIODS INDICATED
| Per share operating performance |
| | | |
| Net asset
value,
beginning
of period | Net
investment
income
(loss)(b) | Net realized
and unrealized
gains (losses)
on investments | Total from
investment
operations | | | |
JPMorgan Large Cap Growth Fund | | | | | | | |
| | | | | | | |
Six Months Ended December 31, 2024 (Unaudited) | | | | | | | |
| | | | | | | |
| | | | | | | |
| | | | | | | |
| | | | | | | |
| | | | | | | |
| | | | | | | |
Six Months Ended December 31, 2024 (Unaudited) | | | | | | | |
| | | | | | | |
| | | | | | | |
| | | | | | | |
| | | | | | | |
| | | | | | | |
| | | | | | | |
Six Months Ended December 31, 2024 (Unaudited) | | | | | | | |
| | | | | | | |
| | | | | | | |
| | | | | | | |
| | | | | | | |
| | | | | | | |
| | | | | | | |
Six Months Ended December 31, 2024 (Unaudited) | | | | | | | |
| | | | | | | |
| | | | | | | |
| | | | | | | |
| | | | | | | |
| | | | | | | |
| | | | | | | |
Six Months Ended December 31, 2024 (Unaudited) | | | | | | | |
| | | | | | | |
| | | | | | | |
| | | | | | | |
| | | | | | | |
| | | | | | | |
| | | | | | | |
Six Months Ended December 31, 2024 (Unaudited) | | | | | | | |
| | | | | | | |
| | | | | | | |
| | | | | | | |
| | | | | | | |
| | | | | | | |
SEE NOTES TO FINANCIAL STATEMENTS.
| J.P. Morgan Large Cap Funds | |
| |
| | | Ratios to average net assets(a) |
Net asset
value,
end of
period | Total return
(excludes
sales charge)(c)(d) | Net assets,
end of
period
(000's) | | Net
investment
income
(loss) | Expenses without
waivers and
reimbursements | |
| | | | | | |
| | | | | | |
| | | | | | |
| | | | | | |
| | | | | | |
| | | | | | |
| | | | | | |
| | | | | | |
| | | | | | |
| | | | | | |
| | | | | | |
| | | | | | |
| | | | | | |
| | | | | | |
| | | | | | |
| | | | | | |
| | | | | | |
| | | | | | |
| | | | | | |
| | | | | | |
| | | | | | |
| | | | | | |
| | | | | | |
| | | | | | |
| | | | | | |
| | | | | | |
| | | | | | |
| | | | | | |
| | | | | | |
| | | | | | |
| | | | | | |
| | | | | | |
| | | | | | |
| | | | | | |
| | | | | | |
| | | | | | |
| | | | | | |
| | | | | | |
| | | | | | |
| | | | | | |
| | | | | | |
| | | | | | |
| | | | | | |
SEE NOTES TO FINANCIAL STATEMENTS.
| J.P. Morgan Large Cap Funds | |
FINANCIAL HIGHLIGHTSFOR THE PERIODS INDICATED (continued)
| Per share operating performance |
| | | |
| Net asset
value,
beginning
of period | Net
investment
income
(loss)(b) | Net realized
and unrealized
gains (losses)
on investments | Total from
investment
operations | | | |
JPMorgan Large Cap Growth Fund (continued) | | | | | | | |
| | | | | | | |
Six Months Ended December 31, 2024 (Unaudited) | | | | | | | |
| | | | | | | |
| | | | | | | |
| | | | | | | |
| | | | | | | |
| | | | | | | |
| | | | | | | |
Six Months Ended December 31, 2024 (Unaudited) | | | | | | | |
| | | | | | | |
| | | | | | | |
| | | | | | | |
| | | | | | | |
| | | | | | | |
| | | | | | | |
|
| Annualized for periods less than one year, unless otherwise noted. |
| Calculated based upon average shares outstanding. |
| Not annualized for periods less than one year. |
| Includes adjustments in accordance with accounting principles generally accepted in the United States of America and as such, the net asset values for financial reporting purposes and the returns based upon those net asset values may differ from the net asset values and returns for shareholder transactions. |
| Includes interest expense, if applicable, which is less than 0.005% unless otherwise noted. |
| Net investment income (loss) may appear disproportionate among the classes due to the timing of recognition of income and changes in the relative size of the classes. |
| Certain non-recurring expenses incurred by the Fund were not annualized for the period indicated. |
| Amount rounds to less than $0.005. |
SEE NOTES TO FINANCIAL STATEMENTS.
| J.P. Morgan Large Cap Funds | |
| |
| | | Ratios to average net assets(a) |
Net asset
value,
end of
period | Total return
(excludes
sales charge)(c)(d) | Net assets,
end of
period
(000's) | | Net
investment
income
(loss) | Expenses without
waivers and
reimbursements | |
|
| | | | | | |
| | | | | | |
| | | | | | |
| | | | | | |
| | | | | | |
| | | | | | |
| | | | | | |
| | | | | | |
| | | | | | |
| | | | | | |
| | | | | | |
| | | | | | |
| | | | | | |
| | | | | | |
| | | | | | |
SEE NOTES TO FINANCIAL STATEMENTS.
| J.P. Morgan Large Cap Funds | |
FINANCIAL HIGHLIGHTSFOR THE PERIODS INDICATED
| Per share operating performance |
| | | |
| Net asset
value,
beginning
of period | Net
investment
income
(loss)(b) | Net realized
and unrealized
gains (losses)
on investments | Total from
investment
operations | | | |
JPMorgan Large Cap Value Fund | | | | | | | |
| | | | | | | |
Six Months Ended December 31, 2024 (Unaudited) | | | | | | | |
| | | | | | | |
| | | | | | | |
| | | | | | | |
| | | | | | | |
| | | | | | | |
| | | | | | | |
Six Months Ended December 31, 2024 (Unaudited) | | | | | | | |
| | | | | | | |
| | | | | | | |
| | | | | | | |
| | | | | | | |
| | | | | | | |
| | | | | | | |
Six Months Ended December 31, 2024 (Unaudited) | | | | | | | |
| | | | | | | |
| | | | | | | |
| | | | | | | |
| | | | | | | |
| | | | | | | |
| | | | | | | |
Six Months Ended December 31, 2024 (Unaudited) | | | | | | | |
| | | | | | | |
| | | | | | | |
| | | | | | | |
| | | | | | | |
| | | | | | | |
| | | | | | | |
Six Months Ended December 31, 2024 (Unaudited) | | | | | | | |
| | | | | | | |
| | | | | | | |
| | | | | | | |
| | | | | | | |
| | | | | | | |
| | | | | | | |
Six Months Ended December 31, 2024 (Unaudited) | | | | | | | |
| | | | | | | |
| | | | | | | |
| | | | | | | |
| | | | | | | |
| | | | | | | |
SEE NOTES TO FINANCIAL STATEMENTS.
| J.P. Morgan Large Cap Funds | |
| |
| | | Ratios to average net assets(a) |
Net asset
value,
end of
period | Total return
(excludes
sales charge)(c)(d) | Net assets,
end of
period
(000's) | | Net
investment
income
(loss) | Expenses without
waivers and
reimbursements | |
| | | | | | |
| | | | | | |
| | | | | | |
| | | | | | |
| | | | | | |
| | | | | | |
| | | | | | |
| | | | | | |
| | | | | | |
| | | | | | |
| | | | | | |
| | | | | | |
| | | | | | |
| | | | | | |
| | | | | | |
| | | | | | |
| | | | | | |
| | | | | | |
| | | | | | |
| | | | | | |
| | | | | | |
| | | | | | |
| | | | | | |
| | | | | | |
| | | | | | |
| | | | | | |
| | | | | | |
| | | | | | |
| | | | | | |
| | | | | | |
| | | | | | |
| | | | | | |
| | | | | | |
| | | | | | |
| | | | | | |
| | | | | | |
| | | | | | |
| | | | | | |
| | | | | | |
| | | | | | |
| | | | | | |
| | | | | | |
| | | | | | |
SEE NOTES TO FINANCIAL STATEMENTS.
| J.P. Morgan Large Cap Funds | |
FINANCIAL HIGHLIGHTSFOR THE PERIODS INDICATED (continued)
| Per share operating performance |
| | | |
| Net asset
value,
beginning
of period | Net
investment
income
(loss)(b) | Net realized
and unrealized
gains (losses)
on investments | Total from
investment
operations | | | |
JPMorgan Large Cap Value Fund (continued) | | | | | | | |
| | | | | | | |
Six Months Ended December 31, 2024 (Unaudited) | | | | | | | |
| | | | | | | |
| | | | | | | |
| | | | | | | |
| | | | | | | |
| | | | | | | |
| | | | | | | |
Six Months Ended December 31, 2024 (Unaudited) | | | | | | | |
| | | | | | | |
| | | | | | | |
| | | | | | | |
| | | | | | | |
| | | | | | | |
| | | | | | | |
|
| Annualized for periods less than one year, unless otherwise noted. |
| Calculated based upon average shares outstanding. |
| Not annualized for periods less than one year. |
| Includes adjustments in accordance with accounting principles generally accepted in the United States of America and as such, the net asset values for financial reporting purposes and the returns based upon those net asset values may differ from the net asset values and returns for shareholder transactions. |
| Includes interest expense, if applicable, which is less than 0.005% unless otherwise noted. |
SEE NOTES TO FINANCIAL STATEMENTS.
| J.P. Morgan Large Cap Funds | |
| |
| | | Ratios to average net assets(a) |
Net asset
value,
end of
period | Total return
(excludes
sales charge)(c)(d) | Net assets,
end of
period
(000's) | | Net
investment
income
(loss) | Expenses without
waivers and
reimbursements | |
|
| | | | | | |
| | | | | | |
| | | | | | |
| | | | | | |
| | | | | | |
| | | | | | |
| | | | | | |
| | | | | | |
| | | | | | |
| | | | | | |
| | | | | | |
| | | | | | |
| | | | | | |
| | | | | | |
| | | | | | |
SEE NOTES TO FINANCIAL STATEMENTS.
| J.P. Morgan Large Cap Funds | |
FINANCIAL HIGHLIGHTSFOR THE PERIODS INDICATED
| Per share operating performance |
| | | |
| Net asset
value,
beginning
of period | Net
investment
income
(loss)(b) | Net realized
and unrealized
gains (losses)
on investments | Total from
investment
operations | | | |
JPMorgan U.S. Applied Data Science Value Fund | | | | | | | |
| | | | | | | |
Six Months Ended December 31, 2024 (Unaudited) | | | | | | | |
| | | | | | | |
| | | | | | | |
| | | | | | | |
| | | | | | | |
| | | | | | | |
| | | | | | | |
Six Months Ended December 31, 2024 (Unaudited) | | | | | | | |
| | | | | | | |
| | | | | | | |
| | | | | | | |
| | | | | | | |
| | | | | | | |
| | | | | | | |
Six Months Ended December 31, 2024 (Unaudited) | | | | | | | |
| | | | | | | |
| | | | | | | |
| | | | | | | |
| | | | | | | |
| | | | | | | |
| | | | | | | |
Six Months Ended December 31, 2024 (Unaudited) | | | | | | | |
| | | | | | | |
| | | | | | | |
| | | | | | | |
| | | | | | | |
| | | | | | | |
| | | | | | | |
Six Months Ended December 31, 2024 (Unaudited) | | | | | | | |
| | | | | | | |
| | | | | | | |
| | | | | | | |
| | | | | | | |
| | | | | | | |
SEE NOTES TO FINANCIAL STATEMENTS.
| J.P. Morgan Large Cap Funds | |
| |
| | | Ratios to average net assets(a) |
Net asset
value,
end of
period | Total return
(excludes
sales charge)(c)(d) | Net assets,
end of
period
(000's) | | Net
investment
income
(loss) | Expenses without
waivers and
reimbursements | |
| | | | | | |
| | | | | | |
| | | | | | |
| | | | | | |
| | | | | | |
| | | | | | |
| | | | | | |
| | | | | | |
| | | | | | |
| | | | | | |
| | | | | | |
| | | | | | |
| | | | | | |
| | | | | | |
| | | | | | |
| | | | | | |
| | | | | | |
| | | | | | |
| | | | | | |
| | | | | | |
| | | | | | |
| | | | | | |
| | | | | | |
| | | | | | |
| | | | | | |
| | | | | | |
| | | | | | |
| | | | | | |
| | | | | | |
| | | | | | |
| | | | | | |
| | | | | | |
| | | | | | |
| | | | | | |
| | | | | | |
| | | | | | |
SEE NOTES TO FINANCIAL STATEMENTS.
| J.P. Morgan Large Cap Funds | |
FINANCIAL HIGHLIGHTSFOR THE PERIODS INDICATED (continued)
| Per share operating performance |
| | | |
| Net asset
value,
beginning
of period | Net
investment
income
(loss)(b) | Net realized
and unrealized
gains (losses)
on investments | Total from
investment
operations | | | |
JPMorgan U.S. Applied Data Science Value Fund (continued) | | | | | | | |
| | | | | | | |
Six Months Ended December 31, 2024 (Unaudited) | | | | | | | |
| | | | | | | |
| | | | | | | |
| | | | | | | |
| | | | | | | |
| | | | | | | |
| | | | | | | |
|
| Annualized for periods less than one year, unless otherwise noted. |
| Calculated based upon average shares outstanding. |
| Not annualized for periods less than one year. |
| Includes adjustments in accordance with accounting principles generally accepted in the United States of America and as such, the net asset values for financial reporting purposes and the returns based upon those net asset values may differ from the net asset values and returns for shareholder transactions. |
| Includes interest expense, if applicable, which is less than 0.005% unless otherwise noted. |
| Reflects special dividends paid out during the year by several of the Fund’s holdings. Had the Fund not received the special dividends, the net investment income (loss) per share would have been $0.46, $0.30, $0.53, $0.38, $0.57 and $0.60 for Class A, Class C, Class I, Class R2, Class R5 and Class R6 Shares, respectively, and the net investment income (loss) ratio would have been 1.56%, 1.05%, 1.70%, 1.30%, 1.85% and 2.04% for Class A, Class C, Class I, Class R2, Class R5 and Class R6 Shares, respectively. |
SEE NOTES TO FINANCIAL STATEMENTS.
| J.P. Morgan Large Cap Funds | |
| |
| | | Ratios to average net assets(a) |
Net asset
value,
end of
period | Total return
(excludes
sales charge)(c)(d) | Net assets,
end of
period
(000's) | | Net
investment
income
(loss) | Expenses without
waivers and
reimbursements | |
|
| | | | | | |
| | | | | | |
| | | | | | |
| | | | | | |
| | | | | | |
| | | | | | |
| | | | | | |
| | | | | | |
SEE NOTES TO FINANCIAL STATEMENTS.
| J.P. Morgan Large Cap Funds | |
FINANCIAL HIGHLIGHTSFOR THE PERIODS INDICATED
| Per share operating performance |
| | | |
| Net asset
value,
beginning
of period | Net
investment
income
(loss)(b) | Net realized
and unrealized
gains (losses)
on investments | Total from
investment
operations | | | |
JPMorgan U.S. Equity Fund | | | | | | | |
| | | | | | | |
Six Months Ended December 31, 2024 (Unaudited) | | | | | | | |
| | | | | | | |
| | | | | | | |
| | | | | | | |
| | | | | | | |
| | | | | | | |
| | | | | | | |
Six Months Ended December 31, 2024 (Unaudited) | | | | | | | |
| | | | | | | |
| | | | | | | |
| | | | | | | |
| | | | | | | |
| | | | | | | |
| | | | | | | |
Six Months Ended December 31, 2024 (Unaudited) | | | | | | | |
| | | | | | | |
| | | | | | | |
| | | | | | | |
| | | | | | | |
| | | | | | | |
| | | | | | | |
Six Months Ended December 31, 2024 (Unaudited) | | | | | | | |
| | | | | | | |
| | | | | | | |
| | | | | | | |
| | | | | | | |
| | | | | | | |
| | | | | | | |
Six Months Ended December 31, 2024 (Unaudited) | | | | | | | |
| | | | | | | |
| | | | | | | |
| | | | | | | |
| | | | | | | |
| | | | | | | |
| | | | | | | |
Six Months Ended December 31, 2024 (Unaudited) | | | | | | | |
| | | | | | | |
| | | | | | | |
| | | | | | | |
| | | | | | | |
| | | | | | | |
SEE NOTES TO FINANCIAL STATEMENTS.
| J.P. Morgan Large Cap Funds | |
| |
| | | Ratios to average net assets(a) |
Net asset
value,
end of
period | Total return
(excludes
sales charge)(c)(d) | Net assets,
end of
period
(000's) | | Net
investment
income
(loss) | Expenses without
waivers and
reimbursements | |
| | | | | | |
| | | | | | |
| | | | | | |
| | | | | | |
| | | | | | |
| | | | | | |
| | | | | | |
| | | | | | |
| | | | | | |
| | | | | | |
| | | | | | |
| | | | | | |
| | | | | | |
| | | | | | |
| | | | | | |
| | | | | | |
| | | | | | |
| | | | | | |
| | | | | | |
| | | | | | |
| | | | | | |
| | | | | | |
| | | | | | |
| | | | | | |
| | | | | | |
| | | | | | |
| | | | | | |
| | | | | | |
| | | | | | |
| | | | | | |
| | | | | | |
| | | | | | |
| | | | | | |
| | | | | | |
| | | | | | |
| | | | | | |
| | | | | | |
| | | | | | |
| | | | | | |
| | | | | | |
| | | | | | |
| | | | | | |
| | | | | | |
SEE NOTES TO FINANCIAL STATEMENTS.
| J.P. Morgan Large Cap Funds | |
FINANCIAL HIGHLIGHTSFOR THE PERIODS INDICATED (continued)
| Per share operating performance |
| | | |
| Net asset
value,
beginning
of period | Net
investment
income
(loss)(b) | Net realized
and unrealized
gains (losses)
on investments | Total from
investment
operations | | | |
JPMorgan U.S. Equity Fund (continued) | | | | | | | |
| | | | | | | |
Six Months Ended December 31, 2024 (Unaudited) | | | | | | | |
| | | | | | | |
| | | | | | | |
| | | | | | | |
| | | | | | | |
| | | | | | | |
| | | | | | | |
Six Months Ended December 31, 2024 (Unaudited) | | | | | | | |
| | | | | | | |
| | | | | | | |
| | | | | | | |
| | | | | | | |
| | | | | | | |
| | | | | | | |
Six Months Ended December 31, 2024 (Unaudited) | | | | | | | |
| | | | | | | |
| | | | | | | |
| | | | | | | |
| | | | | | | |
| | | | | | | |
| | | | | | | |
|
| Annualized for periods less than one year, unless otherwise noted. |
| Calculated based upon average shares outstanding. |
| Not annualized for periods less than one year. |
| Includes adjustments in accordance with accounting principles generally accepted in the United States of America and as such, the net asset values for financial reporting purposes and the returns based upon those net asset values may differ from the net asset values and returns for shareholder transactions. |
| Includes interest expense, if applicable, which is less than 0.005% unless otherwise noted. |
| Net investment income (loss) may appear disproportionate among the classes due to the timing of recognition of income and changes in the relative size of the classes. |
| Amount rounds to less than $0.005. |
SEE NOTES TO FINANCIAL STATEMENTS.
| J.P. Morgan Large Cap Funds | |
| |
| | | Ratios to average net assets(a) |
Net asset
value,
end of
period | Total return
(excludes
sales charge)(c)(d) | Net assets,
end of
period
(000's) | | Net
investment
income
(loss) | Expenses without
waivers and
reimbursements | |
|
| | | | | | |
| | | | | | |
| | | | | | |
| | | | | | |
| | | | | | |
| | | | | | |
| | | | | | |
| | | | | | |
| | | | | | |
| | | | | | |
| | | | | | |
| | | | | | |
| | | | | | |
| | | | | | |
| | | | | | |
| | | | | | |
| | | | | | |
| | | | | | |
| | | | | | |
| | | | | | |
| | | | | | |
| | | | | | |
SEE NOTES TO FINANCIAL STATEMENTS.
| J.P. Morgan Large Cap Funds | |
FINANCIAL HIGHLIGHTSFOR THE PERIODS INDICATED
| Per share operating performance |
| | | |
| Net asset
value,
beginning
of period | Net
investment
income
(loss)(b) | Net realized
and unrealized
gains (losses)
on investments | Total from
investment
operations | | | |
JPMorgan U.S. GARP Equity Fund | | | | | | | |
| | | | | | | |
Six Months Ended December 31, 2024 (Unaudited) | | | | | | | |
| | | | | | | |
| | | | | | | |
| | | | | | | |
| | | | | | | |
| | | | | | | |
| | | | | | | |
Six Months Ended December 31, 2024 (Unaudited) | | | | | | | |
| | | | | | | |
| | | | | | | |
| | | | | | | |
| | | | | | | |
| | | | | | | |
| | | | | | | |
Six Months Ended December 31, 2024 (Unaudited) | | | | | | | |
| | | | | | | |
| | | | | | | |
| | | | | | | |
| | | | | | | |
| | | | | | | |
| | | | | | | |
Six Months Ended December 31, 2024 (Unaudited) | | | | | | | |
| | | | | | | |
| | | | | | | |
| | | | | | | |
| | | | | | | |
| | | | | | | |
| | | | | | | |
Six Months Ended December 31, 2024 (Unaudited) | | | | | | | |
| | | | | | | |
| | | | | | | |
| | | | | | | |
| | | | | | | |
| | | | | | | |
SEE NOTES TO FINANCIAL STATEMENTS.
| J.P. Morgan Large Cap Funds | |
| |
| | | Ratios to average net assets(a) |
Net asset
value,
end of
period | Total return
(excludes
sales charge)(c)(d) | Net assets,
end of
period
(000's) | | Net
investment
income
(loss) | Expenses without
waivers and
reimbursements | |
| | | | | | |
| | | | | | |
| | | | | | |
| | | | | | |
| | | | | | |
| | | | | | |
| | | | | | |
| | | | | | |
| | | | | | |
| | | | | | |
| | | | | | |
| | | | | | |
| | | | | | |
| | | | | | |
| | | | | | |
| | | | | | |
| | | | | | |
| | | | | | |
| | | | | | |
| | | | | | |
| | | | | | |
| | | | | | |
| | | | | | |
| | | | | | |
| | | | | | |
| | | | | | |
| | | | | | |
| | | | | | |
| | | | | | |
| | | | | | |
| | | | | | |
| | | | | | |
| | | | | | |
| | | | | | |
| | | | | | |
| | | | | | |
SEE NOTES TO FINANCIAL STATEMENTS.
| J.P. Morgan Large Cap Funds | |
FINANCIAL HIGHLIGHTSFOR THE PERIODS INDICATED (continued)
| Per share operating performance |
| | | |
| Net asset
value,
beginning
of period | Net
investment
income
(loss)(b) | Net realized
and unrealized
gains (losses)
on investments | Total from
investment
operations | | | |
JPMorgan U.S. GARP Equity Fund (continued) | | | | | | | |
| | | | | | | |
Six Months Ended December 31, 2024 (Unaudited) | | | | | | | |
| | | | | | | |
| | | | | | | |
| | | | | | | |
| | | | | | | |
| | | | | | | |
| | | | | | | |
|
| Annualized for periods less than one year, unless otherwise noted. |
| Calculated based upon average shares outstanding. |
| Not annualized for periods less than one year. |
| Includes adjustments in accordance with accounting principles generally accepted in the United States of America and as such, the net asset values for financial reporting purposes and the returns based upon those net asset values may differ from the net asset values and returns for shareholder transactions. |
| Includes interest expense, if applicable, which is less than 0.005% unless otherwise noted. |
| Net investment income (loss) may appear disproportionate among the classes due to the timing of recognition of income and changes in the relative size of the classes. |
| Certain non-recurring expenses incurred by the Fund were not annualized for the period indicated. |
| Reflects special dividends paid out during the year by several of the Fund’s holdings. Had the Fund not received the special dividends, the net investment income (loss) per share would have been $0.27, $(0.01), $0.41, $0.13, $0.49 and $0.55 for Class A, Class C, Class I, Class R2, Class R5 and Class R6 Shares, respectively, and the net investment income (loss) ratio would have been 0.48%, (0.02)%, 0.73%, 0.23%, 0.88% and 0.99% for Class A, Class C, Class I, Class R2, Class R5 and Class R6 Shares, respectively. |
SEE NOTES TO FINANCIAL STATEMENTS.
| J.P. Morgan Large Cap Funds | |
| |
| | | Ratios to average net assets(a) |
Net asset
value,
end of
period | Total return
(excludes
sales charge)(c)(d) | Net assets,
end of
period
(000's) | | Net
investment
income
(loss) | Expenses without
waivers and
reimbursements | |
|
| | | | | | |
| | | | | | |
| | | | | | |
| | | | | | |
| | | | | | |
| | | | | | |
| | | | | | |
| | | | | | |
SEE NOTES TO FINANCIAL STATEMENTS.
| J.P. Morgan Large Cap Funds | |
FINANCIAL HIGHLIGHTSFOR THE PERIODS INDICATED
| Per share operating performance |
| | | |
| Net asset
value,
beginning
of period | Net
investment
income
(loss)(b) | Net realized
and unrealized
gains (losses)
on investments | Total from
investment
operations | | | |
JPMorgan U.S. Large Cap Core Plus Fund | | | | | | | |
| | | | | | | |
Six Months Ended December 31, 2024 (Unaudited) | | | | | | | |
| | | | | | | |
| | | | | | | |
| | | | | | | |
| | | | | | | |
| | | | | | | |
| | | | | | | |
Six Months Ended December 31, 2024 (Unaudited) | | | | | | | |
| | | | | | | |
| | | | | | | |
| | | | | | | |
| | | | | | | |
| | | | | | | |
| | | | | | | |
Six Months Ended December 31, 2024 (Unaudited) | | | | | | | |
| | | | | | | |
| | | | | | | |
| | | | | | | |
| | | | | | | |
| | | | | | | |
| | | | | | | |
Six Months Ended December 31, 2024 (Unaudited) | | | | | | | |
| | | | | | | |
| | | | | | | |
| | | | | | | |
| | | | | | | |
| | | | | | | |
| | | | | | | |
Six Months Ended December 31, 2024 (Unaudited) | | | | | | | |
| | | | | | | |
| | | | | | | |
| | | | | | | |
| | | | | | | |
| | | | | | | |
SEE NOTES TO FINANCIAL STATEMENTS.
| J.P. Morgan Large Cap Funds | |
| |
| | | Ratios to average net assets(a) |
Net asset
value,
end of
period | Total return
(excludes
sales charge)(c)(d) | Net assets,
end of
period
(000's) | Net
expenses
(including dividend
and interest expense
for securities sold
short)(e)(f) | Net
investment
income
(loss) | Expenses without
waivers and
reimbursements
(including dividend
and interest expense
for securities sold
short)(f) | Portfolio
turnover rate
(excluding securities
sold short)(c) | Portfolio
turnover rate
(including securities
sold short)(c) |
| | | | | | | |
| | | | | | | |
| | | | | | | |
| | | | | | | |
| | | | | | | |
| | | | | | | |
| | | | | | | |
| | | | | | | |
| | | | | | | |
| | | | | | | |
| | | | | | | |
| | | | | | | |
| | | | | | | |
| | | | | | | |
| | | | | | | |
| | | | | | | |
| | | | | | | |
| | | | | | | |
| | | | | | | |
| | | | | | | |
| | | | | | | |
| | | | | | | |
| | | | | | | |
| | | | | | | |
| | | | | | | |
| | | | | | | |
| | | | | | | |
| | | | | | | |
| | | | | | | |
| | | | | | | |
| | | | | | | |
| | | | | | | |
| | | | | | | |
| | | | | | | |
| | | | | | | |
| | | | | | | |
SEE NOTES TO FINANCIAL STATEMENTS.
| J.P. Morgan Large Cap Funds | |
FINANCIAL HIGHLIGHTSFOR THE PERIODS INDICATED (continued)
| Per share operating performance |
| | | |
| Net asset
value,
beginning
of period | Net
investment
income
(loss)(b) | Net realized
and unrealized
gains (losses)
on investments | Total from
investment
operations | | | |
JPMorgan U.S. Large Cap Core Plus Fund (continued) | | | | | | | |
| | | | | | | |
Six Months Ended December 31, 2024 (Unaudited) | | | | | | | |
| | | | | | | |
| | | | | | | |
| | | | | | | |
| | | | | | | |
| | | | | | | |
| | | | | | | |
|
| Annualized for periods less than one year, unless otherwise noted. |
| Calculated based upon average shares outstanding. |
| Not annualized for periods less than one year. |
| Includes adjustments in accordance with accounting principles generally accepted in the United States of America and as such, the net asset values for financial reporting purposes and the returns based upon those net asset values may differ from the net asset values and returns for shareholder transactions. |
| Includes interest expense, if applicable, which is less than 0.005% unless otherwise noted. |
| |
| | | | | | |
Net expenses (excluding dividend and interest expense for securities sold short) | | | | | | |
| | | | | | |
| | | | | | |
| | | | | | |
| | | | | | |
| | | | | | |
| | | | | | |
Expenses without waivers and reimbursements (excluding dividend and interest expense for securities sold short) | | | | | | |
| | | | | | |
| | | | | | |
| | | | | | |
| | | | | | |
| | | | | | |
| | | | | | |
|
| Amount rounds to less than $0.005. |
| Reflects income payments received from litigation settlements during the year. Had the fund not received these payments, the net realized and unrealized gains (losses) on investments per share amount would have been $1.35, $1.06, $1.43, $1.19, $1.45 and $1.45 for Class A, Class C, Class I, Class R2, Class R5 and Class R6 Shares, respectively, and total return would have been 6.54%, 6.25%, 6.67%, 6.34%, 6.65% and 6.69% for Class A, Class C, Class I, Class R2, Class R5 and Class R6 Shares, respectively. |
| Interest expense on securities sold short is 0.07%. |
| Net investment income (loss) may appear disproportionate among the classes due to the timing of recognition of income and changes in the relative size of the classes. |
| Interest expense on securities sold short is 0.14%. |
| Interest expense on securities sold short is 0.62%. |
| Interest expense on securities sold short is 0.16%. |
SEE NOTES TO FINANCIAL STATEMENTS.
| J.P. Morgan Large Cap Funds | |
| |
| | | Ratios to average net assets(a) |
Net asset
value,
end of
period | Total return
(excludes
sales charge)(c)(d) | Net assets,
end of
period
(000's) | Net
expenses
(including dividend
and interest expense
for securities sold
short)(e)(f) | Net
investment
income
(loss) | Expenses without
waivers and
reimbursements
(including dividend
and interest expense
for securities sold
short)(f) | Portfolio
turnover rate
(excluding securities
sold short)(c) | Portfolio
turnover rate
(including securities
sold short)(c) |
|
| | | | | | | |
| | | | | | | |
| | | | | | | |
| | | | | | | |
| | | | | | | |
| | | | | | | |
| | | | | | | |
| | | | | | | |
SEE NOTES TO FINANCIAL STATEMENTS.
| J.P. Morgan Large Cap Funds | |
FINANCIAL HIGHLIGHTSFOR THE PERIODS INDICATED
| Per share operating performance |
| | | |
| Net asset
value,
beginning
of period | Net
investment
income
(loss)(b) | Net realized
and unrealized
gains (losses)
on investments | Total from
investment
operations | | | |
JPMorgan U.S. Research Enhanced Equity Fund | | | | | | | |
| | | | | | | |
Six Months Ended December 31, 2024 (Unaudited) | | | | | | | |
| | | | | | | |
| | | | | | | |
| | | | | | | |
| | | | | | | |
| | | | | | | |
| | | | | | | |
Six Months Ended December 31, 2024 (Unaudited) | | | | | | | |
| | | | | | | |
| | | | | | | |
| | | | | | | |
| | | | | | | |
| | | | | | | |
| | | | | | | |
Six Months Ended December 31, 2024 (Unaudited) | | | | | | | |
| | | | | | | |
| | | | | | | |
| | | | | | | |
| | | | | | | |
| | | | | | | |
| | | | | | | |
|
| Annualized for periods less than one year, unless otherwise noted. |
| Calculated based upon average shares outstanding. |
| Not annualized for periods less than one year. |
| Includes adjustments in accordance with accounting principles generally accepted in the United States of America and as such, the net asset values for financial reporting purposes and the returns based upon those net asset values may differ from the net asset values and returns for shareholder transactions. |
| Includes interest expense, if applicable, which is less than 0.005% unless otherwise noted. |
SEE NOTES TO FINANCIAL STATEMENTS.
| J.P. Morgan Large Cap Funds | |
| |
| | | Ratios to average net assets(a) |
Net asset
value,
end of
period | Total return
(excludes
sales charge)(c)(d) | Net assets,
end of
period
(000's) | | Net
investment
income
(loss) | Expenses without
waivers and
reimbursements | |
| | | | | | |
| | | | | | |
| | | | | | |
| | | | | | |
| | | | | | |
| | | | | | |
| | | | | | |
| | | | | | |
| | | | | | |
| | | | | | |
| | | | | | |
| | | | | | |
| | | | | | |
| | | | | | |
| | | | | | |
| | | | | | |
| | | | | | |
| | | | | | |
| | | | | | |
| | | | | | |
| | | | | | |
| | | | | | |
| | | | | | |
SEE NOTES TO FINANCIAL STATEMENTS.
| J.P. Morgan Large Cap Funds | |
FINANCIAL HIGHLIGHTSFOR THE PERIODS INDICATED
| Per share operating performance |
| | | |
| Net asset
value,
beginning
of period | Net
investment
income
(loss)(b) | Net realized
and unrealized
gains (losses)
on investments | Total from
investment
operations | | | |
JPMorgan U.S. Sustainable Leaders Fund | | | | | | | |
| | | | | | | |
Six Months Ended December 31, 2024 (Unaudited) | | | | | | | |
| | | | | | | |
| | | | | | | |
| | | | | | | |
| | | | | | | |
| | | | | | | |
| | | | | | | |
Six Months Ended December 31, 2024 (Unaudited) | | | | | | | |
| | | | | | | |
| | | | | | | |
| | | | | | | |
| | | | | | | |
| | | | | | | |
| | | | | | | |
Six Months Ended December 31, 2024 (Unaudited) | | | | | | | |
| | | | | | | |
| | | | | | | |
| | | | | | | |
| | | | | | | |
| | | | | | | |
| | | | | | | |
Six Months Ended December 31, 2024 (Unaudited) | | | | | | | |
| | | | | | | |
| | | | | | | |
| | | | | | | |
September 30, 2020 (f) through June 30, 2021 | | | | | | | |
| | | | | | | |
|
| Annualized for periods less than one year, unless otherwise noted. |
| Calculated based upon average shares outstanding. |
| Not annualized for periods less than one year. |
| Includes adjustments in accordance with accounting principles generally accepted in the United States of America and as such, the net asset values for financial reporting purposes and the returns based upon those net asset values may differ from the net asset values and returns for shareholder transactions. |
| Includes interest expense, if applicable, which is less than 0.005% unless otherwise noted. |
| Commencement of offering of class of shares. |
SEE NOTES TO FINANCIAL STATEMENTS.
| J.P. Morgan Large Cap Funds | |
FINANCIAL HIGHLIGHTSFOR THE PERIODS INDICATED
| |
| | | Ratios to average net assets(a) |
Net asset
value,
end of
period | Total return
(excludes
sales charge)(c)(d) | Net assets,
end of
period
(000's) | | Net
investment
income
(loss) | Expenses without
waivers and
reimbursements | |
| | | | | | |
| | | | | | |
| | | | | | |
| | | | | | |
| | | | | | |
| | | | | | |
| | | | | | |
| | | | | | |
| | | | | | |
| | | | | | |
| | | | | | |
| | | | | | |
| | | | | | |
| | | | | | |
| | | | | | |
| | | | | | |
| | | | | | |
| | | | | | |
| | | | | | |
| | | | | | |
| | | | | | |
| | | | | | |
| | | | | | |
| | | | | | |
| | | | | | |
| | | | | | |
| | | | | | |
| | | | | | |
| | | | | | |
SEE NOTES TO FINANCIAL STATEMENTS.
| J.P. Morgan Large Cap Funds | |
FINANCIAL HIGHLIGHTSFOR THE PERIODS INDICATED (continued)
| Per share operating performance |
| | | |
| Net asset
value,
beginning
of period | Net
investment
income
(loss)(b) | Net realized
and unrealized
gains (losses)
on investments | Total from
investment
operations | | | |
| | | | | | | |
| | | | | | | |
Six Months Ended December 31, 2024 (Unaudited) | | | | | | | |
| | | | | | | |
| | | | | | | |
| | | | | | | |
| | | | | | | |
| | | | | | | |
| | | | | | | |
Six Months Ended December 31, 2024 (Unaudited) | | | | | | | |
| | | | | | | |
| | | | | | | |
| | | | | | | |
| | | | | | | |
| | | | | | | |
| | | | | | | |
Six Months Ended December 31, 2024 (Unaudited) | | | | | | | |
| | | | | | | |
| | | | | | | |
| | | | | | | |
| | | | | | | |
| | | | | | | |
| | | | | | | |
Six Months Ended December 31, 2024 (Unaudited) | | | | | | | |
| | | | | | | |
| | | | | | | |
| | | | | | | |
| | | | | | | |
| | | | | | | |
| | | | | | | |
Six Months Ended December 31, 2024 (Unaudited) | | | | | | | |
| | | | | | | |
| | | | | | | |
| | | | | | | |
| | | | | | | |
| | | | | | | |
| | | | | | | |
Six Months Ended December 31, 2024 (Unaudited) | | | | | | | |
| | | | | | | |
| | | | | | | |
| | | | | | | |
| | | | | | | |
| | | | | | | |
SEE NOTES TO FINANCIAL STATEMENTS.
| J.P. Morgan Large Cap Funds | |
| |
| | | Ratios to average net assets(a) |
Net asset
value,
end of
period | Total return
(excludes
sales charge)(c)(d) | Net assets,
end of
period
(000's) | | Net
investment
income
(loss) | Expenses without
waivers and
reimbursements | |
| | | | | | |
| | | | | | |
| | | | | | |
| | | | | | |
| | | | | | |
| | | | | | |
| | | | | | |
| | | | | | |
| | | | | | |
| | | | | | |
| | | | | | |
| | | | | | |
| | | | | | |
| | | | | | |
| | | | | | |
| | | | | | |
| | | | | | |
| | | | | | |
| | | | | | |
| | | | | | |
| | | | | | |
| | | | | | |
| | | | | | |
| | | | | | |
| | | | | | |
| | | | | | |
| | | | | | |
| | | | | | |
| | | | | | |
| | | | | | |
| | | | | | |
| | | | | | |
| | | | | | |
| | | | | | |
| | | | | | |
| | | | | | |
| | | | | | |
| | | | | | |
| | | | | | |
| | | | | | |
| | | | | | |
| | | | | | |
| | | | | | |
SEE NOTES TO FINANCIAL STATEMENTS.
| J.P. Morgan Large Cap Funds | |
FINANCIAL HIGHLIGHTSFOR THE PERIODS INDICATED (continued)
| Per share operating performance |
| | | |
| Net asset
value,
beginning
of period | Net
investment
income
(loss)(b) | Net realized
and unrealized
gains (losses)
on investments | Total from
investment
operations | | | |
JPMorgan U.S. Value Fund (continued) | | | | | | | |
| | | | | | | |
Six Months Ended December 31, 2024 (Unaudited) | | | | | | | |
| | | | | | | |
| | | | | | | |
| | | | | | | |
| | | | | | | |
| | | | | | | |
| | | | | | | |
Six Months Ended December 31, 2024 (Unaudited) | | | | | | | |
| | | | | | | |
| | | | | | | |
| | | | | | | |
| | | | | | | |
| | | | | | | |
| | | | | | | |
|
| Annualized for periods less than one year, unless otherwise noted. |
| Calculated based upon average shares outstanding. |
| Not annualized for periods less than one year. |
| Includes adjustments in accordance with accounting principles generally accepted in the United States of America and as such, the net asset values for financial reporting purposes and the returns based upon those net asset values may differ from the net asset values and returns for shareholder transactions. |
| Includes interest expense, if applicable, which is less than 0.005% unless otherwise noted. |
SEE NOTES TO FINANCIAL STATEMENTS.
| J.P. Morgan Large Cap Funds | |
| |
| | | Ratios to average net assets(a) |
Net asset
value,
end of
period | Total return
(excludes
sales charge)(c)(d) | Net assets,
end of
period
(000's) | | Net
investment
income
(loss) | Expenses without
waivers and
reimbursements | |
|
| | | | | | |
| | | | | | |
| | | | | | |
| | | | | | |
| | | | | | |
| | | | | | |
| | | | | | |
| | | | | | |
| | | | | | |
| | | | | | |
| | | | | | |
| | | | | | |
| | | | | | |
| | | | | | |
| | | | | | |
SEE NOTES TO FINANCIAL STATEMENTS.
| J.P. Morgan Large Cap Funds | |
NOTES TO FINANCIAL STATEMENTSAS OF December 31, 2024 (Unaudited)
(Dollar values in thousands)
1. Organization
JPMorgan Trust I (“JPM I”), JPMorgan Trust II (“JPM II”) and JPMorgan Trust IV (“JPM IV”) (collectively, the “Trusts”) were formed on November 12, 2004 for JPM I and JPM II and November 11, 2015 for JPM IV, as Delaware statutory trusts, pursuant to Declarations of Trust dated November 5, 2004 and November 11, 2015, respectively, and are registered under the Investment Company Act of 1940, as amended (the “1940 Act”), as open-end management investment companies.
The following are 15 separate funds of the Trusts (each, a "Fund" and collectively, the "Funds") covered by this report:
| | | Diversification Classification |
JPMorgan Equity Income Fund | Class A, Class C, Class I, Class R2, Class R3, Class R4, Class R5 and Class R6 | | |
JPMorgan Equity Index Fund | Class A, Class C, Class I and Class R6 | | |
JPMorgan Equity Premium Income Fund | Class A, Class C, Class I, Class R5 and Class R6 | | |
JPMorgan Hedged Equity Fund | Class A, Class C, Class I, Class R5 and Class R6 | | |
JPMorgan Hedged Equity 2 Fund | Class A, Class C, Class I, Class R5 and Class R6 | | |
JPMorgan Hedged Equity 3 Fund | Class A, Class C, Class I, Class R5 and Class R6 | | |
JPMorgan Large Cap Growth Fund | Class A, Class C, Class I, Class R2, Class R3, Class R4, Class R5 and Class R6 | | |
JPMorgan Large Cap Value Fund | Class A, Class C, Class I, Class R2, Class R3, Class R4, Class R5 and Class R6 | | |
JPMorgan U.S. Applied Data Science Value Fund | Class A, Class C, Class I, Class R2, Class R5 and Class R6 | | |
JPMorgan U.S. Equity Fund | Class A, Class C, Class I, Class L, Class R2, Class R3, Class R4, Class R5 and Class R6 | | |
JPMorgan U.S. GARP Equity Fund | Class A, Class C, Class I, Class R2, Class R5 and Class R6 | | |
JPMorgan U.S. Large Cap Core Plus Fund | Class A, Class C, Class I, Class R2, Class R5 and Class R6 | | |
JPMorgan U.S. Research Enhanced Equity Fund | Class A, Class I and Class R6 | | |
JPMorgan U.S. Sustainable Leaders Fund | Class A, Class C, Class I and Class R6 | | |
| Class A, Class C, Class I, Class R2, Class R3, Class R4, Class R5 and Class R6 | | |
|
| Prior to December 2, 2024, JPMorgan U.S. GARP Equity Fund operated as a diversified company. |
The investment objective of JPMorgan Equity Income Fund (“Equity Income Fund”) is to seek capital appreciation and current income.
The investment objective of JPMorgan Equity Index Fund ("Equity Index Fund") is to seek investment results that correspond to the aggregate price and dividend performance of securities in the Standard & Poor's 500 Composite Stock Price Index.
The investment objective of JPMorgan Equity Premium Income Fund (“Equity Premium Income Fund”) is to seek current income while maintaining prospects for capital appreciation.
The investment objective of JPMorgan Hedged Equity Fund (“Hedged Equity Fund”), JPMorgan Hedged Equity 2 Fund (“Hedged Equity 2 Fund”) and JPMorgan Hedged Equity 3 Fund (“Hedged Equity 3 Fund”) is to seek to provide capital appreciation.
The investment objective of JPMorgan Large Cap Growth Fund ("Large Cap Growth Fund") is to seek long-term capital appreciation.
The investment objective of JPMorgan Large Cap Value Fund (“Large Cap Value Fund”) is to seek capital appreciation with the incidental goal of achieving current income by investing primarily in equity securities.
The investment objective of JPMorgan U.S. Applied Data Science Value Fund (“U.S. Applied Data Science Value Fund”) and JPMorgan U.S. Sustainable Leaders Fund (“U.S. Sustainable Leaders Fund”) is to seek to provide long-term capital appreciation.
The investment objective of JPMorgan U.S. Equity Fund (“U.S. Equity Fund”) and JPMorgan U.S. Large Cap Core Plus Fund ("U.S. Large Cap Core Plus Fund") is to seek to provide high total return from a portfolio of selected equity securities.
The investment objective of JPMorgan U.S. GARP Equity Fund (“U.S. GARP Equity Fund”) is to seek to provide long-term capital growth.
The investment objective of JPMorgan U.S. Research Enhanced Equity Fund (“U.S. Research Enhanced Equity Fund”) is to seek to provide a consistently high total return from a broadly diversified portfolio of equity securities with risk characteristics similar to the Standard and Poor’s 500 Composite Stock Price Index.
| J.P. Morgan Large Cap Funds | |
The investment objective of JPMorgan U.S. Value Fund (“U.S. Value Fund”) is to seek to provide capital growth over the long-term and to earn income from dividends.
Class L Shares of U.S. Equity Fund and Class A Shares of U.S. Research Enhanced Equity Fund are publicly offered on a limited basis. Investors are not eligible to purchase Class L Shares of the Funds unless they meet certain requirements as described in the Funds’ prospectus.
Class A Shares generally provide for a front-end sales charge while Class C Shares provide for a contingent deferred sales charge ("CDSC"). No sales charges are assessed with respect to Class I, Class L, Class R2, Class R3, Class R4, Class R5 and Class R6 Shares. Certain Class A Shares, for which front-end sales charges have been waived, may be subject to a CDSC as described in the Funds' prospectus. Class C Shares automatically convert to Class A Shares after eight years. All classes of shares have equal rights as to earnings, assets and voting privileges, except that each class may bear different transfer agency, distribution and service fees and each class has exclusive voting rights with respect to its distribution plan and shareholder servicing agreements.
J.P. Morgan Investment Management Inc. (“JPMIM”), an indirect, wholly-owned subsidiary of JPMorgan Chase & Co. (“JPMorgan”), acts as adviser (the “Adviser”) and administrator (the “Administrator”) to the Funds.
2. Significant Accounting Policies
The following is a summary of significant accounting policies followed by the Funds in the preparation of their financial statements. The Funds are investment companies and, accordingly, follow the investment company accounting and reporting guidance of the Financial Accounting Standards Board (“FASB”) Accounting Standards Codification Topic 946 — Investment Companies, which is part of U.S. generally accepted accounting principles (“GAAP”). The preparation of financial statements in conformity with GAAP requires management to make estimates and assumptions that affect (i) the reported amounts of assets and liabilities, (ii) disclosure of contingent assets and liabilities at the date of the financial statements, and (iii) the reported amounts of increases and decreases in net assets from operations during the reporting period. Actual results could differ from those estimates.
A. Valuation of Investments— Investments are valued in accordance with GAAP and the Funds' valuation policies set forth by, and under the supervision and responsibility of, the Boards of Trustees of the Trusts (the "Boards"), which established the following approach to valuation, as described more fully below: (i) investments for which market quotations are readily available shall be valued at their market value and (ii) all other investments for which market quotations are not readily available shall be valued at their fair value as determined in good faith by the Boards.
Under Section 2(a)(41) of the 1940 Act, the Boards are required to determine fair value for securities that do not have readily available market quotations. Under Securities and Exchange Commission (“SEC”) Rule 2a-5 (Good Faith Determinations of Fair Value), the Boards may designate the performance of these fair valuation determinations to a valuation designee. The Boards have designated the Adviser as the “Valuation Designee” to perform fair valuation determinations for the Funds on behalf of the Boards subject to appropriate oversight by the Boards. The Adviser, as Valuation Designee, leverages the J.P. Morgan Asset Management Americas Valuation Committee (“AVC”) to help oversee and carry out the policies for the valuation of investments held in the Funds. The Adviser, as Valuation Designee, remains responsible for the valuation determinations.
This oversight by the AVC includes monitoring the appropriateness of fair values based on results of ongoing valuation oversight including, but not limited to, consideration of macro or security specific events, market events, and pricing vendor and broker due diligence. The Administrator is responsible for discussing and assessing the potential impacts to the fair values on an ongoing basis, and, at least on a quarterly basis, with the AVC and the Boards.
A market-based approach is primarily used to value the Funds' investments. Investments for which market quotations are not readily available are fair valued using prices supplied by approved affiliated and/or unaffiliated pricing vendors or third party broker-dealers (collectively referred to as “Pricing Services”) or may be internally fair valued using methods set forth by the valuation policies approved by the Boards. This may include the use of related or comparable assets or liabilities, recent transactions, market multiples, book values and other relevant information for the investment. An income-based valuation approach may be used in which the anticipated future cash flows of the investment are discounted to calculate the fair value. Discounts may also be applied due to the nature or duration of any restrictions on the disposition of the investments. Valuations may be based upon current market prices of securities that are comparable in coupon, rating, maturity and industry. It is possible that the estimated values may differ significantly from the values that would have been used had a ready market for the investments existed, and such differences could be material.
Fixed income instruments are valued based on prices received from approved affiliated and unaffiliated pricing vendors or third party broker-dealers (collectively referred to as “Pricing Services”). The Pricing Services use multiple valuation techniques to determine the valuation of fixed income instruments. In instances where sufficient market activity exists, the Pricing Services may utilize a market-based approach through which trades or quotes from market makers are used to determine the valuation of these instruments. In instances where sufficient market activity may not exist, the Pricing Services also utilize proprietary valuation models which may consider market transactions in comparable securities and the various relationships between securities in determining fair value and/or market characteristics in order to estimate the relevant cash flows, which are then discounted to calculate the fair values.
Equities and other exchange-traded instruments are valued at the last sale price or official market closing price on the primary exchange on which the instrument is traded before the net asset values (“NAV”) of the Funds are calculated on a valuation date.
| J.P. Morgan Large Cap Funds | |
NOTES TO FINANCIAL STATEMENTSAS OF December 31, 2024 (Unaudited) (continued)
(Dollar values in thousands)
Investments in open-end investment companies (“Underlying Funds”) are valued at each Underlying Fund’s NAV per share as of the report date.
Futures contracts and options are generally valued on the basis of available market quotations.
Valuations reflected in this report are as of the report date. As a result, changes in valuation due to market events and/or issuer-related events after the report date and prior to issuance of the report are not reflected herein.
The various inputs that are used in determining the valuation of the Funds' investments are summarized into the three broad levels listed below.
•
Level 1 — Unadjusted inputs using quoted prices in active markets for identical investments.
•
Level 2 — Other significant observable inputs including, but not limited to, quoted prices for similar investments, inputs other than quoted prices that are observable for investments (such as interest rates, prepayment speeds, credit risk, etc.) or other market corroborated inputs.
•
Level 3 — Significant inputs based on the best information available in the circumstances, to the extent observable inputs are not available (including the Funds' assumptions in determining the fair value of investments).
A financial instrument’s level within the fair value hierarchy is based on the lowest level of any input, both individually and in the aggregate, that is significant to the fair value measurement. The inputs or methodology used for valuing instruments are not necessarily an indication of the risk associated with investing in those instruments.
The following tables represent each valuation input as presented on the Schedules of Portfolio Investments ("SOIs"):
| | | | |
| | Level 2
Other significant
observable inputs | Level 3
Significant
unobservable inputs | |
Total Investments in Securities (a) | | | | |
|
| Please refer to the SOI for specifics of portfolio holdings. |
| | | | |
| | Level 2
Other significant
observable inputs | Level 3
Significant
unobservable inputs | |
Investments in Securities | | | | |
| | | | |
| | | | |
| | | | |
| | | | |
Investment of Cash Collateral from Securities Loaned | | | | |
Total Short-Term Investments | | | | |
Total Investments in Securities | | | | |
Depreciation in Other Financial Instruments | | | | |
| | | | |
Equity Premium Income Fund | | | | |
| | Level 2
Other significant
observable inputs | Level 3
Significant
unobservable inputs | |
Investments in Securities | | | | |
| | | | |
| | | | |
| | | | |
| | | | |
Total Investments in Securities | | | | |
| J.P. Morgan Large Cap Funds | |
| | | | |
| | Level 2
Other significant
observable inputs | Level 3
Significant
unobservable inputs | |
Total Investments in Securities (a) | | | | |
Depreciation in Other Financial Instruments | | | | |
| | | | |
| | | | |
| | | | |
| | | | |
Total Depreciation in Other Financial Instruments | | | | |
|
| Please refer to the SOI for specifics of portfolio holdings. |
| | | | |
| | Level 2
Other significant
observable inputs | Level 3
Significant
unobservable inputs | |
Total Investments in Securities (a) | | | | |
|
| Please refer to the SOI for specifics of portfolio holdings. |
| J.P. Morgan Large Cap Funds | |
NOTES TO FINANCIAL STATEMENTSAS OF December 31, 2024 (Unaudited) (continued)
(Dollar values in thousands)
| | | | |
| | Level 2
Other significant
observable inputs | Level 3
Significant
unobservable inputs | |
Total Investments in Securities (a) | | | | |
|
| Please refer to the SOI for specifics of portfolio holdings. |
U.S. Applied Data Science Value Fund | | | | |
| | Level 2
Other significant
observable inputs | Level 3
Significant
unobservable inputs | |
Total Investments in Securities (a) | | | | |
Depreciation in Other Financial Instruments | | | | |
| | | | |
|
| Please refer to the SOI for specifics of portfolio holdings. |
| | | | |
| | Level 2
Other significant
observable inputs | Level 3
Significant
unobservable inputs | |
Total Investments in Securities (a) | | | | |
Depreciation in Other Financial Instruments | | | | |
| | | | |
|
| Please refer to the SOI for specifics of portfolio holdings. |
| | | | |
| | Level 2
Other significant
observable inputs | Level 3
Significant
unobservable inputs | |
Total Investments in Securities (a) | | | | |
Depreciation in Other Financial Instruments | | | | |
| | | | |
|
| Please refer to the SOI for specifics of portfolio holdings. |
U.S. Large Cap Core Plus Fund | | | | |
| | Level 2
Other significant
observable inputs | Level 3
Significant
unobservable inputs | |
Total Investments in Securities (a) | | | | |
Total Liabilities in Securities Sold Short (a) | | | | |
|
| Please refer to the SOI for specifics of portfolio holdings. |
| J.P. Morgan Large Cap Funds | |
U.S. Research Enhanced Equity Fund | | | | |
| | Level 2
Other significant
observable inputs | Level 3
Significant
unobservable inputs | |
Total Investments in Securities (a) | | | | |
Depreciation in Other Financial Instruments | | | | |
| | | | |
|
| Please refer to the SOI for specifics of portfolio holdings. |
U.S. Sustainable Leaders Fund | | | | |
| | Level 2
Other significant
observable inputs | Level 3
Significant
unobservable inputs | |
Total Investments in Securities (a) | | | | |
Depreciation in Other Financial Instruments | | | | |
| | | | |
|
| Please refer to the SOI for specifics of portfolio holdings. |
| | | | |
| | Level 2
Other significant
observable inputs | Level 3
Significant
unobservable inputs | |
Total Investments in Securities (a) | | | | |
|
| Please refer to the SOI for specifics of portfolio holdings. |
B. Restricted Securities— Certain securities held by the Funds may be subject to legal or contractual restrictions on resale. Restricted securities generally are resold in transactions exempt from registration under the Securities Act of 1933, as amended (the “Securities Act”). Disposal of these securities may involve time-consuming negotiations and expense. Prompt sale at the current valuation may be difficult and could adversely affect the NAVs of the Funds.
As of December 31, 2024, the Funds had no investments in restricted securities other than securities sold to the Funds under Rule 144A and/or Regulation S under the Securities Act.
C. Securities Lending — The Funds are authorized to engage in securities lending in order to generate additional income. The Funds are able to lend to approved borrowers. Citibank N.A. (“Citibank”) serves as lending agent for the Funds, pursuant to a Securities Lending Agency Agreement (the “Securities Lending Agency Agreement”). Securities loaned are collateralized by cash equal to at least 100% of the market value plus accrued interest on the securities lent, which is invested in the Class IM Shares of the JPMorgan U.S. Government Money Market Fund, the Class IM Shares of the JPMorgan Prime Money Market Fund, and the Agency SL Class Shares of the JPMorgan Securities Lending Money Market Fund. The Funds retain the interest earned on cash collateral investments but are required to pay the borrower a rebate for the use of the cash collateral. In cases where the lent security is of high value to borrowers, there may be a negative rebate (i.e., a net payment from the borrower to the Funds). Upon termination of a loan, the Funds are required to return to the borrower an amount equal to the cash collateral, plus any rebate owed to the borrowers. The remaining maturities of the securities lending transactions are considered overnight and continuous. Loans are subject to termination by the Funds or the borrower at any time.
The net income earned on the securities lending (after payment of rebates and Citibank’s fee) is included on the Statements of Operations as Income from securities lending (net). The Funds also receive payments from the borrower during the period of the loan, equivalent to dividends and interest earned on the securities loaned, which are recorded as Dividend or Interest income, respectively, on the Statements of Operations.
Under the Securities Lending Agency Agreement, Citibank marks to market the loaned securities on a daily basis. In the event the cash received from the borrower is less than 102% of the value of the loaned securities (105% for loans of non-U.S. securities), Citibank requests additional cash from the borrower so as to maintain a collateralization level of at least 102% of the value of the loaned securities plus accrued interest (105% for loans of non-U.S. securities), subject to certain de minimis amounts.
| J.P. Morgan Large Cap Funds | |
NOTES TO FINANCIAL STATEMENTSAS OF December 31, 2024 (Unaudited) (continued)
(Dollar values in thousands)
The value of securities out on loan is recorded as an asset on the Statements of Assets and Liabilities. The value of the cash collateral received is recorded as a liability on the Statements of Assets and Liabilities and details of collateral investments are disclosed on the SOIs.
The Funds bear the risk of loss associated with the collateral investments and are not entitled to additional collateral from the borrower to cover any such losses. To the extent that the value of the collateral investments declines below the amount owed to a borrower, the Funds may incur losses that exceed the amount they earned on lending the security. Upon termination of a loan, the Funds may use leverage (borrow money) to repay the borrower for cash collateral posted if the Adviser does not believe that it is prudent to sell the collateral investments to fund the payment of this liability. Securities lending activity is subject to master netting arrangements.
The following table presents for each lending Fund, the value of the securities on loan with Citibank, net of amounts available for offset under the master netting arrangements and any related collateral received or posted by the Funds as of December 31, 2024.
| Investment Securities
on Loan, at value,
Presented on the
Statements of Assets
and Liabilities | Cash Collateral
Posted by Borrower* | Net Amount Due
to Counterparty
(not less than zero) |
| | | |
| | | |
| | | |
|
| Collateral posted reflects the value of securities on loan and does not include any additional amounts received from the borrower. |
Securities lending also involves counterparty risks, including the risk that the loaned securities may not be returned in a timely manner or at all. Subject to certain conditions, Citibank has agreed to indemnify the Funds from losses resulting from a borrower’s failure to return a loaned security.
JPMIM voluntarily waived investment advisory fees charged to the Funds to reduce the impact of the cash collateral investment in the JPMorgan U.S. Government Money Market Fund from 0.13% to 0.06%. For the six months ended December 31, 2024, JPMIM waived fees associated with the Funds' investment in the JPMorgan U.S. Government Money Market Fund as follows:
|
| Amount rounds to less than one thousand. |
The above waiver is included in the determination of earnings on cash collateral investment and in the calculation of Citibank’s compensation and is included on the Statements of Operations as Income from securities lending (net).
Equity Income Fund, Equity Premium Income Fund, Large Cap Growth Fund, U.S. Applied Data Science Value Fund and U.S. Value Fund did not have any securities out on loan at December 31, 2024. Hedged Equity Fund, Hedged Equity 2 Fund, Hedged Equity 3 Fund, U.S. Equity Fund, U.S. Large Cap Core Plus Fund, U.S. Research Enhanced Equity Fund and U.S. Sustainable Leaders Fund did not lend out any securities during the six months ended December 31, 2024.
| J.P. Morgan Large Cap Funds | |
D. Investment Transactions with Affiliates— The Funds invested in Underlying Funds advised by the Adviser. An issuer which is under common control with a Fund may be considered an affiliate. For the purposes of the financial statements, the Funds assume the issuers listed in the tables below to be affiliated issuers. The Underlying Funds’ distributions may be reinvested into such Underlying Funds. Reinvestment amounts are included in the purchases at cost amounts in the tables below.
|
For the six months ended December 31, 2024 |
| | | | | Change in
Unrealized
Appreciation/
(Depreciation) | | Shares at
December 31,
2024 | | Capital Gain
Distributions |
JPMorgan Prime Money Market Fund Class IM Shares, 4.54% (a) (b) | | | | | | | | | |
JPMorgan Securities Lending Money Market Fund Agency SL Class Shares, 4.47% (a) (b) | | | | | | | | | |
| | | | | | | | | |
|
| Investment in an affiliated fund, which is registered under the Investment Company Act of 1940, as amended, and is advised by J.P. Morgan Investment Management Inc. |
| The rate shown is the current yield as of December 31, 2024. |
| Amount is included on the Statements of Operations as Income from securities lending (net) (after payments of rebates and Citibank’s fee). |
|
For the six months ended December 31, 2024 |
| | | | | Change in
Unrealized
Appreciation/
(Depreciation) | | Shares at
December 31,
2024 | | Capital Gain
Distributions |
| | | | | | | | | |
JPMorgan Securities Lending Money Market Fund Agency SL Class Shares, 4.47% (b) (c) | | | | | | | | | |
JPMorgan U.S. Government Money Market Fund Class IM Shares, 4.44% (b) (c) | | | | | | | | | |
JPMorgan U.S. Government Money Market Fund Class Institutional Shares, 4.34% (b) (c) | | | | | | | | | |
| | | | | | | | | |
|
| Investment in affiliate. This security is included in an index in which the Fund, as an index fund, tracks. |
| Investment in an affiliated fund, which is registered under the Investment Company Act of 1940, as amended, and is advised by J.P. Morgan Investment Management Inc. |
| The rate shown is the current yield as of December 31, 2024. |
| Amount is included on the Statements of Operations as Income from securities lending (net) (after payments of rebates and Citibank’s fee). |
| J.P. Morgan Large Cap Funds | |
NOTES TO FINANCIAL STATEMENTSAS OF December 31, 2024 (Unaudited) (continued)
(Dollar values in thousands)
Equity Premium Income Fund |
For the six months ended December 31, 2024 |
| | | | | Change in
Unrealized
Appreciation/
(Depreciation) | | Shares at
December 31,
2024 | | Capital Gain
Distributions |
JPMorgan Prime Money Market Fund Class IM Shares, 4.54% (a) (b) | | | | | | | | | |
JPMorgan Securities Lending Money Market Fund Agency SL Class Shares, 4.47% (a) (b) | | | | | | | | | |
| | | | | | | | | |
|
| Investment in an affiliated fund, which is registered under the Investment Company Act of 1940, as amended, and is advised by J.P. Morgan Investment Management Inc. |
| The rate shown is the current yield as of December 31, 2024. |
| Amount is included on the Statements of Operations as Income from securities lending (net) (after payments of rebates and Citibank’s fee). |
|
For the six months ended December 31, 2024 |
| | | | | Change in
Unrealized
Appreciation/
(Depreciation) | | Shares at
December 31,
2024 | | Capital Gain
Distributions |
JPMorgan U.S. Government Money Market Fund Class Institutional Shares, 4.34% (a) (b) | | | | | | | | | |
|
| Investment in an affiliated fund, which is registered under the Investment Company Act of 1940, as amended, and is advised by J.P. Morgan Investment Management Inc. |
| The rate shown is the current yield as of December 31, 2024. |
|
For the six months ended December 31, 2024 |
| | | | | Change in
Unrealized
Appreciation/
(Depreciation) | | Shares at
December 31,
2024 | | Capital Gain
Distributions |
JPMorgan U.S. Government Money Market Fund Class IM Shares, 4.44% (a) (b) | | | | | | | | | |
|
| Investment in an affiliated fund, which is registered under the Investment Company Act of 1940, as amended, and is advised by J.P. Morgan Investment Management Inc. |
| The rate shown is the current yield as of December 31, 2024. |
| J.P. Morgan Large Cap Funds | |
|
For the six months ended December 31, 2024 |
| | | | | Change in
Unrealized
Appreciation/
(Depreciation) | | Shares at
December 31,
2024 | | Capital Gain
Distributions |
JPMorgan U.S. Government Money Market Fund Class IM Shares, 4.44% (a) (b) | | | | | | | | | |
|
| Investment in an affiliated fund, which is registered under the Investment Company Act of 1940, as amended, and is advised by J.P. Morgan Investment Management Inc. |
| The rate shown is the current yield as of December 31, 2024. |
|
For the six months ended December 31, 2024 |
| | | | | Change in
Unrealized
Appreciation/
(Depreciation) | | Shares at
December 31,
2024 | | Capital Gain
Distributions |
JPMorgan Prime Money Market Fund Class IM Shares, 4.54% (a) (b) | | | | | | | | | |
JPMorgan Securities Lending Money Market Fund Agency SL Class Shares, 4.47% | | | | | | | | | |
JPMorgan U.S. Government Money Market Fund Class IM Shares, 4.44% (a) (b) | | | | | | | | | |
| | | | | | | | | |
|
| Investment in an affiliated fund, which is registered under the Investment Company Act of 1940, as amended, and is advised by J.P. Morgan Investment Management Inc. |
| The rate shown is the current yield as of December 31, 2024. |
| Amount is included on the Statements of Operations as Income from securities lending (net) (after payments of rebates and Citibank’s fee). |
|
For the six months ended December 31, 2024 |
| | | | | Change in
Unrealized
Appreciation/
(Depreciation) | | Shares at
December 31,
2024 | | Capital Gain
Distributions |
JPMorgan Prime Money Market Fund Class IM Shares, 4.54% (a) (b) | | | | | | | | | |
JPMorgan Securities Lending Money Market Fund Agency SL Class Shares, 4.47% (a) (b) | | | | | | | | | |
JPMorgan U.S. Government Money Market Fund Class IM Shares, 4.44% (a) (b) | | | | | | | | | |
| | | | | | | | | |
|
| Investment in an affiliated fund, which is registered under the Investment Company Act of 1940, as amended, and is advised by J.P. Morgan Investment Management Inc. |
| The rate shown is the current yield as of December 31, 2024. |
| Amount is included on the Statements of Operations as Income from securities lending (net) (after payments of rebates and Citibank’s fee). |
| J.P. Morgan Large Cap Funds | |
NOTES TO FINANCIAL STATEMENTSAS OF December 31, 2024 (Unaudited) (continued)
(Dollar values in thousands)
U.S. Applied Data Science Value Fund |
For the six months ended December 31, 2024 |
| | | | | Change in
Unrealized
Appreciation/
(Depreciation) | | Shares at
December 31,
2024 | | Capital Gain
Distributions |
JPMorgan Prime Money Market Fund Class IM Shares, 4.54% (a) (b) | | | | | | | | | |
JPMorgan Securities Lending Money Market Fund Agency SL Class Shares, 4.47% (a) (b) | | | | | | | | | |
| | | | | | | | | |
|
| Investment in an affiliated fund, which is registered under the Investment Company Act of 1940, as amended, and is advised by J.P. Morgan Investment Management Inc. |
| The rate shown is the current yield as of December 31, 2024. |
| Amount rounds to less than one thousand. |
| Amount is included on the Statements of Operations as Income from securities lending (net) (after payments of rebates and Citibank’s fee). |
|
For the six months ended December 31, 2024 |
| | | | | Change in
Unrealized
Appreciation/
(Depreciation) | | Shares at
December 31,
2024 | | Capital Gain
Distributions |
JPMorgan Prime Money Market Fund Class IM Shares, 4.54% (a) (b) | | | | | | | | | |
JPMorgan Securities Lending Money Market Fund Agency SL Class Shares, 4.47% (a) (b) | | | | | | | | | |
| | | | | | | | | |
|
| Investment in an affiliated fund, which is registered under the Investment Company Act of 1940, as amended, and is advised by J.P. Morgan Investment Management Inc. |
| The rate shown is the current yield as of December 31, 2024. |
| Amount is included on the Statements of Operations as Income from securities lending (net) (after payments of rebates and Citibank’s fee). |
| J.P. Morgan Large Cap Funds | |
U.S. Large Cap Core Plus Fund |
For the six months ended December 31, 2024 |
| | | | | Change in
Unrealized
Appreciation/
(Depreciation) | | Shares at
December 31,
2024 | | Capital Gain
Distributions |
JPMorgan Prime Money Market Fund Class IM Shares, 4.54% (a) (b) | | | | | | | | | |
|
| Investment in an affiliated fund, which is registered under the Investment Company Act of 1940, as amended, and is advised by J.P. Morgan Investment Management Inc. |
| The rate shown is the current yield as of December 31, 2024. |
U.S. Research Enhanced Equity Fund |
For the six months ended December 31, 2024 |
| | | | | Change in
Unrealized
Appreciation/
(Depreciation) | | Shares at
December 31,
2024 | | Capital Gain
Distributions |
JPMorgan Prime Money Market Fund Class IM Shares, 4.54% (a) (b) | | | | | | | | | |
|
| Investment in an affiliated fund, which is registered under the Investment Company Act of 1940, as amended, and is advised by J.P. Morgan Investment Management Inc. |
| The rate shown is the current yield as of December 31, 2024. |
U.S. Sustainable Leaders Fund |
For the six months ended December 31, 2024 |
| | | | | Change in
Unrealized
Appreciation/
(Depreciation) | | Shares at
December 31,
2024 | | Capital Gain
Distributions |
JPMorgan Prime Money Market Fund Class IM Shares, 4.54% (a) (b) | | | | | | | | | |
|
| Investment in an affiliated fund, which is registered under the Investment Company Act of 1940, as amended, and is advised by J.P. Morgan Investment Management Inc. |
| The rate shown is the current yield as of December 31, 2024. |
| Amount rounds to less than one thousand. |
|
For the six months ended December 31, 2024 |
| | | | | Change in
Unrealized
Appreciation/
(Depreciation) | | Shares at
December 31,
2024 | | Capital Gain
Distributions |
JPMorgan Prime Money Market Fund Class IM Shares, 4.54% (a) (b) | | | | | | | | | |
JPMorgan Securities Lending Money Market Fund Agency SL Class Shares, 4.47% (a) (b) | | | | | | | | | |
| | | | | | | | | |
|
| Investment in an affiliated fund, which is registered under the Investment Company Act of 1940, as amended, and is advised by J.P. Morgan Investment Management Inc. |
| J.P. Morgan Large Cap Funds | |
NOTES TO FINANCIAL STATEMENTSAS OF December 31, 2024 (Unaudited) (continued)
(Dollar values in thousands)
| The rate shown is the current yield as of December 31, 2024. |
| Amount is included on the Statements of Operations as Income from securities lending (net) (after payments of rebates and Citibank’s fee). |
E. Foreign Currency Translation — The books and records of the Funds are maintained in U.S. dollars. Foreign currency amounts are translated into U.S. dollars at the prevailing exchange rates of such currencies against the U.S. dollar. The market value of investment securities and other assets and liabilities are translated at the exchange rate as of the valuation date. Purchases and sales of investment securities, income and expenses are translated at the exchange rate prevailing on the respective dates of such transactions.
The Funds do not isolate the effect of changes in foreign exchange rates from changes in market prices on securities held. Accordingly, such changes are included within Change in net unrealized appreciation/depreciation on investments in non-affiliates on the Statements of Operations.
Reported realized foreign currency gains and losses arise from the disposition of foreign currency, currency gains or losses realized between the trade and settlement dates on securities transactions, and the difference between the amounts of dividends, interest and foreign withholding taxes recorded on each Fund's books on the transaction date and the U.S. dollar equivalent of the amounts actually received or paid. These reported realized foreign currency gains and losses are included in Net realized gain (loss) on foreign currency transactions on the Statements of Operations. Unrealized foreign currency gains and losses arise from changes (due to changes in exchange rates) in the value of foreign currency and other assets and liabilities denominated in foreign currencies, which are held at period end and are included in Change in net unrealized appreciation/depreciation on foreign currency translations on the Statements of Operations.
F. Options— Hedged Equity Fund, Hedged Equity 2 Fund and Hedged Equity 3 Fund purchased and sold (“wrote”) put and call options on various instruments including options on indices to manage and hedge interest rate risks within their portfolios and also to gain long or short exposure to the underlying instrument, index, currency or rate. A purchaser of a put option has the right, but not the obligation, to sell the underlying instrument at an agreed upon price (“strike price”) to the option seller. A purchaser of a call option has the right, but not the obligation, to purchase the underlying instrument at the strike price from the option seller.
Options Purchased— Premiums paid by the Funds for options purchased are included on the Statements of Assets and Liabilities as Options purchased. The option is adjusted daily to reflect the current market value of the option and the change is recorded as Change in net unrealized appreciation/depreciation on options purchased on the Statements of Operations. If the option is allowed to expire, the Funds will lose the entire premium they paid and record a realized loss for the premium amount. Premiums paid for options purchased which are exercised or closed are added to the amounts paid or offset against the proceeds on the underlying investment transaction to determine the realized gain (loss) or cost basis of the underlying investment.
Options Written— Premiums received by the Funds for options written are included on the Statements of Assets and Liabilities as a liability. The amount of the liability is adjusted daily to reflect the current market value of the option written and the change in market value is recorded as Change in net unrealized appreciation/depreciation on options written on the Statements of Operations. Premiums received from options written that expire are treated as realized gains. If a written option is closed, the Funds record a realized gain or loss on options written based on whether the cost of the closing transaction exceeds the premium received. If a call option is exercised by the option buyer, the premium received by the Funds is added to the proceeds from the sale of the underlying security to the option buyer and compared to the cost of the closing transaction to determine whether there has been a realized gain or loss. If a put option is exercised by an option buyer, the premium received by the option seller reduces the cost basis of the purchased security.
The Funds pledge collateral to the counterparty in the form of securities for options written. Securities designated as collateral are denoted on the SOIs.
Written uncovered call options subject the Funds to unlimited risk of loss. Written covered call options limit the upside potential of a security above the strike price. Written put options subject the Funds to risk of loss if the value of the security declines below the exercise price minus the put premium.
The Funds are not subject to credit risk on options written as the counterparty has already performed its obligation by paying the premium at the inception of the contract.
The Funds’ exchange-traded option contracts are not subject to master netting arrangements (the right to close out all transactions traded with a counterparty and net amounts owed or due across transactions).
G. Futures Contracts— Equity Index Fund, Equity Premium Income Fund, Hedged Equity Fund, Hedged Equity 2 Fund, Hedged Equity 3 Fund, U.S. Applied Data Science Value Fund, U.S. Equity Fund, U.S. GARP Equity Fund, U.S. Large Cap Core Plus Fund, U.S. Research Enhanced Equity Fund and U.S. Sustainable Leaders Fund used index futures contracts to gain or reduce exposure to the stock market, or maintain liquidity or minimize transaction costs. The Funds also purchased futures contracts to invest incoming cash in the market or sold futures in response to cash outflows, thereby simulating an invested position in the underlying index while maintaining a cash balance for liquidity.
Futures contracts provide for the delayed delivery of the underlying instrument at a fixed price or are settled for a cash amount based on the change in the value of the underlying instrument at a specific date in the future. Upon entering into a futures contract, the Funds are required to deposit with the broker, cash or securities in an amount equal to a certain percentage of the contract amount, which is referred to as the initial margin
| J.P. Morgan Large Cap Funds | |
deposit. Subsequent payments, referred to as variation margin, are made or received by the Funds periodically and are based on changes in the market value of open futures contracts. Changes in the market value of open futures contracts are recorded as Change in net unrealized appreciation/depreciation on futures contracts on the Statements of Operations. Realized gains or losses, representing the difference between the value of the contract at the time it was opened and the value at the time it was closed, are reported on the Statements of Operations at the closing or expiration of the futures contract. Securities deposited as initial margin are designated on the SOIs, while cash deposited, which is considered restricted, is recorded on the Statements of Assets and Liabilities. A receivable from and/or a payable to brokers for the daily variation margin is also recorded on the Statements of Assets and Liabilities.
The use of futures contracts exposes the Funds to equity price risk. The Funds may be subject to the risk that the change in the value of the futures contract may not correlate perfectly with the underlying instrument. Use of long futures contracts subjects the Funds to risk of loss in excess of the amounts shown on the Statements of Assets and Liabilities, up to the notional amount of the futures contracts. Use of short futures contracts subjects the Funds to unlimited risk of loss. The Funds may enter into futures contracts only on exchanges or boards of trade. The exchange or board of trade acts as the counterparty to each futures transaction; therefore, the Funds' credit risk is limited to failure of the exchange or board of trade. Under some circumstances, futures exchanges may establish daily limits on the amount that the price of a futures contract can vary from the previous day’s settlement price, which could effectively prevent liquidation of positions.
The Funds' futures contracts are not subject to master netting arrangements (the right to close out all transactions traded with a counterparty and net amounts owed or due across transactions).
The table below discloses the volume of the Funds' options and futures contracts activity during the six months ended December 31, 2024. Please refer to the tables in the Summary of Derivatives Information for derivative-related gains and losses associated with volume activity (amounts in thousands, except number of contracts):
| | Equity Premium
Income Fund |
| | |
Average Notional Balance Long | | |
Average Notional Balance Short | | |
Ending Notional Balance Long | | |
| | | |
| | | |
Average Notional Balance Long | | | |
Ending Notional Balance Long | | | |
| | | |
Average Number of Contracts Purchased | | | |
Average Number of Contracts Written | | | |
Ending Number of Contracts Purchased | | | |
Ending Number of Contracts Written | | | |
| U.S.
Applied Data
Science
Value Fund | | |
| | | |
Average Notional Balance Long | | | |
Ending Notional Balance Long | | | |
| U.S.
Large Cap
Core Plus
Fund | U.S.
Research
Enhanced
Equity
Fund | U.S.
Sustainable
Leaders
Fund |
| | | |
Average Notional Balance Long | | | |
Ending Notional Balance Long | | | |
The Funds' derivatives contracts held at December 31, 2024 are not accounted for as hedging instruments under GAAP.
| J.P. Morgan Large Cap Funds | |
NOTES TO FINANCIAL STATEMENTSAS OF December 31, 2024 (Unaudited) (continued)
(Dollar values in thousands)
H. Equity-Linked Notes— Equity Premium Income Fund invested in Equity-Linked Notes (“ELNs”). These are hybrid instruments which combine both debt and equity characteristics into a single note form. ELNs' values are linked to the performance of an underlying index. ELNs are unsecured debt obligations of an issuer and may not be publicly listed or traded on an exchange. ELNs are valued daily, under procedures adopted by the Board, based on values provided by an approved pricing source. These notes have a coupon which is accrued and recorded as interest income on the Statements of Operations. Changes in the market value of ELNs are recorded as Change in net unrealized appreciation or depreciation on the Statements of Operations. The Fund realizes a gain or loss when an ELN is sold or matures, which is recorded as Net realized gain (loss) on transactions from investments in non-affiliates on the Statements of Operations.
As of December 31, 2024, Equity Premium Income Fund had outstanding ELNs as listed on the SOIs.
I. Short Sales— U.S. Large Cap Core Plus Fund engaged in short sales as part of its normal investment activities. In a short sale, the Fund sells securities it does not own in anticipation of a decline in the market value of those securities. In order to deliver securities to the purchaser, the Fund borrows securities from a broker. To close out a short position, the Fund delivers the same securities to the broker.
The Fund is required to pledge cash or securities to the broker as collateral for the securities sold short. Collateral requirements are calculated daily based on the current market value of the short positions. Cash collateral deposited with the broker is recorded as Deposits at broker for securities sold short, while cash collateral deposited at the Fund's custodian for the benefit of the broker is recorded as Restricted cash for securities sold short on the Statements of Assets and Liabilities. Securities segregated as collateral are denoted on the SOIs. The Fund may receive or pay the net of the following amounts: (i) a portion of the income from the investment of cash collateral; (ii) the broker’s fee on the borrowed securities (calculated daily based upon the market value of each borrowed security and a variable rate that is dependent on availability of the security); and (iii) a financing charge for the difference between the market value of the short position and cash collateral deposited with the broker. The net amounts of income or fees are included as interest income or interest expense on securities sold short on the Statements of Operations.
The Fund is obligated to pay the broker dividends declared on short positions when a position is open on the record date. Dividends on short positions are reported on ex-dividend date on the Statements of Operations as Dividend expense on securities sold short. The Fund is obligated to pay the broker interest accrued on short positions while the position is outstanding. Interest expense on short positions is reported as Interest expense to non-affiliates on securities sold short on the Statements of Operations. Liabilities for securities sold short are reported at market value on the Statements of Assets and Liabilities and the change in market value is recorded as Change in net unrealized appreciation/depreciation on the Statements of Operations. Short sale transactions may result in unlimited losses as the security’s price increases and the short position loses value. There is no upward limit on the price a borrowed security could attain. The Fund is also subject to risk of loss if the broker were to fail to perform its obligations under the contractual terms.
The Fund will record a realized loss if the price of the borrowed security increases between the date of the short sale and the date on which the Fund replaces the borrowed security. The Fund will record a realized gain if the price of the borrowed security declines between those dates.
As of December 31, 2024, U.S. Large Cap Core Plus Fund had outstanding short sales as listed on its SOI.
J. Security Transactions and Investment Income— Investment transactions are accounted for on the trade date (the date the order to buy or sell is executed). Securities gains and losses are calculated on a specifically identified cost basis.
Interest income and interest expense on securities sold short, if any, is determined on the basis of coupon interest accrued using the effective interest method, which adjusts for amortization of premiums and accretion of discounts.
Dividend income and dividend expense on securities sold short, if any, is recorded on the ex-dividend date or when the Funds first learn of the dividend.
To the extent such information is publicly available, the Funds record distributions received in excess of income earned from underlying investments as a reduction of cost of investments and/or realized gain. Such amounts are based on estimates if actual amounts are not available and actual amounts of income, realized gain and return of capital may differ from the estimated amounts. The Funds adjust the estimated amounts of the components of distributions (and consequently their net investment income) as necessary, once the issuers provide information about the actual composition of the distributions.
| J.P. Morgan Large Cap Funds | |
K. Allocation of Income and Expenses— Expenses directly attributable to a Fund are charged directly to that Fund, while the expenses attributable to more than one fund of the Trusts are allocated among the applicable funds. Investment income, realized and unrealized gains and losses and expenses, other than class-specific expenses, are allocated daily to each class of shares based upon the proportion of net assets of each class at the beginning of each day.
Transfer agency fees are class-specific expenses. The amount of the transfer agency fees charged to each share class of the Funds for the six months ended December 31, 2024 are as follows:
| | | | | | | | | | |
| | | | | | | | | | |
| | | | | | | | | | |
| | | | | | | | | | |
| | | | | | | | | | |
Equity Premium Income Fund | | | | | | | | | | |
| | | | | | | | | | |
| | | | | | | | | | |
| | | | | | | | | | |
| | | | | | | | | | |
| | | | | | | | | | |
| | | | | | | | | | |
| | | | | | | | | | |
| | | | | | | | | | |
| | | | | | | | | | |
| | | | | | | | | | |
| | | | | | | | | | |
U.S. Applied Data Science Value Fund | | | | | | | | | | |
| | | | | | | | | | |
| | | | | | | | | | |
| | | | | | | | | | |
| | | | | | | | | | |
| | | | | | | | | | |
U.S. Large Cap Core Plus Fund | | | | | | | | | | |
| | | | | | | | | | |
U.S. Research Enhanced Equity Fund | | | | | | | | | | |
| | | | | | | | | | |
U.S. Sustainable Leaders Fund | | | | | | | | | | |
| | | | | | | | | | |
| | | | | | | | | | |
| | | | | | | | | | |
|
| Amount rounds to less than one thousand. |
| J.P. Morgan Large Cap Funds | |
NOTES TO FINANCIAL STATEMENTSAS OF December 31, 2024 (Unaudited) (continued)
(Dollar values in thousands)
L. Federal Income Taxes— Each Fund is treated as a separate taxable entity for Federal income tax purposes. Each Fund's policy is to comply with the provisions of the Internal Revenue Code (the “Code”) applicable to regulated investment companies and to distribute to shareholders all of its distributable net investment income and net realized capital gains on investments. Accordingly, no provision for Federal income tax is necessary. Management has reviewed the Funds' tax positions for all open tax years and has determined that as of December 31, 2024, no liability for Federal income tax is required in the Funds' financial statements for net unrecognized tax benefits. However, management’s conclusions may be subject to future review based on changes in, or the interpretation of, the accounting standards or tax laws and regulations. Each Fund's Federal tax returns for the prior three fiscal years, or since inception if shorter, remain subject to examination by the Internal Revenue Service.
M. Distributions to Shareholders— Distributions from net investment income, if any, are generally declared and paid at least quarterly, except for Large Cap Growth Fund, U.S. GARP Equity Fund, U.S. Large Cap Core Plus Fund and U.S. Sustainable Leaders Fund, for which distributions are generally declared and paid at least annually, Equity Income Fund, for which distributions are generally declared and paid at least monthly, and Equity Premium Income Fund, for which distributions are generally declared daily and paid at least monthly. Distributions are declared separately for each class. No class has preferential dividend rights; differences in per share rates are due to differences in separate class expenses. Net realized capital gains, if any, are distributed by each Fund at least annually. The amount of distributions from net investment income and net realized capital gains is determined in accordance with Federal income tax regulations, which may differ from GAAP. To the extent these “book/tax” differences are permanent in nature (i.e., that they result from other than timing of recognition — “temporary differences”), such amounts are reclassified within the capital accounts based on their Federal tax basis treatment.
3. Fees and Other Transactions with Affiliates
A. Investment Advisory Fee — Pursuant to an Investment Advisory Agreement, the Adviser manages the investments of each Fund and for such services is paid a fee. The investment advisory fee is accrued daily and paid monthly at an annual rate based on each Fund's respective average daily net assets. The annual rate for each Fund is as follows:
| |
| |
| |
Equity Premium Income Fund | |
| |
| |
| |
| |
| |
U.S. Applied Data Science Value Fund | |
| |
| |
U.S. Large Cap Core Plus Fund | |
U.S. Research Enhanced Equity Fund | |
U.S. Sustainable Leaders Fund | |
| |
The Adviser waived investment advisory fees and/or reimbursed expenses as outlined in Note 3.F.
B. Administration Fee— Pursuant to an Administration Agreement, the Administrator provides certain administration services to each Fund. In consideration of these services, the Administrator receives a fee accrued daily and paid monthly at an annual rate of 0.075% of the first $10 billion of each Fund's respective average daily net assets, plus 0.050% of each Fund's respective average daily net assets between $10 billion and $20 billion, plus 0.025% of each Fund's respective average daily net assets between $20 billion and $25 billion, plus 0.01% of each Fund's respective average daily net assets in excess of $25 billion. For the six months ended December 31, 2024, the effective annualized rate for Equity Income Fund, Equity Index Fund, Equity Premium Income Fund, Hedged Equity Fund, Hedged Equity 2 Fund, Hedged Equity 3 Fund, Large Cap Growth Fund, Large Cap Value Fund, U.S. Applied Data Science Value Fund, U.S. Equity Fund, U.S. GARP Equity Fund, U.S. Large Cap Core Plus Fund, U.S. Research Enhanced Equity Fund, U.S. Sustainable Leaders Fund and U.S. Value Fund was 0.035%, 0.075%, 0.075%, 0.065%, 0.075%, 0.075%, 0.027%, 0.075%, 0.075%, 0.057%, 0.075%, 0.075%, 0.075%, 0.075% and 0.075%, respectively, of each Fund’s average daily net assets, notwithstanding any fee waivers and/or expense reimbursements.
The Administrator waived administration fees as outlined in Note 3.F.
JPMorgan Chase Bank, N.A. ("JPMCB"), a wholly-owned subsidiary of JPMorgan, serves as the Funds' sub-administrator (the “Sub-administrator”). For its services as Sub-administrator, JPMCB receives a portion of the fees payable to the Administrator.
| J.P. Morgan Large Cap Funds | |
C. Distribution Fees— Pursuant to a Distribution Agreement, JPMorgan Distribution Services, Inc. (“JPMDS”), an indirect, wholly-owned subsidiary of JPMorgan, serves as each Fund's principal underwriter and promotes and arranges for the sale of each Fund's shares.
The Boards have adopted a Distribution Plan (the “Distribution Plan”) for Class A, Class C, Class R2 and Class R3 Shares of the Funds, as applicable, pursuant to Rule 12b-1 under the 1940 Act. Class I, Class L, Class R4, Class R5 and Class R6 Shares of the Funds do not charge a distribution fee. The Distribution Plan provides that each Fund shall pay, with respect to the applicable share classes, distribution fees, including payments to JPMDS, at annual rates of the average daily net assets as shown in the table below:
| | | | |
| | | | |
| | | | |
Equity Premium Income Fund | | | | |
| | | | |
| | | | |
| | | | |
| | | | |
| | | | |
U.S. Applied Data Science Value Fund | | | | |
| | | | |
| | | | |
U.S. Large Cap Core Plus Fund | | | | |
U.S. Research Enhanced Equity Fund | | | | |
U.S. Sustainable Leaders Fund | | | | |
| | | | |
In addition, JPMDS is entitled to receive the front-end sales charges from purchases of Class A Shares and the CDSC from redemptions of Class C Shares and certain Class A Shares for which front-end sales charges have been waived. For the six months ended December 31, 2024, JPMDS retained the following:
| | |
| | |
| | |
Equity Premium Income Fund | | |
| | |
| | |
| | |
| | |
| | |
U.S. Applied Data Science Value Fund | | |
| | |
| | |
U.S. Large Cap Core Plus Fund | | |
U.S. Research Enhanced Equity Fund | | |
U.S. Sustainable Leaders Fund | | |
| | |
|
| Amount rounds to less than one thousand. |
| J.P. Morgan Large Cap Funds | |
NOTES TO FINANCIAL STATEMENTSAS OF December 31, 2024 (Unaudited) (continued)
(Dollar values in thousands)
D. Service Fees— The Trusts, on behalf of the Funds, have entered into a Shareholder Servicing Agreement with JPMDS under which JPMDS provides certain support services to fund shareholders. For performing these services, JPMDS receives a fee with respect to all share classes, except Class R6 Shares which do not charge a service fee, that is accrued daily and paid monthly equal to a percentage of the average daily net assets as shown in the table below:
| | | | | | | | |
| | | | | | | | |
| | | | | | | | |
Equity Premium Income Fund | | | | | | | | |
| | | | | | | | |
| | | | | | | | |
| | | | | | | | |
| | | | | | | | |
| | | | | | | | |
U.S. Applied Data Science Value Fund | | | | | | | | |
| | | | | | | | |
| | | | | | | | |
U.S. Large Cap Core Plus Fund | | | | | | | | |
U.S. Research Enhanced Equity Fund | | | | | | | | |
U.S. Sustainable Leaders Fund | | | | | | | | |
| | | | | | | | |
| | | | | | | | |
JPMDS has entered into shareholder services contracts with affiliated and unaffiliated financial intermediaries who provide shareholder services and other related services to their clients or customers who invest in the Funds. Pursuant to such contracts, JPMDS will pay all or a portion of such fees earned to financial intermediaries for performing such services.
JPMDS waived service fees as outlined in Note 3.F.
E. Custodian and Accounting Fees— JPMCB provides portfolio custody and accounting services to the Funds. For performing these services, the Funds pay JPMCB transaction and asset-based fees that vary according to the number of transactions and positions, plus out-of-pocket expenses. The amounts paid directly to JPMCB by the Funds for custody and accounting services are included in Custodian and accounting fees on the Statements of Operations.
Interest income earned on cash balances at the custodian, if any, is included in Interest income from affiliates on the Statements of Operations.
Interest expense paid to the custodian related to cash overdrafts, if any, is included in Interest expense to affiliates on the Statements of Operations.
| J.P. Morgan Large Cap Funds | |
F. Waivers and Reimbursements—The Adviser, Administrator and/or JPMDS have contractually agreed to waive fees and/or reimburse the Funds to the extent that total annual operating expenses (excluding acquired fund fees and expenses other than certain money market fund fees as described below, dividend and interest expenses related to short sales, interest, taxes, expenses related to litigation and potential litigation, expenses related to trustee elections and extraordinary expenses) exceed the percentages of the Funds' respective average daily net assets as shown in the table below:
| | | | | | | | |
| | | | | | | | |
Equity Premium Income Fund | | | | | | | | |
| | | | | | | | |
| | | | | | | | |
| | | | | | | | |
| | | | | | | | |
| | | | | | | | |
U.S. Applied Data Science Value Fund | | | | | | | | |
| | | | | | | | |
| | | | | | | | |
U.S. Large Cap Core Plus Fund | | | | | | | | |
U.S. Research Enhanced Equity Fund | | | | | | | | |
U.S. Sustainable Leaders Fund | | | | | | | | |
| | | | | | | | |
| | | | | | | | |
The expense limitation agreements were in effect for the six months ended December 31, 2024 and the contractual expense limitation percentages in the table above are in place until at least October 31, 2025.
For the six months ended December 31, 2024, the Funds' service providers waived fees and/or reimbursed expenses for each of the Funds as follows. None of these parties expect the Funds to repay any such waived fees and/or reimbursed expenses in future years.
| | |
| | | | | Contractual
Reimbursements |
| | | | | |
Equity Premium Income Fund | | | | | |
| | | | | |
| | | | | |
| | | | | |
| | | | | |
U.S. Applied Data Science Value Fund | | | | | |
| | | | | |
| | | | | |
U.S. Large Cap Core Plus Fund | | | | | |
U.S. Research Enhanced Equity Fund | | | | | |
U.S. Sustainable Leaders Fund | | | | | |
| | | | | |
|
| Amount rounds to less than one thousand. |
Additionally, the Funds may invest in one or more money market funds advised by the Adviser (affiliated money market funds). The Adviser, Administrator and/or JPMDS, as shareholder servicing agent, have contractually agreed to waive fees and/or reimburse expenses in an amount
| J.P. Morgan Large Cap Funds | |
NOTES TO FINANCIAL STATEMENTSAS OF December 31, 2024 (Unaudited) (continued)
(Dollar values in thousands)
sufficient to offset the respective net fees each collects from the affiliated money market fund on the applicable Fund’s investment in such affiliated money market fund, except for investments of securities lending cash collateral. None of these parties expect the Funds to repay any such waived fees and/ or reimbursed expenses in future years.
The amounts of these waivers resulting from investments in these money market funds for the six months ended December 31, 2024 were as follows:
| |
| |
| |
Equity Premium Income Fund | |
| |
| |
| |
| |
| |
U.S. Applied Data Science Value Fund | |
| |
| |
U.S. Large Cap Core Plus Fund | |
U.S. Research Enhanced Equity Fund | |
U.S. Sustainable Leaders Fund | |
| |
G. Other— Certain officers of the Trusts are affiliated with the Adviser, the Administrator and JPMDS. Such officers, with the exception of the Chief Compliance Officer, receive no compensation from the Funds for serving in their respective roles.
The Boards designated and appointed a Chief Compliance Officer to the Funds pursuant to Rule 38a-1 under the 1940 Act. Each Fund, along with affiliated funds, makes reimbursement payments, on a pro-rata basis, to the Administrator for a portion of the fees associated with the office of the Chief Compliance Officer. Such fees are included in Trustees’ and Chief Compliance Officer’s fees on the Statements of Operations.
The Trusts adopted a Trustee Deferred Compensation Plan (the “Plan”) which allows the independent Trustees to defer the receipt of all or a portion of compensation related to performance of their duties as Trustees. The deferred fees are invested in various J.P. Morgan Funds until distribution in accordance with the Plan.
During the six months ended December 31, 2024, Large Cap Value Fund purchased securities from an underwriting syndicate in which the principal underwriter or members of the syndicate were affiliated with the Adviser.
The below Funds used related party broker-dealers during the six months ended December 31, 2024, and incurred brokerage commissions with broker-dealers affiliated with the Adviser as follows:
| |
| |
Equity Premium Income Fund | |
| |
| |
| |
| |
U.S. Applied Data Science Value Fund | |
| |
U.S. Large Cap Core Plus Fund | |
The SEC has granted an exemptive order permitting the Funds to engage in principal transactions with J.P. Morgan Securities LLC, an affiliated broker, involving taxable money market instruments, subject to certain conditions.
| J.P. Morgan Large Cap Funds | |
4. Investment Transactions
During the six months ended December 31, 2024, purchases and sales of investments (excluding short-term investments) were as follows:
| Purchases
(excluding
U.S. Government) | Sales
(excluding
U.S. Government) | | Covers on
Securities
Sold Short |
| | | | |
| | | | |
Equity Premium Income Fund | | | | |
| | | | |
| | | | |
| | | | |
| | | | |
| | | | |
U.S. Applied Data Science Value Fund | | | | |
| | | | |
| | | | |
U.S. Large Cap Core Plus Fund | | | | |
U.S. Research Enhanced Equity Fund | | | | |
U.S. Sustainable Leaders Fund | | | | |
| | | | |
During the six months ended December 31, 2024, there were no purchases or sales of U.S. Government securities.
5. Federal Income Tax Matters
For Federal income tax purposes, the estimated cost and unrealized appreciation (depreciation) in value of investments held at December 31, 2024 were as follows:
| | Gross
Unrealized
Appreciation | Gross
Unrealized
Depreciation | Net Unrealized
Appreciation
(Depreciation) |
| | | | |
| | | | |
Equity Premium Income Fund | | | | |
| | | | |
| | | | |
| | | | |
| | | | |
| | | | |
U.S. Applied Data Science Value Fund | | | | |
| | | | |
| | | | |
U.S. Large Cap Core Plus Fund * | | | | |
U.S. Research Enhanced Equity Fund | | | | |
U.S. Sustainable Leaders Fund | | | | |
| | | | |
|
| The tax cost includes the proceeds from short sales which may result in a net negative cost. |
| J.P. Morgan Large Cap Funds | |
NOTES TO FINANCIAL STATEMENTSAS OF December 31, 2024 (Unaudited) (continued)
(Dollar values in thousands)
At June 30, 2024, the following Funds had net capital loss carryforwards, which are available to offset future realized gains:
| Capital Loss Carryforward Character |
| | |
| | |
Equity Premium Income Fund | | |
| | |
| | |
| | |
| | |
U.S. Sustainable Leaders Fund | | |
Net capital losses (gains) incurred after October 31, and within the taxable year are deemed to arise on the first business day of the Funds' next taxable year. For the year ended June 30, 2024, the Funds deferred to July 1, 2024 the following net capital losses (gains) of:
| Net Capital Losses (Gains) |
| | |
| | |
Equity Premium Income Fund | | |
| | |
| | |
| | |
| | |
During the year ended June 30, 2024, the following Funds utilized capital loss carryforwards as follows:
| |
| | |
| | |
| | |
| | |
U.S. Sustainable Leaders Fund | | |
| | |
The Funds rely upon an exemptive order granted by the SEC (the “Order”) permitting the establishment and operation of an Interfund Lending Facility (the “Facility”). The Facility allows the Funds to directly lend and borrow money to or from any other fund relying upon the Order at rates beneficial to both the borrowing and lending funds. Advances under the Facility are taken primarily for temporary or emergency purposes, including the meeting of redemption requests that otherwise might require the untimely disposition of securities, and are subject to each Fund's borrowing restrictions. The interfund loan rate is determined, as specified in the Order, by averaging the current repurchase agreement rate and the current bank loan rate. The Order was granted to JPM II and may be relied upon by the Funds because the Funds and the series of JPM II are all investment companies in the same “group of investment companies” (as defined in Section 12(d)(1)(G) of the 1940 Act).
The Trusts and JPMCB have entered into a financing arrangement. Under this arrangement, JPMCB provides an unsecured, uncommitted credit facility in the aggregate amount of $100 million to certain of the J.P. Morgan Funds, including the Funds. Advances under the arrangement are taken primarily for temporary or emergency purposes, including the meeting of redemption requests that otherwise might require the untimely disposition of securities, and are subject to each Fund's borrowing restrictions. Interest on borrowings is payable at a rate determined by JPMCB at the time of borrowing. This agreement has been extended until October 28, 2025.
The Funds had no borrowings outstanding from the unsecured, uncommitted credit facility during the six months ended December 31, 2024.
The Trusts, along with certain other trusts for J.P. Morgan Funds (“Borrowers”), have entered into a joint syndicated senior unsecured revolving credit facility totaling $1.5 billion (“Credit Facility”) with various lenders and The Bank of New York Mellon, as administrative agent for the lenders. This Credit Facility provides a source of funds to the Borrowers for temporary and emergency purposes, including the meeting of redemption requests that otherwise might require the untimely disposition of securities. Under the terms of the Credit Facility, a borrowing fund must have a
| J.P. Morgan Large Cap Funds | |
minimum of $25 million in adjusted net asset value and not exceed certain adjusted net asset coverage ratios prior to and during the time in which any borrowings are outstanding. If a fund does not comply with the aforementioned requirements, the fund must remediate within three business days with respect to the $25 million minimum adjusted net asset value or within one business day with respect to certain asset coverage ratios or the administrative agent at the request of, or with the consent of, the lenders may terminate the Credit Facility and declare any outstanding borrowings to be due and payable immediately.
Interest associated with any borrowing under the Credit Facility is charged to the borrowing fund at a rate of interest equal to 1.00%, plus the greater on the day of the borrowing, of the federal funds effective rate, or the Adjusted Secured Overnight Financing Rate (SOFR). Effective August 6, 2024, the Credit Facility was amended and restated for a term of 364 days, unless extended.
The Funds did not utilize the Credit Facility during the six months ended December 31, 2024.
7. Risks, Concentrations and Indemnifications
In the normal course of business, the Funds enter into contracts that contain a variety of representations which provide general indemnifications. Each Fund's maximum exposure under these arrangements is unknown. The amount of exposure would depend on future claims that may be brought against each Fund. However, based on experience, the Funds expect the risk of loss to be remote.
As of December 31, 2024, the Funds had individual shareholder and/or omnibus accounts each owning more than 10% of the respective Fund's outstanding shares as follows:
| Number of
Individual Shareholder
and/or Affiliated
Omnibus Accounts | | Number of
Individual Shareholder
and/or Non-Affiliated
Omnibus Accounts | |
| | | | |
| | | | |
Equity Premium Income Fund | | | | |
| | | | |
| | | | |
| | | | |
| | | | |
| | | | |
U.S. Applied Data Science Value Fund | | | | |
| | | | |
| | | | |
U.S. Large Cap Core Plus Fund | | | | |
U.S. Research Enhanced Equity Fund | | | | |
U.S. Sustainable Leaders Fund | | | | |
| | | | |
As of December 31, 2024, J.P. Morgan Investor Funds, JPMorgan SmartRetirement Funds and JPMorgan SmartRetirement Blend Funds, which are affiliated fund of funds, each owned in the aggregate, shares representing more than 10% of the net assets of the Funds as follows:
| | JPMorgan
SmartRetirement
Funds | JPMorgan
SmartRetirement
Blend Funds |
| | | |
| | | |
| | | |
U.S. Research Enhanced Equity Fund | | | |
Equity Premium Income Fund’s investments in ELNs entail varying degrees of risks. The Fund is subject to loss of their full principal amount. In addition, the ELNs are subject to a stated maximum return which may limit the payment at maturity. The Fund may also be exposed to additional risks associated with structured notes including: counterparty credit risk related to the issuer’s ability to make payment at maturity; liquidity risk related to a lack of liquid market for these notes, preventing the Fund from trading or selling the notes easily; and a greater degree of market risk than other types of debt securities because the investor bears the risk associated with the underlying financial instruments.
| J.P. Morgan Large Cap Funds | |
NOTES TO FINANCIAL STATEMENTSAS OF December 31, 2024 (Unaudited) (continued)
(Dollar values in thousands)
The Funds are subject to infectious disease epidemics/pandemics risk. The effects of any future pandemic or other global event to public health and business and market conditions may have a significant negative impact on the performance of a Fund's investments, increase a Fund's volatility, exacerbate pre-existing political, social and economic risks to the Funds, and negatively impact broad segments of businesses and populations. In addition, governments, their regulatory agencies, or self-regulatory organizations have taken or may take actions in response to a pandemic or other global event that affect the instruments in which the Funds invest, or the issuers of such instruments, in ways that could have a significant negative impact on a Fund’s investment performance. The ultimate impact of any pandemic or other global event and the extent to which the associated conditions and governmental responses impact a Fund will also depend on future developments, which are highly uncertain, difficult to accurately predict and subject to frequent changes.
At a meeting held on February 11-13, 2025, the JPM Trust IV Board approved the reorganization (the “Reorganization”) of the JPMorgan U.S. Applied Data Science Value Fund (the “Fund”) into a newly created exchange-traded fund, JPMorgan Fundamental Data Science Large Value ETF (“JPM Fundamental Data Science Large Value ETF”), a series of J.P. Morgan Exchange-Traded Fund Trust. The Reorganization is expected to occur as of the close of business on or about July 11, 2025. Following the Reorganization, the Fund’s performance and financial history would be adopted by JPM Fundamental Data Science Large Value ETF. JPM Fundamental Data Science Large Value ETF will be managed in a substantially similar way, but in order to meet the requirements of Rule 35d-1 under the 1940 Act, the new ETF will have a new 80% policy to invest 80% in large, well established equity securities (companies with market capitalizations similar to those within the universe of the Russell 1000® Value Index), while the mutual fund currently invests at least 80% in securities of U.S. large and mid-capitalization companies.
| J.P. Morgan Large Cap Funds | |
J.P. Morgan Funds are distributed by JPMorgan Distribution Services, Inc., which is an affiliate of JPMorgan Chase & Co. Affiliates of JPMorgan Chase & Co. receive fees for providing various services to the Funds.
Contact JPMorgan Distribution Services, Inc. at 1-800-480-4111 for a fund prospectus. You can also visit us at www.jpmorganfunds.com. Investors should carefully consider the investment objectives and risk as well as charges and expenses of the mutual fund before investing. The prospectus contains this and other information about the mutual fund. Read the prospectus carefully before investing.
Investors may obtain information about the Securities Investor Protection Corporation (SIPC), including the SIPC brochure, by visiting www.sipc.org or by calling SIPC at 202-371-8300.
J.P. Morgan Asset Management is the brand name for the asset management business of JPMorgan Chase & Co. and its affiliates worldwide.
© JPMorgan Chase & Co., 2024. All rights reserved. December 2024.
SAN-LCE-1224
Changes in and Disagreements with Accountants for Open-End Management Investment Companies
Proxy Disclosures for Open-End Management Investment Companies
JPMorgan Trust I held a special meeting of shareholders on October 2, 2024, for the purpose of considering and voting upon the approval to change the JPMorgan U.S. GARP Equity Fund (the “Fund”) from a diversified company to a non-diversified company by eliminating the Fund’s related fundamental investment policy. The elimination of the fundamental investment policy was approved by shareholders on October 2, 2024.
The results of the voting were as follows:
| Dollar value of Votes Received (000’s) |
| |
| |
| |
| |
JPMorgan Trust II held a special meeting of shareholders on October 2, 2024 for the purpose of considering and voting upon the approval to change the JPMorgan Large Cap Growth Fund (the “Fund”) from a diversified company to a non-diversified company by eliminating the Fund’s related fundamental investment policy.
The special meeting was adjourned to October 30, 2024, November 21, 2024, December 18, 2024 and January 30, 2025, to allow shareholders additional time to vote on the proposal. The proposal has not yet been approved by either 67% or more of the shares present or represented by proxy at the meeting, or by more than 50% of the outstanding shares (as of the record date set for the special shareholder meeting) of the Fund, as is required. The January 30, 2025 special meeting was adjourned to February 27, 2025.
The results of the voting were as follows:
| Dollar value of Votes Received (000’s) |
| |
| |
| |
| |
October 30, 2024 Meeting: | |
| |
| |
| |
| |
November 21, 2024 Meeting: | |
| |
| |
| |
| |
December 18, 2024 Meeting: | |
| |
| |
| |
| |
January 30, 2025 Meeting: | |
| |
| |
| |
| |
Remuneration Paid to Directors, Officers, and Others of Open-End Management Investment Companies
Included in the Statements of Operations within the Funds' Financial Statements.
Statement Regarding Basis for Approval of Investment Advisory Agreements
The Board of Trustees (the “Board” or the “Trustees”) has established various standing committees composed of Trustees with diverse backgrounds, to which the Board has assigned specific subject matter responsibilities to further enhance the effectiveness of the Board’s oversight and decision making. The Board and its investment committees (Money Market and Alternative Products Committee, Equity Committee, and Fixed Income Committee) met regularly throughout the year and, at each meeting, considered factors that are relevant to their annual consideration of the continuation of the investment advisory agreements. The Board also met for the specific purpose of considering investment advisory agreement annual renewals. The Board held meetings June 25-26, 2024 and August 20-22, 2024, at which the Trustees considered the continuation of the investment advisory agreements for each Fund whose semi-annual report is contained herein (each an “Advisory Agreement” and collectively, the “Advisory Agreements”). At the June meeting, the Board’s investment committees met to review and consider performance, expense and related information for the J.P. Morgan Funds. Each investment committee reported to the full Board, which then considered each investment committee’s preliminary findings. At the August meeting, the Trustees continued their review and consideration. The Trustees, including a majority of the Trustees who are not parties to an Advisory Agreement or “interested persons” (as defined in the Investment Company Act of 1940) of any party to an Advisory Agreement or any of their affiliates, approved the continuation of each Advisory Agreement on August 22, 2024.
As part of their review of the Advisory Agreements, the Trustees considered and reviewed performance and other information about the Funds received from J.P. Morgan Investment Management Inc. (the “Adviser”). This information included the Funds’ performance as compared to the performance of their peers and benchmarks, and analyses by the Adviser of the Funds’ performance. In addition, at each of their regular meetings throughout the year, the Trustees considered reports on the performance of certain J.P. Morgan Funds provided by an independent investment consulting firm (the “independent consultant”). In addition, in preparation for the June and August meetings, the Trustees requested, received and evaluated extensive materials from the Adviser, including performance and expense information compiled by Broadridge, using data from Lipper Inc. and/or Morningstar, Inc., independent providers of investment company data (together, “Broadridge”). The Trustees’ independent consultant also provided additional quantitative and statistical analyses of certain Funds, including risk and performance return assessments as compared to the Funds’ objectives, benchmarks, and peers. Before voting on the Advisory Agreements, the Trustees reviewed the Advisory Agreements with representatives of the
Adviser, counsel to the Funds, and independent legal counsel to the Trustees, and received a memorandum from independent legal counsel to the Trustees discussing the legal standards for their consideration of the Advisory Agreements. The Trustees also discussed the Advisory Agreements in executive sessions with independent legal counsel at which no representatives of the Adviser were present.
A summary of the material factors evaluated by the Trustees in determining whether to approve each Advisory Agreement is provided below. Each Trustee attributed different weights to the various factors, and no factor alone was considered determinative. The Trustees considered information provided with respect to the Funds throughout the year, as well as materials furnished specifically in connection with the annual review process. From year to year, the Trustees consider and place emphasis on relevant information in light of changing circumstances in market and economic conditions.
After considering and weighing the factors and information they had received, the Trustees found that the compensation to be received by the Adviser from each Fund under the applicable Advisory Agreement was fair and reasonable under the circumstances, and determined that the continuance of each Advisory Agreement was in the best interests of each Fund and its shareholders.
Nature, Extent and Quality of Services Provided by the Adviser
The Trustees received and considered information regarding the nature, extent and quality of services provided to each Fund under the applicable Advisory Agreement. The Trustees took into account information furnished throughout the year at Trustee meetings, as well as the materials furnished specifically in connection with this annual review process. Among other things, the Trustees considered:
•
The background and experience of the Adviser’s senior management and investment personnel, including personnel changes, if any;
•
The qualifications, backgrounds and responsibilities of the portfolio management team primarily responsible for the day-to-day management of each Fund, including personnel changes, if any;
•
The investment strategy for each Fund, and the infrastructure supporting the portfolio management teams;
•
Information about the structure and distribution strategy for each Fund and how it fits within the Adviser’s other fund offerings within the J.P. Morgan Funds complex;
•
The administration services provided by the Adviser in its role as Administrator;
•
Their knowledge of the nature and quality of the services provided by the Adviser and its affiliates gained from their experience as Trustees of the Funds and in the financial industry generally;
•
The overall reputation and capabilities of the Adviser and its affiliates;
•
The commitment of the Adviser to provide high quality service to the Funds;
•
Their overall confidence in the Adviser’s integrity; and
•
The Adviser’s responsiveness to requests for additional information, questions or concerns raised by them, including the Adviser’s willingness to consider and implement organizational and operational changes designed to improve investment results and the services provided to each Fund.
Based upon these considerations and other factors, the Trustees concluded that they were satisfied with the nature, extent and quality of the services provided to the Funds by the Adviser.
Costs of Services Provided and Profitability to the Adviser and its Affiliates
The Trustees received and considered information regarding the profitability to the Adviser and its affiliates from providing services to each Fund. The Trustees reviewed and discussed this information. The Trustees recognized that this information is not audited and represents the Adviser’s determination of its and its affiliates’ revenues from the contractual services provided to the Funds, less expenses of providing such services. Expenses include direct and indirect costs and are calculated using an allocation methodology developed by the Adviser and reviewed with the Board. The Trustees also recognized that it is difficult to make comparisons of profitability from fund investment advisory contracts because comparative information is not generally publicly available and is affected by numerous factors, including the structure of the particular adviser, the types of funds it manages, its business mix, numerous assumptions regarding allocations and the fact that publicly-traded fund managers’ operating profits and net income are net of distribution and marketing expenses. Based upon their review, and taking into consideration the factors noted above, the Trustees concluded that the profitability to the Adviser under each Advisory Agreement was not unreasonable in light of the services and benefits provided to each Fund.
The Trustees also considered that JPMorgan Distribution Services, Inc. (“JPMDS”), an affiliate of the Adviser, and the Adviser earn fees from the Funds for providing shareholder and administration services, respectively. These fees were shown separately in the profitability analysis presented to the Trustees. The Trustees also considered the payments of Rule 12b-1 fees to JPMDS, which also acts as the Funds’ distributor, and that these fees are in turn generally paid to
financial intermediaries that sell the Funds, including financial intermediaries that are affiliates of the Adviser (although they are retained by JPMDS in certain instances). The Trustees also considered the fees earned by JPMorgan Chase Bank, N.A. (“JPMCB”), an affiliate of the Adviser, for custody, fund accounting and other related services for each Fund, and the profitability of the arrangements to JPMCB.
The Trustees reviewed information regarding potential “fall-out” or ancillary benefits received by the Adviser and its affiliates as a result of their relationship with the Funds. The Trustees considered that the J.P. Morgan Funds' operating accounts are held at JPMCB, which, as a result, will receive float benefits for certain J.P. Morgan Funds, as applicable. The Trustees also noted that the Adviser supports a diverse set of products and services, which benefits the Adviser by allowing it to leverage its infrastructure to serve additional clients, including benefits that may be received by the Adviser and its affiliates in connection with the Funds’ potential investments in other funds advised by the Adviser. The Trustees also reviewed the Adviser’s allocation of fund brokerage for the J.P. Morgan Funds complex, including allocations to brokers who provide research to the Adviser, as well as the Adviser’s use of affiliates to provide other services and the benefits to such affiliates of doing so. The Trustees also considered the benefit to the Adviser and its affiliates from allocating client assets to the Funds.
The Trustees considered the extent to which the Funds may benefit from potential economies of scale. The Trustees considered that there may not be a direct relationship between economies of scale realized by the Funds and those realized by the Adviser as assets increase. The Trustees considered the extent to which the Funds were priced to scale and whether it would be appropriate to add advisory fee breakpoints. The Trustees noted certain Funds with contractual expense limitations and fee waivers (“Fee Caps”) which allow a Fund’s shareholders to share potential economies of scale from a Fund’s inception, prior to reaching scale. The Trustees also noted that certain other Funds that had achieved scale as asset levels had increased no longer had Fee Caps in place for some or all of their share classes, but shared economies of scale through lower average expenses. The Trustees noted that the fees remain fair and reasonable relative to peer funds. The Trustees considered the benefits to the Funds of the use of an affiliated distributor and custodian, including the ability to rely on existing infrastructure supporting distribution, custodial and transfer agent services and the ability to negotiate competitive fees for the Funds. The Trustees further considered the Adviser's and JPMDS's ongoing investments in their business in support of the Funds, including the Adviser's and/or JPMDS's
investments in trading systems, technology (including improvements to the J.P. Morgan Funds’ website, and cybersecurity improvements), retention of key talent, and regulatory support enhancements. The Trustees concluded that the current fee structure for each Fund, including any Fee Caps the Adviser has in place that serve to limit the overall net expense ratios of each Fund at competitive levels, was reasonable. The Trustees concluded that, for Funds with Fee Caps in place for some or all of their share classes, the relevant Fund’s shareholders received the benefits of potential economies of scale through the Fee Caps and, for Funds that achieved scale and no longer had Fee Caps in place for some or all of their share classes, the relevant Fund’s shareholders benefited from lower average expenses resulting from increased assets. The Trustees also concluded that all Funds benefited from the Adviser’s reinvestment in its operations to serve the Funds and their shareholders. The Trustees noted that the Adviser’s reinvestment ensures sufficient resources in terms of personnel and infrastructure to support the Funds.
Independent Written Evaluation of the Funds’ Senior Officer
The Trustees noted that, upon their direction, the Senior Officer for the Equity Income Fund, Equity Index Fund, Large Cap Growth Fund, Large Cap Value Fund and U.S. Equity Fund had prepared an independent written evaluation in order to assist the Trustees in determining the reasonableness of the proposed management fees. In determining whether to continue the Advisory Agreements, the Trustees considered the Senior Officer’s report.
Fees Relative to Adviser’s Other Clients
The Trustees received and considered information about the nature and extent of investment advisory services and fee rates offered to other clients of the Adviser, including, to the extent applicable, institutional separate accounts, collective investment trusts, other registered investment companies and/or private funds sub-advised by the Adviser, and for investment management styles substantially similar to that of each Fund. The Trustees considered the complexity of investment management for registered investment companies relative to the Adviser’s other clients and noted differences, as applicable, in the fee structure and the regulatory, legal and other risks and responsibilities of providing services to the different clients. The Trustees considered that serving as an adviser to a registered investment company involves greater responsibilities and risks than acting as a sub-adviser and observed that sub-advisory fees may be lower than those charged by the Adviser to each Fund. The Trustees also noted that the adviser, not the applicable registered investment company, typically bears the sub-advisory fee and that many responsibilities related to the advisory function are typically retained by the primary adviser. The Trustees concluded that the fee rates charged to each Fund in comparison to those charged to the Adviser’s other clients were reasonable.
Investment Performance
The Trustees receive and consider information about each Fund’s performance throughout the year. In addition, the Trustees received and considered absolute and/or relative performance information for the Funds in a report prepared by Broadridge. The Trustees considered the total return performance information, which included the ranking of the Funds within a performance universe comprised of funds’ selected share classes with the same Broadridge investment classification and objective (the “Universe”), by total return for the applicable one-, three- and five-year periods. The Trustees reviewed a description of Broadridge’s methodology for selecting mutual funds in each Fund’s Universe, and noted that Universe quintile rankings were not calculated if the number of funds in the Universe did not meet a predetermined minimum. The Trustees also considered enhancements to the methodology employed by Broadridge for identifying funds in the Peer Groups for Class I shares, based upon discussions with the Adviser, Broadridge and certain Trustees in advance of, and in preparation for, the June meeting. The Broadridge materials provided to the Trustees highlighted information with respect to certain representative classes to assist the Trustees in their review. As part of this review, the Trustees also reviewed each Fund’s performance against its benchmark and considered the performance information provided for the Funds at regular Board meetings by the Adviser and the Trustees’ independent consultant and also considered the special analysis prepared for certain Funds by the Trustees’ independent consultant. The Trustees also engaged with the Adviser to consider what steps might be taken to improve performance, as applicable. The Broadridge performance data noted by the Trustees as part of their review and the determinations made by the Trustees with respect to each Fund’s performance for certain representative classes are summarized below:
The Trustees noted that the Equity Income Fund’s performance for both Class A and Class I shares was in the fifth, fourth and fourth quintiles of the Universe for the one-, three- and five-year periods ended December 31, 2023, respectively. The Trustees noted that the performance for Class R6 shares was in the fifth, fourth and third quintiles of the Universe for the one-, three- and five-year periods ended December 31, 2023, respectively. The Trustees discussed the performance and investment strategy of the Fund with the Adviser and reviewed the performance analysis and evaluation prepared by the independent consultant. Based upon these discussions and various other factors, the Trustees concluded that the Fund’s performance was satisfactory under the circumstances. The Trustees requested, however, that the Fund’s Adviser provide additional Fund performance information to be reviewed with the members of the Equity Committee at each of their regular meetings over the course of the next year.
The Trustees noted that the Equity Index Fund’s performance for Class A, Class I and Class R6 shares was in the second quintile of the Universe for each of the one-, three- and five-year periods ended December 31, 2023. The Trustees discussed the performance and investment strategy of the Fund with the Adviser and reviewed the performance analysis and evaluation prepared by the independent consultant. Based upon these discussions and various other factors, the Trustees concluded that the Fund’s performance was satisfactory.
The Trustees noted that the Equity Premium Income Fund’s performance for both Class A and Class I shares was in the fourth, second and third quintiles of the Universe for the one-, three- and five-year periods ended December 31, 2023, respectively. The Trustees noted that the performance for Class R6 shares was in the fourth, second and second quintiles of the Universe for the one-, three- and five-year periods ended December 31, 2023, respectively. The Trustees discussed the performance and investment strategy of the Fund with the Advisor and reviewed the performance analysis and evaluation prepared by the independent consultant. Based upon these discussions and various other factors, the Trustees concluded that the Fund’s performance was satisfactory under the circumstances.
The Trustees noted that the Hedged Equity Fund’s performance for Class A shares was in the second, first and second quintiles of the Universe for the one-, three- and five-year periods ended December 31, 2023, respectively. The Trustees noted that the performance for Class I shares was in the fourth, second and second quintiles of the Universe for the one-, three- and five-year periods ended December 31, 2023, respectively. The Trustees noted that the performance for Class R6 shares was in the third, second and second quintiles of the Universe for the one-, three- and five-year periods ended December 31, 2023, respectively. The Trustees discussed the performance and investment strategy of the Fund with the Adviser and reviewed the performance analysis and evaluation prepared by the independent consultant. Based upon these discussions and various other factors, the Trustees concluded that the Fund’s performance was satisfactory under the circumstances.
The Trustees noted that the Hedged Equity 2 Fund’s performance for Class A shares was in the second quintile of the Universe for the one-year period ended December 31, 2023. The Trustees noted that the performance for both Class I and Class R6 shares was in the fourth quintile of the Universe for one-year period ended December 31, 2023. The Trustees discussed the performance and investment strategy of the Fund with the Advisor and reviewed the performance analysis and evaluation prepared by the independent consultant. Based upon these discussions and various other factors, the Trustees concluded that the Fund’s performance was satisfactory under the circumstances.
The Trustees noted that the Hedged Equity 3 Fund’s performance for Class A shares was in the first quintile of the Universe for the one-year period ended December 31, 2023. The Trustees noted that the performance for both Class I and Class R6 shares was in the second quintile of the Universe for one-year period ended December 31, 2023. The Trustees discussed the performance and investment strategy of the Fund with the Advisor and reviewed the performance analysis and evaluation prepared by the independent consultant. Based upon these discussions and various other factors, the Trustees concluded that the Fund’s performance was satisfactory.
The Trustees noted that the Large Cap Growth Fund’s performance for Class A, Class I and Class R6 shares was in the fourth, third and first quintiles of the Universe for the one-, three- and five-year periods ended December 31, 2023, respectively. The Trustees discussed the performance and investment strategy of the Fund with the Adviser and reviewed the performance analysis and evaluation prepared by the independent consultant. Based upon these discussions and various other factors, the Trustees concluded that the Fund’s performance was satisfactory under the circumstances.
The Trustees noted that the Large Cap Value Fund’s performance for both Class A and Class I shares was in the third, second and first quintiles of the Universe for the one-, three- and five-year periods ended December 31, 2023, respectively. The Trustees noted that the performance for Class R6 shares was in the third, first and first quintiles of the Universe for the one-, three- and five-year periods ended December 31, 2023, respectively. The Trustees discussed the performance and investment strategy of the Fund with the Adviser and reviewed the performance analysis and evaluation prepared by the independent consultant. Based upon these discussions and various other factors, the Trustees concluded that the Fund’s performance was satisfactory.
The Trustees noted that the U.S. Applied Data Science Value Fund’s performance for Class A shares was in the third, second and third quintiles of the Universe for the one-, three- and five-year periods ended December 31, 2023, respectively. The Trustees noted that the performance for Class I shares was in the third, first and third quintiles of the Universe for the one-, three- and five-year periods ended December 31, 2023, respectively. The Trustees noted that the performance for Class R6 shares was in the third, first and second quintiles of the Universe for the one-, three- and five-year periods ended December 31, 2023, respectively. The Trustees discussed the performance and investment strategy of the Fund with the Adviser and reviewed the performance analysis and evaluation prepared by the independent consultant. Based upon these discussions and various other factors, the Trustees concluded that the Fund’s performance was satisfactory.
The Trustees noted that the U.S. Equity Fund’s performance for Class A, Class I and Class R6 shares was in the first, second and first quintiles of the Universe for the one-, three and five-year periods ended December 31, 2023, respectively. The Trustees discussed the performance and investment strategy of the Fund with the Adviser and reviewed the performance analysis and evaluation prepared by the independent consultant. Based upon these discussions and various other factors, the Trustees concluded that the Fund’s performance was satisfactory.
The Trustees noted that the U.S. GARP Equity Fund’s performance for Class A, Class I and Class R6 shares was in the second, first and second quintiles of the Universe for the one-, three- and five-year periods ended December 31, 2023, respectively. The Trustees discussed the performance and investment strategy of the Fund with the Adviser and reviewed the performance analysis and evaluation prepared by the independent consultant. Based upon these discussions and various other factors, the Trustees concluded that the Fund’s performance was satisfactory.
The Trustees noted that the U.S. Large Cap Core Plus Fund’s performance for Class A, Class I and Class R6 shares was in the first quintile of the Universe for each of the one-, three- and five-year periods ended December 31, 2023. The Trustees discussed the performance and investment strategy of the Fund with the Adviser and reviewed the performance analysis prepared by the independent consultant. Based upon these discussions, and various other factors, the Trustees concluded that the Fund’s performance was satisfactory.
The Trustees noted that the U.S. Research Enhanced Equity Fund’s performance for Class A, Class I and Class R6 shares was in the first quintile of the Universe for each of the one-, three- and five-year periods ended December 31, 2023. The Trustees discussed the performance and investment strategy of the Fund with the Adviser and reviewed the performance analysis and evaluation prepared by the independent consultant. Based upon these discussions and various other factors, the Trustees concluded that the Fund’s performance was satisfactory.
The Trustees noted that the U.S. Sustainable Leaders Fund’s performance for Class A shares was in the second, third and third quintiles of the Universe for the one-, three- and five-year periods ended December 31, 2023, respectively. The Trustees noted that the performance for Class I shares was in the third quintile of the Universe for each of the one-, three- and five-year periods ended December 31, 2023. The Trustees noted that the performance for Class R6 shares was in the third quintile of the Universe for both the one- and three-year periods ended December 31, 2023. The Trustees discussed the performance and investment strategy of the Fund with the Adviser, and reviewed the performance analysis and evaluation
prepared by the independent consultant. Based upon these discussions and various other factors, the Trustees concluded that the Fund’s performance was satisfactory.
The Trustees noted that the U.S. Value Fund’s performance for both Class A and Class I shares was in the fourth, second and second quintiles of the Universe for the one-, three- and five-year periods ended December 31, 2023, respectively. The Trustees noted that the performance for Class R6 shares was in the fourth, second and first quintiles of the Universe for the one-, three- and five-year periods ended December 31, 2023, respectively. The Trustees discussed the performance and investment strategy of the Fund with the Adviser and reviewed the performance analysis and evaluation prepared by the independent consultant. Based upon these discussions and various other factors, the Trustees concluded that the Fund’s performance was satisfactory under the circumstances.
Advisory Fees and Expense Ratios
The Trustees considered the contractual advisory fee rate and administration fee rate paid by each Fund to the Adviser and compared the combined rate to the information prepared by Broadridge concerning management fee rates paid by other funds’ selected share classes in the Universe, as well as a subset of funds within the Universe (the “Peer Group”). The Trustees recognized that Broadridge reported each Fund’s management fee rate as the combined contractual advisory fee and administration fee rates. The Trustees also reviewed information about other expenses and the expense ratios for each Fund and noted that Universe and Peer Group quintile rankings were not calculated if the number of funds in the Universe and/or Peer Groups did not meet a predetermined minimum. For each Fund that had a Fee Cap in place, the Trustees considered the net advisory fee rate and net expense ratio for each share class, as applicable, taking into account any waivers and/or reimbursements. The Trustees recognized that it can be difficult to make comparisons of advisory fees because there are variations in the services that are included in the fees paid by other funds. The Trustees’ determinations as a result of the review of each Fund’s advisory fees and expense ratios for certain representative classes are summarized below:
The Trustees noted that the Equity Income Fund’s net advisory fee for both Class A and Class I shares was in the second quintile of both the Peer Group and Universe, and that the actual total expenses for both Class A and Class I shares were in the fourth and second quintiles of the Peer Group and Universe, respectively. The Trustees noted that the net advisory fee for Class R6 shares was in the first and second quintiles of the Peer Group and Universe, respectively, and that the actual total expenses for Class R6 shares were in the first quintile of both the Peer Group and Universe. After considering the factors identified above, in light of this information, the Trustees concluded that the advisory fee was fair and reasonable in light of the services provided to the Fund.
The Trustees noted that the Equity Index Fund’s net advisory fee for Class A shares was in the first quintile of both the Peer Group and Universe, and that the actual total expenses for Class A shares were in the second quintile of both the Peer Group and Universe. The Trustees noted that the net advisory fee for Class I shares was in the first quintile of both the Peer Group and Universe, and that the actual total expenses for Class I shares were in the first and third quintiles of the Peer Group and Universe, respectively. The Trustees noted that the net advisory fee and actual total expenses for Class R6 shares were in the first quintile of the Universe. Broadridge did not calculate quintile rankings of the Peer Group for Class R6 shares due to the limited number of funds in the Peer Group. After considering the factors identified above, in light of this information, the Trustees concluded that the advisory fee was fair and reasonable in light of the services provided to the Fund.
The Trustees noted that the Equity Premium Income Fund’s net advisory fee for Class A shares was in the first and second quintiles of the Peer Group and Universe, respectively, and that the actual total expenses for Class A shares were in the first quintile of both the Peer Group and Universe. The Trustees noted that the net advisory fee and actual total expenses for both Class I and Class R6 shares were in the first quintile of the Universe. Broadridge did not calculate quintile rankings of the Peer Group for both Class I and Class R6 shares due to the limited number of funds in the Peer Groups. After considering the factors identified above, in light of this information, the Trustees concluded that the advisory fee was fair and reasonable in light of the services provided to the Fund.
The Trustees noted that the Hedged Equity Fund’s net advisory fee and actual total expenses for both Class A and Class R6 shares were in the first quintile of both the Peer Group and Universe. The Trustees noted that the net advisory fee for Class I shares was in the first quintile of both the Peer Group and Universe, and that the actual total expenses for Class I shares were in the first and second quintiles of the Peer Group and Universe, respectively. After considering the factors identified above, in light of this information, the Trustees concluded that the advisory fee was fair and reasonable in light of the services provided to the Fund.
The Trustees noted that the Hedged Equity 2 Fund’s net advisory fee for both Class A and Class R6 shares was in the first and second quintiles of the Peer Group and Universe, respectively, and that the actual total expenses for both Class A and Class R6 shares were in the first quintile of both the Peer Group and Universe. The Trustees noted that the net advisory fee and actual total expense for Class I shares were both in first and second quintiles of the Peer Group and Universe, respec
tively. After considering the factors identified above, in light of this information, the Trustees concluded that the advisory fee was fair and reasonable in light of the services provided to the Fund.
The Trustees noted that the Hedged Equity 3 Fund’s net advisory fee and actual total expenses for both Class A and Class R6 shares were in the first quintile of both the Peer Group and Universe. The Trustees noted that the net advisory fee for Class I shares was in first quintile of both the Peer Group and Universe, and that the actual total expenses for Class I shares were in the first and second quintiles of the Peer Group and Universe, respectively. After considering the factors identified above, in light of this information, the Trustees concluded that the advisory fee was fair and reasonable in light of the services provided to the Fund.
The Trustees noted that the Large Cap Growth Fund’s net advisory fee for Class A shares was in the first quintile of both the Peer Group and Universe, and that the actual total expenses for Class A shares were in the fourth and second quintiles of the Peer Group and Universe, respectively. The Trustees noted that the net advisory fee for Class I shares was in the second and first quintile of the Peer Group and Universe, respectively, and that the actual total expenses for Class I shares were in the fourth and second quintiles of the Peer Group and Universe, respectively. The Trustees noted that both the net advisory fee and actual total expenses for Class R6 shares were in the first quintile of both the Peer Group and Universe. After considering the factors identified above, in light of this information, the Trustees concluded that the advisory fee was fair and reasonable in light of the services provided to the Fund.
The Trustees noted that the Large Cap Value Fund’s net advisory fee for Class A shares was in the first quintile of both the Peer Group and Universe, and that the actual total expenses for Class A shares were in the second quintile of both the Peer Group and Universe. The Trustees noted that the net advisory fee for Class I shares was in the first and second quintiles of the Peer Group and Universe, respectively, and that the actual total expenses for Class I shares were in the third and second quintiles of the Peer Group and Universe, respectively. The Trustees noted that the net advisory fee for Class R6 shares was in the first and second quintile of the Peer Group and Universe, respectively, and that the actual total expenses were in the first quintile of both the Peer Group and Universe. After considering the factors identified above, in light of this information, the Trustees concluded that the advisory fee was fair and reasonable in light of the services provided to the Fund.
The Trustees noted that the U.S. Applied Data Science Value Fund’s net advisory fee and actual total expenses for Class A, Class I and Class R6 shares were in the first quintile of both the Peer Group and the Universe. After considering the factors
identified above, in light of this information, the Trustees concluded that the advisory fee was fair and reasonable in light of the services provided to the Fund.
The Trustees noted that the U.S. Equity Fund’s net advisory fee for Class A shares was in the first and second quintiles of the Peer Group and Universe, respectively, and that the actual total expenses for Class A shares were in the third and second quintiles of the Peer Group and Universe, respectively. The Trustees noted that the net advisory fee for Class I shares was in the first and second quintiles of the Peer Group and Universe, respectively, and that the actual total expenses for Class I shares were in the second and third quintiles of the Peer Group and Universe, respectively. The Trustees noted that the net advisory fee for Class R6 shares was in the second quintile of both the Peer Group and Universe, and that the actual total expenses for Class R6 shares were in the second and first quintiles of the Peer Group and Universe, respectively. After considering the factors identified above, in light of this information, the Trustees concluded that the advisory fee was fair and reasonable in light of the services provided to the Fund.
The Trustees noted that the U.S. GARP Equity Fund’s net advisory fee and actual total expenses for Class A, Class I and Class R6 shares were in the first quintile of both the Peer Group and Universe. After considering the factors identified above, in light of this information, the Trustees concluded that the advisory fee was fair and reasonable in light of the services provided to the Fund.
The Trustees noted that the U.S. Large Cap Core Plus Fund’s net advisory fee for Class A shares was in the third and fourth quintiles of the Peer Group and Universe, respectively, and that the actual total expenses for Class A shares were in third and second quintiles of the Peer Group and Universe, respectively. The Trustees noted that the net advisory fee for Class I shares was in the fifth and fourth quintile of the Peer Group and Universe, respectively, and that the actual total expenses for Class I shares were in the second and third quintiles of the Peer Group and Universe, respectively. The Trustees noted that the net advisory fee for Class R6 shares was in the fifth and fourth
quintile of the Peer Group and Universe, respectively, and that the actual total expenses for Class R6 shares were in the third and second quintiles of the Peer Group and Universe, respectively. After considering all of the factors identified above, in light of this information, the Trustees concluded that the advisory fee was fair and reasonable in light of the services provided to the Fund.
The Trustees noted that the U.S. Research Enhanced Equity Fund’s net advisory fee and actual total expenses for Class A, Class I and Class R6 shares were in the first quintile of both the Peer Group and Universe. After considering the factors identified above, in light of this information, the Trustees concluded that the advisory fee was fair and reasonable in light of the services provided to the Fund.
The Trustees noted that the U.S. Sustainable Leader Fund’s net advisory fee and actual total expenses for Class A, Class I and Class R6 shares were in the first quintile of both the Peer Group and Universe. After considering the factors identified above, in light of this information, the Trustees concluded that the advisory fee was fair and reasonable in light of the services provided to the Fund.
The Trustees noted that the U.S. Value Fund’s net advisory fee for Class A shares was in the first quintile of both the Peer Group and Universe, and that the actual total expenses for Class A shares were in the second quintiles of both the Peer Group and Universe. The Trustees noted that the net advisory fee for Class I shares was in the first and second quintiles of the Peer Group and Universe, respectively, and that the actual total expenses for Class I shares were in the third and second quintiles of the Peer Group and Universe, respectively. The Trustees noted that the net advisory fee for Class R6 shares was in the first and second quintiles of the Peer Group and Universe, respectively, and that the actual total expenses for Class R6 shares were in the first quintile of both the Peer Group and Universe. After considering the factors identified above, in light of this information, the Trustees concluded that the advisory fee was fair and reasonable in light of the services provided to the Fund.
Semi-Annual Financial Statements
J.P. Morgan Mid Cap/Multi-Cap Funds
December 31, 2024 (Unaudited)
JPMorgan Growth Advantage Fund |
JPMorgan Mid Cap Equity Fund |
JPMorgan Mid Cap Growth Fund |
JPMorgan Mid Cap Value Fund |
JPMorgan Value Advantage Fund |
CONTENTS
Investments in a Fund are not deposits or obligations of, or guaranteed or endorsed by, any bank and are not insured or guaranteed by the FDIC, the Federal Reserve Board or any other government agency. You could lose money if you sell when a Fund’s share price is lower than when you invested.
Past performance is no guarantee of future performance. The general market views expressed in this report are opinions based on market and other conditions through the end of the reporting period and are subject to change without notice. These views are not intended to predict the future performance of a Fund or the securities markets.
Prospective investors should refer to the Funds’ prospectuses for a discussion of the Funds’ investment objectives, strategies and risks. Call J.P. Morgan Funds Service Center at 1-800-480-4111 for a prospectus containing more complete information about a Fund, including management fees and other expenses. Please read it carefully before investing.
JPMorgan Growth Advantage Fund
SCHEDULE OF PORTFOLIO INVESTMENTSAS OF December 31, 2024 (Unaudited)
| | |
|
|
| | |
|
Constellation Brands, Inc., Class A | | |
|
Alnylam Pharmaceuticals, Inc. * | | |
| | |
| | |
Regeneron Pharmaceuticals, Inc. * | | |
| | |
|
| | |
|
| | |
|
| | |
Goldman Sachs Group, Inc. (The) | | |
Interactive Brokers Group, Inc., Class A | | |
| | |
| | |
Robinhood Markets, Inc., Class A * | | |
| | |
Commercial Services & Supplies — 0.9% |
| | |
Communications Equipment — 0.7% |
| | |
Construction & Engineering — 1.2% |
| | |
Construction Materials — 0.4% |
| | |
|
| | |
Electrical Equipment — 2.3% |
| | |
| | |
| | |
Vertiv Holdings Co., Class A | | |
| | |
Energy Equipment & Services — 0.8% |
TechnipFMC plc (United Kingdom) | | |
| | |
|
|
| | |
Take-Two Interactive Software, Inc. * | | |
| | |
Financial Services — 2.8% |
Mastercard, Inc., Class A | | |
Ground Transportation — 1.8% |
JB Hunt Transport Services, Inc. | | |
| | |
Uber Technologies, Inc. * | | |
| | |
Health Care Equipment & Supplies — 2.1% |
Cooper Cos., Inc. (The) * | | |
Intuitive Surgical, Inc. * | | |
| | |
Health Care Providers & Services — 0.5% |
| | |
Hotels, Restaurants & Leisure — 3.7% |
| | |
DoorDash, Inc., Class A * | | |
Flutter Entertainment plc (United Kingdom) * | | |
Hilton Worldwide Holdings, Inc. | | |
| | |
| | |
Household Durables — 0.7% |
| | |
Industrial Conglomerates — 0.6% |
| | |
|
| | |
Interactive Media & Services — 9.5% |
| | |
Meta Platforms, Inc., Class A | | |
| | |
|
| | |
Shopify, Inc., Class A (Canada) * | | |
Snowflake, Inc., Class A * | | |
| | |
SEE NOTES TO FINANCIAL STATEMENTS.
| J.P. Morgan Mid Cap/Multi-Cap Funds | |
JPMorgan Growth Advantage Fund
SCHEDULE OF PORTFOLIO INVESTMENTSAS OF December 31, 2024 (Unaudited) (continued)
| | |
Common Stocks — continued |
Life Sciences Tools & Services — 1.3% |
| | |
Mettler-Toledo International, Inc. * | | |
Thermo Fisher Scientific, Inc. | | |
| | |
|
| | |
| | |
| | |
|
Trade Desk, Inc. (The), Class A * | | |
Oil, Gas & Consumable Fuels — 0.7% |
| | |
Personal Care Products — 0.5% |
| | |
|
| | |
Intra-Cellular Therapies, Inc. * | | |
| | |
Professional Services — 0.6% |
Booz Allen Hamilton Holding Corp. | | |
Semiconductors & Semiconductor Equipment — 15.7% |
| | |
| | |
| | |
| | |
Taiwan Semiconductor Manufacturing Co. Ltd., ADR (Taiwan) | | |
| | |
| | |
|
AppLovin Corp., Class A * | | |
Atlassian Corp., Class A * | | |
| | |
Crowdstrike Holdings, Inc., Class A * | | |
| | |
| | |
| | |
| | |
| | |
|
|
Palo Alto Networks, Inc. * | | |
| | |
| | |
|
| | |
| | |
| | |
Technology Hardware, Storage & Peripherals — 6.5% |
| | |
Trading Companies & Distributors — 0.3% |
| | |
Total Common Stocks
(Cost $9,304,685) | | |
Short-Term Investments — 1.3% |
Investment Companies — 1.1% |
JPMorgan Prime Money Market Fund Class IM Shares, 4.54% (c) (d)
(Cost $227,128) | | |
Investment of Cash Collateral from Securities Loaned — 0.2% |
JPMorgan Securities Lending Money Market Fund Agency SL Class Shares, 4.47% (c) (d)
(Cost $48,146) | | |
Total Short-Term Investments
(Cost $275,274) | | |
Total Investments — 100.5%
(Cost $9,579,959) | | |
Liabilities in Excess of Other Assets — (0.5)% | | |
| | |
Percentages indicated are based on net assets. |
| |
| American Depositary Receipt |
| Value determined using significant unobservable inputs. |
| Non-income producing security. |
| The security or a portion of this security is on loan at December 31, 2024. The total value of securities on loan at December 31, 2024 is $46,604. |
| Fund is subject to legal or contractual restrictions on the resale of the security. |
SEE NOTES TO FINANCIAL STATEMENTS.
| J.P. Morgan Mid Cap/Multi-Cap Funds | |
| Investment in an affiliated fund, which is registered under the Investment Company Act of 1940, as amended, and is advised by J.P. Morgan Investment Management Inc. |
| The rate shown is the current yield as of December 31, 2024. |
SEE NOTES TO FINANCIAL STATEMENTS.
| J.P. Morgan Mid Cap/Multi-Cap Funds | |
JPMorgan Mid Cap Equity Fund
SCHEDULE OF PORTFOLIO INVESTMENTSAS OF December 31, 2024 (Unaudited)
| | |
|
Aerospace & Defense — 1.2% |
| | |
| | |
| | |
| | |
| | |
|
| | |
|
| | |
First Citizens BancShares, Inc., Class A | | |
| | |
NU Holdings Ltd., Class A (Brazil) * | | |
| | |
| | |
|
Constellation Brands, Inc., Class A | | |
| | |
| | |
|
Alnylam Pharmaceuticals, Inc. * | | |
| | |
| | |
| | |
| | |
REVOLUTION Medicines, Inc. * | | |
| | |
Viking Therapeutics, Inc. * | | |
| | |
|
| | |
| | |
Fortune Brands Innovations, Inc. | | |
Simpson Manufacturing Co., Inc. | | |
| | |
| | |
|
Ameriprise Financial, Inc. | | |
| | |
| | |
Coinbase Global, Inc., Class A * | | |
FactSet Research Systems, Inc. | | |
| | |
|
Capital Markets — continued |
Interactive Brokers Group, Inc., Class A | | |
Jefferies Financial Group, Inc. | | |
LPL Financial Holdings, Inc. | | |
| | |
| | |
| | |
Raymond James Financial, Inc. | | |
Robinhood Markets, Inc., Class A * | | |
| | |
| | |
Tradeweb Markets, Inc., Class A | | |
| | |
|
| | |
| | |
| | |
Commercial Services & Supplies — 1.2% |
| | |
| | |
| | |
| | |
| | |
Communications Equipment — 0.3% |
| | |
| | |
| | |
Construction & Engineering — 0.7% |
Comfort Systems USA, Inc. | | |
| | |
| | |
Construction Materials — 1.0% |
| | |
Martin Marietta Materials, Inc. | | |
| | |
|
Discover Financial Services | | |
Consumer Staples Distribution & Retail — 1.7% |
Casey's General Stores, Inc. | | |
SEE NOTES TO FINANCIAL STATEMENTS.
| J.P. Morgan Mid Cap/Multi-Cap Funds | |
| | |
Common Stocks — continued |
Consumer Staples Distribution & Retail — continued |
| | |
| | |
| | |
Containers & Packaging — 2.4% |
| | |
Graphic Packaging Holding Co. | | |
| | |
Packaging Corp. of America | | |
| | |
| | |
|
| | |
| | |
| | |
Diversified Consumer Services — 0.3% |
Bright Horizons Family Solutions, Inc. * | | |
Electric Utilities — 1.8% |
| | |
| | |
| | |
Electrical Equipment — 3.9% |
| | |
| | |
| | |
| | |
Vertiv Holdings Co., Class A | | |
| | |
Electronic Equipment, Instruments & Components — 3.8% |
| | |
| | |
| | |
| | |
Teledyne Technologies, Inc. * | | |
Zebra Technologies Corp., Class A * | | |
| | |
Energy Equipment & Services — 1.0% |
| | |
TechnipFMC plc (United Kingdom) | | |
| | |
| | |
|
|
Take-Two Interactive Software, Inc. * | | |
Warner Music Group Corp., Class A | | |
| | |
Financial Services — 2.4% |
| | |
Fidelity National Information Services, Inc. | | |
| | |
Rocket Cos., Inc., Class A * | | |
| | |
|
| | |
| | |
| | |
| | |
Ground Transportation — 1.4% |
JB Hunt Transport Services, Inc. | | |
| | |
| | |
Health Care Equipment & Supplies — 1.8% |
Cooper Cos., Inc. (The) * | | |
| | |
GE HealthCare Technologies, Inc. | | |
Globus Medical, Inc., Class A * | | |
IDEXX Laboratories, Inc. * | | |
Inspire Medical Systems, Inc. * | | |
| | |
Health Care Providers & Services — 4.3% |
| | |
| | |
| | |
| | |
| | |
| | |
Universal Health Services, Inc., Class B | | |
| | |
|
| | |
Health Care Technology — 0.4% |
Veeva Systems, Inc., Class A * | | |
SEE NOTES TO FINANCIAL STATEMENTS.
| J.P. Morgan Mid Cap/Multi-Cap Funds | |
JPMorgan Mid Cap Equity Fund
SCHEDULE OF PORTFOLIO INVESTMENTSAS OF December 31, 2024 (Unaudited) (continued)
| | |
Common Stocks — continued |
Hotel & Resort REITs — 0.5% |
Host Hotels & Resorts, Inc. | | |
Hotels, Restaurants & Leisure — 3.7% |
| | |
| | |
DoorDash, Inc., Class A * | | |
| | |
Flutter Entertainment plc (United Kingdom) * | | |
Hilton Worldwide Holdings, Inc. | | |
| | |
Planet Fitness, Inc., Class A * | | |
| | |
Household Durables — 0.8% |
| | |
Mohawk Industries, Inc. * | | |
| | |
Independent Power and Renewable Electricity Producers — 0.3% |
| | |
|
| | |
| | |
Hartford Financial Services Group, Inc. (The) | | |
| | |
| | |
| | |
Interactive Media & Services — 0.4% |
| | |
|
| | |
| | |
| | |
| | |
Snowflake, Inc., Class A * | | |
| | |
Life Sciences Tools & Services — 0.9% |
Agilent Technologies, Inc. | | |
| | |
Mettler-Toledo International, Inc. * | | |
West Pharmaceutical Services, Inc. | | |
| | |
| | |
|
|
| | |
| | |
| | |
| | |
Lincoln Electric Holdings, Inc. | | |
| | |
Westinghouse Air Brake Technologies Corp. | | |
| | |
|
Trade Desk, Inc. (The), Class A * | | |
|
| | |
|
| | |
| | |
Public Service Enterprise Group, Inc. | | |
| | |
| | |
Oil, Gas & Consumable Fuels — 3.7% |
| | |
| | |
| | |
| | |
Williams Cos., Inc. (The) | | |
| | |
Personal Care Products — 0.3% |
| | |
|
Intra-Cellular Therapies, Inc. * | | |
Jazz Pharmaceuticals plc * | | |
| | |
Professional Services — 1.4% |
Booz Allen Hamilton Holding Corp. | | |
| | |
UL Solutions, Inc., Class A | | |
| | |
Real Estate Management & Development — 0.7% |
CBRE Group, Inc., Class A * | | |
|
American Homes 4 Rent, Class A | | |
SEE NOTES TO FINANCIAL STATEMENTS.
| J.P. Morgan Mid Cap/Multi-Cap Funds | |
| | |
Common Stocks — continued |
Residential REITs — continued |
AvalonBay Communities, Inc. | | |
Mid-America Apartment Communities, Inc. | | |
| | |
|
| | |
Semiconductors & Semiconductor Equipment — 2.4% |
| | |
| | |
Microchip Technology, Inc. | | |
Monolithic Power Systems, Inc. | | |
| | |
| | |
| | |
| | |
| | |
|
AppLovin Corp., Class A * | | |
Atlassian Corp., Class A * | | |
Confluent, Inc., Class A * | | |
Crowdstrike Holdings, Inc., Class A * | | |
| | |
| | |
| | |
| | |
| | |
| | |
Palantir Technologies, Inc., Class A * | | |
Palo Alto Networks, Inc. * | | |
| | |
Tyler Technologies, Inc. * | | |
| | |
|
| | |
| | |
| | |
| | |
|
| | |
| | |
|
Specialty Retail — continued |
| | |
| | |
Burlington Stores, Inc. * | | |
Floor & Decor Holdings, Inc., Class A * | | |
| | |
| | |
| | |
| | |
Textiles, Apparel & Luxury Goods — 1.4% |
| | |
On Holding AG, Class A (Switzerland) * | | |
| | |
| | |
Trading Companies & Distributors — 0.2% |
| | |
Total Common Stocks
(Cost $3,721,840) | | |
Short-Term Investments — 2.7% |
Investment Companies — 2.7% |
JPMorgan Prime Money Market Fund Class IM Shares, 4.54% (a) (b)
(Cost $140,828) | | |
Total Investments — 99.9%
(Cost $3,862,668) | | |
Other Assets in Excess of Liabilities — 0.1% | | |
| | |
Percentages indicated are based on net assets. |
| |
| Real Estate Investment Trust |
| Non-income producing security. |
| Investment in an affiliated fund, which is registered under the Investment Company Act of 1940, as amended, and is advised by J.P. Morgan Investment Management Inc. |
| The rate shown is the current yield as of December 31, 2024. |
SEE NOTES TO FINANCIAL STATEMENTS.
| J.P. Morgan Mid Cap/Multi-Cap Funds | |
JPMorgan Mid Cap Growth Fund
SCHEDULE OF PORTFOLIO INVESTMENTSAS OF December 31, 2024 (Unaudited)
| | |
|
Aerospace & Defense — 2.7% |
| | |
| | |
| | |
| | |
|
| | |
|
NU Holdings Ltd., Class A (Brazil) * | | |
|
Constellation Brands, Inc., Class A | | |
|
Alnylam Pharmaceuticals, Inc. * | | |
| | |
| | |
| | |
| | |
REVOLUTION Medicines, Inc. * | | |
| | |
Viking Therapeutics, Inc. * (a) | | |
| | |
|
| | |
Simpson Manufacturing Co., Inc. | | |
| | |
| | |
|
| | |
Coinbase Global, Inc., Class A * | | |
FactSet Research Systems, Inc. | | |
Interactive Brokers Group, Inc., Class A | | |
Jefferies Financial Group, Inc. | | |
LPL Financial Holdings, Inc. | | |
| | |
| | |
Raymond James Financial, Inc. | | |
Robinhood Markets, Inc., Class A * | | |
| | |
Tradeweb Markets, Inc., Class A | | |
| | |
Commercial Services & Supplies — 1.9% |
| | |
| | |
|
Commercial Services & Supplies — continued |
| | |
| | |
| | |
Communications Equipment — 0.4% |
| | |
Construction & Engineering — 2.1% |
Comfort Systems USA, Inc. | | |
| | |
| | |
Construction Materials — 0.8% |
| | |
Consumer Staples Distribution & Retail — 1.0% |
Casey's General Stores, Inc. | | |
|
| | |
Diversified Consumer Services — 1.0% |
Bright Horizons Family Solutions, Inc. * | | |
Electrical Equipment — 3.7% |
| | |
| | |
| | |
Vertiv Holdings Co., Class A | | |
| | |
Electronic Equipment, Instruments & Components — 1.2% |
| | |
Teledyne Technologies, Inc. * | | |
| | |
Energy Equipment & Services — 0.9% |
TechnipFMC plc (United Kingdom) | | |
|
Take-Two Interactive Software, Inc. * | | |
Financial Services — 0.9% |
| | |
Rocket Cos., Inc., Class A * (a) | | |
| | |
Ground Transportation — 2.0% |
JB Hunt Transport Services, Inc. | | |
| | |
| | |
SEE NOTES TO FINANCIAL STATEMENTS.
| J.P. Morgan Mid Cap/Multi-Cap Funds | |
| | |
Common Stocks — continued |
Health Care Equipment & Supplies — 2.1% |
Cooper Cos., Inc. (The) * | | |
| | |
IDEXX Laboratories, Inc. * | | |
Inspire Medical Systems, Inc. * | | |
| | |
Health Care Providers & Services — 0.9% |
| | |
Health Care Technology — 1.1% |
Veeva Systems, Inc., Class A * | | |
Hotels, Restaurants & Leisure — 6.9% |
| | |
DoorDash, Inc., Class A * | | |
Flutter Entertainment plc (United Kingdom) * | | |
Hilton Worldwide Holdings, Inc. | | |
| | |
Planet Fitness, Inc., Class A * | | |
| | |
Household Durables — 0.7% |
| | |
Independent Power and Renewable Electricity Producers — 0.9% |
| | |
|
| | |
|
| | |
| | |
| | |
Snowflake, Inc., Class A * | | |
| | |
Life Sciences Tools & Services — 2.7% |
Agilent Technologies, Inc. | | |
| | |
Mettler-Toledo International, Inc. * | | |
West Pharmaceutical Services, Inc. | | |
| | |
|
| | |
| | |
| | |
|
|
| | |
Westinghouse Air Brake Technologies Corp. | | |
| | |
|
Trade Desk, Inc. (The), Class A * | | |
Oil, Gas & Consumable Fuels — 2.2% |
| | |
| | |
| | |
Personal Care Products — 0.7% |
| | |
|
Intra-Cellular Therapies, Inc. * | | |
Professional Services — 1.1% |
Booz Allen Hamilton Holding Corp. | | |
Semiconductors & Semiconductor Equipment — 5.3% |
| | |
| | |
Monolithic Power Systems, Inc. | | |
| | |
| | |
| | |
| | |
| | |
|
AppLovin Corp., Class A * | | |
Atlassian Corp., Class A * | | |
Confluent, Inc., Class A * | | |
| | |
Crowdstrike Holdings, Inc., Class A * | | |
| | |
| | |
| | |
| | |
| | |
| | |
Palantir Technologies, Inc., Class A * | | |
Palo Alto Networks, Inc. * | | |
| | |
Tyler Technologies, Inc. * | | |
| | |
SEE NOTES TO FINANCIAL STATEMENTS.
| J.P. Morgan Mid Cap/Multi-Cap Funds | |
JPMorgan Mid Cap Growth Fund
SCHEDULE OF PORTFOLIO INVESTMENTSAS OF December 31, 2024 (Unaudited) (continued)
| | |
Common Stocks — continued |
|
| | |
Burlington Stores, Inc. * | | |
Floor & Decor Holdings, Inc., Class A * | | |
| | |
| | |
| | |
| | |
Textiles, Apparel & Luxury Goods — 0.7% |
On Holding AG, Class A (Switzerland) * | | |
Trading Companies & Distributors — 0.5% |
| | |
Total Common Stocks
(Cost $8,386,150) | | |
Short-Term Investments — 1.7% |
Investment Companies — 1.6% |
JPMorgan Prime Money Market Fund Class IM Shares, 4.54% (c) (d)
(Cost $190,756) | | |
Investment of Cash Collateral from Securities Loaned — 0.1% |
JPMorgan Securities Lending Money Market Fund Agency SL Class Shares, 4.47% (c) (d)
(Cost $9,270) | | |
Total Short-Term Investments
(Cost $200,026) | | |
Total Investments — 100.3%
(Cost $8,586,176) | | |
Liabilities in Excess of Other Assets — (0.3)% | | |
| | |
Percentages indicated are based on net assets. |
| Value determined using significant unobservable inputs. |
| Non-income producing security. |
| The security or a portion of this security is on loan at December 31, 2024. The total value of securities on loan at December 31, 2024 is $9,156. |
| Fund is subject to legal or contractual restrictions on the resale of the security. |
| Investment in an affiliated fund, which is registered under the Investment Company Act of 1940, as amended, and is advised by J.P. Morgan Investment Management Inc. |
| The rate shown is the current yield as of December 31, 2024. |
SEE NOTES TO FINANCIAL STATEMENTS.
| J.P. Morgan Mid Cap/Multi-Cap Funds | |
JPMorgan Mid Cap Value Fund
SCHEDULE OF PORTFOLIO INVESTMENTSAS OF December 31, 2024 (Unaudited)
| | |
|
Aerospace & Defense — 0.4% |
| | |
|
| | |
First Citizens BancShares, Inc., Class A | | |
| | |
| | |
| | |
|
Constellation Brands, Inc., Class A | | |
| | |
| | |
|
| | |
Fortune Brands Innovations, Inc. | | |
| | |
|
Ameriprise Financial, Inc. | | |
| | |
| | |
Raymond James Financial, Inc. | | |
| | |
| | |
|
| | |
| | |
| | |
Commercial Services & Supplies — 0.8% |
| | |
Communications Equipment — 0.3% |
| | |
Construction Materials — 1.1% |
Martin Marietta Materials, Inc. | | |
|
Discover Financial Services | | |
Consumer Staples Distribution & Retail — 2.0% |
| | |
| | |
| | |
| | |
|
Containers & Packaging — 3.7% |
| | |
Graphic Packaging Holding Co. | | |
| | |
Packaging Corp. of America | | |
| | |
| | |
|
| | |
Electric Utilities — 2.9% |
| | |
| | |
| | |
Electrical Equipment — 4.0% |
| | |
| | |
| | |
| | |
Electronic Equipment, Instruments & Components — 5.2% |
| | |
| | |
| | |
Teledyne Technologies, Inc. * | | |
Zebra Technologies Corp., Class A * | | |
| | |
Energy Equipment & Services — 1.0% |
| | |
|
Take-Two Interactive Software, Inc. * | | |
Warner Music Group Corp., Class A | | |
| | |
Financial Services — 3.2% |
| | |
Fidelity National Information Services, Inc. | | |
| | |
| | |
|
| | |
| | |
| | |
| | |
SEE NOTES TO FINANCIAL STATEMENTS.
| J.P. Morgan Mid Cap/Multi-Cap Funds | |
JPMorgan Mid Cap Value Fund
SCHEDULE OF PORTFOLIO INVESTMENTSAS OF December 31, 2024 (Unaudited) (continued)
| | |
Common Stocks — continued |
Ground Transportation — 1.1% |
JB Hunt Transport Services, Inc. | | |
Health Care Equipment & Supplies — 1.7% |
GE HealthCare Technologies, Inc. | | |
Globus Medical, Inc., Class A * | | |
| | |
Health Care Providers & Services — 6.1% |
| | |
| | |
| | |
| | |
| | |
Universal Health Services, Inc., Class B | | |
| | |
|
| | |
Hotel & Resort REITs — 0.7% |
Host Hotels & Resorts, Inc. | | |
Hotels, Restaurants & Leisure — 2.0% |
| | |
| | |
| | |
Household Durables — 0.9% |
Mohawk Industries, Inc. * | | |
|
| | |
Hartford Financial Services Group, Inc. (The) | | |
| | |
| | |
| | |
Interactive Media & Services — 0.6% |
| | |
|
| | |
|
| | |
| | |
| | |
Lincoln Electric Holdings, Inc. | | |
| | |
| | |
| | |
|
|
| | |
|
| | |
| | |
Public Service Enterprise Group, Inc. | | |
| | |
| | |
Oil, Gas & Consumable Fuels — 4.5% |
| | |
| | |
Williams Cos., Inc. (The) | | |
| | |
|
Jazz Pharmaceuticals plc * | | |
Professional Services — 1.6% |
| | |
UL Solutions, Inc., Class A | | |
| | |
Real Estate Management & Development — 1.0% |
CBRE Group, Inc., Class A * | | |
|
American Homes 4 Rent, Class A | | |
AvalonBay Communities, Inc. | | |
Mid-America Apartment Communities, Inc. | | |
| | |
|
| | |
Semiconductors & Semiconductor Equipment — 1.0% |
Microchip Technology, Inc. | | |
| | |
| | |
|
| | |
| | |
| | |
| | |
|
| | |
SEE NOTES TO FINANCIAL STATEMENTS.
| J.P. Morgan Mid Cap/Multi-Cap Funds | |
| | |
Common Stocks — continued |
Specialty Retail — continued |
| | |
| | |
| | |
Textiles, Apparel & Luxury Goods — 1.8% |
| | |
| | |
| | |
Total Common Stocks
(Cost $7,534,020) | | |
Short-Term Investments — 2.2% |
Investment Companies — 2.2% |
JPMorgan Prime Money Market Fund Class IM Shares, 4.54% (a) (b)
(Cost $288,108) | | |
Total Investments — 100.1%
(Cost $7,822,128) | | |
Liabilities in Excess of Other Assets — (0.1)% | | |
| | |
Percentages indicated are based on net assets. |
| |
| Real Estate Investment Trust |
| Non-income producing security. |
| Investment in an affiliated fund, which is registered under the Investment Company Act of 1940, as amended, and is advised by J.P. Morgan Investment Management Inc. |
| The rate shown is the current yield as of December 31, 2024. |
SEE NOTES TO FINANCIAL STATEMENTS.
| J.P. Morgan Mid Cap/Multi-Cap Funds | |
JPMorgan Value Advantage Fund
SCHEDULE OF PORTFOLIO INVESTMENTSAS OF December 31, 2024 (Unaudited)
| | |
|
Aerospace & Defense — 1.9% |
| | |
| | |
| | |
| | |
Air Freight & Logistics — 1.8% |
| | |
United Parcel Service, Inc., Class B | | |
| | |
Automobile Components — 0.2% |
| | |
|
| | |
Columbia Banking System, Inc. | | |
| | |
First Citizens BancShares, Inc., Class A | | |
| | |
PNC Financial Services Group, Inc. (The) | | |
| | |
| | |
| | |
|
| | |
|
| | |
Regeneron Pharmaceuticals, Inc. * | | |
Vertex Pharmaceuticals, Inc. * | | |
| | |
|
| | |
|
| | |
Fortune Brands Innovations, Inc. | | |
| | |
|
Charles Schwab Corp. (The) | | |
| | |
| | |
Raymond James Financial, Inc. | | |
| | |
| | |
| | |
|
|
Axalta Coating Systems Ltd. * | | |
Communications Equipment — 0.5% |
| | |
Construction & Engineering — 0.7% |
WillScot Holdings Corp. * | | |
Construction Materials — 0.7% |
Martin Marietta Materials, Inc. | | |
|
| | |
Capital One Financial Corp. | | |
Discover Financial Services | | |
| | |
Containers & Packaging — 3.1% |
Graphic Packaging Holding Co. | | |
| | |
Packaging Corp. of America | | |
| | |
| | |
| | |
Diversified Telecommunication Services — 0.5% |
Verizon Communications, Inc. | | |
Electric Utilities — 3.0% |
| | |
| | |
| | |
| | |
| | |
| | |
Electrical Equipment — 0.4% |
| | |
Electronic Equipment, Instruments & Components — 1.1% |
| | |
|
| | |
Financial Services — 4.4% |
Berkshire Hathaway, Inc., Class B * | | |
| | |
SEE NOTES TO FINANCIAL STATEMENTS.
| J.P. Morgan Mid Cap/Multi-Cap Funds | |
| | |
Common Stocks — continued |
Financial Services — continued |
| | |
| | |
| | |
|
| | |
Ground Transportation — 0.8% |
| | |
Health Care Equipment & Supplies — 0.7% |
| | |
| | |
| | |
Health Care Providers & Services — 6.4% |
| | |
| | |
| | |
| | |
| | |
| | |
| | |
| | |
| | |
| | |
Hotel & Resort REITs — 0.8% |
Apple Hospitality REIT, Inc. | | |
Host Hotels & Resorts, Inc. | | |
| | |
Hotels, Restaurants & Leisure — 2.5% |
| | |
| | |
| | |
| | |
| | |
Household Durables — 0.6% |
Mohawk Industries, Inc. * | | |
Household Products — 1.1% |
Procter & Gamble Co. (The) | | |
Industrial Conglomerates — 0.5% |
Honeywell International, Inc. | | |
|
EastGroup Properties, Inc. | | |
| | |
|
|
| | |
| | |
| | |
Oscar Health, Inc., Class A * | | |
| | |
Travelers Cos., Inc. (The) | | |
| | |
| | |
Interactive Media & Services — 0.7% |
| | |
Meta Platforms, Inc., Class A | | |
| | |
|
Cognizant Technology Solutions Corp., Class A | | |
International Business Machines Corp. | | |
| | |
|
| | |
| | |
| | |
| | |
|
Nexstar Media Group, Inc. | | |
Sirius XM Holdings, Inc. (a) | | |
| | |
|
| | |
Public Service Enterprise Group, Inc. | | |
| | |
Oil, Gas & Consumable Fuels — 7.2% |
| | |
| | |
| | |
| | |
| | |
| | |
| | |
Williams Cos., Inc. (The) | | |
| | |
SEE NOTES TO FINANCIAL STATEMENTS.
| J.P. Morgan Mid Cap/Multi-Cap Funds | |
JPMorgan Value Advantage Fund
SCHEDULE OF PORTFOLIO INVESTMENTSAS OF December 31, 2024 (Unaudited) (continued)
| | |
Common Stocks — continued |
Passenger Airlines — 0.4% |
| | |
|
| | |
| | |
| | |
| | |
Professional Services — 0.4% |
Paylocity Holding Corp. * | | |
Real Estate Management & Development — 0.5% |
CBRE Group, Inc., Class A * | | |
|
American Homes 4 Rent, Class A | | |
Mid-America Apartment Communities, Inc. | | |
| | |
|
Federal Realty Investment Trust | | |
| | |
| | |
| | |
Semiconductors & Semiconductor Equipment — 2.5% |
| | |
ASML Holding NV (Registered), NYRS (Netherlands) | | |
Microchip Technology, Inc. | | |
| | |
| | |
|
Lamar Advertising Co., Class A | | |
| | |
| | |
| | |
| | |
| | |
| | |
|
| | |
| | |
| | |
Dick's Sporting Goods, Inc. | | |
| | |
| | |
|
Specialty Retail — continued |
| | |
| | |
| | |
Technology Hardware, Storage & Peripherals — 1.4% |
Hewlett Packard Enterprise Co. | | |
| | |
| | |
Textiles, Apparel & Luxury Goods — 0.3% |
| | |
|
Philip Morris International, Inc. | | |
Wireless Telecommunication Services — 0.4% |
| | |
Total Common Stocks
(Cost $5,366,665) | | |
Short-Term Investments — 2.4% |
Investment Companies — 2.2% |
JPMorgan Prime Money Market Fund Class IM Shares, 4.54% (b) (c)
(Cost $198,067) | | |
Investment of Cash Collateral from Securities Loaned — 0.2% |
JPMorgan Securities Lending Money Market Fund Agency SL Class Shares, 4.47% (b) (c)
(Cost $19,729) | | |
Total Short-Term Investments
(Cost $217,796) | | |
Total Investments — 99.5%
(Cost $5,584,461) | | |
Other Assets in Excess of Liabilities — 0.5% | | |
| | |
Percentages indicated are based on net assets. |
| |
| |
| Real Estate Investment Trust |
| Non-income producing security. |
| The security or a portion of this security is on loan at December 31, 2024. The total value of securities on loan at December 31, 2024 is $19,162. |
SEE NOTES TO FINANCIAL STATEMENTS.
| J.P. Morgan Mid Cap/Multi-Cap Funds | |
| Investment in an affiliated fund, which is registered under the Investment Company Act of 1940, as amended, and is advised by J.P. Morgan Investment Management Inc. |
| The rate shown is the current yield as of December 31, 2024. |
SEE NOTES TO FINANCIAL STATEMENTS.
| J.P. Morgan Mid Cap/Multi-Cap Funds | |
STATEMENTS OF ASSETS AND LIABILITIESAS OF December 31, 2024 (Unaudited)
(Amounts in thousands, except per share amounts)
| JPMorgan
Growth
Advantage Fund | JPMorgan
Mid Cap
Equity Fund | |
| | | |
Investments in non-affiliates, at value | | | |
Investments in affiliates, at value | | | |
Investments of cash collateral received from securities loaned, at value (See Note 2.C.) | | | |
| | | |
| | | |
| | | |
Interest from non-affiliates | | | |
Dividends from non-affiliates | | | |
Dividends from affiliates | | | |
Securities lending income (See Note 2.C.) | | | |
| | | |
| | | |
| | | |
| | | |
Collateral received on securities loaned (See Note 2.C.) | | | |
| | | |
| | | |
| | | |
| | | |
| | | |
| | | |
Custodian and accounting fees | | | |
Trustees’ and Chief Compliance Officer’s fees | | | |
| | | |
| | | |
| | | |
SEE NOTES TO FINANCIAL STATEMENTS.
| J.P. Morgan Mid Cap/Multi-Cap Funds | |
| JPMorgan Growth Advantage Fund | JPMorgan Mid Cap Equity Fund | |
| | | |
| | | |
Total distributable earnings (loss) | | | |
| | | |
| | | |
| | | |
| | | |
| | | |
| | | |
| | | |
| | | |
| | | |
| | | |
| | | |
Outstanding units of beneficial interest (shares)
($0.0001 par value; unlimited number of shares authorized): | | | |
| | | |
| | | |
| | | |
| | | |
| | | |
| | | |
| | | |
| | | |
| | | |
Class A — Redemption price per share | | | |
Class C — Offering price per share (b) | | | |
Class I — Offering and redemption price per share | | | |
Class R2 — Offering and redemption price per share | | | |
Class R3 — Offering and redemption price per share | | | |
Class R4 — Offering and redemption price per share | | | |
Class R5 — Offering and redemption price per share | | | |
Class R6 — Offering and redemption price per share | | | |
Class A maximum sales charge | | | |
Class A maximum public offering price per share
[net asset value per share/(100% – maximum sales charge)] | | | |
Cost of investments in non-affiliates | | | |
Cost of investments in affiliates | | | |
Investment securities on loan, at value (See Note 2.C.) | | | |
Cost of investment of cash collateral (See Note 2.C.) | | | |
(a)
Per share amounts may not recalculate due to rounding of net assets and/or shares outstanding.
(b)
Redemption price for Class C Shares varies based upon length of time the shares are held.
SEE NOTES TO FINANCIAL STATEMENTS.
| J.P. Morgan Mid Cap/Multi-Cap Funds | |
STATEMENTS OF ASSETS AND LIABILITIESAS OF December 31, 2024 (Unaudited) (continued)
(Amounts in thousands, except per share amounts)
| JPMorgan
Mid Cap
Value Fund | |
| | |
Investments in non-affiliates, at value | | |
Investments in affiliates, at value | | |
Investments of cash collateral received from securities loaned, at value (See Note 2.C.) | | |
| | |
| | |
| | |
Interest from non-affiliates | | |
Dividends from non-affiliates | | |
Dividends from affiliates | | |
Securities lending income (See Note 2.C.) | | |
| | |
| | |
| | |
Collateral received on securities loaned (See Note 2.C.) | | |
| | |
| | |
| | |
| | |
| | |
| | |
Custodian and accounting fees | | |
Trustees’ and Chief Compliance Officer’s fees | | |
| | |
| | |
| | |
(a)
Amount rounds to less than one thousand.
SEE NOTES TO FINANCIAL STATEMENTS.
| J.P. Morgan Mid Cap/Multi-Cap Funds | |
| JPMorgan Mid Cap Value Fund | |
| | |
| | |
Total distributable earnings (loss) | | |
| | |
| | |
| | |
| | |
| | |
| | |
| | |
| | |
| | |
| | |
| | |
| | |
Outstanding units of beneficial interest (shares)
($0.0001 par value; unlimited number of shares authorized): | | |
| | |
| | |
| | |
| | |
| | |
| | |
| | |
| | |
| | |
| | |
Class A — Redemption price per share | | |
Class C — Offering price per share (b) | | |
Class I — Offering and redemption price per share | | |
Class L — Offering and redemption price per share | | |
Class R2 — Offering and redemption price per share | | |
Class R3 — Offering and redemption price per share | | |
Class R4 — Offering and redemption price per share | | |
Class R5 — Offering and redemption price per share | | |
Class R6 — Offering and redemption price per share | | |
Class A maximum sales charge | | |
Class A maximum public offering price per share
[net asset value per share/(100% – maximum sales charge)] | | |
Cost of investments in non-affiliates | | |
Cost of investments in affiliates | | |
Investment securities on loan, at value (See Note 2.C.) | | |
Cost of investment of cash collateral (See Note 2.C.) | | |
(a)
Per share amounts may not recalculate due to rounding of net assets and/or shares outstanding.
(b)
Redemption price for Class C Shares varies based upon length of time the shares are held.
SEE NOTES TO FINANCIAL STATEMENTS.
| J.P. Morgan Mid Cap/Multi-Cap Funds | |
STATEMENTS OF OPERATIONSFOR THE SIX MONTHS ENDED December 31, 2024 (Unaudited)
(Amounts in thousands)
| JPMorgan
Growth
Advantage Fund | JPMorgan
Mid Cap
Equity Fund | |
| | | |
Dividend income from non-affiliates | | | |
Dividend income from affiliates | | | |
Income from securities lending (net) (See Note 2.C.) | | | |
| | | |
| | | |
| | | |
| | | |
| | | |
| | | |
| | | |
| | | |
| | | |
| | | |
| | | |
| | | |
| | | |
| | | |
| | | |
| | | |
| | | |
Custodian and accounting fees | | | |
Interest expense to affiliates | | | |
| | | |
Trustees’ and Chief Compliance Officer’s fees | | | |
Printing and mailing costs | | | |
Registration and filing fees | | | |
Transfer agency fees (See Note 2.G.) | | | |
| | | |
| | | |
| | | |
Less expense reimbursements | | | |
| | | |
Net investment income (loss) | | | |
SEE NOTES TO FINANCIAL STATEMENTS.
| J.P. Morgan Mid Cap/Multi-Cap Funds | |
| JPMorgan Growth Advantage Fund | JPMorgan Mid Cap Equity Fund | |
REALIZED/UNREALIZED GAINS (LOSSES): | | | |
Net realized gain (loss) on transactions from: | | | |
Investments in non-affiliates | | | |
Investments in affiliates | | | |
| | | |
Change in net unrealized appreciation/depreciation on: | | | |
Investments in non-affiliates | | | |
Investments in affiliates | | | |
Change in net unrealized appreciation/depreciation | | | |
Net realized/unrealized gains (losses) | | | |
Change in net assets resulting from operations | | | |
(a)
Amount rounds to less than one thousand.
SEE NOTES TO FINANCIAL STATEMENTS.
| J.P. Morgan Mid Cap/Multi-Cap Funds | |
STATEMENTS OF OPERATIONSFOR THE SIX MONTHS ENDED December 31, 2024 (Unaudited) (continued)
(Amounts in thousands)
| JPMorgan
Mid Cap
Value Fund | JPMorgan
Value
Advantage Fund |
| | |
Dividend income from non-affiliates | | |
Dividend income from affiliates | | |
Income from securities lending (net) (See Note 2.C.) | | |
| | |
| | |
| | |
| | |
| | |
| | |
| | |
| | |
| | |
| | |
| | |
| | |
| | |
| | |
| | |
| | |
| | |
| | |
Custodian and accounting fees | | |
| | |
Trustees’ and Chief Compliance Officer’s fees | | |
Printing and mailing costs | | |
Registration and filing fees | | |
Transfer agency fees (See Note 2.G.) | | |
| | |
| | |
| | |
Less expense reimbursements | | |
| | |
Net investment income (loss) | | |
SEE NOTES TO FINANCIAL STATEMENTS.
| J.P. Morgan Mid Cap/Multi-Cap Funds | |
| JPMorgan Mid Cap Value Fund | JPMorgan Value Advantage Fund |
REALIZED/UNREALIZED GAINS (LOSSES): | | |
Net realized gain (loss) on transactions from: | | |
Investments in non-affiliates | | |
Investments in affiliates | | |
| | |
Change in net unrealized appreciation/depreciation on: | | |
Investments in non-affiliates | | |
Investments in affiliates | | |
Change in net unrealized appreciation/depreciation | | |
Net realized/unrealized gains (losses) | | |
Change in net assets resulting from operations | | |
SEE NOTES TO FINANCIAL STATEMENTS.
| J.P. Morgan Mid Cap/Multi-Cap Funds | |
STATEMENTS OF CHANGES IN NET ASSETSFOR THE PERIODS INDICATED
(Amounts in thousands)
| JPMorgan Growth Advantage Fund | JPMorgan Mid Cap Equity Fund |
| Six Months Ended
December 31, 2024
(Unaudited) | | Six Months Ended
December 31, 2024
(Unaudited) | |
CHANGE IN NET ASSETS RESULTING FROM OPERATIONS: | | | | |
Net investment income (loss) | | | | |
| | | | |
Change in net unrealized appreciation/depreciation | | | | |
Change in net assets resulting from operations | | | | |
DISTRIBUTIONS TO SHAREHOLDERS: | | | | |
| | | | |
| | | | |
| | | | |
| | | | |
| | | | |
| | | | |
| | | | |
| | | | |
Total distributions to shareholders | | | | |
| | | | |
Change in net assets resulting from capital transactions | | | | |
| | | | |
| | | | |
| | | | |
| | | | |
SEE NOTES TO FINANCIAL STATEMENTS.
| J.P. Morgan Mid Cap/Multi-Cap Funds | |
| JPMorgan Mid Cap Growth Fund | JPMorgan Mid Cap Value Fund |
| Six Months Ended
December 31, 2024
(Unaudited) | | Six Months Ended
December 31, 2024
(Unaudited) | |
CHANGE IN NET ASSETS RESULTING FROM OPERATIONS: | | | | |
Net investment income (loss) | | | | |
| | | | |
Change in net unrealized appreciation/depreciation | | | | |
Change in net assets resulting from operations | | | | |
DISTRIBUTIONS TO SHAREHOLDERS: | | | | |
| | | | |
| | | | |
| | | | |
| | | | |
| | | | |
| | | | |
| | | | |
| | | | |
| | | | |
Total distributions to shareholders | | | | |
| | | | |
Change in net assets resulting from capital transactions | | | | |
| | | | |
| | | | |
| | | | |
| | | | |
SEE NOTES TO FINANCIAL STATEMENTS.
| J.P. Morgan Mid Cap/Multi-Cap Funds | |
STATEMENTS OF CHANGES IN NET ASSETSFOR THE PERIODS INDICATED (continued)
(Amounts in thousands)
| JPMorgan Value Advantage Fund |
| Six Months Ended
December 31, 2024
(Unaudited) | |
CHANGE IN NET ASSETS RESULTING FROM OPERATIONS: | | |
Net investment income (loss) | | |
| | |
Change in net unrealized appreciation/depreciation | | |
Change in net assets resulting from operations | | |
DISTRIBUTIONS TO SHAREHOLDERS: | | |
| | |
| | |
| | |
| | |
| | |
| | |
| | |
| | |
| | |
Total distributions to shareholders | | |
| | |
Change in net assets resulting from capital transactions | | |
| | |
| | |
| | |
| | |
SEE NOTES TO FINANCIAL STATEMENTS.
| J.P. Morgan Mid Cap/Multi-Cap Funds | |
| JPMorgan Growth Advantage Fund | JPMorgan Mid Cap Equity Fund |
| Six Months Ended December 31, 2024
(Unaudited) | | Six Months Ended December 31, 2024
(Unaudited) | |
| | | | |
| | | | |
Proceeds from shares issued | | | | |
| | | | |
| | | | |
Change in net assets resulting from Class A capital transactions | | | | |
| | | | |
Proceeds from shares issued | | | | |
| | | | |
| | | | |
Change in net assets resulting from Class C capital transactions | | | | |
| | | | |
Proceeds from shares issued | | | | |
| | | | |
| | | | |
Change in net assets resulting from Class I capital transactions | | | | |
| | | | |
Proceeds from shares issued | | | | |
| | | | |
| | | | |
Change in net assets resulting from Class R2 capital transactions | | | | |
| | | | |
Proceeds from shares issued | | | | |
| | | | |
| | | | |
Change in net assets resulting from Class R3 capital transactions | | | | |
| | | | |
Proceeds from shares issued | | | | |
| | | | |
| | | | |
Change in net assets resulting from Class R4 capital transactions | | | | |
| | | | |
Proceeds from shares issued | | | | |
| | | | |
| | | | |
Change in net assets resulting from Class R5 capital transactions | | | | |
SEE NOTES TO FINANCIAL STATEMENTS.
| J.P. Morgan Mid Cap/Multi-Cap Funds | |
STATEMENTS OF CHANGES IN NET ASSETSFOR THE PERIODS INDICATED (continued)
(Amounts in thousands)
| JPMorgan Growth Advantage Fund | JPMorgan Mid Cap Equity Fund |
| Six Months Ended December 31, 2024 (Unaudited) | | Six Months Ended December 31, 2024 (Unaudited) | |
CAPITAL TRANSACTIONS: (continued) | | | | |
| | | | |
Proceeds from shares issued | | | | |
| | | | |
| | | | |
Change in net assets resulting from Class R6 capital transactions | | | | |
Total change in net assets resulting from capital transactions | | | | |
| | | | |
| | | | |
| | | | |
| | | | |
| | | | |
| | | | |
| | | | |
| | | | |
| | | | |
| | | | |
| | | | |
| | | | |
| | | | |
| | | | |
| | | | |
| | | | |
| | | | |
| | | | |
| | | | |
| | | | |
Change in Class R2 Shares | | | | |
| | | | |
| | | | |
| | | | |
| | | | |
Change in Class R3 Shares | | | | |
| | | | |
| | | | |
| | | | |
| | | | |
Change in Class R4 Shares | | | | |
(a)
Amount rounds to less than one thousand.
SEE NOTES TO FINANCIAL STATEMENTS.
| J.P. Morgan Mid Cap/Multi-Cap Funds | |
| JPMorgan Growth Advantage Fund | JPMorgan Mid Cap Equity Fund |
| Six Months Ended December 31, 2024 (Unaudited) | | Six Months Ended December 31, 2024 (Unaudited) | |
SHARE TRANSACTIONS: (continued) | | | | |
| | | | |
| | | | |
| | | | |
| | | | |
Change in Class R5 Shares | | | | |
| | | | |
| | | | |
| | | | |
| | | | |
Change in Class R6 Shares | | | | |
SEE NOTES TO FINANCIAL STATEMENTS.
| J.P. Morgan Mid Cap/Multi-Cap Funds | |
STATEMENTS OF CHANGES IN NET ASSETSFOR THE PERIODS INDICATED (continued)
(Amounts in thousands)
| JPMorgan Mid Cap Growth Fund | JPMorgan Mid Cap Value Fund |
| Six Months Ended December 31, 2024
(Unaudited) | | Six Months Ended December 31, 2024
(Unaudited) | |
| | | | |
| | | | |
Proceeds from shares issued | | | | |
| | | | |
| | | | |
Change in net assets resulting from Class A capital transactions | | | | |
| | | | |
Proceeds from shares issued | | | | |
| | | | |
| | | | |
Change in net assets resulting from Class C capital transactions | | | | |
| | | | |
Proceeds from shares issued | | | | |
| | | | |
| | | | |
Change in net assets resulting from Class I capital transactions | | | | |
| | | | |
Proceeds from shares issued | | | | |
| | | | |
| | | | |
Change in net assets resulting from Class L capital transactions | | | | |
| | | | |
Proceeds from shares issued | | | | |
| | | | |
| | | | |
Change in net assets resulting from Class R2 capital transactions | | | | |
| | | | |
Proceeds from shares issued | | | | |
| | | | |
| | | | |
Change in net assets resulting from Class R3 capital transactions | | | | |
| | | | |
Proceeds from shares issued | | | | |
| | | | |
| | | | |
Change in net assets resulting from Class R4 capital transactions | | | | |
SEE NOTES TO FINANCIAL STATEMENTS.
| J.P. Morgan Mid Cap/Multi-Cap Funds | |
| JPMorgan Mid Cap Growth Fund | JPMorgan Mid Cap Value Fund |
| Six Months Ended December 31, 2024 (Unaudited) | | Six Months Ended December 31, 2024 (Unaudited) | |
CAPITAL TRANSACTIONS: (continued) | | | | |
| | | | |
Proceeds from shares issued | | | | |
| | | | |
| | | | |
Change in net assets resulting from Class R5 capital transactions | | | | |
| | | | |
Proceeds from shares issued | | | | |
| | | | |
| | | | |
Change in net assets resulting from Class R6 capital transactions | | | | |
Total change in net assets resulting from capital transactions | | | | |
| | | | |
| | | | |
| | | | |
| | | | |
| | | | |
| | | | |
| | | | |
| | | | |
| | | | |
| | | | |
| | | | |
| | | | |
| | | | |
| | | | |
| | | | |
| | | | |
| | | | |
| | | | |
| | | | |
| | | | |
| | | | |
| | | | |
| | | | |
| | | | |
| | | | |
Change in Class R2 Shares | | | | |
SEE NOTES TO FINANCIAL STATEMENTS.
| J.P. Morgan Mid Cap/Multi-Cap Funds | |
STATEMENTS OF CHANGES IN NET ASSETSFOR THE PERIODS INDICATED (continued)
(Amounts in thousands)
| JPMorgan Mid Cap Growth Fund | JPMorgan Mid Cap Value Fund |
| Six Months Ended December 31, 2024 (Unaudited) | | Six Months Ended December 31, 2024 (Unaudited) | |
SHARE TRANSACTIONS: (continued) | | | | |
| | | | |
| | | | |
| | | | |
| | | | |
Change in Class R3 Shares | | | | |
| | | | |
| | | | |
| | | | |
| | | | |
Change in Class R4 Shares | | | | |
| | | | |
| | | | |
| | | | |
| | | | |
Change in Class R5 Shares | | | | |
| | | | |
| | | | |
| | | | |
| | | | |
Change in Class R6 Shares | | | | |
(a)
Amount rounds to less than one thousand.
SEE NOTES TO FINANCIAL STATEMENTS.
| J.P. Morgan Mid Cap/Multi-Cap Funds | |
| JPMorgan Value Advantage Fund |
| Six Months Ended December 31, 2024
(Unaudited) | |
| | |
| | |
Proceeds from shares issued | | |
| | |
| | |
Change in net assets resulting from Class A capital transactions | | |
| | |
Proceeds from shares issued | | |
| | |
| | |
Change in net assets resulting from Class C capital transactions | | |
| | |
Proceeds from shares issued | | |
| | |
| | |
Change in net assets resulting from Class I capital transactions | | |
| | |
Proceeds from shares issued | | |
| | |
| | |
Change in net assets resulting from Class L capital transactions | | |
| | |
Proceeds from shares issued | | |
| | |
| | |
Change in net assets resulting from Class R2 capital transactions | | |
| | |
Proceeds from shares issued | | |
| | |
| | |
Change in net assets resulting from Class R3 capital transactions | | |
| | |
Proceeds from shares issued | | |
| | |
| | |
Change in net assets resulting from Class R4 capital transactions | | |
SEE NOTES TO FINANCIAL STATEMENTS.
| J.P. Morgan Mid Cap/Multi-Cap Funds | |
STATEMENTS OF CHANGES IN NET ASSETSFOR THE PERIODS INDICATED (continued)
(Amounts in thousands)
| JPMorgan Value Advantage Fund |
| Six Months Ended December 31, 2024 (Unaudited) | |
CAPITAL TRANSACTIONS: (continued) | | |
| | |
Proceeds from shares issued | | |
| | |
| | |
Change in net assets resulting from Class R5 capital transactions | | |
| | |
Proceeds from shares issued | | |
| | |
| | |
Change in net assets resulting from Class R6 capital transactions | | |
Total change in net assets resulting from capital transactions | | |
| | |
| | |
| | |
| | |
| | |
| | |
| | |
| | |
| | |
| | |
| | |
| | |
| | |
| | |
| | |
| | |
| | |
| | |
| | |
| | |
| | |
| | |
| | |
| | |
| | |
Change in Class R2 Shares | | |
(a)
Amount rounds to less than one thousand.
SEE NOTES TO FINANCIAL STATEMENTS.
| J.P. Morgan Mid Cap/Multi-Cap Funds | |
| JPMorgan Value Advantage Fund |
| Six Months Ended December 31, 2024 (Unaudited) | |
SHARE TRANSACTIONS: (continued) | | |
| | |
| | |
| | |
| | |
Change in Class R3 Shares | | |
| | |
| | |
| | |
| | |
Change in Class R4 Shares | | |
| | |
| | |
| | |
| | |
Change in Class R5 Shares | | |
| | |
| | |
| | |
| | |
Change in Class R6 Shares | | |
(a)
Amount rounds to less than one thousand.
SEE NOTES TO FINANCIAL STATEMENTS.
| J.P. Morgan Mid Cap/Multi-Cap Funds | |
FINANCIAL HIGHLIGHTSFOR THE PERIODS INDICATED
| Per share operating performance |
| | | |
| Net asset
value,
beginning
of period | Net
investment
income
(loss)(b) | Net realized
and unrealized
gains (losses)
on investments | Total from
investment
operations | | | |
JPMorgan Growth Advantage Fund | | | | | | | |
| | | | | | | |
Six Months Ended December 31, 2024 (Unaudited) | | | | | | | |
| | | | | | | |
| | | | | | | |
| | | | | | | |
| | | | | | | |
| | | | | | | |
| | | | | | | |
Six Months Ended December 31, 2024 (Unaudited) | | | | | | | |
| | | | | | | |
| | | | | | | |
| | | | | | | |
| | | | | | | |
| | | | | | | |
| | | | | | | |
Six Months Ended December 31, 2024 (Unaudited) | | | | | | | |
| | | | | | | |
| | | | | | | |
| | | | | | | |
| | | | | | | |
| | | | | | | |
| | | | | | | |
Six Months Ended December 31, 2024 (Unaudited) | | | | | | | |
| | | | | | | |
| | | | | | | |
| | | | | | | |
| | | | | | | |
| | | | | | | |
| | | | | | | |
Six Months Ended December 31, 2024 (Unaudited) | | | | | | | |
| | | | | | | |
| | | | | | | |
| | | | | | | |
| | | | | | | |
| | | | | | | |
| | | | | | | |
Six Months Ended December 31, 2024 (Unaudited) | | | | | | | |
| | | | | | | |
| | | | | | | |
| | | | | | | |
| | | | | | | |
| | | | | | | |
SEE NOTES TO FINANCIAL STATEMENTS.
| J.P. Morgan Mid Cap/Multi-Cap Funds | |
| |
| | | Ratios to average net assets(a) |
Net asset
value,
end of
period | Total return
(excludes
sales charge)(c)(d) | Net assets,
end of
period
(000's) | | Net
investment
income
(loss) | Expenses without
waivers and
reimbursements | |
| | | | | | |
| | | | | | |
| | | | | | |
| | | | | | |
| | | | | | |
| | | | | | |
| | | | | | |
| | | | | | |
| | | | | | |
| | | | | | |
| | | | | | |
| | | | | | |
| | | | | | |
| | | | | | |
| | | | | | |
| | | | | | |
| | | | | | |
| | | | | | |
| | | | | | |
| | | | | | |
| | | | | | |
| | | | | | |
| | | | | | |
| | | | | | |
| | | | | | |
| | | | | | |
| | | | | | |
| | | | | | |
| | | | | | |
| | | | | | |
| | | | | | |
| | | | | | |
| | | | | | |
| | | | | | |
| | | | | | |
| | | | | | |
| | | | | | |
| | | | | | |
| | | | | | |
| | | | | | |
| | | | | | |
| | | | | | |
| | | | | | |
SEE NOTES TO FINANCIAL STATEMENTS.
| J.P. Morgan Mid Cap/Multi-Cap Funds | |
FINANCIAL HIGHLIGHTSFOR THE PERIODS INDICATED (continued)
| Per share operating performance |
| | | |
| Net asset
value,
beginning
of period | Net
investment
income
(loss)(b) | Net realized
and unrealized
gains (losses)
on investments | Total from
investment
operations | | | |
JPMorgan Growth Advantage Fund (continued) | | | | | | | |
| | | | | | | |
Six Months Ended December 31, 2024 (Unaudited) | | | | | | | |
| | | | | | | |
| | | | | | | |
| | | | | | | |
| | | | | | | |
| | | | | | | |
| | | | | | | |
Six Months Ended December 31, 2024 (Unaudited) | | | | | | | |
| | | | | | | |
| | | | | | | |
| | | | | | | |
| | | | | | | |
| | | | | | | |
| | | | | | | |
|
| Annualized for periods less than one year, unless otherwise noted. |
| Calculated based upon average shares outstanding. |
| Not annualized for periods less than one year. |
| Includes adjustments in accordance with accounting principles generally accepted in the United States of America and as such, the net asset values for financial reporting purposes and the returns based upon those net asset values may differ from the net asset values and returns for shareholder transactions. |
| Includes interest expense, if applicable, which is less than 0.005% unless otherwise noted. |
| Certain non-recurring expenses incurred by the Fund were not annualized for the period indicated. |
| Amount rounds to less than $0.005. |
SEE NOTES TO FINANCIAL STATEMENTS.
| J.P. Morgan Mid Cap/Multi-Cap Funds | |
| |
| | | Ratios to average net assets(a) |
Net asset
value,
end of
period | Total return
(excludes
sales charge)(c)(d) | Net assets,
end of
period
(000's) | | Net
investment
income
(loss) | Expenses without
waivers and
reimbursements | |
|
| | | | | | |
| | | | | | |
| | | | | | |
| | | | | | |
| | | | | | |
| | | | | | |
| | | | | | |
| | | | | | |
| | | | | | |
| | | | | | |
| | | | | | |
| | | | | | |
| | | | | | |
| | | | | | |
| | | | | | |
SEE NOTES TO FINANCIAL STATEMENTS.
| J.P. Morgan Mid Cap/Multi-Cap Funds | |
FINANCIAL HIGHLIGHTSFOR THE PERIODS INDICATED
| Per share operating performance |
| | | |
| Net asset
value,
beginning
of period | Net
investment
income
(loss)(b) | Net realized
and unrealized
gains (losses)
on investments | Total from
investment
operations | | | |
JPMorgan Mid Cap Equity Fund | | | | | | | |
| | | | | | | |
Six Months Ended December 31, 2024 (Unaudited) | | | | | | | |
| | | | | | | |
| | | | | | | |
| | | | | | | |
| | | | | | | |
| | | | | | | |
| | | | | | | |
Six Months Ended December 31, 2024 (Unaudited) | | | | | | | |
| | | | | | | |
| | | | | | | |
| | | | | | | |
| | | | | | | |
| | | | | | | |
| | | | | | | |
Six Months Ended December 31, 2024 (Unaudited) | | | | | | | |
| | | | | | | |
| | | | | | | |
| | | | | | | |
| | | | | | | |
| | | | | | | |
| | | | | | | |
Six Months Ended December 31, 2024 (Unaudited) | | | | | | | |
| | | | | | | |
| | | | | | | |
| | | | | | | |
| | | | | | | |
| | | | | | | |
| | | | | | | |
Six Months Ended December 31, 2024 (Unaudited) | | | | | | | |
| | | | | | | |
| | | | | | | |
| | | | | | | |
| | | | | | | |
| | | | | | | |
| |
| | | Ratios to average net assets(a) |
Net asset
value,
end of
period | Total return
(excludes
sales charge)(c)(d) | Net assets,
end of
period
(000's) | | Net
investment
income
(loss) | Expenses without
waivers and
reimbursements | |
| | | | | | |
| | | | | | |
| | | | | | |
| | | | | | |
| | | | | | |
| | | | | | |
| | | | | | |
| | | | | | |
| | | | | | |
| | | | | | |
| | | | | | |
| | | | | | |
| | | | | | |
| | | | | | |
| | | | | | |
| | | | | | |
| | | | | | |
| | | | | | |
| | | | | | |
| | | | | | |
| | | | | | |
| | | | | | |
| | | | | | |
| | | | | | |
| | | | | | |
| | | | | | |
| | | | | | |
| | | | | | |
| | | | | | |
| | | | | | |
| | | | | | |
| | | | | | |
| | | | | | |
| | | | | | |
| | | | | | |
| | | | | | |
FINANCIAL HIGHLIGHTSFOR THE PERIODS INDICATED (continued)
| Per share operating performance |
| | | |
| Net asset
value,
beginning
of period | Net
investment
income
(loss)(b) | Net realized
and unrealized
gains (losses)
on investments | Total from
investment
operations | | | |
JPMorgan Mid Cap Equity Fund (continued) | | | | | | | |
| | | | | | | |
Six Months Ended December 31, 2024 (Unaudited) | | | | | | | |
| | | | | | | |
| | | | | | | |
| | | | | | | |
| | | | | | | |
| | | | | | | |
| | | | | | | |
|
| Annualized for periods less than one year, unless otherwise noted. |
| Calculated based upon average shares outstanding. |
| Not annualized for periods less than one year. |
| Includes adjustments in accordance with accounting principles generally accepted in the United States of America and as such, the net asset values for financial reporting purposes and the returns based upon those net asset values may differ from the net asset values and returns for shareholder transactions. |
| Includes interest expense, if applicable, which is less than 0.005% unless otherwise noted. |
| |
| | | Ratios to average net assets(a) |
Net asset
value,
end of
period | Total return
(excludes
sales charge)(c)(d) | Net assets,
end of
period
(000's) | | Net
investment
income
(loss) | Expenses without
waivers and
reimbursements | |
|
| | | | | | |
| | | | | | |
| | | | | | |
| | | | | | |
| | | | | | |
| | | | | | |
| | | | | | |
| | | | | | |
FINANCIAL HIGHLIGHTSFOR THE PERIODS INDICATED
| Per share operating performance |
| | | |
| Net asset
value,
beginning
of period | Net
investment
income
(loss)(b) | Net realized
and unrealized
gains (losses)
on investments | Total from
investment
operations | | | |
JPMorgan Mid Cap Growth Fund | | | | | | | |
| | | | | | | |
Six Months Ended December 31, 2024 (Unaudited) | | | | | | | |
| | | | | | | |
| | | | | | | |
| | | | | | | |
| | | | | | | |
| | | | | | | |
| | | | | | | |
Six Months Ended December 31, 2024 (Unaudited) | | | | | | | |
| | | | | | | |
| | | | | | | |
| | | | | | | |
| | | | | | | |
| | | | | | | |
| | | | | | | |
Six Months Ended December 31, 2024 (Unaudited) | | | | | | | |
| | | | | | | |
| | | | | | | |
| | | | | | | |
| | | | | | | |
| | | | | | | |
| | | | | | | |
Six Months Ended December 31, 2024 (Unaudited) | | | | | | | |
| | | | | | | |
| | | | | | | |
| | | | | | | |
| | | | | | | |
| | | | | | | |
| | | | | | | |
Six Months Ended December 31, 2024 (Unaudited) | | | | | | | |
| | | | | | | |
| | | | | | | |
| | | | | | | |
| | | | | | | |
| | | | | | | |
| | | | | | | |
Six Months Ended December 31, 2024 (Unaudited) | | | | | | | |
| | | | | | | |
| | | | | | | |
| | | | | | | |
| | | | | | | |
| | | | | | | |
| |
| | | Ratios to average net assets(a) |
Net asset
value,
end of
period | | Net assets,
end of
period
(000's) | | Net
investment
income
(loss) | Expenses without
waivers and
reimbursements | |
| | | | | | |
| | | | | | |
| | | | | | |
| | | | | | |
| | | | | | |
| | | | | | |
| | | | | | |
| | | | | | |
| | | | | | |
| | | | | | |
| | | | | | |
| | | | | | |
| | | | | | |
| | | | | | |
| | | | | | |
| | | | | | |
| | | | | | |
| | | | | | |
| | | | | | |
| | | | | | |
| | | | | | |
| | | | | | |
| | | | | | |
| | | | | | |
| | | | | | |
| | | | | | |
| | | | | | |
| | | | | | |
| | | | | | |
| | | | | | |
| | | | | | |
| | | | | | |
| | | | | | |
| | | | | | |
| | | | | | |
| | | | | | |
| | | | | | |
| | | | | | |
| | | | | | |
| | | | | | |
| | | | | | |
| | | | | | |
| | | | | | |
FINANCIAL HIGHLIGHTSFOR THE PERIODS INDICATED (continued)
| Per share operating performance |
| | | |
| Net asset
value,
beginning
of period | Net
investment
income
(loss)(b) | Net realized
and unrealized
gains (losses)
on investments | Total from
investment
operations | | | |
JPMorgan Mid Cap Growth Fund (continued) | | | | | | | |
| | | | | | | |
Six Months Ended December 31, 2024 (Unaudited) | | | | | | | |
| | | | | | | |
| | | | | | | |
| | | | | | | |
| | | | | | | |
| | | | | | | |
| | | | | | | |
Six Months Ended December 31, 2024 (Unaudited) | | | | | | | |
| | | | | | | |
| | | | | | | |
| | | | | | | |
| | | | | | | |
| | | | | | | |
| | | | | | | |
|
| Annualized for periods less than one year, unless otherwise noted. |
| Calculated based upon average shares outstanding. |
| Not annualized for periods less than one year. |
| Includes adjustments in accordance with accounting principles generally accepted in the United States of America and as such, the net asset values for financial reporting purposes and the returns based upon those net asset values may differ from the net asset values and returns for shareholder transactions. |
| Includes interest expense, if applicable, which is less than 0.005% unless otherwise noted. |
| |
| | | Ratios to average net assets(a) |
Net asset
value,
end of
period | | Net assets,
end of
period
(000's) | | Net
investment
income
(loss) | Expenses without
waivers and
reimbursements | |
|
| | | | | | |
| | | | | | |
| | | | | | |
| | | | | | |
| | | | | | |
| | | | | | |
| | | | | | |
| | | | | | |
| | | | | | |
| | | | | | |
| | | | | | |
| | | | | | |
| | | | | | |
| | | | | | |
| | | | | | |
FINANCIAL HIGHLIGHTSFOR THE PERIODS INDICATED
| Per share operating performance |
| | | |
| Net asset
value,
beginning
of period | Net
investment
income
(loss)(b) | Net realized
and unrealized
gains (losses)
on investments | Total from
investment
operations | | | |
JPMorgan Mid Cap Value Fund | | | | | | | |
| | | | | | | |
Six Months Ended December 31, 2024 (Unaudited) | | | | | | | |
| | | | | | | |
| | | | | | | |
| | | | | | | |
| | | | | | | |
| | | | | | | |
| | | | | | | |
Six Months Ended December 31, 2024 (Unaudited) | | | | | | | |
| | | | | | | |
| | | | | | | |
| | | | | | | |
| | | | | | | |
| | | | | | | |
| | | | | | | |
Six Months Ended December 31, 2024 (Unaudited) | | | | | | | |
| | | | | | | |
| | | | | | | |
| | | | | | | |
| | | | | | | |
| | | | | | | |
| | | | | | | |
Six Months Ended December 31, 2024 (Unaudited) | | | | | | | |
| | | | | | | |
| | | | | | | |
| | | | | | | |
| | | | | | | |
| | | | | | | |
| | | | | | | |
Six Months Ended December 31, 2024 (Unaudited) | | | | | | | |
| | | | | | | |
| | | | | | | |
| | | | | | | |
| | | | | | | |
| | | | | | | |
| | | | | | | |
Six Months Ended December 31, 2024 (Unaudited) | | | | | | | |
| | | | | | | |
| | | | | | | |
| | | | | | | |
| | | | | | | |
| | | | | | | |
| |
| | | Ratios to average net assets(a) |
Net asset
value,
end of
period | Total return
(excludes
sales charge)(c)(d) | Net assets,
end of
period
(000's) | | Net
investment
income
(loss) | Expenses without
waivers and
reimbursements | |
| | | | | | |
| | | | | | |
| | | | | | |
| | | | | | |
| | | | | | |
| | | | | | |
| | | | | | |
| | | | | | |
| | | | | | |
| | | | | | |
| | | | | | |
| | | | | | |
| | | | | | |
| | | | | | |
| | | | | | |
| | | | | | |
| | | | | | |
| | | | | | |
| | | | | | |
| | | | | | |
| | | | | | |
| | | | | | |
| | | | | | |
| | | | | | |
| | | | | | |
| | | | | | |
| | | | | | |
| | | | | | |
| | | | | | |
| | | | | | |
| | | | | | |
| | | | | | |
| | | | | | |
| | | | | | |
| | | | | | |
| | | | | | |
| | | | | | |
| | | | | | |
| | | | | | |
| | | | | | |
| | | | | | |
| | | | | | |
| | | | | | |
FINANCIAL HIGHLIGHTSFOR THE PERIODS INDICATED (continued)
| Per share operating performance |
| | | |
| Net asset
value,
beginning
of period | Net
investment
income
(loss)(b) | Net realized
and unrealized
gains (losses)
on investments | Total from
investment
operations | | | |
JPMorgan Mid Cap Value Fund (continued) | | | | | | | |
| | | | | | | |
Six Months Ended December 31, 2024 (Unaudited) | | | | | | | |
| | | | | | | |
| | | | | | | |
| | | | | | | |
| | | | | | | |
| | | | | | | |
| | | | | | | |
Six Months Ended December 31, 2024 (Unaudited) | | | | | | | |
| | | | | | | |
| | | | | | | |
| | | | | | | |
| | | | | | | |
| | | | | | | |
| | | | | | | |
Six Months Ended December 31, 2024 (Unaudited) | | | | | | | |
| | | | | | | |
| | | | | | | |
| | | | | | | |
| | | | | | | |
| | | | | | | |
| | | | | | | |
|
| Annualized for periods less than one year, unless otherwise noted. |
| Calculated based upon average shares outstanding. |
| Not annualized for periods less than one year. |
| Includes adjustments in accordance with accounting principles generally accepted in the United States of America and as such, the net asset values for financial reporting purposes and the returns based upon those net asset values may differ from the net asset values and returns for shareholder transactions. |
| Includes interest expense, if applicable, which is less than 0.005% unless otherwise noted. |
| |
| | | Ratios to average net assets(a) |
Net asset
value,
end of
period | Total return
(excludes
sales charge)(c)(d) | Net assets,
end of
period
(000's) | | Net
investment
income
(loss) | Expenses without
waivers and
reimbursements | |
|
| | | | | | |
| | | | | | |
| | | | | | |
| | | | | | |
| | | | | | |
| | | | | | |
| | | | | | |
| | | | | | |
| | | | | | |
| | | | | | |
| | | | | | |
| | | | | | |
| | | | | | |
| | | | | | |
| | | | | | |
| | | | | | |
| | | | | | |
| | | | | | |
| | | | | | |
| | | | | | |
| | | | | | |
| | | | | | |
FINANCIAL HIGHLIGHTSFOR THE PERIODS INDICATED
| Per share operating performance |
| | | |
| Net asset
value,
beginning
of period | Net
investment
income
(loss)(b) | Net realized
and unrealized
gains (losses)
on investments | Total from
investment
operations | | | |
JPMorgan Value Advantage Fund | | | | | | | |
| | | | | | | |
Six Months Ended December 31, 2024 (Unaudited) | | | | | | | |
| | | | | | | |
| | | | | | | |
| | | | | | | |
| | | | | | | |
| | | | | | | |
| | | | | | | |
Six Months Ended December 31, 2024 (Unaudited) | | | | | | | |
| | | | | | | |
| | | | | | | |
| | | | | | | |
| | | | | | | |
| | | | | | | |
| | | | | | | |
Six Months Ended December 31, 2024 (Unaudited) | | | | | | | |
| | | | | | | |
| | | | | | | |
| | | | | | | |
| | | | | | | |
| | | | | | | |
| | | | | | | |
Six Months Ended December 31, 2024 (Unaudited) | | | | | | | |
| | | | | | | |
| | | | | | | |
| | | | | | | |
| | | | | | | |
| | | | | | | |
| | | | | | | |
Six Months Ended December 31, 2024 (Unaudited) | | | | | | | |
| | | | | | | |
| | | | | | | |
| | | | | | | |
| | | | | | | |
| | | | | | | |
| | | | | | | |
Six Months Ended December 31, 2024 (Unaudited) | | | | | | | |
| | | | | | | |
| | | | | | | |
| | | | | | | |
| | | | | | | |
| | | | | | | |
| |
| | | Ratios to average net assets(a) |
Net asset
value,
end of
period | Total return
(excludes
sales charge)(c)(d) | Net assets,
end of
period
(000's) | | Net
investment
income
(loss) | Expenses without
waivers and
reimbursements | |
| | | | | | |
| | | | | | |
| | | | | | |
| | | | | | |
| | | | | | |
| | | | | | |
| | | | | | |
| | | | | | |
| | | | | | |
| | | | | | |
| | | | | | |
| | | | | | |
| | | | | | |
| | | | | | |
| | | | | | |
| | | | | | |
| | | | | | |
| | | | | | |
| | | | | | |
| | | | | | |
| | | | | | |
| | | | | | |
| | | | | | |
| | | | | | |
| | | | | | |
| | | | | | |
| | | | | | |
| | | | | | |
| | | | | | |
| | | | | | |
| | | | | | |
| | | | | | |
| | | | | | |
| | | | | | |
| | | | | | |
| | | | | | |
| | | | | | |
| | | | | | |
| | | | | | |
| | | | | | |
| | | | | | |
| | | | | | |
| | | | | | |
FINANCIAL HIGHLIGHTSFOR THE PERIODS INDICATED (continued)
| Per share operating performance |
| | | |
| Net asset
value,
beginning
of period | Net
investment
income
(loss)(b) | Net realized
and unrealized
gains (losses)
on investments | Total from
investment
operations | | | |
JPMorgan Value Advantage Fund (continued) | | | | | | | |
| | | | | | | |
Six Months Ended December 31, 2024 (Unaudited) | | | | | | | |
| | | | | | | |
| | | | | | | |
| | | | | | | |
| | | | | | | |
| | | | | | | |
| | | | | | | |
Six Months Ended December 31, 2024 (Unaudited) | | | | | | | |
| | | | | | | |
| | | | | | | |
| | | | | | | |
| | | | | | | |
| | | | | | | |
| | | | | | | |
Six Months Ended December 31, 2024 (Unaudited) | | | | | | | |
| | | | | | | |
| | | | | | | |
| | | | | | | |
| | | | | | | |
| | | | | | | |
| | | | | | | |
|
| Annualized for periods less than one year, unless otherwise noted. |
| Calculated based upon average shares outstanding. |
| Not annualized for periods less than one year. |
| Includes adjustments in accordance with accounting principles generally accepted in the United States of America and as such, the net asset values for financial reporting purposes and the returns based upon those net asset values may differ from the net asset values and returns for shareholder transactions. |
| Includes interest expense, if applicable, which is less than 0.005% unless otherwise noted. |
| |
| | | Ratios to average net assets(a) |
Net asset
value,
end of
period | Total return
(excludes
sales charge)(c)(d) | Net assets,
end of
period
(000's) | | Net
investment
income
(loss) | Expenses without
waivers and
reimbursements | |
|
| | | | | | |
| | | | | | |
| | | | | | |
| | | | | | |
| | | | | | |
| | | | | | |
| | | | | | |
| | | | | | |
| | | | | | |
| | | | | | |
| | | | | | |
| | | | | | |
| | | | | | |
| | | | | | |
| | | | | | |
| | | | | | |
| | | | | | |
| | | | | | |
| | | | | | |
| | | | | | |
| | | | | | |
| | | | | | |
NOTES TO FINANCIAL STATEMENTSAS OF December 31, 2024 (Unaudited)
(Dollar values in thousands)
1. Organization
JPMorgan Trust I (“JPM I") and JPMorgan Trust II (“JPM II") (collectively, the “Trusts”) were formed on November 12, 2004, as Delaware statutory trusts, pursuant to Declarations of Trust dated November 5, 2004 and are registered under the Investment Company Act of 1940, as amended (the “1940 Act”), as open-end management investment companies.
J.P. Morgan Mutual Fund Investment Trust (“JPMMFIT”) was organized as a Massachusetts business trust on September 23, 1997, as an open-end management investment company.
J.P. Morgan Fleming Mutual Fund Group, Inc. (“JPMFMFG,” and with JPM I, JPM II and JPMMFIT, collectively, the “Trusts”) was organized as a Maryland corporation on August 19, 1997, as an open-end management investment company.
The following are 5 separate funds of the Trusts (each, a "Fund" and collectively, the "Funds") covered by this report:
| | | Diversification Classification |
JPMorgan Growth Advantage Fund | Class A, Class C, Class I, Class R2, Class R3, Class R4, Class R5 and Class R6 | | |
JPMorgan Mid Cap Equity Fund | Class A, Class C, Class I, Class R2, Class R5 and Class R6 | | |
JPMorgan Mid Cap Growth Fund | Class A, Class C, Class I, Class R2, Class R3, Class R4, Class R5 and Class R6 | | |
JPMorgan Mid Cap Value Fund | Class A, Class C, Class I, Class L, Class R2, Class R3, Class R4, Class R5 and Class R6 | | |
JPMorgan Value Advantage Fund | Class A, Class C, Class I, Class L, Class R2, Class R3, Class R4, Class R5 and Class R6 | | |
The investment objective of JPMorgan Growth Advantage Fund (“Growth Advantage Fund”) and JPMorgan Mid Cap Equity Fund (“Mid Cap Equity Fund”) is to seek to provide long-term capital growth.
The investment objective of JPMorgan Mid Cap Growth Fund (“Mid Cap Growth Fund”) is to seek growth of capital.
The investment objective of JPMorgan Mid Cap Value Fund (“Mid Cap Value Fund”) is to seek growth from capital appreciation.
The investment objective of JPMorgan Value Advantage Fund (“Value Advantage Fund”) is to seek to provide long-term total return from a combination of income and capital gains.
Class L Shares of Mid Cap Value Fund and Value Advantage Fund are publicly offered on a limited basis. Investors are not eligible to purchase Class L Shares of the Funds unless they meet certain requirements as described in the Funds’ prospectus.
Class A Shares generally provide for a front-end sales charge while Class C Shares provide for a contingent deferred sales charge ("CDSC"). No sales charges are assessed with respect to Class I, Class L, Class R2, Class R3, Class R4, Class R5 and Class R6 Shares. Certain Class A Shares, for which front-end sales charges have been waived, may be subject to a CDSC as described in the Funds' prospectus. Class C Shares automatically convert to Class A Shares after eight years. All classes of shares have equal rights as to earnings, assets and voting privileges, except that each class may bear different transfer agency, distribution and service fees and each class has exclusive voting rights with respect to its distribution plan and shareholder servicing agreements.
J.P. Morgan Investment Management Inc. (“JPMIM”), an indirect, wholly-owned subsidiary of JPMorgan Chase & Co. (“JPMorgan”), acts as adviser (the “Adviser”) and administrator (the “Administrator”) to the Funds.
2. Significant Accounting Policies
The following is a summary of significant accounting policies followed by the Funds in the preparation of their financial statements. The Funds are investment companies and, accordingly, follow the investment company accounting and reporting guidance of the Financial Accounting Standards Board (“FASB”) Accounting Standards Codification Topic 946 — Investment Companies, which is part of U.S. generally accepted accounting principles (“GAAP”). The preparation of financial statements in conformity with GAAP requires management to make estimates and assumptions that affect (i) the reported amounts of assets and liabilities, (ii) disclosure of contingent assets and liabilities at the date of the financial statements, and (iii) the reported amounts of increases and decreases in net assets from operations during the reporting period. Actual results could differ from those estimates.
| J.P. Morgan Mid Cap/Multi-Cap Funds | |
A. Valuation of Investments— Investments are valued in accordance with GAAP and the Funds' valuation policies set forth by, and under the supervision and responsibility of, the Boards of Trustees of the Trusts (the "Boards"), which established the following approach to valuation, as described more fully below: (i) investments for which market quotations are readily available shall be valued at their market value and (ii) all other investments for which market quotations are not readily available shall be valued at their fair value as determined in good faith by the Boards.
Under Section 2(a)(41) of the 1940 Act, the Boards are required to determine fair value for securities that do not have readily available market quotations. Under Securities and Exchange Commission (“SEC”) Rule 2a-5 (Good Faith Determinations of Fair Value), the Boards may designate the performance of these fair valuation determinations to a valuation designee. The Boards have designated the Adviser as the “Valuation Designee” to perform fair valuation determinations for the Funds on behalf of the Boards subject to appropriate oversight by the Boards. The Adviser, as Valuation Designee, leverages the J.P. Morgan Asset Management Americas Valuation Committee (“AVC”) to help oversee and carry out the policies for the valuation of investments held in the Funds. The Adviser, as Valuation Designee, remains responsible for the valuation determinations.
This oversight by the AVC includes monitoring the appropriateness of fair values based on results of ongoing valuation oversight including, but not limited to, consideration of macro or security specific events, market events, and pricing vendor and broker due diligence. The Administrator is responsible for discussing and assessing the potential impacts to the fair values on an ongoing basis, and, at least on a quarterly basis, with the AVC and the Boards.
Equities and other exchange-traded instruments are valued at the last sale price or official market closing price on the primary exchange on which the instrument is traded before the net asset values (“NAV”) of the Funds are calculated on a valuation date.
Investments in open-end investment companies (“Underlying Funds”) are valued at each Underlying Fund’s NAV per share as of the report date.
Valuations reflected in this report are as of the report date. As a result, changes in valuation due to market events and/or issuer-related events after the report date and prior to issuance of the report are not reflected herein.
The various inputs that are used in determining the valuation of the Funds' investments are summarized into the three broad levels listed below.
•
Level 1 — Unadjusted inputs using quoted prices in active markets for identical investments.
•
Level 2 — Other significant observable inputs including, but not limited to, quoted prices for similar investments, inputs other than quoted prices that are observable for investments (such as interest rates, prepayment speeds, credit risk, etc.) or other market corroborated inputs.
•
Level 3 — Significant inputs based on the best information available in the circumstances, to the extent observable inputs are not available (including the Funds' assumptions in determining the fair value of investments).
A financial instrument’s level within the fair value hierarchy is based on the lowest level of any input, both individually and in the aggregate, that is significant to the fair value measurement. The inputs or methodology used for valuing instruments are not necessarily an indication of the risk associated with investing in those instruments.
The following tables represent each valuation input as presented on the Schedules of Portfolio Investments ("SOIs"):
| | | | |
| | Level 2
Other significant
observable inputs | Level 3
Significant
unobservable inputs | |
Investments in Securities | | | | |
| | | | |
| | | | |
| | | | |
| | | | |
| | | | |
| | | | |
| | | | |
Commercial Services & Supplies | | | | |
| | | | |
Construction & Engineering | | | | |
| | | | |
| | | | |
| | | | |
Energy Equipment & Services | | | | |
| | | | |
| | | | |
| J.P. Morgan Mid Cap/Multi-Cap Funds | |
NOTES TO FINANCIAL STATEMENTSAS OF December 31, 2024 (Unaudited) (continued)
(Dollar values in thousands)
Growth Advantage Fund (continued) | | | | |
| | Level 2 Other significant observable inputs | Level 3 Significant unobservable inputs | |
| | | | |
Health Care Equipment & Supplies | | | | |
Health Care Providers & Services | | | | |
Hotels, Restaurants & Leisure | | | | |
| | | | |
| | | | |
| | | | |
Interactive Media & Services | | | | |
| | | | |
Life Sciences Tools & Services | | | | |
| | | | |
| | | | |
Oil, Gas & Consumable Fuels | | | | |
| | | | |
| | | | |
| | | | |
Semiconductors & Semiconductor Equipment | | | | |
| | | | |
| | | | |
Technology Hardware, Storage & Peripherals | | | | |
Trading Companies & Distributors | | | | |
| | | | |
| | | | |
| | | | |
Investment of Cash Collateral from Securities Loaned | | | | |
Total Short-Term Investments | | | | |
Total Investments in Securities | | | | |
| | | | |
| | Level 2
Other significant
observable inputs | Level 3
Significant
unobservable inputs | |
Total Investments in Securities (a) | | | | |
|
| Please refer to the SOI for specifics of portfolio holdings. |
| | | | |
| | Level 2
Other significant
observable inputs | Level 3
Significant
unobservable inputs | |
Investments in Securities | | | | |
| | | | |
| | | | |
| | | | |
| | | | |
| | | | |
| | | | |
| | | | |
| J.P. Morgan Mid Cap/Multi-Cap Funds | |
Mid Cap Growth Fund (continued) | | | | |
| | Level 2 Other significant observable inputs | Level 3 Significant unobservable inputs | |
| | | | |
Commercial Services & Supplies | | | | |
| | | | |
Construction & Engineering | | | | |
| | | | |
Consumer Staples Distribution & Retail | | | | |
| | | | |
Diversified Consumer Services | | | | |
| | | | |
Electronic Equipment, Instruments & Components | | | | |
Energy Equipment & Services | | | | |
| | | | |
| | | | |
| | | | |
Health Care Equipment & Supplies | | | | |
Health Care Providers & Services | | | | |
| | | | |
Hotels, Restaurants & Leisure | | | | |
| | | | |
Independent Power and Renewable Electricity Producers | | | | |
| | | | |
| | | | |
Life Sciences Tools & Services | | | | |
| | | | |
| | | | |
Oil, Gas & Consumable Fuels | | | | |
| | | | |
| | | | |
| | | | |
Semiconductors & Semiconductor Equipment | | | | |
| | | | |
| | | | |
Textiles, Apparel & Luxury Goods | | | | |
Trading Companies & Distributors | | | | |
| | | | |
| | | | |
| | | | |
Investment of Cash Collateral from Securities Loaned | | | | |
Total Short-Term Investments | | | | |
Total Investments in Securities | | | | |
| J.P. Morgan Mid Cap/Multi-Cap Funds | |
NOTES TO FINANCIAL STATEMENTSAS OF December 31, 2024 (Unaudited) (continued)
(Dollar values in thousands)
| | | | |
| | Level 2
Other significant
observable inputs | Level 3
Significant
unobservable inputs | |
Total Investments in Securities (a) | | | | |
|
| Please refer to the SOI for specifics of portfolio holdings. |
| | | | |
| | Level 2
Other significant
observable inputs | Level 3
Significant
unobservable inputs | |
Total Investments in Securities (a) | | | | |
|
| Please refer to the SOI for specifics of portfolio holdings. |
B. Restricted Securities— Certain securities held by the Funds may be subject to legal or contractual restrictions on resale. Restricted securities generally are resold in transactions exempt from registration under the Securities Act of 1933, as amended (the “Securities Act”). Disposal of these securities may involve time-consuming negotiations and expense. Prompt sale at the current valuation may be difficult and could adversely affect the NAVs of the Funds.
As of December 31, 2024, the Funds, with the exception of Growth Advantage Fund and Mid Cap Growth Fund, had no investments in restricted securities other than securities sold to the Funds under Rule 144A and/or Regulation S under the Securities Act.
As of December 31, 2024, Growth Advantage Fund and Mid Cap Growth Fund held restricted securities as follows:
| | | | Percentage
of Fund's
Net Assets |
| | | | |
| | | | Percentage
of Fund's
Net Assets |
| | | | |
C. Securities Lending — The Funds are authorized to engage in securities lending in order to generate additional income. The Funds are able to lend to approved borrowers. Citibank N.A. (“Citibank”) serves as lending agent for the Funds, pursuant to a Securities Lending Agency Agreement (the “Securities Lending Agency Agreement”). Securities loaned are collateralized by cash equal to at least 100% of the market value plus accrued interest on the securities lent, which is invested in the Class IM Shares of the JPMorgan U.S. Government Money Market Fund and the Agency SL Class Shares of the JPMorgan Securities Lending Money Market Fund. The Funds retain the interest earned on cash collateral investments but are required to pay the borrower a rebate for the use of the cash collateral. In cases where the lent security is of high value to borrowers, there may be a negative rebate (i.e., a net payment from the borrower to the Funds). Upon termination of a loan, the Funds are required to return to the borrower an amount equal to the cash collateral, plus any rebate owed to the borrowers. The remaining maturities of the securities lending transactions are considered overnight and continuous. Loans are subject to termination by the Funds or the borrower at any time.
The net income earned on the securities lending (after payment of rebates and Citibank’s fee) is included on the Statements of Operations as Income from securities lending (net). The Funds also receive payments from the borrower during the period of the loan, equivalent to dividends and interest earned on the securities loaned, which are recorded as Dividend or Interest income, respectively, on the Statements of Operations.
Under the Securities Lending Agency Agreement, Citibank marks to market the loaned securities on a daily basis. In the event the cash received from the borrower is less than 102% of the value of the loaned securities (105% for loans of non-U.S. securities), Citibank requests additional cash from the borrower so as to maintain a collateralization level of at least 102% of the value of the loaned securities plus accrued interest (105% for loans of non-U.S. securities), subject to certain de minimis amounts.
| J.P. Morgan Mid Cap/Multi-Cap Funds | |
The value of securities out on loan is recorded as an asset on the Statements of Assets and Liabilities. The value of the cash collateral received is recorded as a liability on the Statements of Assets and Liabilities and details of collateral investments are disclosed on the SOIs.
The Funds bear the risk of loss associated with the collateral investments and are not entitled to additional collateral from the borrower to cover any such losses. To the extent that the value of the collateral investments declines below the amount owed to a borrower, the Funds may incur losses that exceed the amount they earned on lending the security. Upon termination of a loan, the Funds may use leverage (borrow money) to repay the borrower for cash collateral posted if the Adviser does not believe that it is prudent to sell the collateral investments to fund the payment of this liability. Securities lending activity is subject to master netting arrangements.
The following table presents for each lending Fund, the value of the securities on loan with Citibank, net of amounts available for offset under the master netting arrangements and any related collateral received or posted by the Funds as of December 31, 2024.
| Investment Securities
on Loan, at value,
Presented on the
Statements of Assets
and Liabilities | Cash Collateral
Posted by Borrower* | Net Amount Due
to Counterparty
(not less than zero) |
| | | |
| | | |
| | | |
|
| Collateral posted reflects the value of securities on loan and does not include any additional amounts received from the borrower. |
Securities lending also involves counterparty risks, including the risk that the loaned securities may not be returned in a timely manner or at all. Subject to certain conditions, Citibank has agreed to indemnify the Funds from losses resulting from a borrower’s failure to return a loaned security.
JPMIM voluntarily waived investment advisory fees charged to the Funds to reduce the impact of the cash collateral investment in the JPMorgan U.S. Government Money Market Fund from 0.13% to 0.06%. For the six months ended December 31, 2024, JPMIM waived fees associated with the Funds' investment in the JPMorgan U.S. Government Money Market Fund as follows:
|
| Amount rounds to less than one thousand. |
The above waiver is included in the determination of earnings on cash collateral investment and in the calculation of Citibank’s compensation and is included on the Statements of Operations as Income from securities lending (net).
Growth Advantage Fund did not have any securities out on loan at December 31, 2024.
| J.P. Morgan Mid Cap/Multi-Cap Funds | |
NOTES TO FINANCIAL STATEMENTSAS OF December 31, 2024 (Unaudited) (continued)
(Dollar values in thousands)
D. Investment Transactions with Affiliates— The Funds invested in Underlying Funds advised by the Adviser. An issuer which is under common control with a Fund may be considered an affiliate. For the purposes of the financial statements, the Funds assume the issuers listed in the tables below to be affiliated issuers. The Underlying Funds’ distributions may be reinvested into such Underlying Funds. Reinvestment amounts are included in the purchases at cost amounts in the tables below.
|
For the six months ended December 31, 2024 |
| | | | | Change in
Unrealized
Appreciation/
(Depreciation) | | Shares at
December 31,
2024 | | Capital Gain
Distributions |
JPMorgan Prime Money Market Fund Class IM Shares, 4.54% (a) (b) | | | | | | | | | |
JPMorgan Securities Lending Money Market Fund Agency SL Class Shares, 4.47% (a) (b) | | | | | | | | | |
| | | | | | | | | |
|
| Investment in an affiliated fund, which is registered under the Investment Company Act of 1940, as amended, and is advised by J.P. Morgan Investment Management Inc. |
| The rate shown is the current yield as of December 31, 2024. |
| Amount rounds to less than one thousand. |
| Amount is included on the Statements of Operations as Income from securities lending (net) (after payments of rebates and Citibank’s fee). |
|
For the six months ended December 31, 2024 |
| | | | | Change in
Unrealized
Appreciation/
(Depreciation) | | Shares at
December 31,
2024 | | Capital Gain
Distributions |
JPMorgan Prime Money Market Fund Class IM Shares, 4.54% (a) (b) | | | | | | | | | |
JPMorgan Securities Lending Money Market Fund Agency SL Class Shares, 4.47% (a) (b) | | | | | | | | | |
JPMorgan U.S. Government Money Market Fund Class IM Shares, 4.44% (a) (b) | | | | | | | | | |
| | | | | | | | | |
|
| Investment in an affiliated fund, which is registered under the Investment Company Act of 1940, as amended, and is advised by J.P. Morgan Investment Management Inc. |
| The rate shown is the current yield as of December 31, 2024. |
| Amount rounds to less than one thousand. |
| Amount is included on the Statements of Operations as Income from securities lending (net) (after payments of rebates and Citibank’s fee). |
|
For the six months ended December 31, 2024 |
| | | | | Change in
Unrealized
Appreciation/
(Depreciation) | | Shares at
December 31,
2024 | | Capital Gain
Distributions |
JPMorgan Prime Money Market Fund Class IM Shares, 4.54% (a) (b) | | | | | | | | | |
| J.P. Morgan Mid Cap/Multi-Cap Funds | |
Mid Cap Growth Fund (continued) |
For the six months ended December 31, 2024 |
| | | | | Change in Unrealized Appreciation/ (Depreciation) | | Shares at December 31, 2024 | | Capital Gain Distributions |
JPMorgan Securities Lending Money Market Fund Agency SL Class Shares, 4.47% (a) (b) | | | | | | | | | |
JPMorgan U.S. Government Money Market Fund Class IM Shares, 4.44% (a) (b) | | | | | | | | | |
| | | | | | | | | |
|
| Investment in an affiliated fund, which is registered under the Investment Company Act of 1940, as amended, and is advised by J.P. Morgan Investment Management Inc. |
| The rate shown is the current yield as of December 31, 2024. |
| Amount rounds to less than one thousand. |
| Amount is included on the Statements of Operations as Income from securities lending (net) (after payments of rebates and Citibank’s fee). |
|
For the six months ended December 31, 2024 |
| | | | | Change in
Unrealized
Appreciation/
(Depreciation) | | Shares at
December 31,
2024 | | Capital Gain
Distributions |
JPMorgan Prime Money Market Fund Class IM Shares, 4.54% (a) (b) | | | | | | | | | |
| J.P. Morgan Mid Cap/Multi-Cap Funds | |
NOTES TO FINANCIAL STATEMENTSAS OF December 31, 2024 (Unaudited) (continued)
(Dollar values in thousands)
Value Advantage Fund (continued) |
For the six months ended December 31, 2024 |
| | | | | Change in Unrealized Appreciation/ (Depreciation) | | Shares at December 31, 2024 | | Capital Gain Distributions |
JPMorgan Securities Lending Money Market Fund Agency SL Class Shares, 4.47% (a) (b) | | | | | | | | | |
JPMorgan U.S. Government Money Market Fund Class IM Shares, 4.44% (a) (b) | | | | | | | | | |
| | | | | | | | | |
|
| Investment in an affiliated fund, which is registered under the Investment Company Act of 1940, as amended, and is advised by J.P. Morgan Investment Management Inc. |
| The rate shown is the current yield as of December 31, 2024. |
| Amount is included on the Statements of Operations as Income from securities lending (net) (after payments of rebates and Citibank’s fee). |
E. Foreign Currency Translation — The books and records of the Funds are maintained in U.S. dollars. Foreign currency amounts are translated into U.S. dollars at the prevailing exchange rates of such currencies against the U.S. dollar. The market value of investment securities and other assets and liabilities are translated at the exchange rate as of the valuation date. Purchases and sales of investment securities, income and expenses are translated at the exchange rate prevailing on the respective dates of such transactions.
The Funds do not isolate the effect of changes in foreign exchange rates from changes in market prices on securities held. Accordingly, such changes are included within Change in net unrealized appreciation/depreciation on investments in non-affiliates on the Statements of Operations.
Reported realized foreign currency gains and losses arise from the disposition of foreign currency, currency gains or losses realized between the trade and settlement dates on securities transactions, and the difference between the amounts of dividends, interest and foreign withholding taxes recorded on each Fund's books on the transaction date and the U.S. dollar equivalent of the amounts actually received or paid. These reported realized foreign currency gains and losses are included in Net realized gain (loss) on foreign currency transactions on the Statements of Operations. Unrealized foreign currency gains and losses arise from changes (due to changes in exchange rates) in the value of foreign currency and other assets and liabilities denominated in foreign currencies, which are held at period end and are included in Change in net unrealized appreciation/depreciation on foreign currency translations on the Statements of Operations.
F. Security Transactions and Investment Income— Investment transactions are accounted for on the trade date (the date the order to buy or sell is executed). Securities gains and losses are calculated on a specifically identified cost basis.
Dividend income is recorded on the ex-dividend date or when a Fund first learns of the dividend.
To the extent such information is publicly available, the Funds record distributions received in excess of income earned from underlying investments as a reduction of cost of investments and/or realized gain. Such amounts are based on estimates if actual amounts are not available and actual amounts of income, realized gain and return of capital may differ from the estimated amounts. The Funds adjust the estimated amounts of the components of distributions (and consequently their net investment income) as necessary, once the issuers provide information about the actual composition of the distributions.
G. Allocation of Income and Expenses— Expenses directly attributable to a Fund are charged directly to that Fund, while the expenses attributable to more than one fund of the Trusts are allocated among the applicable funds. Investment income, realized and unrealized gains and losses and expenses, other than class-specific expenses, are allocated daily to each class of shares based upon the proportion of net assets of each class at the beginning of each day.
Transfer agency fees are class-specific expenses. The amount of the transfer agency fees charged to each share class of the Funds for the six months ended December 31, 2024 are as follows:
| J.P. Morgan Mid Cap/Multi-Cap Funds | |
|
| Amount rounds to less than one thousand. |
H. Federal Income Taxes— Each Fund is treated as a separate taxable entity for Federal income tax purposes. Each Fund's policy is to comply with the provisions of the Internal Revenue Code (the “Code”) applicable to regulated investment companies and to distribute to shareholders all of its distributable net investment income and net realized capital gains on investments. Accordingly, no provision for Federal income tax is necessary. Management has reviewed the Funds' tax positions for all open tax years and has determined that as of December 31, 2024, no liability for Federal income tax is required in the Funds' financial statements for net unrecognized tax benefits. However, management’s conclusions may be subject to future review based on changes in, or the interpretation of, the accounting standards or tax laws and regulations. Each Fund's Federal tax returns for the prior three fiscal years remain subject to examination by the Internal Revenue Service.
I. Distributions to Shareholders— Distributions from net investment income, if any, are generally declared and paid at least annually and are declared separately for each class. No class has preferential dividend rights; differences in per share rates are due to differences in separate class expenses. Net realized capital gains, if any, are distributed by each Fund at least annually. The amount of distributions from net investment income and net realized capital gains is determined in accordance with Federal income tax regulations, which may differ from GAAP. To the extent these “book/tax” differences are permanent in nature (i.e., that they result from other than timing of recognition — “temporary differences”), such amounts are reclassified within the capital accounts based on their Federal tax basis treatment.
3. Fees and Other Transactions with Affiliates
A. Investment Advisory Fee — Pursuant to an Investment Advisory Agreement, the Adviser manages the investments of each Fund and for such services is paid a fee. The investment advisory fee is accrued daily and paid monthly at an annual rate based on each Fund's respective average daily net assets. The annual rate for each Fund is as follows:
Prior to November 1, 2024, the investment advisory fee was accrued daily and paid monthly at an annual rate based on each Fund's respective average daily net assets. The annual rate for each Fund is as follows:
The Adviser waived investment advisory fees and/or reimbursed expenses as outlined in Note 3.F.
B. Administration Fee— Pursuant to an Administration Agreement, the Administrator provides certain administration services to each Fund. In consideration of these services, the Administrator receives a fee accrued daily and paid monthly at an annual rate of 0.075% of the first $10 billion of each Fund's respective average daily net assets, plus 0.050% of each Fund's respective average daily net assets between $10 billion and $20 billion, plus 0.025% of each Fund's respective average daily net assets between $20 billion and $25 billion, plus 0.010% of each Fund's respective average daily net assets in excess of $25 billion. For the six months ended December 31, 2024, the effective annualized rate was 0.064%, 0.075%, 0.075%, 0.069% and 0.075%, respectively, of each Fund's average daily net assets, notwithstanding any fee waivers and/or expense reimbursements.
The Administrator waived administration fees as outlined in Note 3.F.
| J.P. Morgan Mid Cap/Multi-Cap Funds | |
NOTES TO FINANCIAL STATEMENTSAS OF December 31, 2024 (Unaudited) (continued)
(Dollar values in thousands)
JPMorgan Chase Bank, N.A. ("JPMCB"), a wholly-owned subsidiary of JPMorgan, serves as the Funds' sub-administrator (the “Sub-administrator”). For its services as Sub-administrator, JPMCB receives a portion of the fees payable to the Administrator.
C. Distribution Fees— Pursuant to a Distribution Agreement, JPMorgan Distribution Services, Inc. (“JPMDS”), an indirect, wholly-owned subsidiary of JPMorgan, serves as each Fund's principal underwriter and promotes and arranges for the sale of each Fund's shares.
The Boards have adopted a Distribution Plan (the “Distribution Plan”) for Class A, Class C, Class R2 and Class R3 Shares of the Funds, as applicable, pursuant to Rule 12b-1 under the 1940 Act. Class I, Class L, Class R4, Class R5 and Class R6 Shares of the Funds do not charge a distribution fee. The Distribution Plan provides that each Fund shall pay, with respect to the applicable share classes, distribution fees, including payments to JPMDS, at annual rates of the average daily net assets as shown in the table below:
In addition, JPMDS is entitled to receive the front-end sales charges from purchases of Class A Shares and the CDSC from redemptions of Class C Shares and certain Class A Shares for which front-end sales charges have been waived. For the six months ended December 31, 2024, JPMDS retained the following:
|
| Amount rounds to less than one thousand. |
D. Service Fees— The Trusts, on behalf of the Funds, have entered into a Shareholder Servicing Agreement with JPMDS under which JPMDS provides certain support services to fund shareholders. For performing these services, JPMDS receives a fee with respect to all share classes, except Class R6 Shares which do not charge a service fee, that is accrued daily and paid monthly equal to a percentage of the average daily net assets as shown in the table below:
JPMDS has entered into shareholder services contracts with affiliated and unaffiliated financial intermediaries who provide shareholder services and other related services to their clients or customers who invest in the Funds. Pursuant to such contracts, JPMDS will pay all or a portion of such fees earned to financial intermediaries for performing such services.
JPMDS waived service fees as outlined in Note 3.F.
E. Custodian and Accounting Fees— JPMCB provides portfolio custody and accounting services to the Funds. For performing these services, the Funds pay JPMCB transaction and asset-based fees that vary according to the number of transactions and positions, plus out-of-pocket expenses. The amounts paid directly to JPMCB by the Funds for custody and accounting services are included in Custodian and accounting fees on the Statements of Operations.
Interest income earned on cash balances at the custodian, if any, is included in Interest income from affiliates on the Statements of Operations.
Interest expense paid to the custodian related to cash overdrafts, if any, is included in Interest expense to affiliates on the Statements of Operations.
| J.P. Morgan Mid Cap/Multi-Cap Funds | |
F. Waivers and Reimbursements—The Adviser, Administrator and/or JPMDS have contractually agreed to waive fees and/or reimburse the Funds to the extent that total annual operating expenses (excluding acquired fund fees and expenses other than certain money market fund fees as described below, dividend and interest expenses related to short sales, interest, taxes, expenses related to litigation and potential litigation, expenses related to trustee elections and extraordinary expenses) exceed the percentages of the Funds' respective average daily net assets as shown in the table below:
Prior to November 1, 2024, the contractual expense limitation is shown in the table below:
The expense limitation agreements were in effect for the six months ended December 31, 2024 and are in place until at least October 31, 2025.
For the six months ended December 31, 2024, the Funds' service providers waived fees and/or reimbursed expenses for each of the Funds as follows. None of these parties expect the Funds to repay any such waived fees and/or reimbursed expenses in future years.
| | |
| | | | | Contractual
Reimbursements |
| | | | | |
| | | | | |
| | | | | |
| | | | | |
| | | | | |
Additionally, the Funds may invest in one or more money market funds advised by the Adviser (affiliated money market funds). The Adviser, Administrator and/or JPMDS, as shareholder servicing agent, have contractually agreed to waive fees and/or reimburse expenses in an amount sufficient to offset the respective net fees each collects from the affiliated money market fund on the applicable Fund's investment in such affiliated money market fund, except for investments of securities lending cash collateral. None of these parties expect the Funds to repay any such waived fees and/or reimbursed expenses in future years.
The amounts of these waivers resulting from investments in these money market funds for the six months ended December 31, 2024 were as follows:
| J.P. Morgan Mid Cap/Multi-Cap Funds | |
NOTES TO FINANCIAL STATEMENTSAS OF December 31, 2024 (Unaudited) (continued)
(Dollar values in thousands)
G. Other— Certain officers of the Trusts are affiliated with the Adviser, the Administrator and JPMDS. Such officers, with the exception of the Chief Compliance Officer, receive no compensation from the Funds for serving in their respective roles.
The Boards designated and appointed a Chief Compliance Officer to the Funds pursuant to Rule 38a-1 under the 1940 Act. Each Fund, along with affiliated funds, makes reimbursement payments, on a pro-rata basis, to the Administrator for a portion of the fees associated with the office of the Chief Compliance Officer. Such fees are included in Trustees’ and Chief Compliance Officer’s fees on the Statements of Operations.
The Trusts adopted a Trustee Deferred Compensation Plan (the “Plan”) which allows the independent Trustees to defer the receipt of all or a portion of compensation related to performance of their duties as Trustees. The deferred fees are invested in various J.P. Morgan Funds until distribution in accordance with the Plan.
During the six months ended December 31, 2024, Mid Cap Equity Fund and Mid Cap Growth Fund purchased securities from an underwriting syndicate in which the principal underwriter or members of the syndicate were affiliated with the Adviser.
The below Funds used related party broker-dealers during the six months ended December 31, 2024, and incurred brokerage commissions with broker-dealers affiliated with the Adviser as follows:
The SEC has granted an exemptive order permitting the Funds to engage in principal transactions with J.P. Morgan Securities LLC, an affiliated broker, involving taxable money market instruments, subject to certain conditions.
4. Investment Transactions
During the six months ended December 31, 2024, purchases and sales of investments (excluding short-term investments) were as follows:
| Purchases
(excluding
U.S. Government) | Sales
(excluding
U.S. Government) |
| | |
| | |
| | |
| | |
| | |
During the six months ended December 31, 2024, there were no purchases or sales of U.S. Government securities.
5. Federal Income Tax Matters
For Federal income tax purposes, the estimated cost and unrealized appreciation (depreciation) in value of investments held at December 31, 2024 were as follows:
| | Gross
Unrealized
Appreciation | Gross
Unrealized
Depreciation | Net Unrealized
Appreciation
(Depreciation) |
| | | | |
| | | | |
| | | | |
| | | | |
| | | | |
At June 30, 2024, the Funds did not have any net capital loss carryforwards.
| J.P. Morgan Mid Cap/Multi-Cap Funds | |
Net capital losses (gains) and specified ordinary losses incurred after October 31 and late year ordinary losses incurred after December 31 and within the taxable year are deemed to arise on the first business day of the Funds' next taxable year. For the year ended June 30, 2024, the following Funds deferred to July 1, 2024 the following net capital losses (gains), specified ordinary losses and late year ordinary losses of:
| Net Capital Losses (Gains) | Late Year
Ordinary Loss Deferral |
| |
| | |
| | |
| | |
During the year ended June 30, 2024, the following Funds utilized capital loss carryforwards as follows:
The Funds rely upon an exemptive order granted by the SEC (the “Order”) permitting the establishment and operation of an Interfund Lending Facility (the “Facility”). The Facility allows the Funds to directly lend and borrow money to or from any other fund relying upon the Order at rates beneficial to both the borrowing and lending funds. Advances under the Facility are taken primarily for temporary or emergency purposes, including the meeting of redemption requests that otherwise might require the untimely disposition of securities, and are subject to each Fund's borrowing restrictions. The interfund loan rate is determined, as specified in the Order, by averaging the current repurchase agreement rate and the current bank loan rate. The Order was granted to JPM II and may be relied upon by the Funds because the Funds and the series of JPM II are all investment companies in the same “group of investment companies” (as defined in Section 12(d)(1)(G) of the 1940 Act).
The Funds had no borrowings outstanding from another fund, or loans outstanding to another fund, during the six months ended December 31, 2024.
The Trusts and JPMCB have entered into a financing arrangement. Under this arrangement, JPMCB provides an unsecured, uncommitted credit facility in the aggregate amount of $100 million to certain of the J.P. Morgan Funds, including the Funds. Advances under the arrangement are taken primarily for temporary or emergency purposes, including the meeting of redemption requests that otherwise might require the untimely disposition of securities, and are subject to each Fund's borrowing restrictions. Interest on borrowings is payable at a rate determined by JPMCB at the time of borrowing. This agreement has been extended until October 28, 2025.
The Funds had no borrowings outstanding from the unsecured, uncommitted credit facility during the six months ended December 31, 2024.
The Trusts, along with certain other trusts for J.P. Morgan Funds (“Borrowers”), have entered into a joint syndicated senior unsecured revolving credit facility totaling $1.5 billion (“Credit Facility”) with various lenders and The Bank of New York Mellon, as administrative agent for the lenders. This Credit Facility provides a source of funds to the Borrowers for temporary and emergency purposes, including the meeting of redemption requests that otherwise might require the untimely disposition of securities. Under the terms of the Credit Facility, a borrowing fund must have a minimum of $25 million in adjusted net asset value and not exceed certain adjusted net asset coverage ratios prior to and during the time in which any borrowings are outstanding. If a fund does not comply with the aforementioned requirements, the fund must remediate within three business days with respect to the $25 million minimum adjusted net asset value or within one business day with respect to certain asset coverage ratios or the administrative agent at the request of, or with the consent of, the lenders may terminate the Credit Facility and declare any outstanding borrowings to be due and payable immediately.
Interest associated with any borrowing under the Credit Facility is charged to the borrowing fund at a rate of interest equal to 1.00%, plus the greater on the day of the borrowing, of the federal funds effective rate, or the Adjusted Secured Overnight Financing Rate (SOFR). Effective August 6, 2024, the Credit Facility was amended and restated for a term of 364 days, unless extended.
The Funds did not utilize the Credit Facility during the six months ended December 31, 2024.
7. Risks, Concentrations and Indemnifications
In the normal course of business, the Funds enter into contracts that contain a variety of representations which provide general indemnifications. Each Fund's maximum exposure under these arrangements is unknown. The amount of exposure would depend on future claims that may be brought against each Fund. However, based on experience, the Funds expect the risk of loss to be remote.
| J.P. Morgan Mid Cap/Multi-Cap Funds | |
NOTES TO FINANCIAL STATEMENTSAS OF December 31, 2024 (Unaudited) (continued)
(Dollar values in thousands)
As of December 31, 2024, the Funds had individual shareholders and/or non-affiliated omnibus accounts each owning more than 10% of the respective Fund's outstanding shares as follows:
| Number of
Individual Shareholder
and/or Affiliated
Omnibus Accounts | | Number of
Individual Shareholder
and/or Non-Affiliated
Omnibus Accounts | |
| | | | |
| | | | |
| | | | |
| | | | |
| | | | |
Significant shareholder transactions by these shareholders may impact the Funds' performance and liquidity.
As of December 31, 2024, JPMorgan SmartRetirement Funds, which are affiliated fund of funds, each owned in the aggregate, shares representing more than 10% of the net assets of the Funds as follows:
| JPMorgan
SmartRetirement
Funds |
| |
Because Mid Cap Equity Fund, Mid Cap Value Fund and Value Advantage Fund invest in Real Estate Investment Trusts (“REITs”), the Funds may be subject to certain risks similar to those associated with direct investments in real estate. REITs may be affected by changes in the value of their underlying properties and by defaults by tenants. REITs depend generally on their ability to generate cash flow to make distributions to shareholders, and certain REITs have self-liquidation provisions by which mortgages held may be paid in full and distributions of capital returns may be made at any time.
The Funds are subject to infectious disease epidemics/pandemics risk. The effects of any future pandemic or other global event to public health and business and market conditions may have a significant negative impact on the performance of a Fund's investments, increase a Fund's volatility, exacerbate pre-existing political, social and economic risks to the Funds, and negatively impact broad segments of businesses and populations. In addition, governments, their regulatory agencies, or self-regulatory organizations have taken or may take actions in response to a pandemic or other global event that affect the instruments in which the Funds invest, or the issuers of such instruments, in ways that could have a significant negative impact on a Fund’s investment performance. The ultimate impact of any pandemic or other global event and the extent to which the associated conditions and governmental responses impact a Fund will also depend on future developments, which are highly uncertain, difficult to accurately predict and subject to frequent changes.
Effective February 5, 2025, Growth Advantage Fund changed from operating as a diversified company to operating as a non-diversified company.
| J.P. Morgan Mid Cap/Multi-Cap Funds | |
THIS PAGE IS INTENTIONALLY LEFT BLANK
J.P. Morgan Funds are distributed by JPMorgan Distribution Services, Inc., which is an affiliate of JPMorgan Chase & Co. Affiliates of JPMorgan Chase & Co. receive fees for providing various services to the Funds.
Contact JPMorgan Distribution Services, Inc. at 1-800-480-4111 for a fund prospectus. You can also visit us at www.jpmorganfunds.com. Investors should carefully consider the investment objectives and risk as well as charges and expenses of the mutual fund before investing. The prospectus contains this and other information about the mutual fund. Read the prospectus carefully before investing.
Investors may obtain information about the Securities Investor Protection Corporation (SIPC), including the SIPC brochure, by visiting www.sipc.org or by calling SIPC at 202-371-8300.
J.P. Morgan Asset Management is the brand name for the asset management business of JPMorgan Chase & Co. and its affiliates worldwide.
© JPMorgan Chase & Co., 2024. All rights reserved. December 2024.
SAN-MC-1224
Changes in and Disagreements with Accountants for Open-End Management Investment Companies
Proxy Disclosures for Open-End Management Investment Companies
JPM Growth Advantage Fund
J.P. Morgan Mutual Fund Investment Trust held a special meeting of shareholders on October 2, 2024, for the purpose of considering and voting upon the approval to change the JPMorgan Growth Advantage Fund (the “Fund”) from a diversified company to a non-diversified company by eliminating the Fund’s related fundamental investment policy.
The special meeting was adjourned to October 30, 2024, November 21, 2024 and December 18, 2024 to allow shareholders additional time to vote on the proposal. The proposal was not approved by either 67% or more of the shares present or represented by proxy at the meeting, or by more than 50% of the outstanding shares (as of the record date set for the special shareholder meeting) of the Fund, as is required, at the October 2, 2024 meeting, the October 30, 2024 meeting and the November 21, 2024 meeting. The elimination of the fundamental investment policy was approved by shareholders of the Fund when the special meeting reconvened on December 18, 2024.
The results of the voting were as follows:
| Dollar value of Votes Received (000’s) |
| |
| |
| |
| |
| |
October 30, 2024 Meeting: | |
| |
| |
| |
| |
| |
November 21, 2024 Meeting: | |
| |
| |
| |
| |
| |
December 18, 2024 Meeting: | |
| |
| |
| |
| |
| |
Remuneration Paid to Directors, Officers, and Others of Open-End Management Investment Companies
Included in the Statements of Operations within the Funds' Financial Statements.
Statement Regarding Basis for Approval of Investment Advisory Agreements
The Board of Trustees (the “Board” or the “Trustees”) has established various standing committees composed of Trustees with diverse backgrounds, to which the Board has assigned specific subject matter responsibilities to further enhance the effectiveness of the Board’s oversight and decision making. The Board and its investment committees (Money Market and Alternative Products Committee, Equity Committee, and Fixed Income Committee) met regularly throughout the year and, at each meeting, considered factors that are relevant to their annual consideration of the continuation of the investment advisory agreements. The Board also met for the specific purpose of considering investment advisory agreement annual renewals. The Board held meetings June 25-26, 2024 and August 20-22, 2024, at which the Trustees considered the continuation of the investment advisory agreements for each Fund whose semi-annual report is contained herein (each an “Advisory Agreement” and collectively, the “Advisory Agreements”). At the June meeting, the Board’s investment committees met to review and consider performance, expense and related information for the J.P. Morgan Funds. Each investment committee reported to the full Board, which then considered each investment committee’s preliminary findings. At the August meeting, the Trustees continued their review and consideration. The Trustees, including a majority of the Trustees who are not parties to an Advisory Agreement or “interested persons” (as defined in the Investment Company Act of 1940) of any party to an Advisory Agreement or any of their affiliates, approved the continuation of each Advisory Agreement on August 22, 2024.
As part of their review of the Advisory Agreements, the Trustees considered and reviewed performance and other information about the Funds received from J.P. Morgan Investment Management Inc. (the “Adviser”). This information included the Funds’ performance as compared to the performance of their peers and benchmarks, and analyses by the Adviser of the Funds’ performance. In addition, at each of their regular meetings throughout the year, the Trustees considered reports on the performance of certain J.P. Morgan Funds provided by an independent investment consulting firm (the “independent consultant”). In addition, in preparation for the June and August meetings, the Trustees requested, received and evaluated extensive materials from the Adviser, including performance and expense information compiled by Broadridge, using data from Lipper Inc. and/or Morningstar, Inc., independent providers of investment company data (together, “Broadridge”). The Trustees’ independent consultant also provided additional quantitative and statistical analyses of the Funds, including risk and performance return assessments as compared to the Funds’ objectives, benchmarks, and peers. Before voting on the Advisory Agreements, the Trustees reviewed the Advisory Agreements with representatives of the
Adviser, counsel to the Funds, and independent legal counsel to the Trustees, and received a memorandum from independent legal counsel to the Trustees discussing the legal standards for their consideration of the Advisory Agreements. The Trustees also discussed the Advisory Agreements with independent legal counsel in executive sessions at which no representatives of the Adviser were present.
A summary of the material factors evaluated by the Trustees in determining whether to approve each Advisory Agreement is provided below. Each Trustee attributed different weights to the various factors, and no factor alone was considered determinative. The Trustees considered information provided with respect to the Funds throughout the year, as well as materials furnished specifically in connection with the annual review process. From year to year, the Trustees consider and place emphasis on relevant information in light of changing circumstances in market and economic conditions.
After considering and weighing the factors and information they had received, the Trustees found that the compensation to be received by the Adviser from each Fund under the applicable Advisory Agreement was fair and reasonable under the circumstances, and determined that the continuance of each Advisory Agreement was in the best interests of each Fund and its shareholders.
Nature, Extent and Quality of Services Provided by the Adviser
The Trustees received and considered information regarding the nature, extent and quality of services provided to each Fund under the applicable Advisory Agreement. The Trustees took into account information furnished throughout the year at Trustee meetings, as well as the materials furnished specifically in connection with this annual review process. Among other things, the Trustees considered:
•
The background and experience of the Adviser’s senior management and investment personnel, including personnel changes, if any;
•
The qualifications, backgrounds and responsibilities of the portfolio management team primarily responsible for the day-to-day management of each Fund, including personnel changes, if any;
•
The investment strategy for each Fund, and the infrastructure supporting the portfolio management teams;
•
Information about the structure and distribution strategy for each Fund and how it fits within the Adviser’s other fund offerings within the J.P. Morgan Funds complex;
•
The administration services provided by the Adviser in its role as Administrator;
•
Their knowledge of the nature and quality of the services provided by the Adviser and its affiliates gained from their experience as Trustees of the Funds and in the financial industry generally;
•
The overall reputation and capabilities of the Adviser and its affiliates;
•
The commitment of the Adviser to provide high quality service to the Funds;
•
Their overall confidence in the Adviser’s integrity; and
•
The Adviser’s responsiveness to requests for additional information, questions or concerns raised by them, including the Adviser’s willingness to consider and implement organizational and operational changes designed to improve investment results and the services provided to each Fund.
Based upon these considerations and other factors, the Trustees concluded that they were satisfied with the nature, extent and quality of the services provided to the Funds by the Adviser.
Costs of Services Provided and Profitability to the Adviser and its Affiliates
The Trustees received and considered information regarding the profitability to the Adviser and its affiliates from providing services to each Fund. The Trustees reviewed and discussed this information. The Trustees recognized that this information is not audited and represents the Adviser’s determination of its and its affiliates’ revenues from the contractual services provided to the Funds, less expenses of providing such services. Expenses include direct and indirect costs and are calculated using an allocation methodology developed by the Adviser and reviewed with the Board. The Trustees also recognized that it is difficult to make comparisons of profitability from fund investment advisory contracts because comparative information is not generally publicly available and is affected by numerous factors, including the structure of the particular adviser, the types of funds it manages, its business mix, numerous assumptions regarding allocations and the fact that publicly-traded fund managers’ operating profits and net income are net of distribution and marketing expenses. Based upon their review, and taking into consideration the factors noted above, the Trustees concluded that the profitability to the Adviser under each Advisory Agreement was not unreasonable in light of the services and benefits provided to each Fund.
The Trustees also considered that JPMorgan Distribution Services, Inc. (“JPMDS”), an affiliate of the Adviser, and the Adviser earn fees from the Funds for providing shareholder and administration services, respectively. These fees were shown separately in the profitability analysis presented to the Trustees. The Trustees also considered the payments of Rule 12b-1 fees to JPMDS, which also acts as the Funds’ distributor, and that these fees are in turn generally paid to
financial intermediaries that sell the Funds, including financial intermediaries that are affiliates of the Adviser (although they are retained by JPMDS in certain instances). The Trustees also considered the fees earned by JPMorgan Chase Bank, N.A. (“JPMCB”), an affiliate of the Adviser, for custody, fund accounting and other related services for each Fund, and the profitability of the arrangements to JPMCB.
The Trustees reviewed information regarding potential “fall-out” or ancillary benefits received by the Adviser and its affiliates as a result of their relationship with the Funds. The Trustees considered that the J.P. Morgan Funds’ operating accounts are held at JPMCB, which, as a result, will receive float benefits for certain J.P. Morgan Funds, as applicable. The Trustees also noted that the Adviser supports a diverse set of products and services, which benefits the Adviser by allowing it to leverage its infrastructure to serve additional clients, including benefits that may be received by the Adviser and its affiliates in connection with the Funds’ potential investments in other funds advised by the Adviser. The Trustees also reviewed the Adviser’s allocation of fund brokerage for the J.P. Morgan Funds complex, including allocations to brokers who provide research to the Adviser, as well as the Adviser’s use of affiliates to provide other services and the benefits to such affiliates of doing so. The Trustees also considered the benefit to the Adviser and its affiliates from allocating client assets to the Funds.
The Trustees considered the extent to which the Funds may benefit from potential economies of scale. The Trustees considered that there may not be a direct relationship between economies of scale realized by the Funds and those realized by the Adviser as assets increase. The Trustees considered the extent to which the Funds were priced to scale and whether it would be appropriate to add advisory fee breakpoints. The Trustees noted certain Funds with contractual expense limitations and fee waivers (“Fee Caps”), which allow a Fund’s shareholders to share potential economies of scale from a Fund’s inception, prior to reaching scale. The Trustees also noted that certain other Funds that had achieved scale as asset levels had increased, no longer had Fee Caps in place for some or all of their share classes, but shared economies of scale through lower average expenses. The Trustees noted that the fees remain fair and reasonable relative to peer funds. The Trustees considered the benefits to the Funds of the use of an affiliated distributor and custodian, including the ability to rely on existing infrastructure supporting distribution, custodial and transfer agent services and the ability to negotiate competitive fees for the Funds. The Trustees further considered the Adviser's and JPMDS's ongoing investments in their business in support of the Funds, including the Adviser's and/or JPMDS's
investments in trading systems, technology (including improvements to the J.P. Morgan Funds’ website, and cybersecurity improvements), retention of key talent, and regulatory support enhancements. The Trustees concluded that the current fee structure for each Fund, including any Fee Caps the Adviser has in place that serve to limit the overall net expense ratios of each Fund at competitive levels, was reasonable. The Trustees concluded that, for Funds with Fee Caps in place for some or all of their share classes, the relevant Fund’s shareholders received the benefits of potential economies of scale through the Fee Caps and, for Funds that achieved scale and no longer had Fee Caps in place for some or all of their share classes, the relevant Fund’s shareholders benefited from lower average expenses resulting from increased assets. The Trustees also concluded that all Funds benefited from the Adviser’s reinvestment in its operations to serve the Funds and their shareholders. The Trustees noted that the Adviser’s reinvestment ensures sufficient resources in terms of personnel and infrastructure to support the Funds.
Independent Written Evaluation of the Funds’ Senior Officer
The Trustees noted that, upon their direction, the Senior Officer for the Mid Cap Growth Fund and Mid Cap Value Fund had prepared an independent written evaluation in order to assist the Trustees in determining the reasonableness of the proposed management fees. In determining whether to continue the Advisory Agreements, the Trustees considered the Senior Officer’s report.
Fees Relative to Adviser’s Other Clients
The Trustees received and considered information about the nature and extent of investment advisory services and fee rates offered to other clients of the Adviser, including, to the extent applicable, institutional separate accounts, collective investment trusts, other registered investment companies and/or private funds sub-advised by the Adviser, and for investment management styles substantially similar to that of each Fund. The Trustees considered the complexity of investment management for registered investment companies relative to the Adviser’s other clients and noted differences, as applicable, in the fee structure and the regulatory, legal and other risks and responsibilities of providing services to the different clients. The Trustees considered that serving as an adviser to a registered investment company involves greater responsibilities and risks than acting as a sub-adviser and observed that sub-advisory fees may be lower than those charged by the Adviser to each Fund. The Trustees also noted that the adviser, not the applicable registered investment company, typically bears the sub-advisory fee and that many responsibilities related to the advisory function are typically retained by the primary adviser. The Trustees concluded that the fee rates charged to each Fund in comparison to those charged to the Adviser’s other clients were reasonable.
Investment Performance
The Trustees receive and consider information about each Fund’s performance throughout the year. In addition, the Trustees received and considered absolute and/or relative performance information for the Funds in a report prepared by Broadridge. The Trustees considered the total return performance information, which included the ranking of the Funds within a performance universe comprised of funds’ selected share classes with the same Broadridge investment classification and objective (the “Universe”), by total return for the applicable one-, three- and five-year periods. The Trustees reviewed a description of Broadridge’s methodology for selecting mutual funds in each Fund’s Universe, and noted that Universe quintile rankings were not calculated if the number of funds in the Universe did not meet a predetermined minimum. The Trustees also considered enhancements to the methodology employed by Broadridge for identifying funds in the Peer Groups for Class I shares, based upon discussions with the Adviser, Broadridge and certain Trustees in advance of, and in preparation for, the June meeting. The Broadridge materials provided to the Trustees highlighted information with respect to certain representative classes to assist the Trustees in their review. As part of this review, the Trustees also reviewed each Fund’s performance against its benchmark and considered the performance information provided for the Funds at regular Board meetings by the Adviser and the Trustees’ independent consultant and also considered the special analysis prepared for the Funds by the Trustees’ independent consultant. The Trustees also engaged with the Adviser to consider what steps might be taken to improve performance, as applicable. The Broadridge performance data noted by the Trustees as part of their review and the determinations made by the Trustees with respect to each Fund’s performance for certain representative classes are summarized below:
The Trustees noted that the Growth Advantage Fund’s performance for Class A and Class R6 shares was in the third, second and first quintiles of the Universe for the one-, three- and five-year periods ended December 31, 2023, respectively. The Trustees noted that the performance for Class I shares was in the third, third and first quintiles of the Universe for the one-, three- and five-year periods ended December 31, 2023, respectively. The Trustees discussed the performance and investment strategy of the Fund with the Adviser and reviewed the performance analysis and evaluation prepared by the independent consultant. Based upon these discussions and various other factors, the Trustees concluded that the Fund’s performance was satisfactory.
The Trustees noted that the Mid Cap Equity Fund’s performance for Class A, Class I and Class R6 shares was in the third, fourth and first quintiles of the Universe for the one-, three- and five-year periods ended December 31, 2023, respectively. The Trustees discussed the performance and investment strategy of
the Fund with the Adviser and reviewed the performance analysis and evaluation prepared by the independent consultant. Based upon these discussions and various other factors, the Trustees concluded that the Fund’s performance was satisfactory under the circumstances.
The Trustees noted that the Mid Cap Growth Fund’s performance for Class A shares was in the second, third and first quintiles of the Universe for the one-, three- and five-year periods ended December 31, 2023, respectively. The Trustees noted that the performance for Class I and Class R6 shares was in the second, second and first quintiles of the Universe for the one-, three- and five-year periods ended December 31, 2023, respectively. The Trustees discussed the performance and investment strategy of the Fund with the Adviser and reviewed the performance analysis and evaluation prepared by the independent consultant. Based upon these discussions and various other factors, the Trustees concluded that the Fund’s performance was satisfactory.
The Trustees noted that the Mid Cap Value Fund’s performance for Class A shares was in the fourth quintile of the Universe for each of the one-, three- and five-year periods ended December 31, 2023. The Trustees noted that the performance for Class I shares was in the fourth, third and fourth quintiles for the one-, three- and five-year periods ended December 31, 2023, respectively. The Trustees noted that the performance for Class R6 shares was in the third quintile for each of the one-, three- and five-year periods ended December 31, 2023. The Trustees discussed the performance and investment strategy of the Fund with the Adviser and reviewed the performance analysis and evaluation prepared by the independent consultant. Based upon these discussions and various other factors, the Trustees concluded that the Fund’s performance was satisfactory under the circumstances. The Trustees requested, however, that the Fund’s Adviser provide additional Fund performance information to be reviewed with the members of the Equity Committee at each of their regular meetings over the course of the next year.
The Trustees noted that the Value Advantage Fund’s performance for Class A and Class R6 shares was in the third, second and third quintiles of the Universe for the one-, three- and five-year periods ended December 31, 2023, respectively. The Trustees noted that the performance for Class I shares was in the fourth, second and third quintiles for the one-, three- and five-year periods ended December 31, 2023, respectively. The Trustees discussed the performance and investment strategy of the Fund with the Adviser and reviewed the performance analysis and evaluation prepared by the independent consultant. Based upon these discussions and various other factors, the Trustees concluded that the Fund’s performance was satisfactory under the circumstances.
Advisory Fees and Expense Ratios
The Trustees considered the contractual advisory fee rate and administration fee rate paid by each Fund to the Adviser and compared the combined rate to the information prepared by Broadridge concerning management fee rates paid by other funds’ selected share classes in the Universe, as well as a subset of funds within the Universe (the “Peer Group”). The Trustees recognized that Broadridge reported each Fund’s management fee rate as the combined contractual advisory fee and administration fee rates. The Trustees also reviewed information about other expenses and the expense ratios for each Fund and noted that Universe and Peer Group quintile rankings were not calculated if the number of funds in the Universe and/or Peer Groups did not meet a predetermined minimum. For each Fund that had a Fee Cap in place, the Trustees considered the net advisory fee rate and net expense ratio for each share class, as applicable, taking into account any waivers and/or reimbursements. The Trustees also considered any proposed changes to a Fee Cap, and, where deemed appropriate by the Trustees, additional waivers and/or reimbursements. The Trustees recognized that it can be difficult to make comparisons of advisory fees because there are variations in the services that are included in the fees paid by other funds. The Trustees’ determinations as a result of the review of each Fund’s advisory fees and expense ratios for certain representative classes are summarized below:
The Trustees noted that the Growth Advantage Fund’s net advisory fee for Class A shares was in the third and second quintiles of the Peer Group and Universe, respectively, and that the actual total expenses for Class A shares were in the fifth and third quintiles of the Peer Group and Universe, respectively. The Trustees noted that the net advisory fee for Class I shares was in the third and second quintiles of the Peer Group and Universe, respectively, and that the actual total expenses for Class I shares were in the third quintile of both the Peer Group and Universe. The Trustees noted that the net advisory fee for Class R6 shares was in the second quintile of both the Peer Group and Universe, and that the actual total expenses for Class R6 shares were in the second and first quintiles of the Peer Group and Universe, respectively. After considering the factors identified above, including reductions to the contractual advisory fee and Fee Caps effective November 1, 2024, in light of this information, the Trustees concluded that the advisory fee was fair and reasonable in light of the services provided to the Fund.
The Trustees noted that the Mid Cap Equity Fund’s net advisory fee for Class A shares was in the first and second quintiles of the Peer Group and Universe, respectively, and that the actual total expenses for Class A shares were in the second quintile of both the Peer Group and Universe. The Trustees noted that the net advisory fee for Class I shares was in the first and second quintiles of the Peer Group and Universe, respectively, and that
the actual total expenses for Class I shares were in the third quintile of both the Peer Group and Universe. The Trustees noted that the net advisory fee for Class R6 shares was in the first and second quintiles of the Peer Group and Universe, respectively, and that the actual total expenses for Class R6 shares were in the first quintile of both the Peer Group and Universe. After considering the factors identified above, including reductions to the contractual advisory fee and Fee Caps effective November 1, 2024, in light of this information, the Trustees concluded that the advisory fee was fair and reasonable in light of the services provided to the Fund.
The Trustees noted that the Mid Cap Growth Fund’s net advisory fee for Class A shares was in the third and second quintiles of the Peer Group and Universe, respectively, and that the actual total expenses for Class A shares were in the fourth and second quintiles of the Peer Group and Universe, respectively. The Trustees noted that the net advisory fee for Class I shares was in the fourth and third quintiles of the Peer Group and Universe, respectively, and that the actual total expenses for Class I shares were in the third quintile of both the Peer Group and Universe. The Trustees noted that the net advisory fee for Class R6 shares was in the third quintile of both the Peer Group and Universe, and that the actual total expenses for Class R6 shares were in the third and first quintiles of the Peer Group and Universe, respectively. After considering the factors identified above, including reductions to the contractual advisory fee and Fee Caps effective November 1, 2024, in light of this information, the Trustees concluded that the advisory fee was fair and reasonable in light of the services provided to the Fund.
The Trustees noted that the Mid Cap Value Fund’s net advisory fee for Class A shares was in the second quintile of both the Peer Group and Universe, and that the actual total expenses for Class A shares were in the fourth and third quintile of the Peer
Group and Universe, respectively. The Trustees noted that the net advisory fee for Class I shares was in the second quintile of both the Peer Group and Universe, and that the actual total expenses for Class I shares were in the fifth and fourth quintiles of the Peer Group and Universe, respectively. The Trustees noted that the net advisory fee for Class R6 shares was in the third and second quintiles of the Peer Group and Universe, respectively, and that the actual total expenses for Class R6 shares were in the third and first quintiles of the Peer Group and Universe, respectively. After considering the factors identified above, including reductions to the contractual advisory fee and Fee Caps effective November 1, 2024, in light of this information, the Trustees concluded that the advisory fee was fair and reasonable in light of the services provided to the Fund.
The Trustees noted that the Value Advantage Fund’s net advisory fee Class A shares was in the second quintile of both the Peer Group and Universe, and that the actual total expenses for Class A shares were in the fourth and third quintiles of the Peer Group and Universe, respectively. The Trustees noted that the net advisory fee for Class I shares was in the second and third quintiles of the Peer Group and Universe, respectively, and that the actual total expenses for Class I shares were in the fifth and fourth quintiles of the Peer Group and Universe, respectively. The Trustees noted that the net advisory fee for Class R6 shares was in the second and third quintiles of the Peer Group and Universe, respectively, and that the actual total expenses for Class R6 shares were in the second and first quintiles of the Peer Group and Universe, respectively. After considering the factors identified above, including reductions to the contractual advisory fee and Fee Caps effective November 1, 2024, in light of this information, the Trustees concluded that the advisory fee was fair and reasonable in light of the services provided to the Fund.
Semi-Annual Financial Statements
J.P. Morgan Small Cap Funds
December 31, 2024 (Unaudited)
JPMorgan Small Cap Blend Fund |
JPMorgan Small Cap Equity Fund |
JPMorgan Small Cap Growth Fund |
JPMorgan Small Cap Value Fund |
JPMorgan SMID Cap Equity Fund |
JPMorgan U.S. Small Company Fund |
CONTENTS
Investments in a Fund are not deposits or obligations of, or guaranteed or endorsed by, any bank and are not insured or guaranteed by the FDIC, the Federal Reserve Board or any other government agency. You could lose money if you sell when a Fund’s share price is lower than when you invested.
Past performance is no guarantee of future performance. The general market views expressed in this report are opinions based on market and other conditions through the end of the reporting period and are subject to change without notice. These views are not intended to predict the future performance of a Fund or the securities markets.
Prospective investors should refer to the Funds’ prospectuses for a discussion of the Funds’ investment objectives, strategies and risks. Call J.P. Morgan Funds Service Center at 1-800-480-4111 for a prospectus containing more complete information about a Fund, including management fees and other expenses. Please read it carefully before investing.
JPMorgan Small Cap Blend Fund
SCHEDULE OF PORTFOLIO INVESTMENTSAS OF December 31, 2024 (Unaudited)
| | |
|
Aerospace & Defense — 1.7% |
| | |
| | |
| | |
| | |
Rocket Lab USA, Inc. * (a) | | |
| | |
Automobile Components — 1.9% |
| | |
| | |
Modine Manufacturing Co. * | | |
| | |
| | |
| | |
|
Winnebago Industries, Inc. | | |
|
| | |
| | |
| | |
Columbia Banking System, Inc. | | |
| | |
First Commonwealth Financial Corp. | | |
| | |
| | |
| | |
| | |
| | |
Pinnacle Financial Partners, Inc. | | |
| | |
Provident Financial Services, Inc. | | |
| | |
Simmons First National Corp., Class A | | |
| | |
| | |
| | |
| | |
|
| | |
|
Agios Pharmaceuticals, Inc. * | | |
Allogene Therapeutics, Inc. * | | |
| | |
|
Biotechnology — continued |
Amicus Therapeutics, Inc. * | | |
Arrowhead Pharmaceuticals, Inc. * | | |
| | |
Blueprint Medicines Corp. * | | |
| | |
Halozyme Therapeutics, Inc. * | | |
| | |
Kyverna Therapeutics, Inc. * | | |
Madrigal Pharmaceuticals, Inc. * | | |
| | |
| | |
Relay Therapeutics, Inc. * | | |
REVOLUTION Medicines, Inc. * | | |
| | |
| | |
Viking Therapeutics, Inc. * (a) | | |
Xenon Pharmaceuticals, Inc. (Canada) * | | |
| | |
|
Global-e Online Ltd. (Israel) * | | |
|
| | |
| | |
| | |
Simpson Manufacturing Co., Inc. | | |
| | |
| | |
|
Donnelley Financial Solutions, Inc. * | | |
| | |
Hamilton Lane, Inc., Class A | | |
| | |
Virtus Investment Partners, Inc. | | |
| | |
|
| | |
| | |
| | |
| | |
| | |
| | |
SEE NOTES TO FINANCIAL STATEMENTS.
| J.P. Morgan Small Cap Funds | |
JPMorgan Small Cap Blend Fund
SCHEDULE OF PORTFOLIO INVESTMENTSAS OF December 31, 2024 (Unaudited) (continued)
| | |
Common Stocks — continued |
Commercial Services & Supplies — 2.2% |
ACV Auctions, Inc., Class A * | | |
Aris Water Solutions, Inc., Class A | | |
Casella Waste Systems, Inc., Class A * | | |
| | |
| | |
Communications Equipment — 0.5% |
| | |
Construction & Engineering — 0.9% |
| | |
| | |
| | |
Construction Materials — 0.4% |
| | |
|
Upstart Holdings, Inc. * (a) | | |
Consumer Staples Distribution & Retail — 1.0% |
Chefs' Warehouse, Inc. (The) * | | |
Sprouts Farmers Market, Inc. * | | |
| | |
Containers & Packaging — 0.5% |
| | |
Diversified Consumer Services — 0.9% |
Bright Horizons Family Solutions, Inc. * | | |
Graham Holdings Co., Class B | | |
| | |
|
Essential Properties Realty Trust, Inc. | | |
Diversified Telecommunication Services — 0.3% |
Iridium Communications, Inc. | | |
Electric Utilities — 0.7% |
| | |
Portland General Electric Co. | | |
| | |
Electrical Equipment — 1.2% |
Bloom Energy Corp., Class A * (a) | | |
NEXTracker, Inc., Class A * | | |
| | |
| | |
| | |
|
Electronic Equipment, Instruments & Components — 3.3% |
| | |
Ingram Micro Holding Corp. * | | |
| | |
| | |
Napco Security Technologies, Inc. | | |
| | |
| | |
| | |
Vishay Intertechnology, Inc. | | |
| | |
Energy Equipment & Services — 2.1% |
| | |
| | |
| | |
TechnipFMC plc (United Kingdom) | | |
Weatherford International plc | | |
| | |
Financial Services — 2.1% |
AvidXchange Holdings, Inc. * | | |
PennyMac Financial Services, Inc. | | |
| | |
| | |
| | |
|
| | |
| | |
| | |
| | |
| | |
|
Chesapeake Utilities Corp. | | |
| | |
Southwest Gas Holdings, Inc. | | |
| | |
Ground Transportation — 0.5% |
| | |
Health Care Equipment & Supplies — 2.6% |
Establishment Labs Holdings, Inc. (Costa Rica) * (a) | | |
| | |
| | |
| | |
SEE NOTES TO FINANCIAL STATEMENTS.
| J.P. Morgan Small Cap Funds | |
| | |
Common Stocks — continued |
Health Care Equipment & Supplies — continued |
iRhythm Technologies, Inc. * | | |
Lantheus Holdings, Inc. * | | |
| | |
PROCEPT BioRobotics Corp. * | | |
TransMedics Group, Inc. * (a) | | |
Utah Medical Products, Inc. | | |
| | |
Health Care Providers & Services — 2.7% |
Acadia Healthcare Co., Inc. * | | |
Concentra Group Holdings Parent, Inc. | | |
| | |
| | |
Hims & Hers Health, Inc. * | | |
| | |
| | |
| | |
|
| | |
Sabra Health Care REIT, Inc. | | |
| | |
Health Care Technology — 0.6% |
Evolent Health, Inc., Class A * | | |
| | |
| | |
Hotel & Resort REITs — 0.5% |
| | |
Sunstone Hotel Investors, Inc. | | |
| | |
Hotels, Restaurants & Leisure — 3.4% |
| | |
| | |
First Watch Restaurant Group, Inc. * | | |
Life Time Group Holdings, Inc. * | | |
Planet Fitness, Inc., Class A * | | |
Six Flags Entertainment Corp. | | |
| | |
Wyndham Hotels & Resorts, Inc. | | |
| | |
Household Durables — 1.4% |
| | |
| | |
| | |
|
Household Durables — continued |
| | |
| | |
| | |
|
Plymouth Industrial REIT, Inc. | | |
| | |
| | |
|
Oscar Health, Inc., Class A * | | |
Safety Insurance Group, Inc. | | |
Selective Insurance Group, Inc. | | |
| | |
Interactive Media & Services — 0.5% |
| | |
|
| | |
DigitalOcean Holdings, Inc. * | | |
| | |
| | |
|
| | |
Life Sciences Tools & Services — 0.3% |
| | |
Maravai LifeSciences Holdings, Inc., Class A * | | |
| | |
|
Atmus Filtration Technologies, Inc. | | |
| | |
| | |
| | |
| | |
John Bean Technologies Corp. | | |
| | |
| | |
| | |
| | |
| | |
| | |
|
John Wiley & Sons, Inc., Class A | | |
SEE NOTES TO FINANCIAL STATEMENTS.
| J.P. Morgan Small Cap Funds | |
JPMorgan Small Cap Blend Fund
SCHEDULE OF PORTFOLIO INVESTMENTSAS OF December 31, 2024 (Unaudited) (continued)
| | |
Common Stocks — continued |
|
| | |
|
| | |
Highwoods Properties, Inc. | | |
| | |
Oil, Gas & Consumable Fuels — 2.5% |
| | |
| | |
Magnolia Oil & Gas Corp., Class A | | |
| | |
| | |
| | |
Personal Care Products — 1.0% |
Edgewell Personal Care Co. | | |
| | |
| | |
| | |
|
| | |
Intra-Cellular Therapies, Inc. * | | |
Neumora Therapeutics, Inc. * | | |
Prestige Consumer Healthcare, Inc. * | | |
| | |
Professional Services — 1.9% |
| | |
ExlService Holdings, Inc. * | | |
UL Solutions, Inc., Class A | | |
| | |
| | |
|
| | |
Independence Realty Trust, Inc. | | |
| | |
|
| | |
| | |
| | |
Semiconductors & Semiconductor Equipment — 3.2% |
Allegro MicroSystems, Inc. (Japan) * | | |
Credo Technology Group Holding Ltd. * | | |
| | |
|
Semiconductors & Semiconductor Equipment — continued |
| | |
MACOM Technology Solutions Holdings, Inc. * | | |
| | |
| | |
| | |
| | |
| | |
|
| | |
Alkami Technology, Inc. * | | |
| | |
| | |
| | |
Clear Secure, Inc., Class A | | |
Clearwater Analytics Holdings, Inc., Class A * | | |
Confluent, Inc., Class A * | | |
| | |
Freshworks, Inc., Class A * | | |
| | |
Informatica, Inc., Class A * | | |
| | |
MARA Holdings, Inc. * (a) | | |
| | |
SentinelOne, Inc., Class A * | | |
| | |
| | |
| | |
| | |
|
| | |
|
| | |
Floor & Decor Holdings, Inc., Class A * | | |
| | |
Lithia Motors, Inc., Class A | | |
| | |
| | |
Technology Hardware, Storage & Peripherals — 0.1% |
| | |
Textiles, Apparel & Luxury Goods — 1.7% |
| | |
SEE NOTES TO FINANCIAL STATEMENTS.
| J.P. Morgan Small Cap Funds | |
| | |
Common Stocks — continued |
Textiles, Apparel & Luxury Goods — continued |
| | |
| | |
Wolverine World Wide, Inc. | | |
| | |
Trading Companies & Distributors — 4.9% |
| | |
Applied Industrial Technologies, Inc. | | |
Beacon Roofing Supply, Inc. * | | |
| | |
| | |
Rush Enterprises, Inc., Class A | | |
SiteOne Landscape Supply, Inc. * | | |
WESCO International, Inc. | | |
| | |
|
American States Water Co. | | |
Total Common Stocks
(Cost $1,252,655) | | |
Short-Term Investments — 2.6% |
Investment Companies — 1.7% |
JPMorgan Prime Money Market Fund Class IM Shares, 4.54% (b) (c)
(Cost $27,530) | | |
| | |
|
Investment of Cash Collateral from Securities Loaned — 0.9% |
JPMorgan Securities Lending Money Market Fund Agency SL Class Shares, 4.47% (b) (c)
(Cost $14,532) | | |
Total Short-Term Investments
(Cost $42,062) | | |
Total Investments — 100.9%
(Cost $1,294,717) | | |
Liabilities in Excess of Other Assets — (0.9)% | | |
| | |
Percentages indicated are based on net assets. |
| |
| Real Estate Investment Trust |
| Non-income producing security. |
| The security or a portion of this security is on loan at December 31, 2024. The total value of securities on loan at December 31, 2024 is $13,984. |
| Investment in an affiliated fund, which is registered under the Investment Company Act of 1940, as amended, and is advised by J.P. Morgan Investment Management Inc. |
| The rate shown is the current yield as of December 31, 2024. |
SEE NOTES TO FINANCIAL STATEMENTS.
| J.P. Morgan Small Cap Funds | |
JPMorgan Small Cap Equity Fund
SCHEDULE OF PORTFOLIO INVESTMENTSAS OF December 31, 2024 (Unaudited)
| | |
|
Aerospace & Defense — 1.4% |
Loar Holdings, Inc. * (a) | | |
| | |
| | |
Automobile Components — 0.7% |
| | |
|
| | |
Commerce Bancshares, Inc. | | |
Cullen/Frost Bankers, Inc. | | |
| | |
| | |
First Interstate BancSystem, Inc., Class A | | |
ServisFirst Bancshares, Inc. | | |
| | |
| | |
| | |
|
| | |
|
Savers Value Village, Inc. * (a) | | |
|
| | |
| | |
| | |
Janus International Group, Inc. * | | |
Simpson Manufacturing Co., Inc. | | |
| | |
|
| | |
MarketAxess Holdings, Inc. | | |
| | |
| | |
StepStone Group, Inc., Class A | | |
| | |
|
Axalta Coating Systems Ltd. * | | |
| | |
| | |
| | |
|
|
Perimeter Solutions, Inc. * | | |
| | |
| | |
Commercial Services & Supplies — 4.8% |
Casella Waste Systems, Inc., Class A * | | |
Driven Brands Holdings, Inc. * | | |
| | |
| | |
| | |
Construction & Engineering — 2.2% |
WillScot Holdings Corp. * | | |
Construction Materials — 1.2% |
| | |
Consumer Staples Distribution & Retail — 3.6% |
BJ's Wholesale Club Holdings, Inc. * | | |
Casey's General Stores, Inc. | | |
Performance Food Group Co. * | | |
| | |
Containers & Packaging — 1.0% |
| | |
Diversified Consumer Services — 1.4% |
Bright Horizons Family Solutions, Inc. * | | |
Electric Utilities — 1.2% |
Portland General Electric Co. | | |
Electronic Equipment, Instruments & Components — 3.4% |
| | |
| | |
| | |
| | |
| | |
Energy Equipment & Services — 1.0% |
| | |
Financial Services — 1.3% |
| | |
|
| | |
| | |
| | |
SEE NOTES TO FINANCIAL STATEMENTS.
| J.P. Morgan Small Cap Funds | |
| | |
Common Stocks — continued |
Ground Transportation — 1.6% |
Knight-Swift Transportation Holdings, Inc. | | |
| | |
| | |
Health Care Equipment & Supplies — 3.1% |
| | |
| | |
| | |
| | |
| | |
Health Care Providers & Services — 4.3% |
| | |
Concentra Group Holdings Parent, Inc. | | |
| | |
| | |
| | |
Health Care Technology — 0.2% |
| | |
Hotel & Resort REITs — 1.3% |
Ryman Hospitality Properties, Inc. | | |
Hotels, Restaurants & Leisure — 4.7% |
Monarch Casino & Resort, Inc. | | |
Planet Fitness, Inc., Class A * | | |
| | |
| | |
Wyndham Hotels & Resorts, Inc. | | |
| | |
|
EastGroup Properties, Inc. | | |
|
Baldwin Insurance Group, Inc. (The), Class A * | | |
Kinsale Capital Group, Inc. | | |
Oscar Health, Inc., Class A * | | |
| | |
| | |
|
| | |
| | |
| | |
Life Sciences Tools & Services — 0.6% |
| | |
| | |
|
|
Hillman Solutions Corp. * | | |
Lincoln Electric Holdings, Inc. | | |
| | |
| | |
| | |
Oil, Gas & Consumable Fuels — 2.5% |
| | |
| | |
| | |
Professional Services — 3.5% |
First Advantage Corp. * (a) | | |
Paylocity Holding Corp. * | | |
| | |
| | |
Real Estate Management & Development — 1.7% |
Cushman & Wakefield plc * | | |
|
| | |
Semiconductors & Semiconductor Equipment — 3.8% |
Allegro MicroSystems, Inc. (Japan) * | | |
MACOM Technology Solutions Holdings, Inc. * | | |
| | |
| | |
|
CCC Intelligent Solutions Holdings, Inc. * | | |
Clearwater Analytics Holdings, Inc., Class A * | | |
| | |
| | |
| | |
| | |
| | |
|
| | |
|
| | |
SEE NOTES TO FINANCIAL STATEMENTS.
| J.P. Morgan Small Cap Funds | |
JPMorgan Small Cap Equity Fund
SCHEDULE OF PORTFOLIO INVESTMENTSAS OF December 31, 2024 (Unaudited) (continued)
| | |
Common Stocks — continued |
Trading Companies & Distributors — 2.6% |
Applied Industrial Technologies, Inc. | | |
Core & Main, Inc., Class A * | | |
| | |
Total Common Stocks
(Cost $2,863,830) | | |
Short-Term Investments — 2.4% |
Investment Companies — 1.9% |
JPMorgan Prime Money Market Fund Class IM Shares, 4.54% (b) (c)
(Cost $81,503) | | |
Investment of Cash Collateral from Securities Loaned — 0.5% |
JPMorgan Securities Lending Money Market Fund Agency SL Class Shares, 4.47% (b) (c)
(Cost $21,656) | | |
Total Short-Term Investments
(Cost $103,159) | | |
Total Investments — 100.4%
(Cost $2,966,989) | | |
Liabilities in Excess of Other Assets — (0.4)% | | |
| | |
Percentages indicated are based on net assets. |
| |
| Real Estate Investment Trust |
| Non-income producing security. |
| The security or a portion of this security is on loan at December 31, 2024. The total value of securities on loan at December 31, 2024 is $21,044. |
| Investment in an affiliated fund, which is registered under the Investment Company Act of 1940, as amended, and is advised by J.P. Morgan Investment Management Inc. |
| The rate shown is the current yield as of December 31, 2024. |
SEE NOTES TO FINANCIAL STATEMENTS.
| J.P. Morgan Small Cap Funds | |
JPMorgan Small Cap Growth Fund
SCHEDULE OF PORTFOLIO INVESTMENTSAS OF December 31, 2024 (Unaudited)
| | |
|
Aerospace & Defense — 1.9% |
| | |
| | |
Rocket Lab USA, Inc. * (a) | | |
| | |
Automobile Components — 2.7% |
| | |
Modine Manufacturing Co. * | | |
| | |
| | |
|
Winnebago Industries, Inc. | | |
|
Pinnacle Financial Partners, Inc. | | |
|
Agios Pharmaceuticals, Inc. * | | |
Allogene Therapeutics, Inc. * (a) | | |
Amicus Therapeutics, Inc. * | | |
Arrowhead Pharmaceuticals, Inc. * | | |
| | |
Blueprint Medicines Corp. * | | |
| | |
Halozyme Therapeutics, Inc. * | | |
| | |
Kyverna Therapeutics, Inc. * (a) | | |
Madrigal Pharmaceuticals, Inc. * (a) | | |
| | |
| | |
Relay Therapeutics, Inc. * | | |
REVOLUTION Medicines, Inc. * | | |
| | |
| | |
Viking Therapeutics, Inc. * (a) | | |
Xenon Pharmaceuticals, Inc. (Canada) * | | |
| | |
|
Global-e Online Ltd. (Israel) * | | |
|
| | |
Simpson Manufacturing Co., Inc. | | |
| | |
| | |
|
|
| | |
Hamilton Lane, Inc., Class A | | |
| | |
| | |
Commercial Services & Supplies — 3.7% |
ACV Auctions, Inc., Class A * | | |
Casella Waste Systems, Inc., Class A * | | |
| | |
| | |
Communications Equipment — 0.9% |
| | |
Construction & Engineering — 1.7% |
| | |
| | |
| | |
Construction Materials — 0.8% |
| | |
|
Upstart Holdings, Inc. * (a) | | |
Consumer Staples Distribution & Retail — 2.0% |
Chefs' Warehouse, Inc. (The) * | | |
Sprouts Farmers Market, Inc. * | | |
| | |
Diversified Consumer Services — 1.0% |
Bright Horizons Family Solutions, Inc. * | | |
Electrical Equipment — 2.2% |
Bloom Energy Corp., Class A * (a) | | |
NEXTracker, Inc., Class A * | | |
| | |
| | |
Electronic Equipment, Instruments & Components — 2.3% |
| | |
Ingram Micro Holding Corp. * | | |
| | |
| | |
Energy Equipment & Services — 2.1% |
| | |
TechnipFMC plc (United Kingdom) | | |
| | |
SEE NOTES TO FINANCIAL STATEMENTS.
| J.P. Morgan Small Cap Funds | |
JPMorgan Small Cap Growth Fund
SCHEDULE OF PORTFOLIO INVESTMENTSAS OF December 31, 2024 (Unaudited) (continued)
| | |
Common Stocks — continued |
Financial Services — 1.9% |
AvidXchange Holdings, Inc. * | | |
PennyMac Financial Services, Inc. | | |
| | |
| | |
|
| | |
| | |
| | |
Health Care Equipment & Supplies — 3.6% |
Establishment Labs Holdings, Inc. (Costa Rica) * (a) | | |
| | |
| | |
iRhythm Technologies, Inc. * | | |
Lantheus Holdings, Inc. * | | |
PROCEPT BioRobotics Corp. * | | |
TransMedics Group, Inc. * (a) | | |
| | |
Health Care Providers & Services — 0.8% |
Acadia Healthcare Co., Inc. * | | |
Hims & Hers Health, Inc. * | | |
| | |
| | |
Health Care Technology — 1.2% |
Evolent Health, Inc., Class A * | | |
| | |
| | |
Hotels, Restaurants & Leisure — 6.5% |
| | |
First Watch Restaurant Group, Inc. * | | |
Life Time Group Holdings, Inc. * | | |
Planet Fitness, Inc., Class A * | | |
Six Flags Entertainment Corp. | | |
| | |
Wyndham Hotels & Resorts, Inc. | | |
| | |
Household Durables — 0.8% |
| | |
|
| | |
| | |
|
|
Oscar Health, Inc., Class A * | | |
|
Core Scientific, Inc. * (a) | | |
DigitalOcean Holdings, Inc. * | | |
| | |
| | |
Life Sciences Tools & Services — 0.3% |
Maravai LifeSciences Holdings, Inc., Class A * | | |
|
| | |
| | |
| | |
John Bean Technologies Corp. | | |
| | |
| | |
Oil, Gas & Consumable Fuels — 1.1% |
| | |
| | |
| | |
Personal Care Products — 0.5% |
| | |
|
| | |
Intra-Cellular Therapies, Inc. * | | |
Neumora Therapeutics, Inc. * (a) | | |
| | |
Professional Services — 3.8% |
| | |
ExlService Holdings, Inc. * | | |
UL Solutions, Inc., Class A | | |
| | |
| | |
Semiconductors & Semiconductor Equipment — 4.7% |
Allegro MicroSystems, Inc. (Japan) * | | |
Credo Technology Group Holding Ltd. * | | |
MACOM Technology Solutions Holdings, Inc. * | | |
| | |
| | |
| | |
| | |
SEE NOTES TO FINANCIAL STATEMENTS.
| J.P. Morgan Small Cap Funds | |
| | |
Common Stocks — continued |
|
| | |
Alkami Technology, Inc. * | | |
| | |
| | |
| | |
Clear Secure, Inc., Class A | | |
Clearwater Analytics Holdings, Inc., Class A * | | |
Confluent, Inc., Class A * | | |
| | |
Freshworks, Inc., Class A * | | |
| | |
Informatica, Inc., Class A * | | |
| | |
MARA Holdings, Inc. * (a) | | |
| | |
SentinelOne, Inc., Class A * | | |
| | |
| | |
| | |
| | |
|
| | |
Floor & Decor Holdings, Inc., Class A * | | |
Lithia Motors, Inc., Class A | | |
| | |
Technology Hardware, Storage & Peripherals — 0.2% |
| | |
Textiles, Apparel & Luxury Goods — 0.7% |
Wolverine World Wide, Inc. | | |
Trading Companies & Distributors — 6.6% |
| | |
Applied Industrial Technologies, Inc. | | |
| | |
| | |
|
Trading Companies & Distributors — continued |
Rush Enterprises, Inc., Class A | | |
SiteOne Landscape Supply, Inc. * | | |
WESCO International, Inc. | | |
| | |
Total Common Stocks
(Cost $2,707,047) | | |
Short-Term Investments — 3.3% |
Investment Companies — 1.0% |
JPMorgan Prime Money Market Fund Class IM Shares, 4.54% (b) (c)
(Cost $33,558) | | |
Investment of Cash Collateral from Securities Loaned — 2.3% |
JPMorgan Securities Lending Money Market Fund Agency SL Class Shares, 4.47% (b) (c)
(Cost $82,262) | | |
Total Short-Term Investments
(Cost $115,820) | | |
Total Investments — 102.4%
(Cost $2,822,867) | | |
Liabilities in Excess of Other Assets — (2.4)% | | |
| | |
Percentages indicated are based on net assets. |
| |
| Real Estate Investment Trust |
| Non-income producing security. |
| The security or a portion of this security is on loan at December 31, 2024. The total value of securities on loan at December 31, 2024 is $79,455. |
| Investment in an affiliated fund, which is registered under the Investment Company Act of 1940, as amended, and is advised by J.P. Morgan Investment Management Inc. |
| The rate shown is the current yield as of December 31, 2024. |
SEE NOTES TO FINANCIAL STATEMENTS.
| J.P. Morgan Small Cap Funds | |
JPMorgan Small Cap Value Fund
SCHEDULE OF PORTFOLIO INVESTMENTSAS OF December 31, 2024 (Unaudited)
| | |
|
Aerospace & Defense — 0.3% |
Archer Aviation, Inc., Class A * (a) | | |
| | |
| | |
| | |
Air Freight & Logistics — 0.1% |
Radiant Logistics, Inc. * | | |
Automobile Components — 1.4% |
| | |
American Axle & Manufacturing Holdings, Inc. * | | |
| | |
Goodyear Tire & Rubber Co. (The) * | | |
Modine Manufacturing Co. * | | |
| | |
| | |
|
| | |
Amalgamated Financial Corp. | | |
| | |
| | |
| | |
Atlantic Union Bankshares Corp. | | |
| | |
| | |
| | |
Bank of NT Butterfield & Son Ltd. (The) (Bermuda) | | |
| | |
| | |
Bridgewater Bancshares, Inc. * | | |
| | |
Business First Bancshares, Inc. | | |
| | |
| | |
Capital City Bank Group, Inc. | | |
Capitol Federal Financial, Inc. | | |
Central Pacific Financial Corp. | | |
| | |
Community Financial System, Inc. | | |
Community Trust Bancorp, Inc. | | |
| | |
CrossFirst Bankshares, Inc. * | | |
Customers Bancorp, Inc. * | | |
| | |
| | |
|
|
Dime Community Bancshares, Inc. | | |
| | |
Enterprise Financial Services Corp. | | |
Equity Bancshares, Inc., Class A | | |
| | |
First BanCorp (Puerto Rico) | | |
First Bancshares, Inc. (The) | | |
First Commonwealth Financial Corp. | | |
| | |
First Interstate BancSystem, Inc., Class A | | |
| | |
First Mid Bancshares, Inc. | | |
| | |
| | |
| | |
Heartland Financial USA, Inc. | | |
| | |
| | |
| | |
HomeTrust Bancshares, Inc. | | |
| | |
| | |
| | |
Metropolitan Bank Holding Corp. * | | |
| | |
Midland States Bancorp, Inc. | | |
| | |
National Bank Holdings Corp., Class A | | |
| | |
OceanFirst Financial Corp. | | |
OFG Bancorp (Puerto Rico) | | |
| | |
| | |
Orrstown Financial Services, Inc. | | |
| | |
Peapack-Gladstone Financial Corp. | | |
Pinnacle Financial Partners, Inc. | | |
| | |
| | |
| | |
Seacoast Banking Corp. of Florida | | |
| | |
South Plains Financial, Inc. | | |
Southern Missouri Bancorp, Inc. | | |
SEE NOTES TO FINANCIAL STATEMENTS.
| J.P. Morgan Small Cap Funds | |
| | |
Common Stocks — continued |
|
Southside Bancshares, Inc. | | |
| | |
Texas Capital Bancshares, Inc. * | | |
| | |
| | |
| | |
| | |
| | |
United Community Banks, Inc. | | |
| | |
| | |
| | |
| | |
| | |
| | |
| | |
|
| | |
|
| | |
Akero Therapeutics, Inc. * | | |
Aurinia Pharmaceuticals, Inc. (Canada) * | | |
Avidity Biosciences, Inc. * | | |
Beam Therapeutics, Inc. * | | |
| | |
| | |
Denali Therapeutics, Inc. * | | |
Enanta Pharmaceuticals, Inc. * | | |
| | |
Intellia Therapeutics, Inc. * | | |
iTeos Therapeutics, Inc. * | | |
| | |
Prothena Corp. plc (Ireland) * | | |
Relay Therapeutics, Inc. * | | |
Syndax Pharmaceuticals, Inc. * | | |
Tenaya Therapeutics, Inc. * (a) | | |
Travere Therapeutics, Inc. * | | |
| | |
Verve Therapeutics, Inc. * | | |
Vir Biotechnology, Inc. * | | |
| | |
|
Biotechnology — continued |
Viridian Therapeutics, Inc. * | | |
Zentalis Pharmaceuticals, Inc. * | | |
| | |
|
Gibraltar Industries, Inc. * | | |
| | |
| | |
Quanex Building Products Corp. | | |
Resideo Technologies, Inc. * | | |
| | |
| | |
|
| | |
| | |
| | |
Victory Capital Holdings, Inc., Class A | | |
Virtus Investment Partners, Inc. | | |
| | |
|
| | |
| | |
| | |
| | |
| | |
Minerals Technologies, Inc. | | |
Perimeter Solutions, Inc. * | | |
| | |
| | |
Commercial Services & Supplies — 1.4% |
| | |
| | |
| | |
| | |
Healthcare Services Group, Inc. * | | |
| | |
Communications Equipment — 1.0% |
Digi International, Inc. * | | |
| | |
| | |
| | |
SEE NOTES TO FINANCIAL STATEMENTS.
| J.P. Morgan Small Cap Funds | |
JPMorgan Small Cap Value Fund
SCHEDULE OF PORTFOLIO INVESTMENTSAS OF December 31, 2024 (Unaudited) (continued)
| | |
Common Stocks — continued |
Construction & Engineering — 3.3% |
| | |
| | |
Comfort Systems USA, Inc. | | |
| | |
| | |
| | |
| | |
| | |
Construction Materials — 0.4% |
Summit Materials, Inc., Class A * | | |
|
Enova International, Inc. * | | |
| | |
| | |
| | |
Consumer Staples Distribution & Retail — 0.5% |
| | |
Sprouts Farmers Market, Inc. * | | |
United Natural Foods, Inc. * | | |
| | |
Containers & Packaging — 0.2% |
| | |
| | |
| | |
Diversified Consumer Services — 1.1% |
Adtalem Global Education, Inc. * | | |
KinderCare Learning Cos., Inc. * (a) | | |
Laureate Education, Inc., Class A * | | |
| | |
| | |
| | |
|
Alexander & Baldwin, Inc. | | |
American Assets Trust, Inc. | | |
Armada Hoffler Properties, Inc. | | |
Broadstone Net Lease, Inc. | | |
Empire State Realty Trust, Inc., Class A | | |
Essential Properties Realty Trust, Inc. | | |
| | |
| | |
|
Diversified Telecommunication Services — 0.8% |
AST SpaceMobile, Inc. * (a) | | |
| | |
Liberty Latin America Ltd., Class C (Puerto Rico) * (a) | | |
Lumen Technologies, Inc. * | | |
| | |
Electric Utilities — 1.5% |
| | |
Portland General Electric Co. | | |
| | |
| | |
Electrical Equipment — 0.1% |
| | |
Electronic Equipment, Instruments & Components — 3.5% |
| | |
Benchmark Electronics, Inc. | | |
| | |
| | |
| | |
| | |
| | |
| | |
Vishay Intertechnology, Inc. | | |
Vishay Precision Group, Inc. * | | |
| | |
Energy Equipment & Services — 1.9% |
Expro Group Holdings NV * | | |
Helix Energy Solutions Group, Inc. * | | |
| | |
| | |
| | |
Patterson-UTI Energy, Inc. | | |
Select Water Solutions, Inc. | | |
| | |
| | |
|
Cinemark Holdings, Inc. * | | |
Vivid Seats, Inc., Class A * (a) | | |
| | |
Financial Services — 4.1% |
Banco Latinoamericano de Comercio Exterior SA, Class E (Panama) * | | |
SEE NOTES TO FINANCIAL STATEMENTS.
| J.P. Morgan Small Cap Funds | |
| | |
Common Stocks — continued |
Financial Services — continued |
| | |
| | |
Jackson Financial, Inc., Class A | | |
| | |
| | |
| | |
NMI Holdings, Inc., Class A * | | |
PennyMac Financial Services, Inc. | | |
| | |
StoneCo Ltd., Class A (Brazil) * | | |
| | |
|
| | |
| | |
Fresh Del Monte Produce, Inc. | | |
| | |
| | |
|
Chesapeake Utilities Corp. | | |
New Jersey Resources Corp. | | |
Northwest Natural Holding Co. | | |
| | |
Southwest Gas Holdings, Inc. | | |
| | |
| | |
Ground Transportation — 0.2% |
| | |
Health Care Equipment & Supplies — 1.5% |
Alphatec Holdings, Inc. * | | |
| | |
| | |
| | |
| | |
| | |
OraSure Technologies, Inc. * | | |
| | |
Health Care Providers & Services — 1.0% |
| | |
Option Care Health, Inc. * | | |
Pediatrix Medical Group, Inc. * | | |
| | |
| | |
|
|
American Healthcare REIT, Inc. | | |
| | |
Community Healthcare Trust, Inc. | | |
Sabra Health Care REIT, Inc. | | |
| | |
Health Care Technology — 0.1% |
| | |
Hotel & Resort REITs — 1.3% |
Apple Hospitality REIT, Inc. | | |
| | |
DiamondRock Hospitality Co. | | |
Ryman Hospitality Properties, Inc. | | |
Xenia Hotels & Resorts, Inc. | | |
| | |
Hotels, Restaurants & Leisure — 0.6% |
Biglari Holdings, Inc., Class B * | | |
Brinker International, Inc. * | | |
El Pollo Loco Holdings, Inc. * | | |
Life Time Group Holdings, Inc. * | | |
Lindblad Expeditions Holdings, Inc. * | | |
Sweetgreen, Inc., Class A * | | |
| | |
Household Durables — 2.3% |
Century Communities, Inc. | | |
| | |
Green Brick Partners, Inc. * | | |
| | |
| | |
| | |
| | |
Taylor Morrison Home Corp. * | | |
| | |
| | |
Independent Power and Renewable Electricity Producers — 0.2% |
| | |
Clearway Energy, Inc., Class C | | |
Sunnova Energy International, Inc. * (a) | | |
| | |
|
First Industrial Realty Trust, Inc. | | |
| | |
SEE NOTES TO FINANCIAL STATEMENTS.
| J.P. Morgan Small Cap Funds | |
JPMorgan Small Cap Value Fund
SCHEDULE OF PORTFOLIO INVESTMENTSAS OF December 31, 2024 (Unaudited) (continued)
| | |
Common Stocks — continued |
Industrial REITs — continued |
Plymouth Industrial REIT, Inc. | | |
| | |
| | |
|
CNO Financial Group, Inc. | | |
Genworth Financial, Inc., Class A * | | |
Hamilton Insurance Group Ltd., Class B (Bermuda) * | | |
Oscar Health, Inc., Class A * | | |
| | |
Selective Insurance Group, Inc. | | |
| | |
Interactive Media & Services — 0.1% |
| | |
| | |
| | |
|
| | |
| | |
| | |
| | |
|
| | |
Peloton Interactive, Inc., Class A * (a) | | |
| | |
Life Sciences Tools & Services — 0.3% |
Adaptive Biotechnologies Corp. * | | |
Cytek Biosciences, Inc. * | | |
| | |
|
| | |
Hillman Solutions Corp. * | | |
| | |
| | |
Titan International, Inc. * | | |
| | |
Marine Transportation — 0.7% |
| | |
| | |
Safe Bulkers, Inc. (Monaco) | | |
| | |
| | |
|
|
AMC Networks, Inc., Class A * | | |
EchoStar Corp., Class A * | | |
| | |
John Wiley & Sons, Inc., Class A | | |
| | |
| | |
| | |
| | |
|
| | |
Carpenter Technology Corp. | | |
| | |
| | |
| | |
| | |
| | |
| | |
| | |
Mortgage Real Estate Investment Trusts (REITs) — 1.0% |
Brightspire Capital, Inc. | | |
| | |
KKR Real Estate Finance Trust, Inc. | | |
| | |
| | |
| | |
TPG RE Finance Trust, Inc. | | |
| | |
|
| | |
| | |
Northwestern Energy Group, Inc. | | |
| | |
| | |
|
| | |
| | |
| | |
| | |
Piedmont Office Realty Trust, Inc., Class A | | |
| | |
| | |
SEE NOTES TO FINANCIAL STATEMENTS.
| J.P. Morgan Small Cap Funds | |
| | |
Common Stocks — continued |
Oil, Gas & Consumable Fuels — 4.5% |
California Resources Corp. | | |
| | |
| | |
| | |
| | |
| | |
International Seaways, Inc. | | |
Magnolia Oil & Gas Corp., Class A | | |
| | |
| | |
| | |
Par Pacific Holdings, Inc. * | | |
PBF Energy, Inc., Class A | | |
| | |
| | |
REX American Resources Corp. * | | |
Scorpio Tankers, Inc. (Monaco) | | |
| | |
Teekay Tankers Ltd., Class A (Canada) | | |
| | |
| | |
| | |
Passenger Airlines — 0.8% |
Blade Air Mobility, Inc. * | | |
| | |
| | |
Sun Country Airlines Holdings, Inc. * | | |
| | |
Personal Care Products — 0.4% |
| | |
Edgewell Personal Care Co. | | |
| | |
| | |
|
Amneal Pharmaceuticals, Inc. * | | |
ANI Pharmaceuticals, Inc. * | | |
Pacira BioSciences, Inc. * | | |
Prestige Consumer Healthcare, Inc. * | | |
| | |
Professional Services — 1.3% |
Barrett Business Services, Inc. | | |
| | |
| | |
|
Professional Services — continued |
Heidrick & Struggles International, Inc. | | |
| | |
| | |
| | |
| | |
Real Estate Management & Development — 0.5% |
Anywhere Real Estate, Inc. * | | |
Cushman & Wakefield plc * | | |
Newmark Group, Inc., Class A | | |
| | |
|
Independence Realty Trust, Inc. | | |
| | |
| | |
| | |
|
| | |
Curbline Properties Corp. | | |
InvenTrust Properties Corp. | | |
| | |
| | |
| | |
Phillips Edison & Co., Inc. | | |
Retail Opportunity Investments Corp. | | |
| | |
Semiconductors & Semiconductor Equipment — 1.1% |
| | |
Rigetti Computing, Inc. * (a) | | |
| | |
|
| | |
Aurora Innovation, Inc. * | | |
| | |
Consensus Cloud Solutions, Inc. * | | |
| | |
LiveRamp Holdings, Inc. * | | |
MARA Holdings, Inc. * (a) | | |
| | |
| | |
| | |
SEE NOTES TO FINANCIAL STATEMENTS.
| J.P. Morgan Small Cap Funds | |
JPMorgan Small Cap Value Fund
SCHEDULE OF PORTFOLIO INVESTMENTSAS OF December 31, 2024 (Unaudited) (continued)
| | |
Common Stocks — continued |
|
| | |
| | |
| | |
|
| | |
| | |
| | |
|
Abercrombie & Fitch Co., Class A * | | |
Academy Sports & Outdoors, Inc. | | |
American Eagle Outfitters, Inc. | | |
| | |
Asbury Automotive Group, Inc. * | | |
| | |
| | |
| | |
| | |
| | |
| | |
| | |
| | |
| | |
National Vision Holdings, Inc. * | | |
Petco Health & Wellness Co., Inc. * | | |
| | |
| | |
| | |
Victoria's Secret & Co. * | | |
| | |
Technology Hardware, Storage & Peripherals — 0.0% ^ |
| | |
Textiles, Apparel & Luxury Goods — 0.1% |
G-III Apparel Group Ltd. * | | |
|
Turning Point Brands, Inc. | | |
Trading Companies & Distributors — 2.5% |
Beacon Roofing Supply, Inc. * | | |
BlueLinx Holdings, Inc. * | | |
| | |
| | |
| | |
| | |
|
Trading Companies & Distributors — continued |
| | |
Hudson Technologies, Inc. * | | |
| | |
Rush Enterprises, Inc., Class A | | |
WESCO International, Inc. | | |
| | |
|
American States Water Co. | | |
Consolidated Water Co. Ltd., Class D | | |
| | |
Wireless Telecommunication Services — 0.3% |
| | |
| | |
Telephone and Data Systems, Inc. | | |
| | |
Total Common Stocks
(Cost $983,892) | | |
Short-Term Investments — 4.5% |
Investment Companies — 3.0% |
JPMorgan Prime Money Market Fund Class IM Shares, 4.54% (b) (c)
(Cost $37,499) | | |
Investment of Cash Collateral from Securities Loaned — 1.5% |
JPMorgan Securities Lending Money Market Fund Agency SL Class Shares, 4.47% (b) (c)
(Cost $19,744) | | |
Total Short-Term Investments
(Cost $57,243) | | |
Total Investments — 100.7%
(Cost $1,041,135) | | |
Liabilities in Excess of Other Assets — (0.7)% | | |
| | |
Percentages indicated are based on net assets. |
| |
| Real Estate Investment Trust |
| Amount rounds to less than 0.1% of net assets. |
| Non-income producing security. | |
SEE NOTES TO FINANCIAL STATEMENTS.
| J.P. Morgan Small Cap Funds | |
| The security or a portion of this security is on loan at December 31, 2024. The total value of securities on loan at December 31, 2024 is $18,073. | |
| Investment in an affiliated fund, which is registered under the Investment Company Act of 1940, as amended, and is advised by J.P. Morgan Investment Management Inc. | |
| The rate shown is the current yield as of December 31, 2024. | |
Futures contracts outstanding as of December 31, 2024 (amounts in thousands, except number of contracts):
| | | | | VALUE AND
UNREALIZED
APPRECIATION
(DEPRECIATION) ($) |
| | | | | |
Russell 2000 E-Mini Index | | | | | |
SEE NOTES TO FINANCIAL STATEMENTS.
| J.P. Morgan Small Cap Funds | |
JPMorgan SMID Cap Equity Fund
SCHEDULE OF PORTFOLIO INVESTMENTSAS OF December 31, 2024 (Unaudited)
| | |
|
Aerospace & Defense — 0.8% |
| | |
| | |
| | |
Automobile Components — 0.6% |
| | |
|
Commerce Bancshares, Inc. | | |
Cullen/Frost Bankers, Inc. | | |
| | |
First Interstate BancSystem, Inc., Class A | | |
ServisFirst Bancshares, Inc. | | |
| | |
| | |
| | |
|
| | |
| | |
Fortune Brands Innovations, Inc. | | |
| | |
Janus International Group, Inc. * | | |
Lennox International, Inc. | | |
Simpson Manufacturing Co., Inc. | | |
| | |
|
Cboe Global Markets, Inc. | | |
| | |
FactSet Research Systems, Inc. | | |
LPL Financial Holdings, Inc. | | |
MarketAxess Holdings, Inc. | | |
| | |
| | |
StepStone Group, Inc., Class A | | |
| | |
|
Axalta Coating Systems Ltd. * | | |
Perimeter Solutions, Inc. * | | |
| | |
| | |
Commercial Services & Supplies — 4.9% |
Driven Brands Holdings, Inc. * | | |
| | |
| | |
|
Commercial Services & Supplies — continued |
| | |
| | |
| | |
Construction & Engineering — 2.1% |
WillScot Holdings Corp. * | | |
Construction Materials — 1.3% |
| | |
Consumer Staples Distribution & Retail — 3.7% |
BJ's Wholesale Club Holdings, Inc. * | | |
Casey's General Stores, Inc. | | |
Performance Food Group Co. * | | |
| | |
Containers & Packaging — 0.7% |
| | |
|
| | |
| | |
| | |
Diversified Consumer Services — 1.3% |
Bright Horizons Family Solutions, Inc. * | | |
Electronic Equipment, Instruments & Components — 0.6% |
| | |
Energy Equipment & Services — 0.9% |
| | |
Financial Services — 2.3% |
Jack Henry & Associates, Inc. | | |
| | |
| | |
|
Lamb Weston Holdings, Inc. | | |
| | |
| | |
|
| | |
Ground Transportation — 1.8% |
| | |
| | |
| | |
SEE NOTES TO FINANCIAL STATEMENTS.
| J.P. Morgan Small Cap Funds | |
| | |
Common Stocks — continued |
Health Care Equipment & Supplies — 3.8% |
| | |
| | |
| | |
| | |
| | |
Health Care Providers & Services — 4.8% |
| | |
Concentra Group Holdings Parent, Inc. | | |
| | |
| | |
Molina Healthcare, Inc. * | | |
| | |
Hotel & Resort REITs — 1.1% |
Ryman Hospitality Properties, Inc. | | |
Hotels, Restaurants & Leisure — 4.8% |
| | |
Planet Fitness, Inc., Class A * | | |
| | |
| | |
Wyndham Hotels & Resorts, Inc. | | |
| | |
|
EastGroup Properties, Inc. | | |
|
| | |
Kinsale Capital Group, Inc. | | |
| | |
| | |
|
| | |
Life Sciences Tools & Services — 1.5% |
| | |
West Pharmaceutical Services, Inc. | | |
| | |
|
Hillman Solutions Corp. * | | |
| | |
Lincoln Electric Holdings, Inc. | | |
| | |
| | |
|
|
| | |
| | |
| | |
Oil, Gas & Consumable Fuels — 2.3% |
| | |
| | |
| | |
Professional Services — 5.4% |
Broadridge Financial Solutions, Inc. | | |
| | |
Paylocity Holding Corp. * | | |
SS&C Technologies Holdings, Inc. | | |
| | |
| | |
Real Estate Management & Development — 1.6% |
Cushman & Wakefield plc * | | |
|
Mid-America Apartment Communities, Inc. | | |
|
| | |
Semiconductors & Semiconductor Equipment — 4.1% |
Allegro MicroSystems, Inc. (Japan) * | | |
| | |
| | |
| | |
| | |
|
Clearwater Analytics Holdings, Inc., Class A * | | |
Guidewire Software, Inc. * | | |
Manhattan Associates, Inc. * | | |
| | |
| | |
Tyler Technologies, Inc. * | | |
| | |
|
| | |
|
Burlington Stores, Inc. * | | |
| | |
| | |
SEE NOTES TO FINANCIAL STATEMENTS.
| J.P. Morgan Small Cap Funds | |
JPMorgan SMID Cap Equity Fund
SCHEDULE OF PORTFOLIO INVESTMENTSAS OF December 31, 2024 (Unaudited) (continued)
| | |
Common Stocks — continued |
Trading Companies & Distributors — 1.5% |
Core & Main, Inc., Class A * | | |
Total Common Stocks
(Cost $337,065) | | |
Short-Term Investments — 1.4% |
Investment Companies — 1.4% |
JPMorgan Prime Money Market Fund Class IM Shares, 4.54% (a) (b)
(Cost $5,745) | | |
Total Investments — 100.2%
(Cost $342,810) | | |
Liabilities in Excess of Other Assets — (0.2)% | | |
| | |
Percentages indicated are based on net assets. |
| |
| Real Estate Investment Trust |
| Non-income producing security. |
| Investment in an affiliated fund, which is registered under the Investment Company Act of 1940, as amended, and is advised by J.P. Morgan Investment Management Inc. |
| The rate shown is the current yield as of December 31, 2024. |
SEE NOTES TO FINANCIAL STATEMENTS.
| J.P. Morgan Small Cap Funds | |
JPMorgan U.S. Small Company Fund
SCHEDULE OF PORTFOLIO INVESTMENTSAS OF December 31, 2024 (Unaudited)
| | |
|
Aerospace & Defense — 1.0% |
Archer Aviation, Inc., Class A * (a) | | |
| | |
Rocket Lab USA, Inc. * (a) | | |
| | |
| | |
| | |
Air Freight & Logistics — 0.1% |
Radiant Logistics, Inc. * | | |
Automobile Components — 1.4% |
| | |
American Axle & Manufacturing Holdings, Inc. * | | |
| | |
| | |
Modine Manufacturing Co. * | | |
| | |
| | |
| | |
|
Amalgamated Financial Corp. | | |
| | |
| | |
| | |
Atlantic Union Bankshares Corp. | | |
| | |
| | |
| | |
Bank of NT Butterfield & Son Ltd. (The) (Bermuda) | | |
| | |
| | |
Bridgewater Bancshares, Inc. * | | |
| | |
Business First Bancshares, Inc. | | |
| | |
| | |
Capital City Bank Group, Inc. | | |
Capitol Federal Financial, Inc. | | |
Central Pacific Financial Corp. | | |
| | |
Coastal Financial Corp. * | | |
Community Financial System, Inc. | | |
| | |
Customers Bancorp, Inc. * | | |
| | |
|
|
Dime Community Bancshares, Inc. | | |
| | |
Enterprise Financial Services Corp. | | |
Equity Bancshares, Inc., Class A | | |
| | |
First BanCorp (Puerto Rico) | | |
First Bancshares, Inc. (The) | | |
| | |
First Interstate BancSystem, Inc., Class A | | |
| | |
First Mid Bancshares, Inc. | | |
| | |
| | |
| | |
Heartland Financial USA, Inc. | | |
| | |
| | |
| | |
| | |
| | |
| | |
Metropolitan Bank Holding Corp. * | | |
| | |
MidWestOne Financial Group, Inc. | | |
| | |
OceanFirst Financial Corp. | | |
OFG Bancorp (Puerto Rico) | | |
| | |
| | |
| | |
Peapack-Gladstone Financial Corp. | | |
Pinnacle Financial Partners, Inc. | | |
| | |
| | |
| | |
Seacoast Banking Corp. of Florida | | |
South Plains Financial, Inc. | | |
Southern Missouri Bancorp, Inc. | | |
Southside Bancshares, Inc. | | |
| | |
Texas Capital Bancshares, Inc. * | | |
| | |
| | |
| | |
SEE NOTES TO FINANCIAL STATEMENTS.
| J.P. Morgan Small Cap Funds | |
JPMorgan U.S. Small Company Fund
SCHEDULE OF PORTFOLIO INVESTMENTSAS OF December 31, 2024 (Unaudited) (continued)
| | |
Common Stocks — continued |
|
| | |
| | |
United Community Banks, Inc. | | |
| | |
| | |
| | |
| | |
| | |
| | |
| | |
|
| | |
Vita Coco Co., Inc. (The) * | | |
| | |
|
ACADIA Pharmaceuticals, Inc. * | | |
Akero Therapeutics, Inc. * | | |
| | |
Allogene Therapeutics, Inc. * (a) | | |
Amicus Therapeutics, Inc. * | | |
| | |
Arcutis Biotherapeutics, Inc. * (a) | | |
Arrowhead Pharmaceuticals, Inc. * | | |
| | |
Blueprint Medicines Corp. * | | |
| | |
Caribou Biosciences, Inc. * (a) | | |
Cartesian Therapeutics, Inc. * (a) | | |
Catalyst Pharmaceuticals, Inc. * | | |
Crinetics Pharmaceuticals, Inc. * | | |
Fate Therapeutics, Inc. * | | |
| | |
| | |
| | |
Intellia Therapeutics, Inc. * | | |
iTeos Therapeutics, Inc. * | | |
Janux Therapeutics, Inc. * | | |
| | |
Kyverna Therapeutics, Inc. * (a) | | |
| | |
Mersana Therapeutics, Inc. * | | |
Mirum Pharmaceuticals, Inc. * | | |
| | |
| | |
|
Biotechnology — continued |
| | |
Olema Pharmaceuticals, Inc. * | | |
OmniAb Operations, Inc. ‡ * | | |
Ovid therapeutics, Inc. * | | |
Protagonist Therapeutics, Inc. * | | |
Prothena Corp. plc (Ireland) * | | |
| | |
Recursion Pharmaceuticals, Inc., Class A * (a) | | |
Relay Therapeutics, Inc. * | | |
| | |
REVOLUTION Medicines, Inc. * | | |
Sana Biotechnology, Inc. * (a) | | |
Sera Prognostics, Inc., Class A * (a) | | |
SpringWorks Therapeutics, Inc. * (a) | | |
| | |
Syndax Pharmaceuticals, Inc. * | | |
Taysha Gene Therapies, Inc. * (a) | | |
Tenaya Therapeutics, Inc. * (a) | | |
Travere Therapeutics, Inc. * | | |
| | |
| | |
| | |
Viking Therapeutics, Inc. * | | |
| | |
Y-mAbs Therapeutics, Inc. * | | |
| | |
|
| | |
Gibraltar Industries, Inc. * | | |
| | |
Quanex Building Products Corp. | | |
Resideo Technologies, Inc. * | | |
Simpson Manufacturing Co., Inc. | | |
| | |
| | |
|
| | |
Brightsphere Investment Group, Inc. | | |
Donnelley Financial Solutions, Inc. * | | |
| | |
| | |
| | |
SEE NOTES TO FINANCIAL STATEMENTS.
| J.P. Morgan Small Cap Funds | |
| | |
Common Stocks — continued |
Capital Markets — continued |
Victory Capital Holdings, Inc., Class A | | |
Virtus Investment Partners, Inc. | | |
| | |
|
| | |
| | |
| | |
| | |
| | |
| | |
| | |
| | |
| | |
| | |
Commercial Services & Supplies — 1.7% |
| | |
| | |
| | |
| | |
| | |
| | |
| | |
Communications Equipment — 0.3% |
| | |
| | |
| | |
Construction & Engineering — 4.3% |
| | |
| | |
Comfort Systems USA, Inc. | | |
Construction Partners, Inc., Class A * | | |
| | |
| | |
Granite Construction, Inc. (a) | | |
| | |
| | |
| | |
| | |
Sterling Infrastructure, Inc. * | | |
| | |
| | |
|
Construction Materials — 0.4% |
| | |
Summit Materials, Inc., Class A * | | |
| | |
|
Enova International, Inc. * | | |
| | |
| | |
| | |
Upstart Holdings, Inc. * (a) | | |
| | |
Consumer Staples Distribution & Retail — 1.1% |
| | |
Chefs' Warehouse, Inc. (The) * | | |
Sprouts Farmers Market, Inc. * | | |
United Natural Foods, Inc. * | | |
| | |
Containers & Packaging — 0.1% |
| | |
| | |
| | |
|
GigaCloud Technology, Inc., Class A (Hong Kong) * (a) | | |
Diversified Consumer Services — 1.5% |
Adtalem Global Education, Inc. * | | |
| | |
KinderCare Learning Cos., Inc. * (a) | | |
Laureate Education, Inc., Class A * | | |
OneSpaWorld Holdings Ltd. (Bahamas) | | |
| | |
| | |
| | |
|
American Assets Trust, Inc. | | |
Armada Hoffler Properties, Inc. | | |
Broadstone Net Lease, Inc. | | |
Empire State Realty Trust, Inc., Class A | | |
Essential Properties Realty Trust, Inc. | | |
| | |
Diversified Telecommunication Services — 0.6% |
AST SpaceMobile, Inc. * (a) | | |
SEE NOTES TO FINANCIAL STATEMENTS.
| J.P. Morgan Small Cap Funds | |
JPMorgan U.S. Small Company Fund
SCHEDULE OF PORTFOLIO INVESTMENTSAS OF December 31, 2024 (Unaudited) (continued)
| | |
Common Stocks — continued |
Diversified Telecommunication Services — continued |
Bandwidth, Inc., Class A * | | |
| | |
Iridium Communications, Inc. | | |
Liberty Latin America Ltd., Class C (Puerto Rico) * | | |
Lumen Technologies, Inc. * | | |
| | |
Electric Utilities — 0.8% |
| | |
Portland General Electric Co. | | |
| | |
| | |
Electrical Equipment — 0.7% |
| | |
Bloom Energy Corp., Class A * (a) | | |
Fluence Energy, Inc. * (a) | | |
NEXTracker, Inc., Class A * | | |
| | |
Thermon Group Holdings, Inc. * | | |
| | |
Electronic Equipment, Instruments & Components — 3.2% |
| | |
Benchmark Electronics, Inc. | | |
Evolv Technologies Holdings, Inc. * (a) | | |
Insight Enterprises, Inc. * | | |
| | |
| | |
| | |
| | |
Richardson Electronics Ltd. | | |
| | |
| | |
Vishay Intertechnology, Inc. | | |
| | |
Energy Equipment & Services — 1.7% |
| | |
| | |
Expro Group Holdings NV * | | |
| | |
| | |
| | |
Oceaneering International, Inc. * | | |
Patterson-UTI Energy, Inc. | | |
| | |
|
Energy Equipment & Services — continued |
Select Water Solutions, Inc. | | |
| | |
Weatherford International plc | | |
| | |
|
Cinemark Holdings, Inc. * | | |
| | |
Lions Gate Entertainment Corp., Class A * | | |
Vivid Seats, Inc., Class A * (a) | | |
| | |
Financial Services — 2.8% |
Banco Latinoamericano de Comercio Exterior SA, Class E (Panama) * | | |
| | |
| | |
EVERTEC, Inc. (Puerto Rico) | | |
Federal Agricultural Mortgage Corp., Class C | | |
International Money Express, Inc. * | | |
Jackson Financial, Inc., Class A | | |
| | |
| | |
NMI Holdings, Inc., Class A * | | |
PennyMac Financial Services, Inc. | | |
| | |
| | |
| | |
|
| | |
| | |
Fresh Del Monte Produce, Inc. | | |
| | |
SunOpta, Inc. (Canada) * (a) | | |
| | |
| | |
| | |
|
Chesapeake Utilities Corp. | | |
New Jersey Resources Corp. | | |
Northwest Natural Holding Co. | | |
| | |
| | |
SEE NOTES TO FINANCIAL STATEMENTS.
| J.P. Morgan Small Cap Funds | |
| | |
Common Stocks — continued |
Ground Transportation — 0.1% |
| | |
Health Care Equipment & Supplies — 3.7% |
Alphatec Holdings, Inc. * | | |
| | |
| | |
| | |
| | |
| | |
| | |
| | |
iRhythm Technologies, Inc. * | | |
Lantheus Holdings, Inc. * | | |
| | |
| | |
PROCEPT BioRobotics Corp. * | | |
| | |
| | |
| | |
Treace Medical Concepts, Inc. * | | |
| | |
Health Care Providers & Services — 1.3% |
| | |
| | |
| | |
Hims & Hers Health, Inc. * | | |
National HealthCare Corp. | | |
| | |
| | |
Option Care Health, Inc. * | | |
| | |
| | |
| | |
|
American Healthcare REIT, Inc. | | |
| | |
Community Healthcare Trust, Inc. | | |
Sabra Health Care REIT, Inc. | | |
| | |
Health Care Technology — 0.2% |
| | |
| | |
|
Hotel & Resort REITs — 1.1% |
Apple Hospitality REIT, Inc. | | |
| | |
DiamondRock Hospitality Co. | | |
Ryman Hospitality Properties, Inc. | | |
Xenia Hotels & Resorts, Inc. | | |
| | |
Hotels, Restaurants & Leisure — 1.6% |
Accel Entertainment, Inc. * | | |
Biglari Holdings, Inc., Class B * | | |
Brinker International, Inc. * | | |
El Pollo Loco Holdings, Inc. * | | |
Hilton Grand Vacations, Inc. * | | |
Kura Sushi USA, Inc., Class A * (a) | | |
Life Time Group Holdings, Inc. * | | |
Lindblad Expeditions Holdings, Inc. * | | |
Monarch Casino & Resort, Inc. | | |
Shake Shack, Inc., Class A * | | |
Sweetgreen, Inc., Class A * | | |
| | |
Household Durables — 1.7% |
| | |
Century Communities, Inc. | | |
| | |
Green Brick Partners, Inc. * | | |
Installed Building Products, Inc. | | |
| | |
| | |
| | |
| | |
Taylor Morrison Home Corp. * | | |
| | |
| | |
Independent Power and Renewable Electricity Producers — 0.2% |
| | |
Clearway Energy, Inc., Class C | | |
Sunnova Energy International, Inc. * (a) | | |
| | |
|
First Industrial Realty Trust, Inc. | | |
SEE NOTES TO FINANCIAL STATEMENTS.
| J.P. Morgan Small Cap Funds | |
JPMorgan U.S. Small Company Fund
SCHEDULE OF PORTFOLIO INVESTMENTSAS OF December 31, 2024 (Unaudited) (continued)
| | |
Common Stocks — continued |
Industrial REITs — continued |
| | |
Plymouth Industrial REIT, Inc. | | |
| | |
|
CNO Financial Group, Inc. | | |
Genworth Financial, Inc., Class A * | | |
Hamilton Insurance Group Ltd., Class B (Bermuda) * | | |
Oscar Health, Inc., Class A * | | |
| | |
| | |
Selective Insurance Group, Inc. | | |
Skyward Specialty Insurance Group, Inc. * | | |
| | |
Interactive Media & Services — 0.9% |
| | |
| | |
| | |
| | |
| | |
|
| | |
| | |
| | |
| | |
|
| | |
Peloton Interactive, Inc., Class A * (a) | | |
| | |
Life Sciences Tools & Services — 0.1% |
Adaptive Biotechnologies Corp. * | | |
| | |
| | |
| | |
| | |
| | |
|
| | |
Greenbrier Cos., Inc. (The) | | |
| | |
| | |
Mueller Water Products, Inc., Class A | | |
| | |
|
|
| | |
Titan International, Inc. * | | |
Watts Water Technologies, Inc., Class A | | |
| | |
Marine Transportation — 0.3% |
| | |
Safe Bulkers, Inc. (Monaco) | | |
| | |
|
EchoStar Corp., Class A * | | |
| | |
John Wiley & Sons, Inc., Class A | | |
| | |
| | |
| | |
| | |
| | |
|
Alpha Metallurgical Resources, Inc. * | | |
| | |
| | |
Carpenter Technology Corp. | | |
| | |
| | |
| | |
| | |
| | |
| | |
| | |
| | |
Mortgage Real Estate Investment Trusts (REITs) — 0.4% |
Brightspire Capital, Inc. | | |
KKR Real Estate Finance Trust, Inc. | | |
| | |
| | |
| | |
TPG RE Finance Trust, Inc. | | |
| | |
|
| | |
SEE NOTES TO FINANCIAL STATEMENTS.
| J.P. Morgan Small Cap Funds | |
| | |
Common Stocks — continued |
Multi-Utilities — continued |
| | |
| | |
| | |
|
| | |
| | |
| | |
Piedmont Office Realty Trust, Inc., Class A | | |
| | |
| | |
Oil, Gas & Consumable Fuels — 3.1% |
California Resources Corp. | | |
| | |
| | |
| | |
| | |
| | |
| | |
| | |
International Seaways, Inc. | | |
Magnolia Oil & Gas Corp., Class A | | |
| | |
| | |
| | |
PBF Energy, Inc., Class A | | |
| | |
| | |
REX American Resources Corp. * | | |
Scorpio Tankers, Inc. (Monaco) | | |
| | |
Teekay Corp. Ltd. (Bermuda) | | |
Teekay Tankers Ltd., Class A (Canada) | | |
| | |
| | |
| | |
Passenger Airlines — 0.6% |
Blade Air Mobility, Inc. * | | |
| | |
Joby Aviation, Inc. * (a) | | |
| | |
Sun Country Airlines Holdings, Inc. * | | |
| | |
| | |
|
Personal Care Products — 0.6% |
| | |
Edgewell Personal Care Co. | | |
| | |
| | |
Oddity Tech Ltd., Class A (Israel) * (a) | | |
| | |
|
ANI Pharmaceuticals, Inc. * | | |
| | |
Axsome Therapeutics, Inc. * | | |
Esperion Therapeutics, Inc. * | | |
Ventyx Biosciences, Inc. * | | |
WaVe Life Sciences Ltd. * | | |
| | |
Professional Services — 2.1% |
Barrett Business Services, Inc. | | |
| | |
| | |
Heidrick & Struggles International, Inc. | | |
Huron Consulting Group, Inc. * | | |
| | |
| | |
| | |
| | |
| | |
| | |
| | |
| | |
| | |
Real Estate Management & Development — 0.3% |
Cushman & Wakefield plc * | | |
Newmark Group, Inc., Class A | | |
Real Brokerage, Inc. (The) (Canada) * | | |
| | |
|
Independence Realty Trust, Inc. | | |
| | |
| | |
| | |
|
| | |
SEE NOTES TO FINANCIAL STATEMENTS.
| J.P. Morgan Small Cap Funds | |
JPMorgan U.S. Small Company Fund
SCHEDULE OF PORTFOLIO INVESTMENTSAS OF December 31, 2024 (Unaudited) (continued)
| | |
Common Stocks — continued |
|
Curbline Properties Corp. | | |
InvenTrust Properties Corp. | | |
| | |
| | |
Phillips Edison & Co., Inc. | | |
Retail Opportunity Investments Corp. | | |
| | |
Semiconductors & Semiconductor Equipment — 2.8% |
Axcelis Technologies, Inc. * | | |
| | |
| | |
| | |
| | |
Penguin Solutions, Inc. * | | |
| | |
Rigetti Computing, Inc. * (a) | | |
| | |
Ultra Clean Holdings, Inc. * | | |
| | |
|
| | |
| | |
Asana, Inc., Class A * (a) | | |
Aurora Innovation, Inc. * | | |
| | |
| | |
| | |
| | |
| | |
| | |
Commvault Systems, Inc. * | | |
| | |
| | |
| | |
LiveRamp Holdings, Inc. * | | |
Logility Supply Chain Solutions, Inc., Class A | | |
MARA Holdings, Inc. * (a) | | |
| | |
| | |
| | |
| | |
| | |
| | |
| | |
|
|
| | |
| | |
Viant Technology, Inc., Class A * | | |
| | |
| | |
Zeta Global Holdings Corp., Class A * | | |
| | |
| | |
|
| | |
| | |
| | |
|
Abercrombie & Fitch Co., Class A * | | |
Academy Sports & Outdoors, Inc. | | |
American Eagle Outfitters, Inc. | | |
| | |
Asbury Automotive Group, Inc. * | | |
| | |
Boot Barn Holdings, Inc. * | | |
| | |
| | |
| | |
| | |
| | |
| | |
| | |
| | |
Petco Health & Wellness Co., Inc. * | | |
| | |
| | |
| | |
Victoria's Secret & Co. * | | |
Warby Parker, Inc., Class A * | | |
| | |
Technology Hardware, Storage & Peripherals — 0.3% |
| | |
| | |
| | |
Textiles, Apparel & Luxury Goods — 0.5% |
| | |
SEE NOTES TO FINANCIAL STATEMENTS.
| J.P. Morgan Small Cap Funds | |
| | |
Common Stocks — continued |
Textiles, Apparel & Luxury Goods — continued |
| | |
Wolverine World Wide, Inc. | | |
| | |
|
Turning Point Brands, Inc. | | |
Trading Companies & Distributors — 3.3% |
Applied Industrial Technologies, Inc. | | |
Beacon Roofing Supply, Inc. * | | |
BlueLinx Holdings, Inc. * | | |
| | |
| | |
| | |
| | |
| | |
| | |
Hudson Technologies, Inc. * | | |
| | |
| | |
Rush Enterprises, Inc., Class A | | |
WESCO International, Inc. | | |
| | |
|
American States Water Co. | | |
Consolidated Water Co. Ltd., Class D | | |
| | |
Wireless Telecommunication Services — 0.2% |
| | |
| | |
Telephone and Data Systems, Inc. | | |
| | |
Total Common Stocks
(Cost $828,843) | | |
Short-Term Investments — 6.7% |
Investment Companies — 2.7% |
JPMorgan Prime Money Market Fund Class IM Shares, 4.54% (b) (c)
(Cost $26,685) | | |
| | |
|
Investment of Cash Collateral from Securities Loaned — 4.0% |
JPMorgan Securities Lending Money Market Fund Agency SL Class Shares, 4.47% (b) (c)
(Cost $39,696) | | |
Total Short-Term Investments
(Cost $66,381) | | |
Total Investments — 104.2%
(Cost $895,224) | | |
Liabilities in Excess of Other Assets — (4.2)% | | |
| | |
Percentages indicated are based on net assets. |
Amounts presented as a dash ("-") represent amounts that round to less than a thousand. |
| |
| Real Estate Investment Trust |
| Value determined using significant unobservable inputs. |
| Non-income producing security. |
| The security or a portion of this security is on loan at December 31, 2024. The total value of securities on loan at December 31, 2024 is $37,438. |
| Investment in an affiliated fund, which is registered under the Investment Company Act of 1940, as amended, and is advised by J.P. Morgan Investment Management Inc. |
| The rate shown is the current yield as of December 31, 2024. |
SEE NOTES TO FINANCIAL STATEMENTS.
| J.P. Morgan Small Cap Funds | |
JPMorgan U.S. Small Company Fund
SCHEDULE OF PORTFOLIO INVESTMENTSAS OF December 31, 2024 (Unaudited) (continued)
Futures contracts outstanding as of December 31, 2024 (amounts in thousands, except number of contracts):
| | | | | VALUE AND
UNREALIZED
APPRECIATION
(DEPRECIATION) ($) |
| | | | | |
Russell 2000 E-Mini Index | | | | | |
SEE NOTES TO FINANCIAL STATEMENTS.
| J.P. Morgan Small Cap Funds | |
STATEMENTS OF ASSETS AND LIABILITIESAS OF December 31, 2024 (Unaudited)
(Amounts in thousands, except per share amounts)
| JPMorgan
Small Cap
Blend Fund | JPMorgan
Small Cap
Equity Fund | |
| | | |
Investments in non-affiliates, at value | | | |
Investments in affiliates, at value | | | |
Investments of cash collateral received from securities loaned, at value (See Note 2.C.) | | | |
| | | |
| | | |
| | | |
Dividends from non-affiliates | | | |
Dividends from affiliates | | | |
Securities lending income (See Note 2.C.) | | | |
| | | |
| | | |
| | | |
Collateral received on securities loaned (See Note 2.C.) | | | |
| | | |
| | | |
| | | |
| | | |
| | | |
| | | |
Custodian and accounting fees | | | |
Trustees’ and Chief Compliance Officer’s fees | | | |
| | | |
| | | |
| | | |
SEE NOTES TO FINANCIAL STATEMENTS.
| J.P. Morgan Small Cap Funds | |
STATEMENTS OF ASSETS AND LIABILITIESAS OF December 31, 2024 (Unaudited) (continued)
(Amounts in thousands, except per share amounts)
| JPMorgan Small Cap Blend Fund | JPMorgan Small Cap Equity Fund | |
| | | |
| | | |
Total distributable earnings (loss) | | | |
| | | |
| | | |
| | | |
| | | |
| | | |
| | | |
| | | |
| | | |
| | | |
| | | |
| | | |
| | | |
Outstanding units of beneficial interest (shares)
($0.0001 par value; unlimited number of shares authorized): | | | |
| | | |
| | | |
| | | |
| | | |
| | | |
| | | |
| | | |
| | | |
| | | |
| | | |
Class A — Redemption price per share | | | |
Class C — Offering price per share (b) | | | |
Class I — Offering and redemption price per share | | | |
Class L — Offering and redemption price per share | | | |
Class R2 — Offering and redemption price per share | | | |
Class R3 — Offering and redemption price per share | | | |
Class R4 — Offering and redemption price per share | | | |
Class R5 — Offering and redemption price per share | | | |
Class R6 — Offering and redemption price per share | | | |
Class A maximum sales charge | | | |
Class A maximum public offering price per share
[net asset value per share/(100% – maximum sales charge)] | | | |
Cost of investments in non-affiliates | | | |
Cost of investments in affiliates | | | |
Investment securities on loan, at value (See Note 2.C.) | | | |
Cost of investment of cash collateral (See Note 2.C.) | | | |
(a)
Per share amounts may not recalculate due to rounding of net assets and/or shares outstanding.
(b)
Redemption price for Class C Shares varies based upon length of time the shares are held.
SEE NOTES TO FINANCIAL STATEMENTS.
| J.P. Morgan Small Cap Funds | |
| JPMorgan
Small Cap
Value Fund | JPMorgan
SMID Cap
Equity Fund | |
| | | |
Investments in non-affiliates, at value | | | |
Investments in affiliates, at value | | | |
Investments of cash collateral received from securities loaned, at value (See Note 2.C.) | | | |
| | | |
Deposits at broker for futures contracts | | | |
| | | |
| | | |
Dividends from non-affiliates | | | |
Dividends from affiliates | | | |
Securities lending income (See Note 2.C.) | | | |
Variation margin on futures contracts | | | |
| | | |
| | | |
| | | |
Investment securities purchased | | | |
Collateral received on securities loaned (See Note 2.C.) | | | |
| | | |
| | | |
| | | |
| | | |
| | | |
| | | |
Custodian and accounting fees | | | |
Trustees’ and Chief Compliance Officer’s fees | | | |
| | | |
| | | |
| | | |
(a)
Amount rounds to less than one thousand.
SEE NOTES TO FINANCIAL STATEMENTS.
| J.P. Morgan Small Cap Funds | |
STATEMENTS OF ASSETS AND LIABILITIESAS OF December 31, 2024 (Unaudited) (continued)
(Amounts in thousands, except per share amounts)
| JPMorgan Small Cap Value Fund | JPMorgan SMID Cap Equity Fund | |
| | | |
| | | |
Total distributable earnings (loss) | | | |
| | | |
| | | |
| | | |
| | | |
| | | |
| | | |
| | | |
| | | |
| | | |
| | | |
| | | |
| | | |
Outstanding units of beneficial interest (shares)
($0.0001 par value; unlimited number of shares authorized): | | | |
| | | |
| | | |
| | | |
| | | |
| | | |
| | | |
| | | |
| | | |
| | | |
| | | |
Class A — Redemption price per share | | | |
Class C — Offering price per share (b) | | | |
Class I — Offering and redemption price per share | | | |
Class L — Offering and redemption price per share | | | |
Class R2 — Offering and redemption price per share | | | |
Class R3 — Offering and redemption price per share | | | |
Class R4 — Offering and redemption price per share | | | |
Class R5 — Offering and redemption price per share | | | |
Class R6 — Offering and redemption price per share | | | |
Class A maximum sales charge | | | |
Class A maximum public offering price per share
[net asset value per share/(100% – maximum sales charge)] | | | |
Cost of investments in non-affiliates | | | |
Cost of investments in affiliates | | | |
Investment securities on loan, at value (See Note 2.C.) | | | |
Cost of investment of cash collateral (See Note 2.C.) | | | |
(a)
Per share amounts may not recalculate due to rounding of net assets and/or shares outstanding.
(b)
Redemption price for Class C Shares varies based upon length of time the shares are held.
SEE NOTES TO FINANCIAL STATEMENTS.
| J.P. Morgan Small Cap Funds | |
STATEMENTS OF OPERATIONSFOR THE SIX MONTHS ENDED December 31, 2024 (Unaudited)
(Amounts in thousands)
| JPMorgan
Small Cap
Blend Fund | JPMorgan
Small Cap
Equity Fund | |
| | | |
Dividend income from non-affiliates | | | |
Dividend income from affiliates | | | |
Income from securities lending (net) (See Note 2.C.) | | | |
| | | |
| | | |
| | | |
| | | |
| | | |
| | | |
| | | |
| | | |
| | | |
| | | |
| | | |
| | | |
| | | |
| | | |
| | | |
| | | |
| | | |
| | | |
Custodian and accounting fees | | | |
Interest expense to affiliates | | | |
| | | |
Trustees’ and Chief Compliance Officer’s fees | | | |
Printing and mailing costs | | | |
Registration and filing fees | | | |
Transfer agency fees (See Note 2.G.) | | | |
| | | |
| | | |
| | | |
Less expense reimbursements | | | |
| | | |
Net investment income (loss) | | | |
(a)
Amount rounds to less than one thousand.
SEE NOTES TO FINANCIAL STATEMENTS.
| J.P. Morgan Small Cap Funds | |
STATEMENTS OF OPERATIONSFOR THE SIX MONTHS ENDED December 31, 2024 (Unaudited) (continued)
(Amounts in thousands)
| JPMorgan Small Cap Blend Fund | JPMorgan Small Cap Equity Fund | |
REALIZED/UNREALIZED GAINS (LOSSES): | | | |
Net realized gain (loss) on transactions from: | | | |
Investments in non-affiliates | | | |
Investments in affiliates | | | |
| | | |
Change in net unrealized appreciation/depreciation on: | | | |
Investments in non-affiliates | | | |
Investments in affiliates | | | |
Change in net unrealized appreciation/depreciation | | | |
Net realized/unrealized gains (losses) | | | |
Change in net assets resulting from operations | | | |
SEE NOTES TO FINANCIAL STATEMENTS.
| J.P. Morgan Small Cap Funds | |
| JPMorgan
Small Cap
Value Fund | JPMorgan
SMID Cap
Equity Fund | |
| | | |
Interest income from non-affiliates | | | |
Dividend income from non-affiliates | | | |
Dividend income from affiliates | | | |
Income from securities lending (net) (See Note 2.C.) | | | |
| | | |
| | | |
| | | |
| | | |
| | | |
| | | |
| | | |
| | | |
| | | |
| | | |
| | | |
| | | |
| | | |
| | | |
| | | |
| | | |
| | | |
| | | |
Custodian and accounting fees | | | |
Interest expense to affiliates | | | |
| | | |
Trustees’ and Chief Compliance Officer’s fees | | | |
Printing and mailing costs | | | |
Registration and filing fees | | | |
Transfer agency fees (See Note 2.G.) | | | |
| | | |
| | | |
| | | |
Less expense reimbursements | | | |
| | | |
Net investment income (loss) | | | |
(a)
Amount rounds to less than one thousand.
SEE NOTES TO FINANCIAL STATEMENTS.
| J.P. Morgan Small Cap Funds | |
STATEMENTS OF OPERATIONSFOR THE SIX MONTHS ENDED December 31, 2024 (Unaudited) (continued)
(Amounts in thousands)
| JPMorgan Small Cap Value Fund | JPMorgan SMID Cap Equity Fund | |
REALIZED/UNREALIZED GAINS (LOSSES): | | | |
Net realized gain (loss) on transactions from: | | | |
Investments in non-affiliates | | | |
Investments in affiliates | | | |
| | | |
| | | |
Change in net unrealized appreciation/depreciation on: | | | |
Investments in non-affiliates | | | |
Investments in affiliates | | | |
| | | |
Change in net unrealized appreciation/depreciation | | | |
Net realized/unrealized gains (losses) | | | |
Change in net assets resulting from operations | | | |
SEE NOTES TO FINANCIAL STATEMENTS.
| J.P. Morgan Small Cap Funds | |
STATEMENTS OF CHANGES IN NET ASSETSFOR THE PERIODS INDICATED
(Amounts in thousands)
| JPMorgan Small
Cap Blend Fund | JPMorgan Small Cap Equity Fund |
| Six Months Ended
December 31, 2024
(Unaudited) | | Six Months Ended
December 31, 2024
(Unaudited) | |
CHANGE IN NET ASSETS RESULTING FROM OPERATIONS: | | | | |
Net investment income (loss) | | | | |
| | | | |
Change in net unrealized appreciation/depreciation | | | | |
Change in net assets resulting from operations | | | | |
DISTRIBUTIONS TO SHAREHOLDERS: | | | | |
| | | | |
| | | | |
| | | | |
| | | | |
| | | | |
| | | | |
| | | | |
| | | | |
Total distributions to shareholders | | | | |
| | | | |
Change in net assets resulting from capital transactions | | | | |
| | | | |
| | | | |
| | | | |
| | | | |
SEE NOTES TO FINANCIAL STATEMENTS.
| J.P. Morgan Small Cap Funds | |
STATEMENTS OF CHANGES IN NET ASSETSFOR THE PERIODS INDICATED (continued)
(Amounts in thousands)
| JPMorgan Small Cap Growth Fund | JPMorgan Small Cap Value Fund |
| Six Months Ended
December 31, 2024
(Unaudited) | | Six Months Ended
December 31, 2024
(Unaudited) | |
CHANGE IN NET ASSETS RESULTING FROM OPERATIONS: | | | | |
Net investment income (loss) | | | | |
| | | | |
Change in net unrealized appreciation/depreciation | | | | |
Change in net assets resulting from operations | | | | |
DISTRIBUTIONS TO SHAREHOLDERS: | | | | |
| | | | |
| | | | |
| | | | |
| | | | |
| | | | |
| | | | |
| | | | |
| | | | |
| | | | |
Total distributions to shareholders | | | | |
| | | | |
Change in net assets resulting from capital transactions | | | | |
| | | | |
| | | | |
| | | | |
| | | | |
SEE NOTES TO FINANCIAL STATEMENTS.
| J.P. Morgan Small Cap Funds | |
| JPMorgan SMID Cap Equity Fund | JPMorgan U.S. Small Company Fund |
| Six Months Ended
December 31, 2024
(Unaudited) | | Six Months Ended
December 31, 2024
(Unaudited) | |
CHANGE IN NET ASSETS RESULTING FROM OPERATIONS: | | | | |
Net investment income (loss) | | | | |
| | | | |
Change in net unrealized appreciation/depreciation | | | | |
Change in net assets resulting from operations | | | | |
DISTRIBUTIONS TO SHAREHOLDERS: | | | | |
| | | | |
| | | | |
| | | | |
| | | | |
| | | | |
| | | | |
| | | | |
| | | | |
| | | | |
Total distributions to shareholders | | | | |
| | | | |
Change in net assets resulting from capital transactions | | | | |
| | | | |
| | | | |
| | | | |
| | | | |
SEE NOTES TO FINANCIAL STATEMENTS.
| J.P. Morgan Small Cap Funds | |
STATEMENTS OF CHANGES IN NET ASSETSFOR THE PERIODS INDICATED (continued)
(Amounts in thousands)
| JPMorgan Small
Cap Blend Fund | JPMorgan Small Cap Equity Fund |
| Six Months Ended December 31, 2024
(Unaudited) | | Six Months Ended December 31, 2024
(Unaudited) | |
| | | | |
| | | | |
Proceeds from shares issued | | | | |
| | | | |
| | | | |
Change in net assets resulting from Class A capital transactions | | | | |
| | | | |
Proceeds from shares issued | | | | |
| | | | |
| | | | |
Change in net assets resulting from Class C capital transactions | | | | |
| | | | |
Proceeds from shares issued | | | | |
| | | | |
| | | | |
Change in net assets resulting from Class I capital transactions | | | | |
| | | | |
Proceeds from shares issued | | | | |
| | | | |
| | | | |
Change in net assets resulting from Class R2 capital transactions | | | | |
| | | | |
Proceeds from shares issued | | | | |
| | | | |
| | | | |
Change in net assets resulting from Class R3 capital transactions | | | | |
| | | | |
Proceeds from shares issued | | | | |
| | | | |
| | | | |
Change in net assets resulting from Class R4 capital transactions | | | | |
| | | | |
Proceeds from shares issued | | | | |
| | | | |
| | | | |
Change in net assets resulting from Class R5 capital transactions | | | | |
SEE NOTES TO FINANCIAL STATEMENTS.
| J.P. Morgan Small Cap Funds | |
| JPMorgan Small Cap Blend Fund | JPMorgan Small Cap Equity Fund |
| Six Months Ended December 31, 2024 (Unaudited) | | Six Months Ended December 31, 2024 (Unaudited) | |
CAPITAL TRANSACTIONS: (continued) | | | | |
| | | | |
Proceeds from shares issued | | | | |
| | | | |
| | | | |
Change in net assets resulting from Class R6 capital transactions | | | | |
Total change in net assets resulting from capital transactions | | | | |
| | | | |
| | | | |
| | | | |
| | | | |
| | | | |
| | | | |
| | | | |
| | | | |
| | | | |
| | | | |
| | | | |
| | | | |
| | | | |
| | | | |
| | | | |
| | | | |
| | | | |
| | | | |
| | | | |
| | | | |
Change in Class R2 Shares | | | | |
| | | | |
| | | | |
| | | | |
| | | | |
Change in Class R3 Shares | | | | |
| | | | |
| | | | |
| | | | |
| | | | |
Change in Class R4 Shares | | | | |
(a)
Amount rounds to less than one thousand.
SEE NOTES TO FINANCIAL STATEMENTS.
| J.P. Morgan Small Cap Funds | |
STATEMENTS OF CHANGES IN NET ASSETSFOR THE PERIODS INDICATED (continued)
(Amounts in thousands)
| JPMorgan Small Cap Blend Fund | JPMorgan Small Cap Equity Fund |
| Six Months Ended December 31, 2024 (Unaudited) | | Six Months Ended December 31, 2024 (Unaudited) | |
SHARE TRANSACTIONS: (continued) | | | | |
| | | | |
| | | | |
| | | | |
| | | | |
Change in Class R5 Shares | | | | |
| | | | |
| | | | |
| | | | |
| | | | |
Change in Class R6 Shares | | | | |
SEE NOTES TO FINANCIAL STATEMENTS.
| J.P. Morgan Small Cap Funds | |
| JPMorgan Small Cap Growth Fund | JPMorgan Small Cap Value Fund |
| Six Months Ended December 31, 2024
(Unaudited) | | Six Months Ended December 31, 2024
(Unaudited) | |
| | | | |
| | | | |
Proceeds from shares issued | | | | |
| | | | |
| | | | |
Change in net assets resulting from Class A capital transactions | | | | |
| | | | |
Proceeds from shares issued | | | | |
| | | | |
| | | | |
Change in net assets resulting from Class C capital transactions | | | | |
| | | | |
Proceeds from shares issued | | | | |
| | | | |
| | | | |
Change in net assets resulting from Class I capital transactions | | | | |
| | | | |
Proceeds from shares issued | | | | |
| | | | |
| | | | |
Change in net assets resulting from Class L capital transactions | | | | |
| | | | |
Proceeds from shares issued | | | | |
| | | | |
| | | | |
Change in net assets resulting from Class R2 capital transactions | | | | |
| | | | |
Proceeds from shares issued | | | | |
| | | | |
| | | | |
Change in net assets resulting from Class R3 capital transactions | | | | |
| | | | |
Proceeds from shares issued | | | | |
| | | | |
| | | | |
Change in net assets resulting from Class R4 capital transactions | | | | |
SEE NOTES TO FINANCIAL STATEMENTS.
| J.P. Morgan Small Cap Funds | |
STATEMENTS OF CHANGES IN NET ASSETSFOR THE PERIODS INDICATED (continued)
(Amounts in thousands)
| JPMorgan Small Cap Growth Fund | JPMorgan Small Cap Value Fund |
| Six Months Ended December 31, 2024 (Unaudited) | | Six Months Ended December 31, 2024 (Unaudited) | |
CAPITAL TRANSACTIONS: (continued) | | | | |
| | | | |
Proceeds from shares issued | | | | |
| | | | |
| | | | |
Change in net assets resulting from Class R5 capital transactions | | | | |
| | | | |
Proceeds from shares issued | | | | |
| | | | |
| | | | |
Change in net assets resulting from Class R6 capital transactions | | | | |
Total change in net assets resulting from capital transactions | | | | |
| | | | |
| | | | |
| | | | |
| | | | |
| | | | |
| | | | |
| | | | |
| | | | |
| | | | |
| | | | |
| | | | |
| | | | |
| | | | |
| | | | |
| | | | |
| | | | |
| | | | |
| | | | |
| | | | |
| | | | |
| | | | |
| | | | |
| | | | |
| | | | |
| | | | |
Change in Class R2 Shares | | | | |
SEE NOTES TO FINANCIAL STATEMENTS.
| J.P. Morgan Small Cap Funds | |
| JPMorgan Small Cap Growth Fund | JPMorgan Small Cap Value Fund |
| Six Months Ended December 31, 2024 (Unaudited) | | Six Months Ended December 31, 2024 (Unaudited) | |
SHARE TRANSACTIONS: (continued) | | | | |
| | | | |
| | | | |
| | | | |
| | | | |
Change in Class R3 Shares | | | | |
| | | | |
| | | | |
| | | | |
| | | | |
Change in Class R4 Shares | | | | |
| | | | |
| | | | |
| | | | |
| | | | |
Change in Class R5 Shares | | | | |
| | | | |
| | | | |
| | | | |
| | | | |
Change in Class R6 Shares | | | | |
(a)
Amount rounds to less than one thousand.
SEE NOTES TO FINANCIAL STATEMENTS.
| J.P. Morgan Small Cap Funds | |
STATEMENTS OF CHANGES IN NET ASSETSFOR THE PERIODS INDICATED (continued)
(Amounts in thousands)
| JPMorgan SMID Cap Equity Fund | JPMorgan U.S. Small Company Fund |
| Six Months Ended December 31, 2024
(Unaudited) | | Six Months Ended December 31, 2024
(Unaudited) | |
| | | | |
| | | | |
Proceeds from shares issued | | | | |
| | | | |
| | | | |
Change in net assets resulting from Class A capital transactions | | | | |
| | | | |
Proceeds from shares issued | | | | |
| | | | |
| | | | |
Change in net assets resulting from Class C capital transactions | | | | |
| | | | |
Proceeds from shares issued | | | | |
| | | | |
| | | | |
Change in net assets resulting from Class I capital transactions | | | | |
| | | | |
Proceeds from shares issued | | | | |
| | | | |
| | | | |
Change in net assets resulting from Class L capital transactions | | | | |
| | | | |
Proceeds from shares issued | | | | |
| | | | |
| | | | |
Change in net assets resulting from Class R2 capital transactions | | | | |
| | | | |
Proceeds from shares issued | | | | |
| | | | |
| | | | |
Change in net assets resulting from Class R3 capital transactions | | | | |
| | | | |
Proceeds from shares issued | | | | |
| | | | |
| | | | |
Change in net assets resulting from Class R4 capital transactions | | | | |
(a)
Amount rounds to less than one thousand.
SEE NOTES TO FINANCIAL STATEMENTS.
| J.P. Morgan Small Cap Funds | |
| JPMorgan SMID Cap Equity Fund | JPMorgan U.S. Small Company Fund |
| Six Months Ended December 31, 2024 (Unaudited) | | Six Months Ended December 31, 2024 (Unaudited) | |
CAPITAL TRANSACTIONS: (continued) | | | | |
| | | | |
Proceeds from shares issued | | | | |
| | | | |
| | | | |
Change in net assets resulting from Class R5 capital transactions | | | | |
| | | | |
Proceeds from shares issued | | | | |
| | | | |
| | | | |
Change in net assets resulting from Class R6 capital transactions | | | | |
Total change in net assets resulting from capital transactions | | | | |
| | | | |
| | | | |
| | | | |
| | | | |
| | | | |
| | | | |
| | | | |
| | | | |
| | | | |
| | | | |
| | | | |
| | | | |
| | | | |
| | | | |
| | | | |
| | | | |
| | | | |
| | | | |
| | | | |
| | | | |
| | | | |
| | | | |
| | | | |
| | | | |
| | | | |
Change in Class R2 Shares | | | | |
SEE NOTES TO FINANCIAL STATEMENTS.
| J.P. Morgan Small Cap Funds | |
STATEMENTS OF CHANGES IN NET ASSETSFOR THE PERIODS INDICATED (continued)
(Amounts in thousands)
| JPMorgan SMID Cap Equity Fund | JPMorgan U.S. Small Company Fund |
| Six Months Ended December 31, 2024 (Unaudited) | | Six Months Ended December 31, 2024 (Unaudited) | |
SHARE TRANSACTIONS: (continued) | | | | |
| | | | |
| | | | |
| | | | |
| | | | |
Change in Class R3 Shares | | | | |
| | | | |
| | | | |
| | | | |
| | | | |
Change in Class R4 Shares | | | | |
| | | | |
| | | | |
| | | | |
| | | | |
Change in Class R5 Shares | | | | |
| | | | |
| | | | |
| | | | |
| | | | |
Change in Class R6 Shares | | | | |
(a)
Amount rounds to less than one thousand.
SEE NOTES TO FINANCIAL STATEMENTS.
| J.P. Morgan Small Cap Funds | |
THIS PAGE IS INTENTIONALLY LEFT BLANK
FINANCIAL HIGHLIGHTSFOR THE PERIODS INDICATED
| Per share operating performance |
| | | |
| Net asset
value,
beginning
of period | Net
investment
income
(loss)(b) | Net realized
and unrealized
gains
(losses) on
investments | Total from
investment
operations | | | |
JPMorgan Small Cap Blend Fund | | | | | | | |
| | | | | | | |
Six Months Ended December 31, 2024 (Unaudited) | | | | | | | |
| | | | | | | |
| | | | | | | |
| | | | | | | |
| | | | | | | |
| | | | | | | |
| | | | | | | |
Six Months Ended December 31, 2024 (Unaudited) | | | | | | | |
| | | | | | | |
| | | | | | | |
| | | | | | | |
| | | | | | | |
| | | | | | | |
| | | | | | | |
Six Months Ended December 31, 2024 (Unaudited) | | | | | | | |
| | | | | | | |
| | | | | | | |
| | | | | | | |
| | | | | | | |
| | | | | | | |
| | | | | | | |
Six Months Ended December 31, 2024 (Unaudited) | | | | | | | |
| | | | | | | |
| | | | | | | |
| | | | | | | |
| | | | | | | |
| | | | | | | |
| | | | | | | |
|
| Annualized for periods less than one year, unless otherwise noted. |
| Calculated based upon average shares outstanding. |
| Not annualized for periods less than one year. |
| Includes adjustments in accordance with accounting principles generally accepted in the United States of America and as such, the net asset values for financial reporting purposes and the returns based upon those net asset values may differ from the net asset values and returns for shareholder transactions. |
| Includes interest expense, if applicable, which is less than 0.005% unless otherwise noted. |
| Amount rounds to less than $0.005. |
SEE NOTES TO FINANCIAL STATEMENTS.
| J.P. Morgan Small Cap Funds | |
| |
| | | Ratios to average net assets(a) |
Net asset
value,
end of
period | Total return
(excludes
sales charge)(c)(d) | Net assets,
end of
period
(000's) | | Net
investment
income
(loss) | Expenses without
waivers and
reimbursements | |
| | | | | | |
| | | | | | |
| | | | | | |
| | | | | | |
| | | | | | |
| | | | | | |
| | | | | | |
| | | | | | |
| | | | | | |
| | | | | | |
| | | | | | |
| | | | | | |
| | | | | | |
| | | | | | |
| | | | | | |
| | | | | | |
| | | | | | |
| | | | | | |
| | | | | | |
| | | | | | |
| | | | | | |
| | | | | | |
| | | | | | |
| | | | | | |
| | | | | | |
| | | | | | |
| | | | | | |
| | | | | | |
| | | | | | |
| | | | | | |
SEE NOTES TO FINANCIAL STATEMENTS.
| J.P. Morgan Small Cap Funds | |
FINANCIAL HIGHLIGHTSFOR THE PERIODS INDICATED
| Per share operating performance |
| | | |
| Net asset
value,
beginning
of period | Net
investment
income
(loss)(b) | Net realized
and unrealized
gains
(losses) on
investments | Total from
investment
operations | | | |
JPMorgan Small Cap Equity Fund | | | | | | | |
| | | | | | | |
Six Months Ended December 31, 2024 (Unaudited) | | | | | | | |
| | | | | | | |
| | | | | | | |
| | | | | | | |
| | | | | | | |
| | | | | | | |
| | | | | | | |
Six Months Ended December 31, 2024 (Unaudited) | | | | | | | |
| | | | | | | |
| | | | | | | |
| | | | | | | |
| | | | | | | |
| | | | | | | |
| | | | | | | |
Six Months Ended December 31, 2024 (Unaudited) | | | | | | | |
| | | | | | | |
| | | | | | | |
| | | | | | | |
| | | | | | | |
| | | | | | | |
| | | | | | | |
Six Months Ended December 31, 2024 (Unaudited) | | | | | | | |
| | | | | | | |
| | | | | | | |
| | | | | | | |
| | | | | | | |
| | | | | | | |
| | | | | | | |
Six Months Ended December 31, 2024 (Unaudited) | | | | | | | |
| | | | | | | |
| | | | | | | |
| | | | | | | |
| | | | | | | |
| | | | | | | |
| | | | | | | |
Six Months Ended December 31, 2024 (Unaudited) | | | | | | | |
| | | | | | | |
| | | | | | | |
| | | | | | | |
| | | | | | | |
| | | | | | | |
| |
| | | Ratios to average net assets(a) |
Net asset
value,
end of
period | Total return
(excludes
sales charge)(c)(d) | Net assets,
end of
period
(000's) | | Net
investment
income
(loss) | Expenses without
waivers and
reimbursements | |
| | | | | | |
| | | | | | |
| | | | | | |
| | | | | | |
| | | | | | |
| | | | | | |
| | | | | | |
| | | | | | |
| | | | | | |
| | | | | | |
| | | | | | |
| | | | | | |
| | | | | | |
| | | | | | |
| | | | | | |
| | | | | | |
| | | | | | |
| | | | | | |
| | | | | | |
| | | | | | |
| | | | | | |
| | | | | | |
| | | | | | |
| | | | | | |
| | | | | | |
| | | | | | |
| | | | | | |
| | | | | | |
| | | | | | |
| | | | | | |
| | | | | | |
| | | | | | |
| | | | | | |
| | | | | | |
| | | | | | |
| | | | | | |
| | | | | | |
| | | | | | |
| | | | | | |
| | | | | | |
| | | | | | |
| | | | | | |
| | | | | | |
FINANCIAL HIGHLIGHTSFOR THE PERIODS INDICATED (continued)
| Per share operating performance |
| | | |
| Net asset
value,
beginning
of period | Net
investment
income
(loss)(b) | Net realized
and unrealized
gains
(losses) on
investments | Total from
investment
operations | | | |
JPMorgan Small Cap Equity Fund (continued) | | | | | | | |
| | | | | | | |
Six Months Ended December 31, 2024 (Unaudited) | | | | | | | |
| | | | | | | |
| | | | | | | |
| | | | | | | |
| | | | | | | |
| | | | | | | |
| | | | | | | |
Six Months Ended December 31, 2024 (Unaudited) | | | | | | | |
| | | | | | | |
| | | | | | | |
| | | | | | | |
| | | | | | | |
| | | | | | | |
| | | | | | | |
|
| Annualized for periods less than one year, unless otherwise noted. |
| Calculated based upon average shares outstanding. |
| Not annualized for periods less than one year. |
| Includes adjustments in accordance with accounting principles generally accepted in the United States of America and as such, the net asset values for financial reporting purposes and the returns based upon those net asset values may differ from the net asset values and returns for shareholder transactions. |
| Includes interest expense, if applicable, which is less than 0.005% unless otherwise noted. |
| Amount rounds to less than $0.005. |
| Amount rounds to less than 0.005%. |
| |
| | | Ratios to average net assets(a) |
Net asset
value,
end of
period | Total return
(excludes
sales charge)(c)(d) | Net assets,
end of
period
(000's) | | Net
investment
income
(loss) | Expenses without
waivers and
reimbursements | |
|
| | | | | | |
| | | | | | |
| | | | | | |
| | | | | | |
| | | | | | |
| | | | | | |
| | | | | | |
| | | | | | |
| | | | | | |
| | | | | | |
| | | | | | |
| | | | | | |
| | | | | | |
| | | | | | |
| | | | | | |
FINANCIAL HIGHLIGHTSFOR THE PERIODS INDICATED
| Per share operating performance |
| | | |
| Net asset
value,
beginning
of period | Net
investment
income
(loss)(b) | Net realized
and unrealized
gains
(losses) on
investments | Total from
investment
operations | | | |
JPMorgan Small Cap Growth Fund | | | | | | | |
| | | | | | | |
Six Months Ended December 31, 2024 (Unaudited) | | | | | | | |
| | | | | | | |
| | | | | | | |
| | | | | | | |
| | | | | | | |
| | | | | | | |
| | | | | | | |
Six Months Ended December 31, 2024 (Unaudited) | | | | | | | |
| | | | | | | |
| | | | | | | |
| | | | | | | |
| | | | | | | |
| | | | | | | |
| | | | | | | |
Six Months Ended December 31, 2024 (Unaudited) | | | | | | | |
| | | | | | | |
| | | | | | | |
| | | | | | | |
| | | | | | | |
| | | | | | | |
| | | | | | | |
Six Months Ended December 31, 2024 (Unaudited) | | | | | | | |
| | | | | | | |
| | | | | | | |
| | | | | | | |
| | | | | | | |
| | | | | | | |
| | | | | | | |
Six Months Ended December 31, 2024 (Unaudited) | | | | | | | |
| | | | | | | |
| | | | | | | |
| | | | | | | |
| | | | | | | |
| | | | | | | |
| | | | | | | |
Six Months Ended December 31, 2024 (Unaudited) | | | | | | | |
| | | | | | | |
| | | | | | | |
| | | | | | | |
| | | | | | | |
| | | | | | | |
| |
| | | Ratios to average net assets(a) |
Net asset
value,
end of
period | Total return
(excludes
sales charge)(c)(d) | Net assets,
end of
period
(000's) | | Net
investment
income
(loss) | Expenses without
waivers and
reimbursements | |
| | | | | | |
| | | | | | |
| | | | | | |
| | | | | | |
| | | | | | |
| | | | | | |
| | | | | | |
| | | | | | |
| | | | | | |
| | | | | | |
| | | | | | |
| | | | | | |
| | | | | | |
| | | | | | |
| | | | | | |
| | | | | | |
| | | | | | |
| | | | | | |
| | | | | | |
| | | | | | |
| | | | | | |
| | | | | | |
| | | | | | |
| | | | | | |
| | | | | | |
| | | | | | |
| | | | | | |
| | | | | | |
| | | | | | |
| | | | | | |
| | | | | | |
| | | | | | |
| | | | | | |
| | | | | | |
| | | | | | |
| | | | | | |
| | | | | | |
| | | | | | |
| | | | | | |
| | | | | | |
| | | | | | |
| | | | | | |
| | | | | | |
FINANCIAL HIGHLIGHTSFOR THE PERIODS INDICATED (continued)
| Per share operating performance |
| | | |
| Net asset
value,
beginning
of period | Net
investment
income
(loss)(b) | Net realized
and unrealized
gains
(losses) on
investments | Total from
investment
operations | | | |
JPMorgan Small Cap Growth Fund (continued) | | | | | | | |
| | | | | | | |
Six Months Ended December 31, 2024 (Unaudited) | | | | | | | |
| | | | | | | |
| | | | | | | |
| | | | | | | |
| | | | | | | |
| | | | | | | |
| | | | | | | |
Six Months Ended December 31, 2024 (Unaudited) | | | | | | | |
| | | | | | | |
| | | | | | | |
| | | | | | | |
| | | | | | | |
| | | | | | | |
| | | | | | | |
Six Months Ended December 31, 2024 (Unaudited) | | | | | | | |
| | | | | | | |
| | | | | | | |
| | | | | | | |
| | | | | | | |
| | | | | | | |
| | | | | | | |
|
| Annualized for periods less than one year, unless otherwise noted. |
| Calculated based upon average shares outstanding. |
| Not annualized for periods less than one year. |
| Includes adjustments in accordance with accounting principles generally accepted in the United States of America and as such, the net asset values for financial reporting purposes and the returns based upon those net asset values may differ from the net asset values and returns for shareholder transactions. |
| Includes interest expense, if applicable, which is less than 0.005% unless otherwise noted. |
| |
| | | Ratios to average net assets(a) |
Net asset
value,
end of
period | Total return
(excludes
sales charge)(c)(d) | Net assets,
end of
period
(000's) | | Net
investment
income
(loss) | Expenses without
waivers and
reimbursements | |
|
| | | | | | |
| | | | | | |
| | | | | | |
| | | | | | |
| | | | | | |
| | | | | | |
| | | | | | |
| | | | | | |
| | | | | | |
| | | | | | |
| | | | | | |
| | | | | | |
| | | | | | |
| | | | | | |
| | | | | | |
| | | | | | |
| | | | | | |
| | | | | | |
| | | | | | |
| | | | | | |
| | | | | | |
| | | | | | |
FINANCIAL HIGHLIGHTSFOR THE PERIODS INDICATED
| Per share operating performance |
| | | |
| Net asset
value,
beginning
of period | Net
investment
income
(loss)(b) | Net realized
and unrealized
gains
(losses) on
investments | Total from
investment
operations | | | |
JPMorgan Small Cap Value Fund | | | | | | | |
| | | | | | | |
Six Months Ended December 31, 2024 (Unaudited) | | | | | | | |
| | | | | | | |
| | | | | | | |
| | | | | | | |
| | | | | | | |
| | | | | | | |
| | | | | | | |
Six Months Ended December 31, 2024 (Unaudited) | | | | | | | |
| | | | | | | |
| | | | | | | |
| | | | | | | |
| | | | | | | |
| | | | | | | |
| | | | | | | |
Six Months Ended December 31, 2024 (Unaudited) | | | | | | | |
| | | | | | | |
| | | | | | | |
| | | | | | | |
| | | | | | | |
| | | | | | | |
| | | | | | | |
Six Months Ended December 31, 2024 (Unaudited) | | | | | | | |
| | | | | | | |
| | | | | | | |
| | | | | | | |
| | | | | | | |
| | | | | | | |
| | | | | | | |
Six Months Ended December 31, 2024 (Unaudited) | | | | | | | |
| | | | | | | |
| | | | | | | |
| | | | | | | |
| | | | | | | |
| | | | | | | |
| | | | | | | |
Six Months Ended December 31, 2024 (Unaudited) | | | | | | | |
| | | | | | | |
| | | | | | | |
| | | | | | | |
| | | | | | | |
| | | | | | | |
| |
| | | Ratios to average net assets(a) |
Net asset
value,
end of
period | Total return
(excludes
sales charge)(c)(d) | Net assets,
end of
period
(000's) | | Net
investment
income
(loss) | Expenses without
waivers and
reimbursements | |
| | | | | | |
| | | | | | |
| | | | | | |
| | | | | | |
| | | | | | |
| | | | | | |
| | | | | | |
| | | | | | |
| | | | | | |
| | | | | | |
| | | | | | |
| | | | | | |
| | | | | | |
| | | | | | |
| | | | | | |
| | | | | | |
| | | | | | |
| | | | | | |
| | | | | | |
| | | | | | |
| | | | | | |
| | | | | | |
| | | | | | |
| | | | | | |
| | | | | | |
| | | | | | |
| | | | | | |
| | | | | | |
| | | | | | |
| | | | | | |
| | | | | | |
| | | | | | |
| | | | | | |
| | | | | | |
| | | | | | |
| | | | | | |
| | | | | | |
| | | | | | |
| | | | | | |
| | | | | | |
| | | | | | |
| | | | | | |
| | | | | | |
FINANCIAL HIGHLIGHTSFOR THE PERIODS INDICATED (continued)
| Per share operating performance |
| | | |
| Net asset
value,
beginning
of period | Net
investment
income
(loss)(b) | Net realized
and unrealized
gains
(losses) on
investments | Total from
investment
operations | | | |
JPMorgan Small Cap Value Fund (continued) | | | | | | | |
| | | | | | | |
Six Months Ended December 31, 2024 (Unaudited) | | | | | | | |
| | | | | | | |
| | | | | | | |
| | | | | | | |
| | | | | | | |
| | | | | | | |
| | | | | | | |
Six Months Ended December 31, 2024 (Unaudited) | | | | | | | |
| | | | | | | |
| | | | | | | |
| | | | | | | |
| | | | | | | |
| | | | | | | |
| | | | | | | |
|
| Annualized for periods less than one year, unless otherwise noted. |
| Calculated based upon average shares outstanding. |
| Not annualized for periods less than one year. |
| Includes adjustments in accordance with accounting principles generally accepted in the United States of America and as such, the net asset values for financial reporting purposes and the returns based upon those net asset values may differ from the net asset values and returns for shareholder transactions. |
| Includes interest expense, if applicable, which is less than 0.005% unless otherwise noted. |
| |
| | | Ratios to average net assets(a) |
Net asset
value,
end of
period | Total return
(excludes
sales charge)(c)(d) | Net assets,
end of
period
(000's) | | Net
investment
income
(loss) | Expenses without
waivers and
reimbursements | |
|
| | | | | | |
| | | | | | |
| | | | | | |
| | | | | | |
| | | | | | |
| | | | | | |
| | | | | | |
| | | | | | |
| | | | | | |
| | | | | | |
| | | | | | |
| | | | | | |
| | | | | | |
| | | | | | |
| | | | | | |
FINANCIAL HIGHLIGHTSFOR THE PERIODS INDICATED
| Per share operating performance |
| | | |
| Net asset
value,
beginning
of period | Net
investment
income
(loss)(b) | Net realized
and unrealized
gains
(losses) on
investments | Total from
investment
operations | | | |
JPMorgan SMID Cap Equity Fund | | | | | | | |
| | | | | | | |
Six Months Ended December 31, 2024 (Unaudited) | | | | | | | |
| | | | | | | |
| | | | | | | |
| | | | | | | |
| | | | | | | |
| | | | | | | |
| | | | | | | |
Six Months Ended December 31, 2024 (Unaudited) | | | | | | | |
| | | | | | | |
| | | | | | | |
| | | | | | | |
| | | | | | | |
| | | | | | | |
| | | | | | | |
Six Months Ended December 31, 2024 (Unaudited) | | | | | | | |
| | | | | | | |
| | | | | | | |
| | | | | | | |
| | | | | | | |
| | | | | | | |
| | | | | | | |
Six Months Ended December 31, 2024 (Unaudited) | | | | | | | |
| | | | | | | |
| | | | | | | |
| | | | | | | |
| | | | | | | |
| | | | | | | |
| | | | | | | |
Six Months Ended December 31, 2024 (Unaudited) | | | | | | | |
| | | | | | | |
| | | | | | | |
| | | | | | | |
| | | | | | | |
| | | | | | | |
| |
| | | Ratios to average net assets(a) |
Net asset
value,
end of
period | Total return
(excludes
sales charge)(c)(d) | Net assets,
end of
period
(000's) | | Net
investment
income
(loss) | Expenses without
waivers and
reimbursements | |
| | | | | | |
| | | | | | |
| | | | | | |
| | | | | | |
| | | | | | |
| | | | | | |
| | | | | | |
| | | | | | |
| | | | | | |
| | | | | | |
| | | | | | |
| | | | | | |
| | | | | | |
| | | | | | |
| | | | | | |
| | | | | | |
| | | | | | |
| | | | | | |
| | | | | | |
| | | | | | |
| | | | | | |
| | | | | | |
| | | | | | |
| | | | | | |
| | | | | | |
| | | | | | |
| | | | | | |
| | | | | | |
| | | | | | |
| | | | | | |
| | | | | | |
| | | | | | |
| | | | | | |
| | | | | | |
| | | | | | |
| | | | | | |
FINANCIAL HIGHLIGHTSFOR THE PERIODS INDICATED (continued)
| Per share operating performance |
| | | |
| Net asset
value,
beginning
of period | Net
investment
income
(loss)(b) | Net realized
and unrealized
gains
(losses) on
investments | Total from
investment
operations | | | |
JPMorgan SMID Cap Equity Fund (continued) | | | | | | | |
| | | | | | | |
Six Months Ended December 31, 2024 (Unaudited) | | | | | | | |
| | | | | | | |
| | | | | | | |
| | | | | | | |
| | | | | | | |
| | | | | | | |
| | | | | | | |
|
| Annualized for periods less than one year, unless otherwise noted. |
| Calculated based upon average shares outstanding. |
| Not annualized for periods less than one year. |
| Includes adjustments in accordance with accounting principles generally accepted in the United States of America and as such, the net asset values for financial reporting purposes and the returns based upon those net asset values may differ from the net asset values and returns for shareholder transactions. |
| Includes interest expense, if applicable, which is less than 0.005% unless otherwise noted. |
| |
| | | Ratios to average net assets(a) |
Net asset
value,
end of
period | Total return
(excludes
sales charge)(c)(d) | Net assets,
end of
period
(000's) | | Net
investment
income
(loss) | Expenses without
waivers and
reimbursements | |
|
| | | | | | |
| | | | | | |
| | | | | | |
| | | | | | |
| | | | | | |
| | | | | | |
| | | | | | |
| | | | | | |
FINANCIAL HIGHLIGHTSFOR THE PERIODS INDICATED
| Per share operating performance |
| | | |
| Net asset
value,
beginning
of period | Net
investment
income
(loss)(b) | Net realized
and unrealized
gains
(losses) on
investments | Total from
investment
operations | | | |
JPMorgan U.S. Small Company Fund | | | | | | | |
| | | | | | | |
Six Months Ended December 31, 2024 (Unaudited) | | | | | | | |
| | | | | | | |
| | | | | | | |
| | | | | | | |
| | | | | | | |
| | | | | | | |
| | | | | | | |
Six Months Ended December 31, 2024 (Unaudited) | | | | | | | |
| | | | | | | |
| | | | | | | |
| | | | | | | |
| | | | | | | |
| | | | | | | |
| | | | | | | |
Six Months Ended December 31, 2024 (Unaudited) | | | | | | | |
| | | | | | | |
| | | | | | | |
| | | | | | | |
| | | | | | | |
| | | | | | | |
| | | | | | | |
Six Months Ended December 31, 2024 (Unaudited) | | | | | | | |
| | | | | | | |
| | | | | | | |
| | | | | | | |
| | | | | | | |
| | | | | | | |
| | | | | | | |
Six Months Ended December 31, 2024 (Unaudited) | | | | | | | |
| | | | | | | |
| | | | | | | |
| | | | | | | |
| | | | | | | |
| | | | | | | |
| | | | | | | |
Six Months Ended December 31, 2024 (Unaudited) | | | | | | | |
| | | | | | | |
| | | | | | | |
| | | | | | | |
| | | | | | | |
| | | | | | | |
| |
| | | Ratios to average net assets(a) |
Net asset
value,
end of
period | Total return
(excludes
sales charge)(c)(d) | Net assets,
end of
period
(000's) | | Net
investment
income
(loss) | Expenses without
waivers and
reimbursements | |
| | | | | | |
| | | | | | |
| | | | | | |
| | | | | | |
| | | | | | |
| | | | | | |
| | | | | | |
| | | | | | |
| | | | | | |
| | | | | | |
| | | | | | |
| | | | | | |
| | | | | | |
| | | | | | |
| | | | | | |
| | | | | | |
| | | | | | |
| | | | | | |
| | | | | | |
| | | | | | |
| | | | | | |
| | | | | | |
| | | | | | |
| | | | | | |
| | | | | | |
| | | | | | |
| | | | | | |
| | | | | | |
| | | | | | |
| | | | | | |
| | | | | | |
| | | | | | |
| | | | | | |
| | | | | | |
| | | | | | |
| | | | | | |
| | | | | | |
| | | | | | |
| | | | | | |
| | | | | | |
| | | | | | |
| | | | | | |
| | | | | | |
FINANCIAL HIGHLIGHTSFOR THE PERIODS INDICATED (continued)
| Per share operating performance |
| | | |
| Net asset
value,
beginning
of period | Net
investment
income
(loss)(b) | Net realized
and unrealized
gains
(losses) on
investments | Total from
investment
operations | | | |
JPMorgan U.S. Small Company Fund (continued) | | | | | | | |
| | | | | | | |
Six Months Ended December 31, 2024 (Unaudited) | | | | | | | |
| | | | | | | |
| | | | | | | |
| | | | | | | |
| | | | | | | |
| | | | | | | |
| | | | | | | |
Six Months Ended December 31, 2024 (Unaudited) | | | | | | | |
| | | | | | | |
| | | | | | | |
| | | | | | | |
| | | | | | | |
| | | | | | | |
| | | | | | | |
Six Months Ended December 31, 2024 (Unaudited) | | | | | | | |
| | | | | | | |
| | | | | | | |
| | | | | | | |
| | | | | | | |
| | | | | | | |
| | | | | | | |
|
| Annualized for periods less than one year, unless otherwise noted. |
| Calculated based upon average shares outstanding. |
| Not annualized for periods less than one year. |
| Includes adjustments in accordance with accounting principles generally accepted in the United States of America and as such, the net asset values for financial reporting purposes and the returns based upon those net asset values may differ from the net asset values and returns for shareholder transactions. |
| Includes interest expense, if applicable, which is less than 0.005% unless otherwise noted. |
| |
| | | Ratios to average net assets(a) |
Net asset
value,
end of
period | Total return
(excludes
sales charge)(c)(d) | Net assets,
end of
period
(000's) | | Net
investment
income
(loss) | Expenses without
waivers and
reimbursements | |
|
| | | | | | |
| | | | | | |
| | | | | | |
| | | | | | |
| | | | | | |
| | | | | | |
| | | | | | |
| | | | | | |
| | | | | | |
| | | | | | |
| | | | | | |
| | | | | | |
| | | | | | |
| | | | | | |
| | | | | | |
| | | | | | |
| | | | | | |
| | | | | | |
| | | | | | |
| | | | | | |
| | | | | | |
| | | | | | |
NOTES TO FINANCIAL STATEMENTSAS OF December 31, 2024 (Unaudited)
(Dollar values in thousands)
1. Organization
JPMorgan Trust I (“JPM I") and JPMorgan Trust II (“JPM II") (collectively, the “Trusts”) were formed on November 12, 2004, as Delaware statutory trusts, pursuant to Declarations of Trust dated November 5, 2004 and are registered under the Investment Company Act of 1940, as amended (the “1940 Act”), as open-end management investment companies.
The following are 6 separate funds of the Trusts (each, a "Fund" and collectively, the "Funds") covered by this report:
| | | Diversification Classification |
JPMorgan Small Cap Blend Fund | Class A, Class C, Class I and Class R6 | | |
JPMorgan Small Cap Equity Fund | Class A, Class C, Class I, Class R2, Class R3, Class R4, Class R5 and Class R6 | | |
JPMorgan Small Cap Growth Fund | Class A, Class C, Class I, Class L, Class R2, Class R3, Class R4, Class R5 and Class R6 | | |
JPMorgan Small Cap Value Fund | Class A, Class C, Class I, Class R2, Class R3, Class R4, Class R5 and Class R6 | | |
JPMorgan SMID Cap Equity Fund | Class A, Class C, Class I, Class R3, Class R4 and Class R6 | | |
JPMorgan U.S. Small Company Fund | Class A, Class C, Class I, Class L, Class R2, Class R3, Class R4, Class R5 and Class R6 | | |
The investment objective of JPMorgan Small Cap Blend Fund (“Small Cap Blend Fund”) and JPMorgan Small Cap Equity Fund (“Small Cap Equity Fund”) is to seek capital growth over the long term.
The investment objective of JPMorgan Small Cap Growth Fund (“Small Cap Growth Fund”) is to seek long-term capital growth primarily by investing in a portfolio of equity securities of small-capitalization and emerging growth companies.
The investment objective of JPMorgan Small Cap Value Fund (“Small Cap Value Fund”) is to seek long-term capital growth primarily by investing in equity securities of small-capitalization companies.
The investment objective of JPMorgan SMID Cap Equity Fund (“SMID Cap Equity Fund”) is to seek long-term capital growth by investing primarily in equity securities of companies with intermediate capitalizations.
The investment objective of JPMorgan U.S. Small Company Fund (“U.S. Small Company Fund”) is to seek to provide high total return from a portfolio of small company stocks.
All share classes of Small Cap Growth Fund and Class L Shares of U.S. Small Company Fund are publicly offered on a limited basis. Investors are not eligible to purchase shares of Small Cap Growth Fund and Class L Shares of the U.S. Small Company Fund unless they meet certain requirements as described in the Small Cap Growth Fund's and U.S. Small Company Fund's prospectuses.
Class A Shares generally provide for a front-end sales charge while Class C Shares provide for a contingent deferred sales charge ("CDSC"). No sales charges are assessed with respect to Class I, Class L, Class R2, Class R3, Class R4, Class R5 and Class R6 Shares. Certain Class A Shares, for which front-end sales charges have been waived, may be subject to a CDSC as described in the Funds' prospectus. Class C Shares automatically convert to Class A Shares after eight years. All classes of shares have equal rights as to earnings, assets and voting privileges, except that each class may bear different transfer agency, distribution and service fees and each class has exclusive voting rights with respect to its distribution plan and shareholder servicing agreements.
J.P. Morgan Investment Management Inc. (“JPMIM”), an indirect, wholly-owned subsidiary of JPMorgan Chase & Co. (“JPMorgan”), acts as adviser (the “Adviser”) and administrator (the “Administrator”) to the Funds.
2. Significant Accounting Policies
The following is a summary of significant accounting policies followed by the Funds in the preparation of their financial statements. The Funds are investment companies and, accordingly, follow the investment company accounting and reporting guidance of the Financial Accounting Standards Board (“FASB”) Accounting Standards Codification Topic 946 — Investment Companies, which is part of U.S. generally accepted accounting principles (“GAAP”). The preparation of financial statements in conformity with GAAP requires management to make estimates and assumptions that affect (i) the reported amounts of assets and liabilities, (ii) disclosure of contingent assets and liabilities at the date of the financial statements, and (iii) the reported amounts of increases and decreases in net assets from operations during the reporting period. Actual results could differ from those estimates.
| J.P. Morgan Small Cap Funds | |
A. Valuation of Investments— Investments are valued in accordance with GAAP and the Funds' valuation policies set forth by, and under the supervision and responsibility of, the Boards of Trustees of the Trusts (the "Boards"), which established the following approach to valuation, as described more fully below: (i) investments for which market quotations are readily available shall be valued at their market value and (ii) all other investments for which market quotations are not readily available shall be valued at their fair value as determined in good faith by the Boards.
Under Section 2(a)(41) of the 1940 Act, the Boards are required to determine fair value for securities that do not have readily available market quotations. Under Securities and Exchange Commission (“SEC”) Rule 2a-5 (Good Faith Determinations of Fair Value), the Boards may designate the performance of these fair valuation determinations to a valuation designee. The Boards have designated the Adviser as the “Valuation Designee” to perform fair valuation determinations for the Funds on behalf of the Boards subject to appropriate oversight by the Boards. The Adviser, as Valuation Designee, leverages the J.P. Morgan Asset Management Americas Valuation Committee (“AVC”) to help oversee and carry out the policies for the valuation of investments held in the Funds. The Adviser, as Valuation Designee, remains responsible for the valuation determinations.
This oversight by the AVC includes monitoring the appropriateness of fair values based on results of ongoing valuation oversight including, but not limited to, consideration of macro or security specific events, market events, and pricing vendor and broker due diligence. The Administrator is responsible for discussing and assessing the potential impacts to the fair values on an ongoing basis, and, at least on a quarterly basis, with the AVC and the Boards.
A market-based approach is primarily used to value the Funds' investments. Investments for which market quotations are not readily available are fair valued using prices supplied by approved affiliated and/or unaffiliated pricing vendors or third party broker-dealers (collectively referred to as “Pricing Services”) or may be internally fair valued using methods set forth by the valuation policies approved by the Boards. This may include the use of related or comparable assets or liabilities, recent transactions, market multiples, book values and other relevant information for the investment. An income-based valuation approach may be used in which the anticipated future cash flows of the investment are discounted to calculate the fair value. Discounts may also be applied due to the nature or duration of any restrictions on the disposition of the investments. Valuations may be based upon current market prices of securities that are comparable in coupon, rating, maturity and industry. It is possible that the estimated values may differ significantly from the values that would have been used had a ready market for the investments existed, and such differences could be material.
Equities and other exchange-traded instruments are valued at the last sale price or official market closing price on the primary exchange on which the instrument is traded before the net asset values (“NAV”) of the Funds are calculated on a valuation date.
Investments in open-end investment companies (“Underlying Funds”) are valued at each Underlying Fund’s NAV per share as of the report date.
Futures contracts are generally valued on the basis of available market quotations.
Valuations reflected in this report are as of the report date. As a result, changes in valuation due to market events and/or issuer-related events after the report date and prior to issuance of the report are not reflected herein.
The various inputs that are used in determining the valuation of the Funds' investments are summarized into the three broad levels listed below.
•
Level 1 — Unadjusted inputs using quoted prices in active markets for identical investments.
•
Level 2 — Other significant observable inputs including, but not limited to, quoted prices for similar investments, inputs other than quoted prices that are observable for investments (such as interest rates, prepayment speeds, credit risk, etc.) or other market corroborated inputs.
•
Level 3 — Significant inputs based on the best information available in the circumstances, to the extent observable inputs are not available (including the Funds' assumptions in determining the fair value of investments).
A financial instrument’s level within the fair value hierarchy is based on the lowest level of any input, both individually and in the aggregate, that is significant to the fair value measurement. The inputs or methodology used for valuing instruments are not necessarily an indication of the risk associated with investing in those instruments.
The following tables represent each valuation input as presented on the Schedules of Portfolio Investments ("SOIs"):
| | | | |
| | Level 2
Other significant
observable inputs | Level 3
Significant
unobservable inputs | |
Total Investments in Securities (a) | | | | |
|
| Please refer to the SOI for specifics of portfolio holdings. |
| J.P. Morgan Small Cap Funds | |
NOTES TO FINANCIAL STATEMENTSAS OF December 31, 2024 (Unaudited) (continued)
(Dollar values in thousands)
| | | | |
| | Level 2
Other significant
observable inputs | Level 3
Significant
unobservable inputs | |
Total Investments in Securities (a) | | | | |
|
| Please refer to the SOI for specifics of portfolio holdings. |
| | | | |
| | Level 2
Other significant
observable inputs | Level 3
Significant
unobservable inputs | |
Total Investments in Securities (a) | | | | |
|
| Please refer to the SOI for specifics of portfolio holdings. |
| | | | |
| | Level 2
Other significant
observable inputs | Level 3
Significant
unobservable inputs | |
Total Investments in Securities (a) | | | | |
Depreciation in Other Financial Instruments | | | | |
| | | | |
|
| Please refer to the SOI for specifics of portfolio holdings. |
| | | | |
| | Level 2
Other significant
observable inputs | Level 3
Significant
unobservable inputs | |
Total Investments in Securities (a) | | | | |
|
| Please refer to the SOI for specifics of portfolio holdings. |
| | | | |
| | Level 2
Other significant
observable inputs | Level 3
Significant
unobservable inputs | |
Investments in Securities | | | | |
| | | | |
| | | | |
| | | | |
| | | | |
| | | | |
| | | | |
| | | | |
| | | | |
| | | | |
| | | | |
Commercial Services & Supplies | | | | |
| | | | |
Construction & Engineering | | | | |
| | | | |
| J.P. Morgan Small Cap Funds | |
U.S. Small Company Fund (continued) | | | | |
| | Level 2 Other significant observable inputs | Level 3 Significant unobservable inputs | |
| | | | |
Consumer Staples Distribution & Retail | | | | |
| | | | |
| | | | |
Diversified Consumer Services | | | | |
| | | | |
Diversified Telecommunication Services | | | | |
| | | | |
| | | | |
Electronic Equipment, Instruments & Components | | | | |
Energy Equipment & Services | | | | |
| | | | |
| | | | |
| | | | |
| | | | |
| | | | |
Health Care Equipment & Supplies | | | | |
Health Care Providers & Services | | | | |
| | | | |
| | | | |
| | | | |
Hotels, Restaurants & Leisure | | | | |
| | | | |
Independent Power and Renewable Electricity Producers | | | | |
| | | | |
| | | | |
Interactive Media & Services | | | | |
| | | | |
| | | | |
Life Sciences Tools & Services | | | | |
| | | | |
| | | | |
| | | | |
| | | | |
Mortgage Real Estate Investment Trusts (REITs) | | | | |
| | | | |
| | | | |
Oil, Gas & Consumable Fuels | | | | |
| | | | |
| | | | |
| | | | |
| | | | |
Real Estate Management & Development | | | | |
| | | | |
| | | | |
Semiconductors & Semiconductor Equipment | | | | |
| | | | |
| | | | |
| | | | |
| J.P. Morgan Small Cap Funds | |
NOTES TO FINANCIAL STATEMENTSAS OF December 31, 2024 (Unaudited) (continued)
(Dollar values in thousands)
U.S. Small Company Fund (continued) | | | | |
| | Level 2 Other significant observable inputs | Level 3 Significant unobservable inputs | |
Technology Hardware, Storage & Peripherals | | | | |
Textiles, Apparel & Luxury Goods | | | | |
| | | | |
Trading Companies & Distributors | | | | |
| | | | |
Wireless Telecommunication Services | | | | |
| | | | |
| | | | |
| | | | |
Investment of Cash Collateral from Securities Loaned | | | | |
Total Short-Term Investments | | | | |
Total Investments in Securities | | | | |
Depreciation in Other Financial Instruments | | | | |
| | | | |
|
| Amount rounds to less than one thousand. |
B. Restricted Securities— Certain securities held by the Funds may be subject to legal or contractual restrictions on resale. Restricted securities generally are resold in transactions exempt from registration under the Securities Act of 1933, as amended (the “Securities Act”). Disposal of these securities may involve time-consuming negotiations and expense. Prompt sale at the current valuation may be difficult and could adversely affect the NAVs of the Funds.
As of December 31, 2024, the Funds had no investments in restricted securities other than securities sold to the Funds under Rule 144A and/or Regulation S under the Securities Act.
C. Securities Lending — The Funds are authorized to engage in securities lending in order to generate additional income. The Funds are able to lend to approved borrowers. Citibank N.A. (“Citibank”) serves as lending agent for the Funds, pursuant to a Securities Lending Agency Agreement (the “Securities Lending Agency Agreement”). Securities loaned are collateralized by cash equal to at least 100% of the market value plus accrued interest on the securities lent, which is invested in the Class IM Shares of the JPMorgan U.S. Government Money Market Fund and the Agency SL Class Shares of the JPMorgan Securities Lending Money Market Fund. The Funds retain the interest earned on cash collateral investments but are required to pay the borrower a rebate for the use of the cash collateral. In cases where the lent security is of high value to borrowers, there may be a negative rebate (i.e., a net payment from the borrower to the Funds). Upon termination of a loan, the Funds are required to return to the borrower an amount equal to the cash collateral, plus any rebate owed to the borrowers. The remaining maturities of the securities lending transactions are considered overnight and continuous. Loans are subject to termination by the Funds or the borrower at any time.
The net income earned on the securities lending (after payment of rebates and Citibank’s fee) is included on the Statements of Operations as Income from securities lending (net). The Funds also receive payments from the borrower during the period of the loan, equivalent to dividends and interest earned on the securities loaned, which are recorded as Dividend or Interest income, respectively, on the Statements of Operations.
Under the Securities Lending Agency Agreement, Citibank marks to market the loaned securities on a daily basis. In the event the cash received from the borrower is less than 102% of the value of the loaned securities (105% for loans of non-U.S. securities), Citibank requests additional cash from the borrower so as to maintain a collateralization level of at least 102% of the value of the loaned securities plus accrued interest (105% for loans of non-U.S. securities), subject to certain de minimis amounts.
The value of securities out on loan is recorded as an asset on the Statements of Assets and Liabilities. The value of the cash collateral received is recorded as a liability on the Statements of Assets and Liabilities and details of collateral investments are disclosed on the SOIs.
The Funds bear the risk of loss associated with the collateral investments and are not entitled to additional collateral from the borrower to cover any such losses. To the extent that the value of the collateral investments declines below the amount owed to a borrower, the Funds may incur losses that exceed the amount they earned on lending the security. Upon termination of a loan, the Funds may use leverage (borrow money) to repay the borrower for cash collateral posted if the Adviser does not believe that it is prudent to sell the collateral investments to fund the payment of this liability. Securities lending activity is subject to master netting arrangements.
| J.P. Morgan Small Cap Funds | |
The following table presents for each lending Fund, the value of the securities on loan with Citibank, net of amounts available for offset under the master netting arrangements and any related collateral received or posted by the Funds as of December 31, 2024.
| Investment Securities
on Loan, at value,
Presented on the
Statements of Assets
and Liabilities | Cash Collateral
Posted by Borrower* | Net Amount Due
to Counterparty
(not less than zero) |
| | | |
| | | |
| | | |
| | | |
| | | |
|
| Collateral posted reflects the value of securities on loan and does not include any additional amounts received from the borrower. |
Securities lending also involves counterparty risks, including the risk that the loaned securities may not be returned in a timely manner or at all. Subject to certain conditions, Citibank has agreed to indemnify the Funds from losses resulting from a borrower’s failure to return a loaned security.
JPMIM voluntarily waived investment advisory fees charged to the Funds to reduce the impact of the cash collateral investment in the JPMorgan U.S. Government Money Market Fund from 0.13% to 0.06%. For the six months ended December 31, 2024, JPMIM waived fees associated with the Funds' investment in the JPMorgan U.S. Government Money Market Fund as follows:
|
| Amount rounds to less than one thousand. |
The above waiver is included in the determination of earnings on cash collateral investment and in the calculation of Citibank’s compensation and is included on the Statements of Operations as Income from securities lending (net).
D. Investment Transactions with Affiliates— The Funds invested in Underlying Funds advised by the Adviser. An issuer which is under common control with a Fund may be considered an affiliate. For the purposes of the financial statements, the Funds assume the issuers listed in the tables below to be affiliated issuers. The Underlying Funds’ distributions may be reinvested into such Underlying Funds. Reinvestment amounts are included in the purchases at cost amounts in the tables below.
|
For the six months ended December 31, 2024 |
| | | | | Change in
Unrealized
Appreciation/
(Depreciation) | | Shares at
December 31,
2024 | | Capital Gain
Distributions |
JPMorgan Prime Money Market Fund Class IM Shares, 4.54% (a) (b) | | | | | | | | | |
JPMorgan Securities Lending Money Market Fund Agency SL Class Shares, 4.47% (a) (b) | | | | | | | | | |
JPMorgan U.S. Government Money Market Fund Class IM Shares, 4.44% (a) (b) | | | | | | | | | |
| | | | | | | | | |
|
| Investment in an affiliated fund, which is registered under the Investment Company Act of 1940, as amended, and is advised by J.P. Morgan Investment Management Inc. |
| The rate shown is the current yield as of December 31, 2024. |
| J.P. Morgan Small Cap Funds | |
NOTES TO FINANCIAL STATEMENTSAS OF December 31, 2024 (Unaudited) (continued)
(Dollar values in thousands)
| Amount is included on the Statements of Operations as Income from securities lending (net) (after payments of rebates and Citibank’s fee). |
|
For the six months ended December 31, 2024 |
| | | | | Change in
Unrealized
Appreciation/
(Depreciation) | | Shares at
December 31,
2024 | | Capital Gain
Distributions |
JPMorgan Prime Money Market Fund Class IM Shares, 4.54% (a) (b) | | | | | | | | | |
JPMorgan Securities Lending Money Market Fund Agency SL Class Shares, 4.47% (a) (b) | | | | | | | | | |
JPMorgan U.S. Government Money Market Fund Class IM Shares, 4.44% (a) (b) | | | | | | | | | |
| | | | | | | | | |
|
| Investment in an affiliated fund, which is registered under the Investment Company Act of 1940, as amended, and is advised by J.P. Morgan Investment Management Inc. |
| The rate shown is the current yield as of December 31, 2024. |
| Amount is included on the Statements of Operations as Income from securities lending (net) (after payments of rebates and Citibank’s fee). |
|
For the six months ended December 31, 2024 |
| | | | | Change in
Unrealized
Appreciation/
(Depreciation) | | Shares at
December 31,
2024 | | Capital Gain
Distributions |
JPMorgan Prime Money Market Fund Class IM Shares, 4.54% (a) (b) | | | | | | | | | |
| J.P. Morgan Small Cap Funds | |
Small Cap Value Fund (continued) |
For the six months ended December 31, 2024 |
| | | | | Change in Unrealized Appreciation/ (Depreciation) | | Shares at December 31, 2024 | | Capital Gain Distributions |
JPMorgan Securities Lending Money Market Fund Agency SL Class Shares, 4.47% (a) (b) | | | | | | | | | |
JPMorgan U.S. Government Money Market Fund Class IM Shares, 4.44% (a) (b) | | | | | | | | | |
| | | | | | | | | |
|
| Investment in an affiliated fund, which is registered under the Investment Company Act of 1940, as amended, and is advised by J.P. Morgan Investment Management Inc. |
| The rate shown is the current yield as of December 31, 2024. |
| Amount is included on the Statements of Operations as Income from securities lending (net) (after payments of rebates and Citibank’s fee). |
|
For the six months ended December 31, 2024 |
| | | | | Change in
Unrealized
Appreciation/
(Depreciation) | | Shares at
December 31,
2024 | | Capital Gain
Distributions |
JPMorgan Prime Money Market Fund Class IM Shares, 4.54% (a) (b) | | | | | | | | | |
JPMorgan Securities Lending Money Market Fund Agency SL Class Shares, 4.47% | | | | | | | | | |
JPMorgan U.S. Government Money Market Fund Class IM Shares, 4.44% (a) (b) | | | | | | | | | |
| | | | | | | | | |
|
| Investment in an affiliated fund, which is registered under the Investment Company Act of 1940, as amended, and is advised by J.P. Morgan Investment Management Inc. |
| The rate shown is the current yield as of December 31, 2024. |
| Amount is included on the Statements of Operations as Income from securities lending (net) (after payments of rebates and Citibank’s fee). |
|
For the six months ended December 31, 2024 |
| | | | | Change in
Unrealized
Appreciation/
(Depreciation) | | Shares at
December 31,
2024 | | Capital Gain
Distributions |
JPMorgan Prime Money Market Fund Class IM Shares, 4.54% (a) (b) | | | | | | | | | |
JPMorgan Securities Lending Money Market Fund Agency SL Class Shares, 4.47% (a) (b) | | | | | | | | | |
JPMorgan U.S. Government Money Market Fund Class IM Shares, 4.44% (a) (b) | | | | | | | | | |
| | | | | | | | | |
|
| Investment in an affiliated fund, which is registered under the Investment Company Act of 1940, as amended, and is advised by J.P. Morgan Investment Management Inc. |
| The rate shown is the current yield as of December 31, 2024. |
| Amount is included on the Statements of Operations as Income from securities lending (net) (after payments of rebates and Citibank’s fee). |
| J.P. Morgan Small Cap Funds | |
NOTES TO FINANCIAL STATEMENTSAS OF December 31, 2024 (Unaudited) (continued)
(Dollar values in thousands)
E. Futures Contracts— Small Cap Value Fund and U.S. Small Company Fund used index futures contracts to gain or reduce exposure to the stock market, or maintain liquidity or minimize transaction costs. The Funds also purchased futures contracts to invest incoming cash in the market or sold futures in response to cash outflows, thereby simulating an invested position in the underlying index while maintaining a cash balance for liquidity.
Futures contracts provide for the delayed delivery of the underlying instrument at a fixed price or are settled for a cash amount based on the change in the value of the underlying instrument at a specific date in the future. Upon entering into a futures contract, the Funds are required to deposit with the broker, cash or securities in an amount equal to a certain percentage of the contract amount, which is referred to as the initial margin deposit. Subsequent payments, referred to as variation margin, are made or received by the Funds periodically and are based on changes in the market value of open futures contracts. Changes in the market value of open futures contracts are recorded as Change in net unrealized appreciation/depreciation on futures contracts on the Statements of Operations. Realized gains or losses, representing the difference between the value of the contract at the time it was opened and the value at the time it was closed, are reported on the Statements of Operations at the closing or expiration of the futures contract. Securities deposited as initial margin are designated on the SOIs, while cash deposited, which is considered restricted, is recorded on the Statements of Assets and Liabilities. A receivable from and/or a payable to brokers for the daily variation margin is also recorded on the Statements of Assets and Liabilities.
The use of futures contracts exposes the Funds to equity price risk. The Funds may be subject to the risk that the change in the value of the futures contract may not correlate perfectly with the underlying instrument. Use of long futures contracts subjects the Funds to risk of loss in excess of the amounts shown on the Statements of Assets and Liabilities, up to the notional amount of the futures contracts. Use of short futures contracts subjects the Funds to unlimited risk of loss. The Funds may enter into futures contracts only on exchanges or boards of trade. The exchange or board of trade acts as the counterparty to each futures transaction; therefore, the Funds' credit risk is limited to failure of the exchange or board of trade. Under some circumstances, futures exchanges may establish daily limits on the amount that the price of a futures contract can vary from the previous day’s settlement price, which could effectively prevent liquidation of positions.
The Funds' futures contracts are not subject to master netting arrangements (the right to close out all transactions traded with a counterparty and net amounts owed or due across transactions).
The table below discloses the volume of the Funds' futures contracts activity during the six months ended December 31, 2024 (amounts in thousands, except number of contracts):
| | |
| | |
Average Notional Balance Long | | |
Ending Notional Balance Long | | |
F. Security Transactions and Investment Income— Investment transactions are accounted for on the trade date (the date the order to buy or sell is executed). Securities gains and losses are calculated on a specifically identified cost basis.
Interest income is determined on the basis of coupon interest accrued using the effective interest method, which adjusts for amortization of premiums and accretion of discounts.
Dividend income is recorded on the ex-dividend date or when a Fund first learns of the dividend.
To the extent such information is publicly available, the Funds record distributions received in excess of income earned from underlying investments as a reduction of cost of investments and/or realized gain. Such amounts are based on estimates if actual amounts are not available and actual amounts of income, realized gain and return of capital may differ from the estimated amounts. The Funds adjust the estimated amounts of the components of distributions (and consequently their net investment income) as necessary, once the issuers provide information about the actual composition of the distributions.
G. Allocation of Income and Expenses— Expenses directly attributable to a Fund are charged directly to that Fund, while the expenses attributable to more than one fund of the Trusts are allocated among the applicable funds. Investment income, realized and unrealized gains and losses and expenses, other than class-specific expenses, are allocated daily to each class of shares based upon the proportion of net assets of each class at the beginning of each day.
Transfer agency fees are class-specific expenses. The amount of the transfer agency fees charged to each share class of the Funds for the six months ended December 31, 2024 are as follows:
| J.P. Morgan Small Cap Funds | |
|
| Amount rounds to less than one thousand. |
H. Federal Income Taxes— Each Fund is treated as a separate taxable entity for Federal income tax purposes. Each Fund's policy is to comply with the provisions of the Internal Revenue Code (the “Code”) applicable to regulated investment companies and to distribute to shareholders all of its distributable net investment income and net realized capital gains on investments. Accordingly, no provision for Federal income tax is necessary. Management has reviewed the Funds' tax positions for all open tax years and has determined that as of December 31, 2024, no liability for Federal income tax is required in the Funds' financial statements for net unrecognized tax benefits. However, management’s conclusions may be subject to future review based on changes in, or the interpretation of, the accounting standards or tax laws and regulations. Each Fund's Federal tax returns for the prior three fiscal years remain subject to examination by the Internal Revenue Service.
I. Distributions to Shareholders— Distributions from net investment income, if any, are generally declared and paid at least annually, except for Small Cap Value Fund, for which distributions are generally declared and paid at least quarterly. Distributions are declared separately for each class. No class has preferential dividend rights; differences in per share rates are due to differences in separate class expenses. Net realized capital gains, if any, are distributed by each Fund at least annually. The amount of distributions from net investment income and net realized capital gains is determined in accordance with Federal income tax regulations, which may differ from GAAP. To the extent these “book/tax” differences are permanent in nature (i.e., that they result from other than timing of recognition — “temporary differences”), such amounts are reclassified within the capital accounts based on their Federal tax basis treatment.
3. Fees and Other Transactions with Affiliates
A. Investment Advisory Fee — Pursuant to an Investment Advisory Agreement, the Adviser manages the investments of each Fund and for such services is paid a fee. The investment advisory fee is accrued daily and paid monthly at an annual rate based on each Fund's respective average daily net assets. The annual rate for each Fund is as follows:
The Adviser waived investment advisory fees and/or reimbursed expenses as outlined in Note 3.F.
B. Administration Fee— Pursuant to an Administration Agreement, the Administrator provides certain administration services to each Fund. In consideration of these services, the Administrator receives a fee accrued daily and paid monthly at an annual rate of 0.075% of the first $10 billion of each Fund's respective average daily net assets, plus 0.050% of each Fund's respective average daily net assets between $10 billion and $20 billion, plus 0.025% of each Fund's respective average daily net assets between $20 billion and $25 billion, plus 0.010% of each Fund's respective average daily net assets in excess of $25 billion. For the six months ended December 31, 2024, the effective annualized rate was 0.075% of each Fund's average daily net assets, notwithstanding any fee waivers and/or expense reimbursements.
The Administrator waived administration fees as outlined in Note 3.F.
JPMorgan Chase Bank, N.A. ("JPMCB"), a wholly-owned subsidiary of JPMorgan, serves as the Funds' sub-administrator (the “Sub-administrator”). For its services as Sub-administrator, JPMCB receives a portion of the fees payable to the Administrator.
| J.P. Morgan Small Cap Funds | |
NOTES TO FINANCIAL STATEMENTSAS OF December 31, 2024 (Unaudited) (continued)
(Dollar values in thousands)
C. Distribution Fees— Pursuant to a Distribution Agreement, JPMorgan Distribution Services, Inc. (“JPMDS”), an indirect, wholly-owned subsidiary of JPMorgan, serves as each Fund's principal underwriter and promotes and arranges for the sale of each Fund's shares.
The Boards have adopted a Distribution Plan (the “Distribution Plan”) for Class A, Class C, Class R2 and Class R3 Shares of the Funds, as applicable, pursuant to Rule 12b-1 under the 1940 Act. Class I, Class L, Class R4, Class R5 and Class R6 Shares of the Funds do not charge a distribution fee. The Distribution Plan provides that each Fund shall pay, with respect to the applicable share classes, distribution fees, including payments to JPMDS, at annual rates of the average daily net assets as shown in the table below:
In addition, JPMDS is entitled to receive the front-end sales charges from purchases of Class A Shares and the CDSC from redemptions of Class C Shares and certain Class A Shares for which front-end sales charges have been waived. For the six months ended December 31, 2024, JPMDS retained the following:
|
| Amount rounds to less than one thousand. |
D. Service Fees— The Trusts, on behalf of the Funds, have entered into a Shareholder Servicing Agreement with JPMDS under which JPMDS provides certain support services to fund shareholders. For performing these services, JPMDS receives a fee with respect to all share classes, except Class R6 Shares which do not charge a service fee, that is accrued daily and paid monthly equal to a percentage of the average daily net assets as shown in the table below:
JPMDS has entered into shareholder services contracts with affiliated and unaffiliated financial intermediaries who provide shareholder services and other related services to their clients or customers who invest in the Funds. Pursuant to such contracts, JPMDS will pay all or a portion of such fees earned to financial intermediaries for performing such services.
JPMDS waived service fees as outlined in Note 3.F.
E. Custodian and Accounting Fees— JPMCB provides portfolio custody and accounting services to the Funds. For performing these services, the Funds pay JPMCB transaction and asset-based fees that vary according to the number of transactions and positions, plus out-of-pocket expenses. The amounts paid directly to JPMCB by the Funds for custody and accounting services are included in Custodian and accounting fees on the Statements of Operations.
Interest income earned on cash balances at the custodian, if any, is included in Interest income from affiliates on the Statements of Operations.
Interest expense paid to the custodian related to cash overdrafts, if any, is included in Interest expense to affiliates on the Statements of Operations.
| J.P. Morgan Small Cap Funds | |
F. Waivers and Reimbursements—The Adviser, Administrator and/or JPMDS have contractually agreed to waive fees and/or reimburse the Funds to the extent that total annual operating expenses (excluding acquired fund fees and expenses other than certain money market fund fees as described below, dividend and interest expenses related to short sales, interest, taxes, expenses related to litigation and potential litigation, expenses related to trustee elections and extraordinary expenses) exceed the percentages of the Funds' respective average daily net assets as shown in the table below:
The expense limitation agreements were in effect for the six months ended December 31, 2024 and the contractual expense limitation percentages in the table above are in place until at least October 31, 2025.
For the six months ended December 31, 2024, the Funds' service providers waived fees and/or reimbursed expenses for each of the Funds as follows. None of these parties expect the Funds to repay any such waived fees and/or reimbursed expenses in future years.
| | |
| | | | | Contractual
Reimbursements |
| | | | | |
| | | | | |
| | | | | |
| | | | | |
| | | | | |
| | | | | |
Additionally, the Funds may invest in one or more money market funds advised by the Adviser (affiliated money market funds). The Adviser, Administrator and/or JPMDS, as shareholder servicing agent, have contractually agreed to waive fees and/or reimburse expenses in an amount sufficient to offset the respective net fees each collects from the affiliated money market fund on the applicable Fund's investment in such affiliated money market fund, except for investments of securities lending cash collateral. None of these parties expect the Funds to repay any such waived fees and/or reimbursed expenses in future years.
The amounts of these waivers resulting from investments in these money market funds for the six months ended December 31, 2024 were as follows:
G. Other— Certain officers of the Trusts are affiliated with the Adviser, the Administrator and JPMDS. Such officers, with the exception of the Chief Compliance Officer, receive no compensation from the Funds for serving in their respective roles.
The Boards designated and appointed a Chief Compliance Officer to the Funds pursuant to Rule 38a-1 under the 1940 Act. Each Fund, along with affiliated funds, makes reimbursement payments, on a pro-rata basis, to the Administrator for a portion of the fees associated with the office of the Chief Compliance Officer. Such fees are included in Trustees’ and Chief Compliance Officer’s fees on the Statements of Operations.
The Trusts adopted a Trustee Deferred Compensation Plan (the “Plan”) which allows the independent Trustees to defer the receipt of all or a portion of compensation related to performance of their duties as Trustees. The deferred fees are invested in various J.P. Morgan Funds until distribution in accordance with the Plan.
| J.P. Morgan Small Cap Funds | |
NOTES TO FINANCIAL STATEMENTSAS OF December 31, 2024 (Unaudited) (continued)
(Dollar values in thousands)
The below Funds used related party broker-dealers during the six months ended December 31, 2024, and incurred brokerage commissions with broker-dealers affiliated with the Adviser as follows:
The SEC has granted an exemptive order permitting the Funds to engage in principal transactions with J.P. Morgan Securities LLC, an affiliated broker, involving taxable money market instruments, subject to certain conditions.
4. Investment Transactions
During the six months ended December 31, 2024, purchases and sales of investments (excluding short-term investments and transfers in-kind) were as follows:
| Purchases
(excluding
U.S. Government) | Sales
(excluding
U.S. Government) |
| | |
| | |
| | |
| | |
| | |
| | |
During the six months ended December 31, 2024, there were no purchases or sales of U.S. Government securities.
5. Federal Income Tax Matters
For Federal income tax purposes, the estimated cost and unrealized appreciation (depreciation) in value of investments held at December 31, 2024 were as follows:
| | Gross
Unrealized
Appreciation | Gross
Unrealized
Depreciation | Net Unrealized
Appreciation
(Depreciation) |
| | | | |
| | | | |
| | | | |
| | | | |
| | | | |
| | | | |
At June 30, 2024, the following Funds had net capital loss carryforwards, which are available to offset future realized gains:
| Capital Loss Carryforward Character |
| | |
| | |
| | |
| | |
During the year ended June 30, 2024, the following Funds utilized capital loss carryforwards as follows:
| J.P. Morgan Small Cap Funds | |
6. Borrowings
The Funds rely upon an exemptive order granted by the SEC (the “Order”) permitting the establishment and operation of an Interfund Lending Facility (the “Facility”). The Facility allows the Funds to directly lend and borrow money to or from any other fund relying upon the Order at rates beneficial to both the borrowing and lending funds. Advances under the Facility are taken primarily for temporary or emergency purposes, including the meeting of redemption requests that otherwise might require the untimely disposition of securities, and are subject to each Fund's borrowing restrictions. The interfund loan rate is determined, as specified in the Order, by averaging the current repurchase agreement rate and the current bank loan rate. The Order was granted to JPM II and may be relied upon by the Funds because the Funds and the series of JPM II are all investment companies in the same “group of investment companies” (as defined in Section 12(d)(1)(G) of the 1940 Act).
The Funds had no borrowings outstanding from another fund, or loans outstanding to another fund, during the six months ended December 31, 2024.
The Trusts and JPMCB have entered into a financing arrangement. Under this arrangement, JPMCB provides an unsecured, uncommitted credit facility in the aggregate amount of $100 million to certain of the J.P. Morgan Funds, including the Funds. Advances under the arrangement are taken primarily for temporary or emergency purposes, including the meeting of redemption requests that otherwise might require the untimely disposition of securities, and are subject to each Fund's borrowing restrictions. Interest on borrowings is payable at a rate determined by JPMCB at the time of borrowing. This agreement has been extended until October 28, 2025.
The Funds had no borrowings outstanding from the unsecured, uncommitted credit facility during the six months ended December 31, 2024.
The Trusts, along with certain other trusts for J.P. Morgan Funds (“Borrowers”), have entered into a joint syndicated senior unsecured revolving credit facility totaling $1.5 billion (“Credit Facility”) with various lenders and The Bank of New York Mellon, as administrative agent for the lenders. This Credit Facility provides a source of funds to the Borrowers for temporary and emergency purposes, including the meeting of redemption requests that otherwise might require the untimely disposition of securities. Under the terms of the Credit Facility, a borrowing fund must have a minimum of $25 million in adjusted net asset value and not exceed certain adjusted net asset coverage ratios prior to and during the time in which any borrowings are outstanding. If a fund does not comply with the aforementioned requirements, the fund must remediate within three business days with respect to the $25 million minimum adjusted net asset value or within one business day with respect to certain asset coverage ratios or the administrative agent at the request of, or with the consent of, the lenders may terminate the Credit Facility and declare any outstanding borrowings to be due and payable immediately.
Interest associated with any borrowing under the Credit Facility is charged to the borrowing fund at a rate of interest equal to 1.00%, plus the greater on the day of the borrowing, of the federal funds effective rate, or the Adjusted Secured Overnight Financing Rate (SOFR). Effective August 6, 2024, the Credit Facility was amended and restated for a term of 364 days, unless extended.
The Funds did not utilize the Credit Facility during the six months ended December 31, 2024.
7. Risks, Concentrations and Indemnifications
In the normal course of business, the Funds enter into contracts that contain a variety of representations which provide general indemnifications. Each Fund's maximum exposure under these arrangements is unknown. The amount of exposure would depend on future claims that may be brought against each Fund. However, based on experience, the Funds expect the risk of loss to be remote.
As of December 31, 2024, the Funds had individual shareholder and/or affiliated omnibus accounts each owning more than 10% of the respective Fund's outstanding shares as follows:
| Number of
Individual Shareholder
and/or Affiliated
Omnibus Accounts | | Number of
Individual Shareholder
and/or Non-Affiliated
Omnibus Accounts | |
| | | | |
| | | | |
| | | | |
| | | | |
| | | | |
| | | | |
| J.P. Morgan Small Cap Funds | |
NOTES TO FINANCIAL STATEMENTSAS OF December 31, 2024 (Unaudited) (continued)
(Dollar values in thousands)
As of December 31, 2024, J.P. Morgan Investor Funds and JPMorgan SmartRetirement Funds, which are affiliated fund of funds, each owned in the aggregate, shares representing more than 10% of the net assets of the Funds as follows:
| | JPMorgan
SmartRetirement
Funds |
| | |
Significant shareholder transactions by these shareholders may impact the Funds' performance and liquidity.
Because the Funds invest in Real Estate Investment Trusts ("REITs"), the Funds may be subject to certain risks similar to those associated with direct investments in real estate. REITs may be affected by changes in the value of their underlying properties and by defaults by tenants. REITs depend generally on their ability to generate cash flow to make distributions to shareholders, and certain REITs have self-liquidation provisions by which mortgages held may be paid in full and distributions of capital returns may be made at any time.
The Funds invest in companies with relatively small market capitalizations. Investments in companies with relatively small market capitalizations may involve greater risk than is usually associated with stocks of larger companies. These securities may have limited marketability and may be subject to more abrupt or erratic movements in price than securities of companies with larger capitalizations.
The Funds are subject to infectious disease epidemics/pandemics risk. The effects of any future pandemic or other global event to public health and business and market conditions may have a significant negative impact on the performance of a Fund's investments, increase a Fund's volatility, exacerbate pre-existing political, social and economic risks to the Funds, and negatively impact broad segments of businesses and populations. In addition, governments, their regulatory agencies, or self-regulatory organizations have taken or may take actions in response to a pandemic or other global event that affect the instruments in which the Funds invest, or the issuers of such instruments, in ways that could have a significant negative impact on a Fund’s investment performance. The ultimate impact of any pandemic or other global event and the extent to which the associated conditions and governmental responses impact a Fund will also depend on future developments, which are highly uncertain, difficult to accurately predict and subject to frequent changes.
| J.P. Morgan Small Cap Funds | |
J.P. Morgan Funds are distributed by JPMorgan Distribution Services, Inc., which is an affiliate of JPMorgan Chase & Co. Affiliates of JPMorgan Chase & Co. receive fees for providing various services to the Funds.
Contact JPMorgan Distribution Services, Inc. at 1-800-480-4111 for a fund prospectus. You can also visit us at www.jpmorganfunds.com. Investors should carefully consider the investment objectives and risk as well as charges and expenses of the mutual fund before investing. The prospectus contains this and other information about the mutual fund. Read the prospectus carefully before investing.
Investors may obtain information about the Securities Investor Protection Corporation (SIPC), including the SIPC brochure, by visiting www.sipc.org or by calling SIPC at 202-371-8300.
J.P. Morgan Asset Management is the brand name for the asset management business of JPMorgan Chase & Co. and its affiliates worldwide.
© JPMorgan Chase & Co., 2024. All rights reserved. December 2024.
SAN-SC-1224
Changes in and Disagreements with Accountants for Open-End Management Investment Companies
Proxy Disclosures for Open-End Management Investment Companies
Remuneration Paid to Directors, Officers, and Others of Open-End Management Investment Companies
Included in the Statements of Operations within the Funds' Financial Statements.
Statement Regarding Basis for Approval of Investment Advisory Agreements
The Board of Trustees (the “Board” or the “Trustees”) has established various standing committees composed of Trustees with diverse backgrounds, to which the Board has assigned specific subject matter responsibilities to further enhance the effectiveness of the Board’s oversight and decision making. The Board and its investment committees (Money Market and Alternative Products Committee, Equity Committee, and Fixed Income Committee) met regularly throughout the year and, at each meeting, considered factors that are relevant to their annual consideration of the continuation of the investment advisory agreements. The Board also met for the specific purpose of considering the continuation of the investment advisory agreement annual renewals. The Board held meetings June 25-26, 2024 and August 20-22, 2024, at which the Trustees considered the continuation of the investment advisory agreements for each Fund whose semi-annual report is contained herein (each an “Advisory Agreement” and collectively, the “Advisory Agreements”). At the June meeting, the Board’s investment committees met to review and consider performance, expense and related information for the J.P. Morgan Funds. Each investment committee reported to the full Board, which then considered each investment committee’s preliminary findings. At the August meeting, the Trustees continued their review and consideration. The Trustees, including a majority of the Trustees who are not parties to an Advisory Agreement or “interested persons” (as defined in the Investment Company Act of 1940) of any party to an Advisory Agreement or any of their affiliates, approved the continuation of each Advisory Agreement on August 22, 2024.
As part of their review of the Advisory Agreements, the Trustees considered and reviewed performance and other information about the Funds received from J.P. Morgan Investment Management Inc. (the “Adviser”). This information included the Funds’ performance as compared to the performance of their peers and benchmarks, and analyses by the Adviser of the Funds’ performance. In addition, at each of their regular meetings throughout the year, the Trustees considered reports on the performance of certain J.P. Morgan Funds provided by an independent investment consulting firm (“independent consultant”). In addition, in preparation for the June and August meetings, the Trustees requested, received and evaluated extensive materials from the Adviser, including performance and expense information compiled by Broadridge, using data from Lipper Inc. and/or Morningstar, Inc., independent providers of investment company data (together, “Broadridge”). The Trustees’ independent consultant also provided additional quantitative and statistical analyses of the Funds, including risk and performance return assessments as compared to the Funds’ objectives, benchmarks, and peers. Before voting on the Advisory Agreements, the Trustees reviewed the Advisory Agreements with representatives of the
Adviser, counsel to the Funds, and independent legal counsel to the Trustees, and received a memorandum from independent legal counsel to the Trustees discussing the legal standards for their consideration of the Advisory Agreements. The Trustees also discussed the Advisory Agreements in executive sessions with independent legal counsel at which no representatives of the Adviser were present.
A summary of the material factors evaluated by the Trustees in determining whether to approve each Advisory Agreement is provided below. Each Trustee attributed different weights to the various factors and no factor alone was considered determinative. The Trustees considered information provided with respect to the Funds throughout the year, as well as materials furnished specifically in connection with the annual review process. From year to year, the Trustees consider and place emphasis on relevant information in light of changing circumstances in market and economic conditions.
After considering and weighing the factors and information they had received, the Trustees found that the compensation to be received by the Adviser from each Fund under the applicable Advisory Agreement was fair and reasonable under the circumstances, and determined that the continuance of each Advisory Agreement was in the best interests of each Fund and its shareholders.
Nature, Extent and Quality of Services Provided by the Adviser
•
The Trustees received and considered information regarding the nature, extent and quality of services provided to each Fund under the applicable Advisory Agreement. The Trustees took into account information furnished throughout the year at Trustee meetings, as well as the materials furnished specifically in connection with this annual review process. Among other things, the Trustees considered:
•
The background and experience of the Adviser’s senior management and investment personnel, including personnel changes, if any;
•
The qualifications, backgrounds and responsibilities of the portfolio management team primarily responsible for the day-to-day management of each Fund, including personnel changes, if any;
•
The investment strategy for each Fund, and the infrastructure supporting the portfolio management teams;
•
Information about the structure and distribution strategy for each Fund and how it fits within the Adviser’s other fund offerings within the J.P. Morgan Funds complex;
•
The administration services provided by the Adviser in its role as Administrator;
•
Their knowledge of the nature and quality of the services provided by the Adviser and its affiliates gained from their experience as Trustees of the Funds and in the financial industry generally;
•
The overall reputation and capabilities of the Adviser and its affiliates;
•
The commitment of the Adviser to provide high quality service to the Funds;
•
Their overall confidence in the Adviser’s integrity; and
•
The Adviser’s responsiveness to requests for additional information, questions or concerns raised by them, including the Adviser’s willingness to consider and implement organizational and operational changes designed to improve investment results and the services provided to each Fund.
Based upon these considerations and other factors, the Trustees concluded that they were satisfied with the nature, extent and quality of the services provided to the Funds by the Adviser.
Costs of Services Provided and Profitability to the Adviser and its Affiliates
The Trustees received and considered information regarding the profitability to the Adviser and its affiliates from providing services to each Fund. The Trustees reviewed and discussed this information. The Trustees recognized that this information is not audited and represents the Adviser’s determination of its and its affiliates’ revenues from the contractual services provided to the Funds, less expenses of providing such services. Expenses include direct and indirect costs and are calculated using an allocation methodology developed by the Adviser and reviewed with the Board. The Trustees also recognized that it is difficult to make comparisons of profitability from fund investment advisory contracts because comparative information is not generally publicly available and is affected by numerous factors, including the structure of the particular adviser, the types of funds it manages, its business mix, numerous assumptions regarding allocations and the fact that publicly-traded fund managers’ operating profits and net income are net of distribution and marketing expenses. Based upon their review, and taking into consideration the factors noted above, the Trustees concluded that the profitability to the Adviser under each Advisory Agreement was not unreasonable in light of the services and benefits provided to each Fund.
The Trustees also considered that JPMorgan Distribution Services, Inc. (“JPMDS”), an affiliate of the Adviser, and the Adviser earn fees from the Funds for providing shareholder and administration services, respectively. These fees were shown separately in the profitability analysis presented to the Trustees. The Trustees also considered the payments of Rule 12b-1 fees to JPMDS, which also acts as the Funds’ distributor, and that these fees are in turn generally paid to
financial intermediaries that sell the Funds, including financial intermediaries that are affiliates of the Adviser (although they are retained by JPMDS in certain instances). The Trustees also considered the fees earned by JPMorgan Chase Bank, N.A. (“JPMCB”), an affiliate of the Adviser, for custody, fund accounting and other related services for each Fund, and the profitability of the arrangements to JPMCB.
The Trustees reviewed information regarding potential “fall-out” or ancillary benefits received by the Adviser and its affiliates as a result of their relationship with the Funds. The Trustees considered that the J.P. Morgan Funds’ operating accounts are held at JPMCB, which, as a result, will receive float benefits for certain J.P. Morgan Funds, as applicable. The Trustees also noted that the Adviser supports a diverse set of products and services, which benefits the Adviser by allowing it to leverage its infrastructure to serve additional clients, including benefits that may be received by the Adviser and its affiliates in connection with the Funds’ potential investments in other funds advised by the Adviser. The Trustees also reviewed the Adviser’s allocation of fund brokerage for the J.P. Morgan Funds complex, including allocations to brokers who provide research to the Adviser, as well as the Adviser’s use of affiliates to provide other services and the benefits to such affiliates of doing so. The Trustees also considered the benefit to the Adviser and its affiliates from allocating client assets to the Funds.
The Trustees considered the extent to which the Funds may benefit from potential economies of scale. The Trustees considered that there may not be a direct relationship between economies of scale realized by the Funds and those realized by the Adviser as assets increase. The Trustees considered the extent to which the Funds were priced to scale and whether it would be appropriate to add advisory fee breakpoints. The Trustees noted certain Funds with contractual expense limitations and fee waivers (“Fee Caps”), which allow a Fund’s shareholders to share potential economies of scale from a Fund’s inception, prior to reaching scale. The Trustees also noted that certain other Funds that had achieved scale as asset levels had increased no longer had Fee Caps in place for some or all of their share classes, but shared economies of scale through lower average expenses. The Trustees noted that the fees remain fair and reasonable relative to peer funds. The Trustees considered the benefits to the Funds of the use of an affiliated distributor and custodian, including the ability to rely on existing infrastructure supporting distribution, custodial and transfer agent services and the ability to negotiate competitive fees for the Funds. The Trustees further considered the Adviser's and JPMDS's ongoing investments in their business in support of the Funds, including the Adviser's and/or JPMDS's
investments in trading systems, technology (including improvements to the J.P. Morgan Funds’ website, and cybersecurity improvements), retention of key talent, and regulatory support enhancements. The Trustees concluded that the current fee structure for each Fund, including any Fee Caps the Adviser has in place that serve to limit the overall net expense ratios of each Fund at competitive levels, was reasonable. The Trustees concluded that, for Funds with Fee Caps in place for some or all of their share classes, the relevant Fund’s shareholders received the benefits of potential economies of scale through the Fee Caps and, for Funds that achieved scale and no longer had Fee Caps in place for some or all of their share classes, the relevant Fund’s shareholders benefited from lower average expenses resulting from increased assets. The Trustees also concluded that all Funds benefited from the Adviser’s reinvestment in its operations to serve the Funds and their shareholders. The Trustees noted that the Adviser’s reinvestment ensures sufficient resources in terms of personnel and infrastructure to support the Funds.
Independent Written Evaluation of the Funds’ Senior Officer
The Trustees noted that, upon their direction, the Senior Officer for the Small Cap Growth Fund, Small Cap Value Fund, and SMID Cap Equity Fund had prepared an independent written evaluation in order to assist the Trustees in determining the reasonableness of the proposed management fees. In determining whether to continue the Advisory Agreements, the Trustees considered the Senior Officer’s report.
Fees Relative to Adviser’s Other Clients
The Trustees received and considered information about the nature and extent of investment advisory services and fee rates offered to other clients of the Adviser, including, to the extent applicable, institutional separate accounts, collective investment trusts, other registered investment companies and/or private funds sub-advised by the Adviser, and for investment management styles substantially similar to that of each Fund. The Trustees considered the complexity of investment management for registered investment companies relative to the Adviser’s other clients and noted differences, as applicable, in the fee structure and the regulatory, legal and other risks and responsibilities of providing services to the different clients. The Trustees considered that serving as an adviser to a registered investment company involves greater responsibilities and risks than acting as a sub-adviser and observed that sub-advisory fees may be lower than those charged by the Adviser to each Fund. The Trustees also noted that the adviser, not the applicable registered investment company, typically bears the sub-advisory fee and that many responsibilities related to the advisory function are typically retained by the primary adviser. The Trustees concluded that the fee rates charged to each Fund in comparison to those charged to the Adviser’s other clients were reasonable.
Investment Performance
The Trustees receive and consider information about each Fund’s performance throughout the year. In addition, the Trustees received and considered absolute and/or relative performance information for the Funds in a report prepared by Broadridge. The Trustees considered the total return performance information, which included the ranking of the Funds within a performance universe comprised of funds’ selected share classes with the same Broadridge investment classification and objective (the “Universe”), by total return for the applicable one-, three- and five-year periods. The Trustees reviewed a description of Broadridge’s methodology for selecting mutual funds in each Fund’s Universe, and noted that Universe quintile rankings were not calculated if the number of funds in the Universe did not meet a predetermined minimum. The Trustees also considered enhancements to the methodology employed by Broadridge for identifying funds in the Peer Groups for Class I shares, based upon discussions with the Adviser, Broadridge and certain Trustees in advance of, and in preparation for, the June meeting. The Broadridge materials provided to the Trustees highlighted information with respect to certain representative classes to assist the Trustees in their review. As part of this review, the Trustees also reviewed each Fund’s performance against its benchmark and considered the performance information provided for the Funds at regular Board meetings by the Adviser and the Trustees’ independent consultant and also considered the special analysis prepared for the Funds by the Trustees’ independent consultant. The Trustees also engaged with the Adviser to consider what steps might be taken to improve performance, as applicable. The Broadridge performance data noted by the Trustees as part of their review and the determinations made by the Trustees with respect to each Fund’s performance for certain representative classes are summarized below:
The Trustees noted that the Small Cap Blend Fund’s performance for Class A shares was in the fourth, fourth and second quintiles of the Universe for the one-, three- and five-year periods ended December 31, 2023, respectively. The Trustees noted that the performance for Class I shares was in the fourth, fifth and second quintiles of the Universe for the one-, three- and five-year periods ended December 31, 2023, respectively. The Trustees noted that the performance for Class R6 shares was in the fourth, fifth and second quintiles of the Universe for the one-, three- and five-year periods ended December 31, 2023, respectively. The Trustees discussed the performance and investment strategy of the Fund with the Adviser and reviewed the performance analysis and evaluation prepared by the independent consultant. Based upon these discussions and various other factors, the Trustees concluded that the Fund’s performance was satisfactory under the circumstances.
The Trustees noted that the Small Cap Equity Fund’s performance for Class A shares was in the fifth, fourth and third quintiles of the Universe for the one-, three- and five-year periods ended December 31, 2023, respectively. The Trustees noted that the performance for Class I shares was in the fifth, fifth and fourth quintiles of the Universe for the one-, three- and five-year periods ended December 31, 2023, respectively. The Trustees noted that the performance for Class R6 shares was in the fifth, fifth and third quintiles of the Universe for the one-, three- and five-year periods ended December 31, 2023, respectively. The Trustees discussed the performance and investment strategy of the Fund with the Adviser and reviewed the performance analysis and evaluation prepared by the independent consultant. Based upon these discussions and various other factors, the Trustees concluded that the Fund’s performance was satisfactory under the circumstances. The Trustees requested, however, that the Fund’s Adviser provide additional Fund performance information to be reviewed with the members of the Equity Committee at each of their regular meetings over the course of the next year.
The Trustees noted that the Small Cap Growth Fund’s performance for Class A and Class I shares was in the fourth, fifth and fourth quintiles of the Universe for the one-, three- and five-year periods ended December 31, 2023, respectively. The Trustees noted that the performance for Class R6 shares was in the fourth, fifth and third quintiles of the Universe for the one-, three- and five-year periods ended December 31, 2023, respectively. The Trustees discussed the performance and investment strategy of the Fund with the Adviser and reviewed the performance analysis and evaluation prepared by the independent consultant. Based upon these discussions and various other factors, the Trustees concluded that the Fund’s performance was satisfactory under the circumstances. The Trustees requested, however, that the Fund’s Adviser provide additional Fund performance information to be reviewed with the members of the Equity Committee at each of their regular meetings over the course of the next year.
The Trustees noted that the Small Cap Value Fund’s performance for Class A, Class I and Class R6 shares was in the fourth quintile of each of the Universe for the one-, three- and five-year periods ended December 31, 2023. The Trustees discussed the performance and investment strategy of the Fund with the Adviser and reviewed the performance analysis and evaluation prepared by the independent consultant. Based upon these discussions and various other factors, the Trustees concluded that the Fund’s performance was satisfactory under the circumstances.
The Trustees noted that the SMID Cap Equity Fund’s performance for Class A and Class R6 shares was in the fourth, fourth and fifth quintiles of the Universe for the one-, three- and five-year periods ended December 31, 2023, respectively. The Trustees noted that the performance for Class I shares was in
the fourth, fifth and fifth quintiles of the Universe for the one-, three- and five-year periods ended December 31, 2023, respectively. The Trustees discussed the performance and investment strategy of the Fund with the Adviser and reviewed the performance analysis and evaluation prepared by the independent consultant. Based upon these discussions and various other factors, the Trustees concluded that the Fund’s performance was satisfactory under the circumstances. The Trustees requested, however, that the Fund’s Adviser provide additional Fund performance information to be reviewed with the members of the Equity Committee at each of their regular meetings over the course of the next year.
The Trustees noted that the U.S. Small Company Fund’s performance for Class A and Class R6 shares was in the fourth, third and third quintiles of the Universe for the one-, three- and five-year periods ended December 31, 2023, respectively. The Trustees noted that the performance for Class I shares was in the fourth, fourth and third quintiles of the Universe for the one-, three- and five-year periods ended December 31, 2023, respectively. The Trustees discussed the performance and investment strategy of the Fund with the Adviser and reviewed the performance analysis and evaluation prepared by the independent consultant. Based upon these discussions and various other factors, the Trustees concluded that the Fund’s performance was satisfactory under the circumstances.
Advisory Fees and Expense Ratios
The Trustees considered the contractual advisory fee rate and administration fee rate paid by each Fund to the Adviser and compared the combined rate to the information prepared by Broadridge concerning management fee rates paid by other funds’ selected share classes in the Universe, as well as a subset of funds within the Universe (the “Peer Group”). The Trustees recognized that Broadridge reported each Fund’s management fee rate as the combined contractual advisory fee and administration fee rates. The Trustees also reviewed information about other expenses and the expense ratios for each Fund and noted that Universe and Peer Group quintile rankings were not calculated if the number of funds in the Universe and/or Peer Groups did not meet a predetermined minimum. For each Fund that had a Fee Cap in place, the Trustees considered the net advisory fee rate and net expense ratio for each share class, as applicable, taking into account any waivers and/or reimbursements. The Trustees recognized that it can be difficult to make comparisons of advisory fees because there are variations in the services that are included in the fees paid by other funds. The Trustees’ determinations as a result of the review of each Fund’s advisory fees and expense ratios for certain representative classes are summarized below:
The Trustees noted that the Small Cap Blend Fund’s net advisory fee for Class A shares was in the first and second quintiles of the Peer Group and Universe, respectively, and that the actual total expenses for Class A shares were in the third
quintile of both the Peer Group and Universe. The Trustees noted that the net advisory fee for Class I shares was in the second quintile of both the Peer Group and Universe, and that the actual total expenses for Class I shares were in the third and fourth quintiles of the Peer Group and Universe, respectively. The Trustees noted that the net advisory fee for Class R6 shares was in the first and second quintile of the Peer Group and Universe, respectively, and that the actual total expenses for Class R6 shares were in the first quintile of both the Peer Group and Universe. After considering the factors identified above, in light of this information, the Trustees concluded that the advisory fee was fair and reasonable in light of the services provided to the Fund.
The Trustees noted that the Small Cap Equity Fund’s net advisory fee for Class A shares was in the second and third quintiles of the Peer Group and Universe, respectively, and that the actual total expenses for Class A shares were in the fourth and third quintiles of the Peer Group and Universe, respectively. The Trustees noted that the net advisory fee for Class I shares was in the third quintile of both the Peer Group and Universe, and that the actual total expenses for Class I shares were in the fourth quintile of both the Peer Group and Universe. The Trustees noted that the net advisory fee for Class R6 shares was in the second and third quintiles of the Peer Group and Universe, respectively, and that the actual total expenses for Class R6 shares were in the second and first quintiles of the Peer Group and Universe, respectively. After considering the factors identified above, in light of this information, the Trustees concluded that the advisory fee was fair and reasonable in light of the services provided to the Fund.
The Trustees noted that the Small Cap Growth Fund’s net advisory fee for Class A shares was in the second quintile of both the Peer Group and Universe, and that the actual total expenses were in the third quintile of both the Peer Group and Universe. The Trustees noted that the net advisory fee for Class I shares was in the second quintiles of both the Peer Group and Universe, and that the actual total expenses were in the fourth and third quintiles of the Peer Group and Universe, respectively. The Trustees noted that the net advisory fee for Class R6 shares was in the second quintile of both the Peer Group and Universe, and that the actual total expenses for Class R6 shares were in the second and first quintiles of the Peer Group and Universe, respectively. After considering the factors identified above, in light of this information, in light of this information, the Trustees concluded that the advisory fee was fair and reasonable in light of the services provided to the Fund.
The Trustees noted that the Small Cap Value Fund’s net advisory fee for Class A shares was in the second quintile of both the Peer Group and Universe, and that the actual total
expenses for Class A shares were in the third and second quintiles of the Peer Group and Universe, respectively. The Trustees noted that the net advisory fee for Class I shares was in the second quintile of both the Peer Group and Universe, and that the actual total expenses for Class I shares were in the second and third quintiles of the Peer Group and Universe, respectively. The Trustees noted that the net advisory fee for Class R6 shares was in the third and second quintiles of the Peer Group and Universe, respectively, and that the actual total expenses for Class R6 shares were in the second and first quintiles of the Peer Group and Universe, respectively. After considering the factors identified above, in light of this information, the Trustees concluded that the advisory fee was fair and reasonable in light of the services provided to the Fund.
The Trustees noted that the SMID Cap Equity Fund’s net advisory fee for Class A shares was in the second quintile of both the Peer Group and Universe, and that the actual total expenses for Class A shares were in the first and second quintiles of the Peer Group and Universe, respectively. The Trustees noted that the net advisory fee for Class I shares was in the first quintile of both the Peer Group and Universe, and that the actual total expenses for Class I shares were in the first and second quintiles of the Peer Group and Universe, respectively. The Trustees noted that the net advisory fee and actual total expenses for Class R6 shares were both in the first quintile of both the Peer Group and Universe. After considering the factors identified above, in light of this information, the Trustees concluded that the advisory fee was fair and reasonable in light of the services provided to the Fund.
The Trustees noted that the U.S. Small Company Fund’s net advisory fee for Class A shares was in the first and second quintiles of the Peer Group and Universe, respectively, and that the actual total expenses for Class A shares were in the third and second quintiles of the Peer Group and Universe, respectively. The Trustees noted that the net advisory fee for Class I shares was in the first and second quintiles of the Peer Group and Universe, respectively, and that the actual total expenses for Class I shares were in the third quintile of both the Peer Group and Universe, respectively. The Trustees noted that the net advisory fee for Class R6 shares was in the first and second quintiles of the Peer Group and Universe, respectively, and that the actual total expenses for Class R6 shares were in the first quintile of both the Peer Group and Universe. After considering the factors identified above, in light of this information, the Trustees concluded that the advisory fee was fair and reasonable in light of the services provided to the Fund.
Semi-Annual Financial Statements
J.P. Morgan Investor Funds
December 31, 2024 (Unaudited)
JPMorgan Investor Balanced Fund |
JPMorgan Investor Conservative Growth Fund |
JPMorgan Investor Growth Fund |
JPMorgan Investor Growth & Income Fund |
CONTENTS
Investments in a Fund are not deposits or obligations of, or guaranteed or endorsed by, any bank and are not insured or guaranteed by the FDIC, the Federal Reserve Board or any other government agency. You could lose money if you sell when a Fund’s share price is lower than when you invested.
Past performance is no guarantee of future performance. The general market views expressed in this report are opinions based on market and other conditions through the end of the reporting period and are subject to change without notice. These views are not intended to predict the future performance of a Fund or the securities markets.
Prospective investors should refer to the Funds’ prospectuses for a discussion of the Funds’ investment objectives, strategies and risks. Call J.P. Morgan Funds Service Center at 1-800-480-4111 for a prospectus containing more complete information about a Fund, including management fees and other expenses. Please read it carefully before investing.
JPMorgan Investor Balanced Fund
SCHEDULE OF PORTFOLIO INVESTMENTSAS OF December 31, 2024 (Unaudited)
| | |
Investment Companies — 86.7% |
Alternative Assets — 0.8% |
JPMorgan Unconstrained Debt Fund Class R6 Shares (a) | | |
|
JPMorgan Core Bond Fund Class R6 Shares (a) | | |
JPMorgan Core Plus Bond Fund Class R6 Shares (a) | | |
JPMorgan Emerging Markets Debt Fund Class R6 Shares (a) | | |
JPMorgan High Yield Fund Class R6 Shares (a) | | |
JPMorgan Income Fund Class R6 Shares (a) | | |
JPMorgan Short Duration Core Plus Fund Class R6 Shares (a) | | |
| | |
International Equity — 5.0% |
JPMorgan Emerging Markets Equity Fund Class R6 Shares (a) | | |
JPMorgan Emerging Markets Research Enhanced Equity Fund Class R6 Shares (a) | | |
JPMorgan Europe Dynamic Fund Class R6 Shares (a) | | |
JPMorgan International Equity Fund Class R6 Shares (a) | | |
Total International Equity | | |
|
JPMorgan Equity Income Fund Class R6 Shares (a) | | |
JPMorgan Large Cap Growth Fund Class R6 Shares (a) | | |
JPMorgan Large Cap Value Fund Class R6 Shares (a) | | |
JPMorgan Mid Cap Growth Fund Class R6 Shares * (a) | | |
JPMorgan Small Cap Equity Fund Class R6 Shares (a) | | |
JPMorgan Small Cap Value Fund Class R6 Shares (a) | | |
JPMorgan U.S. Equity Fund Class R6 Shares (a) | | |
JPMorgan U.S. GARP Equity Fund Class R6 Shares (a) | | |
JPMorgan U.S. Research Enhanced Equity Fund Class R6 Shares (a) | | |
JPMorgan Value Advantage Fund Class R6 Shares (a) | | |
| | |
Total Investment Companies
(Cost $3,867,792) | | |
Exchange-Traded Funds — 12.5% |
|
JPMorgan Limited Duration Bond ETF (a) | | |
| | |
|
International Equity — 6.7% |
JPMorgan Global Select Equity ETF (a) | | |
JPMorgan International Research Enhanced Equity ETF (a) | | |
Total International Equity | | |
|
JPMorgan Small & Mid Cap Enhanced Equity ETF (a) | | |
Total Exchange-Traded Funds
(Cost $544,418) | | |
Short-Term Investments — 1.2% |
Investment Companies — 1.2% |
JPMorgan U.S. Government Money Market Fund Class IM Shares, 4.44% (a) (b)
(Cost $67,324) | | |
Total Investments — 100.4%
(Cost $4,479,534) | | |
Liabilities in Excess of Other Assets — (0.4)% | | |
| | |
Percentages indicated are based on net assets. |
| Non-income producing security. |
| Investment in an affiliated fund, which is registered under the Investment Company Act of 1940, as amended, and is advised by J.P. Morgan Investment Management Inc. |
| The rate shown is the current yield as of December 31, 2024. |
Detailed information about investment portfolios of the Underlying Funds, as defined in the Notes to Financial Statements, and ETFs can be found in the financial statements filed with the Securities and Exchange Commission (SEC) by each such underlying fund semi-annually on Form N-CSR and in portfolio holdings filed quarterly on Form N-PORT, and are available for download from both the SEC’s as well as each respective underlying fund’s website. Detailed information about Underlying J.P. Morgan Funds can also be found at www.jpmorganfunds.com or by calling 1-800-480-4111.
SEE NOTES TO FINANCIAL STATEMENTS.
| J.P. Morgan Investor Funds | |
JPMorgan Investor Conservative Growth Fund
SCHEDULE OF PORTFOLIO INVESTMENTSAS OF December 31, 2024 (Unaudited)
| | |
Investment Companies — 86.8% |
Alternative Assets — 1.0% |
JPMorgan Unconstrained Debt Fund Class R6 Shares (a) | | |
|
JPMorgan Core Bond Fund Class R6 Shares (a) | | |
JPMorgan Core Plus Bond Fund Class R6 Shares (a) | | |
JPMorgan Emerging Markets Debt Fund Class R6 Shares (a) | | |
JPMorgan Government Bond Fund Class R6 Shares (a) | | |
JPMorgan High Yield Fund Class R6 Shares (a) | | |
JPMorgan Income Fund Class R6 Shares (a) | | |
JPMorgan Short Duration Core Plus Fund Class R6 Shares (a) | | |
| | |
International Equity — 3.4% |
JPMorgan Emerging Markets Equity Fund Class R6 Shares (a) | | |
JPMorgan Emerging Markets Research Enhanced Equity Fund Class R6 Shares (a) | | |
JPMorgan Europe Dynamic Fund Class R6 Shares (a) | | |
JPMorgan International Equity Fund Class R6 Shares (a) | | |
Total International Equity | | |
|
JPMorgan Equity Income Fund Class R6 Shares (a) | | |
JPMorgan Large Cap Growth Fund Class R6 Shares (a) | | |
JPMorgan Large Cap Value Fund Class R6 Shares (a) | | |
JPMorgan Mid Cap Growth Fund Class R6 Shares * (a) | | |
JPMorgan Small Cap Equity Fund Class R6 Shares (a) | | |
JPMorgan Small Cap Value Fund Class R6 Shares (a) | | |
JPMorgan U.S. Equity Fund Class R6 Shares (a) | | |
JPMorgan U.S. GARP Equity Fund Class R6 Shares (a) | | |
JPMorgan U.S. Research Enhanced Equity Fund Class R6 Shares (a) | | |
JPMorgan Value Advantage Fund Class R6 Shares (a) | | |
| | |
Total Investment Companies
(Cost $3,215,650) | | |
| | |
Exchange-Traded Funds — 12.0% |
|
JPMorgan Limited Duration Bond ETF (a) | | |
International Equity — 5.2% |
JPMorgan Global Select Equity ETF (a) | | |
JPMorgan International Research Enhanced Equity ETF (a) | | |
Total International Equity | | |
|
JPMorgan Small & Mid Cap Enhanced Equity ETF (a) | | |
Total Exchange-Traded Funds
(Cost $406,054) | | |
Short-Term Investments — 2.0% |
Investment Companies — 2.0% |
JPMorgan U.S. Government Money Market Fund Class IM Shares, 4.44% (a) (b)
(Cost $79,846) | | |
Total Investments — 100.8%
(Cost $3,701,550) | | |
Liabilities in Excess of Other Assets — (0.8)% | | |
| | |
Percentages indicated are based on net assets. |
| Non-income producing security. |
| Investment in an affiliated fund, which is registered under the Investment Company Act of 1940, as amended, and is advised by J.P. Morgan Investment Management Inc. |
| The rate shown is the current yield as of December 31, 2024. |
Detailed information about investment portfolios of the Underlying Funds, as defined in the Notes to Financial Statements, and ETFs can be found in the financial statements filed with the Securities and Exchange Commission (SEC) by each such underlying fund semi-annually on Form N-CSR and in portfolio holdings filed quarterly on Form N-PORT, and are available for download from both the SEC’s as well as each respective underlying fund’s website. Detailed information about Underlying J.P. Morgan Funds can also be found at www.jpmorganfunds.com or by calling 1-800-480-4111.
SEE NOTES TO FINANCIAL STATEMENTS.
| J.P. Morgan Investor Funds | |
JPMorgan Investor Growth Fund
SCHEDULE OF PORTFOLIO INVESTMENTSAS OF December 31, 2024 (Unaudited)
| | |
Investment Companies — 84.2% |
|
JPMorgan Core Bond Fund Class R6 Shares (a) | | |
JPMorgan Core Plus Bond Fund Class R6 Shares (a) | | |
JPMorgan Emerging Markets Debt Fund Class R6 Shares (a) | | |
JPMorgan High Yield Fund Class R6 Shares (a) | | |
JPMorgan Income Fund Class R6 Shares (a) | | |
| | |
International Equity — 13.0% |
JPMorgan Emerging Markets Equity Fund Class R6 Shares (a) | | |
JPMorgan Emerging Markets Research Enhanced Equity Fund Class R6 Shares (a) | | |
JPMorgan Europe Dynamic Fund Class R6 Shares (a) | | |
JPMorgan International Equity Fund Class R6 Shares (a) | | |
JPMorgan International Focus Fund Class R6 Shares (a) | | |
Total International Equity | | |
|
JPMorgan Equity Income Fund Class R6 Shares (a) | | |
JPMorgan Large Cap Growth Fund Class R6 Shares (a) | | |
JPMorgan Large Cap Value Fund Class R6 Shares (a) | | |
JPMorgan Mid Cap Growth Fund Class R6 Shares * (a) | | |
JPMorgan Small Cap Equity Fund Class R6 Shares (a) | | |
JPMorgan Small Cap Value Fund Class R6 Shares (a) | | |
JPMorgan U.S. Equity Fund Class R6 Shares (a) | | |
JPMorgan U.S. GARP Equity Fund Class R6 Shares (a) | | |
JPMorgan U.S. Research Enhanced Equity Fund Class R6 Shares (a) | | |
JPMorgan Value Advantage Fund Class R6 Shares (a) | | |
| | |
Total Investment Companies
(Cost $3,205,618) | | |
Exchange-Traded Funds — 14.6% |
International Equity — 10.0% |
JPMorgan Global Select Equity ETF (a) | | |
JPMorgan International Research Enhanced Equity ETF (a) | | |
Total International Equity | | |
| | |
|
|
JPMorgan Small & Mid Cap Enhanced Equity ETF (a) | | |
Total Exchange-Traded Funds
(Cost $693,148) | | |
Short-Term Investments — 1.7% |
Investment Companies — 1.7% |
JPMorgan U.S. Government Money Market Fund Class IM Shares, 4.44% (a) (b)
(Cost $97,266) | | |
Total Investments — 100.5%
(Cost $3,996,032) | | |
Liabilities in Excess of Other Assets — (0.5)% | | |
| | |
Percentages indicated are based on net assets. |
| Non-income producing security. |
| Investment in an affiliated fund, which is registered under the Investment Company Act of 1940, as amended, and is advised by J.P. Morgan Investment Management Inc. |
| The rate shown is the current yield as of December 31, 2024. |
Detailed information about investment portfolios of the Underlying Funds, as defined in the Notes to Financial Statements, and ETFs can be found in the financial statements filed with the Securities and Exchange Commission (SEC) by each such underlying fund semi-annually on Form N-CSR and in portfolio holdings filed quarterly on Form N-PORT, and are available for download from both the SEC’s as well as each respective underlying fund’s website. Detailed information about Underlying J.P. Morgan Funds can also be found at www.jpmorganfunds.com or by calling 1-800-480-4111.
SEE NOTES TO FINANCIAL STATEMENTS.
| J.P. Morgan Investor Funds | |
JPMorgan Investor Growth & Income Fund
SCHEDULE OF PORTFOLIO INVESTMENTSAS OF December 31, 2024 (Unaudited)
| | |
Investment Companies — 87.2% |
|
JPMorgan Core Bond Fund Class R6 Shares (a) | | |
JPMorgan Core Plus Bond Fund Class R6 Shares (a) | | |
JPMorgan Emerging Markets Debt Fund Class R6 Shares (a) | | |
JPMorgan High Yield Fund Class R6 Shares (a) | | |
JPMorgan Income Fund Class R6 Shares (a) | | |
JPMorgan Short Duration Core Plus Fund Class R6 Shares (a) | | |
| | |
International Equity — 8.1% |
JPMorgan Emerging Markets Equity Fund Class R6 Shares (a) | | |
JPMorgan Emerging Markets Research Enhanced Equity Fund Class R6 Shares (a) | | |
JPMorgan Europe Dynamic Fund Class R6 Shares (a) | | |
JPMorgan International Equity Fund Class R6 Shares (a) | | |
JPMorgan International Focus Fund Class R6 Shares (a) | | |
Total International Equity | | |
|
JPMorgan Equity Income Fund Class R6 Shares (a) | | |
JPMorgan Large Cap Growth Fund Class R6 Shares (a) | | |
JPMorgan Large Cap Value Fund Class R6 Shares (a) | | |
JPMorgan Mid Cap Growth Fund Class R6 Shares * (a) | | |
JPMorgan Small Cap Equity Fund Class R6 Shares (a) | | |
JPMorgan Small Cap Value Fund Class R6 Shares (a) | | |
JPMorgan U.S. Equity Fund Class R6 Shares (a) | | |
JPMorgan U.S. GARP Equity Fund Class R6 Shares (a) | | |
JPMorgan U.S. Research Enhanced Equity Fund Class R6 Shares (a) | | |
JPMorgan Value Advantage Fund Class R6 Shares (a) | | |
| | |
Total Investment Companies
(Cost $3,049,392) | | |
Exchange-Traded Funds — 11.6% |
|
JPMorgan Limited Duration Bond ETF (a) | | |
| | |
|
International Equity — 6.9% |
JPMorgan Global Select Equity ETF (a) | | |
JPMorgan International Research Enhanced Equity ETF (a) | | |
Total International Equity | | |
|
JPMorgan Small & Mid Cap Enhanced Equity ETF (a) | | |
Total Exchange-Traded Funds
(Cost $443,354) | | |
Short-Term Investments — 1.4% |
Investment Companies — 1.4% |
JPMorgan U.S. Government Money Market Fund Class IM Shares, 4.44% (a) (b)
(Cost $66,856) | | |
Total Investments — 100.2%
(Cost $3,559,602) | | |
Liabilities in Excess of Other Assets — (0.2)% | | |
| | |
Percentages indicated are based on net assets. |
| Non-income producing security. |
| Investment in an affiliated fund, which is registered under the Investment Company Act of 1940, as amended, and is advised by J.P. Morgan Investment Management Inc. |
| The rate shown is the current yield as of December 31, 2024. |
Detailed information about investment portfolios of the Underlying Funds, as defined in the Notes to Financial Statements, and ETFs can be found in the financial statements filed with the Securities and Exchange Commission (SEC) by each such underlying fund semi-annually on Form N-CSR and in portfolio holdings filed quarterly on Form N-PORT, and are available for download from both the SEC’s as well as each respective underlying fund’s website. Detailed information about Underlying J.P. Morgan Funds can also be found at www.jpmorganfunds.com or by calling 1-800-480-4111.
SEE NOTES TO FINANCIAL STATEMENTS.
| J.P. Morgan Investor Funds | |
STATEMENTS OF ASSETS AND LIABILITIESAS OF December 31, 2024 (Unaudited)
(Amounts in thousands, except per share amounts)
| JPMorgan
Investor
Balanced Fund | JPMorgan
Investor
Conservative
Growth Fund | JPMorgan
Investor
Growth
Fund | |
| | | | |
Investments in affiliates, at value | | | | |
| | | | |
| | | | |
| | | | |
Dividends from affiliates | | | | |
| | | | |
| | | | |
| | | | |
| | | | |
| | | | |
Investment securities purchased | | | | |
| | | | |
| | | | |
| | | | |
| | | | |
| | | | |
Custodian and accounting fees | | | | |
Trustees’ and Chief Compliance Officer’s fees | | | | |
| | | | |
| | | | |
| | | | |
(a)
Amount rounds to less than one thousand.
SEE NOTES TO FINANCIAL STATEMENTS.
| J.P. Morgan Investor Funds | |
STATEMENTS OF ASSETS AND LIABILITIESAS OF December 31, 2024 (Unaudited) (continued)
(Amounts in thousands, except per share amounts)
| JPMorgan Investor Balanced Fund | JPMorgan Investor Conservative Growth Fund | JPMorgan Investor Growth Fund | |
| | | | |
| | | | |
Total distributable earnings (loss) | | | | |
| | | | |
| | | | |
| | | | |
| | | | |
| | | | |
| | | | |
| | | | |
Outstanding units of beneficial interest (shares)
($0.0001 par value; unlimited number of shares authorized): | | | | |
| | | | |
| | | | |
| | | | |
| | | | |
| | | | |
Class A — Redemption price per share | | | | |
Class C — Offering price per share (b) | | | | |
Class I — Offering and redemption price per share | | | | |
Class R6 — Offering and redemption price per share | | | | |
Class A maximum sales charge | | | | |
Class A maximum public offering price per share
[net asset value per share/(100% – maximum sales charge)] | | | | |
Cost of investments in affiliates | | | | |
(a)
Per share amounts may not recalculate due to rounding of net assets and/or shares outstanding.
(b)
Redemption price for Class C Shares varies based upon length of time the shares are held.
SEE NOTES TO FINANCIAL STATEMENTS.
| J.P. Morgan Investor Funds | |
STATEMENTS OF OPERATIONSFOR THE SIX MONTHS ENDED December 31, 2024 (Unaudited)
(Amounts in thousands)
| JPMorgan
Investor
Balanced Fund | JPMorgan
Investor
Conservative
Growth Fund | JPMorgan
Investor
Growth
Fund | JPMorgan
Investor
Growth &
Income Fund |
| | | | |
Interest income from affiliates | | | | |
Dividend income from affiliates | | | | |
| | | | |
| | | | |
| | | | |
| | | | |
| | | | |
| | | | |
| | | | |
| | | | |
| | | | |
| | | | |
Custodian and accounting fees | | | | |
| | | | |
Trustees’ and Chief Compliance Officer’s fees | | | | |
Printing and mailing costs | | | | |
Registration and filing fees | | | | |
Transfer agency fees (See Note 2.E.) | | | | |
| | | | |
| | | | |
| | | | |
| | | | |
Net investment income (loss) | | | | |
REALIZED/UNREALIZED GAINS (LOSSES): | | | | |
Net realized gain (loss) on transactions from investments in affiliates | | | | |
Distribution of capital gains received from investment company affiliates | | | | |
Change in net unrealized appreciation/depreciation on investments in affiliates | | | | |
Net realized/unrealized gains (losses) | | | | |
Change in net assets resulting from operations | | | | |
SEE NOTES TO FINANCIAL STATEMENTS.
| J.P. Morgan Investor Funds | |
STATEMENTS OF CHANGES IN NET ASSETSFOR THE PERIODS INDICATED
(Amounts in thousands)
| JPMorgan Investor Balanced Fund | JPMorgan Investor Conservative
Growth Fund |
| Six Months Ended
December 31, 2024
(Unaudited) | | Six Months Ended
December 31, 2024
(Unaudited) | |
CHANGE IN NET ASSETS RESULTING FROM OPERATIONS: | | | | |
Net investment income (loss) | | | | |
Net realized gain (loss) on investments in affiliates | | | | |
Distributions of capital gains received from investment company affiliates | | | | |
Change in net unrealized appreciation/depreciation of investments in affiliates | | | | |
Change in net assets resulting from operations | | | | |
DISTRIBUTIONS TO SHAREHOLDERS: | | | | |
| | | | |
| | | | |
| | | | |
| | | | |
Total distributions to shareholders | | | | |
| | | | |
Change in net assets resulting from capital transactions | | | | |
| | | | |
| | | | |
| | | | |
| | | | |
SEE NOTES TO FINANCIAL STATEMENTS.
| J.P. Morgan Investor Funds | |
| JPMorgan Investor Growth Fund | JPMorgan Investor Growth &
Income Fund |
| Six Months Ended
December 31, 2024
(Unaudited) | | Six Months Ended
December 31, 2024
(Unaudited) | |
CHANGE IN NET ASSETS RESULTING FROM OPERATIONS: | | | | |
Net investment income (loss) | | | | |
Net realized gain (loss) on investments in affiliates | | | | |
Distributions of capital gains received from investment company affiliates | | | | |
Change in net unrealized appreciation/depreciation of investments in affiliates | | | | |
Change in net assets resulting from operations | | | | |
DISTRIBUTIONS TO SHAREHOLDERS: | | | | |
| | | | |
| | | | |
| | | | |
| | | | |
Total distributions to shareholders | | | | |
| | | | |
Change in net assets resulting from capital transactions | | | | |
| | | | |
| | | | |
| | | | |
| | | | |
SEE NOTES TO FINANCIAL STATEMENTS.
| J.P. Morgan Investor Funds | |
STATEMENTS OF CHANGES IN NET ASSETSFOR THE PERIODS INDICATED (continued)
(Amounts in thousands)
| JPMorgan Investor Balanced Fund | JPMorgan Investor Conservative
Growth Fund |
| Six Months Ended December 31, 2024
(Unaudited) | | Six Months Ended December 31, 2024
(Unaudited) | |
| | | | |
| | | | |
Proceeds from shares issued | | | | |
| | | | |
| | | | |
Change in net assets resulting from Class A capital transactions | | | | |
| | | | |
Proceeds from shares issued | | | | |
| | | | |
| | | | |
Change in net assets resulting from Class C capital transactions | | | | |
| | | | |
Proceeds from shares issued | | | | |
| | | | |
| | | | |
Change in net assets resulting from Class I capital transactions | | | | |
| | | | |
Proceeds from shares issued | | | | |
| | | | |
| | | | |
Change in net assets resulting from Class R6 capital transactions | | | | |
Total change in net assets resulting from capital transactions | | | | |
| | | | |
| | | | |
| | | | |
| | | | |
| | | | |
| | | | |
| | | | |
| | | | |
| | | | |
| | | | |
| | | | |
| | | | |
| | | | |
| | | | |
| | | | |
| | | | |
SEE NOTES TO FINANCIAL STATEMENTS.
| J.P. Morgan Investor Funds | |
| JPMorgan Investor Balanced Fund | JPMorgan Investor Conservative Growth Fund |
| Six Months Ended December 31, 2024 (Unaudited) | | Six Months Ended December 31, 2024 (Unaudited) | |
SHARE TRANSACTIONS: (continued) | | | | |
| | | | |
| | | | |
| | | | |
| | | | |
Change in Class R6 Shares | | | | |
SEE NOTES TO FINANCIAL STATEMENTS.
| J.P. Morgan Investor Funds | |
STATEMENTS OF CHANGES IN NET ASSETSFOR THE PERIODS INDICATED (continued)
(Amounts in thousands)
| JPMorgan Investor Growth Fund | JPMorgan Investor Growth &
Income Fund |
| Six Months Ended December 31, 2024
(Unaudited) | | Six Months Ended December 31, 2024
(Unaudited) | |
| | | | |
| | | | |
Proceeds from shares issued | | | | |
| | | | |
| | | | |
Change in net assets resulting from Class A capital transactions | | | | |
| | | | |
Proceeds from shares issued | | | | |
| | | | |
| | | | |
Change in net assets resulting from Class C capital transactions | | | | |
| | | | |
Proceeds from shares issued | | | | |
| | | | |
| | | | |
Change in net assets resulting from Class I capital transactions | | | | |
| | | | |
Proceeds from shares issued | | | | |
| | | | |
| | | | |
Change in net assets resulting from Class R6 capital transactions | | | | |
Total change in net assets resulting from capital transactions | | | | |
| | | | |
| | | | |
| | | | |
| | | | |
| | | | |
| | | | |
| | | | |
| | | | |
| | | | |
| | | | |
| | | | |
| | | | |
| | | | |
| | | | |
| | | | |
| | | | |
SEE NOTES TO FINANCIAL STATEMENTS.
| J.P. Morgan Investor Funds | |
| JPMorgan Investor Growth Fund | JPMorgan Investor Growth & Income Fund |
| Six Months Ended December 31, 2024 (Unaudited) | | Six Months Ended December 31, 2024 (Unaudited) | |
SHARE TRANSACTIONS: (continued) | | | | |
| | | | |
| | | | |
| | | | |
| | | | |
Change in Class R6 Shares | | | | |
SEE NOTES TO FINANCIAL STATEMENTS.
| J.P. Morgan Investor Funds | |
FINANCIAL HIGHLIGHTSFOR THE PERIODS INDICATED
| Per share operating performance |
| | | |
| Net asset
value,
beginning
of period | Net
investment
income
(loss)(b)(c) | Net realized
and unrealized
gains
(losses) on
investments | Total from
investment
operations | | | |
JPMorgan Investor Balanced Fund | | | | | | | |
| | | | | | | |
Six Months Ended December 31, 2024 (Unaudited) | | | | | | | |
| | | | | | | |
| | | | | | | |
| | | | | | | |
| | | | | | | |
| | | | | | | |
| | | | | | | |
Six Months Ended December 31, 2024 (Unaudited) | | | | | | | |
| | | | | | | |
| | | | | | | |
| | | | | | | |
| | | | | | | |
| | | | | | | |
| | | | | | | |
Six Months Ended December 31, 2024 (Unaudited) | | | | | | | |
| | | | | | | |
| | | | | | | |
| | | | | | | |
| | | | | | | |
| | | | | | | |
| | | | | | | |
Six Months Ended December 31, 2024 (Unaudited) | | | | | | | |
| | | | | | | |
| | | | | | | |
| | | | | | | |
| | | | | | | |
| | | | | | | |
| | | | | | | |
|
| Annualized for periods less than one year, unless otherwise noted. |
| Net investment income (loss) is affected by the timing of distributions from Underlying Funds. |
| Calculated based upon average shares outstanding. |
| Not annualized for periods less than one year. |
| Includes adjustments in accordance with accounting principles generally accepted in the United States of America and as such, the net asset values for financial reporting purposes and the returns based upon those net asset values may differ from the net asset values and returns for shareholder transactions. |
| Includes interest expense, if applicable, which is less than 0.005% unless otherwise noted. |
| Does not include expenses of Underlying Funds. |
SEE NOTES TO FINANCIAL STATEMENTS.
| J.P. Morgan Investor Funds | |
FINANCIAL HIGHLIGHTSFOR THE PERIODS INDICATED
| |
| | | Ratios to average net assets(a) |
Net asset
value,
end of
period | Total return
(excludes
sales charge)(d)(e) | Net assets,
end of
period
(000's) | | Net
investment
income
(loss) | Expenses without
waivers and
reimbursements(g) | |
| | | | | | |
| | | | | | |
| | | | | | |
| | | | | | |
| | | | | | |
| | | | | | |
| | | | | | |
| | | | | | |
| | | | | | |
| | | | | | |
| | | | | | |
| | | | | | |
| | | | | | |
| | | | | | |
| | | | | | |
| | | | | | |
| | | | | | |
| | | | | | |
| | | | | | |
| | | | | | |
| | | | | | |
| | | | | | |
| | | | | | |
| | | | | | |
| | | | | | |
| | | | | | |
| | | | | | |
| | | | | | |
| | | | | | |
| | | | | | |
SEE NOTES TO FINANCIAL STATEMENTS.
| J.P. Morgan Investor Funds | |
FINANCIAL HIGHLIGHTSFOR THE PERIODS INDICATED (continued)
| Per share operating performance |
| | | |
| Net asset
value,
beginning
of period | Net
investment
income
(loss)(b)(c) | Net realized
and unrealized
gains
(losses) on
investments | Total from
investment
operations | | | |
JPMorgan Investor Conservative Growth Fund | | | | | | | |
| | | | | | | |
Six Months Ended December 31, 2024 (Unaudited) | | | | | | | |
| | | | | | | |
| | | | | | | |
| | | | | | | |
| | | | | | | |
| | | | | | | |
| | | | | | | |
Six Months Ended December 31, 2024 (Unaudited) | | | | | | | |
| | | | | | | |
| | | | | | | |
| | | | | | | |
| | | | | | | |
| | | | | | | |
| | | | | | | |
Six Months Ended December 31, 2024 (Unaudited) | | | | | | | |
| | | | | | | |
| | | | | | | |
| | | | | | | |
| | | | | | | |
| | | | | | | |
| | | | | | | |
Six Months Ended December 31, 2024 (Unaudited) | | | | | | | |
| | | | | | | |
| | | | | | | |
| | | | | | | |
| | | | | | | |
| | | | | | | |
| | | | | | | |
|
| Annualized for periods less than one year, unless otherwise noted. |
| Net investment income (loss) is affected by the timing of distributions from Underlying Funds. |
| Calculated based upon average shares outstanding. |
| Not annualized for periods less than one year. |
| Includes adjustments in accordance with accounting principles generally accepted in the United States of America and as such, the net asset values for financial reporting purposes and the returns based upon those net asset values may differ from the net asset values and returns for shareholder transactions. |
| Includes interest expense, if applicable, which is less than 0.005% unless otherwise noted. |
| Does not include expenses of Underlying Funds. |
SEE NOTES TO FINANCIAL STATEMENTS.
| J.P. Morgan Investor Funds | |
FINANCIAL HIGHLIGHTSFOR THE PERIODS INDICATED
| |
| | | Ratios to average net assets(a) |
Net asset
value,
end of
period | Total return
(excludes
sales charge)(d)(e) | Net assets,
end of
period
(000's) | | Net
investment
income
(loss) | Expenses without
waivers and
reimbursements(g) | |
| | | | | | |
| | | | | | |
| | | | | | |
| | | | | | |
| | | | | | |
| | | | | | |
| | | | | | |
| | | | | | |
| | | | | | |
| | | | | | |
| | | | | | |
| | | | | | |
| | | | | | |
| | | | | | |
| | | | | | |
| | | | | | |
| | | | | | |
| | | | | | |
| | | | | | |
| | | | | | |
| | | | | | |
| | | | | | |
| | | | | | |
| | | | | | |
| | | | | | |
| | | | | | |
| | | | | | |
| | | | | | |
| | | | | | |
| | | | | | |
SEE NOTES TO FINANCIAL STATEMENTS.
| J.P. Morgan Investor Funds | |
FINANCIAL HIGHLIGHTSFOR THE PERIODS INDICATED (continued)
| Per share operating performance |
| | | |
| Net asset
value,
beginning
of period | Net
investment
income
(loss)(b)(c) | Net realized
and unrealized
gains
(losses) on
investments | Total from
investment
operations | | | |
JPMorgan Investor Growth Fund | | | | | | | |
| | | | | | | |
Six Months Ended December 31, 2024 (Unaudited) | | | | | | | |
| | | | | | | |
| | | | | | | |
| | | | | | | |
| | | | | | | |
| | | | | | | |
| | | | | | | |
Six Months Ended December 31, 2024 (Unaudited) | | | | | | | |
| | | | | | | |
| | | | | | | |
| | | | | | | |
| | | | | | | |
| | | | | | | |
| | | | | | | |
Six Months Ended December 31, 2024 (Unaudited) | | | | | | | |
| | | | | | | |
| | | | | | | |
| | | | | | | |
| | | | | | | |
| | | | | | | |
| | | | | | | |
Six Months Ended December 31, 2024 (Unaudited) | | | | | | | |
| | | | | | | |
| | | | | | | |
| | | | | | | |
| | | | | | | |
| | | | | | | |
| | | | | | | |
|
| Annualized for periods less than one year, unless otherwise noted. |
| Net investment income (loss) is affected by the timing of distributions from Underlying Funds. |
| Calculated based upon average shares outstanding. |
| Not annualized for periods less than one year. |
| Includes adjustments in accordance with accounting principles generally accepted in the United States of America and as such, the net asset values for financial reporting purposes and the returns based upon those net asset values may differ from the net asset values and returns for shareholder transactions. |
| Includes interest expense, if applicable, which is less than 0.005% unless otherwise noted. |
| Does not include expenses of Underlying Funds. |
SEE NOTES TO FINANCIAL STATEMENTS.
| J.P. Morgan Investor Funds | |
FINANCIAL HIGHLIGHTSFOR THE PERIODS INDICATED
| |
| | | Ratios to average net assets(a) |
Net asset
value,
end of
period | Total return
(excludes
sales charge)(d)(e) | Net assets,
end of
period
(000's) | | Net
investment
income
(loss) | Expenses without
waivers and
reimbursements(g) | |
| | | | | | |
| | | | | | |
| | | | | | |
| | | | | | |
| | | | | | |
| | | | | | |
| | | | | | |
| | | | | | |
| | | | | | |
| | | | | | |
| | | | | | |
| | | | | | |
| | | | | | |
| | | | | | |
| | | | | | |
| | | | | | |
| | | | | | |
| | | | | | |
| | | | | | |
| | | | | | |
| | | | | | |
| | | | | | |
| | | | | | |
| | | | | | |
| | | | | | |
| | | | | | |
| | | | | | |
| | | | | | |
| | | | | | |
| | | | | | |
SEE NOTES TO FINANCIAL STATEMENTS.
| J.P. Morgan Investor Funds | |
FINANCIAL HIGHLIGHTSFOR THE PERIODS INDICATED (continued)
| Per share operating performance |
| | | |
| Net asset
value,
beginning
of period | Net
investment
income
(loss)(b)(c) | Net realized
and unrealized
gains
(losses) on
investments | Total from
investment
operations | | | |
JPMorgan Investor Growth & Income Fund | | | | | | | |
| | | | | | | |
Six Months Ended December 31, 2024 (Unaudited) | | | | | | | |
| | | | | | | |
| | | | | | | |
| | | | | | | |
| | | | | | | |
| | | | | | | |
| | | | | | | |
Six Months Ended December 31, 2024 (Unaudited) | | | | | | | |
| | | | | | | |
| | | | | | | |
| | | | | | | |
| | | | | | | |
| | | | | | | |
| | | | | | | |
Six Months Ended December 31, 2024 (Unaudited) | | | | | | | |
| | | | | | | |
| | | | | | | |
| | | | | | | |
| | | | | | | |
| | | | | | | |
| | | | | | | |
Six Months Ended December 31, 2024 (Unaudited) | | | | | | | |
| | | | | | | |
| | | | | | | |
| | | | | | | |
| | | | | | | |
| | | | | | | |
| | | | | | | |
|
| Annualized for periods less than one year, unless otherwise noted. |
| Net investment income (loss) is affected by the timing of distributions from Underlying Funds. |
| Calculated based upon average shares outstanding. |
| Not annualized for periods less than one year. |
| Includes adjustments in accordance with accounting principles generally accepted in the United States of America and as such, the net asset values for financial reporting purposes and the returns based upon those net asset values may differ from the net asset values and returns for shareholder transactions. |
| Includes interest expense, if applicable, which is less than 0.005% unless otherwise noted. |
| Does not include expenses of Underlying Funds. |
SEE NOTES TO FINANCIAL STATEMENTS.
| J.P. Morgan Investor Funds | |
| |
| | | Ratios to average net assets(a) |
Net asset
value,
end of
period | Total return
(excludes
sales charge)(d)(e) | Net assets,
end of
period
(000's) | | Net
investment
income
(loss) | Expenses without
waivers and
reimbursements(g) | |
| | | | | | |
| | | | | | |
| | | | | | |
| | | | | | |
| | | | | | |
| | | | | | |
| | | | | | |
| | | | | | |
| | | | | | |
| | | | | | |
| | | | | | |
| | | | | | |
| | | | | | |
| | | | | | |
| | | | | | |
| | | | | | |
| | | | | | |
| | | | | | |
| | | | | | |
| | | | | | |
| | | | | | |
| | | | | | |
| | | | | | |
| | | | | | |
| | | | | | |
| | | | | | |
| | | | | | |
| | | | | | |
| | | | | | |
| | | | | | |
SEE NOTES TO FINANCIAL STATEMENTS.
| J.P. Morgan Investor Funds | |
NOTES TO FINANCIAL STATEMENTSAS OF December 31, 2024 (Unaudited)
(Dollar values in thousands)
1. Organization
JPMorgan Trust II (the “Trust”) was formed on November 12, 2004, as a Delaware statutory trust, pursuant to a Declaration of Trust dated November 5, 2004 and is registered under the Investment Company Act of 1940, as amended (the “1940 Act”), as an open-end management investment company.
The following are 4 separate funds of the Trust (each, a "Fund" and collectively, the "Funds") covered by this report:
| | Diversification Classification |
JPMorgan Investor Balanced Fund | Class A, Class C, Class I and Class R6 | |
JPMorgan Investor Conservative Growth Fund | Class A, Class C, Class I and Class R6 | |
JPMorgan Investor Growth Fund | Class A, Class C, Class I and Class R6 | |
JPMorgan Investor Growth & Income Fund | Class A, Class C, Class I and Class R6 | |
The investment objective of JPMorgan Investor Balanced Fund (“Investor Balanced Fund”) is to seek high total return consistent with the preservation of capital by investing primarily in a diversified group of mutual funds within the same group of investment companies that invest primarily in equity and fixed income securities.
The investment objective of JPMorgan Investor Conservative Growth Fund (“Investor Conservative Growth Fund”) is to seek income and capital appreciation by investing primarily in a diversified group of mutual funds within the same group of investment companies that invest primarily in fixed income and equity securities.
The investment objective of JPMorgan Investor Growth Fund (“Investor Growth Fund”) is to seek long-term capital appreciation by investing primarily in a diversified group of mutual funds within the same group of investment companies that invest primarily in equity securities.
The investment objective of JPMorgan Investor Growth & Income Fund (“Investor Growth & Income Fund”) is to seek long-term capital appreciation and growth of income by investing primarily in a diversified group of mutual funds within the same group of investment companies that invest primarily in equity securities.
Class A Shares generally provide for a front-end sales charge while Class C Shares provide for a contingent deferred sales charge ("CDSC"). No sales charges are assessed with respect to Class I and Class R6 shares. Certain Class A Shares, for which front-end sales charges have been waived, may be subject to a CDSC as described in the Funds' prospectus. Class C Shares automatically convert to Class A Shares after eight years. All classes of shares have equal rights as to earnings, assets and voting privileges, except that each class may bear different transfer agency, distribution and service fees and each class has exclusive voting rights with respect to its distribution plan and shareholder servicing agreements.
J.P. Morgan Investment Management Inc. (“JPMIM”), an indirect, wholly-owned subsidiary of JPMorgan Chase & Co. (“JPMorgan”), acts as adviser (the “Adviser”) and administrator (the “Administrator”) to the Funds.
2. Significant Accounting Policies
The following is a summary of significant accounting policies followed by the Funds in the preparation of their financial statements. The Funds are investment companies and, accordingly, follow the investment company accounting and reporting guidance of the Financial Accounting Standards Board (“FASB”) Accounting Standards Codification Topic 946 — Investment Companies, which is part of U.S. generally accepted accounting principles (“GAAP”). The preparation of financial statements in conformity with GAAP requires management to make estimates and assumptions that affect (i) the reported amounts of assets and liabilities, (ii) disclosure of contingent assets and liabilities at the date of the financial statements, and (iii) the reported amounts of increases and decreases in net assets from operations during the reporting period. Actual results could differ from those estimates.
A. Valuation of Investments— Investments are valued in accordance with GAAP and the Funds' valuation policies set forth by, and under the supervision and responsibility of, the Board of Trustees of the Trust (the "Board"), which established the following approach to valuation, as described more fully below: (i) investments for which market quotations are readily available shall be valued at their market value and (ii) all other investments for which market quotations are not readily available shall be valued at their fair value as determined in good faith by the Board.
Under Section 2(a)(41) of the 1940 Act, the Board is required to determine fair value for securities that do not have readily available market quotations. Under Securities and Exchange Commission (“SEC”) Rule 2a-5 (Good Faith Determinations of Fair Value), the Board may designate the performance of these fair valuation determinations to a valuation designee. The Board has designated the Adviser as the “Valuation Designee” to perform fair valuation determinations for the Funds on behalf of the Board subject to appropriate oversight by the Board. The Adviser, as Valuation Designee, leverages the J.P. Morgan Asset Management Americas Valuation Committee (“AVC”) to help oversee and carry out the policies for the valuation of investments held in the Funds. The Adviser, as Valuation Designee, remains responsible for the valuation determinations.
| J.P. Morgan Investor Funds | |
This oversight by the AVC includes monitoring the appropriateness of fair values based on results of ongoing valuation oversight including, but not limited to, consideration of macro or security specific events, market events, and pricing vendor and broker due diligence. The Administrator is responsible for discussing and assessing the potential impacts to the fair values on an ongoing basis, and, at least on a quarterly basis, with the AVC and the Board.
Investments in open-end investment companies, excluding exchange-traded funds (“ETFs”) (“Underlying Funds”), are valued at each Underlying Fund’s net asset value ("NAV") per share as of the report date.
Valuations reflected in this report are as of the report date. As a result, changes in valuation due to market events and/or issuer-related events after the report date and prior to issuance of the report are not reflected herein.
The various inputs that are used in determining the valuation of the Funds' investments are summarized into the three broad levels listed below.
•
Level 1 — Unadjusted inputs using quoted prices in active markets for identical investments.
•
Level 2 — Other significant observable inputs including, but not limited to, quoted prices for similar investments, inputs other than quoted prices that are observable for investments (such as interest rates, prepayment speeds, credit risk, etc.) or other market corroborated inputs.
•
Level 3 — Significant inputs based on the best information available in the circumstances, to the extent observable inputs are not available (including the Funds' assumptions in determining the fair value of investments).
A financial instrument’s level within the fair value hierarchy is based on the lowest level of any input, both individually and in the aggregate, that is significant to the fair value measurement. The inputs or methodology used for valuing instruments are not necessarily an indication of the risk associated with investing in those instruments.
The following tables represent each valuation input as presented on the Schedules of Portfolio Investments ("SOIs"):
| | | | |
| | Level 2
Other significant
observable inputs | Level 3
Significant
unobservable inputs | |
Total Investments in Securities (a) | | | | |
|
| Please refer to the SOI for specifics of portfolio holdings. |
Investor Conservative Growth Fund | | | | |
| | Level 2
Other significant
observable inputs | Level 3
Significant
unobservable inputs | |
Total Investments in Securities (a) | | | | |
|
| Please refer to the SOI for specifics of portfolio holdings. |
| | | | |
| | Level 2
Other significant
observable inputs | Level 3
Significant
unobservable inputs | |
Total Investments in Securities (a) | | | | |
|
| Please refer to the SOI for specifics of portfolio holdings. |
Investor Growth & Income Fund | | | | |
| | Level 2
Other significant
observable inputs | Level 3
Significant
unobservable inputs | |
Total Investments in Securities (a) | | | | |
|
| Please refer to the SOI for specifics of portfolio holdings. |
| J.P. Morgan Investor Funds | |
NOTES TO FINANCIAL STATEMENTSAS OF December 31, 2024 (Unaudited) (continued)
(Dollar values in thousands)
B. Restricted Securities— Certain securities held by the Funds may be subject to legal or contractual restrictions on resale. Restricted securities generally are resold in transactions exempt from registration under the Securities Act of 1933, as amended (the “Securities Act”). Disposal of these securities may involve time-consuming negotiations and expense. Prompt sale at the current valuation may be difficult and could adversely affect the NAVs of the Funds.
As of December 31, 2024, the Funds had no investments in restricted securities including securities sold to the Funds under Rule 144A and/or Regulation S under the Securities Act.
C. Investment Transactions with Affiliates— The Funds invested in Underlying Funds and ETFs advised by the Adviser. An issuer which is under common control with a Fund may be considered an affiliate. For the purposes of the financial statements, the Funds assume the issuers listed in the tables below to be affiliated issuers. The Underlying Funds’ and ETFs' distributions may be reinvested into such Underlying Funds and ETFs. Reinvestment amounts are included in the purchases at cost amounts in the tables below.
|
For the six months ended December 31, 2024 |
| | | | | Change in
Unrealized
Appreciation/
(Depreciation) | | Shares at
December 31,
2024 | | Capital Gain
Distributions |
JPMorgan Core Bond Fund Class R6 Shares (a) | | | | | | | | | |
JPMorgan Core Plus Bond Fund Class R6 Shares (a) | | | | | | | | | |
JPMorgan Emerging Markets Debt Fund Class R6 Shares (a) | | | | | | | | | |
JPMorgan Emerging Markets Equity Fund Class R6 Shares (a) | | | | | | | | | |
JPMorgan Emerging Markets Research Enhanced Equity Fund Class R6 Shares (a) | | | | | | | | | |
JPMorgan Equity Income Fund Class R6 Shares (a) | | | | | | | | | |
JPMorgan Europe Dynamic Fund Class R6 Shares (a) | | | | | | | | | |
JPMorgan Global Select Equity ETF (a) | | | | | | | | | |
JPMorgan High Yield Fund Class R6 Shares (a) | | | | | | | | | |
JPMorgan Income Fund Class R6 Shares (a) | | | | | | | | | |
JPMorgan International Equity Fund Class R6 Shares (a) | | | | | | | | | |
JPMorgan International Research Enhanced Equity ETF (a) | | | | | | | | | |
JPMorgan Large Cap Growth Fund Class R6 Shares (a) | | | | | | | | | |
JPMorgan Large Cap Value Fund Class R6 Shares (a) | | | | | | | | | |
JPMorgan Limited Duration Bond ETF (a) | | | | | | | | | |
JPMorgan Mid Cap Growth Fund Class R6 Shares (a) * | | | | | | | | | |
JPMorgan Short Duration Core Plus Fund Class R6 Shares (a) | | | | | | | | | |
JPMorgan Small & Mid Cap Enhanced Equity ETF (a) | | | | | | | | | |
JPMorgan Small Cap Equity Fund Class R6 Shares (a) | | | | | | | | | |
JPMorgan Small Cap Value Fund Class R6 Shares (a) | | | | | | | | | |
JPMorgan U.S. Equity Fund Class R6 Shares (a) | | | | | | | | | |
JPMorgan U.S. GARP Equity Fund Class R6 Shares (a) | | | | | | | | | |
| J.P. Morgan Investor Funds | |
Investor Balanced Fund (continued) |
For the six months ended December 31, 2024 |
| | | | | Change in Unrealized Appreciation/ (Depreciation) | | Shares at December 31, 2024 | | Capital Gain Distributions |
JPMorgan U.S. Government Money Market Fund Class IM Shares, 4.44% (a) (b) | | | | | | | | | |
JPMorgan U.S. Research Enhanced Equity Fund Class R6 Shares (a) | | | | | | | | | |
JPMorgan Unconstrained Debt Fund Class R6 Shares (a) | | | | | | | | | |
JPMorgan Value Advantage Fund Class R6 Shares (a) | | | | | | | | | |
| | | | | | | | | |
|
| Investment in an affiliated fund, which is registered under the Investment Company Act of 1940, as amended, and is advised by J.P. Morgan Investment Management Inc. |
| The rate shown is the current yield as of December 31, 2024. |
| Non-income producing security. |
Investor Conservative Growth Fund |
For the six months ended December 31, 2024 |
| | | | | Change in
Unrealized
Appreciation/
(Depreciation) | | Shares at
December 31,
2024 | | Capital Gain
Distributions |
JPMorgan Core Bond Fund Class R6 Shares (a) | | | | | | | | | |
JPMorgan Core Plus Bond Fund Class R6 Shares (a) | | | | | | | | | |
JPMorgan Emerging Markets Debt Fund Class R6 Shares (a) | | | | | | | | | |
JPMorgan Emerging Markets Equity Fund Class R6 Shares (a) | | | | | | | | | |
JPMorgan Emerging Markets Research Enhanced Equity Fund Class R6 Shares (a) | | | | | | | | | |
JPMorgan Equity Income Fund Class R6 Shares (a) | | | | | | | | | |
JPMorgan Europe Dynamic Fund Class R6 Shares (a) | | | | | | | | | |
JPMorgan Global Select Equity ETF (a) | | | | | | | | | |
JPMorgan Government Bond Fund Class R6 Shares (a) | | | | | | | | | |
JPMorgan High Yield Fund Class R6 Shares (a) | | | | | | | | | |
JPMorgan Income Fund Class R6 Shares (a) | | | | | | | | | |
JPMorgan International Equity Fund Class R6 Shares (a) | | | | | | | | | |
JPMorgan International Research Enhanced Equity ETF (a) | | | | | | | | | |
JPMorgan Large Cap Growth Fund Class R6 Shares (a) | | | | | | | | | |
JPMorgan Large Cap Value Fund Class R6 Shares (a) | | | | | | | | | |
JPMorgan Limited Duration Bond ETF (a) | | | | | | | | | |
| J.P. Morgan Investor Funds | |
NOTES TO FINANCIAL STATEMENTSAS OF December 31, 2024 (Unaudited) (continued)
(Dollar values in thousands)
Investor Conservative Growth Fund (continued) |
For the six months ended December 31, 2024 |
| | | | | Change in Unrealized Appreciation/ (Depreciation) | | Shares at December 31, 2024 | | Capital Gain Distributions |
JPMorgan Mid Cap Growth Fund Class R6 Shares (a) * | | | | | | | | | |
JPMorgan Short Duration Core Plus Fund Class R6 Shares (a) | | | | | | | | | |
JPMorgan Small & Mid Cap Enhanced Equity ETF (a) | | | | | | | | | |
JPMorgan Small Cap Equity Fund Class R6 Shares (a) | | | | | | | | | |
JPMorgan Small Cap Value Fund Class R6 Shares (a) | | | | | | | | | |
JPMorgan U.S. Equity Fund Class R6 Shares (a) | | | | | | | | | |
JPMorgan U.S. GARP Equity Fund Class R6 Shares (a) | | | | | | | | | |
JPMorgan U.S. Government Money Market Fund Class IM Shares, 4.44% (a) (b) | | | | | | | | | |
JPMorgan U.S. Research Enhanced Equity Fund Class R6 Shares (a) | | | | | | | | | |
JPMorgan Unconstrained Debt Fund Class R6 Shares (a) | | | | | | | | | |
JPMorgan Value Advantage Fund Class R6 Shares (a) | | | | | | | | | |
| | | | | | | | | |
|
| Investment in an affiliated fund, which is registered under the Investment Company Act of 1940, as amended, and is advised by J.P. Morgan Investment Management Inc. |
| The rate shown is the current yield as of December 31, 2024. |
| Non-income producing security. |
|
For the six months ended December 31, 2024 |
| | | | | Change in
Unrealized
Appreciation/
(Depreciation) | | Shares at
December 31,
2024 | | Capital Gain
Distributions |
JPMorgan Core Bond Fund Class R6 Shares (a) | | | | | | | | | |
JPMorgan Core Plus Bond Fund Class R6 Shares (a) | | | | | | | | | |
JPMorgan Emerging Markets Debt Fund Class R6 Shares (a) | | | | | | | | | |
JPMorgan Emerging Markets Equity Fund Class R6 Shares (a) | | | | | | | | | |
JPMorgan Emerging Markets Research Enhanced Equity Fund Class R6 Shares (a) | | | | | | | | | |
JPMorgan Equity Income Fund Class R6 Shares (a) | | | | | | | | | |
JPMorgan Europe Dynamic Fund Class R6 Shares (a) | | | | | | | | | |
JPMorgan Global Select Equity ETF (a) | | | | | | | | | |
JPMorgan High Yield Fund Class R6 Shares (a) | | | | | | | | | |
| J.P. Morgan Investor Funds | |
Investor Growth Fund (continued) |
For the six months ended December 31, 2024 |
| | | | | Change in Unrealized Appreciation/ (Depreciation) | | Shares at December 31, 2024 | | Capital Gain Distributions |
JPMorgan Income Fund Class R6 Shares (a) | | | | | | | | | |
JPMorgan International Equity Fund Class R6 Shares (a) | | | | | | | | | |
JPMorgan International Focus Fund Class R6 Shares (a) | | | | | | | | | |
JPMorgan International Research Enhanced Equity ETF (a) | | | | | | | | | |
JPMorgan Large Cap Growth Fund Class R6 Shares (a) | | | | | | | | | |
JPMorgan Large Cap Value Fund Class R6 Shares (a) | | | | | | | | | |
JPMorgan Mid Cap Growth Fund Class R6 Shares (a) * | | | | | | | | | |
JPMorgan Small & Mid Cap Enhanced Equity ETF (a) | | | | | | | | | |
JPMorgan Small Cap Equity Fund Class R6 Shares (a) | | | | | | | | | |
JPMorgan Small Cap Value Fund Class R6 Shares (a) | | | | | | | | | |
JPMorgan U.S. Equity Fund Class R6 Shares (a) | | | | | | | | | |
JPMorgan U.S. GARP Equity Fund Class R6 Shares (a) | | | | | | | | | |
JPMorgan U.S. Government Money Market Fund Class IM Shares, 4.44% (a) (b) | | | | | | | | | |
JPMorgan U.S. Research Enhanced Equity Fund Class R6 Shares (a) | | | | | | | | | |
JPMorgan Value Advantage Fund Class R6 Shares (a) | | | | | | | | | |
| | | | | | | | | |
|
| Investment in an affiliated fund, which is registered under the Investment Company Act of 1940, as amended, and is advised by J.P. Morgan Investment Management Inc. |
| The rate shown is the current yield as of December 31, 2024. |
| Non-income producing security. |
Investor Growth & Income Fund |
For the six months ended December 31, 2024 |
| | | | | Change in
Unrealized
Appreciation/
(Depreciation) | | Shares at
December 31,
2024 | | Capital Gain
Distributions |
JPMorgan Core Bond Fund Class R6 Shares (a) | | | | | | | | | |
JPMorgan Core Plus Bond Fund Class R6 Shares (a) | | | | | | | | | |
JPMorgan Emerging Markets Debt Fund Class R6 Shares (a) | | | | | | | | | |
JPMorgan Emerging Markets Equity Fund Class R6 Shares (a) | | | | | | | | | |
| J.P. Morgan Investor Funds | |
NOTES TO FINANCIAL STATEMENTSAS OF December 31, 2024 (Unaudited) (continued)
(Dollar values in thousands)
Investor Growth & Income Fund (continued) |
For the six months ended December 31, 2024 |
| | | | | Change in Unrealized Appreciation/ (Depreciation) | | Shares at December 31, 2024 | | Capital Gain Distributions |
JPMorgan Emerging Markets Research Enhanced Equity Fund Class R6 Shares (a) | | | | | | | | | |
JPMorgan Equity Income Fund Class R6 Shares (a) | | | | | | | | | |
JPMorgan Europe Dynamic Fund Class R6 Shares (a) | | | | | | | | | |
JPMorgan Global Select Equity ETF (a) | | | | | | | | | |
JPMorgan High Yield Fund Class R6 Shares (a) | | | | | | | | | |
JPMorgan Income Fund Class R6 Shares (a) | | | | | | | | | |
JPMorgan International Equity Fund Class R6 Shares (a) | | | | | | | | | |
JPMorgan International Focus Fund Class R6 Shares (a) | | | | | | | | | |
JPMorgan International Research Enhanced Equity ETF (a) | | | | | | | | | |
JPMorgan Large Cap Growth Fund Class R6 Shares (a) | | | | | | | | | |
JPMorgan Large Cap Value Fund Class R6 Shares (a) | | | | | | | | | |
JPMorgan Limited Duration Bond ETF (a) | | | | | | | | | |
JPMorgan Mid Cap Growth Fund Class R6 Shares (a) * | | | | | | | | | |
JPMorgan Short Duration Core Plus Fund Class R6 Shares (a) | | | | | | | | | |
JPMorgan Small & Mid Cap Enhanced Equity ETF (a) | | | | | | | | | |
JPMorgan Small Cap Equity Fund Class R6 Shares (a) | | | | | | | | | |
JPMorgan Small Cap Value Fund Class R6 Shares (a) | | | | | | | | | |
JPMorgan U.S. Equity Fund Class R6 Shares (a) | | | | | | | | | |
JPMorgan U.S. GARP Equity Fund Class R6 Shares (a) | | | | | | | | | |
JPMorgan U.S. Government Money Market Fund Class IM Shares, 4.44% (a) (b) | | | | | | | | | |
JPMorgan U.S. Research Enhanced Equity Fund Class R6 Shares (a) | | | | | | | | | |
JPMorgan Value Advantage Fund Class R6 Shares (a) | | | | | | | | | |
| | | | | | | | | |
|
| Investment in an affiliated fund, which is registered under the Investment Company Act of 1940, as amended, and is advised by J.P. Morgan Investment Management Inc. |
| The rate shown is the current yield as of December 31, 2024. |
| Non-income producing security. |
| J.P. Morgan Investor Funds | |
D. Security Transactions and Investment Income— Investment transactions are accounted for on the trade date (the date the order to buy or sell is executed). Securities gains and losses are calculated on a specifically identified cost basis. Distributions of net investment income and realized capital gains from the Underlying Funds and ETFs are recorded on the ex-dividend date.
E. Allocation of Income and Expenses— Expenses directly attributable to a Fund are charged directly to that Fund, while the expenses attributable to more than one fund of the Trust are allocated among the applicable funds. Investment income, realized and unrealized gains and losses and expenses, other than class-specific expenses, are allocated daily to each class of shares based upon the proportion of net assets of each class at the beginning of each day.
Transfer agency fees are class-specific expenses. The amount of the transfer agency fees charged to each share class of the Funds for the six months ended December 31, 2024 are as follows:
| | | | | |
| | | | | |
| | | | | |
Investor Conservative Growth Fund | | | | | |
| | | | | |
| | | | | |
| | | | | |
Investor Growth & Income Fund | | | | | |
| | | | | |
The Funds invested in Underlying Funds and ETFs and, as a result bear a portion of the expenses incurred by these Underlying Funds and ETFs. These expenses are not reflected in the expenses shown on the Statements of Operations and are not included in the ratios to average net assets shown in the Financial Highlights. Certain expenses of affiliated Underlying Funds and ETFs are waived as described in Note 3.F.
F. Federal Income Taxes— Each Fund is treated as a separate taxable entity for Federal income tax purposes. Each Fund's policy is to comply with the provisions of the Internal Revenue Code (the “Code”) applicable to regulated investment companies and to distribute to shareholders all of its distributable net investment income and net realized capital gains on investments. Accordingly, no provision for Federal income tax is necessary. Management has reviewed the Funds' tax positions for all open tax years and has determined that as of December 31, 2024, no liability for Federal income tax is required in the Funds' financial statements for net unrecognized tax benefits. However, management’s conclusions may be subject to future review based on changes in, or the interpretation of, the accounting standards or tax laws and regulations. Each Fund's Federal tax returns for the prior three fiscal years remain subject to examination by the Internal Revenue Service.
G. Distributions to Shareholders— Distributions from net investment income, if any, are generally declared and paid at least quarterly, except for Investor Conservative Growth Fund, for which distributions are generally declared and paid at least monthly. Distributions are declared separately for each class. No class has preferential dividend rights; differences in per share rates are due to differences in separate class expenses. Net realized capital gains, if any, are distributed by each Fund at least annually. The amount of distributions from net investment income and net realized capital gains is determined in accordance with Federal income tax regulations, which may differ from GAAP. To the extent these “book/tax” differences are permanent in nature (i.e., that they result from other than timing of recognition — “temporary differences”), such amounts are reclassified within the capital accounts based on their Federal tax basis treatment.
3. Fees and Other Transactions with Affiliates
A. Investment Advisory Fee— Pursuant to an Investment Advisory Agreement, the Adviser manages the investments of each Fund and for such services is paid a fee. The investment advisory fee is accrued daily and paid monthly at an annual rate of 0.05% of the Funds' average daily net assets.
The Adviser waived investment advisory fees and/or reimbursed expenses as outlined in Note 3.F.
B. Administration Fee— Pursuant to an Administration Agreement, the Administrator provides certain administration services to each Fund. The Administrator does not receive a fee for these services.
JPMorgan Chase Bank, N.A. ("JPMCB"), a wholly-owned subsidiary of JPMorgan, serves as the Funds' sub-administrator (the “Sub-administrator”). For its services as Sub-administrator, JPMCB receives a portion of the fees payable to the Administrator.
C. Distribution Fees— Pursuant to a Distribution Agreement, JPMorgan Distribution Services, Inc. (“JPMDS”), an indirect, wholly-owned subsidiary of JPMorgan, serves as each Fund's principal underwriter and promotes and arranges for the sale of each Fund's shares.
The Board has adopted a Distribution Plan (the “Distribution Plan”) for Class A and Class C Shares of the Funds, as applicable, pursuant to Rule 12b-1 under the 1940 Act. Class I and Class R6 Shares of the Funds do not charge a distribution fee. The Distribution Plan provides that each Fund shall
| J.P. Morgan Investor Funds | |
NOTES TO FINANCIAL STATEMENTSAS OF December 31, 2024 (Unaudited) (continued)
(Dollar values in thousands)
pay, with respect to the applicable share classes, distribution fees, including payments to JPMDS, at annual rates of the average daily net assets as shown in the table below:
In addition, JPMDS is entitled to receive the front-end sales charges from purchases of Class A Shares and the CDSC from redemptions of Class C Shares and certain Class A Shares for which front-end sales charges have been waived. For the six months ended December 31, 2024, JPMDS retained the following:
| | |
| | |
Investor Conservative Growth Fund | | |
| | |
Investor Growth & Income Fund | | |
|
| Amount rounds to less than one thousand. |
D. Service Fees— The Trust, on behalf of the Funds, has entered into a Shareholder Servicing Agreement with JPMDS under which JPMDS provides certain support services to fund shareholders. For performing these services, JPMDS receives a fee with respect to all share classes, except Class R6 Shares which do not charge a service fee, that is accrued daily and paid monthly equal to a percentage of the average daily net assets as shown in the table below:
JPMDS has entered into shareholder services contracts with affiliated and unaffiliated financial intermediaries who provide shareholder services and other related services to their clients or customers who invest in the Funds. Pursuant to such contracts, JPMDS will pay all or a portion of such fees earned to financial intermediaries for performing such services.
JPMDS waived service fees as outlined in Note 3.F.
E. Custodian and Accounting Fees— JPMCB provides portfolio custody and accounting services to the Funds. For performing these services, the Funds pay JPMCB transaction and asset-based fees that vary according to the number of transactions and positions, plus out-of-pocket expenses. The amounts paid directly to JPMCB by the Funds for custody and accounting services are included in Custodian and accounting fees on the Statements of Operations.
Interest income earned on cash balances at the custodian, if any, is included in Interest income from affiliates on the Statements of Operations.
Interest expense paid to the custodian related to cash overdrafts, if any, is included in Interest expense to affiliates on the Statements of Operations.
F. Waivers and Reimbursements—The Adviser, Administrator and/or JPMDS have contractually agreed to waive fees and/or reimburse the Funds to the extent that total annual operating expenses (excluding acquired fund fees and expenses other than certain money market fund fees as described below, dividend and interest expenses related to short sales, interest, taxes, expenses related to litigation and potential litigation, expenses related to trustee elections and extraordinary expenses) exceed the percentages of the Funds' respective average daily net assets as shown in the table below:
| | | | |
JPMorgan Investor Balanced Fund | | | | |
JPMorgan Investor Conservative Growth Fund | | | | |
JPMorgan Investor Growth Fund | | | | |
JPMorgan Investor Growth & Income Fund | | | | |
The expense limitation agreements were in effect for the six months ended December 31, 2024 and the contractual expense limitation percentages in the table above are in place until at least October 31, 2025.
The Underlying Funds may impose separate advisory and service fees. To avoid charging a service fee at an effective rate above 0.25% for Class A, Class C and Class I Shares, JPMDS will waive service fees with respect to the Funds in an amount equal to the weighted average pro-rata amount of
| J.P. Morgan Investor Funds | |
service fees charged by the Underlying Funds up to 0.25% for Class A, Class C and Class I Shares. These waivers may be in addition to any waivers required to meet the Funds’ contractual expense limitations, but will not exceed the Funds’ service fees.
For the six months ended December 31, 2024, the Funds' service providers waived fees and/or reimbursed expenses for each of the Funds as follows. None of these parties expect the Funds to repay any such waived fees and/or reimbursed expenses in future years.
| |
| |
| |
Investor Growth & Income Fund | |
Additionally, the Funds may invest in one or more money market funds advised by the Adviser (affiliated money market funds). The Adviser, Administrator and/or JPMDS, as shareholder servicing agent, have contractually agreed to waive fees and/or reimburse expenses in an amount sufficient to offset the respective net fees each collects from the affiliated money market fund on the applicable Fund’s investment in such affiliated money market fund, except for investments of securities lending cash collateral. None of these parties expect the Funds to repay any such waived fees and/ or reimbursed expenses in future years.
The amounts of these waivers resulting from investments in these money market funds for the six months ended December 31, 2024 were as follows:
| |
| |
Investor Conservative Growth Fund | |
| |
Investor Growth & Income Fund | |
G. Other— Certain officers of the Trust are affiliated with the Adviser, the Administrator and JPMDS. Such officers, with the exception of the Chief Compliance Officer, receive no compensation from the Funds for serving in their respective roles.
The Board designated and appointed a Chief Compliance Officer to the Funds pursuant to Rule 38a-1 under the 1940 Act. Each Fund, along with affiliated funds, makes reimbursement payments, on a pro-rata basis, to the Administrator for a portion of the fees associated with the office of the Chief Compliance Officer. Such fees are included in Trustees’ and Chief Compliance Officer’s fees on the Statements of Operations.
The Trust adopted a Trustee Deferred Compensation Plan (the “Plan”) which allows the independent Trustees to defer the receipt of all or a portion of compensation related to performance of their duties as Trustees. The deferred fees are invested in various J.P. Morgan Funds until distribution in accordance with the Plan.
4. Investment Transactions
During the six months ended December 31, 2024, purchases and sales of investments (excluding short-term investments) were as follows:
| Purchases
(excluding
U.S. Government) | Sales
(excluding
U.S. Government) |
| | |
Investor Conservative Growth Fund | | |
| | |
Investor Growth & Income Fund | | |
During the six months ended December 31, 2024, there were no purchases or sales of U.S. Government securities.
| J.P. Morgan Investor Funds | |
NOTES TO FINANCIAL STATEMENTSAS OF December 31, 2024 (Unaudited) (continued)
(Dollar values in thousands)
5. Federal Income Tax Matters
For Federal income tax purposes, the estimated cost and unrealized appreciation (depreciation) in value of investments held at December 31, 2024 were as follows:
| | Gross
Unrealized
Appreciation | Gross
Unrealized
Depreciation | Net Unrealized
Appreciation
(Depreciation) |
| | | | |
Investor Conservative Growth Fund | | | | |
| | | | |
Investor Growth & Income Fund | | | | |
At June 30, 2024, the Funds did not have any net capital loss carryforwards.
The Funds rely upon an exemptive order granted by the SEC (the “Order”) permitting the establishment and operation of an Interfund Lending Facility (the “Facility”). The Facility allows the Funds to directly lend and borrow money to or from any other fund relying upon the Order at rates beneficial to both the borrowing and lending funds. Advances under the Facility are taken primarily for temporary or emergency purposes, including the meeting of redemption requests that otherwise might require the untimely disposition of securities, and are subject to each Fund's borrowing restrictions. The interfund loan rate is determined, as specified in the Order, by averaging the current repurchase agreement rate and the current bank loan rate. The Order was granted to the Trust and may be relied upon by the Funds because the Funds and the series of the Trust are all investment companies in the same “group of investment companies” (as defined in Section 12(d)(1)(G) of the 1940 Act).
The Funds had no borrowings outstanding from another fund, or loans outstanding to another fund, during the six months ended December 31, 2024.
The Trust and JPMCB have entered into a financing arrangement. Under this arrangement, JPMCB provides an unsecured, uncommitted credit facility in the aggregate amount of $100 million to certain of the J.P. Morgan Funds, including the Funds. Advances under the arrangement are taken primarily for temporary or emergency purposes, including the meeting of redemption requests that otherwise might require the untimely disposition of securities, and are subject to each Fund's borrowing restrictions. Interest on borrowings is payable at a rate determined by JPMCB at the time of borrowing. This agreement has been extended until October 28, 2025.
The Funds had no borrowings outstanding from the unsecured, uncommitted credit facility during the six months ended December 31, 2024.
The Trust, along with certain other trusts for J.P. Morgan Funds (“Borrowers”), have entered into a joint syndicated senior unsecured revolving credit facility totaling $1.5 billion (“Credit Facility”) with various lenders and The Bank of New York Mellon, as administrative agent for the lenders. This Credit Facility provides a source of funds to the Borrowers for temporary and emergency purposes, including the meeting of redemption requests that otherwise might require the untimely disposition of securities. Under the terms of the Credit Facility, a borrowing fund must have a minimum of $25 million in adjusted net asset value and not exceed certain adjusted net asset coverage ratios prior to and during the time in which any borrowings are outstanding. If a fund does not comply with the aforementioned requirements, the fund must remediate within three business days with respect to the $25 million minimum adjusted net asset value or within one business day with respect to certain asset coverage ratios or the administrative agent at the request of, or with the consent of, the lenders may terminate the Credit Facility and declare any outstanding borrowings to be due and payable immediately.
Interest associated with any borrowing under the Credit Facility is charged to the borrowing fund at a rate of interest equal to 1.00%, plus the greater on the day of the borrowing, of the federal funds effective rate, or the Adjusted Secured Overnight Financing Rate (SOFR). Effective August 6, 2024, the Credit Facility was amended and restated for a term of 364 days, unless extended.
The Funds did not utilize the Credit Facility during the six months ended December 31, 2024.
7. Risks, Concentrations and Indemnifications
In the normal course of business, the Funds enter into contracts that contain a variety of representations which provide general indemnifications. Each Fund's maximum exposure under these arrangements is unknown. The amount of exposure would depend on future claims that may be brought against each Fund. However, based on experience, the Funds expect the risk of loss to be remote.
| J.P. Morgan Investor Funds | |
As of December 31, 2024, the Funds had individual shareholder and/or omnibus accounts each owning more than 10% of the respective Fund's outstanding shares as follows:
| Number of
Individual Shareholder
and/or Affiliated
Omnibus Accounts | | Number of
Individual Shareholder
and/or Non-Affiliated
Omnibus Accounts | |
| | | | |
Investor Conservative Growth Fund | | | | |
| | | | |
Investor Growth & Income Fund | | | | |
Significant shareholder transactions by these shareholders may impact the Funds' performance and liquidity.
As of December 31, 2024, the Funds owned in the aggregate, shares representing more than 10% of the net assets of the following Underlying Funds:
| |
JPMorgan U.S. GARP Equity Fund | |
JPMorgan Limited Duration Bond ETF | |
JPMorgan Small & Mid Cap Enhanced Equity ETF (formerly known as JPMorgan Market Expansion Enhanced Equity ETF) | |
JPMorgan Large Cap Value Fund | |
JPMorgan International Research Enhanced Equity ETF | |
JPMorgan Small Cap Value Fund | |
JPMorgan U.S. Research Enhanced Equity Fund | |
Because of the Funds’ investments in Underlying Funds and ETFs, the Funds indirectly pay a portion of the expenses incurred by the Underlying Funds and ETFs. As a result, the cost of investing in the Funds may be higher than the cost of investing in a mutual fund that invests directly in individual securities and financial instruments. The Funds are also subject to certain risks related to the Underlying Funds’ and ETFs’ investments in securities and financial instruments such as fixed income securities, including high yield, asset-backed and mortgage-related securities, equity securities, foreign and emerging markets securities, commodities and real estate securities. These securities are subject to risks specific to their structure, sector or market.
The Funds invest in ETFs. ETFs are pooled investment vehicles whose ownership interests are purchased and sold on a securities exchange. ETFs may be structured as investment companies, depositary receipts or other pooled investment vehicles and may be passively or actively managed. Passively managed ETFs generally seek to track the performance of a particular market index, including broad-based market indices, as well as indices relating to particular sectors, markets, regions or industries. Actively managed ETFs do not seek to track the performance of a particular market index. The price movement of an index-based ETF may not track the underlying index and may result in a loss. In addition, ETFs may trade at a price below or above their NAV (also known as a discount or premium, respectively).
In addition, the Underlying Funds and ETFs may use derivative instruments in connection with their individual investment strategies including futures contracts, forward foreign currency exchange contracts, options, swaps and other derivatives, which are also subject to specific risks related to their structure, sector or market and may be riskier than investments in other types of securities.
Specific risks and concentrations present in the Underlying Funds and ETFs are disclosed within their individual financial statements and registration statements, as appropriate.
Derivatives may be riskier than other types of investments because they may be more sensitive to changes in economic and market conditions and could result in losses that significantly exceed the Funds’ original investment. Derivatives also expose the Funds to counterparty risk (the risk that the derivative counterparty will not fulfill its contractual obligations), including credit risk of the derivative counterparty. The possible lack of a liquid secondary market for derivatives and the resulting inability of the Funds to sell or otherwise close a derivatives position could expose the Funds to losses.
The Funds are subject to infectious disease epidemics/pandemics risk. The effects of any future pandemic or other global event to public health and business and market conditions may have a significant negative impact on the performance of a Fund's investments, increase a Fund's volatility, exacerbate pre-existing political, social and economic risks to the Funds, and negatively impact broad segments of businesses and populations. In addition, governments, their regulatory agencies, or self-regulatory organizations have taken or may take actions in response to a pandemic or other global event that affect the instruments in which the Funds invest, or the issuers of such instruments, in ways that could have a significant negative impact on a Fund’s investment performance. The ultimate impact of any pandemic or other global event and the extent to which the
| J.P. Morgan Investor Funds | |
NOTES TO FINANCIAL STATEMENTSAS OF December 31, 2024 (Unaudited) (continued)
(Dollar values in thousands)
associated conditions and governmental responses impact a Fund will also depend on future developments, which are highly uncertain, difficult to accurately predict and subject to frequent changes.
| J.P. Morgan Investor Funds | |
TAX LETTER(Unaudited)
(Dollar values in thousands)
Certain tax information for the J.P. Morgan Funds is required to be provided to shareholders based upon the Funds' income and distributions for the taxable year ended December 31, 2024. The information and distributions reported in this letter may differ from the information and taxable distributions reported to the shareholders for the calendar year ending December 31, 2024. The information necessary to complete your income tax returns for the calendar year ending December 31, 2024 will be provided under separate cover.
Foreign Source Income and Foreign Tax Credit Pass Through
For the fiscal year ended June 30, 2024, the following Funds intend to elect to pass through to shareholders taxes paid to foreign countries. Gross income and foreign tax expenses are as follows or amounts as finally determined:
| Total Foreign
Source Income | |
JPMorgan Investor Balanced Fund | | |
JPMorgan Investor Conservative Growth Fund | | |
JPMorgan Investor Growth Fund | | |
JPMorgan Investor Growth & Income Fund | | |
| J.P. Morgan Investor Funds | |
THIS PAGE IS INTENTIONALLY LEFT BLANK
THIS PAGE IS INTENTIONALLY LEFT BLANK
THIS PAGE IS INTENTIONALLY LEFT BLANK
J.P. Morgan Funds are distributed by JPMorgan Distribution Services, Inc., which is an affiliate of JPMorgan Chase & Co. Affiliates of JPMorgan Chase & Co. receive fees for providing various services to the Funds.
Contact JPMorgan Distribution Services, Inc. at 1-800-480-4111 for a fund prospectus. You can also visit us at www.jpmorganfunds.com. Investors should carefully consider the investment objectives and risk as well as charges and expenses of the mutual fund before investing. The prospectus contains this and other information about the mutual fund. Read the prospectus carefully before investing.
Investors may obtain information about the Securities Investor Protection Corporation (SIPC), including the SIPC brochure, by visiting www.sipc.org or by calling SIPC at 202-371-8300.
J.P. Morgan Asset Management is the brand name for the asset management business of JPMorgan Chase & Co. and its affiliates worldwide.
© JPMorgan Chase & Co., 2024. All rights reserved. December 2024.
SAN-INV-1224
Changes in and Disagreements with Accountants for Open-End Management Investment Companies
Proxy Disclosures for Open-End Management Investment Companies
Remuneration Paid to Directors, Officers, and Others of Open-End Management Investment Companies
Included in the Statements of Operations within the Funds' Financial Statements.
Statement Regarding Basis for Approval of Investment Advisory Agreements
The Board of Trustees (the “Board” or the “Trustees”) has established various standing committees composed of Trustees with diverse backgrounds, to which the Board has assigned specific subject matter responsibilities to further enhance the effectiveness of the Board’s oversight and decision making. The Board and its investment committees (Money Market and Alternative Products Committee, Equity Committee, and Fixed Income Committee) met regularly throughout the year and, at each meeting, considered factors that are relevant to their annual consideration of the continuation of the investment advisory agreements. The Board also met for the specific purpose of considering investment advisory agreement annual renewals. The Board held meetings June 25-26, 2024 and August 20-22, 2024, at which the Trustees considered the continuation of the investment advisory agreement for each Fund whose semi-annual report is contained herein (each an “Advisory Agreement” and collectively, the “Advisory Agreements”). At the June meeting, the Board’s investment committees met to review and consider performance, expense and related information for the Funds and the other J.P. Morgan Funds overseen by the Board in which each Fund invests (the “Underlying Funds”). Each investment committee reported to the full Board, which then considered each investment committee’s preliminary findings. At the August meeting, the Trustees continued their review and consideration. The Trustees, including a majority of the Trustees who are not parties to an Advisory Agreement or “interested persons” (as defined in the Investment Company Act of 1940) of any party to an Advisory Agreement or any of their affiliates, approved the continuation of each Advisory Agreement on August 22, 2024.
As part of their review of the Advisory Agreements, the Trustees considered and reviewed performance and other information about the Funds and Underlying Funds received from J.P. Morgan Investment Management Inc. (the “Adviser”). This information included the Funds’ and Underlying Funds’ performance as compared to the performance of the Funds’ and Underlying Funds’ peers and benchmarks, and analyses by the Adviser of the Funds’ and the Underlying Funds’ performance. In addition, at each of their regular meetings throughout the year, the Trustees considered reports on the performance of certain J.P. Morgan Funds provided by an independent investment consulting firm (the “independent consultant”). In addition, in preparation for the June and August meetings, the Trustees requested, received and evaluated extensive materials from the Adviser, including, with respect to the Funds and/or Underlying Funds, performance and expense information compiled by Broadridge, using data from Lipper Inc. and/or Morningstar, Inc., independent providers of investment company data (together, “Broadridge”). The Trustees’ independent consultant also provided additional quantitative and statistical analyses of the Funds and certain
Underlying Funds, including risk and performance return assessments as compared to the Funds’ and/or Underlying Funds’ objectives, benchmarks, and peers. Before voting on the Advisory Agreements, the Trustees reviewed the Advisory Agreements with representatives of the Adviser, counsel to the Funds, and independent legal counsel to the Trustees, and received a memorandum from independent legal counsel to the Trustees discussing the legal standards for their consideration of the Advisory Agreements. The Trustees also discussed the Advisory Agreements with independent legal counsel in executive sessions at which no representatives of the Adviser were present.
A summary of the material factors evaluated by the Trustees in determining whether to approve each Advisory Agreement is provided below. Each Trustee attributed different weights to the various factors and no factor alone was considered determinative. The Trustees considered information provided with respect to the Funds and Underlying Funds throughout the year, as well as materials furnished specifically in connection with the annual review process. From year to year, the Trustees consider and place emphasis on relevant information in light of changing circumstances in market and economic conditions.
After considering and weighing the factors and information they had received, the Trustees found that the compensation to be received by the Adviser from each Fund under the applicable Advisory Agreement was fair and reasonable under the circumstances, and determined that the continuance of each Advisory Agreement was in the best interests of each Fund and its shareholders.
Nature, Extent and Quality of Services Provided by the Adviser
The Trustees received and considered information regarding the nature, extent and quality of services provided to each Fund under the applicable Advisory Agreement. The Trustees took into account information furnished throughout the year at Trustee meetings, as well as the materials furnished specifically in connection with this annual review process. Among other things, the Trustees considered:
•
The background and experience of the Adviser’s senior management and investment personnel, including personnel changes, if any;
•
The qualifications, backgrounds and responsibilities of the portfolio management team primarily responsible for the day-to-day management of each Fund and Underlying Funds, including personnel changes, if any;
•
The investment strategy for each Fund, and the infrastructure supporting the portfolio management teams;
•
Information about the structure and distribution strategy for each Fund and how it fits within the Adviser’s other fund offerings within the J.P. Morgan Funds complex;
•
The administration services provided by the Adviser in its role as Administrator;
•
Their knowledge of the nature and quality of the services provided by the Adviser and its affiliates gained from their experience as Trustees of the Funds and in the financial industry generally;
•
The overall reputation and capabilities of the Adviser and its affiliates;
•
The commitment of the Adviser to provide high quality service to the Funds and Underlying Funds, as applicable;
•
Their overall confidence in the Adviser’s integrity; and
•
The Adviser’s responsiveness to requests for additional information, questions or concerns raised by them, including the Adviser’s willingness to consider and implement organizational and operational changes designed to improve investment results and the services provided to each Fund and Underlying Funds.
Based upon these considerations and other factors, the Trustees concluded that they were satisfied with the nature, extent and quality of the services provided to the Funds by the Adviser.
Costs of Services Provided and Profitability to the Adviser and its Affiliates
The Trustees received and considered information regarding the profitability to the Adviser and its affiliates from providing services to the Funds and Underlying Funds. The Trustees reviewed and discussed this information. The Trustees recognized that this information is not audited and represents the Adviser’s determination of its and its affiliates’ revenues from the contractual services provided to the Funds and Underlying Funds, less expenses of providing such services. Expenses include direct and indirect costs and are calculated using an allocation methodology developed by the Adviser and reviewed with the Board. The Trustees also recognized that it is difficult to make comparisons of profitability from fund investment advisory contracts because comparative information is not generally publicly available and is affected by numerous factors, including the structure of the particular adviser, the types of funds it manages, its business mix, numerous assumptions regarding allocations and the fact that publicly-traded fund managers’ operating profits and net income are net of distribution and marketing expenses. Based upon their review, and taking into consideration the factors noted above, the Trustees concluded that the profitability to the
Adviser under each Advisory Agreement was not unreasonable in light of the services and benefits provided to each Fund and Underlying Fund.
The Trustees also considered that JPMorgan Distribution Services, Inc. (“JPMDS”), an affiliate of the Adviser, and the Adviser earn fees from the Funds and/or Underlying Funds for providing shareholder and administration services, respectively. These fees were shown separately in the profitability analysis presented to the Trustees. The Trustees also considered the payments of Rule 12b-1 fees to JPMDS, which also acts as the Funds’ distributor and that these fees are in turn generally paid to financial intermediaries that sell the Funds, including financial intermediaries that are affiliates of the Adviser (although they are retained by JPMDS in certain instances). The Trustees also considered the fees earned by JPMorgan Chase Bank, N.A. (“JPMCB”), an affiliate of the Adviser, for custody, fund accounting and other related services for the Funds and/or Underlying Funds, and the profitability of the arrangements to JPMCB.
The Trustees reviewed information regarding potential “fall-out” or ancillary benefits received by the Adviser and its affiliates as a result of their relationship with the Funds. The Trustees considered that the J.P. Morgan Funds' operating accounts are held at JPMCB, which, as a result, will receive float benefits for certain J.P. Morgan Funds, as applicable. The Trustees also noted that the Adviser supports a diverse set of products and services, which benefits the Adviser by allowing it to leverage its infrastructure to serve additional clients, including the benefits received by the Adviser and its affiliates in connection with the Funds’ investments in the Underlying Funds. The Trustees also reviewed the Adviser’s allocation of fund brokerage for the J.P. Morgan Funds complex, including allocations to brokers who provide research to the Adviser, as well as the Adviser’s use of affiliates to provide other services and the benefits to such affiliates of doing so. The Trustees also considered the benefit to the Adviser and its affiliates from allocating client assets to the Funds.
The Trustees considered the extent to which the Funds may benefit from potential economies of scale. The Trustees considered that there may not be a direct relationship between economies of scale realized by the Funds and those realized by the Adviser as assets increase. The Trustees considered the extent to which the Funds were priced to scale and whether it would be appropriate to add advisory fee breakpoints. The Trustees noted certain Funds with contractual expense limitations and fee waivers (“Fee Caps”) which allow a Fund’s shareholders to share potential economies of scale from a Fund’s inception, prior to reaching scale. The Trustees also noted that certain other Funds that had achieved scale as asset
levels had increased, no longer had Fee Caps in place for some or all of their share classes, but shared economies of scale through lower average expenses. The Trustees noted that the fees remain fair and reasonable relative to peer funds. The Trustees considered the benefits to the Funds of the use of an affiliated distributor and custodian, including the ability to rely on existing infrastructure supporting distribution, custodial and transfer agent services and the ability to negotiate competitive fees for the Funds. The Trustees further considered the Adviser's and JPMDS's ongoing investments in their business in support of the Funds, including the Adviser's and/or JPMDS's investments in trading systems, technology (including improvements to the J.P. Morgan Funds’ website, and cybersecurity improvements), retention of key talent, and regulatory support enhancements. The Trustees concluded that the current fee structure for each Fund, including any Fee Caps the Adviser has in place that serve to limit the overall net expense ratios of each Fund at competitive levels, was reasonable. The Trustees concluded that, for Funds with Fee Caps in place for some or all of their share classes, the relevant Fund’s shareholders received the benefits of potential economies of scale through the Fee Caps and, for Funds that achieved scale and no longer had Fee Caps in place for some or all of their share classes, the relevant Fund’s shareholders benefited from lower average expenses resulting from increased assets. The Trustees also concluded that all Funds benefited from the Adviser’s reinvestment in its operations to serve the Funds and their shareholders. The Trustees noted that the Adviser’s reinvestment ensures sufficient resources in terms of personnel and infrastructure to support the Funds.
Independent Written Evaluation of the Funds’ Senior Officer
The Trustees noted that, upon their direction, the Senior Officer for the Funds had prepared an independent written evaluation in order to assist the Trustees in determining the reasonableness of the proposed management fees. In determining whether to continue the Advisory Agreements, the Trustees considered the Senior Officer’s report.
Fees Relative to Adviser’s Other Clients
The Trustees received and considered information about the nature and extent of investment advisory services and fee rates offered to other clients of the Adviser, including, to the extent applicable, institutional separate accounts, collective investment trusts, other registered investment companies and/or private funds sub-advised by the Adviser, and for investment management styles substantially similar to that of each Fund. The Trustees considered the complexity of investment management for registered investment companies relative to the Adviser’s other clients and noted differences, as applicable, in the fee structure and the regulatory, legal and other risks and responsibilities of providing services to the different clients. The Trustees considered that serving as an adviser to a registered investment company involves greater responsibilities
and risks than acting as a sub-adviser and observed that sub-advisory fees may be lower than those charged by the Adviser to each Fund. The Trustees also noted that the adviser, not the applicable registered investment company, typically bears the sub-advisory fee and that many responsibilities related to the advisory function are typically retained by the primary adviser. The Trustees concluded that the fee rates charged to each Fund in comparison to those charged to the Adviser’s other clients were reasonable.
The Trustees receive and consider information about each Fund’s performance throughout the year. In addition, the Trustees received and considered absolute and/or relative performance information for the Funds in a report prepared by Broadridge. The Trustees considered the total return performance information, which included the ranking of the Funds within a performance universe comprised of funds’ selected share classes with the same Broadridge investment classification and objective (the “Universe”), by total return for the applicable one-, three- and five-year periods. The Trustees reviewed a description of Broadridge’s methodology for selecting mutual funds in each Fund’s Universe, and noted that Universe quintile rankings were not calculated if the number of funds in the Universe did not meet a predetermined minimum. The Trustees also considered enhancements to the methodology employed by Broadridge for identifying funds in the Peer Groups for Class I shares, based upon discussions with the Adviser, Broadridge and certain Trustees in advance of, and in preparation for, the June meeting. The Broadridge materials provided to the Trustees highlighted information with respect to certain representative classes to assist the Trustees in their review. As part of this review, the Trustees also reviewed each Fund’s performance against its benchmark and considered the performance information provided for the Funds at regular Board meetings by the Adviser and the Trustees’ independent consultant and also considered the special analysis prepared for the Funds by the Trustees’ independent consultant. The Trustees also engaged with the Adviser to consider what steps might be taken to improve performance, as applicable. The Broadridge performance data noted by the Trustees as part of their review and the determinations made by the Trustees with respect to each Fund’s performance for certain representative classes are summarized below:
The Trustees noted that the Investor Balanced Fund’s performance for Class A shares was in the second, third and second quintiles of the Universe for the one-, three- and five-year periods ended December 31, 2023, respectively. The Trustees noted that the performance for Class I and Class R6 shares was in the second quintile of the Universe for each of the one-, three- and five-year periods ended December 31, 2023. The Trustees discussed the performance and investment strategy of the Fund with the Adviser and reviewed the performance
analysis prepared by the independent consultant. Based upon these discussions, and various other factors, the Trustees concluded that the Fund’s performance was satisfactory.
The Trustees noted that the Investor Conservative Growth Fund’s performance for Class A and Class I shares was in the second quintile of the Universe for each of the one-, three- and five-year periods ended December 31, 2023. The Trustees noted that the performance for Class R6 shares was in the second, second and first quintiles of the Universe for the one-, three- and five-year periods ended December 31, 2023, respectively. The Trustees discussed the performance and investment strategy of the Fund with the Adviser and reviewed the performance analysis prepared by the independent consultant. Based upon these discussions, and various other factors, the Trustees concluded that the Fund’s performance was satisfactory.
The Trustees noted that the Investor Growth Fund’s performance for Class A and Class R6 shares was in the second, first and first quintiles of the Universe for the one-, three- and five-year periods ended December 31, 2023, respectively. The Trustees noted that the performance for Class I shares was in the third, first and first quintiles of the Universe for the one-, three- and five-year periods ended December 31, 2023, respectively. The Trustees discussed the performance and investment strategy of the Fund with the Adviser and reviewed the performance analysis prepared by the independent consultant. Based upon these discussions, and various other factors, the Trustees concluded that the Fund’s performance was satisfactory.
The Trustees noted that the Investor Growth & Income Fund’s performance for Class A and Class I shares was in the third, third and second quintiles of the Universe for the one-, three- and five-year periods ended December 31, 2023, respectively. The Trustees noted that the performance for Class R6 shares was in the third, second and first quintiles of the Universe for the one-, three- and five-year periods ended December 31, 2023, respectively. The Trustees discussed the performance and investment strategy of the Fund with the Adviser and reviewed the performance analysis prepared by the independent consultant. Based upon these discussions, and various other factors, the Trustees concluded that the Fund’s performance was satisfactory.
Advisory Fees and Expense Ratios
The Trustees considered the contractual advisory fee rate and administration fee rate paid by each Fund to the Adviser and compared the combined rate to the information prepared by Broadridge concerning management fee rates paid by other funds’ selected share classes in the Universe, as well as a subset of funds within the Universe (the “Peer Group”). The Trustees recognized that Broadridge reported each Fund’s management fee rate as the combined contractual advisory fee
and the administration fee rates. The Trustees also reviewed information about other expenses and the expense ratios for each Fund and noted that Universe and/or Peer Group quintile rankings were not calculated if the number of funds in the Universe and/or Peer Groups did not meet a predetermined minimum. For each Fund that had a Fee Cap in place, the Trustees considered the net advisory fee rate and net expense ratio for each share class, as applicable, taking into account any waivers and/or reimbursements. The Trustees recognized that it can be difficult to make comparisons of advisory fees because there are variations in the services that are included in the fees paid by other funds. The Trustees’ determinations as a result of the review of each Fund’s advisory fees and expense ratios for certain representative classes are summarized below:
The Trustees noted that the Investor Balanced Fund’s net advisory fee for Class A shares was in the second and third quintiles of the Peer Group and Universe, respectively, and that the actual total expenses for Class A shares were in the second quintile of both the Peer Group and Universe. The Trustees noted that the net advisory fee for Class I shares was in the fourth and third quintiles of the Peer Group and Universe, respectively, and that the actual total expenses for Class I shares were in the second quintile of both the Peer Group and Universe. The Trustees noted that the net advisory fee for Class R6 shares was in the fourth and third quintiles of the Peer Group and Universe, respectively, and that the actual total expenses for Class R6 shares were in the second and first quintiles of the Peer Group and Universe, respectively. After considering the factors identified above, in light of the information, the Trustees concluded that the advisory fee was fair and reasonable in light of the services provided to the Fund and that such fees would be for services provided in addition to, rather than duplicative of, services provided under the advisory contract of the Underlying Funds in which the Fund invests.
The Trustees noted that the Investor Conservative Growth Fund’s net advisory fee for Class A shares was in the second and third quintiles of the Peer Group and Universe, respectively, and that the actual total expenses for Class A shares were in the second quintile of both the Peer Group and Universe. The Trustees noted that the net advisory fee for Class I shares was in the fourth and third quintiles of the Peer Group and Universe, respectively, and that the actual total expenses for Class I shares were in the second and third quintiles of the Peer Group and Universe, respectively. The Trustees noted that the net advisory fee for Class R6 shares was in the fourth and third quintiles of the Peer Group and Universe, respectively, and that the actual total expenses were in the second and first quintiles of the Peer Group and Universe, respectively. After considering the factors identified above, in light of the information, the Trustees concluded that the advisory fee was fair and reasonable in light of the services provided to the Fund and that such
fees would be for services provided in addition to, rather than duplicative of, services provided under the advisory contract of the Underlying Funds in which the Fund invests.
The Trustees noted that the Investor Growth Fund’s net advisory fee for Class A and Class I shares was in the second and third quintiles of the Peer Group and Universe, respectively, and that the actual total expenses for Class A and Class I shares were in the first and second quintile of the Peer Group and Universe, respectively. The Trustees noted that the net advisory fee for Class R6 shares was in the third quintile of both the Peer Group and Universe, and that the actual total expenses for Class R6 shares were in the first quintile of both the Peer Group and Universe. After considering the factors identified above, in light of the information, the Trustees concluded that the advisory fee was fair and reasonable in light of the services provided to the Fund and that such fees would be for services provided in addition to, rather than duplicative of, services provided under the advisory contract of the Underlying Funds in which the Fund invests.
The Trustees noted that the Investor Growth & Income Fund’s net advisory fee for Class A shares was in the third quintile of
both the Peer Group and Universe, and that the actual total expenses for Class A shares were in the first and second quintiles of the Peer Group and Universe, respectively. The Trustees noted that the net advisory fee for Class I shares was in the third and fourth quintiles of the Peer Group and Universe, respectively, and that the actual total expenses for Class I shares were in the second and third quintiles of the Peer Group and Universe, respectively. The Trustees noted that the net advisory fee for Class R6 shares was in the third and fourth quintiles of the Peer Group and Universe, respectively, and that the actual total expenses for Class R6 shares were in the second and first quintiles of the Peer Group and Universe, respectively. After considering the factors identified above, in light of the information, the Trustees concluded that the advisory fee was fair and reasonable in light of the services provided to the Fund and that such fees would be for services provided in addition to, rather than duplicative of, services provided under the advisory contract of the Underlying Funds in which the Fund invests.
ITEM 8. CHANGES IN AND DISAGREEMENTS WITH ACCOUNTANTS FOR OPEN-END MANAGEMENT INVESTMENT COMPANIES.
Refer to Item 7.
ITEM 9. PROXY DISCLOSURES FOR OPEN-END MANAGEMENT INVESTMENT COMPANIES.
Refer to Item 7.
ITEM 10. REMUNERATION PAID TO DIRECTORS, OFFICERS, AND OTHERS OF OPEN-END MANAGEMENT INVESTMENT COMPANIES.
Refer to Item 7.
ITEM 11. STATEMENT REGARDING BASIS FOR APPROVAL OF INVESTMENT ADVISORY CONTRACT.
Refer to Item 7.
ITEM 12. DISCLOSURE OF PROXY VOTING POLICIES AND PROCEDURES FOR CLOSED-END MANAGEMENT INVESTMENT COMPANIES.
Not applicable.
ITEM 13. PORTFOLIO MANAGERS OF CLOSED-END MANAGEMENT INVESTMENT COMPANIES.
Not applicable.
ITEM 14. PURCHASES OF EQUITY SECURITIES BY CLOSED-END MANAGEMENT INVESTMENT COMPANY AND AFFILIATED PURCHASERS.
Not applicable.
ITEM 15. SUBMISSION OF MATTERS TO A VOTE OF SECURITY HOLDERS.
Describe any material changes to the procedures by which shareholders may recommend nominees to the registrant’s board of directors, where those changes were implemented after the registrant last provided disclosure in response to the requirements of Item 7(d)(2)(ii)(G) of Schedule 14A (17 CFR 240.14a-101), or this Item.
No material changes to report.
ITEM 16. CONTROLS AND PROCEDURES.
(a) Disclose the conclusions of the registrant’s principal executive and principal financial officers, or persons performing similar functions, regarding the effectiveness of the registrant’s disclosure controls and procedures (as defined in Rule 30a-3(c) under the Act (17 CFR 270.30a-3(c))) as of a date within 90 days of the filing date of the report that includes the disclosure required by this paragraph, based on the evaluation of these controls and procedures required by Rule 30a-3(b) under the Act (17 CFR 270.30a-3(b)) and Rules 13a-15(b) or 15d-15(b) under the Exchange Act (17 CFR 240.13a-15(b) or 240.15d-15(b)).
The Registrant’s principal executive and principal financial officers have concluded, based on their evaluation of the Registrant’s disclosure controls and procedures as of a date within 90 days of the filing date of this report, that the Registrant’s disclosure controls and procedures are reasonably designed to ensure that information required to be disclosed by the Registrant on Form N-CSR is recorded, processed, summarized and reported within the required time periods and that information required to be disclosed by the Registrant in the reports that it files or submits on Form N-CSR is accumulated and communicated to the Registrant’s management, including its principal executive and principal financial officers, as appropriate to allow timely decisions regarding required disclosure.
(b) Disclose any change in the registrant’s internal control over financial reporting (as defined in Rule 30a-3(d) under the Act (17 CFR 270.30a-3(d)) that occurred during the period covered by this report that has materially affected, or is reasonably likely to materially affect, the registrant’s internal control over financial reporting.
There were no changes in the Registrant’s internal control over financial reporting that occurred during the period covered by this report that have materially affected, or are reasonably likely to materially affect, the Registrant’s internal control over financial reporting.
ITEM 17. DISCLOSURE OF SECURITIES LENDING ACTIVITIES FOR CLOSED-END MANAGEMENT INVESTMENT COMPANIES.
Not applicable.
ITEM 18. RECOVERY OF ERRONEOUSLY AWARDED COMPENSATION.
Not applicable.
ITEM 19. EXHIBITS
| | (a) | File the exhibits listed below as part of this Form. Letter or number the exhibits in the sequence indicated. |
(1) Any code of ethics, or amendment thereto, that is the subject of the disclosure required by Item 2, to the extent that the registrant intends to satisfy the Item 2 requirements through filing of an exhibit.
Not applicable.
(2) A separate certification for each principal executive officer and principal financial officer of the registrant as required by Rule 30a-2(a) under the Act (17 CFR 270.30a-2), exactly as set forth below:
Certifications pursuant to Rule 30a-2(a) under the Investment Company Act of 1940 are attached hereto.
(1) Any written solicitation to purchase securities under Rule 23c-1 under the Act (17 CFR 270.23c-1) sent or given during the period covered by the report by or on behalf of the registrant to 10 or more persons.
Not applicable.
(2) Change in the registrant’s independent public accountant. Provide the information called for by Item 4 of Form 8-K under the Exchange Act (17 CFR 249.308). Unless otherwise specified by Item 4, or related to and necessary for a complete understanding of information not previously disclosed, the information should relate to events occurring during the reporting period.
Not applicable.
| | (b) | A separate or combined certification for each principal executive officer and principal officer of the registrant as required by Rule 30a-2(b) under the Act of 1940. |
Certifications pursuant to Rule 30a-2(b) under the Investment Company Act of 1940 are attached hereto.
SIGNATURES
Pursuant to the requirements of the Securities Exchange Act of 1934 and the Investment Company Act of 1940, the registrant has duly caused this report to be signed on its behalf by the undersigned, thereunto duly authorized.
| | |
| JPMorgan Trust II |
| |
| By: | | /s/ Brian S. Shlissel |
| | Brian S. Shlissel |
| | President and Principal Executive Officer |
| |
| | March 5, 2025 |
Pursuant to the requirements of the Securities Exchange Act of 1934 and the Investment Company Act of 1940, this report has been signed below by the following persons on behalf of the registrant and in the capacities and on the dates indicated.
| | |
| By: | | /s/ Brian S. Shlissel |
| | Brian S. Shlissel |
| | President and Principal Executive Officer |
| |
| | March 5, 2025 |
| |
| By: | | /s/ Timothy J. Clemens |
| | Timothy J. Clemens |
| | Treasurer and Principal Financial Officer |
| |
| | March 5, 2025 |