UNITED STATES
SECURITIES AND EXCHANGE COMMISSION
Washington, D.C. 20549
FORM N-CSR
CERTIFIED SHAREHOLDER REPORT OF REGISTERED
MANAGEMENT INVESTMENT COMPANIES
| | |
Investment Company Act file number | | 811-4244 |
SOUND SHORE FUND, INC.
|
| (Exact name of registrant as specified in charter) |
| | |
| 3435 Stelzer Road Columbus, OH | | 43219 |
| (Address of principal executive offices) | | (Zip code) |
T. Gibbs Kane, Jr., President 8 Sound Shore Drive, Greenwich, CT 06830
|
| (Name and address of agent for service) |
Registrant’s telephone number, including area code: (800) 551-1980
Date of fiscal year end: December 31. 2008
Date of reporting period: January 1, 2008-December 31, 2008
| Item 1. | Reports to Stockholders. |

3435 STELZER ROAD, COLUMBUS, OH 43219 1-800-754-8758
December 31, 2008
Dear Shareholder:
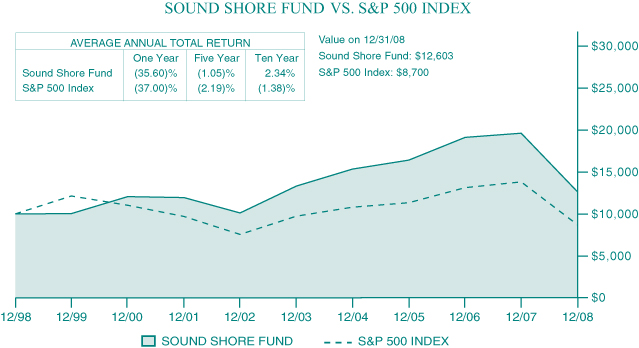
The Sound Shore Fund, Inc. (the “Fund”) ended December 31, 2008 with a net asset value of $22.76 per share following year-end per share distributions of $0.119724 in dividends. For the Year 2008, the Fund had a total return of -35.60%, while the Standard & Poor’s 500 Index (S&P 500) declined -37.00%. In the fourth quarter of 2008, the Fund dropped -24.81% versus -21.94% for the S&P 500.
We are required by the SEC to say that: Performance data quoted represents past performance and is no guarantee of future results. Current performance may be lower or higher than the performance data quoted. Investment return and principal value will fluctuate so that an investor’s shares, when redeemed, may be worth more or less than original cost. The Fund’s 1, 5, 10, and 15-year average annual total returns for the period ended December 31, 2008 were -35.60%, -1.05%, 2.34%, and 7.87%, respectively. As stated in the current prospectus, the Fund’s annual operating gross expense ratio is .92%. For the most recent month-end performance, please visit the Fund’s website at www.soundshorefund.com.
In 2008 the stock market endured its second worst year since Standard & Poor’s began measurement in the 1920s. Remarkably, the US was the seventh best of thirty-six major markets as repercussions from our financial tsunami proved that the World today is indeed flat.
The Fund’s 2008 results were only modestly better than the S&P 500, despite avoiding much of the serious damage in the financial sector. We did not own Ambac Corp., Bear Stearns, CIT Group, Citigroup Inc., Freddie Mac, Lehman Bros., MBIA, Inc., MGIC Corp., Wachovia, or Washington Mutual. Additionally, we sold AIG (American International Group) in January of 2008 incurring less than 3% of the stock’s 97% decline for the year and owned Fannie Mae only briefly in 2008, selling it at a modest loss. However, we clearly had our share of disappointing performers. One example, global utility AES Corp., fell approximately 60% due to concerns about its emerging market presence and access to project financing. In fact, developed markets represent approximately 60% of the company’s cash flow and long-term contracts account for about 85% of its revenue. Further, the company reported stable third quarter earnings and cash flow yet the stock price fell to 5 times estimated 2009 earnings.
Similarly, medical device maker Boston Scientific Corp., which was up on the year as recently as Labor Day, dropped by 40% from mid-September through the year-end, triggered by margin call selling by a co-founder and former executive chairman of the company. Away from that development, Boston continued to execute: its drug-coated stent market share remained at or above the company’s target and financial results were solid. We added to our position during November with the stock trading below 6 times our cash earnings estimate for 2009.
We did have several positive performers for the year, including generic drug maker Barr Pharmaceutical, Inc. and for-profit education provider Apollo Group, Inc. We started our Barr holding in early 2007 when the stock was at the low end of historical valuations, having declined 25% from its
1
peak. Versus tepid consensus forecasts, our analysis suggested that Barr had strong growth potential especially from its acquisitions in Eastern Europe. During the first half of 2008, with the stock lower due to industry pricing concerns, we added to the position, and when management announced its agreement to sell to rival Teva for a 55% percent premium, Barr was our largest holding.
For the second year running, Apollo was among our best performers. We had sold Apollo in the fourth quarter of 2007, and returned to the stock in the first quarter of 2008 following its 50% drop on concerns about private student loan availability and the company’s enrollment acquisition costs. At that time, it was once again valued at the bottom end of its historical price to earnings (P/E) range and less than 10 times cash flow. We concluded that since only 4% of revenues were from students receiving private lender loans, credit market dislocations were likely a minimal problem. As well, recent cost issues were being addressed. Through the year, Apollo realized better than expected enrollment growth and margins and the stock advanced more than 40% from our initial investment. We sold the position in the fourth quarter as it achieved our target valuation.
In general, consumers, businesses, and governments are undergoing significant changes in response to the most testing economic conditions in many decades. In our 30 year history of analyzing and investing in out-of-favor companies, we have tried to take advantage of what the late John Templeton called “points of maximum pessimism.” We continue to look for companies that we believe can provide attractive risk reward characteristics in these uncharted waters and we are proceeding with even more focus on balance sheet strength and proven management effectiveness.
Thank you for your confidence and investment alongside us in Sound Shore.
Sincerely,
SOUND SHORE FUND
Harry Burn, III
John P. DeGulis
T. Gibbs Kane, Jr.
Co-Portfolio Managers
Fund returns assume the reinvestment of all dividend and capital gain distributions. The S&P 500 is an unmanaged index representing the average performance of 500 widely held, publicly traded, large capitalization stocks. It is not possible to invest directly in an index. Price to earnings ratio is the value of a company’s stock price relative to company earnings.
This letter may contain discussions about certain investments both held and not held in the portfolio. As required by Rule 2210(d)(1)(A), we must remind you that current and future portfolio holdings are subject to risk. Percent of net assets as of 12/31/08: Ambac Corp.: 0.00%; AES Corp.: 2.31%; American International
2
Group: 0.00%; Apollo Group, Inc.: 0.00%; Barr Pharmaceuticals, Inc.: 0.00%; Bear Stearns: 0.00%; Boston Scientific Corp.: 3.75%; CIT Group: 0.00%; Citigroup, Inc.: 0.00%; Fannie Mae: 0.00%; Freddie Mac: 0.00%; Lehman Bros.: 0.00%; MBIA, Inc.: 0.00%; MGIC Corp.: 0.00%; Wachovia: 0.00%; and Washington Mutual: 0.00%.
The Fund may invest in medium-sized companies, which involves greater risk than investing in larger, more established companies such as increased volatility of earnings and prospects, higher failure rates, and limited markets, product lines or financial resources.
The views in this letter were those of the Fund managers as of 12/31/08 and may not necessarily reflect their views on the date this letter is first published or anytime thereafter. These views (i) are intended to assist shareholders in understanding the Fund’s present investment methodology and (ii) do not constitute investment advice. This letter must be preceded or accompanied by a current Fund prospectus. Distributed by Foreside Fund Services, LLC.
3
The following chart reflects a ten-year comparison in the change in value of a hypothetical $10,000 investment in the Fund, including reinvested dividends and distributions, compared with a broad-based securities market index. The Standard and Poor’s 500 Index (the “S&P 500”) is a market-weighted index composed of 500 large capitalization companies and reflects the reinvestment of dividends. The Fund is professionally managed, while the S&P 500 is unmanaged and is not available for investment. The S&P 500 excludes the effect of any expenses, which have been deducted from the Fund’s return. The performance table and graph do not reflect the deduction of taxes that a shareholder would pay on Fund distributions or the redemption of Fund shares. Furthermore, during the period, certain fees were waived and/or expenses reimbursed; otherwise, returns would have been lower. Past performance cannot predict nor guarantee future results. Investment return and principal value of an investment in the Fund will fluctuate so that an investor’s shares, when redeemed, may be worth more or less than their original cost. Results of an investment made today may differ substantially from the Fund’s historical performance. Current performance may be lower or higher than the performance data quoted.
4
SOUND SHORE FUND, INC.
STATEMENT OF NET ASSETS
DECEMBER 31, 2008
| | | | | |
| | | Share
Amount
| | Market
Value
|
Common Stock (94.8%) | | | | | |
Consumer Discretionary (9.1%) | | | | | |
Comcast Corp., Class A | | 2,845,300 | | $ | 48,028,664 |
Time Warner, Inc. | | 5,623,200 | | | 56,569,392 |
Washington Post Co., Class B | | 108,800 | | | 42,459,200 |
| | | | |
|
|
| | | | | | 147,057,256 |
| | | | |
|
|
Consumer Staples (8.8%) | | | | | |
Dr Pepper Snapple Group, Inc. † | | 2,372,900 | | | 38,559,625 |
Kimberly-Clark Corp. | | 747,100 | | | 39,402,054 |
The Coca-Cola Co. | | 692,400 | | | 31,344,948 |
Unilever NV NY ADR | | 1,380,300 | | | 33,886,365 |
| | | | |
|
|
| | | | | | 143,192,992 |
| | | | |
|
|
Diversified Financials (2.6%) | | | | | |
Credit Suisse Group AG ADR | | 1,486,100 | | | 41,997,186 |
| | | | |
|
|
| | | | | | 41,997,186 |
| | | | |
|
|
Energy (14.6%) | | | | | |
Devon Energy Corp. | | 607,400 | | | 39,912,254 |
El Paso Corp. | | 5,204,000 | | | 40,747,320 |
Marathon Oil Corp. | | 1,239,000 | | | 33,899,040 |
Royal Dutch Shell PLC Class A, ADR | | 858,700 | | | 45,459,578 |
Schlumberger, Ltd. | | 736,100 | | | 31,159,113 |
Spectra Energy Corp. | | 2,912,700 | | | 45,845,898 |
| | | | |
|
|
| | | | | | 237,023,203 |
| | | | |
|
|
Health Care (14.4%) | | | | | |
Aetna, Inc. | | 1,591,300 | | | 45,352,050 |
Baxter International, Inc. | | 690,000 | | | 36,977,100 |
Boston Scientific Corp. † | | 7,872,900 | | | 60,936,246 |
Cardinal Health, Inc. | | 1,468,400 | | | 50,615,748 |
CIGNA Corp. | | 1,506,600 | | | 25,386,210 |
McKesson Corp. | | 400,500 | | | 15,511,365 |
| | | | |
|
|
| | | | | | 234,778,719 |
| | | | |
|
|
See Notes to Financial Statements.
5
SOUND SHORE FUND, INC.
STATEMENT OF NET ASSETS (Continued)
DECEMBER 31, 2008
| | | | | |
| | | Share
Amount
| | Market
Value
|
Industrials (1.7%) | | | | | |
Southwest Airlines Co. | | 3,235,200 | | $ | 27,887,424 |
| | | | |
|
|
Insurance (15.3%) | | | | | |
AON Corp. | | 850,100 | | | 38,832,568 |
Berkshire Hathaway, Inc., Class A † | | 653 | | | 63,079,800 |
Marsh & McLennan Cos., Inc. | | 1,899,000 | | | 46,088,730 |
The Chubb Corp. | | 721,000 | | | 36,771,000 |
The Progressive Corp. † | | 2,465,100 | | | 36,508,131 |
Unum Group | | 1,472,800 | | | 27,394,080 |
| | | | |
|
|
| | | | | | 248,674,309 |
| | | | |
|
|
Materials (1.6%) | | | | | |
Newmont Mining Corp. | | 638,300 | | | 25,978,810 |
| | | | |
|
|
Pharmaceuticals (8.7%) | | | | | |
Abbott Laboratories | | 799,900 | | | 42,690,663 |
Novartis AG ADR | | 759,700 | | | 37,802,672 |
Pfizer, Inc. | | 3,444,700 | | | 61,005,637 |
| | | | |
|
|
| | | | | | 141,498,972 |
| | | | |
|
|
Technology (10.6%) | | | | | |
Flextronics International, Ltd. † | | 10,764,700 | | | 27,557,632 |
Intuit, Inc. † | | 1,129,700 | | | 26,875,563 |
Symantec Corp. † | | 3,222,300 | | | 43,565,496 |
Texas Instruments, Inc. | | 3,198,900 | | | 49,646,928 |
Visa, Inc., Class A | | 464,800 | | | 24,378,760 |
| | | | |
|
|
| | | | | | 172,024,379 |
| | | | |
|
|
Utilities (7.4%) | | | | | |
AES Corp. † | | 4,548,300 | | | 37,477,992 |
Duke Energy Corp. | | 2,739,400 | | | 41,118,394 |
Exelon Corp. | | 759,500 | | | 42,235,795 |
| | | | |
|
|
| | | | | | 120,832,181 |
| | | | |
|
|
Total Common Stock (cost $1,885,129,937) | | | | $ | 1,540,945,431 |
| | | | |
|
|
See Notes to Financial Statements.
6
SOUND SHORE FUND, INC.
STATEMENT OF NET ASSETS (Continued)
DECEMBER 31, 2008
| | | | | |
| | | Share
Amount
| | Market
Value
|
Short-Term Investments (5.1%) | | | | | |
Money Market Fund (4.8%) | | | | | |
CitiFunds Institutional U.S. Treasury Reserves, 0.50% (cost $77,866,659) (a) | | 77,866,659 | | $ | 77,866,659 |
| | | | |
|
|
| | |
| | | Principal
| | |
Money Market Deposit Account (0.3%) | | | | | |
Citibank Money Market Deposit Account, 0.06% (cost $4,875,689) (a) | | 4,875,689 | | $ | 4,875,689 |
| | | | |
|
|
Total Short-Term Investments (cost $82,742,348) | | | | $ | 82,742,348 |
| | | | |
|
|
Total Investments (99.9%) (cost $1,967,872,285) * | | | | $ | 1,623,687,779 |
Other Assets less Liabilities (0.1%) | | | | | 986,210 |
| | | | |
|
|
Net Assets (100.0%) (shares outstanding 71,375,566) | | | | $ | 1,624,673,989 |
| | | | |
|
|
Net Asset Value (offering and redemption price per share) | | | | $ | 22.76 |
| | | | |
|
|
| (a) | Represents current yield as of 12/31/2008. |
| † | Non-income producing security. |
ADR — American Depositary Receipt.
| * | Cost for Federal income tax purposes is $1,992,113,080 and net unrealized depreciation consists of: |
| | | | |
Gross Unrealized Appreciation | | $ | 70,613,411 | |
Gross Unrealized Depreciation | | | (439,038,712 | ) |
| | |
|
|
|
Net Unrealized Depreciation | | $ | (368,425,301 | ) |
| | |
|
|
|
See Notes to Financial Statements.
7
SOUND SHORE FUND, INC.
STATEMENT OF NET ASSETS (Concluded)
DECEMBER 31, 2008
| | | | |
AT DECEMBER 31, 2008 NET ASSETS CONSISTED OF: | | | | |
Par Value (100,000,000 shares authorized) | | $ | 71,376 | |
Paid in Capital | | | 2,303,349,735 | |
Unrealized Depreciation on Investments | | | (344,184,506 | ) |
Accumulated Net Realized Loss on Investments | | | (334,562,616 | ) |
| | |
|
|
|
NET ASSETS | | $ | 1,624,673,989 | |
| | |
|
|
|
| | |
PORTFOLIO HOLDINGS
% of Net Assets | | |
Consumer Discretionary | | 9.1% |
Consumer Staples | | 8.8% |
Diversified Financials | | 2.6% |
Energy | | 14.6% |
Health Care | | 14.4% |
Industrials | | 1.7% |
Insurance | | 15.3% |
Materials | | 1.6% |
Pharmaceuticals | | 8.7% |
Technology | | 10.6% |
Utilities | | 7.4% |
Short-Term Investments | | 5.1% |
Other Assets less Liabilities | | 0.1% |
| | |
|
| | | 100.0% |
| | |
|
See Notes to Financial Statements.
8
SOUND SHORE FUND, INC.
STATEMENT OF OPERATIONS
FOR THE YEAR ENDED DECEMBER 31, 2008
| | | | |
| INVESTMENT INCOME | | | | |
Income: | | | | |
Dividends (net of foreign withholding taxes $96,801) | | $ | 38,787,925 | |
Interest | | | 211,343 | |
| | |
|
|
|
Total Income | | | 38,999,268 | |
| | |
|
|
|
Expenses: | | | | |
Advisory fee (Note 3) | | | 17,037,170 | |
Administrator fee | | | 588,892 | |
Transfer Agency fee | | | 2,271,590 | |
Custodian fee | | | 181,319 | |
Accountant fee | | | 5,193 | |
Professional fees | | | 192,119 | |
Directors’ fees and expenses (Note 3) | | | 114,653 | |
Compliance services fees (Note 3) | | | 155,094 | |
Miscellaneous | | | 224,844 | |
| | |
|
|
|
Total Expenses | | | 20,770,874 | |
| | |
|
|
|
Net Investment Income | | | 18,228,394 | |
| | |
|
|
|
| |
| REALIZED AND UNREALIZED GAIN (LOSS) ON INVESTMENTS | | | | |
Net realized (loss) on investments sold | | | (334,562,616 | ) |
Net change in unrealized depreciation on investments | | | (628,956,507 | ) |
| | |
|
|
|
Net realized and unrealized gain (loss) on investments | | | (963,519,123 | ) |
| | |
|
|
|
Net decrease in net assets from operations | | $ | (945,290,729 | ) |
| | |
|
|
|
See Notes to Financial Statements.
9
SOUND SHORE FUND, INC.
STATEMENTS OF CHANGES IN NET ASSETS
| | | | | | | | |
| INCREASE (DECREASE) IN NET ASSETS | | | | | | | | |
| | | For the
Year Ended
December 31,
2008
| | | For the
Year Ended
December 31,
2007
| |
Operations: | | | | | | | | |
Net investment income | | $ | 18,228,394 | | | $ | 14,813,012 | |
Net realized gain (loss) on investments sold | | | (334,562,616 | ) | | | 300,272,997 | |
Net change in unrealized depreciation on investments | | | (628,956,507 | ) | | | (234,691,808 | ) |
| | |
|
|
| |
|
|
|
Increase (decrease) in net assets from operations | | | (945,290,729 | ) | | | 80,394,201 | |
| | |
|
|
| |
|
|
|
Dividends to shareholders from net investment income | | | (18,329,460 | ) | | | (14,841,050 | ) |
Dividends to shareholders from net realized gains | | | — | | | | (299,146,427 | ) |
| | |
|
|
| |
|
|
|
Total distributions to shareholders | | | (18,329,460 | ) | | | (313,987,477 | ) |
| | |
|
|
| |
|
|
|
Capital share transactions (Note 6) | | | (142,633,646 | ) | | | 88,185,609 | |
| | |
|
|
| |
|
|
|
Total decrease | | | (1,106,253,835 | ) | | | (145,407,667 | ) |
Net assets: | | | | | | | | |
Beginning of the year | | | 2,730,927,824 | | | | 2,876,335,491 | |
| | |
|
|
| |
|
|
|
End of the year (Including line (A)) | | $ | 1,624,673,989 | | | $ | 2,730,927,824 | |
| | |
|
|
| |
|
|
|
(A) Accumulated undistributed net investment income | | $ | — | | | $ | — | |
| | |
|
|
| |
|
|
|
See Notes to Financial Statements.
10
SOUND SHORE FUND, INC.
NOTES TO FINANCIAL STATEMENTS
1. Organization
Sound Shore Fund, Inc. (the “Fund”) was incorporated under the laws of the State of Maryland on February 19, 1985 and is registered as a diversified, open-end management investment company under the Investment Company Act of 1940 (the “Act”), as amended. The investment objective of the Fund is growth of capital.
2. Significant Accounting Policies
These financial statements are prepared in accordance with accounting principles generally accepted in the United States of America (“generally accepted accounting principles”), which require management to make estimates and assumptions that affect the reported amounts of assets and liabilities, disclosure of contingent liabilities at the date of the financial statements, and the reported amounts of increase and decrease in net assets from operations during the fiscal period. Actual results could differ from those estimates.
The following represent significant accounting policies of the Fund:
a) Security Valuation
Exchange traded securities (including those traded on the National Association of Securities Dealers’ Automated Quotation system) not subject to restrictions against resale are valued at the last quoted sale price, as provided by independent pricing services as of the close of trading on the market or exchange for which they are primarily traded, on each Fund business day. In the absence of a sale, such securities are valued at the mean of the last bid and asked prices. Non-exchange traded securities for which over-the-counter market quotations are readily available are generally valued at the mean between the current bid and asked prices provided by independent pricing services. Debt securities may be valued at prices supplied by a Fund’s pricing agent based on broker or dealer supplied valuations or matrix pricing, a method of valuing securities by reference to the value of other securities with similar characteristics, such as rating, interest rate and maturity. Investments in other investment companies are valued at net asset value. Money market instruments that mature in sixty days or less may be valued at amortized cost.
Securities (including restricted securities) for which market quotations are insufficient or not readily available, or in the judgment of the Fund’s investment adviser, the prices or values available do not represent the fair value of the instrument, are valued in good faith, pursuant to procedures adopted by the Fund’s Board of Directors (the “Board”). Fair valuation is based on subjective factors and as a result, the fair value price of an asset may differ from the asset’s market price and may not be the price at which the asset may be sold. Fair valuation could result in a different net asset value (“NAV”) than a NAV determined by using market quotes.
b) Security Transactions and Investment Income
Dividend income is recorded on the ex-dividend date. Interest income is recorded on an accrual basis. Foreign dividend income is recorded on the ex-dividend date or as soon as practical after the Fund determines the existence of a dividend declaration after exercising reasonable due diligence. Income and capital gains on some
11
SOUND SHORE FUND, INC.
NOTES TO FINANCIAL STATEMENTS (Continued)
foreign securities may be subject to foreign withholding tax, which is accrued as applicable. Security transactions are recorded on a trade date basis. Realized gain and loss on investments sold are recorded on the basis of identified cost.
c) Dividends to Shareholders
Dividends from net investment income, if any, are declared and paid semi-annually. Capital gains, if any, are distributed to shareholders at least annually. The Fund determines its net investment income and capital gains distributions in accordance with income tax regulations, which may differ from generally accepted accounting principles. These differences are due primarily to differing treatments of income and gains on various investment securities held by the Fund, timing differences and differing characterizations of distributions made by the Fund.
d) Federal Taxes
The Fund intends to qualify each year as a regulated investment company and distribute all of its taxable income. In addition, by distributing in each calendar year substantially all of its net investment income, capital gain and certain other amounts, if any, the Fund will not be subject to a federal excise tax. Therefore, no federal income or excise tax provision is required.
In addition, Financial Accounting Standards Board Interpretation No. 48, Accounting for Uncertainty in Income Taxes (“FIN 48”) provides guidance for how uncertain tax positions should be recognized, measured, presented and disclosed in the financial statements. FIN 48 requires the affirmative evaluation of tax positions taken or expected to be taken in the course of preparing the Fund’s tax returns to determine whether it is more-likely-than-not (i.e., greater than 50-percent) that each tax position will be sustained upon examination by a taxing authority based on the technical merits of the position. A tax position that meets the more-likely-than-not recognition threshold is measured to determine the amount of benefit to recognize in the financial statements. Differences between tax positions taken in a tax return and amounts recognized in the financial statements will generally result in an increase in a liability for taxes payable (or a reduction of a tax refund receivable), including the recognition of any related interest and penalties as an operating expense. Implementation of FIN 48 included a review of tax positions taken in tax years that remain subject to examination by tax authorities in all major tax jurisdictions, including federal tax (i.e., the last 4 tax year ends as applicable). FIN 48 did not impact the Fund’s net assets or results of operations for the year ended December 31, 2008.
New Accounting Pronouncements - In September 2006, the Financial Accounting Standards Board issued Statement of Financial Accounting Standards No. 157, “Fair Value Measurements” (“SFAS 157”). This standard establishes a single authoritative definition of fair value, sets out a framework for measuring fair value, and requires additional disclosures about fair value measurements. SFAS 157 applies to fair value measurements already required or permitted by existing standards. SFAS 157 is effective for financial statements issued for fiscal years beginning after November 15, 2007 and interim periods within those fiscal years. The changes to current GAAP from the application of this Statement relate to the definition of fair value, the methods used to measure fair value, and the expanded
12
SOUND SHORE FUND, INC.
NOTES TO FINANCIAL STATEMENTS (Continued)
disclosures about fair value measurements. Effective January 1, 2008, the Fund adopted SFAS 157. There was no impact to the Fund’s net assets or results of operations upon adoption.
One key component of the implementation of SFAS 157 includes the development of a three-tier fair value hierarchy. The basis of the tiers is dependant upon the various “inputs” used to determine the value of the Fund’s investments. These inputs are summarized in the three broad levels listed below:
Level 1 - quoted prices in active markets for identical assets
Level 2 - other significant inputs (including quoted prices of similar securities, interest rates, prepayment speeds, credit risk, etc.)
Level 3 - significant unobservable inputs (including the Fund’s own assumptions in determining the fair value of investments)
The inputs or methodology used for valuing securities are not necessarily an indication of the risk associated with investing in those securities.
The following is a summary of the inputs used to value the Fund’s net assets as of December 31, 2008:
| | | |
Valuation Inputs
| | Investments in
Securities
|
Level 1 | | $ | 1,623,687,779 |
Level 2 | | | — |
Level 3 | | | — |
| | |
|
|
Total Investments | | $ | 1,623,687,779 |
| | |
|
|
In March 2008, the FASB issued Statement of Financial Accounting Standards No. 161, “Disclosures about Derivative Instruments and Hedging Activities” (“SFAS 161”). SFAS 161 is effective for fiscal years and interim periods beginning after November 15, 2008. SFAS 161 requires enhanced disclosures about the Fund’s derivative and hedging activities, including how such activities are accounted for and their effect on the Fund’s financial position, performance and cash flows. Management intends to adopt SFAS 161 during the fiscal year ending December 31, 2009. Management is currently evaluating the application of SFAS 161, and has not at this time determined the impact, if any, resulting from the adoption on the Fund’s future financial statements.
3. Investment Advisory and Other Services
Investment Adviser
The Fund’s investment adviser is Sound Shore Management, Inc. (the “Adviser”). Pursuant to an investment advisory agreement, the Adviser receives an advisory fee at an annual rate of 0.75% of the Fund’s average daily net assets.
Fees due to the Adviser in the amount of $993,016 were payable at December 31, 2008.
13
SOUND SHORE FUND, INC.
NOTES TO FINANCIAL STATEMENTS (Continued)
Other Services
Citi Fund Services Ohio, Inc. (“Citi”) provides certain administration, portfolio accounting and transfer agency services to the Fund.
Foreside Fund Services, LLC is the Fund’s distributor (the “Distributor”). The Distributor is not affiliated with the Adviser, Citi or its affiliated companies. The Distributor receives no compensation from the Fund for its distribution services.
Under a Compliance Services Agreement with the Fund, the Distributor provided a Chief Compliance Officer, Treasurer and Anti-Money Laundering Officer to the Fund as well as some additional compliance support functions (“Compliance Services”) until January 24, 2007. Since January 25, 2007, the Compliance Services have been provided by Foreside Compliance Services, LLC (“FCS”), an affiliate of the Distributor, pursuant to a Compliance Services Agreement between FCS and the Fund. The Treasurer of the Fund is a minority owner of the Distributor. Neither the Distributor, FCS or their employees that serve as officers of the Fund, has any role in determining the investment policies or which securities are to be purchased or sold by the Fund.
Compliance Services fees due to FCS in the amount of $12,298 were payable at December 31, 2008.
The Fund pays each director who is not an “interested person” of the Fund as defined in Section 2(a)(19) of the Act (“Independent Director”) $5,000 per year, payable quarterly, plus $5,000 for each Board meeting attended in person and $2,000 for each Board meeting attended by telephone.
Director fees due in the amount of $23,453 were payable at December 31, 2008.
Certain Officers and Directors of the Fund are officers, directors, or employees of the aforementioned companies.
4. Purchases and Sales of Securities
The cost of securities purchased and the proceeds from sales of securities (excluding short-term investments) for the year ended December 31, 2008 aggregated $2,442,808,260 and $2,610,655,419, respectively. Securities sold and purchased in the amount of $480,951 and $6,510,812, respectively, were receivable/payable at December 31, 2008.
5. Federal Income Tax and Investment Transactions
Distributions during the fiscal years ended as noted were characterized for tax purposes as follows:
| | | | | | |
| | | December 31,
2008
| | December 31,
2007
|
Ordinary Income | | $ | 18,329,460 | | $ | 41,403,302 |
Long-Term Capital Gain | | | — | | | 272,584,175 |
14
SOUND SHORE FUND, INC.
NOTES TO FINANCIAL STATEMENTS (Concluded)
As of December 31, 2008, the components of distributable earnings on a tax basis were as follows:
| | | | |
Capital and Other Losses | | $ | (310,321,821 | ) |
Net Unrealized Depreciation | | | (368,425,301 | ) |
On the Statement of Net Assets, as a result of permanent book to tax differences, certain amounts have been reclassified for the year ended December 31, 2008.
| | | | |
Accumulated Undistributed Net Investment Income | | $ | 101,066 | |
Paid-In-Capital | | | (101,066 | ) |
For the year ended December 31, 2008 the Fund had a capital loss carryforward in the amount of $310,321,821 which expires in 2016.
6. Capital Stock
As of December 31, 2008, 100,000,000 shares of $.001 par value stock were authorized and capital paid in amounted to $2,303,522,177. Capital shares redeemed in the amount of $2,987,998 were payable at December 31, 2008. Capital shares sold in the amount of $9,344,987 were receivable by the Fund at December 31, 2008. Transactions in capital stock were as follows:
| | | | | | | | | | | | | | |
| | | For the
Year Ended
December 31, 2008
| | | For the
Year Ended
December 31, 2007
| |
| | | Shares
| | | Amount
| | | Shares
| | | Amount
| |
Sale of shares | | 19,215,389 | | | $ | 562,282,350 | | | 11,804,776 | | | $ | 474,406,610 | |
Reinvestment of dividends | | 660,025 | | | | 17,826,107 | | | 8,546,609 | | | | 307,497,611 | |
Redemption of shares | | (25,043,355 | ) | | | (722,742,103 | ) | | (17,207,498 | ) | | | (693,718,612 | ) |
| | |
|
| |
|
|
| |
|
| |
|
|
|
Net increase (decrease) from capital transactions | | (5,167,941 | ) | | $ | (142,633,646 | ) | | 3,143,887 | | | $ | 88,185,609 | |
| | |
|
| |
|
|
| |
|
| |
|
|
|
Of the 71,375,566 shares outstanding as of December 31, 2008, the Employees’ Profit Sharing Plan of the Adviser owned 523,374 shares.
7. Other Information
On December 31, 2008, three entities, Charles Schwab & Co. Inc., National Financial Services Corp., and State Street Bank & Trust, Co., held of record in omnibus accounts approximately 75% of the outstanding shares of the Fund on behalf of numerous individual investors.
15
SOUND SHORE FUND, INC.
FINANCIAL HIGHLIGHTS
These financial highlights reflect selected data for a share outstanding throughout each period.
| | | | | | | | | | | | | | | | | | | | |
| | | Year Ended December 31,
| |
| | | 2008
| | | 2007
| | | 2006
| | | 2005
| | | 2004
| |
Net Asset Value, Beginning of Period | | $ | 35.68 | | | $ | 39.19 | | | $ | 36.63 | | | $ | 36.71 | | | $ | 33.51 | |
| | |
|
|
| |
|
|
| |
|
|
| |
|
|
| |
|
|
|
Investment Operations | | | | | | | | | | | | | | | | | | | | |
Net investment income | | | 0.25 | (a) | | | 0.20 | (a) | | | 0.21 | (a) | | | 0.07 | (a) | | | 0.10 | |
Net realized and unrealized gain (loss) on investments | | | (12.91 | ) | | | 0.83 | | | | 5.86 | | | | 2.43 | | | | 5.05 | |
| | |
|
|
| |
|
|
| |
|
|
| |
|
|
| |
|
|
|
Total from Investment Operations | | | (12.66 | ) | | | 1.03 | | | | 6.07 | | | | 2.50 | | | | 5.15 | |
| | |
|
|
| |
|
|
| |
|
|
| |
|
|
| |
|
|
|
Distributions from | | | | | | | | | | | | | | | | | | | | |
Net investment income | | | (0.26 | ) | | | (0.21 | ) | | | (0.21 | ) | | | (0.07 | ) | | | (0.10 | ) |
Net realized gains | | | — | | | | (4.33 | ) | | | (3.30 | ) | | | (2.51 | ) | | | (1.85 | ) |
| | |
|
|
| |
|
|
| |
|
|
| |
|
|
| |
|
|
|
Total Distributions | | | (0.26 | ) | | | (4.54 | ) | | | (3.51 | ) | | | (2.58 | ) | | | (1.95 | ) |
| | |
|
|
| |
|
|
| |
|
|
| |
|
|
| |
|
|
|
Net Asset Value, End of Period | | $ | 22.76 | | | $ | 35.68 | | | $ | 39.19 | | | $ | 36.63 | | | $ | 36.71 | |
| | |
|
|
| |
|
|
| |
|
|
| |
|
|
| |
|
|
|
Total Return | | | (35.60 | )% | | | 2.58 | % | | | 16.56 | % | | | 6.81 | % | | | 15.37 | % |
Ratio/Supplementary Data | | | | | | | | | | | | | | | | | | | | |
Net Assets at End of Period (in thousands) | | $ | 1,624,674 | | | $ | 2,730,928 | | | $ | 2,876,335 | | | $ | 2,268,234 | | | $ | 1,698,232 | |
Ratios to Average Net Assets: | | | | | | | | | | | | | | | | | | | | |
Expenses (net of reimbursement) | | | 0.92 | % | | | 0.92 | % | | | 0.92 | % | | | 0.98 | % | | | 0.98 | % |
Expenses (gross)(b) | | | 0.92 | % | | | 0.92 | % | | | 0.92 | % | | | 0.99 | % | | | 0.99 | % |
Net Investment Income | | | 0.80 | % | | | 0.50 | % | | | 0.54 | % | | | 0.20 | % | | | 0.33 | % |
Portfolio Turnover Rate | | | 111 | % | | | 84 | % | | | 66 | % | | | 62 | % | | | 50 | % |
| (a) | Calculated using the average shares outstanding for the period. |
| (b) | Reflects expense ratio in the absence of expense waiver and reimbursement. |
16
REPORT OF INDEPENDENT REGISTERED PUBLIC ACCOUNTING FIRM
To the Shareholders and Board of Directors of
Sound Shore Fund, Inc.
We have audited the accompanying statement of net assets of Sound Shore Fund, Inc. (the “Fund”) as of December 31, 2008, and the related statement of operations for the year ended, the statements of changes in net assets for each of the two years in the period then ended, and financial highlights for each of the five years in the period then ended. These financial statements and financial highlights are the responsibility of the Fund’s management. Our responsibility is to express an opinion on these financial statements and financial highlights based on our audits.
We conducted our audits in accordance with the standards of the Public Company Accounting Oversight Board (United States). Those standards require that we plan and perform the audit to obtain reasonable assurance about whether the financial statements and financial highlights are free of material misstatement. The Fund is not required to have, nor were we engaged to perform, an audit of its internal control over financial reporting. Our audits included consideration of internal control over financial reporting as a basis for designing audit procedures that are appropriate in the circumstances, but not for the purpose of expressing an opinion on the effectiveness of the Fund’s internal control over financial reporting. Accordingly, we express no such opinion. An audit also includes examining, on a test basis, evidence supporting the amounts and disclosures in the financial statements, assessing the accounting principles used and significant estimates made by management, as well as evaluating the overall financial statement presentation. Our procedures included confirmation of securities owned as of December 31, 2008, by correspondence with the custodian and brokers; where replies were not received from brokers, we performed other auditing procedures. We believe that our audits provide a reasonable basis for our opinion.
In our opinion, the financial statements and financial highlights referred to above present fairly, in all material respects, the financial position of Sound Shore Fund, Inc. as of December 31, 2008, the results of its operations for the year then ended, and the changes in its net assets for each of the two years in the period then ended, and the financial highlights for each of the five years in the period then ended, in conformity with accounting principles generally accepted in the United States of America.
DELOITTE & TOUCHE LLP
Chicago, Illinois
February 24, 2009
17
SOUND SHORE FUND, INC.
DECEMBER 31, 2008 (Unaudited)
Shareholder Expense Example
As a shareholder of the Fund, you incur ongoing costs, including management fees and other Fund expenses. This example is intended to help you understand your ongoing costs (in dollars) of investing in the Fund and to compare these costs with the ongoing costs of investing in other mutual funds.
The following example is based on $1,000 invested at the beginning of the period and held for the entire period from July 1, 2008 through December 31, 2008.
Actual Expenses - The first line of the table below provides information about actual account values and actual expenses. You may use the information in this line, together with the amount you invested, to estimate the expenses that you paid over the period. Simply divide your account value by $1,000 (for example, an $8,600 account value divided by $1,000 = 8.6), then multiply the result by the number in the first line under the heading entitled “Expenses Paid During Period” to estimate the expenses you paid on your account during this period.
Hypothetical Example for Comparison Purposes - The second line of the table below provides information about hypothetical account values and hypothetical expenses based on the Fund’s actual expense ratio and an assumed rate of return of 5% per year before expenses, which is not the Fund’s actual return. The hypothetical account values and expenses may not be used to estimate the actual ending account balance or expenses you paid for the period. You may use this information to compare the ongoing cost of investing in the Fund and other funds. To do so, compare this 5% hypothetical example with the 5% hypothetical examples that appear in the shareholder reports of other funds.
Expenses shown in the table are meant to highlight your ongoing costs only and do not reflect any transactional costs. Therefore, the second line of the table is useful in comparing ongoing costs only, and will not help you determine the relative total costs of owning different funds. In addition, if these transactional costs were included, your costs would have been higher.
| | | | | | | | | |
| | | Beginning
Account Value
July 1, 2008
| | Ending
Account Value
December 31, 2008
| | Expenses Paid
During Period*
|
Actual Return | | $ | 1,000.00 | | $ | 698.50 | | $ | 3.93 |
Hypothetical Return | | $ | 1,000.00 | | $ | 1,020.51 | | $ | 4.67 |
| * | Expenses are equal to the Fund’s annualized expense ratio of 0.92%, multiplied by the average account value over the period, multiplied by the number of days in most recent fiscal half-year divided by 366 to reflect the half-year period. |
Federal Tax Status of Dividends Declared during the Fiscal Year
Income Dividends - For Federal income tax purposes, dividends from short-term capital gains are classified as ordinary income. All net investment income dividends were ordinary income. The Fund paid income dividends of $18,329,460 for the tax year ended December 31, 2008, of which $0 were short term capital gain dividends. The Fund designates 100.00% of its income dividend distributed as qualifying for the corporate dividends-received
18
SOUND SHORE FUND, INC.
DECEMBER 31, 2008 (Unaudited) (Continued)
deduction (DRD) and 100.00% for the qualified dividend rate (QDI) as defined in Section 1(h)(11) of the Internal Revenue Code. The Fund also designates 0.54% of its income dividends as qualified interest income (QII) and 0.00% as qualified short-term capital gain dividends exempt from U.S. tax for foreign shareholders (QSD).
19
SOUND SHORE FUND, INC.
DECEMBER 31, 2008
Proxy Voting Information
A description of the policies and procedures that the Fund uses to determine how to vote proxies relating to securities held in the Fund’s portfolio is available, without charge and upon request, by calling (800) 551-1980 or by visiting the Fund’s web site at http://www.soundshorefund.com. This information is available on the SEC’s IDEA database found on the SEC’s website www.sec.gov under the name of the Fund (Company Name).
The Fund’s proxy voting record for the most recent 12-month period ended June 30 is available, without charge and upon request, by calling (800) 551-1980 or by visiting the Fund’s web site at http://www.soundshorefund.com. This information is available on the SEC’s IDEA database found on the SEC’s website www.sec.gov under the name of the Fund (Company Name).
Availability of Quarterly Portfolio Schedule
The Fund files its complete schedule of portfolio holdings with the SEC for the first and third quarters of each fiscal year on Form N-Q. This information is available on the SEC’s IDEA database found on the SEC’s website www.sec.gov under the name of the Fund (Company Name). It may be reviewed and copied at the SEC’s Public Reference Room in Washington, DC. Information on the operation of the Public Reference Room may be obtained by calling (800) SEC-0330.
Directors and Officers of the Fund
The following is relevant information regarding each Director and Officer of the Fund:
| | | | | | | | |
Name, Address and Age
| | Position(s) With the Fund
| | Length of Time
Served(1)
| | Principal Occupation(s) During the Past Five Years
| | Other Directorships Held by Director
|
| | | |
Independent Directors | | | | | | |
Dr. D. Kenneth Baker c/o Sound Shore Fund, Inc. 3435 Stelzer Road Columbus, OH 43219 Age: 84 | | Director, Audit Committee (member); Nominating Committee (Chair); Valuation Committee (member) | | March 1987 to present | | Retired, since 1999; Consultant, Princeton University, 1990 - 1998; Consultant, University of Pennsylvania, 1992 - 1998. | | |
| | | | |
Harry W. Clark c/o Sound Shore Fund, Inc. 3435 Stelzer Road Columbus, OH 43219 Age: 58 | | Director; Audit Committee (member); Nominating Committee (member); Valuation Committee (member) | | January 23, 2006 to present | | Managing Partner, Stanwich Group LLC (public policy consulting firm) since January 2001; Managing Partner, Clark & Weinstock (policy and communications consulting firm) July 1987 - December 2001. | | |
20
SOUND SHORE FUND, INC.
DECEMBER 31, 2008
Directors and Officers of the Fund (Continued)
| | | | | | | | |
Name, Address and Age
| | Position(s) With the Fund
| | Length of Time
Served(1)
| | Principal Occupation(s) During the Past Five Years
| | Other Directorships Held by Director
|
H. Williamson Ghriskey Jr. c/o Sound Shore Fund, Inc. 3435 Stelzer Road Columbus, OH 43219 Age: 63 | | Director; Audit Committee (Chair); Nominating Committee (member); Valuation Committee (member) | | January 23, 2006 to present | | Director/Portfolio Management, First Republic Investment Management (investment counseling firm) September 1978 to present (Director since September 1997). | | |
| | | | |
David Blair Kelso c/o Sound Shore Fund, Inc. 3435 Stelzer Road Columbus, OH 43219 Age: 56 | | Director; Audit Committee (member); Nominating Committee (member); Valuation Committee (member) | | January 23, 2006 to present | | Managing Partner, Kelso Advisory Services (consulting firm) since October 2003; Executive Vice President, Strategy & Finance, Aetna, Inc. (insurance firm) September 2001 - September 2003); Chief Financial Officer, Executive Vice President, and Managing Director, Chubb, Inc. (insurance firm) August 1996 - August 2001; Director, Aspen Holdings, Inc. (insurance firm) June 2005 to present; Director, Kelso Risk Management (insurance brokerage) September 1990 to present. | | Director (since July 2006) of Exl Service Holdings, Inc.; Director (since May 2006) Assurant, Inc. |
| | | | |
John J. McCloy II c/o Sound Shore Fund, Inc. 3435 Stelzer Road Columbus, OH 43219 Age: 71 | | Director; Audit Committee (member, previously Chair through January 23, 2006); Nominating Committee (member); Valuation Committee (member) | | April 1985 to present | | Director, Clean Diesel Technology, Inc. (environmental technology firm) since 2005; Director, Ashland Management (investment management) since 2003; Chairman, SpringerRun, Inc. (marketing) since 2002; Director, American Council on Germany (non-profit entity) since 2002; Chairman, Gravitas Technologies, Inc. (information technology) since 2001; Entrepreneur, J.J. McCloy II, Inc. (investment management) since 1980. | | |
| | | |
Interested Directors(2) | | | | | | |
Harry Burn, III, M.B.A. 8 Sound Shore Drive Greenwich, Connecticut 06830 Age: 64 | | Chairman and Director; Valuation Committee (member) | | April 1985 to present (Chairman September 1992 to present) | | Chairman and Director, Sound Shore Management, Inc. since 1978; Chartered Financial Analyst. | | |
21
SOUND SHORE FUND, INC.
DECEMBER 31, 2008 (Continued)
Directors and Officers of the Fund
| | | | | | | | |
Name, Address and Age
| | Position(s) With the Fund
| | Length of Time
Served(1)
| | Principal Occupation(s) During the Past Five Years
| | Other Directorships Held by Director
|
T. Gibbs Kane, Jr. 8 Sound Shore Drive Greenwich, Connecticut 06830 Age: 60 | | President and Director, Valuation Committee (member) | | April 1985 to present | | President and Director, Sound Shore Management, Inc. since 1977; Chartered Financial Analyst. | | |
| | | | |
Officers | | | | | | | | |
Shanna S. Sullivan 8 Sound Shore Drive Greenwich, Connecticut 06830 Age: 63 | | Secretary; Valuation Committee (Chair) | | October 1985 to present | | Vice President, Treasurer, Secretary and Director, Sound Shore Management, Inc. since 1979. | | |
| | | | |
Simon D. Collier Three Canal Plaza, Suite 100 Portland, Maine 04101 Age: 47 | | Treasurer | | April 2005 to present | | Partner, Foreside Financial Group, LLC since April 2005 (managing Partner from April 2005 - May 2008); President and Founder, Sondent Group, LLC (financial services consulting company) since May 2008; Chief Operating Officer and Managing Director, Global Fund Services, Citigroup 2003-2005. Mr. Collier serves as an officer to other unaffiliated mutual funds or closed-end funds for which the Distributor or its affiliates, act as distributor or provider of other services. | | |
| | | | |
Leslie K. Klenk Three Canal Plaza, Suite 100 Portland, Maine 04101 Age: 43 | | Chief Compliance Officer | | November 2006-present | | Director, Foreside Compliance Services, LLC (mutual fund compliance services provider) since November 2006; Chief Compliance Officer, Monarch Funds since June 2008; Chief Compliance Officer, Brown Advisory Funds since June 2008; Chief Compliance Officer, Ironwood Series Trust (mutual fund) November 2006 to May 2008; Chief Compliance Officer, Wintergreen Fund, Inc. (mutual fund) since December 2006; Senior Vice President and Counsel, Citigroup Fund Services, LLC (mutual fund services provider) (1998 - 2006). | | |
| (1) | Term of Service is until his/her successor is elected or qualified or until his/her earlier resignation or removal. |
| (2) | Harry Burn, III and T. Gibbs Kane, Jr. are “interested persons” of the Fund as defined in Section 2(a)(19) of the 1940 Act by virtue of their position as shareholders, senior officers, and Directors of the Adviser. Each is a portfolio manager of the Fund. |
The Statement of Additional Information (“SAI”) contains additional information about the Fund’s Directors. The SAI is available for free, by contacting the Fund at (800) 551-1980.
22

Investment Adviser
Sound Shore Management, Inc.
Greenwich, Connecticut
Administrator
Citi Fund Services Ohio, Inc.
Columbus, Ohio
Distributor
Foreside Fund Services, LLC
Portland, Maine
Transfer and
Distribution Paying Agent
Citi Fund Services Ohio, Inc.
Columbus, Ohio
Custodian
Citibank, N.A.
New York, New York
Counsel
Dechert LLP
New York, New York
Independent Registered
Public Accounting Firm
Deloitte & Touche LLP
Chicago, Illinois
107-AR-1208
This report is submitted for the general information of the shareholders of the Fund. It is not authorized for distribution to prospective investors in the Fund unless preceded or accompanied by an effective prospectus, which includes information regarding the Fund’s objectives and policies, experience of its management, marketability of shares, and other information.
SOUND SHORE FUND, INC.
3435 Stelzer Road
Columbus, OH 43219
http://www.soundshorefund.com
(800) 551-1980
Annual Report
DECEMBER 31, 2008


Sound Shore Fund, Inc. maintains a code of ethics, as defined in Item 2 of Form N-CSR, that applies to its President and Treasurer. A copy of the code of ethics is filed as an exhibit to this Form N-CSR.
| Item 3. | Audit Committee Financial Expert. |
The Board of Directors (the “Board”) has determined that no member of the Audit Committee is an “audit committee financial expert” as that term is defined under applicable regulatory guidelines. The Board believes that the Audit Committee, as a group, possesses many of the attributes of an “audit committee financial expert.”
| Item 4. | Principal Accountant Fees and Services. |
a) The aggregate fees billed for each of the last two fiscal years (the “Reporting Periods”) for professional services rendered by the Registrant’s principal accountant for the audit of the Registrant’s annual financial statements, or services that are normally provided by the principal accountant in connection with the statutory and regulatory filings or engagements for the Reporting Periods, were $43,000 in 2008 and $32,750 in 2007.
(b) Audit-Related Fees - The aggregate fees billed in the Reporting Periods for assurance and related services rendered by the principal accountant that were reasonably related to the performance of the audit of the Registrant’s financial statements and are not reported under paragraph (a) of this Item 4 were $0 in 2008 and $0 in 2007.
(c) The aggregate fees billed in the Reporting Periods for professional services rendered by the principal accountant to the Registrant for tax compliance, tax advice and tax planning (“Tax Services”) were $4,300 in 2008 and $4,100 in 2007. These services consisted of review or preparation of U.S. federal, state, local and excise tax returns.
(d) There were no other fees billed in the Reporting Periods for products and services provided by the principal accountant to the Registrant, other than the services reported in paragraphs (a) through (c) of this Item.
(e)(1) Pre-Approval Requirements for Audit and Non-Audit Services. The Audit Committee reviews and approves in advance all audit and “permissible non-audit services” (as defined under Rule 2-01(c)(4) of Regulation S-X) for the Fund. In addition, the Audit Committee reviews and approves in advance all “permissible non-audit services” to be provided to Sound Shore Management, Inc.,
the Fund’s investment adviser (“Sound Shore Management”), the Fund’s investment adviser, by the Fund’s independent auditor if the engagement relates to the operations and financial reporting of the Fund. The Audit Committee considers whether fees paid by Sound Shore Management for audit and permissible non-audit services are consistent with the independent auditor’s independence. Pre-approval of any permissible non-audit services provided to the Fund is not required so long as: (i) the aggregate amount of all such permissible non-audit services provided to the Fund constitutes not more than 5% of the total amount of revenues paid by the Fund to its auditor during the fiscal year in which the permissible non-audit services are provided; (ii) the permissible non-audit services were not recognized by the Fund at the time of the engagement to be non-audit services; and (iii) such services are promptly brought to the attention of the Audit Committee and approved prior to the completion of the audit by the Audit Committee or its authorized delegate(s). Pre-approval of permissible non-audit services rendered to Sound Shore Management is not required if such services constitute not more than 5% of the total amount of revenues paid by the Fund and Sound Shore Management collectively to the Fund’s independent auditor during the fiscal year in which such services are provided. The Audit Committee may delegate to one or more of its members authority to pre-approve permissible non-audit services to be provided to the Fund. Any pre-approval determination of a delegate will be presented to the full Audit Committee at its next meeting.
(e)(2) No services included in (b) - (d) above were approved pursuant to paragraph (c)(7)(i)(C) of Rule 2-01 of Regulation S-X.
(f) Not applicable as less than 50%.
(g) The aggregate fees billed in the Reporting Periods for Non-Audit Services by the principal accountant to the Registrant and Sound Shore Management were $4,300 in 2008 and $26,100 in 2007.
(h) The Registrant’s Audit Committee considers the provision of any non-audit services rendered to the investment adviser, to the extent applicable, in evaluating the independence of the Registrant’s principal accountant. Any services provided by the principal accountant to the Registrant or to Sound Shore Management require pre-approval were pre-approved.
| Item 5. | Audit Committee of Listed Registrants. |
NOT APPLICABLE.
| Item 6. | Schedule of Investments. |
(a) Included as part of report to stockholders under Item 1.
(b) NOT APPLICABLE.
| Item 7. | Disclosure of Proxy Voting Policies and Procedures for Closed-End Management Investment Companies. |
NOT APPLICABLE.
| Item 8. | Portfolio Managers of Closed-End Management Investment Companies. |
NOT APPLICABLE.
| Item 9. | Purchases of Equity Securities by Closed-End Management Investment Company and Affiliated Purchasers. |
NOT APPLICABLE.
| Item 10. | Submission of Matters to a Vote of Security Holders. |
NOT APPLICABLE.
| Item 11. | Controls and Procedures. |
(a) The registrant’s principal executive officer and principal financial officer have concluded, based on their evaluation of the registrant’s disclosure controls and procedures as conducted within 90 days of the filing date of this report, that these disclosure controls and procedures are adequately designed and are operating effectively to ensure that information required to be disclosed by the registrant on Form N-CSR is recorded, processed, summarized and reported within the time periods specified in the Securities and Exchange Commission’s rules and forms.
(b) There were no changes in the registrant’s internal control over financial reporting that occurred during the second fiscal quarter of the period covered by this report that have materially affected or are reasonably likely to materially affect, the registrant’s internal control over financial reporting.
(a)(1) A copy of the Code of Ethics (Exhibit filed herewith).
(a)(2) Certifications pursuant to Rule 30a-2(a) of the Investment Company Act of 1940 as amended, and Section 302 of the Sarbanes-Oxley Act of 2002 (Exhibit filed herewith).
(a)(3) NOT APPLICABLE.
(b) Certifications pursuant to Rule 30a-2(b) of the Investment Company Act of 1940, as amended, and Section 906 of the Sarbanes-Oxley Act of 2002 (Exhibit filed herewith).
SIGNATURES
Pursuant to the requirements of the Securities Exchange Act of 1934 and the Investment Company Act of 1940, the registrant has duly caused this report to be signed on its behalf by the undersigned, thereunto duly authorized.
| | |
| (Registrant) | | Sound Shore Funds, Inc. |
| | |
| By (Signature and Title) | | /s/ T. Gibbs Kane, Jr. |
| | T. Gibbs Kane, Jr., President |
Pursuant to the requirements of the Securities Exchange Act of 1934 and the Investment Company Act of 1940, this report has been signed below by the following persons on behalf of the registrant and in the capacities and on the dates indicated.
| | |
| By (Signature and Title) | | /s/ T. Gibbs Kane, Jr. |
| | T. Gibbs Kane, Jr., President |
| | |
| By (Signature and Title) | | /s/ Simon D. Collier |
| | Simon D. Collier, Treasurer |