UNITED STATES
SECURITIES AND EXCHANGE COMMISSION
Washington, D.C. 20549
FORM N-CSR
CERTIFIED SHAREHOLDER REPORT OF REGISTERED
MANAGEMENT INVESTMENT COMPANIES
Investment Company Act file number 811-04244
SOUND SHORE FUND, INC.
(Exact name of registrant as specified in charter)
3435 Stelzer Road
Columbus, OH 43219
(Address of principal executive offices) (Zip Code)
T. Gibbs Kane, Jr., President
8 Sound Shore Drive
Greenwich, Connecticut 06830
(Name and address of agent for service)
Registrant’s telephone number, including area code: (800) 551-1980
Date of fiscal year end: December 31
Date of reporting period: December 31, 2011
Item 1. Reports to Stockholders.

3435 STELZER ROAD, COLUMBUS, OH 43219 1-800-551-1980
December 31, 2011
Dear Shareholder:
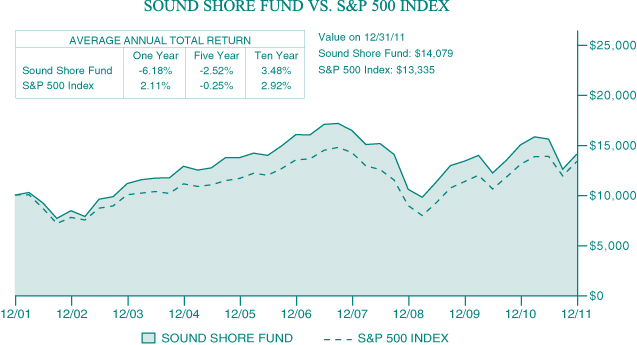
The Sound Shore Fund ended December 31, 2011 with a net asset value of $29.53 per share after a distribution of $0.196684 at year-end. The fourth quarter total return of 12.05% was ahead of the Standard & Poor’s 500 Index (“S&P 500”), which returned 11.82% and lagged the Dow Jones Industrial Average (“Dow Jones”), which returned 12.78%. For the year, the Fund declined -6.18%, which trailed results for the S&P 500 and the Dow Jones of 2.11% and 8.38%, respectively. Over the last decade, the Fund’s cumulative total return has been 40.79% versus 33.35% for the S&P 500.
We are required by the SEC to say that: Performance data quoted represents past performance and is no guarantee of future results. Current performance may be lower or higher than the performance data quoted. Investment return and principal value will fluctuate so that an investor’s shares, when redeemed, may be worth more or less than original cost. The Fund’s 1, 5, 10, and 15-year average annual total returns for the period ended December 31, 2011 were -6.18%, -2.52%, 3.48%, and 5.98%, respectively. As stated in the current prospectus, the Fund’s annual operating expense ratio is 0.95%. For the most recent month-end performance, please visit the Fund’s website at www.soundshorefund.com.
US equity indices posted only marginal gains in 2011, yet were among the best performing in the world. Behind the slightly positive return of the US stock market there were significant divergences. For example, the downside volatility of the third quarter was almost matched by the strong fourth quarter rebound, up nearly 12% for the S&P 500. As well, the defensive and higher yield utilities sector was up 19% for the year while the financials were at the other end of the spectrum, down -17%. Now in our 34th year, Sound Shore Management, Inc. has seen many challenging markets and, though our performance trailed in 2011, our prior experience is that staying committed to our disciplined value strategy remains the best route to competitive long-term returns for our investors.
The recent environment of solid earnings amidst global economic uncertainty has caused many companies to recalibrate growth expectations. Shareholders have often been beneficiaries of this evolving mindset via increased dividends and share repurchases or other restructuring activities. Sound Shore’s low price earnings investment framework has always included free cash flow and balanced capital allocation as criteria and several of our best contributors for 2011, including Marathon, Lowe’s, and Pfizer, were leaders in this shareholder-friendly trend.
At Marathon, for example, we initiated our position in early 2010 when the integrated oil company was selling at 7 times forward earnings and 4 times cash flow. At the time, we believed the company’s refining and marketing results could prove better than depressed forecasts due to a recent expansion at the company’s largest refinery. After executing on significant improvement through 2010, Marathon
1
announced in early 2011 that it would split into separately traded upstream and downstream companies, further unlocking value. As part of the split, the company used its de-leveraged balance sheet to increase its dividend as well. We sold our Marathon positions as they achieved target valuations during the second half of 2011.
Meanwhile, home improvement retailer Lowe’s, a new holding in 2011, hit our valuation screens in late 2010 when the stock was trading well below norm at 11 times forward earnings with a 2.5% dividend yield. We viewed management’s recently changed capital allocation plan, emphasizing lower investment and narrowing the profitability gap to Home Depot, as a significant departure from its past prioritization of store growth. After initiating our position in the third quarter, we benefited from the company’s fourth quarter announcement that its considerable free cash flow would be used to repurchase up to 15% of its shares outstanding per year for a multi-year period.
Similarly, global drug maker Pfizer, a longer term position, started the year valued at 7 times 2011 earnings due to investor concerns about the expiration of its Lipitor patent. Our analysis concluded that the company’s earnings and free cash flow would prove sturdier than expected due to the significant cost cuts and portfolio restructuring moves being taken by new CEO Ian Read. Pfizer shares steadily outperformed through the year as earnings estimates gradually rose and also after the company announced a higher than expected dividend increase and 2012 share repurchase program during the fourth quarter.
Several of our larger 2011 detractors, including General Motors and Citigroup, saw their valuation multiples compress despite improving financial performance. At GM, for example, strong vehicle pricing discipline, cost control, and market share improvement allowed the company to grow 2011 earnings by 29% versus 2010. However, the company’s forward P/E multiple declined to 5 times our 2012 estimate due to concerns about the global economy. Likewise, Citi’s 2011 tangible book value progressed 12% through the year but fallout from Europe’s rocky credit markets cut Citi’s price to tangible book multiple from 1.1 times to 0.5 times. Both GM and Citi are compelling risk-reward opportunities given their low valuations, stable financial positions, and completely new management teams that are successfully executing on focused strategies that are significant departures from their over-diversified histories.
Extended uncertainty in the global economy has depressed equity valuation multiples, which we view as an opportunity for our disciplined value investment framework. Indeed, Sound Shore’s portfolio is valued at 10.3 times forward earnings which compares favorably to both the S&P 500 at 12.4 times and generationally low competitive yields for 10 Year US Treasury Bonds. Since 1978 Sound Shore has been fortunate in the stability of our long-term client base and the commitment of our experienced research team to our one value investment strategy. As in the past, we believe these critical factors should allow us to take advantage of the current confluence of economic uncertainties, investor disdain for equities, and very low valuations. We strive to keep the confidence you have placed with us.
2
As always, thank you for your investment alongside ours in Sound Shore.
Sincerely,
SOUND SHORE FUND
Harry Burn, III
John P. DeGulis
T. Gibbs Kane, Jr.
Co-Portfolio Managers
Fund returns assume the reinvestment of all dividend and capital gain distributions. The Standard & Poor’s 500 Index is an unmanaged index representing the average performance of 500 widely held, publicly traded, large capitalization stocks. The Dow Jones Industrial Average consists of 30 stocks that are considered to be major factors in their industries and that are widely held by individuals and institutional investors. It is not possible to invest directly in an Index or Average.
Because of ongoing market volatility, fund performance may be subject to substantial short-term changes.
This letter may contain discussions about certain investments both held and not held in the portfolio. As required by the Financial Industry Regulatory Authority (FINRA), we must remind you that current and future portfolio holdings are subject to risk. Percent of net assets as of 12/31/11: Citigroup, Inc.: 2.59%; General Motors Company: 2.37%; Home Depot: 0.00%; Lowe’s Companies, Inc.: 2.90%; Marathon Oil Corp.: 0.00%; Marathon Petroleum Corp.: 0.00%; and Pfizer, Inc.: 2.96%.
An investment in the Fund is subject to risk, including the possible loss of principal amount invested. Mid Cap Risk: Securities of medium sized companies may be more volatile and more difficult to liquidate during market downturns than securities of large, more widely traded companies. Foreign Securities Risk: The Fund may invest in foreign securities primarily in the form of American Depositary Receipts. Investing in the securities of foreign issuers also involves certain special risks, which are not typically associated with investing in U.S. dollar-denominated securities or quoted securities of U.S. issuers including increased risks of adverse issuer, political, regulatory, market or economic developments. Investments in foreign securities also may be affected favorably or unfavorably by changes in currency rates and in exchange control regulations.
The views in this letter were those of the Fund managers as of 12/31/11 and may not necessarily reflect their views on the date this letter is first published or anytime thereafter. These views (i) are intended to assist shareholders in understanding the Fund’s present investment methodology and (ii) do not constitute investment advice. This letter must be preceded or accompanied by a current Fund prospectus. Distributed by Foreside Fund Services, LLC.
3
The following chart reflects a ten-year comparison in the change in value of a hypothetical $10,000 investment in the Fund, including reinvested dividends and distributions, compared with a broad-based securities market index. The Standard and Poor’s 500 Index (the “S&P 500”) is a market-weighted index composed of 500 large capitalization companies and reflects the reinvestment of dividends. The Fund is professionally managed, while the S&P 500 is unmanaged and is not available for investment. The S&P 500 excludes the effect of any expenses, which have been deducted from the Fund’s return. The performance table and graph do not reflect the deduction of taxes that a shareholder would pay on Fund distributions or the redemption of Fund shares. Furthermore, in the years 2001 through 2005, certain fees were waived and/or expenses reimbursed; otherwise, returns would have been lower. Past performance cannot predict nor guarantee future results. Investment return and principal value of an investment in the Fund will fluctuate so that an investor’s shares, when redeemed, may be worth more or less than their original cost. Results of an investment made today may differ substantially from the Fund’s historical performance. Current performance may be lower or higher than the performance data quoted.
The above information is not covered by the Report of the Independent Registered Public Accounting Firm.
4
SOUND SHORE FUND, INC.
SCHEDULE OF INVESTMENTS
DECEMBER 31, 2011
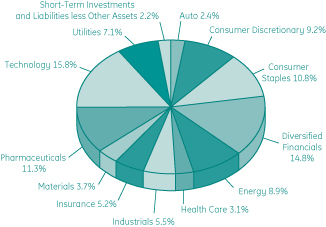
Sector/Industry Weightings (as of December 31, 2011)
as a percentage of Net Assets
| | | | | | | | |
| | | Share
Amount
| | | Market
Value
| |
Common Stocks (97.8%) | | | | | | | | |
Auto (2.4%) | | | | | | | | |
General Motors Co. † | | | 1,860,400 | | | $ | 37,710,308 | |
| | | | | | |
|
|
|
Consumer Discretionary (9.2%) | | | | | | | | |
Comcast Corp., Class A | | | 1,877,400 | | | | 44,513,154 | |
Lowe’s Companies, Inc. | | | 1,813,200 | | | | 46,019,016 | |
Time Warner, Inc. | | | 1,548,300 | | | | 55,955,562 | |
| | | | | | |
|
|
|
| | | | | | | | 146,487,732 | |
| | | | | | |
|
|
|
Consumer Staples (10.8%) | | | | | | | | |
CVS Caremark Corp. | | | 1,265,600 | | | | 51,611,168 | |
Procter & Gamble Co. | | | 623,900 | | | | 41,620,369 | |
Sysco Corp. | | | 1,098,500 | | | | 32,219,005 | |
Wal-Mart Stores, Inc. | | | 778,900 | | | | 46,547,064 | |
| | | | | | |
|
|
|
| | | | | | | | 171,997,606 | |
| | | | | | |
|
|
|
See Notes to Financial Statements.
5
SOUND SHORE FUND, INC.
SCHEDULE OF INVESTMENTS (Continued)
DECEMBER 31, 2011
| | | | | | | | |
| | | Share
Amount
| | | Market
Value
| |
Diversified Financials (14.8%) | | | | | | | | |
Bank of America Corp. | | | 5,295,500 | | | $ | 29,442,980 | |
Citigroup, Inc. | | | 1,566,990 | | | | 41,227,507 | |
Credit Suisse Group AG ADR | | | 1,326,600 | | | | 31,148,568 | |
Invesco, Ltd. | | | 2,474,400 | | | | 49,710,696 | |
State Street Corp. | | | 1,147,100 | | | | 46,239,601 | |
The Charles Schwab Corp. | | | 3,332,700 | | | | 37,526,202 | |
| | | | | | |
|
|
|
| | | | | | | | 235,295,554 | |
| | | | | | |
|
|
|
Energy (8.9%) | | | | | | | | |
Devon Energy Corp. | | | 733,600 | | | | 45,483,200 | |
Sunoco, Inc. | | | 1,367,900 | | | | 56,111,258 | |
Weatherford International Ltd. † | | | 2,756,900 | | | | 40,361,016 | |
| | | | | | |
|
|
|
| | | | | | | | 141,955,474 | |
| | | | | | |
|
|
|
Health Care (3.1%) | | | | | | | | |
Life Technologies Corp. † | | | 1,106,800 | | | | 43,065,588 | |
UnitedHealth Group, Inc. | | | 117,800 | | | | 5,970,104 | |
| | | | | | |
|
|
|
| | | | | | | | 49,035,692 | |
| | | | | | |
|
|
|
Industrials (5.5%) | | | | | | | | |
Cintas Corp. | | | 516,500 | | | | 17,979,365 | |
Delta Air Lines, Inc. † | | | 3,637,200 | | | | 29,424,948 | |
Southwest Airlines Co. | | | 4,599,400 | | | | 39,370,864 | |
| | | | | | |
|
|
|
| | | | | | | | 86,775,177 | |
| | | | | | |
|
|
|
Insurance (5.2%) | | | | | | | | |
Marsh & McLennan Companies, Inc. | | | 1,383,400 | | | | 43,743,108 | |
Metlife Inc. | | | 1,257,300 | | | | 39,202,614 | |
| | | | | | |
|
|
|
| | | | | | | | 82,945,722 | |
| | | | | | |
|
|
|
Materials (3.7%) | | | | | | | | |
Barrick Gold Corp. | | | 321,300 | | | | 14,538,825 | |
LyondellBasell Industries NV, Class A | | | 484,800 | | | | 15,751,152 | |
Owens-Illinois, Inc. † | | | 1,480,000 | | | | 28,682,400 | |
| | | | | | |
|
|
|
| | | | | | | | 58,972,377 | |
| | | | | | |
|
|
|
See Notes to Financial Statements.
6
SOUND SHORE FUND, INC.
SCHEDULE OF INVESTMENTS (Continued)
DECEMBER 31, 2011
| | | | | | | | |
| | | Share
Amount
| | | Market
Value
| |
Pharmaceuticals (11.3%) | | | | | | | | |
Abbott Laboratories | | | 903,300 | | | $ | 50,792,559 | |
Novartis AG ADR | | | 682,200 | | | | 39,001,374 | |
Pfizer, Inc. | | | 2,171,900 | | | | 46,999,916 | |
Sanofi SA ADR | | | 1,155,100 | | | | 42,207,354 | |
| | | | | | |
|
|
|
| | | | | | | | 179,001,203 | |
| | | | | | |
|
|
|
Technology (15.8%) | | | | | | | | |
Applied Materials, Inc. | | | 3,087,100 | | | | 33,062,841 | |
Flextronics International, Ltd. † | | | 6,510,700 | | | | 36,850,562 | |
Microsoft Corp. | | | 1,889,700 | | | | 49,056,612 | |
Symantec Corp. † | | | 2,281,900 | | | | 35,711,735 | |
Texas Instruments, Inc. | | | 1,600,400 | | | | 46,587,644 | |
Visa, Inc., Class A | | | 495,100 | | | | 50,267,503 | |
| | | | | | |
|
|
|
| | | | | | | | 251,536,897 | |
| | | | | | |
|
|
|
Utilities (7.1%) | | | | | | | | |
AES Corp. † | | | 4,018,300 | | | | 47,576,672 | |
Exelon Corp. | | | 1,105,200 | | | | 47,932,524 | |
Public Service Enterprise Group, Inc. | | | 493,800 | | | | 16,300,338 | |
| | | | | | |
|
|
|
| | | | | | | | 111,809,534 | |
| | | | | | |
|
|
|
Total Common Stocks (cost $1,512,970,587) | | | | | | $ | 1,553,523,276 | |
| | | | | | |
|
|
|
Short-Term Investments (2.4%) | | | | | | | | |
Money Market (2.4%) | | | | | | | | |
Western Asset Institutional U.S. Treasury Fund, 0.01%
(cost $38,658,955) (a) | | | 38,658,955 | | | $ | 38,658,955 | |
| | | | | | |
|
|
|
Total Investments (100.2%) (cost $1,551,629,542) * | | | | | | $ | 1,592,182,231 | |
Liabilities less Other Assets (-0.2%) | | | | | | | (3,359,430 | ) |
| | | | | | |
|
|
|
Net Assets (100.0%) | | | | | | $ | 1,588,822,801 | |
| | | | | | |
|
|
|
| † | Non-income producing security |
| (a) | Rate disclosed is as of December 31, 2011. |
ADR — American Depositary Receipt
See Notes to Financial Statements.
7
SOUND SHORE FUND, INC.
SCHEDULE OF INVESTMENTS (Concluded)
DECEMBER 31, 2011
| * | Cost for federal income tax purposes is $1,560,921,549 and net unrealized appreciation consists of: |
| | | | |
Gross Unrealized Appreciation | | $ | 190,820,006 | |
Gross Unrealized Depreciation | | | (159,559,324 | ) |
| | |
|
|
|
Net Unrealized Appreciation | | $ | 31,260,682 | |
| | |
|
|
|
See Notes to Financial Statements.
8
SOUND SHORE FUND, INC.
STATEMENT OF ASSETS AND LIABILITIES
DECEMBER 31, 2011
| | | | |
| ASSETS | | | | |
Investments, at value (Cost $1,551,629,542) | | $ | 1,592,182,231 | |
Receivables: | | | | |
Capital shares sold | | | 1,207,212 | |
Dividends | | | 932,290 | |
Prepaid expenses | | | 50,876 | |
| | |
|
|
|
Total Assets | | | 1,594,372,609 | |
| | |
|
|
|
| |
| LIABILITIES | | | | |
Payables: | | | | |
Investments purchased | | | 154,646 | |
Capital shares redeemed | | | 4,022,240 | |
Accrued liabilities: | | | | |
Advisory fees | | | 1,014,518 | |
Administrator fees | | | 35,433 | |
Transfer Agent fees and expenses | | | 161,182 | |
Custodian fees | | | 15,106 | |
Compliance and Treasurer Services fees | | | 12,422 | |
Other | | | 134,261 | |
| | |
|
|
|
Total Liabilities | | | 5,549,808 | |
| | |
|
|
|
Net Assets | | $ | 1,588,822,801 | |
| | |
|
|
|
| |
| COMPONENTS OF NET ASSETS | | | | |
Par Value (200,000,000 shares authorized) | | $ | 53,802 | |
Paid-in capital | | | 1,781,626,592 | |
Accumulated net realized loss on investments | | | (233,410,282 | ) |
Net unrealized appreciation on investments | | | 40,552,689 | |
| | |
|
|
|
Net Assets | | $ | 1,588,822,801 | |
| | |
|
|
|
| |
| NET ASSET VALUE | | | | |
Net Assets | | $ | 1,588,822,801 | |
Shares Outstanding | | | 53,802,324 | |
| | |
|
|
|
Net Asset Value (offering price & redemption price per share) | | $ | 29.53 | |
| | |
|
|
|
See Notes to Financial Statements.
9
SOUND SHORE FUND, INC.
STATEMENT OF OPERATIONS
FOR THE YEAR ENDED DECEMBER 31, 2011
| | | | |
| INVESTMENT INCOME | | | | |
Income: | | | | |
Dividends (net of foreign withholding taxes $1,534,480) | | $ | 29,909,489 | |
| | |
|
|
|
Total Income | | | 29,909,489 | |
| | |
|
|
|
Expenses: | | | | |
Advisory fees (Note 3) | | | 13,764,845 | |
Administrator fees | | | 494,745 | |
Transfer Agent fees and expenses | | | 1,962,869 | |
Custodian fees | | | 173,570 | |
Compliance and Treasurer Services fees (Note 3) | | | 141,500 | |
Directors’ fees and expenses (Note 3) | | | 93,071 | |
Professional fees | | | 261,162 | |
Insurance fees | | | 84,957 | |
Registration fees | | | 62,919 | |
Printing fees | | | 129,169 | |
Miscellaneous | | | 28,475 | |
| | |
|
|
|
Total Expenses | | | 17,197,282 | |
| | |
|
|
|
Net Investment Income | | | 12,712,207 | |
| | |
|
|
|
| |
| REALIZED AND UNREALIZED GAIN (LOSS) ON INVESTMENTS | | | | |
Net realized gain on investments sold | | | 133,631,618 | |
Net change in unrealized appreciation/depreciation on investments | | | (264,726,637 | ) |
| | |
|
|
|
Net realized and unrealized gain (loss) on investments | | | (131,095,019 | ) |
| | |
|
|
|
Net decrease in net assets from operations | | $ | (118,382,812 | ) |
| | |
|
|
|
See Notes to Financial Statements.
10
SOUND SHORE FUND, INC.
STATEMENTS OF CHANGES IN NET ASSETS
| | | | | | | | |
| INCREASE (DECREASE) IN NET ASSETS | | | | | | | | |
| | | For the
Year Ended
December 31,
2011
| | | For the
Year Ended
December 31,
2010
| |
Operations: | | | | | | | | |
Net investment income | | $ | 12,712,207 | | | $ | 13,026,435 | |
Net realized gain on investments sold | | | 133,631,618 | | | | 131,179,822 | |
Net change in unrealized appreciation/depreciation on investments | | | (264,726,637 | ) | | | 60,812,094 | |
| | |
|
|
| |
|
|
|
Increase (decrease) in net assets from operations | | | (118,382,812 | ) | | | 205,018,351 | |
| | |
|
|
| |
|
|
|
Dividends to shareholders from net investment income | | | (12,901,175 | ) | | | (12,971,367 | ) |
Return of Capital | | | (5,861,925 | ) | | | — | |
| | |
|
|
| |
|
|
|
Total distributions to shareholders | | | (18,763,100 | ) | | | (12,971,367 | ) |
| | |
|
|
| |
|
|
|
Capital share transactions (Note 6) | | | (201,894,126 | ) | | | (380,706,594 | ) |
| | |
|
|
| |
|
|
|
Total decrease | | | (339,040,038 | ) | | | (188,659,610 | ) |
Net assets: | | | | | | | | |
Beginning of the year | | | 1,927,862,839 | | | | 2,116,522,449 | |
| | |
|
|
| |
|
|
|
End of the year (Including line (A)) | | $ | 1,588,822,801 | | | $ | 1,927,862,839 | |
| | |
|
|
| |
|
|
|
(A) Accumulated undistributed net investment income | | $ | — | | | $ | 188,968 | |
| | |
|
|
| |
|
|
|
See Notes to Financial Statements.
11
SOUND SHORE FUND, INC.
NOTES TO FINANCIAL STATEMENTS
DECEMBER 31, 2011
1. Organization
Sound Shore Fund, Inc. (the “Fund”) was incorporated under the laws of the State of Maryland on February 19, 1985 and is registered as a diversified, open-end management investment company under the Investment Company Act of 1940 (the “Act”). The investment objective of the Fund is growth of capital.
2. Significant Accounting Policies
These financial statements are prepared in accordance with accounting principles generally accepted in the United States of America (“GAAP”), which require management to make estimates and assumptions that affect the reported amounts of assets and liabilities, disclosure of contingent liabilities at the date of the financial statements, and the reported amounts of increase and decrease in net assets from operations during the fiscal period. Actual results could differ from those estimates.
The following represent significant accounting policies of the Fund:
a. Security Valuation
Exchange traded securities (including those traded on the National Association of Securities Dealers’ Automated Quotation system) are valued at the last quoted sale price as provided by independent pricing services as of the close of trading on the system or exchange on which they are primarily traded, on each Fund business day. In the absence of a sale, such securities are valued at the mean of the last bid and asked prices. Non-exchange traded securities for which over-the-counter market quotations are readily available are generally valued at the mean between the current bid and asked prices provided by independent pricing services. Fixed-income securities may be valued at prices supplied by the Fund’s pricing agent based on broker or dealer supplied valuations or matrix pricing, a method of valuing securities by reference to the value of other securities with similar characteristics, such as rating, interest rate and maturity. Investments in other open-end regulated investment companies are valued at net asset value (“NAV”). Money market instruments that mature in sixty days or less may be valued at amortized cost.
The Fund values securities at fair value pursuant to procedures adopted by the Board of Directors if market quotations are not readily available (including a short and temporary lapse in the provision of a price by the regular pricing source) or, if in the judgment of the Advisor, the prices or values available do not represent the fair value of the instrument. Factors which may cause the Advisor to make such a judgment include, but are not limited to, the following, (i) only a bid price or an asked price is available, (ii) the spread between the bid price and the asked price is substantial, (iii) the frequency of sales, (iv) the thinness of the market, (v) the size of reported trades, and (vi) actions of the securities markets, such as the suspension or limitation of trading. Fair valuation is based on subjective factors and, as a result, the fair value price of an asset may differ from the asset’s market price and may not be the price at which the asset may be sold. Fair value estimates are based on judgments regarding the current economic environment, financial reports, credit, collateral and other such factors. Fair valuation could result in a NAV different from one determined by using market quotations.
12
SOUND SHORE FUND, INC.
NOTES TO FINANCIAL STATEMENTS (Continued)
DECEMBER 31, 2011
Valuation inputs used to determine the value of the Fund’s investments are summarized in the three broad levels listed below:
| | • | | Level 1 - quoted prices in active markets for identical assets |
| | • | | Level 2 - other significant observable inputs (including quoted prices of similar securities, interest rates, prepayment speeds, credit risk, etc.) |
| | • | | Level 3 - significant unobservable inputs (including the Fund’s own assumptions in determining the fair value of investments) |
The inputs or methodology used for valuing securities are not necessarily an indication of the risk associated with investing in those securities.
Pursuant to the valuation procedures noted previously, equity securities (including exchange traded securities and other open-end regulated investment companies) are generally categorized as Level 1 securities in the fair value hierarchy. Fixed-income securities and money market instruments are generally categorized as Level 2 securities in the fair value hierarchy. Investments for which there are no quotations, or for which quotations do not appear reliable, are valued at fair value as determined in good faith by the Pricing Committee under the direction of the Board. These valuations are typically categorized as Level 2 or Level 3 in the fair value hierarchy.
The following is a summary of the inputs used to value the Fund’s investments in securities as of December 31, 2011:
| | | | | | | | | | | | | | | | |
Valuation Inputs
| | Level 1
| | | Level 2
| | | Level 3
| | | Total
Investments
in Securities
| |
Common Stocks | | $ | 1,553,523,276 | | | $ | — | | | $ | — | | | $ | 1,553,523,276 | |
Short-Term Investments | | $ | 38,658,955 | | | $ | — | | | $ | — | | | $ | 38,658,955 | |
| | |
|
|
| |
|
|
| |
|
|
| |
|
|
|
Total Investments | | $ | 1,592,182,231 | | | $ | — | | | $ | — | | | $ | 1,592,182,231 | |
| | |
|
|
| |
|
|
| |
|
|
| |
|
|
|
At December 31, 2011, all equity securities and open-end mutual funds were included in Level 1 in the table above. Please refer to the Schedule of Investments to view equity securities categorized by industry type.
The Fund’s policy is to disclose significant transfers between Levels based on valuations at the end of the reporting period. There were no significant transfers between Levels 1, 2, or 3 as of December 31, 2011, based on the valuation input Levels on December 31, 2010.
In May 2011, the FASB issued ASU No. 2011-04 “Amendments to Achieve Common Fair Value Measurement and Disclosure Requirements in U.S. GAAP and International Financial Reporting Standards (“IFRS”).” ASU 2011-04 includes common requirements for measurement of and disclosure about fair value between U.S. GAAP and IFRS. ASU 2011-04 will require reporting entities to disclose quantitative information about the unobservable inputs used in the fair value measurements categorized within Level 3 of the fair value hierarchy. In addition, ASU 2011-04 will require reporting entities to make disclosures about amounts and reasons for all
13
SOUND SHORE FUND, INC.
NOTES TO FINANCIAL STATEMENTS (Continued)
DECEMBER 31, 2011
transfers in and out of Level 1 and Level 2 fair value measurements. The new and revised disclosures are effective for interim and annual reporting periods beginning after December 15, 2011. Management does not anticipate that ASU 2011-04 will materially impact the Fund’s financial statements.
b. Security Transactions and Investment Income
Dividend income is recorded on the ex-dividend date. Interest income is recorded on an accrual basis. Foreign dividend income is recorded on the ex-dividend date or as soon as practicable after the Fund determines the existence of a dividend declaration after exercising reasonable due diligence. Income and capital gains on some foreign securities may be subject to foreign withholding tax, which is accrued as applicable. Security transactions are recorded on a trade date basis. Realized gain and loss on investments sold are recorded on the basis of identified cost.
c. Dividends to Shareholders
Dividends from net investment income, if any, are declared and paid semiannually. Capital gains, if any, are distributed to shareholders at least annually. The Fund determines its net investment income and capital gains distributions in accordance with income tax regulations, which may differ from GAAP. These differences are due primarily to differing treatments of income and gains on various investment securities held by the Fund, timing differences and differing characterizations of distributions made by the Fund.
d. Federal Taxes
The Fund intends to qualify each year as a regulated investment company and to distribute substantially all of its taxable income. In addition, by distributing in each calendar year substantially all of its net investment income, capital gain and certain other amounts, if any, the Fund will not be subject to federal taxation. Therefore, no federal income or excise tax provision is required.
For all open tax years and all major taxing jurisdictions, management of the Fund has concluded that there are no significant uncertain tax positions that would require recognition in the financial statements. Open tax years are those that are open for examination by taxing authorities (i.e., generally, the last four tax year ends and the interim tax period since then). Further, management of the Fund is also not aware of any uncertain tax positions that would require the Fund to record a tax liability and, therefore, there is no impact to the Fund’s financial statements.
3. Investment Advisory and Other Services
Investment Adviser
The Fund’s investment adviser is Sound Shore Management, Inc. (the “Adviser”). Pursuant to an investment advisory agreement, the Adviser receives an advisory fee, accrued daily and paid monthly at an annual rate of 0.75% of the Fund’s average daily net assets.
14
SOUND SHORE FUND, INC.
NOTES TO FINANCIAL STATEMENTS (Continued)
DECEMBER 31, 2011
Other Services
Citi Fund Services Ohio, Inc. (“Citi”) provides certain administration, portfolio accounting and transfer agency services to the Fund.
The Fund also has agreements with various financial intermediaries and “mutual fund supermarkets” under which customers of these intermediaries may purchase and hold Fund shares. These intermediaries effectively provide sub-transfer agent services that the Fund transfer agent would have otherwise had to provide. In recognition of this, the transfer agent, the Fund and the Fund’s Adviser have entered into an agreement whereby the transfer agent agrees to pay financial intermediaries a portion of the amount denoted on the Statement of Operations as “Transfer Agent fees and expenses” that it receives from the Fund and the Adviser agrees to pay the excess, if any, charged by a financial intermediary.
Foreside Fund Services, LLC is the Fund’s distributor (the “Distributor”). The Distributor is neither affiliated with the Adviser, Citi nor its affiliated companies. The Distributor receives no compensation from the Fund for its distribution services.
Pursuant to a Compliance Services Agreement with the Fund, Foreside Compliance Services, LLC (“FCS”), an affiliate of the Distributor, provides a Chief Compliance Officer and Anti-Money Laundering Officer to the Fund as well as some additional compliance support functions. Under a Treasurer Services Agreement with the Fund, Foreside Management Services, LLC (“FMS”), an affiliate of the Distributor, provides a Treasurer to the Fund. Neither the Distributor, FCS, FMS, nor their employees that serve as officers of the Fund, have any role in determining the investment policies of or securities to be purchased or sold by the Fund.
The Fund pays each director who is not an “interested person” of the Fund, as defined in Section 2(a)(19) of the Act (“Independent Director”), quarterly fees of $1,250, plus $5,000 per quarterly in-person meeting, $2,000 per quarterly meeting attended telephonically and $1,000 per special meeting attended in person or telephonically.
Certain Officers and Directors of the Fund are officers, directors, or employees of the aforementioned companies.
4. Purchases and Sales of Securities
The cost of securities purchased and the proceeds from sales of securities (excluding short-term investments) for the year ended December 31, 2011 aggregated $1,084,451,374 and $1,262,288,949, respectively.
15
SOUND SHORE FUND, INC.
NOTES TO FINANCIAL STATEMENTS (Continued)
DECEMBER 31, 2011
5. Federal Income Tax and Investment Transactions
Distributions during the fiscal years ended as noted were characterized for tax purposes as follows:
| | | | | | | | |
| | | December 31,
2011
| | | December 31,
2010
| |
Ordinary Income | | $ | 12,901,175 | | | $ | 12,971,367 | |
Long-Term Capital Gains | | | — | | | | — | |
| | |
|
|
| |
|
|
|
Total Taxable Distributions | | | 12,901,175 | | | | 12,971,367 | |
Return of Capital | | | 5,861,925 | | | | — | |
| | |
|
|
| |
|
|
|
Total Distributions Paid | | $ | 18,763,100 | | | $ | 12,971,367 | |
| | |
|
|
| |
|
|
|
As of December 31, 2011, the components of distributable earnings on a tax basis were as follows:
| | | | |
Capital and Other Losses | | $ | (224,118,275 | ) |
Net Unrealized Appreciation | | | 31,260,682 | |
There were no permanent book to tax differences for the year ended December 31, 2011. As a result, no amounts were reclassified on the Statement of Assets and Liabilities.
For the year ended December 31, 2011, the Fund had capital loss carry forwards (CLFCs) as summarized in the table below. CLCFs that originated in a tax year that began before December 23, 2010 (pre-effective CLCFs) may be carried forward, subject to certain limitations, and applied to offset future capital gains, and thus reduce the amount of distributable capital gains, for up to eight succeeding tax years, after which any unutilized CLCFs expire. Pre-effective CLCFs are applied as short-term capital loss regardless of whether the originating capital loss was short term or long term. CLCFs that originate in tax years beginning after December 22, 2010 (post-effective CLCFs) are applied consistent with the character in which they originated as a new loss on the first day of the immediately succeeding tax year, and thus take precedent over the application of pre-effective CLCFs.
Capital loss carry forwards subject to expiration:
| | | | |
Expires tax year ending
| | Capital loss carry
forwards
| |
2016 | | $ | 46,386,182 | |
2017 | | | 177,732,093 | |
16
SOUND SHORE FUND, INC.
NOTES TO FINANCIAL STATEMENTS (Concluded)
DECEMBER 31, 2011
6. Capital Stock
As of December 31, 2011, 200,000,000 shares of $.001 par value stock were authorized and capital paid in amounted to $1,781,626,592. Transactions in capital stock were as follows:
| | | | | | | | | | | | | | | | |
| | | For the
Year Ended
December 31, 2011
| | | For the
Year Ended
December 31, 2010
| |
| | | Shares
| | | Amount
| | | Shares
| | | Amount
| |
Sale of shares | | | 8,394,594 | | | $ | 265,779,132 | | | | 11,141,573 | | | $ | 320,909,013 | |
Reinvestment of dividends | | | 591,692 | | | | 18,094,876 | | | | 443,100 | | | | 12,542,005 | |
Redemption of shares | | | (15,779,452 | ) | | | (485,768,134 | ) | | | (25,035,524 | ) | | | (714,157,612 | ) |
| | |
|
|
| |
|
|
| |
|
|
| |
|
|
|
Net decrease from capital transactions | | | (6,793,166 | ) | | $ | (201,894,126 | ) | | | (13,450,851 | ) | | $ | (380,706,594 | ) |
| | |
|
|
| |
|
|
| |
|
|
| |
|
|
|
Of the 53,802,324 shares outstanding as of December 31, 2011, the Employees’ Profit Sharing Plan of the Adviser owned 590,846 shares.
7. Other Information
On December 31, 2011, two entities, Charles Schwab & Co. Inc. and National Financial Services LLC, held of record in omnibus accounts approximately 66% of the outstanding shares of the Fund on behalf of numerous investors.
8. Subsequent Events
Subsequent events occurring after the date of this report have been evaluated for potential impact to this report through the date the report was available to be issued.
17
SOUND SHORE FUND, INC.
FINANCIAL HIGHLIGHTS
These financial highlights reflect selected data for a share outstanding throughout each period.
| | | | | | | | | | | | | | | | | | | | |
| | | Year Ended December 31,
| |
| | | 2011
| | | 2010
| | | 2009
| | | 2008
| | | 2007
| |
Net Asset Value, Beginning of Year | | $ | 31.82 | | | $ | 28.58 | | | $ | 22.76 | | | $ | 35.68 | | | $ | 39.19 | |
| | |
|
|
| |
|
|
| |
|
|
| |
|
|
| |
|
|
|
Investment Operations | | | | | | | | | | | | | | | | | | | | |
Net investment income(a) | | | 0.22 | | | | 0.19 | | | | 0.22 | | | | 0.25 | | | | 0.20 | |
Net realized and unrealized gain (loss) on investments | | | (2.18 | ) | | | 3.25 | | | | 5.82 | | | | (12.91 | ) | | | 0.83 | |
| | |
|
|
| |
|
|
| |
|
|
| |
|
|
| |
|
|
|
Total from Investment Operations | | | (1.96 | ) | | | 3.44 | | | | 6.04 | | | | (12.66 | ) | | | 1.03 | |
| | |
|
|
| |
|
|
| |
|
|
| |
|
|
| |
|
|
|
Distributions from | | | | | | | | | | | | | | | | | | | | |
Net investment income | | | (0.23 | ) | | | (0.20 | ) | | | (0.22 | ) | | | (0.26 | ) | | | (0.21 | ) |
Return of capital | | | (0.10 | ) | | | — | | | | — | | | | — | | | | — | |
Net realized gains | | | — | | | | — | | | | — | | | | — | | | | (4.33 | ) |
| | |
|
|
| |
|
|
| |
|
|
| |
|
|
| |
|
|
|
Total Distributions | | | (0.33 | ) | | | (0.20 | ) | | | (0.22 | ) | | | (0.26 | ) | | | (4.54 | ) |
| | |
|
|
| |
|
|
| |
|
|
| |
|
|
| |
|
|
|
Net Asset Value, End of Year | | $ | 29.53 | | | $ | 31.82 | | | $ | 28.58 | | | $ | 22.76 | | | $ | 35.68 | |
| | |
|
|
| |
|
|
| |
|
|
| |
|
|
| |
|
|
|
Total Return | | | (6.18 | )% | | | 12.13 | % | | | 26.64 | % | | | (35.60 | )% | | | 2.58 | % |
Ratios/Supplemental Data | | | | | | | | | | | | | | | | | | | | |
Net Assets at End of Year (in thousands) | | $ | 1,588,823 | | | $ | 1,927,863 | | | $ | 2,116,522 | | | $ | 1,624,674 | | | $ | 2,730,928 | |
Ratios to Average Net Assets: | | | | | | | | | | | | | | | | | | | | |
Expenses | | | 0.94 | % | | | 0.94 | % | | | 0.94 | % | | | 0.92 | % | | | 0.92 | % |
Net Investment Income | | | 0.69 | % | | | 0.66 | % | | | 0.89 | % | | | 0.80 | % | | | 0.50 | % |
Portfolio Turnover Rate | | | 61 | % | | | 64 | % | | | 97 | % | | | 111 | % | | | 84 | % |
| (a) | Calculated using the average shares outstanding for the period. |
18
REPORT OF INDEPENDENT REGISTERED PUBLIC ACCOUNTING FIRM
To the Shareholders and Board of Directors of
Sound Shore Fund, Inc.:
We have audited the accompanying statement of assets and liabilities of Sound Shore Fund, Inc. (the “Fund”), including the schedule of investments, as of December 31, 2011, and the related statement of operations for the year then ended, the statements of changes in net assets for each of the two years in the period then ended, and the financial highlights for each of the five years in the period then ended. These financial statements and financial highlights are the responsibility of the Fund’s management. Our responsibility is to express an opinion on these financial statements and financial highlights based on our audits.
We conducted our audits in accordance with the standards of the Public Company Accounting Oversight Board (United States). Those standards require that we plan and perform the audit to obtain reasonable assurance about whether the financial statements and financial highlights are free of material misstatement. The Fund is not required to have, nor were we engaged to perform an audit of its internal control over financial reporting. Our audits included consideration of internal control over financial reporting as a basis for designing audit procedures that are appropriate in the circumstances, but not for the purpose of expressing an opinion on the effectiveness of the Fund’s internal control over financial reporting. Accordingly, we express no such opinion. An audit also includes examining, on a test basis, evidence supporting the amounts and disclosures in the financial statements, assessing the accounting principles used and significant estimates made by management, as well as evaluating the overall financial statement presentation. Our procedures included confirmation of the securities owned as of December 31, 2011, by correspondence with the custodian and brokers. We believe that our audits provide a reasonable basis for our opinion.
In our opinion, the financial statements and financial highlights referred to above present fairly, in all material respects, the financial position of Sound Shore Fund, Inc. as of December 31, 2011, the results of its operations for the year then ended, the changes in its net assets for each of the two years in the period then ended, and the financial highlights for each of the five years in the period then ended, in conformity with accounting principles generally accepted in the United States of America.
DELOITTE & TOUCHE LLP
New York, New York
February 27, 2012
19
SOUND SHORE FUND, INC.
DECEMBER 31, 2011 (Unaudited)
Shareholder Expense Example
As a shareholder of the Fund, you incur ongoing costs, including management fees and other Fund expenses. This example is intended to help you understand your ongoing costs (in dollars) of investing in the Fund and to compare these costs with the ongoing costs of investing in other mutual funds.
The following example is based on $1,000 invested at the beginning of the period and held for the entire period from July 1, 2011 through December 31, 2011.
Actual Expenses - The first line of the table below provides information about actual account values and actual expenses. You may use the information in this line, together with the amount you invested, to estimate the expenses that you paid over the period. Simply divide your account value by $1,000 (for example, an $8,600 account value divided by $1,000 = 8.6), then multiply the result by the number in the first line under the heading entitled “Expenses Paid During Period” to estimate the expenses you paid on your account during this period.
Hypothetical Example for Comparison Purposes - The second line of the table below provides information about hypothetical account values and hypothetical expenses based on the Fund’s actual expense ratio and an assumed rate of return of 5% per year before expenses, which is not the Fund’s actual return. The hypothetical account values and expenses may not be used to estimate the actual ending account balance or expenses you paid for the period. You may use this information to compare the ongoing cost of investing in the Fund and other funds. To do so, compare this 5% hypothetical example with the 5% hypothetical examples that appear in the shareholder reports of other funds.
Expenses shown in the table are meant to highlight your ongoing costs only and do not reflect any transactional costs. Therefore, the second line of the table is useful in comparing ongoing costs only, and will not help you determine the relative total costs of owning different funds.
| | | | | | | | | | | | |
| | | Beginning
Account Value
July 1, 2011
| | | Ending
Account Value
December 31, 2011
| | | Expenses Paid
During Period*
| |
Actual Return | | $ | 1,000.00 | | | $ | 905.50 | | | $ | 4.51 | |
Hypothetical Return | | $ | 1,000.00 | | | $ | 1020.46 | | | $ | 4.79 | |
| * | Expenses are equal to the Fund’s annualized expense ratio of 0.94%, multiplied by the average account value over the period, multiplied by the number of days in the most recent fiscal half-year divided by 365 to reflect the half-year period. |
20
SOUND SHORE FUND, INC.
DECEMBER 31, 2011
Federal Tax Status of Dividends Declared during the Fiscal Year (Unaudited)
Income Dividends - For federal income tax purposes, dividends from short-term capital gains are classified as ordinary income. All net investment income dividends were ordinary income. The Fund paid income dividends of $12,901,175 for the tax year ended December 31, 2011, of which $0 were short-term capital gain dividends. The Fund designated 100% of its income dividend distributed as qualifying for the corporate dividends-received deductions (DRD) and 100% for the qualified dividend rate (QDI) as defined in Section 1(h)(11) of the Internal Revenue Code. The Fund also designates 0% of its income dividends as qualified interest income (QII) and 0% as qualified short-term capital gain dividends exempt from U.S. tax for foreign shareholders (QSD).
Proxy Voting Information
A description of the policies and procedures that the Fund uses to determine how to vote proxies relating to securities held in the Fund’s portfolio is available, without charge and upon request, by calling (800) 551-1980 or by visiting the Fund’s web site at http://www.soundshorefund.com. This information is also available on the SEC’s web site at http://www.sec.gov under the name of the Sound Shore Fund.
The Fund’s proxy voting record for the most recent 12-month period ended December 31 is available, without charge and upon request, by calling (800) 551-1980 or by visiting the Fund’s web site at http://www.soundshorefund.com. This information is available on the SEC’s web site at http://www.sec.gov under the name of the Sound Shore Fund.
Availability of Quarterly Portfolio Schedule
The Fund files its complete schedule of portfolio holdings with the SEC for the first and third quarters of each fiscal year on Form N-Q. This information is available on the SEC’s web site at http://www.sec.gov under the name of the Sound Shore Fund. It may be reviewed and copied at the SEC’s Public Reference Room in Washington, DC. Information on the operation of the Public Reference Room may be obtained by calling (800) SEC-0330.
21
SOUND SHORE FUND, INC.
DECEMBER 31, 2011
Directors and Officers of the Fund
The following is relevant information regarding Directors and Officers of the Fund:
| | | | | | | | |
Name, Address and Age
| | Position(s) With the Fund
| | Length of Time
Served(1)
| | Principal Occupation(s) During the Past Five Years
| | Other
Directorships
Held by Director
|
| | | |
Independent Directors | | | | | | |
Harry W. Clark c/o Sound Shore Fund, Inc. 3435 Stelzer Road Columbus, OH 43219 Age: 62 | | Director; Audit Committee (member); Nominating Committee (member); Valuation Committee (member) | | January 23, 2006 to present | | Managing Partner, Stanwich Group LLC (public policy consulting firm) since January 2001; Senior Counselor, Brunswick Group LLC (international financial communications consulting firm) since January 2005. | | |
| | | | |
H. Williamson Ghriskey, Jr. c/o Sound Shore Fund, Inc. 3435 Stelzer Road Columbus, OH 43219 Age: 67 | | Director; Audit Committee (member); Nominating Committee (member); Valuation Committee (member) | | January 23, 2006 to present | | Senior Managing Director/Portfolio Management, First Republic Investment Management (investment counseling firm) September 1978 to present (Director since September 1997). | | Past President of Investment Advisor Association 1990 - 1992 |
| | | | |
David Blair Kelso c/o Sound Shore Fund, Inc. 3435 Stelzer Road Columbus, OH 43219 Age: 59 | | Lead Independent Director; Audit Committee (Chair); Nominating Committee (Chair); Valuation Committee (member); Audit Committee Financial Expert | | January 23, 2006 to present | | Managing Partner, Kelso Advisory Services (consulting firm) since October 2003; Trustee, Connecticut College, since October 2007; Director, Round Hill Development Corp (resort development firm)., since 2006; Director, Aspen Holdings, Inc. (insurance firm) 2005 - April 2011; Executive Vice President, Strategy & Finance, Aetna, Inc. (insurance firm) September 2001 - September 2003; Chief Financial Officer, Executive Vice President, and Managing Director, Chubb, Inc. (insurance firm) August 1996 - August 2001. | | Director, EXL Service Holdings, Inc. (since July 2006) Director, Assurant, Inc. (since March 2007) |
| | | | |
John J. McCloy, II c/o Sound Shore Fund, Inc. 3435 Stelzer Road Columbus, OH 43219 Age: 74 | | Director | | April 1985 to present | | Chairman, Apelles - III (military housing); Director, American Council on Germany (non-profit entity) until April 2011; Chairman, Gravitas Technologies, Inc. (information technology firm); entrepreneur, J.J. McCloy II, Inc.; Chairman, SpringerRun, Inc. (marketing firm) until 2010. | | |
22
SOUND SHORE FUND, INC.
DECEMBER 31, 2011
Directors and Officers of the Fund
| | | | | | | | |
Name, Address and Age
| | Position(s) With the Fund
| | Length of Time
Served(1)
| | Principal Occupation(s) During the Past Five Years
| | Other
Directorships
Held by Director
|
| | | |
Interested Directors(2) | | | | | | |
Harry Burn, III, M.B.A. 8 Sound Shore Drive Greenwich, Connecticut 06830 Age: 67 | | Chairman and Director; Valuation Committee (member) | | April 1985 to present (Chairman September 1992 to present) | | Chairman and Director, Sound Shore Management, Inc. since 1978; Chartered Financial Analyst. | | |
| | | | |
T. Gibbs Kane, Jr. 8 Sound Shore Drive Greenwich, Connecticut 06830 Age: 64 | | President and Director, Valuation Committee (member) | | April 1985 to present | | President and Director, Sound Shore Management, Inc. since 1977; Chartered Financial Analyst. | | |
| | | | |
Officers | | | | | | | | |
Lowell E. Haims 8 Sound Shore Drive Greenwich, Connecticut 06830 Age: 44 | | Secretary, Valuation Committee (Chair) | | October 2010 to present | | Chief Administrative Officer, Sound Shore Management, Inc. since October 2005; Chief Compliance Officer, Sound Shore Management, Inc. since June 2007; Chartered Financial Analyst. | | |
| | | | |
Charles S. Todd Three Canal Plaza, Suite 100 Portland, Maine 04101 Age: 40 | | Treasurer | | June 2009 to present | | Director, Foreside Management Services, LLC (December 2008 to present); Vice President/Assistant Vice President within the Fund Administration Department of J.P. Morgan Investor Services Co. (June 2000 - December 2008). | | |
| | | | |
Julie Walsh 10 High Street, Suite 302A Boston, Massachusetts 02110 Age: 40 | | Chief Compliance Officer | | May 2011 to present | | Managing Director, Foreside Compliance Services, LLC (May 2010 to present). Compliance Marketing Consultant, Grantham, Mayo, & Van Otterloo & Co LLC (May 2008 - May 2010). Chief Compliance Officer, Grantham, Mayo, & Van Otterloo LLC (April 1995 - May 2008) | | |
| (1) | Term of Service is until his/her successor is elected or qualified or until his/her earlier resignation or removal. Mr. McCloy resigned effective February 1, 2012. |
| (2) | Harry Burn, III and T. Gibbs Kane, Jr. are “interested persons” of the Fund as defined in Section 2(a)(19) of the 1940 Act by virtue of their position as shareholders, senior officers, and Directors of the Adviser. Each is a portfolio manager of the Fund. |
The Fund’s Statement of Additional Information (“SAI”) contains additional information about the Fund’s Directors. The SAI is available for free, by contacting the Fund at (800) 551-1980.
23

Investment Adviser
Sound Shore Management, Inc.
Greenwich, Connecticut
Administrator
Citi Fund Services Ohio, Inc.
Columbus, Ohio
Distributor
Foreside Fund Services, LLC
Portland, Maine
www.foreside.com
Transfer and
Distribution Paying Agent
Citi Fund Services Ohio, Inc.
Columbus, Ohio
Custodian
Citibank, N.A.
New York, New York
Fund Counsel
Dechert LLP
New York, New York
Counsel to the Independent Directors
Wilmer Cutler Pickering Hale
and Dorr, LLP
New York, New York
Independent Registered
Public Accounting Firm
Deloitte & Touche LLP
New York, New York
107-AR-1211
This report is submitted for the general information of the shareholders of the Fund. It is not authorized for distribution to prospective investors in the Fund unless preceded or accompanied by an effective prospectus, which includes information regarding the Fund’s objectives and policies, experience of its management, and other information.
SOUND SHORE FUND, INC.
3435 Stelzer Road
Columbus, OH 43219
http://www.soundshorefund.com
(800) 551-1980
Annual Report
DECEMBER 31, 2011


Item 2. Code of Ethics.
Sound Shore Fund, Inc. maintains a code of ethics, as defined in Item 2 of Form N-CSR, that applies to its President and Treasurer. A copy of the code of ethics is filed as an exhibit to this Form N-CSR.
Item 3. Audit Committee Financial Expert.
The Board of Directors has determined that David Blair Kelso, who meets the definition of an independent director as specified by Item 3, is an “audit committee financial expert” as that term is defined by applicable regulator guideline.
Item 4. Principal Accountant Fees and Services.
| (a) | Audit Fees – The aggregate fees billed for each of the last two fiscal years (the “Reporting Periods”) for professional services rendered by the Registrant’s principal accountant for the audit of the Registrant’s annual financial statements, or services that are normally provided by the principal accountant in connection with the statutory and regulatory filings or engagements for the Reporting Periods, were $42,120 in 2011 and $42,120 in 2010. |
| (b) | Audit-Related Fees – The aggregate fees billed in the Reporting Periods for assurance and related services rendered by the principal accountant that were reasonably related to the performance of the audit of the Registrant’s financial statements and are not reported under paragraph (a) of this item 4 were $0 in 2011 and $0 in 2010. |
| (c) | Tax Fees – The aggregate fees billed in the Reporting Periods for professional services rendered by the principal accountant to the Registrant for tax compliance, tax advice and tax planning (“Tax Fees”) were $4,475 in 2011 and $4,475 in 2010. These services consisted of review or preparation of U.S. federal, state, local and excise tax returns. |
| (d) | All Other Fees – There were no other fees billed in the Reporting Periods for products and services provided by the principal accountant to the Registrant, other than the services reported in paragraphs (a) through (c) of this Item. |
| (e)(1) | Pre-Approval Requirements for Audit and Non-Audit Services. The Audit Committee reviews and approves in advance all audit and “permissible non-audit services” to be provided to Sound Shore Management, Inc. (“Sound Shore Management”), the Fund’s investment adviser, by the Fund’s independent auditor if the engagement relates to the operations and financial reporting of the Fund. The Audit Committee considers whether fees paid by Sound Shore Management for audit and permissible non-audit services are consistent with the independent auditor’s independence. Pre-approval of any permissible non-audit services provided to the Fund is not required so long as: (i) the aggregate amount of all such permissible non-audit services provided to the Fund constitutes not more than 5% of the total amount of revenues paid by the Fund to its auditor during the fiscal year in which the permissible non-audit services are provided; (ii) the permissible non-audit services were not recognized by the Fund at the time of engagement to be non-audit services; and (iii) such services are promptly brought to the attention of the Audit Committee and approved prior to the completion of the audit by the Audit Committee or its authorized delegate(s). Pre-approval of permissible non-audit services rendered to Sound Shore Management is not required if provided. The Audit Committee may delegate to one or more of its members authority to pre-approve permissible non-audit services to be provided to the Fund. Any pre-approval determination of a delegate will be presented to the full Audit Committee at its next meeting. |
| (e)(2) | No services included in (b) - (d) above were approved pursuant to paragraph (c)(7)(i)(C) of Rule 2-01 of Regulation S-X. |
| (f) | Not applicable as less than 50%. |
| (g) | The aggregate fees billed in the Reporting Periods for Non-Audit Services by the principal accountant to the Registrant and Sound Shore Management were $50,225 in 2011 and $50,225 in 2010. |
| (h) | The Registrant’s Audit Committee considers the provision of any non-audit services rendered to the investment adviser, to the extent applicable, in evaluating the independence of the Registrant’s principal accountant. Any services provided by the principal accountant to the Registrant or to Sound Shore Management requiring pre-approval were pre-approved. |
Item 5. Audit Committee of Listed Registrants.
Not applicable.
Item 6. Schedule of Investments.
| (a) | Included as part of the report to stockholders under Item 1. |
Item 7. Disclosure of Proxy Voting Policies and Procedures for Closed-End Management Investment Companies.
Not applicable.
Item 8. Portfolio Managers of Closed-End Management Investment Companies.
Not applicable.
Item 9. Purchases of Equity Securities by Closed-End Management Investment Company and Affiliated Purchasers.
Not applicable.
Item 10. Submission of Matters to a Vote of Security Holders.
Not applicable.
Item 11. Controls and Procedures.
(a) The registrant’s principal executive officer and principal financial officer concluded that the registrant’s disclosure controls and procedures (as defined in Rule 30a-3(c) under the Investment Company Act of 1940 (the “Act”)) were effective as of a date within 90 days of the filing date of this report (the “Evaluation Date”) based on their evaluation of the registrant’s disclosure controls and procedures as of the Evaluation Date.
(b) There were no changes in the registrant’s internal control over financial reporting (as defined in Rule 30a-3(d) under the Act) that occurred during the second fiscal quarter of the period covered by this report that have materially affected, or are reasonably likely to materially affect, the registrant’s internal control over financial reporting.
Item 12. Exhibits.
(a)(1) A copy of the Code of Ethics (Exhibit filed herewith).
(a)(2) Certifications pursuant to Rule 30a-2(a) of the Investment Company Act of 1940 as amended, and Section 302 of the Sarbanes-Oxley Act of 2002 (Exhibit filed herewith).
(a)(3) Not applicable.
(b) Certifications pursuant to Rule 30a-2(b) of the Investment Company Act of 1940, as amended, and Section 906 of the Sarbanes-Oxley Act of 2002 (Exhibit filed herewith).
SIGNATURES
Pursuant to the requirements of the Securities Exchange Act of 1934 and the Investment Company Act of 1940, the registrant has duly caused this report to be signed on its behalf by the undersigned, thereunto duly authorized.
| | | | |
| Registrant | | Sound Shore Fund, Inc. | | |
| | |
| By (Signature and Title) | | /s/ T. GIBBS KANE, JR. | | |
| | T. Gibbs Kane, Jr., President | | |
Date March 6, 2012
Pursuant to the requirements of the Securities Exchange Act of 1934 and the Investment Company Act of 1940, this report has been signed below by the following persons on behalf of the registrant and in the capacities and on the dates indicated.
| | | | |
| By (Signature and Title) | | /s/ T. GIBBS KANE, JR. | | |
| | T. Gibbs Kane, Jr., President | | |
Date March 6, 2012 | | |
| By (Signature and Title) | | /s/ CHARLES S. TODD | | |
| | Charles S. Todd, Treasurer | | |
Date March 6, 2012