UNITED STATES
SECURITIES AND EXCHANGE COMMISSION
Washington, D.C. 20549
FORM N-CSR
CERTIFIED SHAREHOLDER REPORT OF REGISTERED
MANAGEMENT INVESTMENT COMPANIES
Investment Company Act file number 811-04244
SOUND SHORE FUND, INC.
(Exact name of registrant as specified in charter)
3435 Stelzer Road
Columbus, OH 43219
(Address of principal executive offices) (Zip Code)
T. Gibbs Kane, Jr., President
8 Sound Shore Drive
Greenwich, CT 06830
(Name and address of agent for service)
Registrant’s telephone number, including area code: (800) 551-1980
Date of fiscal year end: December 31
Date of reporting period: December 31, 2014
| Item 1. | Reports to Stockholders. |

3435 STELZER ROAD, COLUMBUS, OH 43219 1-800-551-1980
December 31, 2014
Dear Investor:
The Sound Shore Fund’s Investor Class (ticker SSHFX) ended December 31, 2014 with a net asset value of $48.79 per share, after a year-end capital gains distribution of $5.055042 per share. The fourth quarter total return of 2.96% lagged the Standard & Poor’s 500 Index (“S&P 500”) which rose 4.93% and the Dow Jones Industrial Average (“Dow Jones”) which rose 5.20%. For the year, the Fund’s Investor Class gained 11.76% which trailed the S&P 500 and outperformed the Dow Jones, which had returns of 13.69% and 10.04%, respectively.
We are required by the SEC to say that: Performance data quoted represents past performance and is no guarantee of future results. Current performance may be lower or higher than the performance data quoted. Investment return and principal value will fluctuate so that an investor’s shares, when redeemed, may be worth more or less than original cost. The Fund’s Investor Class 1, 5, 10, and 15-year average annual total returns for the period ended December 31, 2014 were 11.76%, 14.70%, 7.53%, and 7.99%, respectively. As stated in the current prospectus dated May 1, 2014, the Fund’s Investor Class total annual operating expense ratio (gross) is 0.93%. Subsequently, for the fiscal year ended December 31, 2014, the total annual operating expense ratio (gross) was 0.92%, as shown in the financial highlights later in this Annual Report.
Stock markets gained in 2014 as investors took encouragement from solid corporate profits, and otherwise looked through concerns that ranged from geopolitical unrest to the end of Quantitative Easing in the US. Uneven domestic growth and generally slower international economies led to more divergent than usual central bank policies and volatile currency markets. Against a backdrop of lower than expected interest rates, the “bond proxy” utility stocks were the S&P 500’s best performers. By contrast, energy was the market’s only declining sector as oil prices nearly halved from September to year end.
Sound Shore’s company-specific focus on undervalued earnings and free cash flow resulted in a diverse lineup of 2014 contributors: Our seven best stocks spanned six different sectors. Among these was aluminum maker Alcoa, the year’s best performer, which outdistanced its lagging materials peers and also provided a great Sound Shore case study. We invested in Alcoa during the second half of 2013 when the stock was attractively priced at five times cash flow, ten times normalized earnings, and below book value. Alcoa was so out of favor that, in September 2013, Dow Jones removed the stock from its iconic Industrial Average after 55 years of inclusion. Our research concluded, however, that Alcoa’s plans to grow its highly profitable engineered products unit and also cut smelting and refining costs would build significant value. Since our investment, consensus earnings forecasts for Alcoa have doubled as management has executed internally and also as aluminum fundamentals have tightened. After a gain of 67%, well ahead of the market, Alcoa achieved our target valuation and we sold our position in December 2014.
Pharmaceutical supplier Hospira also performed well in 2014, advancing 48%. We started our position in this injectable generic drug leader in early 2013 when the stock was priced well below historic
1
norm on sales due to a manufacturing startup delay. We viewed the facility issue as temporary, and also believed that management’s plan to improve returns through both improved manufacturing consistency and new biosimilar products would yield above consensus earnings power. In the interim, Hospira shares have advanced as the company executed on its plan and also benefitted from industry capacity constraints.
A few holdings with greater international exposure lagged, especially in the fourth quarter. Global glass packaging leader Owens-Illinois was the biggest 2014 detractor due to demand concerns in Europe, its largest market. Valued at under ten times earnings and with a 9% free cash flow yield, we believe O-I retains an attractive risk-reward profile. As well, integrated oil BP, which we purchased well after the 2010 Gulf of Mexico oil spill, declined due to lower oil prices. BP’s merits include a strong balance sheet, a competitive cost structure, and proactive management. Viewing energy overall, Sound Shore managed to eke out a modest gain from the sector in 2014 and had limited direct exposure at year-end.
The chart below from the Fund’s website (www.soundshorefund.com) illustrates the historical, long-term rewards of patience combined with our investment process: A hypothetical $10,000 purchase of the Sound Shore Fund at its May 17, 1985 inception would be worth $249,398 (assuming dividend reinvestment) as of December 31, 2014. This 25-fold gain occurred during a 29-year timeframe which saw three bear markets (S&P 500 declines of 25% or more) and nine corrections (declines greater than 10%). Sound Shore’s results have been due to our absolute performance amplified by the power of compound interest, which Albert Einstein is reported to have described as the “eighth wonder of the world.”
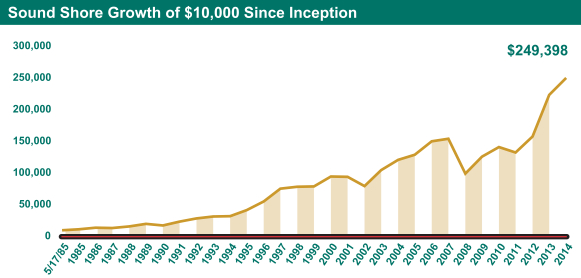
Past performance is not indicative of future results.
2
As the Sound Shore Fund approaches its 30th year, we very much appreciate your confidence in us. With the outlook, as always, unclear, we will continue to invest in out-of-favor stocks of companies with solid managements, sound balance sheets, and good business prospects.
Thank you for your investment alongside ours in Sound Shore.
Sincerely,
SOUND SHORE FUND
Harry Burn, III
John P. DeGulis
T. Gibbs Kane, Jr.
Co-Portfolio Managers
Important Information
Fund returns assume the reinvestment of all dividend and capital gain distributions. The Standard & Poor’s 500 Index is an unmanaged index representing the average performance of 500 widely held, publicly traded, large capitalization stocks. The Dow Jones Industrial Average consists of 30 stocks that are considered to be major factors in their industries and that are widely held by individuals and institutional investors. It is not possible to invest directly in an Index or Average.
Short-term performance, in particular, is not a good indication of the Fund’s future performance, and an investment should not be made based solely on returns. Because of ongoing market volatility, Fund performance may be subject to substantial short-term changes.
Yield discussed within the material is not that of the Fund.
This letter may contain discussions about certain investments both held and not held in the portfolio. As required by the Financial Industry Regulatory Authority (FINRA), we must remind you that current and future portfolio holdings are subject to risk. Percent of net assets as of 12/31/14: Alcoa, Inc.: 0.00%; BP PLC: 2.32%; Hospira, Inc.: 2.47%; and Owens-Illinois, Inc.: 2.41%.
An investment in the Fund is subject to risk, including the possible loss of principal amount invested. Mid Cap Risk: Securities of medium sized companies may be more volatile and more difficult to liquidate during market downturns than securities of large, more widely traded companies. Foreign Securities Risk: The Fund may invest in foreign securities primarily in the form of American Depositary Receipts. Investing in the securities of foreign issuers also involves certain special risks, which are not typically associated with investing in U.S. dollar-denominated securities or quoted securities of U.S. issuers including increased risks of adverse issuer, political, regulatory, market or economic developments. Investments in foreign securities also may be affected favorably or unfavorably by changes in currency rates and in exchange control regulations.
The views in this letter were those of the Fund managers as of 12/31/14 and may not necessarily reflect their views on the date this letter is first published or anytime thereafter. These views (i) are intended to assist shareholders in understanding the Fund’s present investment methodology and (ii) do not constitute investment advice.
3
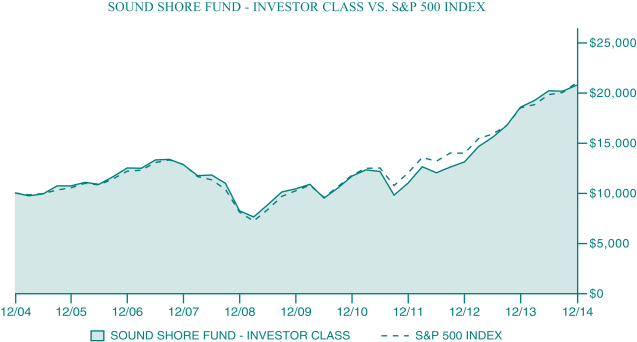
Investment and Performance Comparison (Unaudited)
The following chart reflects a ten-year comparison in the change in value of a hypothetical $10,000 investment in shares of the Investor Class of the Fund, including reinvested dividends and distributions, compared with a broad-based securities market index. The Standard and Poor’s 500 Index (the “S&P 500”) is a market-weighted index composed of 500 large capitalization companies and reflects the reinvestment of dividends. The Fund is professionally managed, while the S&P 500 is unmanaged and is not available for investment. The S&P 500 excludes the effect of any expenses, which have been deducted from the Fund’s return. The performance table and graph do not reflect the deduction of taxes that a shareholder would pay on Fund distributions or the redemption of Fund shares. Furthermore, in 2005, certain fees were waived and/or expenses reimbursed; otherwise, returns would have been lower. Past performance cannot predict nor guarantee future results. Investment return and principal value of an investment in the Fund will fluctuate so that an investor’s shares, when redeemed, may be worth more or less than their original cost. Results of an investment made today may differ substantially from the Fund’s historical performance. Current performance may be lower or higher than the performance data quoted.
4
| | | | | | | | | | | | |
| AVERAGE ANNUAL TOTAL RETURN as of December 31, 2014 | | | | | | | | | |
| | | One Year | | | Five Year | | | Ten Year | |
Sound Shore Fund - Investor Class | | | 11.76 | % | | | 14.70 | % | | | 7.53 | % |
Sound Shore Fund - Institutional Class1 | | | 11.94 | % | | | 14.92 | % | | | 7.74 | % |
S&P 500 Index | | | 13.69 | % | | | 15.45 | % | | | 7.67 | % |
| 1 | Performance information for the Institutional Class, prior to the commencement of operations on December 9, 2013, is based on the performance of the Investor Class, and adjusted for the lower expenses applicable to the Institutional Class. As stated in the current prospectus dated May 1, 2014, the total annual fund operating expense ratio (gross) is 0.93% for the Investor Class and 0.87% for the Institutional Class. Subsequently, for the fiscal year ended December 31, 2014, the total annual operating expense ratio (gross) for the Investor Class was 0.92% and 0.83% for the Institutional Class, as shown in the financial highlights later in this Annual Report. The Institutional Class’ net expense ratio is 0.75% since the Fund Adviser has agreed to reimburse essentially all of the ordinary expenses in excess of 0.75%. This agreement is in effect until at least May 1, 2015. For more information about expense reimbursements please see the Notes to Financial Statements. |
The above information, including the Letter to Investors, is not covered by the Report of the Independent Registered Public Accounting Firm.
5
SOUND SHORE FUND, INC.
SCHEDULE OF INVESTMENTS
DECEMBER 31, 2014
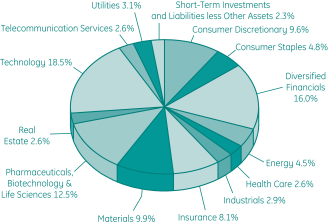
Sector/Industry Weightings (as of December 31, 2014)
as a percentage of Net Assets (Unaudited)
| | | | | | | | |
| | | Share
Amount
| | | Market
Value
| |
Common Stocks (97.7%) | | | | | | | | |
Consumer Discretionary (9.6%) | | | | | | | | |
CBS Corp. | | | 961,000 | | | $ | 53,181,740 | |
Comcast Corp., Class A | | | 1,074,200 | | | | 62,314,342 | |
Lowe’s Cos., Inc. | | | 741,100 | | | | 50,987,680 | |
Time Warner, Inc. | | | 669,700 | | | | 57,205,774 | |
| | | | | | |
|
|
|
| | | | | | | | 223,689,536 | |
| | | | | | |
|
|
|
Consumer Staples (4.8%) | | | | | | | | |
CVS Health Corp. | | | 558,600 | | | | 53,798,766 | |
Procter & Gamble Co. | | | 652,000 | | | | 59,390,680 | |
| | | | | | |
|
|
|
| | | | | | | | 113,189,446 | |
| | | | | | |
|
|
|
Diversified Financials (16.0%) | | | | | | | | |
Bank of America Corp. | | | 3,907,900 | | | | 69,912,331 | |
Capital One Financial Corp. | | | 682,200 | | | | 56,315,610 | |
See Notes to Financial Statements.
6
SOUND SHORE FUND, INC.
SCHEDULE OF INVESTMENTS (Continued)
DECEMBER 31, 2014
| | | | | | | | |
| | | Share
Amount
| | | Market
Value
| |
Diversified Financials (Continued) | | | | | | | | |
CIT Group, Inc. | | | 1,361,900 | | | $ | 65,139,677 | |
Citigroup, Inc. | | | 1,208,700 | | | | 65,402,757 | |
Citizens Financial Group, Inc. | | | 2,379,500 | | | | 59,154,370 | |
Invesco, Ltd. | | | 1,452,800 | | | | 57,414,656 | |
| | | | | | |
|
|
|
| | | | | | | | 373,339,401 | |
| | | | | | |
|
|
|
Energy (4.5%) | | | | | | | | |
BP PLC ADR | | | 1,420,800 | | | | 54,160,896 | |
Hess Corp. | | | 699,000 | | | | 51,600,180 | |
| | | | | | |
|
|
|
| | | | | | | | 105,761,076 | |
| | | | | | |
|
|
|
Health Care (2.6%) | | | | | | | | |
Anthem, Inc. | | | 483,800 | | | | 60,799,146 | |
| | | | | | |
|
|
|
Industrials (2.9%) | | | | | | | | |
General Electric Co. | | | 2,655,100 | | | | 67,094,377 | |
| | | | | | |
|
|
|
Insurance (8.1%) | | | | | | | | |
American International Group, Inc. | | | 1,190,100 | | | | 66,657,501 | |
Aon PLC | | | 745,600 | | | | 70,705,248 | |
Marsh & McLennan Cos., Inc. | | | 927,000 | | | | 53,061,480 | |
| | | | | | |
|
|
|
| | | | | | | | 190,424,229 | |
| | | | | | |
|
|
|
Materials (9.9%) | | | | | | | | |
E.I. du Pont de Nemours & Co. | | | 746,100 | | | | 55,166,634 | |
International Paper Co. | | | 1,245,000 | | | | 66,707,100 | |
Owens-Illinois, Inc. † | | | 2,088,900 | | | | 56,379,411 | |
Reliance Steel & Aluminum Co. | | | 863,300 | | | | 52,894,391 | |
| | | | | | |
|
|
|
| | | | | | | | 231,147,536 | |
| | | | | | |
|
|
|
Pharmaceuticals, Biotechnology & Life Sciences (12.5%) | | | | | | | | |
Agilent Technologies, Inc. | | | 1,128,600 | | | | 46,204,884 | |
Hospira, Inc. † | | | 944,300 | | | | 57,838,375 | |
Novartis AG ADR | | | 683,900 | | | | 63,370,174 | |
Sanofi SA ADR | | | 1,250,200 | | | | 57,021,622 | |
See Notes to Financial Statements.
7
SOUND SHORE FUND, INC.
STATEMENT OF INVESTMENTS (Continued)
DECEMBER 31, 2014
| | | | | | | | |
| | | Share
Amount
| | | Market
Value
| |
Pharmaceuticals, Biotechnology & Life Sciences (Continued) | | | | | | | | |
Thermo Fisher Scientific, Inc. | | | 545,700 | | | $ | 68,370,753 | |
| | | | | | |
|
|
|
| | | | | | | | 292,805,808 | |
| | | | | | |
|
|
|
Real Estate (2.6%) | | | | | | | | |
Realogy Holdings Corp. † | | | 1,355,100 | | | | 60,288,399 | |
| | | | | | |
|
|
|
Technology (18.5%) | | | | | | | | |
Applied Materials, Inc. | | | 2,375,300 | | | | 59,192,476 | |
Flextronics International, Ltd. † | | | 4,395,700 | | | | 49,143,926 | |
Google, Inc., Class A † | | | 52,900 | | | | 28,071,914 | |
Google, Inc., Class C † | | | 53,800 | | | | 28,320,320 | |
Keysight Technologies, Inc. † | | | 1,642,700 | | | | 55,473,979 | |
Microsoft Corp. | | | 1,245,500 | | | | 57,853,475 | |
Oracle Corp. | | | 1,587,900 | | | | 71,407,863 | |
Qualcomm, Inc. | | | 487,900 | | | | 36,265,607 | |
Texas Instruments, Inc. | | | 870,000 | | | | 46,514,550 | |
| | | | | | |
|
|
|
| | | | | | | | 432,244,110 | |
| | | | | | |
|
|
|
Telecommunication Services (2.6%) | | | | | | | | |
Vodafone Group PLC – ADR | | | 1,772,800 | | | | 60,576,576 | |
| | | | | | |
|
|
|
Utilities (3.1%) | | | | | | | | |
AES Corp. | | | 5,277,500 | | | | 72,671,175 | |
| | | | | | |
|
|
|
Total Common Stocks (cost $1,614,437,633) | | | | | | | $2,284,030,815 | |
| | | | | | |
|
|
|
Short-Term Investments (2.4%) | | | | | | | | |
Money Market Fund (2.4%) | | | | | | | | |
Western Asset Institutional U.S. Treasury Fund, 0.02% (a) | | | 54,951,559 | | | $ | 54,951,559 | |
| | | | | | |
|
|
|
Total Money Markets (cost $54,951,559) | | | | | | $ | 54,951,559 | |
| | | | | | |
|
|
|
Total Investments (100.1%) (cost $1,669,389,192) * | | | | | | | $2,338,982,374 | |
Liabilities less Other Assets (-0.1%) | | | | | | | (1,355,486 | ) |
| | | | | | |
|
|
|
Net Assets (100.0%) | | | | | | | $2,337,626,888 | |
| | | | | | |
|
|
|
| † | Non-income producing security |
See Notes to Financial Statements.
8
SOUND SHORE FUND, INC.
SCHEDULE OF INVESTMENTS (Concluded)
DECEMBER 31, 2014
| (a) | Rate disclosed is as of December 31, 2014. |
ADR — American Depositary Receipt
PLC — Public Limited Company
| * | Cost for federal income tax purposes is $1,671,608,296 and net unrealized appreciation consists of: |
| | | | |
Gross Unrealized Appreciation | | $ | 704,269,468 | |
Gross Unrealized Depreciation | | | (36,895,390 | ) |
| | |
|
|
|
Net Unrealized Appreciation | | $ | 667,374,078 | |
| | |
|
|
|
See Notes to Financial Statements.
9
SOUND SHORE FUND, INC.
STATEMENT OF ASSETS AND LIABILITIES
DECEMBER 31, 2014
| | | | |
| ASSETS | | | | |
Investments, at value (Cost $1,669,389,192) | | $ | 2,338,982,374 | |
Cash | | | 22,680 | |
Receivables: | | | | |
Capital shares sold | | | 1,659,339 | |
Dividends | | | 1,676,898 | |
Prepaid expenses | | | 62,852 | |
| | |
|
|
|
Total Assets | | | 2,342,404,143 | |
| | |
|
|
|
| |
| LIABILITIES | | | | |
Payables: | | | | |
Capital shares redeemed | | | 2,942,651 | |
Accrued liabilities: | | | | |
Advisory fees | | | 1,459,694 | |
Administrator fees | | | 58,671 | |
Transfer agent fees and expenses | | | 142,988 | |
Custodian fees | | | 17,125 | |
Compliance and Treasurer Services fees | | | 23,637 | |
Professional fees | | | 100,582 | |
Other | | | 31,907 | |
| | |
|
|
|
Total Liabilities | | | 4,777,255 | |
| | |
|
|
|
Net Assets | | $ | 2,337,626,888 | |
| | |
|
|
|
| |
| COMPONENTS OF NET ASSETS | | | | |
Common stock, at Par Value | | $ | 47,893 | |
Paid-in Capital | | | 1,670,196,225 | |
Undistributed net investment income | | | — | |
Accumulated net realized loss on investments | | | (2,210,412 | ) |
Net unrealized appreciation on investments | | | 669,593,182 | |
| | |
|
|
|
Net Assets | | $ | 2,337,626,888 | |
| | |
|
|
|
| |
| NET ASSET VALUE | | | | |
Net Assets - Investor Class Shares | | $ | 1,786,366,088 | |
Shares outstanding - Investor Class (100,000,000 shares authorized, par value $0.001) | | | 36,613,446 | |
| | |
|
|
|
Net Asset Value (offering price & redemption price per share) - Investor Class Shares | | $ | 48.79 | |
| | |
|
|
|
Net Assets - Institutional Class Shares | | $ | 551,260,800 | |
Shares Outstanding - Institutional Class (100,000,000 shares authorized, par value $0.001) | | | 11,279,889 | |
| | |
|
|
|
Net Asset Value (offering price & redemption price per share) - Institutional Class Shares | | $ | 48.87 | |
| | |
|
|
|
See Notes to Financial Statements.
10
SOUND SHORE FUND, INC.
STATEMENT OF OPERATIONS
FOR THE YEAR ENDED DECEMBER 31, 2014
| | | | |
| INVESTMENT INCOME | | | | |
Income: | | | | |
Dividends (net of foreign withholding taxes of $330,268) | | $ | 63,719,504 | |
| | |
|
|
|
Total Income | | | 63,719,504 | |
| | |
|
|
|
Expenses: | | | | |
Advisory fees (Note 3) | | | 17,642,384 | |
Administrator fees | | | 587,929 | |
Transfer agent fees and expenses - Investor Class Shares | | | 2,020,569 | |
Transfer agent fees and expenses - Institutional Class Shares | | | 39,733 | |
Custodian fees | | | 215,609 | |
Compliance and Treasurer Services fees (Note 3) | | | 198,933 | |
Directors’ fees and expenses (Note 3) | | | 155,000 | |
Professional fees | | | 205,063 | |
Registration fees - Investor Class Shares | | | 100,734 | |
Registration fees - Institutional Class Shares | | | 24,166 | |
Printing fees - Investor Class Shares | | | 62,684 | |
Printing fees - Institutional Class Shares | | | 22,295 | |
Miscellaneous | | | 84,190 | |
| | |
|
|
|
Total Expenses | | | 21,359,289 | |
| | |
|
|
|
Expense Reimbursements - Institutional Class Shares (Note 3) | | | (317,621 | ) |
| | |
|
|
|
Net expenses | | | 21,041,668 | |
| | |
|
|
|
Net Investment Income | | | 42,677,836 | |
| | |
|
|
|
| |
| REALIZED AND UNREALIZED GAIN (LOSS) ON INVESTMENTS | | | | |
Net realized gain on investments sold | | | 240,017,780 | |
Net change in unrealized appreciation/(depreciation) on investments | | | (23,930,190 | ) |
| | |
|
|
|
Net realized and unrealized gain on investments | | | 216,087,590 | |
| | |
|
|
|
Net increase in net assets from operations | | $ | 258,765,426 | |
| | |
|
|
|
See Notes to Financial Statements.
11
SOUND SHORE FUND, INC.
STATEMENTS OF CHANGES IN NET ASSETS
| | | | | | | | |
| | | For the
Year Ended
December 31,
2014
| | | For the
Year Ended
December 31,
2013
| |
Operations: | | | | | | | | |
Net investment income | | $ | 42,677,836 | | | $ | 13,873,201 | |
Net realized gain on investments sold | | | 240,017,780 | | | | 147,889,027 | |
Net change in unrealized appreciation/(depreciation) on investments | | | (23,930,190 | ) | | | 455,080,961 | |
| | |
|
|
| |
|
|
|
Increase in net assets from operations | | | 258,765,426 | | | | 616,843,189 | |
| | |
|
|
| |
|
|
|
Dividends to shareholders from net investment income: | | | | | | | | |
Investor Class | | | (37,463,670 | ) | | | (13,540,219 | ) |
Institutional Class (a) | | | (8,227,298 | ) | | | (236,921 | ) |
Return of capital: | | | | | | | | |
Investor Class | | | (1,029,167 | ) | | | — | |
Institutional Class (a) | | | (226,013 | ) | | | — | |
Distributions to shareholders from net realized gains: | | | | | | | | |
Investor Class | | | (170,455,350 | ) | | | — | |
Institutional Class (a) | | | (52,138,597 | ) | | | — | |
| | |
|
|
| |
|
|
|
Total dividends/distributions to shareholders | | | (269,540,095 | ) | | | (13,777,140 | ) |
| | |
|
|
| |
|
|
|
Net capital share transactions (Note 6): | | | | | | | | |
Investor Class | | | (287,120,256 | ) | | | (25,899,521 | ) |
Institutional Class (a) | | | 491,511,001 | | | | 75,419,208 | |
| | |
|
|
| |
|
|
|
Total capital share transactions | | | 204,390,745 | | | | 49,519,687 | |
| | |
|
|
| |
|
|
|
Total increase | | | 193,616,076 | | | | 652,585,736 | |
Net assets: | | | | | | | | |
Beginning of the year | | | 2,144,010,812 | | | | 1,491,425,076 | |
| | |
|
|
| |
|
|
|
End of the year (including accumulated undistributed net investment income of $— and $135,739, respectively) | | $ | 2,337,626,888 | | | $ | 2,144,010,812 | |
| | |
|
|
| |
|
|
|
| (a) | Institutional Class commenced operations December 9, 2013. |
See Notes to Financial Statements.
12
SOUND SHORE FUND, INC.
NOTES TO FINANCIAL STATEMENTS
DECEMBER 31, 2014
1. Organization
Sound Shore Fund, Inc. (the “Fund”) was incorporated under the laws of the State of Maryland on February 19, 1985 and is registered as a diversified, open-end management investment company under the Investment Company Act of 1940 (the “Act”). The investment objective of the Fund is growth of capital. The Fund qualifies as an investment company as defined in the Financial Accounting Standards Codification 946 – Financial Services – Investment Companies.
The total number of shares of common stock which the Fund is authorized to issue is 200,000,000, par value $0.001 per share of which 100,000,000 shares are designated to the Investor Class and 100,000,000 shares are designated to the Institutional Class. The Board may, without shareholder approval, classify or reclassify any unissued shares into other classes or series of shares.
Each share of the Fund has equal divided, distribution, liquidation and voting rights (except as to matters relating exclusively to one class of shares), and fractional shares have those rights proportionately.
2. Significant Accounting Policies
These financial statements are prepared in accordance with accounting principles generally accepted in the United States of America (“GAAP”), which require management to make estimates and assumptions that affect the reported amounts of assets and liabilities, disclosure of contingent liabilities, if any, at the date of the financial statements, and the reported amounts of increase and decrease in net assets from operations during the fiscal period. Actual results could differ from those estimates.
The following represent significant accounting policies of the Fund:
a. Security Valuation
Exchange-traded securities including those traded on the National Association of Securities Dealers’ Automated Quotation system (“NASDAQ”), are valued at the last quoted sale price as provided by independent pricing services as of the close of trading on the system or exchange on which they are primarily traded, on each Fund business day. In the absence of a sale, such securities are valued at the mean of the last bid and asked prices. Non-exchange-traded securities for which over-the-counter market quotations are readily available are generally valued at the mean between the current bid and asked prices provided by independent pricing services. Investments in other open-end regulated investment companies are valued at net asset value (“NAV”).
The Fund values securities at fair value pursuant to procedures adopted by the Board of Directors if market quotations are not readily available (including a short and temporary lapse in the provision of a price by the regular pricing source) or, if in the judgment of the Adviser, the prices or values available do not represent the fair value of the instrument. Factors which may cause the Adviser to make such a judgment include, but are not limited to, the following: (i) only a bid price or an asked price is available, (ii) the spread between the bid price and the asked price is substantial, (iii) the frequency of sales, (iv) the thinness of the market, (v) the size of
13
SOUND SHORE FUND, INC.
NOTES TO FINANCIAL STATEMENTS (Continued)
DECEMBER 31, 2014
reported trades, and (vi) actions of the securities markets, such as the suspension or limitation of trading. Fair valuation is based on subjective factors and, as a result, the fair value price of an asset may differ from the asset’s market price and may not be the price at which the asset may be sold. Fair valuation could result in a NAV different from one determined by using market quotations.
Valuation inputs used to determine the value of the Fund’s investments are summarized in the three broad levels listed below:
Level 1 - quoted prices in active markets for identical assets
Level 2 - other significant observable inputs (including quoted prices of similar securities, interest rates, prepayment speeds, credit risk, etc.)
Level 3 - significant unobservable inputs (including the Fund’s own assumptions in determining the fair value of investments)
The inputs or methodology used for valuing securities are not necessarily an indication of the risk associated with investing in those securities.
Pursuant to the valuation procedures noted previously, equity securities (including exchange-traded securities and other open-end regulated investment companies) are generally categorized as Level 1 securities in the fair value hierarchy. Investments for which there are no quotations, or for which quotations do not appear reliable, are valued at fair value as determined in good faith by the Pricing Committee under the direction of the Board. These valuations are typically categorized as Level 2 or Level 3 in the fair value hierarchy.
The following table summarizes the Fund’s investments categorized in the fair value hierarchy as of December 31, 2014:
| | | | | | | | | | | | | | | | |
Security Type
| | Level 1
| | | Level 2
| | | Level 3
| | | Total
Investments
in Securities
| |
Common Stocks | | $ | 2,284,030,815 | | | $ | — | | | $ | — | | | $ | 2,284,030,815 | |
Short-Term Investments | | | 54,951,559 | | | | — | | | | — | | | | 54,951,559 | |
| | |
|
|
| |
|
|
| |
|
|
| |
|
|
|
Total Investments | | $ | 2,338,982,374 | | | $ | — | | | $ | — | | | $ | 2,338,982,374 | |
| | |
|
|
| |
|
|
| |
|
|
| |
|
|
|
At December 31, 2014, all equity securities and open-end mutual funds were included in Level 1 in the table above. Please refer to the Schedule of Investments to view equity securities categorized by sector/industry type.
The Fund’s policy is to disclose transfers between Levels based on valuations at the end of the reporting period. There were no transfers between Levels as of December 31, 2014, based on the valuation input Levels on December 31, 2013.
14
SOUND SHORE FUND, INC.
NOTES TO FINANCIAL STATEMENTS (Continued)
DECEMBER 31, 2014
b. Security Transactions, Investment Income and Expenses
Security transactions are recorded on a trade date basis. Realized gain and loss on investments sold are recorded on the basis of identified cost. Dividend income is recorded on the ex-dividend date. Interest income is recorded on an accrual basis. Foreign dividend income is recorded on the ex-dividend date or as soon as practicable after the Fund determines the existence of a dividend declaration after exercising reasonable due diligence. Income and capital gains on some foreign securities may be subject to foreign withholding tax, which is accrued as applicable. Investment income, realized and unrealized gains and losses and certain Fund-level expenses are allocated to each class based on relative average daily net assets. Certain expenses are incurred at the class level and charged directly to that particular class. Class level expenses are denoted as such on the Fund’s Statement of Operations.
c. Dividends to Shareholders
Dividends are declared separately for each class. No class has preferential dividend rights; differences in per-share dividend rates are generally due to class-specific fee waivers and expenses. Dividends and distributions payable to shareholders are recorded by the Fund on the ex-dividend date. Dividends from net investment income, if any, are declared and paid semiannually. Capital gains, if any, are distributed to shareholders at least annually. The Fund determines its net investment income and capital gains distributions in accordance with income tax regulations, which may differ from GAAP. These differences are due primarily to differing treatments of income and gains on various investment securities held by the Fund, timing differences and differing characterizations of distributions made by the Fund. To the extent distributions exceed net investment income and net realized capital gains for tax purposes, they are reported as a return of capital.
d. Federal Taxes
The Fund intends to qualify each year as a regulated investment company and to distribute substantially all of its taxable income. In addition, by distributing in each calendar year substantially all of its net investment income, capital gain and certain other amounts, if any, the Fund will not be subject to federal taxation. Therefore, no federal income or excise tax provision is required. For all open tax years and all major taxing jurisdictions, management of the Fund has concluded that there are no significant uncertain tax positions that would require the Fund to record a tax liability or would otherwise require recognition in the financial statements. Open tax years are those that are open for examination by taxing authorities (i.e., generally, the last three tax year-ends 2011 – 2013, and the interim tax period since then).
3. Investment Advisory and Other Services
Investment Adviser
The Fund’s investment adviser is Sound Shore Management, Inc. (the “Adviser”). Pursuant to an investment advisory agreement, the Adviser receives an advisory fee, accrued daily and paid monthly at an annual rate of 0.75% of the Fund’s average daily net assets. Pursuant to an expense limitation agreement between the Adviser and the Fund, the
15
SOUND SHORE FUND, INC.
NOTES TO FINANCIAL STATEMENTS (Continued)
DECEMBER 31, 2014
Adviser has agreed to reimburse all of the ordinary expenses of the Institutional Class, excluding its advisory fees, interest, taxes, securities lending costs, brokerage commissions and acquired fund fees and expenses, extraordinary expenses and all litigation costs until at least May 1, 2015. This reimbursement is shown on the Statement of Operations as a reduction of expenses.
Other Services
Citi Fund Services Ohio, Inc. (“Citi”) provides certain administration, portfolio accounting, and transfer agency services to the Fund.
The Fund also has agreements with various financial intermediaries and “mutual fund supermarkets” under which customers of these intermediaries may purchase and hold Fund shares. These intermediaries effectively provide sub-transfer agent services that the Fund transfer agent would have otherwise had to provide. In recognition of this, the transfer agent, the Fund and the Fund’s Adviser have entered into an agreement whereby the transfer agent agrees to pay financial intermediaries a portion of the amount denoted on the Statement of Operations as “Transfer agent fees and expenses – Investor Class Shares” that it receives from the Fund for its services as transfer agent for the Investor Class and the Adviser agrees to pay the excess, if any, charged by a financial intermediary for that class.
Foreside Fund Services, LLC is the Fund’s distributor (the “Distributor”). The Distributor is not affiliated with the Adviser, Citi, or its affiliated companies. The Distributor receives no compensation from the Fund for its distribution services.
Pursuant to a Compliance Services Agreement with the Fund, Foreside Compliance Services, LLC (“FCS”), an affiliate of the Distributor, provides a Chief Compliance Officer and Anti-Money Laundering Officer to the Fund as well as some additional compliance support functions. Under a Treasurer Services Agreement with the Fund, Foreside Management Services, LLC (“FMS”), an affiliate of the Distributor, provides a Treasurer to the Fund. Neither the Distributor, FCS, FMS, nor their employees that serve as officers of the Fund, have any role in determining the investment policies of or securities to be purchased or sold by the Fund.
The Fund pays each director who is not an “interested person” of the Fund, as defined in Section 2(a)(19) of the Act (“Independent Director”), quarterly fees of $2,500, plus $10,000 per quarterly in-person meeting, $4,000 per quarterly meeting attended telephonically, and $2,000 per special meeting attended in person or telephonically. In addition, the Chairman of the Audit Committee receives a quarterly fee of $1,250.
Certain Officers and Directors of the Fund are officers, directors, or employees of the aforementioned companies.
4. Purchases and Sales of Securities
The cost of securities purchased and the proceeds from sales of securities (excluding short-term investments) for the year ending December 31, 2014 aggregated $1,073,406,038 and $1,125,052,106, respectively.
16
SOUND SHORE FUND, INC.
NOTES TO FINANCIAL STATEMENTS (Continued)
DECEMBER 31, 2014
5. Federal Income Tax and Investment Transactions
Distributions during the fiscal years ending as noted were characterized for tax purposes as follows:
| | | | | | | | |
| | | December 31,
2014
| | | December 31,
2013
| |
Ordinary Income | | $ | 56,535,425 | | | $ | 13,777,140 | |
Long-Term Capital Gains | | | 211,749,490 | | | | — | |
| | |
|
|
| |
|
|
|
Total Taxable Distributions | | | 268,284,915 | | | | 13,777,140 | |
Return of Capital | | | 1,255,180 | | | | — | |
| | |
|
|
| |
|
|
|
Total Distributions Paid | | $ | 269,540,095 | | | $ | 13,777,140 | |
| | |
|
|
| |
|
|
|
Components of capital on a federal income tax basis at December 31, 2014, were as follows:
| | | | |
Par Value + Paid-in Capital | | $ | 1,670,244,118 | |
Undistributed Long-Term Capital Gains | | | 8,692 | |
Capital Loss Carryforwards | | | — | |
Net Unrealized Appreciation | | | 667,374,078 | |
| | |
|
|
|
| | | | $2,337,626,888 | |
On the Statement of Assets and Liabilities, primarily as a result of permanent book to tax differences arising from the character of distributions received from certain of the Fund’s portfolio holdings, the following amounts have been reclassified for the year ended December 31, 2014.
| | | | |
Undistributed net investment income | | $ | 2,877,393 | |
Accumulated net realized loss on investments | | $ | (2,877,393 | ) |
During the year ended December 31, 2014, the Fund utilized $13,460,322 of its pre-effective capital loss carryforwards. At December 31, 2014, the Fund, for federal income tax purposes, had no remaining capital loss carryforwards.
17
SOUND SHORE FUND, INC.
NOTES TO FINANCIAL STATEMENTS (Concluded)
DECEMBER 31, 2014
6. Capital Stock
Transactions in capital stock for the periods ended December 31, 2014 and December 31, 2013 were as follows:
| | | | | | | | | | | | | | | | |
| | | For the Year Ended December 31, 2014
| |
| | | Investor Class | | | Institutional Class | |
| | | Shares
| | | Amount
| | | Shares
| | | Amount
| |
Sale of shares | | | 8,382,874 | | | $ | 427,141,999 | | | | 9,465,815 | | | $ | 481,621,660 | |
Reinvestment of dividends | | | 4,019,596 | | | | 200,818,623 | | | | 1,212,437 | | | | 60,521,783 | |
Redemption of shares | | | (17,922,231 | ) | | | (915,080,878 | ) | | | (976,671 | ) | | | (50,632,442 | ) |
| | |
|
|
| |
|
|
| |
|
|
| |
|
|
|
Net increase (decrease) from capital transactions | | | (5,519,761 | ) | | $ | (287,120,256 | ) | | | 9,701,581 | | | $ | 491,511,001 | |
| | |
|
|
| |
|
|
| |
|
|
| |
|
|
|
| | | | | | | | | | | | | | | | |
| | | For the Year Ended December 31, 2013
| |
| | | Investor Class | | | Institutional Class(a) | |
| | | Shares
| | | Amount
| | | Shares
| | | Amount
| |
Sale of shares | | | 10,434,656 | | | $ | 440,596,089 | | | | 1,575,491 | | | $ | 75,280,682 | |
Reinvestment of dividends | | | 295,203 | | | | 13,018,686 | | | | 4,855 | | | | 236,921 | |
Redemption of shares | | | (11,315,549 | ) | | | (479,514,296 | ) | | | (2,038 | ) | | | (98,395 | ) |
| | |
|
|
| |
|
|
| |
|
|
| |
|
|
|
Net increase (decrease) from capital transactions | | | (585,690 | ) | | $ | (25,899,521 | ) | | | 1,578,308 | | | $ | 75,419,208 | |
| | |
|
|
| |
|
|
| |
|
|
| |
|
|
|
| (a) | Commenced operations December 9, 2013. |
As of December 31, 2014, the Employees’ Profit Sharing Plan of the Adviser owned 708,882 Institutional Class shares which represented 1.48% of the Fund’s Net Assets.
7. Other Information
On December 31, 2014, two entities, Charles Schwab & Co. Inc. and National Financial Services LLC, held of record in omnibus accounts approximately 61% of the outstanding shares of the Fund on behalf of numerous investors.
8. Subsequent Events
Subsequent events occurring after the date of this report have been evaluated for potential impact to this report through the date the report was issued.
18
SOUND SHORE FUND, INC.
FINANCIAL HIGHLIGHTS
These financial highlights reflect selected data for a share outstanding throughout each period.
| | | | | | | | | | | | | | | | | | | | |
| | | Year Ended December 31,
| |
| | | 2014
| | | 2013
| | | 2012
| | | 2011
| | | 2010
| |
Investor Class Shares | | | | | | | | | | | | | | | | | | | | |
Net Asset Value,
Beginning of Year | | $ | 49.05 | | | $ | 34.91 | | | $ | 29.53 | | | $ | 31.82 | | | $ | 28.58 | |
| | |
|
|
| |
|
|
| |
|
|
| |
|
|
| |
|
|
|
Investment Operations | | | | | | | | | | | | | | | | | | | | |
Net investment income (a) | | | 0.98 | | | | 0.32 | | | | 0.29 | | | | 0.22 | | | | 0.19 | |
Net realized and unrealized gain (loss) on investments | | | 4.83 | | | | 14.14 | | | | 5.39 | | | | (2.18 | ) | | | 3.25 | |
| | |
|
|
| |
|
|
| |
|
|
| |
|
|
| |
|
|
|
Total from Investment Operations | | | 5.81 | | | | 14.46 | | | | 5.68 | | | | (1.96 | ) | | | 3.44 | |
| | |
|
|
| |
|
|
| |
|
|
| |
|
|
| |
|
|
|
Distributions from | | | | | | | | | | | | | | | | | | | | |
Net investment income | | | (0.98 | ) | | | (0.32 | ) | | | (0.30 | ) | | | (0.23 | ) | | | (0.20 | ) |
Return of capital | | | (0.03 | ) | | | — | | | | — | | | | (0.10 | ) | | | — | |
Net realized gains | | | (5.06 | ) | | | — | | | | — | | | | — | | | | — | |
| | |
|
|
| |
|
|
| |
|
|
| |
|
|
| |
|
|
|
Total Distributions | | | (6.07 | ) | | | (0.32 | ) | | | (0.30 | ) | | | (0.33 | ) | | | (0.20 | ) |
| | |
|
|
| |
|
|
| |
|
|
| |
|
|
| |
|
|
|
Net Asset Value,
End of Year | | $ | 48.79 | | | $ | 49.05 | | | $ | 34.91 | | | $ | 29.53 | | | $ | 31.82 | |
| | |
|
|
| |
|
|
| |
|
|
| |
|
|
| |
|
|
|
Total Return | | | 11.76 | % | | | 41.53 | % | | | 19.32 | % | | | (6.18 | )% | | | 12.13 | % |
Ratios/Supplemental Data | | | | | | | | | | | | | | | | | | | | |
Net Assets at End of Year (in thousands) | | $ | 1,786,366 | | | $ | 2,066,584 | | | $ | 1,491,425 | | | $ | 1,588,823 | | | $ | 1,927,863 | |
Ratios to Average Net Assets: | | | | | | | | | | | | | | | | | | | | |
Expenses | | | 0.92 | % | | | 0.93 | % | | | 0.94 | % | | | 0.94 | % | | | 0.94 | % |
Net Investment Income | | | 1.92 | %(b) | | | 0.77 | % | | | 0.89 | % | | | 0.69 | % | | | 0.66 | % |
Portfolio Turnover Rate (c) | | | 47 | % | | | 44 | % | | | 56 | % | | | 61 | % | | | 64 | % |
| (a) | Calculated using the average shares outstanding for the period. |
| (b) | Net investment income for the period was positively impacted due to the divestiture by Vodafone (one of the Fund’s portfolio holdings) of its 45% stake in Verizon Wireless in a transaction that included the payment of an extraordinary dividend of cash and shares of Verizon to Vodafone shareholders. Absent this distribution, the ratio of net investment income to average net assets would have been 0.53% for the period. |
| (c) | Portfolio turnover rate is calculated on the basis of the Fund as a whole without distinguishing between the classes of shares issued. |
19
SOUND SHORE FUND, INC.
FINANCIAL HIGHLIGHTS (Concluded)
| | | | | | | | |
| | | Year Ended
December 31, 2014
| | | For the Period
December 9, 2013 to
December 31, 2013(a)
| |
Institutional Class Shares | | | | | | | | |
Net Asset Value,
Beginning of Year | | $ | 49.06 | | | $ | 47.78 | |
| | |
|
|
| |
|
|
|
Investment Operations | | | | | | | | |
Net investment income (b) | | | 0.67 | | | | 0.01 | |
Net realized and unrealized gain on investments | | | 5.23 | | | | 1.42 | |
| | |
|
|
| |
|
|
|
Total from Investment Operations | | | 5.90 | | | | 1.43 | |
| | |
|
|
| |
|
|
|
Distributions from | | | | | | | | |
Net investment income | | | (1.00 | ) | | | (0.15 | ) |
Return of capital | | | (0.03 | ) | | | — | |
Net realized gains | | | (5.06 | ) | | | — | |
| | |
|
|
| |
|
|
|
Total Distributions | | | (6.09 | ) | | | (0.15 | ) |
| | |
|
|
| |
|
|
|
Net Asset Value,
End of Year | | $ | 48.87 | | | $ | 49.06 | |
| | |
|
|
| |
|
|
|
Total Return (c) | | | 11.94 | % | | | 3.00 | % |
Ratios/Supplemental Data | | | | | | | | |
Net Assets at End of Year (in thousands) | | $ | 551,261 | | | $ | 77,427 | |
| | |
|
|
| |
|
|
|
Ratios to Average Net Assets: (d) | | | | | | | | |
Expenses (gross)(e) | | | 0.83 | % | | | 0.87 | % |
Expenses (net) | | | 0.75 | % | | | 0.75 | % |
Net Investment Income | | | 1.29 | %(g) | | | 0.45 | % |
Portfolio Turnover Rate (c)(f) | | | 47 | % | | | 44 | % |
| (a) | Commenced operations December 9, 2013. |
| (b) | Calculated using the average shares outstanding for the period. |
| (c) | Not annualized for periods less than one year. |
| (d) | Annualized for periods less than one year. |
| (e) | Reflects expense ratio in the absence of expense waiver and reimbursement. |
| (f) | Portfolio turnover rate is calculated on the basis of the Fund as a whole, without distinguishing between the classes of shares issued. |
| (g) | Net investment income for the period was positively impacted due to the divestiture by Vodafone (one of the Fund’s portfolio holdings) of its 45% stake in Verizon Wireless in a transaction that included the payment of an extraordinary dividend of cash and shares of Verizon to Vodafone shareholders. Absent this distribution, the ratio of net investment income to average net assets would have been 0.72% for the period. |
20
REPORT OF INDEPENDENT REGISTERED PUBLIC ACCOUNTING FIRM
To the Board of Directors and Shareholders of
Sound Shore Fund, Inc.:
We have audited the accompanying statement of assets and liabilities, including the schedule of investments, of Sound Shore Fund, Inc. (the “Fund”) as of December 31, 2014, and the related statement of operations for the year then ended, the statement of changes in net assets for each of the two years in the period then ended, and the financial highlights for each of the five years in the period then ended. These financial statements and financial highlights are the responsibility of the Fund’s management. Our responsibility is to express an opinion on these financial statements and financial highlights based on our audits.
We conducted our audits in accordance with the standards of the Public Company Accounting Oversight Board (United States). Those standards require that we plan and perform the audit to obtain reasonable assurance about whether the financial statements and financial highlights are free of material misstatement. The Fund is not required to have, nor were we engaged to perform, an audit of its internal control over financial reporting. Our audits included consideration of internal control over financial reporting as a basis for designing audit procedures that are appropriate in the circumstances, but not for the purpose of expressing an opinion on the effectiveness of the Fund’s internal control over financial reporting. Accordingly, we express no such opinion. An audit also includes examining, on a test basis, evidence supporting the amounts and disclosures in the financial statements, assessing the accounting principles used and significant estimates made by management, as well as evaluating the overall financial statement presentation. Our procedures included confirmation of securities owned as of December 31, 2014, by correspondence with the custodian. We believe that our audits provide a reasonable basis for our opinion.
In our opinion, the financial statements and financial highlights referred to above, present fairly, in all material respects, the financial position of Sound Shore Fund, Inc. as of December 31, 2014, the results of its operations for the year then ended, the change in its net assets for each of the two years in the period then ended, and the financial highlights for each of the five years in the period then ended, in conformity with accounting principles generally accepted in the United States of America.
DELOITTE & TOUCHE LLP
New York, New York
February 27, 2015
21
SOUND SHORE FUND, INC.
DECEMBER 31, 2014 (Unaudited)
Shareholder Expense Example
As a shareholder of the Fund, you incur ongoing costs, including management fees and other Fund expenses. This example is intended to help you understand your ongoing costs (in dollars) of investing in the Fund and to compare these costs with the ongoing costs of investing in other mutual funds.
The following example is based on $1,000 invested at the beginning of the period and held for the entire period from July 1, 2014 through December 31, 2014.
Actual Expenses - The Actual Return lines of the table below provide information about actual account values and actual expenses for each share class. You may use the information in these lines, together with the amount you invested, to estimate the expenses that you paid over the period. Simply divide your account value by $1,000 (for example, an $8,600 account value divided by $1,000 = 8.6), then multiply the result by the number in the Actual Return line under the heading entitled “Expenses Paid During Period” to estimate the expenses you paid on your account during this period.
Hypothetical Example for Comparison Purposes - The Hypothetical Return lines of the table below provide information about hypothetical account values and hypothetical expenses based on each class’ actual expense ratio and an assumed rate of return of 5% per year before expenses, which is not the Fund’s actual return. The hypothetical account values and expenses may not be used to estimate the actual ending account balance or expenses you paid for the period. You may use this information to compare the ongoing cost of investing in the Fund and other funds. To do so, compare this 5% hypothetical example with the 5% hypothetical examples that appear in the shareholder reports of other funds.
Expenses shown in the table are meant to highlight your ongoing costs only and do not reflect any transactional costs. Therefore, the Hypothetical Return lines of the table are useful in comparing ongoing costs only, and will not help you determine the relative total costs of owning different funds.
| | | | | | | | | | | | |
| | | Beginning
Account Value
July 1, 2014
| | | Ending
Account Value
December 31, 2014
| | | Expenses Paid
During Period*
| |
Investor Class Actual Return | | $ | 1,000.00 | | | $ | 1,027.60 | | | $ | 4.70 | |
Investor Class Hypothetical Return | | $ | 1,000.00 | | | $ | 1,020.57 | | | $ | 4.69 | |
Institutional Class Actual Return | | $ | 1,000.00 | | | $ | 1,028.50 | | | $ | 3.83 | |
Institutional Class Hypothetical Return | | $ | 1,000.00 | | | $ | 1,021.42 | | | $ | 3.82 | |
| * | Expenses are equal to the Investor Class’ and Institutional Class’ annualized expense ratios of 0.92% and 0.75% respectively, multiplied by the average account value over the period, multiplied by 184/365 to reflect the most recent one-half year period. |
22
SOUND SHORE FUND, INC.
DECEMBER 31, 2014
Federal Tax Status of Dividends Declared during the Fiscal Year (Unaudited)
Income Dividends - For federal income tax purposes, dividends from short-term capital gains are classified as ordinary income. The Fund paid income dividends of $56,535,425 for the tax year ended December 31, 2014, of which $13,721,851 were short-term capital gain dividends. The Fund designated 42.59% of its income dividend distributed as qualifying for the corporate dividends-received deductions (DRD) and 100% for the qualified dividend rate (QDI) as defined in Section 1(h)(11) of the Internal Revenue Code. The Fund also designates 0% of its income dividends as qualified interest income (QII) and 0% as qualified short-term capital gain dividends exempt from U.S. tax for foreign shareholders (QSD).
Capital Gain and other distributions - The Fund paid long-term capital gain dividends of $211,749,490. Additionally, $1,255,180 was distributed from paid-in capital.
Proxy Voting Information
A description of the policies and procedures that the Fund uses to determine how to vote proxies relating to securities held in the Fund’s portfolio is available, without charge and upon request, by calling (800) 551-1980 or by visiting the Fund’s web site at http://www.soundshorefund.com. This information is also available on the SEC’s web site at http://www.sec.gov under the name of the Sound Shore Fund.
The Fund’s proxy voting record for the most recent 12-month period ended June 30 is available, without charge and upon request, by calling (800) 551-1980 or by visiting the Fund’s web site at http://www.soundshorefund.com. This information is available on the SEC’s web site at http://www.sec.gov under the name of the Sound Shore Fund.
Availability of Quarterly Portfolio Schedule
The Fund files its complete schedule of portfolio holdings with the SEC for the first and third quarters of each fiscal year on Form N-Q. This information is available on the SEC’s web site at http://www.sec.gov under the name of the Sound Shore Fund. It may be reviewed and copied at the SEC’s Public Reference Room in Washington, DC. Information on the operation of the Public Reference Room may be obtained by calling (800) SEC-0330.
23
SOUND SHORE FUND, INC.
DECEMBER 31, 2014
Directors and Officers of the Fund
The following is relevant information regarding Directors and Officers of the Fund:
| | | | | | | | |
Name, Address and Age
| | Position(s) With the Fund
| | Length of Time
Served(1)
| | Principal Occupation(s) During the Past Five Years
| | Other
Directorships
Held by Director
|
| | | | |
Independent Directors | | | | | | | | |
Harry W. Clark c/o Sound Shore Fund, Inc. 3435 Stelzer Road Columbus, OH 43219 Age: 65 | | Director; Audit Committee (member); Nominating Committee (member); Valuation Committee (member) | | January 23, 2006 to present | | Managing Partner, Stanwich Group LLC (public policy consulting firm) since January 2001; Senior Counselor, Brunswick Group LLC (international financial communications consulting firm) since January 2005. Senior Director, Albright Stonebridge Group (international political risk consultancy) since May, 2012. | | Director, U.S. Chamber of Commerce Foundation since 2005. |
| | | | |
H. Williamson Ghriskey, Jr. c/o Sound Shore Fund, Inc. 3435 Stelzer Road Columbus, OH 43219 Age: 70 | | Director; Audit Committee (member); Nominating Committee (member); Valuation Committee (member) | | January 23, 2006 to present | | Senior Managing Director/Portfolio Management, First Republic Investment Management (investment counseling firm) since September 1978. | | Past President of Investment Advisor Association 1990 - 1992 |
| | | | |
David Blair Kelso c/o Sound Shore Fund, Inc. 3435 Stelzer Road Columbus, OH 43219 Age: 62 | | Lead Independent Director; Audit Committee (Chair); Nominating Committee (Chair); Valuation Committee (member); Audit Committee Financial Expert | | January 23, 2006 to present | | Managing Partner, Kelso Advisory Services (consulting firm) since October 2003; Trustee, Connecticut College, since October 2007; Director, Round Hill Development Corp (resort development firm), since 2006; Director, Aspen Holdings, Inc. (insurance firm), (2005 - April 2011); Executive Vice President, Strategy & Finance, Aetna, Inc. (insurance firm); Chairman, Aetna Life Insurance Company, (September 2001 - September 2003); Chief Financial Officer, Executive Vice President, and Managing Director, Chubb, Inc. (insurance firm) August 1996 - August 2001. | | Director, EXL Service Holdings, Inc. (since July 2006) Director, Assurant, Inc. (since March 2007) |
24
SOUND SHORE FUND, INC.
DECEMBER 31, 2014
Directors and Officers of the Fund
| | | | | | | | |
Name, Address and Age
| | Position(s) With the Fund
| | Length of Time
Served(1)
| | Principal Occupation(s) During the Past Five Years
| | Other
Directorships
Held by Director
|
| | | | |
Interested Directors(2) | | | | | | | | |
Harry Burn, III, 8 Sound Shore Drive Greenwich, Connecticut 06830 Age: 70 | | Chairman and Director; Valuation Committee (member) | | April 1985 to present (Chairman September 1992 to present) | | Co-Chairman and Director, Sound Shore Management, Inc. since 1978; Chartered Financial Analyst. | | |
| | | | |
T. Gibbs Kane, Jr. 8 Sound Shore Drive Greenwich, Connecticut 06830 Age: 67 | | President and Director, Valuation Committee (member) | | April 1985 to present | | Co-Chairman and Director, Sound Shore Management, Inc. since 1977; Chartered Financial Analyst. | | |
| | | | |
Officers | | | | | | | | |
Lowell E. Haims 8 Sound Shore Drive Greenwich, Connecticut 06830 Age: 47 | | Secretary, Valuation Committee (Chair) | | October 2010 to present | | Chief Administrative Officer, Sound Shore Management, Inc. since October 2005; Chief Compliance Officer, Sound Shore Management, Inc. since June 2007; Chartered Financial Analyst. | | |
| | | | |
Charles S. Todd Three Canal Plaza, Suite 100 Portland, Maine 04101 Age: 43 | | Treasurer | | June 2009 to present | | Foreside Management Services, LLC, Business Head, Treasurer Services (Since 2012); Director, (2008 - 2012). | | |
| | | | |
Julie Walsh 10 High Street, Suite 302A Boston, Massachusetts 02110 Age: 44 | | Chief Compliance Officer | | May 2011 to present | | Managing Director, Foreside Compliance Services, LLC (May 2010 to present); Compliance Marketing Consultant, Grantham, Mayo, & Van Otterloo & Co LLC (May 2008 - May 2010). Chief Compliance Officer, Grantham, Mayo, & Van Otterloo LLC (April 1995 - May 2008) | | |
| (1) | Term of Service is until his/her successor is elected or qualified or until his/her earlier resignation or removal. |
| (2) | Harry Burn, III and T. Gibbs Kane, Jr. are “interested persons” of the Fund as defined in Section 2(a)(19) of the 1940 Act by virtue of their position as shareholders, senior officers, and Directors of the Adviser. Each is a portfolio manager of the Fund. |
The Fund’s Statement of Additional Information (“SAI”) contains additional information about the Fund’s Directors. The SAI is available for free, by contacting the Fund at (800) 551-1980.
25

Investment Adviser
Sound Shore Management, Inc.
Greenwich, Connecticut
Administrator
Citi Fund Services Ohio, Inc.
Columbus, Ohio
Distributor
Foreside Fund Services, LLC
Portland, Maine
www.foreside.com
Transfer and
Distribution Paying Agent
Citi Fund Services Ohio, Inc.
Columbus, Ohio
Custodian
Citibank, N.A.
New York, New York
Fund Counsel
Dechert LLP
New York, New York
Independent Registered
Public Accounting Firm
Deloitte & Touche LLP
New York, New York
107-AR-1214
This report is submitted for the general information of the shareholders of the Fund. It is not authorized for distribution to prospective investors in the Fund unless preceded or accompanied by an effective prospectus, which includes information regarding the Fund’s objectives and policies, experience of its management, and other information.
SOUND SHORE FUND, INC.
3435 Stelzer Road
Columbus, OH 43219
http://www.soundshorefund.com
(800) 551-1980
Annual Report
DECEMBER 31, 2014


Sound Shore Fund, Inc. maintains a code of ethics, as defined in Item 2 of Form N-CSR, that applies to its President and Treasurer. A copy of the code of ethics is filed as an exhibit to this Form N-CSR. During the period covered by the Report, there were no amendments to the Code of Ethics as filed nor were there any waivers from its provisions granted.
| Item 3. | Audit Committee Financial Expert. |
The Board of Directors has determined that David Blair Kelso, who meets the definition of an independent director as specified by Item 3, is an “audit committee financial expert” as that term is defined by applicable regulator guideline.
| Item 4. | Principal Accountant Fees and Services. |
| (a) | Audit Fees – The aggregate fees billed for each of the last two fiscal years (the “Reporting Periods”) for professional services rendered by the Registrant’s principal accountant for the audit of the Registrant’s annual financial statements, or services that are normally provided by the principal accountant in connection with the statutory and regulatory filings or engagements for the Reporting Periods, were $48,500 in 2014 and $47,100 in 2013. |
| (b) | Audit-Related Fees – The aggregate fees billed in the Reporting Periods for assurance and related services rendered by the principal accountant that were reasonably related to the performance of the audit of the Registrant’s financial statements and are not reported under paragraph (a) of this item 4 were $0 in 2014 and $1,750 in 2013. |
| (c) | Tax Fees – The aggregate fees billed in the Reporting Periods for professional services rendered by the principal accountant to the Registrant for tax compliance, tax advice and tax planning (“Tax Fees”) were $4,750 in 2014 and $4,600 in 2013. These services consisted of review or preparation of U.S. federal, state, local and excise tax returns. |
| (d) | All Other Fees – There were no other fees billed in the Reporting Periods for products and services provided by the principal accountant to the Registrant, other than the services reported in paragraphs (a) through (c) of this Item. |
| (e)(1) | Pre-Approval Requirements for Audit and Non-Audit Services. The Audit Committee reviews and approves in advance all audit and “permissible non-audit services” to be provided to Sound Shore Management, Inc. (“Sound Shore Management”), the Fund’s investment adviser, by the Fund’s independent auditor if the engagement relates to the operations and financial reporting of the Fund. The Audit Committee considers whether fees paid by Sound Shore Management for audit and permissible non-audit services are consistent with the independent auditor’s independence. Pre-approval of any permissible non-audit services provided to the Fund is not required so long as: (i) the aggregate amount of all such permissible non-audit services provided to the Fund constitutes not more than 5% of the total amount of revenues paid by the Fund to its auditor during the fiscal year in which the permissible non-audit services are provided; (ii) the permissible non-audit services were not recognized by the Fund at the time of engagement to be non-audit services; and (iii) such services are promptly brought to the attention of the Audit Committee and approved prior to the completion of the audit by the Audit Committee or its authorized delegate(s). Pre-approval of permissible non-audit services rendered to Sound Shore Management is not required if provided. The Audit Committee may delegate to one or more of its members authority to pre-approve permissible non-audit services to be provided to the Fund. Any pre-approval determination of a delegate will be presented to the full Audit Committee at its next meeting. |
| (e)(2) | No services included in (b) - (d) above were approved pursuant to paragraph (c)(7)(i)(C) of Rule 2- 01 of Regulation S-X. |
| (f) | Not applicable as less than 50%. |
| (g) | The aggregate fees billed in the Reporting Periods for Non-Audit Services by the principal accountant to the Registrant and Sound Shore Management were $54,700 in 2014 and $35,800 in 2013. |
| (h) | The Registrant’s Audit Committee considers the provision of any non-audit services rendered to the investment adviser, to the extent applicable, in evaluating the independence of the Registrant’s principal accountant. Any services provided by the principal accountant to the Registrant or to Sound Shore Management requiring pre-approval were pre-approved. |
| Item 5. | Audit Committee of Listed Registrants. |
Not applicable.
| Item 6. | Schedule of Investments. |
| (a) | Included as part of the report to stockholders under Item 1. |
Item 7. Disclosure of Proxy Voting Policies and Procedures for Closed-End Management Investment Companies.
Not applicable.
| Item 8. | Portfolio Managers of Closed-End Management Investment Companies. |
Not applicable.
Item 9. Purchases of Equity Securities by Closed-End Management Investment Company and Affiliated Purchasers.
Not applicable.
| Item 10. | Submission of Matters to a Vote of Security Holders. |
Not applicable.
| Item 11. | Controls and Procedures. |
(a) The registrant’s principal executive officer and principal financial officer concluded that the registrant’s disclosure controls and procedures (as defined in Rule 30a-3(c) under the Investment Company Act of 1940 (the “Act”)) were effective as of a date within 90 days of the filing date of this report (the “Evaluation Date”) based on their evaluation of the registrant’s disclosure controls and procedures as of the Evaluation Date.
(b) There were no changes in the registrant’s internal control over financial reporting (as defined in Rule 30a-3(d) under the Act) that occurred during the second fiscal quarter of the period covered by this report that have materially affected, or are reasonably likely to materially affect, the registrant’s internal control over financial reporting.
(a)(1) A copy of the Code of Ethics (Exhibit filed herewith).
(a)(2) Certifications pursuant to Rule 30a-2(a) of the Investment Company Act of 1940 as amended, and Section 302 of the Sarbanes-Oxley Act of 2002 (Exhibit filed herewith).
(a)(3) Not applicable.
(b) Certifications pursuant to Rule 30a-2(b) of the Investment Company Act of 1940, as amended, and Section 906 of the Sarbanes-Oxley Act of 2002 (Exhibit filed herewith).
SIGNATURES
Pursuant to the requirements of the Securities Exchange Act of 1934 and the Investment Company Act of 1940, the registrant has duly caused this report to be signed on its behalf by the undersigned, thereunto duly authorized.
| | |
| Registrant | | Sound Shore Fund, Inc. |
| | |
| By (Signature and Title) | | /s/ T. Gibbs Kane, Jr. |
| | T. Gibbs Kane, Jr., President |
Date February 25, 2015
Pursuant to the requirements of the Securities Exchange Act of 1934 and the Investment Company Act of 1940, this report has been signed below by the following persons on behalf of the registrant and in the capacities and on the dates indicated.
| | |
| By (Signature and Title) | | /s/ T. Gibbs Kane, Jr. |
| | T. Gibbs Kane, Jr., President |
Date February 25, 2015
| | |
| By (Signature and Title) | | /s/ Charles S. Todd |
| | Charles S. Todd, Treasurer |
Date February 25, 2015