UNITED STATES
SECURITIES AND EXCHANGE COMMISSION
Washington, D.C. 20549
FORM N-CSR
CERTIFIED SHAREHOLDER REPORT OF REGISTERED
MANAGEMENT INVESTMENT COMPANIES
Investment Company Act file number 811-04244
SOUND SHORE FUND, INC.
(Exact name of registrant as specified in charter)
3435 Stelzer Road
Columbus, OH 43219
(Address of principal executive offices) (Zip Code)
T. Gibbs Kane, Jr., President
8 Sound Shore Drive
Greenwich, Connecticut 06830
(Name and address of agent for service)
Registrant’s telephone number, including area code: (800) 551-1980
Date of fiscal year end: December 31
Date of reporting period: June 30, 2011
| Item 1. | Reports to Stockholders. |

3435 STELZER ROAD, COLUMBUS, OH 43219 1-800-551-1980
June 30, 2011
Dear Shareholder:
The Sound Shore Fund ended June 30, 2011 with a net asset value of $32.83 per share, after an income distribution of $0.1375 on June 23rd. The second quarter total return of -1.40% lagged the Standard & Poor’s 500 Index (“S&P 500”) and the Dow Jones Industrial Average (“Dow Jones”), which returned 0.10% and 1.42%, respectively. Over the ten year period ending June 30, 2011, the Sound Shore Fund’s cumulative total return was 53.25% versus 30.76% for the S&P 500.
We are required by the SEC to say that: Performance data quoted represents past performance and is no guarantee of future results. Current performance may be lower or higher than the performance data quoted. Investment return and principal value will fluctuate so that an investor’s shares, when redeemed, may be worth more or less than original cost. The Fund’s 1, 5, 10, and 15-year average annual total returns for the period ended June 30, 2011 were 27.58%, 2.22%, 4.36%, and 7.81%, respectively. As stated in the current prospectus, the Fund’s annual operating expense ratio is 0.95%. For the most recent month-end performance, please visit the Fund’s website at www.soundshorefund.com.
After a strong first quarter 2011, stocks treaded water in the second due to uncertainty about global growth. As emerging economies fought inflation and the European Union and U.S. worked on debt and deficit challenges, it was the health care, utility, and consumer staples sectors that performed best. In contrast to this otherwise cautious backdrop, small cap stocks continued to outperform large caps and growth continued to outpace value, extending trends from the first quarter, according to data from Standard & Poor’s.
Sound Shore's portfolio was behind the indices during the quarter as signals of a slower economy caused a few holdings to decline. For example, shares of glass bottle maker Owens-Illinois were lower as currency-driven sluggishness in Australian wine exports caused the company to marginally lower its 2011 earnings outlook. Similarly, semiconductor equipment provider Applied Materials and electronics assembler Flextronics pulled back on mixed demand for technology products, partly due to Japan’s slowdown. Meanwhile, despite stable book value per share Bank of America was down due to regulatory and revenue pressures.
On the plus side, global pharma leader Novartis was our best contributor as it benefitted from better than expected generic drug sales and a strengthening Swiss franc. Fellow health care related holdings Baxter International and CVS were also strong performers, as the former advanced after reporting faster than expected gains in its core blood plasma business, and the latter was up following a significant drug distribution contract award. Meanwhile, Visa moved higher after the federal government approved a smaller than expected reduction in merchant debit fees. And finally integrated gas company El Paso, an investment since 2004, outpaced the lagging energy sector after announcing plans to spin off its exploration and production segment.
Similar to last summer, midyear 2011 markets seem to reflect great uncertainty about how macro factors will unfold. As uncertainty often yields profitable investment opportunities, Sound Shore remains diligently focused on identifying inexpensive stocks with strong earnings and cash flow prospects that are likely to beat low
1
expectations. Our bottom-up based portfolio currently has a forward four quarters price/earnings multiple of 11 times versus 14 times for the S&P 500 and should be well positioned going forward.
Thank you for your investment alongside ours in the Sound Shore Fund.
Sincerely,
SOUND SHORE FUND
Harry Burn, III
John P. DeGulis
T. Gibbs Kane, Jr.
Co-Portfolio Managers
Fund returns assume the reinvestment of all dividend and capital gain distributions. The Standard & Poor’s 500 Index is an unmanaged index representing the average performance of 500 widely held, publicly traded, large capitalization stocks. The Dow Jones Industrial Average consists of 30 stocks that are considered to be major factors in their industries and that are widely held by individuals and institutional investors. It is not possible to invest directly in an Index or Average.
The recent growth rate in the stock market has helped to produce short-term returns for some asset classes that are not typical and may not continue in the future. Because of ongoing market volatility, fund performance may be subject to substantial short-term changes.
This letter may contain discussions about certain investments both held and not held in the portfolio. As required by the Financial Industry Regulatory Authority (FINRA), we must remind you that current and future portfolio holdings are subject to risk. Percent of net assets as of 6/30/11: Applied Materials, Inc.: 2.54%; Bank of America Corp.: 2.68%; Baxter International, Inc.: 1.97%; CVS Caremark Corp.: 2.50%; El Paso Corp.: 1.95%; Flextronics International, Ltd.: 2.20%; Novartis AG ADR: 2.20%; Owens-Illinois, Inc.: 2.54%; and Visa, Inc.: 2.56%.
An investment in the Fund is subject to risk, including the possible loss of principal amount invested. Investments in medium-sized companies pose greater risks than those typically associated with larger, more established companies, such as increased volatility. Foreign investing involves certain risks and increased volatility not associated with investing solely in the US. These risks include currency fluctuations, economic or financial instability, lack of timely or reliable financial information, or unfavorable political or legal developments.
The views in this letter were those of the Fund managers as of 6/30/11 and may not necessarily reflect their views on the date this letter is first published or anytime thereafter. These views (i) are intended to assist shareholders in understanding the Fund’s present investment methodology and (ii) do not constitute investment advice. This letter must be preceded or accompanied by a current Fund prospectus. Distributed by Foreside Fund Services, LLC.
2
SOUND SHORE FUND, INC.
SCHEDULE OF INVESTMENTS
JUNE 30, 2011 (Unaudited)
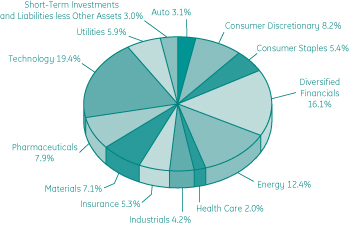
Sector/Industry Weightings (as of June 30, 2011)
as a percentage of Net Assets
| | | | | | | | |
| | | Share
Amount
| | | Market
Value
| |
Common Stocks (97.0%) | | | | | | | | |
Auto (3.1%) | | | | | | | | |
General Motors Co. † | | | 2,016,900 | | | $ | 61,233,084 | |
| | | | | | |
|
|
|
Consumer Discretionary (8.2%) | | | | | | | | |
Comcast Corp., Class A | | | 2,024,100 | | | | 51,290,694 | |
International Game Technology | | | 2,928,400 | | | | 51,481,272 | |
Time Warner, Inc. | | | 1,621,400 | | | | 58,970,318 | |
| | | | | | |
|
|
|
| | | | | | | | 161,742,284 | |
| | | | | | |
|
|
|
Consumer Staples (5.4%) | | | | | | | | |
CVS Caremark Corp. | | | 1,306,400 | | | | 49,094,512 | |
Wal-Mart Stores, Inc. | | | 1,057,900 | | | | 56,216,806 | |
| | | | | | |
|
|
|
| | | | | | | | 105,311,318 | |
| | | | | | |
|
|
|
Diversified Financials (16.1%) | | | | | | | | |
Bank of America Corp. | | | 4,799,100 | | | | 52,598,136 | |
See Notes to Financial Statements.
3
SOUND SHORE FUND, INC.
SCHEDULE OF INVESTMENTS (Continued)
JUNE 30, 2011 (Unaudited)
| | | | | | | | |
| | | Share
Amount
| | | Market
Value
| |
Diversified Financials (Continued) | | | | | | | | |
Citigroup, Inc. | | | 1,695,190 | | | $ | 70,587,712 | |
Credit Suisse Group AG ADR | | | 1,252,300 | | | | 48,864,746 | |
Invesco, Ltd. | | | 2,317,200 | | | | 54,222,480 | |
State Street Corp. | | | 997,500 | | | | 44,977,275 | |
The Charles Schwab Corp. | | | 2,695,200 | | | | 44,336,040 | |
| | | | | | |
|
|
|
| | | | | | | | 315,586,389 | |
| | | | | | |
|
|
|
Energy (12.4%) | | | | | | | | |
Diamond Offshore Drilling, Inc. | | | 703,900 | | | | 49,561,599 | |
El Paso Corp. | | | 1,898,500 | | | | 38,349,700 | |
EQT Corp. | | | 746,600 | | | | 39,211,432 | |
Marathon Oil Corp. | | | 569,600 | | | | 30,006,528 | |
Sunoco, Inc. | | | 1,229,600 | | | | 51,286,616 | |
Valero Energy Corp. | | | 1,381,300 | | | | 35,319,841 | |
| | | | | | |
|
|
|
| | | | | | | | 243,735,716 | |
| | | | | | |
|
|
|
Health Care (2.0%) | | | | | | | | |
Baxter International, Inc. | | | 647,800 | | | | 38,667,182 | |
| | | | | | |
|
|
|
Industrials (4.2%) | | | | | | | | |
Delta Air Lines, Inc. † | | | 3,733,700 | | | | 34,238,029 | |
Southwest Airlines Co. | | | 4,300,400 | | | | 49,110,568 | |
| | | | | | |
|
|
|
| | | | | | | | 83,348,597 | |
| | | | | | |
|
|
|
Insurance (5.3%) | | | | | | | | |
MetLife, Inc. | | | 1,262,100 | | | | 55,368,327 | |
The Allstate Corp. | | | 1,608,700 | | | | 49,113,611 | |
| | | | | | |
|
|
|
| | | | | | | | 104,481,938 | |
| | | | | | |
|
|
|
Materials (7.1%) | | | | | | | | |
LyondellBasell Industries NV, Class A | | | 1,031,200 | | | | 39,721,824 | |
Newmont Mining Corp. | | | 906,300 | | | | 48,913,011 | |
Owens-Illinois, Inc. † | | | 1,936,500 | | | | 49,981,065 | |
| | | | | | |
|
|
|
| | | | | | | | 138,615,900 | |
| | | | | | |
|
|
|
See Notes to Financial Statements.
4
SOUND SHORE FUND, INC.
SCHEDULE OF INVESTMENTS (Continued)
JUNE 30, 2011 (Unaudited)
| | | | | | | | |
| | | Share
Amount
| | | Market
Value
| |
Pharmaceuticals (7.9%) | | | | | | | | |
Abbott Laboratories | | | 1,126,300 | | | $ | 59,265,906 | |
Novartis AG ADR | | | 706,500 | | | | 43,174,215 | |
Pfizer, Inc. | | | 2,587,700 | | | | 53,306,620 | |
| | | | | | |
|
|
|
| | | | | | | | 155,746,741 | |
| | | | | | |
|
|
|
Technology (19.4%) | | | | | | | | |
Applied Materials, Inc. | | | 3,831,400 | | | | 49,846,514 | |
eBay, Inc. † | | | 1,778,400 | | | | 57,388,968 | |
Flextronics International, Ltd. † | | | 6,741,300 | | | | 43,279,146 | |
Microsoft Corp. | | | 2,654,400 | | | | 69,014,400 | |
Symantec Corp. † | | | 3,143,800 | | | | 61,995,736 | |
Texas Instruments, Inc. | | | 1,525,300 | | | | 50,075,599 | |
Visa, Inc., Class A | | | 596,700 | | | | 50,277,942 | |
| | | | | | |
|
|
|
| | | | | | | | 381,878,305 | |
| | | | | | |
|
|
|
Utilities (5.9%) | | | | | | | | |
AES Corp. † | | | 4,090,700 | | | | 52,115,518 | |
Exelon Corp. | | | 1,506,300 | | | | 64,529,892 | |
| | | | | | |
|
|
|
| | | | | | | | 116,645,410 | |
| | | | | | |
|
|
|
Total Common Stocks (cost $1,641,915,853) | | | | | | $ | 1,906,992,864 | |
| | | | | | |
|
|
|
Short -Term Investments (3.3%) | | | | | | | | |
Money Market Fund (3.3%) | | | | | | | | |
Western Asset Institutional U.S. Treasury Fund, 0.02%
(cost $63,695,975) (a) | | | 63,695,975 | | | $ | 63,695,975 | |
| | | | | | |
|
|
|
Total Investments (100.3%) (cost $ 1,705,611,828) * | | | | | | $ | 1,970,688,839 | |
Liabilities less Other Assets (-0.3%) | | | | | | | (5,161,818 | ) |
| | | | | | |
|
|
|
Net Assets ( 100.0% ) | | | | | | $ | 1,965,527,021 | |
| | | | | | |
|
|
|
| (a) | Variable or Floating Rate Security. Rate disclosed is as of June 30, 2011. |
| † | Non-income producing security |
ADR — American Depositary Receipt
See Notes to Financial Statements.
5
SOUND SHORE FUND, INC.
SCHEDULE OF INVESTMENTS (Concluded)
JUNE 30, 2011 (Unaudited)
| * | Cost for federal income tax purposes is $1,713,864,989 and net unrealized appreciation consists of : |
| | | | |
Gross Unrealized Appreciation | | $ | 310,725,082 | |
Gross Unrealized Depreciation | | | (53,901,232 | ) |
| | |
|
|
|
Net Unrealized Appreciation (Depreciation) | | $ | 256,823,850 | |
| | |
|
|
|
See Notes to Financial Statements.
6
SOUND SHORE FUND, INC.
STATEMENT OF ASSETS AND LIABILITIES
JUNE 30, 2011 (Unaudited)
| | | | |
| ASSETS | | | | |
Investments, at value (Cost $1,705,611,828) | | $ | 1,970,688,839 | |
Receivables: | | | | |
Investments sold | | | 15,317,158 | |
Capital shares sold | | | 2,497,106 | |
Dividends | | | 936,626 | |
Prepaid expenses | | | 30,589 | |
| | |
|
|
|
Total Assets | | | 1,989,470,318 | |
| | |
|
|
|
| |
| LIABILITIES | | | | |
Payables: | | | | |
Investments purchased | | | 20,846,854 | |
Capital shares redeemed | | | 1,474,025 | |
Accrued liabilities: | | | | |
Advisory fees | | | 1,188,098 | |
Administrator fees | | | 37,431 | |
Transfer Agent fees and expenses | | | 184,317 | |
Custodian fees | | | 39,599 | |
Compliance and Treasurer Services fees | | | 32,269 | |
Directors’ fees and expenses | | | 19,992 | |
Other | | | 120,712 | |
| | |
|
|
|
Total Liabilities | | | 23,943,297 | |
| | |
|
|
|
Net Assets | | $ | 1,965,527,021 | |
| | |
|
|
|
| |
| COMPONENTS OF NET ASSETS | | | | |
Par Value (200,000,000 shares authorized) | | $ | 59,864 | |
Paid-in capital | | | 1,964,976,696 | |
Accumulated distributions in excess of net investment income | | | (378,277 | ) |
Accumulated net realized loss on investments | | | (264,208,273 | ) |
Net unrealized appreciation on investments | | | 265,077,011 | |
| | |
|
|
|
Net Assets | | $ | 1,965,527,021 | |
| | |
|
|
|
| |
| NET ASSET VALUE | | | | |
Net Assets | | $ | 1,965,527,021 | |
Shares Outstanding | | | 59,863,695 | |
| | |
|
|
|
Net Asset Value (offering price & redemption price per share) | | $ | 32.83 | |
| | |
|
|
|
See Notes to Financial Statements.
7
SOUND SHORE FUND, INC.
STATEMENT OF OPERATIONS
FOR THE SIX MONTHS ENDED JUNE 30, 2011 (Unaudited)
| | | | |
| INVESTMENT INCOME | | | | |
Income: | | | | |
Dividends (net of foreign withholding taxes $ 304,127) | | $ | 16,963,889 | |
| | |
|
|
|
Total Income | | | 16,963,889 | |
| | |
|
|
|
Expenses: | | | | |
Advisory fees (Note 3) | | | 7,465,206 | |
Administrator fees | | | 246,743 | |
Transfer Agent fees and expenses | | | 1,056,956 | |
Custodian fees | | | 98,410 | |
Compliance and Treasurer Services fees (Note 3) | | | 80,007 | |
Directors’ fees and expenses (Note 3) | | | 56,032 | |
Professional fees | | | 133,184 | |
Insurance fees | | | 39,238 | |
Registration fees | | | 34,760 | �� |
Printing fees | | | 92,523 | |
Miscellaneous | | | 9,609 | |
| | |
|
|
|
Total Expenses | | | 9,312,668 | |
| | |
|
|
|
Net Investment Income | | | 7,651,221 | |
| | |
|
|
|
| |
| REALIZED AND UNREALIZED GAIN (LOSS) ON INVESTMENTS | | | | |
Net realized gain on investments sold | | | 102,833,627 | |
Net change in unrealized appreciation (depreciation) on investments | | | (40,202,315 | ) |
| | |
|
|
|
Net realized and unrealized gain (loss) on investments | | | 62,631,312 | |
| | |
|
|
|
Net increase in net assets from operations | | $ | 70,282,533 | |
| | |
|
|
|
See Notes to Financial Statements.
8
SOUND SHORE FUND, INC.
STATEMENTS OF CHANGES IN NET ASSETS
| | | | | | | | |
| INCREASE (DECREASE) IN NET ASSETS | | | | | | | | |
| | | For the
Six Months Ended
June 30, 2011
(Unaudited)
| | | For the
Year Ended
December 31,
2010
| |
Operations: | | | | | | | | |
Net investment income | | $ | 7,651,221 | | | $ | 13,026,435 | |
Net realized gain on investments sold | | | 102,833,627 | | | | 131,179,822 | |
Net change in unrealized appreciation (depreciation) on investments | | | (40,202,315 | ) | | | 60,812,094 | |
| | |
|
|
| |
|
|
|
Increase in net assets from operations | | | 70,282,533 | | | | 205,018,351 | |
| | |
|
|
| |
|
|
|
Dividends to shareholders from net investment income | | | (8,218,466 | ) | | | (12,971,367 | ) |
| | |
|
|
| |
|
|
|
Capital share transactions (Note 6) | | | (24,399,885 | ) | | | (380,706,594 | ) |
| | |
|
|
| |
|
|
|
Total increase (decrease) | | | 37,664,182 | | | | (188,659,610 | ) |
Net assets: | | | | | | | | |
Beginning of the period | | | 1,927,862,839 | | | | 2,116,522,449 | |
| | |
|
|
| |
|
|
|
End of the period (Including line (A)) | | $ | 1,965,527,021 | | | $ | 1,927,862,839 | |
| | |
|
|
| |
|
|
|
(A) Accumulated undistributed (distributions in excess of) net investment income | | $ | (378,277 | ) | | $ | 188,968 | |
| | |
|
|
| |
|
|
|
See Notes to Financial Statements.
9
SOUND SHORE FUND, INC.
NOTES TO FINANCIAL STATEMENTS (Unaudited)
1. Organization
Sound Shore Fund, Inc. (the “Fund”) was incorporated under the laws of the State of Maryland on February 19, 1985 and is registered as a diversified, open-end management investment company under the Investment Company Act of 1940, as amended (the “Act”). The investment objective of the Fund is growth of capital.
2. Significant Accounting Policies
These financial statements are prepared in accordance with accounting principles generally accepted in the United States of America (“GAAP”), which require management to make estimates and assumptions that affect the reported amounts of assets and liabilities, disclosure of contingent liabilities at the date of the financial statements, and the reported amounts of increase and decrease in net assets from operations during the fiscal period. Actual results could differ from those estimates.
The following represent significant accounting policies of the Fund:
a) Security Valuation
Exchange traded securities (including those traded on the National Association of Securities Dealers’ Automated Quotation system) are valued at the last quoted sale price as provided by independent pricing services as of the close of trading on the system or exchange on which they are primarily traded, on each Fund business day. In the absence of a sale, such securities are valued at the mean of the last bid and asked price. Non-exchange traded securities for which over-the-counter market quotations are readily available are generally valued at the mean between the current bid and asked prices provided by independent pricing services. Fixed income securities may be valued at prices supplied by the Fund’s pricing agent based on broker or dealer supplied valuations or matrix pricing, a method of valuing securities by reference to the value of other securities with similar characteristics, such as rating, interest rate and maturity. Investments in other open-end regulated investment companies are valued at net asset value (“NAV”). Money market instruments that mature in sixty days or less may be valued at amortized cost.
The Fund values securities at fair value pursuant to procedures adopted by the Board of Directors if market quotations are not readily available (including a short and temporary lapse in the provision of a price by the regular pricing source) or, if in the judgment of the Advisor, the prices or values available do not represent the fair value of the instrument. Factors which may cause the Advisor to make such a judgment include, but are not limited to, the following, (i) only a bid price or an asked price is available, (ii) the spread between the bid price and the asked price is substantial, (iii) the frequency of sales, (iv) the thinness of the market, (v) the size of reported trades, and (vi) actions of the securities markets, such as the suspension or limitation of trading. Fair valuation is based on subjective factors and, as a result, the fair value price of an asset may differ from the asset’s market price and may not be the price at which the asset may be sold. Fair value estimates are based on judgments regarding the current economic environment, financial reports, credit, collateral and other such factors. Fair valuation could result in a NAV different from one determined by using market quotations.
10
SOUND SHORE FUND, INC.
NOTES TO FINANCIAL STATEMENTS (Unaudited) (Continued)
Valuation inputs used to determine the value of the Fund’s investments are summarized in the three broad levels listed below:
• Level 1 - quoted prices in active markets for identical assets
• Level 2 - other significant observable inputs (including quoted prices of similar securities, interest rates, prepayment speeds, credit risk, etc.)
• Level 3 - significant unobservable inputs (including the Fund’s own assumptions in determining the fair value of investments)
The inputs or methodology used for valuing securities are not necessarily an indication of the risk associated with investing in those securities.
Pursuant to the valuation procedures noted previously, equity securities (including exchange traded securities and other open-end regulated investment companies) are generally categorized as Level 1 securities in the fair value hierarchy. Fixed income securities and money market instruments are generally categorized as Level 2 securities in the fair value hierarchy. Investments for which there are no such quotations, or for which quotations do not appear reliable, are valued at fair value as determined in good faith by the Pricing Committee under the direction of the Board. These valuations are typically categorized as Level 2 or Level 3 in the fair value hierarchy.
The following is a summary of the inputs used to value the Fund’s investments in securities as of June 30, 2011:
| | | | | | | | | | | | | | | | |
Valuation Inputs
| | Level 1
| | | Level 2
| | | Level 3
| | | Total
Investments
in Securities
| |
Common Stocks | | $ | 1,906,992,864 | | | $ | — | | | $ | — | | | $ | 1,906,992,864 | |
Short-Term Investments | | | 63,695,975 | | | | — | | | | — | | | | 63,695,975 | |
| | |
|
|
| |
|
|
| |
|
|
| |
|
|
|
Total Investments | | $ | 1,970,688,839 | | | $ | — | | | $ | — | | | $ | 1,970,688,839 | |
| | |
|
|
| |
|
|
| |
|
|
| |
|
|
|
At June 30, 2011, all equity securities and open-end mutual funds were included in Level 1 in the table above. Please refer to the Schedule of Investments to view equity securities categorized by industry type.
The Fund’s policy is to disclose significant transfers between Levels based on valuations at the end of the reporting period. There were no significant transfers between Levels 1, 2, or 3 as of June 30, 2011, based on the valuation input levels on December 31, 2010.
In May 2011, the FASB issued ASU No. 2011-04 “Amendments to Achieve Common Fair Value Measurement and Disclosure Requirements in U.S. GAAP and International Financial Reporting Standards (“IFRSs”).” ASU 2011-04 includes common requirements for measurement of and disclosure about fair value between U.S. GAAP and IFRS. ASU 2011-04 will require reporting entities to disclose quantitative information about the unobservable inputs used in the fair value measurements categorized within Level 3 of the fair value hierarchy. In addition, ASU 2011-04 will require reporting entities to make disclosures about amounts and reasons for all transfers in and out of Level 1 and Level 2 fair value measurements. The new and revised disclosures are effective
11
SOUND SHORE FUND, INC.
NOTES TO FINANCIAL STATEMENTS (Unaudited) (Continued)
for interim and annual reporting periods beginning after December 15, 2011. At this time, management is evaluating the implications of ASU 2011-04 and its impact on the financial statements has not been determined.
b) Security Transactions and Investment Income
Dividend income is recorded on the ex-dividend date. Interest income is recorded on an accrual basis. Foreign dividend income is recorded on the ex-dividend date or as soon as practicable after the Fund determines the existence of a dividend declaration after exercising reasonable due diligence. Income and capital gains on some foreign securities may be subject to foreign withholding tax, which is accrued as applicable. Security transactions are recorded on a trade date basis. Realized gain and loss on investments sold are recorded on the basis of identified cost.
c) Dividends to Shareholders
Dividends from net investment income, if any, are declared and paid semiannually. Capital gains, if any, are distributed to shareholders at least annually. The Fund determines its net investment income and capital gains distributions in accordance with income tax regulations, which may differ from GAAP. These differences are due primarily to differing treatments of income and gains on various investment securities held by the Fund, timing differences and differing characterizations of distributions made by the Fund.
d) Federal Taxes
The Fund intends to qualify each year as a regulated investment company and to distribute substantially all of its taxable income. In addition, by distributing in each calendar year substantially all of its net investment income, capital gain and certain other amounts, if any, the Fund will not be subject to federal taxation. Therefore, no federal income or excise tax provision is required.
For all open tax years and all major taxing jurisdictions, management of the Fund has concluded that there are no significant uncertain tax positions that would require recognition in the financial statements. Open tax years are those that are open for examination by taxing authorities (i.e., generally, the last four tax year ends and the interim tax period since then). Further, management of the Fund is also not aware of any uncertain tax positions that would require the Fund to record a tax liability and, therefore, there is no impact to the Fund’s financial statements.
3. Investment Advisory and Other Services
Investment Adviser
The Fund’s investment adviser is Sound Shore Management, Inc. (the “Adviser”). Pursuant to an investment advisory agreement, the Adviser receives an advisory fee, accrued daily and paid monthly at an annual rate of 0.75% of the Fund’s average daily net assets.
12
SOUND SHORE FUND, INC.
NOTES TO FINANCIAL STATEMENTS (Unaudited) (Continued)
Other Services
Citi Fund Services Ohio, Inc. (“Citi”) provides certain administration, portfolio accounting and transfer agency services to the Fund.
The Fund also has agreements with various financial intermediaries and “mutual fund supermarkets” under which customers of these intermediaries may purchase and hold Fund shares. These intermediaries effectively provide sub-transfer agent services that the Fund transfer agent would have otherwise had to provide. In recognition of this, the transfer agent, the Fund and the Fund’s Adviser have entered into an agreement whereby the transfer agent agrees to pay financial intermediaries a portion of the amount denoted on the Statement of Operations as “Transfer Agent fees and expenses” that it receives from the Fund and the Adviser agrees to pay the excess, if any, charged by a financial intermediary.
Foreside Fund Services, LLC is the Fund’s distributor (the “Distributor”). The Distributor is neither affiliated with the Adviser, Citi nor its affiliated companies. The Distributor receives no compensation from the Fund for its distribution services.
Pursuant to a Compliance Services Agreement with the Fund, Foreside Compliance Services, LLC (“FCS”), an affiliate of the Distributor, provides a Chief Compliance Officer and Anti-Money Laundering Officer to the Fund as well as some additional compliance support functions. Under a Treasurer Services Agreement with the Fund, Foreside Management Services, LLC (“FMS”), an affiliate of the Distributor, provides a Treasurer to the Fund. Neither the Distributor, FCS, FMS, nor their employees that serve as officers of the Fund, have any role in determining the investment policies of or securities to be purchased or sold by the Fund.
The Fund pays each director who is not an “interested person” of the Fund, as defined in Section 2(a)(19) of the Act (“Independent Director”), quarterly fees of $1,250, plus $5,000 per quarterly in-person meeting, $2,000 per quarterly meeting attended telephonically and $1,000 per special meeting attended in person or telephonically.
Certain Officers and Directors of the Fund are officers, directors, or employees of the aforementioned companies.
4. Purchases and Sales of Securities
The cost of securities purchased and the proceeds from sales of securities (excluding short-term investments) for the period ended June 30, 2011 aggregated $508,948,891 and $533,061,949, respectively.
5. Federal Income Tax and Investment Transactions
Distributions during the fiscal years ended as noted were characterized for tax purposes as follows:
| | | | | | | | |
| | | December 31, 2010
| | | December 31, 2009
| |
Ordinary Income | | $ | 12,971,367 | | | $ | 15,901,483 | |
Long-Term Capital Gain | | | — | | | | — | |
13
SOUND SHORE FUND, INC.
NOTES TO FINANCIAL STATEMENTS (Unaudited) (Continued)
As of December 31, 2010, the components of distributable earnings on a tax basis were as follows:
| | | | |
Accumulated Net Investment Income | | $ | 188,968 | |
Capital and Other Losses | | | (355,765,875 | ) |
Net Unrealized Appreciation | | | 294,003,301 | |
For the year ended December 31, 2010, the Fund had capital loss carryforwards in the amounts of $178,033,782 and $177,732,093 which expire in 2016 and 2017, respectively.
The Regulated Investment Company Modernization Act of 2010, (the “Modernization Act”), was signed into law on December 22, 2010. The Act makes a number of changes to the provisions in the Internal Revenue Code of 1986, as amended, relating to regulated investment companies (“RICs”) that will generally become effective for taxable years beginning after December 22, 2010. The Modernization Act allows RICs to generally carryover net capital losses indefinitely, effective for losses arising in taxable years beginning after December 22, 2010. Such losses will retain their character as either long-term capital losses or short-term capital losses. Under pre-enactment law, capital losses could be carried forward for eight years as short-term capital losses irrespective of the character of the original loss. Loss carryforwards from years beginning prior to December 22, 2010 will still expire subject to the eight-year limitation. The Modernization Act further provides that losses arising in taxable years after December 22, 2010 shall be utilized prior to loss carryforwards arising in taxable years beginning prior to December 22, 2010. As a result, pre-enactment loss carryforwards may be more likely to expire unused.
6. Capital Stock
As of June 30, 2011, 200,000,000 shares of $.001 par value stock were authorized and capital paid in amounted to $1,964,976,696. Transactions in capital stock were as follows:
| | | | | | | | | | | | | | | | |
| | | For the
Six Months Ended
June 30, 2011
| | | For the
Year Ended
December 31, 2010
| |
| | | Shares
| | | Amount
| | | Shares
| | | Amount
| |
Sale of shares | | | 5,274,812 | | | $ | 174,820,915 | | | | 11,141,573 | | | $ | 320,909,013 | |
Reinvestment of dividends | | | 247,817 | | | | 7,912,746 | | | | 443,100 | | | | 12,542,005 | |
Redemption of shares | | | (6,254,424 | ) | | | (207,133,546 | ) | | | (25,035,524 | ) | | | (714,157,612 | ) |
| | |
|
|
| |
|
|
| |
|
|
| |
|
|
|
Net decrease from capital transactions | | | (731,795 | ) | | $ | (24,399,885 | ) | | | (13,450,851 | ) | | $ | (380,706,594 | ) |
| | |
|
|
| |
|
|
| |
|
|
| |
|
|
|
Of the 59,863,695 shares outstanding as of June 30, 2011, the Employees’ Profit Sharing Plan of the Adviser owned 579,273 shares.
14
SOUND SHORE FUND, INC.
NOTES TO FINANCIAL STATEMENTS (Unaudited) (Concluded)
7. Other Information
On June 30, 2011, two entities, Charles Schwab & Co. Inc. and National Financial Services LLC, held of record in omnibus accounts approximately 68% of the outstanding shares of the Fund on behalf of numerous investors.
8. Subsequent Events
Subsequent events occurring after the date of this report have been evaluated for potential impact to this report through the date the report was available to be issued.
15
SOUND SHORE FUND, INC.
FINANCIAL HIGHLIGHTS
These financial highlights reflect selected data for a share outstanding throughout each period.
| | | | | | | | | | | | | | | | | | | | | | | | |
| | | Six Months
Ended
June 30, 2011
(Unaudited)
| | | Year Ended December 31,
| |
| | | | 2010
| | | 2009
| | | 2008
| | | 2007
| | | 2006
| |
Net Asset Value, Beginning of Period | | $ | 31.82 | | | $ | 28.58 | | | $ | 22.76 | | | $ | 35.68 | | | $ | 39.19 | | | $ | 36.63 | |
| | |
|
|
| |
|
|
| |
|
|
| |
|
|
| |
|
|
| |
|
|
|
Investment Operations | | | | | | | | | | | | | | | | | | | | | | | | |
Net investment income(a) | | | 0.13 | | | | 0.19 | | | | 0.22 | | | | 0.25 | | | | 0.20 | | | | 0.21 | |
Net realized and unrealized gain (loss) on investments | | | 1.02 | | | | 3.25 | | | | 5.82 | | | | (12.91 | ) | | | 0.83 | | | | 5.86 | |
| | |
|
|
| |
|
|
| |
|
|
| |
|
|
| |
|
|
| |
|
|
|
Total from Investment Operations | | | 1.15 | | | | 3.44 | | | | 6.04 | | | | (12.66 | ) | | | 1.03 | | | | 6.07 | |
| | |
|
|
| |
|
|
| |
|
|
| |
|
|
| |
|
|
| |
|
|
|
Distributions from | | | | | | | | | | | | | | | | | | | | | | | | |
Net investment income | | | (0.14 | ) | | | (0.20 | ) | | | (0.22 | ) | | | (0.26 | ) | | | (0.21 | ) | | | (0.21 | ) |
Net realized gains | | | — | | | | — | | | | — | | | | — | | | | (4.33 | ) | | | (3.30 | ) |
| | |
|
|
| |
|
|
| |
|
|
| |
|
|
| |
|
|
| |
|
|
|
Total Distributions | | | (0.14 | ) | | | (0.20 | ) | | | (0.22 | ) | | | (0.26 | ) | | | (4.54 | ) | | | (3.51 | ) |
| | |
|
|
| |
|
|
| |
|
|
| |
|
|
| |
|
|
| |
|
|
|
Net Asset Value, End of Period | | $ | 32.83 | | | $ | 31.82 | | | $ | 28.58 | | | $ | 22.76 | | | $ | 35.68 | | | $ | 39.19 | |
| | |
|
|
| |
|
|
| |
|
|
| |
|
|
| |
|
|
| |
|
|
|
Total Return(b) | | | 3.62 | % | | | 12.13 | % | | | 26.64 | % | | | (35.60 | )% | | | 2.58 | % | | | 16.56 | % |
Ratios/Supplemental Data | | | | | | | | | | | | | | | | | | | | | | | | |
Net Assets at End of Period (in thousands) | | $ | 1,965,527 | | | $ | 1,927,863 | | | $ | 2,116,522 | | | $ | 1,624,674 | | | $ | 2,730,928 | | | $ | 2,876,335 | |
Ratios to Average Net Assets:(c) | | | | | | | | | | | | | | | | | | | | | | | | |
Expenses | | | 0.94 | % | | | 0.94 | % | | | 0.94 | % | | | 0.92 | % | | | 0.92 | % | | | 0.92 | % |
Net Investment Income | | | 0.77 | % | | | 0.66 | % | | | 0.89 | % | | | 0.80 | % | | | 0.50 | % | | | 0.54 | % |
Portfolio Turnover Rate(b) | | | 26 | % | | | 64 | % | | | 97 | % | | | 111 | % | | | 84 | % | | | 66 | % |
| (a) | Calculated using the average shares outstanding for the period. |
| (b) | Not annualized for periods less than one year. |
| (c) | Annualized for periods less than one year. |
16
SOUND SHORE FUND, INC.
JUNE 30, 2011 (Unaudited)
Shareholder Expense Example
As a shareholder of the Fund, you incur ongoing costs, including management fees and other Fund expenses. This example is intended to help you understand your ongoing costs (in dollars) of investing in the Fund and to compare these costs with the ongoing costs of investing in other mutual funds.
The following example is based on $1,000 invested at the beginning of the period and held for the entire period from January 1, 2011 through June 30, 2011.
Actual Expenses - The first line of the table below provides information about actual account values and actual expenses. You may use the information in this line, together with the amount you invested, to estimate the expenses that you paid over the period. Simply divide your account value by $1,000 (for example, an $8,600 account value divided by $1,000 = 8.6), then multiply the result by the number in the first line under the heading entitled “Expenses Paid During Period” to estimate the expenses you paid on your account during this period.
Hypothetical Example for Comparison Purposes - The second line of the table below provides information about hypothetical account values and hypothetical expenses based on the Fund’s actual expense ratio and an assumed rate of return of 5% per year before expenses, which is not the Fund’s actual return. The hypothetical account values and expenses may not be used to estimate the actual ending account balance or expenses you paid for the period. You may use this information to compare the ongoing cost of investing in the Fund and other funds. To do so, compare this 5% hypothetical example with the 5% hypothetical examples that appear in the shareholder reports of other funds.
Expenses shown in the table are meant to highlight your ongoing costs only and do not reflect any transactional costs. Therefore, the second line of the table is useful in comparing ongoing costs only, and will not help you determine the relative total costs of owning different funds.
| | | | | | | | | | | | |
| | | Beginning
Account Value
January 1, 2011
| | | Ending
Account Value
June 30, 2011
| | | Expenses Paid
During Period*
| |
Actual Return | | $ | 1,000.00 | | | $ | 1,036.20 | | | $ | 4.75 | |
Hypothetical Return | | $ | 1,000.00 | | | $ | 1,020.13 | | | $ | 4.71 | |
| * | Expenses are equal to the Fund’s annualized expense ratio of 0.94%, multiplied by the average account value over the period, multiplied by the number of days in the most recent fiscal half-year divided by 365 to reflect the half-year period. |
17
SOUND SHORE FUND, INC.
JUNE 30, 2011
Investment Advisory Agreement Approval
The Independent Directors met separately in advance of the Board meeting, held on January 31, 2011, with their independent counsel and had an extensive discussion regarding consideration of the Investment Advisory Agreement. In this meeting, they reviewed the Board materials that had been provided in advance of the meeting and discussed these matters in light of the relevant factors set forth in judicial precedent. The Independent Directors also recognized that some factors, such as fall out benefits, were not applicable given the nature of the Adviser’s operations. The Independent Directors expressed their confidence in management and their ability to ask questions of management to get the information that is necessary in considering approval of the contracts.
At the Board meeting, the Independent Directors and the full Board reviewed, considered and discussed the written materials provided to them, which included the terms of the Investment Advisory Agreement, the long, mid and short term performance of the Fund as measured against relevant benchmarks, revenue received by the Adviser from the Fund, and the costs incurred by the Adviser in connection with the services it renders to the Fund, as well as Adviser financial information provided at the meeting. The materials also included comparative analyses of advisory, administration, transfer agency and fund accounting fees and total expenses borne by the Fund to all 55 mutual funds included in an independently selected universe of no-load U.S. diversified equity funds with no 12b-1 or non-12b-1 fees with assets of $1 billion to $3 billion and additional analysis of its fees as compared to a subset of 12 small fund families within this comparison group.
The Directors, including the Independent Directors, also took into account (1) the consistent quality of services provided by the Adviser, including the Fund’s long-term performance record, (2) the reputation of the Adviser, and (3) the professional credentials of its personnel and the efficiency and economy of its operations. The Directors, including the Independent Directors, recognized that while the fees charged by the Adviser to private accounts are lower than those charged to the Fund, the nature of the private accounts and the services provided to them are different from the Fund. While the Directors, including the Independent Directors, did not identify any single factor as controlling, after considering all the factors, they resolved unanimously to approve continuance of the Investment Advisory Agreement as in the best interests of the Fund and its shareholders.
Proxy Voting Information
A description of the policies and procedures that the Fund uses to determine how to vote proxies relating to securities held in the Fund’s portfolio is available, without charge and upon request, by calling (800) 551-1980 or by visiting the Fund’s web site at http://www.soundshorefund.com. This information is also available on the SEC’s web site at http://www.sec.gov under the name of Sound Shore Fund.
The Fund’s proxy voting record for the most recent 12-month period ended June 30 is available, without charge and upon request, by calling (800) 551-1980 or by visiting the Fund’s web site at http://www.soundshorefund.com. This information is available on the SEC’s web site at http://www.sec.gov under the name of Sound Shore Fund.
Availability of Quarterly Portfolio Schedule
The Fund files its complete schedule of portfolio holdings with the SEC for the first and third quarters of each fiscal year on Form N-Q. This information is available on the SEC’s web site at http://www.sec.gov under the name of Sound Shore Fund. It may be reviewed and copied at the SEC’s Public Reference Room in Washington, DC. Information on the operation of the Public Reference Room may be obtained by calling (800) SEC-0330.
18

Investment Adviser
Sound Shore Management, Inc.
Greenwich, Connecticut
Administrator
Citi Fund Services Ohio, Inc.
Columbus, Ohio
Distributor
Foreside Fund Services, LLC
Portland, Maine
www.foreside.com
Transfer and Distribution Paying Agent
Citi Fund Services Ohio, Inc.
Columbus, Ohio
Custodian
Citibank, N.A.
New York, New York
Fund Counsel
Dechert LLP
New York, New York
Counsel to the Independent Directors
Wilmer Cutler Pickering Hale
and Dorr, LLP
New York, New York
Independent Registered
Public Accounting Firm
Deloitte & Touche LLP
Chicago, Illinois
107-SAR-0611
This report is submitted for the general information of the shareholders of the Fund. It is not authorized for distribution to prospective investors in the Fund unless preceded or accompanied by an effective prospectus, which includes information regarding the Fund’s objectives and policies, experience of its management, and other information.
SOUND SHORE FUND, INC.
3435 Stelzer Road
Columbus, OH 43219
http://www.soundshorefund.com
(800) 551-1980
Semiannual Report
(Unaudited)
JUNE 30, 2011


Not applicable.
| Item 3. | Audit Committee Financial Expert. |
Not applicable.
| Item 4. | Principal Accountant Fees and Services. |
Not applicable.
| Item 5. | Audit Committee of Listed Registrants. |
Not applicable.
| Item 6. | Schedule of Investments. |
| (a) | Included as part of the Report to Stockholders under Item 1. |
| Item 7. | Disclosure of Proxy Voting Policies and Procedures for Closed-End Management Investment Companies. |
Not applicable.
| Item 8. | Portfolio Managers of Closed-End Management Investment Companies. |
Not applicable.
| Item 9. | Purchases of Equity Securities by Closed-End Management Investment Company and Affiliated Purchasers. |
Not applicable.
| Item 10. | Submission of Matters to a Vote of Security Holders. |
Not applicable.
| Item 11. | Controls and Procedures. |
(a) The registrant’s principal executive officer and principal financial officer concluded that the registrant’s disclosure controls and procedures (as defined in Rule 30a-3(c) under the Investment Company Act of 1940 (the “Act”)) were effective as of a date within 90 days of the filing date of this report (the “Evaluation Date”) based on their evaluation of the registrant’s disclosure controls and procedures as of the Evaluation Date.
(b) There were no changes in the registrant’s internal control over financial reporting (as defined in Rule 30a-3(d) under the Act) that occurred during the second fiscal quarter of the period covered by this report that have materially affected, or are reasonably likely to materially affect, the registrant’s internal control over financial reporting.
(a)(1) Not applicable.
(a)(2) Certifications pursuant to Rule 30a-2(a) of the Investment Company Act of 1940 as amended, and Section 302 of the Sarbanes-Oxley Act of 2002 (Exhibit filed herewith).
(a)(3) Not applicable.
(b) Certifications pursuant to Rule 30a-2(b) of the Investment Company Act of 1940, as amended, and Section 906 of the Sarbanes-Oxley Act of 2002 (Exhibit filed herewith).
SIGNATURES
Pursuant to the requirements of the Securities Exchange Act of 1934 and the Investment Company Act of 1940, the registrant has duly caused this report to be signed on its behalf by the undersigned, thereunto duly authorized.
| | |
| |
| Registrant | | Sound Shore Fund, Inc. |
| | |
| |
| By (Signature and Title) | | /s/ T. GIBBS KANE, JR. |
| | T. Gibbs Kane, Jr., President |
Date August 23, 2011
Pursuant to the requirements of the Securities Exchange Act of 1934 and the Investment Company Act of 1940, this report has been signed below by the following persons on behalf of the registrant and in the capacities and on the dates indicated.
| | |
| |
| By (Signature and Title) | | /s/ T. GIBBS KANE, JR. |
| | T. Gibbs Kane, Jr., President |
Date August 23, 2011
| | |
| |
| By (Signature and Title) | | /s/ CHARLES S. TODD |
| | Charles S. Todd, Treasurer |
Date August 23, 2011