UNITED STATES
SECURITIES AND EXCHANGE COMMISSION
Washington, D.C. 20549
FORM N-CSR
CERTIFIED SHAREHOLDER REPORT OF REGISTERED
MANAGEMENT INVESTMENT COMPANIES
Investment Company Act file number 811-04244
SOUND SHORE FUND, INC.
(Exact name of registrant as specified in charter)
3435 Stelzer Road
Columbus, OH 43219
(Address of principal executive offices) (Zip Code)
T. Gibbs Kane, Jr., President
8 Sound Shore Drive
Greenwich, Connecticut 06830
(Name and address of agent for service)
Registrant’s telephone number, including area code: (800) 551-1980
Date of fiscal year end: December 31
Date of reporting period: June 30, 2014
Item 1. Reports to Stockholders.

3435 STELZER ROAD, COLUMBUS, OH 43219 1-800-551-1980
June 30, 2014
Dear Investor:
The Sound Shore Fund Investor Class (ticker SSHFX) ended June 30, 2014 with a net asset value of $52.33 per share, after a distribution of $1.011380 on June 19th*. The second quarter total return was 5.01% versus the Standard & Poor’s 500 Index (“S&P 500”) and Dow Jones Industrial Average (“Dow Jones”), which returned 5.23% and 2.83%, respectively. Year to date, the Fund has gained 8.75% versus 7.14% for the S&P 500 and 2.68% for the Dow Jones.
We are required by the SEC to say that: Performance data quoted represents past performance and is no guarantee of future results. Current performance may be lower or higher than the performance data quoted. Investment return and principal value will fluctuate so that an investor’s shares, when redeemed, may be worth more or less than original cost. The Fund’s Investor Class 1, 5, 10, and 15-year average annual total returns for the period ended June 30, 2014 were 29.62%, 17.99%, 8.25%, and 7.35%, respectively. As stated in the current prospectus, the Fund’s Investor Class total annual operating expense ratio (gross) is 0.93%. For the most recent month-end performance, please visit the Fund’s website at www.soundshorefund.com.
Investors who ignored the old market adage “sell in May and go away” were rewarded in the second quarter of 2014, as the S&P 500 climbed 5.23%. Stock performance reflected modest global economic growth trends and central banks still mostly focused on employment. After several quarters of strong equity market gains, including 24.61% for S&P 500 in the last 12 months ended June 30, 2014, and with stocks at “norm” valuations, it seems prudent to expect more moderate returns for the broader indices from here.
Against that backdrop, Sounds Shore’s contrarian investment process, which focuses on company-specific value drivers seems particularly timely. We invest in stocks that are out of favor and priced below their historic norms, but which have strong underlying businesses being overlooked by the consensus or with transitory issues being addressed by management.
For example, electronics manufacturer Flextronics (“Flex”), one of the June quarter’s strongest contributors, traded for 6 times forward earnings with a double digit free cash flow yield just 24 months ago. Despite a blue chip customer base that includes multinationals Cisco and Microsoft, Flex’s low valuation at the time reflected skepticism about its earnings power. Over the last several quarters, however, management has targeted improved margins and returns on capital through greater focus on its diversified and profitable industrial and networking segments. During this two year transition period, Flex has improved earnings per share by one-third, doubled free cash flow, and reduced its share count by 14%. Flex’s shares have outperformed the S&P 500 Index by 35% for the past 2 years ended June 30, 2014, and even so remain reasonably valued at 11 times earnings.
1
Oilfield service leader Schlumberger was also a solid second quarter performer, outdistancing both the market and a strong energy sector. We invested in Schlumberger in early 2013 when it was valued well below average at 14 times forward earnings due to concerns about upstream spending. Shares were higher in the quarter after the company detailed its targets to double asset productivity by 2017 and with modest improvement in North American end-markets.
Meanwhile, detractors for the period included financial holdings Bank of America and CIT Group. Bank of America was held back by sluggish capital market trading volumes and CIT lagged due to narrower net interest margins. Short term revenue pressures notwithstanding, each of these companies trade for less than 10 times normalized earnings and each has excess capital which can either be returned to shareholders or invested for growth.
Despite improved corporate profits, underlying skepticism persists about equities. For example, a recent article in the Wall Street Journal pointed out that many institutional investors have missed the rally for stocks since 2009 due to concerns about volatility. By contrast, taking a full cycle approach to equities has allowed Sound Shore investors to benefit from the powers of compounding: Over the past 15 years, our clients have realized a cumulative total return of 189.88% (net) versus 89.27% for the S&P 500 Index and 126.50% for the Barclays Aggregate Bond Index. This period included two major bear markets and required patience to remain invested, but such patience was well rewarded.
We continue to identify compelling opportunities with solid corporate earnings and cash flow, healthy balance sheets, and an increasingly constructive alignment between companies and shareholders. Our focused portfolio contains approximately 40 holdings that appear attractively valued and poised for internally driven financial improvement. We believe investors may continue to benefit through higher dividends, share repurchases, and balanced investments for growth.
Thank you for your investment alongside ours in Sound Shore.
Sincerely,
SOUND SHORE FUND
Harry Burn, III
John P. DeGulis
T. Gibbs Kane, Jr.
Co-Portfolio Managers
| * | The June 19, 2014 distribution of $1.011380 was larger than Fund’s typical mid-year distribution, primarily due to the one-time income impact of a taxable corporate action related to Vodafone Group PLC, one of the Fund’s portfolio securities. This corporate action had the effect of increasing the Fund’s distributable net investment |
2
| | income by $0.639048 per Investor Class Share. Additionally, a portion of the June dividend ($0.196891 per Investor Class share) amounted to a distribution in excess of net investment income. Should the Fund not earn sufficient income to cover the full amount of the dividend prior to December 31, 2014; a portion of the dividend will be considered to be a ‘return of capital’ for tax purposes. |
Fund returns assume the reinvestment of all dividend and capital gain distributions. The Standard & Poor’s 500 Index is an unmanaged index representing the average performance of 500 widely held, publicly traded, large capitalization stocks. The Dow Jones Industrial Average consists of 30 stocks that are considered to be major factors in their industries and that are widely held by individuals and institutional investors. The Barclays Aggregate Bond Index measures the performance of the U.S. investment grade bond market. It is not possible to invest directly in an Index or Average.
Short-term performance, in particular, is not a good indication of the Fund’s future performance, and an investment should not be made based solely on returns. Because of ongoing market volatility, Fund performance may be subject to substantial short-term changes.
This letter may contain discussions about certain investments both held and not held in the portfolio. As required by the Financial Industry Regulatory Authority (FINRA), we must remind you that current and future portfolio holdings are subject to risk. Percent of net assets as of 6/30/14: Bank of America: 2.68%; CIT Group, Inc.: 2.55%; Cisco Systems, Inc.: 0.00%; Flextronics International, Ltd.: 2.23%; Microsoft Corporation: 2.72%; Schlumberger Ltd.: 2.23%; and Vodafone Group PLC: 2.06%.
An investment in the Fund is subject to risk, including the possible loss of principal amount invested. Mid Cap Risk: Securities of medium sized companies may be more volatile and more difficult to liquidate during market downturns than securities of large, more widely traded companies. Foreign Securities Risk: The Fund may invest in foreign securities primarily in the form of American Depositary Receipts. Investing in the securities of foreign issuers also involves certain special risks, which are not typically associated with investing in U.S. dollar-denominated securities or quoted securities of U.S. issuers including increased risks of adverse issuer, political, regulatory, market or economic developments. Investments in foreign securities also may be affected favorably or unfavorably by changes in currency rates and in exchange control regulations.
The views in this letter were those of the Fund managers as of 6/30/14 and may not necessarily reflect their views on the date this letter is first published or anytime thereafter. These views (i) are intended to assist shareholders in understanding the Fund’s present investment methodology and (ii) do not constitute investment advice. This letter must be preceded or accompanied by a current Fund prospectus. Distributed by Foreside Fund Services, LLC.
3
SOUND SHORE FUND, INC.
SCHEDULE OF INVESTMENTS
JUNE 30, 2014 (Unaudited)
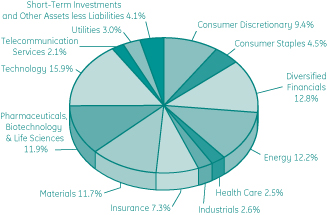
Sector/Industry Weightings (as of June 30, 2014)
as a percentage of Net Assets (Unaudited)
| | | | | | | | |
| | | Share
Amount
| | | Market
Value
| |
Common Stocks (95.9%) | | | | | | | | |
Consumer Discretionary (9.4%) | | | | | | | | |
Comcast Corp., Class A | | | 1,164,200 | | | $ | 62,494,256 | |
DIRECTV † | | | 424,000 | | | | 36,044,240 | |
Kohl’s Corp. | | | 457,200 | | | | 24,085,296 | |
Lowe’s Cos., Inc. | | | 1,279,500 | | | | 61,403,205 | |
Time Warner, Inc. | | | 683,000 | | | | 47,980,750 | |
| | | | | | |
|
|
|
| | | | | | | | 232,007,747 | |
| | | | | | |
|
|
|
Consumer Staples (4.5%) | | | | | | | | |
CVS Caremark Corp. | | | 752,700 | | | | 56,730,999 | |
Procter & Gamble Co. | | | 700,900 | | | | 55,083,731 | |
| | | | | | |
|
|
|
| | | | | | | | 111,814,730 | |
| | | | | | |
|
|
|
See Notes to Financial Statements.
4
SOUND SHORE FUND, INC.
SCHEDULE OF INVESTMENTS (Continued)
JUNE 30, 2014 (Unaudited)
| | | | | | | | |
| | | Share
Amount
| | | Market
Value
| |
Diversified Financials (12.8%) | | | | | | | | |
Bank of America Corp. | | | 4,295,700 | | | $ | 66,024,909 | |
Capital One Financial Corp. | | | 709,400 | | | | 58,596,440 | |
CIT Group, Inc. | | | 1,373,700 | | | | 62,860,512 | |
Citigroup, Inc. | | | 1,404,900 | | | | 66,170,790 | |
Invesco, Ltd. | | | 1,618,300 | | | | 61,090,825 | |
| | | | | | |
|
|
|
| | | | | | | | 314,743,476 | |
| | | | | | |
|
|
|
Energy (12.2%) | | | | | | | | |
Baker Hughes, Inc. | | | 666,100 | | | | 49,591,145 | |
BP PLC ADR | | | 1,311,200 | | | | 69,165,800 | |
Hess Corp. | | | 691,000 | | | | 68,332,990 | |
Schlumberger, Ltd. | | | 466,800 | | | | 55,059,060 | |
Weatherford International PLC † | | | 2,592,200 | | | | 59,620,600 | |
| | | | | | |
|
|
|
| | | | | | | | 301,769,595 | |
| | | | | | |
|
|
|
Health Care (2.5%) | | | | | | | | |
WellPoint, Inc. | | | 574,000 | | | | 61,768,140 | |
| | | | | | |
|
|
|
Industrials (2.6%) | | | | | | | | |
General Electric Co. | | | 2,421,100 | | | | 63,626,508 | |
| | | | | | |
|
|
|
Insurance (7.3%) | | | | | | | | |
American International Group, Inc. | | | 1,238,800 | | | | 67,613,704 | |
Aon PLC | | | 694,700 | | | | 62,585,523 | |
Marsh & McLennan Cos., Inc. | | | 980,400 | | | | 50,804,328 | |
| | | | | | |
|
|
|
| | | | | | | | 181,003,555 | |
| | | | | | |
|
|
|
Materials (11.7%) | | | | | | | | |
Alcoa, Inc. | | | 3,985,800 | | | | 59,348,562 | |
E.I. du Pont de Nemours & Co. | | | 864,700 | | | | 56,585,968 | |
International Paper Co. | | | 1,141,800 | | | | 57,626,646 | |
Owens-Illinois, Inc. † | | | 1,725,500 | | | | 59,771,320 | |
Reliance Steel & Aluminum Co. | | | 751,400 | | | | 55,385,694 | |
| | | | | | |
|
|
|
| | | | | | | | 288,718,190 | |
| | | | | | |
|
|
|
See Notes to Financial Statements.
5
SOUND SHORE FUND, INC.
SCHEDULE OF INVESTMENTS (Continued)
JUNE 30, 2014 (Unaudited)
| | | | | | | | |
| | | Share
Amount
| | | Market
Value
| |
Pharmaceuticals, Biotechnology & Life Sciences (11.9%) | | | | | | | | |
Agilent Technologies, Inc. | | | 1,043,400 | | | $ | 59,932,896 | |
Hospira, Inc. † | | | 1,033,500 | | | | 53,090,895 | |
Novartis AG ADR | | | 591,900 | | | | 53,584,707 | |
Sanofi SA ADR | | | 1,254,300 | | | | 66,691,131 | |
Thermo Fisher Scientific, Inc. | | | 507,700 | | | | 59,908,600 | |
| | | | | | |
|
|
|
| | | | | | | | 293,208,229 | |
| | | | | | |
|
|
|
Technology (15.9%) | | | | | | | | |
Applied Materials, Inc. | | | 2,506,300 | | | | 56,517,065 | |
Flextronics International, Ltd. † | | | 4,969,000 | | | | 55,006,830 | |
Google, Inc., Class A † | | | 55,100 | | | | 32,215,317 | |
Google, Inc., Class C † | | | 55,900 | | | | 32,158,152 | |
Microsoft Corp. | | | 1,606,400 | | | | 66,986,880 | |
Qualcomm, Inc. | | | 846,500 | | | | 67,042,800 | |
Teradata Corp. † | | | 742,100 | | | | 29,832,420 | |
Texas Instruments, Inc. | | | 1,083,200 | | | | 51,766,128 | |
| | | | | | |
|
|
|
| | | | | | | | 391,525,592 | |
| | | | | | |
|
|
|
Telecommunication Services (2.1%) | | | | | | | | |
Vodafone Group PLC — ADR | | | 1,522,600 | | | | 50,839,614 | |
| | | | | | |
|
|
|
Utilities (3.0%) | | | | | | | | |
AES Corp. | | | 4,666,400 | | | | 72,562,520 | |
| | | | | | |
|
|
|
Total Common Stocks (cost $1,642,106,881) | | | | | | $ | 2,363,587,896 | |
| | | | | | |
|
|
|
Short-Term Investments (3.2%) | | | | | | | | |
Money Market Fund (3.2%) | | | | | | | | |
Western Asset Institutional U.S. Treasury Fund, 0.02% (a) | | | 78,260,007 | | | $ | 78,260,007 | |
| | | | | | |
|
|
|
Total Money Markets (cost $78,260,007) | | | | | | $ | 78,260,007 | |
| | | | | | |
|
|
|
Total Investments (99.1%) (cost $1,720,366,888) * | | | | | | $ | 2,441,847,903 | |
Other Assets less Liabilities (0.9%) | | | | | | | 23,246,763 | |
| | | | | | |
|
|
|
Net Assets (100.0%) | | | | | | $ | 2,465,094,666 | |
| | | | | | |
|
|
|
See Notes to Financial Statements.
6
SOUND SHORE FUND, INC.
SCHEDULE OF INVESTMENTS (Concluded)
JUNE 30, 2014 (Unaudited)
| † | Non-income producing security |
(a) Rate disclosed is as of June 30, 2014.
ADR — American Depositary Receipt
PLC — Public Limited Company
| * | Cost for federal income tax purposes is substantially the same as for financial statement purposes and net unrealized appreciation consists of: |
| | | | |
Gross Unrealized Appreciation | | $ | 753,120,430 | |
Gross Unrealized Depreciation | | | (31,639,415 | ) |
| | |
|
|
|
Net Unrealized Appreciation | | $ | 721,481,015 | |
| | |
|
|
|
See Notes to Financial Statements.
7
SOUND SHORE FUND, INC.
STATEMENT OF ASSETS AND LIABILITIES
JUNE 30, 2014 (Unaudited)
| | | | |
| ASSETS | | | | |
Investments, at value (Cost $1,720,366,888) | | $ | 2,441,847,903 | |
Cash | | | 10 | |
Receivables: | | | | |
Investments sold | | | 20,877,454 | |
Capital shares sold | | | 2,528,077 | |
Dividends | | | 3,059,580 | |
Prepaid expenses | | | 105,323 | |
| | |
|
|
|
Total Assets | | | 2,468,418,347 | |
| | |
|
|
|
| |
| LIABILITIES | | | | |
Payables: | | | | |
Capital shares redeemed | | | 1,449,542 | |
Accrued liabilities: | | | | |
Advisory fees | | | 1,475,255 | |
Administrator fees | | | 47,066 | |
Transfer agent fees and expenses | | | 187,454 | |
Custodian fees | | | 2,076 | |
Compliance and Treasurer Services fees | | | 8,958 | |
Professional fees | | | 81,141 | |
Other | | | 72,189 | |
| | |
|
|
|
Total Liabilities | | | 3,323,681 | |
| | |
|
|
|
Net Assets | | $ | 2,465,094,666 | |
| | |
|
|
|
| |
| COMPONENTS OF NET ASSETS | | | | |
Common stock, at Par Value | | $ | 47,106 | |
Paid-in capital | | | 1,639,451,865 | |
Distributions in excess of net investment income | | | (9,138,750 | ) |
Accumulated net realized gain on investments | | | 113,253,430 | |
Net unrealized appreciation on investments | | | 721,481,015 | |
| | |
|
|
|
Net Assets | | | 2,465,094,666 | |
| | |
|
|
|
See Notes to Financial Statements.
8
SOUND SHORE FUND, INC.
STATEMENT OF ASSETS AND LIABILITIES (Concluded)
JUNE 30, 2014 (Unaudited)
| | | | |
NET ASSET VALUE | | | | |
Net Assets — Investor Class Shares | | $ | 2,021,710,163 | |
Shares Outstanding — Investor Class (100,000,000 shares authorized, par value $0.001) | | | 38,637,149 | |
| | |
|
|
|
Net Asset Value (offering price & redemption price per share) — Investor Class Shares | | $ | 52.33 | |
| | |
|
|
|
Net Assets — Institutional Class Shares | | $ | 443,384,503 | |
Shares Outstanding — Institutional Class (100,000,000 shares authorized, par value $0.001) | | | 8,467,906 | |
| | |
|
|
|
Net Asset Value (offering price & redemption price per share) — Institutional Class Shares | | $ | 52.36 | |
| | |
|
|
|
See Notes to Financial Statements.
9
SOUND SHORE FUND, INC.
STATEMENT OF OPERATIONS
FOR THE SIX MONTHS ENDED JUNE 30, 2014 (Unaudited)
| | | | |
| INVESTMENT INCOME | | | | |
Income: | | | | |
Dividends (net of foreign withholding taxes of $330,268) | | $ | 47,786,445 | |
| | |
|
|
|
Total Income | | | 47,786,445 | |
| | |
|
|
|
Expenses: | | | | |
Advisory fees (Note 3) | | | 8,393,664 | |
Administrator fees | | | 278,958 | |
Transfer agent fees and expenses — Investor Class Shares | | | 1,018,282 | |
Transfer agent fees and expenses — Institutional Class Shares | | | 12,397 | |
Custodian fees | | | 90,903 | |
Compliance and Treasurer Services fees (Note 3) | | | 90,468 | |
Directors’ fees and expenses (Note 3) | | | 80,243 | |
Professional fees | | | 102,447 | |
Insurance fees | | | 46,149 | |
Registration fees | | | 51,731 | |
Printing Fees — Investor Class Shares | | | 54,793 | |
Printing fees — Institutional Class Shares | | | 5,258 | |
| | |
|
|
|
Total Expenses | | | 10,225,293 | |
Expense Reimbursements - Institutional Class | | | (110,507 | ) |
| | |
|
|
|
Net Expenses | | | 10,114,786 | |
| | |
|
|
|
Net Investment Income | | | 37,671,659 | |
| | |
|
|
|
| |
| REALIZED AND UNREALIZED GAIN (LOSS) ON INVESTMENTS | | | | |
Net realized gain on investments sold | | | 130,010,282 | |
Net change in unrealized appreciation/(depreciation) on investments | | | 27,957,643 | |
| | |
|
|
|
Net realized and unrealized gain on investments | | | 157,967,925 | |
| | |
|
|
|
Net increase in net assets from operations | | $ | 195,639,584 | |
| | |
|
|
|
See Notes to Financial Statements.
10
SOUND SHORE FUND, INC.
STATEMENTS OF CHANGES IN NET ASSETS
| | | | | | | | |
| | | For the
Six Months Ended
June 30, 2014
(Unaudited)
| | | For the
Year Ended
December 31,
2013
| |
Operations: | | | | | | | | |
Net investment income | | $ | 37,671,659 | | | $ | 13,873,201 | |
Net realized gain on investments sold | | | 130,010,282 | | | | 147,889,027 | |
Net change in unrealized appreciation/(depreciation) on investments | | | 27,957,643 | | | | 455,080,961 | |
| | |
|
|
| |
|
|
|
Increase in net assets from operations | | | 195,639,584 | | | | 616,843,189 | |
| | |
|
|
| |
|
|
|
Dividends to shareholders from net investment income | | | | | | | | |
Investor Class | | | (38,492,837 | ) | | | (13,540,219 | ) |
Institutional Class | | | (8,453,311 | ) | | | (236,921 | ) |
| | |
|
|
| |
|
|
|
Total dividends to shareholders | | | (46,946,148 | ) | | | (13,777,140 | ) |
Capital share transactions (Note 6) | | | | | | | | |
Investor Class | | | (173,259,909 | ) | | | (25,899,521 | ) |
Institutional Class | | | 345,650,327 | | | | 75,419,208 | |
| | |
|
|
| |
|
|
|
Total capital share transactions | | | 172,390,418 | | | | 49,519,687 | |
| | |
|
|
| |
|
|
|
Total increase (decrease) | | | 321,083,854 | | | | 652,585,736 | |
Net assets: | | | | | | | | |
Beginning of the period | | | 2,144,010,812 | | | | 1,491,425,076 | |
| | |
|
|
| |
|
|
|
End of the period (including accumulated undistributed (distributions in excess of) net investment income of ($9,138,750) and $135,739, respectively) | | $ | 2,465,094,666 | | | $ | 2,144,010,812 | |
| | |
|
|
| |
|
|
|
See Notes to Financial Statements.
11
SOUND SHORE FUND, INC.
FINANCIAL HIGHLIGHTS
These financial highlights reflect selected data for a share outstanding throughout each period.
| | | | | | | | | | | | | | | | | | | | | | | | |
| | | Six Months
Ended
June 30, 2014
(Unaudited)
| | | Year Ended December 31,
| |
| | | 2013
| | | 2012
| | | 2011
| | | 2010
| | | 2009
| |
Investor Class Shares | | | | | | | | | | | | | | | | | | | | | | | | |
Net Asset Value, Beginning of Period | | $ | 49.05 | | | $ | 34.91 | | | $ | 29.53 | | | $ | 31.82 | | | $ | 28.58 | | | $ | 22.76 | |
| | |
|
|
| |
|
|
| |
|
|
| |
|
|
| |
|
|
| |
|
|
|
Investment Operations | | | | | | | | | | | | | | | | | | | | | | | | |
Net investment income (a) | | | 0.86 | | | | 0.32 | | | | 0.29 | | | | 0.22 | | | | 0.19 | | | | 0.22 | |
Net realized and unrealized gain (loss) on investments | | | 3.43 | | | | 14.14 | | | | 5.39 | | | | (2.18 | ) | | | 3.25 | | | | 5.82 | |
| | |
|
|
| |
|
|
| |
|
|
| |
|
|
| |
|
|
| |
|
|
|
Total from Investment Operations | | | 4.29 | | | | 14.46 | | | | 5.68 | | | | (1.96 | ) | | | 3.44 | | | | 6.04 | |
| | |
|
|
| |
|
|
| |
|
|
| |
|
|
| |
|
|
| |
|
|
|
Distributions from Net investment income | | | (1.01 | ) | | | (0.32 | ) | | | (0.30 | ) | | | (0.23 | ) | | | (0.20 | ) | | | (0.22 | ) |
Return of capital | | | — | | | | — | | | | — | | | | (0.10 | ) | | | — | | | | — | |
| | |
|
|
| |
|
|
| |
|
|
| |
|
|
| |
|
|
| |
|
|
|
Total Distributions | | | (1.01 | ) | | | (0.32 | ) | | | (0.30 | ) | | | (0.33 | ) | | | (0.20 | ) | | | (0.22 | ) |
| | |
|
|
| |
|
|
| |
|
|
| |
|
|
| |
|
|
| |
|
|
|
Net Asset Value, End of Period | | $ | 52.33 | | | $ | 49.05 | | | $ | 34.91 | | | $ | 29.53 | | | $ | 31.82 | | | $ | 28.58 | |
| | |
|
|
| |
|
|
| |
|
|
| |
|
|
| |
|
|
| |
|
|
|
Total Return (b) | | | 8.75 | % | | | 41.53 | % | | | 19.32 | % | | | (6.18 | )% | | | 12.13 | % | | | 26.64 | % |
Ratios/Supplemental Data | | | | | | | | | | | | | | | | | | | | | | | | |
Net Assets at End of Period (in thousands) | | $ | 2,021,710 | | | $ | 2,066,584 | | | $ | 1,491,425 | | | $ | 1,588,823 | | | $ | 1,927,863 | | | $ | 2,116,522 | |
Ratios to Average Net Assets: (c) | | | | | | | | | | | | | | | | | | | | | | | | |
Expenses | | | 0.92 | % | | | 0.93 | % | | | 0.94 | % | | | 0.94 | % | | | 0.94 | % | | | 0.94 | % |
Net Investment Income | | | 3.46 | % (d) | | | 0.77 | % | | | 0.89 | % | | | 0.69 | % | | | 0.66 | % | | | 0.89 | % |
Portfolio Turnover Rate (b) | | | 19 | % | | | 44 | % | | | 56 | % | | | 61 | % | | | 64 | % | | | 97 | % |
| (a) | Calculated using the average shares outstanding for the period. |
| (b) | Not annualized for periods less than one year. |
| (c) | Annualized for periods less than one year. |
| (d) | Net investment income for the period was unusually large due to the divestiture by Vodafone (one of the Fund’s portfolio holdings) of its 45% stake in Verizon Wireless in a transaction that included the payment of an extraordinary dividend of cash and shares of Verizon to Vodafone shareholders. Absent this distribution, the ratio of net investment income to average net assets would have been 0.68% for the period. |
12
SOUND SHORE FUND, INC.
FINANCIAL HIGHLIGHTS
| | | | | | | | |
| | | Six Months
Ended
June 30, 2014
(Unaudited)
| | | For the Period
December 9, 2013 to
December 31, 2013(a)
| |
Institutional Class Shares | | | | | | | | |
Net Asset Value, Beginning of Period | | $ | 49.06 | | | $ | 47.78 | |
| | |
|
|
| |
|
|
|
Investment Operations | | | | | | | | |
Net investment income (b) | | | 0.67 | | | | 0.01 | |
Net realized and unrealized gain on investments | | | 3.66 | | | | 1.42 | |
| | |
|
|
| |
|
|
|
Total from Investment Operations | | | 4.33 | | | | 1.43 | |
| | |
|
|
| |
|
|
|
Distributions from
Net investment income | | | (1.03 | ) | | | (0.15 | ) |
Total Distributions | | | (1.03 | ) | | | (0.15 | ) |
| | |
|
|
| |
|
|
|
Net Asset Value, End of Period | | $ | 52.36 | | | $ | 49.06 | |
| | |
|
|
| |
|
|
|
Total Return (c) | | | 8.84 | % | | | 3.00 | % |
Ratios/Supplemental Data | | | | | | | | |
Net Assets at End of Period (in thousands) | | $ | 443,385 | | | $ | 77,427 | |
Ratios to Average Net Assets: (d) | | | | | | | | |
Expenses (gross) (e) | | | 0.83 | % | | | 0.87 | % |
Expenses (net) | | | 0.75 | % | | | 0.75 | % |
Net Investment Income | | | 2.65 | % (g) | | | 0.45 | % |
Portfolio Turnover Rate (c)(f) | | | 19 | % | | | 44 | % |
| (a) | Commenced operations December 9, 2013. |
| (b) | Calculated using the average shares outstanding for the period. |
| (c) | Not annualized for periods less than one year. |
| (d) | Annualized for periods less than one year. |
| (e) | Reflects expense ratio in the absence of expense waiver and reimbursement. |
| (f) | Portfolio turnover rate is calculated on the basis of the Fund as a whole without distinguishing between classes of shares issued. |
| (g) | Net investment income for the period was unusually large due the divestiture by Vodafone (one of the Fund’s portfolio holdings) of its 45% stake in Verizon Wireless in a transaction that included the payment of an extraordinary dividend of cash and shares of Verizon to Vodafone shareholders. Absent this distribution, the ratio of net investment income to average net assets would have been 1.03% for the period. |
13
SOUND SHORE FUND, INC.
NOTES TO FINANCIAL STATEMENTS
JUNE 30, 2014 (Unaudited)
1. Organization
Sound Shore Fund, Inc. (the “Fund”) was incorporated under the laws of the State of Maryland on February 19, 1985 and is registered as a diversified, open-end management investment company under the Investment Company Act of 1940 (the “Act”). The investment objective of the Fund is growth of capital.
The total number of shares of common stock which the Fund is authorized to issue is 200,000,000, par value $0.001 per share of which 100,000,000 shares are designated to the Investor Class and 100,000,000 shares are designated to the Institutional Class. The Board may, without shareholder approval, classify or reclassify any unissued shares into other classes or series of shares.
Each share of the Fund has equal divided, distribution, liquidation and voting rights (except as to matters relating exclusively to one class of shares), and fractional shares have those rights proportionately.
2. Significant Accounting Policies
These financial statements are prepared in accordance with accounting principles generally accepted in the United States of America (“GAAP”), which require management to make estimates and assumptions that affect the reported amounts of assets and liabilities, disclosure of contingent liabilities, if any, at the date of the financial statements, and the reported amounts of increase and decrease in net assets from operations during the fiscal period. Actual results could differ from those estimates.
The following represent significant accounting policies of the Fund:
a. Security Valuation
Exchange-traded securities, including those traded on the National Association of Securities Dealers’ Automated Quotation system (“NASDAQ”), are valued at the last quoted sale price as provided by independent pricing services as of the close of trading on the system or exchange on which they are primarily traded, on each Fund business day. In the absence of a sale, such securities are valued at the mean of the last bid and asked prices. Non-exchange-traded securities for which over-the-counter market quotations are readily available are generally valued at the mean between the current bid and asked prices provided by independent pricing services. Investments in other open-end regulated investment companies are valued at net asset value (“NAV”).
The Fund values securities at fair value pursuant to procedures adopted by the Board of Directors if market quotations are not readily available (including a short and temporary lapse in the provision of a price by the regular pricing source) or, if in the judgment of the Adviser, the prices or values available do not represent the fair value of the instrument. Factors which may cause the Adviser to make such a judgment include, but are not limited to, the following: (i) only a bid price or an asked price is available, (ii) the spread between the bid price and the asked price is substantial, (iii) the frequency of sales, (iv) the thinness of the market, (v) the size of reported trades, and (vi) actions of the securities markets, such as the suspension or limitation of trading. Fair valuation is based on subjective factors and, as a result, the fair value price of an asset may differ from the asset’s market price and may not be the price at
14
SOUND SHORE FUND, INC.
NOTES TO FINANCIAL STATEMENTS
JUNE 30, 2014 (Unaudited) (Continued)
which the asset may be sold. Fair valuation could result in a NAV different from one determined by using market quotations.
Valuation inputs used to determine the value of the Fund’s investments are summarized in the three broad levels listed below:
Level 1 – quoted prices in active markets for identical assets
Level 2 – other significant observable inputs (including quoted prices of similar securities, interest rates, prepayment speeds, credit risk, etc.)
Level 3 – significant unobservable inputs (including the Fund’s own assumptions in determining the fair value of investments)
The inputs or methodology used for valuing securities are not necessarily an indication of the risk associated with investing in those securities.
Pursuant to the valuation procedures noted previously, equity securities (including exchange-traded securities and other open-end regulated investment companies) are generally categorized as Level 1 securities in the fair value hierarchy. Investments for which there are no quotations, or for which quotations do not appear reliable, are valued at fair value as determined in good faith by the Pricing Committee under the direction of the Board. These valuations are typically categorized as Level 2 or Level 3 in the fair value hierarchy.
The following table summarizes the Fund’s investments categorized in the fair value hierarchy as of June 30, 2014:
| | | | | | | | | | | | | | | | |
Security Type
| | Level 1
| | | Level 2
| | | Level 3
| | | Total
Investments
in Securities
| |
Common Stocks | | $ | 2,363,587,896 | | | $ | — | | | $ | — | | | $ | 2,363,587,896 | |
Short-Term Investments | | $ | 78,260,007 | | | $ | — | | | $ | — | | | $ | 78,260,007 | |
| | |
|
|
| |
|
|
| |
|
|
| |
|
|
|
Total Investments | | $ | 2,441,847,903 | | | $ | — | | | $ | — | | | $ | 2,441,847,903 | |
| | |
|
|
| |
|
|
| |
|
|
| |
|
|
|
At June 30, 2014, all equity securities and open-end mutual funds were included in Level 1 in the table above. Please refer to the Schedule of Investments to view equity securities categorized by industry type.
The Fund’s policy is to disclose transfers between Levels based on valuations at the end of the reporting period. There were no transfers between Levels as of June 30, 2014, based on the valuation input Levels on December 31, 2013.
b. Security Transactions, Investment Income and Expenses
Security transactions are recorded on a trade date basis. Realized gain and loss on investments sold are recorded on the basis of identified cost. Dividend income is recorded on the ex-dividend date. Interest income is recorded on an accrual basis. Foreign dividend income is recorded on the ex-dividend date or as soon as practicable after the Fund determines the existence of a dividend declaration after exercising reasonable due diligence. Income and capital
15
SOUND SHORE FUND, INC.
NOTES TO FINANCIAL STATEMENTS
JUNE 30, 2014 (Unaudited) (Continued)
gains on some foreign securities may be subject to foreign withholding tax, which is accrued as applicable. Investment income, realized and unrealized gains and losses and certain Fund-level expenses are allocated to each class based on relative average daily net assets. Certain expenses are incurred at the class level and charged directly to that particular class. Class level expenses are denoted as such on the Fund’s Statement of Operations.
c. Dividends to Shareholders
Dividends are declared separately for each class. No class has preferential dividend rights; differences in per-share dividend rates are generally due to class-specific fee waivers and expenses. Dividends and distributions payable to shareholders are recorded by the Fund on the ex-dividend date. Dividends from net investment income, if any, are declared and paid semiannually. Capital gains, if any, are distributed to shareholders at least annually. The Fund determines its net investment income and capital gains distributions in accordance with income tax regulations, which may differ from GAAP. These differences are due primarily to differing treatments of income and gains on various investment securities held by the Fund, timing differences and differing characterizations of distributions made by the Fund.
d. Federal Taxes
The Fund intends to qualify each year as a regulated investment company and to distribute substantially all of its taxable income. In addition, by distributing in each calendar year substantially all of its net investment income, capital gain and certain other amounts, if any, the Fund will not be subject to federal taxation. Therefore, no federal income or excise tax provision is required. For all open tax years and all major taxing jurisdictions, management of the Fund has concluded that there are no significant uncertain tax positions that would require recognition in the financial statements. Open tax years are those that are open for examination by taxing authorities (i.e., generally, the last three tax year-ends 2011-2013, and the interim tax period since then).
3. Investment Advisory and Other Services
Investment Adviser
The Fund’s investment adviser is Sound Shore Management, Inc. (the “Adviser”). Pursuant to an investment advisory agreement, the Adviser receives an advisory fee, accrued daily and paid monthly at an annual rate of 0.75% of the Fund’s average daily net assets. Pursuant to an expense limitation agreement between the Adviser and the Fund, the Adviser has agreed to reimburse all of the ordinary expenses of the Institutional Class, excluding its advisory fees, interest, taxes, securities lending costs, brokerage commissions, acquired fund fees and expenses, extraordinary expenses and all litigation costs until at least May 1, 2015. This reimbursement is shown on the Statement of Operations as a reduction of expenses.
Other Services
Citi Fund Services Ohio, Inc. (“Citi”) provides certain administration, portfolio accounting, and transfer agency services to the Fund.
16
SOUND SHORE FUND, INC.
NOTES TO FINANCIAL STATEMENTS
JUNE 30, 2014 (Unaudited) (Continued)
The Fund also has agreements with various financial intermediaries and “mutual fund supermarkets” under which customers of these intermediaries may purchase and hold Fund shares. These intermediaries effectively provide sub-transfer agent services that the Fund transfer agent would have otherwise had to provide. In recognition of this, the transfer agent, the Fund and the Fund’s Adviser have entered into an agreement whereby the transfer agent agrees to pay financial intermediaries a portion of the amount denoted on the Statement of Operations as “Transfer agent fees and expenses - Investor Class Shares” that it receives from the Fund for its services as transfer agent for the Investor Class and the Adviser agrees to pay the excess, if any, charged by a financial intermediary for that class.
Foreside Fund Services, LLC is the Fund’s distributor (the “Distributor”). The Distributor is not affiliated with the Adviser, Citi, or its affiliated companies. The Distributor receives no compensation from the Fund for its distribution services.
Pursuant to a Compliance Services Agreement with the Fund, Foreside Compliance Services, LLC (“FCS”), an affiliate of the Distributor, provides a Chief Compliance Officer and Anti-Money Laundering Officer to the Fund as well as some additional compliance support functions. Under a Treasurer Services Agreement with the Fund, Foreside Management Services, LLC (“FMS”), an affiliate of the Distributor, provides a Treasurer to the Fund. Neither the Distributor, FCS, FMS, nor their employees that serve as officers of the Fund, have any role in determining the investment policies of or securities to be purchased or sold by the Fund.
The Fund pays each director who is not an “interested person” of the Fund, as defined in Section 2(a)(19) of the Act (“Independent Director”), quarterly fees of $2,500, plus $10,000 per quarterly in-person meeting, $4,000 per quarterly meeting attended telephonically, and $2,000 per special meeting attended in person or telephonically. In addition, the Chairman of the Audit Committee receives a quarterly fee of $1,250.
Certain Officers and Directors of the Fund are officers, directors, or employees of the aforementioned companies.
4. Purchases and Sales of Securities
The cost of securities purchased and the proceeds from sales of securities (excluding short-term investments) for the period ending June 30, 2014 aggregated $505,431,645 and $421,030,169, respectively.
5. Federal Income Tax and Investment Transactions
Distributions during the fiscal years ending as noted were characterized for tax purposes as follows:
| | | | | | | | |
| | | December 31,
2013
| | | December 31,
2012
| |
Ordinary Income | | $ | 13,777,140 | | | $ | 13,720,813 | |
Long-Term Capital Gains | | | — | | | | — | |
| | |
|
|
| |
|
|
|
Total Taxable Distributions | | | 13,777,140 | | | | 13,720,813 | |
Return of Capital | | | — | | | | — | |
| | |
|
|
| |
|
|
|
Total Distributions Paid | | $ | 13,777,140 | | | $ | 13,720,813 | |
| | |
|
|
| |
|
|
|
17
SOUND SHORE FUND, INC.
NOTES TO FINANCIAL STATEMENTS
JUNE 30, 2014 (Unaudited) (Continued)
Components of capital on a federal income tax basis at December 31, 2013, were as follows:
| | | | |
Par Value + Paid-in Capital | | $ | 1,467,108,553 | |
Undistributed Ordinary Income | | | 135,739 | |
Capital Loss Carryforwards | | | (13,460,322 | ) |
Net Unrealized Appreciation | | | 690,226,842 | |
| | |
|
|
|
| | | $ | 2,144,010,812 | |
At December 31, 2013, the Fund, for federal income tax purposes, had capital loss carryforwards which expire (pre-effective capital loss carryforwards) as set forth in the table below. These amounts may be applied against future net realized gains until the earlier of their utilization or expiration.
Capital loss carryforwards subject to expiration:
| | |
Expires tax year ending
| | Capital loss carryforwards
|
2017 | | $13,460,322 |
Under the Regulated Investment Company Modernization Act of 2010, capital losses incurred by the Fund after December 31, 2010 will not be subject to expiration (post-effective capital loss carryforwards). In addition, post-effective capital loss carryforwards must be utilized prior to the utilization of pre-effective capital loss carryforwards. At December 31, 2013, the Fund had no post-effective capital loss carryforwards.
6. Capital Stock
Transactions in capital stock for the periods ending June 30, 2014 and December 31, 2013 were as follows:
| | | | | | | | | | | | | | | | |
| | | For the Six Months Ending June 30, 2014
| |
| | | Investor Class | | | Institutional Class | |
| | | Shares
| | | Amount
| | | Shares
| | | Amount
| |
Sale of shares | | | 4,917,020 | | | $ | 246,225,233 | | | | 6,979,599 | | | $ | 350,093,805 | |
Reinvestment of dividends | | | 706,591 | | | | 36,891,096 | | | | 161,712 | | | | 8,447,854 | |
Redemption of shares | | | (9,119,669 | ) | | | (456,376,238 | ) | | | (251,713 | ) | | | (12,891,332 | ) |
| | |
|
|
| |
|
|
| |
|
|
| |
|
|
|
Net increase (decrease) from capital transactions | | | (3,496,058 | ) | | $ | (173,259,909 | ) | | | 6,889,598 | | | $ | 345,650,327 | |
| | |
|
|
| |
|
|
| |
|
|
| |
|
|
|
18
SOUND SHORE FUND, INC.
NOTES TO FINANCIAL STATEMENTS
JUNE 30, 2014 (Unaudited) (Concluded)
| | | | | | | | | | | | | | | | |
| | | For the Year Ending December 31, 2013
| |
| | | Investor Class | | | Institutional Class (a) | |
| | | Shares
| | | Amount
| | | Shares
| | | Amount
| |
Sale of shares | | | 10,434,656 | | | $ | 440,596,089 | | | | 1,575,491 | | | $ | 75,280,682 | |
Reinvestment of dividends | | | 295,203 | | | | 13,018,686 | | | | 4,855 | | | | 236,921 | |
Redemption of shares | | | (11,315,549 | ) | | | (479,514,296 | ) | | | (2,038 | ) | | | (98,395 | ) |
| | |
|
|
| |
|
|
| |
|
|
| |
|
|
|
Net increase (decrease) from capital transactions | | | (585,690 | ) | | $ | (25,899,521 | ) | | | 1,578,308 | | | $ | 75,419,208 | |
| | |
|
|
| |
|
|
| |
|
|
| |
|
|
|
| (a) | Commenced operations December 9, 2013. |
As of June 30, 2014, the Employees’ Profit Sharing Plan of the Adviser owned 645,972 Institutional Class shares which represented 1.37% of the Fund’s Net Assets.
7. Other Information
On June 30, 2014, two entities, Charles Schwab & Co. Inc. and National Financial Services LLC, held of record in omnibus accounts approximately 62% of the outstanding shares of the Fund on behalf of numerous investors.
8. Subsequent Events
Subsequent events occurring after the date of this report have been evaluated for potential impact to this report through the date the report was issued.
19
SOUND SHORE FUND, INC.
JUNE 30, 2014 (Unaudited)
Shareholder Expense Example
As a shareholder of the Fund, you incur ongoing costs, including management fees and other Fund expenses. This example is intended to help you understand your ongoing costs (in dollars) of investing in the Fund and to compare these costs with the ongoing costs of investing in other mutual funds.
The following example is based on $1,000 invested at the beginning of the period and held for the entire period from January 1, 2014 through June 30, 2014.
Actual Expenses - The Actual Return lines of the table below provide information about actual account values and actual expenses for each share class. You may use the information in these lines, together with the amount you invested, to estimate the expenses that you paid over the period. Simply divide your account value by $1,000 (for example, an $8,600 account value divided by $1,000 = 8.6), then multiply the result by the number in the Actual Return line under the heading entitled “Expenses Paid During Period” to estimate the expenses you paid on your account during this period.
Hypothetical Example for Comparison Purposes - The Hypothetical Return lines of the table below provide information about hypothetical account values and hypothetical expenses based on each class’ actual expense ratio and an assumed rate of return of 5% per year before expenses, which is not the Fund’s actual return. The hypothetical account values and expenses may not be used to estimate the actual ending account balance or expenses you paid for the period. You may use this information to compare the ongoing cost of investing in the Fund and other funds. To do so, compare this 5% hypothetical example with the 5% hypothetical examples that appear in the shareholder reports of other funds.
Expenses shown in the table are meant to highlight your ongoing costs only and do not reflect any transactional costs. Therefore, the Hypothetical Return lines of the table are useful in comparing ongoing costs only, and will not help you determine the relative total costs of owning different funds.
| | | | | | | | | | | | |
| | | Beginning
Account Value
January 1, 2014
| | | Ending
Account Value
June 30, 2014
| | | Expenses Paid
During Period*
| |
Investor Class Actual Return | | $ | 1,000.00 | | | $ | 1,087.50 | | | $ | 4.76 | |
Investor Class Hypothetical Return | | $ | 1,000.00 | | | $ | 1,020.23 | | | $ | 4.61 | |
Institutional Class Actual Return | | $ | 1,000.00 | | | $ | 1,088.40 | | | $ | 3.88 | |
Institutional Class Hypothetical Return | | $ | 1,000.00 | | | $ | 1,021.08 | | | $ | 3.76 | |
| * | Expenses are equal to the Investor Class’ and Institutional Class’ annualized expense ratios of 0.92% and 0.75%, respectively , multiplied by the average account value over the period, multiplied by 181/365 to reflect the most recent one-half year period. |
20
SOUND SHORE FUND, INC.
JUNE 30, 2014
Investment Advisory Agreement Approval
The Directors of the Fund approved continuance of the Investment Advisory Agreement at a meeting held on January 29, 2014. In advance of that meeting, the Independent Directors met separately with their independent counsel to discuss consideration of the Investment Advisory Agreement. In this separate meeting, they took into account their historical and ongoing knowledge of the Fund and the Adviser and reviewed the Board materials they had received in light of the relevant factors set forth in judicial precedent. In particular, they reviewed the generally strong performance record of the Fund as measured against relevant benchmarks, as well as the fee and expense comparisons described in more detail below. Their consideration of Fund expenses focused on the expenses of the Investor class, since the Institutional class had not commenced operations until December 2013. They discussed the fact that the Fund’s expenses and advisory fee were below 1.00% (0.932% for expenses and 0.750% for the contractual advisory fee) and were below the top of the range for the comparison groups discussed below. They also recognized that, as in prior years, some factors, such as economies of scale and fall out benefits, were not applicable given the size of the Fund and the nature of the Adviser’s operations. The Independent Directors expressed their continuing confidence in management and their ability to ask questions of management to get the information necessary in considering approval of the Investment Advisory Agreement.
At the Board meeting, the Independent Directors and the full Board reviewed and discussed with senior management of the Adviser and counsel the written materials provided to them. These materials included the terms of the Investment Advisory Agreement; a memorandum from Fund counsel describing legal considerations relevant to approval of the Advisory Agreement; and the long, mid and short term performance of the Fund as measured against relevant benchmarks, as well as revenue received by the Adviser from the Fund, costs incurred by the Adviser in connection with the advisory services it renders to the Fund and profitability data and other Adviser financial information provided at the meeting.
The materials also included analyses comparing advisory and certain other fees and total expenses borne by the Fund to approximately 70 mutual funds included in an independently selected universe of no-load U.S. diversified equity funds with no 12b-1 or non-12b-1 fees and with assets of $1 billion to $3 billion and summary information comparing the Fund’s total expenses and fees to the funds in this universe, as well as to a selected subset of this universe consisting of 12 funds in small fund families (under 10 funds). The Independent Directors recognized that the Fund’s total expense ratio and contractual advisory fee rate were higher than the average total expense ratios and contractual advisory fee rates of the broader comparison universe and the subset of funds in small fund families. However, the Independent Directors did not consider either comparison group to be entirely apt since the Fund is a stand-alone fund and the funds in both comparison groups are part of fund families. Of the two comparison groups, they viewed the subset of funds in small fund families as somewhat more comparable and noted that the Fund’s expense ratio and its advisory fee ranked fourth and fifth, respectively, in that subset of 12 funds. The Independent Directors observed that there were many data points to be taken into account in addition to fee and expense comparisons, including the quality of service provided by the Adviser. The Fund’s performance record was considered as indicative of the consistent high quality of service provided by the Adviser over time. The Fund’s one-year
21
SOUND SHORE FUND, INC.
JUNE 30, 2014
performance had been strong, and its performance over the mid and longer-term had generally been favorable as well, with a 25-year average annual return of 11.06%.
Additional information included in the material provided to the Directors addressed fees paid by the Adviser’s institutional clients. The Directors, including the Independent Directors, recognized that while the fees charged by the Adviser to private accounts are lower than those charged to the Fund, the nature of the private accounts and the services provided to them are different from the Fund.
After discussion, the Independent Directors in particular noted their favorable impression of the Adviser’s management and other personnel and of its operational efficiency and economy. They also recognized that the Fund had demonstrated strong performance over time and that its contractual advisory fee of 0.75% and expense ratio of 0.932% provided Fund shareholders with good value. While the Directors, including the Independent Directors, did not identify any single factor as controlling, after considering all the factors, they resolved unanimously to approve continuance of the Investment Advisory Agreement as in the best interests of the Fund and its shareholders.
Proxy Voting Information
A description of the policies and procedures that the Fund uses to determine how to vote proxies relating to securities held in the Fund’s portfolio is available, without charge and upon request, by calling (800) 551-1980 or by visiting the Fund’s web site at http://www.soundshorefund.com. This information is also available on the SEC’s web site at http://www.sec.gov under the name of the Sound Shore Fund.
The Fund’s proxy voting record for the most recent 12-month period ending June 30 is available, without charge and upon request, by calling (800) 551-1980 or by visiting the Fund’s web site at http://www.soundshorefund.com. This information is available on the SEC’s web site at http://www.sec.gov under the name of the Sound Shore Fund.
Availability of Quarterly Portfolio Schedule
The Fund files its complete schedule of portfolio holdings with the SEC for the first and third quarters of each fiscal year on Form N-Q. This information is available on the SEC’s web site at http://www.sec.gov under the name of the Sound Shore Fund. It may be reviewed and copied at the SEC’s Public Reference Room in Washington, DC. Information on the operation of the Public Reference Room may be obtained by calling (800) SEC-0330.
22

Investment Adviser
Sound Shore Management, Inc.
Greenwich, Connecticut
Administrator
Citi Fund Services Ohio, Inc.
Columbus, Ohio
Distributor
Foreside Fund Services, LLC
Portland, Maine
www.foreside.com
Transfer and
Distribution Paying Agent
Citi Fund Services Ohio, Inc.
Columbus, Ohio
Custodian
Citibank, N.A.
New York, New York
Fund Counsel
Dechert LLP
New York, New York
Independent Registered
Public Accounting Firm
Deloitte & Touche LLP
New York, New York
107-SAR-0614
This report is submitted for the general information of the shareholders of the Fund. It is not authorized for distribution to prospective investors in the Fund unless preceded or accompanied by an effective prospectus, which includes information regarding the Fund’s objectives and policies, experience of its management and other information.
SOUND SHORE FUND, INC.
3435 Stelzer Road
Columbus, OH 43219
http://www.soundshorefund.com
(800) 551-1980
Semi-Annual Report
(Unaudited)
JUNE 30, 2014


Item 2. Code of Ethics.
Not applicable.
Item 3. Audit Committee Financial Expert.
Not applicable.
Item 4. Principal Accountant Fees and Services.
Not applicable.
Item 5. Audit Committee of Listed Registrants.
Not applicable.
Item 6. Schedule of Investments.
| (a) | Included as part of the report to stockholders under Item 1. |
Item 7. Disclosure of Proxy Voting Policies and Procedures for Closed-End Management Investment Companies.
Not applicable.
Item 8. Portfolio Managers of Closed-End Management Investment Companies.
Not applicable.
Item 9. Purchases of Equity Securities by Closed-End Management Investment Company and Affiliated Purchasers.
Not applicable.
Item 10. Submission of Matters to a Vote of Security Holders.
Not applicable.
Item 11. Controls and Procedures.
(a) The registrant’s principal executive officer and principal financial officer concluded that the registrant’s disclosure controls and procedures (as defined in Rule 30a-3(c) under the Investment Company Act of 1940 (the “Act”)) were effective as of a date within 90 days of the filing date of this report (the “Evaluation Date”) based on their evaluation of the registrant’s disclosure controls and procedures as of the Evaluation Date.
(b) There were no changes in the registrant’s internal control over financial reporting (as defined in Rule 30a-3(d) under the Act) that occurred during the second fiscal quarter of the period covered by this report that have materially affected, or are reasonably likely to materially affect, the registrant’s internal control over financial reporting.
Item 12. Exhibits.
(a)(1) Not applicable.
(a)(2) Certifications pursuant to Rule 30a-2(a) of the Investment Company Act of 1940 as amended, and Section 302 of the Sarbanes-Oxley Act of 2002 (Exhibit filed herewith).
(a)(3) Not applicable.
(b) Certifications pursuant to Rule 30a-2(b) of the Investment Company Act of 1940, as amended, and Section 906 of the Sarbanes-Oxley Act of 2002 (Exhibit filed herewith).
SIGNATURES
Pursuant to the requirements of the Securities Exchange Act of 1934 and the Investment Company Act of 1940, the registrant has duly caused this report to be signed on its behalf by the undersigned, thereunto duly authorized.
| | |
| Registrant | | Sound Shore Fund, Inc. |
| | |
| By (Signature and Title) | | /s/ T. Gibbs Kane, Jr. |
| | T. Gibbs Kane, Jr., President |
Pursuant to the requirements of the Securities Exchange Act of 1934 and the Investment Company Act of 1940, this report has been signed below by the following persons on behalf of the registrant and in the capacities and on the dates indicated.
| | |
| By (Signature and Title) | | /s/ T. Gibbs Kane, Jr. |
| | T. Gibbs Kane, Jr., President |
| | |
| By (Signature and Title) | | /s/ Charles S. Todd |
| | Charles S. Todd, Treasurer |