UNITED STATES
SECURITIES AND EXCHANGE COMMISSION
Washington, D.C. 20549
FORM N-CSR
CERTIFIED SHAREHOLDER REPORT OF REGISTERED
MANAGEMENT INVESTMENT COMPANIES
Investment Company Act file number 811-04244
SOUND SHORE FUND, INC.
(Exact name of registrant as specified in charter)
3435 Stelzer Road
Columbus, OH 43219
(Address of principal executive offices) (Zip Code)
T. Gibbs Kane, Jr., President
8 Sound Shore Drive
Greenwich, CT 06830
(Name and address of agent for service)
Registrant’s telephone number, including area code: (800) 551-1980
Date of fiscal year end: December 31
Date of reporting period: June 30, 2015
Item 1. Reports to Stockholders.

3435 STELZER ROAD, COLUMBUS, OH 43219 1-800-551-1980
June 30, 2015
Dear Investor:
The Sound Shore Fund Investor Class (ticker SSHFX) ended June 30, 2015 with a net asset value of $48.83 per share, after an income distribution of $0.248570 on June 18th. The second quarter total return was -0.32% versus the Standard & Poor’s 500 Index (“S&P 500”) and Dow Jones Industrial Average (“Dow Jones”), which returned 0.28% and -0.29%, respectively. Year to date, the Fund has gained 0.58% versus 1.23% for the S&P 500 and 0.03% for the Dow Jones.
We are required by the SEC to say that: Performance data quoted represents past performance and is no guarantee of future results. Current performance may be lower or higher than the performance data quoted. Investment return and principal value will fluctuate so that an investor’s shares, when redeemed, may be worth more or less than original cost. The Fund’s Investor Class 1, 5, 10, and 15-year average annual total returns for the period ended June 30, 2015 were 3.35%, 17.00%, 7.73%, and 8.12%, respectively. As stated in the current prospectus, the Fund’s Investor Class total annual operating expense ratio (gross) is 0.92%. For the most recent month-end performance, please visit the Fund’s website at www.soundshorefund.com.
The broad equity indices were little changed in the second quarter of 2015, as investors balanced sturdy corporate earnings reports with global economic concerns related to Greece, China, and Brazil. The apparent calm at the markets’ surface, however, belied a reasonable amount of movement underneath. For example, interest rates rose more than forecast during the period which contributed to strong performing financial stocks and lagging “bond proxies” in utilities and staples. Similarly, global GDP worries drove investors further into health care stocks and away from energy names, extending longer term trends for both.
Sound Shore’s value driven investment process seeks out-of-favor stocks where managements are positioned to add value in a full range of macro scenarios. Our investment in global industrial leader General Electric, a strong second quarter contributor that also bucked the declining trend in its sector, provides a useful example. We invested in GE when its shares were valued below norm at 13 times forward earnings due to concerns about its finance segment and the integration of recent acquisitions. Through our research, we concluded that GE’s sum of the parts valuation was higher than its stock price implied at the time, and also that management had a long-term plan for unlocking that value. During the second quarter, this process continued with GE’s announcement to sell the bulk of its finance segment, which will allow the company greater focus on its profitable and growing core industrial and health care businesses.
Likewise, our holding in regional bank Citizens Financial outperformed both the market and its financial peers in the quarter, substantially driven by internal improvements. We initiated our Citizen’s
1
position last summer when the company was being spun out of Royal Bank of Scotland with a below market P/E ratio and for less than book value. We viewed new management’s targets for asset growth, expense control, and higher returns on equity as achievable and not reflected in the company’s 40% discount to peer regional bank valuations at the time. Leveraging its market leading positions in New England and the Midwest, Citizens has steadily executed and narrowed the valuation gap, though it remains valued below norm at 0.8 times book.
Meanwhile, global economic concerns held back semiconductor maker Texas Instruments, a long term Sound Shore holding. Among analog chip firms, Texas has successfully established itself as a “new industrial,” with its products designed into long duration manufacturing platforms such as autos and aerospace. As well, Texas’ management is focused on return on capital and free cash, and the company has repurchased 28% of its shares outstanding in the last 5 years. We believe Texas’ 7% free cash yield and below norm 9 times enterprise value to EBITDA multiple make for a compelling risk/reward profile.
Industrial packaging leader International Paper also declined in the quarter due to news that its containerboard mills would not qualify for MLP treatment under revised IRS guidelines. We view the decision as a transitory factor and consider IP attractively valued at 12 times forward earnings with a 9% free cash yield.
Our contrarian investment process is turning up a normal flow of company-specific opportunities, despite plenty of market skepticism. While the debate about above average corporate profit margins continues, we believe that well below norm capital spending versus history suggests many corporate management teams remain level-headed about balancing growth and shareholder yield opportunities. This backdrop combined with the S&P 500’s fairly typical 16.2 times forward P/E multiple should continue to prove a productive environment for Sound Shore’s research.
Thank you for your investment alongside ours in Sound Shore.
Sincerely,
SOUND SHORE FUND
Harry Burn, III
John P. DeGulis
T. Gibbs Kane, Jr.
Co-Portfolio Managers
2
Important Information
Fund returns assume the reinvestment of all dividend and capital gain distributions. The Standard & Poor’s 500 Index is an unmanaged index representing the average performance of 500 widely held, publicly traded, large capitalization stocks. The Dow Jones Industrial Average consists of 30 stocks that are considered to be major factors in their industries and that are widely held by individuals and institutional investors. It is not possible to invest directly in an Index or Average.
Short-term performance, in particular, is not a good indication of the Fund’s future performance, and an investment should not be made based solely on returns. Because of ongoing market volatility, Fund performance may be subject to substantial short-term changes.
The price-to-earnings (P/E) of an index is the total price of the index divided by its total earnings. Book value is the total assets of a company minus total liability. Free cash flow is the amount of cash left over after the company has paid all its expenses and what was spent for reinvesting into the company (capital expenditures). Texas Instruments and IP’s free cash flow yield are not representative of Fund yield. Enterprise value is the calculation of the overall current value of a business, similar to a balance sheet. EBITDA is used to analyze a company’s operating profitability before non-operating expenses
This letter may contain discussions about certain investments both held and not held in the portfolio. As required by the Financial Industry Regulatory Authority (FINRA), we must remind you that current and future portfolio holdings are subject to risk.
An investment in the Fund is subject to risk, including the possible loss of principal amount invested. Mid Cap Risk: Securities of medium sized companies may be more volatile and more difficult to liquidate during market downturns than securities of large, more widely traded companies. Foreign Securities Risk: The Fund may invest in foreign securities primarily in the form of American Depositary Receipts. Investing in the securities of foreign issuers also involves certain special risks, which are not typically associated with investing in U.S. dollar-denominated securities or quoted securities of U.S. issuers including increased risks of adverse issuer, political, regulatory, market or economic developments. Investments in foreign securities also may be affected favorably or unfavorably by changes in currency rates and in exchange control regulations.
The views in this letter were those of the Fund managers as of 6/30/15 and may not necessarily reflect their views on the date this letter is first published or anytime thereafter. These views (i) are intended to assist shareholders in understanding the Fund’s present investment methodology and (ii) do not constitute investment advice.
3
SOUND SHORE FUND, INC.
SCHEDULE OF INVESTMENTS
JUNE 30, 2015 (Unaudited)
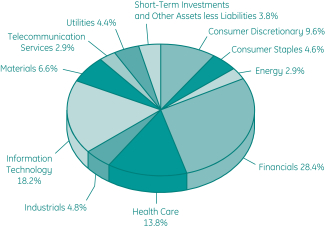
Sector Weightings (as of June 30, 2015)
as a percentage of Net Assets (Unaudited)
| | | | | | | | |
| | | Share
Amount
| | | Market
Value
| |
Common Stocks (96.2%) | | | | | | | | |
Consumer Discretionary (9.6%) | | | | | | | | |
CBS Corp., Class B | | | 1,043,800 | | | $ | 57,930,900 | |
Comcast Corp., Class A | | | 993,400 | | | | 59,743,076 | |
Lowe’s Cos., Inc. | | | 683,800 | | | | 45,794,086 | |
Time Warner, Inc. | | | 712,300 | | | | 62,262,143 | |
| | | | | | |
|
|
|
| | | | | | | | 225,730,205 | |
| | | | | | |
|
|
|
Consumer Staples (4.6%) | | | | | | | | |
CVS Health Corp. | | | 480,100 | | | | 50,352,888 | |
Procter & Gamble Co. | | | 726,800 | | | | 56,864,832 | |
| | | | | | |
|
|
|
| | | | | | | | 107,217,720 | |
| | | | | | |
|
|
|
Energy (2.9%) | | | | | | | | |
BP PLC ADR | | | 1,674,600 | | | | 66,917,016 | |
| | | | | | |
|
|
|
| | | | | | | | | |
Financials (28.4%) | | | | | | | | |
American International Group, Inc. | | | 1,103,900 | | | | 68,243,098 | |
See Notes to Financial Statements.
4
SOUND SHORE FUND, INC.
SCHEDULE OF INVESTMENTS (Continued)
JUNE 30, 2015 (Unaudited)
| | | | | | | | |
| | | Share
Amount
| | | Market
Value
| |
Financials (Continued) | | | | | | | | |
Aon PLC | | | 652,000 | | | $ | 64,991,360 | |
Bank of America Corp. | | | 4,298,900 | | | | 73,167,278 | |
Capital One Financial Corp. | | | 826,000 | | | | 72,663,220 | |
CIT Group, Inc. | | | 1,572,800 | | | | 73,119,472 | |
Citigroup, Inc. | | | 1,278,000 | | | | 70,596,720 | |
Citizens Financial Group, Inc. | | | 2,189,800 | | | | 59,803,438 | |
Invesco, Ltd. | | | 1,548,100 | | | | 58,038,269 | |
Marsh & McLennan Cos., Inc. | | | 1,012,300 | | | | 57,397,410 | |
Realogy Holdings Corp. † | | | 1,427,600 | | | | 66,697,472 | |
| | | | | | |
|
|
|
| | | | | | | | 664,717,737 | |
| | | | | | |
|
|
|
Health Care (13.8%) | | | | | | | | |
Agilent Technologies, Inc. | | | 1,342,400 | | | | 51,789,792 | |
Anthem, Inc. | | | 360,200 | | | | 59,123,228 | |
Merck & Co., Inc. | | | 1,320,900 | | | | 75,198,837 | |
Sanofi SA ADR | | | 1,356,500 | | | | 67,187,445 | |
Thermo Fisher Scientific, Inc. | | | 538,800 | | | | 69,914,688 | |
| | | | | | |
|
|
|
| | | | | | | | 323,213,990 | |
| | | | | | |
|
|
|
Industrials (4.8%) | | | | | | | | |
Aercap Holdings NV † | | | 1,160,600 | | | | 53,143,874 | |
General Electric Co. | | | 2,188,800 | | | | 58,156,416 | |
| | | | | | |
|
|
|
| | | | | | | | 111,300,290 | |
| | | | | | |
|
|
|
Information Technology (18.2%) | | | | | | | | |
Applied Materials, Inc. | | | 3,382,300 | | | | 65,007,806 | |
Flextronics International, Ltd. † | | | 5,408,100 | | | | 61,165,611 | |
Google, Inc., Class A † | | | 71,600 | | | | 38,666,864 | |
Google, Inc., Class C † | | | 53,247 | | | | 27,715,596 | |
Keysight Technologies, Inc. † | | | 1,622,000 | | | | 50,590,180 | |
Oracle Corp. | | | 1,799,600 | | | | 72,523,880 | |
Qualcomm, Inc. | | | 793,800 | | | | 49,715,694 | |
Texas Instruments, Inc. | | | 1,198,500 | | | | 61,734,735 | |
| | | | | | |
|
|
|
| | | | | | | | 427,120,366 | |
| | | | | | |
|
|
|
See Notes to Financial Statements.
5
SOUND SHORE FUND, INC.
SCHEDULE OF INVESTMENTS (Concluded)
JUNE 30, 2015 (Unaudited)
| | | | | | | | |
| | | Share
Amount
| | | Market
Value
| |
Materials (6.6%) | | | | | | | | |
International Paper Co. | | | 1,303,000 | | | $ | 62,009,770 | |
Owens-Illinois, Inc. † | | | 2,236,200 | | | | 51,298,428 | |
Reliance Steel & Aluminum Co. | | | 697,900 | | | | 42,208,992 | |
| | | | | | |
|
|
|
| | | | | | | | 155,517,190 | |
| | | | | | |
|
|
|
Telecommunication Services (2.9%) | | | | | | | | |
Vodafone Group PLC — ADR | | | 1,894,700 | | | | 69,061,815 | |
| | | | | | |
|
|
|
| | | | | | | | | |
Utilities (4.4%) | | | | | | | | |
AES Corp. | | | 4,423,300 | | | | 58,652,958 | |
Exelon Corp. | | | 1,433,300 | | | | 45,034,286 | |
| | | | | | |
|
|
|
| | | | | | | | 103,687,244 | |
| | | | | | |
|
|
|
Total Common Stocks (cost $1,723,279,666) | | | | | | $ | 2,254,483,573 | |
| | | | | | |
|
|
|
| | | | | | | | | |
Short-Term Investments (2.7%) | | | | | | | | |
Money Market Fund (2.7%) | | | | | | | | |
Western Asset Institutional U.S. Treasury Fund, 0.02% (a) | | | 63,712,715 | | | $ | 63,712,715 | |
| | | | | | |
|
|
|
Total Money Markets (cost $63,712,715) | | | | | | $ | 63,712,715 | |
| | | | | | |
|
|
|
Total Investments (98.9%) (cost $1,786,992,381) * | | | | | | $ | 2,318,196,288 | |
Other Assets less Liabilities (1.1%) | | | | | | | 24,751,312 | |
| | | | | | |
|
|
|
Net Assets (100.0%) | | | | | | $ | 2,342,947,600 | |
| | | | | | |
|
|
|
| † | Non-income producing security |
| (a) | Rate disclosed is as of June 30, 2015. |
ADR — American Depositary Receipt
PLC — Public Limited Company
| * | Cost for federal income tax purposes is substantially the same as for financial statement purposes and net unrealized appreciation consists of: |
| | | | |
Gross Unrealized Appreciation | | $ | 572,286,885 | |
Gross Unrealized Depreciation | | | (41,082,978 | ) |
| | |
|
|
|
Net Unrealized Appreciation | | $ | 531,203,907 | |
| | |
|
|
|
See Notes to Financial Statements.
6
SOUND SHORE FUND, INC.
STATEMENT OF ASSETS AND LIABILITIES
JUNE 30, 2015 (Unaudited)
| | | | |
| ASSETS | | | | |
Investments, at value (Cost $1,786,992,381) | | $ | 2,318,196,288 | |
Receivables: | | | | |
Investments sold | | | 23,335,755 | |
Capital shares sold | | | 1,245,332 | |
Dividends | | | 3,995,587 | |
Prepaid expenses | | | 26,839 | |
| | |
|
|
|
Total Assets | | | 2,346,799,801 | |
| | |
|
|
|
| |
| LIABILITIES | | | | |
Payables: | | | | |
Capital shares redeemed | | | 2,038,354 | |
Accrued liabilities: | | | | |
Advisory fees | | | 1,455,789 | |
Administrator fees | | | 55,800 | |
Transfer agent fees and expenses | | | 190,970 | |
Custodian fees | | | 34,571 | |
Compliance and Treasurer Services fees | | | 29,049 | |
Professional fees | | | 42,203 | |
Other | | | 5,465 | |
| | |
|
|
|
Total Liabilities | | | 3,852,201 | |
| | |
|
|
|
Net Assets | | $ | 2,342,947,600 | |
| | |
|
|
|
| |
| COMPONENTS OF NET ASSETS | | | | |
Common stock, at Par Value | | $ | 47,956 | |
Paid-in Capital | | | 1,667,520,874 | |
Distributions in excess of net investment income | | | (186,545 | ) |
Accumulated net realized gain on investments | | | 144,361,408 | |
Net unrealized appreciation on investments | | | 531,203,907 | |
| | |
|
|
|
Net Assets | | $ | 2,342,947,600 | |
| | |
|
|
|
| |
| NET ASSET VALUE | | | | |
Net Assets — Investor Class Shares | | $ | 1,683,316,309 | |
Shares Outstanding — Investor Class (100,000,000 shares authorized, par value $0.001) | | | 34,471,634 | |
| | |
|
|
|
Net Asset Value (offering price & redemption price per share) — Investor Class Shares | | $ | 48.83 | |
| | |
|
|
|
Net Assets — Institutional Class Shares | | $ | 659,631,291 | |
Shares Outstanding — Institutional Class (100,000,000 shares authorized, par value $0.001) | | | 13,484,024 | |
| | |
|
|
|
Net Asset Value (offering price & redemption price per share) — Institutional Class Shares | | $ | 48.92 | |
| | |
|
|
|
See Notes to Financial Statements.
7
SOUND SHORE FUND, INC.
STATEMENT OF OPERATIONS
FOR THE SIX MONTHS ENDED JUNE 30, 2015 (Unaudited)
| | | | |
| INVESTMENT INCOME | | | | |
Income: | | | | |
Dividends (net of reclaimed foreign taxes of $17,745) | | $ | 22,774,296 | |
| | |
|
|
|
Total Income | | | 22,774,296 | |
| | |
|
|
|
Expenses: | | | | |
Advisory fees (Note 3) | | | 8,978,775 | |
Administrator fees | | | 281,426 | |
Transfer agent fees and expenses — Investor Class Shares | | | 901,120 | |
Transfer agent fees and expenses — Institutional Class Shares | | | 23,216 | |
Custodian fees | | | 84,463 | |
Compliance and Treasurer Services fees (Note 3) | | | 95,062 | |
Directors’ fees and expenses (Note 3) | | | 76,439 | |
Professional fees | | | 48,214 | |
Registration fee — Investor Class Shares | | | 38,587 | |
Registration fees — Institutional Class Shares | | | 11,425 | |
Printing fees — Investor Class Shares | | | 31,984 | |
Printing fees — Institutional Class Shares | | | 14,219 | |
Miscellaneous | | | 44,337 | |
| | |
|
|
|
Total Expenses | | | 10,629,267 | |
Expense Reimbursements — Institutional Class Shares (Note 3) | | | (227,515 | ) |
| | |
|
|
|
Net expenses | | | 10,401,752 | |
| | |
|
|
|
Net Investment Income | | | 12,372,544 | |
| | |
|
|
|
| |
| REALIZED AND UNREALIZED GAIN (LOSS) ON INVESTMENTS | | | | |
Net realized gain on investments sold | | | 146,571,820 | |
Net change in unrealized appreciation/(depreciation) on investments | | | (138,389,275 | ) |
| | |
|
|
|
Net realized and unrealized gain on investments | | | 8,182,545 | |
| | |
|
|
|
Net increase in net assets from operations | | $ | 20,555,089 | |
| | |
|
|
|
See Notes to Financial Statements.
8
SOUND SHORE FUND, INC.
STATEMENTS OF CHANGES IN NET ASSETS
| | | | | | | | |
| | | For the
Six Months Ended
June 30, 2015
(Unaudited)
| | | For the
Year Ended
December 31,
2014
| |
Operations: | | | | | | | | |
Net investment income | | $ | 12,372,544 | | | $ | 42,677,836 | |
Net realized gain on investments sold | | | 146,571,820 | | | | 240,017,780 | |
Net change in unrealized appreciation/(depreciation) on investments | | | (138,389,275 | ) | | | (23,930,190 | ) |
| | |
|
|
| |
|
|
|
Increase in net assets from operations | | | 20,555,089 | | | | 258,765,426 | |
| | |
|
|
| |
|
|
|
Dividends to shareholders from net investment income: | | | | | | | | |
Investor Class | | | (8,563,998 | ) | | | (37,463,670 | ) |
Institutional Class | | | (3,995,091 | ) | | | (8,227,298 | ) |
Return of capital: | | | | | | | | |
Investor Class | | | — | | | | (1,029,167 | ) |
Institutional Class | | | — | | | | (226,013 | ) |
Distributions to shareholders from net realized gains: | | | | | | | | |
Investor Class | | | — | | | | (170,455,350 | ) |
Institutional Class | | | — | | | | (52,138,597 | ) |
| | |
|
|
| |
|
|
|
Total dividends/distributions to shareholders | | | (12,559,089 | ) | | | (269,540,095 | ) |
| | |
|
|
| |
|
|
|
Net capital share transactions (Note 6): | | | | | | | | |
Investor Class | | | (105,365,567 | ) | | | (287,120,256 | ) |
Institutional Class | | | 102,690,279 | | | | 491,511,001 | |
| | |
|
|
| |
|
|
|
Total capital share transactions | | | (2,675,288 | ) | | | 204,390,745 | |
| | |
|
|
| |
|
|
|
Total increase | | | 5,320,712 | | | | 193,616,076 | |
Net assets: | | | | | | | | |
Beginning of the period | | | 2,337,626,888 | | | | 2,144,010,812 | |
| | |
|
|
| |
|
|
|
End of the period (including distributions in excess of net investment income of $(186,545) and $—, respectively) | | $ | 2,342,947,600 | | | $ | 2,337,626,888 | |
| | |
|
|
| |
|
|
|
See Notes to Financial Statements.
9
SOUND SHORE FUND, INC.
FINANCIAL HIGHLIGHTS
These financial highlights reflect selected data for a share outstanding throughout each period.
| | | | | | | | | | | | | | | | | | | | | | | | |
| | | Six Months
Ended
June 30, 2015
(Unaudited)
| | | Year Ended December 31,
| |
| | | | 2014
| | | 2013
| | | 2012
| | | 2011
| | | 2010
| |
Investor Class Shares | | | | | | | | | | | | | | | | | | | | | | | | |
Net Asset Value, Beginning of Period | | $ | 48.79 | | | $ | 49.05 | | | $ | 34.91 | | | $ | 29.53 | | | $ | 31.82 | | | $ | 28.58 | |
| | |
|
|
| |
|
|
| |
|
|
| |
|
|
| |
|
|
| |
|
|
|
Investment Operations | | | | | | | | | | | | | | | | | | | | | | | | |
Net investment income (a) | | | 0.25 | | | | 0.98 | | | | 0.32 | | | | 0.29 | | | | 0.22 | | | | 0.19 | |
Net realized and unrealized gain (loss) on investments | | | 0.04 | | | | 4.83 | | | | 14.14 | | | | 5.39 | | | | (2.18 | ) | | | 3.25 | |
| | |
|
|
| |
|
|
| |
|
|
| |
|
|
| |
|
|
| |
|
|
|
Total from Investment Operations | | | 0.29 | | | | 5.81 | | | | 14.46 | | | | 5.68 | | | | (1.96 | ) | | | 3.44 | |
| | |
|
|
| |
|
|
| |
|
|
| |
|
|
| |
|
|
| |
|
|
|
Distributions from | | | | | | | | | | | | | | | | | | | | | | | | |
Net investment income | | | (0.25 | ) | | | (0.98 | ) | | | (0.32 | ) | | | (0.30 | ) | | | (0.23 | ) | | | (0.20 | ) |
Return of capital | | | — | | | | (0.03 | ) | | | — | | | | — | | | | (0.10 | ) | | | — | |
Net realized gains | | | — | | | | (5.06 | ) | | | — | | | | — | | | | — | | | | — | |
| | |
|
|
| |
|
|
| |
|
|
| |
|
|
| |
|
|
| |
|
|
|
Total Distributions | | | (0.25 | ) | | | (6.07 | ) | | | (0.32 | ) | | | (0.30 | ) | | | (0.33 | ) | | | (0.20 | ) |
| | |
|
|
| |
|
|
| |
|
|
| |
|
|
| |
|
|
| |
|
|
|
Net Asset Value, End of Period | | $ | 48.83 | | | $ | 48.79 | | | $ | 49.05 | | | $ | 34.91 | | | $ | 29.53 | | | $ | 31.82 | |
| | |
|
|
| |
|
|
| |
|
|
| |
|
|
| |
|
|
| |
|
|
|
Total Return (b) | | | 0.58 | % | | | 11.76 | % | | | 41.53 | % | | | 19.32 | % | | | (6.18 | )% | | | 12.13 | % |
Ratios/Supplemental Data | | | | | | | | | | | | | | | | | | | | | | | | |
Net Assets at End of Period (in thousands) | | $ | 1,683,316 | | | $ | 1,786,366 | | | $ | 2,066,584 | | | $ | 1,491,425 | | | $ | 1,588,823 | | | $ | 1,927,863 | |
Ratios to Average Net Assets: (c) | | | | | | | | | | | | | | | | | | | | | | | | |
Expenses | | | 0.91 | % | | | 0.92 | % | | | 0.93 | % | | | 0.94 | % | | | 0.94 | % | | | 0.94 | % |
Net Investment Income | | | 0.98 | % | | | 1.92 | %(d) | | | 0.77 | % | | | 0.89 | % | | | 0.69 | % | | | 0.66 | % |
Portfolio Turnover
Rate (b)(e) | | | 22 | % | | | 47 | % | | | 44 | % | | | 56 | % | | | 61 | % | | | 64 | % |
| (a) | Calculated using the average shares outstanding for the period. |
| (b) | Not annualized for periods less than one year. |
| (c) | Annualized for periods less than one year. |
| (d) | Net investment income for the period was positively impacted due to the divestiture by Vodafone (one of the Fund’s portfolio holdings) of its 45% stake in Verizon Wireless in a transaction that included the payment of an extraordinary dividend of cash and shares of Verizon to Vodafone shareholders. Absent this distribution, the ratio of net investment income to average net assets would have been 0.53% for the period. |
| (e) | Portfolio turnover is calculated on the basis of the Fund as a whole without distinguishing between the classes of shares issued. |
10
SOUND SHORE FUND, INC.
FINANCIAL HIGHLIGHTS (Concluded)
| | | | | | | | | | | | |
| | | Six Months
Ended
June 30, 2015
(Unaudited)
| | | Year Ended
December 31,
2014
| | | For the Period
December 9, 2013 to
December 31, 2013(a)
| |
Institutional Class Shares | | | | | | | | | | | | |
Net Asset Value,
Beginning of Period | | $ | 48.87 | | | $ | 49.06 | | | $ | 47.78 | |
| | |
|
|
| |
|
|
| |
|
|
|
Investment Operations | | | | | | | | | | | | |
Net investment income (b) | | | 0.28 | | | | 0.67 | | | | 0.01 | |
Net realized and unrealized gain on investments | | | 0.05 | | | | 5.23 | | | | 1.42 | |
| | |
|
|
| |
|
|
| |
|
|
|
Total from Investment Operations | | | 0.33 | | | | 5.90 | | | | 1.43 | |
| | |
|
|
| |
|
|
| |
|
|
|
Distributions from | | | | | | | | | | | | |
Net investment income | | | (0.28 | ) | | | (1.00 | ) | | | (0.15 | ) |
Return of capital | | | — | | | | (0.03 | ) | | | — | |
Net realized gains | | | — | | | | (5.06 | ) | | | — | |
| | |
|
|
| |
|
|
| |
|
|
|
Total Distributions | | | (0.28 | ) | | | (6.09 | ) | | | (0.15 | ) |
| | |
|
|
| |
|
|
| |
|
|
|
Net Asset Value, End of Period | | $ | 48.92 | | | $ | 48.87 | | | $ | 49.06 | |
| | |
|
|
| |
|
|
| |
|
|
|
Total Return (c) | | | 0.67 | % | | | 11.94 | % | | | 3.00 | % |
Ratios/Supplemental Data | | | | | | | | | | | | |
Net Assets at End of Period (in thousands) | | $ | 659,631 | | | $ | 551,261 | | | $ | 77,427 | |
| | |
|
|
| |
|
|
| |
|
|
|
Ratios to Average Net Assets: (d) | | | | | | | | | | | | |
Expenses (gross)(e) | | | 0.82 | % | | | 0.83 | % | | | 0.87 | % |
Expenses (net) | | | 0.75 | % | | | 0.75 | % | | | 0.75 | % |
Net Investment Income | | | 1.17 | % | | | 1.29 | %(f) | | | 0.45 | % |
Portfolio Turnover Rate (c)(g) | | | 22 | % | | | 47 | % | | | 44 | % |
| (a) | Commenced operations December 9, 2013. |
| (b) | Calculated using the average shares outstanding for the period. |
| (c) | Not annualized for periods less than one year. |
| (d) | Annualized for periods less than one year. |
| (e) | Reflects expense ratio in the absence of expense waiver and reimbursement. |
| (f) | Net investment income for the period was positively impacted due to the divestiture by Vodafone (one of the Fund’s portfolio holdings) of its 45% stake in Verizon Wireless in a transaction that included the payment of an extraordinary dividend of cash and shares of Verizon to Vodafone shareholders. Absent this distribution, the ratio of net investment income to average net assets would have been 0.72% for the period. |
| (g) | Portfolio turnover is calculated on the basis of the Fund as a whole without distinguishing between the classes of shares issued. |
11
SOUND SHORE FUND, INC.
NOTES TO FINANCIAL STATEMENTS
JUNE 30, 2015 (Unaudited)
1. Organization
Sound Shore Fund, Inc. (the “Fund”) was incorporated under the laws of the State of Maryland on February 19, 1985 and is registered as a diversified, open-end management investment company under the Investment Company Act of 1940 (the “Act”). The investment objective of the Fund is growth of capital. The Fund qualifies as an investment company as defined in the Financial Accounting Standards Codification 946 — Financial Services —Investment Companies.
The total number of shares of common stock which the Fund is authorized to issue is 200,000,000, par value $0.001 per share of which 100,000,000 shares are designated to the Investor Class and 100,000,000 shares are designated to the Institutional Class. The Board of Directors (“the Board”) may, without shareholder approval, classify or reclassify any unissued shares into other classes or series of shares.
Each share of the Fund has equal divided, distribution, liquidation and voting rights (except as to matters relating exclusively to one class of shares), and fractional shares have those rights proportionately.
2. Significant Accounting Policies
These financial statements are prepared in accordance with accounting principles generally accepted in the United States of America (“GAAP”), which require management to make estimates and assumptions that affect the reported amounts of assets and liabilities, disclosure of contingent liabilities, if any, at the date of the financial statements, and the reported amounts of increase and decrease in net assets from operations during the fiscal period. Actual results could differ from those estimates.
The following represent significant accounting policies of the Fund:
a. Security Valuation
Exchange-traded securities including those traded on the National Association of Securities Dealers’ Automated Quotation system (“NASDAQ”), are valued at the last quoted sale price as provided by independent pricing services as of the close of trading on the system or exchange on which they are primarily traded, on each Fund business day. In the absence of a sale, such securities are valued at the mean of the last bid and asked prices. Non-exchange-traded securities for which over-the-counter market quotations are readily available are generally valued at the mean between the current bid and asked prices provided by independent pricing services. Investments in other open-end regulated investment companies are valued at net asset value (“NAV”).
The Fund values securities at fair value pursuant to procedures adopted by the Board if market quotations are not readily available (including a short and temporary lapse in the provision of a price by the regular pricing source) or, if in the judgment of the Adviser, the prices or values available do not represent the fair value of the instrument. Factors which may cause the Adviser to make such a judgment include, but are not limited to, the following: (i) only a bid price or an asked price is available, (ii) the spread between the bid price and the asked price is substantial, (iii) the frequency of sales, (iv) the thinness of the market, (v) the size of reported trades, and
12
SOUND SHORE FUND, INC.
NOTES TO FINANCIAL STATEMENTS (Continued)
JUNE 30, 2015 (Unaudited)
(vi) actions of the securities markets, such as the suspension or limitation of trading. Fair valuation is based on subjective factors and, as a result, the fair value price of an asset may differ from the asset’s market price and may not be the price at which the asset may be sold. Fair valuation could result in a NAV different from one determined by using market quotations.
Valuation inputs used to determine the value of the Fund’s investments are summarized in the three broad levels listed below:
Level 1 - quoted prices in active markets for identical assets
Level 2 - other significant observable inputs (including quoted prices of similar securities, interest rates, prepayment speeds, credit risk, etc.)
Level 3 - significant unobservable inputs (including the Fund’s own assumptions in determining the fair value of investments)
The inputs or methodology used for valuing securities are not necessarily an indication of the risk associated with investing in those securities.
Pursuant to the valuation procedures noted previously, equity securities (including exchange-traded securities and other open-end regulated investment companies) are generally categorized as Level 1 securities in the fair value hierarchy. Investments for which there are no quotations, or for which quotations do not appear reliable, are valued at fair value as determined in good faith by the Pricing Committee under the direction of the Board. These valuations are typically categorized as Level 2 or Level 3 in the fair value hierarchy.
The following table summarizes the Fund’s investments categorized in the fair value hierarchy as of June 30, 2015:
| | | | | | | | | | | | | | | | |
Security Type
| | Level 1
| | | Level 2
| | | Level 3
| | | Total
Investments
in Securities
| |
Common Stocks | | $ | 2,254,483,573 | | | $ | — | | | $ | — | | | $ | 2,254,483,573 | |
Short-Term Investments | | | 63,712,715 | | | | — | | | | — | | | | 63,712,715 | |
| | |
|
|
| |
|
|
| |
|
|
| |
|
|
|
Total Investments | | $ | 2,318,196,288 | | | $ | — | | | $ | — | | | $ | 2,318,196,288 | |
| | |
|
|
| |
|
|
| |
|
|
| |
|
|
|
At June 30, 2015, all equity securities and open-end mutual funds were included in Level 1 in the table above. Please refer to the Schedule of Investments to view equity securities categorized by sector/industry type.
The Fund’s policy is to disclose transfers between Levels based on valuations at the end of the reporting period. There were no transfers between Levels as of June 30, 2015, based on the valuation input Levels on December 31, 2014.
13
SOUND SHORE FUND, INC.
NOTES TO FINANCIAL STATEMENTS (Continued)
JUNE 30, 2015 (Unaudited)
b. Security Transactions, Investment Income and Expenses
Security transactions are recorded on a trade date basis. Realized gain and loss on investments sold are recorded on the basis of identified cost. Dividend income is recorded on the ex-dividend date. Interest income is recorded on an accrual basis. Foreign dividend income is recorded on the ex-dividend date or as soon as practicable after the Fund determines the existence of a dividend declaration after exercising reasonable due diligence. Income and capital gains on some foreign securities may be subject to foreign withholding tax, which is accrued as applicable. Investment income, realized and unrealized gains and losses and certain Fund-level expenses are allocated to each class based on relative average daily net assets. Certain expenses are incurred at the class level and charged directly to that particular class. Class level expenses are denoted as such on the Fund’s Statement of Operations.
c. Dividends to Shareholders
Dividends are declared separately for each class. No class has preferential dividend rights; differences in per share dividend rates are generally due to class-specific fee waivers and expenses. Dividends and distributions payable to shareholders are recorded by the Fund on the ex-dividend date. Dividends from net investment income, if any, are declared and paid semiannually. Capital gains, if any, are distributed to shareholders at least annually. The Fund determines its net investment income and capital gains distributions in accordance with income tax regulations, which may differ from GAAP. These differences are due primarily to differing treatments of income and gains on various investment securities held by the Fund, timing differences and differing characterizations of distributions made by the Fund. To the extent distributions exceed net investment income and net realized capital gains for tax purposes, they are reported as a return of capital.
d. Federal Taxes
The Fund intends to qualify each year as a regulated investment company and to distribute substantially all of its taxable income. In addition, by distributing in each calendar year substantially all of its net investment income, capital gain and certain other amounts, if any, the Fund will not be subject to federal taxation. Therefore, no federal income or excise tax provision is required. For all open tax years and all major taxing jurisdictions, management of the Fund has concluded that there are no significant uncertain tax positions that would require the Fund to record a tax liability or would otherwise require recognition in the financial statements. Open tax years are those that are open for examination by taxing authorities (i.e., generally, the last three tax year-ends 2012-2014, and the interim tax period since then).
3. Investment Advisory and Other Services
Investment Adviser
The Fund’s investment adviser is Sound Shore Management, Inc. (the “Adviser”). Pursuant to an investment advisory agreement, the Adviser receives an advisory fee, accrued daily and paid monthly at an annual rate of 0.75% of the Fund’s average daily net assets. Pursuant to an expense limitation agreement between the Adviser and the Fund, the
14
SOUND SHORE FUND, INC.
NOTES TO FINANCIAL STATEMENTS (Continued)
JUNE 30, 2015 (Unaudited)
Adviser has agreed to reimburse all of the ordinary expenses of the Institutional Class, excluding its advisory fees, interest, taxes, securities lending costs, brokerage commissions and acquired fund fees and expenses, extraordinary expenses and all litigation costs until at least May 1, 2016. This reimbursement is shown on the Statement of Operations as a reduction of expenses.
Other Services
Citi Fund Services Ohio, Inc. (“Citi”) provides certain administration and portfolio accounting services to the Fund. Prior to April 1, 2015, Citi also provided transfer agency services to the Fund.
Effective April 1, 2015, SunGard Investor Services LLC (“SunGard”) serves as the Fund’s transfer agent.
The Fund also has agreements with various financial intermediaries and “mutual fund supermarkets” under which customers of these intermediaries may purchase and hold Fund shares. These intermediaries effectively provide sub-transfer agent services that the Fund transfer agent would have otherwise had to provide. In recognition of this, the transfer agent, the Fund and the Fund’s Adviser have entered into an agreement whereby the transfer agent agrees to pay financial intermediaries a portion of the amount denoted on the Statement of Operations as “Transfer agent fees and expenses — Investor Class Shares” that it receives from the Fund for its services as transfer agent for the Investor Class and the Adviser agrees to pay the excess, if any, charged by a financial intermediary for that class.
Foreside Fund Services, LLC is the Fund’s distributor (the “Distributor”). The Distributor is not affiliated with the Adviser, Citi, SunGard, or its affiliated companies. The Distributor receives no compensation from the Fund for its distribution services.
Pursuant to a Compliance Services Agreement with the Fund, Foreside Compliance Services, LLC (“FCS”), an affiliate of the Distributor, provides a Chief Compliance Officer and Anti-Money Laundering Officer to the Fund as well as some additional compliance support functions. Under a Treasurer Services Agreement with the Fund, Foreside Management Services, LLC (“FMS��), an affiliate of the Distributor, provides a Treasurer to the Fund. Neither the Distributor, FCS, FMS, nor their employees that serve as officers of the Fund, have any role in determining the investment policies of or securities to be purchased or sold by the Fund.
The Fund pays each director who is not an “interested person” of the Fund, as defined in Section 2(a)(19) of the Act (“Independent Director”), quarterly fees of $2,500, plus $10,000 per quarterly in-person meeting, $4,000 per quarterly meeting attended telephonically, and $2,000 per special meeting attended in person or telephonically. In addition, the Chairman of the Audit Committee receives a quarterly fee of $1,250.
Certain Officers and Directors of the Fund are officers, directors, or employees of the aforementioned companies.
4. Purchases and Sales of Securities
The cost of securities purchased and the proceeds from sales of securities (excluding short-term investments and in kind transactions) for the period ending June 30, 2015 aggregated $496,290,873 and $499,797,526, respectively.
15
SOUND SHORE FUND, INC.
NOTES TO FINANCIAL STATEMENTS (Continued)
JUNE 30, 2015 (Unaudited)
The cost of securities purchased and the proceeds from sales of securities (including in kind redemptions) for the period ending June 30, 2015 aggregated $496,290,873 and $534,020,660, respectively.
5. Federal Income Tax and Investment Transactions
Distributions during the fiscal years ending as noted were characterized for tax purposes as follows:
| | | | | | | | |
| | | December 31,
2014
| | | December 31,
2013
| |
Ordinary Income | | $ | 56,535,425 | | | $ | 13,777,140 | |
Long-Term Capital Gains | | | 211,749,490 | | | | — | |
| | |
|
|
| |
|
|
|
Total Taxable Distributions | | | 268,284,915 | | | | 13,777,140 | |
Return of Capital | | | 1,255,180 | | | | — | |
| | |
|
|
| |
|
|
|
Total Distributions Paid | | $ | 269,540,095 | | | $ | 13,777,140 | |
| | |
|
|
| |
|
|
|
Components of capital on a federal income tax basis at December 31, 2014, were as follows:
| | | | |
Par Value + Paid-in Capital | | $ | 1,670,244,118 | |
Undistributed Long-Term Capital Gains | | | 8,692 | |
Capital Loss Carryforwards | | | — | |
Net Unrealized Appreciation | | | 667,374,078 | |
| | |
|
|
|
| | | $ | 2,337,626,888 | |
| | |
|
|
|
6. Capital Stock
Transactions in capital stock for the periods ended June 30, 2015 and December 31, 2014 were as follows:
| | | | | | | | | | | | | | | | |
| | | For the Six Months Ended June 30, 2015
| |
| | | Investor Class | | | Institutional Class | |
| | | Shares
| | | Amount
| | | Shares
| | | Amount
| |
Sale of shares | | | 1,916,271 | | | $ | 94,455,609 | | | | 4,111,135 | | | $ | 198,040,407 | |
Reinvestment of dividends | | | 162,178 | | | | 8,174,992 | | | | 76,791 | | | | 3,877,936 | |
Redemption of shares | | | (4,220,261 | ) | | | (207,996,168 | ) | | | (1,983,791 | ) | | | (99,228,064 | ) |
| | |
|
|
| |
|
|
| |
|
|
| |
|
|
|
Net increase (decrease) from capital transactions | | | (2,141,812 | ) | | $ | (105,365,567 | ) | | | 2,204,135 | | | $ | 102,690,279 | |
| | |
|
|
| |
|
|
| |
|
|
| |
|
|
|
| | | | | | | | | | | | | | | | | |
16
SOUND SHORE FUND, INC.
NOTES TO FINANCIAL STATEMENTS (Concluded)
JUNE 30, 2015 (Unaudited)
| | | | | | | | | | | | | | | | |
| | | For the Year Ended December 31, 2014
| |
| | | Investor Class | | | Institutional Class | |
| | | Shares
| | | Amount
| | | Shares
| | | Amount
| |
Sale of shares | | | 8,382,874 | | | $ | 427,141,999 | | | | 9,465,815 | | | $ | 481,621,660 | |
Reinvestment of dividends | | | 4,019,596 | | | | 200,818,623 | | | | 1,212,437 | | | | 60,521,783 | |
Redemption of shares | | | (17,922,231 | ) | | | (915,080,878 | ) | | | (976,671 | ) | | | (50,632,442 | ) |
| | |
|
|
| |
|
|
| |
|
|
| |
|
|
|
Net increase (decrease) from capital transactions | | | (5,519,761 | ) | | $ | (287,120,256 | ) | | | 9,701,581 | | | $ | 491,511,001 | |
| | |
|
|
| |
|
|
| |
|
|
| |
|
|
|
Redemption proceeds normally are paid in cash. However, the Fund reserves the right to pay redemption proceeds in portfolio securities rather than cash. These redemptions “in kind” usually occur if the amount to be redeemed is large enough to affect Fund operations (for example, if it represents more than 1% of the Fund’s assets). For book purposes, the Fund will recognize a gain on the redemption in kind to the extent the value of the distributed securities on the date of redemption exceeds the cost of those securities; the Fund recognizes a loss if cost exceeds value. Gains and losses realized on a redemption in kind are generally not recognized for tax purposes. During the period ended June 30, 2015, the Fund realized $11,479,845 of net gain on $34,223,134, of redemption in kind.
As of June 30, 2015, the Employees’ Profit Sharing Plan of the Adviser owned 721,454 Institutional Class shares which represented 1.51% of the Fund’s Net Assets.
7. Other Information
On June 30, 2015, two entities, Charles Schwab & Co. Inc. and National Financial Services LLC, held of record in omnibus accounts approximately 61% of the outstanding shares of the Fund on behalf of numerous investors.
8. Subsequent Events
Subsequent events occurring after the date of this report have been evaluated for potential impact to this report through the date the report was issued.
17
SOUND SHORE FUND, INC.
JUNE 30, 2015 (Unaudited)
Shareholder Expense Example
As a shareholder of the Fund, you incur ongoing costs, including management fees and other Fund expenses. This example is intended to help you understand your ongoing costs (in dollars) of investing in the Fund and to compare these costs with the ongoing costs of investing in other mutual funds.
The following example is based on $1,000 invested at the beginning of the period and held for the entire period from January 1, 2015 through June 30, 2015.
Actual Expenses - The Actual Return lines of the table below provide information about actual account values and actual expenses for each share class. You may use the information in these lines, together with the amount you invested, to estimate the expenses that you paid over the period. Simply divide your account value by $1,000 (for example, an $8,600 account value divided by $1,000 = 8.6), then multiply the result by the number in the Actual Return line under the heading entitled “Expenses Paid During Period” to estimate the expenses you paid on your account during this period.
Hypothetical Example for Comparison Purposes - The Hypothetical Return lines of the table below provide information about hypothetical account values and hypothetical expenses based on each class’ actual expense ratio and an assumed rate of return of 5% per year before expenses, which is not the Fund’s actual return. The hypothetical account values and expenses may not be used to estimate the actual ending account balance or expenses you paid for the period. You may use this information to compare the ongoing cost of investing in the Fund and other funds. To do so, compare this 5% hypothetical example with the 5% hypothetical examples that appear in the shareholder reports of other funds.
Expenses shown in the table are meant to highlight your ongoing costs only and do not reflect any transactional costs. Therefore, the Hypothetical Return lines of the table are useful in comparing ongoing costs only, and will not help you determine the relative total costs of owning different funds.
| | | | | | | | | | | | |
| | | Beginning
Account Value
January 1, 2015
| | | Ending
Account Value
June 30, 2015
| | | Expenses Paid
During Period*
| |
Investor Class Actual Return | | $ | 1,000.00 | | | $ | 1,005.80 | | | $ | 4.53 | |
Investor Class Hypothetical Return | | $ | 1,000.00 | | | $ | 1,020.28 | | | $ | 4.56 | |
Institutional Class Actual Return | | $ | 1,000.00 | | | $ | 1,006.70 | | | $ | 3.73 | |
Institutional Class Hypothetical Return | | $ | 1,000.00 | | | $ | 1,021.08 | | | $ | 3.76 | |
| * | Expenses are equal to the Investor Class’ and Institutional Class’ annualized expense ratio of 0.91% and 0.75% respectively, multiplied by the average account value over the period, multiplied by 181/365 to reflect the most recent one-half year period. |
18
SOUND SHORE FUND, INC.
JUNE 30, 2015
Investment Advisory Agreement Approval
In advance of the Board meeting, held on January 29, 2015, the Independent Directors met by telephone with their independent counsel to consider the Investment Advisory Agreement and the Board materials that had been provided in advance of the meeting, including a legal memorandum outlining relevant judicial precedent and the duties of the Directors under the Investment Company Act and the law of Maryland, and the fee and expense comparisons described in more detail below.
At the Board meeting, the Independent Directors and the full Board reviewed, considered and discussed the written materials provided to them. These materials included the terms of the Investment Advisory Agreement; revenue received by the Adviser from the Fund; and the costs incurred by the Adviser in connection with the services it renders to the Fund, a summary of Lipper data on the Fund’s comparative performance, recent news articles commenting on the Fund’s performance and a comparison of expenses, size and other relevant data including returns over the last fifteen years of twenty-seven funds that the Adviser has been tracking for that period of time. The materials also included comparative analyses of advisory and certain other fees and total expenses borne by the Fund to all mutual funds included in an independently selected universe of no-load U.S. diversified equity funds with no 12b-1 or non-12b-1 fees with assets of $1 billion to $3 billion and additional analysis of its fees as compared to funds in a group of small fund families (under 10 funds) within the select-fund universe. The Adviser pointed out that the 0.922% expense ratio of the Investor Class was slightly higher than the Fund’s Lipper peer group, and that this was attributable to the Fund being a “stand alone” fund, so that the Adviser could not realize the efficiencies that often result for fund families with more funds and an aggregate higher amount of assets under management. The Directors reviewed the Adviser’s personnel and their professional qualifications, the team approach to portfolio management, the operations and compliance program, the ranges of fees paid by institutional client accounts and private funds managed by the Adviser, and the additional work of the Adviser necessary to discharge the requirements of the Investment Company Act, including the oversight of the Fund’s service providers and the work involved in supporting Board meetings and shareholder reporting.
The Independent Directors met in executive session with fund and independent counsel to discuss the Board materials and the Adviser’s presentation, including information that had been presented by the Adviser about its profitability attributable to its services to the Fund. They noted that the concepts of “economies of scale” and “fall out benefits” did not apply, because the Fund is the Adviser’s sole mutual fund, and that the combined assets of the Investor and Institutional Class, at $1.970 billion, were not of a scale to result in excessive profits to the Adviser. The Independent Directors noted the Fund’s consistent long term performance and the Adviser’s continuing disciplined adherence to its investment strategy, including investing assets fully to the extent feasible. They discussed the detailed information presented by the Adviser about the Fund’s portfolio and securities positions at the quarterly board meetings, and the responsiveness of management to questions from the Independent Directors. They reviewed the Fund’s performance in 2014, with a total return of 11.76% for the Investor Class and 11.94% for the Institutional Class that outperformed the Morningstar Large Cap Value Category, the Morningstar Domestic and Large Cap Growth Categories, and that the Fund’s three, five, ten and fifteen year records were also strong. The Independent
19
SOUND SHORE FUND, INC.
JUNE 30, 2015
Directors agreed that an advisory fee of 0.75% was fair, and not excessive, considering the assets in the Investor Class and the services provided by the Adviser. The Independent Directors evaluated the Institutional Class, noting that the Adviser was capping its expenses at 0.75%, to compete in the institutional market, and that the class was gradually attracting new assets as an indication that it was competing in the institutional space. The Independent Directors concluded that the expense ratios for both the Investor Class and the Institutional Class were reflective of the Fund’s necessary and reasonable expenses. Taking into account the materials provided by the Adviser for the meeting and throughout the year, they expressed their confidence in the Adviser and concluded that they would unanimously vote to approve the continuance of the Investment Advisory Agreement.
Thereafter, the full Board meeting resumed and discussion about the renewal of the Agreement continued. While the Directors, including the Independent Directors, did not identify any single factor as controlling, after considering all the factors, they resolved unanimously, first by the Independent Directors and then by the full Board, to approve continuance of the Investment Advisory Agreement as in the best interests of the Fund and its shareholders.
Proxy Voting Information
A description of the policies and procedures that the Fund uses to determine how to vote proxies relating to securities held in the Fund’s portfolio is available, without charge and upon request, by calling (800) 551-1980 or by visiting the Fund’s web site at http://www.soundshorefund.com. This information is also available on the Securities and Exchange Commission’s (“SEC”) web site at http://www.sec.gov under the name of the Sound Shore Fund.
The Fund’s proxy voting record for the most recent 12-month period ended June 30 is available, without charge and upon request, by calling (800) 551-1980 or by visiting the Fund’s web site at http://www.soundshorefund.com. This information is available on the SEC’s web site at http://www.sec.gov under the name of the Sound Shore Fund.
Availability of Quarterly Portfolio Schedule
The Fund files its complete schedule of portfolio holdings with the SEC for the first and third quarters of each fiscal year on Form N-Q. This information is available on the SEC’s web site at http://www.sec.gov under the name of the Sound Shore Fund. It may be reviewed and copied at the SEC’s Public Reference Room in Washington, DC. Information on the operation of the Public Reference Room may be obtained by calling (800) SEC-0330.
20

Investment Adviser
Sound Shore Management, Inc.
Greenwich, Connecticut
Administrator
Citi Fund Services Ohio, Inc.
Columbus, Ohio
Distributor
Foreside Fund Services, LLC
Portland, Maine
www.foreside.com
Transfer Agent
SunGard Investor Services LLC
Columbus, Ohio
Distribution Paying Agent
Citi Fund Services Ohio, Inc.
Columbus, Ohio
Custodian
Citibank, N.A.
New York, New York
Fund Counsel
Dechert LLP
New York, New York
Independent Registered
Public Accounting Firm
Deloitte & Touche LLP
New York, New York
107-SAR-0615
This report is submitted for the general information of the shareholders of the Fund. It is not authorized for distribution to prospective investors in the Fund unless preceded or accompanied by an effective prospectus, which includes information regarding the Fund’s objectives and policies, experience of its management, and other information.
SOUND SHORE FUND, INC.
3435 Stelzer Road
Columbus, OH 43219
http://www.soundshorefund.com
(800) 551-1980
Semi-Annual Report
(Unaudited)
JUNE 30, 2015


Item 2. Code of Ethics.
Not applicable.
Item 3. Audit Committee Financial Expert.
Not applicable.
Item 4. Principal Accountant Fees and Services.
Not applicable.
Item 5. Audit Committee of Listed Registrants.
Not applicable.
Item 6. Schedule of Investments.
| (a) | Included as part of the report to stockholders under Item 1. |
Item 7. Disclosure of Proxy Voting Policies and Procedures for Closed-End Management Investment Companies.
Not applicable.
Item 8. Portfolio Managers of Closed-End Management Investment Companies.
Not applicable.
Item 9. Purchases of Equity Securities by Closed-End Management Investment Company and Affiliated Purchasers.
Not applicable.
Item 10. Submission of Matters to a Vote of Security Holders.
Not applicable.
Item 11. Controls and Procedures.
(a) The registrant’s principal executive officer and principal financial officer concluded that the registrant’s disclosure controls and procedures (as defined in Rule 30a-3(c) under the Investment Company Act of 1940 (the “Act”)) were effective as of a date within 90 days of the filing date of this report (the “Evaluation Date”) based on their evaluation of the registrant’s disclosure controls and procedures as of the Evaluation Date.
(b) There were no changes in the registrant’s internal control over financial reporting (as defined in Rule 30a-3(d) under the Act) that occurred during the second fiscal quarter of the period covered by this report that have materially affected, or are reasonably likely to materially affect, the registrant’s internal control over financial reporting.
Item 12. Exhibits.
(a)(1) Not applicable.
(a)(2) Certifications pursuant to Rule 30a-2(a) of the Investment Company Act of 1940 as amended, and Section 302 of the Sarbanes-Oxley Act of 2002 (Exhibit filed herewith).
(a)(3) Not applicable.
(b) Certifications pursuant to Rule 30a-2(b) of the Investment Company Act of 1940, as amended, and Section 906 of the Sarbanes-Oxley Act of 2002 (Exhibit filed herewith).
SIGNATURES
Pursuant to the requirements of the Securities Exchange Act of 1934 and the Investment Company Act of 1940, the registrant has duly caused this report to be signed on its behalf by the undersigned, thereunto duly authorized.
| | |
| Registrant | | Sound Shore Fund, Inc. |
| | |
| By (Signature and Title) | | /s/ T. Gibbs Kane, Jr. |
| | T. Gibbs Kane, Jr. President |
Pursuant to the requirements of the Securities Exchange Act of 1934 and the Investment Company Act of 1940, this report has been signed below by the following persons on behalf of the registrant and in the capacities and on the dates indicated.
| | |
| By (Signature and Title) | | /s/ T. Gibbs Kane, Jr. |
| | T. Gibbs Kane, Jr. President |
| | |
| By (Signature and Title) | | /s/ Charles S. Todd |
| | Charles S. Todd Treasurer |