UNITED STATES
SECURITIES AND EXCHANGE COMMISSION
WASHINGTON, D.C. 20549
FORM N-CSR
CERTIFIED SHAREHOLDER REPORT OF REGISTERED MANAGEMENT
INVESTMENT COMPANIES
Investment Company Act file number 811-04244
SOUND SHORE FUND, INC.
Three Canal Plaza, Suite 600
Portland, Maine 04101
T. Gibbs Kane, Jr., President
8 Sound Shore Drive
Greenwich, Connecticut 06830
Date of fiscal year end: December 31
Date of reporting period: January 1, 2018 – June 30, 2018
Item 1. Reports to Stockholders.

THREE CANAL PLAZA, PORTLAND, ME 04101 1-800-551-1980
June 30, 2018
Dear Investor:
The Sound Shore Fund Investor (SSHFX) and Institutional (SSHVX) class shares rose 0.81% and 0.86%, respectively, in the 2nd quarter of 2018, which slightly lagged the 1.18% return for the Russell 1000 Value Index (Russell Value), and trailed the 3.43% return for the Standard & Poor’s 500 Index (S&P 500). Year-to-date returns for SSHFX of -1.87% and for SSHVX -1.79% were also marginally behind the Russell Value’s -1.69% and below the S&P 500’s 2.65%. Longer-term, the SSHFX and SSHVX five-year returns of 10.59% and 10.78%, respectively, were ahead of the Russell Value at 10.34%, but lower than the 13.42% of the S&P 500.
We are required by the SEC to say that: Past performance is no guarantee of future results. Current performance may be lower or higher than the performance data quoted. Investment return and principal value will fluctuate so that an investor’s shares, when redeemed, may be worth more or less than their original cost. The Fund’s Investor Class 1, 5, and 10-year average annual total returns for the period ended June 30, 2018 were 5.38%, 10.59%, and 8.11%, respectively. The Fund’s Institutional Class 1, 5, and 10-year average annual total returns for the period ended June 30, 2018 were 5.54%, 10.78%, and 8.30%, respectively. Fund returns assume the reinvestment of all dividend and capital gain distributions. As stated in the current prospectus, the total annual operating expense ratio (gross) is 0.91% for the Investor Class and 0.82% for the Institutional Class. The net expense ratio for the Institutional Class is 0.76% pursuant to an expense limitation agreement between the Adviser and the Fund. This agreement is in effect until at least May 1, 2019. The performance for the Institutional Class prior to its inception on 12/9/13 is based on the performance of the Investor Class, adjusted to reflect the lower expense ratio of the Institutional Class (net of expense reimbursements). For the most recent month-end performance, please visit the Fund’s website at www.soundshorefund.com.
Equities advanced in the quarter even with the global economy showing signs of divergence and US short-term interest rates continuing to rise. Strong employment, higher wages, and resurgent inflation domestically contrasted with moderating trends in Europe and many emerging markets. Fixed income and currency markets took notice, as the spread between the US and German 2 year treasuries widened significantly, and the US dollar index appreciated 5%. This uneven macro backdrop combined with trade tensions to yield more correlated equity markets. Meanwhile, in contrast to the long-term trend, growth stocks continued to outperform their value counterparts: Over the last 12-months the Russell 1000 Growth beat the Russell 1000 Value by 16%.
The current environment is yielding ample investment opportunities for Sound Shore's bottom up, contrarian strategy. As a reminder, Sound Shore's 40-year young process starts with a mechanical screen to identify the least expensive stocks based upon earnings and cash flow. We then conduct thorough fundamental research to determine the company-specific drivers that will grow value ahead of low consensus expectations. Realizing or exceeding our outlook for earnings and cash flow is crucial, and we assemble financial models to track a company’s progress. Through Sound Shore’s four decades of investing, it has been rare for a stock to outperform without improving earnings and cash flow.
One such second quarter example was electronic payments firm First Data, which led all contributors after raising its 2018 earnings outlook. We started our investment in 2016 when the shares were valued at less than 10 times earnings and after a long period of underperformance. In contrast with Wall Street's bearish view, our analysis indicated that First Data's plans to improve its core merchant acquiring product and reduce debt would create significant value. Since purchase, our 70% gain in the stock coincides with the company’s improved customer service, new business wins, and better than expected expense control. First Data remains a full position as it is still valued at a 30% discount to peers on price to cash flow.
Similarly, travel IT provider Sabre performed well for the quarter as market share gains drove better than expected earnings. Sabre, a late 2017 portfolio addition at 13 times 2018 earnings, is executing on a plan to be the comprehensive software and services provider to travel industry participants. Even after recent gains, the stock retains an attractive risk/reward profile based upon our sum of the parts valuation.
First Data and Sabre are also terrific illustrations of companies winning in industries that are seeing significant "disruption": respectively, cashless commerce and online travel reservations. An important part of Sound Shore’s process has always been to investigate companies and industries where change is underway, but perhaps being overlooked by the market. Businesses today need to consider every potential change from customer behavior and new competition to shifting regulation and innovative distribution. While the headlines focus on high P/E technology disruptors, Sound Shore has identified a number of less conspicuous and undervalued opportunities.
Stocks that underperformed in the quarter included insurer Chubb, which was off despite promising underwriting results. We added Chubb to the portfolio in the second half of 2017 when the stock was valued below norm at 11 times earnings. Led by CEO Evan Greenberg, the very competent team has completed the integration of Chubb and ACE. With a conservative investment portfolio and strong balance sheet, improved pricing and market share gains should drive premium and earnings growth. We used the stock’s second quarter pullback to increase our holding.
Contract manufacturer Flex also lagged after a strong 2017, due to a slower than expected ramp up in its revenue and earnings from its Nike manufacturing contract and trade concerns. However, Flex’s business model of having manufacturing capabilities around the globe drives efficiency for its customers and should be a distinct advantage longer term. We believe Flex’s valuation of just 11 times earnings does not reflect the company’s long-term potential, and we used the recent underperformance to add to our investment.
Through the first half of 2018, the top 10 contributing stocks in the S&P 500 Index accounted for an astounding 122% of the index's total return, according to data from Goldman Sachs. Similarly, growth's now decade-long lead over value has taken those benchmarks’ relative price-to-book ratio to the high end of its long-term range. While market pundits speculate about whether current trends will prevail or correct, Sound Shore remains committed to its value investment framework. Our portfolio appears favorably valued, with a forward price-earnings multiple of 12.5 times, compared to 16.1 times for the S&P. With interest rates moving off post-crisis emergency levels and correlations and volatility normalizing, we believe our portfolio represents an attractive risk/reward profile.
Thank you for your investment alongside ours in Sound Shore.
Sincerely,
SOUND SHORE FUND
Harry Burn, III
John P. DeGulis
T. Gibbs Kane, Jr.
Co-Portfolio Managers
Important Information
The Standard & Poor’s 500 Index is an unmanaged index representing the average performance of 500 widely held, publicly traded, large capitalization stocks. The Russell 1000 Value Index measures the performance of the large-cap value segment of the U.S. equity universe. It includes those Russell 1000 companies with lower price-to-book ratios and lower expected growth values. It is not possible to invest directly in an Index.
This letter may contain discussions about certain investments both held and not held in the portfolio. As required by the Financial Industry Regulatory Authority (FINRA), we must remind you that current and future portfolio holdings are subject to risk.
An investment in the Fund is subject to risk, including the possible loss of principal amount invested. Mid Cap Risk: Securities of medium sized companies may be more volatile and more difficult to liquidate during market downturns than securities of large, more widely traded companies. Foreign Securities Risk: The Fund may invest in foreign securities primarily in the form of American Depositary Receipts. Investing in the securities of foreign issuers also involves certain special risks, which are not typically associated with investing in U.S. dollar-denominated securities or quoted securities of U.S. issuers including increased risks of adverse issuer, political, regulatory, market or economic developments, changes in currency rates and in exchange control regulations. The Fund is also subject to other risks, including, but not limited to, risks associated with value investing.
The views in this letter were those of the Fund managers as of 6/30/18 and may not necessarily reflect their views on the date this letter is first published or anytime thereafter.
SOUND SHORE FUND, INC.
SCHEDULE OF INVESTMENTS (Unaudited)
JUNE 30, 2018
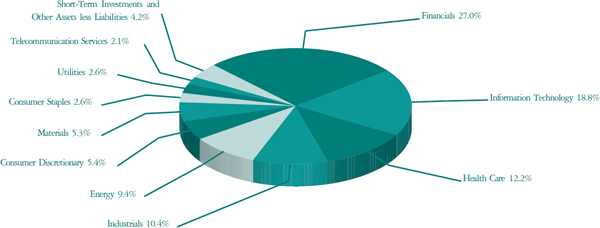
Sector Weightings(a) (as of June 30, 2018)
as a percentage of Net Assets (Unaudited)
| | | Share
Amount | | | Value | |
| Common Stock (95.8%) (a) | | | | | | |
| Consumer Discretionary (5.4%) | | | | | | | | |
| CBS Corp., Class B | | | 1,155,600 | | | $ | 64,967,832 | |
| The Goodyear Tire & Rubber Co. | | | 1,879,650 | | | | 43,777,049 | |
| | | | | | | | 108,744,881 | |
| Consumer Staples (2.6%) | | | | | | | | |
| Walmart, Inc. | | | 614,450 | | | | 52,627,643 | |
| | | | | | | | | |
| Energy (9.4%) | | | | | | | | |
| Antero Resources Corp. (b) | | | 3,386,000 | | | | 72,291,100 | |
| EQT Corp. | | | 1,034,050 | | | | 57,058,879 | |
| Total SA, ADR | | | 1,000,500 | | | | 60,590,280 | |
| | | | | | | | 189,940,259 | |
See Notes to Financial Statements.
SOUND SHORE FUND, INC.
SCHEDULE OF INVESTMENTS (Unaudited) (Continued)
JUNE 30, 2018
| | | Share
Amount | | | Value | |
| Financials (27.0%) | | | | |
| American International Group, Inc. | | | 1,130,650 | | | $ | 59,947,063 | |
| Aon PLC | | | 398,600 | | | | 54,675,962 | |
| Bank of America Corp. | | | 2,472,850 | | | | 69,709,641 | |
| Berkshire Hathaway, Inc., Class B (b) | | | 325,050 | | | | 60,670,583 | |
| Capital One Financial Corp. | | | 687,700 | | | | 63,199,630 | |
| Chubb, Ltd. | | | 501,950 | | | | 63,757,689 | |
| Citigroup, Inc. | | | 1,193,950 | | | | 79,899,134 | |
| Marsh & McLennan Cos., Inc. | | | 526,950 | | | | 43,194,092 | |
| MetLife, Inc. | | | 1,185,000 | | | | 51,666,000 | |
| | | | | | | | 546,719,794 | |
| Health Care (12.2%) | | | | | | | | |
| Alexion Pharmaceuticals, Inc. (b) | | | 347,850 | | | | 43,185,577 | |
| Merck & Co., Inc. | | | 1,474,500 | | | | 89,502,150 | |
| Pfizer, Inc. | | | 1,824,950 | | | | 66,209,186 | |
| Thermo Fisher Scientific, Inc. | | | 226,700 | | | | 46,958,638 | |
| | | | | | | | 245,855,551 | |
| Industrials (10.4%) | | | | | | | | |
| Delta Air Lines, Inc. | | | 918,000 | | | | 45,477,720 | |
| Eaton Corp. PLC | | | 539,650 | | | | 40,333,441 | |
| Fluor Corp. | | | 916,800 | | | | 44,721,504 | |
| nVent Electric PLC (b) | | | 1,550,350 | | | | 38,913,785 | |
| Pentair PLC | | | 972,050 | | | | 40,903,864 | |
| | | | | | | | 210,350,314 | |
| Information Technology (18.8%) | | | | | | | | |
| Alphabet, Inc., Class A (b) | | | 48,060 | | | | 54,268,871 | |
| Applied Materials, Inc. | | | 884,200 | | | | 40,841,198 | |
| First Data Corp., Class A (b) | | | 3,844,150 | | | | 80,458,059 | |
| Flex, Ltd. (b) | | | 3,598,800 | | | | 50,779,068 | |
| Microsoft Corp. | | | 511,250 | | | | 50,414,363 | |
| Oracle Corp. | | | 920,850 | | | | 40,572,651 | |
| Sabre Corp. | | | 2,589,450 | | | | 63,804,048 | |
| | | | | | | | 381,138,258 | |
See Notes to Financial Statements.
SOUND SHORE FUND, INC.
SCHEDULE OF INVESTMENTS (Unaudited) (Concluded)
JUNE 30, 2018
| | | Share
Amount | | | Value | |
| Materials (5.3%) | | | | |
| Freeport-McMoRan, Inc. | | | 2,718,900 | | | $ | 46,928,214 | |
| International Paper Co. | | | 1,152,550 | | | | 60,024,804 | |
| | | | | | | | 106,953,018 | |
| Telecommunication Services (2.1%) | | | | | | | | |
| Vodafone Group PLC, ADR | | | 1,709,200 | | | | 41,550,652 | |
| | | | | | | | | |
| Utilities (2.6%) | | | | | | | | |
| Exelon Corp. | | | 1,256,150 | | | | 53,511,990 | |
| Total Common Stock (95.8%) (cost $1,549,655,299) | | | | | | | 1,937,392,360 | |
| | | | | | | | | |
| Short-Term Investments (4.0%) | | | | | | | | | | | | | |
| Money Market Fund (4.0%) | | | | | | | | |
| Morgan Stanley Institutional Liquidity Funds Government Portfolio, Institutional Class, 1.75% (c) | | | 80,564,767 | | | | 80,564,767 | |
| Total Short-Term Investments (4.0%) (cost $80,564,767) | | | | | | | 80,564,767 | |
| | | | | | | | | |
| Investments, at value (99.8%) (cost $1,630,220,066) | | | | | | $ | 2,017,957,127 | |
| Other Assets Less Liabilities (0.2%) | | | | | | | 3,979,613 | |
| Net Assets (100.0%) | | | | | | $ | 2,021,936,740 | |
| (a) | More narrow industries are utilized for compliance purposes, whereas broad sectors are utilized for reporting purposes. |
| (b) | Non-income producing security. |
| (c) | Percentage disclosed reflects the money market fund’s institutional class shares 30-day yield as of June 30, 2018. |
| ADR | American Depositary Receipt |
| PLC | Public Limited Company |
See Notes to Financial Statements.
SOUND SHORE FUND, INC.
STATEMENT OF ASSETS AND LIABILITIES (Unaudited)
JUNE 30, 2018
| ASSETS | | |
| Investments, at value (Cost $1,630,220,066) | | $ | 2,017,957,127 | |
| Receivables: | | | | |
| Capital shares sold | | | 1,300,411 | |
| Investment securities sold | | | 9,055,979 | |
| Dividends | | | 4,065,730 | |
| Foreign tax reclaims | | | 234,465 | |
| Prepaid expenses | | | 43,466 | |
| Total Assets | | | 2,032,657,178 | |
| | | | | |
| LIABILITIES | | | | |
| Payables: | | | | |
| Capital shares redeemed | | | 879,527 | |
| Due to custodian | | | 10,375 | |
| Investments purchased | | | 8,400,242 | |
| Accrued liabilities: | | | | |
| Advisory fees | | | 1,228,944 | |
| Administrator fees | | | 20,621 | |
| Transfer agent fees and expenses | | | 71,829 | |
| Custodian fees | | | 21,046 | |
| Compliance and Treasurer Services fees | | | 9,704 | |
| Professional fees | | | 13,367 | |
| Other accrued liabilities | | | 64,783 | |
| Total Liabilities | | | 10,720,438 | |
| Net Assets | | $ | 2,021,936,740 | |
| | | | | |
| COMPONENTS OF NET ASSETS | | | | |
| Common stock, at Par Value | | $ | 45,098 | |
| Paid-in Capital | | | 1,544,582,288 | |
| Distributions in excess of net investment income | | | (408,908 | ) |
| Accumulated net realized gain on investments | | | 89,981,201 | |
| Net unrealized appreciation on investments | | | 387,737,061 | |
| Net Assets | | $ | 2,021,936,740 | |
| NET ASSET VALUE | | | | |
| Net Assets - Investor Class Shares | | $ | 1,196,943,221 | |
| Shares Outstanding - Investor Class (100,000,000 shares authorized, par value $0.001) | | | 26,739,802 | |
| Net Asset Value (offering & redemption price per share) - Investor Class Shares | | $ | 44.76 | |
| Net Assets - Institutional Class Shares | | $ | 824,993,519 | |
| Shares Outstanding - Institutional Class (100,000,000 shares authorized, par value $0.001) | | | 18,357,916 | |
| Net Asset Value (offering & redemption price per share) - Institutional Class Shares | | $ | 44.94 | |
See Notes to Financial Statements.
SOUND SHORE FUND, INC.
STATEMENT OF OPERATIONS (Unaudited)
JUNE 30, 2018
| INVESTMENT INCOME |
| Income: | | | | |
| Dividend income (net of foreign withholding taxes of $9,869) | | $ | 21,113,472 | |
| Total Income | | | 21,113,472 | |
| | | | | |
| Expenses: | | | | |
| Advisory fees (Note 3) | | | 7,820,086 | |
| Administrator fees | | | 128,595 | |
| Transfer agent fees and expenses - Investor Class Shares | | | 637,954 | |
| Transfer agent fees and expenses - Institutional Class Shares | | | 22,949 | |
| Custodian fees | | | 64,827 | |
| Compliance and Treasurer Services fees (Note 3) | | | 74,703 | |
| Directors' fees and expenses (Note 3) | | | 81,118 | |
| Professional fees | | | 50,867 | |
| Registration fees - Investor Class Shares | | | 13,112 | |
| Registration fees - Institutional Class Shares | | | 13,235 | |
| Printing and postage fees - Investor Class Shares | | | 36,108 | |
| Printing and postage fees - Institutional Class Shares | | | 13,847 | |
| Miscellaneous | | | 62,360 | |
| Total Expenses | | | 9,019,761 | |
| Expense Reimbursements - Institutional Class Shares (Note 3) | | | (231,881 | ) |
| Net Expenses | | | 8,787,880 | |
| Net Investment Income | | | 12,325,592 | |
| | | | | |
| REALIZED AND UNREALIZED GAIN (LOSS) ON INVESTMENTS |
| Net realized gain on investments | | | 91,907,318 | |
| Net change in unrealized appreciation (depreciation) on investments | | | (142,402,861 | ) |
| Net realized and unrealized loss on investments | | | (50,495,543 | ) |
| Net decrease in net asset from operations | | $ | (38,169,951 | ) |
See Notes to Financial Statements.
SOUND SHORE FUND, INC.
STATEMENTS OF CHANGES IN NET ASSETS
| | | For the Six Months Ended June 30, 2018 (Unaudited) | | | For the Year Ended December 31, 2017 | |
| Operations: | | | | | | | | |
| Net investment income | | $ | 12,325,592 | | | $ | 23,142,578 | |
| Net realized gain on investments | | | 91,907,318 | | | | 208,494,216 | |
| Net change in unrealized appreciation (depreciation) on investments | | | (142,402,861 | ) | | | 79,123,421 | |
| Increase (decrease) in net assets from operations | | | (38,169,951 | ) | | | 310,760,215 | |
| Dividends to shareholders from net investment income: | | | | | | | | |
| Investor Class Shares | | | (7,414,716 | ) | | | (14,857,273 | ) |
| Institutional Class Shares | | | (5,472,339 | ) | | | (8,221,795 | ) |
| Distributions to shareholders from net realized gains: | | | | | | | | |
| Investor Class Shares | | | – | | | | (133,474,549 | ) |
| Institutional Class Shares | | | – | | | | (75,019,661 | ) |
| Total dividends/distributions to shareholders | | | (12,887,055 | ) | | | (231,573,278 | ) |
| Net capital share transactions (Note 6): | | | | | | | | |
| Investor Class Shares | | | (139,934,879 | ) | | | (165,369,287 | ) |
| Institutional Class Shares | | | 81,709,648 | | | | 253,243,617 | |
| Total capital share transactions | | | (58,225,231 | ) | | | 87,874,330 | |
| Total increase (decrease) | | | (109,282,237 | ) | | | 167,061,267 | |
| | | | | | | | | |
| NET ASSETS |
| Beginning of the period | | | 2,131,218,977 | | | | 1,964,157,710 | |
| End of the period (including undistributed net investment income (distributions in excess of net investment income) of $(408,908) and $152,555, respectively) | | $ | 2,021,936,740 | | | $ | 2,131,218,977 | |
See Notes to Financial Statements.
SOUND SHORE FUND, INC.
NOTES TO FINANCIAL STATEMENTS (Unaudited)
JUNE 30, 2018
1. Organization
Sound Shore Fund, Inc. (the “Fund”) was incorporated under the laws of the State of Maryland on February 19, 1985 and is registered as a diversified, open-end management investment company under the Investment Company Act of 1940 (the “Act”). The investment objective of the Fund is growth of capital. The Fund qualifies as an investment company as defined in the Financial Accounting Standards Codification 946 — Financial Services — Investment Companies.
The total number of shares of common stock which the Fund is authorized to issue is 200,000,000, par value $0.001 per share of which 100,000,000 shares are designated to the Investor Class and 100,000,000 shares are designated to the Institutional Class. The Board of Directors (the “Board”) may, without shareholder approval, classify or reclassify any unissued shares into other classes or series of shares.
Each share of the Fund has equal dividend, distribution, liquidation and voting rights (except as to matters relating exclusively to one class of shares), and fractional shares have those rights proportionately.
2. Significant Accounting Policies
These financial statements are prepared in accordance with accounting principles generally accepted in the United States of America (“GAAP”), which require management to make estimates and assumptions that affect the reported amounts of assets and liabilities, disclosure of contingent liabilities, if any, at the date of the financial statements, and the reported amounts of increase and decrease in net assets from operations during the fiscal period Actual results could differ from those estimates.
The following represents the significant accounting policies of the Fund:
a. Security Valuation
Exchange-traded securities including those traded on the National Association of Securities Dealers’ Automated Quotation system (“NASDAQ”), are valued at the last quoted sale price or official closing price as provided by independent pricing services as of the close of trading on the system or exchange on which they are primarily traded, on each Fund business day. In the absence of a sale, such securities are valued at the mean of the last bid and asked prices. Non-exchange-traded securities for which over-the-counter market quotations are readily available are generally valued at the mean between the current bid and asked prices provided by independent pricing services. Investments in other open-end regulated investment companies are valued at their publicly traded net asset value (“NAV”).
The Fund values securities at fair value pursuant to procedures adopted by the Board if market quotations are not readily available (including a short and temporary lapse in the provision of a price by the regular pricing source) or, if in the judgment of the Adviser, as defined in Note 3, the prices or values available do not represent the fair value of the instrument. Factors which may cause the Adviser to make such a judgment include, but are not limited to, the following: (i) only a bid price or an asked price is available, (ii) the spread between the bid price and the asked price is substantial, (iii) the frequency of sales, (iv) the thinness of the market, (v) the size of reported trades, and (vi) actions of the securities markets, such as the suspension or limitation of trading. Fair valuation is based on subjective factors and, as a result, the fair value price of a security may differ from the security’s market price and may not be the price at which the security may be sold. Fair valuation could result in a NAV different from one determined by using market quotations.
SOUND SHORE FUND, INC.
NOTES TO FINANCIAL STATEMENTS (Unaudited) (Continued)
JUNE 30, 2018
Valuation inputs used to determine the value of the Fund’s investments are summarized in the three broad levels listed below:
Level 1 - quoted prices in active markets for identical assets
Level 2 - other significant observable inputs (including quoted prices of similar securities, interest rates, prepayment speeds, credit risk, etc.)
Level 3 - significant unobservable inputs (including the Fund’s own assumptions in determining the fair value of investments)
The inputs or methodology used for valuing securities are not necessarily an indication of the risk associated with investing in those securities.
Pursuant to the valuation procedures noted previously, equity securities (including exchange-traded securities and other open-end regulated investment companies) are generally categorized as Level 1 securities in the fair value hierarchy. Investments for which there are no quotations, or for which quotations do not appear reliable, are valued at fair value as determined in good faith by the Pricing Committee under the direction of the Board. These valuations are typically categorized as Level 2 or Level 3 in the fair value hierarchy.
The following table summarizes the Fund’s investments categorized in the fair value hierarchy as of June 30, 2018:
| Security Type | | Level 1 | | | Level 2 | | | Level 3 | | | Total Investments in Securities | |
| Common Stock | | $ | 1,937,392,360 | | | $ | – | | | $ | – | | | $ | 1,937,392,360 | |
| Short-Term Investments | | | 80,564,767 | | | | – | | | | – | | | | 80,564,767 | |
| Total Investments | | $ | 2,017,957,127 | | | $ | – | | | $ | – | | | $ | 2,017,957,127 | |
At June 30, 2018, all equity securities and open-end regulated investment companies were included in Level 1 in the table above. Please refer to the Schedule of Investments to view equity securities categorized by sector/industry type.
The Fund’s policy is to disclose transfers between Levels based on valuations at the end of the reporting period. There were no transfers between Levels as of June 30, 2018, based on the valuation input Levels on December 31, 2017.
b. Security Transactions, Investment Income and Expenses
Security transactions are recorded on a trade date basis. Realized gain and loss on investments sold are recorded on the basis of identified cost. Dividend income is recorded on the ex-dividend date. Interest income is recorded on an accrual
SOUND SHORE FUND, INC.
NOTES TO FINANCIAL STATEMENTS (Unaudited) (Continued)
JUNE 30, 2018
basis. Foreign dividend income is recorded on the ex-dividend date or as soon as practicable after the Fund determines the existence of a dividend declaration after exercising reasonable due diligence. Income and capital gains on some foreign securities may be subject to foreign withholding tax, which is accrued as applicable. Investment income, realized and unrealized gains and losses and certain Fund-level expenses are allocated to each class based on relative average daily net assets. Certain expenses are incurred at the class level and charged directly to that particular class. Class level expenses are denoted as such on the Fund’s Statement of Operations.
c. Dividends and Distributions to Shareholders
Dividends are declared separately for each class. No class has preferential dividend rights; differences in per-share dividend rates are generally due to class-specific fee waivers and expenses. Dividends and distributions payable to shareholders are recorded by the Fund on the ex-dividend date. Dividends from net investment income, if any, are declared and paid semiannually. Capital gains, if any, are distributed to shareholders at least annually. The Fund determines its net investment income and capital gains distributions in accordance with income tax regulations, which may differ from GAAP. These differences are due primarily to differing treatments of income and gains on various securities held by the Fund, timing differences and differing characterizations of distributions made by the Fund. To the extent distributions exceed net investment income and net realized capital gains for tax purposes, they are reported as a return of capital.
d. Federal Taxes
The Fund intends to qualify each year as a regulated investment company and to distribute substantially all of its taxable income. In addition, by distributing in each calendar year substantially all of its net investment income, capital gain and certain other amounts, if any, the Fund will not be subject to federal taxation. Therefore, no federal income or excise tax provision is required. For all open tax years and all major taxing jurisdictions, management of the Fund has concluded that there are no significant uncertain tax positions that would require the Fund to record a tax liability or would otherwise require recognition in the financial statements. Open tax years are those that are open for examination by taxing authorities (i.e., generally, the last three tax year-ends 2015 – 2017, and the interim tax period since then).
3. Fees and Expenses
Investment Adviser
The Fund’s investment adviser is Sound Shore Management, Inc. (the “Adviser”). Pursuant to an investment advisory agreement, the Adviser receives an advisory fee, accrued daily and paid monthly at an annual rate of 0.75% of the Fund’s average daily net assets. Pursuant to an expense limitation agreement between the Adviser and the Fund, the Adviser has agreed to reimburse all of the ordinary expenses of the Institutional Class, excluding advisory fees, interest, taxes, securities lending costs, brokerage commissions, acquired fund fees and expenses, extraordinary expenses and all litigation costs until at least May 1, 2019. This reimbursement is shown on the Statement of Operations as a reduction of expenses, and such amounts are not subject to future recoupment by the Adviser.
Other Services
Atlantic Fund Administration, LLC (d/b/a Atlantic Fund Services) (“Atlantic”) provides certain administration and portfolio accounting services to the Fund. MUFG Union Bank, N.A. (“Union Bank”) serves as custodian to the Fund.
SOUND SHORE FUND, INC.
NOTES TO FINANCIAL STATEMENTS (Unaudited) (Continued)
JUNE 30, 2018
Atlantic Shareholder Services, LLC provides transfer agency services to the Fund.
The Fund also has agreements with various financial intermediaries and “mutual fund supermarkets” under which customers of these intermediaries may purchase and hold Fund shares. These intermediaries effectively provide subtransfer agent services that the Fund’s transfer agent would have otherwise had to provide. In recognition of this, the transfer agent, the Fund and the Fund’s Adviser have entered into an agreement whereby the transfer agent agrees to pay financial intermediaries a portion of the amount denoted on the Statement of Operations as “Transfer agent fees and expenses — Investor Class Shares” that it receives from the Fund for its services as transfer agent for the Investor Class and the Adviser agrees to pay the excess, if any, charged by a financial intermediary for that class.
Foreside Fund Services, LLC is the Fund’s distributor (the “Distributor”). The Distributor is not affiliated with the Adviser, Atlantic, Union Bank, or its affiliated companies. The Distributor receives no compensation from the Fund for its distribution services.
Pursuant to a Compliance Services Agreement with the Fund, Foreside Fund Officer Services, LLC (“FFOS”), an affiliate of the Distributor, provides a Chief Compliance Officer and Anti-Money Laundering Officer to the Fund as well as some additional compliance support functions. Under a Treasurer Services Agreement with the Fund, Foreside Management Services, LLC (“FMS”), an affiliate of the Distributor, provides a Treasurer to the Fund. Neither the Distributor, FFOS, FMS, nor their employees that serve as officers of the Fund, have any role in determining the investment policies of or securities to be purchased or sold by the Fund.
The Fund pays each director who is not an “interested person” of the Fund, as defined in Section 2(a)(19) of the Act (“Independent Director”), quarterly fees of $2,500 ($5,000 effective as of July 2018), plus $10,000 per quarterly in-person meeting, $4,000 per quarterly meeting attended telephonically, and $2,000 per special meeting attended in person or telephonically. In addition, the Chairman of the Audit Committee receives a quarterly fee of $1,250 ($2,500 effective as of July 2018).
Certain Officers and Directors of the Fund are officers, directors, or employees of the aforementioned companies.
4. Purchases and Sales of Securities
The cost of securities purchased and proceeds from sales of securities (excluding short-term investments and in kind transactions) for the period ending June 30, 2018, aggregated $503,188,261 and $596,925,772, respectively.
5. Federal Income Tax
Cost for federal income tax purposes is substantially the same as for financial statement purposes and net unrealized appreciation consists of:
| Gross Unrealized Appreciation | | $ | 451,868,353 | |
| Gross Unrealized Depreciation | | | (64,131,292 | ) |
| Net Unrealized Appreciation | | $ | 387,737,061 | |
SOUND SHORE FUND, INC.
NOTES TO FINANCIAL STATEMENTS (Unaudited) (Continued)
JUNE 30, 2018
Distributions during the fiscal years ended December 31, 2017 and December 31, 2016 were characterized for tax purposes as follows:
| | | 2017 | | | 2016 | |
| Ordinary Income | | $ | 23,079,072 | | | $ | 25,713,146 | |
| Long-Term Capital Gain | | | 208,494,206 | | | | 108,011,451 | |
| Total Taxable Distributions | | $ | 231,573,278 | | | $ | 133,724,597 | |
Components of capital on a federal income tax basis at December 31, 2017, were as follows:
| Par Value + Paid-in Capital | | $ | 1,602,852,617 | |
| Undistributed Ordinary Income | | | 152,555 | |
| Net Unrealized Appreciation | | | 528,213,805 | |
| Net Assets | | $ | 2,131,218,977 | |
6. Capital Stock
Transactions in capital stock for the period ended June 30, 2018 and the year ended December 31, 2017, were as follows:
| | | For the Period Ended June 30, 2018 |
| | | | Investor Class | | | | Institutional Class | |
| | | | Shares | | | | Amount | | | | Shares | | | | Amount | |
| Sale of shares | | | 658,521 | | | $ | 30,269,206 | | | | 3,683,275 | | | $ | 170,870,333 | |
| Reinvestment of dividends | | | 155,830 | | | | 7,068,464 | | | | 108,393 | | | | 4,936,201 | |
| Redemption of shares | | | (3,839,796 | ) | | | (177,272,549 | ) | | | (2,049,988 | ) | | | (94,096,886 | ) |
| Net increase (decrease) from capital transactions | | | (3,025,445 | ) | | $ | (139,934,879 | ) | | | 1,741,680 | | | $ | 81,709,648 | |
| | | For the Year Ended December 31, 2017 |
| | | | Investor Class | | | Institutional Class |
| | | | Shares | | | | Amount | | | | Shares | | | | Amount | |
| Sale of shares | | | 3,304,068 | | | $ | 156,826,544 | | | | 6,331,314 | | | $ | 304,347,221 | |
| Reinvestment of dividends | | | 3,107,756 | | | | 142,937,146 | | | | 1,670,081 | | | | 77,072,000 | |
| Redemption of shares | | | (9,802,101 | ) | | | (465,132,977 | ) | | | (2,664,780 | ) | | | (128,175,604 | ) |
| Net increase (decrease) from capital transactions | | | (3,390,277 | ) | | $ | (165,369,287 | ) | | | 5,336,615 | | | $ | 253,243,617 | |
7. Risks
As of June 30, 2018, the Fund invested a significant portion of its assets in securities in the Financials and Information Technology sectors. Changes in economic conditions affecting such sectors would have a greater impact on the Fund and could affect the value, income and/or liquidity of positions in such securities.
SOUND SHORE FUND, INC.
NOTES TO FINANCIAL STATEMENTS (Unaudited) (Concluded)
JUNE 30, 2018
8. Subsequent Events
Subsequent events occurring after the date of this report have been evaluated for potential impact to this report through the date the report was issued.
SOUND SHORE FUND, INC.
FINANCIAL HIGHLIGHTS
These financial highlights reflect selected data for a share outstanding throughout each period.
| | | Six Months | | For the Year Ended December 31, |
| | | Ended June 30, 2018 (Unaudited) | | 2017 | | 2016 | | 2015 | | 2014 | | 2013 |
| Investor Class Shares | | | | | | | | | | | | |
| Net Asset Value, Beginning of Period | | $ | 45.89 | | | $ | 44.17 | | | $ | 41.30 | | | $ | 48.79 | | | $ | 49.05 | | | $ | 34.91 | |
| Investment Operations | | | | | | | | | | | | | | | | | | | | | | | | |
| Net investment income (a) | | | 0.25 | | | | 0.51 | | | | 0.45 | | | | 0.39 | | | | 0.98 | | | | 0.32 | |
| Net realized and unrealized gain (loss) on investments | | | (1.10 | ) | | | 6.63 | | | | 5.57 | | | | (2.75 | ) | | | 4.83 | | | | 14.14 | |
| Total from Investment Operations | | | (0.85 | ) | | | 7.14 | | | | 6.02 | | | | (2.36 | ) | | | 5.81 | | | | 14.46 | |
| Distributions from | | | | | | | | | | | | | | | | | | | | | | | | |
| Net investment income | | | (0.28 | ) | | | (0.52 | ) | | | (0.46 | ) | | | (0.39 | ) | | | (0.98 | ) | | | (0.32 | ) |
| Return of capital | | | – | | | | – | | | | – | | | | – | | | | (0.03 | ) | | | – | |
| Net realized gains | | | – | | | | (4.90 | ) | | | (2.69 | ) | | | (4.74 | ) | | | (5.06 | ) | | | – | |
| Total Distributions | | | (0.28 | ) | | | (5.42 | ) | | | (3.15 | ) | | | (5.13 | ) | | | (6.07 | ) | | | (0.32 | ) |
| Net Asset Value, End of Period | | $ | 44.76 | | | $ | 45.89 | | | $ | 44.17 | | | $ | 41.30 | | | $ | 48.79 | | | $ | 49.05 | |
| Total Return | | | (1.87 | )%(b) | | | 16.22 | % | | | 14.63 | % | | | (5.02 | )% | | | 11.76 | % | | | 41.53 | % |
| Ratios/Supplemental Data | | | | | | | | | | | | | | | | | | | | | | | | |
| Net Assets at End of Period (in thousands) | | $ | 1,196,943 | | | $ | 1,365,922 | | | $ | 1,464,566 | | | $ | 1,462,946 | | | $ | 1,786,366 | | | $ | 2,066,584 | |
| Ratios to Average Net Assets: | | | | | | | | | | | | | | | | | | | | | | | | |
| Expenses | | | 0.90 | %(c) | | | 0.90 | % | | | 0.91 | % | | | 0.93 | % | | | 0.92 | % | | | 0.93 | % |
| Net Investment Income | | | 1.12 | %(c) | | | 1.06 | % | | | 1.05 | % | | | 0.80 | % | | | 1.92 | %(d) | | | 0.77 | % |
| Portfolio Turnover Rate (e) | | | 25 | %(b) | | | 44 | % | | | 46 | % | | | 39 | %(f) | | | 47 | % | | | 44 | % |
| (a) | Calculated based on average shares outstanding during each period. |
| (d) | Net investment income for the period includes /reflects the divestiture by Vodafone (one of the Fund's portfolio holdings) of its 45% stake in Verizon Wireless in a transaction that included the payment of an extraordinary dividend of cash and shares of Verizon to Vodafone shareholders. Absent this distribution, the ratio of net investment income to average net assets would have been 0.53% for the period. |
| (e) | Portfolio turnover is calculated on the basis of the Fund, as a whole, without distinguishing between the classes of shares issued. |
| (f) | Amount excludes redemption in-kind of $30,223,998. |
SOUND SHORE FUND, INC.
FINANCIAL HIGHLIGHTS (Concluded)
These financial highlights reflect selected data for a share outstanding throughout each period.
| | | Six Months | | For the Year Ended December 31, | December 9, |
| | | Ended June 30, 2018 (Unaudited) | | 2017 | | 2016 | | 2015 | | 2014 | | 2013(a) through December 31, 2013 |
| Institutional Class Shares | | | | | | | | | | | | |
| Net Asset Value, Beginning of Period | | $ | 46.06 | | | $ | 44.29 | | | $ | 41.38 | | | $ | 48.87 | | | $ | 49.06 | | | $ | 47.78 | |
| Investment Operations | | | | | | | | | | | | | | | | | | | | | | | | |
| Net investment income (b) | | | 0.29 | | | | 0.60 | | | | 0.52 | | | | 0.48 | | | | 0.67 | | | | 0.01 | |
| Net realized and unrealized gain (loss) on investments | | | (1.11 | ) | | | 6.64 | | | | 5.58 | | | | (2.75 | ) | | | 5.23 | | | | 1.42 | |
| Total from Investment Operations | | | (0.82 | ) | | | 7.24 | | | | 6.10 | | | | (2.27 | ) | | | 5.90 | | | | 1.43 | |
| Distributions from | | | | | | | | | | | | | | | | | | | | | | | | |
| Net investment income | | | (0.30 | ) | | | (0.57 | ) | | | (0.50 | ) | | | (0.48 | ) | | | (1.00 | ) | | | (0.15 | ) |
| Return of capital | | | – | | | | – | | | | – | | | | – | | | | (0.03 | ) | | | – | |
| Net realized gains | | | – | | | | (4.90 | ) | | | (2.69 | ) | | | (4.74 | ) | | | (5.06 | ) | | | – | |
| Total Distributions | | | (0.30 | ) | | | (5.47 | ) | | | (3.19 | ) | | | (5.22 | ) | | | (6.09 | ) | | | (0.15 | ) |
| Net Asset Value, End of Period | | $ | 44.94 | | | $ | 46.06 | | | $ | 44.29 | | | $ | 41.38 | | | $ | 48.87 | | | $ | 49.06 | |
| Total Return | | | (1.79 | )%(c) | | | 16.40 | % | | | 14.80 | % | | | (4.84 | )% | | | 11.94 | % | | | 3.00 | %(c) |
| Ratios/Supplemental Data | | | | | | | | | | | | | | | | | | | | | | | | |
| Net Assets at End of Period (in thousands) | | $ | 824,994 | | | $ | 765,297 | | | $ | 499,591 | | | $ | 450,442 | | | $ | 551,261 | | | $ | 77,427 | |
| Ratios to Average Net Assets: | | | | | | | | | | | | | | | | | | | | | | | | |
| Expenses (gross) (d) | | | 0.81 | %(e) | | | 0.81 | % | | | 0.82 | % | | | 0.83 | % | | | 0.83 | % | | | 0.87 | %(e) |
| Expenses (net) | | | 0.75 | %(e) | | | 0.75 | % | | | 0.75 | % | | | 0.75 | % | | | 0.75 | % | | | 0.75 | %(e) |
| Net Investment Income | | | 1.28 | %(e) | | | 1.25 | % | | | 1.21 | % | | | 0.98 | % | | | 1.29 | %(f) | | | 0.45 | %(e) |
| Portfolio Turnover Rate (g) | | | 25 | %(c) | | | 44 | % | | | 46 | % | | | 39 | %(h) | | | 47 | % | | | 44 | %(c) |
| (a) | Commencement of operations. |
| (b) | Calculated based on average shares outstanding during each period. |
| (d) | Reflects the expense ratio excluding any waivers and/or reimbursements. |
| (f) | Net investment income for the period includes/reflects the divestiture by Vodafone (one of the Fund's portfolio holdings) of its 45% stake in Verizon Wireless in a transaction that included the payment of an extraordinary dividend of cash and shares of Verizon to Vodafone shareholders. Absent this distribution, the ratio of net investment income to average net assets would have been 0.72% for the period. |
| (g) | Portfolio turnover is calculated on the basis of the Fund, as a whole, without distinguishing between the classes of shares issued. |
| (h) | Amount excludes redemption in-kind of $30,223,998. |
SOUND SHORE FUND, INC.
ADDITIONAL INFORMATION (Unaudited)
JUNE 30, 2018
Shareholder Expense Example
��
As a shareholder of the Fund, you incur ongoing costs, including management fees and other Fund expenses. This example is intended to help you understand your ongoing costs (in dollars) of investing in the Fund and to compare these costs with the ongoing costs of investing in other mutual funds.
The following example is based on $1,000 invested at the beginning of the period and held for the entire period from January 1, 2018 through June 30, 2018.
Actual Expenses - The Actual Return lines of the table below provide information about actual account values and actual expenses for each share class. You may use the information in these lines, together with the amount you invested, to estimate the expenses that you paid over the period. Simply divide your account value by $1,000 (for example, an $8,600 account value divided by $1,000 = 8.6), then multiply the result by the number in the Actual Return line under the heading entitled “Expenses Paid During Period” to estimate the expenses you paid on your account during this period.
Hypothetical Example for Comparison Purposes - The Hypothetical Return lines of the table below provide information about hypothetical account values and hypothetical expenses based on each class’ actual expense ratio and an assumed rate of return of 5% per year before expenses, which is not the Fund’s actual return. The hypothetical account values and expenses may not be used to estimate the actual ending account balance or expenses you paid for the period. You may use this information to compare the ongoing cost of investing in the Fund and other funds. To do so, compare this 5% hypothetical example with the 5% hypothetical examples that appear in the shareholder reports of other funds.
Expenses shown in the table are meant to highlight your ongoing costs only and do not reflect any transactional costs. Therefore, the Hypothetical Return lines of the table are useful in comparing ongoing costs only, and will not help you determine the relative total costs of owning different funds.
| | Beginning Account Value January 1, 2018 | Ending Account Value June 30, 2018 | Expenses Paid During Period* |
| Investor Class Actual Return | $1,000.00 | $981.32 | $4.42 |
| Investor Class Hypothetical Return | $1,000.00 | $1,020.33 | $4.51 |
| Institutional Class Actual Return | $1,000.00 | $982.12 | $3.69 |
| Institutional Class Hypothetical Return | $1,000.00 | $1,021.08 | $3.76 |
| * | Expenses are equal to the Investor Class' and Institutional Class' annualized expense ratios of 0.90% and 0.75%, respectively, multiplied by the average account value over the period, multiplied by 181/365 to reflect the most recent one-half year period. |
SOUND SHORE FUND, INC.
ADDITIONAL INFORMATION (Unaudited) (Continued)
JUNE 30, 2018
Investment Advisory Agreement Approval
On January 25, 2018, the Independent Directors and the full Board held a Board meeting (“January Meeting”) and approved the continuance of the Advisory Agreement. In reaching this determination, the Board considered information about the Adviser, the performance of the Fund and certain additional factors described below that it deemed relevant. The following summary details the materials and factors that the Board considered, among others, and the conclusions they reached, in approving the continuance of the Advisory Agreement.
(1) The nature, extent and quality of services provided by the Adviser.
The Board considered the scope and quality of services provided by the Adviser, particularly the qualifications, capabilities and experience of the investment, operational, compliance, legal and other personnel who are responsible for providing services to the Fund. The Board also considered the fact that the Adviser pays the costs of all investment and management facilities necessary for the efficient conduct of its services as well as all distribution costs incurred on behalf of the Fund and all servicing costs to financial intermediaries beyond the 10 basis points borne by the Fund.
In addition, the Board considered that the Adviser manages the overall investment program of the Fund and that the Adviser keeps the Board informed of important developments affecting the Fund, both in connection with the Board’s annual review of the Advisory Agreement and at each Board meeting. The Board evaluated these factors based on its direct experience with the Adviser, and in consultation with Counsel to the Fund and Counsel to the Independent Directors. The Board also considered the Adviser’s effectiveness in ensuring that the Fund is in compliance with its investment policies and restrictions and the requirements of the 1940 Act and related securities regulations. The Board further noted the Adviser’s efforts to oversee the Fund’s other service providers, including those providing administrative, accounting and custodial services.
Based on these factors, as well as other factors discussed herein, the Board concluded that the nature, quality and extent of services provided by the Adviser have been and continues to be satisfactory.
(2) The performance of the Fund and the Adviser.
The Board’s analysis of the Fund’s performance included the discussion and review of the performance data of the Fund against securities benchmarks as well as against a competitive group of similar funds, based on, in part, information provided by an independent, third-party mutual fund data provider. The Board reviewed comparative performance over long-, intermediate- and short-term periods. In reviewing performance, the Board placed greater emphasis on longer-term performance than on shorter-term performance, taking into account that over short periods of time underperformance may be transitory. The Board also considered the performance of the Fund in the context of whether the Fund was meeting the expectations of the clients invested in the Fund.
The Board also considered the performance of the Fund against comparative benchmarks as well as against similarly managed accounts, if applicable, managed by the Adviser. When reviewing performance against similarly managed accounts, the Board considered, among other things, differences in the nature of such accounts from a regulatory and tax perspective and differences in the investment mandate from that of the Fund.
SOUND SHORE FUND, INC.
ADDITIONAL INFORMATION (Unaudited) (Continued)
JUNE 30, 2018
(3) The cost of the advisory services and the profits to the Adviser from the relationship with the Fund.
In connection with the Board’s consideration of the level of the advisory fee, the Board considered a number of factors. The Board’s analysis of the Fund’s advisory fee and expenses included a discussion and review of data concerning the current fee and expense ratio of the Fund compared to a peer group of similar funds and noted that the Fund’s advisory fee and expenses were only slightly above, and generally in line, with those of their peer group. The Board noted that the advisory fee was competitive with other mutual funds with similar strategies and characteristics. The Board also considered that the Institutional Class has a lower expense ratio than the Investor Class because the Adviser has capped expenses at 75 basis points to compete in the institutional market. They concluded that the expense ratios for both classes appeared to be competitive with similarly managed funds.
Additionally, the Board considered fee data from the Adviser’s similarly managed accounts and considered the relevance of differences in the services provided to separate accounts as they relate to differences in the fees charged in connection with the Fund.
The Board also considered the profitability of the Fund to the Adviser. In this regard, the Board noted that the Fund, with an advisory fee of 75 basis points and assets slightly over $2 billion, did not appear to generate “excessive” fees to the Adviser. Based on this analysis, the Board concluded that the advisory fee for the Fund was fair and reasonable in light of the quality of services provided by the Adviser.
(4) The extent to which economies of scale will be realized as the Fund grows and whether fee levels reflect those economies of scale.
In considering economies of scale, the Board noted that at its current relatively small size, there did not appear to be “economies” of scale applicable to the Fund at this time.
(5) Ancillary benefits and other factors.
In addition to the above factors, the Board also discussed other benefits received by the Adviser from the management of the Fund, such as soft-dollar credits. The Board concluded that the advisory fee was reasonable in light of these fall-out benefits.
Conclusion
The Board, including all of the Independent Directors, concluded that the fees payable under the Advisory Agreement were fair and reasonable with respect to the services that the Adviser provides, in light of the factors described above that the Board deemed relevant. The Board based its decision on an evaluation of all these factors as a whole and did not consider any one factor as all-important or controlling. The Independent Directors were also assisted by the advice of Counsel to the Independent Directors in making this determination.
SOUND SHORE FUND, INC.
ADDITIONAL INFORMATION (Unaudited) (Concluded)
JUNE 30, 2018
Proxy Voting Information
A description of the policies and procedures that the Fund uses to determine how to vote proxies relating to securities held in the Fund’s portfolio is available, without charge and upon request, by calling (800) 551-1980 or by visiting the Fund’s website at http://www.soundshorefund.com. This information is also available on the Securities and Exchange Commission’s (“SEC”) website at http://www.sec.gov under the name of the Sound Shore Fund.
The Fund’s proxy voting record for the most recent 12-month period ended June 30 is available, without charge and upon request, by calling (800) 551-1980 or by visiting the Fund’s website at http://www.soundshorefund.com. This information is available on the SEC’s website at http://www.sec.gov under the name of the Sound Shore Fund.
Availability of Quarterly Portfolio Schedule
The Fund files its complete schedule of portfolio holdings with the SEC for the first and third quarters of each fiscal year on Form N-Q. This information is available on the SEC’s website at http://www.sec.gov under the name of the Sound Shore Fund. It may be reviewed and copied at the SEC’s Public Reference Room in Washington, DC. Information on the operation of the Public Reference Room may be obtained by calling (800) SEC-0330.

Investment Adviser
Sound Shore Management, Inc.
Greenwich, Connecticut
Administrator
Atlantic Fund Administration, LLC
Portland, Maine
Distributor
Foreside Fund Services, LLC
Portland, Maine
www.foreside.com
Transfer and Distribution Paying Agent
Atlantic Shareholder Services, LLC
Portland, Maine
Custodian
MUFG Union Bank, N.A.
San Francisco, California
Fund Counsel
Schiff Hardin LLP
New York, New York
Independent Registered
Public Accounting Firm
BBD, LLP
Philadelphia, Pennsylvania
Item 2. Code of Ethics.
Not applicable.
Item 3. Audit Committee Financial Expert.
Not applicable.
Item 4. Principal Accountant Fees and Services.
Not applicable.
Item 5. Audit Committee of Listed Registrants.
Not applicable.
Item 6. Schedule of Investments.
| (a) | Included as part of the report to stockholders under Item 1. |
| (b) | Not applicable. |
Item 7. Disclosure of Proxy Voting Policies and Procedures for Closed-End Management Investment Companies.
Not applicable.
Item 8. Portfolio Managers of Closed-End Management Investment Companies.
Not applicable.
Item 9. Purchases of Equity Securities by Closed-End Management Investment Company and Affiliated Purchasers.
Not applicable.
Item 10. Submission of Matters to a Vote of Security Holders.
Not applicable.
Item 11. Controls and Procedures.
(a) The registrant's principal executive officer and principal financial officer concluded that the registrant's disclosure controls and procedures (as defined in Rule 30a-3(c) under the Investment Company Act of 1940 (the "Act")) were effective as of a date within 90 days of the filing date of this report (the "Evaluation Date") based on their evaluation of the registrant's disclosure controls and procedures as of the Evaluation Date.
(b) There were no changes in the registrant's internal control over financial reporting (as defined in Rule 30a-3(d) under the Act) that occurred during the second fiscal quarter of the period covered by this report that have materially affected, or are reasonably likely to materially affect, the registrant's internal control over financial reporting.
Item 12. Disclosure of Securities Lending Activities for Closed-End Management Investment Companies.
Not applicable.
Item 13. Exhibits.
(a)(1) Not applicable.
(a)(2) Certifications pursuant to Rule 30a-2(a) of the Investment Company Act of 1940 as amended, and Section 302 of the Sarbanes-Oxley Act of 2002 (Exhibit filed herewith).
(a)(3) Not applicable.
(b) Certifications pursuant to Rule 30a-2(b) of the Investment Company Act of 1940, as amended, and Section 906 of the Sarbanes-Oxley Act of 2002 (Exhibit filed herewith).
SIGNATURES
Pursuant to the requirements of the Securities Exchange Act of 1934 and the Investment Company Act of 1940, the registrant has duly caused this report to be signed on its behalf by the undersigned, thereunto duly authorized.
SOUND SHORE FUND, INC.
| By | /s/ T. Gibbs Kane, Jr. | |
| | T. Gibbs Kane, Jr., President | |
| | | |
| Date | 8/23/18 | |
Pursuant to the requirements of the Securities Exchange Act of 1934 and the Investment Company Act of 1940, this report has been signed below by the following persons on behalf of the registrant and in the capacities and on the dates indicated.
| By | /s/ T. Gibbs Kane, Jr. | |
| | T. Gibbs Kane, Jr., President | |
| | | |
| Date | 8/23/18 | |
| By | /s/ Charles S. Todd | |
| | Charles S. Todd, Treasurer | |
| | | |
| Date | 8/23/18 | |