Exhibit (17)(f)

SEMI-ANNUAL REPORT / JANUARY 31, 2008
Legg Mason Partners High Income Fund
INVESTMENT PRODUCTS: NOT FDIC INSURED • NO BANK GUARANTEE • MAY LOSE VALUE
Fund objective
The Fund seeks high current income.
What’s inside
| | |
| Letter from the chairman | | I |
| |
| Fund at a glance | | 1 |
| |
| Fund expenses | | 2 |
| |
| Schedule of investments | | 4 |
| |
| Statement of assets and liabilities | | 18 |
| |
| Statement of operations | | 19 |
| |
| Statements of changes in net assets | | 20 |
| |
| Financial highlights | | 21 |
| |
| Notes to financial statements | | 25 |
| |
| Board approval of management and subadvisory agreements | | 36 |
Legg Mason Partners Fund Advisor, LLC (“LMPFA”) is the Fund’s investment manager. Western Asset Management Company (“Western Asset”) and Western Asset Management Company Limited (“Western Asset Limited”) are the Fund’s subadvisers. LMPFA, Western Asset and Western Asset Limited are wholly-owned subsidiaries of Legg Mason, Inc.
Letter from the chairman

R. Jay Gerken, CFA
Chairman, President and Chief Executive Officer
Dear Shareholder,
While the U.S. economy continued to expand during the six-month reporting period ended January 31, 2008, it weakened significantly as the period progressed. After U.S. gross domestic product (“GDP”)i growth was a tepid 0.6% in the first quarter of 2007, the economy then rebounded during the next six months. Second quarter 2007 GDP growth was a solid 3.8% and third quarter GDP growth accelerated to 4.9%, its strongest showing in four years. However, continued weakness in the housing market and an ongoing credit crunch took their toll on the economy during the last three months of 2007. During this period, the preliminary estimate for GDP growth was 0.6%. Recently, there have been additional signs of an economic slowdown, leading some to believe that the U.S. may be headed for a recession. The U.S. Commerce Department reported that consumer spending rose an anemic 0.3% in December 2007, the weakest growth rate in 15 months. Elsewhere, the U.S. Department of Labor estimated that non-farm payroll employment fell 22,000 in January 2008, the first monthly decline in more than four years.
Ongoing issues related to the housing and subprime mortgage markets and an abrupt tightening in the credit markets prompted the Federal Reserve Board (“Fed”)ii to take several actions during the reporting period. The Fed initially responded by lowering the discount rate — the rate the Fed uses for loans it makes directly to banks — from 6.25% to 5.75% in mid-August 2007. Then, at its meeting on September 18, the Fed reduced the discount rate to 5.25% and the federal funds rateiii from 5.25% to 4.75%. This marked the first reduction in the federal funds rate since June 2003. The Fed again lowered rates in October and December 2007, bringing the federal funds rate to 4.25% at the end of 2007. In January 2008, the Fed continued to aggressively ease monetary policy in an attempt to ward off a recession. In a surprise move, the Fed cut the federal funds rate on January 22, 2008 by 0.75% to 3.50%. The Fed again lowered the federal funds rate during its meeting on January 30, 2008, bringing it to 3.00%, its lowest level since May 2005. In its statement accompanying its latest rate cut, the Fed stated: “Today’s policy action, combined with those taken earlier, should help to
Legg Mason Partners High Income Fund | I
Letter from the chairman continued
promote moderate growth over time and to mitigate the risks to economic activity. However, downside risks to growth remain. The Committee will continue to assess the effects of financial and other developments on economic prospects and will act in a timely manner as needed to address those risks.”
During the six-month reporting period, both short- and long-term Treasury yields experienced periods of volatility. This was due, in part, to mixed economic and inflation data, the fallout from the subprime mortgage market and shifting expectations regarding the Fed’s monetary policy. Within the bond market, investors were initially focused on the subprime segment of the mortgage-backed market. These concerns broadened, however, to include a wide range of financial institutions and markets. As a result, other fixed-income instruments also experienced increased price volatility. This turmoil triggered several “flights to quality,” causing Treasury yields to move sharply lower (and their prices higher), while riskier segments of the market saw their yields move higher (and their prices lower).
Overall, during the six months ended January 31, 2008, two-year Treasury yields fell from 4.56% to 2.17%. Over the same time frame, 10-year Treasury yields fell from 4.78% to 3.67%. The U.S. yield curveiv steepened during the reporting period. Short-term yields fell sharply in concert with the Fed’s rate cuts while longer-term yields fell less dramatically due to inflationary concerns. Looking at the six-month period as a whole, the overall bond market, as measured by the Lehman Brothers U.S. Aggregate Indexv, returned 6.82%.
Increased investor risk aversion in November 2007 and again at the end of the reporting period caused the high-yield bond market to post only a modest gain for the six months ended January 31, 2008. During that period, the Citigroup High Yield Market Indexvi returned 1.26%. While high-yield bond prices rallied several times during the period, several flights to quality dragged down the sector, despite continued low default rates.
Despite increased investor risk aversion, emerging markets debt generated strong results, as the JPMorgan Emerging Markets Bond Index Global (“EMBI Global”)vii returned 7.15% over the six months ended January 31, 2008. Overall solid demand, an expanding global economy, increased domestic spending and the Fed’s numerous rate cuts supported the emerging market debt asset class.
II | Legg Mason Partners High Income Fund
Performance review
For the six months ended January 31, 2008, Class A shares of Legg Mason Partners High Income Fund, excluding sales charges, returned -0.64%. The Fund’s new unmanaged benchmark, the Lehman Brothers U.S. Corporate High Yield 2% Issuer Cap Indexviii, and its former unmanaged benchmark, the Citigroup High Yield Market (7-10 Year) Indexix, returned 1.33% and 1.12%, respectively, for the same period. The Lipper High Current Yield Funds Category Average1 returned -0.10% over the same time frame.
PERFORMANCE SNAPSHOT as of January 31, 2008 (excluding sales charges) (unaudited)
| | | |
| | | 6 MONTHS | |
High Income Fund — Class A Shares | | -0.64 | % |
Lehman Brothers U.S. Corporate High Yield 2% Issuer Cap Index | | 1.33 | % |
Citigroup High Yield Market (7-10 Year) Index | | 1.12 | % |
Lipper High Current Yield Funds Category Average1 | | -0.10 | % |
The performance shown represents past performance. Past performance is no guarantee of future results and current performance may be higher or lower than the performance shown above. Principal value, investment returns and yields will fluctuate and investors’ shares, when redeemed, may be worth more or less than their original cost. To obtain performance data current to the most recent month-end, please visit our website at www.leggmason.com/individualinvestors.
Excluding sales charges, Class B shares returned -1.05%, Class C shares returned -1.01% and Class I shares returned -0.64% over the six months ended January 31, 2008. All share class returns assume the reinvestment of all distributions, including returns of capital, if any, at net asset value and the deduction of all Fund expenses. Returns have not been adjusted to include sales charges that may apply when shares are purchased or the deduction of taxes that a shareholder would pay on Fund distributions.
Performance figures reflect expense reimbursements and/or fee waivers, without which the performance would have been lower.
The 30-Day SEC Yields for the period ending January 31, 2008 for Class A, B, C and I shares were 9.44%, 9.24%, 9.43% and 10.18%, respectively. Absent current expense reimbursements and/or fee waivers, the 30-Day SEC Yields for Class A, B, C and I shares would have been 9.44%, 9.24%, 9.41% and 10.18%, respectively. The 30-Day SEC Yield is the average annualized net investment income per share for the 30-day period indicated and is subject to change.
TOTAL ANNUAL OPERATING EXPENSES (unaudited)
As of the Fund’s most current prospectus dated December 1, 2007, the gross total operating expenses for Class A, Class B, Class C and Class I shares were 0.92%, 1.40%, 1.38% and 0.62%, respectively.
As a result of a contractual expense limitation, the ratio of expenses, other than brokerage, taxes and extraordinary expenses, to average net assets will not exceed 1.38% for Class C shares until December 1, 2008.
1 | Lipper, Inc. is a major independent mutual-fund tracking organization. Returns are based on the six-month period ended January 31, 2008, including the reinvestment of all distributions, including returns of capital, if any, calculated among the 472 funds in the Fund’s Lipper category, and excluding sales charges. |
Legg Mason Partners High Income Fund | III
Letter from the chairman continued
Special shareholder notice
On September 24, 2007, the Fund’s benchmark was changed from the Citigroup High Yield Market (7-10 Year) Index to the Lehman Brothers U.S. Corporate High Yield 2% Issuer Cap Index to better reflect the composition of the Fund’s portfolio holdings.
Information about your fund
As you may be aware, several issues in the mutual fund industry have come under the scrutiny of federal and state regulators. Affiliates of the Fund’s manager have, in recent years, received requests for information from various government regulators regarding market timing, late trading, fees, and other mutual fund issues in connection with various investigations. The regulators appear to be examining, among other things, the Fund’s response to market timing and shareholder exchange activity, including compliance with prospectus disclosure related to these subjects. The Fund is not in a position to predict the outcome of these requests and investigations.
Important information with regard to recent regulatory developments that may affect the Fund is contained in the Notes to Financial Statements included in this report.
As always, thank you for your confidence in our stewardship of your assets. We look forward to helping you meet your financial goals.
|
| Sincerely, |
|
 |
| R. Jay Gerken, CFA |
| Chairman, President and Chief Executive Officer |
March 7, 2008
IV | Legg Mason Partners High Income Fund
The information provided is not intended to be a forecast of future events, a guarantee of future results or investment advice. Views expressed may differ from those of the firm as a whole.
RISKS: Keep in mind, high-yield bonds are rated below investment-grade and carry more risk than higher-rated securities. Investments in bonds are subject to interest rate and credit risks. As interest rates rise, bond prices fall, reducing the value of the Fund’s share price. Also, the Fund is subject to certain risks of overseas investing, including currency fluctuations, differing securities regulations and periods of illiquidity, which could result in significant market fluctuations. These risks are magnified in emerging markets. The Fund may use derivatives, such as options and futures, which can be illiquid, may disproportionately increase losses, and have a potentially large impact on Fund performance. Please see the Fund’s prospectus for more information on these and other risks.
All index performance reflects no deduction for fees, expenses or taxes. Please note an investor cannot invest directly in an index.
i | Gross domestic product (“GDP”) is the market value of all final goods and services produced within a country in a given period of time. |
ii | The Federal Reserve Board (“Fed”) is responsible for the formulation of policies designed to promote economic growth, full employment, stable prices, and a sustainable pattern of international trade and payments. |
iii | The federal funds rate is the rate charged by one depository institution on an overnight sale of immediately available funds (balances at the Federal Reserve) to another depository institution; the rate may vary from depository institution to depository institution and from day to day. |
iv | The yield curve is the graphical depiction of the relationship between the yield on bonds of the same credit quality but different maturities. |
v | The Lehman Brothers U.S. Aggregate Index is a broad-based bond index comprised of government, corporate, mortgage- and asset-backed issues, rated investment grade or higher, and having at least one year to maturity. |
vi | The Citigroup High Yield Market Index is a broad-based unmanaged index of high-yield securities. |
vii | The JPMorgan Emerging Markets Bond Index Global (“EMBI Global”) tracks total returns for U.S. dollar denominated debt instruments issued by emerging market sovereign and quasi-sovereign entities: Brady bonds, loans, Eurobonds, and local market instruments. Countries covered are Algeria, Argentina, Brazil, Bulgaria, Chile, China, Colombia, Cote d’Ivoire, Croatia, Ecuador, Greece, Hungary, Lebanon, Malaysia, Mexico, Morocco, Nigeria, Panama, Peru, the Philippines, Poland, Russia, South Africa, South Korea, Thailand, Turkey and Venezuela. |
viii | The Lehman Brothers U.S. Corporate High Yield 2% Issuer Cap Index is an index of the 2% Issuer Cap component of the Lehman Brothers U.S. Corporate High Yield Index, which covers the U.S. dollar-denominated, non-investment grade, fixed-rate, taxable corporate bond market. |
ix | The Citigroup High Yield Market (7-10 Year) Index is an unmanaged broad-based index of high-yield bonds with a remaining maturity of at least seven years, but less than ten years. |
Legg Mason Partners High Income Fund | V
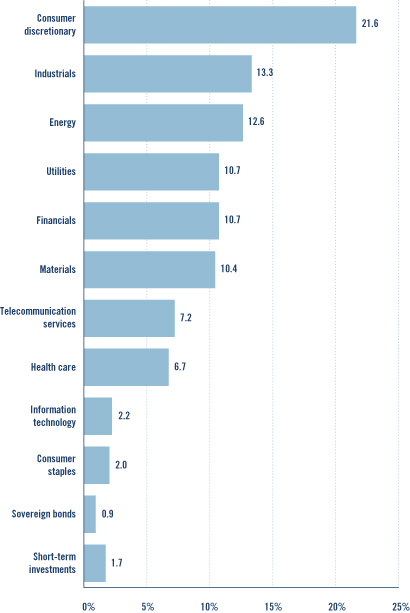
Fund at a glance (unaudited)
INVESTMENT BREAKDOWN (%) As a percent of total investments — January 31, 2008
Legg Mason Partners High Income Fund 2008 Semi-Annual Report | 1
Fund expenses (unaudited)
Example
As a shareholder of the Fund, you may incur two types of costs: (1) transaction costs, including front-end and back-end sales charges (loads) on purchase payments; and (2) ongoing costs, including management fees; distribution and/or service (12b-1) fees; and other Fund expenses. This example is intended to help you understand your ongoing costs (in dollars) of investing in the Fund and to compare these costs with the ongoing costs of investing in other mutual funds.
This example is based on an investment of $1,000 invested on August 1, 2007 and held for the six months ended January 31, 2008.
Actual expenses
The table below titled “Based on Actual Total Return” provides information about actual account values and actual expenses. You may use the information provided in this table, together with the amount you invested, to estimate the expenses that you paid over the period. To estimate the expenses you paid on your account, divide your ending account value by $1,000 (for example, an $8,600 ending account value divided by $1,000 = 8.6), then multiply the result by the number under the heading entitled “Expenses Paid During the Period”.
BASED ON ACTUAL TOTAL RETURN1
| | | | | | | | | | | | | | | |
| | | ACTUAL TOTAL
RETURN
WITHOUT
SALES
CHARGES2 | | | BEGINNING
ACCOUNT
VALUE | | ENDING
ACCOUNT
VALUE | | ANNUALIZED
EXPENSE
RATIO | | | EXPENSES
PAID DURING
THE PERIOD3 |
Class A | | (0.64 | )% | | $ | 1,000.00 | | $ | 993.60 | | 0.92 | % | | $ | 4.61 |
Class B | | (1.05 | ) | | | 1,000.00 | | | 989.50 | | 1.46 | | | | 7.30 |
Class C | | (1.01 | ) | | | 1,000.00 | | | 989.90 | | 1.38 | | | | 6.90 |
Class I | | (0.64 | ) | | | 1,000.00 | | | 993.60 | | 0.64 | | | | 3.21 |
1 | For the six months ended January 31, 2008. |
2 | Assumes reinvestment of all distributions, including returns of capital, if any, at net asset value and does not reflect the deduction of the applicable sales charge with respect to Class A shares or the applicable contingent deferred sales charges (“CDSC”) with respect to Class B and C shares. Total return is not annualized, as it may not be representative of the total return for the year. Performance figures may reflect fee waivers and/or expense reimbursements. Past performance is no guarantee of future results. In the absence of fee waivers and/or expense reimbursements, the total return would have been lower. |
3 | Expenses (net of fee waivers and/or expense reimbursements) are equal to each class’ respective annualized expense ratio multiplied by the average account value over the period, multiplied by the number of days in the most recent fiscal half-year, then divided by 366. |
2 | Legg Mason Partners High Income Fund 2008 Semi-Annual Report
Hypothetical example for comparison purposes
The table below titled “Based on Hypothetical Total Return” provides information about hypothetical account values and hypothetical expenses based on the actual expense ratio and an assumed rate of return of 5.00% per year before expenses, which is not the Fund’s actual return. The hypothetical account values and expenses may not be used to estimate the actual ending account balance or expenses you paid for the period. You may use the information provided in this table to compare the ongoing costs of investing in the Fund and other funds. To do so, compare the 5.00% hypothetical example relating to the Fund with the 5.00% hypothetical examples that appear in the shareholder reports of the other funds.
Please note that the expenses shown in the table below are meant to highlight your ongoing costs only and do not reflect any transactional costs, such as front-end or back-end sales charges (loads). Therefore, the table is useful in comparing ongoing costs only, and will not help you determine the relative total costs of owning different funds. In addition, if these transaction costs were included, your costs would have been higher.
BASED ON HYPOTHETICAL TOTAL RETURN1
| | | | | | | | | | | | | | | |
| | | HYPOTHETICAL
ANNUALIZED
TOTAL RETURN | | | BEGINNING
ACCOUNT
VALUE | | ENDING
ACCOUNT
VALUE | | ANNUALIZED
EXPENSE
RATIO | | | EXPENSES
PAID DURING
THE PERIOD2 |
Class A | | 5.00 | % | | $ | 1,000.00 | | $ | 1,020.51 | | 0.92 | % | | $ | 4.67 |
Class B | | 5.00 | | | | 1,000.00 | | | 1,017.80 | | 1.46 | | | | 7.41 |
Class C | | 5.00 | | | | 1,000.00 | | | 1,018.20 | | 1.38 | | | | 7.00 |
Class I | | 5.00 | | | | 1,000.00 | | | 1,021.92 | | 0.64 | | | | 3.25 |
1 | For the six months ended January 31, 2008. |
2 | Expenses (net of fee waivers and/or expense reimbursements) are equal to each class’ respective annualized expense ratio multiplied by the average account value over the period, multiplied by the number of days in the most recent fiscal half-year, then divided by 366. |
Legg Mason Partners High Income Fund 2008 Semi-Annual Report | 3
Schedule of investments (unaudited)
January 31, 2008
LEGG MASON PARTNERS HIGH INCOME FUND
| | | | | | |
FACE
AMOUNT | | SECURITY | | VALUE |
| | CORPORATE BONDS & NOTES — 90.7% | | | |
| | | Aerospace & Defense — 2.0% | | | |
| $ | 2,610,000 | | Alliant Techsystems Inc., Senior Subordinated Notes, 6.750% due 4/1/16 | | $ | 2,531,700 |
| | 2,915,000 | | DRS Technologies Inc., Senior Subordinated Notes, 6.625% due 2/1/16 | | | 2,863,987 |
| | | Hawker Beechcraft Acquisition Co.: | | | |
| | 3,300,000 | | Senior Notes, 8.875% due 4/1/15a,b | | | 3,242,250 |
| | 1,205,000 | | Senior Subordinated Notes, 9.750% due 4/1/17a | | | 1,150,775 |
| | 2,075,000 | | L-3 Communications Corp., Senior Subordinated Notes, 5.875% due 1/15/15 | | | 2,028,313 |
| | | | | | |
| | | Total Aerospace & Defense | | | 11,817,025 |
| | | Airlines — 1.6% | | | |
| | 1,260,000 | | Continental Airlines Inc., Pass-Through Certificates, 7.339% due 4/19/14 | | | 1,152,900 |
| | 4,670,000 | | DAE Aviation Holdings Inc., Senior Notes, 11.250% due 8/1/15a | | | 4,856,800 |
| | 1,455,000 | | Delta Air Lines Inc., 8.954% due 8/10/14a | | | 1,393,163 |
| | | United Airlines Inc., Pass-Through Certificates: | | | |
| | 316,338 | | 8.030% due 7/1/11c | | | 365,370 |
| | 1,483,330 | | 7.186% due 10/1/12 | | | 1,485,184 |
| | 311,913 | | Senior Secured Notes, 7.032% due 10/1/10 | | | 311,645 |
| | | | | | |
| | | Total Airlines | | | 9,565,062 |
| | | Auto Components — 1.7% | | | |
| | | Allison Transmission Inc.: | | | |
| | 1,270,000 | | 11.000% due 11/1/15a | | | 1,073,150 |
| | 2,500,000 | | Senior Notes, 11.250% due 11/1/15a,b | | | 2,037,500 |
| | 1,955,000 | | Keystone Automotive Operations Inc., Senior Subordinated Notes, 9.750% due 11/1/13 | | | 1,319,625 |
| | 6,719,000 | | Visteon Corp., Senior Notes, 8.250% due 8/1/10 | | | 5,526,377 |
| | | | | | |
| | | Total Auto Components | | | 9,956,652 |
| | | Automobiles — 2.1% | | | |
| | 1,310,000 | | Ford Motor Co., Notes, 7.450% due 7/16/31 | | | 972,675 |
| | | General Motors Corp.: | | | |
| | 2,110,000 | | Notes, 7.200% due 1/15/11 | | | 1,935,925 |
| | 11,335,000 | | Senior Debentures, 8.375% due 7/15/33 | | | 9,266,362 |
| | | | | | |
| | | Total Automobiles | | | 12,174,962 |
| | | Building Products — 1.5% | | | |
| | | Associated Materials Inc.: | | | |
| | 6,040,000 | | Senior Discount Notes, step bond to yield 12.921% due 3/1/14 | | | 3,956,200 |
| | 1,010,000 | | Senior Subordinated Notes, 9.750% due 4/15/12 | | | 994,850 |
| | 2,635,000 | | Nortek Inc., Senior Subordinated Notes, 8.500% due 9/1/14 | | | 2,068,475 |
See Notes to Financial Statements.
4 | Legg Mason Partners High Income Fund 2008 Semi-Annual Report
LEGG MASON PARTNERS HIGH INCOME FUND
| | | | | | |
FACE
AMOUNT | | SECURITY | | VALUE |
| | | Building Products — 1.5% continued | | | |
| $ | 2,635,000 | | NTK Holdings Inc., Senior Discount Notes, step bond to yield 12.136% due 3/1/14 | | $ | 1,488,775 |
| | | | | | |
| | | Total Building Products | | | 8,508,300 |
| | | Chemicals — 1.7% | | | |
| | | Georgia Gulf Corp., Senior Notes: | | | |
| | 2,505,000 | | 9.500% due 10/15/14 | | | 1,953,900 |
| | 1,130,000 | | 10.750% due 10/15/16 | | | 734,500 |
| | 1,360,000 | | Huntsman International LLC, Senior Subordinated Notes, 7.875% due 11/15/14 | | | 1,421,200 |
| | 2,060,000 | | Methanex Corp., Senior Notes, 8.750% due 8/15/12 | | | 2,219,650 |
| | 4,555,000 | | Montell Finance Co. BV, Debentures, 8.100% due 3/15/27a | | | 3,530,125 |
| | | | | | |
| | | Total Chemicals | | | 9,859,375 |
| | | Commercial Banks — 0.5% | | | |
| | 750,000 | | ATF Capital BV, Senior Notes, 9.250% due 2/21/14a | | | 759,375 |
| | | TuranAlem Finance BV, Bonds: | | | |
| | 1,490,000 | | 8.250% due 1/22/37a | | | 1,307,475 |
| | 1,090,000 | | 8.250% due 1/22/37a | | | 956,475 |
| | | | | | |
| | | Total Commercial Banks | | | 3,023,325 |
| | | Commercial Services & Supplies — 3.2% | | | |
| | 4,126,000 | | Allied Security Escrow Corp., Senior Subordinated Notes, 11.375% due 7/15/11 | | | 3,744,345 |
| | 675,000 | | Ashtead Holdings PLC, Secured Notes, 8.625% due 8/1/15a | | | 556,875 |
| | 5,670,000 | | DynCorp International LLC/DIV Capital Corp., Senior Subordinated Notes, 9.500% due 2/15/13 | | | 5,910,975 |
| | 4,443,000 | | Interface Inc., Senior Notes, 10.375% due 2/1/10 | | | 4,598,505 |
| | 2,675,000 | | Rental Services Corp., Senior Notes, 9.500% due 12/1/14 | | | 2,280,437 |
| | 1,440,000 | | US Investigations Services Inc., 11.750% due 5/1/16a | | | 1,216,800 |
| | | | | | |
| | | Total Commercial Services & Supplies | | | 18,307,937 |
| | | Consumer Finance — 4.1% | | | |
| | 2,525,000 | | AmeriCredit Corp., 8.500% due 7/1/15 | | | 1,849,563 |
| | | Ford Motor Credit Co.: | | | |
| | 585,000 | | Notes, 8.708% due 4/15/12d | | | 572,059 |
| | | Senior Notes: | | | |
| | 2,466,000 | | 10.241% due 6/15/11d | | | 2,221,548 |
| | 4,300,000 | | 9.875% due 8/10/11 | | | 4,128,709 |
| | 1,000,000 | | 7.127% due 1/13/12d | | | 843,058 |
| | 1,500,000 | | 8.000% due 12/15/16 | | | 1,261,287 |
| | | General Motors Acceptance Corp.: | | | |
| | 8,740,000 | | Bonds, 8.000% due 11/1/31 | | | 7,260,432 |
See Notes to Financial Statements.
Legg Mason Partners High Income Fund 2008 Semi-Annual Report | 5
Schedule of investments (unaudited) continued
January 31, 2008
LEGG MASON PARTNERS HIGH INCOME FUND
| | | | | | |
FACE
AMOUNT | | SECURITY | | VALUE |
| | | Consumer Finance — 4.1% continued | | | |
| $ | 6,510,000 | | Notes, 6.875% due 8/28/12 | | $ | 5,532,458 |
| | | | | | |
| | | Total Consumer Finance | | | 23,669,114 |
| | | Containers & Packaging — 0.9% | | | |
| | 3,394,000 | | Graphic Packaging International Corp., Senior Subordinated Notes, 9.500% due 8/15/13 | | | 3,215,815 |
| | 2,125,000 | | Plastipak Holdings Inc., Senior Notes, 8.500% due 12/15/15a | | | 2,008,125 |
| | 1,775,000 | | Radnor Holdings Corp., Senior Notes, 11.000% due 3/15/10c | | | 22,187 |
| | | | | | |
| | | Total Containers & Packaging | | | 5,246,127 |
| | | Diversified Consumer Services — 0.8% | | | |
| | | Education Management LLC/Education Management Finance Corp.: | | | |
| | 1,475,000 | | Senior Notes, 8.750% due 6/1/14 | | | 1,427,063 |
| | 310,000 | | Senior Subordinated Notes, 10.250% due 6/1/16 | | | 296,825 |
| | 2,695,000 | | Service Corp. International, Debentures, 7.875% due 2/1/13 | | | 2,698,603 |
| | | | | | |
| | | Total Diversified Consumer Services | | | 4,422,491 |
| | | Diversified Financial Services — 2.3% | | | |
| | 1,220,000 | | AAC Group Holding Corp., Senior Discount Notes, step bond to yield 10.260% due 10/1/12 | | | 1,018,700 |
| | 1,080,000 | | Basell AF SCA, Senior Secured Subordinated Second Priority Notes, 8.375% due 8/15/15a | | | 820,800 |
| | 2,010,000 | | CCM Merger Inc., Notes, 8.000% due 8/1/13a | | | 1,809,000 |
| | 1,500,000 | | Leucadia National Corp., Senior Notes, 8.125% due 9/15/15 | | | 1,500,000 |
| | 310,000 | | LVB Acquisition Merger, 11.625% due 10/15/17a | | | 304,187 |
| | | Residential Capital LLC: | | | |
| | 1,400,000 | | 7.328% due 4/17/09a,d | | | 686,000 |
| | 590,000 | | 8.375% due 6/30/15 | | | 371,700 |
| | 2,470,000 | | Notes, 7.875% due 6/30/10 | | | 1,617,850 |
| | 3,120,000 | | Senior Notes, 7.500% due 2/22/11d | | | 1,965,600 |
| | 2,345,000 | | Vanguard Health Holdings Co. I LLC, Senior Discount Notes, step bond to yield 12.580% due 10/1/15 | | | 1,676,675 |
| | 1,700,000 | | Vanguard Health Holdings Co. II LLC, Senior Subordinated Notes, 9.000% due 10/1/14 | | | 1,619,250 |
| | | | | | |
| | | Total Diversified Financial Services | | | 13,389,762 |
| | | Diversified Telecommunication Services — 5.3% | | | |
| | 695,000 | | Cincinnati Bell Telephone Co., Senior Debentures, 6.300% due 12/1/28 | | | 594,225 |
| | | Citizens Communications Co.: | | | |
| | 170,000 | | 7.050% due 10/1/46 | | | 134,300 |
| | 3,055,000 | | Senior Notes, 7.875% due 1/15/27 | | | 2,810,600 |
| | 3,570,000 | | GT Group Telecom Inc., Senior Discount Notes, 13.250% due 2/1/10c,e,f | | | 0 |
See Notes to Financial Statements.
6 | Legg Mason Partners High Income Fund 2008 Semi-Annual Report
LEGG MASON PARTNERS HIGH INCOME FUND
| | | | | | |
FACE
AMOUNT | | SECURITY | | VALUE |
| | | Diversified Telecommunication Services — 5.3% continued | | | |
| $ | 6,200,000 | | Intelsat Bermuda Ltd., Senior Notes, 11.250% due 6/15/16 | | $ | 6,231,000 |
| | | Intelsat Corp.: | | | |
| | 645,000 | | 9.000% due 6/15/16 | | | 643,388 |
| | 6,000 | | Senior Notes, 9.000% due 8/15/14 | | | 5,985 |
| | 850,000 | | L-3 Communications Corp., Senior Subordinated Notes, 6.375% due 10/15/15 | | | 847,875 |
| | | Level 3 Financing Inc.: | | | |
| | 2,690,000 | | 9.150% due 2/15/15d | | | 2,017,500 |
| | 2,250,000 | | Senior Notes, 9.250% due 11/1/14 | | | 1,946,250 |
| | 3,035,000 | | Nordic Telephone Co. Holdings, Senior Secured Bonds, 8.875% due 5/1/16a | | | 3,095,700 |
| | 200,000 | | Qwest Communications International Inc., Senior Notes, 7.500% due 2/15/14 | | | 199,000 |
| | 4,665,000 | | Virgin Media Finance PLC, Senior Notes, 9.125% due 8/15/16 | | | 4,245,150 |
| | 3,000,000 | | Wind Acquisition Finance SA, Senior Bonds, 10.750% due 12/1/15a | | | 3,195,000 |
| | 4,765,000 | | Windstream Corp., Senior Notes, 8.625% due 8/1/16 | | | 4,955,600 |
| | | | | | |
| | | Total Diversified Telecommunication Services | | | 30,921,573 |
| | | Electric Utilities — 2.0% | | | |
| | 740,000 | | IPALCO Enterprises Inc., Secured Notes, 8.625% due 11/14/11 | | | 788,100 |
| | 4,000,000 | | Orion Power Holdings Inc., Senior Notes, 12.000% due 5/1/10 | | | 4,370,000 |
| | 4,080,000 | | Texas Competitive Electric Holding Co. LLC, 10.500% due 11/1/16a,b | | | 3,978,000 |
| | 3,310,000 | | VeraSun Energy Corp., Senior Notes, 9.375% due 6/1/17a | | | 2,648,000 |
| | | | | | |
| | | Total Electric Utilities | | | 11,784,100 |
| | | Electronic Equipment & Instruments — 0.4% | | | |
| | | NXP BV/NXP Funding LLC: | | | |
| | 650,000 | | Senior Notes, 9.500% due 10/15/15 | | | 569,562 |
| | 1,935,000 | | Senior Secured Notes, 7.875% due 10/15/14 | | | 1,782,619 |
| | | | | | |
| | | Total Electronic Equipment & Instruments | | | 2,352,181 |
| | | Energy Equipment & Services — 1.5% | | | |
| | 327,000 | | ANR Pipeline Co., Debentures, 9.625% due 11/1/21 | | | 420,928 |
| | 2,795,000 | | Complete Production Services Inc., Senior Notes, 8.000% due 12/15/16 | | | 2,725,125 |
| | 1,165,000 | | GulfMark Offshore Inc., Senior Subordinated Notes, 7.750% due 7/15/14 | | | 1,188,300 |
| | 900,000 | | Key Energy Services Inc., Senior Notes, 8.375% due 12/1/14a | | | 906,750 |
| | 1,735,000 | | Pride International Inc., Senior Notes, 7.375% due 7/15/14 | | | 1,795,725 |
| | 1,540,000 | | Tennessee Gas Pipeline Co., Bonds, 8.375% due 6/15/32 | | | 1,803,054 |
| | | | | | |
| | | Total Energy Equipment & Services | | | 8,839,882 |
| | | Food & Staples Retailing — 0.7% | | | |
| | 3,302,000 | | Delhaize America Inc., Debentures, 9.000% due 4/15/31 | | | 3,919,352 |
See Notes to Financial Statements.
Legg Mason Partners High Income Fund 2008 Semi-Annual Report | 7
Schedule of investments (unaudited) continued
January 31, 2008
LEGG MASON PARTNERS HIGH INCOME FUND
| | | | | | |
FACE
AMOUNT | | SECURITY | | VALUE |
| | | Food Products — 0.6% | | | |
| $ | 3,825,000 | | Dole Food Co. Inc., Senior Notes, 7.250% due 6/15/10 | | $ | 3,385,125 |
| | | Gas Utilities — 0.8% | | | |
| | 4,685,000 | | Suburban Propane Partners LP/Suburban Energy Finance Corp., Senior Notes, 6.875% due 12/15/13 | | | 4,567,875 |
| | | Health Care Equipment & Supplies — 0.3% | | | |
| | 1,600,000 | | Advanced Medical Optics Inc., 7.500% due 5/1/17 | | | 1,360,000 |
| | 100,000 | | Fresenius Medical Care Capital Trust II, 7.875% due 2/1/08 | | | 100,000 |
| | 170,000 | | Fresenius Medical Care Capital Trust IV, 7.875% due 6/15/11 | | | 174,675 |
| | | | | | |
| | | Total Health Care Equipment & Supplies | | | 1,634,675 |
| | | Health Care Providers & Services — 5.8% | | | |
| | 970,000 | | Community Health Systems Inc., Senior Notes, 8.875% due 7/15/15 | | | 980,913 |
| | 5,370,000 | | DaVita Inc., Senior Subordinated Notes, 7.250% due 3/15/15 | | | 5,370,000 |
| | | HCA Inc.: | | | |
| | | Notes: | | | |
| | 270,000 | | 9.000% due 12/15/14 | | | 259,202 |
| | 815,000 | | 6.375% due 1/15/15 | | | 698,863 |
| | 1,790,000 | | 7.690% due 6/15/25 | | | 1,448,448 |
| | 2,445,000 | | Senior Notes, 9.250% due 11/15/16 | | | 2,570,306 |
| | 4,810,000 | | Senior Secured Notes, 9.625% due 11/15/16b | | | 5,074,550 |
| | 4,250,000 | | IASIS Healthcare LLC/IASIS Capital Corp., Senior Subordinated Notes, 8.750% due 6/15/14 | | | 4,271,250 |
| | | Tenet Healthcare Corp., Senior Notes: | | | |
| | 2,575,000 | | 6.375% due 12/1/11 | | | 2,375,437 |
| | 470,000 | | 6.500% due 6/1/12 | | | 414,775 |
| | 6,800,000 | | 7.375% due 2/1/13 | | | 6,018,000 |
| | | Universal Hospital Services Inc.: | | | |
| | 740,000 | | 8.288% due 6/1/15d | | | 706,700 |
| | 715,000 | | 8.500% due 6/1/15b | | | 725,725 |
| | 3,545,000 | | US Oncology Holdings Inc., Senior Notes, 10.759% due 3/15/12b,d | | | 2,685,337 |
| | | | | | |
| | | Total Health Care Providers & Services | | | 33,599,506 |
| | | Hotels, Restaurants & Leisure — 4.5% | | | |
| | 180,000 | | Boyd Gaming Corp., Senior Subordinated Notes, 6.750% due 4/15/14 | | | 157,500 |
| | 2,215,000 | | Buffets Inc., Senior Notes, 12.500% due 11/1/14c | | | 155,050 |
| | 1,540,000 | | Denny’s Holdings Inc., Senior Notes, 10.000% due 10/1/12 | | | 1,455,300 |
| | 815,000 | | Downstream Development Quapaw, Senior Notes, 12.000% due 10/15/15a | | | 717,200 |
| | 1,510,000 | | El Pollo Loco Inc., Senior Notes, 11.750% due 11/15/13 | | | 1,449,600 |
| | 1,690,000 | | Indianapolis Downs LLC & Capital Corp., 11.000% due 11/1/12a | | | 1,580,150 |
| | 4,970,000 | | Inn of the Mountain Gods Resort & Casino, Senior Notes, 12.000% due 11/15/10 | | | 4,970,000 |
See Notes to Financial Statements.
8 | Legg Mason Partners High Income Fund 2008 Semi-Annual Report
LEGG MASON PARTNERS HIGH INCOME FUND
| | | | | | |
FACE
AMOUNT | | SECURITY | | VALUE |
| | | Hotels, Restaurants & Leisure — 4.5% continued | | | |
| $ | 1,500,000 | | Mandalay Resort Group, Senior Subordinated Debentures, 7.625% due 7/15/13 | | $ | 1,421,250 |
| | | MGM MIRAGE Inc.: | | | |
| | | Senior Notes: | | | |
| | 505,000 | | 7.500% due 6/1/16 | | | 487,325 |
| | 1,355,000 | | 7.625% due 1/15/17 | | | 1,321,125 |
| | 1,025,000 | | Senior Subordinated Notes, 8.375% due 2/1/11 | | | 1,053,187 |
| | 2,418,750 | | Nortek Bank Debt, Senior Subordinated Notes, 7.050% due 9/1/14d | | | 2,237,344 |
| | 550,000 | | Pinnacle Entertainment Inc., Senior Subordinated Notes, 8.250% due 3/15/12 | | | 530,750 |
| | 2,015,000 | | Sbarro Inc., Senior Notes, 10.375% due 2/1/15 | | | 1,722,825 |
| | | Snoqualmie Entertainment Authority, Senior Secured Notes: | | | |
| | 1,130,000 | | 9.063% due 2/1/14a,d | | | 1,022,650 |
| | 510,000 | | 9.125% due 2/1/15a | | | 469,200 |
| | | Station Casinos Inc.: | | | |
| | 3,045,000 | | Senior Notes, 7.750% due 8/15/16 | | | 2,698,631 |
| | 250,000 | | Senior Subordinated Notes, 6.625% due 3/15/18 | | | 161,875 |
| | 2,625,000 | | Turning Stone Casino Resort Enterprise, Senior Notes, 9.125% due 12/15/10a | | | 2,559,375 |
| | | | | | |
| | | Total Hotels, Restaurants & Leisure | | | 26,170,337 |
| | | Household Durables — 1.8% | | | |
| | 2,860,000 | | Jarden Corp., Senior Subordinated Notes, 7.500% due 5/1/17 | | | 2,459,600 |
| | | K Hovnanian Enterprises Inc.: | | | |
| | 820,000 | | 6.250% due 1/15/16 | | | 567,850 |
| | 1,445,000 | | Senior Notes, 7.500% due 5/15/16 | | | 1,040,400 |
| | 1,000,000 | | KB Home, 7.750% due 2/1/10 | | | 970,000 |
| | 2,890,000 | | Norcraft Cos. LP/Norcraft Finance Corp., Senior Subordinated Notes, 9.000% due 11/1/11 | | | 2,890,000 |
| | 2,660,000 | | Norcraft Holdings LP/Norcraft Capital Corp., Senior Discount Notes, step bond to yield 10.390% due 9/1/12 | | | 2,327,500 |
| | | | | | |
| | | Total Household Durables | | | 10,255,350 |
| | | Household Products — 0.3% | | | |
| | 1,825,000 | | Visant Holding Corp., Senior Notes, 8.750% due 12/1/13 | | | 1,774,813 |
| | | Independent Power Producers & Energy Traders — 8.2% | | | |
| | 1,305,000 | | AES China Generating Co., Ltd., 8.250% due 6/26/10 | | | 1,280,403 |
| | | AES Corp.: | | | |
| | 3,700,000 | | 8.000% due 10/15/17 | | | 3,792,500 |
| | 1,985,000 | | Senior Notes, 9.500% due 6/1/09 | | | 2,054,475 |
| | 3,960,000 | | Dynegy Holdings Inc., Senior Notes, 7.750% due 6/1/19 | | | 3,623,400 |
See Notes to Financial Statements.
Legg Mason Partners High Income Fund 2008 Semi-Annual Report | 9
Schedule of investments (unaudited) continued
January 31, 2008
LEGG MASON PARTNERS HIGH INCOME FUND
| | | | | | |
FACE
AMOUNT | | SECURITY | | VALUE |
| | | Independent Power Producers & Energy Traders — 8.2% continued | | | |
| | | Edison Mission Energy, Senior Notes: | | | |
| $ | 2,240,000 | | 7.750% due 6/15/16 | | $ | 2,296,000 |
| | 1,780,000 | | 7.200% due 5/15/19 | | | 1,744,400 |
| | 2,385,000 | | 7.625% due 5/15/27 | | | 2,247,863 |
| | 19,830,000 | | Energy Future Holdings, Senior Notes, 11.250% due 11/1/17a,b | | | 19,631,700 |
| | | Mirant Mid Atlantic LLC: | | | |
| | 282,545 | | 10.060% due 12/30/28 | | | 336,229 |
| | 1,127,105 | | Pass-Through Certificates, 9.125% due 6/30/17 | | | 1,246,860 |
| | 2,680,000 | | Mirant North America LLC, Senior Notes, 7.375% due 12/31/13 | | | 2,693,400 |
| | 7,000,000 | | NRG Energy Inc., Senior Notes, 7.375% due 2/1/16 | | | 6,781,250 |
| | | | | | |
| | | Total Independent Power Producers & Energy Traders | | | 47,728,480 |
| | | IT Services — 1.5% | | | |
| | 1,400,000 | | Ceridian Corp., Senior Notes, 12.250% due 11/15/15a,b | | | 1,183,000 |
| | 2,620,000 | | First Data Corp., 9.875% due 9/24/15a | | | 2,321,975 |
| | | SunGard Data Systems Inc.: | | | |
| | 1,950,000 | | Senior Notes, 9.125% due 8/15/13 | | | 1,989,000 |
| | 2,995,000 | | Senior Subordinated Notes, 10.250% due 8/15/15 | | | 3,009,975 |
| | | | | | |
| | | Total IT Services | | | 8,503,950 |
| | | Machinery — 0.3% | | | |
| | 1,060,000 | | American Railcar Industries Inc., Senior Notes, 7.500% due 3/1/14 | | | 959,300 |
| | 800,000 | | Terex Corp., Senior Subordinated Notes, 7.375% due 1/15/14 | | | 794,000 |
| | | | | | |
| | | Total Machinery | | | 1,753,300 |
| | | Media — 7.0% | | | |
| | 3,730,000 | | Affinion Group Inc., Senior Subordinated Notes, 11.500% due 10/15/15 | | | 3,468,900 |
| | | CCH I Holdings LLC/CCH I Holdings Capital Corp.: | | | |
| | 2,000,000 | | Senior Accreting Notes, 12.125% due 1/15/15 | | | 1,070,000 |
| | 2,540,000 | | Senior Notes, 11.750% due 5/15/14 | | | 1,371,600 |
| | 9,067,000 | | CCH I LLC/CCH Capital Corp., Senior Secured Notes, 11.000% due 10/1/15 | | | 6,539,574 |
| | | CCH II LLC/CCH II Capital Corp., Senior Notes: | | | |
| | 1,520,000 | | 10.250% due 9/15/10 | | | 1,447,800 |
| | 185,000 | | 10.250% due 10/1/13 | | | 172,050 |
| | 1,230,000 | | Charter Communications Holdings LLC, Senior Discount Notes, 12.125% due 1/15/12 | | | 777,975 |
| | 960,000 | | Charter Communications Holdings LLC/Charter Communications Holdings Capital Corp., Senior Discount Notes, 11.750% due 5/15/11 | | | 620,400 |
See Notes to Financial Statements.
10 | Legg Mason Partners High Income Fund 2008 Semi-Annual Report
LEGG MASON PARTNERS HIGH INCOME FUND
| | | | | | |
FACE
AMOUNT | | SECURITY | | VALUE |
| | | Media — 7.0% continued | | | |
| | | CSC Holdings Inc.: | | | |
| | | Senior Debentures: | | | |
| $ | 155,000 | | 8.125% due 8/15/09 | | $ | 158,100 |
| | 125,000 | | 7.625% due 7/15/18 | | | 112,500 |
| | | Senior Notes: | | | |
| | 2,775,000 | | 8.125% due 7/15/09 | | | 2,830,500 |
| | 1,345,000 | | 7.625% due 4/1/11 | | | 1,338,275 |
| | 2,025,000 | | 6.750% due 4/15/12 | | | 1,928,812 |
| | 3,174,000 | | Dex Media West LLC/Dex Media Finance Co., Senior Subordinated Notes, 9.875% due 8/15/13 | | | 3,245,415 |
| | 2,260,000 | | DIRECTV Holdings LLC/DIRECTV Financing Co. Inc., Senior Notes, 8.375% due 3/15/13 | | | 2,347,575 |
| | 3,315,000 | | Idearc Inc., Senior Notes, 8.000% due 11/15/16 | | | 2,983,500 |
| | | R.H. Donnelley Corp.: | | | |
| | 1,260,000 | | Senior Discount Notes, 6.875% due 1/15/13 | | | 1,064,700 |
| | 2,070,000 | | Senior Notes, 8.875% due 10/15/17a | | | 1,764,675 |
| | 2,785,000 | | Sun Media Corp., 7.625% due 2/15/13 | | | 2,652,712 |
| | | TL Acquisitions Inc.: | | | |
| | 1,480,000 | | Senior Notes, 10.500% due 1/15/15a | | | 1,354,200 |
| | 2,500,000 | | Senior Subordinated Notes, step bond to yield 13.249% due 7/15/15a | | | 1,912,500 |
| | | XM Satellite Radio Inc., Senior Notes: | | | |
| | 1,640,000 | | 9.411% due 5/1/13d | | | 1,410,400 |
| | 225,000 | | 9.750% due 5/1/14 | | | 205,313 |
| | | | | | |
| | | Total Media | | | 40,777,476 |
| | | Metals & Mining — 4.3% | | | |
| | 8,690,000 | | Freeport-McMoRan Copper & Gold Inc., Senior Notes, 8.375% due 4/1/17 | | | 9,254,850 |
| | 650,000 | | Metals USA Holdings Corp., Senior Notes, 10.729% due 7/1/12a,b,d | | | 481,000 |
| | 3,280,000 | | Metals USA Inc., Senior Secured Notes, 11.125% due 12/1/15 | | | 3,271,800 |
| | 640,000 | | Noranda Aluminum Acquisition Corp., 8.738% due 5/15/15a,b,d | | | 489,600 |
| | 1,700,000 | | Noranda Aluminum Holding Corp., Senior Notes, 10.488% due 11/15/14a,b,d | | | 1,300,500 |
| | 2,915,000 | | Novelis Inc., Senior Notes, 7.250% due 2/15/15 | | | 2,703,662 |
| | 4,170,000 | | Ryerson Inc., Senior Secured Notes, 12.000% due 11/1/15a | | | 3,940,650 |
| | 1,040,000 | | Steel Dynamics Inc., 7.375% due 11/1/12a | | | 1,042,600 |
| | 2,400,000 | | Tube City IMS Corp., Senior Subordinated Notes, 9.750% due 2/1/15 | | | 2,172,000 |
| | | | | | |
| | | Total Metals & Mining | | | 24,656,662 |
See Notes to Financial Statements.
Legg Mason Partners High Income Fund 2008 Semi-Annual Report | 11
Schedule of investments (unaudited) continued
January 31, 2008
LEGG MASON PARTNERS HIGH INCOME FUND
| | | | | | |
FACE
AMOUNT | | SECURITY | | VALUE |
| | | Multiline Retail — 1.4% | | | |
| $ | 3,705,000 | | Dollar General Corp., Senior Subordinated Notes, 11.875% due 7/15/17a,b | | $ | 2,982,525 |
| | | Neiman Marcus Group Inc.: | | | |
| | 710,000 | | Senior Notes, 9.000% due 10/15/15b | | | 713,550 |
| | 4,130,000 | | Senior Subordinated Notes, 10.375% due 10/15/15 | | | 4,130,000 |
| | | | | | |
| | | Total Multiline Retail | | | 7,826,075 |
| | | Oil, Gas & Consumable Fuels — 8.9% | | | |
| | 5,465,000 | | Belden & Blake Corp., Secured Notes, 8.750% due 7/15/12 | | | 5,465,000 |
| | | Chesapeake Energy Corp., Senior Notes: | | | |
| | 1,865,000 | | 6.375% due 6/15/15 | | | 1,818,375 |
| | 4,505,000 | | 6.250% due 1/15/18 | | | 4,347,325 |
| | 1,520,000 | | Compagnie Generale de Geophysique SA, Senior Notes, 7.500% due 5/15/15 | | | 1,504,800 |
| | 5,915,000 | | El Paso Corp., Medium-Term Notes, 7.800% due 8/1/31 | | | 5,911,723 |
| | | Enterprise Products Operating LP: | | | |
| | 525,000 | | 7.034% due 1/15/68d | | | 467,180 |
| | 1,920,000 | | Junior Subordinated Notes, 8.375% due 8/1/66d | | | 1,921,576 |
| | 3,000,000 | | EXCO Resources Inc., Senior Notes, 7.250% due 1/15/11 | | | 2,880,000 |
| | 2,950,000 | | International Coal Group Inc., Senior Notes, 10.250% due 7/15/14 | | | 2,765,625 |
| | | Mariner Energy Inc., Senior Notes: | | | |
| | 1,580,000 | | 7.500% due 4/15/13 | | | 1,520,750 |
| | 555,000 | | 8.000% due 5/15/17 | | | 532,800 |
| | 1,565,000 | | OPTI Canada Inc., Senior Secured Notes, 8.250% due 12/15/14a | | | 1,541,525 |
| | 915,000 | | Petrohawk Energy Corp., Senior Notes, 9.125% due 7/15/13 | | | 949,313 |
| | | Petroplus Finance Ltd.: | | | |
| | 900,000 | | 6.750% due 5/1/14a | | | 828,000 |
| | 1,300,000 | | Senior Note, 7.000% due 5/1/17a | | | 1,186,250 |
| | 4,000,000 | | SemGroup LP, Senior Notes, 8.750% due 11/15/15a | | | 3,760,000 |
| | 1,440,000 | | Southwestern Energy Co., Senior Notes, 7.500% due 2/1/18a | | | 1,486,800 |
| | 1,855,000 | | W&T Offshore Inc., Senior Notes, 8.250% due 6/15/14a | | | 1,752,975 |
| | 2,080,000 | | Whiting Petroleum Corp., Senior Subordinated Notes, 7.000% due 2/1/14 | | | 2,048,800 |
| | 8,160,000 | | Williams Cos. Inc., Notes, 7.875% due 9/1/21 | | | 9,037,200 |
| | | | | | |
| | | Total Oil, Gas & Consumable Fuels | | | 51,726,017 |
| | | Paper & Forest Products — 2.7% | | | |
| | | Abitibi-Consolidated Co. of Canada, Senior Notes: | | | |
| | 490,000 | | 7.750% due 6/15/11 | | | 376,075 |
| | 1,320,000 | | 8.491% due 6/15/11d | | | 965,250 |
| | 2,000,000 | | 8.375% due 4/1/15 | | | 1,425,000 |
See Notes to Financial Statements.
12 | Legg Mason Partners High Income Fund 2008 Semi-Annual Report
LEGG MASON PARTNERS HIGH INCOME FUND
| | | | | | |
FACE
AMOUNT | | SECURITY | | VALUE |
| | | Paper & Forest Products — 2.7% continued | | | |
| | | Abitibi-Consolidated Inc.: | | | |
| $ | 1,280,000 | | 7.875% due 8/1/09 | | $ | 1,228,800 |
| | 1,695,000 | | Debentures, 7.400% due 4/1/18 | | | 1,084,800 |
| | 3,410,000 | | Appleton Papers Inc., Senior Subordinated Notes, 9.750% due 6/15/14 | | | 3,333,275 |
| | | NewPage Corp.: | | | |
| | 340,000 | | 10.000% due 5/1/12a | | | 340,000 |
| | 4,685,000 | | Senior Secured Notes, 11.161% due 5/1/12d | | | 4,614,725 |
| | 1,120,000 | | Newpage Holding Corp., 11.818% due 11/1/13b,d | | | 980,000 |
| | 1,250,000 | | Smurfit Capital Funding PLC, Debentures, 7.500% due 11/20/25 | | | 1,156,250 |
| | | | | | |
| | | Total Paper & Forest Products | | | 15,504,175 |
| | | Pharmaceuticals — 0.4% | | | |
| | 6,270,000 | | Leiner Health Products Inc., Senior Subordinated Notes, 11.000% due 6/1/12g | | | 2,539,350 |
| | | Real Estate Investment Trusts (REITs) — 0.7% | | | |
| | 830,000 | | Forest City Enterprises Inc., Senior Notes, 6.500% due 2/1/17 | | | 751,150 |
| | | Ventas Realty LP/Ventas Capital Corp.: | | | |
| | 475,000 | | 8.750% due 5/1/09 | | | 492,813 |
| | 200,000 | | 6.750% due 6/1/10 | | | 204,500 |
| | 158,000 | | 9.000% due 5/1/12 | | | 172,615 |
| | | Senior Notes: | | | |
| | 735,000 | | 6.500% due 6/1/16 | | | 735,000 |
| | 1,840,000 | | 6.750% due 4/1/17 | | | 1,858,400 |
| | | | | | |
| | | Total Real Estate Investment Trusts (REITs) | | | 4,214,478 |
| | | Real Estate Management & Development — 0.7% | | | |
| | 1,665,000 | | Ashton Woods USA LLC/Ashton Woods Finance Co., Senior Subordinated Notes, 9.500% due 10/1/15 | | | 815,850 |
| | | Realogy Corp.: | | | |
| | 410,000 | | Senior Notes, 10.500% due 4/15/14a | | | 295,200 |
| | 4,795,000 | | Senior Subordinated Notes, 12.375% due 4/15/15a | | | 2,877,000 |
| | | | | | |
| | | Total Real Estate Management & Development | | | 3,988,050 |
| | | Road & Rail — 2.1% | | | |
| | 3,785,000 | | Grupo Transportacion Ferroviaria Mexicana SA de CV, Senior Notes, 9.375% due 5/1/12 | | | 3,917,475 |
| | 6,955,000 | | Hertz Corp., Senior Subordinated Notes, 10.500% due 1/1/16 | | | 6,720,269 |
| | | Kansas City Southern de Mexico, Senior Notes: | | | |
| | 1,380,000 | | 7.625% due 12/1/13 | | | 1,338,600 |
| | 235,000 | | 7.375% due 6/1/14a | | | 223,837 |
| | | | | | |
| | | Total Road & Rail | | | 12,200,181 |
See Notes to Financial Statements.
Legg Mason Partners High Income Fund 2008 Semi-Annual Report | 13
Schedule of investments (unaudited) continued
January 31, 2008
LEGG MASON PARTNERS HIGH INCOME FUND
| | | | | | |
FACE
AMOUNT | | SECURITY | | VALUE |
| | | Software — 0.3% | | | |
| $ | 1,805,000 | | Activant Solutions Inc., Senior Subordinated Notes, 9.500% due 5/1/16 | | $ | 1,531,994 |
| | | Specialty Retail — 0.7% | | | |
| | 2,000,000 | | Blockbuster Inc., Senior Subordinated Notes, 9.000% due 9/1/12 | | | 1,590,000 |
| | 465,000 | | Eye Care Centers of America, Senior Subordinated Notes, 10.750% due 2/15/15 | | | 494,063 |
| | | Michaels Stores Inc.: | | | |
| | 1,050,000 | | 11.375% due 11/1/16 | | | 855,750 |
| | 1,485,000 | | Senior Notes, 10.000% due 11/1/14 | | | 1,329,075 |
| | | | | | |
| | | Total Specialty Retail | | | 4,268,888 |
| | | Textiles, Apparel & Luxury Goods — 0.3% | | | |
| | 691,000 | | Oxford Industries Inc., Senior Notes, 8.875% due 6/1/11 | | | 678,908 |
| | 1,700,000 | | Simmons Co., Senior Discount Notes, step bond to yield 10.060% due 12/15/14 | | | 1,130,500 |
| | | | | | |
| | | Total Textiles, Apparel & Luxury Goods | | | 1,809,408 |
| | | Thrifts & Mortgage Finance — 1.1% | | | |
| | 7,090,000 | | Ocwen Capital Trust I, Capital Securities, 10.875% due 8/1/27 | | | 6,097,400 |
| | | Tobacco — 0.4% | | | |
| | | Alliance One International Inc., Senior Notes: | | | |
| | 1,450,000 | | 8.500% due 5/15/12 | | | 1,355,750 |
| | 690,000 | | 11.000% due 5/15/12 | | | 707,250 |
| | | | | | |
| | | Total Tobacco | | | 2,063,000 |
| | | Trading Companies & Distributors — 1.1% | | | |
| | 1,737,000 | | Ashtead Capital Inc., Notes, 9.000% due 8/15/16a | | | 1,459,080 |
| | 2,785,000 | | H&E Equipment Services Inc., Senior Notes, 8.375% due 7/15/16 | | | 2,576,125 |
| | 2,975,000 | | Penhall International Corp., Senior Secured Notes, 12.000% due 8/1/14a | | | 2,484,125 |
| | | | | | |
| | | Total Trading Companies & Distributors | | | 6,519,330 |
| | | Transportation Infrastructure — 0.4% | | | |
| | | Saint Acquisition Corp.: | | | |
| | 2,785,000 | | Secured Notes, 12.500% due 5/15/17a | | | 1,114,000 |
| | 2,975,000 | | Senior Secured Notes, 12.619% due 5/15/15a,d | | | 1,145,375 |
| | | | | | |
| | | Total Transportation Infrastructure | | | 2,259,375 |
| | | Wireless Telecommunication Services — 1.8% | | | |
| | 1,680,000 | | ALLTEL Communications Inc., Senior Notes, 10.375% due 12/1/17a,b | | | 1,461,600 |
| | 1,040,000 | | MetroPCS Wireless Inc., Senior Notes, 9.250% due 11/1/14 | | | 962,000 |
| | | Rural Cellular Corp.: | | | |
| | 1,335,000 | | Senior Notes, 9.875% due 2/1/10 | | | 1,388,400 |
| | 1,480,000 | | Senior Secured Notes, 8.250% due 3/15/12 | | | 1,531,800 |
See Notes to Financial Statements.
14 | Legg Mason Partners High Income Fund 2008 Semi-Annual Report
LEGG MASON PARTNERS HIGH INCOME FUND
| | | | | | |
FACE
AMOUNT | | SECURITY | | VALUE |
| | | Wireless Telecommunication Services — 1.8% continued | | | |
| $ | 5,590,000 | | True Move Co., Ltd., 10.750% due 12/16/13a | | $ | 5,338,450 |
| | | | | | |
| | | Total Wireless Telecommunication Services | | | 10,682,250 |
| | | | | | |
| | | TOTAL CORPORATE BONDS & NOTES (Cost — $576,182,461) | | | 525,794,740 |
| | | | | | |
| | ASSET-BACKED SECURITY — 0.0% | | | |
| | | Diversified Financial Services — 0.0% | | | |
| | 8,721,391 | | Airplanes Pass-Through Trust, Subordinated Notes, 10.875% due 3/15/19c,e,f (Cost — $9,766,723) | | | 0 |
| | | | | | |
| | COLLATERALIZED SENIOR LOANS — 3.2% | | | |
| | | Auto Components — 0.5% | | | |
| | 2,992,500 | | Allison Transmission, Term Loan B, 8.540% due 8/7/14 | | | 2,631,796 |
| | | Containers & Packaging — 0.4% | | | |
| | 3,117,787 | | Berry Plastics Corp., Senior Term Loan, 11.646% due 6/15/14d | | | 2,369,518 |
| | | Oil, Gas & Consumable Fuels — 1.2% | | | |
| | 5,000,000 | | SandRidge Energy, Term Loan, 8.625% due 4/1/15d | | | 4,962,500 |
| | 2,000,000 | | Stallion Oilfield Services, Term Loan, 9.384% due 7/31/12 | | | 1,800,000 |
| | | | | | |
| | | Total Oil, Gas & Consumable Fuels | | | 6,762,500 |
| | | Paper & Forest Products — 0.9% | | | |
| | | Bluegrass Container Co. LLC: | | | |
| | 3,030,303 | | Second Lien, 8.396% due 12/30/13d | | | 3,018,939 |
| | 969,697 | | Term Loans, 8.396% due 12/30/13d | | | 966,061 |
| | 1,500,000 | | Verso Paper Holdings Term Loan, 11.210% due 2/1/12d | | | 1,387,500 |
| | | | | | |
| | | Total Paper & Forest Products | | | 5,372,500 |
| | | Trading Companies & Distributors — 0.2% | | | |
| | 1,590,301 | | Penhall International Corp., Term Loan, 12.393% due 4/1/12d | | | 1,415,368 |
| | | | | | |
| | | TOTAL COLLATERALIZED SENIOR LOANS (Cost — $19,869,432) | | | 18,551,682 |
| | | | | | |
| | SOVEREIGN BOND — 0.9% | | | |
| | | Russia — 0.9% | | | |
| | 4,524,300 | | Russian Federation, 7.500% due 3/31/30a,d (Cost — $4,980,469) | | | 5,217,083 |
| | | | | | |
| | SHARES | | | | | |
| | COMMON STOCKS — 0.0% | | | |
| | CONSUMER DISCRETIONARY — 0.0% | | | |
| | | Household Durables — 0.0% | | | |
| | 8,819,088 | | Home Interiors & Gifts Inc.e,f ,* | | | 9 |
| | | | | | |
| | CONSUMER STAPLES — 0.0% | | | |
| | | Food Products — 0.0% | | | |
| | 185,784 | | Aurora Foods Inc.e,f,* | | | 0 |
| | | | | | |
See Notes to Financial Statements.
Legg Mason Partners High Income Fund 2008 Semi-Annual Report | 15
Schedule of investments (unaudited) continued
January 31, 2008
LEGG MASON PARTNERS HIGH INCOME FUND
| | | | | | |
| SHARES | | SECURITY | | VALUE |
| | MATERIALS — 0.0% | | | |
| | | Chemicals — 0.0% | | | |
| | 3 | | Pliant Corp.e,f,* | | $ | 0 |
| | | | | | |
| | TELECOMMUNICATION SERVICES — 0.0% | | | |
| | | Diversified Telecommunication Services — 0.0% | | | |
| | 7,716 | | McLeodUSA Inc., Class A Sharese,f,* | | | 0 |
| | 18,375 | | Pagemart Wirelesse,f,* | | | 184 |
| | | | | | |
| | | TOTAL TELECOMMUNICATION SERVICES | | | 184 |
| | | | | | |
| | | TOTAL COMMON STOCKS (Cost — $4,375,892) | | | 193 |
| | | | | | |
| | PREFERRED STOCKS — 0.0% | | | |
| | CONSUMER DISCRETIONARY — 0.0% | | | |
| | | Media — 0.0% | | | |
| | 6 | | ION Media Networks Inc., Series B* (Cost — $263,807) | | | 26,845 |
| | | | | | |
| | CONVERTIBLE PREFERRED STOCKS — 0.9% | | | |
| | FINANCIALS — 0.9% | | | |
| | 2,920 | | Bank of America Corp., 7.250% due 12/31/49 | | | 3,276,240 |
| | 39,200 | | Citigroup Inc., 6.500% due 12/31/49 | | | 2,118,760 |
| | | | | | |
| | | TOTAL CONVERTIBLE PREFERRED STOCKS (Cost — $4,880,000) | | | 5,395,000 |
| | | | | | |
| | WARRANTS | | | |
| | WARRANTS — 0.0% | | | |
| | 3,650 | | Cybernet Internet Services International Inc., Expires 7/1/09a,e,f,* | | | 0 |
| | 3,305 | | GT Group Telecom Inc., Class B Shares, Expires 2/1/10a,e,f,* | | | 0 |
| | 2,735 | | IWO Holdings Inc., Expires 1/15/11a,e,f,* | | | 0 |
| | 1,835 | | Jazztel PLC, Expires 7/15/10a,e,f,* | | | 0 |
| | 3,775 | | Merrill Corp., Class B Shares, Expires 5/1/09a,e,f,* | | | 0 |
| | 15,803 | | Next Generation Network Inc., Expires 2/1/08e,f,* | | | 0 |
| | 10,149 | | Viasystems Group Inc., Expires 1/31/10e,f,* | | | 0 |
| | | | | | |
| | | TOTAL WARRANTS (Cost — $1,598,964) | | | 0 |
| | | | | | |
| | | TOTAL INVESTMENTS BEFORE SHORT-TERM INVESTMENTS (Cost — $621,917,748) | | | 554,985,543 |
| | | | | | |
| | |
FACE
AMOUNT | | | | |
| | SHORT-TERM INVESTMENTS — 1.7% | | | |
| | | Sovereign Bonds — 1.0% | | | |
| | | Egypt Treasury Bills: | | | |
| $ | 16,625,000 | | Zero coupon bond to yield 7.080% due 11/4/08 | | | 2,836,944 |
See Notes to Financial Statements.
16 | Legg Mason Partners High Income Fund 2008 Semi-Annual Report
LEGG MASON PARTNERS HIGH INCOME FUND
| | | | | |
FACE
AMOUNT | | SECURITY | | VALUE |
| | Sovereign Bonds — 1.0% continued | | | |
| $16,125,000 | | Zero coupon bond to yield 7.090% due 11/11/08 | | $ | 2,747,706 |
| | | | | |
| | Total Sovereign Bonds (Cost — $5,675,315) | | | 5,584,650 |
| | | | | |
| | Repurchase Agreement — 0.7% | | | |
| 4,283,000 | | Morgan Stanley tri-party repurchase agreement dated 1/31/08, 2.800% due 2/1/08;
Proceeds at maturity — $4,283,333;
(Fully collateralized by U.S. government agency obligation, 5.250% due 8/1/12;
Market value — $4,501,180)
(Cost — $4,283,000) | | | 4,283,000 |
| | | | | |
| | TOTAL SHORT-TERM INVESTMENTS (Cost — $9,958,315) | | | 9,867,650 |
| | | | | |
| | TOTAL INVESTMENTS — 97.4% (Cost — $631,876,063#) | | | 564,853,193 |
| | Other Assets in Excess of Liabilities — 2.6% | | | 14,837,438 |
| | TOTAL NET ASSETS — 100.0% | | $ | 579,690,631 |
| * | Non-income producing security. |
a | Security is exempt from registration under Rule 144A of the Securities Act of 1933. This security may be resold in transactions that are exempt from registration, normally to qualified institutional buyers. This security has been deemed liquid pursuant to guidelines approved by the Board of Trustees, unless otherwise noted. |
b | Payment-in-kind security for which part of the income earned may be paid as additional principal. |
c | Security is currently in default. |
d | Variable rate security. Interest rate disclosed is that which is in effect at January 31, 2008. |
f | Security is valued in good faith at fair value by or under the direction of the Board of Trustees (See Note 1). |
g | Subsequent to the reporting period, on March 10, 2008 the security went into default. |
| # | Aggregate cost for federal income tax purposes is substantially the same. |
See Notes to Financial Statements.
Legg Mason Partners High Income Fund 2008 Semi-Annual Report | 17
Statement of assets and liabilities (unaudited)
January 31, 2008
| | | | |
ASSETS: | | | | |
Investments, at value (Cost — $631,876,063) | | $ | 564,853,193 | |
Cash | | | 538 | |
Interest receivable | | | 14,338,887 | |
Receivable for securities sold | | | 8,974,303 | |
Receivable for Fund shares sold | | | 921,088 | |
Prepaid expenses | | | 773,921 | |
| | | | |
Total Assets | | | 589,861,930 | |
| | | | |
LIABILITIES: | | | | |
Payable for securities purchased | | | 6,423,609 | |
Distributions payable | | | 2,131,469 | |
Payable for Fund shares repurchased | | | 837,709 | |
Investment management fee payable | | | 293,569 | |
Distribution fees payable | | | 246,713 | |
Deferred compensation payable | | | 27,876 | |
Trustees’ fees payable | | | 22,037 | |
Accrued expenses | | | 188,317 | |
| | | | |
Total Liabilities | | | 10,171,299 | |
| | | | |
TOTAL NET ASSETS | | $ | 579,690,631 | |
| | | | |
NET ASSETS: | | | | |
Par value (Note 6) | | $ | 927 | |
Paid-in capital in excess of par value | | | 1,314,502,953 | |
Overdistributed net investment income | | | (2,538,752 | ) |
Accumulated net realized loss on investments | | | (665,251,627 | ) |
Net unrealized depreciation on investments | | | (67,022,870 | ) |
| | | | |
TOTAL NET ASSETS | | $ | 579,690,631 | |
| | | | |
| Shares Outstanding: | | | | |
Class A | | | 41,902,265 | |
Class B | | | 15,056,924 | |
Class C | | | 34,545,688 | |
Class I | | | 1,239,524 | |
| Net Asset Value: | | | | |
Class A (and redemption price) | | $ | 6.24 | |
Class B1 | | $ | 6.26 | |
Class C1 | | $ | 6.26 | |
Class I (and redemption price) | | $ | 6.26 | |
| Maximum Public Offering Price Per Share: | | | | |
Class A (based on maximum initial sales charge of 4.25%) | | $ | 6.52 | |
1 | Redemption price per share is NAV of Class B and C shares reduced by a 4.50% and 1.00% CDSC, respectively, if shares are redeemed within one year from purchase payment (See Note 2). |
See Notes to Financial Statements.
18 | Legg Mason Partners High Income Fund 2008 Semi-Annual Report
Statement of operations (unaudited)
For the Six Months Ended January 31, 2008
| | | | |
INVESTMENT INCOME: | | | | |
Interest | | $ | 30,393,827 | |
Dividends | | | 19,680 | |
| | | | |
Total Investment Income | | | 30,413,507 | |
| | | | |
EXPENSES: | | | | |
Investment management fee (Note 2) | | | 1,950,576 | |
Distribution fees (Notes 2 and 4) | | | 1,617,689 | |
Transfer agent fees (Note 4) | | | 126,128 | |
Shareholder reports (Note 4) | | | 49,789 | |
Audit and tax | | | 35,820 | |
Legal fees | | | 19,581 | |
Trustees’ fees | | | 9,352 | |
Registration fees | | | 7,276 | |
Insurance | | | 7,106 | |
Custody fees | | | 5,840 | |
Miscellaneous expenses | | | 1,728 | |
| | | | |
Total Expenses | | | 3,830,885 | |
Less: Fee waivers and/or expense reimbursements (Note 2) | | | (8,201 | ) |
Fees paid indirectly (Note 1) | | | (123 | ) |
| | | | |
Net Expenses | | | 3,822,561 | |
| | | | |
NET INVESTMENT INCOME | | | 26,590,946 | |
| | | | |
REALIZED AND UNREALIZED LOSS ON INVESTMENTS (NOTES 1 AND 3): | | | | |
Net Realized Loss From Investments | | | (7,903,111 | ) |
Change in Net Unrealized Appreciation/Depreciation | | | (22,146,704 | ) |
| | | | |
Net Loss on Investments | | | (30,049,815 | ) |
| | | | |
DECREASE IN NET ASSETS FROM OPERATIONS | | $ | (3,458,869 | ) |
| | | | |
See Notes to Financial Statements.
Legg Mason Partners High Income Fund 2008 Semi-Annual Report | 19
Statements of changes in net assets
| | | | | | | | |
FOR THE SIX MONTHS ENDED JANUARY 31, 2008 (unaudited) AND THE YEAR ENDED JULY 31, 2007 | | 2008 | | | 2007 | |
OPERATIONS: | | | | | | | | |
Net investment income | | $ | 26,590,946 | | | $ | 50,989,377 | |
Net realized loss | | | (7,903,111 | ) | | | 25,261,226 | |
Change in net unrealized appreciation/depreciation | | | (22,146,704 | ) | | | (35,426,035 | ) |
Increase (Decrease) in Net Assets From Operations | | | (3,458,869 | ) | | | 40,824,568 | |
| | | | | | | | |
DISTRIBUTIONS TO SHAREHOLDERS FROM (NOTES 1 AND 5): | | | | | | | | |
Net investment income | | | (27,279,667 | ) | | | (52,463,403 | ) |
Decrease in Net Assets From Distributions to Shareholders | | | (27,279,667 | ) | | | (52,463,403 | ) |
| | | | | | | | |
FUND SHARE TRANSACTIONS (NOTE 6): | | | | | | | | |
Net proceeds from sale of shares | | | 16,469,803 | | | | 65,951,809 | |
Reinvestment of distributions | | | 13,364,771 | | | | 23,076,397 | |
Cost of shares repurchased | | | (109,889,977 | ) | | | (219,255,606 | ) |
Net assets of shares issued in connection with merger (Note 7) | | | — | | | | 155,921,079 | |
Increase (Decrease) in Net Assets From Fund Share Transactions | | | (80,055,403 | ) | | | 25,693,679 | |
| | | | | | | | |
INCREASE (DECREASE) IN NET ASSETS | | | (110,793,939 | ) | | | 14,054,844 | |
| | | | | | | | |
NET ASSETS: | | | | | | | | |
Beginning of period | | | 690,484,570 | | | | 676,429,726 | |
| | | | | | | | |
End of period* | | $ | 579,690,631 | | | $ | 690,484,570 | |
| | | | | | | | |
* Includes overdistributed net investment income of | | $ | (2,538,752 | ) | | $ | (1,850,031 | ) |
See Notes to Financial Statements.
| 20 | Legg | Mason Partners High Income Fund 2008 Semi-Annual Report |
Financial highlights
FOR A SHARE OF EACH CLASS OF BENEFICIAL INTEREST OUTSTANDING THROUGHOUT EACH YEAR ENDED JULY 31, UNLESS OTHERWISE NOTED:
| | | | | | | | | | | | | | | | | | | | | | | | |
CLASS A SHARES1 | | 20082 | | | 2007 | | | 2006 | | | 2005 | | | 2004 | | | 2003 | |
NET ASSET VALUE, BEGINNING OF PERIOD | | $ | 6.56 | | | $ | 6.64 | | | $ | 6.94 | | | $ | 6.79 | | | $ | 6.62 | | | $ | 5.97 | |
INCOME (LOSS) FROM OPERATIONS: | | | | | | | | | | | | | | | | | | | | | | | | |
Net investment income | | | 0.28 | | | | 0.52 | | | | 0.53 | | | | 0.52 | | | | 0.55 | | | | 0.62 | |
Net realized and unrealized gain (loss) | | | (0.32 | ) | | | (0.07 | ) | | | (0.30 | ) | | | 0.16 | | | | 0.23 | | | | 0.69 | |
Total income from operations | | | (0.04 | ) | | | 0.45 | | | | 0.23 | | | | 0.68 | | | | 0.78 | | | | 1.31 | |
LESS DISTRIBUTIONS FROM: | | | | | | | | | | | | | | | | | | | | | | | | |
Net investment income | | | (0.28 | ) | | | (0.53 | ) | | | (0.53 | ) | | | (0.53 | ) | | | (0.59 | ) | | | (0.61 | ) |
Return of capital | | | — | | | | — | | | | — | | | | — | | | | (0.02 | ) | | | (0.05 | ) |
Total distributions | | | (0.28 | ) | | | (0.53 | ) | | | (0.53 | ) | | | (0.53 | ) | | | (0.61 | ) | | | (0.66 | ) |
NET ASSET VALUE, END OF PERIOD | | $ | 6.24 | | | $ | 6.56 | | | $ | 6.64 | | | $ | 6.94 | | | $ | 6.79 | | | $ | 6.62 | |
Total return3 | | | (0.64 | )% | | | 6.75 | % | | | 3.38 | % | | | 10.26 | %4 | | | 12.16 | % | | | 23.23 | % |
NET ASSETS, END OF PERIOD (MILLIONS) | | $ | 261 | | | $ | 310 | | | $ | 347 | | | $ | 397 | | | $ | 438 | | | $ | 421 | |
RATIOS TO AVERAGE NET ASSETS: | | | | | | | | | | | | | | | | | | | | | | | | |
Gross expenses | | | 0.92 | %5 | | | 0.94 | %6 | | | 0.94 | % | | | 0.98 | % | | | 1.03 | % | | | 1.07 | % |
Net expenses | | | 0.92 | 5,† | | | 0.94 | 6,7 | | | 0.92 | 7 | | | 0.96 | 7 | | | 1.03 | | | | 1.07 | |
Net investment income | | | 8.44 | 5 | | | 7.54 | | | | 7.77 | | | | 7.47 | | | | 7.97 | | | | 9.76 | |
PORTFOLIO TURNOVER RATE | | | 23 | % | | | 63 | % | | | 55 | % | | | 18 | % | | | 44 | % | | | 53 | % |
1 | Per share amounts have been calculated using the average shares method. |
2 | For the six months ended January 31, 2008 (unaudited). |
3 | Performance figures may reflect fee waivers and/or expense reimbursements. In the absence of fee waivers and/or expense reimbursements, the total return would have been lower. Past performance is no guarantee of future results. Total returns for periods of less than one year are not annualized. |
4 | The prior investment manager fully reimbursed the Fund for losses incurred resulting from an investment transaction error. Without this reimbursement, total return would not have changed. |
6 | Included in the expense ratios are certain non-recurring restructuring (and reorganization, if applicable) fees that were incurred by the Fund during the period. Without these fees, the gross and net expense ratios would both have been 0.92%. |
7 | Reflects fee waivers and/or expense reimbursements. |
† | There was no impact to the expense ratio as a result of fees paid indirectly. |
See Notes to Financial Statements.
Legg Mason Partners High Income Fund 2008 Semi-Annual Report | 21
Financial highlights continued
FOR A SHARE OF EACH CLASS OF BENEFICIAL INTEREST OUTSTANDING THROUGHOUT EACH YEAR ENDED JULY 31, UNLESS OTHERWISE NOTED:
| | | | | | | | | | | | | | | | | | | | | | | | |
CLASS B SHARES1 | | 20082 | | | 2007 | | | 2006 | | | 2005 | | | 2004 | | | 2003 | |
NET ASSET VALUE, BEGINNING OF PERIOD | | $ | 6.59 | | | $ | 6.67 | | | $ | 6.97 | | | $ | 6.82 | | | $ | 6.64 | | | $ | 5.99 | |
INCOME (LOSS) FROM OPERATIONS: | | | | | | | | | | | | | | | | | | | | | | | | |
Net investment income | | | 0.26 | | | | 0.49 | | | | 0.49 | | | | 0.48 | | | | 0.51 | | | | 0.59 | |
Net realized and unrealized gain (loss) | | | (0.32 | ) | | | (0.06 | ) | | | (0.30 | ) | | | 0.16 | | | | 0.25 | | | | 0.68 | |
Total income (loss) from operations | | | (0.06 | ) | | | 0.43 | | | | 0.19 | | | | 0.64 | | | | 0.76 | | | | 1.27 | |
LESS DISTRIBUTIONS FROM: | | | | | | | | | | | | | | | | | | | | | | | | |
Net investment income | | | (0.27 | ) | | | (0.51 | ) | | | (0.49 | ) | | | (0.49 | ) | | | (0.56 | ) | | | (0.57 | ) |
Return of capital | | | — | | | | — | | | | — | | | | — | | | | (0.02 | ) | | | (0.05 | ) |
Total distributions | | | (0.27 | ) | | | (0.51 | ) | | | (0.49 | ) | | | (0.49 | ) | | | (0.58 | ) | | | (0.62 | ) |
NET ASSET VALUE, END OF PERIOD | | $ | 6.26 | | | $ | 6.59 | | | $ | 6.67 | | | $ | 6.97 | | | $ | 6.82 | | | $ | 6.64 | |
Total return3 | | | (1.05 | )% | | | 6.25 | % | | | 2.87 | % | | | 9.65 | %4 | | | 11.72 | % | | | 22.45 | % |
NET ASSETS, END OF PERIOD (MILLIONS) | | $ | 94 | | | $ | 118 | | | $ | 180 | | | $ | 273 | | | $ | 353 | | | $ | 392 | |
RATIOS TO AVERAGE NET ASSETS: | �� | | | | | | | | | | | | | | | | | | | | | | | |
Gross expenses | | | 1.46 | %5 | | | 1.42 | %6 | | | 1.46 | % | | | 1.49 | % | | | 1.55 | % | | | 1.57 | % |
Net expenses | | | 1.46 | 5,† | | | 1.42 | 6,7 | | | 1.44 | 7 | | | 1.47 | 7 | | | 1.55 | | | | 1.57 | |
Net investment income | | | 7.89 | 5 | | | 7.06 | | | | 7.22 | | | | 6.95 | | | | 7.46 | | | | 9.31 | |
PORTFOLIO TURNOVER RATE | | | 23 | % | | | 63 | % | | | 55 | % | | | 18 | % | | | 44 | % | | | 53 | % |
1 | Per share amounts have been calculated using the average shares method. |
2 | For the six months ended January 31, 2008 (unaudited). |
3 | Performance figures may reflect fee waivers and/or expense reimbursements. In the absence of fee waivers and/or expense reimbursements, the total return would have been lower. Past performance is no guarantee of future results. Total returns for periods of less than one year are not annualized. |
4 | The prior investment manager fully reimbursed the Fund for losses incurred resulting from an investment transaction error. Without this reimbursement, total return would not have changed. |
6 | Included in the expense ratios are certain non-recurring restructuring (and reorganization, if applicable) fees that were incurred by the Fund during the period. Without these fees, the gross and net expense ratios would both have been 1.40%. |
7 | Reflects fee waivers and/or expense reimbursements. |
† | There was no impact to the expense ratio as a result of fees paid indirectly. |
See Notes to Financial Statements.
22 | Legg Mason Partners High Income Fund 2008 Semi-Annual Report
FOR A SHARE OF EACH CLASS OF BENEFICIAL INTEREST OUTSTANDING THROUGHOUT EACH YEAR ENDED JULY 31, UNLESS OTHERWISE NOTED:
| | | | | | | | | | | | | | | | | | | | | | | | |
CLASS C SHARES1 | | 20082 | | | 2007 | | | 2006 | | | 2005 | | | 2004 | | | 2003 | |
NET ASSET VALUE, BEGINNING OF PERIOD | | $ | 6.59 | | | $ | 6.67 | | | $ | 6.98 | | | $ | 6.82 | | | $ | 6.65 | | | $ | 6.00 | |
INCOME (LOSS) FROM OPERATIONS: | | | | | | | | | | | | | | | | | | | | | | | | |
Net investment income | | | 0.26 | | | | 0.49 | | | | 0.50 | | | | 0.49 | | | | 0.52 | | | | 0.59 | |
Net realized and unrealized gain (loss) | | | (0.32 | ) | | | (0.06 | ) | | | (0.31 | ) | | | 0.17 | | | | 0.24 | | | | 0.69 | |
Total income (loss) from operations | | | (0.06 | ) | | | 0.43 | | | | 0.19 | | | | 0.66 | | | | 0.76 | | | | 1.28 | |
LESS DISTRIBUTIONS FROM: | | | | | | | | | | | | | | | | | | | | | | | | |
Net investment income | | | (0.27 | ) | | | (0.51 | ) | | | (0.50 | ) | | | (0.50 | ) | | | (0.57 | ) | | | (0.58 | ) |
Return of capital | | | — | | | | — | | | | — | | | | — | | | | (0.02 | ) | | | (0.05 | ) |
Total distributions | | | (0.27 | ) | | | (0.51 | ) | | | (0.50 | ) | | | (0.50 | ) | | | (0.59 | ) | | | (0.63 | ) |
NET ASSET VALUE, END OF PERIOD | | $ | 6.26 | | | $ | 6.59 | | | $ | 6.67 | | | $ | 6.98 | | | $ | 6.82 | | | $ | 6.65 | |
Total return3 | | | (1.01 | )% | | | 6.31 | % | | | 2.78 | % | | | 9.90 | %4 | | | 11.64 | % | | | 22.55 | % |
NET ASSETS, END OF PERIOD (MILLIONS) | | $ | 217 | | | $ | 255 | | | $ | 142 | | | $ | 191 | | | $ | 230 | | | $ | 217 | |
RATIOS TO AVERAGE NET ASSETS: | | | | | | | | | | | | | | | | | | | | | | | | |
Gross expenses | | | 1.39 | %5 | | | 1.39 | %6 | | | 1.39 | % | | | 1.42 | % | | | 1.48 | % | | | 1.50 | % |
Net expenses | | | 1.38 | 5,7,8,† | | | 1.36 | 6,7,8 | | | 1.37 | 7 | | | 1.40 | 7 | | | 1.48 | | | | 1.50 | |
Net investment income | | | 7.98 | 5 | | | 7.10 | | | | 7.30 | | | | 7.02 | | | | 7.53 | | | | 9.31 | |
PORTFOLIO TURNOVER RATE | | | 23 | % | | | 63 | % | | | 55 | % | | | 18 | % | | | 44 | % | | | 53 | % |
1 | Per share amounts have been calculated using the average shares method. |
2 | For the six months ended January 31, 2008 (unaudited). |
3 | Performance figures may reflect fee waivers and/or expense reimbursements. In the absence of fee waivers and/or expense reimbursements, the total return would have been lower. Past performance is no guarantee of future results. Total returns for periods of less than one year are not annualized. |
4 | The prior investment manager fully reimbursed the Fund for losses incurred resulting from an investment transaction error. Without this reimbursement, total return would not have changed. |
6 | Included in the expense ratios are certain non-recurring restructuring (and reorganization, if applicable) fees that were incurred by the Fund during the period. Without these fees, the gross and net expense ratios would have been 1.38% and 1.34%, respectively. |
7 | Reflects fee waivers and/or expense reimbursements. |
8 | As a result of a contractual expense limitation effective March 16, 2007 through December 1, 2008, the ratio of expenses, other than interest, brokerage, taxes and extraordinary expenses, to average net assets of Class C shares will not exceed 1.38%. |
† | There was no impact to the expense ratio as a result of fees paid indirectly. |
See Notes to Financial Statements.
Legg Mason Partners High Income Fund 2008 Semi-Annual Report | 23
Financial highlights continued
FOR A SHARE OF EACH CLASS OF BENEFICIAL INTEREST OUTSTANDING THROUGHOUT EACH YEAR ENDED JULY 31, UNLESS OTHERWISE NOTED:
| | | | | | | | | | | | | | | | | | | | | | | | |
CLASS I SHARES1 | | 20082 | | | 2007 | | | 2006 | | | 2005 | | | 2004 | | | 2003 | |
NET ASSET VALUE, BEGINNING OF PERIOD | | $ | 6.59 | | | $ | 6.68 | | | $ | 6.98 | | | $ | 6.82 | | | $ | 6.65 | | | $ | 6.00 | |
INCOME (LOSS) FROM OPERATIONS: | | | | | | | | | | | | | | | | | | | | | | | | |
Net investment income | | | 0.29 | | | | 0.54 | | | | 0.53 | | | | 0.54 | | | | 0.56 | | | | 0.65 | |
Net realized and unrealized gain (loss) | | | (0.33 | ) | | | (0.07 | ) | | | (0.28 | ) | | | 0.17 | | | | 0.25 | | | | 0.68 | |
Total income (loss) from operations | | | (0.04 | ) | | | 0.47 | | | | 0.25 | | | | 0.71 | | | | 0.81 | | | | 1.33 | |
LESS DISTRIBUTIONS FROM: | | | | | | | | | | | | | | | | | | | | | | | | |
Net investment income | | | (0.29 | ) | | | (0.56 | ) | | | (0.55 | ) | | | (0.55 | ) | | | (0.62 | ) | | | (0.63 | ) |
Return of capital | | | — | | | | — | | | | — | | | | — | | | | (0.02 | ) | | | (0.05 | ) |
Total distributions | | | (0.29 | ) | | | (0.56 | ) | | | (0.55 | ) | | | (0.55 | ) | | | (0.64 | ) | | | (0.68 | ) |
NET ASSET VALUE, END OF PERIOD | | $ | 6.26 | | | $ | 6.59 | | | $ | 6.68 | | | $ | 6.98 | | | $ | 6.82 | | | $ | 6.65 | |
Total return3 | | | (0.64 | )% | | | 6.90 | % | | | 3.67 | % | | | 10.72 | %4 | | | 12.46 | % | | | 23.58 | % |
NET ASSETS, END OF PERIOD (MILLIONS) | | $ | 8 | | | $ | 7 | | | $ | 7 | | | $ | 148 | | | $ | 178 | | | $ | 159 | |
RATIOS TO AVERAGE NET ASSETS: | | | | | | | | | | | | | | | | | | | | | | | | |
Gross expenses | | | 0.64 | %5 | | | 0.65 | %6 | | | 0.62 | % | | | 0.62 | % | | | 0.71 | % | | | 0.73 | % |
Net expenses | | | 0.64 | 5,† | | | 0.65 | 6,7 | | | 0.62 | 7 | | | 0.60 | 7 | | | 0.71 | | | | 0.73 | |
Net investment income | | | 8.74 | 5 | | | 7.72 | | | | 7.66 | | | | 7.81 | | | | 8.30 | | | | 10.14 | |
PORTFOLIO TURNOVER RATE | | | 23 | % | | | 63 | % | | | 55 | % | | | 18 | % | | | 44 | % | | | 53 | % |
1 | Per share amounts have been calculated using the average shares method. |
2 | For the six months ended January 31, 2008 (unaudited). |
3 | Performance figures may reflect fee waivers and/or expense reimbursements. In the absence of fee waivers and/or expense reimbursements, the total return would have been lower. Past performance is no guarantee of future results. Total returns for periods of less than one year are not annualized. |
4 | The prior investment manager fully reimbursed the Fund for losses incurred resulting from an investment transaction error. Without this reimbursement, total return would not have changed. |
6 | Included in the expense ratios are certain non-recurring restructuring (and reorganization, if applicable) fees that were incurred by the Fund during the period. Without these fees, the gross and net expense ratios would both have been 0.62%. |
7 | Reflects fee waivers and/or expense reimbursements. |
† | There was no impact to the expense ratio as a result of fees paid indirectly. |
See Notes to Financial Statements.
24 | Legg Mason Partners High Income Fund 2008 Semi-Annual Report
Notes to financial statements (unaudited)
1. Organization and significant accounting policies
Legg Mason Partners High Income Fund (the “Fund”) is a separate diversified investment series of Legg Mason Partners Income Trust (the “Trust”). The Trust, a Maryland business trust, is registered under the Investment Company Act of 1940, as amended (the “1940 Act”), as an open-end management investment company.
The following are significant accounting policies consistently followed by the Fund and are in conformity with U.S. generally accepted accounting principles (“GAAP”). Estimates and assumptions are required to be made regarding assets, liabilities and changes in net assets resulting from operations when financial statements are prepared. Changes in the economic environment, financial markets and any other parameters used in determining these estimates could cause actual results to differ.
(a) Investment valuation. Debt securities are valued at the mean between the last quoted bid and asked prices provided by an independent pricing service that are based on transactions in debt obligations, quotations from bond dealers, market transactions in comparable securities and various other relationships between securities. Publicly traded foreign government debt securities are typically traded internationally in the over-the-counter market, and are valued at the mean between the last quoted bid and asked prices as of the close of business of that market. Equity securities for which market quotations are available are valued at the last reported sales price or official closing price on the primary market or exchange on which they trade. When prices are not readily available, or are determined not to reflect fair value, such as when the value of a security has been significantly affected by events after the close of the exchange or market on which the security is principally traded, but before the Fund calculates its net asset value, the Fund may value these securities at fair value as determined in accordance with the procedures approved by the Fund’s Board of Trustees. Short-term obligations with maturities of 60 days or less are valued at amortized cost, which approximates fair value.
(b) Repurchase agreements. When entering into repurchase agreements, it is the Fund’s policy that its custodian or a third party custodian take possession of the underlying collateral securities, the market value of which, at all times, at least equals the principal amount of the repurchase transaction, including accrued interest. To the extent that any repurchase transaction exceeds one business day, the value of the collateral is marked-to-market to ensure the adequacy of the collateral. If the seller defaults, and the market value of the collateral declines or if bankruptcy proceedings are commenced with respect to the seller of the security, realization of the collateral by the Fund may be delayed or limited.
(c) Credit and market risk. The Fund invests in high yield instruments that are subject to certain credit and market risks. The yields of high yield obligations
Legg Mason Partners High Income Fund 2008 Semi-Annual Report | 25
Notes to financial statements (unaudited) continued
reflect, among other things, perceived credit and market risks. The Fund’s investment in securities rated below investment grade typically involves risks not associated with higher rated securities including, among others, greater risk related to timely and ultimate payment of interest and principal, greater market price volatility and less liquid secondary market trading.
(d) Security transactions and investment income. Security transactions are accounted for on a trade date basis. Interest income, adjusted for amortization of premium and accretion of discount, is recorded on the accrual basis. Dividend income is recorded on the ex-dividend date. The cost of investments sold is determined by use of the specific identification method. To the extent any issuer defaults on an expected interest payment, the Fund’s policy is to generally halt any additional interest income accruals and consider the realizability of interest accrued up to the date of default.
(e) Fees Paid Indirectly. The Fund’s custodian calculates its fees based on the Fund’s average daily net assets. The fee is reduced according to a fee arrangement, which provides for a reduction based on the level of cash deposited with the custodian by the Fund.
(f) Distributions to shareholders. Distributions from net investment income on the shares of the Fund are declared each business day to shareholders of record, and are paid monthly. Distributions of net realized gains, if any, are declared at least annually. Distributions are recorded on the ex-dividend date and are determined in accordance with income tax regulations, which may differ from GAAP.
(g) Class accounting. Investment income, common expenses and realized/unrealized gain (loss) on investments are allocated to the various classes of the Fund on the basis of daily net assets of each class. Fees relating to a specific class are charged directly to that class.
(h) Federal and other taxes. It is the Fund’s policy to comply with the federal income and excise tax requirements of the Internal Revenue Code of 1986, as amended, applicable to regulated investment companies. Accordingly, the Fund intends to distribute substantially all of its taxable income and net realized gains, if any, to shareholders each year. Therefore, no federal income tax provision is required in the Fund’s financial statements.
Management has analyzed the Fund’s tax positions taken on federal income tax returns for all open tax years and has concluded that as of January 31, 2008, no provision for income tax would be required in the Fund’s financial statements. The Fund’s federal and state income and federal excise tax returns for tax years for which the applicable statutes of limitations have not expired are subject to examination by the Internal Revenue Service and state departments of revenue.
(i) Reclassification. GAAP requires that certain components of net assets be adjusted to reflect permanent differences between financial and tax
26 | Legg Mason Partners High Income Fund 2008 Semi-Annual Report
reporting. These reclassifications have no effect on net assets or net asset values per share.
2. Investment management agreement and other transactions with affiliates
Legg Mason Partners Fund Advisor, LLC (“LMPFA”) is the Fund’s investment manager. Western Asset Management Company (“Western Asset”) and Western Asset Management Company Limited (“Western Asset Limited”) are the Fund’s subadvisers. LMPFA, Western Asset and Western Asset Limited are wholly-owned subsidiaries of Legg Mason.
Under the investment management agreement, the Fund pays an investment management fee, calculated daily and paid monthly, at an annual rate of 0.60% of the Fund’s average daily net assets.
LMPFA provides administrative and certain oversight services to the Fund. LMPFA delegates to the subadvisers the day-to-day portfolio management of the Fund. For its services, LMPFA pays Western Asset 70% of the net management fee it receives from the Fund. Western Asset pays Western Assets Limited a sub-advisory fee of 0.30% on the net assets managed by Western Assets Limited.
As a result of a contractual expense limitation, effective March 16, 2007 through December 1, 2008, the ratio of expenses other than interest, brokerage, taxes and extraordinary expenses, to average net assets of Class C shares will not exceed 1.38%.
During the six months ended January 31, 2008, LMPFA waived a portion of its investment management fee in the amount of $8,201.
Effective December 1, 2007, Legg Mason Investor Services, LLC (“LMIS”), a wholly-owned broker-dealer subsidiary of Legg Mason, serves as the Fund’s sole and exclusive distributor. Prior to December 1, 2007, Citigroup Global Markets Inc. (“CGM”) and LMIS served as co-distributors of the Fund.
There is a maximum initial sales charge of 4.25% for Class A shares. There is a contingent deferred sales charge (“CDSC”) of 4.50% on Class B shares, which applies if redemption occurs within one year from purchase payment. This CDSC declines by 0.50% the first year after purchase payment and thereafter by 1.00% per year until no CDSC is incurred. Class C shares have a 1.00% CDSC, which applies if redemption occurs within one year from purchase payment. In certain cases, Class A shares have a 1.00% CDSC, which applies if redemption occurs within one year from purchase payment. This CDSC only applies to those purchases of Class A shares, which, when combined with current holdings of Class A shares, equal or exceed $500,000 in the aggregate. These purchases do not incur an initial sales charge.
Legg Mason Partners High Income Fund 2008 Semi-Annual Report | 27
Notes to financial statements (unaudited) continued
For the six months ended January 31, 2008, LMIS and its affiliates received sales charges of approximately $4,000 on sales of the Fund’s Class A shares. In addition, for the six months ended January 31, 2008, CDSCs paid to LMIS and its affiliates were approximately:
| | | | | | | | | | |
| | | CLASS A | | | CLASS B | | CLASS C |
CDSCs | | $ | 0 | * | | $ | 100,000 | | $ | 4,000 |
| * | Amount represents less than $1,000. |
The Fund had adopted an unfunded, non-qualified deferred compensation plan (the “Plan”) which allowed non-interested trustees (“Trustees”) to defer the receipt of all or a portion of the trustees’ fees earned until a later date specified by the Trustees. The deferred fees earn a return based on notional investments selected by the Trustees. The balance of the deferred fees payable may change depending upon the investment performance. Any gains or losses incurred in the deferred balances are reported in the Statement of Operations under Trustees’ fees. Under the Plan, deferred fees are considered a general obligation of the Fund and any payments made pursuant to the Plan will be made from the Fund’s general assets. The Plan was terminated effective January 1, 2006. This change will have no effect on fees previously deferred. As of January 31, 2008, the Fund had accrued $27,876 as deferred compensation payable under the Plan.
Certain officers and one Trustee of the Trust are employees of Legg Mason or its affiliates and do not receive compensation from the Trust.
3. Investments
During the six months ended January 31, 2008, the aggregate cost of purchases and proceeds from sales of investments (excluding short-term investments) were as follows:
| | | |
Purchases | | $ | 145,704,562 |
Sales | | | 227,485,242 |
At January 31, 2008, the aggregate gross unrealized appreciation and depreciation of investments for federal income tax purposes were substantially as follows:
| | | | |
Gross unrealized appreciation | | $ | 6,043,142 | |
Gross unrealized depreciation | | | (73,066,012 | ) |
| | | | |
Net unrealized depreciation | | $ | (67,022,870 | ) |
| | | | |
28 | Legg Mason Partners High Income Fund 2008 Semi-Annual Report
4. Class specific expenses
The Fund has adopted a Rule 12b-1 distribution plan and under that plan the Fund pays a service fee with respect to its Class A, B and C shares calculated at the annual rate of 0.25% of the average daily net assets of each respective class. The Fund also pays a distribution fee with respect to its Class B and C shares calculated at the annual rate of 0.50% and 0.45% of the average daily net assets of each class, respectively. Distribution fees are accrued daily and paid monthly.
For the six months ended January 31, 2008, class specific expenses were as follows:
| | | | | | | | | |
| | | DISTRIBUTION
FEES | | TRANSFER AGENT
FEES | | SHAREHOLDER REPORTS
EXPENSES |
Class A | | $ | 366,094 | | $ | 42,885 | | $ | 14,856 |
Class B | | | 404,131 | | | 33,791 | | | 11,647 |
Class C | | | 847,464 | | | 49,162 | | | 22,992 |
Class I | | | — | | | 290 | | | 294 |
| | | | | | | | | |
Total | | $ | 1,617,689 | | $ | 126,128 | | $ | 49,789 |
| | | | | | | | | |
5. Distributions to shareholders by class
| | | | | | |
| | | SIX MONTHS ENDED
JANUARY 31, 2008 | | YEAR ENDED
JULY 31, 2007 |
Net Investment Income: | | | | | | |
| | |
Class A | | $ | 12,665,503 | | $ | 26,786,341 |
Class B | | | 4,366,774 | | | 11,149,087 |
Class C | | | 9,915,304 | | | 14,083,986 |
Class I | | | 332,086 | | | 443,989 |
| | | | | | |
Total | | $ | 27,279,667 | | $ | 52,463,403 |
| | | | | | |
Legg Mason Partners High Income Fund 2008 Semi-Annual Report | 29
Notes to financial statements (unaudited) continued
6. Shares of beneficial interest
At January 31, 2008, the Trust had an unlimited number of shares of beneficial interest authorized with a par value of $0.00001 per share. The Fund has the ability to issue multiple classes of shares. Each share of a class represents an identical interest and has the same rights, except that each class bears certain direct expenses, including those specifically related to the distribution of its shares.
Transactions in shares of each class were as follows:
| | | | | | | | | | | | | | |
| | | SIX MONTHS ENDED
JANUARY 31, 2008 | | | YEAR ENDED
JULY 31, 2007 | |
| | | SHARES | | | AMOUNT | | | SHARES | | | AMOUNT | |
Class A | | | | | | | | | | | | | | |
| | | | |
Shares sold | | 1,367,974 | | | $ | 8,896,708 | | | 6,354,704 | | | $ | 43,871,376 | |
Shares issued on reinvestment | | 893,191 | | | | 5,812,512 | | | 1,720,297 | | | | 11,839,827 | |
Shares repurchased | | (7,659,864 | ) | | | (50,203,861 | ) | | (13,034,017 | ) | | | (89,789,219 | ) |
| | | | | | | | | | | | | | |
Net decrease | | (5,398,699 | ) | | $ | (35,494,641 | ) | | (4,959,016 | ) | | $ | (34,078,016 | ) |
| | | | | | | | | | | | | | |
Class B | | | | | | | | | | | | | | |
| | | | |
Shares sold | | 165,988 | | | $ | 1,078,783 | | | 949,596 | | | $ | 6,548,989 | |
Shares issued on reinvestment | | 260,944 | | | | 1,705,651 | | | 597,158 | | | | 4,121,711 | |
Shares repurchased | | (3,269,181 | ) | | | (21,422,899 | ) | | (10,635,711 | ) | | | (73,504,571 | ) |
| | | | | | | | | | | | | | |
Net decrease | | (2,842,249 | ) | | $ | (18,638,465 | ) | | (9,088,957 | ) | | $ | (62,833,871 | ) |
| | | | | | | | | | | | | | |
Class C | | | | | | | | | | | | | | |
| | | | |
Shares sold | | 718,296 | | | $ | 4,684,903 | | | 1,891,733 | | | $ | 13,176,486 | |
Shares issued on reinvestment | | 852,501 | | | | 5,572,994 | | | 1,006,475 | | | | 6,968,628 | |
Shares repurchased | | (5,677,321 | ) | | | (37,133,420 | ) | | (6,913,905 | ) | | | (47,920,064 | ) |
Shares issued with merger | | — | | | | — | | | 21,354,459 | | | | 150,273,765 | |
| | | | | | | | | | | | | | |
Net increase (decrease) | | (4,106,524 | ) | | $ | (26,875,523 | ) | | 17,338,762 | | | $ | 122,498,815 | |
| | | | | | | | | | | | | | |
Class I | | | | | | | | | | | | | | |
| | | | |
Shares sold | | 274,777 | | | $ | 1,809,409 | | | 348,123 | | | $ | 2,354,958 | |
Shares issued on reinvestment | | 41,929 | | | | 273,614 | | | 21,097 | | | | 146,231 | |
Shares repurchased | | (172,499 | ) | | | (1,129,797 | ) | | (1,151,622 | ) | | | (8,041,752 | ) |
Shares issued with merger | | — | | | | — | | | 802,506 | | | | 5,647,314 | |
| | | | | | | | | | | | | | |
Net increase | | 144,207 | | | $ | 953,226 | | | 20,104 | | | $ | 106,751 | |
| | | | | | | | | | | | | | |
7. Transfer of Net Assets
On March 16, 2007, the Fund acquired the assets and certain liabilities of the Legg Mason High Yield Portfolio (the “Acquired Fund”), pursuant to a plan of reorganization approved by the Acquired Fund shareholders. Total shares issued by the Fund and the total net assets of the Acquired Fund and the Fund on the date of the transfer were as follows:
| | | | | | | | |
ACQUIRED FUND | | SHARES ISSUED
BY THE FUND | | TOTAL NET ASSETS OF THE
HIGH YIELD PORTFOLIO | | TOTAL NET ASSETS
OF THE FUND |
Legg Mason High Yield Portfolio | | 22,156,965 | | $ | 155,921,079 | | $ | 631,070,897 |
30 | Legg Mason Partners High Income Fund 2008 Semi-Annual Report
The total net assets of the Acquired Fund before acquisition included unrealized appreciation of $4,786,330 and accumulated net realized loss of $150,925,805. Total net assets of the Fund immediately after the transfer were $786,991,976. The transaction was structured to qualify as a tax-free reorganization under the Internal Revenue Code of 1986, as amended.
8. Capital loss carryforward
On July 31, 2007, the Fund had a net capital loss carryforward of approximately $655,556,449, of which $53,168,760 expires in 2008, $143,558,396 expires in 2009, $302,952,815 expires in 2010, $139,767,629 expires in 2011 and $16,108,849 expires in 2012. These amounts will be available to offset like amounts of any future taxable gains.
9. Regulatory matters
On May 31, 2005, the U.S. Securities and Exchange Commission (“SEC”) issued an order in connection with the settlement of an administrative proceeding against Smith Barney Fund Management LLC (“SBFM”), a wholly-owned subsidiary of Legg Mason and the then investment adviser or manager to the Fund, and CGM, a former distributor of the Fund, relating to the appointment of an affiliated transfer agent for the Smith Barney family of mutual funds, including the fund (the “Affected Funds”).
The SEC order found that SBFM and CGM willfully violated Section 206(1) of the Investment Advisers Act of 1940, as amended, and the rules promulgated thereunder (the “Advisers Act”). Specifically, the order found that SBFM and CGM knowingly or recklessly failed to disclose to the boards of the Affected Funds in 1999 when proposing a new transfer agent arrangement with an affiliated transfer agent that: First Data Investors Services Group (“First Data”), the Affected Funds’ then-existing transfer agent, had offered to continue as transfer agent and do the same work for substantially less money than before; and that Citigroup Asset Management (“CAM”), the Citigroup business unit that, at the time, included the Affected Funds’ investment manager and other investment advisory companies, had entered into a side letter with First Data under which CAM agreed to recommend the appointment of First Data as sub-transfer agent to the affiliated transfer agent in exchange for, among other things, a guarantee by First Data of specified amounts of asset management and investment banking fees to CAM and CGM. The order also found that SBFM and CGM willfully violated Section 206(2) of the Advisers Act by virtue of the omissions discussed above and other misrepresentations and omissions in the materials provided to the Affected Funds’ boards, including the failure to make clear that the affiliated transfer agent would earn a high profit for performing limited functions while First Data continued to perform almost all of the transfer agent functions, and the suggestion that the proposed arrangement was in the Affected Funds’ best interests and that no viable alternatives existed.
Legg Mason Partners High Income Fund 2008 Semi-Annual Report | 31
Notes to financial statements (unaudited) continued
SBFM and CGM do not admit or deny any wrongdoing or liability. The settlement does not establish wrongdoing or liability for purposes of any other proceeding. The SEC censured SBFM and CGM and ordered them to cease and desist from violations of Sections 206(1) and 206(2) of the Advisers Act. The order required Citigroup to pay $208.1 million, including $109 million in disgorgement of profits, $19.1 million in interest, and a civil money penalty of $80 million. Approximately $24.4 million has already been paid to the Affected Funds, primarily through fee waivers. The remaining $183.7 million, including the penalty, has been paid to the U.S. Treasury and will be distributed pursuant to a plan submitted for the approval of the SEC. At this time, there is no certainty as to how the above-described proceeds of the settlement will be distributed, to whom such distributions will be made, the methodology by which such distributions will be allocated, and when such distributions will be made. The order also required that transfer agency fees received from the Affected Funds since December 1, 2004, less certain expenses, be placed in escrow and provided that a portion of such fees might be subsequently distributed in accordance with the terms of the order. On April 3, 2006, an aggregate amount of approximately $9 million held in escrow was distributed to the Affected Funds.
The order required SBFM to recommend a new transfer agent contract to the Affected Funds’ boards within 180 days of the entry of the order; if a Citigroup affiliate submitted a proposal to serve as transfer agent or sub-transfer agent, SBFM and CGM would have been required, at their expense, to engage an independent monitor to oversee a competitive bidding process. On November 21, 2005, and within the specified timeframe, the Affected Funds’ Boards selected a new transfer agent for the Affected Funds. No Citigroup affiliate submitted a proposal to serve as transfer agent. Under the order, SBFM also must comply with an amended version of a vendor policy that Citigroup instituted in August 2004.
Although there can be no assurance, the manager does not believe that this matter will have a material adverse effect on the Affected Funds.
On December 1, 2005, Citigroup completed the sale of substantially all of its global asset management business, including SBFM, to Legg Mason.
10. Legal matters
Beginning in June 2004, class action lawsuits alleging violations of the federal securities laws were filed against CGM, a former distributor of the Fund and other affiliated funds (collectively, the “Funds”), and a number of its then affiliates, including SBFM and Salomon Brothers Asset Management Inc (“SBAM”), which were then investment adviser or manager to certain of the Funds (the “Managers”), substantially all of the mutual funds then managed by the Managers (the “Defendant Funds”), and Board Members of the Defendant Funds (collectively, the “Defendants”). The complaints alleged, among other things, that CGM created various undisclosed incentives for its brokers to sell
32 | Legg Mason Partners High Income Fund 2008 Semi-Annual Report
Smith Barney and Salomon Brothers funds. In addition, according to the complaints, the Managers caused the Defendant Funds to pay excessive brokerage commissions to CGM for steering clients towards proprietary funds. The complaints also alleged that the Defendants breached their fiduciary duty to the Defendant Funds by improperly charging Rule 12b-1 fees and by drawing on fund assets to make undisclosed payments of soft dollars and excessive brokerage commissions. The complaints also alleged that the Defendant Funds failed to adequately disclose certain of the allegedly wrongful conduct. The complaints sought injunctive relief and compensatory and punitive damages, rescission of the Defendant Funds’ contracts with the Managers, recovery of all fees paid to the Managers pursuant to such contracts and an award of attorneys’ fees and litigation expenses.
On December 15, 2004, a consolidated amended complaint (the “Complaint”) was filed alleging substantially similar causes of action. On May 27, 2005, all of the Defendants filed motions to dismiss the Complaint. On July 26, 2006, the court issued a decision and order (1) finding that plaintiffs lacked standing to sue on behalf of the shareholders of the Funds in which none of the plaintiffs had invested and dismissing those Funds from the case (although stating that they could be brought back into the case if standing as to them could be established), and (2) other than one stayed claim, dismissing all of the causes of action against the remaining Defendants, with prejudice, except for the cause of action under Section 36(b) of the 1940 Act, which the court granted plaintiffs leave to repeal as a derivative claim.
On October 16, 2006, plaintiffs filed their Second Consolidated Amended Complaint (“Second Amended Complaint”) which alleges derivative claims on behalf of nine funds identified in the Second Amended Complaint, under Section 36(b) of the 1940 Act, against Citigroup Asset Management (“CAM”), SBAM and SBFM as investment advisers to the identified funds, as well as CGM as a distributor for the identified funds (collectively, the “Second Amended Complaint Defendants”). The Fund was not identified in the Second Amended Complaint.
The Second Amended Complaint alleges no claims against any of the Funds or any of their Board Members. Under Section 36(b), the Second Amended Complaint alleges similar facts and seeks similar relief against the Second Amended Complaint Defendants as the Complaint.
On December 3, 2007, the court granted the Defendants’ motion to dismiss, with prejudice. On January 2, 2008, the plaintiffs filed a notice of appeal to Second Circuit Court of Appeals.
Additional lawsuits arising out of these circumstances and presenting similar allegations and requests for relief may be filed in the future.
* * *
Beginning in August 2005, five class action lawsuits alleging violations of federal securities laws and state law were filed against CGM and SBFM, (collectively,
Legg Mason Partners High Income Fund 2008 Semi-Annual Report | 33
Notes to financial statements (unaudited) continued
the “Defendants”) based on the May 31, 2005 settlement order issued against the Defendants by the SEC as described in Note 9. The complaints seek injunctive relief and compensatory and punitive damages, removal of SBFM as the investment manager for the Smith Barney family of funds, rescission of the funds’ management and other contracts with SBFM, recovery of all fees paid to SBFM pursuant to such contracts, and an award of attorneys’ fees and litigation expenses.
On October 5, 2005, a motion to consolidate the five actions and any subsequently filed, related action was filed. That motion contemplates that a consolidated amended complaint alleging substantially similar causes of action will be filed in the future.
On September 26, 2007, the United States District Court for the Southern District of New York issued an order dismissing the consolidated complaint. The plaintiffs have filed a notice of appeal.
11. Other matters
As previously disclosed, on September 16, 2005 the staff of the SEC informed SBFM and SBAM, that the staff was considering recommending administrative proceedings against SBFM and SBAM for alleged violations of Section 19(a) and 34(b) of the Investment Company Act (and related Rule 19a-1). On September 27, 2007, SBFM and SBAM, without admitting or denying any findings therein, consented to the entry of an order by the SEC relating to the disclosure by certain other funds that are closed-end funds of the sources of distributions paid by the funds between 2001 and 2004. Each of SBFM and SBAM agreed to pay a fine of $450,000, for which it was indemnified by Citigroup, Inc., its former parent. It is not expected that this matter will adversely impact the Fund or its current investment adviser.
* * *
On or about May 30, 2006, John Halebian, a purported shareholder of Citi New York Tax Free Reserves, a series of Legg Mason Partners Money Market Trust, formerly a series of CitiFunds Trust III (the “Subject Trust”), filed a complaint in the United States District Court for the Southern District of New York against the independent trustees of the Subject Trust (Elliott J. Berv, Donald M. Carlton, A. Benton Cocanougher, Mark T. Finn, Stephen Randolph Gross, Diana R. Harrington, Susan B. Kerley, Alan G. Merten and R. Richardson Pettit).
The Subject Trust is also named in the complaint as a nominal defendant. The complaint alleges both derivative claims on behalf of the Subject Trust and class claims on behalf of a putative class of shareholders of the Subject Trust in connection with the 2005 sale of Citigroup’s asset management business to Legg Mason and the related approval of new investment advisory agreements by the trustees and shareholders. In the derivative claim, the plaintiff alleges, among other things, that the independent trustees breached their fiduciary
34 | Legg Mason Partners High Income Fund 2008 Semi-Annual Report
duty to the Subject Trust and its shareholders by failing to negotiate lower fees or seek competing bids from other qualified investment advisers in connection with Citigroup’s sale to Legg Mason. In the claims brought on behalf of the putative class of shareholders, the plaintiff alleges that the independent trustees violated the proxy solicitation requirements of the 1940 Act, and breached their fiduciary duty to shareholders, by virtue of the voting procedures, including “echo voting,” used to obtain approval of the new investment advisory agreements and statements made in a proxy statement regarding those voting procedures. The plaintiff alleges that the proxy statement was misleading because it failed to disclose that the voting procedures violated the 1940 Act. The relief sought includes an award of damages, rescission of the advisory agreement, and an award of costs and attorney fees.
In advance of filing the complaint, Mr. Halebian’s lawyers made written demand for relief on the Board of the Subject Trust, and the Board’s independent trustees formed a demand review committee to investigate the matters raised in the demand, and subsequently in the complaint, and recommend a course of action to the Board. The committee, after a thorough review, has determined that the independent trustees did not breach their fiduciary duties as alleged by Mr. Halebian, and that the action demanded by Mr. Halebian would not be in the best interests of the Subject Trust. The Board of the Subject Trust (the trustee who is an “interested person” of the Subject Trust, within the meaning of the 1940 Act, having recused himself from the matter), after receiving and considering the committee’s report and based upon the findings of the committee, subsequently also has so determined and, adopting the recommendation of the committee, has directed counsel to move to dismiss Mr. Halebian’s complaint. A motion to dismiss was filed on October 23, 2006. Opposition papers were filed on or about December 7, 2006. The complaint was dismissed on July 31, 2007. Mr. Halebian has filed an appeal in the U.S. Court of Appeals for the Second Circuit. The appeal is pending.
12. Recent accounting pronouncement
On September 20, 2006, the Financial Accounting Standards Board released Statement of Financial Accounting Standards No. 157, Fair Value Measurements (“FAS 157”). FAS 157 establishes an authoritative definition of fair value, sets out a framework for measuring fair value, and requires additional disclosures about fair value measurements. The application of FAS 157 is required for fiscal years beginning after November 15, 2007 and interim periods within those fiscal years. At this time, management is evaluating the implications of FAS 157.
Legg Mason Partners High Income Fund 2008 Semi-Annual Report | 35
Board approval of management and subadvisory agreements (unaudited)
At a meeting of the Board of Trustees of Legg Mason Partners Income Trust (the “Trust”) held on November 12-13, 2007, the Board, including the Board members who are not considered to be “interested persons” of the Trust (the “Independent Board Members”) under the Investment Company Act of 1940, as amended (the “1940 Act”), approved for an annual period the continuation of the management agreement (the “Management Agreement”) between the Trust and Legg Mason Partners Fund Advisor, LLC (the “Manager”) with respect to the Legg Mason Partners High Income Fund, a series of the Trust (the “Fund”), and the sub-advisory agreement (the “Sub-Advisory Agreement”) between the Manager and Western Asset Management Company (the “Subadviser”), an affiliate of the Manager, with respect to the Fund. At that meeting, the Board, including the Independent Board Members, also approved for an annual period the continuation of a sub-advisory agreement (together with the Sub-Advisory Agreement, the “Sub-Advisory Agreements”) between the Subadviser and Western Asset Management Company Limited (together with the Subadviser, the “Subadvisers”), an affiliate of the Manager and the Subadviser.
Background
The Board received information in advance of the meeting from the Manager to assist it in its consideration of the Management Agreement and the Sub-Advisory Agreements and was given the opportunity to ask questions and request additional information from management. The Board received and considered a variety of information about the Manager, the Subadvisers and the Fund’s distributor (and any distributors affiliated with the Fund during the past two years), as well as the management, sub-advisory and distribution arrangements for the Fund and other funds overseen by the Board, certain portions of which are discussed below. The presentation made to the Board encompassed the Fund and all funds for which the Board has responsibility. The discussion below covers both the advisory and the administrative functions being rendered by the Manager, both of which functions are encompassed by the Management Agreement, as well as the advisory functions rendered by the Subadvisers pursuant to the Sub-Advisory Agreements.
Board approval of management agreement and sub-advisory agreements
The Independent Board Members were advised by separate independent legal counsel throughout the process. Prior to voting, the Independent Board Members received a memorandum from their independent legal counsel discussing the legal standards for their consideration of the proposed continuation of the Management Agreement and the Sub-Advisory Agreements. The Independent Board Members also discussed the proposed continuation of the Management Agreement and the Sub-Advisory Agreements in private sessions with their independent legal counsel at which no representatives of the Manager were present. In approving the Management Agreement and Sub-Advisory Agreements, the Board, including the Independent Board
36 | Legg Mason Partners High Income Fund
Members, considered a variety of factors, including those factors discussed below. No single factor reviewed by the Board was identified by the Board as the principal factor in determining whether to approve the Management Agreement and the Sub-Advisory Agreements, and each Board Member attributed different weight to the various factors.
Nature, extent and quality of the services under the management agreement and sub-advisory agreements
The Board received and considered information regarding the nature, extent and quality of services provided to the Fund by the Manager and the Subadvisers under the Management Agreement and the Sub-Advisory Agreements during the past two years. The Board noted information received at regular meetings throughout the year related to the services rendered by the Manager in its management of the Fund’s affairs and the Manager’s role in coordinating the activities of the Fund’s other service providers. The Board’s evaluation of the services provided by the Manager and the Subadvisers took into account the Board’s knowledge and familiarity gained as Board members of funds in the Legg Mason Partners fund complex, including the scope and quality of the investment management and other capabilities of the Manager and the Subadvisers, and the quality of the Manager’s administrative and other services. The Board observed that the scope of services provided by the Manager and the Subadvisers had expanded over time as a result of regulatory and other developments, including maintaining and monitoring their own and the Fund’s expanded compliance programs. The Board reviewed information received from the Manager and the Subadvisers regarding the Fund’s compliance policies and procedures established pursuant to Rule 38a-1 under the 1940 Act.
The Board reviewed the qualifications, backgrounds and responsibilities of the Fund’s senior personnel and the portfolio management team primarily responsible for the day-to-day portfolio management of the Fund. The Board also considered the degree to which the Manager implemented organizational changes to improve investment results and the services provided to the Legg Mason Partners fund complex. The Board also considered, based on its knowledge of the Manager and its affiliates, the financial resources available to Legg Mason, Inc., the parent organization of the Manager and the Subadvisers.
The Board considered the division of responsibilities among the Manager and the Subadvisers and the oversight provided by the Manager. The Board also considered the Manager’s and the Subadvisers’ brokerage policies and practices. In addition, management also reported to the Board on, among other things, its business plans, organizational changes and portfolio manager compensation plan.
Legg Mason Partners High Income Fund | 37
Board approval of management and sub-advisory agreements (unaudited) continued
The Board concluded that, overall, the nature, extent and quality of services provided (and expected to be provided) under the Management Agreement and the Sub-Advisory Agreements were satisfactory.
Fund performance
The Board received and considered performance information for the Fund as well as for a group of funds (the “Performance Universe”) selected by Lipper, Inc. (“Lipper”), an independent provider of investment company data. The Board was provided with a description of the methodology Lipper used to determine the similarity of the Fund with the funds included in the Performance Universe. The Board also noted that it had received and discussed with management information throughout the year at periodic intervals comparing the Fund’s performance against its benchmark.
The information comparing the Fund’s performance to that of its Performance Universe, consisting of all retail and institutional funds classified as high current yield funds by Lipper, showed, among other data, that the Fund’s performance for the 1-, 3- and 5-year periods ended June 30, 2007 was above the median. Management noted that there has been a change in the portfolio management team, effective December 2005.
Based on its review, which included careful consideration of all of the factors noted above, the Board concluded that the Fund’s performance was satisfactory.
Management fees and expense ratios
The Board reviewed and considered the contractual management fee (the “Contractual Management Fee”) payable by the Fund to the Manager in light of the nature, extent and quality of the management and sub-advisory services provided by the Manager and the Subadvisers. The Board also reviewed and considered that fee waivers and/or expense reimbursement arrangements are currently in place for the Fund and considered the actual fee rate (after taking waivers and reimbursements into account) (the “Actual Management Fee”), and that the Manager contractually had agreed to continue its fee waivers and/or reimbursements until December 2008. In addition, the Board noted that the compensation paid to the Subadvisers is paid directly or indirectly by the Manager, not the Fund, and, accordingly, that the retention of the Subadvisers does not increase the fees or expenses otherwise incurred by the Fund’s shareholders.
Additionally, the Board received and considered information comparing the Contractual Management Fees and the Actual Management Fee and the Fund’s overall expenses with those of funds in both the relevant expense group and a broader group of funds, each selected and provided by Lipper. The Board also reviewed information regarding fees charged by the Manager to other U.S.
38 | Legg Mason Partners High Income Fund
clients investing primarily in an asset class similar to that of the Fund, including, where applicable, separate accounts.
The Manager reviewed with the Board the differences in scope of services provided to the Fund and to these other clients, noting that the Fund is provided with administrative services, office facilities, Fund officers (including the Fund’s chief executive, chief financial and chief compliance officers), and that the Manager coordinates and oversees the provision of services to the Fund by other Fund service providers. The Board considered the fee comparisons in light of the differences required to manage these different types of accounts. The Board also considered and discussed information about the Subadvisers’ fees, including the amount of the management fees retained by the Manager after payment of the subadvisory fee. The Board also received an analysis of complex-wide management fees provided by the Manager, which, among other things, set out a framework of fees based on asset classes.
Management also discussed with the Board the Fund’s distribution arrangements. The Board was provided with information concerning revenues received by and certain expenses incurred by distributors affiliated with the Fund during the past two years and how the amounts received by the distributors were paid during that period.
The information comparing the Fund’s Contractual and Actual Management Fees as well as its actual total expense ratio to its Expense Group, consisting of a group of retail funds (including the Fund) classified as high current yield funds and chosen by Lipper to be comparable to the Fund, showed that the Fund’s Contractual Fee and Actual Management Fee (which reflects a fee waiver) were slightly above the median. The Board noted, however, that the Fund’s actual total expense ratio was below the median.
Taking all of the above into consideration, the Board determined that the management fee and the subadvisory fees for the Fund were reasonable in light of the nature, extent and quality of the services provided to the Fund under the Management Agreement and the Sub-Advisory Agreements.
Manager profitability
The Board received and considered an analysis of the profitability of the Manager and its affiliates in providing services to the Fund. The Board also received profitability information with respect to the Legg Mason Partners fund complex as a whole. In addition, the Board received information with respect to the Manager’s allocation methodologies used in preparing this profitability data, as well as a report from an outside consultant that had reviewed the methodologies. The profitability of the Manager and its affiliates was considered by the Board not excessive in light of the nature, extent and quality of the services provided to the Fund and the type of fund.
Legg Mason Partners High Income Fund | 39
Board approval of management and subadvisory agreements (unaudited) continued
Economies of scale
The Board received and discussed information concerning whether the Manager realizes economies of scale as the Fund’s assets grow. The Board noted that the Fund’s Contractual Management Fee is approximately equivalent to the asset-weighted average of management fees paid by the funds in the Expense Group at all asset levels and that the Fund’s actual total expense ratio was below the median of the Expense Group. The Board also considered the effect of the Fund’s growth and size on its performance and fees, noting that if the Fund’s assets increase over time, certain expenses, such as fees for Board members, auditors and legal fees, become a smaller percentage of overall assets. The Board also considered fee waivers by the Manager and the fact that the Manager pays the subadvisory fee out of the management fee.
The Board determined that the management fee structure for the Fund was reasonable.
Other benefits to the manager and the subadvisers
The Board considered other benefits received by the Manager, the Subadvisers and their affiliates as a result of their relationship with the Fund, including the opportunity to offer additional products and services to Fund shareholders.
In light of the costs of providing investment management and other services to the Fund and the ongoing commitment of the Manager and the Subadvisers to the Fund, the Board considered the ancillary benefits that the Manager and its affiliates received were reasonable.
* * *
In light of all of the foregoing, the Board determined that the continuation of each of the Management Agreement and Sub-Advisory Agreements would be in the best interests of the Fund’s shareholders and approved the continuation of such agreements for another year.
40 | Legg Mason Partners High Income Fund
Legg Mason Partners High Income Fund
| | |
Trustees Elliott J. Berv A. Benton Cocanougher Jane F. Dasher Mark T. Finn R. Jay Gerken, CFA Chairman Rainer Greeven Stephen R. Gross Richard E. Hanson, Jr. Diana R. Harrington Susan M. Heilbron Susan B. Kerley Alan G. Merten R. Richardson Pettit Investment manager Legg Mason Partners Fund Advisor, LLC Subadvisers Western Asset Management Company Western Asset Management Company Limited | | Distributor Legg Mason Investor Services, LLC Custodian State Street Bank and Trust Company Transfer agent PFPC Inc. 4400 Computer Drive Westborough, Massachusetts 01581 Independent registered public accounting firm KPMG LLP 345 Park Avenue New York, New York 10154 |
Legg Mason Partners High Income Fund
The Fund is a separate investment series of the Legg Mason Partners Income Trust, a Maryland business trust.
LEGG MASON PARTNERS HIGH INCOME FUND
Legg Mason Partners Funds
55 Water Street
32nd Floor
New York, New York 10041
The Fund files its complete schedule of portfolio holdings with the Securities and Exchange Commission (“SEC”) for the first and third quarters of each fiscal year on Form N-Q. The Fund’s Forms N-Q are available on the SEC’s website at www.sec.gov. The Fund’s Forms N-Q may be reviewed and copied at the SEC’s Public Reference Room in Washington, D.C., and information on the operation of the Public Reference Room may be obtained by calling 1-800-SEC-0330. To obtain information on Form N-Q from the Fund, shareholders can call Legg Mason Partners Shareholder Services at 1-800-451-2010.
Information on how the Fund voted proxies relating to portfolio securities during the prior 12-month period ended June 30th of each year and a description of the policies and procedures that the Fund uses to determine how to vote proxies relating to portfolio transactions are available (1) without charge, upon request, by calling 1-800-451-2010, (2) on the Fund’s website at www.leggmason.com/individualinvestors and (3) on the SEC’s website at www.sec.gov.
This report is submitted for the general information of the shareholders of Legg Mason Partners High Income Fund. This report is not authorized for distribution to prospective investors in the Fund unless proceded or accompanied by a current prospectus.
Investors should consider the Fund’s investment objectives, risks, charges and expenses carefully before investing. The prospectus contains this and other important information about the Fund. Please read the prospectus carefully before investing.
www.leggmason.com/individualinvestors
© 2008 Legg Mason Investor Services, LLC
Member FINRA, SIPC
BUILT TO WINSM
At Legg Mason, we’ve assembled a collection of experienced investment management firms and empowered each of them with the tools, the resources and, most importantly, the independence to pursue the strategies they know best.
| • | | Each was purposefully chosen for their commitment to investment excellence. |
| • | | Each is focused on specific investment styles and asset classes. |
| • | | Each exhibits thought leadership in their chosen area of focus. |
Together, we’ve built a powerful portfolio of solutions for financial advisors and their clients. And it has made us a world leader in money management.*
| * | Ranked ninth-largest investment manager in 2007, based on 12/31/06 assets under management, according to Pensions & Investments May 2007. |
www.leggmason.com/individualinvestors
©2008 Legg Mason Investor Services, LLC Member FINRA, SIPC
FD2172 3/08 SR08-530