UNITED STATES
SECURITIES AND EXCHANGE COMMISSION
Washington, D.C. 20549
FORM N-CSR
CERTIFIED SHAREHOLDER REPORT OF REGISTERED
MANAGEMENT INVESTMENT COMPANIES
Investment Company Act file number 811-04254
Legg Mason Partners Income Trust
(Exact name of registrant as specified in charter)
620 Eighth Avenue, 47th Floor, New York, NY 10018
(Address of principal executive offices) (Zip code)
Marc A. De Oliveira
Franklin Templeton
100 First Stamford Place
Stamford, CT 06902
(Name and address of agent for service)
Registrant’s telephone number, including area code: 877-6LM-FUND/656-3863
Date of fiscal year end: November 30
Date of reporting period: November 30, 2023
| ITEM 1. | REPORT TO STOCKHOLDERS. |
The Annual Report to Stockholders is filed herewith.

| | |
| Annual Report | | November 30, 2023 |
WESTERN ASSET
INTERMEDIATE MATURITY CALIFORNIA MUNICIPALS FUND
The Securities and Exchange Commission has adopted new regulations that will result in changes to the design and delivery of annual and semi-annual shareholder reports beginning in July 2024.
If you have previously elected to receive shareholder reports electronically, you will continue to do so and need not take any action.
Otherwise, paper copies of the Fund’s shareholder reports will be mailed to you beginning in July 2024. If you would like to receive shareholder reports and other communications from the Fund electronically instead of by mail, you may make that request at any time by contacting your financial intermediary (such as a broker-dealer or bank) or, if you are a direct investor, enrolling at franklintempleton.com.
You may access franklintempleton.com by scanning the code below.


|
| INVESTMENT PRODUCTS: NOT FDIC INSURED • NO BANK GUARANTEE • MAY LOSE VALUE |
| * | Certain investors may be subject to the federal alternative minimum tax (“AMT”), and state and local taxes may apply. Capital gains, if any, are fully taxable. Please consult your personal tax or legal adviser. |
Fund objective
The Fund seeks to provide California investors with as high a level of current income exempt from federal income tax and California state personal income tax* as is consistent with the preservation of principal.
| | |
| II | | Western Asset Intermediate Maturity California Municipals Fund |
Letter from the president

Dear Shareholder,
We are pleased to provide the annual report of Western Asset Intermediate Maturity California Municipals Fund for the twelve-month reporting period ended November 30, 2023. Please read on for a detailed look at prevailing economic and market conditions during the Fund’s reporting period and to learn how those conditions have affected Fund performance.
As always, we remain committed to providing you with excellent service and a full spectrum of investment choices. We also remain committed to supplementing the support you receive from your financial advisor. One way we accomplish this is through our website, www.franklintempleton.com. Here you can gain immediate access to market and investment information, including:
| • | | Fund prices and performance, |
| • | | Market insights and commentaries from our portfolio managers, and |
| • | | A host of educational resources. |
We look forward to helping you meet your financial goals.
Sincerely,

Jane Trust, CFA
President and Chief Executive Officer
December 29, 2023
| | |
| Western Asset Intermediate Maturity California Municipals Fund | | III |
Fund overview
Q. What is the Fund’s investment strategy?
A. The Fund seeks to provide California investors with as high a level of current income exempt from federal income tax and California State personal income tax as is consistent with the preservation of principal. Under normal circumstances, the Fund invests at least 80% of its assets in investment grade “California municipal securities” or other investments with similar economic characteristics. California municipal securities are securities the interest on which is exempt from regular federal income tax and California State personal income taxes. Interest on California municipal securities may be subject to the federal alternative minimum tax. California municipal securities include debt obligations issued by the State of California and its political subdivisions, agencies and public authorities, certain other governmental issuers (such as Puerto Rico, the U.S. Virgin Islands and Guam) and other qualifying issuers. These securities include participation or other interests in municipal securities issued or backed by banks, insurance companies and other financial institutions.
The Fund focuses on investment grade bonds (that is, securities rated in the Baa/ BBB categories or above or, if unrated, that we deemed to be of comparable credit quality) but may invest up to 20% of its assets in below investment grade bonds, (commonly known as “high yield” or “junk” bonds). The Fund may invest up to 20% of its assets in unrated securities that we determine to be equivalent to investment grade. Although the Fund may invest in securities of any maturity, the Fund normally maintains an average effective portfolio maturity of between three and ten years.
The Fund may also invest in securities of other open-end or closed-end investment companies, including exchange-traded funds (“ETFs”), that invest primarily in municipal securities.
Instead of, and/or in addition to, investing directly in particular securities, the Fund may use instruments such as derivatives, including options, futures contracts and inverse floating rate instruments issued in tender option bond transactions, and other synthetic instruments that are intended to provide economic exposure to the securities or the issuer or to be used as a hedging technique. The Fund may use one or more types of these instruments without limit, except that these instruments are taken into account when determining compliance with the Fund’s 80% policy. The Fund may also engage in a variety of transactions using derivatives in order to change the investment characteristics of its portfolio (such as shortening or lengthening duration) and for other purposes. We select securities primarily by identifying undervalued sectors and individual securities, while also selecting securities we believe will benefit from changes in market conditions.
The Fund is classified as “non-diversified,” which means it may invest a larger percentage of its assets in a smaller number of issuers than a diversified fund.
At Western Asset Management Company, LLC (“Western Asset”), the Fund’s subadviser, we utilize a fixed income team approach, with decisions derived from interaction among
| | | | | | |
| Western Asset Intermediate Maturity California Municipals Fund 2023 Annual Report | | | | | 1 | |
Fund overview (cont’d)
various investment management sector specialists. The sector teams are comprised of Western Asset’s senior portfolio management personnel, research analysts and an in-house economist. Under this team approach, management of client fixed income portfolios will reflect a consensus of interdisciplinary views within the Western Asset organization.
Q. What were the overall market conditions during the Fund’s reporting period?
A. The overall U.S. fixed income market experienced periods of volatility and generated a modest return over the twelve-month reporting period ended November 30, 2023. The market was driven by several factors, including elevated inflation, aggressive Federal Reserve Board (the “Fed”) monetary policy tightening, the repercussions from the war in Ukraine, unrest in the banking industry, and several geopolitical issues. The fixed income market rallied sharply toward the end of the reporting period given expectations for the end of Fed rate hikes.
Short-term U.S. Treasury yields moved higher as the Fed raised interest rates in an attempt to rein in elevated inflation. The yield for the two-year Treasury note began the reporting period at 4.38% and ended the period at 4.73%. The low of 3.75% took place on May 4, 2023, and the high of 5.19% occurred on October 17 and 18, 2023. Long-term U.S. Treasury yields also moved higher given stubbornly high inflation and Fed monetary policy tightening. The yield for the ten-year Treasury note began the reporting period at 3.68% and ended the period at 4.37%. The low of 3.30% occurred on April 5 and 6, 2023, and the high of 4.98% took place on October 19, 2023.
The municipal bond market produced a positive absolute return and outperformed its taxable bond counterpart during the twelve-month reporting period. Over that time, the Bloomberg Municipal Bond Indexi and the Bloomberg U.S. Aggregate Indexii returned 4.28% and 1.18%, respectively. Returns in both the taxable and tax-free bond markets were limited given the negative impact from rising interest rates.
The California intermediate municipal bond market, as measured by the Blomberg California Intermediate Municipal Bond Indexiii, returned 3.44% during the reporting period. California delayed property tax collections from April to the end of October 2023 due to the winter storms impacting various areas. The uncertainty in the forecast is the deferral of approximately $42 billion in income tax payments from April to October 2023. While this is not expected to materially affect the state’s budgetary reporting, since the delayed revenues will accrue to the fiscal 2023 budget, it affects cash flow and increases uncertainty in the forecast. The enacted budget includes $225.9 billion in general fund spending, down from $234.6 billion in 2022-23. Surpluses turned to deficits as revenue estimates fell, creating a $30 billion budget problem. The enacted budget includes a variety of solutions to close this shortfall without any major cuts to core services. These include delaying or reducing some previously committed spending, shifting some spending between state funds, and internal borrowing.
| | | | |
| 2 | | | | Western Asset Intermediate Maturity California Municipals Fund 2023 Annual Report |
Q. How did we respond to these changing market conditions?
A. We reduced the Fund’s duration during the reporting period, ending underweight duration. From a sector positioning perspective, we increased the Fund’s allocations to industrial revenue bonds. In contrast, we reduced its exposures to the transportation and power sectors. Looking at the Fund’s quality positioning, we increased its exposure to AAA securities and reduced its exposure to AA and A securities.
Performance review
For the twelve months ended November 30, 2023, Class A shares of Western Asset Intermediate Maturity California Municipals Fund, excluding sales charges, returned 2.55%. The Fund’s unmanaged benchmark, the Bloomberg California Intermediate Municipal Bond Index, returned 3.44% for the same period.
Certain investors may be subject to the federal alternative minimum tax, and state and local taxes may apply. Capital gains, if any, are fully taxable. Please consult your personal tax or legal adviser.
| | | | | | | | |
Performance Snapshot as of November 30, 2023
(unaudited) | |
| (excluding sales charges) | | 6 months | | | 12 months | |
| Western Asset Intermediate Maturity California Municipals Fund: | | | | | | | | |
Class A | | | 0.99 | % | | | 2.55 | % |
Class C | | | 0.57 | % | | | 1.84 | % |
Class I | | | 1.10 | % | | | 2.79 | % |
| Bloomberg California Intermediate Municipal Bond Index | | | 2.05 | % | | | 3.44 | % |
The performance shown represents past performance. Past performance is no guarantee of future results and current performance may be higher or lower than the performance shown above. Principal value, investment returns and yields will fluctuate and investors’ shares, when redeemed, may be worth more or less than their original cost. To obtain performance data current to the most recent month-end, please visit our website at www.franklintempleton.com.
All share class returns assume the reinvestment of all distributions at net asset value and the deduction of all Fund expenses. Returns have not been adjusted to include sales charges that may apply or the deduction of taxes that a shareholder would pay on Fund distributions. If sales charges were reflected, the performance quoted would be lower. Performance figures for periods shorter than one year represent cumulative figures and are not annualized.
Fund performance figures reflect fee waivers and/or expense reimbursements, without which the performance would have been lower.
The 30-Day SEC Yields for the period ended November 30, 2023, for Class A, Class C and Class I shares were 3.23%, 2.72% and 3.54%, respectively. Absent fee waivers and/or expense reimbursements, the 30-Day SEC Yields for Class A, Class C and Class I shares would have been 3.17%, 2.69% and 3.33%, respectively. The 30-Day SEC Yield, calculated pursuant to the standard SEC formula, is based on the Fund’s investments over an annualized trailing 30-day period, and not on the distributions paid by the Fund, which may differ.
| | | | | | |
| Western Asset Intermediate Maturity California Municipals Fund 2023 Annual Report | | | | | 3 | |
Fund overview (cont’d)
| | | | |
| Total Annual Operating Expenses (unaudited) |
As of the Fund’s current prospectus dated March 31, 2023, the gross total annual fund operating expense ratios for Class A, Class C and Class I shares were 0.76%, 1.32% and 0.63%, respectively.
Actual expenses may be higher. For example, expenses may be higher than those shown if average net assets decrease. Net assets are more likely to decrease and Fund expense ratios are more likely to increase when markets are volatile.
As a result of expense limitation arrangements, the ratio of total annual fund operating expenses, other than interest, brokerage, taxes, extraordinary expenses and acquired fund fees and expenses, to average net assets will not exceed 0.75% for Class A shares, 1.35% for Class C shares and 0.50% for Class I shares. These expense limitation arrangements cannot be terminated prior to December 31, 2025 without the Board of Trustees’ consent.
The manager is permitted to recapture amounts waived and/or reimbursed to a class within two years after the fiscal year in which the manager earned the fee or incurred the expense if the class’ total annual fund operating expenses have fallen to a level below the expense limitation (“expense cap”) in effect at the time the fees were earned or the expenses incurred. In no case will the manager recapture any amount that would result, on any particular business day of the Fund, in the class’ total annual fund operating expenses exceeding the expense cap or any other lower limit then in effect.
Q. What were the leading contributors to performance?
A. The largest contributor to the Fund’s relative performance during the reporting period was its sector positioning in select areas. In particular, strong security selection within water & sewer and education sectors contributed to returns. Overweights to the transportation and state general obligation sectors were also additive for performance. From a quality perspective, strong security selection within AA securities contributed, as did an overweight to BBB securities.
Q. What were the leading detractors from performance?
A. The largest detractor from the Fund’s relative performance was its security selection within the power sector. Having a longer duration than the benchmark was also a headwind for returns, as yields were volatile over the reporting period but ultimately ended higher. Finally, security selection within the housing sector detracted.
Thank you for your investment in the Western Asset Intermediate Maturity California Municipals Fund. As always, we appreciate that you have chosen us to manage your assets and we remain focused on achieving the Fund’s investment goals.
Sincerely,
Western Asset Management Company, LLC
December 11, 2023
| | | | |
| 4 | | | | Western Asset Intermediate Maturity California Municipals Fund 2023 Annual Report |
RISKS: The Fund’s investments are subject to interest rate and credit risks. As interest rates rise, bond prices fall, reducing the value of the Fund’s share price. Lower rated, higher yielding bonds known as “junk bonds” are subject to greater credit risk, including the risk of default, than higher rated obligations. As a non-diversified fund, it can invest a larger percentage of its assets in a smaller number of issuers than a diversified fund, which may magnify the Fund’s losses from events affecting a particular issuer. Municipal securities purchased by the Fund may be adversely affected by changes in the financial condition of municipal issuers and insurers, regulatory and political developments, uncertainties and public perceptions, and other factors. The Fund may use derivatives, such as options and futures, which can be illiquid, may disproportionately increase losses, and have a potentially large impact on Fund performance. Investing in securities issued by investment companies, including exchange-traded funds (“ETFs”), involves risks similar to those of investing directly in the securities and other assets held by the investment company or ETF. The Fund will pay brokerage commissions in connection with the purchase and sale of shares of ETFs. In addition, the Fund will indirectly bear its pro rata share of the fees and expenses incurred by a fund it invests in, including advisory fees. These expenses are in addition to the advisory and other expenses that the Fund bears directly in connection with its own operations. The market values of securities or other assets will fluctuate, sometimes sharply and unpredictably, due to changes in general market conditions, overall economic trends or events, governmental actions or intervention, actions taken by the U.S. Federal Reserve or foreign central banks, market disruptions caused by trade disputes or other factors, political developments, armed conflicts, economic sanctions and countermeasures in response to sanctions, major cybersecurity events, investor sentiment, the global and domestic effects of a pandemic, and other factors that may or may not be related to the issuer of the security or other asset. Please see the Fund’s prospectus for a more complete discussion of these and other risks and the Fund’s investment strategies.
The mention of sector breakdowns is for informational purposes only and should not be construed as a recommendation to purchase or sell any securities. The information provided regarding such sectors is not a sufficient basis upon which to make an investment decision. Investors seeking financial advice regarding the appropriateness of investing in any securities or investment strategies discussed should consult their financial professional. Portfolio holdings are subject to change at any time and may not be representative of the portfolio managers’ current or future investments. The Fund’s portfolio composition is subject to change at any time.
All investments are subject to risk including the possible loss of principal. Past performance is no guarantee of future results. All index performance reflects no deduction for fees, expenses or taxes. Please note that an investor cannot invest directly in an index.
The information provided is not intended to be a forecast of future events, a guarantee of future results or investment advice. Views expressed may differ from those of the firm as a whole.
| | | | | | |
| Western Asset Intermediate Maturity California Municipals Fund 2023 Annual Report | | | | | 5 | |
Fund overview (cont’d)
| i | The Bloomberg Municipal Bond Index is a market value weighted index of investment grade municipal bonds with maturities of one year or more. |
| ii | The Bloomberg U.S. Aggregate Index is a broad-based bond index comprised of government, corporate, mortgage-and asset-backed issues, rated investment grade or higher, and having at least one year to maturity. |
| iii | The Bloomberg California Intermediate Municipal Bond Index is a market value weighted index of California investment grade (Baa3/BBB- or higher) fixed-rate municipal bonds with maturities of five to ten years. |
| | | | |
| 6 | | | | Western Asset Intermediate Maturity California Municipals Fund 2023 Annual Report |
Fund at a glance† (unaudited)
Investment breakdown (%) as a percent of total investments
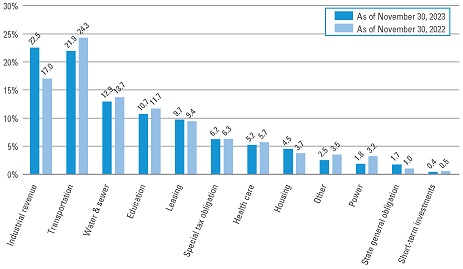
| † | The bar graph above represents the composition of the Fund’s investments as of November 30, 2023 and November 30, 2022. The Fund is actively managed. As a result, the composition of the Fund’s investments is subject to change at any time. |
| | | | | | |
| Western Asset Intermediate Maturity California Municipals Fund 2023 Annual Report | | | | | 7 | |
Fund expenses (unaudited)
Example
As a shareholder of the Fund, you may incur two types of costs: (1) transaction costs, including front-end and back-end sales charges (loads) on purchase payments; and (2) ongoing costs, including management fees; service and/or distribution (12b-1) fees; and other Fund expenses. This example is intended to help you understand your ongoing costs (in dollars) of investing in the Fund and to compare these costs with the ongoing costs of investing in other mutual funds.
This example is based on an investment of $1,000 invested on June 1, 2023 and held for the six months ended November 30, 2023.
Actual expenses
The table below titled “Based on actual total return” provides information about actual account values and actual expenses. You may use the information provided in this table, together with the amount you invested, to estimate the expenses that you paid over the period. To estimate the expenses you paid on your account, divide your ending account value by $1,000 (for example, an $8,600 ending account value divided by $1,000 = 8.6), then multiply the result by the number under the heading entitled “Expenses Paid During the Period”.
Hypothetical example for comparison purposes
The table below titled “Based on hypothetical total return” provides information about hypothetical account values and hypothetical expenses based on the actual expense ratio and an assumed rate of return of 5.00% per year before expenses, which is not the Fund’s actual return. The hypothetical account values and expenses may not be used to estimate the actual ending account balance or expenses you paid for the period. You may use the information provided in this table to compare the ongoing costs of investing in the Fund and other funds. To do so, compare the 5.00% hypothetical example relating to the Fund with the 5.00% hypothetical examples that appear in the shareholder reports of the other funds.
Please note that the expenses shown in the table below are meant to highlight your ongoing costs only and do not reflect any transactional costs, such as front-end or back-end sales charges (loads). Therefore, the table is useful in comparing ongoing costs only, and will not help you determine the relative total costs of owning different funds. In addition, if these transaction costs were included, your costs would have been higher.
| | | | | | | | | | | | | | | | | | | | | | | | | | | | | | | | | | | | | | | | | | | | | | |
| | | |
| Based on actual total return1 | | | | | | | | | Based on hypothetical total return1 | |
| | | Actual Total Return Without Sales Charge2 | | | Beginning Account Value | | | Ending Account Value | | | Annualized Expense Ratio | | | Expenses Paid During the Period3 | | | | | | | | Hypothetical Annualized Total Return | | | Beginning Account Value | | | Ending Account Value | | | Annualized Expense Ratio | | | Expenses Paid During the Period3 | |
| Class A | | | 0.99 | % | | $ | 1,000.00 | | | $ | 1,009.90 | | | | 0.75 | % | | $ | 3.78 | | | | | | | Class A | | | 5.00 | % | | $ | 1,000.00 | | | $ | 1,021.31 | | | | 0.75 | % | | $ | 3.80 | |
| Class C | | | 0.57 | | | | 1,000.00 | | | | 1,005.70 | | | | 1.35 | | | | 6.79 | | | | | | | Class C | | | 5.00 | | | | 1,000.00 | | | | 1,018.30 | | | | 1.35 | | | | 6.83 | |
| Class I | | | 1.10 | | | | 1,000.00 | | | | 1,011.00 | | | | 0.50 | | | | 2.52 | | | | | | | Class I | | | 5.00 | | | | 1,000.00 | | | | 1,022.56 | | | | 0.50 | | | | 2.54 | |
| | | | |
| 8 | | | | Western Asset Intermediate Maturity California Municipals Fund 2023 Annual Report |
| 1 | For the six months ended November 30, 2023. |
| 2 | Assumes the reinvestment of all distributions, including returns of capital, if any, at net asset value and does not reflect the deduction of the applicable sales charge with respect to Class A shares. Total return is not annualized, as it may not be representative of the total return for the year. Performance figures may reflect compensating balance arrangements, fee waivers and/or expense reimbursements. In the absence of compensating balance arrangements, fee waivers and/or expense reimbursements, the total return would have been lower. Past performance is no guarantee of future results. |
| 3 | Expenses (net of compensating balance arrangements, fee waivers and/or expense reimbursements) are equal to each class’ respective annualized expense ratio multiplied by the average account value over the period, multiplied by the number of days in the most recent fiscal half-year (183), then divided by 365. |
| | | | | | |
| Western Asset Intermediate Maturity California Municipals Fund 2023 Annual Report | | | | | 9 | |
Fund performance (unaudited)
| | | | | | | | | | | | |
| Average annual total returns | | | | | | | | | |
| | | |
| Without sales charges1 | | Class A | | | Class C | | | Class I | |
| Twelve Months Ended 11/30/23 | | | 2.55 | % | | | 1.84 | % | | | 2.79 | % |
| Five Years Ended 11/30/23 | | | 0.69 | | | | 0.07 | | | | 0.87 | |
| Ten Years Ended 11/30/23 | | | 1.70 | | | | 1.08 | | | | 1.86 | |
| | | |
| With sales charges2 | | Class A | | | Class C | | | Class I | |
| Twelve Months Ended 11/30/23 | | | 0.29 | % | | | 1.84 | % | | | 2.79 | % |
| Five Years Ended 11/30/23 | | | 0.23 | | | | 0.07 | | | | 0.87 | |
| Ten Years Ended 11/30/23 | | | 1.46 | | | | 1.08 | | | | 1.86 | |
| | | | |
| Cumulative total returns | |
| |
| Without sales charges1 | | | |
| Class A (11/30/13 through 11/30/23) | | | 18.33 | % |
| Class C (11/30/13 through 11/30/23) | | | 11.35 | |
| Class I (11/30/13 through 11/30/23) | | | 20.24 | |
All figures represent past performance and are not a guarantee of future results. Investment return and principal value of an investment will fluctuate so that an investor’s shares, when redeemed, may be worth more or less than their original cost. The returns shown do not reflect the deduction of taxes that a shareholder would pay on Fund distributions or the redemption of Fund shares. Performance figures may reflect compensating balance arrangements, fee waivers and/or expense reimbursements. In the absence of compensating balance arrangements, fee waivers and/or expense reimbursements, the total return would have been lower.
| 1 | Assumes the reinvestment of all distributions, including returns of capital, if any, at net asset value and does not reflect the deduction of the applicable sales charge with respect to Class A shares. |
| 2 | Assumes the reinvestment of all distributions, including returns of capital, if any, at net asset value. In addition, Class A shares reflect the deduction of the maximum initial sales charge of 2.25%. |
| | | | |
| 10 | | | | Western Asset Intermediate Maturity California Municipals Fund 2023 Annual Report |
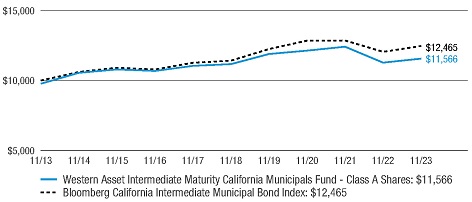
Historical performance
Value of $10,000 invested in
Class A Shares of Western Asset Intermediate Maturity California Municipals Fund vs. Bloomberg California Intermediate Municipal Bond Index† — November 2013 - November 2023
All figures represent past performance and are not a guarantee of future results. Investment return and principal value of an investment will fluctuate so that an investor’s shares, when redeemed, may be worth more or less than their original cost. The returns shown do not reflect the deduction of taxes that a shareholder would pay on Fund distributions or the redemption of Fund shares. Performance figures may reflect compensating balance arrangements, fee waivers and/or expense reimbursements. In the absence of compensating balance arrangements, fee waivers and/or expense reimbursements, the total return would have been lower.
| † | Hypothetical illustration of $10,000 invested in Class A shares of Western Asset Intermediate Maturity California Municipals Fund on November 30, 2013, assuming the deduction of the maximum initial sales charge of 2.25% at the time of investment and the reinvestment of all distributions, including returns of capital, if any, at net asset value through November 30, 2023. The hypothetical illustration also assumes a $10,000 investment, in the Bloomberg California Intermediate Municipal Bond Index. The Bloomberg California Intermediate Municipal Bond Index (the “Index”) is a market value weighted index of California investment grade (Baa3/BBB-or higher) fixed-rate municipal bonds with maturities of five to ten years. The Index is unmanaged and is not subject to the same management and trading expenses as a mutual fund. Please note that an investor cannot invest directly in an index. The performance of the Fund’s other classes may be greater or less than the Class A shares’ performance indicated on this chart, depending on whether greater or lesser sales charges and fees were incurred by shareholders investing in the other classes. |
| | | | | | |
| Western Asset Intermediate Maturity California Municipals Fund 2023 Annual Report | | | | | 11 | |
Schedule of investments
November 30, 2023
Western Asset Intermediate Maturity California Municipals Fund
(Percentages shown based on Fund net assets)
| | | | | | | | | | | | | | | | |
| Security | | Rate | | | Maturity
Date | | | Face Amount | | | Value | |
| Municipal Bonds — 99.0% | | | | | | | | | | | | | | | | |
Education — 10.7% | | | | | | | | | | | | | | | | |
California Enterprise Development Authority, Student Housing Revenue, M@College Project, Series A | | | 5.000 | % | | | 8/1/35 | | | $ | 400,000 | | | $ | 417,217 | |
California State Infrastructure & Economic Development Bank Revenue, Colburn School, Refunding | | | 1.750 | % | | | 8/1/26 | | | | 5,000,000 | | | | 4,686,134 | (a)(b) |
California State MFA Revenue: | | | | | | | | | | | | | | | | |
CHF-Davis II, LLC, Orchard Park Student Housing Project, Green Bond, Series 2021, BAM | | | 4.000 | % | | | 5/15/39 | | | | 500,000 | | | | 479,029 | |
CHF-Davis II, LLC, Orchard Park Student Housing Project, Green Bond, Series 2021, BAM | | | 4.000 | % | | | 5/15/41 | | | | 550,000 | | | | 517,563 | |
California State School Finance Authority Revenue: | | | | | | | | | | | | | | | | |
KIPP LA Project, Series A | | | 5.000 | % | | | 7/1/35 | | | | 1,200,000 | | | | 1,217,755 | (c) |
KIPP LA Project, Series A | | | 5.000 | % | | | 7/1/37 | | | | 1,180,000 | | | | 1,207,332 | (c) |
KIPP SoCal Project, Series A | | | 4.000 | % | | | 7/1/40 | | | | 800,000 | | | | 738,183 | (c) |
California Statewide CDA Revenue, College Housing, NCCD Hooper Street LLC | | | 5.000 | % | | | 7/1/29 | | | | 800,000 | | | | 812,014 | (c) |
Total Education | | | | | | | | | | | | | | | 10,075,227 | |
Health Care — 5.2% | | | | | | | | | | | | | | | | |
California State MFA Revenue, Humangood Obligated Group, Series A, Refunding | | | 4.000 | % | | | 10/1/39 | | | | 750,000 | | | | 714,687 | |
California State Public Finance Authority, Senior Living Revenue: | | | | | | | | | | | | | | | | |
Enso Village Project, Green Bond, Series A | | | 5.000 | % | | | 11/15/36 | | | | 250,000 | | | | 238,969 | |
Enso Village Project, Green Bond, Series B-3, Refunding | | | 2.125 | % | | | 11/15/27 | | | | 250,000 | | | | 238,316 | (c) |
California Statewide CDA Revenue: | | | | | | | | | | | | | | | | |
Adventist Health System/West | | | 5.000 | % | | | 3/1/27 | | | | 1,715,000 | | | | 1,774,872 | (a)(b) |
Los Angeles Jewish Home for the Aging, Refunding | | | 5.000 | % | | | 11/15/30 | | | | 1,100,000 | | | | 1,231,326 | |
Viamonte Senior Living 1 Project, Series A | | | 5.000 | % | | | 7/1/30 | | | | 225,000 | | | | 246,752 | |
Viamonte Senior Living 1 Project, Series A | | | 5.000 | % | | | 7/1/31 | | | | 300,000 | | | | 328,996 | |
Viamonte Senior Living 1 Project, Series A | | | 5.000 | % | | | 7/1/32 | | | | 100,000 | | | | 109,556 | |
Total Health Care | | | | | | | | | | | | | | | 4,883,474 | |
Housing — 4.4% | | | | | | | | | | | | | | | | |
California Statewide CDA Revenue, Provident Group-Pomona Properties LLC, Series A | | | 5.600 | % | | | 1/15/36 | | | | 635,000 | | | | 626,182 | (c) |
See Notes to Financial Statements.
| | | | |
| 12 | | | | Western Asset Intermediate Maturity California Municipals Fund 2023 Annual Report |
Western Asset Intermediate Maturity California Municipals Fund
(Percentages shown based on Fund net assets)
| | | | | | | | | | | | | | | | |
| Security | | Rate | | | Maturity
Date | | | Face Amount | | | Value | |
Housing — continued | | | | | | | | | | | | | | | | |
California Statewide CDA, Student Housing Revenue: | | | | | | | | | | | | | | | | |
CHF Irvine LLC, Refunding | | | 5.000 | % | | | 5/15/27 | | | $ | 1,000,000 | | | $ | 1,022,602 | |
CHF Irvine LLC, Refunding | | | 5.000 | % | | | 5/15/28 | | | | 1,220,000 | | | | 1,248,146 | |
CHF Irvine LLC, Refunding | | | 5.000 | % | | | 5/15/29 | | | | 1,250,000 | | | | 1,277,959 | |
Total Housing | | | | | | | | | | | | | | | 4,174,889 | |
Industrial Revenue — 22.3% | | | | | | | | | | | | | | | | |
California County Tobacco Securitization Agency, Tobacco Settlement Revenue: | | | | | | | | | | | | | | | | |
Series A | | | 4.000 | % | | | 6/1/34 | | | | 300,000 | | | | 305,238 | |
Series A | | | 4.000 | % | | | 6/1/35 | | | | 235,000 | | | | 238,059 | |
Series A | | | 4.000 | % | | | 6/1/36 | | | | 275,000 | | | | 276,331 | |
Series A | | | 4.000 | % | | | 6/1/37 | | | | 275,000 | | | | 273,049 | |
Series A | | | 4.000 | % | | | 6/1/38 | | | | 275,000 | | | | 268,776 | |
Series A | | | 4.000 | % | | | 6/1/39 | | | | 750,000 | | | | 727,234 | |
California State Community Choice Financing Authority Revenue: | | | | | | | | | | | | | | | | |
Clean Energy Project, Green Bonds, Series A-1 | | | 4.000 | % | | | 8/1/28 | | | | 1,500,000 | | | | 1,488,720 | (a)(b) |
Clean Energy Project, Green Bonds, Series B-1 | | | 5.000 | % | | | 8/1/29 | | | | 1,100,000 | | | | 1,141,702 | (a)(b) |
Clean Energy Project, Green Bonds, Series B-1 | | | 4.000 | % | | | 8/1/31 | | | | 2,500,000 | | | | 2,439,314 | (a)(b) |
California State MFA Special Facility Revenue, United Airlines, Inc., Los Angeles International Airport Project | | | 4.000 | % | | | 7/15/29 | | | | 2,000,000 | | | | 1,936,607 | (d) |
Golden State, CA, Tobacco Securitization Corp., Tobacco Settlement Revenue, Senior Asset-Backed Bonds, Series A-1, Refunding | | | 5.000 | % | | | 6/1/51 | | | | 1,100,000 | | | | 1,129,232 | |
M-S-R Energy Authority, CA, Natural Gas Revenue, Series B | | | 6.125 | % | | | 11/1/29 | | | | 4,140,000 | | | | 4,435,444 | |
San Francisco, CA, City & County Airport Commission, International Airport Revenue, SFO Fuel Company LLC, Series A, Refunding | | | 5.000 | % | | | 1/1/36 | | | | 600,000 | | | | 634,128 | (d) |
Southern California Public Power Authority, Natural Gas Project Revenue: | | | | | | | | | | | | | | | | |
Project Number 1, Series A | | | 5.250 | % | | | 11/1/24 | | | | 2,435,000 | | | | 2,461,916 | |
Project Number 1, Series A | | | 5.250 | % | | | 11/1/26 | | | | 2,000,000 | | | | 2,074,607 | |
Tobacco Securitization Authority of Southern California Revenue, Asset Backed Refunding, San Diego County Tobacco Asset Securitization Corporation, Class 2, Series B | | | 5.000 | % | | | 6/1/48 | | | | 1,210,000 | | | | 1,228,760 | |
Total Industrial Revenue | | | | | | | | | | | | | | | 21,059,117 | |
See Notes to Financial Statements.
| | | | | | |
| Western Asset Intermediate Maturity California Municipals Fund 2023 Annual Report | | | | | 13 | |
Schedule of investments (cont’d)
November 30, 2023
Western Asset Intermediate Maturity California Municipals Fund
(Percentages shown based on Fund net assets)
| | | | | | | | | | | | | | | | |
| Security | | Rate | | | Maturity
Date | | | Face Amount | | | Value | |
Leasing — 9.6% | | | | | | | | | | | | | | | | |
San Bernardino, CA, USD Revenue, COP, 2019 School Financing Project, AGM | | | 5.000 | % | | | 10/1/38 | | | $ | 250,000 | | | $ | 266,266 | |
San Diego, CA, Public Facilities Financing Authority, Lease Revenue: | | | | | | | | | | | | | | | | |
Capital Improvement Projects, Series A | | | 5.000 | % | | | 10/15/34 | | | | 1,000,000 | | | | 1,033,716 | |
Capital Improvement Projects, Series A | | | 5.000 | % | | | 10/15/35 | | | | 1,040,000 | | | | 1,073,350 | |
Capital Improvement Projects, Series A, Refunding | | | 5.000 | % | | | 10/15/40 | | | | 1,525,000 | | | | 1,687,198 | |
San Mateo County, CA, Joint Powers Financing Authority, Lease Revenue, Capital Project, Series A | | | 5.000 | % | | | 7/15/38 | | | | 1,000,000 | | | | 1,077,766 | |
San Mateo, CA, Foster City PFA Revenue: | | | | | | | | | | | | | | | | |
Street and Flood Control Project, Series A | | | 4.000 | % | | | 5/1/38 | | | | 360,000 | | | | 366,943 | |
Street and Flood Control Project, Series A | | | 4.000 | % | | | 5/1/39 | | | | 300,000 | | | | 305,107 | |
Street and Flood Control Project, Series A | | | 4.000 | % | | | 5/1/40 | | | | 400,000 | | | | 405,698 | |
Sanger, CA, USD Revenue, COP, Capital Projects, Refunding, AGM | | | 5.000 | % | | | 6/1/45 | | | | 1,620,000 | | | | 1,710,211 | |
Tahoe-Truckee, CA, USD, COP: | | | | | | | | | | | | | | | | |
School Financing Project, BAM | | | 4.000 | % | | | 6/1/36 | | | | 505,000 | | | | 509,995 | |
School Financing Project, BAM | | | 4.000 | % | | | 6/1/37 | | | | 610,000 | | | | 613,292 | |
Total Leasing | | | | | | | | | | | | | | | 9,049,542 | |
Other — 2.5% | | | | | | | | | | | | | | | | |
California State MFA Revenue: | | | | | | | | | | | | | | | | |
Senior Lien, LINXS APM Project, Series A | | | 5.000 | % | | | 12/31/33 | | | | 1,250,000 | | | | 1,303,462 | (d) |
Senior Lien, LINXS APM Project, Series A | | | 5.000 | % | | | 12/31/34 | | | | 1,000,000 | | | | 1,040,700 | (d) |
Total Other | | | | | | | | | | | | | | | 2,344,162 | |
Power — 1.8% | | | | | | | | | | | | | | | | |
Anaheim, CA, Housing & Public Improvements Authority Revenue, Series A | | | 5.000 | % | | | 10/1/45 | | | | 1,190,000 | | | | 1,211,364 | |
Puerto Rico Electric Power Authority Revenue: | | | | | | | | | | | | | | | | |
Series A | | | 5.000 | % | | | 7/1/29 | | | | 750,000 | | | | 189,375 | *(e) |
Series A | | | 5.050 | % | | | 7/1/42 | | | | 70,000 | | | | 17,675 | *(e) |
Series DDD, Refunding | | | — | | | | 7/1/21 | | | | 275,000 | | | | 68,750 | *(f) |
Series TT | | | 5.000 | % | | | 7/1/37 | | | | 450,000 | | | | 113,625 | *(e) |
Series XX | | | 5.250 | % | | | 7/1/40 | | | | 190,000 | | | | 47,975 | *(e) |
Total Power | | | | | | | | | | | | | | | 1,648,764 | |
Special Tax Obligation — 6.1% | | | | | | | | | | | | | | | | |
Irvine, CA, Improvement Bond Act 1915, Ltd. Obligation Reassessment District No 12-1, Refunding | | | 5.000 | % | | | 9/2/24 | | | | 600,000 | | | | 602,430 | |
See Notes to Financial Statements.
| | | | |
| 14 | | | | Western Asset Intermediate Maturity California Municipals Fund 2023 Annual Report |
Western Asset Intermediate Maturity California Municipals Fund
(Percentages shown based on Fund net assets)
| | | | | | | | | | | | | | | | |
| Security | | Rate | | | Maturity
Date | | | Face
Amount | | | Value | |
Special Tax Obligation — continued | | | | | | | | | | | | | | | | |
Puerto Rico Sales Tax Financing Corp., Sales Tax Revenue: | | | | | | | | | | | | | | | | |
CAB, Restructured, Series A-1 | | | 0.000 | % | | | 7/1/27 | | | $ | 450,000 | | | $ | 388,679 | |
Restructured, Series A-1 | | | 4.550 | % | | | 7/1/40 | | | | 50,000 | | | | 48,709 | |
Restructured, Series A-2 | | | 4.329 | % | | | 7/1/40 | | | | 80,000 | | | | 75,924 | |
Restructured, Series A-2A | | | 4.550 | % | | | 7/1/40 | | | | 2,000,000 | | | | 1,948,351 | |
Rancho Cucamonga, CA, RDA, Successor Agency Tax Allocation, Rancho Redevelopment Project Area, Refunding, AGM | | | 5.000 | % | | | 9/1/27 | | | | 1,700,000 | | | | 1,721,483 | |
River Islands, CA, Public Financing Authority, Special Tax Revenue: | | | | | | | | | | | | | | | | |
Community Facilities District No 2003-1 | | | 5.500 | % | | | 9/1/37 | | | | 250,000 | | | | 253,482 | |
Community Facilities District No 2003-1, Series A-1, Refunding, AGM | | | 5.000 | % | | | 9/1/42 | | | | 300,000 | | | | 324,601 | |
Community Facilities District No 2023-1 | | | 5.500 | % | | | 9/1/43 | | | | 400,000 | | | | 406,445 | |
Total Special Tax Obligation | | | | | | | | | | | | | | | 5,770,104 | |
State General Obligation — 1.8% | | | | | | | | | | | | | | | | |
California State, GO, Various Purpose, Refunding | | | 4.000 | % | | | 3/1/37 | | | | 1,000,000 | | | | 1,036,049 | |
Puerto Rico Commonwealth, GO: | | | | | | | | | | | | | | | | |
CAB, Restructured, Series A-1 | | | 0.000 | % | | | 7/1/24 | | | | 1,525 | | | | 1,489 | |
CAB, Restructured, Series A-1 | | | 0.000 | % | | | 7/1/33 | | | | 12,094 | | | | 7,378 | |
Restructured, Series A-1 | | | 5.375 | % | | | 7/1/25 | | | | 10,466 | | | | 10,651 | |
Restructured, Series A-1 | | | 5.625 | % | | | 7/1/27 | | | | 10,372 | | | | 10,840 | |
Restructured, Series A-1 | | | 5.625 | % | | | 7/1/29 | | | | 10,203 | | | | 10,799 | |
Restructured, Series A-1 | | | 5.750 | % | | | 7/1/31 | | | | 9,910 | | | | 10,677 | |
Restructured, Series A-1 | | | 4.000 | % | | | 7/1/33 | | | | 9,398 | | | | 8,792 | |
Restructured, Series A-1 | | | 4.000 | % | | | 7/1/35 | | | | 163,447 | | | | 149,884 | |
Restructured, Series A-1 | | | 4.000 | % | | | 7/1/37 | | | | 435,000 | | | | 389,706 | |
Restructured, Series A-1 | | | 4.000 | % | | | 7/1/41 | | | | 74,857 | | | | 64,822 | |
Restructured, Series A-1 | | | 4.000 | % | | | 7/1/46 | | | | 10,251 | | | | 8,544 | |
Subseries CW | | | 0.000 | % | | | 11/1/43 | | | | 41,550 | | | | 21,658 | (b) |
Total State General Obligation | | | | | | | | | | | | | | | 1,731,289 | |
Transportation — 21.7% | | | | | | | | | | | | | | | | |
Alameda, CA, Corridor Transportation Authority Revenue, Second Subordinated Lien, Series B, Refunding | | | 5.000 | % | | | 10/1/34 | | | | 2,700,000 | | | | 2,763,963 | |
Bay Area Toll Authority, CA, Toll Bridge Revenue, San Francisco Bay Area, Series B-1 (SIFMA Municipal Swap Index Yield + 1.100%) | | | 4.400 | % | | | 4/1/24 | | | | 1,000,000 | | | | 1,000,105 | (a)(b) |
See Notes to Financial Statements.
| | | | | | |
| Western Asset Intermediate Maturity California Municipals Fund 2023 Annual Report | | | | | 15 | |
Schedule of investments (cont’d)
November 30, 2023
Western Asset Intermediate Maturity California Municipals Fund
(Percentages shown based on Fund net assets)
| | | | | | | | | | | | | | | | |
| Security | | Rate | | | Maturity
Date | | | Face
Amount | | | Value | |
Transportation — continued | | | | | | | | | | | | | | | | |
Foothill-Eastern Transportation Corridor Agency, CA, Toll Road Revenue, Senior Lien, Series A, Refunding | | | 4.000 | % | | | 1/15/46 | | | $ | 500,000 | | | $ | 480,475 | |
Long Beach, CA, Marina System Revenue: | | | | | | | | | | | | | | | | |
Alamitos Bay Marina Project | | | 5.000 | % | | | 5/15/28 | | | | 850,000 | | | | 862,197 | |
Alamitos Bay Marina Project | | | 5.000 | % | | | 5/15/31 | | | | 445,000 | | | | 450,663 | |
Los Angeles, CA, Department of Airports Revenue, Los Angeles International Airport, Subordinated, Series F | | | 5.000 | % | | | 5/15/26 | | | | 4,610,000 | | | | 4,772,067 | (d) |
Los Angeles, CA, Harbor Department Revenue, Series A, Refunding | | | 5.000 | % | | | 8/1/25 | | | | 1,000,000 | | | | 1,029,709 | (d) |
Port of Oakland, CA, Intermediate Lien Revenue, Series D, Refunding | | | 5.000 | % | | | 11/1/27 | | | | 1,000,000 | | | | 1,062,575 | (d) |
Puerto Rico Commonwealth Highway & Transportation Authority Revenue: | | | | | | | | | | | | | | | | |
CAB, Restructured, Series B | | | 0.000 | % | | | 7/1/32 | | | | 55,000 | | | | 35,677 | |
Restructured, Series A | | | 5.000 | % | | | 7/1/62 | | | | 50,000 | | | | 49,500 | |
San Francisco, CA, City & County Airport Commission, International Airport Revenue: | | | | | | | | | | | | | | | | |
Series A, Refunding | | | 5.000 | % | | | 5/1/36 | | | | 2,100,000 | | | | 2,261,500 | (d) |
Series E | | | 5.000 | % | | | 5/1/35 | | | | 3,600,000 | | | | 3,837,425 | (d) |
Stockton, CA, PFA Parking Revenue: | | | | | | | | | | | | | | | | |
Refunding | | | 5.000 | % | | | 3/1/34 | | | | 885,000 | | | | 902,283 | |
Refunding | | | 5.000 | % | | | 3/1/36 | | | | 975,000 | | | | 986,216 | |
Total Transportation | | | | | | | | | | | | | | | 20,494,355 | |
Water & Sewer — 12.9% | | | | | | | | | | | | | | | | |
California State PCFA Water Furnishing Revenue: | | | | | | | | | | | | | | | | |
San Diego County Water Authority Desalination Project, Refunding | | | 5.000 | % | | | 7/1/29 | | | | 1,000,000 | | | | 1,041,213 | (c) |
San Diego County Water Authority Desalination Project, Refunding | | | 5.000 | % | | | 7/1/39 | | | | 1,000,000 | | | | 1,021,971 | (c) |
Fillmore, CA, Wastewater Revenue, Series 2017, Refunding, AGM | | | 5.000 | % | | | 5/1/36 | | | | 1,730,000 | | | | 1,829,009 | |
Puerto Rico Commonwealth Aqueduct & Sewer Authority Revenue, Senior Lien, Series A, Refunding | | | 5.000 | % | | | 7/1/47 | | | | 500,000 | | | | 485,160 | (c) |
San Francisco, CA, City & County Public Utilities Commission Revenue, Green Bonds, Sub-Series C, Refunding | | | 4.000 | % | | | 11/1/40 | | | | 1,500,000 | | | | 1,549,581 | |
See Notes to Financial Statements.
| | | | |
| 16 | | | | Western Asset Intermediate Maturity California Municipals Fund 2023 Annual Report |
Western Asset Intermediate Maturity California Municipals Fund
(Percentages shown based on Fund net assets)
| | | | | | | | | | | | | | | | |
| Security | | Rate | | | Maturity Date | | | Face Amount | | | Value | |
Water & Sewer — continued | | | | | | | | | | | | | | | | |
Stockton, CA, PFA Revenue: | | | | | | | | | | | | | | | | |
1998 Wastewater Project and 2003 Wastewater Project, Refunding, BAM | | | 5.000 | % | | | 9/1/26 | | | $ | 1,375,000 | | | $ | 1,390,670 | |
1998 Wastewater Project and 2003 Wastewater Project, Refunding, BAM | | | 5.000 | % | | | 9/1/28 | | | | 1,500,000 | | | | 1,515,553 | |
Green Bond, Series A, Refunding, BAM | | | 5.000 | % | | | 10/1/32 | | | | 1,000,000 | | | | 1,098,135 | |
Green Bond, Series A, Refunding, BAM | | | 5.000 | % | | | 10/1/33 | | | | 2,000,000 | | | | 2,193,546 | |
Total Water & Sewer | | | | | | | | | | | | | | | 12,124,838 | |
Total Investments before Short-Term Investments (Cost — $96,561,342) | | | | 93,355,761 | |
| Short-Term Investments — 0.4% | | | | | | | | | | | | | | | | |
| Municipal Bonds — 0.4% | | | | | | | | | | | | | | | | |
Housing: Multi-Family — 0.4% | | | | | | | | | | | | | | | | |
California Statewide CDA, MFH Revenue, David Avenue Apartments, Series WW, LIQ - FHLMC (Cost — $400,000) | | | 3.500 | % | | | 12/1/42 | | | | 400,000 | | | | 400,000 | (d)(g)(h) |
Total Investments — 99.4% (Cost — $96,961,342) | | | | | | | | | | | | | | | 93,755,761 | |
Other Assets in Excess of Liabilities — 0.6% | | | | | | | | | | | | | | | 555,535 | |
Total Net Assets — 100.0% | | | | | | | | | | | | | | $ | 94,311,296 | |
| * | Non-income producing security. |
| (a) | Maturity date shown represents the mandatory tender date. |
| (b) | Variable rate security. Interest rate disclosed is as of the most recent information available. Certain variable rate securities are not based on a published reference rate and spread but are determined by the issuer or agent and are based on current market conditions. These securities do not indicate a reference rate and spread in their description above. |
| (c) | Security is exempt from registration under Rule 144A of the Securities Act of 1933. This security may be resold in transactions that are exempt from registration, normally to qualified institutional buyers. This security has been deemed liquid pursuant to guidelines approved by the Board of Trustees. |
| (d) | Income from this issue is considered a preference item for purposes of calculating the alternative minimum tax (“AMT”). |
| (e) | The coupon payment on this security is currently in default as of November 30, 2023. |
| (f) | The maturity principal is currently in default as of November 30, 2023. |
| (g) | Variable rate demand obligations (“VRDOs”) have a demand feature under which the Fund can tender them back to the issuer or liquidity provider on no more than 7 days notice. The interest rate generally resets on a daily or weekly basis and is determined on the specific interest rate reset date by the remarketing agent, pursuant to a formula specified in official documents for the VRDO, or set at the highest rate allowable as specified in official documents for the VRDO. VRDOs are benchmarked to the Securities Industry and Financial Markets Association (“SIFMA”) Municipal Swap Index. The SIFMA Municipal Swap Index is compiled from weekly interest rate resets of tax-exempt VRDOs reported to the Municipal Securities Rulemaking Board’s Short-term Obligation Rate Transparency System. |
| (h) | Maturity date shown is the final maturity date. The security may be sold back to the issuer before final maturity. |
See Notes to Financial Statements.
| | | | | | |
| Western Asset Intermediate Maturity California Municipals Fund 2023 Annual Report | | | | | 17 | |
Schedule of investments (cont’d)
November 30, 2023
Western Asset Intermediate Maturity California Municipals Fund
| | |
Abbreviation(s) used in this schedule: |
| |
| AGM | | — Assured Guaranty Municipal Corporation — Insured Bonds |
| |
| BAM | | — Build America Mutual — Insured Bonds |
| |
| CAB | | — Capital Appreciation Bonds |
| |
| CDA | | — Communities Development Authority |
| |
| COP | | — Certificates of Participation |
| |
| FHLMC | | — Federal Home Loan Mortgage Corporation |
| |
| GO | | — General Obligation |
| |
| LIQ | | — Liquidity Facility |
| |
| MFA | | — Municipal Finance Authority |
| |
| MFH | | — Multi-Family Housing |
| |
| PCFA | | — Pollution Control Financing Authority |
| |
| PFA | | — Public Facilities Authority |
| |
| RDA | | — Redevelopment Agency |
| |
| SIFMA | | — Securities Industry and Financial Markets Association |
| |
| USD | | — Unified School District |
See Notes to Financial Statements.
| | | | |
| 18 | | | | Western Asset Intermediate Maturity California Municipals Fund 2023 Annual Report |
Statement of assets and liabilities
November 30, 2023
| | | | |
| |
| Assets: | | | | |
Investments, at value (Cost — $96,961,342) | | $ | 93,755,761 | |
Cash | | | 31,677 | |
Interest receivable | | | 943,026 | |
Receivable for Fund shares sold | | | 25,923 | |
Prepaid expenses | | | 8,253 | |
Total Assets | | | 94,764,640 | |
| |
| Liabilities: | | | | |
Payable for Fund shares repurchased | | | 319,359 | |
Audit and tax fees payable | | | 33,516 | |
Fund accounting fees payable | | | 26,591 | |
Investment management fee payable | | | 25,831 | |
Service and/or distribution fees payable | | | 14,711 | |
Distributions payable | | | 12,671 | |
Trustees’ fees payable | | | 455 | |
Accrued expenses | | | 20,210 | |
Total Liabilities | | | 453,344 | |
| Total Net Assets | | $ | 94,311,296 | |
| |
| Net Assets: | | | | |
Par value (Note 7) | | $ | 118 | |
Paid-in capital in excess of par value | | | 111,000,467 | |
Total distributable earnings (loss) | | | (16,689,289) | |
| Total Net Assets | | $ | 94,311,296 | |
| |
| Net Assets: | | | | |
Class A | | | $63,634,829 | |
Class C | | | $11,552,149 | |
Class I | | | $19,124,318 | |
| |
| Shares Outstanding: | | | | |
Class A | | | 7,988,266 | |
Class C | | | 1,452,919 | |
Class I | | | 2,392,012 | |
| |
| Net Asset Value: | | | | |
Class A (and redemption price) | | | $7.97 | |
Class C (and redemption price) | | | $7.95 | |
Class I (and redemption price) | | | $8.00 | |
| Maximum Public Offering Price Per Share: | | | | |
Class A (based on maximum initial sales charge of 2.25%) | | | $8.15 | |
See Notes to Financial Statements.
| | | | | | |
| Western Asset Intermediate Maturity California Municipals Fund 2023 Annual Report | | | | | 19 | |
Statement of operations
For the Year Ended November 30, 2023
| | | | |
| |
| Investment Income: | | | | |
Interest | | $ | 3,353,311 | |
| |
| Expenses: | | | | |
Investment management fee (Note 2) | | | 426,448 | |
Service and/or distribution fees (Notes 2 and 5) | | | 209,138 | |
Transfer agent fees (Notes 2 and 5) | | | 86,417 | |
Fund accounting fees | | | 65,352 | |
Registration fees | | | 49,798 | |
Audit and tax fees | | | 33,516 | |
Fees recaptured by investment manager (Note 2) | | | 21,671 | |
Shareholder reports | | | 13,735 | |
Legal fees | | | 9,024 | |
Trustees’ fees | | | 2,488 | |
Interest expense | | | 1,468 | |
Commitment fees (Note 8) | | | 1,121 | |
Insurance | | | 869 | |
Miscellaneous expenses | | | 6,233 | |
Total Expenses | | | 927,278 | |
Less: Fee waivers and/or expense reimbursements (Notes 2 and 5) | | | (101,858) | |
Net Expenses | | | 825,420 | |
| Net Investment Income | | | 2,527,891 | |
| |
| Realized and Unrealized Gain (Loss) on Investments (Notes 1 and 3): | | | | |
Net Realized Loss From Investment Transactions | | | (1,044,050) | |
Change in Net Unrealized Appreciation (Depreciation) From Investments | | | 996,678 | |
| Net Loss on Investments | | | (47,372) | |
| Increase in Net Assets From Operations | | $ | 2,480,519 | |
See Notes to Financial Statements.
| | | | |
| 20 | | | | Western Asset Intermediate Maturity California Municipals Fund 2023 Annual Report |
Statements of changes in net assets
| | | | | | | | |
| For the Years Ended November 30, | | 2023 | | | 2022 | |
| | |
| Operations: | | | | | | | | |
Net investment income | | $ | 2,527,891 | | | $ | 2,637,956 | |
Net realized loss | | | (1,044,050) | | | | (3,041,810) | |
Change in net unrealized appreciation (depreciation) | | | 996,678 | | | | (14,091,097) | |
Increase (Decrease) in Net Assets From Operations | | | 2,480,519 | | | | (14,494,951) | |
| | |
| Distributions to Shareholders From (Notes 1 and 6): | | | | | | | | |
Total distributable earnings | | | (2,519,547) | | | | (2,632,680) | |
Decrease in Net Assets From Distributions to Shareholders | | | (2,519,547) | | | | (2,632,680) | |
| | |
| Fund Share Transactions (Note 7): | | | | | | | | |
Net proceeds from sale of shares | | | 25,426,106 | | | | 27,000,273 | |
Reinvestment of distributions | | | 2,359,477 | | | | 2,489,599 | |
Cost of shares repurchased | | | (48,252,429) | | | | (62,780,195) | |
Decrease in Net Assets From Fund Share Transactions | | | (20,466,846) | | | | (33,290,323) | |
Decrease in Net Assets | | | (20,505,874) | | | | (50,417,954) | |
| | |
| Net Assets: | | | | | | | | |
Beginning of year | | | 114,817,170 | | | | 165,235,124 | |
End of year | | $ | 94,311,296 | | | $ | 114,817,170 | |
See Notes to Financial Statements.
| | | | | | |
| Western Asset Intermediate Maturity California Municipals Fund 2023 Annual Report | | | | | 21 | |
Financial highlights
| | | | | | | | | | | | | | | | | | | | |
| For a share of each class of beneficial interest outstanding throughout each year ended November 30: | |
| Class A Shares1 | | 2023 | | | 2022 | | | 2021 | | | 2020 | | | 2019 | |
| | | | | |
| Net asset value, beginning of year | | | $7.96 | | | | $8.94 | | | | $8.90 | | | | $8.89 | | | | $8.57 | |
| | | | | |
| Income (loss) from operations: | | | | | | | | | | | | | | | | | | | | |
Net investment income | | | 0.19 | | | | 0.16 | | | | 0.16 | | | | 0.17 | | | | 0.22 | |
Net realized and unrealized gain (loss) | | | 0.01 | 2 | | | (0.98) | | | | 0.04 | | | | 0.01 | 2 | | | 0.33 | |
Total income (loss) from operations | | | 0.20 | | | | (0.82) | | | | 0.20 | | | | 0.18 | | | | 0.55 | |
| | | | | |
| Less distributions from: | | | | | | | | | | | | | | | | | | | | |
Net investment income | | | (0.19) | | | | (0.16) | | | | (0.16) | | | | (0.17) | | | | (0.23) | |
Total distributions | | | (0.19) | | | | (0.16) | | | | (0.16) | | | | (0.17) | | | | (0.23) | |
| | | | | |
| Net asset value, end of year | | | $7.97 | | | | $7.96 | | | | $8.94 | | | | $8.90 | | | | $8.89 | |
Total return3 | | | 2.55 | % | | | (9.16) | % | | | 2.28 | % | | | 2.04 | % | | | 6.46 | % |
| | | | | |
| Net assets, end of year (000s) | | | $63,635 | | | | $71,245 | | | | $86,806 | | | | $85,928 | | | | $89,418 | |
| | | | | |
| Ratios to average net assets: | | | | | | | | | | | | | | | | | | | | |
Gross expenses | | | 0.82 | %4 | | | 0.86 | % | | | 0.84 | % | | | 0.84 | % | | | 0.84 | % |
Net expenses5,6 | | | 0.75 | 4 | | | 0.75 | | | | 0.75 | | | | 0.75 | | | | 0.75 | |
Net investment income | | | 2.40 | | | | 1.99 | | | | 1.81 | | | | 1.92 | | | | 2.53 | |
| | | | | |
| Portfolio turnover rate | | | 7 | % | | | 10 | % | | | 21 | % | | | 44 | % | | | 33 | % |
| 1 | Per share amounts have been calculated using the average shares method. |
| 2 | Calculation of the net gain per share (both realized and unrealized) does not correlate to the aggregate realized and unrealized losses presented in the Statement of Operations due to the timing of the sales and repurchases of Fund shares in relation to fluctuating market values of the investments of the Fund. |
| 3 | Performance figures, exclusive of sales charges, may reflect compensating balance arrangements, fee waivers and/or expense reimbursements. In the absence of compensating balance arrangements, fee waivers and/or expense reimbursements, the total return would have been lower. Past performance is no guarantee of future results. |
| 4 | Reflects recapture of fees waived and/or expenses reimbursed from prior fiscal years. |
| 5 | Reflects fee waivers and/or expense reimbursements. |
| 6 | As a result of an expense limitation arrangement, the ratio of total annual fund operating expenses, other than interest, brokerage, taxes, extraordinary expenses and acquired fund fees and expenses, to average net assets of Class A shares did not exceed 0.75%. This expense limitation arrangement cannot be terminated prior to December 31, 2025 without the Board of Trustees’ consent. |
See Notes to Financial Statements.
| | | | |
| 22 | | | | Western Asset Intermediate Maturity California Municipals Fund 2023 Annual Report |
| | | | | | | | | | | | | | | | | | | | |
| For a share of each class of beneficial interest outstanding throughout each year ended November 30: | |
| Class C Shares1 | | 2023 | | | 2022 | | | 2021 | | | 2020 | | | 2019 | |
| | | | | |
| Net asset value, beginning of year | | | $7.95 | | | | $8.93 | | | | $8.88 | | | | $8.88 | | | | $8.56 | |
| | | | | |
| Income (loss) from operations: | | | | | | | | | | | | | | | | | | | | |
Net investment income | | | 0.14 | | | | 0.11 | | | | 0.11 | | | | 0.11 | | | | 0.16 | |
Net realized and unrealized gain (loss) | | | 0.01 | 2 | | | (0.98) | | | | 0.05 | | | | 0.01 | 2 | | | 0.34 | |
Total income (loss) from operations | | | 0.15 | | | | (0.87) | | | | 0.16 | | | | 0.12 | | | | 0.50 | |
| | | | | |
| Less distributions from: | | | | | | | | | | | | | | | | | | | | |
Net investment income | | | (0.15) | | | | (0.11) | | | | (0.11) | | | | (0.12) | | | | (0.18) | |
Total distributions | | | (0.15) | | | | (0.11) | | | | (0.11) | | | | (0.12) | | | | (0.18) | |
| | | | | |
| Net asset value, end of year | | | $7.95 | | | | $7.95 | | | | $8.93 | | | | $8.88 | | | | $8.88 | |
Total return3 | | | 1.84 | % | | | (9.72) | % | | | 1.79 | % | | | 1.34 | % | | | 5.83 | % |
| | | | | |
| Net assets, end of year (000s) | | | $11,552 | | | | $18,182 | | | | $40,303 | | | | $36,338 | | | | $142,949 | |
| | | | | |
| Ratios to average net assets: | | | | | | | | | | | | | | | | | | | | |
Gross expenses | | | 1.42 | %4 | | | 1.42 | % | | | 1.39 | % | | | 1.40 | % | | | 1.40 | % |
Net expenses5,6 | | | 1.35 | 4 | | | 1.35 | | | | 1.35 | | | | 1.35 | | | | 1.35 | |
Net investment income | | | 1.79 | | | | 1.37 | | | | 1.20 | | | | 1.26 | | | | 1.87 | |
| | | | | |
| Portfolio turnover rate | | | 7 | % | | | 10 | % | | | 21 | % | | | 44 | % | | | 33 | % |
| 1 | Per share amounts have been calculated using the average shares method. |
| 2 | Calculation of the net gain per share (both realized and unrealized) does not correlate to the aggregate realized and unrealized losses presented in the Statement of Operations due to the timing of the sales and repurchases of Fund shares in relation to fluctuating market values of the investments of the Fund. |
| 3 | Performance figures may reflect compensating balance arrangements, fee waivers and/or expense reimbursements. In the absence of compensating balance arrangements, fee waivers and/or expense reimbursements, the total return would have been lower. Past performance is no guarantee of future results. |
| 4 | Reflects recapture of fees waived and/or expenses reimbursed from prior fiscal years. |
| 5 | Reflects fee waivers and/or expense reimbursements. |
| 6 | As a result of an expense limitation arrangement, the ratio of total annual fund operating expenses, other than interest, brokerage, taxes, extraordinary expenses and acquired fund fees and expenses, to average net assets of Class C shares did not exceed 1.35%. This expense limitation arrangement cannot be terminated prior to December 31, 2025 without the Board of Trustees’ consent. |
See Notes to Financial Statements.
| | | | | | |
| Western Asset Intermediate Maturity California Municipals Fund 2023 Annual Report | | | | | 23 | |
Financial highlights (cont’d)
| | | | | | | | | | | | | | | | | | | | |
| For a share of each class of beneficial interest outstanding throughout each year ended November 30: | |
| Class I Shares1 | | 2023 | | | 2022 | | | 2021 | | | 2020 | | | 2019 | |
| | | | | |
| Net asset value, beginning of year | | | $7.99 | | | | $8.97 | | | | $8.93 | | | | $8.92 | | | | $8.60 | |
| | | | | |
| Income (loss) from operations: | | | | | | | | | | | | | | | | | | | | |
Net investment income | | | 0.21 | | | | 0.18 | | | | 0.18 | | | | 0.18 | | | | 0.24 | |
Net realized and unrealized gain (loss) | | | 0.01 | 2 | | | (0.98) | | | | 0.04 | | | | 0.01 | 2 | | | 0.32 | |
Total income (loss) from operations | | | 0.22 | | | | (0.80) | | | | 0.22 | | | | 0.19 | | | | 0.56 | |
| | | | | |
| Less distributions from: | | | | | | | | | | | | | | | | | | | | |
Net investment income | | | (0.21) | | | | (0.18) | | | | (0.18) | | | | (0.18) | | | | (0.24) | |
Total distributions | | | (0.21) | | | | (0.18) | | | | (0.18) | | | | (0.18) | | | | (0.24) | |
| | | | | |
| Net asset value, end of year | | | $8.00 | | | | $7.99 | | | | $8.97 | | | | $8.93 | | | | $8.92 | |
Total return3 | | | 2.79 | % | | | (8.99) | % | | | 2.43 | % | | | 2.20 | % | | | 6.61 | % |
| | | | | |
| Net assets, end of year (000s) | | | $19,124 | | | | $25,389 | | | | $38,126 | | | | $38,327 | | | | $38,546 | |
| | | | | |
| Ratios to average net assets: | | | | | | | | | | | | | | | | | | | | |
Gross expenses | | | 0.68 | % | | | 0.73 | % | | | 0.71 | % | | | 0.70 | % | | | 0.70 | % |
Net expenses4,5 | | | 0.50 | | | | 0.60 | | | | 0.60 | | | | 0.60 | | | | 0.60 | |
Net investment income | | | 2.64 | | | | 2.13 | | | | 1.96 | | | | 2.07 | | | | 2.72 | |
| | | | | |
| Portfolio turnover rate | | | 7 | % | | | 10 | % | | | 21 | % | | | 44 | % | | | 33 | % |
| 1 | Per share amounts have been calculated using the average shares method. |
| 2 | Calculation of the net gain per share (both realized and unrealized) does not correlate to the aggregate realized and unrealized losses presented in the Statement of Operations due to the timing of the sales and repurchases of Fund shares in relation to fluctuating market values of the investments of the Fund. |
| 3 | Performance figures may reflect compensating balance arrangements, fee waivers and/or expense reimbursements. In the absence of compensating balance arrangements, fee waivers and/or expense reimbursements, the total return would have been lower. Past performance is no guarantee of future results. |
| 4 | Reflects fee waivers and/or expense reimbursements. |
| 5 | As a result of an expense limitation arrangement, effective December 1, 2022, the ratio of total annual fund operating expenses, other than interest, brokerage, taxes, extraordinary expenses and acquired fund fees and expenses, to average net assets of Class I shares did not exceed 0.50%. This expense limitation arrangement cannot be terminated prior to December 31, 2025 without the Board of Trustees’ consent. Prior to December 1, 2022, the expense limitation was 0.60%. |
See Notes to Financial Statements.
| | | | |
| 24 | | | | Western Asset Intermediate Maturity California Municipals Fund 2023 Annual Report |
Notes to financial statements
1. Organization and significant accounting policies
Western Asset Intermediate Maturity California Municipals Fund (the “Fund”) is a separate non-diversified investment series of Legg Mason Partners Income Trust (the “Trust”). The Trust, a Maryland statutory trust, is registered under the Investment Company Act of 1940, as amended (the “1940 Act”), as an open-end management investment company.
The Fund follows the accounting and reporting guidance in Financial Accounting Standards Board (“FASB”) Accounting Standards Codification Topic 946, Financial Services — Investment Companies (“ASC 946”). The following are significant accounting policies consistently followed by the Fund and are in conformity with U.S. generally accepted accounting principles (“GAAP”), including, but not limited to, ASC 946. Estimates and assumptions are required to be made regarding assets, liabilities and changes in net assets resulting from operations when financial statements are prepared. Changes in the economic environment, financial markets and any other parameters used in determining these estimates could cause actual results to differ. Subsequent events have been evaluated through the date the financial statements were issued.
(a) Investment valuation. The valuations for fixed income securities (which may include, but are not limited to, corporate, government, municipal, mortgage-backed, collateralized mortgage obligations and asset-backed securities) and certain derivative instruments are typically the prices supplied by independent third party pricing services, which may use market prices or broker/dealer quotations or a variety of valuation techniques and methodologies. The independent third party pricing services typically use inputs that are observable such as issuer details, interest rates, yield curves, prepayment speeds, credit risks/spreads, default rates and quoted prices for similar securities. Investments in open-end funds are valued at the closing net asset value per share of each fund on the day of valuation. If independent third party pricing services are unable to supply prices for a portfolio investment, or if the prices supplied are deemed by the manager to be unreliable, the market price may be determined by the manager using quotations from one or more broker/dealers or at the transaction price if the security has recently been purchased and no value has yet been obtained from a pricing service or pricing broker. When reliable prices are not readily available, such as when the value of a security has been significantly affected by events after the close of the exchange or market on which the security is principally traded, but before the Fund calculates its net asset value, the Fund values these securities as determined in accordance with procedures approved by the Fund’s Board of Trustees.
Pursuant to policies adopted by the Board of Trustees, the Fund’s manager has been designated as the valuation designee and is responsible for the oversight of the daily valuation process. The Fund’s manager is assisted by the Global Fund Valuation Committee (the “Valuation Committee”). The Valuation Committee is responsible for making fair value determinations, evaluating the effectiveness of the Fund’s pricing policies, and reporting to the Fund’s manager and the Board of Trustees. When determining the reliability of third
| | | | | | |
| Western Asset Intermediate Maturity California Municipals Fund 2023 Annual Report | | | | | 25 | |
Notes to financial statements (cont’d)
party pricing information for investments owned by the Fund, the Valuation Committee, among other things, conducts due diligence reviews of pricing vendors, monitors the daily change in prices and reviews transactions among market participants.
The Valuation Committee will consider pricing methodologies it deems relevant and appropriate when making fair value determinations. Examples of possible methodologies include, but are not limited to, multiple of earnings; discount from market of a similar freely traded security; discounted cash-flow analysis; book value or a multiple thereof; risk premium/yield analysis; yield to maturity; and/or fundamental investment analysis. The Valuation Committee will also consider factors it deems relevant and appropriate in light of the facts and circumstances. Examples of possible factors include, but are not limited to, the type of security; the issuer’s financial statements; the purchase price of the security; the discount from market value of unrestricted securities of the same class at the time of purchase; analysts’ research and observations from financial institutions; information regarding any transactions or offers with respect to the security; the existence of merger proposals or tender offers affecting the security; the price and extent of public trading in similar securities of the issuer or comparable companies; and the existence of a shelf registration for restricted securities.
For each portfolio security that has been fair valued pursuant to the policies adopted by the Board of Trustees, the fair value price is compared against the last available and next available market quotations. The Valuation Committee reviews the results of such back testing monthly and fair valuation occurrences are reported to the Board of Trustees quarterly.
The Fund uses valuation techniques to measure fair value that are consistent with the market approach and/or income approach, depending on the type of security and the particular circumstance. The market approach uses prices and other relevant information generated by market transactions involving identical or comparable securities. The income approach uses valuation techniques to discount estimated future cash flows to present value.
GAAP establishes a disclosure hierarchy that categorizes the inputs to valuation techniques used to value assets and liabilities at measurement date. These inputs are summarized in the three broad levels listed below:
| • | | Level 1 — unadjusted quoted prices in active markets for identical investments |
| • | | Level 2 — other significant observable inputs (including quoted prices for similar investments, interest rates, prepayment speeds, credit risk, etc.) |
| • | | Level 3 — significant unobservable inputs (including the Fund’s own assumptions in determining the fair value of investments) |
The inputs or methodologies used to value securities are not necessarily an indication of the risk associated with investing in those securities.
| | | | |
| 26 | | | | Western Asset Intermediate Maturity California Municipals Fund 2023 Annual Report |
The following is a summary of the inputs used in valuing the Fund’s assets carried at fair value:
| | | | | | | | | | | | | | | | |
| ASSETS | |
| Description | | Quoted Prices (Level 1) | | | Other Significant Observable Inputs (Level 2) | | | Significant Unobservable Inputs (Level 3) | | | Total | |
| Municipal Bonds† | | | — | | | $ | 93,355,761 | | | | — | | | $ | 93,355,761 | |
| Short-Term Investments† | | | — | | | | 400,000 | | | | — | | | | 400,000 | |
| Total Investments | | | — | | | $ | 93,755,761 | | | | — | | | $ | 93,755,761 | |
| † | See Schedule of Investments for additional detailed categorizations. |
(b) Fund concentration. Since the Fund invests primarily in obligations of issuers within California, it is subject to possible risks associated with economic, political, credit or legal developments or industrial or regional matters specifically affecting California.
(c) Security transactions and investment income. Security transactions are accounted for on a trade date basis. Interest income (including interest income from payment-in-kind securities) is recorded on the accrual basis. Amortization of premiums and accretion of discounts on debt securities are recorded to interest income over the lives of the respective securities, except for premiums on certain callable debt securities which are amortized to the earliest call date. The cost of investments sold is determined by use of the specific identification method. To the extent any issuer defaults or a credit event occurs that impacts the issuer, the Fund may halt any additional interest income accruals and consider the realizability of interest accrued up to the date of default or credit event.
(d) Distributions to shareholders. Distributions from net investment income of the Fund are declared each business day to shareholders of record and are paid monthly. The Fund intends to satisfy conditions that will enable interest from municipal securities, which is exempt from federal and certain state income taxes, to retain such tax-exempt status when distributed to the shareholders of the Fund. Distributions of net realized gains, if any, are taxable and declared at least annually. Distributions to shareholders of the Fund are recorded on the ex-dividend date and are determined in accordance with income tax regulations, which may differ from GAAP.
(e) Share class accounting. Investment income, common expenses and realized/ unrealized gains (losses) on investments are allocated to the various classes of the Fund on the basis of daily net assets of each class. Fees relating to a specific class are charged directly to that share class.
(f) Compensating balance arrangements. The Fund has an arrangement with its custodian bank whereby a portion of the custodian’s fees is paid indirectly by credits earned on the Fund’s cash on deposit with the bank.
| | | | | | |
| Western Asset Intermediate Maturity California Municipals Fund 2023 Annual Report | | | | | 27 | |
Notes to financial statements (cont’d)
(g) Federal and other taxes. It is the Fund’s policy to comply with the federal income and excise tax requirements of the Internal Revenue Code of 1986 (the “Code”), as amended, applicable to regulated investment companies. Accordingly, the Fund intends to distribute its taxable income and net realized gains, if any, to shareholders in accordance with timing requirements imposed by the Code. Therefore, no federal or state income tax provision is required in the Fund’s financial statements.
Management has analyzed the Fund’s tax positions taken on income tax returns for all open tax years and has concluded that as of November 30, 2023, no provision for income tax is required in the Fund’s financial statements. The Fund’s federal and state income and federal excise tax returns for tax years for which the applicable statutes of limitations have not expired are subject to examination by the Internal Revenue Service and state departments of revenue.
(h) Reclassification. GAAP requires that certain components of net assets be reclassified to reflect permanent differences between financial and tax reporting. These reclassifications have no effect on net assets or net asset value per share. During the current year, the Fund had no reclassifications.
2. Investment management agreement and other transactions with affiliates
Franklin Templeton Fund Adviser, LLC (“FTFA”) (formerly known as Legg Mason Partners Fund Advisor, LLC prior to November 30, 2023) is the Fund’s investment manager and Western Asset Management Company, LLC (“Western Asset”) is the Fund’s subadviser. FTFA and Western Asset are indirect, wholly-owned subsidiaries of Franklin Resources, Inc. (“Franklin Resources”).
Under the investment management agreement, the Fund pays an investment management fee, calculated daily and paid monthly, at an annual rate of 0.40% of the Fund’s average daily net assets.
FTFA provides administrative and certain oversight services to the Fund. FTFA delegates to the subadviser the day-to-day portfolio management of the Fund. For its services, FTFA pays Western Asset a fee monthly, at an annual rate equal to 70% of the net management fee it receives from the Fund.
As a result of expense limitation arrangements between the Fund and FTFA, the ratio of total annual fund operating expenses, other than interest, brokerage, taxes, extraordinary expenses and acquired fund fees and expenses, to average net assets of Class A, Class C and Class I shares did not exceed 0.75%, 1.35% and 0.50%, respectively. These expense limitation arrangements cannot be terminated prior to December 31, 2025 without the Board of Trustees’ consent.
During the year ended November 30, 2023, fees waived and/or expenses reimbursed amounted to $101,858.
| | | | |
| 28 | | | | Western Asset Intermediate Maturity California Municipals Fund 2023 Annual Report |
FTFA is permitted to recapture amounts waived and/or reimbursed to a class within two years after the fiscal year in which FTFA earned the fee or incurred the expense if the class’ total annual fund operating expenses have fallen to a level below the expense limitation (“expense cap”) in effect at the time the fees were earned or the expenses incurred. In no case will FTFA recapture any amount that would result, on any particular business day of the Fund, in the class’ total annual fund operating expenses exceeding the expense cap or any other lower limit then in effect.
Pursuant to these arrangements, at November 30, 2023, the Fund had remaining fee waivers and/or expense reimbursements subject to recapture by FTFA and respective dates of expiration as follows:
| | | | | | | | | | | | |
| | | Class A | | | Class C | | | Class I | |
| Expires November 30, 2024 | | $ | 88,390 | | | $ | 19,654 | | | $ | 41,044 | |
| Expires November 30, 2025 | | | 47,515 | | | | 10,173 | | | | 44,170 | |
| Total fee waivers/expense reimbursements subject to recapture | | $ | 135,905 | | | $ | 29,827 | | | $ | 85,214 | |
For the year ended November 30, 2023, fee waivers and/or expense reimbursements recaptured by FTFA, if any, were as follows:
| | | | | | | | |
| | | Class A | | | Class C | |
| FTFA recaptured | | $ | 14,070 | | | $ | 7,601 | |
Franklin Distributors, LLC (“Franklin Distributors”) serves as the Fund’s sole and exclusive distributor. Franklin Distributors is an indirect, wholly-owned broker-dealer subsidiary of Franklin Resources. Franklin Templeton Investor Services, LLC (“Investor Services”) serves as the Fund’s shareholder servicing agent and acts as the Fund’s transfer agent and dividend-paying agent. Investor Services is an indirect, wholly-owned subsidiary of Franklin Resources. Each class of shares of the Fund pays transfer agent fees to Investor Services for its performance of shareholder servicing obligations. Investor Services charges account-based fees based on the number of individual shareholder accounts, as well as a fixed percentage fee based on the total account-based fees charged. In addition, each class reimburses Investor Services for out of pocket expenses incurred. For the year ended November 30, 2023, the Fund incurred transfer agent fees as reported on the Statement of Operations, of which $528 was earned by Investor Services.
There is a maximum initial sales charge of 2.25% for Class A shares. In certain cases, Class A shares have a 0.50% CDSC, which applies if redemption occurs within 18 months from purchase payment. This CDSC only applies to those purchases of Class A shares, which, when combined with current holdings of other shares of funds sold by Franklin Distributors, equal or exceed $250,000 in the aggregate. These purchases do not incur an initial sales charge.
| | | | | | |
| Western Asset Intermediate Maturity California Municipals Fund 2023 Annual Report | | | | | 29 | |
Notes to financial statements (cont’d)
For the year ended November 30, 2023, sales charges retained by and CDSCs paid to Franklin Distributors and its affiliates, if any, were as follows:
| | | | |
| | | Class A | |
| Sales charges | | $ | 4,134 | |
| CDSCs | | | 544 | |
All officers and one Trustee of the Trust are employees of Franklin Resources or its affiliates and do not receive compensation from the Trust.
The Fund is permitted to purchase or sell short-term variable rate demand obligations from or to certain other affiliated funds or portfolios under specified conditions outlined in procedures adopted by the Board of Trustees. The procedures have been designed to provide assurance that any purchase or sale of securities by the Fund from or to another fund or portfolio that is, or could be considered, an affiliate by virtue of having a common investment manager or subadviser (or affiliated investment manager or subadviser), common Trustees and/or common officers complies with Rule 17a-7 under the 1940 Act. Further, as defined under the procedures, each transaction is effected at the current market price. For the year ended November 30, 2023, such purchase and sale transactions (excluding accrued interest) were $17,800,000 and $20,500,000, respectively.
3. Investments
During the year ended November 30, 2023, the aggregate cost of purchases and proceeds from sales of investments (excluding short-term investments) were as follows:
| | | | |
| Purchases | | $ | 7,285,926 | |
| Sales | | | 26,194,099 | |
At November 30, 2023, the aggregate cost of investments and the aggregate gross unrealized appreciation and depreciation of investments for federal income tax purposes were as follows:
| | | | | | | | | | | | | | | | |
| | | Cost | | | Gross Unrealized Appreciation | | | Gross Unrealized Depreciation | | | Net Unrealized Depreciation | |
| Securities | | $ | 97,020,695 | | | $ | 879,761 | | | $ | (4,144,695) | | | $ | (3,264,934) | |
4. Derivative instruments and hedging activities
During the year ended November 30, 2023, the Fund did not invest in derivative instruments.
5. Class specific expenses, waivers and/or expense reimbursements
The Fund has adopted a Rule 12b-1 shareholder services and distribution plan and under that plan the Fund pays service and/or distribution fees with respect to its Class A and Class C shares calculated at the annual rate of 0.15% and 0.75% of the average daily net assets of each class, respectively. Service and/or distribution fees are accrued daily and paid monthly.
| | | | |
| 30 | | | | Western Asset Intermediate Maturity California Municipals Fund 2023 Annual Report |
For the year ended November 30, 2023, class specific expenses were as follows:
| | | | | | | | |
| | | Service and/or Distribution Fees | | | Transfer Agent Fees | |
| Class A | | $ | 101,011 | | | $ | 52,927 | |
| Class C | | | 108,127 | | | | 6,857 | |
| Class I | | | — | | | | 26,633 | |
| Total | | $ | 209,138 | | | $ | 86,417 | |
For the year ended November 30, 2023, waivers and/or expense reimbursements by class were as follows:
| | | | |
| | | Waivers/Expense Reimbursements | |
| Class A | | $ | 47,516 | |
| Class C | | | 10,172 | |
| Class I | | | 44,170 | |
| Total | | $ | 101,858 | |
6. Distributions to shareholders by class
| | | | | | | | |
| | | Year Ended November 30, 2023 | | | Year Ended November 30, 2022 | |
| Net Investment Income: | | | | | | | | |
| Class A | | $ | 1,609,490 | | | $ | 1,535,759 | |
| Class C | | | 261,014 | | | | 414,090 | |
| Class I | | | 649,043 | | | | 682,831 | |
| Total | | $ | 2,519,547 | | | $ | 2,632,680 | |
7. Shares of beneficial interest
At November 30, 2023, the Trust had an unlimited number of shares of beneficial interest authorized with a par value of $0.00001 per share. The Fund has the ability to issue multiple classes of shares. Each class of shares represents an identical interest and has the same rights, except that each class bears certain direct expenses, including those specifically related to the distribution of its shares.
Transactions in shares of each class were as follows:
| | | | | | | | | | | | | | | | |
| | | Year Ended
November 30, 2023 | | | Year Ended
November 30, 2022 | |
| | | | |
| | | Shares | | | Amount | | | Shares | | | Amount | |
| Class A | | | | | | | | | | | | | | | | |
| Shares sold | | | 1,578,326 | | | $ | 12,598,505 | | | | 1,763,818 | | | $ | 14,369,305 | |
| Shares issued on reinvestment | | | 195,501 | | | | 1,554,989 | | | | 180,938 | | | | 1,483,206 | |
| Shares repurchased | | | (2,735,087) | | | | (21,771,063) | | | | (2,701,856) | | | | (22,140,628) | |
| Net decrease | | | (961,260) | | | $ | (7,617,569) | | | | (757,100) | | | $ | (6,288,117) | |
| | | | | | |
| Western Asset Intermediate Maturity California Municipals Fund 2023 Annual Report | | | | | 31 | |
Notes to financial statements (cont’d)
| | | | | | | | | | | | | | | | |
| | | Year Ended
November 30, 2023 | | | Year Ended
November 30, 2022 | |
| | | | |
| | | Shares | | | Amount | | | Shares | | | Amount | |
| Class C | | | | | | | | | | | | | | | | |
| Shares sold | | | 136,269 | | | $ | 1,089,614 | | | | 334,698 | | | $ | 2,721,061 | |
| Shares issued on reinvestment | | | 32,842 | | | | 261,014 | | | | 50,437 | | | | 414,000 | |
| Shares repurchased | | | (1,003,764) | | | | (8,030,371) | | | | (2,611,548) | | | | (21,470,244) | |
| Net decrease | | | (834,653) | | | $ | (6,679,743) | | | | (2,226,413) | | | $ | (18,335,183) | |
| | | | |
| Class I | | | | | | | | | | | | | | | | |
| Shares sold | | | 1,458,719 | | | $ | 11,737,987 | | | | 1,201,472 | | | $ | 9,909,907 | |
| Shares issued on reinvestment | | | 68,058 | | | | 543,474 | | | | 71,784 | | | | 592,393 | |
| Shares repurchased | | | (2,313,118) | | | | (18,450,995) | | | | (2,343,388) | | | | (19,169,323) | |
| Net decrease | | | (786,341) | | | $ | (6,169,534) | | | | (1,070,132) | | | $ | (8,667,023) | |
8. Redemption facility
The Fund, together with other U.S. registered and foreign investment funds (collectively, the “Borrowers”) managed by Franklin Resources or its affiliates, is a borrower in a joint syndicated senior unsecured credit facility totaling $2.675 billion (the “Global Credit Facility”). The Global Credit Facility provides a source of funds to the Borrowers for temporary and emergency purposes, including the ability to meet future unanticipated or unusually large redemption requests. Unless renewed, the Global Credit Facility will terminate on February 2, 2024.
Under the terms of the Global Credit Facility, the Fund shall, in addition to interest charged on any borrowings made by the Fund and other costs incurred by the Fund, pay its share of fees and expenses incurred in connection with the implementation and maintenance of the Global Credit Facility, based upon its relative share of the aggregate net assets of all the Borrowers, including an annual commitment fee of 0.15% based upon the unused portion of the Global Credit Facility. These fees are reflected in the Statement of Operations. The Fund did not utilize the Global Credit Facility during the year ended November 30, 2023.
9. Income tax information and distributions to shareholders
The tax character of distributions paid during the fiscal years ended November 30, was as follows:
| | | | | | | | |
| | | 2023 | | | 2022 | |
| Distributions paid from: | | | | | | | | |
| Tax-exempt income | | $ | 2,518,863 | | | $ | 2,632,497 | |
| Ordinary income | | | 684 | | | | 183 | |
| Total distributions paid | | $ | 2,519,547 | | | $ | 2,632,680 | |
| | | | |
| 32 | | | | Western Asset Intermediate Maturity California Municipals Fund 2023 Annual Report |
As of November 30, 2023, the components of distributable earnings (loss) on a tax basis were as follows:
| | | | |
| Undistributed tax-exempt income — net | | $ | 89,694 | |
| Deferred capital losses* | | | (13,465,630) | |
| Other book/tax temporary differences(a) | | | (48,419) | |
| Unrealized appreciation (depreciation)(b) | | | (3,264,934) | |
| Total distributable earnings (loss) — net | | $ | (16,689,289) | |
| * | These capital losses have been deferred in the current year as either short-term or long-term losses. The losses will be deemed to occur on the first day of the next taxable year in the same character as they were originally deferred and will be available to offset future taxable capital gains. |
| (a) | Other book/tax temporary differences are attributable to the difference between cash and accrual basis distributions paid and book/tax differences in the timing of the deductibility of various expenses. |
| (b) | The difference between book-basis and tax-basis unrealized appreciation (depreciation) is attributable to the difference between book and tax accretion methods for market discount on fixed income securities. |
| | | | | | |
| Western Asset Intermediate Maturity California Municipals Fund 2023 Annual Report | | | | | 33 | |
Report of independent registered public accounting firm
To the Board of Trustees of Legg Mason Partners Income Trust and Shareholders of Western Asset Intermediate Maturity California Municipals Fund
Opinion on the Financial Statements
We have audited the accompanying statement of assets and liabilities, including the schedule of investments, of Western Asset Intermediate Maturity California Municipals Fund (one of the funds constituting Legg Mason Partners Income Trust, referred to hereafter as the “Fund”) as of November 30, 2023, the related statement of operations for the year ended November 30, 2023, the statement of changes in net assets for each of the two years in the period ended November 30, 2023, including the related notes, and the financial highlights for each of the five years in the period ended November 30, 2023 (collectively referred to as the “financial statements”). In our opinion, the financial statements present fairly, in all material respects, the financial position of the Fund as of November 30, 2023, the results of its operations for the year then ended, the changes in its net assets for each of the two years in the period ended November 30, 2023 and the financial highlights for each of the five years in the period ended November 30, 2023 in conformity with accounting principles generally accepted in the United States of America.
Basis for Opinion
These financial statements are the responsibility of the Fund’s management. Our responsibility is to express an opinion on the Fund’s financial statements based on our audits. We are a public accounting firm registered with the Public Company Accounting Oversight Board (United States) (PCAOB) and are required to be independent with respect to the Fund in accordance with the U.S. federal securities laws and the applicable rules and regulations of the Securities and Exchange Commission and the PCAOB.
We conducted our audits of these financial statements in accordance with the standards of the PCAOB. Those standards require that we plan and perform the audit to obtain reasonable assurance about whether the financial statements are free of material misstatement, whether due to error or fraud.
Our audits included performing procedures to assess the risks of material misstatement of the financial statements, whether due to error or fraud, and performing procedures that respond to those risks. Such procedures included examining, on a test basis, evidence regarding the amounts and disclosures in the financial statements. Our audits also included evaluating the accounting principles used and significant estimates made by management, as well as evaluating the overall presentation of the financial statements. Our procedures included confirmation of securities owned as of November 30, 2023 by correspondence with the custodian. We believe that our audits provide a reasonable basis for our opinion.
/s/PricewaterhouseCoopers LLP
Baltimore, Maryland
January 18, 2024
We have served as the auditor of one or more investment companies in the Franklin Templeton Group of Funds since 1948.
| | | | |
| 34 | | | | Western Asset Intermediate Maturity California Municipals Fund 2023 Annual Report |
Additional information (unaudited)
Information about Trustees and Officers
The business and affairs of Western Asset Intermediate Maturity California Municipals Fund (the “Fund”) are conducted by management under the supervision and subject to the direction of its Board of Trustees. The business address of each Trustee is c/o Jane Trust, Franklin Templeton, 280 Park Avenue, 8th Floor, New York, New York 10017.
Information pertaining to the Trustees and officers of the Fund is set forth below. The Statement of Additional Information includes additional information about Trustees and is available, without charge, upon request by calling the Fund at 877-6LM-FUND/656-3863.
| | |
| Independent Trustees† |
|
| Robert Abeles, Jr. |
| |
| Year of birth | | 1945 |
| Position(s) with Fund | | Trustee |
| Term of office1 and length of time served2 | | Since 2013 |
| Principal occupation(s) during the past five years | | Board Member of Excellent Education Development (since 2012); Senior Vice President Emeritus (since 2016) and formerly, Senior Vice President, Finance and Chief Financial Officer (2009 to 2016) at University of Southern California; and formerly, Board Member of Great Public Schools Now (2018 to 2022) |
| Number of funds in fund complex overseen by Trustee3 | | 50 |
| Other Trusteeships held by Trustee during the past five years | | None |
|
| Jane F. Dasher |
| |
| Year of birth | | 1949 |
| Position(s) with Fund | | Trustee |
| Term of office1 and length of time served2 | | Since 1999 |
| Principal occupation(s) during the past five years | | Director (since 2022) and formerly, Chief Financial Officer, Long Light Capital, LLC, formerly known as Korsant Partners, LLC (a family investment company) (since 1997) |
| Number of funds in fund complex overseen by Trustee3 | | 50 |
| Other Trusteeships held by Trustee during the past five years | | Formerly, Director, Visual Kinematics, Inc. (2018 to 2022) |
|
| Anita L. DeFrantz |
| |
| Year of birth | | 1952 |
| Position(s) with Fund | | Trustee |
| Term of office1 and length of time served2 | | Since 1998 |
| Principal occupation(s) during the past five years | | President of Tubman Truth Corp. (since 2015); Vice President (since 2017), Member of the Executive Board (since 2013) and Member of the International Olympic Committee (since 1986); and President Emeritus (since 2015) and formerly, President (1987 to 2015) and Director (1990 to 2015) of LA84 (formerly Amateur Athletic Foundation of Los Angeles) |
| Number of funds in fund complex overseen by Trustee3 | | 50 |
| Other Trusteeships held by Trustee during the past five years | | None |
| | | | | | |
| Western Asset Intermediate Maturity California Municipals Fund | | | | | 35 | |
Additional information (unaudited) (cont’d)
Information about Trustees and Officers
| | |
| Independent Trustees† (cont’d) |
|
| Susan B. Kerley |
| |
| Year of birth | | 1951 |
| Position(s) with Fund | | Trustee |
| Term of office1 and length of time served2 | | Since 1992 |
| Principal occupation(s) during the past five years | | Investment Consulting Partner, Strategic Management Advisors, LLC (investment consulting) (since 1990) |
| Number of funds in fund complex overseen by Trustee3 | | 50 |
| Other Trusteeships held by Trustee during the past five years | | Director and Trustee (since 1990) and Chairman (since 2017 and 2005 to 2012) of various series of MainStay Family of Funds (66 funds); formerly, Chairman of the Independent Directors Council (2012 to 2014); ICI Executive Committee (2011 to 2014); and Investment Company Institute (ICI) Board of Governors (2006 to 2014) |
|
| Michael Larson |
| |
| Year of birth | | 1959 |
| Position(s) with Fund | | Trustee |
| Term of office1 and length of time served2 | | Since 2004 |
| Principal occupation(s) during the past five years | | Chief Investment Officer for William H. Gates III (since 1994)4 |
| Number of funds in fund complex overseen by Trustee3 | | 50 |
| Other Trusteeships held by Trustee during the past five years | | Ecolab Inc. (since 2012); Fomento Economico Mexicano, SAB (since 2011); Republic Services, Inc. (since 2009); and formerly, AutoNation, Inc. (2010 to 2018) |
|
| Avedick B. Poladian |
| |
| Year of birth | | 1951 |
| Position(s) with Fund | | Trustee |
| Term of office1 and length of time served2 | | Since 2007 |
| Principal occupation(s) during the past five years | | Director and Advisor (since 2017) and formerly, Executive Vice President and Chief Operating Officer (2002 to 2016) of Lowe Enterprises, Inc. (privately held real estate and hospitality firm); and formerly, Partner, Arthur Andersen, LLP (1974 to 2002) |
| Number of funds in fund complex overseen by Trustee3 | | 50 |
| Other Trusteeships held by Trustee during the past five years | | Public Storage (since 2010); Occidental Petroleum Corporation (since 2008); and formerly, California Resources Corporation (2014 to 2021) |
| | | | |
| 36 | | | | Western Asset Intermediate Maturity California Municipals Fund |
| | |
| Independent Trustees† (cont’d) |
|
| William E.B. Siart |
| |
| Year of birth | | 1946 |
| Position(s) with Fund | | Trustee and Chairman of the Board |
| Term of office1 and length of time served2 | | Since 1997 (Chairman of the Board since 2020) |
| Principal occupation(s) during the past five years | | Chairman of Excellent Education Development (since 2000); formerly, Chairman of Great Public Schools Now (2015 to 2020); Trustee of The Getty Trust (2005 to 2017); and Chairman of Walt Disney Concert Hall, Inc. (1998 to 2006) |
| Number of funds in fund complex overseen by Trustee3 | | 50 |
| Other Trusteeships held by Trustee during the past five years | | Trustee, University of Southern California (since 1994); and formerly, Member of Board of United States Golf Association, Executive Committee Member (2017 to 2021) |
|
| Jaynie Miller Studenmund |
| |
| Year of birth | | 1954 |
| Position(s) with Fund | | Trustee |
| Term of office1 and length of time served2 | | Since 2004 |
| Principal occupation(s) during the past five years | | Corporate Board Member and Advisor (since 2004); formerly, Chief Operating Officer of Overture Services, Inc. (publicly traded internet company that created search engine marketing) (2001 to 2004); President and Chief Operating Officer, PayMyBills (internet innovator in bill presentment/payment space) (1999 to 2001); and Executive vice president for consumer and business banking for three national financial institutions (1984 to 1997) |
| Number of funds in fund complex overseen by Trustee3 | | 50 |
| Other Trusteeships held by Trustee during the past five years | | Director of Pacific Premier Bancorp Inc. and Pacific Premier Bank (since 2019); Director of EXL (operations management and analytics company) (since 2018); formerly, Director of LifeLock, Inc. (identity theft protection company) (2015 to 2017); Director of CoreLogic, Inc. (information, analytics and business services company) (2012 to 2021); and Director of Pinnacle Entertainment, Inc. (gaming and hospitality company) (2012 to 2018) |
|
| Peter J. Taylor |
| |
| Year of birth | | 1958 |
| Position(s) with Fund | | Trustee |
| Term of office1 and length of time served2 | | Since 2019 |
| Principal occupation(s) during the past five years | | Retired; formerly, President, ECMC Foundation (nonprofit organization) (2014 to 2023); and Executive Vice President and Chief Financial Officer for University of California system (2009 to 2014) |
| Number of funds in fund complex overseen by Trustee3 | | 50 |
| Other Trusteeships held by Trustee during the past five years | | Director of 23andMe, Inc. (genetics and health care services company) (since 2021); Director of Pacific Mutual Holding Company5 (since 2016); Ralph M. Parson Foundation (since 2015); Edison International (since 2011); formerly, Member of the Board of Trustees of California State University system (2015 to 2022); and Kaiser Family Foundation (2012 to 2022) |
| | | | | | |
| Western Asset Intermediate Maturity California Municipals Fund | | | | | 37 | |
Additional information (unaudited) (cont’d)
Information about Trustees and Officers
| | |
| Interested Trustee | | |
| |
| Ronald L. Olson6 | | |
| |
| Year of birth | | 1941 |
| Position(s) with Fund | | Trustee |
| Term of office1 and length of time served2 | | Since 2005 |
| Principal occupation(s) during the past five years | | Partner of Munger, Tolles & Olson LLP (a law partnership) (since 1968) |
| Number of funds in fund complex overseen by Trustee3 | | 50 |
| Other Trusteeships held by Trustee during the past five years | | Director of Provivi, Inc. (since 2017); and Director of Berkshire Hathaway, Inc. (since 1997) |
| | |
| Interested Trustee and Officer | | |
| |
| Jane Trust, CFA7 | | |
| |
| Year of birth | | 1962 |
| Position(s) with Fund | | Trustee, President and Chief Executive Officer |
| Term of office1 and length of time served2 | | Since 2015 |
| Principal occupation(s) during the past five years | | Senior Vice President, Fund Board Management, Franklin Templeton (since 2020); Officer and/or Trustee/Director of 123 funds associated with FTFA or its affiliates (since 2015); President and Chief Executive Officer of FTFA (since 2015); formerly, Senior Managing Director (2018 to 2020) and Managing Director (2016 to 2018) of Legg Mason & Co., LLC (“Legg Mason & Co.”); and Senior Vice President of FTFA (2015) |
| Number of funds in fund complex overseen by Trustee3 | | 123 |
| Other Trusteeships held by Trustee during the past five years | | None |
| | |
| Additional Officers | | |
| |
| Ted P. Becker | | |
| |
| Franklin Templeton | | |
| 280 Park Avenue, 8th Floor, New York, NY 10017 | | |
| Year of birth | | 1951 |
| Position(s) with Fund | | Chief Compliance Officer |
| Term of office1 and length of time served2 | | Since 2007 |
| Principal occupation(s) during the past five years | | Vice President, Global Compliance of Franklin Templeton (since 2020); Chief Compliance Officer of FTFA (since 2006); Chief Compliance Officer of certain funds associated with Legg Mason & Co. or its affiliates (since 2006); formerly, Director of Global Compliance at Legg Mason, Inc. (2006 to 2020); Managing Director of Compliance of Legg Mason & Co. (2005 to 2020) |
| | | | |
| 38 | | | | Western Asset Intermediate Maturity California Municipals Fund |
| | |
| Additional Officers (cont’d) | | |
| |
| Susan Kerr | | |
| |
| Franklin Templeton | | |
| 280 Park Avenue, 8th Floor, New York, NY 10017 | | |
| |
| Year of birth | | 1949 |
| Position(s) with Fund | | Chief Anti-Money Laundering Compliance Officer |
| Term of office1 and length of time served2 | | Since 2013 |
| Principal occupation(s) during the past five years | | Senior Compliance Analyst, Franklin Templeton (since 2020); Chief Anti-Money Laundering Compliance Officer of certain funds associated with Legg Mason & Co. or its affiliates (since 2013) and Anti-Money Laundering Compliance Officer (since 2012), Senior Compliance Officer (since 2011) and Assistant Vice President (since 2010) of Franklin Distributors, LLC; formerly, Assistant Vice President of Legg Mason & Co. (2010 to 2020) |
| |
| Marc A. De Oliveira | | |
| |
| Franklin Templeton | | |
| 100 First Stamford Place, 6th Floor, Stamford, CT 06902 | | |
| |
| Year of birth | | 1971 |
| Position(s) with Fund | | Secretary and Chief Legal Officer |
| Term of office1 and length of time served2 | | Since 2020 |
| Principal occupation(s) during the past five years | | Associate General Counsel of Franklin Templeton (since 2020); Assistant Secretary of certain funds associated with Legg Mason & Co. or its affiliates (since 2006); formerly, Managing Director (2016 to 2020) and Associate General Counsel of Legg Mason & Co. (2005 to 2020) |
| |
| Thomas C. Mandia | | |
| |
| Franklin Templeton | | |
| 100 First Stamford Place, 6th Floor, Stamford, CT 06902 | | |
| |
| Year of birth | | 1962 |
| Position(s) with Fund | | Senior Vice President |
| Term of office1 and length of time served2 | | Since 2020 |
| Principal occupation(s) during the past five years | | Senior Associate General Counsel of Franklin Templeton (since 2020); Secretary of FTFA (since 2006); Assistant Secretary of certain funds associated with Legg Mason & Co. or its affiliates (since 2006); Secretary of LM Asset Services, LLC (“LMAS”) (since 2002) and Legg Mason Fund Asset Management, Inc. (“LMFAM”) (since 2013) (formerly registered investment advisers); formerly, Managing Director and Deputy General Counsel of Legg Mason & Co. (2005 to 2020) |
| | | | | | |
| Western Asset Intermediate Maturity California Municipals Fund | | | | | 39 | |
Additional information (unaudited) (cont’d)
Information about Trustees and Officers
| | |
| Additional Officers (cont’d) | | |
| |
| Christopher Berarducci | | |
| |
| Franklin Templeton | | |
| 280 Park Avenue, 8th Floor, New York, NY 10017 | | |
| |
| Year of birth | | 1974 |
| Position(s) with Fund | | Treasurer and Principal Financial Officer |
| Term of office1 and length of time served2 | | Since 2019 |
| Principal occupation(s) during the past five years | | Vice President, Fund Administration and Reporting, Franklin Templeton (since 2020); Treasurer (since 2010) and Principal Financial Officer (since 2019) of certain funds associated with Legg Mason & Co. or its affiliates; formerly, Managing Director (2020), Director (2015 to 2020), and Vice President (2011 to 2015) of Legg Mason & Co. |
| |
| Jeanne M. Kelly | | |
| |
| Franklin Templeton | | |
| 280 Park Avenue, 8th Floor, New York, NY 10017 | | |
| |
| Year of birth | | 1951 |
| Position(s) with Fund | | Senior Vice President |
| Term of office1 and length of time served2 | | Since 2007 |
| Principal occupation(s) during the past five years | | U.S. Fund Board Team Manager, Franklin Templeton (since 2020); Senior Vice President of certain funds associated with Legg Mason & Co. or its affiliates (since 2007); Senior Vice President of FTFA (since 2006); President and Chief Executive Officer of LMAS and LMFAM (since 2015); formerly, Managing Director of Legg Mason & Co. (2005 to 2020); Senior Vice President of LMFAM (2013 to 2015) |
| | FTFA, referenced above, was formerly known as LMPFA prior to November 30, 2023. |
| † | Trustees who are not “interested persons” of the Fund within the meaning of Section 2(a)(19) of the Investment Company Act of 1940, as amended (the “1940 Act”). |
| 1 | Each Trustee and officer serves until his or her respective successor has been duly elected and qualified or until his or her earlier death, resignation, retirement or removal. |
| 2 | Indicates the earliest year in which the Trustee became a board member for a fund in the Legg Mason fund complex or the officer took such office. |
| 3 | Each board member also serves as a Director of Western Asset Investment Grade Income Fund Inc. and a Trustee of Western Asset Premier Bond Fund (closed-end investment companies), which are considered part of the same fund complex. Additionally, each board member serves as a Trustee of Western Asset Inflation-Linked Income Fund and Western Asset Inflation-Linked Opportunities & Income Fund, closed-end investment companies that are part of the same fund complex. |
| 4 | Mr. Larson is the chief investment officer for William H. Gates III and in that capacity oversees the investments of Mr. Gates and the investments of the Bill and Melinda Gates Foundation Trust (such combined investments are referred to as the “Accounts”). Since 1997, Western Asset has provided discretionary investment advice with respect to one or more Accounts. |
| 5 | Western Asset and its affiliates provide investment advisory services with respect to registered investment companies sponsored by an affiliate of Pacific Mutual Holding Company (“Pacific Holdings”). Affiliates of Pacific Holdings receive compensation from FTFA or its affiliates for shareholder or distribution services provided with respect to registered investment companies for which Western Asset or its affiliates serve as investment adviser. |
| | | | |
| 40 | | | | Western Asset Intermediate Maturity California Municipals Fund |
| 6 | Mr. Olson is an “interested person” of the Fund, as defined in the 1940 Act, because his law firm has provided legal services to Western Asset. |
| 7 | Ms. Trust is an “interested person” of the Fund, as defined in the 1940 Act, because of her position with FTFA and/or certain of its affiliates. |
| | | | | | |
| Western Asset Intermediate Maturity California Municipals Fund | | | | | 41 | |
Important tax information (unaudited)
By mid-February, tax information related to a shareholder’s proportionate share of distributions paid during the preceding calendar year will be received, if applicable. Please also refer to www.franklintempleton.com for per share tax information related to any distributions paid during the preceding calendar year. Shareholders are advised to consult with their tax advisors for further information on the treatment of these amounts on their tax returns.
The following tax information for the Fund is required to be furnished to shareholders with respect to income earned and distributions paid during its fiscal year.
The Fund hereby reports the following amounts, or if subsequently determined to be different, the maximum allowable amounts, for the fiscal year ended November 30, 2023:
| | | | | | | | |
| | | Pursuant to: | | | Amount Reported | |
| Exempt-Interest Dividends Distributed | | § | 852(b)(5)(A) | | | $ | 2,518,863 | |
| Qualified Net Interest Income (QII) | | § | 871(k)(1)(C) | | | $ | 4,626 | |
| Section 163(j) Interest Earned | | § | 163(j) | | | $ | 4,763 | |
| | | | |
| 42 | | | | Western Asset Intermediate Maturity California Municipals Fund |
Western Asset
Intermediate Maturity California Municipals Fund
Trustees
Robert Abeles, Jr.
Jane F. Dasher
Anita L. DeFrantz
Susan B. Kerley
Michael Larson
Ronald L. Olson
Avedick B. Poladian
William E.B. Siart
Chairman
Jaynie M. Studenmund
Peter J. Taylor
Jane Trust
Investment manager
Franklin Templeton Fund Adviser, LLC*
Subadviser
Western Asset Management Company, LLC
Distributor
Franklin Distributors, LLC
Custodian
The Bank of New York Mellon
| * | Formerly known as Legg Mason Partners Fund Advisor, LLC. |
Transfer agent
Franklin Templeton Investor Services, LLC
3344 Quality Drive
Rancho Cordova, CA 95670-7313
Independent registered public accounting firm
PricewaterhouseCoopers LLP Baltimore, MD
Western Asset Intermediate Maturity California Municipals Fund
The Fund is a separate investment series of Legg Mason Partners Income Trust, a Maryland statutory trust.
Western Asset Intermediate Maturity California Municipals Fund
Legg Mason Funds
620 Eighth Avenue, 47th Floor
New York, NY 10018
The Fund files its complete schedule of portfolio holdings with the Securities and Exchange Commission (“SEC”) for the first and third quarters of each fiscal year as an exhibit to its reports on Form N-PORT. The Fund’s Forms N-PORT are available on the SEC’s website at www.sec.gov. To obtain information on Form N-PORT, shareholders can call the Fund at 877-6LM-FUND/656-3863.
Information on how the Fund voted proxies relating to portfolio securities during the prior 12-month period ended June 30th of each year and a description of the policies and procedures that the Fund uses to determine how to vote proxies related to portfolio transactions are available (1) without charge, upon request, by calling the Fund at 877-6LM-FUND/656-3863, (2) at www.franklintempleton.com and (3) on the SEC’s website at www.sec.gov.
This report is submitted for the general information of the shareholders of Western Asset Intermediate Maturity California Municipals Fund. This report is not authorized for distribution to prospective investors in the Fund unless preceded or accompanied by a current prospectus.
Investors should consider the Fund’s investment objectives, risks, charges and expenses carefully before investing. The prospectus contains this and other important information about the Fund. Please read the prospectus carefully before investing.
www.franklintempleton.com
© 2024 Franklin Distributors, LLC,
Member FINRA/SIPC. All rights reserved.
Legg Mason Funds Privacy and Security Notice
Your Privacy Is Our Priority
Franklin Templeton* is committed to safeguarding your personal information. This notice is designed to provide you with a summary of the non-public personal information Franklin Templeton may collect and maintain about current or former individual investors; our policy regarding the use of that information; and the measures we take to safeguard the information. We do not sell individual investors’ non-public personal information to anyone and only share it as described in this notice.
Information We Collect
When you invest with us, you provide us with your non-public personal information. We collect and use this information to service your accounts and respond to your requests. The non-public personal information we may collect falls into the following categories:
| • | | Information we receive from you or your financial intermediary on applications or other forms, whether we receive the form in writing or electronically. For example, this information may include your name, address, tax identification number, birth date, investment selection, beneficiary information, and your personal bank account information and/or email address if you have provided that information. |
| • | | Information about your transactions and account history with us, or with other companies that are part of Franklin Templeton, including transactions you request on our website or in our app. This category also includes your communications to us concerning your investments. |
| • | | Information we receive from third parties (for example, to update your address if you move, obtain or verify your email address or obtain additional information to verify your identity). |
| • | | Information collected from you online, such as your IP address or device ID and data gathered from your browsing activity and location. (For example, we may use cookies to collect device and browser information so our website recognizes your online preferences and device information.) Our website contains more information about cookies and similar technologies and ways you may limit them. |
| • | | Other general information that we may obtain about you such as demographic information. |
Disclosure Policy
To better service your accounts and process transactions or services you requested, we may share non-public personal information with other Franklin Templeton companies. From time to time we may also send you information about products/services offered by other Franklin Templeton companies although we will not share your non-public personal information with these companies without first offering you the opportunity to prevent that sharing.
We will only share non-public personal information with outside parties in the limited circumstances permitted by law. For example, this includes situations where we need to share information with companies who work on our behalf to service or maintain your account or process transactions you requested, when the disclosure is to companies assisting us with our own marketing efforts, when the disclosure is to a party representing you, or when required by law (for example, in response to legal process). Additionally, we will ensure that any outside
|
| NOT PART OF THE ANNUAL REPORT |
Legg Mason Funds Privacy and Security Notice (cont’d)
companies working on our behalf, or with whom we have joint marketing agreements, are under contractual obligations to protect the confidentiality of your information, and to use it only to provide the services we asked them to perform.
Confidentiality and Security
Our employees are required to follow procedures with respect to maintaining the confidentiality of our investors’ non-public personal information. Additionally, we maintain physical, electronic and procedural safeguards to protect the information. This includes performing ongoing evaluations of our systems containing investor information and making changes when appropriate.
At all times, you may view our current privacy notice on our website at franklintempleton.com or contact us for a copy at (800) 632-2301.
*For purposes of this privacy notice Franklin Templeton shall refer to the following entities:
Fiduciary Trust International of the South (FTIOS), as custodian for individual retirement plans
Franklin Advisers, Inc.
Franklin Distributors, LLC, including as program manager of the Franklin Templeton 529 College Savings Plan and the NJBEST 529 College Savings Plan
Franklin Mutual Advisers, LLC
Franklin, Templeton and Mutual Series Funds
Franklin Templeton Institutional, LLC
Franklin Templeton Investments Corp., Canada
Franklin Templeton Investments Management, Limited UK
Franklin Templeton Portfolio Advisors, Inc.
Legg Mason Funds serviced by Franklin Templeton Investor Services, LLC
Templeton Asset Management, Limited
Templeton Global Advisors, Limited
Templeton Investment Counsel, LLC
If you are a customer of other Franklin Templeton affiliates and you receive notices from them, you will need to read those notices separately.
|
| NOT PART OF THE ANNUAL REPORT |
www.franklintempleton.com
© 2024 Franklin Distributors, LLC, Member FINRA/SIPC. All rights reserved.
FD0310 1/24 SR23-4791
The registrant has adopted a code of ethics that applies to the registrant’s principal executive officer, principal financial officer, principal accounting officer or controller.
| ITEM 3. | AUDIT COMMITTEE FINANCIAL EXPERT. |
The Board of Trustees of the registrant has determined that Robert Abeles, Jr., possess the technical attributes identified in Instruction 2(b) of Item 3 to Form N-CSR to qualify an “audit committee financial experts,” and has designated Mr. Abeles, Jr. as the Audit Committee’s financial experts. Mr. Abeles, Jr. is an “independent” Trustees pursuant to paragraph (a) (2) of Item 3 to Form N-CSR.
| ITEM 4. | PRINCIPAL ACCOUNTANT FEES AND SERVICES. |
a) Audit-Related Fees. The aggregate fees billed in the last two fiscal years ending November 30, 2022 and November 30, 2023 (the “Reporting Periods”) for professional services rendered by the Registrant’s principal accountant (the “Auditor”) for the audit of the Registrant’s annual financial statements, or services that are normally provided by the Auditor in connection with the statutory and regulatory filings or engagements for the Reporting Periods, were $88,168 in November 30, 2022 and $88,168 in November 30, 2023.
b) Audit-Related Fees. The aggregate fees billed in the Reporting Period for assurance and related services by the Auditor that are reasonably related to the performance of the Registrant’s financial statements were $0 in November 30, 2022 and $0 in November 30, 2023.
(c) Tax Fees. The aggregate fees billed in the Reporting Periods for professional services rendered by the Auditor for tax compliance, tax advice and tax planning (“Tax Services”) were $29,250 in November 30, 2022 and $29,250 in November 30, 2023. These services consisted of (i) review or preparation of U.S. federal, state, local and excise tax returns; (ii) U.S. federal, state and local tax planning, advice and assistance regarding statutory, regulatory or administrative developments, and (iii) tax advice regarding tax qualification matters and/or treatment of various financial instruments held or proposed to be acquired or held.
There were no fees billed for tax services by the Auditors to service affiliates during the Reporting Periods that required pre-approval by the Audit Committee.
d) All Other Fees. The aggregate fees billed in the Reporting Periods for products and services provided by the Auditor, other than the services reported in paragraphs (a) through (c) for the Item 4 for the Legg Mason Partners Income Trust, were $0 in November 30, 2022 and $0 in November 30, 2023.
All Other Fees. There were no other non-audit services rendered by the Auditor to Legg Mason Partners Fund Advisors, LLC (“LMPFA”), and any entity controlling, controlled by or under common control with LMPFA that provided ongoing services to Legg Mason Partners Income Trust requiring pre-approval by the Audit Committee in the Reporting Period.
(e) Audit Committee’s pre–approval policies and procedures described in paragraph (c) (7) of Rule 2-01 of Regulation S-X.
(1) The Charter for the Audit Committee (the “Committee”) of the Board of each registered investment company (the “Fund”) advised by LMPFA or one of their affiliates (each, an “Adviser”) requires that the Committee shall approve (a) all audit and permissible non-audit services to be provided to the Fund and (b) all permissible non-audit services to be provided by the Fund’s independent auditors to the Adviser and any Covered Service Providers if the engagement relates directly to the operations and financial reporting of the Fund. The
Committee may implement policies and procedures by which such services are approved other than by the full Committee.
The Committee shall not approve non-audit services that the Committee believes may impair the independence of the auditors. As of the date of the approval of this Audit Committee Charter, permissible non-audit services include any professional services (including tax services), that are not prohibited services as described below, provided to the Fund by the independent auditors, other than those provided to the Fund in connection with an audit or a review of the financial statements of the Fund. Permissible non-audit services may not include: (i) bookkeeping or other services related to the accounting records or financial statements of the Fund; (ii) financial information systems design and implementation; (iii) appraisal or valuation services, fairness opinions or contribution-in-kind reports; (iv) actuarial services; (v) internal audit outsourcing services; (vi) management functions or human resources; (vii) broker or dealer, investment adviser or investment banking services; (viii) legal services and expert services unrelated to the audit; and (ix) any other service the Public Company Accounting Oversight Board determines, by regulation, is impermissible.
Pre-approval by the Committee of any permissible non-audit services is not required so long as: (i) the aggregate amount of all such permissible non-audit services provided to the Fund, the Adviser and any service providers controlling, controlled by or under common control with the Adviser that provide ongoing services to the Fund (“Covered Service Providers”) constitutes not more than 5% of the total amount of revenues paid to the independent auditors during the fiscal year in which the permissible non-audit services are provided to (a) the Fund, (b) the Adviser and (c) any entity controlling, controlled by or under common control with the Adviser that provides ongoing services to the Fund during the fiscal year in which the services are provided that would have to be approved by the Committee; (ii) the permissible non-audit services were not recognized by the Fund at the time of the engagement to be non-audit services; and (iii) such services are promptly brought to the attention of the Committee and approved by the Committee (or its delegate(s)) prior to the completion of the audit.
(2) None of the services described in paragraphs (b) through (d) of this Item were performed in reliance on paragraph (c)(7)(i)(C) of Rule 2-01 of Regulation S-X.
(f) Not applicable.
(g) Non-audit fees billed by the Auditor for services rendered to Legg Mason Partners Income Trust, LMPFA and any entity controlling, controlled by, or under common control with LMPFA that provides ongoing services to Legg Mason Partners Income Trust during the reporting period were $350,359 in November 30, 2022 and $342,635 in November 30, 2023.
(h) Yes. Legg Mason Partners Income Trust’s Audit Committee has considered whether the provision of non-audit services that were rendered to Service Affiliates, which were not pre-approved (not requiring pre-approval), is compatible with maintaining the Accountant’s independence. All services provided by the Auditor to the Legg Mason Partners Income Trust or to Service Affiliates, which were required to be pre-approved, were pre-approved as required.
(i) Not applicable.
(j) Not applicable.
| ITEM 5. | AUDIT COMMITTEE OF LISTED REGISTRANTS. |
| | a) | The independent board members are acting as the registrant’s audit committee as specified in Section 3(a)(58)(B) of the Exchange Act. The Audit Committee consists of the following Board members: |
Robert Abeles, Jr.
Jane F. Dasher
Anita L. DeFrantz
Susan B. Kerley
Michael Larson
Avedick B. Poladian
William E.B. Siart
Jaynie M. Studenmund
Peter J. Taylor
| ITEM 6. | SCHEDULE OF INVESTMENTS. |
Included herein under Item 1.
| ITEM 7. | DISCLOSURE OF PROXY VOTING POLICIES AND PROCEDURES FOR CLOSED-END MANAGEMENT INVESTMENT COMPANIES. |
Not applicable.
| ITEM 8. | PORTFOLIO MANAGERS OF CLOSED-END MANAGEMENT INVESTMENT COMPANIES. |
Not applicable.
| ITEM 9. | PURCHASES OF EQUITY SECURITIES BY CLOSED-END MANAGEMENT INVESTMENT COMPANY AND AFFILIATED PURCHASERS. |
Not applicable.
| ITEM 10. | SUBMISSION OF MATTERS TO A VOTE OF SECURITY HOLDERS. |
Not applicable.
| ITEM 11. | CONTROLS AND PROCEDURES. |
| | (a) | The registrant’s principal executive officer and principal financial officer have concluded that the registrant’s disclosure controls and procedures (as defined in Rule 30a- 3(c) under the Investment Company Act of 1940, as amended (the “1940 Act”)) are effective as of a date within 90 days of the filing date of this report that includes the disclosure required by this paragraph, based on their evaluation of the disclosure controls and procedures required by Rule 30a-3(b) under the 1940 Act and 15d-15(b) under the Securities Exchange Act of 1934. |
| | (b) | There were no changes in the registrant’s internal control over financial reporting (as defined in Rule 30a-3(d) under the 1940 Act) that occurred during the period covered by this report that have materially affected, or are likely to materially affect the registrant’s internal control over financial reporting. |
| ITEM 12. | DISCLOSURE OF SECURITIES LENDING ACTIVITIES FOR CLOSED-END MANAGEMENT INVESTMENT COMPANIES. |
Not applicable.
| ITEM 13. | RECOVERY OF ERRONEOUSLY AWARDED COMPENSATION. |
(a) (1) Code of Ethics attached hereto.
Exhibit 99.CODE ETH
(a) (2) Certifications pursuant to section 302 of the Sarbanes-Oxley Act of 2002 attached hereto.
Exhibit 99.CERT
(b) Certifications pursuant to Section 906 of the Sarbanes-Oxley Act of 2002 attached hereto.
Exhibit 99.906CERT
SIGNATURES
Pursuant to the requirements of the Securities Exchange Act of 1934 and the Investment Company Act of 1940, the registrant has duly caused this Report to be signed on its behalf by the undersigned, there unto duly authorized.
Legg Mason Partners Income Trust
| | |
| By: | | /s/ Jane Trust |
| | Jane Trust |
| | Chief Executive Officer |
| |
| Date: | | January 26, 2024 |
Pursuant to the requirements of the Securities Exchange Act of 1934 and the Investment Company Act of 1940, this report has been signed below by the following persons on behalf of the registrant and in the capacities and on the dates indicated.
| | |
| By: | | /s/ Jane Trust |
| | Jane Trust |
| | Chief Executive Officer |
| |
| Date: | | January 26, 2024 |
| |
| By: | | /s/ Christopher Berarducci |
| | Christopher Berarducci |
| | Principal Financial Officer |
| |
| Date: | | January 26, 2024 |