UNITED STATES
SECURITIES AND EXCHANGE COMMISSION
Washington, D.C. 20549
FORM N-CSR
CERTIFIED SHAREHOLDER REPORT OF REGISTERED
MANAGEMENT INVESTMENT COMPANIES
Investment Company Act file number 811-04254
Legg Mason Partners Income Trust
(Exact name of registrant as specified in charter)
620 Eighth Avenue, 47th Floor, New York, NY 10018
(Address of principal executive offices) (Zip code)
Marc A. De Oliveira
Franklin Templeton
100 First Stamford Place
Stamford, CT 06902
(Name and address of agent for service)
Registrant’s telephone number, including area code: 877-6LM-FUND/656-3863
Date of fiscal year end: December 31
Date of reporting period: December 31, 2023
| ITEM 1. | REPORT TO STOCKHOLDERS. |
The Annual Report to Stockholders is filed herewith.

| | |
| Annual Report | | December 31, 2023 |
WESTERN ASSET
MORTGAGE TOTAL
RETURN FUND
The Securities and Exchange Commission has adopted new regulations that will result in changes to the design and delivery of annual and semi-annual shareholder reports beginning in July 2024.
If you have previously elected to receive shareholder reports electronically, you will continue to do so and need not take any action.
Otherwise, paper copies of the Fund’s shareholder reports will be mailed to you beginning in July 2024. If you would like to receive shareholder reports and other communications from the Fund electronically instead of by mail, you may make that request at any time by contacting your financial intermediary (such as a broker-dealer or bank) or, if you are a direct investor, enrolling at franklintempleton.com.
You may access franklintempleton.com by scanning the code below.


|
| INVESTMENT PRODUCTS: NOT FDIC INSURED • NO BANK GUARANTEE • MAY LOSE VALUE |
Fund objective
The Fund seeks high current return.
Letter from the president

Dear Shareholder,
We are pleased to provide the annual report of Western Asset Mortgage Total Return Fund for the twelve-month reporting period ended December 31, 2023. Please read on for a detailed look at prevailing economic and market conditions during the Fund’s reporting period and to learn how those conditions have affected Fund performance.
As always, we remain committed to providing you with excellent service and a full spectrum of investment choices. We also remain committed to supplementing the support you receive from your financial advisor. One way we accomplish this is through our website, www.franklintempleton.com. Here you can gain immediate access to market and investment information, including:
| • | | Fund prices and performance, |
| • | | Market insights and commentaries from our portfolio managers, and |
| • | | A host of educational resources. |
We look forward to helping you meet your financial goals.
Sincerely,

Jane Trust, CFA
President and Chief Executive Officer
January 31, 2024
| | |
| II | | Western Asset Mortgage Total Return Fund |
Fund overview
Q. What is the Fund’s investment strategy?
A. The Fund seeks high current return. Under normal circumstances, the Fund invests at least 80% of its assets in mortgage-backed securities (“MBS”). MBS may be issued by U.S. government-sponsored entities such as the Federal National Mortgage Association (“Fannie Mae”) or the Federal Home Loan Mortgage Corporation (“Freddie Mac”) and by agencies of the U.S. government, such as the Government National Mortgage Association (“Ginnie Mae”). MBS represent direct or indirect participations in, or are collateralized by and payable from, mortgage loans secured by real property. These securities may or may not be backed by the full faith and credit of the U.S. government. Even when the U.S. government guarantees principal and interest payments on securities, this guarantee does not apply to losses resulting from declines in the market value of these securities. The Fund may invest in government stripped MBS and other stripped securities. The Fund may invest in securities of any maturity or duration, and the securities may have fixed, floating or variable rates. The Fund may enter into dollar rolls (sometimes referred to as mortgage dollar rolls).
The Fund will not invest more than 25% of its assets in MBS that are not issued or guaranteed by, or comprised of MBS issued or guaranteed by, a U.S. government agency or U.S. government-sponsored entity.
The Fund focuses on securities rated investment grade (that is securities rated in the Baa/ BBB categories or above, or, if unrated, securities that we determined to be of comparable credit quality). The Fund may invest up to 20% of its assets in securities rated below investment grade, or, if unrated, securities that we determined to be below investment grade.
Instead of, and/or in addition to, investing directly in particular securities, the Fund may use instruments such as derivatives, including options, swaps, interest rate swaps, futures contracts, and other synthetic instruments that are intended to provide economic exposure to the securities or the issuer or to be used as a hedging technique. The Fund may use one or more types of these instruments without limit. These instruments are taken into account when determining compliance with the Fund’s 80% policy. The Fund may also engage in a variety of transactions using derivatives in order to change the investment characteristics of its portfolio (such as shortening or lengthening duration) and for other purposes.
At Western Asset Management Company, LLC (“Western Asset”), the Fund’s subadviser, we utilize a fixed income team approach, with decisions derived from interaction among various investment management sector specialists. The sector teams are comprised of Western Asset’s senior portfolio management personnel, research analysts and an in-house economist. Under this team approach, management of client fixed income portfolios will reflect a consensus of interdisciplinary views within the Western Asset organization.
Q. What were the overall market conditions during the Fund’s reporting period?
A. The U.S. fixed income market experienced periods of elevated volatility, but ultimately generated solid results in 2023. The market moved higher over the first quarter of the
| | | | | | |
Western Asset Mortgage Total Return Fund 2023 Annual Report | | | | | 1 | |
Fund overview (cont’d)
reporting period amid shifting expectations for Federal Reserve Board (the “Fed”) rate hikes. Turmoil in the regional banking industry also triggered a flight to quality assets. Those market gains were then erased during the second and third quarters of 2023, as persistent inflation led to expectations of a “higher for longer” interest rate environment. The market ended the year on a positive note, as the Fed indicated it would likely pivot from raising rates to cutting rates in 2024. Moderating inflation and hopes that the central bank could orchestrate a “soft landing” for the economy also supported the market.
Short-term U.S. Treasury yields declined as inflation fell and the Fed indicated the likely end of its rate hike cycle. The yield for the two-year Treasury note began the reporting period at 4.41% and ended the period at 4.23%. The low of 3.75% was on May 4, 2023, and the peak of 5.19% occurred on October 17 and 18, 2023. The yield for the ten-year Treasury note began and ended the reporting period at 3.88%. The low of 3.30% was on April 5 and 6, 2023, and the peak of 4.98% occurred on October 19, 2023.
The overall agency residential MBS market posted a positive return during the reporting period. During the twelve months ended December 31, 2023, the overall agency MBS market, as measured by the Bloomberg U.S. Mortgage-Backed Securities Index (the “Index”)i, returned 5.05%. Bloomberg Agency Commercial Mortgage-Backed Securities (“CMBS”) Indexii returned 5.37%. Within non-agency residential mortgage-backed securities (“NARMBS”), Credit Risk Transfer (“CRT”) and Residential MBS sectors returned 17.31% and 6.79%, respectively, according to J.P. Morgan. Lastly, the non-agency CMBS sector, as measured by Bloomberg Non-Agency CMBS Indexiii, returned 5.47%.
Q. How did we respond to these changing market conditions?
A. We remain focused on portfolio construction with underweights to lower coupons in agency MBS versus overweights to higher coupons and an emphasis on security selection. We were constructive on the investment prospects for agency MBS, while actively repositioning across sub-sectors, coupons and collateral selection. In addition, we continued to hold non-benchmark allocations across agency collateralized mortgage obligations (“CMOs”), CMBS and high-quality non-agency sectors for portfolio diversification and better yield opportunities relative to low coupon generic agency MBS, which make up a significant portion in the Index.
During the reporting period, we utilized Treasury futures and options and SOFR futures to manage the Fund’s duration and yield curve exposure. In aggregate, these derivatives detracted from performance.
Performance review
For the twelve months ended December 31, 2023, Class A shares of Western Asset Mortgage Total Return Fund, excluding sales charges, returned 3.88%. The Fund’s unmanaged benchmark, the Bloomberg U.S. Mortgage-Backed Securities Index, returned 5.05% for the same period.
| | | | |
| 2 | | | | Western Asset Mortgage Total Return Fund 2023 Annual Report |
| | | | | | | | |
Performance Snapshot as of December 31, 2023
(unaudited) | |
| (excluding sales charges) | | 6 months | | | 12 months | |
| Western Asset Mortgage Total Return Fund: | | | | | | | | |
Class 11 | | | 2.81 | % | | | 4.15 | % |
Class A | | | 2.68 | % | | | 3.88 | % |
Class C | | | 2.34 | % | | | 3.19 | % |
Class C12 | | | 2.35 | %3 | | | 3.05 | %3 |
Class I | | | 2.84 | % | | | 4.20 | % |
Class IS | | | 2.88 | % | | | 4.30 | % |
| Bloomberg U.S. Mortgage-Backed Securities Index | | | 3.12 | % | | | 5.05 | % |
The performance shown represents past performance. Past performance is no guarantee of future results and current performance may be higher or lower than the performance shown above. Principal value, investment returns and yields will fluctuate and investors’ shares, when redeemed, may be worth more or less than their original cost. To obtain performance data current to the most recent month-end, please visit our website at www.franklintempleton.com.
All share class returns assume the reinvestment of all distributions at net asset value and the deduction of all Fund expenses. Returns have not been adjusted to include sales charges that may apply or the deduction of taxes that a shareholder would pay on Fund distributions. If sales charges were reflected, the performance quoted would be lower. Performance figures for periods shorter than one year represent cumulative figures and are not annualized.
The 30-Day SEC Yields for the period ended December 31, 2023 for Class 1, Class A, Class C, Class C1, Class I and Class IS shares were 4.38%, 3.98%, 3.52%, 3.31%, 4.51% and 4.50%, respectively. The 30-Day SEC Yield, calculated pursuant to the standard SEC formula, is based on the Fund’s investments over an annualized trailing 30-day period, and not on the distributions paid by the Fund, which may differ.
|
| Total Annual Operating Expenses (unaudited) |
As of the Fund’s current prospectus dated May 1, 2023, the gross total annual fund operating expense ratios for Class 1, Class A, Class C, Class C1, Class I and Class IS shares were 0.69%, 0.95%, 1.62%, 2.60%, 0.65% and 0.56%, respectively.
Actual expenses may be higher. For example, expenses may be higher than those shown if average net assets decrease. Net assets are more likely to decrease and Fund expense ratios are more likely to increase when markets are volatile.
| 1 | Class 1 shares of the Fund are closed to all new purchases and incoming exchanges. Investors owning Class 1 shares may continue to maintain their then-current Class 1 shares, but are no longer permitted to add to their Class 1 share positions (excluding reinvestment of dividends and distributions). |
| 2 | Class C1 shares are not available for purchase by new or existing investors (except for certain retirement plan programs authorized by the Fund’s distributor). Class C1 shares continue to be available for dividend reinvestment and incoming exchanges. |
| 3 | Total return information is based on net asset values calculated for shareholder transactions. Certain adjustments were made to the prior year net assets of the Fund at December 31, 2022 for financial reporting purposes. Accordingly, adjusted total returns have been disclosed in the Financial Highlights and differ from those reported here. |
| | | | | | |
Western Asset Mortgage Total Return Fund 2023 Annual Report | | | | | 3 | |
Fund overview (cont’d)
As a result of expense limitation arrangements, the ratio of total annual fund operating expenses, other than interest, brokerage, taxes, extraordinary expenses and acquired fund fees and expenses, to average net assets will not exceed 1.75% for Class C shares, 1.75% for Class C1 shares, 0.70% for Class I shares and 0.60% for Class IS shares. In addition, the ratio of total annual fund operating expenses for Class 1 shares will not exceed the ratio of total annual fund operating expenses for Class A shares and the ratio of total annual fund operating expenses for Class IS shares will not exceed the ratio of total annual fund operating expenses for Class I shares. These expense limitation arrangements cannot be terminated prior to December 31, 2025 without the Board of Trustees’ consent. In addition, the manager has agreed to waive the Fund’s management fee to an extent sufficient to offset the net management fee payable in connection with any investment in an affiliated money market fund. This management fee waiver is not subject to the recapture provision discussed below.
The manager is permitted to recapture amounts waived and/or reimbursed to a class within two years after the fiscal year in which the manager earned the fee or incurred the expense if the class’ total annual fund operating expenses have fallen to a level below the expense limitation (“expense cap”) in effect at the time the fees were earned or the expenses incurred. In no case will the manager recapture any amount that would result, on any particular business day of the Fund, in the class’ total annual fund operating expenses exceeding the expense cap or any other lower limit then in effect.
Q. What were the leading contributors to performance?
A. The Fund’s allocation to NARMBS was the largest contributor to relative performance during the reporting period, as CRT and legacy NARMBS outperformed agency MBS. Agency CMOs were the second largest contributor to returns during the reporting period. We continued to maintain an allocation to non-benchmark asset-backed securities (“ABS”) in the portfolio.
Q. What were the leading detractors from performance?
A. Duration was the largest detractor from performance during the reporting period, particularly an overweight positioning to the 20-year duration relative to the benchmark. In addition, exposure to Single-Asset Single-Borrower CMBS positions detracted from performance.
Thank you for your investment in the Western Asset Mortgage Total Return Fund. As always, we appreciate that you have chosen us to manage your assets and we remain focused on achieving the Fund’s investment goals.
Sincerely,
Western Asset Management Company, LLC
January 25, 2024
| | | | |
| 4 | | | | Western Asset Mortgage Total Return Fund 2023 Annual Report |
RISKS: Fixed income securities are subject to interest rate, credit and market risks. As interest rates rise, bond prices fall, reducing the value of the Fund’s share price. To the extent that the Fund invests in asset-backed, mortgage-backed or mortgage-related securities, its exposure to prepayment and extension risks may be greater than investments in other fixed income securities. High yield (“junk”) bonds are generally subject to greater credit risks than higher-grade bonds. The U.S. government guarantee of principal and interest payments applies only to underlying securities in the Fund’s portfolio, not the Fund’s shares. Please note that the Fund’s shares are not guaranteed by the U.S. government or its agencies. The Fund may use derivatives, such as options and futures, which can be illiquid, may disproportionately increase losses, and have a potentially large impact on Fund performance. The use of leverage may increase volatility and possibility of loss. The market values of securities or other assets will fluctuate, sometimes sharply and unpredictably, due to changes in general market conditions, overall economic trends or events, governmental actions or intervention, actions taken by the U.S. Federal Reserve or foreign central banks, market disruptions caused by trade disputes or other factors, political developments, armed conflicts, economic sanctions and countermeasures in response to sanctions, major cybersecurity events, investor sentiment, the global and domestic effects of a pandemic, and other factors that may or may not be related to the issuer of the security or other asset. Please see the Fund’s prospectus for a more complete discussion of these and other risks and the Fund’s investment strategies.
The mention of sector breakdowns is for informational purposes only and should not be construed as a recommendation to purchase or sell any securities. The information provided regarding such sectors is not a sufficient basis upon which to make an investment decision. Investors seeking financial advice regarding the appropriateness of investing in any securities or investment strategies discussed should consult their financial professional. Portfolio holdings are subject to change at any time and may not be representative of the portfolio managers’ current or future investments. The Fund’s top four sector holdings (as a percentage of net assets) as of December 31, 2023 were: mortgage-backed securities (52.2%), collateralized mortgage obligations (51.0%), asset-backed securities (10.1%) and convertible bonds & notes (0.3%). The Fund’s portfolio composition is subject to change at any time.
All investments are subject to risk including the possible loss of principal. Past performance is no guarantee of future results. All index performance reflects no deduction for fees, expenses or taxes. Please note that an investor cannot invest directly in an index.
The information provided is not intended to be a forecast of future events, a guarantee of future results or investment advice. Views expressed may differ from those of the firm as a whole.
| i | The Bloomberg U.S. Mortgage-Backed Securities Index tracks the performance of fixed-rate agency mortgage-backed pass-through securities guaranteed by the Government National Mortgage Association, Federal National Mortgage Association and Federal Home Loan Mortgage Corporation. |
| ii | The Bloomberg Agency Commercial Mortgage-Backed Securities (“CMBS”) Index is a fixed-rate, investment-grade benchmark that tracks the market for multi-family CMBS debt issued by U.S. government agencies, Freddie Mac and Fannie Mae. |
| iii | The Bloomberg Non-Agency CMBS Index is made up of fixed-rate, publicly issued, U.S. dollar-denominated, non-agency collateralized mortgage-backed securities (CMBS). The Index only holds securities with a remaining weighted average life of less than five years. |
| | | | | | |
Western Asset Mortgage Total Return Fund 2023 Annual Report | | | | | 5 | |
Fund at a glance† (unaudited)
Investment breakdown (%) as a percent of total investments
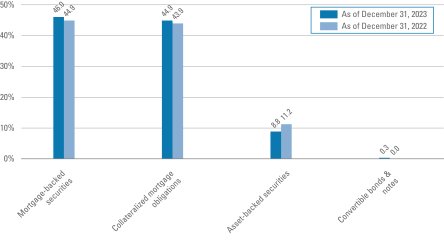
| † | The bar graph above represents the composition of the Fund’s investments as of December 31, 2023 and December 31, 2022 and does not include derivatives, such as futures contracts. The Fund is actively managed. As a result, the composition of the Fund’s investments is subject to change at any time. |
| | | | |
| 6 | | | | Western Asset Mortgage Total Return Fund 2023 Annual Report |
Fund expenses (unaudited)
Example
As a shareholder of the Fund, you may incur two types of costs: (1) transaction costs, including front-end and back-end sales charges (loads) on purchase payments; and (2) ongoing costs, including management fees; service and/or distribution (12b-1) fees; and other Fund expenses. This example is intended to help you understand your ongoing costs (in dollars) of investing in the Fund and to compare these costs with the ongoing costs of investing in other mutual funds.
This example is based on an investment of $1,000 invested on July 1, 2023 and held for the six months ended December 31, 2023.
Actual expenses
The table below titled “Based on actual total return” provides information about actual account values and actual expenses. You may use the information provided in this table, together with the amount you invested, to estimate the expenses that you paid over the period. To estimate the expenses you paid on your account, divide your ending account value by $1,000 (for example, an $8,600 ending account value divided by $1,000 = 8.6), then multiply the result by the number under the heading entitled “Expenses Paid During the Period”.
Hypothetical example for comparison purposes
The table below titled “Based on hypothetical total return” provides information about hypothetical account values and hypothetical expenses based on the actual expense ratio and an assumed rate of return of 5.00% per year before expenses, which is not the Fund’s actual return. The hypothetical account values and expenses may not be used to estimate the actual ending account balance or expenses you paid for the period. You may use the information provided in this table to compare the ongoing costs of investing in the Fund and other funds. To do so, compare the 5.00% hypothetical example relating to the Fund with the 5.00% hypothetical examples that appear in the shareholder reports of the other funds.
Please note that the expenses shown in the table below are meant to highlight your ongoing costs only and do not reflect any transactional costs, such as front-end or back-end sales charges (loads). Therefore, the table is useful in comparing ongoing costs only, and will not help you determine the relative total costs of owning different funds. In addition, if these transaction costs were included, your costs would have been higher.
| | | | | | | | | | | | | | | | | | | | | | | | | | | | | | | | | | | | | | | | | | | | | | |
| | | |
| Based on actual total return1 | | | | | | | | | Based on hypothetical total return1 | |
| | | Actual Total Return Without Sales Charge2 | | | Beginning Account Value | | | Ending Account Value | | | Annualized Expense Ratio | | | Expenses Paid During the Period3 | | | | | | | | Hypothetical Annualized Total Return | | | Beginning Account Value | | | Ending Account Value | | | Annualized Expense Ratio | | | Expenses Paid During the Period3 | |
| Class 1 | | | 2.81 | % | | $ | 1,000.00 | | | $ | 1,028.10 | | | | 0.71 | % | | $ | 3.63 | | | | | | | Class 1 | | | 5.00 | % | | $ | 1,000.00 | | | $ | 1,021.63 | | | | 0.71 | % | | $ | 3.62 | |
| Class A | | | 2.68 | | | | 1,000.00 | | | | 1,026.80 | | | | 0.96 | | | | 4.90 | | | | | | | Class A | | | 5.00 | | | | 1,000.00 | | | | 1,020.37 | | | | 0.96 | | | | 4.89 | |
| Class C | | | 2.34 | | | | 1,000.00 | | | | 1,023.40 | | | | 1.64 | | | | 8.36 | | | | | | | Class C | | | 5.00 | | | | 1,000.00 | | | | 1,016.94 | | | | 1.64 | | | | 8.34 | |
| Class C1 | | | 2.35 | | | | 1,000.00 | | | | 1,023.50 | | | | 1.75 | | | | 8.93 | | | | | | | Class C1 | | | 5.00 | | | | 1,000.00 | | | | 1,016.38 | | | | 1.75 | | | | 8.89 | |
| Class I | | | 2.84 | | | | 1,000.00 | | | | 1,028.40 | | | | 0.66 | | | | 3.37 | | | | | | | Class I | | | 5.00 | | | | 1,000.00 | | | | 1,021.88 | | | | 0.66 | | | | 3.36 | |
| Class IS | | | 2.88 | | | | 1,000.00 | | | | 1,028.80 | | | | 0.56 | | | | 2.86 | | | | | | | Class IS | | | 5.00 | | | | 1,000.00 | | | | 1,022.38 | | | | 0.56 | | | | 2.85 | |
| | | | | | |
Western Asset Mortgage Total Return Fund 2023 Annual Report | | | | | 7 | |
Fund expenses (unaudited) (cont’d)
| 1 | For the six months ended December 31, 2023. |
| 2 | Assumes the reinvestment of all distributions, including returns of capital, if any, at net asset value and does not reflect the deduction of the applicable sales charge with respect to Class A shares or the applicable contingent deferred sales charge (“CDSC”) with respect to Class C shares and Class C1 shares. Total return is not annualized, as it may not be representative of the total return for the year. Performance figures may reflect compensating balance arrangements, fee waivers and/or expense reimbursements. In the absence of compensating balance arrangements, fee waivers and/or expense reimbursements, the total return would have been lower. Past performance is no guarantee of future results. |
| 3 | Expenses (net of compensating balance arrangements, fee waivers and/or expense reimbursements) are equal to each class’ respective annualized expense ratio multiplied by the average account value over the period, multiplied by the number of days in the most recent fiscal half-year (184), then divided by 365. |
| | | | |
| 8 | | | | Western Asset Mortgage Total Return Fund 2023 Annual Report |
Fund performance (unaudited)
| | | | | | | | | | | | | | | | | | | | | | | | |
| Average annual total returns | | | | | | | | | | | | | | | | | | |
| Without sales charges1 | | Class 1 | | | Class A | | | Class C | | | Class C12 | | | Class I | | | Class IS | |
| Twelve Months Ended 12/31/23 | | | 4.15 | % | | | 3.88 | % | | | 3.19 | % | | | 3.05 | %3 | | | 4.20 | % | | | 4.30 | % |
| Five Years Ended 12/31/23 | | | -0.18 | | | | -0.45 | | | | -1.10 | | | | -1.14 | | | | -0.14 | | | | -0.06 | |
| Ten Years Ended 12/31/23 | | | 1.64 | | | | 1.37 | | | | 0.68 | | | | 0.79 | | | | 1.68 | | | | N/A | |
| Inception* through 12/31/23 | | | — | | | | — | | | | — | | | | — | | | | — | | | | 0.83 | |
| | | | | | |
| With sales charges4 | | Class 1 | | | Class A | | | Class C | | | Class C12 | | | Class I | | | Class IS | |
| Twelve Months Ended 12/31/23 | | | 4.15 | % | | | -0.06 | % | | | 2.20 | % | | | 2.06 | %3 | | | 4.20 | % | | | 4.30 | % |
| Five Years Ended 12/31/23 | | | -0.18 | | | | -1.30 | | | | -1.10 | | | | -1.14 | | | | -0.14 | | | | -0.06 | |
| Ten Years Ended 12/31/23 | | | 1.64 | | | | 0.93 | | | | 0.68 | | | | 0.79 | | | | 1.68 | | | | N/A | |
| Inception* through 12/31/23 | | | — | | | | — | | | | — | | | | — | | | | — | | | | 0.83 | |
| | | | |
| Cumulative total returns | |
| Without sales charges1 | | | |
| Class 1 (12/31/13 through 12/31/23) | | | 17.69 | % |
| Class A (12/31/13 through 12/31/23) | | | 14.59 | |
| Class C (12/31/13 through 12/31/23) | | | 7.00 | |
| Class C1 (12/31/13 through 12/31/23) | | | 8.20 | |
| Class I (12/31/13 through 12/31/23) | | | 18.18 | |
| Class IS (Inception date of 6/30/16 through 12/31/23) | | | 6.42 | |
All figures represent past performance and are not a guarantee of future results. Investment return and principal value of an investment will fluctuate so that an investor’s shares, when redeemed, may be worth more or less than their original cost. The returns shown do not reflect the deduction of taxes that a shareholder would pay on Fund distributions or the redemption of Fund shares. Performance figures may reflect compensating balance arrangements, fee waivers and/or expense reimbursements. In the absence of compensating balance arrangements, fee waivers and/or expense reimbursements, the total return would have been lower.
| 1 | Assumes the reinvestment of all distributions, including returns of capital, if any, at net asset value and does not reflect the deduction of the applicable sales charge with respect to Class A shares or the applicable contingent deferred sales charge (“CDSC”) with respect to Class C and Class C1 shares. |
| 2 | On August 1, 2012, Class C shares were reclassified as Class C1 shares. |
| 3 | Total return information is based on net asset values calculated for shareholder transactions. Certain adjustments were made to the net assets of the Fund at December 31, 2022 for financial reporting purposes. Accordingly, adjusted total returns have been disclosed in the Financial Highlights and differ from those reported here. |
| 4 | Assumes the reinvestment of all distributions, including returns of capital, if any, at net asset value. In addition, Class A shares reflect the deduction of the maximum initial sales charge of 4.25% on purchases made prior to August 15, 2022. Purchases made on or after August 15, 2022 incur a maximum sales charge of 3.75%. Class C shares and Class C1 shares reflect the deduction of a 1.00% CDSC, which applies if shares are redeemed within one year from purchase payment. |
| * | Inception dates for Class 1, A, C, C1, I and IS shares are September 12, 2000, November 6, 1992, August 1, 2012, February 4, 1993, February 7, 1996 and June 30, 2016, respectively. |
| | | | | | |
Western Asset Mortgage Total Return Fund 2023 Annual Report | | | | | 9 | |
Fund performance (unaudited) (cont’d)
Historical performance
Value of $10,000 invested in
Class A Shares of Western Asset Mortgage Total Return Fund vs. Bloomberg U.S. Mortgage-Backed Securities Index† — December 2013 - December 2023
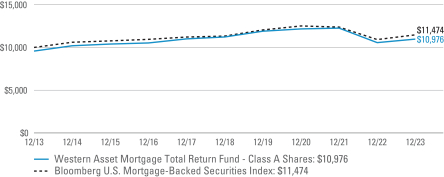
All figures represent past performance and are not a guarantee of future results. Investment return and principal value of an investment will fluctuate so that an investor’s shares, when redeemed, may be worth more or less than their original cost. The returns shown do not reflect the deduction of taxes that a shareholder would pay on Fund distributions or the redemption of Fund shares. Performance figures may reflect compensating balance arrangements, fee waivers and/or expense reimbursements. In the absence of compensating balance arrangements, fee waivers and/or expense reimbursements, the total return would have been lower.
| † | Hypothetical illustration of $10,000 invested in Class A shares of Western Asset Mortgage Total Return Fund on December 31, 2013, assuming the deduction of the maximum initial sales charge of 4.25% on purchases made prior to August 15, 2022. Purchases made on or after August 15, 2022 incur a maximum sales charge of 3.75% at the time of investment and the reinvestment of all distributions, including returns of capital, if any, at net asset value through December 31, 2023. The hypothetical illustration also assumes a $10,000 investment in the Bloomberg U.S. Mortgage-Backed Securities Index. The Bloomberg U.S. Mortgage-Backed Securities Index (the “Index”) is an unmanaged index composed of agency mortgage-backed pass-through securities, both fixed-rate and hybrid adjustable-rate mortgages, issued by the Government National Mortgage Association, Federal National Mortgage Association and Federal Home Loan Mortgage Corporation. The Index is unmanaged and is not subject to the same management and trading expenses as a mutual fund. Please note that an investor cannot invest directly in an index. The performance of the Fund’s other classes may be greater or less than the Class A shares’ performance indicated on this chart, depending on whether greater or lesser sales charges and fees were incurred by shareholders investing in the other classes. |
| | | | |
| 10 | | | | Western Asset Mortgage Total Return Fund 2023 Annual Report |
Schedule of investments
December 31, 2023
Western Asset Mortgage Total Return Fund
(Percentages shown based on Fund net assets)
| | | | | | | | | | | | | | | | |
| Security | | Rate | | | Maturity Date | | | Face Amount | | | Value | |
| Mortgage-Backed Securities — 52.2% | | | | | | | | | | | | | | | | |
FHLMC — 12.5% | | | | | | | | | | | | | | | | |
Federal Home Loan Mortgage Corp. (FHLMC) | | | 3.500 | % | | | 4/1/33-8/1/52 | | | $ | 10,430,372 | | | $ | 9,756,018 | |
Federal Home Loan Mortgage Corp. (FHLMC) | | | 3.000 | % | | | 2/1/40-2/1/51 | | | | 3,192,354 | | | | 2,907,364 | |
Federal Home Loan Mortgage Corp. (FHLMC) | | | 2.500 | % | | | 4/1/41-1/1/52 | | | | 18,526,120 | | | | 16,061,920 | |
Federal Home Loan Mortgage Corp. (FHLMC) | | | 2.000 | % | | | 9/1/41-12/1/51 | | | | 4,059,007 | | | | 3,384,944 | |
Federal Home Loan Mortgage Corp. (FHLMC) | | | 4.500 | % | | | 7/1/45-7/1/49 | | | | 409,055 | | | | 406,131 | |
Federal Home Loan Mortgage Corp. (FHLMC) | | | 6.000 | % | | | 12/1/52 | | | | 85,309 | | | | 88,092 | |
Federal Home Loan Mortgage Corp. (FHLMC) (1 year Refinitiv USD IBOR Consumer Cash Fallbacks + 1.619%) | | | 2.871 | % | | | 11/1/47 | | | | 354,423 | | | | 340,247 | (a) |
Federal Home Loan Mortgage Corp. (FHLMC) (1 year Refinitiv USD IBOR Consumer Cash Fallbacks + 1.621%) | | | 3.098 | % | | | 2/1/50 | | | | 455,278 | | | | 431,928 | (a) |
Federal Home Loan Mortgage Corp. (FHLMC) (1 year Refinitiv USD IBOR Consumer Cash Fallbacks + 1.628%) | | | 3.006 | % | | | 11/1/48 | | | | 1,660,899 | | | | 1,576,835 | (a) |
Federal Home Loan Mortgage Corp. (FHLMC) Gold | | | 4.000 | % | | | 12/1/33-3/1/47 | | | | 5,958,237 | | | | 5,823,273 | |
Federal Home Loan Mortgage Corp. (FHLMC) Gold | | | 5.500 | % | | | 11/1/35 | | | | 1,724 | | | | 1,763 | |
Federal Home Loan Mortgage Corp. (FHLMC) Gold | | | 4.500 | % | | | 9/1/46- 4/1/49 | | | | 768,624 | | | | 761,038 | |
Federal Home Loan Mortgage Corp. (FHLMC) Gold | | | 3.000 | % | | | 10/1/46 | | | | 16,260,983 | | | | 14,862,219 | |
Total FHLMC | | | | | | | | | | | | | | | 56,401,772 | |
FNMA — 23.8% | | | | | | | | | | | | | | | | |
Federal National Mortgage Association (FNMA) | | | 7.500 | % | | | 8/1/29- 4/1/32 | | | | 76,753 | | | | 77,410 | |
Federal National Mortgage Association (FNMA) | | | 8.500 | % | | | 10/1/30 | | | | 5,612 | | | | 5,644 | |
Federal National Mortgage Association (FNMA) | | | 5.170 | % | | | 12/1/33 | | | | 2,200,000 | | | | 2,321,132 | |
Federal National Mortgage Association (FNMA) | | | 3.500 | % | | | 12/1/34-3/1/57 | | | | 10,925,139 | | | | 10,261,274 | |
See Notes to Financial Statements.
| | | | | | |
Western Asset Mortgage Total Return Fund 2023 Annual Report | | | | | 11 | |
Schedule of investments (cont’d)
December 31, 2023
Western Asset Mortgage Total Return Fund
(Percentages shown based on Fund net assets)
| | | | | | | | | | | | | | | | |
| Security | | Rate | | | Maturity Date | | | Face Amount | | | Value | |
FNMA — continued | | | | | | | | | | | | | | | | |
Federal National Mortgage Association (FNMA) | | | 2.789 | % | | | 1/1/35 | | | $ | 1,169,140 | | | $ | 1,014,217 | (a) |
Federal National Mortgage Association (FNMA) | | | 3.000 | % | | | 7/1/35-1/1/52 | | | | 11,226,628 | | | | 10,334,791 | |
Federal National Mortgage Association (FNMA) | | | 2.500 | % | | | 4/1/41-9/1/61 | | | | 14,041,619 | | | | 12,105,407 | |
Federal National Mortgage Association (FNMA) | | | 4.000 | % | | | 5/1/42-8/1/50 | | | | 5,952,653 | | | | 5,781,546 | |
Federal National Mortgage Association (FNMA) | | | 5.000 | % | | | 11/1/45-10/1/46 | | | | 5,504,121 | | | | 5,610,208 | |
Federal National Mortgage Association (FNMA) | | | 4.500 | % | | | 2/1/48- 1/1/59 | | | | 12,124,358 | | | | 11,989,542 | |
Federal National Mortgage Association (FNMA) | | | 2.000 | % | | | 8/1/50- 3/1/52 | | | | 8,298,241 | | | | 6,885,211 | |
Federal National Mortgage Association (FNMA) | | | 6.500 | % | | | 11/1/52 | | | | 89,489 | | | | 92,750 | |
Federal National Mortgage Association (FNMA) | | | 2.000 | % | | | 1/1/54 | | | | 9,500,000 | | | | 7,766,250 | (b) |
Federal National Mortgage Association (FNMA) | | | 2.500 | % | | | 1/1/54 | | | | 8,400,000 | | | | 7,147,219 | (b) |
Federal National Mortgage Association (FNMA) | | | 3.000 | % | | | 1/1/54 | | | | 5,100,000 | | | | 4,512,106 | (b) |
Federal National Mortgage Association (FNMA) | | | 3.500 | % | | | 1/1/54 | | | | 100,000 | | | | 91,750 | (b) |
Federal National Mortgage Association (FNMA) | | | 4.000 | % | | | 1/1/54 | | | | 2,900,000 | | | | 2,743,105 | (b) |
Federal National Mortgage Association (FNMA) | | | 4.500 | % | | | 1/1/54 | | | | 900,000 | | | | 872,508 | (b) |
Federal National Mortgage Association (FNMA) | | | 5.000 | % | | | 1/1/54 | | | | 6,600,000 | | | | 6,530,391 | (b) |
Federal National Mortgage Association (FNMA) | | | 5.500 | % | | | 1/1/54 | | | | 6,900,000 | | | | 6,930,187 | (b) |
Federal National Mortgage Association (FNMA) | | | 6.000 | % | | | 1/1/54 | | | | 3,300,000 | | | | 3,351,047 | (b) |
Federal National Mortgage Association (FNMA) | | | 6.500 | % | | | 1/1/54 | | | | 1,100,000 | | | | 1,127,371 | (b) |
Total FNMA | | | | | | | | | | | | | | | 107,551,066 | |
See Notes to Financial Statements.
| | | | |
| 12 | | | | Western Asset Mortgage Total Return Fund 2023 Annual Report |
Western Asset Mortgage Total Return Fund
(Percentages shown based on Fund net assets)
| | | | | | | | | | | | | | | | |
| Security | | Rate | | | Maturity Date | | | Face Amount | | | Value | |
GNMA — 15.9% | | | | | | | | | | | | | | | | |
Government National Mortgage Association (GNMA) | | | 8.500 | % | | | 6/15/25 | | | $ | 1,901 | | | $ | 1,899 | |
Government National Mortgage Association (GNMA) | | | 7.500 | % | | | 4/15/29-9/15/31 | | | | 47,106 | | | | 47,531 | |
Government National Mortgage Association (GNMA) | | | 6.000 | % | | | 11/15/32 | | | | 175,160 | | | | 180,196 | |
Government National Mortgage Association (GNMA) | | | 5.000 | % | | | 4/15/40-5/15/40 | | | | 343,754 | | | | 344,555 | |
Government National Mortgage Association (GNMA) | | | 3.000 | % | | | 9/15/42-11/15/42 | | | | 560,989 | | | | 508,898 | |
Government National Mortgage Association (GNMA) | | | 3.500 | % | | | 6/15/48- 6/15/50 | | | | 2,108,447 | | | | 1,985,378 | |
Government National Mortgage Association (GNMA) | | | 4.000 | % | | | 3/15/50 | | | | 63,507 | | | | 61,073 | |
Government National Mortgage Association (GNMA) II | | | 3.500 | % | | | 6/20/44- 3/20/52 | | | | 5,481,775 | | | | 5,154,845 | |
Government National Mortgage Association (GNMA) II | | | 3.000 | % | | | 11/20/46-3/20/52 | | | | 12,760,617 | | | | 11,643,160 | |
Government National Mortgage Association (GNMA) II | | | 4.000 | % | | | 7/20/47- 8/20/50 | | | | 4,990,515 | | | | 4,808,934 | |
Government National Mortgage Association (GNMA) II | | | 4.500 | % | | | 8/20/47- 7/20/50 | | | | 3,223,081 | | | | 3,165,971 | |
Government National Mortgage Association (GNMA) II | | | 5.000 | % | | | 5/20/48- 1/20/53 | | | | 1,638,427 | | | | 1,647,856 | |
Government National Mortgage Association (GNMA) II | | | 5.500 | % | | | 12/20/48-6/20/49 | | | | 4,657,141 | | | | 4,770,052 | |
Government National Mortgage Association (GNMA) II | | | 2.500 | % | | | 12/20/50-8/20/52 | | | | 8,098,246 | | | | 7,088,167 | |
Government National Mortgage Association (GNMA) II | | | 2.000 | % | | | 3/20/51 | | | | 329,270 | | | | 269,812 | |
Government National Mortgage Association (GNMA) II | | | 2.000 | % | | | 1/20/54 | | | | 3,100,000 | | | | 2,625,434 | (b) |
Government National Mortgage Association (GNMA) II | | | 2.500 | % | | | 1/20/54 | | | | 1,000,000 | | | | 874,924 | (b) |
Government National Mortgage Association (GNMA) II | | | 3.500 | % | | | 1/20/54 | | | | 1,200,000 | | | | 1,117,687 | (b) |
Government National Mortgage Association (GNMA) II | | | 4.000 | % | | | 1/20/54 | | | | 4,100,000 | | | | 3,914,870 | (b) |
Government National Mortgage Association (GNMA) II | | | 4.500 | % | | | 1/20/54 | | | | 8,700,000 | | | | 8,492,037 | (b) |
See Notes to Financial Statements.
| | | | | | |
Western Asset Mortgage Total Return Fund 2023 Annual Report | | | | | 13 | |
Schedule of investments (cont’d)
December 31, 2023
Western Asset Mortgage Total Return Fund
(Percentages shown based on Fund net assets)
| | | | | | | | | | | | | | | | |
| Security | | Rate | | | Maturity Date | | | Face Amount | | | Value | |
GNMA — continued | | | | | | | | | | | | | | | | |
Government National Mortgage Association (GNMA) II | | | 5.000 | % | | | 1/20/54 | | | $ | 7,900,000 | | | $ | 7,845,697 | (b) |
Government National Mortgage Association (GNMA) II | | | 5.500 | % | | | 1/20/54 | | | | 2,400,000 | | | | 2,417,631 | (b) |
Government National Mortgage Association (GNMA) II | | | 6.000 | % | | | 1/20/54 | | | | 1,200,000 | | | | 1,220,297 | (b) |
Government National Mortgage Association (GNMA) II | | | 6.500 | % | | | 3/20/54 | | | | 300,000 | | | | 306,434 | (b) |
Government National Mortgage Association (GNMA) II (1 mo. Refinitiv USD IBOR Consumer Cash Fallbacks + 1.777%) | | | 7.184 | % | | | 6/20/60 | | | | 1,557,741 | | | | 1,578,307 | (a) |
Government National Mortgage Association (GNMA) II (1 year Treasury Constant Maturity Rate + 1.087%) | | | 6.532 | % | | | 8/20/58 | | | | 7,284 | | | | 7,276 | (a) |
Total GNMA | | | | | | | | | | | | | | | 72,078,921 | |
Total Mortgage-Backed Securities (Cost — $245,975,147) | | | | 236,031,759 | |
| Collateralized Mortgage Obligations (c) — 51.0% | | | | | | | | | | | | | | | | |
280 Park Avenue Mortgage Trust, 2017-280P F (1 mo. Term SOFR + 3.127%) | | | 8.485 | % | | | 9/15/34 | | | | 2,500,000 | | | | 2,234,107 | (a)(d) |
Alternative Loan Trust, 2006-OA9 2A1B (1 mo. Term SOFR + 0.314%) | | | 5.672 | % | | | 7/20/46 | | | | 70,665 | | | | 56,621 | (a) |
AOA Mortgage Trust, 2021-1177 A (1 mo. Term SOFR + 0.989%) | | | 6.351 | % | | | 10/15/38 | | | | 670,000 | | | | 606,532 | (a)(d) |
AREIT Trust, 2021-CRE5 A (1 mo. Term SOFR + 1.194%) | | | 6.553 | % | | | 11/17/38 | | | | 710,916 | | | | 695,881 | (a)(d) |
BAMLL Re-REMIC Trust, 2016-GG10 AJA | | | 5.630 | % | | | 8/10/45 | | | | 1,826,913 | | | | 392,311 | (a)(d) |
BANK, 2021-BN32 XA, IO | | | 0.774 | % | | | 4/15/54 | | | | 6,073,521 | | | | 234,184 | (a) |
Benchmark Mortgage Trust, 2019-B13 A3 | | | 2.701 | % | | | 8/15/57 | | | | 1,440,000 | | | | 1,283,142 | |
Benchmark Mortgage Trust, 2019-B13 XA, IO | | | 1.116 | % | | | 8/15/57 | | | | 10,003,331 | | | | 423,128 | (a) |
Benchmark Mortgage Trust, 2020-B16 A4 | | | 2.483 | % | | | 2/15/53 | | | | 1,450,000 | | | | 1,262,979 | |
Benchmark Mortgage Trust, 2020-IG3 C | | | 3.291 | % | | | 9/15/48 | | | | 2,000,000 | | | | 900,437 | (a)(d) |
Benchmark Mortgage Trust, 2021-B25 XA, IO | | | 1.092 | % | | | 4/15/54 | | | | 16,766,580 | | | | 944,275 | (a) |
BHMS Mortgage Trust, 2018-ATLS C (1 mo. Term SOFR + 2.197%) | | | 7.559 | % | | | 7/15/35 | | | | 2,250,000 | | | | 2,196,920 | (a)(d) |
BHMS Mortgage Trust, 2018-MZB (1 mo. Term SOFR + 6.934%) | | | 12.295 | % | | | 7/15/25 | | | | 1,070,000 | | | | 975,246 | (a)(d) |
BPR Trust, 2021-TY C (1 mo. Term SOFR + 1.814%) | | | 7.176 | % | | | 9/15/38 | | | | 1,060,000 | | | | 1,011,774 | (a)(d) |
BX Commercial Mortgage Trust, 2019-IMC G (1 mo. Term SOFR + 3.646%) | | | 9.008 | % | | | 4/15/34 | | | | 1,500,000 | | | | 1,469,953 | (a)(d) |
See Notes to Financial Statements.
| | | | |
| 14 | | | | Western Asset Mortgage Total Return Fund 2023 Annual Report |
Western Asset Mortgage Total Return Fund
(Percentages shown based on Fund net assets)
| | | | | | | | | | | | | | | | |
| Security | | Rate | | | Maturity Date | | | Face Amount | | | Value | |
| Collateralized Mortgage Obligations (c) — continued | | | | | | | | | | | | | | | | |
BX Trust, 2021-ARIA G (1 mo. Term SOFR + 3.257%) | | | 8.619 | % | | | 10/15/36 | | | $ | 1,070,000 | | | $ | 1,005,436 | (a)(d) |
BXHPP Trust, 2021-FILM C (1 mo. Term SOFR + 1.214%) | | | 6.576 | % | | | 8/15/36 | | | | 2,540,000 | | | | 2,283,969 | (a)(d) |
CAFL Issuer LLC, 2023-RTL1 A2 | | | 9.300 | % | | | 12/28/30 | | | | 1,140,000 | | | | 1,151,186 | (d) |
Citigroup Commercial Mortgage Trust, 2015- GC33 D | | | 3.172 | % | | | 9/10/58 | | | | 2,900,000 | | | | 1,144,673 | |
Credit Suisse First Boston Mortgage Securities Corp., 2002-10 2A1 | | | 7.500 | % | | | 5/25/32 | | | | 121,551 | | | | 124,532 | |
CSAIL Commercial Mortgage Trust, 2015-C3 C | | | 4.351 | % | | | 8/15/48 | | | | 1,100,000 | | | | 831,139 | (a) |
CSMC Trust, 2014-USA C | | | 4.336 | % | | | 9/15/37 | | | | 2,500,000 | | | | 1,764,317 | (d) |
CSMC Trust, 2017-CHOP H (PRIME + 4.294%) | | | 12.794 | % | | | 7/15/32 | | | | 1,472,000 | | | | 1,241,049 | (a)(d) |
CSMC Trust, 2017-RPL1 B1 | | | 2.962 | % | | | 7/25/57 | | | | 4,076,582 | | | | 2,571,348 | (a)(d) |
CSMC Trust, 2017-RPL1 B2 | | | 2.962 | % | | | 7/25/57 | | | | 4,676,961 | | | | 2,627,224 | (a)(d) |
CSMC Trust, 2017-RPL1 B3 | | | 2.962 | % | | | 7/25/57 | | | | 3,976,476 | | | | 1,683,809 | (a)(d) |
CSMC Trust, 2017-RPL1 B4 | | | 2.962 | % | | | 7/25/57 | | | | 4,025,711 | | | | 740,630 | (a)(d) |
CSMC Trust, 2017-RPL3 B3 | | | 4.529 | % | | | 8/1/57 | | | | 2,733,114 | | | | 2,594,955 | (a)(d) |
CSMC Trust, 2022-NWPT A (1 mo. Term SOFR + 3.143%) | | | 8.505 | % | | | 9/9/24 | | | | 1,750,000 | | | | 1,772,583 | (a)(d) |
Deephaven Residential Mortgage Trust, 2020-2 A3 | | | 2.856 | % | | | 5/25/65 | | | | 3,087,716 | | | | 3,027,580 | (d) |
Ellington Financial Mortgage Trust, 2020-1 B2 | | | 5.104 | % | | | 5/25/65 | | | | 3,570,000 | | | | 3,285,586 | (a)(d) |
EverBank Mortgage Loan Trust, 2018-1 AX1, IO | | | 0.076 | % | | | 2/25/48 | | | | 49,777,395 | | | | 73,934 | (a)(d) |
EverBank Mortgage Loan Trust, 2018-1 B4 | | | 3.576 | % | | | 2/25/48 | | | | 2,268,915 | | | | 1,512,792 | (a)(d) |
EverBank Mortgage Loan Trust, 2018-1 B5 | | | 3.576 | % | | | 2/25/48 | | | | 2,291,956 | | | | 955,166 | (a)(d) |
Federal Home Loan Mortgage Corp. (FHLMC) Multifamily PC REMIC Trust,
2019-RR01 X, IO | | | 1.534 | % | | | 6/25/28 | | | | 2,300,000 | | | | 128,416 | (a) |
Federal Home Loan Mortgage Corp. (FHLMC) Multifamily Structured Pass-Through Certificates, K110 X1, IO | | | 1.696 | % | | | 4/25/30 | | | | 993,303 | | | | 80,708 | (a) |
Federal Home Loan Mortgage Corp. (FHLMC) Multifamily Structured Pass-Through Certificates, K115 X1, IO | | | 1.324 | % | | | 6/25/30 | | | | 994,632 | | | | 67,055 | (a) |
Federal Home Loan Mortgage Corp. (FHLMC) Multifamily Structured Pass-Through Certificates, K116 X1, IO | | | 1.423 | % | | | 7/25/30 | | | | 992,208 | | | | 71,311 | (a) |
Federal Home Loan Mortgage Corp. (FHLMC) Multifamily Structured Pass-Through Certificates, K132 X1, IO | | | 0.508 | % | | | 8/25/31 | | | | 9,995,871 | | | | 314,442 | (a) |
See Notes to Financial Statements.
| | | | | | |
Western Asset Mortgage Total Return Fund 2023 Annual Report | | | | | 15 | |
Schedule of investments (cont’d)
December 31, 2023
Western Asset Mortgage Total Return Fund
(Percentages shown based on Fund net assets)
| | | | | | | | | | | | | | | | |
| Security | | Rate | | | Maturity Date | | | Face Amount | | | Value | |
| Collateralized Mortgage Obligations (c) — continued | | | | | | | | | | | | | | | | |
Federal Home Loan Mortgage Corp. (FHLMC) Multifamily Structured Pass-Through Certificates, K141 X1, IO | | | 0.305 | % | | | 2/25/32 | | | $ | 34,192,272 | | | $ | 735,431 | (a) |
Federal Home Loan Mortgage Corp. (FHLMC) Multifamily Structured Pass-Through Certificates, K142 X1, IO | | | 0.296 | % | | | 3/25/32 | | | | 17,087,929 | | | | 356,037 | (a) |
Federal Home Loan Mortgage Corp. (FHLMC) Multifamily Structured Pass-Through Certificates, K143 X1, IO | | | 0.342 | % | | | 4/25/55 | | | | 66,413,384 | | | | 1,621,330 | (a) |
Federal Home Loan Mortgage Corp. (FHLMC) Multifamily Structured Pass-Through Certificates, K148 X1, IO | | | 0.250 | % | | | 7/25/32 | | | | 20,083,223 | | | | 410,569 | (a) |
Federal Home Loan Mortgage Corp. (FHLMC) Multifamily Structured Pass-Through Certificates, K742 X1, IO | | | 0.776 | % | | | 3/25/28 | | | | 6,173,415 | | | | 132,800 | (a) |
Federal Home Loan Mortgage Corp. (FHLMC) Multifamily Structured Pass-Through Certificates, K1510 X1, IO | | | 0.482 | % | | | 1/25/34 | | | | 39,878,722 | | | | 1,343,115 | (a) |
Federal Home Loan Mortgage Corp. (FHLMC) Multifamily Structured Pass-Through Certificates, K1516 X1, IO | | | 1.510 | % | | | 5/25/35 | | | | 4,337,030 | | | | 517,097 | (a) |
Federal Home Loan Mortgage Corp. (FHLMC) Multifamily Structured Pass-Through Certificates, K1520 X1, IO | | | 0.471 | % | | | 2/25/36 | | | | 14,940,621 | | | | 571,589 | (a) |
Federal Home Loan Mortgage Corp. (FHLMC) Multifamily Structured Pass-Through Certificates, KG06 X1, IO | | | 0.532 | % | | | 10/25/31 | | | | 14,683,115 | | | | 477,717 | (a) |
Federal Home Loan Mortgage Corp. (FHLMC) Reference REMIC, R007 ZA | | | 6.000 | % | | | 5/15/36 | | | | 325,880 | | | | 341,981 | |
Federal Home Loan Mortgage Corp. (FHLMC) REMIC, 2525 AM | | | 4.500 | % | | | 4/15/32 | | | | 42,331 | | | | 41,678 | |
Federal Home Loan Mortgage Corp. (FHLMC) REMIC, 3027 AS, IO (-1.000 x 30 Day Average SOFR + 6.036%) | | | 0.697 | % | | | 5/15/29 | | | | 15,090 | | | | 575 | (a) |
Federal Home Loan Mortgage Corp. (FHLMC) REMIC, 3265 SB, IO (-1.000 x 30 Day Average SOFR + 6.026%) | | | 0.687 | % | | | 1/15/37 | | | | 26,245 | | | | 1,843 | (a) |
Federal Home Loan Mortgage Corp. (FHLMC) REMIC, 3397 GS, IO (-1.000 x 30 Day Average SOFR + 6.886%) | | | 1.547 | % | | | 12/15/37 | | | | 231,468 | | | | 23,291 | (a) |
See Notes to Financial Statements.
| | | | |
| 16 | | | | Western Asset Mortgage Total Return Fund 2023 Annual Report |
Western Asset Mortgage Total Return Fund
(Percentages shown based on Fund net assets)
| | | | | | | | | | | | | | | | |
| Security | | Rate | | | Maturity Date | | | Face Amount | | | Value | |
| Collateralized Mortgage Obligations (c) — continued | | | | | | | | | | | | | | | | |
Federal Home Loan Mortgage Corp. (FHLMC) REMIC, 3947 SG, IO (-1.000 x 30 Day Average SOFR + 5.836%) | | | 0.497 | % | | | 10/15/41 | | | $ | 206,407 | | | $ | 20,922 | (a) |
Federal Home Loan Mortgage Corp. (FHLMC) REMIC, 3966 SA, IO (-1.000 x 30 Day Average SOFR + 5.786%) | | | 0.447 | % | | | 12/15/41 | | | | 1,415,610 | | | | 135,179 | (a) |
Federal Home Loan Mortgage Corp. (FHLMC) REMIC, 4048 IK, IO | | | 3.000 | % | | | 5/15/27 | | | | 99,691 | | | | 3,159 | |
Federal Home Loan Mortgage Corp. (FHLMC) REMIC, 4077 TO, PO | | | 0.000 | % | | | 5/15/41 | | | | 1,045,851 | | | | 858,373 | |
Federal Home Loan Mortgage Corp. (FHLMC) REMIC, 4085 IO, IO | | | 3.000 | % | | | 6/15/27 | | | | 309,184 | | | | 8,799 | |
Federal Home Loan Mortgage Corp. (FHLMC) REMIC, 4114 LI, IO | | | 3.500 | % | | | 10/15/32 | | | | 1,485,500 | | | | 138,882 | |
Federal Home Loan Mortgage Corp. (FHLMC) REMIC, 4134 IM, IO, PAC | | | 3.500 | % | | | 11/15/42 | | | | 2,554,719 | | | | 410,283 | |
Federal Home Loan Mortgage Corp. (FHLMC) REMIC, 4144 GI, IO, PAC-1 | | | 3.000 | % | | | 12/15/32 | | | | 1,007,977 | | | | 68,138 | |
Federal Home Loan Mortgage Corp. (FHLMC) REMIC, 4147 IN, IO | | | 3.500 | % | | | 12/15/32 | | | | 1,494,876 | | | | 132,476 | |
Federal Home Loan Mortgage Corp. (FHLMC) REMIC, 4170 PI, IO, PAC-1 | | | 3.000 | % | | | 1/15/33 | | | | 1,202,267 | | | | 66,914 | |
Federal Home Loan Mortgage Corp. (FHLMC) REMIC, 4203 PS, IO, PAC (-1.000 x 30 Day Average SOFR + 6.136%) | | | 0.797 | % | | | 9/15/42 | | | | 511,236 | | | | 45,421 | (a) |
Federal Home Loan Mortgage Corp. (FHLMC) REMIC, 4210 Z | | | 3.000 | % | | | 5/15/43 | | | | 3,367,506 | | | | 2,760,421 | |
Federal Home Loan Mortgage Corp. (FHLMC) REMIC, 4377 UZ | | | 3.000 | % | | | 8/15/44 | | | | 2,618,038 | | | | 2,135,187 | |
Federal Home Loan Mortgage Corp. (FHLMC) REMIC, 4403 IG, IO | | | 3.500 | % | | | 7/15/32 | | | | 202,382 | | | | 5,173 | |
Federal Home Loan Mortgage Corp. (FHLMC) REMIC, 4715 JS, IO (-1.000 x 30 Day Average SOFR + 6.036%) | | | 0.697 | % | | | 8/15/47 | | | | 1,127,943 | | | | 148,607 | (a) |
Federal Home Loan Mortgage Corp. (FHLMC) REMIC, 4759 MI, IO, PAC | | | 4.000 | % | | | 9/15/45 | | | | 377,343 | | | | 21,839 | |
Federal Home Loan Mortgage Corp. (FHLMC) REMIC, 4808 SB, IO (-1.000 x 30 Day Average SOFR + 6.086%) | | | 0.747 | % | | | 7/15/48 | | | | 1,163,697 | | | | 166,061 | (a) |
Federal Home Loan Mortgage Corp. (FHLMC) REMIC, 4813 CJ | | | 3.000 | % | | | 8/15/48 | | | | 303,679 | | | | 269,518 | |
See Notes to Financial Statements.
| | | | | | |
Western Asset Mortgage Total Return Fund 2023 Annual Report | | | | | 17 | |
Schedule of investments (cont’d)
December 31, 2023
Western Asset Mortgage Total Return Fund
(Percentages shown based on Fund net assets)
| | | | | | | | | | | | | | | | |
| Security | | Rate | | | Maturity Date | | | Face Amount | | | Value | |
| Collateralized Mortgage Obligations (c) — continued | | | | | | | | | | | | | | | | |
Federal Home Loan Mortgage Corp. (FHLMC) REMIC, 4856 IO, IO | | | 5.000 | % | | | 1/15/49 | | | $ | 1,410,181 | | | $ | 242,771 | |
Federal Home Loan Mortgage Corp. (FHLMC) REMIC, 4882 S, IO, PAC (-1.000 x 30 Day Average SOFR + 5.936%) | | | 0.597 | % | | | 5/15/49 | | | | 1,545,332 | | | | 196,607 | (a) |
Federal Home Loan Mortgage Corp. (FHLMC) REMIC, 4921 SN, IO (-1.000 x 30 Day Average SOFR + 5.936%) | | | 0.598 | % | | | 10/25/49 | | | | 2,904,319 | | | | 367,931 | (a) |
Federal Home Loan Mortgage Corp. (FHLMC) REMIC, 4931 DZ, PAC | | | 2.500 | % | | | 11/25/49 | | | | 3,345,329 | | | | 2,453,252 | |
Federal Home Loan Mortgage Corp. (FHLMC) REMIC, 4962 SP, IO, PAC (-1.000 x 30 Day Average SOFR + 5.936%) | | | 0.598 | % | | | 3/25/50 | | | | 1,536,863 | | | | 191,009 | (a) |
Federal Home Loan Mortgage Corp. (FHLMC) REMIC, 4988 AZ | | | 2.000 | % | | | 7/25/50 | | | | 3,646,315 | | | | 2,238,313 | |
Federal Home Loan Mortgage Corp. (FHLMC) REMIC, 4995 IQ, IO, PAC | | | 2.500 | % | | | 7/25/50 | | | | 2,256,255 | | | | 334,004 | |
Federal Home Loan Mortgage Corp. (FHLMC) REMIC, 4995 QI, IO, PAC | | | 2.500 | % | | | 7/25/50 | | | | 11,613,078 | | | | 1,818,576 | |
Federal Home Loan Mortgage Corp. (FHLMC) REMIC, 5000 IB, IO | | | 2.500 | % | | | 7/25/50 | | | | 5,864,034 | | | | 727,201 | |
Federal Home Loan Mortgage Corp. (FHLMC) REMIC, 5000 UI, IO | | | 2.500 | % | | | 7/25/50 | | | | 4,997,674 | | | | 862,893 | |
Federal Home Loan Mortgage Corp. (FHLMC) REMIC, 5040 IB, IO | | | 2.500 | % | | | 11/25/50 | | | | 138,563 | | | | 20,107 | |
Federal Home Loan Mortgage Corp. (FHLMC) REMIC, 5058 IL, IO | | | 2.500 | % | | | 1/25/51 | | | | 2,125,056 | | | | 371,893 | |
Federal Home Loan Mortgage Corp. (FHLMC) REMIC, 5059 IB, IO | | | 2.500 | % | | | 1/25/51 | | | | 740,082 | | | | 116,575 | |
Federal Home Loan Mortgage Corp. (FHLMC) REMIC, 5070 NI, IO | | | 2.000 | % | | | 2/25/51 | | | | 4,571,040 | | | | 630,431 | |
Federal Home Loan Mortgage Corp. (FHLMC) REMIC, 5078 EI, IO | | | 1.500 | % | | | 1/25/51 | | | | 5,325,791 | | | | 547,696 | |
Federal Home Loan Mortgage Corp. (FHLMC) REMIC, 5085 IK, IO | | | 2.500 | % | | | 3/25/51 | | | | 17,506,297 | | | | 2,768,412 | |
Federal Home Loan Mortgage Corp. (FHLMC) REMIC, 5092 IU, IO | | | 2.500 | % | | | 2/25/51 | | | | 8,000,560 | | | | 916,691 | |
Federal Home Loan Mortgage Corp. (FHLMC) REMIC, 5113 NI, IO, PAC | | | 2.500 | % | | | 6/25/51 | | | | 2,419,474 | | | | 297,658 | |
Federal Home Loan Mortgage Corp. (FHLMC) REMIC, 5134 KI, IO | | | 2.500 | % | | | 7/25/48 | | | | 7,882,992 | | | | 1,047,644 | |
See Notes to Financial Statements.
| | | | |
| 18 | | | | Western Asset Mortgage Total Return Fund 2023 Annual Report |
Western Asset Mortgage Total Return Fund
(Percentages shown based on Fund net assets)
| | | | | | | | | | | | | | | | |
| Security | | Rate | | | Maturity Date | | | Face Amount | | | Value | |
| Collateralized Mortgage Obligations (c) — continued | | | | | | | | | | | | | | | | |
Federal Home Loan Mortgage Corp. (FHLMC) REMIC, 5135 DI, IO | | | 2.500 | % | | | 5/25/48 | | | $ | 7,521,542 | | | $ | 990,497 | |
Federal Home Loan Mortgage Corp. (FHLMC) REMIC, 5149 NI, IO, PAC | | | 2.500 | % | | | 1/25/51 | | | | 976,228 | | | | 138,019 | |
Federal Home Loan Mortgage Corp. (FHLMC) REMIC, 5160 IU, IO | | | 2.500 | % | | | 11/25/50 | | | | 5,259,799 | | | | 692,863 | |
Federal Home Loan Mortgage Corp. (FHLMC) REMIC, 5169 PW, PAC | | | 2.000 | % | | | 9/25/51 | | | | 4,700,000 | | | | 3,184,420 | |
Federal Home Loan Mortgage Corp. (FHLMC) REMIC, 5178 CY | | | 2.000 | % | | | 1/25/42 | | | | 4,400,000 | | | | 3,014,432 | |
Federal Home Loan Mortgage Corp. (FHLMC) REMIC, 5200 KQ, PAC | | | 3.000 | % | | | 9/25/49 | | | | 1,022,622 | | | | 935,203 | |
Federal Home Loan Mortgage Corp. (FHLMC) REMIC, 5209 EQ | | | 3.000 | % | | | 4/25/52 | | | | 2,800,000 | | | | 2,156,965 | |
Federal Home Loan Mortgage Corp. (FHLMC) REMIC, 5274 IO, IO | | | 2.500 | % | | | 1/25/51 | | | | 1,770,919 | | | | 282,592 | |
Federal Home Loan Mortgage Corp. (FHLMC) REMIC, Structured Agency Credit Risk Debt Notes, 2019-HQA4 B2 (30 Day Average SOFR + 6.714%) | | | 12.052 | % | | | 11/25/49 | | | | 1,240,000 | | | | 1,333,554 | (a)(d) |
Federal Home Loan Mortgage Corp. (FHLMC) Seasoned Credit Risk Transfer Trust, 2016-1 B, PO | | | 0.000 | % | | | 9/25/55 | | | | 4,392,218 | | | | 462,520 | (d) |
Federal Home Loan Mortgage Corp. (FHLMC) Seasoned Credit Risk Transfer Trust, 2016-1 BIO, IO | | | 1.503 | % | | | 9/25/55 | | | | 7,696,900 | | | | 912,591 | (a)(d) |
Federal Home Loan Mortgage Corp. (FHLMC) Seasoned Credit Risk Transfer Trust, 2016-1 XSIO, IO | | | 0.075 | % | | | 9/25/55 | | | | 49,458,226 | | | | 219,941 | (a)(d) |
Federal Home Loan Mortgage Corp. (FHLMC) Seasoned Credit Risk Transfer Trust, 2017-2 B, PO | | | 0.000 | % | | | 8/25/56 | | | | 7,788,204 | | | | 733,525 | (d) |
Federal Home Loan Mortgage Corp. (FHLMC) Seasoned Credit Risk Transfer Trust, 2017-2 BIO, IO | | | 1.404 | % | | | 8/25/56 | | | | 16,174,852 | | | | 1,813,769 | (a)(d) |
Federal Home Loan Mortgage Corp. (FHLMC) Seasoned Credit Risk Transfer Trust, 2017-2 XSIO, IO | | | 0.075 | % | | | 8/25/56 | | | | 308,330,336 | | | | 1,361,587 | (a)(d) |
Federal Home Loan Mortgage Corp. (FHLMC) STRIPS, 312 S1, IO (-1.000 x 30 Day Average SOFR + 5.836%) | | | 0.497 | % | | | 9/15/43 | | | | 1,046,700 | | | | 127,057 | (a) |
See Notes to Financial Statements.
| | | | | | |
Western Asset Mortgage Total Return Fund 2023 Annual Report | | | | | 19 | |
Schedule of investments (cont’d)
December 31, 2023
Western Asset Mortgage Total Return Fund
(Percentages shown based on Fund net assets)
| | | | | | | | | | | | | | | | |
| Security | | Rate | | | Maturity Date | | | Face Amount | | | Value | |
| Collateralized Mortgage Obligations (c) — continued | | | | | | | | | | | | | |
Federal Home Loan Mortgage Corp. (FHLMC) STRIPS, 317 PO, PO | | | 0.000 | % | | | 11/15/43 | | | $ | 2,479,822 | | | $ | 1,831,963 | |
Federal Home Loan Mortgage Corp. (FHLMC) STRIPS, 328 S4, IO | | | 0.000 | % | | | 2/15/38 | | | | 236,520 | | | | 14,254 | (a) |
Federal Home Loan Mortgage Corp. (FHLMC) Structured Agency Credit Risk Debt Notes, 2016-DNA2 B (30 Day Average SOFR + 10.614%) | | | 15.952 | % | | | 10/25/28 | | | | 2,374,614 | | | | 2,665,208 | (a) |
Federal Home Loan Mortgage Corp. (FHLMC) Structured Agency Credit Risk Debt Notes, 2017-DNA1 B2 (30 Day Average SOFR + 10.114%) | | | 15.452 | % | | | 7/25/29 | | | | 2,505,561 | | | | 2,834,514 | (a) |
Federal Home Loan Mortgage Corp. (FHLMC) Structured Agency Credit Risk Debt Notes, 2017-SPI1 B | | | 4.116 | % | | | 9/25/47 | | | | 1,813,836 | | | | 1,203,446 | (a)(d) |
Federal Home Loan Mortgage Corp. (FHLMC) Structured Agency Credit Risk Debt Notes, 2018-HRP1 B2 (30 Day Average SOFR + 11.864%) | | | 17.202 | % | | | 5/25/43 | | | | 4,901,565 | | | | 5,766,762 | (a)(d) |
Federal National Mortgage Association (FNMA) — CAS, 2016-C04 1B (30 Day Average SOFR + 10.364%) | | | 15.702 | % | | | 1/25/29 | | | | 4,596,056 | | | | 5,283,340 | (a)(d) |
Federal National Mortgage Association (FNMA) — CAS, 2016-C06 1B (30 Day Average SOFR + 9.364%) | | | 14.702 | % | | | 4/25/29 | | | | 3,743,972 | | | | 4,256,034 | (a)(d) |
Federal National Mortgage Association (FNMA) ACES, 2019-M11 X1, IO | | | 1.063 | % | | | 6/25/29 | | | | 14,813,755 | | | | 629,000 | (a) |
Federal National Mortgage Association (FNMA) ACES, 2020-M11 IO, IO | | | 1.747 | % | | | 1/25/29 | | | | 6,737,516 | | | | 464,112 | (a) |
Federal National Mortgage Association (FNMA) ACES, 2020-M16 X1, IO | | | 0.462 | % | | | 4/25/32 | | | | 40,539,466 | | | | 1,045,014 | (a) |
Federal National Mortgage Association (FNMA) ACES, 2020-M24 X1, IO | | | 1.594 | % | | | 1/25/37 | | | | 5,385,542 | | | | 491,143 | (a) |
Federal National Mortgage Association (FNMA) ACES, 2020-M31 X2, IO | | | 1.231 | % | | | 12/25/32 | | | | 18,642,286 | | | | 1,083,257 | (a) |
Federal National Mortgage Association (FNMA) REMIC, 2003-22 IO, IO | | | 6.000 | % | | | 4/25/33 | | | | 43,323 | | | | 6,441 | |
Federal National Mortgage Association (FNMA) REMIC, 2009-6 KZ | | | 5.000 | % | | | 2/25/49 | | | | 224,346 | | | | 223,649 | |
Federal National Mortgage Association (FNMA) REMIC, 2009-59 LB | | | 4.689 | % | | | 8/25/39 | | | | 238,417 | | | | 237,852 | (a) |
See Notes to Financial Statements.
| | | | |
| 20 | | | | Western Asset Mortgage Total Return Fund 2023 Annual Report |
Western Asset Mortgage Total Return Fund
(Percentages shown based on Fund net assets)
| | | | | | | | | | | | | | | | |
| Security | | Rate | | | Maturity Date | | | Face Amount | | | Value | |
| Collateralized Mortgage Obligations (c) — continued | | | | | | | | | | | | | | | | |
Federal National Mortgage Association (FNMA) REMIC, 2009-74 TX, PAC | | | 5.000 | % | | | 9/25/39 | | | $ | 628,471 | | | $ | 633,303 | |
Federal National Mortgage Association (FNMA) REMIC, 2010-2 AI, IO | | | 5.500 | % | | | 2/25/40 | | | | 228,617 | | | | 36,671 | |
Federal National Mortgage Association (FNMA) REMIC, 2010-84 SK, IO (-1.000 x 30 Day Average SOFR + 6.446%) | | | 1.108 | % | | | 8/25/40 | | | | 494,946 | | | | 41,456 | (a) |
Federal National Mortgage Association (FNMA) REMIC, 2011-59 NZ | | | 5.500 | % | | | 7/25/41 | | | | 134,263 | | | | 138,643 | |
Federal National Mortgage Association (FNMA) REMIC, 2011-144 PT | | | 12.126 | % | | | 1/25/38 | | | | 216,962 | | | | 261,737 | (a) |
Federal National Mortgage Association (FNMA) REMIC, 2012-14 SL, IO (-1.000 x 30 Day Average SOFR + 6.436%) | | | 1.098 | % | | | 12/25/40 | | | | 580,609 | | | | 7,836 | (a) |
Federal National Mortgage Association (FNMA) REMIC, 2012-28 B | | | 6.500 | % | | | 6/25/39 | | | | 36,163 | | | | 36,797 | |
Federal National Mortgage Association (FNMA) REMIC, 2012-51 B | | | 7.000 | % | | | 5/25/42 | | | | 149,697 | | | | 163,826 | |
Federal National Mortgage Association (FNMA) REMIC, 2012-75 NS, IO (-1.000 x 30 Day Average SOFR + 6.486%) | | | 1.148 | % | | | 7/25/42 | | | | 914,976 | | | | 113,640 | (a) |
Federal National Mortgage Association (FNMA) REMIC, 2012-123 BI, IO | | | 3.500 | % | | | 11/25/32 | | | | 727,732 | | | | 68,123 | |
Federal National Mortgage Association (FNMA) REMIC, 2012-135 AI, IO | | | 3.000 | % | | | 12/25/27 | | | | 488,025 | | | | 17,826 | |
Federal National Mortgage Association (FNMA) REMIC, 2012-149 AI, IO | | | 3.000 | % | | | 1/25/28 | | | | 1,024,570 | | | | 33,104 | |
Federal National Mortgage Association (FNMA) REMIC, 2013-9 BC | | | 6.500 | % | | | 7/25/42 | | | | 145,373 | | | | 155,774 | |
Federal National Mortgage Association (FNMA) REMIC, 2013-9 CB | | | 5.500 | % | | | 4/25/42 | | | | 1,181,530 | | | | 1,212,834 | |
Federal National Mortgage Association (FNMA) REMIC, 2014-47 AI, IO | | | 0.000 | % | | | 8/25/44 | | | | 624,776 | | | | 26,718 | (a) |
Federal National Mortgage Association (FNMA) REMIC, 2014-47 IA, IO | | | 0.000 | % | | | 8/25/44 | | | | 1,147,174 | | | | 56,083 | (a) |
Federal National Mortgage Association (FNMA) REMIC, 2014-49 KS, IO | | | 0.000 | % | | | 8/25/44 | | | | 900,359 | | | | 56,102 | (a) |
Federal National Mortgage Association (FNMA) REMIC, 2015-39 LZ | | | 3.000 | % | | | 6/25/45 | | | | 220,101 | | | | 197,291 | |
Federal National Mortgage Association (FNMA) REMIC, 2016-48 IA, IO | | | 4.500 | % | | | 6/25/38 | | | | 5,060,324 | | | | 706,287 | |
See Notes to Financial Statements.
| | | | | | |
Western Asset Mortgage Total Return Fund 2023 Annual Report | | | | | 21 | |
Schedule of investments (cont’d)
December 31, 2023
Western Asset Mortgage Total Return Fund
(Percentages shown based on Fund net assets)
| | | | | | | | | | | | | | | | |
| Security | | Rate | | | Maturity Date | | | Face Amount | | | Value | |
| Collateralized Mortgage Obligations (c) — continued | | | | | | | | | | | | | | | | |
Federal National Mortgage Association (FNMA) REMIC, 2018-74 AB | | | 3.500 | % | | | 10/25/48 | | | $ | 1,400,881 | | | $ | 1,304,317 | |
Federal National Mortgage Association (FNMA) REMIC, 2018-3 IO, IO | | | 4.000 | % | | | 2/25/48 | | | | 4,132,392 | | | | 807,868 | |
Federal National Mortgage Association (FNMA) REMIC, 2019-25 PI, IO | | | 5.000 | % | | | 5/25/48 | | | | 1,031,517 | | | | 206,486 | |
Federal National Mortgage Association (FNMA) REMIC, 2019-33 ZJ | | | 2.750 | % | | | 7/25/49 | | | | 2,344,167 | | | | 1,683,719 | |
Federal National Mortgage Association (FNMA) REMIC, 2019-38 SH, IO (-1.000 x 30 Day Average SOFR + 5.936%) | | | 0.607 | % | | | 7/25/49 | | | | 3,602,758 | | | | 413,415 | (a) |
Federal National Mortgage Association (FNMA) REMIC, 2019-44 SM, IO (-1.000 x 30 Day Average SOFR + 5.936%) | | | 0.598 | % | | | 8/25/49 | | | | 1,838,464 | | | | 288,821 | (a) |
Federal National Mortgage Association (FNMA) REMIC, 2019-45 BS, IO (-1.000 x 30 Day Average SOFR + 5.936%) | | | 0.598 | % | | | 8/25/49 | | | | 1,953,219 | | | | 234,189 | (a) |
Federal National Mortgage Association (FNMA) REMIC, 2019-57 NS, IO (-1.000 x 30 Day Average SOFR + 5.886%) | | | 0.548 | % | | | 10/25/49 | | | | 1,183,459 | | | | 155,807 | (a) |
Federal National Mortgage Association (FNMA) REMIC, 2019-58 HS, IO (-1.000 x 30 Day Average SOFR + 5.886%) | | | 0.548 | % | | | 10/25/49 | | | | 1,744,205 | | | | 218,679 | (a) |
Federal National Mortgage Association (FNMA) REMIC, 2019-59 SH, IO (-1.000 x 30 Day Average SOFR + 5.886%) | | | 0.548 | % | | | 10/25/49 | | | | 3,606,702 | | | | 479,727 | (a) |
Federal National Mortgage Association (FNMA) REMIC, 2020-26 SA, IO (-1.000 x 30 Day Average SOFR + 5.836%) | | | 0.498 | % | | | 5/25/50 | | | | 1,527,204 | | | | 186,566 | (a) |
Federal National Mortgage Association (FNMA) REMIC, 2020-47 GZ | | | 2.000 | % | | | 7/25/50 | | | | 1,179,690 | | | | 722,540 | |
Federal National Mortgage Association (FNMA) REMIC, 2020-62 BI, IO | | | 2.000 | % | | | 9/25/50 | | | | 1,679,775 | | | | 202,561 | |
Federal National Mortgage Association (FNMA) REMIC, 2020-67 IH, IO | | | 2.000 | % | | | 9/25/50 | | | | 2,379,763 | | | | 312,268 | |
Federal National Mortgage Association (FNMA) REMIC, 2020-74 EI, IO | | | 2.500 | % | | | 10/25/50 | | | | 149,236 | | | | 23,971 | |
Federal National Mortgage Association (FNMA) REMIC, 2020-88 GI, IO | | | 2.500 | % | | | 12/25/50 | | | | 1,944,274 | | | | 297,970 | |
Federal National Mortgage Association (FNMA) REMIC, 2020-89 DI, IO | | | 2.500 | % | | | 12/25/50 | | | | 1,030,966 | | | | 159,012 | |
See Notes to Financial Statements.
| | | | |
| 22 | | | | Western Asset Mortgage Total Return Fund 2023 Annual Report |
Western Asset Mortgage Total Return Fund
(Percentages shown based on Fund net assets)
| | | | | | | | | | | | | | | | |
| Security | | Rate | | | Maturity Date | | | Face Amount | | | Value | |
| Collateralized Mortgage Obligations (c) — continued | | | | | | | | | | | | | | | | |
Federal National Mortgage Association (FNMA) REMIC, 2020-93 LI, IO, PAC | | | 2.500 | % | | | 1/25/51 | | | $ | 5,483,161 | | | $ | 766,910 | |
Federal National Mortgage Association (FNMA) REMIC, 2021-33 AI, IO | | | 2.500 | % | | | 5/25/47 | | | | 939,798 | | | | 120,662 | |
Federal National Mortgage Association (FNMA) REMIC, 2021-42 NI, IO | | | 2.500 | % | | | 11/25/48 | | | | 8,294,143 | | | | 1,065,410 | |
Federal National Mortgage Association (FNMA) REMIC, 2021-46 BI, IO | | | 2.500 | % | | | 12/25/48 | | | | 5,471,625 | | | | 717,912 | |
Federal National Mortgage Association (FNMA) REMIC, 2021-49 GI, IO | | | 2.500 | % | | | 10/25/48 | | | | 2,836,100 | | | | 383,822 | |
Federal National Mortgage Association (FNMA) REMIC, 2021-54 KI, IO | | | 2.500 | % | | | 5/25/49 | | | | 804,133 | | | | 106,390 | |
Federal National Mortgage Association (FNMA) REMIC, 2021-59 TI, IO | | | 2.500 | % | | | 9/25/51 | | | | 5,544,159 | | | | 819,799 | |
Federal National Mortgage Association (FNMA) REMIC, 2021-61 KI, IO | | | 2.500 | % | | | 4/25/49 | | | | 964,384 | | | | 131,320 | |
Federal National Mortgage Association (FNMA) REMIC, 2021-63 QI, IO, PAC | | | 2.500 | % | | | 6/25/51 | | | | 855,449 | | | | 109,456 | |
Federal National Mortgage Association (FNMA) REMIC, 2021-74 IO, IO | | | 2.500 | % | | | 10/25/51 | | | | 12,101,480 | | | | 1,996,805 | |
Federal National Mortgage Association (FNMA) REMIC, 2021-85 IN, IO | | | 2.500 | % | | | 2/25/50 | | | | 4,031,440 | | | | 632,104 | |
Federal National Mortgage Association (FNMA) REMIC, 2021-91 IG, IO | | | 2.500 | % | | | 1/25/52 | | | | 2,050,714 | | | | 301,834 | |
Federal National Mortgage Association (FNMA) REMIC, 2022-29 KZ | | | 1.500 | % | | | 6/25/42 | | | | 6,758,526 | | | | 4,850,944 | |
Federal National Mortgage Association (FNMA) REMIC, 2022-57 BC | | | 4.000 | % | | | 9/25/52 | | | | 874,596 | | | | 841,506 | |
Federal National Mortgage Association (FNMA) STRIPS, 362 6, IO | | | 5.000 | % | | | 8/25/35 | | | | 504,490 | | | | 73,319 | |
Federal National Mortgage Association (FNMA) STRIPS, 364 13, IO | | | 6.000 | % | | | 9/25/35 | | | | 39,705 | | | | 5,825 | |
Federal National Mortgage Association (FNMA) STRIPS, 383 18, IO | | | 5.500 | % | | | 1/25/38 | | | | 50,633 | | | | 8,863 | |
Federal National Mortgage Association (FNMA) STRIPS, 383 20, IO | | | 5.500 | % | | | 7/25/37 | | | | 37,641 | | | | 6,253 | |
Federal National Mortgage Association (FNMA) STRIPS, 406 2, IO | | | 4.000 | % | | | 2/25/41 | | | | 1,362,300 | | | | 228,764 | |
Federal National Mortgage Association (FNMA) STRIPS, 407 41, IO | | | 6.000 | % | | | 1/25/38 | | | | 28,109 | | | | 5,984 | |
See Notes to Financial Statements.
| | | | | | |
Western Asset Mortgage Total Return Fund 2023 Annual Report | | | | | 23 | |
Schedule of investments (cont’d)
December 31, 2023
Western Asset Mortgage Total Return Fund
(Percentages shown based on Fund net assets)
| | | | | | | | | | | | | | | | |
| Security | | Rate | | | Maturity Date | | | Face Amount | | | Value | |
| Collateralized Mortgage Obligations (c) — continued | | | | | | | | | | | | | | | | |
Federal National Mortgage Association (FNMA) STRIPS, 407 42, IO | | | 6.000 | % | | | 1/25/38 | | | $ | 21,038 | | | $ | 3,508 | |
Federal National Mortgage Association (FNMA) STRIPS, 407 C10, IO | | | 5.000 | % | | | 1/25/38 | | | | 223,520 | | | | 36,651 | |
Federal National Mortgage Association (FNMA) STRIPS, 417 C5, IO | | | 3.500 | % | | | 2/25/43 | | | | 2,602,254 | | | | 439,593 | |
Federal National Mortgage Association (FNMA) STRIPS, 418 C15, IO | | | 3.500 | % | | | 8/25/43 | | | | 6,073,681 | | | | 1,020,715 | |
Government National Mortgage Association (GNMA), 2004-59 FP (1 mo. Term SOFR + 0.414%) | | | 5.773 | % | | | 8/16/34 | | | | 332,409 | | | | 332,128 | (a) |
Government National Mortgage Association (GNMA), 2004-81 SK, IO (-1.000 x 1 mo. Term SOFR + 6.086%) | | | 0.727 | % | | | 10/16/34 | | | | 326,711 | | | | 14,200 | (a) |
Government National Mortgage Association (GNMA), 2007-17 IB, IO (-1.000 x 1 mo. Term SOFR + 6.136%) | | | 0.778 | % | | | 4/20/37 | | | | 1,955,089 | | | | 77,830 | (a) |
Government National Mortgage Association (GNMA), 2007-45 QB, IO, PAC (-1.000 x 1 mo. Term SOFR + 6.486%) | | | 1.128 | % | | | 7/20/37 | | | | 334,389 | | | | 25,342 | (a) |
Government National Mortgage Association (GNMA), 2009-H01 FA (1 mo. Term SOFR + 1.264%) | | | 6.622 | % | | | 11/20/59 | | | | 127,099 | | | | 127,051 | (a) |
Government National Mortgage Association (GNMA), 2010-4 SI, IO (-1.000 x 1 mo. Term SOFR + 5.986%) | | | 0.627 | % | | | 11/16/34 | | | | 690,912 | | | | 16,657 | (a) |
Government National Mortgage Association (GNMA), 2010-42 BS, IO (-1.000 x 1 mo. Term SOFR + 6.366%) | | | 1.008 | % | | | 4/20/40 | | | | 3,873 | | | | 458 | (a) |
Government National Mortgage Association (GNMA), 2010-59 SM, IO (-1.000 x 1 mo. Term SOFR + 5.886%) | | | 0.527 | % | | | 5/16/40 | | | | 245,277 | | | | 13,414 | (a) |
Government National Mortgage Association (GNMA), 2010-85 HS, IO, PAC (-1.000 x 1 mo. Term SOFR + 6.536%) | | | 1.178 | % | | | 1/20/40 | | | | 895 | | | | 5 | (a) |
Government National Mortgage Association (GNMA), 2010-H02 FA (1 mo. Term SOFR + 0.794%) | | | 6.142 | % | | | 2/20/60 | | | | 624,458 | | | | 621,348 | (a) |
Government National Mortgage Association (GNMA), 2011-40 EI, IO | | | 4.000 | % | | | 12/16/25 | | | | 13,605 | | | | 87 | |
See Notes to Financial Statements.
| | | | |
| 24 | | | | Western Asset Mortgage Total Return Fund 2023 Annual Report |
Western Asset Mortgage Total Return Fund
(Percentages shown based on Fund net assets)
| | | | | | | | | | | | | | | | |
| Security | | Rate | | | Maturity Date | | | Face Amount | | | Value | |
| Collateralized Mortgage Obligations (c) — continued | | | | | | | | | | | | | | | | |
Government National Mortgage Association (GNMA), 2011-79 KS, IO (-1.000 x 1 mo. Term SOFR + 5.286%) | | | 0.000 | % | | | 5/20/41 | | | $ | 963,979 | | | $ | 86,951 | (a) |
Government National Mortgage Association (GNMA), 2011-113 PQ | | | 5.000 | % | | | 6/20/39 | | | | 722,184 | | | | 734,420 | |
Government National Mortgage Association (GNMA), 2011-142 IO, IO | | | 0.000 | % | | | 9/16/46 | | | | 2,515,718 | | | | 25 | (a) |
Government National Mortgage Association (GNMA), 2011-146 KS, IO (-1.000 x 1 mo. Term SOFR + 5.986%) | | | 0.627 | % | | | 11/16/41 | | | | 747,594 | | | | 84,669 | (a) |
Government National Mortgage Association (GNMA), 2012-13 SK, IO (-1.000 x 1 mo. Term SOFR + 6.536%) | | | 1.178 | % | | | 2/20/41 | | | | 242,665 | | | | 17,000 | (a) |
Government National Mortgage Association (GNMA), 2012-70 IO, IO | | | 0.094 | % | | | 8/16/52 | | | | 756,805 | | | | 350 | (a) |
Government National Mortgage Association (GNMA), 2013-90 PI, IO, PAC-1 | | | 3.500 | % | | | 10/20/41 | | | | 1,826,087 | | | | 111,985 | |
Government National Mortgage Association (GNMA), 2013-142 IO, IO | | | 0.992 | % | | | 9/16/51 | | | | 2,038,151 | | | | 37,147 | (a) |
Government National Mortgage Association (GNMA), 2013-163 IO, IO | | | 1.008 | % | | | 2/16/46 | | | | 2,175,313 | | | | 46,919 | (a) |
Government National Mortgage Association (GNMA), 2014-2 CI, IO | | | 4.500 | % | | | 1/20/44 | | | | 818,435 | | | | 170,378 | |
Government National Mortgage Association (GNMA), 2014-16 IO, IO | | | 0.447 | % | | | 6/16/55 | | | | 3,013,509 | | | | 40,417 | (a) |
Government National Mortgage Association (GNMA), 2014-50 IO, IO | | | 0.628 | % | | | 9/16/55 | | | | 1,020,518 | | | | 25,307 | (a) |
Government National Mortgage Association (GNMA), 2014-60 SA, IO (-1.000 x 1 mo. Term SOFR + 5.986%) | | | 0.627 | % | | | 4/16/44 | | | | 2,267,976 | | | | 241,896 | (a) |
Government National Mortgage Association (GNMA), 2014-91 SB, IO (-1.000 x 1 mo. Term SOFR + 5.486%) | | | 0.127 | % | | | 6/16/44 | | | | 895,904 | | | | 84,330 | (a) |
Government National Mortgage Association (GNMA), 2014-118 HS, IO (-1.000 x 1 mo. Term SOFR + 6.086%) | | | 0.728 | % | | | 8/20/44 | | | | 492,364 | | | | 62,412 | (a) |
Government National Mortgage Association (GNMA), 2015-167 OI, IO | | | 4.000 | % | | | 4/16/45 | | | | 1,927,108 | | | | 356,106 | |
Government National Mortgage Association (GNMA), 2016-51 NS, IO (-1.000 x 1 mo. Term SOFR + 5.936%) | | | 0.578 | % | | | 4/20/46 | | | | 1,578,321 | | | | 190,201 | (a) |
See Notes to Financial Statements.
| | | | | | |
Western Asset Mortgage Total Return Fund 2023 Annual Report | | | | | 25 | |
Schedule of investments (cont’d)
December 31, 2023
Western Asset Mortgage Total Return Fund
(Percentages shown based on Fund net assets)
| | | | | | | | | | | | | | | | |
| Security | | Rate | | | Maturity Date | | | Face Amount | | | Value | |
| Collateralized Mortgage Obligations (c) — continued | |
Government National Mortgage Association (GNMA), 2016-87 IO, IO | | | 0.640 | % | | | 8/16/58 | | | $ | 2,738,904 | | | $ | 67,181 | (a) |
Government National Mortgage Association (GNMA), 2016-156 PB | | | 2.000 | % | | | 11/20/46 | | | | 5,417,124 | | | | 3,800,067 | |
Government National Mortgage Association (GNMA), 2017-19 SE, IO (-1.000 x 1 mo. Term SOFR + 6.036%) | | | 0.677 | % | | | 2/16/47 | | | | 2,260,687 | | | | 242,358 | (a) |
Government National Mortgage Association (GNMA), 2017-21 IO, IO | | | 0.633 | % | | | 10/16/58 | | | | 8,024,523 | | | | 275,502 | (a) |
Government National Mortgage Association (GNMA), 2017-26 IQ, IO | | | 5.000 | % | | | 2/20/40 | | | | 3,388,825 | | | | 655,702 | |
Government National Mortgage Association (GNMA), 2017-41 IO, IO | | | 0.585 | % | | | 7/16/58 | | | | 491,815 | | | | 13,904 | (a) |
Government National Mortgage Association (GNMA), 2017-190 IO, IO | | | 0.618 | % | | | 3/16/60 | | | | 1,422,517 | | | | 49,625 | (a) |
Government National Mortgage Association (GNMA), 2018-168 PA, PAC | | | 4.000 | % | | | 8/20/48 | | | | 932,891 | | | | 889,482 | |
Government National Mortgage Association (GNMA), 2018-125 HS, IO (-1.000 x 1 mo. Term SOFR + 6.136%) | | | 0.778 | % | | | 9/20/48 | | | | 1,390,371 | | | | 145,129 | (a) |
Government National Mortgage Association (GNMA), 2018-134 SM, IO (-1.000 x 1 mo. Term SOFR + 6.086%) | | | 0.728 | % | | | 10/20/48 | | | | 2,119,929 | | | | 223,856 | (a) |
Government National Mortgage Association (GNMA), 2019-18 TP, PAC | | | 3.500 | % | | | 2/20/49 | | | | 634,285 | | | | 582,444 | |
Government National Mortgage Association (GNMA), 2019-85 LS, IO (-1.000 x 1 mo. Term SOFR + 3.176%) | | | 0.000 | % | | | 7/20/49 | | | | 15,157,241 | | | | 460,098 | (a) |
Government National Mortgage Association (GNMA), 2020-33 SD, IO (-1.000 x 1 mo. Term SOFR + 6.036%) | | | 0.678 | % | | | 7/20/47 | | | | 875,069 | | | | 112,151 | (a) |
Government National Mortgage Association (GNMA), 2020-36 GS, IO (-1.000 x 1 mo. Term SOFR + 5.986%) | | | 0.628 | % | | | 3/20/50 | | | | 5,436,145 | | | | 799,358 | (a) |
Government National Mortgage Association (GNMA), 2020-47 MI, IO, PAC | | | 3.500 | % | | | 4/20/50 | | | | 485,233 | | | | 82,003 | |
Government National Mortgage Association (GNMA), 2020-47 NI, IO, PAC | | | 3.500 | % | | | 4/20/50 | | | | 206,336 | | | | 34,339 | |
Government National Mortgage Association (GNMA), 2020-61 CI, IO, PAC | | | 4.000 | % | | | 3/20/50 | | | | 1,182,014 | | | | 203,922 | |
See Notes to Financial Statements.
| | | | |
| 26 | | | | Western Asset Mortgage Total Return Fund 2023 Annual Report |
Western Asset Mortgage Total Return Fund
(Percentages shown based on Fund net assets)
| | | | | | | | | | | | | | | | |
| Security | | Rate | | | Maturity Date | | | Face Amount | | | Value | |
| Collateralized Mortgage Obligations (c) — continued | |
Government National Mortgage Association (GNMA), 2020-85 CI, IO, PAC | | | 3.500 | % | | | 4/20/50 | | | $ | 1,235,432 | | | $ | 202,242 | |
Government National Mortgage Association (GNMA), 2020-109 AI, IO | | | 0.838 | % | | | 5/16/60 | | | | 4,680,737 | | | | 260,461 | (a) |
Government National Mortgage Association (GNMA), 2020-116 GI, IO | | | 2.500 | % | | | 8/20/50 | | | | 6,230,452 | | | | 844,614 | |
Government National Mortgage Association (GNMA), 2020-122 IM, IO | | | 2.500 | % | | | 8/20/50 | | | | 2,267,527 | | | | 309,036 | |
Government National Mortgage Association (GNMA), 2020-123 EI, IO | | | 2.500 | % | | | 8/20/50 | | | | 4,514,558 | | | | 614,152 | |
Government National Mortgage Association (GNMA), 2020-129 IE, IO | | | 2.500 | % | | | 9/20/50 | | | | 150,667 | | | | 20,512 | |
Government National Mortgage Association (GNMA), 2020-160 QI, IO | | | 2.500 | % | | | 10/20/50 | | | | 4,860,982 | | | | 869,593 | |
Government National Mortgage Association (GNMA), 2020-160 VI, IO | | | 2.500 | % | | | 10/20/50 | | | | 226,444 | | | | 32,291 | |
Government National Mortgage Association (GNMA), 2020-160 YI, IO | | | 2.500 | % | | | 10/20/50 | | | | 611,047 | | | | 82,413 | |
Government National Mortgage Association (GNMA), 2020-181 WI, IO | | | 2.000 | % | | | 12/20/50 | | | | 1,154,883 | | | | 125,760 | |
Government National Mortgage Association (GNMA), 2020-191 IX, IO | | | 2.500 | % | | | 12/20/50 | | | | 3,905,240 | | | | 702,696 | |
Government National Mortgage Association (GNMA), 2020-H02 FG (1 mo. Term SOFR + 0.714%) | | | 6.037 | % | | | 1/20/70 | | | | 956,689 | | | | 951,925 | (a) |
Government National Mortgage Association (GNMA), 2020-H08 BI, IO | | | 0.026 | % | | | 4/1/70 | | | | 7,101,386 | | | | 232,322 | (a) |
Government National Mortgage Association (GNMA), 2020-H12 F (1 mo. Term SOFR + 0.614%) | | | 5.937 | % | | | 7/20/70 | | | | 48,923 | | | | 47,629 | (a) |
Government National Mortgage Association (GNMA), 2020-H13 FA (1 mo. Term SOFR + 0.564%) | | | 5.887 | % | | | 7/20/70 | | | | 499,384 | | | | 483,980 | (a) |
Government National Mortgage Association (GNMA), 2021-8 AQ | | | 5.000 | % | | | 1/20/51 | | | | 731,547 | | | | 745,581 | |
Government National Mortgage Association (GNMA), 2021-14 AB | | | 1.340 | % | | | 6/16/63 | | | | 1,152,825 | | | | 871,623 | |
Government National Mortgage Association (GNMA), 2021-21 AH | | | 1.400 | % | | | 6/16/63 | | | | 2,948,261 | | | | 2,235,687 | |
Government National Mortgage Association (GNMA), 2021-29 AG | | | 5.000 | % | | | 2/20/51 | | | | 1,100,013 | | | | 1,096,815 | |
See Notes to Financial Statements.
| | | | | | |
Western Asset Mortgage Total Return Fund 2023 Annual Report | | | | | 27 | |
Schedule of investments (cont’d)
December 31, 2023
Western Asset Mortgage Total Return Fund
(Percentages shown based on Fund net assets)
| | | | | | | | | | | | | | | | |
| Security | | Rate | | | Maturity
Date | | | Face
Amount | | | Value | |
| Collateralized Mortgage Obligations (c) — continued | |
Government National Mortgage Association (GNMA), 2021-216 NI, IO | | | 3.000 | % | | | 12/20/51 | | | $ | 4,261,006 | | | $ | 782,856 | |
Government National Mortgage Association (GNMA), 2021-7 TI, IO | | | 2.500 | % | | | 1/16/51 | | | | 4,706,792 | | | | 815,674 | |
Government National Mortgage Association (GNMA), 2021-15 TQ, IO (-1.000 x 1 mo. Term SOFR + 6.186%) | | | 0.828 | % | | | 12/20/50 | | | | 21,521,376 | | | | 1,406,695 | (a) |
Government National Mortgage Association (GNMA), 2021-29 TI, IO | | | 2.500 | % | | | 2/20/51 | | | | 723,181 | | | | 130,399 | |
Government National Mortgage Association (GNMA), 2021-60 IO, IO | | | 0.826 | % | | | 5/16/63 | | | | 4,591,172 | | | | 271,480 | (a) |
Government National Mortgage Association (GNMA), 2021-68 IO, IO | | | 0.871 | % | | | 10/16/62 | | | | 4,493,389 | | | | 273,273 | (a) |
Government National Mortgage Association (GNMA), 2021-156 IE, IO | | | 2.500 | % | | | 9/20/51 | | | | 4,565,152 | | | | 712,118 | |
Government National Mortgage Association (GNMA), 2021-158 IN, IO | | | 2.500 | % | | | 9/20/51 | | | | 7,806,887 | | | | 1,073,401 | |
Government National Mortgage Association (GNMA), 2021-158 XB, IO | | | 2.500 | % | | | 9/20/51 | | | | 5,027,862 | | | | 690,969 | |
Government National Mortgage Association (GNMA), 2021-180 IO, IO | | | 0.912 | % | | | 11/16/63 | | | | 2,323,558 | | | | 159,437 | (a) |
Government National Mortgage Association (GNMA), 2022-54 Z | | | 2.000 | % | | | 10/16/63 | | | | 1,864,061 | | | | 930,027 | (a) |
Government National Mortgage Association (GNMA), 2022-139 AL | | | 4.000 | % | | | 7/20/51 | | | | 1,200,000 | | | | 1,091,942 | |
Government National Mortgage Association (GNMA), 2022-147 B | | | 2.200 | % | | | 10/16/63 | | | | 6,500,000 | | | | 4,581,926 | |
Government National Mortgage Association (GNMA), 2022-158 AL | | | 2.100 | % | | | 8/16/64 | | | | 5,936,356 | | | | 4,362,696 | |
Government National Mortgage Association (GNMA), 2022-86 C | | | 2.250 | % | | | 10/16/63 | | | | 800,000 | | | | 396,944 | (a) |
Government National Mortgage Association (GNMA), 2023-92 AH | | | 2.000 | % | | | 6/16/64 | | | | 2,899,701 | | | | 2,245,458 | |
Government National Mortgage Association (GNMA), 2023-92 IA, IO | | | 0.611 | % | | | 6/16/64 | | | | 1,999,794 | | | | 124,860 | (a) |
Government National Mortgage Association (GNMA), 2023-179 IO, IO | | | 0.612 | % | | | 9/16/63 | | | | 7,487,035 | | | | 313,890 | (a) |
GS Mortgage Securities Corp. II, 2018-SRP5 D (1 mo. Term SOFR + 6.614%) | | | 11.976 | % | | | 9/15/31 | | | | 4,450,678 | | | | 483,223 | (a)(d) |
GS Mortgage Securities Corp. Trust, 2018- LUAU G (1 mo. Term SOFR + 4.747%) | | | 10.109 | % | | | 11/15/32 | | | | 1,070,000 | | | | 1,034,909 | (a)(d) |
See Notes to Financial Statements.
| | | | |
| 28 | | | | Western Asset Mortgage Total Return Fund 2023 Annual Report |
Western Asset Mortgage Total Return Fund
(Percentages shown based on Fund net assets)
| | | | | | | | | | | | | | | | |
| Security | | Rate | | | Maturity
Date | | | Face Amount | | | Value | |
| Collateralized Mortgage Obligations (c) — continued | |
GS Mortgage Securities Corp. Trust, 2021-IP A (1 mo. Term SOFR + 1.064%) | | | 6.426 | % | | | 10/15/36 | | | $ | 360,000 | | | $ | 347,661 | (a)(d) |
GS Mortgage Securities Trust, 2019-GC39 XA, IO | | | 1.105 | % | | | 5/10/52 | | | | 40,068,395 | | | | 1,661,777 | (a) |
GS Mortgage Securities Trust, 2020-GC47 XA, IO | | | 1.127 | % | | | 5/12/53 | | | | 16,930,142 | | | | 938,086 | (a) |
GS Mortgage-Backed Securities Trust, 2022- NQM1 B4 | | | 4.103 | % | | | 5/25/62 | | | | 1,492,742 | | | | 1,130,826 | (a)(d) |
GSMPS Mortgage Loan Trust, 2006-RP2 1AF1 (1 mo. Term SOFR + 0.514%) | | | 5.870 | % | | | 4/25/36 | | | | 993,144 | | | | 817,696 | (a)(d) |
Impac CMB Trust, 2004-10 3A1 (1 mo. Term SOFR + 0.814%) | | | 6.170 | % | | | 3/25/35 | | | | 70,553 | | | | 66,980 | (a) |
IMPAC CMB Trust, 2007-A A (1 mo. Term SOFR + 0.614%) | | | 5.970 | % | | | 5/25/37 | | | | 186,162 | | | | 174,569 | (a)(d) |
JPMDB Commercial Mortgage Securities Trust, 2017-C7 B | | | 3.985 | % | | | 10/15/50 | | | | 420,000 | | | | 358,918 | |
JPMorgan Chase Commercial Mortgage Securities Trust, 2007-LD12 AJ | | | 6.349 | % | | | 2/15/51 | | | | 15,831 | | | | 14,679 | (a) |
JPMorgan Chase Commercial Mortgage Securities Trust, 2015-FL7 D (PRIME + 0.693%) | | | 9.193 | % | | | 5/15/28 | | | | 2,873,012 | | | | 2,558,106 | (a)(d) |
JPMorgan Chase Commercial Mortgage Securities Trust, 2015-JP1 C | | | 4.723 | % | | | 1/15/49 | | | | 130,000 | | | | 109,083 | (a) |
JPMorgan Chase Commercial Mortgage Securities Trust, 2019-COR5 XA, IO | | | 1.465 | % | | | 6/13/52 | | | | 15,583,021 | | | | 834,896 | (a) |
JPMorgan Chase Commercial Mortgage Securities Trust, 2020-MKST G (1 mo. Term SOFR + 4.614%) | | | 10.226 | % | | | 12/15/36 | | | | 2,018,000 | | | | 115,069 | (a)(d) |
JPMorgan Chase Commercial Mortgage Securities Trust, 2020-MKST H (1 mo. Term SOFR + 7.114%) | | | 12.726 | % | | | 12/15/36 | | | | 2,106,000 | | | | 76,220 | (a)(d) |
JPMorgan Chase Commercial Mortgage Securities Trust, 2020-NNN GFX | | | 4.688 | % | | | 1/16/37 | | | | 2,530,000 | | | | 1,114,278 | (a)(d) |
JPMorgan Chase Commercial Mortgage Securities Trust, 2021-NYAH H (1 mo. Term SOFR + 3.504%) | | | 8.866 | % | | | 6/15/38 | | | | 360,000 | | | | 244,174 | (a)(d) |
La Hipotecaria El Salvadorian Mortgage Trust, 2019-1A AAA | | | 4.250 | % | | | 9/29/46 | | | | 1,258,018 | | | | 1,180,964 | (d)(e)(f) |
MASTR Adjustable Rate Mortgages Trust, 2006-OA1 1A1 (1 mo. Term SOFR + 0.324%) | | | 5.680 | % | | | 4/25/46 | | | | 240,557 | | | | 211,322 | (a) |
See Notes to Financial Statements.
| | | | | | |
Western Asset Mortgage Total Return Fund 2023 Annual Report | | | | | 29 | |
Schedule of investments (cont’d)
December 31, 2023
Western Asset Mortgage Total Return Fund
(Percentages shown based on Fund net assets)
| | | | | | | | | | | | | | | | |
| Security | | Rate | | | Maturity
Date | | | Face
Amount | | | Value | |
| Collateralized Mortgage Obligations (c) — continued | |
Med Trust, 2021-MDLN F (1 mo. Term SOFR + 4.114%) | | | 9.476 | % | | | 11/15/38 | | | $ | 1,990,447 | | | $ | 1,937,532 | (a)(d) |
ML-CFC Commercial Mortgage Trust, 2007-5 AJFL | | | 5.450 | % | | | 8/12/48 | | | | 350,068 | | | | 55,503 | (a)(d) |
Morgan Stanley Capital I Trust, 2007-IQ16 AJ | | | 6.079 | % | | | 12/12/49 | | | | 39,657 | | | | 19,645 | (a) |
Morgan Stanley Mortgage Loan Trust, 2006- 8AR 1A2 (1 mo. Term SOFR + 0.254%) | | | 5.610 | % | | | 6/25/36 | | | | 29,426 | | | | 5,963 | (a) |
Morgan Stanley Re-REMIC Trust, 2015-R6 1A1 (1 mo. Term SOFR + 0.374%) | | | 4.698 | % | | | 7/26/45 | | | | 474 | | | | 474 | (a)(d) |
MRCD Mortgage Trust, 2019-PRKC A | | | 4.250 | % | | | 12/15/36 | | | | 2,097,000 | | | | 1,257,055 | (a)(d) |
Multifamily CAS Trust, 2020-1 CE (30 Day Average SOFR + 7.614%) | | | 12.952 | % | | | 3/25/50 | | | | 4,500,000 | | | | 4,423,332 | (a)(d) |
Multifamily Trust, 2016-1 B | | | 6.270 | % | | | 4/25/46 | | | | 638,133 | | | | 637,174 | (a)(d) |
Natixis Commercial Mortgage Securities Trust, 2019-FAME D | | | 4.398 | % | | | 8/15/36 | | | | 1,950,000 | | | | 1,166,796 | (a)(d) |
Natixis Commercial Mortgage Securities Trust, 2019-FAME E | | | 4.398 | % | | | 8/15/36 | | | | 2,077,000 | | | | 1,035,127 | (a)(d) |
New Residential Mortgage Loan Trust, 2014-1A A | | | 3.750 | % | | | 1/25/54 | | | | 447,030 | | | | 423,432 | (a)(d) |
NewRez Warehouse Securitization Trust, 2021-1 F (1 mo. Term SOFR + 5.364%) | | | 10.720 | % | | | 5/25/55 | | | | 1,157,000 | | | | 1,159,323 | (a)(d) |
NovaStar Mortgage Funding Trust, 2006- MTA1 2A1A (1 mo. Term SOFR + 0.494%) | | | 0.523 | % | | | 9/25/46 | | | | 54,134 | | | | 49,147 | (a) |
OPG Trust, 2021-PORT A (1 mo. Term SOFR + 0.598%) | | | 5.960 | % | | | 10/15/36 | | | | 454,264 | | | | 444,151 | (a)(d) |
PMT Credit Risk Transfer Trust, 2019-2R A (1 mo. Term SOFR + 3.864%) | | | 9.221 | % | | | 5/30/25 | | | | 955,632 | | | | 957,145 | (a)(d) |
PRKCM Trust, 2023-AFC1 A3 | | | 7.304 | % | | | 2/25/58 | | | | 2,515,819 | | | | 2,513,227 | (d) |
Redwood Funding Trust, 2019-1 PT | | | 4.968 | % | | | 9/27/24 | | | | 6,368,253 | | | | 6,408,655 | (d) |
Starwood Retail Property Trust, 2014-STAR C | | | 8.500 | % | | | 11/15/27 | | | | 2,324,000 | | | | 241,115 | (a)(d) |
Starwood Retail Property Trust, 2014-STAR D | | | 8.500 | % | | | 11/15/27 | | | | 650,000 | | | | 26,000 | (a)(d) |
Structured Asset Mortgage Investments II Trust, 2006-AR6 1A1 (1 mo. Term SOFR + 0.474%) | | | 5.830 | % | | | 7/25/46 | | | | 69,266 | | | | 57,158 | (a) |
Structured Asset Securities Corp., 2005-RF3 1A (1 mo. Term SOFR + 0.464%) | | | 5.820 | % | | | 6/25/35 | | | | 133,654 | | | | 115,036 | (a)(d) |
WaMu Mortgage Pass-Through Certificates Trust, 2003-AR5 A7 | | | 4.821 | % | | | 6/25/33 | | | | 17,261 | | | | 17,128 | (a) |
See Notes to Financial Statements.
| | | | |
| 30 | | | | Western Asset Mortgage Total Return Fund 2023 Annual Report |
Western Asset Mortgage Total Return Fund
(Percentages shown based on Fund net assets)
| | | | | | | | | | | | | | | | |
| Security | | Rate | | | Maturity Date | | | Face Amount | | | Value | |
| Collateralized Mortgage Obligations (c) — continued | | | | | | | | | | | | | | | | |
Wells Fargo Commercial Mortgage Trust, 2019-C51 A4 | | | 3.311 | % | | | 6/15/52 | | | $ | 1,370,000 | | | $ | 1,226,836 | |
Wells Fargo Commercial Mortgage Trust, 2021-C59 XA, IO | | | 1.521 | % | | | 4/15/54 | | | | 12,377,008 | | | | 931,976 | (a) |
Total Collateralized Mortgage Obligations (Cost — $266,259,296) | | | | 230,425,136 | |
| | | | |
| | | | | | | | | Face Amount/ Units | | | | |
| Asset-Backed Securities — 10.1% | | | | | | | | | | | | | | | | |
Applebee’s Funding LLC/IHOP Funding LLC, 2019-1A A2II | | | 4.723 | % | | | 6/5/49 | | | | 298,980 | | | | 287,517 | (d) |
Aqua Finance Trust, 2020-AA C | | | 3.970 | % | | | 7/17/46 | | | | 3,200,000 | | | | 2,835,476 | (d) |
Avis Budget Rental Car Funding AESOP LLC, 2023-8A C | | | 7.340 | % | | | 2/20/30 | | | | 3,700,000 | | | | 3,784,512 | (d) |
CARS-DB7 LP, 2023-1A A1 | | | 5.750 | % | | | 9/15/53 | | | | 1,247,400 | | | | 1,255,448 | (d) |
Castlelake Aircraft Structured Trust, 2021-1A A | | | 3.474 | % | | | 1/15/46 | | | | 539,841 | | | | 496,169 | (d) |
College Ave Student Loans LLC, 2021-C D | | | 4.110 | % | | | 7/26/55 | | | | 1,500,000 | | | | 1,301,760 | (d) |
Conseco Finance Corp., 1997-4 M1 | | | 7.220 | % | | | 2/15/29 | | | | 416,658 | | | | 419,116 | (a) |
Countrywide Asset-Backed Certificates Trust, 2002-S3 M1 | | | 4.800 | % | | | 5/25/32 | | | | 1,855 | | | | 1,360 | (a) |
Countrywide Asset-Backed Certificates Trust, 2006-SD3 A1 (1 mo. Term SOFR + 0.774%) | | | 6.130 | % | | | 7/25/36 | | | | 62,506 | | | | 61,584 | (a)(d) |
Credit Suisse European Mortgage Capital Ltd., 2019-1OTF A (3 mo. USD LIBOR + 2.900%) | | | 8.552 | % | | | 8/9/24 | | | | 4,600,000 | | | | 4,512,167 | (a)(d) |
Credit Suisse European Mortgage Capital Ltd., 2020-1OTF A (3 mo. USD LIBOR + 2.900%) | | | 7.390 | % | | | 8/9/24 | | | | 2,773,869 | | | | 2,704,939 | (d) |
GoodLeap Sustainable Home Solutions Trust, 2021-5CS C | | | 3.500 | % | | | 10/20/48 | | | | 1,372,662 | | | | 1,016,485 | (d) |
Helios Issuer LLC, 2023-GRID1 1A | | | 5.750 | % | | | 12/20/50 | | | | 2,154,608 | | | | 2,213,322 | (d) |
Hertz Vehicle Financing LLC, 2023-4A C | | | 7.510 | % | | | 3/25/30 | | | | 1,750,000 | | | | 1,818,331 | (d) |
J.G. Wentworth LLC, 2018-1A B | | | 4.700 | % | | | 10/15/74 | | | | 1,816,293 | | | | 1,512,377 | (d) |
Lunar Structured Aircraft Portfolio Notes, 2021-1 B | | | 3.432 | % | | | 10/15/46 | | | | 818,127 | | | | 679,945 | (d) |
Navient Private Education Refi Loan Trust, 2020-BA B | | | 2.770 | % | | | 1/15/69 | | | | 5,000,000 | | | | 4,019,383 | (d) |
Renew, 2023-1A A | | | 5.900 | % | | | 11/20/58 | | | | 1,669,500 | | | | 1,642,515 | (d) |
See Notes to Financial Statements.
| | | | | | |
Western Asset Mortgage Total Return Fund 2023 Annual Report | | | | | 31 | |
Schedule of investments (cont’d)
December 31, 2023
Western Asset Mortgage Total Return Fund
(Percentages shown based on Fund net assets)
| | | | | | | | | | | | | | | | |
| Security | | Rate | | | Maturity Date | | | Face Amount/ Units | | | Value | |
| Asset-Backed Securities — continued | | | | | | | | | |
SBA Small Business Investment Cos., 2023-10B 1 | | | 5.688 | % | | | 9/10/33 | | | $ | 2,060,000 | | | $ | 2,145,003 | |
SMB Private Education Loan Trust, 2014-A R | | | 0.000 | % | | | 9/15/45 | | | | 22,179 | | | | 1,524,247 | (d) |
SMB Private Education Loan Trust, 2015-C R | | | 0.000 | % | | | 9/18/46 | | | | 2,751 | | | | 682,497 | (d) |
SMB Private Education Loan Trust, 2020-A B | | | 3.000 | % | | | 8/15/45 | | | | 2,000,000 | | | | 1,721,527 | (d) |
SMB Private Education Loan Trust, 2021-A C | | | 2.990 | % | | | 1/15/53 | | | | 4,247,777 | | | | 3,617,675 | (d) |
SoFi Professional Loan Program LLC, 2017-F R1 | | | 0.000 | % | | | 1/25/41 | | | | 25,000 | | | | 262,082 | (d) |
SoFi Professional Loan Program Trust, 2020-A BFX | | | 3.120 | % | | | 5/15/46 | | | | 3,200,000 | | | | 2,598,349 | (d) |
Stonepeak, 2021-1A B | | | 3.821 | % | | | 2/28/33 | | | | 1,738,469 | | | | 1,488,442 | (d) |
Structured Asset Securities Corp. Mortgage Loan Trust, 2006-ARS1 A1 (1 mo. Term SOFR + 0.334%) | | | 5.690 | % | | | 2/25/36 | | | | 1,355,739 | | | | 29,694 | (a)(d) |
Thrust Engine Leasing, 2021-1A A | | | 4.163 | % | | | 7/15/40 | | | | 890,813 | | | | 770,005 | (d) |
Total Asset-Backed Securities (Cost — $62,311,656) | | | | | | | | 45,401,927 | |
| | | | |
| | | | | | | | | Face Amount | | | | |
| Convertible Bonds & Notes — 0.3% | | | | | | | | | | | | | | | | |
| Financials — 0.3% | | | | | | | | | | | | | | | | |
Mortgage Real Estate Investment Trusts (REITs) — 0.3% | | | | | | | | | |
Two Harbors Investment Corp., Senior Notes
(Cost — $1,476,259) | | | 6.250 | % | | | 1/15/26 | | | | 1,600,000 | | | | 1,480,000 | |
Total Investments — 113.6% (Cost — $576,022,358) | | | | | | | | 513,338,822 | |
Liabilities in Excess of Other Assets — (13.6)% | | | | | | | | | | | | | | | (61,358,084 | ) |
Total Net Assets — 100.0% | | | | | | | | | | | | | | $ | 451,980,738 | |
See Notes to Financial Statements.
| | | | |
| 32 | | | | Western Asset Mortgage Total Return Fund 2023 Annual Report |
Western Asset Mortgage Total Return Fund
| (a) | Variable rate security. Interest rate disclosed is as of the most recent information available. Certain variable rate securities are not based on a published reference rate and spread but are determined by the issuer or agent and are based on current market conditions. These securities do not indicate a reference rate and spread in their description above. |
| (b) | This security is traded on a to-be-announced (“TBA”) basis. At December 31, 2023, the Fund held TBA securities with a total cost of $65,982,490. |
| (c) | Collateralized mortgage obligations are secured by an underlying pool of mortgages or mortgage pass-through certificates that are structured to direct payments on underlying collateral to different series or classes of the obligations. The interest rate may change positively or inversely in relation to one or more interest rates, financial indices or other financial indicators and may be subject to an upper and/or lower limit. |
| (d) | Security is exempt from registration under Rule 144A of the Securities Act of 1933. This security may be resold in transactions that are exempt from registration, normally to qualified institutional buyers. This security has been deemed liquid pursuant to guidelines approved by the Board of Trustees. |
| (e) | Security is fair valued in accordance with procedures approved by the Board of Trustees (Note 1). |
| (f) | Security is valued using significant unobservable inputs (Note 1). |
| | |
Abbreviation(s) used in this schedule: |
| |
| ACES | | — Alternative Credit Enhancement Securities |
| |
| CAS | | — Connecticut Avenue Securities |
| |
| IBOR | | — Interbank Offered Rate |
| |
| IO | | — Interest Only |
| |
| LIBOR | | — London Interbank Offered Rate |
| |
| PAC | | — Planned Amortization Class |
| |
| PO | | — Principal Only |
| |
| REMIC | | — Real Estate Mortgage Investment Conduit |
| |
| Re-REMIC | | — Resecuritization of Real Estate Mortgage Investment Conduit |
| |
| SOFR | | — Secured Overnight Financing Rate |
| |
| STRIPS | | — Separate Trading of Registered Interest and Principal Securities |
| |
| USD | | — United States Dollar |
At December 31, 2023, the Fund had the following open futures contracts:
| | | | | | | | | | | | | | | | | | | | |
| | | Number of Contracts | | | Expiration Date | | | Notional Amount | | | Market Value | | | Unrealized Appreciation (Depreciation) | |
| Contracts to Buy: | | | | | | | | | | | | | | | | | | | | |
| U.S. Treasury 5-Year Notes | | | 343 | | | | 3/24 | | | $ | 37,203,943 | | | $ | 37,309,290 | | | $ | 105,347 | |
| U.S. Treasury 10-Year Notes | | | 202 | | | | 3/24 | | | | 22,731,147 | | | | 22,803,908 | | | | 72,761 | |
| U.S. Treasury Long-Term Bonds | | | 93 | | | | 3/24 | | | | 11,657,692 | | | | 11,619,187 | | | | (38,505) | |
| Net unrealized appreciation on open futures contracts | | | | | | | $ | 139,603 | |
See Notes to Financial Statements.
| | | | | | |
Western Asset Mortgage Total Return Fund 2023 Annual Report | | | | | 33 | |
Statement of assets and liabilities
December 31, 2023
| | | | |
| |
| Assets: | | | | |
Investments, at value (Cost — $576,022,358) | | $ | 513,338,822 | |
Foreign currency, at value (Cost — $102,983) | | | 93,973 | |
Cash | | | 861,891 | |
Receivable for securities sold | | | 150,146,982 | |
Interest receivable | | | 2,318,776 | |
Deposits with brokers for open futures contracts | | | 1,362,795 | |
Receivable for Fund shares sold | | | 212,704 | |
Receivable from brokers — net variation margin on open futures contracts | | | 12,040 | |
Dividends receivable from affiliated investments | | | 3,754 | |
Prepaid expenses | | | 12,529 | |
Total Assets | | | 668,364,266 | |
| |
| Liabilities: | | | | |
Payable for securities purchased | | | 215,282,885 | |
Payable for Fund shares repurchased | | | 495,679 | |
Investment management fee payable | | | 191,654 | |
Distributions payable | | | 127,203 | |
Service and/or distribution fees payable | | | 79,238 | |
Trustees’ fees payable | | | 2,911 | |
Accrued expenses | | | 203,958 | |
Total Liabilities | | | 216,383,528 | |
| Total Net Assets | | $ | 451,980,738 | |
| |
| Net Assets: | | | | |
Par value (Note 7) | | $ | 544 | |
Paid-in capital in excess of par value | | | 624,182,353 | |
Total distributable earnings (loss) | | | (172,202,159) | |
| Total Net Assets | | $ | 451,980,738 | |
See Notes to Financial Statements.
| | | | |
| 34 | | | | Western Asset Mortgage Total Return Fund 2023 Annual Report |
| | | | |
| |
| Net Assets: | | | | |
Class 1 | | | $15,213,753 | |
Class A | | | $365,438,868 | |
Class C | | | $2,921,294 | |
Class C1 | | | $44,463 | |
Class I | | | $56,519,913 | |
Class IS | | | $11,842,447 | |
| |
| Shares Outstanding: | | | | |
Class 1 | | | 1,830,471 | |
Class A | | | 44,019,354 | |
Class C | | | 351,845 | |
Class C1 | | | 5,373 | |
Class I | | | 6,776,989 | |
Class IS | | | 1,419,434 | |
| |
| Net Asset Value: | | | | |
Class 1 (and redemption price) | | | $8.31 | |
Class A (and redemption price) | | | $8.30 | |
Class C* | | | $8.30 | |
Class C1* | | | $8.28 | |
Class I (and redemption price) | | | $8.34 | |
Class IS (and redemption price) | | | $8.34 | |
| Maximum Public Offering Price Per Share: | | | | |
Class A (based on maximum initial sales charge of 3.75%) | | | $8.62 | |
| * | Redemption price per share is NAV of Class C and Class C1 shares reduced by a 1.00% CDSC if shares are redeemed within one year from purchase payment (Note 2). |
See Notes to Financial Statements.
| | | | | | |
Western Asset Mortgage Total Return Fund 2023 Annual Report | | | | | 35 | |
Statement of operations
For the Year Ended December 31, 2023
| | | | |
| |
| Investment Income: | | | | |
Interest | | $ | 25,920,570 | |
Dividends from affiliated investments | | | 38,446 | |
Total Investment Income | | | 25,959,016 | |
| |
| Expenses: | | | | |
Investment management fee (Note 2) | | | 2,469,815 | |
Service and/or distribution fees (Notes 2 and 5) | | | 997,482 | |
Transfer agent fees (Notes 2 and 5) | | | 677,145 | |
Registration fees | | | 91,773 | |
Fund accounting fees | | | 69,948 | |
Audit and tax fees | | | 47,221 | |
Shareholder reports | | | 26,290 | |
Legal fees | | | 20,067 | |
Trustees’ fees | | | 11,298 | |
Commitment fees (Note 9) | | | 4,213 | |
Insurance | | | 3,630 | |
Custody fees | | | 413 | |
Miscellaneous expenses | | | 8,516 | |
Total Expenses | | | 4,427,811 | |
Less: Fee waivers and/or expense reimbursements (Notes 2 and 5) | | | (931) | |
Net Expenses | | | 4,426,880 | |
| Net Investment Income | | | 21,532,136 | |
| |
Realized and Unrealized Gain (Loss) on Investments, Futures Contracts,
Written Options and Foreign Currency Transactions (Notes 1, 3 and 4): | | | | |
Net Realized Loss From: | | | | |
Investment transactions in unaffiliated securities | | | (8,870,490) | |
Futures contracts | | | (10,390,040) | |
Written options | | | (10,371) | |
Net Realized Loss | | | (19,270,901) | |
Change in Net Unrealized Appreciation (Depreciation) From: | | | | |
Investments in unaffiliated securities | | | 15,318,364 | |
Futures contracts | | | 240,594 | |
Foreign currencies | | | 2,847 | |
Change in Net Unrealized Appreciation (Depreciation) | | | 15,561,805 | |
| Net Loss on Investments, Futures Contracts, Written Options and Foreign Currency Transactions | | | (3,709,096) | |
| Increase in Net Assets From Operations | | $ | 17,823,040 | |
See Notes to Financial Statements.
| | | | |
| 36 | | | | Western Asset Mortgage Total Return Fund 2023 Annual Report |
Statements of changes in net assets
| | | | | | | | |
| For the Years Ended December 31, | | 2023 | | | 2022 | |
| | |
| Operations: | | | | | | | | |
Net investment income | | $ | 21,532,136 | | | $ | 18,131,520 | |
Net realized loss | | | (19,270,901) | | | | (43,069,620) | |
Change in net unrealized appreciation (depreciation) | | | 15,561,805 | | | | (67,704,758) | |
Increase (Decrease) in Net Assets From Operations | | | 17,823,040 | | | | (92,642,858) | |
| | |
| Distributions to Shareholders From (Notes 1 and 6): | | | | | | | | |
Total distributable earnings | | | (21,874,888) | | | | (22,095,602) | |
Decrease in Net Assets From Distributions to Shareholders | | | (21,874,888) | | | | (22,095,602) | |
| | |
| Fund Share Transactions (Note 7): | | | | | | | | |
Net proceeds from sale of shares | | | 50,577,908 | | | | 94,519,788 | |
Reinvestment of distributions | | | 20,051,959 | | | | 20,337,419 | |
Cost of shares repurchased | | | (143,670,369) | | | | (177,623,466) | |
Decrease in Net Assets From Fund Share Transactions | | | (73,040,502) | | | | (62,766,259) | |
Decrease in Net Assets | | | (77,092,350) | | | | (177,504,719) | |
| | |
| Net Assets: | | | | | | | | |
Beginning of year | | | 529,073,088 | | | | 706,577,807 | |
End of year | | $ | 451,980,738 | | | $ | 529,073,088 | |
See Notes to Financial Statements.
| | | | | | |
Western Asset Mortgage Total Return Fund 2023 Annual Report | | | | | 37 | |
Financial highlights
| | | | | | | | | | | | | | | | | | | | |
| For a share of each class of beneficial interest outstanding throughout each year ended December 31: | |
| Class 1 Shares1 | | 2023 | | | 2022 | | | 2021 | | | 2020 | | | 2019 | |
| | | | | |
| Net asset value, beginning of year | | | $8.36 | | | | $10.06 | | | | $10.25 | | | | $10.37 | | | | $10.22 | |
| | | | | |
| Income (loss) from operations: | | | | | | | | | | | | | | | | | | | | |
Net investment income | | | 0.38 | | | | 0.29 | | | | 0.13 | | | | 0.24 | | | | 0.45 | |
Net realized and unrealized gain (loss) | | | (0.05) | | | | (1.64) | | | | (0.03) | | | | 0.01 | 2 | | | 0.18 | |
Total income (loss) from operations | | | 0.33 | | | | (1.35) | | | | 0.10 | | | | 0.25 | | | | 0.63 | |
| | | | | |
| Less distributions from: | | | | | | | | | | | | | | | | | | | | |
Net investment income | | | (0.38) | | | | (0.35) | | | | (0.29) | | | | (0.37) | | | | (0.48) | |
Total distributions | | | (0.38) | | | | (0.35) | | | | (0.29) | | | | (0.37) | | | | (0.48) | |
| | | | | |
| Net asset value, end of year | | | $8.31 | | | | $8.36 | | | | $10.06 | | | | $10.25 | | | | $10.37 | |
Total return3 | | | 4.15 | % | | | (13.60) | % | | | 1.03 | % | | | 2.53 | % | | | 6.31 | % |
| | | | | |
| Net assets, end of year (000s) | | | $15,214 | | | | $16,756 | | | | $21,899 | | | | $24,394 | | | | $26,363 | |
| | | | | |
| Ratios to average net assets: | | | | | | | | | | | | | | | | | | | | |
Gross expenses | | | 0.71 | % | | | 0.69 | % | | | 0.66 | % | | | 0.70 | % | | | 0.67 | % |
Net expenses4,5 | | | 0.71 | | | | 0.69 | | | | 0.66 | | | | 0.69 | | | | 0.67 | |
Net investment income | | | 4.57 | | | | 3.18 | | | | 1.28 | | | | 2.30 | | | | 4.32 | |
| | | | | |
| Portfolio turnover rate6 | | | 56 | % | | | 43 | % | | | 52 | % | | | 108 | % | | | 74 | % |
| 1 | Per share amounts have been calculated using the average shares method. |
| 2 | Calculation of the net gain per share (both realized and unrealized) does not correlate to the aggregate realized and unrealized losses presented in the Statement of Operations due to the timing of the sales and repurchases of Fund shares in relation to fluctuating market values of the investments of the Fund. |
| 3 | Performance figures may reflect compensating balance arrangements, fee waivers and/or expense reimbursements. In the absence of compensating balance arrangements, fee waivers and/or expense reimbursements, the total return would have been lower. Past performance is no guarantee of future results. |
| 4 | Reflects fee waivers and/or expense reimbursements. |
| 5 | As a result of an expense limitation arrangement, the ratio of total annual fund operating expenses for Class 1 shares did not exceed the ratio of total annual fund operating expenses for Class A shares. This expense limitation arrangement cannot be terminated prior to December 31, 2025 without the Board of Trustees’ consent. In addition, the manager has agreed to waive the Fund’s management fee to an extent sufficient to offset the net management fee payable in connection with any investment in an affiliated money market fund. |
| 6 | Excluding mortgage dollar roll transactions. If mortgage dollar roll transactions had been included, the portfolio turnover rate would have been 101%, 58%, 123%, 160% and 115% for the years ended December 31, 2023, 2022, 2021, 2020 and 2019, respectively. |
See Notes to Financial Statements.
| | | | |
| 38 | | | | Western Asset Mortgage Total Return Fund 2023 Annual Report |
| | | | | | | | | | | | | | | | | | | | |
| For a share of each class of beneficial interest outstanding throughout each year ended December 31: | |
| Class A Shares1 | | 2023 | | | 2022 | | | 2021 | | | 2020 | | | 2019 | |
| | | | | |
| Net asset value, beginning of year | | | $8.35 | | | | $10.05 | | | | $10.24 | | | | $10.36 | | | | $10.21 | |
| | | | | |
| Income (loss) from operations: | | | | | | | | | | | | | | | | | | | | |
Net investment income | | | 0.36 | | | | 0.27 | | | | 0.10 | | | | 0.21 | | | | 0.42 | |
Net realized and unrealized gain (loss) | | | (0.05) | | | | (1.64) | | | | (0.02) | | | | 0.02 | 2 | | | 0.19 | |
Total income (loss) from operations | | | 0.31 | | | | (1.37) | | | | 0.08 | | | | 0.23 | | | | 0.61 | |
| | | | | |
| Less distributions from: | | | | | | | | | | | | | | | | | | | | |
Net investment income | | | (0.36) | | | | (0.33) | | | | (0.27) | | | | (0.35) | | | | (0.46) | |
Total distributions | | | (0.36) | | | | (0.33) | | | | (0.27) | | | | (0.35) | | | | (0.46) | |
| | | | | |
| Net asset value, end of year | | | $8.30 | | | | $8.35 | | | | $10.05 | | | | $10.24 | | | | $10.36 | |
Total return3 | | | 3.88 | % | | | (13.84) | % | | | 0.77 | % | | | 2.25 | % | | | 6.01 | % |
| | | | | |
| Net assets, end of year (millions) | | | $365 | | | | $404 | | | | $520 | | | | $521 | | | | $506 | |
| | | | | |
| Ratios to average net assets: | | | | | | | | | | | | | | | | | | | | |
Gross expenses | | | 0.96 | % | | | 0.95 | % | | | 0.93 | % | | | 0.96 | % | | | 0.95 | % |
Net expenses4,5 | | | 0.96 | | | | 0.95 | | | | 0.93 | | | | 0.96 | | | | 0.94 | |
Net investment income | | | 4.31 | | | | 2.92 | | | | 1.03 | | | | 2.03 | | | | 4.02 | |
| | | | | |
| Portfolio turnover rate6 | | | 56 | % | | | 43 | % | | | 52 | % | | | 108 | % | | | 74 | % |
| 1 | Per share amounts have been calculated using the average shares method. |
| 2 | Calculation of the net gain per share (both realized and unrealized) does not correlate to the aggregate realized and unrealized losses presented in the Statement of Operations due to the timing of the sales and repurchases of Fund shares in relation to fluctuating market values of the investments of the Fund. |
| 3 | Performance figures, exclusive of sales charges, may reflect compensating balance arrangements, fee waivers and/or expense reimbursements. In the absence of compensating balance arrangements, fee waivers and/or expense reimbursements, the total return would have been lower. Past performance is no guarantee of future results. |
| 4 | Reflects fee waivers and/or expense reimbursements. |
| 5 | The manager has agreed to waive the Fund’s management fee to an extent sufficient to offset the net management fee payable in connection with any investment in an affiliated money market fund. |
| 6 | Excluding mortgage dollar roll transactions. If mortgage dollar roll transactions had been included, the portfolio turnover rate would have been 101%, 58%, 123%, 160% and 115% for the years ended December 31, 2023, 2022, 2021, 2020 and 2019, respectively. |
See Notes to Financial Statements.
| | | | | | |
Western Asset Mortgage Total Return Fund 2023 Annual Report | | | | | 39 | |
Financial highlights (cont’d)
| | | | | | | | | | | | | | | | | | | | |
| For a share of each class of beneficial interest outstanding throughout each year ended December 31: | |
| Class C Shares1 | | 2023 | | | 2022 | | | 2021 | | | 2020 | | | 2019 | |
| | | | | |
| Net asset value, beginning of year | | | $8.35 | | | | $10.05 | | | | $10.24 | | | | $10.36 | | | | $10.20 | |
| | | | | |
| Income (loss) from operations: | | | | | | | | | | | | | | | | | | | | |
Net investment income | | | 0.29 | | | | 0.20 | | | | 0.03 | | | | 0.14 | | | | 0.35 | |
Net realized and unrealized gain (loss) | | | (0.03) | | | | (1.64) | | | | (0.02) | | | | 0.02 | 2 | | | 0.19 | |
Total income (loss) from operations | | | 0.26 | | | | (1.44) | | | | 0.01 | | | | 0.16 | | | | 0.54 | |
| | | | | |
| Less distributions from: | | | | | | | | | | | | | | | | | | | | |
Net investment income | | | (0.31) | | | | (0.26) | | | | (0.20) | | | | (0.28) | | | | (0.38) | |
Total distributions | | | (0.31) | | | | (0.26) | | | | (0.20) | | | | (0.28) | | | | (0.38) | |
| | | | | |
| Net asset value, end of year | | | $8.30 | | | | $8.35 | | | | $10.05 | | | | $10.24 | | | | $10.36 | |
Total return3 | | | 3.19 | % | | | (14.42) | % | | | 0.07 | %4 | | | 1.57 | % | | | 5.39 | % |
| | | | | |
| Net assets, end of year (000s) | | | $2,921 | | | | $4,861 | | | | $9,514 | | | | $14,849 | | | | $18,218 | |
| | | | | |
| Ratios to average net assets: | | | | | | | | | | | | | | | | | | | | |
Gross expenses | | | 1.64 | % | | | 1.62 | % | | | 1.62 | % | | | 1.64 | % | | | 1.64 | % |
Net expenses5,6 | | | 1.63 | | | | 1.62 | | | | 1.61 | | | | 1.64 | | | | 1.64 | |
Net investment income | | | 3.55 | | | | 2.20 | | | | 0.30 | | | | 1.36 | | | | 3.36 | |
| | | | | |
| Portfolio turnover rate7 | | | 56 | % | | | 43 | % | | | 52 | % | | | 108 | % | | | 74 | % |
| 1 | Per share amounts have been calculated using the average shares method. |
| 2 | Calculation of the net gain per share (both realized and unrealized) does not correlate to the aggregate realized and unrealized losses presented in the Statement of Operations due to the timing of the sales and repurchases of Fund shares in relation to fluctuating market values of the investments of the Fund. |
| 3 | Performance figures, exclusive of CDSC, may reflect compensating balance arrangements, fee waivers and/or expense reimbursements. In the absence of compensating balance arrangements, fee waivers and/or expense reimbursements, the total return would have been lower. Past performance is no guarantee of future results. |
| 4 | The total return includes a payment by an affiliate to reimburse for an error. Absent this payment, total return would have been (0.03)% for the year ended December 31, 2021. |
| 5 | Reflects fee waivers and/or expense reimbursements. |
| 6 | As a result of an expense limitation arrangement, the ratio of total annual fund operating expenses, other than interest, brokerage, taxes, extraordinary expenses and acquired fund fees and expenses, to average net assets of Class C shares did not exceed 1.75%. This expense limitation arrangement cannot be terminated prior to December 31, 2025 without the Board of Trustees’ consent. In addition, the manager has agreed to waive the Fund’s management fee to an extent sufficient to offset the net management fee payable in connection with any investment in an affiliated money market fund. |
| 7 | Excluding mortgage dollar roll transactions. If mortgage dollar roll transactions had been included, the portfolio turnover rate would have been 101%, 58%, 123%, 160% and 115% for the years ended December 31, 2023, 2022, 2021, 2020 and 2019, respectively. |
See Notes to Financial Statements.
| | | | |
| 40 | | | | Western Asset Mortgage Total Return Fund 2023 Annual Report |
| | | | | | | | | | | | | | | | | | | | |
| For a share of each class of beneficial interest outstanding throughout each year ended December 31: | |
| Class C1 Shares1 | | 2023 | | | 2022 | | | 2021 | | | 2020 | | | 2019 | |
| | | | | |
| Net asset value, beginning of year | | | $8.34 | | | | $10.06 | | | | $10.25 | | | | $10.37 | | | | $10.22 | |
| | | | | |
| Income (loss) from operations: | | | | | | | | | | | | | | | | | | | | |
Net investment income | | | 0.29 | | | | 0.14 | | | | 0.03 | | | | 0.15 | | | | 0.39 | |
Net realized and unrealized gain (loss) | | | (0.03) | | | | (1.63) | | | | (0.02) | | | | 0.02 | 2 | | | 0.18 | |
Total income (loss) from operations | | | 0.26 | | | | (1.49) | | | | 0.01 | | | | 0.17 | | | | 0.57 | |
| | | | | |
| Less distributions from: | | | | | | | | | | | | | | | | | | | | |
Net investment income | | | (0.32) | | | | (0.23) | | | | (0.20) | | | | (0.29) | | | | (0.42) | |
Total distributions | | | (0.32) | | | | (0.23) | | | | (0.20) | | | | (0.29) | | | | (0.42) | |
| | | | | |
| Net asset value, end of year | | | $8.28 | | | | $8.34 | | | | $10.06 | | | | $10.25 | | | | $10.37 | |
Total return3 | | | 3.18 | % | | | (14.92) | % | | | 0.11 | %4 | | | 1.72 | % | | | 5.65 | % |
| | | | | |
| Net assets, end of year (000s) | | | $44 | | | | $61 | | | | $498 | | | | $1,271 | | | | $1,562 | |
| | | | | |
| Ratios to average net assets: | | | | | | | | | | | | | | | | | | | | |
Gross expenses | | | 2.32 | % | | �� | 2.60 | % | | | 1.58 | % | | | 1.49 | % | | | 1.36 | % |
Net expenses5,6 | | | 1.75 | | | | 2.18 | | | | 1.57 | | | | 1.49 | | | | 1.36 | |
Net investment income | | | 3.50 | | | | 1.48 | | | | 0.27 | | | | 1.51 | | | | 3.75 | |
| | | | | |
| Portfolio turnover rate7 | | | 56 | % | | | 43 | % | | | 52 | % | | | 108 | % | | | 74 | % |
| 1 | Per share amounts have been calculated using the average shares method. |
| 2 | Calculation of the net gain per share (both realized and unrealized) does not correlate to the aggregate realized and unrealized losses presented in the Statement of Operations due to the timing of the sales and repurchases of Fund shares in relation to fluctuating market values of the investments of the Fund. |
| 3 | Performance figures, exclusive of CDSC, may reflect compensating balance arrangements, fee waivers and/or expense reimbursements. In the absence of compensating balance arrangements, fee waivers and/or expense reimbursements, the total return would have been lower. Past performance is no guarantee of future results. |
| 4 | The total return includes a payment by an affiliate to reimburse for an error. Absent this payment, total return would have been 0.01% for the year ended December 31, 2021. |
| 5 | Reflects fee waivers and/or expense reimbursements. |
| 6 | As a result of an expense limitation arrangement, effective June 1, 2022, the ratio of total annual fund operating expenses, other than interest, brokerage, taxes, extraordinary expenses and acquired fund fees and expenses, to average net assets of Class C1 shares did not exceed 1.75%. This expense limitation arrangement cannot be terminated prior to December 31, 2025 without the Board of Trustees’ consent. In addition, the manager has agreed to waive the Fund’s management fee to an extent sufficient to offset the net management fee payable in connection with any investment in an affiliated money market fund. |
| 7 | Excluding mortgage dollar roll transactions. If mortgage dollar roll transactions had been included, the portfolio turnover rate would have been 101%, 58%, 123%, 160% and 115% for the years ended December 31, 2023, 2022, 2021, 2020 and 2019, respectively. |
See Notes to Financial Statements.
| | | | | | |
Western Asset Mortgage Total Return Fund 2023 Annual Report | | | | | 41 | |
Financial highlights (cont’d)
| | | | | | | | | | | | | | | | | | | | |
| For a share of each class of beneficial interest outstanding throughout each year ended December 31: | |
| Class I Shares1 | | 2023 | | | 2022 | | | 2021 | | | 2020 | | | 2019 | |
| | | | | |
| Net asset value, beginning of year | | | $8.39 | | | | $10.09 | | | | $10.28 | | | | $10.41 | | | | $10.25 | |
| | | | | |
| Income (loss) from operations: | | | | | | | | | | | | | | | | | | | | |
Net investment income | | | 0.38 | | | | 0.29 | | | | 0.13 | | | | 0.24 | | | | 0.44 | |
Net realized and unrealized gain (loss) | | | (0.04) | | | | (1.64) | | | | (0.02) | | | | 0.01 | 2 | | | 0.21 | |
Total income (loss) from operations | | | 0.34 | | | | (1.35) | | | | 0.11 | | | | 0.25 | | | | 0.65 | |
| | | | | |
| Less distributions from: | | | | | | | | | | | | | | | | | | | | |
Net investment income | | | (0.39) | | | | (0.35) | | | | (0.30) | | | | (0.38) | | | | (0.49) | |
Total distributions | | | (0.39) | | | | (0.35) | | | | (0.30) | | | | (0.38) | | | | (0.49) | |
| | | | | |
| Net asset value, end of year | | | $8.34 | | | | $8.39 | | | | $10.09 | | | | $10.28 | | | | $10.41 | |
Total return3 | | | 4.20 | % | | | (13.51) | % | | | 0.96 | % | | | 2.56 | % | | | 6.41 | % |
| | | | | |
| Net assets, end of year (000s) | | | $56,520 | | | | $75,811 | | | | $125,664 | | | | $188,031 | | | | $414,949 | |
| | | | | |
| Ratios to average net assets: | | | | | | | | | | | | | | | | | | | | |
Gross expenses | | | 0.66 | % | | | 0.65 | % | | | 0.64 | % | | | 0.66 | % | | | 0.67 | % |
Net expenses4,5 | | | 0.66 | | | | 0.65 | | | | 0.64 | | | | 0.66 | | | | 0.67 | |
Net investment income | | | 4.56 | | | | 3.18 | | | | 1.27 | | | | 2.38 | | | | 4.26 | |
| | | | | |
| Portfolio turnover rate6 | | | 56 | % | | | 43 | % | | | 52 | % | | | 108 | % | | | 74 | % |
| 1 | Per share amounts have been calculated using the average shares method. |
| 2 | Calculation of the net gain per share (both realized and unrealized) does not correlate to the aggregate realized and unrealized losses presented in the Statement of Operations due to the timing of the sales and repurchases of Fund shares in relation to fluctuating market values of the investments of the Fund. |
| 3 | Performance figures may reflect compensating balance arrangements, fee waivers and/or expense reimbursements. In the absence of compensating balance arrangements, fee waivers and/or expense reimbursements, the total return would have been lower. Past performance is no guarantee of future results. |
| 4 | Reflects fee waivers and/or expense reimbursements. |
| 5 | As a result of an expense limitation arrangement, the ratio of total annual fund operating expenses, other than interest, brokerage, taxes, extraordinary expenses and acquired fund fees and expenses, to average net assets of Class I shares did not exceed 0.70%. This expense limitation arrangement cannot be terminated prior to December 31, 2025 without the Board of Trustees’ consent. In addition, the manager has agreed to waive the Fund’s management fee to an extent sufficient to offset the net management fee payable in connection with any investment in an affiliated money market fund. |
| 6 | Excluding mortgage dollar roll transactions. If mortgage dollar roll transactions had been included, the portfolio turnover rate would have been 101%, 58%, 123%, 160% and 115% for the years ended December 31, 2023, 2022, 2021, 2020 and 2019, respectively. |
See Notes to Financial Statements.
| | | | |
| 42 | | | | Western Asset Mortgage Total Return Fund 2023 Annual Report |
| | | | | | | | | | | | | | | | | | | | |
| For a share of each class of beneficial interest outstanding throughout each year ended December 31: | |
| Class IS Shares1 | | 2023 | | | 2022 | | | 2021 | | | 2020 | | | 2019 | |
| | | | | |
| Net asset value, beginning of year | | | $8.39 | | | | $10.10 | | | | $10.29 | | | | $10.42 | | | | $10.26 | |
| | | | | |
| Income (loss) from operations: | | | | | | | | | | | | | | | | | | | | |
Net investment income | | | 0.39 | | | | 0.31 | | | | 0.14 | | | | 0.25 | | | | 0.43 | |
Net realized and unrealized gain (loss) | | | (0.04) | | | | (1.66) | | | | (0.02) | | | | 0.01 | 2 | | | 0.23 | |
Total income (loss) from operations | | | 0.35 | | | | (1.35) | | | | 0.12 | | | | 0.26 | | | | 0.66 | |
| | | | | |
| Less distributions from: | | | | | | | | | | | | | | | | | | | | |
Net investment income | | | (0.40) | | | | (0.36) | | | | (0.31) | | | | (0.39) | | | | (0.50) | |
Total distributions | | | (0.40) | | | | (0.36) | | | | (0.31) | | | | (0.39) | | | | (0.50) | |
| | | | | |
| Net asset value, end of year | | | $8.34 | | | | $8.39 | | | | $10.10 | | | | $10.29 | | | | $10.42 | |
Total return3 | | | 4.30 | % | | | (13.51) | % | | | 1.16 | % | | | 2.56 | % | | | 6.52 | % |
| | | | | |
| Net assets, end of year (000s) | | | $11,842 | | | | $27,811 | | | | $28,952 | | | | $36,562 | | | | $15,120 | |
| | | | | |
| Ratios to average net assets: | | | | | | | | | | | | | | | | | | | | |
Gross expenses | | | 0.56 | % | | | 0.56 | % | | | 0.55 | % | | | 0.58 | % | | | 0.56 | % |
Net expenses4,5 | | | 0.56 | | | | 0.56 | | | | 0.54 | | | | 0.58 | | | | 0.56 | |
Net investment income | | | 4.64 | | | | 3.36 | | | | 1.36 | | | | 2.41 | | | | 4.16 | |
| | | | | |
| Portfolio turnover rate6 | | | 56 | % | | | 43 | % | | | 52 | % | | | 108 | % | | | 74 | % |
| 1 | Per share amounts have been calculated using the average shares method. |
| 2 | Calculation of the net gain per share (both realized and unrealized) does not correlate to the aggregate realized and unrealized losses presented in the Statement of Operations due to the timing of the sales and repurchases of Fund shares in relation to fluctuating market values of the investments of the Fund. |
| 3 | Performance figures may reflect compensating balance arrangements, fee waivers and/or expense reimbursements. In the absence of compensating balance arrangements, fee waivers and/or expense reimbursements, the total return would have been lower. Past performance is no guarantee of future results. Total returns for periods of less than one year are not annualized. |
| 4 | Reflects fee waivers and/or expense reimbursements. |
| 5 | As a result of an expense limitation arrangement, the ratio of total annual fund operating expenses, other than interest, brokerage, taxes, extraordinary expenses and acquired fund fees and expenses, to average net assets of Class IS shares did not exceed 0.60%. In addition, the ratio of total annual fund operating expenses for Class IS shares did not exceed the ratio of total annual fund operating expenses for Class I shares. These expense limitation arrangements cannot be terminated prior to December 31, 2025 without the Board of Trustees’ consent. In addition, the manager has agreed to waive the Fund’s management fee to an extent sufficient to offset the net management fee payable in connection with any investment in an affiliated money market fund. |
| 6 | Excluding mortgage dollar roll transactions. If mortgage dollar roll transactions had been included, the portfolio turnover rate would have been 101%, 58%, 123%, 160% and 115% for the years ended December 31, 2023, 2022, 2021, 2020 and 2019, respectively. |
See Notes to Financial Statements.
| | | | | | |
Western Asset Mortgage Total Return Fund 2023 Annual Report | | | | | 43 | |
Notes to financial statements
1. Organization and significant accounting policies
Western Asset Mortgage Total Return Fund (the “Fund”) is a separate diversified investment series of Legg Mason Partners Income Trust (the “Trust”). The Trust, a Maryland statutory trust, is registered under the Investment Company Act of 1940, as amended (the “1940 Act”), as an open-end management investment company.
The Fund follows the accounting and reporting guidance in Financial Accounting Standards Board (“FASB”) Accounting Standards Codification Topic 946, Financial Services –Investment Companies (“ASC 946”). The following are significant accounting policies consistently followed by the Fund and are in conformity with U.S. generally accepted accounting principles (“GAAP”), including, but not limited to, ASC 946. Estimates and assumptions are required to be made regarding assets, liabilities and changes in net assets resulting from operations when financial statements are prepared. Changes in the economic environment, financial markets and any other parameters used in determining these estimates could cause actual results to differ. Subsequent events have been evaluated through the date the financial statements were issued.
(a) Investment valuation. The valuations for fixed income securities (which may include, but are not limited to, corporate, government, municipal, mortgage-backed, collateralized mortgage obligations and asset-backed securities) and certain derivative instruments are typically the prices supplied by independent third party pricing services, which may use market prices or broker/dealer quotations or a variety of valuation techniques and methodologies. The independent third party pricing services typically use inputs that are observable such as issuer details, interest rates, yield curves, prepayment speeds, credit risks/spreads, default rates and quoted prices for similar securities. Investments in open-end funds are valued at the closing net asset value per share of each fund on the day of valuation. Futures contracts are valued daily at the settlement price established by the board of trade or exchange on which they are traded. Equity securities for which market quotations are available are valued at the last reported sales price or official closing price on the primary market or exchange on which they trade. When the Fund holds securities or other assets that are denominated in a foreign currency, the Fund will normally use the currency exchange rates as of 4:00 p.m. (Eastern Time). If independent third party pricing services are unable to supply prices for a portfolio investment, or if the prices supplied are deemed by the manager to be unreliable, the market price may be determined by the manager using quotations from one or more broker/dealers or at the transaction price if the security has recently been purchased and no value has yet been obtained from a pricing service or pricing broker. When reliable prices are not readily available, such as when the value of a security has been significantly affected by events after the close of the exchange or market on which the security is principally traded, but before the Fund calculates its net asset value, the Fund values these securities as determined in accordance with procedures approved by the Fund’s Board of Trustees.
Pursuant to policies adopted by the Board of Trustees, the Fund’s manager has been designated as the valuation designee and is responsible for the oversight of the daily valuation process. The Fund’s manager is assisted by the Global Fund Valuation Committee (the “Valuation Committee”). The Valuation Committee is responsible for making fair value determinations, evaluating the effectiveness of the Fund’s pricing policies, and reporting to the Fund’s manager and the Board of Trustees. When determining the reliability of third party pricing information for investments owned by the Fund, the Valuation Committee,
| | | | |
| 44 | | | | Western Asset Mortgage Total Return Fund 2023 Annual Report |
among other things, conducts due diligence reviews of pricing vendors, monitors the daily change in prices and reviews transactions among market participants.
The Valuation Committee will consider pricing methodologies it deems relevant and appropriate when making fair value determinations. Examples of possible methodologies include, but are not limited to, multiple of earnings; discount from market of a similar freely traded security; discounted cash-flow analysis; book value or a multiple thereof; risk premium/yield analysis; yield to maturity; and/or fundamental investment analysis. The Valuation Committee will also consider factors it deems relevant and appropriate in light of the facts and circumstances. Examples of possible factors include, but are not limited to, the type of security; the issuer’s financial statements; the purchase price of the security; the discount from market value of unrestricted securities of the same class at the time of purchase; analysts’ research and observations from financial institutions; information regarding any transactions or offers with respect to the security; the existence of merger proposals or tender offers affecting the security; the price and extent of public trading in similar securities of the issuer or comparable companies; and the existence of a shelf registration for restricted securities.
For each portfolio security that has been fair valued pursuant to the policies adopted by the Board of Trustees, the fair value price is compared against the last available and next available market quotations. The Valuation Committee reviews the results of such back testing monthly and fair valuation occurrences are reported to the Board of Trustees quarterly.
The Fund uses valuation techniques to measure fair value that are consistent with the market approach and/or income approach, depending on the type of security and the particular circumstance. The market approach uses prices and other relevant information generated by market transactions involving identical or comparable securities. The income approach uses valuation techniques to discount estimated future cash flows to present value.
GAAP establishes a disclosure hierarchy that categorizes the inputs to valuation techniques used to value assets and liabilities at measurement date. These inputs are summarized in the three broad levels listed below:
| • | | Level 1 — unadjusted quoted prices in active markets for identical investments |
| • | | Level 2 — other significant observable inputs (including quoted prices for similar investments, interest rates, prepayment speeds, credit risk, etc.) |
| • | | Level 3 — significant unobservable inputs (including the Fund’s own assumptions in determining the fair value of investments) |
The inputs or methodologies used to value securities are not necessarily an indication of the risk associated with investing in those securities.
| | | | | | |
| Western Asset Mortgage Total Return Fund 2023 Annual Report | | | | | 45 | |
Notes to financial statements (cont’d)
The following is a summary of the inputs used in valuing the Fund’s assets and liabilities carried at fair value:
| | | | | | | | | | | | | | | | |
| ASSETS | |
| Description | | Quoted Prices (Level 1) | | | Other Significant Observable Inputs (Level 2) | | | Significant Unobservable Inputs (Level 3) | | | Total | |
| Long-Term Investments†: | | | | | | | | | | | | | | | | |
Mortgage-Backed Securities | | | — | | | $ | 236,031,759 | | | | — | | | $ | 236,031,759 | |
Collateralized Mortgage Obligations | | | — | | | | 229,244,172 | | | $ | 1,180,964 | | | | 230,425,136 | |
Asset-Backed Securities | | | — | | | | 45,401,927 | | | | — | | | | 45,401,927 | |
Convertible Bonds & Notes | | | — | | | | 1,480,000 | | | | — | | | | 1,480,000 | |
| Total Investments | | | — | | | $ | 512,157,858 | | | $ | 1,180,964 | | | $ | 513,338,822 | |
| Other Financial Instruments: | | | | | | | | | | | | | | | | |
Futures Contracts†† | | $ | 178,108 | | | | — | | | | — | | | $ | 178,108 | |
| Total | | $ | 178,108 | | | $ | 512,157,858 | | | $ | 1,180,964 | | | $ | 513,516,930 | |
|
| LIABILITIES | |
| Description | | Quoted Prices (Level 1) | | | Other Significant Observable Inputs (Level 2) | | | Significant Unobservable Inputs (Level 3) | | | Total | |
| Other Financial Instruments: | | | | | | | | | | | | | | | | |
Futures Contracts†† | | $ | 38,505 | | | | — | | | | — | | | $ | 38,505 | |
| † | See Schedule of Investments for additional detailed categorizations. |
| †† | Reflects the unrealized appreciation (depreciation) of the instruments. |
(b) Purchased options. The Fund may purchase option contracts generally to gain or reduce exposure to types of investments or market factors or as a means of attempting to enhance returns. When the Fund purchases an option, an amount equal to the premium paid by the Fund is recorded as an investment on the Statement of Assets and Liabilities, the value of which is marked-to-market to reflect the current market value of the option purchased. If the purchased option expires, the Fund realizes a loss equal to the amount of premium paid. When an instrument is purchased or sold through the exercise of an option, the related premium paid is added to the basis of the instrument acquired or deducted from the proceeds of the instrument sold. The risk associated with purchasing put and call options is limited to the premium paid.
(c) Written options. The Fund may write option contracts generally to gain or reduce exposure to types of investments or market factors or as a means of attempting to enhance returns. When the Fund writes an option, an amount equal to the premium received by the Fund is recorded as a liability, the value of which is marked-to-market daily to reflect the current market value of the option written. If the option expires, the premium received is recorded as a realized gain. When a written call option is exercised, the difference between the premium received plus the option exercise price and the Fund’s basis in the underlying security (in the case of a covered written call option), or the cost to purchase the underlying security (in the case of an uncovered written call option), including brokerage commission,
| | | | |
| 46 | | | | Western Asset Mortgage Total Return Fund 2023 Annual Report |
is recognized as a realized gain or loss. When a written put option is exercised, the amount of the premium received is subtracted from the cost of the security purchased by the Fund from the exercise of the written put option to form the Fund’s basis in the underlying security purchased. The writer or buyer of an option traded on an exchange can liquidate the position before the exercise of the option by entering into a closing transaction. The cost of a closing transaction is deducted from the original premium received resulting in a realized gain or loss to the Fund.
The risk in writing a covered call option is that the Fund may forego the opportunity of profit if the market price of the underlying security increases and the option is exercised. The risk in writing a put option is that the Fund may incur a loss if the market price of the underlying security decreases and the option is exercised. The risk in writing an uncovered call option is that the Fund is exposed to the risk of loss if the market price of the underlying security increases. In addition, there is the risk that the Fund may not be able to enter into a closing transaction because of an illiquid secondary market.
(d) Futures contracts. The Fund uses futures contracts generally to gain exposure to, or hedge against, changes in interest rates or gain exposure to, or hedge against, changes in certain asset classes. A futures contract represents a commitment for the future purchase or sale of an asset at a specified price on a specified date.
Upon entering into a futures contract, the Fund is required to deposit cash or securities with a broker in an amount equal to a certain percentage of the contract amount. This is known as the ‘‘initial margin’’ and subsequent payments (‘‘variation margin’’) are made or received by the Fund each day, depending on the daily fluctuation in the value of the contract. For certain futures, including foreign denominated futures, variation margin is not settled daily, but is recorded as a net variation margin payable or receivable. The daily changes in contract value are recorded as unrealized appreciation or depreciation in the Statement of Operations and the Fund recognizes a realized gain or loss when the contract is closed.
Futures contracts involve, to varying degrees, risk of loss in excess of the amounts reflected in the financial statements. In addition, there is the risk that the Fund may not be able to enter into a closing transaction because of an illiquid secondary market.
(e) Stripped securities. The Fund may invest in ‘‘Stripped Securities,’’ a term used collectively for components, or strips, of fixed income securities. Stripped Securities can be principal only securities (“PO”), which are debt obligations that have been stripped of unmatured interest coupons, or interest only securities (“IO”), which are unmatured interest coupons that have been stripped from debt obligations. The market value of Stripped Securities will fluctuate in response to changes in economic conditions, rates of prepayment, interest rates and the market’s perception of the securities. However, fluctuations in response to interest rates may be greater in Stripped Securities than for debt obligations of comparable maturities that pay interest currently. The amount of fluctuation may increase with a longer period of maturity.
The yield to maturity on IO’s is sensitive to the rate of principal repayments (including prepayments) on the related underlying debt obligation and principal payments may have a material effect on yield to maturity. If the underlying debt obligation experiences greater than anticipated prepayments of principal, the Fund may not fully recoup its initial investment in IO’s.
| | | | | | |
| Western Asset Mortgage Total Return Fund 2023 Annual Report | | | | | 47 | |
Notes to financial statements (cont’d)
(f) Securities traded on a to-be-announced basis. The Fund may trade securities on a to-be-announced (“TBA”) basis. In a TBA transaction, the Fund commits to purchasing or selling securities which have not yet been issued by the issuer and for which specific information, such as the face amount, maturity date and underlying pool of investments in U.S. government agency mortgage pass-through securities, is not announced. Securities purchased on a TBA basis are not settled until they are delivered to the Fund. Beginning on the date the Fund enters into a TBA transaction, cash, U.S. government securities or other liquid high-grade debt obligations are segregated in an amount equal in value to the purchase price of the TBA security. These securities are subject to market fluctuations and their current value is determined in the same manner as for other securities.
At December 31, 2023, the Fund held non-cash collateral for TBA securities from Goldman Sachs Group Inc., JPMorgan Chase & Co. and Morgan Stanley & Co. Inc. in the amounts of $1,427,604, $1,582,584 and $1,251,320, respectively.
(g) Mortgage dollar rolls. The Fund may enter into mortgage dollar rolls in which the Fund sells mortgage-backed securities for delivery in the current month, realizing a gain or loss, and simultaneously entering into contracts to repurchase substantially similar (same type, coupon and maturity) securities to settle on a specified future date.
The Fund executes its mortgage dollar rolls entirely in the TBA market, whereby the Fund makes a forward commitment to purchase a security and, instead of accepting delivery, the position is offset by a sale of the security with a simultaneous agreement to repurchase at a future date. The Fund accounts for mortgage dollar rolls as purchases and sales.
The risk of entering into mortgage dollar rolls is that the market value of the securities the Fund is obligated to repurchase under the agreement may decline below the repurchase price. In the event the buyer of securities under a mortgage dollar roll files for bankruptcy or becomes insolvent, the Fund’s use of the proceeds of the mortgage dollar roll may be restricted pending a determination by the counterparty, or its trustee or receiver, whether to enforce the Fund’s obligation to repurchase the securities.
(h) Foreign currency translation. Investment securities and other assets and liabilities denominated in foreign currencies are translated into U.S. dollar amounts based upon prevailing exchange rates on the date of valuation. Purchases and sales of investment securities and income and expense items denominated in foreign currencies are translated into U.S. dollar amounts based upon prevailing exchange rates on the respective dates of such transactions.
The Fund does not isolate that portion of the results of operations resulting from fluctuations in foreign exchange rates on investments from the fluctuations arising from changes in market prices of securities held. Such fluctuations are included with the net realized and unrealized gain or loss on investments.
Net realized foreign exchange gains or losses arise from sales of foreign currencies, including gains and losses on forward foreign currency contracts, currency gains or losses realized between the trade and settlement dates on securities transactions, and the difference between the amounts of dividends, interest, and foreign withholding taxes recorded on the Fund’s books and the U.S. dollar equivalent of the amounts actually received or paid. Net unrealized foreign exchange gains and losses arise from changes in
| | | | |
| 48 | | | | Western Asset Mortgage Total Return Fund 2023 Annual Report |
the values of assets and liabilities, other than investments in securities, on the date of valuation, resulting from changes in exchange rates.
Foreign security and currency transactions may involve certain considerations and risks not typically associated with those of U.S. dollar denominated transactions as a result of, among other factors, the possibility of lower levels of governmental supervision and regulation of foreign securities markets and the possibility of political or economic instability.
(i) Credit and market risk. Investments in securities that are collateralized by real estate mortgages are subject to certain credit and liquidity risks. When market conditions result in an increase in default rates of the underlying mortgages and the foreclosure values of underlying real estate properties are materially below the outstanding amount of these underlying mortgages, collection of the full amount of accrued interest and principal on these investments may be doubtful. Such market conditions may significantly impair the value and liquidity of these investments and may result in a lack of correlation between their credit ratings and values.
(j) Foreign investment risks. The Fund’s investments in foreign securities may involve risks not present in domestic investments. Since securities may be denominated in foreign currencies, may require settlement in foreign currencies or may pay interest or dividends in foreign currencies, changes in the relationship of these foreign currencies to the U.S. dollar can significantly affect the value of the investments and earnings of the Fund. Foreign investments may also subject the Fund to foreign government exchange restrictions, expropriation, taxation or other political, social or economic developments, all of which affect the market and/or credit risk of the investments.
(k) Counterparty risk and credit-risk-related contingent features of derivative instruments. The Fund may invest in certain securities or engage in other transactions where the Fund is exposed to counterparty credit risk in addition to broader market risks. The Fund may invest in securities of issuers, which may also be considered counterparties as trading partners in other transactions. This may increase the risk of loss in the event of default or bankruptcy by the counterparty or if the counterparty otherwise fails to meet its contractual obligations. The Fund’s subadviser attempts to mitigate counterparty risk by (i) periodically assessing the creditworthiness of its trading partners, (ii) monitoring and/or limiting the amount of its net exposure to each individual counterparty based on its assessment and (iii) requiring collateral from the counterparty for certain transactions. Market events and changes in overall economic conditions may impact the assessment of such counterparty risk by the subadviser. In addition, declines in the values of underlying collateral received may expose the Fund to increased risk of loss.
With exchange traded and centrally cleared derivatives, there is less counterparty risk to the Fund since the exchange or clearinghouse, as counterparty to such instruments, guarantees against a possible default. The clearinghouse stands between the buyer and the seller of the contract; therefore, the credit risk is limited to failure of the clearinghouse. While offset rights may exist under applicable law, the Fund does not have a contractual right of offset against a clearing broker or clearinghouse in the event of a default of the clearing broker or clearinghouse.
| | | | | | |
| Western Asset Mortgage Total Return Fund 2023 Annual Report | | | | | 49 | |
Notes to financial statements (cont’d)
The Fund has entered into master agreements, such as an International Swaps and Derivatives Association, Inc. Master Agreement (“ISDA Master Agreement”) or similar agreement, with certain of its derivative counterparties that govern over-the-counter (“OTC”) derivatives and provide for general obligations, representations, agreements, collateral posting terms, netting provisions in the event of default or termination and credit related contingent features. The credit related contingent features include, but are not limited to, a percentage decrease in the Fund’s net assets or net asset value per share over a specified period of time. If these credit related contingent features were triggered, the derivatives counterparty could terminate the positions and demand payment or require additional collateral.
Under an ISDA Master Agreement, the Fund may, under certain circumstances, offset with the counterparty certain derivative financial instruments’ payables and/or receivables with collateral held and/or posted and create one single net payment. However, absent an event of default by the counterparty or a termination of the agreement, the terms of the ISDA Master Agreements do not result in an offset of reported amounts of financial assets and financial liabilities in the Statement of Assets and Liabilities across transactions between the Fund and the applicable counterparty. The enforceability of the right to offset may vary by jurisdiction.
Collateral requirements differ by type of derivative. Collateral or margin requirements are set by the broker or exchange clearinghouse for exchange traded derivatives while collateral terms are contract specific for OTC traded derivatives. Cash collateral that has been pledged to cover obligations of the Fund under derivative contracts, if any, will be reported separately in the Statement of Assets and Liabilities. Securities pledged as collateral, if any, for the same purpose are noted in the Schedule of Investments.
As of December 31, 2023, the Fund did not have any open OTC derivative transactions with credit related contingent features in a net liability position.
(l) Security transactions and investment income. Security transactions are accounted for on a trade date basis. Interest income (including interest income from payment-in-kind securities) is recorded on the accrual basis. Amortization of premiums and accretion of discounts on debt securities are recorded to interest income over the lives of the respective securities, except for premiums on certain callable debt securities, which are amortized to the earliest call date. Paydown gains and losses on mortgage- and asset-backed securities are recorded as adjustments to interest income. Dividend income is recorded on the ex-dividend date for dividends received in cash and/or securities. The cost of investments sold is determined by use of the specific identification method. To the extent any issuer defaults or a credit event occurs that impacts the issuer, the Fund may halt any additional interest income accruals and consider the realizability of interest accrued up to the date of default or credit event.
(m) Partnership accounting policy. The Fund records its pro rata share of the income (loss) and capital gains (losses), to the extent of distributions it has received, allocated from the underlying partnerships and accordingly adjusts the cost basis of the underlying partnerships for return of capital. These amounts are included in the Fund’s Statement of Operations.
| | | | |
| 50 | | | | Western Asset Mortgage Total Return Fund 2023 Annual Report |
(n) Distributions to shareholders. Distributions from net investment income of the Fund are declared each business day to shareholders of record and are paid monthly. Distributions of net realized gains, if any, are declared at least annually. Distributions to shareholders of the Fund are recorded on the ex-dividend date and are determined in accordance with income tax regulations, which may differ from GAAP.
(o) Share class accounting. Investment income, common expenses and realized/ unrealized gains (losses) on investments are allocated to the various classes of the Fund on the basis of daily net assets of each class. Fees relating to a specific class are charged directly to that share class.
(p) Compensating balance arrangements. The Fund has an arrangement with its custodian bank whereby a portion of the custodian’s fees is paid indirectly by credits earned on the Fund’s cash on deposit with the bank.
(q) Federal and other taxes. It is the Fund’s policy to comply with the federal income and excise tax requirements of the Internal Revenue Code of 1986 (the “Code”), as amended, applicable to regulated investment companies. Accordingly, the Fund intends to distribute its taxable income and net realized gains, if any, to shareholders in accordance with timing requirements imposed by the Code. Therefore, no federal or state income tax provision is required in the Fund’s financial statements.
Management has analyzed the Fund’s tax positions taken on income tax returns for all open tax years and has concluded that as of December 31, 2023, no provision for income tax is required in the Fund’s financial statements. The Fund’s federal and state income and federal excise tax returns for tax years for which the applicable statutes of limitations have not expired are subject to examination by the Internal Revenue Service and state departments of revenue.
(r) Reclassification. GAAP requires that certain components of net assets be reclassified to reflect permanent differences between financial and tax reporting. These reclassifications have no effect on net assets or net asset value per share. During the current year, the Fund had no reclassifications.
2. Investment management agreement and other transactions with affiliates
Franklin Templeton Fund Adviser, LLC (“FTFA”) (formerly known as Legg Mason Partners Fund Advisor, LLC (“LMPFA”) prior to November 30, 2023) is the Fund’s investment manager and Western Asset Management Company, LLC (“Western Asset”) is the Fund’s subadviser. FTFA and Western Asset are indirect, wholly-owned subsidiaries of Franklin Resources, Inc. “Franklin Resources”).
Under the investment management agreement, the Fund pays an investment management fee, calculated daily and paid monthly, in accordance with the following breakpoint schedule:
| | | | |
| Average Daily Net Assets | | Annual Rate | |
| First $4 billion | | | 0.500 | % |
| Next $2 billion | | | 0.450 | |
| Next $2 billion | | | 0.400 | |
| Over $8 billion | | | 0.350 | |
| | | | | | |
| Western Asset Mortgage Total Return Fund 2023 Annual Report | | | | | 51 | |
Notes to financial statements (cont’d)
FTFA provides administrative and certain oversight services to the Fund. FTFA delegates to the subadviser the day-to-day portfolio management of the Fund. For its services, FTFA pays Western Asset monthly 70% of the net management fee it receives from the Fund.
As a result of expense limitation arrangements between the Fund and FTFA, the ratio of total annual fund operating expenses, other than interest, brokerage, taxes, extraordinary expenses and acquired fund fees and expenses, to average net assets of Class C, Class C1, Class I and Class IS shares did not exceed 1.75%, 1.75%, 0.70% and 0.60%, respectively. In addition, the ratio of total annual fund operating expenses for Class IS shares did not exceed the ratio of total annual fund operating expenses for Class I shares and the ratio of total annual fund operating expenses for Class 1 shares did not exceed the ratio of total annual fund operating expenses for Class A shares. These expense limitation arrangements cannot be terminated prior to December 31, 2025 without the Board of Trustees’ consent. In addition, the manager has agreed to waive the Fund’s management fee to an extent sufficient to offset the net management fee payable in connection with any investment in an affiliated money market fund (the “affiliated money market fund waiver”). The affiliated money market fund waiver is not subject to the recapture provision discussed below.
During the year ended December 31, 2023, fees waived and/or expenses reimbursed amounted to $931, which included an affiliated money market fund waiver of $642.
FTFA is permitted to recapture amounts waived and/or reimbursed to a class within two years after the fiscal year in which FTFA earned the fee or incurred the expense if the class’ total annual fund operating expenses have fallen to a level below the expense limitation (“expense cap”) in effect at the time the fees were earned or the expenses incurred. In no case will FTFA recapture any amount that would result, on any particular business day of the Fund, in the class’ total annual fund operating expenses exceeding the expense cap or any other lower limit then in effect.
Pursuant to these arrangements, at December 31, 2023, the Fund had remaining fee waivers and/or expense reimbursements subject to recapture by FTFA and respective dates of expiration as follows:
| | | | |
| | | Class C1 | |
| Expires December 31, 2024 | | $ | 416 | |
| Expires December 31, 2025 | | | 289 | |
| Total fee waivers/expense reimbursements subject to recapture | | $ | 705 | |
For the year ended December 31, 2023, FTFA did not recapture any fees.
Franklin Distributors, LLC (“Franklin Distributors”) serves as the Fund’s sole and exclusive distributor. Franklin Distributors is an indirect, wholly-owned broker-dealer subsidiary of Franklin Resources. Franklin Templeton Investor Services, LLC (“Investor Services”) serves as the Fund’s shareholder servicing agent and acts as the Fund’s transfer agent and dividend-paying agent. Investor Services is an indirect, wholly-owned subsidiary of Franklin Resources. Each class of shares of the Fund pays transfer agent fees to Investor Services for its performance of shareholder servicing obligations. Investor Services charges account-based fees based on the number of individual shareholder accounts, as well as a fixed percentage fee based on the total account-based fees charged. In addition, each class reimburses Investor Services for out of pocket expenses incurred. For the year ended
| | | | |
| 52 | | | | Western Asset Mortgage Total Return Fund 2023 Annual Report |
December 31, 2023, the Fund incurred transfer agent fees as reported on the Statement of Operations, of which $18,833 was earned by Investor Services.
There is a maximum initial sales charge of 3.75% for Class A shares. There is a contingent deferred sales charge (“CDSC”) of 1.00% on Class C and Class C1 shares which applies if redemption occurs within 12 months from purchase payment. In certain cases, Class A shares have a 1.00% CDSC, which applies if redemption occurs within 18 months from purchase payment. This CDSC only applies to those purchases of Class A shares, which, when combined with current holdings of other shares of funds sold by Franklin Distributors, equal or exceed $500,000 in the aggregate. These purchases do not incur an initial sales charge.
For the year ended December 31, 2023, sales charges retained by and CDSCs paid to Franklin Distributors and its affiliates, if any, were as follows:
| | | | |
| | | Class A | |
| Sales charges | | $ | 22,012 | |
| CDSCs | | | 8,100 | |
All officers and one Trustee of the Trust are employees of Franklin Resources or its affiliates and do not receive compensation from the Trust.
3. Investments
During the year ended December 31, 2023, the aggregate cost of purchases and proceeds from sales of investments (excluding short-term investments) and U.S. Government & Agency Obligations were as follows:
| | | | | | | | |
| | | Investments | | | U.S. Government & Agency Obligations | |
| Purchases | | $ | 27,010,004 | | | $ | 526,417,026 | |
| Sales | | | 45,779,322 | | | | 522,220,272 | |
At December 31, 2023, the aggregate cost of investments and the aggregate gross unrealized appreciation and depreciation of investments for federal income tax purposes were as follows:
| | | | | | | | | | | | | | | | |
| | | Cost | | | Gross Unrealized Appreciation | | | Gross Unrealized Depreciation | | | Net Unrealized Appreciation (Depreciation) | |
| Securities | | $ | 573,872,336 | | | $ | 20,050,196 | | | $ | (80,583,710) | | | $ | (60,533,514) | |
| Futures contracts | | | — | | | | 178,108 | | | | (38,505) | | | | 139,603 | |
| | | | | | |
| Western Asset Mortgage Total Return Fund 2023 Annual Report | | | | | 53 | |
Notes to financial statements (cont’d)
4. Derivative instruments and hedging activities
Below is a table, grouped by derivative type, that provides information about the fair value and the location of derivatives within the Statement of Assets and Liabilities at December 31, 2023.
| | | | | | | | |
| ASSET DERIVATIVES1 | |
| | | | | | Interest Rate Risk | |
| Futures contracts2 | | | | | | $ | 178,108 | |
|
| LIABILITY DERIVATIVES1 | |
| | | | | | Interest Rate Risk | |
| Futures contracts2 | | | | | | $ | 38,505 | |
| 1 | Generally, the balance sheet location for asset derivatives is receivables/net unrealized appreciation and for liability derivatives is payables/net unrealized depreciation. |
| 2 | Includes cumulative unrealized appreciation (depreciation) of futures contracts as reported in the Schedule of Investments. Only net variation margin is reported within the receivables and/or payables on the Statement of Assets and Liabilities. |
The following tables provide information about the effect of derivatives and hedging activities on the Fund’s Statement of Operations for the year ended December 31, 2023. The first table provides additional detail about the amounts and sources of gains (losses) realized on derivatives during the period. The second table provides additional information about the change in net unrealized appreciation (depreciation) resulting from the Fund’s derivatives and hedging activities during the period.
| | | | |
| AMOUNT OF NET REALIZED GAIN (LOSS) ON DERIVATIVES RECOGNIZED | |
| | | Interest Rate Risk | |
| Purchased options1 | | $ | (7,464) | |
| Futures contracts | | | (10,390,040) | |
| Written options | | | (10,371) | |
| Total | | $ | (10,407,875) | |
| 1 | Net realized gain (loss) from purchased options is reported in Net Realized Gain (Loss) From Investment transactions in unaffiliated securities in the Statement of Operations. |
| | | | |
| CHANGE IN NET UNREALIZED APPRECIATION (DEPRECIATION) ON DERIVATIVES RECOGNIZED | |
| | | Interest Rate Risk | |
| Futures contracts | | $ | 240,594 | |
| | | | |
| 54 | | | | Western Asset Mortgage Total Return Fund 2023 Annual Report |
During the year ended December 31, 2023, the volume of derivative activity for the Fund was as follows:
| | | | |
| | | Average Market Value | |
| Purchased options† | | $ | 6 | |
| Written options† | | | 44 | |
| Futures contracts (to buy) | | | 190,750,655 | |
| Futures contracts (to sell) | | | 52,283,807 | |
| † | At December 31, 2023, there were no open positions held in this derivative. |
5. Class specific expenses, waivers and/or expense reimbursements
The Fund has adopted a Rule 12b-1 shareholder services and distribution plan and under that plan the Fund pays service and/or distribution fees with respect to its Class A, Class C and Class C1 shares calculated at the annual rate of 0.25%, 1.00%, and 0.70% of the average daily net assets of each class, respectively. Service and/or distribution fees are accrued daily and paid monthly.
For the year ended December 31, 2023, class specific expenses were as follows:
| | | | | | | | |
| | | Service and/or Distribution Fees | | | Transfer Agent Fees | |
| Class 1 | | | — | | | $ | 23,058 | |
| Class A | | $ | 957,358 | | | | 581,912 | |
| Class C | | | 39,772 | | | | 3,100 | |
| Class C1 | | | 352 | | | | 538 | |
| Class I | | | — | | | | 67,407 | |
| Class IS | | | — | | | | 1,130 | |
| Total | | $ | 997,482 | | | $ | 677,145 | |
For the year ended December 31, 2023, waivers and/or expense reimbursements by class were as follows:
| | | | |
| | | Waivers/Expense Reimbursements | |
| Class 1 | | $ | 20 | |
| Class A | | | 500 | |
| Class C | | | 5 | |
| Class C1 | | | 289 | |
| Class I | | | 87 | |
| Class IS | | | 30 | |
| Total | | $ | 931 | |
| | | | | | |
| Western Asset Mortgage Total Return Fund 2023 Annual Report | | | | | 55 | |
Notes to financial statements (cont’d)
6. Distributions to shareholders by class
| | | | | | | | |
| | | Year Ended December 31, 2023 | | | Year Ended December 31, 2022 | |
| Net Investment Income: | | | | | | | | |
| Class 1 | | $ | 722,629 | | | $ | 726,360 | |
| Class A | | | 16,750,760 | | | | 16,297,685 | |
| Class C | | | 144,429 | | | | 201,738 | |
| Class C1 | | | 1,888 | | | | 2,157 | |
| Class I | | | 3,146,635 | | | | 3,746,331 | |
| Class IS | | | 1,108,547 | | | | 1,121,331 | |
| Total | | $ | 21,874,888 | | | $ | 22,095,602 | |
7. Shares of beneficial interest
At December 31, 2023, the Trust had an unlimited number of shares of beneficial interest authorized with a par value of $0.00001 per share. The Fund has the ability to issue multiple classes of shares. Each class of shares represents an identical interest and has the same rights, except that each class bears certain direct expenses, including those specifically related to the distribution of its shares.
Transactions in shares of each class were as follows:
| | | | | | | | | | | | | | | | |
| | | Year Ended
December 31, 2023 | | | Year Ended
December 31, 2022 | |
| | | Shares | | | Amount | | | Shares | | | Amount | |
| Class 1 | | | | | | | | | | | | | | | | |
| Shares sold | | | — | | | | — | | | | — | | | | — | |
| Shares issued on reinvestment | | | 87,882 | | | $ | 722,616 | | | | 81,082 | | | $ | 726,360 | |
| Shares repurchased | | | (262,135) | | | | (2,181,379) | | | | (253,869) | | | | (2,318,275) | |
| Net decrease | | | (174,253) | | | $ | (1,458,763) | | | | (172,787) | | | $ | (1,591,915) | |
| | | | |
| Class A | | | | | | | | | | | | | | | | |
| Shares sold | | | 2,939,551 | | | $ | 24,333,634 | | | | 5,420,171 | | | $ | 49,942,683 | |
| Shares issued on reinvestment | | | 2,016,750 | | | | 16,562,816 | | | | 1,800,660 | | | | 16,101,855 | |
| Shares repurchased | | | (9,299,119) | | | | (76,441,683) | | | | (10,627,822) | | | | (96,589,650) | |
| Net decrease | | | (4,342,818) | | | $ | (35,545,233) | | | | (3,406,991) | | | $ | (30,545,112) | |
| | | | |
| Class C | | | | | | | | | | | | | | | | |
| Shares sold | | | 26,957 | | | $ | 225,816 | | | | 45,538 | | | $ | 413,462 | |
| Shares issued on reinvestment | | | 16,493 | | | | 135,912 | | | | 20,739 | | | | 186,125 | |
| Shares repurchased | | | (273,753) | | | | (2,250,150) | | | | (431,117) | | | | (3,881,738) | |
| Net decrease | | | (230,303) | | | $ | (1,888,422) | | | | (364,840) | | | $ | (3,282,151) | |
| | | | |
| Class C1 | | | | | | | | | | | | | | | | |
| Shares sold | | | 323 | | | $ | 2,663 | | | | 677 | | | $ | 6,241 | |
| Shares issued on reinvestment | | | 229 | | | | 1,878 | | | | 237 | | | | 2,116 | |
| Shares repurchased | | | (2,516) | | | | (20,634) | | | | (43,081) | | | | (425,961) | |
| Net decrease | | | (1,964) | | | $ | (16,093) | | | | (42,167) | | | $ | (417,604) | |
| | | | |
| 56 | | | | Western Asset Mortgage Total Return Fund 2023 Annual Report |
| | | | | | | | | | | | | | | | |
| | | Year Ended
December 31, 2023 | | | Year Ended
December 31, 2022 | |
| | | Shares | | | Amount | | | Shares | | | Amount | |
| Class I | | | | | | | | | | | | | | | | |
| Shares sold | | | 1,779,002 | | | $ | 14,964,361 | | | | 2,538,463 | | | $ | 23,775,260 | |
| Shares issued on reinvestment | | | 254,603 | | | | 2,107,224 | | | | 312,231 | | | | 2,819,350 | |
| Shares repurchased | | | (4,295,864) | | | | (35,482,410) | | | | (6,264,629) | | | | (57,574,576) | |
| Net decrease | | | (2,262,259) | | | $ | (18,410,825) | | | | (3,413,935) | | | $ | (30,979,966) | |
| | | | |
| Class IS | | | | | | | | | | | | | | | | |
| Shares sold | | | 1,326,412 | | | $ | 11,051,434 | | | | 2,266,655 | | | $ | 20,382,142 | |
| Shares issued on reinvestment | | | 63,005 | | | | 521,513 | | | | 56,421 | | | | 501,613 | |
| Shares repurchased | | | (3,284,623) | | | | (27,294,113) | | | | (1,876,055) | | | | (16,833,266) | |
| Net increase (decrease) | | | (1,895,206) | | | $ | (15,721,166) | | | | 447,021 | | | $ | 4,050,489 | |
8. Transactions with affiliated company
As defined by the 1940 Act, an affiliated company is one in which the Fund owns 5% or more of the outstanding voting securities, or a company which is under common ownership or control with the Fund. The following company was considered an affiliated company for all or some portion of the year ended December 31, 2023. The following transactions were effected in such company for the year ended December 31, 2023.
| | | | | | | | | | | | | | | | | | |
| | | Affiliate
Value at
December 31,
2022 | | Purchased | | | Sold | |
| | | Cost | | | Shares | | | Proceeds | | | Shares | |
| Western Asset Premier Institutional Government Reserves, Premium Shares | | — | | $ | 84,773,197 | | | | 84,773,197 | | | $ | 84,773,197 | | | | 84,773,197 | |
| | | | | | | | | | |
| (cont’d) | | Realized Gain (Loss) | | Dividend Income | | | Net Increase (Decrease) in Unrealized Appreciation (Depreciation) | | Affiliate Value at December 31, 2023 |
| Western Asset Premier Institutional Government Reserves, Premium Shares | | — | | $ | 38,446 | | | — | | — |
9. Redemption facility
The Fund, together with other U.S. registered and foreign investment funds (collectively, the “Borrowers”) managed by Franklin Resources or its affiliates, is a borrower in a joint syndicated senior unsecured credit facility totaling $2.675 billion (the “Global Credit Facility”). The Global Credit Facility provides a source of funds to the Borrowers for temporary and emergency purposes, including the ability to meet future unanticipated or unusually large redemption requests. Unless renewed, the Global Credit Facility will terminate on January 31, 2025.
| | | | | | |
| Western Asset Mortgage Total Return Fund 2023 Annual Report | | | | | 57 | |
Notes to financial statements (cont’d)
Under the terms of the Global Credit Facility, the Fund shall, in addition to interest charged on any borrowings made by the Fund and other costs incurred by the Fund, pay its share of fees and expenses incurred in connection with the implementation and maintenance of the Global Credit Facility, based upon its relative share of the aggregate net assets of all the Borrowers, including an annual commitment fee of 0.15% based upon the unused portion of the Global Credit Facility. These fees are reflected in the Statement of Operations. The Fund did not utilize the Global Credit Facility during the year ended December 31, 2023.
10. Income tax information and distributions to shareholders
The tax character of distributions paid during the fiscal years ended December 31, was as follows:
| | | | | | | | |
| | | 2023 | | | 2022 | |
| Distributions paid from: | | | | | | | | |
| Ordinary income | | $ | 21,874,888 | | | $ | 22,095,602 | |
As of December 31, 2023, the components of distributable earnings (loss) on a tax basis were as follows:
| | | | |
| Undistributed ordinary income — net | | $ | 4,566,815 | |
| Deferred capital losses* | | | (115,777,665) | |
| Other book/tax temporary differences(a) | | | (604,751) | |
| Unrealized appreciation (depreciation)(b) | | | (60,386,558) | |
| Total distributable earnings (loss) — net | | $ | (172,202,159) | |
| * | These capital losses have been deferred in the current year as either short-term or long-term losses. The losses will be deemed to occur on the first day of the next taxable year in the same character as they were originally deferred and will be available to offset future taxable capital gains. |
| (a) | Other book/tax temporary differences are attributable to the tax deferral of losses on straddles, the realization for tax purposes of unrealized gains (losses) on certain futures contracts, book/tax differences in the treatment of certain passive activity losses from partnership investments and book/tax differences in the timing of the deductibility of various expenses. |
| (b) | The difference between book-basis and tax-basis unrealized appreciation (depreciation) is attributable to the tax deferral of losses on wash sales, the difference between book and tax amortization methods for premium on fixed income securities and the difference between the book and tax cost basis in partnership investments. |
11. Recent accounting pronouncement
In March 2020, the Financial Accounting Standards Board (FASB) issued Accounting Standards Update (ASU) No. 2020-04, Reference Rate Reform (Topic 848) — Facilitation of the Effects of Reference Rate Reform on Financial Reporting. In January 2021 and December 2022, the FASB issued ASU No. 2021-01 and ASU No. 2022-06, with further amendments to Topic 848. The amendments in the ASUs provide optional temporary accounting recognition and financial reporting relief from the effect of certain types of contract modifications due to the planned discontinuation of the London Interbank Offered Rate (LIBOR) and other interbank-offered based reference rates as of the end of 2021 for certain LIBOR settings and 2023 for the remainder. The ASUs are effective for certain reference rate-related contract modifications that occur during the period March 12, 2020 through December 31, 2024. Management has reviewed the requirements and believes the adoption of these ASUs will not have a material impact on the financial statements.
| | | | |
| 58 | | | | Western Asset Mortgage Total Return Fund 2023 Annual Report |
Report of independent registered public accounting firm
To the Board of Trustees of Legg Mason Partners Income Trust and Shareholders of Western Asset Mortgage Total Return Fund
Opinion on the Financial Statements
We have audited the accompanying statement of assets and liabilities, including the schedule of investments, of Western Asset Mortgage Total Return Fund (one of the funds constituting Legg Mason Partners Income Trust, referred to hereafter as the “Fund”) as of December 31, 2023, the related statement of operations for the year ended December 31, 2023, the statement of changes in net assets for each of the two years in the period ended December 31, 2023, including the related notes, and the financial highlights for each of the five years in the period ended December 31, 2023 (collectively referred to as the “financial statements”). In our opinion, the financial statements present fairly, in all material respects, the financial position of the Fund as of December 31, 2023, the results of its operations for the year then ended, the changes in its net assets for each of the two years in the period ended December 31, 2023 and the financial highlights for each of the five years in the period ended December 31, 2023 in conformity with accounting principles generally accepted in the United States of America.
Basis for Opinion
These financial statements are the responsibility of the Fund’s management. Our responsibility is to express an opinion on the Fund’s financial statements based on our audits. We are a public accounting firm registered with the Public Company Accounting Oversight Board (United States) (PCAOB) and are required to be independent with respect to the Fund in accordance with the U.S. federal securities laws and the applicable rules and regulations of the Securities and Exchange Commission and the PCAOB.
We conducted our audits of these financial statements in accordance with the standards of the PCAOB. Those standards require that we plan and perform the audit to obtain reasonable assurance about whether the financial statements are free of material misstatement, whether due to error or fraud.
Our audits included performing procedures to assess the risks of material misstatement of the financial statements, whether due to error or fraud, and performing procedures that respond to those risks. Such procedures included examining, on a test basis, evidence regarding the amounts and disclosures in the financial statements. Our audits also included evaluating the accounting principles used and significant estimates made by management, as well as evaluating the overall presentation of the financial statements. Our procedures included confirmation of securities owned as of December 31, 2023 by correspondence with the custodian and brokers; when replies were not received from brokers, we performed other auditing procedures. We believe that our audits provide a reasonable basis for our opinion.
/s/PricewaterhouseCoopers LLP
Baltimore, Maryland
February 20, 2024
We have served as the auditor of one or more investment companies in the Franklin Templeton Group of Funds since 1948.
| | | | | | |
| Western Asset Mortgage Total Return Fund 2023 Annual Report | | | | | 59 | |
Additional information (unaudited)
Information about Trustees and Officers
The business and affairs of Western Asset Mortgage Total Return Fund (the “Fund”) are conducted by management under the supervision and subject to the direction of its Board of Trustees. The business address of each Trustee is c/o Jane Trust, Franklin Templeton, 280 Park Avenue, 8th Floor, New York, New York 10017.
Information pertaining to the Trustees and officers of the Fund is set forth below. The Statement of Additional Information includes additional information about Trustees and is available, without charge, upon request by calling the Fund at 877-6LM-FUND/656-3863.
| | |
| Independent Trustees† | | |
| |
| Robert Abeles, Jr. | | |
| |
| Year of birth | | 1945 |
| Position(s) with Fund | | Trustee |
| Term of office1 and length of time served2 | | Since 2013 |
| Principal occupation(s) during the past five years | | Board Member of Excellent Education Development (since 2012); Senior Vice President Emeritus (since 2016) and formerly, Senior Vice President, Finance and Chief Financial Officer (2009 to 2016) at University of Southern California; and formerly, Board Member of Great Public Schools Now (2018 to 2022) |
| Number of funds in fund complex overseen by Trustee3 | | 50 |
| Other Trusteeships held by Trustee during the past five years | | None |
| |
| Jane F. Dasher | | |
| |
| Year of birth | | 1949 |
| Position(s) with Fund | | Trustee |
| Term of office1 and length of time served2 | | Since 1999 |
| Principal occupation(s) during the past five years | | Director (since 2022) and formerly, Chief Financial Officer, Long Light Capital, LLC, formerly known as Korsant Partners, LLC (a family investment company) (since 1997) |
| Number of funds in fund complex overseen by Trustee3 | | 50 |
| Other Trusteeships held by Trustee during the past five years | | Formerly, Director, Visual Kinematics, Inc. (2018 to 2022) |
| |
| Anita L. DeFrantz | | |
| |
| Year of birth | | 1952 |
| Position(s) with Fund | | Trustee |
| Term of office1 and length of time served2 | | Since 1998 |
| Principal occupation(s) during the past five years | | President of Tubman Truth Corp. (since 2015); Vice President (since 2017), Member of the Executive Board (since 2013) and Member of the International Olympic Committee (since 1986); and President Emeritus (since 2015) and formerly, President (1987 to 2015) and Director (1990 to 2015) of LA84 (formerly Amateur Athletic Foundation of Los Angeles) |
| Number of funds in fund complex overseen by Trustee3 | | 50 |
| Other Trusteeships held by Trustee during the past five years | | None |
| | | | |
| 60 | | | | Western Asset Mortgage Total Return Fund |
| | |
| Independent Trustees† (cont’d) | | |
| |
| Susan B. Kerley | | |
| |
| Year of birth | | 1951 |
| Position(s) with Fund | | Trustee |
| Term of office1 and length of time served2 | | Since 1992 |
| Principal occupation(s) during the past five years | | Investment Consulting Partner, Strategic Management Advisors, LLC (investment consulting) (since 1990) |
| Number of funds in fund complex overseen by Trustee3 | | 50 |
| Other Trusteeships held by Trustee during the past five years | | Director and Trustee (since 1990) and Chairman (since 2017 and 2005 to 2012) of various series of MainStay Family of Funds (66 funds); formerly, Chairman of the Independent Directors Council (2012 to 2014); ICI Executive Committee (2011 to 2014); and Investment Company Institute (ICI) Board of Governors (2006 to 2014) |
| |
| Michael Larson | | |
| |
| Year of birth | | 1959 |
| Position(s) with Fund | | Trustee |
| Term of office1 and length of time served2 | | Since 2004 |
| Principal occupation(s) during the past five years | | Chief Investment Officer for William H. Gates III (since 1994)4 |
| Number of funds in fund complex overseen by Trustee3 | | 50 |
| Other Trusteeships held by Trustee during the past five years | | Ecolab Inc. (since 2012); Fomento Economico Mexicano, SAB (since 2011); and Republic Services, Inc. (since 2009) |
| |
| Avedick B. Poladian | | |
| |
| Year of birth | | 1951 |
| Position(s) with Fund | | Trustee |
| Term of office1 and length of time served2 | | Since 2007 |
| Principal occupation(s) during the past five years | | Director and Advisor (since 2017) and formerly, Executive Vice President and Chief Operating Officer (2002 to 2016) of Lowe Enterprises, Inc. (privately held real estate and hospitality firm); and formerly, Partner, Arthur Andersen, LLP (1974 to 2002) |
| Number of funds in fund complex overseen by Trustee3 | | 50 |
| Other Trusteeships held by Trustee during the past five years | | Public Storage (since 2010); Occidental Petroleum Corporation (since 2008); and formerly, California Resources Corporation (2014 to 2021) |
| |
| William E.B. Siart | | |
| Year of birth | | 1946 |
| Position(s) with Fund | | Trustee and Chairman of the Board |
| Term of office1 and length of time served2 | | Since 1997 (Chairman of the Board since 2020) |
| Principal occupation(s) during the past five years | | Chairman of Excellent Education Development (since 2000); formerly, Chairman of Great Public Schools Now (2015 to 2020); Trustee of The Getty Trust (2005 to 2017); and Chairman of Walt Disney Concert Hall, Inc. (1998 to 2006) |
| Number of funds in fund complex overseen by Trustee3 | | 50 |
| Other Trusteeships held by Trustee during the past five years | | Trustee, University of Southern California (since 1994); and formerly, Member of Board of United States Golf Association, Executive Committee Member (2017 to 2021) |
| | | | | | |
| Western Asset Mortgage Total Return Fund | | | | | 61 | |
Additional information (unaudited) (cont’d)
Information about Trustees and Officers
| | |
| Independent Trustees† (cont’d) | | |
| |
| Jaynie Miller Studenmund | | |
| |
| Year of birth | | 1954 |
| Position(s) with Fund | | Trustee |
| Term of office1 and length of time served2 | | Since 2004 |
| Principal occupation(s) during the past five years | | Corporate Board Member and Advisor (since 2004); formerly, Chief Operating Officer of Overture Services, Inc. (publicly traded internet company that created search engine marketing) (2001 to 2004); President and Chief Operating Officer, PayMyBills (internet innovator in bill presentment/payment space) (1999 to 2001); and Executive vice president for consumer and business banking for three national financial institutions (1984 to 1997) |
| Number of funds in fund complex overseen by Trustee3 | | 50 |
| Other Trusteeships held by Trustee during the past five years | | Director of Pacific Premier Bancorp Inc. and Pacific Premier Bank (since 2019); Director of EXL (operations management and analytics company) (since 2018); formerly, Director of LifeLock, Inc. (identity theft protection company) (2015 to 2017); Director of CoreLogic, Inc. (information, analytics and business services company) (2012 to 2021); and Director of Pinnacle Entertainment, Inc. (gaming and hospitality company) (2012 to 2018) |
| |
| Peter J. Taylor | | |
| |
| Year of birth | | 1958 |
| Position(s) with Fund | | Trustee |
| Term of office1 and length of time served2 | | Since 2019 |
| Principal occupation(s) during the past five years | | Retired; formerly, President, ECMC Foundation (nonprofit organization) (2014 to 2023); and Executive Vice President and Chief Financial Officer for University of California system (2009 to 2014) |
| Number of funds in fund complex overseen by Trustee3 | | 50 |
| Other Trusteeships held by Trustee during the past five years | | Director of 23andMe, Inc. (genetics and health care services company) (since 2021); Director of Pacific Mutual Holding Company5 (since 2016); Ralph M. Parson Foundation (since 2015); Edison International (since 2011); formerly, Member of the Board of Trustees of California State University system (2015 to 2022); and Kaiser Family Foundation (2012 to 2022) |
| | | |
| Interested Trustee | | |
| |
| Ronald L. Olson6 | | |
| |
| Year of birth | | 1941 |
| Position(s) with Fund | | Trustee |
| Term of office1 and length of time served2 | | Since 2005 |
| Principal occupation(s) during the past five years | | Partner of Munger, Tolles & Olson LLP (a law partnership) (since 1968) |
| Number of funds in fund complex overseen by Trustee3 | | 50 |
| Other Trusteeships held by Trustee during the past five years | | Director of Provivi, Inc. (since 2017); and Director of Berkshire Hathaway, Inc. (since 1997) |
| | | | |
| 62 | | | | Western Asset Mortgage Total Return Fund |
| | |
| Interested Trustee and Officer | | |
| |
| Jane Trust, CFA7 | | |
| |
| Year of birth | | 1962 |
| Position(s) with Fund | | Trustee, President and Chief Executive Officer |
| Term of office1 and length of time served2 | | Since 2015 |
| Principal occupation(s) during the past five years | | Senior Vice President, Fund Board Management, Franklin Templeton (since 2020); Officer and/or Trustee/Director of 123 funds associated with FTFA or its affiliates (since 2015); President and Chief Executive Officer of FTFA (since 2015); formerly, Senior Managing Director (2018 to 2020) and Managing Director (2016 to 2018) of Legg Mason & Co., LLC (“Legg Mason & Co.”); and Senior Vice President of FTFA (2015) |
| Number of funds in fund complex overseen by Trustee3 | | 123 |
| Other Trusteeships held by Trustee during the past five years | | None |
| | | |
| Additional Officers | | |
| |
Ted P. Becker
Franklin Templeton 280 Park Avenue, 8th Floor, New York, NY 10017 | | |
| |
| Year of birth | | 1951 |
| Position(s) with Fund | | Chief Compliance Officer |
| Term of office1 and length of time served2 | | Since 2007 |
| Principal occupation(s) during the past five years | | Vice President, Global Compliance of Franklin Templeton (since 2020); Chief Compliance Officer of FTFA (since 2006); Chief Compliance Officer of certain funds associated with Legg Mason & Co. or its affiliates (since 2006); formerly, Director of Global Compliance at Legg Mason (2006 to 2020); Managing Director of Compliance of Legg Mason & Co. (2005 to 2020) |
| |
Susan Kerr
Franklin Templeton 280 Park Avenue, 8th Floor, New York, NY 10017 | | |
| |
| Year of birth | | 1949 |
| Position(s) with Fund | | Chief Anti-Money Laundering Compliance Officer |
| Term of office1 and length of time served2 | | Since 2013 |
| Principal occupation(s) during the past five years | | Senior Compliance Analyst, Franklin Templeton (since 2020); Chief Anti-Money Laundering Compliance Officer of certain funds associated with Legg Mason & Co. or its affiliates (since 2013) and Anti-Money Laundering Compliance Officer (since 2012), Senior Compliance Officer (since 2011) and Assistant Vice President (since 2010) of Franklin Distributors, LLC; formerly, Assistant Vice President of Legg Mason & Co. (2010 to 2020) |
| | | | | | |
| Western Asset Mortgage Total Return Fund | | | | | 63 | |
Additional information (unaudited) (cont’d)
Information about Trustees and Officers
| | |
| Additional Officers (cont’d) | | |
| |
Marc A. De Oliveira
Franklin Templeton 100 First Stamford Place, 6th Floor, Stamford, CT 06902 | | |
| |
| Year of birth | | 1971 |
| Position(s) with Fund | | Secretary and Chief Legal Officer |
| Term of office1 and length of time served2 | | Since 2020 |
| Principal occupation(s) during the past five years | | Associate General Counsel of Franklin Templeton (since 2020); Assistant Secretary of certain funds associated with Legg Mason & Co. or its affiliates (since 2006); formerly, Managing Director (2016 to 2020) and Associate General Counsel of Legg Mason & Co. (2005 to 2020) |
| |
Thomas C. Mandia
Franklin Templeton 100 First Stamford Place, 6th Floor, Stamford, CT 06902 | | |
| |
| Year of birth | | 1962 |
| Position(s) with Fund | | Senior Vice President |
| Term of office1 and length of time served2 | | Since 2020 |
| Principal occupation(s) during the past five years | | Senior Associate General Counsel of Franklin Templeton (since 2020); Secretary of FTFA (since 2006); Assistant Secretary of certain funds associated with Legg Mason & Co. or its affiliates (since 2006); Secretary of LM Asset Services, LLC (“LMAS”) (since 2002) and Legg Mason Fund Asset Management, Inc. (“LMFAM”) (since 2013) (formerly registered investment advisers); formerly, Managing Director and Deputy General Counsel of Legg Mason & Co. (2005 to 2020) |
| |
Christopher Berarducci
Franklin Templeton 280 Park Avenue, 8th Floor, New York, NY 10017 | | |
| |
| Year of birth | | 1974 |
| Position(s) with Fund | | Treasurer and Principal Financial Officer |
| Term of office1 and length of time served2 | | Since 2019 |
| Principal occupation(s) during the past five years | | Vice President, Fund Administration and Reporting, Franklin Templeton (since 2020); Treasurer (since 2010) and Principal Financial Officer (since 2019) of certain funds associated with Legg Mason & Co. or its affiliates; formerly, Managing Director (2020), Director (2015 to 2020), and Vice President (2011 to 2015) of Legg Mason & Co. |
| | | | |
| 64 | | | | Western Asset Mortgage Total Return Fund |
| | |
| Additional Officers (cont’d) | | |
| |
Jeanne M. Kelly
Franklin Templeton 280 Park Avenue, 8th Floor, New York, NY 10017 | | |
| |
| Year of birth | | 1951 |
| Position(s) with Fund | | Senior Vice President |
| Term of office1 and length of time served2 | | Since 2007 |
| Principal occupation(s) during the past five years | | U.S. Fund Board Team Manager, Franklin Templeton (since 2020); Senior Vice President of certain funds associated with Legg Mason & Co. or its affiliates (since 2007); Senior Vice President of FTFA (since 2006); President and Chief Executive Officer of LMAS and LMFAM (since 2015); formerly, Managing Director of Legg Mason & Co. (2005 to 2020); and Senior Vice President of LMFAM (2013 to 2015) |
| | FTFA, referenced above, was formerly known as LMPFA prior to November 30, 2023. |
| † | Trustees who are not “interested persons” of the Fund within the meaning of Section 2(a)(19) of the Investment Company Act of 1940, as amended (the “1940 Act”). |
| 1 | Each Trustee and officer serves until his or her respective successor has been duly elected and qualified or until his or her earlier death, resignation, retirement or removal. |
| 2 | Indicates the earliest year in which the Trustee became a board member for a fund in the Legg Mason fund complex or the officer took such office. |
| 3 | Each board member also serves as a Director of Western Asset Investment Grade Income Fund Inc. and a Trustee of Western Asset Premier Bond Fund (closed-end investment companies), which are considered part of the same fund complex. Additionally, each board member serves as a Trustee of Western Asset Inflation-Linked Income Fund and Western Asset Inflation-Linked Opportunities & Income Fund, closed-end investment companies that are part of the same fund complex. |
| 4 | Mr. Larson is the chief investment officer for William H. Gates III and in that capacity oversees the non-Microsoft investments of Mr. Gates and the all of investments of the Bill and Melinda Gates Foundation Trust (such combined investments are referred to as the “Accounts”). Since 1997, Western Asset has provided discretionary investment advice with respect to one or more Accounts. |
| 5 | Western Asset and its affiliates provide investment advisory services with respect to registered investment companies sponsored by an affiliate of Pacific Mutual Holding Company (“Pacific Holdings”). Affiliates of Pacific Holdings receive compensation from FTFA or its affiliates for shareholder or distribution services provided with respect to registered investment companies for which Western Asset or its affiliates serve as investment adviser. |
| 6 | Mr. Olson is an “interested person” of the Fund, as defined in the 1940 Act, because his law firm has provided legal services to Western Asset. |
| 7 | Ms. Trust is an “interested person” of the Fund, as defined in the 1940 Act, because of her position with FTFA and/or certain of its affiliates. |
| | | | | | |
| Western Asset Mortgage Total Return Fund | | | | | 65 | |
Important tax information (unaudited)
By mid-February, tax information related to a shareholder’s proportionate share of distributions paid during the preceding calendar year will be received, if applicable. Please also refer to www.franklintempleton.com for per share tax information related to any distributions paid during the preceding calendar year. Shareholders are advised to consult with their tax advisors for further information on the treatment of these amounts on their tax returns.
The following tax information for the Fund is required to be furnished to shareholders with respect to income earned and distributions paid during its fiscal year.
The Fund hereby reports the following amounts, or if subsequently determined to be different, the maximum allowable amounts, for the fiscal year ended December 31, 2023:
| | | | | | | | |
| | | Pursuant to: | | | Amount Reported | |
| Qualified Net Interest Income (QII) | | | §871(k)(1)(C) | | | | $20,801,460 | |
| Section 163(j) Interest Earned | | | §163(j) | | | | $27,068,090 | |
| | | | |
| 66 | | | | Western Asset Mortgage Total Return Fund |
Western Asset
Mortgage Total Return Fund
Trustees
Robert Abeles, Jr.
Jane F. Dasher
Anita L. DeFrantz
Susan B. Kerley
Michael Larson
Ronald L. Olson
Avedick B. Poladian
William E.B. Siart
Chairman
Jaynie M. Studenmund
Peter J. Taylor
Jane Trust
Investment manager
Franklin Templeton Fund Adviser, LLC*
Subadviser
Western Asset Management Company, LLC
Distributor
Franklin Distributors, LLC
Custodian
The Bank of New York Mellon
| * | Formerly known as Legg Mason Partners Fund Advisor, LLC. |
Transfer agent
Franklin Templeton Investor Services, LLC
3344 Quality Drive
Rancho Cordova, CA 95670-7313
Independent registered public accounting firm
PricewaterhouseCoopers LLP Baltimore, MD
Western Asset Mortgage Total Return Fund
The Fund is a separate investment series of Legg Mason Partners Income Trust, a Maryland statutory trust.
Western Asset Mortgage Total Return Fund
Legg Mason Funds
620 Eighth Avenue, 47th Floor
New York, NY 10018
The Fund files its complete schedule of portfolio holdings with the Securities and Exchange Commission (“SEC”) for the first and third quarters of each fiscal year as an exhibit to its reports on Form N-PORT. The Fund’s Forms N-PORT are available on the SEC’s website at www.sec.gov. To obtain information on Form N-PORT, shareholders can call the Fund at 877-6LM-FUND/656-3863.
Information on how the Fund voted proxies relating to portfolio securities during the prior 12-month period ended June 30th of each year and a description of the policies and procedures that the Fund uses to determine how to vote proxies related to portfolio transactions are available (1) without charge, upon request, by calling the Fund at 877-6LM-FUND/656- 3863, (2) at www.franklintempleton.com and (3) on the SEC’s website at www.sec.gov.
This report is submitted for the general information of the shareholders of Western Asset Mortgage Total Return Fund. This report is not authorized for distribution to prospective investors in the Fund unless preceded or accompanied by a current prospectus.
Investors should consider the Fund’s investment objectives, risks, charges and expenses carefully before investing. The prospectus contains this and other important information about the Fund. Please read the prospectus carefully before investing.
www.franklintempleton.com
© 2024 Franklin Distributors, LLC,
Member FINRA/SIPC. All rights reserved.
Legg Mason Funds Privacy and Security Notice
Your Privacy Is Our Priority
Franklin Templeton* is committed to safeguarding your personal information. This notice is designed to provide you with a summary of the non-public personal information Franklin Templeton may collect and maintain about current or former individual investors; our policy regarding the use of that information; and the measures we take to safeguard the information. We do not sell individual investors’ non-public personal information to anyone and only share it as described in this notice.
Information We Collect
When you invest with us, you provide us with your non-public personal information. We collect and use this information to service your accounts and respond to your requests. The non-public personal information we may collect falls into the following categories:
| • | | Information we receive from you or your financial intermediary on applications or other forms, whether we receive the form in writing or electronically. For example, this information may include your name, address, tax identification number, birth date, investment selection, beneficiary information, and your personal bank account information and/or email address if you have provided that information. |
| • | | Information about your transactions and account history with us, or with other companies that are part of Franklin Templeton, including transactions you request on our website or in our app. This category also includes your communications to us concerning your investments. |
| • | | Information we receive from third parties (for example, to update your address if you move, obtain or verify your email address or obtain additional information to verify your identity). |
| • | | Information collected from you online, such as your IP address or device ID and data gathered from your browsing activity and location. (For example, we may use cookies to collect device and browser information so our website recognizes your online preferences and device information.) Our website contains more information about cookies and similar technologies and ways you may limit them. |
| • | | Other general information that we may obtain about you such as demographic information. |
Disclosure Policy
To better service your accounts and process transactions or services you requested, we may share non-public personal information with other Franklin Templeton companies. From time to time we may also send you information about products/services offered by other Franklin Templeton companies although we will not share your non-public personal information with these companies without first offering you the opportunity to prevent that sharing.
We will only share non-public personal information with outside parties in the limited circumstances permitted by law. For example, this includes situations where we need to share information with companies who work on our behalf to service or maintain your account or process transactions you requested, when the disclosure is to companies assisting us with our own marketing efforts, when the disclosure is to a party representing you, or when required by law (for example, in response to legal process). Additionally, we will ensure that any outside
|
| NOT PART OF THE ANNUAL REPORT |
Legg Mason Funds Privacy and Security Notice (cont’d)
companies working on our behalf, or with whom we have joint marketing agreements, are under contractual obligations to protect the confidentiality of your information, and to use it only to provide the services we asked them to perform.
Confidentiality and Security
Our employees are required to follow procedures with respect to maintaining the confidentiality of our investors’ non-public personal information. Additionally, we maintain physical, electronic and procedural safeguards to protect the information. This includes performing ongoing evaluations of our systems containing investor information and making changes when appropriate.
At all times, you may view our current privacy notice on our website at franklintempleton.com or contact us for a copy at (800) 632-2301.
*For purposes of this privacy notice Franklin Templeton shall refer to the following entities:
Fiduciary Trust International of the South (FTIOS), as custodian for individual retirement plans Franklin Advisers, Inc.
Franklin Distributors, LLC, including as program manager of the Franklin Templeton 529 College Savings Plan and the NJBEST 529 College Savings Plan
Franklin Mutual Advisers, LLC
Franklin, Templeton and Mutual Series Funds
Franklin Templeton Institutional, LLC
Franklin Templeton Investments Corp., Canada
Franklin Templeton Investments Management, Limited UK
Franklin Templeton Portfolio Advisors, Inc.
Legg Mason Funds serviced by Franklin Templeton Investor Services, LLC
Templeton Asset Management, Limited
Templeton Global Advisors, Limited
Templeton Investment Counsel, LLC
If you are a customer of other Franklin Templeton affiliates and you receive notices from them, you will need to read those notices separately.
|
| NOT PART OF THE ANNUAL REPORT |
www.franklintempleton.com
© 2024 Franklin Distributors, LLC, Member FINRA/SIPC. All rights reserved.
FD0316 2/24 SR24-4835
The registrant has adopted a code of ethics that applies to the registrant’s principal executive officer, principal financial officer, principal accounting officer or controller.
| ITEM 3. | AUDIT COMMITTEE FINANCIAL EXPERT. |
The Board of Trustees of the registrant has determined that Robert Abeles, Jr., possess the technical attributes identified in Instruction 2(b) of Item 3 to Form N-CSR to qualify an “audit committee financial expert,” and has designated Mr. Abeles, Jr. as the Audit Committee’s financial expert. Mr. Abeles, Jr. is an “independent” Trustees pursuant to paragraph (a) (2) of Item 3 to Form N-CSR.
| ITEM 4. | PRINCIPAL ACCOUNTANT FEES AND SERVICES. |
a) Audit-Related Fees. The aggregate fees billed in the last two fiscal years ending December 31, 2022 and December 31, 2023 (the “Reporting Periods”) for professional services rendered by the Registrant’s principal accountant (the “Auditor”) for the audit of the Registrant’s annual financial statements, or services that are normally provided by the Auditor in connection with the statutory and regulatory filings or engagements for the Reporting Periods, were $124,686 in December 31, 2022 and $124,686 in December 31, 2023.
b) Audit-Related Fees. The aggregate fees billed in the Reporting Period for assurance and related services by the Auditor that are reasonably related to the performance of the Registrant’s financial statements were $0 in December 31, 2022 and $0 in December 31, 2023.
(c) Tax Fees. The aggregate fees billed in the Reporting Periods for professional services rendered by the Auditor for tax compliance, tax advice and tax planning (“Tax Services”) were $30,000 in December 31, 2022 and $30,000 in December 31, 2023. These services consisted of (i) review or preparation of U.S. federal, state, local and excise tax returns; (ii) U.S. federal, state and local tax planning, advice and assistance regarding statutory, regulatory or administrative developments, and (iii) tax advice regarding tax qualification matters and/or treatment of various financial instruments held or proposed to be acquired or held.
There were no fees billed for tax services by the Auditors to service affiliates during the Reporting Periods that required pre-approval by the Audit Committee.
d) All Other Fees. The aggregate fees billed in the Reporting Periods for products and services provided by the Auditor, other than the services reported in paragraphs (a) through (c) for the Item 4 for the Legg Mason Partners Income Trust, were $0 in December 31, 2022 and $0 in December 31, 2023.
All Other Fees. There were no other non-audit services rendered by the Auditor to Franklin Templeton Fund Adviser, LLC (“FTFA”), and any entity controlling, controlled by or under common control with FTFA that provided ongoing services to Legg Mason Partners Income Trust requiring pre-approval by the Audit Committee in the Reporting Period.
(e) Audit Committee’s pre–approval policies and procedures described in paragraph (c) (7) of Rule 2-01 of Regulation S-X.
(1) The Charter for the Audit Committee (the “Committee”) of the Board of each registered investment company (the “Fund”) advised by FTFA or one of their affiliates (each, an “Adviser”) requires that the Committee shall approve (a) all audit and permissible non-audit services to be provided to the Fund and (b) all permissible non-audit services to be provided by the Fund’s independent auditors to the Adviser and any Covered Service Providers if the engagement
relates directly to the operations and financial reporting of the Fund. The Committee may implement policies and procedures by which such services are approved other than by the full Committee.
The Committee shall not approve non-audit services that the Committee believes may impair the independence of the auditors. As of the date of the approval of this Audit Committee Charter, permissible non-audit services include any professional services (including tax services), that are not prohibited services as described below, provided to the Fund by the independent auditors, other than those provided to the Fund in connection with an audit or a review of the financial statements of the Fund. Permissible non-audit services may not include: (i) bookkeeping or other services related to the accounting records or financial statements of the Fund; (ii) financial information systems design and implementation; (iii) appraisal or valuation services, fairness opinions or contribution-in-kind reports; (iv) actuarial services; (v) internal audit outsourcing services; (vi) management functions or human resources; (vii) broker or dealer, investment adviser or investment banking services; (viii) legal services and expert services unrelated to the audit; and (ix) any other service the Public Company Accounting Oversight Board determines, by regulation, is impermissible.
Pre-approval by the Committee of any permissible non-audit services is not required so long as: (i) the aggregate amount of all such permissible non-audit services provided to the Fund, the Adviser and any service providers controlling, controlled by or under common control with the Adviser that provide ongoing services to the Fund (“Covered Service Providers”) constitutes not more than 5% of the total amount of revenues paid to the independent auditors during the fiscal year in which the permissible non-audit services are provided to (a) the Fund, (b) the Adviser and (c) any entity controlling, controlled by or under common control with the Adviser that provides ongoing services to the Fund during the fiscal year in which the services are provided that would have to be approved by the Committee; (ii) the permissible non-audit services were not recognized by the Fund at the time of the engagement to be non-audit services; and (iii) such services are promptly brought to the attention of the Committee and approved by the Committee (or its delegate(s)) prior to the completion of the audit.
(2) None of the services described in paragraphs (b) through (d) of this Item were performed in reliance on paragraph (c)(7)(i)(C) of Rule 2-01 of Regulation S-X.
(f) Not applicable.
(g) Non-audit fees billed by the Auditor for services rendered to Legg Mason Partners Income Trust, FTFA and any entity controlling, controlled by, or under common control with FTFA that provides ongoing services to Legg Mason Partners Income Trust during the reporting period were $350,359 in December 31, 2022 and $342,635 in December 31, 2023.
(h) Yes. Legg Mason Partners Income Trust’s Audit Committee has considered whether the provision of non-audit services that were rendered to Service Affiliates, which were not pre-approved (not requiring pre-approval), is compatible with maintaining the Accountant’s independence. All services provided by the Auditor to the Legg Mason Partners Income Trust or to Service Affiliates, which were required to be pre-approved, were pre-approved as required.
(i) Not applicable.
(j) Not applicable.
| ITEM 5. | AUDIT COMMITTEE OF LISTED REGISTRANTS. |
| | a) | The independent board members are acting as the registrant’s audit committee as specified in Section 3(a)(58)(B) of the Exchange Act. The Audit Committee consists of the following Board members: |
Robert Abeles, Jr.
Jane F. Dasher
Anita L. DeFrantz
Susan B. Kerley
Michael Larson
Avedick B. Poladian
William E.B. Siart
Jaynie M. Studenmund
Peter J. Taylor
| ITEM 6. | SCHEDULE OF INVESTMENTS. |
Included herein under Item 1.
| ITEM 7. | DISCLOSURE OF PROXY VOTING POLICIES AND PROCEDURES FOR CLOSED-END MANAGEMENT INVESTMENT COMPANIES. |
Not applicable.
| ITEM 8. | PORTFOLIO MANAGERS OF CLOSED-END MANAGEMENT INVESTMENT COMPANIES. |
Not applicable.
| ITEM 9. | PURCHASES OF EQUITY SECURITIES BY CLOSED-END MANAGEMENT INVESTMENT COMPANY AND AFFILIATED PURCHASERS. |
Not applicable.
| ITEM 10. | SUBMISSION OF MATTERS TO A VOTE OF SECURITY HOLDERS. |
Not applicable.
| ITEM 11. | CONTROLS AND PROCEDURES. |
| | (a) | The registrant’s principal executive officer and principal financial officer have concluded that the registrant’s disclosure controls and procedures (as defined in Rule 30a- 3(c) under the Investment Company Act of 1940, as amended (the “1940 Act”)) are effective as of a date within 90 days of the filing date of this report that includes the disclosure required by this paragraph, based on their evaluation of the disclosure controls and procedures required by Rule 30a-3(b) under the 1940 Act and 15d-15(b) under the Securities Exchange Act of 1934. |
| | (b) | There were no changes in the registrant’s internal control over financial reporting (as defined in Rule 30a-3(d) under the 1940 Act) that occurred during the period covered by this report that have materially affected, or are likely to materially affect the registrant’s internal control over financial reporting. |
| ITEM 12. | DISCLOSURE OF SECURITIES LENDING ACTIVITIES FOR CLOSED-END MANAGEMENT INVESTMENT COMPANIES. |
Not applicable.
| ITEM 13. | RECOVERY OF ERRONEOUSLY AWARDED COMPENSATION. |
(a) (1) Code of Ethics attached hereto.
Exhibit 99.CODE ETH
(a) (2) Certifications pursuant to section 302 of the Sarbanes-Oxley Act of 2002 attached hereto.
Exhibit 99.CERT
(b) Certifications pursuant to Section 906 of the Sarbanes-Oxley Act of 2002 attached hereto.
Exhibit 99.906CERT
SIGNATURES
Pursuant to the requirements of the Securities Exchange Act of 1934 and the Investment Company Act of 1940, the registrant has duly caused this Report to be signed on its behalf by the undersigned, there unto duly authorized.
| | |
| Legg Mason Partners Income Trust |
| |
| By: | | /s/ Jane Trust |
| | Jane Trust |
| | Chief Executive Officer |
| |
| Date: | | February 28, 2024 |
Pursuant to the requirements of the Securities Exchange Act of 1934 and the Investment Company Act of 1940, this report has been signed below by the following persons on behalf of the registrant and in the capacities and on the dates indicated.
| | |
| By: | | /s/ Jane Trust |
| | Jane Trust |
| | Chief Executive Officer |
| |
| Date: | | February 28, 2024 |
| | |
| By: | | /s/ Christopher Berarducci |
| | Christopher Berarducci |
| | Principal Financial Officer |
| |
| Date: | | February 28, 2024 |