UNITED STATES
SECURITIES AND EXCHANGE COMMISSION
Washington, D.C. 20549
FORM N-CSR
CERTIFIED SHAREHOLDER REPORT OF REGISTERED
MANAGEMENT INVESTMENT COMPANIES
Investment Company Act file number 811-04254
Legg Mason Partners Income Trust
(Exact name of registrant as specified in charter)
620 Eighth Avenue, 47th Floor, New York, NY 10018
(Address of principal executive offices) (Zip code)
Marc A. De Oliveira
Franklin Templeton
100 First Stamford Place
Stamford, CT 06902
(Name and address of agent for service)
Registrant’s telephone number, including area code: 877-6LM-FUND/656-3863
Date of fiscal year end: December 31
Date of reporting period: December 31, 2023
| ITEM 1. | REPORT TO STOCKHOLDERS. |
The Annual Report to Stockholders is filed herewith.

| | |
| Annual Report | | December 31, 2023 |
WESTERN ASSET
CORPORATE BOND FUND
The Securities and Exchange Commission has adopted new regulations that will result in changes to the design and delivery of annual and semi-annual shareholder reports beginning in July 2024.
If you have previously elected to receive shareholder reports electronically, you will continue to do so and need not take any action.
Otherwise, paper copies of the Fund’s shareholder reports will be mailed to you beginning in July 2024. If you would like to receive shareholder reports and other communications from the Fund electronically instead of by mail, you may make that request at any time by contacting your financial intermediary (such as a broker-dealer or bank) or, if you are a direct investor, enrolling at franklintempleton.com.
You may access franklintempleton.com by scanning the code below.


|
| INVESTMENT PRODUCTS: NOT FDIC INSURED • NO BANK GUARANTEE • MAY LOSE VALUE |
Fund objective
The Fund seeks to maximize total return, consistent with prudent investment management. Total return consists of income and capital appreciation.
Letter from the president

Dear Shareholder,
We are pleased to provide the annual report of Western Asset Corporate Bond Fund for the twelve-month reporting period ended December 31, 2023. Please read on for a detailed look at prevailing economic and market conditions during the Fund’s reporting period and to learn how those conditions have affected Fund performance.
As always, we remain committed to providing you with excellent service and a full spectrum of investment choices. We also remain committed to supplementing the support you receive from your financial advisor. One way we accomplish this is through our website, www.franklintempleton.com. Here you can gain immediate access to market and investment information, including:
| • | | Fund prices and performance, |
| • | | Market insights and commentaries from our portfolio managers, and |
| • | | A host of educational resources. |
We look forward to helping you meet your financial goals.
Sincerely,

Jane Trust, CFA
President and Chief Executive Officer
January 31, 2024
| | |
II | | Western Asset Corporate Bond Fund |
Fund overview
Q. What is the Fund’s investment strategy?
A. The Fund seeks to maximize total return, consistent with prudent investment management. Total return consists of income and capital appreciation. Under normal circumstances, the Fund invests at least 80% of its assets in corporate debt securities (including notes, bonds, debentures and commercial paper) and at least 80% of its assets in “investment grade” debt securities. Investment grade securities are those rated by a rating agency at the time of purchase in one of the top four ratings categories or, if unrated, securities that we determined to be of comparable credit quality. These securities may be secured or unsecured, may be issued by U.S. or foreign entities and may carry variable or floating rates of interest. The Fund also may invest in U.S. government securities and U.S. dollar denominated fixed income securities of foreign issuers. The Fund may invest in securities of any maturity or duration.
The Fund may invest up to 25% of its assets in non-U.S. dollar denominated fixed income securities of foreign issuers. The Fund intends to invest not more than 10% of its assets in non-U.S. dollar denominated fixed income securities of foreign issuers for which the Fund has not implemented a currency hedge.
Instead of, and/or in addition to, investing directly in particular securities, the Fund may use instruments such as derivatives, including options, swaps, interest rate swaps, credit default swaps (including buying and selling credit default swaps and options on credit default swaps), foreign currency futures, forwards, futures contracts, and other synthetic instruments that are intended to provide economic exposure to the securities or the issuer or to be used as a hedging technique. The Fund may use one or more of these instruments without limit. These instruments are taken into account when determining compliance with the Fund’s 80% policies. The Fund may also engage in a variety of transactions using derivatives in order to change the investment characteristics of its portfolio (such as shortening or lengthening duration) and for other purposes.
At Western Asset Management Company, LLC (“Western Asset”), the Fund’s subadviser, we utilize a fixed income team approach, with decisions derived from interaction among various investment management sector specialists. The sector teams are comprised of Western Asset’s senior portfolio management personnel, research analysts and an in-house economist. Under this team approach, management of client fixed income portfolios will reflect a consensus of interdisciplinary views within the Western Asset organization.
Q. What were the overall market conditions during the Fund’s reporting period?
A. The U.S. fixed income market experienced periods of elevated volatility, but ultimately generated solid results in 2023. The market moved higher over the first quarter of the reporting period amid shifting expectations for Federal Reserve Board (the “Fed”) rate hikes. Turmoil in the regional banking industry also triggered a flight to quality assets. Those market gains were then erased during the second and third quarters of 2023, as persistent inflation led to expectations of a “higher for longer” interest rate environment. The market ended the year on a positive note, as the Fed indicated it would likely pivot from raising rates to cutting rates in 2024. Moderating inflation and hopes that the central bank could orchestrate a “soft landing” for the economy also supported the market.
| | | | |
| Western Asset Corporate Bond Fund 2023 Annual Report | | | | 1 |
Fund overview (cont’d)
Short-term U.S. Treasury yields declined as inflation fell and the Fed indicated the likely end of its rate hike cycle. The yield for the two-year treasury note began the reporting period at 4.41% and ended at 4.23%. The low of 3.75% was on May 4, 2023, and the peak of 5.19% occurred on October 17 and 18, 2023. The yield for the ten-year Treasury note began and ended the reporting period at 3.88%. The low of 3.30% was on April 5 and 6, 2023, and the peak of 4.98% occurred on October 19, 2023.
All told, the overall credit market, as represented by the Bloomberg U.S. Credit Indexi, returned 8.18% during the twelve months ended December 31, 2023. Over the same period, the overall bond market, as measured by the Bloomberg U.S. Aggregate Indexii, returned 5.53%.
Q. How did we respond to these changing market conditions?
A. A number of adjustments were made to the Fund during the reporting period. We tactically managed the Fund’s duration, decreasing the Fund’s exposure to the short-end of the curve and adding to the long-end of the curve. Overall, we ended the reporting period with duration only slightly lower than where we started. Elsewhere, we increased the Fund’s allocations to investment-grade bonds and utilities (electric). Conversely, we reduced the Fund’s allocations to below-investment-grade securities, emerging markets (corporates) and financials (banking).
During the reporting period, Treasury and euro futures, which were used to manage the Fund’s duration and yield curve positioning, detracted from performance. Credit default swaps and investment-grade index swaps, which were used for hedging purposes, detracted from performance. Currency forwards, which were used to manage the Fund’s currency exposures, modestly detracted from performance.
Performance review
For the twelve months ended December 31, 2023, Class A shares of Western Asset Corporate Bond Fund, excluding sales charges, returned 7.41%. The Fund’s unmanaged benchmark, the Bloomberg U.S. Credit Index, returned 8.18% for the same period.
| | | | | | | | |
Performance Snapshot as of December 31, 2023
(unaudited) | |
| (excluding sales charges) | | 6 months | | | 12 months | |
| Western Asset Corporate Bond Fund: | | | | | | | | |
Class A | | | 5.12 | % | | | 7.41 | % |
Class C | | | 4.77 | % | | | 6.70 | % |
Class C11 | | | 4.91 | % | | | 6.84 | % |
Class I | | | 5.29 | % | | | 7.76 | % |
Class P | | | 5.00 | % | | | 7.18 | % |
| Bloomberg U.S. Credit Index | | | 4.90 | % | | | 8.18 | % |
The performance shown represents past performance. Past performance is no guarantee of future results and current performance may be higher or lower than the performance shown above.
| 1 | Class C1 shares are not available for purchase by new or existing investors (except for certain retirement plan programs authorized by the Fund’s distributor). Class C1 shares continue to be available for dividend reinvestment and incoming exchanges. |
| | | | |
2 | | | | Western Asset Corporate Bond Fund 2023 Annual Report |
Principal value, investment returns and yields will fluctuate and investors’ shares, when redeemed, may be worth more or less than their original cost. To obtain performance data current to the most recent month-end, please visit our website at www.franklintempleton.com.
All share class returns assume the reinvestment of all distributions at net asset value and the deduction of all Fund expenses. Returns have not been adjusted to include sales charges that may apply or the deduction of taxes that a shareholder would pay on Fund distributions. If sales charges were reflected, the performance quoted would be lower. Performance figures for periods shorter than one year represent cumulative figures and are not annualized.
Fund performance figures reflect fee waivers and/or expense reimbursements, without which the performance would have been lower.
The 30-Day SEC Yields for the period ended December 31, 2023 for Class A, Class C, Class C1, Class I and Class P shares were 4.94%, 4.47%, 4.59%, 5.44% and 4.93%, respectively. The 30-Day SEC Yield, calculated pursuant to the standard SEC formula, is based on the Fund’s investments over an annualized trailing 30-day period, and not on the distributions paid by the Fund, which may differ.
|
| Total Annual Operating Expenses (unaudited) |
As of the Fund’s current prospectus dated May 1, 2023, the gross total annual fund operating expense ratios for Class A, Class C, Class C1, Class I and Class P shares were 0.89%, 1.56%, 1.84%, 0.60% and 1.09%, respectively.
Actual expenses may be higher. For example, expenses may be higher than those shown if average net assets decrease. Net assets are more likely to decrease and Fund expense ratios are more likely to increase when markets are volatile.
As a result of expense limitation arrangements, the ratio of total annual fund operating expenses, other than interest, brokerage, taxes, extraordinary expenses and acquired fund fees and expenses, to average net assets will not exceed 0.95% for Class A shares, 1.70% for Class C shares, 1.40% for Class C1 shares, 0.55% for Class I shares and 1.20% for Class P shares. These expense limitation arrangements cannot be terminated prior to December 31, 2025 without the Board of Trustees’ consent. In addition, the manager has agreed to waive the Fund’s management fee to an extent sufficient to offset the net management fee payable in connection with any investment in an affiliated money market fund. This management fee waiver is not subject to the recapture provision discussed below.
The manager is permitted to recapture amounts waived and/or reimbursed to a class within two years after the fiscal year in which the manager earned the fee or incurred the expense if the class’ total annual fund operating expenses have fallen to a level below the expense limitation (“expense cap”) in effect at the time the fees were earned or the expenses incurred. In no case will the manager recapture any amount that would result, on any particular business day of the Fund, in the class’ total annual fund operating expenses exceeding the expense cap or any other lower limit then in effect.
Q. What were the leading contributors to performance?
A. The largest contributor to the Fund’s relative performance during the reporting period was the Fund’s allocation to lower quality, with securities rated BBB and below meaningfully beating the benchmark. In terms of sector selection, an overweight to energy provided the largest contribution to performance. Issue selection within energy, information
| | | | |
| Western Asset Corporate Bond Fund 2023 Annual Report | | | | 3 |
Fund overview (cont’d)
technology (“IT”), and consumers (both cyclical1 and non-cyclical2) were also notably additive to performance. In terms of individual holdings, overweights to Energy Transfer (energy), Kyndryl Holdings (IT), Sands China (consumer cyclicals), and Altria Group (consumer non-cyclicals) were our primary drivers of returns.
Q. What were the leading detractors from performance?
A. The largest detractors from the Fund’s relative performance during the reporting period were its overweight to financials and underweight to the IT sectors. Despite the multiple banking crises in the reporting period, our performance from allocation to that sector ended nearly flat. Looking at issue selection, within banking, our overweight to Credit Suisse was a major headwind for returns. Within basic industry, our slight underweights across several issuers detracted from performance. Finally, our overweight to duration slightly detracted from returns despite bond yields spiking drastically during the reporting period, thanks to our active duration and curve management.
Thank you for your investment in the Western Asset Corporate Bond Fund. As always, we appreciate that you have chosen us to manage your assets and we remain focused on achieving the Fund’s investment goals.
Sincerely,
Western Asset Management Company, LLC
January 17, 2024
RISKS: The Fund is subject to interest rate and credit risks. As interest rates rise, bond prices fall, reducing the value of the Fund’s share price. High yield bonds, also known as “junk” bonds, possess greater price volatility, illiquidity and possibility of default than higher grade bonds. Foreign investments are subject to special risks, including currency fluctuations and social, economic and political uncertainties, which could increase volatility. These risks are magnified in emerging markets. Emerging market countries tend to have economic, political and legal systems that are less developed and are less stable than those of more developed countries. The Fund may use derivatives, such as options and futures, which can be illiquid, may disproportionately increase losses, and have a potentially large impact on Fund performance. The market values of securities or other assets will fluctuate, sometimes sharply and unpredictably, due to changes in general market conditions, overall economic trends or events, governmental actions or intervention, actions taken by the U.S. Federal Reserve or foreign central banks, market disruptions caused by trade disputes or other factors, political developments, armed conflicts, economic sanctions and countermeasures in response to sanctions, major cybersecurity events, investor sentiment, the global and domestic effects of a pandemic, and other factors that may or may not be related to the issuer of the security or other asset. Please see the Fund’s prospectus for a more complete discussion of these and other risks and the Fund’s investment strategies.
Portfolio holdings and breakdowns are as of December 31, 2023 and are subject to change and may not be representative of the portfolio managers’ current or future investments. Please refer to pages 11 through 48 for a list and percentage breakdown of the Fund’s holdings.
| 1 | Cyclicals consists of the following industries: automotive, entertainment, gaming, home construction, lodging, retailers, restaurants, textiles and other consumer services. |
| 2 | Non-cyclicals consists of the following industries: consumer products, food/beverage, health care, pharmaceuticals, supermarkets and tobacco. |
| | | | |
4 | | | | Western Asset Corporate Bond Fund 2023 Annual Report |
The mention of sector breakdowns is for informational purposes only and should not be construed as a recommendation to purchase or sell any securities. The information provided regarding such sectors is not a sufficient basis upon which to make an investment decision. Investors seeking financial advice regarding the appropriateness of investing in any securities or investment strategies discussed should consult their financial professional. Portfolio holdings are subject to change at any time and may not be representative of the portfolio managers’ current or future investments. The Fund’s top five sector holdings (as a percentage of net assets) as of December 31, 2023 were: financials (27.3%), energy (15.5%), industrials (9.8%), consumer discretionary (8.4%) and utilities (5.6%). The Fund’s portfolio composition is subject to change at any time.
All investments are subject to risk including the possible loss of principal. Past performance is no guarantee of future results. All index performance reflects no deduction for fees, expenses or taxes. Please note that an investor cannot invest directly in an index.
The information provided is not intended to be a forecast of future events, a guarantee of future results or investment advice. Views expressed may differ from those of the firm as a whole.
| i | The Bloomberg U.S. Credit Index is an index composed of corporate and non-corporate debt issues that are investment grade (rated Baa3/BBB or higher). |
| ii | The Bloomberg U.S. Aggregate Index is a broad-based bond index comprised of government, corporate, mortgage-and asset-backed issues, rated investment grade or higher, and having at least one year to maturity. |
| | | | |
| Western Asset Corporate Bond Fund 2023 Annual Report | | | | 5 |
Fund at a glance† (unaudited)
Investment breakdown (%) as a percent of total investments
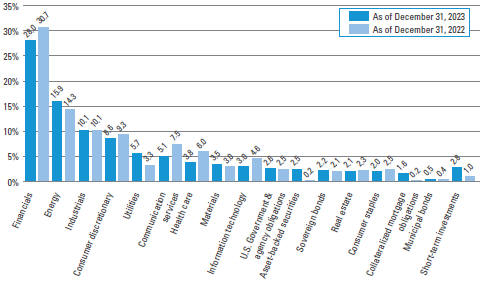
| † | The bar graph above represents the composition of the Fund’s investments as of December 31, 2023 and December 31, 2022, and does not include derivatives, such as futures contracts, forward foreign currency contracts and swap contracts. The Fund is actively managed. As a result, the composition of the Fund’s investments is subject to change at any time. |
| | | | |
6 | | | | Western Asset Corporate Bond Fund 2023 Annual Report |
Fund expenses (unaudited)
Example
As a shareholder of the Fund, you may incur two types of costs: (1) transaction costs, including front-end and back-end sales charges (loads) on purchase payments; and (2) ongoing costs, including management fees; service and/or distribution (12b-1) fees; and other Fund expenses. This example is intended to help you understand your ongoing costs (in dollars) of investing in the Fund and to compare these costs with the ongoing costs of investing in other mutual funds.
This example is based on an investment of $1,000 invested on July 1, 2023 and held for the six months ended December 31, 2023.
Actual expenses
The table below titled “Based on actual total return” provides information about actual account values and actual expenses. You may use the information provided in this table, together with the amount you invested, to estimate the expenses that you paid over the period. To estimate the expenses you paid on your account, divide your ending account value by $1,000 (for example, an $8,600 ending account value divided by $1,000 = 8.6), then multiply the result by the number under the heading entitled “Expenses Paid During the Period”.
Hypothetical example for comparison purposes
The table below titled “Based on hypothetical total return” provides information about hypothetical account values and hypothetical expenses based on the actual expense ratio and an assumed rate of return of 5.00% per year before expenses, which is not the Fund’s actual return. The hypothetical account values and expenses may not be used to estimate the actual ending account balance or expenses you paid for the period. You may use the information provided in this table to compare the ongoing costs of investing in the Fund and other funds. To do so, compare the 5.00% hypothetical example relating to the Fund with the 5.00% hypothetical examples that appear in the shareholder reports of the other funds.
Please note that the expenses shown in the table below are meant to highlight your ongoing costs only and do not reflect any transactional costs, such as front-end or back-end sales charges (loads). Therefore, the table is useful in comparing ongoing costs only, and will not help you determine the relative total costs of owning different funds. In addition, if these transaction costs were included, your costs would have been higher.
| | | | | | | | | | | | | | | | | | | | | | | | | | | | | | | | | | | | | | | | | | | | | | |
| | | |
| Based on actual total return1 | | | | | | | | | Based on hypothetical total return1 | |
| | | Actual Total Return Without Sales Charge2 | | | Beginning Account
Value | | | Ending Account Value | | | Annualized Expense Ratio | | | Expenses Paid During the Period3 | | | | | | | | Hypothetical
Annualized
Total Return | | | Beginning
Account
Value | | | Ending
Account
Value | | | Annualized
Expense
Ratio | | | Expenses
Paid
During
the
Period3 | |
| Class A | | | 5.12 | % | | $ | 1,000.00 | | | $ | 1,051.20 | | | | 0.87 | % | | $ | 4.50 | | | | | | | Class A | | | 5.00 | % | | $ | 1,000.00 | | | $ | 1,020.82 | | | | 0.87 | % | | $ | 4.43 | |
| Class C | | | 4.77 | | | | 1,000.00 | | | | 1,047.70 | | | | 1.54 | | | | 7.95 | | | | | | | Class C | | | 5.00 | | | | 1,000.00 | | | | 1,017.44 | | | | 1.54 | | | | 7.83 | |
| Class C1 | | | 4.91 | | | | 1,000.00 | | | | 1,049.10 | | | | 1.40 | | | | 7.23 | | | | | | | Class C1 | | | 5.00 | | | | 1,000.00 | | | | 1,018.15 | | | | 1.40 | | | | 7.12 | |
| Class I | | | 5.29 | | | | 1,000.00 | | | | 1,052.90 | | | | 0.55 | | | | 2.85 | | | | | | | Class I | | | 5.00 | | | | 1,000.00 | | | | 1,022.43 | | | | 0.55 | | | | 2.80 | |
| Class P | | | 5.00 | | | | 1,000.00 | | | | 1,050.00 | | | | 1.10 | | | | 5.68 | | | | | | | Class P | | | 5.00 | | | | 1,000.00 | | | | 1,019.66 | | | | 1.10 | | | | 5.60 | |
| | | | |
| Western Asset Corporate Bond Fund 2023 Annual Report | | | | 7 |
Fund expenses (unaudited) (cont’d)
| 1 | For the six months ended December 31, 2023. |
| 2 | Assumes the reinvestment of all distributions, including returns of capital, if any, at net asset value and does not reflect the deduction of the applicable sales charge with respect to Class A shares or the applicable contingent deferred sales charge (“CDSC”) with respect to Class C shares and Class C1 shares. Total return is not annualized, as it may not be representative of the total return for the year. Performance figures may reflect compensating balance arrangements, fee waivers and/or expense reimbursements. In the absence of compensating balance arrangements, fee waivers and/or expense reimbursements, the total return would have been lower. Past performance is no guarantee of future results. |
| 3 | Expenses (net of compensating balance arrangements, fee waivers and/or expense reimbursements) are equal to each class’ respective annualized expense ratio multiplied by the average account value over the period, multiplied by the number of days in the most recent fiscal half-year (184), then divided by 365. |
| | | | |
8 | | | | Western Asset Corporate Bond Fund 2023 Annual Report |
Fund performance (unaudited)
| | | | | | | | | | | | | | | | | | | | |
| Average annual total returns | |
| Without sales charges1 | | Class A | | | Class C | | | Class C1 | | | Class I | | | Class P | |
| Twelve Months Ended 12/31/23 | | | 7.41 | % | | | 6.70 | % | | | 6.84 | % | | | 7.76 | % | | | 7.18 | % |
| Five Years Ended 12/31/23 | | | 2.36 | | | | 1.68 | | | | 1.89 | | | | 2.69 | | | | 2.16 | |
| Ten Years Ended 12/31/23 | | | 3.00 | | | | 2.30 | | | | 2.53 | | | | 3.33 | | | | 2.82 | |
| | | | | |
| With sales charges2 | | Class A | | | Class C | | | Class C1 | | | Class I | | | Class P | |
| Twelve Months Ended 12/31/23 | | | 3.38 | % | | | 5.70 | % | | | 5.84 | % | | | 7.76 | % | | | 7.18 | % |
| Five Years Ended 12/31/23 | | | 1.47 | | | | 1.68 | | | | 1.89 | | | | 2.69 | | | | 2.16 | |
| Ten Years Ended 12/31/23 | | | 2.55 | | | | 2.30 | | | | 2.53 | | | | 3.33 | | | | 2.82 | |
| | | | |
| Cumulative total returns | |
| Without sales charges1 | | | |
| Class A (12/31/13 through 12/31/23) | | | 34.44 | % |
| Class C (12/31/13 through 12/31/23) | | | 25.52 | |
| Class C1 (12/31/13 through 12/31/23) | | | 28.39 | |
| Class I (12/31/13 through 12/31/23) | | | 38.82 | |
| Class P (12/31/13 through 12/31/23) | | | 32.10 | |
All figures represent past performance and are not a guarantee of future results. Investment return and principal value of an investment will fluctuate so that an investor’s shares, when redeemed, may be worth more or less than their original cost. The returns shown do not reflect the deduction of taxes that a shareholder would pay on Fund distributions or the redemption of Fund shares. Performance figures may reflect compensating balance arrangements, fee waivers and/or expense reimbursements. In the absence of compensating balance arrangements, fee waivers and/or expense reimbursements, the total return would have been lower.
| 1 | Assumes the reinvestment of all distributions, including returns of capital, if any, at net asset value and does not reflect the deduction of the applicable sales charge with respect to Class A shares or the applicable contingent deferred sales charge (“CDSC”) with respect to Class C shares and Class C1 shares. |
| 2 | Assumes the reinvestment of all distributions, including returns of capital, if any, at net asset value. In addition, Class A shares reflect the deduction of the maximum initial sales charge of 4.25% on purchases made prior to August 15, 2022. Purchases made on or after August 15, 2022 incur a maximum initial sales charge of 3.75%. Class C shares and Class C1 shares reflect the deduction of a 1.00% CDSC, which applies if shares are redeemed within one year from purchase payment. |
| | | | |
| Western Asset Corporate Bond Fund 2023 Annual Report | | | | 9 |
Fund performance (unaudited) (cont’d)
Historical performance
Value of $10,000 invested in
Class A Shares of Western Asset Corporate Bond Fund vs. Bloomberg U.S. Credit Index† — December 2013 - December 2023
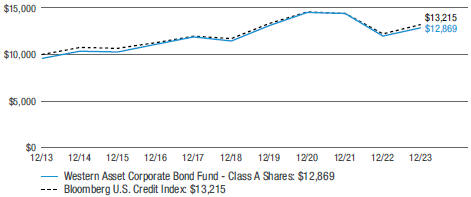
All figures represent past performance and are not a guarantee of future results. Investment return and principal value of an investment will fluctuate so that an investor’s shares, when redeemed, may be worth more or less than their original cost. The returns shown do not reflect the deduction of taxes that a shareholder would pay on Fund distributions or the redemption of Fund shares. Performance figures may reflect compensating balance arrangements, fee waivers and/or expense reimbursements. In the absence of compensating balance arrangements, fee waivers and/or expense reimbursements, the total return would have been lower.
| † | Hypothetical illustration of $10,000 invested in Class A shares of Western Asset Corporate Bond Fund on December 31, 2013, assuming the deduction of the maximum initial sales charge of 4.25% at the time of investment and the reinvestment of all distributions, including returns of capital, if any, at net asset value through December 31, 2023. Effective August 15, 2022, the maximum initial sales charge was reduced to 3.75%. Returns based on an initial investment made prior to August 15, 2022 have not been restated to reflect the new maximum initial sales charge. The hypothetical illustration also assumes a $10,000 investment in the Bloomberg U.S. Credit Index. The Bloomberg U.S. Credit Index (the “Index”) is an index composed of corporate and non-corporate debt issues that are investment grade (rated Baa3/BBB- or higher). The Index is unmanaged and not subject to the same management and trading expenses as a mutual fund. Please note that an investor cannot invest directly in an index. The performance of the Fund’s other classes may be greater or less than the performance of Class A shares indicated on this chart, depending on whether higher or lesser sales charges and fees were incurred by shareholders investing in the other classes. |
| | | | |
10 | | | | Western Asset Corporate Bond Fund 2023 Annual Report |
Schedule of investments
December 31, 2023
Western Asset Corporate Bond Fund
(Percentages shown based on Fund net assets)
| | | | | | | | | | | | | | | | |
| Security | | Rate | | | Maturity Date | | | Face Amount† | | | Value | |
| Corporate Bonds & Notes — 84.8% | | | | | | | | | | | | | | | | |
| Communication Services — 4.6% | | | | | | | | | | | | | | | | |
Diversified Telecommunication Services — 1.5% | | | | | | | | | | | | | | | | |
AT&T Inc., Senior Notes | | | 6.950 | % | | | 1/15/28 | | | | 3,460,000 | | | $ | 3,625,573 | |
AT&T Inc., Senior Notes | | | 4.500 | % | | | 5/15/35 | | | | 1,820,000 | | | | 1,725,355 | |
AT&T Inc., Senior Notes | | | 6.375 | % | | | 3/1/41 | | | | 1,063,000 | | | | 1,167,558 | |
AT&T Inc., Senior Notes | | | 4.800 | % | | | 6/15/44 | | | | 208,000 | | | | 190,244 | |
AT&T Inc., Senior Notes | | | 4.500 | % | | | 3/9/48 | | | | 690,000 | | | | 602,789 | (a) |
AT&T Inc., Senior Notes | | | 3.500 | % | | | 9/15/53 | | | | 216,000 | | | | 156,931 | |
AT&T Inc., Senior Notes | | | 3.550 | % | | | 9/15/55 | | | | 1,793,000 | | | | 1,290,359 | |
AT&T Inc., Senior Notes | | | 3.800 | % | | | 12/1/57 | | | | 1,680,000 | | | | 1,250,260 | |
AT&T Inc., Senior Notes | | | 3.650 | % | | | 9/15/59 | | | | 133,000 | | | | 95,436 | |
British Telecommunications PLC, Senior Notes | | | 9.625 | % | | | 12/15/30 | | | | 255,000 | | | | 315,775 | |
Telefonica Emisiones SA, Senior Notes | | | 4.665 | % | | | 3/6/38 | | | | 230,000 | | | | 210,617 | |
Telefonica Emisiones SA, Senior Notes | | | 5.213 | % | | | 3/8/47 | | | | 500,000 | | | | 464,121 | |
Verizon Communications Inc., Senior Notes | | | 1.500 | % | | | 9/18/30 | | | | 1,110,000 | | | | 915,016 | |
Verizon Communications Inc., Senior Notes | | | 2.550 | % | | | 3/21/31 | | | | 678,000 | | | | 584,793 | |
Verizon Communications Inc., Senior Notes | | | 2.650 | % | | | 11/20/40 | | | | 290,000 | | | | 209,163 | |
Verizon Communications Inc., Senior Notes | | | 3.400 | % | | | 3/22/41 | | | | 1,180,000 | | | | 939,981 | |
Verizon Communications Inc., Senior Notes | | | 2.850 | % | | | 9/3/41 | | | | 540,000 | | | | 399,342 | |
Verizon Communications Inc., Senior Notes | | | 6.550 | % | | | 9/15/43 | | | | 230,000 | | | | 264,912 | |
Verizon Communications Inc., Senior Notes | | | 4.125 | % | | | 8/15/46 | | | | 190,000 | | | | 162,883 | |
Verizon Communications Inc., Senior Notes | | | 4.000 | % | | | 3/22/50 | | | | 470,000 | | | | 390,879 | |
Verizon Communications Inc., Senior Notes | | | 2.875 | % | | | 11/20/50 | | | | 360,000 | | | | 245,056 | |
Verizon Communications Inc., Senior Notes | | | 2.987 | % | | | 10/30/56 | | | | 440,000 | | | | 292,438 | |
Total Diversified Telecommunication Services | | | | | | | | | | | | | | | 15,499,481 | |
Entertainment — 0.4% | | | | | | | | | | | | | | | | |
Walt Disney Co., Senior Notes | | | 6.200 | % | | | 12/15/34 | | | | 70,000 | | | | 79,206 | |
Walt Disney Co., Senior Notes | | | 6.400 | % | | | 12/15/35 | | | | 69,000 | | | | 78,586 | |
Walt Disney Co., Senior Notes | | | 6.650 | % | | | 11/15/37 | | | | 160,000 | | | | 188,053 | |
Walt Disney Co., Senior Notes | | | 5.400 | % | | | 10/1/43 | | | | 690,000 | | | | 723,478 | |
Warnermedia Holdings Inc., Senior Notes | | | 5.050 | % | | | 3/15/42 | | | | 2,840,000 | | | | 2,505,108 | |
Total Entertainment | | | | | | | | | | | | | | | 3,574,431 | |
Interactive Media & Services — 0.1% | | | | | | | | | | | | | | | | |
Tencent Holdings Ltd., Senior Notes | | | 3.840 | % | | | 4/22/51 | | | | 1,120,000 | | | | 837,917 | (a) |
Media — 2.0% | | | | | | | | | | | | | | | | |
Charter Communications Operating LLC/ Charter Communications Operating Capital Corp., Senior Secured Notes | | | 3.750 | % | | | 2/15/28 | | | | 3,179,000 | | | | 3,003,347 | |
See Notes to Financial Statements.
| | | | |
| Western Asset Corporate Bond Fund 2023 Annual Report | | | | 11 |
Schedule of investments (cont’d)
December 31, 2023
Western Asset Corporate Bond Fund
(Percentages shown based on Fund net assets)
| | | | | | | | | | | | | | | | |
| Security | | Rate | | | Maturity Date | | | Face Amount† | | | Value | |
Media — continued | | | | | | | | | | | | | | | | |
Charter Communications Operating LLC/ Charter Communications Operating Capital Corp., Senior Secured Notes | | | 2.250 | % | | | 1/15/29 | | | | 2,560,000 | | | $ | 2,222,699 | |
Charter Communications Operating LLC/ Charter Communications Operating Capital Corp., Senior Secured Notes | | | 3.500 | % | | | 6/1/41 | | | | 830,000 | | | | 587,395 | |
Charter Communications Operating LLC/ Charter Communications Operating Capital Corp., Senior Secured Notes | | | 3.500 | % | | | 3/1/42 | | | | 790,000 | | | | 550,226 | |
Charter Communications Operating LLC/ Charter Communications Operating Capital Corp., Senior Secured Notes | | | 5.125 | % | | | 7/1/49 | | | | 1,540,000 | | | | 1,252,720 | |
Charter Communications Operating LLC/ Charter Communications Operating Capital Corp., Senior Secured Notes | | | 3.850 | % | | | 4/1/61 | | | | 450,000 | | | | 280,847 | |
Charter Communications Operating LLC/ Charter Communications Operating Capital Corp., Senior Secured Notes | | | 3.950 | % | | | 6/30/62 | | | | 1,190,000 | | | | 749,990 | |
Comcast Corp., Senior Notes | | | 7.050 | % | | | 3/15/33 | | | | 880,000 | | | | 1,027,007 | |
Comcast Corp., Senior Notes | | | 4.200 | % | | | 8/15/34 | | | | 100,000 | | | | 95,649 | |
Comcast Corp., Senior Notes | | | 6.500 | % | | | 11/15/35 | | | | 205,000 | | | | 233,451 | |
Comcast Corp., Senior Notes | | | 3.969 | % | | | 11/1/47 | | | | 200,000 | | | | 168,117 | |
Comcast Corp., Senior Notes | | | 2.887 | % | | | 11/1/51 | | | | 7,000 | | | | 4,739 | |
Comcast Corp., Senior Notes | | | 2.937 | % | | | 11/1/56 | | | | 2,113,000 | | | | 1,391,004 | |
Comcast Corp., Senior Notes | | | 4.950 | % | | | 10/15/58 | | | | 800,000 | | | | 784,729 | |
DISH DBS Corp., Senior Notes | | | 5.875 | % | | | 11/15/24 | | | | 600,000 | | | | 563,129 | |
Fox Corp., Senior Notes | | | 6.500 | % | | | 10/13/33 | | | | 1,380,000 | | | | 1,494,642 | |
Fox Corp., Senior Notes | | | 5.476 | % | | | 1/25/39 | | | | 880,000 | | | | 856,545 | |
NBCUniversal Media LLC, Senior Notes | | | 4.450 | % | | | 1/15/43 | | | | 62,000 | | | | 56,751 | |
Time Warner Cable Enterprises LLC, Senior Secured Notes | | | 8.375 | % | | | 7/15/33 | | | | 1,438,000 | | | | 1,666,859 | |
Time Warner Cable LLC, Senior Secured Notes | | | 6.550 | % | | | 5/1/37 | | | | 610,000 | | | | 601,775 | |
Time Warner Cable LLC, Senior Secured Notes | | | 7.300 | % | | | 7/1/38 | | | | 1,030,000 | | | | 1,063,490 | |
Time Warner Cable LLC, Senior Secured Notes | | | 6.750 | % | | | 6/15/39 | | | | 2,130,000 | | | | 2,115,235 | |
Total Media | | | | | | | | | | | | | | | 20,770,346 | |
Wireless Telecommunication Services — 0.6% | | | | | | | | | | | | | | | | |
Sprint LLC, Senior Notes | | | 7.125 | % | | | 6/15/24 | | | | 2,027,000 | | | | 2,037,159 | |
See Notes to Financial Statements.
| | | | |
12 | | | | Western Asset Corporate Bond Fund 2023 Annual Report |
Western Asset Corporate Bond Fund
(Percentages shown based on Fund net assets)
| | | | | | | | | | | | | | | | |
| Security | | Rate | | | Maturity Date | | | Face Amount† | | | Value | |
Wireless Telecommunication Services — continued | | | | | | | | | | | | | | | | |
T-Mobile USA Inc., Senior Notes | | | 2.550 | % | | | 2/15/31 | | | | 1,460,000 | | | $ | 1,258,217 | |
T-Mobile USA Inc., Senior Notes | | | 2.250 | % | | | 11/15/31 | | | | 760,000 | | | | 633,160 | |
T-Mobile USA Inc., Senior Notes | | | 4.375 | % | | | 4/15/40 | | | | 150,000 | | | | 135,459 | |
T-Mobile USA Inc., Senior Notes | | | 3.000 | % | | | 2/15/41 | | | �� | 1,500,000 | | | | 1,123,603 | |
T-Mobile USA Inc., Senior Notes | | | 3.300 | % | | | 2/15/51 | | | | 1,000,000 | | | | 723,247 | |
Vodafone Group PLC, Senior Notes | | | 6.150 | % | | | 2/27/37 | | | | 370,000 | | | | 400,587 | |
Total Wireless Telecommunication Services | | | | | | | | | | | | | | | 6,311,432 | |
Total Communication Services | | | | | | | | | | | | | | | 46,993,607 | |
| Consumer Discretionary — 8.4% | | | | | | | | | | | | | | | | |
Automobile Components — 0.6% | | | | | | | | | | | | | | | | |
ZF North America Capital Inc., Senior Notes | | | 4.750 | % | | | 4/29/25 | | | | 6,370,000 | | | | 6,301,808 | (a) |
Automobiles — 2.6% | | | | | | | | | | | | | | | | |
Ford Holdings LLC, Senior Notes | | | 9.300 | % | | | 3/1/30 | | | | 300,000 | | | | 343,228 | |
Ford Motor Co., Senior Notes | | | 3.250 | % | | | 2/12/32 | | | | 540,000 | | | | 449,346 | |
Ford Motor Co., Senior Notes | | | 4.750 | % | | | 1/15/43 | | | | 420,000 | | | | 347,197 | |
Ford Motor Credit Co. LLC, Senior Notes | | | 6.950 | % | | | 3/6/26 | | | | 990,000 | | | | 1,014,575 | |
Ford Motor Credit Co. LLC, Senior Notes | | | 2.700 | % | | | 8/10/26 | | | | 1,150,000 | | | | 1,065,629 | |
Ford Motor Credit Co. LLC, Senior Notes | | | 4.950 | % | | | 5/28/27 | | | | 3,010,000 | | | | 2,938,826 | |
Ford Motor Credit Co. LLC, Senior Notes | | | 4.125 | % | | | 8/17/27 | | | | 420,000 | | | | 397,973 | |
Ford Motor Credit Co. LLC, Senior Notes | | | 3.625 | % | | | 6/17/31 | | | | 780,000 | | | | 673,029 | |
Ford Motor Credit Co. LLC, Senior Notes | | | 7.122 | % | | | 11/7/33 | | | | 2,050,000 | | | | 2,209,864 | |
General Motors Co., Senior Notes | | | 6.125 | % | | | 10/1/25 | | | | 1,450,000 | | | | 1,469,912 | |
General Motors Co., Senior Notes | | | 5.600 | % | | | 10/15/32 | | | | 1,398,000 | | | | 1,430,065 | |
General Motors Co., Senior Notes | | | 6.600 | % | | | 4/1/36 | | | | 560,000 | | | | 600,120 | |
General Motors Co., Senior Notes | | | 6.750 | % | | | 4/1/46 | | | | 770,000 | | | | 829,702 | |
General Motors Co., Senior Notes | | | 5.950 | % | | | 4/1/49 | | | | 190,000 | | | | 186,295 | |
Nissan Motor Acceptance Co. LLC, Senior Notes | | | 1.050 | % | | | 3/8/24 | | | | 2,120,000 | | | | 2,100,266 | (a) |
Nissan Motor Acceptance Co. LLC, Senior Notes | | | 2.000 | % | | | 3/9/26 | | | | 510,000 | | | | 468,885 | (a) |
Nissan Motor Acceptance Co. LLC, Senior Notes | | | 1.850 | % | | | 9/16/26 | | | | 370,000 | | | | 332,897 | (a) |
Nissan Motor Acceptance Co. LLC, Senior Notes | | | 2.750 | % | | | 3/9/28 | | | | 240,000 | | | | 211,947 | (a) |
Nissan Motor Co. Ltd., Senior Notes | | | 3.522 | % | | | 9/17/25 | | | | 7,675,000 | | | | 7,392,614 | (a) |
Nissan Motor Co. Ltd., Senior Notes | | | 4.810 | % | | | 9/17/30 | | | | 220,000 | | | | 205,812 | (a) |
PM General Purchaser LLC, Senior Secured Notes | | | 9.500 | % | | | 10/1/28 | | | | 1,730,000 | | | | 1,756,235 | (a) |
Total Automobiles | | | | | | | | | | | | | | | 26,424,417 | |
See Notes to Financial Statements.
| | | | |
| Western Asset Corporate Bond Fund 2023 Annual Report | | | | 13 |
Schedule of investments (cont’d)
December 31, 2023
Western Asset Corporate Bond Fund
(Percentages shown based on Fund net assets)
| | | | | | | | | | | | | | | | |
| Security | | Rate | | | Maturity Date | | | Face Amount† | | | Value | |
Broadline Retail — 0.9% | | | | | | | | | | | | | | | | |
Alibaba Group Holding Ltd., Senior Notes | | | 2.125 | % | | | 2/9/31 | | | | 840,000 | | | $ | 696,578 | |
Alibaba Group Holding Ltd., Senior Notes | | | 2.700 | % | | | 2/9/41 | | | | 500,000 | | | | 342,463 | |
Alibaba Group Holding Ltd., Senior Notes | | | 4.200 | % | | | 12/6/47 | | | | 200,000 | | | | 163,484 | |
Alibaba Group Holding Ltd., Senior Notes | | | 3.150 | % | | | 2/9/51 | | | | 1,570,000 | | | | 1,030,795 | |
Amazon.com Inc., Senior Notes | | | 3.875 | % | | | 8/22/37 | | | | 720,000 | | | | 668,833 | |
Amazon.com Inc., Senior Notes | | | 3.950 | % | | | 4/13/52 | | | | 270,000 | | | | 236,507 | |
MercadoLibre Inc., Senior Notes | | | 2.375 | % | | | 1/14/26 | | | | 240,000 | | | | 224,294 | |
MercadoLibre Inc., Senior Notes | | | 3.125 | % | | | 1/14/31 | | | | 920,000 | | | | 788,779 | |
Nordstrom Inc., Senior Notes | | | 2.300 | % | | | 4/8/24 | | | | 2,500,000 | | | | 2,474,575 | |
QVC Inc., Senior Secured Notes | | | 4.850 | % | | | 4/1/24 | | | | 2,180,000 | | | | 2,159,868 | |
Total Broadline Retail | | | | | | | | | | | | | | | 8,786,176 | |
Diversified Consumer Services — 0.0%†† | | | | | | | | | | | | | | | | |
California Institute of Technology, Senior Notes | | | 3.650 | % | | | 9/1/2119 | | | | 590,000 | | | | 421,196 | |
Hotels, Restaurants & Leisure — 3.3% | | | | | | | | | | | | | | | | |
Full House Resorts Inc., Senior Secured Notes | | | 8.250 | % | | | 2/15/28 | | | | 540,000 | | | | 508,097 | (a) |
Genting New York LLC/GENNY Capital Inc., Senior Notes | | | 3.300 | % | | | 2/15/26 | | | | 4,519,000 | | | | 4,118,519 | (a) |
Las Vegas Sands Corp., Senior Notes | | | 3.200 | % | | | 8/8/24 | | | | 699,000 | | | | 685,867 | |
Las Vegas Sands Corp., Senior Notes | | | 2.900 | % | | | 6/25/25 | | | | 5,930,000 | | | | 5,702,288 | |
McDonald’s Corp., Senior Notes | | | 4.450 | % | | | 3/1/47 | | | | 660,000 | | | | 604,538 | |
Melco Resorts Finance Ltd., Senior Notes | | | 5.375 | % | | | 12/4/29 | | | | 990,000 | | | | 875,932 | (a) |
Sands China Ltd., Senior Notes | | | 5.375 | % | | | 8/8/25 | | | | 5,973,000 | | | | 5,894,149 | |
Sands China Ltd., Senior Notes | | | 4.300 | % | | | 1/8/26 | | | | 2,901,000 | | | | 2,787,653 | |
Sands China Ltd., Senior Notes | | | 4.300 | % | | | 1/8/26 | | | | 150,000 | | | | 144,148 | (b) |
Sands China Ltd., Senior Notes | | | 5.650 | % | | | 8/8/28 | | | | 1,890,000 | | | | 1,875,397 | |
Sands China Ltd., Senior Notes | | | 4.625 | % | | | 6/18/30 | | | | 870,000 | | | | 792,772 | (b) |
Sands China Ltd., Senior Notes | | | 4.625 | % | | | 6/18/30 | | | | 1,580,000 | | | | 1,439,747 | |
Sands China Ltd., Senior Notes | | | 3.500 | % | | | 8/8/31 | | | | 1,050,000 | | | | 880,796 | |
Wynn Las Vegas LLC/Wynn Las Vegas Capital Corp., Senior Notes | | | 5.500 | % | | | 3/1/25 | | �� | | 780,000 | | | | 776,519 | (a) |
Wynn Macau Ltd., Senior Notes | | | 4.875 | % | | | 10/1/24 | | | | 7,110,000 | | | | 7,024,897 | (a) |
Wynn Macau Ltd., Senior Notes | | | 5.125 | % | | | 12/15/29 | | | | 420,000 | | | | 373,654 | (a) |
Total Hotels, Restaurants & Leisure | | | | | | | | | | | | | | | 34,484,973 | |
Household Durables — 0.3% | | | | | | | | | | | | | | | | |
MDC Holdings Inc., Senior Notes | | | 2.500 | % | | | 1/15/31 | | | | 1,290,000 | | | | 1,061,160 | |
See Notes to Financial Statements.
| | | | |
14 | | | | Western Asset Corporate Bond Fund 2023 Annual Report |
Western Asset Corporate Bond Fund
(Percentages shown based on Fund net assets)
| | | | | | | | | | | | | | | | |
| Security | | Rate | | | Maturity Date | | | Face Amount† | | | Value | |
Household Durables — continued | | | | | | | | | | | | | | | | |
MDC Holdings Inc., Senior Notes | | | 6.000 | % | | | 1/15/43 | | | | 570,000 | | | $ | 531,112 | |
Newell Brands Inc., Senior Notes | | | 4.000 | % | | | 12/1/24 | | | | 1,340,000 | | | | 1,315,329 | |
Total Household Durables | | | | | | | | | | | | | | | 2,907,601 | |
Specialty Retail — 0.3% | | | | | | | | | | | | | | | | |
Lithia Motors Inc., Senior Notes | | | 4.625 | % | | | 12/15/27 | | | | 600,000 | | | | 577,076 | (a) |
Lithia Motors Inc., Senior Notes | | | 3.875 | % | | | 6/1/29 | | | | 840,000 | | | | 759,519 | (a) |
Lowe’s Cos. Inc., Senior Notes | | | 1.700 | % | | | 10/15/30 | | | | 460,000 | | | | 382,295 | |
Lowe’s Cos. Inc., Senior Notes | | | 2.800 | % | | | 9/15/41 | | | | 770,000 | | | | 563,117 | |
Lowe’s Cos. Inc., Senior Notes | | | 4.250 | % | | | 9/15/44 | | | | 6,000 | | | | 4,947 | |
Lowe’s Cos. Inc., Senior Notes | | | 3.000 | % | | | 10/15/50 | | | | 1,450,000 | | | | 987,584 | |
Total Specialty Retail | | | | | | | | | | | | | | | 3,274,538 | |
Textiles, Apparel & Luxury Goods — 0.4% | | | | | | | | | | | | | | | | |
Tapestry Inc., Senior Notes | | | 7.000 | % | | | 11/27/26 | | | | 3,720,000 | | | | 3,858,048 | |
Tapestry Inc., Senior Notes | | | 7.700 | % | | | 11/27/30 | | | | 510,000 | | | | 537,293 | |
Total Textiles, Apparel & Luxury Goods | | | | | | | | | | | | | | | 4,395,341 | |
Total Consumer Discretionary | | | | | | | | | | | | | | | 86,996,050 | |
| Consumer Staples — 2.0% | | | | | | | | | | | | | | | | |
Beverages — 0.0%†† | | | | | | | | | | | | | | | | |
Anheuser-Busch InBev Worldwide Inc., Senior Notes | | | 4.600 | % | | | 4/15/48 | | | | 597,000 | | | | 565,712 | |
Constellation Brands Inc., Senior Notes | | | 3.500 | % | | | 5/9/27 | | | | 60,000 | | | | 57,841 | |
Total Beverages | | | | | | | | | | | | | | | 623,553 | |
Consumer Staples Distribution & Retail — 0.2% | | | | | | | | | | | | | | | | |
Albertsons Cos. Inc./Safeway Inc./New Albertsons LP/Albertsons LLC, Senior Notes | | | 5.875 | % | | | 2/15/28 | | | | 1,760,000 | | | | 1,762,281 | (a) |
Food Products — 0.3% | | | | | | | | | | | | | | | | |
J M Smucker Co., Senior Notes | | | 6.200 | % | | | 11/15/33 | | | | 1,900,000 | | | | 2,073,320 | |
Mars Inc., Senior Notes | | | 2.375 | % | | | 7/16/40 | | | | 940,000 | | | | 674,921 | (a) |
Total Food Products | | | | | | | | | | | | | | | 2,748,241 | |
Personal Care Products — 0.1% | | | | | | | | | | | | | | | | |
Kenvue Inc., Senior Notes | | | 5.050 | % | | | 3/22/53 | | | | 380,000 | | | | 393,482 | |
Kenvue Inc., Senior Notes | | | 5.200 | % | | | 3/22/63 | | | | 330,000 | | | | 345,413 | |
Total Personal Care Products | | | | | | | | | | | | | | | 738,895 | |
Tobacco — 1.4% | | | | | | | | | | | | | | | | |
Altria Group Inc., Senior Notes | | | 4.800 | % | | | 2/14/29 | | | | 397,000 | | | | 396,097 | |
Altria Group Inc., Senior Notes | | | 2.450 | % | | | 2/4/32 | | | | 4,400,000 | | | | 3,590,921 | |
Altria Group Inc., Senior Notes | | | 3.400 | % | | | 2/4/41 | | | | 2,450,000 | | | | 1,796,854 | |
Altria Group Inc., Senior Notes | | | 4.250 | % | | | 8/9/42 | | | | 60,000 | | | | 48,838 | |
Altria Group Inc., Senior Notes | | | 3.875 | % | | | 9/16/46 | | | | 200,000 | | | | 150,187 | |
See Notes to Financial Statements.
| | | | |
| Western Asset Corporate Bond Fund 2023 Annual Report | | | | 15 |
Schedule of investments (cont’d)
December 31, 2023
Western Asset Corporate Bond Fund
(Percentages shown based on Fund net assets)
| | | | | | | | | | | | | | | | |
| Security | | Rate | | | Maturity Date | | | Face Amount† | | | Value | |
Tobacco — continued | | | | | | | | | | | | | | | | |
Altria Group Inc., Senior Notes | | | 5.950 | % | | | 2/14/49 | | | | 600,000 | | | $ | 612,519 | |
BAT Capital Corp., Senior Notes | | | 2.259 | % | | | 3/25/28 | | | | 2,070,000 | | | | 1,853,705 | |
BAT International Finance PLC, Senior Notes | | | 5.931 | % | | | 2/2/29 | | | | 3,150,000 | | | | 3,275,056 | |
Philip Morris International Inc., Senior Notes | | | 1.750 | % | | | 11/1/30 | | | | 1,680,000 | | | | 1,385,706 | |
Reynolds American Inc., Senior Notes | | | 8.125 | % | | | 5/1/40 | | | | 760,000 | | | | 873,162 | |
Reynolds American Inc., Senior Notes | | | 5.850 | % | | | 8/15/45 | | | | 600,000 | | | | 562,726 | |
Total Tobacco | | | | | | | | | | | | | | | 14,545,771 | |
Total Consumer Staples | | | | | | | | | | | | | | | 20,418,741 | |
| Energy — 15.5% | | | | | | | | | | | | | | | | |
Oil, Gas & Consumable Fuels — 15.5% | | | | | | | | | | | | | | | | |
Apache Corp., Senior Notes | | | 7.950 | % | | | 4/15/26 | | | | 685,000 | | | | 719,264 | |
Apache Corp., Senior Notes | | | 5.350 | % | | | 7/1/49 | | | | 1,690,000 | | | | 1,407,790 | |
Berry Petroleum Co. LLC, Senior Notes | | | 7.000 | % | | | 2/15/26 | | | | 4,124,000 | | | | 3,994,135 | (a) |
Blue Racer Midstream LLC/Blue Racer Finance Corp., Senior Notes | | | 7.625 | % | | | 12/15/25 | | | | 2,590,000 | | | | 2,626,397 | (a) |
Blue Racer Midstream LLC/Blue Racer Finance Corp., Senior Notes | | | 6.625 | % | | | 7/15/26 | | | | 1,824,000 | | | | 1,814,689 | (a) |
BP Capital Markets America Inc., Senior Notes | | | 3.000 | % | | | 2/24/50 | | | | 990,000 | | | | 700,943 | |
Cheniere Energy Partners LP, Senior Notes | | | 3.250 | % | | | 1/31/32 | | | | 710,000 | | | | 605,812 | |
Chesapeake Energy Corp., Senior Notes | | | 5.500 | % | | | 2/1/26 | | | | 4,900,000 | | | | 4,861,971 | (a) |
Chesapeake Energy Corp., Senior Notes | | | 6.750 | % | | | 4/15/29 | | | | 1,460,000 | | | | 1,475,145 | (a) |
Chord Energy Corp., Senior Notes | | | 6.375 | % | | | 6/1/26 | | | | 1,198,000 | | | | 1,199,210 | (a) |
Cimarex Energy Co., Senior Notes | | | 4.375 | % | | | 3/15/29 | | | | 2,490,000 | | | | 2,104,371 | |
Columbia Pipelines Holding Co. LLC, Senior Notes | | | 6.055 | % | | | 8/15/26 | | | | 410,000 | | | | 419,879 | (a) |
Columbia Pipelines Holding Co. LLC, Senior Notes | | | 6.042 | % | | | 8/15/28 | | | | 1,370,000 | | | | 1,415,030 | (a) |
Columbia Pipelines Operating Co. LLC, Senior Notes | | | 6.036 | % | | | 11/15/33 | | | | 1,890,000 | | | | 1,980,280 | (a) |
ConocoPhillips Co., Senior Notes | | | 5.050 | % | | | 9/15/33 | | | | 1,910,000 | | | | 1,963,363 | |
Continental Resources Inc., Senior Notes | | | 2.268 | % | | | 11/15/26 | | | | 400,000 | | | | 368,208 | (a) |
Continental Resources Inc., Senior Notes | | | 4.375 | % | | | 1/15/28 | | | | 1,510,000 | | | | 1,463,225 | |
Continental Resources Inc., Senior Notes | | | 2.875 | % | | | 4/1/32 | | | | 3,020,000 | | | | 2,452,490 | (a) |
Coterra Energy Inc., Senior Notes | | | 3.900 | % | | | 5/15/27 | | | | 530,000 | | | | 513,054 | |
DCP Midstream Operating LP, Senior Notes | | | 3.250 | % | | | 2/15/32 | | | | 1,150,000 | | | | 998,571 | |
DCP Midstream Operating LP, Senior Notes | | | 6.450 | % | | | 11/3/36 | | | | 790,000 | | | | 842,345 | (a) |
Devon Energy Corp., Senior Notes | | | 5.250 | % | | | 10/15/27 | | | | 72,000 | | | | 72,438 | |
Devon Energy Corp., Senior Notes | | | 5.875 | % | | | 6/15/28 | | | | 994,000 | | | | 1,004,745 | |
See Notes to Financial Statements.
| | | | |
16 | | | | Western Asset Corporate Bond Fund 2023 Annual Report |
Western Asset Corporate Bond Fund
(Percentages shown based on Fund net assets)
| | | | | | | | | | | | | | | | |
| Security | | Rate | | | Maturity Date | | | Face Amount† | | | Value | |
Oil, Gas & Consumable Fuels — continued | | | | | | | | | | | | | | | | |
Devon Energy Corp., Senior Notes | | | 4.500 | % | | | 1/15/30 | | | | 400,000 | | | $ | 384,363 | |
Devon Energy Corp., Senior Notes | | | 7.950 | % | | | 4/15/32 | | | | 519,000 | | | | 604,749 | |
Devon Energy Corp., Senior Notes | | | 5.600 | % | | | 7/15/41 | | | | 2,750,000 | | | | 2,663,082 | |
Devon Energy Corp., Senior Notes | | | 5.000 | % | | | 6/15/45 | | | | 1,580,000 | | | | 1,398,106 | |
Devon OEI Operating LLC, Senior Notes | | | 7.500 | % | | | 9/15/27 | | | | 1,400,000 | | | | 1,480,908 | |
Diamondback Energy Inc., Senior Notes | | | 4.400 | % | | | 3/24/51 | | | | 2,630,000 | | | | 2,180,139 | |
Ecopetrol SA, Senior Notes | | | 4.625 | % | | | 11/2/31 | | | | 1,560,000 | | | | 1,325,066 | |
Ecopetrol SA, Senior Notes | | | 5.875 | % | | | 5/28/45 | | | | 499,000 | | | | 394,716 | |
Ecopetrol SA, Senior Notes | | | 5.875 | % | | | 11/2/51 | | | | 1,150,000 | | | | 871,395 | |
El Paso Natural Gas Co. LLC, Senior Notes | | | 7.500 | % | | | 11/15/26 | | | | 815,000 | | | | 871,257 | |
Endeavor Energy Resources LP/EER Finance Inc., Senior Notes | | | 5.750 | % | | | 1/30/28 | | | | 500,000 | | | | 500,784 | (a) |
Energy Transfer LP, Junior Subordinated Notes (6.500% to 11/15/26 then 5 year Treasury Constant Maturity Rate + 5.694%) | | | 6.500 | % | | | 11/15/26 | | | | 885,000 | | | | 843,210 | (c)(d) |
Energy Transfer LP, Junior Subordinated Notes (6.625% to 2/15/28 then 3 mo. USD LIBOR + 4.155%) | | | 6.625 | % | | | 2/15/28 | | | | 890,000 | | | | 746,478 | (c)(d) |
Energy Transfer LP, Junior Subordinated Notes (6.750% to 5/15/25 then 5 year Treasury Constant Maturity Rate + 5.134%) | | | 6.750 | % | | | 5/15/25 | | | | 3,920,000 | | | | 3,753,763 | (c)(d) |
Energy Transfer LP, Junior Subordinated Notes (7.125% to 5/15/30 then 5 year Treasury Constant Maturity Rate + 5.306%) | | | 7.125 | % | | | 5/15/30 | | | | 1,170,000 | | | | 1,081,055 | (c)(d) |
Energy Transfer LP, Senior Notes | | | 4.950 | % | | | 6/15/28 | | | | 2,018,000 | | | | 2,012,121 | |
Energy Transfer LP, Senior Notes | | | 6.000 | % | | | 2/1/29 | | | | 6,510,000 | | | | 6,572,748 | (a) |
Energy Transfer LP, Senior Notes | | | 5.250 | % | | | 4/15/29 | | | | 670,000 | | | | 675,543 | |
Energy Transfer LP, Senior Notes | | | 8.250 | % | | | 11/15/29 | | | | 1,281,000 | | | | 1,460,074 | |
Energy Transfer LP, Senior Notes | | | 6.400 | % | | | 12/1/30 | | | | 2,390,000 | | | | 2,558,110 | |
Energy Transfer LP, Senior Notes | | | 7.375 | % | | | 2/1/31 | | | | 254,000 | | | | 267,096 | (a) |
Energy Transfer LP, Senior Notes | | | 5.800 | % | | | 6/15/38 | | | | 120,000 | | | | 120,803 | |
Energy Transfer LP, Senior Notes | | | 6.125 | % | | | 12/15/45 | | | | 290,000 | | | | 292,734 | |
Enterprise Products Operating LLC, Senior Notes | | | 2.800 | % | | | 1/31/30 | | | | 360,000 | | | | 325,700 | |
Enterprise Products Operating LLC, Senior Notes | | | 6.875 | % | | | 3/1/33 | | | | 1,350,000 | | | | 1,550,537 | |
Enterprise Products Operating LLC, Senior Notes | | | 5.700 | % | | | 2/15/42 | | | | 270,000 | | | | 285,053 | |
Enterprise Products Operating LLC, Senior Notes | | | 4.250 | % | | | 2/15/48 | | | | 2,650,000 | | | | 2,331,687 | |
See Notes to Financial Statements.
| | | | |
| Western Asset Corporate Bond Fund 2023 Annual Report | | | | 17 |
Schedule of investments (cont’d)
December 31, 2023
Western Asset Corporate Bond Fund
(Percentages shown based on Fund net assets)
| | | | | | | | | | | | | | | | |
| Security | | Rate | | | Maturity Date | | | Face Amount† | | | Value | |
Oil, Gas & Consumable Fuels — continued | | | | | | | | | | | | | | | | |
Enterprise Products Operating LLC, Senior Notes | | | 3.300 | % | | | 2/15/53 | | | | 2,290,000 | | | $ | 1,698,865 | |
Enterprise Products Operating LLC, Senior Notes | | | 3.950 | % | | | 1/31/60 | | | | 720,000 | | | | 584,457 | |
Enterprise Products Operating LLC, Senior Notes (3 mo. Term SOFR + 3.248%) | | | 8.638 | % | | | 8/16/77 | | | | 3,000,000 | | | | 2,986,433 | (d) |
Enterprise Products Operating LLC, Senior Notes (5.375% to 2/15/28 then 3 mo. Term SOFR + 2.832%) | | | 5.375 | % | | | 2/15/78 | | | | 3,260,000 | | | | 2,929,893 | (d) |
EQM Midstream Partners LP, Senior Notes | | | 7.500 | % | | | 6/1/27 | | | | 1,790,000 | | | | 1,845,529 | (a) |
EQT Corp., Senior Notes | | | 6.125 | % | | | 2/1/25 | | | | 705,000 | | | | 708,578 | |
EQT Corp., Senior Notes | | | 3.125 | % | | | 5/15/26 | | | | 1,440,000 | | | | 1,367,567 | (a) |
EQT Corp., Senior Notes | | | 3.900 | % | | | 10/1/27 | | | | 380,000 | | | | 363,763 | |
EQT Corp., Senior Notes | | | 3.625 | % | | | 5/15/31 | | | | 1,340,000 | | | | 1,198,396 | (a) |
Exxon Mobil Corp., Senior Notes | | | 4.227 | % | | | 3/19/40 | | | | 660,000 | | | | 613,035 | |
Exxon Mobil Corp., Senior Notes | | | 3.452 | % | | | 4/15/51 | | | | 60,000 | | | | 47,128 | |
Florida Gas Transmission Co. LLC, Senior Notes | | | 2.300 | % | | | 10/1/31 | | | | 4,910,000 | | | | 4,030,897 | (a) |
KazMunayGas National Co. JSC, Senior Notes | | | 3.500 | % | | | 4/14/33 | | | | 1,000,000 | | | | 833,567 | (a) |
Kinder Morgan Energy Partners LP, Senior Notes | | | 7.300 | % | | | 8/15/33 | | | | 390,000 | | | | 442,295 | |
Kinder Morgan Inc., Senior Notes | | | 5.300 | % | | | 12/1/34 | | | | 20,000 | | | | 19,870 | |
MPLX LP, Senior Notes | | | 4.500 | % | | | 4/15/38 | | | | 4,190,000 | | | | 3,735,510 | |
Northwest Pipeline LLC, Senior Notes | | | 7.125 | % | | | 12/1/25 | | | | 2,070,000 | | | | 2,123,249 | |
Northwest Pipeline LLC, Senior Notes | | | 4.000 | % | | | 4/1/27 | | | | 2,280,000 | | | | 2,252,706 | |
Occidental Petroleum Corp., Senior Notes | | | 3.400 | % | | | 4/15/26 | | | | 530,000 | | | | 507,427 | |
Occidental Petroleum Corp., Senior Notes | | | 7.125 | % | | | 10/15/27 | | | | 550,000 | | | | 575,196 | |
Occidental Petroleum Corp., Senior Notes | | | 7.875 | % | | | 9/15/31 | | | | 1,480,000 | | | | 1,685,504 | |
Occidental Petroleum Corp., Senior Notes | | | 7.950 | % | | | 6/15/39 | | | | 860,000 | | | | 1,003,147 | |
Occidental Petroleum Corp., Senior Notes | | | 4.625 | % | | | 6/15/45 | | | | 170,000 | | | | 134,644 | |
Occidental Petroleum Corp., Senior Notes | | | 4.400 | % | | | 4/15/46 | | | | 320,000 | | | | 260,917 | |
Occidental Petroleum Corp., Senior Notes | | | 4.100 | % | | | 2/15/47 | | | | 100,000 | | | | 72,330 | |
ONEOK Inc., Senior Notes | | | 6.050 | % | | | 9/1/33 | | | | 3,570,000 | | | | 3,784,111 | |
ONEOK Inc., Senior Notes | | | 6.625 | % | | | 9/1/53 | | | | 2,250,000 | | | | 2,520,901 | |
Parsley Energy LLC/Parsley Finance Corp., Senior Notes | | | 4.125 | % | | | 2/15/28 | | | | 1,170,000 | | | | 1,129,083 | (a) |
Permian Resources Operating LLC, Senior Notes | | | 6.875 | % | | | 4/1/27 | | | | 1,710,000 | | | | 1,710,700 | (a) |
Petrobras Global Finance BV, Senior Notes | | | 6.900 | % | | | 3/19/49 | | | | 1,780,000 | | | | 1,767,932 | |
See Notes to Financial Statements.
| | | | |
18 | | | | Western Asset Corporate Bond Fund 2023 Annual Report |
Western Asset Corporate Bond Fund
(Percentages shown based on Fund net assets)
| | | | | | | | | | | | | | | | |
| Security | | Rate | | | Maturity Date | | | Face Amount† | | | Value | |
Oil, Gas & Consumable Fuels — continued | | | | | | | | | | | | | | | | |
Petrobras Global Finance BV, Senior Notes | | | 5.500 | % | | | 6/10/51 | | | | 1,010,000 | | | $ | 852,406 | |
Petroleos del Peru SA, Senior Notes | | | 5.625 | % | | | 6/19/47 | | | | 420,000 | | | | 259,130 | (a) |
Petroleos Mexicanos, Senior Notes | | | 6.875 | % | | | 10/16/25 | | | | 3,030,000 | | | | 2,983,121 | |
Pioneer Natural Resources Co., Senior Notes | | | 5.100 | % | | | 3/29/26 | | | | 1,130,000 | | | | 1,138,575 | |
Pioneer Natural Resources Co., Senior Notes | | | 2.150 | % | | | 1/15/31 | | | | 1,310,000 | | | | 1,113,599 | |
Plains All American Pipeline LP, Junior Subordinated Notes (3 mo. Term SOFR + 4.372%) | | | 9.751 | % | | | 1/29/24 | | | | 3,932,000 | | | | 3,818,955 | (c)(d) |
Plains All American Pipeline LP/PAA Finance Corp., Senior Notes | | | 6.700 | % | | | 5/15/36 | | | | 150,000 | | | | 158,031 | |
Range Resources Corp., Senior Notes | | | 4.875 | % | | | 5/15/25 | | | | 1,630,000 | | | | 1,610,905 | |
Range Resources Corp., Senior Notes | | | 8.250 | % | | | 1/15/29 | | | | 1,000,000 | | | | 1,036,222 | |
Reliance Industries Ltd., Senior Notes | | | 2.875 | % | | | 1/12/32 | | | | 3,160,000 | | | | 2,709,637 | (a) |
Shell International Finance BV, Senior Notes | | | 4.375 | % | | | 5/11/45 | | | | 570,000 | | | | 523,177 | |
Shell International Finance BV, Senior Notes | | | 3.250 | % | | | 4/6/50 | | | | 370,000 | | | | 278,284 | |
SilverBow Resources Inc., Secured Notes (3 mo. Term SOFR + 7.750%) | | | 13.135 | % | | | 12/15/28 | | | | 3,120,000 | | | | 3,088,800 | (a)(d)(e)(f) |
Southwestern Energy Co., Senior Notes | | | 8.375 | % | | | 9/15/28 | | | | 590,000 | | | | 611,451 | |
Southwestern Energy Co., Senior Notes | | | 4.750 | % | | | 2/1/32 | | | | 580,000 | | | | 537,345 | |
Targa Resources Corp., Senior Notes | | | 4.200 | % | | | 2/1/33 | | | | 2,460,000 | | | | 2,263,750 | |
Targa Resources Partners LP/Targa Resources Partners Finance Corp., Senior Notes | | | 6.875 | % | | | 1/15/29 | | | | 720,000 | | | | 744,235 | |
Targa Resources Partners LP/Targa Resources Partners Finance Corp., Senior Notes | | | 4.875 | % | | | 2/1/31 | | | | 1,790,000 | | | | 1,741,142 | |
Targa Resources Partners LP/Targa Resources Partners Finance Corp., Senior Notes | | | 4.000 | % | | | 1/15/32 | | | | 1,250,000 | | | | 1,142,894 | |
Tennessee Gas Pipeline Co. LLC, Senior Notes | | | 7.000 | % | | | 3/15/27 | | | | 1,250,000 | | | | 1,318,134 | |
Tennessee Gas Pipeline Co. LLC, Senior Notes | | | 7.000 | % | | | 10/15/28 | | | | 3,510,000 | | | | 3,807,329 | |
Transcontinental Gas Pipe Line Co. LLC, Senior Notes | | | 7.250 | % | | | 12/1/26 | | | | 1,580,000 | | | | 1,663,042 | |
Transcontinental Gas Pipe Line Co. LLC, Senior Notes | | | 4.450 | % | | | 8/1/42 | | | | 1,320,000 | | | | 1,167,338 | |
Western Midstream Operating LP, Senior Notes | | | 3.100 | % | | | 2/1/25 | | | | 1,086,000 | | | | 1,057,533 | |
See Notes to Financial Statements.
| | | | |
| Western Asset Corporate Bond Fund 2023 Annual Report | | | | 19 |
Schedule of investments (cont’d)
December 31, 2023
Western Asset Corporate Bond Fund
(Percentages shown based on Fund net assets)
| | | | | | | | | | | | | | | | |
| Security | | Rate | | | Maturity Date | | | Face Amount† | | | Value | |
Oil, Gas & Consumable Fuels — continued | | | | | | | | | | | | | | | | |
Western Midstream Operating LP, Senior Notes | | | 3.950 | % | | | 6/1/25 | | | | 400,000 | | | $ | 390,346 | |
Western Midstream Operating LP, Senior Notes | | | 4.650 | % | | | 7/1/26 | | | | 1,710,000 | | | | 1,682,313 | |
Western Midstream Operating LP, Senior Notes | | | 4.750 | % | | | 8/15/28 | | | | 170,000 | | | | 166,101 | |
Western Midstream Operating LP, Senior Notes | | | 4.050 | % | | | 2/1/30 | | | | 1,110,000 | | | | 1,039,327 | |
Western Midstream Operating LP, Senior Notes | | | 6.150 | % | | | 4/1/33 | | | | 1,470,000 | | | | 1,529,018 | |
Western Midstream Operating LP, Senior Notes | | | 5.450 | % | | | 4/1/44 | | | | 1,950,000 | | | | 1,768,170 | |
Western Midstream Operating LP, Senior Notes | | | 5.300 | % | | | 3/1/48 | | | | 530,000 | | | | 461,988 | |
Western Midstream Operating LP, Senior Notes | | | 5.500 | % | | | 8/15/48 | | | | 910,000 | | | | 812,862 | |
Western Midstream Operating LP, Senior Notes | | | 5.250 | % | | | 2/1/50 | | | | 630,000 | | | | 565,636 | |
Total Energy | | | | | | | | | | | | | | | 159,529,058 | |
| Financials — 27.1% | | | | | | | | | | | | | | | | |
Banks — 15.7% | | | | | | | | | | | | | | | | |
ABN AMRO Bank NV, Senior Notes (6.339%to 9/18/26 then 1 year Treasury Constant Maturity Rate + 1.650%) | | | 6.339 | % | | | 9/18/27 | | | | 900,000 | | | | 920,251 | (a)(d) |
Banco Mercantil del Norte SA, Junior Subordinated Notes (8.375% to 10/14/30 then 10 year Treasury Constant Maturity Rate + 7.760%) | | | 8.375 | % | | | 10/14/30 | | | | 1,370,000 | | | | 1,352,793 | (a)(c)(d) |
Banco Santander SA, Junior Subordinated Notes (9.625% to 11/21/33 then 5 year Treasury Constant Maturity Rate + 5.298%) | | | 9.625 | % | | | 5/21/33 | | | | 2,000,000 | | | | 2,190,000 | (c)(d) |
Banco Santander SA, Senior Notes | | | 6.607 | % | | | 11/7/28 | | | | 2,000,000 | | | | 2,131,014 | |
Banco Santander SA, Senior Notes (4.175% to 3/24/27 then 1 year Treasury Constant Maturity Rate + 2.000%) | | | 4.175 | % | | | 3/24/28 | | | | 2,000,000 | | | | 1,926,333 | (d) |
Bank of America Corp., Senior Notes (1.898% to 7/23/30 then SOFR + 1.530%) | | | 1.898 | % | | | 7/23/31 | | | | 750,000 | | | | 613,937 | (d) |
Bank of America Corp., Senior Notes (1.922% to 10/24/30 then SOFR + 1.370%) | | | 1.922 | % | | | 10/24/31 | | | | 3,390,000 | | | | 2,753,948 | (d) |
Bank of America Corp., Senior Notes (2.299% to 7/21/31 then SOFR + 1.220%) | | | 2.299 | % | | | 7/21/32 | | | | 3,520,000 | | | | 2,875,573 | (d) |
See Notes to Financial Statements.
| | | | |
20 | | | | Western Asset Corporate Bond Fund 2023 Annual Report |
Western Asset Corporate Bond Fund
(Percentages shown based on Fund net assets)
| | | | | | | | | | | | | | | | |
| Security | | Rate | | | Maturity Date | | | Face Amount† | | | Value | |
Banks — continued | | | | | | | | | | | | | | | | |
Bank of America Corp., Senior Notes (2.572% to 10/20/31 then SOFR + 1.210%) | | | 2.572 | % | | | 10/20/32 | | | | 1,170,000 | | | $ | 970,496 | (d) |
Bank of America Corp., Senior Notes (2.592% to 4/29/30 then SOFR + 2.150%) | | | 2.592 | % | | | 4/29/31 | | | | 800,000 | | | | 689,879 | (d) |
Bank of America Corp., Senior Notes (2.676% to 6/19/40 then SOFR + 1.930%) | | | 2.676 | % | | | 6/19/41 | | | | 420,000 | | | | 300,531 | (d) |
Bank of America Corp., Senior Notes (2.687% to 4/22/31 then SOFR + 1.320%) | | | 2.687 | % | | | 4/22/32 | | | | 1,720,000 | | | | 1,452,973 | (d) |
Bank of America Corp., Senior Notes (2.831% to 10/24/50 then SOFR + 1.880%) | | | 2.831 | % | | | 10/24/51 | | | | 260,000 | | | | 175,844 | (d) |
Bank of America Corp., Senior Notes (2.884% to 10/22/29 then 3 mo. Term SOFR + 1.452%) | | | 2.884 | % | | | 10/22/30 | | | | 1,600,000 | | | | 1,420,860 | (d) |
Bank of America Corp., Senior Notes (3.974% to 2/7/29 then 3 mo. Term SOFR + 1.472%) | | | 3.974 | % | | | 2/7/30 | | | | 300,000 | | | | 284,235 | (d) |
Bank of America Corp., Senior Notes (4.271% to 7/23/28 then 3 mo. Term SOFR + 1.572%) | | | 4.271 | % | | | 7/23/29 | | | | 1,130,000 | | | | 1,091,886 | (d) |
Bank of America Corp., Senior Notes (4.330% to 3/15/49 then 3 mo. Term SOFR + 1.782%) | | | 4.330 | % | | | 3/15/50 | | | | 140,000 | | | | 123,425 | (d) |
Bank of America Corp., Senior Notes (4.443% to 1/20/47 then 3 mo. Term SOFR + 2.252%) | | | 4.443 | % | | | 1/20/48 | | | | 90,000 | | | | 81,013 | (d) |
Bank of America Corp., Senior Notes (5.288% to 4/25/33 then SOFR + 1.910%) | | | 5.288 | % | | | 4/25/34 | | | | 4,730,000 | | | | 4,743,424 | (d) |
Bank of America Corp., Subordinated Notes (2.482% to 9/21/31 then 5 year Treasury Constant Maturity Rate + 1.200%) | | | 2.482 | % | | | 9/21/36 | | | | 4,880,000 | | | | 3,867,677 | (d) |
Bank of Nova Scotia, Junior Subordinated Notes (8.625% to 10/27/27 then 5 year Treasury Constant Maturity Rate + 4.389%) | | | 8.625 | % | | | 10/27/82 | | | | 1,080,000 | | | | 1,124,720 | (d) |
BankUnited Inc., Senior Notes | | | 4.875 | % | | | 11/17/25 | | | | 1,580,000 | | | | 1,542,111 | |
BNP Paribas SA, Junior Subordinated Notes (7.750% to 8/16/29 then 5 year Treasury Constant Maturity Rate + 4.899%) | | | 7.750 | % | | | 8/16/29 | | | | 3,390,000 | | | | 3,468,885 | (a)(c)(d) |
BNP Paribas SA, Junior Subordinated Notes (8.500% to 8/14/28 then 5 year Treasury Constant Maturity Rate + 4.354%) | | | 8.500 | % | | | 8/14/28 | | | | 1,900,000 | | | | 1,994,476 | (a)(c)(d) |
See Notes to Financial Statements.
| | | | |
| Western Asset Corporate Bond Fund 2023 Annual Report | | | | 21 |
Schedule of investments (cont’d)
December 31, 2023
Western Asset Corporate Bond Fund
(Percentages shown based on Fund net assets)
| | | | | | | | | | | | | | | | |
| Security | | Rate | | | Maturity Date | | | Face Amount† | | | Value | |
Banks — continued | | | | | | | | | | | | | | | | |
BNP Paribas SA, Junior Subordinated Notes (9.250% to 11/17/27 then 5 year Treasury Constant Maturity Rate + 4.969%) | | | 9.250 | % | | | 11/17/27 | | | | 1,250,000 | | | $ | 1,339,831 | (a)(c)(d) |
BNP Paribas SA, Senior Notes (1.675% to 6/30/26 then SOFR + 0.912%) | | | 1.675 | % | | | 6/30/27 | | | | 1,970,000 | | | | 1,805,332 | (a)(d) |
BNP Paribas SA, Senior Notes (5.894% to 12/5/33 then SOFR + 1.866%) | | | 5.894 | % | | | 12/5/34 | | | | 3,720,000 | | | | 3,889,313 | (a)(d) |
BPCE SA, Subordinated Notes (3.116% to 10/19/31 then SOFR + 1.730%) | | | 3.116 | % | | | 10/19/32 | | | | 2,670,000 | | | | 2,179,501 | (a)(d) |
Citigroup Inc., Junior Subordinated Notes (4.150% to 11/15/26 then 5 year Treasury Constant Maturity Rate + 3.000%) | | | 4.150 | % | | | 11/15/26 | | | | 1,930,000 | | | | 1,661,221 | (c)(d) |
Citigroup Inc., Junior Subordinated Notes (7.625% to 11/15/28 then 5 year Treasury Constant Maturity Rate + 3.211%) | | | 7.625 | % | | | 11/15/28 | | | | 770,000 | | | | 788,172 | (c)(d) |
Citigroup Inc., Senior Notes | | | 8.125 | % | | | 7/15/39 | | | | 407,000 | | | | 524,578 | |
Citigroup Inc., Senior Notes (2.520% to 11/3/31 then SOFR + 1.177%) | | | 2.520 | % | | | 11/3/32 | | | | 1,230,000 | | | | 1,014,523 | (d) |
Citigroup Inc., Senior Notes (2.561% to 5/1/31 then SOFR + 1.167%) | | | 2.561 | % | | | 5/1/32 | | | | 440,000 | | | | 367,269 | (d) |
Citigroup Inc., Senior Notes (2.666% to 1/29/30 then SOFR + 1.146%) | | | 2.666 | % | | | 1/29/31 | | | | 310,000 | | | | 269,053 | (d) |
Citigroup Inc., Senior Notes (3.785% to 3/17/32 then SOFR + 1.939%) | | | 3.785 | % | | | 3/17/33 | | | | 2,020,000 | | | | 1,817,493 | (d) |
Citigroup Inc., Subordinated Notes | | | 6.625 | % | | | 6/15/32 | | | | 60,000 | | | | 65,335 | |
Citizens Financial Group Inc., Subordinated Notes | | | 4.023 | % | | | 10/1/24 | | | | 950,000 | | | | 925,959 | |
Credit Agricole SA, Junior Subordinated Notes (7.875% to 3/23/24 then USD 5 year ICE Swap Rate + 4.898%) | | | 7.875 | % | | | 1/23/24 | | | | 2,000,000 | | | | 2,002,028 | (a)(c)(d) |
Credit Agricole SA, Junior Subordinated Notes (8.125% to 12/23/25 then USD 5 year ICE Swap Rate + 6.185%) | | | 8.125 | % | | | 12/23/25 | | | | 9,530,000 | | | | 9,742,157 | (a)(c)(d) |
Credit Agricole SA, Senior Notes | | | 5.589 | % | | | 7/5/26 | | | | 560,000 | | | | 569,892 | (a) |
Credit Agricole SA, Senior Notes | | | 5.301 | % | | | 7/12/28 | | | | 1,090,000 | | | | 1,115,362 | (a) |
Credit Agricole SA, Senior Notes | | | 5.514 | % | | | 7/5/33 | | | | 2,130,000 | | | | 2,209,535 | (a) |
Danske Bank A/S, Senior Notes (0.976% to 9/10/24 then 1 year Treasury Constant Maturity Rate + 0.550%) | | | 0.976 | % | | | 9/10/25 | | | | 5,400,000 | | | | 5,223,793 | (a)(d) |
See Notes to Financial Statements.
| | | | |
22 | | | | Western Asset Corporate Bond Fund 2023 Annual Report |
Western Asset Corporate Bond Fund
(Percentages shown based on Fund net assets)
| | | | | | | | | | | | | | | | |
| Security | | Rate | | | Maturity Date | | | Face Amount† | | | Value | |
Banks — continued | | | | | | | | | | | | | | | | |
Danske Bank A/S, Senior Notes (1.549% to 9/10/26 then 1 year Treasury Constant Maturity Rate + 0.730%) | | | 1.549 | % | | | 9/10/27 | | | | 3,000,000 | | | $ | 2,708,376 | (a)(d) |
Danske Bank A/S, Senior Notes (3.773% to 3/28/24 then 1 year Treasury Constant Maturity Rate + 1.450%) | | | 3.773 | % | | | 3/28/25 | | | | 380,000 | | | | 378,088 | (a)(d) |
Danske Bank A/S, Senior Notes (4.298% to 4/1/27 then 1 year Treasury Constant Maturity Rate + 1.750%) | | | 4.298 | % | | | 4/1/28 | | | | 7,990,000 | | | | 7,748,904 | (a)(d) |
Danske Bank A/S, Senior Notes (6.466% to 1/9/25 then 1 year Treasury Constant Maturity Rate + 2.100%) | | | 6.466 | % | | | 1/9/26 | | | | 7,340,000 | | | | 7,395,860 | (a)(d) |
Fifth Third Bancorp, Senior Notes (6.339% to 7/27/28 then SOFR + 2.340%) | | | 6.339 | % | | | 7/27/29 | | | | 1,700,000 | | | | 1,770,702 | (d) |
HSBC Holdings PLC, Senior Notes (2.099% to 6/4/25 then SOFR + 1.929%) | | | 2.099 | % | | | 6/4/26 | | | | 630,000 | | | | 599,980 | (d) |
HSBC Holdings PLC, Senior Notes (2.357% to 8/18/30 then SOFR + 1.947%) | | | 2.357 | % | | | 8/18/31 | | | | 560,000 | | | | 464,245 | (d) |
HSBC Holdings PLC, Senior Notes (2.871% to 11/22/31 then SOFR + 1.410%) | | | 2.871 | % | | | 11/22/32 | | | | 300,000 | | | | 249,401 | (d) |
HSBC Holdings PLC, Senior Notes (6.332% to 3/9/43 then SOFR + 2.650%) | | | 6.332 | % | | | 3/9/44 | | | | 540,000 | | | | 582,676 | (d) |
HSBC Holdings PLC, Subordinated Notes | | | 7.625 | % | | | 5/17/32 | | | | 410,000 | | | | 457,907 | |
Huntington Bancshares Inc., Senior Notes (6.208% to 8/21/28 then SOFR + 2.020%) | | | 6.208 | % | | | 8/21/29 | | | | 2,030,000 | | | | 2,094,418 | (d) |
Intesa Sanpaolo SpA, Senior Notes | | | 7.000 | % | | | 11/21/25 | | | | 3,200,000 | | | | 3,280,580 | (a) |
Intesa Sanpaolo SpA, Senior Notes | | | 7.200 | % | | | 11/28/33 | | | | 4,250,000 | | | | 4,533,577 | (a) |
Intesa Sanpaolo SpA, Subordinated Notes | | | 5.017 | % | | | 6/26/24 | | | | 2,949,000 | | | | 2,919,389 | (a) |
Intesa Sanpaolo SpA, Subordinated Notes (4.198% to 6/1/31 then 1 year Treasury Constant Maturity Rate + 2.600%) | | | 4.198 | % | | | 6/1/32 | | | | 2,130,000 | | | | 1,758,502 | (a)(d) |
Intesa Sanpaolo SpA, Subordinated Notes (4.950% to 6/1/41 then 1 year Treasury Constant Maturity Rate + 2.750%) | | | 4.950 | % | | | 6/1/42 | | | | 2,720,000 | | | | 1,938,946 | (a)(d) |
JPMorgan Chase & Co., Senior Notes (1.953% to 2/4/31 then SOFR + 1.065%) | | | 1.953 | % | | | 2/4/32 | | | | 1,880,000 | | | | 1,528,734 | (d) |
JPMorgan Chase & Co., Senior Notes (2.545% to 11/8/31 then SOFR + 1.180%) | | | 2.545 | % | | | 11/8/32 | | | | 4,290,000 | | | | 3,580,818 | (d) |
JPMorgan Chase & Co., Senior Notes (3.897% to 1/23/48 then 3 mo. Term SOFR + 1.482%) | | | 3.897 | % | | | 1/23/49 | | | | 890,000 | | | | 738,912 | (d) |
See Notes to Financial Statements.
| | | | |
| Western Asset Corporate Bond Fund 2023 Annual Report | | | | 23 |
Schedule of investments (cont’d)
December 31, 2023
Western Asset Corporate Bond Fund
(Percentages shown based on Fund net assets)
| | | | | | | | | | | | | | | | |
| Security | | Rate | | | Maturity Date | | | Face Amount† | | | Value | |
Banks — continued | | | | | | | | | | | | | | | | |
JPMorgan Chase & Co., Senior Notes (3.964% to 11/15/47 then 3 mo. Term SOFR + 1.642%) | | | 3.964 | % | | | 11/15/48 | | | | 400,000 | | | $ | 335,416 | (d) |
JPMorgan Chase & Co., Senior Notes (4.260% to 2/22/47 then 3 mo. Term SOFR + 1.842%) | | | 4.260 | % | | | 2/22/48 | | | | 720,000 | | | | 636,928 | (d) |
JPMorgan Chase & Co., Senior Notes (4.586% to 4/26/32 then SOFR + 1.800%) | | | 4.586 | % | | | 4/26/33 | | | | 1,970,000 | | | | 1,903,961 | (d) |
JPMorgan Chase & Co., Senior Notes (6.254% to 10/23/33 then SOFR + 1.810%) | | | 6.254 | % | | | 10/23/34 | | | | 620,000 | | | | 672,432 | (d) |
JPMorgan Chase & Co., Subordinated Notes (2.956% to 5/13/30 then 3 mo. Term SOFR + 2.515%) | | | 2.956 | % | | | 5/13/31 | | | | 650,000 | | | | 571,495 | (d) |
JPMorgan Chase Bank NA, Senior Notes | | | 5.110 | % | | | 12/8/26 | | | | 1,100,000 | | | | 1,110,301 | |
Lloyds Banking Group PLC, Junior Subordinated Notes (6.750% to 6/27/26 then 5 year Treasury Constant Maturity Rate + 4.815%) | | | 6.750 | % | | | 6/27/26 | | | | 450,000 | | | | 443,990 | (c)(d) |
Lloyds Banking Group PLC, Junior Subordinated Notes (7.500% to 6/27/24 then USD 5 year ICE Swap Rate + 4.760%) | | | 7.500 | % | | | 6/27/24 | | | | 410,000 | | | | 406,457 | (c)(d) |
Lloyds Banking Group PLC, Junior Subordinated Notes (7.500% to 9/27/25 then USD 5 year ICE Swap Rate + 4.496%) | | | 7.500 | % | | | 9/27/25 | | | | 880,000 | | | | 863,976 | (c)(d) |
Lloyds Banking Group PLC, Junior Subordinated Notes (8.000% to 3/27/30 then 5 year Treasury Constant Maturity Rate + 3.913%) | | | 8.000 | % | | | 9/27/29 | | | | 1,570,000 | | | | 1,577,062 | (c)(d) |
NatWest Group PLC, Senior Notes (5.847%to 3/2/26 then 1 year Treasury Constant Maturity Rate + 1.350%) | | | 5.847 | % | | | 3/2/27 | | | | 820,000 | | | | 827,539 | (d) |
NatWest Group PLC, Subordinated Notes (3.754% to 11/1/24 then 5 year Treasury Constant Maturity Rate + 2.100%) | | | 3.754 | % | | | 11/1/29 | | | | 1,160,000 | | | | 1,131,784 | (d) |
PNC Financial Services Group Inc., Junior Subordinated Notes (6.250% to 3/15/30 then 7 year Treasury Constant Maturity Rate + 2.808%) | | | 6.250 | % | | | 3/15/30 | | | | 2,427,000 | | | | 2,268,438 | (c)(d) |
PNC Financial Services Group Inc., Senior Notes (6.875% to 10/20/33 then SOFR + 2.284%) | | | 6.875 | % | | | 10/20/34 | | | | 1,110,000 | | | | 1,232,721 | (d) |
See Notes to Financial Statements.
| | | | |
24 | | | | Western Asset Corporate Bond Fund 2023 Annual Report |
Western Asset Corporate Bond Fund
(Percentages shown based on Fund net assets)
| | | | | | | | | | | | | | | | |
| Security | | Rate | | | Maturity Date | | | Face Amount† | | | Value | |
Banks — continued | | | | | | | | | | | | | | | | |
Swedbank AB, Senior Notes | | | 6.136 | % | | | 9/12/26 | | | | 890,000 | | | $ | 908,242 | (a) |
Toronto-Dominion Bank, Junior Subordinated Notes (8.125% to 10/31/27 then 5 year Treasury Constant Maturity Rate + 4.075%) | | | 8.125 | % | | | 10/31/82 | | | | 940,000 | | | | 980,692 | (d) |
Toronto-Dominion Bank, Senior Notes | | | 5.264 | % | | | 12/11/26 | | | | 1,230,000 | | | | 1,254,770 | |
Truist Financial Corp., Senior Notes (5.867%to 6/8/33 then SOFR + 2.361%) | | | 5.867 | % | | | 6/8/34 | | | | 720,000 | | | | 734,970 | (d) |
Truist Financial Corp., Senior Notes (6.047%to 6/8/26 then SOFR + 2.050%) | | | 6.047 | % | | | 6/8/27 | | | | 810,000 | | | | 824,672 | (d) |
US Bancorp, Senior Notes (5.775% to 6/12/28 then SOFR + 2.020%) | | | 5.775 | % | | | 6/12/29 | | | | 1,340,000 | | | | 1,377,603 | (d) |
Wells Fargo & Co., Junior Subordinated Notes | | | 5.900 | % | | | 6/15/24 | | | | 2,390,000 | | | | 2,370,778 | (c)(d) |
Wells Fargo & Co., Senior Notes (3.068% to 4/30/40 then SOFR + 2.530%) | | | 3.068 | % | | | 4/30/41 | | | | 1,170,000 | | | | 885,916 | (d) |
Wells Fargo & Co., Senior Notes (4.611% to 4/25/52 then SOFR + 2.130%) | | | 4.611 | % | | | 4/25/53 | | | | 2,860,000 | | | | 2,574,532 | (d) |
Wells Fargo & Co., Senior Notes (5.013% to 4/4/50 then 3 mo. Term SOFR + 4.502%) | | | 5.013 | % | | | 4/4/51 | | | | 980,000 | | | | 933,157 | (d) |
Wells Fargo & Co., Senior Notes (5.389% to 4/24/33 then SOFR + 2.020%) | | | 5.389 | % | | | 4/24/34 | | | | 1,291,000 | | | | 1,297,361 | (d) |
Wells Fargo & Co., Senior Notes (5.557% to 7/25/33 then SOFR + 1.990%) | | | 5.557 | % | | | 7/25/34 | | | | 3,050,000 | | | | 3,106,823 | (d) |
Wells Fargo & Co., Senior Notes (5.574% to 7/25/28 then SOFR + 1.740%) | | | 5.574 | % | | | 7/25/29 | | | | 540,000 | | | | 551,698 | (d) |
Wells Fargo & Co., Senior Notes (6.491% to 10/23/33 then SOFR + 2.060%) | | | 6.491 | % | | | 10/23/34 | | | | 2,060,000 | | | | 2,242,240 | (d) |
Wells Fargo & Co., Subordinated Notes | | | 5.375 | % | | | 11/2/43 | | | | 880,000 | | | | 858,201 | |
Wells Fargo Bank NA, Senior Notes | | | 5.254 | % | | | 12/11/26 | | | | 3,880,000 | | | | 3,928,912 | |
Westpac Banking Corp., Subordinated Notes (2.668% to 11/15/30 then 5 year Treasury Constant Maturity Rate + 1.750%) | | | 2.668 | % | | | 11/15/35 | | | | 1,850,000 | | | | 1,506,619 | (d) |
Westpac Banking Corp., Subordinated Notes (3.020% to 11/18/31 then 5 year Treasury Constant Maturity Rate + 1.530%) | | | 3.020 | % | | | 11/18/36 | | | | 1,170,000 | | | | 952,344 | (d) |
Total Banks | | | | | | | | | | | | | | | 161,608,676 | |
Capital Markets — 6.3% | | | | | | | | | | | | | | | | |
Ameriprise Financial Inc., Senior Notes | | | 5.150 | % | | | 5/15/33 | | | | 1,870,000 | | | | 1,928,218 | |
Charles Schwab Corp., Junior Subordinated Notes (4.000% to 12/1/30 then 10 year Treasury Constant Maturity Rate + 3.079%) | | | 4.000 | % | | | 12/1/30 | | | | 2,110,000 | | | | 1,669,136 | (c)(d) |
See Notes to Financial Statements.
| | | | |
| Western Asset Corporate Bond Fund 2023 Annual Report | | | | 25 |
Schedule of investments (cont’d)
December 31, 2023
Western Asset Corporate Bond Fund
(Percentages shown based on Fund net assets)
| | | | | | | | | | | | | | | | |
| Security | | Rate | | | Maturity Date | | | Face Amount† | | | Value | |
Capital Markets — continued | | | | | | | | | | | | | | | | |
Charles Schwab Corp., Junior Subordinated Notes (5.375% to 6/1/25 then 5 year Treasury Constant Maturity Rate + 4.971%) | | | 5.375 | % | | | 6/1/25 | | | | 2,539,000 | | | $ | 2,510,105 | (c)(d) |
Charles Schwab Corp., Senior Notes | | | 2.000 | % | | | 3/20/28 | | | | 460,000 | | | | 409,536 | |
Charles Schwab Corp., Senior Notes (5.643%to 5/19/28 then SOFR + 2.210%) | | | 5.643 | % | | | 5/19/29 | | | | 1,540,000 | | | | 1,580,542 | (d) |
Charles Schwab Corp., Senior Notes (5.853%to 5/19/33 then SOFR + 2.500%) | | | 5.853 | % | | | 5/19/34 | | | | 700,000 | | | | 722,948 | (d) |
Charles Schwab Corp., Senior Notes (6.136%to 8/24/33 then SOFR + 2.010%) | | | 6.136 | % | | | 8/24/34 | | | | 2,320,000 | | | | 2,446,347 | (d) |
CI Financial Corp., Senior Notes | | | 3.200 | % | | | 12/17/30 | | | | 5,060,000 | | | | 4,001,103 | |
Credit Suisse AG AT1 Claim | | | — | | | | — | | | | 22,790,000 | | | | 2,734,800 | *(e) |
Goldman Sachs Group Inc., Junior Subordinated Notes (7.500% to 2/10/29 then 5 year Treasury Constant Maturity Rate + 3.156%) | | | 7.500 | % | | | 2/10/29 | | | | 620,000 | | | | 649,384 | (c)(d) |
Goldman Sachs Group Inc., Senior Notes | | | 2.600 | % | | | 2/7/30 | | | | 1,750,000 | | | | 1,538,450 | |
Goldman Sachs Group Inc., Senior Notes (2.383% to 7/21/31 then SOFR + 1.248%) | | | 2.383 | % | | | 7/21/32 | | | | 3,520,000 | | | | 2,893,229 | (d) |
Goldman Sachs Group Inc., Senior Notes (2.615% to 4/22/31 then SOFR + 1.281%) | | | 2.615 | % | | | 4/22/32 | | | | 2,370,000 | | | | 1,990,227 | (d) |
Goldman Sachs Group Inc., Senior Notes (3.615% to 3/15/27 then SOFR + 1.846%) | | | 3.615 | % | | | 3/15/28 | | | | 390,000 | | | | 374,192 | (d) |
Goldman Sachs Group Inc., Senior Notes (3.814% to 4/23/28 then 3 mo. Term SOFR + 1.420%) | | | 3.814 | % | | | 4/23/29 | | | | 1,760,000 | | | | 1,671,959 | (d) |
Intercontinental Exchange Inc., Senior Notes | | | 4.950 | % | | | 6/15/52 | | | | 80,000 | | | | 80,180 | |
KKR Group Finance Co. VII LLC, Senior Notes | | | 3.625 | % | | | 2/25/50 | | | | 310,000 | | | | 223,014 | (a) |
Morgan Stanley, Senior Notes (1.593% to 5/4/26 then SOFR + 0.879%) | | | 1.593 | % | | | 5/4/27 | | | | 1,440,000 | | | | 1,327,354 | (d) |
Morgan Stanley, Senior Notes (1.794% to 2/13/31 then SOFR + 1.034%) | | | 1.794 | % | | | 2/13/32 | | | | 330,000 | | | | 263,663 | (d) |
Morgan Stanley, Senior Notes (2.239% to 7/21/31 then SOFR + 1.178%) | | | 2.239 | % | | | 7/21/32 | | | | 680,000 | | | | 555,302 | (d) |
Morgan Stanley, Senior Notes (2.511% to 10/20/31 then SOFR + 1.200%) | | | 2.511 | % | | | 10/20/32 | | | | 290,000 | | | | 240,241 | (d) |
Morgan Stanley, Senior Notes (3.217% to 4/22/41 then SOFR + 1.485%) | | | 3.217 | % | | | 4/22/42 | | | | 300,000 | | | | 230,972 | (d) |
Morgan Stanley, Senior Notes (5.424% to 7/21/33 then SOFR + 1.880%) | | | 5.424 | % | | | 7/21/34 | | | | 130,000 | | | | 131,997 | (d) |
See Notes to Financial Statements.
| | | | |
26 | | | | Western Asset Corporate Bond Fund 2023 Annual Report |
Western Asset Corporate Bond Fund
(Percentages shown based on Fund net assets)
| | | | | | | | | | | | | | | | |
| Security | | Rate | | | Maturity Date | | | Face Amount† | | | Value | |
Capital Markets — continued | | | | | | | | | | | | | | | | |
Morgan Stanley, Senior Notes (5.449% to 7/20/28 then SOFR + 1.630%) | | | 5.449 | % | | | 7/20/29 | | | | 1,510,000 | | | $ | 1,539,512 | (d) |
Morgan Stanley, Senior Notes (6.342% to 10/18/32 then SOFR + 2.560%) | | | 6.342 | % | | | 10/18/33 | | | | 1,000,000 | | | | 1,078,771 | (d) |
Morgan Stanley, Subordinated Notes (2.484% to 9/16/31 then SOFR + 1.360%) | | | 2.484 | % | | | 9/16/36 | | | | 7,210,000 | | | | 5,718,227 | (d) |
Morgan Stanley, Subordinated Notes (5.297% to 4/20/32 then SOFR + 2.620%) | | | 5.297 | % | | | 4/20/37 | | | | 1,330,000 | | | | 1,294,870 | (d) |
Morgan Stanley, Subordinated Notes (5.948% to 1/19/33 then 5 year Treasury Constant Maturity Rate + 2.430%) | | | 5.948 | % | | | 1/19/38 | | | | 570,000 | | | | 576,686 | (d) |
Morgan Stanley Bank NA, Senior Notes | | | 4.754 | % | | | 4/21/26 | | | | 720,000 | | | | 719,761 | |
Raymond James Financial Inc., Senior Notes | | | 4.950 | % | | | 7/15/46 | | | | 230,000 | | | | 215,091 | |
UBS Group AG, Junior Subordinated Notes (7.000% to 1/31/24 then USD 5 year ICE Swap Rate + 4.344%) | | | 7.000 | % | | | 1/31/24 | | | | 3,300,000 | | | | 3,301,044 | (a)(c)(d) |
UBS Group AG, Junior Subordinated Notes (9.250% to 11/13/28 then 5 year Treasury Constant Maturity Rate + 4.745%) | | | 9.250 | % | | | 11/13/28 | | | | 1,980,000 | | | | 2,140,928 | (a)(c)(d) |
UBS Group AG, Junior Subordinated Notes (9.250% to 11/13/33 then 5 year Treasury Constant Maturity Rate + 4.758%) | | | 9.250 | % | | | 11/13/33 | | | | 1,410,000 | | | | 1,566,179 | (a)(c)(d) |
UBS Group AG, Senior Notes (1.364% to 1/30/26 then 1 year Treasury Constant Maturity Rate + 1.080%) | | | 1.364 | % | | | 1/30/27 | | | | 2,280,000 | | | | 2,091,656 | (a)(d) |
UBS Group AG, Senior Notes (3.091% to 5/14/31 then SOFR + 1.730%) | | | 3.091 | % | | | 5/14/32 | | | | 5,910,000 | | | | 5,036,275 | (a)(d) |
UBS Group AG, Senior Notes (3.179% to 2/11/42 then 1 year Treasury Constant Maturity Rate + 1.100%) | | | 3.179 | % | | | 2/11/43 | | | | 980,000 | | | | 725,445 | (a)(d) |
UBS Group AG, Senior Notes (6.327% to 12/22/26 then 1 year Treasury Constant Maturity Rate + 1.600%) | | | 6.327 | % | | | 12/22/27 | | | | 2,100,000 | | | | 2,165,469 | (a)(d) |
UBS Group AG, Senior Notes (6.537% to 8/12/32 then SOFR + 3.920%) | | | 6.537 | % | | | 8/12/33 | | | | 5,840,000 | | | | 6,235,820 | (a)(d) |
UBS Group AG, Senior Notes (9.016% to 11/15/32 then SOFR + 5.020%) | | | 9.016 | % | | | 11/15/33 | | | | 250,000 | | | | 307,505 | (a)(d) |
Total Capital Markets | | | | | | | | | | | | | | | 64,886,138 | |
Consumer Finance — 0.1% | | | | | | | | | | | | | | | | |
American Express Co., Subordinated Notes (5.625% to 7/28/33 then SOFR + 1.930%) | | | 5.625 | % | | | 7/28/34 | | | | 1,190,000 | | | | 1,230,453 | (d) |
See Notes to Financial Statements.
| | | | |
| Western Asset Corporate Bond Fund 2023 Annual Report | | | | 27 |
Schedule of investments (cont’d)
December 31, 2023
Western Asset Corporate Bond Fund
(Percentages shown based on Fund net assets)
| | | | | | | | | | | | | | | | |
| Security | | Rate | | | Maturity Date | | | Face Amount† | | | Value | |
Financial Services — 2.0% | | | | | | | | | | | | | | | | |
AerCap Ireland Capital DAC/AerCap Global Aviation Trust, Senior Notes | | | 3.150 | % | | | 2/15/24 | | | | 310,000 | | | $ | 308,797 | |
AerCap Ireland Capital DAC/AerCap Global Aviation Trust, Senior Notes | | | 1.650 | % | | | 10/29/24 | | | | 210,000 | | | | 202,790 | |
AerCap Ireland Capital DAC/AerCap Global Aviation Trust, Senior Notes | | | 3.300 | % | | | 1/30/32 | | | | 820,000 | | | | 713,956 | |
AerCap Ireland Capital DAC/AerCap Global Aviation Trust, Senior Notes | | | 3.400 | % | | | 10/29/33 | | | | 290,000 | | | | 249,195 | |
AerCap Ireland Capital DAC/AerCap Global Aviation Trust, Senior Notes | | | 3.850 | % | | | 10/29/41 | | | | 3,800,000 | | | | 3,064,959 | |
DAE Funding LLC, Senior Notes | | | 1.550 | % | | | 8/1/24 | | | | 1,850,000 | | | | 1,802,752 | (a) |
GE Capital European Funding Unlimited Co., Senior Notes | | | 6.025 | % | | | 3/1/38 | | | | 400,000 | EUR | | | 554,806 | |
GE Capital UK Funding Unlimited Co., Senior Notes | | | 5.875 | % | | | 1/18/33 | | | | 1,600,000 | GBP | | | 2,194,675 | |
GE Capital UK Funding Unlimited Co., Senior Notes | | | 8.000 | % | | | 1/14/39 | | | | 180,000 | GBP | | | 285,573 | (b) |
ILFC E-Capital Trust I, Ltd. GTD ((Highest of 3 mo. USD LIBOR, 10 year Treasury Constant Maturity Rate and 30 year Treasury Constant Maturity Rate) + 1.812%) | | | 7.186 | % | | | 12/21/65 | | | | 5,950,000 | | | | 4,429,061 | (a)(d) |
ILFC E-Capital Trust II, Ltd. GTD ((Highest of 3 mo. USD LIBOR, 10 year Treasury Constant Maturity Rate and 30 year Treasury Constant Maturity Rate) + 2.062%) | | | 7.436 | % | | | 12/21/65 | | | | 260,000 | | | | 202,517 | (a)(d) |
LPL Holdings Inc., Senior Notes | | | 6.750 | % | | | 11/17/28 | | | | 1,260,000 | | | | 1,343,973 | |
PayPal Holdings Inc., Senior Notes | | | 3.250 | % | | | 6/1/50 | | | | 370,000 | | | | 277,747 | |
PayPal Holdings Inc., Senior Notes | | | 5.250 | % | | | 6/1/62 | | | | 300,000 | | | | 297,690 | |
Rocket Mortgage LLC/Rocket Mortgage Co-Issuer Inc., Senior Notes | | | 2.875 | % | | | 10/15/26 | | | | 1,140,000 | | | | 1,052,613 | (a) |
Vanguard Group Inc. | | | 3.250 | % | | | 8/22/60 | | | | 5,000,000 | | | | 3,052,318 | |
Total Financial Services | | | | | | | | | | | | | | | 20,033,422 | |
Insurance — 2.7% | | | | | | | | | | | | | | | | |
Americo Life Inc., Senior Notes | | | 3.450 | % | | | 4/15/31 | | | | 490,000 | | | | 384,393 | (a) |
AmFam Holdings Inc., Senior Notes | | | 2.805 | % | | | 3/11/31 | | | | 1,170,000 | | | | 897,772 | (a) |
AmFam Holdings Inc., Senior Notes | | | 3.833 | % | | | 3/11/51 | | | | 360,000 | | | | 219,480 | (a) |
Arthur J Gallagher & Co., Senior Notes | | | 6.500 | % | | | 2/15/34 | | | | 2,280,000 | | | | 2,494,824 | |
Highlands Holdings Bond Issuer Ltd./ Highlands Holdings Bond Co-Issuer Inc., Senior Secured Notes (7.625% Cash or 8.375% PIK) | | | 7.625 | % | | | 10/15/25 | | | | 4,781,411 | | | | 4,863,986 | (a)(g) |
See Notes to Financial Statements.
| | | | |
28 | | | | Western Asset Corporate Bond Fund 2023 Annual Report |
Western Asset Corporate Bond Fund
(Percentages shown based on Fund net assets)
| | | | | | | | | | | | | | | | |
| Security | | Rate | | | Maturity Date | | | Face Amount† | | | Value | |
Insurance — continued | | | | | | | | | | | | | | | | |
Marsh & McLennan Cos. Inc., Senior Notes | | | 2.375 | % | | | 12/15/31 | | | | 900,000 | | | $ | 767,212 | |
Massachusetts Mutual Life Insurance Co., Subordinated Notes | | | 3.375 | % | | | 4/15/50 | | | | 250,000 | | | | 182,654 | (a) |
Massachusetts Mutual Life Insurance Co., Subordinated Notes | | | 4.900 | % | | | 4/1/77 | | | | 830,000 | | | | 709,142 | (a) |
Metropolitan Life Global Funding I, Senior Secured Notes | | | 5.150 | % | | | 3/28/33 | | | | 1,250,000 | | | | 1,272,852 | (a) |
National General Holdings Corp., Senior Notes | | | 6.750 | % | | | 5/15/24 | | | | 7,000,000 | | | | 7,012,666 | (a) |
New York Life Global Funding, Secured Notes | | | 4.550 | % | | | 1/28/33 | | | | 1,040,000 | | | | 1,025,953 | (a) |
New York Life Insurance Co., Subordinated Notes | | | 3.750 | % | | | 5/15/50 | | | | 1,220,000 | | | | 977,885 | (a) |
Nippon Life Insurance Co., Subordinated Notes (2.750% to 1/21/31 then 5 year Treasury Constant Maturity Rate + 2.653%) | | | 2.750 | % | | | 1/21/51 | | | | 1,720,000 | | | | 1,428,004 | (a)(d) |
Nippon Life Insurance Co., Subordinated Notes (3.400% to 1/23/30 then 5 year Treasury Constant Maturity Rate + 2.612%) | | | 3.400 | % | | | 1/23/50 | | | | 320,000 | | | | 283,276 | (a)(d) |
Northwestern Mutual Life Insurance Co., Subordinated Notes | | | 3.850 | % | | | 9/30/47 | | | | 820,000 | | | | 658,563 | (a) |
Northwestern Mutual Life Insurance Co., Subordinated Notes | | | 3.625 | % | | | 9/30/59 | | | | 540,000 | | | | 401,116 | (a) |
Prudential Financial Inc., Junior Subordinated Notes (6.750% to 3/1/33 then 5 year Treasury Constant Maturity Rate + 2.848%) | | | 6.750 | % | | | 3/1/53 | | | | 200,000 | | | | 208,882 | (d) |
Reliance Standard Life Global Funding II, Secured Notes | | | 2.500 | % | | | 10/30/24 | | | | 1,400,000 | | | | 1,363,145 | (a) |
Reliance Standard Life Global Funding II, Secured Notes | | | 1.512 | % | | | 9/28/26 | | | | 1,590,000 | | | | 1,422,851 | (a) |
RenaissanceRe Holdings Ltd., Senior Notes | | | 5.750 | % | | | 6/5/33 | | | | 550,000 | | | | 555,051 | |
Teachers Insurance & Annuity Association of America, Subordinated Notes | | | 4.270 | % | | | 5/15/47 | | | | 800,000 | | | | 698,621 | (a) |
Total Insurance | | | | | | | | | | | | | | | 27,828,328 | |
Mortgage Real Estate Investment Trusts (REITs) — 0.3% | | | | | | | | | | | | | | | | |
Blackstone Holdings Finance Co. LLC, Senior Notes | | | 6.200 | % | | | 4/22/33 | | | | 3,310,000 | | | | 3,537,073 | (a) |
Total Financials | | | | | | | | | | | | | | | 279,124,090 | |
See Notes to Financial Statements.
| | | | |
| Western Asset Corporate Bond Fund 2023 Annual Report | | | | 29 |
Schedule of investments (cont’d)
December 31, 2023
Western Asset Corporate Bond Fund
(Percentages shown based on Fund net assets)
| | | | | | | | | | | | | | | | |
| Security | | Rate | | | Maturity Date | | | Face Amount† | | | Value | |
| Health Care — 3.7% | | | | | | | | | | | | | | | | |
Biotechnology — 0.5% | | | | | | | | | | | | | | | | |
AbbVie Inc., Senior Notes | | | 4.550 | % | | | 3/15/35 | | | | 120,000 | | | $ | 117,734 | |
AbbVie Inc., Senior Notes | | | 4.050 | % | | | 11/21/39 | | | | 2,570,000 | | | | 2,321,968 | |
Amgen Inc., Senior Notes | | | 5.250 | % | | | 3/2/33 | | | | 760,000 | | | | 779,453 | |
Amgen Inc., Senior Notes | | | 4.400 | % | | | 5/1/45 | | | | 350,000 | | | | 311,099 | |
Amgen Inc., Senior Notes | | | 4.663 | % | | | 6/15/51 | | | | 339,000 | | | | 308,626 | |
Amgen Inc., Senior Notes | | | 5.650 | % | | | 3/2/53 | | | | 1,160,000 | | | | 1,221,303 | |
Gilead Sciences Inc., Senior Notes | | | 5.250 | % | | | 10/15/33 | | | | 620,000 | | | | 646,507 | |
Total Biotechnology | | | | | | | | | | | | | | | 5,706,690 | |
Health Care Equipment & Supplies — 0.0%†† | | | | | | | | | | | | | | | | |
Becton Dickinson and Co., Senior Notes | | | 4.875 | % | | | 5/15/44 | | | | 91,000 | | | | 82,187 | |
Health Care Providers & Services — 2.5% | | | | | | | | | | | | | | | | |
Bon Secours Mercy Health Inc., Secured Notes | | | 3.464 | % | | | 6/1/30 | | | | 580,000 | | | | 530,310 | |
Centene Corp., Senior Notes | | | 4.625 | % | | | 12/15/29 | | | | 570,000 | | | | 547,190 | |
Centene Corp., Senior Notes | | | 3.375 | % | | | 2/15/30 | | | | 2,510,000 | | | | 2,255,198 | |
Cigna Group, Senior Notes | | | 3.200 | % | | | 3/15/40 | | | | 740,000 | | | | 579,047 | |
CommonSpirit Health, Secured Notes | | | 4.350 | % | | | 11/1/42 | | | | 100,000 | | | | 86,600 | |
CommonSpirit Health, Senior Secured Notes | | | 2.782 | % | | | 10/1/30 | | | | 620,000 | | | | 537,877 | |
CommonSpirit Health, Senior Secured Notes | | | 3.910 | % | | | 10/1/50 | | | | 620,000 | | | | 488,679 | |
CVS Health Corp., Senior Notes | | | 5.250 | % | | | 1/30/31 | | | | 1,070,000 | | | | 1,098,053 | |
CVS Health Corp., Senior Notes | | | 2.125 | % | | | 9/15/31 | | | | 1,390,000 | | | | 1,151,416 | |
CVS Health Corp., Senior Notes | | | 4.780 | % | | | 3/25/38 | | | | 1,850,000 | | | | 1,753,826 | |
CVS Health Corp., Senior Notes | | | 5.050 | % | | | 3/25/48 | | | | 750,000 | | | | 702,131 | |
Elevance Health Inc., Senior Notes | | | 4.100 | % | | | 5/15/32 | | | | 760,000 | | | | 726,207 | |
Elevance Health Inc., Senior Notes | | | 5.500 | % | | | 10/15/32 | | | | 1,235,000 | | | | 1,292,018 | |
HCA Inc., Senior Notes | | | 5.500 | % | | | 6/1/33 | | | | 2,210,000 | | | | 2,245,634 | |
HCA Inc., Senior Notes | | | 5.125 | % | | | 6/15/39 | | | | 500,000 | | | | 477,160 | |
HCA Inc., Senior Notes | | | 7.500 | % | | | 11/15/95 | | | | 380,000 | | | | 429,979 | |
Humana Inc., Senior Notes | | | 5.875 | % | | | 3/1/33 | | | | 1,160,000 | | | | 1,236,346 | |
Humana Inc., Senior Notes | | | 5.950 | % | | | 3/15/34 | | | | 1,850,000 | | | | 1,980,893 | |
Humana Inc., Senior Notes | | | 4.950 | % | | | 10/1/44 | | | | 750,000 | | | | 711,072 | |
Kaiser Foundation Hospitals, Senior Notes | | | 2.810 | % | | | 6/1/41 | | | | 660,000 | | | | 494,898 | |
Kaiser Foundation Hospitals, Senior Notes | | | 4.150 | % | | | 5/1/47 | | | | 250,000 | | | | 221,226 | |
Kaiser Foundation Hospitals, Senior Notes | | | 3.266 | % | | | 11/1/49 | | | | 180,000 | | | | 135,486 | |
Kaiser Foundation Hospitals, Senior Notes | | | 3.002 | % | | | 6/1/51 | | | | 400,000 | | | | 285,261 | |
Quest Diagnostics Inc., Senior Notes | | | 6.400 | % | | | 11/30/33 | | | | 2,160,000 | | | | 2,396,522 | |
UnitedHealth Group Inc., Senior Notes | | | 5.350 | % | | | 2/15/33 | | | | 790,000 | | | | 836,094 | |
UnitedHealth Group Inc., Senior Notes | | | 3.500 | % | | | 8/15/39 | | | | 640,000 | | | | 544,343 | |
See Notes to Financial Statements.
| | | | |
30 | | | | Western Asset Corporate Bond Fund 2023 Annual Report |
Western Asset Corporate Bond Fund
(Percentages shown based on Fund net assets)
| | | | | | | | | | | | | | | | |
| Security | | Rate | | | Maturity Date | | | Face Amount† | | | Value | |
Health Care Providers & Services — continued | | | | | | | | | | | | | | | | |
UnitedHealth Group Inc., Senior Notes | | | 2.750 | % | | | 5/15/40 | | | | 2,180,000 | | | $ | 1,652,025 | |
UnitedHealth Group Inc., Senior Notes | | | 5.875 | % | | | 2/15/53 | | | | 210,000 | | | | 238,035 | |
Total Health Care Providers & Services | | | | | | | | | | | | | | | 25,633,526 | |
Pharmaceuticals — 0.7% | | | | | | | | | | | | | | | | |
Pfizer Investment Enterprises Pte Ltd., Senior Notes | | | 4.750 | % | | | 5/19/33 | | | | 760,000 | | | | 761,986 | |
Pfizer Investment Enterprises Pte Ltd., Senior Notes | | | 5.110 | % | | | 5/19/43 | | | | 3,110,000 | | | | 3,100,824 | |
Pfizer Investment Enterprises Pte Ltd., Senior Notes | | | 5.300 | % | | | 5/19/53 | | | | 1,450,000 | | | | 1,481,382 | |
Pfizer Investment Enterprises Pte Ltd., Senior Notes | | | 5.340 | % | | | 5/19/63 | | | | 480,000 | | | | 485,005 | |
Teva Pharmaceutical Finance Netherlands III BV, Senior Notes | | | 3.150 | % | | | 10/1/26 | | | | 1,190,000 | | | | 1,102,695 | |
Total Pharmaceuticals | | | | | | | | | | | | | | | 6,931,892 | |
Total Health Care | | | | | | | | | | | | | | | 38,354,295 | |
| Industrials — 9.6% | | | | | | | | | | | | | | | | |
Aerospace & Defense — 2.8% | | | | | | | | | | | | | | | | |
Avolon Holdings Funding Ltd., Senior Notes | | | 2.875 | % | | | 2/15/25 | | | | 840,000 | | | | 810,862 | (a) |
Boeing Co., Senior Notes | | | 2.196 | % | | | 2/4/26 | | | | 1,400,000 | | | | 1,323,084 | |
Boeing Co., Senior Notes | | | 3.100 | % | | | 5/1/26 | | | | 3,300,000 | | | | 3,172,752 | |
Boeing Co., Senior Notes | | | 3.250 | % | | | 2/1/28 | | | | 1,320,000 | | | | 1,253,170 | |
Boeing Co., Senior Notes | | | 5.150 | % | | | 5/1/30 | | | | 1,410,000 | | | | 1,436,191 | |
Boeing Co., Senior Notes | | | 3.300 | % | | | 3/1/35 | | | | 1,540,000 | | | | 1,263,007 | |
Boeing Co., Senior Notes | | | 3.750 | % | | | 2/1/50 | | | | 2,000,000 | | | | 1,554,318 | |
Boeing Co., Senior Notes | | | 3.950 | % | | | 8/1/59 | | | | 2,310,000 | | | | 1,769,620 | |
General Dynamics Corp., Senior Notes | | | 4.250 | % | | | 4/1/40 | | | | 1,230,000 | | | | 1,148,747 | |
L3Harris Technologies Inc., Senior Notes | | | 7.000 | % | | | 1/15/26 | | | | 990,000 | | | | 1,023,873 | |
L3Harris Technologies Inc., Senior Notes | | | 5.400 | % | | | 1/15/27 | | | | 670,000 | | | | 684,231 | |
L3Harris Technologies Inc., Senior Notes | | | 4.400 | % | | | 6/15/28 | | | | 540,000 | | | | 534,142 | |
L3Harris Technologies Inc., Senior Notes | | | 2.900 | % | | | 12/15/29 | | | | 546,000 | | | | 493,741 | |
L3Harris Technologies Inc., Senior Notes | | | 5.400 | % | | | 7/31/33 | | | | 1,610,000 | | | | 1,674,729 | |
Lockheed Martin Corp., Senior Notes | | | 4.150 | % | | | 6/15/53 | | | | 360,000 | | | | 322,233 | |
Lockheed Martin Corp., Senior Notes | | | 4.300 | % | | | 6/15/62 | | | | 440,000 | | | | 394,828 | |
Northrop Grumman Corp., Senior Notes | | | 5.150 | % | | | 5/1/40 | | | | 790,000 | | | | 801,132 | |
Northrop Grumman Corp., Senior Notes | | | 5.050 | % | | | 11/15/40 | | | | 660,000 | | | | 655,960 | |
Northrop Grumman Corp., Senior Notes | | | 5.250 | % | | | 5/1/50 | | | | 200,000 | | | | 206,114 | |
RTX Corp., Senior Notes | | | 6.100 | % | | | 3/15/34 | | | | 5,430,000 | | | | 5,895,097 | |
RTX Corp., Senior Notes | | | 4.050 | % | | | 5/4/47 | | | | 20,000 | | | | 16,700 | |
See Notes to Financial Statements.
| | | | |
| Western Asset Corporate Bond Fund 2023 Annual Report | | | | 31 |
Schedule of investments (cont’d)
December 31, 2023
Western Asset Corporate Bond Fund
(Percentages shown based on Fund net assets)
| | | | | | | | | | | | | | | | |
| Security | | Rate | | | Maturity Date | | | Face Amount† | | | Value | |
Aerospace & Defense — continued | | | | | | | | | | | | | | | | |
RTX Corp., Senior Notes | | | 4.625 | % | | | 11/16/48 | | | | 400,000 | | | $ | 365,630 | |
RTX Corp., Senior Notes | | | 3.030 | % | | | 3/15/52 | | | | 1,230,000 | | | | 849,850 | |
RTX Corp., Senior Notes | | | 5.375 | % | | | 2/27/53 | | | | 1,310,000 | | | | 1,332,213 | |
Total Aerospace & Defense | | | | | | | | | | | | | | | 28,982,224 | |
Building Products — 0.4% | | | | | | | | | | | | | | | | |
Carrier Global Corp., Senior Notes | | | 5.800 | % | | | 11/30/25 | | | | 1,930,000 | | | | 1,956,534 | (a) |
Carrier Global Corp., Senior Notes | | | 5.900 | % | | | 3/15/34 | | | | 1,570,000 | | | | 1,698,747 | (a) |
Total Building Products | | | | | | | | | | | | | | | 3,655,281 | |
Construction & Engineering — 0.1% | | | | | | | | | | | | | | | | |
LBJ Infrastructure Group LLC, Senior Secured Notes | | | 3.797 | % | | | 12/31/57 | | | | 910,000 | | | | 625,151 | (a) |
Electrical Equipment — 0.8% | | | | | | | | | | | | | | | | |
Eaton Corp., Senior Notes | | | 7.650 | % | | | 11/15/29 | | | | 1,400,000 | | | | 1,591,092 | |
Regal Rexnord Corp., Senior Notes | | | 6.050 | % | | | 2/15/26 | | | | 6,730,000 | | | | 6,805,899 | (a) |
Total Electrical Equipment | | | | | | | | | | | | | | | 8,396,991 | |
Ground Transportation — 0.5% | | | | | | | | | | | | | | | | |
Burlington Northern Santa Fe LLC, Senior Notes | | | 4.400 | % | | | 3/15/42 | | | | 650,000 | | | | 601,166 | |
Canadian Pacific Railway Co., Senior Notes | | | 3.100 | % | | | 12/2/51 | | | | 1,690,000 | | | | 1,222,535 | |
Norfolk Southern Corp., Senior Notes | | | 5.550 | % | | | 3/15/34 | | | | 1,710,000 | | | | 1,806,899 | |
Norfolk Southern Railway Co., Senior Notes | | | 7.875 | % | | | 5/15/43 | | | | 348,000 | | | | 417,222 | |
Union Pacific Corp., Senior Notes | | | 2.973 | % | | | 9/16/62 | | | | 1,330,000 | | | | 895,781 | |
Union Pacific Corp., Senior Notes | | | 3.750 | % | | | 2/5/70 | | | | 500,000 | | | | 386,588 | |
Union Pacific Corp., Senior Notes | | | 3.799 | % | | | 4/6/71 | | | | 250,000 | | | | 197,659 | |
Total Ground Transportation | | | | | | | | | | | | | | | 5,527,850 | |
Machinery — 0.4% | | | | | | | | | | | | | | | | |
Ingersoll Rand Inc., Senior Notes | | | 5.700 | % | | | 8/14/33 | | | | 1,930,000 | | | | 2,042,863 | |
Park-Ohio Industries Inc., Senior Notes | | | 6.625 | % | | | 4/15/27 | | | | 2,400,000 | | | | 2,222,712 | |
Total Machinery | | | | | | | | | | | | | | | 4,265,575 | |
Marine Transportation — 0.3% | | | | | | | | | | | | | | | | |
A.P. Moller - Maersk A/S, Senior Notes | | | 5.875 | % | | | 9/14/33 | | | | 2,810,000 | | | | 2,934,637 | (a) |
Passenger Airlines — 3.4% | | | | | | | | | | | | | | | | |
Air Canada Pass-Through Trust | | | 4.125 | % | | | 5/15/25 | | | | 434,137 | | | | 418,179 | (a) |
Air Canada Pass-Through Trust | | | 4.750 | % | | | 5/15/25 | | | | 3,245,620 | | | | 3,106,945 | (a) |
Air Canada Pass-Through Trust | | | 3.750 | % | | | 12/15/27 | | | | 414,921 | | | | 382,160 | (a) |
Alaska Airlines Inc. Pass-Through Trust | | | 4.800 | % | | | 8/15/27 | | | | 715,121 | | | | 695,934 | (a) |
American Airlines Group Inc. Pass-Through Trust | | | 4.950 | % | | | 2/15/25 | | | | 1,878,500 | | | | 1,825,892 | |
See Notes to Financial Statements.
| | | | |
32 | | | | Western Asset Corporate Bond Fund 2023 Annual Report |
Western Asset Corporate Bond Fund
(Percentages shown based on Fund net assets)
| | | | | | | | | | | | | | | | |
| Security | | Rate | | | Maturity Date | | | Face Amount† | | | Value | |
Passenger Airlines — continued | | | | | | | | | | | | | | | | |
American Airlines Group Inc. Pass-Through Trust | | | 4.000 | % | | | 7/15/25 | | | | 117,156 | | | $ | 112,326 | |
American Airlines Group Inc. Pass-Through Trust | | | 3.375 | % | | | 5/1/27 | | | | 126,558 | | | | 116,092 | |
American Airlines Group Inc. Pass-Through Trust | | | 3.575 | % | | | 1/15/28 | | | | 446,717 | | | | 417,050 | |
American Airlines Inc., Senior Secured Notes | | | 7.250 | % | | | 2/15/28 | | | | 2,840,000 | | | | 2,875,060 | (a) |
American Airlines Inc., Senior Secured Notes | | | 8.500 | % | | | 5/15/29 | | | | 850,000 | | | | 898,130 | (a) |
American Airlines Inc./AAdvantage Loyalty IP Ltd., Senior Secured Notes | | | 5.750 | % | | | 4/20/29 | | | | 300,000 | | | | 292,772 | (a) |
British Airways Pass-Through Trust | | | 4.625 | % | | | 6/20/24 | | | | 98,323 | | | | 97,960 | (a) |
British Airways Pass-Through Trust | | | 3.350 | % | | | 6/15/29 | | | | 387,927 | | | | 351,716 | (a) |
Delta Air Lines Inc., Senior Notes | | | 3.750 | % | | | 10/28/29 | | | | 790,000 | | | | 723,922 | |
Delta Air Lines Inc./SkyMiles IP Ltd., Senior Secured Notes | | | 4.500 | % | | | 10/20/25 | | | | 1,680,000 | | | | 1,655,129 | (a) |
Delta Air Lines Inc./SkyMiles IP Ltd., Senior Secured Notes | | | 4.750 | % | | | 10/20/28 | | | | 3,505,000 | | | | 3,449,110 | (a) |
Mileage Plus Holdings LLC/Mileage Plus Intellectual Property Assets Ltd., Senior Secured Notes | | | 6.500 | % | | | 6/20/27 | | | | 3,213,000 | | | | 3,224,467 | (a) |
Southwest Airlines Co., Senior Notes | | | 5.250 | % | | | 5/4/25 | | | | 290,000 | | | | 290,141 | |
Spirit Airlines Inc. Pass-Through Trust | | | 4.450 | % | | | 4/1/24 | | | | 735,739 | | | | 726,553 | |
Spirit Loyalty Cayman Ltd./Spirit IP Cayman Ltd., Senior Secured Notes | | | 8.000 | % | | | 9/20/25 | | | | 10,000 | | | | 7,203 | (a) |
Spirit Loyalty Cayman Ltd./Spirit IP Cayman Ltd., Senior Secured Notes | | | 8.000 | % | | | 9/20/25 | | | | 3,350,000 | | | | 2,413,133 | (a) |
United Airlines Inc., Senior Secured Notes | | | 4.375 | % | | | 4/15/26 | | | | 2,170,000 | | | | 2,116,163 | (a) |
United Airlines Pass-Through Trust | | | 4.875 | % | | | 1/15/26 | | | | 1,222,080 | | | | 1,184,681 | |
United Airlines Pass-Through Trust | | | 3.750 | % | | | 9/3/26 | | | | 348,601 | | | | 332,522 | |
United Airlines Pass-Through Trust | | | 5.800 | % | | | 1/15/36 | | | | 3,710,000 | | | | 3,776,809 | |
US Airways Pass-Through Trust | | | 4.625 | % | | | 6/3/25 | | | | 2,024,313 | | | | 1,969,426 | |
US Airways Pass-Through Trust | | | 3.950 | % | | | 11/15/25 | | | | 2,092,379 | | | | 2,000,907 | |
Total Passenger Airlines | | | | | | | | | | | | | | | 35,460,382 | |
Trading Companies & Distributors — 0.9% | | | | | | | | | | | | | | | | |
Air Lease Corp., Senior Notes | | | 1.875 | % | | | 8/15/26 | | | | 530,000 | | | | 487,792 | |
Air Lease Corp., Senior Notes | | | 5.850 | % | | | 12/15/27 | | | | 3,300,000 | | | | 3,388,073 | |
Air Lease Corp., Senior Notes | | | 5.300 | % | | | 2/1/28 | | | | 2,300,000 | | | | 2,327,205 | |
See Notes to Financial Statements.
| | | | |
| Western Asset Corporate Bond Fund 2023 Annual Report | | | | 33 |
Schedule of investments (cont’d)
December 31, 2023
Western Asset Corporate Bond Fund
(Percentages shown based on Fund net assets)
| | | | | | | | | | | | | | | | |
| Security | | Rate | | | Maturity Date | | | Face Amount† | | | Value | |
Trading Companies & Distributors — continued | | | | | | | | | | | | | | | | |
Aviation Capital Group LLC, Senior Notes | | | 5.500 | % | | | 12/15/24 | | | | 1,710,000 | | | $ | 1,701,684 | (a) |
BOC Aviation USA Corp., Senior Notes | | | 1.625 | % | | | 4/29/24 | | | | 1,700,000 | | | | 1,678,608 | (a) |
Total Trading Companies & Distributors | | | | | | | | | | | | | | | 9,583,362 | |
Total Industrials | | | | | | | | | | | | | | | 99,431,453 | |
| Information Technology — 2.9% | | | | | | | | | | | | | | | | |
Electronic Equipment, Instruments & Components — 0.9% | | | | | | | | | | | | | | | | |
Jabil Inc., Senior Notes | | | 5.450 | % | | | 2/1/29 | | | | 1,270,000 | | | | 1,298,538 | |
TD SYNNEX Corp., Senior Notes | | | 1.250 | % | | | 8/9/24 | | | | 4,250,000 | | | | 4,143,457 | |
Vontier Corp., Senior Notes | | | 1.800 | % | | | 4/1/26 | | | | 1,210,000 | | | | 1,113,862 | |
Vontier Corp., Senior Notes | | | 2.400 | % | | | 4/1/28 | | | | 2,970,000 | | | | 2,612,561 | |
Total Electronic Equipment, Instruments & Components | | | | | | | | | | | | | | | 9,168,418 | |
IT Services — 0.2% | | | | | | | | | | | | | | | | |
Kyndryl Holdings Inc., Senior Notes | | | 3.150 | % | | | 10/15/31 | | | | 2,400,000 | | | | 2,007,276 | |
Kyndryl Holdings Inc., Senior Notes | | | 4.100 | % | | | 10/15/41 | | | | 1,000,000 | | | | 751,839 | |
Total IT Services | | | | | | | | | | | | | | | 2,759,115 | |
Semiconductors & Semiconductor Equipment — 1.1% | | | | | | | | | | | | | | | | |
Broadcom Inc., Senior Notes | | | 4.150 | % | | | 11/15/30 | | | | 576,000 | | | | 550,493 | |
Broadcom Inc., Senior Notes | | | 3.187 | % | | | 11/15/36 | | | | 1,521,000 | | | | 1,233,389 | (a) |
Broadcom Inc., Senior Notes | | | 4.926 | % | | | 5/15/37 | | | | 780,000 | | | | 755,342 | (a) |
Intel Corp., Senior Notes | | | 2.800 | % | | | 8/12/41 | | | | 1,020,000 | | | | 764,640 | |
Intel Corp., Senior Notes | | | 4.900 | % | | | 8/5/52 | | | | 940,000 | | | | 920,902 | |
Intel Corp., Senior Notes | | | 3.200 | % | | | 8/12/61 | | | | 570,000 | | | | 393,311 | |
KLA Corp., Senior Notes | | | 4.950 | % | | | 7/15/52 | | | | 210,000 | | | | 212,390 | |
Micron Technology Inc., Senior Notes | | | 2.703 | % | | | 4/15/32 | | | | 1,310,000 | | | | 1,100,946 | |
Micron Technology Inc., Senior Notes | | | 3.366 | % | | | 11/1/41 | | | | 80,000 | | | | 59,808 | |
QUALCOMM Inc., Senior Notes | | | 4.500 | % | | | 5/20/52 | | | | 320,000 | | | | 299,180 | |
Texas Instruments Inc., Senior Notes | | | 3.875 | % | | | 3/15/39 | | | | 1,160,000 | | | | 1,071,522 | |
TSMC Arizona Corp., Senior Notes | | | 1.750 | % | | | 10/25/26 | | | | 1,130,000 | | | | 1,042,063 | |
TSMC Arizona Corp., Senior Notes | | | 2.500 | % | | | 10/25/31 | | | | 1,460,000 | | | | 1,257,684 | |
TSMC Arizona Corp., Senior Notes | | | 3.125 | % | | | 10/25/41 | | | | 960,000 | | | | 769,781 | |
TSMC Arizona Corp., Senior Notes | | | 3.250 | % | | | 10/25/51 | | | | 850,000 | | | | 674,023 | |
Total Semiconductors & Semiconductor Equipment | | | | | | | | | | | | | | | 11,105,474 | |
Software — 0.6% | | | | | | | | | | | | | | | | |
Intuit Inc., Senior Notes | | | 5.200 | % | | | 9/15/33 | | | | 1,380,000 | | | | 1,445,428 | |
Oracle Corp., Senior Notes | | | 4.000 | % | | | 7/15/46 | | | | 2,680,000 | | | | 2,152,893 | |
Oracle Corp., Senior Notes | | | 6.900 | % | | | 11/9/52 | | | | 380,000 | | | | 446,445 | |
Oracle Corp., Senior Notes | | | 5.550 | % | | | 2/6/53 | | | | 2,590,000 | | | | 2,593,735 | |
Total Software | | | | | | | | | | | | | | | 6,638,501 | |
See Notes to Financial Statements.
| | | | |
34 | | | | Western Asset Corporate Bond Fund 2023 Annual Report |
Western Asset Corporate Bond Fund
(Percentages shown based on Fund net assets)
| | | | | | | | | | | | | | | | |
| Security | | Rate | | | Maturity Date | | | Face Amount† | | | Value | |
Technology Hardware, Storage & Peripherals — 0.1% | | | | | | | | | | | | | | | | |
Dell International LLC/EMC Corp., Senior Notes | | | 8.100 | % | | | 7/15/36 | | | | 567,000 | | | $ | 698,048 | |
Total Information Technology | | | | | | | | | | | | | | | 30,369,556 | |
| Materials — 3.3% | | | | | | | | | | | | | | | | |
Chemicals — 0.5% | | | | | | | | | | | | | | | | |
OCP SA, Senior Notes | | | 3.750 | % | | | 6/23/31 | | | | 890,000 | | | | 767,447 | (a) |
OCP SA, Senior Notes | | | 5.125 | % | | | 6/23/51 | | | | 640,000 | | | | 487,475 | (a) |
Sasol Financing USA LLC, Senior Notes | | | 8.750 | % | | | 5/3/29 | | | | 2,180,000 | | | | 2,226,482 | (a) |
Sociedad Quimica y Minera de Chile SA, Senior Notes | | | 3.500 | % | | | 9/10/51 | | | | 1,860,000 | | | | 1,285,827 | (a) |
Total Chemicals | | | | | | | | | | | | | | | 4,767,231 | |
Metals & Mining — 2.7% | | | | | | | | | | | | | | | | |
Alcoa Nederland Holding BV, Senior Notes | | | 5.500 | % | | | 12/15/27 | | | | 3,175,000 | | | | 3,098,115 | (a) |
Anglo American Capital PLC, Senior Notes | | | 4.500 | % | | | 3/15/28 | | | | 2,500,000 | | | | 2,435,576 | (a) |
ArcelorMittal SA, Senior Notes | | | 6.550 | % | | | 11/29/27 | | | | 1,680,000 | | | | 1,765,351 | |
Barrick North America Finance LLC, Senior Notes | | | 5.700 | % | | | 5/30/41 | | | | 380,000 | | | | 401,628 | |
Barrick PD Australia Finance Pty Ltd., Senior Notes | | | 5.950 | % | | | 10/15/39 | | | | 560,000 | | | | 600,609 | |
First Quantum Minerals Ltd., Senior Notes | | | 7.500 | % | | | 4/1/25 | | | | 2,840,000 | | | | 2,710,511 | (a) |
First Quantum Minerals Ltd., Senior Notes | | | 6.875 | % | | | 10/15/27 | | | | 1,760,000 | | | | 1,498,200 | (a) |
Freeport-McMoRan Inc., Senior Notes | | | 5.400 | % | | | 11/14/34 | | | | 1,450,000 | | | | 1,461,667 | |
Freeport-McMoRan Inc., Senior Notes | | | 5.450 | % | | | 3/15/43 | | | | 390,000 | | | | 380,045 | |
Fresnillo PLC, Senior Notes | | | 4.250 | % | | | 10/2/50 | | | | 2,150,000 | | | | 1,645,014 | (a) |
Glencore Funding LLC, Senior Notes | | | 3.875 | % | | | 10/27/27 | | | | 1,960,000 | | | | 1,895,724 | (a) |
Glencore Funding LLC, Senior Notes | | | 5.400 | % | | | 5/8/28 | | | | 1,250,000 | | | | 1,273,795 | (a) |
Glencore Funding LLC, Senior Notes | | | 2.625 | % | | | 9/23/31 | | | | 1,810,000 | | | | 1,536,891 | (a) |
Southern Copper Corp., Senior Notes | | | 5.250 | % | | | 11/8/42 | | | | 450,000 | | | | 436,255 | |
Teck Resources Ltd., Senior Notes | | | 3.900 | % | | | 7/15/30 | | | | 1,360,000 | | | | 1,263,170 | |
Teck Resources Ltd., Senior Notes | | | 6.250 | % | | | 7/15/41 | | | | 860,000 | | | | 887,863 | |
Teck Resources Ltd., Senior Notes | | | 5.400 | % | | | 2/1/43 | | | | 860,000 | | | | 821,004 | |
Yamana Gold Inc., Senior Notes | | | 4.625 | % | | | 12/15/27 | | | | 3,400,000 | | | | 3,288,649 | |
Yamana Gold Inc., Senior Notes | | | 2.630 | % | | | 8/15/31 | | | | 220,000 | | | | 185,586 | |
Total Metals & Mining | | | | | | | | | | | | | | | 27,585,653 | |
Paper & Forest Products — 0.1% | | | | | | | | | | | | | | | | |
Suzano Austria GmbH, Senior Notes | | | 3.125 | % | | | 1/15/32 | | | | 1,380,000 | | | | 1,146,326 | |
Suzano Austria GmbH, Senior Notes | | | 7.000 | % | | | 3/16/47 | | | | 310,000 | | | | 328,185 | (a) |
Total Paper & Forest Products | | | | | | | | | | | | | | | 1,474,511 | |
Total Materials | | | | | | | | | | | | | | | 33,827,395 | |
See Notes to Financial Statements.
| | | | |
| Western Asset Corporate Bond Fund 2023 Annual Report | | | | 35 |
Schedule of investments (cont’d)
December 31, 2023
Western Asset Corporate Bond Fund
(Percentages shown based on Fund net assets)
| | | | | | | | | | | | | | | | |
| Security | | Rate | | | Maturity Date | | | Face Amount† | | | Value | |
| Real Estate — 2.1% | | | | | | | | | | | | | | | | |
Health Care REITs — 0.1% | | | | | | | | | | | | | | | | |
Diversified Healthcare Trust, Senior Notes | | | 4.750 | % | | | 5/1/24 | | | | 850,000 | | | $ | 847,705 | |
Welltower OP LLC, Senior Notes | | | 3.850 | % | | | 6/15/32 | | | | 760,000 | | | | 703,235 | |
Total Health Care REITs | | | | | | | | | | | | | | | 1,550,940 | |
Industrial REITs — 0.1% | | | | | | | | | | | | | | | | |
Prologis LP, Senior Notes | | | 1.250 | % | | | 10/15/30 | | | | 1,070,000 | | | | 865,231 | |
Office REITs — 0.1% | | | | | | | | | | | | | | | | |
Alexandria Real Estate Equities Inc., Senior Notes | | | 2.000 | % | | | 5/18/32 | | | | 1,520,000 | | | | 1,220,406 | |
Alexandria Real Estate Equities Inc., Senior Notes | | | 3.000 | % | | | 5/18/51 | | | | 370,000 | | | | 244,147 | |
Total Office REITs | | | | | | | | | | | | | | | 1,464,553 | |
Residential REITs — 0.1% | | | | | | | | | | | | | | | | |
Invitation Homes Operating Partnership LP, Senior Notes | | | 4.150 | % | | | 4/15/32 | | | | 770,000 | | | | 708,227 | |
Retail REITs — 1.6% | | | | | | | | | | | | | | | | |
Kimco Realty OP LLC, Senior Notes | | | 2.250 | % | | | 12/1/31 | | | | 2,088,000 | | | | 1,706,166 | |
WEA Finance LLC, Senior Notes | | | 4.125 | % | | | 9/20/28 | | | | 110,000 | | | | 98,071 | (a) |
WEA Finance LLC/Westfield UK & Europe Finance PLC, Senior Notes | | | 3.750 | % | | | 9/17/24 | | | | 13,650,000 | | | | 13,408,864 | (a) |
WEA Finance LLC/Westfield UK & Europe Finance PLC, Senior Notes | | | 4.750 | % | | | 9/17/44 | | | | 1,220,000 | | | | 873,704 | (a) |
Total Retail REITs | | | | | | | | | | | | | | | 16,086,805 | |
Specialized REITs — 0.1% | | | | | | | | | | | | | | | | |
Extra Space Storage LP, Senior Notes | | | 3.900 | % | | | 4/1/29 | | | | 630,000 | | | | 596,380 | |
Total Real Estate | | | | | | | | | | | | | | | 21,272,136 | |
| Utilities — 5.6% | | | | | | | | | | | | | | | | |
Electric Utilities — 5.5% | | | | | | | | | | | | | | | | |
Alabama Power Co., Senior Notes | | | 5.850 | % | | | 11/15/33 | | | | 890,000 | | | | 957,611 | |
American Transmission Systems Inc., Senior Notes | | | 2.650 | % | | | 1/15/32 | | | | 2,210,000 | | | | 1,871,037 | (a) |
CenterPoint Energy Houston Electric LLC, Senior Secured Bonds | | | 4.950 | % | | | 4/1/33 | | | | 410,000 | | | | 417,652 | |
CenterPoint Energy Houston Electric LLC, Senior Secured Bonds | | | 4.500 | % | | | 4/1/44 | | | | 1,240,000 | | | | 1,140,206 | |
CenterPoint Energy Houston Electric LLC, Senior Secured Bonds | | | 5.300 | % | | | 4/1/53 | | | | 120,000 | | | | 125,724 | |
Comision Federal de Electricidad, Senior Notes | | | 3.348 | % | | | 2/9/31 | | | | 1,200,000 | | | | 1,003,553 | (a) |
See Notes to Financial Statements.
| | | | |
36 | | | | Western Asset Corporate Bond Fund 2023 Annual Report |
Western Asset Corporate Bond Fund
(Percentages shown based on Fund net assets)
| | | | | | | | | | | | | | | | |
| Security | | Rate | | | Maturity Date | | | Face Amount† | | | Value | |
Electric Utilities — continued | | | | | | | | | | | | | | | | |
Comision Federal de Electricidad, Senior Notes | | | 4.677 | % | | | 2/9/51 | | | | 530,000 | | | $ | 377,905 | (a) |
Commonwealth Edison Co., First Mortgage Bonds | | | 6.450 | % | | | 1/15/38 | | | | 840,000 | | | | 927,220 | |
Constellation Energy Generation LLC, Senior Notes | | | 6.125 | % | | | 1/15/34 | | | | 1,600,000 | | | | 1,713,556 | |
Consumers Energy Co., First Mortgage Bonds | | | 2.500 | % | | | 5/1/60 | | | | 152,000 | | | | 93,023 | |
Duke Energy Carolinas LLC, First Mortgage Bonds | | | 4.950 | % | | | 1/15/33 | | | | 430,000 | | | | 438,230 | |
Duke Energy Carolinas LLC, Senior Notes | | | 6.100 | % | | | 6/1/37 | | | | 1,260,000 | | | | 1,356,957 | |
Duke Energy Florida LLC, First Mortgage Bonds | | | 5.875 | % | | | 11/15/33 | | | | 1,880,000 | | | | 2,027,721 | |
Duke Energy Indiana LLC, First Mortgage Bonds | | | 3.250 | % | | | 10/1/49 | | | | 1,120,000 | | | | 814,241 | |
Duke Energy Indiana LLC, First Mortgage Bonds | | | 5.400 | % | | | 4/1/53 | | | | 520,000 | | | | 530,780 | |
Duke Energy Ohio Inc., First Mortgage Bonds | | | 2.125 | % | | | 6/1/30 | | | | 1,390,000 | | | | 1,184,410 | |
Duke Energy Ohio Inc., First Mortgage Bonds | | | 5.250 | % | | | 4/1/33 | | | | 1,020,000 | | | | 1,051,611 | |
Edison International, Junior Subordinated Notes (5.000% to 3/15/27 then 5 year Treasury Constant Maturity Rate + 3.901%) | | | 5.000 | % | | | 12/15/26 | | | | 960,000 | | | | 896,259 | (c)(d) |
Edison International, Junior Subordinated Notes (5.375% to 3/15/26 then 5 year Treasury Constant Maturity Rate + 4.698%) | | | 5.375 | % | | | 3/15/26 | | | | 2,020,000 | | | | 1,915,564 | (c)(d) |
EDP Finance BV, Senior Notes | | | 1.710 | % | | | 1/24/28 | | | | 490,000 | | | | 435,727 | (a) |
Enel Finance International NV, Senior Notes | | | 6.800 | % | | | 10/14/25 | | | | 1,500,000 | | | | 1,538,546 | (a) |
Evergy Kansas Central Inc., First Mortgage Bonds | | | 5.900 | % | | | 11/15/33 | | | | 960,000 | | | | 1,027,638 | |
FirstEnergy Corp., Senior Notes | | | 4.150 | % | | | 7/15/27 | | | | 1,340,000 | | | | 1,289,656 | |
FirstEnergy Corp., Senior Notes | | | 5.100 | % | | | 7/15/47 | | | | 360,000 | | | | 330,012 | |
Florida Power & Light Co., First Mortgage Bonds | | | 3.150 | % | | | 10/1/49 | | | | 280,000 | | | | 205,913 | |
Interstate Power and Light Co., Senior Notes | | | 5.700 | % | | | 10/15/33 | | | | 1,220,000 | | | | 1,285,662 | |
Jersey Central Power & Light Co., Senior Notes | | | 4.300 | % | | | 1/15/26 | | | | 370,000 | | | | 362,232 | (a) |
Lamar Funding Ltd., Senior Notes | | | 3.958 | % | | | 5/7/25 | | | | 2,920,000 | | | | 2,849,421 | (a) |
Metropolitan Edison Co., Senior Notes | | | 5.200 | % | | | 4/1/28 | | | | 1,520,000 | | | | 1,533,044 | (a) |
Monongahela Power Co., First Mortgage Bonds | | | 5.850 | % | | | 2/15/34 | | | | 2,750,000 | | | | 2,888,957 | (a) |
NRG Energy Inc., Senior Secured Notes | | | 2.450 | % | | | 12/2/27 | | | | 3,660,000 | | | | 3,302,567 | (a) |
See Notes to Financial Statements.
| | | | |
| Western Asset Corporate Bond Fund 2023 Annual Report | | | | 37 |
Schedule of investments (cont’d)
December 31, 2023
Western Asset Corporate Bond Fund
(Percentages shown based on Fund net assets)
| | | | | | | | | | | | | | | | |
| Security | | Rate | | | Maturity Date | | | Face Amount† | | | Value | |
Electric Utilities — continued | | | | | | | | | | | | | | | | |
Ohio Edison Co., Senior Notes | | | 5.500 | % | | | 1/15/33 | | | | 910,000 | | | $ | 923,590 | (a) |
Ohio Edison Co., Senior Notes | | | 6.875 | % | | | 7/15/36 | | | | 1,160,000 | | | | 1,308,189 | |
Oncor Electric Delivery Co. LLC, Senior Secured Notes | | | 4.150 | % | | | 6/1/32 | | | | 860,000 | | | | 828,024 | |
Oncor Electric Delivery Co. LLC, Senior Secured Notes | | | 5.650 | % | | | 11/15/33 | | | | 2,270,000 | | | | 2,419,780 | (a) |
Oncor Electric Delivery Co. LLC, Senior Secured Notes | | | 3.100 | % | | | 9/15/49 | | | | 590,000 | | | | 422,672 | |
Pacific Gas and Electric Co., First Mortgage Bonds | | | 2.100 | % | | | 8/1/27 | | | | 780,000 | | | | 703,534 | |
Pacific Gas and Electric Co., First Mortgage Bonds | | | 3.300 | % | | | 12/1/27 | | | | 400,000 | | | | 373,692 | |
Pacific Gas and Electric Co., First Mortgage Bonds | | | 2.500 | % | | | 2/1/31 | | | | 860,000 | | | | 710,245 | |
Pacific Gas and Electric Co., First Mortgage Bonds | | | 6.950 | % | | | 3/15/34 | | | | 2,350,000 | | | | 2,584,335 | |
Pacific Gas and Electric Co., First Mortgage Bonds | | | 4.750 | % | | | 2/15/44 | | | | 390,000 | | | | 326,503 | |
Pacific Gas and Electric Co., First Mortgage Bonds | | | 4.950 | % | | | 7/1/50 | | | | 320,000 | | | | 274,035 | |
Pacific Gas and Electric Co., First Mortgage Bonds | | | 3.500 | % | | | 8/1/50 | | | | 1,000,000 | | | | 692,502 | |
Pacific Gas and Electric Co., First Mortgage Bonds | | | 6.700 | % | | | 4/1/53 | | | | 1,580,000 | | | | 1,718,846 | |
Pennsylvania Electric Co., Senior Notes | | | 4.150 | % | | | 4/15/25 | | | | 510,000 | | | | 500,330 | (a) |
Pennsylvania Electric Co., Senior Notes | | | 5.150 | % | | | 3/30/26 | | | | 570,000 | | | | 569,600 | (a) |
PG&E Wildfire Recovery Funding LLC, Senior Secured Notes | | | 5.081 | % | | | 6/1/41 | | | | 910,000 | | | | 905,511 | |
PG&E Wildfire Recovery Funding LLC, Senior Secured Notes | | | 5.212 | % | | | 12/1/47 | | | | 300,000 | | | | 301,199 | |
PG&E Wildfire Recovery Funding LLC, Senior Secured Notes | | | 5.099 | % | | | 6/1/52 | | | | 70,000 | | | | 70,200 | |
SCE Recovery Funding LLC, Senior Secured Notes | | | 4.697 | % | | | 6/15/40 | | | | 1,840,780 | | | | 1,818,797 | |
Southern California Edison Co., First Mortgage Bonds | | | 2.250 | % | | | 6/1/30 | | | | 1,130,000 | | | | 970,643 | |
Southern California Edison Co., First Mortgage Bonds | | | 2.500 | % | | | 6/1/31 | | | | 1,200,000 | | | | 1,029,044 | |
Southern California Edison Co., First Mortgage Bonds | | | 4.000 | % | | | 4/1/47 | | | | 50,000 | | | | 40,866 | |
See Notes to Financial Statements.
| | | | |
38 | | | | Western Asset Corporate Bond Fund 2023 Annual Report |
Western Asset Corporate Bond Fund
(Percentages shown based on Fund net assets)
| | | | | | | | | | | | | | | | |
| Security | | Rate | | | Maturity Date | | | Face Amount† | | | Value | |
Electric Utilities — continued | | | | | | | | | | | | | | | | |
Southern California Edison Co., First Mortgage Bonds | | | 4.125 | % | | | 3/1/48 | | | | 800,000 | | | $ | 673,534 | |
Southern California Edison Co., First Mortgage Bonds | | | 3.650 | % | | | 2/1/50 | | | | 980,000 | | | | 760,031 | |
Total Electric Utilities | | | | | | | | | | | | | | | 56,818,337 | |
Independent Power and Renewable Electricity Producers — 0.0%†† | | | | | |
TransAlta Corp., Senior Notes | | | 6.500 | % | | | 3/15/40 | | | | 210,000 | | | | 209,151 | |
Multi-Utilities — 0.1% | | | | | | | | | | | | | | | | |
San Diego Gas & Electric Co., First Mortgage Bonds | | | 3.750 | % | | | 6/1/47 | | | | 700,000 | | | | 562,450 | |
Total Utilities | | | | | | | | | | | | | | | 57,589,938 | |
Total Corporate Bonds & Notes (Cost — $918,296,785) | | | | | | | | | | | | | | | 873,906,319 | |
| U.S. Government & Agency Obligations — 2.5% | | | | | | | | | | | | | | | | |
U.S. Government Obligations — 2.5% | | | | | | | | | | | | | | | | |
U.S. Treasury Bonds | | | 4.750 | % | | | 11/15/43 | | | | 890,000 | | | | 954,942 | (h) |
U.S. Treasury Notes | | | 4.875 | % | | | 11/30/25 | | | | 140,000 | | | | 141,460 | |
U.S. Treasury Notes | | | 4.375 | % | | | 11/30/28 | | | | 11,120,000 | | | | 11,380,625 | |
U.S. Treasury Notes | | | 4.375 | % | | | 11/30/30 | | | | 2,840,000 | | | | 2,920,984 | |
U.S. Treasury Notes | | | 4.500 | % | | | 11/15/33 | | | | 9,855,000 | | | | 10,349,290 | |
Total U.S. Government & Agency Obligations (Cost — $25,629,417) | | | | | | | | 25,747,301 | |
| Asset-Backed Securities — 2.4% | | | | | | | | | | | | | | | | |
Apidos CLO, 2017-26A A2R (3 mo. Term SOFR + 1.762%) | | | 7.157 | % | | | 7/18/29 | | | | 530,000 | | | | 527,381 | (a)(d) |
Babson CLO Ltd., 2016-1A B1R (3 mo. Term SOFR + 1.862%) | | | 7.274 | % | | | 7/23/30 | | | | 300,000 | | | | 298,511 | (a)(d) |
Ballyrock CLO Ltd., 2018-1A A2 (3 mo. Term SOFR + 1.862%) | | | 7.277 | % | | | 4/20/31 | | | | 840,000 | | | | 837,512 | (a)(d) |
Ballyrock CLO Ltd., 2019-2A A1BR (3 mo. Term SOFR + 1.462%) | | | 6.829 | % | | | 11/20/30 | | | | 1,790,000 | | | | 1,787,376 | (a)(d) |
Bristol Park CLO Ltd., 2016-1A BR (3 mo. Term SOFR + 1.712%) | | | 7.105 | % | | | 4/15/29 | | | | 1,200,000 | | | | 1,194,666 | (a)(d) |
CARLYLE US CLO Ltd., 2018-4A A2 (3 mo. Term SOFR + 2.062%) | | | 7.477 | % | | | 1/20/31 | | | | 600,000 | | | | 598,503 | (a)(d) |
CIFC Funding Ltd., 2017-2A BR (3 mo. Term SOFR + 1.762%) | | | 7.177 | % | | | 4/20/30 | | | | 1,320,000 | | | | 1,315,993 | (a)(d) |
Dryden Senior Loan Fund, 2015-41A BR (3 mo. Term SOFR + 1.562%) | | | 6.955 | % | | | 4/15/31 | | | | 2,710,000 | | | | 2,682,900 | (a)(d) |
GoldenTree Loan Opportunities Ltd., 2014-9A BR2 (3 mo. Term SOFR + 1.862%) | | | 7.252 | % | | | 10/29/29 | | | | 2,100,000 | | | | 2,105,524 | (a)(d) |
Goodgreen, 2022-1A A | | | 3.840 | % | | | 10/15/56 | | | | 388,162 | | | | 342,250 | (a) |
See Notes to Financial Statements.
| | | | |
| Western Asset Corporate Bond Fund 2023 Annual Report | | | | 39 |
Schedule of investments (cont’d)
December 31, 2023
Western Asset Corporate Bond Fund
(Percentages shown based on Fund net assets)
| | | | | | | | | | | | | | | | |
| Security | | Rate | | | Maturity Date | | | Face Amount† | | | Value | |
| Asset-Backed Securities — continued | | | | | | | | | | | | | | | | |
Hilton Grand Vacations Trust, 2023-1A C | | | 6.940 | % | | | 1/25/38 | | | | 540,096 | | | $ | 547,909 | (a) |
Lunar Structured Aircraft Portfolio Notes, 2021-1 A | | | 2.636 | % | | | 10/15/46 | | | | 1,750,151 | | | | 1,512,594 | (a) |
Magnetite Ltd., 2016-17A BR (3 mo. Term SOFR + 1.812%) | | | 7.227 | % | | | 7/20/31 | | | | 680,000 | | | | 680,000 | (a)(d) |
Magnetite Ltd., 2021-29A B (3 mo. Term SOFR + 1.662%) | | | 7.055 | % | | | 1/15/34 | | | | 2,500,000 | | | | 2,482,834 | (a)(d) |
MVW LLC, 2021-1WA C | | | 1.940 | % | | | 1/22/41 | | | | 1,146,762 | | | | 1,051,254 | (a) |
Navient Private Education Refi Loan Trust, 2020-DA A | | | 1.690 | % | | | 5/15/69 | | | | 221,134 | | | | 201,407 | (a) |
Renew, 2023-1A A | | | 5.900 | % | | | 11/20/58 | | | | 2,663,480 | | | | 2,620,428 | (a) |
SoFi Professional Loan Program Trust, 2020-A A2FX | | | 2.540 | % | | | 5/15/46 | | | | 862,579 | | | | 805,939 | (a) |
Texas Natural Gas Securitization Finance Corp., 2023-1 A1 | | | 5.102 | % | | | 4/1/35 | | | | 3,100,000 | | | | 3,162,185 | |
Total Asset-Backed Securities (Cost — $24,533,173) | | | | | | | | | | | | | | | 24,755,166 | |
| Sovereign Bonds — 2.2% | | | | | | | | | | | | | | | | |
Argentina — 0.4% | | | | | | | | | | | | | | | | |
Argentine Republic Government International Bond, Senior Notes | | | 1.000 | % | | | 7/9/29 | | | | 313,244 | | | | 125,924 | |
Argentine Republic Government International Bond, Senior Notes, Step bond (0.750% to 7/9/27 then 1.750%) | | | 0.750 | % | | | 7/9/30 | | | | 1,435,797 | | | | 579,354 | |
Argentine Republic Government International Bond, Senior Notes, Step bond (3.625% to 7/9/24 then 4.125%) | | | 3.625 | % | | | 7/9/35 | | | | 2,774,802 | | | | 958,875 | |
Provincia de Buenos Aires, Senior Notes, Step bond (6.375% to 9/1/24 then 6.625%) | | | 6.375 | % | | | 9/1/37 | | | | 6,098,795 | | | | 2,350,876 | (a) |
Provincia de Buenos Aires, Senior Notes, Step bond (6.375% to 9/1/24 then 6.625%) | | | 6.375 | % | | | 9/1/37 | | | | 210,000 | | | | 80,948 | (b) |
Provincia de Cordoba, Senior Notes | | | 6.875 | % | | | 12/10/25 | | | | 536,100 | | | | 487,951 | (a) |
Total Argentina | | | | | | | | | | | | | | | 4,583,928 | |
Bermuda — 0.1% | | | | | | | | | | | | | | | | |
Bermuda Government International Bond, Senior Notes | | | 2.375 | % | | | 8/20/30 | | | | 1,100,000 | | | | 946,979 | (a) |
Colombia — 0.1% | | | | | | | | | | | | | | | | |
Colombia Government International Bond, Senior Notes | | | 5.625 | % | | | 2/26/44 | | | | 620,000 | | | | 523,211 | |
See Notes to Financial Statements.
| | | | |
40 | | | | Western Asset Corporate Bond Fund 2023 Annual Report |
Western Asset Corporate Bond Fund
(Percentages shown based on Fund net assets)
| | | | | | | | | | | | | | | | |
| Security | | Rate | | | Maturity Date | | | Face Amount† | | | Value | |
Israel — 0.1% | | | | | | | | | | | | | | | | |
Israel Government International Bond, Senior Notes | | | 2.750 | % | | | 7/3/30 | | | | 800,000 | | | $ | 708,500 | |
Jordan — 0.5% | | | | | | | | | | | | | | | | |
Jordan Government International Bond, Senior Notes | | | 4.950 | % | | | 7/7/25 | | | | 5,120,000 | | | | 5,021,404 | (a) |
Mexico — 0.6% | | | | | | | | | | | | | | | | |
Mexican Bonos, Senior Notes | | | 8.500 | % | | | 11/18/38 | | | | 101,170,000 | MXN | | | 5,687,409 | |
Mexico Government International Bond, Senior Notes | | | 4.350 | % | | | 1/15/47 | | | | 1,200,000 | | | | 969,697 | |
Total Mexico | | | | | | | | | | | | | | | 6,657,106 | |
Nigeria — 0.2% | | | | | | | | | | | | | | | | |
Nigeria Government International Bond, Senior Notes | | | 7.143 | % | | | 2/23/30 | | | | 1,690,000 | | | | 1,527,016 | (a) |
Panama — 0.1% | | | | | | | | | | | | | | | | |
Panama Government International Bond, Senior Notes | | | 2.252 | % | | | 9/29/32 | | | | 1,010,000 | | | | 738,914 | |
Peru — 0.0%†† | | | | | | | | | | | | | | | | |
Peruvian Government International Bond, Senior Notes | | | 2.783 | % | | | 1/23/31 | | | | 440,000 | | | | 384,261 | |
Supranational — 0.1% | | | | | | | | | | | | | | | | |
Africa Finance Corp., Senior Notes | | | 3.125 | % | | | 6/16/25 | | | | 606,000 | | | | 580,080 | (b) |
African Export-Import Bank, Senior Notes | | | 2.634 | % | | | 5/17/26 | | | | 1,010,000 | | | | 934,048 | (a) |
Total Supranational | | | | | | | | | | | | | | | 1,514,128 | |
Total Sovereign Bonds (Cost — $24,795,902) | | | | 22,605,447 | |
| Collateralized Mortgage Obligations (i) —1.5% | | | | | | | | | | | | | | | | |
BRAVO Residential Funding Trust, 2023- NQM5 A1 | | | 6.505 | % | | | 6/25/63 | | | | 877,533 | | | | 887,618 | (a) |
BRAVO Residential Funding Trust, 2023- NQM5 A3 | | | 7.012 | % | | | 6/25/63 | | | | 1,259,070 | | | | 1,267,974 | (a) |
CRSO Trust, 2023-BRND A | | | 7.121 | % | | | 7/10/40 | | | | 1,326,393 | | | | 1,383,649 | (a) |
Federal Home Loan Mortgage Corp. (FHLMC) REMIC, Structured Agency Credit Risk Debt Notes, 2021-DNA6 B1 (30 Day Average SOFR + 3.400%) | | | 8.737 | % | | | 10/25/41 | | | | 1,950,000 | | | | 1,985,082 | (a)(d) |
Federal National Mortgage Association (FNMA) — CAS, 2014-C03 1M2 (30 Day Average SOFR + 3.114%) | | | 8.452 | % | | | 7/25/24 | | | | 1,051,463 | | | | 1,062,306 | (d) |
Federal National Mortgage Association (FNMA) — CAS, 2023-R08 1M1 (30 Day Average SOFR + 1.500%) | | | 6.837 | % | | | 10/25/43 | | | | 1,841,256 | | | | 1,846,480 | (a)(d) |
See Notes to Financial Statements.
| | | | |
| Western Asset Corporate Bond Fund 2023 Annual Report | | | | 41 |
Schedule of investments (cont’d)
December 31, 2023
Western Asset Corporate Bond Fund
(Percentages shown based on Fund net assets)
| | | | | | | | | | | | | | | | |
| Security | | Rate | | | Maturity Date | | | Face Amount† | | | Value | |
| Collateralized Mortgage Obligations (i) — continued | | | | | | | | | | | | | | | | |
Federal National Mortgage Association (FNMA) — CAS, 2023-R08 1M2 (30 Day Average SOFR + 2.500%) | | | 7.837 | % | | | 10/25/43 | | | | 2,160,000 | | | $ | 2,215,034 | (a)(d) |
FS Commercial Mortgage Trust, 2023-4SZN B | | | 7.544 | % | | | 11/10/39 | | | | 1,190,000 | | | | 1,239,517 | (a)(d) |
GS Mortgage Securities Corp., 2023-SHIP A | | | 4.322 | % | | | 9/10/38 | | | | 660,000 | | | | 642,088 | (a)(d) |
GS Mortgage Securities Corp., 2023-SHIP B | | | 4.936 | % | | | 9/10/38 | | | | 1,000,000 | | | | 973,951 | (a)(d) |
OBX Trust, 2023-NQM7 A1 | | | 6.844 | % | | | 4/25/63 | | | | 2,367,669 | | | | 2,415,371 | (a) |
Total Collateralized Mortgage Obligations (Cost — $15,644,393) | | | | 15,919,070 | |
| Municipal Bonds — 0.5% | | | | | | | | | | | | | | | | |
California — 0.3% | | | | | | | | | | | | | | | | |
California State, GO, Build America Bonds | | | 7.300 | % | | | 10/1/39 | | | | 600,000 | | | | 726,681 | |
Regents of the University of California Medical Center Pooled Revenue, Series N | | | 3.006 | % | | | 5/15/50 | | | | 1,520,000 | | | | 1,079,507 | |
Regents of the University of California, CA, Medical Center Pooled Revenue, Taxable Bonds, Series Q | | | 4.132 | % | | | 5/15/32 | | | | 1,350,000 | | | | 1,297,043 | |
Total California | | | | | | | | | | | | | | | 3,103,231 | |
Florida — 0.0%†† | | | | | | | | | | | | | | | | |
Sumter Landing, FL, Community Development District Recreational Revenue, Taxable Community Development District | | | 4.172 | % | | | 10/1/47 | | | | 290,000 | | | | 261,164 | |
New York — 0.1% | | | | | | | | | | | | | | | | |
Port Authority of New York & New Jersey Revenue, Taxable Consolidated | | | 4.960 | % | | | 8/1/46 | | | | 770,000 | | | | 751,843 | |
Ohio — 0.1% | | | | | | | | | | | | | | | | |
American Municipal Power-Ohio Inc., Revenue, OH, Build America Bonds | | | 7.499 | % | | | 2/15/50 | | | | 480,000 | | | | 594,585 | |
Total Municipal Bonds (Cost — $5,164,855) | | | | 4,710,823 | |
| Convertible Bonds & Notes — 0.4% | | | | | | | | | | | | | | | | |
| Communication Services — 0.4% | | | | | | | | | | | | | | | | |
Media — 0.4% | | | | | | | | | | | | | | | | |
DISH Network Corp., Senior Notes (Cost — $4,491,325) | | | 2.375 | % | | | 3/15/24 | | | | 4,560,000 | | | | 4,531,500 | |
See Notes to Financial Statements.
| | | | |
42 | | | | Western Asset Corporate Bond Fund 2023 Annual Report |
Western Asset Corporate Bond Fund
(Percentages shown based on Fund net assets)
| | | | | | | | | | | | | | | | |
| Security | | Rate | | | Maturity Date | | | Face Amount† | | | Value | |
| Senior Loans — 0.3% | | | | | | | | | | | | | | | | |
| Industrials — 0.2% | | | | | | | | | | | | | | | | |
Passenger Airlines — 0.2% | | | | | | | | | | | | | | | | |
Delta Air Lines Inc., Initial Term Loan (3 mo. Term SOFR + 3.750%) | | | 9.166 | % | | | 10/20/27 | | | | 960,000 | | | $ | 984,499 | (d)(j)(k) |
United Airlines Inc., Term Loan B (1 mo. Term SOFR + 3.864%) | | | 9.220 | % | | | 4/21/28 | | | | 758,550 | | | | 762,343 | (d)(j)(k) |
Total Industrials | | | | | | | | 1,746,842 | |
| Materials — 0.1% | | | | | | | | | | | | | | | | |
Paper & Forest Products — 0.1% | | | | | | | | | | | | | | | | |
Asplundh Tree Expert LLC, 2021 Refinancing Term Loan (1 mo. Term SOFR + 1.850%) | | | 7.206 | % | | | 9/7/27 | | | | 942,846 | | | | 945,076 | (d)(j)(k) |
Schweitzer-Mauduit International Inc., Term Loan B (1 mo. Term SOFR + 3.864%) | | | 9.220 | % | | | 4/20/28 | | | | 185,982 | | | | 185,284 | (d)(j)(k) |
Total Materials | | | | | | | | 1,130,360 | |
Total Senior Loans (Cost — $2,837,168) | | | | | | | | 2,877,202 | |
| | | | |
| | | | | | | | | Shares | | | | |
| Preferred Stocks — 0.2% | | | | | | | | | | | | | | | | |
| Financials — 0.2% | | | | | | | | | | | | | | | | |
Banks — 0.1% | | | | | | | | | | | | | | | | |
KeyCorp, Non Voting Shares (6.200% to 12/15/27 then 5 year Treasury Constant Maturity Rate + 3.132%) | | | 6.200 | % | | | | | | | 73,799 | | | | 1,583,726 | (d) |
Insurance — 0.1% | | | | | | | | | | | | | | | | |
Delphi Financial Group Inc. (3 mo. Term SOFR + 3.452%) | | | 8.831 | % | | | | | | | 15,675 | | | | 372,203 | (d) |
Prudential Financial Inc. | | | 5.950 | % | | | | | | | 9,800 | | | | 249,116 | |
Total Insurance | | | | | | | | | | | | | | | 621,319 | |
Total Preferred Stocks (Cost — $2,481,693) | | | | | | | | 2,205,045 | |
Total Investments before Short-Term Investments (Cost — $1,023,874,711) | | | | | | | | 977,257,873 | |
| Short-Term Investments — 2.8% | | | | | | | | | | | | | | | | |
Western Asset Premier Institutional Government Reserves, Premium Shares (Cost — $28,530,796) | | | 5.295 | % | | | | | | | 28,530,796 | | | | 28,530,796 | (l)(m) |
Total Investments — 97.6% (Cost — $1,052,405,507) | | | | | | | | 1,005,788,669 | |
Other Assets in Excess of Liabilities — 2.4% | | | | | | | | | | | | | | | 24,966,542 | |
Total Net Assets — 100.0% | | | | | | | | | | | | | | $ | 1,030,755,211 | |
See Notes to Financial Statements.
| | | | |
| Western Asset Corporate Bond Fund 2023 Annual Report | | | | 43 |
Schedule of investments (cont’d)
December 31, 2023
Western Asset Corporate Bond Fund
| † | Face amount denominated in U.S. dollars, unless otherwise noted. |
| †† | Represents less than 0.1%. |
| * | Non-income producing security. |
| (a) | Security is exempt from registration under Rule 144A of the Securities Act of 1933. This security may be resold in transactions that are exempt from registration, normally to qualified institutional buyers. This security has been deemed liquid pursuant to guidelines approved by the Board of Trustees. |
| (b) | Security is exempt from registration under Regulation S of the Securities Act of 1933. Regulation S applies to securities offerings that are made outside of the United States and do not involve direct selling efforts in the United States. This security has been deemed liquid pursuant to guidelines approved by the Board of Trustees. |
| (c) | Security has no maturity date. The date shown represents the next call date. |
| (d) | Variable rate security. Interest rate disclosed is as of the most recent information available. Certain variable rate securities are not based on a published reference rate and spread but are determined by the issuer or agent and are based on current market conditions. These securities do not indicate a reference rate and spread in their description above. |
| (e) | Security is fair valued in accordance with procedures approved by the Board of Trustees (Note 1). |
| (f) | Security is valued using significant unobservable inputs (Note 1). |
| (g) | Payment-in-kind security for which the issuer has the option at each interest payment date of making interest payments in cash or additional securities. |
| (h) | Securities traded on a when-issued or delayed delivery basis. |
| (i) | Collateralized mortgage obligations are secured by an underlying pool of mortgages or mortgage pass-through certificates that are structured to direct payments on underlying collateral to different series or classes of the obligations. The interest rate may change positively or inversely in relation to one or more interest rates, financial indices or other financial indicators and may be subject to an upper and/or lower limit. |
| (j) | Interest rates disclosed represent the effective rates on senior loans. Ranges in interest rates are attributable to multiple contracts under the same loan. |
| (k) | Senior loans may be considered restricted in that the Fund ordinarily is contractually obligated to receive approval from the agent bank and/or borrower prior to the disposition of a senior loan. |
| (l) | Rate shown is one-day yield as of the end of the reporting period. |
| (m) | In this instance, as defined in the Investment Company Act of 1940, an “Affiliated Company” represents Fund ownership of at least 5% of the outstanding voting securities of an issuer, or a company which is under common ownership or control with the Fund. At December 31, 2023, the total market value of investments in Affiliated Companies was $28,530,796 and the cost was $28,530,796 (Note 8). |
See Notes to Financial Statements.
| | | | |
44 | | | | Western Asset Corporate Bond Fund 2023 Annual Report |
Western Asset Corporate Bond Fund
| | |
Abbreviation(s) used in this schedule: |
| |
| CAS | | — Connecticut Avenue Securities |
| |
| CLO | | — Collateralized Loan Obligation |
| |
| EUR | | — Euro |
| |
| GBP | | — British Pound |
| |
| GO | | — General Obligation |
| |
| GTD | | — Guaranteed |
| |
| ICE | | — Intercontinental Exchange |
| |
| JSC | | — Joint Stock Company |
| |
| LIBOR | | — London Interbank Offered Rate |
| |
| MXN | | — Mexican Peso |
| |
| PIK | | — Payment-In-Kind |
| |
| REMIC | | — Real Estate Mortgage Investment Conduit |
| |
| SOFR | | — Secured Overnight Financing Rate |
| |
| USD | | — United States Dollar |
At December 31, 2023, the Fund had the following open futures contracts:
| | | | | | | | | | | | | | | | | | | | |
| | | Number of Contracts | | | Expiration Date | | | Notional Amount | | | Market Value | | | Unrealized
Appreciation
(Depreciation) | |
| Contracts to Buy: | | | | | | | | | | | | | | | | | | | | |
| U.S. Treasury 5-Year Notes | | | 2,054 | | | | 3/24 | | | $ | 218,604,740 | | | $ | 223,420,645 | | | $ | 4,815,905 | |
| U.S. Treasury Long-Term Bonds | | | 311 | | | | 3/24 | | | | 36,043,595 | | | | 38,855,563 | | | | 2,811,968 | |
| U.S. Treasury Ultra Long-Term Bonds | | | 585 | | | | 3/24 | | | | 71,236,960 | | | | 78,152,344 | | | | 6,915,384 | |
| | | | | | | | | | | | | | | | | | | | 14,543,257 | |
| Contracts to Sell: | | | | | | | | | | | | | | | | | | | | |
| Euro-Bund | | | 4 | | | | 3/24 | | | | 591,800 | | | | 605,936 | | | | (14,136) | |
| U.S. Treasury 2-Year Notes | | | 133 | | | | 3/24 | | | | 27,195,687 | | | | 27,386,570 | | | | (190,883) | |
| U.S. Treasury 10-Year Notes | | | 314 | | | | 3/24 | | | | 34,318,757 | | | | 35,447,658 | | | | (1,128,901) | |
| U.S. Treasury Ultra 10-Year Notes | | | 102 | | | | 3/24 | | | | 11,501,639 | | | | 12,037,594 | | | | (535,955) | |
| United Kingdom Long Gilt Bonds | | | 29 | | | | 3/24 | | | | 3,531,941 | | | | 3,794,442 | | | | (262,501) | |
| | | | | | | | | | | | | | | | | | | | (2,132,376) | |
| Net unrealized appreciation on open futures contracts | | | | | | | $ | 12,410,881 | |
See Notes to Financial Statements.
| | | | |
| Western Asset Corporate Bond Fund 2023 Annual Report | | | | 45 |
Schedule of investments (cont’d)
December 31, 2023
Western Asset Corporate Bond Fund
At December 31, 2023, the Fund had the following open forward foreign currency contracts:
| | | | | | | | | | | | | | | | | | |
Currency Purchased | | | Currency Sold | | | Counterparty | | Settlement Date | | Unrealized
Appreciation
(Depreciation) | |
| EUR | | | 8,068,256 | | | USD | | | 8,553,975 | | | BNP Paribas SA | | 1/19/24 | | $ | 360,689 | |
| USD | | | 5,720,710 | | | GBP | | | 4,680,566 | | | BNP Paribas SA | | 1/19/24 | | | (246,092) | |
| MXN | | | 8,716,000 | | | USD | | | 499,115 | | | Goldman Sachs Group Inc. | | 1/19/24 | | | 12,313 | |
| MXN | | | 76,470,000 | | | USD | | | 4,166,803 | | | JPMorgan Chase & Co. | | 1/19/24 | | | 320,224 | |
| BRL | | | 22,953,674 | | | USD | | | 4,483,052 | | | Morgan Stanley & Co. Inc. | | 1/19/24 | | | 236,014 | |
| JPY | | | 1,188,985,486 | | | USD | | | 8,070,433 | | | Morgan Stanley & Co. Inc. | | 1/19/24 | | | 389,923 | |
| Net unrealized appreciation on open forward foreign currency contracts | | $ | 1,073,071 | |
| | |
Abbreviation(s) used in this table: |
| |
| BRL | | — Brazilian Real |
| |
| EUR | | — Euro |
| |
| GBP | | — British Pound |
| |
| JPY | | — Japanese Yen |
| |
| MXN | | — Mexican Peso |
| |
| USD | | — United States Dollar |
At December 31, 2023, the Fund had the following open swap contracts:
| | | | | | | | | | | | | | | | | | | | | | |
| OTC CREDIT DEFAULT SWAPS ON CORPORATE ISSUES — SELL PROTECTION1 | |
Swap Counterparty (Reference Entity) | | Notional Amount2 | | | Termination Date | | Implied Credit Spread at December 31, 20233 | | Periodic Payments Received by the Fund† | | Market Value | | | Upfront Premiums Paid (Received) | | | Unrealized
Appreciation | |
| Morgan Stanley & Co. Inc. (Volkswagen International Finance NV, 5.547%, due 11/16/24)4 | | | 4,500,000 | EUR | | 12/20/24 | | 0.443% | | 1.000% quarterly | | $ | 26,744 | | | $ | 10,300 | | | $ | 16,444 | |
See Notes to Financial Statements.
| | | | |
46 | | | | Western Asset Corporate Bond Fund 2023 Annual Report |
Western Asset Corporate Bond Fund
| | | | | | | | | | | | | | | | | | | | |
| OTC CREDIT DEFAULT SWAPS ON CORPORATE ISSUES — BUY PROTECTION5 | |
Swap Counterparty (Reference Entity) | | Notional Amount2 | | | Termination
Date | | Implied Credit Spread at December 31, 20233 | | Periodic Payments Made by the Fund† | | Market Value | | Upfront Premiums Paid (Received) | | | Unrealized Depreciation | |
| Morgan Stanley & Co. Inc. (Mercedes-Benz Group AG, 1.400%, due 1/12/24) | | | 4,500,000 | EUR | | 12/20/24 | | 0.176% | | 1.000% quarterly | | $(39,669) | | $ | (19,652) | | | $ | (20,017) | |
| | | | | | | | | | | | | | | | | | | | | | | | |
| CENTRALLY CLEARED CREDIT DEFAULT SWAPS ON CREDIT INDICES — BUY PROTECTION5 | |
| Reference Entity | | Notional Amount2 | | | Termination Date | | | Periodic Payments Made by the Fund† | | | Market Value6 | | | Upfront Premiums Paid (Received) | | | Unrealized Depreciation | |
| Markit CDX.NA.HY.41 Index | | $ | 19,255,500 | | | | 12/20/28 | | | | 5.000% quarterly | | | $ | (1,123,229) | | | $ | (131,134) | | | $ | (992,095) | |
| Markit CDX.NA.IG.41 Index | | | 19,584,000 | | | | 12/20/28 | | | | 1.000% quarterly | | | | (379,874) | | | | (267,422) | | | | (112,452) | |
| Total | | $ | 38,839,500 | | | | | | | | | | | $ | (1,503,103) | | | $ | (398,556) | | | $ | (1,104,547) | |
See Notes to Financial Statements.
| | | | |
| Western Asset Corporate Bond Fund 2023 Annual Report | | | | 47 |
Schedule of investments (cont’d)
December 31, 2023
Western Asset Corporate Bond Fund
| 1 | If the Fund is a seller of protection and a credit event occurs, as defined under the terms of that particular swap agreement, the Fund will either (i) pay to the buyer of protection an amount equal to the notional amount of the swap and take delivery of the referenced obligation or underlying securities comprising the referenced index or (ii) pay a net settlement amount in the form of cash or securities equal to the notional amount of the swap less the recovery value of the referenced obligation or underlying securities comprising the referenced index. |
| 2 | The maximum potential amount the Fund could be required to pay as a seller of credit protection or receive as a buyer of credit protection if a credit event occurs as defined under the terms of that particular swap agreement. |
| 3 | Implied credit spreads, utilized in determining the market value of credit default swap agreements on corporate or sovereign issues as of period end, serve as an indicator of the current status of the payment/performance risk and represent the likelihood or risk of default for the credit derivative. The implied credit spread of a particular referenced entity reflects the cost of buying/selling protection and may include upfront payments required to be made to enter into the agreement. Wider credit spreads represent a deterioration of the referenced entity’s credit soundness and a greater likelihood or risk of default or other credit event occurring as defined under the terms of the agreement. A credit spread identified as “Defaulted” indicates a credit event has occurred for the referenced entity or obligation. |
| 4 | Variable rate security. Interest rate disclosed is as of the most recent information available. |
| 5 | If the Fund is a buyer of protection and a credit event occurs, as defined under the terms of that particular swap agreement, the Fund will either (i) receive from the seller of protection an amount equal to the notional amount of the swap and deliver the referenced obligation or the underlying securities comprising the referenced index or (ii) receive a net settlement amount in the form of cash or securities equal to the notional amount of the swap less the recovery value of the referenced obligation or the underlying securities comprising the referenced index. |
| 6 | The quoted market prices and resulting values for credit default swap agreements on asset-backed securities and credit indices serve as an indicator of the current status of the payment/performance risk and represent the likelihood of an expected loss (or profit) for the credit derivative had the notional amount of the swap agreement been closed/sold as of the period end. Decreasing market values (sell protection) or increasing market values (buy protection) when compared to the notional amount of the swap, represent a deterioration of the referenced entity’s credit soundness and a greater likelihood or risk of default or other credit event occurring as defined under the terms of the agreement. |
| † | Percentage shown is an annual percentage rate. |
| | |
Abbreviation(s) used in this table: |
| |
| EUR | | — Euro |
See Notes to Financial Statements.
| | | | |
48 | | | | Western Asset Corporate Bond Fund 2023 Annual Report |
Statement of assets and liabilities
December 31, 2023
| | | | |
| |
| Assets: | | | | |
Investments in unaffiliated securities, at value (Cost — $1,023,874,711) | | $ | 977,257,873 | |
Investments in affiliated securities, at value (Cost — $28,530,796) | | | 28,530,796 | |
Foreign currency, at value (Cost — $3,350,345) | | | 3,483,847 | |
Cash | | | 1,323,424 | |
Interest receivable | | | 11,678,619 | |
Deposits with brokers for open futures contracts | | | 7,152,797 | |
Receivable for Fund shares sold | | | 1,476,107 | |
Unrealized appreciation on forward foreign currency contracts | | | 1,319,163 | |
Deposits with brokers for centrally cleared swap contracts | | | 1,207,000 | |
Foreign currency collateral for open futures contracts, at value (Cost — $187,859) | | | 207,609 | |
Dividends receivable from affiliated investments | | | 43,072 | |
OTC swaps, at value (premiums paid — $10,300) | | | 26,744 | |
Receivable from brokers — net variation margin on centrally cleared swap contracts | | | 20,421 | |
Receivable for open OTC swap contracts | | | 1,655 | |
Other assets | | | 1,226 | |
Prepaid expenses | | | 22,770 | |
Total Assets | | | 1,033,753,123 | |
| |
| Liabilities: | | | | |
Payable for Fund shares repurchased | | | 1,520,248 | |
Investment management fee payable | | | 393,495 | |
Distributions payable | | | 294,016 | |
Unrealized depreciation on forward foreign currency contracts | | | 246,092 | |
Transfer agent fees payable | | | 188,168 | |
Payable to brokers — net variation margin on open futures contracts | | | 141,463 | |
Service and/or distribution fees payable | | | 66,465 | |
OTC swaps, at value (premiums received — $19,652) | | | 39,669 | |
Trustees’ fees payable | | | 6,330 | |
Payable for open OTC swap contracts | | | 1,655 | |
Accrued expenses | | | 100,311 | |
Total Liabilities | | | 2,997,912 | |
| Total Net Assets | | $ | 1,030,755,211 | |
| |
| Net Assets: | | | | |
Par value (Note 7) | | $ | 956 | |
Paid-in capital in excess of par value | | | 1,264,718,119 | |
Total distributable earnings (loss) | | | (233,963,864) | |
| Total Net Assets | | $ | 1,030,755,211 | |
See Notes to Financial Statements.
| | | | |
| Western Asset Corporate Bond Fund 2023 Annual Report | | | | 49 |
Statement of assets and liabilities (cont’d)
December 31, 2023
| | | | |
| |
| Net Assets: | | | | |
Class A | | | $263,239,866 | |
Class C | | | $9,376,031 | |
Class C1 | | | $232,660 | |
Class I | | | $749,292,975 | |
Class P | | | $8,613,679 | |
| |
| Shares Outstanding: | | | | |
Class A | | | 24,410,986 | |
Class C | | | 869,586 | |
Class C1 | | | 21,727 | |
Class I | | | 69,497,102 | |
Class P | | | 799,627 | |
| |
| Net Asset Value: | | | | |
Class A (and redemption price) | | | $10.78 | |
Class C* | | | $10.78 | |
Class C1* | | | $10.71 | |
Class I (and redemption price) | | | $10.78 | |
Class P (and redemption price) | | | $10.77 | |
| Maximum Public Offering Price Per Share: | | | | |
Class A (based on maximum initial sales charge of 3.75%) | | | $11.20 | |
| * | Redemption price per share is NAV of Class C and Class C1 shares reduced by a 1.00% CDSC if shares are redeemed within one year from purchase payment (Note 2). |
See Notes to Financial Statements.
| | | | |
50 | | | | Western Asset Corporate Bond Fund 2023 Annual Report |
Statement of operations
For the Year Ended December 31, 2023
| | | | |
| |
| Investment Income: | | | | |
Interest | | $ | 55,904,027 | |
Dividends from affiliated investments | | | 376,193 | |
Dividends from unaffiliated investments | | | 173,639 | |
Less: Foreign taxes withheld | | | (4,785) | |
Total Investment Income | | | 56,449,074 | |
| |
| Expenses: | | | | |
Investment management fee (Note 2) | | | 4,771,339 | |
Transfer agent fees (Notes 2 and 5) | | | 1,227,537 | |
Service and/or distribution fees (Notes 2 and 5) | | | 771,556 | |
Registration fees | | | 112,055 | |
Fund accounting fees | | | 84,306 | |
Audit and tax fees | | | 42,723 | |
Legal fees | | | 37,174 | |
Shareholder reports | | | 33,418 | |
Trustees’ fees | | | 24,373 | |
Commitment fees (Note 9) | | | 9,110 | |
Insurance | | | 7,633 | |
Custody fees | | | 1,749 | |
Miscellaneous expenses | | | 15,277 | |
Total Expenses | | | 7,138,250 | |
Less: Fee waivers and/or expense reimbursements (Notes 2 and 5) | | | (323,283) | |
Net Expenses | | | 6,814,967 | |
| Net Investment Income | | | 49,634,107 | |
| |
| Realized and Unrealized Gain (Loss) on Investments, Futures Contracts, Swap Contracts, Forward Foreign Currency Contracts and Foreign Currency Transactions (Notes 1, 3 and 4): | | | | |
Net Realized Gain (Loss) From: | | | | |
Investment transactions in unaffiliated securities | | | (82,834,721) | |
Futures contracts | | | (16,229,170) | |
Swap contracts | | | (3,081,494) | |
Forward foreign currency contracts | | | (670,238) | |
Foreign currency transactions | | | 182,715 | |
Net Realized Loss | | | (102,632,908) | |
Change in Net Unrealized Appreciation (Depreciation) From: | | | | |
Investments in unaffiliated securities | | | 118,780,850 | |
Futures contracts | | | 12,697,907 | |
Swap contracts | | | (24,908) | |
Forward foreign currency contracts | | | 652,617 | |
Foreign currencies | | | 117,226 | |
Change in Net Unrealized Appreciation (Depreciation) | | | 132,223,692 | |
| Net Gain on Investments, Futures Contracts, Swap Contracts, Forward Foreign Currency Contracts and Foreign Currency Transactions | | | 29,590,784 | |
| Increase in Net Assets From Operations | | $ | 79,224,891 | |
See Notes to Financial Statements.
| | | | |
| Western Asset Corporate Bond Fund 2023 Annual Report | | | | 51 |
Statements of changes in net assets
| | | | | | | | |
| For the Years Ended December 31, | | 2023 | | | 2022 | |
| | |
| Operations: | | | | | | | | |
Net investment income | | $ | 49,634,107 | | | $ | 44,776,910 | |
Net realized loss | | | (102,632,908) | | | | (81,826,804) | |
Change in net unrealized appreciation (depreciation) | | | 132,223,692 | | | | (208,716,986) | |
Increase (Decrease) in Net Assets From Operations | | | 79,224,891 | | | | (245,766,880) | |
| | |
| Distributions to Shareholders From (Notes 1 and 6): | | | | | | | | |
Total distributable earnings | | | (52,184,941) | | | | (49,854,362) | |
Decrease in Net Assets From Distributions to Shareholders | | | (52,184,941) | | | | (49,854,362) | |
| | |
| Fund Share Transactions (Note 7): | | | | | | | | |
Net proceeds from sale of shares | | | 302,997,979 | | | | 568,282,864 | |
Reinvestment of distributions | | | 48,601,823 | | | | 47,190,543 | |
Cost of shares repurchased | | | (602,819,373) | | | | (539,893,998) | |
Increase (Decrease) in Net Assets From Fund Share Transactions | | | (251,219,571) | | | | 75,579,409 | |
Decrease in Net Assets | | | (224,179,621) | | | | (220,041,833) | |
| | |
| Net Assets: | | | | | | | | |
Beginning of year | | | 1,254,934,832 | | | | 1,474,976,665 | |
End of year | | $ | 1,030,755,211 | | | $ | 1,254,934,832 | |
See Notes to Financial Statements.
| | | | |
52 | | | | Western Asset Corporate Bond Fund 2023 Annual Report |
Financial highlights
| | | | | | | | | | | | | | | | | | | | |
| For a share of each class of beneficial interest outstanding throughout each year ended December 31: | |
| Class A Shares1 | | 2023 | | | 2022 | | | 2021 | | | 2020 | | | 2019 | |
| | | | | |
| Net asset value, beginning of year | | | $10.52 | | | | $13.11 | | | | $13.67 | | | | $12.90 | | | | $11.72 | |
| | | | | |
| Income (loss) from operations: | | | | | | | | | | | | | | | | | | | | |
Net investment income | | | 0.47 | | | | 0.35 | | | | 0.32 | | | | 0.38 | | | | 0.43 | |
Net realized and unrealized gain (loss) | | | 0.28 | | | | (2.55) | | | | (0.43) | | | | 0.98 | | | | 1.24 | |
Total income (loss) from operations | | | 0.75 | | | | (2.20) | | | | (0.11) | | | | 1.36 | | | | 1.67 | |
| | | | | |
| Less distributions from: | | | | | | | | | | | | | | | | | | | | |
Net investment income | | | (0.49) | | | | (0.38) | | | | (0.35) | | | | (0.43) | | | | (0.46) | |
Net realized gains | | | — | | | | (0.01) | | | | (0.10) | | | | (0.16) | | | | (0.03) | |
Total distributions | | | (0.49) | | | | (0.39) | | | | (0.45) | | | | (0.59) | | | | (0.49) | |
| | | | | |
| Net asset value, end of year | | | $10.78 | | | | $10.52 | | | | $13.11 | | | | $13.67 | | | | $12.90 | |
Total return2 | | | 7.41 | % | | | (16.86) | % | | | (0.72) | % | | | 10.80 | % | | | 14.40 | % |
| | | | | |
| Net assets, end of year (millions) | | | $263 | | | | $253 | | | | $329 | | | | $328 | | | | $271 | |
| | | | | |
| Ratios to average net assets: | | | | | | | | | | | | | | | | | | | | |
Gross expenses | | | 0.88 | % | | | 0.89 | % | | | 0.87 | % | | | 0.91 | % | | | 0.93 | % |
Net expenses3,4 | | | 0.88 | | | | 0.89 | | | | 0.87 | | | | 0.90 | | | | 0.93 | |
Net investment income | | | 4.47 | | | | 3.11 | | | | 2.40 | | | | 2.92 | | | | 3.40 | |
| | | | | |
| Portfolio turnover rate | | | 77 | % | | | 79 | % | | | 63 | % | | | 98 | % | | | 84 | % |
| 1 | Per share amounts have been calculated using the average shares method. |
| 2 | Performance figures, exclusive of sales charges, may reflect compensating balance arrangements, fee waivers and/or expense reimbursements. In the absence of compensating balance arrangements, fee waivers and/or expense reimbursements, the total return would have been lower. Past performance is no guarantee of future results. |
| 3 | As a result of an expense limitation arrangement, the ratio of total annual fund operating expenses, other than interest, brokerage, taxes, extraordinary expenses and acquired fund fees and expenses, to average net assets of Class A shares did not exceed 0.95%. This expense limitation arrangement cannot be terminated prior to December 31, 2025 without the Board of Trustees’ consent. In addition, the manager has agreed to waive the Fund’s management fee to an extent sufficient to offset the net management fee payable in connection with any investment in an affiliated money market fund. |
| 4 | Reflects fee waivers and/or expense reimbursements. |
See Notes to Financial Statements.
| | | | |
| Western Asset Corporate Bond Fund 2023 Annual Report | | | | 53 |
Financial highlights (cont’d)
| | | | | | | | | | | | | | | | | | | | |
| For a share of each class of beneficial interest outstanding throughout each year ended December 31: | |
| Class C Shares1 | | 2023 | | | 2022 | | | 2021 | | | 2020 | | | 2019 | |
| | | | | |
| Net asset value, beginning of year | | | $10.52 | | | | $13.11 | | | | $13.66 | | | | $12.90 | | | | $11.72 | |
| | | | | |
| Income (loss) from operations: | | | | | | | | | | | | | | | | | | | | |
Net investment income | | | 0.40 | | | | 0.27 | | | | 0.23 | | | | 0.29 | | | | 0.34 | |
Net realized and unrealized gain (loss) | | | 0.28 | | | | (2.54) | | | | (0.42) | | | | 0.97 | | | | 1.24 | |
Total income (loss) from operations | | | 0.68 | | | | (2.27) | | | | (0.19) | | | | 1.26 | | | | 1.58 | |
| | | | | |
| Less distributions from: | | | | | | | | | | | | | | | | | | | | |
Net investment income | | | (0.42) | | | | (0.31) | | | | (0.26) | | | | (0.34) | | | | (0.37) | |
Net realized gains | | | — | | | | (0.01) | | | | (0.10) | | | | (0.16) | | | | (0.03) | |
Total distributions | | | (0.42) | | | | (0.32) | | | | (0.36) | | | | (0.50) | | | | (0.40) | |
| | | | | |
| Net asset value, end of year | | | $10.78 | | | | $10.52 | | | | $13.11 | | | | $13.66 | | | | $12.90 | |
Total return2 | | | 6.70 | % | | | (17.42) | % | | | (1.41) | % | | | 10.06 | % | | | 13.65 | % |
| | | | | |
| Net assets, end of year (000s) | | | $9,376 | | | | $10,346 | | | | $14,032 | | | | $14,328 | | | | $9,622 | |
| | | | | |
| Ratios to average net assets: | | | | | | | | | | | | | | | | | | | | |
Gross expenses | | | 1.55 | % | | | 1.56 | % | | | 1.56 | % | | | 1.57 | % | | | 1.59 | % |
Net expenses3,4 | | | 1.55 | | | | 1.56 | | | | 1.56 | | | | 1.57 | | | | 1.59 | |
Net investment income | | | 3.78 | | | | 2.42 | | | | 1.72 | | | | 2.24 | | | | 2.74 | |
| | | | | |
| Portfolio turnover rate | | | 77 | % | | | 79 | % | | | 63 | % | | | 98 | % | | | 84 | % |
| 1 | Per share amounts have been calculated using the average shares method. |
| 2 | Performance figures, exclusive of CDSC, may reflect compensating balance arrangements, fee waivers and/or expense reimbursements. In the absence of compensating balance arrangements, fee waivers and/or expense reimbursements, the total return would have been lower. Past performance is no guarantee of future results. |
| 3 | As a result of an expense limitation arrangement, the ratio of total annual fund operating expenses, other than interest, brokerage, taxes, extraordinary expenses and acquired fund fees and expenses, to average net assets of Class C shares did not exceed 1.70%. This expense limitation arrangement cannot be terminated prior to December 31, 2025 without the Board of Trustees’ consent. In addition, the manager has agreed to waive the Fund’s management fee to an extent sufficient to offset the net management fee payable in connection with any investment in an affiliated money market fund. |
| 4 | Reflects fee waivers and/or expense reimbursements. |
See Notes to Financial Statements.
| | | | |
54 | | | | Western Asset Corporate Bond Fund 2023 Annual Report |
| | | | | | | | | | | | | | | | | | | | |
| For a share of each class of beneficial interest outstanding throughout each year ended December 31: | |
| Class C1 Shares1 | | 2023 | | | 2022 | | | 2021 | | | 2020 | | | 2019 | |
| | | | | |
| Net asset value, beginning of year | | | $10.45 | | | | $13.03 | | | | $13.58 | | | | $12.82 | | | | $11.65 | |
| | | | | |
| Income (loss) from operations: | | | | | | | | | | | | | | | | | | | | |
Net investment income | | | 0.41 | | | | 0.29 | | | | 0.25 | | | | 0.32 | | | | 0.38 | |
Net realized and unrealized gain (loss) | | | 0.29 | | | | (2.53) | | | | (0.42) | | | | 0.97 | | | | 1.23 | |
Total income (loss) from operations | | | 0.70 | | | | (2.24) | | | | (0.17) | | | | 1.29 | | | | 1.61 | |
| | | | | |
| Less distributions from: | | | | | | | | | | | | | | | | | | | | |
Net investment income | | | (0.44) | | | | (0.33) | | | | (0.28) | | | | (0.37) | | | | (0.41) | |
Net realized gains | | | — | | | | (0.01) | | | | (0.10) | | | | (0.16) | | | | (0.03) | |
Total distributions | | | (0.44) | | | | (0.34) | | | | (0.38) | | | | (0.53) | | | | (0.44) | |
| | | | | |
| Net asset value, end of year | | | $10.71 | | | | $10.45 | | | | $13.03 | | | | $13.58 | | | | $12.82 | |
Total return2 | | | 6.84 | % | | | (17.21) | % | | | (1.20) | % | | | 10.24 | % | | | 13.98 | % |
| | | | | |
| Net assets, end of year (000s) | | | $233 | | | | $236 | | | | $324 | | | | $979 | | | | $1,514 | |
| | | | | |
| Ratios to average net assets: | | | | | | | | | | | | | | | | | | | | |
Gross expenses | | | 1.54 | % | | | 1.84 | % | | | 1.61 | % | | | 1.48 | % | | | 1.37 | % |
Net expenses3,4 | | | 1.40 | | | | 1.40 | | | | 1.40 | | | | 1.40 | | | | 1.37 | |
Net investment income | | | 3.95 | | | | 2.62 | | | | 1.93 | | | | 2.46 | | | | 3.07 | |
| | | | | |
| Portfolio turnover rate | | | 77 | % | | | 79 | % | | | 63 | % | | | 98 | % | | | 84 | % |
| 1 | Per share amounts have been calculated using the average shares method. |
| 2 | Performance figures, exclusive of CDSC, may reflect compensating balance arrangements, fee waivers and/or expense reimbursements. In the absence of compensating balance arrangements, fee waivers and/or expense reimbursements, the total return would have been lower. Past performance is no guarantee of future results. |
| 3 | As a result of an expense limitation arrangement, the ratio of total annual fund operating expenses, other than interest, brokerage, taxes, extraordinary expenses and acquired fund fees and expenses, to average net assets of Class C1 shares did not exceed 1.40%. This expense limitation arrangement cannot be terminated prior to December 31, 2025 without the Board of Trustees’ consent. In addition, the manager has agreed to waive the Fund’s management fee to an extent sufficient to offset the net management fee payable in connection with any investment in an affiliated money market fund. |
| 4 | Reflects fee waivers and/or expense reimbursements. |
See Notes to Financial Statements.
| | | | |
| Western Asset Corporate Bond Fund 2023 Annual Report | | | | 55 |
Financial highlights (cont’d)
| | | | | | | | | | | | | | | | | | | | |
| For a share of each class of beneficial interest outstanding throughout each year ended December 31: | |
| Class I Shares1 | | 2023 | | | 2022 | | | 2021 | | | 2020 | | | 2019 | |
| | | | | |
| Net asset value, beginning of year | | | $10.52 | | | | $13.11 | | | | $13.67 | | | | $12.90 | | | | $11.72 | |
| | | | | |
| Income (loss) from operations: | | | | | | | | | | | | | | | | | | | | |
Net investment income | | | 0.50 | | | | 0.39 | | | | 0.36 | | | | 0.43 | | | | 0.46 | |
Net realized and unrealized gain (loss) | | | 0.29 | | | | (2.55) | | | | (0.42) | | | | 0.98 | | | | 1.25 | |
Total income (loss) from operations | | | 0.79 | | | | (2.16) | | | | (0.06) | | | | 1.41 | | | | 1.71 | |
| | | | | |
| Less distributions from: | | | | | | | | | | | | | | | | | | | | |
Net investment income | | | (0.53) | | | | (0.42) | | | | (0.40) | | | | (0.48) | | | | (0.50) | |
Net realized gains | | | — | | | | (0.01) | | | | (0.10) | | | | (0.16) | | | | (0.03) | |
Total distributions | | | (0.53) | | | | (0.43) | | | | (0.50) | | | | (0.64) | | | | (0.53) | |
| | | | | |
| Net asset value, end of year | | | $10.78 | | | | $10.52 | | | | $13.11 | | | | $13.67 | | | | $12.90 | |
Total return2 | | | 7.76 | % | | | (16.57) | % | | | (0.40) | % | | | 11.19 | % | | | 14.68 | % |
| | | | | |
| Net assets, end of year (millions) | | | $749 | | | | $982 | | | | $1,118 | | | | $706 | | | | $467 | |
| | | | | |
| Ratios to average net assets: | | | | | | | | | | | | | | | | | | | | |
Gross expenses | | | 0.59 | % | | | 0.60 | % | | | 0.59 | % | | | 0.61 | % | | | 0.62 | % |
Net expenses3,4 | | | 0.55 | | | | 0.55 | | | | 0.55 | | | | 0.55 | | | | 0.60 | |
Net investment income | | | 4.77 | | | | 3.48 | | | | 2.69 | | | | 3.27 | | | | 3.69 | |
| | | | | |
| Portfolio turnover rate | | | 77 | % | | | 79 | % | | | 63 | % | | | 98 | % | | | 84 | % |
| 1 | Per share amounts have been calculated using the average shares method. |
| 2 | Performance figures may reflect compensating balance arrangements, fee waivers and/or expense reimbursements. In the absence of compensating balance arrangements, fee waivers and/or expense reimbursements, the total return would have been lower. Past performance is no guarantee of future results. |
| 3 | As a result of an expense limitation arrangement, effective November 13, 2019, the ratio of total annual fund operating expenses, other than interest, brokerage, taxes, extraordinary expenses and acquired fund fees and expenses, to average net assets of Class I shares did not exceed 0.55%. This expense limitation arrangement cannot be terminated prior to December 31, 2025 without the Board of Trustees’ consent. In addition, the manager has agreed to waive the Fund’s management fee to an extent sufficient to offset the net management fee payable in connection with any investment in an affiliated money market fund. From March 31, 2017 through November 12, 2019, the expense limitation was 0.65%. |
| 4 | Reflects fee waivers and/or expense reimbursements. |
See Notes to Financial Statements.
| | | | |
56 | | | | Western Asset Corporate Bond Fund 2023 Annual Report |
| | | | | | | | | | | | | | | | | | | | |
| For a share of each class of beneficial interest outstanding throughout each year ended December 31: | |
| Class P Shares1 | | 2023 | | | 2022 | | | 2021 | | | 2020 | | | 2019 | |
| | | | | |
| Net asset value, beginning of year | | | $10.51 | | | | $13.09 | | | | $13.65 | | | | $12.89 | | | | $11.71 | |
| | | | | |
| Income (loss) from operations: | | | | | | | | | | | | | | | | | | | | |
Net investment income | | | 0.44 | | | | 0.33 | | | | 0.29 | | | | 0.37 | | | | 0.41 | |
Net realized and unrealized gain (loss) | | | 0.29 | | | | (2.54) | | | | (0.42) | | | | 0.96 | | | | 1.24 | |
Total income (loss) from operations | | | 0.73 | | | | (2.21) | | | | (0.13) | | | | 1.33 | | | | 1.65 | |
| | | | | |
| Less distributions from: | | | | | | | | | | | | | | | | | | | | |
Net investment income | | | (0.47) | | | | (0.36) | | | | (0.33) | | | | (0.41) | | | | (0.44) | |
Net realized gains | | | — | | | | (0.01) | | | | (0.10) | | | | (0.16) | | | | (0.03) | |
Total distributions | | | (0.47) | | | | (0.37) | | | | (0.43) | | | | (0.57) | | | | (0.47) | |
| | | | | |
| Net asset value, end of year | | | $10.77 | | | | $10.51 | | | | $13.09 | | | | $13.65 | | | | $12.89 | |
Total return2 | | | 7.18 | % | | | (16.98) | % | | | (1.01) | % | | | 10.63 | % | | | 14.22 | % |
| | | | | |
| Net assets, end of year (000s) | | | $8,614 | | | | $9,836 | | | | $13,586 | | | | $16,119 | | | | $43,964 | |
| | | | | |
| Ratios to average net assets: | | | | | | | | | | | | | | | | | | | | |
Gross expenses | | | 1.10 | % | | | 1.09 | % | | | 1.09 | % | | | 1.08 | % | | | 1.10 | % |
Net expenses3,4 | | | 1.10 | | | | 1.09 | | | | 1.09 | | | | 1.08 | | | | 1.10 | |
Net investment income | | | 4.23 | | | | 2.90 | | | | 2.19 | | | | 2.85 | | | | 3.24 | |
| | | | | |
| Portfolio turnover rate | | | 77 | % | | | 79 | % | | | 63 | % | | | 98 | % | | | 84 | % |
| 1 | Per share amounts have been calculated using the average shares method. |
| 2 | Performance figures may reflect compensating balance arrangements, fee waivers and/or expense reimbursements. In the absence of compensating balance arrangements, fee waivers and/or expense reimbursements, the total return would have been lower. Past performance is no guarantee of future results. |
| 3 | As a result of an expense limitation arrangement, the ratio of total annual fund operating expenses, other than interest, brokerage, taxes, extraordinary expenses and acquired fund fees and expenses, to average net assets of Class P shares did not exceed 1.20%. This expense limitation arrangement cannot be terminated prior to December 31, 2025 without the Board of Trustees’ consent. In addition, the manager has agreed to waive the Fund’s management fee to an extent sufficient to offset the net management fee payable in connection with any investment in an affiliated money market fund. |
| 4 | Reflects fee waivers and/or expense reimbursements. |
See Notes to Financial Statements.
| | | | |
| Western Asset Corporate Bond Fund 2023 Annual Report | | | | 57 |
Notes to financial statements
1. Organization and significant accounting policies
Western Asset Corporate Bond Fund (the “Fund”) is a separate diversified investment series of Legg Mason Partners Income Trust (the “Trust”). The Trust, a Maryland statutory trust, is registered under the Investment Company Act of 1940, as amended (the “1940 Act”), as an open-end management investment company.
The Fund follows the accounting and reporting guidance in Financial Accounting Standards Board (“FASB”) Accounting Standards Codification Topic 946, Financial Services –Investment Companies (“ASC 946”). The following are significant accounting policies consistently followed by the Fund and are in conformity with U.S. generally accepted accounting principles (“GAAP”), including, but not limited to, ASC 946. Estimates and assumptions are required to be made regarding assets, liabilities and changes in net assets resulting from operations when financial statements are prepared. Changes in the economic environment, financial markets and any other parameters used in determining these estimates could cause actual results to differ. Subsequent events have been evaluated through the date the financial statements were issued.
(a) Investment valuation. The valuations for fixed income securities (which may include, but are not limited to, corporate, government, municipal, mortgage-backed, collateralized mortgage obligations and asset-backed securities) and certain derivative instruments are typically the prices supplied by independent third party pricing services, which may use market prices or broker/dealer quotations or a variety of valuation techniques and methodologies. The independent third party pricing services typically use inputs that are observable such as issuer details, interest rates, yield curves, prepayment speeds, credit risks/spreads, default rates and quoted prices for similar securities. Investments in open-end funds are valued at the closing net asset value per share of each fund on the day of valuation. Futures contracts are valued daily at the settlement price established by the board of trade or exchange on which they are traded. Equity securities for which market quotations are available are valued at the last reported sales price or official closing price on the primary market or exchange on which they trade. When the Fund holds securities or other assets that are denominated in a foreign currency, the Fund will normally use the currency exchange rates as of 4:00 p.m. (Eastern Time). If independent third party pricing services are unable to supply prices for a portfolio investment, or if the prices supplied are deemed by the manager to be unreliable, the market price may be determined by the manager using quotations from one or more broker/dealers or at the transaction price if the security has recently been purchased and no value has yet been obtained from a pricing service or pricing broker. When reliable prices are not readily available, such as when the value of a security has been significantly affected by events after the close of the exchange or market on which the security is principally traded, but before the Fund calculates its net asset value, the Fund values these securities as determined in accordance with procedures approved by the Fund’s Board of Trustees.
Pursuant to policies adopted by the Board of Trustees, the Fund’s manager has been designated as the valuation designee and is responsible for the oversight of the daily valuation process. The Fund’s manager is assisted by the Global Fund Valuation Committee
| | | | |
58 | | | | Western Asset Corporate Bond Fund 2023 Annual Report |
(the “Valuation Committee”). The Valuation Committee is responsible for making fair value determinations, evaluating the effectiveness of the Fund’s pricing policies, and reporting to the Fund’s manager and the Board of Trustees. When determining the reliability of third party pricing information for investments owned by the Fund, the Valuation Committee, among other things, conducts due diligence reviews of pricing vendors, monitors the daily change in prices and reviews transactions among market participants.
The Valuation Committee will consider pricing methodologies it deems relevant and appropriate when making fair value determinations. Examples of possible methodologies include, but are not limited to, multiple of earnings; discount from market of a similar freely traded security; discounted cash-flow analysis; book value or a multiple thereof; risk premium/yield analysis; yield to maturity; and/or fundamental investment analysis. The Valuation Committee will also consider factors it deems relevant and appropriate in light of the facts and circumstances. Examples of possible factors include, but are not limited to, the type of security; the issuer’s financial statements; the purchase price of the security; the discount from market value of unrestricted securities of the same class at the time of purchase; analysts’ research and observations from financial institutions; information regarding any transactions or offers with respect to the security; the existence of merger proposals or tender offers affecting the security; the price and extent of public trading in similar securities of the issuer or comparable companies; and the existence of a shelf registration for restricted securities.
For each portfolio security that has been fair valued pursuant to the policies adopted by the Board of Trustees, the fair value price is compared against the last available and next available market quotations. The Valuation Committee reviews the results of such back testing monthly and fair valuation occurrences are reported to the Board of Trustees quarterly.
The Fund uses valuation techniques to measure fair value that are consistent with the market approach and/or income approach, depending on the type of security and the particular circumstance. The market approach uses prices and other relevant information generated by market transactions involving identical or comparable securities. The income approach uses valuation techniques to discount estimated future cash flows to present value.
GAAP establishes a disclosure hierarchy that categorizes the inputs to valuation techniques used to value assets and liabilities at measurement date. These inputs are summarized in the three broad levels listed below:
| • | | Level 1 — unadjusted quoted prices in active markets for identical investments |
| • | | Level 2 — other significant observable inputs (including quoted prices for similar investments, interest rates, prepayment speeds, credit risk, etc.) |
| • | | Level 3 — significant unobservable inputs (including the Fund’s own assumptions in determining the fair value of investments) |
| | | | |
| Western Asset Corporate Bond Fund 2023 Annual Report | | | | 59 |
Notes to financial statements (cont’d)
The inputs or methodologies used to value securities are not necessarily an indication of the risk associated with investing in those securities.
The following is a summary of the inputs used in valuing the Fund’s assets and liabilities carried at fair value:
| | | | | | | | | | | | | | | | |
| ASSETS | |
| Description | | Quoted Prices
(Level 1) | | | Other Significant
Observable Inputs
(Level 2) | | | Significant
Unobservable
Inputs
(Level 3) | | | Total | |
| Long-Term Investments†: | | | | | | | | | | | | | | | | |
Corporate Bonds & Notes: | | | | | | | | | | | | | | | | |
Energy | | | — | | | $ | 156,440,258 | | | $ | 3,088,800 | | | $ | 159,529,058 | |
Other Corporate Bonds & Notes | | | — | | | | 714,377,261 | | | | — | | | | 714,377,261 | |
U.S. Government & Agency Obligations | | | — | | | | 25,747,301 | | | | — | | | | 25,747,301 | |
Asset-Backed Securities | | | — | | | | 24,755,166 | | | | — | | | | 24,755,166 | |
Sovereign Bonds | | | — | | | | 22,605,447 | | | | — | | | | 22,605,447 | |
Collateralized Mortgage Obligations | | | — | | | | 15,919,070 | | | | — | | | | 15,919,070 | |
Municipal Bonds | | | — | | | | 4,710,823 | | | | — | | | | 4,710,823 | |
Convertible Bonds & Notes | | | — | | | | 4,531,500 | | | | — | | | | 4,531,500 | |
Senior Loans | | | — | | | | 2,877,202 | | | | — | | | | 2,877,202 | |
Preferred Stocks: | | | | | | | | | | | | | | | | |
Financials | | $ | 1,832,842 | | | | 372,203 | | | | — | | | | 2,205,045 | |
| Total Long-Term Investments | | | 1,832,842 | | | | 972,336,231 | | | | 3,088,800 | | | | 977,257,873 | |
| Short-Term Investments† | | | 28,530,796 | | | | — | | | | — | | | | 28,530,796 | |
| Total Investments | | $ | 30,363,638 | | | $ | 972,336,231 | | | $ | 3,088,800 | | | $ | 1,005,788,669 | |
| Other Financial Instruments: | | | | | | | | | | | | | | | | |
Futures Contracts†† | | $ | 14,543,257 | | | | — | | | | — | | | $ | 14,543,257 | |
Forward Foreign Currency Contracts†† | | | — | | | $ | 1,319,163 | | | | — | | | | 1,319,163 | |
OTC Credit Default Swaps on Corporate Issues — Sell Protection‡ | | | — | | | | 26,744 | | | | — | | | | 26,744 | |
| Total Other Financial Instruments | | $ | 14,543,257 | | | $ | 1,345,907 | | | | — | | | $ | 15,889,164 | |
| Total | | $ | 44,906,895 | | | $ | 973,682,138 | | | $ | 3,088,800 | | | $ | 1,021,677,833 | |
| | | | |
`60 | | | | Western Asset Corporate Bond Fund 2023 Annual Report |
| | | | | | | | | | | | | | | | |
| LIABILITIES | |
| Description | | Quoted Prices
(Level 1) | | | Other Significant
Observable Inputs
(Level 2) | | | Significant
Unobservable
Inputs
(Level 3) | | | Total | |
| Other Financial Instruments: | | | | | | | | | | | | | | | | |
Futures Contracts†† | | $ | 2,132,376 | | | | — | | | | — | | | $ | 2,132,376 | |
Forward Foreign Currency Contracts†† | | | — | | | $ | 246,092 | | | | — | | | | 246,092 | |
OTC Credit Default Swaps on Corporate Issues — Buy Protection‡ | | | — | | | | 39,669 | | | | — | | | | 39,669 | |
Centrally Cleared Credit Default Swaps on Credit Indices — Buy Protection†† | | | — | | | | 1,104,547 | | | | — | | | | 1,104,547 | |
| Total | | $ | 2,132,376 | | | $ | 1,390,308 | | | | — | | | $ | 3,522,684 | |
| † | See Schedule of Investments for additional detailed categorizations. |
| †† | Reflects the unrealized appreciation (depreciation) of the instruments. |
| ‡ | Value includes any premium paid or received with respect to swap contracts. |
(b) Futures contracts. The Fund uses futures contracts generally to gain exposure to, or hedge against, changes in interest rates or gain exposure to, or hedge against, changes in certain asset classes. A futures contract represents a commitment for the future purchase or sale of an asset at a specified price on a specified date.
Upon entering into a futures contract, the Fund is required to deposit cash or securities with a broker in an amount equal to a certain percentage of the contract amount. This is known as the ‘‘initial margin’’ and subsequent payments (‘‘variation margin’’) are made or received by the Fund each day, depending on the daily fluctuation in the value of the contract. For certain futures, including foreign denominated futures, variation margin is not settled daily, but is recorded as a net variation margin payable or receivable. The daily changes in contract value are recorded as unrealized appreciation or depreciation in the Statement of Operations and the Fund recognizes a realized gain or loss when the contract is closed.
Futures contracts involve, to varying degrees, risk of loss in excess of the amounts reflected in the financial statements. In addition, there is the risk that the Fund may not be able to enter into a closing transaction because of an illiquid secondary market.
(c) Forward foreign currency contracts. The Fund enters into a forward foreign currency contract to hedge against, or manage exposure to, foreign issuers or markets. The Fund may also enter into a forward foreign currency contract to hedge against foreign currency exchange rate risk on its non-U.S. dollar denominated securities or to facilitate settlement of a foreign currency denominated portfolio transaction. A forward foreign currency contract is an agreement between two parties to buy and sell a currency at a set price with delivery and settlement at a future date. The contract is marked-to-market daily and the change in value is recorded by the Fund as an unrealized gain or loss. When a forward foreign
| | | | |
| Western Asset Corporate Bond Fund 2023 Annual Report | | | | 61 |
Notes to financial statements (cont’d)
currency contract is closed, through either delivery or offset by entering into another forward foreign currency contract, the Fund recognizes a realized gain or loss equal to the difference between the value of the contract at the time it was opened and the value of the contract at the time it is closed.
Non-deliverable forward foreign currency exchange contracts are settled with the counterparty in cash without the delivery of foreign currency.
Forward foreign currency contracts involve elements of market risk in excess of the amounts reflected on the Statement of Assets and Liabilities. The Fund bears the risk of an unfavorable change in the foreign exchange rate underlying the forward foreign currency contract. Risks may also arise upon entering into these contracts from the potential inability of the counterparties to meet the terms of their contracts.
(d) Swap agreements. The Fund invests in swaps for the purpose of managing its exposure to interest rate, credit or market risk, or for other purposes. The use of swaps involves risks that are different from those associated with other portfolio transactions. Swap agreements are privately negotiated in the over-the-counter market and may be entered into as a bilateral contract (“OTC Swaps”) or centrally cleared (“Centrally Cleared Swaps”). Unlike Centrally Cleared Swaps, the Fund has credit exposure to the counterparties of OTC Swaps.
In a Centrally Cleared Swap, immediately following execution of the swap, the swap agreement is submitted to a clearinghouse or central counterparty (the “CCP”) and the CCP becomes the ultimate counterparty of the swap agreement. The Fund is required to interface with the CCP through a broker, acting in an agency capacity. All payments are settled with the CCP through the broker. Upon entering into a Centrally Cleared Swap, the Fund is required to deposit initial margin with the broker in the form of cash or securities.
Swap contracts are marked-to-market daily and changes in value are recorded as unrealized appreciation (depreciation). The daily change in valuation of Centrally Cleared Swaps, if any, is recorded as a net receivable or payable for variation margin on the Statement of Assets and Liabilities. Gains or losses are realized upon termination of the swap agreement. Collateral, in the form of restricted cash or securities, may be required to be held in segregated accounts with the Fund’s custodian in compliance with the terms of the swap contracts. Securities posted as collateral for swap contracts are identified in the Schedule of Investments and restricted cash, if any, is identified on the Statement of Assets and Liabilities. Risks may exceed amounts recorded in the Statement of Assets and Liabilities. These risks include changes in the returns of the underlying instruments, failure of the counterparties to perform under the contracts’ terms, and the possible lack of liquidity with respect to the swap agreements.
OTC Swap payments received or made at the beginning of the measurement period are reflected as a premium or deposit, respectively, on the Statement of Assets and Liabilities. These upfront payments are amortized over the life of the swap and are recognized as realized gain or loss in the Statement of Operations. Net periodic payments received or paid by the Fund are recognized as a realized gain or loss in the Statement of Operations.
| | | | |
`62 | | | | Western Asset Corporate Bond Fund 2023 Annual Report |
The Fund’s maximum exposure in the event of a defined credit event on a credit default swap to sell protection is the notional amount. As of December 31, 2023, the total notional value of all credit default swaps to sell protection was EUR 4,500,000. This amount would be offset by the value of the swap’s reference entity, upfront premiums received on the swap and any amounts received from the settlement of a credit default swap where the Fund bought protection for the same referenced security/entity.
For average notional amounts of swaps held during the year ended December 31, 2023, see Note 4.
Credit default swaps
The Fund enters into credit default swap (“CDS”) contracts for investment purposes, to manage its credit risk or to add leverage. CDS agreements involve one party making a stream of payments to another party in exchange for the right to receive a specified return in the event of a default by a third party, typically corporate or sovereign issuers, on a specified obligation, or in the event of a write-down, principal shortfall, interest shortfall or default of all or part of the referenced entities comprising a credit index. The Fund may use a CDS to provide protection against defaults of the issuers (i.e., to reduce risk where the Fund has exposure to an issuer) or to take an active long or short position with respect to the likelihood of a particular issuer’s default. As a seller of protection, the Fund generally receives an upfront payment or a stream of payments throughout the term of the swap provided that there is no credit event. If the Fund is a seller of protection and a credit event occurs, as defined under the terms of that particular swap agreement, the maximum potential amount of future payments (undiscounted) that the Fund could be required to make under a CDS agreement would be an amount equal to the notional amount of the agreement. These amounts of potential payments will be partially offset by any recovery of values from the respective referenced obligations. As a seller of protection, the Fund effectively adds leverage to its portfolio because, in addition to its total net assets, the Fund is subject to investment exposure on the notional amount of the swap. As a buyer of protection, the Fund generally receives an amount up to the notional value of the swap if a credit event occurs.
Implied spreads are the theoretical prices a lender receives for credit default protection. When spreads rise, market perceived credit risk rises and when spreads fall, market perceived credit risk falls. The implied credit spread of a particular referenced entity reflects the cost of buying/selling protection and may include upfront payments required to enter into the agreement. Wider credit spreads and decreasing market values, when compared to the notional amount of the swap, represent a deterioration of the referenced entity’s credit soundness and a greater likelihood or risk of default or other credit event occurring as defined under the terms of the agreement. Credit spreads utilized in determining the period end market value of CDS agreements on corporate or sovereign issues are disclosed in the Schedule of Investments and serve as an indicator of the current status of the payment/ performance risk and represent the likelihood or risk of default for credit derivatives. For CDS agreements on asset-backed securities and credit indices, the quoted market prices and resulting values, particularly in relation to the notional amount of the contract as well
| | | | |
| Western Asset Corporate Bond Fund 2023 Annual Report | | | | 63 |
Notes to financial statements (cont’d)
as the annual payment rate, serve as an indication of the current status of the payment/ performance risk.
The Fund’s maximum risk of loss from counterparty risk, as the protection buyer, is the fair value of the contract (this risk is mitigated by the posting of collateral by the counterparty to the Fund to cover the Fund’s exposure to the counterparty). As the protection seller, the Fund’s maximum risk is the notional amount of the contract. CDS are considered to have credit risk-related contingent features since they require payment by the protection seller to the protection buyer upon the occurrence of a defined credit event.
Entering into a CDS agreement involves, to varying degrees, elements of credit, market and documentation risk in excess of the related amounts recognized on the Statement of Assets and Liabilities. Such risks involve the possibility that there will be no liquid market for these agreements, that the counterparty to the agreement may default on its obligation to perform or disagree as to the meaning of the contractual terms in the agreement, and that there will be unfavorable changes in net interest rates.
(e) Loan participations. The Fund may invest in loans arranged through private negotiation between one or more financial institutions. The Fund’s investment in any such loan may be in the form of a participation in or an assignment of the loan. In connection with purchasing participations, the Fund generally will have no right to enforce compliance by the borrower with the terms of the loan agreement related to the loan, or any rights of offset against the borrower and the Fund may not benefit directly from any collateral supporting the loan in which it has purchased the participation.
The Fund assumes the credit risk of the borrower, the lender that is selling the participation and any other persons interpositioned between the Fund and the borrower. In the event of the insolvency of the lender selling the participation, the Fund may be treated as a general creditor of the lender and may not benefit from any offset between the lender and the borrower.
(f) Securities traded on a when-issued and delayed delivery basis. The Fund may trade securities on a when-issued or delayed delivery basis. In when-issued and delayed delivery transactions, the securities are purchased or sold by the Fund with payment and delivery taking place in the future in order to secure what is considered to be an advantageous price and yield to the Fund at the time of entering into the transaction.
Purchasing such securities involves risk of loss if the value of the securities declines prior to settlement. These securities are subject to market fluctuations and their current value is determined in the same manner as for other securities.
(g) Foreign currency translation. Investment securities and other assets and liabilities denominated in foreign currencies are translated into U.S. dollar amounts based upon prevailing exchange rates on the date of valuation. Purchases and sales of investment securities and income and expense items denominated in foreign currencies are translated into U.S. dollar amounts based upon prevailing exchange rates on the respective dates of such transactions.
| | | | |
`64 | | | | Western Asset Corporate Bond Fund 2023 Annual Report |
The Fund does not isolate that portion of the results of operations resulting from fluctuations in foreign exchange rates on investments from the fluctuations arising from changes in market prices of securities held. Such fluctuations are included with the net realized and unrealized gain or loss on investments.
Net realized foreign exchange gains or losses arise from sales of foreign currencies, including gains and losses on forward foreign currency contracts, currency gains or losses realized between the trade and settlement dates on securities transactions, and the difference between the amounts of dividends, interest, and foreign withholding taxes recorded on the Fund’s books and the U.S. dollar equivalent of the amounts actually received or paid. Net unrealized foreign exchange gains and losses arise from changes in the values of assets and liabilities, other than investments in securities, on the date of valuation, resulting from changes in exchange rates.
Foreign security and currency transactions may involve certain considerations and risks not typically associated with those of U.S. dollar denominated transactions as a result of, among other factors, the possibility of lower levels of governmental supervision and regulation of foreign securities markets and the possibility of political or economic instability.
(h) Credit and market risk. The Fund invests in high-yield and emerging market instruments that are subject to certain credit and market risks. The yields of high-yield and emerging market debt obligations reflect, among other things, perceived credit and market risks. The Fund’s investments in securities rated below investment grade typically involve risks not associated with higher rated securities including, among others, greater risk related to timely and ultimate payment of interest and principal, greater market price volatility and less liquid secondary market trading. The consequences of political, social, economic or diplomatic changes may have disruptive effects on the market prices of investments held by the Fund. The Fund’s investments in non-U.S. dollar denominated securities may also result in foreign currency losses caused by devaluations and exchange rate fluctuations.
Investments in securities that are collateralized by real estate mortgages are subject to certain credit and liquidity risks. When market conditions result in an increase in default rates of the underlying mortgages and the foreclosure values of underlying real estate properties are materially below the outstanding amount of these underlying mortgages, collection of the full amount of accrued interest and principal on these investments may be doubtful. Such market conditions may significantly impair the value and liquidity of these investments and may result in a lack of correlation between their credit ratings and values.
(i) Foreign investment risks. The Fund’s investments in foreign securities may involve risks not present in domestic investments. Since securities may be denominated in foreign currencies, may require settlement in foreign currencies or may pay interest or dividends in foreign currencies, changes in the relationship of these foreign currencies to the U.S. dollar can significantly affect the value of the investments and earnings of the Fund. Foreign investments may also subject the Fund to foreign government exchange restrictions,
| | | | |
| Western Asset Corporate Bond Fund 2023 Annual Report | | | | 65 |
Notes to financial statements (cont’d)
expropriation, taxation or other political, social or economic developments, all of which affect the market and/or credit risk of the investments.
(j) Counterparty risk and credit-risk-related contingent features of derivative instruments. The Fund may invest in certain securities or engage in other transactions where the Fund is exposed to counterparty credit risk in addition to broader market risks. The Fund may invest in securities of issuers, which may also be considered counterparties as trading partners in other transactions. This may increase the risk of loss in the event of default or bankruptcy by the counterparty or if the counterparty otherwise fails to meet its contractual obligations. The Fund’s subadviser attempts to mitigate counterparty risk by (i) periodically assessing the creditworthiness of its trading partners, (ii) monitoring and/or limiting the amount of its net exposure to each individual counterparty based on its assessment and (iii) requiring collateral from the counterparty for certain transactions. Market events and changes in overall economic conditions may impact the assessment of such counterparty risk by the subadviser. In addition, declines in the values of underlying collateral received may expose the Fund to increased risk of loss.
With exchange traded and centrally cleared derivatives, there is less counterparty risk to the Fund since the exchange or clearinghouse, as counterparty to such instruments, guarantees against a possible default. The clearinghouse stands between the buyer and the seller of the contract; therefore, the credit risk is limited to failure of the clearinghouse. While offset rights may exist under applicable law, the Fund does not have a contractual right of offset against a clearing broker or clearinghouse in the event of a default of the clearing broker or clearinghouse.
The Fund has entered into master agreements, such as an International Swaps and Derivatives Association, Inc. Master Agreement (“ISDA Master Agreement”) or similar agreement, with certain of its derivative counterparties that govern over-the-counter (“OTC”) derivatives and provide for general obligations, representations, agreements, collateral posting terms, netting provisions in the event of default or termination and credit related contingent features. The credit related contingent features include, but are not limited to, a percentage decrease in the Fund net assets or net asset value per share over a specified period of time. If these credit related contingent features were triggered, the derivatives counterparty could terminate the positions and demand payment or require additional collateral.
Under an ISDA Master Agreement, the Fund may, under certain circumstances, offset with the counterparty certain derivative financial instruments’ payables and/or receivables with collateral held and/or posted and create one single net payment. However, absent an event of default by the counterparty or a termination of the agreement, the terms of the ISDA Master Agreements do not result in an offset of reported amounts of financial assets and financial liabilities in the Statement of Assets and Liabilities across transactions between the Fund and the applicable counterparty. The enforceability of the right to offset may vary by jurisdiction.
| | | | |
`66 | | | | Western Asset Corporate Bond Fund 2023 Annual Report |
Collateral requirements differ by type of derivative. Collateral or margin requirements are set by the broker or exchange clearinghouse for exchange traded derivatives while collateral terms are contract specific for OTC traded derivatives. Cash collateral that has been pledged to cover obligations of the Fund under derivative contracts, if any, will be reported separately in the Statement of Assets and Liabilities. Securities pledged as collateral, if any, for the same purpose are noted in the Schedule of Investments.
As of December 31, 2023, the Fund held forward foreign currency contracts and OTC credit default swaps with credit related contingent features which had a liability position of $285,761. If a contingent feature in the master agreements would have been triggered, the Fund would have been required to pay this amount to its derivatives counterparties.
At December 31, 2023, the Fund held non-cash collateral from Morgan Stanley & Co. Inc. in the amount of $224,146. This amount could be used to reduce the Fund’s exposure to the counterparty in the event of default.
(k) Security transactions and investment income. Security transactions are accounted for on a trade date basis. Interest income (including interest income from payment-in-kind securities) is recorded on the accrual basis. Amortization of premiums and accretion of discounts on debt securities are recorded to interest income over the lives of the respective securities, except for premiums on certain callable debt securities, which are amortized to the earliest call date. Paydown gains and losses on mortgage- and asset-backed securities are recorded as adjustments to interest income. Dividend income is recorded on the ex-dividend date for dividends received in cash and/or securities. Foreign dividend income is recorded on the ex-dividend date or as soon as practicable after the Fund determines the existence of a dividend declaration after exercising reasonable due diligence. The cost of investments sold is determined by use of the specific identification method. To the extent any issuer defaults or a credit event occurs that impacts the issuer, the Fund may halt any additional interest income accruals and consider the realizability of interest accrued up to the date of default or credit event.
(l) Distributions to shareholders. Distributions from net investment income of the Fund are declared each business day to shareholders of record and paid monthly. Distributions of net realized gains, if any, are declared at least annually. Distributions to shareholders of the Fund are recorded on the ex-dividend date and are determined in accordance with income tax regulations, which may differ from GAAP.
(m) Share class accounting. Investment income, common expenses and realized/ unrealized gains (losses) on investments are allocated to the various classes of the Fund on the basis of daily net assets of each class. Fees relating to a specific class are charged directly to that share class.
(n) Compensating balance arrangements. The Fund has an arrangement with its custodian bank whereby a portion of the custodian’s fees is paid indirectly by credits earned on the Fund’s cash on deposit with the bank.
| | | | |
| Western Asset Corporate Bond Fund 2023 Annual Report | | | | 67 |
Notes to financial statements (cont’d)
(o) Federal and other taxes. It is the Fund’s policy to comply with the federal income and excise tax requirements of the Internal Revenue Code of 1986 (the “Code”), as amended, applicable to regulated investment companies. Accordingly, the Fund intends to distribute its taxable income and net realized gains, if any, to shareholders in accordance with timing requirements imposed by the Code. Therefore, no federal or state income tax provision is required in the Fund’s financial statements.
Management has analyzed the Fund’s tax positions taken on income tax returns for all open tax years and has concluded that as of December 31, 2023, no provision for income tax is required in the Fund’s financial statements. The Fund’s federal and state income and federal excise tax returns for tax years for which the applicable statutes of limitations have not expired are subject to examination by the Internal Revenue Service and state departments of revenue.
Under the applicable foreign tax laws, a withholding tax may be imposed on interest, dividends and capital gains at various rates.
(p) Reclassification. GAAP requires that certain components of net assets be reclassified to reflect permanent differences between financial and tax reporting. These reclassifications have no effect on net assets or net asset value per share. During the current year, the following reclassifications have been made:
| | | | | | | | |
| | | Total Distributable
Earnings (Loss) | | | Paid-in
Capital | |
| (a) | | $ | 217,366 | | | $ | (217,366) | |
| (a) | Reclassifications are due to a taxable overdistribution. |
2. Investment management agreement and other transactions with affiliates
Franklin Templeton Fund Adviser, LLC (“FTFA”) (formerly known as Legg Mason Partners Fund Advisor, LLC (“LMPFA”) prior to November 30, 2023) is the Fund’s investment manager and Western Asset Management Company, LLC (“Western Asset”) is the Fund’s subadviser. FTFA and Western Asset are indirect, wholly-owned subsidiaries of Franklin Resources, Inc. (“Franklin Resources”).
Under the investment management agreement, the Fund pays an investment management fee, calculated daily and paid monthly, at an annual rate of 0.45% of the Fund’s average daily net assets.
FTFA provides administrative and certain oversight services to the Fund. FTFA delegates to the subadviser the day-to-day portfolio management of the Fund. For its services, FTFA pays Western Asset a fee monthly, at an annual rate equal to 70% of the net management fee it receives from the Fund.
As a result of expense limitation arrangements between the Fund and FTFA, the ratio of total annual fund operating expenses, other than interest, brokerage, taxes, extraordinary expenses and acquired fund fees and expenses, to average net assets of Class A, Class C, Class C1, Class I and Class P shares did not exceed 0.95%, 1.70%, 1.40%, 0.55% and 1.20%, respectively. These expense limitation arrangements cannot be terminated prior to
| | | | |
`68 | | | | Western Asset Corporate Bond Fund 2023 Annual Report |
December 31, 2025 without the Board of Trustees’ consent. In addition, the manager has agreed to waive the Fund’s management fee to an extent sufficient to offset the net management fee payable in connection with any investment in an affiliated money market fund (the “affiliated money market fund waiver”). The affiliated money market fund waiver is not subject to the recapture provision discussed below.
During the year ended December 31, 2023, fees waived and/or expenses reimbursed amounted to $323,283, which included an affiliated money market fund waiver of $5,612.
FTFA is permitted to recapture amounts waived and/or reimbursed to a class within two years after the fiscal year in which FTFA earned the fee or incurred the expense if the class’ total annual fund operating expenses have fallen to a level below the expense limitation (“expense cap”) in effect at the time the fees were earned or the expenses incurred. In no case will FTFA recapture any amount that would result, on any particular business day of the Fund, in the class’ total annual fund operating expenses exceeding the expense cap or any other lower limit then in effect.
Pursuant to these arrangements, at December 31, 2023, the Fund had remaining fee waivers and/or expense reimbursements subject to recapture by FTFA and respective dates of expiration as follows:
| | | | | | | | |
| | | Class C1 | | | Class I | |
| Expires December 31, 2024 | | $ | 1,067 | | | $ | 511,131 | |
| Expires December 31, 2025 | | | 346 | | | | 317,325 | |
| Total fee waivers/expense reimbursements subject to recapture | | $ | 1,771 | | | $ | 1,082,823 | |
For the year ended December 31, 2023, FTFA did not recapture any fees.
Franklin Distributors, LLC (“Franklin Distributors”) serves as the Fund’s sole and exclusive distributor. Franklin Distributors is an indirect, wholly-owned broker-dealer subsidiary of Franklin Resources. Franklin Templeton Investor Services, LLC (“Investor Services”) serves as the Fund’s shareholder servicing agent and acts as the Fund’s transfer agent and dividend-paying agent. Investor Services is an indirect, wholly-owned subsidiary of Franklin Resources. Each class of shares of the Fund pays transfer agent fees to Investor Services for its performance of shareholder servicing obligations. Investor Services charges account-based fees based on the number of individual shareholder accounts, as well as a fixed percentage fee based on the total account-based fees charged. In addition, each class reimburses Investor Services for out of pocket expenses incurred. For the year ended December 31, 2023, the Fund incurred transfer agent fees as reported on the Statement of Operations, of which $18,532 was earned by Investor Services.
There is a maximum initial sales charge of 3.75% for Class A shares. Class C and Class C1 shares have a 1.00% CDSC, which applies if redemption occurs within 12 months from purchase payment. In certain cases, Class A shares have a 1.00% CDSC, which applies if redemption occurs within 18 months from purchase payment. This CDSC only applies to those purchases of Class A shares, which, when combined with current holdings of other
| | | | |
| Western Asset Corporate Bond Fund 2023 Annual Report | | | | 69 |
Notes to financial statements (cont’d)
shares of funds sold by Franklin Distributors, equal or exceed $500,000 in the aggregate. These purchases do not incur an initial sales charge.
For the year ended December 31, 2023, sales charges retained by and CDSCs paid to Franklin Distributors and its affiliates, if any, were as follows:
| | | | | | | | |
| | | Class A | | | Class C | |
| Sales charges | | $ | 10,922 | | | | — | |
| CDSCs | | | 1,108 | | | $ | 680 | |
All officers and one Trustee of the Trust are employees of Franklin Resources or its affiliates and do not receive compensation from the Trust.
3. Investments
During the year ended December 31, 2023, the aggregate cost of purchases and proceeds from sales of investments (excluding short-term investments) and U.S. Government & Agency Obligations were as follows:
| | | | | | | | |
| | | Investments | | | U.S. Government &
Agency Obligations | |
| Purchases | | $ | 599,935,033 | | | $ | 178,747,527 | |
| Sales | | | 837,411,599 | | | | 183,742,979 | |
At December 31, 2023, the aggregate cost of investments and the aggregate gross unrealized appreciation and depreciation of investments for federal income tax purposes were as follows:
| | | | | | | | | | | | | | | | |
| | | Cost/Premiums Paid (Received) | | | Gross Unrealized
Appreciation | | | Gross Unrealized Depreciation | | | Net Unrealized
Appreciation
(Depreciation) | |
| Securities | | $ | 1,065,073,452 | | | $ | 17,879,631 | | | $ | (77,164,414) | | | $ | (59,284,783) | |
| Futures contracts | | | — | | | | 14,543,257 | | | | (2,132,376) | | | | 12,410,881 | |
| Forward foreign currency contracts | | | — | | | | 1,319,163 | | | | (246,092) | | | | 1,073,071 | |
| Swap contracts | | | (407,908) | | | | 16,444 | | | | (1,124,564) | | | | (1,108,120) | |
4. Derivative instruments and hedging activities
Below is a table, grouped by derivative type, that provides information about the fair value and the location of derivatives within the Statement of Assets and Liabilities at December 31, 2023.
| | | | | | | | | | | | | | | | |
| ASSET DERIVATIVES1 | |
| | | Interest Rate
Risk | | | Foreign
Exchange Risk | | | Credit Risk | | | Total | |
| Futures contracts2 | | $ | 14,543,257 | | | | — | | | | — | | | $ | 14,543,257 | |
| Forward foreign currency contracts | | | — | | | $ | 1,319,163 | | | | — | | | | 1,319,163 | |
| OTC swap contracts3 | | | — | | | | — | | | $ | 26,744 | | | | 26,744 | |
| Total | | $ | 14,543,257 | | | $ | 1,319,163 | | | $ | 26,744 | | | $ | 15,889,164 | |
| | | | |
`70 | | | | Western Asset Corporate Bond Fund 2023 Annual Report |
| | | | | | | | | | | | | | | | |
| LIABILITY DERIVATIVES1 | |
| | | Interest Rate
Risk | | | Foreign
Exchange Risk | | | Credit Risk | | | Total | |
| Futures contracts2 | | $ | 2,132,376 | | | | — | | | | — | | | $ | 2,132,376 | |
| Forward foreign currency contracts | | | — | | | $ | 246,092 | | | | — | | | | 246,092 | |
| OTC swap contracts3 | | | — | | | | — | | | $ | 39,669 | | | | 39,669 | |
| Centrally cleared swap contracts4 | | | — | | | | — | | | | 1,104,547 | | | | 1,104,547 | |
| Total | | $ | 2,132,376 | | | $ | 246,092 | | | $ | 1,144,216 | | | $ | 3,522,684 | |
| 1 | Generally, the balance sheet location for asset derivatives is receivables/net unrealized appreciation and for liability derivatives is payables/net unrealized depreciation. |
| 2 | Includes cumulative unrealized appreciation (depreciation) of futures contracts as reported in the Schedule of Investments. Only net variation margin is reported within the receivables and/or payables on the Statement of Assets and Liabilities. |
| 3 | Values include premiums paid (received) on swap contracts which are shown separately in the Statement of Assets and Liabilities. |
| 4 | Includes cumulative unrealized appreciation (depreciation) of centrally cleared swap contracts as reported in the Schedule of Investments. Only net variation margin is reported within the receivables and/or payables on the Statement of Assets and Liabilities. |
The following tables provide information about the effect of derivatives and hedging activities on the Fund’s Statement of Operations for the year ended December 31, 2023. The first table provides additional detail about the amounts and sources of gains (losses) realized on derivatives during the period. The second table provides additional information about the change in net unrealized appreciation (depreciation) resulting from the Fund’s derivatives and hedging activities during the period.
| | | | | | | | | | | | | | | | |
| AMOUNT OF NET REALIZED GAIN (LOSS) ON DERIVATIVES RECOGNIZED | |
| | | Interest Rate Risk | | | Foreign
Exchange Risk | | | Credit Risk | | | Total | |
| Futures contracts | | $ | (16,229,170) | | | | — | | | | — | | | $ | (16,229,170) | |
| Swap contracts | | | — | | | | — | | | $ | (3,081,494) | | | | (3,081,494) | |
| Forward foreign currency contracts | | | — | | | $ | (670,238) | | | | — | | | | (670,238) | |
| Total | | $ | (16,229,170) | | | $ | (670,238) | | | $ | (3,081,494) | | | $ | (19,980,902) | |
|
| .CHANGE IN NET UNREALIZED APPRECIATION (DEPRECIATION) ON DERIVATIVES RECOGNIZED | |
| | | Interest
Rate Risk | | | Foreign
Exchange Risk | | | Credit Risk | | | Total | |
| Futures contracts | | $ | 12,697,907 | | | | — | | | | — | | | $ | 12,697,907 | |
| Swap contracts | | | — | | | | — | | | $ | (24,908) | | | | (24,908) | |
| Forward foreign currency contracts | | | — | | | $ | 652,617 | | | | — | | | | 652,617 | |
| Total | | $ | 12,697,907 | | | $ | 652,617 | | | $ | (24,908) | | | $ | 13,325,616 | |
| | | | |
| Western Asset Corporate Bond Fund 2023 Annual Report | | | | 71 |
Notes to financial statements (cont’d)
During the year ended December 31, 2023, the volume of derivative activity for the Fund was as follows:
| | | | |
| | | Average Market
Value | |
| Futures contracts (to buy) | | $ | 335,195,410 | |
| Futures contracts (to sell) | | | 50,185,412 | |
| Forward foreign currency contracts (to buy) | | | 22,198,391 | |
| Forward foreign currency contracts (to sell) | | | 5,827,026 | |
| |
| | | Average Notional
Balance | |
| Credit default swap contracts (buy protection) | | $ | 64,074,710 | |
| Credit default swap contracts (sell protection) | | | 4,864,657 | |
The following table presents the Fund’s OTC derivative assets and liabilities by counterparty net of amounts available for offset under an ISDA Master Agreement and net of the related collateral pledged (received) by the Fund as of December 31, 2023.
| | | | | | | | | | | | | | | | | | | | |
| Counterparty | | Gross Assets Subject to Master Agreements1 | | | Gross Liabilities Subject to Master Agreements1 | | | Net Assets (Liabilities) Subject to Master Agreements | | | Collateral Pledged (Received)2,3 | | | Net Amount4,5 | |
| BNP Paribas SA | | $ | 360,689 | | | $ | (246,092) | | | $ | 114,597 | | | | — | | | $ | 114,597 | |
| Goldman Sachs Group Inc. | | | 12,313 | | | | — | | | | 12,313 | | | | — | | | | 12,313 | |
| JPMorgan Chase & Co. | | | 320,224 | | | | — | | | | 320,224 | | | | — | | | | 320,224 | |
| Morgan Stanley & Co. Inc. | | | 652,681 | | | | (39,669) | | | | 613,012 | | | $ | (224,146) | | | | 388,866 | |
| Total | | $ | 1,345,907 | | | $ | (285,761) | | | $ | 1,060,146 | | | $ | (224,146) | | | $ | 836,000 | |
| 1 | Absent an event of default or early termination, derivative assets and liabilities are presented gross and not offset in the Statement of Assets and Liabilities. |
| 2 | Gross amounts are not offset in the Statement of Assets and Liabilities. |
| 3 | In some instances, the actual collateral received and/or pledged may be more than the amount shown here due to overcollateralization. |
| 4 | Net amount may also include forward foreign currency exchange contracts that are not required to be collateralized. |
| 5 | Represents the net amount receivable (payable) from (to) the counterparty in the event of default. |
5. Class specific expenses, waivers and/or expense reimbursements
The Fund has adopted a Rule 12b-1 shareholder services and distribution plan and under that plan the Fund pays service and/or distribution fees with respect to its Class A, Class C, Class C1 and Class P shares calculated at the annual rate of 0.25%, 1.00%, 0.70% and 0.50% of the average daily net assets of each class, respectively. Service and/or distribution fees are accrued daily and paid monthly.
| | | | |
`72 | | | | Western Asset Corporate Bond Fund 2023 Annual Report |
For the year ended December 31, 2023, class specific expenses were as follows:
| | | | | | | | |
| | | Service and/or
Distribution Fees | | | Transfer Agent
Fees | |
| Class A | | $ | 629,501 | | | $ | 374,808 | |
| Class C | | | 94,816 | | | | 6,234 | |
| Class C1 | | | 1,683 | | | | 863 | |
| Class I | | | — | | | | 835,031 | |
| Class P | | | 45,556 | | | | 10,601 | |
| Total | | $ | 771,556 | | | $ | 1,227,537 | |
For the year ended December 31, 2023, waivers and/or expense reimbursements by class were as follows:
| | | | |
| | | Waivers/Expense
Reimbursements | |
| Class A | | $ | 1,330 | |
| Class C | | | 50 | |
| Class C1 | | | 347 | |
| Class I | | | 321,508 | |
| Class P | | | 48 | |
| Total | | $ | 323,283 | |
6. Distributions to shareholders by class
| | | | | | | | |
| | | Year Ended
December 31, 2023 | | | Year Ended
December 31, 2022 | |
| Net Investment Income: | | | | | | | | |
| Class A | | $ | 11,856,633 | | | $ | 9,434,586 | |
| Class C | | | 382,002 | | | | 306,701 | |
| Class C1 | | | 10,209 | | | | 7,213 | |
| Class I | | | 39,528,196 | | | | 38,477,388 | |
| Class P | | | 407,901 | | | | 351,905 | |
| Total | | $ | 52,184,941 | | | $ | 48,577,793 | |
| | |
| Net Realized Gains: | | | | | | | | |
| Class A | | | — | | | $ | 258,558 | |
| Class C | | | — | | | | 10,583 | |
| Class C1 | | | — | | | | 225 | |
| Class I | | | — | | | | 997,023 | |
| Class P | | | — | | | | 10,180 | |
| Total | | | — | | | $ | 1,276,569 | |
7. Shares of beneficial interest
At December 31, 2023, the Trust had an unlimited number of shares of beneficial interest authorized with a par value of $0.00001 per share. The Fund has the ability to issue multiple classes of shares. Each class of shares represents an identical interest and has the same
| | | | |
| Western Asset Corporate Bond Fund 2023 Annual Report | | | | 73 |
Notes to financial statements (cont’d)
rights, except that each class bears certain direct expenses, including those specifically related to the distribution of its shares.
Transactions in shares of each class were as follows:
| | | | | | | | | | | | | | | | |
| | | Year Ended
December 31, 2023 | | | Year Ended
December 31, 2022 | |
| | | Shares | | | Amount | | | Shares | | | Amount | |
| Class A | | | | | | | | | | | | | | | | |
| Shares sold | | | 3,418,135 | | | $ | 35,775,152 | | | | 2,781,603 | | | $ | 31,899,824 | |
| Shares issued on reinvestment | | | 1,095,402 | | | | 11,471,173 | | | | 850,419 | | | | 9,414,730 | |
| Shares repurchased | | | (4,130,902) | | | | (43,268,767) | | | | (4,716,659) | | | | (53,203,896) | |
| Net increase (decrease) | | | 382,635 | | | $ | 3,977,558 | | | | (1,084,637) | | | $ | (11,889,342) | |
| | | | |
| Class C | | | | | | | | | | | | | | | | |
| Shares sold | | | 130,025 | | | $ | 1,364,239 | | | | 175,007 | | | $ | 1,926,811 | |
| Shares issued on reinvestment | | | 32,210 | | | | 337,480 | | | | 24,362 | | | | 268,989 | |
| Shares repurchased | | | (276,375) | | | | (2,883,872) | | | | (286,340) | | | | (3,202,045) | |
| Net decrease | | | (114,140) | | | $ | (1,182,153) | | | | (86,971) | | | $ | (1,006,245) | |
| | | | |
| Class C1 | | | | | | | | | | | | | | | | |
| Shares sold | | | 1,785 | | | $ | 18,575 | | | | 1,748 | | | $ | 19,545 | |
| Shares issued on reinvestment | | | 975 | | | | 10,142 | | | | 678 | | | | 7,421 | |
| Shares repurchased | | | (3,573) | | | | (35,277) | | | | (4,746) | | | | (59,612) | |
| Net decrease | | | (813) | | | $ | (6,560) | | | | (2,320) | | | $ | (32,646) | |
| | | | |
| Class I | | | | | | | | | | | | | | | | |
| Shares sold | | | 25,185,776 | | | $ | 265,498,715 | | | | 46,548,368 | | | $ | 533,887,768 | |
| Shares issued on reinvestment | | | 3,467,177 | | | | 36,390,927 | | | | 3,364,573 | | | | 37,153,089 | |
| Shares repurchased | | | (52,508,967) | | | | (554,474,961) | | | | (41,853,686) | | | | (481,347,010) | |
| Net increase (decrease) | | | (23,856,014) | | | $ | (252,585,319) | | | | 8,059,255 | | | $ | 89,693,847 | |
| | | | |
| Class P | | | | | | | | | | | | | | | | |
| Shares sold | | | 32,312 | | | $ | 341,298 | | | | 48,758 | | | $ | 548,916 | |
| Shares issued on reinvestment | | | 37,449 | | | | 392,101 | | | | 31,343 | | | | 346,314 | |
| Shares repurchased | | | (206,329) | | | | (2,156,496) | | | | (181,539) | | | | (2,081,435) | |
| Net decrease | | | (136,568) | | | $ | (1,423,097) | | | | (101,438) | | | $ | (1,186,205) | |
8. Transactions with affiliated company
As defined by the 1940 Act, an affiliated company is one in which the Fund owns 5% or more of the outstanding voting securities, or a company which is under common ownership or control with the Fund. The following company was considered an affiliated company for
| | | | |
74 | | | | Western Asset Corporate Bond Fund 2023 Annual Report |
all or some portion of the year ended December 31, 2023. The following transactions were effected in such company for the year ended December 31, 2023.
| | | | | | | | | | | | | | | | | | | | |
| , | | Affiliate Value at December 31, | | | Purchased | | | Sold | |
| | | 2022 | | | Cost | | | Shares | | | Proceeds | | | Shares | |
| Western Asset Premier Institutional Government Reserves, Premium Shares | | $ | 12,482,788 | | | $ | 439,870,770 | | | | 439,870,770 | | | $ | 423,822,762 | | | | 423,822,762 | |
| | | | | | | | | | | | | | | | |
| (cont’d) | | Realized
Gain (Loss) | | | Dividend
Income | | | Net Increase
(Decrease) in
Unrealized
Appreciation
(Depreciation) | | | Affiliate
Value at
December 31,
2023 | |
| Western Asset Premier Institutional Government Reserves, Premium Shares | | | — | | | $ | 376,193 | | | | — | | | $ | 28,530,796 | |
9. Redemption facility
The Fund, together with other U.S. registered and foreign investment funds (collectively, the “Borrowers”) managed by Franklin Resources or its affiliates, is a borrower in a joint syndicated senior unsecured credit facility totaling $2.675 billion (the “Global Credit Facility”). The Global Credit Facility provides a source of funds to the Borrowers for temporary and emergency purposes, including the ability to meet future unanticipated or unusually large redemption requests. Unless renewed, the Global Credit Facility will terminate on January 31, 2025.
Under the terms of the Global Credit Facility, the Fund shall, in addition to interest charged on any borrowings made by the Fund and other costs incurred by the Fund, pay its share of fees and expenses incurred in connection with the implementation and maintenance of the Global Credit Facility, based upon its relative share of the aggregate net assets of all the Borrowers, including an annual commitment fee of 0.15% based upon the unused portion of the Global Credit Facility. These fees are reflected in the Statement of Operations. The Fund did not utilize the Global Credit Facility during the year ended December 31, 2023.
10. Income tax information and distributions to shareholders
The tax character of distributions paid during the fiscal years ended December 31, was as follows:
| | | | | | | | |
| | | 2023 | | | 2022 | |
| Distributions paid from: | | | | | | | | |
| Ordinary income | | $ | 52,184,941 | | | $ | 48,578,922 | |
| Net long-term capital gains | | | — | | | | 1,275,440 | |
| Total distributions paid | | $ | 52,184,941 | | | $ | 49,854,362 | |
| | | | |
| Western Asset Corporate Bond Fund 2023 Annual Report | | | | 75 |
Notes to financial statements (cont’d)
As of December 31, 2023, the components of distributable earnings (loss) on a tax basis were as follows:
| | | | |
| Deferred capital losses* | | $ | (173,165,157) | |
| Other book/tax temporary differences(a) | | | (14,046,105) | |
| Unrealized appreciation (depreciation)(b) | | | (46,752,602) | |
| Total distributable earnings (loss) — net | | $ | (233,963,864) | |
| * | These capital losses have been deferred in the current year as either short-term or long-term losses. The losses will be deemed to occur on the first day of the next taxable year in the same character as they were originally deferred and will be available to offset future taxable capital gains. |
| (a) | Other book/tax temporary differences are attributable to the tax deferral of losses on straddles, the realization for tax purposes of unrealized gains (losses) on certain futures and foreign currency contracts, the difference between cash and accrual basis distributions paid and book/tax differences in the timing of the deductibility of various expenses. |
| (b) | The difference between book-basis and tax-basis unrealized appreciation (depreciation) is attributable to the tax deferral of losses on wash sales, the difference between book and tax amortization methods for premium on fixed income securities and the difference between the book and tax cost basis of investments in partnerships. |
11. Recent accounting pronouncement
In March 2020, the Financial Accounting Standards Board (FASB) issued Accounting Standards Update (ASU) No. 2020-04, Reference Rate Reform (Topic 848) – Facilitation of the Effects of Reference Rate Reform on Financial Reporting. In January 2021 and December 2022, the FASB issued ASU No. 2021-01 and ASU No. 2022-06, with further amendments to Topic 848. The amendments in the ASUs provide optional temporary accounting recognition and financial reporting relief from the effect of certain types of contract modifications due to the planned discontinuation of the London Interbank Offered Rate (LIBOR) and other interbank-offered based reference rates as of the end of 2021 for certain LIBOR settings and 2023 for the remainder. The ASUs are effective for certain reference rate-related contract modifications that occur during the period March 12, 2020 through December 31, 2024. Management has reviewed the requirements and believes the adoption of these ASUs will not have a material impact on the financial statements.
| | | | |
76 | | | | Western Asset Corporate Bond Fund 2023 Annual Report |
Report of independent registered public accounting firm
To the Board of Trustees of Legg Mason Partners Income Trust and Shareholders of Western Asset Corporate Bond Fund
Opinion on the Financial Statements
We have audited the accompanying statement of assets and liabilities, including the schedule of investments, of Western Asset Corporate Bond Fund (one of the funds constituting Legg Mason Partners Income Trust, referred to hereafter as the “Fund”) as of December 31, 2023, the related statement of operations for the year ended December 31, 2023, the statement of changes in net assets for each of the two years in the period ended December 31, 2023, including the related notes, and the financial highlights for each of the five years in the period ended December 31, 2023 (collectively referred to as the “financial statements”). In our opinion, the financial statements present fairly, in all material respects, the financial position of the Fund as of December 31, 2023, the results of its operations for the year then ended, the changes in its net assets for each of the two years in the period ended December 31, 2023, and the financial highlights for each of the five years in the period ended December 31, 2023 in conformity with accounting principles generally accepted in the United States of America.
Basis for Opinion
These financial statements are the responsibility of the Fund’s management. Our responsibility is to express an opinion on the Fund’s financial statements based on our audit. We are a public accounting firm registered with the Public Company Accounting Oversight Board (United States) (PCAOB) and are required to be independent with respect to the Fund in accordance with the U.S. federal securities laws and the applicable rules and regulations of the Securities and Exchange Commission and the PCAOB.
We conducted our audit of these financial statements in accordance with the standards of the PCAOB. Those standards require that we plan and perform the audit to obtain reasonable assurance about whether the financial statements are free of material misstatement, whether due to error or fraud.
Our audits included performing procedures to assess the risks of material misstatement of the financial statements, whether due to error or fraud, and performing procedures that respond to those risks. Such procedures included examining, on a test basis, evidence regarding the amounts and disclosures in the financial statements. Our audits also included evaluating the accounting principles used and significant estimates made by management, as well as evaluating the overall presentation of the financial statements. Our procedures included confirmation of securities owned as of December 31, 2023 by correspondence with the custodian, agent banks and brokers; when replies were not received, we performed other auditing procedures. We believe that our audits provide a reasonable basis for our opinion.
/s/PricewaterhouseCoopers LLP
Baltimore, Maryland
February 20, 2024
We have served as the auditor of one or more investment companies in the Franklin Templeton Group of Funds since 1948.
| | | | |
| Western Asset Corporate Bond Fund 2023 Annual Report | | | | 77 |
Additional information (unaudited)
Information about Trustees and Officers
The business and affairs of Western Asset Corporate Bond Fund (the “Fund”) are conducted by management under the supervision and subject to the direction of its Board of Trustees. The business address of each Trustee is c/o Jane Trust, Franklin Templeton, 280 Park Avenue, 8th Floor, New York, New York 10017.
Information pertaining to the Trustees and officers of the Fund is set forth below. The Statement of Additional Information includes additional information about Trustees and is available, without charge, upon request by calling the Fund at 877-6LM-FUND/656-3863.
| | |
| Independent Trustees† | | |
| |
| Robert Abeles, Jr. | | |
| |
| Year of birth | | 1945 |
| Position(s) with Fund | | Trustee |
| Term of office1 and length of time served2 | | Since 2013 |
| Principal occupation(s) during the past five years | | Board Member of Excellent Education Development (since 2012); Senior Vice President Emeritus (since 2016) and formerly, Senior Vice President, Finance and Chief Financial Officer (2009 to 2016) at University of Southern California; and formerly, Board Member of Great Public Schools Now (2018 to 2022) |
| Number of funds in fund complex overseen by Trustee3 | | 50 |
| Other Trusteeships held by Trustee during the past five years | | None |
| |
| Jane F. Dasher | | |
| |
| Year of birth | | 1949 |
| Position(s) with Fund | | Trustee |
| Term of office1 and length of time served2 | | Since 1999 |
| Principal occupation(s) during the past five years | | Director (since 2022) and formerly, Chief Financial Officer, Long Light Capital, LLC, formerly known as Korsant Partners, LLC (a family investment company) (since 1997) |
| Number of funds in fund complex overseen by Trustee3 | | 50 |
| Other Trusteeships held by Trustee during the past five years | | Formerly, Director, Visual Kinematics, Inc. (2018 to 2022) |
| |
| Anita L. DeFrantz | | |
| |
| Year of birth | | 1952 |
| Position(s) with Fund | | Trustee |
| Term of office1 and length of time served2 | | Since 1998 |
| Principal occupation(s) during the past five years | | President of Tubman Truth Corp. (since 2015); Vice President (since 2017), Member of the Executive Board (since 2013) and Member of the International Olympic Committee (since 1986); and President Emeritus (since 2015) and formerly, President (1987 to 2015) and Director (1990 to 2015) of LA84 (formerly Amateur Athletic Foundation of Los Angeles) |
| Number of funds in fund complex overseen by Trustee3 | | 50 |
| Other Trusteeships held by Trustee during the past five years | | None |
| | | | |
78 | | | | Western Asset Corporate Bond Fund |
| | |
| Independent Trustees† (cont’d) | | |
| |
| Susan B. Kerley | | |
| |
| Year of birth | | 1951 |
| Position(s) with Fund | | Trustee |
| Term of office1 and length of time served2 | | Since 1992 |
| Principal occupation(s) during the past five years | | Investment Consulting Partner, Strategic Management Advisors, LLC (investment consulting) (since 1990) |
| Number of funds in fund complex overseen by Trustee3 | | 50 |
| Other Trusteeships held by Trustee during the past five years | | Director and Trustee (since 1990) and Chairman (since 2017 and 2005 to 2012) of various series of MainStay Family of Funds (66 funds); formerly, Chairman of the Independent Directors Council (2012 to 2014); ICI Executive Committee (2011 to 2014); and Investment Company Institute (ICI) Board of Governors (2006 to 2014) |
| |
| Michael Larson | | |
| |
| Year of birth | | 1959 |
| Position(s) with Fund | | Trustee |
| Term of office1 and length of time served2 | | Since 2004 |
| Principal occupation(s) during the past five years | | Chief Investment Officer for William H. Gates III (since 1994)4 |
| Number of funds in fund complex overseen by Trustee3 | | 50 |
| Other Trusteeships held by Trustee during the past five years | | Ecolab Inc. (since 2012); Fomento Economico Mexicano, SAB (since 2011); and Republic Services, Inc. (since 2009) |
| |
| Avedick B. Poladian | | |
| |
| Year of birth | | 1951 |
| Position(s) with Fund | | Trustee |
| Term of office1 and length of time served2 | | Since 2007 |
| Principal occupation(s) during the past five years | | Director and Advisor (since 2017) and formerly, Executive Vice President and Chief Operating Officer (2002 to 2016) of Lowe Enterprises, Inc. (privately held real estate and hospitality firm); and formerly, Partner, Arthur Andersen, LLP (1974 to 2002) |
| Number of funds in fund complex overseen by Trustee3 | | 50 |
| Other Trusteeships held by Trustee during the past five years | | Public Storage (since 2010); Occidental Petroleum Corporation (since 2008); and formerly, California Resources Corporation (2014 to 2021) |
| |
| William E.B. Siart | | |
| |
| Year of birth | | 1946 |
| Position(s) with Fund | | Trustee and Chairman of the Board |
| Term of office1 and length of time served2 | | Since 1997 (Chairman of the Board since 2020) |
| Principal occupation(s) during the past five years | | Chairman of Excellent Education Development (since 2000); formerly, Chairman of Great Public Schools Now (2015 to 2020); Trustee of The Getty Trust (2005 to 2017); and Chairman of Walt Disney Concert Hall, Inc. (1998 to 2006) |
| Number of funds in fund complex overseen by Trustee3 | | 50 |
| Other Trusteeships held by Trustee during the past five years | | Trustee, University of Southern California (since 1994); and formerly, Member of Board of United States Golf Association, Executive Committee Member (2017 to 2021) |
| | | | |
| Western Asset Corporate Bond Fund | | | | 79 |
Additional information (unaudited) (cont’d)
Information about Trustees and Officers
| | |
| Independent Trustees† (cont’d) | | |
| |
| Jaynie Miller Studenmund | | |
| |
| Year of birth | | 1954 |
| Position(s) with Fund | | Trustee |
| Term of office1 and length of time served2 | | Since 2004 |
| Principal occupation(s) during the past five years | | Corporate Board Member and Advisor (since 2004); formerly, Chief Operating Officer of Overture Services, Inc. (publicly traded internet company that created search engine marketing) (2001 to 2004); President and Chief Operating Officer, PayMyBills (internet innovator in bill presentment/payment space) (1999 to 2001); and Executive vice president for consumer and business banking for three national financial institutions (1984 to 1997) |
| Number of funds in fund complex overseen by Trustee3 | | 50 |
| Other Trusteeships held by Trustee during the past five years | | Director of Pacific Premier Bancorp Inc. and Pacific Premier Bank (since 2019); Director of EXL (operations management and analytics company) (since 2018); formerly, Director of LifeLock, Inc. (identity theft protection company) (2015 to 2017); Director of CoreLogic, Inc. (information, analytics and business services company) (2012 to 2021); and Director of Pinnacle Entertainment, Inc. (gaming and hospitality company) (2012 to 2018) |
| |
| Peter J. Taylor | | |
| |
| Year of birth | | 1958 |
| Position(s) with Fund | | Trustee |
| Term of office1 and length of time served2 | | Since 2019 |
| Principal occupation(s) during the past five years | | Retired; formerly, President, ECMC Foundation (nonprofit organization) (2014 to 2023); and Executive Vice President and Chief Financial Officer for University of California system (2009 to 2014) |
| Number of funds in fund complex overseen by Trustee3 | | 50 |
| Other Trusteeships held by Trustee during the past five years | | Director of 23andMe, Inc. (genetics and health care services company) (since 2021); Director of Pacific Mutual Holding Company5 (since 2016); Ralph M. Parson Foundation (since 2015); Edison International (since 2011); formerly, Member of the Board of Trustees of California State University system (2015 to 2022); and Kaiser Family Foundation (2012 to 2022) |
| | |
| Interested Trustee | | |
| |
| Ronald L. Olson6 | | |
| |
| Year of birth | | 1941 |
| Position(s) with Fund | | Trustee |
| Term of office1 and length of time served2 | | Since 2005 |
| Principal occupation(s) during the past five years | | Partner of Munger, Tolles & Olson LLP (a law partnership) (since 1968) |
| Number of funds in fund complex overseen by Trustee3 | | 50 |
| Other Trusteeships held by Trustee during the past five years | | Director of Provivi, Inc. (since 2017); and Director of Berkshire Hathaway, Inc. (since 1997) |
| | | | |
80 | | | | Western Asset Corporate Bond Fund |
| | |
| Interested Trustee and Officer | | |
| |
| Jane Trust, CFA7 | | |
| |
| Year of birth | | 1962 |
| Position(s) with Fund | | Trustee, President and Chief Executive Officer |
| Term of office1 and length of time served2 | | Since 2015 |
| Principal occupation(s) during the past five years | | Senior Vice President, Fund Board Management, Franklin Templeton (since 2020); Officer and/or Trustee/Director of 123 funds associated with FTFA or its affiliates (since 2015); President and Chief Executive Officer of FTFA (since 2015); formerly, Senior Managing Director (2018 to 2020) and Managing Director (2016 to 2018) of Legg Mason & Co., LLC (“Legg Mason & Co.”); and Senior Vice President of FTFA (2015) |
| Number of funds in fund complex overseen by Trustee3 | | 123 |
| Other Trusteeships held by Trustee during the past five years | | None |
| | |
| Additional Officers | | |
| |
| Ted P. Becker | | |
| |
Franklin Templeton 280 Park Avenue, 8th Floor, New York, NY 10017 | | |
| |
| Year of birth | | 1951 |
| Position(s) with Fund | | Chief Compliance Officer |
| Term of office1 and length of time served2 | | Since 2007 |
| Principal occupation(s) during the past five years | | Vice President, Global Compliance of Franklin Templeton (since 2020); Chief Compliance Officer of FTFA (since 2006); Chief Compliance Officer of certain funds associated with Legg Mason & Co. or its affiliates (since 2006); formerly, Director of Global Compliance at Legg Mason (2006 to 2020); Managing Director of Compliance of Legg Mason & Co. (2005 to 2020) |
| |
| Susan Kerr | | |
| |
Franklin Templeton 280 Park Avenue, 8th Floor, New York, NY 10017 | | |
| |
| Year of birth | | 1949 |
| Position(s) with Fund | | Chief Anti-Money Laundering Compliance Officer |
| Term of office1 and length of time served2 | | Since 2013 |
| Principal occupation(s) during the past five years | | Senior Compliance Analyst, Franklin Templeton (since 2020); Chief Anti-Money Laundering Compliance Officer of certain funds associated with Legg Mason & Co. or its affiliates (since 2013) and Anti-Money Laundering Compliance Officer (since 2012), Senior Compliance Officer (since 2011) and Assistant Vice President (since 2010) of Franklin Distributors, LLC; formerly, Assistant Vice President of Legg Mason & Co. (2010 to 2020) |
| | | | |
| Western Asset Corporate Bond Fund | | | | 81 |
Additional information (unaudited) (cont’d)
Information about Trustees and Officers
| | |
| Additional Officers (cont’d) | | |
| |
| Marc A. De Oliveira | | |
| |
Franklin Templeton 100 First Stamford Place, 6th Floor, Stamford, CT 06902 | | |
| |
| Year of birth | | 1971 |
| Position(s) with Fund | | Secretary and Chief Legal Officer |
| Term of office1 and length of time served2 | | Since 2020 |
| Principal occupation(s) during the past five years | | Associate General Counsel of Franklin Templeton (since 2020); Assistant Secretary of certain funds associated with Legg Mason & Co. or its affiliates (since 2006); formerly, Managing Director (2016 to 2020) and Associate General Counsel of Legg Mason & Co. (2005 to 2020) |
| |
| Thomas C. Mandia | | |
| |
Franklin Templeton 100 First Stamford Place, 6th Floor, Stamford, CT 06902 | | |
| |
| Year of birth | | 1962 |
| Position(s) with Fund | | Senior Vice President |
| Term of office1 and length of time served2 | | Since 2020 |
| Principal occupation(s) during the past five years | | Senior Associate General Counsel of Franklin Templeton (since 2020); Secretary of FTFA (since 2006); Assistant Secretary of certain funds associated with Legg Mason & Co. or its affiliates (since 2006); Secretary of LM Asset Services, LLC (“LMAS”) (since 2002) and Legg Mason Fund Asset Management, Inc. (“LMFAM”) (since 2013) (formerly registered investment advisers); formerly, Managing Director and Deputy General Counsel of Legg Mason & Co. (2005 to 2020) |
| |
| Christopher Berarducci | | |
| |
Franklin Templeton 280 Park Avenue, 8th Floor, New York, NY 10017 | | |
| |
| Year of birth | | 1974 |
| Position(s) with Fund | | Treasurer and Principal Financial Officer |
| Term of office1 and length of time served2 | | Since 2019 |
| Principal occupation(s) during the past five years | | Vice President, Fund Administration and Reporting, Franklin Templeton (since 2020); Treasurer (since 2010) and Principal Financial Officer (since 2019) of certain funds associated with Legg Mason & Co. or its affiliates; formerly, Managing Director (2020), Director (2015 to 2020), and Vice President (2011 to 2015) of Legg Mason & Co. |
| | | | |
82 | | | | Western Asset Corporate Bond Fund |
| | |
| Additional Officers (cont’d) | | |
| |
| Jeanne M. Kelly | | |
| |
Franklin Templeton 280 Park Avenue, 8th Floor, New York, NY 10017 | | |
| |
| Year of birth | | 1951 |
| Position(s) with Fund | | Senior Vice President |
| Term of office1 and length of time served2 | | Since 2007 |
| Principal occupation(s) during the past five years | | U.S. Fund Board Team Manager, Franklin Templeton (since 2020); Senior Vice President of certain funds associated with Legg Mason & Co. or its affiliates (since 2007); Senior Vice President of FTFA (since 2006); President and Chief Executive Officer of LMAS and LMFAM (since 2015); formerly, Managing Director of Legg Mason & Co. (2005 to 2020); and Senior Vice President of LMFAM (2013 to 2015) |
| | FTFA, referenced above, was formerly known as LMPFA prior to November 30, 2023. |
| † | Trustees who are not “interested persons” of the Fund within the meaning of Section 2(a)(19) of the Investment Company Act of 1940, as amended (the “1940 Act”). |
| 1 | Each Trustee and officer serves until his or her respective successor has been duly elected and qualified or until his or her earlier death, resignation, retirement or removal. |
| 2 | Indicates the earliest year in which the Trustee became a board member for a fund in the Legg Mason fund complex or the officer took such office. |
| 3 | Each board member also serves as a Director of Western Asset Investment Grade Income Fund Inc. and a Trustee of Western Asset Premier Bond Fund (closed-end investment companies), which are considered part of the same fund complex. Additionally, each board member serves as a Trustee of Western Asset Inflation-Linked Income Fund and Western Asset Inflation-Linked Opportunities & Income Fund, closed-end investment companies that are part of the same fund complex. |
| 4 | Mr. Larson is the chief investment officer for William H. Gates III and in that capacity oversees the non-Microsoft investments of Mr. Gates and the all of investments of the Bill and Melinda Gates Foundation Trust (such combined investments are referred to as the “Accounts”). Since 1997, Western Asset has provided discretionary investment advice with respect to one or more Accounts. |
| 5 | Western Asset and its affiliates provide investment advisory services with respect to registered investment companies sponsored by an affiliate of Pacific Mutual Holding Company (“Pacific Holdings”). Affiliates of Pacific Holdings receive compensation from FTFA or its affiliates for shareholder or distribution services provided with respect to registered investment companies for which Western Asset or its affiliates serve as investment adviser. |
| 6 | Mr. Olson is an “interested person” of the Fund, as defined in the 1940 Act, because his law firm has provided legal services to Western Asset. |
| 7 | Ms. Trust is an “interested person” of the Fund, as defined in the 1940 Act, because of her position with FTFA and/or certain of its affiliates. |
| | | | |
| Western Asset Corporate Bond Fund | | | | 83 |
Important tax information (unaudited)
By mid-February, tax information related to a shareholder’s proportionate share of distributions paid during the preceding calendar year will be received, if applicable. Please also refer to www.franklintempleton.com for per share tax information related to any distributions paid during the preceding calendar year. Shareholders are advised to consult with their tax advisors for further information on the treatment of these amounts on their tax returns.
The following tax information for the Fund is required to be furnished to shareholders with respect to income earned and distributions paid during its fiscal year.
The Fund hereby reports the following amounts, or if subsequently determined to be different, the maximum allowable amounts, for the fiscal year ended December 31, 2023:
| | | | | | | | |
| | | Pursuant to: | | | Amount Reported | |
| Income Eligible for Dividends Received Deduction (DRD) | | | §854(b)(1)(A) | | | | $173,639 | |
| Qualified Dividend Income Earned (QDI) | | | §854(b)(1)(B) | | | | $173,639 | |
| Qualified Net Interest Income (QII) | | | §871(k)(1)(C) | | | | $31,107,118 | |
| Section 163(j) Interest Earned | | | §163(j) | | | | $54,226,659 | |
| Interest Earned from Federal Obligations | | | Note (1) | | | | $190,220 | |
Note (1) - The law varies in each state as to whether and what percentage of dividend income attributable to Federal obligations is exempt from state income tax. Shareholders are advised to consult with their tax advisors to determine if any portion of the dividends received is exempt from state income taxes.
| | | | |
84 | | | | Western Asset Corporate Bond Fund |
Western Asset
Corporate Bond Fund
Trustees
Robert Abeles, Jr.
Jane F. Dasher
Anita L. DeFrantz
Susan B. Kerley
Michael Larson
Ronald L. Olson
Avedick B. Poladian
William E.B. Siart
Chairman
Jaynie M. Studenmund
Peter J. Taylor
Jane Trust
Investment manager
Franklin Templeton Fund Adviser, LLC*
Subadviser
Western Asset Management Company, LLC
Distributor
Franklin Distributors, LLC
Custodian
The Bank of New York Mellon
Transfer agent
Franklin Templeton Investor Services, LLC
3344 Quality Drive
Rancho Cordova, CA 95670-7313
Independent registered public accounting firm
PricewaterhouseCoopers LLP
Baltimore, MD
| * | Formerly known as Legg Mason Partners Fund Advisor, LLC. |
Western Asset Corporate Bond Fund
The Fund is a separate investment series of Legg Mason Partners Income Trust, a Maryland statutory trust.
Western Asset Corporate Bond Fund
Legg Mason Funds
620 Eighth Avenue, 47th Floor
New York, NY 10018
The Fund files its complete schedule of portfolio holdings with the Securities and Exchange Commission (“SEC”) for the first and third quarters of each fiscal year as an exhibit to its reports on Form N-PORT. The Fund’s Forms N-PORT are available on the SEC’s website at www.sec.gov. To obtain information on Form N-PORT, shareholders can call the Fund at 877-6LM-FUND/656-3863.
Information on how the Fund voted proxies relating to portfolio securities during the prior 12-month period ended June 30th of each year and a description of the policies and procedures that the Fund uses to determine how to vote proxies related to portfolio transactions are available (1) without charge, upon request, by calling the Fund at 877-6LM-FUND/656-3863, (2) at www.franklintempleton.com and (3) on the SEC’s website at www.sec.gov.
This report is submitted for the general information of the shareholders of Western Asset Corporate Bond Fund. This report is not authorized for distribution to prospective investors in the Fund unless preceded or accompanied by a current prospectus.
Investors should consider the Fund’s investment objectives, risks, charges and expenses carefully before investing. The prospectus contains this and other important information about the Fund. Please read the prospectus carefully before investing.
www.franklintempleton.com
© 2024 Franklin Distributors, LLC, Member FINRA/SIPC. All rights reserved.
Legg Mason Funds Privacy and Security Notice
Your Privacy Is Our Priority
Franklin Templeton* is committed to safeguarding your personal information. This notice is designed to provide you with a summary of the non-public personal information Franklin Templeton may collect and maintain about current or former individual investors; our policy regarding the use of that information; and the measures we take to safeguard the information. We do not sell individual investors’ non-public personal information to anyone and only share it as described in this notice.
Information We Collect
When you invest with us, you provide us with your non-public personal information. We collect and use this information to service your accounts and respond to your requests. The non-public personal information we may collect falls into the following categories:
| • | | Information we receive from you or your financial intermediary on applications or other forms, whether we receive the form in writing or electronically. For example, this information may include your name, address, tax identification number, birth date, investment selection, beneficiary information, and your personal bank account information and/or email address if you have provided that information. |
| • | | Information about your transactions and account history with us, or with other companies that are part of Franklin Templeton, including transactions you request on our website or in our app. This category also includes your communications to us concerning your investments. |
| • | | Information we receive from third parties (for example, to update your address if you move, obtain or verify your email address or obtain additional information to verify your identity). |
| • | | Information collected from you online, such as your IP address or device ID and data gathered from your browsing activity and location. (For example, we may use cookies to collect device and browser information so our website recognizes your online preferences and device information.) Our website contains more information about cookies and similar technologies and ways you may limit them. |
| • | | Other general information that we may obtain about you such as demographic information. |
Disclosure Policy
To better service your accounts and process transactions or services you requested, we may share non-public personal information with other Franklin Templeton companies. From time to time we may also send you information about products/services offered by other Franklin Templeton companies although we will not share your non-public personal information with these companies without first offering you the opportunity to prevent that sharing.
We will only share non-public personal information with outside parties in the limited circumstances permitted by law. For example, this includes situations where we need to share information with companies who work on our behalf to service or maintain your account or
|
| NOT PART OF THE ANNUAL REPORT |
Legg Mason Funds Privacy and Security Notice (cont’d)
process transactions you requested, when the disclosure is to companies assisting us with our own marketing efforts, when the disclosure is to a party representing you, or when required by law (for example, in response to legal process). Additionally, we will ensure that any outside companies working on our behalf, or with whom we have joint marketing agreements, are under contractual obligations to protect the confidentiality of your information, and to use it only to provide the services we asked them to perform.
Confidentiality and Security
Our employees are required to follow procedures with respect to maintaining the confidentiality of our investors’ non-public personal information. Additionally, we maintain physical, electronic and procedural safeguards to protect the information. This includes performing ongoing evaluations of our systems containing investor information and making changes when appropriate.
At all times, you may view our current privacy notice on our website at franklintempleton.com or contact us for a copy at (800) 632-2301.
*For purposes of this privacy notice Franklin Templeton shall refer to the following entities:
Fiduciary Trust International of the South (FTIOS), as custodian for individual retirement plans Franklin Advisers, Inc.
Franklin Distributors, LLC, including as program manager of the Franklin Templeton 529 College Savings Plan and the NJBEST 529 College Savings Plan
Franklin Mutual Advisers, LLC
Franklin, Templeton and Mutual Series Funds
Franklin Templeton Institutional, LLC
Franklin Templeton Investments Corp., Canada
Franklin Templeton Investments Management, Limited UK
Franklin Templeton Portfolio Advisors, Inc.
Legg Mason Funds serviced by Franklin Templeton Investor Services, LLC
Templeton Asset Management, Limited
Templeton Global Advisors, Limited
Templeton Investment Counsel, LLC
If you are a customer of other Franklin Templeton affiliates and you receive notices from them, you will need to read those notices separately.
|
| NOT PART OF THE ANNUAL REPORT |
www.franklintempleton.com
© 2024 Franklin Distributors, LLC, Member FINRA/SIPC. All rights reserved.
FD00317 2/24 SR24-4828
The registrant has adopted a code of ethics that applies to the registrant’s principal executive officer, principal financial officer, principal accounting officer or controller.
| ITEM 3. | AUDIT COMMITTEE FINANCIAL EXPERT. |
The Board of Trustees of the registrant has determined that Robert Abeles, Jr., possess the technical attributes identified in Instruction 2(b) of Item 3 to Form N-CSR to qualify an “audit committee financial expert,” and has designated Mr. Abeles, Jr. as the Audit Committee’s financial expert. Mr. Abeles, Jr. is an “independent” Trustees pursuant to paragraph (a) (2) of Item 3 to Form N-CSR.
| ITEM 4. | PRINCIPAL ACCOUNTANT FEES AND SERVICES. |
a) Audit-Related Fees. The aggregate fees billed in the last two fiscal years ending December 31, 2022 and December 31, 2023 (the “Reporting Periods”) for professional services rendered by the Registrant’s principal accountant (the “Auditor”) for the audit of the Registrant’s annual financial statements, or services that are normally provided by the Auditor in connection with the statutory and regulatory filings or engagements for the Reporting Periods, were $124,686 in December 31, 2022 and $124,686 in December 31, 2023.
b) Audit-Related Fees. The aggregate fees billed in the Reporting Period for assurance and related services by the Auditor that are reasonably related to the performance of the Registrant’s financial statements were $0 in December 31, 2022 and $0 in December 31, 2023.
(c) Tax Fees. The aggregate fees billed in the Reporting Periods for professional services rendered by the Auditor for tax compliance, tax advice and tax planning (“Tax Services”) were $30,000 in December 31, 2022 and $30,000 in December 31, 2023. These services consisted of (i) review or preparation of U.S. federal, state, local and excise tax returns; (ii) U.S. federal, state and local tax planning, advice and assistance regarding statutory, regulatory or administrative developments, and (iii) tax advice regarding tax qualification matters and/or treatment of various financial instruments held or proposed to be acquired or held.
There were no fees billed for tax services by the Auditors to service affiliates during the Reporting Periods that required pre-approval by the Audit Committee.
d) All Other Fees. The aggregate fees billed in the Reporting Periods for products and services provided by the Auditor, other than the services reported in paragraphs (a) through (c) for the Item 4 for the Legg Mason Partners Income Trust, were $0 in December 31, 2022 and $0 in December 31, 2023.
All Other Fees. There were no other non-audit services rendered by the Auditor to Franklin Templeton Fund Adviser, LLC (“FTFA”), and any entity controlling, controlled by or under common control with FTFA that provided ongoing services to Legg Mason Partners Income Trust requiring pre-approval by the Audit Committee in the Reporting Period.
(e) Audit Committee’s pre–approval policies and procedures described in paragraph (c) (7) of Rule 2-01 of Regulation S-X.
(1) The Charter for the Audit Committee (the “Committee”) of the Board of each registered investment company (the “Fund”) advised by FTFA or one of their affiliates (each, an “Adviser”) requires that the Committee shall approve (a) all audit and permissible non-audit services to be provided to the Fund and (b) all permissible non-audit services to be provided by the Fund’s independent auditors to the Adviser and any Covered Service Providers if the engagement relates directly to the operations and financial reporting of the Fund. The Committee may implement policies and procedures by which such services are approved other than by the full Committee.
The Committee shall not approve non-audit services that the Committee believes may impair the independence of the auditors. As of the date of the approval of this Audit Committee Charter, permissible non-audit services include any professional services (including tax services), that are not prohibited services as described below, provided to the Fund by the independent auditors, other than those provided to the Fund in connection with an audit or a review of the financial statements of the Fund. Permissible non-audit services may not include: (i) bookkeeping or other services related to the accounting records or financial statements of the Fund; (ii) financial information systems design and implementation; (iii) appraisal or valuation services, fairness opinions or contribution-in-kind reports; (iv) actuarial services; (v) internal audit outsourcing services; (vi) management functions or human resources; (vii) broker or dealer, investment adviser or investment banking services; (viii) legal services and expert services unrelated to the audit; and (ix) any other service the Public Company Accounting Oversight Board determines, by regulation, is impermissible.
Pre-approval by the Committee of any permissible non-audit services is not required so long as: (i) the aggregate amount of all such permissible non-audit services provided to the Fund, the Adviser and any service providers controlling, controlled by or under common control with the Adviser that provide ongoing services to the Fund (“Covered Service Providers”) constitutes not more than 5% of the total amount of revenues paid to the independent auditors during the fiscal year in which the permissible non-audit services are provided to (a) the Fund, (b) the Adviser and (c) any entity controlling, controlled by or under common control with the Adviser that provides ongoing services to the Fund during the fiscal year in which the services are provided that would have to be approved by the Committee; (ii) the permissible non-audit services were not recognized by the Fund at the time of the engagement to be non-audit services; and (iii) such services are promptly brought to the attention of the Committee and approved by the Committee (or its delegate(s)) prior to the completion of the audit.
(2) None of the services described in paragraphs (b) through (d) of this Item were performed in reliance on paragraph (c)(7)(i)(C) of Rule 2-01 of Regulation S-X.
(f) Not applicable.
(g) Non-audit fees billed by the Auditor for services rendered to Legg Mason Partners Income Trust, FTFA and any entity controlling, controlled by, or under common control with FTFA that provides ongoing services to Legg Mason Partners Income Trust during the reporting period were $350,359 in December 31, 2022 and $342,635 in December 31, 2023.
(h) Yes. Legg Mason Partners Income Trust’s Audit Committee has considered whether the provision of non-audit services that were rendered to Service Affiliates, which were not pre-approved (not requiring pre-approval), is compatible with maintaining the Accountant’s independence. All services provided by the Auditor to the Legg Mason Partners Income Trust or to Service Affiliates, which were required to be pre-approved, were pre-approved as required.
(i) Not applicable.
(j) Not applicable.
| ITEM 5. | AUDIT COMMITTEE OF LISTED REGISTRANTS. |
| | a) | The independent board members are acting as the registrant’s audit committee as specified in Section 3(a)(58)(B) of the Exchange Act. The Audit Committee consists of the following Board members: |
Robert Abeles, Jr.
Jane F. Dasher
Anita L. DeFrantz
Susan B. Kerley
Michael Larson
Avedick B. Poladian
William E.B. Siart
Jaynie M. Studenmund
Peter J. Taylor
| ITEM 6. | SCHEDULE OF INVESTMENTS. |
Included herein under Item 1.
| ITEM 7. | DISCLOSURE OF PROXY VOTING POLICIES AND PROCEDURES FOR CLOSED-END MANAGEMENT INVESTMENT COMPANIES. |
Not applicable.
| ITEM 8. | PORTFOLIO MANAGERS OF CLOSED-END MANAGEMENT INVESTMENT COMPANIES. |
Not applicable.
| ITEM 9. | PURCHASES OF EQUITY SECURITIES BY CLOSED-END MANAGEMENT INVESTMENT COMPANY AND AFFILIATED PURCHASERS. |
Not applicable.
| ITEM 10. | SUBMISSION OF MATTERS TO A VOTE OF SECURITY HOLDERS. |
Not applicable.
| ITEM 11. | CONTROLS AND PROCEDURES. |
| | (a) | The registrant’s principal executive officer and principal financial officer have concluded that the registrant’s disclosure controls and procedures (as defined in Rule 30a- 3(c) under the Investment Company Act of 1940, as amended (the “1940 Act”)) are effective as of a date within 90 days of the filing date of this report that includes the disclosure required by this paragraph, based on their evaluation of the disclosure controls and procedures required by Rule 30a-3(b) under the 1940 Act and 15d-15(b) under the Securities Exchange Act of 1934. |
| | (b) | There were no changes in the registrant’s internal control over financial reporting (as defined in Rule 30a-3(d) under the 1940 Act) that occurred during the period covered by this report that have materially affected, or are likely to materially affect the registrant’s internal control over financial reporting. |
| ITEM 12. | DISCLOSURE OF SECURITIES LENDING ACTIVITIES FOR CLOSED-END MANAGEMENT INVESTMENT COMPANIES. |
Not applicable.
| ITEM 13. | RECOVERY OF ERRONEOUSLY AWARDED COMPENSATION. |
(a) (1) Code of Ethics attached hereto.
Exhibit 99.CODE ETH
(a) (2) Certifications pursuant to section 302 of the Sarbanes-Oxley Act of 2002 attached hereto.
Exhibit 99.CERT
(b) Certifications pursuant to Section 906 of the Sarbanes-Oxley Act of 2002 attached hereto.
Exhibit 99.906CERT
SIGNATURES
Pursuant to the requirements of the Securities Exchange Act of 1934 and the Investment Company Act of 1940, the registrant has duly caused this Report to be signed on its behalf by the undersigned, there unto duly authorized.
| | |
| Legg Mason Partners Income Trust |
| |
| By: | | /s/ Jane Trust |
| | Jane Trust |
| | Chief Executive Officer |
| |
| Date: | | February 28, 2024 |
Pursuant to the requirements of the Securities Exchange Act of 1934 and the Investment Company Act of 1940, this report has been signed below by the following persons on behalf of the registrant and in the capacities and on the dates indicated.
| | |
| By: | | /s/ Jane Trust |
| | Jane Trust |
| | Chief Executive Officer |
| |
| Date: | | February 28, 2024 |
| | |
| By: | | /s/ Christopher Berarducci |
| | Christopher Berarducci |
| | Principal Financial Officer |
| |
| Date: | | February 28, 2024 |