Table of Contents
UNITED STATES
SECURITIES AND EXCHANGE COMMISSION
Washington, D.C. 20549
FORM N-CSR
CERTIFIED SHAREHOLDER REPORT OF
REGISTERED MANAGEMENT INVESTMENT COMPANIES
Investment Company Act file number 811-04253
MFS SERIES TRUST XV
(Exact name of registrant as specified in charter)
111 Huntington Avenue, Boston, Massachusetts 02199
(Address of principal executive offices) (Zip code)
Kristin V. Collins
Massachusetts Financial Services Company
111 Huntington Avenue
Boston, Massachusetts 02199
(Name and address of agents for service)
Registrant’s telephone number, including area code: (617) 954-5000
Date of fiscal year end: October 31
Date of reporting period: April 30, 2016
Table of Contents
| ITEM 1. | REPORTS TO STOCKHOLDERS. |
Table of Contents
SEMIANNUAL REPORT
April 30, 2016

MFS® COMMODITY
STRATEGY FUND

CMS-SEM
Table of Contents
MFS® COMMODITY STRATEGY FUND
The report is prepared for the general information of shareholders.
It is authorized for distribution to prospective investors only when preceded or accompanied by a current prospectus.
NOT FDIC INSURED • MAY LOSE VALUE • NO BANK GUARANTEE
Table of Contents

Dear Shareholders:
Markets have largely recovered after a significant bout of volatility earlier this year. Oil prices have rebounded sharply, and the dollar has weakened against most currencies.
Global economic growth remains sluggish, and almost every major central bank — aside from the U.S. Federal Reserve — is continuing to loosen monetary policy. This should help keep interest rates lower for longer on a global basis.
Even with a weaker dollar, soft global growth continues to negatively impact U.S. exports. In Europe, a crucial referendum on Britain’s continued membership in the European Union is set for June 23. China continues to face headwinds in its shift to a consumer-led economy, which is weighing on its manufacturing sector. Emerging markets have been beneficiaries of the weaker U.S. dollar and firmer commodity prices.
At MFS®, we believe it is best to view markets through a long lens, and not react to short-term swings. That makes it possible to filter out market noise and focus on long-term fundamentals.
In our view, the professional guidance of a financial advisor, along with a patient, long-term approach, will help you reach your investment objectives.
Respectfully,

Robert J. Manning
Chairman
MFS Investment Management
June 16, 2016
The opinions expressed in this letter are subject to change and may not be relied upon for investment advice. No forecasts can be guaranteed.
1
Table of Contents
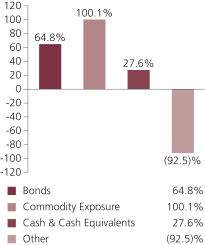
Portfolio structure (c)(i)
| Fixed income sectors (i) | ||||
| Investment Grade Corporates | 46.1% | |||
| Asset-Backed Securities | 8.9% | |||
| Non-U.S. Government Bonds | 2.9% | |||
| Emerging Markets Bonds | 2.2% | |||
| Mortgage-Backed Securities | 1.5% | |||
| U.S. Treasury Securities | 1.2% | |||
| U.S. Government Agencies | 1.0% | |||
| Commercial Mortgage-Backed Securities | 0.4% | |||
| High Yield Corporates | 0.3% | |||
| Collateralized Debt Obligations | 0.2% | |||
| Residential Mortgage-Backed Securities | 0.1% |
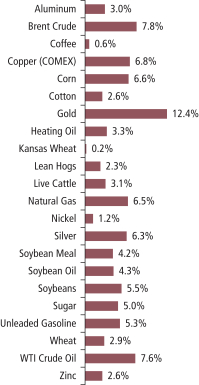
Commodity exposure (c)(i)
| Composition including fixed income credit quality (a)(i) | ||||
| AAA | 11.0% | |||
| AA | 9.3% | |||
| A | 18.9% | |||
| BBB | 21.5% | |||
| BB | 0.3% | |||
| U.S. Government | 1.9% | |||
| Federal Agencies | 2.5% | |||
| Not Rated | (0.6)% | |||
| Non-Fixed Income | 100.1% | |||
| Cash & Cash Equivalents | 27.6% | |||
| Other | (92.5)% | |||
2
Table of Contents
Portfolio Composition – continued
| (a) | For all securities other than those specifically described below, ratings are assigned to underlying securities utilizing ratings from Moody’s, Fitch, and Standard & Poor’s rating agencies and applying the following hierarchy: If all three agencies provide a rating, the middle rating (after dropping the highest and lowest ratings) is assigned; if two of the three agencies rate a security, the lower of the two is assigned. Ratings are shown in the S&P and Fitch scale (e.g., AAA). Securities rated BBB or higher are considered investment grade. All ratings are subject to change. U.S. Government includes securities issued by the U.S. Department of the Treasury. Federal Agencies includes rated and unrated U.S. Agency fixed-income securities, U.S. Agency mortgage-backed securities, and collateralized mortgage obligations of U.S. Agency mortgage-backed securities. Not Rated includes fixed income securities, including fixed income futures contracts, which have not been rated by any rating agency. Non-Fixed Income includes any equity securities (including convertible bonds and equity derivatives) and/or commodity-linked derivatives. The fund may not hold all of these instruments. The fund is not rated by these agencies. |
| (c) | MFS expects to gain exposure to the commodities markets by primarily investing the fund’s assets in the MFS Commodity Strategy Portfolio, a wholly-owned and controlled subsidiary organized in the Cayman Islands (“Subsidiary”). The Subsidiary gains exposure to the commodities markets by investing in commodity-linked derivatives (such as commodity-linked futures, options, and/or swaps). MFS may also gain exposure to the commodities markets by investing the fund’s assets directly in commodity-linked notes. The fund’s and the Subsidiary’s investments in commodity-linked derivatives and/or commodity-linked notes are leveraged (i.e. involves investment exposure greater than the amount of the investment). For more information about commodity-linked derivatives and commodity-linked notes and the risks of investing in such notes, please see the Notes to Consolidated Financial Statements and the fund’s prospectus. |
| (i) | For purposes of this presentation, the components include the value of securities, less any securities sold short, and reflect the impact of the equivalent exposure of derivative positions, if any. These amounts may be negative from time to time. Equivalent exposure is a calculated amount that translates the derivative position into a reasonable approximation of the amount of the underlying asset that the portfolio would have to hold at a given point in time to have the same price sensitivity that results from the portfolio’s ownership of the derivative contract. When dealing with derivatives, equivalent exposure is a more representative measure of the potential impact of a position on portfolio performance than value. The bond component will include any accrued interest amounts. |
From time to time Other may be negative due to equivalent exposure from currency derivatives and/or offsets to derivative positions.
The fund invests a portion of its assets in the MFS Commodity Strategy Portfolio, a wholly-owned subsidiary of the fund. Percentages reflect exposure to the underlying holdings of the MFS Commodity Strategy Portfolio and not to the exposure from investing directly in the MFS Commodity Strategy Portfolio itself.
Where the fund holds convertible bonds, these are treated as part of the equity portion of the portfolio.
Cash & Cash Equivalents includes any cash, investments in money market funds, short-term securities, and other assets less liabilities. Please see the Statement of Assets and Liabilities for additional information related to the fund’s cash position and other assets and liabilities.
Other includes currency derivatives and/or any offsets to derivative positions.
Percentages are based on net assets as of 4/30/16.
The portfolio is actively managed and current holdings may be different.
3
Table of Contents
Fund expenses borne by the shareholders during the period, November 1, 2015 through April 30, 2016
As a shareholder of the fund, you incur two types of costs: (1) transaction costs, including sales charges (loads) on certain purchase or redemption payments, and (2) ongoing costs, including management fees; distribution and service (12b-1) fees; and other fund expenses. This example is intended to help you understand your ongoing costs (in dollars) of investing in the fund and to compare these costs with the ongoing costs of investing in other mutual funds.
The example is based on an investment of $1,000 invested at the beginning of the period and held for the entire period November 1, 2015 through April 30, 2016.
Actual Expenses
The first line for each share class in the following table provides information about actual account values and actual expenses. You may use the information in this line, together with the amount you invested, to estimate the expenses that you paid over the period. Simply divide your account value by $1,000 (for example, an $8,600 account value divided by $1,000 = 8.6), then multiply the result by the number in the first line under the heading entitled “Expenses Paid During Period” to estimate the expenses you paid on your account during this period.
Hypothetical Example for Comparison Purposes
The second line for each share class in the following table provides information about hypothetical account values and hypothetical expenses based on the fund’s actual expense ratio and an assumed rate of return of 5% per year before expenses, which is not the fund’s actual return. The hypothetical account values and expenses may not be used to estimate the actual ending account balance or expenses you paid for the period. You may use this information to compare the ongoing costs of investing in the fund and other funds. To do so, compare this 5% hypothetical example with the 5% hypothetical examples that appear in the shareholder reports of the other funds.
Please note that the expenses shown in the table are meant to highlight your ongoing costs only and do not reflect any transactional costs, such as sales charges (loads). Therefore, the second line for each share class in the table is useful in comparing ongoing costs only, and will not help you determine the relative total costs of owning different funds. In addition, if these transactional costs were included, your costs would have been higher.
4
Table of Contents
Expense Table – continued
| Share Class | Annualized Ratio | Beginning Account Value 11/01/15 | Ending Account Value | Expenses Paid During Period (p) 11/01/15-4/30/16 | ||||||||||||||
| A | Actual | 1.06% | $1,000.00 | $995.56 | $5.26 | |||||||||||||
| Hypothetical (h) | 1.06% | $1,000.00 | $1,019.59 | $5.32 | ||||||||||||||
| I | Actual | 0.83% | $1,000.00 | $997.95 | $4.12 | |||||||||||||
| Hypothetical (h) | 0.83% | $1,000.00 | $1,020.74 | $4.17 | ||||||||||||||
| R5 | Actual | 0.82% | $1,000.00 | $997.95 | $4.07 | |||||||||||||
| Hypothetical (h) | 0.82% | $1,000.00 | $1,020.79 | $4.12 | ||||||||||||||
| (h) | 5% class return per year before expenses. |
| (p) | “Expenses Paid During Period” are equal to each class’s annualized expense ratio, as shown above, multiplied by the average account value over the period, multiplied by 182/366 (to reflect the one-half year period). Expenses paid do not include any applicable sales charges (loads). If these transaction costs had been included, your costs would have been higher. |
5
Table of Contents
CONSOLIDATED PORTFOLIO OF INVESTMENTS
4/30/16 (unaudited)
The Portfolio of Investments is a complete list of all securities owned by your fund. It is categorized by broad-based asset classes.
| Bonds - 65.2% | ||||||||
| Issuer | Shares/Par | Value ($) | ||||||
| Asset-Backed & Securitized - 9.6% | ||||||||
| AmeriCredit Automobile Receivables Trust, 2015-1, “A2A”, 0.77%, 4/09/2018 | $ | 455,991 | $ | 455,804 | ||||
| AmeriCredit Automobile Receivables Trust, 2015-3, “A2A”, 1.07%, 1/08/2019 | 1,007,611 | 1,007,516 | ||||||
| ARI Fleet Lease Trust, “A2”, 0.81%, 11/15/2022 (n) | 299,812 | 299,355 | ||||||
| ARI Fleet Lease Trust, 2016-A, “A2”, 1.82%, 7/15/2024 (n) | 1,185,000 | 1,184,615 | ||||||
| Babson Ltd., CLO, “A1”, FRN, 0.857%, 1/18/2021 (n) | 178,928 | 176,526 | ||||||
| BMW Vehicle Lease Trust, 2015-1, “A2B”, FRN, 0.758%, 2/21/2017 | 834,397 | 834,482 | ||||||
| Carmax Auto Owner Trust, 2014-4, “A2A”, 0.67%, 2/15/2018 | 503,293 | 503,165 | ||||||
| Chesapeake Funding II LLC, 2016-1A, “A2”, FRN, 1.582%, 3/15/2028 (n) | 1,031,000 | 1,030,897 | ||||||
| Chesapeake Funding LLC, “A”, FRN, 0.888%, 1/07/2025 (n) | 568,808 | 568,489 | ||||||
| Chesapeake Funding LLC, 2015-1A, “A”, FRN, 0.938%, 2/07/2027 (n) | 2,410,312 | 2,399,837 | ||||||
| Chrysler Capital Auto Receivables Trust 2016-A, 1.47%, 4/15/2019 (n) | 980,000 | 979,590 | ||||||
| Chrysler Capital Auto Receivables Trust, 2015-AA, “A2”, 0.81%, 11/15/2017 (n) | 613,913 | 613,644 | ||||||
| Citigroup/Deutsche Bank Commercial Mortgage Trust, 5.322%, 12/11/2049 | 614,461 | 624,864 | ||||||
| CNH Equipment Trust, “A2”, 0.63%, 12/15/2017 | 370,346 | 370,233 | ||||||
| CNH Wholesale Master Note Trust, “A”, FRN, 1.032%, 8/15/2019 (n) | 1,444,000 | 1,443,571 | ||||||
| Credit Acceptance Auto Loan Trust, 2015-2A, “A”, 2.4%, 2/15/2023 (n) | 1,524,000 | 1,521,021 | ||||||
| Credit Suisse Commercial Mortgage Trust, “A4”, FRN, 6.14%, 9/15/2039 | 396,111 | 410,446 | ||||||
| CWCapital Cobalt Ltd., “A4”, FRN, 5.956%, 5/15/2046 | 558,171 | 580,051 | ||||||
| DT Auto Owner Trust, 0.98%, 4/16/2018 (n) | 160,623 | 160,539 | ||||||
| DT Auto Owner Trust, 2016-2A, “A”, 1.73%, 8/15/2019 (z) | 740,000 | 739,996 | ||||||
| Enterprise Fleet Financing LLC, 2014-1, “A2”, 0.87%, 9/20/2019 (n) | 500,930 | 500,290 | ||||||
| Exeter Automobile Receivables Trust, 2015-1A, “A”, 1.6%, 6/17/2019 (n) | 636,493 | 636,255 | ||||||
| Exeter Automobile Receivables Trust, 2015-2A, “A”, 1.54%, 11/15/2019 (n) | 804,312 | 801,419 | ||||||
| Exeter Automobile Receivables Trust, 2016-1A, “A”, 2.35%, 7/15/2020 (n) | 540,552 | 540,574 | ||||||
6
Table of Contents
Consolidated Portfolio of Investments (unaudited) – continued
| Issuer | Shares/Par | Value ($) | ||||||
| Bonds - continued | ||||||||
| Asset-Backed & Securitized - continued | ||||||||
| Flagship Credit Auto Trust, 2016-1, “A”, 2.77%, 12/15/2020 (n) | $ | 1,106,158 | $ | 1,110,605 | ||||
| Ford Credit Auto Owner Trust, 2014-1, “A”, 2.26%, 11/15/2025 (n) | 406,000 | 411,405 | ||||||
| Ford Credit Auto Owner Trust, 2014-2, “A”, 2.31%, 4/15/2026 (n) | 1,602,000 | 1,624,131 | ||||||
| Ford Credit Floorplan Master Owner Trust, 2015-1, “A2”, FRN, 0.832%, 1/15/2020 | 2,500,000 | 2,492,846 | ||||||
| GE Dealer Floorplan Master Note Trust, 2014-1, “A”, FRN, 0.818%, 7/20/2019 | 1,700,000 | 1,695,834 | ||||||
| GM Financial Automobile Leasing Trust, 2015-3A, “A2”, 1.17%, 6/20/2018 | 1,500,000 | 1,498,455 | ||||||
| GO Financial Auto Securitization Trust, 2015-1, “A”, 1.81%, 3/15/2018 (n) | 374,958 | 374,594 | ||||||
| GO Financial Auto Securitization, Trust, 2015-2, “A”, 11/19/15, 3.27%, 11/15/2018 (z) | 681,080 | 679,463 | ||||||
| Gulf Stream Sextant CLO Ltd., 2007-1A, “A1A”, FRN, 0.864%, 6/17/2021 (n) | 167,337 | 166,863 | ||||||
| Hertz Fleet Lease Funding LP, 2013-3, “A”, FRN, 0.986%, 12/10/2027 (n) | 699,547 | 698,760 | ||||||
| Hertz Fleet Lease Funding LP, 2016-1, “A2”, 1.96%, 4/10/2030 (n) | 920,000 | 919,983 | ||||||
| Honda Auto Receivables Owner Trust, 2015-1, “A2”, 0.7%, 6/15/2017 | 493,914 | 493,792 | ||||||
| Hyundai Auto Lease Securitization Trust, 2015-A, “A2”, 1%, 10/16/2017 (n) | 1,769,543 | 1,769,805 | ||||||
| Hyundai Auto Receivables Trust 2015-C, “A2A”, 0.99%, 11/15/2018 | 932,404 | 931,960 | ||||||
| JPMorgan Chase Commercial Mortgage Securities Corp., 5.42%, 1/15/2049 | 715,848 | 731,743 | ||||||
| Kingsland III Ltd., “A1”, CDO, FRN, 0.839%, 8/24/2021 (n) | 203,911 | 202,769 | ||||||
| KKR Financial CLO Ltd., 2007-1A, “A”, FRN, 0.968%, 5/15/2021 (n) | 524,013 | 522,598 | ||||||
| Kubota Credit Owner Trust, 2015-1A, “A2”, 0.94%, 12/15/2017 (n) | 1,181,586 | 1,180,527 | ||||||
| Mercedes-Benz Auto Lease Trust, 2015-A, “A2B”, FRN, 0.752%, 2/15/2017 | 201,467 | 201,467 | ||||||
| Mercedes-Benz Auto Lease Trust, 2015-B, “A2A”, 1%, 1/16/2018 | 2,200,000 | 2,201,030 | ||||||
| Motor PLC, 2014-1A, “A1”, FRN, 0.913%, 8/25/2021 (n) | 114,768 | 114,702 | ||||||
| Motor PLC, 2015-1A, “A1”, FRN, 1.033%, 6/25/2022 (n) | 2,277,112 | 2,273,097 | ||||||
| Nationstar HECM Loan Trust, 2015-2A, “A”, 11/19/15, 2.882%, 11/25/2025 (z) | 477,685 | 476,864 | ||||||
| Navient Student Loan Trust, 2016-AA , “A1”, FRN, 1.532%, 12/15/2025 (n) | 662,731 | 663,791 | ||||||
| Nextgear Floorplan Master Owner Trust, 2015-1A, “A”, 1.8%, 7/15/2019 (n) | 2,327,000 | 2,313,580 | ||||||
| Nissan Master Owner Trust Receivables 2015, “A-1”, FRN, 0.832%, 1/15/2020 | 1,140,000 | 1,139,513 | ||||||
| Sierra Receivables Funding Co. LLC, 2015-1A, “A”, 2.4%, 3/22/2032 (n) | 796,534 | 786,267 | ||||||
7
Table of Contents
Consolidated Portfolio of Investments (unaudited) – continued
| Issuer | Shares/Par | Value ($) | ||||||
| Bonds - continued | ||||||||
| Asset-Backed & Securitized - continued | ||||||||
| Suntrust Auto Receivables Trust, 0.99%, 6/15/2018 (n) | $ | 2,876,244 | $ | 2,876,045 | ||||
| Toyota Auto Receivables Owner Trust, 2015-A, “A2”, 0.71%, 7/17/2017 | 1,107,480 | 1,107,093 | ||||||
| Tricon American Homes 2015-SFR1, Trust “1A”, FRN, 1.686%, 5/17/2032 (n) | 710,000 | 699,025 | ||||||
| Volkswagen Credit Auto Master Trust, 2014-1A, “A1”, FRN, 0.788%, 7/22/2019 (n) | 2,700,000 | 2,663,579 | ||||||
| Volvo Financial Equipment LLC, “A2”, 1.44%, 10/15/2018 (n) | 1,061,000 | 1,062,625 | ||||||
| Wheels SPV LLC, 2014-1A, “A2”, 0.84%, 3/20/2023 (n) | 723,709 | 721,323 | ||||||
| Wheels SPV LLC, 2015-1A, “A2”, 1.27%, 4/22/2024 (n) | 2,300,001 | 2,281,842 | ||||||
|
| |||||||
| $ | 57,471,155 | |||||||
| Automotive - 4.2% | ||||||||
| American Honda Finance Corp., 1.6%, 7/13/2018 | $ | 2,000,000 | $ | 2,016,240 | ||||
| American Honda Finance Corp., FRN, 1.073%, 9/20/2017 | 460,000 | 461,142 | ||||||
| American Honda Finance Corp., FRN, 1.009%, 5/26/2016 (n) | 700,000 | 700,309 | ||||||
| Daimler Finance North America LLC, 2.4%, 4/10/2017 (n) | 520,000 | 526,132 | ||||||
| Daimler Finance North America LLC, 1.875%, 1/11/2018 (n) | 1,300,000 | 1,308,762 | ||||||
| Daimler Finance North America LLC, 1.65%, 5/18/2018 (n) | 2,750,000 | 2,756,955 | ||||||
| Daimler Finance North America LLC, FRN, 1.295%, 8/01/2016 (n) | 480,000 | 480,216 | ||||||
| Ford Motor Credit Co. LLC, 2.021%, 5/03/2019 | 340,000 | 340,000 | ||||||
| Ford Motor Credit Co. LLC, FRN, 1.153%, 9/08/2017 | 1,860,000 | 1,852,060 | ||||||
| Ford Motor Credit Co. LLC, FRN, 1.568%, 1/09/2018 | 1,770,000 | 1,765,469 | ||||||
| Hyundai Capital America, 2%, 3/19/2018 (n) | 2,022,000 | 2,030,719 | ||||||
| Hyundai Capital America, 2.4%, 10/30/2018 (n) | 640,000 | 645,177 | ||||||
| Nissan Motor Acceptance Corp., FRN, 1.33%, 9/26/2016 (n) | 1,180,000 | 1,182,086 | ||||||
| Nissan Motor Acceptance Corp., FRN, 1.181%, 3/03/2017 (n) | 1,000,000 | 1,000,227 | ||||||
| Toyota Motor Credit Corp., 1.7%, 2/19/2019 | 1,190,000 | 1,201,610 | ||||||
| Toyota Motor Credit Corp., FRN, 1.022%, 1/17/2019 | 1,620,000 | 1,610,538 | ||||||
| Volkswagen Group of America Finance LLC, 1.65%, 5/22/2018 (n) | 1,900,000 | 1,882,398 | ||||||
| Volkswagen Group of America Finance LLC, FRN, 0.988%, 5/23/2017 (n) | 1,260,000 | 1,249,000 | ||||||
| Volkswagen Group of America Finance LLC, FRN, 1.058%, 11/20/2017 (n) | 1,500,000 | 1,473,120 | ||||||
| Volkswagen International Finance N.V., 1.125%, 11/18/2016 (n) | 570,000 | 569,855 | ||||||
|
| |||||||
| $ | 25,052,015 | |||||||
| Banks & Diversified Financials (Covered Bonds) - 0.5% | ||||||||
| Credit Mutuel-CIC Home Loan, 1.5%, 11/16/2017 (n) | $ | 1,000,000 | $ | 1,001,183 | ||||
| National Bank of Canada, 2.2%, 10/19/2016 (n) | 1,060,000 | 1,065,607 | ||||||
| SpareBank 1 Boligkreditt A.S., 2.625%, 5/27/2016 (n) | 750,000 | 750,593 | ||||||
|
| |||||||
| $ | 2,817,383 | |||||||
| Broadcasting - 0.1% | ||||||||
| SES Global Americas Holdings GP, 2.5%, 3/25/2019 (n) | $ | 371,000 | $ | 370,724 | ||||
8
Table of Contents
Consolidated Portfolio of Investments (unaudited) – continued
| Issuer | Shares/Par | Value ($) | ||||||
| Bonds - continued | ||||||||
| Brokerage & Asset Managers - 0.3% | ||||||||
| Franklin Resources, Inc., 1.375%, 9/15/2017 | $ | 182,000 | $ | 182,652 | ||||
| Intercontinental Exchange, Inc., 2.75%, 12/01/2020 | 1,402,000 | 1,444,043 | ||||||
| NYSE Euronext, 2%, 10/05/2017 | 486,000 | 490,303 | ||||||
|
| |||||||
| $ | 2,116,998 | |||||||
| Business Services - 0.4% | ||||||||
| Cisco Systems, Inc., FRN, 0.911%, 3/03/2017 | $ | 1,800,000 | $ | 1,802,759 | ||||
| Fidelity National Information Services, Inc., 2.85%, 10/15/2018 | 450,000 | 459,202 | ||||||
| Total System Services, Inc., 3.8%, 4/01/2021 | 432,000 | 448,440 | ||||||
|
| |||||||
| $ | 2,710,401 | |||||||
| Chemicals - 1.2% | ||||||||
| CF Industries, Inc., 6.875%, 5/01/2018 | $ | 1,487,000 | $ | 1,620,293 | ||||
| Chevron Phillips Chemical Co. LLC, 1.7%, 5/01/2018 (n) | 3,000,000 | 2,988,453 | ||||||
| Dow Chemical Co., 8.55%, 5/15/2019 | 2,000,000 | 2,388,336 | ||||||
| LyondellBasell Industries N.V., 5%, 4/15/2019 | 390,000 | 420,829 | ||||||
|
| |||||||
| $ | 7,417,911 | |||||||
| Computer Software - 0.5% | ||||||||
| Microsoft Corp., 2%, 11/03/2020 | $ | 2,909,000 | $ | 2,979,770 | ||||
| Computer Software - Systems - 0.3% | ||||||||
| Apple, Inc., 1.7%, 2/22/2019 | $ | 705,000 | $ | 714,636 | ||||
| Apple, Inc., FRN, 0.868%, 5/03/2018 | 910,000 | 910,177 | ||||||
|
| |||||||
| $ | 1,624,813 | |||||||
| Conglomerates - 0.6% | ||||||||
| ABB Finance (USA), Inc., 1.625%, 5/08/2017 | $ | 1,141,000 | $ | 1,147,456 | ||||
| ABB Treasury Center (USA), Inc., 2.5%, 6/15/2016 (n) | 1,156,000 | 1,158,166 | ||||||
| Roper Industries, Inc., 1.85%, 11/15/2017 | 1,164,000 | 1,169,081 | ||||||
|
| |||||||
| $ | 3,474,703 | |||||||
| Consumer Products - 1.0% | ||||||||
| Mattel, Inc., 1.7%, 3/15/2018 | $ | 226,000 | $ | 225,427 | ||||
| Mattel, Inc., 2.5%, 11/01/2016 | 400,000 | 402,586 | ||||||
| Newell Brands, Inc., 2.6%, 3/29/2019 | 523,000 | 535,095 | ||||||
| Newell Rubbermaid, Inc., 2.05%, 12/01/2017 | 426,000 | 429,073 | ||||||
| Newell Rubbermaid, Inc., 2.875%, 12/01/2019 | 1,450,000 | 1,487,851 | ||||||
| Reckitt Benckiser PLC, 2.125%, 9/21/2018 (n) | 2,890,000 | 2,904,912 | ||||||
|
| |||||||
| $ | 5,984,944 | |||||||
| Consumer Services - 0.1% | ||||||||
| Experian Finance PLC, 2.375%, 6/15/2017 (n) | $ | 462,000 | $ | 463,824 | ||||
9
Table of Contents
Consolidated Portfolio of Investments (unaudited) – continued
| Issuer | Shares/Par | Value ($) | ||||||
| Bonds - continued | ||||||||
| Electrical Equipment - 0.4% | ||||||||
| Amphenol Corp., 1.55%, 9/15/2017 | $ | 830,000 | $ | 829,642 | ||||
| Arrow Electronics, Inc., 3%, 3/01/2018 | 240,000 | 243,304 | ||||||
| Molex Electronic Technologies LLC, 2.878%, 4/15/2020 (n) | 1,408,000 | 1,405,170 | ||||||
|
| |||||||
| $ | 2,478,116 | |||||||
| Electronics - 0.5% | ||||||||
| Intel Corp., 1.35%, 12/15/2017 | $ | 1,052,000 | $ | 1,059,055 | ||||
| Lam Research Corp., 2.75%, 3/15/2020 | 801,000 | 803,062 | ||||||
| Tyco Electronics Group S.A., 2.375%, 12/17/2018 | 281,000 | 283,927 | ||||||
| Xilinx, Inc., 2.125%, 3/15/2019 | 890,000 | 897,581 | ||||||
|
| |||||||
| $ | 3,043,625 | |||||||
| Emerging Market Quasi-Sovereign - 0.7% | ||||||||
| CNOOC Finance (2013) Ltd., 1.125%, 5/09/2016 | $ | 730,000 | $ | 729,927 | ||||
| Corporacion Financiera de Desarrollo S.A., 3.25%, 7/15/2019 (n) | 1,170,000 | 1,200,420 | ||||||
| Korea Gas Corp., 2.25%, 7/25/2017 (n) | 440,000 | 443,835 | ||||||
| Petroleos Mexicanos, 3.125%, 1/23/2019 | 321,000 | 320,198 | ||||||
| State Grid International Development Co. Ltd., 1.75%, 5/22/2018 (n) | 1,342,000 | 1,340,729 | ||||||
|
| |||||||
| $ | 4,035,109 | |||||||
| Energy - Independent - 0.0% | ||||||||
| Anadarko Petroleum Corp., 6.375%, 9/15/2017 | $ | 196,000 | $ | 208,104 | ||||
| Energy - Integrated - 0.9% | ||||||||
| BG Energy Capital PLC, 2.875%, 10/15/2016 (n) | $ | 970,000 | $ | 975,264 | ||||
| BP Capital Markets PLC, 2.521%, 1/15/2020 | 806,000 | 824,953 | ||||||
| Chevron Corp., 0.889%, 6/24/2016 | 370,000 | 370,208 | ||||||
| Chevron Corp., 1.104%, 12/05/2017 | 567,000 | 567,330 | ||||||
| Shell International Finance B.V., 1.125%, 8/21/2017 | 550,000 | 550,322 | ||||||
| Shell International Finance B.V., FRN, 0.828%, 11/15/2016 | 1,800,000 | 1,800,531 | ||||||
| Total Capital International S.A., 1.5%, 2/17/2017 | 600,000 | 602,738 | ||||||
|
| |||||||
| $ | 5,691,346 | |||||||
| Financial Institutions - 0.2% | ||||||||
| LeasePlan Corp. N.V., 3%, 10/23/2017 (n) | $ | 540,000 | $ | 543,701 | ||||
| LeasePlan Corp. N.V., 2.5%, 5/16/2018 (n) | 405,000 | 400,796 | ||||||
|
| |||||||
| $ | 944,497 | |||||||
| Food & Beverages - 3.8% | ||||||||
| Anheuser-Busch InBev Finance, Inc., 1.9%, 2/01/2019 | $ | 1,392,000 | $ | 1,411,950 | ||||
| Anheuser-Busch InBev Finance, Inc., 2.65%, 2/01/2021 | 1,465,000 | 1,504,618 | ||||||
| Anheuser-Busch InBev Finance, Inc., FRN, 2.15%, 2/01/2019 | 960,000 | 980,538 | ||||||
| Anheuser-Busch InBev S.A., 1.375%, 7/15/2017 | 1,164,000 | 1,169,045 | ||||||
| Diageo Capital PLC, 1.5%, 5/11/2017 | 850,000 | 854,815 | ||||||
10
Table of Contents
Consolidated Portfolio of Investments (unaudited) – continued
| Issuer | Shares/Par | Value ($) | ||||||
| Bonds - continued | ||||||||
| Food & Beverages - continued | ||||||||
| General Mills, Inc., 1.4%, 10/20/2017 | $ | 2,300,000 | $ | 2,311,413 | ||||
| H.J. Heinz Co., 1.6%, 6/30/2017 (n) | 1,550,000 | 1,555,073 | ||||||
| Ingredion, Inc., 1.8%, 9/25/2017 | 314,000 | 314,989 | ||||||
| J.M. Smucker Co., 1.75%, 3/15/2018 | 1,000,000 | 1,006,369 | ||||||
| Kellogg Co., 4.45%, 5/30/2016 | 320,000 | 320,882 | ||||||
| Kraft Foods Group, Inc., 6.125%, 8/23/2018 | 1,560,000 | 1,720,044 | ||||||
| Mead Johnson Nutrition Co., 3%, 11/15/2020 | 394,000 | 407,826 | ||||||
| Molson Coors Brewing Co., 2%, 5/01/2017 | 778,000 | 782,559 | ||||||
| PepsiCo, Inc., 2.5%, 5/10/2016 | 970,000 | 970,330 | ||||||
| Pernod-Ricard S.A., 2.95%, 1/15/2017 (n) | 2,830,000 | 2,860,224 | ||||||
| SABMiller Holdings, Inc., 2.45%, 1/15/2017 (n) | 600,000 | 605,333 | ||||||
| SABMiller Holdings, Inc., FRN, 1.305%, 8/01/2018 (n) | 1,530,000 | 1,525,233 | ||||||
| Tyson Foods, Inc., 2.65%, 8/15/2019 | 869,000 | 892,068 | ||||||
| Want Want China Finance Co., 1.875%, 5/14/2018 (n) | 680,000 | 675,736 | ||||||
| Wm. Wrigley Jr. Co., 1.4%, 10/21/2016 (n) | 791,000 | 792,701 | ||||||
| Wm. Wrigley Jr. Co., 2.4%, 10/21/2018 (n) | 96,000 | 97,761 | ||||||
|
| |||||||
| $ | 22,759,507 | |||||||
| Food & Drug Stores - 0.7% | ||||||||
| CVS Health Corp., 1.2%, 12/05/2016 | $ | 550,000 | $ | 551,323 | ||||
| CVS Health Corp., 1.9%, 7/20/2018 | 2,000,000 | 2,027,502 | ||||||
| Walgreens Boots Alliance, Inc., 1.75%, 11/17/2017 | 1,700,000 | 1,708,364 | ||||||
|
| |||||||
| $ | 4,287,189 | |||||||
| Gaming & Lodging - 0.1% | ||||||||
| Wyndham Worldwide Corp., 2.95%, 3/01/2017 | $ | 580,000 | $ | 585,940 | ||||
| Insurance - 1.5% | ||||||||
| American International Group, Inc., 2.3%, 7/16/2019 | $ | 1,182,000 | $ | 1,196,321 | ||||
| American International Group, Inc., 3.3%, 3/01/2021 | 1,138,000 | 1,173,202 | ||||||
| MetLife Global Funding I, FRN, 1.008%, 4/10/2017 (n) | 1,700,000 | 1,701,678 | ||||||
| Metropolitan Life Global Funding I, 2%, 4/14/2020 (n) | 2,200,000 | 2,188,404 | ||||||
| Metropolitan Life Global Funding I, 1.158%, 7/15/2016 (n) | 980,000 | 980,908 | ||||||
| Prudential Financial, Inc., FRN, 1.398%, 8/15/2018 | 1,250,000 | 1,247,085 | ||||||
| Voya Financial, Inc., 2.9%, 2/15/2018 | 423,000 | 430,231 | ||||||
|
| |||||||
| $ | 8,917,829 | |||||||
| Insurance - Health - 0.2% | ||||||||
| Aetna, Inc., 1.5%, 11/15/2017 | $ | 100,000 | $ | 100,359 | ||||
| UnitedHealth Group, Inc., 1.45%, 7/17/2017 | 1,210,000 | 1,216,869 | ||||||
|
| |||||||
| $ | 1,317,228 | |||||||
| Insurance - Property & Casualty - 0.2% | ||||||||
| Marsh & McLennan Cos., Inc., 2.35%, 9/10/2019 | $ | 1,300,000 | $ | 1,309,597 | ||||
11
Table of Contents
Consolidated Portfolio of Investments (unaudited) – continued
| Issuer | Shares/Par | Value ($) | ||||||
| Bonds - continued | ||||||||
| International Market Quasi-Sovereign - 1.9% | ||||||||
| Bank Nederlandse Gemeenten N.V., 1.375%, 3/19/2018 (n) | $ | 1,150,000 | $ | 1,156,105 | ||||
| Dexia Credit Local S.A., 1.25%, 10/18/2016 (n) | 1,110,000 | 1,111,369 | ||||||
| Dexia Credit Local S.A., 2.25%, 1/30/2019 (n) | 590,000 | 600,218 | ||||||
| Electricite de France, 2.15%, 1/22/2019 (n) | 1,200,000 | 1,222,050 | ||||||
| KFW Government Development Banks, 1.125%, 11/16/2018 | 1,200,000 | 1,201,975 | ||||||
| KFW Government Development Banks, 0.875%, 4/19/2018 | 695,000 | 693,673 | ||||||
| Kommunalbanken A.S., 0.75%, 11/21/2016 (n) | 560,000 | 559,630 | ||||||
| Kommunalbanken A.S., 1%, 3/15/2018 (n) | 330,000 | 329,943 | ||||||
| Kommunalbanken A.S., FRN, 0.748%, 10/31/2016 (n) | 160,000 | 160,026 | ||||||
| Municipality Finance PLC, 2.375%, 5/16/2016 | 1,180,000 | 1,180,787 | ||||||
| Nederlandse Waterschapsbank N.V., 1.5%, 4/16/2018 (n) | 1,570,000 | 1,581,455 | ||||||
| Statoil A.S.A., 1.8%, 11/23/2016 | 350,000 | 351,837 | ||||||
| Statoil A.S.A., FRN, 0.908%, 5/15/2018 | 852,000 | 844,370 | ||||||
| Statoil A.S.A., FRN, 1.08%, 11/08/2018 | 490,000 | 486,432 | ||||||
|
| |||||||
| $ | 11,479,870 | |||||||
| International Market Sovereign - 0.7% | ||||||||
| Kingdom of Denmark, 0.875%, 3/20/2017 (n) | $ | 500,000 | $ | 500,375 | ||||
| Kingdom of Sweden, 1%, 2/27/2018 (n) | 1,100,000 | 1,101,300 | ||||||
| Republic of Finland, 1%, 4/23/2019 (n) | 2,300,000 | 2,293,178 | ||||||
| Republic of Iceland, 4.875%, 6/16/2016 (n) | 334,000 | 334,839 | ||||||
|
| |||||||
| $ | 4,229,692 | |||||||
| Internet - 0.1% | ||||||||
| Baidu, Inc., 2.75%, 6/09/2019 | $ | 539,000 | $ | 546,165 | ||||
| Local Authorities - 0.5% | ||||||||
| Florida Hurricane Catastrophe Fund Finance Corp. Rev., “A”, 1.298%, 7/01/2016 | $ | 1,400,000 | $ | 1,401,890 | ||||
| Kommuninvest i Sverige AB, 0.875%, 12/13/2016 (n) | 450,000 | 450,147 | ||||||
| Province of Ontario, 1.1%, 10/25/2017 | 1,110,000 | 1,111,566 | ||||||
|
| |||||||
| $ | 2,963,603 | |||||||
| Major Banks - 6.9% | ||||||||
| ABN AMRO Bank N.V., 4.25%, 2/02/2017 (n) | $ | 1,420,000 | $ | 1,446,236 | ||||
| ABN AMRO Bank N.V., 1.8%, 6/04/2018 (n) | 2,750,000 | 2,746,832 | ||||||
| ABN AMRO Bank N.V., FRN, 1.045%, 6/06/2016 (n) | 1,130,000 | 1,130,087 | ||||||
| Bank of Montreal, 1.45%, 4/09/2018 | 3,010,000 | 3,009,031 | ||||||
| BNP Paribas, 2.7%, 8/20/2018 | 1,090,000 | 1,117,787 | ||||||
| BNP Paribas, FRN, 1.222%, 12/12/2016 | 280,000 | 280,600 | ||||||
| BNP Paribas, FRN, 1.122%, 3/17/2017 | 600,000 | 599,796 | ||||||
| Canadian Imperial Bank of Commerce, FRN, 1.152%, 7/18/2016 | 840,000 | 840,922 | ||||||
| Commonwealth Bank of Australia, 1.75%, 11/02/2018 | 1,000,000 | 1,004,585 | ||||||
| Commonwealth Bank of Australia, FRN, 1.123%, 9/20/2016 (n) | 1,020,000 | 1,021,788 | ||||||
12
Table of Contents
Consolidated Portfolio of Investments (unaudited) – continued
| Issuer | Shares/Par | Value ($) | ||||||
| Bonds - continued | ||||||||
| Major Banks - continued | ||||||||
| Commonwealth Bank of Australia, FRN, 0.992%, 3/13/2017 (n) | $ | 410,000 | $ | 410,131 | ||||
| Commonwealth Bank of Australia, FRN, 0.903%, 9/08/2017 (n) | 1,800,000 | 1,794,476 | ||||||
| DBS Bank Ltd., 2.35%, 2/28/2017 (n) | 770,000 | 776,324 | ||||||
| DNB Bank A.S.A., 3.2%, 4/03/2017 (n) | 1,135,000 | 1,154,241 | ||||||
| HSBC Bank PLC, 3.1%, 5/24/2016 (n) | 310,000 | 310,447 | ||||||
| HSBC Bank PLC, FRN, 1.258%, 5/15/2018 (n) | 1,294,000 | 1,287,170 | ||||||
| Huntington National Bank, FRN, 1.063%, 4/24/2017 | 1,910,000 | 1,906,327 | ||||||
| ING Bank N.V., 1.8%, 3/16/2018 (n) | 3,100,000 | 3,111,591 | ||||||
| ING Bank N.V., 3.75%, 3/07/2017 (n) | 424,000 | 432,963 | ||||||
| ING Bank N.V., 2.3%, 3/22/2019 (n) | 500,000 | 505,566 | ||||||
| Mitsubishi UFJ Financial Group, Inc., 2.95%, 3/01/2021 | 780,000 | 796,651 | ||||||
| Mizuho Bank Ltd., FRN, 1.08%, 9/25/2017 (n) | 1,800,000 | 1,791,281 | ||||||
| Nordea Bank AB, FRN, 1.078%, 5/13/2016 (n) | 1,000,000 | 1,000,219 | ||||||
| Nordea Bank AB, FRN, 0.988%, 4/04/2017 (n) | 410,000 | 410,142 | ||||||
| PNC Bank N.A., 1.3%, 10/03/2016 | 790,000 | 791,021 | ||||||
| PNC Bank N.A., 1.15%, 11/01/2016 | 1,200,000 | 1,202,039 | ||||||
| PNC Bank N.A., 1.5%, 10/18/2017 | 1,240,000 | 1,245,868 | ||||||
| PNC Bank N.A., 1.6%, 6/01/2018 | 1,750,000 | 1,758,859 | ||||||
| PNC Bank N.A., 2.25%, 7/02/2019 | 1,140,000 | 1,162,196 | ||||||
| Sumitomo Mitsui Banking Corp., FRN, 0.948%, 7/11/2017 | 1,400,000 | 1,392,217 | ||||||
| Toronto-Dominion Bank, 1.75%, 7/23/2018 | 2,500,000 | 2,515,268 | ||||||
| Wells Fargo & Co., FRN, 0.893%, 9/08/2017 | 1,880,000 | 1,873,710 | ||||||
| Wells Fargo Bank N.A., FRN, 1.375%, 1/22/2018 | 600,000 | 602,844 | ||||||
|
| |||||||
| $ | 41,429,215 | |||||||
| Medical & Health Technology & Services - 0.7% | ||||||||
| Becton, Dickinson and Co., 1.75%, 11/08/2016 | $ | 300,000 | $ | 300,944 | ||||
| Becton, Dickinson and Co., 1.45%, 5/15/2017 | 420,000 | 420,769 | ||||||
| Becton, Dickinson and Co., 1.8%, 12/15/2017 | 1,500,000 | 1,507,928 | ||||||
| Catholic Health Initiatives, 1.6%, 11/01/2017 | 400,000 | 400,954 | ||||||
| Covidien International Finance S.A., 6%, 10/15/2017 | 401,000 | 429,499 | ||||||
| Laboratory Corp. of America Holdings, 2.625%, 2/01/2020 | 1,450,000 | 1,464,689 | ||||||
|
| |||||||
| $ | 4,524,783 | |||||||
| Medical Equipment - 0.4% | ||||||||
| Medtronic, Inc., 1.5%, 3/15/2018 | $ | 260,000 | $ | 262,161 | ||||
| Zimmer Holdings, Inc., 2%, 4/01/2018 | 2,400,000 | 2,419,284 | ||||||
|
| |||||||
| $ | 2,681,445 | |||||||
| Metals & Mining - 0.6% | ||||||||
| Freeport-McMoRan Copper & Gold, Inc., 2.15%, 3/01/2017 | $ | 890,000 | $ | 876,374 | ||||
| Freeport-McMoRan Copper & Gold, Inc., 2.375%, 3/15/2018 | 420,000 | 403,200 | ||||||
| Glencore Funding LLC, 2.125%, 4/16/2018 (n) | 900,000 | 871,083 | ||||||
| Glencore Funding LLC, FRN, 1.795%, 5/27/2016 (n) | 1,520,000 | 1,516,200 | ||||||
|
| |||||||
| $ | 3,666,857 | |||||||
13
Table of Contents
Consolidated Portfolio of Investments (unaudited) – continued
| Issuer | Shares/Par | Value ($) | ||||||
| Bonds - continued | ||||||||
| Midstream - 0.9% | ||||||||
| Energy Transfer Partners LP, 2.5%, 6/15/2018 | $ | 600,000 | $ | 587,301 | ||||
| EnLink Midstream Partners LP, 2.7%, 4/01/2019 | 430,000 | 396,918 | ||||||
| Enterprise Products Operating LP, 6.5%, 1/31/2019 | 930,000 | 1,037,619 | ||||||
| Kinder Morgan (Delaware), Inc., 2%, 12/01/2017 | 660,000 | 654,253 | ||||||
| ONEOK Partners LP, 3.2%, 9/15/2018 | 790,000 | 786,149 | ||||||
| TransCanada PipeLines Ltd., 1.875%, 1/12/2018 | 522,000 | 522,448 | ||||||
| TransCanada PipeLines Ltd., FRN, 1.308%, 6/30/2016 | 1,190,000 | 1,190,524 | ||||||
|
| |||||||
| $ | 5,175,212 | |||||||
| Mortgage-Backed - 1.5% | ||||||||
| Fannie Mae, 3%, 10/01/2030 | $ | 635,441 | $ | 664,277 | ||||
| Fannie Mae, 1.114%, 2/25/2017 | 667,321 | 667,366 | ||||||
| Fannie Mae, 4.5%, 4/01/2024 | 622,676 | 657,512 | ||||||
| Fannie Mae, 4%, 3/01/2025 | 71,034 | 75,893 | ||||||
| Fannie Mae, 4.5%, 5/01/2025 | 227,575 | 242,281 | ||||||
| Fannie Mae, 3%, 4/01/2030 - 5/01/2030 | 1,570,947 | 1,642,234 | ||||||
| Fannie Mae, FRN, 0.744%, 12/25/2017 | 607,246 | 606,223 | ||||||
| Fannie Mae, FRN, 0.653%, 5/25/2018 | 801,277 | 800,656 | ||||||
| Fannie Mae, FRN, 0.788%, 5/25/2018 | 2,036,089 | 2,035,750 | ||||||
| Freddie Mac, 1.655%, 11/25/2016 | 174,289 | 174,383 | ||||||
| Freddie Mac, 1.426%, 8/25/2017 | 220,772 | 221,332 | ||||||
| Freddie Mac, 4%, 7/01/2025 | 465,278 | 496,062 | ||||||
| Freddie Mac, 3.5%, 8/01/2026 | 578,877 | 613,211 | ||||||
|
| |||||||
| $ | 8,897,180 | |||||||
| Natural Gas - Distribution - 0.1% | ||||||||
| Engie, 1.625%, 10/10/2017 (n) | $ | 740,000 | $ | 740,636 | ||||
| Network & Telecom - 1.9% | ||||||||
| AT&T, Inc., 2.4%, 8/15/2016 | $ | 160,000 | $ | 160,758 | ||||
| AT&T, Inc., 2.4%, 3/15/2017 | 520,000 | 525,347 | ||||||
| AT&T, Inc., 2.45%, 6/30/2020 | 730,000 | 741,430 | ||||||
| AT&T, Inc., FRN, 1.545%, 11/27/2018 | 1,570,000 | 1,573,368 | ||||||
| British Telecommunications PLC, 2.35%, 2/14/2019 | 1,090,000 | 1,114,838 | ||||||
| Verizon Communications, Inc., 1.35%, 6/09/2017 | 580,000 | 581,493 | ||||||
| Verizon Communications, Inc., 6.1%, 4/15/2018 | 2,100,000 | 2,290,649 | ||||||
| Verizon Communications, Inc., FRN, 2.163%, 9/15/2016 | 1,850,000 | 1,858,682 | ||||||
| Verizon Communications, Inc., FRN, 1.412%, 6/17/2019 | 2,433,000 | 2,434,995 | ||||||
|
| |||||||
| $ | 11,281,560 | |||||||
| Oil Services - 0.4% | ||||||||
| Schlumberger Holdings Corp., 1.9%, 12/21/2017 (n) | $ | 2,000,000 | $ | 1,995,474 | ||||
| Transocean, Inc., 5.8%, 12/15/2016 | 650,000 | 654,563 | ||||||
|
| |||||||
| $ | 2,650,037 | |||||||
14
Table of Contents
Consolidated Portfolio of Investments (unaudited) – continued
| Issuer | Shares/Par | Value ($) | ||||||
| Bonds - continued | ||||||||
| Oils - 0.4% | ||||||||
| Marathon Petroleum Corp., 2.7%, 12/14/2018 | $ | 2,174,000 | $ | 2,213,560 | ||||
| Other Banks & Diversified Financials - 7.3% | ||||||||
| Abbey National Treasury Services PLC, 3.05%, 8/23/2018 | $ | 439,000 | $ | 452,655 | ||||
| American Express Credit Corp., 2.8%, 9/19/2016 | 420,000 | 423,111 | ||||||
| Banco Santander Chile, FRN, 1.528%, 4/11/2017 (n) | 1,410,000 | 1,406,475 | ||||||
| Bank of Tokyo-Mitsubishi UFJ Ltd., FRN, 1.246%, 9/09/2016 (n) | 1,320,000 | 1,321,321 | ||||||
| Banque Federative du Credit Mutuel, 2.75%, 1/22/2019 (n) | 400,000 | 408,984 | ||||||
| Banque Federative du Credit Mutuel, 2%, 4/12/2019 (n) | 1,590,000 | 1,595,902 | ||||||
| Banque Federative du Credit Mutuel, FRN, 1.484%, 10/28/2016 (n) | 420,000 | 420,964 | ||||||
| Banque Federative du Credit Mutuel, FRN, 1.484%, 1/20/2017 (n) | 1,010,000 | 1,012,641 | ||||||
| BNZ International Funding Ltd. London, 1.9%, 2/26/2018 (n) | 4,000,000 | 4,015,968 | ||||||
| BPCE S.A., 1.625%, 1/26/2018 | 1,430,000 | 1,431,873 | ||||||
| BPCE S.A., 2.5%, 7/15/2019 | 1,234,000 | 1,252,589 | ||||||
| Capital One Bank (USA) N.A., FRN, 1.3%, 2/05/2018 | 2,200,000 | 2,195,475 | ||||||
| Capital One Financial Corp., 2.45%, 4/24/2019 | 420,000 | 424,826 | ||||||
| Citizens Bank N.A., 2.3%, 12/03/2018 | 1,400,000 | 1,408,642 | ||||||
| Discover Bank, 3.1%, 6/04/2020 | 1,190,000 | 1,212,289 | ||||||
| Fifth Third Bancorp, 1.35%, 6/01/2017 | 1,800,000 | 1,800,434 | ||||||
| Fifth Third Bancorp, 2.3%, 3/01/2019 | 364,000 | 366,013 | ||||||
| Fifth Third Bancorp, 2.3%, 3/15/2019 | 1,040,000 | 1,050,892 | ||||||
| First Republic Bank, 2.375%, 6/17/2019 | 278,000 | 278,297 | ||||||
| Groupe BPCE S.A., 2.5%, 12/10/2018 | 920,000 | 937,020 | ||||||
| Intesa Sanpaolo S.p.A., 2.375%, 1/13/2017 | 660,000 | 662,977 | ||||||
| Lloyds Bank PLC, 1.75%, 5/14/2018 | 2,950,000 | 2,951,861 | ||||||
| Lloyds Bank PLC, 2.3%, 11/27/2018 | 630,000 | 638,395 | ||||||
| Macquarie Bank Ltd., FRN, 1.265%, 10/27/2017 (n) | 1,900,000 | 1,894,378 | ||||||
| National Bank of Canada, FRN, 1.472%, 12/14/2018 | 3,200,000 | 3,204,317 | ||||||
| Skandinaviska Enskilda, 1.75%, 3/19/2018 (n) | 480,000 | 479,411 | ||||||
| Skandinaviska Enskilda Banken AB, 2.45%, 5/27/2020 (n) | 2,200,000 | 2,223,234 | ||||||
| Svenska Handelsbanken AB, 2.875%, 4/04/2017 | 566,000 | 575,765 | ||||||
| Svenska Handelsbanken AB, FRN, 1.094%, 9/23/2016 | 250,000 | 250,327 | ||||||
| Swedbank AB, 2.125%, 9/29/2017 (n) | 2,462,000 | 2,486,349 | ||||||
| Union Bank, 3%, 6/06/2016 | 280,000 | 280,559 | ||||||
| Westpac Banking Corp., 2%, 8/14/2017 | 400,000 | 403,976 | ||||||
| Westpac Banking Corp., 1.55%, 5/25/2018 | 3,000,000 | 3,002,016 | ||||||
| Westpac Banking Corp., FRN, 0.949%, 5/19/2017 | 1,000,000 | 999,328 | ||||||
|
| |||||||
| $ | 43,469,264 | |||||||
| Pharmaceuticals - 3.0% | ||||||||
| AbbVie, Inc., 1.8%, 5/14/2018 | $ | 2,500,000 | $ | 2,517,390 | ||||
| Actavis Funding SCS, 2.35%, 3/12/2018 | 1,305,000 | 1,319,288 | ||||||
| Actavis Funding SCS, 3%, 3/12/2020 | 1,058,000 | 1,080,682 | ||||||
| Actavis, Inc., 1.875%, 10/01/2017 | 330,000 | 330,933 | ||||||
15
Table of Contents
Consolidated Portfolio of Investments (unaudited) – continued
| Issuer | Shares/Par | Value ($) | ||||||
| Bonds - continued | ||||||||
| Pharmaceuticals - continued | ||||||||
| Amgen, Inc., 2.3%, 6/15/2016 | $ | 440,000 | $ | 440,866 | ||||
| Bayer U.S. Finance LLC, 1.5%, 10/06/2017 (n) | 1,860,000 | 1,869,153 | ||||||
| Biogen, Inc., 2.9%, 9/15/2020 | 940,000 | 974,108 | ||||||
| Bristol-Myers Squibb Co., 0.875%, 8/01/2017 | 1,087,000 | 1,087,000 | ||||||
| Celgene Corp., 2.125%, 8/15/2018 | 1,410,000 | 1,429,039 | ||||||
| EMD Finance LLC, 1.7%, 3/19/2018 (n) | 3,000,000 | 3,005,400 | ||||||
| Gilead Sciences, Inc., 1.85%, 9/04/2018 | 1,310,000 | 1,332,814 | ||||||
| Mylan, Inc., 1.8%, 6/24/2016 | 790,000 | 790,682 | ||||||
| Mylan, Inc., 1.35%, 11/29/2016 | 205,000 | 204,625 | ||||||
| Sanofi, 1.25%, 4/10/2018 | 1,400,000 | 1,405,964 | ||||||
|
| |||||||
| $ | 17,787,944 | |||||||
| Printing & Publishing - 0.3% | ||||||||
| Pearson PLC, 4%, 5/17/2016 (n) | $ | 1,000,000 | $ | 1,000,809 | ||||
| Thomson Reuters Corp., 0.875%, 5/23/2016 | 740,000 | 740,000 | ||||||
|
| |||||||
| $ | 1,740,809 | |||||||
| Real Estate - Healthcare - 0.1% | ||||||||
| Ventas Realty LP, REIT, 1.55%, 9/26/2016 | $ | 470,000 | $ | 470,686 | ||||
| Welltower, Inc., REIT, 2.25%, 3/15/2018 | 264,000 | 266,362 | ||||||
|
| |||||||
| $ | 737,048 | |||||||
| Real Estate - Office - 0.2% | ||||||||
| Mack-Cali Realty LP, 2.5%, 12/15/2017 | $ | 330,000 | $ | 331,016 | ||||
| Vornado Realty LP, REIT, 2.5%, 6/30/2019 | 595,000 | 600,494 | ||||||
|
| |||||||
| $ | 931,510 | |||||||
| Real Estate - Retail - 0.2% | ||||||||
| Simon Property Group, Inc., REIT, 1.5%, 2/01/2018 (n) | $ | 302,000 | $ | 303,242 | ||||
| WEA Finance LLC/Westfield Co., REIT, 1.75%, 9/15/2017 (n) | 670,000 | 669,349 | ||||||
|
| |||||||
| $ | 972,591 | |||||||
| Restaurants - 0.1% | ||||||||
| McDonald’s Corp., 2.1%, 12/07/2018 | $ | 830,000 | $ | 847,553 | ||||
| Retailers - 0.5% | ||||||||
| Dollar General Corp., 4.125%, 7/15/2017 | $ | 1,760,000 | $ | 1,815,090 | ||||
| Dollar General Corp., 1.875%, 4/15/2018 | 195,000 | 196,728 | ||||||
| Wesfarmers Ltd., 2.983%, 5/18/2016 (n) | 300,000 | 300,252 | ||||||
| Wesfarmers Ltd., 1.874%, 3/20/2018 (n) | 421,000 | 421,541 | ||||||
|
| |||||||
| $ | 2,733,611 | |||||||
| Specialty Chemicals - 0.3% | ||||||||
| Air Products & Chemicals, Inc., 2%, 8/02/2016 | $ | 174,000 | $ | 174,545 | ||||
| Airgas, Inc., 2.95%, 6/15/2016 | 700,000 | 700,225 | ||||||
| Airgas, Inc., 3.05%, 8/01/2020 | 700,000 | 714,662 | ||||||
|
| |||||||
| $ | 1,589,432 | |||||||
16
Table of Contents
Consolidated Portfolio of Investments (unaudited) – continued
| Issuer | Shares/Par | Value ($) | ||||||
| Bonds - continued | ||||||||
| Supranational - 0.6% | ||||||||
| Banco Latinoamericano de Comercio Exterior S.A., 3.25%, 5/07/2020 (n) | $ | 1,370,000 | $ | 1,381,988 | ||||
| Corporacion Andina de Fomento, 1.5%, 8/08/2017 | 1,300,000 | 1,304,407 | ||||||
| Corporacion Andina de Fomento, FRN, 1.188%, 1/29/2018 | 520,000 | 520,645 | ||||||
| West African Development Bank, 4/28/16, 5.5%, 5/06/2021 (z) | 208,000 | 209,664 | ||||||
|
| |||||||
| $ | 3,416,704 | |||||||
| Telecommunications - Wireless - 0.4% | ||||||||
| America Movil S.A.B. de C.V., 2.375%, 9/08/2016 | $ | 262,000 | $ | 263,215 | ||||
| American Tower Trust I, REIT, 1.551%, 3/15/2018 (n) | 900,000 | 898,847 | ||||||
| Crown Castle International Corp., 3.4%, 2/15/2021 | 610,000 | 631,835 | ||||||
| SBA Tower Trust, 2.898%, 10/15/2019 (n) | 878,000 | 880,951 | ||||||
|
| |||||||
| $ | 2,674,848 | |||||||
| Telephone Services - 0.1% | ||||||||
| Qwest Corp., 6.5%, 6/01/2017 | $ | 700,000 | $ | 732,536 | ||||
| Tobacco - 0.6% | ||||||||
| Imperial Tobacco Finance PLC, 2.05%, 7/20/2018 (n) | $ | 1,456,000 | $ | 1,464,614 | ||||
| Reynolds American, Inc., 3.5%, 8/04/2016 | 370,000 | 372,505 | ||||||
| Reynolds American, Inc., 2.3%, 6/12/2018 | 1,700,000 | 1,733,119 | ||||||
|
| |||||||
| $ | 3,570,238 | |||||||
| Transportation - Services - 0.4% | ||||||||
| ERAC USA Finance Co., 2.75%, 3/15/2017 (n) | $ | 302,000 | $ | 305,625 | ||||
| TTX Co., 2.6%, 6/15/2020 (n) | 2,400,000 | 2,407,874 | ||||||
|
| |||||||
| $ | 2,713,499 | |||||||
| U.S. Government Agencies and Equivalents - 1.0% | ||||||||
| AID-Ukraine, 1.844%, 5/16/2019 | $ | 296,000 | $ | 299,873 | ||||
| AID-Ukraine, 1.847%, 5/29/2020 | 3,000,000 | 3,050,346 | ||||||
| Hashemite Kingdom of Jordan, 1.945%, 6/23/2019 | 750,000 | 770,135 | ||||||
| Private Export Funding Corp., 1.875%, 7/15/2018 | 1,120,000 | 1,141,109 | ||||||
| Small Business Administration, 2.25%, 7/01/2021 | 514,812 | 527,251 | ||||||
|
| |||||||
| $ | 5,788,714 | |||||||
| U.S. Treasury Obligations - 1.9% | ||||||||
| U.S. Treasury Notes, 0.875%, 3/31/2018 | $ | 6,500,000 | $ | 6,512,695 | ||||
| U.S. Treasury Notes, 0.625%, 9/30/2017 (f) | 5,000,000 | 4,995,510 | ||||||
|
| |||||||
| $ | 11,508,205 | |||||||
| Utilities - Electric Power - 3.2% | ||||||||
| American Electric Power Co., Inc., 1.65%, 12/15/2017 | $ | 398,000 | $ | 397,583 | ||||
| Dominion Resources, Inc., 1.95%, 8/15/2016 | 880,000 | 882,563 | ||||||
17
Table of Contents
Consolidated Portfolio of Investments (unaudited) – continued
| Issuer | Shares/Par | Value ($) | ||||||
| Bonds - continued | ||||||||
| Utilities - Electric Power - continued | ||||||||
| Dominion Resources, Inc., 2.5%, 12/01/2019 | $ | 1,600,000 | $ | 1,628,043 | ||||
| Duke Energy Corp., 1.625%, 8/15/2017 | 209,000 | 209,508 | ||||||
| Duke Energy Corp., FRN, 1.008%, 4/03/2017 | 1,060,000 | 1,055,666 | ||||||
| Duke Energy Indiana, Inc., FRN, 0.978%, 7/11/2016 | 370,000 | 370,106 | ||||||
| Enel Finance International S.A., 6.25%, 9/15/2017 (n) | 750,000 | 796,553 | ||||||
| Eversource Energy, 1.6%, 1/15/2018 | 2,000,000 | 2,002,594 | ||||||
| Eversource Energy, 2.5%, 3/15/2021 | 730,000 | 744,536 | ||||||
| NextEra Energy Capital Holdings, Inc., 2.056%, 9/01/2017 | 2,003,000 | 2,017,672 | ||||||
| NextEra Energy Capital Holdings, Inc., 2.3%, 4/01/2019 | 1,034,000 | 1,046,499 | ||||||
| PG&E Corp., 2.4%, 3/01/2019 | 660,000 | 671,935 | ||||||
| PPL WEM Holdings PLC, 3.9%, 5/01/2016 (n) | 1,240,000 | 1,240,000 | ||||||
| PSEG Power LLC, 2.75%, 9/15/2016 | 360,000 | 362,420 | ||||||
| Southern Co., 2.45%, 9/01/2018 | 630,000 | 642,573 | ||||||
| Southern Power Co., 1.85%, 12/01/2017 | 1,370,000 | 1,379,137 | ||||||
| Virginia Electric and Power Co., 1.2%, 1/15/2018 | 700,000 | 699,371 | ||||||
| Xcel Energy, Inc., 1.2%, 6/01/2017 | 3,000,000 | 2,996,913 | ||||||
|
| |||||||
| $ | 19,143,672 | |||||||
| Total Bonds (Identified Cost, $389,538,058) | $ | 390,900,721 | ||||||
| Short-Term Obligations (y) - 7.9% | ||||||||
| Federal Home Loan Bank, 0.01%, 5/02/2016, at Amortized Cost and Value | $ | 47,100,000 | $ | 47,099,744 | ||||
| Money Market Funds - 14.6% | ||||||||
| MFS Institutional Money Market Portfolio, 0.36%, at Cost and Net Asset Value (v) | 87,425,280 | $ | 87,425,280 | |||||
| Total Investments (Identified Cost, $524,063,082) | $ | 525,425,745 | ||||||
| Other Assets, Less Liabilities - 12.3% | 73,647,461 | |||||||
| Net Assets - 100.0% | $ | 599,073,206 | ||||||
| (f) | All or a portion of the security has been segregated as collateral for open futures contracts. |
| (n) | Securities exempt from registration under Rule 144A of the Securities Act of 1933. These securities may be sold in the ordinary course of business in transactions exempt from registration, normally to qualified institutional buyers. At period end, the aggregate value of these securities was $154,161,269 representing 25.7% of net assets. |
| (v) | Underlying affiliated fund that is available only to investment companies managed by MFS. The rate quoted for the MFS Institutional Money Market Portfolio is the annualized seven-day yield of the fund at period end. |
| (y) | The rate shown represents an annualized yield at time of purchase. |
| (z) | Restricted securities are not registered under the Securities Act of 1933 and are subject to legal restrictions on resale. These securities generally may be resold in transactions exempt from registration or to the public if the securities are subsequently registered. Disposal of these |
18
Table of Contents
Consolidated Portfolio of Investments (unaudited) – continued
| securities may involve time-consuming negotiations and prompt sale at an acceptable price may be difficult. The fund holds the following restricted securities: |
| Restricted Securities | Acquisition Date | Cost | Value | |||||||
| DT Auto Owner Trust, 2016-2A, “A”, 1.73%, 8/15/2019 | 4/06/16 | $739,976 | $739,996 | |||||||
| GO Financial Auto Securitization, Trust, 2015-2, “A”, 3.27%, 11/15/2018 | 11/19/15 | 681,078 | 679,463 | |||||||
| Nationstar HECM Loan Trust, 2015-2A, “A”, 2.882%, 11/25/2025 | 11/19/15 | 477,684 | 476,864 | |||||||
| West African Development Bank, 5.5%, 5/06/2021 | 4/26/16 | 205,768 | 209,664 | |||||||
| Total Restricted Securities | $2,105,987 | |||||||||
| % of Net assets | 0.4% | |||||||||
The following abbreviations are used in this report and are defined:
| CDO | Collateralized Debt Obligation | |
| CLO | Collateralized Loan Obligation | |
| FRN | Floating Rate Note. Interest rate resets periodically and the current rate may not be the rate reported at period end. | |
| PLC | Public Limited Company | |
| REIT | Real Estate Investment Trust |
Derivative Contracts at 4/30/16
Futures Contracts at 4/30/16
| Description | Currency | Contracts | Value | Expiration Date | Unrealized Appreciation (Depreciation) | |||||||||||||
| Asset Derivatives | ||||||||||||||||||
| Interest Rate Futures | ||||||||||||||||||
| U.S. Treasury Note 5 yr (Short) | USD | 37 | $4,473,820 | June - 2016 | $11,143 | |||||||||||||
|
| |||||||||||||||||
Swap Agreements at 4/30/16
| Expiration | Notional Amount | Counterparty | Cash Flows to Receive | Cash Flows to Pay | Fair Value | |||||||||||||||
| Asset Derivatives | ||||||||||||||||||||
| Total Return Swap Agreements | ||||||||||||||||||||
| 5/17/16 | USD | 2,576,630 | (Short) | Goldman Sachs International | 0.09% | BCOMGCTR (floating rate) | $94 | |||||||||||||
| 5/17/16 | USD | 5,261,345 | (Short) | Morgan Stanley Capital Services, Inc. | 0.18% | BCOMCTTR (floating rate) | 165 | |||||||||||||
| 5/17/16 | USD | 8,371,053 | (Short) | Morgan Stanley Capital Services, Inc. | 0.12% | BCOMTR (floating rate) | 284 | |||||||||||||
| 5/17/16 | USD | 14,937,162 | (Short) | Goldman Sachs International | 0.13% (floating rate) | BCOMF3T (floating rate) | 505 | |||||||||||||
| 5/17/16 | USD | 16,018,374 | (Short) | Citibank N.A. | 0.11% (floating rate) | BCOMTR (floating rate) | 1,562,152 | |||||||||||||
19
Table of Contents
Consolidated Portfolio of Investments (unaudited) – continued
Swap Agreements at 4/30/16 - continued
| Expiration | Notional Amount | Counterparty | Cash Flows to Receive | Cash Flows to Pay | Fair Value | |||||||||||||||
| Asset Derivatives - continued | ||||||||||||||||||||
| Total Return Swap Agreements - continued | ||||||||||||||||||||
| 5/17/16 | USD | 41,855,265 | (Short) | JPMorgan Chase Bank N.A | 0.09% (floating rate) | BCOMTR (floating rate) | $1,471 | |||||||||||||
| 5/17/16 | USD | 50,226,318 | (Short) | Goldman Sachs International | 0.09% (floating rate) | BCOMTR (floating rate) | 1,765 | |||||||||||||
| 8/1/16 | USD | 2,826,435 | (Short) | Morgan Stanley Capital Services, Inc. | 0.18% (floating rate) | BCOMCTTR (floating rate) | 88 | |||||||||||||
| 8/22/16 | USD | 14,830,874 | (Short) | Citibank N.A. | 0.15% (floating rate) | BCOMF3T (floating rate) | 1,357,550 | |||||||||||||
| 9/12/16 | USD | 9,708,204 | (Short) | JPMorgan Chase Bank N.A | 0.09% (floating rate) | BCOMTR (floating rate) | 342 | |||||||||||||
| 9/12/16 | USD | 17,095,833 | (Short) | Goldman Sachs International | 0.13% (floating rate) | BCOMF3T (floating rate) | 576 | |||||||||||||
| 9/19/16 | USD | 3,583,571 | (Short) | JPMorgan Chase Bank N.A | 0.10% (floating rate) | BCOMSITR (floating rate) | 117 | |||||||||||||
| 10/3/16 | USD | 21,821,753 | (Short) | JPMorgan Chase Bank N.A | 0.13% (floating rate) | BCOMF3T (floating rate) | 738 | |||||||||||||
| 10/31/16 | USD | 11,765,749 | (Short) | Goldman Sachs International | 0.10% (floating rate) | BCOMTR (floating rate) | 408 | |||||||||||||
| 11/21/16 | USD | 5,826,149 | (Short) | JPMorgan Chase Bank N.A | 0.09% (floating rate) | BCOMTR (floating rate) | 205 | |||||||||||||
| 12/1/16 | USD | 38,958,424 | (Short) | Goldman Sachs International | 0.13% (floating rate) | BCOMF3T (floating rate) | 1,316 | |||||||||||||
| 12/19/16 | USD | 15,634,961 | (Short) | JPMorgan Chase Bank N.A | 0.09% (floating rate) | BCOMTR (floating rate) | 549 | |||||||||||||
| 12/19/16 | USD | 20,046,332 | (Short) | Goldman Sachs International | 0.13% (floating rate) | BCOMF3T (floating rate) | 678 | |||||||||||||
| 1/18/17 | USD | 5,303,347 | (Short) | Morgan Stanley Capital Services, Inc. | 0.20% (floating rate) | BCOMBOTR (floating rate) | 186 | |||||||||||||
| 1/18/17 | USD | 7,725,179 | (Short) | JPMorgan Chase Bank N.A | 0.09% (floating rate) | BCOMTR (floating rate) | 158 | |||||||||||||
| 2/6/17 | USD | 25,404,902 | (Short) | JPMorgan Chase Bank N.A | 0.13% (floating rate) | BCOMF3T (floating rate) | 859 | |||||||||||||
| 2/14/17 | USD | 41,125,533 | (Short) | JPMorgan Chase Bank N.A. | 0.13% (floating rate) | BCOMF3T (floating rate) | 2,178 | |||||||||||||
| 2/28/17 | USD | 3,768,503 | (Short) | Morgan Stanley Capital Services, Inc. | 0.16% (floating rate) | BCOMLCTR (floating rate) | 143 | |||||||||||||
| 2/28/17 | USD | 5,362,954 | (Short) | Morgan Stanley Capital Services, Inc. | 0.20% (floating rate) | BCOMBOTR (floating rate) | 187 | |||||||||||||
| 2/28/17 | USD | 29,870,941 | (Short) | JPMorgan Chase Bank N.A. | 0.09% (floating rate) | BCOMTR (floating rate) | 1,050 | |||||||||||||
20
Table of Contents
Consolidated Portfolio of Investments (unaudited) – continued
Swap Agreements at 4/30/16 - continued
| Expiration | Notional Amount | Counterparty | Cash Flows to Receive | Cash Flows to Pay | Fair Value | |||||||||||||||
| Asset Derivatives - continued | ||||||||||||||||||||
| Total Return Swap Agreements - continued | ||||||||||||||||||||
| 3/9/17 | USD | 24,936,121 | (Short) | Goldman Sachs International | 0.10% (floating rate) | BCOMTR (floating rate) | $866 | |||||||||||||
| 3/31/17 | USD | 3,414,618 | (Short) | Goldman Sachs International | 0.10% (floating rate) | BCOMTR (floating rate) | 119 | |||||||||||||
| 3/31/17 | USD | 8,147,697 | (Short) | Goldman Sachs International | 0.13% (floating rate) | BCOMSITR (floating rate) | 259 | |||||||||||||
| 4/28/17 | USD | 9,856,332 | (Short) | Goldman Sachs International | 0.16% (floating rate) | BCOMSBTR (floating rate) | 332 | |||||||||||||
| 5/31/17 | USD | 5,000,000 | (Short) | JPMorgan Chase Bank N.A. | 0.14% (floating rate) | BCOMF3T (floating rate) | 69,105 | |||||||||||||
| 5/31/17 | USD | 8,000,000 | (Short) | Morgan Stanley Capital Services, Inc. | 0.25% (floating rate) | BCOMSMT (floating rate) | 158,616 | |||||||||||||
|
| |||||||||||||||||||
| $3,163,061 | ||||||||||||||||||||
|
| |||||||||||||||||||
| Liability Derivatives | ||||||||||||||||||||
| Total Return Swap Agreements | ||||||||||||||||||||
| 5/17/16 | USD | 1,555,671 | (Long) | JPMorgan Chase Bank N.A. | BCOMHOTR (floating rate) | 0.08% (floating rate) | $(151 | ) | ||||||||||||
| 5/17/16 | USD | 3,062,597 | (Long) | Goldman Sachs International | BCOMCLTR (floating rate) | 0.07% (floating rate) | (262 | ) | ||||||||||||
| 5/17/16 | USD | 3,305,861 | (Long) | Goldman Sachs International | BCOMCOT (floating rate) | 0.07% (floating rate) | (284 | ) | ||||||||||||
| 10/18/16 | USD | 2,353,849 | (Long) | Morgan Stanley Capital Services, Inc. | BCOMHOTR (floating rate) | 0.08% (floating rate) | (230 | ) | ||||||||||||
| 10/31/16 | USD | 3,135,190 | (Long) | Morgan Stanley Capital Services, Inc. | BCOMNGTR (floating rate) | 0.05% (floating rate) | (198 | ) | ||||||||||||
| 11/21/16 | USD | 4,618,444 | (Long) | Citibank N.A. | BCOMKWT (floating rate) | 0.10% (floating rate) | (660 | ) | ||||||||||||
| 3/31/17 | USD | 5,469,468 | (Long) | Morgan Stanley Capital Services, Inc. | BCOMNITR (floating rate) | 0.07% (floating rate) | (406 | ) | ||||||||||||
| 4/24/17 | USD | 6,214,420 | (Short) | Citibank N.A. | 0.10% (floating rate) | BCOMGCTR (floating rate) | (319 | ) | ||||||||||||
| 5/2/17 | USD | 7,870,153 | (Long) | Goldman Sachs International | BCOMALTR (floating rate) | 0.07% (floating rate) | (2,152 | ) | ||||||||||||
| 5/15/17 | USD | 7,397,111 | (Short) | Goldman Sachs International | 0.10% (floating rate) | BCOMRBTR (floating rate) | (146 | ) | ||||||||||||
| 5/15/17 | USD | 10,605,434 | (Short) | Morgan Stanley Capital Services, Inc. | 0.12% (floating rate) | BCOMTR (floating rate) | (1,086 | ) | ||||||||||||
21
Table of Contents
Consolidated Portfolio of Investments (unaudited) – continued
Swap Agreements at 4/30/16 - continued
| Expiration | Notional Amount | Counterparty | Cash Flows to Receive | Cash Flows to Pay | Fair Value | |||||||||||||||
| Liability Derivatives - continued | ||||||||||||||||||||
| Total Return Swap Agreements - continued | ||||||||||||||||||||
| 5/15/17 | USD | 68,935,318 | (Short) | JPMorgan Chase Bank N.A | 0.09% (floating rate) | BCOMTR (floating rate) | $(1,285 | ) | ||||||||||||
| 5/31/17 | USD | 8,000,000 | (Long) | Morgan Stanley Capital Services, Inc. | BCOMKCTR (floating rate) | 0.10% (floating rate) | (244 | ) | ||||||||||||
| 6/12/17 | USD | 21,210,867 | (Short) | Citibank N.A. | 0.11% (floating rate) | BCOMTR (floating rate) | (420 | ) | ||||||||||||
| 6/12/17 | USD | 42,421,734 | (Short) | Goldman Sachs International | 0.10% (floating rate) | BCOMTR (floating rate) | (817 | ) | ||||||||||||
|
| |||||||||||||||||||
| $(8,660 | ) | |||||||||||||||||||
|
| |||||||||||||||||||
At April 30, 2016, the fund had cash collateral of $37,090,000 and liquid securities with an aggregate value of $31,971 to cover any commitments for certain derivative contracts. Cash collateral is comprised of “Restricted Cash” on the Consolidated Statement of Assets and Liabilities.
The following abbreviations are used in this report and are defined:
| BCOMALTR | Bloomberg Aluminum Subindex Total Return, this index is composed of futures contracts on aluminum. | |
| BCOMBOTR | Bloomberg Soybean Oil Subindex Total Return, this index is composed of futures contracts on soybean oil. | |
| BCOMCLTR | Bloomberg WTI Crude Oil Subindex Total Return, this index is composed of composed of futures contracts on WTI crude oil. It reflects the return on fully collateralized futures positions. It is quoted in USD. | |
| BCOMCOT | Bloomberg Brent Crude Subindex Total Return, this index composed of futures contracts on brent crude. | |
| BCOMCTTR | Bloomberg Cotton Subindex Total Return, this index is of futures contracts on cotton. It reflects the return on fully collateralized futures positions. It is quoted in USD. | |
| BCOMF3T | Bloomberg Commodity Index 3 Month Forward Total Return, this index is composed of longer-dated futures contracts on 19 physical commodities. | |
| BCOMGCTR | Bloomberg Gold Subindex Total Return, this index is composed of futures contracts on gold. | |
| BCOMHOTR | Bloomberg Heating Oil Subindex Total Return, this index is composed of futures contracts on heating oil. It reflects the return on fully collateralized futures positions. It is quoted in USD. | |
| BCOMKCTR | Bloomberg Coffee Subindex Total Return, this index is composed of futures contracts on coffee. It reflects the return on fully collateralized futures positions. It is quoted in USD. | |
| BCOMKWT | Bloomberg Kansas Wheat Subindex Total Return, this index is composed of futures contracts on wheat and Kansas wheat. It is quoted in USD. | |
| BCOMLCTR | Bloomberg Live Cattle Subindex Total Return, this index is composed of futures contracts on live cattle. |
22
Table of Contents
Consolidated Portfolio of Investments (unaudited) – continued
| BCOMNGTR | Bloomberg Natural Gas Subindex Total Return, this index is composed of futures contracts on natural gas. It reflects the return on fully collateralized futures positions. It is quoted in USD. | |
| BCOMNITR | Bloomberg Nickel Subindex Total Return. A single commodity subindex of the DJ-UBSCITR composed of futures contracts on nickel. It reflects the return on fully collateralized futures positions. It is quoted in USD. | |
| BCOMRBTR | Bloomberg Unleaded Gasoline Subindex Total Return, this index is composed of composed of futures contracts on unleaded gasoline. It reflects the return on fully collateralized futures positions. It is quoted in USD. | |
| BCOMSBTR | Bloomberg Sugar Subindex Total Return, this index is composed of futures contracts on sugar. It reflects the return on fully collateralized futures positions. It is quoted in USD. | |
| BCOMSITR | Bloomberg Silver Subindex Total Return, this index is composed of futures contracts on silver. | |
| BCOMSMT | Bloomberg Soybean Meal Subindex Total Return, this index is composed of futures contracts on soybean meal. | |
| BCOMTR | Bloomberg Commodity Index Total Return, this index is composed of futures contracts on nineteen physical commodities. |
See Notes to Consolidated Financial Statements
23
Table of Contents
Financial Statements
CONSOLIDATED STATEMENT OF ASSETS AND LIABILITIES
At 4/30/16 (unaudited)
This statement represents your fund’s balance sheet, which details the assets and liabilities comprising the total value of the fund.
| Assets | ||||
Investments | ||||
Non-affiliated issuers, at value (identified cost, $436,637,802) | $438,000,465 | |||
Underlying affiliated funds, at cost and value | 87,425,280 | |||
Total investments, at value (identified cost, $524,063,082) | $525,425,745 | |||
Cash | 205,351 | |||
Restricted cash | 37,090,000 | |||
Receivables for | ||||
Due from brokers | 41,329,569 | |||
Fund shares sold | 12 | |||
Interest | 1,710,827 | |||
Swaps, at value | 3,163,061 | |||
Other assets | 2,237 | |||
Total assets | $608,926,802 | |||
| Liabilities | ||||
Payables for | ||||
Daily variation margin on open futures contracts | $3,469 | |||
Investments purchased | 1,176,924 | |||
Due to broker | 3,994,522 | |||
Fund shares reacquired | 4,511,410 | |||
Swaps, at value | 8,660 | |||
Payable to affiliates | ||||
Investment adviser | 37,152 | |||
Shareholder servicing costs | 56 | |||
Distribution and service fees | 1 | |||
Payable for independent Trustees’ compensation | 1,713 | |||
Accrued expenses and other liabilities | 119,689 | |||
Total liabilities | $9,853,596 | |||
Net assets | $599,073,206 | |||
| Net assets consist of | ||||
Paid-in capital | $682,055,721 | |||
Unrealized appreciation (depreciation) on investments | 4,528,206 | |||
Accumulated net realized gain (loss) on investments | (88,204,980 | ) | ||
Undistributed net investment income | 694,259 | |||
Net assets | $599,073,206 | |||
Shares of beneficial interest outstanding | 101,562,856 |
| Net assets | Shares outstanding | Net asset value per share (a) | ||||||||||
Class A | $48,243 | 8,176 | $5.90 | |||||||||
Class I | 48,329 | 8,195 | 5.90 | |||||||||
Class R5 | 598,976,634 | 101,546,485 | 5.90 | |||||||||
| (a) | Maximum offering price per share was equal to the net asset value per share for all share classes, except for Class A, for which the maximum offering price per share was $6.26 [100 / 94.25 x $5.90]. Redemption price per share was equal to the net asset value per share for Classes I and R5. |
See Notes to Consolidated Financial Statements
24
Table of Contents
Financial Statements
CONSOLIDATED STATEMENT OF OPERATIONS
Six months ended 4/30/16 (unaudited)
This statement describes how much your fund earned in investment income and accrued in expenses. It also describes any gains and/or losses generated by fund operations.
| Net investment income | ||||
Income | ||||
Interest | $3,299,813 | |||
Dividends from underlying affiliated funds | 62,601 | |||
Total investment income | $3,362,414 | |||
Expenses | ||||
Management fee | $2,005,485 | |||
Distribution and service fees | 55 | |||
Shareholder servicing costs | 119 | |||
Administrative services fee | 46,435 | |||
Independent Trustees’ compensation | 8,276 | |||
Custodian fee | 35,743 | |||
Shareholder communications | 5,163 | |||
Audit and tax fees | 41,602 | |||
Legal fees | 13,181 | |||
Miscellaneous | 59,044 | |||
Total expenses | $2,215,103 | |||
Fees paid indirectly | (289 | ) | ||
Reduction of expenses by investment adviser | (20,024 | ) | ||
Net expenses | $2,194,790 | |||
Net investment income | $1,167,624 | |||
| Realized and unrealized gain (loss) on investments | ||||
Realized gain (loss) (identified cost basis) | ||||
Investments | $(53,951 | ) | ||
Futures contracts | (18,022 | ) | ||
Swap agreements | (3,440,864 | ) | ||
Net realized gain (loss) on investments | $(3,512,837 | ) | ||
Change in unrealized appreciation (depreciation) | ||||
Investments | $1,695,585 | |||
Futures contracts | 19,710 | |||
Swap agreements | 2,977,355 | |||
Net unrealized gain (loss) on investments | $4,692,650 | |||
Net realized and unrealized gain (loss) on investments | $1,179,813 | |||
Change in net assets from operations | $2,347,437 | |||
See Notes to Consolidated Financial Statements
25
Table of Contents
Financial Statements
CONSOLIDATED STATEMENTS OF CHANGES IN NET ASSETS
These statements describe the increases and/or decreases in net assets resulting from operations, any distributions, and any shareholder transactions.
Six months ended 4/30/16 | Year ended 10/31/15 | |||||||
| Change in net assets | (unaudited) | |||||||
| From operations | ||||||||
Net investment income | $1,167,624 | $1,435,424 | ||||||
Net realized gain (loss) on investments | (3,512,837 | ) | (161,521,394 | ) | ||||
Net unrealized gain (loss) on investments | 4,692,650 | 4,451,041 | ||||||
Change in net assets from operations | $2,347,437 | $(155,634,929 | ) | |||||
| Distributions declared to shareholders | ||||||||
From net investment income | $(2,430,922 | ) | $(1,300,442 | ) | ||||
Change in net assets from fund share transactions | $43,889,534 | $172,515,876 | ||||||
Total change in net assets | $43,806,049 | $15,580,505 | ||||||
| Net assets | ||||||||
At beginning of period | 555,267,157 | 539,686,652 | ||||||
At end of period (including undistributed net investment income of $694,259 and $1,957,557, respectively) | $599,073,206 | $555,267,157 | ||||||
See Notes to Consolidated Financial Statements
26
Table of Contents
Financial Statements
CONSOLIDATED FINANCIAL HIGHLIGHTS
The financial highlights table is intended to help you understand the fund’s financial performance for the semiannual period and the past 5 years (or life of a particular share class, if shorter). The financial highlights for the fund are presented on a consolidated basis for the fund and its subsidiary. Certain information reflects financial results for a single fund share. The total returns in the table represent the rate by which an investor would have earned (or lost) on an investment in the fund share class (assuming reinvestment of all distributions) held for the entire period.
Six months ended | Year ended 10/31/15 | Period ended | Years ended 4/30 | |||||||||||||||||||||
| Class A | 2014 | 2013 | 2012 | |||||||||||||||||||||
| (unaudited) | ||||||||||||||||||||||||
Net asset value, beginning of | $5.93 | $7.88 | $9.28 | $9.09 | $9.57 | $14.49 | ||||||||||||||||||
| Income (loss) from investment operations | ||||||||||||||||||||||||
Net investment income (loss) (d) | $0.01 | $(0.00 | )(w) | $(0.01 | ) | $(0.00 | )(w) | $0.01 | $0.01 | |||||||||||||||
Net realized and unrealized | (0.04 | )(g) | (1.95 | ) | (1.39 | ) | 0.22 | (0.43 | ) | (2.99 | ) | |||||||||||||
Total from investment operations | $(0.03 | ) | $(1.95 | ) | $(1.40 | ) | $0.22 | $(0.42 | ) | $(2.98 | ) | |||||||||||||
| Less distributions declared to shareholders | ||||||||||||||||||||||||
From net investment income | $(0.00 | )(w) | $— | $— | $(0.03 | ) | $(0.06 | ) | $(0.08 | ) | ||||||||||||||
From net realized gain on | — | — | — | — | — | (1.86 | ) | |||||||||||||||||
Total distributions declared to | $(0.00 | )(w) | $— | $— | $(0.03 | ) | $(0.06 | ) | $(1.94 | ) | ||||||||||||||
Net asset value, end of period (x) | $5.90 | $5.93 | $7.88 | $9.28 | $9.09 | $9.57 | ||||||||||||||||||
Total return (%) (r)(s)(t)(x) | (0.44 | )(n) | (24.75 | ) | (15.09 | )(n) | 2.40 | (4.38 | ) | (19.96 | ) | |||||||||||||
| Ratios (%) (to average net assets) and Supplemental data: | ||||||||||||||||||||||||
Expenses before expense | 1.07 | (a) | 1.08 | 1.10 | (a) | 1.06 | 1.07 | 1.08 | ||||||||||||||||
Expenses after expense | 1.06 | (a) | 1.07 | 1.10 | (a) | 1.05 | 1.07 | 1.08 | ||||||||||||||||
Net investment income (loss) | 0.19 | (a) | (0.00 | )(w) | (0.20 | )(a) | (0.05 | ) | 0.13 | 0.11 | ||||||||||||||
Portfolio turnover | 15 | (n) | 51 | 21 | (n) | 43 | 54 | 70 | ||||||||||||||||
Net assets at end of period | $48 | $48 | $97 | $114 | $111 | $116 | ||||||||||||||||||
See Notes to Consolidated Financial Statements
27
Table of Contents
Consolidated Financial Highlights – continued
| Six months ended 4/30/16 | Year ended | Period ended | Years ended 4/30 | |||||||||||||||||||||
| Class I | 2014 | 2013 | 2012 | |||||||||||||||||||||
| (unaudited) | ||||||||||||||||||||||||
Net asset value, beginning of | $5.94 | $7.90 | $9.28 | $9.10 | $9.57 | $14.50 | ||||||||||||||||||
| Income (loss) from investment operations | ||||||||||||||||||||||||
Net investment income (d) | $0.01 | $0.02 | $0.00 | (w) | $0.02 | $0.05 | $0.04 | |||||||||||||||||
Net realized and unrealized | (0.02 | )(g) | (1.96 | ) | (1.38 | ) | 0.21 | (0.43 | ) | (3.00 | ) | |||||||||||||
Total from investment operations | $(0.01 | ) | $(1.94 | ) | $(1.38 | ) | $0.23 | $(0.38 | ) | $(2.96 | ) | |||||||||||||
| Less distributions declared to shareholders | ||||||||||||||||||||||||
From net investment income | $(0.03 | ) | $(0.02 | ) | $— | $(0.05 | ) | $(0.09 | ) | $(0.11 | ) | |||||||||||||
From net realized gain on | — | — | — | — | — | (1.86 | ) | |||||||||||||||||
Total distributions declared to | $(0.03 | ) | $(0.02 | ) | $— | $(0.05 | ) | $(0.09 | ) | $(1.97 | ) | |||||||||||||
Net asset value, end of period (x) | $5.90 | $5.94 | $7.90 | $9.28 | $9.10 | $9.57 | ||||||||||||||||||
Total return (%) (r)(s)(x) | (0.20 | )(n) | (24.63 | ) | (14.87 | )(n) | 2.56 | (4.03 | ) | (19.78 | ) | |||||||||||||
| Ratios (%) (to average net assets) and Supplemental data: | ||||||||||||||||||||||||
Expenses before expense | 0.84 | (a) | 0.83 | 0.85 | (a) | 0.81 | 0.81 | 0.83 | ||||||||||||||||
Expenses after expense | 0.83 | (a) | 0.82 | 0.85 | (a) | 0.80 | 0.81 | 0.83 | ||||||||||||||||
Net investment income | 0.43 | (a) | 0.25 | 0.05 | (a) | 0.20 | 0.50 | 0.37 | ||||||||||||||||
Portfolio turnover | 15 | (n) | 51 | 21 | (n) | 43 | 54 | 70 | ||||||||||||||||
Net assets at end of period | $48 | $48 | $80 | $94 | $92 | $324,532 | ||||||||||||||||||
See Notes to Consolidated Financial Statements
28
Table of Contents
Consolidated Financial Highlights – continued
| Six months ended 4/30/16 | Year ended | Period ended | Years ended 4/30 | |||||||||||||||||
| Class R5 | 2014 | 2013 (i) | ||||||||||||||||||
| (unaudited) | ||||||||||||||||||||
Net asset value, beginning of period | $5.94 | $7.90 | $9.29 | $9.10 | $10.03 | |||||||||||||||
| Income (loss) from investment operations | ||||||||||||||||||||
Net investment income (d) | $0.01 | $0.02 | $0.00 | (w) | $0.02 | $0.02 | ||||||||||||||
Net realized and unrealized gain | (0.02 | )(g) | (1.96 | ) | (1.39 | ) | 0.22 | (0.86 | )(g) | |||||||||||
Total from investment operations | $(0.01 | ) | $(1.94 | ) | $(1.39 | ) | $0.24 | $(0.84 | ) | |||||||||||
| Less distributions declared to shareholders | ||||||||||||||||||||
From net investment income | $(0.03 | ) | $(0.02 | ) | $— | $(0.05 | ) | $(0.09 | ) | |||||||||||
Net asset value, end of period (x) | $5.90 | $5.94 | $7.90 | $9.29 | $9.10 | |||||||||||||||
Total return (%) (r)(s)(x) | (0.20 | )(n) | (24.63 | ) | (14.96 | )(n) | 2.67 | (8.44 | )(n) | |||||||||||
| Ratios (%) (to average net assets) and Supplemental data: | ||||||||||||||||||||
Expenses before expense | 0.83 | (a) | 0.83 | 0.86 | (a) | 0.81 | 0.82 | (a) | ||||||||||||
Expenses after expense | 0.82 | (a) | 0.83 | 0.85 | (a) | 0.81 | 0.82 | (a) | ||||||||||||
Net investment income | 0.44 | (a) | 0.26 | 0.05 | (a) | 0.19 | 0.31 | (a) | ||||||||||||
Portfolio turnover | 15 | (n) | 51 | 21 | (n) | 43 | 54 | |||||||||||||
Net assets at end of period | $598,977 | $555,170 | $539,510 | $547,015 | $413,592 | |||||||||||||||
| (a) | Annualized. |
| (d) | Per share data is based on average shares outstanding. |
| (f) | Ratios do not reflect reductions from fees paid indirectly, if applicable. |
| (g) | The per share amount varies from the net realized and unrealized gain/loss for the period because of the timing of sales and fund shares and the per share amount of realized and unrealized gains and losses at such time. |
| (i) | For the period from the class’ inception, September 4, 2012, through the stated period end. |
| (n) | Not annualized. |
| (r) | Certain expenses have been reduced without which performance would have been lower. |
| (s) | From time to time the fund may receive proceeds from litigation settlements, without which performance would be lower. |
| (t) | Total returns do not include any applicable sales charges. |
| (w) | Per share amount and ratio were less than $0.01. |
| (x) | The net asset values and total returns have been calculated on net assets which include adjustments made in accordance with U.S. generally accepted accounting principles required at period end for financial reporting purposes. |
| (z) | For the period May 1, 2014 through October 31, 2014. On June 10, 2014, the fund changed its fiscal year-end from April 30 to October 31. |
See Notes to Consolidated Financial Statements
29
Table of Contents
NOTES TO CONSOLIDATED FINANCIAL STATEMENTS
(unaudited)
(1) Business and Organization
MFS Commodity Strategy Fund (the fund) is a non-diversified series of MFS Series Trust XV (the trust). The trust is organized as a Massachusetts business trust and is registered under the Investment Company Act of 1940, as amended, as an open-end management investment company.
The fund is an investment company and accordingly follows the investment company accounting and reporting guidance of the Financial Accounting Standards Board (FASB) Accounting Standard Codification Topic 946 Financial Services – Investment Companies.
The fund has entered into contractual arrangements with an investment adviser, administrator, distributor, shareholder servicing agent, 529 program manager (if applicable), and custodian who each provide services to the fund. Unless expressly stated otherwise, shareholders are not parties to, or intended beneficiaries of these contractual arrangements, and these contractual arrangements are not intended to create any shareholder right to enforce them against the service providers or to seek any remedy under them against the service providers, either directly or on behalf of the fund.
Under the Trust’s By-Laws and Declaration of Trust, any claims asserted against or on behalf of the MFS Funds, including claims against Trustees and Officers, must be brought in state and federal courts located within the Commonwealth of Massachusetts.
(2) Significant Accounting Policies
Principles of Consolidation – The fund gains exposure to the commodities markets by primarily investing the fund’s assets in the MFS Commodity Strategy Portfolio, a wholly-owned and controlled subsidiary organized in the Cayman Islands (“Subsidiary”). The fund will not invest directly in commodities. The fund may invest up to 25% of its assets (at the time or purchase) in the Subsidiary. The Subsidiary has the same objective, strategies, and restrictions as the fund, except that the Subsidiary gains exposure to the commodities market by investing primarily in commodity-linked futures, options, and swaps, instead of commodity linked-notes. The fund may also gain exposure to the commodities markets by investing the fund’s assets directly in commodity-linked notes. The fund also invests directly in debt securities, and the Subsidiary may also invest in debt securities. As of April 30, 2016, the Subsidiary’s net assets were $124,870,981, which represented 20.8% of the fund’s net assets. The fund’s financial statements have been consolidated and include the accounts of the fund and the Subsidiary. All inter-fund balances and transactions have been eliminated in consolidation.
General – The preparation of financial statements in conformity with U.S. generally accepted accounting principles requires management to make estimates and assumptions that affect the reported amounts of assets and liabilities, and disclosure of contingent assets and liabilities at the date of the financial statements and the reported amounts of increases and decreases in net assets from operations during the reporting
30
Table of Contents
Notes to Consolidated Financial Statements (unaudited) – continued
period. Actual results could differ from those estimates. In the preparation of these financial statements, management has evaluated subsequent events occurring after the date of the fund’s Consolidated Statement of Assets and Liabilities through the date that the financial statements were issued. The fund invests in foreign securities. Investments in foreign securities are vulnerable to the effects of changes in the relative values of the local currency and the U.S. dollar and to the effects of changes in each country’s legal, political, and economic environment.
Balance Sheet Offsetting – The fund’s accounting policy with respect to balance sheet offsetting is that, absent an event of default by the counterparty or a termination of the agreement, the International Swaps and Derivatives Association (ISDA) Master Agreement does not result in an offset of reported amounts of financial assets and financial liabilities in the Consolidated Statement of Assets and Liabilities across transactions between the fund and the applicable counterparty. The fund’s right to setoff may be restricted or prohibited by the bankruptcy or insolvency laws of the particular jurisdiction to which a specific master netting agreement counterparty is subject. Balance sheet offsetting disclosures, to the extent applicable to the fund, have been included in the fund’s Significant Accounting Policies note under the captions for each of the fund’s in-scope financial instruments and transactions.
Investment Valuations – Debt instruments and floating rate loans, including restricted debt instruments, are generally valued at an evaluated or composite bid as provided by a third-party pricing service. Short-term instruments with a maturity at issuance of 60 days or less may be valued at amortized cost, which approximates market value. Futures contracts are generally valued at last posted settlement price on their primary exchange as provided by a third-party pricing service. Futures contracts for which there were no trades that day for a particular position are generally valued at the closing bid quotation on their primary exchange as provided by a third-party pricing service. Swap agreements are generally valued at valuations provided by a third-party pricing service, which for cleared swaps includes an evaluation of any trading activity at the clearinghouses. Open-end investment companies are generally valued at net asset value per share. Securities and other assets, including commodity-linked structured notes, generally valued on the basis of information from a third-party pricing service may also be valued at a broker/dealer bid quotation. Values obtained from third-party pricing services can utilize both transaction data and market information such as yield, quality, coupon rate, maturity, type of issue, trading characteristics, and other market data. The values of foreign securities and other assets and liabilities expressed in foreign currencies are converted to U.S. dollars using the mean of bid and asked prices for rates provided by a third-party pricing service.
The Board of Trustees has delegated primary responsibility for determining or causing to be determined the value of the fund’s investments (including any fair valuation) to the adviser pursuant to valuation policies and procedures approved by the Board. If the adviser determines that reliable market quotations are not readily available, investments are valued at fair value as determined in good faith by the adviser in accordance with such procedures under the oversight of the Board of Trustees. Under the fund’s valuation policies and procedures, market quotations are not considered to be readily available for most types of debt instruments and floating rate loans and many types of derivatives. These investments are generally valued at fair value based on information
31
Table of Contents
Notes to Consolidated Financial Statements (unaudited) – continued
from third-party pricing services. In addition, investments may be valued at fair value if the adviser determines that an investment’s value has been materially affected by events occurring after the close of the exchange or market on which the investment is principally traded (such as foreign exchange or market) and prior to the determination of the fund’s net asset value, or after the halting of trading of a specific security where trading does not resume prior to the close of the exchange or market on which the security is principally traded. The adviser generally relies on third-party pricing services or other information (such as the correlation with price movements of similar securities in the same or other markets; the type, cost and investment characteristics of the security; the business and financial condition of the issuer; and trading and other market data) to assist in determining whether to fair value and at what value to fair value an investment. The value of an investment for purposes of calculating the fund’s net asset value can differ depending on the source and method used to determine value. When fair valuation is used, the value of an investment used to determine the fund’s net asset value may differ from quoted or published prices for the same investment. There can be no assurance that the fund could obtain the fair value assigned to an investment if it were to sell the investment at the same time at which the fund determines its net asset value per share.
Various inputs are used in determining the value of the fund’s assets or liabilities. These inputs are categorized into three broad levels. In certain cases, the inputs used to measure fair value may fall into different levels of the fair value hierarchy. In such cases, an investment’s level within the fair value hierarchy is based on the lowest level of input that is significant to the fair value measurement. The fund’s assessment of the significance of a particular input to the fair value measurement in its entirety requires judgment, and considers factors specific to the investment. Level 1 includes unadjusted quoted prices in active markets for identical assets or liabilities. Level 2 includes other significant observable market-based inputs (including quoted prices for similar securities, interest rates, prepayment speed, and credit risk). Level 3 includes unobservable inputs, which may include the adviser’s own assumptions in determining the fair value of investments. Other financial instruments are derivative instruments not
32
Table of Contents
Notes to Consolidated Financial Statements (unaudited) – continued
reflected in total investments, such as futures contracts and swap agreements. The following is a summary of the levels used as of April 30, 2016 in valuing the fund’s assets or liabilities:
| Investments at Value | Level 1 | Level 2 | Level 3 | Total | ||||||||||||
| U.S. Treasury Bonds & U.S. Government Agency & Equivalents | $— | $17,296,919 | $— | $17,296,919 | ||||||||||||
| Non-U.S. Sovereign Debt | — | 23,161,375 | — | 23,161,375 | ||||||||||||
| U.S. Corporate Bonds | — | 159,520,456 | — | 159,520,456 | ||||||||||||
| Residential Mortgage-Backed Securities | — | 9,596,203 | — | 9,596,203 | ||||||||||||
| Commercial Mortgage-Backed Securities | — | 2,347,104 | — | 2,347,104 | ||||||||||||
| Asset-Backed Securities (including CDOs) | — | 54,425,036 | — | 54,425,036 | ||||||||||||
| Foreign Bonds | — | 124,553,628 | — | 124,553,628 | ||||||||||||
| Short-Term Securities | 47,099,744 | 47,099,744 | ||||||||||||||
| Mutual Funds | 87,425,280 | — | — | 87,425,280 | ||||||||||||
| Total Investments | $87,425,280 | $438,000,465 | $— | $525,425,745 | ||||||||||||
| Other Financial Instruments | ||||||||||||||||
| Futures Contracts | $11,143 | $— | $— | $11,143 | ||||||||||||
| Swap Agreements | — | 3,154,401 | — | 3,154,401 | ||||||||||||
For further information regarding security characteristics, see the Consolidated Portfolio of Investments.
Derivatives – The fund uses derivatives for different purposes, primarily to increase or decrease exposure to a particular market or segment of the market, or security, to increase or decrease interest rate or currency exposure, or as alternatives to direct investments. Derivatives are used for hedging or non-hedging purposes. While hedging can reduce or eliminate losses, it can also reduce or eliminate gains. When the fund uses derivatives as an investment to increase market exposure, or for hedging purposes, gains and losses from derivative instruments may be substantially greater than the derivative’s original cost.
The derivative instruments used by the fund were futures contracts and swap agreements. The fund’s period end derivatives, as presented in the Consolidated Portfolio of Investments and the associated Derivative Contract tables, generally are indicative of the volume of its derivative activity during the period.
33
Table of Contents
Notes to Consolidated Financial Statements (unaudited) – continued
The following table presents, by major type of derivative contract, the fair value, on a gross basis, of the asset and liability components of derivatives held by the fund at April 30, 2016 as reported in the Consolidated Statement of Assets and Liabilities:
| Fair Value (a) | ||||||||||
| Risk | Derivative Contracts | Asset Derivatives | Liability Derivatives | |||||||
| Interest Rate | Interest Rate Futures | $11,143 | $— | |||||||
| Commodity | Total Return Swap | 3,163,061 | (8,660 | ) | ||||||
| Total | $3,174,204 | $(8,660 | ) | |||||||
| (a) | The value of futures contracts includes cumulative appreciation (depreciation) as reported in the fund’s Consolidated Portfolio of Investments. Only the current day net variation margin for futures contracts is separately reported within the fund’s Statement of Assets and Liabilities. |
The following table presents, by major type of derivative contract, the realized gain (loss) on derivatives held by the fund for the six months ended April 30, 2016 as reported in the Consolidated Statement of Operations:
| Risk | Futures Contracts | Swap Agreements | ||||||
| Interest Rate | $(18,022 | ) | $— | |||||
| Commodity | — | (3,440,864 | ) | |||||
| Total | $(18,022 | ) | $(3,440,864 | ) | ||||
The following table presents, by major type of derivative contract, the change in unrealized appreciation (depreciation) on derivatives held by the fund for the six months ended April 30, 2016 as reported in the Consolidated Statement of Operations:
| Risk | Futures Contracts | Swap Agreements | ||||||
| Interest Rate | $19,710 | $— | ||||||
| Commodity | — | 2,977,355 | ||||||
| Total | $19,710 | $2,977,355 | ||||||
Derivative counterparty credit risk is managed through formal evaluation of the creditworthiness of all potential counterparties. On certain, but not all, uncleared derivatives, the fund attempts to reduce its exposure to counterparty credit risk whenever possible by entering into an ISDA Master Agreement on a bilateral basis. The ISDA Master Agreement gives each party to the agreement the right to terminate all transactions traded under such agreement if there is a certain deterioration in the credit quality of the other party. Upon an event of default or a termination of the ISDA Master Agreement, the non-defaulting party has the right to close out all transactions traded under such agreement and to net amounts owed under each transaction to one net amount payable by one party to the other. This right to close out and net payments across all transactions traded under the ISDA Master Agreement could result in a reduction of the fund’s credit risk to such counterparty equal to any amounts payable by the fund under the applicable transactions, if any. The fund’s right to setoff may be restricted or prohibited by the bankruptcy or insolvency laws of the particular jurisdiction to which a specific ISDA counterparty is subject.
34
Table of Contents
Notes to Consolidated Financial Statements (unaudited) – continued
Collateral and margin requirements differ by type of derivative. Margin requirements are set by the clearing broker and the clearing house for cleared derivatives (e.g., futures contracts, cleared swaps, and exchange-traded options) while collateral terms are contract specific for uncleared derivatives (e.g., forward foreign currency exchange contracts, uncleared swap agreements, and uncleared options). For derivatives traded under an ISDA Master Agreement, which contains a collateral support annex, the collateral requirements are netted across all transactions traded under such agreement and one amount is posted from one party to the other to collateralize such obligations. Cash that has been segregated to cover the fund’s collateral or margin obligations under derivative contracts, if any, will be reported separately in the Consolidated Statement of Assets and Liabilities as “Restricted cash” or “Deposits with brokers.” Securities pledged as collateral or margin for the same purpose, if any, are noted in the Consolidated Portfolio of Investments.
The following table presents the fund’s derivative assets and liabilities (by type) on a gross basis as of April 30, 2016:
| Gross Amounts of: | Derivative Assets | Derivative Liabilities | ||||||
| Futures Contracts (a) | $— | $(3,469 | ) | |||||
| Swaps, at value | 3,163,061 | (8,660 | ) | |||||
| Total Gross Amount of Derivative Assets and Liabilities Presented in the Consolidated Statement of Assets & Liabilities | $3,163,061 | $(12,129 | ) | |||||
| Less: Derivatives Assets and Liabilities Not Subject to a Master Netting Agreement or Similar Arrangement | — | (3,469 | ) | |||||
| Total Gross Amount of Derivative Assets and Liabilities Subject to a Master Netting Agreement or Similar Arrangement | $3,163,061 | $(8,660 | ) | |||||
| (a) | The amount presented here represents the fund’s current day net variation margin for futures contracts. This amount, which is recognized within the fund’s Consolidated Statement of Assets and Liabilities, differs from the fair value of the futures contracts which is presented in the tables that follow the fund’s Consolidated Portfolio of Investments. |
35
Table of Contents
Notes to Consolidated Financial Statements (unaudited) – continued
The following table presents (by counterparty) the fund’s derivative assets net of amounts available for offset under Master Netting Agreements (or similar arrangements) and net of the related collateral held by the fund at April 30, 2016:
| Amounts Not Offset in the Consolidated Statement of Assets & Liabilities | ||||||||||||||||||||
| Gross Amount of Derivative Assets Subject to a Master Netting Agreement (or Similar Arrangement) by Counterparty | Financial Instruments Available for Offset | Financial Instruments Collateral Received (b) | Cash Collateral Received (b) | Net Amount of Derivative Assets by Counterparty | ||||||||||||||||
| Citibank N.A. | $2,919,702 | $(1,399 | ) | $— | $— | $2,918,303 | ||||||||||||||
| Goldman Sachs International | 6,918 | (3,661 | ) | — | (3,257 | ) | — | |||||||||||||
| JPMorgan Chase Bank N.A. | 76,772 | (1,436 | ) | — | (75,336 | ) | — | |||||||||||||
| Morgan Stanley Capital Services, Inc. | 159,669 | (2,164 | ) | — | (157,505 | ) | — | |||||||||||||
| Total | $3,163,061 | $(8,660 | ) | $— | $(236,098 | ) | $2,918,303 | |||||||||||||
The following table presents (by counterparty) the fund’s derivative liabilities net of amounts available for offset under Master Netting Agreements (or similar arrangements) and net of the related collateral pledged by the fund at April 30, 2016:
| Amounts Not Offset in the Consolidated Statement of Assets & Liabilities | ||||||||||||||||||||
Gross Amounts by Counterparty | Financial Instruments Available for Offset | Financial Instruments Collateral Pledged (b) | Cash Collateral Pledged (b) | Net Amount of Derivative Liabilities by Counterparty | ||||||||||||||||
| Citibank N.A. | $(1,399 | ) | $1,399 | $— | $— | $— | ||||||||||||||
| Goldman Sachs International | (3,661 | ) | 3,661 | — | — | — | ||||||||||||||
| JPMorgan Chase Bank N.A. | (1,436 | ) | 1,436 | — | — | — | ||||||||||||||
| Morgan Stanley Capital Services, Inc. | (2,164 | ) | 2,164 | — | — | — | ||||||||||||||
| Total | $(8,660 | ) | $8,660 | $— | $— | $— | ||||||||||||||
| (b) | The amount presented here may be less than the total amount of collateral (received)/pledged as the net amount of derivative assets and liabilities for a counterparty cannot be less than $0. |
Futures Contracts – The fund entered into futures contracts which may be used to hedge against or obtain broad market exposure, interest rate exposure, currency exposure, or to manage duration. A futures contract represents a commitment for the future purchase or sale of an asset at a specified price on a specified date.
36
Table of Contents
Notes to Consolidated Financial Statements (unaudited) – continued
Upon entering into a futures contract, the fund is required to deposit with the broker, either in cash or securities, an initial margin in an amount equal to a certain percentage of the notional amount of the contract. Subsequent payments (variation margin) are made or received by the fund each day, depending on the daily fluctuations in the value of the contract, and are recorded for financial statement purposes as unrealized gain or loss by the fund until the contract is closed or expires at which point the gain or loss on futures contracts is realized.
The fund bears the risk of interest rates, exchange rates or securities prices moving unexpectedly, in which case, the fund may not achieve the anticipated benefits of the futures contracts and may realize a loss. While futures contracts may present less counterparty risk to the fund since the contracts are exchange traded and the exchange’s clearinghouse guarantees payments to the broker, there is still counterparty credit risk due to the insolvency of the broker. The fund’s maximum risk of loss due to counterparty credit risk is equal to the margin posted by the fund to the broker plus any gains or minus any losses on the outstanding futures contracts.
Swap Agreements – During the period the fund entered into swap agreements. Certain types of swaps (“cleared swaps”) are required to be centrally cleared under provisions of the Dodd-Frank Regulatory Reform Bill. In a cleared swap transaction, the ultimate counterparty to the transaction is a clearinghouse (the “clearinghouse”). The contract is transferred and accepted by the clearinghouse immediately following execution of the swap contract with an executing broker. Thereafter, throughout the term of the cleared swap, the fund interfaces indirectly with the clearinghouse through a clearing broker and has counterparty risk to the clearing broker as well.
A swap agreement is generally an exchange of cash payments, at specified intervals or upon the occurrence of specified events, between the fund and a counterparty. The net cash payments exchanged are recorded as a realized gain or loss on swap agreements in the Consolidated Statement of Operations. The value of the swap agreement, which is adjusted daily and includes any related interest accruals to be paid or received by the fund, is recorded in the Consolidated Statement of Assets and Liabilities, as “Swaps, at value” for uncleared swaps and is included in “Due from brokers” or “Due to brokers” for cleared swaps. The daily change in value, including any related interest accruals to be paid or received, is recorded as unrealized appreciation or depreciation on swap agreements in the Consolidated Statement of Operations. The daily change in valuation of cleared swaps is recorded as a receivable or payable for variation margin in the Consolidated Statement of Assets and Liabilities. Amounts paid or received at the inception of the swap agreement are reflected as premiums paid or received in the Consolidated Statement of Assets and Liabilities and are amortized using the effective interest method over the term of the agreement. A liquidation payment received or made upon early termination is recorded as a realized gain or loss on swap agreements in the Consolidated Statement of Operations. Collateral for uncleared swaps, in the form of cash or securities, is held in segregated accounts with the fund’s custodian in connection with these agreements. Collateral for cleared swaps, in the form of cash or securities, is posted by the fund directly with the clearing broker.
Risks related to swap agreements include the possible lack of a liquid market, unfavorable market and interest rate movements of the underlying instrument and the
37
Table of Contents
Notes to Consolidated Financial Statements (unaudited) – continued
failure of the counterparty to perform under the terms of the agreements. The fund’s maximum risk of loss from counterparty credit risk is the discounted net value of the cash flows to be received from/paid to the counterparty over the contract’s remaining life, to the extent that the amount is positive. To address counterparty risk, uncleared swap agreements are limited to only highly-rated counterparties. Risk is further reduced by having an ISDA Master Agreement between the fund and the counterparty providing for netting as described above and, where applicable, by the posting of collateral by the counterparty to the fund to cover the fund’s exposure to the counterparty under such ISDA Master Agreement. The fund’s counterparty risk due to cleared swaps is mitigated by the fact that the clearinghouse is the true counterparty to the transaction and the regulatory requirement safeguards in the event of a clearing broker bankruptcy.
The fund entered into total return swaps on various commodity indexes in order to gain exposure without having to own the underlying commodities. Under a total return swap the fund pays the counterparty interest (based on a fixed or floating rate) and in return receives a payment equal to the increase in the total return of the reference index. To the extent there is a decline in the total return of the index, the fund pays the counterparty for that decline in addition to making the fixed or floating rate interest payment. The total return of the reference index includes changes in the market value of the index and any interest or dividend payments attributable to the index.
Dollar Roll Transactions – The fund enters into dollar roll transactions, with respect to mortgage backed securities issued by Ginnie Mae, Fannie Mae, and Freddie Mac, in which the fund sells mortgage backed securities to financial institutions and simultaneously agrees to purchase similar (same issuer, type and coupon) securities at a later date at an agreed-upon price. During the period between the sale and repurchase in a dollar roll transaction the fund will not be entitled to receive interest and principal payments on the securities sold but is compensated by interest earned on the proceeds of the initial sale and by a lower purchase price on the securities to be repurchased which enhances the fund’s total return. The fund accounts for dollar roll transactions as purchases and sales and realizes gains and losses on these transactions.
Indemnifications – Under the fund’s organizational documents, its officers and Trustees may be indemnified against certain liabilities and expenses arising out of the performance of their duties to the fund. Additionally, in the normal course of business, the fund enters into agreements with service providers that may contain indemnification clauses. The fund’s maximum exposure under these agreements is unknown as this would involve future claims that may be made against the fund that have not yet occurred.
Investment Transactions and Income – Investment transactions are recorded on the trade date. Interest income is recorded on the accrual basis. All premium and discount is amortized or accreted for financial statement purposes in accordance with U.S. generally accepted accounting principles. Interest payments received in additional securities are recorded on the ex-interest date in an amount equal to the value of the security on such date.
The fund may receive proceeds from litigation settlements. Any proceeds received from litigation involving portfolio holdings are reflected in the Consolidated Statement of
38
Table of Contents
Notes to Consolidated Financial Statements (unaudited) – continued
Operations in realized gain/loss if the security has been disposed of by the fund or in unrealized gain/loss if the security is still held by the fund. Any other proceeds from litigation not related to portfolio holdings are reflected as other income in the Consolidated Statement of Operations.
The fund invests a significant portion of its assets in asset-backed and/or mortgage-backed securities. The value of these securities may depend, in part, on the issuer’s or borrower’s credit quality or ability to pay principal and interest when due and that value may fall if an issuer or borrower defaults on its obligation to pay principal or interest or if the instrument’s credit rating is downgraded by a credit rating agency. U.S. Government securities not supported as to the payment of principal or interest by the U.S. Treasury, such as those issued by Fannie Mae, Freddie Mac, and the Federal Home Loan Banks, are subject to greater credit risk than are U.S. Government securities supported by the U.S. Treasury, such as those issued by Ginnie Mae.
The fund purchased or sold debt securities on a when-issued or delayed delivery basis, or in a “To Be Announced” (TBA) or “forward commitment” transaction with delivery or payment to occur at a later date beyond the normal settlement period. At the time a fund enters into a commitment to purchase or sell a security, the transaction is recorded and the value of the security acquired is reflected in the fund’s net asset value. The price of such security and the date that the security will be delivered and paid for are fixed at the time the transaction is negotiated. The value of the security may vary with market fluctuations. No interest accrues to the fund until payment takes place. At the time that a fund enters into this type of transaction, the fund is required to have sufficient cash and/or liquid securities to cover its commitments. Losses may arise due to changes in the value of the underlying securities or if the counterparty does not perform under the contract’s terms, or if the issuer does not issue the securities due to political, economic or other factors. Additionally, losses may arise due to declines in the value of the securities prior to settlement date.
To mitigate this risk of loss on TBA securities and other types of forward settling mortgage-backed securities, the fund whenever possible enters into a Master Securities Forward Transaction Agreement (“MSFTA”) on a bilateral basis with each of the counterparties with whom it undertakes a significant volume of transactions. The MSFTA gives each party to the agreement the right to terminate all transactions traded under such agreement if there is a certain deterioration in the credit quality of the other party. Upon an event of default or a termination of the MSFTA, the non-defaulting party has the right to close out all transactions traded under such agreement and to net amounts owed under each transaction to one net amount payable by one party to the other. This right to close out and net payments across all transactions traded under the MSFTA could result in a reduction of the fund’s credit risk to such counterparty equal to any amounts payable by the fund under the applicable transactions, if any.
For mortgage-backed securities traded under a MSFTA, the collateral and margining requirements are contract specific. Collateral amounts across all transactions traded under such agreement are netted and one amount is posted from one party to the other to collateralize such obligations. Cash that has been pledged to cover the fund’s collateral or margin obligations under a MSFTA, if any, will be reported separately on
39
Table of Contents
Notes to Consolidated Financial Statements (unaudited) – continued
the Consolidated Statement of Assets and Liabilities as restricted cash. Securities pledged as collateral or margin for the same purpose, if any, are noted in the Consolidated Portfolio of Investments.
Fees Paid Indirectly – Prior to October 1, 2015, the fund’s custody fee could be reduced by a credit earned under an arrangement that measured the value of U.S. dollars deposited with the custodian by the fund. The amount of the credit, for the six months ended April 30, 2016, is shown as a reduction of total expenses in the Consolidated Statement of Operations.
Tax Matters and Distributions – The fund intends to qualify as a regulated investment company, as defined under Subchapter M of the Internal Revenue Code, and to distribute all of its taxable income, including realized capital gains. As a result, no provision for federal income tax is required. The fund’s federal tax returns, when filed, will remain subject to examination by the Internal Revenue Service for a three year period. Management has analyzed the fund’s tax positions taken on federal and state tax returns for all open tax years and does not believe that there are any uncertain tax positions that require recognition of a tax liability. Foreign taxes, if any, have been accrued by the fund in the accompanying financial statements in accordance with the applicable foreign tax law. Foreign income taxes may be withheld by certain countries in which the fund invests. Additionally, capital gains realized by the fund on securities issued in or by certain foreign countries may be subject to capital gains tax imposed by those countries.
Distributions to shareholders are recorded on the ex-dividend date. Income and capital gain distributions are determined in accordance with income tax regulations, which may differ from U.S. generally accepted accounting principles. Certain capital accounts in the financial statements are periodically adjusted for permanent differences in order to reflect their tax character. These adjustments have no impact on net assets or net asset value per share. Temporary differences which arise from recognizing certain items of income, expense, gain or loss in different periods for financial statement and tax purposes will reverse at some time in the future. Distributions in excess of net investment income or net realized gains are temporary overdistributions for financial statement purposes resulting from differences in the recognition or classification of income or distributions for financial statement and tax purposes.
Book/tax differences primarily relate to amortization and accretion of debt securities.
The tax character of distributions made during the current period will be determined at fiscal year end. The tax character of distributions declared to shareholders for the last fiscal year is as follows:
| 10/31/15 | ||||
| Ordinary income (including any short-term capital gains) | $1,300,442 | |||
40
Table of Contents
Notes to Consolidated Financial Statements (unaudited) – continued
The federal tax cost and the tax basis components of distributable earnings were as follows:
| As of 4/30/16 | ||||
| Cost of investments | $610,525,520 | |||
| Gross appreciation | 1,993,545 | |||
| Gross depreciation | (87,093,320 | ) | ||
| Net unrealized appreciation (depreciation) | $(85,099,775 | ) | ||
| As of 10/31/15 | ||||
| Undistributed ordinary income | 1,957,557 | |||
| Capital loss carryforwards | (83,453,887 | ) | ||
| Other temporary differences | 85,387,690 | |||
| Net unrealized appreciation (depreciation) | (86,790,390 | ) | ||
The aggregate cost above includes prior fiscal year end tax adjustments, if applicable.
As of October 31, 2015, the fund had capital loss carryforwards available to offset future realized gains. Such losses are characterized as follows:
| Short-Term | $(71,587,119 | ) | ||
| Long-Term | (11,866,768 | ) | ||
| Total | $(83,453,887 | ) |
Under the Regulated Investment Company Modernization Act of 2010 (the “Act”), the above net capital losses may be carried forward indefinitely, and their character is retained as short-term and/or long-term losses. Previously, net capital losses were carried forward for eight years and treated as short-term losses.
Multiple Classes of Shares of Beneficial Interest – The fund offers multiple classes of shares, which differ in their respective distribution and service fees. The fund’s income, realized and unrealized gain (loss), and common expenses are allocated to shareholders based on the daily net assets of each class. Dividends are declared separately for each class. Differences in per share dividend rates are generally due to differences in separate class expenses. The fund’s distributions declared to shareholders as reported in the Consolidated Statements of Changes in Net Assets are presented by class as follows:
| From net investment income | ||||||||
| Six months ended 4/30/16 | Year ended 10/31/15 | |||||||
| Class A | $27 | $— | ||||||
| Class I | 205 | 176 | ||||||
| Class R5 | 2,430,690 | 1,300,266 | ||||||
| Total | $2,430,922 | $1,300,442 | ||||||
(3) Transactions with Affiliates
Investment Adviser – The fund has an investment advisory agreement with MFS to provide overall investment management and related administrative services and
41
Table of Contents
Notes to Consolidated Financial Statements (unaudited) – continued
facilities to the fund. The management fee is computed daily and paid monthly at an annual rate of 0.75% of the fund’s average daily net assets.
The investment adviser has agreed in writing to reduce its management fee to 0.70% of average daily net assets in excess of $1 billion. This written agreement will continue until modified by the fund’s Board of Trustees, but such agreement will continue at least until February 28, 2017. For the six months ended April 30, 2016, the fund’s average daily net assets did not exceed $1 billion and therefore, the management fee was not reduced. MFS has also agreed in writing to reduce its management fee by a specified amount if certain MFS mutual fund assets exceed thresholds agreed to by MFS and the fund’s Board of Trustees. For the six months ended April 30, 2016, this management fee reduction amounted to $20,024, which is included in the reduction of total expenses in the Consolidated Statement of Operations. The management fee incurred for the six months ended April 30, 2016 was equivalent to an annual effective rate of 0.74% of the fund’s average daily net assets.
Distributor – MFS Fund Distributors, Inc. (MFD), a wholly-owned subsidiary of MFS, as distributor, received $0 for the six months ended April 30, 2016, as its portion of the initial sales charge on sales of Class A shares of the fund.
The Board of Trustees has adopted a distribution plan for certain share classes pursuant to Rule 12b-1 of the Investment Company Act of 1940.
The fund’s distribution plan provides that the fund will pay MFD for services provided by MFD and financial intermediaries in connection with the distribution and servicing of certain share classes. One component of the plan is a distribution fee paid to MFD and another component of the plan is a service fee paid to MFD. MFD may subsequently pay all, or a portion, of the distribution and/or service fees to financial intermediaries.
Distribution Plan Fee Table:
| Distribution Fee Rate (d) | Service Fee Rate (d) | Total Distribution Plan (d) | Annual Effective Rate (e) | Distribution and Service Fee | ||||||||||||||||
| Class A | — | 0.25% | 0.25% | 0.25% | $55 | |||||||||||||||
| (d) | In accordance with the distribution plan for certain classes, the fund pays distribution and/or service fees equal to these annual percentage rates of each class’s average daily net assets. The distribution and service fee rates disclosed by class represent the current rates in effect at the end of the reporting period. Any rate changes, if applicable, are detailed below. |
| (e) | The annual effective rates represent actual fees incurred under the distribution plan for the six months ended April 30, 2016 based on each class’s average daily net assets. MFD has voluntarily agreed to rebate a portion of the Class A 0.25% service fee attributable to accounts for which MFD retains the 0.25% service fee except for accounts attributable to MFS or its affiliates’ seed money. For the six months ended April 30, 2016, the rebate amount was $0 for Class A. |
Certain Class A shares are subject to a contingent deferred sales charge (CDSC) in the event of a shareholder redemption within 18 months of purchase. There were no contingent deferred sales charges imposed during the six months ended April 30, 2016.
Shareholder Servicing Agent – MFS Service Center, Inc. (MFSC), a wholly-owned subsidiary of MFS, provides transfer agent and recordkeeping functions in connection with the issuance, transfer, and redemption of shares of the fund under a Shareholder
42
Table of Contents
Notes to Consolidated Financial Statements (unaudited) – continued
Servicing Agent Agreement. MFSC is not paid a fee for providing these services. MFSC may receive payment from the fund for out-of-pocket expenses, sub-accounting and other shareholder servicing costs which may be paid to affiliated and unaffiliated service providers. Class R5 shares do not incur sub-accounting fees. For the six months ended April 30, 2016, out-of-pocket expenses amounted to $119. The fund may also pay shareholder servicing related costs to non-related parties.
Administrator – MFS provides certain financial, legal, shareholder communications, compliance, and other administrative services to the fund. Under an administrative services agreement, the fund reimburses MFS the costs incurred to provide these services. The fund is charged an annual fixed amount of $17,500 plus a fee based on average daily net assets. The administrative services fee incurred for the six months ended April 30, 2016 was equivalent to an annual effective rate of 0.0174% of the fund’s average daily net assets.
Trustees’ and Officers’ Compensation – The fund pays compensation to independent Trustees in the form of a retainer, attendance fees, and additional compensation to Board and Committee chairpersons. The fund does not pay compensation directly to Trustees or officers of the fund who are also officers of the investment adviser, all of whom receive remuneration for their services to the fund from MFS. Certain officers and Trustees of the fund are officers or directors of MFS, MFD, and MFSC.
Other – This fund and certain other funds managed by MFS (the funds) have entered into a service agreement (the ISO Agreement) which provides for payment of fees solely by the funds to Tarantino LLC in return for the provision of services of an Independent Senior Officer (ISO) for the funds. Frank L. Tarantino serves as the ISO and is an officer of the funds and the sole member of Tarantino LLC. The funds can terminate the ISO Agreement with Tarantino LLC at any time under the terms of the ISO Agreement. For the six months ended April 30, 2016, the fee paid by the fund under this agreement was $586 and included in “Miscellaneous” expense in the Consolidated Statement of Operations. MFS has agreed to bear all expenses associated with office space, other administrative support, and supplies provided to the ISO.
The fund invests in the MFS Institutional Money Market Portfolio which is managed by MFS and seeks current income consistent with preservation of capital and liquidity. The Subsidiary does not invest in the MFS Institutional Money Market Portfolio. Income earned on this investment is included in “Dividends from underlying affiliated funds” in the Consolidated Statement of Operations. This money market fund does not pay a management fee to MFS.
On September 9, 2015, MFS redeemed 4,083 shares of Class A for an aggregate amount of $24,335 and 1,988 shares of Class I for an aggregate amount of $11,848.
At April 30, 2016, MFS held 100% of the outstanding shares of Class A and Class I.
(4) Portfolio Securities
For the six months ended April 30, 2016, purchases and sales of investments, other than short-term obligations, were as follows:
| Purchases | Sales | |||||||
| U.S. Government securities | $10,822,966 | $3,006,002 | ||||||
| Investments (non-U.S. Government securities) | $47,725,217 | $61,821,833 | ||||||
43
Table of Contents
Notes to Consolidated Financial Statements (unaudited) – continued
(5) Shares of Beneficial Interest
The fund’s Declaration of Trust permits the Trustees to issue an unlimited number of full and fractional shares of beneficial interest. Transactions in fund shares were as follows:
| Six months ended 4/30/16 | Year ended 10/31/15 | |||||||||||||||
| Shares | Amount | Shares | Amount | |||||||||||||
| Shares sold | ||||||||||||||||
Class R5 | 9,923,663 | $54,016,904 | 26,930,637 | $184,561,567 | ||||||||||||
| Shares issued to shareholders in reinvestment of distributions | ||||||||||||||||
Class A | 5 | $27 | — | $— | ||||||||||||
Class I | 38 | 205 | 25 | 176 | ||||||||||||
Class R5 | 456,897 | 2,430,690 | 178,854 | 1,300,266 | ||||||||||||
| 456,940 | $2,430,922 | 178,879 | $1,300,442 | |||||||||||||
| Shares reacquired | ||||||||||||||||
Class A | — | $— | (4,083 | ) | $(24,335 | ) | ||||||||||
Class I | — | — | (1,988 | ) | (11,848 | ) | ||||||||||
Class R5 | (2,266,128 | ) | (12,558,292 | ) | (1,986,564 | ) | (13,309,950 | ) | ||||||||
| (2,266,128 | ) | $(12,558,292 | ) | (1,992,635 | ) | $(13,346,133 | ) | |||||||||
| Net change | ||||||||||||||||
Class A | 5 | $27 | (4,083 | ) | $(24,335 | ) | ||||||||||
Class I | 38 | 205 | (1,963 | ) | (11,672 | ) | ||||||||||
Class R5 | 8,114,432 | 43,889,302 | 25,122,927 | 172,551,883 | ||||||||||||
| 8,114,475 | $43,889,534 | 25,116,881 | $172,515,876 | |||||||||||||
The fund is one of several mutual funds in which certain MFS funds may invest. The MFS funds do not invest in the underlying funds for the purpose of exercising management or control. At the end of the period, the MFS Growth Allocation Fund, the MFS Moderate Allocation Fund, the MFS Aggressive Growth Allocation Fund, the MFS Conservative Allocation Fund, the MFS Lifetime 2030 Fund, the MFS Lifetime 2040 Fund, and the MFS Lifetime 2035 Fund were the owners of record of approximately 36%, 32%, 15%, 5%, 3%, 3%, and 1%, respectively, of the value of outstanding voting shares of the fund. In addition, the MFS Lifetime Income Fund, the MFS Lifetime 2015 Fund, the MFS Lifetime 2020 Fund, the MFS Lifetime 2025 Fund, the MFS Lifetime 2045 Fund, the MFS Lifetime 2050 Fund, the MFS Lifetime 2055 Fund, and the MFS Global Multi-Asset Fund were each the owners of record of less than 1% of the value of outstanding voting shares of the fund.
(6) Line of Credit
The fund and certain other funds managed by MFS participate in a $1.25 billion unsecured committed line of credit, subject to a $1 billion sublimit, provided by a syndication of banks under a credit agreement. Borrowings may be made for temporary financing needs. Interest is charged to each fund, based on its borrowings, generally at a rate equal to the higher of the Overnight Federal Reserve funds rate or
44
Table of Contents
Notes to Consolidated Financial Statements (unaudited) – continued
daily one month LIBOR plus an agreed upon spread. A commitment fee, based on the average daily, unused portion of the committed line of credit, is allocated among the participating funds at the end of each calendar quarter. In addition, the fund and other funds managed by MFS have established unsecured uncommitted borrowing arrangements with certain banks for temporary financing needs. Interest is charged to each fund, based on its borrowings, at a rate equal to the Overnight Federal Reserve funds rate plus an agreed upon spread. For the six months ended April 30, 2016, the fund’s commitment fee and interest expense were $1,079 and $0, respectively, and are included in “Miscellaneous” expense in the Consolidated Statement of Operations.
(7) Transactions in Underlying Affiliated Funds-Affiliated Issuers
An affiliated issuer may be considered one in which the fund owns 5% or more of the outstanding voting securities, or a company which is under common control. For the purposes of this report, the fund assumes the following to be an affiliated issuer:
| Underlying Affiliated Fund | Beginning Shares/Par Amount | Acquisitions Shares/Par Amount | Dispositions Shares/Par Amount | Ending Shares/Par Amount | ||||||||||||
| MFS Institutional Money Market Portfolio | 60,128,667 | 153,938,776 | (126,642,163 | ) | 87,425,280 | |||||||||||
| Underlying Affiliated Fund | Realized Gain (Loss) | Capital Gain Distributions | Dividend Income | Ending Value | ||||||||||||
| MFS Institutional Money Market Portfolio | $— | $— | $62,601 | $87,425,280 | ||||||||||||
45
Table of Contents
PROXY VOTING POLICIES AND INFORMATION
MFS votes proxies on behalf of the fund pursuant to proxy voting policies and procedures that are available without charge, upon request, by calling 1-800-225-2606, by visiting the Proxy Voting section of mfs.com or by visiting the SEC’s Web site at http://www.sec.gov.
Information regarding how the fund voted proxies relating to portfolio securities during the twelve-month period ended June 30, 2015 is available without charge by visiting the Proxy Voting section of mfs.com or by visiting the SEC’s Web site at http://www.sec.gov.
QUARTERLY PORTFOLIO DISCLOSURE
The fund will file a complete schedule of portfolio holdings with the Securities and Exchange Commission (the Commission) for the first and third quarters of each fiscal year on Form N-Q. A shareholder can obtain the quarterly portfolio holdings report at mfs.com. The fund’s Form N-Q is also available on the EDGAR database on the Commission’s Internet Web site at http://www.sec.gov, and may be reviewed and copied at the:
Public Reference Room
Securities and Exchange Commission
100 F Street, NE, Room 1580
Washington, D.C. 20549
Information on the operation of the Public Reference Room may be obtained by calling the Commission at 1-800-SEC-0330. Copies of the fund’s Form N-Q also may be obtained, upon payment of a duplicating fee, by electronic request at the following e-mail address: publicinfo@sec.gov or by writing the Public Reference Section at the above address.
From time to time, MFS may post important information about the fund or the MFS funds on the MFS web site (mfs.com). This information is available by visiting the “Market Commentary” and “Announcements” sub sections in the “Market Outlooks” section of mfs.com or by clicking on the fund’s name under “Mutual Funds” in the “Products” section of mfs.com.
PROVISION OF FINANCIAL REPORTS AND SUMMARY PROSPECTUSES
The fund produces financial reports every six months and updates its summary prospectus and prospectus annually. To avoid sending duplicate copies of materials to households, only one copy of the fund’s annual and semiannual report and summary prospectus may be mailed to shareholders having the same last name and residential address on the fund’s records. However, any shareholder may contact MFSC (please see back cover for address and telephone number) to request that copies of these reports and summary prospectuses be sent personally to that shareholder.
46
Table of Contents
Save paper with eDelivery.
| MFS® will send you prospectuses, |

reports, and proxies directly via e-mail so you will get information faster with less mailbox clutter.
To sign up:
1. Go to mfs.com.
2. Log in via MFS® Access.
3. Select eDelivery.
If you own your MFS fund shares through a financial institution or a retirement plan, MFS® TALK, MFS® Access, or eDelivery may not be available to you.
WEB SITE
mfs.com
MFS TALK
1-800-637-8255
24 hours a day
ACCOUNT SERVICE AND LITERATURE
Shareholders
1-800-225-2606
Financial advisors
1-800-343-2829
Retirement plan services
1-800-637-1255
MAILING ADDRESS
MFS Service Center, Inc.
P.O. Box 55824
Boston, MA 02205-5824
OVERNIGHT MAIL
MFS Service Center, Inc.
c/o Boston Financial Data Services
30 Dan Road
Canton, MA 02021-2809
Table of Contents
SEMIANNUAL REPORT
April 30, 2016

MFS® GLOBAL ALTERNATIVE STRATEGY FUND

DTR-SEM
Table of Contents
MFS® GLOBAL ALTERNATIVE STRATEGY FUND
The report is prepared for the general information of shareholders.
It is authorized for distribution to prospective investors only when preceded or accompanied by a current prospectus.
NOT FDIC INSURED • MAY LOSE VALUE • NO BANK GUARANTEE
Table of Contents

Dear Shareholders:
Markets have largely recovered after a significant bout of volatility earlier this year. Oil prices have rebounded sharply, and the dollar has weakened against most currencies.
Global economic growth remains sluggish, and almost every major central bank — aside from the U.S. Federal Reserve — is continuing to loosen monetary policy. This should help keep interest rates lower for longer on a global basis.
Even with a weaker dollar, soft global growth continues to negatively impact U.S. exports. In Europe, a crucial referendum on Britain’s continued membership in the European Union is set for June 23. China continues to face headwinds in its shift to a consumer-led economy, which is weighing on its manufacturing sector. Emerging markets have been beneficiaries of the weaker U.S. dollar and firmer commodity prices.
At MFS®, we believe it is best to view markets through a long lens, and not react to short-term swings. That makes it possible to filter out market noise and focus on long-term fundamentals.
In our view, the professional guidance of a financial advisor, along with a patient, long-term approach, will help you reach your investment objectives.
Respectfully,

Robert J. Manning
Chairman
MFS Investment Management
June 16, 2016
The opinions expressed in this letter are subject to change and may not be relied upon for investment advice. No forecasts can be guaranteed.
1
Table of Contents
Portfolio structure
| Active Security Selection (a) | Tactical Overlay (b) | Net Market Exposure (c) | ||||||||||||
| Fixed Income | U.S. | | 18.0% | | 30.6% | 48.6% | ||||||||
| North America ex-U.S. | 0.4% | 0.0% | 0.4% | |||||||||||
| Emerging Markets | 0.2% | 0.0% | 0.2% | |||||||||||
| Japan | 0.2% | 0.0% | 0.2% | |||||||||||
| Asia/Pacific ex-Japan | 0.1% | 0.0% | 0.1% | |||||||||||
| Europe ex-U.K. | 0.6% | (8.6)% | (8.0)% | |||||||||||
| United Kingdom | 0.3% | (10.0)% | (9.7)% | |||||||||||
| Equity | Europe ex-U.K. | 8.6% | 0.4% | 9.0% | ||||||||||
| U.S. Small/Mid Cap | 18.4% | (12.1)% | 6.3% | |||||||||||
| Emerging Markets | 1.9% | (0.4)% | 1.5% | |||||||||||
| Developed - Middle East/Africa | 0.2% | 0.0% | 0.2% | |||||||||||
| North America ex-U.S. | 0.6% | (0.5)% | 0.1% | |||||||||||
| Japan | 3.3% | (3.5)% | (0.2)% | |||||||||||
| Asia/Pacific ex-Japan | 1.3% | (4.0)% | (2.7)% | |||||||||||
| United Kingdom | 4.3% | (10.6)% | (6.3)% | |||||||||||
| U.S. Large Cap | 27.3% | (43.8)% | (16.5)% | |||||||||||
| Cash | Cash & Cash Equivalents (d) | 3.3% | 11.1% | 14.4% | ||||||||||
| Other (e) | 0.0% | 62.4% | 62.4% | |||||||||||
| Top ten holdings (c) | ||||
| Markit CDX North America Investment Grade Index - 1.00% DEC 2020 | 30.6% | |||
| Hang Seng China Enterprises Index Future - MAY 2016 | 6.7% | |||
| S&P MidCap 400 Index Future - JUN 2016 | (5.7)% | |||
| Russell 2000 Index Future - JUN 2016 | (6.4)% | |||
| E-mini MSCI Index Future - JUN 2016 | (7.4)% | |||
| Nikkei 225 Index Future - JUN 2016 | (8.7)% | |||
| United Kingdom Gilt Bond 10 yr Future - JUN 2016 | (10.0)% | |||
| FTSE 100 Index Future - JUN 2016 | (10.6)% | |||
| German Euro Bobl Future - JUN 2016 | (11.6)% | |||
| S&P 500 Index Future - JUN 2016 | (40.7)% |
2
Table of Contents
Portfolio Composition – continued
| (a) | Represents the actively managed portion of the portfolio and for purposes of this presentation, components include the value of securities, less any securities sold short. The bond component will include any accrued interest amounts. This also reflects the equivalent exposure of certain derivative positions. These amounts may be negative from time to time. |
| (b) | Represents the tactical overlay portion of the portfolio which is how the fund manages its exposure to markets and currencies through the use of derivative positions. Percentages reflect the equivalent exposure of those derivative positions. |
| (c) | For purposes of this presentation, the components include the value of securities, less any securities sold short, and reflect the impact of the equivalent exposure of all derivative positions. These amounts may be negative from time to time. The bond component will include any accrued interest amounts. |
| (d) | Cash & Cash Equivalents includes any cash, investments in money market funds, short-term securities, and other assets less liabilities. Please see the Statement of Assets and Liabilities for additional information related to the fund’s cash position and other assets and liabilities. |
| (e) | Other includes currency derivatives and/or the offsetting of the leverage produced by the fund’s derivative positions, including payables and/or receivables of the finance leg of interest rate swaps and the unrealized gain or loss in connection with forward currency exchange contracts. |
Equivalent exposure is a calculated amount that translates the derivative position into a reasonable approximation of the amount of the underlying asset that the portfolio would have to hold at a given point in time to have the same price sensitivity that results from the portfolio’s ownership of the derivative contract. When dealing with derivatives, equivalent exposure is a more representative measure of the potential impact of a position on portfolio performance than value. The value of derivatives may be different.
Where the fund holds convertible bonds, these are treated as part of the equity portion of the portfolio.
Percentages are based on net assets as of 4/30/16.
The portfolio is actively managed and current holdings may be different.
3
Table of Contents
Fund expenses borne by the shareholders during the period, November 1, 2015 through April 30, 2016
As a shareholder of the fund, you incur two types of costs: (1) transaction costs, including sales charges (loads) on certain purchase or redemption payments, and (2) ongoing costs, including management fees; distribution and service (12b-1) fees; and other fund expenses. This example is intended to help you understand your ongoing costs (in dollars) of investing in the fund and to compare these costs with the ongoing costs of investing in other mutual funds.
The example is based on an investment of $1,000 invested at the beginning of the period and held for the entire period November 1, 2015 through April 30, 2016.
Actual Expenses
The first line for each share class in the following table provides information about actual account values and actual expenses. You may use the information in this line, together with the amount you invested, to estimate the expenses that you paid over the period. Simply divide your account value by $1,000 (for example, an $8,600 account value divided by $1,000 = 8.6), then multiply the result by the number in the first line under the heading entitled “Expenses Paid During Period” to estimate the expenses you paid on your account during this period.
Hypothetical Example for Comparison Purposes
The second line for each share class in the following table provides information about hypothetical account values and hypothetical expenses based on the fund’s actual expense ratio and an assumed rate of return of 5% per year before expenses, which is not the fund’s actual return. The hypothetical account values and expenses may not be used to estimate the actual ending account balance or expenses you paid for the period. You may use this information to compare the ongoing costs of investing in the fund and other funds. To do so, compare this 5% hypothetical example with the 5% hypothetical examples that appear in the shareholder reports of the other funds.
Please note that the expenses shown in the table are meant to highlight your ongoing costs only and do not reflect any transactional costs, such as sales charges (loads). Therefore, the second line for each share class in the table is useful in comparing ongoing costs only, and will not help you determine the relative total costs of owning different funds. In addition, if these transactional costs were included, your costs would have been higher.
4
Table of Contents
Expense Table – continued
| Share Class | Annualized Expense Ratio | Beginning Account Value 11/01/15 | Ending Account Value 4/30/16 | Expenses Paid During Period (p) 11/01/15-4/30/16 | ||||||||||||||
| A | Actual | 1.35% | $1,000.00 | $968.39 | $6.61 | |||||||||||||
| Hypothetical (h) | 1.35% | $1,000.00 | $1,018.15 | $6.77 | ||||||||||||||
| B | Actual | 2.11% | $1,000.00 | $965.00 | $10.31 | |||||||||||||
| Hypothetical (h) | 2.11% | $1,000.00 | $1,014.37 | $10.57 | ||||||||||||||
| C | Actual | 2.11% | $1,000.00 | $965.65 | $10.31 | |||||||||||||
| Hypothetical (h) | 2.11% | $1,000.00 | $1,014.37 | $10.57 | ||||||||||||||
| I | Actual | 1.10% | $1,000.00 | $969.00 | $5.39 | |||||||||||||
| Hypothetical (h) | 1.10% | $1,000.00 | $1,019.39 | $5.52 | ||||||||||||||
| R1 | Actual | 2.11% | $1,000.00 | $964.76 | $10.31 | |||||||||||||
| Hypothetical (h) | 2.11% | $1,000.00 | $1,014.37 | $10.57 | ||||||||||||||
| R2 | Actual | 1.61% | $1,000.00 | $967.10 | $7.87 | |||||||||||||
| Hypothetical (h) | 1.61% | $1,000.00 | $1,016.86 | $8.07 | ||||||||||||||
| R3 | Actual | 1.35% | $1,000.00 | $967.87 | $6.61 | |||||||||||||
| Hypothetical (h) | 1.35% | $1,000.00 | $1,018.15 | $6.77 | ||||||||||||||
| R4 | Actual | 1.11% | $1,000.00 | $969.18 | $5.43 | |||||||||||||
| Hypothetical (h) | 1.11% | $1,000.00 | $1,019.34 | $5.57 | ||||||||||||||
| R5 | Actual | 1.03% | $1,000.00 | $969.70 | $5.04 | |||||||||||||
| Hypothetical (h) | 1.03% | $1,000.00 | $1,019.74 | $5.17 | ||||||||||||||
| (h) | 5% class return per year before expenses. |
| (p) | “Expenses Paid During Period” are equal to each class’s annualized expense ratio, as shown above, multiplied by the average account value over the period, multiplied by 182/366 (to reflect the one-half year period). Expenses paid do not include any applicable sales charges (loads). If these transaction costs had been included, your costs would have been higher. |
5
Table of Contents
4/30/16 (unaudited)
The Portfolio of Investments is a complete list of all securities owned by your fund. It is categorized by broad-based asset classes.
| Common Stocks - 65.6% | ||||||||
| Issuer | Shares/Par | Value ($) | ||||||
| Aerospace - 1.2% | ||||||||
| General Dynamics Corp. | 1,660 | $ | 233,263 | |||||
| HEICO Corp. | 1,474 | 90,371 | ||||||
| Honeywell International, Inc. | 1,366 | 156,093 | ||||||
| L-3 Communications Holdings, Inc. | 2,073 | 272,662 | ||||||
| ManTech International Corp., “A” | 5,187 | 175,321 | ||||||
| Northrop Grumman Corp. | 21,404 | 4,414,789 | ||||||
| Orbital ATK, Inc. | 2,038 | 177,306 | ||||||
| Rockwell Collins, Inc. | 2,856 | 251,871 | ||||||
| Rolls-Royce Holdings PLC | 100,908 | 987,122 | ||||||
| Saab AB, “B” | 13,807 | 472,300 | ||||||
| TransDigm Group, Inc. (a) | 2,956 | 673,584 | ||||||
| United Technologies Corp. | 7,540 | 786,950 | ||||||
|
| |||||||
| $ | 8,691,632 | |||||||
| Airlines - 0.1% | ||||||||
| Alaska Air Group, Inc. | 1,789 | $ | 125,999 | |||||
| Delta Air Lines, Inc. | 3,883 | 161,805 | ||||||
| Stagecoach Group PLC | 79,728 | 299,974 | ||||||
|
| |||||||
| $ | 587,778 | |||||||
| Alcoholic Beverages - 1.0% | ||||||||
| AmBev S.A., ADR | 27,260 | $ | 152,383 | |||||
| Constellation Brands, Inc., “A” | 12,751 | 1,989,921 | ||||||
| Heineken N.V. | 18,615 | 1,744,641 | ||||||
| Molson Coors Brewing Co. | 2,530 | 241,944 | ||||||
| Pernod Ricard S.A. | 27,798 | 3,000,942 | ||||||
|
| |||||||
| $ | 7,129,831 | |||||||
| Apparel Manufacturers - 0.9% | ||||||||
| Burberry Group PLC | 5,705 | $ | 99,113 | |||||
| Christian Dior S.A. | 1,147 | 201,406 | ||||||
| Hanesbrands, Inc. | 9,378 | 272,243 | ||||||
| LVMH Moet Hennessy Louis Vuitton S.A. | 15,502 | 2,575,607 | ||||||
| Michael Kors Holdings Ltd. (a) | 50,587 | 2,613,324 | ||||||
| NIKE, Inc., “B” | 9,703 | 571,895 | ||||||
| PVH Corp. | 3,007 | 287,469 | ||||||
| Sequential Brands Group, Inc. (a) | 16,241 | 90,138 | ||||||
|
| |||||||
| $ | 6,711,195 | |||||||
6
Table of Contents
Portfolio of Investments (unaudited) – continued
| Issuer | Shares/Par | Value ($) | ||||||
| Common Stocks - continued | ||||||||
| Automotive - 0.9% | ||||||||
| BorgWarner Transmission Systems, Inc. | 3,340 | $ | 119,973 | |||||
| Delphi Automotive PLC | 2,626 | 193,352 | ||||||
| DENSO Corp. | 8,700 | 325,965 | ||||||
| Fenix Parts, Inc. (a) | 52,829 | 266,258 | ||||||
| Ford Otomotiv Sanayi S.A. | 12,092 | 162,494 | ||||||
| General Motors Co. | 14,395 | 457,761 | ||||||
| GKN PLC | 104,812 | 426,818 | ||||||
| Goodyear Tire & Rubber Co. | 42,839 | 1,241,046 | ||||||
| Guangzhou Automobile Group Co. Ltd., “H” | 432,000 | 498,205 | ||||||
| Harley-Davidson, Inc. | 4,248 | 203,182 | ||||||
| LKQ Corp. (a) | 29,382 | 941,693 | ||||||
| Mobileye N.V. (a) | 2,223 | 84,807 | ||||||
| Stanley Electric Co. Ltd. | 9,200 | 187,335 | ||||||
| Tofas Turk Otomobil Fabriikasi A.S. | 23,255 | 184,012 | ||||||
| USS Co. Ltd. | 81,700 | 1,292,126 | ||||||
|
| |||||||
| $ | 6,585,027 | |||||||
| Biotechnology - 1.1% | ||||||||
| Acadia Pharmaceuticals, Inc. (a) | 2,272 | $ | 73,386 | |||||
| Aduro Biotech, Inc. (a) | 1,851 | 23,970 | ||||||
| Alder Biopharmaceuticals, Inc. (a) | 1,780 | 47,259 | ||||||
| Alexion Pharmaceuticals, Inc. (a) | 8,416 | 1,172,180 | ||||||
| Alnylam Pharmaceuticals, Inc. (a) | 956 | 64,090 | ||||||
| AMAG Pharmaceuticals, Inc. (a) | 5,077 | 134,642 | ||||||
| Amgen, Inc. | 6,129 | 970,221 | ||||||
| Amicus Therapeutics, Inc. (a) | 8,561 | 63,951 | ||||||
| Celgene Corp. (a) | 21,281 | 2,200,668 | ||||||
| Exact Sciences Corp. (a) | 6,743 | 47,336 | ||||||
| Gilead Sciences, Inc. | 27,547 | 2,429,921 | ||||||
| Ionis Pharmaceuticals, Inc. (a) | 2,330 | 95,460 | ||||||
| MiMedx Group, Inc. (a) | 12,317 | 92,747 | ||||||
| NantKwest, Inc. (a) | 2,177 | 18,047 | ||||||
| Neurocrine Biosciences, Inc. (a) | 1,460 | 66,547 | ||||||
| Novavax, Inc. (a) | 7,736 | 40,537 | ||||||
| Seres Therapeutics, Inc. (a) | 1,636 | 48,295 | ||||||
| Tesaro, Inc. (a) | 3,387 | 140,357 | ||||||
| VTV Therapeutics, Inc. (a) | 5,367 | 33,812 | ||||||
|
| |||||||
| $ | 7,763,426 | |||||||
| Broadcasting - 0.4% | ||||||||
| Discovery Communications, Inc., “A” (a) | 5,532 | $ | 151,079 | |||||
| Havas S.A. | 51,875 | 434,091 | ||||||
| Interpublic Group of Companies, Inc. | 10,077 | 231,166 | ||||||
| Live Nation, Inc. (a) | 14,396 | 309,226 | ||||||
7
Table of Contents
Portfolio of Investments (unaudited) – continued
| Issuer | Shares/Par | Value ($) | ||||||
| Common Stocks - continued | ||||||||
| Broadcasting - continued | ||||||||
| Nielsen Holdings PLC | 5,059 | $ | 263,776 | |||||
| Time Warner, Inc. | 16,365 | 1,229,666 | ||||||
| Twenty-First Century Fox, Inc. | 3,877 | 117,318 | ||||||
| WPP Group PLC | 16,001 | 373,143 | ||||||
|
| |||||||
| $ | 3,109,465 | |||||||
| Brokerage & Asset Managers - 1.2% | ||||||||
| Affiliated Managers Group, Inc. (a) | 838 | $ | 142,728 | |||||
| Apollo Global Management, “A” | 4,818 | 81,472 | ||||||
| BlackRock, Inc. | 3,664 | 1,305,593 | ||||||
| Computershare Ltd. | 84,822 | 652,038 | ||||||
| Credit Suisse Group AG | 28,280 | 430,139 | ||||||
| IG Group Holdings PLC | 56,816 | 641,719 | ||||||
| Intercontinental Exchange, Inc. | 7,121 | 1,709,254 | ||||||
| NASDAQ, Inc. | 46,962 | 2,898,025 | ||||||
| Raymond James Financial, Inc. | 9,216 | 480,799 | ||||||
| Schroders PLC | 14,170 | 520,511 | ||||||
| TD Ameritrade Holding Corp. | 4,646 | 138,590 | ||||||
|
| |||||||
| $ | 9,000,868 | |||||||
| Business Services - 4.8% | ||||||||
| Accenture PLC, “A” | 42,309 | $ | 4,777,532 | |||||
| Amadeus IT Holding S.A. | 87,365 | 3,975,482 | ||||||
| Amdocs Ltd. | 3,705 | 209,481 | ||||||
| Ashtead Group PLC | 29,103 | 385,904 | ||||||
| Brenntag AG | 2,314 | 135,688 | ||||||
| Bright Horizons Family Solutions, Inc. (a) | 23,860 | 1,565,693 | ||||||
| Bunzl PLC | 62,018 | 1,847,693 | ||||||
| Cerved Information Solutions S.p.A. | 6,764 | 54,409 | ||||||
| Cognizant Technology Solutions Corp., “A” (a) | 41,575 | 2,426,733 | ||||||
| Compass Group PLC | 193,173 | 3,440,685 | ||||||
| CoStar Group, Inc. (a) | 966 | 190,601 | ||||||
| Equifax, Inc. | 5,819 | 699,735 | ||||||
| Fidelity National Information Services, Inc. | 5,293 | 348,279 | ||||||
| First Data Corp. (a) | 5,823 | 66,324 | ||||||
| Fiserv, Inc. (a) | 17,446 | 1,704,823 | ||||||
| FleetCor Technologies, Inc. (a) | 8,545 | 1,321,741 | ||||||
| Forrester Research, Inc. | 5,031 | 169,142 | ||||||
| Gartner, Inc. (a) | 15,256 | 1,329,866 | ||||||
| Global Payments, Inc. | 51,403 | 3,710,269 | ||||||
| Intertek Group PLC | 14,381 | 684,387 | ||||||
| Mitsubishi Corp. | 9,100 | 149,713 | ||||||
| Nomura Research Institute Ltd. | 16,150 | 567,134 | ||||||
| PRA Group, Inc. (a) | 3,780 | 125,420 | ||||||
8
Table of Contents
Portfolio of Investments (unaudited) – continued
| Issuer | Shares/Par | Value ($) | ||||||
| Common Stocks - continued | ||||||||
| Business Services - continued | ||||||||
| RE/MAX Holdings, Inc., “A” | 6,131 | $ | 225,621 | |||||
| Realogy Holdings Corp. (a) | 4,836 | 172,839 | ||||||
| Resources Connection, Inc. | 18,737 | 276,745 | ||||||
| SGS S.A. | 400 | 880,225 | ||||||
| Sodexo | 6,783 | 684,961 | ||||||
| Travelport Worldwide Ltd. | 131,209 | 1,830,366 | ||||||
| Tyler Technologies, Inc. (a) | 623 | 91,213 | ||||||
| Ultimate Software Group, Inc. (a) | 1,204 | 236,694 | ||||||
| Univar, Inc. (a) | 23,946 | 416,660 | ||||||
| Verisk Analytics, Inc., “A” (a) | 6,247 | 484,642 | ||||||
| vMeitec Corp. | 4,800 | 166,605 | ||||||
| WNS (Holdings) Ltd., ADR (a) | 6,699 | 212,291 | ||||||
|
| |||||||
| $ | 35,565,596 | |||||||
| Cable TV - 0.5% | ||||||||
| Charter Communications, Inc., “A” (a) | 3,861 | $ | 819,459 | |||||
| Comcast Corp., “A” | 44,736 | 2,718,159 | ||||||
| Time Warner Cable, Inc. | 475 | 100,752 | ||||||
|
| |||||||
| $ | 3,638,370 | |||||||
| Chemicals - 1.2% | ||||||||
| 3M Co. | 7,005 | $ | 1,172,497 | |||||
| Celanese Corp. | 2,730 | 193,011 | ||||||
| E.I. du Pont de Nemours & Co. | 1,310 | 86,342 | ||||||
| Givaudan S.A. | 777 | 1,530,835 | ||||||
| LyondellBasell Industries N.V., “A” | 31,852 | 2,633,205 | ||||||
| Monsanto Co. | 5,970 | 559,270 | ||||||
| Orica Ltd. | 43,477 | 504,885 | ||||||
| PPG Industries, Inc. | 16,052 | 1,771,980 | ||||||
| Victrex PLC | 12,418 | 254,024 | ||||||
|
| |||||||
| $ | 8,706,049 | |||||||
| Computer Software - 1.8% | ||||||||
| 2U, Inc. (a) | 7,661 | $ | 214,738 | |||||
| Adobe Systems, Inc. (a) | 14,531 | 1,369,111 | ||||||
| Aspen Technology, Inc. (a) | 3,608 | 137,212 | ||||||
| Cadence Design Systems, Inc. (a) | 45,186 | 1,047,863 | ||||||
| Dassault Systemes S.A. | 1,460 | 114,182 | ||||||
| Enghouse Systems Ltd. | 2,664 | 111,363 | ||||||
| Intuit, Inc. | 14,073 | 1,419,825 | ||||||
| Microsoft Corp. | 14,353 | 715,784 | ||||||
| OBIC Co. Ltd. | 35,200 | 1,828,205 | ||||||
| Oracle Corp. | 26,101 | 1,040,386 | ||||||
| Paylocity Holding Corp. (a) | 3,830 | 146,574 | ||||||
9
Table of Contents
Portfolio of Investments (unaudited) – continued
| Issuer | Shares/Par | Value ($) | ||||||
| Common Stocks - continued | ||||||||
| Computer Software - continued | ||||||||
| Qlik Technologies, Inc. (a) | 12,161 | $ | 374,437 | |||||
| Rovi Corp. (a) | 2,962 | 52,190 | ||||||
| Sabre Corp. | 37,457 | 1,084,380 | ||||||
| Salesforce.com, Inc. (a) | 13,574 | 1,028,909 | ||||||
| SAP SE | 12,670 | 991,172 | ||||||
| SecureWorks Corp. (a) | 11,429 | 152,349 | ||||||
| Symantec Corp. | 5,864 | 97,606 | ||||||
| VeriSign, Inc. (a) | 17,052 | 1,473,293 | ||||||
|
| |||||||
| $ | 13,399,579 | |||||||
| Computer Software - Systems - 1.5% | ||||||||
| Apple, Inc. (s) | 29,279 | $ | 2,744,613 | |||||
| Brother Industries Ltd. | 28,000 | 318,840 | ||||||
| Constellation Software, Inc. | 93 | 36,345 | ||||||
| Cvent, Inc. (a) | 6,125 | 216,519 | ||||||
| Demandware, Inc. (a) | 3,941 | 181,601 | ||||||
| Fleetmatics Group PLC (a) | 5,908 | 214,165 | ||||||
| Hewlett Packard Enterprise | 92,821 | 1,546,398 | ||||||
| HP, Inc. | 20,966 | 257,253 | ||||||
| IMS Health Holdings, Inc. (a) | 17,166 | 457,302 | ||||||
| International Business Machines Corp. | 5,762 | 840,906 | ||||||
| Model N, Inc. (a) | 19,741 | 210,834 | ||||||
| NCR Corp. (a) | 6,192 | 180,125 | ||||||
| NetApp, Inc. | 19,237 | 454,763 | ||||||
| NICE Systems Ltd., ADR | 11,458 | 731,593 | ||||||
| Proofpoint, Inc. (a) | 2,800 | 163,128 | ||||||
| Rapid7, Inc. (a) | 10,014 | 125,375 | ||||||
| ServiceNow, Inc. (a) | 1,820 | 130,094 | ||||||
| SS&C Technologies Holdings, Inc. | 12,930 | 790,670 | ||||||
| Vantiv, Inc., “A” (a) | 16,424 | 895,765 | ||||||
| Venture Corp. Ltd. | 38,400 | 238,992 | ||||||
| Verint Systems, Inc. (a) | 6,311 | 213,564 | ||||||
| Xerox Corp. | 24,099 | 231,350 | ||||||
|
| |||||||
| $ | 11,180,195 | |||||||
| Conglomerates - 0.2% | ||||||||
| CK Hutchison Holdings Ltd. | 21,944 | $ | 262,424 | |||||
| DCC PLC | 9,861 | 873,149 | ||||||
| First Pacific Co. Ltd. | 338,000 | 214,385 | ||||||
|
| |||||||
| $ | 1,349,958 | |||||||
| Construction - 1.1% | ||||||||
| Armstrong World Industries, Inc. (a) | 9,044 | $ | 369,093 | |||||
| Beacon Roofing Supply, Inc. (a) | 3,019 | 129,002 | ||||||
10
Table of Contents
Portfolio of Investments (unaudited) – continued
| Issuer | Shares/Par | Value ($) | ||||||
| Common Stocks - continued | ||||||||
| Construction - continued | ||||||||
| Bellway PLC | 17,389 | $ | 621,732 | |||||
| Fortune Brands Home & Security, Inc. | 11,167 | 618,763 | ||||||
| Geberit AG | 1,289 | 494,880 | ||||||
| Interface, Inc. | 18,142 | 308,777 | ||||||
| Lennox International, Inc. | 1,629 | 219,834 | ||||||
| Owens Corning | 44,246 | 2,038,413 | ||||||
| Pool Corp. | 8,052 | 703,825 | ||||||
| Sherwin-Williams Co. | 388 | 111,476 | ||||||
| Stanley Black & Decker, Inc. | 2,762 | 309,123 | ||||||
| Summit Materials, Inc., “A” (a) | 9,326 | 194,913 | ||||||
| Toll Brothers, Inc. (a) | 9,788 | 267,212 | ||||||
| TopBuild Corp. (a) | 7,938 | 247,824 | ||||||
| Trex Co., Inc. (a) | 2,478 | 117,581 | ||||||
| Vulcan Materials Co. | 14,453 | 1,555,576 | ||||||
|
| |||||||
| $ | 8,308,024 | |||||||
| Consumer Products - 2.2% | ||||||||
| Colgate-Palmolive Co. (s) | 36,611 | $ | 2,596,452 | |||||
| Estee Lauder Cos., Inc., “A” | 8,773 | 841,068 | ||||||
| Kao Corp. | 32,000 | 1,756,552 | ||||||
| Kimberly-Clark Corp. | 762 | 95,395 | ||||||
| Kobayashi Pharmaceutical Co. Ltd. | 39,700 | 3,172,441 | ||||||
| L’Oréal S.A. | 12,210 | 2,215,299 | ||||||
| Newell Brands, Inc. | 26,759 | 1,218,605 | ||||||
| Reckitt Benckiser Group PLC | 37,193 | 3,616,086 | ||||||
| Sensient Technologies Corp. | 5,792 | 389,512 | ||||||
| Uni-Charm Corp. | 9,900 | 203,839 | ||||||
|
| |||||||
| $ | 16,105,249 | |||||||
| Consumer Services - 0.9% | ||||||||
| Asante, Inc. | 25,000 | $ | 341,239 | |||||
| Carriage Services, Inc. | 4,097 | 100,090 | ||||||
| Estacio Participacoes S.A., ADR | 114,892 | 404,420 | ||||||
| Houghton Mifflin Harcourt Co. (a) | 6,177 | 126,690 | ||||||
| Nord Anglia Education, Inc. (a) | 9,346 | 198,416 | ||||||
| Priceline Group, Inc. (a) | 3,571 | 4,798,210 | ||||||
| ServiceMaster Global Holdings, Inc. (a) | 11,125 | 426,310 | ||||||
|
| |||||||
| $ | 6,395,375 | |||||||
| Containers - 0.5% | ||||||||
| Berry Plastics Group, Inc. (a) | 18,233 | $ | 656,753 | |||||
| Brambles Ltd. | 189,201 | 1,795,360 | ||||||
| Fuji Seal International, Inc. | 9,200 | 310,610 | ||||||
| Graphic Packaging Holding Co. | 28,540 | 379,011 | ||||||
11
Table of Contents
Portfolio of Investments (unaudited) – continued
| Issuer | Shares/Par | Value ($) | ||||||
| Common Stocks - continued | ||||||||
| Containers - continued | ||||||||
| Multi Packaging Solutions International Ltd. (a) | 13,073 | $ | 217,273 | |||||
| Owens-Illinois, Inc. (a) | 6,087 | 112,366 | ||||||
|
| |||||||
| $ | 3,471,373 | |||||||
| Electrical Equipment - 2.1% | ||||||||
| Advanced Drainage Systems, Inc. | 11,194 | $ | 258,805 | |||||
| AMETEK, Inc. | 27,433 | 1,319,253 | ||||||
| Amphenol Corp., “A” | 9,186 | 512,854 | ||||||
| Danaher Corp. | 53,634 | 5,189,090 | ||||||
| IMI PLC | 31,680 | 432,804 | ||||||
| Legrand S.A. | 1,809 | 103,031 | ||||||
| Mettler-Toledo International, Inc. (a) | 7,161 | 2,563,280 | ||||||
| MSC Industrial Direct Co., Inc., “A” | 3,735 | 289,463 | ||||||
| Pentair PLC | 2,975 | 172,788 | ||||||
| Schneider Electric S.A. | 26,809 | 1,744,854 | ||||||
| Spectris PLC | 19,827 | 527,548 | ||||||
| TriMas Corp. (a) | 9,364 | 169,488 | ||||||
| Tyco International PLC | 37,969 | 1,462,566 | ||||||
| W.W. Grainger, Inc. | 290 | 68,011 | ||||||
| WESCO International, Inc. (a) | 5,495 | 323,051 | ||||||
|
| |||||||
| $ | 15,136,886 | |||||||
| Electronics - 1.7% | ||||||||
| Analog Devices, Inc. | 23,431 | $ | 1,319,634 | |||||
| ARM Holdings PLC | 13,954 | 191,146 | ||||||
| Broadcom Corp. | 6,335 | 923,326 | ||||||
| Halma PLC | 162,145 | 2,113,310 | ||||||
| Intel Corp. | 31,340 | 948,975 | ||||||
| Iriso Electronics Co. Ltd. | 790 | 37,964 | ||||||
| Keysight Technologies, Inc. (a) | 5,059 | 131,939 | ||||||
| Maxim Integrated Products, Inc. | 4,060 | 145,023 | ||||||
| Mellanox Technologies Ltd. (a) | 2,178 | 94,199 | ||||||
| Microchip Technology, Inc. | 3,359 | 163,214 | ||||||
| Monolithic Power Systems, Inc. | 3,290 | 205,362 | ||||||
| Plexus Corp. (a) | 7,511 | 313,659 | ||||||
| Silicon Laboratories, Inc. (a) | 4,696 | 219,773 | ||||||
| Siliconware Precision Industries Co. Ltd., ADR | 70,088 | 507,087 | ||||||
| Solaredge Technologies, Inc. (a) | 1,615 | 43,266 | ||||||
| Taiwan Semiconductor Manufacturing Co. Ltd. | 81,654 | 374,138 | ||||||
| Taiwan Semiconductor Manufacturing Co. Ltd., ADR | 140,246 | 3,308,403 | ||||||
| Texas Instruments, Inc. | 25,999 | 1,482,983 | ||||||
| Ultratech, Inc. (a) | 4,996 | 108,363 | ||||||
|
| |||||||
| $ | 12,631,764 | |||||||
12
Table of Contents
Portfolio of Investments (unaudited) – continued
| Issuer | Shares/Par | Value ($) | ||||||
| Common Stocks - continued | ||||||||
| Energy - Independent - 1.5% | ||||||||
| Cabot Oil & Gas Corp. | 13,565 | $ | 317,421 | |||||
| Cairn Energy PLC (a) | 31,591 | 103,350 | ||||||
| Cimarex Energy Co. | 1,295 | 141,000 | ||||||
| Energen Corp. | 8,649 | 367,496 | ||||||
| EOG Resources, Inc. | 2,355 | 194,570 | ||||||
| EQT Corp. | 3,764 | 263,856 | ||||||
| Galp Energia SGPS S.A. | 15,516 | 213,110 | ||||||
| Hess Corp. | 5,227 | 311,634 | ||||||
| HollyFrontier Corp. | 5,502 | 195,871 | ||||||
| Marathon Petroleum Corp. | 61,906 | 2,419,286 | ||||||
| Memorial Resource Development Corp. (a) | 6,068 | 79,369 | ||||||
| Noble Energy, Inc. | 4,436 | 160,184 | ||||||
| Occidental Petroleum Corp. | 26,157 | 2,004,934 | ||||||
| Oil Search Ltd. | 32,371 | 170,511 | ||||||
| PDC Energy, Inc. (a) | 2,808 | 176,314 | ||||||
| Pioneer Natural Resources Co. | 3,938 | 654,102 | ||||||
| TORC Oil & Gas Ltd. | 40,174 | 270,879 | ||||||
| Valero Energy Corp. | 46,765 | 2,753,056 | ||||||
| WPX Energy, Inc. (a) | 45,795 | 442,380 | ||||||
|
| |||||||
| $ | 11,239,323 | |||||||
| Energy - Integrated - 0.3% | ||||||||
| BP PLC | 98,703 | $ | 539,022 | |||||
| Chevron Corp. | 2,677 | 273,536 | ||||||
| Eni S.p.A. | 17,834 | 289,976 | ||||||
| Exxon Mobil Corp. | 11,103 | 981,505 | ||||||
|
| |||||||
| $ | 2,084,039 | |||||||
| Engineering - Construction - 0.0% | ||||||||
| Stantec, Inc. | 4,765 | $ | 122,079 | |||||
| Team, Inc. (a) | 6,007 | 172,581 | ||||||
|
| |||||||
| $ | 294,660 | |||||||
| Entertainment - 0.2% | ||||||||
| International Speedway Corp. | 4,529 | $ | 151,676 | |||||
| Netflix, Inc. (a) | 9,647 | 868,519 | ||||||
| Parques Reunidos Servicios Centrales S.A.U. (a) | 12,698 | 214,463 | ||||||
|
| |||||||
| $ | 1,234,658 | |||||||
| Food & Beverages - 3.8% | ||||||||
| Amplify Snack Brands, Inc. (a) | 2,910 | $ | 44,843 | |||||
| Archer Daniels Midland Co. | 46,990 | 1,876,781 | ||||||
| Blue Buffalo Pet Products, Inc. (a) | 4,418 | 109,390 | ||||||
| Britvic PLC | 45,049 | 463,396 | ||||||
13
Table of Contents
Portfolio of Investments (unaudited) – continued
| Issuer | Shares/Par | Value ($) | ||||||
| Common Stocks - continued | ||||||||
| Food & Beverages - continued | ||||||||
| Bunge Ltd. | 14,363 | $ | 897,688 | |||||
| Coca-Cola Co. | 25,190 | 1,128,512 | ||||||
| Coca-Cola Enterprises, Inc. | 3,701 | 194,228 | ||||||
| Danone S.A. | 80,712 | 5,653,287 | ||||||
| Flex Pharma, Inc. (a) | 2,998 | 32,858 | ||||||
| Flowers Foods, Inc. | 6,172 | 118,256 | ||||||
| Freshpet, Inc. (a) | 20,403 | 168,937 | ||||||
| General Mills, Inc. | 13,997 | 858,576 | ||||||
| Ingredion, Inc. | 7,371 | 848,328 | ||||||
| J.M. Smucker Co. | 5,459 | 693,184 | ||||||
| Kellogg Co. | 2,829 | 217,295 | ||||||
| McCormick & Co., Inc. | 893 | 83,746 | ||||||
| Mead Johnson Nutrition Co., “A” | 966 | 84,187 | ||||||
| Mondelez International, Inc. | 15,435 | 663,088 | ||||||
| Nestle S.A. | 70,525 | 5,256,476 | ||||||
| Nestle S.A., ADR | 15,776 | 1,176,416 | ||||||
| Performance Food Group Co. (a) | 6,407 | 165,813 | ||||||
| Pinnacle Foods, Inc. | 6,572 | 279,901 | ||||||
| S Foods, Inc. | 9,400 | 224,841 | ||||||
| Snyders-Lance, Inc. | 50,206 | 1,605,086 | ||||||
| Tate & Lyle PLC | 47,845 | 411,063 | ||||||
| TreeHouse Foods, Inc. (a) | 1,896 | 167,606 | ||||||
| Tyson Foods, Inc., “A” | 55,779 | 3,671,374 | ||||||
| WhiteWave Foods Co., “A” (a) | 14,268 | 573,716 | ||||||
|
| |||||||
| $ | 27,668,872 | |||||||
| Food & Drug Stores - 0.8% | ||||||||
| Alimentation Couche-Tard, Inc. | 10,607 | $ | 464,420 | |||||
| Booker Group PLC | 141,910 | 335,910 | ||||||
| CVS Health Corp. | 28,277 | 2,841,839 | ||||||
| FamilyMart Co. Ltd. | 6,900 | 366,570 | ||||||
| Kroger Co. | 38,089 | 1,347,970 | ||||||
| Magnit PJSC | 441 | 61,290 | ||||||
| Sundrug Co. Ltd. | 3,800 | 269,196 | ||||||
| United Natural Foods, Inc. (a) | 3,834 | 136,759 | ||||||
|
| |||||||
| $ | 5,823,954 | |||||||
| Gaming & Lodging - 0.4% | ||||||||
| Carnival Corp. | 38,018 | $ | 1,864,783 | |||||
| La Quinta Holdings, Inc. (a) | 9,796 | 125,095 | ||||||
| Norwegian Cruise Line Holdings Ltd. (a) | 10,818 | 528,892 | ||||||
| Royal Caribbean Cruises Ltd. | 9,367 | 725,006 | ||||||
|
| |||||||
| $ | 3,243,776 | |||||||
14
Table of Contents
Portfolio of Investments (unaudited) – continued
| Issuer | Shares/Par | Value ($) | ||||||
| Common Stocks - continued | ||||||||
| General Merchandise - 0.6% | ||||||||
| Costco Wholesale Corp. | 878 | $ | 130,058 | |||||
| Dollar Tree, Inc. (a) | 17,579 | 1,401,222 | ||||||
| Five Below, Inc. (a) | 6,179 | 257,664 | ||||||
| Kohl’s Corp. | 2,656 | 117,661 | ||||||
| Ollie’s Bargain Outlet Holdings, Inc. (a) | 4,013 | 106,144 | ||||||
| PriceSmart, Inc. | 1,148 | 99,348 | ||||||
| Target Corp. | 19,674 | 1,564,083 | ||||||
| Woolworths Holdings Ltd. | 58,089 | 373,828 | ||||||
|
| |||||||
| $ | 4,050,008 | |||||||
| Health Maintenance Organizations - 0.2% | ||||||||
| Anthem, Inc. | 6,757 | $ | 951,183 | |||||
| Cigna Corp. | 345 | 47,796 | ||||||
| UnitedHealth Group, Inc. | 5,648 | 743,729 | ||||||
|
| |||||||
| $ | 1,742,708 | |||||||
| Insurance - 3.6% | ||||||||
| AIA Group Ltd. | 535,600 | $ | 3,204,382 | |||||
| Allied World Assurance Co. | 13,984 | 497,551 | ||||||
| American International Group, Inc. | 2,536 | 141,560 | ||||||
| AMP Ltd. | 39,582 | 176,217 | ||||||
| Aon PLC | 12,284 | 1,291,294 | ||||||
| Arthur J. Gallagher & Co. | 4,144 | 190,790 | ||||||
| Aspen Insurance Holdings Ltd. | 4,553 | 211,032 | ||||||
| Beazley PLC | 205,513 | 978,630 | ||||||
| Chubb Ltd. | 17,881 | 2,107,455 | ||||||
| Everest Re Group Ltd. | 2,580 | 477,042 | ||||||
| Fairfax Financial Holdings Ltd. | 2,325 | 1,246,164 | ||||||
| Hanover Insurance Group, Inc. | 4,156 | 356,419 | ||||||
| Hartford Financial Services Group, Inc. | 39,174 | 1,738,542 | ||||||
| Hiscox Ltd. | 26,515 | 348,875 | ||||||
| Jardine Lloyd Thompson Group PLC | 32,183 | 407,700 | ||||||
| Lincoln National Corp. | 4,542 | 197,350 | ||||||
| MetLife, Inc. | 62,543 | 2,820,689 | ||||||
| Prudential Financial, Inc. | 28,895 | 2,243,408 | ||||||
| Safety Insurance Group, Inc. | 3,689 | 208,834 | ||||||
| Sony Financial Holdings, Inc. | 42,100 | 516,859 | ||||||
| Stewart Information Services Corp. | 4,339 | 151,084 | ||||||
| Storebrand A.S.A. (a) | 48,955 | 207,266 | ||||||
| Third Point Reinsurance Ltd. (a) | 23,896 | 271,936 | ||||||
| Travelers Cos., Inc. | 17,748 | 1,950,505 | ||||||
| Unum Group | 49,275 | 1,685,698 | ||||||
| Validus Holdings Ltd. | 48,232 | 2,223,013 | ||||||
| XL Group PLC | 6,486 | 212,287 | ||||||
15
Table of Contents
Portfolio of Investments (unaudited) – continued
| Issuer | Shares/Par | Value ($) | ||||||
| Common Stocks - continued | ||||||||
| Insurance - continued | ||||||||
| Zurich Insurance Group AG | 1,461 | $ | 326,985 | |||||
|
| |||||||
| $ | 26,389,567 | |||||||
| Internet - 1.3% | ||||||||
| Alibaba Group Holding Ltd., ADR (a) | 20,142 | $ | 1,549,725 | |||||
| Alphabet, Inc., “A” (a) | 3,608 | 2,554,031 | ||||||
| Alphabet, Inc., “C” (a) | 1,872 | 1,297,315 | ||||||
| Facebook, Inc., “A” (a) | 15,339 | 1,803,560 | ||||||
| LinkedIn Corp., “A” (a) | 385 | 48,244 | ||||||
| Marketo, Inc. (a) | 9,654 | 212,291 | ||||||
| Naver Corp. | 2,104 | 1,247,188 | ||||||
| Rightmove PLC | 14,220 | 801,598 | ||||||
|
| |||||||
| $ | 9,513,952 | |||||||
| Leisure & Toys - 0.9% | ||||||||
| Activision Blizzard, Inc. | 28,605 | $ | 986,014 | |||||
| Brunswick Corp. | 2,684 | 128,913 | ||||||
| Electronic Arts, Inc. (a) | 62,508 | 3,866,120 | ||||||
| Take-Two Interactive Software, Inc. (a) | 56,748 | 1,939,647 | ||||||
|
| |||||||
| $ | 6,920,694 | |||||||
| Machinery & Tools - 1.9% | ||||||||
| Allison Transmission Holdings, Inc. | 75,094 | $ | 2,163,458 | |||||
| Burckhardt Compression Holding AG | 1,022 | 363,820 | ||||||
| Columbus McKinnon Corp. | 5,615 | 92,704 | ||||||
| Cummins, Inc. | 1,795 | 210,069 | ||||||
| Daikin Industries Ltd. | 4,200 | 330,744 | ||||||
| Deere & Co. | 2,810 | 236,349 | ||||||
| Douglas Dynamics, Inc. | 4,955 | 113,519 | ||||||
| Eaton Corp. PLC | 15,342 | 970,688 | ||||||
| GEA Group AG | 39,388 | 1,826,149 | ||||||
| Herman Miller, Inc. | 5,519 | 166,508 | ||||||
| IPG Photonics Corp. (a) | 881 | 76,356 | ||||||
| Joy Global, Inc. | 5,440 | 115,872 | ||||||
| Kubota Corp. | 26,800 | 391,493 | ||||||
| Nordson Corp. | 733 | 56,243 | ||||||
| Regal Beloit Corp. | 24,608 | 1,585,247 | ||||||
| Roper Technologies, Inc. | 8,920 | 1,570,723 | ||||||
| Schindler Holding AG | 1,818 | 331,080 | ||||||
| Spirax-Sarco Engineering PLC | 8,184 | 408,367 | ||||||
| SPX FLOW, Inc. (a) | 27,403 | 820,994 | ||||||
| United Rentals, Inc. (a) | 9,617 | 643,666 | ||||||
| WABCO Holdings, Inc. (a) | 6,129 | 687,429 | ||||||
| Weir Group PLC | 48,886 | 857,157 | ||||||
16
Table of Contents
Portfolio of Investments (unaudited) – continued
| Issuer | Shares/Par | Value ($) | ||||||
| Common Stocks - continued | ||||||||
| Machinery & Tools - continued | ||||||||
| Xylem, Inc. | 3,776 | $ | 157,761 | |||||
|
| |||||||
| $ | 14,176,396 | |||||||
| Major Banks - 1.6% | ||||||||
| Barclays PLC | 124,139 | $ | 311,076 | |||||
| BNP Paribas | 7,593 | 402,027 | ||||||
| BOC Hong Kong Holdings Ltd. | 44,500 | 132,907 | ||||||
| Comerica, Inc. | 3,886 | 172,538 | ||||||
| Goldman Sachs Group, Inc. | 877 | 143,924 | ||||||
| HSBC Holdings PLC | 223,350 | 1,476,724 | ||||||
| Huntington Bancshares, Inc. | 60,153 | 605,139 | ||||||
| JPMorgan Chase & Co. (s) | 91,162 | 5,761,438 | ||||||
| KeyCorp | 14,022 | 172,330 | ||||||
| Mitsubishi UFJ Financial Group, Inc. | 54,900 | 250,340 | ||||||
| PNC Financial Services Group, Inc. | 1,375 | 120,698 | ||||||
| Sumitomo Mitsui Financial Group, Inc. | 8,500 | 255,511 | ||||||
| Wells Fargo & Co. | 43,821 | 2,190,174 | ||||||
|
| |||||||
| $ | 11,994,826 | |||||||
| Medical & Health Technology & Services - 1.3% | ||||||||
| Adeptus Health, Inc., “A” (a) | 2,539 | $ | 172,957 | |||||
| AmerisourceBergen Corp. | 4,957 | 421,841 | ||||||
| Brookdale Senior Living, Inc. (a) | 7,578 | 139,890 | ||||||
| Capital Senior Living Corp. (a) | 8,142 | 163,329 | ||||||
| Cardinal Health, Inc. | 5,148 | 403,912 | ||||||
| Community Health Systems, Inc. (a) | 40,190 | 766,825 | ||||||
| HCA Holdings, Inc. (a) | 14,158 | 1,141,418 | ||||||
| Healthcare Services Group, Inc. | 11,475 | 434,329 | ||||||
| Henry Schein, Inc. (a) | 4,992 | 842,150 | ||||||
| HMS Holdings Corp. (a) | 17,240 | 291,184 | ||||||
| Hogy Medical Co. Ltd. | 8,800 | 485,504 | ||||||
| INC Research Holdings, Inc., “A” (a) | 3,604 | 173,461 | ||||||
| LifePoint Hospitals, Inc. (a) | 6,757 | 456,503 | ||||||
| McKesson Corp. | 11,971 | 2,008,973 | ||||||
| MEDNAX, Inc. (a) | 9,078 | 647,171 | ||||||
| Miraca Holdings, Inc. | 9,400 | 398,151 | ||||||
| Premier, Inc., “A” (a) | 5,830 | 197,112 | ||||||
| Quest Diagnostics, Inc. | 2,853 | 214,460 | ||||||
| Universal Health Services, Inc. | 1,368 | 182,874 | ||||||
| VCA, Inc. (a) | 4,268 | 268,756 | ||||||
|
| |||||||
| $ | 9,810,800 | |||||||
| Medical Equipment - 2.1% | ||||||||
| Abbott Laboratories | 6,825 | $ | 265,493 | |||||
| Agilent Technologies, Inc. | 4,122 | 168,672 | ||||||
17
Table of Contents
Portfolio of Investments (unaudited) – continued
| Issuer | Shares/Par | Value ($) | ||||||
| Common Stocks - continued | ||||||||
| Medical Equipment - continued | ||||||||
| Ansell Ltd. | 18,274 | $ | 274,920 | |||||
| AtriCure, Inc. (a) | 4,700 | 74,730 | ||||||
| C.R. Bard, Inc. | 3,180 | 674,701 | ||||||
| Cepheid, Inc. (a) | 5,362 | 153,031 | ||||||
| Cooper Cos., Inc. | 4,914 | 752,235 | ||||||
| Dentsply Sirona, Inc. | 3,051 | 181,840 | ||||||
| DexCom, Inc. (a) | 2,386 | 153,611 | ||||||
| Essilor International S.A. | 7,256 | 939,274 | ||||||
| Hologic, Inc. (a) | 8,283 | 278,226 | ||||||
| Insulet Corp. (a) | 4,133 | 137,629 | ||||||
| Masimo Corp. (a) | 66,624 | 2,888,150 | ||||||
| Medtronic PLC | 16,553 | 1,310,170 | ||||||
| Nihon Kohden Corp. | 11,400 | 285,675 | ||||||
| NxStage Medical, Inc. (a) | 9,948 | 160,362 | ||||||
| PerkinElmer, Inc. | 25,723 | 1,296,954 | ||||||
| QIAGEN N.V. (a) | 12,788 | 286,562 | ||||||
| St. Jude Medical, Inc. | 5,392 | 410,870 | ||||||
| Steris PLC | 12,417 | 877,509 | ||||||
| Stryker Corp. | 5,992 | 653,188 | ||||||
| Teleflex, Inc. | 1,124 | 175,097 | ||||||
| Terumo Corp. | 7,400 | 282,144 | ||||||
| Thermo Fisher Scientific, Inc. | 13,013 | 1,877,125 | ||||||
| VWR Corp. (a) | 21,889 | 583,123 | ||||||
| Zimmer Biomet Holdings, Inc. | 2,606 | 301,697 | ||||||
|
| |||||||
| $ | 15,442,988 | |||||||
| Metals & Mining - 0.1% | ||||||||
| BHP Billiton PLC | 14,870 | $ | 202,737 | |||||
| Iluka Resources Ltd. | 28,148 | 136,652 | ||||||
| Rio Tinto PLC | 16,237 | 545,787 | ||||||
|
| |||||||
| $ | 885,176 | |||||||
| Natural Gas - Distribution - 0.1% | ||||||||
| China Resources Gas Group Ltd. | 74,000 | $ | 209,052 | |||||
| Engie | 16,238 | 267,744 | ||||||
| NiSource, Inc. | 6,444 | 146,343 | ||||||
| NorthWestern Corp. | 3,671 | 208,660 | ||||||
| Sempra Energy | 926 | 95,702 | ||||||
|
| |||||||
| $ | 927,501 | |||||||
| Natural Gas - Pipeline - 0.1% | ||||||||
| APA Group | 32,331 | $ | 214,347 | |||||
| Boardwalk Pipeline Partners LP | 17,244 | 280,560 | ||||||
| Columbia Pipeline Partners LP | 10,642 | 154,628 | ||||||
18
Table of Contents
Portfolio of Investments (unaudited) – continued
| Issuer | Shares/Par | Value ($) | ||||||
| Common Stocks - continued | ||||||||
| Natural Gas - Pipeline - continued | ||||||||
| Enbridge, Inc. | 4,167 | $ | 173,096 | |||||
| Enterprise Products Partners LP | 2,723 | 72,677 | ||||||
|
| |||||||
| $ | 895,308 | |||||||
| Network & Telecom - 0.3% | ||||||||
| Cisco Systems, Inc. | 34,982 | $ | 961,655 | |||||
| Ixia (a) | 21,146 | 213,998 | ||||||
| LM Ericsson Telephone Co., “B” | 103,273 | 835,911 | ||||||
| VTech Holdings Ltd. | 34,100 | 350,581 | ||||||
|
| |||||||
| $ | 2,362,145 | |||||||
| Oil Services - 0.4% | ||||||||
| Forum Energy Technologies, Inc. (a) | 31,183 | $ | 522,003 | |||||
| Frank’s International N.V. | 19,831 | 330,186 | ||||||
| Halliburton Co. | 2,550 | 105,341 | ||||||
| John Wood Group PLC | 27,969 | 255,214 | ||||||
| Oil States International, Inc. (a) | 4,460 | 154,494 | ||||||
| Patterson-UTI Energy, Inc. | 4,579 | 90,435 | ||||||
| Schlumberger Ltd. | 19,572 | 1,572,414 | ||||||
| Technip | 1,506 | 88,136 | ||||||
| Tesco Corp. | 10,752 | 101,714 | ||||||
|
| |||||||
| $ | 3,219,937 | |||||||
| Other Banks & Diversified Financials - 3.3% | ||||||||
| ABN AMRO Group N.V., GDR (a) | 13,009 | $ | 278,107 | |||||
| Aeon Financial Service Co. Ltd. | 7,000 | 153,497 | ||||||
| Air Lease Corp. | 4,395 | 133,960 | ||||||
| Bancolombia S.A., ADR | 10,367 | 401,099 | ||||||
| Bank of The Ozarks, Inc. | 2,560 | 105,728 | ||||||
| BB&T Corp. | 6,996 | 247,518 | ||||||
| Berkshire Hills Bancorp, Inc. | 8,409 | 228,220 | ||||||
| Brookline Bancorp, Inc. | 24,083 | 274,065 | ||||||
| Chiba Bank Ltd. | 64,000 | 320,739 | ||||||
| Citigroup, Inc. | 52,691 | 2,438,539 | ||||||
| Citizens Financial Group, Inc. | 11,309 | 258,411 | ||||||
| Credicorp Ltd. | 5,444 | 791,666 | ||||||
| Discover Financial Services | 36,669 | 2,063,365 | ||||||
| East West Bancorp, Inc. | 34,625 | 1,298,091 | ||||||
| Element Financial Corp. | 10,915 | 122,486 | ||||||
| Encore Capital Group, Inc. (a) | 4,469 | 125,802 | ||||||
| Fifth Third Bancorp | 17,790 | 325,735 | ||||||
| First Interstate BancSystem, Inc. | 9,828 | 266,339 | ||||||
| First Republic Bank | 1,968 | 138,390 | ||||||
| Glacier Bancorp, Inc. | 8,582 | 222,188 | ||||||
19
Table of Contents
Portfolio of Investments (unaudited) – continued
| Issuer | Shares/Par | Value ($) | ||||||
| Common Stocks - continued | ||||||||
| Other Banks & Diversified Financials - continued | ||||||||
| HDFC Bank Ltd., ADR | 21,223 | $ | 1,334,290 | |||||
| Intesa Sanpaolo S.p.A | 115,669 | 320,521 | ||||||
| Julius Baer Group Ltd. | 22,236 | 950,587 | ||||||
| Jyske Bank | 6,109 | 250,105 | ||||||
| Kasikornbank PLC | 18,500 | 88,033 | ||||||
| Kasikornbank Public Co. Ltd., NVDR | 4,600 | 21,792 | ||||||
| KBC Group N.V. | 2,960 | 166,180 | ||||||
| Lakeland Financial Corp. | 5,724 | 270,688 | ||||||
| Lloyds Banking Group PLC | 373,739 | 366,262 | ||||||
| M&T Bank Corp. | 1,768 | 209,190 | ||||||
| MasterCard, Inc., “A” | 11,240 | 1,090,168 | ||||||
| New York Community Bancorp, Inc. | 9,705 | 145,866 | ||||||
| Northern Trust Corp. | 2,822 | 200,588 | ||||||
| PrivateBancorp, Inc. | 14,782 | 615,079 | ||||||
| Public Bank Berhad | 55,700 | 266,630 | ||||||
| Sandy Spring Bancorp, Inc. | 9,790 | 279,896 | ||||||
| Santander Consumer USA Holdings, Inc. (a) | 7,863 | 103,556 | ||||||
| SunTrust Banks, Inc. | 3,624 | 151,266 | ||||||
| Svenska Handelsbanken AB | 63,649 | 847,285 | ||||||
| TCF Financial Corp. | 15,535 | 211,897 | ||||||
| Texas Capital Bancshares, Inc. (a) | 9,168 | 420,078 | ||||||
| U.S. Bancorp | 30,850 | 1,316,987 | ||||||
| Valley National Bancorp | 21,042 | 199,057 | ||||||
| Visa, Inc., “A” | 38,307 | 2,958,833 | ||||||
| Webster Financial Corp. | 2,357 | 86,360 | ||||||
| Westpac Banking Corp. | 19,165 | 451,404 | ||||||
| Wintrust Financial Corp. | 13,217 | 687,548 | ||||||
|
| |||||||
| $ | 24,204,091 | |||||||
| Pharmaceuticals - 3.4% | ||||||||
| Allergan PLC (a) | 3,993 | $ | 864,724 | |||||
| Aratana Therapeutics, Inc. (a) | 10,912 | 65,581 | ||||||
| Bayer AG | 24,779 | 2,858,599 | ||||||
| Bristol-Myers Squibb Co. | 28,882 | 2,084,703 | ||||||
| Collegium Pharmaceutical, Inc. (a) | 5,439 | 103,667 | ||||||
| Eli Lilly & Co. | 27,438 | 2,072,392 | ||||||
| Endo International PLC (a) | 4,517 | 121,959 | ||||||
| Genomma Lab Internacional S.A., “B” (a) | 445,235 | 489,109 | ||||||
| Impax Laboratories, Inc. (a) | 2,853 | 95,148 | ||||||
| Johnson & Johnson | 27,118 | 3,039,385 | ||||||
| KYORIN Holdings Ltd. | 11,300 | 223,238 | ||||||
| MediWound Ltd. (a) | 5,896 | 48,819 | ||||||
| Merck & Co., Inc. | 78,142 | 4,285,307 | ||||||
| Novartis AG | 38,879 | 2,966,687 | ||||||
20
Table of Contents
Portfolio of Investments (unaudited) – continued
| Issuer | Shares/Par | Value ($) | ||||||
| Common Stocks - continued | ||||||||
| Pharmaceuticals - continued | ||||||||
| Roche Holding AG | 19,272 | $ | 4,871,740 | |||||
| Santen Pharmaceutical Co. Ltd. | 22,400 | 320,172 | ||||||
| Shionogi & Co. Ltd. | 3,500 | 177,895 | ||||||
| TherapeuticsMD, Inc. (a) | 19,162 | 158,087 | ||||||
| Zoetis, Inc. | 1,650 | 77,600 | ||||||
|
| |||||||
| $ | 24,924,812 | |||||||
| Pollution Control - 0.1% | ||||||||
| Clean Harbors, Inc. (a) | 5,709 | $ | 282,025 | |||||
| Progressive Waste Solutions Ltd. | 4,054 | 130,579 | ||||||
|
| |||||||
| $ | 412,604 | |||||||
| Printing & Publishing - 0.1% | ||||||||
| RELX N.V. | 25,819 | $ | 433,261 | |||||
| Railroad & Shipping - 0.4% | ||||||||
| Canadian National Railway Co. | 26,459 | $ | 1,628,816 | |||||
| Canadian Pacific Railway Ltd. | 350 | 50,488 | ||||||
| Kansas City Southern Co. | 1,839 | 174,245 | ||||||
| Kirby Corp. (a) | 2,758 | 176,016 | ||||||
| StealthGas, Inc. (a) | 30,868 | 120,694 | ||||||
| Union Pacific Corp. | 5,171 | 451,066 | ||||||
|
| |||||||
| $ | 2,601,325 | |||||||
| Real Estate - 2.3% | ||||||||
| Annaly Mortgage Management, Inc., REIT | 7,829 | $ | 81,578 | |||||
| Ascendas Real Estate Investment Trust, REIT | 270,500 | 493,810 | ||||||
| AvalonBay Communities, Inc., REIT | 14,845 | 2,624,448 | ||||||
| Corporate Office Properties Trust, REIT | 25,936 | 666,036 | ||||||
| DDR Corp., REIT | 11,308 | 197,890 | ||||||
| Deutsche Wohnen AG | 5,782 | 177,070 | ||||||
| EPR Properties, REIT | 9,911 | 652,937 | ||||||
| Extra Space Storage, Inc., REIT | 8,937 | 759,198 | ||||||
| Gramercy Property Trust, Inc., REIT | 47,180 | 399,615 | ||||||
| Hatteras Financial Corp., REIT | 7,737 | 122,941 | ||||||
| LEG Immobilien AG | 1,964 | 181,732 | ||||||
| Macquarie Mexico Real Estate S.A. de C.V., REIT | 263,850 | 363,156 | ||||||
| Medical Properties Trust, Inc., REIT | 51,595 | 686,729 | ||||||
| Mid-America Apartment Communities, Inc., REIT | 19,483 | 1,864,718 | ||||||
| Mitsui Fudosan Co. Ltd. | 8,000 | 192,273 | ||||||
| Select Income, REIT | 14,830 | 343,315 | ||||||
| Simon Property Group, Inc., REIT | 3,399 | 683,777 | ||||||
| Sovran Self Storage, Inc., REIT | 14,325 | 1,521,602 | ||||||
| STAG Industrial, Inc., REIT | 10,949 | 218,542 | ||||||
21
Table of Contents
Portfolio of Investments (unaudited) – continued
| Issuer | Shares/Par | Value ($) | ||||||
| Common Stocks - continued | ||||||||
| Real Estate - continued | ||||||||
| Store Capital Corp., REIT | 94,903 | $ | 2,436,160 | |||||
| TAG Immobilien AG | 108,836 | 1,445,000 | ||||||
| Tanger Factory Outlet Centers, Inc., REIT | 7,264 | 254,821 | ||||||
| Ventas, Inc., REIT | 2,055 | 127,657 | ||||||
| Weyerhaeuser Co., REIT | 4,504 | 144,668 | ||||||
|
| |||||||
| $ | 16,639,673 | |||||||
| Restaurants - 0.7% | ||||||||
| Alsea S.A.B. de C.V. | 85,485 | $ | 327,389 | |||||
| Aramark | 45,549 | 1,526,347 | ||||||
| Chuy’s Holdings, Inc. (a) | 3,637 | 111,074 | ||||||
| DineEquity, Inc. | 1,282 | 110,252 | ||||||
| Domino’s Pizza, Inc. | 761 | 91,990 | ||||||
| Dunkin Brands Group, Inc. | 4,501 | 209,297 | ||||||
| El Pollo Loco Holdings, Inc. (a) | 7,437 | 98,094 | ||||||
| Starbucks Corp. | 18,824 | 1,058,474 | ||||||
| Whitbread PLC | 20,207 | 1,143,226 | ||||||
| Wingstop, Inc. (a) | 5,700 | 142,158 | ||||||
| YUM! Brands, Inc. | 2,660 | 211,630 | ||||||
| Zoe’s Kitchen, Inc. (a) | 1,722 | 64,558 | ||||||
|
| |||||||
| $ | 5,094,489 | |||||||
| Special Products & Services - 0.0% | ||||||||
| Boyd Group Income Fund | 3,600 | $ | 216,310 | |||||
| WL Ross Holding Corp., EU (a) | 5,022 | 53,133 | ||||||
|
| |||||||
| $ | 269,443 | |||||||
| Specialty Chemicals - 1.0% | ||||||||
| A. Schulman, Inc. | 4,897 | $ | 136,577 | |||||
| Akzo Nobel N.V. | 9,029 | 639,859 | ||||||
| Albemarle Corp. | 5,652 | 373,936 | ||||||
| Amira Nature Foods Ltd. (a) | 3,881 | 28,137 | ||||||
| Axalta Coating Systems Ltd. (a) | 20,501 | 583,663 | ||||||
| Croda International PLC | 6,830 | 300,487 | ||||||
| Elementis PLC | 104,089 | 328,362 | ||||||
| Ferro Corp. (a) | 17,098 | 217,829 | ||||||
| Ferroglobe PLC | 32,037 | 326,457 | ||||||
| Kansai Paint Co. Ltd. | 9,000 | 155,379 | ||||||
| Linde AG | 14,249 | 2,176,530 | ||||||
| Marine Harvest A.S.A. | 26,808 | 417,176 | ||||||
| Nippon Paint Holdings Co. Ltd. | 15,000 | 390,968 | ||||||
| PolyOne Corp. | 3,137 | 112,869 | ||||||
| RPM International, Inc. | 3,193 | 161,342 | ||||||
| Sika AG | 177 | 753,352 | ||||||
22
Table of Contents
Portfolio of Investments (unaudited) – continued
| Issuer | Shares/Par | Value ($) | ||||||
| Common Stocks - continued | ||||||||
| Specialty Chemicals - continued | ||||||||
| Symrise AG | 3,150 | $ | 208,696 | |||||
|
| |||||||
| $ | 7,311,619 | |||||||
| Specialty Stores - 2.8% | ||||||||
| ABC-Mart, Inc. | 1,900 | $ | 123,217 | |||||
| Amazon.com, Inc. (a) | 9,690 | 6,391,427 | ||||||
| AutoZone, Inc. (a) | 3,549 | 2,715,801 | ||||||
| Best Buy Co., Inc. | 57,784 | 1,853,711 | ||||||
| Citi Trends, Inc. | 15,844 | 284,558 | ||||||
| Esprit Holdings Ltd. (a) | 73,300 | 64,258 | ||||||
| Gap, Inc. | 7,793 | 180,642 | ||||||
| Just Eat PLC (a) | 40,681 | 227,956 | ||||||
| Lululemon Athletica, Inc. (a) | 936 | 61,355 | ||||||
| Monro Muffler Brake, Inc. | 2,800 | 193,816 | ||||||
| NEXT PLC | 6,880 | 511,180 | ||||||
| Nitori Co. Ltd. | 5,000 | 460,808 | ||||||
| O’Reilly Automotive, Inc. (a) | 3,041 | 798,810 | ||||||
| Rent-A-Center, Inc. | 6,072 | 89,258 | ||||||
| Ross Stores, Inc. | 49,465 | 2,808,623 | ||||||
| Sally Beauty Holdings, Inc. (a) | 7,082 | 222,375 | ||||||
| Shimamura Co. Ltd. | 3,200 | 431,814 | ||||||
| Tiffany & Co. | 3,931 | 280,477 | ||||||
| Tractor Supply Co. | 5,789 | 547,987 | ||||||
| Tuesday Morning Corp. (a) | 19,145 | 166,179 | ||||||
| Urban Outfitters, Inc. (a) | 62,255 | 1,887,572 | ||||||
| Zumiez, Inc. (a) | 7,464 | 125,246 | ||||||
|
| |||||||
| $ | 20,427,070 | |||||||
| Telecommunications - Wireless - 0.8% | ||||||||
| American Tower Corp., REIT | 14,980 | $ | 1,571,102 | |||||
| KDDI Corp. | 98,300 | 2,796,084 | ||||||
| Philippine Long Distance Telephone Co. | 375 | 13,732 | ||||||
| SBA Communications Corp. (a) | 7,246 | 746,628 | ||||||
| SoftBank Group Corp. | 4,400 | 231,437 | ||||||
| Vodafone Group PLC | 99,361 | 318,237 | ||||||
|
| |||||||
| $ | 5,677,220 | |||||||
| Telephone Services - 0.6% | ||||||||
| Bezeq - The Israel Telecommunication Corp. Ltd. | 160,965 | $ | 342,271 | |||||
| British Telecom Group, PLC | 28,839 | 186,756 | ||||||
| Frontier Communications Corp. | 28,878 | 160,562 | ||||||
| Hellenic Telecommunications Organization S.A. | 11,560 | 111,236 | ||||||
| Quebecor, Inc., “B” | 5,038 | 134,754 | ||||||
| TDC A.S. | 18,865 | 96,535 | ||||||
23
Table of Contents
Portfolio of Investments (unaudited) – continued
| Issuer | Shares/Par | Value ($) | ||||||
| Common Stocks - continued | ||||||||
| Telephone Services - continued | ||||||||
| Verizon Communications, Inc. | 61,556 | $ | 3,135,663 | |||||
|
| |||||||
| $ | 4,167,777 | |||||||
| Tobacco - 1.0% | ||||||||
| Altria Group, Inc. | 24,992 | $ | 1,567,248 | |||||
| British American Tobacco PLC | 17,855 | 1,087,904 | ||||||
| ITC Ltd. | 69,494 | 339,575 | ||||||
| Japan Tobacco, Inc. | 55,900 | 2,289,746 | ||||||
| Philip Morris International, Inc. | 19,824 | 1,945,131 | ||||||
| Reynolds American, Inc. | 2,028 | 100,589 | ||||||
| Swedish Match AB | 12,156 | 385,549 | ||||||
|
| |||||||
| $ | 7,715,742 | |||||||
| Trucking - 0.4% | ||||||||
| DSV A.S. | 11,639 | $ | 489,756 | |||||
| FedEx Corp. | 1,292 | 213,322 | ||||||
| Knight Transportation, Inc. | 18,383 | 488,436 | ||||||
| Marten Transport Ltd. | 14,425 | 269,171 | ||||||
| Swift Transportation Co. (a) | 21,588 | 358,793 | ||||||
| Yamato Holdings Co. Ltd. | 70,000 | 1,395,562 | ||||||
|
| |||||||
| $ | 3,215,040 | |||||||
| Utilities - Electric Power - 1.9% | ||||||||
| AES Corp. | 105,294 | $ | 1,175,081 | |||||
| American Electric Power Co., Inc. | 25,198 | 1,600,073 | ||||||
| Calpine Corp. (a) | 10,807 | 170,534 | ||||||
| CMS Energy Corp. | 8,311 | 338,091 | ||||||
| DTE Energy Co. | 2,941 | 262,220 | ||||||
| Duke Energy Corp. | 16,336 | 1,286,950 | ||||||
| Dynegy, Inc. (a) | 3,025 | 53,331 | ||||||
| El Paso Electric Co. | 7,642 | 344,654 | ||||||
| Enel S.p.A | 65,303 | 295,960 | ||||||
| Eversource Energy | 3,913 | 220,850 | ||||||
| Exelon Corp. | 97,305 | 3,414,432 | ||||||
| FirstEnergy Corp. | 2,775 | 90,437 | ||||||
| Great Plains Energy, Inc. | 11,772 | 367,640 | ||||||
| NextEra Energy, Inc. | 1,103 | 129,691 | ||||||
| PG&E Corp. | 14,292 | 831,794 | ||||||
| Pinnacle West Capital Corp. | 3,399 | 246,937 | ||||||
| Portland General Electric Co. | 7,214 | 286,540 | ||||||
| PPL Corp. | 57,950 | 2,181,238 | ||||||
| Public Service Enterprise Group, Inc. | 5,359 | 247,211 | ||||||
| WEC Energy Group, Inc. | 2,841 | 165,375 | ||||||
24
Table of Contents
Portfolio of Investments (unaudited) – continued
| Issuer | Shares/Par | Value ($) | ||||||
| Common Stocks - continued | ||||||||
| Utilities - Electric Power - continued | ||||||||
| Xcel Energy, Inc. | 1,683 | $ | 67,370 | |||||
|
| |||||||
| $ | 13,776,409 | |||||||
| Total Common Stocks (Identified Cost, $484,082,078) | $ | 482,259,503 | ||||||
| Bonds - 19.6% | ||||||||
| Aerospace - 0.1% | ||||||||
| Lockheed Martin Corp., 3.55%, 1/15/2026 | $ | 699,000 | $ | 749,332 | ||||
| Automotive - 1.1% | ||||||||
| American Honda Finance Corp., 2.125%, 2/28/2017 (n) | $ | 400,000 | $ | 404,329 | ||||
| Daimler Finance North America LLC, 1.875%, 1/11/2018 (n) | 250,000 | 251,685 | ||||||
| Delphi Automotive PLC, 4.15%, 3/15/2024 | 369,000 | 387,448 | ||||||
| Delphi Automotive PLC, 4.25%, 1/15/2026 | 824,000 | 873,269 | ||||||
| Ford Motor Credit Co. LLC, 1.7%, 5/09/2016 | 800,000 | 800,090 | ||||||
| Ford Motor Credit Co. LLC, 1.461%, 3/27/2017 | 938,000 | 938,645 | ||||||
| Ford Motor Credit Co. LLC, 2.145%, 1/09/2018 | 982,000 | 989,550 | ||||||
| General Motors Co., 4.875%, 10/02/2023 | 1,000,000 | 1,070,510 | ||||||
| Nissan Motor Acceptance Corp., 1.95%, 9/12/2017 (n) | 900,000 | 906,482 | ||||||
| Volkswagen Group America Finance LLC, 2.4%, 5/22/2020 (n) | 1,200,000 | 1,189,542 | ||||||
|
| |||||||
| $ | 7,811,550 | |||||||
| Biotechnology - 0.1% | ||||||||
| Life Technologies Corp., 6%, 3/01/2020 | $ | 325,000 | $ | 365,623 | ||||
| Life Technologies Corp., 5%, 1/15/2021 | 532,000 | 585,196 | ||||||
|
| |||||||
| $ | 950,819 | |||||||
| Broadcasting - 0.4% | ||||||||
| 21st Century Fox America, Inc., 6.15%, 2/15/2041 | $ | 500,000 | $ | 617,853 | ||||
| Omnicom Group, Inc., 3.6%, 4/15/2026 | 718,000 | 747,541 | ||||||
| Omnicom Group, Inc., 3.625%, 5/01/2022 | 300,000 | 318,329 | ||||||
| Omnicom Group, Inc., 3.65%, 11/01/2024 | 121,000 | 127,929 | ||||||
| SES Global Americas Holdings GP, 2.5%, 3/25/2019 (n) | 422,000 | 421,686 | ||||||
| Time Warner, Inc., 5.35%, 12/15/2043 | 300,000 | 336,030 | ||||||
| Viacom, Inc., 3.5%, 4/01/2017 | 500,000 | 508,260 | ||||||
|
| |||||||
| $ | 3,077,628 | |||||||
| Brokerage & Asset Managers - 0.3% | ||||||||
| CME Group, Inc., 3%, 3/15/2025 | $ | 555,000 | $ | 564,923 | ||||
| Intercontinental Exchange, Inc., 2.75%, 12/01/2020 | 473,000 | 487,184 | ||||||
| Intercontinental Exchange, Inc., 3.75%, 12/01/2025 | 777,000 | 805,545 | ||||||
|
| |||||||
| $ | 1,857,652 | |||||||
25
Table of Contents
Portfolio of Investments (unaudited) – continued
| Issuer | Shares/Par | Value ($) | ||||||
| Bonds - continued | ||||||||
| Building - 0.1% | ||||||||
| Martin Marietta Materials, Inc., 4.25%, 7/02/2024 | $ | 418,000 | $ | 436,405 | ||||
| Masco Corp., 4.375%, 4/01/2026 | 2,000 | 2,060 | ||||||
| Mohawk Industries, Inc., 3.85%, 2/01/2023 | 300,000 | 309,822 | ||||||
| Owens Corning, Inc., 4.2%, 12/15/2022 | 152,000 | 156,378 | ||||||
|
| |||||||
| $ | 904,665 | |||||||
| Business Services - 0.5% | ||||||||
| Cisco Systems, Inc., 2.2%, 2/28/2021 | $ | 1,015,000 | $ | 1,035,736 | ||||
| Fidelity National Information Services, Inc., 3.5%, 4/15/2023 | 700,000 | 709,335 | ||||||
| Fidelity National Information Services, Inc., 5%, 10/15/2025 | 945,000 | 1,043,376 | ||||||
| Fiserv, Inc., 2.7%, 6/01/2020 | 1,108,000 | 1,136,216 | ||||||
|
| |||||||
| $ | 3,924,663 | |||||||
| Cable TV - 0.5% | ||||||||
| CCO Safari II LLC, 6.384%, 10/23/2035 (n) | $ | 885,000 | $ | 1,021,552 | ||||
| Comcast Corp., 4.65%, 7/15/2042 | 325,000 | 366,760 | ||||||
| Comcast Corp., 4.75%, 3/01/2044 | 710,000 | 821,870 | ||||||
| Cox Communications, Inc., 6.25%, 6/01/2018 (n) | 400,000 | 428,694 | ||||||
| NBCUniversal Enterprise, Inc., 1.974%, 4/15/2019 (n) | 400,000 | 406,562 | ||||||
| Time Warner Cable, Inc., 4.5%, 9/15/2042 | 368,000 | 344,741 | ||||||
|
| |||||||
| $ | 3,390,179 | |||||||
| Chemicals - 0.4% | ||||||||
| Dow Chemical Co., 8.55%, 5/15/2019 | $ | 325,000 | $ | 388,105 | ||||
| LYB International Finance B.V., 4.875%, 3/15/2044 | 386,000 | 403,108 | ||||||
| LyondellBasell Industries N.V., 5%, 4/15/2019 | 588,000 | 634,480 | ||||||
| Monsanto Co., 4.7%, 7/15/2064 | 1,189,000 | 1,052,974 | ||||||
|
| |||||||
| $ | 2,478,667 | |||||||
| Computer Software - 0.1% | ||||||||
| Oracle Corp., 3.4%, 7/08/2024 | $ | 336,000 | $ | 357,424 | ||||
| Computer Software - Systems - 0.1% | ||||||||
| Apple, Inc., 4.375%, 5/13/2045 | $ | 700,000 | $ | 741,598 | ||||
| Conglomerates - 0.1% | ||||||||
| General Electric Capital Corp., 3.1%, 1/09/2023 | $ | 464,000 | $ | 492,655 | ||||
| Roper Industries, Inc., 1.85%, 11/15/2017 | 557,000 | 559,431 | ||||||
|
| |||||||
| $ | 1,052,086 | |||||||
| Consumer Products - 0.3% | ||||||||
| Hasbro, Inc., 5.1%, 5/15/2044 | $ | 438,000 | $ | 453,450 | ||||
| Mattel, Inc., 5.45%, 11/01/2041 | 244,000 | 248,149 | ||||||
| Newell Rubbermaid, Inc., 5.375%, 4/01/2036 | 268,000 | 293,696 | ||||||
26
Table of Contents
Portfolio of Investments (unaudited) – continued
| Issuer | Shares/Par | Value ($) | ||||||
| Bonds - continued | ||||||||
| Consumer Products - continued | ||||||||
| Newell Rubbermaid, Inc., 3.85%, 4/01/2023 | $ | 550,000 | $ | 575,089 | ||||
| Newell Rubbermaid, Inc., 4%, 12/01/2024 | 310,000 | 318,945 | ||||||
| Reckitt Benckiser Treasury Services PLC, 3.625%, 9/21/2023 (n) | 300,000 | 315,519 | ||||||
|
| |||||||
| $ | 2,204,848 | |||||||
| Consumer Services - 0.2% | ||||||||
| Priceline Group, Inc., 3.65%, 3/15/2025 | $ | 319,000 | $ | 326,657 | ||||
| Visa, Inc., 4.15%, 12/14/2035 | 1,027,000 | 1,117,264 | ||||||
|
| |||||||
| $ | 1,443,921 | |||||||
| Electrical Equipment - 0.0% | ||||||||
| Arrow Electronics, Inc., 3.5%, 4/01/2022 | $ | 192,000 | $ | 191,833 | ||||
| Electronics - 0.2% | ||||||||
| Flextronics International Ltd., 4.75%, 6/15/2025 | $ | 1,000,000 | $ | 997,500 | ||||
| Tyco Electronics Group S.A., 3.5%, 2/03/2022 | 400,000 | 414,544 | ||||||
|
| |||||||
| $ | 1,412,044 | |||||||
| Emerging Market Quasi-Sovereign - 0.0% | ||||||||
| Comision Federal de Electricidad, 5.75%, 2/14/2042 | $ | 232,000 | $ | 228,520 | ||||
| Energy - Independent - 0.1% | ||||||||
| EQT Corp., 4.875%, 11/15/2021 | $ | 500,000 | $ | 504,404 | ||||
| Pioneer Natural Resources Co., 7.5%, 1/15/2020 | 219,000 | 250,561 | ||||||
|
| |||||||
| $ | 754,965 | |||||||
| Energy - Integrated - 0.0% | ||||||||
| BP Capital Markets PLC, 2.521%, 1/15/2020 | $ | 213,000 | $ | 218,009 | ||||
| Entertainment - 0.1% | ||||||||
| Carnival Corp., 1.875%, 12/15/2017 | $ | 471,000 | $ | 473,034 | ||||
| Financial Institutions - 0.2% | ||||||||
| GE Capital International Funding Co., 3.373%, 11/15/2025 (n) | $ | 1,207,000 | $ | 1,289,261 | ||||
| International Lease Finance Corp., 7.125%, 9/01/2018 (n) | 325,000 | 356,525 | ||||||
|
| |||||||
| $ | 1,645,786 | |||||||
| Food & Beverages - 1.5% | ||||||||
| Anheuser-Busch InBev Worldwide, Inc., 3.3%, 2/01/2023 | $ | 1,088,000 | $ | 1,133,905 | ||||
| Anheuser-Busch InBev Worldwide, Inc., 4.7%, 2/01/2036 | 1,423,000 | 1,556,240 | ||||||
| J.M. Smucker Co., 2.5%, 3/15/2020 | 1,326,000 | 1,354,005 | ||||||
| J.M. Smucker Co., 3.5%, 10/15/2021 | 400,000 | 425,007 | ||||||
| J.M. Smucker Co., 4.375%, 3/15/2045 | 134,000 | 140,161 | ||||||
| Kraft Foods Group, Inc., 6.5%, 2/09/2040 | 400,000 | 503,966 | ||||||
27
Table of Contents
Portfolio of Investments (unaudited) – continued
| Issuer | Shares/Par | Value ($) | ||||||
| Bonds - continued | ||||||||
| Food & Beverages - continued | ||||||||
| Kraft Heinz Co., 5%, 7/15/2035 (n) | $ | 225,000 | $ | 251,063 | ||||
| Kraft Heinz Foods Co., 3.5%, 7/15/2022 (n) | 738,000 | 778,813 | ||||||
| Mead Johnson Nutrition Co., 4.125%, 11/15/2025 | 369,000 | 394,858 | ||||||
| PepsiCo, Inc., 4.45%, 4/14/2046 | 469,000 | 523,460 | ||||||
| Pernod Ricard S.A., 5.75%, 4/07/2021 (n) | 500,000 | 568,835 | ||||||
| SABMiller Holdings, Inc., 3.75%, 1/15/2022 (n) | 860,000 | 918,804 | ||||||
| SYSCO Corp., 2.5%, 7/15/2021 | 315,000 | 318,833 | ||||||
| Tyson Foods, Inc., 2.65%, 8/15/2019 | 171,000 | 175,539 | ||||||
| Tyson Foods, Inc., 4.5%, 6/15/2022 | 400,000 | 442,658 | ||||||
| Tyson Foods, Inc., 5.15%, 8/15/2044 | 107,000 | 122,456 | ||||||
| Wm. Wrigley Jr. Co., 2.9%, 10/21/2019 (n) | 600,000 | 620,240 | ||||||
| Wm. Wrigley Jr. Co., 3.375%, 10/21/2020 (n) | 700,000 | 735,477 | ||||||
|
| |||||||
| $ | 10,964,320 | |||||||
| Food & Drug Stores - 0.3% | ||||||||
| CVS Health Corp., 4.875%, 7/20/2035 | $ | 1,381,000 | $ | 1,548,036 | ||||
| CVS Health Corp., 2.75%, 12/01/2022 | 300,000 | 306,313 | ||||||
|
| |||||||
| $ | 1,854,349 | |||||||
| Forest��& Paper Products - 0.1% | ||||||||
| Georgia-Pacific LLC, 5.4%, 11/01/2020 (n) | $ | 325,000 | $ | 366,243 | ||||
| International Paper Co., 6%, 11/15/2041 | 300,000 | 349,398 | ||||||
| Packaging Corp. of America, 3.9%, 6/15/2022 | 43,000 | 43,602 | ||||||
| Packaging Corp. of America, 3.65%, 9/15/2024 | 203,000 | 204,257 | ||||||
|
| |||||||
| $ | 963,500 | |||||||
| Gaming & Lodging - 0.2% | ||||||||
| Wyndham Worldwide Corp., 2.5%, 3/01/2018 | $ | 500,000 | $ | 500,493 | ||||
| Wyndham Worldwide Corp., 4.25%, 3/01/2022 | 500,000 | 524,465 | ||||||
| Wyndham Worldwide Corp., 5.1%, 10/01/2025 | 701,000 | 754,830 | ||||||
|
| |||||||
| $ | 1,779,788 | |||||||
| Insurance - 0.3% | ||||||||
| American International Group, Inc., 4.875%, 6/01/2022 | $ | 325,000 | $ | 356,732 | ||||
| American International Group, Inc., 4.7%, 7/10/2035 | 1,081,000 | 1,100,362 | ||||||
| American International Group, Inc., 4.5%, 7/16/2044 | 331,000 | 319,789 | ||||||
| Unum Group, 4%, 3/15/2024 | 600,000 | 603,913 | ||||||
|
| |||||||
| $ | 2,380,796 | |||||||
| Insurance - Health - 0.4% | ||||||||
| Aetna, Inc., 1.5%, 11/15/2017 | $ | 812,000 | $ | 814,915 | ||||
| Anthem, Inc., 1.875%, 1/15/2018 | 500,000 | 502,073 | ||||||
| UnitedHealth Group, Inc., 4.625%, 7/15/2035 | 1,115,000 | 1,258,573 | ||||||
|
| |||||||
| $ | 2,575,561 | |||||||
28
Table of Contents
Portfolio of Investments (unaudited) – continued
| Issuer | Shares/Par | Value ($) | ||||||
| Bonds - continued | ||||||||
| Insurance - Property & Casualty - 0.5% | ||||||||
| Aon PLC, 4.6%, 6/14/2044 | $ | 600,000 | $ | 600,037 | ||||
| Berkshire Hathaway, Inc., 2.75%, 3/15/2023 | 588,000 | 606,479 | ||||||
| Chubb INA Holdings, Inc., 2.3%, 11/03/2020 | 247,000 | 252,749 | ||||||
| Chubb INA Holdings, Inc., 2.875%, 11/03/2022 | 574,000 | 594,735 | ||||||
| CNA Financial Corp., 5.875%, 8/15/2020 | 400,000 | 447,948 | ||||||
| Liberty Mutual Group, Inc., 4.85%, 8/01/2044 (n) | 281,000 | 270,442 | ||||||
| Marsh & McLennan Cos., Inc., 3.5%, 6/03/2024 | 700,000 | 717,305 | ||||||
|
| |||||||
| $ | 3,489,695 | |||||||
| Major Banks - 2.0% | ||||||||
| ABN AMRO Bank N.V., 1.8%, 6/04/2018 (n) | $ | 1,200,000 | $ | 1,198,618 | ||||
| Bank of America Corp., 1.75%, 6/05/2018 | 1,200,000 | 1,204,721 | ||||||
| Bank of America Corp., 4.125%, 1/22/2024 | 561,000 | 594,768 | ||||||
| Bank of America Corp., 3.875%, 8/01/2025 | 979,000 | 1,016,643 | ||||||
| Bank of America Corp., 3.5%, 4/19/2026 | 625,000 | 631,699 | ||||||
| Goldman Sachs Group, Inc., 5.625%, 1/15/2017 | 1,000,000 | 1,029,701 | ||||||
| JPMorgan Chase & Co., 4.25%, 10/15/2020 | 800,000 | 865,345 | ||||||
| JPMorgan Chase & Co., 3.25%, 9/23/2022 | 1,650,000 | 1,713,337 | ||||||
| JPMorgan Chase & Co., 3.125%, 1/23/2025 | 449,000 | 450,222 | ||||||
| JPMorgan Chase & Co., 6.75% to 2/01/2024, FRN to 1/29/2049 | 500,000 | 553,175 | ||||||
| Morgan Stanley, 2.2%, 12/07/2018 | 632,000 | 637,546 | ||||||
| Morgan Stanley, 5.5%, 7/28/2021 | 450,000 | 511,217 | ||||||
| Morgan Stanley, 3.95%, 4/23/2027 | 480,000 | 479,297 | ||||||
| PNC Bank N.A., 2.6%, 7/21/2020 | 2,081,000 | 2,138,134 | ||||||
| Regions Financial Corp., 2%, 5/15/2018 | 325,000 | 324,557 | ||||||
| Wells Fargo & Co., 4.1%, 6/03/2026 | 1,200,000 | 1,262,357 | ||||||
| Wells Fargo & Co., 5.875% to 6/15/2025, FRN to 12/31/2049 | 224,000 | 239,260 | ||||||
|
| |||||||
| $ | 14,850,597 | |||||||
| Medical & Health Technology & Services - 0.6% | ||||||||
| Becton, Dickinson and Co., 2.675%, 12/15/2019 | $ | 1,187,000 | $ | 1,218,013 | ||||
| Becton, Dickinson and Co., 3.734%, 12/15/2024 | 156,000 | 166,065 | ||||||
| Becton, Dickinson and Co., 4.685%, 12/15/2044 | 896,000 | 991,269 | ||||||
| Laboratory Corp. of America Holdings, 2.625%, 2/01/2020 | 600,000 | 606,078 | ||||||
| Laboratory Corp. of America Holdings, 3.6%, 2/01/2025 | 207,000 | 210,991 | ||||||
| Laboratory Corp. of America Holdings, 4.7%, 2/01/2045 | 359,000 | 365,940 | ||||||
| Thermo Fisher Scientific, Inc., 3.15%, 1/15/2023 | 400,000 | 407,388 | ||||||
| Thermo Fisher Scientific, Inc., 3%, 4/15/2023 | 585,000 | 592,905 | ||||||
|
| |||||||
| $ | 4,558,649 | |||||||
| Medical Equipment - 0.5% | ||||||||
| Medtronic, Inc., 3.5%, 3/15/2025 | $ | 863,000 | $ | 925,640 | ||||
| Medtronic, Inc., 4.375%, 3/15/2035 | 1,311,000 | 1,459,991 | ||||||
| Zimmer Holdings, Inc., 4.45%, 8/15/2045 | 1,070,000 | 1,079,348 | ||||||
|
| |||||||
| $ | 3,464,979 | |||||||
29
Table of Contents
Portfolio of Investments (unaudited) – continued
| Issuer | Shares/Par | Value ($) | ||||||
| Bonds - continued | ||||||||
| Metals & Mining - 0.4% | ||||||||
| Barrick Gold Corp., 3.85%, 4/01/2022 | $ | 178,000 | $ | 182,422 | ||||
| Barrick Gold Corp., 4.1%, 5/01/2023 | 231,000 | 238,528 | ||||||
| Barrick North America Finance LLC, 4.4%, 5/30/2021 | 231,000 | 246,225 | ||||||
| Barrick North America Finance LLC, 5.75%, 5/01/2043 | 1,343,000 | 1,393,405 | ||||||
| Southern Copper Corp., 5.25%, 11/08/2042 | 1,291,000 | 1,112,206 | ||||||
|
| |||||||
| $ | 3,172,786 | |||||||
| Midstream - 0.8% | ||||||||
| APT Pipelines Ltd., 5%, 3/23/2035 (n) | $ | 472,000 | $ | 460,450 | ||||
| Dominion Gas Holdings LLC, 2.8%, 11/15/2020 | 713,000 | 728,633 | ||||||
| Energy Transfer Partners LP, 6.5%, 2/01/2042 | 325,000 | 315,257 | ||||||
| Energy Transfer Partners LP, 5.15%, 2/01/2043 | 400,000 | 338,816 | ||||||
| Enterprise Products Operating LLC, 3.9%, 2/15/2024 | 150,000 | 156,111 | ||||||
| Enterprise Products Operating LLC, 4.45%, 2/15/2043 | 300,000 | 286,489 | ||||||
| Enterprise Products Operating LLC, 4.85%, 3/15/2044 | 114,000 | 115,055 | ||||||
| Kinder Morgan (Delaware), Inc., 5.55%, 6/01/2045 | 105,000 | 97,827 | ||||||
| Kinder Morgan Energy Partners LP, 3.5%, 3/01/2021 | 800,000 | 783,876 | ||||||
| Kinder Morgan Energy Partners LP, 4.15%, 2/01/2024 | 617,000 | 595,671 | ||||||
| Kinder Morgan Energy Partners LP, 5.4%, 9/01/2044 | 888,000 | 798,433 | ||||||
| ONEOK Partners LP, 2%, 10/01/2017 | 500,000 | 497,457 | ||||||
| Spectra Energy Partners LP, 4.75%, 3/15/2024 | 300,000 | 323,082 | ||||||
| Sunoco Logistics Partners LP, 5.3%, 4/01/2044 | 92,000 | 82,116 | ||||||
| TransCanada PipeLines Ltd., 1.875%, 1/12/2018 | 553,000 | 553,475 | ||||||
|
| |||||||
| $ | 6,132,748 | |||||||
| Natural Gas - Distribution - 0.1% | ||||||||
| NiSource Finance Corp., 3.85%, 2/15/2023 | $ | 300,000 | $ | 317,569 | ||||
| NiSource Finance Corp., 4.8%, 2/15/2044 | 300,000 | 326,139 | ||||||
|
| |||||||
| $ | 643,708 | |||||||
| Network & Telecom - 0.7% | ||||||||
| AT&T, Inc., 2.45%, 6/30/2020 | $ | 1,426,000 | $ | 1,448,328 | ||||
| AT&T, Inc., 5.65%, 2/15/2047 | 611,000 | 688,320 | ||||||
| Verizon Communications, Inc., 2.625%, 2/21/2020 | 858,000 | 884,057 | ||||||
| Verizon Communications, Inc., 5.15%, 9/15/2023 | 325,000 | 373,780 | ||||||
| Verizon Communications, Inc., 5.05%, 3/15/2034 | 1,387,000 | 1,522,270 | ||||||
| Verizon Communications, Inc., 6.55%, 9/15/2043 | 400,000 | 527,615 | ||||||
|
| |||||||
| $ | 5,444,370 | |||||||
| Oils - 0.3% | ||||||||
| Marathon Petroleum Corp., 3.4%, 12/15/2020 | $ | 1,246,000 | $ | 1,254,744 | ||||
| Marathon Petroleum Corp., 3.625%, 9/15/2024 | 147,000 | 140,787 | ||||||
| Marathon Petroleum Corp., 4.75%, 9/15/2044 | 373,000 | 311,761 | ||||||
| Valero Energy Corp., 4.9%, 3/15/2045 | 879,000 | 819,595 | ||||||
|
| |||||||
| $ | 2,526,887 | |||||||
30
Table of Contents
Portfolio of Investments (unaudited) – continued
| Issuer | Shares/Par | Value ($) | ||||||
| Bonds - continued | ||||||||
| Other Banks & Diversified Financials - 0.9% | ||||||||
| Capital One Bank (USA) N.A., 3.375%, 2/15/2023 | $ | 350,000 | $ | 352,200 | ||||
| Capital One Financial Corp., 3.75%, 4/24/2024 | 213,000 | 220,094 | ||||||
| Capital One Financial Corp., 2.35%, 8/17/2018 | 1,833,000 | 1,849,930 | ||||||
| Citigroup, Inc., 4.4%, 6/10/2025 | 1,000,000 | 1,032,113 | ||||||
| Citizens Financial Group, Inc., 4.3%, 12/03/2025 | 667,000 | 688,195 | ||||||
| Discover Bank, 7%, 4/15/2020 | 500,000 | 566,723 | ||||||
| Discover Bank, 3.1%, 6/04/2020 | 860,000 | 876,108 | ||||||
| Discover Bank, 4.25%, 3/13/2026 | 162,000 | 167,155 | ||||||
| First Republic Bank, 2.375%, 6/17/2019 | 352,000 | 352,376 | ||||||
| Macquarie Group Ltd., 3%, 12/03/2018 (n) | 86,000 | 88,247 | ||||||
| U.S. Bancorp, 3%, 3/15/2022 | 300,000 | 313,756 | ||||||
|
| |||||||
| $ | 6,506,897 | |||||||
| Pharmaceuticals - 1.5% | ||||||||
| Actavis Funding SCS, 2.45%, 6/15/2019 | $ | 588,000 | $ | 593,961 | ||||
| Actavis Funding SCS, 3.45%, 3/15/2022 | 394,000 | 403,632 | ||||||
| Actavis Funding SCS, 3.8%, 3/15/2025 | 311,000 | 319,294 | ||||||
| Actavis Funding SCS, 4.55%, 3/15/2035 | 750,000 | 750,262 | ||||||
| Actavis, Inc., 4.625%, 10/01/2042 | 300,000 | 297,325 | ||||||
| Amgen, Inc., 2.3%, 6/15/2016 | 1,000,000 | 1,001,969 | ||||||
| Bayer U.S. Finance LLC, 3.375%, 10/08/2024 (n) | 200,000 | 212,622 | ||||||
| Biogen, Inc., 3.625%, 9/15/2022 | 1,348,000 | 1,438,346 | ||||||
| Celgene Corp., 2.875%, 8/15/2020 | 2,377,000 | 2,461,811 | ||||||
| Gilead Sciences, Inc., 2.35%, 2/01/2020 | 654,000 | 671,572 | ||||||
| Gilead Sciences, Inc., 3.7%, 4/01/2024 | 593,000 | 639,999 | ||||||
| Gilead Sciences, Inc., 3.65%, 3/01/2026 | 1,000,000 | 1,068,478 | ||||||
| Gilead Sciences, Inc., 4.5%, 2/01/2045 | 519,000 | 553,284 | ||||||
| Mylan, Inc., 2.55%, 3/28/2019 | 400,000 | 400,714 | ||||||
|
| |||||||
| $ | 10,813,269 | |||||||
| Pollution Control - 0.1% | ||||||||
| Republic Services, Inc., 5.25%, 11/15/2021 | $ | 300,000 | $ | 342,107 | ||||
| Railroad & Shipping - 0.1% | ||||||||
| Canadian Pacific Railway Co., 7.25%, 5/15/2019 | $ | 500,000 | $ | 573,598 | ||||
| Real Estate - Apartment - 0.1% | ||||||||
| ERP Operating LP, REIT, 4.625%, 12/15/2021 | $ | 448,000 | $ | 503,361 | ||||
| Real Estate - Healthcare - 0.1% | ||||||||
| HCP, Inc., REIT, 3.875%, 8/15/2024 | $ | 164,000 | $ | 160,881 | ||||
| HCP, Inc., REIT, 3.4%, 2/01/2025 | 600,000 | 566,348 | ||||||
|
| |||||||
| $ | 727,229 | |||||||
31
Table of Contents
Portfolio of Investments (unaudited) – continued
| Issuer | Shares/Par | Value ($) | ||||||
| Bonds - continued | ||||||||
| Real Estate - Office - 0.2% | ||||||||
| Boston Properties LP, REIT, 3.7%, 11/15/2018 | $ | 1,150,000 | $ | 1,205,106 | ||||
| Vornado Realty LP, REIT, 2.5%, 6/30/2019 | 460,000 | 464,247 | ||||||
|
| |||||||
| $ | 1,669,353 | |||||||
| Real Estate - Other - 0.0% | ||||||||
| Host Hotels & Resorts, Inc., REIT, 4%, 6/15/2025 | $ | 186,000 | $ | 185,162 | ||||
| Real Estate - Retail - 0.2% | ||||||||
| DDR Corp., REIT, 3.625%, 2/01/2025 | $ | 874,000 | $ | 858,264 | ||||
| Simon Property Group, Inc., REIT, 1.5%, 2/01/2018 (n) | 388,000 | 389,595 | ||||||
| Simon Property Group, Inc., REIT, 4.375%, 3/01/2021 | 400,000 | 442,106 | ||||||
|
| |||||||
| $ | 1,689,965 | |||||||
| Restaurants - 0.1% | ||||||||
| McDonald’s Corp., 4.875%, 12/09/2045 | $ | 821,000 | $ | 927,777 | ||||
| Retailers - 0.8% | ||||||||
| Bed Bath & Beyond, Inc., 5.165%, 8/01/2044 | $ | 279,000 | $ | 252,499 | ||||
| Best Buy Co., Inc., 5.5%, 3/15/2021 | 1,500,000 | 1,601,250 | ||||||
| Dollar General Corp., 4.15%, 11/01/2025 | 1,117,000 | 1,185,041 | ||||||
| Gap, Inc., 5.95%, 4/12/2021 | 971,000 | 1,035,523 | ||||||
| Home Depot, Inc., 2%, 6/15/2019 | 400,000 | 409,288 | ||||||
| Home Depot, Inc., 2.625%, 6/01/2022 | 1,000,000 | 1,034,950 | ||||||
| Home Depot, Inc., 4.875%, 2/15/2044 | 300,000 | 354,182 | ||||||
|
| |||||||
| $ | 5,872,733 | |||||||
| Specialty Chemicals - 0.2% | ||||||||
| Ecolab, Inc., 2.25%, 1/12/2020 | $ | 700,000 | $ | 703,021 | ||||
| Ecolab, Inc., 4.35%, 12/08/2021 | 400,000 | 445,619 | ||||||
|
| |||||||
| $ | 1,148,640 | |||||||
| Telecommunications - Wireless - 0.4% | ||||||||
| American Tower Corp., REIT, 3.5%, 1/31/2023 | $ | 325,000 | $ | 332,891 | ||||
| American Tower Corp., REIT, 5%, 2/15/2024 | 400,000 | 444,303 | ||||||
| American Tower Corp., REIT, 4%, 6/01/2025 | 464,000 | 485,543 | ||||||
| Crown Castle International Corp., 4.45%, 2/15/2026 | 617,000 | 662,765 | ||||||
| Crown Castle International Corp., 3.7%, 6/15/2026 | 369,000 | 374,671 | ||||||
| SBA Tower Trust, 2.898%, 10/15/2044 (n) | 618,000 | 620,077 | ||||||
|
| |||||||
| $ | 2,920,250 | |||||||
| Tobacco - 0.6% | ||||||||
| Altria Group, Inc., 2.95%, 5/02/2023 | $ | 259,000 | $ | 269,799 | ||||
| Altria Group, Inc., 4%, 1/31/2024 | 1,135,000 | 1,254,728 | ||||||
| Imperial Tobacco Finance PLC, 4.25%, 7/21/2025 (n) | 1,051,000 | 1,131,579 | ||||||
32
Table of Contents
Portfolio of Investments (unaudited) – continued
| Issuer | Shares/Par | Value ($) | ||||||
| Bonds - continued | ||||||||
| Tobacco - continued | ||||||||
| Philip Morris International, Inc., 4.875%, 11/15/2043 | $ | 230,000 | $ | 267,802 | ||||
| Reynolds American, Inc., 8.125%, 6/23/2019 | 266,000 | 317,289 | ||||||
| Reynolds American, Inc., 3.25%, 6/12/2020 | 357,000 | 374,351 | ||||||
| Reynolds American, Inc., 4%, 6/12/2022 | 238,000 | 258,812 | ||||||
| Reynolds American, Inc., 4.45%, 6/12/2025 | 196,000 | 217,063 | ||||||
| Reynolds American, Inc., 5.7%, 8/15/2035 | 257,000 | 306,773 | ||||||
|
| |||||||
| $ | 4,398,196 | |||||||
| Transportation - Services - 0.1% | ||||||||
| ERAC USA Finance LLC, 3.85%, 11/15/2024 (n) | $ | 191,000 | $ | 202,249 | ||||
| ERAC USA Finance LLC, 7%, 10/15/2037 (n) | 578,000 | 747,047 | ||||||
| ERAC USA Finance LLC, 4.5%, 2/15/2045 (n) | 80,000 | 80,784 | ||||||
|
| |||||||
| $ | 1,030,080 | |||||||
| Utilities - Electric Power - 0.6% | ||||||||
| American Electric Power Co., Inc., 1.65%, 12/15/2017 | $ | 312,000 | $ | 311,673 | ||||
| Berkshire Hathaway Energy, 4.5%, 2/01/2045 | 506,000 | 561,432 | ||||||
| CMS Energy Corp., 3.875%, 3/01/2024 | 700,000 | 749,705 | ||||||
| DTE Electric Co., 3.7%, 3/15/2045 | 500,000 | 508,091 | ||||||
| EDP Finance B.V., 4.9%, 10/01/2019 (n) | 750,000 | 791,228 | ||||||
| PG&E Corp., 2.4%, 3/01/2019 | 403,000 | 410,288 | ||||||
| PPL Capital Funding, Inc., 4.2%, 6/15/2022 | 300,000 | 323,621 | ||||||
| PPL Capital Funding, Inc., 5%, 3/15/2044 | 285,000 | 315,620 | ||||||
| PPL WEM Holdings PLC, 5.375%, 5/01/2021 (n) | 200,000 | 221,555 | ||||||
|
| |||||||
| $ | 4,193,213 | |||||||
| Total Bonds (Identified Cost, $139,108,981) | $ | 144,173,786 | ||||||
| Preferred Stocks - 0.2% | ||||||||
| Aerospace - 0.0% | ||||||||
| Rolls-Royce Holdings PLC (a) | 7,164,468 | $ | 10,468 | |||||
| Consumer Products - 0.2% | ||||||||
| Henkel AG & Co. KGaA | 12,797 | $ | 1,460,631 | |||||
| Specialty Chemicals - 0.0% | ||||||||
| Fuchs Petrolub SE | 5,633 | $ | 240,942 | |||||
| Total Preferred Stocks (Identified Cost, $1,672,005) | $ | 1,712,041 | ||||||
| Convertible Preferred Stocks - 0.0% | ||||||||
| Telephone Services - 0.0% | ||||||||
| Frontier Communications Corp., 11.125% (Identified Cost, $188,100) | 1,876 | $ | 195,667 | |||||
33
Table of Contents
Portfolio of Investments (unaudited) – continued
| Put Options Purchased - 0.9% | ||||||||
| Issuer/Expiration Date/Strike Price | Number of Contracts | Value ($) | ||||||
| S&P 500 Index - December 2017 @ $1,800 (Premiums Paid, $6,311,114) | 537 | $ | 6,229,200 | |||||
| Issuer | Shares/Par | |||||||
| Money Market Funds - 6.7% | ||||||||
| MFS Institutional Money Market Portfolio, 0.36%, at Cost and Net Asset Value (v) | 49,386,724 | $ | 49,386,724 | |||||
| Total Investments (Identified Cost, $680,749,002) | $ | 683,956,921 | ||||||
| Securities Sold Short - 0.0% | ||||||||
| Telecommunications - Wireless - 0.0% | ||||||||
| Crown Castle International Corp., REIT (Proceeds Received, $17,412) | (212 | ) | $ | (18,419 | ) | |||
| Other Assets, Less Liabilities - 7.0% | 50,988,032 | |||||||
| Net Assets - 100.0% | $ | 734,926,534 | ||||||
| (a) | Non-income producing security. |
| (n) | Securities exempt from registration under Rule 144A of the Securities Act of 1933. These securities may be sold in the ordinary course of business in transactions exempt from registration, normally to qualified institutional buyers. At period end, the aggregate value of these securities was $17,645,805, representing 2.4% of net assets. |
| (s) | Security or a portion of the security was pledged to cover collateral requirements for securities sold short and certain derivative transactions. |
| (v) | Underlying affiliated fund that is available only to investment companies managed by MFS. The rate quoted for the MFS Institutional Money Market Portfolio is the annualized seven-day yield of the fund at period end. |
The following abbreviations are used in this report and are defined:
| ADR | American Depositary Receipt |
| EU | Equity Unit |
| FRN | Floating Rate Note. Interest rate resets periodically and the current rate may not be the rate reported at period end. |
| GDR | Global Depositary Receipt |
| NVDR | Non-Voting Depositary Receipt |
| PLC | Public Limited Company |
| REIT | Real Estate Investment Trust |
Abbreviations indicate amounts shown in currencies other than the U.S. dollar. All amounts are stated in U.S. dollars unless otherwise indicated. A list of abbreviations is shown below:
| AUD | Australian Dollar |
| CAD | Canadian Dollar |
| CHF | Swiss Franc |
| CNY | Chinese Yuan Renminbi |
| EUR | Euro |
| GBP | British Pound |
| HKD | Hong Kong Dollar |
34
Table of Contents
Portfolio of Investments (unaudited) – continued
| INR | Indian Rupee |
| JPY | Japanese Yen |
| KRW | Korean Won |
| NZD | New Zealand Dollar |
| SEK | Swedish Krona |
| SGD | Singapore Dollar |
| TWD | Taiwan Dollar |
Derivative Contracts at 4/30/16
Forward Foreign Currency Exchange Contracts at 4/30/16
| Type | Currency | Counter- party | Contracts to Deliver/ Receive | Settlement Date Range | In Exchange For | Contracts at Value | Net Unrealized Appreciation (Depreciation) | |||||||||||||||||
| Asset Derivatives | ||||||||||||||||||||||||
| BUY | CHF | JPMorgan Chase Bank N.A. | 14,257,432 | 6/20/16 | $14,775,000 | $14,894,569 | $119,569 | |||||||||||||||||
| BUY | INR | Deutsche Bank AG | 1,535,830,000 | 6/20/16 | 22,501,355 | 22,936,203 | 434,848 | |||||||||||||||||
| BUY | INR | Goldman Sachs International | 2,488,089,950 | 6/20/16 | 37,015,000 | 37,157,324 | 142,324 | |||||||||||||||||
| BUY | JPY | JPMorgan Chase Bank N.A. | 503,200,000 | 6/20/16 | 4,630,235 | 4,735,769 | 105,534 | |||||||||||||||||
|
| |||||||||||||||||||||||
| $802,275 | ||||||||||||||||||||||||
|
| |||||||||||||||||||||||
| Liability Derivatives | ||||||||||||||||||||||||
| SELL | AUD | JPMorgan Chase Bank N.A. | 13,365,000 | 6/20/16 | $9,986,328 | $10,141,094 | $(154,766 | ) | ||||||||||||||||
| SELL | CAD | JPMorgan Chase Bank N.A. | 4,645,000 | 6/20/16 | 3,507,964 | 3,702,104 | (194,140 | ) | ||||||||||||||||
| SELL | CHF | Barclays Bank PLC | 28,345,000 | 6/20/16 | 28,796,705 | 29,611,684 | (814,979 | ) | ||||||||||||||||
| SELL | CNY | Goldman Sachs International | 3,510,000 | 6/20/16 | 535,837 | 540,255 | (4,418 | ) | ||||||||||||||||
| SELL | EUR | Goldman Sachs International | 13,300,000 | 6/20/16 | 15,021,033 | 15,252,387 | (231,354 | ) | ||||||||||||||||
| SELL | EUR | JPMorgan Chase Bank N.A. | 42,897,937 | 6/20/16 | 47,915,776 | 49,195,182 | (1,279,406 | ) | ||||||||||||||||
| SELL | GBP | Barclays Bank PLC | 22,210,000 | 6/20/16 | 31,780,511 | 32,456,783 | (676,272 | ) | ||||||||||||||||
35
Table of Contents
Portfolio of Investments (unaudited) – continued
Forward Foreign Currency Exchange Contracts at 4/30/16 - continued
| Type | Currency | Counter- party | Contracts to Deliver/ Receive | Settlement Date Range | In Exchange For | Contracts at Value | Net Unrealized Appreciation (Depreciation) | |||||||||||||||||
| Liability Derivatives - continued | ||||||||||||||||||||||||
| SELL | HKD | Barclays Bank PLC | 19,825,000 | 6/20/16 | $2,555,641 | $2,556,940 | $(1,299 | ) | ||||||||||||||||
| SELL | JPY | Barclays Bank PLC | 1,635,400,000 | 6/20/16 | 14,415,351 | 15,391,248 | (975,897 | ) | ||||||||||||||||
| SELL | JPY | JPMorgan Chase Bank N.A. | 2,504,600,000 | 6/20/16 | 22,341,854 | 23,571,555 | (1,229,701 | ) | ||||||||||||||||
| SELL | KRW | JPMorgan Chase Bank N.A. | 17,323,158,250 | 6/20/16 | 14,855,000 | 15,192,289 | (337,289 | ) | ||||||||||||||||
| SELL | KRW | Morgan Stanley Capital Services, Inc. | 16,995,239,250 | 6/20/16 | 14,775,000 | 14,904,706 | (129,706 | ) | ||||||||||||||||
| SELL | NZD | Barclays Bank PLC | 10,760,000 | 6/20/16 | 7,422,248 | 7,493,370 | (71,122 | ) | ||||||||||||||||
| SELL | NZD | JPMorgan Chase Bank N.A. | 31,515,000 | 6/20/16 | 20,982,845 | 21,947,358 | (964,513 | ) | ||||||||||||||||
| SELL | SEK | Barclays Bank PLC | 44,320,000 | 6/20/16 | 5,298,077 | 5,528,906 | (230,829 | ) | ||||||||||||||||
| SELL | SGD | JPMorgan Chase Bank N.A. | 1,175,000 | 6/20/16 | 852,190 | 872,711 | (20,521 | ) | ||||||||||||||||
| SELL | TWD | Barclays Bank PLC | 239,007,380 | 6/20/16 | 7,390,000 | 7,413,955 | (23,955 | ) | ||||||||||||||||
| SELL | TWD | Deutsche Bank AG | 744,300,000 | 6/20/16 | 22,755,204 | 23,088,018 | (332,814 | ) | ||||||||||||||||
|
| |||||||||||||||||||||||
| $(7,672,981 | ) | |||||||||||||||||||||||
|
| |||||||||||||||||||||||
Futures Contracts at 4/30/16
| Description | Currency | Contracts | Value | Expiration Date | Unrealized Appreciation (Depreciation) | |||||||||||||
| Asset Derivatives | ||||||||||||||||||
| Equity Futures | ||||||||||||||||||
| AEX 25 Index (Long) | EUR | 292 | $29,199,187 | May - 2016 | $443,996 | |||||||||||||
| E-mini MSCI Index (Short) | USD | 1,300 | 54,496,000 | June - 2016 | 346,470 | |||||||||||||
| E-mini NASDAQ-100 Index (Long) | USD | 97 | 8,403,110 | June - 2016 | 106,191 | |||||||||||||
| FTSE China Index (Short) | USD | 1,706 | 16,191,801 | May - 2016 | 76,308 | |||||||||||||
| Hang Seng Index (Short) | HKD | 58 | 7,718,588 | May - 2016 | 247,735 | |||||||||||||
36
Table of Contents
Portfolio of Investments (unaudited) – continued
Futures Contracts at 4/30/16 - continued
| Description | Currency | Contracts | Value | Expiration Date | Unrealized Appreciation (Depreciation) | |||||||||||||
| Asset Derivatives - continued | ||||||||||||||||||
| Equity Futures - continued | ||||||||||||||||||
| MSCI Singapore Index (Short) | SGD | 218 | $5,138,994 | May - 2016 | $173,546 | |||||||||||||
| Nikkei 225 Index (Short) | JPY | 410 | 60,746,839 | June - 2016 | 4,796,997 | |||||||||||||
|
| |||||||||||||||||
| $6,191,243 | ||||||||||||||||||
|
| |||||||||||||||||
| Interest Rate Futures | ||||||||||||||||||
| German Euro Bobl (Short) | EUR | 571 | $85,552,810 | June - 2016 | $144,560 | |||||||||||||
|
| |||||||||||||||||
| $6,335,803 | ||||||||||||||||||
|
| |||||||||||||||||
| Liability Derivatives | ||||||||||||||||||
| Equity Futures | ||||||||||||||||||
| ASX SPI 200 Index (Short) | AUD | 167 | $16,578,589 | June - 2016 | $(109,820 | ) | ||||||||||||
| CAC 40 Index (Short) | EUR | 459 | 22,996,663 | May - 2016 | (631,577 | ) | ||||||||||||
| Canadian S&P/TSX 60 Index (Short) | CAD | 28 | 3,631,721 | June - 2016 | (156,378 | ) | ||||||||||||
| DAX Index (Short) | EUR | 53 | 15,301,632 | June - 2016 | (101,749 | ) | ||||||||||||
| Euro STOXX 50 Index (Long) | EUR | 664 | 22,664,936 | June - 2016 | (80,115 | ) | ||||||||||||
| FTSE 100 Index (Short) | GBP | 855 | 77,605,473 | June - 2016 | (1,319,493 | ) | ||||||||||||
| Hang Seng China Enterprises Index (Long) | HKD | 860 | 49,055,201 | May - 2016 | (1,591,460 | ) | ||||||||||||
| KOSPI 200 Index (Long) | KRW | 170 | 18,256,765 | June - 2016 | (328,011 | ) | ||||||||||||
| OMX Index (Short) | SEK | 644 | 10,836,317 | May - 2016 | (58,791 | ) | ||||||||||||
| Russell 2000 Index (Short) | USD | 417 | 47,066,790 | June - 2016 | (2,963,169 | ) | ||||||||||||
| S&P 500 Index (Short) | USD | 581 | 299,084,275 | June - 2016 | (11,570,905 | ) | ||||||||||||
| S&P MidCap 400 Index (Short) | USD | 287 | 41,853,210 | June - 2016 | (2,410,011 | ) | ||||||||||||
| Topix Index (Long) | JPY | 303 | 36,058,554 | June - 2016 | (2,796,541 | ) | ||||||||||||
|
| |||||||||||||||||
| $(24,118,020 | ) | |||||||||||||||||
|
| |||||||||||||||||
| Interest Rate Futures | ||||||||||||||||||
| German Euro Buxl 30 yr (Long) | EUR | 120 | $22,463,133 | June - 2016 | $(290,090 | ) | ||||||||||||
| United Kingdom Gilt Bond 10 yr (Short) | GBP | 421 | 73,571,238 | June - 2016 | (133,782 | ) | ||||||||||||
|
| |||||||||||||||||
| $(423,872 | ) | |||||||||||||||||
|
| |||||||||||||||||
| $(24,541,892 | ) | |||||||||||||||||
|
| |||||||||||||||||
37
Table of Contents
Portfolio of Investments (unaudited) – continued
Cleared Swap Agreements at 4/30/16
| Expiration | Notional Amount | Counterparty | Cash Flows to Receive | Cash Flows to Pay | Fair Value | |||||||||||||
| Asset Derivatives | ||||||||||||||||||
| Credit Default Swap Agreements | ||||||||||||||||||
| 12/20/20 | USD | 222,900,000 | Morgan Stanley (a) | 1.00% (fixed rate) | (1) | $2,027,111 | ||||||||||||
|
| |||||||||||||||||
| (1) | Fund, as protection seller, to pay notional amount upon a defined credit event by a reference obligation specified in the Markit CDX North America Investment Grade Index, a BBB+ rated credit default index. The fund entered into the contract to gain issuer exposure. |
| (a) | Net unamortized premiums paid by the fund amounted to $2,208,377. |
The credit ratings presented here are an indicator of the current payment/performance risk of the related swap agreement, the reference obligation for which may be either a single security or, in the case of a credit default index, a basket of securities issued by corporate or sovereign issuers. Ratings are assigned to each reference security, including each individual security within a reference basket of securities, utilizing ratings from Moody’s, Fitch, and Standard & Poor’s rating agencies and applying the following hierarchy: If all three agencies provide a rating, the middle rating (after dropping the highest and lowest ratings) is assigned; if two of the three agencies rate a security, the lower of the two is assigned. Ratings are shown in the S&P and Fitch scale (e.g., AAA). The ratings for a credit default index are calculated by MFS as a weighted average of the external credit ratings of the individual securities that compose the index’s reference basket of securities.
At April 30, 2016, the fund had cash collateral of $42,765,237 and other liquid securities with an aggregate value of $573,063 to cover any commitments for securities sold short and certain derivative contracts. Cash collateral is comprised of “Deposits with brokers” on the Statement of Assets and Liabilities.
See Notes to Financial Statements
38
Table of Contents
Financial Statements
STATEMENT OF ASSETS AND LIABILITIES
At 4/30/16 (unaudited)
This statement represents your fund’s balance sheet, which details the assets and liabilities comprising the total value of the fund.
| Assets | ||||
Investments | ||||
Non-affiliated issuers, at value (identified cost, $631,362,278) | $634,570,197 | |||
Underlying affiliated funds, at cost and value | 49,386,724 | |||
Total investments, at value (identified cost, $680,749,002) | $683,956,921 | |||
Foreign currency, at value (identified cost, $3,874,098) | 3,920,671 | |||
Deposits with brokers | 42,765,237 | |||
Receivables for | ||||
Due from brokers (net unamortized premiums paid, $2,208,377) | 4,315,757 | |||
Forward foreign currency exchange contracts | 802,275 | |||
Daily variation margin on open futures contracts | 4,623,784 | |||
Investments sold | 8,864,527 | |||
Fund shares sold | 1,706,028 | |||
Interest and dividends | 2,361,891 | |||
Other assets | 3,276 | |||
Total assets | $753,320,367 | |||
| Liabilities | ||||
Payable to custodian | $17,540 | |||
Payables for | ||||
Securities sold short, at value (proceeds received, $17,412) | 18,419 | |||
Forward foreign currency exchange contracts | 7,672,981 | |||
Daily variation margin on open swap agreements | 9,923 | |||
Investments purchased | 7,712,993 | |||
Fund shares reacquired | 2,541,658 | |||
Payable to affiliates | ||||
Investment adviser | 54,954 | |||
Shareholder servicing costs | 173,153 | |||
Distribution and service fees | 8,506 | |||
Payable for independent Trustees’ compensation | 158 | |||
Deferred country tax expense payable | 136 | |||
Accrued expenses and other liabilities | 183,412 | |||
Total liabilities | $18,393,833 | |||
Net assets | $734,926,534 | |||
| Net assets consist of | ||||
Paid-in capital | $806,338,564 | |||
Unrealized appreciation (depreciation) on investments and translation of assets and liabilities in foreign currencies (net of $136 deferred country tax) | (21,998,066 | ) | ||
Accumulated net realized gain (loss) on investments and foreign currency | (52,122,540 | ) | ||
Undistributed net investment income | 2,708,576 | |||
Net assets | $734,926,534 | |||
Shares of beneficial interest outstanding | 73,517,335 |
39
Table of Contents
Statement of Assets and Liabilities (unaudited) – continued
| Net assets | Shares outstanding | Net asset value per share (a) | ||||||||||
Class A | $160,515,716 | 16,129,634 | $9.95 | |||||||||
Class B | 9,687,756 | 993,516 | 9.75 | |||||||||
Class C | 52,634,880 | 5,407,011 | 9.73 | |||||||||
Class I | 504,996,918 | 50,280,437 | 10.04 | |||||||||
Class R1 | 243,388 | 25,061 | 9.71 | |||||||||
Class R2 | 1,257,759 | 127,640 | 9.85 | |||||||||
Class R3 | 412,401 | 41,159 | 10.02 | |||||||||
Class R4 | 200,995 | 19,956 | 10.07 | |||||||||
Class R5 | 4,976,721 | 492,921 | 10.10 | |||||||||
Shares outstanding are rounded for presentation purposes.
| (a) | Maximum offering price per share was equal to the net asset value per share for all share classes, except for Class A, for which the maximum offering price per share was $10.56 [100 / 94.25 x $9.95]. On sales of $50,000 or more, the maximum offering price of Class A shares is reduced. A contingent deferred sales charge may be imposed on redemptions of Class A, Class B, and Class C shares. Redemption price per share was equal to the net asset value per share for Classes I, R1, R2, R3, R4, and R5. |
See Notes to Financial Statements
40
Table of Contents
Financial Statements
Six months ended 4/30/16 (unaudited)
This statement describes how much your fund earned in investment income and accrued in expenses. It also describes any gains and/or losses generated by fund operations.
| Net investment income | ||||
Income | ||||
Dividends | $5,259,680 | |||
Interest | 2,326,659 | |||
Dividends from underlying affiliated funds | 55,838 | |||
Foreign taxes withheld | (188,837 | ) | ||
Total investment income | $7,453,340 | |||
Expenses | ||||
Management fee | $3,466,135 | |||
Distribution and service fees | 541,343 | |||
Shareholder servicing costs | 324,350 | |||
Administrative services fee | 64,673 | |||
Independent Trustees’ compensation | 6,251 | |||
Custodian fee | 179,951 | |||
Shareholder communications | 27,216 | |||
Audit and tax fees | 47,295 | |||
Legal fees | 3,162 | |||
Dividend and interest expense on securities sold short | 464 | |||
Miscellaneous | 158,271 | |||
Total expenses | $4,819,111 | |||
Fees paid indirectly | (1,470 | ) | ||
Reduction of expenses by investment adviser and distributor | (30,271 | ) | ||
Net expenses | $4,787,370 | |||
Net investment income | $2,665,970 | |||
| Realized and unrealized gain (loss) on investments and foreign currency | ||||
Realized gain (loss) (identified cost basis) | ||||
Investments | $2,274,000 | |||
Written options | 123,469 | |||
Futures contracts | (19,256,446 | ) | ||
Swap agreements | 5,349,537 | |||
Foreign currency | 554,732 | |||
Net realized gain (loss) on investments and foreign currency | $(10,954,708 | ) | ||
Change in unrealized appreciation (depreciation) | ||||
Investments (net of $29 increase in deferred country tax) | $(7,424,885 | ) | ||
Futures contracts | 383,921 | |||
Swap agreements | (2,468,878 | ) | ||
Securities sold short | (301 | ) | ||
Translation of assets and liabilities in foreign currencies | (8,061,793 | ) | ||
Net unrealized gain (loss) on investments and foreign currency translation | $(17,571,936 | ) | ||
Net realized and unrealized gain (loss) on investments and foreign currency | $(28,526,644 | ) | ||
Change in net assets from operations | $(25,860,674 | ) | ||
See Notes to Financial Statements
41
Table of Contents
Financial Statements
STATEMENTS OF CHANGES IN NET ASSETS
These statements describe the increases and/or decreases in net assets resulting from operations, any distributions, and any shareholder transactions.
| Change in net assets | Six months ended 4/30/16 (unaudited) | Year ended | ||||||
| From operations | ||||||||
Net investment income | $2,665,970 | $3,196,365 | ||||||
Net realized gain (loss) on investments and foreign currency | (10,954,708 | ) | (523,265 | ) | ||||
Net unrealized gain (loss) on investments and foreign currency translation | (17,571,936 | ) | (20,992,812 | ) | ||||
Change in net assets from operations | $(25,860,674 | ) | $(18,319,712 | ) | ||||
| Distributions declared to shareholders | ||||||||
From net investment income | $(8,270,546 | ) | $(4,060,201 | ) | ||||
Change in net assets from fund share transactions | $(22,688,212 | ) | $404,966,176 | |||||
Total change in net assets | $(56,819,432 | ) | $382,586,263 | |||||
| Net assets | ||||||||
At beginning of period | 791,745,966 | 409,159,703 | ||||||
At end of period (including undistributed net investment income of $2,708,576 and $8,313,152, respectively) | $734,926,534 | $791,745,966 | ||||||
See Notes to Financial Statements
42
Table of Contents
Financial Statements
The financial highlights table is intended to help you understand the fund’s financial performance for the semiannual period and the past 5 fiscal years. Certain information reflects financial results for a single fund share. The total returns in the table represent the rate by which an investor would have earned (or lost) on an investment in the fund share class (assuming reinvestment of all distributions) held for the entire period.
Six months | Years ended 10/31 | |||||||||||||||||||||||
| Class A | 2015 | 2014 | 2013 | 2012 | 2011 | |||||||||||||||||||
| (unaudited) | ||||||||||||||||||||||||
Net asset value, beginning of period | $10.38 | $10.65 | $10.28 | $9.81 | $9.25 | $9.17 | ||||||||||||||||||
| Income (loss) from investment operations | ||||||||||||||||||||||||
Net investment income (d) | $0.03 | $0.05 | $0.05 | $0.03 | $0.03 | $0.04 | ||||||||||||||||||
Net realized and unrealized gain (loss) | (0.37 | ) | (0.23 | ) | 0.45 | 0.70 | 0.81 | 0.26 | ||||||||||||||||
Total from investment operations | $(0.34 | ) | $(0.18 | ) | $0.50 | $0.73 | $0.84 | $0.30 | ||||||||||||||||
| Less distributions declared to shareholders | ||||||||||||||||||||||||
From net investment income | $(0.09 | ) | $(0.09 | ) | $(0.13 | ) | $(0.26 | ) | $(0.28 | ) | $(0.22 | ) | ||||||||||||
Net asset value, end of period (x) | $9.95 | $10.38 | $10.65 | $10.28 | $9.81 | $9.25 | ||||||||||||||||||
Total return (%) (r)(s)(t)(x) | (3.25 | )(n) | (1.67 | ) | 4.93 | 7.57 | 9.31 | 3.25 | ||||||||||||||||
| Ratios (%) (to average net assets) and Supplemental data: | ||||||||||||||||||||||||
Expenses before expense reductions (f) | 1.36 | (a) | 1.40 | 1.47 | 1.64 | 1.80 | 1.85 | |||||||||||||||||
Expenses after expense reductions (f) | 1.35 | (a) | 1.39 | 1.40 | 1.39 | 1.39 | 1.40 | |||||||||||||||||
Net investment income | 0.59 | (a) | 0.49 | 0.45 | 0.30 | 0.35 | 0.46 | |||||||||||||||||
Portfolio turnover | 30 | (n) | 49 | 94 | 44 | 63 | 69 | |||||||||||||||||
Net assets at end of period (000 omitted) | $160,516 | $181,537 | $128,066 | $86,701 | $41,964 | $41,358 | ||||||||||||||||||
| Supplemental Ratios (%): | ||||||||||||||||||||||||
Ratio of expenses to average net assets | 1.35 | (a) | 1.39 | 1.40 | 1.39 | 1.39 | 1.40 | |||||||||||||||||
See Notes to Financial Statements
43
Table of Contents
Financial Highlights – continued
| Six months ended 4/30/16 | Years ended 10/31 | |||||||||||||||||||||||
| Class B | 2015 | 2014 | 2013 | 2012 | 2011 | |||||||||||||||||||
| (unaudited) | ||||||||||||||||||||||||
Net asset value, beginning of period | $10.14 | $10.41 | $10.07 | $9.62 | $9.06 | $8.98 | ||||||||||||||||||
| Income (loss) from investment operations | ||||||||||||||||||||||||
Net investment loss (d) | $(0.01 | ) | $(0.03 | ) | $(0.03 | ) | $(0.04 | ) | $(0.04 | ) | $(0.03 | ) | ||||||||||||
Net realized and unrealized gain (loss) | (0.35 | ) | (0.22 | ) | 0.44 | 0.69 | 0.80 | 0.25 | ||||||||||||||||
Total from investment operations | $(0.36 | ) | $(0.25 | ) | $0.41 | $0.65 | $0.76 | $0.22 | ||||||||||||||||
| Less distributions declared to shareholders | ||||||||||||||||||||||||
From net investment income | $(0.03 | ) | $(0.02 | ) | $(0.07 | ) | $(0.20 | ) | $(0.20 | ) | $(0.14 | ) | ||||||||||||
Net asset value, end of period (x) | $9.75 | $10.14 | $10.41 | $10.07 | $9.62 | $9.06 | ||||||||||||||||||
Total return (%) (r)(s)(t)(x) | (3.60 | )(n) | (2.42 | ) | 4.10 | 6.87 | 8.52 | 2.45 | ||||||||||||||||
| Ratios (%) (to average net assets) and Supplemental data: | ||||||||||||||||||||||||
Expenses before expense reductions (f) | 2.11 | (a) | 2.15 | 2.22 | 2.39 | 2.54 | 2.61 | |||||||||||||||||
Expenses after expense reductions (f) | 2.11 | (a) | 2.14 | 2.15 | 2.14 | 2.14 | 2.15 | |||||||||||||||||
Net investment loss | (0.16 | )(a) | (0.24 | ) | (0.30 | ) | (0.39 | ) | (0.39 | ) | (0.28 | ) | ||||||||||||
Portfolio turnover | 30 | (n) | 49 | 94 | 44 | 63 | 69 | |||||||||||||||||
Net assets at end of period (000 omitted) | $9,688 | $9,654 | $8,637 | $7,418 | $4,677 | $3,958 | ||||||||||||||||||
| Supplemental Ratios (%): | ||||||||||||||||||||||||
Ratio of expenses to average net assets | 2.11 | (a) | 2.14 | 2.15 | 2.14 | 2.14 | 2.15 | |||||||||||||||||
See Notes to Financial Statements
44
Table of Contents
Financial Highlights – continued
| Six months ended 4/30/16 | Years ended 10/31 | |||||||||||||||||||||||
| Class C | 2015 | 2014 | 2013 | 2012 | 2011 | |||||||||||||||||||
| (unaudited) | ||||||||||||||||||||||||
Net asset value, beginning of period | $10.13 | $10.40 | $10.06 | $9.61 | $9.04 | $8.97 | ||||||||||||||||||
| Income (loss) from investment operations | ||||||||||||||||||||||||
Net investment loss (d) | $(0.01 | ) | $(0.03 | ) | $(0.03 | ) | $(0.04 | ) | $(0.04 | ) | $(0.03 | ) | ||||||||||||
Net realized and unrealized gain (loss) | (0.36 | ) | (0.22 | ) | 0.44 | 0.68 | 0.80 | 0.25 | ||||||||||||||||
Total from investment operations | $(0.37 | ) | $(0.25 | ) | $0.41 | $0.64 | $0.76 | $0.22 | ||||||||||||||||
| Less distributions declared to shareholders | ||||||||||||||||||||||||
From net investment income | $(0.03 | ) | $(0.02 | ) | $(0.07 | ) | $(0.19 | ) | $(0.19 | ) | $(0.15 | ) | ||||||||||||
Net asset value, end of period (x) | $9.73 | $10.13 | $10.40 | $10.06 | $9.61 | $9.04 | ||||||||||||||||||
Total return (%) (r)(s)(t)(x) | (3.63 | )(n) | (2.37 | ) | 4.12 | 6.75 | 8.53 | 2.50 | ||||||||||||||||
| Ratios (%) (to average net assets) and Supplemental data: | ||||||||||||||||||||||||
Expenses before expense reductions (f) | 2.11 | (a) | 2.15 | 2.22 | 2.39 | 2.55 | 2.61 | |||||||||||||||||
Expenses after expense reductions (f) | 2.11 | (a) | 2.14 | 2.15 | 2.14 | 2.14 | 2.15 | |||||||||||||||||
Net investment loss | (0.16 | )(a) | (0.26 | ) | (0.30 | ) | (0.42 | ) | (0.41 | ) | (0.28 | ) | ||||||||||||
Portfolio turnover | 30 | (n) | 49 | 94 | 44 | 63 | 69 | |||||||||||||||||
Net assets at end of period (000 omitted) | $52,635 | $55,745 | $41,318 | $30,918 | $18,622 | $18,845 | ||||||||||||||||||
| Supplemental Ratios (%): | ||||||||||||||||||||||||
Ratio of expenses to average net assets | 2.11 | (a) | 2.14 | 2.15 | 2.14 | 2.14 | 2.15 | |||||||||||||||||
See Notes to Financial Statements
45
Table of Contents
Financial Highlights – continued
| Six months ended 4/30/16 | Years ended 10/31 | |||||||||||||||||||||||
| Class I | 2015 | 2014 | 2013 | 2012 | 2011 | |||||||||||||||||||
| (unaudited) | ||||||||||||||||||||||||
Net asset value, beginning of period | $10.48 | $10.75 | $10.37 | $9.89 | $9.33 | $9.25 | ||||||||||||||||||
| Income (loss) from investment operations | ||||||||||||||||||||||||
Net investment income (d) | $0.04 | $0.07 | $0.07 | $0.05 | $0.06 | $0.06 | ||||||||||||||||||
Net realized and unrealized gain (loss) | (0.36 | ) | (0.22 | ) | 0.46 | 0.71 | 0.81 | 0.26 | ||||||||||||||||
Total from investment operations | $(0.32 | ) | $(0.15 | ) | $0.53 | $0.76 | $0.87 | $0.32 | ||||||||||||||||
| Less distributions declared to shareholders | ||||||||||||||||||||||||
From net investment income | $(0.12 | ) | $(0.12 | ) | $(0.15 | ) | $(0.28 | ) | $(0.31 | ) | $(0.24 | ) | ||||||||||||
Net asset value, end of period (x) | $10.04 | $10.48 | $10.75 | $10.37 | $9.89 | $9.33 | ||||||||||||||||||
Total return (%) (r)(s)(x) | (3.10 | )(n) | (1.44 | ) | 5.18 | 7.87 | 9.59 | 3.54 | ||||||||||||||||
| Ratios (%) (to average net assets) and Supplemental data: | ||||||||||||||||||||||||
Expenses before expense reductions (f) | 1.11 | (a) | 1.15 | 1.23 | 1.40 | 1.49 | 1.55 | |||||||||||||||||
Expenses after expense reductions (f) | 1.10 | (a) | 1.15 | 1.15 | 1.14 | 1.14 | 1.15 | |||||||||||||||||
Net investment income | 0.83 | (a) | 0.69 | 0.68 | 0.50 | 0.60 | 0.60 | |||||||||||||||||
Portfolio turnover | 30 | (n) | 49 | 94 | 44 | 63 | 69 | |||||||||||||||||
Net assets at end of period (000 omitted) | $504,997 | $538,464 | $228,066 | $124,997 | $31,289 | $10,737 | ||||||||||||||||||
| Supplemental Ratios (%): | ||||||||||||||||||||||||
Ratio of expenses to average net assets | 1.10 | (a) | 1.15 | 1.15 | 1.14 | 1.14 | 1.15 | |||||||||||||||||
See Notes to Financial Statements
46
Table of Contents
Financial Highlights – continued
| Six months ended 4/30/16 | Years ended 10/31 | |||||||||||||||||||||||
| Class R1 | 2015 | 2014 | 2013 | 2012 | 2011 | |||||||||||||||||||
| (unaudited) | ||||||||||||||||||||||||
Net asset value, beginning of period | $10.10 | $10.37 | $10.02 | $9.56 | $9.03 | $8.97 | ||||||||||||||||||
| Income (loss) from investment operations | ||||||||||||||||||||||||
Net investment loss (d) | $(0.01 | ) | $(0.03 | ) | $(0.03 | ) | $(0.03 | ) | $(0.04 | ) | $(0.02 | ) | ||||||||||||
Net realized and unrealized gain (loss) | (0.35 | ) | (0.22 | ) | 0.44 | 0.67 | 0.79 | 0.24 | ||||||||||||||||
Total from investment operations | $(0.36 | ) | $(0.25 | ) | $0.41 | $0.64 | $0.75 | $0.22 | ||||||||||||||||
| Less distributions declared to shareholders | ||||||||||||||||||||||||
From net investment income | $(0.03 | ) | $(0.02 | ) | $(0.06 | ) | $(0.18 | ) | $(0.22 | ) | $(0.16 | ) | ||||||||||||
Net asset value, end of period (x) | $9.71 | $10.10 | $10.37 | $10.02 | $9.56 | $9.03 | ||||||||||||||||||
Total return (%) (r)(s)(x) | (3.62 | )(n) | (2.42 | ) | 4.14 | 6.81 | 8.56 | 2.42 | ||||||||||||||||
| Ratios (%) (to average net assets) and Supplemental data: | ||||||||||||||||||||||||
Expenses before expense reductions (f) | 2.11 | (a) | 2.15 | 2.22 | 2.39 | 2.56 | 2.63 | |||||||||||||||||
Expenses after expense reductions (f) | 2.11 | (a) | 2.14 | 2.15 | 2.14 | 2.14 | 2.15 | |||||||||||||||||
Net investment loss | (0.16 | )(a) | (0.29 | ) | (0.29 | ) | (0.36 | ) | (0.45 | ) | (0.23 | ) | ||||||||||||
Portfolio turnover | 30 | (n) | 49 | 94 | 44 | 63 | 69 | |||||||||||||||||
Net assets at end of period (000 omitted) | $243 | $239 | $151 | $122 | $112 | $131 | ||||||||||||||||||
| Supplemental Ratios (%): | ||||||||||||||||||||||||
Ratio of expenses to average net assets | 2.11 | (a) | 2.14 | 2.15 | 2.14 | 2.14 | 2.15 | |||||||||||||||||
See Notes to Financial Statements
47
Table of Contents
Financial Highlights – continued
| Six months ended 4/30/16 | Years ended 10/31 | |||||||||||||||||||||||
| Class R2 | 2015 | 2014 | 2013 | 2012 | 2011 | |||||||||||||||||||
| (unaudited) | ||||||||||||||||||||||||
Net asset value, beginning of period | $10.26 | $10.53 | $10.18 | $9.73 | $9.18 | $9.11 | ||||||||||||||||||
| Income (loss) from investment operations | ||||||||||||||||||||||||
Net investment income (d) | $0.02 | $0.03 | $0.02 | $(0.00 | )(w) | $0.01 | $0.02 | |||||||||||||||||
Net realized and unrealized gain (loss) | (0.37 | ) | (0.23 | ) | 0.45 | 0.69 | 0.80 | 0.25 | ||||||||||||||||
Total from investment operations | $(0.35 | ) | $(0.20 | ) | $0.47 | $0.69 | $0.81 | $0.27 | ||||||||||||||||
| Less distributions declared to shareholders | ||||||||||||||||||||||||
From net investment income | $(0.06 | ) | $(0.07 | ) | $(0.12 | ) | $(0.24 | ) | $(0.26 | ) | $(0.20 | ) | ||||||||||||
Net asset value, end of period (x) | $9.85 | $10.26 | $10.53 | $10.18 | $9.73 | $9.18 | ||||||||||||||||||
Total return (%) (r)(s)(x) | (3.38 | )(n) | (1.88 | ) | 4.64 | 7.27 | 9.03 | 3.02 | ||||||||||||||||
| Ratios (%) (to average net assets) and Supplemental data: | ||||||||||||||||||||||||
Expenses before expense reductions (f) | 1.61 | (a) | 1.65 | 1.73 | 1.90 | 2.02 | 2.12 | |||||||||||||||||
Expenses after expense reductions (f) | 1.61 | (a) | 1.64 | 1.65 | 1.65 | 1.64 | 1.65 | |||||||||||||||||
Net investment income (loss) | 0.36 | (a) | 0.26 | 0.18 | (0.05 | ) | 0.12 | 0.24 | ||||||||||||||||
Portfolio turnover | 30 | (n) | 49 | 94 | 44 | 63 | 69 | |||||||||||||||||
Net assets at end of period (000 omitted) | $1,258 | $1,139 | $1,028 | $627 | $176 | $119 | ||||||||||||||||||
| Supplemental Ratios (%): | ||||||||||||||||||||||||
Ratio of expenses to average net assets | 1.61 | (a) | 1.64 | 1.65 | 1.65 | 1.64 | 1.65 | |||||||||||||||||
See Notes to Financial Statements
48
Table of Contents
Financial Highlights – continued
| Six months ended 4/30/16 | Years ended 10/31 | |||||||||||||||||||||||
| Class R3 | 2015 | 2014 | 2013 | 2012 | 2011 | |||||||||||||||||||
| (unaudited) | ||||||||||||||||||||||||
Net asset value, beginning of period | $10.39 | $10.65 | $10.28 | $9.81 | $9.25 | $9.18 | ||||||||||||||||||
| Income (loss) from investment operations | ||||||||||||||||||||||||
Net investment income (d) | $0.03 | $0.05 | $0.05 | $0.04 | $0.04 | $0.05 | ||||||||||||||||||
Net realized and unrealized gain (loss) | (0.36 | ) | (0.23 | ) | 0.45 | 0.69 | 0.80 | 0.24 | ||||||||||||||||
Total from investment operations | $(0.33 | ) | $(0.18 | ) | $0.50 | $0.73 | $0.84 | $0.29 | ||||||||||||||||
| Less distributions declared to shareholders | ||||||||||||||||||||||||
From net investment income | $(0.04 | ) | $(0.08 | ) | $(0.13 | ) | $(0.26 | ) | $(0.28 | ) | $(0.22 | ) | ||||||||||||
Net asset value, end of period (x) | $10.02 | $10.39 | $10.65 | $10.28 | $9.81 | $9.25 | ||||||||||||||||||
Total return (%) (r)(s)(x) | (3.21 | )(n) | (1.72 | ) | 4.87 | 7.62 | 9.40 | 3.20 | ||||||||||||||||
| Ratios (%) (to average net assets) and Supplemental data: | ||||||||||||||||||||||||
Expenses before expense reductions (f) | 1.36 | (a) | 1.40 | 1.47 | 1.64 | 1.79 | 1.87 | |||||||||||||||||
Expenses after expense reductions (f) | 1.35 | (a) | 1.39 | 1.40 | 1.39 | 1.39 | 1.40 | |||||||||||||||||
Net investment income | 0.57 | (a) | 0.43 | 0.48 | 0.35 | 0.37 | 0.50 | |||||||||||||||||
Portfolio turnover | 30 | (n) | 49 | 94 | 44 | 63 | 69 | |||||||||||||||||
Net assets at end of period (000 omitted) | $412 | $707 | $270 | $355 | $114 | $105 | ||||||||||||||||||
| Supplemental Ratios (%): | ||||||||||||||||||||||||
Ratio of expenses to average net assets | 1.35 | (a) | 1.39 | 1.40 | 1.39 | 1.39 | 1.40 | |||||||||||||||||
See Notes to Financial Statements
49
Table of Contents
Financial Highlights – continued
| Six months ended 4/30/16 | Years ended 10/31 | |||||||||||||||||||||||
| Class R4 | 2015 | 2014 | 2013 | 2012 | 2011 | |||||||||||||||||||
| (unaudited) | ||||||||||||||||||||||||
Net asset value, beginning of period | $10.44 | $10.76 | $10.38 | $9.89 | $9.33 | $9.25 | ||||||||||||||||||
| Income (loss) from investment operations | ||||||||||||||||||||||||
Net investment income (d) | $0.04 | $0.09 | $0.08 | $0.07 | $0.06 | $0.07 | ||||||||||||||||||
Net realized and unrealized gain (loss) | (0.36 | ) | (0.30 | )(g) | 0.45 | 0.70 | 0.81 | 0.25 | ||||||||||||||||
Total from investment operations | $(0.32 | ) | $(0.21 | ) | $0.53 | $0.77 | $0.87 | $0.32 | ||||||||||||||||
| Less distributions declared to shareholders | ||||||||||||||||||||||||
From net investment income | $(0.05 | ) | $(0.11 | ) | $(0.15 | ) | $(0.28 | ) | $(0.31 | ) | $(0.24 | ) | ||||||||||||
Net asset value, end of period (x) | $10.07 | $10.44 | $10.76 | $10.38 | $9.89 | $9.33 | ||||||||||||||||||
Total return (%) (r)(s)(x) | (3.08 | )(n) | (1.94 | ) | 5.13 | 7.96 | 9.59 | 3.54 | ||||||||||||||||
| Ratios (%) (to average net assets) and Supplemental data: | ||||||||||||||||||||||||
Expenses before expense reductions (f) | 1.12 | (a) | 1.14 | 1.21 | 1.39 | 1.50 | 1.62 | |||||||||||||||||
Expenses after expense reductions (f) | 1.11 | (a) | 1.13 | 1.15 | 1.14 | 1.14 | 1.15 | |||||||||||||||||
Net investment income | 0.88 | (a) | 0.81 | 0.75 | 0.67 | 0.61 | 0.73 | |||||||||||||||||
Portfolio turnover | 30 | (n) | 49 | 94 | 44 | 63 | 69 | |||||||||||||||||
Net assets at end of period (000 omitted) | $201 | $161 | $1,483 | $1,359 | $1,492 | $881 | ||||||||||||||||||
| Supplemental Ratios (%): | ||||||||||||||||||||||||
Ratio of expenses to average net assets | 1.11 | (a) | 1.13 | 1.15 | 1.14 | 1.14 | 1.15 | |||||||||||||||||
See Notes to Financial Statements
50
Table of Contents
Financial Highlights – continued
| Six months ended 4/30/16 | Years ended 10/31 | |||||||||||||||||||||||
| Class R5 (y) | 2015 | 2014 | 2013 | 2012 | 2011 | |||||||||||||||||||
| (unaudited) | ||||||||||||||||||||||||
Net asset value, beginning of period | $10.54 | $10.81 | $10.42 | $9.92 | $9.32 | $9.23 | ||||||||||||||||||
| Income (loss) from investment operations | ||||||||||||||||||||||||
Net investment income (d) | $0.05 | $0.06 | $0.08 | $0.07 | $0.04 | $0.04 | ||||||||||||||||||
Net realized and unrealized gain (loss) | (0.37 | ) | (0.21 | ) | 0.46 | 0.70 | 0.83 | 0.28 | ||||||||||||||||
Total from investment operations | $(0.32 | ) | $(0.15 | ) | $0.54 | $0.77 | $0.87 | $0.32 | ||||||||||||||||
| Less distributions declared to shareholders | ||||||||||||||||||||||||
From net investment income | $(0.12 | ) | $(0.12 | ) | $(0.15 | ) | $(0.27 | ) | $(0.27 | ) | $(0.23 | ) | ||||||||||||
Net asset value, end of period (x) | $10.10 | $10.54 | $10.81 | $10.42 | $9.92 | $9.32 | ||||||||||||||||||
Total return (%) (r)(s)(x) | (3.03 | )(n) | (1.38 | ) | 5.29 | 7.91 | 9.58 | 3.53 | ||||||||||||||||
| Ratios (%) (to average net assets) and Supplemental data: | ||||||||||||||||||||||||
Expenses before expense reductions (f) | 1.04 | (a) | 1.08 | 1.14 | 1.32 | 1.74 | 1.65 | |||||||||||||||||
Expenses after expense reductions (f) | 1.03 | (a) | 1.07 | 1.07 | 1.07 | 1.21 | 1.25 | |||||||||||||||||
Net investment income | 0.95 | (a) | 0.61 | 0.79 | 0.70 | 0.42 | 0.40 | |||||||||||||||||
Portfolio turnover | 30 | (n) | 49 | 94 | 44 | 63 | 69 | |||||||||||||||||
Net assets at end of period (000 omitted) | $4,977 | $4,099 | $140 | $115 | $105 | $289 | ||||||||||||||||||
| Supplemental Ratios (%): | ||||||||||||||||||||||||
Ratio of expenses to average net assets | 1.03 | (a) | 1.07 | 1.07 | 1.07 | 1.21 | 1.25 | |||||||||||||||||
See Notes to Financial Statements
51
Table of Contents
Financial Highlights – continued
| (a) | Annualized. |
| (d) | Per share data is based on average shares outstanding. |
| (f) | Ratios do not reflect reductions from fees paid indirectly, if applicable. |
| (g) | The per share amount varies from the net realized and unrealized gain/loss for the period because of the timing of sales of fund shares and the per share amount of realized and unrealized gains and losses at such time. |
| (n) | Not annualized. |
| (r) | Certain expenses have been reduced without which performance would have been lower. |
| (s) | From time to time the fund may receive proceeds from litigation settlements, without which performance would be lower. |
| (t) | Total returns do not include any applicable sales charges. |
| (w) | Per share amount was less than $0.01. |
| (x) | The net asset values and total returns have been calculated on net assets which include adjustments made in accordance with U.S. generally accepted accounting principles required at period end for financial reporting purposes. |
| (y) | On May 11, 2012, certain Class W shares were automatically converted to Class I shares. Shareholders of certain Class W shares became shareholders of Class I and received Class I shares with a total net asset value equal to their Class W shares at the time of the conversion. On May 30, 2012, remaining Class W shares, which represented MFS seed money, were redesignated Class R5. Class R5 shares do not pay a 12b-1 distribution fee or sub-accounting costs. On June 1, 2012, Class R5 shares were offered for sale to the public. |
See Notes to Financial Statements
52
Table of Contents
(unaudited)
(1) Business and Organization
MFS Global Alternative Strategy Fund (the fund) is a diversified series of MFS Series Trust XV (the trust). The trust is organized as a Massachusetts business trust and is registered under the Investment Company Act of 1940, as amended, as an open-end management investment company.
The fund is an investment company and accordingly follows the investment company accounting and reporting guidance of the Financial Accounting Standards Board (FASB) Accounting Standards Codification Topic 946 Financial Services – Investment Companies.
The fund has entered into contractual arrangements with an investment adviser, sub-adviser, administrator, distributor, shareholder servicing agent, 529 program manager (if applicable), and custodian who each provide services to the fund. Unless expressly stated otherwise, shareholders are not parties to, or intended beneficiaries of these contractual arrangements, and these contractual arrangements are not intended to create any shareholder right to enforce them against the service providers or to seek any remedy under them against the service providers, either directly or on behalf of the fund.
Under the Trust’s By-Laws and Declaration of Trust, any claims asserted against or on behalf of the MFS Funds, including claims against Trustees and Officers, must be brought in state and federal courts located within the Commonwealth of Massachusetts.
(2) Significant Accounting Policies
General – The preparation of financial statements in conformity with U.S. generally accepted accounting principles requires management to make estimates and assumptions that affect the reported amounts of assets and liabilities, and disclosure of contingent assets and liabilities at the date of the financial statements and the reported amounts of increases and decreases in net assets from operations during the reporting period. Actual results could differ from those estimates. In the preparation of these financial statements, management has evaluated subsequent events occurring after the date of the fund’s Statement of Assets and Liabilities through the date that the financial statements were issued. The fund invests in derivatives as part of its principal investment strategy. Derivatives can be highly volatile and involve risks in addition to the risks of the underlying indicators on which the derivative is based. The fund invests in foreign securities. Investments in foreign securities are vulnerable to the effects of changes in the relative values of the local currency and the U.S. dollar and to the effects of changes in each country’s legal, political, and economic environment.
In January 2016, FASB issued Accounting Standards Update 2016-01, Financial Instruments – Overall (Subtopic 825-10) – Recognition and Measurement of Financial Assets and Financial Liabilities (“ASU 2016-01”) which would first be effective for annual reporting periods beginning after December 15, 2017, and interim periods therein. ASU 2016-01, which changes the accounting for equity investments and for certain financial liabilities, also modifies the presentation and disclosure requirements for financial instruments. Investment companies are specifically exempted from
53
Table of Contents
Notes to Financial Statements (unaudited) – continued
ASU 2016-01’s equity investment accounting provisions and will continue to follow the industry specific guidance for investment accounting under ASC 946. Although still evaluating the potential impacts of ASU 2016-01 to the fund, management expects that the impact of the fund’s adoption will be limited to additional financial statement disclosures.
Balance Sheet Offsetting – The fund’s accounting policy with respect to balance sheet offsetting is that, absent an event of default by the counterparty or a termination of the agreement, the International Swaps and Derivatives Association (ISDA) Master Agreement does not result in an offset of reported amounts of financial assets and financial liabilities in the Statement of Assets and Liabilities across transactions between the fund and the applicable counterparty. The fund’s right to setoff may be restricted or prohibited by the bankruptcy or insolvency laws of the particular jurisdiction to which a specific master netting agreement counterparty is subject. Balance sheet offsetting disclosures, to the extent applicable to the fund, have been included in the fund’s Significant Accounting Policies note under the captions for each of the fund’s in-scope financial instruments and transactions.
Investment Valuations – Equity securities, including restricted equity securities, are generally valued at the last sale or official closing price on their primary market or exchange as provided by a third-party pricing service. Equity securities, for which there were no sales reported that day, are generally valued at the last quoted daily bid quotation on their primary market or exchange as provided by a third-party pricing service. Equity securities held short, for which there were no sales reported for that day, are generally valued at the last quoted daily ask quotation on their primary market or exchange as provided by a third-party pricing service. Debt instruments and floating rate loans, including restricted debt instruments, are generally valued at an evaluated or composite bid as provided by a third-party pricing service. Short-term instruments with a maturity at issuance of 60 days or less may be valued at amortized cost, which approximates market value. Exchange-traded options are generally valued at the last sale or official closing price on their primary exchange as provided by a third-party pricing service. Exchange-traded options for which there were no sales reported that day are generally valued at the last daily bid quotation on their primary exchange as provided by a third-party pricing service. Options not traded on an exchange are generally valued at a broker/dealer bid quotation. Foreign currency options are generally valued at valuations provided by a third-party pricing service. Futures contracts are generally valued at last posted settlement price on their primary exchange as provided by a third-party pricing service. Futures contracts for which there were no trades that day for a particular position are generally valued at the closing bid quotation on their primary exchange as provided by a third-party pricing service. Forward foreign currency exchange contracts are generally valued at the mean of bid and asked prices for the time period interpolated from rates provided by a third-party pricing service for proximate time periods. Swap agreements are generally valued at valuations provided by a third-party pricing service, which for cleared swaps includes an evaluation of any trading activity at the clearinghouses. Open-end investment companies are generally valued at net asset value per share. Securities and other assets generally valued on the basis of information from a third-party pricing service may also be valued at a broker/dealer bid quotation. Values obtained from third-party pricing
54
Table of Contents
Notes to Financial Statements (unaudited) – continued
services can utilize both transaction data and market information such as yield, quality, coupon rate, maturity, type of issue, trading characteristics, and other market data. The values of foreign securities and other assets and liabilities expressed in foreign currencies are converted to U.S. dollars using the mean of bid and asked prices for rates provided by a third-party pricing service.
The Board of Trustees has delegated primary responsibility for determining or causing to be determined the value of the fund’s investments (including any fair valuation) to the adviser pursuant to valuation policies and procedures approved by the Board. If the adviser determines that reliable market quotations are not readily available, investments are valued at fair value as determined in good faith by the adviser in accordance with such procedures under the oversight of the Board of Trustees. Under the fund’s valuation policies and procedures, market quotations are not considered to be readily available for most types of debt instruments and floating rate loans and many types of derivatives. These investments are generally valued at fair value based on information from third-party pricing services. In addition, investments may be valued at fair value if the adviser determines that an investment’s value has been materially affected by events occurring after the close of the exchange or market on which the investment is principally traded (such as foreign exchange or market) and prior to the determination of the fund’s net asset value, or after the halting of trading of a specific security where trading does not resume prior to the close of the exchange or market on which the security is principally traded. Events that occur on a frequent basis after foreign markets close (such as developments in foreign markets and significant movements in the U.S. markets) and prior to the determination of the fund’s net asset value may be deemed to have a material effect on the value of securities traded in foreign markets. Accordingly, the fund’s foreign equity securities may often be valued at fair value. The adviser generally relies on third-party pricing services or other information (such as the correlation with price movements of similar securities in the same or other markets; the type, cost and investment characteristics of the security; the business and financial condition of the issuer; and trading and other market data) to assist in determining whether to fair value and at what value to fair value an investment. The value of an investment for purposes of calculating the fund’s net asset value can differ depending on the source and method used to determine value. When fair valuation is used, the value of an investment used to determine the fund’s net asset value may differ from quoted or published prices for the same investment. There can be no assurance that the fund could obtain the fair value assigned to an investment if it were to sell the investment at the same time at which the fund determines its net asset value per share.
Various inputs are used in determining the value of the fund’s assets or liabilities. These inputs are categorized into three broad levels. In certain cases, the inputs used to measure fair value may fall into different levels of the fair value hierarchy. In such cases, an investment’s level within the fair value hierarchy is based on the lowest level of input that is significant to the fair value measurement. The fund’s assessment of the significance of a particular input to the fair value measurement in its entirety requires judgment, and considers factors specific to the investment. Level 1 includes unadjusted quoted prices in active markets for identical assets or liabilities. Level 2 includes other significant observable market-based inputs (including quoted prices for similar securities, interest rates, prepayment speed, and credit risk). Level 3 includes
55
Table of Contents
Notes to Financial Statements (unaudited) – continued
unobservable inputs, which may include the adviser’s own assumptions in determining the fair value of investments. Other financial instruments are derivative instruments not reflected in total investments, such as futures contracts, forward foreign currency exchange contracts, and swap agreements. The following is a summary of the levels used as of April 30, 2016 in valuing the fund’s assets or liabilities:
| Investments at Value | Level 1 | Level 2 | Level 3 | Total | ||||||||||||
| Equity Securities: | ||||||||||||||||
United States | $341,986,176 | $— | $— | $341,986,176 | ||||||||||||
United Kingdom | 31,468,307 | 10,468 | — | 31,478,775 | ||||||||||||
Japan | — | 24,378,425 | — | 24,378,425 | ||||||||||||
Switzerland | 20,333,222 | — | — | 20,333,222 | ||||||||||||
France | 18,424,841 | — | — | 18,424,841 | ||||||||||||
Germany | 11,988,771 | — | — | 11,988,771 | ||||||||||||
Canada | 4,707,779 | — | — | 4,707,779 | ||||||||||||
Hong Kong | 477,059 | 3,950,294 | — | 4,427,353 | ||||||||||||
Australia | 2,447,398 | 1,928,936 | — | 4,376,334 | ||||||||||||
Other Countries | 24,508,145 | 3,786,590 | — | 28,294,735 | ||||||||||||
| Non-U.S. Sovereign Debt | — | 228,520 | — | 228,520 | ||||||||||||
| U.S. Corporate Bonds | — | 130,780,394 | — | 130,780,394 | ||||||||||||
| Foreign Bonds | — | 13,164,872 | — | 13,164,872 | ||||||||||||
| Mutual Funds | 49,386,724 | — | — | 49,386,724 | ||||||||||||
| Total Investments | $505,728,422 | $178,228,499 | $— | $683,956,921 | ||||||||||||
| Short Sales | $(18,419 | ) | $— | $— | $(18,419 | ) | ||||||||||
| Other Financial Instruments | ||||||||||||||||
| Futures Contracts – Assets | $597,221 | $5,738,582 | $— | $6,335,803 | ||||||||||||
| Futures Contracts – Liabilities | (17,524,335 | ) | (7,017,557 | ) | — | (24,541,892 | ) | |||||||||
| Swap Agreements | — | 2,027,111 | — | 2,027,111 | ||||||||||||
| Forward Foreign Currency Exchange Contracts | — | (6,870,706 | ) | — | (6,870,706 | ) | ||||||||||
For further information regarding security characteristics, see the Portfolio of Investments.
Of the level 2 investments presented above, equity investments amounting to $1,760,795 would have been considered level 1 investments at the beginning of the period. Of the level 1 investments presented above, equity investments amounting to $517,634 would have been considered level 2 investments at the beginning of the period. The primary reason for changes in the classifications between levels 1 and 2 occurs when foreign equity securities are fair valued using other observable market-based inputs in place of the closing exchange price due to events occurring after the close of the exchange or market on which the investment is principally traded. The fund’s foreign equity securities may often be valued at fair value. The fund’s policy is to recognize transfers between the levels as of the end of the period.
Foreign Currency Translation – Purchases and sales of foreign investments, income, and expenses are converted into U.S. dollars based upon currency exchange rates prevailing on the respective dates of such transactions or on the reporting date for foreign denominated receivables and payables. Gains and losses attributable to foreign
56
Table of Contents
Notes to Financial Statements (unaudited) – continued
currency exchange rates on sales of securities are recorded for financial statement purposes as net realized gains and losses on investments. Gains and losses attributable to foreign exchange rate movements on receivables, payables, income and expenses are recorded for financial statement purposes as foreign currency transaction gains and losses. That portion of both realized and unrealized gains and losses on investments that results from fluctuations in foreign currency exchange rates is not separately disclosed.
Derivatives – The fund uses derivatives in an attempt to reduce volatility compared to the overall equity markets and to generate positive returns by adjusting the fund’s exposure to markets and currencies resulting from the fund’s individual security selections. Derivatives are used to increase the fund’s exposure to markets or currencies to which the fund’s individual security selections have resulted in no or little exposure. Alternatively, the fund uses derivatives to decrease its exposure to markets or currencies to which the fund’s individual security selections have resulted in exposure. Derivatives are used for hedging or non-hedging purposes. While hedging can reduce or eliminate losses, it can also reduce or eliminate gains. When the fund uses derivatives as an investment to increase or decrease market exposure, or for hedging purposes, gains and losses from derivative instruments may be substantially greater than the derivative’s original cost.
The derivative instruments used by the fund were, written options, purchased options, futures contracts, forward foreign currency exchange contracts, and swap agreements. The fund’s period end derivatives, as presented in the Portfolio of Investments and the associated Derivative Contract tables, generally are indicative of the volume of its derivative activity during the period.
The following table presents, by major type of derivative contract, the fair value, on a gross basis, of the asset and liability components of derivatives held by the fund at April 30, 2016 as reported in the Statement of Assets and Liabilities:
| Fair Value (a) | ||||||||||
| Risk | Derivative Contracts | Asset Derivatives | Liability Derivatives | |||||||
| Interest Rate | Interest Rate Futures | $144,560 | $(423,872 | ) | ||||||
| Foreign Exchange | Forward Foreign Currency Exchange | 802,275 | (7,672,981 | ) | ||||||
| Equity | Equity Futures | 6,191,243 | (24,118,020 | ) | ||||||
| Equity | Purchased Equity Options | 6,229,200 | — | |||||||
| Credit | Credit Default Swaps | 2,027,111 | — | |||||||
| Total | $15,394,389 | $(32,214,873 | ) | |||||||
| (a) | The value of purchased options outstanding is included in total investments, at value, within the fund’s Statement of Assets and Liabilities. The value of futures contracts and cleared swap agreements includes cumulative appreciation (depreciation) as reported in the fund’s Portfolio of Investments. Only the current day net variation margin for futures contracts and cleared swap agreements is separately reported within the fund’s Statement of Assets and Liabilities. |
57
Table of Contents
Notes to Financial Statements (unaudited) – continued
The following table presents, by major type of derivative contract, the realized gain (loss) on derivatives held by the fund for the six months ended April 30, 2016 as reported in the Statement of Operations:
| Risk | Futures Contracts | Swap Agreements | Foreign Currency | Investments (Purchased Options) | Written Options | |||||||||||||||
| Interest Rate | $(922,404 | ) | $4,815,670 | $— | $— | $— | ||||||||||||||
| Foreign Exchange | — | — | 1,222,652 | — | — | |||||||||||||||
| Equity | (18,334,042 | ) | — | — | (6,729,427 | ) | 123,469 | |||||||||||||
| Credit | — | 533,867 | — | — | — | |||||||||||||||
| Total | $(19,256,446 | ) | $5,349,537 | $1,222,652 | $(6,729,427 | ) | $123,469 | |||||||||||||
The following table presents, by major type of derivative contract, the change in unrealized appreciation (depreciation) on derivatives held by the fund for the six months ended April 30, 2016 as reported in the Statement of Operations:
| Risk | Futures Contracts | Swap Agreements | Translation of Assets and Liabilities in Foreign | Investments (Purchased Options) | ||||||||||||
| Interest Rate | $(1,095,379 | ) | $(1,942,296 | ) | $— | $— | ||||||||||
| Foreign Exchange | — | — | (8,145,505 | ) | — | |||||||||||
| Equity | 1,479,300 | — | — | (1,344,637 | ) | |||||||||||
| Credit | — | (526,582 | ) | — | — | |||||||||||
| Total | $383,921 | $(2,468,878 | ) | $(8,145,505 | ) | $(1,344,637 | ) | |||||||||
Derivative counterparty credit risk is managed through formal evaluation of the creditworthiness of all potential counterparties. On certain, but not all, uncleared derivatives, the fund attempts to reduce its exposure to counterparty credit risk whenever possible by entering into an ISDA Master Agreement on a bilateral basis. The ISDA Master Agreement gives each party to the agreement the right to terminate all transactions traded under such agreement if there is a certain deterioration in the credit quality of the other party. Upon an event of default or a termination of the ISDA Master Agreement, the non-defaulting party has the right to close out all transactions traded under such agreement and to net amounts owed under each transaction to one net amount payable by one party to the other. This right to close out and net payments across all transactions traded under the ISDA Master Agreement could result in a reduction of the fund’s credit risk to such counterparty equal to any amounts payable by the fund under the applicable transactions, if any.
Collateral and margin requirements differ by type of derivative. Margin requirements are set by the clearing broker and the clearing house for cleared derivatives (e.g., futures contracts, cleared swaps, and exchange-traded options) while collateral terms are contract specific for uncleared derivatives (e.g., forward foreign currency exchange contracts, uncleared swap agreements, and uncleared options). For derivatives traded under an ISDA Master Agreement, which contains a collateral support annex, the collateral requirements are netted across all transactions traded under such agreement and one amount is posted from one party to the other to collateralize such obligations. Cash that has been segregated to cover the fund’s
58
Table of Contents
Notes to Financial Statements (unaudited) – continued
collateral or margin obligations under derivative contracts, if any, will be reported separately in the Statement of Assets and Liabilities as “Restricted cash” or “Deposits with brokers.” Securities pledged as collateral or margin for the same purpose, if any, are noted in the Portfolio of Investments.
The following table presents the fund’s derivative assets and liabilities (by type) on a gross basis as of April 30, 2016:
| Gross Amounts of: | Derivative Assets | Derivative Liabilities | ||||||
| Futures Contracts (a) | $4,623,784 | $— | ||||||
| Cleared Swaps Agreements (a) | 4,305,834 | — | ||||||
| Forward Foreign Currency Exchange Contracts | 802,275 | (7,672,981 | ) | |||||
| Purchased Options | 6,229,200 | — | ||||||
| Total Gross Amount of Derivative Assets and Liabilities Presented in the Statement of Assets & Liabilities | $15,961,093 | $(7,672,981 | ) | |||||
| Less: Derivatives Assets and Liabilities Not Subject to a Master Netting Agreement or Similar Arrangement | 15,158,818 | — | ||||||
| Total Gross Amount of Derivative Assets and Liabilities Subject to a Master Netting Agreement or Similar Arrangement | $802,275 | $(7,672,981 | ) | |||||
| (a) | The amount presented here represents the fund’s current day net variation margin for futures contracts. The amount presented here represents the fund’s current day net variation margin and due from brokers for the cleared swap agreements. This amount, which is recognized within the fund’s Statement of Assets and Liabilities, differs from the fair value of the futures contracts and cleared swap agreements which is presented in the tables that follow the fund’s Portfolio of Investments. |
The following table presents (by counterparty) the fund’s derivative assets net of amounts available for offset under Master Netting Agreements (or similar arrangements) and net of the related collateral held by the fund at April 30, 2016:
| Amounts Not Offset in the Statement of Assets & Liabilities | ||||||||||||||||||||
| Gross Amount of Derivative Assets Subject to a Master Netting Agreement (or Similar Arrangement) by Counterparty | Financial Instruments Available for Offset | Financial Instruments Collateral Received (b) | Cash Collateral Received (b) | Net Amount of Derivative Assets by Counterparty | ||||||||||||||||
| Deutsche Bank AG | $434,848 | $(332,814 | ) | $— | $(102,034 | ) | $— | |||||||||||||
| Goldman Sachs International | 142,324 | (142,324 | ) | — | — | — | ||||||||||||||
| JPMorgan Chase Bank N.A. | 225,103 | (225,103 | ) | — | — | — | ||||||||||||||
| Total | $802,275 | $(700,241 | ) | $— | $(102,034 | ) | $— | |||||||||||||
59
Table of Contents
Notes to Financial Statements (unaudited) – continued
The following table presents (by counterparty) the fund’s derivative liabilities net of amounts available for offset under Master Netting Agreements (or similar arrangements) and net of the related collateral pledged by the fund at April 30, 2016:
| Amounts Not Offset in the Statement of Assets & Liabilities | ||||||||||||||||||||
Gross Amounts by Counterparty | Financial Instruments Available for Offset | Financial Instruments Collateral Pledged (b) | Cash Collateral Pledged (b) | Net Amount of Derivative Liabilities by Counterparty | ||||||||||||||||
| Barclays Bank PLC | $(2,794,353 | ) | $— | $— | $1,190,000 | $(1,604,353 | ) | |||||||||||||
| Deutsche Bank AG | (332,814 | ) | 332,814 | — | — | — | ||||||||||||||
| Goldman Sachs International | (235,772 | ) | 142,324 | — | — | (93,448 | ) | |||||||||||||
| JPMorgan Chase Bank N.A. | (4,180,336 | ) | 225,103 | — | 2,370,000 | (1,585,233 | ) | |||||||||||||
| Morgan Stanley & Co. International PLC | (129,706 | ) | — | — | — | — | ||||||||||||||
| Total | $(7,672,981 | ) | $700,241 | $— | $3,560,000 | $(3,412,740 | ) | |||||||||||||
| (b) | The amount presented here may be less than the total amount of collateral (received)/pledged as the net amount of derivative assets and liabilities for a counterparty cannot be less than $0. |
Written Options – In exchange for a premium, the fund wrote put options on securities for which it anticipated the price would increase. At the time the option was written, the fund believed the premium received exceeded the potential loss that could result from adverse price changes in the options’ underlying securities. In a written option, the fund as the option writer grants the buyer the right to purchase from, or sell to, the fund a specified number of shares or units of a particular security, currency or index at a specified price within a specified period of time.
The premium received is initially recorded as a liability in the Statement of Assets and Liabilities. The option is subsequently marked-to-market daily with the difference between the premium received and the market value of the written option being recorded as unrealized appreciation or depreciation. When a written option expires, the fund realizes a gain equal to the amount of the premium received. The difference between the premium received and the amount paid on effecting a closing transaction is considered a realized gain or loss. When a written put option is exercised, the premium reduces the cost basis of the security purchased by the fund.
At the initiation of the written option contract, for exchange traded options, the fund is required to deposit securities or cash as collateral with the custodian for the benefit of the broker or directly with the clearing broker, based on the type of option. For uncleared options, the fund may post collateral subject to the terms of an ISDA Master Agreement as generally described above if the market value of the options contract moves against it. The fund, as writer of an option, may have no control over whether the underlying securities may be sold (call) or purchased (put) and, as a result, bears the
60
Table of Contents
Notes to Financial Statements (unaudited) – continued
market risk of an unfavorable change in the price of the securities underlying the written option. Losses from writing options can exceed the premium received and can exceed the potential loss from an ordinary buy and sell transaction. Although the fund’s market risk may be significant, the maximum counterparty credit risk to the fund is equal to the market value of any collateral posted to the broker. For uncleared options, this risk is mitigated in cases where there is an ISDA Master Agreement between the fund and the counterparty providing for netting as described above.
The following table represents the written option activity in the fund during the six months ended April 30, 2016:
| Number of contracts | Premiums received | |||||||
| Outstanding, beginning of period | — | $— | ||||||
| Options written | 380 | 272,635 | ||||||
| Options closed | (380 | ) | (272,635 | ) | ||||
| Options expired | — | — | ||||||
| Outstanding, end of period | — | $— | ||||||
Purchased Options – The fund purchased call and put options for a premium. Purchased call and put options entitle the holder to buy and sell a specified number of shares or units of a particular security, currency or index at a specified price at a specified date or within a specified period of time. Purchasing call options may hedge against an anticipated increase in the dollar cost of securities or currency to be acquired or increase the fund’s exposure to an underlying instrument. Purchasing put options may hedge against an anticipated decline in the value of portfolio securities or currency or decrease the fund’s exposure to an underlying instrument.
The premium paid is initially recorded as an investment in the Statement of Assets and Liabilities. That investment is subsequently marked-to-market daily with the difference between the premium paid and the market value of the purchased option being recorded as unrealized appreciation or depreciation. Premiums paid for purchased call and put options which have expired are treated as realized losses on investments in the Statement of Operations. Upon the exercise or closing of a purchased call option, the premium paid is added to the cost of the security or financial instrument purchased. Upon the exercise or closing of a purchased put option, the premium paid is offset against the proceeds on the sale of the underlying security or financial instrument in order to determine the realized gain or loss on investments.
Whether or not the option is exercised, the fund’s maximum risk of loss from purchasing an option is the amount of premium paid. All option contracts involve credit risk if the counterparty to the option contract fails to perform. For uncleared options, this risk is mitigated in cases where there is an ISDA Master Agreement between the fund and the counterparty providing for netting as described above and, where applicable, by the posting of collateral by the counterparty to the fund to cover the fund’s exposure to the counterparty under such ISDA Master Agreement.
Futures Contracts – The fund entered into futures contracts which may be used to hedge against or obtain broad market exposure, interest rate exposure, currency exposure, or to manage duration. A futures contract represents a commitment for the future purchase or sale of an asset at a specified price on a specified date.
61
Table of Contents
Notes to Financial Statements (unaudited) – continued
Upon entering into a futures contract, the fund is required to deposit with the broker, either in cash or securities, an initial margin in an amount equal to a certain percentage of the notional amount of the contract. Subsequent payments (variation margin) are made or received by the fund each day, depending on the daily fluctuations in the value of the contract, and are recorded for financial statement purposes as unrealized gain or loss by the fund until the contract is closed or expires at which point the gain or loss on futures contracts is realized.
The fund bears the risk of interest rates, exchange rates or securities prices moving unexpectedly, in which case, the fund may not achieve the anticipated benefits of the futures contracts and may realize a loss. While futures contracts may present less counterparty risk to the fund since the contracts are exchange traded and the exchange’s clearinghouse guarantees payments to the broker, there is still counterparty credit risk due to the insolvency of the broker. The fund’s maximum risk of loss due to counterparty credit risk is equal to the margin posted by the fund to the broker plus any gains or minus any losses on the outstanding futures contracts.
Forward Foreign Currency Exchange Contracts – The fund entered into forward foreign currency exchange contracts for the purchase or sale of a specific foreign currency at a fixed price on a future date. These contracts may be used to hedge the fund’s currency risk or for non-hedging purposes. For hedging purposes, the fund may enter into contracts to deliver or receive foreign currency that the fund will receive from or use in its normal investment activities. The fund may also use contracts to hedge against declines in the value of foreign currency denominated securities due to unfavorable exchange rate movements. For non-hedging purposes, the fund may enter into contracts with the intent of changing the relative exposure of the fund’s portfolio of securities to different currencies to take advantage of anticipated exchange rate changes.
Forward foreign currency exchange contracts are adjusted by the daily exchange rate of the underlying currency and any unrealized gains or losses are recorded as a receivable or payable for forward foreign currency exchange contracts until the contract settlement date. On contract settlement date, any gain or loss on the contract is recorded as realized gains or losses on foreign currency.
Risks may arise upon entering into these contracts from unanticipated movements in the value of the contract and from the potential inability of counterparties to meet the terms of their contracts. Generally, the fund’s maximum risk due to counterparty credit risk is the unrealized gain on the contract due to the use of Continuous Linked Settlement. This risk is mitigated in cases where there is an ISDA Master Agreement between the fund and the counterparty providing for netting as described above and, where applicable, by the posting of collateral by the counterparty to the fund to cover the fund’s exposure to the counterparty under such ISDA Master Agreement.
Swap Agreements – During the period the fund entered into swap agreements. Certain types of swaps (“cleared swaps”) are required to be centrally cleared under provisions of the Dodd-Frank Regulatory Reform Bill. In a cleared swap transaction, the ultimate counterparty to the transaction is a clearinghouse (the “clearinghouse”). The contract is transferred and accepted by the clearinghouse immediately following execution of the swap contract with an executing broker. Thereafter, throughout the
62
Table of Contents
Notes to Financial Statements (unaudited) – continued
term of the cleared swap, the fund interfaces indirectly with the clearinghouse through a clearing broker and has counterparty risk to the clearing broker as well.
A swap agreement is generally an exchange of cash payments, at specified intervals or upon the occurrence of specified events, between the fund and a counterparty. The net cash payments exchanged are recorded as a realized gain or loss on swap agreements in the Statement of Operations. The value of the swap agreement, which is adjusted daily and includes any related interest accruals to be paid or received by the fund, is recorded in the Statement of Assets and Liabilities, as “Swaps, at value” for uncleared swaps and is included in “Due from brokers” or “Due to brokers” for cleared swaps. The daily change in value, including any related interest accruals to be paid or received, is recorded as unrealized appreciation or depreciation on swap agreements in the Statement of Operations. The daily change in valuation of cleared swaps is recorded as a receivable or payable for variation margin in the Statement of Assets and Liabilities. Amounts paid or received at the inception of the swap agreement are reflected as premiums paid or received in the Statement of Assets and Liabilities and are amortized using the effective interest method over the term of the agreement. A liquidation payment received or made upon early termination is recorded as a realized gain or loss on swap agreements in the Statement of Operations. Collateral for uncleared swaps, in the form of cash or securities, is held in segregated accounts with the fund’s custodian in connection with these agreements. Collateral for cleared swaps, in the form of cash or securities, is posted by the fund directly with the clearing broker.
Risks related to swap agreements include the possible lack of a liquid market, unfavorable market and interest rate movements of the underlying instrument and the failure of the counterparty to perform under the terms of the agreements. The fund’s maximum risk of loss from counterparty credit risk is the discounted net value of the cash flows to be received from/paid to the counterparty over the contract’s remaining life, to the extent that the amount is positive. To address counterparty risk, uncleared swap agreements are limited to only highly-rated counterparties. Risk is further reduced by having an ISDA Master Agreement between the fund and the counterparty providing for netting as described above and, where applicable, by the posting of collateral by the counterparty to the fund to cover the fund’s exposure to the counterparty under such ISDA Master Agreement. The fund’s counterparty risk due to cleared swaps is mitigated by the fact that the clearinghouse is the true counterparty to the transaction and the regulatory requirement safeguards in the event of a clearing broker bankruptcy.
The fund entered into interest rate swap agreements in order to manage its exposure to interest or foreign exchange rate fluctuations. Interest rate swap agreements involve the periodic exchange of cash flows, between the fund and a counterparty, based on the difference between two interest rates applied to a notional principal amount. The two interest rates exchanged may either be a fixed rate and a floating rate or two floating rates based on different indices.
The fund entered into credit default swap agreements in order to manage its exposure to the market or certain sectors of the market, to reduce its credit risk exposure to defaults of corporate and sovereign issuers or to create exposure to corporate or sovereign issuers to which it is not otherwise exposed. In a credit default swap
63
Table of Contents
Notes to Financial Statements (unaudited) – continued
agreement, the protection buyer can make an upfront payment and will make a stream of payments to the protection seller based on a fixed percentage applied to the agreement notional amount in exchange for the right to receive a specified return upon the occurrence of a defined credit event on the reference obligation (which may be either a single security or a basket of securities issued by corporate or sovereign issuers) and, with respect to the cases where physical settlement applies, the delivery by the buyer to the seller of a defined deliverable obligation. Although agreement-specific, credit events generally consist of a combination of the following: bankruptcy, failure to pay, restructuring, obligation acceleration, obligation default, or repudiation/moratorium, each as defined in the 2003 ISDA Credit Derivatives Definitions as amended by the relevant agreement. Restructuring is generally not applicable when the reference obligation is issued by a North American corporation and obligation acceleration, obligation default, or repudiation/moratorium are generally only applicable when the reference obligation is issued by a sovereign entity or an entity in an emerging country. Upon determination of the final price for the deliverable obligation (or upon delivery of the deliverable obligation in the case of physical settlement), the difference between the value of the deliverable obligation and the swap agreement’s notional amount is recorded as realized gain or loss on swap agreements in the Statement of Operations.
Credit default swap agreements are considered to have credit-risk-related contingent features since they trigger payment by the protection seller to the protection buyer upon the occurrence of a defined credit event. The maximum amount of future, undiscounted payments that the fund, as protection seller, could be required to make is equal to the swap agreement’s notional amount. The protection seller’s payment obligation would be offset to the extent of the value of the agreement’s deliverable obligation. At April 30, 2016, the fund did not hold any credit default swap agreements at an unrealized loss where it is the protection seller. The fund’s maximum risk of loss from counterparty risk, either as the protection seller or as the protection buyer, is the fair value of the agreement.
Short Sales – The fund entered into short sales whereby it sells a security it does not own in anticipation of a decline in the value of that security. The fund will realize a gain if the security price decreases and a loss if the security price increases between the date of the short sale and the date on which the fund replaces the borrowed security. Losses from short sales can exceed the proceeds of the security sold; and they can also exceed the potential loss from an ordinary buy and sell transaction. The amount of any premium, dividends, or interest the fund may be required to pay in connection with a short sale will be recognized as a fund expense. During the six months ended April 30, 2016, this expense amounted to $464. The fund segregates cash or marketable securities in an amount that, when combined with the amount of proceeds from the short sale deposited with the broker, at least equals the current market value of the security sold short.
Indemnifications – Under the fund’s organizational documents, its officers and Trustees may be indemnified against certain liabilities and expenses arising out of the performance of their duties to the fund. Additionally, in the normal course of business, the fund enters into agreements with service providers that may contain
64
Table of Contents
Notes to Financial Statements (unaudited) – continued
indemnification clauses. The fund’s maximum exposure under these agreements is unknown as this would involve future claims that may be made against the fund that have not yet occurred.
Investment Transactions and Income – Investment transactions are recorded on the trade date. Interest income is recorded on the accrual basis. All premium and discount is amortized or accreted for financial statement purposes in accordance with U.S. generally accepted accounting principles. Dividends received in cash are recorded on the ex-dividend date. Certain dividends from foreign securities will be recorded when the fund is informed of the dividend if such information is obtained subsequent to the ex-dividend date. Dividend and interest payments received in additional securities are recorded on the ex-dividend or ex-interest date in an amount equal to the value of the security on such date.
The fund may receive proceeds from litigation settlements. Any proceeds received from litigation involving portfolio holdings are reflected in the Statement of Operations in realized gain/loss if the security has been disposed of by the fund or in unrealized gain/loss if the security is still held by the fund. Any other proceeds from litigation not related to portfolio holdings are reflected as other income in the Statement of Operations.
Fees Paid Indirectly – The fund’s custody fee may be reduced by a credit earned under an arrangement that measures the value of U.S. dollars deposited with the custodian by the fund. The amount of the credit, for the six months ended April 30, 2016, is shown as a reduction of total expenses in the Statement of Operations.
Tax Matters and Distributions – The fund intends to qualify as a regulated investment company, as defined under Subchapter M of the Internal Revenue Code, and to distribute all of its taxable income, including realized capital gains. As a result, no provision for federal income tax is required. The fund’s federal tax returns, when filed, will remain subject to examination by the Internal Revenue Service for a three year period. Management has analyzed the fund’s tax positions taken on federal and state tax returns for all open tax years and does not believe that there are any uncertain tax positions that require recognition of a tax liability. Foreign taxes, if any, have been accrued by the fund in the accompanying financial statements in accordance with the applicable foreign tax law. Foreign income taxes may be withheld by certain countries in which the fund invests. Additionally, capital gains realized by the fund on securities issued in or by certain foreign countries may be subject to capital gains tax imposed by those countries.
Distributions to shareholders are recorded on the ex-dividend date. Income and capital gain distributions are determined in accordance with income tax regulations, which may differ from U.S. generally accepted accounting principles. Certain capital accounts in the financial statements are periodically adjusted for permanent differences in order to reflect their tax character. These adjustments have no impact on net assets or net asset value per share. Temporary differences which arise from recognizing certain items of income, expense, gain or loss in different periods for financial statement and tax purposes will reverse at some time in the future. Distributions in excess of net investment income or net realized gains are temporary overdistributions for financial
65
Table of Contents
Notes to Financial Statements (unaudited) – continued
statement purposes resulting from differences in the recognition or classification of income or distributions for financial statement and tax purposes.
Book/tax differences primarily relate to amortization and accretion of debt securities, wash sale loss deferrals, and derivative transactions.
The tax character of distributions made during the current period will be determined at fiscal year end. The tax character of distributions declared to shareholders for the last fiscal year is as follows:
| 10/31/15 | ||||
| Ordinary income (including any short-term capital gains) | $4,060,201 | |||
The federal tax cost and the tax basis components of distributable earnings were as follows:
| As of 4/30/16 | ||||
| Cost of investments | $681,917,864 | |||
| Gross appreciation | 33,519,909 | |||
| Gross depreciation | (31,480,852 | ) | ||
| Net unrealized appreciation (depreciation) | $2,039,057 | |||
| As of 10/31/15 | ||||
| Undistributed ordinary income | 8,262,932 | |||
| Capital loss carryforwards | (54,651,955 | ) | ||
| Other temporary differences | (464,160 | ) | ||
| Net unrealized appreciation (depreciation) | 9,572,373 | |||
The aggregate cost above includes prior fiscal year end tax adjustments, if applicable.
Under the Regulated Investment Company Modernization Act of 2010 (the “Act”), net capital losses recognized for fund fiscal years beginning after October 31, 2011 may be carried forward indefinitely, and their character is retained as short-term and/or long-term losses (“post-enactment losses”). Previously, net capital losses were carried forward for eight years and treated as short-term losses (“pre-enactment losses”). As a transition rule, the Act requires that all post-enactment net capital losses be used before pre-enactment net capital losses.
As of October 31, 2015, the fund had capital loss carryforwards available to offset future realized gains as follows:
| 10/31/17 | $(23,271,864 | ) | ||
| 10/31/18 | (11,844,509 | ) | ||
| Total | $(35,116,373 | ) |
| Post-enactment losses which are characterized as follows: | ||||
| Short-Term | $(19,362,886 | ) | ||
| Long-Term | (172,696 | ) | ||
| Total | $(19,535,582 | ) | ||
Multiple Classes of Shares of Beneficial Interest – The fund offers multiple classes of shares, which differ in their respective distribution, and service fees. The fund’s
66
Table of Contents
Notes to Financial Statements (unaudited) – continued
income, realized and unrealized gain (loss), and common expenses are allocated to shareholders based on the daily net assets of each class. Dividends are declared separately for each class. Differences in per share dividend rates are generally due to differences in separate class expenses. Class B shares will convert to Class A shares approximately eight years after purchase. The fund’s distributions declared to shareholders as reported in the Statements of Changes in Net Assets are presented by class as follows:
| From net investment income | ||||||||
| Six months ended 4/30/16 | Year ended 10/31/15 | |||||||
| Class A | $1,628,398 | $1,168,508 | ||||||
| Class B | 26,078 | 15,581 | ||||||
| Class C | 185,778 | 94,783 | ||||||
| Class I | 6,371,943 | 2,754,968 | ||||||
| Class R1 | 600 | 295 | ||||||
| Class R2 | 7,088 | 7,229 | ||||||
| Class R3 | 774 | 1,979 | ||||||
| Class R4 | 829 | 15,248 | ||||||
| Class R5 | 49,058 | 1,610 | ||||||
| Total | $8,270,546 | $4,060,201 | ||||||
(3) Transactions with Affiliates
Investment Adviser – The fund has an investment advisory agreement with MFS to provide overall investment management and related administrative services and facilities to the fund. The management fee is computed daily and paid monthly at the following annual rates:
| First $1 billion of average daily net assets | 0.90% | |||
| Next $1.5 billion of average daily net assets | 0.75% | |||
| Average daily net assets in excess of $2.5 billion | 0.65% |
MFS has agreed in writing to reduce its management fee by a specified amount if certain MFS mutual fund assets exceed thresholds agreed to by MFS and the fund’s Board of Trustees. For the six months ended April 30, 2016, this management fee reduction amounted to $28,919, which is included in the reduction of total expenses in the Statement of Operations. The management fee incurred for the six months ended April 30, 2016 was equivalent to an annual effective rate of 0.89% of the fund’s average daily net assets.
MFS has engaged UBS Global Asset Management (Americas) Inc. (UBS) as a sub-adviser to the fund to manage the fund’s exposure to markets and currencies through the use of derivative instruments. The fund is not responsible for paying the sub-advisory fee. MFS pays UBS a sub-advisory fee at the following annual rates:
| First $1 billion of average daily net assets | 0.28% | |||
| Next $1.5 billion of average daily net assets | 0.185% | |||
| Average daily net assets in excess of $2.5 billion | 0.16% |
67
Table of Contents
Notes to Financial Statements (unaudited) – continued
The investment adviser has agreed in writing to pay a portion of the fund’s total annual operating expenses, excluding interest, taxes, extraordinary expenses, brokerage and transaction costs, and investment-related expenses such as short sale dividend and interest expenses incurred in connection with the fund’s investment activity, such that total fund operating expenses do not exceed the following rates annually of each class’s average daily net assets:
| Classes | ||||||||||||||||||||||||||||||||
| A | B | C | I | R1 | R2 | R3 | R4 | R5 | ||||||||||||||||||||||||
| 1.40% | 2.15% | 2.15% | 1.15% | 2.15% | 1.65% | 1.40% | 1.15% | 1.07% | ||||||||||||||||||||||||
This written agreement will continue until modified by the fund’s Board of Trustees, but such agreement will continue at least until February 28, 2017. For the six months ended April 30, 2016, the fund’s actual operating expenses did not exceed the limit and therefore, the investment adviser did not pay any portion of the fund’s expenses related to this agreement.
Distributor – MFS Fund Distributors, Inc. (MFD), a wholly-owned subsidiary of MFS, as distributor, received $11,185 for the six months ended April 30, 2016, as its portion of the initial sales charge on sales of Class A shares of the fund.
The Board of Trustees has adopted a distribution plan for certain share classes pursuant to Rule 12b-1 of the Investment Company Act of 1940.
The fund’s distribution plan provides that the fund will pay MFD for services provided by MFD and financial intermediaries in connection with the distribution and servicing of certain share classes. One component of the plan is a distribution fee paid to MFD and another component of the plan is a service fee paid to MFD. MFD may subsequently pay all, or a portion, of the distribution and/or service fees to financial intermediaries.
Distribution Plan Fee Table:
| Distribution Fee Rate (d) | Service Fee Rate (d) | Total Distribution Plan (d) | Annual Effective Rate (e) | Distribution and Service Fee | ||||||||||||||||
| Class A | — | 0.25% | 0.25% | 0.25% | $214,010 | |||||||||||||||
| Class B | 0.75% | 0.25% | 1.00% | 1.00% | 49,525 | |||||||||||||||
| Class C | 0.75% | 0.25% | 1.00% | 1.00% | 273,217 | |||||||||||||||
| Class R1 | 0.75% | 0.25% | 1.00% | 1.00% | 1,188 | |||||||||||||||
| Class R2 | 0.25% | 0.25% | 0.50% | 0.50% | 2,945 | |||||||||||||||
| Class R3 | — | 0.25% | 0.25% | 0.25% | 458 | |||||||||||||||
| Total Distribution and Service Fees | $541,343 | |||||||||||||||||||
| (d) | In accordance with the distribution plan for certain classes, the fund pays distribution and/or service fees equal to these annual percentage rates of each class’s average daily net assets. The distribution and service fee rates disclosed by class represent the current rates in effect at the end of the reporting period. Any rate changes, if applicable, are detailed below. |
| (e) | The annual effective rates represent actual fees incurred under the distribution plan for the six months ended April 30, 2016 based on each class’s average daily net assets. MFD has voluntarily agreed to rebate a portion of each class’s 0.25% service fee attributable to accounts for which MFD retains the 0.25% service fee except for accounts attributable to MFS or its affiliates’ seed money. For the six months ended April 30, 2016, this rebate amounted to $1,350 and $2, for Class A and Class B, respectively, and is included in the reduction of total expenses in the Statement of Operations. |
68
Table of Contents
Notes to Financial Statements (unaudited) – continued
Certain Class A shares are subject to a contingent deferred sales charge (CDSC) in the event of a shareholder redemption within 18 months of purchase. Class C shares are subject to a CDSC in the event of a shareholder redemption within 12 months of purchase. Class B shares are subject to a CDSC in the event of a shareholder redemption within six years of purchase. All contingent deferred sales charges are paid to MFD and during the six months ended April 30, 2016, were as follows:
| Amount | ||||
| Class A | $1,296 | |||
| Class B | 5,177 | |||
| Class C | 5,921 | |||
Shareholder Servicing Agent – MFS Service Center, Inc. (MFSC), a wholly-owned subsidiary of MFS, receives a fee from the fund for its services as shareholder servicing agent calculated as a percentage of the average daily net assets of the fund as determined periodically under the supervision of the fund’s Board of Trustees. For the six months ended April 30, 2016, the fee was $16,703, which equated to 0.0043% annually of the fund’s average daily net assets. MFSC also receives payment from the fund for out-of-pocket expenses, sub-accounting and other shareholder servicing costs which may be paid to affiliated and unaffiliated service providers. Class R5 shares do not incur sub-accounting fees. For the six months ended April 30, 2016, these out-of-pocket expenses, sub-accounting and other shareholder servicing costs amounted to $307,647.
Administrator – MFS provides certain financial, legal, shareholder communications, compliance, and other administrative services to the fund. Under an administrative services agreement, the fund reimburses MFS the costs incurred to provide these services. The fund is charged an annual fixed amount of $17,500 plus a fee based on average daily net assets. The administrative services fee incurred for the six months ended April 30, 2016 was equivalent to an annual effective rate of 0.0168% of the fund’s average daily net assets.
Trustees’ and Officers’ Compensation – The fund pays compensation to independent Trustees in the form of a retainer, attendance fees, and additional compensation to Board and Committee chairpersons. The fund does not pay compensation directly to Trustees or officers of the fund who are also officers of the investment adviser, all of whom receive remuneration for their services to the fund from MFS. Certain officers and Trustees of the fund are officers or directors of MFS, MFD, and MFSC.
Other – This fund and certain other funds managed by MFS (the funds) have entered into a service agreement (the ISO Agreement) which provides for payment of fees solely by the funds to Tarantino LLC in return for the provision of services of an Independent Senior Officer (ISO) for the funds. Frank L. Tarantino serves as the ISO and is an officer of the funds and the sole member of Tarantino LLC. The funds can terminate the ISO Agreement with Tarantino LLC at any time under the terms of the ISO Agreement. For the six months ended April 30, 2016, the fee paid by the fund under this agreement was $828 and is included in “Miscellaneous” expense in the Statement of Operations. MFS has agreed to bear all expenses associated with office space, other administrative support, and supplies provided to the ISO.
69
Table of Contents
Notes to Financial Statements (unaudited) – continued
The fund invests in the MFS Institutional Money Market Portfolio which is managed by MFS and seeks current income consistent with preservation of capital and liquidity. Income earned on this investment is included in “Dividends from underlying affiliated funds” in the Statement of Operations. This money market fund does not pay a management fee to MFS.
On March 16, 2016, MFS redeemed 6,330 shares each of Class R4 for an aggregate amount of $63,743.
(4) Portfolio Securities
For the six months ended April 30, 2016, purchases and sales of investments, other than purchased option transactions, short sales, and short-term obligations, aggregated $201,304,583 and $244,927,989, respectively.
(5) Shares of Beneficial Interest
The fund’s Declaration of Trust permits the Trustees to issue an unlimited number of full and fractional shares of beneficial interest. Transactions in fund shares were as follows:
| Six months ended 4/30/16 | Year ended 10/31/15 | |||||||||||||||
| Shares | Amount | Shares | Amount | |||||||||||||
| Shares sold | ||||||||||||||||
Class A | 3,126,988 | $31,585,103 | 9,890,756 | $105,351,762 | ||||||||||||
Class B | 129,333 | 1,290,519 | 250,071 | 2,599,065 | ||||||||||||
Class C | 639,182 | 6,359,060 | 2,281,323 | 23,686,926 | ||||||||||||
Class I | 15,513,125 | 158,621,720 | 42,584,531 | 457,605,283 | ||||||||||||
Class R1 | 1,330 | 12,976 | 16,315 | 171,776 | ||||||||||||
Class R2 | 26,970 | 268,556 | 26,506 | 279,217 | ||||||||||||
Class R3 | 20,983 | 209,958 | 58,308 | 627,574 | ||||||||||||
Class R4 | 10,968 | 112,443 | 186,710 | 2,016,947 | ||||||||||||
Class R5 | 190,578 | 1,953,508 | 399,893 | 4,241,215 | ||||||||||||
| 19,659,457 | $200,413,843 | 55,694,413 | $596,579,765 | |||||||||||||
| Shares issued to shareholders in reinvestment of distributions | ||||||||||||||||
Class A | 149,101 | $1,526,795 | 103,320 | $1,080,730 | ||||||||||||
Class B | 1,948 | 19,592 | 1,181 | 12,155 | ||||||||||||
Class C | 14,808 | 148,825 | 7,043 | 72,406 | ||||||||||||
Class I | 450,824 | 4,657,008 | 212,456 | 2,239,287 | ||||||||||||
Class R1 | 60 | 600 | 29 | 295 | ||||||||||||
Class R2 | 698 | 7,088 | 698 | 7,229 | ||||||||||||
Class R3 | 75 | 774 | 189 | 1,979 | ||||||||||||
Class R4 | 80 | 829 | 1,445 | 15,248 | ||||||||||||
Class R5 | 2,435 | 25,276 | 152 | 1,610 | ||||||||||||
| 620,029 | $6,386,787 | 326,513 | $3,430,939 | |||||||||||||
70
Table of Contents
Notes to Financial Statements (unaudited) – continued
| Six months ended 4/30/16 | Year ended 10/31/15 | |||||||||||||||
| Shares | Amount | Shares | Amount | |||||||||||||
| Shares reacquired | ||||||||||||||||
Class A | (4,640,277 | ) | $(46,810,832 | ) | (4,527,965 | ) | $(47,999,277 | ) | ||||||||
Class B | (89,986 | ) | (884,699 | ) | (128,932 | ) | (1,345,077 | ) | ||||||||
Class C | (750,497 | ) | (7,413,130 | ) | (756,669 | ) | (7,841,761 | ) | ||||||||
Class I | (17,048,899 | ) | (172,793,231 | ) | (12,643,878 | ) | (133,945,480 | ) | ||||||||
Class R1 | (37 | ) | (362 | ) | (7,223 | ) | (72,640 | ) | ||||||||
Class R2 | (11,020 | ) | (110,899 | ) | (13,809 | ) | (141,437 | ) | ||||||||
Class R3 | (47,968 | ) | (495,498 | ) | (15,789 | ) | (162,965 | ) | ||||||||
Class R4 | (6,545 | ) | (65,914 | ) | (310,606 | ) | (3,278,289 | ) | ||||||||
Class R5 | (88,978 | ) | (914,277 | ) | (24,153 | ) | (257,602 | ) | ||||||||
| (22,684,207 | ) | $(229,488,842 | ) | (18,429,024 | ) | $(195,044,528 | ) | |||||||||
| Net change | ||||||||||||||||
Class A | (1,364,188 | ) | $(13,698,934 | ) | 5,466,111 | $58,433,215 | ||||||||||
Class B | 41,295 | 425,412 | 122,320 | 1,266,143 | ||||||||||||
Class C | (96,507 | ) | (905,245 | ) | 1,531,697 | 15,917,571 | ||||||||||
Class I | (1,084,950 | ) | (9,514,503 | ) | 30,153,109 | 325,899,090 | ||||||||||
Class R1 | 1,353 | 13,214 | 9,121 | 99,431 | ||||||||||||
Class R2 | 16,648 | 164,745 | 13,395 | 145,009 | ||||||||||||
Class R3 | (26,910 | ) | (284,766 | ) | 42,708 | 466,588 | ||||||||||
Class R4 | 4,503 | 47,358 | (122,451 | ) | (1,246,094 | ) | ||||||||||
Class R5 | 104,035 | 1,064,507 | 375,892 | 3,985,223 | ||||||||||||
| (2,404,721 | ) | $(22,688,212 | ) | 37,591,902 | $404,966,176 | |||||||||||
(6) Line of Credit
The fund and certain other funds managed by MFS participate in a $1.25 billion unsecured committed line of credit, subject to a $1 billion sublimit, provided by a syndication of banks under a credit agreement. Borrowings may be made for temporary financing needs. Interest is charged to each fund, based on its borrowings, generally at a rate equal to the higher of the Overnight Federal Reserve funds rate or daily one month LIBOR plus an agreed upon spread. A commitment fee, based on the average daily, unused portion of the committed line of credit, is allocated among the participating funds at the end of each calendar quarter. In addition, the fund and other funds managed by MFS have established unsecured uncommitted borrowing arrangements with certain banks for temporary financing needs. Interest is charged to each fund, based on its borrowings, at a rate equal to the Overnight Federal Reserve funds rate plus an agreed upon spread. For the six months ended April 30, 2016, the fund’s commitment fee and interest expense were $1,326 and $0, respectively, and are included in “Miscellaneous” expense in the Statement of Operations.
71
Table of Contents
Notes to Financial Statements (unaudited) – continued
(7) Transactions in Underlying Affiliated Funds-Affiliated Issuers
An affiliated issuer may be considered one in which the fund owns 5% or more of the outstanding voting securities, or a company which is under common control. For the purposes of this report, the fund assumes the following to be an affiliated issuer:
| Underlying Affiliated Fund | Beginning Shares/Par Amount | Acquisitions Shares/Par Amount | Dispositions Shares/Par Amount | Ending Shares/Par Amount | ||||||||||||
| MFS Institutional Money Market Portfolio | 31,806,274 | 470,484,548 | (452,904,098 | ) | 49,386,724 | |||||||||||
| Underlying Affiliated Fund | Realized Gain (Loss) | Capital Gain Distributions | Dividend Income | Ending Value | ||||||||||||
| MFS Institutional Money Market Portfolio | $— | $— | $55,838 | $49,386,724 | ||||||||||||
72
Table of Contents
PROXY VOTING POLICIES AND INFORMATION
MFS votes proxies on behalf of the fund pursuant to proxy voting policies and procedures that are available without charge, upon request, by calling 1-800-225-2606, by visiting the Proxy Voting section of mfs.com or by visiting the SEC’s Web site at http://www.sec.gov.
Information regarding how the fund voted proxies relating to portfolio securities during the twelve-month period ended June 30, 2015 is available without charge by visiting the Proxy Voting section of mfs.com or by visiting the SEC’s Web site at http://www.sec.gov.
QUARTERLY PORTFOLIO DISCLOSURE
The fund will file a complete schedule of portfolio holdings with the Securities and Exchange Commission (the Commission) for the first and third quarters of each fiscal year on Form N-Q. A shareholder can obtain the quarterly portfolio holdings report at mfs.com. The fund’s Form N-Q is also available on the EDGAR database on the Commission’s Internet Web site at http://www.sec.gov, and may be reviewed and copied at the:
Public Reference Room
Securities and Exchange Commission
100 F Street, NE, Room 1580
Washington, D.C. 20549
Information on the operation of the Public Reference Room may be obtained by calling the Commission at 1-800-SEC-0330. Copies of the fund’s Form N-Q also may be obtained, upon payment of a duplicating fee, by electronic request at the following e-mail address: publicinfo@sec.gov or by writing the Public Reference Section at the above address.
From time to time, MFS may post important information about the fund or the MFS funds on the MFS web site (mfs.com). This information is available by visiting the “Market Commentary” and “Announcements” sub sections in the “Market Outlooks” section of mfs.com or by clicking on the fund’s name under “Mutual Funds” in the “Products” section of mfs.com.
PROVISION OF FINANCIAL REPORTS AND SUMMARY PROSPECTUSES
The fund produces financial reports every six months and updates its summary prospectus and prospectus annually. To avoid sending duplicate copies of materials to households, only one copy of the fund’s annual and semiannual report and summary prospectus may be mailed to shareholders having the same last name and residential address on the fund’s records. However, any shareholder may contact MFSC (please see back cover for address and telephone number) to request that copies of these reports and summary prospectuses be sent personally to that shareholder.
73
Table of Contents
Save paper with eDelivery.
| MFS® will send you prospectuses, |

reports, and proxies directly via e-mail so you will get information faster with less mailbox clutter.
To sign up:
1. Go to mfs.com.
2. Log in via MFS® Access.
3. Select eDelivery.
If you own your MFS fund shares through a financial institution or a retirement plan, MFS® TALK, MFS® Access, or eDelivery may not be available to you.
WEB SITE
mfs.com
MFS TALK
1-800-637-8255
24 hours a day
ACCOUNT SERVICE AND LITERATURE
Shareholders
1-800-225-2606
Financial advisors
1-800-343-2829
Retirement plan services
1-800-637-1255
MAILING ADDRESS
MFS Service Center, Inc.
P.O. Box 55824
Boston, MA 02205-5824
OVERNIGHT MAIL
MFS Service Center, Inc.
c/o Boston Financial Data Services
30 Dan Road
Canton, MA 02021-2809
Table of Contents
| ITEM 2. | CODE OF ETHICS. |
During the period covered by this report, the Registrant has not amended any provision in its Code of Ethics (the “Code”) that relates to an element of the Code’s definitions enumerated in paragraph (b) of Item 2 of this Form N-CSR. During the period covered by this report, the Registrant did not grant a waiver, including an implicit waiver, from any provision of the Code.
| ITEM 3. | AUDIT COMMITTEE FINANCIAL EXPERT. |
Not applicable for semi-annual reports.
| ITEM 4. | PRINCIPAL ACCOUNTANT FEES AND SERVICES. |
Not applicable for semi-annual reports.
| ITEM 5. | AUDIT COMMITTEE OF LISTED REGISTRANTS. |
Not applicable to the Registrant.
| ITEM 6. | INVESTMENTS |
A schedule of investments for each series of the Registrant is included as part of the report to shareholders of such series under Item 1 of this Form N-CSR.
| ITEM 7. | DISCLOSURE OF PROXY VOTING POLICIES AND PROCEDURES FOR CLOSED-END MANAGEMENT INVESTMENT COMPANIES. |
Not applicable to the Registrant.
| ITEM 8. | PORTFOLIO MANAGERS OF CLOSED-END MANAGEMENT INVESTMENT COMPANIES. |
Not applicable to the Registrant.
| ITEM 9. | PURCHASES OF EQUITY SECURITIES BY CLOSED-END MANAGEMENT INVESTMENT COMPANY AND AFFILIATED PURCHASERS. |
Not applicable to the Registrant.
| ITEM 10. | SUBMISSION OF MATTERS TO A VOTE OF SECURITY HOLDERS. |
There were no material changes to the procedures by which shareholders may send recommendations to the Board for nominees to the Registrant’s Board since the Registrant last provided disclosure as to such procedures in response to the requirements of Item 407 (c)(2)(iv) of Regulation S-K or this Item.
Table of Contents
| ITEM 11. | CONTROLS AND PROCEDURES. |
| (a) | Based upon their evaluation of the effectiveness of the registrant’s disclosure controls and procedures (as defined in Rule 30a-3(c) under the Investment Company Act of 1940 (the “Act”)) as conducted within 90 days of the filing date of this report on Form N-CSR, the registrant’s principal financial officer and principal executive officer have concluded that those disclosure controls and procedures provide reasonable assurance that the material information required to be disclosed by the registrant on this report is recorded, processed, summarized and reported within the time periods specified in the Securities and Exchange Commission’s rules and forms. |
| (b) | There were no changes in the registrant’s internal controls over financial reporting (as defined in Rule 30a-3(d) under the Act) that occurred during the second fiscal quarter of the period covered by the report that have materially affected, or are reasonably likely to materially affect, the registrant’s internal control over financial reporting. |
| ITEM 12. | EXHIBITS. |
| (a) | File the exhibits listed below as part of this form. Letter or number the exhibits in the sequence indicated. |
| (1) | Any code of ethics, or amendment thereto, that is the subject of the disclosure required by Item 2, to the extent that the registrant intends to satisfy the Item 2 requirements through filing of an exhibit. |
| (2) | A separate certification for each principal executive officer and principal financial officer of the registrant as required by Rule 30a-2(a) under the Act (17 CFR 270.30a-2): Attached hereto. |
| (b) | If the report is filed under Section 13(a) or 15(d) of the Exchange Act, provide the certifications required by Rule 30a-2(b) under the Act (17 CFR 270.30a-2(b)), Rule 13a-14(b) or Rule 15d-14(b) under the Exchange Act (17 CFR 240.13a-14(b) or 240.15d-14(b)) and Section 1350 of Chapter 63 of Title 18 of the United States Code (18 U.S.C. 1350) as an exhibit. A certification furnished pursuant to this paragraph will not be deemed “filed” for the purposes of Section 18 of the Exchange Act (15 U.S.C. 78r), or otherwise subject to the liability of that section. Such certification will not be deemed to be incorporated by reference into any filing under the Securities Act of 1933 or the Exchange Act, except to the extent that the registrant specifically incorporates it by reference: Attached hereto. |
Table of Contents
Notice
A copy of the Amended and Restated Declaration of Trust, as amended, of the Registrant is on file with the Secretary of State of The Commonwealth of Massachusetts and notice is hereby given that this instrument is executed on behalf of the Registrant by an officer of the Registrant as an officer and not individually and the obligations of or arising out of this instrument are not binding upon any of the Trustees or shareholders individually, but are binding only upon the assets and property of the respective constituent series of the Registrant.
Table of Contents
SIGNATURES
Pursuant to the requirements of the Securities Exchange Act of 1934 and the Investment Company Act of 1940, the registrant has duly caused this report to be signed on its behalf by the undersigned, thereunto duly authorized.
(Registrant) MFS SERIES TRUST XV
| By (Signature and Title)* | ROBIN A. STELMACH | |
| Robin A. Stelmach, President |
Date: June 16, 2016
Pursuant to the requirements of the Securities Exchange Act of 1934 and the Investment Company Act of 1940, this report has been signed below by the following persons on behalf of the registrant and in the capacities and on the dates indicated.
| By (Signature and Title)* | ROBIN A. STELMACH | |
Robin A. Stelmach, President (Principal Executive Officer) |
Date: June 16, 2016
| By (Signature and Title)* | DAVID L. DILORENZO | |
David L. DiLorenzo, Treasurer (Principal Financial Officer and Accounting Officer) |
Date: June 16, 2016
| * | Print name and title of each signing officer under his or her signature. |