UNITED STATES
SECURITIES AND EXCHANGE COMMISSION
Washington, D.C. 20549
FORMN-CSR
CERTIFIED SHAREHOLDER REPORT OF
REGISTERED MANAGEMENT INVESTMENT COMPANIES
Investment Company Act file number811-04253
MFS SERIES TRUST XV
(Exact name of registrant as specified in charter)
111 Huntington Avenue, Boston, Massachusetts 02199
(Address of principal executive offices) (Zip code)
Christopher R. Bohane
Massachusetts Financial Services Company
111 Huntington Avenue
Boston, Massachusetts 02199
(Name and address of agents for service)
Registrant’s telephone number, including area code: (617)954-5000
Date of fiscal year end: October 31
Date of reporting period: April 30, 2019
| ITEM 1. | REPORTS TO STOCKHOLDERS. |
Semiannual Report
April 30, 2019

MFS® Commodity Strategy Fund

Beginning on January 1, 2021, as permitted by regulations adopted by the U.S. Securities and Exchange Commission, paper copies of the fund’s annual and semiannual shareholder reports will no longer be sent by mail, unless you specifically request paper copies of the reports. Instead, the complete reports will be made available on the fund’s Web site (funds.mfs.com), and you will be notified by mail each time a report is posted and provided with a Web site link to access the report.
If you are already signed up to receive shareholder reports by email, you will not be affected by this change and you need not take any action. You may sign up to receive shareholder reports and other communications from the fund by email by contacting your financial intermediary (such as a broker-dealer or bank) or, if you hold your shares directly with the fund, by calling 1-800-225-2606 or by logging on to MFS Access at mfs.com.
Beginning on January 1, 2019, you may elect to receive all future reports in paper free of charge. Contact your financial intermediary to request that you continue to receive paper copies of your shareholder reports. If you invest directly with the fund, you can call 1-800-225-2606 or send an email request to orderliterature@mfs.com to let the fund know that you wish to continue receiving paper copies of your shareholder reports. Your election to receive reports in paper will apply to all funds held in your account if you invest through your financial intermediary or all funds held with the MFS fund complex if you invest directly.
CMS-SEM
MFS® Commodity Strategy Fund
CONTENTS
The report is prepared for the general information of shareholders.
It is authorized for distribution to prospective investors only when preceded or accompanied by a current prospectus.
NOT FDIC INSURED• MAY LOSE VALUE• NO BANK GUARANTEE

LETTER FROM THE EXECUTIVE CHAIRMAN
Dear Shareholders:
Markets experienced a bout of volatility in late 2018 as a result of higher interest rates, international trade friction, and geopolitical uncertainty surrounding issues such as
Brexit. Those concerns dissipated in the early months of 2019 due to the more dovish posture of the U.S. Federal Reserve and other global central banks, reported progress toward a trade pact between the United States and China, and action against ano-deal Brexit by the British Parliament. However, a last-minute breakdown in negotiations between the U.S. and China derailed the market’s momentum and increased concerns over the future pace of global growth. Compounding Brexit uncertainty was the resignation of British Prime Minister Theresa May, potentially ushering in a harder form of Brexit than she had advocated. U.S. equities have continued to outperform their global peers due in
part to fiscal stimulus undertaken in late 2017 and early 2018, which contributed to the continuation of relatively healthy levels of U.S. economic output against a backdrop of slower global growth. Inflation remains largely subdued globally, which is encouraging for asset markets. Rising incomes in many developed and emerging markets are supportive of gains in consumption, though a challenging environment for global trade has hindered manufacturing in most regions.
Since launching the first U.S.open-end mutual fund in 1924, MFS® has been committed to a single purpose: to create value by allocating capital responsibly for clients. Through our powerful global investment platform, we combine collective expertise, thoughtful risk management, and long-term discipline to uncover what we believe are the best investment opportunities in the market.
Respectfully,

Robert J. Manning
Executive Chairman
MFS Investment Management
June 17, 2019
The opinions expressed in this letter are subject to change and may not be relied upon for investment advice. No forecasts can be guaranteed.
1
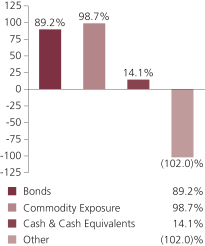
PORTFOLIO COMPOSITION
Portfolio structure (c)(i)
| | | | |
| Fixed income sectors (i) | |
| Investment Grade Corporates | | | 33.0% | |
| U.S. Treasury Securities | | | 28.2% | |
| Collateralized Debt Obligations | | | 8.7% | |
| Asset-Backed Securities | | | 8.3% | |
| Commercial Mortgage-Backed Securities | | | 5.0% | |
| Emerging Markets Bonds | | | 2.5% | |
| Non-U.S. Government Bonds | | | 1.5% | |
| Residential Mortgage-Backed Securities | | | 1.0% | |
| Mortgage-Backed Securities | | | 0.5% | |
| Municipal Bonds | | | 0.4% | |
| U.S. Government Agencies | | | 0.1% | |
| | | | |
| Composition including fixed income credit quality (a)(i) | |
| AAA | | | 8.4% | |
| AA | | | 12.4% | |
| A | | | 13.6% | |
| BBB | | | 23.2% | |
| U.S. Government | | | 25.0% | |
| Federal Agencies | | | 0.6% | |
| Not Rated | | | 6.0% | |
| Non-Fixed Income | | | 98.7% | |
| Cash & Cash Equivalents | | | 14.1% | |
| Other | | | (102.0)% | |
| |
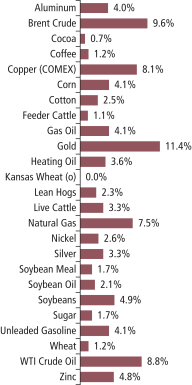
| Commodity exposure (c)(i) | | | | |
2
Portfolio Composition – continued
| (a) | For all securities other than those specifically described below, ratings are assigned to underlying securities utilizing ratings from Moody’s, Fitch, and Standard & Poor’s rating agencies and applying the following hierarchy: If all three agencies provide a rating, the middle rating (after dropping the highest and lowest ratings) is assigned; if two of the three agencies rate a security, the lower of the two is assigned. Ratings are shown in the S&P and Fitch scale (e.g., AAA). Securities rated BBB or higher are considered investment grade. All ratings are subject to change. U.S. Government includes securities issued by the U.S. Department of the Treasury. Federal Agencies includes rated and unrated U.S. Agency fixed-income securities, U.S. Agency mortgage-backed securities, and collateralized mortgage obligations of U.S. Agency mortgage-backed securities. Not Rated includes fixed income securities and fixed income derivatives, which have not been rated by any rating agency.Non-Fixed Income includes equity securities (including convertible bonds and equity derivatives) and/or commodity-linked derivatives. The fund may or may not have held all of these instruments on this date. The fund is not rated by these agencies. |
| (c) | MFS expects to gain exposure to the commodities markets by investing a portion of the fund’s assets in the MFS Commodity Strategy Portfolio, a wholly-owned and controlled subsidiary organized in the Cayman Islands (“Subsidiary”). The Subsidiary gains exposure to the commodities markets by investing in commodity linked derivatives (such as commodity-linked futures, options, and/or swaps). The Subsidiary’s investments in commodity-linked derivatives are leveraged (i.e. involves investment exposure greater than the amount of the investment). For more information about commodity-linked derivatives and the risks of investing in such derivatives, please see the fund’s prospectus. |
| (i) | For purposes of this presentation, the components include the value of securities, and reflect the impact of the equivalent exposure of derivative positions, if any. These amounts may be negative from time to time. Equivalent exposure is a calculated amount that translates the derivative position into a reasonable approximation of the amount of the underlying asset that the portfolio would have to hold at a given point in time to have the same price sensitivity that results from the portfolio’s ownership of the derivative contract. When dealing with derivatives, equivalent exposure is a more representative measure of the potential impact of a position on portfolio performance than value. The bond component will include any accrued interest amounts. |
The fund invests a portion of its assets in the MFS Commodity Strategy Portfolio, a wholly-owned subsidiary of the fund. Percentages reflect exposure to the underlying holdings of the MFS Commodity Strategy Portfolio and not to the exposure from investing directly in the MFS Commodity Strategy Portfolio itself.
Where the fund holds convertible bonds, they are treated as part of the equity portion of the portfolio.
Cash & Cash Equivalents includes any cash, investments in money market funds, short-term securities, and other assets less liabilities. Please see the Statement of Assets and Liabilities for additional information related to the fund’s cash position and other assets and liabilities.
Other includes equivalent exposure from currency derivatives and/or any offsets to derivative positions and may be negative.
Percentages are based on net assets as of April 30, 2019.
The portfolio is actively managed and current holdings may be different.
3
EXPENSE TABLE
Fund expenses borne by the shareholders during the period, November 1, 2018 through April 30, 2019
As a shareholder of the fund, you incur two types of costs: (1) transaction costs, including sales charges (loads) on certain purchase or redemption payments, and (2) ongoing costs, including management fees; distribution and service(12b-1) fees; and other fund expenses. This example is intended to help you understand your ongoing costs (in dollars) of investing in the fund and to compare these costs with the ongoing costs of investing in other mutual funds.
The example is based on an investment of $1,000 invested at the beginning of the period and held for the entire period November 1, 2018 through April 30, 2019.
Actual Expenses
The first line for each share class in the following table provides information about actual account values and actual expenses. You may use the information in this line, together with the amount you invested, to estimate the expenses that you paid over the period. Simply divide your account value by $1,000 (for example, an $8,600 account value divided by $1,000 = 8.6), then multiply the result by the number in the first line under the heading entitled “Expenses Paid During Period” to estimate the expenses you paid on your account during this period.
Hypothetical Example for Comparison Purposes
The second line for each share class in the following table provides information about hypothetical account values and hypothetical expenses based on the fund’s actual expense ratio and an assumed rate of return of 5% per year before expenses, which is not the fund’s actual return. The hypothetical account values and expenses may not be used to estimate the actual ending account balance or expenses you paid for the period. You may use this information to compare the ongoing costs of investing in the fund and other funds. To do so, compare this 5% hypothetical example with the 5% hypothetical examples that appear in the shareholder reports of the other funds.
Please note that the expenses shown in the table are meant to highlight your ongoing costs only and do not reflect any transactional costs, such as sales charges (loads). Therefore, the second line for each share class in the table is useful in comparing ongoing costs only, and will not help you determine the relative total costs of owning different funds. In addition, if these transactional costs were included, your costs would have been higher.
4
Expense Table – continued
| | | | | | | | | | | | | | | | | | |
Share
Class | | | | Annualized
Expense
Ratio | | | Beginning
Account Value
11/01/18 | | | Ending
Account Value
4/30/19 | | | Expenses
Paid During
Period (p)
11/01/18-4/30/19 | |
| A | | Actual | | | 1.08% | | | | $1,000.00 | | | | $990.42 | | | | $5.33 | |
| | Hypothetical (h) | | | 1.08% | | | | $1,000.00 | | | | $1,019.44 | | | | $5.41 | |
| B | | Actual | | | 1.83% | | | | $1,000.00 | | | | $986.92 | | | | $9.02 | |
| | Hypothetical (h) | | | 1.83% | | | | $1,000.00 | | | | $1,015.72 | | | | $9.15 | |
| C | | Actual | | | 1.83% | | | | $1,000.00 | | | | $986.82 | | | | $9.01 | |
| | Hypothetical (h) | | | 1.83% | | | | $1,000.00 | | | | $1,015.72 | | | | $9.15 | |
| I | | Actual | | | 0.83% | | | | $1,000.00 | | | | $992.63 | | | | $4.10 | |
| | Hypothetical (h) | | | 0.83% | | | | $1,000.00 | | | | $1,020.68 | | | | $4.16 | |
| R1 | | Actual | | | 1.83% | | | | $1,000.00 | | | | $986.82 | | | | $9.01 | |
| | Hypothetical (h) | | | 1.83% | | | | $1,000.00 | | | | $1,015.72 | | | | $9.15 | |
| R2 | | Actual | | | 1.33% | | | | $1,000.00 | | | | $988.82 | | | | $6.56 | |
| | Hypothetical (h) | | | 1.33% | | | | $1,000.00 | | | | $1,018.20 | | | | $6.66 | |
| R3 | | Actual | | | 1.08% | | | | $1,000.00 | | | | $991.66 | | | | $5.33 | |
| | Hypothetical (h) | | | 1.08% | | | | $1,000.00 | | | | $1,019.44 | | | | $5.41 | |
| R4 | | Actual | | | 0.83% | | | | $1,000.00 | | | | $992.63 | | | | $4.10 | |
| | Hypothetical (h) | | | 0.83% | | | | $1,000.00 | | | | $1,020.68 | | | | $4.16 | |
| R6 | | Actual | | | 0.83% | | | | $1,000.00 | | | | $992.60 | | | | $4.10 | |
| | Hypothetical (h) | | | 0.83% | | | | $1,000.00 | | | | $1,020.68 | | | | $4.16 | |
| (h) | 5% class return per year before expenses. |
| (p) | “Expenses Paid During Period” are equal to each class’s annualized expense ratio, as shown above, multiplied by the average account value over the period, multiplied by 181/365 (to reflect theone-half year period). Expenses paid do not include any applicable sales charges (loads). If these transaction costs had been included, your costs would have been higher. |
5
CONSOLIDATED PORTFOLIO OF INVESTMENTS
4/30/19 (unaudited)
The Consolidated Portfolio of Investments is a complete list of all securities owned by your fund. It is categorized by broad-based asset classes.
| | | | | | | | |
| Bonds - 85.6% | | | | | | | | |
| | |
| Issuer | | Shares/Par | | | Value ($) | |
| Asset-Backed & Securitized - 22.9% | | | | | | | | |
| A Voce CLO Ltd.,2014-1A, “A2R”, FLR, 4.147% (LIBOR - 3mo. + 1.55%), 7/15/2026 (n) | | $ | 1,167,000 | | | $ | 1,165,813 | |
| A Voce CLO Ltd.,2014-1A, “BR”, FLR, 4.747% (LIBOR - 3mo. + 2.15%), 7/15/2026 (n) | | | 1,518,000 | | | | 1,514,931 | |
| AIMCO Properties CLO LP,2014-AA, “B1R”, FLR, 4.191% (LIBOR -3mo. + 1.6%), 7/20/2026 (n) | | | 1,183,000 | | | | 1,183,904 | |
| AIMCO Properties CLO LP,2014-AA, “B2R”, 3.49%, 7/20/2026 (n) | | | 376,000 | | | | 372,129 | |
| Allegro CLO Ltd.,2014-1RA, “A2”, FLR, 4.191% (LIBOR - 3mo. + 1.6%), 10/21/2028 (n) | | | 252,269 | | | | 249,681 | |
| ALM Loan Funding CLO,2015-12A, “A2A2”, FLR, 3.951% (LIBOR -3mo. + 1.35%), 4/16/2027 (n) | | | 2,726,878 | | | | 2,690,585 | |
| ALM Loan Funding CLO,2015-16A, “BR2”, FLR, 4.497% (LIBOR -3mo. + 1.9%), 7/15/2027 (n) | | | 1,497,569 | | | | 1,484,073 | |
| Americredit Automobile Receivables Trust,2017-2, “C”, 2.97%, 3/20/2023 | | | 1,265,000 | | | | 1,269,321 | |
| Avery Point CLO Ltd.,2014-1A, “CR”, FLR, 4.93% (LIBOR - 3mo. + 2.35%), 4/25/2026 (n) | | | 1,150,000 | | | | 1,150,881 | |
| Avis Budget Rental Car Funding LLC,2019-1A, “A”, 3.45%, 3/20/2023 (n) | | | 2,690,000 | | | | 2,722,720 | |
| Ballyrock Ltd., CLO,2018-1A, “A2”, FLR, 4.191% (LIBOR - 3mo. + 1.6%), 4/20/2031 (n) | | | 1,368,365 | | | | 1,340,314 | |
| Ballyrock Ltd., CLO,2018-1A, “B”, FLR, 4.491% (LIBOR - 3mo. + 1.9%), 4/20/2031 (n) | | | 579,877 | | | | 554,717 | |
| Bancorp Commercial Mortgage Trust,2018-CR3, “B”, FLR, 4.022% (LIBOR - 1mo. + 1.55%), 1/15/2033 (n) | | | 1,177,240 | | | | 1,180,442 | |
| Bancorp Commercial Mortgage Trust, 2018-CRE4, “AS”, FLR, 3.573% (LIBOR - 1mo. + 1.1%), 9/15/2035 (n) | | | 1,512,000 | | | | 1,504,590 | |
| Bancorp Commercial Mortgage Trust, 2019-CRE5, “AS”, FLR, 3.822% (LIBOR - 1mo. + 1.35%), 3/15/2036 (n) | | | 1,181,173 | | | | 1,181,542 | |
| Bancorp Commercial Mortgage Trust, 2019-CRE5, “B”, FLR, 3.972% (LIBOR - 1mo. + 1.5%), 3/15/2036 (n) | | | 1,635,470 | | | | 1,635,470 | |
| Barclays Commercial Mortgage Securities LLC,2018-C2, “XA”, 0.938%, 12/15/2051 (i)(z) | | | 19,666,350 | | | | 1,190,044 | |
| BSPRT,2018-FL4 Issuer Ltd., FLR, 4.572% (LIBOR - 1mo. + 2.1%), 9/15/2035 (n) | | | 1,813,000 | | | | 1,816,385 | |
| Business Jet Securities LLC,2018-1, “A”, 4.335%, 2/15/2033 (n) | | | 1,460,092 | | | | 1,471,126 | |
| BXMT Ltd.,2017-FL1 “A”, FLR, 3.343% (LIBOR - 1mo. + 0.87%), 6/15/2035 (n) | | | 1,415,000 | | | | 1,412,360 | |
6
Consolidated Portfolio of Investments (unaudited) – continued
| | | | | | | | |
| | |
| Issuer | | Shares/Par | | | Value ($) | |
| Bonds - continued | | | | | | | | |
| Asset-Backed & Securitized - continued | | | | | | | | |
| Caravana Auto Receivables Trust,2019-1A, “B”, 3.29%, 8/15/2023 (n) | | $ | 2,715,000 | | | $ | 2,727,473 | |
| CD Commercial Mortgage Trust,2017-CD4, “XA”, 1.471%, 5/10/2050 (i) | | | 12,036,863 | | | | 900,360 | |
| Chesapeake Funding II LLC,2016-1A, “A2”, FLR, 3.622% (LIBOR -1mo. + 1.15%), 3/15/2028 (n) | | | 128,471 | | | | 128,619 | |
| Chesapeake Funding II LLC,2017-2A, “B”, 2.81%, 5/15/2029 (n) | | | 832,000 | | | | 830,214 | |
| Chesapeake Funding II LLC,2017-2A, “C”, 3.01%, 5/15/2029 (n) | | | 372,000 | | | | 370,888 | |
| Chesapeake Funding II LLC,2017-3A, “B”, 2.57%, 8/15/2029 (n) | | | 536,000 | | | | 532,890 | |
| Chesapeake Funding II LLC,2017-4A, “B”, 2.59%, 11/15/2029 (n) | | | 578,000 | | | | 572,323 | |
| Chesapeake Funding II LLC,2017-4A, “C”, 2.76%, 11/15/2029 (n) | | | 709,000 | | | | 701,405 | |
| CNH Equipment Trust,2016-C, “A4”, 1.76%, 9/15/2023 | | | 1,855,638 | | | | 1,833,224 | |
| Colony Starwood Homes,2016-2A, “A”, FLR, 3.722% (LIBOR - 1mo. + 1.25%), 12/17/2033 (n) | | | 870,615 | | | | 870,613 | |
| CPS Auto Trust,2016-D, “B”, 2.11%, 3/15/2021 (n) | | | 685,269 | | | | 684,498 | |
| CPS Auto Trust,2017-C, “C”, 2.86%, 6/15/2023 (n) | | | 820,000 | | | | 818,790 | |
| Credit Acceptance Auto Loan Trust,2016-3A, “A”, 2.15%, 4/15/2024 (n) | | | 546,852 | | | | 545,947 | |
| Credit Acceptance Auto Loan Trust,2017-2A, “B”, 3.02%, 4/15/2026 (n) | | | 1,822,000 | | | | 1,816,626 | |
| Cutwater CLO Ltd.,2015-1A, “AR”, FLR, 3.816% (LIBOR - 3mo. + 1.22%), 1/15/2029 (n) | | | 2,261,829 | | | | 2,256,880 | |
| Cutwater Ltd.,2014-1A, “A2R”, FLR, 4.296% (LIBOR - 3mo. + 1.7%), 7/15/2026 (n) | | | 2,250,000 | | | | 2,247,709 | |
| Dell Equipment Finance Trust,2017-2, “B”, 2.47%, 10/24/2022 (n) | | | 510,000 | | | | 508,142 | |
| Dell Equipment Finance Trust,2018-2, “B”, 3.55%, 10/22/2023 (n) | | | 1,616,000 | | | | 1,639,577 | |
| DLL Securitization Trust,2017-A, “A3”, 2.14%, 12/15/2021 (n) | | | 555,000 | | | | 551,880 | |
| DT Auto Owner Trust,2017-1A, “D”, 3.55%, 11/15/2022 (n) | | | 905,000 | | | | 907,864 | |
| DT Auto Owner Trust,2017-2A, “C”, 3.03%, 1/17/2023 (n) | | | 998,805 | | | | 999,024 | |
| DT Auto Owner Trust,2017-2A, “D”, 3.89%, 1/15/2023 (n) | | | 1,290,000 | | | | 1,296,926 | |
| DT Auto Owner Trust,2017-3A, “C”, 3.01%, 5/15/2023 (n) | | | 901,000 | | | | 901,176 | |
| DT Auto Owner Trust,2018-2A, “C”, 3.67%, 3/15/2024 (n) | | | 576,000 | | | | 580,785 | |
| Enterprise Fleet Financing LLC, 1.74%, 2/22/2022 (n) | | | 111,483 | | | | 111,271 | |
| Exantas Capital Corp. CLO Ltd., 2019-RS07, “B”, FLR, 4.199% (LIBOR - 1mo. + 1.7%), 4/15/2036 (z) | | | 1,788,500 | | | | 1,790,744 | |
| Exeter Automobile Receivables Trust,2018-1A, “B”, 2.75%, 4/15/2022 (n) | | | 1,385,000 | | | | 1,383,543 | |
| Exeter Automobile Receivables Trust,2018-2A, “C”, 3.69%, 3/15/2023 (n) | | | 1,825,000 | | | | 1,838,703 | |
| Figueroa CLO Ltd.,2014-1A, “BR”, FLR, 4.096% (LIBOR - 3mo. + 1.5%), 1/15/2027 (n) | | | 2,050,000 | | | | 2,043,801 | |
| Flagship CLO,2014-8A, “BRR”, FLR, 4.001% (LIBOR - 3mo. + 1.4%), 1/16/2026 (z) | | | 1,598,837 | | | | 1,587,442 | |
7
Consolidated Portfolio of Investments (unaudited) – continued
| | | | | | | | |
| | |
| Issuer | | Shares/Par | | | Value ($) | |
| Bonds - continued | | | | | | | | |
| Asset-Backed & Securitized - continued | | | | | | | | |
| Flagship Credit Auto Trust,2016-1, “A”, 2.77%, 12/15/2020 (n) | | $ | 1,301 | | | $ | 1,301 | |
| Ford Credit Auto Owner Trust,2014-2, “A”, 2.31%, 4/15/2026 (n) | | | 1,602,000 | | | | 1,598,344 | |
| Fort Cre LLC,2018-1A, “A1”, FLR, 3.837% (LIBOR - 1mo. + 1.35%), 11/21/2035 (n) | | | 1,471,500 | | | | 1,471,497 | |
| Freedom Financial,2019-1, “A”, 3.42%, 6/18/2026 (z) | | | 759,000 | | | | 759,217 | |
| GMF Floorplan Owner Revolving Trust,2017-A1, “A”, 2.22%, 1/18/2022 (n) | | | 1,010,000 | | | | 1,006,508 | |
| Granite Point Mortgage Trust, Inc., FLR, 3.387% (LIBOR - 1mo. + 0.9%), 11/21/2035 (n) | | | 2,152,704 | | | | 2,153,378 | |
| GS Mortgage Securities Trust, 4.592%, 8/10/2043 (n) | | | 2,104,000 | | | | 2,130,263 | |
| GS Mortgage Securities Trust,2017-GS6, “XA”, 1.046%, 5/10/2050 (i) | | | 10,970,881 | | | | 765,294 | |
| GS Mortgage Securities Trust,2017-GS7, “XA”, 1.134%, 8/10/2050 (i) | | | 11,420,030 | | | | 814,011 | |
| Hertz Fleet Lease Funding LP,2016-1, “A2”, 1.96%, 4/10/2030 (n) | | | 203,167 | | | | 202,966 | |
| Hertz Fleet Lease Funding LP,2017-1, “A2”, 2.13%, 4/10/2031 (n) | | | 1,610,591 | | | | 1,605,592 | |
| Hertz Fleet Lease Funding LP,2018-1, “B”, 3.64%, 5/10/2032 (n) | | | 862,000 | | | | 868,651 | |
| Hertz Fleet Lease Funding LP,2018-1, “C”, 3.77%, 5/10/2032 (n) | | | 495,000 | | | | 498,772 | |
| Invitation Homes Trust, 2018-SFR1, “B”, FLR, 3.423% (LIBOR - 1mo. + 0.95%), 3/17/2037 (n) | | | 953,000 | | | | 945,812 | |
| Invitation Homes Trust, 2018-SFR2, “A”, FLR, 3.323% (LIBOR - 1mo. + 0.85%), 12/17/2036 (n) | | | 1,683,753 | | | | 1,672,373 | |
| JPMorgan Chase & Co., 4.717%, 2/15/2046 (n) | | | 1,791,104 | | | | 1,838,772 | |
| JPMorgan Chase Commercial Mortgage Securities Corp., 1.228%, 9/15/2050 (i) | | | 13,042,618 | | | | 835,686 | |
| KKR Real Estate Financial Trust, Inc. Ltd.,2018-FL1, “C”, FLR, 4.472% (LIBOR - 1mo. + 2%), 6/15/2036 (n) | | | 1,177,500 | | | | 1,186,126 | |
| LoanCore Ltd., 2018-CRE1, “AS”, FLR, 3.972% (LIBOR - 1mo. + 1.5%), 5/15/2028 (n) | | | 1,731,000 | | | | 1,730,996 | |
| LoanCore Ltd., 2018-CRE1, “C”, FLR, 5.022% (LIBOR - 1mo. + 2.55%), 5/15/2028 (n) | | | 577,000 | | | | 579,162 | |
| Loomis, Sayles & Co., CLO, “A2”, FLR, 3.996% (LIBOR - 3mo. + 1.4%), 4/15/2028 (n) | | | 2,652,449 | | | | 2,632,190 | |
| Loomis, Sayles & Co., CLO,2015-2A, “A1R”, FLR, 3.496% (LIBOR -3mo. + 0.9%), 4/15/2028 (n) | | | 1,283,932 | | | | 1,273,070 | |
| Madison Park Funding Ltd.,2014-13A, “BR2”, FLR, 4.091% (LIBOR - 3mo. + 1.5%), 4/19/2030 (n) | | | 2,174,539 | | | | 2,153,861 | |
| Magnetite CLO Ltd.,2015-16A, “BR”, FLR, 3.8% (LIBOR - 3mo. + 1.2%), 1/18/2028 (n) | | | 2,590,000 | | | | 2,555,480 | |
| Magnetite XI Ltd.,2014-11A, “BR”, FLR, 4.7% (LIBOR - 3mo. + 2.1%), 1/18/2027 (n) | | | 805,000 | | | | 803,717 | |
| Man GLG U.S. CLO2018-2 Ltd.,2018-2A, “BR”, FLR, 5.046% (LIBOR - 3mo. + 2.45%), 10/15/2028 | | | 2,019,578 | | | | 2,013,441 | |
8
Consolidated Portfolio of Investments (unaudited) – continued
| | | | | | | | |
| | |
| Issuer | | Shares/Par | | | Value ($) | |
| Bonds - continued | | | | | | | | |
| Asset-Backed & Securitized - continued | | | | | | | | |
| Morgan Stanley Bank of America Merrill Lynch Trust,2017-C33, “XA”, 1.431%, 5/15/2050 (i) | | $ | 11,917,635 | | | $ | 884,909 | |
| Morgan Stanley Capital I Trust,2017-H1, “XA”, 1.443%, 6/15/2050 (i) | | | 4,676,343 | | | | 367,519 | |
| Morgan Stanley Capital I Trust,2018-H4, “XA”, 0.867%, 12/15/2051 (i) | | | 16,471,411 | | | | 1,082,122 | |
| Mountain Hawk CLO Ltd.,2013-2A, “BR”, FLR, 4.191% (LIBOR -3mo. + 1.6%), 7/20/2024 (n) | | | 1,809,670 | | | | 1,809,686 | |
| Mountain Hawk CLO Ltd.,2014-3A, “BR”, FLR, 4.4% (LIBOR - 3mo. + 1.8%), 4/18/2025 (n) | | | 2,325,000 | | | | 2,323,872 | |
| Nationstar HECM Loan Trust,2018-1A, “M1”, 3.238%, 2/25/2028 (n) | | | 1,027,000 | | | | 1,026,148 | |
| Nationstar HECM Loan Trust,2018-2A, “M1”, 3.551%, 7/25/2028 (n) | | | 1,072,000 | | | | 1,069,840 | |
| Nationstar HECM Loan Trust,2018-3, “A”, 3.554%, 11/25/2028 (n) | | | 1,467,234 | | | | 1,462,710 | |
| Navistar Financial Dealer Note Master Owner Trust II,2018-1, “B”, FLR, 3.276% (LIBOR - 1mo. + 0.8%), 9/25/2023 (n) | | | 302,000 | | | | 302,497 | |
| Navistar Financial Dealer Note Master Owner Trust II,2018-1, “C”, FLR, 3.526% (LIBOR - 1mo. + 1.05%), 9/25/2023 (n) | | | 340,000 | | | | 340,842 | |
| Neuberger Berman CLO Ltd.,2015-20A, “BR”, 3.846%, 1/15/2028 (z) | | | 2,729,000 | | | | 2,664,085 | |
| Neuberger Berman CLO Ltd.,2016-21A, “CR”, FLR, 4.191% (LIBOR - 3mo. + 1.6%), 4/20/2027 (n) | | | 1,515,565 | | | | 1,462,113 | |
| NextGear Floorplan Master Owner Trust,2017-1A, “A2”, 2.54%, 4/18/2022 (n) | | | 938,000 | | | | 935,309 | |
| NextGear Floorplan Master Owner Trust,2017-2A, “B”, 3.02%, 10/17/2022 (n) | | | 766,000 | | | | 765,230 | |
| Oaktree CLO Ltd.,2014-2A, “BR”, FLR, 5.141% (LIBOR - 3mo. + 2.55%), 10/20/2026 (n) | | | 1,149,000 | | | | 1,147,965 | |
| OCP CLO Ltd.,2015-10A, “A2R”, FLR, 3.886% (LIBOR - 3mo. + 1.3%), 10/26/2027 (z) | | | 2,211,957 | | | | 2,188,039 | |
| OneMain Financial Issuance Trust,2017-1A, “A1”, 2.37%, 9/14/2032 (n) | | | 1,525,000 | | | | 1,514,654 | |
| Oscar U.S. Funding Trust,2017-1A, “A3”, 2.82%, 6/10/2021 (n) | | | 1,048,217 | | | | 1,047,424 | |
| Oscar U.S. Funding Trust,2017-2A, “A2B”, FLR, 3.131% (LIBOR -1mo. + 0.65%), 11/10/2020 (n) | | | 232,046 | | | | 232,119 | |
| Oscar U.S. Funding Trust,2018-2A, “A3”, 3.39%, 9/12/2022 (n) | | | 820,000 | | | | 825,498 | |
| PFS Financing Corp.,2017-C, “A”, FLR, 2.942% (LIBOR - 1mo. + 0.47%), 10/15/2021 (n) | | | 670,000 | | | | 669,401 | |
| Santander Drive Auto Receivables Trust,2017-2, “C”, 2.79%, 8/15/2022 | | | 769,000 | | | | 768,397 | |
| Santander Drive Auto Receivables Trust,2018-1, “B”, 2.63%, 7/15/2022 | | | 1,246,000 | | | | 1,244,944 | |
9
Consolidated Portfolio of Investments (unaudited) – continued
| | | | | | | | |
| | |
| Issuer | | Shares/Par | | | Value ($) | |
| Bonds - continued | | | | | | | | |
| Asset-Backed & Securitized - continued | | | | | | | | |
| Santander Retail Auto Lease Trust,2017-A, “B”, 2.68%, 1/20/2022 (n) | | $ | 866,000 | | | $ | 864,261 | |
| Shackelton Ltd., CLO,2013-4RA, “B”, FLR, 4.496% (LIBOR - 3mo. + 1.9%), 4/13/2031 (n) | | | 722,762 | | | | 699,833 | |
| Shelter Growth CRE,2018-FL1, “A”, FLR, 3.472% (LIBOR - 1mo. + 1%), 1/15/2035 (z) | | | 510,562 | | | | 511,038 | |
| Sierra Receivables Funding Co. LLC,2015-1A, “A”, 2.4%, 3/22/2032 (n) | | | 186,618 | | | | 185,973 | |
| Starwood Waypoint Homes Trust,2017-1, “B”, FLR, 3.642% (LIBOR - 1mo. + 1.17%), 1/17/2035 (n) | | | 1,514,489 | | | | 1,510,752 | |
| Thacher Park CLO Ltd.,2014-1A, “CR”, FLR, 4.791% (LIBOR - 3mo. + 2.2%), 10/20/2026 (n) | | | 1,143,000 | | | | 1,142,960 | |
| TICP Ltd., CLO,2018-3R, “B”, FLR, 3.941% (LIBOR - 3mo. + 1.35%), 4/20/2028 (n) | | | 681,356 | | | | 670,974 | |
| TICP Ltd., CLO,2018-3R, “C”, FLR, 4.391% (LIBOR - 3mo. + 1.8%), 4/20/2028 (n) | | | 1,195,706 | | | | 1,162,034 | |
| TPG Real Estate Finance,2018-FL2, “AS”, FLR, 3.922% (LIBOR -1mo. + 1.45%), 11/15/2037 (n) | | | 1,914,000 | | | | 1,917,004 | |
| Tricon American Homes Trust, 2015-SFR1, “1A”, 2.589%, 11/17/2033 (n) | | | 1,020,915 | | | | 1,009,324 | |
| UBS Commercial Mortgage Trust,2017-C1, “XA”, 1.022%, 11/15/2050 (i) | | | 7,924,307 | | | | 486,545 | |
| UBS Commercial Mortgage Trust,2018-C14, “XA”, 1.01%, 12/15/2051 (i) | | | 8,078,694 | | | | 593,202 | |
| Verizon Owner Trust,2016-1A, “A”, 1.42%, 1/20/2021 (n) | | | 368,963 | | | | 367,906 | |
| Verizon Owner Trust,2017-3A, “B”, 2.38%, 4/20/2022 (n) | | | 769,000 | | | | 764,263 | |
| Veros Auto Receivables Trust,2017-1, “A”, 2.84%, 4/17/2023 (n) | | | 112,024 | | | | 111,882 | |
| Veros Auto Receivables Trust,2018-1, “A”, 3.63%, 5/15/2023 (n) | | | 1,034,809 | | | | 1,036,775 | |
| West CLO Ltd.,2013-1A, “A2BR”, 3.393%, 11/07/2025 (n) | | | 1,174,000 | | | | 1,163,155 | |
| WF-RBS Commercial Mortgage Trust,2011-C3, “A4”, 4.375%, 3/15/2044 (n) | | | 2,276,538 | | | | 2,333,872 | |
| | | | | | | | |
| | | | | | | $ | 137,833,921 | |
| Automotive - 1.5% | | | | | | | | |
| BMW US Capital LLC, 3.1%, 4/12/2021 (n) | | $ | 1,639,000 | | | $ | 1,651,542 | |
| Ford Motor Credit Co. LLC, 5.085%, 1/07/2021 | | | 984,000 | | | | 1,009,676 | |
| Harley-Davidson Financial Services, 4.05%, 2/04/2022 (n) | | | 1,251,000 | | | | 1,276,473 | |
| Harley-Davidson Financial Services, FLR, 3.555% (LIBOR - 3mo. + 0.94%), 3/02/2021 (n) | | | 1,473,000 | | | | 1,472,779 | |
| Hyundai Capital America, 3.75%, 7/08/2021 (n) | | | 1,082,000 | | | | 1,091,623 | |
| Volkswagen Group of America Co., 3.875%, 11/13/2020 (n) | | | 1,177,000 | | | | 1,193,347 | |
| Volkswagen Group of America Co., 4%, 11/12/2021 (n) | | | 1,177,000 | | | | 1,201,894 | |
| | | | | | | | |
| | | | | | | $ | 8,897,334 | |
10
Consolidated Portfolio of Investments (unaudited) – continued
| | | | | | | | |
| | |
| Issuer | | Shares/Par | | | Value ($) | |
| Bonds - continued | | | | | | | | |
| Broadcasting - 0.4% | | | | | | | | |
| Fox Corp., 3.666%, 1/25/2022 (n) | | $ | 716,000 | | | $ | 730,978 | |
| Interpublic Group of Companies, Inc., 3.5%, 10/01/2020 | | | 1,512,000 | | | | 1,524,490 | |
| | | | | | | | |
| | | | | | | $ | 2,255,468 | |
| Brokerage & Asset Managers - 0.9% | | | | | | | | |
| E*TRADE Financial Corp., 2.95%, 8/24/2022 | | $ | 3,060,000 | | | $ | 3,057,278 | |
| Intercontinental Exchange, Inc., 2.75%, 12/01/2020 | | | 2,520,000 | | | | 2,521,610 | |
| | | | | | | | |
| | | | | | | $ | 5,578,888 | |
| Cable TV - 1.0% | | | | | | | | |
| Comcast Corp., 3.45%, 10/01/2021 | | $ | 1,507,000 | | | $ | 1,534,733 | |
| NBCUniversal Media LLC, 4.375%, 4/01/2021 | | | 1,800,000 | | | | 1,856,197 | |
| Time Warner Cable, Inc., 5%, 2/01/2020 | | | 2,308,000 | | | | 2,340,434 | |
| | | | | | | | |
| | | | | | | $ | 5,731,364 | |
| Chemicals - 0.2% | | | | | | | | |
| Sasol Chemicals (USA) LLC, 5.875%, 3/27/2024 | | $ | 1,003,000 | | | $ | 1,064,358 | |
| | |
| Computer Software - 0.7% | | | | | | | | |
| Dell Investments LLC/EMC Corp., 4.42%, 6/15/2021 | | $ | 2,707,000 | | | $ | 2,772,367 | |
| Dell Investments LLC/EMC Corp., 4%, 7/15/2024 (n) | | | 1,422,000 | | | | 1,437,617 | |
| | | | | | | | |
| | | | | | | $ | 4,209,984 | |
| Conglomerates - 1.4% | | | | | | | | |
| Roper Technologies, Inc., 2.8%, 12/15/2021 | | $ | 508,000 | | | $ | 506,631 | |
| United Technologies Corp., 3.1%, 6/01/2022 | | | 881,000 | | | | 887,097 | |
| United Technologies Corp., 3.65%, 8/16/2023 | | | 3,088,000 | | | | 3,165,198 | |
| Westinghouse Air Brake Technologies Corp., 4.4%, 3/15/2024 | | | 2,892,000 | | | | 2,972,891 | |
| Westinghouse Air Brake Technologies Corp., FLR, 3.91% (LIBOR - 3mo. + 1.05%), 9/15/2021 | | | 754,000 | | | | 754,371 | |
| | | | | | | | |
| | | | | | | $ | 8,286,188 | |
| Consumer Products - 0.4% | | | | | | | | |
| Reckitt Benckiser Treasury Services PLC, 2.375%, 6/24/2022 (n) | | $ | 2,414,000 | | | $ | 2,374,660 | |
| | |
| Consumer Services - 0.4% | | | | | | | | |
| Alibaba Group Holding Ltd., 2.8%, 6/06/2023 | | $ | 1,506,000 | | | $ | 1,489,291 | |
| QVC, Inc., 5.125%, 7/02/2022 | | | 1,156,000 | | | | 1,208,740 | |
| | | | | | | | |
| | | | | | | $ | 2,698,031 | |
| Electrical Equipment - 0.2% | | | | | | | | |
| Molex Electronic Technologies LLC, 2.878%, 4/15/2020 (n) | | $ | 1,408,000 | | | $ | 1,405,880 | |
11
Consolidated Portfolio of Investments (unaudited) – continued
| | | | | | | | |
| | |
| Issuer | | Shares/Par | | | Value ($) | |
| Bonds - continued | | | | | | | | |
| Electronics - 1.3% | | | | | | | | |
| Broadcom Corp./Broadcom Cayman Finance Ltd., 3%, 1/15/2022 | | $ | 3,985,000 | | | $ | 3,961,230 | |
| Broadcom, Inc., 3.125%, 4/15/2021 (n) | | | 1,550,000 | | | | 1,549,302 | |
| Microchip Technology, Inc., 3.922%, 6/01/2021 (n) | | | 2,558,000 | | | | 2,594,837 | |
| | | | | | | | |
| | | | | | | $ | 8,105,369 | |
| Emerging Market Quasi-Sovereign - 0.6% | | | | | | | | |
| Bharat Petroleum Corp. Ltd., 4.625%, 10/25/2022 | | $ | 1,716,000 | | | $ | 1,777,879 | |
| Corporacion Financiera de Desarrollo S.A., 3.25%, 7/15/2019 (n) | | | 1,170,000 | | | | 1,170,351 | |
| Indian Oil Corp. Ltd., 5.75%, 8/01/2023 | | | 858,000 | | | | 925,441 | |
| | | | | | | | |
| | | | | | | $ | 3,873,671 | |
| Energy - Integrated - 1.1% | | | | | | | | |
| BP Capital Markets PLC, 2.521%, 1/15/2020 | | $ | 806,000 | | | $ | 805,220 | |
| Cenovus Energy, Inc., 3%, 8/15/2022 | | | 2,172,000 | | | | 2,144,564 | |
| Cenovus Energy, Inc., 3.8%, 9/15/2023 | | | 593,000 | | | | 596,154 | |
| Eni S.p.A., 4%, 9/12/2023 (n) | | | 740,000 | | | | 758,574 | |
| Shell International Finance B.V., 1.375%, 5/10/2019 | | | 2,500,000 | | | | 2,499,350 | |
| | | | | | | | |
| | | | | | | $ | 6,803,862 | |
| Entertainment - 0.1% | | | | | | | | |
| Royal Caribbean Cruises Ltd., 2.65%, 11/28/2020 | | $ | 836,000 | | | $ | 832,960 | |
| | |
| Financial Institutions - 1.5% | | | | | | | | |
| AerCap Ireland Capital Ltd., 4.45%, 12/16/2021 | | $ | 1,723,000 | | | $ | 1,769,958 | |
| Avolon Holdings Funding Ltd., 3.625%, 5/01/2022 (z) | | | 1,818,000 | | | | 1,821,727 | |
| Avolon Holdings Funding Ltd., 3.95%, 7/01/2024 (z) | | | 1,131,000 | | | | 1,123,796 | |
| GE Capital International Funding Co., 2.342%, 11/15/2020 | | | 4,269,000 | | | | 4,222,825 | |
| | | | | | | | |
| | | | | | | $ | 8,938,306 | |
| Food & Beverages - 0.7% | | | | | | | | |
| Conagra Brands, Inc., 3.8%, 10/22/2021 | | $ | 1,039,000 | | | $ | 1,059,335 | |
| Conagra Brands, Inc., FLR, 3.341% (LIBOR - 3mo. + 0.75%), 10/22/2020 | | | 742,000 | | | | 742,240 | |
| Constellation Brands, Inc., FLR, 3.383% (LIBOR - 3mo. + 0.7%), 11/15/2021 | | | 739,000 | | | | 739,559 | |
| Diageo PLC, 3%, 5/18/2020 | | | 967,000 | | | | 970,730 | |
| Pernod Ricard S.A., 5.75%, 4/07/2021 (n) | | | 480,000 | | | | 504,992 | |
| | | | | | | | |
| | | | | | | $ | 4,016,856 | |
| Health Maintenance Organizations - 0.3% | | | | | | | | |
| Halfmoon Parent, Inc., FLR, 3.264% (LIBOR - 3mo. + 0.65%), 9/17/2021 (n) | | $ | 1,496,000 | | | $ | 1,496,390 | |
12
Consolidated Portfolio of Investments (unaudited) – continued
| | | | | | | | |
| | |
| Issuer | | Shares/Par | | | Value ($) | |
| Bonds - continued | | | | | | | | |
| Industrial - 0.1% | | | | | | | | |
| Century Housing Corp., 3.995%, 11/01/2021 | | $ | 691,000 | | | $ | 692,784 | |
| | |
| Insurance - 0.6% | | | | | | | | |
| American International Group, Inc., 2.3%, 7/16/2019 | | $ | 1,182,000 | | | $ | 1,181,100 | |
| Metropolitan Life Global Funding I, 2%, 4/14/2020 (n) | | | 2,200,000 | | | | 2,185,967 | |
| | | | | | | | |
| | | | | | | $ | 3,367,067 | |
| Insurance - Health - 0.3% | | | | | | | | |
| UnitedHealth Group, Inc., 1.95%, 10/15/2020 | | $ | 1,775,000 | | | $ | 1,758,333 | |
| | |
| Insurance - Property & Casualty - 0.3% | | | | | | | | |
| Marsh & McLennan Cos., Inc., 2.75%, 1/30/2022 | | $ | 1,522,000 | | | $ | 1,521,203 | |
| | |
| International Market Quasi-Sovereign - 1.1% | | | | | | | | |
| Caisse d’Amortissement de la Dette Sociale, 1.875%, 1/13/2020 (n) | | $ | 1,230,000 | | | $ | 1,225,006 | |
| CPPIB Capital, Inc., 1.25%, 9/20/2019 (n) | | | 1,980,000 | | | | 1,970,116 | |
| Dexia Credit Local S.A., 2.25%, 2/18/2020 (n) | | | 580,000 | | | | 578,570 | |
| Dexia Credit Local S.A., 1.875%, 9/15/2021 (n) | | | 2,010,000 | | | | 1,979,233 | |
| Kommunalbanken A.S., 1.375%, 10/26/2020 (n) | | | 720,000 | | | | 708,810 | |
| | | | | | | | |
| | | | | | | $ | 6,461,735 | |
| Internet - 0.5% | | | | | | | | |
| Baidu, Inc., 2.75%, 6/09/2019 | | $ | 539,000 | | | $ | 538,945 | |
| Baidu, Inc., 3.875%, 9/29/2023 | | | 2,225,000 | | | | 2,266,621 | |
| | | | | | | | |
| | | | | | | $ | 2,805,566 | |
| Local Authorities - 0.4% | | | | | | | | |
| Kommuninvest i Sverige AB, 1.125%, 9/17/2019 (n) | | $ | 2,390,000 | | | $ | 2,377,156 | |
| | |
| Machinery & Tools - 0.3% | | | | | | | | |
| CNH Industrial Capital LLC, 4.2%, 1/15/2024 | | $ | 1,931,000 | | | $ | 1,973,413 | |
| | |
| Major Banks - 7.1% | | | | | | | | |
| ABN AMRO Bank N.V., 2.65%, 1/19/2021 (n) | | $ | 3,685,000 | | | $ | 3,671,808 | |
| Barclays PLC, 4.61% to 2/15/2022, FLR (LIBOR - 3mo. + 1.4%) to 2/15/2023 | | | 5,181,000 | | | | 5,309,276 | |
| Commonwealth Bank of Australia, 2.3%, 9/06/2019 | | | 1,725,000 | | | | 1,723,047 | |
| Credit Agricole, “A”, FLR, 4.014% (LIBOR - 3mo. + 1.43%), 1/10/2022 (n) | | | 750,000 | | | | 760,351 | |
| Credit Suisse Group AG, 3.8%, 9/15/2022 | | | 1,764,000 | | | | 1,800,569 | |
| Credit Suisse Group AG, 3.574%, 1/09/2023 (n) | | | 2,060,000 | | | | 2,077,184 | |
| DNB Bank A.S.A., 2.125%, 10/02/2020 (n) | | | 1,910,000 | | | | 1,894,037 | |
| HSBC Holdings PLC, 3.262% to 3/13/2022, FLR (LIBOR - 3mo. + 1.055%) to 3/13/2023 | | | 2,661,000 | | | | 2,679,834 | |
13
Consolidated Portfolio of Investments (unaudited) – continued
| | | | | | | | |
| | |
| Issuer | | Shares/Par | | | Value ($) | |
| Bonds - continued | | | | | | | | |
| Major Banks - continued | | | | | | | | |
| HSBC Holdings PLC, 3.033% to 11/22/2022, FLR (LIBOR - 3mo. + 0.923%) to 11/22/2023 | | $ | 957,000 | | | $ | 956,724 | |
| JPMorgan Chase & Co., 3.207% to 4/01/2022, FLR (LIBOR - 3mo. + 0.695%) to 4/01/2023 | | | 2,839,000 | | | | 2,857,482 | |
| KeyBank N.A., 3.3%, 2/01/2022 | | | 772,000 | | | | 783,681 | |
| Mitsubishi UFJ Financial Group, Inc., 2.95%, 3/01/2021 | | | 449,000 | | | | 450,350 | |
| Mitsubishi UFJ Financial Group, Inc., 3.535%, 7/26/2021 | | | 1,593,000 | | | | 1,619,131 | |
| National Australia Bank Ltd., 1.375%, 7/12/2019 | | | 1,100,000 | | | | 1,097,439 | |
| NatWest Markets PLC, 3.625%, 9/29/2022 (n) | | | 1,150,000 | | | | 1,152,695 | |
| PNC Bank N.A., 2.25%, 7/02/2019 | | | 1,140,000 | | | | 1,139,225 | |
| Royal Bank of Scotland Group PLC, 4.269% to 3/22/2024, FLR | | | | | | | | |
| (LIBOR - 3mo. + 1.762%) to 3/22/2025 | | | 1,282,000 | | | | 1,306,994 | |
| Skandinaviska Enskilda Banken AB, 2.45%, 5/27/2020 (n) | | | 2,200,000 | | | | 2,191,750 | |
| Svenska Handelsbanken AB, 2.25%, 6/17/2019 | | | 1,725,000 | | | | 1,723,922 | |
| UBS Group Funding (Switzerland) AG, 3.491%, 5/23/2023 (n) | | | 4,587,000 | | | | 4,614,949 | |
| UBS Group Funding Ltd., 3%, 4/15/2021 (n) | | | 3,100,000 | | | | 3,106,917 | |
| | | | | | | | |
| | | | | | | $ | 42,917,365 | |
| Medical & Health Technology & Services - 0.3% | | | | | | | | |
| Becton, Dickinson and Co., 2.404%, 6/05/2020 | | $ | 796,000 | | | $ | 791,832 | |
| Becton, Dickinson and Co., 2.894%, 6/06/2022 | | | 948,000 | | | | 945,480 | |
| | | | | | | | |
| | | | | | | $ | 1,737,312 | |
| Medical Equipment - 0.4% | | | | | | | | |
| Zimmer Biomet Holdings, Inc., 2.7%, 4/01/2020 | | $ | 1,894,000 | | | $ | 1,890,259 | |
| Zimmer Biomet Holdings, Inc., FLR, 3.375% (LIBOR - 3mo. + 0.75%), 3/19/2021 | | | 356,000 | | | | 354,870 | |
| | | | | | | | |
| | | | | | | $ | 2,245,129 | |
| Metals & Mining - 0.5% | | | | | | | | |
| Glencore Finance (Canada) Ltd., 4.95%, 11/15/2021 (n) | | $ | 729,000 | | | $ | 760,347 | |
| Glencore Funding LLC, 3%, 10/27/2022 (n) | | | 610,000 | | | | 603,423 | |
| Glencore Funding LLC, 4.125%, 3/12/2024 (n) | | | 1,280,000 | | | | 1,297,956 | |
| Vale Overseas Ltd., 4.375%, 1/11/2022 | | | 285,000 | | | | 289,987 | |
| | | | | | | | |
| | | | | | | $ | 2,951,713 | |
| Midstream - 0.7% | | | | | | | | |
| Andeavor Logistics LP/Tesoro Logistics Finance Corp., 3.5%, 12/01/2022 | | $ | 1,661,000 | | | $ | 1,679,319 | |
| El Paso LLC, 6.5%, 9/15/2020 | | | 1,874,000 | | | | 1,962,304 | |
| MPLX LP, 3.375%, 3/15/2023 | | | 471,000 | | | | 473,872 | |
| | | | | | | | |
| | | | | | | $ | 4,115,495 | |
14
Consolidated Portfolio of Investments (unaudited) – continued
| | | | | | | | |
| | |
| Issuer | | Shares/Par | | | Value ($) | |
| Bonds - continued | | | | | | | | |
| Mortgage-Backed - 0.5% | | | | | | | | |
| Fannie Mae, 4.5%, 4/01/2024 - 5/01/2025 | | $ | 307,931 | | | $ | 316,996 | |
| Fannie Mae, 4%, 3/01/2025 | | | 27,470 | | | | 28,414 | |
| Fannie Mae, 3%, 12/01/2031 | | | 601,951 | | | | 606,346 | |
| Fannie Mae, 2%, 5/25/2044 | | | 1,765,277 | | | | 1,728,928 | |
| Freddie Mac, 1.017%, 4/25/2024 (i) | | | 127,600 | | | | 4,498 | |
| Freddie Mac, 4%, 7/01/2025 | | | 211,148 | | | | 218,863 | |
| | | | | | | | |
| | | | | | | $ | 2,904,045 | |
| Municipals - 0.4% | | | | | | | | |
| New Jersey Economic Development Authority State Pension Funding Rev., Capital Appreciation, “B”, 0%, 2/15/2023 | | $ | 3,058,000 | | | $ | 2,689,328 | |
| | |
| Oils - 0.1% | | | | | | | | |
| Phillips 66, FLR, 3.246% (LIBOR - 3mo. + 0.6%), 2/26/2021 | | $ | 839,000 | | | $ | 839,060 | |
| | |
| Other Banks & Diversified Financials - 3.5% | | | | | | | | |
| American Express Co., 3.7%, 11/05/2021 | | $ | 1,473,000 | | | $ | 1,504,414 | |
| Banque Federative du Credit Mutuel S.A., 2.2%, 7/20/2020 (n) | | | 1,854,000 | | | | 1,840,510 | |
| Branch Banking & Trust Co., 1.45%, 5/10/2019 | | | 1,570,000 | | | | 1,569,529 | |
| Capital One Financial Corp., 2.4%, 10/30/2020 | | | 590,000 | | | | 587,228 | |
| Compass Bank, 3.5%, 6/11/2021 | | | 1,498,000 | | | | 1,513,684 | |
| Compass Bank, 2.875%, 6/29/2022 | | | 2,837,000 | | | | 2,822,584 | |
| Discover Bank, 3.1%, 6/04/2020 | | | 1,190,000 | | | | 1,193,284 | |
| First Republic Bank, 2.375%, 6/17/2019 | | | 278,000 | | | | 277,860 | |
| Groupe BPCE S.A., 2.5%, 7/15/2019 | | | 1,234,000 | | | | 1,233,346 | |
| Groupe BPCE S.A., 4%, 9/12/2023 (n) | | | 1,193,000 | | | | 1,218,380 | |
| Groupe BPCE S.A., FLR, 3.836% (LIBOR - 3mo. + 1.24%), 9/12/2023 (n) | | | 1,193,000 | | | | 1,193,491 | |
| Intesa Sanpaolo S.p.A., FLR, 3.218% (LIBOR - 3mo. + 0.63%), 7/17/2019 | | | 3,136,000 | | | | 3,136,301 | |
| UniCredito Italiano S.p.A., 6.572%, 1/14/2022 (n) | | | 1,297,000 | | | | 1,366,790 | |
| UniCredito Italiano S.p.A., 3.75%, 4/12/2022 (n) | | | 1,342,000 | | | | 1,342,225 | |
| | | | | | | | |
| | | | | | | $ | 20,799,626 | |
| Pharmaceuticals - 2.1% | | | | | | | | |
| Actavis Funding SCS, 3%, 3/12/2020 | | $ | 1,058,000 | | | $ | 1,058,141 | |
| Actavis Funding SCS, 3.45%, 3/15/2022 | | | 2,322,000 | | | | 2,333,763 | |
| Bayer U.S. Finance II LLC, 3.5%, 6/25/2021 (n) | | | 2,275,000 | | | | 2,286,506 | |
| Celgene Corp., 2.875%, 8/15/2020 | | | 1,912,000 | | | | 1,913,721 | |
| Celgene Corp., 2.75%, 2/15/2023 | | | 1,297,000 | | | | 1,284,833 | |
| Shire Acquisitions Investments Ireland Designated Activity Co., 1.9%, 9/23/2019 | | | 2,740,000 | | | | 2,729,463 | |
| Takeda Pharmaceutical Co. Ltd., 3.8%, 11/26/2020 (n) | | | 1,031,000 | | | | 1,045,090 | |
| | | | | | | | |
| | | | | | | $ | 12,651,517 | |
15
Consolidated Portfolio of Investments (unaudited) – continued
| | | | | | | | |
| | |
| Issuer | | Shares/Par | | | Value ($) | |
| Bonds - continued | | | | | | | | |
| Printing & Publishing - 0.2% | | | | | | | | |
| Moody’s Corp., 3.25%, 6/07/2021 | | $ | 1,266,000 | | | $ | 1,277,577 | |
| | |
| Retailers - 0.4% | | | | | | | | |
| Alimentation Couche-Tard, Inc., 2.35%, 12/13/2019 (n) | | $ | 1,786,000 | | | $ | 1,780,099 | |
| Macy’s Retail Holdings, Inc., 3.875%, 1/15/2022 | | | 580,000 | | | | 584,485 | |
| | | | | | | | |
| | | | | | | $ | 2,364,584 | |
| Supranational - 0.2% | | | | | | | | |
| Corporacion Andina de Fomento, 2%, 5/10/2019 | | $ | 1,180,000 | | | $ | 1,179,776 | |
| | |
| Telecommunications - Wireless - 1.2% | | | | | | | | |
| American Tower Corp., REIT, 2.8%, 6/01/2020 | | $ | 573,000 | | | $ | 573,008 | |
| American Tower Corp., REIT, 2.25%, 1/15/2022 | | | 2,250,000 | | | | 2,216,325 | |
| American Tower Corp., REIT, 3%, 6/15/2023 | | | 1,462,000 | | | | 1,457,964 | |
| Crown Castle International Corp., 3.4%, 2/15/2021 | | | 610,000 | | | | 614,678 | |
| Crown Castle International Corp., 3.15%, 7/15/2023 | | | 755,000 | | | | 755,540 | |
| SBA Tower Trust, 2.877%, 7/09/2021 (n) | | | 660,000 | | | | 656,358 | |
| SBA Tower Trust, 2.898%, 10/15/2044 (n) | | | 878,000 | | | | 877,122 | |
| | | | | | | | |
| | | | | | | $ | 7,150,995 | |
| Tobacco - 1.1% | | | | | | | | |
| B.A.T Capital Corp., 2.297%, 8/14/2020 | | $ | 2,011,000 | | | $ | 1,995,596 | |
| B.A.T Capital Corp., 2.764%, 8/15/2022 | | | 708,000 | | | | 697,959 | |
| Imperial Tobacco Finance PLC, 2.95%, 7/21/2020 (n) | | | 3,866,000 | | | | 3,856,137 | |
| | | | | | | | |
| | | | | | | $ | 6,549,692 | |
| Transportation - Services - 0.4% | | | | | | | | |
| TTX Co., 2.6%, 6/15/2020 (n) | | $ | 2,400,000 | | | $ | 2,396,484 | |
| | |
| U.S. Government Agencies and Equivalents - 0.1% | | | | | | | | |
| Hashemite Kingdom of Jordan, 1.945%, 6/23/2019 | | $ | 750,000 | | | $ | 749,459 | |
| Small Business Administration, 2.25%, 7/01/2021 | | | 110,662 | | | | 110,609 | |
| | | | | | | | |
| | | | | | | $ | 860,068 | |
| U.S. Treasury Obligations - 24.9% | | | | | | | | |
| U.S. Treasury Notes, 1.25%, 5/31/2019 (f)(s) | | $ | 15,000,000 | | | $ | 14,985,532 | |
| U.S. Treasury Notes, 0.875%, 7/31/2019 (f)(s) | | | 15,000,000 | | | | 14,940,820 | |
| U.S. Treasury Notes, 1%, 9/30/2019 (f)(s) | | | 15,000,000 | | | | 14,912,572 | |
| U.S. Treasury Notes, 1%, 11/15/2019 (f)(s) | | | 15,000,000 | | | | 14,882,813 | |
| U.S. Treasury Notes, 1.375%, 10/31/2020 | | | 38,541,000 | | | | 38,006,545 | |
| U.S. Treasury Notes, 2.375%, 3/15/2021 (f) | | | 8,081,000 | | | | 8,092,995 | |
| U.S. Treasury Notes, 2.25%, 3/31/2021 | | | 14,000,000 | | | | 13,991,797 | |
| U.S. Treasury Notes, 2.625%, 6/15/2021 | | | 29,872,000 | | | | 30,096,040 | |
| | | | | | | | |
| | | | | | | $ | 149,909,114 | |
16
Consolidated Portfolio of Investments (unaudited) – continued
| | | | | | | | |
| | |
| Issuer | | Shares/Par | | | Value ($) | |
| Bonds - continued | | | | | | | | |
| Utilities - Electric Power - 2.3% | | | | | | | | |
| Dominion Energy, Inc., 2.962%, 7/01/2019 | | $ | 780,000 | | | $ | 779,998 | |
| Dominion Energy, Inc., 2.579%, 7/01/2020 | | | 1,136,000 | | | | 1,131,265 | |
| Emera U.S. Finance LP, 2.15%, 6/15/2019 | | | 1,165,000 | | | | 1,163,722 | |
| Emera U.S. Finance LP, 2.7%, 6/15/2021 | | | 468,000 | | | | 464,894 | |
| Enel Finance International N.V., 2.875%, 5/25/2022 (n) | | | 2,820,000 | | | | 2,786,819 | |
| Engie Energia Chile S.A., 5.625%, 1/15/2021 | | | 2,755,000 | | | | 2,861,756 | |
| Eversource Energy, 2.5%, 3/15/2021 | | | 730,000 | | | | 726,153 | |
| FirstEnergy Corp., 2.85%, 7/15/2022 | | | 581,000 | | | | 576,871 | |
| NextEra Energy, Inc., 2.9%, 4/01/2022 | | | 1,411,000 | | | | 1,417,100 | |
| WEC Energy Group, Inc., 3.375%, 6/15/2021 | | | 1,056,000 | | | | 1,068,702 | |
| WEC Energy Group, Inc., 3.1%, 3/08/2022 | | | 826,000 | | | | 831,969 | |
| | | | | | | | |
| | | | | | | $ | 13,809,249 | |
| Total Bonds (Identified Cost, $513,149,456) | | | $ | 514,708,876 | |
| | |
| Investment Companies (h) - 6.1% | | | | | | | | |
| Money Market Funds - 6.1% | | | | | | | | |
MFS Institutional Money Market Portfolio, 2.48% (v)
(Identified Cost, $36,607,955) | | | 36,612,902 | | | $ | 36,612,902 | |
| | |
| Short-Term Obligations (s)(y) - 2.7% | | | | | | | | |
| Bank of Montreal/Chicago Branch, 2.45%, due 5/03/2019 | | $ | 1,000,000 | | | $ | 1,000,000 | |
| Cisco Systems, Inc., 2.42%, due 5/16/2019 | | | 4,000,000 | | | | 3,995,967 | |
| Exxon Mobil Corp., 2.41%, due 5/03/2019 | | | 4,000,000 | | | | 3,999,464 | |
| Freddie Mac, 2.35%, due 5/01/2019 | | | 152,000 | | | | 152,000 | |
| Intel Corp., 2.44%, due 5/17/2019 | | | 3,000,000 | | | | 2,996,747 | |
| Siemens Capital Co. LLC, 2.45%, due 5/06/2019 | | | 4,000,000 | | | | 3,998,639 | |
| Total Short-Term Obligations (Identified Cost, $16,142,817) | | | $ | 16,142,817 | |
| | |
| Other Assets, Less Liabilities - 5.6% | | | | | | | 33,553,286 | |
| Net Assets - 100.0% | | | | | | $ | 601,017,881 | |
| (f) | All or a portion of the security has been segregated as collateral for open futures contracts and uncleared swap agreements. |
| (h) | An affiliated issuer, which may be considered one in which the fund owns 5% or more of the outstanding voting securities, or a company which is under common control. At period end, the aggregate values of the fund’s investments in affiliated issuers and in unaffiliated issuers were $36,612,902 and $530,851,693, respectively. |
| (i) | Interest only security for which the fund receives interest on notional principal (Par amount). Par amount shown is the notional principal and does not reflect the cost of the security. |
| (n) | Securities exempt from registration under Rule 144A of the Securities Act of 1933. These securities may be sold in the ordinary course of business in transactions exempt from registration, normally to qualified institutional buyers. At period end, the aggregate value of these securities was $190,997,862, representing 31.8% of net assets. |
17
Consolidated Portfolio of Investments (unaudited) – continued
| (s) | All or a portion of security is held by a wholly-owned subsidiary. See Note 2 of the Notes to Consolidated Financial Statements for details of the wholly-owned subsidiary. |
| (v) | Affiliated issuer that is available only to investment companies managed by MFS. The rate quoted for the MFS Institutional Money Market Portfolio is the annualizedseven-day yield of the fund at period end. |
| (y) | The rate shown represents an annualized yield at time of purchase. |
| (z) | Restricted securities are not registered under the Securities Act of 1933 and are subject to legal restrictions on resale. These securities generally may be resold in transactions exempt from registration or to the public if the securities are subsequently registered. Disposal of these securities may involve time-consuming negotiations and prompt sale at an acceptable price may be difficult. The fund holds the following restricted securities: |
| | | | | | | | | | |
| Restricted Securities | | Acquisition
Date | | Cost | | | Value | |
| Avolon Holdings Funding Ltd., 3.625%, 5/01/2022 | | 4/11/19-4/12/19 | | | $1,817,202 | | | | $1,821,727 | |
| Avolon Holdings Funding Ltd., 3.95%, 7/01/2024 | | 4/11/19-4/12/19 | | | 1,124,955 | | | | 1,123,796 | |
| Barclays Commercial Mortgage Securities LLC,2018-C2, “XA”, 0.938%, 12/15/2051 | | 12/06/18 | | | 1,188,892 | | | | 1,190,044 | |
| Exantas Capital Corp. CLO Ltd., 2019-RS07, “B”, FLR, 4.199% (LIBOR - 1mo. + 1.7%), 4/15/2036 | | 4/04/19 | | | 1,788,500 | | | | 1,790,744 | |
Flagship CLO,2014-8A, “BRR”, FLR, 4.001%
(LIBOR - 3mo. + 1.4%), 1/16/2026 | | 2/07/19 | | | 1,589,146 | | | | 1,587,442 | |
| Freedom Financial,2019-1, “A”, 3.42%, 6/18/2026 | | 4/25/19 | | | 758,950 | | | | 759,217 | |
| Neuberger Berman CLO Ltd.,2015-20A, “BR”, 3.846%, 1/15/2028 | | 11/15/17 | | | 2,729,000 | | | | 2,664,085 | |
OCP CLO Ltd.,2015-10A, “A2R”, FLR,
3.886% (LIBOR - 3mo. + 1.3%), 10/26/2027 | | 11/27/17 | | | 2,211,957 | | | | 2,188,039 | |
Shelter Growth CRE,2018-FL1, “A”, FLR,
3.483% (LIBOR - 1mo. + 1%), 1/15/2035 | | 4/26/19 | | | 511,359 | | | | 511,038 | |
| Total Restricted Securities | | | | | | | | | $13,636,132 | |
| % of Net assets | | | | | | | | | 2.3% | |
The following abbreviations are used in this report and are defined:
| | |
| |
| BCOMALTR | | Bloomberg Aluminum Subindex Total Return, this index is composed of futures contracts on aluminum. |
| BCOMBOTR | | Bloomberg Soybean Oil Subindex Total Return, this index is composed of futures contracts on soybean oil. |
| BCOMCNTR | | Bloomberg Corn Subindex Total Return, this index is composed of futures contracts on corn. It reflects the return on fully collateralized futures positions. It is quoted in USD. |
| BCOMCOT | | Bloomberg Brent Crude Subindex Total Return, this index is composed of futures contracts on brent crude. |
| BCOMCTTR | | Bloomberg Cotton Subindex Total Return, this index is composed of futures contracts on cotton. It reflects the return on fully collateralized futures positions. It is quoted in USD. |
| BCOMF3T | | Bloomberg Commodity Index 3 Month Forward Total Return, this index is composed of longer-dated futures contracts on 19 physical commodities. |
| BCOMFCT | | Bloomberg Feeder Cattle Subindex Total Return, this index is comprised of futures contracts on feeder cattle. It is quoted in USD. |
18
Consolidated Portfolio of Investments (unaudited) – continued
| | |
| BCOMGCTR | | Bloomberg Gold Subindex Total Return, this index is composed of futures contracts on gold. |
| BCOMGOT | | Bloomberg Gas and Oil Subindex Total Return, this index is composed of futures contracts on gas and oil. |
| BCOMHGTR | | Bloomberg Copper Subindex Total Return, this index is composed of futures contracts on copper. |
| BCOMHOTR | | Bloomberg Heating Oil Subindex Total Return, this index is composed of futures contracts on heating oil. It reflects the return on fully collateralized futures positions. It is quoted in USD. |
| BCOMKCTR | | Bloomberg Coffee Subindex Total Return, this index is composed of futures contracts on coffee. It reflects the return on fully collateralized futures positions. It is quoted in USD. |
| BCOMKWT | | Bloomberg Kansas Wheat Subindex Total Return, this index is composed of futures contracts on wheat and Kansas wheat. It is quoted in USD. |
| BCOMNGTR | | Bloomberg Natural Gas Subindex Total Return, this index is composed of futures contracts on natural gas. It reflects the return on fully collateralized futures positions. It is quoted in USD. |
| BCOMRBTR | | Bloomberg Unleaded Gasoline Subindex Total Return, this index is composed of futures contracts on unleaded gasoline. It reflects the return on fully collateralized futures positions. It is quoted in USD. |
| BCOMSBTR | | Bloomberg Sugar Subindex Total Return, this index is composed of futures contracts on sugar. It reflects the return on fully collateralized futures positions. It is quoted in USD. |
| BCOMSMT | | Bloomberg Soybean Meal Subindex Total Return, this index is composed of futures contracts on soybean meal. |
| BCOMTR | | Bloomberg Commodity Index Total Return |
| BCOMWHTR | | Bloomberg Wheat Subindex Total Return, this index is composed of futures contracts on wheat. It reflects the return on fully collateralized futures positions. It is quoted in USD. |
| BCOMZSTR | | Bloomberg Zinc Subindex Total Return, this index is composed of futures contracts on zinc. |
| CLO | | Collateralized Loan Obligation |
| FLR | | Floating Rate. Interest rate resets periodically based on the parenthetically disclosed reference rate plus a spread (if any). Theperiod-end rate reported may not be the current rate. All reference rates are USD unless otherwise noted. |
| LIBOR | | London Interbank Offered Rate |
| MLCILPRT | | Merrill Lynch International Bloomberg Commodity Index Total Return |
| REIT | | Real Estate Investment Trust |
| SPGCCCTR | | S&P GSCI Cocoa Index Total Return |
Derivative Contracts at 4/30/19
Futures Contracts
| | | | | | | | | | | | | | | | | | | | | | |
| Description | | Long/
Short | | | Currency | | | Contracts | | | Notional
Amount | | Expiration
Date | | | Value/ Unrealized
Appreciation
(Depreciation) | |
| Asset Derivatives | | | | | | | | | | | | | | | | | | | |
| | | | |
| Interest Rate Futures | | | | | | | | | | | | | | | |
| U.S. Treasury Note 2 yr | | | Long | | | | USD | | | | 90 | | | $19,170,703 | | | June - 2019 | | | | $53,120 | |
| | | | | | | | | | | | | | | | | | | | | | |
19
Consolidated Portfolio of Investments (unaudited) – continued
Uncleared Swap Agreements
| | | | | | | | | | | | | | | | | | | | | | | | | | |
Maturity
Date | | | | Notional
Amount | | | | | Counterparty | | Cash Flows to
Receive (Monthly) | | Cash Flows to
Pay (Monthly) | | Unrealized
Appreciation
(Depreciation) | | | Net
Unamortized Upfront
Payments
(Receipts) | | | Value | |
| Asset Derivatives | | | | | | | | | | | | | | | | | | |
| | | | | | |
| Total Return Swaps | | | | | | | | | | | | | | | | | | |
| 5/31/19 | | USD | | | 6,077,757 | | | (Short) | | Merrill Lynch International | | 3 month T-Bill + 0.05% | | BCOMSBTR (floating rate) | | | $13,422 | | | | $— | | | | $13,422 | |
| 6/17/19 | | USD | | | 3,499,509 | | | (Short) | | Merrill Lynch International | | 3 monthT-Bill + 0% | | BCOMBOTR (floating rate) | | | 7,588 | | | | — | | | | 7,588 | |
| 8/21/19 | | USD | | | 4,410,720 | | | (Short) | | Merrill Lynch International | | 3 month T-Bill + 0.04% | | BCOMKCTR (floating rate) | | | 9,849 | | | | — | | | | 9,849 | |
| 1/08/20 | | USD | | | 6,604,191 | | | (Short) | | Merrill Lynch International | | 3 monthT-Bill + 0% | | BCOMSMT (floating rate) | | | 14,390 | | | | — | | | | 14,390 | |
| 2/28/20 | | USD | | | 5,235,975 | | | (Short) | | Merrill Lynch International | | 3 month T-Bill + 0.04% | | BCOMKWT (floating rate) | | | 12,449 | | | | — | | | | 12,449 | |
| 4/14/20 | | USD | | | 4,728,460 | | | (Short) | | Merrill Lynch International | | 3 monthT-Bill + 0% | | BCOMCNTR (floating rate) | | | 10,039 | | | | — | | | | 10,039 | |
| 4/22/20 | | USD | | | 6,540,589 | | | (Short) | | Morgan Stanley | | 3 month T-Bill + 0.01% | | BCOMWHTR (floating rate) | | | 14,902 | | | | — | | | | 14,902 | |
| 6/04/20 | | USD | | | 10,000,000 | | | (Long) | | JPMorgan Chase Bank N.A. | | BCOMTR (floating rate) | | 3 month T-Bill + 0.09% | | | 4,724 | | | | — | | | | 4,724 | |
| 6/04/20 | | USD | | | 75,000,000 | | | (Long) | | Merrill Lynch International | | MLCILPRT (floating rate) | | 3 month T-Bill + 0.13% | | | 26,824 | | | | — | | | | 26,824 | |
| | | | | | | | | | | | | | | | | | | | | | | | | | |
| | | | | | | | | | | | | | | | | $114,187 | | | | $— | | | | $114,187 | |
| | | | | | | | | | | | | | | | | | | | | | | | | | |
| Liability Derivatives | | | | | | | | | | | | | | | | | | |
| | | | | | |
| Total Return Swaps | | | | | | | | | | | | | | | | | | |
| 6/17/19 | | USD | | | 3,954,429 | | | (Long) | | JPMorgan Chase Bank N.A. | | BCOMGCTR (floating rate) | | 3 month T-Bill + 0.07% | | | $(8,666 | ) | | | $— | | | | $(8,666 | ) |
| 6/17/19 | | USD | | | 4,651,618 | | | (Long) | | JPMorgan Chase Bank N.A. | | BCOMNGTR (floating rate) | | 3 month T-Bill + 0.08% | | | (10,692 | ) | | | — | | | | (10,692 | ) |
| 7/12/19 | | USD | | | 73,121,974 | | | (Long) | | Merrill Lynch International | | MLCILPRT (floating rate) | | 3 month T-Bill + 0.13% | | | (163,725 | ) | | | — | | | | (163,725 | ) |
| 7/26/19 | | USD | | | 12,399,810 | | | (Long) | | JPMorgan Chase Bank N.A. | | BCOMTR (floating rate) | | 3 month T-Bill + 0.09% | | | (27,293 | ) | | | — | | | | (27,293 | ) |
| 8/21/19 | | USD | | | 11,603,374 | | | (Long) | | Goldman Sachs International | | BCOMF3T (floating rate) | | 3 month T-Bill + 0.11% | | | (25,804 | ) | | | — | | | | (25,804 | ) |
| 8/21/19 | | USD | | | 57,444,034 | | | (Long) | | Goldman Sachs International | | BCOMTR (floating rate) | | 3 month T-Bill + 0.09% | | | (126,641 | ) | | | — | | | | (126,641 | ) |
| 8/21/19 | | USD | | | 9,574,006 | | | (Long) | | Citibank N.A. | | BCOMTR (floating rate) | | 3 month T-Bill + 0.12% | | | (21,326 | ) | | | — | | | | (21,326 | ) |
| 8/21/19 | | USD | | | 30,626,424 | | | (Long) | | Merrill Lynch International | | MLCILPRT (floating rate) | | 3 month T-Bill + 0.13% | | | (68,575 | ) | | | — | | | | (68,575 | ) |
| 8/21/19 | | USD | | | 67,018,040 | | | (Long) | | JPMorgan Chase Bank N.A. | | BCOMTR (floating rate) | | 3 month T-Bill + 0.09% | | | (147,510 | ) | | | — | | | | (147,510 | ) |
| 9/23/19 | | USD | | | 7,164,897 | | | (Long) | | JPMorgan Chase Bank N.A. | | BCOMCTTR (floating rate) | | 3 month T-Bill + 0.15% | | | (16,320 | ) | | | — | | | | (16,320 | ) |
| 10/28/19 | | USD | | | 9,317,395 | | | (Long) | | JPMorgan Chase Bank N.A. | | BCOMZSTR (floating rate) | | 3 month T-Bill + 0.09% | | | (20,927 | ) | | | — | | | | (20,927 | ) |
| 11/19/19 | | USD | | | 1,738,177 | | | (Long) | | JPMorgan Chase Bank N.A. | | BCOMALTR (floating rate) | | 3 month T-Bill + 0.09% | | | (4,078 | ) | | | — | | | | (4,078 | ) |
| 11/19/19 | | USD | | | 4,248,469 | | | (Long) | | JPMorgan Chase Bank N.A. | | SPGCCCTR (floating rate) | | 3 month T-Bill + 0.09% | | | (8,922 | ) | | | — | | | | (8,922 | ) |
| 11/26/19 | | USD | | | 15,658,337 | | | (Long) | | JPMorgan Chase Bank N.A. | | BCOMF3T (floating rate) | | 3 month T-Bill + 0.11% | | | (34,823 | ) | | | — | | | | (34,823 | ) |
| 12/19/19 | | USD | | | 8,662,648 | | | (Long) | | JPMorgan Chase Bank N.A. | | BCOMCOT (floating rate) | | 3 month T-Bill + 0.08% | | | (17,603 | ) | | | — | | | | (17,603 | ) |
| 12/19/19 | | USD | | | 6,771,849 | | | (Long) | | Merrill Lynch International | | BCOMFCT (floating rate) | | 3 month T-Bill + 0.15% | | | (15,867 | ) | | | — | | | | (15,867 | ) |
20
Consolidated Portfolio of Investments (unaudited) – continued
Uncleared Swap Agreements – continued
| | | | | | | | | | | | | | | | | | | | | | | | | | |
Maturity
Date | | | | Notional Amount | | | | | Counterparty | | Cash Flows to
Receive (Monthly) | | Cash Flows to
Pay (Monthly) | | Unrealized
Appreciation
(Depreciation) | | | Net
Unamortized
Upfront
Payments
(Receipts) | | | Value | |
| Liability Derivatives - continued | | | | | | | | | | | | | | | | |
| | | | | |
| Total Return Swaps - continued | | | | | | | | | | | | | | | | |
| 1/08/20 | | USD | | | 17,537,244 | | | (Long) | | Goldman Sachs International | | BCOMF3T (floating rate) | | 3 month T-Bill + 0.12% | | | $(39,158 | ) | | | $— | | | | $(39,158 | ) |
| 1/08/20 | | USD | | | 18,568,846 | | | (Long) | | JPMorgan Chase Bank N.A. | | BCOMF3T (floating rate) | | 3 month T-Bill + 0.11% | | | (41,298 | ) | | | — | | | | (41,298 | ) |
| 2/20/20 | | USD | | | 20,968,816 | | | (Long) | | JPMorgan Chase Bank N.A. | | BCOMTR (floating rate) | | 3 month T-Bill + 0.09% | | | (46,154 | ) | | | — | | | | (46,154 | ) |
| 3/19/20 | | USD | | | 56,437,385 | | | (Long) | | Goldman Sachs International | | BCOMF3T (floating rate) | | 3 month T-Bill + 0.12% | | | (126,011 | ) | | | — | | | | (126,011 | ) |
| 4/14/20 | | USD | | | 5,946,600 | | | (Long) | | JPMorgan Chase Bank N.A. | | BCOMHGTR (floating rate) | | 3 month T-Bill + 0.08% | | | (13,130 | ) | | | — | | | | (13,130 | ) |
| 4/14/20 | | USD | | | 8,281,624 | | | (Long) | | JPMorgan Chase Bank N.A. | | BCOMHOTR (floating rate) | | 3 month T-Bill + 0.07% | | | (17,073 | ) | | | — | | | | (17,073 | ) |
| 4/14/20 | | USD | | | 8,294,997 | | | (Long) | | Merrill Lynch International | | BCOMGOT (floating rate) | | 3 month T-Bill + 0.09% | | | (17,390 | ) | | | — | | | | (17,390 | ) |
| 4/22/20 | | USD | | | 21,605,568 | | | (Long) | | JPMorgan Chase Bank N.A. | | BCOMF3T (floating rate) | | 3 month T-Bill + 0.10% | | | (47,857 | ) | | | — | | | | (47,857 | ) |
| 4/22/20 | | USD | | | 6,889,711 | | | (Long) | | JPMorgan Chase Bank N.A. | | BCOMTR (floating rate) | | 3 month T-Bill + 0.09% | | | (15,165 | ) | | | — | | | | (15,165 | ) |
| 4/22/20 | | USD | | | 21,605,568 | | | (Long) | | Goldman Sachs International | | BCOMF3T (floating rate) | | 3 month T-Bill + 0.12% | | | (48,239 | ) | | | — | | | | (48,239 | ) |
| 4/22/20 | | USD | | | 6,697,583 | | | (Long) | | Citibank N.A. | | BCOMRBTR (floating rate) | | 3 month T-Bill + 0.11% | | | (13,319 | ) | | | — | | | | (13,319 | ) |
| 4/22/20 | | USD | | | 20,623,497 | | | (Long) | | Merrill Lynch International | | BCOMF3T (floating rate) | | 3 month T-Bill + 0.13% | | | (46,229 | ) | | | — | | | | (46,229 | ) |
| 6/04/20 | | USD | | | 9,000,000 | | | (Long) | | JPMorgan Chase Bank N.A. | | BCOMF3T (floating rate) | | 3 month T-Bill + 0.10% | | | (655 | ) | | | — | | | | (655 | ) |
| | | | | | | | | | | | | | | | | | | | | | | | | | |
| | | | | | | | | | | | | | | | | $(1,190,450 | ) | | | $— | | | | $(1,190,450 | ) |
| | | | | | | | | | | | | | | | | | | | | | | | | | |
At April 30, 2019, the fund had liquid securities with an aggregate value of $56,328,870 to cover any collateral or margin obligations for certain derivative contracts.
See Notes to Consolidated Financial Statements
21
Financial Statements
CONSOLIDATED STATEMENT OF ASSETS AND LIABILITIES
At 4/30/19 (unaudited)
This statement represents your fund’s balance sheet, which details the assets and liabilities comprising the total value of the fund.
| | | | |
| Assets | | | | |
Investments in unaffiliated issuers, at value (identified cost, $529,292,273) | | | $530,851,693 | |
Investments in affiliated issuers, at value (identified cost, $36,607,955) | | | 36,612,902 | |
Cash | | | 34,636,387 | |
Receivables for | | | | |
Due from uncleared swap brokers | | | 3,921,166 | |
Net daily variation margin on open futures contracts | | | 9,126 | |
Fund shares sold | | | 459,163 | |
Interest | | | 2,628,478 | |
Uncleared swaps, at value | | | 114,187 | |
Other assets | | | 1,855 | |
Total assets | | | $609,234,957 | |
| |
| Liabilities | | | | |
Payables for | | | | |
Due to uncleared swap brokers | | | $4,363,823 | |
Investments purchased | | | 2,517,567 | |
Uncleared swaps, at value | | | 1,190,450 | |
Payable to affiliates | | | | |
Investment adviser | | | 24,874 | |
Shareholder servicing costs | | | 138 | |
Distribution and service fees | | | 13 | |
Payable for independent Trustees’ compensation | | | 51 | |
Accrued expenses and other liabilities | | | 120,160 | |
Total liabilities | | | $8,217,076 | |
Net assets | | | $601,017,881 | |
| |
| Net assets consist of | | | | |
Paid-in capital | | | $712,137,469 | |
Total distributable earnings (loss) | | | (111,119,588 | ) |
Net assets | | | $601,017,881 | |
Shares of beneficial interest outstanding | | | 110,630,395 | |
22
Consolidated Statement of Assets and Liabilities (unaudited) – continued
| | | | | | | | | | | | |
| | | |
| | | Net assets | | | Shares
outstanding | | | Net asset value
per share (a) | |
Class A | | | $207,139 | | | | 38,127 | | | | $5.43 | |
Class B | | | 48,828 | | | | 9,021 | | | | 5.41 | |
Class C | | | 60,229 | | | | 11,126 | | | | 5.41 | |
Class I | | | 73,510 | | | | 13,532 | | | | 5.43 | |
Class R1 | | | 48,767 | | | | 9,009 | | | | 5.41 | |
Class R2 | | | 48,941 | | | | 9,026 | | | | 5.42 | |
Class R3 | | | 49,028 | | | | 9,035 | | | | 5.43 | |
Class R4 | | | 49,114 | | | | 9,044 | | | | 5.43 | |
Class R6 | | | 600,432,325 | | | | 110,522,475 | | | | 5.43 | |
| (a) | Maximum offering price per share was equal to the net asset value per share for all share classes, except for Class A, for which the maximum offering price per share was $5.76 [100 / 94.25 x $5.43]. Redemption price per share was equal to the net asset value per share for Classes I, R1, R2, R3, R4, and R6. |
See Notes to Consolidated Financial Statements
23
Financial Statements
CONSOLIDATED STATEMENT OF OPERATIONS
Six months ended 4/30/19 (unaudited)
This statement describes how much your fund earned in investment income and accrued in expenses. It also describes any gains and/or losses generated by fund operations.
| | | | |
| Net investment income (loss) | | | | |
Income | | | | |
Interest | | | $8,190,212 | |
Dividends from affiliated issuers | | | 528,569 | |
Foreign taxes withheld | | | (413 | ) |
Total investment income | | | $8,718,368 | |
Expenses | | | | |
Management fee | | | $2,182,472 | |
Distribution and service fees | | | 1,032 | |
Shareholder servicing costs | | | 573 | |
Administrative services fee | | | 44,889 | |
Independent Trustees’ compensation | | | 6,790 | |
Custodian fee | | | 24,284 | |
Shareholder communications | | | 5,526 | |
Audit and tax fees | | | 46,527 | |
Legal fees | | | 4,341 | |
Miscellaneous | | | 122,473 | |
Total expenses | | | $2,438,907 | |
Reduction of expenses by investment adviser | | | (28,649 | ) |
Net expenses | | | $2,410,258 | |
Net investment income (loss) | | | $6,308,110 | |
| |
| Realized and unrealized gain (loss) | | | | |
Realized gain (loss) (identified cost basis) | | | | |
Unaffiliated issuers | | | $44,483 | |
Affiliated issuers | | | 1,821 | |
Futures contracts | | | 79,674 | |
Swap agreements | | | (16,623,924 | ) |
Net realized gain (loss) | | | $(16,497,946 | ) |
Change in unrealized appreciation or depreciation | | | | |
Unaffiliated issuers | | | $5,636,443 | |
Affiliated issuers | | | 625 | |
Futures contracts | | | 106,790 | |
Swap agreements | | | 406,298 | |
Net unrealized gain (loss) | | | $6,150,156 | |
Net realized and unrealized gain (loss) | | | $(10,347,790 | ) |
Change in net assets from operations | | | $(4,039,680 | ) |
See Notes to Consolidated Financial Statements
24
Financial Statements
CONSOLIDATED STATEMENTS OF CHANGES IN NET ASSETS
These statements describe the increases and/or decreases in net assets resulting from operations, any distributions, and any shareholder transactions.
| | | | | | | | |
| Change in net assets | | Six months ended
4/30/19
(unaudited) | | | Year ended
10/31/18 | |
| | |
| From operations | | | | | | | | |
Net investment income (loss) | | | $6,308,110 | | | | $8,802,961 | |
Net realized gain (loss) | | | (16,497,946 | ) | | | (17,795,994 | ) |
Net unrealized gain (loss) | | | 6,150,156 | | | | (5,986,791 | ) |
Change in net assets from operations | | | $(4,039,680 | ) | | | $(14,979,824 | ) |
Total distributions to shareholders | | | $(18,500,721 | ) | | | $(18,500,745 | ) |
Change in net assets from fund share transactions | | | $35,283,673 | | | | $29,680,123 | |
Total change in net assets | | | $12,743,272 | | | | $(3,800,446 | ) |
| | |
| Net assets | | | | | | | | |
At beginning of period | | | 588,274,609 | | | | 592,075,055 | |
At end of period | | | $601,017,881 | | | | $588,274,609 | |
See Notes to Consolidated Financial Statements
25
Financial Statements
CONSOLIDATED FINANCIAL HIGHLIGHTS
The financial highlights table is intended to help you understand the fund’s financial performance for the semiannual period and the past 5 fiscal years (or life of a particular share class, if shorter). Certain information reflects financial results for a single fund share. The total returns in the table represent the rate that an investor would have earned (or lost) on an investment in the fund share class (assuming reinvestment of all distributions) held for the entire period.
| | | | | | | | | | | | | | | | | | | | | | | | | | | | |
| | | Six months ended 4/30/19 | | | Year ended | |
| Class A | | 10/31/18 | | | 10/31/17 | | | 10/31/16 | | | 10/31/15 | | | 10/31/14 (z) | | | 4/30/14 | |
| | | (unaudited) | | | | | | | | | | | | | | | | | | | |
Net asset value,
beginning of
period | | | $5.65 | | | | $6.00 | | | | $5.89 | | | | $5.93 | | | | $7.88 | | | | $9.28 | | | | $9.09 | |
| | | | |
| Income (loss) from investment operations | | | | | | | | | | | | | | | | | |
Net investment
income
(loss) (d) | | | $0.05 | | | | $0.07 | | | | $0.03 | (c) | | | $0.01 | | | | $(0.00 | )(w) | | | $(0.01 | ) | | | $(0.00 | )(w) |
Net realized and
unrealized
gain (loss) | | | (0.11 | ) | | | (0.25 | ) | | | 0.10 | | | | (0.05 | )(g) | | | (1.95 | ) | | | (1.39 | ) | | | 0.22 | |
Total from investment
operations | | | $(0.06 | ) | | | $(0.18 | ) | | | $0.13 | | | | $(0.04 | ) | | | $(1.95 | ) | | | $(1.40 | ) | | | $0.22 | |
| | | | |
| Less distributions declared to shareholders | | | | | | | | | | | | | | | | | |
From net
investment
income | | | $(0.16 | ) | | | $(0.17 | ) | | | $(0.02 | ) | | | $(0.00 | )(w) | | | $— | | | | $— | | | | $(0.03 | ) |
Net asset value, end
of period (x) | | | $5.43 | | | | $5.65 | | | | $6.00 | | | | $5.89 | | | | $5.93 | | | | $7.88 | | | | $9.28 | |
Total return (%)
(r)(s)(t)(x) | | | (0.96 | )(n) | | | (2.98 | ) | | | 2.25 | (c) | | | (0.61 | ) | | | (24.75 | ) | | | (15.09 | )(n) | | | 2.40 | |
| | | | |
Ratios (%) (to average net assets)
and Supplemental data: | | | | | | | | | | | | | | | | | |
Expenses before
expense
reductions (f) | | | 1.09 | (a) | | | 1.09 | | | | 1.06 | (c) | | | 1.07 | | | | 1.08 | | | | 1.10 | (a) | | | 1.06 | |
Expenses after
expense
reductions (f) | | | 1.08 | (a) | | | 1.08 | | | | 1.05 | (c) | | | 1.06 | | | | 1.07 | | | | 1.10 | (a) | | | 1.05 | |
Net investment
income (loss) | | | 1.93 | (a) | | | 1.22 | | | | 0.58 | (c) | | | 0.21 | | | | (0.00 | )(w) | | | (0.20 | )(a) | | | (0.05 | ) |
Portfolio turnover | | | 20 | (n) | | | 72 | | | | 51 | | | | 32 | | | | 51 | | | | 21 | (n) | | | 43 | |
Net assets at end
of period
(000 omitted) | | | $207 | | | | $63 | | | | $49 | | | | $48 | | | | $48 | | | | $97 | | | | $114 | |
See Notes to Consolidated Financial Statements
26
Consolidated Financial Highlights – continued
| | | | | | | | |
| | | Six months
ended 4/30/19 | | | Year ended 10/31/18 (i) | |
| Class B |
| | | (unaudited) | | | | |
Net asset value, beginning of period | | | $5.64 | | | | $5.71 | |
|
| Income (loss) from investment operations | |
Net investment income (loss) (d) | | | $0.03 | | | | $0.02 | |
Net realized and unrealized gain (loss) | | | (0.10 | ) | | | (0.09 | ) |
Total from investment operations | | | $(0.07 | ) | | | $(0.07 | ) |
|
| Less distributions declared to shareholders | |
From net investment income | | | $(0.16 | ) | | | $— | |
Net asset value, end of period (x) | | | $5.41 | | | | $5.64 | |
Total return (%) (r)(s)(t)(x) | | | (1.31 | )(n) | | | (1.23 | )(n) |
|
Ratios (%) (to average net assets)
and Supplemental data: | |
Expenses before expense reductions (f) | | | 1.84 | (a) | | | 1.94 | (a) |
Expenses after expense reductions (f) | | | 1.83 | (a) | | | 1.93 | (a) |
Net investment income (loss) | | | 1.15 | (a) | | | 1.34 | (a) |
Portfolio turnover | | | 20 | (n) | | | 72 | |
Net assets at end of period (000 omitted) | | | $49 | | | | $52 | |
| | |
| | | Six months ended 4/30/19 | | | Year ended 10/31/18 (i) | |
| Class C |
| | | (unaudited) | | | | |
Net asset value, beginning of period | | | $5.64 | | | | $5.71 | |
|
| Income (loss) from investment operations | |
Net investment income (loss) (d) | | | $0.03 | | | | $0.02 | |
Net realized and unrealized gain (loss) | | | (0.11 | ) | | | (0.09 | ) |
Total from investment operations | | | $(0.08 | ) | | | $(0.07 | ) |
|
| Less distributions declared to shareholders | |
From net investment income | | | $(0.15 | ) | | | $— | |
Net asset value, end of period (x) | | | $5.41 | | | | $5.64 | |
Total return (%) (r)(s)(t)(x) | | | (1.32 | )(n) | | | (1.23 | )(n) |
|
Ratios (%) (to average net assets)
and Supplemental data: | |
Expenses before expense reductions (f) | | | 1.84 | (a) | | | 1.94 | (a) |
Expenses after expense reductions (f) | | | 1.83 | (a) | | | 1.93 | (a) |
Net investment income (loss) | | | 1.17 | (a) | | | 1.41 | (a) |
Portfolio turnover | | | 20 | (n) | | | 72 | |
Net assets at end of period (000 omitted) | | | $60 | | | | $49 | |
See Notes to Consolidated Financial Statements
27
Consolidated Financial Highlights – continued
| | | | | | | | | | | | | | | | | | | | | | | | | | | | |
| | | Six months ended
4/30/19 | | | Year ended | |
| Class I | | 10/31/18 | | | 10/31/17 | | | 10/31/16 | | | 10/31/15 | | | 10/31/14 (z) | | | 4/30/14 | |
| | | (unaudited) | | | | | | | | | | | | | | | | | | | |
Net asset value,
beginning of
period | | | $5.65 | | | | $6.00 | | | | $5.90 | | | | $5.94 | | | | $7.90 | | | | $9.28 | | | | $9.10 | |
| | | | |
| Income (loss) from investment operations | | | | | | | | | | | | | | | | | |
Net investment
income
(loss) (d) | | | $0.06 | | | | $0.09 | | | | $0.05 | (c) | | | $0.03 | | | | $0.02 | | | | $0.00 | (w) | | | $0.02 | |
Net realized and
unrealized
gain (loss) | | | (0.10 | ) | | | (0.25 | ) | | | 0.09 | | | | (0.04 | )(g) | | | (1.96 | ) | | | (1.38 | ) | | | 0.21 | |
Total from investment
operations | | | $(0.04 | ) | | | $(0.16 | ) | | | $0.14 | | | | $(0.01 | ) | | | $(1.94 | ) | | | $(1.38 | ) | | | $0.23 | |
| | | | |
| Less distributions declared to shareholders | | | | | | | | | | | | | | | | | |
From net
investment
income | | | $(0.18 | ) | | | $(0.19 | ) | | | $(0.04 | ) | | | $(0.03 | ) | | | $(0.02 | ) | | | $— | | | | $(0.05 | ) |
Net asset value, end
of period (x) | | | $5.43 | | | | $5.65 | | | | $6.00 | | | | $5.90 | | | | $5.94 | | | | $7.90 | | | | $9.28 | |
Total return (%)
(r)(s)(t)(x) | | | (0.74 | )(n) | | | (2.73 | ) | | | 2.32 | (c) | | | (0.20 | ) | | | (24.63 | ) | | | (14.87 | )(n) | | | 2.56 | |
| | | | |
Ratios (%) (to average net assets)
and Supplemental data: | | | | | | | | | | | | | | | | | |
Expenses before
expense
reductions (f) | | | 0.84 | (a) | | | 0.85 | | | | 0.82 | (c) | | | 0.83 | | | | 0.83 | | | | 0.85 | (a) | | | 0.81 | |
Expenses after
expense
reductions (f) | | | 0.83 | (a) | | | 0.84 | | | | 0.81 | (c) | | | 0.82 | | | | 0.82 | | | | 0.85 | (a) | | | 0.80 | |
Net investment
income (loss) | | | 2.20 | (a) | | | 1.45 | | | | 0.83 | (c) | | | 0.45 | | | | 0.25 | | | | 0.05 | (a) | | | 0.20 | |
Portfolio turnover | | | 20 | (n) | | | 72 | | | | 51 | | | | 32 | | | | 51 | | | | 21 | (n) | | | 43 | |
Net assets at end
of period
(000 omitted) | | | $74 | | | | $48 | | | | $49 | | | | $48 | | | | $48 | | | | $80 | | | | $94 | |
See Notes to Consolidated Financial Statements
28
Consolidated Financial Highlights – continued
| | | | | | | | |
| Class R1 | | Six months ended
4/30/19 | | | Year ended
10/31/18 (i) | |
| | | (unaudited) | | | | |
Net asset value, beginning of period | | | $5.64 | | | | $5.71 | |
|
| Income (loss) from investment operations | |
Net investment income (loss) (d) | | | $0.03 | | | | $0.02 | |
Net realized and unrealized gain (loss) | | | (0.11 | ) | | | (0.09 | ) |
Total from investment operations | | | $(0.08 | ) | | | $(0.07 | ) |
|
| Less distributions declared to shareholders | |
From net investment income | | | $(0.15 | ) | | | $— | |
Net asset value, end of period (x) | | | $5.41 | | | | $5.64 | |
Total return (%) (r)(s)(t)(x) | | | (1.32 | )(n) | | | (1.23 | )(n) |
|
Ratios (%) (to average net assets)
and Supplemental data: | |
Expenses before expense reductions (f) | | | 1.84 | (a) | | | 1.94 | (a) |
Expenses after expense reductions (f) | | | 1.83 | (a) | | | 1.93 | (a) |
Net investment income (loss) | | | 1.17 | (a) | | | 1.35 | (a) |
Portfolio turnover | | | 20 | (n) | | | 72 | |
Net assets at end of period (000 omitted) | | | $49 | | | | $49 | |
| | |
| Class R2 | | Six months
ended
4/30/19 | | | Year ended
10/31/18 (i) | |
| | | (unaudited) | | | | |
Net asset value, beginning of period | | | $5.65 | | | | $5.71 | |
|
| Income (loss) from investment operations | |
Net investment income (loss) (d) | | | $0.04 | | | | $0.02 | |
Net realized and unrealized gain (loss) | | | (0.10 | ) | | | (0.08 | ) |
Total from investment operations | | | $(0.06 | ) | | | $(0.06 | ) |
|
| Less distributions declared to shareholders | |
From net investment income | | | $(0.17 | ) | | | $— | |
Net asset value, end of period (x) | | | $5.42 | | | | $5.65 | |
Total return (%) (r)(s)(t)(x) | | | (1.12 | )(n) | | | (1.05 | )(n) |
|
Ratios (%) (to average net assets)
and Supplemental data: | |
Expenses before expense reductions (f) | | | 1.34 | (a) | | | 1.44 | (a) |
Expenses after expense reductions (f) | | | 1.33 | (a) | | | 1.43 | (a) |
Net investment income (loss) | | | 1.67 | (a) | | | 1.86 | (a) |
Portfolio turnover | | | 20 | (n) | | | 72 | |
Net assets at end of period (000 omitted) | | | $49 | | | | $49 | |
See Notes to Consolidated Financial Statements
29
Consolidated Financial Highlights – continued
| | | | | | | | |
| Class R3 | | Six months
ended
4/30/19 | | | Year ended
10/31/18 (i) | |
| | | (unaudited) | | | | |
Net asset value, beginning of period | | | $5.65 | | | | $5.71 | |
|
| Income (loss) from investment operations | |
Net investment income (loss) (d) | | | $0.05 | | | | $0.03 | |
Net realized and unrealized gain (loss) | | | (0.10 | ) | | | (0.09 | ) |
Total from investment operations | | | $(0.05 | ) | | | $(0.06 | ) |
|
| Less distributions declared to shareholders | |
From net investment income | | | $(0.17 | ) | | | $— | |
Net asset value, end of period (x) | | | $5.43 | | | | $5.65 | |
Total return (%) (r)(s)(t)(x) | | | (0.83 | )(n) | | | (1.05 | )(n) |
|
Ratios (%) (to average net assets)
and Supplemental data: | |
Expenses before expense reductions (f) | | | 1.09 | (a) | | | 1.19 | (a) |
Expenses after expense reductions (f) | | | 1.08 | (a) | | | 1.18 | (a) |
Net investment income (loss) | | | 1.91 | (a) | | | 2.10 | (a) |
Portfolio turnover | | | 20 | (n) | | | 72 | |
Net assets at end of period (000 omitted) | | | $49 | | | | $49 | |
| | |
| Class R4 | | Six months
ended
4/30/19 | | | Year ended
10/31/18 (i) | |
| | | (unaudited) | | | | |
Net asset value, beginning of period | | | $5.65 | | | | $5.71 | |
|
| Income (loss) from investment operations | |
Net investment income (loss) (d) | | | $0.06 | | | | $0.03 | |
Net realized and unrealized gain (loss) | | | (0.10 | ) | | | (0.09 | ) |
Total from investment operations | | | $(0.04 | ) | | | $(0.06 | ) |
|
| Less distributions declared to shareholders | |
From net investment income | | | $(0.18 | ) | | | $— | |
Net asset value, end of period (x) | | | $5.43 | | | | $5.65 | |
Total return (%) (r)(s)(t)(x) | | | (0.74 | )(n) | | | (1.05 | )(n) |
|
Ratios (%) (to average net assets)
and Supplemental data: | |
Expenses before expense reductions (f) | | | 0.84 | (a) | | | 0.94 | (a) |
Expenses after expense reductions (f) | | | 0.83 | (a) | | | 0.93 | (a) |
Net investment income (loss) | | | 2.16 | (a) | | | 2.35 | (a) |
Portfolio turnover | | | 20 | (n) | | | 72 | |
Net assets at end of period (000 omitted) | | | $49 | | | | $49 | |
See Notes to Consolidated Financial Statements
30
Consolidated Financial Highlights – continued
| | | | | | | | | | | | | | | | | | | | | | | | | | | | |
| | | Six months ended
4/30/19 | | | Year ended | |
| Class R6 | | 10/31/18 | | | 10/31/17 | | | 10/31/16 | | | 10/31/15 | | | 10/31/14 (z) | | | 4/30/14 | |
| | | (unaudited) | | | | | | | | | | | | | | | | | | | |
Net asset value,
beginning of
period | | | $5.65 | | | | $6.00 | | | | $5.90 | | | | $5.94 | | | | $7.90 | | | | $9.29 | | | | $9.10 | |
| | | | |
| Income (loss) from investment operations | | | | | | | | | | | | | | | | | |
Net investment
income
(loss) (d) | | | $0.06 | | | | $0.09 | | | | $0.05 | (c) | | | $0.03 | | | | $0.02 | | | | $0.00 | (w) | | | $0.02 | |
Net realized and
unrealized
gain (loss) | | | (0.10 | ) | | | (0.25 | ) | | | 0.09 | | | | (0.04 | )(g) | | | (1.96 | ) | | | (1.39 | ) | | | 0.22 | |
Total from investment
operations | | | $(0.04 | ) | | | $(0.16 | ) | | | $0.14 | | | | $(0.01 | ) | | | $(1.94 | ) | | | $(1.39 | ) | | | $0.24 | |
| | | | |
| Less distributions declared to shareholders | | | | | | | | | | | | | | | | | |
From net
investment
income | | | $(0.18 | ) | | | $(0.19 | ) | | | $(0.04 | ) | | | $(0.03 | ) | | | $(0.02 | ) | | | $— | | | | $(0.05 | ) |
Net asset value, end
of period (x) | | | $5.43 | | | | $5.65 | | | | $6.00 | | | | $5.90 | | | | $5.94 | | | | $7.90 | | | | $9.29 | |
Total return (%)
(r)(s)(t)(x) | | | (0.74 | )(n) | | | (2.74 | ) | | | 2.32 | (c) | | | (0.20 | ) | | | (24.63 | ) | | | (14.96 | )(n) | | | 2.67 | |
| | | | |
Ratios (%) (to average net assets)
and Supplemental data: | | | | | | | | | | | | | | | | | |
Expenses before
expense
reductions (f) | | | 0.84 | (a) | | | 0.84 | | | | 0.81 | (c) | | | 0.82 | | | | 0.83 | | | | 0.86 | (a) | | | 0.81 | |
Expenses after
expense
reductions (f) | | | 0.83 | (a) | | | 0.83 | | | | 0.80 | (c) | | | 0.82 | | | | 0.83 | | | | 0.85 | (a) | | | 0.81 | |
Net investment
income (loss) | | | 2.17 | (a) | | | 1.46 | | | | 0.83 | (c) | | | 0.45 | | | | 0.26 | | | | 0.05 | (a) | | | 0.19 | |
Portfolio turnover | | | 20 | (n) | | | 72 | | | | 51 | | | | 32 | | | | 51 | | | | 21 | (n) | | | 43 | |
Net assets at end
of period
(000 omitted) | | | $600,432 | | | | $587,864 | | | | $591,976 | | | | $563,314 | | | | $555,170 | | | | $539,510 | | | | $547,015 | |
See Notes to Consolidated Financial Statements
31
Consolidated Financial Highlights – continued
| (c) | Amount reflects aone-time reimbursement of expenses by the custodian (or former custodian) without which net investment income and performance would be lower and expenses would be higher. |
| (d) | Per share data is based on average shares outstanding. |
| (f) | Ratios do not reflect reductions from fees paid indirectly, if applicable. |
| (g) | The per share amount varies from the net realized and unrealized gain/loss for the period because of the timing of sales of fund shares and the per share amount of realized and unrealized gains and losses at such time. |
| (i) | For Class B, Class C, Class R1, Class R2, Class R3, and Class R4, the period is from the class inception, August 15, 2018, through the stated period end. |
| (r) | Certain expenses have been reduced without which performance would have been lower. |
| (s) | From time to time the fund may receive proceeds from litigation settlements, without which performance would be lower. |
| (t) | Total returns do not include any applicable sales charges. |
| (w) | Per share amount was less than $0.01 and total return or ratio was less than 0.01%, as applicable. |
| (x) | The net asset values and total returns have been calculated on net assets which include adjustments made in accordance with U.S. generally accepted accounting principles required at period end for financial reporting purposes. |
| (z) | For the period May 1, 2014 through October 31, 2014. On June 10, 2014, the fund changed its fiscalyear-end from April 30 to October 31. |
See Notes to Consolidated Financial Statements
32
NOTES TO CONSOLIDATED FINANCIAL STATEMENTS
(unaudited)
(1) Business and Organization
MFS Commodity Strategy Fund (the fund) is a diversified series of MFS Series Trust XV (the trust). The trust is organized as a Massachusetts business trust and is registered under the Investment Company Act of 1940, as amended, as anopen-end management investment company.
The fund is an investment company and accordingly follows the investment company accounting and reporting guidance of the Financial Accounting Standards Board (FASB) Accounting Standards Codification Topic 946 Financial Services – Investment Companies.
(2) Significant Accounting Policies
Principles of Consolidation– The fund gains exposure to the commodities markets by investing a portion of the fund’s assets in the MFS Commodity Strategy Portfolio, a wholly-owned and controlled subsidiary organized in the Cayman Islands (“Subsidiary”). The fund will not invest directly in commodities. The fund may invest up to 25% of its assets (at the time of purchase) in the Subsidiary. The Subsidiary has the same objective, strategies, and restrictions as the fund, except that the Subsidiary gains exposure to the commodities market by investing directly in commodity-linked futures, options, and swaps. The fund also invests directly in debt securities, and the Subsidiary may also invest in debt securities. As of April 30, 2019, the Subsidiary’s net assets were $109,213,839, which represented 18.2% of the fund’s net assets. The fund’s financial statements have been consolidated and include the accounts of the fund and the Subsidiary. All inter-fund balances and transactions have been eliminated in consolidation.
General – The preparation of Consolidated Financial Statements in conformity with U.S. generally accepted accounting principles requires management to make estimates and assumptions that affect the reported amounts of assets and liabilities, and disclosure of contingent assets and liabilities at the date of the Consolidated Financial Statements and the reported amounts of increases and decreases in net assets from operations during the reporting period. Actual results could differ from those estimates. In the preparation of these Consolidated Financial Statements, management has evaluated subsequent events occurring after the date of the fund’s Consolidated Statement of Assets and Liabilities through the date that the Consolidated Financial Statements were issued. The fund invests in foreign securities. Investments in foreign securities are vulnerable to the effects of changes in the relative values of the local currency and the U.S. dollar and to the effects of changes in each country’s market, economic, industrial, political, regulatory, geopolitical, and other conditions.
In March 2017, the FASB issued Accounting Standards Update2017-08, Receivables – Nonrefundable Fees and Other Costs (Subtopic310-20) – Premium Amortization on Purchased Callable Debt Securities (“ASU2017-08”). For entities that hold callable debt securities at a premium, ASU2017-08 requires that the premium be amortized to the earliest call date. ASU2017-08 will be effective for fiscal years beginning after December 15, 2018, and interim periods within those fiscal years. Management has
33
Notes to Consolidated Financial Statements (unaudited) – continued
evaluated the potential impacts of ASU2017-08 and believes that adoption ofASU 2017-08 will not have a material effect on the fund’s overall financial position or its overall results of operations.
Balance Sheet Offsetting – The fund’s accounting policy with respect to balance sheet offsetting is that, absent an event of default by the counterparty or a termination of the agreement, the International Swaps and Derivatives Association (ISDA) Master Agreement, or similar agreement, does not result in an offset of reported amounts of financial assets and financial liabilities in the Consolidated Statement of Assets and Liabilities across transactions between the fund and the applicable counterparty. The fund’s right to setoff may be restricted or prohibited by the bankruptcy or insolvency laws of the particular jurisdiction to which a specific master netting agreement counterparty is subject. Balance sheet offsetting disclosures, to the extent applicable to the fund, have been included in the fund’s Significant Accounting Policies note under the captions for each of the fund’sin-scope financial instruments and transactions.
Investment Valuations – Debt instruments and floating rate loans, including restricted debt instruments, are generally valued at an evaluated or composite bid as provided by a third-party pricing service. Short-term instruments with a maturity at issuance of 60 days or less may be valued at amortized cost, which approximates market value. Futures contracts are generally valued at last posted settlement price on their primary exchange as provided by a third-party pricing service. Futures contracts for which there were no trades that day for a particular position are generally valued at the closing bid quotation on their primary exchange as provided by a third-party pricing service. Swap agreements are generally valued at valuations provided by a third-party pricing service, which for cleared swaps includes an evaluation of any trading activity at the clearinghouses.Open-end investment companies are generally valued at net asset value per share. Securities and other assets generally valued on the basis of information from a third-party pricing service may also be valued at a broker/dealer bid quotation. In determining values, third-party pricing services can utilize both transaction data and market information such as yield, quality, coupon rate, maturity, type of issue, trading characteristics, and other market data. The values of foreign securities and other assets and liabilities expressed in foreign currencies are converted to U.S. dollars using the mean of bid and asked prices for rates provided by a third-party pricing service.
The Board of Trustees has delegated primary responsibility for determining or causing to be determined the value of the fund’s investments (including any fair valuation) to the adviser pursuant to valuation policies and procedures approved by the Board. If the adviser determines that reliable market quotations are not readily available, investments are valued at fair value as determined in good faith by the adviser in accordance with such procedures under the oversight of the Board of Trustees. Under the fund’s valuation policies and procedures, market quotations are not considered to be readily available for most types of debt instruments and floating rate loans and many types of derivatives. These investments are generally valued at fair value based on information from third-party pricing services. In addition, investments may be valued at fair value if the adviser determines that an investment’s value has been materially affected by events occurring after the close of the exchange or market on which the investment is principally traded (such as foreign exchange or market) and prior to the determination of the fund’s net asset value, or after the halting of trading of a specific security where
34
Notes to Consolidated Financial Statements (unaudited) – continued
trading does not resume prior to the close of the exchange or market on which the security is principally traded. The adviser generally relies on third-party pricing services or other information (such as the correlation with price movements of similar securities in the same or other markets; the type, cost and investment characteristics of the security; the business and financial condition of the issuer; and trading and other market data) to assist in determining whether to fair value and at what value to fair value an investment. The value of an investment for purposes of calculating the fund’s net asset value can differ depending on the source and method used to determine value. When fair valuation is used, the value of an investment used to determine the fund’s net asset value may differ from quoted or published prices for the same investment. There can be no assurance that the fund could obtain the fair value assigned to an investment if it were to sell the investment at the same time at which the fund determines its net asset value per share.
Various inputs are used in determining the value of the fund’s assets or liabilities. These inputs are categorized into three broad levels. In certain cases, the inputs used to measure fair value may fall into different levels of the fair value hierarchy. In such cases, an investment’s level within the fair value hierarchy is based on the lowest level of input that is significant to the fair value measurement. The fund’s assessment of the significance of a particular input to the fair value measurement in its entirety requires judgment, and considers factors specific to the investment. Level 1 includes unadjusted quoted prices in active markets for identical assets or liabilities. Level 2 includes other significant observable market-based inputs (including quoted prices for similar securities, interest rates, prepayment speed, and credit risk). Level 3 includes unobservable inputs, which may include the adviser’s own assumptions in determining the fair value of investments. Other financial instruments are derivative instruments, such as futures contracts and swap agreements. The following is a summary of the levels used as of April 30, 2019 in valuing the fund’s assets or liabilities:
| | | | | | | | | | | | | | | | |
| | | | |
| Financial Instruments | | Level 1 | | | Level 2 | | | Level 3 | | | Total | |
| U.S. Treasury Bonds & U.S. Government Agency & Equivalents | | | $— | | | | $150,769,182 | | | | $— | | | | $150,769,182 | |
| Non-U.S. Sovereign Debt | | | — | | | | 11,515,182 | | | | — | | | | 11,515,182 | |
| Municipal Bonds | | | — | | | | 2,689,328 | | | | — | | | | 2,689,328 | |
| U.S. Corporate Bonds | | | — | | | | 109,394,404 | | | | — | | | | 109,394,404 | |
| Residential Mortgage-Backed Securities | | | — | | | | 8,912,920 | | | | — | | | | 8,912,920 | |
| Commercial Mortgage-Backed Securities | | | — | | | | 29,655,752 | | | | — | | | | 29,655,752 | |
| Asset-Backed Securities (including CDOs) | | | — | | | | 102,169,294 | | | | — | | | | 102,169,294 | |
| Foreign Bonds | | | — | | | | 99,602,814 | | | | — | | | | 99,602,814 | |
| Short Term Securities | | | — | | | | 16,142,817 | | | | — | | | | 16,142,817 | |
| Mutual Funds | | | 36,612,902 | | | | — | | | | — | | | | 36,612,902 | |
| Total | | | $36,612,902 | | | | $530,851,693 | | | | $— | | | | $567,464,595 | |
| | | | |
| Other Financial Instruments | | | | | | | | | | | | |
| Futures Contracts – Assets | | | $53,120 | | | | $— | | | | $— | | | | $53,120 | |
| Swap Agreements – Assets | | | — | | | | 114,187 | | | | — | | | | 114,187 | |
| Swap Agreements – Liabilities | | | — | | | | (1,190,450 | ) | | | — | | | | (1,190,450 | ) |
For further information regarding security characteristics, see the Consolidated Portfolio of Investments.
35
Notes to Consolidated Financial Statements (unaudited) – continued
Derivatives– The fund uses derivatives primarily to increase or decrease exposure to a particular market or segment of the market, or security, to increase or decrease interest rate or currency exposure, or as alternatives to direct investments. Derivatives are used for hedging ornon-hedging purposes. While hedging can reduce or eliminate losses, it can also reduce or eliminate gains. When the fund uses derivatives as an investment to increase market exposure, or for hedging purposes, gains and losses from derivative instruments may be substantially greater than the derivative’s original cost.
The derivative instruments used by the fund during the period were futures contracts and swap agreements. Depending on the type of derivative, the fund may exit a derivative position by entering into an offsetting transaction with a counterparty or exchange, negotiating an agreement with the derivative counterparty, or novating the position to a third party. The fund may be unable to promptly close out a futures position in instances where the daily fluctuation in the price for that type of future exceeds the daily limit set by the exchange. The fund’s period end derivatives, as presented in the Consolidated Portfolio of Investments and the associated Derivative Contract tables, generally are indicative of the volume of its derivative activity during the period.
The following table presents, by major type of derivative contract, the fair value, on a gross basis, of the asset and liability components of derivatives held by the fund at April 30, 2019 as reported in the Consolidated Statement of Assets and Liabilities:
| | | | | | | | | | |
| | | | | Fair Value (a) | |
| | | |
| Risk | | Derivative Contracts | | Asset Derivatives | | | Liability Derivatives | |
| Interest Rate | | Interest Rate Futures | | | $53,120 | | | | $— | |
| Commodity | | Total Return Swaps | | | 114,187 | | | | (1,190,450 | ) |
| Total | | | | | $167,307 | | | $ | (1,190,450 | ) |
| (a) | Values presented in this table for futures contracts correspond to the values reported in the fund’s Consolidated Portfolio of Investments. Only the current day net variation margin for futures contract is separately reported within the Consolidated Statement of Assets and Liabilities. |
The following table presents, by major type of derivative contract, the realized gain (loss) on derivatives held by the fund for the six months ended April 30, 2019 as reported in the Consolidated Statement of Operations:
| | | | | | | | |
| | |
| Risk | | Futures
Contracts | | | Swap
Agreements | |
| Interest Rate | | | $79,674 | | | | $— | |
| Commodity | | | — | | | | (16,623,924 | ) |
| Total | | | $79,674 | | | | $(16,623,924 | ) |
36
Notes to Consolidated Financial Statements (unaudited) – continued
The following table presents, by major type of derivative contract, the change in unrealized appreciation or depreciation on derivatives held by the fund for the six months ended April 30, 2019 as reported in the Consolidated Statement of Operations:
| | | | | | | | |
| | |
| Risk | | Futures
Contracts | | | Swap
Agreements | |
| Interest Rate | | | $106,790 | | | | $— | |
| Commodity | | | — | | | | 406,298 | |
| Total | | | $106,790 | | | | $406,298 | |
Derivative counterparty credit risk is managed through formal evaluation of the creditworthiness of all potential counterparties. On certain, but not all, uncleared derivatives, the fund attempts to reduce its exposure to counterparty credit risk whenever possible by entering into an ISDA Master Agreement on a bilateral basis. The ISDA Master Agreement gives each party to the agreement the right to terminate all transactions traded under such agreement if there is a specified deterioration in the credit quality of the other party. Upon an event of default or a termination of the ISDA Master Agreement, thenon-defaulting party has the right to close out all transactions traded under such agreement and to net amounts owed under each agreement to one net amount payable by one party to the other. This right to close out and net payments across all transactions traded under the ISDA Master Agreement could result in a reduction of the fund’s credit risk to such counterparty equal to any amounts payable by the fund under the applicable transactions, if any.
Collateral and margin requirements differ by type of derivative. For cleared derivatives (e.g., futures contracts, cleared swaps, and exchange-traded options), margin requirements are set by the clearing broker and the clearing house and collateral, in the form of cash or securities, is posted by the fund directly with the clearing broker. Collateral terms are counterparty agreement specific for uncleared derivatives (e.g., forward foreign currency exchange contracts, uncleared swap agreements, and uncleared options) and collateral, in the form of cash and securities, is held in segregated accounts with the fund’s custodian in connection with these agreements. For derivatives traded under an ISDA Master Agreement, which contains a collateral support annex, the collateral requirements are netted across all transactions traded under such counterparty-specific agreement and an amount is posted from one party to the other to collateralize such obligations. Cash that has been segregated or delivered to cover the fund’s collateral or margin obligations under derivative contracts, if any, will be reported separately in the Consolidated Statement of Assets and Liabilities as restricted cash for uncleared derivatives and/or deposits with brokers for cleared derivatives. Securities pledged as collateral or margin for the same purpose, if any, are noted in the Consolidated Portfolio of Investments. The fund may be required to make payments of interest on uncovered collateral or margin obligations with the broker. Any such payments are included in “Miscellaneous” expense in the Consolidated Statement of Operations.
37
Notes to Consolidated Financial Statements (unaudited) – continued
The following table presents the fund’s derivative assets and liabilities (by type) on a gross basis as of April 30, 2019:
| | | | | | | | |
| | |
| Gross Amounts of: | | Derivative Assets | | | Derivative Liabilities | |
| Future Contracts (a) | | | $9,126 | | | | $— | |
| Swaps, at value | | | 114,187 | | | | (1,190,450 | ) |
| Total Gross Amount of Derivative Assets and Liabilities Presented in the Consolidated Statement of Assets & Liabilities | | | $123,313 | | | | $(1,190,450 | ) |
| Less: Derivatives Assets and Liabilities Not Subject to a Master Netting Agreement or Similar Arrangement | | | 9,126 | | | | — | |
| Total Gross Amount of Derivative Assets and Liabilities Subject to a Master Netting Agreement or Similar Arrangement | | | $114,187 | | | | $(1,190,450 | ) |
| (a) | The amount presented here represents the fund’s current day net variation margin for futures contracts. This amount, which is recognized within the fund’s Consolidated Statement of Assets and Liabilities, differs from the fair value of the futures contracts which is presented in the tables that follow the fund’s Consolidated Portfolio of Investments. |
The following table presents (by counterparty) the fund’s derivative assets net of amounts available for offset under Master Netting Agreements (or similar arrangements) and net of the related collateral held by the fund at April 30, 2019:
| | | | | | | | | | | | | | | | | | | | |
| | | | | | Amounts Not Offset in the
Consolidated Statement of Assets & Liabilities | |
| | | | | |
| | | Gross Amount
of Derivative
Assets Subject
to a Master
Netting
Agreement (or
Similar
Arrangement)
by Counterparty | | | Financial
Instruments
Available
for Offset | | | Financial
Instruments
Collateral
Received (b) | | | Cash
Collateral
Received (b) | | | Net Amount
of Derivative
Assets by
Counterparty | |
| JPMorgan Chase Bank N.A. | | | $4,724 | | | | $(4,724 | ) | | | $— | | | | $— | | | | $— | |
| Merrill Lynch | | | | | | | | | | | | | | | | | | | | |
| International | | | 94,561 | | | | (94,561 | ) | | | — | | | | — | | | | — | |
| Morgan Stanley | | | 14,902 | | | | — | | | | — | | | | — | | | | 14,902 | |
| Total | | | $114,187 | | | | $(99,285 | ) | | | $— | | | | $— | | | | $14,902 | |
38
Notes to Consolidated Financial Statements (unaudited) – continued
The following table presents (by counterparty) the fund’s derivative liabilities net of amounts available for offset under Master Netting Agreements (or similar arrangements) and net of the related collateral pledged by the fund at April 30, 2019:
| | | | | | | | | | | | | | | | | | | | |
| | | | | | Amounts Not Offset in the
Consolidated Statement of Assets & Liabilities | |
| | | | | |
| | | Gross Amounts
of Derivative
Liabilities Subject
to a Master
Netting
Agreement (or
Similar
Arrangement)
by Counterparty | | | Financial
Instruments
Available
for Offset | | | Financial
Instruments
Collateral
Pledged (b) | | | Cash
Collateral
Pledged (b) | | | Net Amount
of Derivative
Liabilities by
Counterparty | |
| Citibank N.A. | | | $(34,645 | ) | | | $— | | | | $34,645 | | | | $— | | | | $— | |
| Goldman Sachs International | | | (365,853 | ) | | | — | | | | 365,853 | | | | — | | | | — | |
| JPMorgan Chase Bank N.A. | | | (478,166 | ) | | | 4,724 | | | | 473,442 | | | | — | | | | — | |
| Merrill Lynch International | | | (311,786 | ) | | | 94,561 | | | | 217,225 | | | | — | | | | — | |
| Total | | | $(1,190,450 | ) | | | $99,285 | | | | $1,091,165 | | | | $— | | | | $— | |
| (b) | The amount presented here may be less than the total amount of collateral (received)/pledged as the excess collateral (received)/pledged is not shown for purposes of this presentation. |
Futures Contracts– The fund entered into futures contracts which may be used to hedge against or obtain broad market exposure, interest rate exposure, currency exposure, or to manage duration. A futures contract represents a commitment for the future purchase or sale of an asset at a specified price on a specified date.
Upon entering into a futures contract, the fund is required to deposit with the broker, either in cash or securities, an initial margin in an amount equal to a specified percentage of the notional amount of the contract. Subsequent payments (variation margin) are made or received by the fund each day, depending on the daily fluctuations in the value of the contract, and are recorded for financial statement purposes as unrealized gain or loss by the fund until the contract is closed or expires at which point the gain or loss on futures contracts is realized.
The fund bears the risk of interest rates, exchange rates or securities prices moving unexpectedly, in which case, the fund may not achieve the anticipated benefits of the futures contracts and may realize a loss. While futures contracts may present less counterparty risk to the fund since the contracts are exchange traded and the exchange’s clearinghouse guarantees payments to the broker, there is still counterparty credit risk due to the insolvency of the broker. The fund’s maximum risk of loss due to counterparty credit risk is equal to the margin posted by the fund to the broker plus any gains or minus any losses on the outstanding futures contracts.
Swap Agreements– During the period the fund entered into swap agreements. Swap agreements generally involve a periodic exchange of cash payments on a net basis, at specified intervals or upon the occurrence of specified events, between the fund and a counterparty. Certain swap agreements may be entered into as a bilateral contract
39
Notes to Consolidated Financial Statements (unaudited) – continued
(“uncleared swaps”) while others are required to be centrally cleared (“cleared swaps”). In a cleared swap transaction, the ultimate counterparty to the transaction is a clearinghouse (the “clearinghouse”). The contract is transferred and accepted by the clearinghouse immediately following execution of the swap contract with an executing broker. Thereafter, throughout the term of the cleared swap, the fund interfaces indirectly with the clearinghouse through a clearing broker and has counterparty risk to the clearing broker as well.
Both cleared and uncleared swap agreements are marked to market daily. The value of uncleared swap agreements is reported in the Consolidated Statement of Assets and Liabilities as “Uncleared swaps, at value” which includes any related interest accruals to be paid or received by the fund. For cleared swaps, payments (variation margin) are made or received by the fund each day, depending on the daily fluctuations in the value of the cleared swap, such that only the current day net receivable or payable for variation margin is reported in the Consolidated Statement of Assets and Liabilities.
For both cleared and uncleared swaps, the periodic exchange of net cash payments, at specified intervals or upon the occurrence of specified events as stipulated by the agreement, is recorded as realized gain or loss on swap agreements in the Consolidated Statement of Operations. Premiums paid or received at the inception of the agreements are amortized using the effective interest method over the term of the agreement as realized gain or loss on swap agreements in the Consolidated Statement of Operations. A liquidation payment received or made upon early termination is recorded as a realized gain or loss on swap agreements in the Consolidated Statement of Operations. The change in unrealized appreciation or depreciation on swap agreements in the Consolidated Statement of Operations reflects the aggregate change over the reporting period in the value of swaps net of any unamortized premiums paid or received.
Risks related to swap agreements include the possible lack of a liquid market, unfavorable market and interest rate movements of the underlying instrument and the failure of the counterparty to perform under the terms of the agreements. The fund’s maximum risk of loss from counterparty credit risk is the discounted net value of the cash flows to be received from/paid to the counterparty over the contract’s remaining life, to the extent that the amount is positive. To address counterparty risk, uncleared swap agreements are limited to only highly-rated counterparties. Risk is further reduced by having an ISDA Master Agreement between the fund and the counterparty providing for netting as described above and, where applicable, by the posting of collateral by the counterparty to the fund to cover the fund’s exposure to the counterparty under such ISDA Master Agreement. The fund’s counterparty risk due to cleared swaps is mitigated by the fact that the clearinghouse is the true counterparty to the transaction and the regulatory requirement safeguards in the event of a clearing broker bankruptcy.
The fund entered into total return swaps on various commodity indexes in order to gain exposure without having to own the underlying commodities. Under a total return swap the fund pays the counterparty interest (based on a fixed or floating rate) and in return receives a payment equal to the increase in the total return of the reference index. To the extent there is a decline in the total return of the index, the fund pays the counterparty for that decline in addition to making the fixed or floating rate interest
40
Notes to Consolidated Financial Statements (unaudited) – continued
payment. On a monthly basis, the change in the total return of the index is measured to determine the monthly payment due to or from the counterparty. These payments are included in “Due from uncleared swap brokers” or “Due to uncleared swap brokers” in the Consolidated Statement of Assets and Liabilities. The total return of the reference index includes changes in the market value of the index and any interest or dividend payments attributable to the index.
Indemnifications– Under the fund’s organizational documents, its officers and Trustees may be indemnified against certain liabilities and expenses arising out of the performance of their duties to the fund. Additionally, in the normal course of business, the fund enters into agreements with service providers that may contain indemnification clauses. The fund’s maximum exposure under these agreements is unknown as this would involve future claims that may be made against the fund that have not yet occurred.
Investment Transactions and Income– Investment transactions are recorded on the trade date. Interest income is recorded on the accrual basis. All premium and discount is amortized or accreted for financial statement purposes in accordance with U.S. generally accepted accounting principles. Some securities may be purchased on a “when-issued” or “forward delivery” basis, which means that the securities will be delivered to the fund at a future date, usually beyond customary settlement time. Interest payments received in additional securities are recorded on theex-interest date in an amount equal to the value of the security on such date.
The fund may receive proceeds from litigation settlements. Any proceeds received from litigation involving portfolio holdings are reflected in the Consolidated Statement of Operations in realized gain/loss if the security has been disposed of by the fund or in unrealized gain/loss if the security is still held by the fund. Any other proceeds from litigation not related to portfolio holdings are reflected as other income in the Consolidated Statement of Operations.
The fund invests a significant portion of its assets in asset-backed and/ormortgage-backed securities. For these securities, the value of the debt instrument also depends on the credit quality and adequacy of the underlying assets or collateral as well as whether there is a security interest in the underlying assets or collateral. Enforcing rights, if any, against the underlying assets or collateral may be difficult. U.S. Government securities not supported as to the payment of principal or interest by the U.S. Treasury, such as those issued by Fannie Mae, Freddie Mac, and the Federal Home Loan Banks, are subject to greater credit risk than are U.S. Government securities supported by the U.S. Treasury, such as those issued by Ginnie Mae.
The fund purchased or sold debt securities on a when-issued or delayed delivery basis, or in a “To Be Announced” (TBA) or “forward commitment” transaction with delivery or payment to occur at a later date beyond the normal settlement period. At the time a fund enters into a commitment to purchase or sell a security, the transaction is recorded and the value of the security acquired is reflected in the fund’s net asset value. The price of such security and the date that the security will be delivered and paid for are fixed at the time the transaction is negotiated. The value of the security may vary with market fluctuations. No interest accrues to the fund until payment takes place. At the time that a fund enters into this type of transaction, the fund is required
41
Notes to Consolidated Financial Statements (unaudited) – continued
to have sufficient cash and/or liquid securities to cover its commitments. Losses may arise due to changes in the value of the underlying securities or if the counterparty does not perform under the contract’s terms, or if the issuer does not issue the securities due to political, economic or other factors. Additionally, losses may arise due to declines in the value of the securities prior to settlement date.
To mitigate the counterparty credit risk on TBA securities and other types of forward settling mortgage-backed securities, the fund whenever possible enters into a Master Securities Forward Transaction Agreement (“MSFTA”) on a bilateral basis with each of the counterparties with whom it undertakes a significant volume of transactions. The MSFTA gives each party to the agreement the right to terminate all transactions traded under such agreement if there is a specified deterioration in the credit quality of the other party. Upon an event of default or a termination of the MSFTA, thenon-defaulting party has the right to close out all transactions traded under such agreement and to net amounts owed under each transaction to one net amount payable by one party to the other. This right to close out and net payments across all transactions traded under the MSFTA could result in a reduction of the fund’s credit risk to such counterparty equal to any amounts payable by the fund under the applicable transactions, if any.
For mortgage-backed securities traded under a MSFTA, the collateral and margining requirements are contract specific. Collateral amounts across all transactions traded under such agreement are netted and an amount is posted from one party to the other to collateralize such obligations. Cash that has been pledged to cover the fund’s collateral or margin obligations under a MSFTA, if any, will be reported separately on the Consolidated Statement of Assets and Liabilities as restricted cash. Securities pledged as collateral or margin for the same purpose, if any, are noted in the Consolidated Portfolio of Investments.
Tax Matters and Distributions– The fund intends to qualify as a regulated investment company, as defined under Subchapter M of the Internal Revenue Code, and to distribute all of its taxable income, including realized capital gains. As a result, no provision for federal income tax is required. The fund’s federal tax returns, when filed, will remain subject to examination by the Internal Revenue Service for a three year period. Management has analyzed the fund’s tax positions taken on federal and state tax returns for all open tax years and does not believe that there are any uncertain tax positions that require recognition of a tax liability. Foreign taxes, if any, have been accrued by the fund in the accompanying financial statements in accordance with the applicable foreign tax law. Foreign income taxes may be withheld by certain countries in which the fund invests. Additionally, capital gains realized by the fund on securities issued in or by certain foreign countries may be subject to capital gains tax imposed by those countries.
Distributions to shareholders are recorded on theex-dividend date. Income and capital gain distributions are determined in accordance with income tax regulations, which may differ from U.S. generally accepted accounting principles. Certain capital accounts in the financial statements are periodically adjusted for permanent differences in order to reflect their tax character. These adjustments have no impact on net assets or net asset value per share. Temporary differences which arise from recognizing certain items of income, expense, gain or loss in different periods for financial statement and tax
42
Notes to Consolidated Financial Statements (unaudited) – continued
purposes will reverse at some time in the future. Distributions in excess of net investment income or net realized gains are temporary overdistributions for financial statement purposes resulting from differences in the recognition or classification of income or distributions for financial statement and tax purposes.
Book/tax differences primarily relate to amortization and accretion of debt securities and treating the Subsidiary as a separate holding for tax purposes instead of a consolidated entity.
The tax character of distributions made during the current period will be determined at fiscal year end. The tax character of distributions declared to shareholders for the last fiscal year is as follows:
| | | | |
| |
| | | Year ended
10/31/18 | |
Ordinary income (including any
short-term capital gains) | | | $18,500,745 | |
The federal tax cost and the tax basis components of distributable earnings were as follows:
| | | | |
| |
| As of 4/30/19 | | | |
| |
| Cost of investments | | | $566,231,431 | |
| Gross appreciation | | | 2,711,115 | |
| |
| Gross depreciation | | | (1,477,951 | ) |
| Net unrealized appreciation (depreciation) | | | $1,233,164 | |
| |
| As of 10/31/18 | | | |
| |
| Undistributed ordinary income | | | 16,044,335 | |
| Capital loss carryforwards | | | (98,195,348 | ) |
| Other temporary differences | | | 149,243,111 | |
| Net unrealized appreciation (depreciation) | | | (155,671,285 | ) |
The aggregate cost above includes prior fiscal year end tax adjustments, if applicable.
As of October 31, 2018, the fund had capital loss carryforwards available to offset future realized gains. These net capital losses may be carried forward indefinitely and their character is retained as short-term and/or long-term losses. Such losses are characterized as follows:
| | | | |
| Short-Term | | | $(76,689,367 | ) |
| Long-Term | | | (21,505,981 | ) |
| Total | | | $(98,195,348 | ) |
Multiple Classes of Shares of Beneficial Interest– The fund offers multiple classes of shares, which differ in their respective distribution and service fees. The fund’s income, realized and unrealized gain (loss), and common expenses are allocated to shareholders based on the daily net assets of each class. Dividends are declared separately for each class. Differences in per share dividend rates are generally due to differences in separate class expenses. Class B shares will convert to Class A shares approximately eight years after purchase. Class C shares will convert to Class A shares
43
Notes to Consolidated Financial Statements (unaudited) – continued
approximately ten years after purchase. The fund’s distributions declared to shareholders as reported in the Consolidated Statements of Changes in Net Assets are presented by class as follows:
| | | | | | | | |
| | | From net investment
income | |
| | |
| | | Six months
ended
4/30/19 | | | Year
ended
10/31/18 | |
| Class A | | | $1,840 | | | | $1,416 | |
| Class B | | | 1,445 | | | | — | |
| Class C | | | 1,355 | | | | — | |
| Class I | | | 1,502 | | | | 1,543 | |
| Class R1 | | | 1,356 | | | | — | |
| Class R2 | | | 1,450 | | | | — | |
| Class R3 | | | 1,497 | | | | — | |
| Class R4 | | | 1,545 | | | | — | |
| Class R6 | | | 18,488,731 | | | | 18,497,786 | |
| Total | | | $18,500,721 | | | | $18,500,745 | |
(3) Transactions with Affiliates
Investment Adviser– The fund and the Subsidiary have investment advisory agreements with MFS to provide overall investment management and related administrative services and facilities to the fund. The management fee is computed daily and paid monthly at the following annual rates based on the fund’s average daily net assets:
| | | | |
| Up to $1 billion | | | 0.75 | % |
| In excess of $1 billion | | | 0.70 | % |
The Subsidiary does not pay a management fee to MFS.
MFS has agreed in writing to reduce its management fee by a specified amount if certain MFS mutual fund assets exceed thresholds agreed to by MFS and the fund’s Board of Trustees. For the six months ended April 30, 2019, this management fee reduction amounted to $28,649, which is included in the reduction of total expenses in the Consolidated Statement of Operations. The management fee incurred for the six months ended April 30, 2019 was equivalent to an annual effective rate of 0.74% of the fund’s average daily net assets.
Distributor– MFS Fund Distributors, Inc. (MFD), a wholly-owned subsidiary of MFS, as distributor, received $291 for the six months ended April 30, 2019, as its portion of the initial sales charge on sales of Class A shares of the fund.
The Board of Trustees has adopted a distribution plan for certain share classes pursuant to Rule12b-1 of the Investment Company Act of 1940.
The fund’s distribution plan provides that the fund will pay MFD for services provided by MFD and financial intermediaries in connection with the distribution and servicing of certain share classes. One component of the plan is a distribution fee paid to MFD and another component of the plan is a service fee paid to MFD. MFD may subsequently pay all, or a portion, of the distribution and/or service fees to financial intermediaries.
44
Notes to Consolidated Financial Statements (unaudited) – continued
Distribution Plan Fee Table:
| | | | | | | | | | | | | | | | | | | | |
| | | | | |
| | | Distribution
Fee Rate (d) | | | Service
Fee Rate (d) | | | Total
Distribution
Plan (d) | | | Annual
Effective
Rate (e) | | | Distribution
and Service
Fee | |
| Class A | | | — | | | | 0.25% | | | | 0.25% | | | | 0.25% | | | | $106 | |
| Class B | | | 0.75% | | | | 0.25% | | | | 1.00% | | | | 1.00% | | | | 251 | |
| Class C | | | 0.75% | | | | 0.25% | | | | 1.00% | | | | 1.00% | | | | 256 | |
| Class R1 | | | 0.75% | | | | 0.25% | | | | 1.00% | | | | 1.00% | | | | 239 | |
| Class R2 | | | 0.25% | | | | 0.25% | | | | 0.50% | | | | 0.50% | | | | 120 | |
| Class R3 | | | — | | | | 0.25% | | | | 0.25% | | | | 0.25% | | | | 60 | |
| Total Distribution and Service Fees | | | | | | | | | | | | $1,032 | |
| (d) | In accordance with the distribution plan for certain classes, the fund pays distribution and/or service fees equal to these annual percentage rates of each class’s average daily net assets. The distribution and service fee rates disclosed by class represent the current rates in effect at the end of the reporting period. |
| (e) | The annual effective rates represent actual fees incurred under the distribution plan for the six months ended April 30, 2019 based on each class’s average daily net assets. MFD has voluntarily agreed to rebate a portion of each class’s 0.25% service fee attributable to accounts for which MFD retains the 0.25% service fee except for accounts attributable to MFS or its affiliates’ seed money. There were no service fee rebates for the period ending April 30, 2019. |
Certain Class A shares are subject to a contingent deferred sales charge (CDSC) in the event of a shareholder redemption within 18 months of purchase. Class B shares are subject to a CDSC in the event of a shareholder redemption within six years of purchase. Class C shares are subject to a CDSC in the event of a shareholder redemption within 12 months of purchase. There were no contingent deferred sales charges imposed during the six months ended April 30, 2019.
Shareholder Servicing Agent– MFS Service Center, Inc. (MFSC), a wholly-owned subsidiary of MFS, receives a fee from the fund for its services as shareholder servicing agent calculated as a percentage of the average daily net assets of the fund as determined periodically under the supervision of the fund’s Board of Trustees. For the six months ended April 30, 2019, the fee was $387, which equated to 0.0001% annually of the fund’s average daily net assets. MFSC also receives payment from the fund forout-of-pocket expenses,sub-accounting and other shareholder servicing costs which may be paid to affiliated and unaffiliated service providers. Class R6 shares do not incursub-accounting fees. For the six months ended April 30, 2019, theseout-of-pocket expenses,sub-accounting and other shareholder servicing costs amounted to $186.
Administrator– MFS provides certain financial, legal, shareholder communications, compliance, and other administrative services to the fund. Under an administrative services agreement, the fund reimburses MFS the costs incurred to provide these services. The fund is charged an annual fixed amount of $17,500 plus a fee based on average daily net assets. The administrative services fee incurred for the six months ended April 30, 2019 was equivalent to an annual effective rate of 0.0154% of the fund’s average daily net assets.
Trustees’ and Officers’ Compensation– The fund pays compensation to independent Trustees in the form of a retainer, attendance fees, and additional
45
Notes to Consolidated Financial Statements (unaudited) – continued
compensation to Board and Committee chairpersons. The fund does not pay compensation directly to Trustees or officers of the fund who are also officers of the investment adviser, all of whom receive remuneration for their services to the fund from MFS. Certain officers and Trustees of the fund are officers or directors of MFS, MFD, and MFSC.
Other– This fund and certain other funds managed by MFS (the funds) have entered into a service agreement (the ISO Agreement) which provides for payment of fees solely by the funds to Tarantino LLC in return for the provision of services of an Independent Senior Officer (ISO) for the funds. Frank L. Tarantino serves as the ISO and is an officer of the funds and the sole member of Tarantino LLC. The funds can terminate the ISO Agreement with Tarantino LLC at any time under the terms of the ISO Agreement. For the six months ended April 30, 2019, the fee paid by the fund under this agreement was $519 and is included in “Miscellaneous” expense in the Consolidated Statement of Operations. MFS has agreed to bear all expenses associated with office space, other administrative support, and supplies provided to the ISO.
The fund invests in the MFS Institutional Money Market Portfolio which is managed by MFS and seeks current income consistent with preservation of capital and liquidity. This money market fund does not pay a management fee to MFS.
On August 15, 2018, MFS purchased 8,757 shares each of Class B, Class C, Class R1, Class R2, Class R3, and Class R4 for an aggregate amount of $300,000 as an initial investment in the class.
At April 30, 2019, MFS held approximately 81% and 65% of the outstanding shares of Class C and Class I, respectively, and 100% of the outstanding shares of Class B, Class R1, Class R2, Class R3, and Class R4.
(4) Portfolio Securities
For the six months ended April 30, 2019, purchases and sales of investments, other than short-term obligations, were as follows:
| | | | | | | | |
| | |
| | | Purchases | | | Sales | |
| U.S. Government securities | | | $13,977,625 | | | | $13,759,968 | |
| Non-U.S. Government securities | | | $100,821,400 | | | | $81,147,085 | |
46
Notes to Consolidated Financial Statements (unaudited) – continued
(5) Shares of Beneficial Interest
The fund’s Declaration of Trust permits the Trustees to issue an unlimited number of full and fractional shares of beneficial interest. Transactions in fund shares were as follows:
| | | | | | | | | | | | | | | | |
| | | Six months ended
4/30/19 | | | Year ended
10/31/18 (i) | |
| | | | |
| | | Shares | | | Amount | | | Shares | | | Amount | |
| Shares sold | | | | | | | | | | | | | | | | |
Class A | | | 26,591 | | | | $144,466 | | | | 2,739 | | | | $15,758 | |
Class B | | | 52 | | | | 275 | | | | 9,284 | | | | 53,114 | |
Class C | | | 2,118 | | | | 11,295 | | | | 8,756 | | | | 50,000 | |
Class I | | | 4,735 | | | | 25,000 | | | | — | | | | — | |
Class R1 | | | — | | | | — | | | | 8,756 | | | | 50,000 | |
Class R2 | | | — | | | | — | | | | 8,757 | | | | 50,000 | |
Class R3 | | | — | | | | — | | | | 8,757 | | | | 50,000 | |
Class R4 | | | — | | | | — | | | | 8,757 | | | | 50,000 | |
Class R6 | | | 6,020,290 | | | | 32,220,754 | | | | 17,803,093 | | | | 104,027,255 | |
| | | 6,053,786 | | | | $32,401,790 | | | | 17,858,899 | | | | $104,346,127 | |
| | | | |
| Shares issued to shareholders in reinvestment of distributions | | | | | | | | | | | | | | | | |
Class A | | | 342 | | | | $1,840 | | | | 249 | | | | $1,416 | |
Class B | | | 269 | | | | 1,445 | | | | — | | | | — | |
Class C | | | 252 | | | | 1,355 | | | | — | | | | — | |
Class I | | | 280 | | | | 1,502 | | | | 272 | | | | 1,543 | |
Class R1 | | | 253 | | | | 1,356 | | | | — | | | | — | |
Class R2 | | | 269 | | | | 1,450 | | | | — | | | | — | |
Class R3 | | | 278 | | | | 1,497 | | | | — | | | | — | |
Class R4 | | | 287 | | | | 1,545 | | | | — | | | | — | |
Class R6 | | | 3,436,567 | | | | 18,488,731 | | | | 3,250,929 | | | | 18,497,786 | |
| | | 3,438,797 | | | | $18,500,721 | | | | 3,251,450 | | | | $18,500,745 | |
| | | | |
| Shares reacquired | | | | | | | | | | | | | | | | |
Class B | | | (584 | ) | | | $(3,156 | ) | | | — | | | | $— | |
Class R6 | | | (2,892,395 | ) | | | (15,615,682 | ) | | | (15,685,327 | ) | | | (93,166,749 | ) |
| | | (2,892,979 | ) | | | $(15,618,838 | ) | | | (15,685,327 | ) | | | $(93,166,749 | ) |
| | | | |
| Net change | | | | | | | | | | | | | | | | |
Class A | | | 26,933 | | | | $146,306 | | | | 2,988 | | | | $17,174 | |
Class B | | | (263 | ) | | | (1,436 | ) | | | 9,284 | | | | 53,114 | |
Class C | | | 2,370 | | | | 12,650 | | | | 8,756 | | | | 50,000 | |
Class I | | | 5,015 | | | | 26,502 | | | | 272 | | | | 1,543 | |
Class R1 | | | 253 | | | | 1,356 | | | | 8,756 | | | | 50,000 | |
Class R2 | | | 269 | | | | 1,450 | | | | 8,757 | | | | 50,000 | |
Class R3 | | | 278 | | | | 1,497 | | | | 8,757 | | | | 50,000 | |
Class R4 | | | 287 | | | | 1,545 | | | | 8,757 | | | | 50,000 | |
Class R6 | | | 6,564,462 | | | | 35,093,803 | | | | 5,368,695 | | | | 29,358,292 | |
| | | 6,599,604 | | | | $35,283,673 | | | | 5,425,022 | | | | $29,680,123 | |
| (i) | For Class B, Class C, Class R1, Class R2, Class R3, and Class R4, the period is from the class inception, August 15, 2018, through the stated period end. |
47
Notes to Consolidated Financial Statements (unaudited) – continued
Class T shares were not publicly available for sale during the period. Please see the fund’s prospectus for details.
Effective June 1, 2019, purchases of the fund’s Class B shares are closed to new and existing investors subject to certain exceptions. Please see the fund’s prospectus for details.
The fund is one of several mutual funds in which certain MFS funds may invest. The MFS funds do not invest in the underlying funds for the purpose of exercising management or control. At the end of the period, the MFS Growth Allocation Fund, the MFS Moderate Allocation Fund, the MFS Aggressive Growth Allocation Fund, the MFS Conservative Allocation Fund, the MFS Lifetime 2040 Fund, the MFS Lifetime 2030 Fund, the MFS Lifetime Income Fund, the MFS Lifetime 2035 Fund, the MFS Lifetime 2050 Fund, the MFS Lifetime 2045 Fund, the MFS Lifetime 2020 Fund, and the MFS Lifetime 2025 Fund were the owners of record of approximately 32%, 27%, 15%, 9%, 3%, 3%, 2%, 2%, 2%, 2%, 1%, and 1%, respectively, of the value of outstanding voting shares of the fund. In addition, the MFS Lifetime 2055 Fund and the MFS Lifetime 2060 Fund were each the owners of record of less than 1% of the value of outstanding voting shares of the fund.
(6) Line of Credit
The fund and certain other funds managed by MFS participate in a $1.25 billion unsecured committed line of credit, subject to a $1 billion sublimit, provided by a syndicate of banks under a credit agreement. Borrowings may be made for temporary financing needs. Interest is charged to each fund, based on its borrowings, generally at a rate equal to the highest of one month LIBOR, the Federal Funds Effective Rate and the Overnight Bank Funding Rate, plus an agreed upon spread. A commitment fee, based on the average daily, unused portion of the committed line of credit, is allocated among the participating funds. In addition, the fund and other funds managed by MFS have established unsecured uncommitted borrowing arrangements with certain banks for temporary financing needs. Interest is charged to each fund, based on its borrowings, at rates equal to customary reference rates plus an agreed upon spread. For the six months ended April 30, 2019, the fund’s commitment fee and interest expense were $1,824 and $0, respectively, and are included in “Miscellaneous” expense in the Consolidated Statement of Operations.
(7) Investments in Affiliated Issuers
An affiliated issuer may be considered one in which the fund owns 5% or more of the outstanding voting securities, or a company which is under common control. For the purposes of this report, the fund assumes the following to be affiliated issuers:
| | | | | | | | | | | | | | | | | | | | | | | | |
| | | | | | |
| Affiliated Issuers | | Beginning
Value | | | Purchases | | | Sales
Proceeds | | | Realized
Gain
(Loss) | | | Change in
Unrealized
Appreciation or
Depreciation | | | Ending
Value | |
| MFS Institutional Money Market Portfolio | | | $67,288,030 | | | | $111,093,221 | | | | $141,770,795 | | | | $1,821 | | | | $625 | | | | $36,612,902 | |
| | | | | | |
| Affiliated Issuers | | | | | | | | | | | | | | Dividend
Income | | | Capital Gain
Distributions | |
| MFS Institutional Money Market Portfolio | | | | | | | | | | | | $528,569 | | | | $— | |
48
PROXY VOTING POLICIES AND INFORMATION
MFS votes proxies on behalf of the fund pursuant to proxy voting policies and procedures that are available without charge, upon request, by calling1-800-225-2606, by visitingmfs.com/proxyvoting, or by visiting the SEC’s Web site athttp://www.sec.gov.
Information regarding how the fund voted proxies relating to portfolio securities during the most recent twelve-month period ended June 30 is available by August 31 of each year without charge by visitingmfs.com/proxyvoting, or by visiting the SEC’s Web site athttp://www.sec.gov.
QUARTERLY PORTFOLIO DISCLOSURE
The fund files a complete schedule of portfolio holdings with the SEC for the first and third quarters of each fiscal year on Form N-Q or as an exhibit to its reports onForm N-PORT (for first and third fiscal quarters ending March 31, 2019 or after). The fund’s Form N-Q or Form N-PORT reports are available on the SEC’s website athttp://www.sec.gov.A shareholder can obtain the portfolio holdings report for the first and third quarters of the fund’s fiscal year atmfs.com/openendfunds by choosing the fund’s name and then selecting the “Resources” tab and clicking on “Prospectus and Reports”.
FURTHER INFORMATION
From time to time, MFS may post important information about the fund or the MFS funds on the MFS web site (mfs.com). This information is available athttps://www.mfs.com/en-us/what-we-do/announcements.html or atmfs.com/openendfunds by choosing the fund’s name.
INFORMATION ABOUT FUND CONTRACTS AND LEGAL CLAIMS
The fund has entered into contractual arrangements with an investment adviser, administrator, distributor, shareholder servicing agent, 529 program manager (if applicable), and custodian who each provide services to the fund. Unless expressly stated otherwise, shareholders are not parties to, or intended beneficiaries of these contractual arrangements, and these contractual arrangements are not intended to create any shareholder right to enforce them against the service providers or to seek any remedy under them against the service providers, either directly or on behalf of the fund.
Under the Trust’s By-Laws and Declaration of Trust, any claims asserted against or on behalf of the MFS Funds, including claims against Trustees and Officers, must be brought in state and federal courts located within the Commonwealth of Massachusetts.
PROVISION OF FINANCIAL REPORTS AND SUMMARY PROSPECTUSES
The fund produces financial reports every six months and updates its summary prospectus and prospectus annually. To avoid sending duplicate copies of materials to households, only one copy of the fund’s annual and semiannual report and summary prospectus may be mailed to shareholders having the same last name and residential address on the fund’s records. However, any shareholder may contact MFSC (please see back cover for address and telephone number) to request that copies of these reports and summary prospectuses be sent personally to that shareholder.
49
Save paper with eDelivery.

MFS® will send you prospectuses, |
reports, and proxies directly viae-mail so you will get information faster with less mailbox clutter.
To sign up:
1. Go to mfs.com.
2. Log in via MFS® Access.
3. Select eDelivery.
If you own your MFS fund shares through a financial institution or a retirement plan, MFS® TALK, MFS® Access, or eDelivery may not be available to you.
CONTACT
WEB SITE
mfs.com
MFS TALK
1-800-637-8255
24 hours a day
ACCOUNT SERVICE AND LITERATURE
Shareholders
1-800-225-2606
Financial advisors
1-800-343-2829
Retirement plan services
1-800-637-1255
MAILING ADDRESS
MFS Service Center, Inc.
P.O. Box 219341
Kansas City, MO 64121-9341
OVERNIGHT MAIL
MFS Service Center, Inc.
Suite 219341
430 W 7th Street
Kansas City, MO 64105-1407
Semiannual Report
April 30, 2019

MFS® Global Alternative Strategy Fund

Beginning on January 1, 2021, as permitted by regulations adopted by the U.S. Securities and Exchange Commission, paper copies of the fund’s annual and semiannual shareholder reports will no longer be sent by mail, unless you specifically request paper copies of the reports. Instead, the complete reports will be made available on the fund’s Web site (funds.mfs.com), and you will be notified by mail each time a report is posted and provided with a Web site link to access the report.
If you are already signed up to receive shareholder reports by email, you will not be affected by this change and you need not take any action. You may sign up to receive shareholder reports and other communications from the fund by email by contacting your financial intermediary (such as a broker-dealer or bank) or, if you hold your shares directly with the fund, by calling 1-800-225-2606 or by logging on to MFS Access at mfs.com.
Beginning on January 1, 2019, you may elect to receive all future reports in paper free of charge. Contact your financial intermediary to request that you continue to receive paper copies of your shareholder reports. If you invest directly with the fund, you can call 1-800-225-2606 or send an email request to orderliterature@mfs.com to let the fund know that you wish to continue receiving paper copies of your shareholder reports. Your election to receive reports in paper will apply to all funds held in your account if you invest through your financial intermediary or all funds held with the MFS fund complex if you invest directly.
DTR-SEM
MFS® Global Alternative Strategy Fund
CONTENTS
The report is prepared for the general information of shareholders.
It is authorized for distribution to prospective investors only when preceded or accompanied by a current prospectus.
NOT FDIC INSURED• MAY LOSE VALUE• NO BANK GUARANTEE

LETTER FROM THE EXECUTIVE CHAIRMAN
Dear Shareholders:
Markets experienced a bout of volatility in late 2018 as a result of higher interest rates, international trade friction, and geopolitical uncertainty surrounding issues such as
Brexit. Those concerns dissipated in the early months of 2019 due to the more dovish posture of the U.S. Federal Reserve and other global central banks, reported progress toward a trade pact between the United States and China, and action against ano-deal Brexit by the British Parliament. However, a last-minute breakdown in negotiations between the U.S. and China derailed the market’s momentum and increased concerns over the future pace of global growth. Compounding Brexit uncertainty was the resignation of British Prime Minister Theresa May, potentially ushering in a harder form of Brexit than she had advocated. U.S. equities have continued to outperform their global peers due in
part to fiscal stimulus undertaken in late 2017 and early 2018, which contributed to the continuation of relatively healthy levels of U.S. economic output against a backdrop of slower global growth. Inflation remains largely subdued globally, which is encouraging for asset markets. Rising incomes in many developed and emerging markets are supportive of gains in consumption, though a challenging environment for global trade has hindered manufacturing in most regions.
Since launching the first U.S.open-end mutual fund in 1924, MFS® has been committed to a single purpose: to create value by allocating capital responsibly for clients. Through our powerful global investment platform, we combine collective expertise, thoughtful risk management, and long-term discipline to uncover what we believe are the best investment opportunities in the market.
Respectfully,

Robert J. Manning
Executive Chairman
MFS Investment Management
June 17, 2019
The opinions expressed in this letter are subject to change and may not be relied upon for investment advice. No forecasts can be guaranteed.
1
PORTFOLIO COMPOSITION
Portfolio structure
| | | | | | | | | | | | | | | | | | |
| | | | | | | | Derivative Overlay
Positions (b) | | | | |
| | | | | Active Security Selection (a) | | | Long | | | Short | | | Net Market
Exposure (c) | |
| Fixed Income | | U.S. | | | 18.4% | | | | 35.6% | | | | (11.9)% | | | | 42.1% | |
| | Japan | | | 0.0% | | | | 9.3% | | | | 0.0% | | | | 9.3% | |
| | United Kingdom | | | 0.4% | | | | 2.1% | | | | 0.0% | | | | 2.5% | |
| | Europe ex-U.K. | | | 0.8% | | | | 0.7% | | | | 0.0% | | | | 1.5% | |
| | Emerging Markets | | | 0.3% | | | | 0.0% | | | | 0.0% | | | | 0.3% | |
| | Asia/Pacific ex-Japan | | | 0.3% | | | | 0.0% | | | | (2.7)% | | | | (2.4)% | |
| | | North America ex-U.S. | | | 0.0% | | | | 0.0% | | | | (10.6)% | | | | (10.6)% | |
| Equity | | Europe ex-U.K. | | | 9.0% | | | | 7.2% | | | | (2.9)% | | | | 13.3% | |
| | U.S. Large Cap | | | 28.2% | | | | 0.0% | | | | (18.0)% | | | | 10.2% | |
| | United Kingdom | | | 3.4% | | | | 1.3% | | | | 0.0% | | | | 4.7% | |
| | Emerging Markets | | | 2.3% | | | | 5.1% | | | | (6.0)% | | | | 1.4% | |
| | North America ex-U.S. | | | 1.0% | | | | 0.0% | | | | 0.0% | | | | 1.0% | |
| | Asia/Pacific ex-Japan | | | 1.1% | | | | 3.6% | | | | (4.0)% | | | | 0.7% | |
| | Japan | | | 3.0% | | | | 0.0% | | | | (2.6)% | | | | 0.4% | |
| | U.S Small/Mid Cap | | | 19.1% | | | | 0.0% | | | | (19.0)% | | | | 0.1% | |
| | | Developed - Middle East/Africa | | | 0.1% | | | | 0.0% | | | | 0.0% | | | | 0.1% | |
| Cash | | Cash & Cash Equivalent (d) | | | | | | | | | | | | | | | 12.6% | |
| | Other (e) | | | | | | | | | | | | | | | 12.8% | |
| | | | |
| Top ten holdings (c) | |
| USD Interest Rate Swap, Receive 2.437% - APR 2021 | | | 24.3% | |
| USD Interest Rate Swap, Receive 2.533% - MAR 2024 | | | 11.4% | |
| Japan Government Bond 10 yr Future - JUN 2019 | | | 9.3% | |
| S&P/ASX 200 Index Future - JUN 2019 | | | (3.8)% | |
| U.S. Treasury Note 10 yr Future - JUN 2019 | | | (4.1)% | |
| USD Interest Rate Swap, Pay 2.482% - APR 2029 | | | (5.3)% | |
| S&P MidCap 400 Index Future - JUN 2019 | | | (9.1)% | |
| Russell 2000 Index Future - JUN 2019 | | | (9.8)% | |
| Canadian Treasury Bond 10 yr Future - JUN 2019 | | | (10.6)% | |
| S&P 500 Index Future - JUN 2019 | | | (18.0)% | |
2
Portfolio Composition – continued
| (a) | Represents the actively managed portion of the portfolio and for purposes of this presentation, components include the value of securities, less any securities sold short. The bond component will include any accrued interest amounts. This also reflects the equivalent exposure of certain derivative positions. These amounts may be negative from time to time. |
| (b) | Represents the tactical overlay portion of the portfolio which is how the fund manages its exposure to markets and currencies through the use of derivative positions. Percentages reflect the equivalent exposure of those derivative positions. |
| (c) | For purposes of this presentation, the components include the value of securities, less any securities sold short, and reflect the impact of the equivalent exposure of all derivative positions. These amounts may be negative from time to time. The bond component will include any accrued interest amounts. |
| (d) | Cash & Cash Equivalents includes any cash, investments in money market funds, short term securities, and other assets less liabilities. Please see the Statement of Assets and Liabilities for additional information related to the fund’s cash position and other assets and liabilities. |
| (e) | Other includes currency derivatives and/or the offsetting of the leverage produced by the fund’s derivative positions, including payables and/or receivables of the finance leg of interest rate swaps and the unrealized gain or loss in connection with forward currency exchange contracts. |
Equivalent exposure is a calculated amount that translates the derivative position into a reasonable approximation of the amount of the underlying asset that the portfolio would have to hold at a given point in time to have the same price sensitivity that results from the portfolio’s ownership of the derivative contract. When dealing with derivatives, equivalent exposure is a more representative measure of the potential impact of a position on portfolio performance than value. The value of derivatives may be different.
Where the fund holds convertible bonds, they are treated as part of the equity portion of the portfolio.
Percentages are based on net assets as of April 30, 2019.
The portfolio is actively managed and current holdings may be different.
3
EXPENSE TABLE
Fund expenses borne by the shareholders during the period, November 1, 2018 through April 30, 2019
As a shareholder of the fund, you incur two types of costs: (1) transaction costs, including sales charges (loads) on certain purchase or redemption payments, and (2) ongoing costs, including management fees; distribution and service(12b-1) fees; and other fund expenses. This example is intended to help you understand your ongoing costs (in dollars) of investing in the fund and to compare these costs with the ongoing costs of investing in other mutual funds.
The example is based on an investment of $1,000 invested at the beginning of the period and held for the entire period November 1, 2018 through April 30, 2019.
Actual Expenses
The first line for each share class in the following table provides information about actual account values and actual expenses. You may use the information in this line, together with the amount you invested, to estimate the expenses that you paid over the period. Simply divide your account value by $1,000 (for example, an $8,600 account value divided by $1,000 = 8.6), then multiply the result by the number in the first line under the heading entitled “Expenses Paid During Period” to estimate the expenses you paid on your account during this period.
Hypothetical Example for Comparison Purposes
The second line for each share class in the following table provides information about hypothetical account values and hypothetical expenses based on the fund’s actual expense ratio and an assumed rate of return of 5% per year before expenses, which is not the fund’s actual return. The hypothetical account values and expenses may not be used to estimate the actual ending account balance or expenses you paid for the period. You may use this information to compare the ongoing costs of investing in the fund and other funds. To do so, compare this 5% hypothetical example with the 5% hypothetical examples that appear in the shareholder reports of the other funds.
Please note that the expenses shown in the table are meant to highlight your ongoing costs only and do not reflect any transactional costs, such as sales charges (loads). Therefore, the second line for each share class in the table is useful in comparing ongoing costs only, and will not help you determine the relative total costs of owning different funds. In addition, if these transactional costs were included, your costs would have been higher.
4
Expense Table – continued
| | | | | | | | | | | | | | | | | | |
Share
Class | | | | Annualized
Expense
Ratio | | | Beginning
Account Value
11/01/18 | | | Ending Account Value
4/30/19 | | | Expenses Paid During
Period (p) 11/01/18-4/30/19 | |
| A | | Actual | | | 1.35% | | | | $1,000.00 | | | | $1,057.06 | | | | $6.89 | |
| | Hypothetical (h) | | | 1.35% | | | | $1,000.00 | | | | $1,018.10 | | | | $6.76 | |
| B | | Actual | | | 2.10% | | | | $1,000.00 | | | | $1,053.99 | | | | $10.69 | |
| | Hypothetical (h) | | | 2.10% | | | | $1,000.00 | | | | $1,014.38 | | | | $10.49 | |
| C | | Actual | | | 2.10% | | | | $1,000.00 | | | | $1,052.79 | | | | $10.69 | |
| | Hypothetical (h) | | | 2.10% | | | | $1,000.00 | | | | $1,014.38 | | | | $10.49 | |
| I | | Actual | | | 1.10% | | | | $1,000.00 | | | | $1,058.95 | | | | $5.62 | |
| | Hypothetical (h) | | | 1.10% | | | | $1,000.00 | | | | $1,019.34 | | | | $5.51 | |
| R1 | | Actual | | | 2.10% | | | | $1,000.00 | | | | $1,053.50 | | | | $10.69 | |
| | Hypothetical (h) | | | 2.10% | | | | $1,000.00 | | | | $1,014.38 | | | | $10.49 | |
| R2 | | Actual | | | 1.60% | | | | $1,000.00 | | | | $1,055.01 | | | | $8.15 | |
| | Hypothetical (h) | | | 1.60% | | | | $1,000.00 | | | | $1,016.86 | | | | $8.00 | |
| R3 | | Actual | | | 1.35% | | | | $1,000.00 | | | | $1,056.85 | | | | $6.88 | |
| | Hypothetical (h) | | | 1.35% | | | | $1,000.00 | | | | $1,018.10 | | | | $6.76 | |
| R4 | | Actual | | | 1.10% | | | | $1,000.00 | | | | $1,058.77 | | | | $5.62 | |
| | Hypothetical (h) | | | 1.10% | | | | $1,000.00 | | | | $1,019.34 | | | | $5.51 | |
| R6 | | Actual | | | 1.03% | | | | $1,000.00 | | | | $1,059.29 | | | | $5.26 | |
| | Hypothetical (h) | | | 1.03% | | | | $1,000.00 | | | | $1,019.69 | | | | $5.16 | |
| (h) | 5% class return per year before expenses. |
| (p) | “Expenses Paid During Period” are equal to each class’s annualized expense ratio, as shown above, multiplied by the average account value over the period, multiplied by 181/365 (to reflect theone-half year period). Expenses paid do not include any applicable sales charges (loads). If these transaction costs had been included, your costs would have been higher. |
Notes to Expense Table
Expense ratios include 0.06% of interest expense on uncovered collateral or margin obligations with the broker (See Note 2 of the Notes to Financial Statements) that are outside of the expense limitation arrangement (See Note 3 of the Notes to Financial Statements).
5
PORTFOLIO OF INVESTMENTS
4/30/19 (unaudited)
The Portfolio of Investments is a complete list of all securities owned by your fund. It is categorized by broad-based asset classes.
| | | | | | | | |
| Common Stocks - 66.9% | | | | | | | | |
| | |
| Issuer | | Shares/Par | | | Value ($) | |
| Aerospace - 1.6% | | | | | | | | |
| Boeing Co. (f) | | | 2,047 | | | $ | 773,131 | |
| CACI International, Inc., “A” (a) | | | 2,307 | | | | 449,727 | |
| Cubic Corp. | | | 986 | | | | 55,985 | |
| Curtiss-Wright Corp. | | | 461 | | | | 52,526 | |
| FLIR Systems, Inc. | | | 1,307 | | | | 69,193 | |
| Harris Corp. | | | 1,228 | | | | 206,918 | |
| Honeywell International, Inc. | | | 291 | | | | 50,526 | |
| L3 Technologies, Inc. | | | 255 | | | | 55,738 | |
| Leidos Holdings, Inc. | | | 5,000 | | | | 367,400 | |
| Malaysia Airports Holdings Berhad | | | 8,800 | | | | 16,240 | |
| ManTech International Corp., “A” | | | 734 | | | | 45,501 | |
| Northrop Grumman Corp. | | | 102 | | | | 29,571 | |
| Rolls-Royce Holdings PLC | | | 26,507 | | | | 316,133 | |
| Saab AB, “B” | | | 2,194 | | | | 72,193 | |
| Singapore Technologies Engineering Ltd. | | | 26,800 | | | | 78,029 | |
| TransDigm Group, Inc. (a) | | | 167 | | | | 80,581 | |
| United Technologies Corp. | | | 273 | | | | 38,932 | |
| | | | | | | | |
| | | | | | | $ | 2,758,324 | |
| Airlines - 0.1% | | | | | | | | |
| Aena S.A. | | | 254 | | | $ | 47,106 | |
| Alaska Air Group, Inc. | | | 407 | | | | 25,193 | |
| Delta Air Lines, Inc. | | | 1,103 | | | | 64,294 | |
| Grupo Aeroportuario del Centro Norte S.A.B. de C.V. | | | 10,631 | | | | 65,498 | |
| | | | | | | | |
| | | | | | | $ | 202,091 | |
| Alcoholic Beverages - 1.4% | | | | | | | | |
| Ambev S.A., ADR | | | 5,975 | | | $ | 28,142 | |
| China Resources Beer Holdings Co. Ltd. | | | 44,000 | | | | 201,076 | |
| Compania Cervecerias Unidas S.A., ADR | | | 2,930 | | | | 80,692 | |
| Constellation Brands, Inc., “A” | | | 1,324 | | | | 280,251 | |
| Diageo PLC | | | 6,799 | | | | 286,679 | |
| Heineken N.V. | | | 3,616 | | | | 390,321 | |
| Molson Coors Brewing Co. | | | 7,152 | | | | 459,087 | |
| Pernod Ricard S.A. | | | 4,823 | | | | 840,362 | |
| | | | | | | | |
| | | | | | | $ | 2,566,610 | |
| Apparel Manufacturers - 0.9% | | | | | | | | |
| Adidas AG | | | 286 | | | $ | 73,490 | |
| Coats Group PLC | | | 65,499 | | | | 73,795 | |
6
Portfolio of Investments (unaudited) – continued
| | | | | | | | |
| | |
| Issuer | | Shares/Par | | | Value ($) | |
| Common Stocks - continued | | | | | | | | |
| Apparel Manufacturers - continued | | | | | | | | |
| Compagnie Financiere Richemont S.A. | | | 2,508 | | | $ | 183,371 | |
| Hanesbrands, Inc. | | | 1,283 | | | | 23,184 | |
| Levi Strauss & Co., “A” (a) | | | 3,054 | | | | 68,440 | |
| LVMH Moet Hennessy Louis Vuitton SE | | | 2,100 | | | | 822,138 | |
| NIKE, Inc., “B” | | | 2,105 | | | | 184,882 | |
| PVH Corp. | | | 336 | | | | 43,341 | |
| Skechers USA, Inc., “A” (a) | | | 5,174 | | | | 163,809 | |
| | | | | | | | |
| | | | | | | $ | 1,636,450 | |
| Automotive - 0.6% | | | | | | | | |
| Copart, Inc. (a) | | | 1,535 | | | $ | 103,336 | |
| Harley-Davidson, Inc. | | | 822 | | | | 30,603 | |
| Hella KGaA Hueck & Co. | | | 699 | | | | 37,992 | |
| KAR Auction Services, Inc. | | | 1,133 | | | | 63,992 | |
| Koito Manufacturing Co. Ltd. | | | 1,300 | | | | 77,638 | |
| Lear Corp. | | | 2,171 | | | | 310,453 | |
| LKQ Corp. (a) | | | 2,517 | | | | 75,762 | |
| NGK Spark Plug Co. Ltd | | | 3,200 | | | | 61,632 | |
| Stoneridge, Inc. (a) | | | 2,202 | | | | 69,209 | |
| USS Co. Ltd. | | | 8,300 | | | | 158,952 | |
| Visteon Corp. (a) | | | 1,387 | | | | 91,570 | |
| | | | | | | | |
| | | | | | | $ | 1,081,139 | |
| Biotechnology - 0.7% | | | | | | | | |
| Aimmune Therapeutics, Inc. (a) | | | 1,031 | | | $ | 20,764 | |
| Alder Biopharmaceuticals, Inc. (a) | | | 2,275 | | | | 30,917 | |
| Amgen, Inc. | | | 778 | | | | 139,511 | |
| Amicus Therapeutics, Inc. (a) | | | 2,520 | | | | 33,617 | |
| Biogen, Inc. (a)(f) | | | 1,433 | | | | 328,501 | |
| Bio-Techne Corp. | | | 1,325 | | | | 271,082 | |
| Gilead Sciences, Inc. | | | 1,380 | | | | 89,755 | |
| Immunomedics, Inc. (a) | | | 1,149 | | | | 18,407 | |
| Morphosys AG, ADR (a) | | | 1,155 | | | | 28,482 | |
| Neurocrine Biosciences, Inc. (a) | | | 325 | | | | 23,478 | |
| Regeneron Pharmaceuticals, Inc. (a) | | | 207 | | | | 71,030 | |
| Tricida, Inc. (a) | | | 652 | | | | 22,338 | |
| Twist Bioscience Corp. | | | 425 | | | | 10,056 | |
| Vertex Pharmaceuticals, Inc. (a) | | | 675 | | | | 114,061 | |
| | | | | | | | |
| | | | | | | $ | 1,201,999 | |
| Broadcasting - 0.3% | | | | | | | | |
| Interpublic Group of Companies, Inc. | | | 1,491 | | | $ | 34,293 | |
| Netflix, Inc. (a) | | | 1,565 | | | | 579,895 | |
| | | | | | | | |
| | | | | | | $ | 614,188 | |
7
Portfolio of Investments (unaudited) – continued
| | | | | | | | |
| | |
| Issuer | | Shares/Par | | | Value ($) | |
| Common Stocks - continued | | | | | | | | |
| Brokerage & Asset Managers - 1.4% | | | | | | | | |
| Apollo Global Management LLC, “A” | | | 2,185 | | | $ | 71,428 | |
| ASX Ltd. | | | 1,565 | | | | 82,192 | |
| BlackRock, Inc. | | | 538 | | | | 261,059 | |
| Blackstone Group LP | | | 1,019 | | | | 40,210 | |
| CME Group, Inc. | | | 195 | | | | 34,886 | |
| Computershare Ltd. | | | 9,825 | | | | 123,493 | |
| Daiwa Securities Group, Inc. | | | 14,400 | | | | 66,904 | |
| Euronext N.V. | | | 1,020 | | | | 70,873 | |
| Hamilton Lane, Inc., “A” | | | 1,052 | | | | 51,401 | |
| HealthEquity, Inc. (a) | | | 530 | | | | 35,907 | |
| IG Group Holdings PLC | | | 10,314 | | | | 68,565 | |
| Intercontinental Exchange, Inc. | | | 1,121 | | | | 91,193 | |
| Invesco Ltd. | | | 2,014 | | | | 44,248 | |
| NASDAQ, Inc. (f) | | | 7,554 | | | | 696,479 | |
| Raymond James Financial, Inc. | | | 655 | | | | 59,978 | |
| Schroders PLC | | | 2,030 | | | | 83,834 | |
| TD Ameritrade Holding Corp. (f) | | | 8,533 | | | | 448,665 | |
| TMX Group Ltd. | | | 3,070 | | | | 195,837 | |
| WisdomTree Investments, Inc. | | | 5,106 | | | | 36,763 | |
| | | | | | | | |
| | | | | | | $ | 2,563,915 | |
| Business Services - 4.0% | | | | | | | | |
| Accenture PLC, “A” (f) | | | 6,251 | | | $ | 1,141,870 | |
| Amdocs Ltd. | | | 1,081 | | | | 59,541 | |
| Ashtead Group PLC | | | 3,755 | | | | 103,904 | |
| BrightView Holdings, Inc. (a) | | | 3,695 | | | | 59,268 | |
| Bunzl PLC | | | 3,941 | | | | 118,661 | |
| CarGurus, Inc. (a) | | | 1,267 | | | | 51,618 | |
| Cerved Information Solutions S.p.A. | | | 1,657 | | | | 16,169 | |
| Cognizant Technology Solutions Corp., “A” | | | 1,437 | | | | 104,843 | |
| Compass Group PLC | | | 14,178 | | | | 322,248 | |
| CoStar Group, Inc. (a) | | | 226 | | | | 112,152 | |
| Doshisha Co. Ltd. | | | 3,700 | | | | 59,156 | |
| DXC Technology Co. (s) | | | 6,177 | | | | 406,076 | |
| Edenred | | | 485 | | | | 22,852 | |
| Endava PLC, ADR (a) | | | 2,419 | | | | 79,996 | |
| Equifax, Inc. | | | 2,214 | | | | 278,853 | |
| EVO Payments, Inc., “A” (a) | | | 1,312 | | | | 38,980 | |
| Fidelity National Information Services, Inc. | | | 4,238 | | | | 491,311 | |
| First Data Corp. (a) | | | 2,493 | | | | 64,469 | |
| Fiserv, Inc. (a)(f) | | | 9,350 | | | | 815,694 | |
| FleetCor Technologies, Inc. (a) | | | 547 | | | | 142,740 | |
| Global Payments, Inc. | | | 3,785 | | | | 552,875 | |
8
Portfolio of Investments (unaudited) – continued
| | | | | | | | |
| | |
| Issuer | | Shares/Par | | | Value ($) | |
| Common Stocks - continued | | | | | | | | |
| Business Services - continued | | | | | | | | |
| Intertek Group PLC | | | 2,307 | | | $ | 160,946 | |
| Meitec Corp. | | | 2,500 | | | | 116,212 | |
| MSCI, Inc. | | | 1,176 | | | | 265,047 | |
| Nomura Research Institute Ltd. | | | 3,600 | | | | 176,115 | |
| PRA Group, Inc. (a) | | | 1,531 | | | | 43,052 | |
| SGS S.A. | | | 77 | | | | 203,202 | |
| Sodexo | | | 942 | | | | 108,032 | |
| Total System Services, Inc. | | | 1,365 | | | | 139,558 | |
| TransUnion | | | 1,970 | | | | 137,210 | |
| Verisk Analytics, Inc., “A” (f) | | | 2,491 | | | | 351,580 | |
| WNS (Holdings) Ltd., ADR (a) | | | 1,313 | | | | 75,038 | |
| Worldpay, Inc. (a) | | | 2,156 | | | | 252,705 | |
| | | | | | | | |
| | | | | | | $ | 7,071,973 | |
| Cable TV - 0.5% | | | | | | | | |
| Altice USA, Inc. | | | 3,092 | | | $ | 72,847 | |
| Comcast Corp., “A” (f) | | | 17,696 | | | | 770,307 | |
| | | | | | | | |
| | | | | | | $ | 843,154 | |
| Chemicals - 1.1% | | | | | | | | |
| 3M Co. | | | 996 | | | $ | 188,752 | |
| Celanese Corp. | | | 412 | | | | 44,451 | |
| CF Industries Holdings, Inc. | | | 5,366 | | | | 240,289 | |
| DowDuPont, Inc. | | | 637 | | | | 24,493 | |
| Eastman Chemical Co. | | | 785 | | | | 61,921 | |
| FMC Corp. | | | 990 | | | | 78,269 | |
| Givaudan S.A. | | | 149 | | | | 385,898 | |
| Ingevity Corp. (a) | | | 484 | | | | 55,665 | |
| LyondellBasell Industries N.V., “A” | | | 4,616 | | | | 407,270 | |
| PPG Industries, Inc. | | | 3,824 | | | | 449,320 | |
| | | | | | | | |
| | | | | | | $ | 1,936,328 | |
| Computer Software - 4.4% | | | | | | | | |
| 8x8, Inc. (a) | | | 2,334 | | | $ | 55,829 | |
| Adobe Systems, Inc. (a)(f) | | | 4,892 | | | | 1,415,011 | |
| ANSYS, Inc. (a) | | | 1,515 | | | | 296,637 | |
| Autodesk, Inc. (a) | | | 1,153 | | | | 205,476 | |
| Avalara, Inc. (a) | | | 919 | | | | 54,101 | |
| Cadence Design Systems, Inc. (a)(f) | | | 12,097 | | | | 839,290 | |
| Check Point Software Technologies Ltd. (a) | | | 455 | | | | 54,946 | |
| Dassault Systemes S.A. | | | 2,150 | | | | 340,134 | |
| DocuSign, Inc. (a) | | | 766 | | | | 43,409 | |
| EMIS Group PLC | | | 5,910 | | | | 86,160 | |
| Everbridge, Inc. (a) | | | 936 | | | | 69,161 | |
9
Portfolio of Investments (unaudited) – continued
| | | | | | | | |
| | |
| Issuer | | Shares/Par | | | Value ($) | |
| Common Stocks - continued | | | | | | | | |
| Computer Software - continued | | | | | | | | |
| Microsoft Corp. (f) | | | 13,713 | | | $ | 1,790,918 | |
| OBIC Co. Ltd. | | | 5,300 | | | | 615,014 | |
| Okta, Inc. (a) | | | 2,056 | | | | 213,886 | |
| Oracle Corp. | | | 1,517 | | | | 83,936 | |
| Pagerduty, Inc. | | | 810 | | | | 37,989 | |
| Paylocity Holding Corp. (a) | | | 626 | | | | 60,440 | |
| PTC, Inc. (a) | | | 1,147 | | | | 103,769 | |
| RingCentral, Inc. (a) | | | 322 | | | | 37,471 | |
| Salesforce.com, Inc. (a) | | | 2,123 | | | | 351,038 | |
| SAP SE | | | 5,075 | | | | 652,203 | |
| Veeva Systems, Inc. | | | 247 | | | | 34,548 | |
| VeriSign, Inc. | | | 1,037 | | | | 204,756 | |
| Zendesk, Inc. (a) | | | 803 | | | | 70,487 | |
| | | | | | | | |
| | | | | | | $ | 7,716,609 | |
| Computer Software - Systems - 2.6% | | | | | | | | |
| Amadeus IT Group S.A. | | | 11,622 | | | $ | 924,459 | |
| Apple, Inc. | | | 3,409 | | | | 684,084 | |
| Box, Inc. (a) | | | 2,545 | | | | 52,478 | |
| Constellation Software, Inc. | | | 59 | | | | 52,058 | |
| EPAM Systems, Inc. (a) | | | 335 | | | | 60,086 | |
| Five9, Inc. (a) | | | 407 | | | | 21,600 | |
| Hitachi Ltd. | | | 10,700 | | | | 356,373 | |
| International Business Machines Corp. | | | 2,405 | | | | 337,349 | |
| Model N, Inc. (a) | | | 2,237 | | | | 41,474 | |
| NCR Corp. (a) | | | 1,012 | | | | 29,297 | |
| NICE Systems Ltd., ADR (a) | | | 407 | | | | 56,109 | |
| Pluralsight, Inc., “A” (a) | | | 1,297 | | | | 46,031 | |
| Presidio, Inc. | | | 2,893 | | | | 43,453 | |
| Proofpoint, Inc. (a) | | | 390 | | | | 48,914 | |
| Q2 Holdings, Inc. (a) | | | 884 | | | | 66,671 | |
| Rapid7, Inc. (a) | | | 1,191 | | | | 64,719 | |
| RealPage, Inc. (a) | | | 773 | | | | 50,407 | |
| ServiceNow, Inc. (a) | | | 2,347 | | | | 637,234 | |
| SS&C Technologies Holdings, Inc. | | | 2,235 | | | | 151,220 | |
| Tableau Software, Inc., “A” | | | 2,399 | | | | 292,222 | |
| Tech Data Corp. (a) | | | 3,019 | | | | 321,856 | |
| Temenos Group AG | | | 155 | | | | 25,769 | |
| Venture Corp. Ltd. | | | 6,600 | | | | 82,348 | |
| Verint Systems, Inc. (a) | | | 1,484 | | | | 89,619 | |
| Workday, Inc. | | | 486 | | | | 99,936 | |
| Zebra Technologies Corp., “A” (a) | | | 182 | | | | 38,427 | |
| | | | | | | | |
| | | | | | | $ | 4,674,193 | |
10
Portfolio of Investments (unaudited) – continued
| | | | | | | | |
| | |
| Issuer | | Shares/Par | | | Value ($) | |
| Common Stocks - continued | | | | | | | | |
| Conglomerates - 0.1% | | | | | | | | |
| DCC PLC | | | 1,482 | | | $ | 132,340 | |
| Melrose Industries PLC | | | 13,514 | | | | 35,632 | |
| | | | | | | | |
| | | | | | | $ | 167,972 | |
| Construction - 1.6% | | | | | | | | |
| Bellway PLC | | | 2,405 | | | $ | 97,596 | |
| Eagle Materials, Inc. | | | 510 | | | | 46,364 | |
| Forterra PLC | | | 19,824 | | | | 80,653 | |
| Foundation Building Materials, Inc. (a) | | | 3,334 | | | | 45,309 | |
| Geberit AG | | | 231 | | | | 96,871 | |
| GMS, Inc. (a) | | | 2,661 | | | | 46,887 | |
| Lennox International, Inc. | | | 240 | | | | 65,148 | |
| Mid-America Apartment Communities, Inc., REIT | | | 532 | | | | 58,206 | |
| Mohawk Industries, Inc. (a) | | | 211 | | | | 28,749 | |
| Owens Corning | | | 2,796 | | | | 143,351 | |
| Reliance Worldwide Corp. | | | 27,156 | | | | 93,421 | |
| Sherwin-Williams Co. | | | 1,220 | | | | 554,893 | |
| Stanley Black & Decker, Inc. | | | 561 | | | | 82,243 | |
| Summit Materials, Inc., “A” (a) | | | 3,772 | | | | 66,085 | |
| Techtronic Industries Co. Ltd. | | | 10,500 | | | | 75,891 | |
| Toll Brothers, Inc. (f) | | | 20,015 | | | | 762,571 | |
| Toto Ltd. | | | 1,700 | | | | 71,850 | |
| Vulcan Materials Co. | | | 2,765 | | | | 348,694 | |
| | | | | | | | |
| | | | | | | $ | 2,764,782 | |
| Consumer Products - 1.9% | | | | | | | | |
| Colgate-Palmolive Co. | | | 7,645 | | | $ | 556,480 | |
| Estee Lauder Cos., Inc., “A” | | | 879 | | | | 151,021 | |
| Kao Corp. | | | 4,700 | | | | 362,354 | |
| Kimberly-Clark Corp. | | | 187 | | | | 24,007 | |
| Kobayashi Pharmaceutical Co. Ltd. | | | 11,600 | | | | 926,615 | |
| L’Oréal S.A. | | | 2,533 | | | | 696,332 | |
| Newell Brands, Inc. | | | 4,059 | | | | 58,368 | |
| Prestige Brands Holdings, Inc. (a) | | | 981 | | | | 28,861 | |
| Reckitt Benckiser Group PLC | | | 7,261 | | | | 586,753 | |
| Sensient Technologies Corp. | | | 925 | | | | 64,861 | |
| | | | | | | | |
| | | | | | | $ | 3,455,652 | |
| Consumer Services - 0.9% | | | | | | | | |
| 51job, Inc., ADR (a) | | | 167 | | | $ | 15,421 | |
| Asante, Inc. | | | 4,100 | | | | 80,058 | |
| Bookings Holdings, Inc. (a) | | | 160 | | | | 296,798 | |
| Bright Horizons Family Solutions, Inc. (a) | | | 3,466 | | | | 444,168 | |
| Kroton Educacional S.A. | | | 25,934 | | | | 64,576 | |
11
Portfolio of Investments (unaudited) – continued
| | | | | | | | |
| | |
| Issuer | | Shares/Par | | | Value ($) | |
| Common Stocks - continued | | | | | | | | |
| Consumer Services - continued | | | | | | | | |
| MakeMyTrip Ltd. (a) | | | 5,491 | | | $ | 138,428 | |
| OneSpaWorld Holdings Ltd. (a) | | | 3,234 | | | | 43,918 | |
| Planet Fitness, Inc. (a) | | | 6,823 | | | | 516,501 | |
| | | | | | | | |
| | | | | | | $ | 1,599,868 | |
| Containers - 0.3% | | | | | | | | |
| Berry Global Group, Inc. (a) | | | 3,019 | | | $ | 177,517 | |
| Brambles Ltd. | | | 8,216 | | | | 69,792 | |
| Graphic Packaging Holding Co. | | | 11,043 | | | | 153,277 | |
| Sealed Air Corp. | | | 871 | | | | 40,606 | |
| WestRock Co. | | | 917 | | | | 35,194 | |
| | | | | | | | |
| | | | | | | $ | 476,386 | |
| Electrical Equipment - 1.8% | | | | | | | | |
| AMETEK, Inc. | | | 3,710 | | | $ | 327,111 | |
| Amphenol Corp., “A” | | | 2,762 | | | | 274,985 | |
| CTS Corp. | | | 1,172 | | | | 35,101 | |
| HD Supply Holdings, Inc. (a) | | | 3,530 | | | | 161,286 | |
| IMI PLC | | | 9,174 | | | | 125,670 | |
| Johnson Controls International PLC | | | 7,701 | | | | 288,787 | |
| Legrand S.A. | | | 1,059 | | | | 77,823 | |
| Littlefuse, Inc. | | | 827 | | | | 166,268 | |
| Mettler-Toledo International, Inc. (a) | | | 689 | | | | 513,484 | |
| Resideo Technologies, Inc. (a) | | | 3,326 | | | | 75,500 | |
| Rockwell Automation, Inc. | | | 1,213 | | | | 219,201 | |
| Schneider Electric S.A. | | | 6,607 | | | | 559,190 | |
| Sensata Technologies Holding PLC (a) | | | 1,199 | | | | 59,878 | |
| Spectris PLC | | | 3,697 | | | | 132,478 | |
| TE Connectivity Ltd. | | | 691 | | | | 66,094 | |
| TriMas Corp. (a) | | | 1,416 | | | | 43,797 | |
| WESCO International, Inc. (a) | | | 698 | | | | 39,954 | |
| | | | | | | | |
| | | | | | | $ | 3,166,607 | |
| Electronics - 2.4% | | | | | | | | |
| Analog Devices, Inc. | | | 4,002 | | | $ | 465,192 | |
| ASM International N.V. | | | 440 | | | | 29,887 | |
| Broadcom, Inc. | | | 1,033 | | | | 328,907 | |
| Brooks Automation, Inc. | | | 1,355 | | | | 50,826 | |
| Halma PLC | | | 31,750 | | | | 745,029 | |
| Intel Corp. | | | 7,915 | | | | 403,982 | |
| IPG Photonics Corp. (a) | | | 144 | | | | 25,161 | |
| Keysight Technologies, Inc. (a) | | | 714 | | | | 62,139 | |
| Kyocera Corp. | | | 400 | | | | 25,725 | |
| Marvell Technology Group Ltd. | | | 2,245 | | | | 56,170 | |
12
Portfolio of Investments (unaudited) – continued
| | | | | | | | |
| | |
| Issuer | | Shares/Par | | | Value ($) | |
| Common Stocks - continued | | | | | | | | |
| Electronics - continued | | | | | | | | |
| Maxim Integrated Products, Inc. | | | 937 | | | $ | 56,220 | |
| Mellanox Technologies Ltd. (a) | | | 377 | | | | 45,353 | |
| Monolithic Power Systems, Inc. | | | 1,199 | | | | 186,696 | |
| nLIGHT, Inc. (a) | | | 2,823 | | | | 73,765 | |
| OSI Systems, Inc. (a) | | | 244 | | | | 21,992 | |
| Plexus Corp. (a) | | | 696 | | | | 41,885 | |
| Samsung Electronics Co. Ltd. | | | 782 | | | | 30,694 | |
| Silicon Laboratories, Inc. (a) | | | 454 | | | | 48,878 | |
| Silicon Motion Technology Corp., ADR | | | 2,693 | | | | 102,980 | |
| Stanley Electric Co. Ltd. | | | 2,500 | | | | 67,818 | |
| Taiwan Semiconductor Manufacturing Co. Ltd. | | | 11,654 | | | | 97,679 | |
| Taiwan Semiconductor Manufacturing Co. Ltd., ADR | | | 17,835 | | | | 781,530 | |
| Texas Instruments, Inc. | | | 3,749 | | | | 441,745 | |
| | | | | | | | |
| | | | | | | $ | 4,190,253 | |
| Energy - Independent - 1.0% | | | | | | | | |
| Cabot Oil & Gas Corp. | | | 2,088 | | | $ | 54,058 | |
| Cairn Energy PLC (a) | | | 12,912 | | | | 28,825 | |
| Caltex Australia Ltd. | | | 2,154 | | | | 41,317 | |
| Concho Resources, Inc. | | | 198 | | | | 22,845 | |
| Diamondback Energy, Inc. | | | 124 | | | | 13,192 | |
| EOG Resources, Inc. | | | 321 | | | | 30,832 | |
| Hess Corp. | | | 815 | | | | 52,258 | |
| Marathon Petroleum Corp. | | | 6,710 | | | | 408,438 | |
| Matador Resources Co. (a) | | | 1,318 | | | | 25,951 | |
| Oil Search Ltd. | | | 5,811 | | | | 31,871 | |
| Parsley Energy, Inc., “A” (a) | | | 2,499 | | | | 49,880 | |
| Phillips 66 | | | 5,696 | | | | 536,962 | |
| Pioneer Natural Resources Co. | | | 471 | | | | 78,403 | |
| Valero Energy Corp. | | | 3,381 | | | | 306,522 | |
| WPX Energy, Inc. (a) | | | 7,201 | | | | 100,022 | |
| | | | | | | | |
| | | | | | | $ | 1,781,376 | |
| Energy - Integrated - 0.3% | | | | | | | | |
| BP PLC | | | 15,017 | | | $ | 109,464 | |
| BP PLC, ADR | | | 1,215 | | | | 53,132 | |
| Chevron Corp. | | | 552 | | | | 66,273 | |
| Eni S.p.A. | | | 3,587 | | | | 61,225 | |
| Exxon Mobil Corp. | | | 2,969 | | | | 238,351 | |
| Galp Energia SGPS S.A. | | | 4,005 | | | | 67,246 | |
| | | | | | | | |
| | | | | | | $ | 595,691 | |
13
Portfolio of Investments (unaudited) – continued
| | | | | | | | |
| | |
| Issuer | | Shares/Par | | | Value ($) | |
| Common Stocks - continued | | | | | | | | |
| Engineering - Construction - 0.1% | | | | | | | | |
| Construction Partners, Inc., “A” (a) | | | 2,664 | | | $ | 34,898 | |
| KBR, Inc. | | | 7,036 | | | | 156,340 | |
| | | | | | | | |
| | | | | | | $ | 191,238 | |
| Entertainment - 0.2% | | | | | | | | |
| CTS Eventim AG | | | 750 | | | $ | 38,392 | |
| IMAX Corp. (a) | | | 2,376 | | | | 57,927 | |
| Live Nation, Inc. (a) | | | 444 | | | | 29,011 | |
| Manchester United PLC, “A” | | | 2,183 | | | | 43,027 | |
| Merlin Entertainments PLC | | | 25,149 | | | | 120,093 | |
| | | | | | | | |
| | | | | | | $ | 288,450 | |
| Food & Beverages - 2.8% | | | | | | | | |
| Archer Daniels Midland Co. | | | 1,278 | | | $ | 56,999 | |
| Beazley PLC | | | 39,941 | | | | 299,998 | |
| Britvic PLC | | | 8,180 | | | | 97,441 | |
| Cal-Maine Foods, Inc. | | | 847 | | | | 34,820 | |
| Chocoladefabriken Lindt & Sprungli AG | | | 19 | | | | 126,331 | |
| Coca-Cola European Partners PLC | | | 941 | | | | 50,428 | |
| Danone S.A. | | | 9,764 | | | | 789,370 | |
| General Mills, Inc. | | | 6,658 | | | | 342,687 | |
| Hostess Brands, Inc. (a) | | | 4,056 | | | | 54,350 | |
| Ingredion, Inc. | | | 3,283 | | | | 311,064 | |
| J.M. Smucker Co. | | | 494 | | | | 60,579 | |
| Kellogg Co. | | | 492 | | | | 29,668 | |
| Mondelez International, Inc. | | | 729 | | | | 37,070 | |
| Mowi A.S.A. | | | 5,165 | | | | 111,892 | |
| Nestle S.A. | | | 14,637 | | | | 1,408,467 | |
| Nestle S.A., ADR | | | 2,964 | | | | 286,115 | |
| Nomad Foods Ltd. | | | 1,812 | | | | 37,690 | |
| PepsiCo, Inc. | | | 363 | | | | 46,482 | |
| Post Holdings, Inc. (a) | | | 232 | | | | 26,165 | |
| S Foods, Inc. | | | 2,400 | | | | 82,253 | |
| Sanderson Farms, Inc. | | | 770 | | | | 116,755 | |
| Tate & Lyle PLC | | | 9,199 | | | | 92,077 | |
| TreeHouse Foods, Inc. (a) | | | 675 | | | | 45,212 | |
| Tyson Foods, Inc., “A” | | | 5,224 | | | | 391,852 | |
| | | | | | | | |
| | | | | | | $ | 4,935,765 | |
| Food & Drug Stores - 0.1% | | | | | | | | |
| Japan Meat Co. Ltd. | | | 3,700 | | | $ | 56,823 | |
| Kroger Co. | | | 1,747 | | | | 45,037 | |
| Sundrug Co. Ltd. | | | 1,200 | | | | 32,271 | |
| | | | | | | | |
| | | | | | | $ | 134,131 | |
14
Portfolio of Investments (unaudited) – continued
| | | | | | | | |
| | |
| Issuer | | Shares/Par | | | Value ($) | |
| Common Stocks - continued | | | | | | | | |
| Forest & Paper Products - 0.1% | | | | | | | | |
| Suzano Papel e Celulose S.A., ADR | | | 3,373 | | | $ | 69,619 | |
| Trex Co., Inc. (a) | | | 563 | | | | 38,999 | |
| | | | | | | | |
| | | | | | | $ | 108,618 | |
| Furniture & Appliances - 0.2% | | | | | | | | |
| Whirlpool Corp. | | | 2,212 | | | $ | 307,070 | |
| | |
| Gaming & Lodging - 0.4% | | | | | | | | |
| Crown Resorts Ltd. | | | 11,026 | | | $ | 103,300 | |
| Marriott International, Inc., “A” | | | 1,439 | | | | 196,308 | |
| Paddy Power Betfair PLC | | | 3,724 | | | | 315,064 | |
| Royal Caribbean Cruises Ltd. | | | 371 | | | | 44,869 | |
| Wyndham Hotels Group, LLC | | | 578 | | | | 32,206 | |
| | | | | | | | |
| | | | | | | $ | 691,747 | |
| General Merchandise - 0.2% | | | | | | | | |
| B&M European Value Retail S.A. | | | 15,520 | | | $ | 79,839 | |
| Dollar General Corp. | | | 313 | | | | 39,466 | |
| Dollar Tree, Inc. (a) | | | 1,430 | | | | 159,131 | |
| Dollarama, Inc. | | | 4,051 | | | | 121,678 | |
| Ollie’s Bargain Outlet Holdings, Inc. (a) | | | 302 | | | | 28,883 | |
| | | | | | | | |
| | | | | | | $ | 428,997 | |
| Health Maintenance Organizations - 0.9% | | | | | | | | |
| Anthem, Inc. | | | 395 | | | $ | 103,897 | |
| Cigna Corp. (f) | | | 5,310 | | | | 843,441 | |
| Humana, Inc. | | | 1,452 | | | | 370,855 | |
| Molina Healthcare, Inc. (a) | | | 464 | | | | 60,148 | |
| UnitedHealth Group, Inc. (f) | | | 1,218 | | | | 283,879 | |
| | | | | | | | |
| | | | | | | $ | 1,662,220 | |
| Insurance - 2.4% | | | | | | | | |
| AIA Group Ltd. | | | 76,600 | | | $ | 780,666 | |
| Aon PLC (s) | | | 4,128 | | | | 743,618 | |
| Arthur J. Gallagher & Co. | | | 767 | | | | 64,137 | |
| Assurant, Inc. | | | 538 | | | | 51,110 | |
| Athene Holding Ltd. (a) | | | 1,024 | | | | 46,244 | |
| Chubb Ltd. | | | 272 | | | | 39,494 | |
| Everest Re Group Ltd. | | | 488 | | | | 114,924 | |
| Fairfax Financial Holdings Ltd. | | | 449 | | | | 214,120 | |
| Hanover Insurance Group, Inc. | | | 793 | | | | 95,644 | |
| Hartford Financial Services Group, Inc. | | | 1,928 | | | | 100,854 | |
| Hiscox Ltd. | | | 5,173 | | | | 112,921 | |
| Lincoln National Corp. | | | 844 | | | | 56,312 | |
15
Portfolio of Investments (unaudited) – continued
| | | | | | | | |
| | |
| Issuer | | Shares/Par | | | Value ($) | |
| Common Stocks - continued | | | | | | | | |
| Insurance - continued | | | | | | | | |
| MetLife, Inc. | | | 12,302 | | | $ | 567,491 | |
| Prudential Financial, Inc. | | | 4,414 | | | | 466,604 | |
| Reinsurance Group of America, Inc. | | | 141 | | | | 21,363 | |
| Safety Insurance Group, Inc. | | | 195 | | | | 18,119 | |
| Sony Financial Holdings, Inc. | | | 4,700 | | | | 95,976 | |
| Swiss Re Ltd. | | | 457 | | | | 43,980 | |
| Third Point Reinsurance Ltd. (a) | | | 2,787 | | | | 32,357 | |
| Travelers Cos., Inc. | | | 2,770 | | | | 398,188 | |
| Unum Group | | | 924 | | | | 34,114 | |
| Zurich Insurance Group AG | | | 217 | | | | 69,192 | |
| | | | | | | | |
| | | | | | | $ | 4,167,428 | |
| Internet - 1.4% | | | | | | | | |
| Alphabet, Inc., “A” (a)(f) | | | 505 | | | $ | 605,475 | |
| Alphabet, Inc., “C” (a) | | | 469 | | | | 557,397 | |
| Baidu, Inc., ADR (a) | | | 2,511 | | | | 417,404 | |
| Facebook, Inc., “A” (a) | | | 1,978 | | | | 382,545 | |
| IAC/InterActiveCorp (a) | | | 468 | | | | 105,225 | |
| Naver Corp. | | | 2,016 | | | | 206,234 | |
| Rightmove PLC | | | 22,825 | | | | 160,903 | |
| Scout24 AG | | | 593 | | | | 30,528 | |
| Stamps.com, Inc. (a) | | | 366 | | | | 31,403 | |
| Tradeweb Markets, Inc. | | | 340 | | | | 13,685 | |
| | | | | | | | |
| | | | | | | $ | 2,510,799 | |
| Leisure & Toys - 0.5% | | | | | | | | |
| Brunswick Corp. | | | 7,146 | | | $ | 365,947 | |
| Electronic Arts, Inc. (a)(f) | | | 3,763 | | | | 356,168 | |
| Take-Two Interactive Software, Inc. (a) | | | 982 | | | | 95,087 | |
| | | | | | | | |
| | | | | | | $ | 817,202 | |
| Machinery & Tools - 3.1% | | | | | | | | |
| Actuant Corp., “A” | | | 826 | | | $ | 21,129 | |
| AGCO Corp. | | | 6,159 | | | | 435,934 | |
| Allison Transmission Holdings, Inc. | | | 4,365 | | | | 204,544 | |
| Cummins, Inc. | | | 3,626 | | | | 602,967 | |
| Daikin Industries Ltd. | | | 900 | | | | 114,458 | |
| Eaton Corp. PLC (s) | | | 8,777 | | | | 726,911 | |
| Flowserve Corp. | | | 297 | | | | 14,562 | |
| Gardner Denver Holdings, Inc. (a) | | | 665 | | | | 22,444 | |
| Gates Industrial Corp. PLC (a) | | | 1,024 | | | | 16,466 | |
| GEA Group AG | | | 10,403 | | | | 290,767 | |
| Illinois Tool Works, Inc. | | | 2,377 | | | | 369,932 | |
| ITT, Inc. | | | 1,426 | | | | 86,344 | |
16
Portfolio of Investments (unaudited) – continued
| | | | | | | | |
| | |
| Issuer | | Shares/Par | | | Value ($) | |
| Common Stocks - continued | | | | | | | | |
| Machinery & Tools - continued | | | | | | | | |
| Kennametal, Inc. | | | 1,873 | | | $ | 76,231 | |
| Kubota Corp. | | | 4,900 | | | | 73,743 | |
| Nordson Corp. | | | 824 | | | | 120,263 | |
| PACCAR, Inc. | | | 4,201 | | | | 301,086 | |
| Regal Beloit Corp. | | | 6,482 | | | | 551,489 | |
| Ritchie Bros. Auctioneers, Inc. | | | 2,135 | | | | 74,277 | |
| Ritchie Bros. Auctioneers, Inc. | | | 8,706 | | | | 302,959 | |
| Roper Technologies, Inc. | | | 1,469 | | | | 528,399 | |
| Schindler Holding AG | | | 303 | | | | 65,361 | |
| Spirax-Sarco Engineering PLC | | | 4,574 | | | | 492,071 | |
| United Rentals, Inc. | | | 602 | | | | 84,834 | |
| | | | | | | | |
| | | | | | | $ | 5,577,171 | |
| Major Banks - 1.2% | | | | | | | | |
| Bank of America Corp. (f) | | | 17,070 | | | $ | 522,001 | |
| Barclays PLC | | | 29,489 | | | | 63,172 | |
| BNP Paribas | | | 1,874 | | | | 99,734 | |
| Capital One Financial Corp. | | | 693 | | | | 64,331 | |
| Comerica, Inc. | | | 790 | | | | 62,086 | |
| Goldman Sachs Group, Inc. | | | 190 | | | | 39,125 | |
| Huntington Bancshares, Inc. | | | 5,270 | | | | 73,358 | |
| JPMorgan Chase & Co. (f) | | | 5,490 | | | | 637,115 | |
| KeyCorp | | | 4,338 | | | | 76,132 | |
| Mitsubishi UFJ Financial Group, Inc. | | | 13,000 | | | | 65,140 | |
| PNC Financial Services Group, Inc. | | | 189 | | | | 25,880 | |
| State Street Corp. | | | 261 | | | | 17,659 | |
| Svenska Handelsbanken AB | | | 12,371 | | | | 135,015 | |
| UBS Group AG | | | 8,115 | | | | 108,829 | |
| Wells Fargo & Co. | | | 3,310 | | | | 160,237 | |
| | | | | | | | |
| | | | | | | $ | 2,149,814 | |
| Medical & Health Technology & Services - 1.3% | | | | | | | | |
| AmerisourceBergen Corp. | | | 2,538 | | | $ | 189,741 | |
| Charles River Laboratories International, Inc. (a) | | | 310 | | | | 43,546 | |
| CVS Health Corp. | | | 8,067 | | | | 438,683 | |
| Guardant Health, Inc. (a) | | | 407 | | | | 26,663 | |
| HCA Healthcare, Inc. | | | 2,929 | | | | 372,657 | |
| Henry Schein, Inc. (a) | | | 924 | | | | 59,191 | |
| Hogy Medical Co. Ltd. | | | 2,500 | | | | 81,691 | |
| ICON PLC (a) | | | 1,311 | | | | 179,056 | |
| McKesson Corp. | | | 1,944 | | | | 231,822 | |
| Medidata Solutions, Inc. (a) | | | 347 | | | | 31,348 | |
| Miraca Holdings, Inc. | | | 2,500 | | | | 64,111 | |
17
Portfolio of Investments (unaudited) – continued
| | | | | | | | |
| | |
| Issuer | | Shares/Par | | | Value ($) | |
| Common Stocks - continued | | | | | | | | |
| Medical & Health Technology & Services - continued | | | | | | | | |
| Premier, Inc., “A” (a) | | | 4,451 | | | $ | 147,907 | |
| Quest Diagnostics, Inc. | | | 704 | | | | 67,852 | |
| Sonic Healthcare Ltd. | | | 2,180 | | | | 39,419 | |
| Syneos Health, Inc. (a) | | | 643 | | | | 30,176 | |
| Teladoc Health, Inc. (a) | | | 1,016 | | | | 57,790 | |
| Universal Health Services, Inc. | | | 481 | | | | 61,024 | |
| Walgreens Boots Alliance, Inc. (f) | | | 4,205 | | | | 225,262 | |
| | | | | | | | |
| | | | | | | $ | 2,347,939 | |
| Medical Equipment - 2.5% | | | | | | | | |
| Ansell Ltd. | | | 5,653 | | | $ | 107,597 | |
| Becton, Dickinson and Co. | | | 145 | | | | 34,907 | |
| Boston Scientific Corp. (a) | | | 4,412 | | | | 163,773 | |
| Cooper Cos., Inc. | | | 427 | | | | 123,796 | |
| Danaher Corp. | | | 4,475 | | | | 592,669 | |
| Edwards Lifesciences Corp. (a) | | | 694 | | | | 122,193 | |
| EssilorLuxottica | | | 3,444 | | | | 419,113 | |
| Inspire Medical Systems, Inc. (a) | | | 422 | | | | 21,813 | |
| iRhythm Technologies, Inc. (a) | | | 454 | | | | 34,645 | |
| Masimo Corp. (a) | | | 665 | | | | 86,550 | |
| Medtronic PLC | | | 6,946 | | | | 616,874 | |
| Merit Medical Systems, Inc. (a) | | | 917 | | | | 51,517 | |
| Mesa Laboratories, Inc. | | | 183 | | | | 43,314 | |
| Nevro Corp. (a) | | | 442 | | | | 27,276 | |
| Nihon Kohden Corp. | | | 2,500 | | | | 72,990 | |
| OptiNose, Inc. (a) | | | 2,151 | | | | 21,424 | |
| OrthoPediatrics Corp. | | | 193 | | | | 7,863 | |
| PerkinElmer, Inc. | | | 4,441 | | | | 425,625 | |
| QIAGEN N.V. (a) | | | 4,937 | | | | 190,650 | |
| Quidel Corp. (a) | | | 783 | | | | 50,065 | |
| Senseonics Holdings, Inc. (a) | | | 4,282 | | | | 9,977 | |
| Silk Road Medical, Inc. | | | 690 | | | | 28,732 | |
| STERIS PLC | | | 1,907 | | | | 249,779 | |
| Stryker Corp. | | | 802 | | | | 151,506 | |
| Terumo Corp. | | | 3,000 | | | | 90,520 | |
| Thermo Fisher Scientific, Inc. | | | 2,146 | | | | 595,408 | |
| West Pharmaceutical Services, Inc. | | | 669 | | | | 82,815 | |
| Zimmer Biomet Holdings, Inc. | | | 586 | | | | 72,172 | |
| | | | | | | | |
| | | | | | | $ | 4,495,563 | |
| Metals & Mining - 0.0% | | | | | | | | |
| Rio Tinto PLC | | | 1,405 | | | $ | 81,804 | |
18
Portfolio of Investments (unaudited) – continued
| | | | | | | | |
| | |
| Issuer | | Shares/Par | | | Value ($) | |
| Common Stocks - continued | | | | | | | | |
| Natural Gas - Distribution - 0.2% | | | | | | | | |
| China Resources Gas Group Ltd. | | | 8,000 | | | $ | 37,018 | |
| Italgas S.p.A | | | 17,412 | | | | 108,583 | |
| New Jersey Resources Corp. | | | 845 | | | | 42,317 | |
| NiSource, Inc. | | | 1,478 | | | | 41,059 | |
| Sempra Energy | | | 587 | | | | 75,107 | |
| South Jersey Industries, Inc. | | | 3,959 | | | | 127,163 | |
| | | | | | | | |
| | | | | | | $ | 431,247 | |
| Natural Gas - Pipeline - 0.5% | | | | | | | | |
| APA Group | | | 5,520 | | | $ | 37,435 | |
| Enbridge, Inc. | | | 1,243 | | | | 45,918 | |
| Enterprise Products Partners LP | | | 11,621 | | | | 332,709 | |
| EQM Midstream Partners LP | | | 3,695 | | | | 169,970 | |
| Equitrans Midstream Corp. | | | 9,057 | | | | 188,657 | |
| Plains GP Holdings LP | | | 2,418 | | | | 57,065 | |
| | | | | | | | |
| | | | | | | $ | 831,754 | |
| Network & Telecom - 0.3% | | | | | | | | |
| Cisco Systems, Inc. | | | 6,929 | | | $ | 387,678 | |
| Interxion Holding N.V. (a) | | | 910 | | | | 62,963 | |
| LM Ericsson Telephone Co., “B” | | | 3,712 | | | | 36,740 | |
| Motorola Solutions, Inc. | | | 387 | | | | 56,080 | |
| VTech Holdings Ltd. | | | 7,200 | | | | 65,669 | |
| | | | | | | | |
| | | | | | | $ | 609,130 | |
| Oil Services - 0.3% | | | | | | | | |
| Apergy Corp. (a) | | | 429 | | | $ | 17,027 | |
| Core Laboratories N.V. | | | 866 | | | | 54,896 | |
| Frank’s International N.V. (a) | | | 11,423 | | | | 66,710 | |
| Liberty Oilfield Services, Inc. | | | 2,355 | | | | 35,113 | |
| NOW, Inc. (a) | | | 4,447 | | | | 65,015 | |
| Oil States International, Inc. (a) | | | 989 | | | | 19,107 | |
| Patterson-UTI Energy, Inc. | | | 8,891 | | | | 120,829 | |
| Schlumberger Ltd. | | | 1,836 | | | | 78,361 | |
| | | | | | | | |
| | | | | | | $ | 457,058 | |
| Other Banks & Diversified Financials - 3.8% | | | | | | | | |
| Aeon Financial Service Co. Ltd. | | | 3,400 | | | $ | 69,908 | |
| AIB Group PLC | | | 15,512 | | | | 71,994 | |
| Air Lease Corp. | | | 1,183 | | | | 45,616 | |
| Bank of Hawaii Corp. | | | 846 | | | | 69,693 | |
| Bank OZK | | | 1,015 | | | | 33,140 | |
| BB&T Corp. | | | 661 | | | | 33,843 | |
| Berkshire Hills Bancorp, Inc. | | | 616 | | | | 18,474 | |
19
Portfolio of Investments (unaudited) – continued
| | | | | | | | |
| | |
| Issuer | | Shares/Par | | | Value ($) | |
| Common Stocks - continued | | | | | | | | |
| Other Banks & Diversified Financials - continued | | | | | | | | |
| Brookline Bancorp, Inc. | | | 3,528 | | | $ | 53,096 | |
| Cathay General Bancorp, Inc. | | | 1,518 | | | | 55,847 | |
| Chiba Bank Ltd. | | | 13,700 | | | | 71,732 | |
| Citigroup, Inc. (f) | | | 19,807 | | | | 1,400,355 | |
| Credicorp Ltd. | | | 1,080 | | | | 255,852 | |
| CVB Financial Corp. | | | 216 | | | | 4,687 | |
| Discover Financial Services | | | 2,910 | | | | 237,136 | |
| Element Fleet Management Corp. | | | 13,802 | | | | 85,612 | |
| First Hawaiian, Inc. | | | 3,324 | | | | 91,909 | |
| First Republic Bank | | | 792 | | | | 83,651 | |
| Grupo Financiero Banorte S.A. de C.V. | | | 38,722 | | | | 244,758 | |
| Hanmi Financial Corp. | | | 2,314 | | | | 54,888 | |
| HDFC Bank Ltd. | | | 2,741 | | | | 91,327 | |
| HDFC Bank Ltd., ADR | | | 3,379 | | | | 387,402 | |
| Intesa Sanpaolo S.p.A | | | 36,609 | | | | 95,959 | |
| Julius Baer Group Ltd. | | | 5,051 | | | | 243,491 | |
| Jyske Bank | | | 1,455 | | | | 58,604 | |
| KBC Group N.V. | | | 1,069 | | | | 79,157 | |
| Lakeland Financial Corp. | | | 1,500 | | | | 71,625 | |
| Legacytextas Financial Group, Inc. | | | 3,122 | | | | 125,130 | |
| M&T Bank Corp. | | | 325 | | | | 55,273 | |
| Mastercard, Inc., “A” | | | 624 | | | | 158,646 | |
| Metropolitan Bank & Trust Co. | | | 58,850 | | | | 83,850 | |
| Northern Trust Corp. | | | 657 | | | | 64,747 | |
| Prosperity Bancshares, Inc. | | | 900 | | | | 66,276 | |
| Sandy Spring Bancorp, Inc. | | | 1,098 | | | | 38,309 | |
| Signature Bank | | | 1,719 | | | | 227,028 | |
| SunTrust Banks, Inc. | | | 1,181 | | | | 77,332 | |
| Synchrony Financial | | | 5,171 | | | | 179,279 | |
| TCF Financial Corp. | | | 2,807 | | | | 62,119 | |
| Texas Capital Bancshares, Inc. | | | 708 | | | | 45,829 | |
| Textainer Group Holdings Ltd. (a) | | | 2,424 | | | | 23,246 | |
| U.S. Bancorp | | | 7,713 | | | | 411,257 | |
| UMB Financial Corp. | | | 1,209 | | | | 84,461 | |
| Visa, Inc., “A” (f) | | | 4,944 | | | | 812,942 | |
| Wintrust Financial Corp. | | | 2,328 | | | | 177,394 | |
| | | | | | | | |
| | | | | | | $ | 6,702,874 | |
| Pharmaceuticals - 2.5% | | | | | | | | |
| Aquestive Therapeutics, Inc. (a) | | | 1,164 | | | $ | 6,646 | |
| Bayer AG | | | 7,684 | | | | 511,414 | |
| Bristol-Myers Squibb Co. | | | 5,709 | | | | 265,069 | |
| Collegium Pharmaceutical, Inc. (a) | | | 1,447 | | | | 20,157 | |
20
Portfolio of Investments (unaudited) – continued
| | | | | | | | |
| | |
| Issuer | | Shares/Par | | | Value ($) | |
| Common Stocks - continued | | | | | | | | |
| Pharmaceuticals - continued | | | | | | | | |
| Elanco Animal Health, Inc. (a) | | | 2,692 | | | $ | 84,798 | |
| Eli Lilly & Co. | | | 7,865 | | | | 920,520 | |
| Forty Seven, Inc. (a) | | | 800 | | | | 15,192 | |
| Genomma Lab Internacional S.A., “B” (a) | | | 19,110 | | | | 15,362 | |
| GW Pharmaceuticals PLC, ADR (a) | | | 192 | | | | 32,508 | |
| Johnson & Johnson (s) | | | 6,727 | | | | 949,852 | |
| Merck & Co., Inc. | | | 1,595 | | | | 125,542 | |
| Mylan N.V. (a) | | | 1,153 | | | | 31,119 | |
| Novo Nordisk A.S., “B” | | | 2,500 | | | | 122,253 | |
| Orchard RX Ltd., ADR (a) | | | 1,116 | | | | 20,166 | |
| PetIQ, Inc. (a) | | | 1,378 | | | | 37,854 | |
| Pfizer, Inc. | | | 1,530 | | | | 62,133 | |
| Principia Biopharma, Inc. (a) | | | 661 | | | | 19,771 | |
| Roche Holding AG | | | 2,968 | | | | 782,379 | |
| Santen Pharmaceutical Co. Ltd. | | | 13,200 | | | | 201,516 | |
| Zoetis, Inc. | | | 1,875 | | | | 190,950 | |
| | | | | | | | |
| | | | | | | $ | 4,415,201 | |
| Pollution Control - 0.1% | | | | | | | | |
| Evoqua Water Technologies LLC (a) | | | 5,094 | | | $ | 69,380 | |
| Stericycle, Inc. (a) | | | 397 | | | | 23,181 | |
| | | | | | | | |
| | | | | | | $ | 92,561 | |
| Precious Metals & Minerals - 0.0% | | | | | | | | |
| Agnico-Eagle Mines Ltd. | | | 1,546 | | | $ | 64,020 | |
| | |
| Printing & Publishing - 0.4% | | | | | | | | |
| IHS Markit Ltd. (a) | | | 2,908 | | | $ | 166,512 | |
| Moody’s Corp. | | | 1,905 | | | | 374,561 | |
| RELX PLC | | | 3,940 | | | | 90,415 | |
| S&P Global, Inc. | | | 396 | | | | 87,381 | |
| | | | | | | | |
| | | | | | | $ | 718,869 | |
| Railroad & Shipping - 0.5% | | | | | | | | |
| Canadian National Railway Co. | | | 4,945 | | | $ | 458,797 | |
| Canadian Pacific Railway Ltd. | | | 115 | | | | 25,768 | |
| Kansas City Southern Co. | | | 702 | | | | 86,444 | |
| StealthGas, Inc. (a) | | | 4,413 | | | | 15,755 | |
| Union Pacific Corp. | | | 1,730 | | | | 306,279 | |
| | | | | | | | |
| | | | | | | $ | 893,043 | |
| Real Estate - 2.6% | | | | | | | | |
| Annaly Mortgage Management, Inc., REIT | | | 2,432 | | | $ | 24,539 | |
| Ascendas Real Estate Investment Trust, REIT | | | 49,000 | | | | 108,080 | |
21
Portfolio of Investments (unaudited) – continued
| | | | | | | | |
| | |
| Issuer | | Shares/Par | | | Value ($) | |
| Common Stocks - continued | | | | | | | | |
| Real Estate - continued | | | | | | | | |
| Big Yellow Group PLC, REIT | | | 2,348 | | | $ | 31,873 | |
| Brixmor Property Group Inc., REIT | | | 5,803 | | | | 103,758 | |
| Concentradora Fibra Danhos S.A. de C.V., REIT | | | 54,038 | | | | 79,043 | |
| Corporate Office Properties Trust, REIT | | | 2,848 | | | | 79,402 | |
| Deutsche Wohnen SE | | | 5,592 | | | | 251,319 | |
| EPR Properties, REIT | | | 6,887 | | | | 543,109 | |
| Equity Commonwealth, REIT | | | 1,579 | | | | 50,212 | |
| Grand City Properties S.A. | | | 3,505 | | | | 82,398 | |
| Hibernia PLC, REIT | | | 43,207 | | | | 69,299 | |
| Industrial Logistics Properties Trust, REIT | | | 20,568 | | | | 408,275 | |
| LEG Immobilien AG | | | 760 | | | | 88,438 | |
| Life Storage, Inc., REIT | | | 1,329 | | | | 126,640 | |
| Medical Properties Trust, Inc., REIT | | | 35,962 | | | | 627,897 | |
| Office Properties Income Trust | | | 1,767 | | | | 47,956 | |
| Public Storage, Inc., REIT | | | 127 | | | | 28,090 | |
| Simon Property Group, Inc., REIT | | | 1,122 | | | | 194,891 | |
| Spirit Realty Capital, Inc., REIT | | | 1,772 | | | | 71,695 | |
| STAG Industrial, Inc., REIT | | | 5,061 | | | | 145,656 | |
| STORE Capital Corp., REIT | | | 24,867 | | | | 828,568 | |
| Sun Communities, Inc., REIT | | | 482 | | | | 59,325 | |
| TAG Immobilien AG | | | 21,147 | | | | 475,318 | |
| Two Harbors Investment Corp, REIT | | | 3,129 | | | | 43,368 | |
| VICI Properties, Inc., REIT | | | 1,757 | | | | 40,060 | |
| W.P. Carey, Inc., REIT | | | 822 | | | | 65,201 | |
| | | | | | | | |
| | | | | | | $ | 4,674,410 | |
| Restaurants - 1.2% | | | | | | | | |
| Aramark | | | 1,250 | | | $ | 38,850 | |
| Chipotle Mexican Grill, Inc., “A” (a) | | | 17 | | | | 11,697 | |
| Darden Restaurants, Inc. | | | 3,622 | | | | 425,947 | |
| Performance Food Group Co. (a) | | | 1,901 | | | | 77,846 | |
| Starbucks Corp. (f) | | | 9,964 | | | | 774,004 | |
| U.S. Foods Holding Corp. (a)(f) | | | 9,469 | | | | 346,092 | |
| Wendy’s Co. | | | 1,677 | | | | 31,209 | |
| Yum China Holdings, Inc. | | | 7,562 | | | | 359,497 | |
| | | | | | | | |
| | | | | | | $ | 2,065,142 | |
| Special Products & Services - 0.0% | | | | | | | | |
| Boyd Group Income Fund, EU | | | 491 | | | $ | 53,945 | |
| | |
| Specialty Chemicals - 1.3% | | | | | | | | |
| Akzo Nobel N.V. | | | 1,094 | | | $ | 92,886 | |
| Axalta Coating Systems Ltd. (a) | | | 5,608 | | | | 151,304 | |
| Croda International PLC | | | 2,486 | | | | 167,955 | |
22
Portfolio of Investments (unaudited) – continued
| | | | | | | | |
| | |
| Issuer | | Shares/Par | | | Value ($) | |
| Common Stocks - continued | | | | | | | | |
| Specialty Chemicals - continued | | | | | | | | |
| Ferro Corp. (a) | | | 7,815 | | | $ | 139,654 | |
| Ferroglobe PLC | | | 7,656 | | | | 16,460 | |
| Kansai Paint Co. Ltd. | | | 5,100 | | | | 97,162 | |
| Linde PLC | | | 4,141 | | | | 744,985 | |
| Nitto Denko Corp. | | | 700 | | | | 37,499 | |
| RPM International, Inc. | | | 1,572 | | | | 95,342 | |
| Sika AG | | | 3,148 | | | | 481,955 | |
| Symrise AG | | | 833 | | | | 80,069 | |
| Univar, Inc. (a) | | | 6,583 | | | | 146,998 | |
| | | | | | | | |
| | | | | | | $ | 2,252,269 | |
| Specialty Stores - 2.3% | | | | | | | | |
| Amazon.com, Inc. (a) | | | 1,190 | | | $ | 2,292,559 | |
| Best Buy Co., Inc. | | | 2,538 | | | | 188,853 | |
| BJ’s Wholesale Club Holdings, Inc. (a) | | | 2,157 | | | | 61,151 | |
| Costco Wholesale Corp. | | | 157 | | | | 38,548 | |
| Dufry AG | | | 635 | | | | 62,032 | |
| Floor & Decor Holdings, Inc. (a) | | | 780 | | | | 37,456 | |
| Hudson Ltd., “A” (a) | | | 4,298 | | | | 65,931 | |
| Just Eat PLC (a) | | | 9,215 | | | | 83,994 | |
| Michaels Co., Inc. (a) | | | 3,133 | | | | 35,215 | |
| Nitori Co. Ltd. | | | 500 | | | | 59,621 | |
| O’Reilly Automotive, Inc. (a) | | | 320 | | | | 121,142 | |
| Ross Stores, Inc. | | | 2,895 | | | | 282,726 | |
| Ryohin Keikaku Co. Ltd. | | | 400 | | | | 75,632 | |
| Target Corp. | | | 4,515 | | | | 349,551 | |
| Tractor Supply Co. | | | 1,371 | | | | 141,899 | |
| Urban Outfitters, Inc. (a) | | | 1,764 | | | | 52,444 | |
| Zumiez, Inc. (a) | | | 2,032 | | | | 54,112 | |
| | | | | | | | |
| | | | | | | $ | 4,002,866 | |
| Telecommunications - Wireless - 0.6% | | | | | | | | |
| Advanced Info Service Public Co. Ltd. | | | 7,000 | | | $ | 41,660 | |
| American Tower Corp., REIT | | | 1,694 | | | | 330,838 | |
| Infrastrutture Wireless Italiane S.p.A. (n) | | | 1,259 | | | | 10,421 | |
| KDDI Corp. | | | 10,600 | | | | 242,306 | |
| SBA Communications Corp., REIT (a) | | | 1,160 | | | | 236,327 | |
| SoftBank Group Corp. | | | 1,000 | | | | 104,394 | |
| Tele2 AB, “B” | | | 1,854 | | | | 24,734 | |
| | | | | | | | |
| | | | | | | $ | 990,680 | |
| Telephone Services - 0.1% | | | | | | | | |
| Bezeq - The Israel Telecommunication Corp. Ltd. | | | 84,998 | | | $ | 58,115 | |
| Hellenic Telecommunications Organization S.A. | | | 2,778 | | | | 38,574 | |
23
Portfolio of Investments (unaudited) – continued
| | | | | | | | |
| | |
| Issuer | | Shares/Par | | | Value ($) | |
| Common Stocks - continued | | | | | | | | |
| Telephone Services - continued | | | | | | | | |
| Verizon Communications, Inc. | | | 2,377 | | | $ | 135,940 | |
| | | | | | | | |
| | | | | | | $ | 232,629 | |
| Tobacco - 0.8% | | | | | | | | |
| Altria Group, Inc. | | | 6,800 | | | $ | 369,444 | |
| British American Tobacco PLC | | | 2,525 | | | | 98,449 | |
| Japan Tobacco, Inc. | | | 5,900 | | | | 136,768 | |
| Philip Morris International, Inc. (f) | | | 8,217 | | | | 711,264 | |
| Swedish Match AB | | | 2,390 | | | | 116,415 | |
| | | | | | | | |
| | | | | | | $ | 1,432,340 | |
| Trucking - 0.1% | | | | | | | | |
| Hamakyorex Co. Ltd. | | | 2,000 | | | $ | 73,898 | |
| Schneider National, Inc. | | | 999 | | | | 20,879 | |
| Yamato Holdings Co. Ltd. | | | 1,500 | | | | 32,596 | |
| | | | | | | | |
| | | | | | | $ | 127,373 | |
| Utilities - Electric Power - 2.0% | | | | | | | | |
| AES Corp. | | | 17,366 | | | $ | 297,306 | |
| American Electric Power Co., Inc. | | | 286 | | | | 24,467 | |
| Black Hills Corp. | | | 1,325 | | | | 96,407 | |
| CenterPoint Energy, Inc. | | | 1,768 | | | | 54,808 | |
| CLP Holdings Ltd. | | | 5,500 | | | | 62,363 | |
| CMS Energy Corp. | | | 1,668 | | | | 92,657 | |
| Duke Energy Corp. | | | 4,840 | | | | 441,021 | |
| E.ON AG | | | 4,681 | | | | 50,234 | |
| Eversource Energy | | | 920 | | | | 65,927 | |
| Exelon Corp. (f) | | | 15,007 | | | | 764,607 | |
| FirstEnergy Corp. | | | 1,170 | | | | 49,175 | |
| Iberdrola S.A. | | | 8,475 | | | | 76,976 | |
| NextEra Energy, Inc. | | | 148 | | | | 28,777 | |
| NRG Energy, Inc. (f) | | | 10,757 | | | | 442,866 | |
| Pinnacle West Capital Corp. | | | 748 | | | | 71,262 | |
| Portland General Electric Co. | | | 1,793 | | | | 93,792 | |
| Public Service Enterprise Group, Inc. | | | 1,328 | | | | 79,215 | |
| Southern Co. | | | 9,158 | | | | 487,389 | |
| Vistra Energy Corp. | | | 4,818 | | | | 131,290 | |
| WEC Energy Group, Inc. | | | 690 | | | | 54,117 | |
| | | | | | | | |
| | | | | | | $ | 3,464,656 | |
| Total Common Stocks (Identified Cost, $105,692,236) | | | | | | $ | 118,473,583 | |
24
Portfolio of Investments (unaudited) – continued
| | | | | | | | |
| Bonds - 19.9% | | | | | | | | |
| | |
| Issuer | | Shares/Par | | | Value ($) | |
| Aerospace - 0.2% | | | | | | | | |
| Huntington Ingalls Industries, Inc., 3.483%, 12/01/2027 | | $ | 160,000 | | | $ | 156,450 | |
| L3 Technologies, Inc., 3.85%, 6/15/2023 | | | 238,000 | | | | 245,930 | |
| | | | | | | | |
| | | | | | | $ | 402,380 | |
| Apparel Manufacturers - 0.2% | | | | | | | | |
| Tapestry, Inc., 4.125%, 7/15/2027 | | $ | 412,000 | | | $ | 399,237 | |
| | |
| Automotive - 0.5% | | | | | | | | |
| General Motors Co., 4.875%, 10/02/2023 | | $ | 400,000 | | | $ | 421,389 | |
| General Motors Co., 5.15%, 4/01/2038 | | | 166,000 | | | | 159,665 | |
| Lear Corp., 3.8%, 9/15/2027 | | | 221,000 | | | | 215,162 | |
| | | | | | | | |
| | | | | | | $ | 796,216 | |
| Broadcasting - 0.2% | | | | | | | | |
| Fox Corp., 4.03%, 1/25/2024 (n) | | $ | 300,000 | | | $ | 311,871 | |
| | |
| Brokerage & Asset Managers - 0.9% | | | | | | | | |
| Charles Schwab Corp., 3.2%, 1/25/2028 | | $ | 564,000 | | | $ | 561,571 | |
| E*TRADE Financial Corp., 2.95%, 8/24/2022 | | | 201,000 | | | | 200,821 | |
| E*TRADE Financial Corp., 3.8%, 8/24/2027 | | | 131,000 | | | | 127,738 | |
| Intercontinental Exchange, Inc., 2.35%, 9/15/2022 | | | 353,000 | | | | 347,451 | |
| Intercontinental Exchange, Inc., 3.75%, 12/01/2025 | | | 277,000 | | | | 288,437 | |
| | | | | | | | |
| | | | | | | $ | 1,526,018 | |
| Building - 0.5% | | | | | | | | |
| Martin Marietta Materials, Inc., 4.25%, 7/02/2024 | | $ | 418,000 | | | $ | 435,759 | |
| Martin Marietta Materials, Inc., 3.5%, 12/15/2027 | | | 194,000 | | | | 186,799 | |
| Masco Corp., 4.375%, 4/01/2026 | | | 302,000 | | | | 308,411 | |
| | | | | | | | |
| | | | | | | $ | 930,969 | |
| Business Services - 0.5% | | | | | | | | |
| Fidelity National Information Services, Inc., 3.5%, 4/15/2023 | | $ | 369,000 | | | $ | 375,091 | |
| Fidelity National Information Services, Inc., 5%, 10/15/2025 | | | 263,000 | | | | 286,239 | |
| Verisk Analytics, Inc., 4.125%, 3/15/2029 | | | 173,000 | | | | 178,056 | |
| | | | | | | | |
| | | | | | | $ | 839,386 | |
| Cable TV - 0.2% | | | | | | | | |
| Charter Communications Operating LLC/Charter Communications Operating Capital Corp., 6.384%, 10/23/2035 | | $ | 335,000 | | | $ | 378,498 | |
| | |
| Chemicals - 0.1% | | | | | | | | |
| Sasol Chemicals (USA) LLC, 5.875%, 3/27/2024 | | $ | 228,000 | | | $ | 241,948 | |
25
Portfolio of Investments (unaudited) – continued
| | | | | | | | |
| | |
| Issuer | | Shares/Par | | | Value ($) | |
| Bonds - continued | | | | | | | | |
| Computer Software - 0.5% | | | | | | | | |
| Dell International LLC/EMC Corp., 4.9%, 10/01/2026 (n) | | $ | 238,000 | | | $ | 243,778 | |
| Microsoft Corp., 4.25%, 2/06/2047 | | | 600,000 | | | | 657,018 | |
| | | | | | | | |
| | | | | | | $ | 900,796 | |
| Computer Software - Systems - 0.2% | | | | | | | | |
| Apple, Inc., 4.25%, 2/09/2047 | | $ | 300,000 | | | $ | 316,508 | |
| | |
| Conglomerates - 0.1% | | | | | | | | |
| Wabtec Corp., 4.95%, 9/15/2028 | | $ | 118,000 | | | $ | 121,588 | |
| Westinghouse Air Brake Technologies Corp., 4.4%, 3/15/2024 | | | 61,000 | | | | 62,706 | |
| | | | | | | | |
| | | | | | | $ | 184,294 | |
| Consumer Products - 0.3% | | | | | | | | |
| Reckitt Benckiser Treasury Services PLC, 3.625%, 9/21/2023 (n) | | $ | 300,000 | | | $ | 307,868 | |
| Whirlpool Corp., 4.75%, 2/26/2029 | | | 228,000 | | | | 236,933 | |
| | | | | | | | |
| | | | | | | $ | 544,801 | |
| Consumer Services - 1.1% | | | | | | | | |
| IHS Markit Ltd., 3.625%, 5/01/2024 | | $ | 47,000 | | | $ | 47,150 | |
| IHS Markit Ltd., 4%, 3/01/2026 (n) | | | 250,000 | | | | 249,293 | |
| IHS Markit Ltd., 4.25%, 5/01/2029 | | | 71,000 | | | | 70,881 | |
| Priceline Group, Inc., 3.65%, 3/15/2025 | | | 319,000 | | | | 328,003 | |
| Priceline Group, Inc., 3.6%, 6/01/2026 | | | 536,000 | | | | 547,787 | |
| Visa, Inc., 2.75%, 9/15/2027 | | | 220,000 | | | | 217,037 | |
| Visa, Inc., 4.15%, 12/14/2035 | | | 527,000 | | | | 564,418 | |
| | | | | | | | |
| | | | | | | $ | 2,024,569 | |
| Electronics - 0.3% | | | | | | | | |
| Broadcom Corp./Broadcom Cayman Finance Ltd., 3.875%, 1/15/2027 | | $ | 300,000 | | | $ | 286,275 | |
| Broadcom Corp./Broadcom Cayman Finance Ltd., 3.5%, 1/15/2028 | | | 306,000 | | | | 282,028 | |
| | | | | | | | |
| | | | | | | $ | 568,303 | |
| Energy - Integrated - 0.3% | | | | | | | | |
| BP Capital Markets America, Inc., 3.41%, 2/11/2026 | | $ | 340,000 | | | $ | 346,276 | |
| Eni S.p.A., 4.75%, 9/12/2028 (n) | | | 200,000 | | | | 209,201 | |
| | | | | | | | |
| | | | | | | $ | 555,477 | |
| Entertainment - 0.2% | | | | | | | | |
| Royal Caribbean Cruises Ltd., 3.7%, 3/15/2028 | | $ | 312,000 | | | $ | 302,123 | |
| | |
| Financial Institutions - 0.3% | | | | | | | | |
| AerCap Ireland Capital Ltd., 4.875%, 1/16/2024 | | $ | 150,000 | | | $ | 157,540 | |
| AerCap Ireland Capital Ltd., 3.65%, 7/21/2027 | | | 300,000 | | | | 285,346 | |
| Avolon Holdings Funding Ltd., 4.375%, 5/01/2026 (z) | | | 94,000 | | | | 93,443 | |
| | | | | | | | |
| | | | | | | $ | 536,329 | |
26
Portfolio of Investments (unaudited) – continued
| | | | | | | | |
| | |
| Issuer | | Shares/Par | | | Value ($) | |
| Bonds - continued | | | | | | | | |
| Food & Beverages - 0.3% | | | | | | | | |
| Anheuser-Busch InBev Worldwide, Inc., 4.15%, 1/23/2025 | | $ | 300,000 | | | $ | 313,304 | |
| Constellation Brands, Inc., 3.5%, 5/09/2027 | | | 300,000 | | | | 294,708 | |
| | | | | | | | |
| | | | | | | $ | 608,012 | |
| Forest & Paper Products - 0.2% | | | | | | | | |
| Suzano Austria GmbH, 6%, 1/15/2029 (n) | | $ | 250,000 | | | $ | 267,500 | |
| | |
| Gaming & Lodging - 0.3% | | | | | | | | |
| GLP Capital LP/GLP Financing II, Inc., 5.3%, 1/15/2029 | | $ | 108,000 | | | $ | 113,919 | |
| Marriott International, Inc., 4%, 4/15/2028 | | | 386,000 | | | | 393,262 | |
| | | | | | | | |
| | | | | | | $ | 507,181 | |
| Health Maintenance Organizations - 0.1% | | | | | | | | |
| Halfmoon Parent, Inc., 4.125%, 11/15/2025 (n) | | $ | 170,000 | | | $ | 175,716 | |
| | |
| Insurance - 0.2% | | | | | | | | |
| American International Group, Inc., 4.5%, 7/16/2044 | | $ | 331,000 | | | $ | 323,225 | |
| | |
| Insurance - Health - 0.4% | | | | | | | | |
| UnitedHealth Group, Inc., 4.625%, 7/15/2035 | | $ | 615,000 | | | $ | 670,984 | |
| | |
| Insurance - Property & Casualty - 0.7% | | | | | | | | |
| Berkshire Hathaway, Inc., 2.75%, 3/15/2023 | | $ | 588,000 | | | $ | 589,580 | |
| Marsh & McLennan Cos., Inc., 3.5%, 6/03/2024 | | | 700,000 | | | | 717,691 | |
| | | | | | | | |
| | | | | | | $ | 1,307,271 | |
| Machinery & Tools - 0.2% | | | | | | | | |
| CNH Industrial Capital LLC, 4.2%, 1/15/2024 | | $ | 327,000 | | | $ | 334,182 | |
| | |
| Major Banks - 2.7% | | | | | | | | |
| Bank of America Corp., 3.124% to 1/20/2022, FLR (LIBOR - 3mo. + 1.16%) to 1/20/2023 | | $ | 397,000 | | | $ | 398,168 | |
| Bank of America Corp., 3.366% to 1/23/2025, FLR (LIBOR - 3mo. + 0.81%) to 1/23/2026 | | | 700,000 | | | | 700,593 | |
| Bank of America Corp., 3.419% to 12/20/2027, FLR (LIBOR - 3mo. + 1.04%) to 12/20/2028 | | | 550,000 | | | | 540,107 | |
| JPMorgan Chase & Co., 3.25%, 9/23/2022 | | | 650,000 | | | | 657,917 | |
| JPMorgan Chase & Co., 3.782% to 2/01/2027, FLR (LIBOR - 3mo. + 1.337%) to 2/01/2028 | | | 500,000 | | | | 508,426 | |
| JPMorgan Chase & Co., 6.75% to 2/01/2024, FLR (LIBOR - 3mo. + 3.78%) to 1/29/2049 | | | 500,000 | | | | 553,905 | |
| Morgan Stanley, 3.125%, 7/27/2026 | | | 686,000 | | | | 668,166 | |
| Morgan Stanley, 3.95%, 4/23/2027 | | | 580,000 | | | | 585,668 | |
| Wells Fargo & Co., 3.75%, 1/24/2024 | | | 210,000 | | | | 216,099 | |
| | | | | | | | |
| | | | | | | $ | 4,829,049 | |
27
Portfolio of Investments (unaudited) – continued
| | | | | | | | |
| | |
| Issuer | | Shares/Par | | | Value ($) | |
| Bonds - continued | | | | | | | | |
| Medical & Health Technology & Services - 1.6% | | | | | | | | |
| Becton, Dickinson and Co., 3.734%, 12/15/2024 | | $ | 73,000 | | | $ | 74,180 | |
| Becton, Dickinson and Co., 4.685%, 12/15/2044 | | | 496,000 | | | | 507,847 | |
| Laboratory Corp. of America Holdings, 3.6%, 2/01/2025 | | | 207,000 | | | | 207,336 | |
| Laboratory Corp. of America Holdings, 4.7%, 2/01/2045 | | | 359,000 | | | | 349,496 | |
| Life Technologies Corp., 6%, 3/01/2020 | | | 325,000 | | | | 333,343 | |
| Life Technologies Corp., 5%, 1/15/2021 | | | 532,000 | | | | 547,463 | |
| Northwell Healthcare, Inc., 3.979%, 11/01/2046 | | | 39,000 | | | | 37,341 | |
| Northwell Healthcare, Inc., 4.26%, 11/01/2047 | | | 310,000 | | | | 310,292 | |
| Thermo Fisher Scientific, Inc., 3.15%, 1/15/2023 | | | 400,000 | | | | 402,833 | |
| | | | | | | | |
| | | | | | | $ | 2,770,131 | |
| Medical Equipment - 0.4% | | | | | | | | |
| Abbott Laboratories, 4.9%, 11/30/2046 | | $ | 300,000 | | | $ | 341,985 | |
| Boston Scientific Corp., 3.75%, 3/01/2026 | | | 84,000 | | | | 85,733 | |
| Zimmer Biomet Holdings, Inc., 3.55%, 4/01/2025 | | | 250,000 | | | | 249,307 | |
| | | | | | | | |
| | | | | | | $ | 677,025 | |
| Metals & Mining - 0.2% | | | | | | | | |
| Glencore Funding LLC, 4.125%, 5/30/2023 (n) | | $ | 331,000 | | | $ | 338,133 | |
| | |
| Midstream - 1.1% | | | | | | | | |
| APT Pipelines Ltd., 5%, 3/23/2035 (n) | | $ | 472,000 | | | $ | 483,390 | |
| Dominion Gas Holdings LLC, 2.8%, 11/15/2020 | | | 713,000 | | | | 713,801 | |
| MPLX LP, 4.5%, 4/15/2038 | | | 182,000 | | | | 174,552 | |
| ONEOK, Inc., 4.95%, 7/13/2047 | | | 250,000 | | | | 249,532 | |
| Sabine Pass Liquefaction LLC, 4.2%, 3/15/2028 | | | 336,000 | | | | 340,338 | |
| | | | | | | | |
| | | | | | | $ | 1,961,613 | |
| Natural Gas - Distribution - 0.1% | | | | | | | | |
| NiSource, Inc., 5.65%, 2/01/2045 | | $ | 85,000 | | | $ | 99,483 | |
| | |
| Network & Telecom - 0.4% | | | | | | | | |
| AT&T, Inc., 5.65%, 2/15/2047 | | $ | 611,000 | | | $ | 686,832 | |
| | |
| Oils - 0.5% | | | | | | | | |
| Marathon Petroleum Corp., 4.75%, 9/15/2044 | | $ | 373,000 | | | $ | 374,593 | |
| Valero Energy Corp., 4.9%, 3/15/2045 | | | 479,000 | | | | 503,280 | |
| | | | | | | | |
| | | | | | | $ | 877,873 | |
| Other Banks & Diversified Financials - 0.1% | | | | | | | | |
| Capital One Financial Corp., 3.75%, 3/09/2027 | | $ | 229,000 | | | $ | 227,061 | |
| | |
| Pollution Control - 0.1% | | | | | | | | |
| Republic Services, Inc., 3.95%, 5/15/2028 | | $ | 243,000 | | | $ | 253,708 | |
28
Portfolio of Investments (unaudited) – continued
| | | | | | | | |
| | |
| Issuer | | Shares/Par | | | Value ($) | |
| Bonds - continued | | | | | | | | |
| Retailers - 0.4% | | | | | | | | |
| Best Buy Co., Inc., 4.45%, 10/01/2028 | | $ | 158,000 | | | $ | 161,138 | |
| Dollar Tree, Inc., 4%, 5/15/2025 | | | 193,000 | | | | 196,827 | |
| Dollar Tree, Inc., 4.2%, 5/15/2028 | | | 57,000 | | | | 57,403 | |
| Home Depot, Inc., 3.9%, 6/15/2047 | | | 245,000 | | | | 247,062 | |
| | | | | | | | |
| | | | | | | $ | 662,430 | |
| Specialty Chemicals - 0.2% | | | | | | | | |
| Ecolab, Inc., 4.35%, 12/08/2021 | | $ | 326,000 | | | $ | 339,062 | |
| | |
| Telecommunications - Wireless - 1.5% | | | | | | | | |
| American Tower Corp., REIT, 3.5%, 1/31/2023 | | $ | 325,000 | | | $ | 329,998 | |
| American Tower Corp., REIT, 5%, 2/15/2024 | | | 400,000 | | | | 431,729 | |
| American Tower Corp., REIT, 4%, 6/01/2025 | | | 264,000 | | | | 272,778 | |
| Crown Castle International Corp., 4.45%, 2/15/2026 | | | 617,000 | | | | 646,661 | |
| Crown Castle International Corp., 3.7%, 6/15/2026 | | | 369,000 | | | | 369,963 | |
| SBA Tower Trust, 2.898%, 10/15/2044 (n) | | | 618,000 | | | | 617,382 | |
| | | | | | | | |
| | | | | | | $ | 2,668,511 | |
| Tobacco - 0.3% | | | | | | | | |
| Altria Group, Inc., 4.4%, 2/14/2026 | | $ | 57,000 | | | $ | 58,875 | |
| Altria Group, Inc., 4.8%, 2/14/2029 | | | 146,000 | | | | 151,710 | |
| Reynolds American, Inc., 3.25%, 6/12/2020 | | | 357,000 | | | | 358,320 | |
| | | | | | | | |
| | | | | | | $ | 568,905 | |
| Transportation - Services - 0.2% | | | | | | | | |
| ERAC USA Finance LLC, 7%, 10/15/2037 (n) | | $ | 328,000 | | | $ | 428,056 | |
| | |
| Utilities - Electric Power - 1.1% | | | | | | | | |
| Berkshire Hathaway Energy, 4.5%, 2/01/2045 | | $ | 273,000 | | | $ | 288,715 | |
| Duke Energy Progress LLC, 3.45%, 3/15/2029 | | | 289,000 | | | | 295,499 | |
| Enel Finance International N.V., 4.875%, 6/14/2029 (n) | | | 250,000 | | | | 260,499 | |
| Exelon Corp., 3.497%, 6/01/2022 | | | 346,000 | | | | 350,858 | |
| Jersey Central Power & Light Co., 4.3%, 1/15/2026 (z) | | | 182,000 | | | | 189,277 | |
| PPL Capital Funding, Inc., 5%, 3/15/2044 | | | 285,000 | | | | 305,370 | |
| PPL WEM Holdings PLC, 5.375%, 5/01/2021 (n) | | | 200,000 | | | | 206,436 | |
| | | | | | | | |
| | | | | | | $ | 1,896,654 | |
| Total Bonds (Identified Cost, $34,503,090) | | | $ | 35,238,320 | |
| | |
| Preferred Stocks - 0.2% | | | | | | | | |
| Aerospace - 0.0% | | | | | | | | |
| Rolls-Royce Holdings PLC | | | 1,837,977 | | | $ | 2,397 | |
29
Portfolio of Investments (unaudited) – continued
| | | | | | | | |
| | |
| Issuer | | Shares/Par | | | Value ($) | |
| Preferred Stocks - continued | | | | | | | | |
| Consumer Products - 0.1% | | | | | | | | |
| Henkel AG & Co. KGaA | | | 2,287 | | | $ | 231,475 | |
| | |
| Specialty Chemicals - 0.1% | | | | | | | | |
| Fuchs Petrolub SE | | | 2,648 | | | $ | 115,176 | |
| Total Preferred Stocks (Identified Cost, $397,342) | | | $ | 349,048 | |
| | |
| Investment Companies (h) - 12.0% | | | | | | | | |
| Money Market Funds - 12.0% | | | | | | | | |
MFS Institutional Money Market Portfolio, 2.48% (v)
(Identified Cost, $21,233,083) | | | 21,233,083 | | | $ | 21,233,083 | |
| | |
| Securities Sold Short - (0.0)% | | | | | | | | |
| Medical & Health Technology & Services - (0.0)% | | | | | | | | |
| Healthcare Services Group, Inc. | | | (256 | ) | | $ | (8,666 | ) |
| | |
| Telecommunications - Wireless - (0.0)% | | | | | | | | |
| Crown Castle International Corp., REIT | | | (114 | ) | | $ | (14,339 | ) |
| Total Securities Sold Short (Proceeds Received, $17,614) | | | $ | (23,005 | ) |
| | |
| Other Assets, Less Liabilities - 1.0% | | | | | | | 1,752,439 | |
| Net Assets - 100.0% | | | | | | $ | 177,023,468 | |
| (a) | Non-income producing security. |
| (f) | All or a portion of the security has been segregated as collateral for open futures contracts and cleared swap agreements. |
| (h) | An affiliated issuer, which may be considered one in which the fund owns 5% or more of the outstanding voting securities, or a company which is under common control. At period end, the aggregate values of the fund’s investments in affiliated issuers and in unaffiliated issuers were $21,233,083 and $154,060,951, respectively. |
| (n) | Securities exempt from registration under Rule 144A of the Securities Act of 1933. These securities may be sold in the ordinary course of business in transactions exempt from registration, normally to qualified institutional buyers. At period end, the aggregate value of these securities was $4,109,544, representing 2.3% of net assets. |
| (s) | Security or a portion of the security was pledged to cover collateral requirements for securities sold short. |
| (v) | Affiliated issuer that is available only to investment companies managed by MFS. The rate quoted for the MFS Institutional Money Market Portfolio is the annualizedseven-day yield of the fund at period end. |
30
Portfolio of Investments (unaudited) – continued
| (z) | Restricted securities are not registered under the Securities Act of 1933 and are subject to legal restrictions on resale. These securities generally may be resold in transactions exempt from registration or to the public if the securities are subsequently registered. Disposal of these securities may involve time-consuming negotiations and prompt sale at an acceptable price may be difficult. The fund holds the following restricted securities: |
| | | | | | | | | | |
| Restricted Securities | | Acquisition
Date | | Cost | | | Value | |
| Avolon Holdings Funding Ltd., 4.375%, 5/01/2026 | | 4/11/19 | | | $93,556 | | | | $93,443 | |
| Jersey Central Power & Light Co., 4.3%, 1/15/2026 | | 2/05/19 | | | 184,601 | | | | 189,277 | |
| Total Restricted Securities | | | | | | | | | $282,720 | |
| % of Net assets | | | | | | | | | 0.2% | |
The following abbreviations are used in this report and are defined:
| ADR | | American Depositary Receipt |
| FLR | | Floating Rate. Interest rate resets periodically based on the parenthetically disclosed reference rate plus a spread (if any). Theperiod-end rate reported may not be the current rate. All reference rates are USD unless otherwise noted. |
| LIBOR | | London Interbank Offered Rate |
| REIT | | Real Estate Investment Trust |
Abbreviations indicate amounts shown in currencies other than the U.S. dollar. All amounts are stated in U.S. dollars unless otherwise indicated. A list of abbreviations is shown below:
31
Portfolio of Investments (unaudited) – continued
Derivative Contracts at 4/30/19
Forward Foreign Currency Exchange Contracts
| | | | | | | | | | | | | | | | | | |
Currency
Purchased | | | Currency
Sold | | Counterparty | | Settlement
Date | | | Unrealized
Appreciation
(Depreciation) | |
| Asset Derivatives | | | | | | | | | | | | |
| CHF | | | 678,311 | | | USD | | 670,000 | | JPMorgan Chase Bank N.A. | | | 7/10/2019 | | | | $293 | |
| EUR | | | 457,249 | | | USD | | 511,000 | | JPMorgan Chase Bank N.A. | | | 5/13/2019 | | | | 2,348 | |
| GBP | | | 2,101,017 | | | USD | | 2,728,000 | | JPMorgan Chase Bank N.A. | | | 7/10/2019 | | | | 21,847 | |
| JPY | | | 319,014,375 | | | USD | | 2,861,000 | | JPMorgan Chase Bank N.A. | | | 5/13/2019 | | | | 5,495 | |
| NOK | | | 11,396,423 | | | USD | | 1,315,043 | | Goldman Sachs International | | | 5/13/2019 | | | | 6,529 | |
| NOK | | | 14,791,550 | | | USD | | 1,711,000 | | Goldman Sachs International | | | 7/10/2019 | | | | 8,204 | |
| USD | | | 122,651 | | | AUD | | 173,413 | | JPMorgan Chase Bank N.A. | | | 5/13/2019 | | | | 371 | |
| USD | | | 239,802 | | | BRL | | 909,113 | | Goldman Sachs International | | | 5/14/2019 | | | | 8,185 | |
| USD | | | 9,910,806 | | | CHF | | 9,869,825 | | JPMorgan Chase Bank N.A. | | | 5/13/2019 | | | | 213,936 | |
| USD | | | 1,053,000 | | | CHF | | 1,046,564 | | JPMorgan Chase Bank N.A. | | | 5/14/2019 | | | | 24,671 | |
| USD | | | 548,483 | | | DKK | | 3,600,026 | | JPMorgan Chase Bank N.A. | | | 5/13/2019 | | | | 7,075 | |
| USD | | | 18,869,231 | | | EUR | | 16,594,638 | | JPMorgan Chase Bank N.A. | | | 5/13/2019 | | | | 238,609 | |
| USD | | | 1,654,506 | | | HKD | | 12,943,366 | | Goldman Sachs International | | | 5/14/2019 | | | | 4,272 | |
| USD | | | 191,000 | | | HKD | | 1,496,573 | | JPMorgan Chase Bank N.A. | | | 7/10/2019 | | | | 24 | |
| USD | | | 8,398,776 | | | JPY | | 923,104,513 | | JPMorgan Chase Bank N.A. | | | 5/13/2019 | | | | 104,248 | |
| USD | | | 585,129 | | | KRW | | 656,982,480 | | JPMorgan Chase Bank N.A. | | | 7/10/2019 | | | | 21,219 | |
| USD | | | 4,122,000 | | | NOK | | 35,540,910 | | Goldman Sachs International | | | 5/13/2019 | | | | 544 | |
| USD | | | 2,684,850 | | | NZD | | 3,975,730 | | Goldman Sachs International | | | 5/13/2019 | | | | 28,948 | |
| USD | | | 5,159,000 | | | NZD | | 7,481,094 | | Goldman Sachs International | | | 5/14/2019 | | | | 161,312 | |
| USD | | | 1,133,516 | | | SEK | | 10,449,091 | | Goldman Sachs International | | | 5/13/2019 | | | | 32,265 | |
| USD | | | 3,298,000 | | | SEK | | 30,538,408 | | Goldman Sachs International | | | 5/14/2019 | | | | 79,224 | |
| USD | | | 3,757,000 | | | SEK | | 35,457,725 | | Goldman Sachs International | | | 7/10/2019 | | | | 2,240 | |
| USD | | | 464,847 | | | SGD | | 631,442 | | JPMorgan Chase Bank N.A. | | | 5/13/2019 | | | | 505 | |
| USD | | | 358,442 | | | TWD | | 11,006,325 | | JPMorgan Chase Bank N.A. | | | 7/10/2019 | | | | 606 | |
| USD | | | 255,795 | | | ZAR | | 3,558,491 | | Goldman Sachs International | | | 5/13/2019 | | | | 7,365 | |
| | | | | | | | | | | | | | | | | | |
| | | | | | | | | | | | | | | | | $980,335 | |
| | | | | | | | | | | | | | | | | | |
32
Portfolio of Investments (unaudited) – continued
Forward Foreign Currency Exchange Contracts - continued
| | | | | | | | | | | | | | | | | | |
Currency
Purchased | | | Currency
Sold | | Counterparty | | Settlement
Date | | | Unrealized
Appreciation
(Depreciation) | |
| Liability Derivatives | | | | | | | | | | | | |
| AUD | | | 186,540 | | | USD | | 132,000 | | JPMorgan Chase Bank N.A. | | | 5/13/2019 | | | | $(463 | ) |
| AUD | | | 3,458,098 | | | USD | | 2,484,000 | | JPMorgan Chase Bank N.A. | | | 5/14/2019 | | | | (45,493 | ) |
| CAD | | | 3,304,613 | | | USD | | 2,488,721 | | JPMorgan Chase Bank N.A. | | | 5/13/2019 | | | | (21,308 | ) |
| CAD | | | 6,417,832 | | | USD | | 4,872,000 | | JPMorgan Chase Bank N.A. | | | 5/14/2019 | | | | (79,949 | ) |
| GBP | | | 940,897 | | | USD | | 1,244,000 | | JPMorgan Chase Bank N.A. | | | 5/13/2019 | | | | (16,327 | ) |
| GBP | | | 1,326,534 | | | USD | | 1,763,000 | | JPMorgan Chase Bank N.A. | | | 5/14/2019 | | | | (32,052 | ) |
| INR | | | 5,980,440 | | | USD | | 86,000 | | JPMorgan Chase Bank N.A. | | | 5/13/2019 | | | | (143 | ) |
| KRW | | | 135,486,000 | | | USD | | 120,584 | | Goldman Sachs International | | | 5/14/2019 | | | | (4,548 | ) |
| NOK | | | 35,373,634 | | | USD | | 4,126,000 | | Goldman Sachs International | | | 5/14/2019 | | | | (23,770 | ) |
| NZD | | | 15,187,162 | | | USD | | 10,322,000 | | Goldman Sachs International | | | 5/14/2019 | | | | (176,333 | ) |
| SEK | | | 37,590,507 | | | USD | | 4,066,000 | | Goldman Sachs International | | | 5/14/2019 | | | | (103,926 | ) |
| USD | | | 812,000 | | | AUD | | 1,151,218 | | JPMorgan Chase Bank N.A. | | | 7/10/2019 | | | | (917 | ) |
| USD | | | 4,201,000 | | | CAD | | 5,637,015 | | JPMorgan Chase Bank N.A. | | | 5/14/2019 | | | | (8,033 | ) |
| USD | | | 758,000 | | | CAD | | 1,019,219 | | JPMorgan Chase Bank N.A. | | | 7/10/2019 | | | | (4,141 | ) |
| USD | | | 6,388,319 | | | GBP | | 4,943,387 | | JPMorgan Chase Bank N.A. | | | 5/13/2019 | | | | (61,763 | ) |
| USD | | | 121,299 | | | ILS | | 439,381 | | JPMorgan Chase Bank N.A. | | | 5/13/2019 | | | | (915 | ) |
| USD | | | 329,466 | | | INR | | 23,458,980 | | JPMorgan Chase Bank N.A. | | | 7/10/2019 | | | | (4,859 | ) |
| USD | | | 114,806 | | | MXN | | 2,241,897 | | Goldman Sachs International | | | 5/13/2019 | | | | (3,238 | ) |
| USD | | | 5,310,000 | | | NZD | | 7,956,415 | | Goldman Sachs International | | | 7/10/2019 | | | | (11,059 | ) |
| USD | | | 112,573 | | | RUB | | 7,501,212 | | Goldman Sachs International | | | 5/14/2019 | | | | (3,237 | ) |
| | | | | | | | | | | | | | | | | | |
| | | | | | | | | | | | | | | | | $(602,474 | ) |
| | | | | | | | | | | | | | | | | | |
Futures Contracts
| | | | | | | | | | | | | | | | | | | | | | |
| Description | | Long/
Short | | | Currency | | | Contracts | | | Notional
Amount | | | Expiration
Date | | Value/ Unrealized
Appreciation
(Depreciation) | |
| Asset Derivatives | | | | | | | | | | | | | | | | | | | |
| | | | | |
| Equity Futures | | | | | | | | | | | | | | | | | | | |
| BIST 30 Index | | | Long | | | | TRY | | | | 2,520 | | | | $5,142,922 | | | June - 2019 | | | $12,838 | |
| CAC 40 Index | | | Long | | | | EUR | | | | 57 | | | | 3,545,944 | | | May - 2019 | | | 94,702 | |
| FTSE 100 Index | | | Long | | | | GBP | | | | 24 | | | | 2,306,985 | | | June - 2019 | | | 94,716 | |
| FTSE MIB Index | | | Long | | | | EUR | | | | 28 | | | | 3,369,264 | | | June - 2019 | | | 185,442 | |
| Hang Seng China Enterprises Index | | | Short | | | | HKD | | | | 78 | | | | 5,701,752 | | | May - 2019 | | | 26,810 | |
| IBEX 35 Index | | | Long | | | | EUR | | | | 36 | | | | 3,860,219 | | | May - 2019 | | | 38,103 | |
33
Portfolio of Investments (unaudited) – continued
Futures Contracts - continued
| | | | | | | | | | | | | | | | | | | | | | |
| Description | | Long/
Short | | | Currency | | | Contracts | | | Notional
Amount | | | Expiration
Date | | Value/ Unrealized
Appreciation
(Depreciation) | |
| Asset Derivatives - continued | | | | | | | | | | | |
| | | |
| Equity Futures - continued | | | | | | | | | | | |
| IBOV Index | | | Long | | | | BRL | | | | 30 | | | | $742,330 | | | June - 2019 | | | $2,242 | |
| KOSPI 200 Index | | | Long | | | | KRW | | | | 51 | | | | 3,115,054 | | | June - 2019 | | | 39,493 | |
| NIFTY Index | | | Short | | | | USD | | | | 153 | | | | 3,604,374 | | | May - 2019 | | | 9,476 | |
| OMX Stockholm 30 Index | | | Long | | | | SEK | | | | 114 | | | | 2,003,401 | | | May - 2019 | | | 47,602 | |
| S&P/ASX 200 Index | | | Short | | | | AUD | | | | 61 | | | | 6,777,107 | | | June - 2019 | | | 63,656 | |
| | | | | | | | | | | | | | | | | | | | | | |
| | | | | | | | | | | | | | | | | | | | | $615,080 | |
| | | | | | | | | | | | | | | | | | | | | | |
| | | | |
| Interest Rate Futures | | | | | | | | | | | | | | | |
| German Euro-Bund 10 yr | | | Long | | | | EUR | | | | 7 | | | | $1,297,882 | | | June - 2019 | | | $2,396 | |
| Japan Government Bond 10 yr | | | Long | | | | JPY | | | | 12 | | | | 16,452,803 | | | June - 2019 | | | 4,506 | |
| | | | | | | | | | | | | | | | | | | | | | |
| | | | | | | | | | | | | | | | | | | | | $6,902 | |
| | | | | | | | | | | | | | | | | | | | | | |
| | | | | | | | | | | | | | | | | | | | | $621,982 | |
| | | | | | | | | | | | | | | | | | | | | | |
| Liability Derivatives | | | | | | | | | | | | | | | |
| | | | | |
| Equity Futures | | | | | | | | | | | | | | | | | | | |
| AEX 25 Index | | | Short | | | | EUR | | | | 18 | | | | $2,294,376 | | | May - 2019 | | | $(54,693 | ) |
| DAX Index | | | Short | | | | EUR | | | | 8 | | | | 2,770,576 | | | June - 2019 | | | (191,257 | ) |
| FTSE/JSE Top 40 Index | | | Short | | | | ZAR | | | | 20 | | | | 735,911 | | | June - 2019 | | | (18,735 | ) |
| Hang Seng Index | | | Long | | | | HKD | | | | 34 | | | | 6,385,835 | | | May - 2019 | | | (80,560 | ) |
| Mexican Bolsa Index | | | Short | | | | MXN | | | | 17 | | | | 400,767 | | | June - 2019 | | | (13,248 | ) |
| MSCI Singapore Index | | | Short | | | | SGD | | | | 8 | | | | 222,660 | | | May - 2019 | | | (1,529 | ) |
| MSCI Taiwan Index | | | Short | | | | USD | | | | 3 | | | | 122,610 | | | May - 2019 | | | (471 | ) |
| Russell 2000 Index | | | Short | | | | USD | | | | 218 | | | | 17,376,780 | | | June - 2019 | | | (624,751 | ) |
| S&P 500 Index | | | Short | | | | USD | | | | 216 | | | | 31,843,800 | | | June - 2019 | | | (1,973,621 | ) |
| S&P MidCap 400 Index | | | Short | | | | USD | | | | 82 | | | | 16,181,880 | | | June - 2019 | | | (817,144 | ) |
| Topix Index | | | Short | | | | JPY | | | | 32 | | | | 4,626,514 | | | June - 2019 | | | (27,928 | ) |
| | | | | | | | | | | | | | | | | | | | | | |
| | | | | | | | | | | | | | | | | | | | | $(3,803,937 | ) |
| | | | | | | | | | | | | | | | | | | | | | |
| | |
| Interest Rate Futures | | | | | | | |
| Australian Note 10 yr | | | Short | | | | AUD | | | | 49 | | | | $4,776,542 | | | June - 2019 | | | $(78,554 | ) |
| Canadian Treasury Bond 10 yr | | | Short | | | | CAD | | | | 182 | | | | 18,771,934 | | | June - 2019 | | | (131,408 | ) |
| Long Gilt 10 yr | | | Long | | | | GBP | | | | 22 | | | | 3,652,556 | | | June - 2019 | | | (1,182 | ) |
| U.S. Treasury Note 10 yr | | | Short | | | | USD | | | | 58 | | | | 7,172,969 | | | June - 2019 | | | (62,012 | ) |
| | | | | | | | | | | | | | | | | | | | | | |
| | | | | | | | | | | | | | | | | | | | | $(273,156 | ) |
| | | | | | | | | | | | | | | | | | | | | | |
| | | | | | | | | | | | | | | | | | | | | $(4,077,093 | ) |
| | | | | | | | | | | | | | | | | | | | | | |
34
Portfolio of Investments (unaudited) – continued
Cleared Swap Agreements
| | | | | | | | | | | | | | | | | | | | | | | | | | |
Maturity
Date | | Notional
Amount | | Counterparty | | Cash Flows to
Receive/ Frequency | | Cash Flows to Pay/Frequency | | Unrealized
Appreciation
(Depreciation) | | | Net
Unamortized
Upfront
Payments
(Receipts) | | | Value | |
| Asset Derivatives | | | | | | | | | | | | | | | | | | | | | |
| | | | | | | |
| Interest Rate Swaps | | | | | | | | | | | | | | | | | | | | | |
| 4/11/21 | | USD | | | 42,850,000 | | | | | centrally cleared | | 2.437%/Semi-annually | | 2.581% FLR(3-Month Libor)/Quarterly | | | $34,358 | | | | $— | | | | $34,358 | |
| 3/01/24 | | USD | | | 19,822,000 | | | | | centrally cleared | | 2.533%/Semi-annually | | 2.629% FLR(3-Month Libor)/Quarterly | | | 189,659 | | | | — | | | | 189,659 | |
| 4/11/29 | | USD | | | 9,414,447 | | | | | centrally cleared | | 2.581% FLR(3-Month Libor)/Quarterly | | 2.482%/Semi-annually | | | 6,168 | | | | — | | | | 6,168 | |
| | | | | | | | | | | | | | | | | | | | | | | | | | |
| | | | | | | | | | | | | | | | | $230,185 | | | | $— | | | | $230,185 | |
| | | | | | | | | | | | | | | | | | | | | | | | | | |
| Liability Derivatives | | | | | | | | | | | | | | | | | | | | | |
| | | | | | | |
| Interest Rate Swaps | | | | | | | | | | | | | | | | | | | | | |
| 3/01/49 | | USD | | | 4,400,000 | | | | | centrally cleared | | 2.629% FLR(3-Month Libor)/Quarterly | | 2.844%/Semi-annually | | | $(135,317 | ) | | | $— | | | | $(135,317 | ) |
| | | | | | | | | | | | | | | | | | | | | | | | | | |
At April 30, 2019, the fund had cash collateral of $712,057 and other liquid securities with an aggregate value of $13,398,318 to cover any collateral or margin obligations for securities sold short and certain derivative contracts. Restricted cash and/or deposits with brokers in the Statement of Assets and Liabilities are comprised of cash collateral.
See Notes to Financial Statements
35
Financial Statements
STATEMENT OF ASSETS AND LIABILITIES
At 4/30/19 (unaudited)
This statement represents your fund’s balance sheet, which details the assets and liabilities comprising the total value of the fund.
| | | | |
| Assets | | | | |
Investments in unaffiliated issuers, at value (identified cost, $140,592,668) | | | $154,060,951 | |
Investments in affiliated issuers, at value (identified cost, $21,233,083) | | | 21,233,083 | |
Cash | | | 166,389 | |
Foreign currency, at value (identified cost, $61,578) | | | 61,578 | |
Deposits with brokers for | | | | |
Futures contracts | | | 700,038 | |
Securities sold short | | | 12,019 | |
Receivables for | | | | |
Net daily variation margin on open cleared swap agreements | | | 18,160 | |
Forward foreign currency exchange contracts | | | 980,335 | |
Net daily variation margin on open futures contracts | | | 151,192 | |
Investments sold | | | 292,450 | |
Fund shares sold | | | 159,246 | |
Interest and dividends | | | 744,889 | |
Receivable from investment adviser | | | 15,397 | |
Other assets | | | 752 | |
Total assets | | | $178,596,479 | |
| |
| Liabilities | | | | |
Payables for | | | | |
Securities sold short, at value (proceeds received, $17,614) | | | $23,005 | |
Forward foreign currency exchange contracts | | | 602,474 | |
Net daily variation margin on open futures contracts | | | 30,569 | |
Investments purchased | | | 605,473 | |
Fund shares reacquired | | | 71,594 | |
Payable to affiliates | | | | |
Shareholder servicing costs | �� | | 90,234 | |
Distribution and service fees | | | 1,385 | |
Payable for independent Trustees’ compensation | | | 853 | |
Deferred country tax expense payable | | | 2,062 | |
Accrued expenses and other liabilities | | | 145,362 | |
Total liabilities | | | $1,573,011 | |
Net assets | | | $177,023,468 | |
| |
| Net assets consist of | | | | |
Paid-in capital | | | $204,451,127 | |
Total distributable earnings (loss) | | | (27,427,659 | ) |
Net assets | | | $177,023,468 | |
Shares of beneficial interest outstanding | | | 16,709,170 | |
36
Statement of Assets and Liabilities (unaudited) – continued
| | | | | | | | | | | | |
| | | |
| | | Net assets | | | Shares
outstanding | | | Net asset value
per share (a) | |
Class A | | | $33,042,550 | | | | 3,127,609 | | | | $10.56 | |
Class B | | | 4,933,242 | | | | 476,763 | | | | 10.35 | |
Class C | | | 11,289,981 | | | | 1,088,208 | | | | 10.37 | |
Class I | | | 120,626,415 | | | | 11,345,249 | | | | 10.63 | |
Class R1 | | | 205,822 | | | | 20,098 | | | | 10.24 | |
Class R2 | | | 819,534 | | | | 78,470 | | | | 10.44 | |
Class R3 | | | 1,004,447 | | | | 95,002 | | | | 10.57 | |
Class R4 | | | 50,634 | | | | 4,752 | | | | 10.66 | |
Class R6 | | | 5,050,843 | | | | 473,019 | | | | 10.68 | |
| (a) | Maximum offering price per share was equal to the net asset value per share for all share classes, except for Class A, for which the maximum offering price per share was $11.20 [100 / 94.25 x $10.56]. On sales of $50,000 or more, the maximum offering price of Class A shares is reduced. A contingent deferred sales charge may be imposed on redemptions of Class A, Class B, and Class C shares. Redemption price per share was equal to the net asset value per share for Classes I, R1, R2, R3, R4, and R6. |
See Notes to Financial Statements
37
Financial Statements
STATEMENT OF OPERATIONS
Six months ended 4/30/19 (unaudited)
This statement describes how much your fund earned in investment income and accrued in expenses. It also describes any gains and/or losses generated by fund operations.
| | | | |
| Net investment income (loss) | | | | |
Income | | | | |
Dividends | | | $1,261,633 | |
Interest | | | 665,692 | |
Dividends from affiliated issuers | | | 284,413 | |
Other | | | 4,907 | |
Foreign taxes withheld | | | (45,584 | ) |
Total investment income | | | $2,171,061 | |
Expenses | | | | |
Management fee | | | $704,178 | |
Distribution and service fees | | | 130,324 | |
Shareholder servicing costs | | | 74,553 | |
Administrative services fee | | | 17,242 | |
Independent Trustees’ compensation | | | 3,338 | |
Custodian fee | | | 95,087 | |
Shareholder communications | | | 16,667 | |
Audit and tax fees | | | 49,595 | |
Legal fees | | | 1,085 | |
Dividend and interest expense on securities sold short | | | 377 | |
Interest expense and fees | | | 51,933 | |
Registration fees | | | 68,275 | |
Miscellaneous | | | 37,094 | |
Total expenses | | | $1,249,748 | |
Fees paid indirectly | | | (4,114 | ) |
Reduction of expenses by investment adviser and distributor | | | (150,464 | ) |
Net expenses | | | $1,095,170 | |
Net investment income (loss) | | | $1,075,891 | |
| |
| Realized and unrealized gain (loss) | | | | |
Realized gain (loss) (identified cost basis) | | | | |
Unaffiliated issuers (net of $221 country tax) | | | $4,787,460 | |
Affiliated issuers | | | 64 | |
Futures contracts | | | 5,194,395 | |
Forward foreign currency exchange contracts | | | 854,373 | |
Foreign currency | | | (87,190 | ) |
Net realized gain (loss) | | | $10,749,102 | |
Change in unrealized appreciation or depreciation | | | | |
Unaffiliated issuers (net of $1,059 increase in deferred country tax) | | | $9,398,831 | |
Affiliated issuers | | | 1,398 | |
Futures contracts | | | (11,092,207 | ) |
Swap agreements | | | 94,868 | |
Securities sold short | | | (2,358 | ) |
Forward foreign currency exchange contracts | | | (770,330 | ) |
Translation of assets and liabilities in foreign currencies | | | (67,040 | ) |
Net unrealized gain (loss) | | | $(2,436,838 | ) |
Net realized and unrealized gain (loss) | | | $8,312,264 | |
Change in net assets from operations | | | $9,388,155 | |
See Notes to Financial Statements
38
Financial Statements
STATEMENTS OF CHANGES IN NET ASSETS
These statements describe the increases and/or decreases in net assets resulting from operations, any distributions, and any shareholder transactions.
| | | | | | | | |
| Change in net assets | | Six months ended
4/30/19
(unaudited) | | | Year ended
10/31/18 | |
| | |
| From operations | | | | | | | | |
Net investment income (loss) | | | $1,075,891 | | | | $1,884,157 | |
Net realized gain (loss) | | | 10,749,102 | | | | 7,078,537 | |
Net unrealized gain (loss) | | | (2,436,838 | ) | | | (8,965,439 | ) |
Change in net assets from operations | | | $9,388,155 | | | | $(2,745 | ) |
Total distributions to shareholders | | | $(1,715,111 | ) | | | $(5,670,263 | ) |
Change in net assets from fund share transactions | | | $(30,646,242 | ) | | | $(96,629,679 | ) |
Total change in net assets | | | $(22,973,198 | ) | | | $(102,302,687 | ) |
| | |
| Net assets | | | | | | | | |
At beginning of period | | | 199,996,666 | | | | 302,299,353 | |
At end of period | | | $177,023,468 | | | | $199,996,666 | |
See Notes to Financial Statements
39
Financial Statements
FINANCIAL HIGHLIGHTS
The financial highlights table is intended to help you understand the fund’s financial performance for the semiannual period and the past 5 fiscal years. Certain information reflects financial results for a single fund share. The total returns in the table represent the rate that an investor would have earned (or lost) on an investment in the fund share class (assuming reinvestment of all distributions) held for the entire period.
| | | | | | | | | | | | | | | | | | | | | | | | |
| | | Six months
ended 4/30/19 | | | Year ended | |
| Class A | | 10/31/18 | | | 10/31/17 | | | 10/31/16 | | | 10/31/15 | | | 10/31/14 | |
| | | (unaudited) | | | | | | | | | | | | | | | | |
Net asset value, beginning of period | | | $10.07 | | | | $10.26 | | | | $10.00 | | | | $10.38 | | | | $10.65 | | | | $10.28 | |
| | | |
| Income (loss) from investment operations | | | | | | | | | | | | | |
Net investment income (loss) (d) | | | $0.06 | | | | $0.06 | | | | $0.04 | | | | $0.06 | | | | $0.05 | | | | $0.05 | |
Net realized and unrealized
gain (loss) | | | 0.51 | | | | (0.07 | ) | | | 0.46 | | | | (0.35 | ) | | | (0.23 | ) | | | 0.45 | |
Total from investment operations | | | $0.57 | | | | $(0.01 | ) | | | $0.50 | | | | $(0.29 | ) | | | $(0.18 | ) | | | $0.50 | |
| | | |
| Less distributions declared to shareholders | | | | | | | | | | | | | |
From net investment income | | | $(0.08 | ) | | | $(0.18 | ) | | | $(0.24 | ) | | | $(0.09 | ) | | | $(0.09 | ) | | | $(0.13 | ) |
Net asset value, end of period (x) | | | $10.56 | | | | $10.07 | | | | $10.26 | | | | $10.00 | | | | $10.38 | | | | $10.65 | |
Total return (%) (r)(s)(t)(x) | | | 5.71 | (n) | | | (0.06 | ) | | | 5.18 | | | | (2.77 | ) | | | (1.67 | ) | | | 4.93 | |
| | | |
Ratios (%) (to average net assets)
and Supplemental data: | | | | | | | | | | | | | |
Expenses before expense
reductions (f) | | | 1.52 | (a) | | | 1.46 | | | | 1.63 | | | | 1.47 | | | | 1.40 | | | | 1.47 | |
Expenses after expense
reductions (f) | | | 1.35 | (a) | | | 1.37 | | | | 1.51 | | | | 1.46 | | | | 1.39 | | | | 1.40 | |
Net investment income (loss) | | | 1.12 | (a) | | | 0.64 | | | | 0.39 | | | | 0.57 | | | | 0.49 | | | | 0.45 | |
Portfolio turnover | | | 25 | (n) | | | 37 | | | | 37 | | | | 51 | | | | 49 | | | | 94 | |
Net assets at end of period
(000 omitted) | | | $33,043 | | | | $35,972 | | | | $50,452 | | | | $125,642 | | | | $181,537 | | | | $128,066 | |
| | | |
| Supplemental Ratios (%): | | | | | | | | | | | | | |
Ratio of expenses to average
net assets after expense
reductions excluding short
sale expenses and interest
expense and fees (f) | | | 1.29 | (a) | | | 1.34 | | | | 1.40 | | | | 1.39 | | | | 1.39 | | | | 1.40 | |
See Notes to Financial Statements
40
Financial Highlights – continued
| | | | | | | | | | | | | | | | | | | | | | | | |
| | | Six months
ended 4/30/19 | | | Year ended | |
| Class B | | 10/31/18 | | | 10/31/17 | | | 10/31/16 | | | 10/31/15 | | | 10/31/14 | |
| | | (unaudited) | | | | | | | | | | | | | | | | |
Net asset value, beginning of period | | | $9.82 | | | | $10.01 | | | | $9.76 | | | | $10.14 | | | | $10.41 | | | | $10.07 | |
| | | |
| Income (loss) from investment operations | | | | | | | | | | | | | |
Net investment income (loss) (d) | | | $0.02 | | | | $(0.01 | ) | | | $(0.03 | ) | | | $(0.02 | ) | | | $(0.03 | ) | | | $(0.03 | ) |
Net realized and unrealized
gain (loss) | | | 0.51 | | | | (0.07 | ) | | | 0.44 | | | | (0.33 | ) | | | (0.22 | ) | | | 0.44 | |
Total from investment operations | | | $0.53 | | | | $(0.08 | ) | | | $0.41 | | | | $(0.35 | ) | | | $(0.25 | ) | | | $0.41 | |
| | | |
| Less distributions declared to shareholders | | | | | | | | | | | | | |
From net investment income | | | $(0.00 | )(w) | | | $(0.11 | ) | | | $(0.16 | ) | | | $(0.03 | ) | | | $(0.02 | ) | | | $(0.07 | ) |
Net asset value, end of period (x) | | | $10.35 | | | | $9.82 | | | | $10.01 | | | | $9.76 | | | | $10.14 | | | | $10.41 | |
Total return (%) (r)(s)(t)(x) | | | 5.40 | (n) | | | (0.81 | ) | | | 4.35 | | | | (3.50 | ) | | | (2.42 | ) | | | 4.10 | |
| | | |
Ratios (%) (to average net assets)
and Supplemental data: | | | | | | | | | | | | | |
Expenses before expense
reductions (f) | | | 2.27 | (a) | | | 2.21 | | | | 2.37 | | | | 2.22 | | | | 2.15 | | | | 2.22 | |
Expenses after expense
reductions (f) | | | 2.10 | (a) | | | 2.12 | | | | 2.25 | | | | 2.21 | | | | 2.14 | | | | 2.15 | |
Net investment income (loss) | | | 0.37 | (a) | | | (0.09 | ) | | | (0.29 | ) | | | (0.18 | ) | | | (0.24 | ) | | | (0.30 | ) |
Portfolio turnover | | | 25 | (n) | | | 37 | | | | 37 | | | | 51 | | | | 49 | | | | 94 | |
Net assets at end of period
(000 omitted) | | | $4,933 | | | | $5,061 | | | | $6,354 | | | | $8,714 | | | | $9,654 | | | | $8,637 | |
| | | |
| Supplemental Ratios (%): | | | | | | | | | | | | | |
Ratio of expenses to average
net assets after expense
reductions excluding short
sale expenses and interest
expense and fees (f) | | | 2.04 | (a) | | | 2.09 | | | | 2.15 | | | | 2.14 | | | | 2.14 | | | | 2.15 | |
See Notes to Financial Statements
41
Financial Highlights – continued
| | | | | | | | | | | | | | | | | | | | | | | | |
| | | Six months ended
4/30/19 | | | Year ended | |
| Class C | | 10/31/18 | | | 10/31/17 | | | 10/31/16 | | | 10/31/15 | | | 10/31/14 | |
| | | (unaudited) | | | | | | | | | | | | | | | | |
Net asset value, beginning of period | | | $9.85 | | | | $10.00 | | | | $9.74 | | | | $10.13 | | | | $10.40 | | | | $10.06 | |
| | | |
| Income (loss) from investment operations | | | | | | | | | | | | | |
Net investment income (loss) (d) | | | $0.02 | | | | $(0.01 | ) | | | $(0.03 | ) | | | $(0.02 | ) | | | $(0.03 | ) | | | $(0.03 | ) |
Net realized and unrealized
gain (loss) | | | 0.50 | | | | (0.06 | ) | | | 0.44 | | | | (0.34 | ) | | | (0.22 | ) | | | 0.44 | |
Total from investment operations | | | $0.52 | | | | $(0.07 | ) | | | $0.41 | | | | $(0.36 | ) | | | $(0.25 | ) | | | $0.41 | |
| | | |
| Less distributions declared to shareholders | | | | | | | | | | | | | |
From net investment income | | | $— | | | | $(0.08 | ) | | | $(0.15 | ) | | | $(0.03 | ) | | | $(0.02 | ) | | | $(0.07 | ) |
Net asset value, end of period (x) | | | $10.37 | | | | $9.85 | | | | $10.00 | | | | $9.74 | | | | $10.13 | | | | $10.40 | |
Total return (%) (r)(s)(t)(x) | | | 5.28 | (n) | | | (0.72 | ) | | | 4.35 | | | | (3.53 | ) | | | (2.37 | ) | | | 4.12 | |
| | | |
Ratios (%) (to average net assets)
and Supplemental data: | | | | | | | | | | | | | |
Expenses before expense
reductions (f) | | | 2.27 | (a) | | | 2.22 | | | | 2.38 | | | | 2.22 | | | | 2.15 | | | | 2.22 | |
Expenses after expense
reductions (f) | | | 2.10 | (a) | | | 2.13 | | | | 2.26 | | | | 2.21 | | | | 2.14 | | | | 2.15 | |
Net investment income (loss) | | | 0.36 | (a) | | | (0.10 | ) | | | (0.30 | ) | | | (0.18 | ) | | | (0.26 | ) | | | (0.30 | ) |
Portfolio turnover | | | 25 | (n) | | | 37 | | | | 37 | | | | 51 | | | | 49 | | | | 94 | |
Net assets at end of period
(000 omitted) | | | $11,290 | | | | $13,845 | | | | $24,540 | | | | $43,754 | | | | $55,745 | | | | $41,318 | |
| | | |
| Supplemental Ratios (%): | | | | | | | | | | | | | |
Ratio of expenses to average
net assets after expense
reductions excluding short
sale expenses and interest
expense and fees (f) | | | 2.04 | (a) | | | 2.10 | | | | 2.15 | | | | 2.14 | | | | 2.14 | | | | 2.15 | |
See Notes to Financial Statements
42
Financial Highlights – continued
| | | | | | | | | | | | | | | | | | | | | | | | |
| | | Six months ended
4/30/19 | | | Year ended | |
| Class I | | 10/31/18 | | | 10/31/17 | | | 10/31/16 | | | 10/31/15 | | | 10/31/14 | |
| | | (unaudited) | | | | | | | | | | | | | | | | |
Net asset value, beginning of period | | | $10.15 | | | | $10.35 | | | | $10.10 | | | | $10.48 | | | | $10.75 | | | | $10.37 | |
| | | |
| Income (loss) from investment operations | | | | | | | | | | | | | |
Net investment income (loss) (d) | | | $0.07 | | | | $0.09 | | | | $0.07 | | | | $0.08 | | | | $0.07 | | | | $0.07 | |
Net realized and unrealized
gain (loss) | | | 0.52 | | | | (0.07 | ) | | | 0.46 | | | | (0.34 | ) | | | (0.22 | ) | | | 0.46 | |
Total from investment operations | | | $0.59 | | | | $0.02 | | | | $0.53 | | | | $(0.26 | ) | | | $(0.15 | ) | | | $0.53 | |
| | | |
| Less distributions declared to shareholders | | | | | | | | | | | | | |
From net investment income | | | $(0.11 | ) | | | $(0.22 | ) | | | $(0.28 | ) | | | $(0.12 | ) | | | $(0.12 | ) | | | $(0.15 | ) |
Net asset value, end of period (x) | | | $10.63 | | | | $10.15 | | | | $10.35 | | | | $10.10 | | | | $10.48 | | | | $10.75 | |
Total return (%) (r)(s)(t)(x) | | | 5.89 | (n) | | | 0.19 | | | | 5.42 | | | | (2.52 | ) | | | (1.44 | ) | | | 5.18 | |
| | | |
Ratios (%) (to average net assets)
and Supplemental data: | | | | | | | | | | | | | |
Expenses before expense
reductions (f) | | | 1.27 | (a) | | | 1.21 | | | | 1.38 | | | | 1.22 | | | | 1.15 | | | | 1.23 | |
Expenses after expense
reductions (f) | | | 1.10 | (a) | | | 1.12 | | | | 1.26 | | | | 1.21 | | | | 1.15 | | | | 1.15 | |
Net investment income (loss) | | | 1.37 | (a) | | | 0.90 | | | | 0.71 | | | | 0.82 | | | | 0.69 | | | | 0.68 | |
Portfolio turnover | | | 25 | (n) | | | 37 | | | | 37 | | | | 51 | | | | 49 | | | | 94 | |
Net assets at end of period
(000 omitted) | | | $120,626 | | | | $137,065 | | | | $211,360 | | | | $371,340 | | | | $538,464 | | | | $228,066 | |
| | | |
| Supplemental Ratios (%): | | | | | | | | | | | | | |
Ratio of expenses to average
net assets after expense
reductions excluding short
sale expenses and interest
expense and fees (f) | | | 1.04 | (a) | | | 1.10 | | | | 1.15 | | | | 1.14 | | | | 1.15 | | | | 1.15 | |
See Notes to Financial Statements
43
Financial Highlights – continued
| | | | | | | | | | | | | | | | | | | | | | | | |
| | | Six months ended
4/30/19 | | | Year ended | |
| Class R1 | | 10/31/18 | | | 10/31/17 | | | 10/31/16 | | | 10/31/15 | | | 10/31/14 | |
| | | (unaudited) | | | | | | | | | | | | | | | | |
Net asset value, beginning of period | | | $9.72 | | | | $9.93 | | | | $9.72 | | | | $10.10 | | | | $10.37 | | | | $10.02 | |
| | | |
| Income (loss) from investment operations | | | | | | | | | | | | | |
Net investment income (loss) (d) | | | $0.02 | | | | $(0.01 | ) | | | $(0.03 | ) | | | $(0.02 | ) | | | $(0.03 | ) | | | $(0.03 | ) |
Net realized and unrealized
gain (loss) | | | 0.50 | | | | (0.07 | ) | | | 0.44 | | | | (0.33 | ) | | | (0.22 | ) | | | 0.44 | |
Total from investment operations | | | $0.52 | | | | $(0.08 | ) | | | $0.41 | | | | $(0.35 | ) | | | $(0.25 | ) | | | $0.41 | |
| | | |
| Less distributions declared to shareholders | | | | | | | | | | | | | |
From net investment income | | | $— | | | | $(0.13 | ) | | | $(0.20 | ) | | | $(0.03 | ) | | | $(0.02 | ) | | | $(0.06 | ) |
Net asset value, end of period (x) | | | $10.24 | | | | $9.72 | | | | $9.93 | | | | $9.72 | | | | $10.10 | | | | $10.37 | |
Total return (%) (r)(s)(t)(x) | | | 5.35 | (n) | | | (0.83 | ) | | | 4.38 | | | | (3.52 | ) | | | (2.42 | ) | | | 4.14 | |
| | | |
Ratios (%) (to average net assets)
and Supplemental data: | | | | | | | | | | | | | |
Expenses before expense
reductions (f) | | | 2.27 | (a) | | | 2.22 | | | | 2.37 | | | | 2.23 | | | | 2.15 | | | | 2.22 | |
Expenses after expense
reductions (f) | | | 2.10 | (a) | | | 2.13 | | | | 2.24 | | | | 2.22 | | | | 2.14 | | | | 2.15 | |
Net investment income (loss) | | | 0.38 | (a) | | | (0.08 | ) | | | (0.26 | ) | | | (0.21 | ) | | | (0.29 | ) | | | (0.29 | ) |
Portfolio turnover | | | 25 | (n) | | | 37 | | | | 37 | | | | 51 | | | | 49 | | | | 94 | |
Net assets at end of period
(000 omitted) | | | $206 | | | | $195 | | | | $363 | | | | $328 | | | | $239 | | | | $151 | |
| | | |
| Supplemental Ratios (%): | | | | | | | | | | | | | |
Ratio of expenses to average
net assets after expense
reductions excluding short
sale expenses and interest
expense and fees (f) | | | 2.04 | (a) | | | 2.10 | | | | 2.15 | | | | 2.15 | | | | 2.14 | | | | 2.15 | |
See Notes to Financial Statements
44
Financial Highlights – continued
| | | | | | | | | | | | | | | | | | | | | | | | |
| | | Six months ended
4/30/19 | | | Year ended | |
| Class R2 | | 10/31/18 | | | 10/31/17 | | | 10/31/16 | | | 10/31/15 | | | 10/31/14 | |
| | | (unaudited) | | | | | | | | | | | | | | | | |
Net asset value, beginning of period | | | $9.91 | | | | $10.11 | | | | $9.89 | | | | $10.26 | | | | $10.53 | | | | $10.18 | |
| | | |
| Income (loss) from investment operations | | | | | | | | | | | | | |
Net investment income (loss) (d) | | | $0.04 | | | | $0.04 | | | | $0.02 | | | | $0.03 | | | | $0.03 | | | �� | $0.02 | |
Net realized and unrealized
gain (loss) | | | 0.50 | | | | (0.06 | ) | | | 0.44 | | | | (0.34 | ) | | | (0.23 | ) | | | 0.45 | |
Total from investment operations | | | $0.54 | | | | $(0.02 | ) | | | $0.46 | | | | $(0.31 | ) | | | $(0.20 | ) | | | $0.47 | |
| | | |
| Less distributions declared to shareholders | | | | | | | | | | | | | |
From net investment income | | | $(0.01 | ) | | | $(0.18 | ) | | | $(0.24 | ) | | | $(0.06 | ) | | | $(0.07 | ) | | | $(0.12 | ) |
Net asset value, end of period (x) | | | $10.44 | | | | $9.91 | | | | $10.11 | | | | $9.89 | | | | $10.26 | | | | $10.53 | |
Total return (%) (r)(s)(t)(x) | | | 5.50 | (n) | | | (0.22 | ) | | | 4.81 | | | | (2.99 | ) | | | (1.88 | ) | | | 4.64 | |
| | | |
Ratios (%) (to average net assets)
and Supplemental data: | | | | | | | | | | | | | |
Expenses before expense
reductions (f) | | | 1.77 | (a) | | | 1.71 | | | | 1.86 | | | | 1.72 | | | | 1.65 | | | | 1.73 | |
Expenses after expense
reductions (f) | | | 1.60 | (a) | | | 1.61 | | | | 1.74 | | | | 1.72 | | | | 1.64 | | | | 1.65 | |
Net investment income (loss) | | | 0.85 | (a) | | | 0.42 | | | | 0.23 | | | | 0.31 | | | | 0.26 | | | | 0.18 | |
Portfolio turnover | | | 25 | (n) | | | 37 | | | | 37 | | | | 51 | | | | 49 | | | | 94 | |
Net assets at end of period
(000 omitted) | | | $820 | | | | $1,434 | | | | $1,560 | | | | $1,300 | | | | $1,139 | | | | $1,028 | |
| | | |
| Supplemental Ratios (%): | | | | | | | | | | | | | |
Ratio of expenses to average
net assets after expense
reductions excluding short
sale expenses and interest
expense and fees (f) | | | 1.54 | (a) | | | 1.59 | | | | 1.65 | | | | 1.65 | | | | 1.64 | | | | 1.65 | |
See Notes to Financial Statements
45
Financial Highlights – continued
| | | | | | | | | | | | | | | | | | | | | | | | |
| | | Six months ended
4/30/19 | | | Year ended | |
| Class R3 | | 10/31/18 | | | 10/31/17 | | | 10/31/16 | | | 10/31/15 | | | 10/31/14 | |
| | | (unaudited) | | | | | | | | | | | | | | | | |
Net asset value, beginning of period | | | $10.09 | | | | $10.29 | | | | $10.06 | | | | $10.39 | | | | $10.65 | | | | $10.28 | |
| | | |
| Income (loss) from investment operations | | | | | | | | | | | | | |
Net investment income (loss) (d) | | | $0.06 | | | | $0.07 | | | | $0.05 | | | | $0.05 | | | | $0.05 | | | | $0.05 | |
Net realized and unrealized
gain (loss) | | | 0.51 | | | | (0.07 | ) | | | 0.45 | | | | (0.34 | ) | | | (0.23 | ) | | | 0.45 | |
Total from investment operations | | | $0.57 | | | | $0.00 | (w) | | | $0.50 | | | | $(0.29 | ) | | | $(0.18 | ) | | | $0.50 | |
| | | |
| Less distributions declared to shareholders | | | | | | | | | | | | | |
From net investment income | | | $(0.09 | ) | | | $(0.20 | ) | | | $(0.27 | ) | | | $(0.04 | ) | | | $(0.08 | ) | | | $(0.13 | ) |
Net asset value, end of period (x) | | | $10.57 | | | | $10.09 | | | | $10.29 | | | | $10.06 | | | | $10.39 | | | | $10.65 | |
Total return (%) (r)(s)(t)(x) | | | 5.69 | (n) | | | 0.00 | (w) | | | 5.17 | | | | (2.83 | ) | | | (1.72 | ) | | | 4.87 | |
| | | |
Ratios (%) (to average net assets)
and Supplemental data: | | | | | | | | | | | | | |
Expenses before expense
reductions (f) | | | 1.52 | (a) | | | 1.46 | | | | 1.61 | | | | 1.49 | | | | 1.40 | | | | 1.47 | |
Expenses after expense
reductions (f) | | | 1.35 | (a) | | | 1.37 | | | | 1.49 | | | | 1.47 | | | | 1.39 | | | | 1.40 | |
Net investment income (loss) | | | 1.13 | (a) | | | 0.65 | | | | 0.49 | | | | 0.47 | | | | 0.43 | | | | 0.48 | |
Portfolio turnover | | | 25 | (n) | | | 37 | | | | 37 | | | | 51 | | | | 49 | | | | 94 | |
Net assets at end of period
(000 omitted) | | | $1,004 | | | | $997 | | | | $1,009 | | | | $932 | | | | $707 | | | | $270 | |
| | | |
| Supplemental Ratios (%): | | | | | | | | | | | | | |
Ratio of expenses to average
net assets after expense
reductions excluding short
sale expenses and interest
expense and fees (f) | | | 1.29 | (a) | | | 1.34 | | | | 1.40 | | | | 1.40 | | | | 1.39 | | | | 1.40 | |
See Notes to Financial Statements
46
Financial Highlights – continued
| | | | | | | | | | | | | | | | | | | | | | | | |
| | | Six months ended
4/30/19 | | | Year ended | |
| Class R4 | | 10/31/18 | | | 10/31/17 | | | 10/31/16 | | | 10/31/15 | | | 10/31/14 | |
| | | (unaudited) | | | | | | | | | | | | | | | | |
Net asset value, beginning of period | | | $10.18 | | | | $10.37 | | | | $10.13 | | | | $10.44 | | | | $10.76 | | | | $10.38 | |
| | | |
| Income (loss) from investment operations | | | | | | | | | | | | | |
Net investment income (loss) (d) | | | $0.07 | | | | $0.09 | | | | $0.07 | | | | $0.09 | | | | $0.09 | | | | $0.08 | |
Net realized and unrealized
gain (loss) | | | 0.52 | | | | (0.07 | ) | | | 0.46 | | | | (0.35 | ) | | | (0.30 | )(g) | | | 0.45 | |
Total from investment operations | | | $0.59 | | | | $0.02 | | | | $0.53 | | | | $(0.26 | ) | | | $(0.21 | ) | | | $0.53 | |
| | | |
| Less distributions declared to shareholders | | | | | | | | | | | | | |
From net investment income | | | $(0.11 | ) | | | $(0.21 | ) | | | $(0.29 | ) | | | $(0.05 | ) | | | $(0.11 | ) | | | $(0.15 | ) |
Net asset value, end of period (x) | | | $10.66 | | | | $10.18 | | | | $10.37 | | | | $10.13 | | | | $10.44 | | | | $10.76 | |
Total return (%) (r)(s)(t)(x) | | | 5.88 | (n) | | | 0.24 | | | | 5.40 | | | | (2.50 | ) | | | (1.94 | ) | | | 5.13 | |
| | | |
Ratios (%) (to average net assets)
and Supplemental data: | | | | | | | | | | | | | |
Expenses before expense
reductions (f) | | | 1.27 | (a) | | | 1.22 | | | | 1.39 | | | | 1.22 | | | | 1.14 | | | | 1.21 | |
Expenses after expense
reductions (f) | | | 1.10 | (a) | | | 1.13 | | | | 1.26 | | | | 1.21 | | | | 1.13 | | | | 1.15 | |
Net investment income (loss) | | | 1.33 | (a) | | | 0.91 | | | | 0.71 | | | | 0.85 | | | | 0.81 | | | | 0.75 | |
Portfolio turnover | | | 25 | (n) | | | 37 | | | | 37 | | | | 51 | | | | 49 | | | | 94 | |
Net assets at end of period
(000 omitted) | | | $51 | | | | $90 | | | | $128 | | | | $192 | | | | $161 | | | | $1,483 | |
| | | |
| Supplemental Ratios (%): | | | | | | | | | | | | | |
Ratio of expenses to average
net assets after expense
reductions excluding short
sale expenses and interest
expense and fees (f) | | | 1.04 | (a) | | | 1.10 | | | | 1.15 | | | | 1.14 | | | | 1.13 | | | | 1.15 | |
See Notes to Financial Statements
47
Financial Highlights – continued
| | | | | | | | | | | | | | | | | | | | | | | | |
| | | Six months ended
4/30/19 | | | Year ended | |
| Class R6 | | 10/31/18 | | | 10/31/17 | | | 10/31/16 | | | 10/31/15 | | | 10/31/14 | |
| | | (unaudited) | | | | | | | | | | | | | | | | |
Net asset value, beginning of period | | | $10.20 | | | | $10.41 | | | | $10.16 | | | | $10.54 | | | | $10.81 | | | | $10.42 | |
| | | |
| Income (loss) from investment operations | | | | | | | | | | | | | |
Net investment income (loss) (d) | | | $0.07 | | | | $0.10 | | | | $0.09 | | | | $0.09 | | | | $0.06 | | | | $0.08 | |
Net realized and unrealized
gain (loss) | | | 0.53 | | | | (0.08 | ) | | | 0.45 | | | | (0.35 | ) | | | (0.21 | ) | | | 0.46 | |
Total from investment operations | | | $0.60 | | | | $0.02 | | | | $0.54 | | | | $(0.26 | ) | | | $(0.15 | ) | | | $0.54 | |
| | | |
| Less distributions declared to shareholders | | | | | | | | | | | | | |
From net investment income | | | $(0.12 | ) | | | $(0.23 | ) | | | $(0.29 | ) | | | $(0.12 | ) | | | $(0.12 | ) | | | $(0.15 | ) |
Net asset value, end of period (x) | | | $10.68 | | | | $10.20 | | | | $10.41 | | | | $10.16 | | | | $10.54 | | | | $10.81 | |
Total return (%) (r)(s)(t)(x) | | | 5.93 | (n) | | | 0.24 | | | | 5.57 | | | | (2.45 | ) | | | (1.38 | ) | | | 5.29 | |
| | | |
Ratios (%) (to average net assets)
and Supplemental data: | | | | | | | | | | | | | |
Expenses before expense
reductions (f) | | | 1.20 | (a) | | | 1.16 | | | | 1.24 | | | | 1.12 | | | | 1.08 | | | | 1.14 | |
Expenses after expense
reductions (f) | | | 1.03 | (a) | | | 1.07 | | | | 1.12 | | | | 1.11 | | | | 1.07 | | | | 1.07 | |
Net investment income (loss) | | | 1.45 | (a) | | | 0.97 | | | | 0.84 | | | | 0.92 | | | | 0.61 | | | | 0.79 | |
Portfolio turnover | | | 25 | (n) | | | 37 | | | | 37 | | | | 51 | | | | 49 | | | | 94 | |
Net assets at end of period
(000 omitted) | | | $5,051 | | | | $5,337 | | | | $6,533 | | | | $5,743 | | | | $4,099 | | | | $140 | |
| | | |
| Supplemental Ratios (%): | | | | | | | | | | | | | |
Ratio of expenses to average
net assets after expense
reductions excluding short
sale expenses and interest
expense and fees (f) | | | 0.97 | (a) | | | 1.04 | | | | 1.03 | | | | 1.04 | | | | 1.07 | | | | 1.07 | |
See Notes to Financial Statements
48
Financial Highlights – continued
| (d) | Per share data is based on average shares outstanding. |
| (f) | Ratios do not reflect reductions from fees paid indirectly, if applicable. |
| (g) | The per share amount varies from the net realized and unrealized gain/loss for the period because of the timing of sales of fund shares and the per share amount of realized and unrealized gains and losses at such time. |
| (r) | Certain expenses have been reduced without which performance would have been lower. |
| (s) | From time to time the fund may receive proceeds from litigation settlements, without which performance would be lower. |
| (t) | Total returns do not include any applicable sales charges. |
| (w) | Per share amount was less than $0.01 and total return or ratio was less than 0.01%, as applicable. |
| (x) | The net asset values and total returns have been calculated on net assets which include adjustments made in accordance with U.S. generally accepted accounting principles required at period end for financial reporting purposes. |
See Notes to Financial Statements
49
NOTES TO FINANCIAL STATEMENTS
(unaudited)
(1) Business and Organization
MFS Global Alternative Strategy Fund (the fund) is a diversified series of MFS Series Trust XV (the trust). The trust is organized as a Massachusetts business trust and is registered under the Investment Company Act of 1940, as amended, as anopen-end management investment company.
The fund is an investment company and accordingly follows the investment company accounting and reporting guidance of the Financial Accounting Standards Board (FASB) Accounting Standards Codification Topic 946 Financial Services – Investment Companies.
(2) Significant Accounting Policies
General– The preparation of financial statements in conformity with U.S. generally accepted accounting principles requires management to make estimates and assumptions that affect the reported amounts of assets and liabilities, and disclosure of contingent assets and liabilities at the date of the financial statements and the reported amounts of increases and decreases in net assets from operations during the reporting period. Actual results could differ from those estimates. In the preparation of these financial statements, management has evaluated subsequent events occurring after the date of the fund’s Statement of Assets and Liabilities through the date that the financial statements were issued. The fund invests in derivatives as part of its principal investment strategy. Derivatives can be highly volatile and involve risks in addition to the risks of the underlying indicators on which the derivative is based. Derivatives can involve leverage. The fund invests in foreign securities. Investments in foreign securities are vulnerable to the effects of changes in the relative values of the local currency and the U.S. dollar and to the effects of changes in each country’s market, economic, industrial, political, regulatory, geopolitical, and other conditions.
In March 2017, the FASB issued Accounting Standards Update2017-08, Receivables – Nonrefundable Fees and Other Costs (Subtopic310-20) – Premium Amortization on Purchased Callable Debt Securities (“ASU2017-08”). For entities that hold callable debt securities at a premium, ASU2017-08 requires that the premium be amortized to the earliest call date. ASU2017-08 will be effective for fiscal years beginning after December 15, 2018, and interim periods within those fiscal years. Management has evaluated the potential impacts of ASU2017-08 and believes that adoption ofASU 2017-08 will not have a material effect on the fund’s overall financial position or its overall results of operations.
Balance Sheet Offsetting– The fund’s accounting policy with respect to balance sheet offsetting is that, absent an event of default by the counterparty or a termination of the agreement, the International Swaps and Derivatives Association (ISDA) Master Agreement, or similar agreement, does not result in an offset of reported amounts of financial assets and financial liabilities in the Statement of Assets and Liabilities across transactions between the fund and the applicable counterparty. The fund’s right to setoff may be restricted or prohibited by the bankruptcy or insolvency laws of the particular jurisdiction to which a specific master netting agreement counterparty is subject. Balance sheet offsetting disclosures, to the extent applicable to the fund, have
50
Notes to Financial Statements (unaudited) – continued
been included in the fund’s Significant Accounting Policies note under the captions for each of the fund’sin-scope financial instruments and transactions.
Investment Valuations– Equity securities, including restricted equity securities and equity securities sold short, are generally valued at the last sale or official closing price on their primary market or exchange as provided by a third-party pricing service. Equity securities, for which there were no sales reported that day, are generally valued at the last quoted daily bid quotation on their primary market or exchange as provided by a third-party pricing service. Equity securities sold short, for which there were no sales reported for that day, are generally valued at the last quoted daily ask quotation on their primary market or exchange as provided by a third-party pricing service. Debt instruments and floating rate loans, including restricted debt instruments, are generally valued at an evaluated or composite bid as provided by a third-party pricing service. Short-term instruments with a maturity at issuance of 60 days or less may be valued at amortized cost, which approximates market value. Futures contracts are generally valued at last posted settlement price on their primary exchange as provided by athird-party pricing service. Futures contracts for which there were no trades that day for a particular position are generally valued at the closing bid quotation on their primary exchange as provided by a third-party pricing service. Forward foreign currency exchange contracts are generally valued at the mean of bid and asked prices for the time period interpolated from rates provided by a third-party pricing service for proximate time periods. Swap agreements are generally valued at valuations provided by a third-party pricing service, which for cleared swaps includes an evaluation of any trading activity at the clearinghouses.Open-end investment companies are generally valued at net asset value per share. Securities and other assets generally valued on the basis of information from a third-party pricing service may also be valued at a broker/dealer bid quotation. In determining values, third-party pricing services can utilize both transaction data and market information such as yield, quality, coupon rate, maturity, type of issue, trading characteristics, and other market data. The values of foreign securities and other assets and liabilities expressed in foreign currencies are converted to U.S. dollars using the mean of bid and asked prices for rates provided by athird-party pricing service.
The Board of Trustees has delegated primary responsibility for determining or causing to be determined the value of the fund’s investments (including any fair valuation) to the adviser pursuant to valuation policies and procedures approved by the Board. If the adviser determines that reliable market quotations are not readily available, investments are valued at fair value as determined in good faith by the adviser in accordance with such procedures under the oversight of the Board of Trustees. Under the fund’s valuation policies and procedures, market quotations are not considered to be readily available for most types of debt instruments and floating rate loans and many types of derivatives. These investments are generally valued at fair value based on information from third-party pricing services. In addition, investments may be valued at fair value if the adviser determines that an investment’s value has been materially affected by events occurring after the close of the exchange or market on which the investment is principally traded (such as foreign exchange or market) and prior to the determination of the fund’s net asset value, or after the halting of trading of a specific security where trading does not resume prior to the close of the exchange or market on which the
51
Notes to Financial Statements (unaudited) – continued
security is principally traded. Events that occur on a frequent basis after foreign markets close (such as developments in foreign markets and significant movements in the U.S. markets) and prior to the determination of the fund’s net asset value may be deemed to have a material effect on the value of securities traded in foreign markets. Accordingly, the fund’s foreign equity securities may often be valued at fair value. The adviser generally relies on third-party pricing services or other information (such as the correlation with price movements of similar securities in the same or other markets; the type, cost and investment characteristics of the security; the business and financial condition of the issuer; and trading and other market data) to assist in determining whether to fair value and at what value to fair value an investment. The value of an investment for purposes of calculating the fund’s net asset value can differ depending on the source and method used to determine value. When fair valuation is used, the value of an investment used to determine the fund’s net asset value may differ from quoted or published prices for the same investment. There can be no assurance that the fund could obtain the fair value assigned to an investment if it were to sell the investment at the same time at which the fund determines its net asset value per share.
Various inputs are used in determining the value of the fund’s assets or liabilities. These inputs are categorized into three broad levels. In certain cases, the inputs used to measure fair value may fall into different levels of the fair value hierarchy. In such cases, an investment’s level within the fair value hierarchy is based on the lowest level of input that is significant to the fair value measurement. The fund’s assessment of the significance of a particular input to the fair value measurement in its entirety requires judgment, and considers factors specific to the investment. Level 1 includes unadjusted quoted prices in active markets for identical assets or liabilities. Level 2 includes other significant observable market-based inputs (including quoted prices for similar securities, interest rates, prepayment speed, and credit risk). Level 3 includes unobservable inputs, which may include the adviser’s own assumptions in determining the fair value of investments. Other financial instruments are derivative instruments, such as futures contracts, forward foreign currency exchange contracts, and swap
52
Notes to Financial Statements (unaudited) – continued
agreements. The following is a summary of the levels used as of April 30, 2019 in valuing the fund’s assets or liabilities:
| | | | | | | | | | | | | | | | |
| | | | |
| Financial Instruments | | Level 1 | | | Level 2 | | | Level 3 | | | Total | |
| Equity Securities: | | | | | | | | | | | | | | | | |
United States | | | $83,499,781 | | | | $— | | | | $— | | | | $83,499,781 | |
United Kingdom | | | 6,085,318 | | | | 2,397 | | | | — | | | | 6,087,715 | |
Japan | | | 81,691 | | | | 5,173,732 | | | | — | | | | 5,255,423 | |
France | | | 4,845,953 | | | | — | | | | — | | | | 4,845,953 | |
Switzerland | | | 4,573,243 | | | | — | | | | — | | | | 4,573,243 | |
Germany | | | 3,228,347 | | | | — | | | | — | | | | 3,228,347 | |
Canada | | | 1,694,989 | | | | — | | | | — | | | | 1,694,989 | |
China | | | 1,053,662 | | | | — | | | | — | | | | 1,053,662 | |
Spain | | | 1,048,541 | | | | — | | | | — | | | | 1,048,541 | |
Other Countries | | | 7,493,317 | | | | 41,660 | | | | — | | | | 7,534,977 | |
| U.S. Corporate Bonds | | | — | | | | 32,247,177 | | | | — | | | | 32,247,177 | |
| Foreign Bonds | | | — | | | | 2,991,143 | | | | — | | | | 2,991,143 | |
| Mutual Funds | | | 21,233,083 | | | | — | | | | — | | | | 21,233,083 | |
| Total | | | $134,837,925 | | | | $40,456,109 | | | | $— | | | | $175,294,034 | |
| | | | |
| Securities Sold Short | | | $(23,005 | ) | | | $— | | | | $— | | | | $(23,005 | ) |
| | | | |
| Other Financial Instruments | | | | | | | | | | | | |
| Futures Contracts – Assets | | | $9,144 | | | | $612,838 | | | | $— | | | | $621,982 | |
| Futures Contracts – Liabilities | | | (3,701,920 | ) | | | (375,173 | ) | | | — | | | | (4,077,093 | ) |
| Forward Foreign Currency Exchange Contracts – Assets | | | — | | | | 980,335 | | | | — | | | | 980,335 | |
| Forward Foreign Currency Exchange Contracts – Liabilities | | | — | | | | (602,474 | ) | | | — | | | | (602,474 | ) |
| Swap Agreements – Assets | | | — | | | | 230,185 | | | | — | | | | 230,185 | |
| Swap Agreements – Liabilities | | | — | | | | (135,317 | ) | | | — | | | | (135,317 | ) |
For further information regarding security characteristics, see the Portfolio of Investments.
Foreign Currency Translation– Purchases and sales of foreign investments, income, and expenses are converted into U.S. dollars based upon currency exchange rates prevailing on the respective dates of such transactions or on the reporting date for foreign denominated receivables and payables. Gains and losses attributable to foreign currency exchange rates on sales of securities are recorded for financial statement purposes as net realized gains and losses on investments. Gains and losses attributable to foreign exchange rate movements on receivables, payables, income and expenses are recorded for financial statement purposes as foreign currency transaction gains and losses. That portion of both realized and unrealized gains and losses on investments that results from fluctuations in foreign currency exchange rates is not separately disclosed.
Derivatives– The fund uses derivatives in an attempt to reduce volatility compared to the overall equity markets and to generate positive returns by adjusting the fund’s exposure to markets, asset classes, and currencies resulting from the fund’s individual
53
Notes to Financial Statements (unaudited) – continued
security selections. Derivatives are used to increase the fund’s exposure to markets, asset classes, or currencies to which the fund’s individual security selections have resulted in no or little exposure. Alternatively, the fund uses derivatives to decrease its exposure to markets or currencies to which the fund’s individual security selections have resulted in exposure. Derivatives are used for hedging ornon-hedging purposes. While hedging can reduce or eliminate losses, it can also reduce or eliminate gains. When the fund uses derivatives as an investment to increase or decrease market exposure, or for hedging purposes, gains and losses from derivative instruments may be substantially greater than the derivative’s original cost.
The derivative instruments used by the fund during the period were futures contracts, forward foreign currency exchange contracts, and swap agreements. Depending on the type of derivative, the fund may exit a derivative position by entering into an offsetting transaction with a counterparty or exchange, negotiating an agreement with the derivative counterparty, or novating the position to a third party. The fund may be unable to promptly close out a futures position in instances where the daily fluctuation in the price for that type of future exceeds the daily limit set by the exchange. The fund’s period end derivatives, as presented in the Portfolio of Investments and the associated Derivative Contract tables, generally are indicative of the volume of its derivative activity during the period.
The following table presents, by major type of derivative contract, the fair value, on a gross basis, of the asset and liability components of derivatives held by the fund at April 30, 2019 as reported in the Statement of Assets and Liabilities:
| | | | | | | | | | |
| | | | | Fair Value (a) | |
| | | |
| Risk | | Derivative Contracts | | Asset Derivatives | | | Liability Derivatives | |
| Interest Rate | | Interest Rate Futures | | | $6,902 | | | | $(273,156 | ) |
| Interest Rate | | Interest Rate Swaps | | | 230,185 | | | | (135,317 | ) |
| Foreign Exchange | | Forward Foreign Currency Exchange Contracts | | | 980,335 | | | | (602,474 | ) |
| Equity | | Equity Futures | | | 615,080 | | | | (3,803,937 | ) |
| Total | | | | | $1,832,502 | | | | $(4,814,884 | ) |
| (a) | Values presented in this table for futures contracts and cleared swap agreements correspond to the values reported in the fund’s Portfolio of Investments. Only the current day net variation margin for futures contracts and cleared swap agreements is separately reported within the fund’s Statement of Assets and Liabilities. |
The following table presents, by major type of derivative contract, the realized gain (loss) on derivatives held by the fund for the six months ended April 30, 2019 as reported in the Statement of Operations:
| | | | | | | | |
| | |
| Risk | | Futures
Contracts | | | Forward Foreign
Currency
Exchange
Contracts | |
| Interest Rate | | | $7,295 | | | | $— | |
| Foreign Exchange | | | — | | | | 854,373 | |
| Equity | | | 5,187,100 | | | | — | |
| Total | | | $5,194,395 | | | | $854,373 | |
54
Notes to Financial Statements (unaudited) – continued
The following table presents, by major type of derivative contract, the change in unrealized appreciation or depreciation on derivatives held by the fund for the six months ended April 30, 2019 as reported in the Statement of Operations:
| | | | | | | | | | | | |
| | | |
| Risk | | Futures
Contracts | | | Swap
Agreements | | | Forward Foreign
Currency
Exchange
Contracts | |
| Interest Rate | | | $(754,049 | ) | | | $94,868 | | | | $— | |
| Foreign Exchange | | | — | | | | — | | | | (770,330 | ) |
| Equity | | | (10,338,158 | ) | | | — | | | | — | |
| Total | | | $(11,092,207 | ) | | | $94,868 | | | | $(770,330 | ) |
Derivative counterparty credit risk is managed through formal evaluation of the creditworthiness of all potential counterparties. On certain, but not all, uncleared derivatives, the fund attempts to reduce its exposure to counterparty credit risk whenever possible by entering into an ISDA Master Agreement on a bilateral basis. The ISDA Master Agreement gives each party to the agreement the right to terminate all transactions traded under such agreement if there is a specified deterioration in the credit quality of the other party. Upon an event of default or a termination of the ISDA Master Agreement, thenon-defaulting party has the right to close out all transactions traded under such agreement and to net amounts owed under each agreement to one net amount payable by one party to the other. This right to close out and net payments across all transactions traded under the ISDA Master Agreement could result in a reduction of the fund’s credit risk to such counterparty equal to any amounts payable by the fund under the applicable transactions, if any.
Collateral and margin requirements differ by type of derivative. For cleared derivatives (e.g., futures contracts, cleared swaps, and exchange-traded options), margin requirements are set by the clearing broker and the clearing house and collateral, in the form of cash or securities, is posted by the fund directly with the clearing broker. Collateral terms are counterparty agreement specific for uncleared derivatives (e.g., forward foreign currency exchange contracts, uncleared swap agreements, and uncleared options) and collateral, in the form of cash and securities, is held in segregated accounts with the fund’s custodian in connection with these agreements. For derivatives traded under an ISDA Master Agreement, which contains a collateral support annex, the collateral requirements are netted across all transactions traded under such counterparty-specific agreement and an amount is posted from one party to the other to collateralize such obligations. Cash that has been segregated or delivered to cover the fund’s collateral or margin obligations under derivative contracts, if any, will be reported separately in the Statement of Assets and Liabilities as restricted cash for uncleared derivatives and/or deposits with brokers for cleared derivatives. Securities pledged as collateral or margin for the same purpose, if any, are noted in the Portfolio of Investments. The fund may be required to make payments of interest on uncovered collateral or margin obligations with the broker. Any such payments are included in “Interest expense and fees” in the Statement of Operations.
55
Notes to Financial Statements (unaudited) – continued
The following table presents the fund’s derivative assets and liabilities (by type) on a gross basis as of April 30, 2019:
| | | | | | | | |
| | |
| Gross Amounts of: | | Derivative Assets | | | Derivative Liabilities | |
| Future Contracts (a) | | | $151,192 | | | | $(30,569 | ) |
| Cleared Swaps Agreements (a) | | | 18,160 | | | | — | |
| Forward Foreign Currency Exchange Contracts | | | 980,335 | | | | (602,474 | ) |
| Total Gross Amount of Derivative Assets and Liabilities Presented in the Statement of Assets & Liabilities | | | $1,149,687 | | | | $(633,043 | ) |
| Less: Derivatives Assets and Liabilities Not Subject to a Master Netting Agreement or Similar Arrangement | | | 169,352 | | | | (30,569 | ) |
| Total Gross Amount of Derivative Assets and Liabilities Subject to a Master Netting Agreement or Similar Arrangement | | | $980,335 | | | | $(602,474 | ) |
| (a) | The amount presented here represents the fund’s current day net variation margin for futures contracts and for cleared swaps agreements. This amount, which is recognized within the fund’s Statement of Assets and Liabilities, differs from the fair value of the futures contracts and cleared swap agreements which is presented in the tables that follow the fund’s Portfolio of Investments. |
The following table presents (by counterparty) the fund’s derivative assets net of amounts available for offset under Master Netting Agreements (or similar arrangements) and net of the related collateral held by the fund at April 30, 2019:
| | | | | | | | | | | | | | | | | | | | |
| | | | | | Amounts Not Offset in the
Statement of Assets & Liabilities | |
| | | | | |
| | | Gross Amount
of Derivative
Assets Subject
to a Master
Netting
Agreement (or
Similar
Arrangement)
by Counterparty | | | Financial
Instruments
Available
for Offset | | | Financial
Instruments
Collateral
Received (b) | | | Cash
Collateral
Received (b) | | | Net Amount
of Derivative
Assets by
Counterparty | |
| Goldman Sachs International | | | $339,089 | | | | $(326,111 | ) | | | $— | | | | $— | | | | $12,978 | |
| JPMorgan Chase Bank N.A. | | | 641,246 | | | | (276,363 | ) | | | — | | | | (310,000 | ) | | | 54,883 | |
| Total | | | $980,335 | | | | $(602,474 | ) | | | $— | | | | $(310,000 | ) | | | $67,861 | |
56
Notes to Financial Statements (unaudited) – continued
The following table presents (by counterparty) the fund’s derivative liabilities net of amounts available for offset under Master Netting Agreements (or similar arrangements) and net of the related collateral pledged by the fund at April 30, 2019:
| | | | | | | | | | | | | | | | | | | | |
| | | | | | Amounts Not Offset in the
Statement of Assets & Liabilities | |
| | | | | |
| | | Gross Amounts
of Derivative
Liabilities Subject
to a Master
Netting
Agreement (or
Similar
Arrangement)
by Counterparty | | | Financial
Instruments
Available
for Offset | | | Financial
Instruments
Collateral
Pledged (b) | | | Cash
Collateral
Pledged (b) | | | Net Amount
of Derivative
Liabilities by
Counterparty | |
| Goldman Sachs International | | | $(326,111 | ) | | | $326,111 | | | | $— | | | | $— | | | | $— | |
| JPMorgan Chase Bank N.A. | | | (276,363 | ) | | | 276,363 | | | | — | | | | — | | | | — | |
| Total | | | $(602,474 | ) | | | $602,474 | | | | $— | | | | $— | | | | $— | |
| (b) | The amount presented here may be less than the total amount of collateral (received)/pledged as the excess collateral (received)/pledged is not shown for purposes of this presentation. |
Futures Contracts– The fund entered into futures contracts which may be used to hedge against or obtain broad market exposure, interest rate exposure, currency exposure, or to manage duration. A futures contract represents a commitment for the future purchase or sale of an asset at a specified price on a specified date.
Upon entering into a futures contract, the fund is required to deposit with the broker, either in cash or securities, an initial margin in an amount equal to a specified percentage of the notional amount of the contract. Subsequent payments (variation margin) are made or received by the fund each day, depending on the daily fluctuations in the value of the contract, and are recorded for financial statement purposes as unrealized gain or loss by the fund until the contract is closed or expires at which point the gain or loss on futures contracts is realized.
The fund bears the risk of interest rates, exchange rates or securities prices moving unexpectedly, in which case, the fund may not achieve the anticipated benefits of the futures contracts and may realize a loss. While futures contracts may present less counterparty risk to the fund since the contracts are exchange traded and the exchange’s clearinghouse guarantees payments to the broker, there is still counterparty credit risk due to the insolvency of the broker. The fund’s maximum risk of loss due to counterparty credit risk is equal to the margin posted by the fund to the broker plus any gains or minus any losses on the outstanding futures contracts.
Forward Foreign Currency Exchange Contracts– The fund entered into forward foreign currency exchange contracts for the purchase or sale of a specific foreign currency at a fixed price on a future date. These contracts may be used to hedge the fund’s currency risk or fornon-hedging purposes. For hedging purposes, the fund may enter into contracts to deliver or receive foreign currency that the fund will receive from or use in its normal investment activities. The fund may also use contracts to hedge against declines in the value of foreign currency denominated securities due to
57
Notes to Financial Statements (unaudited) – continued
unfavorable exchange rate movements. Fornon-hedging purposes, the fund may enter into contracts with the intent of changing the relative exposure of the fund’s portfolio of securities to different currencies to take advantage of anticipated exchange rate changes.
Forward foreign currency exchange contracts are adjusted by the daily exchange rate of the underlying currency and any unrealized gains or losses are recorded as a receivable or payable for forward foreign currency exchange contracts until the contract settlement date. On contract settlement date, any gain or loss on the contract is recorded as realized gains or losses on forward foreign currency exchange contracts.
Risks may arise upon entering into these contracts from unanticipated movements in the value of the contract and from the potential inability of counterparties to meet the terms of their contracts. Generally, the fund’s maximum risk due to counterparty credit risk is the unrealized gain on the contract due to the use of Continuous Linked Settlement, a multicurrency cash settlement system for the centralized settlement of foreign transactions. This risk is mitigated in cases where there is an ISDA Master Agreement between the fund and the counterparty providing for netting as described above and, where applicable, by the posting of collateral by the counterparty to the fund to cover the fund’s exposure to the counterparty under such ISDA Master Agreement.
Swap Agreements– During the period the fund entered into swap agreements. Swap agreements generally involve a periodic exchange of cash payments on a net basis, at specified intervals or upon the occurrence of specified events, between the fund and a counterparty. Certain swap agreements may be entered into as a bilateral contract (“uncleared swaps”) while others are required to be centrally cleared (“cleared swaps”). In a cleared swap transaction, the ultimate counterparty to the transaction is a clearinghouse (the “clearinghouse”). The contract is transferred and accepted by the clearinghouse immediately following execution of the swap contract with an executing broker. Thereafter, throughout the term of the cleared swap, the fund interfaces indirectly with the clearinghouse through a clearing broker and has counterparty risk to the clearing broker as well.
Both cleared and uncleared swap agreements are marked to market daily. The value of uncleared swap agreements is reported in the Statement of Assets and Liabilities as “Uncleared swaps, at value” which includes any related interest accruals to be paid or received by the fund. For cleared swaps, payments (variation margin) are made or received by the fund each day, depending on the daily fluctuations in the value of the cleared swap, such that only the current day net receivable or payable for variation margin is reported in the Statement of Assets and Liabilities.
For both cleared and uncleared swaps, the periodic exchange of net cash payments, at specified intervals or upon the occurrence of specified events as stipulated by the agreement, is recorded as realized gain or loss on swap agreements in the Statement of Operations. Premiums paid or received at the inception of the agreements are amortized using the effective interest method over the term of the agreement as realized gain or loss on swap agreements in the Statement of Operations. A liquidation payment received or made upon early termination is recorded as a realized gain or loss on swap agreements in the Statement of Operations. The change in unrealized
58
Notes to Financial Statements (unaudited) – continued
appreciation or depreciation on swap agreements in the Statement of Operations reflects the aggregate change over the reporting period in the value of swaps net of any unamortized premiums paid or received.
Risks related to swap agreements include the possible lack of a liquid market, unfavorable market and interest rate movements of the underlying instrument and the failure of the counterparty to perform under the terms of the agreements. The fund’s maximum risk of loss from counterparty credit risk is the discounted net value of the cash flows to be received from/paid to the counterparty over the contract’s remaining life, to the extent that the amount is positive. To address counterparty risk, uncleared swap agreements are limited to only highly-rated counterparties. Risk is further reduced by having an ISDA Master Agreement between the fund and the counterparty providing for netting as described above and, where applicable, by the posting of collateral by the counterparty to the fund to cover the fund’s exposure to the counterparty under such ISDA Master Agreement. The fund’s counterparty risk due to cleared swaps is mitigated by the fact that the clearinghouse is the true counterparty to the transaction and the regulatory requirement safeguards in the event of a clearing broker bankruptcy.
The fund entered into interest rate swap agreements in order to manage its exposure to interest or foreign exchange rate fluctuations. Interest rate swap agreements involve the periodic exchange of cash flows, between the fund and a counterparty, based on the difference between two interest rates applied to a notional principal amount. The two interest rates exchanged may either be a fixed rate and a floating rate or two floating rates based on different indices.
Short Sales– The fund entered into short sales whereby it sells a security it does not own in anticipation of a decline in the value of that security. The fund will realize a gain if the security price decreases and a loss if the security price increases between the date of the short sale and the date on which the fund replaces the borrowed security. Losses from short sales can exceed the proceeds of the security sold; and they can also exceed the potential loss from an ordinary buy and sell transaction. The amount of any premium, dividends, or interest the fund may be required to pay in connection with a short sale will be recognized as a fund expense. During the six months ended April 30, 2019, this expense amounted to $377. The fund segregates cash or marketable securities in an amount that, when combined with the amount of proceeds from the short sale deposited with the broker, at least equals the current market value of the security sold short.
Indemnifications– Under the fund’s organizational documents, its officers and Trustees may be indemnified against certain liabilities and expenses arising out of the performance of their duties to the fund. Additionally, in the normal course of business, the fund enters into agreements with service providers that may contain indemnification clauses. The fund’s maximum exposure under these agreements is unknown as this would involve future claims that may be made against the fund that have not yet occurred.
Investment Transactions and Income– Investment transactions are recorded on the trade date. Interest income is recorded on the accrual basis. All premium and discount is amortized or accreted for financial statement purposes in accordance with U.S.
59
Notes to Financial Statements (unaudited) – continued
generally accepted accounting principles. Dividends received in cash are recorded on theex-dividend date. Certain dividends from foreign securities will be recorded when the fund is informed of the dividend if such information is obtained subsequent to theex-dividend date. Dividend and interest payments received in additional securities are recorded on theex-dividend orex-interest date in an amount equal to the value of the security on such date.
The fund may receive proceeds from litigation settlements. Any proceeds received from litigation involving portfolio holdings are reflected in the Statement of Operations in realized gain/loss if the security has been disposed of by the fund or in unrealized gain/loss if the security is still held by the fund. Any other proceeds from litigation not related to portfolio holdings are reflected as other income in the Statement of Operations.
Fees Paid Indirectly– The fund’s custody fee may be reduced by a credit earned under an arrangement that measures the value of U.S. dollars deposited with the custodian by the fund. The amount of the credit, for the six months ended April 30, 2019, is shown as a reduction of total expenses in the Statement of Operations.
Tax Matters and Distributions– The fund intends to qualify as a regulated investment company, as defined under Subchapter M of the Internal Revenue Code, and to distribute all of its taxable income, including realized capital gains. As a result, no provision for federal income tax is required. The fund’s federal tax returns, when filed, will remain subject to examination by the Internal Revenue Service for a three year period. Management has analyzed the fund’s tax positions taken on federal and state tax returns for all open tax years and does not believe that there are any uncertain tax positions that require recognition of a tax liability. Foreign taxes, if any, have been accrued by the fund in the accompanying financial statements in accordance with the applicable foreign tax law. Foreign income taxes may be withheld by certain countries in which the fund invests. Additionally, capital gains realized by the fund on securities issued in or by certain foreign countries may be subject to capital gains tax imposed by those countries.
Distributions to shareholders are recorded on theex-dividend date. Income and capital gain distributions are determined in accordance with income tax regulations, which may differ from U.S. generally accepted accounting principles. Certain capital accounts in the financial statements are periodically adjusted for permanent differences in order to reflect their tax character. These adjustments have no impact on net assets or net asset value per share. Temporary differences which arise from recognizing certain items of income, expense, gain or loss in different periods for financial statement and tax purposes will reverse at some time in the future. Distributions in excess of net investment income or net realized gains are temporary overdistributions for financial statement purposes resulting from differences in the recognition or classification of income or distributions for financial statement and tax purposes.
Book/tax differences primarily relate to expiration of capital loss carryforwards, amortization and accretion of debt securities, wash sale loss deferrals, and derivative transactions.
60
Notes to Financial Statements (unaudited) – continued
The tax character of distributions made during the current period will be determined at fiscal year end. The tax character of distributions declared to shareholders for the last fiscal year is as follows:
| | | | |
| |
| | | Year ended
10/31/18 | |
Ordinary income (including any
short-term capital gains) | | | $5,670,263 | |
The federal tax cost and the tax basis components of distributable earnings were as follows:
| | | | |
| |
| As of 4/30/19 | | | |
| |
| Cost of investments | | | $162,162,420 | |
| Gross appreciation | | | 20,172,938 | |
| |
| Gross depreciation | | | (7,041,324 | ) |
| Net unrealized appreciation (depreciation) | | | $13,131,614 | |
| |
| As of 10/31/18 | | | |
| |
| Undistributed ordinary income | | | 1,713,654 | |
| Capital loss carryforwards | | | (41,158,668 | ) |
| Other temporary differences | | | 40,412 | |
| Net unrealized appreciation (depreciation) | | | 4,303,899 | |
The aggregate cost above includes prior fiscal year end tax adjustments, if applicable.
As of October 31, 2018, the fund had capital loss carryforwards available to offset future realized gains. These net capital losses may be carried forward indefinitely and their character is retained as short-term and/or long-term losses. Such losses are characterized as follows:
Multiple Classes of Shares of Beneficial Interest– The fund offers multiple classes of shares, which differ in their respective distribution and service fees. The fund’s income, realized and unrealized gain (loss), and common expenses are allocated to shareholders based on the daily net assets of each class. Dividends are declared separately for each class. Differences in per share dividend rates are generally due to differences in separate class expenses. Class B shares will convert to Class A shares approximately eight years after purchase. Class C shares will convert to Class A shares
61
Notes to Financial Statements (unaudited) – continued
approximately ten years after purchase. The fund’s distributions declared to shareholders as reported in the Statements of Changes in Net Assets are presented by class as follows:
| | | | | | | | |
| | | From net investment
income | |
| | |
| | | Six months
ended
4/30/19 | | | Year
ended
10/31/18 | |
| Class A | | | $248,713 | | | | $886,465 | |
| Class B | | | 71 | | | | 67,692 | |
| Class C | | | — | | | | 179,880 | |
| Class I | | | 1,397,371 | | | | 4,302,441 | |
| Class R1 | | | — | | | | 4,670 | |
| Class R2 | | | 1,179 | | | | 27,758 | |
| Class R3 | | | 8,830 | | | | 21,731 | |
| Class R4 | | | 915 | | | | 2,787 | |
| Class R6 | | | 58,032 | | | | 176,839 | |
| Total | | | $1,715,111 | | | | $5,670,263 | |
(3) Transactions with Affiliates
Investment Adviser– The fund has an investment advisory agreement with MFS to provide overall investment management and related administrative services and facilities to the fund. The management fee is computed daily and paid monthly at the following annual rates based on the fund’s average daily net assets:
| | | | |
| Up to $1 billion | | | 0.80 | % |
| In excess of $1 billion and up to $2.5 billion | | | 0.70 | % |
| In excess of $2.5 billion | | | 0.65 | % |
MFS has agreed in writing to reduce its management fee by a specified amount if certain MFS mutual fund assets exceed thresholds agreed to by MFS and the fund’s Board of Trustees. For the six months ended April 30, 2019, this management fee reduction amounted to $8,673, which is included in the reduction of total expenses in the Statement of Operations. The management fee incurred for the six months ended April 30, 2019 was equivalent to an annual effective rate of 0.79% of the fund’s average daily net assets.
The investment adviser has agreed in writing to pay a portion of the fund’s total annual operating expenses, excluding interest, taxes, extraordinary expenses, brokerage and transaction costs, and investment-related expenses (such as short sale dividend and interest expenses incurred in connection with the fund’s investment activity), such that total fund operating expenses do not exceed the following rates annually of each class’s average daily net assets:
| | | | | | | | | | | | | | | | | | | | | | | | | | | | | | | | |
| Classes | |
| | | | | | | | |
| A | | B | | | C | | | I | | | R1 | | | R2 | | | R3 | | | R4 | | | R6 | |
| 1.30% | | | 2.05% | | | | 2.05% | | | | 1.05% | | | | 2.05% | | | | 1.55% | | | | 1.30% | | | | 1.05% | | | | 0.97% | |
This written agreement will continue until modified by the fund’s Board of Trustees, but such agreement will continue at least until February 29, 2020. For the six months ended April 30, 2019, this reduction amounted to $141,650, which is included in the reduction of total expenses in the Statement of Operations.
62
Notes to Financial Statements (unaudited) – continued
Distributor– MFS Fund Distributors, Inc. (MFD), a wholly-owned subsidiary of MFS, as distributor, received $2,274 for the six months ended April 30, 2019, as its portion of the initial sales charge on sales of Class A shares of the fund.
The Board of Trustees has adopted a distribution plan for certain share classes pursuant to Rule12b-1 of the Investment Company Act of 1940.
The fund’s distribution plan provides that the fund will pay MFD for services provided by MFD and financial intermediaries in connection with the distribution and servicing of certain share classes. One component of the plan is a distribution fee paid to MFD and another component of the plan is a service fee paid to MFD. MFD may subsequently pay all, or a portion, of the distribution and/or service fees to financial intermediaries.
Distribution Plan Fee Table:
| | | | | | | | | | | | | | | | | | | | |
| | | | | |
| | | Distribution
Fee Rate (d) | | | Service
Fee Rate (d) | | | Total
Distribution
Plan (d) | | | Annual
Effective
Rate (e) | | | Distribution
and Service
Fee | |
| Class A | | | — | | | | 0.25% | | | | 0.25% | | | | 0.25% | | | | $40,407 | |
| Class B | | | 0.75% | | | | 0.25% | | | | 1.00% | | | | 1.00% | | | | 24,447 | |
| Class C | | | 0.75% | | | | 0.25% | | | | 1.00% | | | | 1.00% | | | | 61,131 | |
| Class R1 | | | 0.75% | | | | 0.25% | | | | 1.00% | | | | 1.00% | | | | 980 | |
| Class R2 | | | 0.25% | | | | 0.25% | | | | 0.50% | | | | 0.50% | | | | 2,133 | |
| Class R3 | | | — | | | | 0.25% | | | | 0.25% | | | | 0.25% | | | | 1,226 | |
| Total Distribution and Service Fees | | | | | | | | | | | | $130,324 | |
| (d) | In accordance with the distribution plan for certain classes, the fund pays distribution and/or service fees equal to these annual percentage rates of each class’s average daily net assets. The distribution and service fee rates disclosed by class represent the current rates in effect at the end of the reporting period. Any rate changes, if applicable, are detailed below. |
| (e) | The annual effective rates represent actual fees incurred under the distribution plan for the six months ended April 30, 2019 based on each class’s average daily net assets. MFD has voluntarily agreed to rebate a portion of each class’s 0.25% service fee attributable to accounts for which MFD retains the 0.25% service fee except for accounts attributable to MFS or its affiliates’ seed money. For the six months ended April 30, 2019, this rebate amounted to $141 for Class A and is included in the reduction of total expenses in the Statement of Operations. |
Certain Class A shares are subject to a contingent deferred sales charge (CDSC) in the event of a shareholder redemption within 18 months of purchase. Class B shares are subject to a CDSC in the event of a shareholder redemption within six years of purchase. Class C shares are subject to a CDSC in the event of a shareholder redemption within 12 months of purchase. All contingent deferred sales charges are paid to MFD and during the six months ended April 30, 2019, were as follows:
| | | | |
| |
| | | Amount | |
| Class A | | | $— | |
| Class B | | | 5,212 | |
| Class C | | | 11 | |
Shareholder Servicing Agent– MFS Service Center, Inc. (MFSC), a wholly-owned subsidiary of MFS, receives a fee from the fund for its services as shareholder servicing agent calculated as a percentage of the average daily net assets of the fund as
63
Notes to Financial Statements (unaudited) – continued
determined periodically under the supervision of the fund’s Board of Trustees. For the six months ended April 30, 2019, the fee was $5,345, which equated to 0.0061% annually of the fund’s average daily net assets. MFSC also receives payment from the fund forout-of-pocket expenses,sub-accounting and other shareholder servicing costs which may be paid to affiliated and unaffiliated service providers. Class R6 shares do not incursub-accounting fees. For the six months ended April 30, 2019, theseout-of-pocket expenses,sub-accounting and other shareholder servicing costs amounted to $69,208.
Administrator– MFS provides certain financial, legal, shareholder communications, compliance, and other administrative services to the fund. Under an administrative services agreement, the fund reimburses MFS the costs incurred to provide these services. The fund is charged an annual fixed amount of $17,500 plus a fee based on average daily net assets. The administrative services fee incurred for the six months ended April 30, 2019 was equivalent to an annual effective rate of 0.0196% of the fund’s average daily net assets.
Trustees’ and Officers’ Compensation– The fund pays compensation to independent Trustees in the form of a retainer, attendance fees, and additional compensation to Board and Committee chairpersons. The fund does not pay compensation directly to Trustees or officers of the fund who are also officers of the investment adviser, all of whom receive remuneration for their services to the fund from MFS. Certain officers and Trustees of the fund are officers or directors of MFS, MFD, and MFSC.
Other– This fund and certain other funds managed by MFS (the funds) have entered into a service agreement (the ISO Agreement) which provides for payment of fees solely by the funds to Tarantino LLC in return for the provision of services of an Independent Senior Officer (ISO) for the funds. Frank L. Tarantino serves as the ISO and is an officer of the funds and the sole member of Tarantino LLC. The funds can terminate the ISO Agreement with Tarantino LLC at any time under the terms of the ISO Agreement. For the six months ended April 30, 2019, the fee paid by the fund under this agreement was $167 and is included in “Miscellaneous” expense in the Statement of Operations. MFS has agreed to bear all expenses associated with office space, other administrative support, and supplies provided to the ISO.
The fund invests in the MFS Institutional Money Market Portfolio which is managed by MFS and seeks current income consistent with preservation of capital and liquidity. This money market fund does not pay a management fee to MFS.
The fund is permitted to engage in purchase and sale transactions with funds and accounts for which MFS serves as investment adviser orsub-adviser (“cross-trades”) pursuant to a policy adopted by the Board of Trustees. This policy has been designed to ensure that cross-trades conducted by the fund comply with Rule17a-7 under the Investment Company Act of 1940. During the six months ended April 30, 2019, the fund engaged in purchase and sale transactions pursuant to this policy, which amounted to $19,380 and $61,742, respectively. The sales transactions resulted in net realized gains (losses) of $11,453.
64
Notes to Financial Statements (unaudited) – continued
(4) Portfolio Securities
For the six months ended April 30, 2019, purchases and sales of investments, other than short-term obligations, were as follows:
| | | | | | | | |
| | |
| | | Purchases | | | Sales | |
| U.S. Government securities | | | $— | | | | $1,366,035 | |
| Non-U.S. Government securities | | | $38,701,428 | | | | $61,543,604 | |
(5) Shares of Beneficial Interest
The fund’s Declaration of Trust permits the Trustees to issue an unlimited number of full and fractional shares of beneficial interest. Transactions in fund shares were as follows:
| | | | | | | | | | | | | | | | |
| | | Six months ended
4/30/19 | | | Year ended
10/31/18 | |
| | | | |
| | | Shares | | | Amount | | | Shares | | | Amount | |
| Shares sold | | | | | | | | | | | | | | | | |
Class A | | | 429,925 | | | | $4,322,719 | | | | 780,705 | | | | $7,850,865 | |
Class B | | | 16,594 | | | | 165,756 | | | | 48,937 | | | | 481,543 | |
Class C | | | 33,258 | | | | 332,636 | | | | 48,226 | | | | 475,523 | |
Class I | | | 2,414,849 | | | | 25,044,392 | | | | 3,262,292 | | | | 33,086,213 | |
Class R1 | | | 28 | | | | 273 | | | | 376 | | | | 3,660 | |
Class R2 | | | 1,008 | | | | 10,088 | | | | 23,026 | | | | 227,746 | |
Class R3 | | | 10,094 | | | | 102,224 | | | | 36,340 | | | | 368,536 | |
Class R4 | | | 668 | | | | 6,935 | | | | 1,370 | | | | 14,015 | |
Class R6 | | | 78,755 | | | | 805,174 | | | | 266,994 | | | | 2,743,614 | |
| | | 2,985,179 | | | | $30,790,197 | | | | 4,468,266 | | | | $45,251,715 | |
| | | | |
Shares issued to shareholders in
reinvestment of distributions | | | | | | | | | | | | | | | | |
Class A | | | 22,165 | | | | $217,875 | | | | 78,434 | | | | $785,123 | |
Class B | | | 6 | | | | 71 | | | | 5,720 | | | | 56,224 | |
Class C | | | — | | | | — | | | | 16,232 | | | | 159,888 | |
Class I | | | 127,664 | | | | 1,262,597 | | | | 381,284 | | | | 3,839,533 | |
Class R1 | | | — | | | | — | | | | 480 | | | | 4,670 | |
Class R2 | | | 121 | | | | 1,179 | | | | 2,812 | | | | 27,758 | |
Class R3 | | | 898 | | | | 8,830 | | | | 2,167 | | | | 21,731 | |
Class R4 | | | 92 | | | | 915 | | | | 276 | | | | 2,787 | |
Class R6 | | | 4,608 | | | | 45,760 | | | | 14,958 | | | | 151,223 | |
| | | 155,554 | | | | $1,537,227 | | | | 502,363 | | | | $5,048,937 | |
65
Notes to Financial Statements (unaudited) – continued
| | | | | | | | | | | | | | | | |
| | |
| | | Six months ended
4/30/19 | | | Year ended
10/31/18 | |
| | | | |
| | | Shares | | | Amount | | | Shares | | | Amount | |
| Shares reacquired | | | | | | | | | | | | | | | | |
Class A | | | (896,862 | ) | | | $(9,033,528 | ) | | | (2,205,097 | ) | | | $(22,134,668 | ) |
Class B | | | (55,196 | ) | | | (547,584 | ) | | | (174,047 | ) | | | (1,714,749 | ) |
Class C | | | (351,159 | ) | | | (3,489,808 | ) | | | (1,111,342 | ) | | | (10,957,958 | ) |
Class I | | | (4,698,147 | ) | | | (47,688,992 | ) | | | (10,560,632 | ) | | | (107,220,948 | ) |
Class R1 | | | (7 | ) | | | (66 | ) | | | (17,348 | ) | | | (170,377 | ) |
Class R2 | | | (67,390 | ) | | | (666,023 | ) | | | (35,295 | ) | | | (351,816 | ) |
Class R3 | | | (14,822 | ) | | | (149,026 | ) | | | (37,752 | ) | | | (378,874 | ) |
Class R4 | | | (4,885 | ) | | | (51,045 | ) | | | (5,155 | ) | | | (51,731 | ) |
Class R6 | | | (133,682 | ) | | | (1,347,594 | ) | | | (386,248 | ) | | | (3,949,210 | ) |
| | | (6,222,150 | ) | | | $(62,973,666 | ) | | | (14,532,916 | ) | | | $(146,930,331 | ) |
| | | | |
| Net change | | | | | | | | | | | | | | | | |
Class A | | | (444,772 | ) | | | $(4,492,934 | ) | | | (1,345,958 | ) | | | $(13,498,680 | ) |
Class B | | | (38,596 | ) | | | (381,757 | ) | | | (119,390 | ) | | | (1,176,982 | ) |
Class C | | | (317,901 | ) | | | (3,157,172 | ) | | | (1,046,884 | ) | | | (10,322,547 | ) |
Class I | | | (2,155,634 | ) | | | (21,382,003 | ) | | | (6,917,056 | ) | | | (70,295,202 | ) |
Class R1 | | | 21 | | | | 207 | | | | (16,492 | ) | | | (162,047 | ) |
Class R2 | | | (66,261 | ) | | | (654,756 | ) | | | (9,457 | ) | | | (96,312 | ) |
Class R3 | | | (3,830 | ) | | | (37,972 | ) | | | 755 | | | | 11,393 | |
Class R4 | | | (4,125 | ) | | | (43,195 | ) | | | (3,509 | ) | | | (34,929 | ) |
Class R6 | | | (50,319 | ) | | | (496,660 | ) | | | (104,296 | ) | | | (1,054,373 | ) |
| | | (3,081,417 | ) | | | $(30,646,242 | ) | | | (9,562,287 | ) | | | $(96,629,679 | ) |
Class T shares were not publicly available for sale during the period. Please see the fund’s prospectus for details.
Effective June 1, 2019, purchases of the fund’s Class B shares are closed to new and existing investors subject to certain exceptions. Please see the fund’s prospectus for details.
(6) Line of Credit
The fund and certain other funds managed by MFS participate in a $1.25 billion unsecured committed line of credit, subject to a $1 billion sublimit, provided by a syndicate of banks under a credit agreement. Borrowings may be made for temporary financing needs. Interest is charged to each fund, based on its borrowings, generally at a rate equal to the highest of one month LIBOR, the Federal Funds Effective Rate and the Overnight Bank Funding Rate, plus an agreed upon spread. A commitment fee, based on the average daily, unused portion of the committed line of credit, is allocated among the participating funds. In addition, the fund and other funds managed by MFS have established unsecured uncommitted borrowing arrangements with certain banks for temporary financing needs. Interest is charged to each fund, based on its borrowings, at rates equal to customary reference rates plus an agreed upon spread. For the six months ended April 30, 2019, the fund’s commitment fee and interest expense were $607 and $0, respectively, and are included in “Interest expense and fees” in the Statement of Operations.
66
Notes to Financial Statements (unaudited) – continued
(7) Investments in Affiliated Issuers
An affiliated issuer may be considered one in which the fund owns 5% or more of the outstanding voting securities, or a company which is under common control. For the purposes of this report, the fund assumes the following to be affiliated issuers:
| | | | | | | | | | | | | | | | | | | | | | | | |
| | | | | | |
| Affiliated Issuers | | Beginning
Value | | | Purchases | | | Sales
Proceeds | | | Realized
Gain
(Loss) | | | Change in
Unrealized
Appreciation or
Depreciation | | | Ending
Value | |
| MFS Institutional Money Market Portfolio | | | $34,744,739 | | | | $60,430,642 | | | | $73,943,760 | | | | $64 | | | | $1,398 | | | | $21,233,083 | |
| | | | | | |
| Affiliated Issuers | | | | | | | | | | | | | | Dividend
Income | | | Capital Gain
Distributions | |
| MFS Institutional Money Market Portfolio | | | | | | | | | | | | $284,413 | | | | $— | |
67
PROXY VOTING POLICIES AND INFORMATION
MFS votes proxies on behalf of the fund pursuant to proxy voting policies and procedures that are available without charge, upon request, by calling1-800-225-2606, by visitingmfs.com/proxyvoting, or by visiting the SEC’s Web site athttp://www.sec.gov.
Information regarding how the fund voted proxies relating to portfolio securities during the most recent twelve-month period ended June 30 is available by August 31 of each year without charge by visitingmfs.com/proxyvoting, or by visiting the SEC’s Web site athttp://www.sec.gov.
QUARTERLY PORTFOLIO DISCLOSURE
The fund files a complete schedule of portfolio holdings with the SEC for the first and third quarters of each fiscal year on Form N-Q or as an exhibit to its reports onForm N-PORT (for first and third fiscal quarters ending March 31, 2019 or after). The fund’s Form N-Q or Form N-PORT reports are available on the SEC’s website athttp://www.sec.gov.A shareholder can obtain the portfolio holdings report for the first and third quarters of the fund’s fiscal year atmfs.com/openendfunds by choosing the fund’s name and then selecting the “Resources” tab and clicking on “Prospectus and Reports”.
FURTHER INFORMATION
From time to time, MFS may post important information about the fund or the MFS funds on the MFS web site (mfs.com). This information is available athttps://www.mfs.com/en-us/what-we-do/announcements.html or atmfs.com/openendfunds by choosing the fund’s name.
INFORMATION ABOUT FUND CONTRACTS AND LEGAL CLAIMS
The fund has entered into contractual arrangements with an investment adviser, administrator, distributor, shareholder servicing agent, 529 program manager (if applicable), and custodian who each provide services to the fund. Unless expressly stated otherwise, shareholders are not parties to, or intended beneficiaries of these contractual arrangements, and these contractual arrangements are not intended to create any shareholder right to enforce them against the service providers or to seek any remedy under them against the service providers, either directly or on behalf of the fund.
Under the Trust’s By-Laws and Declaration of Trust, any claims asserted against or on behalf of the MFS Funds, including claims against Trustees and Officers, must be brought in state and federal courts located within the Commonwealth of Massachusetts.
PROVISION OF FINANCIAL REPORTS AND SUMMARY PROSPECTUSES
The fund produces financial reports every six months and updates its summary prospectus and prospectus annually. To avoid sending duplicate copies of materials to households, only one copy of the fund’s annual and semiannual report and summary prospectus may be mailed to shareholders having the same last name and residential address on the fund’s records. However, any shareholder may contact MFSC (please see back cover for address and telephone number) to request that copies of these reports and summary prospectuses be sent personally to that shareholder.
68
Save paper with eDelivery.

MFS® will send you prospectuses, |
reports, and proxies directly viae-mail so you will get information faster with less mailbox clutter.
To sign up:
1. Go to mfs.com.
2. Log in via MFS® Access.
3. Select eDelivery.
If you own your MFS fund shares through a financial institution or a retirement plan, MFS® TALK, MFS® Access, or eDelivery may not be available to you.
CONTACT
WEB SITE
mfs.com
MFS TALK
1-800-637-8255
24 hours a day
ACCOUNT SERVICE AND LITERATURE
Shareholders
1-800-225-2606
Financial advisors
1-800-343-2829
Retirement plan services
1-800-637-1255
MAILING ADDRESS
MFS Service Center, Inc.
P.O. Box 219341
Kansas City, MO 64121-9341
OVERNIGHT MAIL
MFS Service Center, Inc.
Suite 219341
430 W 7th Street
Kansas City, MO 64105-1407
During the period covered by this report, the Registrant has not amended any provision in its Code of Ethics (the “Code”) that relates to an element of the Code’s definition enumerated in paragraph (b) of Item 2 of this FormN-CSR. During the period covered by this report, the Registrant did not grant a waiver, including an implicit waiver, from any provision of the Code.
| ITEM 3. | AUDIT COMMITTEE FINANCIAL EXPERT. |
Not applicable for semi-annual reports.
| ITEM 4. | PRINCIPAL ACCOUNTANT FEES AND SERVICES. |
Not applicable for semi-annual reports.
| ITEM 5. | AUDIT COMMITTEE OF LISTED REGISTRANTS. |
Not applicable to the Registrant.
A schedule of investments for each series of the Registrant is included as part of the report to shareholders of such series under Item 1 of this FormN-CSR.
| ITEM 7. | DISCLOSURE OF PROXY VOTING POLICIES AND PROCEDURES FORCLOSED-END MANAGEMENT INVESTMENT COMPANIES. |
Not applicable to the Registrant.
| ITEM 8. | PORTFOLIO MANAGERS OFCLOSED-END MANAGEMENT INVESTMENT COMPANIES. |
Not applicable to the Registrant.
| ITEM 9. | PURCHASES OF EQUITY SECURITIES BYCLOSED-END MANAGEMENT INVESTMENT COMPANY AND AFFILIATED PURCHASERS. |
Not applicable to the Registrant.
| ITEM 10. | SUBMISSION OF MATTERS TO A VOTE OF SECURITY HOLDERS. |
There were no material changes to the procedures by which shareholders may send recommendations to the Board for nominees to the Registrant’s Board since the Registrant last provided disclosure as to such procedures in response to the requirements of Item 407 (c)(2)(iv) of RegulationS-K or this Item.
| ITEM 11. | CONTROLS AND PROCEDURES. |
| (a) | Based upon their evaluation of the effectiveness of the registrant’s disclosure controls and procedures (as defined in Rule30a-3(c) under the Investment Company Act of 1940 (the “Act”)) as conducted within 90 days of the filing date of this report on FormN-CSR, the registrant’s principal financial officer and principal executive officer have concluded that those disclosure controls and procedures provide reasonable assurance that the material information required to be disclosed by the registrant on this report is recorded, processed, summarized and reported within the time periods specified in the Securities and Exchange Commission’s rules and forms. |
| (b) | There were no changes in the registrant’s internal controls over financial reporting (as defined in Rule30a-3(d) under the Act) that occurred during the second fiscal quarter of the period covered by the report that have materially affected, or are reasonably likely to materially affect, the registrant’s internal control over financial reporting. |
| ITEM 12. | DISCLOSURE OF SECURITIES LENDING ACTIVITIES FORCLOSED-END MANAGEMENT INVESTMENT COMPANIES. |
Not applicable to the Registrant.
| (a) | File the exhibits listed below as part of this form. Letter or number the exhibits in the sequence indicated. |
| | (1) | Any code of ethics, or amendment thereto, that is the subject of the disclosure required by Item 2, to the extent that the registrant intends to satisfy the Item 2 requirements through filing of an exhibit. Not applicable. |
| | (2) | A separate certification for each principal executive officer and principal financial officer of the registrant as required by Rule30a-2(a) under the Act (17 CFR270.30a-2): Attached hereto asEX-99.302CERT. |
| | (3) | Any written solicitation to purchase securities under Rule23c-1 under the Act (17 CFR270.23c-1) sent or given during the period covered by the report by or on behalf of the registrant to 10 or more persons. Not applicable. |
| | (4) | Change in the registrant’s independent public accountant. Not applicable. |
| (b) | If the report is filed under Section 13(a) or 15(d) of the Exchange Act, provide the certifications required by Rule30a-2(b) under the Act (17 CFR270.30a-2(b)), Rule13a-14(b) or Rule15d-14(b) under the Exchange Act (17 CFR240.13a-14(b) or240.15d-14(b)) and Section 1350 of Chapter 63 of Title 18 of the United States Code (18 U.S.C. 1350) as an exhibit. A certification furnished pursuant to this paragraph will not be deemed “filed” for the purposes of Section 18 of the Exchange Act (15 U.S.C. 78r), or otherwise subject to the liability of that section. Such certification will not be deemed to be incorporated by reference into any filing under the Securities Act of 1933 or the Exchange Act, except to the extent that the registrant specifically incorporates it by reference: Attached hereto asEX-99.906CERT. |
Notice
A copy of the Amended and Restated Declaration of Trust, as amended, of the Registrant is on file with the Secretary of State of The Commonwealth of Massachusetts and notice is hereby given that this instrument is executed on behalf of the Registrant by an officer of the Registrant as an officer and not individually and the obligations of or arising out of this instrument are not binding upon any of the Trustees or shareholders individually, but are binding only upon the assets and property of the respective constituent series of the Registrant.
SIGNATURES
Pursuant to the requirements of the Securities Exchange Act of 1934 and the Investment Company Act of 1940, the registrant has duly caused this report to be signed on its behalf by the undersigned, thereunto duly authorized.
(Registrant) MFS SERIES TRUST XV
| | |
| By (Signature and Title)* | | DAVID L. DILORENZO |
| | David L. DiLorenzo, President |
Date: June 17, 2019
Pursuant to the requirements of the Securities Exchange Act of 1934 and the Investment Company Act of 1940, this report has been signed below by the following persons on behalf of the registrant and in the capacities and on the dates indicated.
| | |
| By (Signature and Title)* | | DAVID L. DILORENZO |
| | David L. DiLorenzo, President (Principal Executive Officer) |
Date: June 17, 2019
| | |
| By (Signature and Title)* | | JAMES O. YOST |
| | James O. Yost, Treasurer (Principal Financial Officer and Accounting Officer) |
Date: June 17, 2019
| * | Print name and title of each signing officer under his or her signature. |