UNITED STATES
SECURITIES AND EXCHANGE COMMISSION
Washington, D.C. 20549
FORM N-CSR
CERTIFIED SHAREHOLDER REPORT OF
REGISTERED MANAGEMENT INVESTMENT COMPANIES
Investment Company Act file number 811-04253
MFS SERIES TRUST XV
(Exact name of registrant as specified in charter)
111 Huntington Avenue, Boston, Massachusetts 02199
(Address of principal executive offices) (Zip code)
Christopher R. Bohane
Massachusetts Financial Services Company
111 Huntington Avenue
Boston, Massachusetts 02199
(Name and address of agents for service)
Registrant’s telephone number, including area code: (617) 954-5000
Date of fiscal year end: October 31
Date of reporting period: April 30, 2021
| ITEM 1. | REPORTS TO STOCKHOLDERS. |
Item 1(a):
Semiannual Report
April 30, 2021
MFS® Commodity
Strategy Fund
MFS® Commodity
Strategy Fund
| 1 |
| 2 |
| 5 |
| 7 |
| 30 |
| 32 |
| 33 |
| 34 |
| 40 |
| 57 |
| 58 |
| 58 |
| 58 |
| 58 |
| 58 |
The report is prepared for the general information of shareholders. It is authorized for distribution to prospective investors only when preceded or accompanied by a current prospectus.
NOT FDIC INSURED • MAY LOSE VALUE • NO BANK GUARANTEE
LETTER FROM THE CEO
Dear Shareholders:
Markets have experienced dramatic swings since the coronavirus pandemic brought the global economy to a standstill for several months early in 2020. While the speedy development of vaccines brightened the economic and market outlook, uncertainty remains as new variants of the virus appear and questions persist over how fast vaccines can be made widely available in the developing world.
Global central banks have taken aggressive steps to cushion the economic and market fallout related to the virus, and governments are deploying unprecedented levels of fiscal support. Having passed a $1.9 trillion stimulus package in March, the U.S. Congress is expected to approve additional stimulus later this year, some of it focused on infrastructure. Along with extraordinary government expenditures, pent-up consumer demand has fueled a surge in economic activity as coronavirus restrictions have been eased. Because of this, inflation pressures are being felt, and markets have pushed up yields on global government bonds, resulting in ripple effects across many financial markets.
A spirited debate is underway among investors over whether the current price pressures will persist or prove to be temporary, the consequence of pandemic-induced bottlenecks. The policy measures put in place to counteract the pandemic's effects have helped build a supportive environment and are encouraging economic recovery; however, if markets disconnect from fundamentals, they can sow the seeds of instability. As such, recent dramatic increases in speculative trading in cryptocurrencies, special-purpose acquisition companies (SPACs), and the like, bear watching.
In the aftermath of the crisis, we could see societal changes as households, businesses, and governments adjust to a new reality, and any such alterations could affect the investment landscape. For investors, events such as the COVID-19 outbreak demonstrate the importance of having a deep understanding of company fundamentals, and we have built our global research platform to do just that.
At MFS®, we put our clients’ assets to work responsibly by carefully navigating the increasing complexity of global markets and economies. Guided by our long-term philosophy and adhering to our commitment to sustainable investing, we tune out the noise and aim to uncover what we believe are the best, most durable investment opportunities in the market. Our unique global investment platform combines collective expertise, long-term discipline, and thoughtful risk management to create sustainable value for investors.
Respectfully,
Michael W. Roberge
Chief Executive Officer
MFS Investment Management
June 15, 2021
The opinions expressed in this letter are subject to change and may not be relied upon for investment advice. No forecasts can be guaranteed.
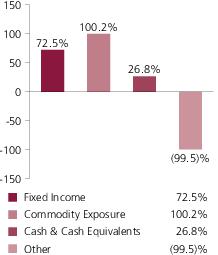
Portfolio structure reflecting equivalent exposure of derivative positions (i)
Fixed income sectors (i)
| Investment Grade Corporates | 34.8% |
| U.S. Treasury Securities | 18.3% |
| Collateralized Debt Obligations | 5.5% |
| Commercial Mortgage-Backed Securities | 4.8% |
| Asset-Backed Securities | 2.7% |
| Municipal Bonds | 2.3% |
| Emerging Markets Bonds | 1.5% |
| High Yield Corporates | 1.0% |
| Mortgage-Backed Securities | 0.7% |
| Residential Mortgage-Backed Securities | 0.7% |
| Non-U.S. Government Bonds | 0.2% |
| U.S. Government Agencies (o) | 0.0% |
Composition including fixed income credit quality (a)(i)
| AAA | 5.4% |
| AA | 6.7% |
| A | 13.5% |
| BBB | 24.2% |
| BB | 1.0% |
| B (o) | 0.0% |
| U.S. Government | 11.5% |
| Federal Agencies | 0.7% |
| Not Rated | 9.5% |
| Non-Fixed Income | 100.2% |
| Cash & Cash Equivalents | 26.8% |
| Other | (99.5)% |
Portfolio Composition - continued
Commodity exposure (c)(i)
| Gold | 11.3% |
| WTI Crude Oil | 9.8% |
| Brent Crude | 8.7% |
| Corn | 7.3% |
| Natural Gas | 6.9% |
| Soybeans | 6.9% |
| Soybean Oil | 5.6% |
| Copper (COMEX) | 5.4% |
| Sugar | 3.9% |
| Unleaded Gasoline | 3.9% |
| Silver | 3.8% |
| Lean Hogs | 3.6% |
| Wheat | 3.4% |
| Aluminum | 3.1% |
| Soybean Meal | 2.9% |
| Cotton | 2.9% |
| Gas Oil | 2.7% |
| Zinc | 2.7% |
| Live Cattle | 2.3% |
| Heating Oil | 2.2% |
| Coffee | 1.7% |
| Nickel | 0.9% |
| Kansas Wheat | 0.5% |
| Feeder Cattle | (1.1)% |
| Lead | (1.1)% |
| (a) | For all securities other than those specifically described below, ratings are assigned to underlying securities utilizing ratings from Moody’s, Fitch, and Standard & Poor’s rating agencies and applying the following hierarchy: If all three agencies provide a rating, the middle rating (after dropping the highest and lowest ratings) is assigned; if two of the three agencies rate a security, the lower of the two is assigned. If none of the 3 rating agencies above assign a rating, but the security is rated by DBRS Morningstar, then the DBRS Morningstar rating is assigned. Ratings are shown in the S&P and Fitch scale (e.g., AAA). Securities rated BBB or higher are considered investment grade. All ratings are subject to change. U.S. Government includes securities issued by the U.S. Department of the Treasury. Federal Agencies includes rated and unrated U.S. Agency fixed-income securities, U.S. Agency mortgage-backed securities, and collateralized mortgage obligations of U.S. Agency mortgage-backed securities. Not Rated includes fixed income securities and fixed income derivatives that have not been rated by any rating agency. The fund may or may not have held all of these instruments on this date. The fund is not rated by these agencies. |
Portfolio Composition - continued
| (c) | MFS expects to gain exposure to the commodities markets by investing a portion of the fund’s assets in the MFS Commodity Strategy Portfolio, a wholly-owned and controlled subsidiary organized in the Cayman Islands (“Subsidiary”). The Subsidiary gains exposure to the commodities markets by investing in commodity linked derivatives (such as commodity-linked futures, options, and/or swaps). The Subsidiary’s investments in commodity-linked derivatives are leveraged (i.e. involves investment exposure greater than the amount of the investment). For more information about commodity-linked derivatives and the risks of investing in such derivatives, please see the fund’s prospectus. |
| (i) | For purposes of this presentation, the components include the value of securities, and reflect the impact of the equivalent exposure of derivative positions, if any. These amounts may be negative from time to time. Equivalent exposure is a calculated amount that translates the derivative position into a reasonable approximation of the amount of the underlying asset that the portfolio would have to hold at a given point in time to have the same price sensitivity that results from the portfolio’s ownership of the derivative contract. When dealing with derivatives, equivalent exposure is a more representative measure of the potential impact of a position on portfolio performance than value. The bond component will include any accrued interest amounts. |
The fund invests a portion of its assets in the MFS Commodity Strategy Portfolio, a wholly-owned subsidiary of the fund. Percentages reflect exposure to the underlying holdings of the MFS Commodity Strategy Portfolio and not to the exposure from investing directly in the MFS Commodity Strategy Portfolio itself.
Where the fund holds convertible bonds, they are treated as part of the equity portion of the portfolio.
Cash & Cash Equivalents includes any cash, investments in money market funds, short-term securities, and other assets less liabilities. Please see the Consolidated Statement of Assets and Liabilities for additional information related to the fund’s cash position and other assets and liabilities.
Other includes equivalent exposure from currency derivatives and/or any offsets to derivative positions and may be negative.
Percentages are based on net assets as of April 30, 2021.
The portfolio is actively managed and current holdings may be different.
Expense Table
Fund expenses borne by the shareholders during the period,
November 1, 2020 through April 30, 2021
As a shareholder of the fund, you incur two types of costs: (1) transaction costs, including sales charges (loads) on certain purchase or redemption payments, and (2) ongoing costs, including management fees; distribution and service (12b-1) fees; and other fund expenses. This example is intended to help you understand your ongoing costs (in dollars) of investing in the fund and to compare these costs with the ongoing costs of investing in other mutual funds.
The example is based on an investment of $1,000 invested at the beginning of the period and held for the entire period November 1, 2020 through April 30, 2021.
Actual Expenses
The first line for each share class in the following table provides information about actual account values and actual expenses. You may use the information in this line, together with the amount you invested, to estimate the expenses that you paid over the period. Simply divide your account value by $1,000 (for example, an $8,600 account value divided by $1,000 = 8.6), then multiply the result by the number in the first line under the heading entitled “Expenses Paid During Period” to estimate the expenses you paid on your account during this period.
Hypothetical Example for Comparison Purposes
The second line for each share class in the following table provides information about hypothetical account values and hypothetical expenses based on the fund’s actual expense ratio and an assumed rate of return of 5% per year before expenses, which is not the fund’s actual return. The hypothetical account values and expenses may not be used to estimate the actual ending account balance or expenses you paid for the period. You may use this information to compare the ongoing costs of investing in the fund and other funds. To do so, compare this 5% hypothetical example with the 5% hypothetical examples that appear in the shareholder reports of the other funds.
Please note that the expenses shown in the table are meant to highlight your ongoing costs only and do not reflect any transactional costs, such as sales charges (loads). Therefore, the second line for each share class in the table is useful in comparing ongoing costs only, and will not help you determine the relative total costs of owning different funds. In addition, if these transactional costs were included, your costs would have been higher.
Expense Table - continued
Share
Class | | Annualized
Expense
Ratio | Beginning
Account Value
11/01/20 | Ending
Account Value
4/30/21 | Expenses
Paid During
Period (p)
11/01/20-4/30/21 |
| A | Actual | 1.13% | $1,000.00 | $1,267.25 | $6.35 |
| Hypothetical (h) | 1.13% | $1,000.00 | $1,019.19 | $5.66 |
| B | Actual | 1.87% | $1,000.00 | $1,263.95 | $10.50 |
| Hypothetical (h) | 1.87% | $1,000.00 | $1,015.52 | $9.35 |
| C | Actual | 1.88% | $1,000.00 | $1,264.14 | $10.55 |
| Hypothetical (h) | 1.88% | $1,000.00 | $1,015.47 | $9.39 |
| I | Actual | 0.88% | $1,000.00 | $1,268.78 | $4.95 |
| Hypothetical (h) | 0.88% | $1,000.00 | $1,020.43 | $4.41 |
| R1 | Actual | 1.87% | $1,000.00 | $1,264.03 | $10.50 |
| Hypothetical (h) | 1.87% | $1,000.00 | $1,015.52 | $9.35 |
| R2 | Actual | 1.37% | $1,000.00 | $1,266.54 | $7.70 |
| Hypothetical (h) | 1.37% | $1,000.00 | $1,018.00 | $6.85 |
| R3 | Actual | 1.12% | $1,000.00 | $1,268.91 | $6.30 |
| Hypothetical (h) | 1.12% | $1,000.00 | $1,019.24 | $5.61 |
| R4 | Actual | 0.87% | $1,000.00 | $1,271.29 | $4.90 |
| Hypothetical (h) | 0.87% | $1,000.00 | $1,020.48 | $4.36 |
| R6 | Actual | 0.80% | $1,000.00 | $1,269.22 | $4.50 |
| Hypothetical (h) | 0.80% | $1,000.00 | $1,020.83 | $4.01 |
| (h) | 5% class return per year before expenses. |
| (p) | “Expenses Paid During Period” are equal to each class’s annualized expense ratio, as shown above, multiplied by the average account value over the period, multiplied by 181/365 (to reflect the one-half year period). Expenses paid do not include any applicable sales charges (loads). If these transaction costs had been included, your costs would have been higher. |
Consolidated Portfolio of Investments
4/30/21 (unaudited)
The Consolidated Portfolio of Investments is a complete list of all securities owned by your fund. It is categorized by broad-based asset classes.
| Issuer | | | Shares/Par | Value ($) |
| Bonds – 65.4% |
| Aerospace & Defense – 1.2% |
| Boeing Co., 2.3%, 8/01/2021 | | $ | 2,524,000 | $ 2,535,298 |
| Boeing Co., 1.167%, 2/04/2023 | | | 1,968,000 | 1,976,172 |
| Boeing Co., 1.433%, 2/04/2024 | | | 3,936,000 | 3,948,237 |
| Huntington Ingalls Industries, Inc., 3.844%, 5/01/2025 | | | 1,422,000 | 1,550,757 |
| Raytheon Technologies Corp., 3.65%, 8/16/2023 | | | 95,000 | 101,280 |
| | | | | $10,111,744 |
| Asset-Backed & Securitized – 13.6% |
| Allegro CLO Ltd., 2014-1RA, “A2”, FLR, 1.786% (LIBOR - 3mo. + 1.6%), 10/21/2028 (n) | | $ | 252,269 | $ 253,144 |
| AmeriCredit Automobile Receivables Trust, 2020-1, “C”, 1.59%, 10/20/2025 | | | 678,000 | 690,505 |
| Arbor Realty Trust, Inc., CLO, 2019-FL1, “A”, FLR, 1.265% (LIBOR - 1mo. + 1.15%), 5/15/2037 (n) | | | 2,110,500 | 2,111,158 |
| Arbor Realty Trust, Inc., CLO, 2021-FL1, “C”, FLR, 2.115% (LIBOR - 1mo. + 2%), 12/15/2035 (n) | | | 153,500 | 153,452 |
| Arbor Realty Trust, Inc., FLR, 1.614% (LIBOR - 1mo. + 1.5%), 12/15/2035 (n) | | | 375,500 | 375,265 |
| AREIT CRE Trust, 2019-CRE3, “AS”, FLR, 1.415% (LIBOR - 1mo. + 1.3%), 9/14/2036 (n) | | | 613,500 | 612,737 |
| AREIT CRE Trust, 2019-CRE3, “B”, FLR, 1.666% (LIBOR - 1mo. + 1.55%), 9/14/2036 (n) | | | 303,000 | 301,494 |
| AREIT CRE Trust, 2019-CRE3, “C”, FLR, 2.015% (LIBOR - 1mo. + 1.9%), 9/14/2036 (n) | | | 250,500 | 248,632 |
| Avery Point CLO Ltd., 2014-1A, “CR”, FLR, 2.525% (LIBOR - 3mo. + 2.35%), 4/25/2026 (n) | | | 1,150,000 | 1,152,918 |
| Avis Budget Rental Car Funding LLC, 2019-1A, “A”, 3.45%, 3/20/2023 (n) | | | 2,690,000 | 2,744,629 |
| Ballyrock Ltd., CLO, 2018-1A, “A2”, FLR, 1.788% (LIBOR - 3mo. + 1.6%), 4/20/2031 (n) | | | 1,368,365 | 1,361,797 |
| Ballyrock Ltd., CLO, 2018-1A, “B”, FLR, 2.088% (LIBOR - 3mo. + 1.9%), 4/20/2031 (n) | | | 579,877 | 576,468 |
| Bancorp Commercial Mortgage Trust, 2018-CRE3, “B”, FLR, 1.664% (LIBOR - 1mo. + 1.55%), 1/15/2033 (n) | | | 1,142,685 | 1,138,051 |
| Bancorp Commercial Mortgage Trust, 2018-CRE4, “AS”, FLR, 1.214% (LIBOR - 1mo. + 1.1%), 9/15/2035 (n) | | | 636,041 | 634,651 |
| Bancorp Commercial Mortgage Trust, 2019-CRE5, “A”, FLR, 1.115% (LIBOR - 1mo. + 1%), 3/15/2036 (n) | | | 657,794 | 657,793 |
| Bancorp Commercial Mortgage Trust, 2019-CRE5, “AS”, FLR, 1.464% (LIBOR - 1mo. + 1.35%), 3/15/2036 (n) | | | 1,181,173 | 1,180,466 |
Consolidated Portfolio of Investments (unaudited) – continued
| Issuer | | | Shares/Par | Value ($) |
| Bonds – continued |
| Asset-Backed & Securitized – continued |
| Bancorp Commercial Mortgage Trust, 2019-CRE5, “B”, FLR, 1.615% (LIBOR - 1mo. + 1.5%), 3/15/2036 (n) | | $ | 1,635,470 | $ 1,634,492 |
| Bancorp Commercial Mortgage Trust, 2019-CRE6, “AS”, FLR, 1.414% (LIBOR - 1mo. + 1.3%), 9/15/2036 (n) | | | 1,360,019 | 1,359,204 |
| Bancorp Commercial Mortgage Trust, 2019-CRE6, “B”, FLR, 1.665% (LIBOR - 1mo. + 1.55%), 9/15/2036 (n) | | | 1,713,302 | 1,710,633 |
| Barclays Commercial Mortgage Securities LLC, 2018-C2, “XA”, 0.933%, 12/15/2051 (i)(n) | | | 19,536,986 | 949,861 |
| BBCMS Mortgage Trust, 2021-C9, “XA”, 1.771%, 2/15/2054 (i) | | | 11,509,803 | 1,457,075 |
| Benchmark Mortgage Trust, 2021-B23, “XA”, 1.387%, 2/15/2054 (i) | | | 12,640,768 | 1,213,209 |
| BPCRE Holder LLC, 1.664%, 2/15/2037 (n) | | | 1,053,500 | 1,051,852 |
| BPCRE Holder LLC, 2021-FL1, “C”, 2.014%, 2/15/2037 (n) | | | 286,000 | 285,552 |
| BSPRT Issuer Ltd., 2021-FL6, “C”, FLR, 2.165% (LIBOR - 1mo. + 2.05%), 3/15/2036 (n) | | | 485,000 | 484,095 |
| BSPRT Ltd., 2018-FL4, “A”, FLR, 2.214% (LIBOR - 1mo. + 2.1%), 9/15/2035 (n) | | | 1,813,000 | 1,801,687 |
| Business Jet Securities LLC, 2020-1A, “A”, 2.981%, 11/15/2035 (n) | | | 473,114 | 480,553 |
| Business Jet Securities LLC, 2021-1A, “A”, 2.162%, 4/15/2036 (n) | | | 483,027 | 482,347 |
| Business Jet Securities LLC, 2021-1A, “B”, 2.918%, 4/15/2036 (n) | | | 98,110 | 97,892 |
| BXMT Ltd., 2020-FL2, “B”, FLR, 1.516% (LIBOR - 1mo. + 1.4%), 2/16/2037 (n) | | | 1,492,000 | 1,488,267 |
| BXMT Ltd., 2020-FL2, “A”, FLR, 1.015% (LIBOR - 1mo. + 0.9%), 2/16/2037 (n) | | | 2,317,500 | 2,314,598 |
| BXMT Ltd., 2021-FL4, “AS”, FLR, 1.42% (LIBOR - 1mo. + 1.3%), 5/15/2038 (n) | | | 2,601,000 | 2,602,602 |
| Capital Automotive, 2020-1A, “A4”, REIT, 3.19%, 2/15/2050 (n) | | | 568,078 | 586,394 |
| CD Commercial Mortgage Trust, 2017-CD4, “XA”, 1.441%, 5/10/2050 (i) | | | 11,793,055 | 630,665 |
| CF Hippolyta Issuer LLC, 2020-1, “A1”, 1.69%, 7/15/2060 (n) | | | 380,127 | 385,393 |
| CF Hippolyta Issuer LLC, 2020-1, “B1”, 2.28%, 7/15/2060 (n) | | | 120,318 | 122,692 |
| Commercial Mortgage Pass-Through Certificates, 2019-BN24,“XA”, 0.764%, 11/15/2062 (i) | | | 9,116,425 | 442,434 |
| Commercial Mortgage Pass-Through Certificates, 2021-BN31,“XA”, 1.445%, 2/15/2054 (i) | | | 11,160,565 | 1,159,626 |
| Commercial Mortgage Pass-Through Certificates, 2021-BN32, “XA”, 0.894%, 4/15/2054 (i) | | | 10,587,445 | 645,777 |
| Credit Acceptance Auto Loan Trust, 2021-2A, “A”, 0.96%, 2/15/2030 (n) | | | 451,000 | 451,428 |
| Credit Acceptance Auto Loan Trust, 2021-2A, “B”, 1.26%, 4/15/2030 (n) | | | 250,000 | 249,414 |
| Cutwater Ltd., 2014-1A, “A2R”, FLR, 1.884% (LIBOR - 3mo. + 1.7%), 7/15/2026 (n) | | | 2,250,000 | 2,251,901 |
Consolidated Portfolio of Investments (unaudited) – continued
| Issuer | | | Shares/Par | Value ($) |
| Bonds – continued |
| Asset-Backed & Securitized – continued |
| Cutwater Ltd., 2015-1A, “AR”, FLR, 1.404% (LIBOR - 3mo. + 1.22%), 1/15/2029 (n) | | $ | 1,723,013 | $ 1,723,094 |
| Dell Equipment Finance Trust, 2018-2, “B”, 3.55%, 10/22/2023 (n) | | | 1,616,000 | 1,626,971 |
| Dell Equipment Finance Trust, 2020-1, “A2”, 2.26%, 6/22/2022 (n) | | | 501,422 | 506,123 |
| Dryden Senior Loan Fund, 2017-49A, “BR”, FLR, 1.79% (LIBOR - 3mo. + 1.6%), 7/18/2030 (n) | | | 1,945,990 | 1,946,200 |
| DT Auto Owner Trust, 2017-3A, “D”, 3.58%, 5/15/2023 (n) | | | 70,119 | 70,213 |
| Exantas Capital Corp. CLO Ltd., 2019-RS07, “B”, FLR, 1.816% (LIBOR - 1mo. + 1.7%), 4/15/2036 (n) | | | 1,222,500 | 1,219,582 |
| Exeter Automobile Receivables Trust, 2019-3A, “C”, 2.79%, 5/15/2024 (n) | | | 2,205,000 | 2,241,243 |
| Exeter Automobile Receivables Trust, 2020-1, 2.26%, 4/15/2024 (n) | | | 375,000 | 377,892 |
| Exeter Automobile Receivables Trust, 2020-1A, 2.49%, 1/15/2025 (n) | | | 510,000 | 520,544 |
| Flagship CLO, 2014-8A, “BRR”, FLR, 1.583% (LIBOR - 3mo. + 1.4%), 1/16/2026 (n) | | | 1,593,234 | 1,596,161 |
| Fort CRE LLC, 2018-1A, “A1”, FLR, 1.46% (LIBOR - 1mo. + 1.35%), 11/16/2035 (n) | | | 1,820,296 | 1,820,296 |
| General Motors, 2019-1, “B”, 2.86%, 4/15/2024 (n) | | | 1,172,000 | 1,200,987 |
| General Motors, 2019-1, “C”, 3.06%, 4/15/2024 (n) | | | 902,000 | 922,550 |
| GLS Auto Receivables Trust, 2020-1A, “A”, 2.17%, 2/15/2024 (n) | | | 386,669 | 389,316 |
| GM Financial Automobile Leasing Trust, 2020-1, “B”, 1.84%, 12/20/2023 | | | 633,000 | 642,830 |
| GM Financial Automobile Leasing Trust, 2020-1, “C”, 2.04%, 12/20/2023 | | | 464,000 | 472,458 |
| Grand Avenue CRE Ltd., 2019-FL1, “A”, FLR, 1.234% (LIBOR - 1mo. + 1.12%), 6/15/2037 (n) | | | 640,403 | 640,403 |
| Granite Point Mortgage Trust, Inc., 2018-FL1, “A” FLR, 1.013% (LIBOR - 1mo. + 0.9%), 11/21/2035 (n) | | | 353,697 | 352,876 |
| GS Mortgage Securities Trust, 2017-GS6, “XA”, 1.031%, 5/10/2050 (i) | | | 10,867,535 | 595,902 |
| GS Mortgage Securities Trust, 2017-GS7, “XA”, 1.264%, 8/10/2050 (i) | | | 11,308,111 | 596,659 |
| GS Mortgage Securities Trust, 2020-GC47, “A5”, 1.246%, 5/12/2053 (i) | | | 8,656,326 | 754,458 |
| Invitation Homes Trust, 2018-SFR1, “B”, FLR, 1.065% (LIBOR - 1mo. + 0.95%), 3/17/2037 (n) | | | 953,000 | 953,744 |
| Invitation Homes Trust, 2018-SFR2, “A”, FLR, 0.965% (LIBOR - 1mo. + 0.85%), 12/17/2036 (n) | | | 1,564,026 | 1,566,222 |
| Invitation Homes Trust, 2018-SFR2, “A”, FLR, 1.015% (LIBOR - 1mo. + 0.9%), 6/17/2037 (n) | | | 3,057,275 | 3,060,136 |
| JPMorgan Chase Commercial Mortgage Securities Corp., 1.195%, 9/15/2050 (i) | | | 12,802,422 | 617,684 |
Consolidated Portfolio of Investments (unaudited) – continued
| Issuer | | | Shares/Par | Value ($) |
| Bonds – continued |
| Asset-Backed & Securitized – continued |
| KKR Real Estate Financial Trust, Inc., 2018-FL1, “C”, FLR, 2.115% (LIBOR - 1mo. + 2%), 6/15/2036 (n) | | $ | 1,177,500 | $ 1,177,500 |
| LoanCore Ltd., 2018-CRE1, “AS”, FLR, 1.614% (LIBOR - 1mo. + 1.5%), 5/15/2028 (n) | | | 1,731,000 | 1,731,000 |
| LoanCore Ltd., 2018-CRE1, “C”, FLR, 2.665% (LIBOR - 1mo. + 2.55%), 5/15/2028 (n) | | | 577,000 | 573,753 |
| LoanCore Ltd., 2019-CRE3, “A”, FLR, 1.164% (LIBOR - 1mo. + 1.05%), 4/15/2034 (n) | | | 1,098,979 | 1,098,636 |
| LoanCore Ltd., 2019-CRE3, “AS”, FLR, 1.485% (LIBOR - 1mo. + 1.37%), 4/15/2034 (n) | | | 1,897,200 | 1,890,095 |
| Madison Park Funding Ltd., 2014-13A, “BR2”, FLR, 1.689% (LIBOR - 3mo. + 1.5%), 4/19/2030 (n) | | | 2,174,539 | 2,185,360 |
| Magnetite CLO Ltd., 2015-16A, “BR”, FLR, 1.389% (LIBOR - 3mo. + 1.2%), 1/18/2028 (n) | | | 2,590,000 | 2,584,486 |
| Man GLG U.S. CLO Ltd., 2018-2A, “BR”, FLR, 2.634% (LIBOR - 3mo. + 2.45%), 10/15/2028 | | | 2,019,578 | 2,019,372 |
| MF1 CLO Ltd., 2019-FL2, “A”, FLR, 1.236% (LIBOR - 1mo. + 1.13%), 12/25/2034 (n) | | | 887,062 | 887,062 |
| MF1 CLO Ltd., 2019-FL2, “AS”, FLR, 1.536% (LIBOR - 1mo. + 1.43%), 12/25/2034 (n) | | | 1,316,000 | 1,316,000 |
| MF1 Ltd., 2020-FL3, “B”, FLR, 3.865% (LIBOR - 1mo. + 3.75%), 7/15/2035 (z) | | | 205,000 | 208,585 |
| MF1 Ltd., 2020-FL3, “C”, FLR, 4.614% (LIBOR - 1mo. + 4.5%), 7/15/2035 (z) | | | 293,000 | 298,490 |
| MF1 Multi-Family Housing Mortgage Loan Trust, 2020-FL4, “B”, FLR, 2.865% (LIBOR - 1mo. + 2.75%), 11/15/2035 (n) | | | 2,437,000 | 2,470,503 |
| Morgan Stanley Bank of America Merrill Lynch Trust, 2.655%, 2/15/2046 | | | 1,340,428 | 1,362,118 |
| Morgan Stanley Bank of America Merrill Lynch Trust, 2017-C33, “XA”, 1.548%, 5/15/2050 (i) | | | 10,060,859 | 585,176 |
| Morgan Stanley Capital I Trust, 2017-H1, “XA”, 1.571%, 6/15/2050 (i) | | | 4,581,187 | 259,396 |
| Morgan Stanley Capital I Trust, 2018-H4, “XA”, 1.026%, 12/15/2051 (i) | | | 16,310,062 | 872,274 |
| Morgan Stanley Capital I Trust, 2021-L5, “XA”, 1.425%, 4/15/2031 (i)(w) | | | 9,524,381 | 942,006 |
| Nationstar HECM Loan Trust, 2019-1A, “A”, 2.651%, 6/25/2029 (n) | | | 248,101 | 248,503 |
| Navistar Financial Dealer Note Master Owner Trust, 2019-1, “C”, FLR, 1.056% (LIBOR - 1mo. + 0.95%), 5/25/2024 (n) | | | 397,000 | 397,057 |
| Navistar Financial Dealer Note Master Owner Trust, 2020-1, “A”, FLR, 1.056% (LIBOR - 1mo. + 0.95%), 7/25/2025 (n) | | | 391,000 | 393,607 |
| Navistar Financial Dealer Note Master Owner Trust, 2020-1, “B”, FLR, 1.456% (LIBOR - 1mo. + 1.35%), 7/25/2025 (n) | | | 359,000 | 362,249 |
Consolidated Portfolio of Investments (unaudited) – continued
| Issuer | | | Shares/Par | Value ($) |
| Bonds – continued |
| Asset-Backed & Securitized – continued |
| Navistar Financial Dealer Note Master Owner Trust, 2020-1, “C”, FLR, 2.256% (LIBOR - 1mo. + 2.15%), 7/25/2025 (n) | | $ | 297,000 | $ 300,583 |
| Neuberger Berman CLO Ltd., 2015-20A, “BR”, 1.433%, 1/15/2028 (n) | | | 2,729,000 | 2,720,905 |
| Neuberger Berman CLO Ltd., 2016-21A, “CR”, FLR, 1.788% (LIBOR - 3mo. + 1.6%), 4/20/2027 (n) | | | 1,515,565 | 1,515,565 |
| NextGear Floorplan Master Owner Trust, 2019-2A, “A2”, 2.07%, 10/15/2024 (n) | | | 1,026,000 | 1,050,568 |
| OCP CLO Ltd., 2015-10A, “A2R”, FLR, 1.475% (LIBOR - 3mo. + 1.3%), 10/26/2027 (n) | | | 2,211,957 | 2,211,346 |
| OneMain Financial Issuance Trust, 2020-1A, “A”, 3.84%, 5/14/2032 (n) | | | 1,759,649 | 1,844,065 |
| Oscar U.S. Funding Trust, 2018-2A, “A3”, 3.39%, 9/12/2022 (n) | | | 190,388 | 191,049 |
| PFP III Ltd., 2021-7, “B”, FLR, 1.516% (LIBOR - 1mo. + 1.4%), 4/14/2038 (n) | | | 604,500 | 601,489 |
| PFP III Ltd., 2021-7, “C”, FLR, 1.766% (LIBOR - 1mo. + 1.65%), 4/14/2038 (n) | | | 191,500 | 191,023 |
| PFS Financing Corp., 2019-B, “A”, FLR, 0.664% (LIBOR - 1mo. + 0.55%), 9/15/2023 (n) | | | 1,972,000 | 1,974,600 |
| Progress Residential Trust, 2021-SFR1, “B”, 1.303%, 4/17/2038 (n) | | | 248,000 | 243,375 |
| Progress Residential Trust, 2021-SFR1, “C”, 1.555%, 4/17/2038 (n) | | | 186,000 | 182,224 |
| Securitized Term Auto Receivable Trust, 2019-CRTA, “B”, 2.453%, 3/25/2026 (n) | | | 209,169 | 212,844 |
| Securitized Term Auto Receivable Trust, 2019-CRTA, “C”, 2.849%, 3/25/2026 (n) | | | 268,527 | 274,356 |
| Shackleton CLO Ltd., 2013-4RA, “B”, FLR, 2.087% (LIBOR - 3mo. + 1.9%), 4/13/2031 (n) | | | 722,762 | 704,504 |
| Shelter Growth CRE, 2019-FL2, “A”, FLR, 1.214% (LIBOR - 1mo. + 1.1%), 5/15/2036 (n) | | | 1,683,628 | 1,683,628 |
| Starwood Property Trust, Inc., REIT, 1.909%, 4/18/2038 (n) | | | 2,295,000 | 2,296,431 |
| TICP CLO Ltd., 2018-3R, “B”, FLR, 1.538% (LIBOR - 3mo. + 1.35%), 4/20/2028 (n) | | | 681,356 | 680,935 |
| TICP CLO Ltd., 2018-3R, “C”, FLR, 1.988% (LIBOR - 3mo. + 1.8%), 4/20/2028 (n) | | | 1,195,706 | 1,196,346 |
| TPG Real Estate Finance, 2018-FL2, “AS”, FLR, 1.565% (LIBOR - 1mo. + 1.45%), 11/15/2037 (n) | | | 1,914,000 | 1,912,808 |
| TPG Real Estate Finance, 2021-FL4, “AS”, FLR, 1.516% (LIBOR - 1mo. + 1.4%), 3/15/2038 (n) | | | 1,305,000 | 1,305,000 |
| TPG Real Estate Finance, 2021-FL4, “B”, FLR, 1.965% (LIBOR - 1mo. + 1.85%), 3/15/2038 (n) | | | 1,957,500 | 1,957,498 |
| UBS Commercial Mortgage Trust, 2017-C1, “XA”, 1.151%, 11/15/2050 (i) | | | 7,853,828 | 354,062 |
Consolidated Portfolio of Investments (unaudited) – continued
| Issuer | | | Shares/Par | Value ($) |
| Bonds – continued |
| Asset-Backed & Securitized – continued |
| UBS Commercial Mortgage Trust, 2018-C14, “XA”, 1.165%, 12/15/2051 (i) | | $ | 7,944,955 | $ 480,127 |
| Veros Auto Receivables Trust, 2020-1, “A”, 1.67%, 9/15/2023 (n) | | | 430,577 | 431,896 |
| | | | | $ 117,327,802 |
| Automotive – 2.5% |
| Daimler Finance North America LLC, 0.75%, 3/01/2024 (n) | | $ | 1,674,000 | $ 1,668,936 |
| Ford Motor Credit Co. LLC, 3.087%, 1/09/2023 | | | 1,222,000 | 1,244,938 |
| General Motors Financial Co., 1.7%, 8/18/2023 | | | 2,471,000 | 2,522,065 |
| Harley-Davidson Financial Services, 4.05%, 2/04/2022 (n) | | | 1,251,000 | 1,284,419 |
| Hyundai Capital America, 2.85%, 11/01/2022 (n) | | | 1,427,000 | 1,468,920 |
| Hyundai Capital America, 2.375%, 2/10/2023 (n) | | | 723,000 | 742,364 |
| Hyundai Capital America, 5.75%, 4/06/2023 (n) | | | 2,315,000 | 2,530,764 |
| Hyundai Capital America, 0.8%, 1/08/2024 (n) | | | 274,000 | 272,555 |
| Hyundai Capital America, 5.875%, 4/07/2025 (n) | | | 2,322,000 | 2,696,685 |
| Volkswagen Group of America Finance LLC, 4%, 11/12/2021 (n) | | | 977,000 | 995,719 |
| Volkswagen Group of America Finance LLC, 2.9%, 5/13/2022 (n) | | | 600,000 | 615,063 |
| Volkswagen Group of America Finance LLC, 3.125%, 5/12/2023 (n) | | | 251,000 | 263,463 |
| Volkswagen Group of America Finance LLC, 2.85%, 9/26/2024 (n) | | | 1,078,000 | 1,145,692 |
| Volkswagen Group of America Finance LLC, 3.35%, 5/13/2025 (n) | | | 2,254,000 | 2,439,726 |
| Volkswagen Group of America Finance LLC, 1.25%, 11/24/2025 (n) | | | 1,559,000 | 1,555,103 |
| | | | | $21,446,412 |
| Brokerage & Asset Managers – 1.6% |
| Charles Schwab Corp., 0.75%, 3/18/2024 | | $ | 1,950,000 | $ 1,962,794 |
| E*TRADE Financial Corp., 2.95%, 8/24/2022 | | | 3,674,000 | 3,787,028 |
| NASDAQ, Inc., 0.445%, 12/21/2022 | | | 1,200,000 | 1,200,432 |
| National Securities Clearing Corp., 1.2%, 4/23/2023 (n) | | | 600,000 | 610,584 |
| National Securities Clearing Corp., 0.4%, 12/07/2023 (n) | | | 1,974,000 | 1,973,385 |
| National Securities Clearing Corp., 1.5%, 4/23/2025 (n) | | | 250,000 | 254,677 |
| National Securities Clearing Corp., 0.75%, 12/07/2025 (n) | | | 3,942,000 | 3,866,814 |
| | | | | $13,655,714 |
| Business Services – 0.7% |
| Equinix, Inc., 1.25%, 7/15/2025 | | $ | 625,000 | $ 624,199 |
| Global Payments, Inc., 1.2%, 3/01/2026 | | | 2,275,000 | 2,250,464 |
| Tencent Holdings Ltd., 1.81%, 1/26/2026 (n) | | | 1,551,000 | 1,574,953 |
| Western Union Co., 1.35%, 3/15/2026 | | | 2,078,000 | 2,057,154 |
| | | | | $6,506,770 |
| Cable TV – 0.3% |
| SES S.A., 3.6%, 4/04/2023 (n) | | $ | 2,416,000 | $ 2,537,244 |
Consolidated Portfolio of Investments (unaudited) – continued
| Issuer | | | Shares/Par | Value ($) |
| Bonds – continued |
| Computer Software – 0.3% |
| Dell International LLC/EMC Corp., 4%, 7/15/2024 (n) | | $ | 1,285,000 | $ 1,399,276 |
| Dell International LLC/EMC Corp., 5.85%, 7/15/2025 (n) | | | 471,000 | 552,255 |
| Infor, Inc., 1.45%, 7/15/2023 (n) | | | 250,000 | 253,320 |
| | | | | $2,204,851 |
| Computer Software - Systems – 0.0% |
| Apple, Inc., 1.7%, 9/11/2022 | | $ | 441,000 | $ 449,892 |
| Conglomerates – 0.6% |
| Carrier Global Corp., 2.242%, 2/15/2025 | | $ | 2,283,000 | $ 2,381,305 |
| Roper Technologies, Inc., 2.8%, 12/15/2021 | | | 640,000 | 648,412 |
| Westinghouse Air Brake Technologies Corp., 4.4%, 3/15/2024 | | | 2,317,000 | 2,526,838 |
| | | | | $5,556,555 |
| Consumer Products – 0.3% |
| Reckitt Benckiser Treasury Services PLC, 2.375%, 6/24/2022 (n) | | $ | 2,213,000 | $ 2,260,425 |
| Consumer Services – 0.2% |
| Alibaba Group Holding Ltd., 2.8%, 6/06/2023 | | $ | 1,506,000 | $ 1,572,947 |
| Containers – 0.1% |
| Berry Global, Inc., 0.95%, 2/15/2024 (n) | | $ | 693,000 | $ 691,240 |
| Electronics – 0.3% |
| Broadcom, Inc., 4.7%, 4/15/2025 | | $ | 690,000 | $ 778,324 |
| Broadcom, Inc., 3.15%, 11/15/2025 | | | 625,000 | 669,411 |
| Microchip Technology, Inc., 3.922%, 6/01/2021 | | | 1,208,000 | 1,211,142 |
| | | | | $2,658,877 |
| Emerging Market Quasi-Sovereign – 0.5% |
| Bharat Petroleum Corp. Ltd., 4.625%, 10/25/2022 | | $ | 1,716,000 | $ 1,793,784 |
| Indian Oil Corp. Ltd., 5.75%, 8/01/2023 | | | 858,000 | 938,007 |
| Sinopec Group Overseas Development (2018) Ltd. (People's Republic of China), 1.45%, 1/08/2026 (n) | | | 1,613,000 | 1,596,838 |
| | | | | $4,328,629 |
| Emerging Market Sovereign – 0.2% |
| Emirate of Abu Dhabi, 0.75%, 9/02/2023 (n) | | $ | 1,671,000 | $ 1,679,579 |
| Energy - Independent – 0.5% |
| Diamondback Energy, Inc., 0.9%, 3/24/2023 | | $ | 1,784,000 | $ 1,784,693 |
| Pioneer Natural Resources Co., 0.75%, 1/15/2024 | | | 2,417,000 | 2,417,930 |
| | | | | $4,202,623 |
Consolidated Portfolio of Investments (unaudited) – continued
| Issuer | | | Shares/Par | Value ($) |
| Bonds – continued |
| Energy - Integrated – 0.6% |
| Cenovus Energy, Inc., 5.375%, 7/15/2025 | | $ | 1,206,000 | $ 1,371,217 |
| Eni S.p.A., 4%, 9/12/2023 (n) | | | 1,723,000 | 1,849,978 |
| Exxon Mobil Corp., 1.571%, 4/15/2023 | | | 983,000 | 1,007,685 |
| Husky Energy, Inc., 3.95%, 4/15/2022 | | | 782,000 | 798,918 |
| | | | | $5,027,798 |
| Financial Institutions – 1.4% |
| AerCap Ireland Capital DAC, 4.875%, 1/16/2024 | | $ | 1,964,000 | $ 2,152,477 |
| AerCap Ireland Capital DAC, 3.15%, 2/15/2024 | | | 1,393,000 | 1,463,749 |
| AerCap Ireland Capital DAC, 6.5%, 7/15/2025 | | | 1,435,000 | 1,688,913 |
| Avolon Holdings Funding Ltd., 3.625%, 5/01/2022 (n) | | | 201,000 | 205,197 |
| Avolon Holdings Funding Ltd., 3.95%, 7/01/2024 (n) | | | 1,131,000 | 1,197,570 |
| Avolon Holdings Funding Ltd., 5.5%, 1/15/2026 (n) | | | 995,000 | 1,113,902 |
| Avolon Holdings Funding Ltd., 2.125%, 2/21/2026 (n) | | | 2,801,000 | 2,738,452 |
| Avolon Holdings Funding Ltd., 4.25%, 4/15/2026 (n) | | | 858,000 | 914,953 |
| Century Housing Corp., 3.995%, 11/01/2021 | | | 691,000 | 694,252 |
| | | | | $12,169,465 |
| Food & Beverages – 0.6% |
| Constellation Brands, Inc., 4.25%, 5/01/2023 | | $ | 1,510,000 | $ 1,618,185 |
| Mondelez International, Inc., 0.625%, 7/01/2022 | | | 3,400,000 | 3,411,319 |
| | | | | $5,029,504 |
| Food & Drug Stores – 0.6% |
| 7-Eleven, Inc., 0.625%, 2/10/2023 (n) | | $ | 3,173,000 | $ 3,176,274 |
| 7-Eleven, Inc., 0.8%, 2/10/2024 (n) | | | 2,380,000 | 2,376,609 |
| | | | | $5,552,883 |
| Gaming & Lodging – 0.8% |
| GLP Capital LP/GLP Financing II, Inc., 5.375%, 11/01/2023 | | $ | 1,259,000 | $ 1,383,137 |
| Las Vegas Sands Corp., 3.2%, 8/08/2024 | | | 1,420,000 | 1,489,331 |
| Marriott International, Inc., 2.3%, 1/15/2022 | | | 2,151,000 | 2,171,654 |
| Marriott International, Inc., 3.75%, 10/01/2025 | | | 509,000 | 548,348 |
| Sands China Ltd., 3.8%, 1/08/2026 | | | 1,030,000 | 1,090,585 |
| | | | | $6,683,055 |
| Industrial – 0.1% |
| Howard University, Washington D.C., 2.738%, 10/01/2022 | | $ | 101,000 | $ 103,384 |
| Howard University, Washington D.C., 2.801%, 10/01/2023 | | | 111,000 | 114,437 |
| Howard University, Washington D.C., AGM, 2.638%, 10/01/2021 | | | 96,000 | 96,463 |
| Howard University, Washington D.C., AGM, 2.416%, 10/01/2024 | | | 123,000 | 126,754 |
| Howard University, Washington D.C., AGM, 2.516%, 10/01/2025 | | | 152,000 | 155,965 |
| | | | | $597,003 |
Consolidated Portfolio of Investments (unaudited) – continued
| Issuer | | | Shares/Par | Value ($) |
| Bonds – continued |
| Insurance – 0.6% |
| AIG Global Funding, 0.8%, 7/07/2023 (n) | | $ | 1,522,000 | $ 1,532,994 |
| Equitable Financial Life Insurance Co., 1.4%, 7/07/2025 (n) | | | 1,662,000 | 1,670,615 |
| Metropolitan Life Global Funding I, 0.4%, 1/07/2024 (n) | | | 2,404,000 | 2,395,481 |
| | | | | $5,599,090 |
| Insurance - Property & Casualty – 0.3% |
| Aon PLC, 2.2%, 11/15/2022 | | $ | 1,193,000 | $ 1,224,852 |
| Marsh & McLennan Cos., Inc., 2.75%, 1/30/2022 | | | 1,383,000 | 1,405,596 |
| | | | | $2,630,448 |
| International Market Quasi-Sovereign – 0.2% |
| Dexia Credit Local S.A. (Kingdom of Belgium), 1.875%, 9/15/2021 (n) | | $ | 2,010,000 | $ 2,022,132 |
| Internet – 0.3% |
| Baidu, Inc., 3.875%, 9/29/2023 | | $ | 2,225,000 | $ 2,372,985 |
| Machinery & Tools – 0.4% |
| CNH Industrial Capital LLC, 4.2%, 1/15/2024 | | $ | 1,931,000 | $ 2,101,349 |
| CNH Industrial Capital LLC, 1.875%, 1/15/2026 | | | 497,000 | 504,732 |
| CNH Industrial N.V., 4.5%, 8/15/2023 | | | 1,073,000 | 1,162,589 |
| | | | | $3,768,670 |
| Major Banks – 8.4% |
| Bank of Montreal, 2.05%, 11/01/2022 | | $ | 1,694,000 | $ 1,738,707 |
| Barclays PLC, 4.61% to 2/15/2022, FLR (LIBOR - 3mo. + 1.4%) to 2/15/2023 | | | 4,665,000 | 4,810,361 |
| Barclays PLC, 1.007%, 12/10/2024 | | | 781,000 | 782,266 |
| Barclays PLC, 2.852% to 5/07/2025, FLR (LIBOR - 3mo. + 2.452%) to 5/07/2026 | | | 759,000 | 799,250 |
| Credit Agricole, “A”, FLR, 1.617% (LIBOR - 3mo. + 1.43%), 1/10/2022 (n) | | | 750,000 | 756,334 |
| Credit Suisse Group AG, 3.574%, 1/09/2023 (n) | | | 2,060,000 | 2,098,518 |
| Credit Suisse Group AG, 4.207% to 6/12/2023, FLR (LIBOR - 3mo. + 1.24%) to 6/12/2024 (n) | | | 410,000 | 437,679 |
| Deutsche Bank AG, 1.447% to 4/1/2024, FLR (SOFR + 1.131%) to 4/01/2025 | | | 3,640,000 | 3,653,708 |
| Goldman Sachs Group, Inc., 1.093% to 12/09/2025, FLR (SOFR + 0.789%) to 12/09/2026 | | | 1,418,000 | 1,397,825 |
| HSBC Holdings PLC, 3.262% to 3/13/2022, FLR (LIBOR - 3mo. + 1.055%) to 3/13/2023 | | | 2,383,000 | 2,439,794 |
| HSBC Holdings PLC, 3.033% to 11/22/2022, FLR (LIBOR - 3mo. + 0.923%) to 11/22/2023 | | | 957,000 | 994,257 |
| HSBC Holdings PLC, 2.099% to 6/04/2025, FLR (SOFR + 1.929%) to 6/04/2026 | | | 928,000 | 949,330 |
Consolidated Portfolio of Investments (unaudited) – continued
| Issuer | | | Shares/Par | Value ($) |
| Bonds – continued |
| Major Banks – continued |
| HSBC Holdings PLC, 1.589% to 5/24/2026, FLR (SOFR + 1.29%) to 5/24/2027 | | $ | 1,060,000 | $ 1,052,633 |
| JPMorgan Chase & Co., 3.207% to 4/01/2022, FLR (LIBOR - 3mo. + 0.695%) to 4/01/2023 | | | 2,839,000 | 2,913,149 |
| JPMorgan Chase & Co., 3.375%, 5/01/2023 | | | 1,196,000 | 1,264,644 |
| JPMorgan Chase & Co., 3.797% to 7/23/2023, FLR (LIBOR - 3mo. + 0.89%) to 7/23/2024 | | | 1,506,000 | 1,609,843 |
| JPMorgan Chase & Co., 1.04% to 2/04/2026, FLR (SOFR + 0.695%) to 2/04/2027 | | | 1,903,000 | 1,867,036 |
| KeyBank N.A., 3.3%, 2/01/2022 | | | 772,000 | 789,480 |
| Mitsubishi UFJ Financial Group, Inc., 2.623%, 7/18/2022 | | | 2,006,000 | 2,060,494 |
| Mitsubishi UFJ Financial Group, Inc., 0.848% to 9/15/2023, FLR (CMT - 1yr. + 0.68%) to 9/15/2024 | | | 3,125,000 | 3,133,490 |
| Mizuho Financial Group, 0.849% to 9/08/2023, FLR (LIBOR - 3mo. + 0.61%) to 9/08/2024 | | | 2,700,000 | 2,707,458 |
| NatWest Group PLC, 2.359% to 5/22/2023, FLR (CMT - 1yr. + 2.15%) to 5/22/2024 | | | 2,485,000 | 2,565,318 |
| NatWest Group PLC, 4.269% to 3/22/2024, FLR (LIBOR - 3mo. + 1.762%) to 3/22/2025 | | | 2,549,000 | 2,779,553 |
| Royal Bank of Canada, 0.5%, 10/26/2023 | | | 3,500,000 | 3,506,658 |
| Standard Chartered PLC, 1.319% to 10/14/2022, FLR (CMT - 1yr. + 1.17%) to 10/14/2023 (n) | | | 1,375,000 | 1,384,969 |
| Standard Chartered PLC, 0.991% to 1/12/2024, FLR (CMT - 1yr. + 0.78%) to 1/12/2025 (n) | | | 2,411,000 | 2,401,292 |
| Standard Chartered PLC, 1.214% to 3/23/2024, FLR (CMT - 1yr. + 0.88%) to 3/23/2025 (n) | | | 812,000 | 814,682 |
| State Street Corp., 2.825% to 3/30/2022, FLR (SOFR + 2.69%) to 3/30/2023 | | | 483,000 | 493,969 |
| State Street Corp., 2.901% to 3/30/2025, FLR (SOFR + 2.6%) to 3/30/2026 | | | 250,000 | 267,173 |
| Sumitomo Mitsui Financial Group, Inc., 0.508%, 1/12/2024 | | | 801,000 | 799,290 |
| Sumitomo Mitsui Financial Group, Inc., 1.474%, 7/08/2025 | | | 1,875,000 | 1,889,455 |
| Sumitomo Mitsui Trust Bank Ltd., 0.85%, 3/25/2024 (n) | | | 1,534,000 | 1,537,940 |
| Toronto-Dominion Bank, 0.25%, 1/06/2023 | | | 1,603,000 | 1,601,955 |
| Toronto-Dominion Bank, 0.75%, 1/06/2026 | | | 1,122,000 | 1,103,765 |
| UBS Group AG, 3.491%, 5/23/2023 (n) | | | 5,533,000 | 5,705,962 |
| UBS Group AG, 1.008% to 7/30/2023, FLR (CMT - 1yr. + 0.83%) to 7/30/2024 (n) | | | 1,470,000 | 1,479,266 |
| UniCredito Italiano S.p.A., 6.572%, 1/14/2022 (n) | | | 1,297,000 | 1,347,233 |
| UniCredito Italiano S.p.A., 3.75%, 4/12/2022 (n) | | | 1,116,000 | 1,146,919 |
| Wells Fargo & Co., 2.164% to 2/11/2025, FLR (LIBOR - 3mo. + 0.75%) to 2/11/2026 | | | 2,912,000 | 3,015,237 |
| | | | | $72,096,892 |
Consolidated Portfolio of Investments (unaudited) – continued
| Issuer | | | Shares/Par | Value ($) |
| Bonds – continued |
| Medical & Health Technology & Services – 0.4% |
| Becton, Dickinson and Co., 2.894%, 6/06/2022 | | $ | 730,000 | $ 748,682 |
| HCA, Inc., 5%, 3/15/2024 | | | 2,522,000 | 2,809,473 |
| | | | | $3,558,155 |
| Metals & Mining – 1.4% |
| Anglo American Capital PLC, 3.625%, 9/11/2024 (n) | | $ | 809,000 | $ 875,074 |
| Anglo American Capital PLC, 5.375%, 4/01/2025 (n) | | | 2,500,000 | 2,872,933 |
| Glencore Finance (Canada) Ltd., 4.95%, 11/15/2021 (n) | | | 729,000 | 746,278 |
| Glencore Funding LLC, 3%, 10/27/2022 (n) | | | 610,000 | 628,715 |
| Glencore Funding LLC, 4.125%, 3/12/2024 (n) | | | 1,280,000 | 1,385,390 |
| Glencore Funding LLC, 4.625%, 4/29/2024 (n) | | | 791,000 | 873,909 |
| Glencore Funding LLC, 1.625%, 9/01/2025 (n) | | | 3,000,000 | 3,019,255 |
| Glencore Funding LLC, 1.625%, 4/27/2026 (n) | | | 1,875,000 | 1,863,678 |
| | | | | $12,265,232 |
| Midstream – 1.1% |
| Energy Transfer Operating Co., 2.9%, 5/15/2025 | | $ | 788,000 | $ 827,094 |
| Gray Oak Pipeline LLC, 2%, 9/15/2023 (n) | | | 1,624,000 | 1,655,795 |
| MPLX LP, 3.5%, 12/01/2022 | | | 2,416,000 | 2,516,586 |
| MPLX LP, 3.375%, 3/15/2023 | | | 471,000 | 493,606 |
| Plains All American Pipeline LP, 3.85%, 10/15/2023 | | | 750,000 | 793,746 |
| Western Midstream Operating LP, 4.35%, 2/01/2025 | | | 1,209,000 | 1,278,106 |
| Western Midstream Operating LP, FLR, 2.288% (LIBOR - 3mo. + 0.85%), 1/13/2023 | | | 1,727,000 | 1,709,866 |
| | | | | $9,274,799 |
| Mortgage-Backed – 0.7% | |
| Fannie Mae, 4.5%, 4/01/2024 - 5/01/2025 | | $ | 103,671 | $ 109,123 |
| Fannie Mae, 3%, 12/01/2031 | | | 398,678 | 424,103 |
| Fannie Mae, 2%, 5/25/2044 | | | 710,182 | 726,445 |
| Freddie Mac, 1.017%, 4/25/2024 (i) | | | 110,044 | 2,255 |
| Freddie Mac, 4%, 7/01/2025 | | | 100,507 | 107,194 |
| Freddie Mac, 1.699%, 4/25/2030 (i) | | | 6,414,204 | 775,340 |
| Freddie Mac, 3%, 4/15/2033 - 6/15/2045 | | | 3,349,910 | 3,591,890 |
| Freddie Mac, 2%, 7/15/2042 | | | 640,645 | 662,239 |
| | | | | $6,398,589 |
| Municipals – 2.3% |
| California Earthquake Authority Rev., “B”, 1.227%, 7/01/2021 | | $ | 245,000 | $ 245,396 |
| California Earthquake Authority Rev., “B”, 1.327%, 7/01/2022 | | | 785,000 | 794,179 |
| California Earthquake Authority Rev., “B”, 1.477%, 7/01/2023 | | | 555,000 | 567,334 |
| California Municipal Finance Authority Rev. (Century Housing Corp.), 1.486%, 11/01/2022 | | | 255,000 | 257,592 |
Consolidated Portfolio of Investments (unaudited) – continued
| Issuer | | | Shares/Par | Value ($) |
| Bonds – continued |
| Municipals – continued |
| California Municipal Finance Authority Rev. (Century Housing Corp.), 1.605%, 11/01/2023 | | $ | 305,000 | $ 309,633 |
| Clifton, TX, Higher Education Finance Corp. Rev. (Idea Public Schools), 0.75%, 8/15/2050 (n) | | | 3,045,000 | 3,044,257 |
| Illinois Sales Tax Securitization Corp., Second Lien, “B”, BAM, 2.128%, 1/01/2023 | | | 430,000 | 440,752 |
| Illinois Sales Tax Securitization Corp., Second Lien, “B”, BAM, 2.225%, 1/01/2024 | | | 1,030,000 | 1,067,525 |
| Massachusetts Educational Financing Authority, Education Loan Rev., “A”, 1.904%, 7/01/2023 | | | 115,000 | 117,310 |
| Massachusetts Educational Financing Authority, Education Loan Rev., “A”, 2.156%, 7/01/2024 | | | 320,000 | 328,769 |
| Massachusetts Educational Financing Authority, Education Loan Rev., “A”, 2.306%, 7/01/2025 | | | 250,000 | 259,234 |
| Massachusetts Educational Financing Authority, Education Loan Rev., “A”, 2.562%, 7/01/2026 | | | 315,000 | 328,540 |
| Michigan Finance Authority Tobacco Settlement Asset-Backed Rev. (2006 Sold Tobacco Receipts), “A-1”, 2.326%, 6/01/2030 | | | 1,320,000 | 1,362,432 |
| New Jersey Economic Development Authority Rev., School Facilities Construction, “HHH”, 3.75%, 9/01/2022 (n) | | | 3,650,000 | 3,777,795 |
| New Jersey Economic Development Authority State Pension Funding Rev., Capital Appreciation, “B”, AGM, 0%, 2/15/2023 | | | 3,058,000 | 3,020,880 |
| New Jersey Transportation Trust Fund Authority, Transportation System, “B”, 2.384%, 6/15/2022 | | | 460,000 | 468,519 |
| New Jersey Transportation Trust Fund Authority, Transportation System, “B”, 2.551%, 6/15/2023 | | | 475,000 | 490,623 |
| New Jersey Transportation Trust Fund Authority, Transportation System, “B”, 2.631%, 6/15/2024 | | | 450,000 | 468,515 |
| Port Authority of NY & NJ, “AAA”, 1.086%, 7/01/2023 | | | 1,635,000 | 1,660,453 |
| Texas Transportation Commission, Central Texas Turnpike System First Tier Refunding Rev., Taxable, “B”, 1.98%, 8/15/2042 | | | 695,000 | 709,291 |
| | | | | $19,719,029 |
| Natural Gas - Distribution – 0.3% |
| CenterPoint Energy, Inc., 0.7%, 3/02/2023 | | $ | 2,491,000 | $ 2,492,512 |
| Network & Telecom – 0.7% |
| AT&T, Inc., 0.9%, 3/25/2024 | | $ | 4,742,000 | $ 4,753,051 |
| Verizon Communications, Inc., 0.75%, 3/22/2024 | | | 930,000 | 933,586 |
| | | | | $5,686,637 |
| Oil Services – 0.0% |
| Halliburton Co., 3.8%, 11/15/2025 | | $ | 152,000 | $ 167,854 |
Consolidated Portfolio of Investments (unaudited) – continued
| Issuer | | | Shares/Par | Value ($) |
| Bonds – continued |
| Oils – 0.5% |
| Marathon Petroleum Corp., 4.75%, 12/15/2023 | | $ | 1,684,000 | $ 1,845,658 |
| Valero Energy Corp., 1.2%, 3/15/2024 | | | 1,400,000 | 1,407,371 |
| Valero Energy Corp., 2.85%, 4/15/2025 | | | 773,000 | 815,917 |
| | | | | $4,068,946 |
| Other Banks & Diversified Financials – 2.8% |
| American Express Co., 3.7%, 11/05/2021 | | $ | 1,307,000 | $ 1,326,412 |
| Banque Federative du Credit Mutuel, 0.65%, 2/27/2024 (n) | | | 3,117,000 | 3,117,930 |
| BBVA USA, 3.5%, 6/11/2021 | | | 1,498,000 | 1,498,936 |
| BBVA USA, 2.875%, 6/29/2022 | | | 2,542,000 | 2,609,934 |
| BBVA USA Bancshares, Inc., 2.5%, 8/27/2024 | | | 1,122,000 | 1,180,811 |
| Groupe BPCE S.A., 4%, 9/12/2023 (n) | | | 1,193,000 | 1,284,468 |
| Groupe BPCE S.A., FLR, 1.424% (LIBOR - 3mo. + 1.24%), 9/12/2023 (n) | | | 1,193,000 | 1,216,022 |
| Macquarie Group Ltd., 1.34% to 1/12/2026, FLR (SOFR + 1.069%) to 1/12/2027 (n) | | | 2,132,000 | 2,103,090 |
| National Bank of Canada, 2.15%, 10/07/2022 (n) | | | 1,305,000 | 1,338,365 |
| National Bank of Canada, 0.9% to 8/15/2022, FLR (CMT - 1yr. + 0.77%) to 8/15/2023 | | | 1,723,000 | 1,733,254 |
| National Bank of Canada, 0.55%, 11/15/2024 | | | 1,562,000 | 1,556,769 |
| SunTrust Banks, Inc., 2.8%, 5/17/2022 | | | 1,884,000 | 1,931,149 |
| Truist Financial Corp., 1.267% to 3/02/2026, FLR (SOFR + 0.609%) to 3/02/2027 | | | 2,511,000 | 2,499,607 |
| UBS AG, 1.75%, 4/21/2022 (n) | | | 395,000 | 400,129 |
| | | | | $23,796,876 |
| Personal Computers & Peripherals – 0.0% |
| Equifax, Inc., 2.6%, 12/15/2025 | | $ | 223,000 | $ 235,131 |
| Pharmaceuticals – 0.9% |
| AbbVie, Inc., 2.15%, 11/19/2021 | | $ | 1,193,000 | $ 1,204,731 |
| AbbVie, Inc., 3.45%, 3/15/2022 | | | 2,322,000 | 2,371,666 |
| Royalty Pharma PLC, 0.75%, 9/02/2023 (n) | | | 2,468,000 | 2,467,545 |
| Viatris, Inc., 1.125%, 6/22/2022 (n) | | | 1,763,000 | 1,774,358 |
| | | | | $7,818,300 |
| Real Estate - Office – 0.1% |
| Corporate Office Property LP, 2.25%, 3/15/2026 | | $ | 1,172,000 | $ 1,201,973 |
| Retailers – 0.5% |
| Alimentation Couche-Tard, Inc., 2.7%, 7/26/2022 (n) | | $ | 566,000 | $ 581,114 |
| Kohl's Corp., 9.5%, 5/15/2025 | | | 2,962,000 | 3,824,622 |
| Macy's Retail Holdings, Inc., 3.875%, 1/15/2022 | | | 324,000 | 325,215 |
| | | | | $4,730,951 |
Consolidated Portfolio of Investments (unaudited) – continued
| Issuer | | | Shares/Par | Value ($) |
| Bonds – continued |
| Specialty Stores – 0.4% |
| Nordstrom, Inc., 2.3%, 4/08/2024 (n) | | $ | 928,000 | $ 931,332 |
| Ross Stores, Inc., 0.875%, 4/15/2026 | | | 1,034,000 | 1,011,238 |
| TJX Cos., Inc., 3.5%, 4/15/2025 | | | 1,080,000 | 1,182,021 |
| | | | | $3,124,591 |
| Telecommunications - Wireless – 0.7% |
| American Tower Corp., REIT, 2.25%, 1/15/2022 | | $ | 1,525,000 | $ 1,545,837 |
| Crown Castle International Corp., 3.15%, 7/15/2023 | | | 680,000 | 717,188 |
| Crown Castle International Corp., 1.35%, 7/15/2025 | | | 546,000 | 548,590 |
| T-Mobile USA, Inc., 3.5%, 4/15/2025 (n) | | | 2,676,000 | 2,901,801 |
| | | | | $5,713,416 |
| Tobacco – 0.4% |
| B.A.T. Capital Corp., 3.222%, 8/15/2024 | | $ | 1,631,000 | $ 1,737,854 |
| Imperial Tobacco Finance PLC, 3.75%, 7/21/2022 (n) | | | 755,000 | 777,909 |
| Philip Morris International, Inc., 1.125%, 5/01/2023 | | | 805,000 | 816,926 |
| | | | | $3,332,689 |
| Transportation - Services – 1.0% |
| Element Fleet Management Corp., 1.6%, 4/06/2024 (n) | | $ | 5,491,000 | $ 5,554,547 |
| ERAC USA Finance LLC, 2.7%, 11/01/2023 (n) | | | 1,087,000 | 1,138,782 |
| ERAC USA Finance LLC, 3.85%, 11/15/2024 (n) | | | 762,000 | 835,819 |
| ERAC USA Finance LLC, 3.8%, 11/01/2025 (n) | | | 762,000 | 839,609 |
| | | | | $8,368,757 |
| U.S. Government Agencies and Equivalents – 0.0% |
| Small Business Administration, 2.25%, 7/01/2021 | | $ | 19,618 | $ 19,681 |
| U.S. Treasury Obligations – 11.4% |
| U.S. Treasury Notes, 2.625%, 12/15/2021 (f) | | $ | 27,750,000 | $ 28,193,178 |
| U.S. Treasury Notes, 1.875%, 4/30/2022 | | | 2,871,000 | 2,922,476 |
| U.S. Treasury Notes, 0.125%, 6/30/2022 | | | 22,900,000 | 22,912,523 |
| U.S. Treasury Notes, 0.125%, 10/15/2023 | | | 20,000,000 | 19,946,875 |
| U.S. Treasury Notes, 1.5%, 11/30/2024 | | | 23,730,000 | 24,579,089 |
| | | | | $98,554,141 |
| Utilities - Electric Power – 2.6% |
| Emera U.S. Finance LP, 2.7%, 6/15/2021 | | $ | 468,000 | $ 468,756 |
| Enel Finance International N.V., 2.875%, 5/25/2022 (n) | | | 2,820,000 | 2,888,113 |
| FirstEnergy Corp., 4.75%, 3/15/2023 | | | 1,635,000 | 1,733,999 |
| FirstEnergy Corp., 2.05%, 3/01/2025 | | | 1,344,000 | 1,354,080 |
| FirstEnergy Corp., 1.6%, 1/15/2026 | | | 818,000 | 795,505 |
| Florida Power & Light Co., FLR, 0.564% (LIBOR - 3mo. + 0.38%), 7/28/2023 | | | 3,100,000 | 3,100,126 |
| NextEra Energy Capital Holdings, Inc., 2.403%, 9/01/2021 | | | 2,062,000 | 2,076,538 |
Consolidated Portfolio of Investments (unaudited) – continued
| Issuer | | | Shares/Par | Value ($) |
| Bonds – continued |
| Utilities - Electric Power – continued |
| NextEra Energy Capital Holdings, Inc., 2.9%, 4/01/2022 | | $ | 1,411,000 | $ 1,444,541 |
| NextEra Energy, Inc., 0.65%, 3/01/2023 | | | 1,950,000 | 1,956,144 |
| Pacific Gas & Electric Co., 1.75%, 6/16/2022 | | | 714,000 | 714,626 |
| Pacific Gas & Electric Co., 1.367%, 3/10/2023 | | | 764,000 | 764,258 |
| Pacific Gas & Electric Co., FLR, 1.573% (LIBOR - 3mo. + 1.375%), 11/15/2021 | | | 3,118,000 | 3,128,288 |
| Southern California Edison Co.'s First & Refunding Mortgage Bonds, 1.2%, 2/01/2026 | | | 750,000 | 743,785 |
| WEC Energy Group, Inc., 0.8%, 3/15/2024 | | | 1,138,000 | 1,139,932 |
| | | | | $22,308,691 |
| Total Bonds (Identified Cost, $555,619,182) | | $ 563,578,179 |
| Investment Companies (h) – 15.6% |
| Money Market Funds – 15.6% | |
| MFS Institutional Money Market Portfolio, 0.04% (v) (Identified Cost, $134,291,889) | | | 134,293,453 | $ 134,293,453 |
| Short-Term Obligations (s)(y) – 1.7% | | | | |
| Freddie Mac, 0%, due 5/03/2021 (Identified Cost, $14,798,000) | | $ | 14,798,000 | $ 14,798,000 |
| Other Assets, Less Liabilities – 17.3% | | 148,903,798 |
| Net Assets – 100.0% | $ 861,573,430 |
| (f) | All or a portion of the security has been segregated as collateral for cleared swap agreements and uncleared swap agreements. |
| (h) | An affiliated issuer, which may be considered one in which the fund owns 5% or more of the outstanding voting securities, or a company which is under common control. At period end, the aggregate values of the fund's investments in affiliated issuers and in unaffiliated issuers were $134,293,453 and $578,376,179, respectively. |
| (i) | Interest only security for which the fund receives interest on notional principal (Par amount). Par amount shown is the notional principal and does not reflect the cost of the security. |
| (n) | Securities exempt from registration under Rule 144A of the Securities Act of 1933. These securities may be sold in the ordinary course of business in transactions exempt from registration, normally to qualified institutional buyers. At period end, the aggregate value of these securities was $228,155,876, representing 26.5% of net assets. |
| (s) | All or a portion of security is held by a wholly-owned subsidiary. See Note 2 of the Notes to Consolidated Financial Statements for details of the wholly-owned subsidiary. |
| (v) | Affiliated issuer that is available only to investment companies managed by MFS. The rate quoted for the MFS Institutional Money Market Portfolio is the annualized seven-day yield of the fund at period end. |
| (w) | When-issued security. |
| (y) | The rate shown represents an annualized yield at time of purchase. |
Consolidated Portfolio of Investments (unaudited) – continued
| (z) | Restricted securities are not registered under the Securities Act of 1933 and are subject to legal restrictions on resale. These securities generally may be resold in transactions exempt from registration or to the public if the securities are subsequently registered. Disposal of these securities may involve time-consuming negotiations and prompt sale at an acceptable price may be difficult. The fund holds the following restricted securities: |
| Restricted Securities | Acquisition
Date | Cost | Value |
| MF1 Ltd., 2020-FL3, “B”, FLR, 3.865% (LIBOR - 1mo. + 3.75%), 7/15/2035 | 6/12/2020 | $205,000 | $208,585 |
| MF1 Ltd., 2020-FL3, “C”, FLR, 4.614% (LIBOR - 1mo. + 4.5%), 7/15/2035 | 6/12/2020 | 293,000 | 298,490 |
| Total Restricted Securities | | | $507,075 |
| % of Net assets | | | 0.1% |
| The following abbreviations are used in this report and are defined: |
| AGM | Assured Guaranty Municipal |
| BAM | Build America Mutual |
| BCOMALTR | Bloomberg Aluminum Subindex Total Return, this index is composed of futures contracts on aluminum. |
| BCOMBOTR | Bloomberg Soybean Oil Subindex Total Return, this index is composed of futures contracts on soybean oil. |
| BCOMCNTR | Bloomberg Corn Subindex Total Return, this index is composed of futures contracts on corn. It reflects the return on fully collateralized futures positions. It is quoted in USD. |
| BCOMCOT | Bloomberg Brent Crude Subindex Total Return, this index is composed of futures contracts on brent crude. |
| BCOMCTTR | Bloomberg Cotton Subindex Total Return, this index is composed of futures contracts on cotton. It reflects the return on fully collateralized futures positions. It is quoted in USD. |
| BCOMF3T | Bloomberg Commodity Index 3 Month Forward Total Return, this index is composed of longer-dated futures contracts on 19 physical commodities. |
| BCOMFCT | Bloomberg Feeder Cattle Subindex Total Return, this index is comprised of futures contracts on feeder cattle. It is quoted in USD. |
| BCOMKCTR | Bloomberg Coffee Subindex Total Return, this index is composed of futures contracts on coffee. It reflects the return on fully collateralized futures positions. It is quoted in USD. |
| BCOMKWT | Bloomberg Kansas Wheat Subindex Total Return, this index is composed of futures contracts on wheat and Kansas wheat. It is quoted in USD. |
| BCOMLCTR | Bloomberg Live Cattle Subindex Total Return, this index is composed of futures contracts on live cattle. |
| BCOMNGTR | Bloomberg Natural Gas Subindex Total Return, this index is composed of futures contracts on natural gas. It reflects the return on fully collateralized futures positions. It is quoted in USD. |
| BCOMPBTR | Bloomberg Lead Subindex Total Return, this index is composed of futures contracts on lead. It reflects the return of underlying commodity futures price movements only. It is quoted in USD. |
| BCOMRBTR | Bloomberg Unleaded Gasoline Subindex Total Return, this index is composed of futures contracts on unleaded gasoline. It reflects the return on fully collateralized futures positions. It is quoted in USD. |
| BCOMSBTR | Bloomberg Sugar Subindex Total Return, this index is composed of futures contracts on sugar. It reflects the return on fully collateralized futures positions. It is quoted in USD. |
Consolidated Portfolio of Investments (unaudited) – continued
| BCOMSITR | Bloomberg Silver Subindex Total Return, this index is composed of futures contracts on silver. |
| BCOMSYTR | Bloomberg Soybeans Subindex Total Return, this index is composed of futures contracts on soybeans. |
| BCOMTR | Bloomberg Commodity Index Total Return |
| BCOMWHTR | Bloomberg Wheat Subindex Total Return, this index is composed of futures contracts on wheat. It reflects the return on fully collateralized futures positions. It is quoted in USD. |
| CLO | Collateralized Loan Obligation |
| CMT | Constant Maturity Treasury |
| FLR | Floating Rate. Interest rate resets periodically based on the parenthetically disclosed reference rate plus a spread (if any). The period-end rate reported may not be the current rate. All reference rates are USD unless otherwise noted. |
| LIBOR | London Interbank Offered Rate |
| MLCILPRT | Merrill Lynch International Bloomberg Commodity Index Total Return |
| REIT | Real Estate Investment Trust |
| SOFR | Secured Overnight Financing Rate |
Consolidated Portfolio of Investments (unaudited) – continued
Derivative Contracts at 4/30/21
| Cleared Swap Agreements |
Maturity
Date | Notional
Amount | Counterparty | Cash Flows
to Receive/
Frequency | Cash Flows
to Pay/
Frequency | Unrealized
Appreciation
(Depreciation) | | Net Unamortized
Upfront Payments
(Receipts) | | Value |
| Asset Derivatives | | | | | |
| Interest Rate Swaps | | | | | |
| 7/15/21 | USD | 35,500,000 | centrally cleared | 1.88%/Semi-annually | 0.24% FLR (3-Month LIBOR)/Quarterly | $319,683 | | $— | | $319,683 |
| 9/19/21 | USD | 22,400,000 | centrally cleared | 1.57%/Semi-annually | 0.12% FLR (1-Month LIBOR)/Monthly | 165,338 | | — | | 165,338 |
| | | | | | | $485,021 | | $— | | $485,021 |
| Uncleared Swap Agreements |
Maturity
Date | Notional
Amount | Counterparty | Cash Flows
to Receive
(Monthly) | Cash Flows
to Pay
(Monthly) | Unrealized
Appreciation
(Depreciation) | Net Unamortized
Upfront Payments
(Receipts) | Value |
| Asset Derivatives | | | |
| Total Return Swaps | | | |
| 12/09/21 | USD | 8,041,883 (Short) | Citibank N.A. | 3 month T-Bill + 0.04% | BCOMLCTR (floating rate) | $418 | $— | $418 |
| 2/11/22 | USD | 5,187,614 (Short) | Goldman Sachs International | 3 month T-Bill + 0.05% | BCOMNGTR (floating rate) | 273 | — | 273 |
| 2/11/22 | USD | 7,925,799 (Short) | Merrill Lynch International | 3 month T-Bill + 0.05% | BCOMKCTR (floating rate) | 404 | — | 404 |
| 2/11/22 | USD | 9,613,867 (Short) | Morgan Stanley | 3 month T-Bill + 0.03% | BCOMPBTR (floating rate) | 365 | — | 365 |
| 3/11/22 | USD | 9,393,725 (Short) | Morgan Stanley | 3 month T-Bill + 0.05% | BCOMFCT (floating rate) | 589 | — | 589 |
| 4/20/22 | USD | 9,132,286 (Short) | Merrill Lynch International | 3 month T-Bill + 0.05% | BCOMKWT (floating rate) | 441 | — | 441 |
Consolidated Portfolio of Investments (unaudited) – continued
| Uncleared Swap Agreements - continued |
Maturity
Date | Notional
Amount | Counterparty | Cash Flows
to Receive
(Monthly) | Cash Flows
to Pay
(Monthly) | Unrealized
Appreciation
(Depreciation) | | Net Unamortized
Upfront Payments
(Receipts) | | Value |
| Asset Derivatives - continued |
| Total Return Swaps - continued |
| 4/20/22 | USD | 8,670,766 (Short) | Merrill Lynch International | 3 month T-Bill + 0.05% | BCOMALTR (floating rate) | $461 | | $— | | $461 |
| | | | | | | $2,951 | | $— | | $2,951 |
| Liability Derivatives | | | | | |
| Total Return Swaps | | | | | |
| 5/14/21 | USD | 12,932,973 (Long) | JPMorgan Chase Bank N.A. | BCOMTR (floating rate) | 3 month T-Bill + 0.09% | $(22,958) | | $— | | $(22,958) |
| 5/21/21 | USD | 14,930,424 (Long) | JPMorgan Chase Bank N.A. | BCOMTR (floating rate) | 3 month T-Bill + 0.09% | (26,504) | | — | | (26,504) |
| 5/21/21 | USD | 26,672,167 (Long) | Goldman Sachs International | BCOMF3T (floating rate) | 3 month T-Bill + 0.13% | (3,054) | | — | | (3,054) |
| 5/21/21 | USD | 29,635,741 (Long) | Citibank N.A. | BCOMF3T (floating rate) | 3 month T-Bill + 0.13% | (3,390) | | — | | (3,390) |
| 5/21/21 | USD | 29,635,741 (Long) | JPMorgan Chase Bank N.A. | BCOMF3T (floating rate) | 3 month T-Bill + 0.10% | (2,715) | | — | | (2,715) |
| 7/14/21 | USD | 108,425,293 (Long) | Merrill Lynch International | MLCILPRT (a) (floating rate) | 3 month T-Bill + 0.14% | (195,013) | | — | | (195,013) |
| 7/16/21 | USD | 12,668,412 (Long) | JPMorgan Chase Bank N.A. | BCOMCTTR (floating rate) | 3 month T-Bill + 0.20% | (2,138) | | — | | (2,138) |
| 7/30/21 | USD | 9,826,181 (Long) | Merrill Lynch International | MLCILPRT (a) (floating rate) | 3 month T-Bill + 0.14% | (17,674) | | — | | (17,674) |
| 7/30/21 | USD | 19,564,003 (Long) | JPMorgan Chase Bank N.A. | BCOMF3T (floating rate) | 3 month T-Bill + 0.10% | (1,789) | | — | | (1,789) |
| 7/30/21 | USD | 9,768,021 (Long) | Goldman Sachs International | BCOMSBTR (floating rate) | 3 month T-Bill + 0.12% | (978) | | — | | (978) |
| 7/30/21 | USD | 9,943,330 (Long) | JPMorgan Chase Bank N.A. | BCOMF3T (floating rate) | 3 month T-Bill + 0.10% | (908) | | — | | (908) |
Consolidated Portfolio of Investments (unaudited) – continued
| Uncleared Swap Agreements - continued |
Maturity
Date | Notional
Amount | Counterparty | Cash Flows
to Receive
(Monthly) | Cash Flows
to Pay
(Monthly) | Unrealized
Appreciation
(Depreciation) | Net Unamortized
Upfront Payments
(Receipts) | Value |
| Liability Derivatives - continued |
| Total Return Swaps - continued |
| 7/30/21 | USD | 11,468,317 (Long) | Merrill Lynch International | MLCILPRT (a) (floating rate) | 3 month T-Bill + 0.14% | $(20,627) | $— | $(20,627) |
| 8/31/21 | USD | 11,942,750 (Long) | Goldman Sachs International | BCOMSYTR (floating rate) | 3 month T-Bill + 0.14% | (1,432) | — | (1,432) |
| 9/17/21 | USD | 105,282,108 (Long) | Merrill Lynch International | MLCILPRT (a) (floating rate) | 3 month T-Bill + 0.13% | (188,566) | — | (188,566) |
| 9/28/21 | USD | 13,832,220 (Long) | JPMorgan Chase Bank N.A. | BCOMTR (floating rate) | 3 month T-Bill + 0.09% | (24,554) | — | (24,554) |
| 10/29/21 | USD | 22,965,344 (Long) | Citibank N.A. | BCOMTR (floating rate) | 3 month T-Bill + 0.11% | (2,266) | — | (2,266) |
| 10/29/21 | USD | 21,599,759 (Long) | JPMorgan Chase Bank N.A. | BCOMF3T (floating rate) | 3 month T-Bill + 0.10% | (1,975) | — | (1,975) |
| 10/29/21 | USD | 63,900,743 (Long) | JPMorgan Chase Bank N.A. | BCOMTR (floating rate) | 3 month T-Bill + 0.09% | (113,432) | — | (113,432) |
| 10/29/21 | USD | 63,900,743 (Long) | Goldman Sachs International | BCOMTR (floating rate) | 3 month T-Bill + 0.09% | (113,432) | — | (113,432) |
| 10/29/21 | USD | 39,661,515 (Long) | Merrill Lynch International | MLCILPRT (a) (floating rate) | 3 month T-Bill + 0.13% | (71,036) | — | (71,036) |
| 11/19/21 | USD | 3,190,770 (Long) | Merrill Lynch International | BCOMSITR (floating rate) | 3 month T-Bill + 0.085% | (264) | — | (264) |
| 12/09/21 | USD | 8,516,272 (Long) | Morgan Stanley | BCOMCNTR (floating rate) | 3 month T-Bill + 0.08% | (572) | — | (572) |
| 1/28/22 | USD | 17,643,794 (Long) | Goldman Sachs International | BCOMTR (floating rate) | 3 month T-Bill + 0.09% | (31,320) | — | (31,320) |
| 1/28/22 | USD | 11,311,438 (Long) | JPMorgan Chase Bank N.A. | BCOMRBTR (floating rate) | 3 month T-Bill + 0.08% | (877) | — | (877) |
| 2/18/22 | USD | 20,151,290 (Long) | JPMorgan Chase Bank N.A. | BCOMF3T (floating rate) | 3 month T-Bill + 0.10% | (1,843) | — | (1,843) |
Consolidated Portfolio of Investments (unaudited) – continued
| Uncleared Swap Agreements - continued |
Maturity
Date | Notional
Amount | Counterparty | Cash Flows
to Receive
(Monthly) | Cash Flows
to Pay
(Monthly) | Unrealized
Appreciation
(Depreciation) | | Net Unamortized
Upfront Payments
(Receipts) | | Value |
| Liability Derivatives - continued |
| Total Return Swaps - continued |
| 2/18/22 | USD | 6,785,028 (Long) | JPMorgan Chase Bank N.A. | BCOMTR (floating rate) | 3 month T-Bill + 0.09% | $(12,045) | | $— | | $(12,045) |
| 2/18/22 | USD | 15,932,706 (Long) | Merrill Lynch International | BCOMBOTR (floating rate) | 3 month T-Bill + 0.13% | (170,864) | | — | | (170,864) |
| 3/11/22 | USD | 22,040,364 (Long) | JPMorgan Chase Bank N.A. | BCOMF3T (floating rate) | 3 month T-Bill + 0.10% | (2,019) | | — | | (2,019) |
| 3/11/22 | USD | 23,142,382 (Long) | Goldman Sachs International | BCOMF3T (floating rate) | 3 month T-Bill + 0.10% | (2,119) | | — | | (2,119) |
| 3/28/22 | USD | 5,542,146 (Long) | Morgan Stanley | BCOMWHTR (floating rate) | 3 month T-Bill + 0.13% | (577) | | — | | (577) |
| 4/20/22 | USD | 14,906,621 (Long) | JPMorgan Chase Bank N.A. | BCOMCOT (floating rate) | 3 month T-Bill + 0.08% | (227) | | — | | (227) |
| 4/28/22 | USD | 9,865,147 (Long) | Merrill Lynch International | MLCILPRT (a) (floating rate) | 3 month T-Bill + 0.14% | (17,776) | | — | | (17,776) |
| 4/28/22 | USD | 31,665,767 (Long) | Goldman Sachs International | BCOMTR (floating rate) | 3 month T-Bill + 0.09% | (56,219) | | — | | (56,219) |
| 4/28/22 | USD | 5,447,050 (Long) | JPMorgan Chase Bank N.A. | BCOMF3T (floating rate) | 3 month T-Bill + 0.10% | (507) | | — | | (507) |
| | | | | | | $(1,111,670) | | $— | | $(1,111,670) |
At April 30, 2021, the fund had cash collateral of $13,197,421 and other liquid securities with an aggregate value of $2,295,976 to cover any collateral or margin obligations for certain derivative contracts. Restricted cash and/or deposits with brokers in the Consolidated Statement of Assets and Liabilities are comprised of cash collateral.
Consolidated Portfolio of Investments (unaudited) – continued
| (a) | The Merrill Lynch MLCILPRT Commodity Index, the components of which are not publicly available, seeks to provide exposure to a diversified group of commodities. Through its investment in the swap, the fund has indirect exposure to the following positions that compose the MLCILPRT: |
| Referenced Commodity Futures Contracts | % of Notional | Notional
Amount: $108,425,293* | Notional
Amount: $9,826,181* | Notional
Amount: $11,468,317* | Notional
Amount: $105,282,108* | Notional
Amount: $39,661,515* | Notional
Amount: $9,865,147* |
| Long Futures Contracts | | | | | | |
| Soybean Oil- Jul 2021 | 4.0% | $4,337,012 | $393,047 | $458,733 | $4,211,284 | $1,586,461 | $394,606 |
| Corn- Jul 2021 | 6.7% | 7,264,495 | 658,354 | 768,377 | 7,053,901 | 2,657,322 | 660,965 |
| WTI- Jul 2021 | 8.9% | 9,649,851 | 874,530 | 1,020,680 | 9,370,108 | 3,529,875 | 877,998 |
| Brent- Jul 2021 | 2.0% | 2,168,506 | 196,524 | 229,366 | 2,105,642 | 793,230 | 197,303 |
| Brent- Sep 2021 | 5.4% | 5,854,966 | 530,614 | 619,289 | 5,685,234 | 2,141,722 | 532,718 |
| Cotton- Jul 2021 | 1.5% | 1,626,379 | 147,393 | 172,025 | 1,579,232 | 594,923 | 147,977 |
| Gold- Jun 2021 | 3.2% | 3,469,609 | 314,438 | 366,986 | 3,369,027 | 1,269,168 | 315,685 |
| Gold- Aug 2021 | 8.7% | 9,433,000 | 854,878 | 997,744 | 9,159,543 | 3,450,552 | 858,268 |
| Copper Comex- Jul 2021 | 5.7% | 6,180,242 | 560,092 | 653,694 | 6,001,080 | 2,260,706 | 562,313 |
| Heating Oil- Jul 2021 | 2.3% | 2,493,782 | 226,002 | 263,771 | 2,421,488 | 912,215 | 226,898 |
| Coffee- Jul 2021 | 2.8% | 3,035,908 | 275,133 | 321,113 | 2,947,899 | 1,110,522 | 276,224 |
| Kansas Wheat- Jul 2021 | 1.6% | 1,734,805 | 157,219 | 183,493 | 1,684,514 | 634,584 | 157,842 |
| Aluminum- Jul 2021 | 4.4% | 4,770,713 | 432,352 | 504,606 | 4,632,413 | 1,745,107 | 434,066 |
| Live Cattle- Jun 2021 | 0.9% | 975,828 | 88,436 | 103,215 | 947,539 | 356,954 | 88,786 |
| Live Cattle- Aug 2021 | 2.6% | 2,819,058 | 255,481 | 298,176 | 2,737,335 | 1,031,199 | 256,494 |
| Lean Hogs- Jun 2021 | 0.8% | 867,402 | 78,609 | 91,747 | 842,257 | 317,292 | 78,921 |
| Lean Hogs- Jul 2021 | 1.6% | 1,734,805 | 157,219 | 183,493 | 1,684,514 | 634,584 | 157,842 |
| Nickel- Jul 2021 | 2.3% | 2,493,782 | 226,002 | 263,771 | 2,421,488 | 912,215 | 226,898 |
| Zinc- Jul 2021 | 2.9% | 3,144,333 | 284,959 | 332,581 | 3,053,181 | 1,150,184 | 286,089 |
| Natural Gas- Jul 2021 | 7.9% | 8,565,598 | 776,268 | 905,997 | 8,317,287 | 3,133,260 | 779,347 |
| Gasoil- Jul 2021 | 2.8% | 3,035,908 | 275,133 | 321,113 | 2,947,899 | 1,110,522 | 276,224 |
| Soybeans- Jul 2021 | 5.8% | 6,288,667 | 569,918 | 665,162 | 6,106,362 | 2,300,368 | 572,179 |
| Sugar- Jul 2021 | 2.9% | 3,144,333 | 284,959 | 332,581 | 3,053,181 | 1,150,184 | 286,089 |
| Silver- Jul 2021 | 3.6% | 3,903,311 | 353,743 | 412,859 | 3,790,156 | 1,427,815 | 355,147 |
| Soybean Meal- Jul 2021 | 3.1% | 3,361,184 | 304,612 | 355,518 | 3,263,745 | 1,229,507 | 305,820 |
| Wheat- Jul 2021 | 2.9% | 3,144,333 | 284,959 | 332,581 | 3,053,181 | 1,150,183 | 286,089 |
Consolidated Portfolio of Investments (unaudited) – continued
| Referenced Commodity Futures Contracts | % of Notional | Notional
Amount: $108,425,293* | Notional
Amount: $9,826,181* | Notional
Amount: $11,468,317* | Notional
Amount: $105,282,108* | Notional
Amount: $39,661,515* | Notional
Amount: $9,865,147* |
| Gasoline RBOB- Jul 2021 | 2.7% | 2,927,483 | 265,307 | 309,646 | 2,842,618 | 1,070,861 | 266,359 |
| | 100.0% | $108,425,293 | $9,826,181 | $11,468,317 | $105,282,108 | $39,661,515 | $9,865,147 |
| * The notional amount is indicative of the quantity and proportionate value of each commodity futures contract. |
See Notes to Consolidated Financial Statements
Consolidated Financial Statements
Consolidated Statement of Assets and Liabilities
At 4/30/21 (unaudited)
This statement represents your fund’s balance sheet, which details the assets and liabilities comprising the total value of the fund.
| Assets | |
| Investments in unaffiliated issuers, at value (identified cost, $570,417,182) | $578,376,179 |
| Investments in affiliated issuers, at value (identified cost, $134,291,889) | 134,293,453 |
| Cash | 69,500,583 |
| Restricted cash for | |
| Uncleared swaps | 13,197,421 |
| Receivables for | |
| Due from uncleared swap brokers | 75,919,819 |
| Net daily variation margin on open cleared swap agreements | 4,334 |
| Fund shares sold | 36,418 |
| Interest | 2,722,550 |
| Uncleared swaps, at value | 2,951 |
| Other assets | 1,814 |
| Total assets | $874,055,522 |
| Liabilities | |
| Payables for | |
| Distributions | $155 |
| Due to uncleared swap brokers | 4,260,557 |
| Investments purchased | 5,245,866 |
| Fund shares reacquired | 772,319 |
| When-issued investments purchased | 945,777 |
| Uncleared swaps, at value | 1,111,670 |
| Payable to affiliates | |
| Investment adviser | 34,736 |
| Administrative services fee | 673 |
| Shareholder servicing costs | 1,573 |
| Distribution and service fees | 84 |
| Payable for independent Trustees' compensation | 1,040 |
| Accrued expenses and other liabilities | 107,642 |
| Total liabilities | $12,482,092 |
| Net assets | $861,573,430 |
| Net assets consist of | |
| Paid-in capital | $771,841,999 |
| Total distributable earnings (loss) | 89,731,431 |
| Net assets | $861,573,430 |
| Shares of beneficial interest outstanding | 141,024,391 |
Consolidated Statement of Assets and Liabilities (unaudited) – continued
| | Net assets | Shares
outstanding | Net asset value
per share (a) |
| Class A | $2,397,416 | 393,074 | $6.10 |
| Class B | 73,952 | 12,178 | 6.07 |
| Class C | 769,241 | 127,013 | 6.06 |
| Class I | 4,086,086 | 668,673 | 6.11 |
| Class R1 | 55,270 | 9,089 | 6.08 |
| Class R2 | 56,023 | 9,194 | 6.09 |
| Class R3 | 56,406 | 9,248 | 6.10 |
| Class R4 | 56,789 | 9,301 | 6.11 |
| Class R6 | 854,022,247 | 139,786,621 | 6.11 |
| (a) | Maximum offering price per share was equal to the net asset value per share for all share classes, except for Class A, for which the maximum offering price per share was $6.47 [100 / 94.25 x $6.10]. Redemption price per share was equal to the net asset value per share for Classes I, R1, R2, R3, R4, and R6. |
See Notes to Consolidated Financial Statements
Consolidated Financial Statements
Consolidated Statement of Operations
Six months ended 4/30/21 (unaudited)
This statement describes how much your fund earned in investment income and accrued in expenses. It also describes any gains and/or losses generated by fund operations.
| Net investment income (loss) | |
| Income | |
| Interest | $5,306,255 |
| Dividends from affiliated issuers | 35,709 |
| Total investment income | $5,341,964 |
| Expenses | |
| Management fee | $2,902,879 |
| Distribution and service fees | 5,611 |
| Shareholder servicing costs | 2,320 |
| Administrative services fee | 53,977 |
| Independent Trustees' compensation | 6,848 |
| Custodian fee | 26,448 |
| Shareholder communications | 5,514 |
| Audit and tax fees | 42,379 |
| Legal fees | 12,331 |
| Miscellaneous | 108,166 |
| Total expenses | $3,166,473 |
| Reduction of expenses by investment adviser | (43,923) |
| Net expenses | $3,122,550 |
| Net investment income (loss) | $2,219,414 |
| Realized and unrealized gain (loss) |
| Realized gain (loss) (identified cost basis) | |
| Unaffiliated issuers | $594,368 |
| Swap agreements | 185,766,179 |
| Net realized gain (loss) | $186,360,547 |
| Change in unrealized appreciation or depreciation | |
| Unaffiliated issuers | $387,271 |
| Swap agreements | (1,407,098) |
| Net unrealized gain (loss) | $(1,019,827) |
| Net realized and unrealized gain (loss) | $185,340,720 |
| Change in net assets from operations | $187,560,134 |
See Notes to Consolidated Financial Statements
Consolidated Financial Statements
Consolidated Statements of Changes in Net Assets
These statements describe the increases and/or decreases in net assets resulting from operations, any distributions, and any shareholder transactions.
| | Six months ended | Year ended |
| | 4/30/21
(unaudited) | 10/31/20 |
| Change in net assets | | |
| From operations | | |
| Net investment income (loss) | $2,219,414 | $8,114,426 |
| Net realized gain (loss) | 186,360,547 | (47,431,141) |
| Net unrealized gain (loss) | (1,019,827) | 4,401,947 |
| Change in net assets from operations | $187,560,134 | $(34,914,768) |
| Total distributions to shareholders | $(7,000,221) | $(12,000,292) |
| Change in net assets from fund share transactions | $(10,590,299) | $112,287,878 |
| Total change in net assets | $169,969,614 | $65,372,818 |
| Net assets | | |
| At beginning of period | 691,603,816 | 626,230,998 |
| At end of period | $861,573,430 | $691,603,816 |
See Notes to Consolidated Financial Statements
Consolidated Financial Statements
Consolidated Financial Highlights
The financial highlights table is intended to help you understand the fund's financial performance for the semiannual period and the past 5 fiscal years (or life of a particular share class, if shorter). Certain information reflects financial results for a single fund share. The total returns in the table represent the rate that an investor would have earned (or lost) on an investment in the fund share class (assuming reinvestment of all distributions) held for the entire period.
| Class A | Six months
ended | Year ended |
| | 4/30/21
(unaudited) | 10/31/20 | 10/31/19 | 10/31/18 | 10/31/17 | 10/31/16 |
| Net asset value, beginning of period | $4.85 | $5.32 | $5.65 | $6.00 | $5.89 | $5.93 |
| Income (loss) from investment operations |
| Net investment income (loss) (d) | $0.01 | $0.04 | $0.10 | $0.07 | $0.03(c) | $0.01 |
| Net realized and unrealized gain (loss) | 1.28 | (0.42) | (0.27) | (0.25) | 0.10 | (0.05)(g) |
| Total from investment operations | $1.29 | $(0.38) | $(0.17) | $(0.18) | $0.13 | $(0.04) |
| Less distributions declared to shareholders |
| From net investment income | $(0.04) | $(0.09) | $(0.16) | $(0.17) | $(0.02) | $(0.00)(w) |
| Net asset value, end of period (x) | $6.10 | $4.85 | $5.32 | $5.65 | $6.00 | $5.89 |
| Total return (%) (r)(s)(t)(x) | 26.73(n) | (7.24) | (2.96) | (2.98) | 2.25(c) | (0.61) |
Ratios (%) (to average net assets)
and Supplemental data: |
| Expenses before expense reductions (f) | 1.14(a) | 1.13 | 1.10 | 1.09 | 1.06(c) | 1.07 |
| Expenses after expense reductions (f) | 1.13(a) | 1.12 | 1.09 | 1.08 | 1.05(c) | 1.06 |
| Net investment income (loss) | 0.26(a)(l) | 0.94 | 1.86 | 1.22 | 0.58(c) | 0.21 |
| Portfolio turnover | 13(n) | 57 | 64 | 72 | 51 | 32 |
| Net assets at end of period (000 omitted) | $2,397 | $1,041 | $321 | $63 | $49 | $48 |
See Notes to Consolidated Financial Statements
Consolidated Financial Highlights – continued
| Class B | Six months
ended | Year ended |
| | 4/30/21
(unaudited) | 10/31/20 | 10/31/19 | 10/31/18(i) |
| Net asset value, beginning of period | $4.81 | $5.28 | $5.64 | $5.71 |
| Income (loss) from investment operations |
| Net investment income (loss) (d) | $(0.01) | $0.01 | $0.06 | $0.02 |
| Net realized and unrealized gain (loss) | 1.28 | (0.43) | (0.26) | (0.09) |
| Total from investment operations | $1.27 | $(0.42) | $(0.20) | $(0.07) |
| Less distributions declared to shareholders |
| From net investment income | $(0.01) | $(0.05) | $(0.16) | $— |
| Net asset value, end of period (x) | $6.07 | $4.81 | $5.28 | $5.64 |
| Total return (%) (r)(s)(t)(x) | 26.39(n) | (8.10) | (3.68) | (1.23)(n) |
Ratios (%) (to average net assets)
and Supplemental data: |
| Expenses before expense reductions (f) | 1.88(a) | 1.87 | 1.84 | 1.94(a) |
| Expenses after expense reductions (f) | 1.87(a) | 1.86 | 1.83 | 1.93(a) |
| Net investment income (loss) | (0.51)(a)(l) | 0.23 | 1.13 | 1.34(a) |
| Portfolio turnover | 13(n) | 57 | 64 | 72 |
| Net assets at end of period (000 omitted) | $74 | $60 | $48 | $52 |
| Class C | Six months
ended | Year ended |
| | 4/30/21
(unaudited) | 10/31/20 | 10/31/19 | 10/31/18(i) |
| Net asset value, beginning of period | $4.80 | $5.28 | $5.64 | $5.71 |
| Income (loss) from investment operations |
| Net investment income (loss) (d) | $(0.01) | $0.01 | $0.06 | $0.02 |
| Net realized and unrealized gain (loss) | 1.28 | (0.43) | (0.27) | (0.09) |
| Total from investment operations | $1.27 | $(0.42) | $(0.21) | $(0.07) |
| Less distributions declared to shareholders |
| From net investment income | $(0.01) | $(0.06) | $(0.15) | $— |
| Net asset value, end of period (x) | $6.06 | $4.80 | $5.28 | $5.64 |
| Total return (%) (r)(s)(t)(x) | 26.41(n) | (8.07) | (3.69) | (1.23)(n) |
Ratios (%) (to average net assets)
and Supplemental data: |
| Expenses before expense reductions (f) | 1.89(a) | 1.88 | 1.84 | 1.94(a) |
| Expenses after expense reductions (f) | 1.88(a) | 1.87 | 1.83 | 1.93(a) |
| Net investment income (loss) | (0.50)(a)(l) | 0.20 | 1.12 | 1.41(a) |
| Portfolio turnover | 13(n) | 57 | 64 | 72 |
| Net assets at end of period (000 omitted) | $769 | $435 | $93 | $49 |
See Notes to Consolidated Financial Statements
Consolidated Financial Highlights – continued
| Class I | Six months
ended | Year ended |
| | 4/30/21
(unaudited) | 10/31/20 | 10/31/19 | 10/31/18 | 10/31/17 | 10/31/16 |
| Net asset value, beginning of period | $4.86 | $5.32 | $5.65 | $6.00 | $5.90 | $5.94 |
| Income (loss) from investment operations |
| Net investment income (loss) (d) | $0.01 | $0.06 | $0.11 | $0.09 | $0.05(c) | $0.03 |
| Net realized and unrealized gain (loss) | 1.29 | (0.42) | (0.26) | (0.25) | 0.09 | (0.04)(g) |
| Total from investment operations | $1.30 | $(0.36) | $(0.15) | $(0.16) | $0.14 | $(0.01) |
| Less distributions declared to shareholders |
| From net investment income | $(0.05) | $(0.10) | $(0.18) | $(0.19) | $(0.04) | $(0.03) |
| Net asset value, end of period (x) | $6.11 | $4.86 | $5.32 | $5.65 | $6.00 | $5.90 |
| Total return (%) (r)(s)(t)(x) | 26.88(n) | (6.90) | (2.75) | (2.73) | 2.32(c) | (0.20) |
Ratios (%) (to average net assets)
and Supplemental data: |
| Expenses before expense reductions (f) | 0.89(a) | 0.89 | 0.84 | 0.85 | 0.82(c) | 0.83 |
| Expenses after expense reductions (f) | 0.88(a) | 0.88 | 0.83 | 0.84 | 0.81(c) | 0.82 |
| Net investment income (loss) | 0.46(a)(l) | 1.17 | 2.13 | 1.45 | 0.83(c) | 0.45 |
| Portfolio turnover | 13(n) | 57 | 64 | 72 | 51 | 32 |
| Net assets at end of period (000 omitted) | $4,086 | $500 | $135 | $48 | $49 | $48 |
| Class R1 | Six months
ended | Year ended |
| | 4/30/21
(unaudited) | 10/31/20 | 10/31/19 | 10/31/18(i) |
| Net asset value, beginning of period | $4.81 | $5.28 | $5.64 | $5.71 |
| Income (loss) from investment operations |
| Net investment income (loss) (d) | $(0.01) | $0.01 | $0.06 | $0.02 |
| Net realized and unrealized gain (loss) | 1.28 | (0.43) | (0.27) | (0.09) |
| Total from investment operations | $1.27 | $(0.42) | $(0.21) | $(0.07) |
| Less distributions declared to shareholders |
| From net investment income | $— | $(0.05) | $(0.15) | $— |
| Net asset value, end of period (x) | $6.08 | $4.81 | $5.28 | $5.64 |
| Total return (%) (r)(s)(t)(x) | 26.40(n) | (8.08) | (3.69) | (1.23)(n) |
Ratios (%) (to average net assets)
and Supplemental data: |
| Expenses before expense reductions (f) | 1.88(a) | 1.87 | 1.84 | 1.94(a) |
| Expenses after expense reductions (f) | 1.87(a) | 1.86 | 1.83 | 1.93(a) |
| Net investment income (loss) | (0.48)(a)(l) | 0.26 | 1.14 | 1.35(a) |
| Portfolio turnover | 13(n) | 57 | 64 | 72 |
| Net assets at end of period (000 omitted) | $55 | $44 | $48 | $49 |
See Notes to Consolidated Financial Statements
Consolidated Financial Highlights – continued
| Class R2 | Six months
ended | Year ended |
| | 4/30/21
(unaudited) | 10/31/20 | 10/31/19 | 10/31/18(i) |
| Net asset value, beginning of period | $4.83 | $5.30 | $5.65 | $5.71 |
| Income (loss) from investment operations |
| Net investment income (loss) (d) | $0.00(w) | $0.04 | $0.09 | $0.02 |
| Net realized and unrealized gain (loss) | 1.28 | (0.44) | (0.27) | (0.08) |
| Total from investment operations | $1.28 | $(0.40) | $(0.18) | $(0.06) |
| Less distributions declared to shareholders |
| From net investment income | $(0.02) | $(0.07) | $(0.17) | $— |
| Net asset value, end of period (x) | $6.09 | $4.83 | $5.30 | $5.65 |
| Total return (%) (r)(s)(t)(x) | 26.65(n) | (7.59) | (3.31) | (1.05)(n) |
Ratios (%) (to average net assets)
and Supplemental data: |
| Expenses before expense reductions (f) | 1.38(a) | 1.37 | 1.34 | 1.44(a) |
| Expenses after expense reductions (f) | 1.37(a) | 1.36 | 1.33 | 1.43(a) |
| Net investment income (loss) | 0.00(a)(l)(w) | 0.75 | 1.64 | 1.86(a) |
| Portfolio turnover | 13(n) | 57 | 64 | 72 |
| Net assets at end of period (000 omitted) | $56 | $44 | $48 | $49 |
| Class R3 | Six months
ended | Year ended |
| | 4/30/21
(unaudited) | 10/31/20 | 10/31/19 | 10/31/18(i) |
| Net asset value, beginning of period | $4.84 | $5.31 | $5.65 | $5.71 |
| Income (loss) from investment operations |
| Net investment income (loss) (d) | $0.01 | $0.05 | $0.10 | $0.03 |
| Net realized and unrealized gain (loss) | 1.28 | (0.43) | (0.27) | (0.09) |
| Total from investment operations | $1.29 | $(0.38) | $(0.17) | $(0.06) |
| Less distributions declared to shareholders |
| From net investment income | $(0.03) | $(0.09) | $(0.17) | $— |
| Net asset value, end of period (x) | $6.10 | $4.84 | $5.31 | $5.65 |
| Total return (%) (r)(s)(t)(x) | 26.89(n) | (7.34) | (3.03) | (1.05)(n) |
Ratios (%) (to average net assets)
and Supplemental data: |
| Expenses before expense reductions (f) | 1.13(a) | 1.12 | 1.09 | 1.19(a) |
| Expenses after expense reductions (f) | 1.12(a) | 1.11 | 1.08 | 1.18(a) |
| Net investment income (loss) | 0.26(a)(l) | 1.00 | 1.89 | 2.10(a) |
| Portfolio turnover | 13(n) | 57 | 64 | 72 |
| Net assets at end of period (000 omitted) | $56 | $44 | $48 | $49 |
See Notes to Consolidated Financial Statements
Consolidated Financial Highlights – continued
| Class R4 | Six months
ended | Year ended |
| | 4/30/21
(unaudited) | 10/31/20 | 10/31/19 | 10/31/18(i) |
| Net asset value, beginning of period | $4.85 | $5.32 | $5.65 | $5.71 |
| Income (loss) from investment operations |
| Net investment income (loss) (d) | $0.01 | $0.06 | $0.11 | $0.03 |
| Net realized and unrealized gain (loss) | 1.30 | (0.43) | (0.26) | (0.09) |
| Total from investment operations | $1.31 | $(0.37) | $(0.15) | $(0.06) |
| Less distributions declared to shareholders |
| From net investment income | $(0.05) | $(0.10) | $(0.18) | $— |
| Net asset value, end of period (x) | $6.11 | $4.85 | $5.32 | $5.65 |
| Total return (%) (r)(s)(t)(x) | 27.13(n) | (7.09) | (2.75) | (1.05)(n) |
Ratios (%) (to average net assets)
and Supplemental data: |
| Expenses before expense reductions (f) | 0.88(a) | 0.87 | 0.84 | 0.94(a) |
| Expenses after expense reductions (f) | 0.87(a) | 0.86 | 0.83 | 0.93(a) |
| Net investment income (loss) | 0.50(a)(l) | 1.25 | 2.14 | 2.35(a) |
| Portfolio turnover | 13(n) | 57 | 64 | 72 |
| Net assets at end of period (000 omitted) | $57 | $45 | $48 | $49 |
| Class R6 | Six months
ended | Year ended |
| | 4/30/21
(unaudited) | 10/31/20 | 10/31/19 | 10/31/18 | 10/31/17 | 10/31/16 |
| Net asset value, beginning of period | $4.86 | $5.33 | $5.65 | $6.00 | $5.90 | $5.94 |
| Income (loss) from investment operations |
| Net investment income (loss) (d) | $0.02 | $0.06 | $0.11 | $0.09 | $0.05(c) | $0.03 |
| Net realized and unrealized gain (loss) | 1.28 | (0.43) | (0.25) | (0.25) | 0.09 | (0.04)(g) |
| Total from investment operations | $1.30 | $(0.37) | $(0.14) | $(0.16) | $0.14 | $(0.01) |
| Less distributions declared to shareholders |
| From net investment income | $(0.05) | $(0.10) | $(0.18) | $(0.19) | $(0.04) | $(0.03) |
| Net asset value, end of period (x) | $6.11 | $4.86 | $5.33 | $5.65 | $6.00 | $5.90 |
| Total return (%) (r)(s)(t)(x) | 26.92(n) | (7.06) | (2.57) | (2.74) | 2.32(c) | (0.20) |
Ratios (%) (to average net assets)
and Supplemental data: |
| Expenses before expense reductions (f) | 0.82(a) | 0.83 | 0.83 | 0.84 | 0.81(c) | 0.82 |
| Expenses after expense reductions (f) | 0.80(a) | 0.82 | 0.82 | 0.83 | 0.80(c) | 0.82 |
| Net investment income (loss) | 0.58(a)(l) | 1.28 | 2.15 | 1.46 | 0.83(c) | 0.45 |
| Portfolio turnover | 13(n) | 57 | 64 | 72 | 51 | 32 |
| Net assets at end of period (000 omitted) | $854,022 | $689,390 | $625,443 | $587,864 | $591,976 | $563,314 |
See Notes to Consolidated Financial Statements
Consolidated Financial Highlights – continued
| (a) | Annualized. |
| (c) | Amount reflects a one-time reimbursement of expenses by the custodian (or former custodian) without which net investment income and performance would be lower and expenses would be higher. |
| (d) | Per share data is based on average shares outstanding. |
| (f) | Ratios do not reflect reductions from fees paid indirectly, if applicable. |
| (g) | The per share amount varies from the net realized and unrealized gain/loss for the period because of the timing of sales of fund shares and the per share amount of realized and unrealized gains and losses at such time. |
| (i) | For Class B, Class C, Class R1, Class R2, Class R3, and Class R4, the period is from the class inception, August 15, 2018, through the stated period end. |
| (l) | Recognition of net investment income by the fund may be affected by the timing of the declaration of dividends by companies in which the fund invests and the actual annual net investment income ratio may differ. |
| (n) | Not annualized. |
| (r) | Certain expenses have been reduced without which performance would have been lower. |
| (s) | From time to time the fund may receive proceeds from litigation settlements, without which performance would be lower. |
| (t) | Total returns do not include any applicable sales charges. |
| (w) | Per share amount was less than $0.01 and total return or ratio was less than 0.01%, as applicable. |
| (x) | The net asset values and total returns have been calculated on net assets which include adjustments made in accordance with U.S. generally accepted accounting principles required at period end for financial reporting purposes. |
See Notes to Consolidated Financial Statements
Notes to Consolidated Financial Statements
(unaudited)
(1) Business and Organization
MFS Commodity Strategy Fund (the fund) is a diversified series of MFS Series Trust XV (the trust). The trust is organized as a Massachusetts business trust and is registered under the Investment Company Act of 1940, as amended, as an open-end management investment company.
The fund is an investment company and accordingly follows the investment company accounting and reporting guidance of the Financial Accounting Standards Board (FASB) Accounting Standards Codification Topic 946 Financial Services - Investment Companies.
(2) Significant Accounting Policies
Principles of Consolidation — The fund gains exposure to the commodities markets by investing a portion of the fund’s assets in the MFS Commodity Strategy Portfolio, a wholly-owned and controlled subsidiary organized in the Cayman Islands (“Subsidiary”). The fund will not invest directly in commodities. The fund may invest up to 25% of its assets (at the time of purchase) in the Subsidiary. The Subsidiary has the same objective, strategies, and restrictions as the fund, except that the Subsidiary gains exposure to the commodities market by investing directly in commodity-linked futures, options, and swaps. The fund also invests directly in debt securities, and the Subsidiary may also invest in debt securities. As of April 30, 2021, the Subsidiary’s net assets were $168,036,489, which represented 19.5% of the fund’s net assets. The fund’s financial statements have been consolidated and include the accounts of the fund and the Subsidiary. All inter-fund balances and transactions have been eliminated in consolidation.
General — The preparation of Consolidated Financial Statements in conformity with U.S. generally accepted accounting principles requires management to make estimates and assumptions that affect the reported amounts of assets and liabilities, and disclosure of contingent assets and liabilities at the date of the Consolidated Financial Statements and the reported amounts of increases and decreases in net assets from operations during the reporting period. Actual results could differ from those estimates. In the preparation of these Consolidated Financial Statements, management has evaluated subsequent events occurring after the date of the fund’s Consolidated Statement of Assets and Liabilities through the date that the Consolidated Financial Statements were issued. The fund invests in foreign securities. Investments in foreign securities are vulnerable to the effects of changes in the relative values of the local currency and the U.S. dollar and to the effects of changes in each country’s market, economic, industrial, political, regulatory, geopolitical, environmental, public health, and other conditions.
In March 2020, the FASB issued Accounting Standards Update 2020-04, Reference Rate Reform (Topic 848) – Facilitation of the Effects of Reference Rate Reform on Financial Reporting (“ASU 2020-04”), which provides optional, temporary relief for certain reference rate-related contract modifications due to the planned discontinuation of the London Interbank Offered Rate (LIBOR) and other IBOR-based reference rates as of the end of 2021. In March 2021, the administrator for LIBOR announced the extension of the publication of the more commonly used U.S. dollar
Notes to Consolidated Financial Statements (unaudited) - continued
LIBOR settings to the end of June 2023. Management is still evaluating the impact of ASU 2020-04 on the fund's accounting for investments, derivatives, debt and other contracts that will undergo reference rate-related modifications as a result of the reference rate reform.
Balance Sheet Offsetting — The fund's accounting policy with respect to balance sheet offsetting is that, absent an event of default by the counterparty or a termination of the agreement, the International Swaps and Derivatives Association (ISDA) Master Agreement, or similar agreement, does not result in an offset of reported amounts of financial assets and financial liabilities in the Consolidated Statement of Assets and Liabilities across transactions between the fund and the applicable counterparty. The fund's right to setoff may be restricted or prohibited by the bankruptcy or insolvency laws of the particular jurisdiction to which a specific master netting agreement counterparty is subject. Balance sheet offsetting disclosures, to the extent applicable to the fund, have been included in the fund’s Significant Accounting Policies note under the captions for each of the fund’s in-scope financial instruments and transactions.
Investment Valuations — Debt instruments and floating rate loans, including restricted debt instruments, are generally valued at an evaluated or composite bid as provided by a third-party pricing service. Short-term instruments with a maturity at issuance of 60 days or less may be valued at amortized cost, which approximates market value. Exchange-traded options are generally valued at the last sale or official closing price on their primary exchange as provided by a third-party pricing service. Exchange-traded options for which there were no sales reported that day are generally valued at the last daily bid quotation on their primary exchange as provided by a third-party pricing service. For put options, the position may be valued at the last daily ask quotation if there are no trades reported during the day. Options not traded on an exchange are generally valued at a broker/dealer bid quotation. Foreign currency options are generally valued at valuations provided by a third-party pricing service.
Swap agreements are generally valued using valuations provided by a third-party pricing service, which for cleared swaps includes an evaluation of any trading activity at the clearinghouses. Open-end investment companies are generally valued at net asset value per share. Securities and other assets generally valued on the basis of information from a third-party pricing service may also be valued at a broker/dealer bid quotation.
In determining values, third-party pricing services can utilize both transaction data and market information such as yield, quality, coupon rate, maturity, type of issue, trading characteristics, and other market data. The values of foreign securities and other assets and liabilities expressed in foreign currencies are converted to U.S. dollars using the mean of bid and asked prices for rates provided by a third-party pricing service.
The Board of Trustees has delegated primary responsibility for determining or causing to be determined the value of the fund’s investments (including any fair valuation) to the adviser pursuant to valuation policies and procedures approved by the Board. If the adviser determines that reliable market quotations are not readily available, investments are valued at fair value as determined in good faith by the adviser in accordance with such procedures under the oversight of the Board of Trustees. Under the fund’s valuation policies and procedures, market quotations are not considered to be readily available for most types of debt instruments and floating rate loans and many types of derivatives. These investments are generally valued at fair value based on information from third-party pricing services. In addition, investments may be valued at fair value if the adviser determines that an investment’s value has been materially affected by events occurring after the close of the exchange or market on which the investment is
Notes to Consolidated Financial Statements (unaudited) - continued
principally traded (such as foreign exchange or market) and prior to the determination of the fund’s net asset value, or after the halt of trading of a specific security where trading does not resume prior to the close of the exchange or market on which the security is principally traded. The adviser generally relies on third-party pricing services or other information (such as the correlation with price movements of similar securities in the same or other markets; the type, cost and investment characteristics of the security; the business and financial condition of the issuer; and trading and other market data) to assist in determining whether to fair value and at what value to fair value an investment. The value of an investment for purposes of calculating the fund’s net asset value can differ depending on the source and method used to determine value. When fair valuation is used, the value of an investment used to determine the fund’s net asset value may differ from quoted or published prices for the same investment. There can be no assurance that the fund could obtain the fair value assigned to an investment if it were to sell the investment at the same time at which the fund determines its net asset value per share.
Various inputs are used in determining the value of the fund's assets or liabilities. These inputs are categorized into three broad levels. In certain cases, the inputs used to measure fair value may fall into different levels of the fair value hierarchy. In such cases, an investment's level within the fair value hierarchy is based on the lowest level of input that is significant to the fair value measurement. The fund's assessment of the significance of a particular input to the fair value measurement in its entirety requires judgment, and considers factors specific to the investment. Level 1 includes unadjusted quoted prices in active markets for identical assets or liabilities. Level 2 includes other significant observable market-based inputs (including quoted prices for similar securities, interest rates, prepayment speed, and credit risk). Level 3 includes unobservable inputs, which may include the adviser's own assumptions in determining the fair value of investments. Other financial instruments are derivative instruments, such as swap agreements. The following is a summary of the levels used as of April 30, 2021 in valuing the fund's assets or liabilities:
Notes to Consolidated Financial Statements (unaudited) - continued
| Financial Instruments | Level 1 | Level 2 | Level 3 | Total |
| U.S. Treasury Bonds & U.S. Government Agencies & Equivalents | $— | $98,573,822 | $— | $98,573,822 |
| Non - U.S. Sovereign Debt | — | 8,030,340 | — | 8,030,340 |
| Municipal Bonds | — | 19,719,029 | — | 19,719,029 |
| U.S. Corporate Bonds | — | 181,275,753 | — | 181,275,753 |
| Residential Mortgage-Backed Securities | — | 12,404,290 | — | 12,404,290 |
| Commercial Mortgage-Backed Securities | — | 40,886,999 | — | 40,886,999 |
| Asset-Backed Securities (including CDOs) | — | 70,435,102 | — | 70,435,102 |
| Foreign Bonds | — | 132,252,844 | — | 132,252,844 |
| Short-Term Securities | — | 14,798,000 | — | 14,798,000 |
| Mutual Funds | 134,293,453 | — | — | 134,293,453 |
| Total | $134,293,453 | $578,376,179 | $— | $712,669,632 |
| Other Financial Instruments | | | | |
| Swap Agreements – Assets | $— | $487,972 | $— | $487,972 |
| Swap Agreements – Liabilities | — | (1,111,670) | — | (1,111,670) |
For further information regarding security characteristics, see the Consolidated Portfolio of Investments.
Derivatives — The fund uses derivatives primarily to increase or decrease exposure to a particular market or segment of the market, or security, to increase or decrease interest rate or currency exposure, or as alternatives to direct investments. Derivatives are used for hedging or non-hedging purposes. While hedging can reduce or eliminate losses, it can also reduce or eliminate gains. When the fund uses derivatives as an investment to increase market exposure, or for hedging purposes, gains and losses from derivative instruments may be substantially greater than the derivative’s original cost.
The derivative instruments used by the fund during the period were purchased options and swap agreements. Depending on the type of derivative, a fund may exit a derivative position by entering into an offsetting transaction with a counterparty or exchange, negotiating an agreement with the derivative counterparty, or novating the position to a third party. The fund's period end derivatives, as presented in the Consolidated Portfolio of Investments and the associated Derivative Contract tables, generally are indicative of the volume of its derivative activity during the period.
Notes to Consolidated Financial Statements (unaudited) - continued
The following table presents, by major type of derivative contract, the fair value, on a gross basis, of the asset and liability components of derivatives held by the fund at April 30, 2021 as reported in the Consolidated Statement of Assets and Liabilities:
| | | Fair Value (a) |
| Risk | Derivative Contracts | Asset Derivatives | Liability Derivatives |
| Interest Rate | Interest Rate Swaps | $485,021 | $— |
| Commodity | Total Return Swaps | 2,951 | (1,111,670) |
| Total | | $487,972 | $(1,111,670) |
| (a) | Values presented in this table for cleared swap agreements correspond to the values reported in the Consolidated Portfolio of Investments. Only the current day net variation margin for cleared swap agreements is separately reported within the Consolidated Statement of Assets and Liabilities. |
The following table presents, by major type of derivative contract, the realized gain (loss) on derivatives held by the fund for the six months ended April 30, 2021 as reported in the Consolidated Statement of Operations:
| Risk | Swap
Agreements | Unaffiliated Issuers
(Purchased Options) |
| Interest Rate | $ 2,141 | $ — |
| Commodity | 185,764,038 | — |
| Credit | — | (151,597) |
| Total | $185,766,179 | $(151,597) |
The following table presents, by major type of derivative contract, the change in unrealized appreciation or depreciation on derivatives held by the fund for the six months ended April 30, 2021 as reported in the Consolidated Statement of Operations:
| Risk | Swap
Agreements |
| Interest Rate | $ (445,017) |
| Commodity | (962,081) |
| Total | $(1,407,098) |
Derivative counterparty credit risk is managed through formal evaluation of the creditworthiness of all potential counterparties. On certain, but not all, uncleared derivatives, the fund attempts to reduce its exposure to counterparty credit risk whenever possible by entering into an ISDA Master Agreement on a bilateral basis. The ISDA Master Agreement gives each party to the agreement the right to terminate all transactions traded under such agreement if there is a specified deterioration in the credit quality of the other party. Upon an event of default or a termination of the ISDA Master Agreement, the non-defaulting party has the right to close out all transactions traded under such agreement and to net amounts owed under each agreement to one net amount payable by one party to the other. This right to close out and net payments across all transactions traded under the ISDA Master Agreement could result in a reduction of the fund's credit risk to such counterparty equal to any amounts payable by the fund under the applicable transactions, if any.
Notes to Consolidated Financial Statements (unaudited) - continued
Collateral and margin requirements differ by type of derivative. For cleared derivatives (e.g., futures contracts, cleared swaps, and exchange-traded options), margin requirements are set by the clearing broker and the clearing house and collateral, in the form of cash or securities, is posted by the fund directly with the clearing broker. Collateral terms are counterparty agreement specific for uncleared derivatives (e.g., forward foreign currency exchange contracts, uncleared swap agreements, and uncleared options) and collateral, in the form of cash and securities, is held in segregated accounts with the fund's custodian in connection with these agreements. For derivatives traded under an ISDA Master Agreement, which contains a collateral support annex, the collateral requirements are netted across all transactions traded under such counterparty-specific agreement and an amount is posted from one party to the other to collateralize such obligations. Cash that has been segregated or delivered to cover the fund's collateral or margin obligations under derivative contracts, if any, will be reported separately in the Consolidated Statement of Assets and Liabilities as restricted cash for uncleared derivatives and/or deposits with brokers for cleared derivatives. Securities pledged as collateral or margin for the same purpose, if any, are noted in the Consolidated Portfolio of Investments. The fund may be required to make payments of interest on uncovered collateral or margin obligations with the broker. Any such payments are included in “Miscellaneous” expense in the Consolidated Statement of Operations.
The following table presents the fund's derivative assets and liabilities (by type) on a gross basis as of April 30, 2021:
| Gross Amounts of: | Derivative Assets | Derivative Liabilities |
| Swaps, at value | $2,951 | $(1,111,670) |
| Cleared Swap Agreements (a) | 4,334 | — |
Total Gross Amount of Derivative Assets
and Liabilities Presented in the Consolidated
Statement of Assets & Liabilities | $7,285 | $(1,111,670) |
Less: Derivatives Assets and Liabilities Not Subject
to a Master Netting Agreement or
Similar Arrangement | 4,334 | — |
Total Gross Amount of Derivative Assets and
Liabilities Subject to a Master Netting Agreement or
Similar Arrangement | $2,951 | $(1,111,670) |
| (a) | The amount presented here represents the fund's current day net variation margin for cleared swaps agreements. This amount, which is recognized within the fund's Consolidated Statement of Assets and Liabilities, differs from the fair value of the cleared swap agreements which is presented in the tables that follow the fund's Consolidated Portfolio of Investments. |
Notes to Consolidated Financial Statements (unaudited) - continued
The following table presents (by counterparty) the fund's derivative assets net of amounts available for offset under Master Netting Agreements (or similar arrangements) and net of the related collateral held by the fund at April 30, 2021:
| | | Amounts Not Offset in the
Consolidated Statement of Assets & Liabilities |
| | Gross Amount
of Derivative
Assets Subject
to a Master
Netting
Agreement (or
Similar
Arrangement)
by Counterparty | Financial
Instruments
Available
for Offset | Financial
Instruments
Collateral
Received (b) | Cash
Collateral
Received (b) | Net Amount
of Derivative
Assets by
Counterparty |
| Citibank N.A. | $418 | $(418) | $— | $— | $— |
| Goldman Sachs International | 273 | (273) | — | — | — |
| Merrill Lynch International | 1,306 | (1,306) | — | — | — |
| Morgan Stanley | 954 | (954) | — | — | — |
| Total | $2,951 | $(2,951) | $— | $— | $— |
The following table presents (by counterparty) the fund's derivative liabilities net of amounts available for offset under Master Netting Agreements (or similar arrangements) and net of the related collateral pledged by the fund at April 30, 2021:
| | | Amounts Not Offset in the
Consolidated Statement of Assets & Liabilities |
| | Gross Amount
of Derivative
Liabilities Subject
to a Master
Netting
Agreement (or
Similar
Arrangement)
by Counterparty | Financial
Instruments
Available
for Offset | Financial
Instruments
Collateral
Pledged (b) | Cash
Collateral
Pledged (b) | Net Amount
of Derivative
Liabilities by
Counterparty |
| Citibank N.A. | $(5,656) | $418 | $— | $5,238 | $— |
| Goldman Sachs International | (208,554) | 273 | — | 208,281 | — |
| JPMorgan Chase Bank N.A. | (214,491) | — | — | 214,491 | — |
| Merrill Lynch International | (681,820) | 1,306 | — | 680,514 | — |
| Morgan Stanley | (1,149) | 954 | — | 195 | — |
| Total | $(1,111,670) | $2,951 | $— | $1,108,719 | $— |
| (b) | The amount presented here may be less than the total amount of collateral (received)/pledged as the excess collateral (received)/pledged is not shown for purposes of this presentation. |
Notes to Consolidated Financial Statements (unaudited) - continued
Purchased Options — The fund purchased put options for a premium. Purchased put options entitle the holder to sell a specified number of shares or units of a particular security, currency or index at a specified price at a specified date or within a specified period of time. Purchasing put options may hedge against an anticipated decline in the value of portfolio securities or currency or decrease the fund's exposure to an underlying instrument.
The premium paid is initially recorded as an investment in the Statement of Assets and Liabilities. That investment is subsequently marked-to-market daily with the difference between the premium paid and the market value of the purchased option being recorded as unrealized appreciation or depreciation. Premiums paid for purchased put options which have expired are treated as realized losses on investments in the Statement of Operations. Upon the exercise or closing of a purchased put option, the premium paid is offset against the proceeds on the sale of the underlying security or financial instrument in order to determine the realized gain or loss on investments.
Whether or not the option is exercised, the fund's maximum risk of loss from purchasing an option is the amount of premium paid. All option contracts involve credit risk if the counterparty to the option contract fails to perform. For uncleared options, this risk is mitigated in cases where there is an ISDA Master Agreement between the fund and the counterparty providing for netting as described above and, where applicable, by the posting of collateral by the counterparty to the fund to cover the fund’s exposure to the counterparty under such ISDA Master Agreement.
Swap Agreements — During the period the fund entered into swap agreements. Swap agreements generally involve a periodic exchange of cash payments on a net basis, at specified intervals or upon the occurrence of specified events, between the fund and a counterparty. Certain swap agreements may be entered into as a bilateral contract (“uncleared swaps”) while others are required to be centrally cleared (“cleared swaps”). In a cleared swap transaction, the ultimate counterparty to the transaction is a clearinghouse (the “clearinghouse”). The contract is transferred and accepted by the clearinghouse immediately following execution of the swap contract with an executing broker. Thereafter, throughout the term of the cleared swap, the fund interfaces indirectly with the clearinghouse through a clearing broker and has counterparty risk to the clearing broker as well.
Both cleared and uncleared swap agreements are marked to market daily. The value of uncleared swap agreements is reported in the Consolidated Statement of Assets and Liabilities as “Uncleared swaps, at value” which includes any related interest accruals to be paid or received by the fund. For cleared swaps, payments (variation margin) are made or received by the fund each day, depending on the daily fluctuations in the value of the cleared swap, such that only the current day net receivable or payable for variation margin is reported in the Consolidated Statement of Assets and Liabilities.
For both cleared and uncleared swaps, the periodic exchange of net cash payments, at specified intervals or upon the occurrence of specified events as stipulated by the agreement, is recorded as realized gain or loss on swap agreements in the Consolidated Statement of Operations. Premiums paid or received at the inception of the agreements are amortized using the effective interest method over the term of the agreement as realized gain or loss on swap agreements in the Consolidated Statement of Operations. A liquidation payment received or made upon early termination is recorded as a realized gain or loss on swap agreements in the Consolidated Statement
Notes to Consolidated Financial Statements (unaudited) - continued
of Operations. The change in unrealized appreciation or depreciation on swap agreements in the Consolidated Statement of Operations reflects the aggregate change over the reporting period in the value of swaps net of any unamortized premiums paid or received.
Risks related to swap agreements include the possible lack of a liquid market, unfavorable market and interest rate movements of the underlying instrument and the failure of the counterparty to perform under the terms of the agreements. The fund's maximum risk of loss from counterparty credit risk is the discounted net value of the cash flows to be received from/paid to the counterparty over the contract's remaining life, to the extent that the amount is positive. To address counterparty risk, uncleared swap agreements are limited to only highly-rated counterparties. Risk is further reduced by having an ISDA Master Agreement between the fund and the counterparty providing for netting as described above and, where applicable, by the posting of collateral by the counterparty to the fund to cover the fund’s exposure to the counterparty under such ISDA Master Agreement. The fund's counterparty risk due to cleared swaps is mitigated by the fact that the clearinghouse is the true counterparty to the transaction and the regulatory requirement safeguards in the event of a clearing broker bankruptcy.
The fund entered into interest rate swap agreements in order to manage its exposure to interest or foreign exchange rate fluctuations. Interest rate swap agreements involve the periodic exchange of cash flows, between the fund and a counterparty, based on the difference between two interest rates applied to a notional principal amount. The two interest rates exchanged may either be a fixed rate and a floating rate or two floating rates based on different indices.
The fund entered into total return swaps on various commodity indexes in order to gain exposure without having to own the underlying commodities. Under a total return swap the fund pays the counterparty interest (based on a fixed or floating rate) and in return receives a payment equal to the increase in the total return of the reference index. To the extent there is a decline in the total return of the index, the fund pays the counterparty for that decline in addition to making the fixed or floating rate interest payment. On a monthly basis, the change in the total return of the index is measured to determine the monthly payment due to or from the counterparty. These payments are included in “Due from uncleared swap brokers” or “Due to uncleared swap brokers” in the Consolidated Statement of Assets and Liabilities. The total return of the reference index includes changes in the market value of the index and any interest or dividend payments attributable to the index.
Indemnifications — Under the fund's organizational documents, its officers and Trustees may be indemnified against certain liabilities and expenses arising out of the performance of their duties to the fund. Additionally, in the normal course of business, the fund enters into agreements with service providers that may contain indemnification clauses. The fund's maximum exposure under these agreements is unknown as this would involve future claims that may be made against the fund that have not yet occurred.
Investment Transactions and Income — Investment transactions are recorded on the trade date. Some securities may be purchased or sold on an extended settlement basis, which means that the receipt or delivery of the securities by the fund and related payments occur at a future date, usually beyond the customary settlement period.
Interest income is recorded on the accrual basis. All premium and discount is amortized
Notes to Consolidated Financial Statements (unaudited) - continued
or accreted for financial statement purposes in accordance with U.S. generally accepted accounting principles. Interest payments received in additional securities are recorded on the ex-interest date in an amount equal to the value of the security on such date.
The fund may receive proceeds from litigation settlements. Any proceeds received from litigation involving portfolio holdings are reflected in the Consolidated Statement of Operations in realized gain/loss if the security has been disposed of by the fund or in unrealized gain/loss if the security is still held by the fund. Any other proceeds from litigation not related to portfolio holdings are reflected as other income in the Consolidated Statement of Operations.
The fund invests a significant portion of its assets in asset-backed and/or mortgage-backed securities. For these securities, the value of the debt instrument also depends on the credit quality and adequacy of the underlying assets or collateral as well as whether there is a security interest in the underlying assets or collateral. Enforcing rights, if any, against the underlying assets or collateral may be difficult. U.S. Government securities not supported as to the payment of principal or interest by the U.S. Treasury, such as those issued by Fannie Mae, Freddie Mac, and the Federal Home Loan Banks, are subject to greater credit risk than are U.S. Government securities supported by the U.S. Treasury, such as those issued by Ginnie Mae.
The fund may purchase or sell securities on a when-issued or delayed delivery basis. In these extended settlement transactions, the receipt or delivery of the securities by the fund and related payments occur at a future date, usually beyond the normal settlement period. The price of such security and the date that the security will be settled are generally fixed at the time the transaction is negotiated. The value of the security varies with market fluctuations and for debt securities no interest accrues to the fund until settlement takes place. When the fund sells securities on a when-issued or delayed delivery basis, the fund typically owns or has the right to acquire securities equivalent in kind and amount to the securities sold. Purchase and sale commitments for when-issued or delayed delivery securities are held at carrying amount, which approximates fair value and are categorized as level 2 within the fair value hierarchy, and included in When-issued investments purchased in the Statement of Assets and Liabilities. Losses may arise due to changes in the value of the underlying securities prior to settlement date or if the counterparty does not perform under the contract’s terms, or if the issuer does not issue the securities due to political, economic or other factors. At the time that it enters into a when-issued or delayed delivery transaction, the fund is required to have sufficient cash and/or liquid securities to cover its commitments.
To mitigate the counterparty credit risk on TBA transactions, mortgage dollar rolls, and other types of forward settling mortgage-backed and asset-backed security transactions, the fund whenever possible enters into a Master Securities Forward Transaction Agreement (“MSFTA”) on a bilateral basis with each of the counterparties with whom it undertakes a significant volume of transactions. The MSFTA gives each party to the agreement the right to terminate all transactions traded under such agreement if there is a specified deterioration in the credit quality of the other party. Upon an event of default or a termination of the MSFTA, the non-defaulting party has the right to close out all transactions traded under such agreement and to net amounts owed under each transaction to one net amount payable by one party to the other.
Notes to Consolidated Financial Statements (unaudited) - continued
This right to close out and net payments across all transactions traded under the MSFTA could result in a reduction of the fund's credit risk to such counterparty equal to any amounts payable by the fund under the applicable transactions, if any.
For mortgage-backed and asset-backed securities traded under a MSFTA, the collateral and margining requirements are contract specific. Collateral amounts across all transactions traded under such agreement are netted and an amount is posted from one party to the other to collateralize such obligations. Cash that has been pledged to cover the fund's collateral or margin obligations under a MSFTA, if any, will be reported separately on the Consolidated Statement of Assets and Liabilities as restricted cash. Securities pledged as collateral or margin for the same purpose, if any, are noted in the Consolidated Portfolio of Investments.
Tax Matters and Distributions — The fund intends to qualify as a regulated investment company, as defined under Subchapter M of the Internal Revenue Code, and to distribute all of its taxable income, including realized capital gains. As a result, no provision for federal income tax is required. The fund’s federal tax returns, when filed, will remain subject to examination by the Internal Revenue Service for a three year period. Management has analyzed the fund’s tax positions taken on federal and state tax returns for all open tax years and does not believe that there are any uncertain tax positions that require recognition of a tax liability. Foreign taxes, if any, have been accrued by the fund in the accompanying financial statements in accordance with the applicable foreign tax law. Foreign income taxes may be withheld by certain countries in which the fund invests. Additionally, capital gains realized by the fund on securities issued in or by certain foreign countries may be subject to capital gains tax imposed by those countries.
Distributions to shareholders are recorded on the ex-dividend date. Income and capital gain distributions are determined in accordance with income tax regulations, which may differ from U.S. generally accepted accounting principles. Certain capital accounts in the financial statements are periodically adjusted for permanent differences in order to reflect their tax character. These adjustments have no impact on net assets or net asset value per share. Temporary differences which arise from recognizing certain items of income, expense, gain or loss in different periods for financial statement and tax purposes will reverse at some time in the future.
Book/tax differences primarily relate to treating the Subsidiary as a separate holding for tax purposes instead of a consolidated entity and amortization and accretion of debt securities.
The tax character of distributions made during the current period will be determined at fiscal year end. The tax character of distributions declared to shareholders for the last fiscal year is as follows:
| | Year ended
10/31/20 |
| Ordinary income (including any short-term capital gains) | $12,000,292 |
Notes to Consolidated Financial Statements (unaudited) - continued
The federal tax cost and the tax basis components of distributable earnings were as follows:
| As of 4/30/21 | |
| Cost of investments | $ 706,095,176 |
| Gross appreciation | 7,636,610 |
| Gross depreciation | (1,062,154) |
| Net unrealized appreciation (depreciation) | $ 6,574,456 |
| As of 10/31/20 | |
| Undistributed ordinary income | 5,154,093 |
| Capital loss carryforwards | (95,564,031) |
| Other temporary differences | 329,696,333 |
| Net unrealized appreciation (depreciation) | (330,114,877) |
The aggregate cost above includes prior fiscal year end tax adjustments, if applicable.
As of October 31, 2020, the fund had capital loss carryforwards available to offset future realized gains. These net capital losses may be carried forward indefinitely and their character is retained as short-term and/or long-term losses. Such losses are characterized as follows:
| Short-Term | $(74,964,623) |
| Long-Term | (20,599,408) |
| Total | $(95,564,031) |
Multiple Classes of Shares of Beneficial Interest — The fund offers multiple classes of shares, which differ in their respective distribution and service fees. The fund's income, realized and unrealized gain (loss), and common expenses are allocated to shareholders based on the daily net assets of each class. Dividends are declared separately for each class. Differences in per share dividend rates are generally due to differences in separate class expenses. Class B and Class C shares will convert to Class A shares approximately eight years after purchase. The fund’s distributions declared to shareholders as reported in the Consolidated Statements of Changes in Net Assets are presented by class as follows:
| | Six months ended
4/30/21 | Year ended
10/31/20 |
| Class A | $9,485 | $5,752 |
| Class B | 98 | 415 |
| Class C | 578 | 1,006 |
| Class I | 4,956 | 2,528 |
| Class R1 | — | 421 |
| Class R2 | 208 | 659 |
| Class R3 | 315 | 779 |
| Class R4 | 424 | 899 |
| Class R6 | 6,984,157 | 11,987,833 |
| Total | $7,000,221 | $12,000,292 |
Notes to Consolidated Financial Statements (unaudited) - continued
(3) Transactions with Affiliates
Investment Adviser — The fund and the Subsidiary have investment advisory agreements with MFS to provide overall investment management and related administrative services and facilities to the fund. The management fee is computed daily and paid monthly at the following annual rates based on the fund's average daily net assets:
| Up to $1 billion | 0.75% |
| In excess of $1 billion | 0.70% |
The Subsidiary does not pay a management fee to MFS.
MFS has agreed in writing to reduce its management fee by a specified amount if certain MFS mutual fund assets exceed thresholds agreed to by MFS and the fund's Board of Trustees. For the six months ended April 30, 2021, this management fee reduction amounted to $43,923, which is included in the reduction of total expenses in the Consolidated Statement of Operations. The management fee incurred for the six months ended April 30, 2021 was equivalent to an annual effective rate of 0.74% of the fund's average daily net assets.
Distributor — MFS Fund Distributors, Inc. (MFD), a wholly-owned subsidiary of MFS, as distributor, received $993 for the six months ended April 30, 2021, as its portion of the initial sales charge on sales of Class A shares of the fund.
The Board of Trustees has adopted a distribution plan for certain share classes pursuant to Rule 12b-1 of the Investment Company Act of 1940.
The fund's distribution plan provides that the fund will pay MFD for services provided by MFD and financial intermediaries in connection with the distribution and servicing of certain share classes. One component of the plan is a distribution fee paid to MFD and another component of the plan is a service fee paid to MFD. MFD may subsequently pay all, or a portion, of the distribution and/or service fees to financial intermediaries.
Distribution Plan Fee Table:
| | Distribution
Fee Rate (d) | Service
Fee Rate (d) | Total
Distribution
Plan (d) | Annual
Effective
Rate (e) | Distribution
and Service
Fee |
| Class A | — | 0.25% | 0.25% | 0.25% | $ 1,992 |
| Class B | 0.75% | 0.25% | 1.00% | 1.00% | 353 |
| Class C | 0.75% | 0.25% | 1.00% | 1.00% | 2,836 |
| Class R1 | 0.75% | 0.25% | 1.00% | 1.00% | 244 |
| Class R2 | 0.25% | 0.25% | 0.50% | 0.50% | 124 |
| Class R3 | — | 0.25% | 0.25% | 0.25% | 62 |
| Total Distribution and Service Fees | | | | | $5,611 |
| (d) | In accordance with the distribution plan for certain classes, the fund pays distribution and/or service fees equal to these annual percentage rates of each class’s average daily net assets. The distribution and service fee rates disclosed by class represent the current rates in effect at the end of the reporting period. |
| (e) | The annual effective rates represent actual fees incurred under the distribution plan for the six months ended April 30, 2021 based on each class’s average daily net assets. MFD has |
Notes to Consolidated Financial Statements (unaudited) - continued
voluntarily agreed to rebate a portion of each class’s 0.25% service fee attributable to accounts for which there is no financial intermediary specified on the account except for accounts attributable to MFS or its affiliates’ seed money. There were no service fee rebates for the six months ended April 30, 2021.
Certain Class A shares are subject to a contingent deferred sales charge (CDSC) in the event of a shareholder redemption within 18 months of purchase. Class B shares are subject to a CDSC in the event of a shareholder redemption within six years of purchase. Class C shares are subject to a CDSC in the event of a shareholder redemption within 12 months of purchase. All contingent deferred sales charges are paid to MFD and during the six months ended April 30, 2021, were as follows:
| | Amount |
| Class A | $284 |
| Class B | — |
| Class C | — |
Shareholder Servicing Agent — MFS Service Center, Inc. (MFSC), a wholly-owned subsidiary of MFS, receives a fee from the fund for its services as shareholder servicing agent calculated as a percentage of the average daily net assets of the fund as determined periodically under the supervision of the fund's Board of Trustees. For the six months ended April 30, 2021, the fee was $297, which equated to 0.0001% annually of the fund's average daily net assets. MFSC also receives reimbursement from the fund for out-of-pocket expenses, sub-accounting and other shareholder servicing costs which may be paid to affiliated and unaffiliated service providers. Class R6 shares do not incur sub-accounting fees. For the six months ended April 30, 2021, these out-of-pocket expenses, sub-accounting and other shareholder servicing costs amounted to $2,023.
Administrator — MFS provides certain financial, legal, shareholder communications, compliance, and other administrative services to the fund. Under an administrative services agreement, the fund reimburses MFS the costs incurred to provide these services. The fund is charged an annual fixed amount of $17,500 plus a fee based on average daily net assets. The administrative services fee incurred for the six months ended April 30, 2021 was equivalent to an annual effective rate of 0.0139% of the fund's average daily net assets.
Trustees’ and Officers’ Compensation — The fund pays compensation to independent Trustees in the form of a retainer, attendance fees, and additional compensation to Board and Committee chairpersons. The fund does not pay compensation directly to Trustees or officers of the fund who are also officers of the investment adviser, all of whom receive remuneration from MFS for their services to the fund. Certain officers and Trustees of the fund are officers or directors of MFS, MFD, and MFSC.
Other — The fund invests in the MFS Institutional Money Market Portfolio which is managed by MFS and seeks current income consistent with preservation of capital and liquidity. This money market fund does not pay a management fee to MFS but does incur investment and operating costs.
At April 30, 2021, MFS held approximately 75% of the outstanding shares of Class B and 100% of the outstanding shares of Class R1, Class R2, Class R3, and Class R4.
Notes to Consolidated Financial Statements (unaudited) - continued
The fund is permitted to engage in purchase and sale transactions with funds and accounts for which MFS serves as investment adviser or sub-adviser (“cross-trades”) pursuant to a policy adopted by the Board of Trustees. This policy has been designed to ensure that cross-trades conducted by the fund comply with Rule 17a-7 under the Investment Company Act of 1940. During the six months ended April 30, 2021, the fund engaged in purchase transactions pursuant to this policy, which amounted to $79,605.
(4) Portfolio Securities
For the six months ended April 30, 2021, purchases and sales of investments, other than short-term obligations, were as follows:
| | Purchases | Sales |
| U.S. Government securities | $— | $15,682,243 |
| Non-U.S. Government securities | 138,511,088 | 70,491,601 |
(5) Shares of Beneficial Interest
The fund's Declaration of Trust permits the Trustees to issue an unlimited number of full and fractional shares of beneficial interest. Transactions in fund shares were as follows:
| | Six months ended
4/30/21 | | Year ended
10/31/20 |
| | Shares | Amount | | Shares | Amount |
| Shares sold | | | | | |
| Class A | 184,117 | $1,012,568 | | 170,072 | $802,998 |
| Class B | 5,290 | 31,055 | | 3,402 | 16,500 |
| Class C | 40,235 | 233,081 | | 94,716 | 387,178 |
| Class I | 574,053 | 3,158,352 | | 147,869 | 714,793 |
| Class R2 | — | (1) | | — | — |
| Class R6 | 5,658,618 | 29,496,159 | | 35,775,424 | 162,183,709 |
| | 6,462,313 | $33,931,214 | | 36,191,483 | $164,105,178 |
Shares issued to shareholders
in reinvestment of distributions | | | | | |
| Class A | 1,886 | $9,485 | | 1,116 | $5,752 |
| Class B | 20 | 98 | | 80 | 415 |
| Class C | 115 | 578 | | 198 | 1,006 |
| Class I | 983 | 4,956 | | 486 | 2,528 |
| Class R1 | — | — | | 80 | 421 |
| Class R2 | 42 | 208 | | 126 | 659 |
| Class R3 | 63 | 315 | | 150 | 779 |
| Class R4 | 83 | 424 | | 174 | 899 |
| Class R6 | 1,385,745 | 6,984,157 | | 2,305,353 | 11,987,833 |
| | 1,388,937 | $7,000,221 | | 2,307,763 | $12,000,292 |
Notes to Consolidated Financial Statements (unaudited) - continued
| | Six months ended
4/30/21 | | Year ended
10/31/20 |
| | Shares | Amount | | Shares | Amount |
| Shares reacquired | | | | | |
| Class A | (7,864) | $(44,343) | | (16,587) | $(78,603) |
| Class B | (5,585) | (31,561) | | (38) | (188) |
| Class C | (3,974) | (31,561) | | (21,829) | (103,890) |
| Class I | (9,228) | (51,546) | | (70,889) | (343,471) |
| Class R6 | (9,226,238) | (51,362,723) | | (13,539,794) | (63,291,440) |
| | (9,252,889) | $(51,521,734) | | (13,649,137) | $(63,817,592) |
| Net change | | | | | |
| Class A | 178,139 | $977,710 | | 154,601 | $730,147 |
| Class B | (275) | (408) | | 3,444 | 16,727 |
| Class C | 36,376 | 202,098 | | 73,085 | 284,294 |
| Class I | 565,808 | 3,111,762 | | 77,466 | 373,850 |
| Class R1 | — | — | | 80 | 421 |
| Class R2 | 42 | 207 | | 126 | 659 |
| Class R3 | 63 | 315 | | 150 | 779 |
| Class R4 | 83 | 424 | | 174 | 899 |
| Class R6 | (2,181,875) | (14,882,407) | | 24,540,983 | 110,880,102 |
| | (1,401,639) | $(10,590,299) | | 24,850,109 | $112,287,878 |
Effective June 1, 2019, purchases of the fund’s Class B shares are closed to new and existing investors subject to certain exceptions. Please see the fund’s prospectus for details.
The fund is one of several mutual funds in which certain MFS funds may invest. The MFS funds do not invest in the underlying funds for the purpose of exercising management or control. At the end of the period, the MFS Growth Allocation Fund, the MFS Moderate Allocation Fund, the MFS Aggressive Growth Allocation Fund, the MFS Conservative Allocation Fund, the MFS Lifetime 2040 Fund, the MFS Lifetime 2030 Fund, the MFS Lifetime 2035 Fund, the MFS Lifetime 2050 Fund, the Lifetime 2045 Fund, the MFS Lifetime Income Fund, the MFS Lifetime 2025 Fund, the MFS Lifetime 2055 Fund, and the MFS Lifetime 2020 Fund were the owners of record of approximately 31%, 26%, 15%, 10%, 3%, 3%, 2%, 2%, 2%, 2%, 1%, 1%, and 1%, respectively, of the value of outstanding voting shares of the fund. In addition, the MFS Lifetime 2060 Fund were each the owners of record of less than 1% of the value of outstanding voting shares of the fund.
(6) Line of Credit
The fund and certain other funds managed by MFS participate in a $1.25 billion unsecured committed line of credit of which $1 billion is reserved for use by the fund and certain other MFS U.S. funds. The line of credit is provided by a syndicate of banks under a credit agreement. Borrowings may be made for temporary financing needs. Interest is charged to each fund, based on its borrowings, generally at a rate equal to the highest of one month LIBOR, the Federal Funds Effective Rate and the Overnight Bank Funding Rate, plus an agreed upon spread. A commitment fee, based on the
Notes to Consolidated Financial Statements (unaudited) - continued
average daily, unused portion of the committed line of credit, is allocated among the participating funds. In addition, the fund and other funds managed by MFS have established unsecured uncommitted borrowing arrangements with certain banks for temporary financing needs. Interest is charged to each fund, based on its borrowings, at rates equal to customary reference rates plus an agreed upon spread. For the six months ended April 30, 2021, the fund’s commitment fee and interest expense were $1,533 and $0, respectively, and are included in “Miscellaneous” expense in the Consolidated Statement of Operations.
(7) Investments in Affiliated Issuers
An affiliated issuer may be considered one in which the fund owns 5% or more of the outstanding voting securities, or a company which is under common control. For the purposes of this report, the following were affiliated issuers:
| Affiliated Issuers | Beginning
Value | Purchases | Sales
Proceeds | Realized
Gain
(Loss) | Change in
Unrealized
Appreciation or
Depreciation | Ending
Value |
| MFS Institutional Money Market Portfolio | $60,805,580 | $290,227,508 | $216,739,635 | $— | $— | $134,293,453 |
| Affiliated Issuers | Dividend
Income | Capital Gain
Distributions |
| MFS Institutional Money Market Portfolio | $35,709 | $— |
(8) Impacts of COVID-19
The pandemic related to the global spread of novel coronavirus disease (COVID-19), which was first detected in December 2019, has resulted in significant disruptions to global business activity and the global economy, as well as the economies of individual countries, the financial performance of individual companies and sectors, and the securities and commodities markets in general. Multiple surges in cases globally, the availability and widespread adoption of vaccines, and the emergence of variant strains of the virus continue to create uncertainty as to the future and long-term impacts resulting from the pandemic including impacts to the prices and liquidity of the fund's investments and the fund's performance.
Statement Regarding Liquidity Risk Management Program
The fund has adopted and implemented a liquidity risk management program (the “Program”) as required by Rule 22e-4 under the Investment Company Act of 1940, as amended. The fund’s Board of Trustees (the “Board”) has designated MFS as the administrator of the Program. The Program is reasonably designed to assess and manage the liquidity risk of the fund. Liquidity risk is the risk that the fund could not meet requests to redeem shares issued by the fund without significant dilution of remaining investors' interests.
MFS provided a written report to the Board for consideration at its April 2021 meeting that addressed the operation of the Program and provided an assessment of the adequacy and effectiveness of the Program during the period from January 1, 2020 to December 31, 2020 (the “Covered Period”). The report concluded that during the Covered Period the Program had operated effectively and had adequately and effectively been implemented to assess and manage the fund’s liquidity risk. MFS also reported that there were no liquidity events that impacted the fund or its ability to timely meet redemptions without dilution to existing shareholders during the Covered Period.
There can be no assurance that the Program will achieve its objectives in the future. Further information on liquidity risk, and other principal risks to which an investment in the fund may be subject, can be found in the prospectus.
Proxy Voting Policies and Information
MFS votes proxies on behalf of the fund pursuant to proxy voting policies and procedures that are available without charge, upon request, by calling 1-800-225-2606, by visiting mfs.com/proxyvoting, or by visiting the SEC’s Web site at http://www.sec.gov.
Information regarding how the fund voted proxies relating to portfolio securities during the most recent twelve-month period ended June 30 is available by August 31 of each year without charge by visiting mfs.com/proxyvoting, or by visiting the SEC’s Web site at http://www.sec.gov.
Quarterly Portfolio Disclosure
The fund files a complete schedule of portfolio holdings with the SEC for the first and third quarters of each fiscal year as an exhibit to its reports on Form N-PORT. The fund's Form N-PORT reports are available on the SEC's Web site at http://www.sec.gov. A shareholder can obtain the portfolio holdings report for the first and third quarters of the fund's fiscal year at mfs.com/openendfunds by choosing the fund's name and then scrolling to the “Resources” section and clicking on the “Prospectus and Reports” tab.
Further Information
From time to time, MFS may post important information about the fund or the MFS Funds on the MFS Web site (mfs.com). This information is available at https://www.mfs.com/announcements or at mfs.com/openendfunds by choosing the fund’s name and then scrolling to the “Resources” section and clicking on the “Announcements” tab, if any.
Information About Fund Contracts and Legal Claims
The fund has entered into contractual arrangements with an investment adviser, administrator, distributor, shareholder servicing agent, 529 program manager (if applicable), and custodian who each provide services to the fund. Unless expressly stated otherwise, shareholders are not parties to, or intended beneficiaries of these contractual arrangements, and these contractual arrangements are not intended to create any shareholder right to enforce them against the service providers or to seek any remedy under them against the service providers, either directly or on behalf of the fund.
Under the Trust’s By-Laws and Declaration of Trust, any claims asserted against or on behalf of the MFS Funds, including claims against Trustees and Officers, must be brought in state and federal courts located within the Commonwealth of Massachusetts.
Provision of Financial Reports and Summary Prospectuses
The fund produces financial reports every six months and updates its summary prospectus and prospectus annually. To avoid sending duplicate copies of materials to households, only one copy of the fund’s annual and semiannual report and summary prospectus may be mailed to shareholders having the same last name and residential address on the fund’s records. However, any shareholder may contact MFSC (please see back cover for address and telephone number) to request that copies of these reports and summary prospectuses be sent personally to that shareholder.
Save paper with eDelivery.
MFS® will send you prospectuses, reports, and proxies directly via e-mail so you will get information faster with less mailbox clutter.
To sign up:
1. Go to mfs.com.
2. Log in via MFS® Access.
3. Select eDelivery.
If you own your MFS fund shares through a financial institution or a retirement plan, MFS® TALK, MFS® Access, or eDelivery may not be available to you.
CONTACT
WEB SITE
mfs.com
MFS TALK
1-800-637-8255
24 hours a day
ACCOUNT SERVICE AND LITERATURE
Shareholders
1-800-225-2606
Financial advisors
1-800-343-2829
Retirement plan services
1-800-637-1255
MAILING ADDRESS
MFS Service Center, Inc.
P.O. Box 219341
Kansas City, MO 64121-9341
OVERNIGHT MAIL
MFS Service Center, Inc.
Suite 219341
430 W 7th Street
Kansas City, MO 64105-1407
Semiannual Report
April 30, 2021
MFS® Global Alternative
Strategy Fund
MFS® Global Alternative
Strategy Fund
| 1 |
| 2 |
| 4 |
| 6 |
| 39 |
| 41 |
| 43 |
| 44 |
| 53 |
| 72 |
| 73 |
| 73 |
| 73 |
| 73 |
| 73 |
The report is prepared for the general information of shareholders. It is authorized for distribution to prospective investors only when preceded or accompanied by a current prospectus.
NOT FDIC INSURED • MAY LOSE VALUE • NO BANK GUARANTEE
LETTER FROM THE CEO
Dear Shareholders:
Markets have experienced dramatic swings since the coronavirus pandemic brought the global economy to a standstill for several months early in 2020. While the speedy development of vaccines brightened the economic and market outlook, uncertainty remains as new variants of the virus appear and questions persist over how fast vaccines can be made widely available in the developing world.
Global central banks have taken aggressive steps to cushion the economic and market fallout related to the virus, and governments are deploying unprecedented levels of fiscal support. Having passed a $1.9 trillion stimulus package in March, the U.S. Congress is expected to approve additional stimulus later this year, some of it focused on infrastructure. Along with extraordinary government expenditures, pent-up consumer demand has fueled a surge in economic activity as coronavirus restrictions have been eased. Because of this, inflation pressures are being felt, and markets have pushed up yields on global government bonds, resulting in ripple effects across many financial markets.
A spirited debate is underway among investors over whether the current price pressures will persist or prove to be temporary, the consequence of pandemic-induced bottlenecks. The policy measures put in place to counteract the pandemic's effects have helped build a supportive environment and are encouraging economic recovery; however, if markets disconnect from fundamentals, they can sow the seeds of instability. As such, recent dramatic increases in speculative trading in cryptocurrencies, special-purpose acquisition companies (SPACs), and the like, bear watching.
In the aftermath of the crisis, we could see societal changes as households, businesses, and governments adjust to a new reality, and any such alterations could affect the investment landscape. For investors, events such as the COVID-19 outbreak demonstrate the importance of having a deep understanding of company fundamentals, and we have built our global research platform to do just that.
At MFS®, we put our clients’ assets to work responsibly by carefully navigating the increasing complexity of global markets and economies. Guided by our long-term philosophy and adhering to our commitment to sustainable investing, we tune out the noise and aim to uncover what we believe are the best, most durable investment opportunities in the market. Our unique global investment platform combines collective expertise, long-term discipline, and thoughtful risk management to create sustainable value for investors.
Respectfully,
Michael W. Roberge
Chief Executive Officer
MFS Investment Management
June 15, 2021
The opinions expressed in this letter are subject to change and may not be relied upon for investment advice. No forecasts can be guaranteed.
Portfolio structure
| | | | Derivative Overlay
Positions (b) | |
| | | Active Security
Selection (a) | Long | Short | Net Market
Exposure (c) |
| Fixed Income | U.S. | 11.8% | 43.5% | (8.0)% | 47.3% |
| | Asia/Pacific ex-Japan | 0.7% | 4.9% | 0.0% | 5.6% |
| | North America ex-U.S. | 0.6% | 4.1% | 0.0% | 4.7% |
| | Emerging Markets | 1.0% | 0.0% | 0.0% | 1.0% |
| | Developed - Middle
East/Africa | 0.1% | 0.0% | 0.0% | 0.1% |
| | United Kingdom | 1.2% | 0.0% | (2.1)% | (0.9)% |
| | Japan | 0.1% | 0.0% | (7.7)% | (7.6)% |
| | Europe ex-U.K. | 1.9% | 0.0% | (11.0)% | (9.1)% |
| Equity | Europe ex-U.K. | 11.1% | 7.2% | (3.1)% | 15.2% |
| | U.S. Large Cap | 33.0% | 0.0% | (25.6)% | 7.4% |
| | Emerging Markets | 3.1% | 6.0% | (5.1)% | 4.0% |
| | U.S. Small/Mid Cap | 18.0% | 0.0% | (15.8)% | 2.2% |
| | Japan | 3.3% | 0.0% | (1.4)% | 1.9% |
| | United Kingdom | 2.9% | 0.0% | (2.7)% | 0.2% |
| | Developed - Middle
East/Africa | 0.1% | 0.0% | 0.0% | 0.1% |
| | North America ex-U.S. | 1.8% | 0.0% | (2.6)% | (0.8)% |
| | Asia/Pacific ex-Japan | 1.5% | 2.4% | (4.7)% | (0.8)% |
| Cash | Cash & Cash
Equivalents (d) | | | | 5.9% |
| | Other (e) | | | | 23.6% |
Portfolio Composition - continued
Top ten holdings (c)
| USD Interest Rate Swap, Receive 0.247% - JUN 2022 | 28.2% |
| USD Interest Rate Swap, Receive 1.582% - NOV 2024 | 11.6% |
| Australian Note 10 yr Future - JUN 2021 | 4.9% |
| S&P/ASX 200 Index Future - JUN 2021 | (4.7)% |
| USD Interest Rate Swap, Pay 1.7% - NOV 2029 | (5.7)% |
| Japan Government Bond 10 yr Future - JUN 2021 | (7.6)% |
| Russell 2000 Index Future - JUN 2021 | (7.7)% |
| S&P MidCap 400 Index Future - JUN 2021 | (8.1)% |
| Euro-Bund 10 yr Future - JUN 2021 | (10.9)% |
| S&P 500 E-Mini Index - JUN 2021 | (25.6)% |
| (a) | Represents the actively managed portion of the portfolio and for purposes of this presentation, components include the value of securities, less any securities sold short. The bond component will include any accrued interest amounts. This also reflects the equivalent exposure of certain derivative positions. These amounts may be negative from time to time. |
| (b) | Represents the tactical overlay portion of the portfolio which is how the fund manages its exposure to markets and currencies through the use of derivative positions. Percentages reflect the equivalent exposure of those derivative positions. |
| (c) | For purposes of this presentation, the components include the value of securities, less any securities sold short, and reflect the impact of the equivalent exposure of all derivative positions. These amounts may be negative from time to time. The bond component will include any accrued interest amounts. |
| (d) | Cash & Cash Equivalents includes any cash, investments in money market funds, short-term securities, and other assets less liabilities. Please see the Statement of Assets and Liabilities for additional information related to the fund’s cash position and other assets and liabilities. |
| (e) | Other includes currency derivatives and/or the offsetting of the leverage produced by the fund’s derivative positions, including payables and/or receivables of the finance leg of interest rate swaps and the unrealized gain or loss in connection with forward currency exchange contracts. |
Equivalent exposure is a calculated amount that translates the derivative position into a reasonable approximation of the amount of the underlying asset that the portfolio would have to hold at a given point in time to have the same price sensitivity that results from the portfolio’s ownership of the derivative contract. When dealing with derivatives, equivalent exposure is a more representative measure of the potential impact of a position on portfolio performance than value. The value of derivatives may be different.
Where the fund holds convertible bonds, they are treated as part of the equity portion of the portfolio.
Percentages are based on net assets as of April 30, 2021.
The portfolio is actively managed and current holdings may be different.
Expense Table
Fund expenses borne by the shareholders during the period,
November 1, 2020 through April 30, 2021
As a shareholder of the fund, you incur two types of costs: (1) transaction costs, including sales charges (loads) on certain purchase or redemption payments, and (2) ongoing costs, including management fees; distribution and service (12b-1) fees; and other fund expenses. This example is intended to help you understand your ongoing costs (in dollars) of investing in the fund and to compare these costs with the ongoing costs of investing in other mutual funds.
The example is based on an investment of $1,000 invested at the beginning of the period and held for the entire period November 1, 2020 through April 30, 2021.
Actual Expenses
The first line for each share class in the following table provides information about actual account values and actual expenses. You may use the information in this line, together with the amount you invested, to estimate the expenses that you paid over the period. Simply divide your account value by $1,000 (for example, an $8,600 account value divided by $1,000 = 8.6), then multiply the result by the number in the first line under the heading entitled “Expenses Paid During Period” to estimate the expenses you paid on your account during this period.
Hypothetical Example for Comparison Purposes
The second line for each share class in the following table provides information about hypothetical account values and hypothetical expenses based on the fund’s actual expense ratio and an assumed rate of return of 5% per year before expenses, which is not the fund’s actual return. The hypothetical account values and expenses may not be used to estimate the actual ending account balance or expenses you paid for the period. You may use this information to compare the ongoing costs of investing in the fund and other funds. To do so, compare this 5% hypothetical example with the 5% hypothetical examples that appear in the shareholder reports of the other funds.
Please note that the expenses shown in the table are meant to highlight your ongoing costs only and do not reflect any transactional costs, such as sales charges (loads). Therefore, the second line for each share class in the table is useful in comparing ongoing costs only, and will not help you determine the relative total costs of owning different funds. In addition, if these transactional costs were included, your costs would have been higher.
Expense Table - continued
Share
Class | | Annualized
Expense
Ratio | Beginning
Account Value
11/01/20 | Ending
Account Value
4/30/21 | Expenses
Paid During
Period (p)
11/01/20-4/30/21 |
| A | Actual | 1.30% | $1,000.00 | $1,052.42 | $6.62 |
| Hypothetical (h) | 1.30% | $1,000.00 | $1,018.35 | $6.51 |
| B | Actual | 2.05% | $1,000.00 | $1,047.53 | $10.41 |
| Hypothetical (h) | 2.05% | $1,000.00 | $1,014.63 | $10.24 |
| C | Actual | 2.05% | $1,000.00 | $1,047.35 | $10.41 |
| Hypothetical (h) | 2.05% | $1,000.00 | $1,014.63 | $10.24 |
| I | Actual | 1.05% | $1,000.00 | $1,052.84 | $5.34 |
| Hypothetical (h) | 1.05% | $1,000.00 | $1,019.59 | $5.26 |
| R1 | Actual | 2.05% | $1,000.00 | $1,048.07 | $10.41 |
| Hypothetical (h) | 2.05% | $1,000.00 | $1,014.63 | $10.24 |
| R2 | Actual | 1.55% | $1,000.00 | $1,049.72 | $7.88 |
| Hypothetical (h) | 1.55% | $1,000.00 | $1,017.11 | $7.75 |
| R3 | Actual | 1.30% | $1,000.00 | $1,051.79 | $6.61 |
| Hypothetical (h) | 1.30% | $1,000.00 | $1,018.35 | $6.51 |
| R4 | Actual | 1.05% | $1,000.00 | $1,053.05 | $5.34 |
| Hypothetical (h) | 1.05% | $1,000.00 | $1,019.59 | $5.26 |
| R6 | Actual | 0.96% | $1,000.00 | $1,053.58 | $4.89 |
| Hypothetical (h) | 0.96% | $1,000.00 | $1,020.03 | $4.81 |
| (h) | 5% class return per year before expenses. |
| (p) | “Expenses Paid During Period” are equal to each class’s annualized expense ratio, as shown above, multiplied by the average account value over the period, multiplied by 181/365 (to reflect the one-half year period). Expenses paid do not include any applicable sales charges (loads). If these transaction costs had been included, your costs would have been higher. |
Portfolio of Investments
4/30/21 (unaudited)
The Portfolio of Investments is a complete list of all securities owned by your fund. It is categorized by broad-based asset classes.
| Issuer | | | Shares/Par | Value ($) |
| Common Stocks – 74.7% |
| Aerospace & Defense – 1.1% | |
| CACI International, Inc., “A” (a) | | 687 | $ 175,089 |
| Honeywell International, Inc. | | 2,241 | 499,832 |
| KBR, Inc. | | 4,369 | 172,838 |
| Kratos Defense & Security Solutions, Inc. (a) | | 945 | 25,269 |
| L3Harris Technologies, Inc. | | 524 | 109,636 |
| Leidos Holdings, Inc. | | 1,381 | 139,868 |
| MTU Aero Engines Holding AG | | 179 | 45,171 |
| Northrop Grumman Corp. | | 1,243 | 440,569 |
| PAE, Inc. (a) | | 6,240 | 55,973 |
| Raytheon Technologies Corp. | | 576 | 47,946 |
| Rolls-Royce Holdings PLC (a) | | 134,594 | 194,469 |
| Singapore Technologies Engineering Ltd. | | 26,900 | 78,027 |
| | | | | $1,984,687 |
| Airlines – 0.1% | |
| Alaska Air Group, Inc. (a) | | 595 | $ 41,138 |
| Delta Air Lines, Inc. (a) | | 518 | 24,305 |
| JetBlue Airways Corp. (a) | | 3,359 | 68,389 |
| Ryanair Holdings PLC, ADR (a) | | 273 | 31,900 |
| | | | | $165,732 |
| Alcoholic Beverages – 1.0% | |
| China Resources Beer Holdings Co. Ltd. | | 28,000 | $ 226,192 |
| Compania Cervecerias Unidas S.A., ADR | | 3,089 | 56,621 |
| Constellation Brands, Inc., “A” | | 134 | 32,203 |
| Diageo PLC | | 9,718 | 436,318 |
| Heineken N.V. | | 1,346 | 156,062 |
| Pernod Ricard S.A. | | 4,406 | 904,217 |
| | | | | $1,811,613 |
| Apparel Manufacturers – 1.1% | |
| Adidas AG | | 312 | $ 96,345 |
| Burberry Group PLC (a) | | 1,084 | 30,854 |
| Compagnie Financiere Richemont S.A. | | 2,192 | 224,757 |
| LVMH Moet Hennessy Louis Vuitton SE | | 1,434 | 1,079,585 |
| NIKE, Inc., “B” | | 1,751 | 232,218 |
| PVH Corp. (a) | | 868 | 98,240 |
| Skechers USA, Inc., “A” (a) | | 4,276 | 207,343 |
| | | | | $1,969,342 |
Portfolio of Investments (unaudited) – continued
| Issuer | | | Shares/Par | Value ($) |
| Common Stocks – continued |
| Automotive – 0.6% | |
| Bridgestone Corp. | | 600 | $ 24,030 |
| Continental AG | | 419 | 56,742 |
| Copart, Inc. (a) | | 1,449 | 180,415 |
| Ford Motor Co. (a) | | 12,044 | 138,988 |
| Koito Manufacturing Co. Ltd. | | 1,100 | 68,542 |
| Lear Corp. | | 361 | 66,366 |
| LKQ Corp. (a) | | 3,212 | 150,033 |
| Methode Electronics, Inc. | | 1,243 | 55,848 |
| NGK Spark Plug Co. Ltd | | 3,100 | 51,738 |
| Stanley Electric Co. Ltd. | | 2,600 | 74,462 |
| Stoneridge, Inc. (a) | | 738 | 24,538 |
| Tesla, Inc. (a) | | 168 | 119,186 |
| Toyota Industries Corp. | | 800 | 64,050 |
| USS Co. Ltd. | | 1,200 | 21,751 |
| Visteon Corp. (a) | | 471 | 57,372 |
| | | | | $1,154,061 |
| Biotechnology – 0.9% | |
| Abcam PLC (a) | | 2,255 | $ 47,586 |
| Adaptive Biotechnologies Corp. (a) | | 1,457 | 60,611 |
| AlloVir, Inc. (a) | | 773 | 18,266 |
| Amicus Therapeutics, Inc. (a) | | 1,577 | 15,518 |
| Berkeley Lights, Inc. (a) | | 371 | 18,220 |
| BioAtla, Inc. (a) | | 522 | 25,886 |
| Biogen, Inc. (a) | | 802 | 214,399 |
| BioXcel Therapeutics, Inc. (a) | | 371 | 12,603 |
| BridgeBio Pharma, Inc. (a) | | 549 | 30,700 |
| Illumina, Inc. (a) | | 65 | 25,534 |
| Immunocore Holdings PLC, ADR (a) | | 121 | 4,883 |
| Incyte Corp. (a) | | 2,868 | 244,870 |
| Morphosys AG, ADR (a) | | 827 | 19,807 |
| Neurocrine Biosciences, Inc. (a) | | 180 | 17,008 |
| Novozymes A/S | | 4,624 | 329,154 |
| Olink Holding AB (a) | | 499 | 17,565 |
| Prelude Therapeutics, Inc. (a) | | 470 | 19,477 |
| Recursion Pharmaceuticals, Inc. (a) | | 1,087 | 36,306 |
| Regeneron Pharmaceuticals, Inc. (a) | | 192 | 92,409 |
| Sana Biotechnology, Inc. (a) | | 607 | 13,050 |
| Vertex Pharmaceuticals, Inc. (a) | | 1,854 | 404,543 |
| | | | | $1,668,395 |
Portfolio of Investments (unaudited) – continued
| Issuer | | | Shares/Par | Value ($) |
| Common Stocks – continued |
| Broadcasting – 0.3% | |
| Discovery Communications, Inc., “C” (a) | | 1,814 | $ 58,610 |
| Netflix, Inc. (a)(f) | | 889 | 456,475 |
| | | | | $515,085 |
| Brokerage & Asset Managers – 1.4% | |
| Apollo Global Management, Inc. | | 1,050 | $ 58,139 |
| ASX Ltd. | | 1,461 | 82,138 |
| BlackRock, Inc. (f) | | 500 | 409,650 |
| Cboe Global Markets, Inc. | | 611 | 63,770 |
| Charles Schwab Corp. | | 1,183 | 83,283 |
| Computershare Ltd. | | 9,068 | 98,636 |
| Daiwa Securities Group, Inc. | | 18,700 | 99,600 |
| Euronext N.V. | | 763 | 76,779 |
| Focus Financial Partners, “A” (a) | | 1,808 | 85,084 |
| GCM Grosvenor, Inc. | | 1,511 | 19,930 |
| GCM Grosvenor, Inc. (PIPE) (a)(zz) | | 2,498 | 32,949 |
| Hamilton Lane, Inc., “A” | | 427 | 38,622 |
| Hong Kong Exchanges & Clearing Ltd. | | 1,300 | 78,659 |
| NASDAQ, Inc. (f) | | 4,345 | 701,891 |
| Omni Bridgeway Ltd. | | 26,082 | 75,346 |
| Raymond James Financial, Inc. | | 1,937 | 253,321 |
| Schroders PLC | | 2,315 | 115,353 |
| TMX Group Ltd. | | 279 | 30,745 |
| WisdomTree Investments, Inc. | | 9,747 | 66,133 |
| | | | | $2,470,028 |
| Business Services – 3.8% | |
| Accenture PLC, “A” | | 2,773 | $ 804,087 |
| Amdocs Ltd. | | 818 | 62,773 |
| Cancom SE | | 1,024 | 63,230 |
| Clarivate PLC (a) | | 10,669 | 297,985 |
| Cognizant Technology Solutions Corp., “A” | | 1,767 | 142,067 |
| CoStar Group, Inc. (a) | | 358 | 305,886 |
| Doshisha Co. Ltd. | | 4,100 | 69,027 |
| Endava PLC, ADR (a) | | 756 | 68,448 |
| Equifax, Inc. | | 2,382 | 546,026 |
| EVO Payments, Inc., “A” (a) | | 1,981 | 56,478 |
| ExlService Holdings, Inc. (a) | | 771 | 71,225 |
| Experian PLC | | 4,003 | 154,351 |
| Fidelity National Information Services, Inc. | | 429 | 65,594 |
| Fiserv, Inc. (a)(f) | | 4,117 | 494,534 |
| Global Payments, Inc. | | 1,826 | 391,914 |
| Intertek Group PLC | | 1,938 | 164,282 |
| Keywords Studios PLC (a) | | 1,854 | 69,286 |
Portfolio of Investments (unaudited) – continued
| Issuer | | | Shares/Par | Value ($) |
| Common Stocks – continued |
| Business Services – continued | |
| MSCI, Inc. | | 1,130 | $ 548,920 |
| Nomura Research Institute Ltd. | | 5,600 | 172,422 |
| Nuvei Corp. (a) | | 1,640 | 114,439 |
| Paya, Inc. (a) | | 2,524 | 28,168 |
| PayPal Holdings, Inc. (a)(f) | | 4,530 | 1,188,174 |
| Proofpoint, Inc. (a) | | 277 | 47,675 |
| SGS S.A. | | 73 | 215,823 |
| Stamps.com, Inc. (a) | | 543 | 111,516 |
| Syneos Health, Inc. (a) | | 1,127 | 95,626 |
| TriNet Group, Inc. (a) | | 646 | 50,847 |
| Verisk Analytics, Inc., “A” | | 1,845 | 347,229 |
| WNS (Holdings) Ltd., ADR (a) | | 1,301 | 94,231 |
| | | | | $6,842,263 |
| Cable TV – 0.9% | |
| Cable One, Inc. | | 11 | $ 19,690 |
| Charter Communications, Inc., “A” (a) | | 1,575 | 1,060,684 |
| Comcast Corp., “A” (f) | | 9,950 | 558,693 |
| Liberty Broadband Corp. (a) | | 342 | 55,650 |
| | | | | $1,694,717 |
| Chemicals – 0.6% | |
| Celanese Corp. | | 371 | $ 58,117 |
| Eastman Chemical Co. | | 1,973 | 227,664 |
| Element Solutions, Inc. | | 3,696 | 80,869 |
| FMC Corp. | | 522 | 61,721 |
| Givaudan S.A. | | 135 | 565,278 |
| Ingevity Corp. (a) | | 865 | 67,539 |
| | | | | $1,061,188 |
| Computer Software – 6.7% | |
| 8x8, Inc. (a) | | 2,224 | $ 73,147 |
| ACI Worldwide, Inc. (a) | | 597 | 22,555 |
| Adobe Systems, Inc. (a) | | 2,020 | 1,026,847 |
| Alkami Technology, Inc. (a) | | 213 | 10,158 |
| ANSYS, Inc. (a) | | 1,398 | 511,193 |
| Asana, Inc. (a) | | 929 | 30,954 |
| Atlassian Corp. PLC, “A” (a) | | 113 | 26,844 |
| Autodesk, Inc. (a) | | 1,016 | 296,581 |
| Avalara, Inc. (a) | | 159 | 22,532 |
| Black Knight, Inc. (a) | | 1,463 | 105,950 |
| Cadence Design Systems, Inc. (a)(f) | | 8,599 | 1,133,090 |
| Citrix Systems, Inc. | | 865 | 107,130 |
| Cognyte Software, Ltd. (a) | | 189 | 4,939 |
Portfolio of Investments (unaudited) – continued
| Issuer | | | Shares/Par | Value ($) |
| Common Stocks – continued |
| Computer Software – continued | |
| Computer Modelling Group Ltd. | | 28,319 | $ 126,256 |
| Coupa Software, Inc. (a) | | 341 | 91,743 |
| CrowdStrike Holdings, Inc. (a) | | 1,956 | 407,846 |
| Dassault Systemes S.A. | | 3,101 | 719,352 |
| DocuSign, Inc. (a) | | 534 | 119,050 |
| DoubleVerify Holdings, Inc. (a) | | 902 | 31,759 |
| Eventbrite, Inc. (a) | | 4,612 | 108,705 |
| Everbridge, Inc. (a) | | 526 | 69,805 |
| McAfee Corp. | | 1,079 | 26,198 |
| Microsoft Corp. (f)(s) | | 15,237 | 3,842,467 |
| nCino, Inc. (a) | | 364 | 23,802 |
| OBIC Co. Ltd. | | 1,300 | 251,340 |
| Okta, Inc. (a) | | 415 | 111,926 |
| Open Lending Corp., “A” (a) | | 1,373 | 53,616 |
| Oracle Corp. (f) | | 13,833 | 1,048,403 |
| Pagerduty, Inc. (a) | | 1,126 | 47,810 |
| Paylocity Holding Corp. (a) | | 208 | 40,194 |
| Ping Identity Holding Corp. (a) | | 2,022 | 49,094 |
| RingCentral, Inc. (a) | | 300 | 95,685 |
| salesforce.com, inc. (a) | | 392 | 90,285 |
| SAP SE | | 4,425 | 621,158 |
| Synopsys, Inc. (a) | | 1,415 | 349,590 |
| VeriSign, Inc. (a)(f) | | 718 | 157,077 |
| VERTEX, Inc. (a) | | 2,465 | 50,360 |
| Zendesk, Inc. (a) | | 198 | 28,938 |
| Zoom Video Communications, Inc. (a) | | 533 | 170,331 |
| Zscaler, Inc. (a) | | 346 | 64,923 |
| | | | | $12,169,633 |
| Computer Software - Systems – 3.2% | |
| Alten S.A. | | 749 | $ 93,741 |
| Amadeus IT Group S.A. (a) | | 6,876 | 468,720 |
| Apple, Inc. (f) | | 17,162 | 2,256,117 |
| Constellation Software, Inc. | | 66 | 96,863 |
| EMIS Group PLC | | 4,960 | 83,981 |
| EPAM Systems, Inc. (a) | | 765 | 350,179 |
| Fujitsu Ltd. | | 600 | 95,553 |
| Hitachi Ltd. | | 15,700 | 773,005 |
| HP, Inc. | | 4,173 | 142,341 |
| Kinaxis, Inc. (a) | | 1,245 | 160,584 |
| NICE Systems Ltd., ADR (a) | | 517 | 124,716 |
| Q2 Holdings, Inc. (a) | | 923 | 96,010 |
| Rapid7, Inc. (a) | | 1,182 | 96,037 |
Portfolio of Investments (unaudited) – continued
| Issuer | | | Shares/Par | Value ($) |
| Common Stocks – continued |
| Computer Software - Systems – continued | |
| Samsung Electronics Co. Ltd. | | 930 | $ 68,140 |
| ServiceNow, Inc. (a) | | 614 | 310,911 |
| Temenos AG | | 428 | 62,847 |
| TransUnion | | 2,902 | 303,520 |
| Venture Corp. Ltd. | | 9,700 | 146,876 |
| Verint Systems, Inc. (a) | | 1,643 | 79,801 |
| Zebra Technologies Corp., “A” (a) | | 173 | 84,379 |
| | | | | $5,894,321 |
| Conglomerates – 0.1% | |
| Ansell Ltd. | | 4,744 | $ 154,441 |
| DCC PLC | | 1,245 | 108,047 |
| | | | | $262,488 |
| Construction – 1.5% | |
| Armstrong World Industries, Inc. | | 564 | $ 58,459 |
| AvalonBay Communities, Inc., REIT | | 70 | 13,440 |
| AZEK Co. LLC (a) | | 1,895 | 91,491 |
| Builders FirstSource, Inc. (a) | | 1,531 | 74,514 |
| Fortune Brands Home & Security, Inc. | | 519 | 54,485 |
| GMS, Inc. (a) | | 952 | 41,612 |
| Lennar Corp. | | 1,517 | 157,161 |
| Masco Corp. | | 1,493 | 95,373 |
| Mid-America Apartment Communities, Inc., REIT | | 401 | 63,089 |
| Otis Worldwide Corp. | | 404 | 31,459 |
| Pool Corp. | | 275 | 116,193 |
| Pulte Homes, Inc. | | 3,216 | 190,130 |
| Sherwin-Williams Co. (f) | | 2,538 | 695,082 |
| Stanley Black & Decker, Inc. | | 426 | 88,084 |
| Techtronic Industries Co. Ltd. | | 6,500 | 118,490 |
| Toll Brothers, Inc. (f) | | 5,732 | 359,396 |
| Trex Co., Inc. (a) | | 397 | 42,872 |
| TS Innovation Acquisitions Corp. (SPAC) (a) | �� | 3,461 | 35,406 |
| Vulcan Materials Co. | | 2,387 | 425,459 |
| | | | | $2,752,195 |
| Consumer Products – 2.2% | |
| Colgate-Palmolive Co. (f) | | 7,049 | $ 568,854 |
| Energizer Holdings, Inc. | | 1,857 | 91,550 |
| Estee Lauder Cos., Inc., “A” | | 709 | 222,484 |
| Kao Corp. | | 4,900 | 314,158 |
| Kimberly-Clark Corp. | | 231 | 30,797 |
| Kobayashi Pharmaceutical Co. Ltd. | | 7,500 | 669,091 |
| L’Oréal S.A. | | 2,014 | 827,248 |
Portfolio of Investments (unaudited) – continued
| Issuer | | | Shares/Par | Value ($) |
| Common Stocks – continued |
| Consumer Products – continued | |
| Newell Brands, Inc. | | 3,106 | $ 83,738 |
| Prestige Brands Holdings, Inc. (a) | | 1,332 | 58,022 |
| Procter & Gamble Co. | | 823 | 109,805 |
| Reckitt Benckiser Group PLC | | 9,120 | 812,515 |
| Reynolds Consumer Products, Inc. | | 941 | 27,590 |
| Scotts Miracle-Gro Co. | | 614 | 141,932 |
| | | | | $3,957,784 |
| Consumer Services – 0.5% | |
| 51job, Inc., ADR (a) | | 400 | $ 24,620 |
| Asante, Inc. | | 4,400 | 72,830 |
| Boyd Group Services, Inc. | | 199 | 36,960 |
| Bright Horizons Family Solutions, Inc. (a) | | 1,275 | 184,658 |
| BrightView Holdings, Inc. (a) | | 1,433 | 25,694 |
| Carsales.com Ltd. | | 1,316 | 20,164 |
| Grand Canyon Education, Inc. (a) | | 1,047 | 113,380 |
| MakeMyTrip Ltd. (a) | | 3,443 | 94,407 |
| Meitec Corp. | | 1,800 | 99,973 |
| Naspers Ltd. | | 213 | 48,620 |
| Persol Holdings Co. Ltd. | | 1,100 | 20,221 |
| Regis Corp. (a) | | 2,528 | 32,712 |
| Seek Ltd. | | 906 | 21,615 |
| Uber Technologies, Inc. (a) | | 1,908 | 104,501 |
| | | | | $900,355 |
| Containers – 0.7% | |
| Berry Global, Inc. (a) | | 2,120 | $ 134,874 |
| Brambles Ltd. | | 7,993 | 64,037 |
| Gerresheimer AG | | 1,581 | 170,023 |
| Graphic Packaging Holding Co. | | 24,011 | 445,404 |
| Owens Corning | | 1,088 | 105,329 |
| Pactiv Evergreen, Inc. | | 3,509 | 51,652 |
| SIG Combibloc Group AG | | 5,025 | 123,032 |
| Silgan Holdings, Inc. | | 976 | 41,158 |
| WestRock Co. | | 1,062 | 59,207 |
| | | | | $1,194,716 |
| Electrical Equipment – 1.9% | |
| Advanced Drainage Systems, Inc. | | 266 | $ 29,702 |
| AMETEK, Inc. | | 1,247 | 168,258 |
| Generac Holdings, Inc. (a) | | 204 | 66,086 |
| Halma PLC | | 23,217 | 829,812 |
| Johnson Controls International PLC | | 2,057 | 128,233 |
| Legrand S.A. | | 1,064 | 103,615 |
Portfolio of Investments (unaudited) – continued
| Issuer | | | Shares/Par | Value ($) |
| Common Stocks – continued |
| Electrical Equipment – continued | |
| Littlefuse, Inc. | | 101 | $ 26,789 |
| nVent Electric PLC | | 1,456 | 44,335 |
| Rockwell Automation, Inc. | | 1,116 | 294,914 |
| Schneider Electric SE | | 7,152 | 1,143,772 |
| Sensata Technologies Holding PLC (a) | | 2,512 | 145,043 |
| Spectris PLC | | 5,045 | 226,719 |
| TE Connectivity Ltd. | | 505 | 67,907 |
| TriMas Corp. (a) | | 1,598 | 50,880 |
| WESCO International, Inc. (a) | | 604 | 55,399 |
| | | | | $3,381,464 |
| Electronics – 3.5% | |
| Advanced Energy Industries, Inc. | | 630 | $ 69,495 |
| Analog Devices, Inc. | | 2,979 | 456,264 |
| Applied Materials, Inc. | | 550 | 72,991 |
| ASM International N.V. | | 722 | 219,523 |
| ASM Pacific Technology Ltd. | | 5,100 | 77,343 |
| Broadcom, Inc. | | 286 | 130,473 |
| Corning, Inc. | | 1,005 | 44,431 |
| Entegris, Inc. | | 1,570 | 176,751 |
| Intel Corp. (f) | | 17,555 | 1,009,939 |
| Kyocera Corp. | | 900 | 54,656 |
| Lam Research Corp. | | 82 | 50,877 |
| Marvell Technology, Inc. | | 1,237 | 55,925 |
| Monolithic Power Systems, Inc. | | 706 | 255,134 |
| nLIGHT, Inc. (a) | | 577 | 16,929 |
| NVIDIA Corp. | | 1,582 | 949,801 |
| NXP Semiconductors N.V. | | 1,046 | 201,365 |
| ON Semiconductor Corp. (a) | | 577 | 22,503 |
| Plexus Corp. (a) | | 744 | 68,775 |
| Silicon Laboratories, Inc. (a) | | 295 | 41,580 |
| Silicon Motion Technology Corp., ADR | | 1,877 | 134,806 |
| Taiwan Semiconductor Manufacturing Co. Ltd. | | 3,654 | 79,182 |
| Taiwan Semiconductor Manufacturing Co. Ltd., ADR | | 13,472 | 1,572,721 |
| Texas Instruments, Inc. (f) | | 2,903 | 524,021 |
| | | | | $6,285,485 |
| Energy - Independent – 0.6% | |
| Cabot Oil & Gas Corp. | | 1,583 | $ 26,389 |
| ConocoPhillips | | 769 | 39,327 |
| Devon Energy Corp. | | 2,763 | 64,599 |
| Diamondback Energy, Inc. | | 696 | 56,884 |
| Hess Corp. | | 616 | 45,898 |
| Magnolia Oil & Gas Corp., “A” (a) | | 4,666 | 52,539 |
Portfolio of Investments (unaudited) – continued
| Issuer | | | Shares/Par | Value ($) |
| Common Stocks – continued |
| Energy - Independent – continued | |
| Oil Search Ltd. | | 12,765 | $ 37,367 |
| Pioneer Natural Resources Co. | | 540 | 83,068 |
| Reliance Industries Ltd. | | 15,048 | 405,187 |
| Valero Energy Corp. | | 4,262 | 315,218 |
| Viper Energy Partners LP | | 2,154 | 38,794 |
| | | | | $1,165,270 |
| Energy - Integrated – 0.2% | |
| Cairn Energy PLC | | 12,711 | $ 29,808 |
| Eni S.p.A. | | 3,742 | 44,673 |
| Exxon Mobil Corp. | | 2,920 | 167,141 |
| Galp Energia SGPS S.A. | | 5,521 | 63,787 |
| Idemitsu Kosan Co. Ltd. | | 2,000 | 47,891 |
| | | | | $353,300 |
| Engineering - Construction – 0.2% | |
| APi Group, Inc. (a) | | 2,664 | $ 56,636 |
| Quanta Services, Inc. | | 3,573 | 345,295 |
| | | | | $401,931 |
| Entertainment – 0.0% | |
| IMAX Corp. (a) | | 1,309 | $ 26,991 |
| Manchester United PLC, “A” | | 3,353 | 59,449 |
| | | | | $86,440 |
| Food & Beverages – 2.3% | |
| Archer Daniels Midland Co. | | 705 | $ 44,507 |
| Britvic PLC | | 6,866 | 83,681 |
| Chocoladefabriken Lindt & Sprungli AG | | 39 | 361,708 |
| Coca-Cola European Partners PLC | | 816 | 46,365 |
| Danone S.A. | | 1,228 | 86,559 |
| Duckhorn Portfolio, Inc. (a) | | 2,708 | 50,667 |
| Hostess Brands, Inc. (a) | | 4,045 | 61,848 |
| Ingredion, Inc. | | 380 | 35,496 |
| J.M. Smucker Co. | | 335 | 43,882 |
| Kellogg Co. | | 774 | 48,313 |
| Laird Superfood, Inc. (a) | | 316 | 11,537 |
| Mondelez International, Inc. | | 3,028 | 184,133 |
| Morinaga & Co. Ltd. | | 2,600 | 86,595 |
| Nestle S.A. | | 13,566 | 1,617,373 |
| Nestle S.A., ADR | | 3,571 | 426,842 |
| Nomad Foods Ltd. (a) | | 1,495 | 43,594 |
| PepsiCo, Inc. | | 359 | 51,753 |
| S Foods, Inc. | | 3,300 | 98,133 |
Portfolio of Investments (unaudited) – continued
| Issuer | | | Shares/Par | Value ($) |
| Common Stocks – continued |
| Food & Beverages – continued | |
| Sanderson Farms, Inc. | | 198 | $ 32,577 |
| Toyo Suisan Kaisha Ltd. | | 6,900 | 281,266 |
| Tyson Foods, Inc., “A” | | 6,642 | 514,423 |
| | | | | $4,211,252 |
| Food & Drug Stores – 0.4% | |
| Albertsons Cos., Inc., “A” | | 1,892 | $ 35,134 |
| JM Holdings Co. Ltd. | | 3,600 | 67,955 |
| Kroger Co. | | 3,866 | 141,264 |
| Patlac Corp. | | 1,800 | 93,714 |
| Sugi Holdings Co. Ltd. | | 500 | 38,430 |
| Sundrug Co. Ltd. | | 3,100 | 105,659 |
| Wal-Mart Stores, Inc. | | 1,469 | 205,528 |
| | | | | $687,684 |
| Forest & Paper Products – 0.0% | |
| Suzano Papel e Celulose S.A., ADR (a) | | 4,346 | $ 55,107 |
| Gaming & Lodging – 0.5% | |
| Flutter Entertainment PLC (a) | | 3,150 | $ 645,585 |
| International Game Technology PLC (a) | | 2,562 | 44,118 |
| Penn National Gaming, Inc. (a) | | 364 | 32,440 |
| Tabcorp Holdings Ltd. | | 25,560 | 97,860 |
| Wyndham Hotels & Resorts, Inc. | | 1,275 | 93,215 |
| | | | | $913,218 |
| General Merchandise – 0.2% | |
| B&M European Value Retail S.A. | | 13,023 | $ 101,761 |
| Dollar General Corp. | | 233 | 50,037 |
| Dollar Tree, Inc. (a) | | 275 | 31,598 |
| Dollarama, Inc. | | 3,774 | 175,873 |
| Ollie's Bargain Outlet Holdings, Inc. (a) | | 226 | 20,853 |
| | | | | $380,122 |
| Health Maintenance Organizations – 0.4% | |
| Cigna Corp. (f) | | 2,542 | $ 632,983 |
| Humana, Inc. | | 291 | 129,565 |
| | | | | $762,548 |
| Insurance – 2.8% | |
| AIA Group Ltd. | | 70,600 | $ 898,888 |
| Allstate Corp. | | 2,332 | 295,698 |
| American International Group, Inc. | | 715 | 34,642 |
| Aon PLC | | 2,465 | 619,800 |
| Arthur J. Gallagher & Co. | | 1,676 | 242,936 |
Portfolio of Investments (unaudited) – continued
| Issuer | | | Shares/Par | Value ($) |
| Common Stocks – continued |
| Insurance – continued | |
| Assurant, Inc. | | 407 | $ 63,329 |
| Athene Holding Ltd. (a) | | 881 | 52,569 |
| Beazley PLC (a) | | 37,820 | 176,960 |
| Chubb Ltd. | | 2,505 | 429,833 |
| Cincinnati Financial Corp. | | 426 | 48,002 |
| CNO Financial Group, Inc. | | 2,388 | 60,966 |
| Equitable Holdings, Inc. | | 9,668 | 330,936 |
| Everest Re Group Ltd. | | 1,117 | 309,353 |
| Hanover Insurance Group, Inc. | | 595 | 82,295 |
| Hartford Financial Services Group, Inc. | | 1,367 | 90,167 |
| Hiscox Ltd. (a) | | 2,477 | 27,777 |
| Marsh & McLennan Cos., Inc. | | 2,466 | 334,636 |
| MetLife, Inc. (f) | | 9,321 | 593,095 |
| Metromile, Inc. (a) | | 4,519 | 42,072 |
| Reinsurance Group of America, Inc. | | 608 | 79,362 |
| Selective Insurance Group, Inc. | | 546 | 41,572 |
| SiriusPoint Ltd. (a) | | 2,480 | 26,238 |
| Willis Towers Watson PLC | | 252 | 65,233 |
| Zurich Insurance Group AG | | 212 | 86,982 |
| | | | | $5,033,341 |
| Internet – 3.8% | |
| Alphabet, Inc., “A” (a) | | 738 | $ 1,736,883 |
| Alphabet, Inc., “C” (a) | | 755 | 1,819,640 |
| Facebook, Inc., “A” (a)(f) | | 4,314 | 1,402,395 |
| IAC/InterActiveCorp (a) | | 683 | 173,120 |
| Match Group, Inc. (a) | | 2,065 | 321,376 |
| Naver Corp. | | 1,598 | 516,457 |
| NetEase.com, Inc., ADR | | 1,130 | 126,628 |
| Scout24 AG | | 661 | 54,945 |
| Tencent Holdings Ltd. | | 9,300 | 745,892 |
| | | | | $6,897,336 |
| Leisure & Toys – 0.8% | |
| Activision Blizzard, Inc. | | 3,470 | $ 316,429 |
| Brunswick Corp. | | 851 | 91,168 |
| Electronic Arts, Inc. | | 1,749 | 248,498 |
| Funko, Inc., “A” (a) | | 1,437 | 30,953 |
| Malibu Boats, Inc., “A” (a) | | 671 | 55,935 |
| Mattel, Inc. (a) | | 1,820 | 39,057 |
| Polaris, Inc. | | 1,878 | 262,976 |
| Take-Two Interactive Software, Inc. (a) | | 2,377 | 416,878 |
| Thule Group AB | | 557 | 25,292 |
Portfolio of Investments (unaudited) – continued
| Issuer | | | Shares/Par | Value ($) |
| Common Stocks – continued |
| Leisure & Toys – continued | |
| Yamaha Corp. | | 600 | $ 32,666 |
| | | | | $1,519,852 |
| Machinery & Tools – 3.5% | |
| AGCO Corp. (f) | | 6,652 | $ 970,659 |
| Azbil Corp. | | 2,000 | 80,886 |
| BELIMO Holding AG | | 368 | 146,676 |
| Cummins, Inc. | | 763 | 192,306 |
| Daikin Industries Ltd. | | 800 | 160,527 |
| Eaton Corp. PLC | | 3,692 | 527,698 |
| Enerpac Tool Group Corp. | | 719 | 19,125 |
| GEA Group AG | | 8,169 | 358,571 |
| IDEX Corp. | | 654 | 146,627 |
| Illinois Tool Works, Inc. | | 2,210 | 509,317 |
| Ingersoll Rand, Inc. (a) | | 1,747 | 86,319 |
| ITT, Inc. | | 721 | 67,997 |
| Kubota Corp. | | 5,200 | 122,280 |
| Nordson Corp. | | 760 | 160,672 |
| Regal Beloit Corp. | | 5,089 | 735,004 |
| Ritchie Bros. Auctioneers, Inc. | | 1,291 | 82,108 |
| Ritchie Bros. Auctioneers, Inc. | | 10,428 | 663,357 |
| Roper Technologies, Inc. | | 549 | 245,096 |
| Schindler Holding AG | | 840 | 238,962 |
| SMC Corp. | | 200 | 116,113 |
| Spirax-Sarco Engineering PLC | | 3,935 | 642,078 |
| Trane Technologies PLC | | 130 | 22,598 |
| Wabtec Corp. | | 491 | 40,296 |
| | | | | $6,335,272 |
| Major Banks – 1.6% | |
| Bank of America Corp. (f) | | 16,871 | $ 683,782 |
| Bank of Ireland Group PLC (a) | | 13,993 | 82,130 |
| Bank of New York Mellon Corp. | | 5,511 | 274,889 |
| BNP Paribas | | 2,570 | 164,963 |
| Capital One Financial Corp. | | 837 | 124,780 |
| Comerica, Inc. | | 597 | 44,871 |
| Credit Suisse Group AG | | 4,703 | 49,159 |
| DBS Group Holdings Ltd. | | 4,800 | 107,885 |
| Goldman Sachs Group, Inc. | | 227 | 79,098 |
| JPMorgan Chase & Co. (f) | | 5,442 | 837,034 |
| KeyCorp | | 2,679 | 58,295 |
| Mitsubishi UFJ Financial Group, Inc. | | 15,700 | 83,032 |
| NatWest Group PLC | | 23,309 | 63,287 |
| PNC Financial Services Group, Inc. | | 327 | 61,133 |
Portfolio of Investments (unaudited) – continued
| Issuer | | | Shares/Par | Value ($) |
| Common Stocks – continued |
| Major Banks – continued | |
| State Street Corp. | | 505 | $ 42,395 |
| TCF Financial Corp. | | 1,034 | 47,068 |
| UBS Group AG | | 4,760 | 72,579 |
| | | | | $2,876,380 |
| Medical & Health Technology & Services – 2.0% | |
| AmerisourceBergen Corp. | | 327 | $ 39,502 |
| Burning Rock Biotech Ltd. (a) | | 3,247 | 99,034 |
| Certara, Inc. (a) | | 2,322 | 73,863 |
| Charles River Laboratories International, Inc. (a) | | 1,000 | 332,450 |
| CVS Health Corp. (f) | | 3,336 | 254,870 |
| Guardant Health, Inc. (a) | | 141 | 22,416 |
| HCA Healthcare, Inc. | | 2,329 | 468,269 |
| Health Catalyst, Inc. (a) | | 431 | 24,955 |
| HealthEquity, Inc. (a) | | 662 | 50,292 |
| Hogy Medical Co. Ltd. | | 3,600 | 108,702 |
| ICON PLC (a) | | 2,440 | 529,358 |
| IDEXX Laboratories, Inc. (a) | | 586 | 321,708 |
| Laboratory Corp. of America Holdings (a) | | 389 | 103,423 |
| McKesson Corp. | | 3,528 | 661,712 |
| PRA Health Sciences, Inc. (a) | | 1,390 | 231,977 |
| Premier, Inc., “A” | | 2,566 | 90,708 |
| Quest Diagnostics, Inc. | | 358 | 47,213 |
| Universal Health Services, Inc. | | 1,323 | 196,346 |
| | | | | $3,656,798 |
| Medical Equipment – 2.8% | |
| Acutus Medical, Inc. (a) | | 1,378 | $ 18,810 |
| Agilent Technologies, Inc. | | 986 | 131,769 |
| Avantor, Inc. (a) | | 5,394 | 172,824 |
| Becton, Dickinson and Co. | | 174 | 43,293 |
| Bio-Techne Corp. | | 489 | 209,043 |
| Boston Scientific Corp. (a) | | 5,875 | 256,150 |
| Danaher Corp. | | 1,584 | 402,241 |
| Dentsply Sirona, Inc. | | 728 | 49,147 |
| EssilorLuxottica | | 3,197 | 531,953 |
| Hologic, Inc. (a) | | 204 | 13,372 |
| Koninklijke Philips N.V. | | 2,456 | 138,424 |
| Maravai Lifesciences Holdings, Inc., “A” (a) | | 1,651 | 64,240 |
| Masimo Corp. (a) | | 469 | 109,122 |
| Medtronic PLC | | 5,117 | 669,918 |
| Merit Medical Systems, Inc. (a) | | 345 | 21,942 |
| Nevro Corp. (a) | | 203 | 35,080 |
| Nihon Kohden Corp. | | 2,200 | 66,529 |
Portfolio of Investments (unaudited) – continued
| Issuer | | | Shares/Par | Value ($) |
| Common Stocks – continued |
| Medical Equipment – continued | |
| OptiNose, Inc. (a) | | 2,280 | $ 8,140 |
| Outset Medical, Inc. (a) | | 506 | 30,320 |
| PerkinElmer, Inc. | | 1,974 | 255,890 |
| QIAGEN N.V. (a) | | 7,771 | 378,659 |
| Quidel Corp. (a) | | 205 | 21,482 |
| Shimadzu Corp. | | 3,600 | 125,995 |
| Silk Road Medical, Inc. (a) | | 349 | 21,338 |
| Smith & Nephew PLC | | 3,254 | 70,577 |
| STERIS PLC | | 1,088 | 229,590 |
| Terumo Corp. | | 1,500 | 56,711 |
| Thermo Fisher Scientific, Inc. (f) | | 1,792 | 842,652 |
| West Pharmaceutical Services, Inc. | | 339 | 111,368 |
| Zimmer Biomet Holdings, Inc. | | 444 | 78,659 |
| | | | | $5,165,238 |
| Metals & Mining – 0.1% | |
| Arconic Corp. (a) | | 1,359 | $ 38,867 |
| Howmet Aerospace, Inc. (a) | | 972 | 31,065 |
| Kaiser Aluminum Corp. | | 172 | 20,721 |
| | | | | $90,653 |
| Natural Gas - Distribution – 0.3% | |
| Atmos Energy Corp. | | 256 | $ 26,519 |
| China Resources Gas Group Ltd. | | 10,000 | 54,263 |
| Italgas S.p.A. | | 15,645 | 101,984 |
| New Jersey Resources Corp. | | 1,535 | 64,393 |
| Sempra Energy | | 1,760 | 242,123 |
| South Jersey Industries, Inc. | | 2,597 | 64,276 |
| | | | | $553,558 |
| Natural Gas - Pipeline – 0.5% | |
| APA Group | | 4,155 | $ 32,104 |
| Cheniere Energy, Inc. (a) | | 1,292 | 100,156 |
| Enterprise Products Partners LP | | 1,114 | 25,633 |
| Equitrans Midstream Corp. | | 1,016 | 8,291 |
| ONEOK, Inc. | | 4,027 | 210,773 |
| Plains GP Holdings LP | | 8,942 | 83,876 |
| Targa Resources Corp. | | 6,974 | 241,928 |
| TC Energy Corp. | | 981 | 48,533 |
| Williams Cos., Inc. | | 6,021 | 146,672 |
| | | | | $897,966 |
Portfolio of Investments (unaudited) – continued
| Issuer | | | Shares/Par | Value ($) |
| Common Stocks – continued |
| Network & Telecom – 0.4% | |
| CoreSite Realty Corp., REIT | | 1,350 | $ 164,011 |
| Equinix, Inc., REIT | | 42 | 30,272 |
| Motorola Solutions, Inc. | | 293 | 55,172 |
| Palo Alto Networks, Inc. (a) | | 255 | 90,114 |
| QTS Realty Trust, Inc., REIT, “A” | | 1,536 | 102,129 |
| Qualcomm, Inc. | | 937 | 130,056 |
| VTech Holdings Ltd. | | 13,600 | 124,747 |
| | | | | $696,501 |
| Oil Services – 0.2% | |
| Baker Hughes Co. | | 5,861 | $ 117,689 |
| ChampionX Corp. (a) | | 2,697 | 56,664 |
| Frank's International N.V. (a) | | 7,486 | 24,330 |
| Halliburton Co. | | 1,158 | 22,650 |
| Schlumberger Ltd. | | 4,290 | 116,044 |
| | | | | $337,377 |
| Other Banks & Diversified Financials – 3.4% | |
| Agiliti Health, Inc. (a) | | 2,086 | $ 32,104 |
| AIB Group PLC (a) | | 25,587 | 74,875 |
| Air Lease Corp. | | 695 | 32,463 |
| American Express Co. | | 2,176 | 333,690 |
| Bank of Hawaii Corp. | | 627 | 56,988 |
| Bank OZK | | 636 | 26,070 |
| Brookline Bancorp, Inc. | | 3,262 | 52,518 |
| Cathay General Bancorp, Inc. | | 1,975 | 79,948 |
| Chiba Bank Ltd. | | 16,000 | 99,844 |
| Citigroup, Inc. (f) | | 18,666 | 1,329,766 |
| Credicorp Ltd. (a) | | 386 | 46,088 |
| Discover Financial Services | | 578 | 65,892 |
| East West Bancorp, Inc. | | 1,164 | 88,639 |
| Element Fleet Management Corp. | | 7,913 | 96,889 |
| Encore Capital Group, Inc. (a) | | 1,533 | 60,308 |
| First Hawaiian, Inc. | | 2,430 | 66,728 |
| FTAC Olympus Acquisition Corp. (SPAC) (a) | | 4,701 | 47,292 |
| Genius Sports Ltd. (SPAC) (a) | | 3,132 | 66,085 |
| Grupo Financiero Banorte S.A. de C.V. | | 35,129 | 199,863 |
| Hanmi Financial Corp. | | 1,942 | 39,423 |
| HDFC Bank Ltd. (a) | | 4,789 | 91,309 |
| HDFC Bank Ltd., ADR (a) | | 6,129 | 430,746 |
| Hudson Executive Investment Corp., “A” (SPAC) (a) | | 4,531 | 44,947 |
| ING Groep N.V. | | 6,403 | 81,830 |
| Julius Baer Group Ltd. | | 1,157 | 72,872 |
| KBC Group N.V. | | 1,033 | 80,253 |
Portfolio of Investments (unaudited) – continued
| Issuer | | | Shares/Par | Value ($) |
| Common Stocks – continued |
| Other Banks & Diversified Financials – continued | |
| Lakeland Financial Corp. | | 764 | $ 49,836 |
| Macquarie Group Ltd. | | 571 | 70,595 |
| Metropolitan Bank & Trust Co. | | 85,017 | 77,689 |
| Northern Trust Corp. | | 847 | 96,389 |
| Prosperity Bancshares, Inc. | | 1,883 | 138,137 |
| Sandy Spring Bancorp, Inc. | | 629 | 28,531 |
| Signature Bank | | 443 | 111,419 |
| SLM Corp. | | 8,087 | 158,990 |
| SVB Financial Group (a) | | 94 | 53,752 |
| Synchrony Financial | | 4,650 | 203,391 |
| Textainer Group Holdings Ltd. (a) | | 2,730 | 69,943 |
| TPG Pace Tech Opportunities Corp. (SPAC) (a) | | 3,802 | 39,313 |
| Truist Financial Corp. | | 2,239 | 132,795 |
| UMB Financial Corp. | | 851 | 82,572 |
| Umpqua Holdings Corp. | | 6,253 | 116,556 |
| Visa, Inc., “A” (f) | | 3,780 | 882,857 |
| Wintrust Financial Corp. | | 1,225 | 94,447 |
| Zions Bancorp NA | | 1,890 | 105,462 |
| | | | | $6,210,104 |
| Pharmaceuticals – 2.9% | |
| Annexon, Inc. (a) | | 896 | $ 17,857 |
| Bayer AG | | 4,965 | 321,261 |
| Bristol-Myers Squibb Co. | | 4,155 | 259,355 |
| Collegium Pharmaceutical, Inc. (a) | | 939 | 20,940 |
| Elanco Animal Health, Inc. (a) | | 741 | 23,497 |
| Eli Lilly & Co. (f) | | 3,265 | 596,744 |
| Harmony Biosciences Holdings (a) | | 848 | 24,846 |
| Johnson & Johnson (f) | | 10,698 | 1,740,886 |
| Kyowa Kirin Co. Ltd. | | 3,500 | 106,323 |
| Merck & Co., Inc. (f) | | 4,142 | 308,579 |
| Novartis AG | | 2,324 | 198,389 |
| Novo Nordisk A.S., “B” | | 2,816 | 206,258 |
| Orchard RX Ltd., ADR (a) | | 644 | 3,838 |
| Roche Holding AG | | 2,829 | 921,884 |
| Santen Pharmaceutical Co. Ltd. | | 13,400 | 171,654 |
| SpringWorks Therapeutics, Inc. (a) | | 488 | 35,068 |
| Turning Point Therapeutics, Inc. (a) | | 288 | 21,954 |
| Viatris, Inc. (a) | | 1,733 | 23,049 |
| Zoetis, Inc. | | 1,440 | 249,163 |
| | | | | $5,251,545 |
Portfolio of Investments (unaudited) – continued
| Issuer | | | Shares/Par | Value ($) |
| Common Stocks – continued |
| Pollution Control – 0.1% | |
| GFL Environmental, Inc. | | 1,526 | $ 50,251 |
| Republic Services, Inc. | | 511 | 54,319 |
| U.S. Ecology, Inc. (a) | | 886 | 37,620 |
| | | | | $142,190 |
| Precious Metals & Minerals – 0.6% | |
| Agnico-Eagle Mines Ltd. | | 7,628 | $ 476,738 |
| Agnico-Eagle Mines Ltd. | | 1,122 | 70,058 |
| Franco-Nevada Corp. | | 2,340 | 325,980 |
| Wheaton Precious Metals Corp. | | 3,566 | 147,932 |
| | | | | $1,020,708 |
| Printing & Publishing – 0.2% | |
| China Literature Ltd. (a) | | 12,000 | $ 125,133 |
| Wolters Kluwer N.V. | | 2,777 | 251,266 |
| | | | | $376,399 |
| Railroad & Shipping – 0.6% | |
| Canadian National Railway Co. | | 4,485 | $ 482,810 |
| Canadian Pacific Railway Ltd. | | 123 | 45,895 |
| CSX Corp. | | 2,278 | 229,509 |
| Kansas City Southern Co. | | 114 | 33,312 |
| Sankyu, Inc. | | 1,400 | 59,694 |
| StealthGas, Inc. (a) | | 2,275 | 6,370 |
| Union Pacific Corp. | | 1,118 | 248,297 |
| | | | | $1,105,887 |
| Real Estate – 2.3% | |
| Annaly Mortgage Management, Inc., REIT | | 1,842 | $ 16,725 |
| Ascendas Real Estate Investment Trust, REIT | | 35,502 | 82,969 |
| Big Yellow Group PLC, REIT | | 2,512 | 41,492 |
| Boston Properties, Inc., REIT | | 213 | 23,292 |
| Brixmor Property Group, Inc., REIT | | 3,866 | 86,366 |
| Broadstone Net Lease, Inc. | | 2,100 | 42,378 |
| Concentradora Fibra Danhos S.A. de C.V., REIT | | 45,350 | 53,550 |
| Deutsche Wohnen SE | | 5,159 | 279,108 |
| Douglas Emmett, Inc. | | 638 | 21,399 |
| Empire State Realty Trust, REIT, “A” | | 3,790 | 43,168 |
| ESR Cayman Ltd. (a) | | 43,400 | 148,340 |
| Extra Space Storage, Inc., REIT | | 1,835 | 272,846 |
| Grand City Properties S.A. | | 4,165 | 111,965 |
| Hibernia PLC, REIT | | 43,610 | 59,666 |
| Host Hotels & Resorts, Inc., REIT (a) | | 2,427 | 44,074 |
| Industrial Logistics Properties Trust, REIT | | 4,314 | 106,987 |
Portfolio of Investments (unaudited) – continued
| Issuer | | | Shares/Par | Value ($) |
| Common Stocks – continued |
| Real Estate – continued | |
| LEG Immobilien AG | | 763 | $ 106,134 |
| Lexington Realty Trust, REIT | | 4,123 | 50,466 |
| Life Storage, Inc., REIT | | 1,302 | 125,070 |
| Mapletree Commercial Trust, REIT | | 37,900 | 62,372 |
| Medical Properties Trust, Inc., REIT | | 2,101 | 46,327 |
| National Storage Affiliates Trust, REIT | | 689 | 31,308 |
| Office Properties Income Trust, REIT | | 1,356 | 37,629 |
| Omega Healthcare Investors, Inc., REIT | | 13,195 | 501,410 |
| Public Storage, Inc., REIT | | 1,352 | 380,128 |
| Spirit Realty Capital, Inc., REIT | | 616 | 29,285 |
| STAG Industrial, Inc., REIT | | 6,228 | 227,384 |
| STORE Capital Corp., REIT | | 9,149 | 327,443 |
| Sun Communities, Inc., REIT | | 364 | 60,726 |
| TAG Immobilien AG | | 19,518 | 603,298 |
| Two Harbors Investment Corp., REIT | | 9,717 | 75,793 |
| VICI Properties, Inc., REIT | | 2,070 | 65,619 |
| W.P. Carey, Inc., REIT | | 622 | 46,582 |
| | | | | $4,211,299 |
| Restaurants – 0.2% | |
| Aramark | | 1,091 | $ 42,407 |
| Chipotle Mexican Grill, Inc., “A” (a) | | 51 | 76,093 |
| Domino's Pizza, Inc. | | 249 | 105,163 |
| Performance Food Group Co. (a) | | 378 | 22,189 |
| Starbucks Corp. | | 642 | 73,502 |
| Texas Roadhouse, Inc. | | 132 | 14,127 |
| Wendy's Co. | | 1,747 | 39,430 |
| Yum China Holdings, Inc. | | 904 | 56,880 |
| | | | | $429,791 |
| Specialty Chemicals – 1.8% | |
| Air Products & Chemicals, Inc. | | 109 | $ 31,444 |
| Akzo Nobel N.V. | | 880 | 105,713 |
| Ashland Global Holdings, Inc. | | 553 | 47,674 |
| Atotech, Ltd. (a) | | 1,874 | 40,422 |
| Avient Corp. | | 1,405 | 71,332 |
| Axalta Coating Systems Ltd. (a) | | 5,434 | 173,290 |
| Compass Minerals International, Inc. | | 681 | 46,254 |
| Corteva, Inc. | | 1,326 | 64,656 |
| Croda International PLC | | 2,036 | 190,191 |
| Diversey Holdings Ltd. (a) | | 2,263 | 40,734 |
| Dow, Inc. | | 1,289 | 80,563 |
| DuPont de Nemours, Inc. | | 1,246 | 96,079 |
| Ferro Corp. (a) | | 7,393 | 123,167 |
Portfolio of Investments (unaudited) – continued
| Issuer | | | Shares/Par | Value ($) |
| Common Stocks – continued |
| Specialty Chemicals – continued | |
| Kansai Paint Co. Ltd. | | 5,000 | $ 125,949 |
| Linde PLC | | 3,375 | 964,490 |
| Nitto Denko Corp. | | 900 | 74,609 |
| Sika AG | | 2,014 | 600,727 |
| Symrise AG | | 754 | 97,358 |
| Tikkurila Oyj | | 4,810 | 194,014 |
| Univar Solutions, Inc. (a) | | 3,596 | 83,967 |
| | | | | $3,252,633 |
| Specialty Stores – 3.4% | |
| ACV Auctions, Inc. (a) | | 1,490 | $ 50,646 |
| Amazon.com, Inc. (a)(f)(s) | | 899 | 3,117,211 |
| AutoZone, Inc. (a) | | 132 | 193,264 |
| Best Buy Co., Inc. | | 984 | 114,410 |
| Burlington Stores, Inc. (a) | | 548 | 178,829 |
| Costco Wholesale Corp. | | 902 | 335,625 |
| Home Depot, Inc. | | 1,057 | 342,119 |
| Just Eat Takeaway.com (a) | | 925 | 95,746 |
| Leslie's, Inc. (a) | | 3,555 | 101,033 |
| Lowe's Cos., Inc. | | 1,067 | 209,399 |
| Lululemon Athletica, Inc. (a) | | 676 | 226,643 |
| Ocado Group PLC (a) | | 620 | 17,956 |
| O'Reilly Automotive, Inc. (a) | | 221 | 122,187 |
| Petco Health & Wellness Co., Inc. (a) | | 1,682 | 39,729 |
| Ross Stores, Inc. | | 343 | 44,912 |
| Ryohin Keikaku Co. Ltd. | | 3,100 | 65,239 |
| Target Corp. (f) | | 3,277 | 679,191 |
| ThredUp, Inc. (a) | | 1,783 | 30,614 |
| Ulta Beauty, Inc. (a) | | 227 | 74,762 |
| Urban Outfitters, Inc. (a) | | 2,867 | 102,925 |
| Vroom, Inc. (a) | | 933 | 43,170 |
| Zozo, Inc. | | 300 | 10,129 |
| Zumiez, Inc. (a) | | 1,332 | 57,236 |
| | | | | $6,252,975 |
| Telecommunications - Wireless – 0.4% | |
| Advanced Info Service Public Co. Ltd. | | 6,300 | $ 34,598 |
| Cellnex Telecom S.A. | | 3,083 | 174,356 |
| KDDI Corp. | | 2,600 | 78,649 |
| SBA Communications Corp., REIT | | 680 | 203,810 |
| SoftBank Group Corp. | | 1,100 | 99,492 |
| T-Mobile USA, Inc. (a) | | 331 | 43,735 |
| | | | | $634,640 |
Portfolio of Investments (unaudited) – continued
| Issuer | | | Shares/Par | Value ($) |
| Common Stocks – continued |
| Telephone Services – 0.2% | |
| Hellenic Telecommunications Organization S.A. | | 2,425 | $ 41,137 |
| Infrastrutture Wireless Italiane S.p.A. | | 9,207 | 107,371 |
| Tele2 AB, “B” | | 951 | 12,284 |
| Verizon Communications, Inc. | | 2,751 | 158,980 |
| | | | | $319,772 |
| Tobacco – 0.7% | |
| Altria Group, Inc. | | 5,934 | $ 283,348 |
| British American Tobacco PLC | | 2,762 | 102,304 |
| Japan Tobacco, Inc. | | 2,700 | 50,497 |
| Philip Morris International, Inc. (f) | | 6,761 | 642,295 |
| Swedish Match AB | | 1,266 | 103,846 |
| | | | | $1,182,290 |
| Trucking – 0.4% | |
| CryoPort, Inc. (a) | | 1,379 | $ 78,010 |
| Hamakyorex Co. Ltd. | | 1,800 | 50,645 |
| Knight-Swift Transportation Holdings, Inc. | | 1,845 | 86,936 |
| Schneider National, Inc. | | 3,170 | 76,809 |
| Seino Holdings Co. Ltd. | | 8,400 | 115,443 |
| SG Holdings Co. Ltd. | | 5,700 | 129,553 |
| United Parcel Service, Inc., “B” | | 687 | 140,052 |
| | | | | $677,448 |
| Utilities - Electric Power – 1.8% | |
| AES Corp. | | 8,827 | $ 245,567 |
| Ameren Corp. | | 551 | 46,747 |
| American Electric Power Co., Inc. | | 250 | 22,177 |
| Array Technologies, Inc. (a) | | 2,427 | 68,344 |
| Black Hills Corp. | | 1,058 | 72,981 |
| CenterPoint Energy, Inc. | | 896 | 21,943 |
| CenterPoint Energy, Inc. (PIPE) (a)(z) | | 1,215 | 29,755 |
| CLP Holdings Ltd. | | 4,500 | 44,405 |
| CMS Energy Corp. | | 938 | 60,398 |
| Dominion Energy, Inc. | | 3,300 | 263,670 |
| Duke Energy Corp. (f) | | 5,107 | 514,224 |
| E.ON SE | | 3,956 | 47,685 |
| Edison International | | 607 | 36,086 |
| Eversource Energy | | 703 | 60,613 |
| Exelon Corp. (f) | | 7,072 | 317,816 |
| Iberdrola S.A. | | 7,239 | 97,779 |
| NextEra Energy, Inc. | | 523 | 40,538 |
| NRG Energy, Inc. | | 10,385 | 371,991 |
| Orsted A.S. | | 294 | 42,883 |
Portfolio of Investments (unaudited) – continued
| Issuer | | | Shares/Par | Value ($) |
| Common Stocks – continued |
| Utilities - Electric Power – continued | |
| PG&E Corp. (a) | | 7,969 | $ 90,209 |
| Pinnacle West Capital Corp. | | 720 | 60,948 |
| Portland General Electric Co. | | 1,361 | 69,220 |
| Public Service Enterprise Group, Inc. | | 1,069 | 67,518 |
| Shoals Technologies Group, Inc. (a) | | 1,706 | 54,711 |
| Southern Co. | | 7,944 | 525,654 |
| | | | | $3,273,862 |
| Total Common Stocks (Identified Cost, $86,838,870) | | $ 135,554,239 |
| Bonds – 18.9% |
| Aerospace & Defense – 0.4% |
| BAE Systems PLC, 3.4%, 4/15/2030 (n) | | $ | 200,000 | $ 213,626 |
| Boeing Co., 5.15%, 5/01/2030 | | | 55,000 | 63,968 |
| Huntington Ingalls Industries, Inc., 3.844%, 5/01/2025 | | | 83,000 | 90,515 |
| Huntington Ingalls Industries, Inc., 3.483%, 12/01/2027 | | | 160,000 | 174,057 |
| L3Harris Technologies, Inc., 3.85%, 6/15/2023 | | | 181,000 | 192,810 |
| | | | | $734,976 |
| Apparel Manufacturers – 0.0% |
| Tapestry, Inc., 4.125%, 7/15/2027 | | $ | 35,000 | $ 38,341 |
| Automotive – 0.7% |
| Aptiv PLC, 5.4%, 3/15/2049 | | $ | 150,000 | $ 190,797 |
| Daimler Finance North America LLC, 1.45%, 3/02/2026 (n) | | | 150,000 | 150,456 |
| Hyundai Capital America, 6.375%, 4/08/2030 (n) | | | 371,000 | 472,323 |
| Lear Corp., 3.8%, 9/15/2027 | | | 221,000 | 243,001 |
| Volkswagen Group of America Finance LLC, 3.35%, 5/13/2025 (n) | | | 200,000 | 216,480 |
| | | | | $1,273,057 |
| Broadcasting – 0.6% |
| Discovery Communications LLC, 3.625%, 5/15/2030 | | $ | 150,000 | $ 160,525 |
| Discovery Communications LLC, 4%, 9/15/2055 (n) | | | 119,000 | 116,367 |
| Prosus N.V., 3.68%, 1/21/2030 (n) | | | 200,000 | 209,075 |
| RELX Capital, Inc., 3%, 5/22/2030 | | | 80,000 | 83,664 |
| Walt Disney Co., 3.35%, 3/24/2025 | | | 160,000 | 174,202 |
| Walt Disney Co., 3.5%, 5/13/2040 | | | 160,000 | 170,982 |
| Walt Disney Co., 3.8%, 5/13/2060 | | | 150,000 | 164,961 |
| | | | | $1,079,776 |
| Brokerage & Asset Managers – 0.2% |
| Charles Schwab Corp., 3.2%, 1/25/2028 | | $ | 156,000 | $ 170,304 |
| E*TRADE Financial Corp., 3.8%, 8/24/2027 | | | 131,000 | 145,148 |
| Intercontinental Exchange, Inc., 1.85%, 9/15/2032 | | | 66,000 | 60,966 |
Portfolio of Investments (unaudited) – continued
| Issuer | | | Shares/Par | Value ($) |
| Bonds – continued |
| Brokerage & Asset Managers – continued |
| Intercontinental Exchange, Inc., 3%, 9/15/2060 | | $ | 65,000 | $ 58,292 |
| | | | | $434,710 |
| Building – 0.1% |
| Masco Corp., 4.5%, 5/15/2047 | | $ | 75,000 | $ 87,562 |
| Vulcan Materials Co., 3.5%, 6/01/2030 | | | 137,000 | 149,101 |
| | | | | $236,663 |
| Business Services – 0.7% |
| Equinix, Inc., 3%, 7/15/2050 | | $ | 98,000 | $ 89,809 |
| Fiserv, Inc., 4.4%, 7/01/2049 | | | 75,000 | 87,463 |
| Mastercard, Inc., 3.85%, 3/26/2050 | | | 182,000 | 208,271 |
| NXP Semiconductors N.V., 3.4%, 5/01/2030 (n) | | | 224,000 | 239,541 |
| Verisk Analytics, Inc., 4.125%, 3/15/2029 | | | 323,000 | 363,028 |
| Visa, Inc., 2.05%, 4/15/2030 | | | 100,000 | 101,169 |
| Visa, Inc., 2.7%, 4/15/2040 | | | 200,000 | 198,547 |
| | | | | $1,287,828 |
| Cable TV – 0.5% |
| Charter Communications Operating LLC/Charter Communications Operating Capital Corp., 6.384%, 10/23/2035 | | $ | 335,000 | $ 436,811 |
| Comcast Corp., 3.75%, 4/01/2040 | | | 100,000 | 110,324 |
| Cox Communications, Inc., 4.6%, 8/15/2047 (n) | | | 250,000 | 293,982 |
| | | | | $841,117 |
| Chemicals – 0.2% |
| LYB International Finance III, LLC, 3.625%, 4/01/2051 | | $ | 71,000 | $ 70,988 |
| Sherwin-Williams Co., 3.45%, 6/01/2027 | | | 155,000 | 170,482 |
| Sherwin-Williams Co., 4.5%, 6/01/2047 | | | 119,000 | 141,796 |
| | | | | $383,266 |
| Computer Software – 0.4% |
| Dell International LLC/EMC Corp., 4.9%, 10/01/2026 (n) | | $ | 413,000 | $ 474,438 |
| Microsoft Corp., 2.525%, 6/01/2050 | | | 350,000 | 325,941 |
| | | | | $800,379 |
| Computer Software - Systems – 0.1% |
| Apple, Inc., 2.05%, 9/11/2026 | | $ | 172,000 | $ 179,690 |
| Apple, Inc., 2.65%, 5/11/2050 | | | 87,000 | 80,773 |
| | | | | $260,463 |
Portfolio of Investments (unaudited) – continued
| Issuer | | | Shares/Par | Value ($) |
| Bonds – continued |
| Conglomerates – 0.2% |
| Carrier Global Corp., 3.377%, 4/05/2040 | | $ | 89,000 | $ 89,801 |
| Roper Technologies, Inc., 2%, 6/30/2030 | | | 159,000 | 153,159 |
| Westinghouse Air Brake Technologies Corp., 4.95%, 9/15/2028 | | | 156,000 | 179,420 |
| | | | | $422,380 |
| Consumer Products – 0.4% |
| Mattel, Inc., 3.75%, 4/01/2029 (n) | | $ | 96,000 | $ 98,383 |
| Reckitt Benckiser Treasury Services PLC, 3.625%, 9/21/2023 (n) | | | 300,000 | 319,423 |
| Whirlpool Corp., 4.75%, 2/26/2029 | | | 228,000 | 267,595 |
| | | | | $685,401 |
| Consumer Services – 0.1% |
| Booking Holdings, Inc., 3.55%, 3/15/2028 | | $ | 132,000 | $ 144,273 |
| Electrical Equipment – 0.2% |
| Arrow Electronics, Inc., 3.875%, 1/12/2028 | | $ | 260,000 | $ 287,027 |
| Electronics – 0.4% |
| Broadcom Corp./Broadcom Cayman Finance Ltd., 3.5%, 1/15/2028 | | $ | 306,000 | $ 327,753 |
| Broadcom, Inc., 5%, 4/15/2030 | | | 175,000 | 201,276 |
| NXP B.V./NXP Funding LLC, 4.625%, 6/01/2023 (n) | | | 200,000 | 215,914 |
| | | | | $744,943 |
| Emerging Market Quasi-Sovereign – 0.2% |
| Ecopetrol S.A., 5.375%, 6/26/2026 | | $ | 237,000 | $ 265,961 |
| Ecopetrol S.A., 6.875%, 4/29/2030 | | | 140,000 | 169,750 |
| | | | | $435,711 |
| Emerging Market Sovereign – 0.4% |
| Republic of Panama, 2.252%, 9/29/2032 | | $ | 241,000 | $ 230,097 |
| State of Qatar, 3.75%, 4/16/2030 (n) | | | 200,000 | 223,940 |
| United Mexican States, 2.659%, 5/24/2031 | | | 200,000 | 192,338 |
| | | | | $646,375 |
| Energy - Independent – 0.1% |
| Hess Corp., 5.8%, 4/01/2047 | | $ | 150,000 | $ 182,919 |
| Energy - Integrated – 0.2% |
| Cenovus Energy, Inc., 5.375%, 7/15/2025 | | $ | 121,000 | $ 137,576 |
| Eni S.p.A., 4.75%, 9/12/2028 (n) | | | 200,000 | 231,271 |
| | | | | $368,847 |
Portfolio of Investments (unaudited) – continued
| Issuer | | | Shares/Par | Value ($) |
| Bonds – continued |
| Financial Institutions – 0.2% |
| Avolon Holdings Funding Ltd., 4.25%, 4/15/2026 (n) | | $ | 100,000 | $ 106,638 |
| Avolon Holdings Funding Ltd., 4.375%, 5/01/2026 (n) | | | 94,000 | 100,554 |
| Avolon Holdings Funding Ltd., 2.75%, 2/21/2028 (n) | | | 180,000 | 175,102 |
| | | | | $382,294 |
| Food & Beverages – 0.9% |
| Anheuser-Busch InBev Worldwide, Inc., 3.5%, 6/01/2030 | | $ | 307,000 | $ 335,174 |
| Anheuser-Busch InBev Worldwide, Inc., 5.55%, 1/23/2049 | | | 150,000 | 193,938 |
| Bacardi Ltd., 5.15%, 5/15/2038 (n) | | | 114,000 | 136,878 |
| Constellation Brands, Inc., 3.5%, 5/09/2027 | | | 300,000 | 328,725 |
| Constellation Brands, Inc., 3.15%, 8/01/2029 | | | 168,000 | 177,181 |
| Constellation Brands, Inc., 4.1%, 2/15/2048 | | | 269,000 | 297,829 |
| SYSCO Corp., 2.4%, 2/15/2030 | | | 24,000 | 23,974 |
| SYSCO Corp., 4.45%, 3/15/2048 | | | 43,000 | 49,347 |
| | | | | $1,543,046 |
| Forest & Paper Products – 0.1% |
| Celulosa Arauco y Constitucion, 4.2%, 1/29/2030 (n) | | $ | 200,000 | $ 216,000 |
| Gaming & Lodging – 0.1% |
| Marriott International, Inc., 4.625%, 6/15/2030 | | $ | 50,000 | $ 56,138 |
| Marriott International, Inc., 2.85%, 4/15/2031 | | | 53,000 | 52,685 |
| Marriott International, Inc., 3.5%, 10/15/2032 | | | 128,000 | 133,615 |
| | | | | $242,438 |
| Industrial – 0.1% |
| Trustees of the University of Pennsylvania, 2.396%, 10/01/2050 | | $ | 234,000 | $ 215,531 |
| Insurance - Health – 0.2% |
| UnitedHealth Group, Inc., 4.625%, 7/15/2035 | | $ | 306,000 | $ 373,500 |
| Insurance - Property & Casualty – 0.5% |
| Fairfax Financial Holdings Ltd., 4.85%, 4/17/2028 | | $ | 157,000 | $ 176,777 |
| Fairfax Financial Holdings Ltd., 4.625%, 4/29/2030 | | | 121,000 | 134,006 |
| Hartford Financial Services Group, Inc., 3.6%, 8/19/2049 | | | 145,000 | 152,880 |
| Progressive Corp., 4.125%, 4/15/2047 | | | 157,000 | 186,066 |
| Willis North America, Inc., 3.875%, 9/15/2049 | | | 200,000 | 215,532 |
| | | | | $865,261 |
| International Market Sovereign – 0.1% |
| Government of Bermuda, 2.375%, 8/20/2030 (n) | | $ | 200,000 | $ 197,500 |
| Machinery & Tools – 0.2% |
| CNH Industrial Capital LLC, 3.85%, 11/15/2027 | | $ | 332,000 | $ 368,059 |
Portfolio of Investments (unaudited) – continued
| Issuer | | | Shares/Par | Value ($) |
| Bonds – continued |
| Major Banks – 2.9% |
| Australia and New Zealand Banking Group Ltd., 2.57%, 11/25/2035 (n) | | $ | 108,000 | $ 102,699 |
| Bank of America Corp., 3.366% to 1/23/2025, FLR (LIBOR - 3mo. + 0.81%) to 1/23/2026 | | | 700,000 | 756,092 |
| Bank of America Corp., 3.419% to 12/20/2027, FLR (LIBOR - 3mo. + 1.04%) to 12/20/2028 | | | 355,000 | 384,490 |
| Bank of America Corp., 2.496% to 2/13/2030, FLR (LIBOR - 3mo. + 0.99%) to 2/13/2031 | | | 159,000 | 159,460 |
| Bank of America Corp., 3.311% to 4/22/2041, FLR (SOFR + 1.58%) to 4/22/2042 | | | 248,000 | 253,032 |
| Commonwealth Bank of Australia, 3.61% to 9/12/2029, FLR (CMT - 1yr. + 2.05%) to 9/12/2034 (n) | | | 200,000 | 208,225 |
| Commonwealth Bank of Australia, 3.305%, 3/11/2041 (n) | | | 200,000 | 196,718 |
| Credit Agricole S.A., 1.247% to 1/26/2026, FLR (SOFR + 0.89162%) to 1/26/2027 (n) | | | 250,000 | 245,510 |
| HSBC Holdings PLC, 2.099% to 6/04/2025, FLR (SOFR + 1.929%) to 6/04/2026 | | | 400,000 | 409,194 |
| HSBC Holdings PLC, 2.357% to 8/18/2030, FLR (SOFR + 1.947%) to 8/18/2031 | | | 450,000 | 438,535 |
| JPMorgan Chase & Co., 3.782% to 2/01/2027, FLR (LIBOR - 3mo. + 1.337%) to 2/01/2028 | | | 550,000 | 610,606 |
| JPMorgan Chase & Co., 3.109% to 4/22/2040, FLR (SOFR + 2.46%) to 4/22/2041 | | | 100,000 | 99,754 |
| Morgan Stanley, 3.125%, 7/27/2026 | | | 364,000 | 394,457 |
| Morgan Stanley, 3.622% to 4/01/2030, FLR (SOFR + 3.12%) to 4/01/2031 | | | 306,000 | 335,095 |
| Morgan Stanley, 3.217% to 4/22/2041, FLR (SOFR + 1.485%) to 4/22/2042 | | | 76,000 | 77,010 |
| Sumitomo Mitsui Financial Group, Inc., 1.71%, 1/12/2031 | | | 200,000 | 189,404 |
| UniCredit S.p.A., 2.569% to 9/22/2025, FLR (CMT - 1yr. + 2.3%) to 9/22/2026 (n) | | | 350,000 | 352,897 |
| | | | | $5,213,178 |
| Medical & Health Technology & Services – 0.5% |
| Alcon Finance Corp., 2.75%, 9/23/2026 (n) | | $ | 200,000 | $ 212,389 |
| Becton, Dickinson and Co., 2.823%, 5/20/2030 | | | 350,000 | 361,868 |
| HCA, Inc., 5.125%, 6/15/2039 | | | 176,000 | 213,459 |
| Memorial Sloan-Kettering Cancer Center, 2.955%, 1/01/2050 | | | 99,000 | 97,381 |
| | | | | $885,097 |
Portfolio of Investments (unaudited) – continued
| Issuer | | | Shares/Par | Value ($) |
| Bonds – continued |
| Medical Equipment – 0.1% |
| Boston Scientific Corp., 3.75%, 3/01/2026 | | $ | 84,000 | $ 93,390 |
| Danaher Corp., 2.6%, 10/01/2050 | | | 135,000 | 120,547 |
| | | | | $213,937 |
| Metals & Mining – 0.2% |
| Anglo American Capital PLC, 4.5%, 3/15/2028 (n) | | $ | 200,000 | $ 227,090 |
| Glencore Funding LLC, 2.5%, 9/01/2030 (n) | | | 100,000 | 96,863 |
| Glencore Funding LLC, 2.85%, 4/27/2031 (n) | | | 101,000 | 99,580 |
| | | | | $423,533 |
| Midstream – 0.8% |
| Energy Transfer Partners LP, 5.15%, 3/15/2045 | | $ | 150,000 | $ 158,803 |
| Galaxy Pipeline Assets Bidco Ltd., 1.75%, 9/30/2027 (n) | | | 220,000 | 221,032 |
| MPLX LP, 4.5%, 4/15/2038 | | | 182,000 | 199,887 |
| Plains All American Pipeline LP/PAA Finance Corp., 3.55%, 12/15/2029 | | | 175,000 | 177,401 |
| Plains All American Pipeline LP/PAA Finance Corp., 4.3%, 1/31/2043 | | | 150,000 | 139,267 |
| Sabine Pass Liquefaction LLC, 4.2%, 3/15/2028 | | | 336,000 | 372,144 |
| Sabine Pass Liquefaction LLC, 4.5%, 5/15/2030 | | | 102,000 | 114,879 |
| | | | | $1,383,413 |
| Municipals – 0.3% |
| Michigan Finance Authority Hospital Rev. (Trinity Health Credit Group), 3.384%, 12/01/2040 | | $ | 160,000 | $ 171,156 |
| New Jersey Transportation Trust Fund Authority, Transportation System, “B”, 4.081%, 6/15/2039 | | | 180,000 | 192,631 |
| State of Florida, “A”, 2.154%, 7/01/2030 | | | 132,000 | 131,993 |
| | | | | $495,780 |
| Natural Gas - Distribution – 0.1% |
| NiSource, Inc., 5.65%, 2/01/2045 | | $ | 85,000 | $ 112,419 |
| Natural Gas - Pipeline – 0.3% |
| APT Pipelines Ltd., 5%, 3/23/2035 (n) | | $ | 472,000 | $ 558,452 |
| Network & Telecom – 0.4% |
| AT&T, Inc., 2.75%, 6/01/2031 | | $ | 364,000 | $ 363,473 |
| AT&T, Inc., 3.3%, 2/01/2052 | | | 185,000 | 168,373 |
| Verizon Communications, Inc., 2.1%, 3/22/2028 | | | 26,000 | 26,236 |
| Verizon Communications, Inc., 3.15%, 3/22/2030 | | | 47,000 | 49,706 |
| Verizon Communications, Inc., 3.4%, 3/22/2041 | | | 95,000 | 97,320 |
| | | | | $705,108 |
Portfolio of Investments (unaudited) – continued
| Issuer | | | Shares/Par | Value ($) |
| Bonds – continued |
| Oil Services – 0.1% |
| Halliburton Co., 5%, 11/15/2045 | | $ | 100,000 | $ 113,225 |
| Other Banks & Diversified Financials – 0.2% |
| Groupe BPCE S.A., 4.5%, 3/15/2025 (n) | | $ | 200,000 | $ 221,192 |
| Mizrahi Tefahot Bank Ltd., 3.077% to 4/07/2026, FLR (CMT - 5yr. + 2.25%) to 4/07/2031 (n) | | | 200,000 | 203,000 |
| | | | | $424,192 |
| Personal Computers & Peripherals – 0.1% |
| Equifax, Inc., 3.1%, 5/15/2030 | | $ | 246,000 | $ 258,417 |
| Pollution Control – 0.1% |
| Republic Services, Inc., 1.45%, 2/15/2031 | | $ | 175,000 | $ 160,523 |
| Real Estate - Apartment – 0.1% |
| Mid-America Apartment Communities, REIT, 1.7%, 2/15/2031 | | $ | 141,000 | $ 131,195 |
| Real Estate - Office – 0.1% |
| Boston Properties, Inc., REIT, 2.55%, 4/01/2032 | | $ | 171,000 | $ 165,370 |
| Corporate Office Property LP, 2.75%, 4/15/2031 | | | 71,000 | 70,078 |
| | | | | $235,448 |
| Real Estate - Other – 0.2% |
| Lexington Realty Trust Co., 2.7%, 9/15/2030 | | $ | 119,000 | $ 118,416 |
| W.P. Carey, Inc., REIT, 2.4%, 2/01/2031 | | | 181,000 | 175,528 |
| | | | | $293,944 |
| Real Estate - Retail – 0.5% |
| Brixmor Operating Partnership LP, REIT, 4.05%, 7/01/2030 | | $ | 173,000 | $ 189,934 |
| National Retail Properties, Inc., REIT, 3.5%, 4/15/2051 | | | 46,000 | 45,929 |
| Regency Centers Corp., 3.7%, 6/15/2030 | | | 225,000 | 245,286 |
| STORE Capital Corp., 2.75%, 11/18/2030 | | | 210,000 | 209,031 |
| VEREIT Operating Partnership LP, REIT, 3.4%, 1/15/2028 | | | 54,000 | 58,412 |
| VEREIT Operating Partnership LP, REIT, 3.1%, 12/15/2029 | | | 169,000 | 177,866 |
| | | | | $926,458 |
| Retailers – 0.2% |
| Alimentation Couche-Tard, Inc., 3.8%, 1/25/2050 (n) | | $ | 151,000 | $ 156,418 |
| Home Depot, Inc., 3.9%, 6/15/2047 | | | 195,000 | 221,552 |
| Kohl's Corp., 3.375%, 5/01/2031 | | | 58,000 | 59,215 |
| | | | | $437,185 |
| Telecommunications - Wireless – 1.0% |
| American Tower Corp., REIT, 5%, 2/15/2024 | | $ | 200,000 | $ 222,433 |
| American Tower Corp., REIT, 4%, 6/01/2025 | | | 264,000 | 291,770 |
| Crown Castle International Corp., 4.45%, 2/15/2026 | | | 304,000 | 343,775 |
Portfolio of Investments (unaudited) – continued
| Issuer | | | Shares/Par | Value ($) |
| Bonds – continued |
| Telecommunications - Wireless – continued |
| Crown Castle International Corp., 3.7%, 6/15/2026 | | $ | 369,000 | $ 405,597 |
| Rogers Communications, Inc., 3.7%, 11/15/2049 | | | 188,000 | 190,894 |
| T-Mobile USA, Inc., 3.5%, 4/15/2025 (n) | | | 240,000 | 260,251 |
| | | | | $1,714,720 |
| Transportation - Services – 0.1% |
| ERAC USA Finance LLC, 3.8%, 11/01/2025 (n) | | $ | �� 197,000 | $ 217,064 |
| U.S. Treasury Obligations – 0.8% |
| U.S. Treasury Bonds, 3.5%, 2/15/2039 | | $ | 338,000 | $ 411,528 |
| U.S. Treasury Bonds, 1.375%, 11/15/2040 | | | 570,000 | 496,613 |
| U.S. Treasury Bonds, 3%, 2/15/2048 (f) | | | 186,000 | 213,021 |
| U.S. Treasury Notes, 1.125%, 8/15/2040 | | | 309,000 | 257,532 |
| | | | | $1,378,694 |
| Utilities - Electric Power – 1.3% |
| Alabama Power Co., 3.45%, 10/01/2049 | | $ | 177,000 | $ 186,958 |
| American Electric Power Co., Inc., 2.3%, 3/01/2030 | | | 105,000 | 103,517 |
| Duke Energy Indiana LLC, 2.75%, 4/01/2050 | | | 76,000 | 69,462 |
| Enel Finance International N.V., 4.875%, 6/14/2029 (n) | | | 250,000 | 293,352 |
| FirstEnergy Corp., 2.65%, 3/01/2030 | | | 220,000 | 215,050 |
| Georgia Power Co., 3.7%, 1/30/2050 | | | 121,000 | 127,593 |
| Jersey Central Power & Light Co., 4.3%, 1/15/2026 (n) | | | 182,000 | 201,205 |
| MidAmerican Energy Co., 3.95%, 8/01/2047 | | | 200,000 | 229,464 |
| PPL Capital Funding, Inc., 5%, 3/15/2044 | | | 135,000 | 166,768 |
| Southern California Edison Co.'s First & Refunding Mortgage Bonds, 3.65%, 2/01/2050 | | | 68,000 | 68,149 |
| Virginia Electric & Power Co., 2.875%, 7/15/2029 | | | 444,000 | 467,927 |
| WEC Energy Group, Inc., 1.8%, 10/15/2030 | | | 292,000 | 274,868 |
| | | | | $2,404,313 |
| Total Bonds (Identified Cost, $33,088,898) | | $ 34,378,376 |
| Preferred Stocks – 0.1% |
| Consumer Products – 0.1% | | | | |
| Henkel AG & Co. KGaA (Identified Cost, $128,142) | | 1,235 | $ 141,885 |
Portfolio of Investments (unaudited) – continued
| Issuer | Strike
Price | First
Exercise | Shares/
Par | Value ($) |
| Rights – 0.0% |
| Brokerage & Asset Managers – 0.0% |
| Euronext N.V. (1 share for 1 share, Expiration 5/24/21) (a) | EUR 59.65 | 4/30/21 | 763 | $ 8,944 |
| Major Banks – 0.0% |
| Credit Suisse Group AG (1 share for 1 share, Expiration 5/20/21) (a) | CHF 1,000.00 | 4/28/21 | 4,703 | $ 196 |
| Total Rights (Identified Cost, $0) | | $ 9,140 |
| | | | Shares/Par | |
| Warrants – 0.0% | | | | |
| Apparel Manufacturers – 0.0% | | | | |
| Compagnie Financiere Richemont S.A. (1 share for 2 warrants, Expiration 12/04/23) (a) (Identified Cost, $0) | CHF 67.00 | 11/20/23 | 1,448 | $ 618 |
| | | | | |
| Investment Companies (h) – 4.4% |
| Money Market Funds – 4.4% | |
| MFS Institutional Money Market Portfolio, 0.04% (v) (Identified Cost, $7,939,583) | | | 7,939,583 | $ 7,939,583 |
| Securities Sold Short – (0.0)% |
| Telecommunications - Wireless – (0.0)% |
| Crown Castle International Corp., REIT (Proceeds Received, $5,996) | | | (73) | $ (13,801) |
| Other Assets, Less Liabilities – 1.9% | | 3,459,207 |
| Net Assets – 100.0% | $181,469,247 |
| (a) | Non-income producing security. |
| (f) | All or a portion of the security has been segregated as collateral for open futures contracts and cleared swap agreements. |
| (h) | An affiliated issuer, which may be considered one in which the fund owns 5% or more of the outstanding voting securities, or a company which is under common control. At period end, the aggregate values of the fund's investments in affiliated issuers and in unaffiliated issuers were $7,939,583 and $170,084,258, respectively. |
| (n) | Securities exempt from registration under Rule 144A of the Securities Act of 1933. These securities may be sold in the ordinary course of business in transactions exempt from registration, normally to qualified institutional buyers. At period end, the aggregate value of these securities was $8,481,828, representing 4.7% of net assets. |
| (s) | Security or a portion of the security was pledged to cover collateral requirements for securities sold short and/or certain derivative transactions. |
| (v) | Affiliated issuer that is available only to investment companies managed by MFS. The rate quoted for the MFS Institutional Money Market Portfolio is the annualized seven-day yield of the fund at period end. |
Portfolio of Investments (unaudited) – continued
| (z) | Restricted securities are not registered under the Securities Act of 1933 and are subject to legal restrictions on resale. These securities generally may be resold in transactions exempt from registration or to the public if the securities are subsequently registered. Disposal of these securities may involve time-consuming negotiations and prompt sale at an acceptable price may be difficult. The fund holds the following restricted securities: |
| Restricted Securities | Acquisition
Date | Cost | Value |
| CenterPoint Energy, Inc. (PIPE) | 12/07/20-4/29/21 | $19,537 | $29,755 |
| % of Net assets | | | 0.0% |
| (zz) | Securities subject to a restriction on resale. | | | |
| The following abbreviations are used in this report and are defined: |
| ADR | American Depositary Receipt |
| CMT | Constant Maturity Treasury |
| FLR | Floating Rate. Interest rate resets periodically based on the parenthetically disclosed reference rate plus a spread (if any). The period-end rate reported may not be the current rate. All reference rates are USD unless otherwise noted. |
| LIBOR | London Interbank Offered Rate |
| PIPE | Private Investment in Public Equity |
| REIT | Real Estate Investment Trust |
| SOFR | Secured Overnight Financing Rate |
| Abbreviations indicate amounts shown in currencies other than the U.S. dollar. All amounts are stated in U.S. dollars unless otherwise indicated. A list of abbreviations is shown below: |
| AUD | Australian Dollar |
| BRL | Brazilian Real |
| CAD | Canadian Dollar |
| CHF | Swiss Franc |
| DKK | Danish Krone |
| EUR | Euro |
| GBP | British Pound |
| HKD | Hong Kong Dollar |
| ILS | Israeli Shekel |
| INR | Indian Rupee |
| JPY | Japanese Yen |
| KRW | South Korean Won |
| MXN | Mexican Peso |
| NOK | Norwegian Krone |
| NZD | New Zealand Dollar |
| RUB | Russian Ruble |
| SEK | Swedish Krona |
| SGD | Singapore Dollar |
| THB | Thai Baht |
| TRY | Turkish Lira |
| TWD | Taiwan Dollar |
| ZAR | South African Rand |
Portfolio of Investments (unaudited) – continued
Derivative Contracts at 4/30/21
| Forward Foreign Currency Exchange Contracts |
Currency
Purchased | Currency
Sold | Counterparty | Settlement
Date | Unrealized
Appreciation
(Depreciation) |
| Asset Derivatives |
| CAD | 453,814 | USD | 363,003 | JPMorgan Chase Bank N.A. | 6/24/2021 | $6,251 |
| NOK | 58,719,011 | USD | 7,030,314 | Goldman Sachs International | 6/24/2021 | 24,385 |
| USD | 9,327,606 | AUD | 12,092,228 | JPMorgan Chase Bank N.A. | 6/24/2021 | 10,097 |
| USD | 1,306,923 | GBP | 944,768 | Goldman Sachs International | 6/24/2021 | 1,960 |
| USD | 1,722,675 | HKD | 13,368,010 | Goldman Sachs International | 6/24/2021 | 1,462 |
| USD | 192,862 | HKD | 1,496,573 | JPMorgan Chase Bank N.A. | 6/24/2021 | 170 |
| USD | 9,904,193 | JPY | 1,070,445,177 | JPMorgan Chase Bank N.A. | 6/24/2021 | 105,390 |
| USD | 111,693 | MXN | 2,241,897 | Goldman Sachs International | 6/24/2021 | 1,672 |
| USD | 4,292,080 | NZD | 5,986,657 | Goldman Sachs International | 6/24/2021 | 8,884 |
| USD | 375,622 | SGD | 499,371 | JPMorgan Chase Bank N.A. | 6/24/2021 | 436 |
| USD | 629,114 | TWD | 17,557,933 | JPMorgan Chase Bank N.A. | 6/24/2021 | 482 |
| USD | 144,198 | ZAR | 2,078,796 | Goldman Sachs International | 6/24/2021 | 1,906 |
| | | | | | | $163,095 |
| Liability Derivatives |
| GBP | 2,050,095 | USD | 2,835,952 | Goldman Sachs International | 6/24/2021 | $(4,254) |
| SEK | 36,289,544 | USD | 4,306,260 | Goldman Sachs International | 6/24/2021 | (17,377) |
| USD | 165,640 | BRL | 909,113 | Goldman Sachs International | 6/24/2021 | (940) |
| USD | 10,965,989 | CHF | 10,056,667 | JPMorgan Chase Bank N.A. | 6/24/2021 | (61,544) |
| USD | 694,616 | DKK | 4,297,065 | JPMorgan Chase Bank N.A. | 6/24/2021 | (731) |
| USD | 4,712,036 | EUR | 3,917,445 | Goldman Sachs International | 6/24/2021 | (2,848) |
| USD | 10,743,038 | EUR | 8,935,502 | JPMorgan Chase Bank N.A. | 6/24/2021 | (11,384) |
| USD | 134,895 | ILS | 439,381 | JPMorgan Chase Bank N.A. | 6/24/2021 | (449) |
| USD | 321,926 | INR | 24,419,084 | JPMorgan Chase Bank N.A. | 6/24/2021 | (5,065) |
| USD | 465,605 | KRW | 521,496,480 | JPMorgan Chase Bank N.A. | 6/24/2021 | (3,234) |
| USD | 98,490 | RUB | 7,501,212 | JPMorgan Chase Bank N.A. | 6/24/2021 | (543) |
| USD | 101,632 | THB | 3,204,240 | JPMorgan Chase Bank N.A. | 6/24/2021 | (983) |
| | | | | | | $(109,352) |
| Futures Contracts |
| Description | Long/
Short | Currency | Contracts | Notional
Amount | Expiration
Date | Value/Unrealized
Appreciation
(Depreciation) |
| Asset Derivatives |
| Equity Futures | | |
| DAX Index | Long | EUR | 4 | $1,823,573 | June – 2021 | $37,991 |
| FTSE Taiwan Index | Long | USD | 28 | 1,732,920 | May – 2021 | 20,930 |
| FTSE/JSE Top 40 Index | Short | ZAR | 47 | 1,989,572 | June – 2021 | 30,931 |
| IBEX 35 Index | Long | EUR | 19 | 2,011,875 | May – 2021 | 77,176 |
| IBOV Index | Long | BRL | 81 | 1,779,195 | June – 2021 | 13,182 |
| Mexbol Index | Long | MXN | 117 | 2,782,887 | June – 2021 | 8,100 |
| MSCI Singapore Index | Long | SGD | 55 | 1,495,116 | May – 2021 | 5,693 |
| Russell 2000 Index | Short | USD | 123 | 13,908,225 | June – 2021 | 124,776 |
Portfolio of Investments (unaudited) – continued
| Futures Contracts - continued |
| Description | Long/
Short | Currency | Contracts | Notional
Amount | Expiration
Date | Value/Unrealized
Appreciation
(Depreciation) |
| Asset Derivatives - continued |
| Equity Futures - continued |
| Topix Index | Short | JPY | 15 | $2,609,800 | June – 2021 | $19,287 |
| | | | | | | $338,066 |
| Interest Rate Futures | | |
| Australian Note 10 yr | Long | AUD | 82 | $8,805,100 | June – 2021 | $1,860 |
| Euro-Bund 10 yr | Short | EUR | 97 | 19,825,103 | June – 2021 | 179,102 |
| Long Gilt 10 yr | Short | GBP | 22 | 3,879,010 | June – 2021 | 47,624 |
| U.S. Treasury Note 10 yr | Long | USD | 50 | 6,601,562 | June – 2021 | 21,692 |
| U.S. Treasury Ultra Note 10 yr | Short | USD | 23 | 3,347,578 | June – 2021 | 69,143 |
| | | | | | | $319,421 |
| | | | | | | $657,487 |
| Liability Derivatives |
| Equity Futures | | |
| AEX 25 Index | Short | EUR | 29 | $4,909,794 | May – 2021 | $(7,849) |
| BIST 30 Index | Long | TRY | 2,543 | 4,543,074 | June – 2021 | (2,817) |
| CAC 40 Index | Short | EUR | 9 | 672,587 | May – 2021 | (10,952) |
| FTSE 100 Index | Short | GBP | 51 | 4,886,328 | June – 2021 | (168,319) |
| FTSE MIB Index | Long | EUR | 46 | 6,611,810 | June – 2021 | (30,404) |
| Hang Seng Index | Long | HKD | 15 | 2,754,659 | May – 2021 | (37,641) |
| KOSPI 200 Index | Short | KRW | 34 | 3,225,469 | June – 2021 | (142,138) |
| NIFTY Index | Short | USD | 138 | 4,041,054 | May – 2021 | (27,469) |
| OMX 30 Index | Long | SEK | 96 | 2,516,363 | May – 2021 | (9,765) |
| S&P 500 E-Mini Index | Short | USD | 222 | 46,335,840 | June – 2021 | (3,190,994) |
| S&P MidCap 400 Index | Short | USD | 54 | 14,689,620 | June – 2021 | (776,880) |
| S&P/ASX 200 Index | Short | AUD | 63 | 8,495,535 | June – 2021 | (283,613) |
| S&P/TSX 60 Index | Short | CAD | 25 | 4,618,639 | June – 2021 | (7,350) |
| | | | | | | $(4,696,191) |
| Interest Rate Futures | | |
| Canadian Treasury Bond 10 yr | Long | CAD | 66 | $7,483,025 | June – 2021 | $(106,387) |
| Japan Government Bond 10 yr | Short | JPY | 10 | 13,847,561 | June – 2021 | (29,875) |
| | | | | | | $(136,262) |
| | | | | | | $(4,832,453) |
Portfolio of Investments (unaudited) – continued
| Cleared Swap Agreements |
Maturity
Date | Notional
Amount | Counterparty | Cash Flows
to Receive/
Frequency | Cash Flows
to Pay/
Frequency | Unrealized
Appreciation
(Depreciation) | | Net Unamortized
Upfront Payments
(Receipts) | | Value |
| Asset Derivatives | | | | | |
| Interest Rate Swaps | | | | | |
| 6/03/22 | USD | 51,000,000 | centrally cleared | 0.247%/Semi-annually | 0.184% FLR (3-Month LIBOR)/Quarterly | $55,416 | | $— | | $55,416 |
| 11/06/24 | USD | 20,200,000 | centrally cleared | 1.582%/Semi-annually | 0.193% FLR (3-Month LIBOR)/Quarterly | 842,087 | | — | | 842,087 |
| 11/06/49 | USD | 3,997,917 | centrally cleared | 0.193% FLR (3-Month LIBOR)/Quarterly | 1.893%/Semi-annually | 105,454 | | — | | 105,454 |
| | | | | | | $1,002,957 | | $— | | $1,002,957 |
| Liability Derivatives | | | | | |
| Interest Rate Swaps | | | | | |
| 11/06/29 | USD | 10,300,000 | centrally cleared | 0.193% FLR (3-Month LIBOR)/Quarterly | 1.702%/Semi-annually | $(258,513) | | $— | | $(258,513) |
At April 30, 2021, the fund had cash collateral of $1,430,551 and other liquid securities with an aggregate value of $20,637,294 to cover any collateral or margin obligations for securities sold short and certain derivative contracts. Restricted cash and/or deposits with brokers in the Statement of Assets and Liabilities are comprised of cash collateral.
See Notes to Financial Statements
Financial Statements
Statement of Assets and Liabilities
At 4/30/21 (unaudited)
This statement represents your fund’s balance sheet, which details the assets and liabilities comprising the total value of the fund.
| Assets | |
| Investments in unaffiliated issuers, at value (identified cost, $120,055,910) | $170,084,258 |
| Investments in affiliated issuers, at value (identified cost, $7,939,583) | 7,939,583 |
| Cash | 14,825 |
| Foreign currency, at value (identified cost, $84) | 98 |
| Restricted cash for | |
| Forward foreign currency exchange contracts | 280,000 |
| Deposits with brokers for | |
| Futures contracts | 1,139,247 |
| Securities sold short | 11,304 |
| Receivables for | |
| Forward foreign currency exchange contracts | 163,095 |
| Net daily variation margin on open futures contracts | 763,305 |
| Investments sold | 65,811 |
| Fund shares sold | 538,307 |
| Interest and dividends | 963,453 |
| Receivable from investment adviser | 15,867 |
| Other assets | 633 |
| Total assets | $181,979,786 |
| Liabilities | |
| Payables for | |
| Net daily variation margin on open cleared swap agreements | $12,123 |
| Securities sold short, at value (proceeds received, $5,996) | 13,801 |
| Forward foreign currency exchange contracts | 109,352 |
| Net daily variation margin on open futures contracts | 34,424 |
| Investments purchased | 107,989 |
| Fund shares reacquired | 49,889 |
| Payable to affiliates | |
| Administrative services fee | 189 |
| Shareholder servicing costs | 47,158 |
| Distribution and service fees | 1,029 |
| Payable for independent Trustees' compensation | 196 |
| Deferred country tax expense payable | 3,648 |
| Accrued expenses and other liabilities | 130,741 |
| Total liabilities | $510,539 |
| Net assets | $181,469,247 |
Statement of Assets and Liabilities (unaudited) – continued
| Net assets consist of | |
| Paid-in capital | $194,416,055 |
| Total distributable earnings (loss) | (12,946,808) |
| Net assets | $181,469,247 |
| Shares of beneficial interest outstanding | 15,692,756 |
| | Net assets | Shares
outstanding | Net asset value
per share (a) |
| Class A | $30,406,868 | 2,640,553 | $11.52 |
| Class B | 3,611,771 | 321,231 | 11.24 |
| Class C | 6,775,567 | 600,477 | 11.28 |
| Class I | 117,074,270 | 10,100,808 | 11.59 |
| Class R1 | 119,045 | 10,708 | 11.12 |
| Class R2 | 459,135 | 40,261 | 11.40 |
| Class R3 | 1,651,420 | 143,222 | 11.53 |
| Class R4 | 55,011 | 4,734 | 11.62 |
| Class R6 | 21,316,160 | 1,830,762 | 11.64 |
| (a) | Maximum offering price per share was equal to the net asset value per share for all share classes, except for Class A, for which the maximum offering price per share was $12.22 [100 / 94.25 x $11.52]. On sales of $50,000 or more, the maximum offering price of Class A shares is reduced. A contingent deferred sales charge may be imposed on redemptions of Class A, Class B, and Class C shares. Redemption price per share was equal to the net asset value per share for Classes I, R1, R2, R3, R4, and R6. |
See Notes to Financial Statements
Financial Statements
Statement of Operations
Six months ended 4/30/21 (unaudited)
This statement describes how much your fund earned in investment income and accrued in expenses. It also describes any gains and/or losses generated by fund operations.
| Net investment income (loss) | |
| Income | |
| Dividends | $1,011,271 |
| Interest | 505,352 |
| Dividends from affiliated issuers | 2,905 |
| Income on securities loaned | 885 |
| Foreign taxes withheld | (47,006) |
| Total investment income | $1,473,407 |
| Expenses | |
| Management fee | $703,549 |
| Distribution and service fees | 98,535 |
| Shareholder servicing costs | 83,640 |
| Administrative services fee | 16,581 |
| Independent Trustees' compensation | 2,141 |
| Custodian fee | 62,296 |
| Shareholder communications | 11,257 |
| Audit and tax fees | 50,218 |
| Legal fees | 816 |
| Dividend and interest expense on securities sold short | 369 |
| Interest expense and fees | 401 |
| Registration fees | 64,328 |
| Miscellaneous | 39,251 |
| Total expenses | $1,133,382 |
| Fees paid indirectly | (254) |
| Reduction of expenses by investment adviser and distributor | (119,658) |
| Net expenses | $1,013,470 |
| Net investment income (loss) | $459,937 |
Statement of Operations (unaudited) – continued
| Realized and unrealized gain (loss) |
| Realized gain (loss) (identified cost basis) | |
| Unaffiliated issuers (net of $600 country tax) | $8,755,772 |
| Futures contracts | (20,362,385) |
| Swap agreements | 362,059 |
| Securities sold short | (504) |
| Forward foreign currency exchange contracts | 359,345 |
| Foreign currency | (133,077) |
| Net realized gain (loss) | $(11,018,790) |
| Change in unrealized appreciation or depreciation | |
| Unaffiliated issuers (net of $2,018 increase in deferred country tax) | $22,659,022 |
| Futures contracts | (4,624,035) |
| Swap agreements | 1,099,036 |
| Securities sold short | (4,792) |
| Forward foreign currency exchange contracts | 483,300 |
| Translation of assets and liabilities in foreign currencies | 23,982 |
| Net unrealized gain (loss) | $19,636,513 |
| Net realized and unrealized gain (loss) | $8,617,723 |
| Change in net assets from operations | $9,077,660 |
See Notes to Financial Statements
Financial Statements
Statements of Changes in Net Assets
These statements describe the increases and/or decreases in net assets resulting from operations, any distributions, and any shareholder transactions.
| | Six months ended | Year ended |
| | 4/30/21
(unaudited) | 10/31/20 |
| Change in net assets | | |
| From operations | | |
| Net investment income (loss) | $459,937 | $1,409,627 |
| Net realized gain (loss) | (11,018,790) | (6,968,804) |
| Net unrealized gain (loss) | 19,636,513 | 9,687,222 |
| Change in net assets from operations | $9,077,660 | $4,128,045 |
| Total distributions to shareholders | $(985,057) | $(1,880,261) |
| Change in net assets from fund share transactions | $136,370 | $(12,054,276) |
| Total change in net assets | $8,228,973 | $(9,806,492) |
| Net assets | | |
| At beginning of period | 173,240,274 | 183,046,766 |
| At end of period | $181,469,247 | $173,240,274 |
See Notes to Financial Statements
Financial Statements
Financial Highlights
The financial highlights table is intended to help you understand the fund's financial performance for the semiannual period and the past 5 fiscal years. Certain information reflects financial results for a single fund share. The total returns in the table represent the rate that an investor would have earned (or lost) on an investment in the fund share class (assuming reinvestment of all distributions) held for the entire period.
| Class A | Six months
ended | Year ended |
| | 4/30/21
(unaudited) | 10/31/20 | 10/31/19 | 10/31/18 | 10/31/17 | 10/31/16 |
| Net asset value, beginning of period | $10.99 | $10.80 | $10.07 | $10.26 | $10.00 | $10.38 |
| Income (loss) from investment operations |
| Net investment income (loss) (d) | $0.02 | $0.07 | $0.10 | $0.06 | $0.04 | $0.06 |
| Net realized and unrealized gain (loss) | 0.56 | 0.22 | 0.71 | (0.07) | 0.46 | (0.35) |
| Total from investment operations | $0.58 | $0.29 | $0.81 | $(0.01) | $0.50 | $(0.29) |
| Less distributions declared to shareholders |
| From net investment income | $(0.05) | $(0.10) | $(0.08) | $(0.18) | $(0.24) | $(0.09) |
| Net asset value, end of period (x) | $11.52 | $10.99 | $10.80 | $10.07 | $10.26 | $10.00 |
| Total return (%) (r)(s)(t)(x) | 5.24(n) | 2.68 | 8.11 | (0.06) | 5.18 | (2.77) |
Ratios (%) (to average net assets)
and Supplemental data: |
| Expenses before expense reductions (f) | 1.44(a) | 1.47 | 1.46 | 1.46 | 1.63 | 1.47 |
| Expenses after expense reductions (f) | 1.30(a) | 1.32 | 1.33 | 1.37 | 1.51 | 1.46 |
| Net investment income (loss) | 0.37(a) | 0.65 | 1.01 | 0.64 | 0.39 | 0.57 |
| Portfolio turnover | 20(n) | 57 | 58 | 37 | 37 | 51 |
| Net assets at end of period (000 omitted) | $30,407 | $29,453 | $33,287 | $35,972 | $50,452 | $125,642 |
| Supplemental Ratios (%): |
| Ratios of expenses to average net assets after expense reductions excluding short sale expenses and interest expense and fees (f) | 1.30(a) | 1.30 | 1.29 | 1.34 | 1.40 | 1.39 |
See Notes to Financial Statements
Financial Highlights – continued
| Class B | Six months
ended | Year ended |
| | 4/30/21
(unaudited) | 10/31/20 | 10/31/19 | 10/31/18 | 10/31/17 | 10/31/16 |
| Net asset value, beginning of period | $10.73 | $10.54 | $9.82 | $10.01 | $9.76 | $10.14 |
| Income (loss) from investment operations |
| Net investment income (loss) (d) | $(0.02) | $(0.01) | $0.03 | $(0.01) | $(0.03) | $(0.02) |
| Net realized and unrealized gain (loss) | 0.53 | 0.21 | 0.69 | (0.07) | 0.44 | (0.33) |
| Total from investment operations | $0.51 | $0.20 | $0.72 | $(0.08) | $0.41 | $(0.35) |
| Less distributions declared to shareholders |
| From net investment income | $— | $(0.01) | $(0.00)(w) | $(0.11) | $(0.16) | $(0.03) |
| Net asset value, end of period (x) | $11.24 | $10.73 | $10.54 | $9.82 | $10.01 | $9.76 |
| Total return (%) (r)(s)(t)(x) | 4.75(n) | 1.92 | 7.33 | (0.81) | 4.35 | (3.50) |
Ratios (%) (to average net assets)
and Supplemental data: |
| Expenses before expense reductions (f) | 2.19(a) | 2.22 | 2.21 | 2.21 | 2.37 | 2.22 |
| Expenses after expense reductions (f) | 2.05(a) | 2.08 | 2.08 | 2.12 | 2.25 | 2.21 |
| Net investment income (loss) | (0.38)(a) | (0.09) | 0.26 | (0.09) | (0.29) | (0.18) |
| Portfolio turnover | 20(n) | 57 | 58 | 37 | 37 | 51 |
| Net assets at end of period (000 omitted) | $3,612 | $4,035 | $4,542 | $5,061 | $6,354 | $8,714 |
| Supplemental Ratios (%): |
| Ratios of expenses to average net assets after expense reductions excluding short sale expenses and interest expense and fees (f) | 2.05(a) | 2.05 | 2.04 | 2.09 | 2.15 | 2.14 |
See Notes to Financial Statements
Financial Highlights – continued
| Class C | Six months
ended | Year ended |
| | 4/30/21
(unaudited) | 10/31/20 | 10/31/19 | 10/31/18 | 10/31/17 | 10/31/16 |
| Net asset value, beginning of period | $10.77 | $10.57 | $9.85 | $10.00 | $9.74 | $10.13 |
| Income (loss) from investment operations |
| Net investment income (loss) (d) | $(0.02) | $(0.01) | $0.03 | $(0.01) | $(0.03) | $(0.02) |
| Net realized and unrealized gain (loss) | 0.53 | 0.21 | 0.69 | (0.06) | 0.44 | (0.34) |
| Total from investment operations | $0.51 | $0.20 | $0.72 | $(0.07) | $0.41 | $(0.36) |
| Less distributions declared to shareholders |
| From net investment income | $— | $(0.00)(w) | $— | $(0.08) | $(0.15) | $(0.03) |
| Net asset value, end of period (x) | $11.28 | $10.77 | $10.57 | $9.85 | $10.00 | $9.74 |
| Total return (%) (r)(s)(t)(x) | 4.74(n) | 1.91 | 7.31 | (0.72) | 4.35 | (3.53) |
Ratios (%) (to average net assets)
and Supplemental data: |
| Expenses before expense reductions (f) | 2.18(a) | 2.22 | 2.22 | 2.22 | 2.38 | 2.22 |
| Expenses after expense reductions (f) | 2.05(a) | 2.08 | 2.08 | 2.13 | 2.26 | 2.21 |
| Net investment income (loss) | (0.39)(a) | (0.08) | 0.26 | (0.10) | (0.30) | (0.18) |
| Portfolio turnover | 20(n) | 57 | 58 | 37 | 37 | 51 |
| Net assets at end of period (000 omitted) | $6,776 | $8,396 | $10,083 | $13,845 | $24,540 | $43,754 |
| Supplemental Ratios (%): |
| Ratios of expenses to average net assets after expense reductions excluding short sale expenses and interest expense and fees (f) | 2.05(a) | 2.05 | 2.04 | 2.10 | 2.15 | 2.14 |
See Notes to Financial Statements
Financial Highlights – continued
| Class I | Six months
ended | Year ended |
| | 4/30/21
(unaudited) | 10/31/20 | 10/31/19 | 10/31/18 | 10/31/17 | 10/31/16 |
| Net asset value, beginning of period | $11.08 | $10.89 | $10.15 | $10.35 | $10.10 | $10.48 |
| Income (loss) from investment operations |
| Net investment income (loss) (d) | $0.04 | $0.10 | $0.13 | $0.09 | $0.07 | $0.08 |
| Net realized and unrealized gain (loss) | 0.54 | 0.22 | 0.72 | (0.07) | 0.46 | (0.34) |
| Total from investment operations | $0.58 | $0.32 | $0.85 | $0.02 | $0.53 | $(0.26) |
| Less distributions declared to shareholders |
| From net investment income | $(0.07) | $(0.13) | $(0.11) | $(0.22) | $(0.28) | $(0.12) |
| Net asset value, end of period (x) | $11.59 | $11.08 | $10.89 | $10.15 | $10.35 | $10.10 |
| Total return (%) (r)(s)(t)(x) | 5.28(n) | 2.91 | 8.49 | 0.19 | 5.42 | (2.52) |
Ratios (%) (to average net assets)
and Supplemental data: |
| Expenses before expense reductions (f) | 1.19(a) | 1.22 | 1.21 | 1.21 | 1.38 | 1.22 |
| Expenses after expense reductions (f) | 1.05(a) | 1.07 | 1.08 | 1.12 | 1.26 | 1.21 |
| Net investment income (loss) | 0.63(a) | 0.90 | 1.25 | 0.90 | 0.71 | 0.82 |
| Portfolio turnover | 20(n) | 57 | 58 | 37 | 37 | 51 |
| Net assets at end of period (000 omitted) | $117,074 | $108,871 | $127,572 | $137,065 | $211,360 | $371,340 |
| Supplemental Ratios (%): |
| Ratios of expenses to average net assets after expense reductions excluding short sale expenses and interest expense and fees (f) | 1.05(a) | 1.05 | 1.04 | 1.10 | 1.15 | 1.14 |
See Notes to Financial Statements
Financial Highlights – continued
| Class R1 | Six months
ended | Year ended |
| | 4/30/21
(unaudited) | 10/31/20 | 10/31/19 | 10/31/18 | 10/31/17 | 10/31/16 |
| Net asset value, beginning of period | $10.61 | $10.43 | $9.72 | $9.93 | $9.72 | $10.10 |
| Income (loss) from investment operations |
| Net investment income (loss) (d) | $(0.02) | $(0.01) | $0.03 | $(0.01) | $(0.03) | $(0.02) |
| Net realized and unrealized gain (loss) | 0.53 | 0.22 | 0.68 | (0.07) | 0.44 | (0.33) |
| Total from investment operations | $0.51 | $0.21 | $0.71 | $(0.08) | $0.41 | $(0.35) |
| Less distributions declared to shareholders |
| From net investment income | $— | $(0.03) | $— | $(0.13) | $(0.20) | $(0.03) |
| Net asset value, end of period (x) | $11.12 | $10.61 | $10.43 | $9.72 | $9.93 | $9.72 |
| Total return (%) (r)(s)(t)(x) | 4.81(n) | 1.97 | 7.30 | (0.83) | 4.38 | (3.52) |
Ratios (%) (to average net assets)
and Supplemental data: |
| Expenses before expense reductions (f) | 2.19(a) | 2.22 | 2.21 | 2.22 | 2.37 | 2.23 |
| Expenses after expense reductions (f) | 2.05(a) | 2.07 | 2.08 | 2.13 | 2.24 | 2.22 |
| Net investment income (loss) | (0.38)(a) | (0.09) | 0.26 | (0.08) | (0.26) | (0.21) |
| Portfolio turnover | 20(n) | 57 | 58 | 37 | 37 | 51 |
| Net assets at end of period (000 omitted) | $119 | $113 | $210 | $195 | $363 | $328 |
| Supplemental Ratios (%): |
| Ratios of expenses to average net assets after expense reductions excluding short sale expenses and interest expense and fees (f) | 2.05(a) | 2.05 | 2.04 | 2.10 | 2.15 | 2.15 |
See Notes to Financial Statements
Financial Highlights – continued
| Class R2 | Six months
ended | Year ended |
| | 4/30/21
(unaudited) | 10/31/20 | 10/31/19 | 10/31/18 | 10/31/17 | 10/31/16 |
| Net asset value, beginning of period | $10.86 | $10.67 | $9.91 | $10.11 | $9.89 | $10.26 |
| Income (loss) from investment operations |
| Net investment income (loss) (d) | $0.01 | $0.04 | $0.08 | $0.04 | $0.02 | $0.03 |
| Net realized and unrealized gain (loss) | 0.53 | 0.22 | 0.69 | (0.06) | 0.44 | (0.34) |
| Total from investment operations | $0.54 | $0.26 | $0.77 | $(0.02) | $0.46 | $(0.31) |
| Less distributions declared to shareholders |
| From net investment income | $— | $(0.07) | $(0.01) | $(0.18) | $(0.24) | $(0.06) |
| Net asset value, end of period (x) | $11.40 | $10.86 | $10.67 | $9.91 | $10.11 | $9.89 |
| Total return (%) (r)(s)(t)(x) | 4.97(n) | 2.43 | 7.82 | (0.22) | 4.81 | (2.99) |
Ratios (%) (to average net assets)
and Supplemental data: |
| Expenses before expense reductions (f) | 1.69(a) | 1.72 | 1.71 | 1.71 | 1.86 | 1.72 |
| Expenses after expense reductions (f) | 1.55(a) | 1.58 | 1.58 | 1.61 | 1.74 | 1.72 |
| Net investment income (loss) | 0.11(a) | 0.41 | 0.75 | 0.42 | 0.23 | 0.31 |
| Portfolio turnover | 20(n) | 57 | 58 | 37 | 37 | 51 |
| Net assets at end of period (000 omitted) | $459 | $498 | $791 | $1,434 | $1,560 | $1,300 |
| Supplemental Ratios (%): |
| Ratios of expenses to average net assets after expense reductions excluding short sale expenses and interest expense and fees (f) | 1.55(a) | 1.55 | 1.54 | 1.59 | 1.65 | 1.65 |
See Notes to Financial Statements
Financial Highlights – continued
| Class R3 | Six months
ended | Year ended |
| | 4/30/21
(unaudited) | 10/31/20 | 10/31/19 | 10/31/18 | 10/31/17 | 10/31/16 |
| Net asset value, beginning of period | $11.00 | $10.81 | $10.09 | $10.29 | $10.06 | $10.39 |
| Income (loss) from investment operations |
| Net investment income (loss) (d) | $0.02 | $0.07 | $0.10 | $0.07 | $0.05 | $0.05 |
| Net realized and unrealized gain (loss) | 0.55 | 0.22 | 0.71 | (0.07) | 0.45 | (0.34) |
| Total from investment operations | $0.57 | $0.29 | $0.81 | $0.00(w) | $0.50 | $(0.29) |
| Less distributions declared to shareholders |
| From net investment income | $(0.04) | $(0.10) | $(0.09) | $(0.20) | $(0.27) | $(0.04) |
| Net asset value, end of period (x) | $11.53 | $11.00 | $10.81 | $10.09 | $10.29 | $10.06 |
| Total return (%) (r)(s)(t)(x) | 5.18(n) | 2.70 | 8.09 | 0.00(w) | 5.17 | (2.83) |
Ratios (%) (to average net assets)
and Supplemental data: |
| Expenses before expense reductions (f) | 1.44(a) | 1.47 | 1.46 | 1.46 | 1.61 | 1.49 |
| Expenses after expense reductions (f) | 1.30(a) | 1.32 | 1.33 | 1.37 | 1.49 | 1.47 |
| Net investment income (loss) | 0.37(a) | 0.69 | 1.00 | 0.65 | 0.49 | 0.47 |
| Portfolio turnover | 20(n) | 57 | 58 | 37 | 37 | 51 |
| Net assets at end of period (000 omitted) | $1,651 | $1,432 | $1,101 | $997 | $1,009 | $932 |
| Supplemental Ratios (%): |
| Ratios of expenses to average net assets after expense reductions excluding short sale expenses and interest expense and fees (f) | 1.30(a) | 1.30 | 1.29 | 1.34 | 1.40 | 1.40 |
See Notes to Financial Statements
Financial Highlights – continued
| Class R4 | Six months
ended | Year ended |
| | 4/30/21
(unaudited) | 10/31/20 | 10/31/19 | 10/31/18 | 10/31/17 | 10/31/16 |
| Net asset value, beginning of period | $11.11 | $10.91 | $10.18 | $10.37 | $10.13 | $10.44 |
| Income (loss) from investment operations |
| Net investment income (loss) (d) | $0.03 | $0.09 | $0.13 | $0.09 | $0.07 | $0.09 |
| Net realized and unrealized gain (loss) | 0.56 | 0.23 | 0.71 | (0.07) | 0.46 | (0.35) |
| Total from investment operations | $0.59 | $0.32 | $0.84 | $0.02 | $0.53 | $(0.26) |
| Less distributions declared to shareholders |
| From net investment income | $(0.08) | $(0.12) | $(0.11) | $(0.21) | $(0.29) | $(0.05) |
| Net asset value, end of period (x) | $11.62 | $11.11 | $10.91 | $10.18 | $10.37 | $10.13 |
| Total return (%) (r)(s)(t)(x) | 5.30(n) | 2.98 | 8.36 | 0.24 | 5.40 | (2.50) |
Ratios (%) (to average net assets)
and Supplemental data: |
| Expenses before expense reductions (f) | 1.19(a) | 1.23 | 1.22 | 1.22 | 1.39 | 1.22 |
| Expenses after expense reductions (f) | 1.05(a) | 1.08 | 1.08 | 1.13 | 1.26 | 1.21 |
| Net investment income (loss) | 0.61(a) | 0.81 | 1.27 | 0.91 | 0.71 | 0.85 |
| Portfolio turnover | 20(n) | 57 | 58 | 37 | 37 | 51 |
| Net assets at end of period (000 omitted) | $55 | $58 | $51 | $90 | $128 | $192 |
| Supplemental Ratios (%): |
| Ratios of expenses to average net assets after expense reductions excluding short sale expenses and interest expense and fees (f) | 1.05(a) | 1.05 | 1.04 | 1.10 | 1.15 | 1.14 |
See Notes to Financial Statements
Financial Highlights – continued
| Class R6 | Six months
ended | Year ended |
| | 4/30/21
(unaudited) | 10/31/20 | 10/31/19 | 10/31/18 | 10/31/17 | 10/31/16 |
| Net asset value, beginning of period | $11.13 | $10.94 | $10.20 | $10.41 | $10.16 | $10.54 |
| Income (loss) from investment operations |
| Net investment income (loss) (d) | $0.04 | $0.11 | $0.14 | $0.10 | $0.09 | $0.09 |
| Net realized and unrealized gain (loss) | 0.55 | 0.21 | 0.72 | (0.08) | 0.45 | (0.35) |
| Total from investment operations | $0.59 | $0.32 | $0.86 | $0.02 | $0.54 | $(0.26) |
| Less distributions declared to shareholders |
| From net investment income | $(0.08) | $(0.13) | $(0.12) | $(0.23) | $(0.29) | $(0.12) |
| Net asset value, end of period (x) | $11.64 | $11.13 | $10.94 | $10.20 | $10.41 | $10.16 |
| Total return (%) (r)(s)(t)(x) | 5.36(n) | 2.97 | 8.51 | 0.24 | 5.57 | (2.45) |
Ratios (%) (to average net assets)
and Supplemental data: |
| Expenses before expense reductions (f) | 1.10(a) | 1.13 | 1.14 | 1.16 | 1.24 | 1.12 |
| Expenses after expense reductions (f) | 0.96(a) | 0.99 | 1.01 | 1.07 | 1.12 | 1.11 |
| Net investment income (loss) | 0.71(a) | 1.04 | 1.32 | 0.97 | 0.84 | 0.92 |
| Portfolio turnover | 20(n) | 57 | 58 | 37 | 37 | 51 |
| Net assets at end of period (000 omitted) | $21,316 | $20,383 | $5,410 | $5,337 | $6,533 | $5,743 |
| Supplemental Ratios (%): |
| Ratios of expenses to average net assets after expense reductions excluding short sale expenses and interest expense and fees (f) | 0.96(a) | 0.96 | 0.97 | 1.04 | 1.03 | 1.04 |
| (a) | Annualized. |
| (d) | Per share data is based on average shares outstanding. |
| (f) | Ratios do not reflect reductions from fees paid indirectly, if applicable. |
| (n) | Not annualized. |
| (r) | Certain expenses have been reduced without which performance would have been lower. |
| (s) | From time to time the fund may receive proceeds from litigation settlements, without which performance would be lower. |
| (t) | Total returns do not include any applicable sales charges. |
| (w) | Per share amount was less than $0.01 and total return or ratio was less than 0.01%, as applicable. |
| (x) | The net asset values and total returns have been calculated on net assets which include adjustments made in accordance with U.S. generally accepted accounting principles required at period end for financial reporting purposes. |
See Notes to Financial Statements
Notes to Financial Statements
(unaudited)
(1) Business and Organization
MFS Global Alternative Strategy Fund (the fund) is a diversified series of MFS Series Trust XV (the trust). The trust is organized as a Massachusetts business trust and is registered under the Investment Company Act of 1940, as amended, as an open-end management investment company.
The fund is an investment company and accordingly follows the investment company accounting and reporting guidance of the Financial Accounting Standards Board (FASB) Accounting Standards Codification Topic 946 Financial Services - Investment Companies.
(2) Significant Accounting Policies
General — The preparation of financial statements in conformity with U.S. generally accepted accounting principles requires management to make estimates and assumptions that affect the reported amounts of assets and liabilities, and disclosure of contingent assets and liabilities at the date of the financial statements and the reported amounts of increases and decreases in net assets from operations during the reporting period. Actual results could differ from those estimates. In the preparation of these financial statements, management has evaluated subsequent events occurring after the date of the fund’s Statement of Assets and Liabilities through the date that the financial statements were issued. The fund invests in derivatives as part of its principal investment strategy. Derivatives can be highly volatile and involve risks in addition to the risks of the underlying indicators on which the derivative is based. Derivatives can involve leverage. The fund invests in foreign securities. Investments in foreign securities are vulnerable to the effects of changes in the relative values of the local currency and the U.S. dollar and to the effects of changes in each country’s market, economic, industrial, political, regulatory, geopolitical, environmental, public health, and other conditions.
In March 2020, the FASB issued Accounting Standards Update 2020-04, Reference Rate Reform (Topic 848) – Facilitation of the Effects of Reference Rate Reform on Financial Reporting (“ASU 2020-04”), which provides optional, temporary relief for certain reference rate-related contract modifications due to the planned discontinuation of the London Interbank Offered Rate (LIBOR) and other IBOR-based reference rates as of the end of 2021. In March 2021, the administrator for LIBOR announced the extension of the publication of the more commonly used U.S. dollar LIBOR settings to the end of June 2023. Management is still evaluating the impact of ASU 2020-04 on the fund's accounting for investments, derivatives, debt and other contracts that will undergo reference rate-related modifications as a result of the reference rate reform.
Balance Sheet Offsetting — The fund's accounting policy with respect to balance sheet offsetting is that, absent an event of default by the counterparty or a termination of the agreement, the International Swaps and Derivatives Association (ISDA) Master Agreement, or similar agreement, does not result in an offset of reported amounts of financial assets and financial liabilities in the Statement of Assets and Liabilities across transactions between the fund and the applicable counterparty. The fund's right to setoff may be restricted or prohibited by the bankruptcy or insolvency laws of the particular jurisdiction to which a specific master netting agreement counterparty is
Notes to Financial Statements (unaudited) - continued
subject. Balance sheet offsetting disclosures, to the extent applicable to the fund, have been included in the fund’s Significant Accounting Policies note under the captions for each of the fund’s in-scope financial instruments and transactions.
Investment Valuations — Equity securities, including restricted equity securities and equity securities sold short, are generally valued at the last sale or official closing price on their primary market or exchange as provided by a third-party pricing service. Equity securities, for which there were no sales reported that day, are generally valued at the last quoted daily bid quotation on their primary market or exchange as provided by a third-party pricing service. Equity securities sold short, for which there were no sales reported that day, are generally valued at the last quoted daily ask quotation on their primary market or exchange as provided by a third-party pricing service. Debt instruments and floating rate loans, including restricted debt instruments, are generally valued at an evaluated or composite bid as provided by a third-party pricing service.
Short-term instruments with a maturity at issuance of 60 days or less may be valued at amortized cost, which approximates market value. Futures contracts are generally valued at last posted settlement price on their primary exchange as provided by a third-party pricing service. Futures contracts for which there were no trades that day for a particular position are generally valued at the closing bid quotation on their primary exchange as provided by a third-party pricing service. Forward foreign currency exchange contracts are generally valued at the mean of bid and asked prices for the time period interpolated from rates provided by a third-party pricing service for proximate time periods. Swap agreements are generally valued using valuations provided by a third-party pricing service, which for cleared swaps includes an evaluation of any trading activity at the clearinghouses. Open-end investment companies are generally valued at net asset value per share. Securities and other assets generally valued on the basis of information from a third-party pricing service may also be valued at a broker/dealer bid quotation. In determining values, third-party pricing services can utilize both transaction data and market information such as yield, quality, coupon rate, maturity, type of issue, trading characteristics, and other market data. The values of foreign securities and other assets and liabilities expressed in foreign currencies are converted to U.S. dollars using the mean of bid and asked prices for rates provided by a third-party pricing service.
The Board of Trustees has delegated primary responsibility for determining or causing to be determined the value of the fund’s investments (including any fair valuation) to the adviser pursuant to valuation policies and procedures approved by the Board. If the adviser determines that reliable market quotations are not readily available, investments are valued at fair value as determined in good faith by the adviser in accordance with such procedures under the oversight of the Board of Trustees. Under the fund’s valuation policies and procedures, market quotations are not considered to be readily available for most types of debt instruments and floating rate loans and many types of derivatives. These investments are generally valued at fair value based on information from third-party pricing services. In addition, investments may be valued at fair value if the adviser determines that an investment’s value has been materially affected by events occurring after the close of the exchange or market on which the investment is principally traded (such as foreign exchange or market) and prior to the determination of the fund’s net asset value, or after the halt of trading of a specific security where trading does not resume prior to the close of the exchange or market on which the security is principally traded. Events that occur after foreign markets close (such as developments in foreign markets and significant movements in the U.S. markets) and
Notes to Financial Statements (unaudited) - continued
prior to the determination of the fund’s net asset value may be deemed to have a material effect on the value of securities traded in foreign markets. Accordingly, the fund’s foreign equity securities may often be valued at fair value. The adviser generally relies on third-party pricing services or other information (such as the correlation with price movements of similar securities in the same or other markets; the type, cost and investment characteristics of the security; the business and financial condition of the issuer; and trading and other market data) to assist in determining whether to fair value and at what value to fair value an investment. The value of an investment for purposes of calculating the fund’s net asset value can differ depending on the source and method used to determine value. When fair valuation is used, the value of an investment used to determine the fund’s net asset value may differ from quoted or published prices for the same investment. There can be no assurance that the fund could obtain the fair value assigned to an investment if it were to sell the investment at the same time at which the fund determines its net asset value per share.
Various inputs are used in determining the value of the fund's assets or liabilities. These inputs are categorized into three broad levels. In certain cases, the inputs used to measure fair value may fall into different levels of the fair value hierarchy. In such cases, an investment's level within the fair value hierarchy is based on the lowest level of input that is significant to the fair value measurement. The fund's assessment of the significance of a particular input to the fair value measurement in its entirety requires judgment, and considers factors specific to the investment. Level 1 includes unadjusted quoted prices in active markets for identical assets or liabilities. Level 2 includes other significant observable market-based inputs (including quoted prices for similar securities, interest rates, prepayment speed, and credit risk). Level 3 includes unobservable inputs, which may include the adviser's own assumptions in determining the fair value of investments. Other financial instruments are derivative instruments, such as futures contracts, forward foreign currency exchange contracts, and swap agreements. The following is a summary of the levels used as of April 30, 2021 in valuing the fund's assets or liabilities:
Notes to Financial Statements (unaudited) - continued
| Financial Instruments | Level 1 | Level 2 | Level 3 | Total |
| Equity Securities: | | | | |
| United States | $92,619,693 | $62,704 | $— | $92,682,397 |
| Japan | 6,007,253 | — | — | 6,007,253 |
| Switzerland | 5,986,508 | 196 | — | 5,986,704 |
| France | 5,740,728 | — | — | 5,740,728 |
| United Kingdom | 5,412,092 | — | — | 5,412,092 |
| Germany | 3,573,345 | — | — | 3,573,345 |
| Canada | 3,232,271 | — | — | 3,232,271 |
| Taiwan | 1,707,527 | 79,182 | — | 1,786,709 |
| China | 1,569,007 | — | — | 1,569,007 |
| Other Countries | 9,680,778 | 34,598 | — | 9,715,376 |
| U.S. Treasury Bonds & U.S. Government Agencies & Equivalents | — | 1,378,694 | — | 1,378,694 |
| Non - U.S. Sovereign Debt | — | 1,279,586 | — | 1,279,586 |
| Municipal Bonds | — | 495,780 | — | 495,780 |
| U.S. Corporate Bonds | — | 22,640,720 | — | 22,640,720 |
| Foreign Bonds | — | 8,583,596 | — | 8,583,596 |
| Mutual Funds | 7,939,583 | — | — | 7,939,583 |
| Total | $143,468,785 | $34,555,056 | $— | $178,023,841 |
| Securities Sold Short | $(13,801) | $— | $— | $(13,801) |
| Other Financial Instruments | | | | |
| Futures Contracts – Assets | $657,487 | $— | $— | $657,487 |
| Futures Contracts – Liabilities | (4,832,453) | — | — | (4,832,453) |
| Forward Foreign Currency Exchange Contracts – Assets | — | 163,095 | — | 163,095 |
| Forward Foreign Currency Exchange Contracts – Liabilities | — | (109,352) | — | (109,352) |
| Swap Agreements – Assets | — | 1,002,957 | — | 1,002,957 |
| Swap Agreements – Liabilities | — | (258,513) | — | (258,513) |
For further information regarding security characteristics, see the Portfolio of Investments.
The following is a reconciliation of level 3 assets for which significant unobservable inputs were used to determine fair value. The table presents the activity of level 3 securities held at the beginning and the end of the period.
| | Equity
Securities |
| Balance as of 10/31/20 | $35,365 |
| Change in unrealized appreciation or depreciation | (2,416) |
| Transfers out of level 3 | (32,949) |
| Balance as of 4/30/21 | $— |
Foreign Currency Translation — Purchases and sales of foreign investments, income, and expenses are converted into U.S. dollars based upon currency exchange rates prevailing on the respective dates of such transactions or on the reporting date for
Notes to Financial Statements (unaudited) - continued
foreign denominated receivables and payables. Gains and losses attributable to foreign currency exchange rates on sales of securities are recorded for financial statement purposes as net realized gains and losses on investments. Gains and losses attributable to foreign exchange rate movements on receivables, payables, income and expenses are recorded for financial statement purposes as foreign currency transaction gains and losses. That portion of both realized and unrealized gains and losses on investments that results from fluctuations in foreign currency exchange rates is not separately disclosed.
Derivatives — The fund uses derivatives in an attempt to reduce volatility compared to the overall equity markets and to generate positive returns by adjusting the fund’s exposure to markets, asset classes, and currencies resulting from the fund’s individual security selections. Derivatives are used to increase the fund’s exposure to markets, asset classes, or currencies to which the fund’s individual security selections have resulted in no or little exposure. Alternatively, the fund uses derivatives to decrease its exposure to markets or currencies to which the fund’s individual security selections have resulted in exposure. Derivatives are used for hedging or non-hedging purposes. While hedging can reduce or eliminate losses, it can also reduce or eliminate gains. When the fund uses derivatives as an investment to increase or decrease market exposure, or for hedging purposes, gains and losses from derivative instruments may be substantially greater than the derivative’s original cost.
The derivative instruments used by the fund during the period were futures contracts, forward foreign currency exchange contracts, and swap agreements. Depending on the type of derivative, a fund may exit a derivative position by entering into an offsetting transaction with a counterparty or exchange, negotiating an agreement with the derivative counterparty, or novating the position to a third party. The fund may be unable to promptly close out a futures position in instances where the daily fluctuation in the price for that type of future exceeds the daily limit set by the exchange. The fund's period end derivatives, as presented in the Portfolio of Investments and the associated Derivative Contract tables, generally are indicative of the volume of its derivative activity during the period.
The following table presents, by major type of derivative contract, the fair value, on a gross basis, of the asset and liability components of derivatives held by the fund at April 30, 2021 as reported in the Statement of Assets and Liabilities:
| | | Fair Value (a) |
| Risk | Derivative Contracts | Asset Derivatives | Liability Derivatives |
| Interest Rate | Interest Rate Futures | $319,421 | $(136,262) |
| Interest Rate | Interest Rate Swaps | 1,002,957 | (258,513) |
| Foreign Exchange | Forward Foreign Currency Exchange Contracts | 163,095 | (109,352) |
| Equity | Equity Futures | 338,066 | (4,696,191) |
| Total | | $1,823,539 | $(5,200,318) |
| (a) | Values presented in this table for futures contracts and cleared swap agreements correspond to the values reported in the Portfolio of Investments. Only the current day net variation margin for futures contracts and cleared swap agreements is separately reported within the Statement of Assets and Liabilities. |
Notes to Financial Statements (unaudited) - continued
The following table presents, by major type of derivative contract, the realized gain (loss) on derivatives held by the fund for the six months ended April 30, 2021 as reported in the Statement of Operations:
| Risk | Futures
Contracts | Swap
Agreements | Forward Foreign
Currency
Exchange
Contracts |
| Interest Rate | $ (261,582) | $ 28,104 | $ — |
| Foreign Exchange | — | — | 359,345 |
| Credit | — | 333,955 | — |
| Equity | (20,100,803) | — | — |
| Total | $(20,362,385) | $362,059 | $359,345 |
The following table presents, by major type of derivative contract, the change in unrealized appreciation or depreciation on derivatives held by the fund for the six months ended April 30, 2021 as reported in the Statement of Operations:
| Risk | Futures
Contracts | Swap
Agreements | Forward Foreign
Currency
Exchange
Contracts |
| Interest Rate | $ 307,826 | $1,095,654 | $ — |
| Foreign Exchange | — | — | 483,300 |
| Equity | (4,931,861) | — | — |
| Credit | — | 3,382 | — |
| Total | $(4,624,035) | $1,099,036 | $483,300 |
Derivative counterparty credit risk is managed through formal evaluation of the creditworthiness of all potential counterparties. On certain, but not all, uncleared derivatives, the fund attempts to reduce its exposure to counterparty credit risk whenever possible by entering into an ISDA Master Agreement on a bilateral basis. The ISDA Master Agreement gives each party to the agreement the right to terminate all transactions traded under such agreement if there is a specified deterioration in the credit quality of the other party. Upon an event of default or a termination of the ISDA Master Agreement, the non-defaulting party has the right to close out all transactions traded under such agreement and to net amounts owed under each agreement to one net amount payable by one party to the other. This right to close out and net payments across all transactions traded under the ISDA Master Agreement could result in a reduction of the fund's credit risk to such counterparty equal to any amounts payable by the fund under the applicable transactions, if any.
Collateral and margin requirements differ by type of derivative. For cleared derivatives (e.g., futures contracts, cleared swaps, and exchange-traded options), margin requirements are set by the clearing broker and the clearing house and collateral, in the form of cash or securities, is posted by the fund directly with the clearing broker. Collateral terms are counterparty agreement specific for uncleared derivatives (e.g., forward foreign currency exchange contracts, uncleared swap agreements, and uncleared options) and collateral, in the form of cash and securities, is held in segregated accounts with the fund's custodian in connection with these agreements. For derivatives traded under an ISDA Master Agreement, which contains a collateral support annex, the collateral requirements are netted across all transactions traded
Notes to Financial Statements (unaudited) - continued
under such counterparty-specific agreement and an amount is posted from one party to the other to collateralize such obligations. Cash that has been segregated or delivered to cover the fund's collateral or margin obligations under derivative contracts, if any, will be reported separately in the Statement of Assets and Liabilities as restricted cash for uncleared derivatives and/or deposits with brokers for cleared derivatives. Securities pledged as collateral or margin for the same purpose, if any, are noted in the Portfolio of Investments. The fund may be required to make payments of interest on uncovered collateral or margin obligations with the broker. Any such payments are included in “Interest expense and fees” in the Statement of Operations.
The following table presents the fund's derivative assets and liabilities (by type) on a gross basis as of April 30, 2021:
| Gross Amounts of: | Derivative Assets | Derivative Liabilities |
| Futures Contracts (a) | $763,305 | $(34,424) |
| Cleared Swap Agreements (a) | — | (12,123) |
| Forward Foreign Currency Exchange Contracts | 163,095 | (109,352) |
Total Gross Amount of Derivative Assets
and Liabilities Presented in the
Statement of Assets & Liabilities | $926,400 | $(155,899) |
Less: Derivatives Assets and Liabilities Not Subject
to a Master Netting Agreement or
Similar Arrangement | 763,305 | (46,457) |
Total Gross Amount of Derivative Assets and
Liabilities Subject to a Master Netting Agreement or
Similar Arrangement | $163,095 | $(109,352) |
| (a) | The amount presented here represents the fund's current day net variation margin for futures contracts and for cleared swaps agreements. This amount, which is recognized within the fund's Statement of Assets and Liabilities, differs from the fair value of the futures contracts and cleared swap agreements which is presented in the tables that follow the fund's Portfolio of Investments. |
Notes to Financial Statements (unaudited) - continued
The following table presents (by counterparty) the fund's derivative assets net of amounts available for offset under Master Netting Agreements (or similar arrangements) and net of the related collateral held by the fund at April 30, 2021:
| | | Amounts Not Offset in the
Statement of Assets & Liabilities |
| | Gross Amount
of Derivative
Assets Subject
to a Master
Netting
Agreement (or
Similar
Arrangement)
by Counterparty | Financial
Instruments
Available
for Offset | Financial
Instruments
Collateral
Received (b) | Cash
Collateral
Received (b) | Net Amount
of Derivative
Assets by
Counterparty |
| Goldman Sachs International | $40,269 | $(25,420) | $(14,849) | $— | $— |
| JPMorgan Chase Bank N.A. | 122,826 | (83,932) | — | — | 38,894 |
| Total | $163,095 | $(109,352) | $(14,849) | $— | $38,894 |
The following table presents (by counterparty) the fund's derivative liabilities net of amounts available for offset under Master Netting Agreements (or similar arrangements) and net of the related collateral pledged by the fund at April 30, 2021:
| | | Amounts Not Offset in the
Statement of Assets & Liabilities |
| | Gross Amount
of Derivative
Liabilities Subject
to a Master
Netting
Agreement (or
Similar
Arrangement)
by Counterparty | Financial
Instruments
Available
for Offset | Financial
Instruments
Collateral
Pledged (b) | Cash
Collateral
Pledged (b) | Net Amount
of Derivative
Liabilities by
Counterparty |
| Goldman Sachs International | $(25,420) | $25,420 | $— | $— | $— |
| JPMorgan Chase Bank N.A. | (83,932) | 83,932 | — | — | — |
| Total | $(109,352) | $109,352 | $— | $— | $— |
| (b) | The amount presented here may be less than the total amount of collateral (received)/pledged as the excess collateral (received)/pledged is not shown for purposes of this presentation. |
Futures Contracts — The fund entered into futures contracts which may be used to hedge against or obtain broad market exposure, interest rate exposure, currency exposure, or to manage duration. A futures contract represents a commitment for the future purchase or sale of an asset at a specified price on a specified date.
Upon entering into a futures contract, the fund is required to deposit with the broker, either in cash or securities, an initial margin in an amount equal to a specified percentage of the notional amount of the contract. Subsequent payments (variation margin) are made or received by the fund each day, depending on the daily fluctuations
Notes to Financial Statements (unaudited) - continued
in the value of the contract, and are recorded for financial statement purposes as unrealized gain or loss by the fund until the contract is closed or expires at which point the gain or loss on futures contracts is realized.
The fund bears the risk of interest rates, exchange rates or securities prices moving unexpectedly, in which case, the fund may not achieve the anticipated benefits of the futures contracts and may realize a loss. While futures contracts may present less counterparty risk to the fund since the contracts are exchange traded and the exchange’s clearinghouse guarantees payments to the broker, there is still counterparty credit risk due to the insolvency of the broker. The fund’s maximum risk of loss due to counterparty credit risk is equal to the margin posted by the fund to the broker plus any gains or minus any losses on the outstanding futures contracts.
Forward Foreign Currency Exchange Contracts — The fund entered into forward foreign currency exchange contracts for the purchase or sale of a specific foreign currency at a fixed price on a future date. These contracts may be used to hedge the fund’s currency risk or for non-hedging purposes. For hedging purposes, the fund may enter into contracts to deliver or receive foreign currency that the fund will receive from or use in its normal investment activities. The fund may also use contracts to hedge against declines in the value of foreign currency denominated securities due to unfavorable exchange rate movements. For non-hedging purposes, the fund may enter into contracts with the intent of changing the relative exposure of the fund’s portfolio of securities to different currencies to take advantage of anticipated exchange rate changes.
Forward foreign currency exchange contracts are adjusted by the daily exchange rate of the underlying currency and any unrealized gains or losses are recorded as a receivable or payable for forward foreign currency exchange contracts until the contract settlement date. On contract settlement date, any gain or loss on the contract is recorded as realized gains or losses on forward foreign currency exchange contracts.
Risks may arise upon entering into these contracts from unanticipated movements in the value of the contract and from the potential inability of counterparties to meet the terms of their contracts. Generally, the fund’s maximum risk due to counterparty credit risk is the unrealized gain on the contract due to the use of Continuous Linked Settlement, a multicurrency cash settlement system for the centralized settlement of foreign transactions. This risk is mitigated in cases where there is an ISDA Master Agreement between the fund and the counterparty providing for netting as described above and, where applicable, by the posting of collateral by the counterparty to the fund to cover the fund’s exposure to the counterparty under such ISDA Master Agreement.
Swap Agreements — During the period the fund entered into swap agreements. Swap agreements generally involve a periodic exchange of cash payments on a net basis, at specified intervals or upon the occurrence of specified events, between the fund and a counterparty. Certain swap agreements may be entered into as a bilateral contract (“uncleared swaps”) while others are required to be centrally cleared (“cleared swaps”). In a cleared swap transaction, the ultimate counterparty to the transaction is a clearinghouse (the “clearinghouse”). The contract is transferred and accepted by the clearinghouse immediately following execution of the swap contract with an executing broker. Thereafter, throughout the term of the cleared swap, the fund interfaces indirectly with the clearinghouse through a clearing broker and has counterparty risk to the clearing broker as well.
Notes to Financial Statements (unaudited) - continued
Both cleared and uncleared swap agreements are marked to market daily. The value of uncleared swap agreements is reported in the Statement of Assets and Liabilities as “Uncleared swaps, at value” which includes any related interest accruals to be paid or received by the fund. For cleared swaps, payments (variation margin) are made or received by the fund each day, depending on the daily fluctuations in the value of the cleared swap, such that only the current day net receivable or payable for variation margin is reported in the Statement of Assets and Liabilities.
For both cleared and uncleared swaps, the periodic exchange of net cash payments, at specified intervals or upon the occurrence of specified events as stipulated by the agreement, is recorded as realized gain or loss on swap agreements in the Statement of Operations. Premiums paid or received at the inception of the agreements are amortized using the effective interest method over the term of the agreement as realized gain or loss on swap agreements in the Statement of Operations. A liquidation payment received or made upon early termination is recorded as a realized gain or loss on swap agreements in the Statement of Operations. The change in unrealized appreciation or depreciation on swap agreements in the Statement of Operations reflects the aggregate change over the reporting period in the value of swaps net of any unamortized premiums paid or received.
Risks related to swap agreements include the possible lack of a liquid market, unfavorable market and interest rate movements of the underlying instrument and the failure of the counterparty to perform under the terms of the agreements. The fund's maximum risk of loss from counterparty credit risk is the discounted net value of the cash flows to be received from/paid to the counterparty over the contract's remaining life, to the extent that the amount is positive. To address counterparty risk, uncleared swap agreements are limited to only highly-rated counterparties. Risk is further reduced by having an ISDA Master Agreement between the fund and the counterparty providing for netting as described above and, where applicable, by the posting of collateral by the counterparty to the fund to cover the fund’s exposure to the counterparty under such ISDA Master Agreement. The fund's counterparty risk due to cleared swaps is mitigated by the fact that the clearinghouse is the true counterparty to the transaction and the regulatory requirement safeguards in the event of a clearing broker bankruptcy.
The fund entered into interest rate swap agreements in order to manage its exposure to interest or foreign exchange rate fluctuations. Interest rate swap agreements involve the periodic exchange of cash flows, between the fund and a counterparty, based on the difference between two interest rates applied to a notional principal amount. The two interest rates exchanged may either be a fixed rate and a floating rate or two floating rates based on different indices.
The fund entered into credit default swap agreements in order to manage its exposure to the market or certain sectors of the market, to reduce its credit risk exposure to defaults of corporate and sovereign issuers or to create exposure to corporate or sovereign issuers to which it is not otherwise exposed. In a credit default swap agreement, the protection buyer can make an upfront payment and will make a stream of payments to the protection seller based on a fixed percentage applied to the agreement notional amount in exchange for the right to receive a specified return upon the occurrence of a defined credit event on the reference obligation (which may be either a single security or a basket of securities issued by corporate or sovereign issuers) and, with respect to the cases where physical settlement applies, the delivery by
Notes to Financial Statements (unaudited) - continued
the buyer to the seller of a defined deliverable obligation. Although agreement-specific, credit events generally consist of a combination of the following: bankruptcy, failure to pay, restructuring, obligation acceleration, obligation default, or repudiation/moratorium, each as defined in the 2003 ISDA Credit Derivatives Definitions as amended by the relevant agreement. Restructuring is generally not applicable when the reference obligation is issued by a North American corporation and obligation acceleration, obligation default, or repudiation/moratorium are generally only applicable when the reference obligation is issued by a sovereign entity or an entity in an emerging country. Upon determination of the final price for the deliverable obligation (or upon delivery of the deliverable obligation in the case of physical settlement), the difference between the value of the deliverable obligation and the swap agreement’s notional amount is recorded as realized gain or loss on swap agreements in the Statement of Operations.
Short Sales — The fund entered into short sales whereby it sells a security it does not own in anticipation of a decline in the value of that security. The fund will realize a gain if the security price decreases and a loss if the security price increases between the date of the short sale and the date on which the fund replaces the borrowed security. Losses from short sales can exceed the proceeds of the security sold; and they can also exceed the potential loss from an ordinary buy and sell transaction. The amount of any premium, dividends, or interest the fund may be required to pay in connection with a short sale will be recognized as a fund expense. During the six months ended April 30, 2021, this expense amounted to $369. The fund segregates cash or marketable securities in an amount that, when combined with the amount of proceeds from the short sale deposited with the broker, at least equals the current market value of the security sold short.
Security Loans — Under its Securities Lending Agency Agreement with the fund, JPMorgan Chase and Co., as lending agent, loans the securities of the fund to certain qualified institutions (the “Borrowers”) approved by the fund. Security loans can be terminated at the discretion of either the lending agent or the fund and the related securities must be returned within the earlier of the standard trade settlement period for such securities or within three business days. The loans are collateralized by cash and/or U.S. Treasury and federal agency obligations in an amount typically at least equal to the market value of the securities loaned. On loans collateralized by cash, the cash collateral is invested in a money market fund. The market value of the loaned securities is determined at the close of business of the fund and any additional required collateral is delivered to the fund on the next business day. The lending agent provides the fund with indemnification against Borrower default. In the event of Borrower default, the lending agent will, for the benefit of the fund, either purchase securities identical to those loaned or, when such purchase is commercially impracticable, pay the fund the market value of the loaned securities. In return, the lending agent assumes the fund's rights to the related collateral. If the collateral value is less than the cost to purchase identical securities, the lending agent is responsible for the shortfall, but only to the extent that such shortfall is not due to a decline in collateral value resulting from collateral reinvestment for which the fund bears the risk of loss. A portion of the income generated upon investment of the collateral is remitted to the Borrowers, and the remainder is allocated between the fund and the lending agent. On loans collateralized by U.S. Treasury and/or federal agency obligations, a fee is received from the Borrower, and is allocated between the fund and the lending agent. Income from
Notes to Financial Statements (unaudited) - continued
securities lending is separately reported in the Statement of Operations. The dividend and interest income earned on the securities loaned is accounted for in the same manner as other dividend and interest income. At April 30, 2021, there were no securities on loan or collateral outstanding.
Indemnifications — Under the fund's organizational documents, its officers and Trustees may be indemnified against certain liabilities and expenses arising out of the performance of their duties to the fund. Additionally, in the normal course of business, the fund enters into agreements with service providers that may contain indemnification clauses. The fund's maximum exposure under these agreements is unknown as this would involve future claims that may be made against the fund that have not yet occurred.
Investment Transactions and Income — Investment transactions are recorded on the trade date. Interest income is recorded on the accrual basis. All premium and discount is amortized or accreted for financial statement purposes in accordance with U.S. generally accepted accounting principles. Dividends received in cash are recorded on the ex-dividend date. Certain dividends from foreign securities will be recorded when the fund is informed of the dividend if such information is obtained subsequent to the ex-dividend date. Dividend and interest payments received in additional securities are recorded on the ex-dividend or ex-interest date in an amount equal to the value of the security on such date.
The fund may receive proceeds from litigation settlements. Any proceeds received from litigation involving portfolio holdings are reflected in the Statement of Operations in realized gain/loss if the security has been disposed of by the fund or in unrealized gain/loss if the security is still held by the fund. Any other proceeds from litigation not related to portfolio holdings are reflected as other income in the Statement of Operations.
Fees Paid Indirectly — The fund's custody fee may be reduced by a credit earned under an arrangement that measures the value of U.S. dollars deposited with the custodian by the fund. The amount of the credit, for the six months ended April 30, 2021, is shown as a reduction of total expenses in the Statement of Operations.
Tax Matters and Distributions — The fund intends to qualify as a regulated investment company, as defined under Subchapter M of the Internal Revenue Code, and to distribute all of its taxable income, including realized capital gains. As a result, no provision for federal income tax is required. The fund’s federal tax returns, when filed, will remain subject to examination by the Internal Revenue Service for a three year period. Management has analyzed the fund’s tax positions taken on federal and state tax returns for all open tax years and does not believe that there are any uncertain tax positions that require recognition of a tax liability. Foreign taxes, if any, have been accrued by the fund in the accompanying financial statements in accordance with the applicable foreign tax law. Foreign income taxes may be withheld by certain countries in which the fund invests. Additionally, capital gains realized by the fund on securities issued in or by certain foreign countries may be subject to capital gains tax imposed by those countries.
Distributions to shareholders are recorded on the ex-dividend date. Income and capital gain distributions are determined in accordance with income tax regulations, which may differ from U.S. generally accepted accounting principles. Certain capital accounts in the financial statements are periodically adjusted for permanent differences in order
Notes to Financial Statements (unaudited) - continued
to reflect their tax character. These adjustments have no impact on net assets or net asset value per share. Temporary differences which arise from recognizing certain items of income, expense, gain or loss in different periods for financial statement and tax purposes will reverse at some time in the future.
Book/tax differences primarily relate to wash sale loss deferrals and derivative transactions.
The tax character of distributions made during the current period will be determined at fiscal year end. The tax character of distributions declared to shareholders for the last fiscal year is as follows:
| | Year ended
10/31/20 |
| Ordinary income (including any short-term capital gains) | $1,880,261 |
The federal tax cost and the tax basis components of distributable earnings were as follows:
| As of 4/30/21 | |
| Cost of investments | $130,497,472 |
| Gross appreciation | 49,075,171 |
| Gross depreciation | (1,548,802) |
| Net unrealized appreciation (depreciation) | $ 47,526,369 |
| As of 10/31/20 | |
| Undistributed ordinary income | 982,773 |
| Capital loss carryforwards | (47,230,145) |
| Other temporary differences | 51,395 |
| Net unrealized appreciation (depreciation) | 25,156,566 |
The aggregate cost above includes prior fiscal year end tax adjustments, if applicable.
As of October 31, 2020, the fund had capital loss carryforwards available to offset future realized gains. These net capital losses may be carried forward indefinitely and their character is retained as short-term and/or long-term losses. Such losses are characterized as follows:
| Short-Term | $(45,343,346) |
| Long-Term | (1,886,799) |
| Total | $(47,230,145) |
Multiple Classes of Shares of Beneficial Interest — The fund offers multiple classes of shares, which differ in their respective distribution and service fees. The fund's income, realized and unrealized gain (loss), and common expenses are allocated to shareholders based on the daily net assets of each class. Dividends are declared separately for each class. Differences in per share dividend rates are generally due to differences in separate class expenses. Class B and Class C shares will convert to
Notes to Financial Statements (unaudited) - continued
Class A shares approximately eight years after purchase. The fund’s distributions declared to shareholders as reported in the Statements of Changes in Net Assets are presented by class as follows:
| | Six months ended
4/30/21 | Year ended
10/31/20 |
| Class A | $124,519 | $299,314 |
| Class B | — | 5,194 |
| Class C | — | 1,807 |
| Class I | 699,213 | 1,482,420 |
| Class R1 | — | 517 |
| Class R2 | — | 5,116 |
| Class R3 | 5,098 | 10,258 |
| Class R4 | 402 | 600 |
| Class R6 | 155,825 | 75,035 |
| Total | $985,057 | $1,880,261 |
(3) Transactions with Affiliates
Investment Adviser — The fund has an investment advisory agreement with MFS to provide overall investment management and related administrative services and facilities to the fund. The management fee is computed daily and paid monthly at the following annual rates based on the fund's average daily net assets:
| Up to $1 billion | 0.80% |
| In excess of $1 billion and up to $2.5 billion | 0.70% |
| In excess of $2.5 billion | 0.65% |
MFS has agreed in writing to reduce its management fee by a specified amount if certain MFS mutual fund assets exceed thresholds agreed to by MFS and the fund's Board of Trustees. For the six months ended April 30, 2021, this management fee reduction amounted to $9,983, which is included in the reduction of total expenses in the Statement of Operations. The management fee incurred for the six months ended April 30, 2021 was equivalent to an annual effective rate of 0.79% of the fund's average daily net assets.
The investment adviser has agreed in writing to pay a portion of the fund’s total annual operating expenses, excluding interest, taxes, extraordinary expenses, brokerage and transaction costs, and investment-related expenses (such as short sale dividend and interest expenses incurred in connection with the fund’s investment activity), such that total fund operating expenses do not exceed the following rates annually of each class’s average daily net assets:
| | | | | Classes | | | | |
| A | B | C | I | R1 | R2 | R3 | R4 | R6 |
| 1.30% | 2.05% | 2.05% | 1.05% | 2.05% | 1.55% | 1.30% | 1.05% | 0.97% |
This written agreement will continue until modified by the fund’s Board of Trustees, but such agreement will continue at least until February 28, 2022. For the six months ended April 30, 2021, this reduction amounted to $109,634, which is included in the reduction of total expenses in the Statement of Operations.
Notes to Financial Statements (unaudited) - continued
Distributor — MFS Fund Distributors, Inc. (MFD), a wholly-owned subsidiary of MFS, as distributor, received $3,360 for the six months ended April 30, 2021, as its portion of the initial sales charge on sales of Class A shares of the fund.
The Board of Trustees has adopted a distribution plan for certain share classes pursuant to Rule 12b-1 of the Investment Company Act of 1940.
The fund's distribution plan provides that the fund will pay MFD for services provided by MFD and financial intermediaries in connection with the distribution and servicing of certain share classes. One component of the plan is a distribution fee paid to MFD and another component of the plan is a service fee paid to MFD. MFD may subsequently pay all, or a portion, of the distribution and/or service fees to financial intermediaries.
Distribution Plan Fee Table:
| | Distribution
Fee Rate (d) | Service
Fee Rate (d) | Total
Distribution
Plan (d) | Annual
Effective
Rate (e) | Distribution
and Service
Fee |
| Class A | — | 0.25% | 0.25% | 0.25% | $ 37,638 |
| Class B | 0.75% | 0.25% | 1.00% | 1.00% | 19,178 |
| Class C | 0.75% | 0.25% | 1.00% | 1.00% | 37,953 |
| Class R1 | 0.75% | 0.25% | 1.00% | 1.00% | 581 |
| Class R2 | 0.25% | 0.25% | 0.50% | 0.50% | 1,215 |
| Class R3 | — | 0.25% | 0.25% | 0.25% | 1,970 |
| Total Distribution and Service Fees | | | | | $98,535 |
| (d) | In accordance with the distribution plan for certain classes, the fund pays distribution and/or service fees equal to these annual percentage rates of each class’s average daily net assets. The distribution and service fee rates disclosed by class represent the current rates in effect at the end of the reporting period. Any rate changes, if applicable, are detailed below. |
| (e) | The annual effective rates represent actual fees incurred under the distribution plan for the six months ended April 30, 2021 based on each class's average daily net assets. MFD has voluntarily agreed to rebate a portion of each class's 0.25% service fee attributable to accounts for which there is no financial intermediary specified on the account except for accounts attributable to MFS or its affiliates' seed money. For the six months ended April 30, 2021, this rebate amounted to $41 for Class A and is included in the reduction of total expenses in the Statement of Operations. |
Certain Class A shares are subject to a contingent deferred sales charge (CDSC) in the event of a shareholder redemption within 18 months of purchase. Class B shares are subject to a CDSC in the event of a shareholder redemption within six years of purchase. Class C shares are subject to a CDSC in the event of a shareholder redemption within 12 months of purchase. All contingent deferred sales charges are paid to MFD and during the six months ended April 30, 2021, were as follows:
| | Amount |
| Class A | $750 |
| Class B | 666 |
| Class C | 48 |
Shareholder Servicing Agent — MFS Service Center, Inc. (MFSC), a wholly-owned subsidiary of MFS, receives a fee from the fund for its services as shareholder servicing agent calculated as a percentage of the average daily net assets of the fund as
Notes to Financial Statements (unaudited) - continued
determined periodically under the supervision of the fund's Board of Trustees. For the six months ended April 30, 2021, the fee was $7,237, which equated to 0.0082% annually of the fund's average daily net assets. MFSC also receives reimbursement from the fund for out-of-pocket expenses, sub-accounting and other shareholder servicing costs which may be paid to affiliated and unaffiliated service providers. Class R6 shares do not incur sub-accounting fees. For the six months ended April 30, 2021, these out-of-pocket expenses, sub-accounting and other shareholder servicing costs amounted to $76,403.
Administrator — MFS provides certain financial, legal, shareholder communications, compliance, and other administrative services to the fund. Under an administrative services agreement, the fund reimburses MFS the costs incurred to provide these services. The fund is charged an annual fixed amount of $17,500 plus a fee based on average daily net assets. The administrative services fee incurred for the six months ended April 30, 2021 was equivalent to an annual effective rate of 0.0188% of the fund's average daily net assets.
Trustees’ and Officers’ Compensation — The fund pays compensation to independent Trustees in the form of a retainer, attendance fees, and additional compensation to Board and Committee chairpersons. The fund does not pay compensation directly to Trustees or officers of the fund who are also officers of the investment adviser, all of whom receive remuneration from MFS for their services to the fund. Certain officers and Trustees of the fund are officers or directors of MFS, MFD, and MFSC.
Other — The fund invests in the MFS Institutional Money Market Portfolio which is managed by MFS and seeks current income consistent with preservation of capital and liquidity. This money market fund does not pay a management fee to MFS but does incur investment and operating costs.
On May 7, 2020, MFS purchased 4,699 shares of Class R4 for an aggregate amount of $50,000. On May 7, 2020, MFS redeemed 4,739 shares of Class R3 for an aggregate amount of $50,000.
At April 30, 2021, MFS held 100% of the outstanding shares of Class R4.
The fund is permitted to engage in purchase and sale transactions with funds and accounts for which MFS serves as investment adviser or sub-adviser (“cross-trades”) pursuant to a policy adopted by the Board of Trustees. This policy has been designed to ensure that cross-trades conducted by the fund comply with Rule 17a-7 under the Investment Company Act of 1940. During the six months ended April 30, 2021, the fund engaged in sale transactions pursuant to this policy, which amounted to $36,116. The sales transactions resulted in net realized gains (losses) of $9,684.
(4) Portfolio Securities
For the six months ended April 30, 2021, purchases and sales of investments, other than short sales and short-term obligations, were as follows:
| | Purchases | Sales |
| U.S. Government securities | $1,231,925 | $1,185,376 |
| Non-U.S. Government securities | 31,967,221 | 52,688,199 |
Notes to Financial Statements (unaudited) - continued
(5) Shares of Beneficial Interest
The fund's Declaration of Trust permits the Trustees to issue an unlimited number of full and fractional shares of beneficial interest. Transactions in fund shares were as follows:
| | Six months ended
4/30/21 | | Year ended
10/31/20 |
| | Shares | Amount | | Shares | Amount |
| Shares sold | | | | | |
| Class A | 427,996 | $4,844,528 | | 480,649 | $5,241,025 |
| Class B | 2,697 | 29,867 | | 39,632 | 388,822 |
| Class C | 22,965 | 256,195 | | 194,075 | 1,995,206 |
| Class I | 1,773,007 | 20,257,995 | | 3,719,821 | 40,828,052 |
| Class R1 | 36 | 391 | | 71 | 750 |
| Class R2 | 535 | 6,006 | | 8,010 | 85,330 |
| Class R3 | 27,695 | 315,065 | | 163,944 | 1,804,167 |
| Class R4 | — | — | | 5,348 | 56,729 |
| Class R6 | 262,955 | 3,017,890 | | 2,180,806 | 24,343,215 |
| | 2,517,886 | $28,727,937 | | 6,792,356 | $74,743,296 |
Shares issued to shareholders
in reinvestment of distributions | | | | | |
| Class A | 10,073 | $113,217 | | 23,804 | $260,420 |
| Class B | — | — | | 395 | 4,247 |
| Class C | — | — | | 158 | 1,702 |
| Class I | 47,512 | 536,886 | | 112,270 | 1,234,975 |
| Class R1 | — | — | | 49 | 517 |
| Class R2 | — | — | | 472 | 5,116 |
| Class R3 | 453 | 5,098 | | 938 | 10,258 |
| Class R4 | 36 | 402 | | 54 | 600 |
| Class R6 | 12,367 | 140,361 | | 5,024 | 55,511 |
| | 70,441 | $795,964 | | 143,164 | $1,573,346 |
| Shares reacquired | | | | | |
| Class A | (476,760) | $(5,424,946) | | (906,557) | $(9,903,425) |
| Class B | (57,507) | (638,603) | | (94,852) | (1,014,804) |
| Class C | (202,169) | (2,253,422) | | (368,605) | (3,930,078) |
| Class I | (1,546,965) | (17,665,813) | | (5,724,197) | (62,393,489) |
| Class R1 | (6) | (61) | | (9,550) | (103,267) |
| Class R2 | (6,159) | (69,305) | | (36,797) | (398,813) |
| Class R3 | (15,080) | (172,574) | | (136,572) | (1,446,045) |
| Class R4 | (495) | (5,631) | | (4,876) | (53,637) |
| Class R6 | (275,241) | (3,157,176) | | (849,873) | (9,127,360) |
| | (2,580,382) | $(29,387,531) | | (8,131,879) | $(88,370,918) |
Notes to Financial Statements (unaudited) - continued
| | Six months ended
4/30/21 | | Year ended
10/31/20 |
| | Shares | Amount | | Shares | Amount |
| Net change | | | | | |
| Class A | (38,691) | $(467,201) | | (402,104) | $(4,401,980) |
| Class B | (54,810) | (608,736) | | (54,825) | (621,735) |
| Class C | (179,204) | (1,997,227) | | (174,372) | (1,933,170) |
| Class I | 273,554 | 3,129,068 | | (1,892,106) | (20,330,462) |
| Class R1 | 30 | 330 | | (9,430) | (102,000) |
| Class R2 | (5,624) | (63,299) | | (28,315) | (308,367) |
| Class R3 | 13,068 | 147,589 | | 28,310 | 368,380 |
| Class R4 | (459) | (5,229) | | 526 | 3,692 |
| Class R6 | 81 | 1,075 | | 1,335,957 | 15,271,366 |
| | 7,945 | $136,370 | | (1,196,359) | $(12,054,276) |
Effective June 1, 2019, purchases of the fund’s Class B shares are closed to new and existing investors subject to certain exceptions. Please see the fund’s prospectus for details.
(6) Line of Credit
The fund and certain other funds managed by MFS participate in a $1.25 billion unsecured committed line of credit of which $1 billion is reserved for use by the fund and certain other MFS U.S. funds. The line of credit is provided by a syndicate of banks under a credit agreement. Borrowings may be made for temporary financing needs. Interest is charged to each fund, based on its borrowings, generally at a rate equal to the highest of one month LIBOR, the Federal Funds Effective Rate and the Overnight Bank Funding Rate, plus an agreed upon spread. A commitment fee, based on the average daily, unused portion of the committed line of credit, is allocated among the participating funds. In addition, the fund and other funds managed by MFS have established unsecured uncommitted borrowing arrangements with certain banks for temporary financing needs. Interest is charged to each fund, based on its borrowings, at rates equal to customary reference rates plus an agreed upon spread. For the six months ended April 30, 2021, the fund’s commitment fee and interest expense were $391 and $0, respectively, and are included in “Interest expense and fees” in the Statement of Operations.
(7) Investments in Affiliated Issuers
An affiliated issuer may be considered one in which the fund owns 5% or more of the outstanding voting securities, or a company which is under common control. For the purposes of this report, the following were affiliated issuers:
| Affiliated Issuers | Beginning
Value | Purchases | Sales
Proceeds | Realized
Gain
(Loss) | Change in
Unrealized
Appreciation or
Depreciation | Ending
Value |
| MFS Institutional Money Market Portfolio | $11,067,592 | $77,036,321 | $80,164,330 | $— | $— | $7,939,583 |
Notes to Financial Statements (unaudited) - continued
| Affiliated Issuers | Dividend
Income | Capital Gain
Distributions |
| MFS Institutional Money Market Portfolio | $2,905 | $— |
(8) Impacts of COVID-19
The pandemic related to the global spread of novel coronavirus disease (COVID-19), which was first detected in December 2019, has resulted in significant disruptions to global business activity and the global economy, as well as the economies of individual countries, the financial performance of individual companies and sectors, and the securities and commodities markets in general. Multiple surges in cases globally, the availability and widespread adoption of vaccines, and the emergence of variant strains of the virus continue to create uncertainty as to the future and long-term impacts resulting from the pandemic including impacts to the prices and liquidity of the fund's investments and the fund's performance.
Statement Regarding Liquidity Risk Management Program
The fund has adopted and implemented a liquidity risk management program (the “Program”) as required by Rule 22e-4 under the Investment Company Act of 1940, as amended. The fund’s Board of Trustees (the “Board”) has designated MFS as the administrator of the Program. The Program is reasonably designed to assess and manage the liquidity risk of the fund. Liquidity risk is the risk that the fund could not meet requests to redeem shares issued by the fund without significant dilution of remaining investors' interests.
MFS provided a written report to the Board for consideration at its April 2021 meeting that addressed the operation of the Program and provided an assessment of the adequacy and effectiveness of the Program during the period from January 1, 2020 to December 31, 2020 (the “Covered Period”). The report concluded that during the Covered Period the Program had operated effectively and had adequately and effectively been implemented to assess and manage the fund’s liquidity risk. MFS also reported that there were no liquidity events that impacted the fund or its ability to timely meet redemptions without dilution to existing shareholders during the Covered Period.
There can be no assurance that the Program will achieve its objectives in the future. Further information on liquidity risk, and other principal risks to which an investment in the fund may be subject, can be found in the prospectus.
Proxy Voting Policies and Information
MFS votes proxies on behalf of the fund pursuant to proxy voting policies and procedures that are available without charge, upon request, by calling 1-800-225-2606, by visiting mfs.com/proxyvoting, or by visiting the SEC’s Web site at http://www.sec.gov.
Information regarding how the fund voted proxies relating to portfolio securities during the most recent twelve-month period ended June 30 is available by August 31 of each year without charge by visiting mfs.com/proxyvoting, or by visiting the SEC’s Web site at http://www.sec.gov.
Quarterly Portfolio Disclosure
The fund files a complete schedule of portfolio holdings with the SEC for the first and third quarters of each fiscal year as an exhibit to its reports on Form N-PORT. The fund's Form N-PORT reports are available on the SEC's Web site at http://www.sec.gov. A shareholder can obtain the portfolio holdings report for the first and third quarters of the fund's fiscal year at mfs.com/openendfunds by choosing the fund's name and then scrolling to the “Resources” section and clicking on the “Prospectus and Reports” tab.
Further Information
From time to time, MFS may post important information about the fund or the MFS Funds on the MFS Web site (mfs.com). This information is available at https://www.mfs.com/announcements or at mfs.com/openendfunds by choosing the fund’s name and then scrolling to the “Resources” section and clicking on the “Announcements” tab, if any.
Information About Fund Contracts and Legal Claims
The fund has entered into contractual arrangements with an investment adviser, administrator, distributor, shareholder servicing agent, 529 program manager (if applicable), and custodian who each provide services to the fund. Unless expressly stated otherwise, shareholders are not parties to, or intended beneficiaries of these contractual arrangements, and these contractual arrangements are not intended to create any shareholder right to enforce them against the service providers or to seek any remedy under them against the service providers, either directly or on behalf of the fund.
Under the Trust’s By-Laws and Declaration of Trust, any claims asserted against or on behalf of the MFS Funds, including claims against Trustees and Officers, must be brought in state and federal courts located within the Commonwealth of Massachusetts.
Provision of Financial Reports and Summary Prospectuses
The fund produces financial reports every six months and updates its summary prospectus and prospectus annually. To avoid sending duplicate copies of materials to households, only one copy of the fund’s annual and semiannual report and summary prospectus may be mailed to shareholders having the same last name and residential address on the fund’s records. However, any shareholder may contact MFSC (please see back cover for address and telephone number) to request that copies of these reports and summary prospectuses be sent personally to that shareholder.
Save paper with eDelivery.
MFS® will send you prospectuses, reports, and proxies directly via e-mail so you will get information faster with less mailbox clutter.
To sign up:
1. Go to mfs.com.
2. Log in via MFS® Access.
3. Select eDelivery.
If you own your MFS fund shares through a financial institution or a retirement plan, MFS® TALK, MFS® Access, or eDelivery may not be available to you.
CONTACT
WEB SITE
mfs.com
MFS TALK
1-800-637-8255
24 hours a day
ACCOUNT SERVICE AND LITERATURE
Shareholders
1-800-225-2606
Financial advisors
1-800-343-2829
Retirement plan services
1-800-637-1255
MAILING ADDRESS
MFS Service Center, Inc.
P.O. Box 219341
Kansas City, MO 64121-9341
OVERNIGHT MAIL
MFS Service Center, Inc.
Suite 219341
430 W 7th Street
Kansas City, MO 64105-1407
Item 1(b):
Not applicable
During the period covered by this report, the Registrant has not amended any provision in its Code of Ethics (the “Code”) that relates to an element of the Code’s definition enumerated in paragraph (b) of Item 2 of this Form N-CSR. During the period covered by this report, the Registrant did not grant a waiver, including an implicit waiver, from any provision of the Code.
| ITEM 3. | AUDIT COMMITTEE FINANCIAL EXPERT. |
Not applicable for semi-annual reports.
| ITEM 4. | PRINCIPAL ACCOUNTANT FEES AND SERVICES. |
Not applicable for semi-annual reports.
| ITEM 5. | AUDIT COMMITTEE OF LISTED REGISTRANTS. |
Not applicable to the Registrant.
A schedule of investments for each series of the Registrant is included as part of the report to shareholders of such series under Item 1(a) of this Form N-CSR.
| ITEM 7. | DISCLOSURE OF PROXY VOTING POLICIES AND PROCEDURES FOR CLOSED-END MANAGEMENT INVESTMENT COMPANIES. |
Not applicable to the Registrant.
| ITEM 8. | PORTFOLIO MANAGERS OF CLOSED-END MANAGEMENT INVESTMENT COMPANIES. |
Not applicable to the Registrant.
| ITEM 9. | PURCHASES OF EQUITY SECURITIES BY CLOSED-END MANAGEMENT INVESTMENT COMPANY AND AFFILIATED PURCHASERS. |
Not applicable to the Registrant.
| ITEM 10. | SUBMISSION OF MATTERS TO A VOTE OF SECURITY HOLDERS. |
There were no material changes to the procedures by which shareholders may send recommendations to the Board for nominees to the Registrant’s Board since the Registrant last provided disclosure as to such procedures in response to the requirements of Item 407 (c)(2)(iv) of Regulation S-K or this Item.
| ITEM 11. | CONTROLS AND PROCEDURES. |
| (a) | Based upon their evaluation of the effectiveness of the registrant’s disclosure controls and procedures (as defined in Rule 30a-3(c) under the Investment Company Act of 1940 (the “Act”)) as conducted within 90 days of the filing date of this report on Form N-CSR, the registrant’s principal financial officer and principal executive officer have concluded that those disclosure controls and procedures provide reasonable assurance that the material information required to be disclosed by the registrant on this report is recorded, processed, summarized and reported within the time periods specified in the Securities and Exchange Commission’s rules and forms. |
| (b) | There were no changes in the registrant’s internal controls over financial reporting (as defined in Rule 30a-3(d) under the Act) that occurred during the period covered by the report that have materially affected, or are reasonably likely to materially affect, the registrant’s internal control over financial reporting. |
| ITEM 12. | DISCLOSURE OF SECURITIES LENDING ACTIVITIES FOR CLOSED-END MANAGEMENT INVESTMENT COMPANIES. |
Not applicable to the Registrant.
| (a) | File the exhibits listed below as part of this form. Letter or number the exhibits in the sequence indicated. |
| | (1) | Any code of ethics, or amendment thereto, that is the subject of the disclosure required by Item 2, to the extent that the registrant intends to satisfy the Item 2 requirements through filing of an exhibit. Not applicable. |
| | (2) | A separate certification for each principal executive officer and principal financial officer of the registrant as required by Rule 30a-2(a) under the Act (17 CFR 270.30a-2): Attached hereto as EX-99.302CERT. |
| | (3) | Any written solicitation to purchase securities under Rule 23c-1 under the Act (17 CFR 270.23c-1) sent or given during the period covered by the report by or on behalf of the registrant to 10 or more persons. Not applicable. |
| | (4) | Change in the registrant’s independent public accountant. Not applicable. |
| (b) | If the report is filed under Section 13(a) or 15(d) of the Exchange Act, provide the certifications required by Rule 30a-2(b) under the Act (17 CFR 270.30a-2(b)), Rule 13a-14(b) or Rule 15d-14(b) under the Exchange Act (17 CFR 240.13a-14(b) or 240.15d-14(b)) and Section 1350 of Chapter 63 of Title 18 of the United States Code (18 U.S.C. 1350) as an exhibit. A certification furnished pursuant to this paragraph will not be deemed “filed” for the purposes of Section 18 of the Exchange Act (15 U.S.C. 78r), or otherwise subject to the liability of that section. Such certification will not be deemed to be incorporated by reference into any filing under the Securities Act of 1933 or the Exchange Act, except to the extent that the registrant specifically incorporates it by reference: Attached hereto as EX-99.906CERT. |
Notice
A copy of the Amended and Restated Declaration of Trust, as amended, of the Registrant is on file with the Secretary of State of The Commonwealth of Massachusetts and notice is hereby given that this instrument is executed on behalf of the Registrant by an officer of the Registrant as an officer and not individually and the obligations of or arising out of this instrument are not binding upon any of the Trustees or shareholders individually, but are binding only upon the assets and property of the respective constituent series of the Registrant.
SIGNATURES
Pursuant to the requirements of the Securities Exchange Act of 1934 and the Investment Company Act of 1940, the registrant has duly caused this report to be signed on its behalf by the undersigned, thereunto duly authorized.
(Registrant) MFS SERIES TRUST XV
| | |
| By (Signature and Title)* | | /S/ DAVID L. DILORENZO |
| | David L. DiLorenzo, President |
Date: June 15, 2021
Pursuant to the requirements of the Securities Exchange Act of 1934 and the Investment Company Act of 1940, this report has been signed below by the following persons on behalf of the registrant and in the capacities and on the dates indicated.
| | |
| By (Signature and Title)* | | /S/ DAVID L. DILORENZO |
| | David L. DiLorenzo, President |
| | (Principal Executive Officer) |
Date: June 15, 2021
| | |
| By (Signature and Title)* | | /S/ JAMES O. YOST |
| | James O. Yost, Treasurer |
| | (Principal Financial Officer |
| | and Accounting Officer) |
Date: June 15, 2021
| * | Print name and title of each signing officer under his or her signature. |