UNITED STATES
SECURITIES AND EXCHANGE COMMISSION Washington, D.C. 20549
FORM N-CSR
CERTIFIED SHAREHOLDER REPORT OF REGISTERED MANAGEMENT INVESTMENT COMPANIES
Investment Company Act file number 811-04253
MFS SERIES TRUST XV
(Exact name of registrant as specified in charter)
111 Huntington Avenue, Boston, Massachusetts 02199 (Address of principal executive offices) (Zip code)
Christopher R. Bohane
Massachusetts Financial Services Company
111 Huntington Avenue
Boston, Massachusetts 02199
(Name and address of agents for service)
Registrant's telephone number, including area code: (617) 954-5000
Date of fiscal year end: October 31
Date of reporting period: October 31, 2022
ITEM 1. REPORTS TO STOCKHOLDERS.
Item 1(a):
Annual Report
October 31, 2022
MFS® Commodity
Strategy Fund
MFS® Commodity
Strategy Fund
| 1 |
| 2 |
| 5 |
| 7 |
| 10 |
| 12 |
| 34 |
| 36 |
| 37 |
| 38 |
| 44 |
| 60 |
| 62 |
| 66 |
| 70 |
| 70 |
| 70 |
| 70 |
| 70 |
| 71 |
The report is prepared for the general information of shareholders. It is authorized for distribution to prospective investors only when preceded or accompanied by a current prospectus.
NOT FDIC INSURED • MAY LOSE VALUE • NO BANK GUARANTEE
LETTER FROM THE CHAIR AND CEO
Dear Shareholders:
Global markets have recently been buffeted by a series of crosscurrents, including rising inflation, tighter financial conditions, and evolving geopolitical tensions. Consequently, at a time when global growth faces multiple headwinds, central banks have been presented with the challenge of reining in rising prices without tipping economies into recession. The U.S. Federal Reserve has made it clear that rates must move higher and tighter policy must be sustained to restore price stability and that this will likely bring some pain to households and businesses. Against that backdrop, richly valued, interest rate–sensitive growth equities have been hit particularly hard by rising interest rates. Volatility in fixed income and currency markets has picked up, with fiscal policy missteps in the United Kingdom leading to a crisis of market confidence that ultimately resulted in the ouster of Prime Minister Liz Truss. That episode could forewarn other governments to avoid policy overreach.
There are, however, encouraging signs for the markets. China has modestly relaxed its zero-COVID policy, and cases globally, while numerous, appear to be causing fewer serious illnesses. Meanwhile, unemployment is low and global supply chain bottlenecks are easing, though lingering coronavirus restrictions in China and disruptions stemming from Russia’s invasion of Ukraine could hamper these advances. Additionally, easier Chinese monetary and regulatory policies and the record pace of corporate stock buybacks are supportive elements, albeit in an otherwise turbulent investment environment.
It is important to have a deep understanding of company fundamentals during times of market transition, and we have built our unique global research platform to do just that.
At MFS®, we put our clients’ assets to work responsibly by carefully navigating increasingly complex global capital markets. Our investment team is guided by a commitment to long-term fundamental investing. Our global investment platform — combining collective expertise, long-term discipline, and thoughtful risk management — seeks to uncover what we believe are the best, most durable investment ideas in markets around the world, enabling us to potentially create value for investors.
Respectfully,
Michael W. Roberge
Chair and Chief Executive Officer
MFS Investment Management
December 15, 2022
The opinions expressed in this letter are subject to change and may not be relied upon for investment advice. No forecasts can be guaranteed.
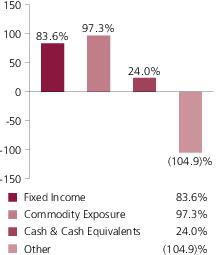
Portfolio structure reflecting equivalent exposure of derivative positions (i)
Fixed income sectors (i)
| Investment Grade Corporates | 33.8% |
| U.S. Treasury Securities | 21.7% |
| Collateralized Debt Obligations | 8.1% |
| Non-U.S. Government Bonds | 7.6% |
| Commercial Mortgage-Backed Securities | 5.1% |
| Asset-Backed Securities | 2.2% |
| Emerging Markets Bonds | 2.0% |
| Municipal Bonds | 1.3% |
| High Yield Corporates | 1.1% |
| Mortgage-Backed Securities | 0.5% |
| Residential Mortgage-Backed Securities | 0.2% |
Composition including fixed income credit quality (a)(i)
| AAA | 6.2% |
| AA | 8.4% |
| A | 15.5% |
| BBB | 22.5% |
| BB | 1.2% |
| U.S. Government | 21.7% |
| Federal Agencies | 0.5% |
| Not Rated | 7.6% |
| Non-Fixed Income | 97.3% |
| Cash & Cash Equivalents | 24.0% |
| Other | (104.9)% |
Portfolio Composition - continued
Commodity exposure (c)(i)
| Natural Gas | 12.9% |
| Gold | 11.8% |
| WTI Crude Oil | 9.0% |
| Brent Crude | 8.6% |
| Corn | 7.7% |
| Soybeans | 5.7% |
| Soybean Oil | 4.5% |
| Gas Oil | 4.2% |
| Soybean Meal | 3.4% |
| Zinc | 3.4% |
| Silver | 3.3% |
| Copper (COMEX) | 2.9% |
| Wheat | 2.9% |
| Heating Oil | 2.8% |
| Lean Hogs | 2.8% |
| Sugar | 2.7% |
| Nickel | 2.6% |
| Live Cattle | 2.3% |
| Unleaded Gasoline | 2.3% |
| Cotton | 2.1% |
| Coffee | 2.0% |
| Aluminum | 1.7% |
| Kansas Wheat | 1.6% |
| Cocoa | (1.3)% |
| Lead | (1.4)% |
| Platinum | (1.5)% |
| Feeder Cattle | (1.7)% |
| (a) | For all securities other than those specifically described below, ratings are assigned to underlying securities utilizing ratings from Moody’s, Fitch, and Standard & Poor’s rating agencies and applying the following hierarchy: If all three agencies provide a rating, the middle rating (after dropping the highest and lowest ratings) is assigned; if two of the three agencies rate a security, the lower of the two is assigned. If none of the 3 rating agencies above assign a rating, but the security is rated by DBRS Morningstar, then the DBRS Morningstar rating is assigned. If none of the 4 rating agencies listed above rate the security, but the security is rated by the Kroll Bond Rating Agency (KBRA), then the KBRA rating is assigned. Ratings are shown in the S&P and Fitch scale (e.g., AAA). Securities rated BBB or higher are considered investment grade. All ratings are subject to change. U.S. Government includes securities issued by the U.S. Department of the Treasury. Federal Agencies includes rated and unrated U.S. Agency fixed-income securities, U.S. Agency mortgage-backed securities, and collateralized mortgage obligations of U.S. Agency mortgage-backed securities. |
Non-Fixed Income includes equity securities (including convertible bonds and equity
Portfolio Composition - continued
derivatives), ETFs, and/or commodity-linked derivatives. The fund may or may not have held all of these instruments on this date. The fund is not rated by these agencies.
| (c) | MFS expects to gain exposure to the commodities markets by investing a portion of the fund’s assets in the MFS Commodity Strategy Portfolio, a wholly-owned and controlled subsidiary organized in the Cayman Islands (“Subsidiary”). The Subsidiary gains exposure to the commodities markets by investing in commodity-linked derivatives (such as commodity-linked futures, options, and/or swaps). The Subsidiary’s investments in commodity-linked derivatives are leveraged (i.e. involves investment exposure greater than the amount of the investment). For more information about commodity-linked derivatives and the risks of investing in such derivatives, please see the fund’s prospectus. |
| (i) | For purposes of this presentation, the components include the value of securities, and reflect the impact of the equivalent exposure of derivative positions, if any. These amounts may be negative from time to time. Equivalent exposure is a calculated amount that translates the derivative position into a reasonable approximation of the amount of the underlying asset that the portfolio would have to hold at a given point in time to have the same price sensitivity that results from the portfolio’s ownership of the derivative contract. When dealing with derivatives, equivalent exposure is a more representative measure of the potential impact of a position on portfolio performance than value. The bond component will include any accrued interest amounts. |
The fund invests a portion of its assets in the MFS Commodity Strategy Portfolio, a wholly-owned subsidiary of the fund. Percentages reflect exposure to the underlying holdings of the MFS Commodity Strategy Portfolio and not to the exposure from investing directly in the MFS Commodity Strategy Portfolio itself.
Where the fund holds convertible bonds, they are treated as part of the equity portion of the portfolio.
Cash & Cash Equivalents includes any cash, investments in money market funds, short-term securities, and other assets less liabilities. Please see the Consolidated Statement of Assets and Liabilities for additional information related to the fund’s cash position and other assets and liabilities.
Other includes equivalent exposure from currency derivatives and/or any offsets to derivative positions and may be negative.
Percentages are based on net assets as of October 31, 2022.
The portfolio is actively managed and current holdings may be different.
Management Review
Summary of Results
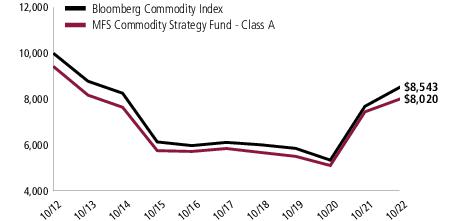
For the twelve months ended October 31, 2022, Class A shares of the MFS Commodity Strategy Fund (fund) provided a total return of 7.71%, at net asset value. This compares with a return of 11.15% for the fund’s benchmark, the Bloomberg Commodity Index.
The fund’s investment adviser expects to gain exposure to the commodities markets by investing a portion of the fund’s assets in the MFS Commodity Strategy Portfolio, a wholly-owned and controlled subsidiary organized in the Cayman Islands (Subsidiary). The Subsidiary gains exposure to the commodities markets by investing in commodity-linked derivatives (such as commodity-linked futures, options and/or swaps).
Market Environment
During the reporting period, markets continued to grapple with the strongest global inflationary pressures in decades along with signs of slowing economic growth. Intermittent coronavirus flareups, particularly in China, where home-grown vaccines have proved less effective than elsewhere, kept supply chains stretched for a considerable period. At the same time, the reopening of the economy in the parts of the world where the virus has been better contained has led to a shift in consumption patterns in favor of services, straining already tight labor markets in most developed economies, while reducing demand for manufactured goods, primarily from Asia. As a result of Russia’s invasion of Ukraine, geopolitical considerations, such as sanctions and trade bans, have resulted in additional supply chain tumult and volatile global energy prices. Taken together, these factors have contributed to market volatility.
The ripple effects from the Russian invasion further complicated the mission central banks must undertake to rein in surging inflation. Energy shocks have historically resulted in global growth slowdowns, if not pullbacks, so policymakers will find themselves in the difficult position of trying to restrain inflation without tipping economies into recession. Despite the challenging macroeconomic and geopolitical environment, policymakers remained focused on corralling inflation, although investors appeared to have expected varying degrees of action from the central banks. The Fed was expected to be the most hawkish developed market central bank and the European Central Bank less so, given the growth-depleting effects on Europe's economy stemming from the invasion, while the Bank of Japan remained on the monetary sidelines, leading to a dramatic weakening of the yen.
Against an environment of still-tight labor markets, tighter global financial conditions and volatile materials prices, investor anxiety appeared to have increased over the potential that corporate profit margins may be past peak for this cycle. That said, tentative signs that supply chain bottlenecks (particularly semiconductors) may be easing, low levels of unemployment across developed markets and somewhat easier prices for non-energy raw materials were supportive factors for the macroeconomic backdrop.
After surging more than 30% after the outbreak of the war in Ukraine, gains in commodities have moderated in recent months amid slowing global economic growth.
Management Review - continued
Factors Affecting Performance
Over the reporting period, the fund underperformed the Bloomberg Commodity Index, primarily led by the fund's fixed income exposure. The fund's slight overweight exposure to soft commodities, particularly within coffee, and its underweight allocation to livestock commodities, further held back relative results.
Conversely, an overweight allocation to energy commodities, and an underweight exposure to both precious metals and grain commodities, contributed to the fund’s relative results. Additionally, the fund’s out-of-benchmark exposure to the commodity swaps curve further supported relative returns..
Respectfully,
Portfolio Manager(s)
Philipp Burgener, Alexander Mackey, Benjamin Nastou, and Natalie Shapiro
The views expressed in this report are those of the portfolio manager(s) only through the end of the period of the report as stated on the cover and do not necessarily reflect the views of MFS or any other person in the MFS organization. These views are subject to change at any time based on market or other conditions, and MFS disclaims any responsibility to update such views. These views may not be relied upon as investment advice or an indication of trading intent on behalf of any MFS portfolio. References to specific securities are not recommendations of such securities, and may not be representative of any MFS portfolio’s current or future investments.
Performance Summary THROUGH 10/31/22
The following chart illustrates a representative class of the fund’s historical performance in comparison to its benchmark(s). Performance results include the deduction of the maximum applicable sales charge and reflect the percentage change in net asset value, including reinvestment of dividends and capital gains distributions. The performance of other share classes will be greater than or less than that of the class depicted below. Benchmarks are unmanaged and may not be invested in directly. Benchmark returns do not reflect sales charges, commissions or expenses. (See Notes to Performance Summary.)
Performance data shown represents past performance and is no guarantee of future results. Investment return and principal value fluctuate so your shares, when sold, may be worth more or less than the original cost; current performance may be lower or higher than quoted. The performance shown does not reflect the deduction of taxes, if any, that a shareholder would pay on fund distributions or the redemption of fund shares.
Growth of a Hypothetical $10,000 Investment
Performance Summary - continued
Total Returns through 10/31/22
Average annual without sales charge
| Share Class | Class Inception Date | 1-yr | 5-yr | 10-yr | Life (t) |
| A | 6/02/10 | 7.71% | 6.53% | (1.60)% | N/A |
| B | 8/15/18 | 7.08% | N/A | N/A | 7.51% |
| C | 8/15/18 | 6.94% | N/A | N/A | 7.46% |
| I | 6/02/10 | 8.05% | 6.83% | (1.34)% | N/A |
| R1 | 8/15/18 | 7.07% | N/A | N/A | 7.51% |
| R2 | 8/15/18 | 7.61% | N/A | N/A | 8.04% |
| R3 | 8/15/18 | 7.75% | N/A | N/A | 8.29% |
| R4 | 8/15/18 | 8.07% | N/A | N/A | 8.56% |
| R6 | 9/04/12 | 8.24% | 6.87% | (1.32)% | N/A |
Comparative benchmark(s)
| | | | | |
| Bloomberg Commodity Index (f) | 11.15% | 6.92% | (1.56)% | N/A |
Average annual with sales charge
| | | | | |
A
With Initial Sales Charge (5.75%) | 1.52% | 5.27% | (2.18)% | N/A |
B
With CDSC (Declining over six years from 4% to 0%) (v) | 4.34% | N/A | N/A | 7.20% |
C
With CDSC (1% for 12 months) (v) | 6.26% | N/A | N/A | 7.46% |
CDSC – Contingent Deferred Sales Charge.
Class I, R1, R2, R3, R4, and R6 shares do not have a sales charge.
| (f) | Source: FactSet Research Systems Inc. |
| (t) | For the period from the class inception date through the stated period end (for those share classes with less than 10 years of performance history). No comparative benchmark performance information is provided for “life” periods. (See Notes to Performance Summary.) |
| (v) | Assuming redemption at the end of the applicable period. |
Benchmark Definition(s)
Bloomberg Commodity Index(a) – a highly liquid and diversified benchmark for the commodity futures market. The index tracks trades on futures contracts for physical commodities, such as energy (petroleum, gas), precious metals (gold, silver), industrial metals (zinc, copper), grains (corn, wheat), livestock (pork bellies), among others, and are traded in a variety of currencies.
Performance Summary - continued
It is not possible to invest directly in an index.
| (a) | Source: Bloomberg Index Services Limited. BLOOMBERG® is a trademark and service mark of Bloomberg Finance L.P. and its affiliates (collectively “Bloomberg”). Bloomberg or Bloomberg's licensors own all proprietary rights in the Bloomberg Indices. Bloomberg neither approves or endorses this material, or guarantees the accuracy or completeness of any information herein, or makes any warranty, express or implied, as to the results to be obtained therefrom and, to the maximum extent allowed by law, neither shall have any liability or responsibility for injury or damages arising in connection therewith. |
Notes to Performance Summary
Average annual total return represents the average annual change in value for each share class for the periods presented. Life returns are presented where the share class has less than 10 years of performance history and represent the average annual total return from the class inception date to the stated period end date. As the fund's share classes may have different inception dates, the life returns may represent different time periods and may not be comparable. As a result, no comparative benchmark performance information is provided for life periods.
Performance results reflect any applicable expense subsidies and waivers in effect during the periods shown. Without such subsidies and waivers the fund's performance results would be less favorable. Please see the prospectus and financial statements for complete details.
Performance results do not include adjustments made for financial reporting purposes in accordance with U.S. generally accepted accounting principles and may differ from amounts reported in the financial highlights.
From time to time the fund may receive proceeds from litigation settlements, without which performance would be lower.
Expense Table
Fund expenses borne by the shareholders during the period,
May 1, 2022 through October 31, 2022
As a shareholder of the fund, you incur two types of costs: (1) transaction costs, including sales charges (loads) on certain purchase or redemption payments, and (2) ongoing costs, including management fees; distribution and service (12b-1) fees; and other fund expenses. This example is intended to help you understand your ongoing costs (in dollars) of investing in the fund and to compare these costs with the ongoing costs of investing in other mutual funds.
The example is based on an investment of $1,000 invested at the beginning of the period and held for the entire period May 1, 2022 through October 31, 2022.
Actual Expenses
The first line for each share class in the following table provides information about actual account values and actual expenses. You may use the information in this line, together with the amount you invested, to estimate the expenses that you paid over the period. Simply divide your account value by $1,000 (for example, an $8,600 account value divided by $1,000 = 8.6), then multiply the result by the number in the first line under the heading entitled “Expenses Paid During Period” to estimate the expenses you paid on your account during this period.
Hypothetical Example for Comparison Purposes
The second line for each share class in the following table provides information about hypothetical account values and hypothetical expenses based on the fund’s actual expense ratio and an assumed rate of return of 5% per year before expenses, which is not the fund’s actual return. The hypothetical account values and expenses may not be used to estimate the actual ending account balance or expenses you paid for the period. You may use this information to compare the ongoing costs of investing in the fund and other funds. To do so, compare this 5% hypothetical example with the 5% hypothetical examples that appear in the shareholder reports of the other funds.
Please note that the expenses shown in the table are meant to highlight your ongoing costs only and do not reflect any transactional costs, such as sales charges (loads). Therefore, the second line for each share class in the table is useful in comparing ongoing costs only, and will not help you determine the relative total costs of owning different funds. In addition, if these transactional costs were included, your costs would have been higher.
Expense Table - continued
Share
Class | | Annualized
Expense
Ratio | Beginning
Account Value
5/01/22 | Ending
Account Value
10/31/22 | Expenses
Paid During
Period (p)
5/01/22-10/31/22 |
| A | Actual | 1.16% | $1,000.00 | $854.09 | $5.42 |
| Hypothetical (h) | 1.16% | $1,000.00 | $1,019.36 | $5.90 |
| B | Actual | 1.91% | $1,000.00 | $853.31 | $8.92 |
| Hypothetical (h) | 1.91% | $1,000.00 | $1,015.58 | $9.70 |
| C | Actual | 1.91% | $1,000.00 | $850.72 | $8.91 |
| Hypothetical (h) | 1.91% | $1,000.00 | $1,015.58 | $9.70 |
| I | Actual | 0.91% | $1,000.00 | $856.38 | $4.26 |
| Hypothetical (h) | 0.91% | $1,000.00 | $1,020.62 | $4.63 |
| R1 | Actual | 1.91% | $1,000.00 | $853.57 | $8.92 |
| Hypothetical (h) | 1.91% | $1,000.00 | $1,015.58 | $9.70 |
| R2 | Actual | 1.41% | $1,000.00 | $854.09 | $6.59 |
| Hypothetical (h) | 1.41% | $1,000.00 | $1,018.10 | $7.17 |
| R3 | Actual | 1.15% | $1,000.00 | $855.87 | $5.38 |
| Hypothetical (h) | 1.15% | $1,000.00 | $1,019.41 | $5.85 |
| R4 | Actual | 0.90% | $1,000.00 | $856.13 | $4.21 |
| Hypothetical (h) | 0.90% | $1,000.00 | $1,020.67 | $4.58 |
| R6 | Actual | 0.81% | $1,000.00 | $857.90 | $3.79 |
| Hypothetical (h) | 0.81% | $1,000.00 | $1,021.12 | $4.13 |
| (h) | 5% class return per year before expenses. |
| (p) | “Expenses Paid During Period” are equal to each class’s annualized expense ratio, as shown above, multiplied by the average account value over the period, multiplied by 184/365 (to reflect the one-half year period). Expenses paid do not include any applicable sales charges (loads). If these transaction costs had been included, your costs would have been higher. |
Consolidated Portfolio of Investments
10/31/22
The Consolidated Portfolio of Investments is a complete list of all securities owned by your fund. It is categorized by broad-based asset classes.
| Issuer | | | Shares/Par | Value ($) |
| Bonds – 75.6% |
| Aerospace & Defense – 0.8% |
| Boeing Co., 1.167%, 2/04/2023 | | $ | 1,759,000 | $1,741,665 |
| Boeing Co., 1.433%, 2/04/2024 | | | 3,511,000 | 3,332,309 |
| Huntington Ingalls Industries, Inc., 3.844%, 5/01/2025 | | | 1,273,000 | 1,211,984 |
| Raytheon Technologies Corp., 3.65%, 8/16/2023 | | | 90,000 | 89,056 |
| | | | | $6,375,014 |
| Asset-Backed & Securitized – 15.5% |
| 3650R Commercial Mortgage Trust, 2021-PF1, “XA”, 1.031%, 11/15/2054 (i) | | $ | 19,942,760 | $1,189,386 |
| ACREC 2021-FL1 Ltd., “AS”, FLR, 4.943% (LIBOR - 1mo. + 1.5%), 10/16/2036 (n) | | | 1,812,000 | 1,710,651 |
| ACREC 2021-FL1 Ltd., “B”, FLR, 5.243% (LIBOR - 1mo. + 1.8%), 10/16/2036 (n) | | | 1,406,000 | 1,328,082 |
| ACREC 2021-FL1 Ltd., “C”, FLR, 5.593% (LIBOR - 1mo. + 2.15%), 10/16/2036 (n) | | | 1,129,000 | 1,056,597 |
| ACRES 2021-FL2 Issuer Ltd., “B”, FLR, 5.662% (LIBOR - 1mo. + 2.25%), 1/15/2037 (n) | | | 1,527,500 | 1,443,615 |
| Allegro CLO Ltd., 2014-1RA, “A2”, FLR, 5.877% (LIBOR - 3mo. + 1.6%), 10/21/2028 (n) | | | 252,269 | 244,238 |
| AmeriCredit Automobile Receivables Trust, 2020-1, “C”, 1.59%, 10/20/2025 | | | 678,000 | 648,113 |
| AmeriCredit Automobile Receivables Trust, 2022-2, “A2A”, 4.2%, 12/18/2025 | | | 1,905,000 | 1,889,445 |
| Arbor Realty Trust, Inc., CLO, 2021-FL1, “B”, FLR, 4.912% (LIBOR - 1mo. + 1.5%), 12/15/2035 (n) | | | 375,500 | 346,316 |
| Arbor Realty Trust, Inc., CLO, 2021-FL1, “C”, FLR, 5.412% (LIBOR - 1mo. + 2%), 12/15/2035 (n) | | | 153,500 | 143,916 |
| Arbor Realty Trust, Inc., CLO, 2021-FL3, “B”, FLR, 5.012% (LIBOR - 1mo. + 1.6%), 8/15/2034 (n) | | | 571,500 | 522,337 |
| Arbor Realty Trust, Inc., CLO, 2021-FL3, “C”, FLR, 5.262% (LIBOR - 1mo. + 1.85%), 8/15/2034 (n) | | | 332,000 | 307,947 |
| Arbor Realty Trust, Inc., CLO, 2021-FL4, “AS”, FLR, 5.112% (LIBOR - 1mo. + 1.7%), 11/15/2036 (n) | | | 1,684,000 | 1,589,777 |
| Arbor Realty Trust, Inc., CLO, 2021-FL4, “B”, FLR, 5.412% (LIBOR - 1mo. + 2%), 11/15/2036 (n) | | | 1,684,000 | 1,580,529 |
| Arbor Realty Trust, Inc., CLO, 2021-FL4, “C”, FLR, 5.712% (LIBOR - 1mo. + 2.3%), 11/15/2036 (n) | | | 1,014,000 | 946,990 |
| Arbor Realty Trust, Inc., CLO, 2022-FL1, “C”, FLR, 5.091% (SOFR - 30 day + 2.3%), 1/15/2037 (n) | | | 2,695,500 | 2,588,076 |
Consolidated Portfolio of Investments – continued
| Issuer | | | Shares/Par | Value ($) |
| Bonds – continued |
| Asset-Backed & Securitized – continued |
| AREIT 2019-CRE3 Trust, “AS”, FLR, 4.79% (LIBOR - 1mo. + 1.3%), 9/14/2036 (n) | | $ | 613,500 | $605,010 |
| AREIT 2019-CRE3 Trust, “B”, FLR, 5.04% (LIBOR - 1mo. + 1.55%), 9/14/2036 (n) | | | 303,000 | 296,945 |
| AREIT 2019-CRE3 Trust, “C”, FLR, 5.39% (SOFR - 1mo. + 2.014%), 9/14/2036 (n) | | | 250,500 | 246,006 |
| AREIT 2022-CRE6 Trust, “C”, FLR, 5.043% (SOFR - 30 day + 2.15%), 1/16/2037 (n) | | | 894,000 | 827,319 |
| AREIT 2022-CRE6 Trust, “D”, FLR, 5.743% (SOFR - 30 day + 2.85%), 12/17/2024 (n) | | | 795,500 | 731,456 |
| AREIT 2022-CRE7 LLC, “B”, FLR, 6.659% (SOFR - 1mo. + 3.244%), 6/17/2039 (n) | | | 2,563,500 | 2,435,686 |
| Avery Point CLO Ltd., 2014-1A, “CR”, FLR, 6.708% (LIBOR - 3mo. + 2.35%), 4/25/2026 (n) | | | 5,082 | 5,057 |
| Balboa Bay Loan Funding Ltd., 2020-1A, “BR”, FLR, 5.893% (LIBOR - 3mo. + 1.65%), 1/20/2032 (n) | | | 1,606,204 | 1,500,047 |
| Balboa Bay Loan Funding Ltd., 2020-1A, “CR”, FLR, 6.342% (LIBOR - 3mo. + 2.1%), 1/20/2032 (n) | | | 870,027 | 783,162 |
| Ballyrock CLO 2018-1A Ltd., “A2”, FLR, 5.843% (LIBOR - 3mo. + 1.6%), 4/20/2031 (n) | | | 1,368,365 | 1,301,865 |
| Ballyrock CLO 2018-1A Ltd., “B”, FLR, 6.142% (LIBOR - 3mo. + 1.9%), 4/20/2031 (n) | | | 579,877 | 535,168 |
| BBCMS Mortgage Trust, 2018-C2, “XA”, 0.759%, 12/15/2051 (i)(n) | | | 19,359,889 | 674,379 |
| BBCMS Mortgage Trust, 2021-C10, “XA”, 1.299%, 7/15/2054 (i) | | | 7,370,054 | 538,831 |
| BBCMS Mortgage Trust, 2021-C11, “XA”, 1.385%, 9/15/2054 (i) | | | 7,480,831 | 578,255 |
| BBCMS Mortgage Trust, 2021-C9, “XA”, 1.628%, 2/15/2054 (i) | | | 11,388,577 | 1,041,040 |
| BDS 2021-FL10 Ltd., “B”, FLR, 5.393% (LIBOR - 1mo. + 1.95%), 12/16/2036 (n) | | | 793,500 | 743,039 |
| BDS 2021-FL10 Ltd., “C”, FLR, 5.743% (LIBOR - 1mo. + 2.3%), 12/16/2036 (n) | | | 577,000 | 535,170 |
| Benchmark 2021-B23 Mortgage Trust, “XA”, 1.272%, 2/15/2054 (i) | | | 12,571,164 | 857,810 |
| Benchmark 2021-B27 Mortgage Trust, “XA”, 1.267%, 7/15/2054 (i) | | | 14,538,813 | 1,035,241 |
| Benchmark 2021-B28 Mortgage Trust, “XA”, 1.284%, 8/15/2054 (i) | | | 10,258,533 | 731,609 |
| Benchmark 2021-B29 Mortgage Trust, “XA”, 1.043%, 9/15/2054 (i) | | | 14,881,933 | 837,564 |
| BSPRT 2021-FL6 Issuer Ltd., “C”, FLR, 5.462% (LIBOR - 1mo. + 2.05%), 3/15/2036 (n) | | | 485,000 | 446,847 |
| BSPRT 2021-FL7 Issuer Ltd., “B”, FLR, 5.462% (LIBOR - 1mo. + 2.05%), 12/15/2038 (n) | | | 339,000 | 313,610 |
| BSPRT 2021-FL7 Issuer Ltd., “C”, FLR, 5.712% (LIBOR - 1mo. + 2.3%), 12/15/2038 (n) | | | 408,500 | 374,533 |
| BSPRT 2022-FL8 Issuer Ltd., “A”, FLR, 4.291% (SOFR - 30 day + 1.5%), 2/15/2037 (n) | | | 3,217,000 | 3,081,161 |
Consolidated Portfolio of Investments – continued
| Issuer | | | Shares/Par | Value ($) |
| Bonds – continued |
| Asset-Backed & Securitized – continued |
| BSPRT 2022-FL8 Issuer Ltd., “B”, FLR, 4.841% (SOFR - 30 day + 2.05%), 2/15/2037 (n) | | $ | 445,500 | $426,525 |
| BSPRT 2022-FL8 Issuer Ltd., “C”, FLR, 5.091% (SOFR - 30 day + 2.3%), 2/15/2037 (n) | | | 719,500 | 686,979 |
| Business Jet Securities LLC, 2020-1A, “A”, 2.981%, 11/15/2035 (n) | | | 277,914 | 253,504 |
| Business Jet Securities LLC, 2021-1A, “A”, 2.162%, 4/15/2036 (n) | | | 356,308 | 308,592 |
| Business Jet Securities LLC, 2021-1A, “B”, 2.918%, 4/15/2036 (n) | | | 76,086 | 61,547 |
| BXMT 2020-FL2 Ltd., “B”, FLR, 4.89% (LIBOR - 1mo. + 1.4%), 2/15/2038 (n) | | | 1,492,000 | 1,397,273 |
| BXMT 2020-FL2 Ltd., “A”, FLR, 4.39% (LIBOR - 1mo. + 0.9%), 2/15/2038 (n) | | | 1,838,178 | 1,814,559 |
| BXMT 2021-FL4 Ltd., “AS”, FLR, 4.712% (LIBOR - 1mo. + 1.3%), 5/15/2038 (n) | | | 2,601,000 | 2,473,377 |
| Capital Automotive, 2020-1A, “A4”, REIT, 3.19%, 2/15/2050 (n) | | | 564,879 | 524,691 |
| CD 2017-CD4 Mortgage Trust, “XA”, 1.226%, 5/10/2050 (i) | | | 9,631,892 | 393,047 |
| CF Hippolyta Issuer LLC, 2020-1, “A1”, 1.69%, 7/15/2060 (n) | | | 364,188 | 320,165 |
| CF Hippolyta Issuer LLC, 2020-1, “B1”, 2.28%, 7/15/2060 (n) | | | 115,273 | 98,908 |
| Commercial Equipment Finance 2021-A, LLC, “A”, 2.05%, 2/16/2027 (n) | | | 759,917 | 730,139 |
| Commercial Mortgage Pass-Through Certificates, 2019-BN24, “XA”, 0.64%, 11/15/2062 (i) | | | 9,037,181 | 319,919 |
| Commercial Mortgage Pass-Through Certificates, 2021-BN31, “XA”, 1.327%, 2/15/2054 (i) | | | 11,049,192 | 838,120 |
| Commercial Mortgage Pass-Through Certificates, 2021-BN32, “XA”, 0.78%, 4/15/2054 (i) | | | 10,557,850 | 463,300 |
| Commercial Mortgage Pass-Through Certificates, 2021-BN34, “XA”, 0.977%, 6/15/2063 (i) | | | 11,395,758 | 643,906 |
| Commercial Mortgage Pass-Through Certificates, 2021-BN35, “XA”, 1.048%, 6/15/2064 (i) | | | 6,130,365 | 364,761 |
| Credit Acceptance Auto Loan Trust, 2021-4, “B”, 1.74%, 12/16/2030 (n) | | | 584,000 | 528,007 |
| Credit Acceptance Auto Loan Trust, 2021-2A, “A”, 0.96%, 2/15/2030 (n) | | | 451,000 | 428,494 |
| Credit Acceptance Auto Loan Trust, 2021-2A, “B”, 1.26%, 4/15/2030 (n) | | | 250,000 | 225,481 |
| Credit Acceptance Auto Loan Trust, 2021-3A, “B”, 1.38%, 7/15/2030 (n) | | | 312,000 | 280,739 |
| Credit Acceptance Auto Loan Trust, 2021-3A, “C”, 1.63%, 9/16/2030 (n) | | | 250,000 | 220,675 |
| Credit Acceptance Auto Loan Trust, 2021-4, “A”, 1.26%, 10/15/2030 (n) | | | 318,000 | 296,090 |
| Cutwater 2015-1A Ltd., “AR”, FLR, 5.299% (LIBOR - 3mo. + 1.22%), 1/15/2029 (n) | | | 811,699 | 803,330 |
Consolidated Portfolio of Investments – continued
| Issuer | | | Shares/Par | Value ($) |
| Bonds – continued |
| Asset-Backed & Securitized – continued |
| Dryden Senior Loan Fund, 2017-49A, “BR”, CLO, FLR, 5.793% (LIBOR - 3mo. + 1.6%), 7/18/2030 (n) | | $ | 1,945,990 | $1,846,974 |
| Exeter Automobile Receivables Trust, 2020-1A, 2.49%, 1/15/2025 (n) | | | 70,054 | 69,980 |
| Fortress CBO Investments Ltd., 2022-FL3, “A”, FLR, 4.821% (SOFR - 30 day + 1.85%), 2/23/2039 (n) | | | 1,917,000 | 1,870,609 |
| Fortress CBO Investments Ltd., 2022-FL3, “AS”, FLR, 5.221% (SOFR - 30 day + 2.25%), 2/23/2039 (n) | | | 1,785,500 | 1,701,756 |
| GLS Auto Receivables Trust, 2021-3A, “B”, 0.78%, 11/17/2025 (n) | | | 890,384 | 857,922 |
| GS Mortgage Securities Trust, 2017-GS6, “XA”, 1.163%, 5/10/2050 (i) | | | 10,676,222 | 392,753 |
| GS Mortgage Securities Trust, 2017-GS7, “XA”, 1.083%, 8/10/2050 (i) | | | 10,876,919 | 398,829 |
| GS Mortgage Securities Trust, 2020-GC47, “A5”, 1.13%, 5/12/2053 (i) | | | 8,645,988 | 545,973 |
| Invitation Homes 2018-SFR1 Trust, “B”, FLR, 4.362% (LIBOR - 1mo. + 0.95%), 3/17/2037 (n) | | | 952,863 | 932,404 |
| Jamestown CLO Ltd., 2020-15A, “C”, FLR, 6.529% (LIBOR - 3mo. + 2.45%), 4/15/2033 (n) | | | 3,069,116 | 2,785,689 |
| JPMorgan Chase Commercial Mortgage Securities Corp., 0.989%, 9/15/2050 (i) | | | 11,704,514 | 386,900 |
| LAD Auto Receivables Trust, 2022-1A, “A”, 5.21%, 6/15/2027 (n) | | | 1,012,995 | 994,397 |
| LoanCore 2018-CRE1 Ltd., “AS”, FLR, 4.912% (LIBOR - 1mo. + 1.5%), 5/15/2028 (n) | | | 1,578,713 | 1,563,478 |
| LoanCore 2018-CRE1 Ltd., “C”, FLR, 5.962% (LIBOR - 1mo. + 2.55%), 5/15/2028 (n) | | | 577,000 | 573,173 |
| LoanCore 2019-CRE3 Ltd., “AS”, FLR, 4.782% (LIBOR - 1mo. + 1.37%), 4/15/2034 (n) | | | 1,731,657 | 1,719,294 |
| LoanCore 2021-CRE5 Ltd., “AS”, FLR, 5.162% (LIBOR - 1mo. + 1.75%), 7/15/2036 (n) | | | 1,752,500 | 1,622,919 |
| LoanCore 2021-CRE5 Ltd., “B”, FLR, 5.412% (LIBOR - 1mo. + 2%), 7/15/2036 (n) | | | 741,000 | 683,745 |
| Madison Park Funding Ltd., 2014-13A, “BR2”, FLR, 5.726% (LIBOR - 3mo. + 1.5%), 4/19/2030 (n) | | | 2,174,539 | 2,097,886 |
| Magnetite CLO Ltd., 2015-16A, “BR”, FLR, 5.393% (LIBOR - 3mo. + 1.2%), 1/18/2028 (n) | | | 2,590,000 | 2,515,398 |
| MF1 2020-FL4 Ltd., “B”, FLR, 6.24% (LIBOR - 1mo. + 2.75%), 11/15/2035 (n) | | | 2,437,000 | 2,337,669 |
| MF1 2021-FL6 Ltd., “B”, FLR, 5.093% (LIBOR - 1mo. + 1.65%), 7/16/2036 (n) | | | 3,089,144 | 2,904,710 |
| MF1 2022-FL8 Ltd., “C”, FLR, 5.094% (SOFR - 30 day + 2.2%), 2/19/2037 (n) | | | 941,914 | 884,273 |
Consolidated Portfolio of Investments – continued
| Issuer | | | Shares/Par | Value ($) |
| Bonds – continued |
| Asset-Backed & Securitized – continued |
| MF1 2022-FL9 Ltd., “B”, FLR, 6.617% (SOFR - 1mo. + 3.15%), 6/19/2037 (n) | | $ | 2,988,000 | $2,938,205 |
| Morgan Stanley Bank of America Merrill Lynch Trust, 2017-C33, “XA”, 1.251%, 5/15/2050 (i) | | | 9,229,057 | 373,012 |
| Morgan Stanley Capital I Trust, 2017-H1, “XA”, 1.325%, 6/15/2050 (i) | | | 4,108,382 | 159,524 |
| Morgan Stanley Capital I Trust, 2018-H4, “XA”, 0.831%, 12/15/2051 (i) | | | 15,870,085 | 588,607 |
| Morgan Stanley Capital I Trust, 2021-L5, “XA”, 1.296%, 5/15/2054 (i) | | | 9,497,111 | 673,239 |
| Morgan Stanley Capital I Trust, 2021-L6, “XA”, 1.23%, 6/15/2054 (i) | | | 8,776,384 | 562,847 |
| Navistar Financial Dealer Note Master Owner Trust, 2022-1, “A”, FLR, 4.195% (SOFR - 30 day + 1.25%), 5/25/2027 (n) | | | 2,109,000 | 2,111,923 |
| NextGear Floorplan Master Owner Trust, 2022-1A, “A1”, FLR, 3.841% (SOFR - 30 day + 1.05%), 3/15/2027 (n) | | | 1,387,000 | 1,377,636 |
| Oaktree CLO 2019-1A Ltd., “BR”, FLR, 6.075% (LIBOR - 3mo. + 1.75%), 4/22/2030 (n) | | | 1,427,638 | 1,335,928 |
| Oaktree CLO 2019-1A Ltd., “CR”, FLR, 6.675% (LIBOR - 3mo. + 2.35%), 4/22/2030 (n) | | | 1,427,638 | 1,297,330 |
| OCP CLO 2015-10A Ltd., “BR2”, FLR, 5.976% (LIBOR - 3mo. + 1.65%), 1/26/2034 (n) | | | 2,250,000 | 2,086,200 |
| OneMain Financial Issuance Trust, 2020-1A, “A”, 3.84%, 5/14/2032 (n) | | | 1,018,202 | 1,005,561 |
| OneMain Financial Issuance Trust, 2020-2A, “A”, 1.75%, 9/14/2035 (n) | | | 1,819,000 | 1,572,663 |
| OneMain Financial Issuance Trust, 2022-S1, “A”, 4.13%, 5/14/2035 (n) | | | 1,170,000 | 1,090,833 |
| PFP III 2021-7 Ltd., “B”, FLR, 4.812% (LIBOR - 1mo. + 1.4%), 4/14/2038 (n) | | | 604,470 | 554,798 |
| PFP III 2021-7 Ltd., “C”, FLR, 5.062% (LIBOR - 1mo. + 1.65%), 4/14/2038 (n) | | | 191,490 | 176,876 |
| PFP III 2021-8 Ltd., “B”, FLR, 4.912% (LIBOR - 1mo. + 1.5%), 8/09/2037 (n) | | | 617,500 | 553,255 |
| Progress Residential 2021-SFR1 Trust, “B”, 1.303%, 4/17/2038 (n) | | | 248,000 | 208,384 |
| Progress Residential 2021-SFR1 Trust, “C”, 1.555%, 4/17/2038 (n) | | | 186,000 | 155,691 |
| Securitized Term Auto Receivable Trust, 2019-CRTA, “B”, 2.453%, 3/25/2026 (n) | | | 67,523 | 66,995 |
| Securitized Term Auto Receivable Trust, 2019-CRTA, “C”, 2.849%, 3/25/2026 (n) | | | 86,685 | 86,063 |
| Shackleton 2013-4RA CLO Ltd., “B”, FLR, 5.84% (LIBOR - 3mo. + 1.9%), 4/13/2031 (n) | | | 722,762 | 659,460 |
Consolidated Portfolio of Investments – continued
| Issuer | | | Shares/Par | Value ($) |
| Bonds – continued |
| Asset-Backed & Securitized – continued |
| Shelter Growth CRE 2021-FL3 Ltd., “C”, FLR, 5.562% (LIBOR - 1mo. + 2.15%), 9/15/2036 (n) | | $ | 2,649,500 | $2,481,011 |
| Southwick Park CLO, Ltd., 2019-4A, “B1R”, FLR, 5.742% (LIBOR - 3mo. + 1.5%), 7/20/2032 (n) | | | 645,000 | 606,971 |
| Southwick Park CLO, Ltd., 2019-4A, “B2R”, 2.46%, 7/20/2032 (n) | | | 1,123,000 | 892,124 |
| Southwick Park CLO, Ltd., 2019-4A, “CR”, FLR, 6.192% (LIBOR - 3mo. + 1.95%), 7/20/2032 (n) | | | 1,528,000 | 1,398,520 |
| Starwood Commercial Mortgage, 2021-FL2, “B”, FLR, 5.243% (LIBOR - 1mo. + 1.8%), 4/18/2038 (n) | | | 2,295,000 | 2,192,555 |
| TICP CLO 2018-3R Ltd., “B”, FLR, 5.592% (LIBOR - 3mo. + 1.35%), 4/20/2028 (n) | | | 681,356 | 665,011 |
| TICP CLO 2018-3R Ltd., “C”, FLR, 6.042% (LIBOR - 3mo. + 1.8%), 4/20/2028 (n) | | | 1,195,706 | 1,151,307 |
| TPG Real Estate Finance, 2021-FL4, “AS”, FLR, 4.812% (LIBOR - 1mo. + 1.4%), 3/15/2038 (n) | | | 1,305,000 | 1,238,820 |
| TPG Real Estate Finance, 2021-FL4, “B”, FLR, 5.262% (LIBOR - 1mo. + 1.85%), 3/15/2038 (n) | | | 2,749,000 | 2,579,980 |
| UBS Commercial Mortgage Trust, 2017-C1, “XA”, 1.023%, 11/15/2050 (i) | | | 6,115,023 | 223,212 |
| UBS Commercial Mortgage Trust, 2018-C14, “XA”, 0.95%, 12/15/2051 (i) | | | 7,682,448 | 337,544 |
| Wells Fargo Commercial Mortgage Trust, 2021-C61, “XA”, 1.37%, 11/15/2054 (i) | | | 6,134,757 | 464,519 |
| World Omni Auto Receivables Trust, 3.67%, 6/15/2027 | | | 678,000 | 655,588 |
| | | | | $117,703,876 |
| Automotive – 2.4% |
| Daimler Trucks Finance North America LLC, 1.625%, 12/13/2024 (n) | | $ | 2,671,000 | $2,455,694 |
| General Motors Financial Co., 1.7%, 8/18/2023 | | | 2,207,000 | 2,136,999 |
| Hyundai Capital America, 2.85%, 11/01/2022 (n) | | | 1,427,000 | 1,427,000 |
| Hyundai Capital America, 2.375%, 2/10/2023 (n) | | | 649,000 | 643,397 |
| Hyundai Capital America, 5.75%, 4/06/2023 (n) | | | 2,068,000 | 2,069,241 |
| Hyundai Capital America, 0.8%, 1/08/2024 (n) | | | 249,000 | 235,013 |
| Hyundai Capital America, 5.875%, 4/07/2025 (n) | | | 2,077,000 | 2,055,419 |
| Mercedes-Benz Finance North America LLC, 0.75%, 3/01/2024 (n) | | | 1,496,000 | 1,408,993 |
| Stellantis Finance US, Inc., 1.711%, 1/29/2027 (n) | | | 1,625,000 | 1,343,345 |
| Volkswagen Group of America Finance LLC, 3.125%, 5/12/2023 (n) | | | 251,000 | 248,069 |
| Volkswagen Group of America Finance LLC, 2.85%, 9/26/2024 (n) | | | 878,000 | 833,327 |
| Volkswagen Group of America Finance LLC, 3.35%, 5/13/2025 (n) | | | 2,014,000 | 1,896,151 |
| Volkswagen Group of America Finance LLC, 1.25%, 11/24/2025 (n) | | | 1,359,000 | 1,186,729 |
| | | | | $17,939,377 |
Consolidated Portfolio of Investments – continued
| Issuer | | | Shares/Par | Value ($) |
| Bonds – continued |
| Broadcasting – 0.7% |
| Warnermedia Holdings, Inc., 3.788%, 3/15/2025 (n) | | $ | 4,233,000 | $3,991,192 |
| Warnermedia Holdings, Inc., 3.755%, 3/15/2027 (n) | | | 1,062,000 | 944,736 |
| | | | | $4,935,928 |
| Brokerage & Asset Managers – 1.2% |
| Brookfield Finance, Inc., 3.9%, 1/25/2028 | | $ | 4,053,000 | $3,628,865 |
| Charles Schwab Corp., 0.75%, 3/18/2024 | | | 1,742,000 | 1,643,029 |
| NASDAQ, Inc., 0.445%, 12/21/2022 | | | 1,200,000 | 1,193,013 |
| National Securities Clearing Corp., 1.2%, 4/23/2023 (n) | | | 600,000 | 589,413 |
| National Securities Clearing Corp., 0.4%, 12/07/2023 (n) | | | 1,724,000 | 1,640,957 |
| National Securities Clearing Corp., 1.5%, 4/23/2025 (n) | | | 250,000 | 228,816 |
| | | | | $8,924,093 |
| Business Services – 0.5% |
| Equinix, Inc., 1.25%, 7/15/2025 | | $ | 972,000 | $865,702 |
| Global Payments, Inc., 1.2%, 3/01/2026 | | | 2,281,000 | 1,946,080 |
| Tencent Holdings Ltd., 1.81%, 1/26/2026 (n) | | | 1,551,000 | 1,362,440 |
| | | | | $4,174,222 |
| Cable TV – 0.3% |
| SES S.A., 3.6%, 4/04/2023 (n) | | $ | 2,158,000 | $2,127,872 |
| Computer Software – 0.2% |
| Dell International LLC/EMC Corp., 4%, 7/15/2024 | | $ | 1,151,000 | $1,123,363 |
| Dell International LLC/EMC Corp., 5.85%, 7/15/2025 | | | 425,000 | 425,278 |
| Infor, Inc., 1.45%, 7/15/2023 (n) | | | 250,000 | 240,986 |
| | | | | $1,789,627 |
| Computer Software - Systems – 0.3% |
| VMware, Inc., 1%, 8/15/2024 | | $ | 1,476,000 | $1,360,915 |
| VMware, Inc., 1.4%, 8/15/2026 | | | 1,143,000 | 975,103 |
| | | | | $2,336,018 |
| Conglomerates – 0.3% |
| Carrier Global Corp., 2.242%, 2/15/2025 | | $ | 289,000 | $268,947 |
| Westinghouse Air Brake Technologies Corp., 4.4%, 3/15/2024 | | | 2,070,000 | 2,023,444 |
| | | | | $2,292,391 |
| Consumer Products – 0.5% |
| GSK Consumer Healthcare Capital UK PLC, 3.125%, 3/24/2025 | | $ | 2,654,000 | $2,499,445 |
| GSK Consumer Healthcare Capital UK PLC, 3.375%, 3/24/2027 | | | 1,154,000 | 1,043,685 |
| | | | | $3,543,130 |
Consolidated Portfolio of Investments – continued
| Issuer | | | Shares/Par | Value ($) |
| Bonds – continued |
| Containers – 0.6% |
| Berry Global, Inc., 1.57%, 1/15/2026 | | $ | 2,361,000 | $2,046,371 |
| Berry Global, Inc., 1.65%, 1/15/2027 | | | 2,847,000 | 2,346,038 |
| | | | | $4,392,409 |
| Electronics – 0.7% |
| Microchip Technology, Inc., 0.983%, 9/01/2024 | | $ | 3,485,000 | $3,198,279 |
| Qorvo, Inc., 1.75%, 12/15/2024 (n) | | | 909,000 | 828,917 |
| Skyworks Solutions, Inc., 0.9%, 6/01/2023 | | | 1,081,000 | 1,050,040 |
| TSMC Arizona Corp., 1.75%, 10/25/2026 | | | 586,000 | 505,683 |
| | | | | $5,582,919 |
| Emerging Market Quasi-Sovereign – 0.4% |
| DAE Funding LLC (United Arab Emirates), 1.55%, 8/01/2024 (n) | | $ | 796,000 | $722,064 |
| DAE Funding LLC (United Arab Emirates), 2.625%, 3/20/2025 (n) | | | 1,375,000 | 1,247,538 |
| Indian Oil Corp. Ltd., 5.75%, 8/01/2023 | | | 858,000 | 859,458 |
| | | | | $2,829,060 |
| Emerging Market Sovereign – 0.2% |
| Emirate of Abu Dhabi, 0.75%, 9/02/2023 (n) | | $ | 1,671,000 | $1,612,943 |
| Energy - Independent – 0.2% |
| EQT Corp., 5.678%, 10/01/2025 | | $ | 779,000 | $770,055 |
| EQT Corp., 5.7%, 4/01/2028 | | | 778,000 | 757,072 |
| Pioneer Natural Resources Co., 0.55%, 5/15/2023 | | | 379,000 | 369,802 |
| | | | | $1,896,929 |
| Energy - Integrated – 0.3% |
| Eni S.p.A., 4%, 9/12/2023 (n) | | $ | 1,523,000 | $1,495,204 |
| Exxon Mobil Corp., 1.571%, 4/15/2023 | | | 882,000 | 869,705 |
| | | | | $2,364,909 |
| Financial Institutions – 1.8% |
| AerCap Ireland Capital DAC/AerCap Global Aviation Trust, 4.875%, 1/16/2024 | | $ | 1,755,000 | $1,722,538 |
| AerCap Ireland Capital DAC/AerCap Global Aviation Trust, 3.15%, 2/15/2024 | | | 1,243,000 | 1,189,744 |
| AerCap Ireland Capital DAC/AerCap Global Aviation Trust, 1.75%, 10/29/2024 | | | 1,571,000 | 1,423,661 |
| AerCap Ireland Capital DAC/AerCap Global Aviation Trust, 6.5%, 7/15/2025 | | | 1,285,000 | 1,264,936 |
| Air Lease Corp., 2.2%, 1/15/2027 | | | 1,590,000 | 1,329,909 |
| Avolon Holdings Funding Ltd., 3.95%, 7/01/2024 (n) | | | 1,013,000 | 948,387 |
| Avolon Holdings Funding Ltd., 5.5%, 1/15/2026 (n) | | | 892,000 | 819,656 |
| Avolon Holdings Funding Ltd., 2.125%, 2/21/2026 (n) | | | 2,500,000 | 2,049,705 |
| Avolon Holdings Funding Ltd., 4.25%, 4/15/2026 (n) | | | 769,000 | 672,208 |
Consolidated Portfolio of Investments – continued
| Issuer | | | Shares/Par | Value ($) |
| Bonds – continued |
| Financial Institutions – continued |
| Avolon Holdings Funding Ltd., 2.528%, 11/18/2027 (n) | | $ | 1,715,000 | $1,309,159 |
| Avolon Holdings Funding Ltd., 2.75%, 2/21/2028 (n) | | | 1,313,000 | 1,003,679 |
| | | | | $13,733,582 |
| Food & Beverages – 0.4% |
| JBS USA Lux S.A./JBS USA Food Co./JBS USA Finance, Inc., 3%, 2/02/2029 (n) | | $ | 2,313,000 | $1,873,908 |
| JDE Peet's N.V., 0.8%, 9/24/2024 (n) | | | 681,000 | 617,797 |
| JDE Peet's N.V., 1.375%, 1/15/2027 (n) | | | 1,050,000 | 861,133 |
| | | | | $3,352,838 |
| Food & Drug Stores – 0.3% |
| 7-Eleven, Inc., 0.8%, 2/10/2024 (n) | | $ | 2,125,000 | $2,003,958 |
| Forest & Paper Products – 0.2% |
| Fibria Overseas Finance Ltd., 5.5%, 1/17/2027 | | $ | 1,286,000 | $1,237,775 |
| Gaming & Lodging – 1.3% |
| GLP Capital LP/GLP Financing II, Inc., 5.375%, 11/01/2023 | | $ | 1,128,000 | $1,115,299 |
| GLP Capital LP/GLP Financing II, Inc., 5.25%, 6/01/2025 | | | 2,186,000 | 2,108,043 |
| GLP Capital LP/GLP Financing II, Inc., 5.375%, 4/15/2026 | | | 405,000 | 386,597 |
| Hyatt Hotels Corp., 1.3%, 10/01/2023 | | | 2,305,000 | 2,211,794 |
| Hyatt Hotels Corp., 1.8%, 10/01/2024 | | | 1,976,000 | 1,843,064 |
| Las Vegas Sands Corp., 3.2%, 8/08/2024 | | | 1,270,000 | 1,209,270 |
| Marriott International, Inc., 3.75%, 10/01/2025 | | | 459,000 | 437,083 |
| Sands China Ltd., 4.3%, 1/08/2026 | | | 1,030,000 | 842,560 |
| | | | | $10,153,710 |
| Industrial – 0.0% |
| Howard University, Washington D.C., AGM, 2.416%, 10/01/2024 | | $ | 123,000 | $115,610 |
| Howard University, Washington D.C., AGM, 2.516%, 10/01/2025 | | | 152,000 | 139,544 |
| | | | | $255,154 |
| Insurance – 1.0% |
| AIG Global Funding, 0.8%, 7/07/2023 (n) | | $ | 1,362,000 | $1,322,852 |
| Corebridge Financial, Inc., 3.5%, 4/04/2025 (n) | | | 1,146,000 | 1,080,021 |
| Corebridge Financial, Inc., 3.65%, 4/05/2027 (n) | | | 1,613,000 | 1,460,855 |
| Equitable Financial Life Insurance Co., 1.4%, 7/07/2025 (n) | | | 1,485,000 | 1,328,095 |
| Metropolitan Life Global Funding I, 0.4%, 1/07/2024 (n) | | | 2,146,000 | 2,028,164 |
| | | | | $7,219,987 |
| Insurance - Property & Casualty – 0.2% |
| Aon PLC, 2.2%, 11/15/2022 | | $ | 1,193,000 | $1,191,824 |
Consolidated Portfolio of Investments – continued
| Issuer | | | Shares/Par | Value ($) |
| Bonds – continued |
| Internet – 0.3% |
| Baidu, Inc., 3.875%, 9/29/2023 | | $ | 2,225,000 | $2,196,075 |
| Machinery & Tools – 0.4% |
| CNH Industrial Capital LLC, 4.2%, 1/15/2024 | | $ | 1,726,000 | $1,696,447 |
| CNH Industrial Capital LLC, 1.875%, 1/15/2026 | | | 448,000 | 394,416 |
| CNH Industrial N.V., 4.5%, 8/15/2023 | | | 962,000 | 954,176 |
| | | | | $3,045,039 |
| Major Banks – 9.4% |
| Bank of Montreal, 2.05%, 11/01/2022 | | $ | 1,694,000 | $1,694,000 |
| Barclays PLC, 1.007% to 12/10/2023, FLR (CMT - 1yr. + 0.8%) to 12/10/2024 | | | 781,000 | 731,203 |
| Barclays PLC, 2.852% to 5/07/2025, FLR (LIBOR - 3mo. + 2.452%) to 5/07/2026 | | | 759,000 | 683,644 |
| Barclays PLC, 2.279% to 11/24/2026, FLR (CMT - 1yr. + 1.05%) to 11/24/2027 | | | 2,856,000 | 2,363,033 |
| BNP Paribas S.A., 2.591% to 1/20/2027, FLR (SOFR - 1 day + 1.228%) to 1/20/2028 (n) | | | 3,494,000 | 2,941,223 |
| Capital One Financial Corp., 4.166%, 5/09/2025 | | | 2,319,000 | 2,228,594 |
| Capital One Financial Corp., 2.636% to 3/03/2025, FLR (SOFR - 1 day + 1.29%) to 3/03/2026 | | | 1,712,000 | 1,569,494 |
| Deutsche Bank AG, 0.898%, 5/28/2024 | | | 694,000 | 636,932 |
| Deutsche Bank AG, 1.447% to 4/1/2024, FLR (SOFR - 1 day + 1.131%) to 4/01/2025 | | | 3,247,000 | 2,960,017 |
| Deutsche Bank AG, 2.311% to 11/16/2026, FLR (SOFR - 1 day + 1.219%) to 11/16/2027 | | | 849,000 | 677,674 |
| Goldman Sachs Group, Inc., 1.093% to 12/09/2025, FLR (SOFR - 1 day + 0.789%) to 12/09/2026 | | | 1,268,000 | 1,087,674 |
| HSBC Holdings PLC, 3.033% to 11/22/2022, FLR (LIBOR - 3mo. + 0.923%) to 11/22/2023 | | | 757,000 | 755,484 |
| HSBC Holdings PLC, 2.099% to 6/04/2025, FLR (SOFR - 1 day + 1.929%) to 6/04/2026 | | | 728,000 | 640,324 |
| HSBC Holdings PLC, 7.336% to 11/03/2025, FLR (SOFR - 1 day + 3.03%) to 11/03/2026 | | | 646,000 | 647,788 |
| HSBC Holdings PLC, 1.589% to 5/24/2026, FLR (SOFR - 1 day + 1.29%) to 5/24/2027 | | | 860,000 | 706,732 |
| HSBC Holdings PLC, 2.251% to 11/22/2026, FLR (SOFR - 1 day + 1.1%) to 11/22/2027 | | | 2,840,000 | 2,335,044 |
| Huntington Bancshares, Inc., 4.008% to 5/16/2024, FLR (SOFR - 1 day + 1.205%) to 5/16/2025 | | | 1,196,000 | 1,165,604 |
| JPMorgan Chase & Co., 3.375%, 5/01/2023 | | | 1,071,000 | 1,063,170 |
| JPMorgan Chase & Co., 3.797% to 7/23/2023, FLR (LIBOR - 3mo. + 0.89%) to 7/23/2024 | | | 1,347,000 | 1,327,769 |
Consolidated Portfolio of Investments – continued
| Issuer | | | Shares/Par | Value ($) |
| Bonds – continued |
| Major Banks – continued |
| JPMorgan Chase & Co., 1.04% to 2/04/2026, FLR (SOFR - 1 day + 0.695%) to 2/04/2027 | | $ | 1,700,000 | $1,445,663 |
| Lloyds Banking Group PLC, 3.511% to 3/18/2025, FLR (CMT - 1yr. + 1.6%) to 3/18/2026 | | | 2,402,000 | 2,222,716 |
| Mitsubishi UFJ Financial Group, Inc., 0.848% to 9/15/2023, FLR (CMT - 1yr. + 0.68%) to 9/15/2024 | | | 2,789,000 | 2,663,009 |
| Mitsubishi UFJ Financial Group, Inc., 0.953% to 7/19/2024, FLR (CMT - 1yr. + 0.55%) to 7/19/2025 | | | 1,997,000 | 1,832,901 |
| Mitsubishi UFJ Financial Group, Inc., 0.962% to 10/11/2024, FLR (CMT - 1yr. + 0.45%) to 10/11/2025 | | | 1,264,000 | 1,149,078 |
| Mizuho Financial Group, 0.849% to 9/08/2023, FLR (LIBOR - 3mo. + 0.61%) to 9/08/2024 | | | 2,411,000 | 2,303,272 |
| Nationwide Building Society, 2.972% to 2/16/2027, FLR (SOFR - 1 day + 1.29%) to 2/16/2028 (n) | | | 2,445,000 | 2,070,510 |
| NatWest Group PLC, 2.359% to 5/22/2023, FLR (CMT - 1yr. + 2.15%) to 5/22/2024 | | | 2,219,000 | 2,158,845 |
| NatWest Group PLC, 4.269% to 3/22/2024, FLR (LIBOR - 3mo. + 1.762%) to 3/22/2025 | | | 2,276,000 | 2,194,495 |
| NatWest Markets PLC, 3.479%, 3/22/2025 (n) | | | 2,257,000 | 2,129,935 |
| PNC Bank N.A., 2.5%, 8/27/2024 | | | 1,122,000 | 1,069,473 |
| Royal Bank of Canada, 0.5%, 10/26/2023 | | | 3,123,000 | 2,981,642 |
| Standard Chartered PLC, 0.991% to 1/12/2024, FLR (CMT - 1yr. + 0.78%) to 1/12/2025 (n) | | | 1,408,000 | 1,308,912 |
| Standard Chartered PLC, 1.214% to 3/23/2024, FLR (CMT - 1yr. + 0.88%) to 3/23/2025 (n) | | | 812,000 | 751,368 |
| Standard Chartered PLC, 1.822% to 11/23/2024, FLR (CMT - 1yr. + 0.95%) to 11/23/2025 (n) | | | 806,000 | 720,560 |
| Standard Chartered PLC, 3.971% to 3/30/2025, FLR (CMT - 1yr. + 1.65%) to 3/30/2026 (n) | | | 1,077,000 | 992,442 |
| Sumitomo Mitsui Financial Group, Inc., 0.508%, 1/12/2024 | | | 801,000 | 754,754 |
| Sumitomo Mitsui Financial Group, Inc., 1.474%, 7/08/2025 | | | 1,675,000 | 1,495,137 |
| Sumitomo Mitsui Financial Group, Inc., 2.174%, 1/14/2027 | | | 2,295,000 | 1,983,514 |
| Sumitomo Mitsui Trust Bank Ltd., 0.85%, 3/25/2024 (n) | | | 1,334,000 | 1,248,696 |
| Toronto-Dominion Bank, 0.25%, 1/06/2023 | | | 1,434,000 | 1,423,231 |
| UBS Group AG, 1.008% to 7/30/2023, FLR (CMT - 1yr. + 0.83%) to 7/30/2024 (n) | | | 1,270,000 | 1,222,233 |
| UBS Group AG, 4.703% to 8/05/2026, FLR (CMT - 1yr. + 2.05%) to 8/05/2027 (n) | | | 1,000,000 | 929,346 |
| UniCredit S.p.A., 2.569% to 9/22/2025, FLR (CMT - 1yr. + 2.3%) to 9/22/2026 (n) | | | 2,522,000 | 2,162,642 |
| Wells Fargo & Co., 2.164% to 2/11/2025, FLR (LIBOR - 3mo. + 0.75%) to 2/11/2026 | | | 2,599,000 | 2,387,109 |
Consolidated Portfolio of Investments – continued
| Issuer | | | Shares/Par | Value ($) |
| Bonds – continued |
| Major Banks – continued |
| Wells Fargo & Co., 3.526% to 3/24/2027, FLR (SOFR - 1 day + 1.51%) to 3/24/2028 | | $ | 3,868,000 | $3,482,957 |
| | | | | $71,299,843 |
| Medical & Health Technology & Services – 0.6% |
| HCA Healthcare, Inc., 3.125%, 3/15/2027 (n) | | $ | 1,186,000 | $1,048,424 |
| Thermo Fisher Scientific, Inc., 1.215%, 10/18/2024 | | | 4,014,000 | 3,732,130 |
| | | | | $4,780,554 |
| Metals & Mining – 0.8% |
| Anglo American Capital PLC, 4.75%, 4/10/2027 (n) | | $ | 911,000 | $853,680 |
| Glencore Funding LLC, 4.125%, 3/12/2024 (n) | | | 1,146,000 | 1,122,728 |
| Glencore Funding LLC, 1.625%, 9/01/2025 (n) | | | 2,677,000 | 2,381,740 |
| Glencore Funding LLC, 1.625%, 4/27/2026 (n) | | | 1,675,000 | 1,438,688 |
| | | | | $5,796,836 |
| Midstream – 0.9% |
| Enbridge, Inc., 2.5%, 2/14/2025 | | $ | 1,542,000 | $1,440,825 |
| Energy Transfer LP, 2.9%, 5/15/2025 | | | 846,000 | 785,325 |
| Gray Oak Pipeline LLC, 2%, 9/15/2023 (n) | | | 1,453,000 | 1,406,163 |
| Plains All American Pipeline LP, 3.85%, 10/15/2023 | | | 673,000 | 660,975 |
| Western Midstream Operating LP, 3.35%, 2/01/2025 | | | 1,082,000 | 1,028,408 |
| Western Midstream Operating LP, FLR, 5.04% (LIBOR - 3mo. + 0.85%), 1/13/2023 | | | 1,544,000 | 1,536,280 |
| | | | | $6,857,976 |
| Mortgage-Backed – 0.5% | |
| Fannie Mae, 4.5%, 4/01/2024 - 5/01/2025 | | $ | 26,095 | $25,875 |
| Fannie Mae, 3%, 12/01/2031 | | | 281,132 | 264,393 |
| Fannie Mae, 2%, 5/25/2044 | | | 184,071 | 176,634 |
| Freddie Mac, 0.901%, 4/25/2024 (i) | | | 84,444 | 896 |
| Freddie Mac, 4%, 7/01/2025 | | | 40,748 | 39,739 |
| Freddie Mac, 1.582%, 4/25/2030 (i) | | | 6,391,933 | 558,706 |
| Freddie Mac, 3%, 4/15/2033 - 6/15/2045 | | | 2,754,701 | 2,529,790 |
| Freddie Mac, 2%, 7/15/2042 | | | 452,334 | 406,011 |
| | | | | $4,002,044 |
| Municipals – 1.3% |
| California Earthquake Authority Rev., Taxable, “B”, 1.477%, 7/01/2023 | | $ | 555,000 | $540,685 |
| California Municipal Finance Authority Rev., Taxable (Century Housing Corp.), 1.486%, 11/01/2022 | | | 255,000 | 255,000 |
| California Municipal Finance Authority Rev., Taxable (Century Housing Corp.), 1.605%, 11/01/2023 | | | 305,000 | 294,210 |
Consolidated Portfolio of Investments – continued
| Issuer | | | Shares/Par | Value ($) |
| Bonds – continued |
| Municipals – continued |
| Illinois Sales Tax Securitization Corp., Second Lien, Taxable, “B”, BAM, 2.128%, 1/01/2023 | | $ | 430,000 | $428,064 |
| Illinois Sales Tax Securitization Corp., Second Lien, Taxable, “B”, BAM, 2.225%, 1/01/2024 | | | 1,030,000 | 990,486 |
| Massachusetts Educational Financing Authority, Education Loan Rev., Taxable, “A”, 1.904%, 7/01/2023 | | | 115,000 | 112,524 |
| Massachusetts Educational Financing Authority, Education Loan Rev., Taxable, “A”, 2.156%, 7/01/2024 | | | 320,000 | 302,867 |
| Massachusetts Educational Financing Authority, Education Loan Rev., Taxable, “A”, 2.306%, 7/01/2025 | | | 250,000 | 229,790 |
| Massachusetts Educational Financing Authority, Education Loan Rev., Taxable, “A”, 2.562%, 7/01/2026 | | | 315,000 | 282,962 |
| Michigan Finance Authority Tobacco Settlement Asset-Backed Rev., Taxable (2006 Sold Tobacco Receipts), “A-1”, 2.326%, 6/01/2030 | | | 657,077 | 587,799 |
| New Jersey Economic Development Authority State Pension Funding Rev., Capital Appreciation, Taxable, “B”, AGM, 0%, 2/15/2023 | | | 3,058,000 | 3,016,093 |
| New Jersey Transportation Trust Fund Authority, Transportation System, Taxable, “B”, 2.551%, 6/15/2023 | | | 475,000 | 468,134 |
| New Jersey Transportation Trust Fund Authority, Transportation System, Taxable, “B”, 2.631%, 6/15/2024 | | | 450,000 | 434,137 |
| Port Authority of NY & NJ, Taxable, “AAA”, 1.086%, 7/01/2023 | | | 1,635,000 | 1,594,696 |
| | | | | $9,537,447 |
| Natural Gas - Distribution – 0.6% |
| Atmos Energy Corp., 0.625%, 3/09/2023 | | $ | 2,625,000 | $2,587,110 |
| CenterPoint Energy Resources Corp., 0.7%, 3/02/2023 | | | 2,225,000 | 2,194,120 |
| | | | | $4,781,230 |
| Natural Gas - Pipeline – 0.5% |
| APA Infrastructure Ltd., 4.2%, 3/23/2025 (n) | | $ | 3,842,000 | $3,663,512 |
| Network & Telecom – 0.5% |
| AT&T, Inc., 0.9%, 3/25/2024 | | $ | 4,229,000 | $3,993,096 |
| Oils – 0.2% |
| Valero Energy Corp., 1.2%, 3/15/2024 | | $ | 1,252,000 | $1,180,601 |
| Other Banks & Diversified Financials – 1.3% |
| American Express Co., 2.25%, 3/04/2025 | | $ | 859,000 | $797,582 |
| Banque Federative du Credit Mutuel S.A., 0.65%, 2/27/2024 (n) | | | 2,782,000 | 2,608,723 |
| Groupe BPCE S.A., 4%, 9/12/2023 (n) | | | 943,000 | 924,123 |
| Groupe BPCE S.A., FLR, 4.476% (LIBOR - 3mo. + 1.24%), 9/12/2023 (n) | | | 943,000 | 942,691 |
Consolidated Portfolio of Investments – continued
| Issuer | | | Shares/Par | Value ($) |
| Bonds – continued |
| Other Banks & Diversified Financials – continued |
| Macquarie Group Ltd., 1.201% to 10/14/2024, FLR (SOFR - 1 day + 0.694%) to 10/14/2025 (n) | | $ | 2,251,000 | $2,038,665 |
| Macquarie Group Ltd., 1.34% to 1/12/2026, FLR (SOFR - 1 day + 1.069%) to 1/12/2027 (n) | | | 1,904,000 | 1,614,955 |
| National Bank of Canada, 0.55% to 11/15/2023, FLR (CMT - 1yr. + 0.4%) to 11/15/2024 | | | 1,312,000 | 1,243,452 |
| | | | | $10,170,191 |
| Pharmaceuticals – 0.3% |
| Royalty Pharma PLC, 0.75%, 9/02/2023 | | $ | 2,204,000 | $2,114,311 |
| Real Estate - Office – 0.1% |
| Corporate Office Property LP, REIT, 2.25%, 3/15/2026 | | $ | 1,172,000 | $1,015,617 |
| Retailers – 0.7% |
| Alibaba Group Holding Ltd., 2.8%, 6/06/2023 | | $ | 1,506,000 | $1,480,022 |
| Kohl's Corp., 9.5%, 5/15/2025 | | | 2,655,000 | 2,739,930 |
| Nordstrom, Inc., 2.3%, 4/08/2024 | | | 832,000 | 780,820 |
| | | | | $5,000,772 |
| Specialty Stores – 0.3% |
| Genuine Parts Co., 1.75%, 2/01/2025 | | $ | 1,302,000 | $1,200,780 |
| Ross Stores, Inc., 0.875%, 4/15/2026 | | | 926,000 | 796,431 |
| | | | | $1,997,211 |
| Telecommunications - Wireless – 0.9% |
| Crown Castle, Inc., REIT, 3.15%, 7/15/2023 | | $ | 611,000 | $601,514 |
| Crown Castle, Inc., REIT, 1.35%, 7/15/2025 | | | 492,000 | 439,482 |
| Crown Castle, Inc., REIT, 2.9%, 3/15/2027 | | | 448,000 | 395,047 |
| Rogers Communications, Inc., 3.2%, 3/15/2027 (n) | | | 3,568,000 | 3,235,996 |
| T-Mobile USA, Inc., 3.5%, 4/15/2025 | | | 2,527,000 | 2,410,788 |
| | | | | $7,082,827 |
| Tobacco – 0.3% |
| B.A.T. Capital Corp., 3.222%, 8/15/2024 | | $ | 1,459,000 | $1,394,451 |
| Philip Morris International, Inc., 1.125%, 5/01/2023 | | | 722,000 | 708,010 |
| | | | | $2,102,461 |
| Transportation - Services – 1.1% |
| Element Fleet Management Corp., 1.6%, 4/06/2024 (n) | | $ | 6,310,000 | $5,936,460 |
| ERAC USA Finance LLC, 2.7%, 11/01/2023 (n) | | | 974,000 | 945,237 |
| ERAC USA Finance LLC, 3.85%, 11/15/2024 (n) | | | 684,000 | 659,388 |
| ERAC USA Finance LLC, 3.8%, 11/01/2025 (n) | | | 684,000 | 643,697 |
| | | | | $8,184,782 |
Consolidated Portfolio of Investments – continued
| Issuer | | | Shares/Par | Value ($) |
| Bonds – continued |
| U.S. Treasury Obligations – 21.6% |
| U.S. Treasury Notes, 0.125%, 1/31/2023 (f)(s) | | $ | 25,000,000 | $24,755,377 |
| U.S. Treasury Notes, 0.125%, 5/31/2023 (f)(s) | | | 25,000,000 | 24,361,328 |
| U.S. Treasury Notes, 0.125%, 8/31/2023 (f)(s) | | | 12,453,000 | 11,986,985 |
| U.S. Treasury Notes, 0.125%, 10/15/2023 (f) | | | 40,540,000 | 38,823,999 |
| U.S. Treasury Notes, 0.5%, 11/30/2023 (f)(s) | | | 12,515,000 | 11,974,802 |
| U.S. Treasury Notes, 2.75%, 5/15/2025 | | | 21,100,000 | 20,234,570 |
| U.S. Treasury Notes, 2.25%, 11/15/2025 | | | 33,829,000 | 31,729,223 |
| | | | | $163,866,284 |
| Utilities - Electric Power – 2.7% |
| Edison International, 4.7%, 8/15/2025 | | $ | 1,686,000 | $1,627,930 |
| Emera US Finance LP, 0.833%, 6/15/2024 | | | 1,057,000 | 974,390 |
| Enel Finance International N.V., 6.8%, 10/14/2025 (n) | | | 889,000 | 892,697 |
| ENGIE Energía Chile S.A., 4.5%, 1/29/2025 (n) | | | 3,214,000 | 3,011,518 |
| Entergy Louisiana LLC, 0.95%, 10/01/2024 | | | 2,141,000 | 1,974,292 |
| FirstEnergy Corp., 2.05%, 3/01/2025 | | | 1,202,000 | 1,104,940 |
| FirstEnergy Corp., 1.6%, 1/15/2026 | | | 734,000 | 638,338 |
| NextEra Energy Capital Holdings, Inc., 0.65%, 3/01/2023 | | | 1,743,000 | 1,718,660 |
| Pacific Gas & Electric Co., 1.7%, 11/15/2023 | | | 854,000 | 818,471 |
| Pacific Gas & Electric Co., 3.25%, 2/16/2024 | | | 3,496,000 | 3,378,816 |
| Vistra Operations Co. LLC, 4.875%, 5/13/2024 (n) | | | 3,851,000 | 3,748,024 |
| WEC Energy Group, Inc., 0.8%, 3/15/2024 | | | 1,019,000 | 957,798 |
| | | | | $20,845,874 |
| Total Bonds (Identified Cost, $606,636,699) | | $573,484,128 |
| Investment Companies (h) – 14.1% |
| Money Market Funds – 14.1% | |
| MFS Institutional Money Market Portfolio, 3.02% (v) (Identified Cost, $107,265,931) | | | 107,271,416 | $107,271,416 |
| Short-Term Obligations (s)(y) – 2.0% | | | | |
| Freddie Mac, 0%, due 11/01/2022 (Identified Cost, $15,235,000) | | $ | 15,235,000 | $15,235,000 |
|
|
| Other Assets, Less Liabilities – 8.3% | | 62,826,362 |
| Net Assets – 100.0% | $758,816,906 |
| (f) | All or a portion of the security has been segregated as collateral for cleared and uncleared swap agreements. | | | |
| (h) | An affiliated issuer, which may be considered one in which the fund owns 5% or more of the outstanding voting securities, or a company which is under common control. At period end, the aggregate values of the fund's investments in affiliated issuers and in unaffiliated issuers were $107,271,416 and $588,719,128, respectively. | | | |
| (i) | Interest only security for which the fund receives interest on notional principal (Par amount). Par amount shown is the notional principal and does not reflect the cost of the security. | | | |
Consolidated Portfolio of Investments – continued
| (n) | Securities exempt from registration under Rule 144A of the Securities Act of 1933. These securities may be sold in the ordinary course of business in transactions exempt from registration, normally to qualified institutional buyers. At period end, the aggregate value of these securities was $207,380,991, representing 27.3% of net assets. | | | |
| (s) | All or a portion of security is held by a wholly-owned subsidiary. See Note 2 of the Notes to Consolidated Financial Statements for details of the wholly-owned subsidiary. | | | |
| (v) | Affiliated issuer that is available only to investment companies managed by MFS. The rate quoted for the MFS Institutional Money Market Portfolio is the annualized seven-day yield of the fund at period end. | | | |
| (y) | The rate quoted is the annualized one-day yield of the fund at period end. | | | |
| The following abbreviations are used in this report and are defined: |
| AGM | Assured Guaranty Municipal |
| BAM | Build America Mutual |
| BCOMALTR | Bloomberg Aluminum Subindex Total Return, this index is composed of futures contracts on aluminum. It is quoted in USD. |
| BCOMBOTR | Bloomberg Soybean Oil Subindex Total Return, this index is composed of futures contracts on soybean oil. It is quoted in USD. |
| BCOMCLTR | Bloomberg WTI Crude Oil Subindex Total Return, this index is composed of composed of futures contracts on WTI crude oil. It reflects the return on fully collateralized futures positions. It is quoted in USD. |
| BCOMCNTR | Bloomberg Corn Subindex Total Return, this index is composed of futures contracts on corn. It reflects the return on fully collateralized futures positions. It is quoted in USD. |
| BCOMCOT | Bloomberg Brent Crude Subindex Total Return, this index is composed of futures contracts on brent crude. It is quoted in USD. |
| BCOMCTTR | Bloomberg Cotton Subindex Total Return, this index is composed of futures contracts on cotton. It reflects the return on fully collateralized futures positions. It is quoted in USD. |
| BCOMF3T | Bloomberg Commodity Index 3 Month Forward Total Return, this index is composed of longer-dated futures contracts on 19 physical commodities. It is quoted in USD. |
| BCOMFCT | Bloomberg Feeder Cattle Subindex Total Return, this index is comprised of futures contracts on feeder cattle. It is quoted in USD. |
| BCOMGCTR | Bloomberg Gold Subindex Total Return, this index is composed of futures contracts on gold. It is quoted in USD. |
| BCOMGOT | Bloomberg Gas and Oil Subindex Total Return, this index is composed of futures contracts on gas and oil. It is quoted in USD. |
| BCOMHGTR | Bloomberg Copper Subindex Total Return, this index is composed of futures contracts on copper. It is quoted in USD. |
| BCOMKWT | Bloomberg Kansas Wheat Subindex Total Return, this index is composed of futures contracts on wheat and Kansas wheat. It is quoted in USD. |
| BCOMLCTR | Bloomberg Live Cattle Subindex Total Return, this index is composed of futures contracts on live cattle. It is quoted in USD. |
| BCOMLHTR | Bloomberg Lean Hogs Subindex Total Return, this index is composed of futures contracts on lean hogs. It reflects the return of underlying commodity futures price movements only. It is quoted in USD. |
| BCOMNITR | Bloomberg Nickel Subindex Total Return, this index is a single commodity subindex of the Bloomberg CI composed of futures contracts on Nickel. It reflects the return of underlying commodity futures price movements only. It is quoted in USD. |
| BCOMPBTR | Bloomberg Lead Subindex Total Return, this index is composed of futures contracts on lead. It reflects the return of underlying commodity futures price movements only. It is quoted in USD. |
Consolidated Portfolio of Investments – continued
| BCOMPLTR | Bloomberg Platinum Subindex Total Return, this index is composed of futures contracts on platinum. It is quoted in USD. |
| BCOMSITR | Bloomberg Silver Subindex Total Return, this index is composed of futures contracts on silver. It is quoted in USD. |
| BCOMTR | Bloomberg Commodity Index Total Return |
| BCOMWHTR | Bloomberg Wheat Subindex Total Return, this index is composed of futures contracts on wheat. It reflects the return on fully collateralized futures positions. It is quoted in USD. |
| BCOMZSTR | Bloomberg Zinc Subindex Total Return, this index is composed of futures contracts on zinc. It is quoted in USD. |
| CLO | Collateralized Loan Obligation |
| CMT | Constant Maturity Treasury |
| FLR | Floating Rate. Interest rate resets periodically based on the parenthetically disclosed reference rate plus a spread (if any). The period-end rate reported may not be the current rate. All reference rates are USD unless otherwise noted. |
| LIBOR | London Interbank Offered Rate |
| MLCILPRT | Merrill Lynch International Bloomberg Commodity Index Total Return |
| REIT | Real Estate Investment Trust |
| SOFR | Secured Overnight Financing Rate |
| SPGCCCTR | S&P GSCI Cocoa Index Total Return |
Consolidated Portfolio of Investments – continued
Derivative Contracts at 10/31/22
| Cleared Swap Agreements |
Maturity
Date | Notional
Amount | Counterparty | Cash Flows
to Receive/
Frequency | Cash Flows
to Pay/
Frequency | Unrealized
Appreciation
(Depreciation) | | Net Unamortized
Upfront Payments
(Receipts) | | Value |
| Liability Derivatives | | | | | |
| Interest Rate Swaps | | | | | |
| 8/19/24 | USD | 14,000,000 | centrally cleared | 3.31%/Annually | Daily SOFR/Annually | $(297,831) | | $— | | $(297,831) |
| 5/13/25 | USD | 31,300,000 | centrally cleared | 2.76%/Annually | Daily SOFR/Annually | (1,118,463) | | — | | (1,118,463) |
| 10/17/25 | USD | 13,600,000 | centrally cleared | 4.20%/Annually | Daily SOFR/Annually | (35,846) | | — | | (35,846) |
| | | | | | | $(1,452,140) | | $— | | $(1,452,140) |
| Uncleared Swap Agreements |
Maturity
Date | Notional
Amount | Counterparty | Cash Flows
to Receive
(Monthly) | Cash Flows
to Pay
(Monthly) | Unrealized
Appreciation
(Depreciation) | Net Unamortized
Upfront Payments
(Receipts) | Value |
| Asset Derivatives | | | |
| Total Return Swaps | | | |
| 11/30/22 | USD | 10,855,130 (Short) | Goldman Sachs International | 3 month T-Bill + 0.045% | BCOMGCTR (floating rate) | $34,202 | $— | $34,202 |
| 1/13/23 | USD | 11,244,587 (Short) | Citibank N.A. | 3 month T-Bill + 0.03% | BCOMLCTR (floating rate) | 33,694 | — | 33,694 |
| 1/13/23 | USD | 9,823,083 (Short) | Morgan Stanley | 3 month T-Bill + 0.03% | SPGCCCTR (floating rate) | 30,743 | — | 30,743 |
| 3/15/23 | USD | 11,076,371 (Short) | Morgan Stanley | 3 month T-Bill - 0.08% | BCOMPLTR (floating rate) | 31,326 | — | 31,326 |
| 4/11/23 | USD | 12,681,496 (Short) | Morgan Stanley | 3 month T-Bill + 0.00% | BCOMFCT (floating rate) | 38,331 | — | 38,331 |
| 4/28/23 | USD | 8,833,631 (Short) | Merrill Lynch International | 3 month T-Bill - 0.08% | BCOMHGTR (floating rate) | 27,349 | — | 27,349 |
| 5/15/23 | USD | 3,123,254 (Short) | JPMorgan Chase Bank N.A. | 3 month T-Bill - 0.05% | BCOMWHTR (floating rate) | 10,072 | — | 10,072 |
| 5/15/23 | USD | 2,635,623 (Short) | Goldman Sachs International | 3 month T-Bill + 0.05% | BCOMNITR (floating rate) | 7,900 | — | 7,900 |
Consolidated Portfolio of Investments – continued
| Uncleared Swap Agreements - continued |
Maturity
Date | Notional
Amount | Counterparty | Cash Flows
to Receive
(Monthly) | Cash Flows
to Pay
(Monthly) | Unrealized
Appreciation
(Depreciation) | | Net Unamortized
Upfront Payments
(Receipts) | | Value |
| Asset Derivatives - continued |
| Total Return Swaps - continued |
| 5/15/23 | USD | 3,381,898 (Short) | JPMorgan Chase Bank N.A. | 3 month T-Bill - 0.05% | BCOMKWT (floating rate) | $10,578 | | $— | | $10,578 |
| 9/29/23 | USD | 5,376,392 (Short) | Morgan Stanley | 3 month T-Bill - 0.03% | BCOMSITR (floating rate) | 16,620 | | — | | 16,620 |
| 9/29/23 | USD | 10,327,148 (Short) | Morgan Stanley | 3 month T-Bill - 0.03% | BCOMPBTR (floating rate) | 30,606 | | — | | 30,606 |
| 10/16/23 | USD | 10,757,681 (Short) | Morgan Stanley | 3 month T-Bill - 0.03% | BCOMALTR (floating rate) | 32,514 | | — | | 32,514 |
| | | | | | | $303,935 | | $— | | $303,935 |
| Liability Derivatives | | | | | |
| Total Return Swaps | | | | | |
| 11/30/22 | USD | 26,239,836 (Long) | Citibank N.A. | BCOMTR (floating rate) | 3 month T-Bill + 0.10% | $(83,065) | | $— | | $(83,065) |
| 11/30/22 | USD | 54,666,326 (Long) | Goldman Sachs International | BCOMTR (floating rate) | 3 month T-Bill + 0.09% | (172,381) | | — | | (172,381) |
| 11/30/22 | USD | 109,332,654 (Long) | JPMorgan Chase Bank N.A. | BCOMTR (floating rate) | 3 month T-Bill + 0.07% | (342,938) | | — | | (342,938) |
| 2/28/23 | USD | 21,750,990 (Long) | Goldman Sachs International | BCOMTR (floating rate) | 3 month T-Bill + 0.08% | (68,407) | | — | | (68,407) |
| 3/15/23 | USD | 8,559,387 (Long) | Morgan Stanley | BCOMCTTR (floating rate) | 3 month T-Bill + 0.15% | (33,040) | | — | | (33,040) |
| 4/07/23 | USD | 23,555,518 (Long) | JPMorgan Chase Bank N.A. | BCOMF3T (floating rate) | 3 month T-Bill + 0.00% | (74,484) | | — | | (74,484) |
| 4/11/23 | USD | 23,555,518 (Long) | Merrill Lynch International | BCOMF3T (floating rate) | 3 month T-Bill + 0.00% | (74,288) | | — | | (74,288) |
| 5/26/23 | USD | 38,451,265 (Long) | Merrill Lynch International | BCOMTR (floating rate) | 3 month T-Bill + 0.07% | (120,607) | | — | | (120,607) |
| 6/20/23 | USD | 94,494,653 (Long) | Merrill Lynch International | BCOMF3T (floating rate) | 3 month T-Bill + 0.09% | (298,021) | | — | | (298,021) |
Consolidated Portfolio of Investments – continued
| Uncleared Swap Agreements - continued |
Maturity
Date | Notional
Amount | Counterparty | Cash Flows
to Receive
(Monthly) | Cash Flows
to Pay
(Monthly) | Unrealized
Appreciation
(Depreciation) | Net Unamortized
Upfront Payments
(Receipts) | Value |
| Liability Derivatives - continued |
| Total Return Swaps - continued |
| 6/23/23 | USD | 4,311,054 (Long) | Merrill Lynch International | BCOMCLTR (floating rate) | 3 month T-Bill + 0.05% | $(12,353) | $— | $(12,353) |
| 7/17/23 | USD | 34,767,353 (Long) | Merrill Lynch International | BCOMF3T (floating rate) | 3 month T-Bill + 0.10% | (109,942) | — | (109,942) |
| 7/17/23 | USD | 34,767,353 (Long) | JPMorgan Chase Bank N.A. | BCOMF3T (floating rate) | 3 month T-Bill + 0.10% | (109,942) | — | (109,942) |
| 7/17/23 | USD | 35,658,824 (Long) | Goldman Sachs International | BCOMF3T (floating rate) | 3 month T-Bill + 0.10% | (112,761) | — | (112,761) |
| 8/07/23 | USD | 7,808,831 (Long) | Merrill Lynch International | BCOMCOT (floating rate) | 3 month T-Bill + 0.06% | (22,356) | — | (22,356) |
| 8/08/23 | USD | 5,264,348 (Long) | Merrill Lynch International | BCOMGOT (floating rate) | 3 month T-Bill + 0.06% | (14,752) | — | (14,752) |
| 9/25/23 | USD | 13,780,541 (Long) | JPMorgan Chase Bank N.A. | BCOMTR (floating rate) | 3 month T-Bill + 0.07% | (43,226) | — | (43,226) |
| 9/25/23 | USD | 119,059,816 (Long) | Merrill Lynch International | MLCILPRT (a) (floating rate) | 3 month T-Bill + 0.14% | (381,889) | — | (381,889) |
| 9/25/23 | USD | 8,502,889 (Long) | JPMorgan Chase Bank N.A. | BCOMZSTR (floating rate) | 3 month T-Bill + 0.10% | (30,018) | — | (30,018) |
| 9/29/23 | USD | 11,409,432 (Long) | Morgan Stanley | BCOMCNTR (floating rate) | 3 month T-Bill + 0.14% | (36,312) | — | (36,312) |
| 10/16/23 | USD | 6,624,669 (Long) | Merrill Lynch International | BCOMBOTR (floating rate) | 3 month T-Bill + 0.10% | (18,079) | — | (18,079) |
| 11/17/23 | USD | 126,913,532 (Long) | Merrill Lynch International | MLCILPRT (a) (floating rate) | 3 month T-Bill + 0.13% | (183,600) | — | (183,600) |
| 11/20/23 | USD | 21,321,039 (Long) | JPMorgan Chase Bank N.A. | BCOMTR (floating rate) | 3 month T-Bill + 0.07% | (30,396) | — | (30,396) |
Consolidated Portfolio of Investments – continued
| Uncleared Swap Agreements - continued |
Maturity
Date | Notional
Amount | Counterparty | Cash Flows
to Receive
(Monthly) | Cash Flows
to Pay
(Monthly) | Unrealized
Appreciation
(Depreciation) | | Net Unamortized
Upfront Payments
(Receipts) | | Value |
| Liability Derivatives - continued |
| Total Return Swaps - continued |
| 11/30/23 | USD | 7,785,977 (Long) | Morgan Stanley | BCOMLHTR (floating rate) | 3 month T-Bill + 0.15% | $(10,920) | | $— | | $(10,920) |
| | | | | | | $(2,383,777) | | $— | | $(2,383,777) |
At October 31, 2022, the fund had cash collateral of $12,660,350 and other liquid securities with an aggregate value of $66,490,744 to cover any collateral or margin obligations for certain derivative contracts. Restricted cash and/or deposits with brokers in the Consolidated Statement of Assets and Liabilities are comprised of cash collateral.
| (a) | The Merrill Lynch MLCILPRT Commodity Index, the components of which are not publicly available, seeks to provide exposure to a diversified group of commodities. Through its investment in the swap, the fund has indirect exposure to the following positions that compose the MLCILPRT: |
| Referenced Commodity Futures Contracts | % of Notional | Notional
Amount:
$119,059,816* | Notional
Amount:
$126,913,532* | |
| Long Futures Contracts | | | | |
| Soybean Oil | 3.5% | 4,167,094 | 4,441,974 | |
| Corn | 4.4% | 5,238,632 | 5,584,195 | |
| Corn | 1.6% | 1,904,957 | 2,030,617 | |
| WTI | 8.1% | 9,643,845 | 10,279,996 | |
| Brent | 2.0% | 2,381,196 | 2,538,271 | |
| Brent | 5.2% | 6,191,110 | 6,599,504 | |
| Cotton | 0.6% | 714,359 | 761,481 | |
| Cotton | 0.2% | 238,119 | 253,827 | |
| Gold | 9.6% | 11,429,742 | 12,183,699 | |
| Gold | 3.4% | 4,048,034 | 4,315,060 | |
Consolidated Portfolio of Investments – continued
| Referenced Commodity Futures Contracts | % of Notional | Notional
Amount:
$119,059,816* | Notional
Amount:
$126,913,532* | |
| Copper Comex | 2.8% | 3,333,675 | 3,553,579 | |
| Copper Comex | 1.0% | 1,190,598 | 1,269,135 | |
| Heating Oil | 2.7% | 3,214,615 | 3,426,665 | |
| Coffee | 1.4% | 1,666,837 | 1,776,789 | |
| Coffee | 0.5% | 595,299 | 634,568 | |
| Kansas Wheat | 1.4% | 1,666,837 | 1,776,789 | |
| Kansas Wheat | 0.5% | 595,299 | 634,568 | |
| Aluminum | 3.0% | 3,571,794 | 3,807,406 | |
| Live Cattle | 2.8% | 3,333,675 | 3,553,579 | |
| Live Cattle | 1.0% | 1,190,598 | 1,269,135 | |
| Lean Hogs | 1.3% | 1,547,778 | 1,649,876 | |
| Lean Hogs | 0.4% | 476,239 | 507,654 | |
| Nickel | 2.7% | 3,214,615 | 3,426,665 | |
| Zinc | 2.2% | 2,619,316 | 2,792,098 | |
| Natural Gas | 13.7% | 16,311,197 | 17,387,154 | |
| Gasoil | 3.5% | 4,167,094 | 4,441,974 | |
| Soybeans | 5.5% | 6,548,289 | 6,980,244 | |
| Sugar | 2.6% | 3,095,555 | 3,299,752 | |
| Silver | 2.8% | 3,333,675 | 3,553,579 | |
| Silver | 1.0% | 1,190,598 | 1,269,135 | |
| Soybean Meal | 3.3% | 3,928,974 | 4,188,147 | |
| Wheat | 2.3% | 2,738,376 | 2,919,011 | |
| Wheat | 0.8% | 952,479 | 1,015,308 | |
| Gasoline RBOB | 2.2% | 2,619,316 | 2,792,098 | |
| | 100% | $119,059,816 | $126,913,532 | |
| * The notional amount is indicative of the quantity and proportionate value of each commodity futures contract. |
See Notes to Consolidated Financial Statements
Consolidated Financial Statements
Consolidated Statement of Assets and Liabilities
At 10/31/22
This statement represents your fund’s balance sheet, which details the assets and liabilities comprising the total value of the fund.
| Assets | |
| Investments in unaffiliated issuers, at value (identified cost, $621,871,699) | $588,719,128 |
| Investments in affiliated issuers, at value (identified cost, $107,265,931) | 107,271,416 |
| Cash | 23,870,135 |
| Restricted cash for | |
| Uncleared swaps | 12,660,350 |
| Receivables for | |
| Due from uncleared swap brokers | 17,647,818 |
| Fund shares sold | 13,909,304 |
| Interest | 2,943,110 |
| Uncleared swaps, at value | 303,935 |
| Other assets | 253 |
| Total assets | $767,325,449 |
| Liabilities | |
| Payables for | |
| Due to uncleared swap brokers | $5,131,344 |
| Net daily variation margin on open cleared swap agreements | 99,714 |
| Investments purchased | 646,001 |
| Fund shares reacquired | 16,065 |
| Uncleared swaps, at value | 2,383,777 |
| Payable to affiliates | |
| Investment adviser | 60,205 |
| Administrative services fee | 1,320 |
| Shareholder servicing costs | 10,154 |
| Distribution and service fees | 600 |
| Payable for independent Trustees' compensation | 10 |
| Accrued expenses and other liabilities | 159,353 |
| Total liabilities | $8,508,543 |
| Net assets | $758,816,906 |
| Net assets consist of | |
| Paid-in capital | $1,221,068,162 |
| Total distributable earnings (loss) | (462,251,256) |
| Net assets | $758,816,906 |
| Shares of beneficial interest outstanding | 157,178,506 |
Consolidated Statement of Assets and Liabilities – continued
| | Net assets | Shares
outstanding | Net asset value
per share (a) |
| Class A | $15,080,426 | 3,139,435 | $4.80 |
| Class B | 111,558 | 23,402 | 4.77 |
| Class C | 1,444,491 | 305,090 | 4.73 |
| Class I | 18,904,529 | 3,912,865 | 4.83 |
| Class R1 | 67,789 | 14,191 | 4.78 |
| Class R2 | 133,605 | 27,840 | 4.80 |
| Class R3 | 69,966 | 14,542 | 4.81 |
| Class R4 | 70,707 | 14,661 | 4.82 |
| Class R6 | 722,933,835 | 149,726,480 | 4.83 |
| (a) | Maximum offering price per share was equal to the net asset value per share for all share classes, except for Class A, for which the maximum offering price per share was $5.09 [100 / 94.25 x $4.80]. Redemption price per share was equal to the net asset value per share for Classes I, R1, R2, R3, R4, and R6. |
See Notes to Consolidated Financial Statements
Consolidated Financial Statements
Consolidated Statement of Operations
Year ended 10/31/22
This statement describes how much your fund earned in investment income and accrued in expenses. It also describes any gains and/or losses generated by fund operations.
| Net investment income (loss) | |
| Income | |
| Interest | $10,812,871 |
| Dividends from affiliated issuers | 1,004,681 |
| Other | 119,880 |
| Total investment income | $11,937,432 |
| Expenses | |
| Management fee | $6,670,914 |
| Distribution and service fees | 44,680 |
| Shareholder servicing costs | 28,883 |
| Administrative services fee | 144,469 |
| Independent Trustees' compensation | 14,964 |
| Custodian fee | 67,138 |
| Shareholder communications | 12,280 |
| Audit and tax fees | 91,560 |
| Legal fees | 24,992 |
| Miscellaneous | 232,640 |
| Total expenses | $7,332,520 |
| Reduction of expenses by investment adviser and distributor | (125,064) |
| Net expenses | $7,207,456 |
| Net investment income (loss) | $4,729,976 |
| Realized and unrealized gain (loss) |
| Realized gain (loss) (identified cost basis) | |
| Unaffiliated issuers | $(8,256,628) |
| Affiliated issuers | (16,417) |
| Futures contracts | (430) |
| Swap agreements | 154,004,579 |
| Net realized gain (loss) | $145,731,104 |
| Change in unrealized appreciation or depreciation | |
| Unaffiliated issuers | $(36,212,930) |
| Affiliated issuers | 3,921 |
| Swap agreements | (720,157) |
| Net unrealized gain (loss) | $(36,929,166) |
| Net realized and unrealized gain (loss) | $108,801,938 |
| Change in net assets from operations | $113,531,914 |
See Notes to Consolidated Financial Statements
Financial Statements
Consolidated Statements of Changes in Net Assets
These statements describe the increases and/or decreases in net assets resulting from operations, any distributions, and any shareholder transactions.
| | Year ended |
| | 10/31/22 | 10/31/21 |
| Change in net assets | | |
| From operations | | |
| Net investment income (loss) | $4,729,976 | $3,819,380 |
| Net realized gain (loss) | 145,731,104 | 321,283,391 |
| Net unrealized gain (loss) | (36,929,166) | (8,106,592) |
| Change in net assets from operations | $113,531,914 | $316,996,179 |
| Total distributions to shareholders | $(322,999,695) | $(7,000,067) |
| Change in net assets from fund share transactions | $31,442,427 | $(64,757,668) |
| Total change in net assets | $(178,025,354) | $245,238,444 |
| Net assets | | |
| At beginning of period | 936,842,260 | 691,603,816 |
| At end of period | $758,816,906 | $936,842,260 |
See Notes to Consolidated Financial Statements
Consolidated Financial Statements
Consolidated Financial Highlights
The financial highlights table is intended to help you understand the fund's financial performance for the past 5 years (or life of a particular share class, if shorter). Certain information reflects financial results for a single fund share. The total returns in the table represent the rate that an investor would have earned (or lost) on an investment in the fund share class (assuming reinvestment of all distributions) held for the entire period.
| Class A | Year ended |
| | 10/31/22 | 10/31/21 | 10/31/20 | 10/31/19 | 10/31/18 |
| Net asset value, beginning of period | $7.02 | $4.85 | $5.32 | $5.65 | $6.00 |
| Income (loss) from investment operations |
| Net investment income (loss) (d) | $0.02 | $0.00(w) | $0.04 | $0.10 | $0.07 |
| Net realized and unrealized gain (loss) | 0.15 | 2.21 | (0.42) | (0.27) | (0.25) |
| Total from investment operations | $0.17 | $2.21 | $(0.38) | $(0.17) | $(0.18) |
| Less distributions declared to shareholders |
| From net investment income | $(2.39) | $(0.04) | $(0.09) | $(0.16) | $(0.17) |
| Net asset value, end of period (x) | $4.80 | $7.02 | $4.85 | $5.32 | $5.65 |
| Total return (%) (r)(s)(t)(x) | 7.71 | 45.84 | (7.24) | (2.96) | (2.98) |
Ratios (%) (to average net assets)
and Supplemental data: |
| Expenses before expense reductions | 1.17 | 1.15 | 1.13 | 1.10 | 1.09 |
| Expenses after expense reductions | 1.15 | 1.14 | 1.12 | 1.09 | 1.08 |
| Net investment income (loss) | 0.37 | 0.07 | 0.94 | 1.86 | 1.22 |
| Portfolio turnover | 37 | 28 | 57 | 64 | 72 |
| Net assets at end of period (000 omitted) | $15,080 | $4,921 | $1,041 | $321 | $63 |
See Notes to Consolidated Financial Statements
Consolidated Financial Highlights – continued
| Class B | Year ended |
| | 10/31/22 | 10/31/21 | 10/31/20 | 10/31/19 | 10/31/18(i) |
| Net asset value, beginning of period | $6.96 | $4.81 | $5.28 | $5.64 | $5.71 |
| Income (loss) from investment operations |
| Net investment income (loss) (d) | $(0.03) | $(0.04) | $0.01 | $0.06 | $0.02 |
| Net realized and unrealized gain (loss) | 0.18 | 2.20 | (0.43) | (0.26) | (0.09) |
| Total from investment operations | $0.15 | $2.16 | $(0.42) | $(0.20) | $(0.07) |
| Less distributions declared to shareholders |
| From net investment income | $(2.34) | $(0.01) | $(0.05) | $(0.16) | $— |
| Net asset value, end of period (x) | $4.77 | $6.96 | $4.81 | $5.28 | $5.64 |
| Total return (%) (r)(s)(t)(x) | 7.08 | 44.93 | (8.10) | (3.68) | (1.23)(n) |
Ratios (%) (to average net assets)
and Supplemental data: |
| Expenses before expense reductions | 1.91 | 1.89 | 1.87 | 1.84 | 1.94(a) |
| Expenses after expense reductions | 1.90 | 1.88 | 1.86 | 1.83 | 1.93(a) |
| Net investment income (loss) | (0.50) | (0.65) | 0.23 | 1.13 | 1.34(a) |
| Portfolio turnover | 37 | 28 | 57 | 64 | 72 |
| Net assets at end of period (000 omitted) | $112 | $98 | $60 | $48 | $52 |
| Class C | Year ended |
| | 10/31/22 | 10/31/21 | 10/31/20 | 10/31/19 | 10/31/18(i) |
| Net asset value, beginning of period | $6.94 | $4.80 | $5.28 | $5.64 | $5.71 |
| Income (loss) from investment operations |
| Net investment income (loss) (d) | $(0.03) | $(0.04) | $0.01 | $0.06 | $0.02 |
| Net realized and unrealized gain (loss) | 0.17 | 2.19 | (0.43) | (0.27) | (0.09) |
| Total from investment operations | $0.14 | $2.15 | $(0.42) | $(0.21) | $(0.07) |
| Less distributions declared to shareholders |
| From net investment income | $(2.35) | $(0.01) | $(0.06) | $(0.15) | $— |
| Net asset value, end of period (x) | $4.73 | $6.94 | $4.80 | $5.28 | $5.64 |
| Total return (%) (r)(s)(t)(x) | 6.94 | 44.77 | (8.07) | (3.69) | (1.23)(n) |
Ratios (%) (to average net assets)
and Supplemental data: |
| Expenses before expense reductions | 1.91 | 1.90 | 1.88 | 1.84 | 1.94(a) |
| Expenses after expense reductions | 1.90 | 1.88 | 1.87 | 1.83 | 1.93(a) |
| Net investment income (loss) | (0.49) | (0.66) | 0.20 | 1.12 | 1.41(a) |
| Portfolio turnover | 37 | 28 | 57 | 64 | 72 |
| Net assets at end of period (000 omitted) | $1,444 | $1,095 | $435 | $93 | $49 |
See Notes to Consolidated Financial Statements
Consolidated Financial Highlights – continued
| Class I | Year ended |
| | 10/31/22 | 10/31/21 | 10/31/20 | 10/31/19 | 10/31/18 |
| Net asset value, beginning of period | $7.04 | $4.86 | $5.32 | $5.65 | $6.00 |
| Income (loss) from investment operations |
| Net investment income (loss) (d) | $0.03 | $0.02 | $0.06 | $0.11 | $0.09 |
| Net realized and unrealized gain (loss) | 0.16 | 2.21 | (0.42) | (0.26) | (0.25) |
| Total from investment operations | $0.19 | $2.23 | $(0.36) | $(0.15) | $(0.16) |
| Less distributions declared to shareholders |
| From net investment income | $(2.40) | $(0.05) | $(0.10) | $(0.18) | $(0.19) |
| Net asset value, end of period (x) | $4.83 | $7.04 | $4.86 | $5.32 | $5.65 |
| Total return (%) (r)(s)(t)(x) | 8.05 | 46.19 | (6.90) | (2.75) | (2.73) |
Ratios (%) (to average net assets)
and Supplemental data: |
| Expenses before expense reductions | 0.92 | 0.90 | 0.89 | 0.84 | 0.85 |
| Expenses after expense reductions | 0.90 | 0.89 | 0.88 | 0.83 | 0.84 |
| Net investment income (loss) | 0.57 | 0.30 | 1.17 | 2.13 | 1.45 |
| Portfolio turnover | 37 | 28 | 57 | 64 | 72 |
| Net assets at end of period (000 omitted) | $18,905 | $6,029 | $500 | $135 | $48 |
| Class R1 | Year ended |
| | 10/31/22 | 10/31/21 | 10/31/20 | 10/31/19 | 10/31/18(i) |
| Net asset value, beginning of period | $6.97 | $4.81 | $5.28 | $5.64 | $5.71 |
| Income (loss) from investment operations |
| Net investment income (loss) (d) | $(0.03) | $(0.04) | $0.01 | $0.06 | $0.02 |
| Net realized and unrealized gain (loss) | 0.18 | 2.20 | (0.43) | (0.27) | (0.09) |
| Total from investment operations | $0.15 | $2.16 | $(0.42) | $(0.21) | $(0.07) |
| Less distributions declared to shareholders |
| From net investment income | $(2.34) | $— | $(0.05) | $(0.15) | $— |
| Net asset value, end of period (x) | $4.78 | $6.97 | $4.81 | $5.28 | $5.64 |
| Total return (%) (r)(s)(t)(x) | 7.07 | 44.91 | (8.08) | (3.69) | (1.23)(n) |
Ratios (%) (to average net assets)
and Supplemental data: |
| Expenses before expense reductions | 1.91 | 1.89 | 1.87 | 1.84 | 1.94(a) |
| Expenses after expense reductions | 1.90 | 1.88 | 1.86 | 1.83 | 1.93(a) |
| Net investment income (loss) | (0.50) | (0.63) | 0.26 | 1.14 | 1.35(a) |
| Portfolio turnover | 37 | 28 | 57 | 64 | 72 |
| Net assets at end of period (000 omitted) | $68 | $63 | $44 | $48 | $49 |
See Notes to Consolidated Financial Statements
Consolidated Financial Highlights – continued
| Class R2 | Year ended |
| | 10/31/22 | 10/31/21 | 10/31/20 | 10/31/19 | 10/31/18(i) |
| Net asset value, beginning of period | $7.00 | $4.83 | $5.30 | $5.65 | $5.71 |
| Income (loss) from investment operations |
| Net investment income (loss) (d) | $0.00(w) | $(0.01) | $0.04 | $0.09 | $0.02 |
| Net realized and unrealized gain (loss) | 0.17 | 2.20 | (0.44) | (0.27) | (0.08) |
| Total from investment operations | $0.17 | $2.19 | $(0.40) | $(0.18) | $(0.06) |
| Less distributions declared to shareholders |
| From net investment income | $(2.37) | $(0.02) | $(0.07) | $(0.17) | $— |
| Net asset value, end of period (x) | $4.80 | $7.00 | $4.83 | $5.30 | $5.65 |
| Total return (%) (r)(s)(t)(x) | 7.61 | 45.58 | (7.59) | (3.31) | (1.05)(n) |
Ratios (%) (to average net assets)
and Supplemental data: |
| Expenses before expense reductions | 1.41 | 1.39 | 1.37 | 1.34 | 1.44(a) |
| Expenses after expense reductions | 1.40 | 1.38 | 1.36 | 1.33 | 1.43(a) |
| Net investment income (loss) | 0.06 | (0.13) | 0.75 | 1.64 | 1.86(a) |
| Portfolio turnover | 37 | 28 | 57 | 64 | 72 |
| Net assets at end of period (000 omitted) | $134 | $64 | $44 | $48 | $49 |
| Class R3 | Year ended |
| | 10/31/22 | 10/31/21 | 10/31/20 | 10/31/19 | 10/31/18(i) |
| Net asset value, beginning of period | $7.02 | $4.84 | $5.31 | $5.65 | $5.71 |
| Income (loss) from investment operations |
| Net investment income (loss) (d) | $0.01 | $0.01 | $0.05 | $0.10 | $0.03 |
| Net realized and unrealized gain (loss) | 0.17 | 2.20 | (0.43) | (0.27) | (0.09) |
| Total from investment operations | $0.18 | $2.21 | $(0.38) | $(0.17) | $(0.06) |
| Less distributions declared to shareholders |
| From net investment income | $(2.39) | $(0.03) | $(0.09) | $(0.17) | $— |
| Net asset value, end of period (x) | $4.81 | $7.02 | $4.84 | $5.31 | $5.65 |
| Total return (%) (r)(s)(t)(x) | 7.75 | 46.03 | (7.34) | (3.03) | (1.05)(n) |
Ratios (%) (to average net assets)
and Supplemental data: |
| Expenses before expense reductions | 1.16 | 1.14 | 1.12 | 1.09 | 1.19(a) |
| Expenses after expense reductions | 1.15 | 1.13 | 1.11 | 1.08 | 1.18(a) |
| Net investment income (loss) | 0.25 | 0.12 | 1.00 | 1.89 | 2.10(a) |
| Portfolio turnover | 37 | 28 | 57 | 64 | 72 |
| Net assets at end of period (000 omitted) | $70 | $65 | $44 | $48 | $49 |
See Notes to Consolidated Financial Statements
Consolidated Financial Highlights – continued
| Class R4 | Year ended |
| | 10/31/22 | 10/31/21 | 10/31/20 | 10/31/19 | 10/31/18(i) |
| Net asset value, beginning of period | $7.03 | $4.85 | $5.32 | $5.65 | $5.71 |
| Income (loss) from investment operations |
| Net investment income (loss) (d) | $0.03 | $0.02 | $0.06 | $0.11 | $0.03 |
| Net realized and unrealized gain (loss) | 0.16 | 2.21 | (0.43) | (0.26) | (0.09) |
| Total from investment operations | $0.19 | $2.23 | $(0.37) | $(0.15) | $(0.06) |
| Less distributions declared to shareholders |
| From net investment income | $(2.40) | $(0.05) | $(0.10) | $(0.18) | $— |
| Net asset value, end of period (x) | $4.82 | $7.03 | $4.85 | $5.32 | $5.65 |
| Total return (%) (r)(s)(t)(x) | 8.07 | 46.27 | (7.09) | (2.75) | (1.05)(n) |
Ratios (%) (to average net assets)
and Supplemental data: |
| Expenses before expense reductions | 0.91 | 0.89 | 0.87 | 0.84 | 0.94(a) |
| Expenses after expense reductions | 0.90 | 0.88 | 0.86 | 0.83 | 0.93(a) |
| Net investment income (loss) | 0.50 | 0.37 | 1.25 | 2.14 | 2.35(a) |
| Portfolio turnover | 37 | 28 | 57 | 64 | 72 |
| Net assets at end of period (000 omitted) | $71 | $65 | $45 | $48 | $49 |
| Class R6 | Year ended |
| | 10/31/22 | 10/31/21 | 10/31/20 | 10/31/19 | 10/31/18 |
| Net asset value, beginning of period | $7.04 | $4.86 | $5.33 | $5.65 | $6.00 |
| Income (loss) from investment operations |
| Net investment income (loss) (d) | $0.03 | $0.03 | $0.06 | $0.11 | $0.09 |
| Net realized and unrealized gain (loss) | 0.17 | 2.20 | (0.43) | (0.25) | (0.25) |
| Total from investment operations | $0.20 | $2.23 | $(0.37) | $(0.14) | $(0.16) |
| Less distributions declared to shareholders |
| From net investment income | $(2.41) | $(0.05) | $(0.10) | $(0.18) | $(0.19) |
| Net asset value, end of period (x) | $4.83 | $7.04 | $4.86 | $5.33 | $5.65 |
| Total return (%) (r)(s)(t)(x) | 8.24 | 46.24 | (7.06) | (2.57) | (2.74) |
Ratios (%) (to average net assets)
and Supplemental data: |
| Expenses before expense reductions | 0.82 | 0.81 | 0.83 | 0.83 | 0.84 |
| Expenses after expense reductions | 0.80 | 0.80 | 0.82 | 0.82 | 0.83 |
| Net investment income (loss) | 0.54 | 0.46 | 1.28 | 2.15 | 1.46 |
| Portfolio turnover | 37 | 28 | 57 | 64 | 72 |
| Net assets at end of period (000 omitted) | $722,934 | $924,441 | $689,390 | $625,443 | $587,864 |
See Notes to Consolidated Financial Statements
Consolidated Financial Highlights – continued
| (a) | Annualized. |
| (d) | Per share data is based on average shares outstanding. |
| (i) | For Class B, Class C, Class R1, Class R2, Class R3, and Class R4, the period is from the class inception, August 15, 2018, through the stated period end. |
| (n) | Not annualized. |
| (r) | Certain expenses have been reduced without which performance would have been lower. |
| (s) | From time to time the fund may receive proceeds from litigation settlements, without which performance would be lower. |
| (t) | Total returns do not include any applicable sales charges. |
| (w) | Per share amount was less than $0.01. |
| (x) | The net asset values and total returns have been calculated on net assets which include adjustments made in accordance with U.S. generally accepted accounting principles required at period end for financial reporting purposes. |
See Notes to Consolidated Financial Statements
Notes to Consolidated Financial Statements
(1) Business and Organization
MFS Commodity Strategy Fund (the fund) is a diversified series of MFS Series Trust XV (the trust). The trust is organized as a Massachusetts business trust and is registered under the Investment Company Act of 1940, as amended, as an open-end management investment company.
The fund is an investment company and accordingly follows the investment company accounting and reporting guidance of the Financial Accounting Standards Board (FASB) Accounting Standards Codification Topic 946 Financial Services - Investment Companies.
(2) Significant Accounting Policies
Principles of Consolidation — The fund gains exposure to the commodities markets by investing a portion of the fund’s assets in the MFS Commodity Strategy Portfolio, a wholly-owned and controlled subsidiary organized in the Cayman Islands (“Subsidiary”). The fund will not invest directly in commodities. The fund may invest up to 25% of its assets (at the time of purchase) in the Subsidiary. The Subsidiary has the same objective, strategies, and restrictions as the fund, except that the Subsidiary gains exposure to the commodities market by investing directly in commodity-linked futures, options, and swaps. The fund also invests directly in debt securities, and the Subsidiary may also invest in debt securities. As of October 31, 2022, the Subsidiary’s net assets were $135,271,764, which represented 17.8% of the fund’s net assets. The fund’s financial statements have been consolidated and include the accounts of the fund and the Subsidiary. All inter-fund balances and transactions have been eliminated in consolidation.
General — The preparation of Consolidated Financial Statements in conformity with U.S. generally accepted accounting principles requires management to make estimates and assumptions that affect the reported amounts of assets and liabilities, and disclosure of contingent assets and liabilities at the date of the Consolidated Financial Statements and the reported amounts of increases and decreases in net assets from operations during the reporting period. Actual results could differ from those estimates. In the preparation of these Consolidated Financial Statements, management has evaluated subsequent events occurring after the date of the fund’s Consolidated Statement of Assets and Liabilities through the date that the Consolidated Financial Statements were issued. The fund invests in foreign securities. Investments in foreign securities are vulnerable to the effects of changes in the relative values of the local currency and the U.S. dollar and to the effects of changes in each country’s market, economic, industrial, political, regulatory, geopolitical, environmental, public health, and other conditions.
Balance Sheet Offsetting — The fund's accounting policy with respect to balance sheet offsetting is that, absent an event of default by the counterparty or a termination of the agreement, the International Swaps and Derivatives Association (ISDA) Master Agreement, or similar agreement, does not result in an offset of reported amounts of financial assets and financial liabilities in the Consolidated Statement of Assets and Liabilities across transactions between the fund and the applicable counterparty. The fund's right to setoff may be restricted or prohibited by the bankruptcy or insolvency laws of the particular jurisdiction to which a specific master netting agreement
Notes to Consolidated Financial Statements - continued
counterparty is subject. Balance sheet offsetting disclosures, to the extent applicable to the fund, have been included in the fund’s Significant Accounting Policies note under the captions for each of the fund’s in-scope financial instruments and transactions.
Investment Valuations — Subject to its oversight, the fund’s Board of Trustees has delegated primary responsibility for determining or causing to be determined the value of the fund’s investments to MFS as the fund’s adviser, pursuant to the fund’s valuation policy and procedures which have been adopted by the adviser and approved by the Board. Effective September 8, 2022, and in accordance with Rule 2a-5 under the Investment Company Act of 1940, the Board of Trustees designated the adviser as the “valuation designee” of the fund. If the adviser, as valuation designee, determines that reliable market quotations are not readily available for an investment, the investment is valued at fair value as determined in good faith by the adviser in accordance with the adviser’s fair valuation policy and procedures.
Under the fund’s valuation policy and procedures, debt instruments and floating rate loans, including restricted debt instruments, are generally valued at an evaluated or composite bid as provided by a third-party pricing service. Short-term instruments with a maturity at issuance of 60 days or less may be valued at amortized cost, which approximates market value. Futures contracts are generally valued at last posted settlement price on their primary exchange as provided by a third-party pricing service. Futures contracts for which there were no trades that day for a particular position are generally valued at the closing bid quotation on their primary exchange as provided by a third-party pricing service. Swap agreements are generally valued using valuations provided by a third-party pricing service, which for cleared swaps includes an evaluation of any trading activity at the clearinghouses. Open-end investment companies are generally valued at net asset value per share. The values of foreign securities and other assets and liabilities expressed in foreign currencies are converted to U.S. dollars using the mean of bid and asked prices for rates provided by a third-party pricing service.
Under the fund’s valuation policy and procedures, market quotations are not considered to be readily available for debt instruments, floating rate loans, and many types of derivatives. These investments are generally valued at fair value based on information from third-party pricing services or otherwise determined by the adviser in accordance with the adviser’s fair valuation policy and procedures. Securities and other assets, including commodity-linked structured notes, generally valued on the basis of information from a third-party pricing service may also be valued at a broker/dealer bid quotation. In determining values, third-party pricing services can utilize both transaction data and market information such as yield, quality, coupon rate, maturity, type of issue, trading characteristics, spreads and other market data. An investment may also be valued at fair value if the adviser determines that the investment’s value has been materially affected by events occurring after the close of the exchange or market on which the investment is principally traded (such as foreign exchange or market) and prior to the determination of the fund’s net asset value, or after the halt of trading of a specific security where trading does not resume prior to the close of the exchange or market on which the security is principally traded. The adviser generally relies on third-party pricing services or other information (such as the correlation with price movements of similar securities in the same or other markets; the type, cost and investment characteristics of the security; the business and financial condition of the issuer; and trading and other market data) to assist in determining whether to fair value and at what value to fair value an investment. The value of an investment for purposes of calculating the fund’s net asset value can differ depending on the source
Notes to Consolidated Financial Statements - continued
and method used to determine value. When fair valuation is used, the value of an investment used to determine the fund’s net asset value may differ from quoted or published prices for the same investment. There can be no assurance that the fund could obtain the fair value assigned to an investment if it were to sell the investment at the same time at which the fund determines its net asset value per share.
Various inputs are used in determining the value of the fund's assets or liabilities. These inputs are categorized into three broad levels. In certain cases, the inputs used to measure fair value may fall into different levels of the fair value hierarchy. In such cases, an investment's level within the fair value hierarchy is based on the lowest level of input that is significant to the fair value measurement. The fund's assessment of the significance of a particular input to the fair value measurement in its entirety requires judgment, and considers factors specific to the investment. Level 1 includes unadjusted quoted prices in active markets for identical assets or liabilities. Level 2 includes other significant observable market-based inputs (including quoted prices for similar securities, interest rates, prepayment speed, and credit risk). Level 3 includes significant unobservable inputs, which may include the adviser's own assumptions in determining the fair value of investments. Other financial instruments are derivative instruments, such as swap agreements. The following is a summary of the levels used as of October 31, 2022 in valuing the fund's assets and liabilities:
| Financial Instruments | Level 1 | Level 2 | Level 3 | Total |
| U.S. Treasury Bonds & U.S. Government Agencies & Equivalents | $— | $163,866,284 | $— | $163,866,284 |
| Non - U.S. Sovereign Debt | — | 4,442,003 | — | 4,442,003 |
| Municipal Bonds | — | 9,537,447 | — | 9,537,447 |
| U.S. Corporate Bonds | — | 145,998,606 | — | 145,998,606 |
| Residential Mortgage-Backed Securities | — | 5,298,523 | — | 5,298,523 |
| Commercial Mortgage-Backed Securities | — | 38,328,986 | — | 38,328,986 |
| Asset-Backed Securities (including CDOs) | — | 78,078,411 | — | 78,078,411 |
| Foreign Bonds | — | 127,933,868 | — | 127,933,868 |
| Short-Term Securities | — | 15,235,000 | — | 15,235,000 |
| Mutual Funds | 107,271,416 | — | — | 107,271,416 |
| Total | $107,271,416 | $588,719,128 | $— | $695,990,544 |
| Other Financial Instruments | | | | |
| Swap Agreements – Assets | $— | $303,935 | $— | $303,935 |
| Swap Agreements – Liabilities | — | (3,835,917) | — | (3,835,917) |
For further information regarding security characteristics, see the Consolidated Portfolio of Investments.
Derivatives — The fund uses derivatives primarily to increase or decrease exposure to a particular market or segment of the market, or security, to increase or decrease interest rate or currency exposure, or as alternatives to direct investments. Derivatives are used for hedging or non-hedging purposes. While hedging can reduce or eliminate
Notes to Consolidated Financial Statements - continued
losses, it can also reduce or eliminate gains. When the fund uses derivatives as an investment to increase market exposure, or for hedging purposes, gains and losses from derivative instruments may be substantially greater than the derivative’s original cost.
The derivative instruments used by the fund during the period were futures and swap agreements. Depending on the type of derivative, a fund may exit a derivative position by entering into an offsetting transaction with a counterparty or exchange, negotiating an agreement with the derivative counterparty, or novating the position to a third party. The fund's period end derivatives, as presented in the Consolidated Portfolio of Investments and the associated Derivative Contract tables, generally are indicative of the volume of its derivative activity during the period.
The following table presents, by major type of derivative contract, the fair value, on a gross basis, of the asset and liability components of derivatives held by the fund at October 31, 2022 as reported in the Consolidated Statement of Assets and Liabilities:
| | | Fair Value (a) |
| Risk | Derivative Contracts | Asset Derivatives | Liability Derivatives |
| Interest Rate | Cleared Swap Agreements | $— | $(1,452,140) |
| Commodity | Uncleared Swap Agreements | 303,935 | (2,383,777) |
| Total | | $303,935 | $(3,835,917) |
| (a) | Values presented in this table for cleared swap agreements correspond to the values reported in the Consolidated Portfolio of Investments. Only the current day net variation margin for cleared swap agreements is reported separately within the Consolidated Statement of Assets and Liabilities. |
The following table presents, by major type of derivative contract, the realized gain (loss) on derivatives held by the fund for the year ended October 31, 2022 as reported in the Consolidated Statement of Operations:
| Risk | Futures
Contracts | Swap
Agreements |
| Commodity | $— | $154,004,579 |
| Equity | (430) | — |
| Total | $(430) | $154,004,579 |
The following table presents, by major type of derivative contract, the change in unrealized appreciation or depreciation on derivatives held by the fund for the year ended October 31, 2022 as reported in the Consolidated Statement of Operations:
| Risk | Swap
Agreements | | | |
| Interest Rate | $(1,452,140) | | | |
| Commodity | 731,983 | | | |
| Total | $(720,157) | | | |
Derivative counterparty credit risk is managed through formal evaluation of the creditworthiness of all potential counterparties. On certain, but not all, uncleared derivatives, the fund attempts to reduce its exposure to counterparty credit risk whenever possible by entering into an ISDA Master Agreement on a bilateral basis. The
Notes to Consolidated Financial Statements - continued
ISDA Master Agreement gives each party to the agreement the right to terminate all transactions traded under such agreement if there is a specified deterioration in the credit quality of the other party. Upon an event of default or a termination of the ISDA Master Agreement, the non-defaulting party has the right to close out all transactions traded under such agreement and to net amounts owed under each agreement to one net amount payable by one party to the other. This right to close out and net payments across all transactions traded under the ISDA Master Agreement could result in a reduction of the fund's credit risk to such counterparty equal to any amounts payable by the fund under the applicable transactions, if any.
Collateral and margin requirements differ by type of derivative. For cleared derivatives (e.g., futures contracts, cleared swaps, and exchange-traded options), margin requirements are set by the clearing broker and the clearing house and collateral, in the form of cash or securities, is posted by the fund directly with the clearing broker. Collateral terms are counterparty agreement specific for uncleared derivatives (e.g., forward foreign currency exchange contracts, uncleared swap agreements, and uncleared options) and collateral, in the form of cash and securities, is held in segregated accounts with the fund's custodian in connection with these agreements. For derivatives traded under an ISDA Master Agreement, which contains a credit support annex, the collateral requirements are netted across all transactions traded under such counterparty-specific agreement and an amount is posted from one party to the other to collateralize such obligations. Cash that has been segregated or delivered to cover the fund's collateral or margin obligations under derivative contracts, if any, will be reported separately in the Consolidated Statement of Assets and Liabilities as restricted cash for uncleared derivatives and/or deposits with brokers for cleared derivatives. Securities pledged as collateral or margin for the same purpose, if any, are noted in the Consolidated Portfolio of Investments. The fund may be required to make payments of interest on uncovered collateral or margin obligations with the broker. Any such payments are included in “Miscellaneous” expense in the Consolidated Statement of Operations.
The following table presents the fund's derivative assets and liabilities (by type) on a gross basis as of October 31, 2022:
| Gross Amounts of: | Derivative Assets | Derivative Liabilities |
| Uncleared Swaps, at value | $303,935 | $(2,383,777) |
| Cleared Swap Agreements (a) | — | (99,714) |
Total Gross Amount of Derivative Assets
and Liabilities Presented in the Consolidated
Statement of Assets & Liabilities | $303,935 | $(2,483,491) |
Less: Derivatives Assets and Liabilities Not Subject
to a Master Netting Agreement or
Similar Arrangement | — | (99,714) |
Total Gross Amount of Derivative Assets and
Liabilities Subject to a Master Netting Agreement or
Similar Arrangement | $303,935 | $(2,383,777) |
| (a) | The amount presented here represents the fund's current day net variation margin for cleared swap agreements. This amount, which is recognized within the fund's Consolidated Statement of Assets and Liabilities, differs from the fair value of the cleared swap agreements which is presented in the tables that follow the fund's Consolidated Portfolio of Investments. |
Notes to Consolidated Financial Statements - continued
The following table presents (by counterparty) the fund's derivative assets net of amounts available for offset under Master Netting Agreements (or similar arrangements) and net of the related collateral held by the fund at October 31, 2022:
| | | Amounts Not Offset in the
Consolidated Statement of Assets & Liabilities |
| | Gross Amount
of Derivative
Assets Subject
to a Master
Netting
Agreement (or
Similar
Arrangement)
by Counterparty | Financial
Instruments
Available
for Offset | Financial
Instruments
Collateral
Received (b) | Cash
Collateral
Received (b) | Net Amount
of Derivative
Assets by
Counterparty |
| Citibank N.A. | $33,694 | $(33,694) | $— | $— | $— |
| Goldman Sachs International | 42,102 | (42,102) | — | — | — |
| JPMorgan Chase Bank N.A. | 20,650 | (20,650) | — | — | — |
| Merrill Lynch International | 27,349 | (27,349) | — | — | — |
| Morgan Stanley | 180,140 | (80,272) | — | — | 99,868 |
| Total | $303,935 | $(204,067) | $— | $— | $99,868 |
The following table presents (by counterparty) the fund's derivative liabilities net of amounts available for offset under Master Netting Agreements (or similar arrangements) and net of the related collateral pledged by the fund at October 31, 2022:
| | | Amounts Not Offset in the
Consolidated Statement of Assets & Liabilities |
| | Gross Amount
of Derivative
Liabilities Subject
to a Master
Netting
Agreement (or
Similar
Arrangement)
by Counterparty | Financial
Instruments
Available
for Offset | Financial
Instruments
Collateral
Pledged (b) | Cash
Collateral
Pledged (b) | Net Amount
of Derivative
Liabilities by
Counterparty |
| Citibank N.A. | $(83,065) | $33,694 | $— | $49,371 | $— |
| Goldman Sachs International | (353,549) | 42,102 | 311,447 | — | — |
| JPMorgan Chase Bank N.A. | (631,004) | 20,650 | — | 610,354 | — |
| Merrill Lynch International | (1,235,887) | 27,349 | 1,208,538 | — | — |
| Morgan Stanley | (80,272) | 80,272 | — | — | — |
| Total | $(2,383,777) | $204,067 | $1,519,985 | $659,725 | $— |
| (b) | The amount presented here may be less than the total amount of collateral (received)/pledged as the excess collateral (received)/pledged is not shown for purposes of this presentation. |
Notes to Consolidated Financial Statements - continued
Futures Contracts – The fund entered into futures contracts which may be used to hedge against or obtain broad market exposure, interest rate exposure, or to manage duration. A futures contract represents a commitment for the future purchase or sale of an asset at a specified price on a specified date.
Upon entering into a futures contract, the fund is required to deposit with the broker, either in cash or securities, an initial margin in an amount equal to a specified percentage of the notional amount of the contract. Subsequent payments (variation margin) are made or received by the fund each day, depending on the daily fluctuations in the value of the contract, and are recorded for financial statement purposes as unrealized gain or loss by the fund until the contract is closed or expires at which point the gain or loss on futures contracts is realized.
The fund bears the risk of interest rates or securities prices moving unexpectedly, in which case, the fund may not achieve the anticipated benefits of the futures contracts and may realize a loss. While futures contracts may present less counterparty risk to the fund since the contracts are exchange traded and the exchange’s clearinghouse guarantees payments to the broker, there is still counterparty credit risk due to the insolvency of the broker. The fund’s maximum risk of loss due to counterparty credit risk is equal to the margin posted by the fund to the broker plus any gains or minus any losses on the outstanding futures contracts.
Swap Agreements — The fund entered into swap agreements which generally involve a periodic exchange of cash payments on a net basis, at specified intervals or upon the occurrence of specified events, between the fund and a counterparty. Certain swap agreements may be entered into as a bilateral contract (“uncleared swaps”) while others are required to be centrally cleared (“cleared swaps”).
Both cleared and uncleared swap agreements are marked to market daily. The value of uncleared swap agreements is reported in the Consolidated Statement of Assets and Liabilities as “Uncleared swaps, at value” which includes any related interest accruals to be paid or received by the fund. For cleared swaps, payments (variation margin) are made or received by the fund each day, depending on the daily fluctuations in the value of the cleared swap, such that only the current day net receivable or payable for variation margin is reported in the Consolidated Statement of Assets and Liabilities.
For both cleared and uncleared swaps, premiums paid or received at the inception of the agreements are amortized over the term of the agreement as realized gain or loss on swap agreements in the Statement of Operations. The periodic exchange of net cash payments, as well as any liquidation payment received or made upon early termination, are recorded as a realized gain or loss on swap agreements in the Consolidated Statement of Operations. The change in unrealized appreciation or depreciation on swap agreements in the Consolidated Statement of Operations reflects the aggregate change over the reporting period in the value of swaps net of any unamortized premiums paid or received.
Risks related to swap agreements include the possible lack of a liquid market, unfavorable market and interest rate movements of the underlying instrument and the failure of the counterparty to perform under the terms of the agreements. The fund's maximum risk of loss from counterparty credit risk is the discounted net value of the cash flows to be received from/paid to the counterparty over the contract's remaining life, to the extent that the amount is positive. To address counterparty risk, uncleared swap agreements are limited to only highly-rated counterparties. Risk is further reduced
Notes to Consolidated Financial Statements - continued
by having an ISDA Master Agreement (“ISDA”) between the fund and the counterparty and, where applicable, by the posting of collateral by the counterparty to the fund to cover the fund’s exposure to the counterparty under such ISDA. The fund's counterparty risk due to cleared swaps is mitigated by the fact that the clearinghouse is the true counterparty to the transaction and the regulatory requirement safeguards in the event of a clearing broker bankruptcy.
The fund entered into interest rate swap agreements in order to manage its exposure to interest or foreign exchange rate fluctuations. Interest rate swap agreements involve the periodic exchange of cash flows, between the fund and a counterparty, based on the difference between two interest rates applied to a notional principal amount. The two interest rates exchanged may either be a fixed rate and a floating rate or two floating rates based on different indices.
The fund entered into total return swaps on various commodity indexes in order to gain exposure without having to own the underlying commodities. Under a total return swap the fund pays the counterparty interest (based on a fixed or floating rate) and in return receives a payment equal to the increase in the total return of the reference index. To the extent there is a decline in the total return of the index, the fund pays the counterparty for that decline in addition to making the fixed or floating rate interest payment. On a monthly basis, the change in the total return of the index is measured to determine the monthly payment due to or from the counterparty. These payments are included in “Due from uncleared swap brokers” or “Due to uncleared swap brokers” in the Consolidated Statement of Assets and Liabilities. The total return of the reference index includes changes in the market value of the index and any interest or dividend payments attributable to the index.
Indemnifications — Under the fund's organizational documents, its officers and Trustees may be indemnified against certain liabilities and expenses arising out of the performance of their duties to the fund. Additionally, in the normal course of business, the fund enters into agreements with service providers that may contain indemnification clauses. The fund's maximum exposure under these agreements is unknown as this would involve future claims that may be made against the fund that have not yet occurred.
Investment Transactions and Income — Investment transactions are recorded on the trade date. Some securities may be purchased or sold on an extended settlement basis, which means that the receipt or delivery of the securities by the fund and related payments occur at a future date, usually beyond the customary settlement period.
Interest income is recorded on the accrual basis. All premium and discount is amortized or accreted for financial statement purposes in accordance with U.S. generally accepted accounting principles. Interest payments received in additional securities are recorded on the ex-interest date in an amount equal to the value of the security on such date.
The fund may receive proceeds from litigation settlements. Any proceeds received from litigation involving portfolio holdings are reflected in the Consolidated Statement of Operations in realized gain/loss if the security has been disposed of by the fund or in unrealized gain/loss if the security is still held by the fund. Any other proceeds from litigation not related to portfolio holdings are reflected as other income in the Consolidated Statement of Operations.
Notes to Consolidated Financial Statements - continued
The fund invests a significant portion of its assets in asset-backed and/or mortgage-backed securities. For these securities, the value of the debt instrument also depends on the credit quality and adequacy of the underlying assets or collateral as well as whether there is a security interest in the underlying assets or collateral. Enforcing rights, if any, against the underlying assets or collateral may be difficult. U.S. Government securities not supported as to the payment of principal or interest by the U.S. Treasury, such as those issued by Fannie Mae, Freddie Mac, and the Federal Home Loan Banks, are subject to greater credit risk than are U.S. Government securities supported by the U.S. Treasury, such as those issued by Ginnie Mae.
To mitigate the counterparty credit risk on TBA transactions, mortgage dollar rolls, and other types of forward settling mortgage-backed and asset-backed security transactions, the fund whenever possible enters into a Master Securities Forward Transaction Agreement (“MSFTA”) on a bilateral basis with each of the counterparties with whom it undertakes a significant volume of transactions. The MSFTA gives each party to the agreement the right to terminate all transactions traded under such agreement if there is a specified deterioration in the credit quality of the other party. Upon an event of default or a termination of the MSFTA, the non-defaulting party has the right to close out all transactions traded under such agreement and to net amounts owed under each transaction to one net amount payable by one party to the other. This right to close out and net payments across all transactions traded under the MSFTA could result in a reduction of the fund's credit risk to such counterparty equal to any amounts payable by the fund under the applicable transactions, if any.
For mortgage-backed and asset-backed securities traded under a MSFTA, the collateral and margining requirements are contract specific. Collateral amounts across all transactions traded under such agreement are netted and an amount is posted from one party to the other to collateralize such obligations. Cash that has been pledged to cover the fund's collateral or margin obligations under a MSFTA, if any, will be reported separately on the Consolidated Statement of Assets and Liabilities as restricted cash. Securities pledged as collateral or margin for the same purpose, if any, are noted in the Consolidated Portfolio of Investments.
Tax Matters and Distributions — The fund intends to qualify as a regulated investment company, as defined under Subchapter M of the Internal Revenue Code, and to distribute all of its taxable income, including realized capital gains. As a result, no provision for federal income tax is required. The fund’s federal tax returns, when filed, will remain subject to examination by the Internal Revenue Service for a three year period. Management has analyzed the fund’s tax positions taken on federal and state tax returns for all open tax years and does not believe that there are any uncertain tax positions that require recognition of a tax liability. Foreign taxes, if any, have been accrued by the fund in the accompanying financial statements in accordance with the applicable foreign tax law. Foreign income taxes may be withheld by certain countries in which the fund invests. Additionally, capital gains realized by the fund on securities issued in or by certain foreign countries may be subject to capital gains tax imposed by those countries.
Distributions to shareholders are recorded on the ex-dividend date. Income and capital gain distributions are determined in accordance with income tax regulations, which may differ from U.S. generally accepted accounting principles. Certain capital accounts in the financial statements are periodically adjusted for permanent differences in order to reflect their tax character. These adjustments have no impact on net assets or net
Notes to Consolidated Financial Statements - continued
asset value per share. Temporary differences which arise from recognizing certain items of income, expense, gain or loss in different periods for financial statement and tax purposes will reverse at some time in the future.
Book/tax differences primarily relate to treating the Subsidiary as a separate holding for tax purposes instead of a consolidated entity and amortization and accretion of debt securities.
The tax character of distributions declared to shareholders for the last two fiscal years is as follows:
| | Year ended
10/31/22 | Year ended
10/31/21 |
| Ordinary income (including any short-term capital gains) | $322,999,695 | $7,000,067 |
The federal tax cost and the tax basis components of distributable earnings were as follows:
| As of 10/31/22 | |
| Cost of investments | $1,055,605,016 |
| Gross appreciation | 8,035,680 |
| Gross depreciation | (367,650,152) |
| Net unrealized appreciation (depreciation) | $(359,614,472) |
| Undistributed ordinary income | 160,981,684 |
| Capital loss carryforwards | (104,752,636) |
| Other temporary differences | (158,865,832) |
| Total distributable earnings (loss) | $(462,251,256) |
As of October 31, 2022, the fund had capital loss carryforwards available to offset future realized gains. These net capital losses may be carried forward indefinitely and their character is retained as short-term and/or long-term losses. Such losses are characterized as follows:
| Short-Term | $(79,196,570) |
| Long-Term | (25,556,066) |
| Total | $(104,752,636) |
Multiple Classes of Shares of Beneficial Interest — The fund offers multiple classes of shares, which differ in their respective distribution and service fees. The fund's income, realized and unrealized gain (loss), and common expenses are allocated to shareholders based on the daily net assets of each class. Dividends are declared separately for each class. Differences in per share dividend rates are generally due to differences in separate class expenses. Class B and Class C shares will convert to
Notes to Consolidated Financial Statements - continued
Class A shares approximately eight years after purchase. The fund’s distributions declared to shareholders as reported in the Consolidated Statements of Changes in Net Assets are presented by class as follows:
| | Year ended
10/31/22 | Year ended
10/31/21 |
| Class A | $1,794,373 | $9,339 |
| Class B | 32,578 | 98 |
| Class C | 375,281 | 570 |
| Class I | 1,842,869 | 4,956 |
| Class R1 | 21,275 | — |
| Class R2 | 23,360 | 208 |
| Class R3 | 22,077 | 315 |
| Class R4 | 22,350 | 424 |
| Class R6 | 318,865,532 | 6,984,157 |
| Total | $322,999,695 | $7,000,067 |
(3) Transactions with Affiliates
Investment Adviser — The fund and the Subsidiary have investment advisory agreements with MFS to provide overall investment management and related administrative services and facilities to the fund. The management fee is computed daily and paid monthly at the following annual rates based on the fund's average daily net assets:
| Up to $1 billion | 0.75% |
| In excess of $1 billion | 0.70% |
The Subsidiary does not pay a management fee to MFS.
MFS has agreed in writing to reduce its management fee by a specified amount if certain MFS mutual fund assets exceed thresholds agreed to by MFS and the fund's Board of Trustees. Effective March 1, 2022, MFS has also agreed in writing to waive at least 0.01% of its management fee as part of this agreement. The agreement to waive at least 0.01% of the management fee will continue until modified by the fund's Board of Trustees, but such agreement will continue at least until February 29, 2024. For the year ended October 31, 2022, this management fee reduction amounted to $124,696, which is included in the reduction of total expenses in the Consolidated Statement of Operations. The management fee incurred for the year ended October 31, 2022 was equivalent to an annual effective rate of 0.74% of the fund's average daily net assets.
Distributor — MFS Fund Distributors, Inc. (MFD), a wholly-owned subsidiary of MFS, as distributor, received $18,807 for the year ended October 31, 2022, as its portion of the initial sales charge on sales of Class A shares of the fund.
The Board of Trustees has adopted a distribution plan for certain share classes pursuant to Rule 12b-1 of the Investment Company Act of 1940.
The fund's distribution plan provides that the fund will pay MFD for services provided by MFD and financial intermediaries in connection with the distribution and servicing of certain share classes. One component of the plan is a distribution fee paid to MFD and another component of the plan is a service fee paid to MFD. MFD may subsequently pay all, or a portion, of the distribution and/or service fees to financial intermediaries.
Notes to Consolidated Financial Statements - continued
Distribution Plan Fee Table:
| | Distribution
Fee Rate (d) | Service
Fee Rate (d) | Total
Distribution
Plan (d) | Annual
Effective
Rate (e) | Distribution
and Service
Fee |
| Class A | — | 0.25% | 0.25% | 0.25% | $ 27,520 |
| Class B | 0.75% | 0.25% | 1.00% | 1.00% | 1,148 |
| Class C | 0.75% | 0.25% | 1.00% | 1.00% | 14,694 |
| Class R1 | 0.75% | 0.25% | 1.00% | 1.00% | 712 |
| Class R2 | 0.25% | 0.25% | 0.50% | 0.50% | 424 |
| Class R3 | — | 0.25% | 0.25% | 0.25% | 182 |
| Total Distribution and Service Fees | | | | | $44,680 |
| (d) | In accordance with the distribution plan for certain classes, the fund pays distribution and/or service fees equal to these annual percentage rates of each class’s average daily net assets. The distribution and service fee rates disclosed by class represent the current rates in effect at the end of the reporting period. Any rate changes, if applicable, are detailed below. |
| (e) | The annual effective rates represent actual fees incurred under the distribution plan for the year ended October 31, 2022 based on each class's average daily net assets. MFD has voluntarily agreed to rebate a portion of each class's 0.25% service fee attributable to accounts for which there is no financial intermediary specified on the account except for accounts attributable to MFS or its affiliates' seed money. For the year ended October 31, 2022, this rebate amounted to $351 and $17 for Class A and Class C shares, respectively, and is included in the reduction of total expenses in the Consolidated Statement of Operations. |
Certain Class A shares are subject to a contingent deferred sales charge (CDSC) in the event of a shareholder redemption within 18 months of purchase. Class B shares are subject to a CDSC in the event of a shareholder redemption within six years of purchase. Class C shares are subject to a CDSC in the event of a shareholder redemption within 12 months of purchase. All contingent deferred sales charges are paid to MFD and during the year ended October 31, 2022, were as follows:
| | Amount |
| Class A | $2,172 |
| Class B | — |
| Class C | 93 |
Shareholder Servicing Agent — MFS Service Center, Inc. (MFSC), a wholly-owned subsidiary of MFS, receives a fee from the fund for its services as shareholder servicing agent calculated as a percentage of the average daily net assets of the fund as determined periodically under the supervision of the fund's Board of Trustees. For the year ended October 31, 2022, the fee was $3,254, which equated to 0.0004% annually of the fund's average daily net assets. MFSC also receives reimbursement from the fund for out-of-pocket expenses, sub-accounting and other shareholder servicing costs which may be paid to affiliated and unaffiliated service providers. Class R6 shares do not incur sub-accounting fees. For the year ended October 31, 2022, these out-of-pocket expenses, sub-accounting and other shareholder servicing costs amounted to $25,629.
Administrator — MFS provides certain financial, legal, shareholder communications, compliance, and other administrative services to the fund. Under an administrative services agreement, the fund reimburses MFS the costs incurred to provide these
Notes to Consolidated Financial Statements - continued
services. The fund is charged an annual fixed amount of $17,500 plus a fee based on average daily net assets. The administrative services fee incurred for the year ended October 31, 2022 was equivalent to an annual effective rate of 0.0163% of the fund's average daily net assets.
Trustees’ and Officers’ Compensation — The fund pays compensation to independent Trustees in the form of a retainer, attendance fees, and additional compensation to Board and Committee chairpersons. The fund does not pay compensation directly to Trustees or officers of the fund who are also officers of the investment adviser, all of whom receive remuneration from MFS for their services to the fund. Certain officers and Trustees of the fund are officers or directors of MFS, MFD, and MFSC.
Other — The fund invests in the MFS Institutional Money Market Portfolio which is managed by MFS and seeks current income consistent with preservation of capital and liquidity. This money market fund does not pay a management fee to MFS but does incur investment and operating costs.
On June 18, 2021, MFS redeemed 8,931 shares of Class A for an aggregate amount of $55,192. On August 3, 2022, MFS redeemed 14,310 shares of Class C and 14,247 shares of Class I for an aggregate amount of $72,266 and $73,372, respectively.
At October 31, 2022, MFS held approximately 61% and 52% of the outstanding shares of Class B and Class R2, and 100% of the outstanding shares of Class R1, Class R3, and Class R4.
The fund is permitted to engage in purchase and sale transactions with funds and accounts for which MFS serves as investment adviser or sub-adviser (“cross-trades”) pursuant to a policy adopted by the Board of Trustees. This policy has been designed to ensure that cross-trades conducted by the fund comply with Rule 17a-7 under the Investment Company Act of 1940. During the year ended October 31, 2022, the fund engaged in purchase transactions pursuant to this policy, which amounted to $2,088,099.
(4) Portfolio Securities
For the year ended October 31, 2022, purchases and sales of investments, other than short-term obligations, were as follows:
| | Purchases | Sales |
| U.S. Government securities | $54,002,431 | $118,668,128 |
| Non-U.S. Government securities | 167,206,177 | 188,447,988 |
Notes to Consolidated Financial Statements - continued
(5) Shares of Beneficial Interest
The fund's Declaration of Trust permits the Trustees to issue an unlimited number of full and fractional shares of beneficial interest. Transactions in fund shares were as follows:
| | Year ended
10/31/22 | | Year ended
10/31/21 |
| | Shares | Amount | | Shares | Amount |
| Shares sold | | | | | |
| Class A | 3,103,863 | $16,573,444 | | 512,320 | $3,128,889 |
| Class B | 6,135 | 30,392 | | 8,896 | 53,738 |
| Class C | 171,395 | 908,942 | | 77,335 | 460,283 |
| Class I | 5,010,784 | 25,979,067 | | 890,561 | 5,176,652 |
| Class R1 | 1 | 5 | | — | — |
| Class R2 | 13,047 | 66,081 | | — | — |
| Class R3 | 1 | 5 | | — | — |
| Class R6 | 15,380,862 | 79,675,363 | | 7,523,833 | 41,419,211 |
| | 23,686,088 | $123,233,299 | | 9,012,945 | $50,238,773 |
Shares issued to shareholders
in reinvestment of distributions | | | | | |
| Class A | 423,412 | $1,761,393 | | 1,886 | $9,339 |
| Class B | 7,834 | 32,578 | | 20 | 98 |
| Class C | 90,870 | 375,281 | | 115 | 570 |
| Class I | 440,879 | 1,842,869 | | 983 | 4,956 |
| Class R1 | 5,102 | 21,275 | | — | — |
| Class R2 | 5,602 | 23,360 | | 42 | 208 |
| Class R3 | 5,294 | 22,077 | | 63 | 315 |
| Class R4 | 5,359 | 22,350 | | 84 | 424 |
| Class R6 | 76,466,554 | 318,865,532 | | 1,385,745 | 6,984,157 |
| | 77,450,906 | $322,966,715 | | 1,388,938 | $7,000,067 |
| Shares reacquired | | | | | |
| Class A | (1,088,785) | $(5,473,361) | | (28,196) | $(174,521) |
| Class B | (4,691) | (24,091) | | (7,245) | (42,300) |
| Class C | (114,905) | (579,642) | | (10,357) | (64,225) |
| Class I | (2,395,076) | (12,770,972) | | (138,131) | (892,634) |
| Class R1 | (1) | (5) | | — | — |
| Class R2 | (3) | (15) | | — | — |
| Class R3 | (1) | (5) | | — | — |
| Class R6 | (73,378,451) | (395,909,496) | | (19,620,559) | (120,822,828) |
| | (76,981,913) | $(414,757,587) | | (19,804,488) | $(121,996,508) |
Notes to Consolidated Financial Statements - continued
| | Year ended
10/31/22 | | Year ended
10/31/21 |
| | Shares | Amount | | Shares | Amount |
| Net change | | | | | |
| Class A | 2,438,490 | $12,861,476 | | 486,010 | $2,963,707 |
| Class B | 9,278 | 38,879 | | 1,671 | 11,536 |
| Class C | 147,360 | 704,581 | | 67,093 | 396,628 |
| Class I | 3,056,587 | 15,050,964 | | 753,413 | 4,288,974 |
| Class R1 | 5,102 | 21,275 | | — | — |
| Class R2 | 18,646 | 89,426 | | 42 | 208 |
| Class R3 | 5,294 | 22,077 | | 63 | 315 |
| Class R4 | 5,359 | 22,350 | | 84 | 424 |
| Class R6 | 18,468,965 | 2,631,399 | | (10,710,981) | (72,419,460) |
| | 24,155,081 | $31,442,427 | | (9,402,605) | $(64,757,668) |
The fund is one of several mutual funds in which certain MFS funds may invest. The MFS funds do not invest in the underlying funds for the purpose of exercising management or control. At the end of the period, the MFS Growth Allocation Fund, the MFS Moderate Allocation Fund, the MFS Aggressive Growth Allocation Fund, the MFS Conservative Allocation Fund, the MFS Lifetime 2040 Fund, the MFS Lifetime 2050 Fund, the MFS Lifetime 2045 Fund, the MFS Lifetime 2030 Fund, the Lifetime 2035 Fund, the MFS Lifetime Income Fund, the MFS Lifetime 2055 Fund, and the MFS Lifetime 2025 Fund were the owners of record of approximately 29%, 23%, 14%, 10%, 3%, 2%, 2%, 2%, 2%, 2%, 1%, and 1%, of the value of outstanding voting shares of the fund. In addition, the MFS Lifetime 2060 and the MFS Lifetime 2065 Fund was the owner of record of less than 1% of the value of outstanding voting shares of the fund.
Effective June 1, 2019, purchases of the fund’s Class B shares were closed to new and existing investors subject to certain exceptions.
(6) Line of Credit
The fund and certain other funds managed by MFS participate in a $1.45 billion unsecured committed line of credit of which $1.2 billion is reserved for use by the fund and certain other MFS U.S. funds. The line of credit is provided by a syndicate of banks under a credit agreement. Borrowings may be made for temporary financing needs. Interest is charged to each fund, based on its borrowings, generally at a rate equal to the highest of 1) Daily Simple SOFR (Secured Overnight Financing Rate) plus 0.10%, 2) the Federal Funds Effective Rate, or 3) the Overnight Bank Funding Rate, each plus an agreed upon spread. A commitment fee, based on the average daily unused portion of the committed line of credit, is allocated among the participating funds. The line of credit expires on March 16, 2023 unless extended or renewed. In addition, the fund and other funds managed by MFS have established unsecured uncommitted borrowing arrangements with certain banks for temporary financing needs. Interest is charged to each fund, based on its borrowings, at rates equal to customary reference rates plus an agreed upon spread. For the year ended October 31, 2022, the fund’s commitment fee and interest expense were $4,107 and $0, respectively, and are included in “Miscellaneous” expense in the Consolidated Statement of Operations.
Notes to Consolidated Financial Statements - continued
(7) Investments in Affiliated Issuers
An affiliated issuer may be considered one in which the fund owns 5% or more of the outstanding voting securities, or a company which is under common control. For the purposes of this report, the following were affiliated issuers:
| Affiliated Issuers | Beginning
Value | Purchases | Sales
Proceeds | Realized
Gain
(Loss) | Change in
Unrealized
Appreciation or
Depreciation | Ending
Value |
| MFS Institutional Money Market Portfolio | $133,814,176 | $873,202,758 | $899,733,022 | $(16,417) | $3,921 | $107,271,416 |
| Affiliated Issuers | Dividend
Income | Capital Gain
Distributions |
| MFS Institutional Money Market Portfolio | $1,004,681 | $— |
(8) LIBOR Transition
Certain of the fund's investments, including investments in certain debt instruments and derivatives (if any), as well as borrowings by the fund and certain other contractual arrangements of the fund, may be based on the London Interbank Offered Rate (“LIBOR”). In 2017, the regulatory authority that oversees financial services firms in the United Kingdom announced plans to transition away from LIBOR by the end of 2021. In March 2021, the administrator of LIBOR announced the extension of the publication of the more commonly used U.S. dollar LIBOR settings to the end of June 2023. Although the full impacts of the transition away from LIBOR are not fully known, the transition may result in, among other things, an increase in volatility or illiquidity of the markets for instruments that currently rely on LIBOR to determine interest rates and this could have an adverse impact on the fund's performance. With respect to the fund's accounting for investments, including investments in certain debt instruments and derivatives, as well as borrowings by the fund and any other contractual arrangements of the fund that undergo reference rate-related modifications as a result of the transition, management will rely upon the relief provided by FASB Codification Topic 848 – Reference Rate Reform (Topic 848). The guidance in Topic 848 permits the fund to account for those modified contracts as a continuation of the existing contracts. Management is still evaluating the impact to the fund of the June 30, 2023 planned discontinuation of the more commonly used U.S. dollar LIBOR settings.
(9) Russia and Ukraine Conflict
The market disruptions, which began in late February 2022, associated with geopolitical events related to the conflict between Russia and Ukraine may adversely affect the value of the fund’s assets and thus the fund’s performance. Management continues to monitor these events and to evaluate the related impacts, if any, to the fund.
Report of Independent Registered Public Accounting Firm
To the Board of Trustees of MFS Series Trust XV and the Shareholders of MFS Commodity Strategy Fund:
Opinion on the Consolidated Financial Statements and Financial Highlights
We have audited the accompanying consolidated statement of assets and liabilities of MFS Commodity Strategy Fund and subsidiary (the “Fund”), including the consolidated portfolio of investments, as of October 31, 2022, the related consolidated statement of operations for the year then ended, the consolidated statements of changes in net assets for each of the two years in the period then ended, the consolidated financial highlights for each of the five years in the period then ended, and the related notes. In our opinion, the consolidated financial statements and financial highlights present fairly, in all material respects, the financial position of the Fund and subsidiary as of October 31, 2022, and the results of their operations for the year then ended, the changes in their net assets for each of the two years in the period then ended, and the financial highlights for each of the five years in the period then ended, in conformity with accounting principles generally accepted in the United States of America.
Basis for Opinion
These consolidated financial statements and financial highlights are the responsibility of the Fund's management. Our responsibility is to express an opinion on the Fund's consolidated financial statements and financial highlights based on our audits. We are a public accounting firm registered with the Public Company Accounting Oversight Board (United States) (PCAOB) and are required to be independent with respect to the Fund in accordance with the U.S. federal securities laws and the applicable rules and regulations of the Securities and Exchange Commission and the PCAOB.
We conducted our audits in accordance with the standards of the PCAOB. Those standards require that we plan and perform the audit to obtain reasonable assurance about whether the financial statements and financial highlights are free of material misstatement, whether due to error or fraud. The Fund is not required to have, nor were we engaged to perform, an audit of its internal control over financial reporting. As part of our audits, we are required to obtain an understanding of internal control over financial reporting but not for the purpose of expressing an opinion on the effectiveness of the Fund's internal control over financial reporting. Accordingly, we express no such opinion.
Our audits included performing procedures to assess the risks of material misstatement of the consolidated financial statements and financial highlights, whether due to error or fraud, and performing procedures that respond to those risks. Such procedures included examining, on a test basis, evidence regarding the amounts and disclosures in the financial statements and financial highlights. Our audits also included evaluating the accounting principles used and significant estimates made by management, as well as evaluating the overall presentation of the consolidated financial statements and financial highlights. Our procedures included confirmation of securities owned as of
Report of Independent Registered Public Accounting Firm – continued
October 31, 2022, by correspondence with the custodian and brokers; when replies were not received from brokers, we performed other auditing procedures. We believe that our audits provide a reasonable basis for our opinion.
DELOITTE & TOUCHE LLP
Boston, Massachusetts
December 15, 2022
We have served as the auditor of one or more of the MFS investment companies since 1924.
Trustees and Officers — Identification and Background
The Trustees and Officers of the Trust, as of December 1, 2022, are listed below, together with their principal occupations during the past five years. (Their titles may have varied during that period.) The address of each Trustee and Officer is 111 Huntington Avenue, Boston, Massachusetts 02199-7618.
| Name, Age | | Position(s) Held with Fund | | Trustee/Officer Since(h) | | Number of MFS Funds overseen by the Trustee | | Principal Occupations During
the Past Five Years | | Other Directorships During
the Past Five Years (j) |
| INTERESTED TRUSTEES | | | | | | | | | | |
Michael W. Roberge (k)
(age 56) | | Trustee | | January 2021 | | 136 | | Massachusetts Financial Services Company, Chairman (since January 2021); Chief Executive Officer (since January 2017); Director; Chairman of the Board (since January 2022); President (until December 2018); Chief Investment Officer (until December 2018) | | N/A |
| INDEPENDENT TRUSTEES | | | | | | | | | | |
John P. Kavanaugh
(age 68) | | Trustee and Chair of Trustees | | January 2009 | | 136 | | Private investor | | N/A |
Steven E. Buller
(age 71) | | Trustee | | February 2014 | | 136 | | Private investor | | N/A |
John A. Caroselli
(age 68) | | Trustee | | March 2017 | | 136 | | Private investor; JC Global Advisors, LLC (management consulting), President (since 2015) | | N/A |
Maureen R. Goldfarb
(age 67) | | Trustee | | January 2009 | | 136 | | Private investor | | N/A |
Peter D. Jones
(age 67) | | Trustee | | January 2019 | | 136 | | Private investor | | N/A |
James W. Kilman, Jr.
(age 61) | | Trustee | | January 2019 | | 136 | | Burford Capital Limited (finance and investment management), Senior Advisor (since May 3, 2021), Chief Financial Officer (2019 - May 2, 2021); KielStrand Capital LLC (family office), Chief Executive Officer (since 2016) | | Alpha-En Corporation, Director (2016-2019) |
Trustees and Officers - continued
| Name, Age | | Position(s) Held with Fund | | Trustee/Officer Since(h) | | Number of MFS Funds overseen by the Trustee | | Principal Occupations During
the Past Five Years | | Other Directorships During
the Past Five Years (j) |
Clarence Otis, Jr.
(age 66) | | Trustee | | March 2017 | | 136 | | Private investor | | VF Corporation, Director; Verizon Communications, Inc., Director; The Travelers Companies, Director |
Maryanne L. Roepke
(age 66) | | Trustee | | May 2014 | | 136 | | Private investor | | N/A |
Laurie J. Thomsen
(age 65) | | Trustee | | March 2005 | | 136 | | Private investor | | The Travelers Companies, Director; Dycom Industries, Inc., Director |
| Name, Age | | Position(s) Held with
Fund | | Trustee/Officer Since(h) | | Number of MFS Funds for which the Person is an Officer | | Principal Occupations During
the Past Five Years |
| OFFICERS | | | | | | | | |
Christopher R. Bohane (k)
(age 48) | | Assistant Secretary and Assistant Clerk | | July 2005 | | 136 | | Massachusetts Financial Services Company, Senior Vice President and Senior Managing Counsel |
Kino Clark (k)
(age 54) | | Assistant Treasurer | | January 2012 | | 136 | | Massachusetts Financial Services Company, Vice President |
John W. Clark, Jr. (k)
(age 55) | | Assistant Treasurer | | April 2017 | | 136 | | Massachusetts Financial Services Company, Vice President |
David L. DiLorenzo (k)
(age 54) | | President | | July 2005 | | 136 | | Massachusetts Financial Services Company, Senior Vice President |
Heidi W. Hardin (k)
(age 55) | | Secretary and Clerk | | April 2017 | | 136 | | Massachusetts Financial Services Company, Executive Vice President and General Counsel |
Brian E. Langenfeld (k)
(age 49) | | Assistant Secretary and Assistant Clerk | | June 2006 | | 136 | | Massachusetts Financial Services Company, Vice President and Managing Counsel |
Trustees and Officers - continued
| Name, Age | | Position(s) Held with
Fund | | Trustee/Officer Since(h) | | Number of MFS Funds for which the Person is an Officer | | Principal Occupations During
the Past Five Years |
Rosa E. Licea-Mailloux (k)
(age 46) | | Chief Compliance Officer | | March 2022 | | 136 | | Massachusetts Financial Services Company, Vice President (since 2018); Director of Corporate Compliance (2018-2021), Senior Director Compliance (2021-2022), Senior Managing Director of North American Compliance & Chief Compliance Officer (since March 2022); Natixis Investment Managers (investment management), Funds Chief Compliance Officer, Deputy General Counsel & Senior Vice President (until 2018) |
Amanda S. Mooradian (k)
(age 43) | | Assistant Secretary and Assistant Clerk | | September 2018 | | 136 | | Massachusetts Financial Services Company, Assistant Vice President and Senior Counsel |
Susan A. Pereira (k)
(age 52) | | Assistant Secretary and Assistant Clerk | | July 2005 | | 136 | | Massachusetts Financial Services Company, Vice President and Managing Counsel |
Kasey L. Phillips (k)
(age 51) | | Assistant Treasurer | | September 2012 | | 136 | | Massachusetts Financial Services Company, Vice President |
Matthew A. Stowe (k)
(age 48) | | Assistant Secretary and Assistant Clerk | | October 2014 | | 136 | | Massachusetts Financial Services Company, Vice President and Senior Managing Counsel |
William B. Wilson (k)
(age 40) | | Assistant Secretary and Assistant Clerk | | October 2022 | | 136 | | Massachusetts Financial Services Company, Assistant Vice President and Counsel |
James O. Yost (k)
(age 62) | | Treasurer | | September 1990 | | 136 | | Massachusetts Financial Services Company, Senior Vice President |
| (h) | Date first appointed to serve as Trustee/Officer of an MFS Fund. Each Trustee has served continuously since appointment unless indicated otherwise. From January 2012 through December 2016, Messrs. DiLorenzo and Yost served as Treasurer and Deputy Treasurer of the Funds, respectively. |
| (j) | Directorships or trusteeships of companies required to report to the Securities and Exchange Commission (i.e., “public companies”). |
| (k) | “Interested person” of the Trust within the meaning of the Investment Company Act of 1940 (referred to as the 1940 Act), which is the principal federal law governing investment companies like the fund, as a result of a position with MFS. The address of MFS is 111 Huntington Avenue, Boston, Massachusetts 02199-7618. |
Trustees and Officers - continued
Each Trustee (other than Messrs. Jones, Kilman and Roberge) has been elected by shareholders and each Trustee and Officer holds office until his or her successor is chosen and qualified or until his or her earlier death, resignation, retirement or removal. Mr. Roberge became a Trustee of the Funds on January 1, 2021 and Messrs. Jones and Kilman became Trustees of the Funds on January 1, 2019. The Trust does not hold annual meetings for the purpose of electing Trustees, and Trustees are not elected for fixed terms. Under the terms of the Board's retirement policy, an Independent Trustee shall retire at the end of the calendar year in which he or she reaches the earlier of 75 years of age or 15 years of service on the Board (or, in the case of any Independent Trustee who joined the Board prior to 2015, 20 years of service on the Board).
Messrs. Buller, Kilman and Otis and Ms. Roepke are members of the Trust’s Audit Committee.
Each of the Interested Trustees and certain Officers hold comparable officer positions with certain affiliates of MFS.
The Statement of Additional Information for a Fund includes further information about the Trustees and is available without charge upon request by calling 1-800-225-2606.
| Investment Adviser | Custodian |
Massachusetts Financial Services Company
111 Huntington Avenue
Boston, MA 02199-7618 | State Street Bank and Trust Company
1 Lincoln Street
Boston, MA 02111-2900 |
| Distributor | Independent Registered Public Accounting Firm |
MFS Fund Distributors, Inc.
111 Huntington Avenue
Boston, MA 02199-7618 | Deloitte & Touche LLP
200 Berkeley Street
Boston, MA 02116 |
| Portfolio Manager(s) | |
Philipp Burgener
Alexander Mackey
Benjamin Nastou
Natalie Shapiro | |
Board Review of Investment Advisory Agreement
MFS Commodity Strategy Fund
The Investment Company Act of 1940 requires that both the full Board of Trustees and a majority of the non-interested (“independent”) Trustees, voting separately, annually approve the continuation of the Fund’s investment advisory agreement with MFS. The Trustees consider matters bearing on the Fund and its advisory arrangements at their meetings throughout the year, including a review of performance data at each regular meeting. In addition, the independent Trustees met several times over the course of three months beginning in May and ending in July, 2022 (“contract review meetings”) for the specific purpose of considering whether to approve the continuation of the investment advisory agreement for the Fund and the other investment companies that the Board oversees (the “MFS Funds”). The independent Trustees were assisted in their evaluation of the Fund’s investment advisory agreement by independent legal counsel, from whom they received separate legal advice and with whom they met separately from MFS during various contract review meetings. The independent Trustees were also assisted in this process by an independent consultant who was retained by and reported to the independent Trustees.
In connection with their deliberations regarding the continuation of the investment advisory agreement, the Trustees, including the independent Trustees, considered such information and factors as they believed, in light of the legal advice furnished to them and their own business judgment, to be relevant. The investment advisory agreement for the Fund was considered separately, although the Trustees also took into account the common interests of all MFS Funds in their review. As described below, the Trustees considered the nature, quality, and extent of the various investment advisory, administrative, and shareholder services performed by MFS under the existing investment advisory agreement and other arrangements with the Fund.
In connection with their contract review meetings, the Trustees received and relied upon materials that included, among other items: (i) information provided by Broadridge Financial Solutions, Inc. (“Broadridge”), an independent third party, on the investment performance of the Fund for various time periods ended December 31, 2021 and the investment performance of a group of funds with substantially similar investment classifications/objectives (the “Broadridge performance universe”), (ii) information provided by Broadridge on the Fund’s advisory fees and other expenses and the advisory fees and other expenses of comparable funds identified by Broadridge as well as all other funds in the same investment classification/category (the “Broadridge expense group and universe”), (iii) information provided by MFS on the advisory fees of portfolios of other clients of MFS, including institutional separate accounts and other clients, (iv) information as to whether and to what extent applicable expense waivers, reimbursements or fee “breakpoints” are observed for the Fund, (v) information regarding MFS’ financial results and financial condition, including MFS’ and certain of its affiliates’ estimated profitability from services performed for the Fund and the MFS Funds as a whole, and compared to MFS’ institutional business, (vi) MFS’ views regarding the outlook for the mutual fund industry and the strategic business plans of MFS, (vii) descriptions of various functions performed by MFS for the Funds, such as compliance monitoring and portfolio trading practices, and (viii) information regarding the overall organization of MFS, including information about
Board Review of Investment Advisory Agreement - continued
MFS’ senior management and other personnel providing investment advisory, administrative and other services to the Fund and the other MFS Funds. The comparative performance, fee and expense information prepared and provided by Broadridge was not independently verified and the independent Trustees did not independently verify any information provided to them by MFS.
The Trustees’ conclusion as to the continuation of the investment advisory agreement was based on a comprehensive consideration of all information provided to the Trustees and not the result of any single factor. Some of the factors that figured particularly in the Trustees’ deliberations are described below, although individual Trustees may have evaluated the information presented differently from one another, giving different weights to various factors. It is also important to recognize that the fee arrangements for the Fund and other MFS Funds are the result of years of review and discussion between the independent Trustees and MFS, that certain aspects of such arrangements may receive greater scrutiny in some years than in others, and that the Trustees’ conclusions may be based, in part, on their consideration of these same arrangements during the course of the year and in prior years.
Based on information provided by Broadridge and MFS, the Trustees reviewed the Fund’s total return investment performance as well as the Broadridge performance universe over various time periods. The Trustees placed particular emphasis on the total return performance of the Fund’s Class I shares in comparison to the performance of funds in its Broadridge performance universe over the five-year period ended December 31, 2021, which the Trustees believed was a long enough period to reflect differing market conditions. The total return performance of the Fund’s Class I shares was in the 3rd quintile relative to the other funds in the universe for this five-year period (the 1st quintile being the best performers and the 5th quintile being the worst performers). The total return performance of the Fund’s Class I shares was in the 4th quintile for the one-year period and the 3rd quintile for the three-year period ended December 31, 2021 relative to the Broadridge performance universe. Because of the passage of time, these performance results may differ from the performance results for more recent periods, including those shown elsewhere in this report.
In the course of their deliberations, the Trustees took into account information provided by MFS in connection with the contract review meetings, as well as during investment review meetings conducted with portfolio management personnel during the course of the year regarding the Fund’s performance. After reviewing these and related factors, the Trustees concluded, within the context of their overall conclusions regarding the investment advisory agreement, that they were satisfied with MFS’ responses and efforts relating to investment performance.
In assessing the reasonableness of the Fund’s advisory fee, the Trustees considered, among other information, the Fund’s advisory fee and the total expense ratio of the Fund’s Class I shares as a percentage of average daily net assets and the advisory fee and total expense ratios of the Broadridge expense group based on information provided by Broadridge. The Trustees considered that, according to the data provided by Broadridge (which takes into account any fee reductions or expense limitations that were in effect during the Fund’s last fiscal year), the Fund’s effective advisory fee rate was higher than the Broadridge expense group median and the Fund’s total expense ratio was approximately at the Broadridge expense group median.
Board Review of Investment Advisory Agreement - continued
The Trustees also considered the advisory fees charged by MFS to any institutional separate accounts advised by MFS (“separate accounts”) and unaffiliated investment companies for which MFS serves as subadviser (“subadvised funds”) that have comparable investment strategies to the Fund, if any. In comparing these fees, the Trustees considered information provided by MFS as to the generally broader scope of services provided by MFS to the Fund, as well as the more extensive regulatory burdens imposed on MFS in managing the Fund, in comparison to separate accounts and subadvised funds. The Trustees also considered the higher demands placed on MFS’ investment personnel and trading infrastructure as a result of the daily cash in-flows and out-flows of the Fund in comparison to separate accounts.
The Trustees also considered whether the Fund may benefit from any economies of scale in the management of the Fund in the event of growth in assets of the Fund and/or growth in assets of the MFS Funds as a whole. They noted that the Fund’s advisory fee rate schedule is subject to a contractual breakpoint that reduces the Fund’s advisory fee rate on average daily net assets over $1 billion. The Trustees also noted that MFS has agreed in writing to waive a portion of the management fees of certain MFS Funds, including the Fund, if the total combined assets of certain funds within the MFS Funds’ complex increase above agreed upon thresholds (the “group fee waiver”), enabling the Fund’s shareholders to share in the benefits from any economies of scale at the complex level. The group fee waiver is reviewed and renewed annually between the Board and MFS. The Trustees concluded that the breakpoint and the group fee waiver were sufficient to allow the Fund to benefit from economies of scale as its assets and overall complex assets grow.
The Trustees also considered information prepared by MFS relating to MFS’ costs and profits with respect to the Fund, the MFS Funds considered as a group, and other investment companies and accounts advised by MFS, as well as MFS’ methodologies used to determine and allocate its costs to the MFS Funds, the Fund and other accounts and products for purposes of estimating profitability.
After reviewing these and other factors described herein, the Trustees concluded, within the context of their overall conclusions regarding the investment advisory agreement, that the advisory fees charged to the Fund represent reasonable compensation in light of the services being provided by MFS to the Fund.
In addition, the Trustees considered MFS’ resources and related efforts to continue to retain, attract and motivate capable personnel to serve the Fund. The Trustees also considered current and developing conditions in the financial services industry, including the presence of large and well-capitalized companies which are spending, and appear to be prepared to continue to spend, substantial sums to engage personnel and to provide services to competing investment companies. In this regard, the Trustees also considered the financial resources of MFS and its ultimate parent, Sun Life Financial Inc. The Trustees also considered the advantages and possible disadvantages to the Fund of having an adviser that also serves other investment companies as well as other accounts.
The Trustees also considered the nature, quality, cost, and extent of administrative, transfer agency, and distribution services provided to the Fund by MFS and its affiliates under agreements and plans other than the investment advisory agreement, including any 12b-1 fees the Fund pays to MFS Fund Distributors, Inc., an affiliate of MFS. The Trustees also considered the nature, extent and quality of certain other services
Board Review of Investment Advisory Agreement - continued
MFS performs or arranges for on the Fund’s behalf, which may include securities lending programs, directed expense payment programs, class action recovery programs, and MFS’ interaction with third-party service providers, principally custodians and sub-custodians. The Trustees concluded that the various non-advisory services provided by MFS and its affiliates on behalf of the Fund were satisfactory.
The Trustees considered so-called “fall-out benefits” to MFS such as reputational value derived from serving as investment manager to the MFS Funds. The Trustees also considered that MFS discontinued its historic practice of obtaining investment research from portfolio brokerage commissions paid by certain MFS Funds effective January 2018, and directly pays or voluntarily reimburses a Fund, if applicable, for the costs of external research acquired through the use of the Fund’s portfolio brokerage commissions.
Based on their evaluation of factors that they deemed to be material, including those factors described above, the Board of Trustees, including the independent Trustees, concluded that the Fund’s investment advisory agreement with MFS should be continued for an additional one-year period, commencing August 1, 2022.
Proxy Voting Policies and Information
MFS votes proxies on behalf of the fund pursuant to proxy voting policies and procedures that are available without charge, upon request, by calling 1-800-225-2606, by visiting mfs.com/proxyvoting, or by visiting the SEC’s Web site at http://www.sec.gov.
Information regarding how the fund voted proxies relating to portfolio securities during the most recent twelve-month period ended June 30 is available by August 31 of each year without charge by visiting mfs.com/proxyvoting, or by visiting the SEC’s Web site at http://www.sec.gov.
Quarterly Portfolio Disclosure
The fund files a complete schedule of portfolio holdings with the SEC for the first and third quarters of each fiscal year as an exhibit to its reports on Form N-PORT. The fund's Form N-PORT reports are available on the SEC's Web site at http://www.sec.gov. A shareholder can obtain the portfolio holdings report for the first and third quarters of the fund's fiscal year at mfs.com/openendfunds by choosing the fund's name and then scrolling to the “Resources” section and clicking on the “Prospectus and Reports” tab.
Further Information
From time to time, MFS may post important information about the fund or the MFS Funds on the MFS Web site (mfs.com). This information is available at https://www.mfs.com/announcements or at mfs.com/openendfunds by choosing the fund’s name and then scrolling to the “Resources” section and clicking on the “Announcements” tab, if any.
Information About Fund Contracts and Legal Claims
The fund has entered into contractual arrangements with an investment adviser, administrator, distributor, shareholder servicing agent, and custodian who each provide services to the fund. Unless expressly stated otherwise, shareholders are not parties to, or intended beneficiaries of these contractual arrangements, and these contractual arrangements are not intended to create any shareholder right to enforce them against the service providers or to seek any remedy under them against the service providers, either directly or on behalf of the fund.
Under the Trust’s By-Laws and Declaration of Trust, any claims asserted against or on behalf of the MFS Funds, including claims against Trustees and Officers, must be brought in state and federal courts located within the Commonwealth of Massachusetts.
Federal Tax Information (unaudited)
The fund will notify shareholders of amounts for use in preparing 2022 income tax forms in January 2023. The following information is provided pursuant to provisions of the Internal Revenue Code.
The fund intends to pass through the maximum amount allowable as Section 163(j) Interest Dividends as defined in Treasury Regulation §1.163(j)-1(b).
| FACTS | WHAT DOES MFS DO WITH YOUR PERSONAL INFORMATION? |
| Why? | Financial companies choose how they share your personal information. Federal law gives consumers the right to limit some but not all sharing. Federal law also requires us to tell you how we collect, share, and protect your personal information. Please read this notice carefully to understand what we do. |
| What? | The types of personal information we collect and share depend on the product or service you have with us. This information can include: |
| • Social Security number and account balances |
| • Account transactions and transaction history |
| • Checking account information and wire transfer instructions |
| When you are no longer our customer, we continue to share your information as described in this notice. |
| How? | All financial companies need to share customers' personal information to run their everyday business. In the section below, we list the reasons financial companies can share their customers' personal information; the reasons MFS chooses to share; and whether you can limit this sharing. |
Reasons we can share your
personal information | Does MFS share? | Can you limit
this sharing? |
For our everyday business purposes –
such as to process your transactions, maintain your
account(s), respond to court orders and legal
investigations, or report to credit bureaus | Yes | No |
For our marketing purposes –
to offer our products and services to you | No | We don't share |
For joint marketing with other
financial companies | No | We don't share |
For our affiliates' everyday business purposes –
information about your transactions and experiences | No | We don't share |
For our affiliates' everyday business purposes –
information about your creditworthiness | No | We don't share |
| For nonaffiliates to market to you | No | We don't share |
| Questions? | Call 800-225-2606 or go to mfs.com. |
| Who we are |
| Who is providing this notice? | MFS Funds, MFS Investment Management, MFS Institutional Advisors, Inc., and MFS Heritage Trust Company. |
| What we do |
How does MFS
protect my personal
information? | To protect your personal information from unauthorized access and use, we use security measures that comply with federal law. These measures include procedural, electronic, and physical safeguards for the protection of the personal information we collect about you. |
How does MFS
collect my personal
information? | We collect your personal information, for example, when you |
| • open an account or provide account information |
| • direct us to buy securities or direct us to sell your securities |
| • make a wire transfer |
| We also collect your personal information from others, such as credit bureaus, affiliates, or other companies. |
| Why can't I limit all sharing? | Federal law gives you the right to limit only |
| • sharing for affiliates' everyday business purposes – information about your creditworthiness |
| • affiliates from using your information to market to you |
| • sharing for nonaffiliates to market to you |
| State laws and individual companies may give you additional rights to limit sharing. |
| Definitions |
| Affiliates | Companies related by common ownership or control. They can be financial and nonfinancial companies. |
| • MFS does not share personal information with affiliates, except for everyday business purposes as described on page one of this notice. |
| Nonaffiliates | Companies not related by common ownership or control. They can be financial and nonfinancial companies. |
| • MFS does not share with nonaffiliates so they can market to you. |
| Joint marketing | A formal agreement between nonaffiliated financial companies that together market financial products or services to you. |
| • MFS doesn't jointly market. |
| Other important information |
| If you own an MFS product or receive an MFS service in the name of a third party such as a bank or broker-dealer, their privacy policy may apply to you instead of ours. |
Save paper with eDelivery.
MFS® will send you prospectuses, reports, and proxies directly via e-mail so you will get information faster with less mailbox clutter.
To sign up:
1. Go to mfs.com.
2. Log in via MFS® Access.
3. Select eDelivery.
If you own your MFS fund shares through a financial institution or a retirement plan, MFS® TALK, MFS® Access, or eDelivery may not be available to you.
CONTACT
WEB SITE
mfs.com
MFS TALK
1-800-637-8255
24 hours a day
ACCOUNT SERVICE AND LITERATURE
Shareholders
1-800-225-2606
Financial advisors
1-800-343-2829
Retirement plan services
1-800-637-1255
MAILING ADDRESS
MFS Service Center, Inc.
P.O. Box 219341
Kansas City, MO 64121-9341
OVERNIGHT MAIL
MFS Service Center, Inc.
Suite 219341
430 W 7th Street
Kansas City, MO 64105-1407
Annual Report
October 31, 2022
MFS® Global Alternative
Strategy Fund
MFS® Global Alternative
Strategy Fund
| 1 |
| 2 |
| 4 |
| 6 |
| 9 |
| 11 |
| 46 |
| 48 |
| 50 |
| 51 |
| 60 |
| 79 |
| 81 |
| 85 |
| 89 |
| 89 |
| 89 |
| 89 |
| 89 |
| 91 |
The report is prepared for the general information of shareholders. It is authorized for distribution to prospective investors only when preceded or accompanied by a current prospectus.
NOT FDIC INSURED • MAY LOSE VALUE • NO BANK GUARANTEE
LETTER FROM THE CHAIR AND CEO
Dear Shareholders:
Global markets have recently been buffeted by a series of crosscurrents, including rising inflation, tighter financial conditions, and evolving geopolitical tensions. Consequently, at a time when global growth faces multiple headwinds, central banks have been presented with the challenge of reining in rising prices without tipping economies into recession. The U.S. Federal Reserve has made it clear that rates must move higher and tighter policy must be sustained to restore price stability and that this will likely bring some pain to households and businesses. Against that backdrop, richly valued, interest rate–sensitive growth equities have been hit particularly hard by rising interest rates. Volatility in fixed income and currency markets has picked up, with fiscal policy missteps in the United Kingdom leading to a crisis of market confidence that ultimately resulted in the ouster of Prime Minister Liz Truss. That episode could forewarn other governments to avoid policy overreach.
There are, however, encouraging signs for the markets. China has modestly relaxed its zero-COVID policy, and cases globally, while numerous, appear to be causing fewer serious illnesses. Meanwhile, unemployment is low and global supply chain bottlenecks are easing, though lingering coronavirus restrictions in China and disruptions stemming from Russia’s invasion of Ukraine could hamper these advances. Additionally, easier Chinese monetary and regulatory policies and the record pace of corporate stock buybacks are supportive elements, albeit in an otherwise turbulent investment environment.
It is important to have a deep understanding of company fundamentals during times of market transition, and we have built our unique global research platform to do just that.
At MFS®, we put our clients’ assets to work responsibly by carefully navigating increasingly complex global capital markets. Our investment team is guided by a commitment to long-term fundamental investing. Our global investment platform — combining collective expertise, long-term discipline, and thoughtful risk management — seeks to uncover what we believe are the best, most durable investment ideas in markets around the world, enabling us to potentially create value for investors.
Respectfully,
Michael W. Roberge
Chair and Chief Executive Officer
MFS Investment Management
December 15, 2022
The opinions expressed in this letter are subject to change and may not be relied upon for investment advice. No forecasts can be guaranteed.
Portfolio structure
| | | | Derivative Overlay
Positions (b) | |
| | | Active Security
Selection (a) | Long | Short | Net Market
Exposure (c) |
| Fixed Income | U.S. | 13.6% | 36.9% | (19.9)% | 30.6% |
| | United Kingdom | 1.0% | 5.7% | 0.0% | 6.7% |
| | Asia/Pacific ex-Japan | 0.8% | 5.1% | 0.0% | 5.9% |
| | Europe ex-U.K. | 1.5% | 4.1% | 0.0% | 5.6% |
| | Japan | 0.4% | 3.2% | 0.0% | 3.6% |
| | Emerging Markets | 0.6% | 0.0% | 0.0% | 0.6% |
| | North America ex-U.S. | 1.3% | 0.0% | (10.6)% | (9.3)% |
| Equity | U.S. Large Cap | 34.6% | 0.0% | (26.8)% | 7.8% |
| | Europe ex-U.K. | 11.0% | 9.1% | (12.9)% | 7.2% |
| | Asia/Pacific ex-Japan | 1.6% | 3.9% | 0.0% | 5.5% |
| | Emerging Markets | 1.9% | 5.6% | (2.9)% | 4.6% |
| | Japan | 3.8% | 0.1% | 0.0% | 3.9% |
| | United Kingdom | 3.2% | 0.3% | 0.0% | 3.5% |
| | North America ex-U.S. | 2.4% | 0.0% | (0.6)% | 1.8% |
| | Developed - Middle East/Africa | 0.1% | 0.0% | 0.0% | 0.1% |
| | U.S. Small/Mid Cap | 18.8% | 0.0% | (20.6)% | (1.8)% |
| Cash | Cash & Cash Equivalents (d) | | | | 2.1% |
| | Other (e) | | | | 21.6% |
Top ten holdings (c)
| USD Interest Rate Swap, Receive 2.57% - JUN 2024 | 23.0% |
| USD Interest Rate Swap, Receive 2.54% - JUN 2027 | 13.9% |
| Long Gilt 10 yr Future - DEC 2022 | 5.7% |
| AEX 25 Index Future - NOV 2022 | (5.1)% |
| USD Interest Rate Swap, Payer 2.53% - JUN 2032 | (5.2)% |
| S&P MidCap 400 Index Future - DEC 2022 | (8.5)% |
| Canadian Treasury Bond 10 yr Future - DEC 2022 | (10.7)% |
| U.S. Treasury Note 10 yr Future - DEC 2022 | (11.4)% |
| Russell 2000 Index Future - DEC 2022 | (12.1)% |
| S&P 500 E-Mini Index Future - DEC 2022 | (26.8)% |
Portfolio Composition - continued
| (a) | Represents the actively managed portion of the portfolio and for purposes of this presentation, components include the value of securities, less any securities sold short. The bond component will include any accrued interest amounts. This also reflects the equivalent exposure of certain derivative positions. These amounts may be negative from time to time. |
| (b) | Represents the tactical overlay portion of the portfolio which is how the fund manages its exposure to markets and currencies through the use of derivative positions. Percentages reflect the equivalent exposure of those derivative positions. |
| (c) | For purposes of this presentation, the components include the value of securities, less any securities sold short, and reflect the impact of the equivalent exposure of all derivative positions. These amounts may be negative from time to time. The bond component will include any accrued interest amounts. |
| (d) | Cash & Cash Equivalents includes any cash, investments in money market funds, short-term securities, and other assets less liabilities. Please see the Statement of Assets and Liabilities for additional information related to the fund’s cash position and other assets and liabilities. |
| (e) | Other includes currency derivatives and/or the offsetting of the leverage produced by the fund’s derivative positions, including payables and/or receivables of the finance leg of interest rate swaps and the unrealized gain or loss in connection with forward currency exchange contracts. |
Equivalent exposure is a calculated amount that translates the derivative position into a reasonable approximation of the amount of the underlying asset that the portfolio would have to hold at a given point in time to have the same price sensitivity that results from the portfolio’s ownership of the derivative contract. When dealing with derivatives, equivalent exposure is a more representative measure of the potential impact of a position on portfolio performance than value. The value of derivatives may be different.
Where the fund holds convertible bonds, they are treated as part of the equity portion of the portfolio.
Percentages are based on net assets as of October 31, 2022.
The portfolio is actively managed and current holdings may be different.
Management Review
Summary of Results
MFS seeks to achieve a total rate of return for the MFS Global Alternative Strategy Fund (fund) that meets or exceeds the FTSE 1-Month U.S. Treasury Bill Index plus 2% to 4%, net of fund expenses, over a full market cycle. There is no assurance that the fund will meet this target over the long term or for any year or period of years.
MFS seeks to achieve the fund’s objective by generating returns from a combination of (1) individual security selection of US and foreign equity securities and debt instruments and (2) a tactical asset allocation overlay to manage the fund’s exposure to asset classes, markets, and currencies, primarily using derivatives.
For the twelve months ended October 31, 2022, Class A shares of the fund provided a total return of -7.79%, at net asset value. This compares with a return of -4.85% for the fund’s benchmark, the Bloomberg 1-3 Year U.S. Treasury Bond Index.
Market Environment
During the reporting period, markets continued to grapple with the strongest global inflationary pressures in decades along with signs of slowing economic growth. Intermittent coronavirus flareups, particularly in China, where home-grown vaccines have proved less effective than elsewhere, kept supply chains stretched for a considerable period. At the same time, the reopening of the economy in the parts of the world where the virus has been better contained has led to a shift in consumption patterns in favor of services, straining already tight labor markets in most developed economies, while reducing demand for manufactured goods, primarily from Asia. As a result of Russia’s invasion of Ukraine, geopolitical considerations, such as sanctions and trade bans, have resulted in additional supply chain tumult and volatile global energy prices. Taken together, these factors have contributed to market volatility.
The ripple effects from the Russian invasion further complicated the mission central banks must undertake to rein in surging inflation. Energy shocks have historically resulted in global growth slowdowns, if not pullbacks, so policymakers will find themselves in the difficult position of trying to restrain inflation without tipping economies into recession. Despite the challenging macroeconomic and geopolitical environment, policymakers remained focused on corralling inflation, although investors appeared to have expected varying degrees of action from the central banks. The Fed was expected to be the most hawkish developed market central bank and the European Central Bank less so, given the growth-depleting effects on Europe's economy stemming from the invasion, while the Bank of Japan remained on the monetary sidelines, leading to a dramatic weakening of the yen.
Against an environment of still-tight labor markets, tighter global financial conditions and volatile materials prices, investor anxiety appeared to have increased over the potential that corporate profit margins may be past peak for this cycle. That said, tentative signs that supply chain bottlenecks (particularly semiconductors) may be easing, low levels of unemployment across developed markets and somewhat easier prices for non-energy raw materials were supportive factors for the macroeconomic backdrop.
Management Review - continued
Factors Affecting Performance
During the reporting period, the fund’s allocation to equity securities detracted from absolute performance and outweighed positive impacts from the fund’s country selection in emerging markets, notably from its long exposure to the Turkish equity market.
The fund’s allocation to fixed income securities also weakened absolute performance.
Within the currency allocation of the fund, short exposures to both the euro and Australian dollar benefited the fund’s performance and more than offset the negative impact from the fund’s exposure to the Norwegian Krone.
Respectfully,
Portfolio Manager(s)
Benjamin Nastou, Natalie Shapiro, and Enrich Shigley
Note to Shareholders: Effective November 1, 2021, Erich Shigley was added as a Portfolio Manager of the fund.
The views expressed in this report are those of the portfolio manager(s) only through the end of the period of the report as stated on the cover and do not necessarily reflect the views of MFS or any other person in the MFS organization. These views are subject to change at any time based on market or other conditions, and MFS disclaims any responsibility to update such views. These views may not be relied upon as investment advice or an indication of trading intent on behalf of any MFS portfolio. References to specific securities are not recommendations of such securities, and may not be representative of any MFS portfolio’s current or future investments.
Performance Summary THROUGH 10/31/22
The following chart illustrates a representative class of the fund’s historical performance in comparison to its benchmark(s). Performance results include the deduction of the maximum applicable sales charge and reflect the percentage change in net asset value, including reinvestment of dividends and capital gains distributions. The performance of other share classes will be greater than or less than that of the class depicted below. Benchmarks are unmanaged and may not be invested in directly. Benchmark returns do not reflect sales charges, commissions or expenses. (See Notes to Performance Summary.)
Performance data shown represents past performance and is no guarantee of future results. Investment return and principal value fluctuate so your shares, when sold, may be worth more or less than the original cost; current performance may be lower or higher than quoted. The performance shown does not reflect the deduction of taxes, if any, that a shareholder would pay on fund distributions or the redemption of fund shares.
Growth of a Hypothetical $10,000 Investment
Performance Summary - continued
Total Returns through 10/31/22
Average annual without sales charge
| Share Class | Class Inception Date | 1-yr | 5-yr | 10-yr |
| A | 12/20/07 | (7.79)% | 2.01% | 2.29% |
| B | 12/20/07 | (8.36)% | 1.26% | 1.53% |
| C | 12/20/07 | (8.41)% | 1.26% | 1.52% |
| I | 12/20/07 | (7.51)% | 2.28% | 2.55% |
| R1 | 12/20/07 | (8.36)% | 1.26% | 1.53% |
| R2 | 12/20/07 | (8.02)% | 1.76% | 2.02% |
| R3 | 12/20/07 | (7.71)% | 2.03% | 2.28% |
| R4 | 12/20/07 | (7.49)% | 2.29% | 2.50% |
| R6 | 12/20/07 | (7.38)% | 2.36% | 2.63% |
Comparative benchmark(s)
| Bloomberg 1-3 Year U.S. Treasury Bond Index (f) | (4.85)% | 0.53% | 0.58% |
| FTSE 1-Month U.S. Treasury Bill Index (f) | 0.84% | 1.10% | 0.64% |
Average annual with sales charge
| | | | |
A
With Initial Sales Charge (5.75%) | (13.09)% | 0.81% | 1.68% |
B
With CDSC (Declining over six years from 4% to 0%) (v) | (12.02)% | 0.88% | 1.53% |
C
With CDSC (1% for 12 months) (v) | (9.33)% | 1.26% | 1.52% |
CDSC – Contingent Deferred Sales Charge.
Class I, R1, R2, R3, R4, and R6 shares do not have a sales charge.
| (f) | Source: FactSet Research Systems Inc. |
| (v) | Assuming redemption at the end of the applicable period. |
Benchmark Definition(s)
Bloomberg 1-3 Year U.S. Treasury Bond Index(a) – measures the performance of public obligations of the U.S. Treasury with a remaining maturity from 1 up to (but not including) 3 years.
FTSE 1-Month U.S. Treasury Bill Index(b) - a market capitalization-weighted index that is designed to measure the performance of public obligations of the U.S. Treasury with maturities of one month.
Performance Summary - continued
It is not possible to invest directly in an index.
| (a) | Source: Bloomberg Index Services Limited. BLOOMBERG® is a trademark and service mark of Bloomberg Finance L.P. and its affiliates (collectively “Bloomberg”). Bloomberg or Bloomberg's licensors own all proprietary rights in the Bloomberg Indices. Bloomberg neither approves or endorses this material, or guarantees the accuracy or completeness of any information herein, or makes any warranty, express or implied, as to the results to be obtained therefrom and, to the maximum extent allowed by law, neither shall have any liability or responsibility for injury or damages arising in connection therewith. |
| (b) | ©2018 FTSE Fixed Income LLC. All rights reserved. |
Notes to Performance Summary
Average annual total return represents the average annual change in value for each share class for the periods presented.
Performance results reflect any applicable expense subsidies and waivers in effect during the periods shown. Without such subsidies and waivers the fund's performance results would be less favorable. Please see the prospectus and financial statements for complete details.
Performance information for periods prior to July 13, 2018 reflects periods when a subadvisor was responsible for managing the fund’s tactical asset allocation overlay under a different investment process.
Performance results do not include adjustments made for financial reporting purposes in accordance with U.S. generally accepted accounting principles and may differ from amounts reported in the financial highlights.
From time to time the fund may receive proceeds from litigation settlements, without which performance would be lower.
Expense Table
Fund expenses borne by the shareholders during the period,
May 1, 2022 through October 31, 2022
As a shareholder of the fund, you incur two types of costs: (1) transaction costs, including sales charges (loads) on certain purchase or redemption payments, and (2) ongoing costs, including management fees; distribution and service (12b-1) fees; and other fund expenses. This example is intended to help you understand your ongoing costs (in dollars) of investing in the fund and to compare these costs with the ongoing costs of investing in other mutual funds.
The example is based on an investment of $1,000 invested at the beginning of the period and held for the entire period May 1, 2022 through October 31, 2022.
Actual Expenses
The first line for each share class in the following table provides information about actual account values and actual expenses. You may use the information in this line, together with the amount you invested, to estimate the expenses that you paid over the period. Simply divide your account value by $1,000 (for example, an $8,600 account value divided by $1,000 = 8.6), then multiply the result by the number in the first line under the heading entitled “Expenses Paid During Period” to estimate the expenses you paid on your account during this period.
Hypothetical Example for Comparison Purposes
The second line for each share class in the following table provides information about hypothetical account values and hypothetical expenses based on the fund’s actual expense ratio and an assumed rate of return of 5% per year before expenses, which is not the fund’s actual return. The hypothetical account values and expenses may not be used to estimate the actual ending account balance or expenses you paid for the period. You may use this information to compare the ongoing costs of investing in the fund and other funds. To do so, compare this 5% hypothetical example with the 5% hypothetical examples that appear in the shareholder reports of the other funds.
Please note that the expenses shown in the table are meant to highlight your ongoing costs only and do not reflect any transactional costs, such as sales charges (loads). Therefore, the second line for each share class in the table is useful in comparing ongoing costs only, and will not help you determine the relative total costs of owning different funds. In addition, if these transactional costs were included, your costs would have been higher.
Expense Table - continued
Share
Class | | Annualized
Expense
Ratio | Beginning
Account Value
5/01/22 | Ending
Account Value
10/31/22 | Expenses
Paid During
Period (p)
5/01/22-10/31/22 |
| A | Actual | 1.30% | $1,000.00 | $976.62 | $6.48 |
| Hypothetical (h) | 1.30% | $1,000.00 | $1,018.65 | $6.61 |
| B | Actual | 2.05% | $1,000.00 | $973.20 | $10.20 |
| Hypothetical (h) | 2.05% | $1,000.00 | $1,014.87 | $10.41 |
| C | Actual | 2.05% | $1,000.00 | $972.38 | $10.19 |
| Hypothetical (h) | 2.05% | $1,000.00 | $1,014.87 | $10.41 |
| I | Actual | 1.05% | $1,000.00 | $977.68 | $5.23 |
| Hypothetical (h) | 1.05% | $1,000.00 | $1,019.91 | $5.35 |
| R1 | Actual | 2.05% | $1,000.00 | $972.90 | $10.19 |
| Hypothetical (h) | 2.05% | $1,000.00 | $1,014.87 | $10.41 |
| R2 | Actual | 1.55% | $1,000.00 | $975.46 | $7.72 |
| Hypothetical (h) | 1.55% | $1,000.00 | $1,017.39 | $7.88 |
| R3 | Actual | 1.30% | $1,000.00 | $976.66 | $6.48 |
| Hypothetical (h) | 1.30% | $1,000.00 | $1,018.65 | $6.61 |
| R4 | Actual | 1.05% | $1,000.00 | $977.74 | $5.23 |
| Hypothetical (h) | 1.05% | $1,000.00 | $1,019.91 | $5.35 |
| R6 | Actual | 0.95% | $1,000.00 | $978.67 | $4.74 |
| Hypothetical (h) | 0.95% | $1,000.00 | $1,020.42 | $4.84 |
| (h) | 5% class return per year before expenses. |
| (p) | “Expenses Paid During Period” are equal to each class’s annualized expense ratio, as shown above, multiplied by the average account value over the period, multiplied by 184/365 (to reflect the one-half year period). Expenses paid do not include any applicable sales charges (loads). If these transaction costs had been included, your costs would have been higher. |
Portfolio of Investments
10/31/22
The Portfolio of Investments is a complete list of all securities owned by your fund. It is categorized by broad-based asset classes.
| Issuer | | | Shares/Par | Value ($) |
| Common Stocks – 77.4% |
| Aerospace & Defense – 2.0% | |
| AeroVironment, Inc. (a) | | 299 | $27,358 |
| CACI International, Inc., “A” (a) | | 366 | 111,275 |
| General Dynamics Corp. | | 3,020 | 754,396 |
| Honeywell International, Inc. (f) | | 1,853 | 378,049 |
| Howmet Aerospace, Inc. | | 4,335 | 154,109 |
| KBR, Inc. | | 2,862 | 142,442 |
| Kratos Defense & Security Solutions, Inc. (a) | | 1,440 | 15,955 |
| L3Harris Technologies, Inc. | | 381 | 93,905 |
| Leidos Holdings, Inc. | | 616 | 62,579 |
| MTU Aero Engines Holding AG | | 719 | 128,788 |
| Northrop Grumman Corp. | | 954 | 523,756 |
| Raytheon Technologies Corp. | | 518 | 49,117 |
| Rolls-Royce Holdings PLC (a) | | 154,108 | 138,115 |
| Singapore Technologies Engineering Ltd. | | 45,500 | 106,068 |
| Textron, Inc. | | 4,806 | 328,923 |
| Thales S.A. | | 212 | 26,953 |
| | | | | $3,041,788 |
| Airlines – 0.1% | |
| Alaska Air Group, Inc. (a) | | 544 | $24,186 |
| Delta Air Lines, Inc. (a) | | 924 | 31,351 |
| JetBlue Airways Corp. (a) | | 4,674 | 37,579 |
| Ryanair Holdings PLC, ADR (a) | | 506 | 34,859 |
| | | | | $127,975 |
| Alcoholic Beverages – 1.0% | |
| Carlsberg Group | | 290 | $34,180 |
| China Resources Beer Holdings Co. Ltd. | | 16,000 | 75,417 |
| Constellation Brands, Inc., “A” | | 127 | 31,379 |
| Diageo PLC | | 10,156 | 419,056 |
| Kirin Holdings Co. Ltd. | | 3,400 | 50,001 |
| Pernod Ricard S.A. | | 5,062 | 888,948 |
| | | | | $1,498,981 |
| Apparel Manufacturers – 1.0% | |
| Burberry Group PLC | | 1,217 | $25,331 |
| Canada Goose Holdings, Inc. (a) | | 955 | 15,624 |
| Compagnie Financiere Richemont S.A. | | 2,641 | 258,311 |
| LVMH Moet Hennessy Louis Vuitton SE | | 1,401 | 884,720 |
| NIKE, Inc., “B” | | 1,475 | 136,703 |
Portfolio of Investments – continued
| Issuer | | | Shares/Par | Value ($) |
| Common Stocks – continued |
| Apparel Manufacturers – continued | |
| On Holding AG (a) | | 1,719 | $30,237 |
| PVH Corp. | | 1,069 | 54,861 |
| Skechers USA, Inc., “A” (a) | | 5,378 | 185,165 |
| | | | | $1,590,952 |
| Automotive – 1.3% | |
| Allison Transmission Holdings, Inc. | | 3,516 | $148,551 |
| Aptiv PLC (a) | | 499 | 45,444 |
| Bridgestone Corp. | | 1,400 | 50,484 |
| Copart, Inc. (a) | | 1,228 | 141,244 |
| Ford Motor Co. | | 24,959 | 333,702 |
| General Motors Co. | | 5,360 | 210,380 |
| Koito Manufacturing Co. Ltd. | | 3,600 | 51,181 |
| Lear Corp. | | 269 | 37,313 |
| LKQ Corp. | | 2,757 | 153,399 |
| Methode Electronics, Inc. | | 2,859 | 117,877 |
| Michelin (CGDE) | | 1,833 | 46,754 |
| NGK Spark Plug Co. Ltd | | 4,600 | 83,836 |
| Oshkosh Corp. | | 1,771 | 155,848 |
| Stanley Electric Co. Ltd. | | 3,300 | 56,104 |
| Stoneridge, Inc. (a) | | 856 | 17,865 |
| Tesla, Inc. (a) | | 1,492 | 339,490 |
| Visteon Corp. (a) | | 702 | 91,590 |
| | | | | $2,081,062 |
| Biotechnology – 0.6% | |
| Abcam PLC (a) | | 3,274 | $50,462 |
| Adaptive Biotechnologies Corp. (a) | | 1,308 | 10,176 |
| AlloVir, Inc. (a)(l) | | 1,333 | 9,238 |
| BioAtla, Inc. (a) | | 847 | 5,836 |
| Biogen, Inc. (a) | | 1,225 | 347,214 |
| BioXcel Therapeutics, Inc. (a) | | 727 | 9,153 |
| Gilead Sciences, Inc. | | 2,997 | 235,145 |
| Illumina, Inc. (a) | | 61 | 13,958 |
| Immunocore Holdings PLC, ADR (a) | | 584 | 33,370 |
| Lyell Immunopharma, Inc. (a)(l) | | 1,683 | 9,896 |
| MaxCyte, Inc. (a)(l) | | 2,778 | 19,224 |
| Moderna, Inc. (a) | | 592 | 88,995 |
| Oxford Nanopore Technologies PLC (a) | | 4,764 | 14,341 |
| Prelude Therapeutics, Inc. (a)(l) | | 820 | 5,486 |
| Recursion Pharmaceuticals, Inc. (a) | | 1,085 | 11,447 |
| Sana Biotechnology, Inc. (a)(l) | | 1,306 | 7,575 |
Portfolio of Investments – continued
| Issuer | | | Shares/Par | Value ($) |
| Common Stocks – continued |
| Biotechnology – continued | |
| Twist Bioscience Corp. (a) | | 497 | $16,316 |
| | | | | $887,832 |
| Broadcasting – 0.0% | |
| Nippon Television Holdings, Inc. | | 4,000 | $29,860 |
| Warner Bros. Discovery, Inc. (a) | | 2,334 | 30,342 |
| | | | | $60,202 |
| Brokerage & Asset Managers – 2.6% | |
| ASX Ltd. | | 1,749 | $75,580 |
| Barclays PLC | | 39,251 | 66,511 |
| BlackRock, Inc. | | 657 | 424,363 |
| Cboe Global Markets, Inc. | | 344 | 42,828 |
| Charles Schwab Corp. | | 3,145 | 250,562 |
| Citigroup, Inc. | | 12,414 | 569,306 |
| CME Group, Inc. | | 1,191 | 206,400 |
| Computershare Ltd. | | 10,460 | 169,075 |
| Deutsche Boerse AG | | 1,328 | 216,086 |
| Euronext N.V. | | 1,344 | 85,404 |
| Evercore Partners, Inc. | | 299 | 31,425 |
| Focus Financial Partners, “A” (a) | | 2,653 | 92,298 |
| GCM Grosvenor, Inc., “A” | | 5,692 | 47,073 |
| Hamilton Lane, Inc., “A” | | 1,293 | 77,347 |
| Hong Kong Exchanges & Clearing Ltd. | | 2,300 | 61,064 |
| Invesco Ltd. | | 1,417 | 21,708 |
| London Stock Exchange Group PLC | | 1,383 | 119,999 |
| NASDAQ, Inc. | | 9,339 | 581,259 |
| Omni Bridgeway Ltd. (a) | | 28,188 | 81,176 |
| Raymond James Financial, Inc. | | 5,014 | 592,354 |
| Schroders PLC | | 12,946 | 58,154 |
| TMX Group Ltd. | | 1,022 | 98,258 |
| TPG, Inc. | | 906 | 27,860 |
| WisdomTree Investments, Inc. | | 14,171 | 76,949 |
| | | | | $4,073,039 |
| Business Services – 3.7% | |
| Accenture PLC, “A” | | 4,436 | $1,259,380 |
| Amdocs Ltd. | | 750 | 64,733 |
| Bunzl PLC | | 1,188 | 38,706 |
| Cognizant Technology Solutions Corp., “A” | | 424 | 26,394 |
| CoStar Group, Inc. (a) | | 6,145 | 508,314 |
| Dropbox, Inc. (a) | | 10,194 | 221,719 |
| Equifax, Inc. (f) | | 2,600 | 440,804 |
| ExlService Holdings, Inc. (a) | | 611 | 111,110 |
Portfolio of Investments – continued
| Issuer | | | Shares/Par | Value ($) |
| Common Stocks – continued |
| Business Services – continued | |
| Experian PLC | | 4,618 | $146,909 |
| Fidelity National Information Services, Inc. | | 577 | 47,885 |
| Fiserv, Inc. (a) | | 232 | 23,836 |
| Global Payments, Inc. | | 393 | 44,904 |
| GoDaddy, Inc. (a) | | 7,205 | 579,282 |
| HireRight Holdings Corp. (a) | | 2,198 | 29,585 |
| Intertek Group PLC | | 2,494 | 104,509 |
| Keywords Studios PLC | | 2,260 | 62,462 |
| Morningstar, Inc. | | 416 | 96,587 |
| MSCI, Inc. | | 1,232 | 577,636 |
| Nomura Research Institute Ltd. | | 5,000 | 110,787 |
| Paya, Inc. (a) | | 7,766 | 62,439 |
| Payoneer Global, Inc. (a) | | 5,984 | 46,376 |
| Remitly Global, Inc. (a) | | 4,856 | 56,427 |
| Secom Co. Ltd. | | 400 | 22,790 |
| SGS S.A. | | 84 | 185,306 |
| TaskUs, Inc., “A” (a) | | 3,863 | 77,994 |
| Thoughtworks Holding, Inc. (a) | | 6,799 | 65,338 |
| Verisk Analytics, Inc., “A” | | 2,209 | 403,871 |
| WEX, Inc. (a) | | 1,433 | 235,213 |
| WNS (Holdings) Ltd., ADR (a) | | 1,530 | 131,702 |
| | | | | $5,782,998 |
| Cable TV – 0.5% | |
| Cable One, Inc. | | 21 | $18,048 |
| Charter Communications, Inc., “A” (a) | | 1,046 | 384,531 |
| Comcast Corp., “A” | | 10,360 | 328,826 |
| | | | | $731,405 |
| Chemicals – 0.4% | |
| Avient Corp. | | 1,382 | $47,665 |
| Eastman Chemical Co. | | 645 | 49,543 |
| Element Solutions, Inc. | | 8,237 | 141,676 |
| Givaudan S.A. | | 94 | 280,681 |
| IMCD Group N.V. | | 597 | 77,465 |
| Ingevity Corp. (a) | | 1,243 | 83,617 |
| | | | | $680,647 |
| Computer Software – 5.8% | |
| ACI Worldwide, Inc. (a) | | 1,634 | $39,755 |
| Adobe Systems, Inc. (a)(f) | | 1,071 | 341,114 |
| Alkami Technology, Inc. (a) | | 3,980 | 63,083 |
| ANSYS, Inc. (a) | | 949 | 209,881 |
| Atlassian Corp. (a) | | 946 | 191,783 |
Portfolio of Investments – continued
| Issuer | | | Shares/Par | Value ($) |
| Common Stocks – continued |
| Computer Software – continued | |
| Autodesk, Inc. (a) | | 364 | $78,005 |
| Black Knight, Inc. (a) | | 2,610 | 157,827 |
| Cadence Design Systems, Inc. (a)(f)(s) | | 5,881 | 890,325 |
| Check Point Software Technologies Ltd. (a) | | 196 | 25,329 |
| Computer Modelling Group Ltd. | | 32,672 | 129,503 |
| CrowdStrike Holdings, Inc. (a) | | 897 | 144,596 |
| Dassault Systemes SE | | 12,261 | 411,370 |
| Definitive Healthcare Corp. (a) | | 1,698 | 26,794 |
| DoubleVerify Holdings, Inc. (a) | | 1,556 | 45,482 |
| Dun & Bradstreet Holdings, Inc. | | 1,724 | 22,153 |
| Elastic N.V. (a) | | 191 | 12,215 |
| EMIS Group PLC | | 7,735 | 164,814 |
| Everbridge, Inc. (a) | | 1,226 | 38,411 |
| Expensify, Inc., “A” (a) | | 1,762 | 23,065 |
| Intuit, Inc. | | 678 | 289,845 |
| Kinaxis, Inc. (a) | | 1,437 | 153,378 |
| Microsoft Corp. (f)(s) | | 15,287 | 3,548,571 |
| Naver Corp. | | 1,690 | 200,344 |
| nCino, Inc. (a) | | 767 | 24,145 |
| NetEase.com, Inc., ADR | | 828 | 46,053 |
| NICE Systems Ltd., ADR (a) | | 692 | 131,404 |
| OBIC Co. Ltd. | | 1,500 | 224,984 |
| Open Lending Corp., “A” (a) | | 2,283 | 16,369 |
| Palo Alto Networks, Inc. (a) | | 1,014 | 173,992 |
| Paycor HCM, Inc. (a) | | 1,520 | 46,314 |
| Paylocity Holding Corp. (a) | | 135 | 31,292 |
| Procore Technologies, Inc. (a) | | 959 | 52,419 |
| Sabre Corp. (a) | | 9,951 | 57,815 |
| Salesforce, Inc. (a) | | 397 | 64,548 |
| SAP SE | | 5,922 | 571,606 |
| Synopsys, Inc. (a) | | 1,064 | 311,273 |
| | | | | $8,959,857 |
| Computer Software - Systems – 3.3% | |
| Alten S.A. | | 774 | $90,488 |
| Amadeus IT Group S.A. (a) | | 8,139 | 424,207 |
| Apple, Inc. (f) | | 18,723 | 2,870,985 |
| Cancom SE | | 1,672 | 41,375 |
| Constellation Software, Inc. | | 87 | 125,798 |
| Five9, Inc. (a) | | 737 | 44,412 |
| Fujitsu Ltd. | | 600 | 69,101 |
| Hitachi Ltd. | | 14,600 | 661,342 |
| Nuvei Corp. (a)(l) | | 1,343 | 40,384 |
Portfolio of Investments – continued
| Issuer | | | Shares/Par | Value ($) |
| Common Stocks – continued |
| Computer Software - Systems – continued | |
| Q2 Holdings, Inc. (a) | | 1,866 | $57,921 |
| Rapid7, Inc. (a) | | 1,302 | 58,942 |
| Samsung Electronics Co. Ltd. | | 1,472 | 61,211 |
| Seagate Technology Holdings PLC | | 428 | 21,254 |
| ServiceNow, Inc. (a) | | 508 | 213,736 |
| Softchoice Corp. (l) | | 2,803 | 35,944 |
| Temenos AG | | 711 | 42,389 |
| Venture Corp. Ltd. | | 8,000 | 90,174 |
| Verint Systems, Inc. (a) | | 1,344 | 47,618 |
| Zebra Technologies Corp., “A” (a) | | 164 | 46,448 |
| | | | | $5,043,729 |
| Conglomerates – 0.1% | |
| Ansell Ltd. | | 6,024 | $108,594 |
| Construction – 1.1% | |
| AZEK Co., Inc. (a) | | 5,776 | $101,138 |
| Essex Property Trust, Inc., REIT | | 139 | 30,891 |
| Fortune Brands Home & Security, Inc. | | 475 | 28,652 |
| Masco Corp. | | 1,418 | 65,611 |
| Mid-America Apartment Communities, Inc., REIT | | 166 | 26,137 |
| Pool Corp. | | 225 | 68,452 |
| Sherwin-Williams Co. (f) | | 2,324 | 522,970 |
| Stanley Black & Decker, Inc. | | 428 | 33,594 |
| Techtronic Industries Co. Ltd. | | 8,000 | 75,464 |
| Toll Brothers, Inc. (f) | | 6,631 | 285,663 |
| Trex Co., Inc. (a) | | 606 | 29,142 |
| Vulcan Materials Co. | | 2,587 | 423,492 |
| | | | | $1,691,206 |
| Consumer Products – 1.9% | |
| Church & Dwight Co., Inc. | | 1,629 | $120,758 |
| Colgate-Palmolive Co. (f) | | 7,937 | 586,068 |
| Estee Lauder Cos., Inc., “A” | | 759 | 152,172 |
| International Flavors & Fragrances, Inc. | | 492 | 48,024 |
| Kao Corp. | | 5,600 | 210,153 |
| Kimberly-Clark Corp. | | 216 | 26,883 |
| Kobayashi Pharmaceutical Co. Ltd. | | 8,800 | 467,534 |
| L’Oréal S.A. | | 723 | 227,284 |
| Newell Brands, Inc. | | 4,584 | 63,305 |
| Prestige Consumer Healthcare, Inc. (a) | | 1,145 | 62,380 |
| Reckitt Benckiser Group PLC | | 13,803 | 914,932 |
| | | | | $2,879,493 |
Portfolio of Investments – continued
| Issuer | | | Shares/Par | Value ($) |
| Common Stocks – continued |
| Consumer Services – 0.9% | |
| Airbnb, Inc., “A” (a) | | 964 | $103,061 |
| Asante, Inc. | | 8,200 | 88,253 |
| Booking Holdings, Inc. (a) | | 377 | 704,794 |
| Boyd Group Services, Inc. | | 398 | 56,635 |
| Bright Horizons Family Solutions, Inc. (a) | | 2,989 | 195,241 |
| Carsales.com Ltd. | | 2,070 | 26,794 |
| European Wax Center, Inc., “A” | | 2,710 | 38,970 |
| Grand Canyon Education, Inc. (a) | | 351 | 35,321 |
| Meitec Corp. | | 7,600 | 128,238 |
| Persol Holdings Co. Ltd. | | 1,700 | 33,975 |
| Seek Ltd. | | 1,492 | 20,508 |
| | | | | $1,431,790 |
| Containers – 0.3% | |
| Ardagh Metal Packaging S.A. (l) | | 6,300 | $27,972 |
| Avery Dennison Corp. | | 203 | 34,419 |
| Crown Holdings, Inc. | | 444 | 30,454 |
| Graphic Packaging Holding Co. | | 5,114 | 117,417 |
| Pactiv Evergreen, Inc. | | 2,153 | 23,489 |
| Silgan Holdings, Inc. | | 1,407 | 66,636 |
| Verallia | | 1,210 | 34,295 |
| WestRock Co. | | 1,498 | 51,022 |
| | | | | $385,704 |
| Electrical Equipment – 1.7% | |
| AMETEK, Inc. | | 1,402 | $181,783 |
| Berry Global, Inc. (a) | | 2,054 | 97,195 |
| Johnson Controls International PLC | | 2,094 | 121,117 |
| Legrand S.A. | | 4,027 | 306,993 |
| Littlefuse, Inc. | | 171 | 37,663 |
| nVent Electric PLC | | 1,241 | 45,296 |
| Rockwell Automation, Inc. | | 863 | 220,324 |
| Schneider Electric SE | | 10,055 | 1,274,501 |
| Sensata Technologies Holding PLC | | 3,217 | 129,355 |
| TE Connectivity Ltd. | | 581 | 71,016 |
| TriMas Corp. | | 1,856 | 42,410 |
| Vertiv Holdings Co. | | 4,473 | 64,009 |
| | | | | $2,591,662 |
| Electronics – 2.4% | |
| Advanced Energy Industries, Inc. | | 772 | $60,718 |
| Analog Devices, Inc. | | 3,220 | 459,236 |
| Applied Materials, Inc. | | 4,651 | 410,637 |
| ASM International N.V. | | 601 | 133,517 |
Portfolio of Investments – continued
| Issuer | | | Shares/Par | Value ($) |
| Common Stocks – continued |
| Electronics – continued | |
| ASM Pacific Technology Ltd. | | 6,300 | $34,551 |
| ASML Holding N.V. | | 71 | 33,539 |
| Cohu, Inc. (a) | | 1,853 | 61,001 |
| Corning, Inc. | | 1,294 | 41,628 |
| Flex Ltd. (a) | | 2,135 | 41,803 |
| Intel Corp. | | 5,976 | 169,898 |
| Kyocera Corp. | | 1,300 | 61,479 |
| Lam Research Corp. | | 67 | 27,120 |
| Marvell Technology, Inc. | | 1,366 | 54,203 |
| Melexis N.V. | | 400 | 27,592 |
| Micron Technology, Inc. | | 4,994 | 270,175 |
| Monolithic Power Systems, Inc. | | 556 | 188,734 |
| NVIDIA Corp. (f) | | 2,447 | 330,272 |
| NXP Semiconductors N.V. | | 986 | 144,035 |
| ON Semiconductor Corp. (a) | | 771 | 47,362 |
| Plexus Corp. (a) | | 496 | 48,806 |
| Taiwan Semiconductor Manufacturing Co. Ltd. | | 3,654 | 43,973 |
| Taiwan Semiconductor Manufacturing Co. Ltd., ADR | | 9,143 | 562,752 |
| Texas Instruments, Inc. (f) | | 3,047 | 489,440 |
| | | | | $3,742,471 |
| Energy - Independent – 1.6% | |
| CNX Resources Corp. (a) | | 3,212 | $53,994 |
| ConocoPhillips | | 790 | 99,611 |
| Coterra Energy, Inc. | | 1,445 | 44,983 |
| Devon Energy Corp. | | 1,047 | 80,985 |
| Diamondback Energy, Inc. | | 1,442 | 226,553 |
| Hess Corp. | | 1,761 | 248,442 |
| Magnolia Oil & Gas Corp., “A” | | 5,125 | 131,610 |
| Matador Resources Co. | | 466 | 30,966 |
| Phillips 66 | | 1,641 | 171,140 |
| Pioneer Natural Resources Co. | | 1,742 | 446,666 |
| Reliance Industries Ltd. | | 11,846 | 364,864 |
| Valero Energy Corp. | | 3,498 | 439,174 |
| Viper Energy Partners LP | | 1,741 | 58,062 |
| Woodside Energy Group Ltd. | | 3,345 | 77,493 |
| | | | | $2,474,543 |
| Energy - Integrated – 0.9% | |
| Eni S.p.A. | | 6,384 | $83,619 |
| Exxon Mobil Corp. (f) | | 2,445 | 270,930 |
| Galp Energia SGPS S.A., “B” | | 8,670 | 88,038 |
| Idemitsu Kosan Co. Ltd. | | 2,500 | 54,642 |
| Shell PLC | | 9,225 | 254,325 |
Portfolio of Investments – continued
| Issuer | | | Shares/Par | Value ($) |
| Common Stocks – continued |
| Energy - Integrated – continued | |
| TotalEnergies SE | | 12,472 | $679,133 |
| | | | | $1,430,687 |
| Energy - Renewables – 0.2% | |
| AES Corp. | | 2,530 | $66,185 |
| Enphase Energy, Inc. (a) | | 460 | 141,220 |
| Generac Holdings, Inc. (a) | | 32 | 3,709 |
| Orsted A/S | | 341 | 28,124 |
| | | | | $239,238 |
| Engineering - Construction – 0.0% | |
| Quanta Services, Inc. | | 280 | $39,771 |
| Entertainment – 0.1% | |
| Live Nation Entertainment, Inc. (a) | | 577 | $45,935 |
| Manchester United PLC, “A” | | 6,020 | 78,621 |
| SeaWorld Entertainment, Inc. (a) | | 938 | 54,554 |
| Vivid Seats, Inc., “A” (a)(l) | | 5,566 | 45,641 |
| | | | | $224,751 |
| Food & Beverages – 2.6% | |
| Archer Daniels Midland Co. | | 3,888 | $377,058 |
| Britvic PLC | | 8,847 | 73,810 |
| Chocoladefabriken Lindt & Sprungli AG | | 42 | 402,656 |
| Coca-Cola Europacific Partners PLC | | 747 | 35,146 |
| Danone S.A. | | 1,048 | 52,137 |
| Duckhorn Portfolio, Inc. (a) | | 3,413 | 49,898 |
| Hostess Brands, Inc. (a) | | 2,072 | 54,867 |
| Ingredion, Inc. | | 513 | 45,719 |
| J.M. Smucker Co. | | 306 | 46,102 |
| Kellogg Co. | | 570 | 43,787 |
| Kerry Group PLC | | 370 | 32,177 |
| Mondelez International, Inc. | | 570 | 35,044 |
| Morinaga & Co. Ltd. | | 4,600 | 115,081 |
| Nestle S.A. | | 14,179 | 1,543,994 |
| Nestle S.A., ADR | | 1,658 | 180,241 |
| Nomad Foods Ltd. (a) | | 3,584 | 55,194 |
| Oatly Group AB, ADR (a) | | 6,760 | 14,872 |
| PepsiCo, Inc. | | 340 | 61,737 |
| S Foods, Inc. | | 4,600 | 84,300 |
| Toyo Suisan Kaisha Ltd. | | 7,900 | 296,459 |
| Tyson Foods, Inc., “A” | | 6,871 | 469,633 |
| | | | | $4,069,912 |
Portfolio of Investments – continued
| Issuer | | | Shares/Par | Value ($) |
| Common Stocks – continued |
| Food & Drug Stores – 0.3% | |
| Albertsons Cos., Inc., “A” | | 1,879 | $38,538 |
| JM Holdings Co. Ltd. | | 8,900 | 101,357 |
| Kroger Co. | | 3,184 | 150,571 |
| Ocado Group PLC (a) | | 1,522 | 8,245 |
| Patlac Corp. | | 2,600 | 73,790 |
| Sugi Holdings Co. Ltd. | | 400 | 16,060 |
| Sundrug Co. Ltd. | | 4,600 | 107,038 |
| | | | | $495,599 |
| Forest & Paper Products – 0.1% | |
| Suzano Papel e Celulose S.A., ADR | | 10,393 | $106,944 |
| Furniture & Appliances – 0.0% | |
| Howden Joinery Group PLC | | 8,956 | $52,791 |
| IMAX Corp. (a) | | 686 | 8,733 |
| | | | | $61,524 |
| Gaming & Lodging – 0.8% | |
| Aristocrat Leisure Ltd. | | 2,241 | $52,883 |
| Flutter Entertainment PLC (a) | | 3,903 | 518,316 |
| Genius Sports Ltd. (a) | | 6,125 | 31,483 |
| Hyatt Hotels Corp. (a) | | 1,276 | 120,212 |
| International Game Technology PLC | | 5,980 | 119,899 |
| Marriott International, Inc., “A” | | 2,020 | 323,422 |
| Penn Entertainment, Inc. (a) | | 2,274 | 75,269 |
| Whitbread PLC | | 1,142 | 33,684 |
| | | | | $1,275,168 |
| General Merchandise – 0.3% | |
| Dollar General Corp. | | 118 | $30,096 |
| Dollar Tree, Inc. (a) | | 550 | 87,175 |
| Dollarama, Inc. | | 3,199 | 190,083 |
| Five Below, Inc. (a) | | 798 | 116,787 |
| Ollie's Bargain Outlet Holdings, Inc. (a) | | 1,301 | 72,856 |
| | | | | $496,997 |
| Health Maintenance Organizations – 0.8% | |
| Cigna Corp. | | 2,604 | $841,248 |
| Elevance Health, Inc. | | 59 | 32,260 |
| Humana, Inc. | | 55 | 30,694 |
| Molina Healthcare, Inc. (a) | | 245 | 87,921 |
| UnitedHealth Group, Inc. | | 535 | 297,005 |
| | | | | $1,289,128 |
Portfolio of Investments – continued
| Issuer | | | Shares/Par | Value ($) |
| Common Stocks – continued |
| Insurance – 4.0% | |
| AIA Group Ltd. | | 78,800 | $595,074 |
| American International Group, Inc. | | 10,249 | 584,193 |
| Ameriprise Financial, Inc. | | 853 | 263,679 |
| Aon PLC | | 2,905 | 817,728 |
| Arthur J. Gallagher & Co. | | 1,903 | 356,013 |
| Assurant, Inc. | | 372 | 50,540 |
| Beazley PLC | | 41,329 | 295,989 |
| Chubb Ltd. | | 201 | 43,193 |
| Cincinnati Financial Corp. | | 290 | 29,963 |
| CNO Financial Group, Inc. | | 2,164 | 47,738 |
| Equitable Holdings, Inc. | | 16,973 | 519,713 |
| Everest Re Group Ltd. | | 1,334 | 430,428 |
| Hanover Insurance Group, Inc. | | 492 | 72,073 |
| Hartford Financial Services Group, Inc. | | 1,249 | 90,440 |
| Hiscox Ltd. | | 3,210 | 33,102 |
| Marsh & McLennan Cos., Inc. | | 2,477 | 400,011 |
| MetLife, Inc. (f) | | 7,333 | 536,849 |
| Progressive Corp. | | 3,951 | 507,308 |
| Reinsurance Group of America, Inc. | | 471 | 69,317 |
| Selective Insurance Group, Inc. | | 635 | 62,281 |
| Steadfast Group Ltd. | | 19,738 | 63,721 |
| Voya Financial, Inc. | | 627 | 42,862 |
| Willis Towers Watson PLC | | 616 | 134,417 |
| Zurich Insurance Group AG | | 234 | 99,853 |
| | | | | $6,146,485 |
| Internet – 2.7% | |
| Alphabet, Inc., “A” (a)(s) | | 16,763 | $1,584,271 |
| Alphabet, Inc., “C” (a) | | 13,939 | 1,319,466 |
| Gartner, Inc. (a) | | 2,183 | 659,091 |
| MakeMyTrip Ltd. (a) | | 1,141 | 31,754 |
| Match Group, Inc. (a) | | 2,272 | 98,150 |
| Meta Platforms, Inc., “A” (a)(f) | | 2,641 | 246,036 |
| Tencent Holdings Ltd. | | 10,600 | 277,638 |
| | | | | $4,216,406 |
| Leisure & Toys – 0.8% | |
| Brunswick Corp. | | 3,625 | $256,179 |
| Corsair Gaming, Inc. (a)(l) | | 1,471 | 20,300 |
| Electronic Arts, Inc. | | 1,530 | 192,719 |
| Funko, Inc., “A” (a) | | 1,559 | 32,193 |
| Mattel, Inc. (a) | | 6,729 | 127,582 |
| Polaris, Inc. | | 2,706 | 274,929 |
| Take-Two Interactive Software, Inc. (a) | | 1,033 | 122,390 |
Portfolio of Investments – continued
| Issuer | | | Shares/Par | Value ($) |
| Common Stocks – continued |
| Leisure & Toys – continued | |
| VTech Holdings Ltd. | | 21,700 | $115,416 |
| Yamaha Corp. | | 800 | 30,236 |
| | | | | $1,171,944 |
| Machinery & Tools – 2.9% | |
| AGCO Corp. (f) | | 4,846 | $601,728 |
| Azbil Corp. | | 2,800 | 76,169 |
| BELIMO Holding AG | | 423 | 172,351 |
| Cummins, Inc. | | 706 | 172,624 |
| Daikin Industries Ltd. | | 700 | 105,380 |
| Eaton Corp. PLC | | 498 | 74,735 |
| ESAB Corp. | | 884 | 32,973 |
| Flowserve Corp. | | 2,037 | 58,421 |
| GEA Group AG | | 14,179 | 496,039 |
| Hydrofarm Holdings Group, Inc. (a) | | 2,518 | 6,497 |
| IDEX Corp. | | 736 | 163,620 |
| Illinois Tool Works, Inc. | | 1,558 | 332,680 |
| Ingersoll Rand, Inc. | | 1,156 | 58,378 |
| ITT, Inc. | | 776 | 59,279 |
| Kubota Corp. | | 5,400 | 75,410 |
| Nordson Corp. | | 881 | 198,225 |
| PACCAR, Inc. | | 807 | 78,142 |
| Regal Rexnord Corp. | | 915 | 115,784 |
| Ritchie Bros. Auctioneers, Inc. | | 1,032 | 67,421 |
| Ritchie Bros. Auctioneers, Inc. | | 6,890 | 450,112 |
| Roper Technologies, Inc. | | 19 | 7,876 |
| Schindler Holding AG | | 966 | 157,487 |
| SIG Combibloc Group AG | | 7,753 | 148,967 |
| SMC Corp. | | 200 | 80,508 |
| Spirax-Sarco Engineering PLC | | 4,140 | 510,383 |
| Timken Co. | | 829 | 59,099 |
| Toyota Industries Corp. | | 1,200 | 61,818 |
| Wabtec Corp. | | 1,012 | 94,399 |
| Weir Group PLC | | 2,361 | 41,223 |
| | | | | $4,557,728 |
| Major Banks – 1.9% | |
| Bank of America Corp. | | 6,406 | $230,872 |
| BNP Paribas | | 2,389 | 112,132 |
| Capital One Financial Corp. | | 1,173 | 124,361 |
| Comerica, Inc. | | 2,555 | 180,128 |
| DBS Group Holdings Ltd. | | 11,000 | 265,753 |
| JPMorgan Chase & Co. | | 6,651 | 837,228 |
| KeyCorp | | 2,452 | 43,817 |
Portfolio of Investments – continued
| Issuer | | | Shares/Par | Value ($) |
| Common Stocks – continued |
| Major Banks – continued | |
| Mitsubishi UFJ Financial Group, Inc. | | 7,800 | $36,977 |
| Morgan Stanley | | 5,801 | 476,668 |
| NatWest Group PLC | | 40,529 | 109,132 |
| PNC Financial Services Group, Inc. | | 232 | 37,545 |
| Resona Holdings, Inc. | | 74,900 | 281,930 |
| State Street Corp. | | 463 | 34,262 |
| UBS AG | | 7,525 | 119,411 |
| | | | | $2,890,216 |
| Medical & Health Technology & Services – 1.7% | |
| AmerisourceBergen Corp. | | 415 | $65,246 |
| Certara, Inc. (a) | | 4,134 | 50,559 |
| CVS Health Corp. (f) | | 4,598 | 435,431 |
| Guardant Health, Inc. (a) | | 330 | 16,335 |
| HealthEquity, Inc. (a) | | 617 | 48,071 |
| Henry Schein, Inc. (a) | | 1,189 | 81,399 |
| ICON PLC (a) | | 2,556 | 505,679 |
| Laboratory Corp. of America Holdings | | 204 | 45,259 |
| McKesson Corp. | | 2,860 | 1,113,598 |
| Premier, Inc., “A” | | 1,388 | 48,413 |
| Syneos Health, Inc. (a) | | 2,912 | 146,707 |
| Universal Health Services, Inc. | | 381 | 44,146 |
| | | | | $2,600,843 |
| Medical Equipment – 3.1% | |
| Agilent Technologies, Inc. | | 1,461 | $202,129 |
| Agiliti Health, Inc. (a) | | 1,625 | 28,389 |
| Becton, Dickinson and Co. | | 145 | 34,216 |
| Boston Scientific Corp. (a)(f) | | 8,401 | 362,167 |
| Bruker BioSciences Corp. | | 1,028 | 63,572 |
| ConvaTec Group PLC | | 18,483 | 46,208 |
| Danaher Corp. (f) | | 1,620 | 407,705 |
| Dentsply Sirona, Inc. | | 1,090 | 33,594 |
| Envista Holdings Corp. (a) | | 6,995 | 230,905 |
| EssilorLuxottica | | 3,421 | 542,112 |
| Gerresheimer AG | | 2,324 | 133,208 |
| Hogy Medical Co. Ltd. | | 4,600 | 101,666 |
| Hologic, Inc. (a) | | 426 | 28,883 |
| Maravai Lifesciences Holdings, Inc., “A” (a) | | 4,710 | 78,186 |
| Medtronic PLC | | 554 | 48,386 |
| Mettler-Toledo International, Inc. (a) | | 67 | 84,750 |
| Nihon Kohden Corp. | | 3,000 | 67,285 |
| OptiNose, Inc. (a) | | 3,225 | 11,255 |
| Outset Medical, Inc. (a) | | 1,025 | 15,929 |
Portfolio of Investments – continued
| Issuer | | | Shares/Par | Value ($) |
| Common Stocks – continued |
| Medical Equipment – continued | |
| PerkinElmer, Inc. | | 1,714 | $228,956 |
| PROCEPT BioRobotics Corp. (a) | | 480 | 21,806 |
| QIAGEN N.V. (a) | | 9,322 | 402,585 |
| Quidel Corp. (a) | | 441 | 39,611 |
| Shimadzu Corp. | | 9,700 | 254,618 |
| Silk Road Medical, Inc. (a) | | 562 | 24,773 |
| Smith & Nephew PLC | | 6,828 | 80,653 |
| STERIS PLC | | 1,222 | 210,893 |
| Terumo Corp. | | 1,800 | 54,764 |
| Thermo Fisher Scientific, Inc. | | 1,396 | 717,502 |
| Waters Corp. (a) | | 468 | 140,012 |
| Zimmer Biomet Holdings, Inc. | | 409 | 46,360 |
| | | | | $4,743,078 |
| Metals & Mining – 0.3% | |
| Arconic Corp. (a) | | 1,705 | $35,396 |
| Glencore PLC | | 67,392 | 386,039 |
| Kaiser Aluminum Corp. | | 267 | 21,571 |
| | | | | $443,006 |
| Natural Gas - Distribution – 0.3% | |
| Atmos Energy Corp. | | 231 | $24,613 |
| China Resources Gas Group Ltd. | | 8,600 | 22,021 |
| DCC PLC | | 2,134 | 118,448 |
| Italgas S.p.A. | | 23,365 | 120,417 |
| New Jersey Resources Corp. | | 1,055 | 47,095 |
| ONE Gas, Inc. | | 655 | 50,750 |
| | | | | $383,344 |
| Natural Gas - Pipeline – 0.9% | |
| APA Group | | 4,803 | $32,206 |
| Cheniere Energy, Inc. | | 4,715 | 831,773 |
| Enterprise Products Partners LP | | 455 | 11,489 |
| Plains GP Holdings LP | | 7,144 | 89,586 |
| Targa Resources Corp. | | 7,241 | 495,067 |
| | | | | $1,460,121 |
| Network & Telecom – 0.5% | |
| Equinix, Inc., REIT | | 49 | $27,756 |
| Fortinet, Inc. (a) | | 8,614 | 492,376 |
| Motorola Solutions, Inc. | | 199 | 49,692 |
| Qualcomm, Inc. | | 1,797 | 211,435 |
| | | | | $781,259 |
Portfolio of Investments – continued
| Issuer | | | Shares/Par | Value ($) |
| Common Stocks – continued |
| Oil Services – 0.3% | |
| Cactus, Inc., “A” | | 1,394 | $72,098 |
| ChampionX Corp. | | 6,793 | 194,416 |
| Expro Group Holdings N.V. (a) | | 2,876 | 54,443 |
| Halliburton Co. | | 1,058 | 38,532 |
| Helmerich & Payne | | 816 | 40,400 |
| | | | | $399,889 |
| Other Banks & Diversified Financials – 3.1% | |
| Air Lease Corp. | | 1,531 | $54,029 |
| American Express Co. (f) | | 2,329 | 345,740 |
| Bank of Hawaii Corp. | | 732 | 55,595 |
| Brookline Bancorp, Inc. | | 3,788 | 52,085 |
| Cathay General Bancorp, Inc. | | 1,700 | 77,520 |
| Chiba Bank Ltd. | | 66,100 | 361,406 |
| Credicorp Ltd. | | 1,639 | 239,884 |
| Discover Financial Services | | 289 | 30,189 |
| East West Bancorp, Inc. | | 1,309 | 93,685 |
| Element Fleet Management Corp. | | 4,747 | 63,242 |
| First Hawaiian, Inc. | | 1,887 | 48,269 |
| First Interstate BancSystem, Inc. | | 2,770 | 126,340 |
| Hanmi Financial Corp. | | 1,795 | 48,070 |
| HDFC Bank Ltd. | | 3,935 | 71,149 |
| HDFC Bank Ltd., ADR | | 7,017 | 437,229 |
| Julius Baer Group Ltd. | | 1,320 | 63,235 |
| Macquarie Group Ltd. | | 687 | 74,061 |
| Metropolitan Bank & Trust Co. | | 107,817 | 96,189 |
| Moody's Corp. | | 84 | 22,249 |
| Northern Trust Corp. | | 709 | 59,804 |
| Pacific Premier Bancorp, Inc. | | 2,239 | 81,522 |
| Prosperity Bancshares, Inc. | | 2,251 | 161,104 |
| Sandy Spring Bancorp, Inc. | | 867 | 30,726 |
| Signature Bank | | 220 | 34,877 |
| SLM Corp. | | 24,769 | 410,918 |
| SVB Financial Group (a) | | 175 | 40,418 |
| Texas Capital Bancshares, Inc. (a) | | 638 | 38,280 |
| Textainer Group Holdings Ltd. | | 1,093 | 32,703 |
| Truist Financial Corp. | | 1,037 | 46,447 |
| UMB Financial Corp. | | 708 | 58,920 |
| Umpqua Holdings Corp. | | 9,250 | 183,890 |
| United Community Bank, Inc. | | 1,035 | 39,848 |
| Visa, Inc., “A” (f) | | 4,469 | 925,798 |
| Wintrust Financial Corp. | | 343 | 32,112 |
Portfolio of Investments – continued
| Issuer | | | Shares/Par | Value ($) |
| Common Stocks – continued |
| Other Banks & Diversified Financials – continued | |
| Zions Bancorp NA | | 5,642 | $293,046 |
| | | | | $4,830,579 |
| Pharmaceuticals – 4.2% | |
| Annexon, Inc. (a) | | 1,264 | $6,042 |
| Ascendis Pharma, ADR (a) | | 569 | 65,435 |
| Bayer AG | | 5,839 | 307,100 |
| Bristol-Myers Squibb Co. (f) | | 4,222 | 327,078 |
| Collegium Pharmaceutical, Inc. (a) | | 1,328 | 23,824 |
| Eli Lilly & Co. | | 185 | 66,987 |
| Harmony Biosciences Holdings (a) | | 623 | 32,396 |
| Incyte Corp. (a) | | 2,582 | 191,946 |
| Johnson & Johnson (f)(s) | | 5,577 | 970,231 |
| Kyowa Kirin Co. Ltd. | | 4,200 | 99,001 |
| Merck & Co., Inc. (f) | | 10,734 | 1,086,281 |
| Merck KGaA | | 494 | 80,552 |
| Neurocrine Biosciences, Inc. (a) | | 261 | 30,046 |
| Novartis AG | | 2,661 | 214,985 |
| Novo Nordisk A.S., “B” | | 2,084 | 226,564 |
| Organon & Co. | | 1,982 | 51,889 |
| Pfizer, Inc. | | 3,196 | 148,774 |
| Regeneron Pharmaceuticals, Inc. (a) | | 189 | 141,514 |
| Roche Holding AG | | 3,279 | 1,088,961 |
| Sanofi | | 716 | 61,794 |
| Santen Pharmaceutical Co. Ltd. | | 15,500 | 106,117 |
| SpringWorks Therapeutics, Inc. (a) | | 689 | 16,543 |
| Suzuken Co. Ltd./Aichi Japan | | 4,000 | 89,041 |
| Vertex Pharmaceuticals, Inc. (a) | | 2,737 | 853,944 |
| Zoetis, Inc. | | 1,540 | 232,201 |
| | | | | $6,519,246 |
| Pollution Control – 0.2% | |
| GFL Environmental, Inc. | | 4,332 | $116,921 |
| Republic Services, Inc. | | 322 | 42,703 |
| Waste Connections, Inc. | | 822 | 108,430 |
| | | | | $268,054 |
| Precious Metals & Minerals – 0.8% | |
| Agnico Eagle Mines Ltd. | | 8,959 | $394,108 |
| Agnico Eagle Mines Ltd. | | 1,761 | 77,414 |
| Franco-Nevada Corp. | | 4,731 | 584,555 |
| Wheaton Precious Metals Corp. | | 6,081 | 198,943 |
| | | | | $1,255,020 |
Portfolio of Investments – continued
| Issuer | | | Shares/Par | Value ($) |
| Common Stocks – continued |
| Printing & Publishing – 0.1% | |
| Wolters Kluwer N.V. | | 2,067 | $219,694 |
| Railroad & Shipping – 0.8% | |
| Canadian National Railway Co. | | 4,525 | $535,941 |
| Canadian Pacific Railway Ltd. | | 3,278 | 244,178 |
| CSX Corp. | | 7,775 | 225,942 |
| Sankyu, Inc. | | 2,400 | 71,744 |
| Union Pacific Corp. | | 1,038 | 204,631 |
| | | | | $1,282,436 |
| Real Estate – 1.5% | |
| Boston Properties, Inc., REIT | | 195 | $14,177 |
| Brixmor Property Group, Inc., REIT | | 3,494 | 74,457 |
| Broadstone Net Lease, Inc., REIT | | 3,120 | 53,477 |
| Capland Ascendas, REIT | | 45,102 | 83,475 |
| Cushman & Wakefield PLC (a) | | 1,738 | 20,074 |
| Douglas Emmett, Inc., REIT | | 743 | 13,069 |
| Empire State Realty Trust, REIT, “A” | | 4,951 | 36,489 |
| ESR Group Ltd. | | 56,200 | 95,938 |
| Extra Space Storage, Inc., REIT | | 2,295 | 407,225 |
| Grand City Properties S.A. | | 3,169 | 30,848 |
| Host Hotels & Resorts, Inc., REIT | | 28,296 | 534,228 |
| Jones Lang LaSalle, Inc. (a) | | 262 | 41,682 |
| LEG Immobilien SE | | 1,001 | 65,408 |
| Life Storage, Inc., REIT | | 674 | 74,551 |
| LXP Industrial Trust, REIT | | 3,931 | 38,052 |
| Mapletree Commercial Trust, REIT | | 48,000 | 53,914 |
| National Storage Affiliates Trust, REIT | | 957 | 40,826 |
| Phillips Edison & Co., REIT | | 1,952 | 58,833 |
| Public Storage, Inc., REIT | | 426 | 131,953 |
| Spirit Realty Capital, Inc., REIT | | 729 | 28,307 |
| STAG Industrial, Inc., REIT | | 2,801 | 88,484 |
| STORE Capital Corp., REIT | | 575 | 18,285 |
| Sun Communities, Inc., REIT | | 333 | 44,905 |
| TAG Immobilien AG | | 22,518 | 141,198 |
| Two Harbors Investment Corp., REIT | | 8,529 | 30,363 |
| VICI Properties, Inc., REIT | | 2,147 | 68,747 |
| W.P. Carey, Inc., REIT | | 568 | 43,338 |
| | | | | $2,332,303 |
| Restaurants – 0.3% | |
| Aramark | | 1,299 | $47,413 |
| Chipotle Mexican Grill, Inc., “A” (a) | | 54 | 80,910 |
| Jack in the Box, Inc. | | 540 | 47,644 |
Portfolio of Investments – continued
| Issuer | | | Shares/Par | Value ($) |
| Common Stocks – continued |
| Restaurants – continued | |
| Performance Food Group Co. (a) | | 590 | $30,704 |
| Sodexo (a) | | 1,255 | 111,300 |
| Starbucks Corp. | | 429 | 37,147 |
| Wendy's Co. | | 3,497 | 72,668 |
| Yum China Holdings, Inc. | | 1,366 | 56,484 |
| | | | | $484,270 |
| Specialty Chemicals – 2.1% | |
| Air Products & Chemicals, Inc. | | 101 | $25,290 |
| Akzo Nobel N.V. | | 619 | 38,196 |
| Ashland, Inc. | | 506 | 53,090 |
| Axalta Coating Systems Ltd. (a) | | 7,451 | 173,757 |
| Celanese Corp. | | 339 | 32,585 |
| Chemours Co. | | 11,664 | 333,940 |
| Corteva, Inc. | | 2,408 | 157,339 |
| Croda International PLC | | 2,473 | 191,716 |
| Diversey Holdings Ltd. (a) | | 8,706 | 47,012 |
| DuPont de Nemours, Inc. | | 1,509 | 86,315 |
| Kansai Paint Co. Ltd. | | 6,700 | 87,414 |
| Linde PLC | | 3,409 | 1,019,611 |
| Nitto Denko Corp. | | 1,200 | 63,190 |
| Novozymes A/S | | 5,338 | 280,351 |
| Quaker Chemical Corp. | | 170 | 27,649 |
| Sika AG | | 2,141 | 482,786 |
| Symrise AG | | 803 | 82,015 |
| Univar Solutions, Inc. (a) | | 3,746 | 95,448 |
| | | | | $3,277,704 |
| Specialty Stores – 2.8% | |
| ACV Auctions, Inc. (a) | | 6,362 | $58,021 |
| Amazon.com, Inc. (a)(f)(s) | | 14,874 | 1,523,693 |
| AutoZone, Inc. (a) | | 233 | 590,161 |
| Builders FirstSource, Inc. (a) | | 342 | 21,088 |
| Costco Wholesale Corp. (f) | | 960 | 481,440 |
| Home Depot, Inc. | | 224 | 66,333 |
| Leslie's, Inc. (a)(l) | | 4,121 | 57,859 |
| Lowe's Cos., Inc. | | 1,553 | 302,757 |
| Lululemon Athletica, Inc. (a) | | 743 | 244,477 |
| Monro Muffler Brake, Inc. | | 689 | 32,900 |
| O'Reilly Automotive, Inc. (a) | | 446 | 373,378 |
| Petco Health & Wellness Co., Inc. (a) | | 4,297 | 45,247 |
| Ross Stores, Inc. | | 733 | 70,141 |
| Ryohin Keikaku Co. Ltd. | | 4,600 | 43,341 |
| Target Corp. | | 309 | 50,753 |
Portfolio of Investments – continued
| Issuer | | | Shares/Par | Value ($) |
| Common Stocks – continued |
| Specialty Stores – continued | |
| Ulta Beauty, Inc. (a) | | 364 | $152,651 |
| Urban Outfitters, Inc. (a) | | 3,799 | 90,644 |
| ZOZO, Inc. | | 4,100 | 86,970 |
| Zumiez, Inc. (a) | | 1,487 | 33,353 |
| | | | | $4,325,207 |
| Telecommunications - Wireless – 0.5% | |
| Advanced Info Service Public Co. Ltd. | | 8,400 | $42,154 |
| American Tower Corp., REIT | | 606 | 125,557 |
| Cellnex Telecom S.A. | | 4,239 | 138,662 |
| KDDI Corp. | | 2,600 | 76,849 |
| Liberty Broadband Corp. (a) | | 423 | 35,714 |
| SBA Communications Corp., REIT | | 853 | 230,225 |
| SoftBank Group Corp. | | 900 | 38,737 |
| T-Mobile US, Inc. (a) | | 154 | 23,340 |
| | | | | $711,238 |
| Telephone Services – 0.4% | |
| AT&T, Inc. | | 13,480 | $245,740 |
| Hellenic Telecommunications Organization S.A. | | 2,303 | 36,187 |
| Infrastrutture Wireless Italiane S.p.A. | | 13,456 | 118,777 |
| Lumen Technologies, Inc. | | 20,725 | 152,536 |
| NOS, SGPS S.A. | | 7,752 | 30,368 |
| | | | | $583,608 |
| Tobacco – 0.7% | |
| Altria Group, Inc. | | 3,923 | $181,517 |
| British American Tobacco PLC | | 3,456 | 136,081 |
| Philip Morris International, Inc. (f) | | 5,348 | 491,214 |
| Swedish Match AB | | 27,730 | 285,307 |
| | | | | $1,094,119 |
| Trucking – 0.3% | |
| CryoPort, Inc. (a) | | 1,469 | $40,779 |
| Knight-Swift Transportation Holdings, Inc. | | 1,959 | 94,091 |
| Saia, Inc. (a) | | 154 | 30,624 |
| Schneider National, Inc. | | 1,545 | 34,361 |
| Seino Holdings Co. Ltd. | | 11,700 | 89,788 |
| SG Holdings Co. Ltd. | | 5,000 | 66,172 |
| XPO Logistics, Inc. (a) | | 1,493 | 77,248 |
| Yamato Holdings Co. Ltd. | | 3,500 | 51,795 |
| | | | | $484,858 |
Portfolio of Investments – continued
| Issuer | | | Shares/Par | Value ($) |
| Common Stocks – continued |
| Utilities - Electric Power – 1.8% | |
| American Electric Power Co., Inc. | | 232 | $20,398 |
| Black Hills Corp. | | 939 | 61,383 |
| CenterPoint Energy, Inc. | | 1,720 | 49,209 |
| CLP Holdings Ltd. | | 4,000 | 26,855 |
| CMS Energy Corp. | | 857 | 48,892 |
| Dominion Energy, Inc. (f) | | 5,601 | 391,902 |
| Duke Energy Corp. (f) | | 4,210 | 392,288 |
| E.ON SE | | 4,458 | 37,342 |
| Edison International | | 554 | 33,262 |
| Eversource Energy | | 562 | 42,869 |
| Exelon Corp. | | 7,564 | 291,895 |
| Iberdrola S.A. | | 8,909 | 90,464 |
| NextEra Energy, Inc. | | 482 | 37,355 |
| PG&E Corp. (a) | | 7,600 | 113,468 |
| Pinnacle West Capital Corp. | | 657 | 44,157 |
| Portland General Electric Co. | | 1,245 | 55,950 |
| Public Service Enterprise Group, Inc. | | 979 | 54,893 |
| Sempra Energy | | 345 | 52,074 |
| Southern Co. | | 5,638 | 369,176 |
| Vistra Corp. | | 26,288 | 603,835 |
| | | | | $2,817,667 |
| Total Common Stocks (Identified Cost, $97,162,243) | | $119,875,971 |
| Bonds – 19.2% |
| Aerospace & Defense – 0.3% |
| Boeing Co., 5.15%, 5/01/2030 | | $ | 194,000 | $179,253 |
| Boeing Co., 5.805%, 5/01/2050 | | | 88,000 | 75,685 |
| General Dynamics Corp., 3.625%, 4/01/2030 | | | 96,000 | 87,248 |
| Raytheon Technologies Corp., 1.9%, 9/01/2031 | | | 50,000 | 37,897 |
| Raytheon Technologies Corp., 2.375%, 3/15/2032 | | | 78,000 | 60,853 |
| Raytheon Technologies Corp., 3.03%, 3/15/2052 | | | 134,000 | 85,421 |
| | | | | $526,357 |
| Apparel Manufacturers – 0.1% |
| Tapestry, Inc., 4.125%, 7/15/2027 | | $ | 52,000 | $47,041 |
| Tapestry, Inc., 3.05%, 3/15/2032 | | | 168,000 | 123,604 |
| | | | | $170,645 |
Portfolio of Investments – continued
| Issuer | | | Shares/Par | Value ($) |
| Bonds – continued |
| Asset-Backed & Securitized – 0.5% |
| 3650R Commercial Mortgage Trust, 2021-PF1, “XA”, 1.031%, 11/15/2054 (i) | | $ | 993,836 | $59,272 |
| ACREC 2021-FL1 Ltd., “A”, FLR, 4.593% (LIBOR - 1mo. + 1.15%), 10/16/2036 (n) | | | 114,000 | 108,480 |
| BDS 2021-FL7 Ltd., “B”, FLR, 4.943% (LIBOR - 1mo. + 1.5%), 6/16/2036 (n) | | | 100,000 | 93,143 |
| Benchmark 2021-B27 Mortgage Trust, “XA”, 1.267%, 7/15/2054 (i) | | | 1,219,337 | 86,823 |
| KREF 2018-FT1 Ltd., “A”, FLR, 4.482% (LIBOR - 1mo. + 1.1%), 2/15/2039 (n) | | | 100,000 | 96,630 |
| KREF 2018-FT1 Ltd., “AS”, FLR, 4.712% (LIBOR - 1mo. + 1.3%), 2/15/2039 (n) | | | 100,000 | 92,594 |
| PFP III 2021-8 Ltd., “A”, FLR, 4.412% (LIBOR - 1mo. + 1%), 8/09/2037 (n) | | | 86,169 | 82,558 |
| PFP III 2021-8 Ltd., “AS”, FLR, 4.662% (LIBOR - 1mo. + 1.25%), 8/09/2037 (n) | | | 104,000 | 97,430 |
| | | | | $716,930 |
| Automotive – 0.2% |
| Hyundai Capital America, 6.375%, 4/08/2030 (n) | | $ | 255,000 | $248,491 |
| Broadcasting – 0.5% |
| Discovery Communications LLC, 3.625%, 5/15/2030 | | $ | 150,000 | $121,091 |
| Discovery Communications LLC, 4%, 9/15/2055 | | | 119,000 | 67,899 |
| Magallanes, Inc., 4.279%, 3/15/2032 (n) | | | 185,000 | 149,433 |
| Magallanes, Inc., 5.391%, 3/15/2062 (n) | | | 97,000 | 67,662 |
| Walt Disney Co., 3.35%, 3/24/2025 | | | 80,000 | 76,944 |
| Walt Disney Co., 3.5%, 5/13/2040 | | | 237,000 | 180,991 |
| Walt Disney Co., 3.8%, 5/13/2060 | | | 150,000 | 106,917 |
| | | | | $770,937 |
| Brokerage & Asset Managers – 0.3% |
| Brookfield Finance, Inc., 2.34%, 1/30/2032 | | $ | 192,000 | $140,080 |
| Charles Schwab Corp., 1.95%, 12/01/2031 | | | 117,000 | 87,464 |
| Intercontinental Exchange, Inc., 1.85%, 9/15/2032 | | | 105,000 | 76,013 |
| Intercontinental Exchange, Inc., 3%, 9/15/2060 | | | 231,000 | 133,525 |
| | | | | $437,082 |
| Building – 0.2% |
| Fortune Brands Home & Security, Inc., 4%, 3/25/2032 | | $ | 232,000 | $189,963 |
| Vulcan Materials Co., 3.5%, 6/01/2030 | | | 44,000 | 37,397 |
| Vulcan Materials Co., 4.5%, 6/15/2047 | | | 50,000 | 38,838 |
| | | | | $266,198 |
Portfolio of Investments – continued
| Issuer | | | Shares/Par | Value ($) |
| Bonds – continued |
| Business Services – 0.5% |
| Equifax, Inc., 2.35%, 9/15/2031 | | $ | 66,000 | $48,816 |
| Equinix, Inc., 2.5%, 5/15/2031 | | | 308,000 | 234,537 |
| Fiserv, Inc., 4.4%, 7/01/2049 | | | 75,000 | 56,390 |
| Mastercard, Inc., 3.85%, 3/26/2050 | | | 143,000 | 112,187 |
| Visa, Inc., 2.05%, 4/15/2030 | | | 277,000 | 228,232 |
| Visa, Inc., 2.7%, 4/15/2040 | | | 88,000 | 62,452 |
| Visa, Inc., 2%, 8/15/2050 | | | 107,000 | 59,392 |
| | | | | $802,006 |
| Cable TV – 0.2% |
| Charter Communications Operating LLC/Charter Communications Operating Capital Corp., 6.384%, 10/23/2035 | | $ | 78,000 | $71,242 |
| Comcast Corp., 1.5%, 2/15/2031 | | | 164,000 | 122,589 |
| Comcast Corp., 3.75%, 4/01/2040 | | | 123,000 | 94,728 |
| | | | | $288,559 |
| Chemicals – 0.0% |
| RPM International, Inc., 4.55%, 3/01/2029 | | $ | 65,000 | $58,802 |
| RPM International, Inc., 4.25%, 1/15/2048 | | | 12,000 | 8,532 |
| | | | | $67,334 |
| Computer Software – 0.2% |
| Cisco Systems, Inc., 5.5%, 1/15/2040 | | $ | 53,000 | $51,802 |
| Microsoft Corp., 3.45%, 8/08/2036 | | | 86,000 | 73,691 |
| Microsoft Corp., 2.525%, 6/01/2050 | | | 313,000 | 196,353 |
| | | | | $321,846 |
| Computer Software - Systems – 0.4% |
| Apple, Inc., 2.05%, 9/11/2026 | | $ | 356,000 | $321,870 |
| Apple, Inc., 1.7%, 8/05/2031 | | | 288,000 | 223,351 |
| Apple, Inc., 2.65%, 5/11/2050 | | | 196,000 | 122,653 |
| | | | | $667,874 |
| Conglomerates – 0.2% |
| Otis Worldwide Corp., 2.565%, 2/15/2030 | | $ | 143,000 | $116,562 |
| Westinghouse Air Brake Technologies Corp., 4.95%, 9/15/2028 | | | 212,000 | 197,199 |
| | | | | $313,761 |
| Consumer Products – 0.1% |
| Hasbro, Inc., 3.9%, 11/19/2029 | | $ | 143,000 | $123,358 |
| Mattel, Inc., 3.75%, 4/01/2029 (n) | | | 96,000 | 82,843 |
| | | | | $206,201 |
Portfolio of Investments – continued
| Issuer | | | Shares/Par | Value ($) |
| Bonds – continued |
| Consumer Services – 0.1% |
| Booking Holdings, Inc., 3.55%, 3/15/2028 | | $ | 84,000 | $76,172 |
| Booking Holdings, Inc., 4.625%, 4/13/2030 | | | 97,000 | 91,274 |
| | | | | $167,446 |
| Electrical Equipment – 0.1% |
| Arrow Electronics, Inc., 3.875%, 1/12/2028 | | $ | 104,000 | $92,518 |
| Electronics – 0.3% |
| Broadcom, Inc., 3.187%, 11/15/2036 (n) | | $ | 114,000 | $77,755 |
| Lam Research Corp., 1.9%, 6/15/2030 | | | 32,000 | 25,109 |
| Lam Research Corp., 4.875%, 3/15/2049 | | | 59,000 | 52,016 |
| NXP B.V./NXP Funding LLC/NXP USA, Inc., 3.4%, 5/01/2030 | | | 81,000 | 67,231 |
| NXP B.V./NXP Funding LLC/NXP USA, Inc., 3.125%, 2/15/2042 | | | 97,000 | 60,891 |
| Qualcomm, Inc., 3.25%, 5/20/2027 | | | 63,000 | 58,531 |
| TSMC Arizona Corp., 3.125%, 10/25/2041 | | | 200,000 | 138,052 |
| | | | | $479,585 |
| Emerging Market Quasi-Sovereign – 0.2% |
| Korea Hydro & Nuclear Power Co. Ltd., 4.25%, 7/27/2027 (n) | | $ | 200,000 | $187,748 |
| Qatar Petroleum, 3.125%, 7/12/2041 (n) | | | 200,000 | 141,760 |
| | | | | $329,508 |
| Emerging Market Sovereign – 0.1% |
| United Mexican States, 4.28%, 8/14/2041 | | $ | 200,000 | $144,718 |
| Energy - Independent – 0.2% |
| EQT Corp., 3.625%, 5/15/2031 (n) | | $ | 61,000 | $50,745 |
| Hess Corp., 5.8%, 4/01/2047 | | | 150,000 | 136,010 |
| Pioneer Natural Resources Co., 1.9%, 8/15/2030 | | | 102,000 | 78,374 |
| | | | | $265,129 |
| Energy - Integrated – 0.3% |
| BP Capital Markets America, Inc., 1.749%, 8/10/2030 | | $ | 84,000 | $65,051 |
| BP Capital Markets America, Inc., 3.001%, 3/17/2052 | | | 39,000 | 24,155 |
| Cenovus Energy, Inc., 2.65%, 1/15/2032 | | | 198,000 | 152,718 |
| Cenovus Energy, Inc., 6.75%, 11/15/2039 | | | 11,000 | 10,821 |
| Cenovus Energy, Inc., 3.75%, 2/15/2052 | | | 25,000 | 16,657 |
| Eni S.p.A., 4.75%, 9/12/2028 (n) | | | 200,000 | 185,927 |
| | | | | $455,329 |
Portfolio of Investments – continued
| Issuer | | | Shares/Par | Value ($) |
| Bonds – continued |
| Financial Institutions – 0.5% |
| AerCap Ireland Capital DAC/AerCap Global Aviation Trust, 3.65%, 7/21/2027 | | $ | 150,000 | $130,437 |
| AerCap Ireland Capital DAC/AerCap Global Aviation Trust, 3.3%, 1/30/2032 | | | 150,000 | 112,583 |
| AerCap Ireland Capital DAC/AerCap Global Aviation Trust, 3.85%, 10/29/2041 | | | 150,000 | 99,699 |
| Air Lease Corp., 2.875%, 1/15/2032 | | | 258,000 | 192,704 |
| Avolon Holdings Funding Ltd., 4.25%, 4/15/2026 (n) | | | 100,000 | 87,413 |
| Avolon Holdings Funding Ltd., 4.375%, 5/01/2026 (n) | | | 94,000 | 82,634 |
| Avolon Holdings Funding Ltd., 2.75%, 2/21/2028 (n) | | | 180,000 | 137,595 |
| | | | | $843,065 |
| Food & Beverages – 0.5% |
| Anheuser-Busch InBev Worldwide, Inc., 5.55%, 1/23/2049 | | $ | 150,000 | $141,266 |
| Bacardi Ltd., 5.15%, 5/15/2038 (n) | | | 114,000 | 95,547 |
| Constellation Brands, Inc., 2.25%, 8/01/2031 | | | 99,000 | 75,808 |
| Constellation Brands, Inc., 4.1%, 2/15/2048 | | | 269,000 | 198,456 |
| JBS USA Lux S.A./JBS USA Food Co./JBS USA Finance, Inc., 3%, 2/02/2029 (n) | | | 119,000 | 96,409 |
| Kraft Heinz Foods Co., 4.875%, 10/01/2049 | | | 90,000 | 74,981 |
| Kraft Heinz Foods Co., 5.5%, 6/01/2050 | | | 86,000 | 78,766 |
| SYSCO Corp., 2.45%, 12/14/2031 | | | 52,000 | 40,571 |
| SYSCO Corp., 4.45%, 3/15/2048 | | | 52,000 | 40,433 |
| | | | | $842,237 |
| Gaming & Lodging – 0.3% |
| Marriott International, Inc., 2.85%, 4/15/2031 | | $ | 157,000 | $122,156 |
| Marriott International, Inc., 3.5%, 10/15/2032 | | | 128,000 | 102,232 |
| VICI Properties LP / VICI Note Co., Inc., 4.25%, 12/01/2026 (n) | | | 29,000 | 26,415 |
| VICI Properties LP / VICI Note Co., Inc., 4.125%, 8/15/2030 (n) | | | 59,000 | 48,737 |
| VICI Properties LP, REIT, 4.75%, 2/15/2028 | | | 145,000 | 132,136 |
| | | | | $431,676 |
| Industrial – 0.1% |
| Trustees of the University of Pennsylvania, 2.396%, 10/01/2050 | | $ | 234,000 | $135,578 |
| Insurance – 0.1% |
| Corebridge Financial, Inc., 3.9%, 4/05/2032 (n) | | $ | 115,000 | $96,117 |
| Corebridge Financial, Inc., 4.35%, 4/05/2042 (n) | | | 39,000 | 29,235 |
| | | | | $125,352 |
Portfolio of Investments – continued
| Issuer | | | Shares/Par | Value ($) |
| Bonds – continued |
| Insurance - Health – 0.4% |
| Humana, Inc., 2.15%, 2/03/2032 | | $ | 205,000 | $154,210 |
| Humana, Inc., 4.95%, 10/01/2044 | | | 100,000 | 85,463 |
| UnitedHealth Group, Inc., 5.3%, 2/15/2030 | | | 90,000 | 89,985 |
| UnitedHealth Group, Inc., 2.3%, 5/15/2031 | | | 57,000 | 45,682 |
| UnitedHealth Group, Inc., 4.625%, 7/15/2035 | | | 129,000 | 118,461 |
| UnitedHealth Group, Inc., 3.25%, 5/15/2051 | | | 103,000 | 69,908 |
| UnitedHealth Group, Inc., 5.875%, 2/15/2053 | | | 95,000 | 96,957 |
| | | | | $660,666 |
| Insurance - Property & Casualty – 0.3% |
| Aon Corp./Aon Global Holdings PLC, 2.05%, 8/23/2031 | | $ | 255,000 | $190,160 |
| Fairfax Financial Holdings Ltd., 5.625%, 8/16/2032 (n) | | | 226,000 | 204,650 |
| | | | | $394,810 |
| International Market Quasi-Sovereign – 0.1% |
| Ontario Teachers' Cadillac Fairview Properties, 2.5%, 10/15/2031 (n) | | $ | 200,000 | $151,112 |
| International Market Sovereign – 0.1% |
| Government of Bermuda, 5%, 7/15/2032 (n) | | $ | 200,000 | $185,307 |
| Machinery & Tools – 0.2% |
| CNH Industrial Capital LLC, 3.85%, 11/15/2027 | | $ | 332,000 | $300,558 |
| Major Banks – 4.4% |
| Australia and New Zealand Banking Group Ltd., 2.57% to 11/25/2030, FLR (CMT - 5yr. + 1.7%) to 11/25/2035 (n) | | $ | 108,000 | $75,216 |
| Bank of America Corp., 3.419% to 12/20/2027, FLR (LIBOR - 3mo. + 1.04%) to 12/20/2028 | | | 258,000 | 227,752 |
| Bank of America Corp., 2.496% to 2/13/2030, FLR (LIBOR - 3mo. + 0.99%) to 2/13/2031 | | | 102,000 | 80,138 |
| Bank of America Corp., 2.687% to 4/22/2031, FLR (SOFR - 1 day + 1.32%) to 4/22/2032 | | | 274,000 | 211,762 |
| Bank of America Corp., 3.311% to 4/22/2041, FLR (SOFR - 1 day + 1.58%) to 4/22/2042 | | | 198,000 | 137,011 |
| Bank of New York Mellon Corp., 5.802% to 10/25/2027, FLR (SOFR - 1 day + 1.802%) to 10/25/2028 | | | 121,000 | 121,788 |
| Bank of New York Mellon Corp., 5.834% to 10/25/2032, FLR (SOFR - 1 day + 2.074%) to 10/25/2033 | | | 156,000 | 156,224 |
| Barclays PLC, 2.894% to 11/24/2031, FLR (CMT - 1yr. + 1.3%) to 11/24/2032 | | | 200,000 | 141,611 |
| Commonwealth Bank of Australia, 3.61% to 9/12/2029, FLR (CMT - 1yr. + 2.05%) to 9/12/2034 (n) | | | 200,000 | 160,705 |
| Commonwealth Bank of Australia, 3.305%, 3/11/2041 (n) | | | 200,000 | 125,629 |
| Credit Agricole S.A., 1.247% to 1/26/2026, FLR (SOFR - 1 day + 0.89162%) to 1/26/2027 (n) | | | 250,000 | 210,573 |
Portfolio of Investments – continued
| Issuer | | | Shares/Par | Value ($) |
| Bonds – continued |
| Major Banks – continued |
| Goldman Sachs Group, Inc., 2.64% to 2/24/2027, FLR (SOFR - 1 day + 1.114%) to 2/24/2028 | | $ | 286,000 | $247,196 |
| Goldman Sachs Group, Inc., 2.65% to 10/21/2031, FLR (SOFR - 1 day + 1.264%) to 10/21/2032 | | | 302,000 | 228,637 |
| Goldman Sachs Group, Inc., 3.102% to 2/24/2032, FLR (SOFR - 1 day + 1.41%) to 2/24/2033 | | | 82,000 | 64,222 |
| HSBC Holdings PLC, 2.099% to 6/04/2025, FLR (SOFR - 1 day + 1.929%) to 6/04/2026 | | | 400,000 | 351,827 |
| HSBC Holdings PLC, 2.357% to 8/18/2030, FLR (SOFR - 1 day + 1.947%) to 8/18/2031 | | | 450,000 | 320,507 |
| JPMorgan Chase & Co., 3.782% to 2/01/2027, FLR (LIBOR - 3mo. + 1.337%) to 2/01/2028 | | | 165,000 | 150,735 |
| JPMorgan Chase & Co., 2.545% to 11/08/2031, FLR (SOFR - 1 day + 1.18%) to 11/08/2032 | | | 423,000 | 319,219 |
| JPMorgan Chase & Co., 3.109% to 4/22/2040, FLR (SOFR - 1 day + 2.46%) to 4/22/2041 | | | 173,000 | 118,403 |
| Mitsubishi UFJ Financial Group, Inc., 1.64% to 10/13/2026, FLR (CMT - 1yr. + 0.67%) to 10/13/2027 | | | 200,000 | 168,364 |
| Mitsubishi UFJ Financial Group, Inc., 2.494% to 10/13/2031, FLR (CMT - 1yr. + 0.97%) to 10/13/2032 | | | 400,000 | 294,530 |
| Morgan Stanley, 3.125%, 7/27/2026 | | | 82,000 | 74,832 |
| Morgan Stanley, 3.622% to 4/01/2030, FLR (SOFR - 1 day + 3.12%) to 4/01/2031 | | | 306,000 | 260,183 |
| Morgan Stanley, 3.217% to 4/22/2041, FLR (SOFR - 1 day + 1.485%) to 4/22/2042 | | | 217,000 | 147,508 |
| National Australia Bank Ltd., 3.347% to 1/12/2032, FLR (CMT - 5yr. + 1.7%) to 1/12/2037 (n) | | | 500,000 | 370,475 |
| Nordea Bank Abp, 1.5%, 9/30/2026 (n) | | | 263,000 | 221,548 |
| Royal Bank of Canada, 2.3%, 11/03/2031 | | | 296,000 | 225,250 |
| Sumitomo Mitsui Financial Group, Inc., 1.71%, 1/12/2031 | | | 200,000 | 142,433 |
| Toronto Dominion Bank, 4.108%, 6/08/2027 | | | 103,000 | 96,475 |
| Toronto Dominion Bank, 2%, 9/10/2031 | | | 275,000 | 203,895 |
| Toronto Dominion Bank, 4.456%, 6/08/2032 | | | 42,000 | 37,745 |
| Toronto-Dominion Bank, 4.693%, 9/15/2027 | | | 117,000 | 112,067 |
| UBS Group AG, 3.179% to 2/11/2042, FLR (CMT - 1yr. + 1.1%) to 2/11/2043 (n) | | | 200,000 | 122,567 |
| UniCredit S.p.A., 2.569% to 9/22/2025, FLR (CMT - 1yr. + 2.3%) to 9/22/2026 (n) | | | 350,000 | 300,129 |
| Wells Fargo & Co., 3.908% to 4/25/2025, FLR (SOFR - 1 day + 1.32%) to 4/25/2026 | | | 161,000 | 153,397 |
| Wells Fargo & Co., 4.54% to 8/15/2025, FLR (SOFR - 1 day + 1.56%) to 8/15/2026 | | | 50,000 | 48,099 |
Portfolio of Investments – continued
| Issuer | | | Shares/Par | Value ($) |
| Bonds – continued |
| Major Banks – continued |
| Wells Fargo & Co., 3.35% to 3/02/2032, FLR (SOFR - 1 day + 1.5%) to 3/02/2033 | | $ | 498,000 | $401,461 |
| Wells Fargo & Co., 3.9%, 5/01/2045 | | | 67,000 | 48,476 |
| | | | | $6,878,589 |
| Medical & Health Technology & Services – 0.5% |
| Alcon, Inc., 2.75%, 9/23/2026 (n) | | $ | 200,000 | $177,859 |
| Alcon, Inc., 2.6%, 5/27/2030 (n) | | | 200,000 | 160,853 |
| Becton, Dickinson and Co., 2.823%, 5/20/2030 | | | 206,000 | 171,775 |
| Becton, Dickinson and Co., 4.298%, 8/22/2032 | | | 132,000 | 119,421 |
| Thermo Fisher Scientific, Inc., 2%, 10/15/2031 | | | 56,000 | 43,933 |
| Thermo Fisher Scientific, Inc., 2.8%, 10/15/2041 | | | 135,000 | 93,243 |
| | | | | $767,084 |
| Medical Equipment – 0.0% |
| Danaher Corp., 2.6%, 10/01/2050 | | $ | 118,000 | $70,815 |
| Metals & Mining – 0.4% |
| Anglo American Capital PLC, 4.5%, 3/15/2028 (n) | | $ | 200,000 | $181,677 |
| Anglo American Capital PLC, 2.875%, 3/17/2031 (n) | | | 200,000 | 153,727 |
| Glencore Funding LLC, 2.5%, 9/01/2030 (n) | | | 100,000 | 76,936 |
| Glencore Funding LLC, 2.85%, 4/27/2031 (n) | | | 228,000 | 176,496 |
| | | | | $588,836 |
| Midstream – 0.8% |
| Cheniere Corpus Christi Holdings LLC, 3.7%, 11/15/2029 | | $ | 34,000 | $29,612 |
| Energy Transfer LP, 4%, 10/01/2027 | | | 52,000 | 47,038 |
| Energy Transfer LP, 3.75%, 5/15/2030 | | | 93,000 | 79,049 |
| Energy Transfer Partners LP, 5.15%, 3/15/2045 | | | 150,000 | 116,962 |
| Galaxy Pipeline Assets Bidco Ltd., 1.75%, 9/30/2027 (n) | | | 178,638 | 161,935 |
| Plains All American Pipeline LP/PAA Finance Corp., 3.55%, 12/15/2029 | | | 201,000 | 167,490 |
| Plains All American Pipeline LP/PAA Finance Corp., 4.3%, 1/31/2043 | | | 126,000 | 84,670 |
| Sabine Pass Liquefaction LLC, 4.2%, 3/15/2028 | | | 336,000 | 306,377 |
| Sabine Pass Liquefaction LLC, 4.5%, 5/15/2030 | | | 102,000 | 93,033 |
| Targa Resources Corp., 4.2%, 2/01/2033 | | | 37,000 | 30,888 |
| Targa Resources Corp., 4.95%, 4/15/2052 | | | 151,000 | 113,301 |
| | | | | $1,230,355 |
Portfolio of Investments – continued
| Issuer | | | Shares/Par | Value ($) |
| Bonds – continued |
| Municipals – 0.2% |
| Golden State, CA, Tobacco Securitization Corp., Tobacco Settlement Rev., Taxable, “B”, 2.746%, 6/01/2034 | | $ | 60,000 | $46,023 |
| Golden State, CA, Tobacco Securitization Corp., Tobacco Settlement Rev., Taxable, “B”, 3%, 6/01/2046 | | | 55,000 | 49,811 |
| Michigan Finance Authority Hospital Rev., Taxable (Trinity Health Credit Group), 3.384%, 12/01/2040 | | | 160,000 | 118,460 |
| State of Florida, Taxable, “A”, 2.154%, 7/01/2030 | | | 132,000 | 103,308 |
| | | | | $317,602 |
| Natural Gas - Distribution – 0.0% |
| NiSource, Inc., 5.65%, 2/01/2045 | | $ | 38,000 | $34,413 |
| Natural Gas - Pipeline – 0.2% |
| APT Pipelines Ltd., 5%, 3/23/2035 (n) | | $ | 287,000 | $248,297 |
| Network & Telecom – 0.1% |
| AT&T, Inc., 2.75%, 6/01/2031 | | $ | 108,000 | $86,405 |
| AT&T, Inc., 3.55%, 9/15/2055 | | | 37,000 | 23,545 |
| Verizon Communications, Inc., 2.1%, 3/22/2028 | | | 36,000 | 30,254 |
| | | | | $140,204 |
| Other Banks & Diversified Financials – 0.2% |
| American Express Co., 4.989% to 5/26/2032, FLR (SOFR - 1 day + 2.255%) to 5/26/2033 | | $ | 178,000 | $161,494 |
| Mizrahi Tefahot Bank Ltd., 3.077% to 4/07/2026, FLR (CMT - 5yr. + 2.25%) to 4/07/2031 (n) | | | 200,000 | 168,000 |
| | | | | $329,494 |
| Pharmaceuticals – 0.1% |
| AstraZeneca PLC, 1.375%, 8/06/2030 | | $ | 64,000 | $48,937 |
| Merck & Co., Inc., 2.75%, 12/10/2051 | | | 58,000 | 36,847 |
| Pfizer, Inc., 2.55%, 5/28/2040 | | | 58,000 | 40,135 |
| | | | | $125,919 |
| Pollution Control – 0.1% |
| Waste Connections, Inc., 4.2%, 1/15/2033 | | $ | 101,000 | $91,337 |
| Railroad & Shipping – 0.1% |
| Canadian Pacific Railway Co., 3%, 12/02/2041 | | $ | 35,000 | $24,256 |
| Canadian Pacific Railway Co., 3.1%, 12/02/2051 | | | 52,000 | 33,078 |
| Wabtec Transportation Netherlands B.V., 1.25%, 12/03/2027 | | EUR | 100,000 | 80,819 |
| | | | | $138,153 |
Portfolio of Investments – continued
| Issuer | | | Shares/Par | Value ($) |
| Bonds – continued |
| Real Estate - Apartment – 0.1% |
| American Homes 4 Rent LP, REIT, 2.375%, 7/15/2031 | | $ | 103,000 | $75,936 |
| American Homes 4 Rent LP, REIT, 3.375%, 7/15/2051 | | | 59,000 | 34,607 |
| | | | | $110,543 |
| Real Estate - Office – 0.1% |
| Corporate Office Property LP, REIT, 2%, 1/15/2029 | | $ | 109,000 | $81,302 |
| Corporate Office Property LP, REIT, 2.75%, 4/15/2031 | | | 176,000 | 127,171 |
| | | | | $208,473 |
| Real Estate - Other – 0.1% |
| EPR Properties, REIT, 3.6%, 11/15/2031 | | $ | 79,000 | $53,333 |
| Lexington Realty Trust Co., 2.7%, 9/15/2030 | | | 119,000 | 91,069 |
| W.P. Carey, Inc., REIT, 2.45%, 2/01/2032 | | | 59,000 | 43,302 |
| | | | | $187,704 |
| Real Estate - Retail – 0.1% |
| Brixmor Operating Partnership LP, REIT, 2.5%, 8/16/2031 | | $ | 65,000 | $46,574 |
| STORE Capital Corp., REIT, 2.75%, 11/18/2030 | | | 210,000 | 163,936 |
| | | | | $210,510 |
| Restaurants – 0.1% |
| Starbucks Corp., 3%, 2/14/2032 | | $ | 140,000 | $115,863 |
| Retailers – 0.4% |
| Alimentation Couche-Tard, Inc., 3.8%, 1/25/2050 (n) | | $ | 111,000 | $72,284 |
| Amazon.com, Inc., 3.6%, 4/13/2032 | | | 273,000 | 244,430 |
| AutoZone, Inc., 4.75%, 8/01/2032 | | | 76,000 | 70,640 |
| Home Depot, Inc., 4.875%, 2/15/2044 | | | 82,000 | 73,049 |
| Home Depot, Inc., 3.9%, 6/15/2047 | | | 195,000 | 149,483 |
| | | | | $609,886 |
| Specialty Chemicals – 0.1% |
| International Flavors & Fragrances, Inc., 2.3%, 11/01/2030 (n) | | $ | 86,000 | $64,632 |
| International Flavors & Fragrances, Inc., 3.268%, 11/15/2040 (n) | | | 86,000 | 57,320 |
| | | | | $121,952 |
| Specialty Stores – 0.1% |
| DICK'S Sporting Goods, 3.15%, 1/15/2032 | | $ | 102,000 | $77,422 |
| DICK'S Sporting Goods, 4.1%, 1/15/2052 | | | 115,000 | 70,119 |
| | | | | $147,541 |
| Telecommunications - Wireless – 0.6% |
| Crown Castle, Inc., REIT, 4.45%, 2/15/2026 | | $ | 165,000 | $157,953 |
| Crown Castle, Inc., REIT, 3.7%, 6/15/2026 | | | 251,000 | 232,997 |
| Rogers Communications, Inc., 3.8%, 3/15/2032 (n) | | | 85,000 | 72,368 |
Portfolio of Investments – continued
| Issuer | | | Shares/Par | Value ($) |
| Bonds – continued |
| Telecommunications - Wireless – continued |
| Rogers Communications, Inc., 4.5%, 3/15/2042 (n) | | $ | 149,000 | $118,093 |
| Rogers Communications, Inc., 3.7%, 11/15/2049 | | | 86,000 | 56,186 |
| T-Mobile USA, Inc., 3.5%, 4/15/2025 | | | 240,000 | 228,963 |
| | | | | $866,560 |
| U.S. Treasury Obligations – 1.2% |
| U.S. Treasury Bonds, 1.375%, 11/15/2040 (f) | | $ | 563,000 | $347,807 |
| U.S. Treasury Bonds, 2.375%, 2/15/2042 | | | 198,000 | 144,571 |
| U.S. Treasury Bonds, 2.875%, 5/15/2052 (f) | | | 178,400 | 138,455 |
| U.S. Treasury Notes, 0.875%, 1/31/2024 (f) | | | 250,000 | 238,525 |
| U.S. Treasury Notes, 2.625%, 4/15/2025 (f) | | | 511,000 | 489,303 |
| U.S. Treasury Notes, 4.125%, 9/30/2027 | | | 77,000 | 76,579 |
| U.S. Treasury Notes, 3.875%, 9/30/2029 | | | 423,000 | 415,465 |
| | | | | $1,850,705 |
| Utilities - Electric Power – 1.6% |
| Alabama Power Co., 3.45%, 10/01/2049 | | $ | 177,000 | $119,676 |
| American Electric Power Co., Inc., 2.3%, 3/01/2030 | | | 55,000 | 43,331 |
| American Transmission Systems, Inc., 2.65%, 1/15/2032 (n) | | | 158,000 | 122,672 |
| CenterPoint Energy, Inc., 2.65%, 6/01/2031 | | | 103,000 | 81,585 |
| Duke Energy Carolinas LLC, 2.85%, 3/15/2032 | | | 213,000 | 174,061 |
| Duke Energy Corp., 3.3%, 6/15/2041 | | | 198,000 | 134,054 |
| Duke Energy Indiana LLC, 2.75%, 4/01/2050 | | | 76,000 | 44,729 |
| Enel Finance International N.V., 4.625%, 6/15/2027 (n) | | | 200,000 | 181,189 |
| Evergy, Inc., 2.9%, 9/15/2029 | | | 71,000 | 58,635 |
| FirstEnergy Corp., 2.65%, 3/01/2030 | | | 134,000 | 108,328 |
| Florida Power & Light Co., 2.85%, 4/01/2025 | | | 50,000 | 47,464 |
| Florida Power & Light Co., 2.45%, 2/03/2032 | | | 246,000 | 198,009 |
| Florida Power & Light Co., 3.95%, 3/01/2048 | | | 50,000 | 38,692 |
| Georgia Power Co., 4.7%, 5/15/2032 | | | 251,000 | 235,710 |
| Jersey Central Power & Light Co., 4.3%, 1/15/2026 (n) | | | 182,000 | 173,627 |
| Jersey Central Power & Light Co., 2.75%, 3/01/2032 (n) | | | 150,000 | 116,718 |
| NextEra Energy Capital Holdings, Inc., 2.44%, 1/15/2032 | | | 52,000 | 40,121 |
| NextEra Energy Capital Holdings, Inc., 3.8% to 3/15/2027, FLR (CMT - 5yr. + 2.547%) to 3/15/2082 | | | 101,000 | 76,953 |
| Pacific Gas & Electric Co., 2.5%, 2/01/2031 | | | 167,000 | 124,784 |
| Southern California Edison Co., 4.5%, 9/01/2040 | | | 50,000 | 39,737 |
| Southern California Edison Co., 3.65%, 2/01/2050 | | | 202,000 | 135,044 |
| Virginia Electric & Power Co., 2.875%, 7/15/2029 | | | 85,000 | 72,994 |
| Xcel Energy, Inc., 4.6%, 6/01/2032 | | | 138,000 | 127,101 |
| | | | | $2,495,214 |
| Total Bonds (Identified Cost, $35,993,039) | | $29,694,864 |
Portfolio of Investments – continued
| Issuer | | | Shares/Par | Value ($) |
| Preferred Stocks – 0.0% |
| Consumer Products – 0.0% | | | | |
| Henkel AG & Co. KGaA (Identified Cost, $24,803) | | 391 | $24,645 |
| | Strike
Price | First
Exercise | | |
| Warrants – 0.0% | | | | |
| Apparel Manufacturers – 0.0% |
| Compagnie Financiere Richemont S.A. (1 share for 2 warrants, Expiration 12/04/23) (a) (Identified Cost, $0) | CHF 67.00 | 11/20/23 | 1,448 | $709 |
| | | | | |
| Investment Companies (h) – 0.9% |
| Money Market Funds – 0.9% | |
| MFS Institutional Money Market Portfolio, 3.02% (v) (Identified Cost, $1,390,855) | | | 1,390,993 | $1,390,993 |
| Collateral for Securities Loaned – 0.0% |
| JPMorgan U.S. Government Money Market Fund - Class IM Shares, 2.84% (j) (Identified Cost, $41,566) | | | 41,566 | $41,566 |
| Securities Sold Short – (0.0)% |
| Telecommunications - Wireless – (0.0)% |
| Crown Castle, Inc., REIT (Proceeds Received, $21,464) | | | (164) | $(21,855) |
|
|
| Other Assets, Less Liabilities – 2.5% | | 3,875,087 |
| Net Assets – 100.0% | $154,881,980 |
| (a) | Non-income producing security. | | | |
| (f) | All or a portion of the security has been segregated as collateral for open futures contracts and cleared swap agreements. | | | |
| (h) | An affiliated issuer, which may be considered one in which the fund owns 5% or more of the outstanding voting securities, or a company which is under common control. At period end, the aggregate values of the fund's investments in affiliated issuers and in unaffiliated issuers were $1,390,993 and $149,637,755, respectively. | | | |
| (i) | Interest only security for which the fund receives interest on notional principal (Par amount). Par amount shown is the notional principal and does not reflect the cost of the security. | | | |
| (j) | The rate quoted is the annualized seven-day yield of the fund at period end. | | | |
| (l) | A portion of this security is on loan. See Note 2 for additional information. | | | |
| (n) | Securities exempt from registration under Rule 144A of the Securities Act of 1933. These securities may be sold in the ordinary course of business in transactions exempt from registration, normally to qualified institutional buyers. At period end, the aggregate value of these securities was $7,075,895, representing 4.6% of net assets. | | | |
| (s) | Security or a portion of the security was pledged to cover collateral requirements for securities sold short and/or certain derivative transactions. | | | |
Portfolio of Investments – continued
| (v) | Affiliated issuer that is available only to investment companies managed by MFS. The rate quoted for the MFS Institutional Money Market Portfolio is the annualized seven-day yield of the fund at period end. | | | |
| The following abbreviations are used in this report and are defined: |
| ADR | American Depositary Receipt |
| CMT | Constant Maturity Treasury |
| FLR | Floating Rate. Interest rate resets periodically based on the parenthetically disclosed reference rate plus a spread (if any). The period-end rate reported may not be the current rate. All reference rates are USD unless otherwise noted. |
| LIBOR | London Interbank Offered Rate |
| REIT | Real Estate Investment Trust |
| SOFR | Secured Overnight Financing Rate |
| Abbreviations indicate amounts shown in currencies other than the U.S. dollar. All amounts are stated in U.S. dollars unless otherwise indicated. A list of abbreviations is shown below: |
| AUD | Australian Dollar |
| BRL | Brazilian Real |
| CAD | Canadian Dollar |
| CHF | Swiss Franc |
| DKK | Danish Krone |
| EUR | Euro |
| GBP | British Pound |
| HKD | Hong Kong Dollar |
| IDR | Indonesian Rupiah |
| ILS | Israeli Shekel |
| INR | Indian Rupee |
| JPY | Japanese Yen |
| KRW | South Korean Won |
| MXN | Mexican Peso |
| NOK | Norwegian Krone |
| NZD | New Zealand Dollar |
| SEK | Swedish Krona |
| SGD | Singapore Dollar |
| THB | Thai Baht |
| TRY | Turkish Lira |
| TWD | Taiwan Dollar |
| ZAR | South African Rand |
Derivative Contracts at 10/31/22
| Forward Foreign Currency Exchange Contracts |
Currency
Purchased | Currency
Sold | Counterparty | Settlement
Date | Unrealized
Appreciation
(Depreciation) |
| Asset Derivatives |
| EUR | 2,750,000 | USD | 2,714,511 | HSBC Bank | 12/02/2022 | $8,962 |
| GBP | 694,000 | USD | 786,465 | HSBC Bank | 12/02/2022 | 10,067 |
| JPY | 716,535,000 | USD | 4,810,535 | HSBC Bank | 12/02/2022 | 24,403 |
| SEK | 6,959,000 | USD | 624,695 | HSBC Bank | 12/02/2022 | 6,806 |
| USD | 4,518,421 | AUD | 6,566,422 | JPMorgan Chase Bank N.A. | 12/02/2022 | 314,617 |
| USD | 9,300,510 | CHF | 8,886,619 | JPMorgan Chase Bank N.A. | 12/02/2022 | 397,100 |
Portfolio of Investments – continued
| Forward Foreign Currency Exchange Contracts - continued |
Currency
Purchased | Currency
Sold | Counterparty | Settlement
Date | Unrealized
Appreciation
(Depreciation) |
| Asset Derivatives - continued |
| USD | 473,510 | CHF | 452,000 | Morgan Stanley Capital Services, Inc. | 12/02/2022 | $20,656 |
| USD | 889,369 | DKK | 6,583,287 | JPMorgan Chase Bank N.A. | 12/02/2022 | 13,580 |
| USD | 4,596,385 | EUR | 4,598,909 | Goldman Sachs International | 12/02/2022 | 41,836 |
| USD | 12,348,936 | EUR | 12,293,425 | JPMorgan Chase Bank N.A. | 12/02/2022 | 174,094 |
| USD | 6,830,859 | GBP | 5,798,795 | Goldman Sachs International | 12/02/2022 | 175,350 |
| USD | 3,880,274 | GBP | 3,348,000 | Morgan Stanley Capital Services, Inc. | 12/02/2022 | 37,640 |
| USD | 1,918,528 | HKD | 15,030,902 | Goldman Sachs International | 12/02/2022 | 2,531 |
| USD | 77,916 | IDR | 1,212,682,000 | Barclays Bank PLC | 12/02/2022 | 211 |
| USD | 135,269 | ILS | 439,381 | JPMorgan Chase Bank N.A. | 12/05/2022 | 10,645 |
| USD | 536,537 | INR | 43,206,252 | JPMorgan Chase Bank N.A. | 12/02/2022 | 15,948 |
| USD | 11,933,733 | JPY | 1,613,452,584 | JPMorgan Chase Bank N.A. | 12/02/2022 | 1,046,694 |
| USD | 1,276,898 | JPY | 181,008,000 | Morgan Stanley Capital Services, Inc. | 12/02/2022 | 55,517 |
| USD | 477,748 | KRW | 637,588,800 | JPMorgan Chase Bank N.A. | 12/02/2022 | 30,082 |
| USD | 841,625 | NZD | 1,356,079 | Goldman Sachs International | 12/02/2022 | 52,810 |
| USD | 139,104 | NZD | 231,000 | Morgan Stanley Capital Services, Inc. | 12/02/2022 | 4,734 |
| USD | 71,945 | SEK | 759,000 | Goldman Sachs International | 12/02/2022 | 3,069 |
| USD | 476,504 | SGD | 662,841 | JPMorgan Chase Bank N.A. | 12/02/2022 | 8,178 |
| USD | 89,428 | THB | 3,204,240 | JPMorgan Chase Bank N.A. | 12/02/2022 | 5,026 |
| USD | 621,350 | TWD | 18,647,323 | JPMorgan Chase Bank N.A. | 12/02/2022 | 41,403 |
| USD | 121,190 | ZAR | 2,078,796 | Goldman Sachs International | 12/02/2022 | 8,287 |
| | | | | | | $2,510,246 |
| Liability Derivatives |
| AUD | 1,768,000 | USD | 1,196,402 | Goldman Sachs International | 12/02/2022 | $(64,534) |
| CAD | 353,000 | USD | 268,504 | Citibank N.A. | 12/02/2022 | (9,351) |
| CAD | 4,953,569 | USD | 3,822,493 | JPMorgan Chase Bank N.A. | 12/02/2022 | (185,851) |
| CHF | 299,000 | USD | 300,002 | HSBC Bank | 12/02/2022 | (437) |
| HKD | 906,000 | USD | 115,499 | HSBC Bank | 12/02/2022 | (10) |
| NOK | 42,685,893 | USD | 4,386,318 | Goldman Sachs International | 12/02/2022 | (276,472) |
| NOK | 18,455,000 | USD | 1,835,541 | JPMorgan Chase Bank N.A. | 12/02/2022 | (58,672) |
| NZD | 2,075,238 | USD | 1,291,302 | JPMorgan Chase Bank N.A. | 12/02/2022 | (84,161) |
| SEK | 13,700,000 | USD | 1,288,617 | Deutsche Bank AG | 12/02/2022 | (45,398) |
| SEK | 24,692,068 | USD | 2,336,383 | JPMorgan Chase Bank N.A. | 12/02/2022 | (95,680) |
| USD | 2,626,643 | AUD | 4,130,000 | HSBC Bank | 12/02/2022 | (17,371) |
| USD | 174,549 | BRL | 909,113 | Goldman Sachs International | 12/02/2022 | (254) |
| USD | 1,608,941 | CAD | 2,200,000 | HSBC Bank | 12/02/2022 | (6,180) |
| USD | 81,208 | EUR | 82,420 | Barclays Bank PLC | 1/20/2023 | (799) |
| USD | 110,051 | MXN | 2,241,897 | Goldman Sachs International | 12/02/2022 | (2,450) |
| USD | 2,022,704 | NOK | 21,321,000 | HSBC Bank | 12/02/2022 | (30,106) |
| USD | 2,826,647 | NZD | 4,926,000 | HSBC Bank | 12/02/2022 | (38,748) |
| | | | | | | $(916,474) |
Portfolio of Investments – continued
| Futures Contracts |
| Description | Long/
Short | Currency | Contracts | Notional
Amount | Expiration
Date | Value/Unrealized
Appreciation
(Depreciation) |
| Asset Derivatives |
| Equity Futures | | |
| CAC 40 Index | Long | EUR | 64 | $3,964,701 | November – 2022 | $177,269 |
| FTSE MIB Index | Long | EUR | 39 | 4,344,233 | December – 2022 | 169,313 |
| IBEX 35 Index | Long | EUR | 73 | 5,735,309 | November – 2022 | 328,918 |
| MSCI Singapore Index | Long | SGD | 104 | 2,047,715 | November – 2022 | 92,521 |
| S&P 500 E-Mini Index | Short | USD | 214 | 41,548,100 | December – 2022 | 1,322,263 |
| S&P MidCap 400 Index | Short | USD | 54 | 13,173,840 | December – 2022 | 79,991 |
| Topix Index | Long | JPY | 1 | 129,614 | December – 2022 | 3,056 |
| | | | | | | $2,173,331 |
| Interest Rate Futures | | |
| Canadian Treasury Bond 10 yr | Short | CAD | 183 | $16,526,216 | December – 2022 | $177,574 |
| Japan Government Bond 10 yr | Long | JPY | 5 | 5,002,522 | December – 2022 | 11,495 |
| U.S. Treasury Note 10 yr | Short | USD | 160 | 17,695,000 | December – 2022 | 827,184 |
| U.S. Treasury Ultra Note 10 yr | Short | USD | 36 | 4,175,437 | December – 2022 | 338,931 |
| | | | | | | $1,355,184 |
| | | | | | | $3,528,515 |
| Liability Derivatives |
| Equity Futures | | |
| AEX 25 Index | Short | EUR | 60 | $7,932,366 | November – 2022 | $(387,469) |
| BIST 30 Index | Long | TRY | 1,927 | 4,760,509 | December – 2022 | (2,490) |
| DAX Index | Short | EUR | 18 | 5,909,784 | December – 2022 | (46,618) |
| FTSE 100 Index | Long | GBP | 5 | 407,544 | December – 2022 | (11,141) |
| FTSE Taiwan Index | Short | USD | 36 | 1,647,720 | November – 2022 | (31,625) |
| FTSE/JSE Top 40 Index | Short | ZAR | 60 | 1,975,039 | December – 2022 | (55,196) |
| Hang Seng Index | Long | HKD | 43 | 4,015,309 | November – 2022 | (122,955) |
| IBOV Index | Long | BRL | 97 | 2,209,902 | December – 2022 | (26,346) |
| KOSPI 200 Index | Long | KRW | 31 | 1,640,800 | December – 2022 | (2,936) |
| Mexbol Index | Short | MXN | 32 | 808,552 | December – 2022 | (29,650) |
| OMX 30 Index | Short | SEK | 349 | 6,204,824 | November – 2022 | (241,934) |
| Russell 2000 Index | Short | USD | 202 | 18,715,300 | December – 2022 | (256,486) |
| S&P/TSX 60 Index | Short | CAD | 5 | 864,389 | December – 2022 | (3,942) |
| | | | | | | $(1,218,788) |
| Interest Rate Futures | | |
| Australian Bond 10 yr | Long | AUD | 104 | $7,881,825 | December – 2022 | $(74,854) |
| Euro-Bund 10 yr | Long | EUR | 46 | 6,293,413 | December – 2022 | (308,521) |
| Long Gilt 10 yr | Long | GBP | 75 | 8,784,201 | December – 2022 | (25,998) |
| U.S. Treasury Note 2 yr | Long | USD | 17 | 3,474,508 | December – 2022 | (72,250) |
| U.S. Treasury Ultra Bond | Long | USD | 5 | 638,281 | December – 2022 | (100,680) |
| | | | | | | $(582,303) |
| | | | | | | $(1,801,091) |
Portfolio of Investments – continued
| Cleared Swap Agreements |
Maturity
Date | Notional
Amount | Counterparty | Cash Flows
to Receive/
Frequency | Cash Flows
to Pay/
Frequency | Unrealized
Appreciation
(Depreciation) | | Net Unamortized
Upfront Payments
(Receipts) | | Value |
| Asset Derivatives | | | | | |
| Interest Rate Swaps | | | | | |
| 6/16/32 | USD | 8,000,000 | centrally cleared | SOFR - 1 day/Annually | 2.530%/Annually | $826,051 | | $(3,223) | | $822,828 |
| 6/19/52 | USD | 5,000,000 | centrally cleared | SOFR - 1 day/Annually | 2.340%/Annually | 959,164 | | 33,988 | | 993,152 |
| | | | | | | $1,785,215 | | $30,765 | | $1,815,980 |
| Liability Derivatives | | | | | |
| Interest Rate Swaps | | | | | |
| 6/19/24 | USD | 36,400,000 | centrally cleared | 2.570%/Annually | SOFR - 1 day/Annually | $(1,168,847) | | $18,741 | | $(1,150,106) |
| 6/16/27 | USD | 22,800,000 | centrally cleared | 2.540%/Annually | SOFR - 1 day/Annually | (1,451,391) | | 27,547 | | (1,423,844) |
| | | | | | | $(2,620,238) | | $46,288 | | $(2,573,950) |
At October 31, 2022, the fund had cash collateral of $1,633,073 and other liquid securities with an aggregate value of $18,726,198 to cover any collateral or margin obligations for securities sold short and certain derivative contracts. Restricted cash and/or deposits with brokers in the Statement of Assets and Liabilities are comprised of cash collateral.
See Notes to Financial Statements
Financial Statements
Statement of Assets and Liabilities
At 10/31/22
This statement represents your fund’s balance sheet, which details the assets and liabilities comprising the total value of the fund.
| Assets | |
| Investments in unaffiliated issuers, at value, including $89,608 of securities on loan (identified cost, $133,221,651) | $149,637,755 |
| Investments in affiliated issuers, at value (identified cost, $1,390,855) | 1,390,993 |
| Foreign currency, at value (identified cost, $22,550) | 22,546 |
| Deposits with brokers for | |
| Futures contracts | 1,606,420 |
| Securities sold short | 26,653 |
| Receivables for | |
| Forward foreign currency exchange contracts | 2,510,246 |
| Net daily variation margin on open futures contracts | 506,781 |
| Investments sold | 77,494 |
| Fund shares sold | 108,437 |
| Interest and dividends | 506,653 |
| Receivable from investment adviser | 12,774 |
| Total assets | $156,406,752 |
| Liabilities | |
| Payable to custodian | $4,028 |
| Payables for | |
| Net daily variation margin on open cleared swap agreements | 7,311 |
| Securities sold short, at value (proceeds received, $21,464) | 21,855 |
| Forward foreign currency exchange contracts | 916,474 |
| Net daily variation margin on open futures contracts | 14,656 |
| Investments purchased | 25,855 |
| Fund shares reacquired | 285,955 |
| Collateral for securities loaned, at value (c) | 41,566 |
| Payable to affiliates | |
| Administrative services fee | 364 |
| Shareholder servicing costs | 43,265 |
| Distribution and service fees | 1,368 |
| Payable for independent Trustees' compensation | 1 |
| Deferred country tax expense payable | 6,389 |
| Accrued expenses and other liabilities | 155,685 |
| Total liabilities | $1,524,772 |
| Net assets | $154,881,980 |
Statement of Assets and Liabilities – continued
| Net assets consist of | |
| Paid-in capital | $177,933,777 |
| Total distributable earnings (loss) | (23,051,797) |
| Net assets | $154,881,980 |
| Shares of beneficial interest outstanding | 14,171,857 |
| (c) | Non-cash collateral is not included. |
| | Net assets | Shares
outstanding | Net asset value
per share (a) |
| Class A | $25,782,520 | 2,373,442 | $10.86 |
| Class B | 1,692,936 | 160,839 | 10.53 |
| Class C | 3,725,010 | 352,677 | 10.56 |
| Class I | 94,554,708 | 8,635,571 | 10.95 |
| Class R1 | 111,483 | 10,712 | 10.41 |
| Class R2 | 499,238 | 46,514 | 10.73 |
| Class R3 | 853,801 | 78,474 | 10.88 |
| Class R4 | 554,426 | 50,493 | 10.98 |
| Class R6 | 27,107,858 | 2,463,135 | 11.01 |
| (a) | Maximum offering price per share was equal to the net asset value per share for all share classes, except for Class A, for which the maximum offering price per share was $11.52 [100 / 94.25 x $10.86]. On sales of $50,000 or more, the maximum offering price of Class A shares is reduced. A contingent deferred sales charge may be imposed on redemptions of Class A, Class B, and Class C shares. Redemption price per share was equal to the net asset value per share for Classes I, R1, R2, R3, R4, and R6. |
See Notes to Financial Statements
Financial Statements
Statement of Operations
Year ended 10/31/22
This statement describes how much your fund earned in investment income and accrued in expenses. It also describes any gains and/or losses generated by fund operations.
| Net investment income (loss) | |
| Income | |
| Dividends | $2,033,171 |
| Interest | 1,120,129 |
| Dividends from affiliated issuers | 86,682 |
| Other | 57,384 |
| Income on securities loaned | 3,742 |
| Foreign taxes withheld | (80,475) |
| Total investment income | $3,220,633 |
| Expenses | |
| Management fee | $1,405,436 |
| Distribution and service fees | 148,975 |
| Shareholder servicing costs | 166,944 |
| Administrative services fee | 36,447 |
| Independent Trustees' compensation | 4,673 |
| Custodian fee | 141,831 |
| Shareholder communications | 27,727 |
| Audit and tax fees | 99,570 |
| Legal fees | 792 |
| Dividend and interest expense on securities sold short | 961 |
| Interest expense and fees | 828 |
| Registration fees | 128,872 |
| Miscellaneous | 84,617 |
| Total expenses | $2,247,673 |
| Fees paid indirectly | (4,700) |
| Reduction of expenses by investment adviser and distributor | (282,916) |
| Net expenses | $1,960,057 |
| Net investment income (loss) | $1,260,576 |
Statement of Operations – continued
| Realized and unrealized gain (loss) |
| Realized gain (loss) (identified cost basis) | |
| Unaffiliated issuers (net of $8,007 country tax) | $2,473,536 |
| Futures contracts | 12,674,703 |
| Swap agreements | (961,125) |
| Forward foreign currency exchange contracts | 4,519,095 |
| Foreign currency | (522,944) |
| Net realized gain (loss) | $18,183,265 |
| Change in unrealized appreciation or depreciation | |
| Unaffiliated issuers (net of $18,721 decrease in deferred country tax) | $(38,610,803) |
| Affiliated issuers | 138 |
| Futures contracts | 4,293,914 |
| Swap agreements | (303,069) |
| Securities sold short | 6,775 |
| Forward foreign currency exchange contracts | 1,000,350 |
| Translation of assets and liabilities in foreign currencies | 13,864 |
| Net unrealized gain (loss) | $(33,598,831) |
| Net realized and unrealized gain (loss) | $(15,415,566) |
| Change in net assets from operations | $(14,154,990) |
See Notes to Financial Statements
Financial Statements
Statements of Changes in Net Assets
These statements describe the increases and/or decreases in net assets resulting from operations, any distributions, and any shareholder transactions.
| | Year ended |
| | 10/31/22 | 10/31/21 |
| Change in net assets | | |
| From operations | | |
| Net investment income (loss) | $1,260,576 | $1,024,242 |
| Net realized gain (loss) | 18,183,265 | (12,359,451) |
| Net unrealized gain (loss) | (33,598,831) | 25,503,990 |
| Change in net assets from operations | $(14,154,990) | $14,168,781 |
| Total distributions to shareholders | $(1,041,120) | $(985,057) |
| Change in net assets from fund share transactions | $(20,315,708) | $3,969,800 |
| Total change in net assets | $(35,511,818) | $17,153,524 |
| Net assets | | |
| At beginning of period | 190,393,798 | 173,240,274 |
| At end of period | $154,881,980 | $190,393,798 |
See Notes to Financial Statements
Financial Statements
Financial Highlights
The financial highlights table is intended to help you understand the fund's financial performance for the past 5 years. Certain information reflects financial results for a single fund share. The total returns in the table represent the rate that an investor would have earned (or lost) on an investment in the fund share class (assuming reinvestment of all distributions) held for the entire period.
| Class A | Year ended |
| | 10/31/22 | 10/31/21 | 10/31/20 | 10/31/19 | 10/31/18 |
| Net asset value, beginning of period | $11.82 | $10.99 | $10.80 | $10.07 | $10.26 |
| Income (loss) from investment operations |
| Net investment income (loss) (d) | $0.06 | $0.05 | $0.07 | $0.10 | $0.06 |
| Net realized and unrealized gain (loss) | (0.98) | 0.83 | 0.22 | 0.71 | (0.07) |
| Total from investment operations | $(0.92) | $0.88 | $0.29 | $0.81 | $(0.01) |
| Less distributions declared to shareholders |
| From net investment income | $(0.04) | $(0.05) | $(0.10) | $(0.08) | $(0.18) |
| Net asset value, end of period (x) | $10.86 | $11.82 | $10.99 | $10.80 | $10.07 |
| Total return (%) (r)(s)(t)(x) | (7.79) | 7.98 | 2.68 | 8.11 | (0.06) |
Ratios (%) (to average net assets)
and Supplemental data: |
| Expenses before expense reductions (f) | 1.46 | 1.43 | 1.47 | 1.46 | 1.46 |
| Expenses after expense reductions (f) | 1.30 | 1.30 | 1.32 | 1.33 | 1.37 |
| Net investment income (loss) | 0.53 | 0.40 | 0.65 | 1.01 | 0.64 |
| Portfolio turnover | 58 | 44 | 57 | 58 | 37 |
| Net assets at end of period (000 omitted) | $25,783 | $31,120 | $29,453 | $33,287 | $35,972 |
| Supplemental Ratios (%): |
| Ratios of expenses to average net assets after expense reductions excluding short sale expenses and interest expense and fees (f) | 1.30 | 1.30 | 1.30 | 1.29 | 1.34 |
See Notes to Financial Statements
Financial Highlights – continued
| Class B | Year ended |
| | 10/31/22 | 10/31/21 | 10/31/20 | 10/31/19 | 10/31/18 |
| Net asset value, beginning of period | $11.49 | $10.73 | $10.54 | $9.82 | $10.01 |
| Income (loss) from investment operations |
| Net investment income (loss) (d) | $(0.03) | $(0.04) | $(0.01) | $0.03 | $(0.01) |
| Net realized and unrealized gain (loss) | (0.93) | 0.80 | 0.21 | 0.69 | (0.07) |
| Total from investment operations | $(0.96) | $0.76 | $0.20 | $0.72 | $(0.08) |
| Less distributions declared to shareholders |
| From net investment income | $— | $— | $(0.01) | $(0.00)(w) | $(0.11) |
| Net asset value, end of period (x) | $10.53 | $11.49 | $10.73 | $10.54 | $9.82 |
| Total return (%) (r)(s)(t)(x) | (8.36) | 7.08 | 1.92 | 7.33 | (0.81) |
Ratios (%) (to average net assets)
and Supplemental data: |
| Expenses before expense reductions (f) | 2.21 | 2.18 | 2.22 | 2.21 | 2.21 |
| Expenses after expense reductions (f) | 2.05 | 2.05 | 2.08 | 2.08 | 2.12 |
| Net investment income (loss) | (0.24) | (0.36) | (0.09) | 0.26 | (0.09) |
| Portfolio turnover | 58 | 44 | 57 | 58 | 37 |
| Net assets at end of period (000 omitted) | $1,693 | $3,129 | $4,035 | $4,542 | $5,061 |
| Supplemental Ratios (%): |
| Ratios of expenses to average net assets after expense reductions excluding short sale expenses and interest expense and fees (f) | 2.05 | 2.05 | 2.05 | 2.04 | 2.09 |
See Notes to Financial Statements
Financial Highlights – continued
| Class C | Year ended |
| | 10/31/22 | 10/31/21 | 10/31/20 | 10/31/19 | 10/31/18 |
| Net asset value, beginning of period | $11.53 | $10.77 | $10.57 | $9.85 | $10.00 |
| Income (loss) from investment operations |
| Net investment income (loss) (d) | $(0.03) | $(0.04) | $(0.01) | $0.03 | $(0.01) |
| Net realized and unrealized gain (loss) | (0.94) | 0.80 | 0.21 | 0.69 | (0.06) |
| Total from investment operations | $(0.97) | $0.76 | $0.20 | $0.72 | $(0.07) |
| Less distributions declared to shareholders |
| From net investment income | $— | $— | $(0.00)(w) | $— | $(0.08) |
| Net asset value, end of period (x) | $10.56 | $11.53 | $10.77 | $10.57 | $9.85 |
| Total return (%) (r)(s)(t)(x) | (8.41) | 7.06 | 1.91 | 7.31 | (0.72) |
Ratios (%) (to average net assets)
and Supplemental data: |
| Expenses before expense reductions (f) | 2.21 | 2.18 | 2.22 | 2.22 | 2.22 |
| Expenses after expense reductions (f) | 2.05 | 2.05 | 2.08 | 2.08 | 2.13 |
| Net investment income (loss) | (0.24) | (0.36) | (0.08) | 0.26 | (0.10) |
| Portfolio turnover | 58 | 44 | 57 | 58 | 37 |
| Net assets at end of period (000 omitted) | $3,725 | $5,966 | $8,396 | $10,083 | $13,845 |
| Supplemental Ratios (%): |
| Ratios of expenses to average net assets after expense reductions excluding short sale expenses and interest expense and fees (f) | 2.05 | 2.05 | 2.05 | 2.04 | 2.10 |
See Notes to Financial Statements
Financial Highlights – continued
| Class I | Year ended |
| | 10/31/22 | 10/31/21 | 10/31/20 | 10/31/19 | 10/31/18 |
| Net asset value, beginning of period | $11.91 | $11.08 | $10.89 | $10.15 | $10.35 |
| Income (loss) from investment operations |
| Net investment income (loss) (d) | $0.09 | $0.08 | $0.10 | $0.13 | $0.09 |
| Net realized and unrealized gain (loss) | (0.98) | 0.82 | 0.22 | 0.72 | (0.07) |
| Total from investment operations | $(0.89) | $0.90 | $0.32 | $0.85 | $0.02 |
| Less distributions declared to shareholders |
| From net investment income | $(0.07) | $(0.07) | $(0.13) | $(0.11) | $(0.22) |
| Net asset value, end of period (x) | $10.95 | $11.91 | $11.08 | $10.89 | $10.15 |
| Total return (%) (r)(s)(t)(x) | (7.51) | 8.19 | 2.91 | 8.49 | 0.19 |
Ratios (%) (to average net assets)
and Supplemental data: |
| Expenses before expense reductions (f) | 1.21 | 1.18 | 1.22 | 1.21 | 1.21 |
| Expenses after expense reductions (f) | 1.05 | 1.05 | 1.07 | 1.08 | 1.12 |
| Net investment income (loss) | 0.79 | 0.66 | 0.90 | 1.25 | 0.90 |
| Portfolio turnover | 58 | 44 | 57 | 58 | 37 |
| Net assets at end of period (000 omitted) | $94,555 | $112,743 | $108,871 | $127,572 | $137,065 |
| Supplemental Ratios (%): |
| Ratios of expenses to average net assets after expense reductions excluding short sale expenses and interest expense and fees (f) | 1.05 | 1.05 | 1.05 | 1.04 | 1.10 |
See Notes to Financial Statements
Financial Highlights – continued
| Class R1 | Year ended |
| | 10/31/22 | 10/31/21 | 10/31/20 | 10/31/19 | 10/31/18 |
| Net asset value, beginning of period | $11.36 | $10.61 | $10.43 | $9.72 | $9.93 |
| Income (loss) from investment operations |
| Net investment income (loss) (d) | $(0.02) | $(0.04) | $(0.01) | $0.03 | $(0.01) |
| Net realized and unrealized gain (loss) | (0.93) | 0.79 | 0.22 | 0.68 | (0.07) |
| Total from investment operations | $(0.95) | $0.75 | $0.21 | $0.71 | $(0.08) |
| Less distributions declared to shareholders |
| From net investment income | $— | $— | $(0.03) | $— | $(0.13) |
| Net asset value, end of period (x) | $10.41 | $11.36 | $10.61 | $10.43 | $9.72 |
| Total return (%) (r)(s)(t)(x) | (8.36) | 7.07 | 1.97 | 7.30 | (0.83) |
Ratios (%) (to average net assets)
and Supplemental data: |
| Expenses before expense reductions (f) | 2.21 | 2.18 | 2.22 | 2.21 | 2.22 |
| Expenses after expense reductions (f) | 2.05 | 2.05 | 2.07 | 2.08 | 2.13 |
| Net investment income (loss) | (0.21) | (0.35) | (0.09) | 0.26 | (0.08) |
| Portfolio turnover | 58 | 44 | 57 | 58 | 37 |
| Net assets at end of period (000 omitted) | $111 | $122 | $113 | $210 | $195 |
| Supplemental Ratios (%): |
| Ratios of expenses to average net assets after expense reductions excluding short sale expenses and interest expense and fees (f) | 2.05 | 2.05 | 2.05 | 2.04 | 2.10 |
See Notes to Financial Statements
Financial Highlights – continued
| Class R2 | Year ended |
| | 10/31/22 | 10/31/21 | 10/31/20 | 10/31/19 | 10/31/18 |
| Net asset value, beginning of period | $11.69 | $10.86 | $10.67 | $9.91 | $10.11 |
| Income (loss) from investment operations |
| Net investment income (loss) (d) | $0.03 | $0.02 | $0.04 | $0.08 | $0.04 |
| Net realized and unrealized gain (loss) | (0.97) | 0.81 | 0.22 | 0.69 | (0.06) |
| Total from investment operations | $(0.94) | $0.83 | $0.26 | $0.77 | $(0.02) |
| Less distributions declared to shareholders |
| From net investment income | $(0.02) | $— | $(0.07) | $(0.01) | $(0.18) |
| Net asset value, end of period (x) | $10.73 | $11.69 | $10.86 | $10.67 | $9.91 |
| Total return (%) (r)(s)(t)(x) | (8.02) | 7.64 | 2.43 | 7.82 | (0.22) |
Ratios (%) (to average net assets)
and Supplemental data: |
| Expenses before expense reductions (f) | 1.71 | 1.68 | 1.72 | 1.71 | 1.71 |
| Expenses after expense reductions (f) | 1.55 | 1.55 | 1.58 | 1.58 | 1.61 |
| Net investment income (loss) | 0.28 | 0.13 | 0.41 | 0.75 | 0.42 |
| Portfolio turnover | 58 | 44 | 57 | 58 | 37 |
| Net assets at end of period (000 omitted) | $499 | $611 | $498 | $791 | $1,434 |
| Supplemental Ratios (%): |
| Ratios of expenses to average net assets after expense reductions excluding short sale expenses and interest expense and fees (f) | 1.55 | 1.55 | 1.55 | 1.54 | 1.59 |
See Notes to Financial Statements
Financial Highlights – continued
| Class R3 | Year ended |
| | 10/31/22 | 10/31/21 | 10/31/20 | 10/31/19 | 10/31/18 |
| Net asset value, beginning of period | $11.83 | $11.00 | $10.81 | $10.09 | $10.29 |
| Income (loss) from investment operations |
| Net investment income (loss) (d) | $0.06 | $0.05 | $0.07 | $0.10 | $0.07 |
| Net realized and unrealized gain (loss) | (0.97) | 0.82 | 0.22 | 0.71 | (0.07) |
| Total from investment operations | $(0.91) | $0.87 | $0.29 | $0.81 | $0.00(w) |
| Less distributions declared to shareholders |
| From net investment income | $(0.04) | $(0.04) | $(0.10) | $(0.09) | $(0.20) |
| Net asset value, end of period (x) | $10.88 | $11.83 | $11.00 | $10.81 | $10.09 |
| Total return (%) (r)(s)(t)(x) | (7.71) | 7.92 | 2.70 | 8.09 | 0.00(w) |
Ratios (%) (to average net assets)
and Supplemental data: |
| Expenses before expense reductions (f) | 1.46 | 1.43 | 1.47 | 1.46 | 1.46 |
| Expenses after expense reductions (f) | 1.30 | 1.30 | 1.32 | 1.33 | 1.37 |
| Net investment income (loss) | 0.54 | 0.40 | 0.69 | 1.00 | 0.65 |
| Portfolio turnover | 58 | 44 | 57 | 58 | 37 |
| Net assets at end of period (000 omitted) | $854 | $1,593 | $1,432 | $1,101 | $997 |
| Supplemental Ratios (%): |
| Ratios of expenses to average net assets after expense reductions excluding short sale expenses and interest expense and fees (f) | 1.30 | 1.30 | 1.30 | 1.29 | 1.34 |
See Notes to Financial Statements
Financial Highlights – continued
| Class R4 | Year ended |
| | 10/31/22 | 10/31/21 | 10/31/20 | 10/31/19 | 10/31/18 |
| Net asset value, beginning of period | $11.94 | $11.11 | $10.91 | $10.18 | $10.37 |
| Income (loss) from investment operations |
| Net investment income (loss) (d) | $0.11 | $0.07 | $0.09 | $0.13 | $0.09 |
| Net realized and unrealized gain (loss) | (1.00) | 0.84 | 0.23 | 0.71 | (0.07) |
| Total from investment operations | $(0.89) | $0.91 | $0.32 | $0.84 | $0.02 |
| Less distributions declared to shareholders |
| From net investment income | $(0.07) | $(0.08) | $(0.12) | $(0.11) | $(0.21) |
| Net asset value, end of period (x) | $10.98 | $11.94 | $11.11 | $10.91 | $10.18 |
| Total return (%) (r)(s)(t)(x) | (7.49) | 8.20 | 2.98 | 8.36 | 0.24 |
Ratios (%) (to average net assets)
and Supplemental data: |
| Expenses before expense reductions (f) | 1.24 | 1.18 | 1.23 | 1.22 | 1.22 |
| Expenses after expense reductions (f) | 1.05 | 1.05 | 1.08 | 1.08 | 1.13 |
| Net investment income (loss) | 0.94 | 0.64 | 0.81 | 1.27 | 0.91 |
| Portfolio turnover | 58 | 44 | 57 | 58 | 37 |
| Net assets at end of period (000 omitted) | $554 | $57 | $58 | $51 | $90 |
| Supplemental Ratios (%): |
| Ratios of expenses to average net assets after expense reductions excluding short sale expenses and interest expense and fees (f) | 1.05 | 1.05 | 1.05 | 1.04 | 1.10 |
See Notes to Financial Statements
Financial Highlights – continued
| Class R6 | Year ended |
| | 10/31/22 | 10/31/21 | 10/31/20 | 10/31/19 | 10/31/18 |
| Net asset value, beginning of period | $11.97 | $11.13 | $10.94 | $10.20 | $10.41 |
| Income (loss) from investment operations |
| Net investment income (loss) (d) | $0.10 | $0.08 | $0.11 | $0.14 | $0.10 |
| Net realized and unrealized gain (loss) | (0.98) | 0.84 | 0.21 | 0.72 | (0.08) |
| Total from investment operations | $(0.88) | $0.92 | $0.32 | $0.86 | $0.02 |
| Less distributions declared to shareholders |
| From net investment income | $(0.08) | $(0.08) | $(0.13) | $(0.12) | $(0.23) |
| Net asset value, end of period (x) | $11.01 | $11.97 | $11.13 | $10.94 | $10.20 |
| Total return (%) (r)(s)(t)(x) | (7.38) | 8.35 | 2.97 | 8.51 | 0.24 |
Ratios (%) (to average net assets)
and Supplemental data: |
| Expenses before expense reductions (f) | 1.11 | 1.08 | 1.13 | 1.14 | 1.16 |
| Expenses after expense reductions (f) | 0.95 | 0.95 | 0.99 | 1.01 | 1.07 |
| Net investment income (loss) | 0.87 | 0.71 | 1.04 | 1.32 | 0.97 |
| Portfolio turnover | 58 | 44 | 57 | 58 | 37 |
| Net assets at end of period (000 omitted) | $27,108 | $35,052 | $20,383 | $5,410 | $5,337 |
| Supplemental Ratios (%): |
| Ratios of expenses to average net assets after expense reductions excluding short sale expenses and interest expense and fees (f) | 0.95 | 0.95 | 0.96 | 0.97 | 1.04 |
| (d) | Per share data is based on average shares outstanding. |
| (f) | Ratios do not reflect reductions from fees paid indirectly, if applicable. See Note 2 in the Notes to Financial Statements for additional information. |
| (r) | Certain expenses have been reduced without which performance would have been lower. |
| (s) | From time to time the fund may receive proceeds from litigation settlements, without which performance would be lower. |
| (t) | Total returns do not include any applicable sales charges. |
| (w) | Per share amount was less than $0.01 and total return or ratio was less than 0.01%, as applicable. |
| (x) | The net asset values and total returns have been calculated on net assets which include adjustments made in accordance with U.S. generally accepted accounting principles required at period end for financial reporting purposes. |
See Notes to Financial Statements
Notes to Financial Statements
(1) Business and Organization
MFS Global Alternative Strategy Fund (the fund) is a diversified series of MFS Series Trust XV (the trust). The trust is organized as a Massachusetts business trust and is registered under the Investment Company Act of 1940, as amended, as an open-end management investment company.
The fund is an investment company and accordingly follows the investment company accounting and reporting guidance of the Financial Accounting Standards Board (FASB) Accounting Standards Codification Topic 946 Financial Services - Investment Companies.
(2) Significant Accounting Policies
General — The preparation of financial statements in conformity with U.S. generally accepted accounting principles requires management to make estimates and assumptions that affect the reported amounts of assets and liabilities, and disclosure of contingent assets and liabilities at the date of the financial statements and the reported amounts of increases and decreases in net assets from operations during the reporting period. Actual results could differ from those estimates. In the preparation of these financial statements, management has evaluated subsequent events occurring after the date of the fund’s Statement of Assets and Liabilities through the date that the financial statements were issued. The fund invests in derivatives as part of its principal investment strategy. Derivatives can be highly volatile and involve risks in addition to the risks of the underlying indicators on which the derivative is based. Derivatives can involve leverage. The fund invests in foreign securities. Investments in foreign securities are vulnerable to the effects of changes in the relative values of the local currency and the U.S. dollar and to the effects of changes in each country’s market, economic, industrial, political, regulatory, geopolitical, environmental, public health, and other conditions.
In June 2022, the FASB issued Accounting Standards Update 2022-03, Fair Value Measurement (Topic 820) – Fair Value Measurement of Equity Securities Subject to Contractual Sale Restrictions (“ASU 2022-03”), which affects all entities that have investments in equity securities measured at fair value that are subject to contractual sale restrictions. ASU 2022-03 clarifies that a contractual restriction on the sale of an equity security is a characteristic of the reporting entity holding the equity security rather than a characteristic of the asset and, therefore, is not considered in measuring the fair value of the equity security. The fund decided to early adopt ASU 2022-03 effective as of June 30, 2022 as the guidance in ASU 2022-03 was consistent with the fund’s existing practices for fair value measurement.
Balance Sheet Offsetting — The fund's accounting policy with respect to balance sheet offsetting is that, absent an event of default by the counterparty or a termination of the agreement, the International Swaps and Derivatives Association (ISDA) Master Agreement, or similar agreement, does not result in an offset of reported amounts of financial assets and financial liabilities in the Statement of Assets and Liabilities across transactions between the fund and the applicable counterparty. The fund's right to setoff may be restricted or prohibited by the bankruptcy or insolvency laws of the particular jurisdiction to which a specific master netting agreement counterparty is subject. Balance sheet offsetting disclosures, to the extent applicable to the fund, have been included in the fund’s Significant Accounting Policies note under the captions for each of the fund’s in-scope financial instruments and transactions.
Notes to Financial Statements - continued
Investment Valuations — Subject to its oversight, the fund's Board of Trustees has delegated primary responsibility for determining or causing to be determined the value of the fund’s investments to MFS as the fund's adviser, pursuant to the fund’s valuation policy and procedures which have been adopted by the adviser and approved by the Board. Effective September 8, 2022, and in accordance with Rule 2a-5 under the Investment Company Act of 1940, the Board of Trustees designated the adviser as the “valuation designee” of the fund. If the adviser, as valuation designee, determines that reliable market quotations are not readily available for an investment, the investment is valued at fair value as determined in good faith by the adviser in accordance with the adviser’s fair valuation policy and procedures.
Under the fund's valuation policy and procedures, equity securities, including restricted equity securities and equity securities sold short, are generally valued at the last sale or official closing price on their primary market or exchange as provided by a third-party pricing service. Equity securities, for which there were no sales reported that day, are generally valued at the last quoted daily bid quotation on their primary market or exchange as provided by a third-party pricing service. Equity securities sold short, for which there were no sales reported that day, are generally valued at the last quoted daily ask quotation on their primary market or exchange as provided by a third-party pricing service. Debt instruments and floating rate loans, including restricted debt instruments, are generally valued at an evaluated or composite bid as provided by a third-party pricing service. Short-term instruments with a maturity at issuance of 60 days or less may be valued at amortized cost, which approximates market value.
Futures contracts are generally valued at last posted settlement price on their primary exchange as provided by a third-party pricing service. Futures contracts for which there were no trades that day for a particular position are generally valued at the closing bid quotation on their primary exchange as provided by a third-party pricing service.
Forward foreign currency exchange contracts are generally valued at the mean of bid and asked prices for the time period interpolated from rates provided by a third-party pricing service for proximate time periods. Swap agreements are generally valued using valuations provided by a third-party pricing service, which for cleared swaps includes an evaluation of any trading activity at the clearinghouses. Open-end investment companies are generally valued at net asset value per share. The values of foreign securities and other assets and liabilities expressed in foreign currencies are converted to U.S. dollars using the mean of bid and asked prices for rates provided by a third-party pricing service.
Under the fund’s valuation policy and procedures, market quotations are not considered to be readily available for debt instruments, floating rate loans, and many types of derivatives. These investments are generally valued at fair value based on information from third-party pricing services or otherwise determined by the adviser in accordance with the adviser’s fair valuation policy and procedures. Securities and other assets generally valued on the basis of information from a third-party pricing service may also be valued at a broker/dealer bid quotation. In determining values, third-party pricing services can utilize both transaction data and market information such as yield, quality, coupon rate, maturity, type of issue, trading characteristics, spreads and other market data. An investment may also be valued at fair value if the adviser determines that the investment’s value has been materially affected by events occurring after the close of the exchange or market on which the investment is principally traded (such as foreign exchange or market) and prior to the determination of the fund’s net asset value, or after the halt of trading of a specific security where trading does not resume
Notes to Financial Statements - continued
prior to the close of the exchange or market on which the security is principally traded. Events that occur after foreign markets close (such as developments in foreign markets and significant movements in the U.S. markets) and prior to the determination of the fund’s net asset value may be deemed to have a material effect on the value of securities traded in foreign markets. Accordingly, the fund’s foreign equity securities may often be valued at fair value. The adviser generally relies on third-party pricing services or other information (such as the correlation with price movements of similar securities in the same or other markets; the type, cost and investment characteristics of the security; the business and financial condition of the issuer; and trading and other market data) to assist in determining whether to fair value and at what value to fair value an investment. The value of an investment for purposes of calculating the fund’s net asset value can differ depending on the source and method used to determine value. When fair valuation is used, the value of an investment used to determine the fund’s net asset value may differ from quoted or published prices for the same investment. There can be no assurance that the fund could obtain the fair value assigned to an investment if it were to sell the investment at the same time at which the fund determines its net asset value per share.
Various inputs are used in determining the value of the fund's assets or liabilities. These inputs are categorized into three broad levels. In certain cases, the inputs used to measure fair value may fall into different levels of the fair value hierarchy. In such cases, an investment's level within the fair value hierarchy is based on the lowest level of input that is significant to the fair value measurement. The fund's assessment of the significance of a particular input to the fair value measurement in its entirety requires judgment, and considers factors specific to the investment. Level 1 includes unadjusted quoted prices in active markets for identical assets or liabilities. Level 2 includes other significant observable market-based inputs (including quoted prices for similar securities, interest rates, prepayment speed, and credit risk). Level 3 includes significant unobservable inputs, which may include the adviser's own assumptions in determining the fair value of investments. Other financial instruments are derivative instruments, such as futures contracts, forward foreign currency exchange contracts, and swap agreements. The following is a summary of the levels used as of October 31, 2022 in valuing the fund's assets and liabilities:
Notes to Financial Statements - continued
| Financial Instruments | Level 1 | Level 2 | Level 3 | Total |
| Equity Securities: | | | | |
| United States | $82,800,591 | $— | $— | $82,800,591 |
| France | 5,836,318 | — | — | 5,836,318 |
| Japan | 3,399,750 | 2,407,405 | — | 5,807,155 |
| Switzerland | 5,472,560 | — | — | 5,472,560 |
| United Kingdom | 4,929,944 | — | — | 4,929,944 |
| Canada | 3,686,872 | — | — | 3,686,872 |
| Germany | 2,758,795 | — | — | 2,758,795 |
| India | 1,036,698 | — | — | 1,036,698 |
| Hong Kong | 238,209 | 766,153 | — | 1,004,362 |
| Other Countries | 5,517,158 | 1,050,872 | — | 6,568,030 |
| U.S. Treasury Bonds & U.S. Government Agencies & Equivalents | — | 1,850,705 | — | 1,850,705 |
| Non - U.S. Sovereign Debt | — | 810,645 | — | 810,645 |
| Municipal Bonds | — | 317,602 | — | 317,602 |
| U.S. Corporate Bonds | — | 18,040,506 | — | 18,040,506 |
| Commercial Mortgage-Backed Securities | — | 434,563 | — | 434,563 |
| Asset-Backed Securities (including CDOs) | — | 282,367 | — | 282,367 |
| Foreign Bonds | — | 7,958,476 | — | 7,958,476 |
| Mutual Funds | 1,432,559 | — | — | 1,432,559 |
| Total | $117,109,454 | $33,919,294 | $— | $151,028,748 |
| Securities Sold Short | $(21,855) | $— | $— | $(21,855) |
| Other Financial Instruments | | | | |
| Futures Contracts – Assets | $3,432,938 | $95,577 | $— | $3,528,515 |
| Futures Contracts – Liabilities | (1,672,710) | (128,381) | — | (1,801,091) |
| Forward Foreign Currency Exchange Contracts – Assets | — | 2,510,246 | — | 2,510,246 |
| Forward Foreign Currency Exchange Contracts – Liabilities | — | (916,474) | — | (916,474) |
| Swap Agreements – Assets | — | 1,815,980 | — | 1,815,980 |
| Swap Agreements – Liabilities | — | (2,573,950) | — | (2,573,950) |
For further information regarding security characteristics, see the Portfolio of Investments.
Foreign Currency Translation — Purchases and sales of foreign investments, income, and expenses are converted into U.S. dollars based upon currency exchange rates prevailing on the respective dates of such transactions or on the reporting date for foreign denominated receivables and payables. Gains and losses attributable to foreign currency exchange rates on sales of securities are recorded for financial statement purposes as net realized gains and losses on investments. Gains and losses attributable to foreign exchange rate movements on receivables, payables, income and expenses
Notes to Financial Statements - continued
are recorded for financial statement purposes as foreign currency transaction gains and losses. That portion of both realized and unrealized gains and losses on investments that results from fluctuations in foreign currency exchange rates is not separately disclosed.
Derivatives — The fund uses derivatives in an attempt to reduce volatility compared to the overall equity markets and to generate positive returns by adjusting the fund’s exposure to markets, asset classes, and currencies resulting from the fund’s individual security selections. Derivatives are used to increase the fund’s exposure to markets, asset classes, or currencies to which the fund’s individual security selections have resulted in no or little exposure. Alternatively, the fund uses derivatives to decrease its exposure to markets or currencies to which the fund’s individual security selections have resulted in exposure. Derivatives are used for hedging or non-hedging purposes. While hedging can reduce or eliminate losses, it can also reduce or eliminate gains. When the fund uses derivatives as an investment to increase or decrease market exposure, or for hedging purposes, gains and losses from derivative instruments may be substantially greater than the derivative’s original cost.
The derivative instruments used by the fund during the period were futures contracts, forward foreign currency exchange contracts, and swap agreements. Depending on the type of derivative, a fund may exit a derivative position by entering into an offsetting transaction with a counterparty or exchange, negotiating an agreement with the derivative counterparty, or novating the position to a third party. The fund may be unable to promptly close out a futures position in instances where the daily fluctuation in the price for that type of future exceeds the daily limit set by the exchange. The fund's period end derivatives, as presented in the Portfolio of Investments and the associated Derivative Contract tables, generally are indicative of the volume of its derivative activity during the period.
The following table presents, by major type of derivative contract, the fair value, on a gross basis, of the asset and liability components of derivatives held by the fund at October 31, 2022 as reported in the Statement of Assets and Liabilities:
| | | Fair Value (a) |
| Risk | Derivative Contracts | Asset Derivatives | Liability Derivatives |
| Interest Rate | Futures Contracts | $1,355,184 | $(582,303) |
| Interest Rate | Cleared Swap Agreements | 1,815,980 | (2,573,950) |
| Foreign Exchange | Forward Foreign Currency Exchange Contracts | 2,510,246 | (916,474) |
| Equity | Futures Contracts | 2,173,331 | (1,218,788) |
| Total | | $7,854,741 | $(5,291,515) |
| (a) | Values presented in this table for futures contracts and cleared swap agreements correspond to the values reported in the Portfolio of Investments. Only the current day net variation margin for futures contracts and cleared swap agreements is reported separately within the Statement of Assets and Liabilities. |
Notes to Financial Statements - continued
The following table presents, by major type of derivative contract, the realized gain (loss) on derivatives held by the fund for the year ended October 31, 2022 as reported in the Statement of Operations:
| Risk | Futures
Contracts | Swap
Agreements | Forward Foreign
Currency
Exchange
Contracts |
| Interest Rate | $925,678 | $(961,125) | $— |
| Foreign Exchange | — | — | 4,519,095 |
| Equity | 11,749,025 | — | — |
| Total | $12,674,703 | $(961,125) | $4,519,095 |
The following table presents, by major type of derivative contract, the change in unrealized appreciation or depreciation on derivatives held by the fund for the year ended October 31, 2022 as reported in the Statement of Operations:
| Risk | Futures
Contracts | Swap
Agreements | Forward Foreign
Currency
Exchange
Contracts |
| Interest Rate | $862,485 | $(303,069) | $— |
| Foreign Exchange | — | — | 1,000,350 |
| Equity | 3,431,429 | — | — |
| Total | $4,293,914 | $(303,069) | $1,000,350 |
Derivative counterparty credit risk is managed through formal evaluation of the creditworthiness of all potential counterparties. On certain, but not all, uncleared derivatives, the fund attempts to reduce its exposure to counterparty credit risk whenever possible by entering into an ISDA Master Agreement on a bilateral basis. The ISDA Master Agreement gives each party to the agreement the right to terminate all transactions traded under such agreement if there is a specified deterioration in the credit quality of the other party. Upon an event of default or a termination of the ISDA Master Agreement, the non-defaulting party has the right to close out all transactions traded under such agreement and to net amounts owed under each agreement to one net amount payable by one party to the other. This right to close out and net payments across all transactions traded under the ISDA Master Agreement could result in a reduction of the fund's credit risk to such counterparty equal to any amounts payable by the fund under the applicable transactions, if any.
Collateral and margin requirements differ by type of derivative. For cleared derivatives (e.g., futures contracts, cleared swaps, and exchange-traded options), margin requirements are set by the clearing broker and the clearing house and collateral, in the form of cash or securities, is posted by the fund directly with the clearing broker. Collateral terms are counterparty agreement specific for uncleared derivatives (e.g., forward foreign currency exchange contracts, uncleared swap agreements, and uncleared options) and collateral, in the form of cash and securities, is held in segregated accounts with the fund's custodian in connection with these agreements. For derivatives traded under an ISDA Master Agreement, which contains a credit support annex, the collateral requirements are netted across all transactions traded under such counterparty-specific agreement and an amount is posted from one party to the other to collateralize such obligations. Cash that has been segregated or
Notes to Financial Statements - continued
delivered to cover the fund's collateral or margin obligations under derivative contracts, if any, will be reported separately in the Statement of Assets and Liabilities as restricted cash for uncleared derivatives and/or deposits with brokers for cleared derivatives. Securities pledged as collateral or margin for the same purpose, if any, are noted in the Portfolio of Investments. The fund may be required to make payments of interest on uncovered collateral or margin obligations with the broker. Any such payments are included in “Interest expense and fees” in the Statement of Operations.
The following table presents the fund's derivative assets and liabilities (by type) on a gross basis as of October 31, 2022:
| Gross Amounts of: | Derivative Assets | Derivative Liabilities |
| Futures Contracts (a) | $506,781 | $(14,656) |
| Cleared Swap Agreements (a) | — | (7,311) |
| Forward Foreign Currency Exchange Contracts | 2,510,246 | (916,474) |
Total Gross Amount of Derivative Assets
and Liabilities Presented in the
Statement of Assets & Liabilities | $3,017,027 | $(938,441) |
Less: Derivatives Assets and Liabilities Not Subject
to a Master Netting Agreement or
Similar Arrangement | 557,019 | (114,819) |
Total Gross Amount of Derivative Assets and
Liabilities Subject to a Master Netting Agreement or
Similar Arrangement | $2,460,008 | $(823,622) |
| (a) | The amount presented here represents the fund's current day net variation margin for futures contracts and for cleared swap agreements. This amount, which is recognized within the Statement of Assets and Liabilities, differs from the fair value of the futures contracts and cleared swap agreements which is presented in the tables that follow the Portfolio of Investments. |
Notes to Financial Statements - continued
The following table presents (by counterparty) the fund's derivative assets net of amounts available for offset under Master Netting Agreements (or similar arrangements) and net of the related collateral held by the fund at October 31, 2022:
| | | Amounts Not Offset in the
Statement of Assets & Liabilities |
| | Gross Amount
of Derivative
Assets Subject
to a Master
Netting
Agreement (or
Similar
Arrangement)
by Counterparty | Financial
Instruments
Available
for Offset | Financial
Instruments
Collateral
Received (b) | Cash
Collateral
Received (b) | Net Amount
of Derivative
Assets by
Counterparty |
| Barclays Bank PLC | $211 | $(211) | $— | $— | $— |
| Goldman Sachs International | 283,883 | (283,883) | — | — | — |
| JPMorgan Chase Bank N.A. | 2,057,367 | (424,364) | (1,365,505) | — | 267,498 |
| Morgan Stanley Capital Services, Inc. | 118,547 | — | — | — | 118,547 |
| Total | $2,460,008 | $(708,458) | $(1,365,505) | $— | $386,045 |
The following table presents (by counterparty) the fund's derivative liabilities net of amounts available for offset under Master Netting Agreements (or similar arrangements) and net of the related collateral pledged by the fund at October 31, 2022:
| | | Amounts Not Offset in the
Statement of Assets & Liabilities |
| | Gross Amount
of Derivative
Liabilities Subject
to a Master
Netting
Agreement (or
Similar
Arrangement)
by Counterparty | Financial
Instruments
Available
for Offset | Financial
Instruments
Collateral
Pledged (b) | Cash
Collateral
Pledged (b) | Net Amount
of Derivative
Liabilities by
Counterparty |
| Barclays Bank PLC | $(799) | $211 | $— | $— | $(588) |
| Deutsche Bank AG | (45,398) | — | — | — | (45,398) |
| Citibank N.A. | (9,351) | — | — | — | (9,351) |
| Goldman Sachs International | (343,710) | 283,883 | — | — | (59,827) |
| JPMorgan Chase Bank N.A. | (424,364) | 424,364 | — | — | — |
| Total | $(823,622) | $708,458 | $— | $— | $(115,164) |
| (b) | The amount presented here may be less than the total amount of collateral (received)/pledged as the excess collateral (received)/pledged is not shown for purposes of this presentation. |
Notes to Financial Statements - continued
Futures Contracts — The fund entered into futures contracts which may be used to hedge against or obtain broad market exposure, interest rate exposure, currency exposure, or to manage duration. A futures contract represents a commitment for the future purchase or sale of an asset at a specified price on a specified date.
Upon entering into a futures contract, the fund is required to deposit with the broker, either in cash or securities, an initial margin in an amount equal to a specified percentage of the notional amount of the contract. Subsequent payments (variation margin) are made or received by the fund each day, depending on the daily fluctuations in the value of the contract, and are recorded for financial statement purposes as unrealized gain or loss by the fund until the contract is closed or expires at which point the gain or loss on futures contracts is realized.
The fund bears the risk of interest rates, exchange rates or securities prices moving unexpectedly, in which case, the fund may not achieve the anticipated benefits of the futures contracts and may realize a loss. While futures contracts may present less counterparty risk to the fund since the contracts are exchange traded and the exchange’s clearinghouse guarantees payments to the broker, there is still counterparty credit risk due to the insolvency of the broker. The fund’s maximum risk of loss due to counterparty credit risk is equal to the margin posted by the fund to the broker plus any gains or minus any losses on the outstanding futures contracts.
Forward Foreign Currency Exchange Contracts — The fund entered into forward foreign currency exchange contracts for the purchase or sale of a specific foreign currency at a fixed price on a future date. These contracts may be used to hedge the fund’s currency risk or for non-hedging purposes. For hedging purposes, the fund may enter into contracts to deliver or receive foreign currency that the fund will receive from or use in its normal investment activities. The fund may also use contracts to hedge against declines in the value of foreign currency denominated securities due to unfavorable exchange rate movements. For non-hedging purposes, the fund may enter into contracts with the intent of changing the relative exposure of the fund’s portfolio of securities to different currencies to take advantage of anticipated exchange rate changes.
Forward foreign currency exchange contracts are adjusted by the daily exchange rate of the underlying currency and any unrealized gains or losses are recorded as a receivable or payable for forward foreign currency exchange contracts until the contract settlement date. On contract settlement date, any gain or loss on the contract is recorded as realized gains or losses on forward foreign currency exchange contracts.
Risks may arise upon entering into these contracts from unanticipated movements in the value of the contract and from the potential inability of counterparties to meet the terms of their contracts. Generally, the fund’s maximum risk due to counterparty credit risk is the unrealized gain on the contract due to the use of Continuous Linked Settlement, a multicurrency cash settlement system for the centralized settlement of foreign transactions. This risk is mitigated in cases where there is an ISDA Master Agreement between the fund and the counterparty providing for netting as described above and, where applicable, by the posting of collateral by the counterparty to the fund to cover the fund’s exposure to the counterparty under such ISDA Master Agreement.
Notes to Financial Statements - continued
Swap Agreements — The fund entered into swap agreements which generally involve a periodic exchange of cash payments on a net basis, at specified intervals or upon the occurrence of specified events, between the fund and a counterparty. Certain swap agreements may be entered into as a bilateral contract (“uncleared swaps”) while others are required to be centrally cleared (“cleared swaps”).
Both cleared and uncleared swap agreements are marked to market daily. The value of uncleared swap agreements is reported in the Statement of Assets and Liabilities as “Uncleared swaps, at value” which includes any related interest accruals to be paid or received by the fund. For cleared swaps, payments (variation margin) are made or received by the fund each day, depending on the daily fluctuations in the value of the cleared swap, such that only the current day net receivable or payable for variation margin is reported in the Statement of Assets and Liabilities.
For both cleared and uncleared swaps, premiums paid or received at the inception of the agreements are amortized over the term of the agreement as realized gain or loss on swap agreements in the Statement of Operations. The periodic exchange of net cash payments, as well as any liquidation payment received or made upon early termination, are recorded as a realized gain or loss on swap agreements in the Statement of Operations. The change in unrealized appreciation or depreciation on swap agreements in the Statement of Operations reflects the aggregate change over the reporting period in the value of swaps net of any unamortized premiums paid or received.
Risks related to swap agreements include the possible lack of a liquid market, unfavorable market and interest rate movements of the underlying instrument and the failure of the counterparty to perform under the terms of the agreements. The fund's maximum risk of loss from counterparty credit risk is the discounted net value of the cash flows to be received from/paid to the counterparty over the contract's remaining life, to the extent that the amount is positive. To address counterparty risk, uncleared swap agreements are limited to only highly-rated counterparties. Risk is further reduced by having an ISDA Master Agreement (“ISDA”) between the fund and the counterparty and, where applicable, by the posting of collateral by the counterparty to the fund to cover the fund’s exposure to the counterparty under such ISDA. The fund's counterparty risk due to cleared swaps is mitigated by the fact that the clearinghouse is the true counterparty to the transaction and the regulatory requirement safeguards in the event of a clearing broker bankruptcy.
The fund entered into interest rate swap agreements in order to manage its exposure to interest or foreign exchange rate fluctuations. Interest rate swap agreements involve the periodic exchange of cash flows, between the fund and a counterparty, based on the difference between two interest rates applied to a notional principal amount. The two interest rates exchanged may either be a fixed rate and a floating rate or two floating rates based on different indices.
Short Sales — The fund entered into short sales whereby it sells a security it does not own in anticipation of a decline in the value of that security. The fund will realize a gain if the security price decreases and a loss if the security price increases between the date of the short sale and the date on which the fund replaces the borrowed security. Losses from short sales can exceed the proceeds of the security sold; and they can also exceed the potential loss from an ordinary buy and sell transaction. The amount of any premium, dividends, or interest the fund may be required to pay in connection with a short sale will be recognized as a fund expense. During the year ended October 31,
Notes to Financial Statements - continued
2022, this expense amounted to $961. The fund segregates cash or marketable securities in an amount that, when combined with the amount of proceeds from the short sale deposited with the broker, at least equals the current market value of the security sold short.
Security Loans — Under its Securities Lending Agency Agreement with the fund, JPMorgan Chase and Co., as lending agent, loans the securities of the fund to certain qualified institutions (the “Borrowers”) approved by the fund. Security loans can be terminated at the discretion of either the lending agent or the fund and the related securities must be returned within the earlier of the standard trade settlement period for such securities or within three business days. The loans are collateralized by cash and/or U.S. Treasury and federal agency obligations in an amount typically at least equal to the market value of the securities loaned. On loans collateralized by cash, the cash collateral is invested in a money market fund. The market value of the loaned securities is determined at the close of business of the fund and any additional required collateral is delivered to the fund on the next business day. The lending agent provides the fund with indemnification against Borrower default. In the event of Borrower default, the lending agent will, for the benefit of the fund, either purchase securities identical to those loaned or, when such purchase is commercially impracticable, pay the fund the market value of the loaned securities. In return, the lending agent assumes the fund's rights to the related collateral. If the collateral value is less than the cost to purchase identical securities, the lending agent is responsible for the shortfall, but only to the extent that such shortfall is not due to a decline in collateral value resulting from collateral reinvestment for which the fund bears the risk of loss. At period end, the fund had investment securities on loan, all of which were classified as equity securities in the fund's Portfolio of Investments, with a fair value of $89,608. The fair value of the fund's investment securities on loan and a related liability of $41,566 for cash collateral received on securities loaned are both presented gross in the Statement of Assets and Liabilities. Additionally, these loans were collateralized by U.S. Treasury Obligations of $52,457 held by the lending agent. The collateral on securities loaned exceeded the value of securities on loan at period end. The liability for cash collateral for securities loaned is carried at fair value, which is categorized as level 2 within the fair value hierarchy. A portion of the income generated upon investment of the collateral is remitted to the Borrowers, and the remainder is allocated between the fund and the lending agent. On loans collateralized by U.S. Treasury and/or federal agency obligations, a fee is received from the Borrower, and is allocated between the fund and the lending agent. Income from securities lending is separately reported in the Statement of Operations. The dividend and interest income earned on the securities loaned is accounted for in the same manner as other dividend and interest income.
Indemnifications — Under the fund's organizational documents, its officers and Trustees may be indemnified against certain liabilities and expenses arising out of the performance of their duties to the fund. Additionally, in the normal course of business, the fund enters into agreements with service providers that may contain indemnification clauses. The fund's maximum exposure under these agreements is unknown as this would involve future claims that may be made against the fund that have not yet occurred.
Investment Transactions and Income — Investment transactions are recorded on the trade date. Interest income is recorded on the accrual basis. All premium and discount is amortized or accreted for financial statement purposes in accordance with U.S. generally accepted accounting principles. Dividends received in cash are recorded
Notes to Financial Statements - continued
on the ex-dividend date. Certain dividends from foreign securities will be recorded when the fund is informed of the dividend if such information is obtained subsequent to the ex-dividend date. Dividend and interest payments received in additional securities are recorded on the ex-dividend or ex-interest date in an amount equal to the value of the security on such date. In determining the net gain or loss on securities sold, the cost of securities is determined on the identified cost basis.
The fund may receive proceeds from litigation settlements. Any proceeds received from litigation involving portfolio holdings are reflected in the Statement of Operations in realized gain/loss if the security has been disposed of by the fund or in unrealized gain/loss if the security is still held by the fund. Any other proceeds from litigation not related to portfolio holdings are reflected as other income in the Statement of Operations.
Fees Paid Indirectly — The fund's custody fee may be reduced by a credit earned under an arrangement that measures the value of U.S. dollars deposited with the custodian by the fund. The amount of the credit, for the year ended October 31, 2022, is shown as a reduction of total expenses in the Statement of Operations.
Tax Matters and Distributions — The fund intends to qualify as a regulated investment company, as defined under Subchapter M of the Internal Revenue Code, and to distribute all of its taxable income, including realized capital gains. As a result, no provision for federal income tax is required. The fund’s federal tax returns, when filed, will remain subject to examination by the Internal Revenue Service for a three year period. Management has analyzed the fund’s tax positions taken on federal and state tax returns for all open tax years and does not believe that there are any uncertain tax positions that require recognition of a tax liability. Foreign taxes, if any, have been accrued by the fund in the accompanying financial statements in accordance with the applicable foreign tax law. Foreign income taxes may be withheld by certain countries in which the fund invests. Additionally, capital gains realized by the fund on securities issued in or by certain foreign countries may be subject to capital gains tax imposed by those countries.
Distributions to shareholders are recorded on the ex-dividend date. Income and capital gain distributions are determined in accordance with income tax regulations, which may differ from U.S. generally accepted accounting principles. Certain capital accounts in the financial statements are periodically adjusted for permanent differences in order to reflect their tax character. These adjustments have no impact on net assets or net asset value per share. Temporary differences which arise from recognizing certain items of income, expense, gain or loss in different periods for financial statement and tax purposes will reverse at some time in the future.
Book/tax differences primarily relate to amortization and accretion of debt securities, wash sale loss deferrals, and derivative transactions.
The tax character of distributions declared to shareholders for the last two fiscal years is as follows:
| | Year ended
10/31/22 | Year ended
10/31/21 |
| Ordinary income (including any short-term capital gains) | $1,041,120 | $985,057 |
Notes to Financial Statements - continued
The federal tax cost and the tax basis components of distributable earnings were as follows:
| As of 10/31/22 | |
| Cost of investments | $142,071,559 |
| Gross appreciation | 28,476,098 |
| Gross depreciation | (16,977,538) |
| Net unrealized appreciation (depreciation) | $11,498,560 |
| Undistributed ordinary income | 853,186 |
| Capital loss carryforwards | (35,496,498) |
| Other temporary differences | 92,955 |
| Total distributable earnings (loss) | $(23,051,797) |
As of October 31, 2022, the fund had capital loss carryforwards available to offset future realized gains. These net capital losses may be carried forward indefinitely and their character is retained as short-term and/or long-term losses. Such losses are characterized as follows:
Multiple Classes of Shares of Beneficial Interest — The fund offers multiple classes of shares, which differ in their respective distribution and service fees. The fund's income, realized and unrealized gain (loss), and common expenses are allocated to shareholders based on the daily net assets of each class. Dividends are declared separately for each class. Differences in per share dividend rates are generally due to differences in separate class expenses. Class B and Class C shares will convert to Class A shares approximately eight years after purchase. The fund’s distributions declared to shareholders as reported in the Statements of Changes in Net Assets are presented by class as follows:
| | Year ended
10/31/22 | Year ended
10/31/21 |
| Class A | $111,071 | $124,519 |
| Class I | 680,285 | 699,213 |
| Class R2 | 1,289 | — |
| Class R3 | 5,416 | 5,098 |
| Class R4 | 335 | 402 |
| Class R6 | 242,724 | 155,825 |
| Total | $1,041,120 | $985,057 |
(3) Transactions with Affiliates
Investment Adviser — The fund has an investment advisory agreement with MFS to provide overall investment management and related administrative services and facilities to the fund. The management fee is computed daily and paid monthly at the following annual rates based on the fund's average daily net assets:
| Up to $1 billion | 0.80% |
| In excess of $1 billion and up to $2.5 billion | 0.70% |
| In excess of $2.5 billion | 0.65% |
Notes to Financial Statements - continued
MFS has agreed in writing to reduce its management fee by a specified amount if certain MFS mutual fund assets exceed thresholds agreed to by MFS and the fund's Board of Trustees. Effective March 1, 2022, MFS has also agreed in writing to waive at least 0.01% of its management fee as part of this agreement. The agreement to waive at least 0.01% of the management fee will continue until modified by the fund's Board of Trustees, but such agreement will continue at least until February 29, 2024. For the year ended October 31, 2022, this management fee reduction amounted to $24,620, which is included in the reduction of total expenses in the Statement of Operations.
The management fee incurred for the year ended October 31, 2022 was equivalent to an annual effective rate of 0.79% of the fund's average daily net assets.
The investment adviser has agreed in writing to pay a portion of the fund’s total annual operating expenses, excluding interest, taxes, extraordinary expenses, brokerage and transaction costs, certain tax reclaim recovery expenses (including contingency fees and closing agreement expenses), and investment-related expenses (such as short sale dividend and interest expenses incurred in connection with the fund’s investment activity), such that total fund operating expenses do not exceed the following rates annually of each class’s average daily net assets:
| | | | | Classes | | | | |
| A | B | C | I | R1 | R2 | R3 | R4 | R6 |
| 1.30% | 2.05% | 2.05% | 1.05% | 2.05% | 1.55% | 1.30% | 1.05% | 0.97% |
This written agreement will continue until modified by the fund’s Board of Trustees, but such agreement will continue at least until February 29, 2024. For the year ended October 31, 2022, this reduction amounted to $258,247, which is included in the reduction of total expenses in the Statement of Operations.
Distributor — MFS Fund Distributors, Inc. (MFD), a wholly-owned subsidiary of MFS, as distributor, received $4,894 for the year ended October 31, 2022, as its portion of the initial sales charge on sales of Class A shares of the fund.
The Board of Trustees has adopted a distribution plan for certain share classes pursuant to Rule 12b-1 of the Investment Company Act of 1940.
The fund's distribution plan provides that the fund will pay MFD for services provided by MFD and financial intermediaries in connection with the distribution and servicing of certain share classes. One component of the plan is a distribution fee paid to MFD and another component of the plan is a service fee paid to MFD. MFD may subsequently pay all, or a portion, of the distribution and/or service fees to financial intermediaries.
Notes to Financial Statements - continued
Distribution Plan Fee Table:
| | Distribution
Fee Rate (d) | Service
Fee Rate (d) | Total
Distribution
Plan (d) | Annual
Effective
Rate (e) | Distribution
and Service
Fee |
| Class A | — | 0.25% | 0.25% | 0.25% | $ 70,239 |
| Class B | 0.75% | 0.25% | 1.00% | 1.00% | 23,656 |
| Class C | 0.75% | 0.25% | 1.00% | 1.00% | 47,897 |
| Class R1 | 0.75% | 0.25% | 1.00% | 1.00% | 1,162 |
| Class R2 | 0.25% | 0.25% | 0.50% | 0.50% | 2,786 |
| Class R3 | — | 0.25% | 0.25% | 0.25% | 3,235 |
| Total Distribution and Service Fees | | | | | $148,975 |
| (d) | In accordance with the distribution plan for certain classes, the fund pays distribution and/or service fees equal to these annual percentage rates of each class’s average daily net assets. The distribution and service fee rates disclosed by class represent the current rates in effect at the end of the reporting period. Any rate changes, if applicable, are detailed below. |
| (e) | The annual effective rates represent actual fees incurred under the distribution plan for the year ended October 31, 2022 based on each class's average daily net assets. MFD has voluntarily agreed to rebate a portion of each class's 0.25% service fee attributable to accounts for which there is no financial intermediary specified on the account except for accounts attributable to MFS or its affiliates' seed money. For the year ended October 31, 2022, this rebate amounted to $49 for Class A shares and is included in the reduction of total expenses in the Statement of Operations. |
Certain Class A shares are subject to a contingent deferred sales charge (CDSC) in the event of a shareholder redemption within 18 months of purchase. Class B shares are subject to a CDSC in the event of a shareholder redemption within six years of purchase. Class C shares are subject to a CDSC in the event of a shareholder redemption within 12 months of purchase. All contingent deferred sales charges are paid to MFD and during the year ended October 31, 2022, were as follows:
| | Amount |
| Class A | $1,097 |
| Class B | 1,136 |
| Class C | 224 |
Shareholder Servicing Agent — MFS Service Center, Inc. (MFSC), a wholly-owned subsidiary of MFS, receives a fee from the fund for its services as shareholder servicing agent calculated as a percentage of the average daily net assets of the fund as determined periodically under the supervision of the fund's Board of Trustees. For the year ended October 31, 2022, the fee was $13,490, which equated to 0.0077% annually of the fund's average daily net assets. MFSC also receives reimbursement from the fund for out-of-pocket expenses, sub-accounting and other shareholder servicing costs which may be paid to affiliated and unaffiliated service providers. Class R6 shares do not incur sub-accounting fees. For the year ended October 31, 2022, these out-of-pocket expenses, sub-accounting and other shareholder servicing costs amounted to $153,454.
Administrator — MFS provides certain financial, legal, shareholder communications, compliance, and other administrative services to the fund. Under an administrative services agreement, the fund reimburses MFS the costs incurred to provide these
Notes to Financial Statements - continued
services. The fund is charged an annual fixed amount of $17,500 plus a fee based on average daily net assets. The administrative services fee incurred for the year ended October 31, 2022 was equivalent to an annual effective rate of 0.0208% of the fund's average daily net assets.
Trustees’ and Officers’ Compensation — The fund pays compensation to independent Trustees in the form of a retainer, attendance fees, and additional compensation to Board and Committee chairpersons. The fund does not pay compensation directly to Trustees or officers of the fund who are also officers of the investment adviser, all of whom receive remuneration from MFS for their services to the fund. Certain officers and Trustees of the fund are officers or directors of MFS, MFD, and MFSC.
Other — The fund invests in the MFS Institutional Money Market Portfolio which is managed by MFS and seeks current income consistent with preservation of capital and liquidity. This money market fund does not pay a management fee to MFS but does incur investment and operating costs.
The fund is permitted to engage in purchase and sale transactions with funds and accounts for which MFS serves as investment adviser or sub-adviser (“cross-trades”) pursuant to a policy adopted by the Board of Trustees. This policy has been designed to ensure that cross-trades conducted by the fund comply with Rule 17a-7 under the Investment Company Act of 1940. During the year ended October 31, 2022, the fund engaged in purchase and sale transactions pursuant to this policy, which amounted to $60,465 and $1,853, respectively. The sales transactions resulted in net realized gains (losses) of $677.
(4) Portfolio Securities
For the year ended October 31, 2022, purchases and sales of investments, other than short sales and short-term obligations, were as follows:
| | Purchases | Sales |
| U.S. Government securities | $2,491,758 | $804,376 |
| Non-U.S. Government securities | 97,154,066 | 93,608,721 |
Notes to Financial Statements - continued
(5) Shares of Beneficial Interest
The fund's Declaration of Trust permits the Trustees to issue an unlimited number of full and fractional shares of beneficial interest. Transactions in fund shares were as follows:
| | Year ended
10/31/22 | | Year ended
10/31/21 |
| | Shares | Amount | | Shares | Amount |
| Shares sold | | | | | |
| Class A | 487,164 | $5,469,700 | | 806,398 | $9,279,252 |
| Class B | 4,910 | 52,271 | | 2,697 | 29,872 |
| Class C | 82,132 | 893,191 | | 65,487 | 745,204 |
| Class I | 3,229,994 | 36,790,220 | | 3,852,642 | 44,743,981 |
| Class R1 | 74 | 799 | | 73 | 819 |
| Class R2 | 2,175 | 24,473 | | 13,743 | 158,828 |
| Class R3 | 10,878 | 123,059 | | 35,437 | 405,547 |
| Class R4 | 45,731 | 513,847 | | — | — |
| Class R6 | 322,341 | 3,658,267 | | 2,447,318 | 28,796,377 |
| | 4,185,399 | $47,525,827 | | 7,223,795 | $84,159,880 |
Shares issued to shareholders
in reinvestment of distributions | | | | | |
| Class A | 8,813 | $103,460 | | 10,073 | $113,217 |
| Class I | 54,315 | 640,921 | | 47,512 | 536,886 |
| Class R2 | 111 | 1,289 | | — | — |
| Class R3 | 461 | 5,416 | | 453 | 5,098 |
| Class R4 | 28 | 335 | | 36 | 402 |
| Class R6 | 6,838 | 81,098 | | 12,367 | 140,361 |
| | 70,566 | $832,519 | | 70,441 | $795,964 |
| Shares reacquired | | | | | |
| Class A | (756,255) | $(8,520,202) | | (861,995) | $(9,925,360) |
| Class B | (116,274) | (1,270,721) | | (106,535) | (1,199,549) |
| Class C | (246,717) | (2,698,221) | | (327,906) | (3,692,400) |
| Class I | (4,115,685) | (46,348,001) | | (4,260,461) | (49,555,579) |
| Class R1 | (102) | (1,067) | | (11) | (126) |
| Class R2 | (8,052) | (88,706) | | (7,348) | (83,037) |
| Class R3 | (67,539) | (751,038) | | (31,370) | (364,075) |
| Class R4 | — | — | | (495) | (5,631) |
| Class R6 | (794,374) | (8,996,098) | | (1,362,036) | (16,160,287) |
| | (6,104,998) | $(68,674,054) | | (6,958,157) | $(80,986,044) |
Notes to Financial Statements - continued
| | Year ended
10/31/22 | | Year ended
10/31/21 |
| | Shares | Amount | | Shares | Amount |
| Net change | | | | | |
| Class A | (260,278) | $(2,947,042) | | (45,524) | $(532,891) |
| Class B | (111,364) | (1,218,450) | | (103,838) | (1,169,677) |
| Class C | (164,585) | (1,805,030) | | (262,419) | (2,947,196) |
| Class I | (831,376) | (8,916,860) | | (360,307) | (4,274,712) |
| Class R1 | (28) | (268) | | 62 | 693 |
| Class R2 | (5,766) | (62,944) | | 6,395 | 75,791 |
| Class R3 | (56,200) | (622,563) | | 4,520 | 46,570 |
| Class R4 | 45,759 | 514,182 | | (459) | (5,229) |
| Class R6 | (465,195) | (5,256,733) | | 1,097,649 | 12,776,451 |
| | (1,849,033) | $(20,315,708) | | 336,079 | $3,969,800 |
Effective June 1, 2019, purchases of the fund’s Class B shares were closed to new and existing investors subject to certain exceptions.
(6) Line of Credit
The fund and certain other funds managed by MFS participate in a $1.45 billion unsecured committed line of credit of which $1.2 billion is reserved for use by the fund and certain other MFS U.S. funds. The line of credit is provided by a syndicate of banks under a credit agreement. Borrowings may be made for temporary financing needs. Interest is charged to each fund, based on its borrowings, generally at a rate equal to the highest of 1) Daily Simple SOFR (Secured Overnight Financing Rate) plus 0.10%, 2) the Federal Funds Effective Rate, or 3) the Overnight Bank Funding Rate, each plus an agreed upon spread. A commitment fee, based on the average daily unused portion of the committed line of credit, is allocated among the participating funds. The line of credit expires on March 16, 2023 unless extended or renewed. In addition, the fund and other funds managed by MFS have established unsecured uncommitted borrowing arrangements with certain banks for temporary financing needs. Interest is charged to each fund, based on its borrowings, at rates equal to customary reference rates plus an agreed upon spread. For the year ended October 31, 2022, the fund’s commitment fee and interest expense were $762 and $0, respectively, and are included in “Interest expense and fees” in the Statement of Operations.
(7) Investments in Affiliated Issuers
An affiliated issuer may be considered one in which the fund owns 5% or more of the outstanding voting securities, or a company which is under common control. For the purposes of this report, the following were affiliated issuers:
| Affiliated Issuers | Beginning
Value | Purchases | Sales
Proceeds | Realized
Gain
(Loss) | Change in
Unrealized
Appreciation or
Depreciation | Ending
Value |
| MFS Institutional Money Market Portfolio | $7,489,894 | $251,432,460 | $257,531,499 | $— | $138 | $1,390,993 |
Notes to Financial Statements - continued
| Affiliated Issuers | Dividend
Income | Capital Gain
Distributions |
| MFS Institutional Money Market Portfolio | $86,682 | $— |
(8) LIBOR Transition
Certain of the fund's investments, including investments in certain debt instruments and derivatives (if any), as well as borrowings by the fund and certain other contractual arrangements of the fund, may be based on the London Interbank Offered Rate (“LIBOR”). In 2017, the regulatory authority that oversees financial services firms in the United Kingdom announced plans to transition away from LIBOR by the end of 2021. In March 2021, the administrator of LIBOR announced the extension of the publication of the more commonly used U.S. dollar LIBOR settings to the end of June 2023. Although the full impacts of the transition away from LIBOR are not fully known, the transition may result in, among other things, an increase in volatility or illiquidity of the markets for instruments that currently rely on LIBOR to determine interest rates and this could have an adverse impact on the fund's performance. With respect to the fund's accounting for investments, including investments in certain debt instruments and derivatives, as well as borrowings by the fund and any other contractual arrangements of the fund that undergo reference rate-related modifications as a result of the transition, management will rely upon the relief provided by FASB Codification Topic 848 – Reference Rate Reform (Topic 848). The guidance in Topic 848 permits the fund to account for those modified contracts as a continuation of the existing contracts. Management is still evaluating the impact to the fund of the June 30, 2023 planned discontinuation of the more commonly used U.S. dollar LIBOR settings.
(9) Russia and Ukraine Conflict
The market disruptions, which began in late February 2022, associated with geopolitical events related to the conflict between Russia and Ukraine may adversely affect the value of the fund’s assets and thus the fund’s performance. Management continues to monitor these events and to evaluate the related impacts, if any, to the fund.
Report of Independent Registered Public Accounting Firm
To the Board of Trustees of MFS Series Trust XV and the Shareholders of MFS Global Alternative Strategy Fund:
Opinion on the Financial Statements and Financial Highlights
We have audited the accompanying statement of assets and liabilities of MFS Global Alternative Strategy Fund (the “Fund”), including the portfolio of investments, as of October 31, 2022, the related statement of operations for the year then ended, the statements of changes in net assets for each of the two years in the period then ended, the financial highlights for each of the five years in the period then ended, and the related notes. In our opinion, the financial statements and financial highlights present fairly, in all material respects, the financial position of the Fund as of October 31, 2022, and the results of its operations for the year then ended, the changes in its net assets for each of the two years in the period then ended, and the financial highlights for each of the five years in the period then ended, in conformity with accounting principles generally accepted in the United States of America.
Basis for Opinion
These financial statements and financial highlights are the responsibility of the Fund's management. Our responsibility is to express an opinion on the Fund's financial statements and financial highlights based on our audits. We are a public accounting firm registered with the Public Company Accounting Oversight Board (United States) (PCAOB) and are required to be independent with respect to the Fund in accordance with the U.S. federal securities laws and the applicable rules and regulations of the Securities and Exchange Commission and the PCAOB.
We conducted our audits in accordance with the standards of the PCAOB. Those standards require that we plan and perform the audit to obtain reasonable assurance about whether the financial statements and financial highlights are free of material misstatement, whether due to error or fraud. The Fund is not required to have, nor were we engaged to perform, an audit of its internal control over financial reporting. As part of our audits, we are required to obtain an understanding of internal control over financial reporting but not for the purpose of expressing an opinion on the effectiveness of the Fund's internal control over financial reporting. Accordingly, we express no such opinion.
Our audits included performing procedures to assess the risks of material misstatement of the financial statements and financial highlights, whether due to error or fraud, and performing procedures that respond to those risks. Such procedures included examining, on a test basis, evidence regarding the amounts and disclosures in the financial statements and financial highlights. Our audits also included evaluating the accounting principles used and significant estimates made by management, as well as evaluating the overall presentation of the financial statements and financial highlights.
Report of Independent Registered Public Accounting Firm – continued
Our procedures included confirmation of securities owned as of October 31, 2022, by correspondence with the custodian and brokers; when replies were not received from brokers, we performed other auditing procedures. We believe that our audits provide a reasonable basis for our opinion.
DELOITTE & TOUCHE LLP
Boston, Massachusetts
December 15, 2022
We have served as the auditor of one or more of the MFS investment companies since 1924.
Trustees and Officers — Identification and Background
The Trustees and Officers of the Trust, as of December 1, 2022, are listed below, together with their principal occupations during the past five years. (Their titles may have varied during that period.) The address of each Trustee and Officer is 111 Huntington Avenue, Boston, Massachusetts 02199-7618.
| Name, Age | | Position(s) Held with Fund | | Trustee/Officer Since(h) | | Number of MFS Funds overseen by the Trustee | | Principal Occupations During
the Past Five Years | | Other Directorships During
the Past Five Years (j) |
| INTERESTED TRUSTEES | | | | | | | | | | |
Michael W. Roberge (k)
(age 56) | | Trustee | | January 2021 | | 136 | | Massachusetts Financial Services Company, Chairman (since January 2021); Chief Executive Officer (since January 2017); Director; Chairman of the Board (since January 2022); President (until December 2018); Chief Investment Officer (until December 2018) | | N/A |
| INDEPENDENT TRUSTEES | | | | | | | | | | |
John P. Kavanaugh
(age 68) | | Trustee and Chair of Trustees | | January 2009 | | 136 | | Private investor | | N/A |
Steven E. Buller
(age 71) | | Trustee | | February 2014 | | 136 | | Private investor | | N/A |
John A. Caroselli
(age 68) | | Trustee | | March 2017 | | 136 | | Private investor; JC Global Advisors, LLC (management consulting), President (since 2015) | | N/A |
Maureen R. Goldfarb
(age 67) | | Trustee | | January 2009 | | 136 | | Private investor | | N/A |
Peter D. Jones
(age 67) | | Trustee | | January 2019 | | 136 | | Private investor | | N/A |
James W. Kilman, Jr.
(age 61) | | Trustee | | January 2019 | | 136 | | Burford Capital Limited (finance and investment management), Senior Advisor (since May 3, 2021), Chief Financial Officer (2019 - May 2, 2021); KielStrand Capital LLC (family office), Chief Executive Officer (since 2016) | | Alpha-En Corporation, Director (2016-2019) |
Trustees and Officers - continued
| Name, Age | | Position(s) Held with Fund | | Trustee/Officer Since(h) | | Number of MFS Funds overseen by the Trustee | | Principal Occupations During
the Past Five Years | | Other Directorships During
the Past Five Years (j) |
Clarence Otis, Jr.
(age 66) | | Trustee | | March 2017 | | 136 | | Private investor | | VF Corporation, Director; Verizon Communications, Inc., Director; The Travelers Companies, Director |
Maryanne L. Roepke
(age 66) | | Trustee | | May 2014 | | 136 | | Private investor | | N/A |
Laurie J. Thomsen
(age 65) | | Trustee | | March 2005 | | 136 | | Private investor | | The Travelers Companies, Director; Dycom Industries, Inc., Director |
| Name, Age | | Position(s) Held with
Fund | | Trustee/Officer Since(h) | | Number of MFS Funds for which the Person is an Officer | | Principal Occupations During
the Past Five Years |
| OFFICERS | | | | | | | | |
Christopher R. Bohane (k)
(age 48) | | Assistant Secretary and Assistant Clerk | | July 2005 | | 136 | | Massachusetts Financial Services Company, Senior Vice President and Senior Managing Counsel |
Kino Clark (k)
(age 54) | | Assistant Treasurer | | January 2012 | | 136 | | Massachusetts Financial Services Company, Vice President |
John W. Clark, Jr. (k)
(age 55) | | Assistant Treasurer | | April 2017 | | 136 | | Massachusetts Financial Services Company, Vice President |
David L. DiLorenzo (k)
(age 54) | | President | | July 2005 | | 136 | | Massachusetts Financial Services Company, Senior Vice President |
Heidi W. Hardin (k)
(age 55) | | Secretary and Clerk | | April 2017 | | 136 | | Massachusetts Financial Services Company, Executive Vice President and General Counsel |
Brian E. Langenfeld (k)
(age 49) | | Assistant Secretary and Assistant Clerk | | June 2006 | | 136 | | Massachusetts Financial Services Company, Vice President and Managing Counsel |
Trustees and Officers - continued
| Name, Age | | Position(s) Held with
Fund | | Trustee/Officer Since(h) | | Number of MFS Funds for which the Person is an Officer | | Principal Occupations During
the Past Five Years |
Rosa E. Licea-Mailloux (k)
(age 46) | | Chief Compliance Officer | | March 2022 | | 136 | | Massachusetts Financial Services Company, Vice President (since 2018); Director of Corporate Compliance (2018-2021), Senior Director Compliance (2021-2022), Senior Managing Director of North American Compliance & Chief Compliance Officer (since March 2022); Natixis Investment Managers (investment management), Funds Chief Compliance Officer, Deputy General Counsel & Senior Vice President (until 2018) |
Amanda S. Mooradian (k)
(age 43) | | Assistant Secretary and Assistant Clerk | | September 2018 | | 136 | | Massachusetts Financial Services Company, Assistant Vice President and Senior Counsel |
Susan A. Pereira (k)
(age 52) | | Assistant Secretary and Assistant Clerk | | July 2005 | | 136 | | Massachusetts Financial Services Company, Vice President and Managing Counsel |
Kasey L. Phillips (k)
(age 51) | | Assistant Treasurer | | September 2012 | | 136 | | Massachusetts Financial Services Company, Vice President |
Matthew A. Stowe (k)
(age 48) | | Assistant Secretary and Assistant Clerk | | October 2014 | | 136 | | Massachusetts Financial Services Company, Vice President and Senior Managing Counsel |
William B. Wilson (k)
(age 40) | | Assistant Secretary and Assistant Clerk | | October 2022 | | 136 | | Massachusetts Financial Services Company, Assistant Vice President and Counsel |
James O. Yost (k)
(age 62) | | Treasurer | | September 1990 | | 136 | | Massachusetts Financial Services Company, Senior Vice President |
| (h) | Date first appointed to serve as Trustee/Officer of an MFS Fund. Each Trustee has served continuously since appointment unless indicated otherwise. From January 2012 through December 2016, Messrs. DiLorenzo and Yost served as Treasurer and Deputy Treasurer of the Funds, respectively. |
| (j) | Directorships or trusteeships of companies required to report to the Securities and Exchange Commission (i.e., “public companies”). |
| (k) | “Interested person” of the Trust within the meaning of the Investment Company Act of 1940 (referred to as the 1940 Act), which is the principal federal law governing investment companies like the fund, as a result of a position with MFS. The address of MFS is 111 Huntington Avenue, Boston, Massachusetts 02199-7618. |
Trustees and Officers - continued
Each Trustee (other than Messrs. Jones, Kilman and Roberge) has been elected by shareholders and each Trustee and Officer holds office until his or her successor is chosen and qualified or until his or her earlier death, resignation, retirement or removal. Mr. Roberge became a Trustee of the Funds on January 1, 2021 and Messrs. Jones and Kilman became Trustees of the Funds on January 1, 2019. The Trust does not hold annual meetings for the purpose of electing Trustees, and Trustees are not elected for fixed terms. Under the terms of the Board's retirement policy, an Independent Trustee shall retire at the end of the calendar year in which he or she reaches the earlier of 75 years of age or 15 years of service on the Board (or, in the case of any Independent Trustee who joined the Board prior to 2015, 20 years of service on the Board).
Messrs. Buller, Kilman and Otis and Ms. Roepke are members of the Trust’s Audit Committee.
Each of the Interested Trustees and certain Officers hold comparable officer positions with certain affiliates of MFS.
The Statement of Additional Information for a Fund includes further information about the Trustees and is available without charge upon request by calling 1-800-225-2606.
| Investment Adviser | Custodian |
Massachusetts Financial Services Company
111 Huntington Avenue
Boston, MA 02199-7618 | JPMorgan Chase Bank, NA
4 Metrotech Center
New York, NY 11245 |
| Distributor | Independent Registered Public Accounting Firm |
MFS Fund Distributors, Inc.
111 Huntington Avenue
Boston, MA 02199-7618 | Deloitte & Touche LLP
200 Berkeley Street
Boston, MA 02116 |
| Portfolio Manager(s) | |
Benjamin Nastou
Natalie Shapiro
Erich Shigley | |
Board Review of Investment Advisory Agreement
MFS Global Alternative Strategy Fund
The Investment Company Act of 1940 requires that both the full Board of Trustees and a majority of the non-interested (“independent”) Trustees, voting separately, annually approve the continuation of the Fund’s investment advisory agreement with MFS. The Trustees consider matters bearing on the Fund and its advisory arrangements at their meetings throughout the year, including a review of performance data at each regular meeting. In addition, the independent Trustees met several times over the course of three months beginning in May and ending in July, 2022 (“contract review meetings”) for the specific purpose of considering whether to approve the continuation of the investment advisory agreement for the Fund and the other investment companies that the Board oversees (the “MFS Funds”). The independent Trustees were assisted in their evaluation of the Fund’s investment advisory agreement by independent legal counsel, from whom they received separate legal advice and with whom they met separately from MFS during various contract review meetings. The independent Trustees were also assisted in this process by an independent consultant who was retained by and reported to the independent Trustees.
In connection with their deliberations regarding the continuation of the investment advisory agreement, the Trustees, including the independent Trustees, considered such information and factors as they believed, in light of the legal advice furnished to them and their own business judgment, to be relevant. The investment advisory agreement for the Fund was considered separately, although the Trustees also took into account the common interests of all MFS Funds in their review. As described below, the Trustees considered the nature, quality, and extent of the various investment advisory, administrative, and shareholder services performed by MFS under the existing investment advisory agreement and other arrangements with the Fund.
In connection with their contract review meetings, the Trustees received and relied upon materials that included, among other items: (i) information provided by Broadridge Financial Solutions, Inc. (“Broadridge”), an independent third party, on the investment performance of the Fund for various time periods ended December 31, 2021 and the investment performance of a group of funds with substantially similar investment classifications/objectives (the “Broadridge performance universe”), (ii) information provided by Broadridge on the Fund’s advisory fees and other expenses and the advisory fees and other expenses of comparable funds identified by Broadridge as well as all other funds in the same investment classification/category (the “Broadridge expense group and universe”), (iii) information provided by MFS on the advisory fees of portfolios of other clients of MFS, including institutional separate accounts and other clients, (iv) information as to whether and to what extent applicable expense waivers, reimbursements or fee “breakpoints” are observed for the Fund, (v) information regarding MFS’ financial results and financial condition, including MFS’ and certain of its affiliates’ estimated profitability from services performed for the Fund and the MFS Funds as a whole, and compared to MFS’ institutional business, (vi) MFS’ views regarding the outlook for the mutual fund industry and the strategic business plans of MFS, (vii) descriptions of various functions performed by MFS for the Funds, such as compliance monitoring and portfolio trading practices, and (viii) information regarding the overall organization of MFS, including information about
Board Review of Investment Advisory Agreement - continued
MFS’ senior management and other personnel providing investment advisory, administrative and other services to the Fund and the other MFS Funds. The comparative performance, fee and expense information prepared and provided by Broadridge was not independently verified and the independent Trustees did not independently verify any information provided to them by MFS.
The Trustees’ conclusion as to the continuation of the investment advisory agreement was based on a comprehensive consideration of all information provided to the Trustees and not the result of any single factor. Some of the factors that figured particularly in the Trustees’ deliberations are described below, although individual Trustees may have evaluated the information presented differently from one another, giving different weights to various factors. It is also important to recognize that the fee arrangements for the Fund and other MFS Funds are the result of years of review and discussion between the independent Trustees and MFS, that certain aspects of such arrangements may receive greater scrutiny in some years than in others, and that the Trustees’ conclusions may be based, in part, on their consideration of these same arrangements during the course of the year and in prior years.
Based on information provided by Broadridge and MFS, the Trustees reviewed the Fund’s total return investment performance as well as the Broadridge performance universe over various time periods. The Trustees placed particular emphasis on the total return performance of the Fund’s Class I shares in comparison to the performance of funds in its Broadridge performance universe over the five-year period ended December 31, 2021, which the Trustees believed was a long enough period to reflect differing market conditions. The total return performance of the Fund’s Class I shares was in the 1st quintile relative to the other funds in the universe for this five-year period (the 1st quintile being the best performers and the 5th quintile being the worst performers). The total return performance of the Fund’s Class I shares was in the 2nd quintile for each of the one- and three-year periods ended December 31, 2021 relative to the Broadridge performance universe. Because of the passage of time, these performance results may differ from the performance results for more recent periods, including those shown elsewhere in this report.
In the course of their deliberations, the Trustees took into account information provided by MFS in connection with the contract review meetings, as well as during investment review meetings conducted with portfolio management personnel during the course of the year regarding the Fund’s performance. After reviewing these and related factors, the Trustees concluded, within the context of their overall conclusions regarding the investment advisory agreement, that they were satisfied with MFS’ responses and efforts relating to investment performance.
In assessing the reasonableness of the Fund’s advisory fee, the Trustees considered, among other information, the Fund’s advisory fee and the total expense ratio of the Fund’s Class I shares as a percentage of average daily net assets and the advisory fee and total expense ratios of the Broadridge expense group based on information provided by Broadridge. The Trustees considered that MFS currently observes an expense limitation for the Fund, which may not be changed without the Trustees’ approval. The Trustees also considered that, according to the data provided by Broadridge (which takes into account any fee reductions or expense limitations that were in effect during the Fund’s last fiscal year), the Fund’s effective advisory fee rate and total expense ratio were each lower than the Broadridge expense group median.
Board Review of Investment Advisory Agreement - continued
The Trustees also considered the advisory fees charged by MFS to any institutional separate accounts advised by MFS (“separate accounts”) and unaffiliated investment companies for which MFS serves as subadviser (“subadvised funds”) that have comparable investment strategies to the Fund, if any. In comparing these fees, the Trustees considered information provided by MFS as to the generally broader scope of services provided by MFS to the Fund, as well as the more extensive regulatory burdens imposed on MFS in managing the Fund, in comparison to separate accounts and subadvised funds. The Trustees also considered the higher demands placed on MFS’ investment personnel and trading infrastructure as a result of the daily cash in-flows and out-flows of the Fund in comparison to separate accounts.
The Trustees also considered whether the Fund may benefit from any economies of scale in the management of the Fund in the event of growth in assets of the Fund and/or growth in assets of the MFS Funds as a whole. They noted that the Fund’s advisory fee rate schedule is subject to contractual breakpoints that reduce the Fund’s advisory fee rate on average daily net assets over $1 billion and $2.5 billion. The Trustees also noted that MFS has agreed in writing to waive a portion of the management fees of certain MFS Funds, including the Fund, if the total combined assets of certain funds within the MFS Funds’ complex increase above agreed upon thresholds (the “group fee waiver”), enabling the Fund’s shareholders to share in the benefits from any economies of scale at the complex level. The group fee waiver is reviewed and renewed annually between the Board and MFS. The Trustees concluded that the breakpoints and the group fee waiver were sufficient to allow the Fund to benefit from economies of scale as its assets and overall complex assets grow.
The Trustees also considered information prepared by MFS relating to MFS’ costs and profits with respect to the Fund, the MFS Funds considered as a group, and other investment companies and accounts advised by MFS, as well as MFS’ methodologies used to determine and allocate its costs to the MFS Funds, the Fund and other accounts and products for purposes of estimating profitability.
After reviewing these and other factors described herein, the Trustees concluded, within the context of their overall conclusions regarding the investment advisory agreement, that the advisory fees charged to the Fund represent reasonable compensation in light of the services being provided by MFS to the Fund.
In addition, the Trustees considered MFS’ resources and related efforts to continue to retain, attract and motivate capable personnel to serve the Fund. The Trustees also considered current and developing conditions in the financial services industry, including the presence of large and well-capitalized companies which are spending, and appear to be prepared to continue to spend, substantial sums to engage personnel and to provide services to competing investment companies. In this regard, the Trustees also considered the financial resources of MFS and its ultimate parent, Sun Life Financial Inc. The Trustees also considered the advantages and possible disadvantages to the Fund of having an adviser that also serves other investment companies as well as other accounts.
The Trustees also considered the nature, quality, cost, and extent of administrative, transfer agency, and distribution services provided to the Fund by MFS and its affiliates under agreements and plans other than the investment advisory agreement, including any 12b-1 fees the Fund pays to MFS Fund Distributors, Inc., an affiliate of MFS. The Trustees also considered the nature, extent and quality of certain other services
Board Review of Investment Advisory Agreement - continued
MFS performs or arranges for on the Fund’s behalf, which may include securities lending programs, directed expense payment programs, class action recovery programs, and MFS’ interaction with third-party service providers, principally custodians and sub-custodians. The Trustees concluded that the various non-advisory services provided by MFS and its affiliates on behalf of the Fund were satisfactory.
The Trustees considered so-called “fall-out benefits” to MFS such as reputational value derived from serving as investment manager to the MFS Funds. The Trustees also considered that MFS discontinued its historic practice of obtaining investment research from portfolio brokerage commissions paid by certain MFS Funds effective January 2018, and directly pays or voluntarily reimburses a Fund, if applicable, for the costs of external research acquired through the use of the Fund’s portfolio brokerage commissions.
Based on their evaluation of factors that they deemed to be material, including those factors described above, the Board of Trustees, including the independent Trustees, concluded that the Fund’s investment advisory agreement with MFS should be continued for an additional one-year period, commencing August 1, 2022.
Proxy Voting Policies and Information
MFS votes proxies on behalf of the fund pursuant to proxy voting policies and procedures that are available without charge, upon request, by calling 1-800-225-2606, by visiting mfs.com/proxyvoting, or by visiting the SEC’s Web site at http://www.sec.gov.
Information regarding how the fund voted proxies relating to portfolio securities during the most recent twelve-month period ended June 30 is available by August 31 of each year without charge by visiting mfs.com/proxyvoting, or by visiting the SEC’s Web site at http://www.sec.gov.
Quarterly Portfolio Disclosure
The fund files a complete schedule of portfolio holdings with the SEC for the first and third quarters of each fiscal year as an exhibit to its reports on Form N-PORT. The fund's Form N-PORT reports are available on the SEC's Web site at http://www.sec.gov. A shareholder can obtain the portfolio holdings report for the first and third quarters of the fund's fiscal year at mfs.com/openendfunds by choosing the fund's name and then scrolling to the “Resources” section and clicking on the “Prospectus and Reports” tab.
Further Information
From time to time, MFS may post important information about the fund or the MFS Funds on the MFS Web site (mfs.com). This information is available at https://www.mfs.com/announcements or at mfs.com/openendfunds by choosing the fund’s name and then scrolling to the “Resources” section and clicking on the “Announcements” tab, if any.
Information About Fund Contracts and Legal Claims
The fund has entered into contractual arrangements with an investment adviser, administrator, distributor, shareholder servicing agent, and custodian who each provide services to the fund. Unless expressly stated otherwise, shareholders are not parties to, or intended beneficiaries of these contractual arrangements, and these contractual arrangements are not intended to create any shareholder right to enforce them against the service providers or to seek any remedy under them against the service providers, either directly or on behalf of the fund.
Under the Trust’s By-Laws and Declaration of Trust, any claims asserted against or on behalf of the MFS Funds, including claims against Trustees and Officers, must be brought in state and federal courts located within the Commonwealth of Massachusetts.
Federal Tax Information (unaudited)
The fund will notify shareholders of amounts for use in preparing 2022 income tax forms in January 2023. The following information is provided pursuant to provisions of the Internal Revenue Code.
The fund designates the maximum amount allowable as qualified dividend income eligible to be taxed at the same rate as long-term capital gain.
For corporate shareholders, 100.00% of the ordinary income dividends paid during the fiscal year qualify for the corporate dividends received deduction.
The fund designates the maximum amount allowable as Section 199A dividends as defined in Proposed Treasury Regulation §1.199A-3(d).
Federal Tax Information (unaudited) - continued
The fund intends to pass through the maximum amount allowable as Section 163(j) Interest Dividends as defined in Treasury Regulation §1.163(j)-1(b).
| FACTS | WHAT DOES MFS DO WITH YOUR PERSONAL INFORMATION? |
| Why? | Financial companies choose how they share your personal information. Federal law gives consumers the right to limit some but not all sharing. Federal law also requires us to tell you how we collect, share, and protect your personal information. Please read this notice carefully to understand what we do. |
| What? | The types of personal information we collect and share depend on the product or service you have with us. This information can include: |
| • Social Security number and account balances |
| • Account transactions and transaction history |
| • Checking account information and wire transfer instructions |
| When you are no longer our customer, we continue to share your information as described in this notice. |
| How? | All financial companies need to share customers' personal information to run their everyday business. In the section below, we list the reasons financial companies can share their customers' personal information; the reasons MFS chooses to share; and whether you can limit this sharing. |
Reasons we can share your
personal information | Does MFS share? | Can you limit
this sharing? |
For our everyday business purposes –
such as to process your transactions, maintain your
account(s), respond to court orders and legal
investigations, or report to credit bureaus | Yes | No |
For our marketing purposes –
to offer our products and services to you | No | We don't share |
For joint marketing with other
financial companies | No | We don't share |
For our affiliates' everyday business purposes –
information about your transactions and experiences | No | We don't share |
For our affiliates' everyday business purposes –
information about your creditworthiness | No | We don't share |
| For nonaffiliates to market to you | No | We don't share |
| Questions? | Call 800-225-2606 or go to mfs.com. |
| Who we are |
| Who is providing this notice? | MFS Funds, MFS Investment Management, MFS Institutional Advisors, Inc., and MFS Heritage Trust Company. |
| What we do |
How does MFS
protect my personal
information? | To protect your personal information from unauthorized access and use, we use security measures that comply with federal law. These measures include procedural, electronic, and physical safeguards for the protection of the personal information we collect about you. |
How does MFS
collect my personal
information? | We collect your personal information, for example, when you |
| • open an account or provide account information |
| • direct us to buy securities or direct us to sell your securities |
| • make a wire transfer |
| We also collect your personal information from others, such as credit bureaus, affiliates, or other companies. |
| Why can't I limit all sharing? | Federal law gives you the right to limit only |
| • sharing for affiliates' everyday business purposes – information about your creditworthiness |
| • affiliates from using your information to market to you |
| • sharing for nonaffiliates to market to you |
| State laws and individual companies may give you additional rights to limit sharing. |
| Definitions |
| Affiliates | Companies related by common ownership or control. They can be financial and nonfinancial companies. |
| • MFS does not share personal information with affiliates, except for everyday business purposes as described on page one of this notice. |
| Nonaffiliates | Companies not related by common ownership or control. They can be financial and nonfinancial companies. |
| • MFS does not share with nonaffiliates so they can market to you. |
| Joint marketing | A formal agreement between nonaffiliated financial companies that together market financial products or services to you. |
| • MFS doesn't jointly market. |
| Other important information |
| If you own an MFS product or receive an MFS service in the name of a third party such as a bank or broker-dealer, their privacy policy may apply to you instead of ours. |
Save paper with eDelivery.
MFS® will send you prospectuses, reports, and proxies directly via e-mail so you will get information faster with less mailbox clutter.
To sign up:
1. Go to mfs.com.
2. Log in via MFS® Access.
3. Select eDelivery.
If you own your MFS fund shares through a financial institution or a retirement plan, MFS® TALK, MFS® Access, or eDelivery may not be available to you.
CONTACT
WEB SITE
mfs.com
MFS TALK
1-800-637-8255
24 hours a day
ACCOUNT SERVICE AND LITERATURE
Shareholders
1-800-225-2606
Financial advisors
1-800-343-2829
Retirement plan services
1-800-637-1255
MAILING ADDRESS
MFS Service Center, Inc.
P.O. Box 219341
Kansas City, MO 64121-9341
OVERNIGHT MAIL
MFS Service Center, Inc.
Suite 219341
430 W 7th Street
Kansas City, MO 64105-1407
Item 1(b):
Not applicable
ITEM 2. CODE OF ETHICS.
The Registrant has adopted a Code of Ethics (the "Code") pursuant to Section 406 of the Sarbanes-Oxley Act and as defined in Form N-CSR that applies to the Registrant's principal executive officer and principal financial and accounting officer. During the period covered by this report, the Registrant has not amended any provision in the Code that relates to an element of the Code's definition enumerated in paragraph (b) of Item 2 of this Form N-CSR. During the period covered by this report, the Registrant did not grant a waiver, including an implicit waiver, from any provision of the Code.
A copy of the Code is attached hereto as EX-99.COE.
ITEM 3. AUDIT COMMITTEE FINANCIAL EXPERT.
Messrs. Steven E. Buller, James Kilman, and Clarence Otis, Jr. and Ms. Maryanne L. Roepke, members of the Audit Committee, have been determined by the Board of Trustees in their reasonable business judgment to meet the definition of "audit committee financial expert" as such term is defined in Form N-CSR. In addition, Messrs. Buller, Kilman, and Otis and Ms. Roepke are "independent" members of the Audit Committee (as such term has been defined by the Securities and Exchange Commission in regulations implementing Section 407 of the Sarbanes-Oxley Act of 2002). The Securities and Exchange Commission has stated that the designation of a person as an audit committee financial expert pursuant to this Item 3 on the Form N-CSR does not impose on such a person any duties, obligations or liability that are greater than the duties, obligations or liability imposed on such person as a member of the Audit Committee and the Board of Trustees in the absence of such designation or identification.
ITEM 4. PRINCIPAL ACCOUNTANT FEES AND SERVICES.
Items 4(a) through 4(d) and 4(g):
The Board of Trustees has appointed Deloitte & Touche LLP ("Deloitte") to serve as independent accountants to each series of the Registrant (each a "Fund" and collectively the "Funds"). The tables below set forth the audit fees billed to each Fund as well as fees for non-audit services provided to each Fund and/or to the Fund's investment adviser, Massachusetts Financial Services Company ("MFS"), and to various entities either controlling, controlled by, or under common control with MFS that provide ongoing services to the Fund ("MFS Related Entities").
For the fiscal years ended October 31, 2022 and 2021, audit fees billed to MFS Global Alternative Strategy Fund by Deloitte were as follows:
Fees billed by Deloitte: | | Audit Fees |
| 2022 | 2021 |
MFS Commodity Strategy Fund | 73,302 | 69,588 |
MFS Global Alternative Strategy Fund | 74,168 | 70,409 |
Total | 147,470 | 139,997 |
For the fiscal years ended October 31, 2022 and 2021, fees billed by Deloitte for audit-related, tax and other services provided to MFS Global Alternative Strategy Fund and for audit-related, tax and other services provided to MFS and MFS Related Entities were as follows:
Fees billed by Deloitte: | | Audit-Related Fees1 | | Tax Fees2 | All Other Fees3 |
| 2022 | | 2021 | 2022 | 2021 | 2022 | 2021 |
To MFS Commodity Strategy Fund | 0 | | 0 | 400 | 14,115 | 0 | 0 |
| | | | | | | |
To MFS Global Alternative Strategy Fund | 0 | | 0 | 400 | 13,160 | 0 | 0 |
Total fees billed by Deloitte | 0 | | 0 | 800 | 27,275 | 0 | 0 |
To above Funds | | | | | | | |
| | | | | |
Fees billed by Deloitte: | | Audit-Related Fees1 | | Tax Fees2 | All Other Fees3 |
| 2022 | | 2021 | 2022 | 2021 | 2022 | 2021 |
To MFS and MFS Related Entities of | | | | | | | |
MFS Commodity Strategy Fund* | 0 | | 0 | 0 | 0 | 3,790 | 5,390 |
To MFS and MFS Related Entities of MFS | | | | | | | |
Global Alternative Strategy Fund* | 0 | | 0 | 0 | 0 | 3,790 | 5,390 |
Fees Billed by Deloitte: | Aggregate Fees for Non-audit Services |
| 2022 | 2021 |
To MFS Commodity Strategy Fund, MFS and | | |
MFS Related Entities # | 4,190 | 19,505 |
To MFS Global Alternative Strategy Fund, | | |
MFS and MFS Related Entities # | 4,190 | 18,550 |
*This amount reflects the fees billed to MFS and MFS Related Entities for non-audit services relating directly to the operations and financial reporting of the Fund (portions of which services also related to the operations and financial reporting of other funds within the MFS Funds complex).
#This amount reflects the aggregate fees billed by Deloitte for non-audit services rendered to the Fund and for non-audit services rendered to MFS and the MFS Related Entities. `
1 The fees included under "Audit-Related Fees" are fees related to assurance and related services that are reasonably related to the performance of the audit or review of financial statements, but not reported under ''Audit Fees,'' including accounting consultations, agreed-upon procedure reports, attestation reports, comfort letters and internal control reviews.
2 The fees included under "Tax Fees" are fees associated with tax compliance, tax advice and tax planning, including services relating to the filing or amendment of federal, state or local income tax returns, regulated investment company qualification reviews and tax distribution and analysis.
3 The fees included under "All Other Fees" are fees for products and services provided by Deloitte other than those reported under "Audit Fees," "Audit-Related Fees" and "Tax Fees".
Item 4(e)(1):
Set forth below are the policies and procedures established by the Audit Committee of the Board of Trustees relating to the pre- approval of audit and non-audit related services:
To the extent required by applicable law, pre-approval by the Audit Committee of the Board is needed for all audit and permissible non-audit services rendered to the Funds and all permissible non-audit services rendered to MFS or MFS Related Entities if the services relate directly to the operations and financial reporting of the Registrant. Pre-approval is currently on an engagement-by- engagement basis. In the event pre-approval of such services is necessary between regular meetings of the Audit Committee and it is not practical to wait to seek pre-approval at the next regular meeting of the Audit Committee, pre-approval of such services may be referred to the Chair of the Audit Committee for approval; provided that the Chair may not pre-approve any individual engagement for such services exceeding $50,000 or multiple engagements for such services in the aggregate exceeding $100,000 in each period between regular meetings of the Audit Committee. Any engagement pre-approved by the Chair between regular meetings of the Audit Committee shall be presented for ratification by the entire Audit Committee at its next regularly scheduled meeting.
Item 4(e)(2):
None, or 0%, of the services relating to the Audit-Related Fees, Tax Fees and All Other Fees paid by the Fund and MFS and MFS Related Entities relating directly to the operations and financial reporting of the Registrant disclosed above were approved by the audit committee pursuant to paragraphs (c)(7)(i)(C) of Rule 2-01 of Regulation S-X (which permits audit committee approval after the start of the engagement with respect to services other than audit, review or attest services, if certain conditions are satisfied).
Item 4(f):
Not applicable.
Item 4(h):
The Registrant's Audit Committee has considered whether the provision by a Registrant's independent registered public accounting firm of non-audit services to MFS and MFS Related Entities that were not pre-approved by the Committee (because such services did not relate directly to the operations and financial reporting of the Registrant) was compatible with maintaining the independence of the independent registered public accounting firm as the Registrant's principal auditors.
ITEM 5. AUDIT COMMITTEE OF LISTED REGISTRANTS.
Not applicable to the Registrant.
ITEM 6. INVESTMENTS
A schedule of investments for each series covered by this Form N-CSR is included as part of the report to shareholders of such series under Item 1(a) of this Form N-CSR.
ITEM 7. DISCLOSURE OF PROXY VOTING POLICIES AND PROCEDURES FOR CLOSED-END MANAGEMENT INVESTMENT COMPANIES.
Not applicable to the Registrant.
ITEM 8. PORTFOLIO MANAGERS OF CLOSED-END MANAGEMENT INVESTMENT COMPANIES.
Not applicable to the Registrant.
ITEM 9. PURCHASES OF EQUITY SECURITIES BY CLOSED-END MANAGEMENT INVESTMENT COMPANY AND AFFILIATED PURCHASERS.
Not applicable to the Registrant.
ITEM 10. SUBMISSION OF MATTERS TO A VOTE OF SECURITY HOLDERS.
There were no material changes to the procedures by which shareholders may send recommendations to the Board for nominees to the Registrant's Board since the Registrant last provided disclosure as to such procedures in response to the requirements of Item 407 (c)(2)(iv) of Regulation S-K or this Item.
ITEM 11. CONTROLS AND PROCEDURES.
(a)Based upon their evaluation of the effectiveness of the registrant's disclosure controls and procedures (as defined in Rule 30a-3(c) under the Investment Company Act of 1940 (the "Act")) as conducted within 90 days of the filing date of this report on Form N-CSR, the registrant's principal financial officer and principal executive officer have concluded that those disclosure controls and procedures provide reasonable assurance that the material information required to be disclosed by the registrant on this report is recorded, processed, summarized and reported within the time periods specified in the Securities and Exchange Commission's rules and forms.
(b)There were no changes in the registrant's internal controls over financial reporting (as defined in Rule 30a-3(d) under the Act) that occurred during the period covered by the report that have materially affected, or are reasonably likely to materially affect, the registrant's internal control over financial reporting.
ITEM 12. DISCLOSURE OF SECURITIES LENDING ACTIVITIES FOR CLOSED-END MANAGEMENT INVESTMENT COMPANIES.
Not applicable to the Registrant.
ITEM 13. EXHIBITS.
(a)(1) Any code of ethics, or amendment thereto, that is the subject of the disclosure required by Item 2, to the extent that the registrant intends to satisfy the Item 2 requirements through filing of an exhibit: Attached hereto as EX-99.COE.
(2)A separate certification for each principal executive officer and principal financial officer of the registrant as required by Rule 30a-2(a) under the Act (17 CFR 270.30a-2): Attached hereto as EX-99.302CERT.
(3)Any written solicitation to purchase securities under Rule 23c-1 under the Act (17 CFR 270.23c-1) sent or given during the period covered by the report by or on behalf of the registrant to 10 or more persons. Not applicable.
(4)Change in the registrant's independent public accountant. Not applicable.
(b)If the report is filed under Section 13(a) or 15(d) of the Exchange Act, provide the certifications required by Rule 30a-2(b) under the Act (17 CFR 270.30a-2(b)), Rule 13a-14(b) or Rule 15d-14(b) under the Exchange Act (17 CFR 240.13a-14(b) or
240.15d-14(b)) and Section 1350 of Chapter 63 of Title 18 of the United States Code (18 U.S.C. 1350) as an exhibit. A certification furnished pursuant to this paragraph will not be deemed "filed" for the purposes of Section 18 of the Exchange Act (15 U.S.C. 78r), or otherwise subject to the liability of that section. Such certification will not be deemed to be incorporated by reference into any filing under the Securities Act of 1933 or the Exchange Act, except to the extent that the registrant specifically incorporates it by reference. Attached hereto as EX-99.906CERT.
Notice
A copy of the Amended and Restated Declaration of Trust, as amended, of the Registrant is on file with the Secretary of State of The Commonwealth of Massachusetts and notice is hereby given that this instrument is executed on behalf of the Registrant by an officer of the Registrant as an officer and not individually and the obligations of or arising out of this instrument are not binding upon any of the Trustees or shareholders individually, but are binding only upon the assets and property of the respective constituent series of the Registrant.
SIGNATURES
Pursuant to the requirements of the Securities Exchange Act of 1934 and the Investment Company Act of 1940, the registrant has duly caused this report to be signed on its behalf by the undersigned, thereunto duly authorized.
(Registrant) MFS SERIES TRUST XV
By (Signature and Title)*
/S/ DAVID L. DILORENZO
David L. DiLorenzo, President
Date: December 15, 2022
Pursuant to the requirements of the Securities Exchange Act of 1934 and the Investment Company Act of 1940, this report has been signed below by the following persons on behalf of the registrant and in the capacities and on the dates indicated.
By (Signature and Title)*
/S/ DAVID L. DILORENZO
David L. DiLorenzo, President (Principal Executive Officer)
Date: December 15, 2022
By (Signature and Title)*
/S/ JAMES O. YOST
James O. Yost, Treasurer (Principal Financial Officer and Accounting Officer)
Date: December 15, 2022
* Print name and title of each signing officer under his or her signature.