UNITED STATES
SECURITIES AND EXCHANGE COMMISSION
Washington, D.C. 20549
FORM N-CSR
CERTIFIED SHAREHOLDER REPORT OF REGISTERED MANAGEMENT INVESTMENT
COMPANIES
Investment Company Act file number: 811-04264
Name of Fund: BlackRock California Municipal Bond Fund of BlackRock California Municipal Series Trust
Fund Address: 100 Bellevue Parkway, Wilmington, DE 19809
Name and address of agent for service: John M. Perlowski, Chief Executive Officer, BlackRock California Municipal Bond Fund of BlackRock California Municipal Series Trust, 55 East 52nd Street, New York, NY 10055
Registrant’s telephone number, including area code: (800) 441-7762
Date of fiscal year end: 05/31/2014
Date of reporting period: 11/30/2013
Item 1 – Report to Stockholders
NOVEMBER 30, 2013
| | | | |
SEMI-ANNUAL REPORT (UNAUDITED) | | | |  |
BlackRock California Municipal Bond Fund | of BlackRock California Municipal Series Trust
BlackRock New Jersey Municipal Bond Fund | of BlackRock Multi-State Municipal Series Trust
BlackRock Pennsylvania Municipal Bond Fund | of BlackRock Multi-State Municipal Series Trust
BlackRock Strategic Municipal Opportunities Fund | of BlackRock Municipal Series Trust
|
| Not FDIC Insured • May Lose Value • No Bank Guarantee |
| | | | | | |
| | | | | | | |
| 2 | | SEMI-ANNUAL REPORT | | NOVEMBER 30, 2013 | | |
Financial markets ended 2012 with heightened volatility driven by Congressional budget battles and worries about the future of US fiscal policy and its potential effect on economic growth. However, a New Year’s Day tax deal averted the so-called “fiscal cliff,” bringing relief to investors and allowing markets to get off to a strong start in 2013. Money that had been held on the sidelines amid tax-rate uncertainty poured back into the markets in January. Key indicators signaling modest but broad-based improvements in the world’s major economies fostered an aura of comfort for investors. Global equities surged, while rising US Treasury yields pressured high-quality fixed income assets. (Bond prices fall when yields rise.)
Global economic momentum slowed in February, however, and the pace of the rally moderated. In the months that followed, US stocks outperformed international stocks, as the US showed greater stability compared to most other regions. Slow, but positive, growth was sufficient to support corporate earnings, while uncomfortably high unemployment reinforced expectations that the Federal Reserve would continue its accommodative monetary policies. International markets experienced higher levels of volatility given a resurgence of political instability in Italy, a banking crisis in Cyprus and a generally poor outlook for European economies, many of which were mired in recession. Emerging markets significantly lagged the rest of the world as growth in these economies, particularly in China and Brazil, fell short of expectations.
In May, after Fed Chairman Bernanke commented on the possibility of reducing — or “tapering” — the central bank’s asset purchase programs, investors broadly retreated from risk assets as they interpreted his remarks as signaling the imminent end of a program that had greatly supported markets. Investors returned in late June, however, when the Fed’s tone turned more dovish, and improving economic indicators and better corporate earnings helped extend gains through July.
Markets slumped again in August as investors became wary of looming risks. Mixed economic data stoked worries about global growth and uncertainty about when and how much the Fed would scale back on stimulus. Also concerning was the escalation of the revolution in Egypt and the civil war in Syria, events that fueled higher oil prices, an additional headwind for global economic growth.
September was surprisingly positive for investors, thanks to the easing of several of these key risks. Most important, the Fed defied market expectations with its decision to delay tapering. On the geopolitical front, turmoil in Egypt and Syria subsided. In Europe, the re-election of Angela Merkel as Chancellor of Germany was welcomed as a continuation of the status quo. Higher volatility returned in late September when the Treasury Department warned that the US national debt would soon breach its statutory maximum. Political brinksmanship led to a partial government shutdown, roiling global financial markets through the first half of October, but the rally quickly resumed when politicians engineered a compromise to reopen the government and extend the debt ceiling until early 2014. Investors focused on strong corporate earnings, although the results were largely attributable to lower operational costs more than revenue growth. Economic data continued to be mixed and inflation remained low, affording the Fed significant latitude in its monetary policy decisions. Investors found additional reassurance in Fed Chair-to-be Janet Yellen affirming the benefits of maintaining loose liquidity conditions while attempting to bolster economic growth.
Despite the persistence of many uncertainties, global central bank support continued to help drive outperformance in riskier asset classes versus lower-risk investments. Developed market equities generated the highest returns for the six- and 12-month periods ended November 30, with particular strength coming from US small-cap stocks. Emerging markets posted smaller, albeit positive, returns after struggling with slowing growth and weakening currencies in the first half of 2013. Rising interest rates resulted in poor performance for US Treasury bonds and other higher-quality sectors such as tax-exempt municipals and investment grade corporate bonds. High yield bonds, on the other hand, moved higher as income-oriented investors sought meaningful returns in the low-rate environment. Short-term interest rates remained near zero, keeping yields on money market securities near historical lows.
At BlackRock, we believe investors need to think globally and extend their scope across a broader array of asset classes and be prepared to move freely as market conditions change over time. We encourage you to talk with your financial advisor and visit www.blackrock.com for further insight about investing in today’s world.
Sincerely,

Rob Kapito
President, BlackRock Advisors, LLC

“Despite the persistence of many uncertainties, global central bank support continued to help drive outperformance in riskier asset classes versus lower-risk investments.”
Rob Kapito
President, BlackRock Advisors, LLC
| | | | | | | | |
| Total Returns as of November 30, 2013 | |
| | | 6-month | | | 12-month | |
US large cap equities
(S&P 500® Index) | | | 11.91 | % | | | 30.30 | % |
US small cap equities
(Russell 2000® Index) | | | 16.91 | | | | 40.99 | |
International equities
(MSCI Europe, Australasia,
Far East Index) | | | 12.07 | | | | 24.84 | |
Emerging market equities
(MSCI Emerging Markets
Index) | | | 2.33 | | | | 3.66 | |
3-month Treasury bill
(BofA Merrill Lynch
3-Month US Treasury Bill Index) | | | 0.03 | | | | 0.08 | |
US Treasury securities
(BofA Merrill Lynch
10-Year US Treasury Index) | | | (3.70 | ) | | | (6.95 | ) |
US investment grade
bonds (Barclays US
Aggregate Bond Index) | | | (0.56 | ) | | | (1.61 | ) |
Tax-exempt municipal
bonds (S&P Municipal
Bond Index) | | | (2.73 | ) | | | (3.57 | ) |
US high yield bonds
(Barclays US Corporate
High Yield 2% Issuer
Capped Index) | | | 2.61 | | | | 8.54 | |
| Past performance is no guarantee of future results. Index performance is shown for illustrative purposes only. You cannot invest directly in an index. | |
| | | | | | |
| | | | | | | |
| | THIS PAGE NOT PART OF YOUR FUND REPORT | | | | 3 |
| | | | |
| Fund Summary as of November 30, 2013 | | BlackRock California Municipal Bond Fund |
BlackRock California Municipal Bond Fund’s (the “Fund”) investment objective is to provide shareholders with income exempt from federal and California income taxes.
| | |
| Portfolio Management Commentary | | |
How did the Fund perform?
| Ÿ | | For the six-month period ended November 30, 2013, the Fund underperformed its primary benchmark, the S&P® Municipal Bond Index, and its secondary benchmark, the S&P® California Municipal Bond Index. The following discussion of relative performance pertains to the S&P® California Municipal Bond Index. |
What factors influenced performance?
| Ÿ | | The Fund’s longer duration posture (greater sensitivity to interest rate movements) relative to the benchmark index detracted from performance as interest rates rose during the period. (Bond prices generally fall when interest rates rise.) Additionally, the Fund’s high-quality bias had a negative impact on results as lower-rated California credits outperformed amid a general improvement in credit fundamentals at the state level. Leverage on the Fund’s assets amplified the negative effect of rising interest rates on the Fund’s performance. |
| Ÿ | | Contributing positively to performance was the high coupon structure of the Fund’s municipal bond holdings. (As of period end, the Fund’s average coupon rate stood at 5.50%.) The timely use of US Treasury futures contracts as a hedge against rising interest rates also had a positive impact on the Fund’s performance for the period. |
Describe recent portfolio activity.
| Ÿ | | During the six-month period, activity in the Fund was focused on managing volatility. More specifically, the Fund reduced its duration profile by concentrating purchases in shorter-maturity municipal bonds with higher coupons and selling lower-yielding, longer-duration holdings. The Fund also slightly reduced leverage during the period. |
Describe portfolio positioning at period end.
| Ÿ | | Relative to the S&P® California Municipal Bond Index, the Fund ended the period with a near-neutral duration posture and overweight exposure to school district and utility revenue bonds. Exposure to water and utility bonds was maximized within the Fund’s investment guidelines. The Fund maintained a bias for higher quality California issues as valuations on lower-rated bonds were less attractive after a period of spread tightening. The Fund held exposure to tender option bonds in order to increase income while the municipal yield curve remained relatively steep and short-term interest rates remained low. In addition, the Fund continued to hold 10-year US Treasury futures contracts as a hedge against interest rate movements. |
The views expressed reflect the opinions of BlackRock as of the date of this report and are subject to change based on changes in market, economic or other conditions. These views are not intended to be a forecast of future events and are no guarantee of future results.
| | |
| Overview of the Fund’s Long-Term Investments | | |
| | | | |
| Sector Allocation | | | |
County/City/Special District/School District | | | 35 | % |
Utilities | | | 25 | |
Education | | | 13 | |
Health | | | 12 | |
Transportation | | | 8 | |
State | | | 7 | |
For Fund compliance purposes, the Fund’s sector classifications refer to any one or more of the sector sub-classifications used by one or more widely recognized market indexes or rating group indexes, and/or as defined by the investment advisor. These definitions may not apply for purposes of this report, which may combine such sector sub-classifications for reporting ease.
| | | | |
| Credit Quality Allocation1 | | | |
AAA/Aaa | | | 12 | % |
AA/Aa | | | 67 | |
A | | | 19 | |
BBB/Baa | | | 2 | |
| | 1 | | Using the higher of Standard & Poor’s (“S&P”) or Moody’s Investors Service (“Moody’s”) ratings. |
| | | | |
| Call/Maturity Schedule2 | | | |
Calendar Year Ended December 31, | | | | |
2013 | | | — | |
2014 | | | 2 | % |
2015 | | | 2 | |
2016 | | | 8 | |
2017 | | | 4 | |
| | 2 | | Scheduled maturity dates and/or bonds that are subject to potential calls by issuers over the next five years. |
| | | | | | |
| | | | | | | |
| 4 | | SEMI-ANNUAL REPORT | | NOVEMBER 30, 2013 | | |
| | |
| | | BlackRock California Municipal Bond Fund |
|
| Total Return Based on a $10,000 Investment |
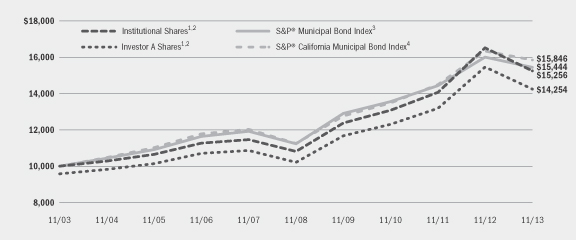
| | 1 | | Assuming maximum sales charges, if any, transaction costs and other operating expenses, including advisory fees. Institutional Shares do not have a sales charge. |
| | 2 | | The Fund invests primarily in a portfolio of long-term investment grade California municipal bonds. |
| | 3 | | The S&P® Municipal Bond Index is composed of bonds held by managed municipal bond fund customers of Standard & Poor’s Securities Pricing, Inc. that are priced daily. Bonds in the S&P® Municipal Bond Index must have an outstanding par value of at least $2 million and a remaining maturity of not less than one month. |
| | 4 | | The S&P® California Municipal Bond Index includes all California bonds in the S&P® Municipal Bond Index. |
|
| Performance Summary for the Period Ended November 30, 2013 |
| | | | | | | | | | | | | | | | | | | | | | | | | | | | | | | | | | | | |
| | | | | | | | | | | | Average Annual Total Returns5 | |
| | | | | | | | | | | | 1 Year | | | 5 Years | | | 10 Years | |
| | | Standardized
30-Day Yields | | | Unsubsidized
30-Day Yields | | | 6-Month
Total Returns | | | w/o sales
charge | | | w/sales
charge | | | w/o sales
charge | | | w/sales
charge | | | w/o sales
charge | | | w/sales
charge | |
Institutional | | | 3.92 | % | | | 3.92 | % | | | (5.37 | )% | | | (7.64 | )% | | | N/A | | | | 7.13 | % | | | N/A | | | | 4.31 | % | | | N/A | |
Investor A | | | 3.59 | | | | 3.59 | | | | (5.46 | ) | | | (7.84 | ) | | | (11.75 | )% | | | 6.89 | | | | 5.97 | % | | | 4.06 | | | | 3.61 | % |
Investor A1 | | | 3.75 | | | | 3.75 | | | | (5.38 | ) | | | (7.69 | ) | | | (11.38 | ) | | | 7.05 | | | | 6.18 | | | | 4.22 | | | | 3.79 | |
Investor B | | | 3.39 | | | | 3.39 | | | | (5.60 | ) | | | (8.09 | ) | | | (11.64 | ) | | | 6.61 | | | | 6.30 | | | | 3.79 | | | | 3.79 | |
Investor C | | | 2.99 | | | | 2.99 | | | | (5.81 | ) | | | (8.53 | ) | | | (9.42 | ) | | | 6.09 | | | | 6.09 | | | | 3.29 | | | | 3.29 | |
Investor C1 | | | 3.40 | | | | 3.40 | | | | (5.62 | ) | | | (8.15 | ) | | | (9.04 | ) | | | 6.52 | | | | 6.52 | | | | 3.70 | | | | 3.70 | |
S&P® Municipal Bond Index | | | — | | | | — | | | | (2.73 | ) | | | (3.57 | ) | | | N/A | | | | 6.57 | | | | N/A | | | | 4.44 | | | | N/A | |
S&P® California Municipal
Bond Index | | | — | | | | — | | | | (2.29 | ) | | | (3.03 | ) | | | N/A | | | | 7.07 | | | | N/A | | | | 4.71 | | | | N/A | |
| | 5 | | Assuming maximum sales charges, if any. Average annual total returns with and without sales charges reflect reductions for distribution and service fees. See “About Fund Performance” on page 12 for a detailed description of share classes, including any related sales charges and fees. |
N/A — Not applicable as share class and index do not have a sales charge.
Past performance is not indicative of future results.
| | | | | | |
| | | | | | | |
| | SEMI-ANNUAL REPORT | | NOVEMBER 30, 2013 | | 5 |
| | | | |
| Fund Summary as of November 30, 2013 | | BlackRock New Jersey Municipal Bond Fund |
BlackRock New Jersey Municipal Bond Fund’s (the “Fund”) investment objective is to provide shareholders with income exempt from federal income tax and New Jersey personal income taxes.
|
| Portfolio Management Commentary |
How did the Fund perform?
| Ÿ | | For the six-month period ended November 30, 2013, the Fund underperformed its primary benchmark, the S&P® Municipal Bond Index, and its secondary benchmark, the S&P® New Jersey Municipal Bond Index. The following discussion of relative performance pertains to the S&P® New Jersey Municipal Bond Index. |
What factors influenced performance?
| Ÿ | | The Fund’s longer duration posture (greater sensitivity to interest rate movements) was detrimental to performance as interest rates increased over the period. (Bond prices generally fall as interest rates rise.) The Fund’s holdings were more concentrated on the long end of the yield curve, which hurt performance as the yield curve steepened with long rates rising more than shorter-term rates. Leverage on the Fund’s assets achieved through the use of tender option bonds amplified the negative effect of rising rates on the Fund’s total return. The Fund’s exposure to Puerto Rico credits hurt returns as these issues broadly underperformed during the period. The Fund’s zero-coupon holdings, which have longer durations for their respective maturities, also negatively impacted performance. |
| Ÿ | | The Fund’s modest use of US Treasury futures contributed positively, as did a small exposure to pre-refunded and very short duration bonds. |
Describe recent portfolio activity.
| Ÿ | | During the six-month period, the Fund’s trading activity was focused on maintaining a fully invested posture and purchasing new-issue bonds as opportunities were presented in the market. The Fund took advantage of periods of increased demand to sell discount coupons and other coupon structures deemed more likely to underperform in a rising interest rate environment. As interest rates rose, the Fund sought to sell its lower-yielding holdings and purchase new issues at more attractive levels. Also during the period, the Fund sold the last of its Puerto Rico holdings. |
Describe portfolio positioning at period end.
| Ÿ | | The Fund ended the period with a neutral-to-slightly positive duration bias as compared to the S&P® New Jersey Municipal Bond Index. |
The views expressed reflect the opinions of BlackRock as of the date of this report and are subject to change based on changes in market, economic or other conditions. These views are not intended to be a forecast of future events and are no guarantee of future results.
| | |
| Overview of the Fund’s Long-Term Investments | | |
| | | | |
| |
| Sector Allocation | | | |
Health | | | 20 | % |
State | | | 19 | |
Transportation | | | 18 | |
Education | | | 16 | |
County/City/Special District/School District | | | 15 | |
Corporate | | | 6 | |
Housing | | | 4 | |
Utilities | | | 2 | |
For Fund compliance purposes, the Fund’s sector classifications refer to any one or more of the sector sub-classifications used by one or more widely recognized market indexes or rating group indexes, and/or as defined by the investment advisor. These definitions may not apply for purposes of this report, which may combine such sector sub-classifications for reporting ease.
| | | | |
| |
| Credit Quality Allocation1 | | | |
AAA/Aaa | | | 7 | % |
AA/Aa | |
| 30
|
|
A | | | 37 | |
BBB/Baa | | | 19 | |
BB/Ba | | | 4 | |
B | | | 2 | |
Not Rated2 | | | 1 | |
| | 1 | | Using the higher of S&P’s or Moody’s ratings. |
| | 2 | | The investment advisor has deemed certain of these securities as investment grade quality. As of November 30, 2013, the market value of these securities was $2,963,411, representing 1% of the Fund’s long-term investments. |
| | | | |
| | |
| Call/Maturity Schedule3 | | | |
Calendar Year Ended December 31, | | | | |
2013 | | | — | |
2014 | | | 7 | % |
2015 | | | 6 | |
2016 | | | 3 | |
2017 | | | 9 | |
| | 3 | | Scheduled maturity dates and/or bonds that are subject to potential calls by issuers over the next five years. |
| | | | | | |
| | | | | | | |
| 6 | | SEMI-ANNUAL REPORT | | NOVEMBER 30, 2013 | | |
| | |
| | | BlackRock New Jersey Municipal Bond Fund |
|
| Total Return Based on a $10,000 Investment |
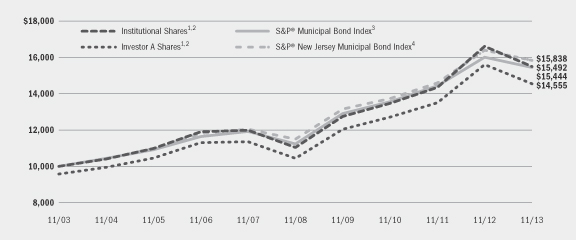
| | 1 | | Assuming maximum sales charges, if any, transaction costs and other operating expenses, including advisory fees. Institutional Shares do not have a sales charge. |
| | 2 | | The Fund invests primarily in a portfolio of long-term investment grade New Jersey municipal bonds. |
| | 3 | | The S&P® Municipal Bond Index is composed of bonds held by managed municipal bond fund customers of Standard & Poor’s Securities Pricing, Inc. that are priced daily. Bonds in the S&P® Municipal Bond Index must have an outstanding par value of at least $2 million and a remaining maturity of not less than one month. |
| | 4 | | The S&P® New Jersey Municipal Bond Index includes all New Jersey bonds in the S&P® Municipal Bond Index. |
|
| Performance Summary for the Period Ended November 30, 2013 |
| | | | | | | | | | | | | | | | | | | | | | | | | | | | | | | | | | | | |
| | | | | | | | | | | | Average Annual Total Returns5 | |
| | | | | | | | | | | | 1 Year | | | 5 Years | | | 10 Years | |
| | | Standardized
30-Day Yields | | | Unsubsidized
30-Day Yields | | | 6-Month
Total Returns | | | w/o sales
charge | | | w/sales
charge | | | w/o sales
charge | | | w/sales
charge | | | w/o sales
charge | | | w/sales
charge | |
Institutional | | | 3.60 | % | | | 3.55 | % | | | (4.86 | )% | | | (6.70 | )% | | | N/A | | | | 7.01 | % | | | N/A | | | | 4.48 | % | | | N/A | |
Service | | | 3.50 | | | | 3.35 | | | | (4.91 | ) | | | (6.79 | ) | | | N/A | | | | 6.85 | | | | N/A | | | | 4.28 | | | | N/A | |
Investor A | | | 3.35 | | | | 3.26 | | | | (4.90 | ) | | | (6.78 | ) | | | (10.74 | )% | | | 6.87 | | | | 5.94 | % | | | 4.28 | | | | 3.82 | % |
Investor A1 | | | 3.51 | | | | 3.42 | | | | (4.83 | ) | | | (6.64 | ) | | | (10.37 | ) | | | 7.01 | | | | 6.14 | | | | 4.43 | | | | 4.01 | |
Investor C | | | 2.73 | | | | 2.66 | | | | (5.19 | ) | | | (7.51 | ) | | | (8.41 | ) | | | 6.06 | | | | 6.06 | | | | 3.49 | | | | 3.49 | |
Investor C1 | | | 3.14 | | | | 3.07 | | | | (5.08 | ) | | | (7.12 | ) | | | (8.02 | ) | | | 6.47 | | | | 6.47 | | | | 3.91 | | | | 3.91 | |
S&P® Municipal Bond Index | | | — | | | | — | | | | (2.73 | ) | | | (3.57 | ) | | | N/A | | | | 6.57 | | | | N/A | | | | 4.44 | | | | N/A | |
S&P® New Jersey Municipal
Bond Index | | | — | | | | — | | | | (2.53 | ) | | | (3.46 | ) | | | N/A | | | | 6.61 | | | | N/A | | | | 4.71 | | | | N/A | |
| | 5 | | Assuming maximum sales charges, if any. Average annual total returns with and without sales charges reflect reductions for distribution and service fees. See “About Fund Performance” on page 12 for a detailed description of share classes, including any related sales charges and fees. |
N/A — Not applicable as share class and index do not have a sales charge.
Past performance is not indicative of future results.
| | | | | | |
| | | | | | | |
| | SEMI-ANNUAL REPORT | | NOVEMBER 30, 2013 | | 7 |
| | | | |
| Fund Summary as of November 30, 2013 | | BlackRock Pennsylvania Municipal Bond Fund |
BlackRock Pennsylvania Municipal Bond Fund’s (the “Fund”) investment objective is to provide shareholders with income exempt from federal income tax and Pennsylvania personal income taxes.
|
| Portfolio Management Commentary |
How did the Fund perform?
| Ÿ | | For the six-month period ended November 30, 2013, the Fund underperformed its primary benchmark, the S&P® Municipal Bond Index, and its secondary benchmark, the S&P® Pennsylvania Municipal Bond Index. The following discussion of relative performance pertains to the S&P® Pennsylvania Municipal Bond Index. |
What factors influenced performance?
| Ÿ | | As tax-exempt municipal rates increased over the six-month period, the Fund’s duration exposure (sensitivity to interest rate movements) had a negative impact on performance. (Bond prices generally fall when interest rates rise.) Exposure to the long-end of the yield curve was detrimental as rates increased more in the long-end than in the short-end of the curve. The Fund’s exposure to Puerto Rico Sales Tax Revenue Bonds also detracted from results as credit spreads on most of Puerto Rico’s debt widened materially during the period due to investors’ lack of confidence and a weak local economy. Leverage on the Fund’s assets amplified the negative effect of rising interest rates on the Fund’s performance. |
| Ÿ | | The timely use of US Treasury futures contracts as a hedge against rising interest rates had a positive impact on the Fund’s performance for the period. |
Describe recent portfolio activity.
| Ÿ | | During the six-month period, trading activity was focused on maintaining the Fund’s high level of income. Cash was committed to purchasing bonds with higher coupons while seeking investments with valuations that remain attractive relative to their level of credit risk. Additionally, the Fund eliminated its positions in Puerto Rico securities during the period. Prior to the sales, the Fund had maintained an underweight exposure to Puerto Rico, therefore the impact from the deterioration in prices in Puerto Rico was minimal. Proceeds from the sales were used to meet modest investor redemptions and to reduce leverage in the Fund. The reduction in leverage reduced the Fund’s duration. |
Describe portfolio positioning at period end.
| Ÿ | | Although the Fund reduced duration during the six-month period, as compared to the S&P® Pennsylvania Municipal Bond Index, the Fund continued to maintain a long duration posture as of period end. |
The views expressed reflect the opinions of BlackRock as of the date of this report and are subject to change based on changes in market, economic or other conditions. These views are not intended to be a forecast of future events and are no guarantee of future results.
| | |
| Overview of the Fund’s Long-Term Investments | | |
| | | | |
| |
| Sector Allocation | | | |
Health | | | 24 | % |
Education | | | 23 | |
State | | | 13 | |
Transportation | | | 13 | |
County/City/Special District/School District | | | 10 | |
Housing | | | 8 | |
Corporate | | | 6 | |
Utilities | | | 3 | |
For Fund compliance purposes, the Fund’s sector classifications refer to any one or more of the sector sub-classifications used by one or more widely recognized market indexes or rating group indexes, and/or as defined by the investment advisor. These definitions may not apply for purposes of this report, which may combine such sector sub-classifications for reporting ease.
| | | | |
| |
| Credit Quality Allocation1 | | | |
AAA/Aaa | | | 2 | % |
AA/Aa | | | 63 | |
A | | | 25 | |
BBB/Baa | | | 7 | |
Not Rated2 | | | 3 | |
| | 1 | | Using the higher of S&P’s or Moody’s ratings. |
| | 2 | | The investment advisor has deemed certain of these securities as investment grade quality. As of November 30, 2013, the market value of these securities was $3,158,400, representing less than 1% of the Fund’s long-term investments. |
| | | | |
| | |
| Call/Maturity Schedule3 | | | |
Calendar Year Ended December 31, | | | | |
2013 | | | — | |
2014 | | | 2 | % |
2015 | | | 7 | |
2016 | | | 6 | |
2017 | | | 6 | |
| | 3 | | Scheduled maturity dates and/or bonds that are subject to potential calls by issuers over the next five years. |
| | | | | | |
| | | | | | | |
| 8 | | SEMI-ANNUAL REPORT | | NOVEMBER 30, 2013 | | |
| | |
| | | BlackRock Pennsylvania Municipal Bond Fund |
|
| Total Return Based on a $10,000 Investment |
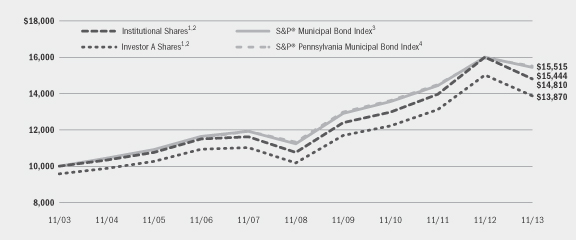
| | 1 | | Assuming maximum sales charges, if any, transaction costs and other operating expenses, including advisory fees. Institutional Shares do not have a sales charge. |
| | 2 | | The Fund invests primarily in a portfolio of long-term investment grade Pennsylvania municipal bonds. |
| | 3 | | The S&P® Municipal Bond Index is composed of bonds held by managed municipal bond fund customers of Standard & Poor’s Securities Pricing, Inc. that are priced daily. Bonds in the S&P® Municipal Bond Index must have an outstanding par value of at least $2 million and a remaining maturity of not less than one month. |
| | 4 | | The S&P® Pennsylvania Municipal Bond Index includes all Pennsylvania bonds in the S&P® Municipal Bond Index. |
|
| Performance Summary for the Period Ended November 30, 2013 |
| | | | | | | | | | | | | | | | | | | | | | | | | | | | | | | | | | | | |
| | | | | | | | | | | | Average Annual Total Returns5 | |
| | | | | | | | | | | | 1 Year | | | 5 Years | | | 10 Years | |
| | | Standardized
30-Day Yields | | | Unsubsidized
30-Day Yields | | | 6-Month
Total Returns | | | w/o sales
charge | | | w/sales
charge | | | w/o sales
charge | | | w/sales
charge | | | w/o sales
charge | | | w/sales
charge | |
Institutional | | | 3.96 | % | | | 3.83 | % | | | (5.65 | )% | | | (7.53 | )% | | | N/A | | | | 6.58 | % | | | N/A | | | | 4.01 | % | | | N/A | |
Service | | | 3.78 | | | | 3.69 | | | | (5.73 | ) | | | (7.70 | ) | | | N/A | | | | 6.38 | | | | N/A | | | | 3.78 | | | | N/A | |
Investor A | | | 3.62 | | | | 3.55 | | | | (5.73 | ) | | | (7.69 | ) | | | (11.62 | )% | | | 6.37 | | | | 5.45 | % | | | 3.78 | | | | 3.33 | % |
Investor A1 | | | 3.78 | | | | 3.72 | | | | (5.65 | ) | | | (7.54 | ) | | | (11.24 | ) | | | 6.54 | | | | 5.67 | | | | 3.94 | | | | 3.51 | |
Investor C | | | 2.99 | | | | 2.96 | | | | (6.10 | ) | | | (8.42 | ) | | | (9.30 | ) | | | 5.54 | | | | 5.54 | | | | 2.99 | | | | 2.99 | |
Investor C1 | | | 3.41 | | | | 3.38 | | | | (5.91 | ) | | | (8.04 | ) | | | (8.93 | ) | | | 5.99 | | | | 5.99 | | | | 3.40 | | | | 3.40 | |
S&P® Municipal Bond Index | | | — | | | | — | | | | (2.73 | ) | | | (3.57 | ) | | | N/A | | | | 6.57 | | | | N/A | | | | 4.44 | | | | N/A | |
S&P® Pennsylvania Municipal
Bond Index | | | — | | | | — | | | | (2.21 | ) | | | (2.75 | ) | | | N/A | | | | 6.50 | | | | N/A | | | | 4.49 | | | | N/A | |
| | 5 | | Assuming maximum sales charges, if any. Average annual total returns with and without sales charges reflect reductions for distribution and service fees. See “About Fund Performance” on page 12 for a description of share classes, including any related sales charges and fees. |
N/A — Not applicable as share class and index do not have a sales charge.
Past performance is not indicative of future results.
| | | | | | |
| | | | | | | |
| | SEMI-ANNUAL REPORT | | NOVEMBER 30, 2013 | | 9 |
| | | | |
| Fund Summary as of November 30, 2013 | | BlackRock Strategic Municipal Opportunities Fund |
BlackRock Strategic Municipal Opportunities Fund’s (the “Fund”) (formerly known as BlackRock Intermediate Municipal Fund) investment objective is to provide shareholders with a high level of income exempt from federal income taxes.
|
| Portfolio Management Commentary |
| Ÿ | | On November 13, 2013, the Board of Trustees of the Fund approved changes to the Fund’s name and investment strategies. The Fund has changed its name to BlackRock Strategic Municipal Opportunities Fund. Under its new investment strategies, the Fund will continue to seek to achieve its investment objective by investing, under normal circumstances, at least 80% of its assets in municipal bonds. The Fund’s new investment strategies provide greater flexibility with respect to the maturity of the issues in which the Fund invests. In addition, the investment advisor has determined to change the Fund’s secondary benchmark from the S&P® Intermediate Municipal Bond Index to a custom blended benchmark comprised of 65% S&P® Municipal Bond Investment Grade Index, 30% S&P® Municipal Bond High Yield Index and 5% Barclays Taxable Municipal: US Aggregate Eligible Index. All of these changes were effective on January 27, 2014. |
How did the Fund perform?
| Ÿ | | For the six-month period ended November 30, 2013, with respect to the Fund’s primary benchmark, the S&P® Municipal Bond Index, Institutional Shares performed in line with this benchmark while the Fund’s other share classes underperformed. All of the Fund’s share classes underperformed the secondary benchmark, the S&P® Intermediate Municipal Bond Index. The following discussion of relative performance pertains to the S&P® Intermediate Municipal Bond Index. |
What factors influenced performance?
| Ÿ | | The Fund’s longer duration posture (greater sensitivity to interest rate movements) was detrimental to performance as interest rates increased over the period. (Bond prices generally fall as interest rates rise.) The Fund’s holdings were more concentrated on the long end of the yield curve (within its intermediate maturity mandate), which hurt performance as the yield curve steepened with long-term interest rates rising more than shorter-term rates. Leverage on the Fund’s assets achieved through the use of tender option bonds amplified the negative effect of rising interest rates on the Fund’s total return. The Fund’s exposure to Puerto Rico credits hurt returns as Puerto Rico bonds broadly underperformed. The Fund’s zero-coupon holdings, which have longer durations for their respective maturities, also negatively impacted performance. |
| Ÿ | | The Fund’s modest use of US Treasury futures contributed positively, as did a small exposure to pre-refunded and very short duration bonds. |
Describe recent portfolio activity.
| Ÿ | | During the six-month period, the Fund’s trading activity centered around two themes. First, the Fund was focused on shortening duration and reducing volatility. This was accomplished by changing the preferred maturity of the Fund’s new-issue purchases from 10 years to 8 years, increasing the average coupon rate of the Fund’s holdings and engaging in limited hedging activity utilizing 10-year US Treasury futures. The second theme was relative value trading; that is, capitalizing on periods of increased demand in certain credits, sectors or coupon structures to reduce holdings in those areas while taking advantage of attractive opportunities in the new-issue market. As interest rates rose, the Fund became active in tax-loss selling and replaced lower-yielding holdings with higher-yielding issues. Also during the period, the Fund sold the last of its Puerto Rico holdings. |
Describe portfolio positioning at period end.
| Ÿ | | The Fund ended the period with a positive duration bias as compared to the S&P® Intermediate Municipal Bond Index. |
The views expressed reflect the opinions of BlackRock as of the date of this report and are subject to change based on changes in market, economic or other conditions. These views are not intended to be a forecast of future events and are no guarantee of future results.
| | |
| Overview of the Fund’s Long-Term Investments | | |
| | | | |
| |
| Sector Allocation | | | |
Transportation | | | 23 | % |
State | | | 20 | |
County/City/Special District/School District | | | 19 | |
Health | | | 13 | |
Corporate | | | 11 | |
Education | | | 8 | |
Tobacco | | | 3 | |
Utilities | | | 2 | |
Housing | | | 1 | |
For Fund compliance purposes, the Fund’s sector classifications refer to any one or more of the sector sub-classifications used by one or more widely recognized market indexes or rating group indexes, and/or as defined by the investment advisor. These definitions may not apply for purposes of this report, which may combine such sector sub-classifications for reporting ease.
| | | | |
| |
| Credit Quality Allocation1 | | | |
AAA/Aaa | | | 4 | % |
AA/Aa | | | 35 | |
A | | | 40 | |
BBB/Baa | | | 9 | |
BB/Ba | | | 3 | |
B | | | 2 | |
Not Rated2 | | | 7 | |
| | 1 | | Using the higher of S&P’s or Moody’s ratings. |
| | 2 | | The investment advisor has deemed certain of these securities as investment grade quality. As of November 30, 2013, the market value of these securities was $13,324,520, representing 2% of the Fund’s long-term investments. |
| | | | |
| | |
| Call/Maturity Schedule3 | | | |
Calendar Year Ended December 31, | | | | |
2013 | | | — | |
2014 | | | 3 | % |
2015 | | | 2 | |
2016 | | | 3 | |
2017 | | | 4 | |
| | 3 | | Scheduled maturity dates and/or bonds that are subject to potential calls by issuers over the next five years. |
| | | | | | |
| | | | | | | |
| 10 | | SEMI-ANNUAL REPORT | | NOVEMBER 30, 2013 | | |
| | |
| | | BlackRock Strategic Municipal Opportunities Fund |
|
| Total Return Based on a $10,000 Investment |
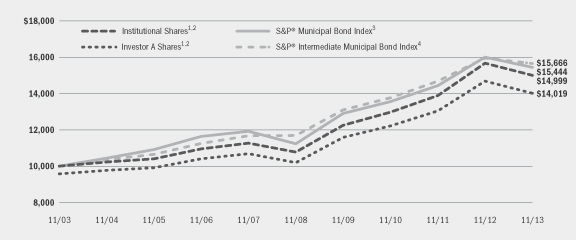
| | 1 | | Assuming maximum sales charges, if any, transaction costs and other operating expenses, including advisory fees. Institutional Shares do not have a sales charge. |
| | 2 | | The Fund invests primarily in a portfolio of investment grade municipal bonds. |
| | 3 | | The S&P® Municipal Bond Index is composed of bonds held by managed municipal bond fund customers of Standard & Poor’s Securities Pricing, Inc. that are priced daily. Bonds in the S&P® Municipal Bond Index must have an outstanding par value of at least $2 million and a remaining maturity of not less than one month. |
| | 4 | | The S&P® Intermediate Municipal Bond Index includes all bonds in the S&P® Municipal Bond Index with a remaining maturity between 3 and 15 years. |
|
| Performance Summary for the Period Ended November 30, 2013 |
| | | | | | | | | | | | | | | | | | | | | | | | | | | | | | | | | | | | |
| | | | | | | | | | | | Average Annual Total Returns5 | |
| | | | | | | | | | | | 1 Year | | | 5 Years | | | 10 Years | |
| | | Standardized
30-Day Yields | | | Unsubsidized
30-Day Yields | | | 6-Month
Total Returns | | | w/o sales
charge | | | w/sales
charge | | | w/o sales
charge | | | w/sales
charge | | | w/o sales
charge | | | w/sales
charge | |
Institutional | | | 2.92 | % | | | 2.87 | % | | | (2.75 | )% | | | (4.27 | )% | | | N/A | | | | 6.84 | % | | | N/A | | | | 4.14 | % | | | N/A | |
Investor A | | | 2.59 | | | | 2.54 | | | | (2.95 | ) | | | (4.59 | ) | | | (8.64 | )% | | | 6.58 | | | | 5.66 | % | | | 3.89 | | | | 3.44 | % |
Investor A1 | | | 2.82 | | | | 2.77 | | | | (2.79 | ) | | | (4.35 | ) | | | (5.30 | ) | | | 6.73 | | | | 6.51 | | | | 4.03 | | | | 3.93 | |
Investor C | | | 1.93 | | | | 1.88 | | | | (3.23 | ) | | | (5.22 | ) | | | (6.14 | ) | | | 5.78 | | | | 5.78 | | | | 3.12 | | | | 3.12 | |
S&P® Municipal Bond Index | | | — | | | | — | | | | (2.73 | ) | | | (3.57 | ) | | | N/A | | | | 6.57 | | | | N/A | | | | 4.44 | | | | N/A | |
S&P® Intermediate Municipal
Bond Index | | | — | | | | — | | | | (1.04 | ) | | | (1.88 | ) | | | N/A | | | | 6.02 | | | | N/A | | | | 4.59 | | | | N/A | |
| | 5 | | Assuming maximum sales charges, if any. Average annual total returns with and without sales charges reflect reductions for distribution and service fees. See “About Fund Performance” on page 12 for a description of share classes, including any related sales charges and fees. |
N/A — Not applicable as share class and index do not have a sales charge.
Past performance is not indicative of future results.
| | | | | | |
| | | | | | | |
| | SEMI-ANNUAL REPORT | | NOVEMBER 30, 2013 | | 11 |
| Ÿ | | Institutional Shares are not subject to any sales charge. These shares bear no ongoing distribution or service fees and are available only to eligible investors. |
| Ÿ | | Service Shares (available only in BlackRock New Jersey Municipal Bond Fund and BlackRock Pennsylvania Municipal Bond Fund) are not subject to any sales charge. These shares are subject to a service fee of 0.25% per year (but no distribution fee) and are available only to eligible investors. Prior to the Service Shares inception date of October 2, 2006, Service Share performance results are those of Institutional Shares (which have no distribution or service fees) restated to reflect Service Share fees. |
| Ÿ | | Investor A Shares are subject to a maximum initial sales charge (front-end load) of 4.25% and a service fee of 0.25% per year (but no distribution fee). Certain redemptions of these shares may be subject to a contingent deferred sales charge (“CDSC”) where no initial sales charge was paid at the time of purchase. Prior to the Investor A Shares inception date of October 2, 2006, Investor A Share performance results are those of Institutional Shares (which have no distribution or service fees) restated to reflect Investor A Share fees. |
| Ÿ | | Investor A1 Shares are subject to a maximum initial sales charge (front-end load) of 4.00% and a service fee of 0.10% per year (but no distribution fee). Investor A1 Shares for BlackRock Strategic Municipal Opportunities Fund incur a maximum initial sales charge (front-end load) of 1.00% and a service fee of 0.10% per year (but no distribution fee). |
| Ÿ | | Investor B Shares (available only in BlackRock California Municipal Bond Fund) are subject to a maximum CDSC of 4.00% declining to 0% after six years. In addition, these shares are subject to a distribution fee of 0.25% and a service fee of 0.25% per year. |
These shares automatically convert to Investor A1 Shares after approximately 10 years. (There is no initial sales charge for automatic share conversions.) On June 10, 2013, all issued and outstanding Investor B Shares of BlackRock New Jersey Municipal Bond Fund and BlackRock Pennsylvania Municipal Bond Fund were converted into Investor A Shares with the same relative aggregate net asset value and all issued and outstanding Investor B Shares of BlackRock Strategic Municipal Opportunities Fund were converted into Investor A1 Shares with the same relative aggregate net asset value.
| Ÿ | | Investor C Shares are subject to a 1.00% CDSC if redeemed within one year of purchase. In addition, these shares are subject to a distribution fee of 0.75% per year and a service fee of 0.25% per year. Prior to the Investor C Shares inception date of October 2, 2006, Investor C Share performance results are those of Institutional Shares (which have no distribution or service fees) restated to reflect Investor C Share fees. |
| Ÿ | | Investor C1 Shares (available in all Funds except BlackRock Strategic Municipal Opportunities Fund) are subject to a 1.00% CDSC if redeemed within one year of purchase. In addition, these shares are subject to a distribution fee of 0.35% per year and a service fee of 0.25% per year. |
Investor A1, Investor B and Investor C1 Shares are only available through exchanges and dividend reinvestments by existing shareholders and for purchase by certain employer-sponsored retirement plans. On June 10, 2013, all issued and outstanding Investor B1 Shares of BlackRock New Jersey Municipal Bond Fund and BlackRock Pennsylvania Municipal Bond Fund were converted into Investor A1 Shares with the same relative aggregate net asset value.
Performance information reflects past performance and does not guarantee future results. Current performance may be lower or higher than the performance data quoted. Refer to www.blackrock.com/funds to obtain performance data current to the most recent month end. Performance results do not reflect the deduction of taxes that a shareholder would pay on fund distributions or the redemption of fund shares. Figures shown in each of the performance tables on the previous pages assume reinvestment of all dividends and capital gain distributions, if any, at net asset value (“NAV”) on the payable date. Investment return and principal value of shares will fluctuate so that shares, when redeemed, may be worth more or less than their original costs. Dividends paid to each class of shares will vary because of the different levels of service, distribution and transfer agency fees applicable to each class, which are deducted from the income available to be paid to shareholders. The Funds’ investment advisor waived and/or reimbursed a portion of each Fund’s expenses. Without such waiver and/or reimbursement, the Funds’ performance would have been lower. The standardized 30-day yield includes the effects of any waivers and/or reimbursements. The unsubsidized 30-day yield excludes the effects of any waivers and/or reimbursements.
| | | | | | |
| | | | | | | |
| 12 | | SEMI-ANNUAL REPORT | | NOVEMBER 30, 2013 | | |
Shareholders of these Funds may incur the following charges: (a) transactional expenses, such as sales charges; and (b) operating expenses, including investment advisory fees, service and distribution fees, including 12b-1 fees, and other Fund expenses. The expense examples shown below (which are based on a hypothetical investment of $1,000 invested on June 1, 2013 and held through November 30, 2013) are intended to assist shareholders both in calculating expenses based on an investment in the Funds and in comparing these expenses with similar costs of investing in other mutual funds.
The expense examples provide information about actual account values and actual expenses. In order to estimate the expenses a shareholder paid during the period covered by this report, shareholders can divide their account value by $1,000 and then multiply the result by the number corresponding to their Fund and share class under the heading entitled “Expenses Paid During the Period.”
The expense examples also provide information about hypothetical account values and hypothetical expenses based on a Fund’s actual expense ratio and an assumed rate of return of 5% per year before expenses. In order to assist shareholders in comparing the ongoing expenses of investing in these Funds and other funds, compare the 5% hypothetical examples with the 5% hypothetical examples that appear in other funds’ shareholder reports.
The expenses shown in the expense examples are intended to highlight shareholders’ ongoing costs only and do not reflect any transactional expenses, such as sales charges, if any. Therefore, the hypothetical examples are useful in comparing ongoing expenses only, and will not help shareholders determine the relative total expenses of owning different funds. If these transactional expenses were included, shareholder expenses would have been higher.
| | | | | | | | | | | | | | | | | | | | | | | | | | | | |
| | | Actual | | | Hypothetical2 | | | | |
BlackRock California Municipal Bond Fund
(Including Interest Expense and Fees) | | Beginning
Account Value
June 1, 2013 | | | Ending
Account Value
November 30, 2013 | | | Expenses Paid
During the Period1 | | | Beginning
Account Value
June 1, 2013 | | | Ending
Account Value
November 30, 2013 | | | Expenses Paid
During the Period1 | | | Annualized
Expense
Ratio | |
Institutional | | $ | 1,000.00 | | | $ | 946.30 | | | $ | 4.05 | | | $ | 1,000.00 | | | $ | 1,020.91 | | | $ | 4.20 | | | | 0.83 | % |
Investor A | | $ | 1,000.00 | | | $ | 945.40 | | | $ | 4.88 | | | $ | 1,000.00 | | | $ | 1,020.05 | | | $ | 5.06 | | | | 1.00 | % |
Investor A1 | | $ | 1,000.00 | | | $ | 946.20 | | | $ | 4.20 | | | $ | 1,000.00 | | | $ | 1,020.76 | | | $ | 4.36 | | | | 0.86 | % |
Investor B | | $ | 1,000.00 | | | $ | 944.00 | | | $ | 6.48 | | | $ | 1,000.00 | | | $ | 1,018.40 | | | $ | 6.73 | | | | 1.33 | % |
Investor C | | $ | 1,000.00 | | | $ | 941.90 | | | $ | 8.57 | | | $ | 1,000.00 | | | $ | 1,016.24 | | | $ | 8.90 | | | | 1.76 | % |
Investor C1 | | $ | 1,000.00 | | | $ | 943.80 | | | $ | 6.63 | | | $ | 1,000.00 | | | $ | 1,018.25 | | | $ | 6.88 | | | | 1.36 | % |
BlackRock California Municipal Bond Fund
(Excluding Interest Expense and Fees) | | | | | | | | | | | | | | | | | | | | | |
Institutional | | $ | 1,000.00 | | | $ | 946.30 | | | $ | 3.56 | | | $ | 1,000.00 | | | $ | 1,021.41 | | | $ | 3.70 | | | | 0.73 | % |
Investor A | | $ | 1,000.00 | | | $ | 945.40 | | | $ | 4.44 | | | $ | 1,000.00 | | | $ | 1,020.51 | | | $ | 4.61 | | | | 0.91 | % |
Investor A1 | | $ | 1,000.00 | | | $ | 946.20 | | | $ | 3.71 | | | $ | 1,000.00 | | | $ | 1,021.26 | | | $ | 3.85 | | | | 0.76 | % |
Investor B | | $ | 1,000.00 | | | $ | 944.00 | | | $ | 6.04 | | | $ | 1,000.00 | | | $ | 1,018.85 | | | $ | 6.28 | | | | 1.24 | % |
Investor C | | $ | 1,000.00 | | | $ | 941.90 | | | $ | 8.13 | | | $ | 1,000.00 | | | $ | 1,016.70 | | | $ | 8.44 | | | | 1.67 | % |
Investor C1 | | $ | 1,000.00 | | | $ | 943.80 | | | $ | 6.19 | | | $ | 1,000.00 | | | $ | 1,018.70 | | | $ | 6.43 | | | | 1.27 | % |
BlackRock New Jersey Municipal Bond Fund
(Including Interest Expense and Fees) | | | | | | | | | | | | | | | | | | | | | |
Institutional | | $ | 1,000.00 | | | $ | 951.40 | | | $ | 3.91 | | | $ | 1,000.00 | | | $ | 1,021.07 | | | $ | 4.05 | | | | 0.80 | % |
Service | | $ | 1,000.00 | | | $ | 950.90 | | | $ | 4.40 | | | $ | 1,000.00 | | | $ | 1,020.57 | | | $ | 4.56 | | | | 0.90 | % |
Investor A | | $ | 1,000.00 | | | $ | 951.00 | | | $ | 4.40 | | | $ | 1,000.00 | | | $ | 1,020.57 | | | $ | 4.56 | | | | 0.90 | % |
Investor A1 | | $ | 1,000.00 | | | $ | 951.70 | | | $ | 3.67 | | | $ | 1,000.00 | | | $ | 1,021.37 | | | $ | 3.80 | | | | 0.75 | % |
Investor C | | $ | 1,000.00 | | | $ | 948.10 | | | $ | 8.16 | | | $ | 1,000.00 | | | $ | 1,016.67 | | | $ | 8.44 | | | | 1.67 | % |
Investor C1 | | $ | 1,000.00 | | | $ | 949.20 | | | $ | 6.16 | | | $ | 1,000.00 | | | $ | 1,018.77 | | | $ | 6.38 | | | | 1.26 | % |
BlackRock New Jersey Municipal Bond Fund
(Excluding Interest Expense and Fees) | | | | | | | | | | | | | | | | | | | | | |
Institutional | | $ | 1,000.00 | | | $ | 951.40 | | | $ | 3.82 | | | $ | 1,000.00 | | | $ | 1,021.17 | | | $ | 3.95 | | | | 0.78 | % |
Service | | $ | 1,000.00 | | | $ | 950.90 | | | $ | 4.25 | | | $ | 1,000.00 | | | $ | 1,020.67 | | | $ | 4.41 | | | | 0.87 | % |
Investor A | | $ | 1,000.00 | | | $ | 950.90 | | | $ | 4.25 | | | $ | 1,000.00 | | | $ | 1,020.67 | | | $ | 4.41 | | | | 0.87 | % |
Investor A1 | | $ | 1,000.00 | | | $ | 951.00 | | | $ | 4.26 | | | $ | 1,000.00 | | | $ | 1,021.47 | | | $ | 4.41 | | | | 0.72 | % |
Investor C | | $ | 1,000.00 | | | $ | 948.10 | | | $ | 8.01 | | | $ | 1,000.00 | | | $ | 1,016.87 | | | $ | 8.29 | | | | 1.64 | % |
Investor C1 | | $ | 1,000.00 | | | $ | 949.20 | | | $ | 5.52 | | | $ | 1,000.00 | | | $ | 1,018.87 | | | $ | 5.72 | | | | 1.23 | % |
| | 1 | | For each class of the Fund, expenses are equal to the annualized net expense ratio for the class, multiplied by the average account value over the period, multiplied by 183/365 (to reflect the one-half year period shown). |
| | 2 | | Hypothetical 5% annual return before expenses is calculated by pro rating the number of days in the most recent fiscal half year divided by 365. |
| | | | | | |
| | | | | | | |
| | SEMI-ANNUAL REPORT | | NOVEMBER 30, 2013 | | 13 |
| | | | |
| Disclosure of Expenses (concluded) | | |
| | |
| Expense Examples (concluded) | | |
| | | | | | | | | | | | | | | | | | | | | | | | | | | | |
| | | Actual | | | Hypothetical2 | | | | |
BlackRock Pennsylvania Municipal Bond Fund
(Including Interest Expense and Fees) | | Beginning
Account Value
June 1, 2013 | | | Ending
Account Value
November 30, 2013 | | | Expenses Paid
During the Period1 | | | Beginning
Account Value
June 1, 2013 | | | Ending
Account Value
November 30, 2013 | | | Expenses Paid
During the Period1 | | | Annualized
Expense
Ratio | |
Institutional | | $ | 1,000.00 | | | $ | 943.50 | | | $ | 3.85 | | | $ | 1,000.00 | | | $ | 1,021.07 | | | $ | 4.00 | | | | 0.79 | % |
Service | | $ | 1,000.00 | | | $ | 942.70 | | | $ | 4.72 | | | $ | 1,000.00 | | | $ | 1,020.17 | | | $ | 4.91 | | | | 0.97 | % |
Investor A | | $ | 1,000.00 | | | $ | 942.70 | | | $ | 4.72 | | | $ | 1,000.00 | | | $ | 1,020.17 | | | $ | 4.91 | | | | 0.97 | % |
Investor A1 | | $ | 1,000.00 | | | $ | 943.50 | | | $ | 3.95 | | | $ | 1,000.00 | | | $ | 1,020.97 | | | $ | 4.10 | | | | 0.81 | % |
Investor C | | $ | 1,000.00 | | | $ | 939.00 | | | $ | 8.55 | | | $ | 1,000.00 | | | $ | 1,016.27 | | | $ | 8.90 | | | | 1.76 | % |
Investor C1 | | $ | 1,000.00 | | | $ | 940.90 | | | $ | 6.52 | | | $ | 1,000.00 | | | $ | 1,018.37 | | | $ | 6.78 | | | | 1.34 | % |
BlackRock Pennsylvania Municipal Bond Fund
(Excluding Interest Expense and Fees) | | | | | | | | | | | | | | | | | | | | | |
Institutional | | $ | 1,000.00 | | | $ | 943.50 | | | $ | 3.46 | | | $ | 1,000.00 | | | $ | 1,021.47 | | | $ | 3.60 | | | | 0.71 | % |
Service | | $ | 1,000.00 | | | $ | 942.70 | | | $ | 4.33 | | | $ | 1,000.00 | | | $ | 1,020.57 | | | $ | 4.51 | | | | 0.89 | % |
Investor A | | $ | 1,000.00 | | | $ | 942.70 | | | $ | 4.33 | | | $ | 1,000.00 | | | $ | 1,020.57 | | | $ | 4.51 | | | | 0.89 | % |
Investor A1 | | $ | 1,000.00 | | | $ | 943.50 | | | $ | 3.56 | | | $ | 1,000.00 | | | $ | 1,021.37 | | | $ | 3.70 | | | | 0.73 | % |
Investor C | | $ | 1,000.00 | | | $ | 939.00 | | | $ | 8.17 | | | $ | 1,000.00 | | | $ | 1,016.67 | | | $ | 8.49 | | | | 1.68 | % |
Investor C1 | | $ | 1,000.00 | | | $ | 940.90 | | | $ | 6.13 | | | $ | 1,000.00 | | | $ | 1,018.77 | | | $ | 6.38 | | | | 1.26 | % |
BlackRock Strategic Municipal Opportunities
Fund (Including Interest Expense and Fees) | | | | | | | | | | | | | | | | | | | | | |
Institutional | | $ | 1,000.00 | | | $ | 972.50 | | | $ | 3.31 | | | $ | 1,000.00 | | | $ | 1,021.71 | | | $ | 3.40 | | | | 0.67 | % |
Investor A | | $ | 1,000.00 | | | $ | 970.50 | | | $ | 4.40 | | | $ | 1,000.00 | | | $ | 1,020.61 | | | $ | 4.51 | | | | 0.89 | % |
Investor A1 | | $ | 1,000.00 | | | $ | 972.10 | | | $ | 3.71 | | | $ | 1,000.00 | | | $ | 1,021.31 | | | $ | 3.80 | | | | 0.75 | % |
Investor C | | $ | 1,000.00 | | | $ | 967.70 | | | $ | 8.19 | | | $ | 1,000.00 | | | $ | 1,016.75 | | | $ | 8.39 | | | | 1.66 | % |
BlackRock Strategic Municipal Opportunities
Fund (Excluding Interest Expense and Fees) | | | | | | | | | | | | | | | | | | | | | |
Institutional | | $ | 1,000.00 | | | $ | 972.50 | | | $ | 3.16 | | | $ | 1,000.00 | | | $ | 1,021.86 | | | $ | 3.24 | | | | 0.64 | % |
Investor A | | $ | 1,000.00 | | | $ | 970.50 | | | $ | 4.30 | | | $ | 1,000.00 | | | $ | 1,020.71 | | | $ | 4.41 | | | | 0.87 | % |
Investor A1 | | $ | 1,000.00 | | | $ | 972.10 | | | $ | 3.61 | | | $ | 1,000.00 | | | $ | 1,021.41 | | | $ | 3.70 | | | | 0.73 | % |
Investor C | | $ | 1,000.00 | | | $ | 967.70 | | | $ | 8.04 | | | $ | 1,000.00 | | | $ | 1,016.90 | | | $ | 8.24 | | | | 1.63 | % |
| | 1 | | For each class of the Fund, expenses are equal to the annualized net expense ratio for the class, multiplied by the average account value over the period, multiplied by 183/365 (to reflect the one-half year period shown). |
| | 2 | | Hypothetical 5% annual return before expenses is calculated by pro rating the number of days in the most recent fiscal half year divided by 365. |
| | | | | | |
| | | | | | | |
| 14 | | SEMI-ANNUAL REPORT | | NOVEMBER 30, 2013 | | |
| | |
| The Benefits and Risks of Leveraging | | |
The Funds may utilize leverage to seek to enhance the yield and NAV. However, these objectives cannot be achieved in all interest rate environments.
The Funds may leverage their assets through the use of tender option bond trusts (“TOBs”), as described in Note 3 of the Notes to Financial Statements. TOB investments generally will provide the Funds with economic benefits in periods of declining short-term interest rates, but expose the Funds to risks during periods of rising short-term interest rates. Additionally, fluctuations in the market value of municipal bonds deposited into the TOB trust may adversely affect each Fund’s NAV per share.
In general, the concept of leveraging is based on the premise that the financing cost of assets to be obtained from leverage, which will be based on short-term interest rates, will normally be lower than the income earned by each Fund on its longer-term portfolio investments. To the extent that the total assets of each Fund (including the assets obtained from leverage) are invested in higher-yielding portfolio investments, each Fund’s shareholders will benefit from the incremental net income.
Furthermore, the value of the Funds’ portfolio investments generally varies inversely with the direction of long-term interest rates, although other factors can influence the value of portfolio investments. Changes in interest rates can influence the Funds’ NAVs positively or negatively in addition to the impact on Fund performance from leverage.
The use of leverage may enhance opportunities for increased income to the Funds, but as described above, it also creates risks as short- or long-term interest rates fluctuate. Leverage also will generally cause greater changes in the Funds’ NAVs and dividend rates than comparable portfolios without leverage. If the income derived from securities purchased with assets received from leverage exceeds the cost of leverage, the Funds’ net income will be greater than if leverage had not been used. Conversely, if the income from the securities purchased is not sufficient to cover the cost of leverage, each Fund’s net income will be less than if leverage had not been used, and therefore the amount available for distribution to shareholders will be reduced. Each Fund may be required to sell portfolio securities at inopportune times or at distressed values in order to comply with regulatory requirements applicable to the use of leverage or as required by the terms of leverage instruments, which may cause a Fund to incur losses. The use of leverage may limit each Fund’s ability to invest in certain types of securities or use certain types of hedging strategies. Each Fund will incur expenses in connection with the use of leverage, all of which are borne by shareholders and may reduce income.
| | |
| Derivative Financial Instruments | | |
The Funds may invest in various derivative financial instruments, including financial futures contracts, as specified in Note 4 of the Notes to Financial Statements, which may constitute forms of economic leverage. Such derivative financial instruments are used to obtain exposure to a security, index and/or market without owning or taking physical custody of securities or to hedge market and/or interest rate risks. Derivative financial instruments involve risks, including the imperfect correlation between the value of a derivative financial instrument and the underlying asset, possible default of the counterparty to the transaction or illiquidity of the derivative financial instrument. The Funds’ ability to use a derivative financial instrument successfully depends on the investment advisor’s ability to predict pertinent market movements accurately, which cannot be assured. The use of derivative financial instruments may result in losses greater than if they had not been used, may require a Fund to sell or purchase portfolio investments at inopportune times or for distressed values, may limit the amount of appreciation a Fund can realize on an investment, may result in lower dividends paid to shareholders or may cause a Fund to hold an investment that it might otherwise sell. The Funds’ investments in these instruments are discussed in detail in the Notes to Financial Statements.
| | | | | | |
| | | | | | | |
| | SEMI-ANNUAL REPORT | | NOVEMBER 30, 2013 | | 15 |
| | |
Schedule of Investments November 30, 2013 (Unaudited) | | BlackRock California Municipal Bond Fund (Percentages shown are based on Net Assets) |
| | | | | | | | |
| Municipal Bonds | | Par (000) | | | Value | |
California — 81.8% | | | | | | | | |
County/City/Special District/School District — 26.0% | | | | | |
Alum Rock Union Elementary School District, GO, Election of 2012, Series A, 6.00%, 8/01/39 | | $ | 1,200 | | | $ | 1,374,276 | |
Centinela Valley Union High School District, GO, Election of 2010, Series A, 5.75%, 8/01/36 | | | 1,665 | | | | 1,817,830 | |
Centinela Valley Union High School District, GO, Refunding, Election of 2008, Series B,
6.00%, 8/01/36 | | | 2,000 | | | | 2,231,360 | |
City & County of San Francisco California, COP, Series C, AMT, 5.25%, 3/01/33 | | | 140 | | | | 145,396 | |
City of Los Angeles California, COP, Senior, Sonnenblick Del Rio West Los Angeles (AMBAC),
6.20%, 11/01/31 | | | 4,000 | | | | 4,014,240 | |
City of Martinez California, GO, Election of 2008, Series A, 5.88%, 2/01/39 | | | 6,035 | | | | 6,648,820 | |
City of San Jose California Hotel Tax, RB, Convention Center Expansion & Renovation Project,
6.50%, 5/01/42 | | | 2,395 | | | | 2,702,350 | |
Clovis Unified School District, GO, CAB, Election of 2012, Series A (a): | | | | | | | | |
5.47%, 8/01/33 | | | 5,420 | | | | 1,874,724 | |
5.53%, 8/01/34 | | | 8,280 | | | | 2,680,981 | |
Contra Costa Community College District, GO, Election of 2006, 5.00%, 8/01/38 | | | 3,000 | | | | 3,142,770 | |
County of Orange California Sanitation District, COP, Series A, 5.00%, 2/01/39 | | | 2,760 | | | | 2,906,473 | |
County of Orange California Water District, COP, Refunding, Series A, 5.00%, 8/15/32 | | | 3,005 | | | | 3,209,250 | |
County of San Joaquin California Transportation Authority, Refunding RB, Series A, Limited Tax, Measure K: | | | | | | | | |
5.50%, 3/01/41 | | | 10,000 | | | | 10,779,200 | |
6.00%, 3/01/36 | | | 2,955 | | | | 3,361,756 | |
County of Santa Clara California Financing Authority, Refunding LRB, Series L, 5.25%, 5/15/36 | | | 10,345 | | | | 11,174,048 | |
County of Ventura California, COP, Refunding, Public Financing Authority III, 5.75%, 8/15/29 | | | 1,000 | | | | 1,105,060 | |
El Camino Community College District, GO, Election of 2002, Series C, 5.00%, 8/01/37 | | | 2,000 | | | | 2,097,380 | |
Foothill-De Anza Community College District, GO, Election of 2006, Series C, 5.00%, 8/01/40 | | | 1,775 | | | | 1,851,822 | |
Grossmont Healthcare District, GO, Election of 2006, Series B: | | | | | | | | |
6.00%, 7/15/34 | | | 2,695 | | | | 3,051,872 | |
6.13%, 7/15/40 | | | 3,045 | | | | 3,428,761 | |
Los Angeles Community College District California, GO, Election of 2008, Series C, 5.25%, 8/01/39 | | | 5,435 | | | | 5,810,069 | |
Los Angeles Community College District California, GO, Refunding, Election of 2008, Series A,
6.00%, 8/01/33 | | | 6,250 | | | | 7,168,625 | |
| Municipal Bonds | | Par (000) | | | Value | |
California (continued) | | | | | | | | |
County/City/Special District/School District (concluded) | |
Millbrae School District, GO: | | | | | | | | |
Election of 2011, 5.00%, 7/01/42 | | $ | 3,570 | | | $ | 3,701,019 | |
Series B-2, 6.00%, 7/01/41 | | | 2,585 | | | | 2,884,576 | |
Milpitas Unified School District, GO, Series A,
5.00%, 8/01/37 | | | 5,250 | | | | 5,470,920 | |
Pittsburg Unified School District, GO, Election of 2006, Series B (AGM), 5.63%, 8/01/39 | | | 5,000 | | | | 5,441,050 | |
Riverside County Transportation Commission, Refunding RB, Limited Tax, Series A: | | | | | | | | |
5.25%, 6/01/33 | | | 2,950 | | | | 3,234,321 | |
5.25%, 6/01/39 | | | 8,500 | | | | 9,117,780 | |
San Diego Regional Building Authority, RB, County Operations Center & Annex, Series A,
5.38%, 2/01/36 | | | 5,455 | | | | 5,942,514 | |
San Jose California Financing Authority, LRB, Convention Center Expansion & Renovation Project, Series A, 5.75%, 5/01/42 | | | 2,010 | | | | 2,160,408 | |
San Jose California Financing Authority, Refunding LRB, Convention Center Expansion & Renovation Project, Series A, 5.00%, 6/01/39 | | | 10,990 | | | | 11,299,808 | |
San Leandro California Unified School District, GO, Election of 2010, Series A, 5.75%, 8/01/41 | | | 5,000 | | | | 5,408,100 | |
West Contra Costa California Unified School District, GO, Election of 2010, Series A (AGM),
5.25%, 8/01/41 | | | 4,395 | | | | 4,583,414 | |
| | | | | | | | |
| | | | | | | | 141,820,973 | |
Education — 8.2% | | | | | | | | |
California Educational Facilities Authority, Refunding RB: | | | | | | | | |
Occidental College, Series A, 5.00%, 10/01/36 | | | 8,145 | | | | 8,348,136 | |
Pitzer College, 6.00%, 4/01/40 | | | 2,500 | | | | 2,726,225 | |
San Francisco University, 6.13%, 10/01/30 | | | 1,250 | | | | 1,438,038 | |
California Municipal Finance Authority, RB, Emerson College: | | | | | | | | |
5.00%, 1/01/28 | | | 5,290 | | | | 5,456,582 | |
6.00%, 1/01/42 | | | 5,500 | | | | 5,987,850 | |
University of California, RB, Series O, 5.75%, 5/15/34 | | | 2,500 | | | | 2,811,950 | |
University of California, Refunding RB, Limited Project, Series G, 5.00%, 5/15/37 | | | 17,200 | | | | 17,934,612 | |
| | | | | | | | |
| | | | | | | | 44,703,393 | |
Health — 10.5% | | | | | | | | |
ABAG Finance Authority for Nonprofit Corps., Refunding RB, Sharp Healthcare: | | | | | | | | |
6.38%, 8/01/34 | | | 5,000 | | | | 5,153,700 | |
6.25%, 8/01/39 | | | 3,025 | | | | 3,386,518 | |
California Health Facilities Financing Authority, RB: | | | | | | | | |
Adventist Health System West, Series A,
5.75%, 9/01/39 | | | 5,265 | | | | 5,665,140 | |
| | | | | | | | |
| To simplify the listings of portfolio holdings in the Schedules of Investments, the names and descriptions of many of the securities have been abbreviated according to the following list: | | ACA | | American Capital Access Holding Ltd. | | GARB | | General Airport Revenue Bonds |
| | AGC | | Assured Guarantee Corp. | | GO | | General Obligation Bonds |
| | AGM | | Assured Guaranty Municipal Corp. | | HFA | | Housing Finance Agency |
| | AMBAC | | American Municipal Bond Assurance Corp. | | HUD | | Department of Housing and Urban Development |
| | AMT | | Alternative Minimum Tax (subject to) | | IDA | | Industrial Development Authority |
| | ARB | | Airport Revenue Bonds | | LRB | | Lease Revenue Bonds |
| | BARB | | Building Aid Revenue Bonds | | M/F | | Multi-Family |
| | BHAC | | Berkshire Hathaway Assurance Corp. | | MRB | | Mortgage Revenue Bonds |
| | CAB | | Capital Appreciation Bonds | | NPFGC | | National Public Finance Guarantee Corp. |
| | COP | | Certificates of Participation | | RB | | Revenue Bonds |
| | EDA | | Economic Development Authority | | S/F | | Single-Family |
| | EDC | | Economic Development Corp. | | | | |
See Notes to Financial Statements.
| | | | | | |
| | | | | | | |
| 16 | | SEMI-ANNUAL REPORT | | NOVEMBER 30, 2013 | | |
| | |
Schedule of Investments (continued) | | BlackRock California Municipal Bond Fund (Percentages shown are based on Net Assets) |
| | | | | | | | |
| Municipal Bonds | | Par (000) | | | Value | |
California (continued) | | | | | | | | |
Health (concluded) | |
California Health Facilities Financing Authority, RB (concluded): | | | | | | | | |
Children’s Hospital, Series A, 5.25%, 11/01/41 | | $ | 5,235 | | | $ | 5,275,257 | |
Scripps Health, Series A, 5.00%, 11/15/40 | | | 5,030 | | | | 5,029,899 | |
Sutter Health, Series B, 6.00%, 8/15/42 | | | 9,680 | | | | 11,065,111 | |
California Health Facilities Financing Authority, Refunding RB: | | | | | | | | |
Catholic Healthcare West, Series A,
6.00%, 7/01/29 | | | 2,670 | | | | 2,950,430 | |
Catholic Healthcare West, Series A,
6.00%, 7/01/39 | | | 6,000 | | | | 6,458,520 | |
Providence Health & Services, Series C,
6.50%, 10/01/33 | | | 4,150 | | | | 4,743,699 | |
California Statewide Communities Development Authority, RB, 5.25%, 8/01/31 | | | 2,500 | | | | 2,540,875 | |
California Statewide Communities Development Authority, Refunding RB, Trinity Health Credit Group Composite Issue, 5.00%, 12/01/41 | | | 5,000 | | | | 4,992,500 | |
| | | | | | | | |
| | | | | | | | 57,261,649 | |
State — 7.9% | | | | | | | | |
California State Public Works Board, LRB, Department of General Services, Buildings 8 & 9, Series A, 6.25%, 4/01/34 | | | 2,425 | | | | 2,745,488 | |
California State Public Works Board, RB: | | | | | | | | |
Department of Corrections and Rehabilitation, Sub-Series I-1, 6.38%, 11/01/34 | | | 1,725 | | | | 1,978,023 | |
Department of Education, Riverside Campus Project, Series B, 6.50%, 4/01/34 | | | 10,000 | | | | 11,442,300 | |
Various Capital Projects, Series I, 5.25%, 11/01/32 | | | 1,115 | | | | 1,171,263 | |
Various Capital Projects, Series I, 5.50%, 11/01/33 | | | 2,295 | | | | 2,480,780 | |
State of California, GO, Various Purposes: | | | | | | | | |
6.00%, 3/01/33 | | | 4,195 | | | | 4,871,360 | |
6.00%, 4/01/38 | | | 16,000 | | | | 18,148,320 | |
| | | | | | | | |
| | | | | | | | 42,837,534 | |
Transportation — 7.5% | | | | | | | | |
City & County of San Francisco California Airports Commission, ARB: | | | | | | | | |
Series E, 6.00%, 5/01/39 | | | 5,150 | | | | 5,835,980 | |
Special Facility Lease, SFO Fuel, Series A, AMT (AGM), 6.10%, 1/01/20 | | | 1,250 | | | | 1,255,363 | |
City & County of San Francisco California Airports Commission, Refunding ARB, 2nd Series A, AMT, 5.25%, 5/01/33 | | | 1,645 | | | | 1,700,519 | |
City of Los Angeles California Department of Airports, ARB, Los Angeles International Airport, Senior Series A, AMT, 5.00%, 5/15/38 | | | 2,550 | | | | 2,574,837 | |
City of Los Angeles California Department of Airports, Refunding RB, Los Angeles International Airport,
Senior Series A: | | | | | | | | |
5.00%, 5/15/34 | | | 8,600 | | | | 9,006,006 | |
AMT, 5.38%, 5/15/33 | | | 790 | | | | 835,686 | |
AMT, 5.38%, 5/15/38 | | | 325 | | | | 337,701 | |
City of San Jose California, Refunding ARB,
Series A-1, AMT: | | | | | | | | |
5.75%, 3/01/34 | | | 4,070 | | | | 4,296,536 | |
6.25%, 3/01/34 | | | 2,450 | | | | 2,707,911 | |
County of Orange California, ARB, Series B, 5.75%, 7/01/34 | | | 3,000 | | | | 3,280,800 | |
County of Sacramento California, ARB: | | | | | | | | |
Senior Series B, 5.75%, 7/01/39 | | | 1,600 | | | | 1,767,408 | |
Senior Series B, AMT (AGM), 5.25%, 7/01/39 | | | 2,500 | | | | 2,563,325 | |
| Municipal Bonds | | Par (000) | | | Value | |
California (concluded) | | | | | | | | |
Transportation (concluded) | |
County of Sacramento California, ARB (concluded): | | | | | | | | |
Subordinated & Passenger Facility Charges/Grant, Series C (AGC), 5.75%, 7/01/39 | | $ | 3,150 | | | $ | 3,490,924 | |
County of San Diego California Regional Airport Authority, Refunding ARB, Sub-Series A, 5.00%, 7/01/40 | | | 1,000 | | | | 1,003,850 | |
| | | | | | | | |
| | | | | | | | 40,656,846 | |
Utilities — 21.7% | | | | | | | | |
City of Los Angeles California Wastewater System, Refunding RB, Series A, 5.38%, 6/01/39 | | | 5,000 | | | | 5,459,200 | |
City of Petaluma California Wastewater, Refunding RB, 6.00%, 5/01/36 | | | 5,625 | | | | 6,325,763 | |
City of San Francisco California Public Utilities Commission Water, RB, Hetch Hetchy, Sub-Series B, 5.00%, 11/01/41 | | | 8,470 | | | | 8,852,675 | |
County of Orange California Sanitation District, COP, Series B (AGM), 5.00%, 2/01/37 | | | 8,015 | | | | 8,409,819 | |
County of Sacramento California Sanitation Districts Financing Authority, RB, Sacramento Regional County Sanitation (NPFGC), 5.00%, 12/01/36 | | | 7,770 | | | | 8,062,230 | |
Dublin-San Ramon Services District Water, Refunding RB, 5.50%, 8/01/36 | | | 4,235 | | | | 4,578,077 | |
Los Angeles Department of Water & Power, RB, Sub-Series A-1, 5.25%, 7/01/38 | | | 5,330 | | | | 5,634,023 | |
Los Angeles Department of Water & Power, Refunding RB, Series A, 5.25%, 7/01/39 | | | 8,000 | | | | 8,510,080 | |
Metropolitan Water District of Southern California, RB, Authorization, Series A, 5.00%, 1/01/39 | | | 17,005 | | | | 18,036,693 | |
Metropolitan Water District of Southern California, Refunding RB, Series A, 5.00%, 10/01/35 | | | 5,000 | | | | 5,362,300 | |
San Diego Public Facilities Financing Authority, Refunding RB, Senior Series A, 5.25%, 5/15/34 | | | 13,000 | | | | 13,862,160 | |
San Diego Public Facilities Financing Authority Sewer, Refunding RB, Senior Series A: | | | | | | | | |
5.25%, 5/15/29 | | | 4,000 | | | | 4,378,400 | |
5.25%, 5/15/39 | | | 1,600 | | | | 1,683,328 | |
San Diego Public Facilities Financing Authority Water, Refunding RB, Series B, 5.75%, 8/01/35 | | | 5,000 | | | | 5,582,400 | |
San Juan Water District, COP, Series A, 6.00%, 2/01/39 | | | 5,700 | | | | 6,378,756 | |
Tuolumne Wind Project Authority, RB, Tuolumne Co. Project, Series A, 5.88%, 1/01/29 | | | 6,395 | | | | 7,221,106 | |
| | | | | | | | |
| | | | | | | | 118,337,010 | |
| Total Municipal Bonds — 81.8% | | | | | | | 445,617,405 | |
| | | | | | | | |
| | | | | | | | | |
| | |
Municipal Bonds Transferred to
Tender Option Bond Trusts (b) | | | | | | |
California — 32.2% | | | | | | | | |
County/City/Special District/School District — 14.4% | |
County of Orange California Water District, COP, Refunding, Series A, 5.25%, 8/15/34 | | | 12,200 | | | | 13,199,668 | |
County of San Mateo California Community College District, GO, Election of 2005, Series B, 5.00%, 9/01/38 (c) | | | 19,000 | | | | 19,884,450 | |
County of Ventura California Public Financing Authority, Refunding LRB, Series A, 5.00%, 11/01/38 | | | 14,390 | | | | 14,482,096 | |
Long Beach Community College District, GO, Refunding, Election of 2008, Series B, 5.00%, 8/01/39 | | | 17,355 | | | | 18,021,757 | |
Sacramento California Unified School District, GO, Election of 2002 (NPFGC), 5.00%, 7/01/30 | | | 7,000 | | | | 7,281,470 | |
See Notes to Financial Statements.
| | | | | | |
| | | | | | | |
| | SEMI-ANNUAL REPORT | | NOVEMBER 30, 2013 | | 17 |
| | |
Schedule of Investments (continued) | | BlackRock California Municipal Bond Fund (Percentages shown are based on Net Assets) |
| | | | | | | | |
Municipal Bonds Transferred to
Tender Option Bond Trusts (b) | | Par (000) | | | Value | |
California (continued) | | | | | | | | |
County/City/Special District/School District (concluded) | |
San Francisco Bay Area Rapid Transit District, Refunding RB, Series A (NPFGC), 5.00%, 7/01/30 | | $ | 5,270 | | | $ | 5,494,502 | |
| | | | | | | | |
| | | | | | | | 78,363,943 | |
Education — 6.3% | | | | | | | | |
California State University, Refunding RB, Systemwide, Series A (AGM), 5.00%, 11/01/32 | | | 10,000 | | | | 10,398,500 | |
University of California, Refunding RB, Limited Project, Series G: | | | | | | | | |
5.00%, 5/15/37 | | | 12,881 | | | | 13,431,374 | |
5.00%, 5/15/42 | | | 10,000 | | | | 10,298,800 | |
| | | | | | | | |
| | | | | | | | 34,128,674 | |
Health — 2.6% | | | | | | | | |
California Health Facilities Financing Authority, RB, Sutter Health, Series A (BHAC), 5.00%, 11/15/42 | | | 14,413 | | | | 14,347,021 | |
Transportation — 2.2% | | | | | | | | |
City of Los Angeles California Department of Airports, Refunding ARB, Los Angeles International Airport, Senior Series A, 5.00%, 5/15/40 | | | 11,708 | | | | 11,980,232 | |
Utilities — 6.7% | | | | | | | | |
City & County of San Francisco California Public Utilities Commission, RB, Water Revenue, Series B, 5.00%, 11/01/39 | | | 13,000 | | | | 13,520,650 | |
County of Sacramento California Sanitation Districts Financing Authority, RB, Sacramento Regional County Sanitation (NPFGC), 5.00%, 12/01/36 | | | 5,000 | | | | 5,188,050 | |
Municipal Bonds Transferred to
Tender Option Bond Trusts (b) | | Par (000) | | | Value | |
California (concluded) | | | | | | | | |
Utilities (concluded) | |
County of San Diego California Water Authority, COP, Refunding, Series A (AGM),
5.00%, 5/01/33 | | $ | 4,760 | | | $ | 5,034,128 | |
San Diego Public Facilities Financing Authority Sewer, Refunding RB, Senior Series A, 5.25%, 5/15/39 | | | 12,108 | | | | 12,738,340 | |
| | | | | | | | |
| | | | | | | | 36,481,168 | |
Total Municipal Bonds Transferred to
Tender Option Bond Trusts — 32.2% | | | | 175,301,038 | |
Total Long-Term Investments
(Cost — $612,990,017) — 114.0% | | | | 620,918,443 | |
| | | | | | | | |
| | | | | | | | | |
| | |
| Short-Term Securities | | Shares | | | | |
BIF California Municipal Money Fund, 0.00% (d)(e) | | | 1,802,853 | | | | 1,802,853 | |
Total Short-Term Securities
(Cost — $1,802,853) — 0.3% | | | | 1,802,853 | |
| Total Investments (Cost — $614,792,870) — 114.3% | | | | 622,721,296 | |
| Other Assets Less Liabilities — 1.2% | | | | 6,634,154 | |
Liability for TOB Trust Certificates, Including Interest
Expense and Fees Payable — (15.5)% | | | | (84,567,928 | ) |
| | | | | | | | |
| Net Assets — 100.0% | | | | | | $ | 544,787,522 | |
| | | | | | | | |
|
| Notes to Schedule of investments |
| (a) | | Represents a zero-coupon bond. Rate shown reflects the current yield as of report date. |
| (b) | | Represent bonds transferred to a TOB. In exchange the Fund acquired residual interest certificates. These bonds serve as collateral in a financing transaction. See Note 3 of the Notes to Financial Statements for details of municipal bonds transferred to TOBs. |
| (c) | | All or a portion of security is subject to a recourse agreement, which may require the Fund to pay the liquidity provider in the event there is a shortfall between the TOB trust certificates and proceeds received from the sale of the security contributed to the TOB trust. In the case of a shortfall, the aggregate maximum potential amount the Fund could ultimately be required to pay under the agreement which expires on March 1, 2015 is $9,988,194. |
| (d) | | Investments in issuers considered to be an affiliate of the Fund during the six months ended November 30, 2013, for purposes of Section 2(a)(3) of the Investment Company Act of 1940, as amended, were as follows: |
| | | | | | | | | | | | | | |
| Affiliate | | Shares Held
at May 31,
2013 | | | Net
Activity | | | Shares Held
at November 30,
2013 | | | Income |
BIF California Municipal Money Fund | | | 1,311,039 | | | | 491,814 | | | | 1,802,853 | | | — |
| (e) | | Represents the current yield as of report date. |
| Ÿ | | Financial futures contracts as of November 30, 2013 were as follows: |
| | | | | | | | | | | | | | |
Contracts
Sold | | Issue | | Exchange | | Expiration | | Notional
Value | | | Unrealized
Depreciation | |
| (410) | | 10-Year US Treasury Note | | Chicago Board of Trade | | December 2013 | | $ | 51,922,656 | | | $ | (193,983 | ) |
| Ÿ | | For Fund compliance purposes, the Fund’s sector classifications refer to any one or more of the sector sub-classifications used by one or more widely recognized market indexes or rating group indexes, and/or as defined by the investment advisor. These definitions may not apply for purposes of this report, which may combine such sector sub-classifications for reporting ease. |
| Ÿ | | Fair Value Measurements — Various inputs are used in determining the fair value of investments and derivative financial instruments. These inputs to valuation techniques are categorized into a disclosure hierarchy consisting of three broad levels for financial statement purposes as follows: |
| | Ÿ | | Level 1 — unadjusted price quotations in active markets/exchanges for identical assets or liabilities that the Fund has the ability to access |
| | Ÿ | | Level 2 — other observable inputs (including, but not limited to, quoted prices for similar assets or liabilities in markets that are active, quoted prices for identical or similar assets or liabilities in markets that are not active, inputs other than quoted prices that are observable for the assets or liabilities (such as interest rates, yield curves, volatilities, prepayment speeds, loss severities, credit risks and default rates) or other market-corroborated inputs) |
| | Ÿ | | Level 3 — unobservable inputs based on the best information available in the circumstances, to the extent observable inputs are not available (including the Fund’s own assumptions used in determining the fair value of investments and derivative financial instruments) |
See Notes to Financial Statements.
| | | | | | |
| | | | | | | |
| 18 | | SEMI-ANNUAL REPORT | | NOVEMBER 30, 2013 | | |
| | |
Schedule of Investments (concluded) | | BlackRock California Municipal Bond Fund |
The hierarchy gives the highest priority to unadjusted quoted prices in active markets for identical assets or liabilities (Level 1 measurements) and the lowest priority to unobservable inputs (Level 3 measurements). Accordingly, the degree of judgment exercised in determining fair value is greatest for instruments categorized in Level 3. The inputs used to measure fair value may fall into different levels of the fair value hierarchy. In such cases, for disclosure purposes, the fair value hierarchy classification is determined based on the lowest level input that is significant to the fair value measurement in its entirety.
Changes in valuation techniques may result in transfers into or out of an assigned level within the disclosure hierarchy. In accordance with the Fund’s policy, transfers between different levels of the fair value disclosure hierarchy are deemed to have occurred as of the beginning of the reporting period. The categorization of a value determined for investments and derivative financial instruments is based on the pricing transparency of the investment and derivative financial instrument and is not necessarily an indication of the risks associated with investing in those securities. For information about the Fund’s policy regarding valuation of investments and derivative financial instruments, please refer to Note 2 of the Notes to Financial Statements.
The following tables summarize the Fund’s investments and derivative financial instruments categorized in the disclosure hierarchy as of November 30, 2013:
| | | | | | | | | | | | | | |
| | | Level 1 | | | Level 2 | | | Level 3 | | Total | |
Assets: | | | | | | | | | | | | | | |
| Investments: | | | | | | | | | | | | | | |
Long-Term Investments1 | | | — | | | $ | 620,918,443 | | | — | | $ | 620,918,443 | |
Short-Term Securities | | $ | 1,802,853 | | | | — | | | — | | | 1,802,853 | |
| | | | |
Total | | $ | 1,802,853 | | | $ | 620,918,443 | | | — | | $ | 622,721,296 | |
| | | | |
1 See above Schedule of Investments for values in each sector. | |
| | | Level 1 | | | Level 2 | | | Level 3 | | Total | |
| Derivative Financial Instruments2 | | | | | | | | | | | | | | |
Liabilities: | | | | | | | | | | | | | | |
Interest rate contracts | | $ | (193,983 | ) | | | — | | | — | | $ | (193,983 | ) |
2 Derivative financial instruments are financial futures contracts, which are valued at the unrealized appreciation/depreciation on the instrument. | |
Certain of the Fund’s assets and/or liabilities are held at carrying amount, which approximates fair value for financial statement purposes. As of November 30, 2013, such assets and liabilities are categorized within the disclosure hierarchy as follows:
| | | | | | | | | | | | | | |
| | | Level 1 | | | Level 2 | | | Level 3 | | Total | |
Assets: | | | | | | | | | | | | | | |
Cash pledged for financial futures contracts | | $ | 726,000 | | | | — | | | — | | $ | 726,000 | |
Liabilities: | | | | | | | | | | | | | | |
Bank overdraft | | | — | | | $ | (17,396 | ) | | — | | | (17,396 | ) |
TOB trust certificates | | | — | | | | (84,544,892 | ) | | — | | | (84,544,892 | ) |
| | | | |
Total | | $ | 726,000 | | | $ | (84,562,288 | ) | | — | | $ | (83,836,288 | ) |
| | | | |
There were no transfers between levels during the six months ended November 30, 2013.
See Notes to Financial Statements.
| | | | | | |
| | | | | | | |
| | SEMI-ANNUAL REPORT | | NOVEMBER 30, 2013 | | 19 |
| | |
Schedule of Investments November 30, 2013 (Unaudited) | | BlackRock New Jersey Municipal Bond Fund (Percentages shown are based on Net Assets) |
| | | | | | | | |
| Municipal Bonds | | Par (000) | | | Value | |
New Jersey — 95.3% | | | | | | | | |
Corporate — 5.0% | | | | | | | | |
New Jersey EDA, RB, AMT: | | | | | | | | |
5.13%, 1/01/39 | | $ | 1,000 | | | $ | 986,750 | |
Continental Airlines, Inc. Project, 5.25%, 9/15/29 | | | 3,500 | | | | 3,240,895 | |
Mandatory Put Bonds, Solid Waste Disposal, Waste Management, Series A,
5.30%, 6/01/15 (a) | | | 2,000 | | | | 2,042,700 | |
New Jersey EDA, Refunding RB: | | | | | | | | |
New Jersey American Water Co., Inc. Project, Series A, AMT, 5.70%, 10/01/39 | | | 1,445 | | | | 1,523,218 | |
New Jersey American Water Co., Inc. Project, Series B, AMT, 5.60%, 11/01/34 | | | 1,000 | | | | 1,058,440 | |
New Jersey American Water Co., Inc. Project, Series D, AMT, 4.88%, 11/01/29 | | | 1,000 | | | | 1,028,050 | |
Newark Airport Marriott Hotel, 7.00%, 10/01/14 | | | 1,250 | | | | 1,260,850 | |
| | | | | | | | |
| | | | | | | | 11,140,903 | |
County/City/Special District/School District — 13.3% | | | | | |
City of Perth Amboy New Jersey, GO, CAB, Refunding (AGM): | | | | | | | | |
5.00%, 7/01/35 | | | 1,250 | | | | 1,270,863 | |
5.00%, 7/01/36 | | | 300 | | | | 304,611 | |
Collingswood School District, GO, Refunding, Board of Education of the Borough of Collingswood,
2.75%, 6/01/30 | | | 1,165 | | | | 908,164 | |
County of Essex New Jersey Improvement Authority, LRB, Newark Project, Series A (AGM), 5.00%, 11/01/20 | | | 735 | | | | 817,886 | |
County of Essex New Jersey Improvement Authority, Refunding RB, Project Consolidation (NPFGC),
5.50%, 10/01/29 | | | 1,500 | | | | 1,721,940 | |
County of Union New Jersey, GO, Refunding, County Vocational Technical School, Series C,
3.50%, 3/01/31 | | | 1,640 | | | | 1,491,334 | |
County of Union New Jersey Utilities Authority, Refunding RB, Series A: | | | | | | | | |
Covanta Union, Inc., AMT, 4.75%, 12/01/31 | | | 1,750 | | | | 1,714,737 | |
Solid Waste System, County Deficiency Agreement, 5.00%, 6/15/41 | | | 2,000 | | | | 2,077,600 | |
Essex County Improvement Authority, LRB, Newark Project, Series A (AGM), 6.00%, 11/01/30 | | | 1,090 | | | | 1,174,857 | |
Hudson County Improvement Authority, RB, Harrison Parking Facility Project, Series C: | | | | | | | | |
4.88%, 1/01/46 | | | 1,000 | | | | 1,009,150 | |
5.25%, 1/01/46 | | | 4,900 | | | | 5,047,294 | |
Middlesex County Improvement Authority, RB: | | | | | | | | |
Golf Course Projects, 5.25%, 6/01/14 (b) | | | 1,705 | | | | 1,748,870 | |
Heldrich Center Hotel, Senior Series A, 5.00%, 1/01/15 | | | 380 | | | | 330,558 | |
New Jersey EDA, RB, Goethals Bridge Replacement Project, AMT: | | | | | | | | |
5.13%, 7/01/42 | | | 1,000 | | | | 978,660 | |
5.38%, 1/01/43 | | | 905 | | | | 886,058 | |
New Jersey EDA, Refunding, Special Assessment, Kapkowski Road Landfill Project, 6.50%, 4/01/28 | | | 2,500 | | | | 2,745,525 | |
New Jersey Health Care Facilities Financing Authority, LRB, Greystone Park Psychiatric Hospital Project, Series A: | | | | | | | | |
5.00%, 9/15/29 | | | 2,000 | | | | 2,068,760 | |
(AGM), 3.50%, 9/15/31 | | | 1,000 | | | | 851,300 | |
New Jersey Sports & Exposition Authority, Refunding RB (NPFGC), 5.50%, 3/01/21 | | | 805 | | | | 919,286 | |
| Municipal Bonds | | Par (000) | | | Value | |
New Jersey (continued) | | | | | | | | |
County/City/Special District/School District (concluded) | |
Newark Housing Authority, Refunding RB, Newark Redevelopment Project (NPFGC), 4.38%, 1/01/37 | | $ | 1,775 | | | $ | 1,553,444 | |
| | | | | | | | |
| | | | | | | | 29,620,897 | |
Education — 15.8% | | | | | | | | |
New Jersey EDA, RB: | | | | | | | | |
6.00%, 10/01/43 | | | 1,000 | | | | 982,190 | |
Patterson Charter School for Science & Technology, Inc. Project, Series A, 6.00%, 7/01/32 | | | 700 | | | | 696,850 | |
Patterson Charter School for Science & Technology, Inc. Project, Series A, 6.10%, 7/01/44 | | | 355 | | | | 346,334 | |
Rutgers University, College Avenue Redevelopment Project, 5.00%, 6/15/38 | | | 2,000 | | | | 2,115,040 | |
New Jersey EDA, Refunding RB, Seeing Eye, Inc. Project (AMBAC), 5.00%, 12/01/24 | | | 5,500 | | | | 5,625,785 | |
New Jersey Educational Facilities Authority, RB, Fairleigh Dickinson University, Series D (ACA), 5.25%, 7/01/32 | | | 1,500 | | | | 1,500,060 | |
New Jersey Educational Facilities Authority, Refunding RB: | | | | | | | | |
College of New Jersey, Series D (AGM), 5.00%, 7/01/35 | | | 3,750 | | | | 3,849,975 | |
Georgian Court University, Series D, 5.00%, 7/01/33 | | | 500 | | | | 496,890 | |
Kean University, Series A, 5.25%, 9/01/29 | | | 1,705 | | | | 1,819,815 | |
Kean University, Series A (AGC), 5.50%, 9/01/36 | | | 1,000 | | | | 1,058,450 | |
Ramapo College, Series B, 5.00%, 7/01/42 | | | 560 | | | | 570,942 | |
Rowan University, Series B (AGM), 3.00%, 7/01/27 | | | 220 | | | | 199,483 | |
Rowan University, Series B (AGC), 5.00%, 7/01/27 | | | 1,250 | | | | 1,344,637 | |
Rowan University, Series B (AGM), 3.00%, 7/01/28 | | | 285 | | | | 252,707 | |
University of Medicine & Dentistry, Series B, 7.50%, 6/01/19 (b) | | | 2,500 | | | | 3,282,150 | |
William Paterson University, Series C (AGC), 5.00%, 7/01/38 | | | 3,200 | | | | 3,215,488 | |
New Jersey Higher Education Student Assistance Authority, Refunding RB: | | | | | | | | |
Series 1, AMT, 5.75%, 12/01/28 | | | 1,000 | | | | 1,053,020 | |
Series 1A, 5.00%, 12/01/25 | | | 95 | | | | 99,245 | |
Series 1A, 5.00%, 12/01/26 | | | 610 | | | | 633,637 | |
New Jersey Institute of Technology, RB, Series A: | | | | | | | | |
5.00%, 7/01/32 | | | 1,500 | | | | 1,571,385 | |
5.00%, 7/01/42 | | | 915 | | | | 935,478 | |
Rutgers The State University of New Jersey, Refunding RB, Series L, 5.00%, 5/01/43 | | | 2,500 | | | | 2,604,800 | |
University of Medicine & Dentistry of New Jersey, COP (NPFGC), 5.00%, 6/15/14 (b) | | | 1,000 | | | | 1,026,340 | |
| | | | | | | | |
| | | | | | | | 35,280,701 | |
Health — 20.3% | | | | | | | | |
County of Burlington New Jersey Bridge Commission, Refunding RB, The Evergreens Project, 5.63%, 1/01/38 | | | 1,850 | | | | 1,588,206 | |
New Jersey EDA, RB: | | | | | | | | |
1st Mortgage, Lions Gate Project, Series A, 5.88%, 1/01/37 | | | 1,000 | | | | 910,760 | |
Masonic Charity Foundation of New Jersey, 5.25%, 6/01/24 | | | 875 | | | | 885,868 | |
Masonic Charity Foundation of New Jersey, 5.25%, 6/01/32 | | | 500 | | | | 502,625 | |
See Notes to Financial Statements.
| | | | | | |
| | | | | | | |
| 20 | | SEMI-ANNUAL REPORT | | NOVEMBER 30, 2013 | | |
| | |
Schedule of Investments (continued) | | BlackRock New Jersey Municipal Bond Fund (Percentages shown are based on Net Assets) |
| | | | | | | | |
| Municipal Bonds | | Par (000) | | | Value | |
New Jersey (continued) | | | | | | | | |
Health (concluded) | |
New Jersey EDA, Refunding RB: | | | | | | | | |
1st Mortgage, Winchester, Series A, 5.80%, 11/01/31 | | $ | 1,500 | | | $ | 1,501,305 | |
Seabrook Village, Inc. Facility, 5.25%, 11/15/26 | | | 2,000 | | | | 1,934,260 | |
Seabrook Village, Inc. Facility, 5.25%, 11/15/36 | | | 600 | | | | 533,694 | |
New Jersey Health Care Facilities Financing Authority, RB: | | | | | | | | |
Children’s Specialized Hospital, Series A, 5.50%, 7/01/36 | | | 460 | | | | 462,613 | |
Hunterdon Medical Center, Series A, 5.25%, 7/01/25 | | | 750 | | | | 811,065 | |
Hunterdon Medical Center, Series A, 5.13%, 7/01/35 | | | 1,100 | | | | 1,101,397 | |
Meridian Health System Obligated Group, Series I (AGC), 5.00%, 7/01/38 | | | 1,870 | | | | 1,895,918 | |
Robert Wood Johnson University Hospital, Series A, 5.25%, 7/01/35 | | | 1,460 | | | | 1,502,033 | |
Robert Wood Johnson University Hospital, Series A, 5.50%, 7/01/43 | | | 495 | | | | 512,122 | |
Virtua Health, Series A (AGC), 5.50%, 7/01/38 | | | 3,620 | | | | 3,730,229 | |
New Jersey Health Care Facilities Financing Authority, Refunding RB: | | | | | | | | |
5.00%, 7/01/29 (c) | | | 285 | | | | 298,563 | |
AHS Hospital Corp., 6.00%, 7/01/37 | | | 2,985 | | | | 3,290,186 | |
CAB, St. Barnabas Health Care System, Series B, 6.03%, 7/01/36 (d) | | | 7,360 | | | | 1,923,389 | |
CAB, St. Barnabas Health Care System, Series B, 6.06%, 7/01/37 (d) | | | 7,000 | | | | 1,711,990 | |
General Hospital Center at Passaic (AGM), 6.75%, 7/01/19 (e) | | | 125 | | | | 149,663 | |
Hackensack University Medical Center (AGC), 5.25%, 1/01/36 | | | 3,600 | | | | 3,719,376 | |
Holy Name Medical Center, 5.00%, 7/01/25 | | | 500 | | | | 505,010 | |
Meridian Health System Obligated Group, 5.00%, 7/01/27 | | | 1,500 | | | | 1,572,495 | |
Robert Wood Johnson University Hospital, 5.00%, 7/01/31 | | | 1,500 | | | | 1,525,905 | |
South Jersey Hospital, 5.00%, 7/01/46 | | | 3,100 | | | | 2,988,865 | |
St. Barnabas Health Care System, Series A, 5.00%, 7/01/25 | | | 2,230 | | | | 2,352,516 | |
St. Barnabas Health Care System, Series A, 5.00%, 7/01/29 | | | 4,185 | | | | 4,201,447 | |
St. Barnabas Health Care System, Series A, 5.63%, 7/01/32 | | | 1,540 | | | | 1,598,120 | |
St. Barnabas Health, Series A, 5.00%, 7/01/24 | | | 1,000 | | | | 1,072,060 | |
St. Luke’s Warren Hospital Obligated Group, 5.00%, 8/15/34 | | | 460 | | | | 458,790 | |
St. Luke’s Warren Hospital Obligated Group, 4.00%, 8/15/37 | | | 230 | | | | 191,250 | |
| | | | | | | | |
| | | | | | | | 45,431,720 | |
Housing — 4.0% | |
Middlesex County Improvement Authority, RB, New Brunswick Apartments Rental Housing, AMT (Fannie Mae), 5.15%, 2/01/24 | | | 1,935 | | | | 1,937,071 | |
New Jersey Housing & Mortgage Finance Agency, RB: | | | | | | | | |
Capital Fund Program, Series A (AGM), 4.70%, 11/01/25 | | | 2,100 | | | | 2,154,726 | |
M/F Housing, Series A, 4.20%, 11/01/32 | | | 1,500 | | | | 1,385,355 | |
S/F Housing, Series AA, 6.50%, 10/01/38 | | | 735 | | | | 745,760 | |
S/F Housing, Series U, AMT, 4.90%, 10/01/27 | | | 1,590 | | | | 1,602,720 | |
S/F Housing, Series U, AMT, 4.95%, 10/01/32 | | | 405 | | | | 406,332 | |
S/F Housing, Series X, AMT, 4.85%, 4/01/16 | | | 610 | | | | 623,310 | |
| | | | | | | | |
| | | | | | | | 8,855,274 | |
| Municipal Bonds | | Par (000) | | | Value | |
New Jersey (continued) | | | | | | | | |
State — 18.6% | |
Garden State Preservation Trust, RB (AGM): | | | | | | | | |
CAB, Series B, 3.85%, 11/01/24 (d) | | $ | 10,000 | | | $ | 6,595,700 | |
CAB, Series B, 4.29%, 11/01/27 (d) | | | 4,135 | | | | 2,288,929 | |
Election of 2005, Series A,
5.80%, 11/01/15 (b) | | | 1,640 | | | | 1,811,954 | |
Election of 2005, Series A, 5.75%, 11/01/28 | | | 2,080 | | | | 2,503,675 | |
New Jersey EDA, RB: | | | | | | | | |
CAB, Motor Vehicle Surcharge, Series A (NPFGC), 3.71%, 7/01/21 (d) | | | 1,675 | | | | 1,267,774 | |
Kapkowski Road Landfill Project, Series B, AMT, 6.50%, 4/01/31 | | | 2,000 | | | | 2,151,600 | |
Motor Vehicle Surcharges, Series A (NPFGC), 5.00%, 7/01/27 | | | 2,000 | | | | 2,033,320 | |
Motor Vehicle Surcharges, Series A (NPFGC), 5.00%, 7/01/29 | | | 1,100 | | | | 1,118,590 | |
School Facilities Construction (AGC), 6.00%, 12/15/18 (b) | | | 330 | | | | 407,141 | |
School Facilities Construction (AGC), 6.00%, 12/15/34 | | | 670 | | | | 751,506 | |
School Facilities Construction, Series KK, 5.00%, 3/01/38 | | | 1,070 | | | | 1,088,136 | |
School Facilities Construction, Series U (AMBAC), 5.00%, 9/01/37 | | | 500 | | | | 511,900 | |
School Facilities Construction, Series Z (AGC), 5.50%, 12/15/34 | | | 1,500 | | | | 1,638,090 | |
New Jersey EDA, Refunding RB: | | | | | | | | |
CAB, Economic Fund, Series A (NPFGC), 3.36%, 3/15/21 (d) | | | 2,000 | | | | 1,568,660 | |
Cigarette Tax, 5.00%, 6/15/22 | | | 1,700 | | | | 1,852,235 | |
Cigarette Tax, 5.00%, 6/15/29 | | | 640 | | | | 632,493 | |
New Jersey Transportation Trust Fund Authority, RB, CAB Transportation System (d): | | | | | | | | |
Series A, 5.50%, 12/15/32 | | | 10,000 | | | | 3,558,300 | |
Series A, 5.85%, 12/15/38 | | | 12,050 | | | | 2,843,318 | |
Series C (AGM), 5.65%, 12/15/34 | | | 4,870 | | | | 1,507,655 | |
New Jersey Transportation Trust Fund Authority, Refunding RB, Transportation System, Series B (NPFGC), 5.50%, 12/15/21 | | | 1,800 | | | | 2,126,376 | |
State of New Jersey, COP, Equipment Lease Purchase, Series A: | | | | | | | | |
5.25%, 6/15/29 | | | 1,000 | | | | 1,052,950 | |
5.25%, 6/15/30 | | | 1,110 | | | | 1,162,059 | |
State of New Jersey, GO, Refunding, Series N (NPFGC), 5.50%, 7/15/17 | | | 1,000 | | | | 1,167,770 | |
| | | | | | | | |
| | | | | | | | 41,640,131 | |
Transportation — 15.9% | | | | | | | | |
Delaware River Joint Toll Bridge Commission, Refunding RB, Series A: | | | | | | | | |
3.00%, 7/01/28 | | | 1,000 | | | | 870,790 | |
3.13%, 7/01/30 | | | 1,000 | | | | 834,730 | |
Delaware River Port Authority, RB, Series D, 5.00%, 1/01/40 | | | 1,875 | | | | 1,921,369 | |
New Jersey State Turnpike Authority, RB: | | | | | | | | |
Growth & Income Securities, Series B (AMBAC), 0.00%, 1/01/35 (f) | | | 1,510 | | | | 1,431,616 | |
Series A, 5.00%, 1/01/43 | | | 500 | | | | 510,125 | |
Series C (AGM), 5.00%, 1/01/15 (b) | | | 2,500 | | | | 2,629,900 | |
New Jersey State Turnpike Authority, Refunding RB: | | | | | | | | |
Series A (BHAC), 5.25%, 1/01/30 | | | 1,000 | | | | 1,139,540 | |
Series B, 3.50%, 1/01/30 | | | 1,000 | | | | 887,750 | |
Series B, 5.00%, 1/01/30 | | | 1,480 | | | | 1,570,931 | |
Series C (NPFGC), 6.50%, 1/01/16 | | | 355 | | | | 398,371 | |
Series I, 5.00%, 1/01/35 | | | 2,500 | | | | 2,586,000 | |
See Notes to Financial Statements.
| | | | | | |
| | | | | | | |
| | SEMI-ANNUAL REPORT | | NOVEMBER 30, 2013 | | 21 |
| | |
Schedule of Investments (continued) | | BlackRock New Jersey Municipal Bond Fund (Percentages shown are based on Net Assets) |
| | | | | | | | |
| Municipal Bonds | | Par (000) | | | Value | |
New Jersey (concluded) | | | | | | | | |
Transportation (concluded) | | | | | | | | |
New Jersey Transportation Trust Fund Authority, RB: | | | | | | | | |
CAB, Transportation System, Series A, 5.71%, 12/15/35 (d) | | $ | 5,500 | | | $ | 1,589,830 | |
CAB, Transportation System, Series C (AMBAC), 5.81%, 12/15/35 (d) | | | 1,380 | | | | 390,457 | |
Transportation Program, Series AA, 5.25%, 6/15/31 | | | 2,000 | | | | 2,134,500 | |
Transportation System, Series A, 6.00%, 6/15/35 | | | 3,185 | | | | 3,517,673 | |
Port Authority of New York & New Jersey, ARB: | | | | | | | | |
Consolidated, 85th Series, 5.20%, 9/01/18 | | | 1,000 | | | | 1,183,140 | |
Consolidated, 93rd Series, 6.13%, 6/01/94 | | | 1,000 | | | | 1,105,720 | |
Special Project, JFK International Air Terminal LLC Project, Series 6, AMT (NPFGC), 5.75%, 12/01/22 | | | 2,000 | | | | 2,019,860 | |
Special Project, JFK International Air Terminal LLC Project, Series 8, 6.00%, 12/01/42 | | | 1,000 | | | | 1,068,840 | |
Port Authority of New York & New Jersey, Refunding ARB, Consolidated, AMT: | | | | | | | | |
147th Series, 4.75%, 4/15/37 | | | 5,000 | | | | 4,930,250 | |
177th Series, 3.50%, 7/15/37 | | | 1,000 | | | | 776,160 | |
177th Series, 4.00%, 1/15/43 | | | 1,000 | | | | 846,060 | |
178th Series, 5.00%, 12/01/43 | | | 285 | | | | 286,112 | |
South Jersey Transportation Authority, Refunding RB, Transportation System, Series A: | | | | | | | | |
5.00%, 11/01/28 | | | 295 | | | | 307,493 | |
5.00%, 11/01/29 | | | 295 | | | | 303,762 | |
| | | | | | | | |
| | | | | | | | 35,240,979 | |
Utilities — 2.4% | | | | | | | | |
North Hudson Sewerage Authority, Refunding RB, Sewerage, Series A (NPFGC), 2.49%, 8/01/21 (d)(e) | | | 5,000 | | | | 4,136,500 | |
Passaic Valley Water Commission, RB, Series A, 6.00%, 12/15/24 | | | 1,195 | | | | 1,339,260 | |
| | | | | | | | |
| | | | | | | | 5,475,760 | |
Total Municipal Bonds — 95.3% | | | | 212,686,365 | |
| | | | | | | | |
Municipal Bonds Transferred to
Tender Option Bond Trusts (g) | | Par (000) | | | Value | |
New Jersey — 5.5% | |
County/City/Special District/School District — 2.9% | |
County of Union New Jersey Utilities Authority, Refunding LRB, Resource Recovery Facility, Covanta Union, Inc., Series A, AMT, 5.25%, 12/01/31 | | $ | 6,300 | | | $ | 6,478,164 | |
Transportation — 2.6% | |
New Jersey Transportation Trust Fund Authority, RB, Transportation System, Series B, 5.25%, 6/15/36 (h) | | | 5,001 | | | | 5,206,254 | |
Port Authority of New York & New Jersey, RB, Consolidated, 169th Series, AMT, 5.00%, 10/15/41 | | | 495 | | | | 497,277 | |
| | | | | | | | |
| | | | | | | | 5,703,531 | |
Total Municipal Bonds Transferred to
Tender Option Bond Trusts — 5.5% | | | | 12,181,695 | |
Total Long-Term Investments (Cost — $219,829,187) — 100.8% | | | | 224,868,060 | |
| | | | | | | | |
| | |
| | |
| Short-Term Securities | | Shares | | | | |
BIF New Jersey Municipal Money
Fund, 0.00% (i)(j) | | | 3,178,364 | | | | 3,178,364 | |
Total Short-Term Securities (Cost — $3,178,364) — 1.4% | | | | 3,178,364 | |
| Total Investments (Cost — $223,007,551) — 102.2% | | | | 228,046,424 | |
| Other Assets Less Liabilities — 1.0% | | | | 2,433,496 | |
Liability for TOB Trust Certificates, Including Interest
Expense and Fees Payable — (3.2)% | | | | (7,234,165 | ) |
| | | | | | | | |
| Net Assets — 100.0% | | | $ | 223,245,755 | |
| | | | | | | | |
|
| Notes to Schedule of investments |
| (a) | | Variable rate security. Rate shown is as of report date. |
| (b) | | US government securities, held in escrow, are used to pay interest on this security, as well as to retire the bond in full at the date indicated, typically at a premium to par. |
| (c) | | When-issued security. Unsettled when-issued transactions were as follows: |
| | | | | | | | |
| Counterparty | | Value | | | Unrealized
Appreciation | |
Morgan Stanley & Co., Inc. | | $ | 298,563 | | | $ | 995 | |
| (d) | | Represents a zero-coupon bond. Rate shown reflects the current yield as of report date. |
| (e) | | Security is collateralized by municipal or US Treasury obligations. |
| (f) | | Represents a step-up bond that pays an initial coupon rate for the first period and then a higher coupon rate for the following periods. Rate shown is as of report date. |
| (g) | | Represent bonds transferred to a TOB. In exchange the Fund acquired residual interest certificates. These bonds serve as collateral in a financing transaction. See Note 3 of the Notes to Financial Statements for details of municipal bonds transferred to TOBs. |
| (h) | | All or a portion of security is subject to a recourse agreement, which may require the Fund to pay the liquidity provider in the event there is a shortfall between the TOB trust certificates and proceeds received from the sale of the security contributed to the TOB trust. In the case of a shortfall, the aggregate maximum potential amount the Fund could ultimately be required to pay under the agreements, which expire on June 15, 2019 is $3,886,081. |
See Notes to Financial Statements.
| | | | | | |
| | | | | | | |
| 22 | | SEMI-ANNUAL REPORT | | NOVEMBER 30, 2013 | | |
| | |
Schedule of Investments (concluded) | | BlackRock New Jersey Municipal Bond Fund |
| (i) | | Investments in issuers considered to be an affiliate of the Fund during the six months ended November 30, 2013, for purposes of Section 2(a)(3) of the Investment Company Act of 1940, as amended, were as follows: |
| | | | | | | | | | | | | | | | |
| Affiliate | | Shares Held
at May 31,
2013 | | | Net
Activity | | | Shares Held
at November 30,
2013 | | | Income | |
BIF New Jersey Municipal Money Fund | | | 8,686,142 | | | | (5,507,778 | ) | | | 3,178,364 | | | | — | |
| (j) | | Represents the current yield as of report date. |
| Ÿ | | Financial futures contracts as of November 30, 2013 were as follows: |
| | | | | | | | | | | | | | |
Contracts
Sold | | Issue | | Exchange | | Expiration | | Notional
Value | | | Unrealized
Appreciation | |
| (93) | | 10-Year US Treasury Note | | Chicago Board of Trade | | December 2013 | | $ | 11,777,578 | | | $ | 59,477 | |
| Ÿ | | For Fund compliance purposes, the Fund’s sector classifications refer to any one or more of the sector sub-classifications used by one or more widely recognized market indexes or rating group indexes, and/or as defined by the investment advisor. These definitions may not apply for purposes of this report, which may combine such sector sub-classifications for reporting ease. |
| Ÿ | | Fair Value Measurements — Various inputs are used in determining the fair value of investments and derivative financial instruments. These inputs to valuation techniques are categorized into a disclosure hierarchy consisting of three broad levels for financial statement purposes as follows: |
| | Ÿ | | Level 1 — unadjusted price quotations in active markets/exchanges for identical assets or liabilities that the Fund has the ability to access |
| | Ÿ | | Level 2 — other observable inputs (including, but not limited to, quoted prices for similar assets or liabilities in markets that are active, quoted prices for identical or similar assets or liabilities in markets that are not active, inputs other than quoted prices that are observable for the assets or liabilities (such as interest rates, yield curves, volatilities, prepayment speeds, loss severities, credit risks and default rates) or other market-corroborated inputs) |
| | Ÿ | | Level 3 — unobservable inputs based on the best information available in the circumstances, to the extent observable inputs are not available (including the Fund’s own assumptions used in determining the fair value of investments and derivative financial instruments) |
The hierarchy gives the highest priority to unadjusted quoted prices in active markets for identical assets or liabilities (Level 1 measurements) and the lowest priority to unobservable inputs (Level 3 measurements). Accordingly, the degree of judgment exercised in determining fair value is greatest for instruments categorized in Level 3. The inputs used to measure fair value may fall into different levels of the fair value hierarchy. In such cases, for disclosure purposes, the fair value hierarchy classification is determined based on the lowest level input that is significant to the fair value measurement in its entirety.
Changes in valuation techniques may result in transfers into or out of an assigned level within the disclosure hierarchy. In accordance with the Fund’s policy, transfers between different levels of the fair value disclosure hierarchy are deemed to have occurred as of the beginning of the reporting period. The categorization of a value determined for investments and derivative financial instruments is based on the pricing transparency of the investment and derivative financial instrument and is not necessarily an indication of the risks associated with investing in those securities. For information about the Fund’s policy regarding valuation of investments and derivative financial instruments, please refer to Note 2 of the Notes to Financial Statements.
The following tables summarize the Fund’s investments and derivative financial instruments categorized in the disclosure hierarchy as of November 30, 2013:
| | | | | | | | | | | | | | | | |
| | | Level 1 | | | Level 2 | | | Level 3 | | | Total | |
Assets: | | | | | | | | | | | | | | | | |
| Investments: | | | | | | | | | | | | | | | | |
Long-Term Investments1 | | | — | | | $ | 224,868,060 | | | | — | | | $ | 224,868,060 | |
Short-Term Securities | | $ | 3,178,364 | | | | — | | | | — | | | | 3,178,364 | |
| | | | | | | | | | | | | | | | |
Total | | $ | 3,178,364 | | | $ | 224,868,060 | | | | — | | | $ | 228,046,424 | |
| | | | | | | | | | | | | | | | |
1 See above Schedule of Investments for values in each sector. | |
| | | Level 1 | | | Level 2 | | | Level 3 | | | Total | |
| Derivative Financial Instruments2 | | | | | | | | | |
Assets: | | | | | | | | | | | | | | | | |
Interest rate contracts | | $ | 59,477 | | | | — | | | | — | | | $ | 59,477 | |
2 Derivative financial instruments are financial futures contracts, which are valued at the unrealized appreciation/depreciation on the instrument. | | | | | |
Certain of the Fund’s assets and/or liabilities are held at carrying amount, which approximates fair value for financial statement purposes. As of November 30, 2013, such assets and liabilities are categorized within the disclosure hierarchy as follows:
| | | | | | | | | | | | | | | | |
| | | Level 1 | | | Level 2 | | | Level 3 | | | Total | |
Assets: | | | | | | | | | | | | | | | | |
Cash pledged for financial futures contracts | | $ | 165,000 | | | | — | | | | — | | | $ | 165,000 | |
Liabilities: | | | | | | | | | | | | | | | | |
Bank overdraft | | | — | | | $ | (6,244 | ) | | | — | | | | (6,244 | ) |
TOB trust certificates | | | — | | | | (7,231,154 | ) | | | — | | | | (7,231,154 | ) |
| | | | | | | | | | | | | | | | |
Total | | $ | 165,000 | | | $ | (7,237,398 | ) | | | — | | | $ | (7,072,398 | ) |
| | | | | | | | | | | | | | | | |
There were no transfers between levels during the six months ended November 30, 2013.
See Notes to Financial Statements.
| | | | | | |
| | | | | | | |
| | SEMI-ANNUAL REPORT | | NOVEMBER 30, 2013 | | 23 |
| | |
Schedule of Investments November 30, 2013 (Unaudited) | | BlackRock Pennsylvania Municipal Bond Fund (Percentages shown are based on Net Assets) |
| | | | | | | | |
| Municipal Bonds | | Par
(000) | | | Value | |
Pennsylvania — 86.8% | | | | | | | | |
Corporate — 6.7% | | | | | | | | |
County of Bradford Pennsylvania IDA, Refunding RB, International Paper Co. Project, Series B, AMT, 5.20%, 12/01/19 | | $ | 1,000 | | | $ | 1,015,190 | |
County of Delaware Pennsylvania IDA, RB, Water Facilities, Aqua Pennsylvania, Inc. Project, Series C, AMT (NPFGC), 5.00%, 2/01/35 | | | 5,670 | | | | 5,688,825 | |
Pennsylvania Economic Development Financing Authority, RB: | | | | | | | | |
American Water Co. Project, 6.20%, 4/01/39 | | | 3,490 | | | | 3,779,565 | |
Aqua Pennsylvania, Inc. Project, Series A, 5.00%, 10/01/39 | | | 3,000 | | | | 3,042,240 | |
Aqua Pennsylvania, Inc. Project, Series A, AMT, 6.75%, 10/01/18 | | | 9,400 | | | | 11,444,406 | |
Waste Management, Inc. Project, Series A, AMT, 5.10%, 10/01/27 | | | 300 | | | | 306,210 | |
Pennsylvania Economic Development Financing Authority, Refunding RB, Series A, AMT: | | | | | | | | |
Amtrak Project, 5.00%, 11/01/41 | | | 1,725 | | | | 1,635,524 | |
Aqua Pennsylvania, Inc. Project, 5.00%, 12/01/34 | | | 1,540 | | | | 1,583,967 | |
| | | | | | | | |
| | | | | | | | 28,495,927 | |
County/City/Special District/School District — 11.4% | |
Allentown Neighborhood Improvement Zone Development Authority, Refunding RB, Series A: | | | | | | | | |
5.00%, 5/01/35 | | | 2,310 | | | | 2,127,395 | |
5.00%, 5/01/42 | | | 5,400 | | | | 4,808,430 | |
City of Pittsburgh Pennsylvania, GO, Series B, 5.00%, 9/01/26 | | | 1,905 | | | | 2,084,184 | |
County of Allegheny Pennsylvania, GO, Refunding, Series C-57 (NPFGC), 5.00%, 11/01/21 | | | 5,775 | | | | 5,982,380 | |
County of Allegheny Pennsylvania IDA, Refunding RB, Residential Resource, Inc. Project, 5.13%, 9/01/31 | | | 705 | | | | 629,614 | |
County of Lycoming Pennsylvania, GO, Series A (AGM): | | | | | | | | |
4.00%, 8/15/38 | | | 1,295 | | | | 1,141,426 | |
4.00%, 8/15/42 | | | 275 | | | | 238,428 | |
County of Lycoming Pennsylvania Water & Sewer Authority, RB (AGM), 5.00%, 11/15/41 | | | 825 | | | | 827,508 | |
County of Northampton Pennsylvania IDA, Tax Allocation Bonds, 7.00%, 7/01/32 | | | 1,950 | | | | 1,856,634 | |
County of York Pennsylvania, GO, Refunding, 5.00%, 3/01/36 | | | 2,500 | | | | 2,570,475 | |
Falls Township Authority, RB, Water & Sewer Authority, 5.00%, 12/01/37 | | | 2,115 | | | | 2,171,111 | |
Philadelphia Redevelopment Authority, RB, Quality Redevelopment Neighborhood, Series B, AMT (NPFGC), 5.00%, 4/15/27 | | | 415 | | | | 429,878 | |
Philadelphia School District, GO, Series E, 6.00%, 9/01/38 | | | 6,600 | | | | 7,051,110 | |
Philipsburg-Osceola Pennsylvania Area School District, GO (AGM): | | | | | | | | |
5.00%, 4/01/41 | | | 1,235 | | | | 1,246,621 | |
Series A, 4.00%, 4/01/35 | | | 1,210 | | | | 1,092,061 | |
Series A, 4.00%, 4/01/38 | | | 1,190 | | | | 1,013,035 | |
Series A, 4.00%, 4/01/41 | | | 450 | | | | 381,524 | |
Souderton Area School District, GO (NPFGC), 5.00%, 11/15/22 | | | 4,290 | | | | 4,539,206 | |
State Public School Building Authority, RB, Community College, Allegheny County Project (AGM), 5.00%, 7/15/34 | | | 5,070 | | | | 5,221,999 | |
State Public School Building Authority, Refunding RB, Harrisburg School District Project, Series A (AGC), 5.00%, 11/15/33 | | | 3,050 | | | | 3,118,594 | |
| | | | | | | | |
| | | | | | | | 48,531,613 | |
| Municipal Bonds | | Par
(000) | | | Value | |
Pennsylvania (continued) | | | | | | | | |
Education — 21.5% | | | | | | | | |
County of Adams Pennsylvania IDA, Refunding RB, Gettysburg College: | | | | | | | | |
5.00%, 8/15/24 | | $ | 580 | | | $ | 627,920 | |
5.00%, 8/15/25 | | | 765 | | | | 819,728 | |
5.00%, 8/15/26 | | | 760 | | | | 808,807 | |
County of Cumberland Pennsylvania Municipal Authority, RB, AICUP Financing Program, Dickinson College Project, 5.00%, 11/01/39 | | | 1,000 | | | | 1,024,140 | |
County of Delaware Pennsylvania Authority, Refunding RB: | | | | | | | | |
Haverford College, 5.00%, 11/15/35 | | | 6,070 | | | | 6,366,702 | |
Villanova University, 5.25%, 12/01/31 | | | 600 | | | | 634,440 | |
East Hempfield Township IDA, RB, Student Services, Inc., Student Housing Project at Millersville University of Pennsylvania, 5.00%, 7/01/35 | | | 765 | | | | 718,809 | |
Pennsylvania Higher Educational Facilities Authority, RB: | | | | | | | | |
Drexel University, Series A (NPFGC), 5.00%, 5/01/37 | | | 2,650 | | | | 2,664,469 | |
Shippensburg University Student Services, Student Housing, 5.00%, 10/01/44 | | | 2,450 | | | | 2,179,447 | |
State System of Higher Education, Series A (NPFGC), 5.00%, 6/15/26 | | | 3,300 | | | | 3,580,995 | |
Thomas Jefferson University, 5.00%, 3/01/40 | | | 11,000 | | | | 11,224,070 | |
Pennsylvania Higher Educational Facilities Authority, Refunding RB: | | | | | | | | |
Drexel University, Series A, 5.25%, 5/01/41 | | | 7,140 | | | | 7,360,840 | |
La Salle University, 5.00%, 5/01/37 | | | 1,595 | | | | 1,535,299 | |
State System of Higher Education, Series AL, 5.00%, 6/15/35 | | | 9,500 | | | | 9,848,175 | |
Thomas Jefferson University, 4.00%, 3/01/37 | | | 755 | | | | 663,139 | |
Thomas Jefferson University, 5.00%, 3/01/42 | | | 630 | | | | 635,286 | |
Trustees of The University of Pennsylvania, Series C, 4.75%, 7/15/35 | | | 11,630 | | | | 11,649,189 | |
University of the Sciences Philadelphia (AGC), 5.00%, 11/01/32 | | | 5,000 | | | | 5,186,450 | |
Widener University, Series A, 5.25%, 7/15/33 | | | 2,420 | | | | 2,380,457 | |
Widener University, Series A, 5.50%, 7/15/38 | | | 1,815 | | | | 1,781,259 | |
Pennsylvania State University, RB: | | | | | | | | |
5.00%, 3/01/40 | | | 10,000 | | | | 10,372,100 | |
Series A, 5.00%, 8/15/28 | | | 5,045 | | | | 5,443,908 | |
Series A, 5.00%, 8/15/29 | | | 2,000 | | | | 2,109,320 | |
Swarthmore Borough Authority, Refunding RB, Swarthmore College Project, 5.00%, 9/15/38 | | | 1,830 | | | | 1,926,917 | |
| | | | | | | | |
| | | | | | | | 91,541,866 | |
Health — 14.7% | | | | | | | | |
County of Centre Pennsylvania Hospital Authority, RB, Mount Nittany Medical Center Project, 7.00%, 11/15/46 | | | 4,110 | | | | 4,644,300 | |
County of Allegheny Pennsylvania IDA, Refunding RB, Commercial Development, MPB Associate Project (AGM), 7.70%, 12/01/13 | | | 645 | | | | 645,245 | |
County of Cumberland Pennsylvania Municipal Authority, Refunding RB: | | | | | | | | |
Asbury Pennsylvania Obligated Group, 5.25%, 1/01/41 | | | 2,540 | | | | 2,188,058 | |
Diakon Lutheran, 6.38%, 1/01/39 | | | 3,000 | | | | 3,158,400 | |
County of Montgomery Pennsylvania Higher Education & Health Authority, Refunding RB, Abington Memorial Hospital Obligated Group, Series A, 5.13%, 6/01/33 | | | 3,255 | | | | 3,293,083 | |
County of Montgomery Pennsylvania IDA, RB, ACTS Retirement Life Community: | | | | | | | | |
Series A, 4.50%, 11/15/36 | | | 4,870 | | | | 4,110,183 | |
Series A-1, 6.25%, 11/15/29 | | | 480 | | | | 506,040 | |
See Notes to Financial Statements.
| | | | | | |
| | | | | | | |
| 24 | | SEMI-ANNUAL REPORT | | NOVEMBER 30, 2013 | | |
| | |
Schedule of Investments (continued) | | BlackRock Pennsylvania Municipal Bond Fund (Percentages shown are based on Net Assets) |
| | | | | | | | |
| Municipal Bonds | | Par
(000) | | | Value | |
Pennsylvania (continued) | | | | | | | | |
Health (concluded) | | | | | | | | |
County of Montgomery Pennsylvania IDA, Refunding RB: | | | | | | | | |
ACTS Retirement Life Communities, 5.00%, 11/15/27 | | $ | 1,385 | | | $ | 1,374,336 | |
ACTS Retirement Life Communities, 5.00%, 11/15/28 | | | 895 | | | | 873,797 | |
ACTS Retirement Life Communities, 5.00%, 11/15/29 | | | 300 | | | | 291,009 | |
Foulkeways at Gwynedd Project, Series A, 5.00%, 12/01/24 | | | 1,000 | | | | 1,015,510 | |
County of Dauphin Pennsylvania General Authority, Refunding RB, Pinnacle Health System Project, Series A, 6.00%, 6/01/29 | | | 5,000 | | | | 5,407,700 | |
County of Lancaster Pennsylvania Hospital Authority, Refunding RB, Brethren Village Project, Series A, 6.50%, 7/01/40 | | | 1,750 | | | | 1,730,225 | |
County of Lebanon Pennsylvania Good Samaritan Hospital Authority, Refunding RB, Pleasant View Retirement, Series A, 5.30%, 12/15/26 | | | 1,000 | | | | 982,990 | |
Pennsylvania Higher Educational Facilities Authority, RB, University of Pennsylvania Health System, Series A, 4.00%, 8/15/39 | | | 2,815 | | | | 2,349,258 | |
Pennsylvania Higher Educational Facilities Authority, Refunding RB, University of Pittsburgh Medical Center, Series E, 5.00%, 5/15/31 | | | 4,800 | | | | 4,884,720 | |
Philadelphia Hospitals & Higher Education Facilities Authority, Refunding RB: | | | | | | | | |
Jefferson Health System of Chester Philadelphia, Series B, 5.00%, 5/15/40 | | | 10,000 | | | | 9,985,200 | |
Presbyterian Medical Center, 6.65%, 12/01/19 (a) | | | 2,390 | | | | 2,814,344 | |
South Fork Municipal Authority, Refunding RB, Conemaugh Valley Memorial Hospital, Series B (AGC), 5.38%, 7/01/35 | | | 3,590 | | | | 3,690,987 | |
Southcentral General Authority, Refunding RB, Wellspan Health Obligation Group, Series A, 6.00%, 6/01/29 | | | 3,750 | | | | 4,117,125 | |
St. Mary Hospital Authority, Refunding RB, Catholic Health East, Series A: | | | | | | | | |
5.00%, 11/15/26 | | | 2,640 | | | | 2,780,131 | |
5.00%, 11/15/27 | | | 1,880 | | | | 1,965,390 | |
| | | | | | | | |
| | | | | | | | 62,808,031 | |
Housing — 7.0% | | | | | | | | |
Pennsylvania HFA, RB, S/F Mortgage, Series 114-C: | | | | | | | | |
3.65%, 10/01/37 | | | 4,120 | | | | 3,405,303 | |
3.70%, 10/01/42 | | | 7,020 | | | | 5,729,794 | |
Pennsylvania HFA, Refunding RB, S/F Mortgage: | | | | | | | | |
Series 92-A, AMT, 4.75%, 4/01/31 | | | 1,860 | | | | 1,859,888 | |
Series 96-A, AMT, 4.70%, 10/01/37 | | | 5,895 | | | | 5,618,348 | |
Series 99-A, AMT, 5.15%, 4/01/38 | | | 2,295 | | | | 2,292,866 | |
Series 110-B, 4.75%, 10/01/39 | | | 1,785 | | | | 1,833,909 | |
Series 113, 4.85%, 10/01/37 | | | 8,100 | | | | 7,953,471 | |
Philadelphia Pennsylvania IDA, RB, Retirement Facilities: | | | | | | | | |
Rieder House Project, Series A, 6.10%, 7/01/33 | | | 495 | | | | 495,114 | |
Saligman House Project, Section 8, Series C (HUD), 6.10%, 7/01/33 | | | 495 | | | | 495,114 | |
| | | | | | | | |
| | | | | | | | 29,683,807 | |
State — 8.3% | | | | | | | | |
Commonwealth Financing Authority, RB, Series B (AGC), 5.00%, 6/01/31 | | | 3,420 | | | | 3,507,586 | |
| Municipal Bonds | | Par
(000) | | | Value | |
Pennsylvania (concluded) | | | | | | | | |
State (concluded) | | | | | | | | |
Commonwealth of Pennsylvania, GO: | | | | | | | | |
1st Series, 5.00%, 4/01/26 | | $ | 1,755 | | | $ | 1,985,151 | |
1st Series, 5.00%, 10/01/26 | | | 2,800 | | | | 3,100,664 | |
1st Series, 5.00%, 3/15/29 | | | 3,900 | | | | 4,379,310 | |
2nd Series A, 5.00%, 8/01/24 | | | 6,000 | | | | 6,782,640 | |
Pennsylvania Economic Development Financing Authority, Refunding RB, Unemployment Compensation, Series B, 5.00%, 7/01/23 | | | 5,825 | | | | 6,190,868 | |
State Public School Building Authority, Refunding RB, School District of Philadelphia Project, Series B (AGM), 5.00%, 6/01/24 | | | 9,000 | | | | 9,571,140 | |
| | | | | | | | |
| | | | | | | | 35,517,359 | |
Transportation — 13.6% | | | | | | | | |
City of Philadelphia Pennsylvania, ARB, Series A: | | | | | | | | |
5.00%, 6/15/40 | | | 14,000 | | | | 14,015,120 | |
AMT (AGM), 5.00%, 6/15/32 | | | 9,500 | | | | 9,542,560 | |
AMT (AGM), 5.00%, 6/15/37 | | | 1,400 | | | | 1,373,372 | |
Delaware River Port Authority, RB, Series D, 5.00%, 1/01/40 | | | 7,500 | | | | 7,685,475 | |
Pennsylvania Turnpike Commission, RB: | | | | | | | | |
Motor License Fund, Enhanced Turnpike, Special Sub-Series A, 5.00%, 12/01/37 | | | 1,405 | | | | 1,434,730 | |
Motor License Fund, Enhanced Turnpike, Special Sub-Series A, 5.00%, 12/01/42 | | | 2,185 | | | | 2,190,703 | |
Senior Lien, Series A, 5.00%, 12/01/42 | | | 5,030 | | | | 5,051,730 | |
Series A (AMBAC), 5.50%, 12/01/31 | | | 1,600 | | | | 1,651,904 | |
Sub-Series A, 5.13%, 12/01/26 | | | 1,285 | | | | 1,373,228 | |
Sub-Series A, 6.00%, 12/01/41 | | | 1,200 | | | | 1,296,648 | |
Pennsylvania Turnpike Commission, Refunding RB, Sub-Series B, 5.25%, 6/01/24 | | | 4,565 | | | | 4,929,059 | |
Southeastern Pennsylvania Transportation Authority, RB, Capital Grant Receipts: | | | | | | | | |
5.00%, 6/01/28 | | | 3,140 | | | | 3,294,080 | |
5.00%, 6/01/29 | | | 4,155 | | | | 4,323,651 | |
| | | | | | | | |
| | | | | | | | 58,162,260 | |
Utilities — 3.6% | | | | | | | | |
City of Philadelphia Pennsylvania Gas Works, RB: | | | | | | | | |
9th Series, 5.25%, 8/01/40 | | | 3,300 | | | | 3,305,280 | |
12th Series B (NPFGC), 7.00%, 5/15/20 (a) | | | 1,180 | | | | 1,420,248 | |
City of Philadelphia Pennsylvania Water & Wastewater, RB: | | | | | | | | |
Series A, 5.25%, 1/01/36 | | | 1,450 | | | | 1,514,322 | |
Series C (AGM), 5.00%, 8/01/40 | | | 2,650 | | | | 2,681,297 | |
County of Allegheny Pennsylvania Sanitary Authority, Refunding RB, Sewer Improvement (AGM), 5.00%, 6/01/40 | | | 1,000 | | | | 1,015,940 | |
County of Bucks Pennsylvania Water & Sewer Authority, RB, Water System (AGM), 5.00%, 12/01/41 | | | 420 | | | | 431,995 | |
Delaware County Regional Water Quality Control Authority, RB, Sewer Improvements, 5.00%, 5/01/33 | | | 980 | | | | 1,027,236 | |
Pennsylvania Economic Development Financing Authority, RB, Philadelphia Biosolids Facility, 6.25%, 1/01/32 | | | 3,895 | | | | 3,857,725 | |
| | | | | | | | |
| | | | | | | | 15,254,043 | |
| Total Municipal Bonds in Pennsylvania | | | | | | | 369,994,906 | |
| | | | | | | | |
Guam — 1.0% | | | | | | | | |
State — 0.4% | | | | | | | | |
Territory of Guam, RB, Limited Obligation Bonds, Section 30, Series A, 5.63%, 12/01/29 | | | 1,760 | | | | 1,823,835 | |
See Notes to Financial Statements.
| | | | | | |
| | | | | | | |
| | SEMI-ANNUAL REPORT | | NOVEMBER 30, 2013 | | 25 |
| | |
Schedule of Investments (continued) | | BlackRock Pennsylvania Municipal Bond Fund (Percentages shown are based on Net Assets) |
| | | | | | | | |
| Municipal Bonds | | Par
(000) | | | Value | |
Guam (concluded) | | | | | | | | |
Tobacco — 0.3% | | | | | | | | |
Guam Economic Development & Commerce Authority, Refunding RB, Tobacco Settlement, Asset-Backed, 5.63%, 6/01/47 | | $ | 1,750 | | | $ | 1,318,555 | |
Utility — 0.3% | | | | | | | | |
Guam Government Waterworks Authority, Refunding RB, Water & Wastewater System, 6.00%, 7/01/25 | | | 1,000 | | | | 1,011,960 | |
| Total Municipal Bonds in Guam | | | | | | | 4,154,350 | |
| Total Municipal Bonds — 87.8% | | | | | | | 374,149,256 | |
| | | | | | | | |
| | | | | | | | | |
| | |
Municipal Bonds Transferred to
Tender Option Bond Trusts (b) | | | | | | |
Pennsylvania — 21.3% | | | | | | | | |
Education — 3.5% | | | | | | | | |
Pennsylvania Higher Educational Facilities Authority, RB, University of Pennsylvania Health System, Series A, 5.75%, 8/15/41 | | | 9,280 | | | | 9,792,906 | |
University of Pittsburgh, RB, The Commonwealth System of Higher Education, Capital Project, Series B, 5.00%, 9/15/28 | | | 4,448 | | | | 4,873,896 | |
| | | | | | | | |
| | | | | | | | 14,666,802 | |
Health — 11.0% | | | | | | | | |
County of Berks Pennsylvania Municipal Authority, Refunding RB, Reading Hospital & Medical Center Project, Series A-3, 5.50%, 11/01/31 | | | 10,000 | | | | 10,998,400 | |
Geisinger Authority Pennsylvania, RB, Health System: | | | | | | | | |
Series A, 5.13%, 6/01/34 | | | 7,460 | | | | 7,623,076 | |
Series A, 5.25%, 6/01/39 | | | 5,997 | | | | 6,128,892 | |
Series A-1, 5.13%, 6/01/41 | | | 12,570 | | | | 12,769,486 | |
Philadelphia Hospitals & Higher Education Facilities Authority, RB, The Children’s Hospital of Philadelphia Project, Series C, 5.00%, 7/01/41 | | | 9,380 | | | | 9,503,722 | |
| | | | | | | | |
| | | | | | | | 47,023,576 | |
Municipal Bonds Transferred to
Tender Option Bond Trusts (b) | | Par
(000) | | | Value | |
Pennsylvania (concluded) | | | | | | | | |
Housing — 1.3% | | | | | | | | |
Pennsylvania HFA, Refunding RB, S/F Mortgage, Series 115A, AMT, 4.20%, 10/01/33 | | $ | 6,250 | | | $ | 5,596,000 | |
State — 5.5% | | | | | | | | |
Commonwealth of Pennsylvania, GO, Series 1, 5.00%, 3/15/28 | | | 10,797 | | | | 12,123,547 | |
Pennsylvania Turnpike Commission, RB, Oil Franchise Tax, Senior Series C (NPFGC), 5.00%, 12/01/32 | | | 11,000 | | | | 11,439,890 | |
| | | | | | | | |
| | | | | | | | 23,563,437 | |
Total Municipal Bonds Transferred to
Tender Option Bond Trusts — 21.3% | | | | 90,849,815 | |
Total Long-Term Investments
(Cost — $456,789,848) — 109.1% | | | | 464,999,071 | |
| | | | | | | | |
| | | | | | | | | |
| | |
| Short-Term Securities | | Shares | | | | |
BIF Pennsylvania Municipal Money Fund, 0.00% (c)(d) | | | 1,815,153 | | | | 1,815,153 | |
Total Short-Term Securities
(Cost — $1,815,153) — 0.4% | | | | 1,815,153 | |
| Total Investments (Cost — $458,605,001) — 109.5% | | | | 466,814,224 | |
| Other Assets Less Liabilities — 1.3% | | | | 5,519,609 | |
Liability for TOB Trust Certificates, Including Interest
Expense and Fees Payable — (10.8)% | | | | (46,141,421 | ) |
| | | | | | | | |
| Net Assets — 100.0% | | | $ | 426,192,412 | |
| | | | | | | | |
|
| Notes to Schedule of investments |
| (a) | | Security is collateralized by municipal or US Treasury obligations. |
| (b) | | Represent bonds transferred to a TOB. In exchange the Fund acquired residual interest certificates. These bonds serve as collateral in a financing transaction. See Note 3 of the Notes to Financial Statements for details of municipal bonds transferred to TOBs. |
| (c) | | Investments in issuers considered to be an affiliate of the Fund during the six months ended November 30, 2013, for purposes of Section 2(a)(3) of the Investment Company Act of 1940, as amended, were as follows: |
| | | | | | | | | | | | | | |
| Affiliate | | Shares Held
at May 31,
2013 | | | Net
Activity | | | Shares Held
at November 30,
2013 | | | Income |
BIF Pennsylvania Municipal Money Fund | | | 8,122,950 | | | | (6,307,797 | ) | | | 1,815,153 | | | — |
| (d) | | Represents the current yield as of report date. |
| Ÿ | | Financial futures contracts as of November 30, 2013 were as follows: |
| | | | | | | | | | | | | | |
Contracts
Sold | | Issue | | Exchange | | Expiration | | Notional
Value | | | Unrealized
Appreciation | |
| (80) | | 10-Year US Treasury Note | | Chicago Board of Trade | | December 2013 | | $ | 10,131,250 | | | $ | 28,663 | |
| Ÿ | | For Fund compliance purposes, the Fund’s sector classifications refer to any one or more of the sector sub-classifications used by one or more widely recognized market indexes or rating group indexes, and/or as defined by the investment advisor. These definitions may not apply for purposes of this report, which may combine such sector sub-classifications for reporting ease. |
See Notes to Financial Statements.
| | | | | | |
| | | | | | | |
| 26 | | SEMI-ANNUAL REPORT | | NOVEMBER 30, 2013 | | |
| | |
Schedule of Investments (concluded) | | BlackRock Pennsylvania Municipal Bond Fund |
| Ÿ | | Fair Value Measurements — Various inputs are used in determining the fair value of investments and derivative financial instruments. These inputs to valuation techniques are categorized into a disclosure hierarchy consisting of three broad levels for financial statement purposes as follows: |
| | Ÿ | | Level 1 — unadjusted price quotations in active markets/exchanges for identical assets or liabilities that the Fund has the ability to access |
| | Ÿ | | Level 2 — other observable inputs (including, but not limited to, quoted prices for similar assets or liabilities in markets that are active, quoted prices for identical or similar assets or liabilities in markets that are not active, inputs other than quoted prices that are observable for the assets or liabilities (such as interest rates, yield curves, volatilities, prepayment speeds, loss severities, credit risks and default rates) or other market-corroborated inputs) |
| | Ÿ | | Level 3 — unobservable inputs based on the best information available in the circumstances, to the extent observable inputs are not available (including the Fund’s own assumptions used in determining the fair value of investments and derivative financial instruments) |
The hierarchy gives the highest priority to unadjusted quoted prices in active markets for identical assets or liabilities (Level 1 measurements) and the lowest priority to unobservable inputs (Level 3 measurements). Accordingly, the degree of judgment exercised in determining fair value is greatest for instruments categorized in Level 3. The inputs used to measure fair value may fall into different levels of the fair value hierarchy. In such cases, for disclosure purposes, the fair value hierarchy classification is determined based on the lowest level input that is significant to the fair value measurement in its entirety.
Changes in valuation techniques may result in transfers into or out of an assigned level within the disclosure hierarchy. In accordance with the Fund’s policy, transfers between different levels of the fair value disclosure hierarchy are deemed to have occurred as of the beginning of the reporting period. The categorization of a value determined for investments and derivative financial instruments is based on the pricing transparency of the investment and derivative financial instrument and is not necessarily an indication of the risks associated with investing in those securities. For information about the Fund’s policy regarding valuation of investments and derivative financial instruments, please refer to Note 2 of the Notes to Financial Statements.
The following tables summarize the Fund’s investments and derivative financial instruments categorized in the disclosure hierarchy as of November 30, 2013:
| | | | | | | | | | | | | | |
| | | Level 1 | | | Level 2 | | | Level 3 | | Total | |
Assets: | | | | | | | | | | | | | | |
| Investments: | | | | | | | | | | | | | | |
Long-Term Investments1 | | | — | | | $ | 464,999,071 | | | — | | $ | 464,999,071 | |
Short-Term Securities | | $ | 1,815,153 | | | | — | | | — | | | 1,815,153 | |
| | | | |
Total | | $ | 1,815,153 | | | $ | 464,999,071 | | | — | | $ | 466,814,224 | |
| | | | |
1 See above Schedule of Investments for values in each sector. | |
| | | Level 1 | | | Level 2 | | | Level 3 | | Total | |
| Derivative Financial Instruments2 | | | | | | | |
Assets: | | | | | | | | | | | | | | |
Interest rate contracts | | $ | 28,663 | | | | — | | | — | | $ | 28,663 | |
2 Derivative financial instruments are financial futures contracts, which are valued at the unrealized appreciation/depreciation on the instrument. | |
Certain of the Fund’s assets and/or liabilities are held at carrying amount, which approximates fair value for financial statement purposes. As of November 30, 2013, such assets and liabilities are categorized within the disclosure hierarchy as follows:
| | | | | | | | | | | | | | |
| | | Level 1 | | | Level 2 | | | Level 3 | | Total | |
Assets: | | | | | | | | | | | | | | |
Cash pledged for financial futures contracts | | $ | 141,000 | | | | — | | | — | | $ | 141,000 | |
Liabilities: | | | | | | | | | | | | | | |
Bank overdraft | | | — | | | $ | (12,166 | ) | | — | | | (12,166 | ) |
TOB trust certificates | | | — | | | | (46,126,645 | ) | | — | | | (46,126,645 | ) |
| | | | |
Total | | $ | 141,000 | | | $ | (46,138,811 | ) | | — | | $ | (45,997,811 | ) |
| | | | |
There were no transfers between levels during the six months ended November 30, 2013.
See Notes to Financial Statements.
| | | | | | |
| | | | | | | |
| | SEMI-ANNUAL REPORT | | NOVEMBER 30, 2013 | | 27 |
| | |
Schedule of Investments November 30, 2013 (Unaudited) | | BlackRock Strategic Municipal Opportunities Fund (Percentages shown are based on Net Assets) |
| | | | | | | | |
| Municipal Bonds | | Par
(000) | | | Value | |
Alabama — 0.3% | | | | | | | | |
Alabama 21st Century Authority, Refunding RB, Tobacco Settlement, Series A, 5.00%, 6/01/21 | | $ | 1,000 | | | $ | 1,121,170 | |
City of Birmingham Alabama Special Care Facilities Financing Authority, RB, Children’s Hospital (AGC), 6.00%, 6/01/34 | | | 750 | | | | 838,748 | |
| | | | | | | | |
| | | | | | | | 1,959,918 | |
Arizona — 1.8% | | | | | | | | |
Arizona Health Facilities Authority, Refunding RB, Phoenix Children’s Hospital, Series A, 5.00%, 2/01/22 | | | 1,550 | | | | 1,679,998 | |
City of Tucson Arizona, COP, Refunding (AGC), 4.00%, 7/01/20 | | | 1,500 | | | | 1,624,050 | |
County of Pima Arizona IDA, Refunding RB, Tucson Electric Power Co. Project, San Juan Project,
Series A, 4.95%, 10/01/20 | | | 1,500 | | | | 1,587,210 | |
County of Pinal Arizona Electric District No. 3, Refunding RB, Electric System, 4.00%, 7/01/23 | | | 1,620 | | | | 1,668,114 | |
Salt Verde Financial Corp., RB, Senior, 5.25%, 12/01/19 | | | 2,000 | | | | 2,220,000 | |
State of Arizona, COP, Department of Administration, Series A (AGM), 4.25%, 10/01/23 | | | 500 | | | | 526,380 | |
University Medical Center Corp., Refunding RB, 5.00%, 7/01/21 | | | 2,740 | | | | 2,944,678 | |
| | | | | | | | |
| | | | | | | | 12,250,430 | |
Arkansas — 0.1% | | | | | | | | |
County of Benton Arkansas Public Facilities Board, RB, BCCSO Project, Series A, 5.00%, 6/01/22 | | | 785 | | | | 808,534 | |
California — 10.9% | | | | | | | | |
Anaheim Public Financing Authority California, RB, Senior, Public Improvements Project, Series A (AGM), 6.00%, 9/01/24 | | | 5,000 | | | | 5,801,250 | |
California County Tobacco Securitization Agency, RB, Asset-Backed, Los Angeles County Securitization, Series A, 5.25%, 6/01/21 | | | 3,750 | | | | 3,601,687 | |
California Health Facilities Financing Authority, Refunding RB, Los Angeles Children’s Hospital, Series A: | | | | | | | | |
5.00%, 11/15/22 | | | 1,500 | | | | 1,623,615 | |
5.00%, 11/15/23 | | | 1,000 | | | | 1,064,120 | |
California Pollution Control Financing Authority, Refunding RB, Pacific Gas, AMT (NPFGC): | | | | | | | | |
Series A, 4.75%, 12/01/23 | | | 4,105 | | | | 4,228,889 | |
Series C, 4.75%, 12/01/23 | | | 1,000 | | | | 1,035,110 | |
California State Public Works Board, Refunding LRB, Various Capital Projects, Series G, 5.00%, 11/01/22 | | | 1,000 | | | | 1,138,300 | |
City of San Jose California, Refunding ARB, Series A-1, AMT: | | | | | | | | |
5.00%, 3/01/24 | | | 3,655 | | | | 3,915,565 | |
5.00%, 3/01/25 | | | 1,260 | | | | 1,334,831 | |
Golden State Tobacco Securitization Corp., Refunding RB, Asset-Backed, Senior Series A-1, 5.00%, 6/01/16 | | | 3,000 | | | | 3,205,140 | |
Los Angeles California Unified School District, GO, Refunding, Series A-1 (NPFGC), 4.50%, 7/01/25 | | | 6,735 | | | | 7,305,118 | |
Palomar Community College District, GO, CAB, Election of 2006, Series B, 4.00%, 8/01/23 (a) | | | 3,950 | | | | 2,694,492 | |
San Marcos Unified School District, GO, CAB, Election of 2010, Series B (a): | | | | | | | | |
2.52%, 8/01/19 | | | 315 | | | | 273,316 | |
2.86%, 8/01/20 | | | 225 | | | | 186,154 | |
Southern California Public Power Authority, RB, Project No. 1, Series A, 5.25%, 11/01/19 | | | 2,445 | | | | 2,733,975 | |
| Municipal Bonds | | Par
(000) | | | Value | |
California (concluded) | | | | | | | | |
State of California, GO, Refunding, Various Purposes: | | | | | | | | |
5.00%, 9/01/22 | | $ | 9,500 | | | $ | 11,035,010 | |
5.00%, 10/01/22 | | | 1,265 | | | | 1,470,234 | |
5.00%, 10/01/23 | | | 15,000 | | | | 17,434,800 | |
3.00%, 2/01/24 | | | 4,740 | | | | 4,591,354 | |
| | | | | | | | |
| | | | | | | | 74,672,960 | |
Colorado — 1.2% | | | | | | | | |
City of Commerce Colorado-Northern Infrastructure General Improvement District, GO, Refunding (AGM): | | | | | | | | |
5.00%, 12/01/22 | | | 600 | | | | 689,994 | |
5.00%, 12/01/23 | | | 1,000 | | | | 1,134,770 | |
City of Lakewood Colorado Plaza Metropolitan District No. 1, Refunding RB, Tax Allocation Bonds, 4.00%, 12/01/23 | | | 1,000 | | | | 923,510 | |
Colorado Educational & Cultural Facilities Authority, RB, Charter Littleton Preparatory School, 5.00%, 12/01/22 | | | 200 | | | | 199,282 | |
Denver Urban Renewal Authority, Refunding, Tax Allocation Bond, Stapleton, Senior-Series A-1, 5.00%, 12/01/23 | | | 5,000 | | | | 5,493,950 | |
| | | | | | | | |
| | | | | | | | 8,441,506 | |
Connecticut — 0.9% | | | | | | | | |
Connecticut State Health & Educational Facility Authority, Refunding RB, Loomis Chaffee School (AGM), 5.00%, 7/01/22 | | | 515 | | | | 574,817 | |
State of Connecticut, GO, Series D, 5.00%, 11/01/23 | | | 5,000 | | | | 5,733,800 | |
| | | | | | | | |
| | | | | | | | 6,308,617 | |
Florida — 3.8% | | | | | | | | |
County of Broward Florida Airport System, ARB, Series Q-2, AMT, 5.00%, 10/01/22 | | | 1,605 | | | | 1,766,415 | |
County of Broward Florida School Board, COP, Refunding, Series A (AGM), 5.00%, 7/01/24 | | | 7,000 | | | | 7,674,800 | |
County of Lee Florida, Refunding ARB, Series A, AMT, 5.50%, 10/01/23 | | | 3,305 | | | | 3,641,317 | |
County of Miami-Dade Florida Water & Sewer System, Refunding RB, Series B (AGM), 5.25%, 10/01/22 | | | 2,000 | | | | 2,333,920 | |
County of Orange Florida Health Facilities Authority, Refunding RB, Mayflower Retirement Center, Inc. Project, 4.00%, 6/01/22 | | | 500 | | | | 485,970 | |
Florida State Board of Governors, RB, Florida State University Dormitory, Series A: | | | | | | | | |
5.00%, 5/01/22 | | | 2,050 | | | | 2,385,790 | |
5.00%, 5/01/23 | | | 2,155 | | | | 2,504,584 | |
Sterling Hill Community Development District, Refunding RB, Special Assessment Bonds, Series B,
5.50%, 11/01/10 (b)(c) | | | 155 | | | | 99,893 | |
Tolomato Community Development District, Refunding, Special Assessment: | | | | | | | | |
Convertible CAB, Series A-2,
6.61%, 5/01/39 (d) | | | 150 | | | | 110,151 | |
Convertible CAB, Series A-3,
6.61%, 5/01/40 (d) | | | 360 | | | | 215,453 | |
Convertible CAB, Series A-4,
6.61%, 5/01/40 (d) | | | 190 | | | | 84,198 | |
Series A-1, 6.38%, 5/01/17 | | | 395 | | | | 378,584 | |
Tolomato Community Development District, Special Assessment (b)(c): | | | | | | | | |
Series 1, 6.38%, 5/01/17 | | | 15 | | | | 14,724 | |
Series 2, 6.38%, 5/01/17 | | | 1,290 | | | | 730,578 | |
Series 3, 6.38%, 5/01/17 | | | 425 | | | | 4 | |
Village Community Development District No. 10, Special Assessment, 4.50%, 5/01/23 | | | 3,870 | | | | 3,648,017 | |
| | | | | | | | |
| | | | | | | | 26,074,398 | |
See Notes to Financial Statements.
| | | | | | |
| | | | | | | |
| 28 | | SEMI-ANNUAL REPORT | | NOVEMBER 30, 2013 | | |
| | |
Schedule of Investments (continued) | | BlackRock Strategic Municipal Opportunities Fund (Percentages shown are based on Net Assets) |
| | | | | | | | |
| Municipal Bonds | | Par
(000) | | | Value | |
Georgia — 0.4% | | | | | | | | |
County of Fulton Georgia Residential Care Facilities for the Elderly Authority, Refunding RB, Canterbury Court Project, Series A, 5.00%, 2/15/14 | | $ | 1,050 | | | $ | 1,050,924 | |
Medical Center Hospital Authority, Refunding RB, Columbus Regional Healthcare (AGM), 4.00%, 8/01/22 | | | 1,580 | | | | 1,627,463 | |
| | | | | | | | |
| | | | | | | | 2,678,387 | |
Guam — 0.7% | | | | | | | | |
Guam Government Waterworks Authority, RB (e): | | | | | | | | |
5.25%, 7/01/22 | | | 525 | | | | 562,821 | |
5.25%, 7/01/25 | | | 1,735 | | | | 1,788,976 | |
5.00%, 7/01/28 | | | 1,250 | | | | 1,235,287 | |
Territory of Guam, GO, Series A, 6.00%, 11/15/19 | | | 570 | | | | 600,256 | |
Territory of Guam, RB, Section 30, Series A, 5.38%, 12/01/24 | | | 500 | | | | 519,285 | |
| | | | | | | | |
| | | | | | | | 4,706,625 | |
Idaho — 0.8% | | | | | | | | |
Ada & Canyon Counties Joint School District No. 2 Meridian, GO, 5.00%, 8/15/15 (f) | | | 5,000 | | | | 5,399,650 | |
Illinois — 8.7% | | | | | | | | |
City of Chicago Illinois O’Hare International Airport, Refunding GARB, Senior Lien, AMT: | | | | | | | | |
Series A, 5.00%, 1/01/23 | | | 12,000 | | | | 12,878,040 | |
Series B, 5.00%, 1/01/22 | | | 7,500 | | | | 8,148,675 | |
Illinois Finance Authority, Refunding RB, Primary Health Care Centers Program, 5.90%, 7/01/14 | | | 115 | | | | 115,120 | |
Metropolitan Pier & Exposition Authority, Refunding RB, CAB, McCormick Place Expansion Project, Series B (NPFGC), 5.70%, 6/15/23 (d) | | | 3,000 | | | | 2,734,950 | |
Railsplitter Tobacco Settlement Authority, RB: | | | | | | | | |
5.50%, 6/01/23 | | | 4,500 | | | | 4,937,040 | |
6.25%, 6/01/24 | | | 3,000 | | | | 3,232,770 | |
State of Illinois, GO, Refunding: | | | | | | | | |
5.00%, 8/01/21 | | | 10,000 | | | | 10,814,800 | |
(AGM), 5.00%, 8/01/20 | | | 15,400 | | | | 16,910,432 | |
| | | | | | | | |
| | | | | | | | 59,771,827 | |
Indiana — 2.3% | | | | | | | | |
City of Valparaiso Indiana, RB, Exempt Facilities, Pratt Paper LLC Project, AMT, 5.88%, 1/01/24 | | | 750 | | | | 754,492 | |
City of Whiting Indiana, RB, BP Products North America, Inc. Project, 5.25%, 1/01/21 | | | 3,200 | | | | 3,707,520 | |
Indiana Bond Bank, RB, Series A, 5.00%, 10/15/17 | | | 2,000 | | | | 2,225,420 | |
Indiana Finance Authority, Refunding RB: | | | | | | | | |
Marquette Project, 4.00%, 3/01/22 | | | 2,650 | | | | 2,564,405 | |
US Steel Corp. Project, 6.00%, 12/01/19 | | | 3,000 | | | | 3,066,600 | |
Indianapolis Local Public Improvement Bond Bank, Refunding RB, Series K, 5.00%, 6/01/24 | | | 3,000 | | | | 3,266,190 | |
| | | | | | | | |
| | | | | | | | 15,584,627 | |
Iowa — 1.6% | | | | | | | | |
Iowa Finance Authority, Refunding RB, Midwestern Disaster Area, Iowa Fertilizer Co. Project: | | | | | | | | |
5.00%, 12/01/19 | | | 5,320 | | | | 5,135,449 | |
5.50%, 12/01/22 | | | 2,500 | | | | 2,352,675 | |
Iowa Higher Education Loan Authority, RB, Private College Facility, Buena Vista University: | | | | | | | | |
5.00%, 4/01/20 | | | 600 | | | | 682,980 | |
5.00%, 4/01/21 | | | 625 | | | | 710,319 | |
5.25%, 4/01/22 | | | 660 | | | | 748,790 | |
Iowa Higher Education Loan Authority, Refunding RB, Private College Facility, Upper Iowa University Project, 5.00%, 9/01/20 | | | 1,000 | | | | 1,101,920 | |
| | | | | | | | |
| | | | | | | | 10,732,133 | |
| Municipal Bonds | | Par
(000) | | | Value | |
Kansas — 0.5% | | | | | | | | |
Kansas Development Finance Authority, RB, Health Facilities, KU Health System, Series H: | | | | | | | | |
5.00%, 3/01/23 | | $ | 750 | | | $ | 810,270 | |
5.00%, 3/01/24 | | | 650 | | | | 696,397 | |
Kansas Development Finance Authority, Refunding RB: | | | | | | | | |
Adventist Health System/Sunbelt Obligated Group, Series C, 5.00%, 11/15/23 | | | 500 | | | | 555,890 | |
Sisters of Charity of Leavenworth Health System, Series A, 4.00%, 1/01/22 | | | 1,325 | | | | 1,377,974 | |
| | | | | | | | |
| | | | | | | | 3,440,531 | |
Kentucky — 1.4% | | | | | | | | |
Lexington-Fayette Urban County Government Public Facilities Corp., Refunding LRB, Eastern State Hospital Project, Series A, 5.00%, 6/01/24 | | | 6,690 | | | | 7,247,076 | |
State of Kentucky Property & Building Commission, Refunding RB, Project No. 93 (AGC), 5.25%, 2/01/24 | | | 2,000 | | | | 2,262,640 | |
| | | | | | | | |
| | | | | | | | 9,509,716 | |
Louisiana — 2.8% | | | | | | | | |
Louisiana Public Facilities Authority, RB, Belle Chasse Educational Foundation Project, 5.63%, 5/01/21 | | | 855 | | | | 911,208 | |
Louisiana Stadium & Exposition District, Refunding RB, Senior Series A, 5.00%, 7/01/22 | | | 1,000 | | | | 1,119,100 | |
Louisiana State Citizens Property Insurance Corp., Refunding RB: | | | | | | | | |
5.00%, 6/01/24 | | | 2,000 | | | | 2,147,720 | |
(AGM), 5.00%, 6/01/24 | | | 8,750 | | | | 9,494,887 | |
New Orleans Aviation Board Louisiana, Refunding GARB, Restructuring, Series A-2 (AGC), 6.00%, 1/01/23 | | | 250 | | | | 282,500 | |
Tobacco Settlement Financing Corp., Refunding RB, Asset-Backed, Series A, 5.00%, 5/15/23 | | | 5,000 | | | | 5,466,800 | |
| | | | | | | | |
| | | | | | | | 19,422,215 | |
Maryland — 0.3% | | | | | | | | |
Maryland EDC, RB, Transportation Facilities Project, Series A, 5.13%, 6/01/20 | | | 250 | | | | 261,595 | |
Maryland EDC, Refunding RB, CNX Marine Terminals, Inc., 5.75%, 9/01/25 | | | 1,770 | | | | 1,840,021 | |
| | | | | | | | |
| | | | | | | | 2,101,616 | |
Massachusetts — 1.1% | | | | | | | | |
Massachusetts Development Finance Agency, Refunding RB, Partners Healthcare System, Series L, 5.00%, 7/01/20 | | | 900 | | | | 1,052,280 | |
Massachusetts Port Authority, RB, Delta Air Lines, Inc. Project, Series A, AMT (AMBAC): | | | | | | | | |
5.50%, 1/01/14 | | | 2,500 | | | | 2,499,700 | |
5.50%, 1/01/15 | | | 4,000 | | | | 3,997,280 | |
| | | | | | | | |
| | | | | | | | 7,549,260 | |
Michigan — 3.7% | | | | | | | | |
City of Detroit Michigan Sewage Disposal System, Refunding RB, Senior Lien, Series A, 5.00%, 7/01/23 | | | 2,000 | | | | 1,897,560 | |
County of Wayne Michigan Airport Authority, Refunding ARB, Series A, AMT (AGM), 4.00%, 12/01/20 | | | 11,690 | | | | 12,108,385 | |
Michigan State Building Authority, Refunding RB, Facilities Program, Series I (AGC), 5.00%, 10/15/23 | | | 5,000 | | | | 5,505,150 | |
Michigan State Hospital Finance Authority, Refunding RB, Henry Ford Health System: | | | | | | | | |
5.00%, 11/15/20 | | | 1,000 | | | | 1,085,250 | |
5.25%, 11/15/24 | | | 2,600 | | | | 2,711,618 | |
See Notes to Financial Statements.
| | | | | | |
| | | | | | | |
| | SEMI-ANNUAL REPORT | | NOVEMBER 30, 2013 | | 29 |
| | |
Schedule of Investments (continued) | | BlackRock Strategic Municipal Opportunities Fund (Percentages shown are based on Net Assets) |
| | | | | | | | |
| Municipal Bonds | | Par
(000) | | | Value | |
Michigan (concluded) | | | | | | | | |
Royal Oak Hospital Finance Authority, Refunding RB, William Beaumont Hospital Obligated Group, Series W, 6.25%, 8/01/23 | | $ | 2,000 | | | $ | 2,030,780 | |
| | | | | | | | |
| | | | | | | | 25,338,743 | |
Missouri — 0.8% | | | | | | | | |
Missouri Development Finance Board, Refunding RB, Nelson Gallery Foundation, Series A, 5.00%, 12/01/23 | | | 1,000 | | | | 1,139,430 | |
Missouri State Health & Educational Facilities Authority, RB, Senior Living Facilities, Lutheran Senior Services, 5.00%, 2/01/24 | | | 3,000 | | | | 3,089,940 | |
Missouri State Health & Educational Facilities Authority, Refunding RB, CoxHealth, Series A,
5.00%, 11/15/23 | | | 1,115 | | | | 1,248,031 | |
| | | | | | | | |
| | | | | | | | 5,477,401 | |
Nebraska — 0.4% | | | | | | | | |
Central Plains Energy Project, RB, Gas Project No. 3, 5.00%, 9/01/22 | | | 2,450 | | | | 2,645,902 | |
Nevada — 0.8% | | | | | | | | |
County of Clark Nevada, Refunding, Special Assessment, Special Improvement District No. 142, Mountain’s Edge: | | | | | | | | |
4.00%, 8/01/22 | | | 1,845 | | | | 1,707,879 | |
4.00%, 8/01/23 | | | 1,200 | | | | 1,096,776 | |
County of Humboldt Nevada, Refunding RB, Idaho Power Co. Project, 5.15%, 12/01/24 | | | 1,700 | | | | 1,804,193 | |
Las Vegas Special Improvement District 607, Refunding, Special Assessment, Local Improvement: | | | | | | | | |
5.00%, 6/01/23 | | | 450 | | | | 450,675 | |
5.00%, 6/01/24 | | | 325 | | | | 325,764 | |
| | | | | | | | |
| | | | | | | | 5,385,287 | |
New Jersey — 9.3% | | | | | | | | |
County of Essex New Jersey Improvement Authority, LRB, Newark Project, Series A (AGM), 5.00%, 11/01/20 | | | 1,500 | | | | 1,669,155 | |
New Jersey EDA, RB: | | | | | | | | |
Continental Airlines, Inc. Project, AMT, 4.88%, 9/15/19 | | | 8,815 | | | | 8,547,905 | |
The Goethals Bridge Replacement Project, AMT, 5.00%, 7/01/22 | | | 600 | | | | 645,036 | |
The Goethals Bridge Replacement Project, AMT, 5.00%, 1/01/23 | | | 620 | | | | 660,511 | |
The Goethals Bridge Replacement Project, AMT, 5.00%, 7/01/23 | | | 1,750 | | | | 1,860,933 | |
The Goethals Bridge Replacement Project, AMT, 5.00%, 1/01/24 | | | 1,000 | | | | 1,052,590 | |
Patterson Charter School for Science and Technology, Inc. Project, Series A, 5.00%, 7/01/22 | | | 630 | | | | 626,063 | |
New Jersey EDA, Refunding RB: | | | | | | | | |
Cigarette Tax, 5.00%, 6/15/22 | | | 2,000 | | | | 2,179,100 | |
Cigarette Tax, 5.00%, 6/15/23 | | | 990 | | | | 1,064,755 | |
New Jersey American Water Co., Inc. Project, Series C, AMT, 5.10%, 6/01/23 | | | 2,000 | | | | 2,176,280 | |
School Facilities Construction, Series AA, 4.25%, 12/15/24 | | | 1,000 | | | | 1,038,730 | |
School Facilities Construction, Series K (AMBAC), 5.25%, 12/15/20 | | | 2,375 | | | | 2,787,751 | |
School Facilities Construction, Series NN, 5.00%, 3/01/22 | | | 3,400 | | | | 3,881,576 | |
School Facilities Construction, Series NN, 5.00%, 3/01/23 | | | 4,600 | | | | 5,211,478 | |
| Municipal Bonds | | Par
(000) | | | Value | |
New Jersey (concluded) | | | | | | | | |
New Jersey Educational Facilities Authority, Refunding RB: | | | | | | | | |
New Jersey Institute of Technology, Series H, 4.00%, 7/01/25 | | $ | 2,260 | | | $ | 2,312,590 | |
University of Medicine & Dentistry, Series B, 6.50%, 6/01/19 (f) | | | 2,000 | | | | 2,520,560 | |
New Jersey Health Care Facilities Financing Authority, RB, Robert Wood Johnson University Hospital, Series A, 5.00%, 7/01/22 | | | 1,010 | | | | 1,130,675 | |
New Jersey Health Care Facilities Financing Authority, Refunding RB: | | | | | | | | |
CAB, St. Barnabas Health, Series B (NPFGC), 5.13%, 7/01/23 (a) | | | 2,720 | | | | 1,673,507 | |
Holy Name Medical Center, 4.00%, 7/01/17 | | | 2,000 | | | | 2,120,720 | |
Holy Name Medical Center, 4.25%, 7/01/18 | | | 780 | | | | 836,737 | |
Meridian Health System Obligated Group, 5.00%, 7/01/21 | | | 2,000 | | | | 2,245,860 | |
St. Barnabas Health, Series A, 4.50%, 7/01/22 | | | 2,450 | | | | 2,562,920 | |
St. Barnabas Health, Series A, 4.63%, 7/01/23 | | | 3,500 | | | | 3,643,045 | |
St. Barnabas Health, Series A, 5.00%, 7/01/24 | | | 1,100 | | | | 1,179,266 | |
New Jersey Higher Education Student Assistance Authority, Refunding RB, Student Loan, Series 1A: | | | | | | | | |
4.50%, 12/01/20 | | | 1,870 | | | | 2,028,165 | |
4.75%, 12/01/21 | | | 560 | | | | 601,350 | |
New Jersey Transportation Trust Fund Authority, RB, Transportation System: | | | | | | | | |
CAB, Series C (AMBAC), 4.61%, 12/15/24 (a) | | | 3,850 | | | | 2,328,172 | |
Series A, 5.25%, 6/15/24 | | | 800 | | | | 892,368 | |
New Jersey Transportation Trust Fund Authority, Refunding RB, Transportation System, Series A, 5.50%, 12/15/23 | | | 1,350 | | | | 1,583,888 | |
Newark Housing Authority, Refunding RB, Additional Newark Redevelopment Project (NPFGC), 5.25%, 1/01/24 | | | 1,430 | | | | 1,540,196 | |
State of New Jersey, GO, Refunding, Series O, 5.25%, 8/01/21 | | | 1,000 | | | | 1,203,590 | |
| | | | | | | | |
| | | | | | | | 63,805,472 | |
New York — 17.3% | |
City of New York New York, GO, Refunding: | | | | | | | | |
Fiscal 2013, Series J, 5.00%, 8/01/23 | | | 5,000 | | | | 5,808,150 | |
Fiscal 2014, Series B, 5.00%, 8/01/21 | | | 5,000 | | | | 5,813,300 | |
Fiscal 2014, Series B, 5.00%, 8/01/22 | | | 7,000 | | | | 8,153,320 | |
Fiscal 2014, Series E, 5.25%, 8/01/22 | | | 2,000 | | | | 2,371,100 | |
Series B, 5.00%, 8/01/23 | | | 10,000 | | | | 11,470,300 | |
City of New York New York, GO: | | | | | | | | |
Sub-Series A-1, 5.00%, 10/01/22 | | | 5,000 | | | | 5,831,350 | |
Sub-Series I-1, 5.13%, 4/01/25 | | | 845 | | | | 947,752 | |
County of Dutchess New York Local Development Corp., Refunding RB, Health Quest System, Inc., Series A (AGM): | | | | | | | | |
5.00%, 7/01/21 | | | 535 | | | | 601,608 | |
5.00%, 7/01/22 | | | 510 | | | | 564,626 | |
5.25%, 7/01/25 | | | 895 | | | | 971,639 | |
County of Essex New York Industrial Development Agency, Refunding RB, International Paper Co. Project, Series A, AMT, 5.20%, 12/01/23 | | | 2,300 | | | | 2,330,544 | |
County of Monroe New York Industrial Development Corp., Refunding RB, Rochester General Hospital Project, Series B, 4.00%, 12/01/24 | | | 1,005 | | | | 1,002,779 | |
County of Suffolk New York Water Authority, Refunding RB, 3.00%, 6/01/25 | | | 1,185 | | | | 1,141,665 | |
County of Westchester New York Healthcare Corp., Refunding RB, Senior Lien, Remarketing, Series A: | | | | | | | | |
5.00%, 11/01/23 | | | 5,685 | | | | 6,157,821 | |
5.00%, 11/01/24 | | | 2,730 | | | | 2,923,257 | |
See Notes to Financial Statements.
| | | | | | |
| | | | | | | |
| 30 | | SEMI-ANNUAL REPORT | | NOVEMBER 30, 2013 | | |
| | |
Schedule of Investments (continued) | | BlackRock Strategic Municipal Opportunities Fund (Percentages shown are based on Net Assets) |
| | | | | | | | |
| Municipal Bonds | | Par
(000) | | | Value | |
New York (concluded) | |
Metropolitan Transportation Authority, RB: | | | | | | | | |
Series A, 5.00%, 11/15/25 | | $ | 500 | | | $ | 547,535 | |
Series B (AGM), 5.00%, 11/15/23 | | | 1,865 | | | | 2,111,553 | |
Series H, 5.00%, 11/15/23 | | | 3,820 | | | | 4,277,751 | |
Sub-Series B-1, 5.00%, 11/15/24 | | | 1,835 | | | | 2,065,843 | |
Sub-Series B-2, 5.00%, 11/15/22 | | | 5,000 | | | | 5,696,400 | |
Sub-Series B-2, 5.00%, 11/15/23 | | | 2,620 | | | | 2,933,955 | |
Sub-Series B-4, 5.00%, 11/15/24 | | | 1,200 | | | | 1,350,960 | |
Metropolitan Transportation Authority, Refunding RB: | | | | | | | | |
Series B, 5.25%, 11/15/25 | | | 1,500 | | | | 1,717,980 | |
Series F, 5.00%, 11/15/22 | | | 4,575 | | | | 5,212,206 | |
New York City Industrial Development Agency, Refunding ARB, Transportation Infrastructure Properties LLC, Series A, AMT, 5.00%, 7/01/22 | | | 1,750 | | | | 1,794,135 | |
New York City Industrial Development Agency, Refunding RB, Terminal One Group Association Project, AMT, 5.50%, 1/01/21 (g) | | | 1,500 | | | | 1,613,895 | |
New York City Transitional Finance Authority, BARB, Fiscal 2009, Series S-3, 5.00%, 1/15/23 | | | 865 | | | | 983,764 | |
New York State Dormitory Authority, RB: | | | | | | | | |
Convent of the Sacred Heart (AGM), 4.00%, 11/01/18 | | | 175 | | | | 194,112 | |
Convent of the Sacred Heart (AGM), 5.00%, 11/01/19 | | | 555 | | | | 650,066 | |
Convent of the Sacred Heart (AGM), 5.00%, 11/01/20 | | | 405 | | | | 473,129 | |
Mount Sinai School of Medicine, Series A (NPFGC), 5.15%, 7/01/24 | | | 500 | | | | 544,595 | |
New York State Association for Retarded Children, Inc., Series A, 5.30%, 7/01/23 | | | 550 | | | | 596,503 | |
New York University Hospitals Center, Series A, 5.00%, 7/01/22 | | | 1,725 | | | | 1,898,966 | |
New York University Hospitals Center, Series A, 5.13%, 7/01/23 | | | 1,665 | | | | 1,821,393 | |
University of Rochester, Series E,
4.00%, 7/01/24 | | | 1,015 | | | | 1,042,618 | |
New York State Dormitory Authority, Refunding RB: | | | | | | | | |
Miriam Osborn Memorial Home Association, 3.00%, 7/01/20 | | | 965 | | | | 951,915 | |
Miriam Osborn Memorial Home Association, 3.13%, 7/01/21 | | | 1,950 | | | | 1,886,449 | |
Mount Sinai Hospital, Series A, 4.25%, 7/01/23 | | | 750 | | | | 777,682 | |
Mount Sinai Hospital, Series A, 5.00%, 7/01/26 | | | 750 | | | | 799,755 | |
North Shore-Long Island Jewish, Series E, 5.00%, 5/01/22 | | | 1,000 | | | | 1,085,140 | |
Niagara Area Development Corp., Refunding RB, Solid Waste Disposal Facility, Covanta Energy Project, Series B, 4.00%, 11/01/24 | | | 1,000 | | | | 921,350 | |
Port Authority of New York & New Jersey, ARB, JFK International Air Terminal LLC Project: | | | | | | | | |
5.00%, 12/01/20 | | | 1,500 | | | | 1,599,345 | |
Series 6, AMT (NPFGC), 6.25%, 12/01/13 | | | 2,000 | | | | 2,000,280 | |
Port Authority of New York & New Jersey, Refunding ARB, Consolidated, AMT: | | | | | | | | |
152nd Series, 5.00%, 11/01/23 | | | 2,000 | | | | 2,159,280 | |
178th Series, 5.00%, 12/01/22 | | | 10,025 | | | | 11,405,342 | |
United Nations Development Corp., Refunding RB, Series A, 4.25%, 7/01/24 | | | 1,200 | | | | 1,250,568 | |
| | | | | | | | |
| | | | | | | | 118,453,676 | |
North Carolina — 0.5% | | | | | | | | |
North Carolina Medical Care Commission, RB, First Mortgage, Galloway Ridge Project, Series A: | | | | | | | | |
4.13%, 1/01/17 | | | 200 | | | | 198,422 | |
4.30%, 1/01/18 | | | 555 | | | | 549,328 | |
4.50%, 1/01/19 | | | 520 | | | | 513,932 | |
| Municipal Bonds | | Par
(000) | | | Value | |
North Carolina (concluded) | | | | | | | | |
North Carolina Medical Care Commission, RB, First Mortgage, Galloway Ridge Project, Series A (concluded): | | | | | | | | |
4.75%, 1/01/21 | | $ | 270 | | | $ | 264,268 | |
5.00%, 1/01/22 | | | 290 | | | | 284,884 | |
North Carolina Medical Care Commission, Refunding RB, Health Care Facilities, Vidant Health, Series A, 5.00%, 6/01/22 | | | 1,595 | | | | 1,797,310 | |
| | | | | | | | |
| | | | | | | | 3,608,144 | |
Ohio — 0.6% | | | | | | | | |
County of Hamilton Ohio, RB, Christ Hospital Project: | | | | | | | | |
5.25%, 6/01/22 | | | 2,000 | | | | 2,200,080 | |
5.25%, 6/01/23 | | | 1,500 | | | | 1,627,020 | |
| | | | | | | | |
| | | | | | | | 3,827,100 | |
Oklahoma — 0.9% | | | | | | | | |
County of Canadian Oklahoma Educational Facilities Authority, RB, Mustang Public Schools Project, 4.00%, 9/01/22 | | | 2,810 | | | | 2,920,714 | |
County of Oklahoma Oklahoma Finance Authority, Refunding RB, Epworth Villa Project, Series A, 5.00%, 4/01/23 | | | 1,050 | | | | 1,022,437 | |
County of Tulsa Oklahoma Industrial Authority, RB, Broken Arrow Public School, 4.00%, 9/01/22 | | | 2,300 | | | | 2,411,320 | |
| | | | | | | | |
| | | | | | | | 6,354,471 | |
Oregon — 2.1% | | | | | | | | |
City of Madras Oregon, GO, Refunding,
4.00%, 2/15/24 | | | 745 | | | | 739,584 | |
County of Klamath Oregon School District, GO: | | | | | | | | |
5.50%, 6/15/22 | | | 1,155 | | | | 1,394,605 | |
5.50%, 6/15/23 | | | 1,315 | | | | 1,589,072 | |
Oregon Department of Transportation, RB, Series A, 5.00%, 11/15/16 | | | 5,000 | | | | 5,658,550 | |
Oregon Health & Science University, Refunding RB, Series A, 5.00%, 7/01/22 | | | 4,000 | | | | 4,600,200 | |
State of Oregon Housing & Community Services Department, RB, S/F Mortgage Program, Series B, AMT, 4.50%, 1/01/23 | | | 715 | | | | 734,905 | |
| | | | | | | | |
| | | | | | | | 14,716,916 | |
Pennsylvania — 2.9% | | | | | | | | |
City of Philadelphia Pennsylvania, GO, Refunding, Series A (AGC), 5.00%, 8/01/24 | | | 2,000 | | | | 2,127,800 | |
City of Philadelphia Pennsylvania, Refunding ARB, Series A, AMT, 5.00%, 6/15/21 | | | 7,820 | | | | 8,642,038 | |
County of Montgomery Pennsylvania IDA, Refunding RB, ACTS Retirement Life Communities, 5.00%, 11/15/23 | | | 1,200 | | | | 1,235,328 | |
Pennsylvania HFA, RB, S/F Mortgage, Series 103-C, 4.38%, 4/01/18 | | | 1,160 | | | | 1,260,874 | |
Pennsylvania Turnpike Commission, Refunding RB, Sub-Series B, 5.25%, 6/01/24 | | | 3,400 | | | | 3,671,150 | |
South Fork Municipal Authority, Refunding RB, Conemaugh Valley Memorial Hospital, Series A (AGC), 6.00%, 7/01/26 | | | 2,475 | | | | 2,744,800 | |
| | | | | | | | |
| | | | | | | | 19,681,990 | |
Rhode Island — 0.5% | | | | | | | | |
City of Providence Rhode Island, GO, Series A: | | | | | | | | |
5.00%, 1/15/21 | | | 705 | | | | 776,868 | |
5.00%, 1/15/22 | | | 1,350 | | | | 1,475,671 | |
Rhode Island Housing & Mortgage Finance Corp., RB, Homeownership Opportunity, S/F Housing, Series 57-B, AMT, 5.15%, 4/01/22 | | | 1,000 | | | | 1,025,660 | |
| | | | | | | | |
| | | | | | | | 3,278,199 | |
See Notes to Financial Statements.
| | | | | | |
| | | | | | | |
| | SEMI-ANNUAL REPORT | | NOVEMBER 30, 2013 | | 31 |
| | |
Schedule of Investments (continued) | | BlackRock Strategic Municipal Opportunities Fund (Percentages shown are based on Net Assets) |
| | | | | | | | |
| Municipal Bonds | | Par
(000) | | | Value | |
South Carolina — 0.8% | | | | | | | | |
County of Richland South Carolina, Refunding RB, International Paper Co. Project, AMT, 6.10%, 4/01/23 | | $ | 4,115 | | | $ | 4,116,975 | |
South Carolina Jobs EDA, Refunding RB, Palmetto Health Alliance, Series A (AGM): | | | | | | | | |
5.25%, 8/01/22 | | | 220 | | | | 243,036 | |
5.25%, 8/01/23 | | | 200 | | | | 217,918 | |
5.50%, 8/01/24 | | | 600 | | | | 656,226 | |
5.50%, 8/01/25 | | | 305 | | | | 330,099 | |
| | | | | | | | |
| | | | | | | | 5,564,254 | |
South Dakota — 0.9% | | | | | | | | |
Educational Enhancement Funding Corp., Refunding RB, Series B: | | | | | | | | |
5.00%, 6/01/23 | | | 1,000 | | | | 1,106,780 | |
5.00%, 6/01/24 | | | 1,350 | | | | 1,469,434 | |
South Dakota Health & Educational Facilities Authority, Refunding RB, Regional Health, 4.25%, 9/01/24 | | | 3,500 | | | | 3,605,490 | |
| | | | | | | | |
| | | | | | | | 6,181,704 | |
Tennessee — 0.6% | | | | | | | | |
City of Johnson Tennessee Health & Educational Facilities Board, Refunding RB, Appalachian Christian Village Project, 4.00%, 2/15/23 | | | 400 | | | | 361,376 | |
County of Memphis Shelby Tennessee Airport Authority, Refunding ARB, Series B, AMT, 5.75%, 7/01/23 | | | 3,170 | | | | 3,536,072 | |
| | | | | | | | |
| | | | | | | | 3,897,448 | |
Texas — 8.4% | | | | | | | | |
Alliance Airport Authority Texas, Refunding RB, FedEx Corp. Project, AMT, 4.85%, 4/01/21 | | | 3,730 | | | | 3,891,136 | |
Central Texas Regional Mobility Authority, Refunding RB: | | | | | | | | |
Senior Lien, Series A, 5.00%, 1/01/23 | | | 500 | | | | 522,255 | |
Subordinate Lien, 5.00%, 1/01/23 | | | 500 | | | | 502,155 | |
City of Houston Texas, Refunding RB, Convention Center & Entertainment Facilities, Series A, 5.00%, 9/01/23 | | | 1,790 | | | | 1,935,491 | |
City of Houston Texas Airport System, Refunding ARB, Subordinate Lien, Series A, AMT: | | | | | | | | |
5.00%, 7/01/23 | | | 3,500 | | | | 3,848,460 | |
5.00%, 7/01/23 | | | 5,000 | | | | 5,554,150 | |
City of San Antonio Texas Airport System, ARB, AMT (AGM), 5.25%, 7/01/19 | | | 3,055 | | | | 3,417,598 | |
City of San Antonio Texas Airport System, Refunding ARB, Passenger Facility Charges, AMT, 5.00%, 7/01/23 | | | 1,000 | | | | 1,084,180 | |
County of Harris Texas Cultural Education Facilities Finance Corp., RB, 5.75%, 1/01/28 (e) | | | 500 | | | | 496,635 | |
County of Harris Texas Cultural Education Facilities Finance Corp., Refunding RB, First Mortgage, Brazos Presbyterian Homes, Inc. Project, 4.00%, 1/01/23 | | | 1,325 | | | | 1,220,895 | |
Dallas-Fort Worth International Airport, Refunding ARB, Series C, 5.00%, 11/01/22 | | | 1,770 | | | | 1,993,958 | |
Dallas-Fort Worth International Airport Facilities Improvement Corp., ARB, Series 2001-A-1, AMT, 6.15%, 1/01/16 | | | 2,145 | | | | 2,114,198 | |
Love Field Airport Modernization Corp., RB, Southwest Airlines Co. Project, AMT, 5.00%, 11/01/22 | | | 2,250 | | | | 2,338,560 | |
Lower Colorado River Authority, Refunding RB, Series A, 5.00%, 5/15/23 | | | 5,015 | | | | 5,587,312 | |
Red River Health Facilities Development Corp., MRB, Eden Home, Inc. Project, 5.63%, 12/15/22 | | | 2,570 | | | | 2,478,662 | |
Texas Municipal Gas Acquisition & Supply Corp. III, RB, Gas Supply, 5.00%, 12/15/22 | | | 16,000 | | | | 16,910,720 | |
| Municipal Bonds | | Par
(000) | | | Value | |
Texas (concluded) | | | | | | | | |
Texas State Turnpike Authority, RB, CAB, 1st Tier, Series A (AMBAC), 4.61%, 8/15/24 (a) | | $ | 6,600 | | | $ | 4,050,816 | |
| | | | | | | | |
| | | | | | | | 57,947,181 | |
Utah — 0.4% | | | | | | | | |
County of Utah Utah, Refunding RB, US Steel Corp. Project, 5.38%, 11/01/15 | | | 3,000 | | | | 3,014,250 | |
Virginia — 1.1% | | | | | | | | |
County of Hanover Virginia EDA, Refunding RB, Covenant Woods, Series A, 4.00%, 7/01/22 | | | 1,320 | | | | 1,179,156 | |
County of Henrico Virginia EDA, Refunding RB, United Methodist Homes: | | | | | | | | |
3.38%, 6/01/20 | | | 1,000 | | | | 945,590 | |
5.00%, 6/01/22 | | | 625 | | | | 641,106 | |
5.00%, 6/01/23 | | | 420 | | | | 425,809 | |
Dulles Town Center Community Development Authority, Refunding, Special Assessment, Dulles Town Center Project, 4.00%, 3/01/23 | | | 1,000 | | | | 902,390 | |
Fredericksburg Virginia EDA, Refunding RB, MediCorp Health System Obligation, 5.00%, 6/15/17 | | | 1,550 | | | | 1,682,587 | |
Shops at White Oak Village Community Development Authority, Special Assessment, 5.30%, 3/01/17 | | | 1,720 | | | | 1,838,439 | |
| | | | | | | | |
| | | | | | | | 7,615,077 | |
West Virginia — 0.4% | | | | | | | | |
West Virginia Hospital Finance Authority, Refunding RB, Charleston Area Medical Center, Inc., Series A: | | | | | | | | |
5.13%, 9/01/23 | | | 1,000 | | | | 1,063,080 | |
5.50%, 9/01/25 | | | 2,000 | | | | 2,015,080 | |
| | | | | | | | |
| | | | | | | | 3,078,160 | |
Wisconsin — 1.0% | | | | | | | | |
Public Finance Authority, Refunding ARB, Transportation Infrastructure Properties LLC, Senior Series B, AMT, 5.00%, 7/01/22 | | | 7,000 | | | | 7,048,300 | |
| Total Municipal Bonds — 93.0% | | | | | | | 638,332,625 | |
| | | | | | | | |
| | |
|
Municipal Bonds Transferred to
Tender Option Bond Trusts (h) | |
Florida — 1.8% | | | | | | | | |
State of Florida, GO, Refunding, Department of Transportation, Bridge Construction, Series B, 5.00%, 7/01/22 | | | 10,285 | | | | 12,187,311 | |
New York — 7.2% | | | | | | | | |
City of New York New York, GO, Refunding, Series E: | | | | | | | | |
5.25%, 8/01/22 | | | 8,000 | | | | 9,484,400 | |
5.00%, 8/01/24 | | | 5,010 | | | | 5,610,198 | |
City of New York New York, GO: | | | | | | | | |
Sub-Series B-1, 5.25%, 9/01/22 | | | 1,000 | | | | 1,144,700 | |
Sub-Series I-1, 5.50%, 4/01/21 | | | 2,009 | | | | 2,325,266 | |
New York State Urban Development Corp., Refunding RB, Service Contracts, Series B, 5.00%, 1/01/21 | | | 1,469 | | | | 1,665,210 | |
Port Authority of New York & New Jersey, RB, Consolidated, 169th Series, AMT,
5.00%, 10/15/21 | | | 12,170 | | | | 13,967,874 | |
Triborough Bridge & Tunnel Authority, Refunding RB, General, MTA Bridges & Tunnels, Series B, 5.00%, 11/15/22 | | | 13,000 | | | | 15,264,080 | |
| | | | | | | | |
| | | | | | | | 49,461,728 | |
See Notes to Financial Statements.
| | | | | | |
| | | | | | | |
| 32 | | SEMI-ANNUAL REPORT | | NOVEMBER 30, 2013 | | |
| | |
Schedule of Investments (continued) | | BlackRock Strategic Municipal Opportunities Fund (Percentages shown are based on Net Assets) |
| | | | | | | | |
Municipal Bonds Transferred to
Tender Option Bond Trusts (h) | | Par (000) | | | Value | |
Texas — 1.3% | | | | | | | | |
City of Houston Texas, GO, Refunding, Series A, 5.00%, 3/01/22 | | $ | 7,500 | | | $ | 8,826,675 | |
Total Municipal Bonds Transferred to
Tender Option Bond Trusts — 10.3% | | | | 70,475,714 | |
Total Long-Term Investments
(Cost — $708,349,248) — 103.3% | | | | | | | 708,808,339 | |
| | | | | | | | |
| | |
| Short-Term Securities | | Shares | | | Value | |
FFI Institutional Tax-Exempt Fund, 0.03% (i)(j) | | | 10,927,232 | | | $ | 10,927,232 | |
Total Short-Term Securities
(Cost — $10,927,232) — 1.6% | | | | | | | 10,927,232 | |
| Total Investments (Cost — $719,276,480) — 104.9% | | | | 719,735,571 | |
| Other Assets Less Liabilities — 0.6% | | | | 4,244,672 | |
Liability for TOB Trust Certificates, Including Interest Expense and Fees Payable — (5.5)% | | | | (37,855,112 | ) |
| | | | | | | | |
| Net Assets — 100.0% | | | | | | $ | 686,125,131 | |
| | | | | | | | |
|
| Notes to Schedule of investments |
| (a) | | Represents a zero-coupon bond. Rate shown reflects the current yield as of report date. |
| (b) | | Issuer filed for bankruptcy and/or is in default of principal and/or interest payments. |
| (c) | | Non-income producing security. |
| (d) | | Represents a step-up bond that pays an initial coupon rate for the first period and then a higher coupon rate for the following periods. Rate shown is as of report date. |
| (e) | | When-issued security. Unsettled when-issued transactions were as follows: |
| | | | | | | | |
| Counterparty | | Value | | | Unrealized
Appreciation | |
Citigroup Global Markets, Inc. | | $ | 3,587,084 | | | $ | 3,220 | |
Scott & Stringfellow LLC | | $ | 496,635 | | | $ | 470 | |
| (f) | | US government securities, held in escrow, are used to pay interest on this security, as well as to retire the bond in full at the date indicated, typically at a premium to par. |
| (g) | | Variable rate security. Rate shown is as of report date. |
| (h) | | Represent bonds transferred to a TOB. In exchange the Fund acquired residual interest certificates. These bonds serve as collateral in a financing transaction. See Note 3 of the Notes to Financial Statements for details of municipal bonds transferred to TOBs. |
| (i) | | Investments in issuers considered to be an affiliate of the Fund during the six months ended November 30, 2013, for purposes of Section 2(a)(3) of the Investment Company Act of 1940, as amended, were as follows: |
| | | | | | | | | | | | | | | | |
| Affiliate | | Shares Held
at May 31,
2013 | | | Net
Activity | | | Shares Held
at November 30,
2013 | | | Income | |
FFI Institutional Tax-Exempt Fund | | | 9,744,786 | | | | 1,182,446 | | | | 10,927,232 | | | $ | 2,746 | |
| (j) | | Represents the current yield as of report date. |
| Ÿ | | Financial futures contracts as of November 30, 2013 were as follows: |
| | | | | | | | | | | | | | |
Contracts
Sold | | Issue | | Exchange | | Expiration | | Notional
Value | | | Unrealized
Appreciation | |
| (306) | | 10-Year US Treasury Note | | Chicago Board of Trade | | December 2013 | | $ | 38,752,031 | | | $ | 195,698 | |
| Ÿ | | Fair Value Measurements — Various inputs are used in determining the fair value of investments and derivative financial instruments. These inputs to valuation techniques are categorized into a disclosure hierarchy consisting of three broad levels for financial statement purposes as follows: |
| | Ÿ | | Level 1 — unadjusted price quotations in active markets/exchanges for identical assets or liabilities that the Fund has the ability to access |
| | Ÿ | | Level 2 — other observable inputs (including, but not limited to, quoted prices for similar assets or liabilities in markets that are active, quoted prices for identical or similar assets or liabilities in markets that are not active, inputs other than quoted prices that are observable for the assets or liabilities (such as interest rates, yield curves, volatilities, prepayment speeds, loss severities, credit risks and default rates) or other market-corroborated inputs) |
| | Ÿ | | Level 3 — unobservable inputs based on the best information available in the circumstances, to the extent observable inputs are not available (including the Fund’s own assumptions used in determining the fair value of investments and derivative financial instruments) |
The hierarchy gives the highest priority to unadjusted quoted prices in active markets for identical assets or liabilities (Level 1 measurements) and the lowest priority to unobservable inputs (Level 3 measurements). Accordingly, the degree of judgment exercised in determining fair value is greatest for instruments categorized in Level 3. The inputs used to measure fair value may fall into different levels of the fair value hierarchy. In such cases, for disclosure purposes, the fair value hierarchy classification is determined based on the lowest level input that is significant to the fair value measurement in its entirety.
Changes in valuation techniques may result in transfers into or out of an assigned level within the disclosure hierarchy. In accordance with the Fund’s policy, transfers between different levels of the fair value disclosure hierarchy are deemed to have occurred as of the beginning of the reporting period. The categorization of a value determined for investments and derivative financial instruments is based on the pricing transparency of the investment and derivative financial instrument and is not necessarily an indication of the risks associated with investing in those securities. For information about the Fund’s policy regarding valuation of investments and derivative financial instruments, please refer to Note 2 of the Notes to Financial Statements.
See Notes to Financial Statements.
| | | | | | |
| | | | | | | |
| | SEMI-ANNUAL REPORT | | NOVEMBER 30, 2013 | | 33 |
| | |
Schedule of Investments (concluded) | | BlackRock Strategic Municipal Opportunities Fund |
The following tables summarize the Fund’s investments and derivative financial instruments categorized in the disclosure hierarchy as of November 30, 2013:
| | | | | | | | | | | | | | | | |
| | | Level 1 | | | Level 2 | | | Level 3 | | | Total | |
Assets: | | | | | | | | | | | | | | | | |
| Investments: | | | | | | | | | | | | | | | | |
Long-Term Investments1 | | | — | | | $ | 708,808,339 | | | | — | | | $ | 708,808,339 | |
Short-Term Securities | | $ | 10,927,232 | | | | — | | | | — | | | | 10,927,232 | |
| | | | | | | | | | | | | | | | |
Total | | $ | 10,927,232 | | | $ | 708,808,339 | | | | — | | | $ | 719,735,571 | |
| | | | | | | | | | | | | | | | |
1 See above Schedule of Investment for values in each state or political subdivision. | |
| | | Level 1 | | | Level 2 | | | Level 3 | | | Total | |
| Derivative Financial Instruments2 | | | | | | | | | | | | | | | | |
Assets: | | | | | | | | | | | | | | | | |
Interest rate contracts | | $ | 195,698 | | | | — | | | | — | | | $ | 195,698 | |
2 Derivative financial instruments are financial futures contracts, which are valued at the unrealized appreciation/depreciation on the instrument. | |
Certain of the Fund’s assets and/or liabilities are held at carrying amount, which approximates fair value for financial statement purposes. As of November 30, 2013, such assets and liabilities are categorized within the disclosure hierarchy as follows: | |
| | | Level 1 | | | Level 2 | | | Level 3 | | | Total | |
Assets: | | | | | | | | | | | | | | | | |
Cash pledged for financial futures contracts | | $ | 542,000 | | | | — | | | | — | | | $ | 542,000 | |
Liabilities: | | | | | | | | | | | | | | | | |
Bank overdraft | | | — | | | $ | (25,527 | ) | | | — | | | | (25,527 | ) |
TOB trust certificates | | | ��� | | | | (37,847,478 | ) | | | — | | | | (37,847,478 | ) |
| | | | | | | | | | | | | | | | |
Total | | $ | 542,000 | | | $ | (37,873,005 | ) | | | — | | | $ | (37,331,005 | ) |
| | | | | | | | | | | | | | | | |
There were no transfers between levels during the six months ended November 30, 2013.
See Notes to Financial Statements.
| | | | | | |
| | | | | | | |
| 34 | | SEMI-ANNUAL REPORT | | NOVEMBER 30, 2013 | | |
| | |
| Statements of Assets and Liabilities | | |
| | | | | | | | | | | | | | | | |
| November 30, 2013 (Unaudited) | | BlackRock
California
Municipal
Bond Fund | | | BlackRock
New Jersey
Municipal
Bond Fund | | | BlackRock
Pennsylvania
Municipal
Bond Fund | | | BlackRock
Strategic
Municipal
Opportunities
Fund | |
| | | | | | | | | | | | | | | | |
| Assets | | | | | | | | | | | | | | | | |
Investments at value — unaffiliated1 | | $ | 620,918,443 | | | $ | 224,868,060 | | | $ | 464,999,071 | | | $ | 708,808,339 | |
Investments at value — affiliated2 | | | 1,802,853 | | | | 3,178,364 | | | | 1,815,153 | | | | 10,927,232 | |
Cash pledged for other derivative contracts | | | 726,000 | | | | 165,000 | | | | 141,000 | | | | 542,000 | |
Interest receivable | | | 7,248,443 | | | | 3,374,930 | | | | 6,837,233 | | | | 9,328,471 | |
Capital shares sold receivable | | | 1,445,940 | | | | 873,572 | | | | 324,484 | | | | 1,983,696 | |
Investments sold receivable | | | — | | | | — | | | | 325,000 | | | | — | |
Variation margin receivable on other derivative contracts | | | 44,842 | | | | 10,171 | | | | 8,750 | | | | 33,467 | |
Prepaid expenses | | | 58,870 | | | | 20,848 | | | | 21,003 | | | | 103,181 | |
| | | | |
Total assets | | | 632,245,391 | | | | 232,490,945 | | | | 474,471,694 | | | | 731,726,386 | |
| | | | |
| | | | | | | | | | | | | | | | |
| Accrued Liabilities | | | | | | | | | | | | | | | | |
Bank overdraft | | | 17,396 | | | | 6,244 | | | | 12,166 | | | | 25,527 | |
Income dividends payable | | | 1,096,600 | | | | 476,888 | | | | 1,192,233 | | | | 896,566 | |
Capital shares redeemed payable | | | 792,832 | | | | 979,715 | | | | 465,530 | | | | 2,156,547 | |
Investments purchased payable | | | 460,564 | | | | 297,569 | | | | — | | | | 4,080,030 | |
Investment advisory fees payable | | | 246,194 | | | | 94,906 | | | | 194,987 | | | | 294,907 | |
Service and distribution fees payable | | | 101,442 | | | | 39,047 | | | | 36,236 | | | | 129,114 | |
Interest expense and fees payable | | | 23,036 | | | | 3,011 | | | | 14,776 | | | | 7,634 | |
Officer’s and Trustees’ fees payable | | | 3,646 | | | | 2,461 | | | | 2,818 | | | | 3,409 | |
Other affiliates payable | | | — | | | | 130 | | | | 409 | | | | — | |
Other accrued expenses payable | | | 171,267 | | | | 114,065 | | | | 233,482 | | | | 160,043 | |
| | | | |
Total accrued liabilities | | | 2,912,977 | | | | 2,014,036 | | | | 2,152,637 | | | | 7,753,777 | |
| | | | |
| | | | | | | | | | | | | | | | |
| Other Liabilities | | | | | | | | | | | | | | | | |
TOB trust certificates | | | 84,544,892 | | | | 7,231,154 | | | | 46,126,645 | | | | 37,847,478 | |
| | | | |
Total liabilities | | | 87,457,869 | | | | 9,245,190 | | | | 48,279,282 | | | | 45,601,255 | |
| | | | |
Net Assets | | $ | 544,787,522 | | | $ | 223,245,755 | | | $ | 426,192,412 | | | $ | 686,125,131 | |
| | | | |
| | | | | | | | | | | | | | | | |
| Net Assets Consist of | | | | | | | | | | | | | | | | |
Paid-in capital | | $ | 553,092,039 | | | $ | 222,738,127 | | | $ | 444,655,981 | | | $ | 687,932,374 | |
Undistributed net investment income | | | 585,138 | | | | 857,208 | | | | 1,022,348 | | | | 223,947 | |
Accumulated net realized loss | | | (16,624,098 | ) | | | (5,447,930 | ) | | | (27,723,803 | ) | | | (2,685,979 | ) |
Net unrealized appreciation/depreciation | | | 7,734,443 | | | | 5,098,350 | | | | 8,237,886 | | | | 654,789 | |
| | | | |
Net Assets | | $ | 544,787,522 | | | $ | 223,245,755 | | | $ | 426,192,412 | | | $ | 686,125,131 | |
| | | | |
1 Investments at cost — unaffiliated | | $ | 612,990,017 | | | $ | 219,829,187 | | | $ | 456,789,848 | | | $ | 708,349,248 | |
2 Investments at cost — affiliated | | $ | 1,802,853 | | | $ | 3,178,364 | | | $ | 1,815,153 | | | $ | 10,927,232 | |
| | | | | | |
| See Notes to Financial Statements. | | | | |
| | | | | | | |
| | SEMI-ANNUAL REPORT | | NOVEMBER 30, 2013 | | 35 |
| | |
| Statements of Assets and Liabilities (concluded) | | |
| | | | | | | | | | | | | | | | |
| November 30, 2013 (Unaudited) | | BlackRock
California
Municipal Bond Fund | | | BlackRock New Jersey
Municipal Bond Fund | | | BlackRock
Pennsylvania
Municipal Bond Fund | | | BlackRock
Strategic
Municipal Opportunities
Fund | |
| | | | | | | | | | | | | | | | |
| Net Asset Value | | | | | | | | | | | | | | | | |
| Institutional: | | | | | | | | | | | | | | | | |
Net assets | | $ | 191,347,713 | | | $ | 101,287,927 | | | $ | 321,042,235 | | | $ | 349,416,158 | |
| | | | | | | | | | | | | | | | |
Shares outstanding, unlimited number of shares authorized, $0.10 par value | | | 16,448,379 | | | | 9,682,391 | | | | 30,144,420 | | | | 31,967,081 | |
| | | | | | | | | | | | | | | | |
Net asset value per share | | $ | 11.63 | | | $ | 10.46 | | | $ | 10.65 | | | $ | 10.93 | |
| | | | | | | | | | | | | | | | |
| Service: | | | | | | | | | | | | | | | | |
Net assets | | | — | | | $ | 17,228,072 | | | $ | 6,638,960 | | | | — | |
| | | | | | | | | | | | | | | | |
Shares outstanding, unlimited number of shares authorized, $0.10 par value | | | — | | | | 1,647,013 | | | | 623,165 | | | | — | |
| | | | | | | | | | | | | | | | |
Net asset value per share | | | — | | | $ | 10.46 | | | $ | 10.65 | | | | — | |
| | | | | | | | | | | | | | | | |
| Investor A: | | | | | | | | | | | | | | | | |
Net assets | | $ | 114,414,371 | | | $ | 40,101,577 | | | $ | 50,879,096 | | | $ | 194,512,861 | |
| | | | | | | | | | | | | | | | |
Shares outstanding, unlimited number of shares authorized, $0.10 par value | | | 9,843,242 | | | | 3,829,879 | | | | 4,772,600 | | | | 17,805,387 | |
| | | | | | | | | | | | | | | | |
Net asset value per share | | $ | 11.62 | | | $ | 10.47 | | | $ | 10.66 | | | $ | 10.92 | |
| | | | | | | | | | | | | | | | |
| Investor A1: | | | | | | | | | | | | | | | | |
Net assets | | $ | 153,686,491 | | | $ | 31,624,132 | | | $ | 17,508,269 | | | $ | 40,015,758 | |
| | | | | | | | | | | | | | | | |
Shares outstanding, unlimited number of shares authorized, $0.10 par value | | | 13,210,673 | | | | 3,019,418 | | | | 1,641,939 | | | | 3,662,154 | |
| | | | | | | | | | | | | | | | |
Net asset value per share | | $ | 11.63 | | | $ | 10.47 | | | $ | 10.66 | | | $ | 10.93 | |
| | | | | | | | | | | | | | | | |
| Investor B: | | | | | | | | | | | | | | | | |
Net assets | | $ | 1,790,936 | | | | — | | | | — | | | | — | |
| | | | | | | | | | | | | | | | |
Shares outstanding, unlimited number of shares authorized, $0.10 par value | | | 153,851 | | | | — | | | | — | | | | — | |
| | | | | | | | | | | | | | | | |
Net asset value per share | | $ | 11.64 | | | | — | | | | — | | | | — | |
| | | | | | | | | | | | | | | | |
| Investor C: | | | | | | | | | | | | | | | | |
Net assets | | $ | 65,612,077 | | | $ | 24,622,785 | | | $ | 24,458,780 | | | $ | 102,180,354 | |
| | | | | | | | | | | | | | | | |
Shares outstanding, unlimited number of shares authorized, $0.10 par value | | | 5,639,413 | | | | 2,354,509 | | | | 2,294,662 | | | | 9,350,209 | |
| | | | | | | | | | | | | | | | |
Net asset value per share | | $ | 11.63 | | | $ | 10.46 | | | $ | 10.66 | | | $ | 10.93 | |
| | | | | | | | | | | | | | | | |
| Investor C1: | | | | | | | | | | | | | | | | |
Net assets | | $ | 17,935,934 | | | $ | 8,381,262 | | | $ | 5,665,072 | | | | — | |
| | | | | | | | | | | | | | | | |
Shares outstanding, unlimited number of shares authorized, $0.10 par value | | | 1,541,551 | | | | 801,232 | | | | 531,917 | | | | — | |
| | | | | | | | | | | | | | | | |
Net asset value per share | | $ | 11.63 | | | $ | 10.46 | | | $ | 10.65 | | | | — | |
| | | | | | | | | | | | | | | | |
| | | | | | |
| See Notes to Financial Statements. | | | | |
| | | | | | | |
| 36 | | SEMI-ANNUAL REPORT | | NOVEMBER 30, 2013 | | |
| | | | | | | | | | | | | | | | |
| Six Months Ended November 30, 2013 (Unaudited) | | BlackRock California Municipal Bond Fund | | | BlackRock New Jersey Municipal Bond Fund | | | BlackRock
Pennsylvania Municipal Bond Fund | | | BlackRock
Strategic
Municipal
Opportunities
Fund | |
| | | | | | | | | | | | | | | | |
| Investment Income | | | | | | | | | | | | | | | | |
Interest | | $ | 14,789,972 | | | $ | 5,784,255 | | | $ | 11,988,522 | | | $ | 14,077,507 | |
Income — affiliated | | | — | | | | — | | | | — | | | | 2,746 | |
| | | | |
Total income | | | 14,789,972 | | | | 5,784,255 | | | | 11,988,522 | | | | 14,080,253 | |
| | | | |
| | | | | | | | | | | | | | | | |
| Expenses | | | | | | | | | | | | | | | | |
Investment advisory | | | 1,668,590 | | | | 649,907 | | | | 1,268,528 | | | | 2,108,937 | |
Service — Service | | | — | | | | 22,575 | | | | 8,754 | | | | — | |
Service — Investor A | | | 164,147 | | | | 54,660 | | | | 67,548 | | | | 264,923 | |
Service — Investor A1 | | | 79,606 | | | | 16,226 | | | | 9,264 | | | | 20,695 | |
Service and distribution — Investor B | | | 5,864 | | | | 53 | | | | 33 | | | | 67 | |
Distribution — Investor B1 | | | — | | | | 126 | | | | 72 | | | | — | |
Service and distribution — Investor C | | | 374,599 | | | | 130,515 | | | | 136,130 | | | | 577,128 | |
Service and distribution — Investor C1 | | | 57,120 | | | | 26,670 | | | | 18,820 | | | | — | |
Transfer agent — Institutional | | | 126,090 | | | | 92,119 | | | | 364,910 | | | | 122,750 | |
Transfer agent — Service | | | — | | | | 10,522 | | | | 3,836 | | | | — | |
Transfer agent — Investor A | | | 23,447 | | | | 10,878 | | | | 20,590 | | | | 43,627 | |
Transfer agent — Investor A1 | | | 31,647 | | | | 8,503 | | | | 6,677 | | | | 10,145 | |
Transfer agent — Investor B | | | 1,498 | | | | 18 | | | | 10 | | | | 32 | |
Transfer agent — Investor B1 | | | — | | | | 44 | | | | 18 | | | | — | |
Transfer agent — Investor C | | | 17,609 | | | | 6,997 | | | | 10,283 | | | | 30,727 | |
Transfer agent — Investor C1 | | | 4,162 | | | | 2,244 | | | | 1,792 | | | | — | |
Accounting services | | | 80,661 | | | | 26,836 | | | | 58,549 | | | | 80,865 | |
Registration | | | 40,144 | | | | 15,047 | | | | 14,714 | | | | 84,865 | |
Professional | | | 35,628 | | | | 32,881 | | | | 32,591 | | | | 38,716 | |
Custodian | | | 25,269 | | | | 8,986 | | | | 14,943 | | | | 21,547 | |
Printing | | | 16,256 | | | | 8,031 | | | | 12,010 | | | | 14,475 | |
Officer and Trustees | | | 14,953 | | | | 11,332 | | | | 13,313 | | | | 15,688 | |
Miscellaneous | | | 23,938 | | | | 21,217 | | | | 23,107 | | | | 37,850 | |
| | | | |
Total expenses excluding interest expense and fees | | | 2,791,228 | | | | 1,156,387 | | | | 2,086,492 | | | | 3,473,037 | |
Interest expense and fees1 | | | 284,510 | | | | 29,680 | | | | 184,758 | | | | 104,973 | |
| | | | |
Total expenses | | | 3,075,738 | | | | 1,186,067 | | | | 2,271,250 | | | | 3,578,010 | |
Less fees waived by Manager | | | (1,138 | ) | | | (40,627 | ) | | | (50 | ) | | | (194,173 | ) |
Less transfer agent fees waived and/or reimbursed — class specific | | | — | | | | (42,997 | ) | | | (240,815 | ) | | | — | |
| | | | |
Total expenses after fees waived and/or reimbursed and/or reimbursed | | | 3,074,600 | | | | 1,102,443 | | | | 2,030,385 | | | | 3,383,837 | |
| | | | |
Net investment income | | | 11,715,372 | | | | 4,681,812 | | | | 9,958,137 | | | | 10,696,416 | |
| | | | |
| | | | | | | | | | | | | | | | |
| Realized and Unrealized Gain (Loss) | | | | | | | | | | | | | | | | |
Net realized gain (loss) from: | | | | | | | | | | | | | | | | |
Investments | | | (21,939,448 | ) | | | (3,259,882 | ) | | | (6,260,691 | ) | | | (7,635,371 | ) |
Financial futures contracts | | | 1,004,066 | | | | 61,681 | | | | 1,014,420 | | | | 744,500 | |
| | | | |
| | | (20,935,382 | ) | | | (3,198,201 | ) | | | (5,246,271 | ) | | | (6,890,871 | ) |
| | | | |
| Net change in unrealized appreciation/depreciation on: | | | | | | | | | | | | | | | | |
Investments | | | (34,194,093 | ) | | | (15,000,287 | ) | | | (34,963,218 | ) | | | (29,497,002 | ) |
Financial futures contracts | | | (573,449 | ) | | | 26,243 | | | | (715,188 | ) | | | (205,529 | ) |
| | | | |
| | | (34,767,542 | ) | | | (14,974,044 | ) | | | (35,678,406 | ) | | | (29,702,531 | ) |
| | | | |
| Total realized and unrealized loss | | | (55,702,924 | ) | | | (18,172,245 | ) | | | (40,924,677 | ) | | | (36,593,402 | ) |
| | | | |
Net Decrease in Net Assets Resulting from Operations | | $ | (43,987,552 | ) | | $ | (13,490,433 | ) | | $ | (30,966,540 | ) | | $ | (25,896,986 | ) |
| | | | |
1 Related to TOBs. | | | | | | | | | | | | | | | | |
| | | | | | |
| See Notes to Financial Statements. | | | | |
| | | | | | | |
| | SEMI-ANNUAL REPORT | | NOVEMBER 30, 2013 | | 37 |
| | |
| Statements of Changes in Net Assets | | |
| | | | | | | | | | | | | | | | | | |
| | | BlackRock California
Municipal Bond Fund | | | | | BlackRock New Jersey
Municipal Bond Fund | |
| Increase (Decrease) in Net Assets: | | Six Months Ended
November 30,
2013
(Unaudited) | | | Year Ended
May 31,
2013 | | | | | Six Months Ended
November 30,
2013
(Unaudited) | | | Year Ended
May 31,
2013 | |
| | | | | | | | | | | | | | | | | | |
| Operations | | | | | | | | | | | | | | | | | | |
Net investment income | | $ | 11,715,372 | | | $ | 24,123,689 | | | | | $ | 4,681,812 | | | $ | 9,395,002 | |
Net realized gain (loss) | | | (20,935,382 | ) | | | 7,499,250 | | | | | | (3,198,201 | ) | | | 1,133,515 | |
Net change in unrealized appreciation/depreciation | | | (34,767,542 | ) | | | (6,915,690 | ) | | | | | (14,974,044 | ) | | | (2,147,472 | ) |
| | | | | | | | | | |
Net increase (decrease) in net assets resulting from operations | | | (43,987,552 | ) | | | 24,707,249 | | | | | | (13,490,433 | ) | | | 8,381,045 | |
| | | | | | | | | | |
| | | | | | | | | | | | | | | | | | |
| Dividends and Distributions to Shareholders From | | | | | | | | | | | | | | | | | | |
| Net investment income: | | | | | | | | | | | | | | | | | | |
Institutional | | | (4,488,763 | ) | | | (9,724,092 | )1 | | | | | (2,154,075 | ) | | | (4,710,228 | )1 |
Service | | | — | | | | — | | | | | | (355,884 | ) | | | (651,499 | )1 |
Investor A | | | (2,517,493 | ) | | | (5,115,970 | )1 | | | | | (860,409 | ) | | | (1,685,598 | )1 |
Investor A1 | | | (3,177,574 | ) | | | (6,400,877 | )1 | | | | | (665,703 | ) | | | (1,425,294 | )1 |
Investor B | | | (41,865 | ) | | | (164,586 | )1 | | | | | (154 | ) | | | (6,641 | )1 |
Investor B1 | | | — | | | | — | | | | | | (844 | ) | | | (52,765 | )1 |
Investor C | | | (1,151,602 | ) | | | (2,086,192 | )1 | | | | | (413,531 | ) | | | (813,833 | )1 |
Investor C1 | | | (332,168 | ) | | | (701,810 | )1 | | | | | (159,251 | ) | | | (368,528 | )1 |
| Net realized gain: | | | | | | | | | | | | | | | | | | |
Institutional | | | — | | | | (349,878 | )1 | | | | | — | | | | — | |
Investor A | | | — | | | | (185,024 | )1 | | | | | — | | | | — | |
Investor A1 | | | — | | | | (220,540 | )1 | | | | | — | | | | — | |
Investor B | | | — | | | | (5,977 | )1 | | | | | — | | | | — | |
Investor C | | | — | | | | (102,472 | )1 | | | | | — | | | | — | |
Investor C1 | | | — | | | | (28,140 | )1 | | | | | — | | | | — | |
| | | | | | | | | | |
Decrease in net assets resulting from dividends and distributions to shareholders | | | (11,709,465 | ) | | | (25,085,558 | ) | | | | | (4,609,851 | ) | | | (9,714,386 | ) |
| | | | | | | | | | |
| | | | | | | | | | | | | | | | | | |
| Capital Share Transactions | | | | | | | | | | | | | | | | | | |
Net increase (decrease) in net assets derived from capital share transactions | | | (154,657,642 | ) | | | 185,351,361 | | | | | | (28,678,744 | ) | | | 26,865,314 | |
| | | | | | | | | | |
| | | | | | | | | | | | | | | | | | |
| Net Assets | | | | | | | | | | | | | | | | | | |
Total increase (decrease) in net assets | | | (210,354,659 | ) | | | 184,973,052 | | | | | | (46,779,028 | ) | | | 25,531,973 | |
Beginning of period | | | 755,142,181 | | | | 570,169,129 | | | | | | 270,024,783 | | | | 244,492,810 | |
| | | | | | | | | | |
End of period | | $ | 544,787,522 | | | $ | 755,142,181 | | | | | $ | 223,245,755 | | | $ | 270,024,783 | |
| | | | | | | | | | |
Undistributed net investment income, end of period | | $ | 585,138 | | | $ | 579,231 | | | | | $ | 857,208 | | | $ | 785,247 | |
| | | | | | | | | | |
1 Determined in accordance with federal income tax regulations. | | | | | | | | | | | | | | | | | | |
| | | | | | |
| See Notes to Financial Statements. | | | | |
| | | | | | | |
| 38 | | SEMI-ANNUAL REPORT | | NOVEMBER 30, 2013 | | |
| | |
| Statements of Changes in Net Assets (concluded) | | |
| | | | | | | | | | | | | | | | | | |
| | | BlackRock Pennsylvania
Municipal Bond Fund | | | | | BlackRock Strategic
Opportunities Municipal Fund | |
| Increase (Decrease) in Net Assets: | | Six Months Ended
November 30,
2013
(Unaudited) | | | Year Ended
May 31,
2013 | | | | | Six Months Ended
November 30,
2013
(Unaudited) | | | Year Ended
May 31,
2013 | |
| | | | | | | | | | | | | | | | | | |
| Operations | | | | | | | | | | | | | | | | | | |
Net investment income | | $ | 9,958,137 | | | $ | 21,371,784 | | | | | $ | 10,696,416 | | | $ | 19,807,325 | |
Net realized gain (loss) | | | (5,246,271 | ) | | | 1,220,944 | | | | | | (6,890,871 | ) | | | 6,293,323 | |
Net change in unrealized appreciation/depreciation | | | (35,678,406 | ) | | | (4,352,426 | ) | | | | | (29,702,531 | ) | | | (4,164,722 | ) |
| | | | | | | | | | |
Net increase (decrease) in net assets resulting from operations | | | (30,966,540 | ) | | | 18,240,302 | | | | | | (25,896,986 | ) | | | 21,935,926 | |
| | | | | �� | | | | | |
| | | | | | | | | | | | | | | | | | |
| Dividends and Distributions to Shareholders From | | | | | | | | | | | | | | | | | | |
| Net investment income: | | | | | | | | | | | | | | | | | | |
Institutional | | | (7,655,857 | ) | | | (16,854,849 | )1 | | | | | (6,005,274 | ) | | | (10,684,105 | )1 |
Service | | | (147,234 | ) | | | (251,301 | )1 | | | | | — | | | | — | |
Investor A | | | (1,138,723 | ) | | | (2,115,366 | )1 | | | | | (2,946,752 | ) | | | (5,434,027 | )1 |
Investor A1 | | | (407,526 | ) | | | (928,462 | )1 | | | | | (607,130 | ) | | | (1,366,034 | )1 |
Investor B | | | (106 | ) | | | (4,429 | )1 | | | | | (564 | ) | | | (32,487 | )1 |
Investor B1 | | | (533 | ) | | | (40,954 | )1 | | | | | — | | | | — | |
Investor C | | | (466,761 | ) | | | (948,357 | )1 | | | | | (1,166,184 | ) | | | (2,308,082 | )1 |
Investor C1 | | | (120,836 | ) | | | (282,626 | )1 | | | | | — | | | | — | |
| Net realized gain: | | | | | | | | | | | | | | | | | | |
Institutional | | | — | | | | — | | | | | | — | | | | (1,557,308 | )1 |
Investor A | | | — | | | | — | | | | | | — | | | | (912,083 | )1 |
Investor A1 | | | — | | | | — | | | | | | — | | | | (197,799 | )1 |
Investor B | | | — | | | | — | | | | | | — | | | | (4,426 | )1 |
Investor C | | | — | | | | — | | | | | | — | | | | (516,995 | )1 |
| | | | | | | | | | |
Decrease in net assets resulting from dividends and distributions to shareholders | | | (9,937,576 | ) | | | (21,426,344 | ) | | | | | (10,725,904 | ) | | | (23,013,346 | ) |
| | | | | | | | | | |
| | | | | | | | | | | | | | | | | | |
| Capital Share Transactions | | | | | | | | | | | | | | | | | | |
Net increase (decrease) in net assets derived from capital share transactions | | | (61,986,625 | ) | | | 25,700,127 | | | | | | (121,549,318 | ) | | | 319,161,959 | |
| | | | | | | | | | |
| | | | | | | | | | | | | | | | | | |
| Net Assets | | | | | | | | | | | | | | | | | | |
Total increase (decrease) in net assets | | | (102,890,741 | ) | | | 22,514,085 | | | | | | (158,172,208 | ) | | | 318,084,539 | |
Beginning of period | | | 529,083,153 | | | | 506,569,068 | | | | | | 844,297,339 | | | | 526,212,800 | |
| | | | | | | | | | |
End of period | | $ | 426,192,412 | | | $ | 529,083,153 | | | | | $ | 686,125,131 | | | $ | 844,297,339 | |
| | | | | | | | | | |
Undistributed net investment income, end of period | | $ | 1,022,348 | | | $ | 1,001,787 | | | | | $ | 223,947 | | | $ | 253,435 | |
| | | | | | | | | | |
1 Determined in accordance with federal income tax regulations. | | | | | | | | | | | | | | | | | | |
| | | | | | |
| See Notes to Financial Statements. | | | | |
| | | | | | | |
| | SEMI-ANNUAL REPORT | | NOVEMBER 30, 2013 | | 39 |
| | | | | | | | |
| Six Months Ended November 30, 2013 (Unaudited) | | BlackRock
California
Municipal
Bond Fund | | | BlackRock
Pennsylvania
Municipal
Bond Fund | |
| | | | | | | | |
| Cash Provided by Operating Activities | | | | | | | | |
Net decrease in net assets resulting from operations | | $ | (43,987,552 | ) | | $ | (30,966,540 | ) |
Adjustments to reconcile net decrease in net assets resulting from operations to net cash provided by operating activities: | | | | | | | | |
Decrease in interest receivable | | | 822,745 | | | | 1,649,270 | |
(Increase) decrease in cash pledged for financial futures contracts | | | (148,000 | ) | | | 392,000 | |
Increase in prepaid expenses | | | (23,907 | ) | | | (5,459 | ) |
Decrease in variation margin receivable on financial futures contracts | | | 54,769 | | | | 98,033 | |
Decrease in investment advisory fees payable | | | (111,322 | ) | | | (53,861 | ) |
Decrease in interest expense and fees payable | | | (3,528 | ) | | | (21,209 | ) |
Increase in other accrued expenses payable | | | 7,020 | | | | 18,443 | |
Increase in Officers and Trustees’ fees payable | | | 2,683 | | | | 2,200 | |
Decrease in other affiliated payable | | | (2,989 | ) | | | (2,279 | ) |
Decrease in service and distribution fees payable | | | (41,970 | ) | | | (12,157 | ) |
Net realized and unrealized loss on investments | | | 56,133,541 | | | | 41,223,909 | |
Amortization of premium and accretion of discount on investments | | | 2,165,771 | | | | 750,334 | |
Proceeds from sales of long-term investments | | | 299,951,480 | | | | 107,473,767 | |
Purchases of long-term investments | | | (136,430,618 | ) | | | (19,967,279 | ) |
Net proceeds from sales (purchases) of short-term securities | | | (491,814 | ) | | | 6,307,797 | |
| | | | |
Cash provided by operating activities | | | 177,896,309 | | | | 106,886,969 | |
| | | | |
| | | | | | | | |
| Cash Used for Financing Activities | | | | | | | | |
Proceeds from issuance of capital shares | | | 63,382,426 | | | | 21,219,807 | |
Payments on redemption of capital shares redeemed | | | (227,256,920 | ) | | | (85,814,732 | ) |
Proceeds from TOB trust certificates | | | 7,195,000 | | | | — | |
Payments for TOB trust certificates | | | (17,394,658 | ) | | | (34,975,490 | ) |
Cash dividends paid to shareholders | | | (3,839,553 | ) | | | (7,328,720 | ) |
Increase in bank overdraft | | | 17,396 | | | | 12,166 | |
| | | | |
Cash used for financing activities | | | (177,896,309 | ) | | | (106,886,969 | ) |
| | | | |
| | | | | | | | |
| Cash | | | | | | | | |
Net increase (decrease) in cash | | | — | | | | — | |
Cash at beginning of period | | | — | | | | — | |
| | | | |
Cash at end of period | | | — | | | | — | |
| | | | |
| | | | | | | | |
| Cash Flow Information | | | | | | | | |
Cash paid during the period for interest and fees | | $ | 288,038 | | | $ | 205,967 | |
| | | | |
| | | | | | | | |
| Non-cash Financing Activities | | | | | | | | |
Capital shares issued in reinvestment of dividends paid to Shareholders | | $ | 8,003,273 | | | $ | 2,794,937 | |
| | | | |
| | | | | | |
| See Notes to Financial Statements. | | | | |
| | | | | | | |
| 40 | | SEMI-ANNUAL REPORT | | NOVEMBER 30, 2013 | | |
| | |
| Financial Highlights | | BlackRock California Municipal Bond Fund |
| | | | | | | | | | | | | | | | | | | | | | | | |
| | | Institutional | |
| | | Six Months Ended
November 30,
2013
(Unaudited) | | | Year Ended May 31, | |
| | | | 2013 | | | 2012 | | | 2011 | | | 2010 | | | 2009 | |
| | | | | | | | | | | | | | | | | | | | | | | | |
| Per Share Operating Performance | | | | | | | | | | | | | | | | | | | | | | | | |
Net asset value, beginning of period | | $ | 12.54 | | | $ | 12.48 | | | $ | 11.20 | | | $ | 11.54 | | | $ | 11.02 | | | $ | 11.22 | |
| | | | |
Net investment income1 | | | 0.23 | | | | 0.45 | | | | 0.53 | | | | 0.55 | | | | 0.53 | | | | 0.47 | |
Net realized and unrealized gain (loss) | | | (0.91 | ) | | | 0.09 | | | | 1.28 | | | | (0.34 | ) | | | 0.52 | | | | (0.20 | ) |
| | | | |
Net increase (decrease) from investment operations | | | (0.68 | ) | | | 0.54 | | | | 1.81 | | | | 0.21 | | | | 1.05 | | | | 0.27 | |
| | | | |
| Dividends and distributions from: | | | | | | | | | | | | | | | | | | | | | | | | |
Net investment income | | | (0.23 | ) | | | (0.46 | )2 | | | (0.53 | )2 | | | (0.55 | )2 | | | (0.53 | )2 | | | (0.47 | )2 |
Net realized gain | | | — | | | | (0.02 | )2 | | | — | | | | — | | | | — | | | | (0.00 | )2,3 |
| | | | |
Total dividends and distributions | | | (0.23 | ) | | | (0.48 | ) | | | (0.53 | ) | | | (0.55 | ) | | | (0.53 | ) | | | (0.47 | ) |
| | | | |
Net asset value, end of period | | $ | 11.63 | | | $ | 12.54 | | | $ | 12.48 | | | $ | 11.20 | | | $ | 11.54 | | | $ | 11.02 | |
| | | | |
| | | | | | | | | | | | | | | | | | | | | | | | |
| Total Investment Return4 | | | | | | | | | | | | | | | | | | | | | | | | |
Based on net asset value | | | (5.37)% | 5 | | | 4.26% | | | | 16.55% | | | | 1.89% | | | | 9.72% | | | | 2.63% | |
| | | | |
| | | | | | | | | | | | | | | | | | | | | | | | |
| Ratios to Average Net Assets | | | | | | | | | | | | | | | | | | | | | | | | |
Total expenses | | | 0.83% | 6 | | | 0.73% | | | | 0.78% | | | | 0.83% | | | | 0.79% | | | | 0.82% | |
| | | | |
Total expenses after fees waived | | | 0.83% | 6 | | | 0.72% | | | | 0.78% | | | | 0.83% | | | | 0.78% | | | | 0.81% | |
| | | | |
Total expenses after fees waived and excluding interest expense and fees7 | | | 0.73% | 6 | | | 0.65% | | | | 0.68% | | | | 0.70% | | | | 0.73% | | | | 0.74% | |
| | | | |
Net investment income | | | 4.00% | 6 | | | 3.54% | | | | 4.44% | | | | 4.90% | | | | 4.67% | | | | 4.36% | |
| | | | |
| | | | | | | | | | | | | | | | | | | | | | | | |
| Supplemental Data | | | | | | | | | | | | | | | | | | | | | | | | |
Net assets, end of period (000) | | $ | 191,348 | | | $ | 293,150 | | | $ | 174,726 | | | $ | 87,977 | | | $ | 59,097 | | | $ | 39,135 | |
| | | | |
Portfolio turnover | | | 18% | | | | 51% | | | | 42% | | | | 41% | | | | 53% | | | | 54% | |
| | | | |
| 1 | | Based on average shares outstanding. |
| 2 | | Determined in accordance with federal income tax regulations. |
| 3 | | Amount is greater than $(0.005) per share. |
| 4 | | Where applicable, assumes the reinvestment of dividends and distributions. |
| 5 | | Aggregate total investment return. |
| 7 | | Interest expense and fees relate to TOBs. See Note 3 of the Notes to Financial Statements for details of municipal bonds transferred to TOBs. |
| | | | | | |
| See Notes to Financial Statements. | | | | |
| | | | | | | |
| | SEMI-ANNUAL REPORT | | NOVEMBER 30, 2013 | | 41 |
| | |
| Financial Highlights (continued) | | BlackRock California Municipal Bond Fund |
| | | | | | | | | | | | | | | | | | | | | | | | |
| | | Investor A | |
| | | Six Months Ended
November 30,
2013
(Unaudited) | | | Year Ended May 31, | |
| | | | 2013 | | | 2012 | | | 2011 | | | 2010 | | | 2009 | |
| | | | | | | | | | | | | | | | | | | | | | | | |
| Per Share Operating Performance | | | | | | | | | | | | | | | | | | | | | | | | |
Net asset value, beginning of period | | $ | 12.53 | | | $ | 12.47 | | | $ | 11.19 | | | $ | 11.53 | | | $ | 11.01 | | | $ | 11.21 | |
| | | | |
Net investment income1 | | | 0.23 | | | | 0.42 | | | | 0.49 | | | | 0.53 | | | | 0.50 | | | | 0.45 | |
Net realized and unrealized gain (loss) | | | (0.91 | ) | | | 0.09 | | | | 1.29 | | | | (0.35 | ) | | | 0.53 | | | | (0.21 | ) |
| | | | |
Net increase (decrease) from investment operations | | | (0.68 | ) | | | 0.51 | | | | 1.78 | | | | 0.18 | | | | 1.03 | | | | 0.24 | |
| | | | |
| Dividends and distributions from: | | | | | | | | | | | | | | | | | | | | | | | | |
Net investment income | | | (0.23 | ) | | | (0.43 | )2 | | | (0.50 | )2 | | | (0.52 | )2 | | | (0.51 | )2 | | | (0.44 | )2 |
Net realized gain | | | — | | | | (0.02 | )2 | | | — | | | | — | | | | — | | | | (0.00 | )2,3 |
| | | | |
Total dividends and distributions | | | (0.23 | ) | | | (0.45 | ) | | | (0.50 | ) | | | (0.52 | ) | | | (0.51 | ) | | | (0.44 | ) |
| | | | |
Net asset value, end of period | | $ | 11.62 | | | $ | 12.53 | | | $ | 12.47 | | | $ | 11.19 | | | $ | 11.53 | | | $ | 11.01 | |
| | | | |
| | | | | | | | | | | | | | | | | | | | | | | | |
| Total Investment Return4 | | | | | | | | | | | | | | | | | | | | | | | | |
Based on net asset value | | | (5.46)% | 5 | | | 4.02% | | | | 16.29% | | | | 1.65% | | | | 9.47% | | | | 2.40% | |
| | | | |
| | | | | | | | | | | | | | | | | | | | | | | | |
| Ratios to Average Net Assets | | | | | | | | | | | | | | | | | | | | | | | | |
Total expenses | | | 1.00% | 6 | | | 0.96% | | | | 1.01% | | | | 1.07% | | | | 1.02% | | | | 1.05% | |
| | | | |
Total expenses after fees waived | | | 1.00% | 6 | | | 0.96% | | | | 1.01% | | | | 1.07% | | | | 1.02% | | | | 1.04% | |
| | | | |
Total expenses after fees waived and excluding interest expense and fees7 | | | 0.91% | 6 | | | 0.88% | | | | 0.91% | | | | 0.94% | | | | 0.97% | | | | 0.97% | |
| | | | |
Net investment income | | | 3.84% | 6 | | | 3.32% | | | | 4.19% | | | | 4.66% | | | | 4.43% | | | | 4.17% | |
| | | | |
| | | | | | | | | | | | | | | | | | | | | | | | |
| Supplemental Data | | | | | | | | | | | | | | | | | | | | | | | | |
Net assets, end of period (000) | | $ | 114,414 | | | $ | 166,056 | | | $ | 117,051 | | | $ | 56,575 | | | $ | 48,331 | | | $ | 25,874 | |
| | | | |
Portfolio turnover | | | 18% | | | | 51% | | | | 42% | | | | 41% | | | | 53% | | | | 54% | |
| | | | |
| 1 | | Based on average shares outstanding. |
| 2 | | Determined in accordance with federal income tax regulations. |
| 3 | | Amount is greater than $(0.005) per share. |
| 4 | | Where applicable, excludes the effects of any sales charges and assumes the reinvestment of dividends and distributions. |
| 5 | | Aggregate total investment return. |
| 7 | | Interest expense and fees relate to TOBs. See Note 3 of the Notes to Financial Statements for details of municipal bonds transferred to TOBs. |
| | | | | | |
| See Notes to Financial Statements. | | | | |
| | | | | | | |
| 42 | | SEMI-ANNUAL REPORT | | NOVEMBER 30, 2013 | | |
| | |
| Financial Highlights (continued) | | BlackRock California Municipal Bond Fund |
| | | | | | | | | | | | | | | | | | | | | | | | |
| | | Investor A1 | |
| | | Six Months Ended
November 30,
2013
(Unaudited) | | | Year Ended May 31, | |
| | | | 2013 | | | 2012 | | | 2011 | | | 2010 | | | 2009 | |
| | | | | | | | | | | | | | | | | | | | | | | | |
| Per Share Operating Performance | | | | | | | | | | | | | | | | | | | | | | | | |
Net asset value, beginning of period | | $ | 12.54 | | | $ | 12.48 | | | $ | 11.20 | | | $ | 11.54 | | | $ | 11.02 | | | $ | 11.22 | |
| | | | |
Net investment income1 | | | 0.23 | | | | 0.44 | | | | 0.52 | | | | 0.54 | | | | 0.52 | | | | 0.46 | |
Net realized and unrealized gain (loss) | | | (0.91 | ) | | | 0.09 | | | | 1.28 | | | | (0.34 | ) | | | 0.52 | | | | (0.20 | ) |
| | | | |
Net increase (decrease) from investment operations | | | (0.68 | ) | | | 0.53 | | | | 1.80 | | | | 0.20 | | | | 1.04 | | | | 0.26 | |
| | | | |
| Dividends and distributions from: | | | | | | | | | | | | | | | | | | | | | | | | |
Net investment income | | | (0.23 | ) | | | (0.45 | )2 | | | (0.52 | )2 | | | (0.54 | )2 | | | (0.52 | )2 | | | (0.46 | )2 |
Net realized gain | | | — | | | | (0.02 | )2 | | | — | | | | — | | | | — | | | | (0.00 | )2,3 |
| | | | |
Total dividends and distributions | | | (0.23 | ) | | | (0.47 | ) | | | (0.52 | ) | | | (0.54 | ) | | | (0.52 | ) | | | (0.46 | ) |
| | | | |
Net asset value, end of period | | $ | 11.63 | | | $ | 12.54 | | | $ | 12.48 | | | $ | 11.20 | | | $ | 11.54 | | | $ | 11.02 | |
| | | | |
| | | | | | | | | | | | | | | | | | | | | | | | |
| Total Investment Return4 | | | | | | | | | | | | | | | | | | | | | | | | |
Based on net asset value | | | (5.38)% | 5 | | | 4.17% | | | | 16.45% | | | | 1.82% | | | | 9.63% | | | | 2.56% | |
| | | | |
| | | | | | | | | | | | | | | | | | | | | | | | |
| Ratios to Average Net Assets | | | | | | | | | | | | | | | | | | | | | | | | |
Total expenses | | | 0.86% | 6 | | | 0.82% | | | | 0.87% | | | | 0.91% | | | | 0.87% | | | | 0.89% | |
| | | | |
Total expenses after fees waived | | | 0.86% | 6 | | | 0.81% | | | | 0.86% | | | | 0.91% | | | | 0.86% | | | | 0.88% | |
| | | | |
Total expenses after fees waived and excluding interest expense and fees7 | | | 0.76% | 6 | | | 0.74% | | | | 0.77% | | | | 0.78% | | | | 0.81% | | | | 0.81% | |
| | | | |
Net investment income | | | 4.00% | 6 | | | 3.48% | | | | 4.42% | | | | 4.81% | | | | 4.57% | | | | 4.30% | |
| | | | |
| | | | | | | | | | | | | | | | | | | | | | | | |
| Supplemental Data | | | | | | | | | | | | | | | | | | | | | | | | |
Net assets, end of period (000) | | $ | 153,686 | | | $ | 177,677 | | | $ | 183,008 | | | $ | 169,576 | | | $ | 187,784 | | | $ | 190,693 | |
| | | | |
Portfolio turnover | | | 18% | | | | 51% | | | | 42% | | | | 41% | | | | 53% | | | | 54% | |
| | | | |
| 1 | | Based on average shares outstanding. |
| 2 | | Determined in accordance with federal income tax regulations. |
| 3 | | Amount is greater than $(0.005) per share. |
| 4 | | Where applicable, excludes the effects of any sales charges and assumes the reinvestment of dividends and distributions. |
| 5 | | Aggregate total investment return. |
| 7 | | Interest expense and fees relate to TOBs. See Note 3 of the Notes to Financial Statements for details of municipal bonds transferred to TOBs. |
| | | | | | |
| See Notes to Financial Statements. | | | | |
| | | | | | | |
| | SEMI-ANNUAL REPORT | | NOVEMBER 30, 2013 | | 43 |
| | |
| Financial Highlights (continued) | | BlackRock California Municipal Bond Fund |
| | | | | | | | | | | | | | | | | | | | | | | | |
| | | Investor B | |
| | | Six Months Ended
November 30,
2013
(Unaudited) | | | Year Ended May 31, | |
| | | | 2013 | | | 2012 | | | 2011 | | | 2010 | | | 2009 | |
| | | | | | | | | | | | | | | | | | | | | | | | |
| Per Share Operating Performance | | | | | | | | | | | | | | | | | | | | | | | | |
Net asset value, beginning of period | | $ | 12.55 | | | $ | 12.49 | | | $ | 11.21 | | | $ | 11.55 | | | $ | 11.03 | | | $ | 11.23 | |
| | | | |
Net investment income1 | | | 0.21 | | | | 0.39 | | | | 0.45 | | | | 0.50 | | | | 0.47 | | | | 0.42 | |
Net realized and unrealized gain (loss) | | | (0.92 | ) | | | 0.08 | | | | 1.30 | | | | (0.35 | ) | | | 0.53 | | | | (0.20 | ) |
| | | | |
Net increase (decrease) from investment operations | | | (0.71 | ) | | | 0.47 | | | | 1.75 | | | | 0.15 | | | | 1.00 | | | | 0.22 | |
| | | | |
| Dividends and distributions from: | | | | | | | | | | | | | | | | | | | | | | | | |
Net investment income | | | (0.20 | ) | | | (0.39 | )2 | | | (0.47 | )2 | | | (0.49 | )2 | | | (0.48 | )2 | | | (0.42 | )2 |
Net realized gain | | | — | | | | (0.02 | )2 | | | — | | | | — | | | | — | | | | (0.00 | )2,3 |
| | | | |
Total dividends and distributions | | | (0.20 | ) | | | (0.41 | ) | | | (0.47 | ) | | | (0.49 | ) | | | (0.48 | ) | | | (0.42 | ) |
| | | | |
Net asset value, end of period | | $ | 11.64 | | | $ | 12.55 | | | $ | 12.49 | | | $ | 11.21 | | | $ | 11.55 | | | $ | 11.03 | |
| | | | |
| | | | | | | | | | | | | | | | | | | | | | | | |
| Total Investment Return4 | | | | | | | | | | | | | | | | | | | | | | | | |
Based on net asset value | | | (5.60)% | 5 | | | 3.73% | | | | 15.94% | | | | 1.39% | | | | 9.17% | | | | 2.13% | |
| | | | |
| | | | | | | | | | | | | | | | | | | | | | | | |
| Ratios to Average Net Assets | | | | | | | | | | | | | | | | | | | | | | | | |
Total expenses | | | 1.33% | 6 | | | 1.25% | | | | 1.31% | | | | 1.34% | | | | 1.29% | | | | 1.31% | |
| | | | |
Total expenses after fees waived | | | 1.33% | 6 | | | 1.24% | | | | 1.30% | | | | 1.33% | | | | 1.28% | | | | 1.30% | |
| | | | |
Total expenses after fees waived and excluding interest expense and fees7 | | | 1.24% | 6 | | | 1.17% | | | | 1.21% | | | | 1.20% | | | | 1.23% | | | | 1.23% | |
| | | | |
Net investment income | | | 3.48% | 6 | | | 3.07% | | | | 3.83% | | | | 4.37% | | | | 4.14% | | | | 3.86% | |
| | | | |
| | | | | | | | | | | | | | | | | | | | | | | | |
| Supplemental Data | | | | | | | | | | | | | | | | | | | | | | | | |
Net assets, end of period (000) | | $ | 1,791 | | | $ | 3,570 | | | $ | 7,382 | | | $ | 11,626 | | | $ | 19,989 | | | $ | 24,705 | |
| | | | |
Portfolio turnover | | | 18% | | | | 51% | | | | 42% | | | | 41% | | | | 53% | | | | 54% | |
| | | | |
| 1 | | Based on average shares outstanding. |
| 2 | | Determined in accordance with federal income tax regulations. |
| 3 | | Amount is greater than $(0.005) per share. |
| 4 | | Where applicable, excludes the effects of any sales charges and assumes the reinvestment of dividends and distributions. |
| 5 | | Aggregate total investment return. |
| 7 | | Interest expense and fees relate to TOBs. See Note 3 of the Notes to Financial Statements for details of municipal bonds transferred to TOBs. |
| | | | | | |
| See Notes to Financial Statements. | | | | |
| | | | | | | |
| 44 | | SEMI-ANNUAL REPORT | | NOVEMBER 30, 2013 | | |
| | |
| Financial Highlights (continued) | | BlackRock California Municipal Bond Fund |
| | | | | | | | | | | | | | | | | | | | | | | | |
| | | Investor C | |
| | | Six Months Ended
November 30,
2013
(Unaudited) | | | Year Ended May 31, | |
| | | | 2013 | | | 2012 | | | 2011 | | | 2010 | | | 2009 | |
| | | | | | | | | | | | | | | | | | | | | | | | |
| Per Share Operating Performance | | | | | | | | | | | | | | | | | | | | | | | | |
Net asset value, beginning of period | | $ | 12.54 | | | $ | 12.48 | | | $ | 11.20 | | | $ | 11.54 | | | $ | 11.02 | | | $ | 11.22 | |
| | | | |
Net investment income1 | | | 0.18 | | | | 0.32 | | | | 0.41 | | | | 0.44 | | | | 0.42 | | | | 0.36 | |
Net realized and unrealized gain (loss) | | | (0.91 | ) | | | 0.09 | | | | 1.29 | | | | (0.34 | ) | | | 0.52 | | | | (0.20 | ) |
| | | | |
Net increase (decrease) from investment operations | | | (0.73 | ) | | | 0.41 | | | | 1.70 | | | | 0.10 | | | | 0.94 | | | | 0.16 | |
| | | | |
| Dividends and distributions from: | | | | | | | | | | | | | | | | | | | | | | | | |
Net investment income | | | (0.18 | ) | | | (0.33 | )2 | | | (0.42 | )2 | | | (0.44 | )2 | | | (0.42 | )2 | | | (0.36 | )2 |
Net realized gain | | | — | | | | (0.02 | )2 | | | — | | | | — | | | | — | | | | (0.00 | )2,3 |
| | | | |
Total dividends and distributions | | | (0.18 | ) | | | (0.35 | ) | | | (0.42 | ) | | | (0.44 | ) | | | (0.42 | ) | | | (0.36 | ) |
| | | | |
Net asset value, end of period | | $ | 11.63 | | | $ | 12.54 | | | $ | 12.48 | | | $ | 11.20 | | | $ | 11.54 | | | $ | 11.02 | |
| | | | |
| | | | | | | | | | | | | | | | | | | | | | | | |
| Total Investment Return4 | | | | | | | | | | | | | | | | | | | | | | | | |
Based on net asset value | | | (5.81)% | 5 | | | 3.23% | | | | 15.42% | | | | 0.91% | | | | 8.65% | | | | 1.64% | |
| | | | |
| | | | | | | | | | | | | | | | | | | | | | | | |
| Ratios to Average Net Assets | | | | | | | | | | | | | | | | | | | | | | | | |
Total expenses | | | 1.76% | 6 | | | 1.73% | | | | 1.76% | | | | 1.81% | | | | 1.77% | | | | 1.80% | |
| | | | |
Total expenses after fees waived | | | 1.76% | 6 | | | 1.72% | | | | 1.76% | | | | 1.81% | | | | 1.77% | | | | 1.79% | |
| | | | |
Total expenses after fees waived and excluding interest expense and fees7 | | | 1.67% | 6 | | | 1.64% | | | | 1.66% | | | | 1.68% | | | | 1.72% | | | | 1.72% | |
| | | | |
Net investment income | | | 3.08% | 6 | | | 2.56% | | | | 3.45% | | | | 3.91% | | | | 3.68% | | | | 3.41% | |
| | | | |
| | | | | | | | | | | | | | | | | | | | | | | | |
| Supplemental Data | | | | | | | | | | | | | | | | | | | | | | | | |
Net assets, end of period (000) | | $ | 65,612 | | | $ | 92,635 | | | $ | 63,515 | | | $ | 30,434 | | | $ | 29,583 | | | $ | 13,588 | |
| | | | |
Portfolio turnover | | | 18% | | | | 51% | | | | 42% | | | | 41% | | | | 53% | | | | 54% | |
| | | | |
| 1 | | Based on average shares outstanding. |
| 2 | | Determined in accordance with federal income tax regulations. |
| 3 | | Amount is greater than $(0.005) per share. |
| 4 | | Where applicable, excludes the effects of any sales charges and assumes the reinvestment of dividends and distributions. |
| 5 | | Aggregate total investment return. |
| 7 | | Interest expense and fees relate to TOBs. See Note 3 of the Notes to Financial Statements for details of municipal bonds transferred to TOBs. |
| | | | | | |
| See Notes to Financial Statements. | | | | |
| | | | | | | |
| | SEMI-ANNUAL REPORT | | NOVEMBER 30, 2013 | | 45 |
| | |
| Financial Highlights (concluded) | | BlackRock California Municipal Bond Fund |
| | | | | | | | | | | | | | | | | | | | | | | | |
| | | Investor C1 | |
| | | Six Months Ended
November 30,
2013
(Unaudited) | | | Year Ended May 31, | |
| | | | 2013 | | | 2012 | | | 2011 | | | 2010 | | | 2009 | |
| | | | | | | | | | | | | | | | | | | | | | | | |
| Per Share Operating Performance | | | | | | | | | | | | | | | | | | | | | | | | |
Net asset value, beginning of period | | $ | 12.54 | | | $ | 12.48 | | | $ | 11.20 | | | $ | 11.54 | | | $ | 11.02 | | | $ | 11.22 | |
| | | | |
Net investment income1 | | | 0.20 | | | | 0.38 | | | | 0.46 | | | | 0.49 | | | | 0.46 | | | | 0.41 | |
Net realized and unrealized gain (loss) | | | (0.91 | ) | | | 0.09 | | | | 1.28 | | | | (0.35 | ) | | | 0.53 | | | | (0.20 | ) |
| | | | |
Net increase (decrease) from investment operations | | | (0.71 | ) | | | 0.47 | | | | 1.74 | | | | 0.14 | | | | 0.99 | | | | 0.21 | |
| | | | |
| Dividends and distributions from: | | | | | | | | | | | | | | | | | | | | | | | | |
Net investment income | | | (0.20 | ) | | | (0.39 | )2 | | | (0.46 | )2 | | | (0.48 | )2 | | | (0.47 | )2 | | | (0.41 | )2 |
Net realized gain | | | — | | | | (0.02 | )2 | | | — | | | | — | | | | — | | | | (0.00 | )2,3 |
| | | | |
Total dividends and distributions | | | (0.20 | ) | | | (0.41 | ) | | | (0.46 | ) | | | (0.48 | ) | | | (0.47 | ) | | | (0.41 | ) |
| | | | |
Net asset value, end of period | | $ | 11.63 | | | $ | 12.54 | | | $ | 12.48 | | | $ | 11.20 | | | $ | 11.54 | | | $ | 11.02 | |
| | | | |
| | | | | | | | | | | | | | | | | | | | | | | | |
| Total Investment Return4 | | | | | | | | | | | | | | | | | | | | | | | | |
Based on net asset value | | | (5.62)% | 5 | | | 3.65% | | | | 15.87% | | | | 1.31% | | | | 9.09% | | | | 2.04% | |
| | | | |
| | | | | | | | | | | | | | | | | | | | | | | | |
| Ratios to Average Net Assets | | | | | | | | | | | | | | | | | | | | | | | | |
Total expenses | | | 1.36% | 6 | | | 1.32% | | | | 1.37% | | | | 1.41% | | | | 1.37% | | | | 1.40% | |
| | | | |
Total expenses after fees waived | | | 1.36% | 6 | | | 1.31% | | | | 1.37% | | | | 1.40% | | | | 1.36% | | | | 1.38% | |
| | | | |
Total expenses after fees waived and excluding interest expense and fees7 | | | 1.27% | 6 | | | 1.24% | | | | 1.27% | | | | 1.28% | | | | 1.31% | | | | 1.32% | |
| | | | |
Net investment income | | | 3.48% | 6 | | | 2.98% | | | | 3.93% | | | | 4.29% | | | | 4.07% | | | | 3.79% | |
| | | | |
| | | | | | | | | | | | | | | | | | | | | | | | |
| Supplemental Data | | | | | | | | | | | | | | | | | | | | | | | | |
Net assets, end of period (000) | | $ | 17,936 | | | $ | 22,054 | | | $ | 24,486 | | | $ | 24,195 | | | $ | 28,506 | | | $ | 30,007 | |
| | | | |
Portfolio turnover | | | 18% | | | | 51% | | | | 42% | | | | 41% | | | | 53% | | | | 54% | |
| | | | |
| 1 | | Based on average shares outstanding. |
| 2 | | Determined in accordance with federal income tax regulations. |
| 3 | | Amount is greater than $(0.005) per share. |
| 4 | | Where applicable, excludes the effects of any sales charges and assumes the reinvestment of dividends and distributions. |
| 5 | | Aggregate total investment return. |
| 7 | | Interest expense and fees relate to TOBs. See Note 3 of the Notes to Financial Statements for details of municipal bonds transferred to TOBs. |
| | | | | | |
| See Notes to Financial Statements. | | | | |
| | | | | | | |
| 46 | | SEMI-ANNUAL REPORT | | NOVEMBER 30, 2013 | | |
| | |
| Financial Highlights | | BlackRock New Jersey Municipal Bond Fund |
| | | | | | | | | | | | | | | | | | | | | | | | |
| | | Institutional | |
| | | Six Months Ended
November 30,
2013
(Unaudited) | | | Year Ended May 31, | |
| | | | 2013 | | | 2012 | | | 2011 | | | 2010 | | | 2009 | |
| | | | | | | | | | | | | | | | | | | | | | | | |
| Per Share Operating Performance | | | | | | | | | | | | | | | | | | | | | | | | |
Net asset value, beginning of period | | $ | 11.22 | | | $ | 11.26 | | | $ | 10.18 | | | $ | 10.45 | | | $ | 9.85 | | | $ | 10.30 | |
| | | | |
Net investment income1 | | | 0.21 | | | | 0.43 | | | | 0.45 | | | | 0.48 | | | | 0.47 | | | | 0.46 | |
Net realized and unrealized gain (loss) | | | (0.76 | ) | | | (0.02 | ) | | | 1.09 | | | | (0.27 | ) | | | 0.58 | | | | (0.45 | ) |
| | | | |
Net increase (decrease) from investment operations | | | (0.55 | ) | | | 0.41 | | | | 1.54 | | | | 0.21 | | | | 1.05 | | | | 0.01 | |
| | | | |
Dividends from net investment income | | | (0.21 | ) | | | (0.45 | )2 | | | (0.46 | )2 | | | (0.48 | )2 | | | (0.45 | )2 | | | (0.46 | )2 |
| | | | |
Net asset value, end of period | | $ | 10.46 | | | $ | 11.22 | | | $ | 11.26 | | | $ | 10.18 | | | $ | 10.45 | | | $ | 9.85 | |
| | | | |
| | | | | | | | | | | | | | | | | | | | | | | | |
| Total Investment Return3 | | | | | | | | | | | | | | | | | | | | | | | | |
Based on net asset value | | | (4.86)% | 4 | | | 3.56% | | | | 15.41% | | | | 2.10% | | | | 10.91% | | | | 0.27% | |
| | | | |
| | | | | | | | | | | | | | | | | | | | | | | | |
| Ratios to Average Net Assets | | | | | | | | | | | | | | | | | | | | | | | | |
Total expenses | | | 0.85% | 5 | | | 0.83% | | | | 0.82% | | | | 0.83% | | | | 0.82% | | | | 0.71% | |
| | | | |
Total expenses after fees waived and/or reimbursed and paid indirectly | | | 0.80% | 5 | | | 0.79% | | | | 0.68% | | | | 0.62% | | | | 0.77% | | | | 0.70% | |
| | | | |
Total expenses after fees waived and/or reimbursed and paid indirectly and excluding interest expense and fees | | | 0.78% | 5,6 | | | 0.78% | 6 | | | 0.68% | 6 | | | 0.62% | | | | 0.77% | 6 | | | 0.69% | 6 |
| | | | |
Net investment income | | | 4.09% | 5 | | | 3.74% | | | | 4.19% | | | | 4.72% | | | | 4.57% | | | | 4.78% | |
| | | | |
| | | | | | | | | | | | | | | | | | | | | | | | |
| Supplemental Data | | | | | | | | | | | | | | | | | | | | | | | | |
Net assets, end of period (000) | | $ | 101,288 | | | $ | 120,851 | | | $ | 119,558 | | | $ | 114,377 | | | $ | 158,244 | | | $ | 156,814 | |
| | | | |
Portfolio turnover | | | 6% | | | | 8% | | | | 18% | | | | 14% | | | | 18% | | | | 17% | |
| | | | |
| 1 | | Based on average shares outstanding. |
| 2 | | Determined in accordance with federal income tax regulations. |
| 3 | | Where applicable, assumes the reinvestment of dividends and distributions. |
| 4 | | Aggregate total investment return. |
| 6 | | Interest expense and fees relate to TOBs. See Note 3 of the Notes to Financial Statements for details of municipal bonds transferred to TOBs. |
| | | | | | |
| See Notes to Financial Statements. | | | | |
| | | | | | | |
| | SEMI-ANNUAL REPORT | | NOVEMBER 30, 2013 | | 47 |
| | |
| Financial Highlights (continued) | | BlackRock New Jersey Municipal Bond Fund |
| | | | | | | | | | | | | | | | | | | | | | | | |
| | | Service | |
| | | Six Months Ended
November 30,
2013
(Unaudited) | | | Year Ended May 31, | |
| | | | 2013 | | | 2012 | | | 2011 | | | 2010 | | | 2009 | |
| | | | | | | | | | | | | | | | | | | | | | | | |
| Per Share Operating Performance | | | | | | | | | | | | | | | | | | | | | | | | |
Net asset value, beginning of period | | $ | 11.22 | | | $ | 11.26 | | | $ | 10.17 | | | $ | 10.45 | | | $ | 9.85 | | | $ | 10.30 | |
| | | | |
Net investment income1 | | | 0.21 | | | | 0.41 | | | | 0.43 | | | | 0.46 | | | | 0.46 | | | | 0.45 | |
Net realized and unrealized gain (loss) | | | (0.76 | ) | | | (0.01 | ) | | | 1.10 | | | | (0.28 | ) | | | 0.58 | | | | (0.46 | ) |
| | | | |
Net increase (decrease) from investment operations | | | (0.55 | ) | | | 0.40 | | | | 1.53 | | | | 0.18 | | | | 1.04 | | | | (0.01 | ) |
| | | | |
Dividends from net investment income | | | (0.21 | ) | | | (0.44 | )2 | | | (0.44 | )2 | | | (0.46 | )2 | | | (0.44 | )2 | | | (0.44 | )2 |
| | | | |
Net asset value, end of period | | $ | 10.46 | | | $ | 11.22 | | | $ | 11.26 | | | $ | 10.17 | | | $ | 10.45 | | | $ | 9.85 | |
| | | | |
| | | | | | | | | | | | | | | | | | | | | | | | |
| Total Investment Return3 | | | | | | | | | | | | | | | | | | | | | | | | |
Based on net asset value | | | (4.91)% | 4 | | | 3.47% | | | | 15.31% | | | | 1.76% | | | | 10.80% | | | | 0.10% | |
| | | | |
| | | | | | | | | | | | | | | | | | | | | | | | |
| Ratios to Average Net Assets | | | | | | | | | | | | | | | | | | | | | | | | |
Total expenses | | | 1.05% | 5 | | | 1.03% | | | | 1.02% | | | | 1.01% | | | | 1.03% | | | | 1.03% | |
| | | | |
Total expenses after fees waived and/or reimbursed and paid indirectly | | | 0.90% | 5 | | | 0.89% | | | | 0.88% | | | | 0.86% | | | | 0.87% | | | | 0.87% | |
| | | | |
Total expenses after fees waived and/or reimbursed and paid indirectly and excluding interest expense and fees | | | 0.87% | 5,6 | | | 0.87% | 6 | | | 0.87% | 6 | | | 0.86% | | | | 0.87% | 6 | | | 0.85% | 6 |
| | | | |
Net investment income | | | 4.00% | 5 | | | 3.64% | | | | 4.00% | | | | 4.50% | | | | 4.47% | | | | 4.62% | |
| | | | |
| | | | | | | | | | | | | | | | | | | | | | | | |
| Supplemental Data | | | | | | | | | | | | | | | | | | | | | | | | |
Net assets, end of period (000) | | $ | 17,228 | | | $ | 19,388 | | | $ | 14,375 | | | $ | 12,804 | | | $ | 10,521 | | | $ | 10,178 | |
| | | | |
Portfolio turnover | | | 6% | | | | 8% | | | | 18% | | | | 14% | | | | 18% | | | | 17% | |
| | | | |
| 1 | | Based on average shares outstanding. |
| 2 | | Determined in accordance with federal income tax regulations. |
| 3 | | Where applicable, assumes the reinvestment of dividends and distributions. |
| 4 | | Aggregate total investment return. |
| 6 | | Interest expense and fees relate to TOBs. See Note 3 of the Notes to Financial Statements for details of municipal bonds transferred to TOBs. |
| | | | | | |
| See Notes to Financial Statements. | | | | |
| | | | | | | |
| 48 | | SEMI-ANNUAL REPORT | | NOVEMBER 30, 2013 | | |
| | |
| Financial Highlights (continued) | | BlackRock New Jersey Municipal Bond Fund |
| | | | | | | | | | | | | | | | | | | | | | | | |
| | | Investor A | |
| | | Six Months Ended
November 30,
2013
(Unaudited) | | | Year Ended May 31, | |
| | | | 2013 | | | 2012 | | | 2011 | | | 2010 | | | 2009 | |
| | | | | | | | | | | | | | | | | | | | | | | | |
| Per Share Operating Performance | | | | | | | | | | | | | | | | | | | | | | | | |
Net asset value, beginning of period | | $ | 11.23 | | | $ | 11.27 | | | $ | 10.19 | | | $ | 10.46 | | | $ | 9.86 | | | $ | 10.31 | |
| | | | |
Net investment income1 | | | 0.21 | | | | 0.41 | | | | 0.43 | | | | 0.46 | | | | 0.46 | | | | 0.45 | |
Net realized and unrealized gain (loss) | | | (0.76 | ) | | | (0.01 | ) | | | 1.09 | | | | (0.27 | ) | | | 0.58 | | | | (0.46 | ) |
| | | | |
Net increase (decrease) from investment operations | | | (0.55 | ) | | | 0.40 | | | | 1.52 | | | | 0.19 | | | | 1.04 | | | | (0.01 | ) |
| | | | |
Dividends from net investment income | | | (0.21 | ) | | | (0.44 | )2 | | | (0.44 | )2 | | | (0.46 | )2 | | | (0.44 | )2 | | | (0.44 | )2 |
| | | | |
Net asset value, end of period | | $ | 10.47 | | | $ | 11.23 | | | $ | 11.27 | | | $ | 10.19 | | | $ | 10.46 | | | $ | 9.86 | |
| | | | |
| | | | | | | | | | | | | | | | | | | | | | | | |
| Total Investment Return3 | | | | | | | | | | | | | | | | | | | | | | | | |
Based on net asset value | | | (4.90)% | 4 | | | 3.47% | | | | 15.18% | | | | 1.86% | | | | 10.79% | | | | 0.11% | |
| | | | |
| | | | | | | | | | | | | | | | | | | | | | | | |
| Ratios to Average Net Assets | | | | | | | | | | | | | | | | | | | | | | | | |
Total expenses | | | 0.98% | 5 | | | 0.97% | | | | 0.95% | | | | 0.96% | | | | 0.97% | | | | 1.01% | |
| | | | |
Total expenses after fees waived and/or reimbursed and paid indirectly | | | 0.90% | 5 | | | 0.89% | | | | 0.88% | | | | 0.87% | | | | 0.87% | | | | 0.87% | |
| | | | |
Total expenses after fees waived and/or reimbursed and paid indirectly and excluding interest expense and fees | | | 0.87% | 5,6 | | | 0.87% | 6 | | | 0.87% | 6 | | | 0.87% | | | | 0.87% | 6 | | | 0.85% | 6 |
| | | | |
Net investment income | | | 4.00% | 5 | | | 3.64% | | | | 3.98% | | | | 4.48% | | | | 4.46% | | | | 4.62% | |
| | | | |
| | | | | | | | | | | | | | | | | | | | | | | | |
| Supplemental Data | | | | | | | | | | | | | | | | | | | | | | | | |
Net assets, end of period (000) | | $ | 40,102 | | | $ | 53,521 | | | $ | 37,824 | | | $ | 27,441 | | | $ | 27,210 | | | $ | 21,227 | |
| | | | |
Portfolio turnover | | | 6% | | | | 8% | | | | 18% | | | | 14% | | | | 18% | | | | 17% | |
| | | | |
| 1 | | Based on average shares outstanding. |
| 2 | | Determined in accordance with federal income tax regulations. |
| 3 | | Where applicable, excludes the effects of any sales charges and assumes the reinvestment of dividends and distributions. |
| 4 | | Aggregate total investment return. |
| 6 | | Interest expense and fees relate to TOBs. See Note 3 of the Notes to Financial Statements for details of municipal bonds transferred to TOBs. |
| | | | | | |
| See Notes to Financial Statements. | | | | |
| | | | | | | |
| | SEMI-ANNUAL REPORT | | NOVEMBER 30, 2013 | | 49 |
| | |
| Financial Highlights (continued) | | BlackRock New Jersey Municipal Bond Fund |
| | | | | | | | | | | | | | | | | | | | | | | | |
| | | Investor A1 | |
| | | Six Months Ended
November 30,
2013
(Unaudited) | | | Year Ended May 31, | |
| | | | 2013 | | | 2012 | | | 2011 | | | 2010 | | | 2009 | |
| | | | | | | | | | | | | | | | | | | | | | | | |
| Per Share Operating Performance | | | | | | | | | | | | | | | | | | | | | | | | |
Net asset value, beginning of period | | $ | 11.23 | | | $ | 11.27 | | | $ | 10.19 | | | $ | 10.46 | | | $ | 9.86 | | | $ | 10.31 | |
| | | | |
Net investment income1 | | | 0.21 | | | | 0.43 | | | | 0.44 | | | | 0.48 | | | | 0.47 | | | | 0.46 | |
Net realized and unrealized gain (loss) | | | (0.75 | ) | | | (0.02 | ) | | | 1.09 | | | | (0.28 | ) | | | 0.59 | | | | (0.45 | ) |
| | | | |
Net increase (decrease) from investment operations | | | (0.54 | ) | | | 0.41 | | | | 1.53 | | | | 0.20 | | | | 1.06 | | | | 0.01 | |
| | | | |
Dividends from net investment income | | | (0.22 | ) | | | (0.45 | )2 | | | (0.45 | )2 | | | (0.47 | )2 | | | (0.46 | )2 | | | (0.46 | )2 |
| | | | |
Net asset value, end of period | | $ | 10.47 | �� | | $ | 11.23 | | | $ | 11.27 | | | $ | 10.19 | | | $ | 10.46 | | | $ | 9.86 | |
| | | | |
| | | | | | | | | | | | | | | | | | | | | | | | |
| Total Investment Return3 | | | | | | | | | | | | | | | | | | | | | | | | |
Based on net asset value | | | (4.83)% | 4 | | | 3.62% | | | | 15.35% | | | | 2.02% | | | | 10.96% | | | | 0.26% | |
| | | | |
| | | | | | | | | | | | | | | | | | | | | | | | |
| Ratios to Average Net Assets | | | | | | | | | | | | | | | | | | | | | | | | |
Total expenses | | | 0.83% | 5 | | | 0.82% | | | | 0.82% | | | | 0.81% | | | | 0.83% | | | | 0.86% | |
| | | | |
Total expenses after fees waived and/or reimbursed and paid indirectly | | | 0.75% | 5 | | | 0.74% | | | | 0.73% | | | | 0.71% | | | | 0.72% | | | | 0.72% | |
| | | | |
Total expenses after fees waived and/or reimbursed and paid indirectly and excluding interest expense and fees | | | 0.72% | 5,6 | | | 0.72% | 6 | | | 0.72% | 6 | | | 0.71% | | | | 0.72% | 6 | | | 0.70% | 6 |
| | | | |
Net investment income | | | 4.15% | 5 | | | 3.80% | | | | 4.14% | | | | 4.64% | | | | 4.62% | | | | 4.77% | |
| | | | |
| | | | | | | | | | | | | | | | | | | | | | | | |
| Supplemental Data | | | | | | | | | | | | | | | | | | | | | | | | |
Net assets, end of period (000) | | $ | 31,624 | | | $ | 34,941 | | | $ | 36,387 | | | $ | 33,063 | | | $ | 36,704 | | | $ | 36,008 | |
| | | | |
Portfolio turnover | | | 6% | | | | 8% | | | | 18% | | | | 14% | | | | 18% | | | | 17% | |
| | | | |
| 1 | | Based on average shares outstanding. |
| 2 | | Determined in accordance with federal income tax regulations. |
| 3 | | Where applicable, excludes the effects of any sales charges and assumes the reinvestment of dividends and distributions. |
| 4 | | Aggregate total investment return. |
| 6 | | Interest expense and fees relate to TOBs. See Note 3 of the Notes to Financial Statements for details of municipal bonds transferred to TOBs. |
| | | | | | |
| See Notes to Financial Statements. | | | | |
| | | | | | | |
| 50 | | SEMI-ANNUAL REPORT | | NOVEMBER 30, 2013 | | |
| | |
| Financial Highlights (continued) | | BlackRock New Jersey Municipal Bond Fund |
| | | | | | | | | | | | | | | | | | | | | | | | |
| | | Investor C | |
| | | Six Months Ended
November 30,
2013
(Unaudited) | | | Year Ended May 31, | |
| | | | 2013 | | | 2012 | | | 2011 | | | 2010 | | | 2009 | |
| | | | | | | | | | | | | | | | | | | | | | | | |
| Per Share Operating Performance | | | | | | | | | | | | | | | | | | | | | | | | |
Net asset value, beginning of period | | $ | 11.21 | | | $ | 11.25 | | | $ | 10.17 | | | $ | 10.45 | | | $ | 9.84 | | | $ | 10.30 | |
| | | | |
Net investment income1 | | | 0.17 | | | | 0.33 | | | | 0.34 | | | | 0.38 | | | | 0.38 | | | | 0.37 | |
Net realized and unrealized gain (loss) | | | (0.75 | ) | | | (0.02 | ) | | | 1.09 | | | | (0.28 | ) | | | 0.60 | | | | (0.46 | ) |
| | | | |
Net increase (decrease) from investment operations | | | (0.58 | ) | | | 0.31 | | | | 1.43 | | | | 0.10 | | | | 0.98 | | | | (0.09 | ) |
| | | | |
Dividends from net investment income | | | (0.17 | ) | | | (0.35 | )2 | | | (0.35 | )2 | | | (0.38 | )2 | | | (0.37 | )2 | | | (0.37 | )2 |
| | | | |
Net asset value, end of period | | $ | 10.46 | | | $ | 11.21 | | | $ | 11.25 | | | $ | 10.17 | | | $ | 10.45 | | | $ | 9.84 | |
| | | | |
| | | | | | | | | | | | | | | | | | | | | | | | |
| Total Investment Return3 | | | | | | | | | | | | | | | | | | | | | | | | |
Based on net asset value | | | (5.19)% | 4 | | | 2.68% | | | | 14.33% | | | | 0.98% | | | | 10.07% | | | | (0.74)% | |
| | | | |
| | | | | | | | | | | | | | | | | | | | | | | | |
| Ratios to Average Net Assets | | | | | | | | | | | | | | | | | | | | | | | | |
Total expenses | | | 1.73% | 5 | | | 1.72% | | | | 1.71% | | | | 1.71% | | | | 1.73% | | | | 1.75% | |
| | | | |
Total expenses after fees waived and/or reimbursed and paid indirectly | | | 1.67% | 5 | | | 1.66% | | | | 1.65% | | | | 1.64% | | | | 1.64% | | | | 1.62% | |
| | | | |
Total expenses after fees waived and/or reimbursed and paid indirectly and excluding interest expense and fees | | | 1.64% | 5,6 | | | 1.64% | 6 | | | 1.64% | 6 | | | 1.64% | | | | 1.64% | 6 | | | 1.60% | 6 |
| | | | |
Net investment income | | | 3.23% | 5 | | | 2.87% | | | | 3.22% | | | | 3.71% | | | | 3.69% | | | | 3.89% | |
| | | | |
| | | | | | | | | | | | | | | | | | | | | | | | |
| Supplemental Data | | | | | | | | | | | | | | | | | | | | | | | | |
Net assets, end of period (000) | | $ | 24,623 | | | $ | 30,139 | | | $ | 22,635 | | | $ | 17,639 | | | $ | 18,802 | | | $ | 14,969 | |
| | | | |
Portfolio turnover | | | 6% | | | | 8% | | | | 18% | | | | 14% | | | | 18% | | | | 17% | |
| | | | |
| 1 | | Based on average shares outstanding. |
| 2 | | Determined in accordance with federal income tax regulations. |
| 3 | | Where applicable, excludes the effects of any sales charges and assumes the reinvestment of dividends and distributions. |
| 4 | | Aggregate total investment return. |
| 6 | | Interest expense and fees relate to TOBs. See Note 3 of the Notes to Financial Statements for details of municipal bonds transferred to TOBs. |
| | | | | | |
| See Notes to Financial Statements. | | | | |
| | | | | | | |
| | SEMI-ANNUAL REPORT | | NOVEMBER 30, 2013 | | 51 |
| | |
| Financial Highlights (concluded) | | BlackRock New Jersey Municipal Bond Fund |
| | | | | | | | | | | | | | | | | | | | | | | | |
| | | Investor C1 | |
| | | Six Months Ended
November 30,
2013
(Unaudited) | | | Year Ended May 31, | |
| | | | 2013 | | | 2012 | | | 2011 | | | 2010 | | | 2009 | |
| | | | | | | | | | | | | | | | | | | | | | | | |
| Per Share Operating Performance | | | | | | | | | | | | | | | | | | | | | | | | |
Net asset value, beginning of period | | $ | 11.22 | | | $ | 11.26 | | | $ | 10.17 | | | $ | 10.45 | | | $ | 9.85 | | | $ | 10.30 | |
| | | | |
Net investment income1 | | | 0.19 | | | | 0.38 | | | | 0.39 | | | | 0.42 | | | | 0.42 | | | | 0.41 | |
Net realized and unrealized gain (loss) | | | (0.76 | ) | | | (0.02 | ) | | | 1.10 | | | | (0.28 | ) | | | 0.59 | | | | (0.45 | ) |
| | | | |
Net increase (decrease) from investment operations | | | (0.57 | ) | | | 0.36 | | | | 1.49 | | | | 0.14 | | | | 1.01 | | | | (0.04 | ) |
| | | | |
Dividends from net investment income | | | (0.19 | ) | | | (0.40 | )2 | | | (0.40 | )2 | | | (0.42 | )2 | | | (0.41 | )2 | | | (0.41 | )2 |
| | | | |
Net asset value, end of period | | $ | 10.46 | | | $ | 11.22 | | | $ | 11.26 | | | $ | 10.17 | | | $ | 10.45 | | | $ | 9.85 | |
| | | | |
| | | | | | | | | | | | | | | | | | | | | | | | |
| Total Investment Return3 | | | | | | | | | | | | | | | | | | | | | | | | |
Based on net asset value | | | (5.08)% | 4 | | | 3.10% | | | | 14.89% | | | | 1.40% | | | | 10.41% | | | | (0.24)% | |
| | | | |
| | | | | | | | | | | | | | | | | | | | | | | | |
| Ratios to Average Net Assets | | | | | | | | | | | | | | | | | | | | | | | | |
Total expenses | | | 1.33% | 5 | | | 1.32% | | | | 1.31% | | | | 1.30% | | | | 1.32% | | | | 1.34% | |
| | | | |
Total expenses after fees waived and/or reimbursed and paid indirectly | | | 1.26% | 5 | | | 1.25% | | | | 1.24% | | | | 1.22% | | | | 1.23% | | | | 1.22% | |
| | | | |
Total expenses after fees waived and/or reimbursed and paid indirectly and excluding interest expense and fees | | | 1.23% | 5,6 | | | 1.23% | 6 | | | 1.23% | 6 | | | 1.22% | | | | 1.23% | 6 | | | 1.20% | 6 |
| | | | |
Net investment income | | | 3.64% | 5 | | | 3.29% | | | | 3.65% | | | | 4.14% | | | | 4.11% | | | | 4.27% | |
| | | | |
| | | | | | | | | | | | | | | | | | | | | | | | |
| Supplemental Data | | | | | | | | | | | | | | | | | | | | | | | | |
Net assets, end of period (000) | | $ | 8,381 | | | $ | 10,070 | | | $ | 11,228 | | | $ | 12,948 | | | $ | 14,942 | | | $ | 14,821 | |
| | | | |
Portfolio turnover | | | 6% | | | | 8% | | | | 18% | | | | 14% | | | | 18% | | | | 17% | |
| | | | |
| 1 | | Based on average shares outstanding. |
| 2 | | Determined in accordance with federal income tax regulations. |
| 3 | | Where applicable, excludes the effects of any sales charges and assumes the reinvestment of dividends and distributions. |
| 4 | | Aggregate total investment return. |
| 6 | | Interest expense and fees relate to TOBs. See Note 3 of the Notes to Financial Statements for details of municipal bonds transferred to TOBs. |
| | | | | | |
| See Notes to Financial Statements. | | | | |
| | | | | | | |
| 52 | | SEMI-ANNUAL REPORT | | NOVEMBER 30, 2013 | | |
| | |
| Financial Highlights | | BlackRock Pennsylvania Municipal Bond Fund |
| | | | | | | | | | | | | | | | | | | | | | | | |
| | | Institutional | |
| | | Six Months Ended
November 30,
2013
(Unaudited) | | | Year Ended May 31, | |
| | | | 2013 | | | 2012 | | | 2011 | | | 2010 | | | 2009 | |
| | | | | | | | | | | | | | | | | | | | | | | | |
| Per Share Operating Performance | | | | | | | | | | | | | | | | | | | | | | | | |
Net asset value, beginning of period | | $ | 11.54 | | | $ | 11.60 | | | $ | 10.62 | | | $ | 10.93 | | | $ | 10.34 | | | $ | 10.79 | |
| | | | |
Net investment income1 | | | 0.24 | | | | 0.49 | | | | 0.51 | | | | 0.52 | | | | 0.49 | | | | 0.48 | |
Net realized and unrealized gain (loss) | | | (0.89 | ) | | | (0.06 | ) | | | 0.98 | | | | (0.31 | ) | | | 0.59 | | | | (0.44 | ) |
| | | | |
Net increase (decrease) from investment operations | | | (0.65 | ) | | | 0.43 | | | | 1.49 | | | | 0.21 | | | | 1.08 | | | | 0.04 | |
| | | | |
Dividends from net investment income | | | (0.24 | ) | | | (0.49 | )2 | | | (0.51 | )2 | | | (0.52 | )2 | | | (0.49 | )2 | | | (0.49 | )2 |
| | | | |
Net asset value, end of period | | $ | 10.65 | | | $ | 11.54 | | | $ | 11.60 | | | $ | 10.62 | | | $ | 10.93 | | | $ | 10.34 | |
| | | | |
| | | | | | | | | | | | | | | | | | | | | | | | |
| Total Investment Return3 | | | | | | | | | | | | | | | | | | | | | | | | |
Based on net asset value | | | (5.65)% | 4 | | | 3.71% | | | | 14.29% | | | | 1.99% | | | | 10.61% | | | | 0.52% | |
| | | | |
| | | | | | | | | | | | | | | | | | | | | | | | |
| Ratios to Average Net Assets | | | | | | | | | | | | | | | | | | | | | | | | |
Total expenses | | | 0.91% | 5 | | | 0.92% | | | | 0.91% | | | | 0.91% | | | | 0.86% | | | | 0.68% | |
| | | | |
Total expenses after fees waived and/or reimbursed and paid indirectly | | | 0.79% | 5 | | | 0.82% | | | | 0.78% | | | | 0.71% | | | | 0.74% | | | | 0.66% | |
| | | | |
Total expenses after fees waived and/or reimbursed and paid indirectly and excluding interest expense and fees6 | | | 0.71% | 5 | | | 0.71% | | | | 0.67% | | | | 0.62% | | | | 0.70% | | | | 0.63% | |
| | | | |
Net investment income | | | 4.41% | 5 | | | 4.16% | | | | 4.58% | | | | 4.86% | | | | 4.55% | | | | 4.77% | |
| | | | |
| | | | | | | | | | | | | | | | | | | | | | | | |
| Supplemental Data | | | | | | | | | | | | | | | | | | | | | | | | |
Net assets, end of period (000) | | $ | 321,042 | | | $ | 397,618 | | | $ | 403,032 | | | $ | 387,251 | | | $ | 445,217 | | | $ | 416,433 | |
| | | | |
Portfolio turnover | | | 4% | | | | 10% | | | | 24% | | | | 25% | | | | 26% | | | | 20% | |
| | | | |
| 1 | | Based on average shares outstanding. |
| 2 | | Determined in accordance with federal income tax regulations. |
| 3 | | Where applicable, assumes the reinvestment of dividends and distributions. |
| 4 | | Aggregate total investment return. |
| 6 | | Interest expense and fees relate to TOBs. See Note 3 of the Notes to Financial Statements for details of municipal bonds transferred to TOBs. |
| | | | | | |
| See Notes to Financial Statements. | | | | |
| | | | | | | |
| | SEMI-ANNUAL REPORT | | NOVEMBER 30, 2013 | | 53 |
| | |
| Financial Highlights (continued) | | BlackRock Pennsylvania Municipal Bond Fund |
| | | | | | | | | | | | | | | | | | | | | | | | |
| | | Service | |
| | | Six Months Ended
November 30,
2013
(Unaudited) | | | Year Ended May 31, | |
| | | | 2013 | | | 2012 | | | 2011 | | | 2010 | | | 2009 | |
| | | | | | | | | | | | | | | | | | | | | | | | |
| Per Share Operating Performance | | | | | | | | | | | | | | | | | | | | | | | | |
Net asset value, beginning of period | | $ | 11.54 | | | $ | 11.60 | | | $ | 10.62 | | | $ | 10.93 | | | $ | 10.34 | | | $ | 10.80 | |
| | | | |
Net investment income1 | | | 0.23 | | | | 0.46 | | | | 0.48 | | | | 0.49 | | | | 0.46 | | | | 0.45 | |
Net realized and unrealized gain (loss) | | | (0.89 | ) | | | (0.05 | ) | | | 0.98 | | | | (0.30 | ) | | | 0.60 | | | | (0.45 | ) |
| | | | |
Net increase (decrease) from investment operations | | | (0.66 | ) | | | 0.41 | | | | 1.46 | | | | 0.19 | | | | 1.06 | | | | — | |
| | | | |
Dividends from net investment income | | | (0.23 | ) | | | (0.47 | )2 | | | (0.48 | )2 | | | (0.50 | )2 | | | (0.47 | )2 | | | (0.46 | )2 |
| | | | |
Net asset value, end of period | | $ | 10.65 | | | $ | 11.54 | | | $ | 11.60 | | | $ | 10.62 | | | $ | 10.93 | | | $ | 10.34 | |
| | | | |
| | | | | | | | | | | | | | | | | | | | | | | | |
| Total Investment Return3 | | | | | | | | | | | | | | | | | | | | | | | | |
Based on net asset value | | | (5.73)% | 4 | | | 3.53% | | | | 14.05% | | | | 1.81% | | | | 10.41% | | | | 0.21% | |
| | | | |
| | | | | | | | | | | | | | | | | | | | | | | | |
| Ratios to Average Net Assets | | | | | | | | | | | | | | | | | | | | | | | | |
Total expenses | | | 1.06% | 5 | | | 1.10% | | | | 1.10% | | | | 1.08% | | | | 1.07% | | | | 0.95% | |
| | | | |
Total expenses after fees waived and/or reimbursed and paid indirectly | | | 0.97% | 5 | | | 1.00% | | | | 0.99% | | | | 0.91% | | | | 0.92% | | | | 0.88% | |
| | | | |
Total expenses after fees waived and/or reimbursed and paid indirectly and excluding interest expense and fees6 | | | 0.89% | 5 | | | 0.89% | | | | 0.89% | | | | 0.82% | | | | 0.88% | | | | 0.85% | |
| | | | |
Net investment income | | | 4.23% | 5 | | | 3.97% | | | | 4.34% | | | | 4.71% | | | | 4.38% | | | | 4.56% | |
| | | | |
| | | | | | | | | | | | | | | | | | | | | | | | |
| Supplemental Data | | | | | | | | | | | | | | | | | | | | | | | | |
Net assets, end of period (000) | | $ | 6,639 | | | $ | 7,973 | | | $ | 3,912 | | | $ | 2,648 | | | $ | 1,302 | | | $ | 1,486 | |
| | | | |
Portfolio turnover | | | 4% | | | | 10% | | | | 24% | | | | 25% | | | | 26% | | | | 20% | |
| | | | |
| 1 | | Based on average shares outstanding. |
| 2 | | Determined in accordance with federal income tax regulations. |
| 3 | | Where applicable, assumes the reinvestment of dividends and distributions. |
| 4 | | Aggregate total investment return. |
| 6 | | Interest expense and fees relate to TOBs. See Note 3 of the Notes to Financial Statements for details of municipal bonds transferred to TOBs. |
| | | | | | |
| See Notes to Financial Statements. | | | | |
| | | | | | | |
| 54 | | SEMI-ANNUAL REPORT | | NOVEMBER 30, 2013 | | |
| | |
| Financial Highlights (continued) | | BlackRock Pennsylvania Municipal Bond Fund |
| | | | | | | | | | | | | | | | | | | | | | | | |
| | | Investor A | |
| | | Six Months Ended
November 30,
2013
(Unaudited) | | | Year Ended May 31, | |
| | | | 2013 | | | 2012 | | | 2011 | | | 2010 | | | 2009 | |
| | | | | | | | | | | | | | | | | | | | | | | | |
| Per Share Operating Performance | | | | | | | | | | | | | | | | | | | | | | | | |
Net asset value, beginning of period | | $ | 11.55 | | | $ | 11.61 | | | $ | 10.63 | | | $ | 10.94 | | | $ | 10.35 | | | $ | 10.81 | |
| | | | |
Net investment income1 | | | 0.23 | | | | 0.46 | | | | 0.49 | | | | 0.49 | | | | 0.47 | | | | 0.46 | |
Net realized and unrealized gain (loss) | | | (0.89 | ) | | | (0.05 | ) | | | 0.97 | | | | (0.31 | ) | | | 0.59 | | | | (0.46 | ) |
| | | | |
Net increase (decrease) from investment operations | | | (0.66 | ) | | | 0.41 | | | | 1.46 | | | | 0.18 | | | | 1.06 | | | | — | |
| | | | |
Dividends from net investment income | | | (0.23 | ) | | | (0.47 | )2 | | | (0.48 | )2 | | | (0.49 | )2 | | | (0.47 | )2 | | | (0.46 | )2 |
| | | | |
Net asset value, end of period | | $ | 10.66 | | | $ | 11.55 | | | $ | 11.61 | | | $ | 10.63 | | | $ | 10.94 | | | $ | 10.35 | |
| | | | |
| | | | | | | | | | | | | | | | | | | | | | | | |
| Total Investment Return3 | | | | | | | | | | | | | | | | | | | | | | | | |
Based on net asset value | | | (5.73)% | 4 | | | 3.53% | | | | 14.04% | | | | 1.76% | | | | 10.40% | | | | 0.21% | |
| | | | |
| | | | | | | | | | | | | | | | | | | | | | | | |
| Ratios to Average Net Assets | | | | | | | | | | | | | | | | | | | | | | | | |
Total expenses | | | 1.03% | 5 | | | 1.06% | | | | 1.03% | | | | 1.02% | | | | 0.98% | | | | 0.98% | |
| | | | |
Total expenses after fees waived and/or reimbursed and paid indirectly | | | 0.97% | 5 | | | 1.00% | | | | 0.99% | | | | 0.94% | | | | 0.93% | | | | 0.88% | |
| | | | |
Total expenses after fees waived and/or reimbursed and paid indirectly and excluding interest expense and fees6 | | | 0.89% | 5 | | | 0.89% | | | | 0.89% | | | | 0.85% | | | | 0.89% | | | | 0.85% | |
| | | | |
Net investment income | | | 4.23% | 5 | | | 3.97% | | | | 4.36% | | | | 4.63% | | | | 4.37% | | | | 4.56% | |
| | | | |
| | | | | | | | | | | | | | | | | | | | | | | | |
| Supplemental Data | | | | | | | | | | | | | | | | | | | | | | | | |
Net assets, end of period (000) | | $ | 50,879 | | | $ | 61,553 | | | $ | 42,275 | | | $ | 33,779 | | | $ | 35,515 | | | $ | 30,849 | |
| | | | |
Portfolio turnover | | | 4% | | | | 10% | | | | 24% | | | | 25% | | | | 26% | | | | 20% | |
| | | | |
| 1 | | Based on average shares outstanding. |
| 2 | | Determined in accordance with federal income tax regulations. |
| 3 | | Where applicable, excludes the effects of any sales charges and assumes the reinvestment of dividends and distributions. |
| 4 | | Aggregate total investment return. |
| 6 | | Interest expense and fees relate to TOBs. See Note 3 of the Notes to Financial Statements for details of municipal bonds transferred to TOBs. |
| | | | | | |
| See Notes to Financial Statements. | | | | |
| | | | | | | |
| | SEMI-ANNUAL REPORT | | NOVEMBER 30, 2013 | | 55 |
| | |
| Financial Highlights (continued) | | BlackRock Pennsylvania Municipal Bond Fund |
| | | | | | | | | | | | | | | | | | | | | | | | |
| | | Investor A1 | |
| | | Six Months Ended
November 30,
2013
(Unaudited) | | | Year Ended May 31, | |
| | | | 2013 | | | 2012 | | | 2011 | | | 2010 | | | 2009 | |
| | | | | | | | | | | | | | | | | | | | | | | | |
| Per Share Operating Performance | | | | | | | | | | | | | | | | | | | | | | | | |
Net asset value, beginning of period | | $ | 11.55 | | | $ | 11.61 | | | $ | 10.63 | | | $ | 10.94 | | | $ | 10.35 | | | $ | 10.81 | |
| | | | |
Net investment income1 | | | 0.23 | | | | 0.49 | | | | 0.51 | | | | 0.51 | | | | 0.48 | | | | 0.48 | |
Net realized and unrealized gain (loss) | | | (0.89 | ) | | | (0.06 | ) | | | 0.97 | | | | (0.31 | ) | | | 0.59 | | | | (0.46 | ) |
| | | | |
Net increase (decrease) from investment operations | | | (0.66 | ) | | | 0.43 | | | | 1.48 | | | | 0.20 | | | | 1.07 | | | | 0.02 | |
| | | | |
Dividends from net investment income | | | (0.23 | ) | | | (0.49 | )2 | | | (0.50 | )2 | | | (0.51 | )2 | | | (0.48 | )2 | | | (0.48 | )2 |
| | | | |
Net asset value, end of period | | $ | 10.66 | | | $ | 11.55 | | | $ | 11.61 | | | $ | 10.63 | | | $ | 10.94 | | | $ | 10.35 | |
| | | | |
| | | | | | | | | | | | | | | | | | | | | | | | |
| Total Investment Return3 | | | | | | | | | | | | | | | | | | | | | | | | |
Based on net asset value | | | (5.65)% | 4 | | | 3.69% | | | | 14.22% | | | | 1.94% | | | | 10.58% | | | | 0.36% | |
| | | | |
| | | | | | | | | | | | | | | | | | | | | | | | |
| Ratios to Average Net Assets | | | | | | | | | | | | | | | | | | | | | | | | |
Total expenses | | | 0.87% | 5 | | | 0.89% | | | | 0.89% | | | | 0.88% | | | | 0.84% | | | | 0.83% | |
| | | | |
Total expenses after fees waived and/or reimbursed and paid indirectly | | | 0.81% | 5 | | | 0.84% | | | | 0.83% | | | | 0.76% | | | | 0.77% | | | | 0.73% | |
| | | | |
Total expenses after fees waived and/or reimbursed and paid indirectly and excluding interest expense and fees6 | | | 0.73% | 5 | | | 0.73% | | | | 0.73% | | | | 0.67% | | | | 0.73% | | | | 0.70% | |
| | | | |
Net investment income | | | 4.39% | 5 | | | 4.14% | | | | 4.52% | | | | 4.81% | | | | 4.53% | | | | 4.71% | |
| | | | |
| | | | | | | | | | | | | | | | | | | | | | | | |
| Supplemental Data | | | | | | | | | | | | | | | | | | | | | | | | |
Net assets, end of period (000) | | $ | 17,508 | | | $ | 21,169 | | | $ | 22,677 | | | $ | 20,940 | | | $ | 22,892 | | | $ | 22,855 | |
| | | | |
Portfolio turnover | | | 4% | | | | 10% | | | | 24% | | | | 25% | | | | 26% | | | | 20% | |
| | | | |
| 1 | | Based on average shares outstanding. |
| 2 | | Determined in accordance with federal income tax regulations. |
| 3 | | Where applicable, excludes the effects of any sales charges and assumes the reinvestment of dividends and distributions. |
| 4 | | Aggregate total investment return. |
| 6 | | Interest expense and fees relate to TOBs. See Note 3 of the Notes to Financial Statements for details of municipal bonds transferred to TOBs. |
| | | | | | |
| See Notes to Financial Statements. | | | | |
| | | | | | | |
| 56 | | SEMI-ANNUAL REPORT | | NOVEMBER 30, 2013 | | |
| | |
| Financial Highlights (continued) | | BlackRock Pennsylvania Municipal Bond Fund |
| | | | | | | | | | | | | | | | | | | | | | | | |
| | | Investor C | |
| | | Six Months Ended
November 30,
2013
(Unaudited) | | | Year Ended May 31, | |
| | | | 2013 | | | 2012 | | | 2011 | | | 2010 | | | 2009 | |
| | | | | | | | | | | | | | | | | | | | | | | | |
| Per Share Operating Performance | | | | | | | | | | | | | | | | | | | | | | | | |
Net asset value, beginning of period | | $ | 11.55 | | | $ | 11.61 | | | $ | 10.63 | | | $ | 10.94 | | | $ | 10.35 | | | $ | 10.80 | |
| | | | |
Net investment income1 | | | 0.18 | | | | 0.37 | | | | 0.39 | | | | 0.41 | | | | 0.38 | | | | 0.38 | |
Net realized and unrealized gain (loss) | | | (0.89 | ) | | | (0.05 | ) | | | 0.99 | | | | (0.31 | ) | | | 0.59 | | | | (0.44 | ) |
| | | | |
Net increase (decrease) from investment operations | | | (0.71 | ) | | | 0.32 | | | | 1.38 | | | | 0.10 | | | | 0.97 | | | | (0.06 | ) |
| | | | |
Dividends from net investment income | | | (0.18 | ) | | | (0.38 | )2 | | | (0.40 | )2 | | | (0.41 | )2 | | | (0.38 | )2 | | | (0.39 | )2 |
| | | | |
Net asset value, end of period | | $ | 10.66 | | | $ | 11.55 | | | $ | 11.61 | | | $ | 10.63 | | | $ | 10.94 | | | $ | 10.35 | |
| | | | |
| | | | | | | | | | | | | | | | | | | | | | | | |
| Total Investment Return3 | | | | | | | | | | | | | | | | | | | | | | | | |
Based on net asset value | | | (6.10)% | 4 | | | 2.73% | | | | 13.15% | | | | 0.94% | | | | 9.54% | | | | (0.44)% | |
| | | | |
| | | | | | | | | | | | | | | | | | | | | | | | |
| Ratios to Average Net Assets | | | | | | | | | | | | | | | | | | | | | | | | |
Total expenses | | | 1.78% | 5 | | | 1.79% | | | | 1.80% | | | | 1.78% | | | | 1.74% | | | | 1.72% | |
| | | | |
Total expenses after fees waived and/or reimbursed and paid indirectly | | | 1.76% | 5 | | | 1.78% | | | | 1.78% | | | | 1.76% | | | | 1.71% | | | | 1.63% | |
| | | | |
Total expenses after fees waived and/or reimbursed and paid indirectly and excluding interest expense and fees6 | | | 1.68% | 5 | | | 1.67% | | | | 1.68% | | | | 1.66% | | | | 1.67% | | | | 1.60% | |
| | | | |
Net investment income | | | 3.43% | 5 | | | 3.20% | | | | 3.56% | | | | 3.82% | | | | 3.58% | | | | 3.83% | |
| | | | |
| | | | | | | | | | | | | | | | | | | | | | | | |
| Supplemental Data | | | | | | | | | | | | | | | | | | | | | | | | |
Net assets, end of period (000) | | $ | 24,459 | | | $ | 32,733 | | | $ | 24,714 | | | $ | 16,603 | | | $ | 17,283 | | | $ | 12,278 | |
| | | | |
Portfolio turnover | | | 4% | | | | 10% | | | | 24% | | | | 25% | | | | 26% | | | | 20% | |
| | | | |
| 1 | | Based on average shares outstanding. |
| 2 | | Determined in accordance with federal income tax regulations. |
| 3 | | Where applicable, excludes the effects of any sales charges and assumes the reinvestment of dividends and distributions. |
| 4 | | Aggregate total investment return. |
| 6 | | Interest expense and fees relate to TOBs. See Note 3 of the Notes to Financial Statements for details of municipal bonds transferred to TOBs. |
| | | | | | |
| See Notes to Financial Statements. | | | | |
| | | | | | | |
| | SEMI-ANNUAL REPORT | | NOVEMBER 30, 2013 | | 57 |
| | |
| Financial Highlights (concluded) | | BlackRock Pennsylvania Municipal Bond Fund |
| | | | | | | | | | | | | | | | | | | | | | | | |
| | | Investor C1 | |
| | | Six Months Ended
November 30,
2013
(Unaudited) | | | Year Ended May 31, | |
| | | | 2013 | | | 2012 | | | 2011 | | | 2010 | | | 2009 | |
| | | | | | | | | | | | | | | | | | | | | | | | |
| Per Share Operating Performance | | | | | | | | | | | | | | | | | | | | | | | | |
Net asset value, beginning of period | | $ | 11.54 | | | $ | 11.60 | | | $ | 10.62 | | | $ | 10.93 | | | $ | 10.34 | | | $ | 10.79 | |
| | | | |
Net investment income1 | | | 0.21 | | | | 0.42 | | | | 0.45 | | | | 0.46 | | | | 0.43 | | | | 0.43 | |
Net realized and unrealized gain (loss) | | | (0.89 | ) | | | (0.05 | ) | | | 0.97 | | | | (0.31 | ) | | | 0.59 | | | | (0.45 | ) |
| | | | |
Net increase (decrease) from investment operations | | | (0.68 | ) | | | 0.37 | | | | 1.42 | | | | 0.15 | | | | 1.02 | | | | (0.02 | ) |
| | | | |
Dividends from net investment income | | | (0.21 | ) | | | (0.43 | )2 | | | (0.44 | )2 | | | (0.46 | )2 | | | (0.43 | )2 | | | (0.43 | )2 |
| | | | |
Net asset value, end of period | | $ | 10.65 | | | $ | 11.54 | | | $ | 11.60 | | | $ | 10.62 | | | $ | 10.93 | | | $ | 10.34 | |
| | | | |
| | | | | | | | | | | | | | | | | | | | | | | | |
| Total Investment Return3 | | | | | | | | | | | | | | | | | | | | | | | | |
Based on net asset value | | | (5.91)% | 4 | | | 3.15% | | | | 13.63% | | | | 1.42% | | | | 10.01% | | | | (0.05)% | |
| | | | |
| | | | | | | | | | | | | | | | | | | | | | | | |
| Ratios to Average Net Assets | | | | | | | | | | | | | | | | | | | | | | | | |
Total expenses | | | 1.36% | 5 | | | 1.37% | | | | 1.38% | | | | 1.37% | | | | 1.33% | | | | 1.32% | |
| | | | |
Total expenses after fees waived and/or reimbursed and paid indirectly | | | 1.34% | 5 | | | 1.37% | | | | 1.36% | | | | 1.27% | | | | 1.29% | | | | 1.23% | |
| | | | |
Total expenses after fees waived and/or reimbursed and paid indirectly and excluding interest expense and fees6 | | | 1.26% | 5 | | | 1.26% | | | | 1.26% | | | | 1.18% | | | | 1.25% | | | | 1.20% | |
| | | | |
Net investment income | | | 3.86% | 5 | | | 3.62% | | | | 3.99% | | | | 4.29% | | | | 4.01% | | | | 4.21% | |
| | | | |
| | | | | | | | | | | | | | | | | | | | | | | | |
| Supplemental Data | | | | | | | | | | | | | | | | | | | | | | | | |
Net assets, end of period (000) | | $ | 5,665 | | | $ | 7,386 | | | $ | 7,988 | | | $ | 7,989 | | | $ | 10,805 | | | $ | 11,324 | |
| | | | |
Portfolio turnover | | | 4% | | | | 10% | | | | 24% | | | | 25% | | | | 26% | | | | 20% | |
| | | | |
| 1 | | Based on average shares outstanding. |
| 2 | | Determined in accordance with federal income tax regulations. |
| 3 | | Where applicable, excludes the effects of any sales charges and assumes the reinvestment of dividends and distributions. |
| 4 | | Aggregate total investment return. |
| 6 | | Interest expense and fees relate to TOBs. See Note 3 of the Notes to Financial Statements for details of municipal bonds transferred to TOBs. |
| | | | | | |
| See Notes to Financial Statements. | | | | |
| | | | | | | |
| 58 | | SEMI-ANNUAL REPORT | | NOVEMBER 30, 2013 | | |
| | |
| Financial Highlights | | BlackRock Strategic Municipal Opportunities Fund |
| | | | | | | | | | | | | | | | | | | | | | | | |
| | | Institutional | |
| | | Six Months Ended
November 30,
2013
(Unaudited) | | | Year Ended May 31, | |
| | | | 2013 | | | 2012 | | | 2011 | | | 2010 | | | 2009 | |
| | | | | | | | | | | | | | | | | | | | | | | | |
| Per Share Operating Performance | | | | | | | | | | | | | | | | | | | | | | | | |
Net asset value, beginning of period | | $ | 11.41 | | | $ | 11.36 | | | $ | 10.52 | | | $ | 10.50 | | | $ | 9.96 | | | $ | 10.13 | |
| | | | |
Net investment income1 | | | 0.17 | | | | 0.35 | | | | 0.40 | | | | 0.41 | | | | 0.39 | | | | 0.37 | |
Net realized and unrealized gain (loss) | | | (0.48 | ) | | | 0.11 | | | | 0.83 | | | | 0.02 | | | | 0.54 | | | | (0.17 | ) |
| | | | |
Net increase (decrease) from investment operations | | | (0.31 | ) | | | 0.46 | | | | 1.23 | | | | 0.43 | | | | 0.93 | | | | 0.20 | |
| | | | |
| Dividends and distributions from: | | | | | | | | | | | | | | | | | | | | | | | | |
Net investment income | | | (0.17 | ) | | | (0.36 | )2 | | | (0.39 | )2 | | | (0.41 | )2 | | | (0.39 | )2 | | | (0.37 | )2 |
Net realized gain | | | — | | | | (0.05 | )2 | | | — | | | | — | | | | — | | | | — | |
| | | | |
Total dividends and distributions | | | (0.17 | ) | | | (0.41 | ) | | | (0.39 | ) | | | (0.41 | ) | | | (0.39 | ) | | | (0.37 | ) |
| | | | |
Net asset value, end of period | | $ | 10.93 | | | $ | 11.41 | | | $ | 11.36 | | | $ | 10.52 | | | $ | 10.50 | | | $ | 9.96 | |
| | | | |
| | | | | | | | | | | | | | | | | | | | | | | | |
| Total Investment Return3 | | | | | | | | | | | | | | | | | |
Based on net asset value | | | (2.75)% | 4 | | | 4.02% | | | | 11.91% | | | | 4.10% | | | | 9.46% | | | | 2.13% | |
| | | | |
| | | | | | | | | | | | | | | | | | | | | | | | |
| Ratios to Average Net Assets | | | | | | | | | | | | | | | | | | | | | | | | |
Total expenses | | | 0.72% | 5 | | | 0.70% | | | | 0.70% | | | | 0.72% | | | | 0.78% | | | | 0.85% | |
| | | | |
Total expenses after fees waived and paid indirectly | | | 0.67% | 5 | | | 0.65% | | | | 0.65% | | | | 0.67% | | | | 0.72% | | | | 0.80% | |
| | | | |
Total expenses after fees waived and paid indirectly and excluding interest expense and fees6 | | | 0.64% | 5 | | | 0.62% | | | | 0.64% | | | | 0.66% | | | | 0.72% | | | | 0.76% | |
| | | | |
Net investment income | | | 3.01% | 5 | | | 3.04% | | | | 3.61% | | | | 3.86% | | | | 3.78% | | | | 3.80% | |
| | | | |
| | | | | | | | | | | | | | | | | | | | | | | | |
| Supplemental Data | | | | | | | | | | | | | | | | | | | | | | | | |
Net assets, end of period (000) | | $ | 349,416 | | | $ | 425,281 | | | $ | 256,517 | | | $ | 164,130 | | | $ | 129,811 | | | $ | 88,941 | |
| | | | |
Portfolio turnover | | | 13% | | | | 17% | | | | 15% | | | | 30% | | | | 23% | | | | 25% | |
| | | | |
| 1 | | Based on average shares outstanding. |
| 2 | | Determined in accordance with federal income tax regulations. |
| 3 | | Where applicable, assumes the reinvestment of dividends and distributions. |
| 4 | | Aggregate total investment return. |
| 6 | | Interest expense and fees relate to TOBs. See Note 3 of the Notes to Financial Statements for details of municipal bonds transferred to TOBs. |
| | | | | | |
| See Notes to Financial Statements. | | | | |
| | | | | | | |
| | SEMI-ANNUAL REPORT | | NOVEMBER 30, 2013 | | 59 |
| | |
| Financial Highlights (continued) | | BlackRock Strategic Municipal Opportunities Fund |
| | | | | | | | | | | | | | | | | | | | | | | | |
| | | Investor A | |
| | | Six Months Ended
November 30,
2013
(Unaudited) | | | Year Ended May 31, | |
| | | | 2013 | | | 2012 | | | 2011 | | | 2010 | | | 2009 | |
| | | | | | | | | | | | | | | | | | | | | | | | |
| Per Share Operating Performance | | | | | | | | | | | | | | | | | | | | | | | | |
Net asset value, beginning of period | | $ | 11.41 | | | $ | 11.36 | | | $ | 10.51 | | | $ | 10.50 | | | $ | 9.95 | | | $ | 10.13 | |
| | | | |
Net investment income1 | | | 0.15 | | | | 0.32 | | | | 0.37 | | | | 0.38 | | | | 0.37 | | | | 0.34 | |
Net realized and unrealized gain (loss) | | | (0.49 | ) | | | 0.11 | | | | 0.85 | | | | 0.01 | | | | 0.54 | | | | (0.17 | ) |
| | | | |
Net increase (decrease) from investment operations | | | (0.34 | ) | | | 0.43 | | | | 1.22 | | | | 0.39 | | | | 0.91 | | | | 0.17 | |
| | | | |
| Dividends and distributions from: | | | | | | | | | | | | | | | | | | | | | | | | |
Net investment income | | | (0.15 | ) | | | (0.33 | )2 | | | (0.37 | )2 | | | (0.38 | )2 | | | (0.36 | )2 | | | (0.35 | )2 |
Net realized gain | | | — | | | | (0.05 | )2 | | | — | | | | — | | | | — | | | | — | |
| | | | |
Total dividends and distributions | | | (0.15 | ) | | | (0.38 | ) | | | (0.37 | ) | | | (0.38 | ) | | | (0.36 | ) | | | (0.35 | ) |
| | | | |
Net asset value, end of period | | $ | 10.92 | | | $ | 11.41 | | | $ | 11.36 | | | $ | 10.51 | | | $ | 10.50 | | | $ | 9.95 | |
| | | | |
| | | | | | | | | | | | | | | | | | | | | | | | |
| Total Investment Return3 | | | | | | | | | | | | | | | | | |
Based on net asset value | | | (2.95)% | 4 | | | 3.75% | | | | 11.76% | | | | 3.75% | | | | 9.31% | | | | 1.79% | |
| | | | |
| | | | | | | | | | | | | | | | | | | | | | | | |
| Ratios to Average Net Assets | | | | | | | | | | | | | | | | | | | | | | | | |
Total expenses | | | 0.95% | 5 | | | 0.96% | | | | 0.94% | | | | 0.96% | | | | 1.01% | | | | 1.11% | |
| | | | |
Total expenses after fees waived and paid indirectly | | | 0.89% | 5 | | | 0.91% | | | | 0.89% | | | | 0.91% | | | | 0.96% | | | | 1.05% | |
| | | | |
Total expenses after fees waived and paid indirectly and excluding interest expense and fees6 | | | 0.87% | 5 | | | 0.88% | | | | 0.88% | | | | 0.90% | | | | 0.96% | | | | 1.01% | |
| | | | |
Net investment income | | | 2.78% | 5 | | | 2.77% | | | | 3.37% | | | | 3.63% | | | | 3.54% | | | | 3.56% | |
| | | | |
| | | | | | | | | | | | | | | | | | | | | | | | |
| Supplemental Data | | | | | | | | | | | | | | | | | | | | | | | | |
Net assets, end of period (000) | | $ | 194,513 | | | $ | 238,482 | | | $ | 139,600 | | | $ | 67,194 | | | $ | 42,294 | | | $ | 11,563 | |
| | | | |
Portfolio turnover | | | 13% | | | | 17% | | | | 15% | | | | 30% | | | | 23% | | | | 25% | |
| | | | |
| 1 | | Based on average shares outstanding. |
| 2 | | Determined in accordance with federal income tax regulations. |
| 3 | | Where applicable, excludes the effects of any sales charges and assumes the reinvestment of dividends and distributions. |
| 4 | | Aggregate total investment return. |
| 6 | | Interest expense and fees relate to TOBs. See Note 3 of the Notes to Financial Statements for details of municipal bonds transferred to TOBs. |
| | | | | | |
| See Notes to Financial Statements. | | | | |
| | | | | | | |
| 60 | | SEMI-ANNUAL REPORT | | NOVEMBER 30, 2013 | | |
| | |
| Financial Highlights (continued) | | BlackRock Strategic Municipal Opportunities Fund |
| | | | | | | | | | | | | | | | | | | | | | | | |
| | | Investor A1 | |
| | | Six Months Ended
November 30,
2013
(Unaudited) | | | Year Ended May 31, | |
| | | | 2013 | | | 2012 | | | 2011 | | | 2010 | | | 2009 | |
| | | | | | | | | | | | | | | | | | | | | | | | |
| Per Share Operating Performance | | | | | | | | | | | | | | | | | | | | | | | | |
Net asset value, beginning of period | | $ | 11.41 | | | $ | 11.36 | | | $ | 10.51 | | | $ | 10.50 | | | $ | 9.96 | | | $ | 10.13 | |
| | | | |
Net investment income1 | | | 0.16 | | | | 0.34 | | | | 0.38 | | | | 0.39 | | | | 0.38 | | | | 0.36 | |
Net realized and unrealized gain (loss) | | | (0.48 | ) | | | 0.11 | | | | 0.85 | | | | 0.01 | | | | 0.54 | | | | (0.17 | ) |
| | | | |
Net increase (decrease) from investment operations | | | (0.32 | ) | | | 0.45 | | | | 1.23 | | | | 0.40 | | | | 0.92 | | | | 0.19 | |
| | | | |
| Dividends and distributions from: | | | | | | | | | | | | | | | | | | | | | | | | |
Net investment income | | | (0.16 | ) | | | (0.35 | )2 | | | (0.38 | )2 | | | (0.39 | )2 | | | (0.38 | )2 | | | (0.36 | )2 |
Net realized gain | | | — | | | | (0.05 | )2 | | | — | | | | — | | | | — | | | | — | |
| | | | |
Total dividends and distributions | | | (0.16 | ) | | | (0.40 | ) | | | (0.38 | ) | | | (0.39 | ) | | | (0.38 | ) | | | (0.36 | ) |
| | | | |
Net asset value, end of period | | $ | 10.93 | | | $ | 11.41 | | | $ | 11.36 | | | $ | 10.51 | | | $ | 10.50 | | | $ | 9.96 | |
| | | | |
| | | | | | | | | | | | | | | | | | | | | | | | |
| Total Investment Return3 | | | | | | | | | | | | | | | | | | | | | | | | |
Based on net asset value | | | (2.79)% | 4 | | | 3.91% | | | | 11.90% | | | | 3.89% | | | | 9.35% | | | | 2.04% | |
| | | | |
| | | | | | | | | | | | | | | | | | | | | | | | |
| Ratios to Average Net Assets | | | | | | | | | | | | | | | | | | | | | | | | |
Total expenses | | | 0.80% | 5 | | | 0.80% | | | | 0.81% | | | | 0.82% | | | | 0.88% | | | | 0.95% | |
| | | | |
Total expenses after fees waived and paid indirectly | | | 0.75% | 5 | | | 0.75% | | | | 0.76% | | | | 0.77% | | | | 0.82% | | | | 0.89% | |
| | | | |
Total expenses after fees waived and paid indirectly and excluding interest expense and fees6 | | | 0.73% | 5 | | | 0.72% | | | | 0.75% | | | | 0.77% | | | | 0.82% | | | | 0.85% | |
| | | | |
Net investment income | | | 2.92% | 5 | | | 2.97% | | | | 3.51% | | | | 3.75% | | | | 3.68% | | | | 3.71% | |
| | | | |
| | | | | | | | | | | | | | | | | | | | | | | | |
| Supplemental Data | | | | | | | | | | | | | | | | | | | | | | | | |
Net assets, end of period (000) | | $ | 40,016 | | | $ | 44,121 | | | $ | 46,021 | | | $ | 44,952 | | | $ | 48,372 | | | $ | 50,184 | |
| | | | |
Portfolio turnover | | | 13% | | | | 17% | | | | 15% | | | | 30% | | | | 23% | | | | 25% | |
| | | | |
| 1 | | Based on average shares outstanding. |
| 2 | | Determined in accordance with federal income tax regulations. |
| 3 | | Where applicable, excludes the effects of any sales charges and assumes the reinvestment of dividends and distributions. |
| 4 | | Aggregate total investment return. |
| 6 | | Interest expense and fees relate to TOBs. See Note 3 of the Notes to Financial Statements for details of municipal bonds transferred to TOBs. |
| | | | | | |
| See Notes to Financial Statements. | | | | |
| | | | | | | |
| | SEMI-ANNUAL REPORT | | NOVEMBER 30, 2013 | | 61 |
| | |
| Financial Highlights (concluded) | | BlackRock Strategic Municipal Opportunities Fund |
| | | | | | | | | | | | | | | | | | | | | | | | |
| | | Investor C | |
| | | Six Months Ended
November 30,
2013
(Unaudited) | | | Year Ended May 31, | |
| | | | 2013 | | | 2012 | | | 2011 | | | 2010 | | | 2009 | |
| | | | | | | | | | | | | | | | | | | | | | | | |
| Per Share Operating Performance | | | | | | | | | | | | | | | | | | | | | | | | |
Net asset value, beginning of period | | $ | 11.41 | | | $ | 11.36 | | | $ | 10.52 | | | $ | 10.50 | | | $ | 9.96 | | | $ | 10.13 | |
| | | | |
Net investment income1 | | | 0.11 | | | | 0.23 | | | | 0.28 | | | | 0.30 | | | | 0.28 | | | | 0.27 | |
Net realized and unrealized gain (loss) | | | (0.48 | ) | | | 0.11 | | | | 0.84 | | | | 0.02 | | | | 0.54 | | | | (0.17 | ) |
| | | | |
Net increase (decrease) from investment operations | | | (0.37 | ) | | | 0.34 | | | | 1.12 | | | | 0.32 | | | | 0.82 | | | | 0.10 | |
| | | | |
| Dividends and distributions from: | | | | | | | | | | | | | | | | | | | | | | | | |
Net investment income | | | (0.11 | ) | | | (0.24 | )2 | | | (0.28 | )2 | | | (0.30 | )2 | | | (0.28 | )2 | | | (0.27 | )2 |
Net realized gain | | | — | | | | (0.05 | )2 | | | — | | | | — | | | | — | | | | — | |
| | | | |
Total dividends and distributions | | | (0.11 | ) | | | (0.29 | ) | | | (0.28 | ) | | | (0.30 | ) | | | (0.28 | ) | | | (0.27 | ) |
| | | | |
Net asset value, end of period | | $ | 10.93 | | | $ | 11.41 | | | $ | 11.36 | | | $ | 10.52 | | | $ | 10.50 | | | $ | 9.96 | |
| | | | |
| | | | | | | | | | | | | | | | | | | | | | | | |
| Total Investment Return3 | | | | | | | | | | | | | | | | | |
Based on net asset value | | | (3.23)% | 4 | | | 2.98% | | | | 10.80% | | | | 3.06% | | | | 8.38% | | | | 1.13% | |
| | | | |
| | | | | | | | | | | | | | | | | | | | | | | | |
| Ratios to Average Net Assets | | | | | | | | | | | | | | | | | | | | | | | | |
Total expenses | | | 1.71% | 5 | | | 1.71% | | | | 1.71% | | | | 1.72% | | | | 1.77% | | | | 1.87% | |
| | | | |
Total expenses after fees waived and paid indirectly | | | 1.66% | 5 | | | 1.66% | | | | 1.65% | | | | 1.67% | | | | 1.72% | | | | 1.82% | |
| | | | |
Total expenses after fees waived and paid indirectly and excluding interest expense and fees6 | | | 1.63% | 5 | | | 1.63% | | | | 1.64% | | | | 1.67% | | | | 1.72% | | | | 1.77% | |
| | | | |
Net investment income | | | 2.01% | 5 | | | 2.03% | | | | 2.60% | | | | 2.86% | | | | 2.78% | | | | 2.82% | |
| | | | |
| | | | | | | | | | | | | | | | | | | | | | | | |
| Supplemental Data | | | | | | | | | | | | | | | | | | | | | | | | |
Net assets, end of period (000) | | $ | 102,180 | | | $ | 135,599 | | | $ | 82,483 | | | $ | 37,243 | | | $ | 31,006 | | | $ | 15,233 | |
| | | | |
Portfolio turnover | | | 13% | | | | 17% | | | | 15% | | | | 30% | | | | 23% | | | | 25% | |
| | | | |
| 1 | | Based on average shares outstanding. |
| 2 | | Determined in accordance with federal income tax regulations. |
| 3 | | Where applicable, excludes the effects of any sales charges and assumes the reinvestment of dividends and distributions. |
| 4 | | Aggregate total investment return. |
| 6 | | Interest expense and fees relate to TOBs. See Note 3 of the Notes to Financial Statements for details of municipal bonds transferred to TOBs. |
| | | | | | |
| See Notes to Financial Statements. | | | | |
| | | | | | | |
| 62 | | SEMI-ANNUAL REPORT | | NOVEMBER 30, 2013 | | |
| | |
| Notes to Financial Statements (Unaudited) | | |
1. Organization:
BlackRock California Municipal Bond Fund, a series of BlackRock California Municipal Series Trust, BlackRock New Jersey Municipal Bond Fund and BlackRock Pennsylvania Municipal Bond Fund, each a series of BlackRock Multi-State Municipal Series Trust, and BlackRock Strategic Municipal Opportunities Fund (formerly known as BlackRock Intermediate Municipal Fund), a series of BlackRock Municipal Series Trust (each a “Fund” or collectively, the “Funds”), are registered under the Investment Company Act of 1940, as amended (the “1940 Act”). BlackRock California Municipal Bond Fund and BlackRock Strategic Municipal Opportunities Fund are registered as diversified, open-end management investment companies. BlackRock New Jersey Municipal Bond Fund and BlackRock Pennsylvania Municipal Bond Fund are registered as non-diversified, open-end management investment companies. BlackRock California Municipal Series Trust, BlackRock Multi-State Municipal Series Trust and BlackRock Municipal Series Trust (each a “Trust” or collectively, the “Trusts”) are organized as Massachusetts business trusts. Each Fund offers multiple classes of shares. Institutional Shares are sold without a sales charge and only to certain eligible investors. Service Shares are sold without a sales charge. Investor A and Investor A1 Shares are generally sold with an initial sales charge, but may be subject to a CDSC for certain redemptions where no initial sales charge was paid at the time of purchase. Investor B, Investor B1, Investor C and Investor C1 Shares may be subject to a CDSC. All classes of shares have identical voting, dividend, liquidation and other rights and are subject to the same terms and conditions, except that Service, Investor A, Investor A1, Investor B, Investor B1, Investor C and Investor C1 Shares bear certain expenses related to the shareholder servicing of such shares, and Investor B, Investor B1, Investor C and Investor C1 Shares also bear certain expenses related to the distribution of such shares. Investor B Shares automatically convert to Investor A1 Shares after approximately ten years for BlackRock California Municipal Bond Fund. On June 10, 2013, certain of the Funds’ share classes converted into other existing share classes, with the same relative aggregate net asset value of the Funds as follows:
| | | | |
| | | Original Shares | | New Shares |
BlackRock New Jersey Municipal Bond Fund | | Investor B | | Investor A |
BlackRock New Jersey Municipal Bond Fund | | Investor B1 | | Investor A1 |
BlackRock Pennsylvania Municipal Bond Fund | | Investor B | | Investor A |
BlackRock Pennsylvania Municipal Bond Fund | | Investor B1 | | Investor A1 |
BlackRock Strategic Municipal Opportunities Fund | | Investor B | | Investor A1 |
Investor A1, Investor B, Investor B1 and Investor C1 Shares are only available through exchanges and dividend reinvestment by existing shareholders and for purchase by certain employer-sponsored retirement plans. Each class has exclusive voting rights with respect to matters relating to its shareholder servicing and distribution expenditures (except that Investor B and Investor B1 shareholders may vote on material changes to the Investor A and Investor A1 distribution and service plans).
2. Significant Accounting Policies:
The Funds’ financial statements are prepared in conformity with accounting principles generally accepted in the United States of America (“US GAAP”), which may require management to make estimates and assumptions that affect the reported amounts of assets and liabilities in the financial statements and the reported amounts of increases and decreases in net assets from operations during the reported period. Actual results could differ from those estimates. The following is a summary of significant accounting policies followed by the Funds:
Valuation: US GAAP defines fair value as the price the Funds would receive to sell an asset or pay to transfer a liability in an orderly transaction between market participants at the measurement date. The Funds determine the fair value of their financial instruments at market value using independent dealers or pricing services under policies approved by the Board of Trustees of each Trust (the “Board”). The BlackRock Global Valuation Methodologies Committee (the “Global Valuation Committee”) is the committee formed by management to develop global pricing policies and procedures and to provide oversight of the pricing function for the Funds for all financial instruments.
Municipal investments (including commitments to purchase such investments on a “when-issued” basis) are valued on the basis of prices provided by dealers or pricing services. In determining the value of a particular investment, pricing services may use certain information with respect to transactions in such investments, quotations from dealers, pricing matrixes, market transactions in comparable investments and information with respect to various relationships between investments. Financial futures contracts traded on exchanges are valued at their last sale price. Investments in open-end registered investment companies are valued at NAV each business day.
In the event that application of these methods of valuation results in a price for an investment that is deemed not to be representative of the market value of such investment, or if a price is not available, the investment will be valued by the Global Valuation Committee, or its delegate, in accordance with a policy approved by the Board as reflecting fair value (“Fair Value Assets”). When determining the price for Fair Value Assets, the Global Valuation Committee, or its delegate, seeks to determine the price that each Fund might reasonably expect to receive from the current sale of that asset in an arm’s-length transaction. Fair value determinations shall be based upon all available factors that the Global Valuation Committee or its delegate deem relevant consistent with the principles of fair value measurement, which include the market approach, income approach and/or in the case of recent investments, the cost approach, as appropriate. The market approach generally consists of using comparable market transactions. The income approach generally is used to discount future cash flows to present value and is adjusted for liquidity as appropriate. These factors include but are not limited to: (i) attributes specific to the investment or asset; (ii) the principal market for the investment or asset; (iii) the customary participants in the principal market for the investment or asset; (iv) data assumptions by market participants for the investment or asset, if reasonably available; (v) quoted prices for similar investments or assets in active markets; and (vi) other factors, such as future cash flows, interest rates, yield curves, volatilities, prepayment speeds, loss severities, credit risks, recovery rates, liquidation amounts and/or default rates. Due to the inherent uncertainty of valuations of such investments, the fair values may differ from the values that would have been used had an active market existed. The Global Valuation Committee, or its delegate, employs various methods for calibrating valuation
| | | | | | |
| | | | | | | |
| | SEMI-ANNUAL REPORT | | NOVEMBER 30, 2013 | | 63 |
| | |
| Notes to Financial Statements (continued) | | |
approaches for investments where an active market does not exist, including regular due diligence of the Funds’ pricing vendors, regular reviews of key inputs and assumptions, transactional back-testing or disposition analysis to compare unrealized gains and losses to realized gains and losses, reviews of missing or stale prices and large movements in market values and reviews of any market related activity. The pricing of all Fair Value Assets is subsequently reported to the Board or a committee thereof on a quarterly basis.
Segregation and Collateralization: In cases where a Fund enters into investments (e.g., financial futures contracts or TOBs), that would be “senior securities” for 1940 Act purposes, the Fund may segregate or designate on its books and records cash or liquid securities having a market value at least equal to the amount of the Fund’s future obligations under such investments or borrowings. Doing so allows the investment to be excluded from treatment as a “senior security.” Furthermore, if required by an exchange or counterparty agreement, the Fund may deliver/deposit cash and/or securities to/with an exchange, or broker-dealer or custodian as collateral for certain investments or obligations.
Investment Transactions and Investment Income: For financial reporting purposes, investment transactions are recorded on the dates the transactions are entered into (the trade dates). Realized gains and losses on investment transactions are determined on the identified cost basis. Interest income, including amortization and accretion of premiums and discounts on debt securities, is recognized on the accrual basis. Income, expenses and realized and unrealized gains and losses are allocated daily to each class based on its relative net assets.
Dividends and Distributions: Dividends from net investment income are declared daily and paid monthly. Distributions of capital gains are recorded on the ex-dividend dates. The character and timing of dividends and distributions are determined in accordance with federal income tax regulations, which may differ from US GAAP.
Income Taxes: It is the Funds’ policy to comply with the requirements of the Internal Revenue Code of 1986, as amended, applicable to regulated investment companies and to distribute substantially all of their taxable income to their shareholders. Therefore, no federal income tax provision is required.
Each Fund files US federal and various state and local tax returns. No income tax returns are currently under examination. The statute of limitations on the Funds’ US federal tax returns remains open for each of the four years ended May 31, 2013. The statutes of limitations on the Funds’ state and local tax returns may remain open for an additional year depending upon the jurisdiction.
Management has analyzed tax laws and regulations and their application to the Funds’ facts and circumstances and does not believe there are any uncertain tax positions that require recognition of a tax liability.
Other: Expenses directly related to a Fund or its classes are charged to that Fund or class. Other operating expenses shared by several funds are pro rated among those funds on the basis of relative net assets or other appropriate methods. Expenses directly related to the Funds and other shared expenses pro rated to the Funds are allocated daily to each class based on its relative net assets or other appropriate methods.
The Funds have an arrangement with the custodians whereby fees may be reduced by credits earned on uninvested cash balances, which, if applicable, are shown as fees paid indirectly in the Statements of Operations. The custodians impose fees on overdrawn cash balances, which can be offset by accumulated credits earned or may result in additional custody charges.
3. Securities and Other Investments:
Zero-Coupon Bonds: The Funds may invest in zero-coupon bonds, which are normally issued at a significant discount from face value and do not provide for periodic interest payments. Zero-coupon bonds may experience greater volatility in market value than similar maturity debt obligations which provide for regular interest payments.
Forward Commitments and When-Issued Delayed Delivery Securities: The Funds may purchase securities on a when-issued basis and may purchase or sell securities on a forward commitment basis. Settlement of such transactions normally occurs within a month or more after the purchase or sale commitment is made. The Funds may purchase securities under such conditions with the intention of actually acquiring them, but may enter into a separate agreement to sell the securities before the settlement date. Since the value of securities purchased may fluctuate prior to settlement, the Funds may be required to pay more at settlement than the security is worth. In addition, the Funds are not entitled to any of the interest earned prior to settlement. When purchasing a security on a delayed delivery basis, the Funds assume the rights and risks of ownership of the security, including the risk of price and yield fluctuations. In the event of default by the counterparty, the Funds’ maximum amount of loss is the unrealized appreciation of unsettled when-issued transactions, which is shown in the Schedules of Investments.
Municipal Bonds Transferred to TOBs: The Funds leverage their assets through the use of TOBs. A TOB is a special purpose entity established by a third party sponsor, into which a fund, or an agent on behalf of the fund, transfers municipal bonds into a trust (“TOB Trust”). Other funds managed by the investment advisor may also contribute municipal bonds to a TOB into which a Fund has contributed bonds. A TOB typically issues two classes of beneficial interests: short-term floating rate certificates (“TOB Trust Certificates”), which are sold to third party investors, and residual certificates (“TOB Residuals”), which are generally issued to the participating funds that contributed the municipal bonds to the TOB Trust. If multiple funds participate in the same TOB, the rights and obligations under the TOB Residual will be shared among the funds ratably in proportion to their participation.
The TOB Residuals held by a Fund include the right of a Fund (1) to cause the holders of a proportional share of the TOB Trust Certificates to tender their certificates at par plus accrued interest upon the occurrence of certain mandatory tender events defined in the TOB agreements, and (2) to transfer, subject to a specified number of days’ prior notice, a corresponding share of the municipal bonds from the TOB to a Fund. The TOB may also be collapsed without the consent of a Fund, as the TOB
| | | | | | |
| | | | | | | |
| 64 | | SEMI-ANNUAL REPORT | | NOVEMBER 30, 2013 | | |
| | |
| Notes to Financial Statements (continued) | | |
Residual holder, upon the occurrence of certain termination events as defined in the TOB agreements. Such termination events may include the bankruptcy or default of the municipal bond, a substantial downgrade in credit quality of the municipal bond, the inability of the TOB to obtain renewal of the liquidity support agreement, a substantial decline in market value of the municipal bond and a judgment or ruling that interest on the municipal bond is subject to federal income taxation. Upon the occurrence of a termination event, the TOB would generally be liquidated in full with the proceeds typically applied first to any accrued fees owed to the trustee, remarketing agent and liquidity provider, and then to the holders of the TOB Trust Certificates up to par plus accrued interest owed on the TOB Trust Certificates, with the balance paid out to the TOB Residual holder. During the six months ended November 30, 2013, no TOBs in which the Funds participated were terminated without the consent of the Funds.
The cash received by the TOB from the sale of TOB Trust certificates, less transaction expenses, is paid to a Fund. The Fund typically invests the cash received in additional municipal bonds. Each Fund’s transfer of the municipal bonds to a TOB Trust is accounted for as a secured borrowings; therefore, the municipal bonds deposited into a TOB are presented in the Funds’ Schedules of Investments and TOB Trust Certificates issued are shown in other liabilities in the Statements of Assets and Liabilities. The carrying amount of each Fund’s payable to the holder of the TOB Trust Certificates, as reported in Statements of Assets and Liabilities as TOB Trust Certificates approximates its fair value.
The Funds may invest in TOBs on either a non-recourse or recourse basis. TOB Trusts are typically supported by a liquidity facility provided by a bank or other financial institution (the “Liquidity Provider”) that allows the holders of the TOB Trust Certificates to tender their certificates in exchange for payment from the Liquidity Provider of par plus accrued interest on any business day prior to the occurrence of the termination events described above. When a Fund invests in TOBS on a non-recourse basis, and the Liquidity Provider is required to make a payment under the liquidity facility due to a termination event, the Liquidity Provider will typically liquidate all or a portion of the municipal securities held in the TOB Trust and then fund, on a net basis, the balance, if any, of the amount owed under the liquidity facility over the liquidation proceeds (the “Liquidation Shortfall”). If a Fund invests in a TOB on a recourse basis, the Fund will typically enter into a reimbursement agreement with the Liquidity Provider where the Fund is required to repay the Liquidity Provider the amount of any Liquidation Shortfall. As a result, a Fund investing in a recourse TOB will bear the risk of loss with respect to any Liquidation Shortfall. If multiple Funds participate in any such TOB, these losses will be shared ratably, including the maximum potential amounts owed by the Funds at November 30, 2013, in proportion to their participation. The recourse TOB Trusts are identified in the Schedules of Investments, including the maximum potential amounts owed by the Funds at November 30, 2013.
Interest income, including amortization and accretion of premiums and discounts, from the underlying municipal bonds is recorded by the Funds on an accrual basis. Interest expense incurred on the secured borrowing and other expenses related to remarketing, administration and trustee services to a TOB are shown as interest expense and fees in the Statements of Operations. The TOB Trust Certificates have interest rates that generally reset weekly and their holders have the option to tender such certificates to the TOB for redemption at par at each reset date. At November 30, 2013, the aggregate value of the underlying municipal bonds transferred to TOBs, the related liability for TOB Trust Certificates and the range of interest rates on the liability for TOB Trust Certificates were as follows:
| | | | | | | | | | | | |
| | | Underlying
Municipal Bonds
Transferred to TOBs | | | Liability
for TOB Trust
Certificates | | | Range of Interest Rates | |
BlackRock California Municipal Bond Fund | | $ | 175,301,038 | | | $ | 84,544,892 | | | | 0.05% - 0.20% | |
BlackRock New Jersey Municipal Bond Fund | | $ | 12,181,695 | | | $ | 7,231,154 | | | | 0.07% - 0.10% | |
BlackRock Pennsylvania Municipal Bond Fund | | $ | 90,849,815 | | | $ | 46,126,645 | | | | 0.06% - 0.12% | |
BlackRock Strategic Municipal Opportunities Fund | | $ | 70,475,714 | | | $ | 37,847,478 | | | | 0.05% - 0.11% | |
For the six months ended November 30, 2013, the Funds’ average TOB trust certificates outstanding and the daily weighted average interest rate, including fees, were as follows:
| | | | | | | | |
| | | Average TOB Trust
Certificates
Outstanding | | | Daily Weighted
Average
Interest Rate | |
BlackRock California Municipal Bond Fund | | $ | 92,659,483 | | | | 0.61 | % |
BlackRock New Jersey Municipal Bond Fund | | $ | 7,368,548 | | | | 0.80 | % |
BlackRock Pennsylvania Municipal Bond Fund | | $ | 60,001,051 | | | | 0.61 | % |
BlackRock Strategic Municipal Opportunities Fund | | $ | 35,515,216 | | | | 0.59 | % |
Should short-term interest rates rise, the Funds’ investments in TOBs may adversely affect the Funds’ net investment income and dividends to shareholders. Also, fluctuations in the market value of municipal bonds deposited into the TOB Trust may adversely affect the Funds’ NAVs per share.
4. Derivative Financial Instruments:
The Funds engage in various portfolio investment strategies using derivative contracts both to increase the returns of the Funds and/or to economically hedge their exposure to certain risks such as interest rate. These contracts may be transacted on an exchange.
Financial Futures Contracts: The Funds purchase and/or sell financial futures contracts to gain exposure to, or economically hedge against, changes in interest rates (interest rate risk). Financial futures contracts are agreements between the Fund and a counterparty to buy or sell a specific quantity of an underlying instrument at a specified price and at a specified date. Depending on the terms of the particular contract, financial futures contracts are settled either through physical delivery of the underlying instrument on the settlement date or by payment of a cash settlement amount on the settlement date. Upon entering into a financial futures contract, the Funds are required to deposit initial margin with the broker in the form of cash or securities in an amount that varies depending on a contract’s size and risk profile. The initial margin deposit must then be maintained at an established level over the life of the contract. Securities deposited as initial margin are designated on the Schedules of Investments and cash deposited, if any, is recorded on the Statements of Assets and Liabilities as cash pledged for other derivative
| | | | | | |
| | | | | | | |
| | SEMI-ANNUAL REPORT | | NOVEMBER 30, 2013 | | 65 |
| | |
| Notes to Financial Statements (continued) | | |
contracts. Pursuant to the contract, the Funds agree to receive from or pay to the broker an amount of cash equal to the daily fluctuation in value of the contract. Such receipts or payments are known as variation margin. Variation margin is recorded by the Funds as unrealized appreciation or depreciation and if applicable as a receivable or payable for variation margin in the Statements of Assets and Liabilities. When the contract is closed, the Funds record a realized gain or loss equal to the difference between the value of the contract at the time it was opened and the value at the time it was closed. The use of financial futures contracts involves the risk of an imperfect correlation in the movements in the price of financial futures contracts, interest rates and the underlying assets.
| | | | | | | | | | | | | | | | | | |
| The following is a summary of the Funds’ derivative financial instruments categorized by risk exposure: | | | | | | | | | | |
| Fair Values of Derivative Financial Instruments as of November 30, 2013 | |
| Asset Derivatives | |
| | | | | BlackRock
California
Municipal
Bond Fund | | | BlackRock
New Jersey
Municipal
Bond Fund | | | BlackRock
Pennsylvania
Municipal
Bond Fund | | | BlackRock
Strategic
Municipal
Opportunities
Fund | |
| | | Statements of Assets and Liabilities Location | | Value | |
| Interest rate contracts: | | | | | | | | | | | | | | | | | | |
Financial futures contracts | | Net unrealized appreciation1 | | | — | | | $ | 59,477 | | | $ | 28,663 | | | $ | 195,698 | |
| Liability Derivatives | |
| | | | | BlackRock
California
Municipal
Bond Fund | | | BlackRock
New Jersey
Municipal
Bond Fund | | | BlackRock
Pennsylvania
Municipal
Bond Fund | | | BlackRock
Strategic
Municipal
Opportunities
Fund | |
| | | Statements of Assets and Liabilities Location | | Value | |
| Interest rate contracts: | | | | | | | | | | | | | | | | | | |
Financial futures contracts | | Net unrealized deprecation1 | | $ | (193,983 | ) | | | — | | | | — | | | | — | |
| | 1 | | Includes cumulative appreciation/depreciation on financial futures contracts as reported in the Schedules of Investments. Only current day’s variation margin is reported within the Statements of Assets and Liabilities. |
| | | | | | | | | | | | | | | | |
The Effect of Derivative Financial Instruments in the Statements of Operations Six Months Ended November 30, 2013 | |
| | | Net Realized Gain (Loss) From | |
| | | BlackRock
California
Municipal
Bond Fund | | | BlackRock
New Jersey
Municipal
Bond Fund | | | BlackRock
Pennsylvania
Municipal Bond Fund | | | BlackRock
Strategic
Municipal
Opportunities
Fund | |
| Interest rate contracts: | | | | | | | | | | | | | | | | |
Financial futures contracts | | $ | 1,004,066 | | | $ | 61,681 | | | $ | 1,014,420 | | | | $ 744,500 | |
| | | Net Change in Unrealized Appreciation/Depreciation on | |
| | | BlackRock
California
Municipal
Bond Fund | | | BlackRock
New Jersey
Municipal
Bond Fund | | | BlackRock
Pennsylvania
Municipal
Bond Fund | | | BlackRock
Strategic
Municipal
Opportunities
Fund | |
| Interest rate contracts: | | | | | | | | | | | | | | | | |
Financial futures contracts | | $ | (573,449 | ) | | $ | 26,243 | | | $ | (715,188 | ) | | $ | (205,529) | |
|
| For the six months ended November 30, 2013, the average quarterly balances of outstanding derivative financial instruments were as follows: |
| | | | | | | | | | | | | | | | |
| | | BlackRock
California
Municipal
Bond Fund | | | BlackRock
New Jersey
Municipal
Bond Fund | | | BlackRock
Pennsylvania
Municipal
Bond Fund | | | BlackRock
Strategic
Municipal
Opportunities
Fund | |
| Financial futures contracts: | | | | | | | | | | | | | | | | |
Average number of contracts purchased | | | 188 | | | | 32 | 2 | | | 297 | | | | 386 | 2 |
Average number of contracts sold | | | 205 | | | | 47 | | | | 40 | | | | 153 | |
Average notional value of contracts purchased | | $ | 23,915,939 | | | $ | 4,106,500 | 2 | | $ | 37,980,797 | | | $ | 49,534,656 | 2 |
Average notional value of contracts sold | | $ | 25,961,328 | | | $ | 5,888,789 | | | $ | 5,065,625 | | | $ | 19,376,016 | |
| | 2 | | Actual contract amount shown due to limited activity. |
| | | | | | |
| | | | | | | |
| 66 | | SEMI-ANNUAL REPORT | | NOVEMBER 30, 2013 | | |
| | |
| Notes to Financial Statements (continued) | | |
Counterparty Credit Risk: A derivative contract may suffer a mark to market loss if the value of the contract decreases due to an unfavorable change in the market rates or values of the underlying instrument. Losses can also occur if the counterparty does not perform under the contract.
A Fund’s risk of loss from counterparty credit risk on over-the-counter derivatives is generally limited to the aggregate unrealized gain netted against any collateral held by such Fund.
With exchange traded purchased options and futures, there is less counterparty credit risk to the Funds since the exchange or clearinghouse, as counterparty to such instruments, guarantees against a possible default. The clearinghouse stands between the buyer and the seller of the contract; therefore, credit risk is limited to failure of the clearinghouse. While offset rights may exist under applicable law, a Fund does not have a contractual right of offset against a clearing broker or clearing house in the event of a default (including the bankruptcy or insolvency) of the clearing broker or clearinghouse. Additionally, credit risk still exists in exchange traded futures with respect to initial and variation margin that is held in a clearing broker’s customer accounts. While clearing brokers are required to segregate customer margin from their own assets, in the event that a clearing broker becomes insolvent or goes into bankruptcy and at that time there is a shortfall in the aggregate amount of margin held by the clearing broker for all its clients, typically the shortfall would be allocated on a pro rata basis across all the clearing broker’s customers, potentially resulting in losses to the Funds.
For financial reporting purposes, the Funds do not offset derivative assets and derivative liabilities that are subject to netting arrangements in the Statements of Assets and Liabilities.
5. Investment Advisory Agreement and Other Transactions with Affiliates:
The PNC Financial Services Group, Inc. is the largest stockholder and an affiliate, for 1940 Act purposes, of BlackRock, Inc. (“BlackRock”).
Each Trust, on behalf of each Fund, entered into an Investment Advisory Agreement with BlackRock Advisors, LLC (the “Manager”), the Funds’ investment advisor, an indirect, wholly owned subsidiary of BlackRock, to provide investment advisory and administration services. The Manager is responsible for the management of each Fund’s portfolio and provides the necessary personnel, facilities, equipment and certain other services necessary to the operations of each Fund. For such services, BlackRock California Municipal Bond Fund, BlackRock New Jersey Municipal Bond Fund and BlackRock Pennsylvania Municipal Bond Fund pay the Manager a monthly fee based on the percentage of each Fund’s average daily net assets at the following annual rates:
| | | | |
| Average Daily Net Assets | | Investment Advisory Fee | |
First $500 Million | | | 0.55 | % |
$500 — $1 Billion | | | 0.525 | % |
Greater than $1 Billion | | | 0.50 | % |
BlackRock Strategic Municipal Opportunities Fund pays the Manager a monthly fee based on a percentage of the Fund’s average daily net assets at the following annual rates:
| | | | |
| Average Daily Net Assets | | Investment Advisory Fee | |
First $1 Billion | | | 0.55 | % |
$1 Billion — $3 Billion | | | 0.52 | % |
$3 Billion — $5 Billion | | | 0.50 | % |
$5 Billion — $10 Billion | | | 0.48 | % |
Greater than $10 Billion | | | 0.47 | % |
The Manager, with respect to each Fund, entered into a sub-advisory agreement with BlackRock Investment Management, LLC (“BIM”), an affiliate of the Manager. The Manager pays BIM for services it provides, a monthly fee that is a percentage of the investment advisory fees paid by each Fund to the Manager.
The Manager, with respect to BlackRock Strategic Municipal Opportunities Fund, contractually agreed to waive 0.05% of the Fund’s investment advisory fee until October 1, 2014. For the six months ended November 30, 2013, the Manager waived $191,722, which is included in fees waived by Manager in the Statements of Operations.
The Manager, with respect to BlackRock New Jersey Municipal Bond Fund and BlackRock Pennsylvania Municipal Bond Fund, voluntarily agreed to waive and/or reimburse fees and/or expenses, in order to limit expenses, excluding interest expense, acquired fund fees and expenses and certain other fund expenses, which constitute extraordinary expenses not incurred in the ordinary course of the Funds’ business. These voluntary waivers and/or reimbursements may be reduced or discontinued at any time without notice. The expense limitations as a percentage of net assets are as follows:
| | | | | | | | |
| | | BlackRock New Jersey
Municipal Bond Fund | | | BlackRock
Pennsylvania
Municipal Bond Fund | |
Institutional | | | 0.78 | % | | | 0.71 | % |
Service | | | 0.87 | % | | | 0.89 | % |
Investor A | | | 0.87 | % | | | 0.89 | % |
Investor A1 | | | 0.72 | % | | | 0.73 | % |
Investor B | | | 1.64 | % | | | 1.68 | % |
Investor B1 | | | 1.13 | % | | | 1.15 | % |
Investor C | | | 1.64 | % | | | 1.68 | % |
Investor C1 | | | 1.23 | % | | | 1.26 | % |
As a result, for the six months ended November 30, 2013, the Manager waived or reimbursed the following amounts, which are shown as transfer agent fees waived and/or reimbursed — class specific in the Statements of Operations:
| | | | | | | | |
| | | BlackRock New Jersey
Municipal Bond Fund | | | BlackRock
Pennsylvania
Municipal Bond Fund | |
Institutional | | $ | 6,961 | | | $ | 212,595 | |
Service | | $ | 10,520 | | | $ | 3,259 | |
Investor A | | $ | 10,890 | | | $ | 15,913 | |
Investor A1 | | $ | 8,452 | | | $ | 5,932 | |
Investor B | | $ | 17 | | | $ | 8 | |
Investor B1 | | $ | 42 | | | $ | 13 | |
Investor C | | $ | 4,349 | | | $ | 2,508 | |
Investor C1 | | $ | 1,766 | | | $ | 587 | |
| | | | | | |
| | | | | | | |
| | SEMI-ANNUAL REPORT | | NOVEMBER 30, 2013 | | 67 |
| | |
| Notes to Financial Statements (continued) | | |
In addition, for BlackRock New Jersey Municipal Bond Fund, for the six months ended November 30, 2013, the Manager waived $38,331, which is included in fees waived by the Manager in the Statements of Operations.
The Manager voluntarily agreed to waive its investment advisory fees by the amount of investment advisory fees each Fund pays to the Manager indirectly through its investment in affiliated money market funds. However, the Manager does not waive its investment advisory fees by the amount of investment advisory fees paid in connection with each Fund’s investment in other affiliated investment companies, if any. These amounts waived or reimbursed are included in fees waived by Manager in the Statements of Operations. For the six months ended November 30, 2013, the amounts waived were as follows:
| | | | |
BlackRock California Municipal Bond Fund | | $ | 1,138 | |
BlackRock New Jersey Municipal Bond Fund | | $ | 2,296 | |
BlackRock Pennsylvania Municipal Bond Fund | | $ | 50 | |
BlackRock Strategic Municipal Opportunities Fund | | $ | 2,451 | |
For the six months ended November 30, 2013, each Fund reimbursed the Manager for certain accounting services, which is included in accounting services in the Statements of Operations. The reimbursements were as follows:
| | | | |
BlackRock California Municipal Bond Fund | | $ | 4,570 | |
BlackRock New Jersey Municipal Bond Fund | | $ | 1,554 | |
BlackRock Pennsylvania Municipal Bond Fund | | $ | 3,097 | |
BlackRock Strategic Municipal Opportunities Fund | | $ | 4,828 | |
Each Trust, on behalf of each Fund, entered into a Distribution Agreement and Distribution and Service Plan with BlackRock Investments, LLC (“BRIL”), an affiliate of the Manager. Pursuant to the Distribution and Service Plan and in accordance with Rule 12b-1 under the 1940 Act, each Fund pays BRIL ongoing service and distribution fees. The fees are accrued daily and paid monthly at annual rates based upon the average daily net assets of the shares of each Fund as follows:
| | | | | | | | | | | | | | | | |
| | | Service Fees | |
| | | BlackRock
California
Municipal
Bond Fund | | | BlackRock New Jersey
Municipal
Bond Fund | | | BlackRock
Pennsylvania
Municipal
Bond Fund | | | BlackRock
Strategic
Municipal
Opportunities
Fund | |
Service | | | — | | | | 0.25 | % | | | 0.25 | % | | | — | |
Investor A | | | 0.25 | % | | | 0.25 | % | | | 0.25 | % | | | 0.25 | % |
Investor A1 | | | 0.10 | % | | | 0.10 | % | | | 0.10 | % | | | 0.10 | % |
Investor B | | | 0.25 | % | | | 0.25 | % | | | 0.25 | % | | | 0.20 | % |
Investor B1 | | | — | | | | 0.25 | % | | | 0.25 | % | | | — | |
Investor C | | | 0.25 | % | | | 0.25 | % | | | 0.25 | % | | | 0.25 | % |
Investor C1 | | | 0.25 | % | | | 0.25 | % | | | 0.25 | % | | | — | |
| | | Distribution Fees | |
| | | BlackRock
California
Municipal
Bond Fund | | | BlackRock New Jersey
Municipal
Bond Fund | | | BlackRock
Pennsylvania
Municipal
Bond Fund | | | BlackRock
Strategic
Municipal
Opportunities
Fund | |
Investor B | | | 0.25 | % | | | 0.75 | % | | | 0.75 | % | | | 0.10 | % |
Investor B1 | | | — | | | | 0.25 | % | | | 0.25 | % | | | — | |
Investor C | | | 0.75 | % | | | 0.75 | % | | | 0.75 | % | | | 0.75 | % |
Investor C1 | | | 0.35 | % | | | 0.35 | % | | | 0.35 | % | | | — | |
Pursuant to sub-agreements with BRIL, broker-dealers and BRIL provide shareholder servicing and distribution services to each Fund. The ongoing service and/or distribution fee compensates BRIL and each broker-dealer for providing shareholder servicing and/or distribution related services to Service, Investor A, Investor A1, Investor B, Investor B1, Investor C and Investor C1 shareholders.
Pursuant to written agreements, certain financial intermediaries, some of which may be affiliates, provide the Funds with sub-accounting, record-keeping, sub-transfer agency and other administrative services with respect to sub-accounts they service. For these services, these entities receive an annual fee per shareholder account, which will vary depending on share class and/or net assets. For the six months ended November 30, 2013, the Funds paid the following to affiliates in return for these services, which is included in transfer agent — class specific in the Statements of Operations:
| | | | | | | | | | | | |
| | | BlackRock New Jersey
Municipal Bond Fund | | | BlackRock
Pennsylvania
Municipal Bond Fund | | | BlackRock
Strategic
Municipal
Opportunities
Fund | |
Institutional | | $ | 76,510 | | | $ | 312,234 | | | | — | |
Service | | $ | 1,964 | | | $ | 186 | | | | — | |
Investor A | | $ | 123 | | | $ | 124 | | | | — | |
Investor A1 | | | — | | | $ | 82 | | | $ | 25 | |
The Manager maintains a call center, which is responsible for providing certain shareholder services to the Funds, such as responding to shareholder inquiries and processing transactions based upon instructions from shareholders with respect to the subscription and redemption of Fund shares. For the six months ended November 30, 2013, the Funds reimbursed the Manager the following amounts for costs incurred in running the call center, which are included in transfer agent — class specific in the Statements of Operations:
| | | | | | | | | | | | | | | | |
| | | BlackRock
California
Municipal
Bond Fund | | | BlackRock New Jersey
Municipal
Bond Fund | | | BlackRock
Pennsylvania
Municipal
Bond Fund | | | BlackRock
Strategic
Municipal
Opportunities
Fund | |
Institutional | | $ | 507 | | | $ | 297 | | | $ | 744 | | | $ | 607 | |
Service | | | — | | | $ | 795 | | | $ | 60 | | | | — | |
Investor A | | $ | 534 | | | $ | 306 | | | $ | 503 | | | $ | 773 | |
Investor A1 | | $ | 1,475 | | | $ | 293 | | | $ | 337 | | | $ | 225 | |
Investor B | | $ | 33 | | | $ | 8 | | | $ | 9 | | | $ | 9 | |
Investor B1 | | | — | | | $ | 11 | | | $ | 10 | | | | — | |
Investor C | | $ | 307 | | | $ | 123 | | | $ | 219 | | | $ | 547 | |
Investor C1 | | $ | 80 | | | $ | 53 | | | $ | 34 | | | | — | |
For the six months ended November 30, 2013, affiliates earned underwriting discounts, direct commissions and dealer concessions on sales of the Funds’ Investor A Shares as follows:
| | | | | | | | | | | | | | | | |
| | | BlackRock
California
Municipal
Bond Fund | | | BlackRock New Jersey
Municipal
Bond Fund | | | BlackRock
Pennsylvania
Municipal
Bond Fund | | | BlackRock
Strategic
Municipal
Opportunities
Fund | |
Investor A | | $ | 7,963 | | | $ | 3,556 | | | $ | 5,045 | | | $ | 11,419 | |
| | | | | | |
| | | | | | | |
| 68 | | SEMI-ANNUAL REPORT | | NOVEMBER 30, 2013 | | |
| | |
| Notes to Financial Statements (continued) | | |
For the six months ended November 30, 2013, affiliates received CDSCs as follows:
| | | | | | | | | | | | | | | | |
| | | BlackRock
California
Municipal
Bond Fund | | | BlackRock New Jersey
Municipal
Bond Fund | | | BlackRock
Pennsylvania
Municipal
Bond Fund | | | BlackRock
Strategic
Municipal
Opportunities
Fund | |
Investor A | | $ | 74,783 | | | $ | 13,961 | | | $ | 1 | | | $ | 21,296 | |
Investor A1 | | | — | | | | — | | | | — | | | $ | 271 | |
Investor B | | $ | 2 | | | | — | | | | — | | | | — | |
Investor C | | $ | 35,819 | | | $ | 6,008 | | | $ | 5,526 | | | $ | 36,216 | |
Certain officers and/or trustees of the Trusts are officers and/or directors of BlackRock or its affiliates. The Funds reimburse the Manager for a portion of the compensation paid to the Funds’ Chief Compliance Officer, which is included in Officer and Trustees in the Statements of Operations.
The Funds may purchase securities from, or sell securities to, an affiliated fund provided the affiliation is due solely to having a common investment advisor, common officers, or common trustees. For the six months ended November 30, 2013, the purchase and sale transactions with an affiliated fund in compliance with Rule 17a-7 of the 1940 Act were as follows:
| | | | |
| | | Sales | |
BlackRock California Municipal Bond Fund | | $ | 8,847,822 | |
6. Purchases and Sales:
Purchases and sales of investments, excluding short-term securities, for the six months ended November 30, 2013, were as follows:
| | | | | | | | |
| | | Purchases | | | Sales | |
BlackRock California Municipal Bond Fund | | $ | 126,597,513 | | | $ | 299,951,480 | |
BlackRock New Jersey Municipal Bond Fund | | $ | 14,405,173 | | | $ | 38,122,193 | |
BlackRock Pennsylvania Municipal Bond Fund | | $ | 19,967,279 | | | $ | 107,798,767 | |
BlackRock Strategic Municipal Opportunities Fund | | $ | 102,024,459 | | | $ | 221,577,837 | |
7. Income Tax Information:
As of May 31, 2013, the Funds had capital loss carryforwards available to offset future realized capital gains through the indicated expiration dates as follows:
| | | | | | | | |
| Expires May 31, | | BlackRock
New Jersey
Municipal
Bond Fund | | | BlackRock
Pennsylvania
Municipal
Bond Fund | |
2014 | | $ | 127,616 | | | | — | |
2017 | | | 1,037,279 | | | $ | 9,367,197 | |
2018 | | | 260,363 | | | | 6,928,880 | |
2019 | | | 243,757 | | | | 720,781 | |
No expiration date1 | | | 127,209 | | | | 3,110,175 | |
| | | | |
Total | | $ | 1,796,224 | | | $ | 20,127,033 | |
| | | | |
| | 1 | | Must be utilized prior to losses subject to expiration. |
As of November 30, 2013, gross unrealized appreciation and depreciation based on cost for federal income tax purposes were as follows:
| | | | | | | | | | | | | | | | |
| | | BlackRock
California
Municipal
Bond Fund | | | BlackRock New Jersey
Municipal
Bond Fund | | | BlackRock
Pennsylvania
Municipal
Bond Fund | | | BlackRock
Strategic
Municipal
Opportunities
Fund | |
Tax cost | | $ | 529,931,906 | | | $ | 216,209,275 | | | $ | 413,457,234 | | | $ | 681,741,718 | |
| | | | |
Gross unrealized appreciation | | $ | 21,134,125 | | | $ | 9,266,589 | | | $ | 16,543,364 | | | $ | 16,706,731 | |
Gross unrealized depreciation | | | (12,889,627 | ) | | | (4,660,594 | ) | | | (9,313,019 | ) | | | (16,560,356 | ) |
| | | | |
Net unrealized appreciation | | $ | 8,244,498 | | | $ | 4,605,995 | | | $ | 7,230,345 | | | $ | 146,375 | |
| | | | |
8. Borrowings:
The Funds, along with certain other funds managed by the Manager and its affiliates (“Participating Funds”), are a party to a 364-day, $800 million credit agreement with a group of lenders, under which the Funds may borrow to fund shareholder redemptions. The agreement expires in April 2014. Excluding commitments designated for a certain individual fund, other Participating Funds, including the Funds, can borrow up to an aggregate commitment amount of $500 million, subject to asset coverage and other limitations as specified in the agreement. The credit agreement has the following terms: a fee of 0.065% per annum on unused commitment amounts and interest at a rate equal to the higher of (a) the one-month LIBOR plus 0.80% per annum or (b) the Fed Funds rate plus 0.80% per annum on amounts borrowed. Participating Funds paid administration and arrangement fees which, along with commitment fees, were allocated among such funds based upon portions of the aggregate commitment available to them and relative net assets of Participating Funds. The Funds did not borrow under the credit agreement during the six months ended November 30, 2013.
9. Concentration, Market and Credit Risk:
Each Fund invests a substantial amount of their assets in issuers located in a single state or limited number of states. Please see the Schedules of Investments for concentrations in specific states or US territories.
Many municipalities insure repayment of their bonds, which may reduce the potential for loss due to credit risk. The market value of these bonds may fluctuate for other reasons, including market perception of the value of such insurance, and there is no guarantee that the insurer will meet its obligation.
In the normal course of business, the Funds invest in securities and enter into transactions where risks exist due to fluctuations in the market (market risk) or failure of the issuer of a security to meet all its obligations (issuer credit risk). The value of securities held by the Funds may decline in response to certain events, including those directly involving the issuers whose securities are owned by the Funds; conditions affecting the general economy; overall market changes; local, regional or global political, social or economic instability; and currency and interest rate and price fluctuations. Similar to issuer credit risk, the Funds may be exposed to counterparty credit risk, or the risk that an entity with which the Funds have unsettled or open transactions may fail to or be unable to perform on its commitments. The Funds manage counterparty credit risk by entering into
| | | | | | |
| | | | | | | |
| | SEMI-ANNUAL REPORT | | NOVEMBER 30, 2013 | | 69 |
| | |
| Notes to Financial Statements (continued) | | |
transactions only with counterparties that they believe have the financial resources to honor their obligations and by monitoring the financial stability of those counterparties. Financial assets, which potentially expose the Funds to market, issuer and counterparty credit risks, consist principally of financial instruments and receivables due from counterparties. The extent of the Funds’ exposure to market, issuer and counterparty credit risks with respect to these financial assets is generally approximated by their value recorded in the Statements of Assets and Liabilities, less any collateral held by the Funds.
As of November 30, 2013, the BlackRock California Municipal Bond Fund invested a significant portion of its assets in securities in the county/city/special district/school district and utilities sectors, BlackRock New Jersey Municipal Bond Fund invested a significant portion of its assets in securities in the health sector, BlackRock Pennsylvania Municipal invested a significant portion of its assets in securities in the education and health sectors and BlackRock Strategic Municipal Opportunities Fund invested a significant portion of its assets in securities in the transportation and state sectors. Changes in economic conditions affecting the county/city/special district/school district, health, education, state, transportation and utilities sectors would have a greater impact on the Funds and could affect the value, income and/or liquidity of positions in such securities.
The Funds may hold a significant amount of bonds subject to calls by the issuers at defined dates and prices. When bonds are called by issuers and the Funds reinvest the proceeds received, such investments may be in securities with lower yields than the bonds originally held, and correspondingly, could adversely impact the yield and total return performance of a Fund.
10. Capital Share Transactions:
Transactions in capital shares for each class were as follows:
| | | | | | | | | | | | | | | | | | |
BlackRock California Municipal Bond Fund | | Six Months Ended
November 30, 2013 | | | | | Year Ended
May 31, 2013 | |
| | Shares | | | Amount | | | | | Shares | | | Amount | |
| Institutional | | | | | | | | | | | | | | |
Shares sold | | | 3,613,576 | | | $ | 42,229,602 | | | | | | 23,772,457 | | | $ | 302,773,858 | |
Shares issued in reinvestment of dividends | | | 285,627 | | | | 3,311,721 | | | | | | 628,233 | | | | 7,993,926 | |
Shares redeemed | | | (10,828,764 | ) | | | (125,002,376 | ) | | | | | (15,023,315 | ) | | | (190,926,983 | ) |
| | | | | | | | | | | | | | | | | | |
Net increase (decrease) | | | (6,929,561 | ) | | $ | (79,461,053 | ) | | | | | 9,377,375 | | | $ | 119,840,801 | |
| | | | | | | | | | | | | | | | | | |
| | | | | | | | | | | | | | | | | | |
| Investor A | | | | | | | | | | | | | | | | | | |
Shares sold | | | 1,306,272 | | | $ | 15,235,216 | | | | | | 7,184,184 | | | $ | 91,235,940 | |
Shares issued in reinvestment of dividends | | | 156,952 | | | | 1,817,901 | | | | | | 325,977 | | | | 4,142,748 | |
Shares redeemed | | | (4,873,297 | ) | | | (56,853,469 | ) | | | | | (3,643,845 | ) | | | (46,276,394 | ) |
| | | | | | | | | | | | | | | | | | |
Net increase (decrease) | | | (3,410,073 | ) | | $ | (39,800,352 | ) | | | | | 3,866,316 | | | $ | 49,102,294 | |
| | | | | | | | | | | | | | | | | | |
| | | | | | | | | | | | | | | | | | |
| Investor A1 | | | | | | | | | | | | | | | | | | |
Shares sold | | | 121,940 | | | $ | 1,424,134 | | | | | | 250,661 | | | $ | 3,179,221 | |
Shares issued in reinvestment of dividends | | | 158,997 | | | | 1,843,018 | | | | | | 299,778 | | | | 3,810,621 | |
Shares redeemed | | | (1,238,981 | ) | | | (14,322,339 | ) | | | | | (1,045,802 | ) | | | (13,316,968 | ) |
| | | | | | | | | | | | | | | | | | |
Net decrease | | | (958,044 | ) | | $ | (11,055,187 | ) | | | | | (495,363 | ) | | $ | (6,327,126 | ) |
| | | | | | | | | | | | | | | | | | |
| | | | | | | | | | | | | | | | | | |
| Investor B | | | | | | | | | | | | | | | | | | |
Shares sold | | | 27 | | | $ | 315 | | | | | | 522 | | | $ | 6,630 | |
Shares issued in reinvestment of dividends | | | 1,798 | | | | 20,870 | | | | | | 7,003 | | | | 88,996 | |
Shares redeemed and automatic conversion of shares | | | (132,455 | ) | | | (1,547,725 | ) | | | | | (314,196 | ) | | | (3,988,470 | ) |
| | | | | | | | | | | | | | |
Net decrease | | | (130,630 | ) | | $ | (1,526,540 | ) | | | | | (306,671 | ) | | $ | (3,892,844 | ) |
| | | | | | | | | | | | | | |
| | | | | | | | | | | | | | | | | | |
| | | | | | | | | | | | | | | | | | |
| Investor C | | | | | | | | | | | | | | | | | | |
Shares sold | | | 393,474 | | | $ | 4,627,168 | | | | | | 3,219,819 | | | $ | 40,959,561 | |
Shares issued in reinvestment of dividends | | | 73,304 | | | | 849,596 | | | | | | 124,760 | | | | 1,586,645 | |
Shares redeemed | | | (2,213,926 | ) | | | (25,782,422 | ) | | | | | (1,046,957 | ) | | | (13,338,756 | ) |
| | | | | | | | | | | | | | |
Net increase (decrease) | | | (1,747,148 | ) | | $ | (20,305,658 | ) | | | | | 2,297,622 | | | $ | 29,207,450 | |
| | | | | | | | | | | | | | |
| | | | | | | | | | | | | | | | | | |
| Investor C1 | | | | | | | | | | | | | | | | | | |
Shares sold | | | 169 | | | $ | 1,965 | | | | | | 5,779 | | | $ | 73,677 | |
Shares issued in reinvestment of dividends | | | 13,814 | | | | 160,167 | | | | | | 29,812 | | | | 378,971 | |
Shares redeemed | | | (230,926 | ) | | | (2,670,984 | ) | | | | | (238,911 | ) | | | (3,031,862 | ) |
| | | | | | | | | | | | | | |
Net decrease | | | (216,943 | ) | | $ | (2,508,852 | ) | | | | | (203,320 | ) | | $ | (2,579,214 | ) |
| | | | | | | | | | | | | | |
Total Net Increase (Decrease) | | | (13,392,399 | ) | | $ | (154,657,642 | ) | | | | | 14,535,959 | | | $ | 185,351,361 | |
| | | | | | | | | | | | | | |
| | | | | | |
| | | | | | | |
| 70 | | SEMI-ANNUAL REPORT | | NOVEMBER 30, 2013 | | |
| | | | |
| Notes to Financial Statements (continued) | | |
| | | | | | | | | | | | | | | | | | |
BlackRock New Jersey
Municipal Bond Fund | | Six Months Ended
November 30, 2013 | | | | | Year Ended
May 31, 2013 | |
| | Shares | | | Amount | | | | | Shares | | | Amount | |
| Institutional | | | | | | | | | | | | | | |
Shares sold | | | 534,626 | | | $ | 5,623,392 | | | | | | 1,522,996 | | | $ | 17,382,424 | |
Shares issued in reinvestment of dividends | | | 48,768 | | | | 510,360 | | | | | | 94,866 | | | | 1,080,653 | |
Shares redeemed | | | (1,674,711 | ) | | | (17,629,194 | ) | | | | | (1,463,977 | ) | | | (16,663,817 | ) |
| | | | | | | | | | | | | | |
Net increase (decrease) | | | (1,091,317 | ) | | $ | (11,495,442 | ) | | | | | 153,885 | | | $ | 1,799,260 | |
| | | | | | | | | | | | | | |
| | | | | | | | | | | | | | | | | | |
| Service | | | | | | | | | | | | | | | | | | |
Shares sold | | | 151,390 | | | $ | 1,590,246 | | | | | | 573,047 | | | $ | 6,537,644 | |
Shares issued in reinvestment of dividends | | | 28,692 | | | | 300,139 | | | | | | 46,344 | | | | 527,948 | |
Shares redeemed | | | (261,603 | ) | | | (2,728,590 | ) | | | | | (167,806 | ) | | | (1,911,638 | ) |
| | | | | | | | | | | | | | |
Net increase (decrease) | | | (81,521 | ) | | $ | (838,205 | ) | | | | | 451,585 | | | $ | 5,153,954 | |
| | | | | | | | | | | | | | |
| | | | | | | | | | | | | | | | | | |
| Investor A | | | | | | | | | | | | | | | | | | |
Shares sold | | | 464,137 | | | $ | 4,921,482 | | | | | | 2,000,104 | | | $ | 22,776,711 | |
Shares issued in reinvestment of dividends | | | 68,877 | | | | 721,608 | | | | | | 116,047 | | | | 1,322,859 | |
Shares redeemed | | | (1,470,021 | ) | | | (15,479,189 | ) | | | | | (705,913 | ) | | | (8,064,453 | ) |
| | | | | | | | | | | | | | |
Net increase (decrease) | | | (937,007 | ) | | $ | (9,836,099 | ) | | | | | 1,410,238 | | | $ | 16,035,117 | |
| | | | | | | | | | | | | | |
| | | | | | | | | | | | | | | | | | |
| Investor A1 | | | | | | | | | | | | | | | | | | |
Shares sold | | | 81,897 | | | $ | 908,940 | | | | | | 117,416 | | | $ | 1,336,599 | |
Shares issued in reinvestment of dividends | | | 39,003 | | | | 408,497 | | | | | | 74,819 | | | | 853,568 | |
Shares redeemed | | | (212,619 | ) | | | (2,234,907 | ) | | | | | (309,275 | ) | | | (3,527,532 | ) |
| | | | | | | | | | | | | | |
Net decrease | | | (91,719 | ) | | $ | (917,470 | ) | | | | | (117,040 | ) | | $ | (1,337,365 | ) |
| | | | | | | | | | | | | | |
| | | | | | | | | | | | | | | | | | |
| Investor B | | | | | | | | | | | | | | | | | | |
Shares sold | | | — | | | | — | | | | | | — | | | $ | 7 | |
Shares issued in reinvestment of dividends | | | — | | | | — | | | | | | 447 | | | | 5,087 | |
Shares redeemed | | | (17,618 | ) | | $ | (195,210 | ) | | | | | (4,508 | ) | | | (51,210 | ) |
| | | | | | | | | | | | | | |
Net decrease | | | (17,618 | ) | | $ | (195,210 | ) | | | | | (4,061 | ) | | $ | (46,116 | ) |
| | | | | | | | | | | | | | |
| | | | | | | | | | | | | | | | | | |
| Investor B1 | | | | | | | | | | | | | | | | | | |
Shares sold | | | — | | | | — | | | | | | 12 | | | $ | 139 | |
Shares issued in reinvestment of dividends | | | — | | | | — | | | | | | 3,034 | | | | 34,577 | |
Shares redeemed | | | (81,704 | ) | | $ | (906,095 | ) | | | | | (120,443 | ) | | | (1,370,220 | ) |
| | | | | | | | | | | | | | |
Net decrease | | | (81,704 | ) | | $ | (906,095 | ) | | | | | (117,397 | ) | | $ | (1,335,504 | ) |
| | | | | | | | | | | | | | | | | | |
| | | | | | | | | | | | | | | | | | |
| Investor C | | | | | | | | | | | | | | | | | | |
Shares sold | | | 115,403 | | | $ | 1,212,613 | | | | | | 1,020,680 | | | $ | 11,650,677 | |
Shares issued in reinvestment of dividends | | | 30,703 | | | | 321,105 | | | | | | 57,015 | | | | 649,320 | |
Shares redeemed | | | (479,271 | ) | | | (5,026,979 | ) | | | | | (401,252 | ) | | | (4,571,365 | ) |
| | | | | | | | | | | | | | | | | | |
Net increase (decrease) | | | (333,165 | ) | | $ | (3,493,261 | ) | | | | | 676,443 | | | $ | 7,728,632 | |
| | | | | | | | | | | | | | | | | | |
| | | | | | | | | | | | | | | | | | |
| Investor C1 | | | | | | | | | | | | | | | | | | |
Shares sold | | | 15 | | | $ | 160 | | | | | | 33 | | | $ | 375 | |
Shares issued in reinvestment of dividends | | | 9,763 | | | | 102,153 | | | | | | 21,025 | | | | 239,512 | |
Shares redeemed | | | (106,369 | ) | | | (1,099,275 | ) | | | | | (120,665 | ) | | | (1,372,551 | ) |
| | | | | | | | | | | | | | | | | | |
Net decrease | | | (96,591 | ) | | $ | (996,962 | ) | | | | | (99,607 | ) | | $ | (1,132,664 | ) |
| | | | | | | | | | | | | | | | | | |
Total Net Increase (Decrease) | | | (2,730,642 | ) | | $ | (28,678,744 | ) | | | | | 2,354,046 | | | $ | 26,865,314 | |
| | | | | | | | | | | | | | | | | | |
| | | | | | | | | | | | | | | | | | |
| | | | | | |
| | | | | | | |
| | SEMI-ANNUAL REPORT | | NOVEMBER 30, 2013 | | 71 |
| | |
| Notes to Financial Statements (continued) | | |
| | | | | | | | | | | | | | | | | | |
BlackRock Pennsylvania Municipal Bond Fund | | Six Months Ended
November 30, 2013 | | | | | Year Ended
May 31, 2013 | |
| | Shares | | | Amount | | | | | Shares | | | Amount | |
| Institutional | | | | | | | | | | | | | | | | | | |
Shares sold | | | 978,942 | | | $ | 10,515,592 | | | | | | 3,950,011 | | | $ | 46,393,090 | |
Shares issued in reinvestment of dividends | | | 87,698 | | | | 934,376 | | | | | | 152,874 | | | | 1,792,488 | |
Shares redeemed | | | (5,381,730 | ) | | | (57,326,462 | ) | | | | | (4,390,552 | ) | | | (51,455,720 | ) |
| | | | | | | | | | | | | | | | | | |
Net decrease | | | (4,315,090 | ) | | $ | (45,876,494 | ) | | | | | (287,667 | ) | | $ | (3,270,142 | ) |
| | | | | | | | | | | | | | | | | | |
| | | | | | | | | | | | | | | | | | |
| Service | | | | | | | | | | | | | | | | | | |
Shares sold | | | 135,673 | | | $ | 1,443,779 | | | | | | 454,305 | | | $ | 5,331,684 | |
Shares issued in reinvestment of dividends | | | 13,306 | | | | 141,763 | | | | | | 19,886 | | | | 233,230 | |
Shares redeemed | | | (216,603 | ) | | | (2,311,824 | ) | | | | | (120,562 | ) | | | (1,416,649 | ) |
| | | | | | | | | | | | | | | | | | |
Net increase (decrease) | | | (67,624 | ) | | $ | (726,282 | ) | | | | | 353,629 | | | $ | 4,148,265 | |
| | | | | | | | | | | | | | | | | | |
| | | | | | | | | | | | | | | | | | |
| Investor A | | | | | | | | | | | | | | | | | | |
Shares sold | | | 693,463 | | | $ | 7,404,561 | | | | | | 2,163,364 | | | $ | 25,410,189 | |
Shares issued in reinvestment of dividends | | | 96,438 | | | | 1,028,477 | | | | | | 160,231 | | | | 1,880,513 | |
Shares redeemed | | | (1,346,683 | ) | | | (14,268,154 | ) | | | | | (635,311 | ) | | | (7,459,020 | ) |
| | | | | | | | | | | | | | | | | | |
Net increase (decrease) | | | (556,782 | ) | | $ | (5,835,116 | ) | | | | | 1,688,284 | | | $ | 19,831,682 | |
| | | | | | | | | | | | | | | | | | |
| | | | | | | | | | | | | | | | | | |
| Investor A1 | | | | | | | | | | | | | | | | | | |
Shares sold | | | 47,261 | | | $ | 538,679 | | | | | | 86,753 | | | $ | 1,014,993 | |
Shares issued in reinvestment of dividends | | | 20,427 | | | | 217,879 | | | | | | 40,464 | | | | 475,087 | |
Shares redeemed | | | (258,139 | ) | | | (2,765,247 | ) | | | | | (247,668 | ) | | | (2,904,896 | ) |
| | | | | | | | | | | | | | | | | | |
Net decrease | | | (190,451 | ) | | $ | (2,008,689 | ) | | | | | (120,451 | ) | | $ | (1,414,816 | ) |
| | | | | | | | | | | | | | | | | | |
| | | | | | | | | | | | | | | | | | |
| Investor B | | | | | | | | | | | | | | | | | | |
Shares sold | | | — | | | | — | | | | | | 4,775 | | | $ | 56,728 | |
Shares issued in reinvestment of dividends | | | — | | | | — | | | | | | 357 | | | | 4,187 | |
Shares redeemed | | | (10,644 | ) | | $ | (121,133 | ) | | | | | (6,910 | ) | | | (81,382 | ) |
| | | | | | | | | | | | | | | | | | |
Net decrease | | | (10,644 | ) | | $ | (121,133 | ) | | | | | (1,778 | ) | | $ | (20,467 | ) |
| | | | | | | | | | | | | | | | | | |
| | | | | | | | | | | | | | | | | | |
| Investor B1 | | | | | | | | | | | | | | | | | | |
Shares sold | | | — | | | | — | | | | | | — | | | | — | |
Shares issued in reinvestment of dividends | | | — | | | | — | | | | | | 1,931 | | | $ | 22,630 | |
Shares redeemed | | | (45,807 | ) | | $ | (521,278 | ) | | | | | (113,682 | ) | | | (1,329,239 | ) |
| | | | | | | | | | |
Net decrease | | | (45,807 | ) | | $ | (521,278 | ) | | | | | (111,751 | ) | | $ | (1,306,609 | ) |
| | | | | | | | | | |
| | | | | | | | | | | | | | | | | | |
| Investor C | | | | | | | | | | | | | | | | | | |
Shares sold | | | 101,702 | | | $ | 1,102,849 | | | | | | 960,965 | | | $ | 11,300,415 | |
Shares issued in reinvestment of dividends | | | 36,563 | | | | 389,942 | | | | | | 67,798 | | | | 795,498 | |
Shares redeemed | | | (678,114 | ) | | | (7,235,086 | ) | | | | | (323,167 | ) | | | (3,793,772 | ) |
| | | | | | | | | | |
Net increase (decrease) | | | (539,849 | ) | | $ | (5,742,295 | ) | | | | | 705,596 | | | $ | 8,302,141 | |
| | | | | | | | | | |
| | | | | | | | | | | | | | | | | | |
| Investor C1 | | | | | | | | | | | | | | | | | | |
Shares sold | | | 121 | | | $ | 1,285 | | | | | | 2 | | | $ | 24 | |
Shares issued in reinvestment of dividends | | | 7,744 | | | | 82,500 | | | | | | 16,628 | | | | 194,964 | |
Shares redeemed | | | (116,061 | ) | | | (1,239,123 | ) | | | | | (65,222 | ) | | | (764,915 | ) |
| | | | | | | | | | |
Net decrease | | | (108,196 | ) | | $ | (1,155,338 | ) | | | | | (48,592 | ) | | $ | (569,927 | ) |
| | | | | | | | | | |
Total Net Increase (Decrease) | | | (5,834,443 | ) | | $ | (61,986,625 | ) | | | | | 2,177,270 | | | $ | 25,700,127 | |
| | | | | | | | | | |
| | | | | | | | | | | | | | | | | | |
| | | | | | |
| | | | | | | |
| 72 | | SEMI-ANNUAL REPORT | | NOVEMBER 30, 2013 | | |
| | | | |
| Notes to Financial Statements (concluded) | | |
| | | | | | | | | | | | | | | | | | |
BlackRock Strategic Municipal Opportunities Fund | | Six Months Ended
November 30, 2013 | | | | | Year Ended
May 31, 2013 | |
| | Shares | | | Amount | | | | | Shares | | | Amount | |
| Institutional | | | | | | | | | | | | | | | | | | |
Shares sold | | | 12,781,593 | | | $ | 139,566,056 | | | | | | 25,825,649 | | | $ | 298,110,756 | |
Shares issued in reinvestment of dividends | | | 317,283 | | | | 3,463,321 | | | | | | 596,496 | | | | 6,880,398 | |
Shares redeemed | | | (18,397,670 | ) | | | (200,408,081 | ) | | | | | (11,733,089 | ) | | | (135,539,292 | ) |
| | | | | | | | | | |
Net increase (decrease) | | | (5,298,794 | ) | | $ | (57,378,704 | ) | | | | | 14,689,056 | | | $ | 169,451,862 | |
| | | | | | | | | | |
| | | | | | | | | | | | | | | | | | |
| Investor A | | | | | | | | | | | | | | | | | | |
Shares sold | | | 3,778,283 | | | $ | 41,378,109 | | | | | | 13,975,538 | | | $ | 161,392,666 | |
Shares issued in reinvestment of dividends | | | 231,024 | | | | 2,519,934 | | | | | | 466,507 | | | | 5,376,675 | |
Shares redeemed | | | (7,112,445 | ) | | | (77,449,766 | ) | | | | | (5,827,011 | ) | | | (67,449,800 | ) |
| | | | | | | | | | |
Net increase (decrease) | | | (3,103,138 | ) | | $ | (33,551,723 | ) | | | | | 8,615,034 | | | $ | 99,319,541 | |
| | | | | | | | | | |
| | | | | | | | | | | | | | | | | | |
| Investor A1 | | | | | | | | | | | | | | | | | | |
Shares sold | | | 83,998 | | | $ | 950,673 | | | | | | 85,003 | | | $ | 980,103 | |
Shares issued in reinvestment of dividends | | | 37,309 | | | | 407,143 | | | | | | 90,365 | | | | 1,041,226 | |
Shares redeemed | | | (326,617 | ) | | | (3,563,476 | ) | | | | | (359,759 | ) | | | (4,157,601 | ) |
| | | | | | | | | | |
Net decrease | | | (205,310 | ) | | $ | (2,205,660 | ) | | | | | (184,391 | ) | | $ | (2,136,272 | ) |
| | | | | | | | | | |
| | | | | | | | | | | | | | | | | | |
| Investor B | | | | | | | | | | | | | | | | | | |
Shares sold | | | — | | | | — | | | | | | 14,643 | | | $ | 169,759 | |
Shares issued in reinvestment of dividends | | | — | | | | — | | | | | | 1,747 | | | | 20,127 | |
Shares redeemed | | | (71,299 | ) | | $ | (807,109 | ) | | | | | (85,173 | ) | | | (981,687 | ) |
| | | | | | | | | | |
Net decrease | | | (71,299 | ) | | $ | (807,109 | ) | | | | | (68,783 | ) | | $ | (791,801 | ) |
| | | | | | | | | | |
| | | | | | | | | | | | | | | | | | |
| Investor C | | | | | | | | | | | | | | | | | | |
Shares sold | | | 937,071 | | | $ | 10,269,567 | | | | | | 6,149,451 | | | $ | 70,962,740 | |
Shares issued in reinvestment of dividends | | | 88,042 | | | | 960,675 | | | | | | 207,811 | | | | 2,394,958 | |
Shares redeemed | | | (3,559,367 | ) | | | (38,836,364 | ) | | | | | (1,733,930 | ) | | | (20,039,069 | ) |
| | | | | | | | | | | | | | | | | | |
Net increase (decrease) | | | (2,534,254 | ) | | $ | (27,606,122 | ) | | | | | 4,623,332 | | | $ | 53,318,629 | |
| | | | | | | | | | | | | | | | | | |
Total Net Increase (Decrease) | | | (11,212,795 | ) | | $ | (121,549,318 | ) | | | | | 27,674,248 | | | $ | 319,161,959 | |
| | | | | | | | | | | | | | | | | | |
11. Subsequent Events:
Management’s evaluation of the impact of all subsequent events on the Funds’ financial statements was completed through the date the financial statements were issued and the following item was noted:
On November 12, 2013, the Board approved certain changes to BlackRock Strategic Municipal Opportunities Fund. In particular, the Board approved a change in the name of the Fund from BlackRock Intermediate Municipal Fund and certain changes to the Fund’s principal investment strategies. These changes were effective on January 27, 2014.
| | | | | | |
| | | | | | | |
| | SEMI-ANNUAL REPORT | | NOVEMBER 30, 2013 | | 73 |
Robert M. Hernandez, Chairman of the Board and Trustee
Fred G. Weiss, Vice Chairman of the Board and Trustee
Paul L. Audet, President and Trustee
James H. Bodurtha, Trustee
Bruce R. Bond, Trustee
Donald W. Burton, Trustee
Honorable Stuart E. Eizenstat, Trustee
Laurence D. Fink, Trustee
Kenneth A. Froot, Trustee
Henry Gabbay, Trustee
John F. O’Brien, Trustee
Roberta Cooper Ramo, Trustee
David H. Walsh, Trustee
John M. Perlowski, Chief Executive Officer
Brendan Kyne, Vice President
Neal Andrews, Chief Financial Officer
Jay Fife, Treasurer
Brian Kindelan, Chief Compliance Officer and Anti-Money Laundering Officer
Benjamin Archibald, Secretary
Investment Advisor
BlackRock Advisors, LLC
Wilmington, DE 19809
Sub-Advisor
BlackRock Investment Management, LLC
Princeton, NJ 08540
Custodians
State Street Bank and Trust Company1
Boston, MA 02110
The Bank of New York Mellon2
New York, NY 10286
Transfer Agent
BNY Mellon Investment Servicing (US) Inc.
Wilmington, DE 19809
Accounting Agent
State Street Bank and Trust Company
Boston, MA 02110
Distributor
BlackRock Investments, LLC
New York, NY 10022
Independent Registered Public Accounting Firm
Deloitte & Touche LLP
Boston, MA 02116
Legal Counsel
Willkie Farr & Gallagher LLP
New York, NY 10019
Address of the Funds
100 Bellevue Parkway
Wilmington, DE 19809
| 1 | | For all Funds except BlackRock California Municipal Bond Fund. |
| 2 | | For BlackRock California Municipal Bond Fund. |
| | | | | | |
| | | | | | | |
| 74 | | SEMI-ANNUAL REPORT | | NOVEMBER 30, 2013 | | |
Electronic Delivery
Electronic copies of most financial reports and prospectuses are available on the Funds’ website or shareholders can sign up for e-mail notifications of quarterly statements, annual and semi-annual reports and prospectuses by enrolling in the Funds’ electronic delivery program.
To enroll:
Shareholders Who Hold Accounts with Investment Advisors, Banks or Brokerages:
Please contact your financial advisor. Please note that not all investment advisors, banks or brokerages may offer this service.
Shareholders Who Hold Accounts Directly with BlackRock:
| 1) | Access the BlackRock website at http://www.blackrock.com/edelivery |
| 2) | Select “eDelivery” under the “More Information” section |
Householding
The Funds will mail only one copy of shareholder documents, including prospectuses, annual and semi-annual reports and proxy statements, to shareholders with multiple accounts at the same address. This practice is commonly called “householding” and is intended to reduce expenses and eliminate duplicate mailings of shareholder documents. Mailings of your shareholder documents may be householded indefinitely unless you instruct us otherwise. If you do not want the mailing of these documents to be combined with those for other members of your household, please call the Funds at (800) 441-7762.
Availability of Quarterly Schedule of Investments
The Funds file their complete schedule of portfolio holdings with the SEC for the first and third quarters of each fiscal year on Form N-Q. The Funds’ Forms N-Q are available on the SEC’s website at http://www.sec.gov and may also be reviewed and copied at the SEC’s Public Reference Room in Washington, DC. Information on how to access documents on the SEC’s website without charge may be obtained by calling (800) SEC-0330. The Funds’ Forms N-Q may also be obtained upon request and without charge by calling (800) 441-7762.
Availability of Proxy Voting Policies and Procedures
A description of the policies and procedures that the Funds use to determine how to vote proxies relating to portfolio securities is available (1) without charge, upon request, by calling (800) 441-7762; (2) at http://www.blackrock.com; and (3) on the SEC’s website at http://www.sec.gov.
Availability of Proxy Voting Record
Information about how the Funds voted proxies relating to securities held in the Funds’ portfolios during the most recent 12-month period ended June 30 is available upon request and without charge (1) at http://www.blackrock.com or by calling (800) 441-7762 and (2) on the SEC’s website at http://www.sec.gov.
| | | | | | |
| | | | | | | |
| | SEMI-ANNUAL REPORT | | NOVEMBER 30, 2013 | | 75 |
| | |
| Additional Information (continued) | | |
Account Information
Call us at (800) 441-7762 from 8:00 AM to 6:00 PM EST on any business day to get information about your account balances, recent transactions and share prices. You can also reach us on the Web at http://www.blackrock.com/funds.
Automatic Investment Plans
Investor Class shareholders who want to invest regularly can arrange to have $50 or more automatically deducted from their checking or savings account and invested in any of the BlackRock funds.
Systematic Withdrawal Plans
Investor Class shareholders can establish a systematic withdrawal plan and receive periodic payments of $50 or more from their BlackRock funds, as long as their account balance is at least $10,000.
Retirement Plans
Shareholders may make investments in conjunction with Traditional, Rollover, Roth, Coverdell, Simple IRAs, SEP IRAs and 403(b) Plans.
| | | | | | |
| | | | | | | |
| 76 | | SEMI-ANNUAL REPORT | | NOVEMBER 30, 2013 | | |
| | | | |
| Additional Information (concluded) | | |
|
| BlackRock Privacy Principles |
BlackRock is committed to maintaining the privacy of its current and former fund investors and individual clients (collectively, “Clients”) and to safeguarding their non-public personal information. The following information is provided to help you understand what personal information BlackRock collects, how we protect that information and why in certain cases we share such information with select parties.
If you are located in a jurisdiction where specific laws, rules or regulations require BlackRock to provide you with additional or different privacy-related rights beyond what is set forth below, then BlackRock will comply with those specific laws, rules or regulations.
BlackRock obtains or verifies personal non-public information from and about you from different sources, including the following: (i) information we receive from you or, if applicable, your financial intermediary, on applications, forms or other documents; (ii) information about your transactions with us, our affiliates, or others; (iii) information we receive from a consumer reporting agency; and (iv) from visits to our websites.
BlackRock does not sell or disclose to non-affiliated third parties any non-public personal information about its Clients, except as permitted by law or as is necessary to respond to regulatory requests or to service Client accounts. These non-affiliated third parties are required to protect the confidentiality and security of this information and to use it only for its intended purpose.
We may share information with our affiliates to service your account or to provide you with information about other BlackRock products or services that may be of interest to you. In addition, BlackRock restricts access to non-public personal information about its Clients to those BlackRock employees with a legitimate business need for the information. BlackRock maintains physical, electronic and procedural safeguards that are designed to protect the non-public personal information of its Clients, including procedures relating to the proper storage and disposal of such information.
| | | | | | |
| | | | | | | |
| | SEMI-ANNUAL REPORT | | NOVEMBER 30, 2013 | | 77 |
| | |
| A World-Class Mutual Fund Family | | |
BlackRock offers a diverse lineup of open-end mutual funds crossing all investment styles and managed by experts in equity, fixed income and tax-exempt investing.
BlackRock ACWI ex-US Index Fund
BlackRock All-Cap Energy & Resources Portfolio
BlackRock Basic Value Fund
BlackRock Capital Appreciation Fund
BlackRock Commodity Strategies Fund
BlackRock Disciplined Small Cap Core Fund
BlackRock Emerging Markets Fund
BlackRock Emerging Markets Dividend Fund
BlackRock Emerging Markets Long/Short Equity Fund
BlackRock Energy & Resources Portfolio
BlackRock Equity Dividend Fund
BlackRock EuroFund
BlackRock Flexible Equity Fund
BlackRock Focus Growth Fund
BlackRock Global Dividend Income Portfolio
BlackRock Global Long/Short Equity Fund
BlackRock Global Opportunities Portfolio
BlackRock Global SmallCap Fund
BlackRock Health Sciences Opportunities Portfolio
BlackRock International Fund
BlackRock International Index Fund
BlackRock International Opportunities Portfolio
BlackRock Large Cap Core Fund
BlackRock Large Cap Core Plus Fund
BlackRock Large Cap Growth Fund
BlackRock Large Cap Value Fund
BlackRock Latin America Fund
BlackRock Long-Horizon Equity Fund
BlackRock Mid-Cap Growth Equity Portfolio
BlackRock Mid Cap Value Opportunities Fund
BlackRock Natural Resources Trust
BlackRock Pacific Fund
BlackRock Real Estate Securities Fund
BlackRock Russell 1000 Index Fund
BlackRock Science & Technology Opportunities Portfolio
BlackRock Small Cap Growth Equity Portfolio
BlackRock Small Cap Growth Fund II
BlackRock Small Cap Index Fund
BlackRock S&P 500 Stock Fund
BlackRock U.S. Opportunities Portfolio
BlackRock Value Opportunities Fund
| | |
| Taxable Fixed Income Funds | | |
BlackRock Bond Index Fund
BlackRock Core Bond Portfolio
BlackRock CoreAlpha Bond Fund
BlackRock Emerging Markets Flexible Dynamic Bond Portfolio
BlackRock Floating Rate Income Portfolio
BlackRock Global Long/Short Credit Fund
BlackRock GNMA Portfolio
BlackRock High Yield Bond Portfolio
BlackRock Inflation Protected Bond Portfolio
BlackRock International Bond Portfolio
BlackRock Investment Grade Bond Portfolio
BlackRock Low Duration Bond Portfolio
BlackRock Secured Credit Portfolio
BlackRock Short Obligations Fund
BlackRock Short-Term Treasury Fund
BlackRock Strategic Income Opportunities Portfolio
BlackRock Total Return Fund
BlackRock U.S. Government Bond Portfolio
BlackRock U.S. Mortgage Portfolio
BlackRock Ultra-Short Obligations Fund
BlackRock World Income Fund
| | |
| Municipal Fixed Income Funds | | |
BlackRock California Municipal Bond Fund
BlackRock High Yield Municipal Fund
BlackRock National Municipal Fund
BlackRock New Jersey Municipal Bond Fund
BlackRock New York Municipal Bond Fund
BlackRock Pennsylvania Municipal Bond Fund
BlackRock Short-Term Municipal Fund
BlackRock Strategic Municipal Opportunities Fund
| | | | | | | | | | | | | | | | |
| BlackRock Balanced Capital Fund | | LifePath Active Portfolios | | | | LifePath Index Portfolios |
BlackRock Emerging Market Allocation Portfolio | | | | 2015 | | 2040 | | | | | | | | Retirement | | 2040 |
BlackRock Global Allocation Fund | | | | 2020 | | 2045 | | | | | | | | 2020 | | 2045 |
BlackRock Managed Volatility Portfolio | | | | 2025 | | 2050 | | | | | | | | 2025 | | 2050 |
BlackRock Multi-Asset Income Portfolio | | | | 2030 | | 2055 | | | | | | | | 2030 | | 2055 |
BlackRock Multi-Asset Real Return Fund | | | | 2035 | | | | | | | | | | 2035 | | |
BlackRock Strategic Risk Allocation Fund | | | | | | | | | | | | | | | | |
| | | | | | | | | | | | | | | | |
| BlackRock Prepared Portfolios | | LifePath Portfolios | | | | | | | | |
Conservative Prepared Portfolio | | | | Retirement | | 2040 | | | | | | | | | | |
Moderate Prepared Portfolio | | | | 2020 | | 2045 | | | | | | | | | | |
Growth Prepared Portfolio | | | | 2025 | | 2050 | | | | | | | | | | |
Aggressive Growth Prepared Portfolio | | | | 2030 | | 2055 | | | | | | | | | | |
| | | | 2035 | | | | | | | | | | | | |
BlackRock mutual funds are currently distributed by BlackRock Investments, LLC. You should consider the investment objectives, risks, charges and expenses of the funds under consideration carefully before investing. Each fund’s prospectus contains this and other information and is available at www.blackrock.com or by calling (800) 441-7762 or from your financial advisor. The prospectus should be read carefully before investing.
| | | | | | |
| | | | | | | |
| 78 | | SEMI-ANNUAL REPORT | | NOVEMBER 30, 2013 | | |
These reports are not authorized for use as an offer of sale or a solicitation of an offer to buy shares of the Funds unless accompanied or preceded by the Funds’ current prospectus. Past performance results shown in this report should not be considered a representation of future performance. Investment returns and principal value of shares will fluctuate so that shares, when redeemed, may be worth more or less than their original cost. Statements and other information herein are as dated and are subject to change.

| | |
| MUNI4-11/13-SAR | |  |
| | |
| Item 2 – | | Code of Ethics – Not Applicable to this semi-annual report |
| |
| Item 3 – | | Audit Committee Financial Expert – Not Applicable to this semi-annual report |
| |
| Item 4 – | | Principal Accountant Fees and Services – Not Applicable to this semi-annual report |
| |
| Item 5 – | | Audit Committee of Listed Registrants – Not Applicable |
| |
| Item 6 – | | Investments (a) The registrant’s Schedule of Investments is included as part of the Report to Stockholders filed under Item 1 of this Form. (b) Not Applicable due to no such divestments during the semi-annual period covered since the previous Form N-CSR filing. |
| |
| Item 7 – | | Disclosure of Proxy Voting Policies and Procedures for Closed-End Management Investment Companies – Not Applicable |
| |
| Item 8 – | | Portfolio Managers of Closed-End Management Investment Companies – Not Applicable |
| |
| Item 9 – | | Purchases of Equity Securities by Closed-End Management Investment Company and Affiliated Purchasers – Not Applicable |
| |
| Item 10 – | | Submission of Matters to a Vote of Security Holders –There have been no material changes to these procedures. |
| |
| Item 11 – | | Controls and Procedures |
| |
| | (a) – The registrant’s principal executive and principal financial officers, or persons performing similar functions, have concluded that the registrant’s disclosure controls and procedures (as defined in Rule 30a-3(c) under the Investment Company Act of 1940, as amended (the “1940 Act”)) are effective as of a date within 90 days of the filing of this report based on the evaluation of these controls and procedures required by Rule 30a-3(b) under the 1940 Act and Rule 15d-15(b) under the Securities Exchange Act of 1934, as amended. |
| |
| | (b) – There were no changes in the registrant’s internal control over financial reporting (as defined in Rule 30a-3(d) under the 1940 Act) that occurred during the second fiscal quarter of the period covered by this report that have materially affected, or are reasonably likely to materially affect, the registrant’s internal control over financial reporting. |
| |
| Item 12 – | | Exhibits attached hereto |
| |
| | (a)(1) – Code of Ethics – Not Applicable to this semi-annual report |
| |
| | (a)(2) – Certifications – Attached hereto |
| |
| | (a)(3) – Not Applicable |
| |
| | (b) – Certifications – Attached hereto |
2
Pursuant to the requirements of the Securities Exchange Act of 1934 and the Investment Company Act of 1940, the registrant has duly caused this report to be signed on its behalf by the undersigned, thereunto duly authorized.
BlackRock California Municipal Bond Fund of BlackRock California Municipal Series Trust
| | | | |
| By: | | /s/ John M. Perlowski | | |
| | | | |
| | John M. Perlowski |
| | Chief Executive Officer (principal executive officer) of |
| | BlackRock California Municipal Bond Fund of BlackRock California Municipal Series Trust |
Date: February 3, 2014
Pursuant to the requirements of the Securities Exchange Act of 1934 and the Investment Company Act of 1940, this report has been signed below by the following persons on behalf of the registrant and in the capacities and on the dates indicated.
| | | | |
| By: | | /s/ John M. Perlowski | | |
| | | | |
| | John M. Perlowski |
| | Chief Executive Officer (principal executive officer) of |
| | BlackRock California Municipal Bond Fund of BlackRock California Municipal Series Trust |
Date: February 3, 2014
| | | | |
| | Neal J. Andrews |
| | Chief Financial Officer (principal financial officer) of |
| | BlackRock California Municipal Bond Fund of BlackRock California Municipal Series Trust |
Date: February 3, 2014
3