UNITED STATES
SECURITIES AND EXCHANGE COMMISSION
Washington, D.C. 20549
FORM N-CSR
CERTIFIED SHAREHOLDER REPORT OF REGISTERED MANAGEMENT INVESTMENT COMPANIES
Investment Company Act file number:
Name of Fund:
| BlackRock California Municipal Series Trust |
| BlackRock California Municipal Opportunities Fund |
|
|
|
|
|
|
|
|
|
|
|
|
|
|
|
|
|
|
|
|
|
|
|
|
|
|
|
|
Fund Address: 100 Bellevue Parkway, Wilmington, DE 19809
Name and address of agent for service: John M. Perlowski, Chief Executive Officer, BlackRock California Municipal Series Trust, 50 Hudson Yards, New York, NY 10001
Registrant's telephone number, including area code:
Date of reporting period:
Item 1 — Report to Stockholders
(a) The Report to Shareholders is attached herewith
(b) Not Applicable
BlackRock California Municipal Opportunities Fund
Institutional Shares | MACMX
Annual Shareholder Report — May 31, 2024
This annual shareholder report contains important information about BlackRock California Municipal Opportunities Fund (the “Fund”) for the period of June 1, 2023 to May 31, 2024. You can find additional information about the Fund at blackrock.com/fundreports. You can also request this information by contacting us at (800) 441‑7762.
This report describes changes to the Fund that occurred during the reporting period.
What were the Fund costs for the last year?
(based on a hypothetical $10,000 investment)
| Class name | Costs of a $10,000
investment | Costs paid as a percentage of a
$10,000 investment |
| Institutional Shares | $53 | 0.52% |
How did the Fund perform last year?
The municipal bond market gained ground during the reporting period, with the benefit of income augmented by a modest gain in prices.
Declining inflation fueled expectations that the U.S. Federal Reserve was set to begin cutting interest rates in 2024, benefiting the broader fixed-income market.
Municipal bonds were further helped by positive economic growth, strong issuer fundamentals, and favorable supply-and-demand trends.
What contributed to performance?
The Fund’s positions in longer-duration and longer-maturity securities were notable contributors. (Duration is a measure of interest rate sensitivity.) The Fund’s holdings in corporate-backed municipals helped results, as did overweights in the utilities and pre-paid gas sectors. The Fund had an above-average weighting in cash, which had no material impact on results due to the attractive yields in this area. The Fund’s use of derivatives marginally contributed to performance.
What detracted from performance?
At a time of positive returns for the broader asset class, there were few meaningful detractors from Fund performance. With this said, its holdings in high-yield bonds—especially those with deep-discount structures—detracted given that yield spreads remained wide. Bonds issued by Puerto Rico Electric Power Authority were particularly notable detractors in this category due to continued uncertainty in the territory’s financial picture.
The views expressed reflect the opinions of BlackRock as of the date of this report and are subject to change based on changes in market, economic or other conditions. These views are not intended to be a forecast of future events and are no guarantee of future results.
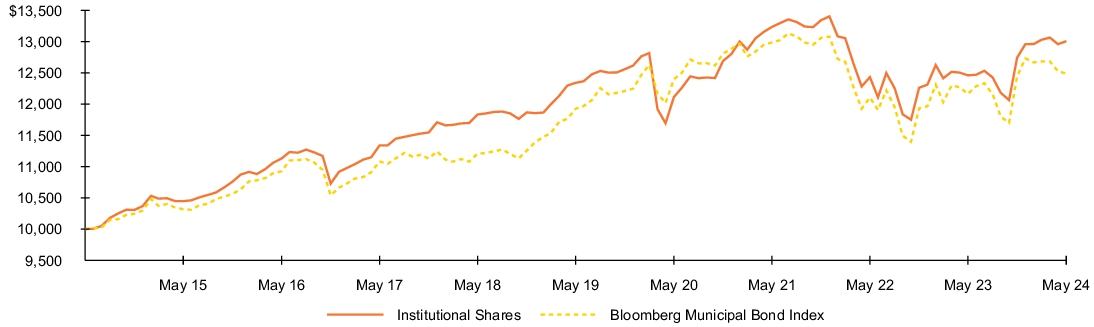
Fund performance
Cumulative performance: June 1, 2014 through May 31, 2024
Initial investment of $10,000
See “Average annual total returns” for additional information on fund performance.
| Average annual total returns | | | |
| 1 Year | 5 Years | 10 Years |
| Institutional Shares | 4.39% | 1.06% | 2.66% |
| Bloomberg Municipal Bond Index | 2.67% | 0.93% | 2.25% |
| California Customized Reference Benchmark | 3.04% | 0.88% | N/A |
| Key Fund statistics | |
| Net Assets | $2,285,640,268% |
| Number of Portfolio Holdings | $284% |
| Net Investment Advisory Fees | $8,253,931% |
| Portfolio Turnover Rate | $77% |
Performance shown prior to January 26, 2015, is that of the Fund when it followed different investment strategies under the name BlackRock California Municipal Bond Fund.
The California Customized Reference Benchmark (commenced on September 30, 2016) is comprised of 85% Bloomberg Municipal Bond: California Exempt Total Return Index Unhedged USD/10% California Bloomberg Municipal Bond: High Yield (non-Investment Grade) Total Return Index/5% Bloomberg Municipal Index California Taxable Bonds Total Return Index Value.
Past performance is not an indication of future results. Performance results may include adjustments made for financial reporting purposes in accordance with U.S. generally accepted accounting principles. Performance results do not reflect the deduction of taxes that a shareholder would pay on fund distributions or on the redemption or sale of fund shares. Visit blackrock.com for more recent performance information.
What did the Fund invest in?
(as of May 31, 2024)
| Sector allocation |
| Sector(a)(b) | Percent of
Total Investments |
| Utilities | 30.6% |
| County/City/Special District/School District | 26.4% |
| Transportation | 12.3% |
| Education | 8.1% |
| Corporate | 8.1% |
| Health | 5.9% |
| State | 5.9% |
| Tobacco | 1.8% |
| Housing | 0.9% |
| Credit quality allocation |
| Credit Rating(a)(c) | Percent of
Total Investments |
| AAA/Aaa | 18.3% |
| AA/Aa | 52.5% |
| A | 15.8% |
| BBB/Baa | 3.1% |
| BB/Ba | 0.2% |
| CCC/Caa | 0.1% |
| N/R(d) | 10.0% |
| (a) (b) (c) (d) | Excludes short-term securities. |
| (a) (b) (c) (d) | For purposes of this report, sector sub-classifications may differ from those utilized for compliance purposes. |
| (a) (b) (c) (d) | For purposes of this report, credit quality ratings shown above reflect the highest rating assigned by either S&P Global Ratings or Moody’s Investors Service, Inc. if ratings differ. These rating agencies are independent, nationally recognized statistical rating organizations and are widely used. Investment grade ratings are credit ratings of BBB/Baa or higher. Below investment grade ratings are credit ratings of BB/Ba or lower. Investments designated N/R are not rated by either rating agency. Unrated investments do not necessarily indicate low credit quality. Credit quality ratings are subject to change. |
| (a) (b) (c) (d) | The investment adviser evaluates the credit quality of unrated investments based upon certain factors including, but not limited to, credit ratings for similar investments and financial analysis of sectors and individual investments. Using this approach, the investment adviser has deemed certain of these unrated securities as investment grade quality. As of May 31, 2024, the market value of unrated securities deemed by the investment adviser to be investment grade represents less than 1.0% of total investments. |
Material Fund changes
This is a summary of certain changes to the Fund since May 31, 2023. For more complete information, you may review the Fund’s next prospectus, which we expect to be available approximately 120 days after May 31, 2024 at blackrock.com/fundreports or upon request by contacting us at (800) 441-7762.
The net expense ratio decreased from the prior fiscal year end primarily due to a decrease in expenses related to financing activities.
Additional information
If you wish to view additional information about the Fund, including but not limited to financial statements, the Fund’s prospectus and proxy voting policies and procedures, please visit blackrock.com/fundreports. For proxy voting records, visit blackrock.com/proxyrecords.
Householding
The Fund will mail only one copy of shareholder documents, including prospectuses, annual and semi-annual reports and proxy statements, to shareholders with multiple accounts at the same address. This practice is commonly called “householding” and is intended to reduce expenses and eliminate duplicate mailings of shareholder documents. Mailings of your shareholder documents may be householded indefinitely unless you instruct us otherwise. If you do not want the mailing of these documents to be combined with those for other members of your household, please call the Fund at (800) 441-7762.
The Fund is not sponsored, endorsed, issued, sold, or promoted by Bloomberg Index Services Limited and its affiliates, nor does this company make any representation regarding the advisability of investing in the Fund. BlackRock is not affiliated with the company listed above.
©2024 BlackRock, Inc. or its affiliates. All rights reserved. BLACKROCK is a registered trademark of BlackRock, Inc. or its affiliates. All other trademarks are those of their respective owners.
BlackRock California Municipal Opportunities Fund
Institutional Shares | MACMX
Annual Shareholder Report — May 31, 2024
MACMX-05/24-AR
BlackRock California Municipal Opportunities Fund
Investor A Shares | MECMX
Annual Shareholder Report — May 31, 2024
This annual shareholder report contains important information about BlackRock California Municipal Opportunities Fund (the “Fund”) for the period of June 1, 2023 to May 31, 2024. You can find additional information about the Fund at blackrock.com/fundreports. You can also request this information by contacting us at (800) 441‑7762.
This report describes changes to the Fund that occurred during the reporting period.
What were the Fund costs for the last year?
(based on a hypothetical $10,000 investment)
| Class name | Costs of a $10,000
investment | Costs paid as a percentage of a
$10,000 investment |
| Investor A Shares | $78 | 0.76% |
How did the Fund perform last year?
The municipal bond market gained ground during the reporting period, with the benefit of income augmented by a modest gain in prices.
Declining inflation fueled expectations that the U.S. Federal Reserve was set to begin cutting interest rates in 2024, benefiting the broader fixed-income market.
Municipal bonds were further helped by positive economic growth, strong issuer fundamentals, and favorable supply-and-demand trends.
What contributed to performance?
The Fund’s positions in longer-duration and longer-maturity securities were notable contributors. (Duration is a measure of interest rate sensitivity.) The Fund’s holdings in corporate-backed municipals helped results, as did overweights in the utilities and pre-paid gas sectors. The Fund had an above-average weighting in cash, which had no material impact on results due to the attractive yields in this area. The Fund’s use of derivatives marginally contributed to performance.
What detracted from performance?
At a time of positive returns for the broader asset class, there were few meaningful detractors from Fund performance. With this said, its holdings in high-yield bonds—especially those with deep-discount structures—detracted given that yield spreads remained wide. Bonds issued by Puerto Rico Electric Power Authority were particularly notable detractors in this category due to continued uncertainty in the territory’s financial picture.
The views expressed reflect the opinions of BlackRock as of the date of this report and are subject to change based on changes in market, economic or other conditions. These views are not intended to be a forecast of future events and are no guarantee of future results.
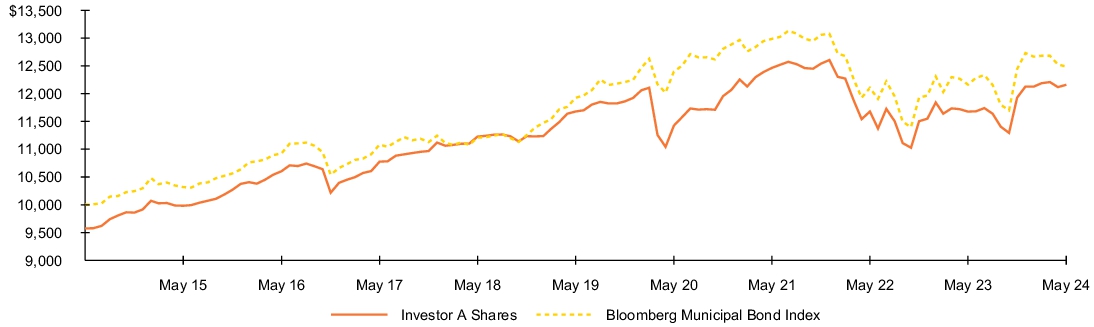
Fund performance
Cumulative performance: June 1, 2014 through May 31, 2024
Initial investment of $10,000
See “Average annual total returns” for additional information on fund performance.
| Average annual total returns | | | |
| 1 Year | 5 Years | 10 Years |
| Investor A Shares | 4.13)% | 0.81)% | 2.42% |
| Investor A Shares (with sales charge) | (0.29)% | (0.06)% | 1.98% |
| Bloomberg Municipal Bond Index | 2.67)% | 0.93)% | 2.25% |
| California Customized Reference Benchmark | 3.04)% | 0.88)% | N/A |
| Key Fund statistics | |
| Net Assets | $2,285,640,268% |
| Number of Portfolio Holdings | $284% |
| Net Investment Advisory Fees | $8,253,931% |
| Portfolio Turnover Rate | $77% |
Performance shown prior to January 26, 2015, is that of the Fund when it followed different investment strategies under the name BlackRock California Municipal Bond Fund.
The California Customized Reference Benchmark (commenced on September 30, 2016) is comprised of 85% Bloomberg Municipal Bond: California Exempt Total Return Index Unhedged USD/10% California Bloomberg Municipal Bond: High Yield (non-Investment Grade) Total Return Index/5% Bloomberg Municipal Index California Taxable Bonds Total Return Index Value.
Assuming maximum sales charges, if any. Average annual total returns with and without sales charges reflect reductions for service fees.
Past performance is not an indication of future results. Performance results may include adjustments made for financial reporting purposes in accordance with U.S. generally accepted accounting principles. Performance results do not reflect the deduction of taxes that a shareholder would pay on fund distributions or on the redemption or sale of fund shares. Visit blackrock.com for more recent performance information.
What did the Fund invest in?
(as of May 31, 2024)
| Sector allocation |
| Sector(a)(b) | Percent of
Total Investments |
| Utilities | 30.6% |
| County/City/Special District/School District | 26.4% |
| Transportation | 12.3% |
| Education | 8.1% |
| Corporate | 8.1% |
| Health | 5.9% |
| State | 5.9% |
| Tobacco | 1.8% |
| Housing | 0.9% |
| Credit quality allocation |
| Credit Rating(a)(c) | Percent of
Total Investments |
| AAA/Aaa | 18.3% |
| AA/Aa | 52.5% |
| A | 15.8% |
| BBB/Baa | 3.1% |
| BB/Ba | 0.2% |
| CCC/Caa | 0.1% |
| N/R(d) | 10.0% |
| (a) (b) (c) (d) | Excludes short-term securities. |
| (a) (b) (c) (d) | For purposes of this report, sector sub-classifications may differ from those utilized for compliance purposes. |
| (a) (b) (c) (d) | For purposes of this report, credit quality ratings shown above reflect the highest rating assigned by either S&P Global Ratings or Moody’s Investors Service, Inc. if ratings differ. These rating agencies are independent, nationally recognized statistical rating organizations and are widely used. Investment grade ratings are credit ratings of BBB/Baa or higher. Below investment grade ratings are credit ratings of BB/Ba or lower. Investments designated N/R are not rated by either rating agency. Unrated investments do not necessarily indicate low credit quality. Credit quality ratings are subject to change. |
| (a) (b) (c) (d) | The investment adviser evaluates the credit quality of unrated investments based upon certain factors including, but not limited to, credit ratings for similar investments and financial analysis of sectors and individual investments. Using this approach, the investment adviser has deemed certain of these unrated securities as investment grade quality. As of May 31, 2024, the market value of unrated securities deemed by the investment adviser to be investment grade represents less than 1.0% of total investments. |
Material Fund changes
This is a summary of certain changes to the Fund since May 31, 2023. For more complete information, you may review the Fund’s next prospectus, which we expect to be available approximately 120 days after May 31, 2024 at blackrock.com/fundreports or upon request by contacting us at (800) 441-7762.
The net expense ratio decreased from the prior fiscal year end primarily due to a decrease in expenses related to financing activities.
Additional information
If you wish to view additional information about the Fund, including but not limited to financial statements, the Fund’s prospectus and proxy voting policies and procedures, please visit blackrock.com/fundreports. For proxy voting records, visit blackrock.com/proxyrecords.
Householding
The Fund will mail only one copy of shareholder documents, including prospectuses, annual and semi-annual reports and proxy statements, to shareholders with multiple accounts at the same address. This practice is commonly called “householding” and is intended to reduce expenses and eliminate duplicate mailings of shareholder documents. Mailings of your shareholder documents may be householded indefinitely unless you instruct us otherwise. If you do not want the mailing of these documents to be combined with those for other members of your household, please call the Fund at (800) 441-7762.
The Fund is not sponsored, endorsed, issued, sold, or promoted by Bloomberg Index Services Limited and its affiliates, nor does this company make any representation regarding the advisability of investing in the Fund. BlackRock is not affiliated with the company listed above.
©2024 BlackRock, Inc. or its affiliates. All rights reserved. BLACKROCK is a registered trademark of BlackRock, Inc. or its affiliates. All other trademarks are those of their respective owners.
BlackRock California Municipal Opportunities Fund
Investor A Shares | MECMX
Annual Shareholder Report — May 31, 2024
MECMX-05/24-AR
BlackRock California Municipal Opportunities Fund
Investor A1 Shares | MDCMX
Annual Shareholder Report — May 31, 2024
This annual shareholder report contains important information about BlackRock California Municipal Opportunities Fund (the “Fund”) for the period of June 1, 2023 to May 31, 2024. You can find additional information about the Fund at blackrock.com/fundreports. You can also request this information by contacting us at (800) 441‑7762.
This report describes changes to the Fund that occurred during the reporting period.
What were the Fund costs for the last year?
(based on a hypothetical $10,000 investment)
| Class name | Costs of a $10,000
investment | Costs paid as a percentage of a
$10,000 investment |
| Investor A1 Shares | $62 | 0.61% |
How did the Fund perform last year?
The municipal bond market gained ground during the reporting period, with the benefit of income augmented by a modest gain in prices.
Declining inflation fueled expectations that the U.S. Federal Reserve was set to begin cutting interest rates in 2024, benefiting the broader fixed-income market.
Municipal bonds were further helped by positive economic growth, strong issuer fundamentals, and favorable supply-and-demand trends.
What contributed to performance?
The Fund’s positions in longer-duration and longer-maturity securities were notable contributors. (Duration is a measure of interest rate sensitivity.) The Fund’s holdings in corporate-backed municipals helped results, as did overweights in the utilities and pre-paid gas sectors. The Fund had an above-average weighting in cash, which had no material impact on results due to the attractive yields in this area. The Fund’s use of derivatives marginally contributed to performance.
What detracted from performance?
At a time of positive returns for the broader asset class, there were few meaningful detractors from Fund performance. With this said, its holdings in high-yield bonds—especially those with deep-discount structures—detracted given that yield spreads remained wide. Bonds issued by Puerto Rico Electric Power Authority were particularly notable detractors in this category due to continued uncertainty in the territory’s financial picture.
The views expressed reflect the opinions of BlackRock as of the date of this report and are subject to change based on changes in market, economic or other conditions. These views are not intended to be a forecast of future events and are no guarantee of future results.
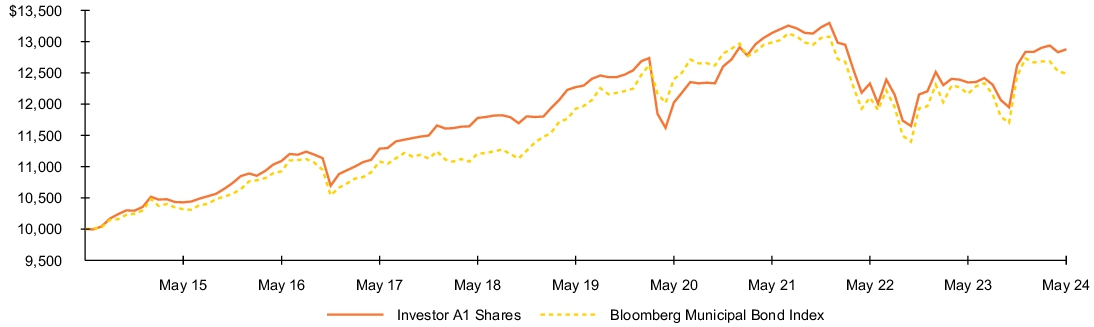
Fund performance
Cumulative performance: June 1, 2014 through May 31, 2024
Initial investment of $10,000
See “Average annual total returns” for additional information on fund performance.
| Average annual total returns | | | |
| 1 Year | 5 Years | 10 Years |
| Investor A1 Shares | 4.29% | 0.97% | 2.56% |
| Bloomberg Municipal Bond Index | 2.67% | 0.93% | 2.25% |
| California Customized Reference Benchmark | 3.04% | 0.88% | N/A |
| Key Fund statistics | |
| Net Assets | $2,285,640,268% |
| Number of Portfolio Holdings | $284% |
| Net Investment Advisory Fees | $8,253,931% |
| Portfolio Turnover Rate | $77% |
Performance shown prior to January 26, 2015, is that of the Fund when it followed different investment strategies under the name BlackRock California Municipal Bond Fund.
The California Customized Reference Benchmark (commenced on September 30, 2016) is comprised of 85% Bloomberg Municipal Bond: California Exempt Total Return Index Unhedged USD/10% California Bloomberg Municipal Bond: High Yield (non-Investment Grade) Total Return Index/5% Bloomberg Municipal Index California Taxable Bonds Total Return Index Value.
Average annual total returns reflect reductions for service fees.
Past performance is not an indication of future results. Performance results may include adjustments made for financial reporting purposes in accordance with U.S. generally accepted accounting principles. Performance results do not reflect the deduction of taxes that a shareholder would pay on fund distributions or on the redemption or sale of fund shares. Visit blackrock.com for more recent performance information.
What did the Fund invest in?
(as of May 31, 2024)
| Sector allocation |
| Sector(a)(b) | Percent of
Total Investments |
| Utilities | 30.6% |
| County/City/Special District/School District | 26.4% |
| Transportation | 12.3% |
| Education | 8.1% |
| Corporate | 8.1% |
| Health | 5.9% |
| State | 5.9% |
| Tobacco | 1.8% |
| Housing | 0.9% |
| Credit quality allocation |
| Credit Rating(a)(c) | Percent of
Total Investments |
| AAA/Aaa | 18.3% |
| AA/Aa | 52.5% |
| A | 15.8% |
| BBB/Baa | 3.1% |
| BB/Ba | 0.2% |
| CCC/Caa | 0.1% |
| N/R(d) | 10.0% |
| (a) (b) (c) (d) | Excludes short-term securities. |
| (a) (b) (c) (d) | For purposes of this report, sector sub-classifications may differ from those utilized for compliance purposes. |
| (a) (b) (c) (d) | For purposes of this report, credit quality ratings shown above reflect the highest rating assigned by either S&P Global Ratings or Moody’s Investors Service, Inc. if ratings differ. These rating agencies are independent, nationally recognized statistical rating organizations and are widely used. Investment grade ratings are credit ratings of BBB/Baa or higher. Below investment grade ratings are credit ratings of BB/Ba or lower. Investments designated N/R are not rated by either rating agency. Unrated investments do not necessarily indicate low credit quality. Credit quality ratings are subject to change. |
| (a) (b) (c) (d) | The investment adviser evaluates the credit quality of unrated investments based upon certain factors including, but not limited to, credit ratings for similar investments and financial analysis of sectors and individual investments. Using this approach, the investment adviser has deemed certain of these unrated securities as investment grade quality. As of May 31, 2024, the market value of unrated securities deemed by the investment adviser to be investment grade represents less than 1.0% of total investments. |
Material Fund changes
This is a summary of certain changes to the Fund since May 31, 2023. For more complete information, you may review the Fund’s next prospectus, which we expect to be available approximately 120 days after May 31, 2024 at blackrock.com/fundreports or upon request by contacting us at (800) 441-7762.
The net expense ratio decreased from the prior fiscal year end primarily due to a decrease in expenses related to financing activities.
Additional information
If you wish to view additional information about the Fund, including but not limited to financial statements, the Fund’s prospectus and proxy voting policies and procedures, please visit blackrock.com/fundreports. For proxy voting records, visit blackrock.com/proxyrecords.
Householding
The Fund will mail only one copy of shareholder documents, including prospectuses, annual and semi-annual reports and proxy statements, to shareholders with multiple accounts at the same address. This practice is commonly called “householding” and is intended to reduce expenses and eliminate duplicate mailings of shareholder documents. Mailings of your shareholder documents may be householded indefinitely unless you instruct us otherwise. If you do not want the mailing of these documents to be combined with those for other members of your household, please call the Fund at (800) 441-7762.
The Fund is not sponsored, endorsed, issued, sold, or promoted by Bloomberg Index Services Limited and its affiliates, nor does this company make any representation regarding the advisability of investing in the Fund. BlackRock is not affiliated with the company listed above.
©2024 BlackRock, Inc. or its affiliates. All rights reserved. BLACKROCK is a registered trademark of BlackRock, Inc. or its affiliates. All other trademarks are those of their respective owners.
BlackRock California Municipal Opportunities Fund
Investor A1 Shares | MDCMX
Annual Shareholder Report — May 31, 2024
MDCMX-05/24-AR
BlackRock California Municipal Opportunities Fund
Investor C Shares | MFCMX
Annual Shareholder Report — May 31, 2024
This annual shareholder report contains important information about BlackRock California Municipal Opportunities Fund (the “Fund”) for the period of June 1, 2023 to May 31, 2024. You can find additional information about the Fund at blackrock.com/fundreports. You can also request this information by contacting us at (800) 441‑7762.
This report describes changes to the Fund that occurred during the reporting period.
What were the Fund costs for the last year?
(based on a hypothetical $10,000 investment)
| Class name | Costs of a $10,000
investment | Costs paid as a percentage of a
$10,000 investment |
| Investor C Shares | $155 | 1.52% |
How did the Fund perform last year?
The municipal bond market gained ground during the reporting period, with the benefit of income augmented by a modest gain in prices.
Declining inflation fueled expectations that the U.S. Federal Reserve was set to begin cutting interest rates in 2024, benefiting the broader fixed-income market.
Municipal bonds were further helped by positive economic growth, strong issuer fundamentals, and favorable supply-and-demand trends.
What contributed to performance?
The Fund’s positions in longer-duration and longer-maturity securities were notable contributors. (Duration is a measure of interest rate sensitivity.) The Fund’s holdings in corporate-backed municipals helped results, as did overweights in the utilities and pre-paid gas sectors. The Fund had an above-average weighting in cash, which had no material impact on results due to the attractive yields in this area. The Fund’s use of derivatives marginally contributed to performance.
What detracted from performance?
At a time of positive returns for the broader asset class, there were few meaningful detractors from Fund performance. With this said, its holdings in high-yield bonds—especially those with deep-discount structures—detracted given that yield spreads remained wide. Bonds issued by Puerto Rico Electric Power Authority were particularly notable detractors in this category due to continued uncertainty in the territory’s financial picture.
The views expressed reflect the opinions of BlackRock as of the date of this report and are subject to change based on changes in market, economic or other conditions. These views are not intended to be a forecast of future events and are no guarantee of future results.
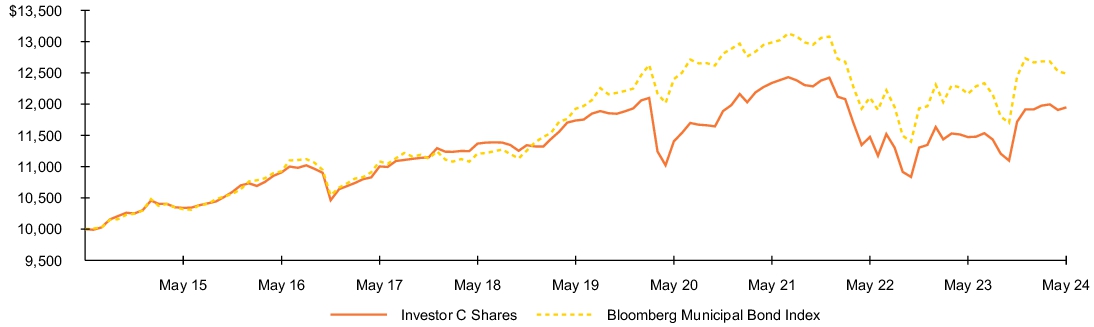
Fund performance
Cumulative performance: June 1, 2014 through May 31, 2024
Initial investment of $10,000
See “Average annual total returns” for additional information on fund performance.
| Average annual total returns | | | |
| 1 Year | 5 Years | 10 Years |
| Investor C Shares | 3.35% | 0.05% | 1.79% |
| Investor C Shares (with sales charge) | 2.35% | 0.05% | 1.79% |
| Bloomberg Municipal Bond Index | 2.67% | 0.93% | 2.25% |
| California Customized Reference Benchmark | 3.04% | 0.88% | N/A |
| Key Fund statistics | |
| Net Assets | $2,285,640,268% |
| Number of Portfolio Holdings | $284% |
| Net Investment Advisory Fees | $8,253,931% |
| Portfolio Turnover Rate | $77% |
Performance shown prior to January 26, 2015, is that of the Fund when it followed different investment strategies under the name BlackRock California Municipal Bond Fund.
The California Customized Reference Benchmark (commenced on September 30, 2016) is comprised of 85% Bloomberg Municipal Bond: California Exempt Total Return Index Unhedged USD/10% California Bloomberg Municipal Bond: High Yield (non-Investment Grade) Total Return Index/5% Bloomberg Municipal Index California Taxable Bonds Total Return Index Value.
Assuming maximum sales charges, if any. Average annual total returns with and without sales charges reflect reductions for distribution and service fees.
Past performance is not an indication of future results. Performance results may include adjustments made for financial reporting purposes in accordance with U.S. generally accepted accounting principles. Performance results do not reflect the deduction of taxes that a shareholder would pay on fund distributions or on the redemption or sale of fund shares. Visit blackrock.com for more recent performance information.
What did the Fund invest in?
(as of May 31, 2024)
| Sector allocation |
| Sector(a)(b) | Percent of
Total Investments |
| Utilities | 30.6% |
| County/City/Special District/School District | 26.4% |
| Transportation | 12.3% |
| Education | 8.1% |
| Corporate | 8.1% |
| Health | 5.9% |
| State | 5.9% |
| Tobacco | 1.8% |
| Housing | 0.9% |
| Credit quality allocation |
| Credit Rating(a)(c) | Percent of
Total Investments |
| AAA/Aaa | 18.3% |
| AA/Aa | 52.5% |
| A | 15.8% |
| BBB/Baa | 3.1% |
| BB/Ba | 0.2% |
| CCC/Caa | 0.1% |
| N/R(d) | 10.0% |
| (a) (b) (c) (d) | Excludes short-term securities. |
| (a) (b) (c) (d) | For purposes of this report, sector sub-classifications may differ from those utilized for compliance purposes. |
| (a) (b) (c) (d) | For purposes of this report, credit quality ratings shown above reflect the highest rating assigned by either S&P Global Ratings or Moody’s Investors Service, Inc. if ratings differ. These rating agencies are independent, nationally recognized statistical rating organizations and are widely used. Investment grade ratings are credit ratings of BBB/Baa or higher. Below investment grade ratings are credit ratings of BB/Ba or lower. Investments designated N/R are not rated by either rating agency. Unrated investments do not necessarily indicate low credit quality. Credit quality ratings are subject to change. |
| (a) (b) (c) (d) | The investment adviser evaluates the credit quality of unrated investments based upon certain factors including, but not limited to, credit ratings for similar investments and financial analysis of sectors and individual investments. Using this approach, the investment adviser has deemed certain of these unrated securities as investment grade quality. As of May 31, 2024, the market value of unrated securities deemed by the investment adviser to be investment grade represents less than 1.0% of total investments. |
Material Fund changes
This is a summary of certain changes to the Fund since May 31, 2023. For more complete information, you may review the Fund’s next prospectus, which we expect to be available approximately 120 days after May 31, 2024 at blackrock.com/fundreports or upon request by contacting us at (800) 441-7762.
The net expense ratio decreased from the prior fiscal year end primarily due to a decrease in expenses related to financing activities.
Additional information
If you wish to view additional information about the Fund, including but not limited to financial statements, the Fund’s prospectus and proxy voting policies and procedures, please visit blackrock.com/fundreports. For proxy voting records, visit blackrock.com/proxyrecords.
Householding
The Fund will mail only one copy of shareholder documents, including prospectuses, annual and semi-annual reports and proxy statements, to shareholders with multiple accounts at the same address. This practice is commonly called “householding” and is intended to reduce expenses and eliminate duplicate mailings of shareholder documents. Mailings of your shareholder documents may be householded indefinitely unless you instruct us otherwise. If you do not want the mailing of these documents to be combined with those for other members of your household, please call the Fund at (800) 441-7762.
The Fund is not sponsored, endorsed, issued, sold, or promoted by Bloomberg Index Services Limited and its affiliates, nor does this company make any representation regarding the advisability of investing in the Fund. BlackRock is not affiliated with the company listed above.
©2024 BlackRock, Inc. or its affiliates. All rights reserved. BLACKROCK is a registered trademark of BlackRock, Inc. or its affiliates. All other trademarks are those of their respective owners.
BlackRock California Municipal Opportunities Fund
Investor C Shares | MFCMX
Annual Shareholder Report — May 31, 2024
MFCMX-05/24-AR
BlackRock California Municipal Opportunities Fund
Class K Shares | MKCMX
Annual Shareholder Report — May 31, 2024
This annual shareholder report contains important information about BlackRock California Municipal Opportunities Fund (the “Fund”) for the period of June 1, 2023 to May 31, 2024. You can find additional information about the Fund at blackrock.com/fundreports. You can also request this information by contacting us at (800) 441‑7762.
This report describes changes to the Fund that occurred during the reporting period.
What were the Fund costs for the last year?
(based on a hypothetical $10,000 investment)
| Class name | Costs of a $10,000
investment | Costs paid as a percentage of a
$10,000 investment |
| Class K Shares | $48 | 0.47% |
How did the Fund perform last year?
The municipal bond market gained ground during the reporting period, with the benefit of income augmented by a modest gain in prices.
Declining inflation fueled expectations that the U.S. Federal Reserve was set to begin cutting interest rates in 2024, benefiting the broader fixed-income market.
Municipal bonds were further helped by positive economic growth, strong issuer fundamentals, and favorable supply-and-demand trends.
What contributed to performance?
The Fund’s positions in longer-duration and longer-maturity securities were notable contributors. (Duration is a measure of interest rate sensitivity.) The Fund’s holdings in corporate-backed municipals helped results, as did overweights in the utilities and pre-paid gas sectors. The Fund had an above-average weighting in cash, which had no material impact on results due to the attractive yields in this area. The Fund’s use of derivatives marginally contributed to performance.
What detracted from performance?
At a time of positive returns for the broader asset class, there were few meaningful detractors from Fund performance. With this said, its holdings in high-yield bonds—especially those with deep-discount structures—detracted given that yield spreads remained wide. Bonds issued by Puerto Rico Electric Power Authority were particularly notable detractors in this category due to continued uncertainty in the territory’s financial picture.
The views expressed reflect the opinions of BlackRock as of the date of this report and are subject to change based on changes in market, economic or other conditions. These views are not intended to be a forecast of future events and are no guarantee of future results.
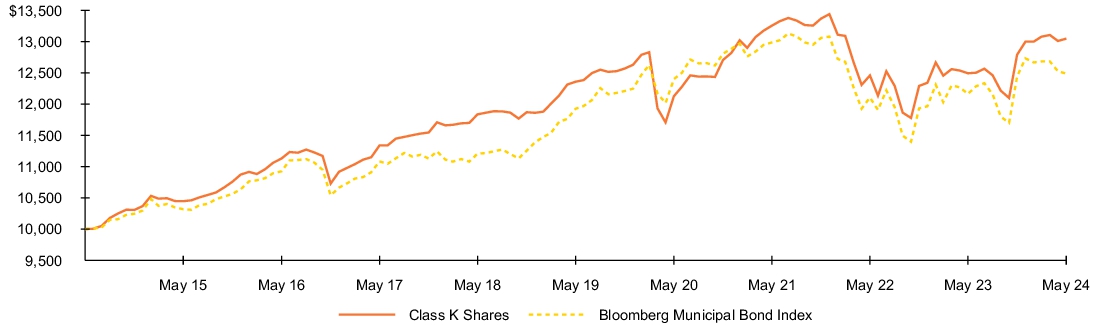
Fund performance
Cumulative performance: June 1, 2014 through May 31, 2024
Initial investment of $10,000
See “Average annual total returns” for additional information on fund performance.
| Average annual total returns | | | |
| 1 Year | 5 Years | 10 Years |
| Class K Shares | 4.44% | 1.09% | 2.70% |
| Bloomberg Municipal Bond Index | 2.67% | 0.93% | 2.25% |
| California Customized Reference Benchmark | 3.04% | 0.88% | N/A |
| Key Fund statistics | |
| Net Assets | $2,285,640,268% |
| Number of Portfolio Holdings | $284% |
| Net Investment Advisory Fees | $8,253,931% |
| Portfolio Turnover Rate | $77% |
Performance shown prior to January 26, 2015, is that of the Fund when it followed different investment strategies under the name BlackRock California Municipal Bond Fund.
The California Customized Reference Benchmark (commenced on September 30, 2016) is comprised of 85% Bloomberg Municipal Bond: California Exempt Total Return Index Unhedged USD/10% California Bloomberg Municipal Bond: High Yield (non-Investment Grade) Total Return Index/5% Bloomberg Municipal Index California Taxable Bonds Total Return Index Value.
Performance shown prior to the Class K Shares inception date of January 25, 2018 is that of Institutional Shares. The performance of Class K Shares would be substantially similar to Institutional Shares because Class K Shares and Institutional Shares invest in the same portfolio of securities and performance would only differ to the extent that Class K Shares and Institutional Shares have different expenses. The actual returns of Class K Shares would have been higher than those of the Institutional Shares because Class K Shares have lower expenses than the Institutional Shares.
Past performance is not an indication of future results. Performance results may include adjustments made for financial reporting purposes in accordance with U.S. generally accepted accounting principles. Performance results do not reflect the deduction of taxes that a shareholder would pay on fund distributions or on the redemption or sale of fund shares. Visit blackrock.com for more recent performance information.
What did the Fund invest in?
(as of May 31, 2024)
| Sector allocation |
| Sector(a)(b) | Percent of
Total Investments |
| Utilities | 30.6% |
| County/City/Special District/School District | 26.4% |
| Transportation | 12.3% |
| Education | 8.1% |
| Corporate | 8.1% |
| Health | 5.9% |
| State | 5.9% |
| Tobacco | 1.8% |
| Housing | 0.9% |
| Credit quality allocation |
| Credit Rating(a)(c) | Percent of
Total Investments |
| AAA/Aaa | 18.3% |
| AA/Aa | 52.5% |
| A | 15.8% |
| BBB/Baa | 3.1% |
| BB/Ba | 0.2% |
| CCC/Caa | 0.1% |
| N/R(d) | 10.0% |
| (a) (b) (c) (d) | Excludes short-term securities. |
| (a) (b) (c) (d) | For purposes of this report, sector sub-classifications may differ from those utilized for compliance purposes. |
| (a) (b) (c) (d) | For purposes of this report, credit quality ratings shown above reflect the highest rating assigned by either S&P Global Ratings or Moody’s Investors Service, Inc. if ratings differ. These rating agencies are independent, nationally recognized statistical rating organizations and are widely used. Investment grade ratings are credit ratings of BBB/Baa or higher. Below investment grade ratings are credit ratings of BB/Ba or lower. Investments designated N/R are not rated by either rating agency. Unrated investments do not necessarily indicate low credit quality. Credit quality ratings are subject to change. |
| (a) (b) (c) (d) | The investment adviser evaluates the credit quality of unrated investments based upon certain factors including, but not limited to, credit ratings for similar investments and financial analysis of sectors and individual investments. Using this approach, the investment adviser has deemed certain of these unrated securities as investment grade quality. As of May 31, 2024, the market value of unrated securities deemed by the investment adviser to be investment grade represents less than 1.0% of total investments. |
Material Fund changes
This is a summary of certain changes to the Fund since May 31, 2023. For more complete information, you may review the Fund’s next prospectus, which we expect to be available approximately 120 days after May 31, 2024 at blackrock.com/fundreports or upon request by contacting us at (800) 441-7762.
The net expense ratio decreased from the prior fiscal year end primarily due to a decrease in expenses related to financing activities.
Additional information
If you wish to view additional information about the Fund, including but not limited to financial statements, the Fund’s prospectus and proxy voting policies and procedures, please visit blackrock.com/fundreports. For proxy voting records, visit blackrock.com/proxyrecords.
Householding
The Fund will mail only one copy of shareholder documents, including prospectuses, annual and semi-annual reports and proxy statements, to shareholders with multiple accounts at the same address. This practice is commonly called “householding” and is intended to reduce expenses and eliminate duplicate mailings of shareholder documents. Mailings of your shareholder documents may be householded indefinitely unless you instruct us otherwise. If you do not want the mailing of these documents to be combined with those for other members of your household, please call the Fund at (800) 441-7762.
The Fund is not sponsored, endorsed, issued, sold, or promoted by Bloomberg Index Services Limited and its affiliates, nor does this company make any representation regarding the advisability of investing in the Fund. BlackRock is not affiliated with the company listed above.
©2024 BlackRock, Inc. or its affiliates. All rights reserved. BLACKROCK is a registered trademark of BlackRock, Inc. or its affiliates. All other trademarks are those of their respective owners.
BlackRock California Municipal Opportunities Fund
Class K Shares | MKCMX
Annual Shareholder Report — May 31, 2024
MKCMX-05/24-AR
| Item 2 – | Code of Ethics – The registrant (or the “Fund”) has adopted a code of ethics, as of the end of the period covered by this report, applicable to the registrant’s principal executive officer, principal financial officer, principal accounting officer or controller, or persons performing similar functions. During the period covered by this report, the code of ethics was amended to update certain information and to make other non-material changes. During the period covered by this report, there have been no waivers granted under the code of ethics. The registrant undertakes to provide a copy of the code of ethics to any person upon request, without charge, who calls 1-800-441-7762. |
| Item 3 – | Audit Committee Financial Expert – The registrant’s board of trustees (the “board of trustees”), has determined that (i) the registrant has the following audit committee financial experts serving on its audit committee and (ii) each audit committee financial expert is independent: |
Lorenzo A. Flores
Catherine A. Lynch
Arthur P. Steinmetz
Under applicable securities laws, a person determined to be an audit committee financial expert will not be deemed an “expert” for any purpose, including without limitation for the purposes of Section 11 of the Securities Act of 1933, as a result of being designated or identified as an audit committee financial expert. The designation or identification of a person as an audit committee financial expert does not impose on such person any duties, obligations, or liabilities greater than the duties, obligations, and liabilities imposed on such person as a member of the audit committee and board of trustees in the absence of such designation or identification. The designation or identification of a person as an audit committee financial expert does not affect the duties, obligations, or liability of any other member of the audit committee or board of trustees.
| Item 4 – | Principal Accountant Fees and Services |
The following table presents fees billed by Deloitte & Touche LLP (“D&T”) in each of the last two fiscal years for the services rendered to the Fund:
| | | | | | | | | | | | | | | | |
| | | (a) Audit Fees | | (b) Audit-Related Fees1 | | (c) Tax Fees2 | | (d) All Other Fees |
| Entity Name | | Current
Fiscal
Year End | | Previous
Fiscal
Year End | | Current
Fiscal
Year End | | Previous
Fiscal
Year End | | Current
Fiscal
Year End | | Previous
Fiscal
Year End | | Current
Fiscal
Year End | | Previous
Fiscal
Year End |
| BlackRock California Municipal Opportunities Fund | | $36,312 | | $36,312 | | $0 | | $44 | | $15,080 | | $19,900 | | $407 | | $218 |
The following table presents fees billed by D&T that were required to be approved by the registrant’s audit committee (the “Committee”) for services that relate directly to the operations or financial reporting of the Fund and that are rendered on behalf of BlackRock Advisors, LLC (the “Investment Adviser” or “BlackRock”) and entities controlling, controlled by, or under common control with BlackRock (not including any sub-adviser whose role is primarily
portfolio management and is subcontracted with or overseen by another investment adviser) that provide ongoing services to the Fund (“Affiliated Service Providers”):
| | | | |
| | | Current Fiscal Year End | | Previous Fiscal Year End |
(b) Audit-Related Fees1 | | $0 | | $0 |
(c) Tax Fees2 | | $0 | | $0 |
(d) All Other Fees3 | | $2,149,000 | | $2,154,000 |
1 The nature of the services includes assurance and related services reasonably related to the performance of the audit or review of financial statements not included in Audit Fees, including accounting consultations, agreed-upon procedure reports, attestation reports, comfort letters, out-of-pocket expenses and internal control reviews not required by regulators.
2 The nature of the services includes tax compliance and/or tax preparation, including services relating to the filing or amendment of federal, state or local income tax returns, regulated investment company qualification reviews, taxable income and tax distribution calculations.
3 Non-audit fees of $2,149,000 and $2,154,000 for the current fiscal year and previous fiscal year, respectively, were paid to the Fund’s principal accountant in their entirety by BlackRock, in connection with services provided to the Affiliated Service Providers of the Fund and of certain other funds sponsored and advised by BlackRock or its affiliates for a service organization review and an accounting research tool subscription. These amounts represent aggregate fees paid by BlackRock and were not allocated on a per fund basis.
(e)(1) Audit Committee Pre-Approval Policies and Procedures:
The Committee has adopted policies and procedures with regard to the pre-approval of services. Audit, audit-related and tax compliance services provided to the registrant on an annual basis require specific pre-approval by the Committee. The Committee also must approve other non-audit services provided to the registrant and those non-audit services provided to the Investment Adviser and Affiliated Service Providers that relate directly to the operations and the financial reporting of the registrant. Certain of these non-audit services that the Committee believes are (a) consistent with the SEC’s auditor independence rules and (b) routine and recurring services that will not impair the independence of the independent accountants may be approved by the Committee without consideration on a specific case-by-case basis (“general pre-approval”). The term of any general pre-approval is 12 months from the date of the pre-approval, unless the Committee provides for a different period. Tax or other non-audit services provided to the registrant which have a direct impact on the operations or financial reporting of the registrant will only be deemed pre-approved provided that any individual project does not exceed $10,000 attributable to the registrant or $50,000 per project. For this purpose, multiple projects will be aggregated to determine if they exceed the previously mentioned cost levels.
Any proposed services exceeding the pre-approved cost levels will require specific pre-approval by the Committee, as will any other services not subject to general pre-approval (e.g., unanticipated but permissible services). The Committee is informed of each service approved subject to general pre-approval at the next regularly scheduled in-person board meeting. At this meeting, an analysis of such services is presented to the Committee for ratification. The Committee may delegate to the Committee Chairman the authority to approve the provision of and fees for any specific engagement of permitted non-audit services, including services exceeding pre-approved cost levels.
(e)(2) None of the services described in each of Items 4(b) through (d) were approved by the Committee pursuant to the de minimis exception in paragraph (c)(7)(i)(C) of Rule 2-01 of Regulation S-X.
(f) Not Applicable
(g) The aggregate non-audit fees, defined as the sum of the fees shown under “Audit-Related Fees,” “Tax Fees” and “All Other Fees,” paid to the accountant for services rendered by the accountant to the registrant, the Investment Adviser and the Affiliated Service Providers were:
| | | | |
| Entity Name | | Current Fiscal Year End | | Previous Fiscal Year End |
| BlackRock California Municipal Opportunities Fund | | $15,487 | | $20,162 |
Additionally, the amounts billed by D&T in connection with services provided to the Affiliated Service Providers of the Fund and of other funds sponsored and advised by BlackRock or its affiliates during the current and previous fiscal years for a service organization review and an accounting research tool subscription were:
| | |
| Current Fiscal Year End | | Previous Fiscal Year End |
$2,149,000 | | $2,154,000 |
These amounts represent aggregate fees paid by BlackRock and were not allocated on a per fund basis.
(h) The Committee has considered and determined that the provision of non-audit services that were rendered to the Investment Adviser and the Affiliated Service Providers that were not pre-approved pursuant to paragraph (c)(7)(ii) of Rule 2-01 of Regulation S-X is compatible with maintaining the principal accountant’s independence.
(i) Not Applicable
(j) Not Applicable
| Item 5 – | Audit Committee of Listed Registrant – Not Applicable |
(a) The registrant’s Schedule of Investments is included as part of the Financial Statement and Financial Highlights for Open-End Management Investment Companies filed under Item 7 of this Form.
(b) Not Applicable due to no such divestments during the semi-annual period covered since the previous Form N-CSR filing.
| Item 7 – | Financial Statements and Financial Highlights for Open-End Management Investment Companies |
(a) The registrant’s Financial Statements are attached herewith.
(b) The registrant’s Financial Highlights are attached herewith.
May 31, 2024
2024 Annual Financial Statements |
BlackRock California Municipal Series Trust |
• BlackRock California Municipal Opportunities Fund |
BlackRock Multi-State Municipal Series Trust |
• BlackRock New Jersey Municipal Bond Fund |
• BlackRock Pennsylvania Municipal Bond Fund |
BlackRock Municipal Bond Fund, Inc. |
• BlackRock Impact Municipal Fund |
BlackRock Municipal Series Trust |
• BlackRock Strategic Municipal Opportunities Fund |
Not FDIC Insured • May Lose Value • No Bank Guarantee |
The Benefits and Risks of Leveraging
The Funds may utilize leverage to seek to enhance returns and net asset value (“NAV”). However, there is no guarantee that these objectives can be achieved in all interest rate environments.
Each Fund may leverage its assets through the use of proceeds received in tender option bond (“TOB”) transactions, as described in the Notes to Financial Statements. In a TOB Trust transaction, each Fund transfers municipal bonds or other municipal securities into a special purpose entity (a “TOB Trust”). TOB investments generally provide each Fund with economic benefits in periods of declining short-term interest rates but expose each Fund to risks during periods of rising short-term interest rates. Additionally, fluctuations in the market value of municipal bonds deposited into a TOB Trust may adversely affect each Fund’s NAV per share.
In general, the concept of leveraging is based on the premise that the financing cost of leverage, which is based on short-term interest rates, is normally lower than the income earned by each Fund on its longer-term portfolio investments purchased with the proceeds from leverage. To the extent that the total assets of each Fund (including the assets obtained from leverage) are invested in higher-yielding portfolio investments, each Fund’s shareholders benefit from the incremental net income.
The interest earned on securities purchased with the proceeds from leverage is distributed to each Fund’s shareholders, and the value of these portfolio holdings is reflected in each Fund’s per share NAV. However, in order to benefit shareholders, the return on assets purchased with leverage proceeds must exceed the ongoing costs associated with the leverage. If interest and other ongoing costs of leverage exceed a Fund’s return on assets purchased with leverage proceeds, income to shareholders is lower than if the Funds had not used leverage.
Furthermore, the value of each Fund’s portfolio investments generally varies inversely with the direction of long-term interest rates, although other factors can also influence the value of portfolio investments. As a result, changes in interest rates can influence each Fund’s NAV positively or negatively in addition to the impact on each Fund’s performance from leverage. Changes in the direction of interest rates are difficult to predict accurately, and there is no assurance that a Fund’s leveraging strategy will be successful.
The use of leverage also generally causes greater changes in each Fund’s NAV and dividend rates than comparable portfolios without leverage. In a declining market, leverage is likely to cause a greater decline in the NAV of a Fund’s shares than if the Fund were not leveraged. In addition, each Fund may be required to sell portfolio securities at inopportune times or at distressed values in order to comply with regulatory requirements applicable to the use of leverage or as required by the terms of the leverage instruments, which may cause the Fund to incur losses. The use of leverage may limit a Fund’s ability to invest in certain types of securities or use certain types of hedging strategies. Each Fund incurs expenses in connection with the use of leverage, all of which are borne by each Fund’s shareholders and may reduce income.
Derivative Financial Instruments
The Funds may invest in various derivative financial instruments. These instruments are used to obtain exposure to a security, commodity, index, market, and/or other assets without owning or taking physical custody of securities, commodities and/or other referenced assets or to manage market, equity, credit, interest rate, foreign currency exchange rate, commodity and/or other risks. Derivative financial instruments may give rise to a form of economic leverage and involve risks, including the imperfect correlation between the value of a derivative financial instrument and the underlying asset, possible default of the counterparty to the transaction or illiquidity of the instrument. Pursuant to Rule 18f-4 under the 1940 Act, among other things, the Funds must either use derivative financial instruments with embedded leverage in a limited manner or comply with an outer limit on fund leverage risk based on value-at-risk. The Funds’ successful use of a derivative financial instrument depends on the investment adviser’s ability to predict pertinent market movements accurately, which cannot be assured. The use of these instruments may result in losses greater than if they had not been used, may limit the amount of appreciation a Fund can realize on an investment and/or may result in lower distributions paid to shareholders. The Funds’ investments in these instruments, if any, are discussed in detail in the Notes to Financial Statements.
The Benefits and Risks of Leveraging / Derivative Financial Instruments3
Schedule of InvestmentsMay 31, 2024
BlackRock California Municipal Opportunities Fund(Percentages shown are based on Net Assets)
| | | |
|
|
Chapman University, 3.00%, 04/01/51 | | | |
Total Corporate Bonds — 0.0%
(Cost: $2,100,000) | |
|
| |
| |
California Community Choice Financing Authority, RB | | | |
| | | |
Sustainability Bonds, 5.50%, 10/01/54 | | | |
Series E-1, Sustainability Bonds, 5.00%, 02/01/54 | | | |
Series G, Sustainability Bonds, 5.25%, 11/01/54 | | | |
California Municipal Finance Authority, RB, AMT, 4.10%, 10/01/45 | | | |
California Municipal Finance Authority, Refunding RB, Series A, AMT, 4.00%, 07/01/41 | | | |
California Pollution Control Financing Authority, RB(b) | | | |
| | | |
Series A-1, AMT, 4.05%, 11/01/42 | | | |
California Pollution Control Financing Authority, Refunding RB, AMT, 4.13%, 07/01/43(b) | | | |
Southern California Public Power Authority, RB, Series A, 5.00%, 04/01/55 | | | |
| | | |
County/City/Special District/School District — 23.0% | |
Burlingame School District, Refunding GO, Series A, Election 2016, 4.00%, 08/01/42 | | | |
California Infrastructure & Economic Development Bank, Refunding RB | | | |
Series A, 1.60%, 10/01/29 | | | |
Series A, 1.84%, 10/01/31 | | | |
Chabot-Las Positas Community College District, GO, Series C, Election 2016, 5.25%, 08/01/48 | | | |
Chino Valley Unified School District, GO, Series B, 4.00%, 08/01/45 | | | |
City & County of San Francisco California Community Facilities District No. 2014-1, ST | | | |
Series B, Sustainability Bonds, 3.78%, 09/01/30 | | | |
Series B, Sustainability Bonds, 3.92%, 09/01/31 | | | |
Series B, Sustainability Bonds, 3.97%, 09/01/32 | | | |
Series B, Sustainability Bonds, 4.02%, 09/01/33 | | | |
City & County of San Francisco California, Refunding COP | | | |
Series R1, 4.00%, 09/01/33 | | | |
Series A, Sustainability Bonds, 4.00%, 04/01/44 | | | |
City of Corona California, RB, 2.24%, 05/01/30 | | | |
City of Huntington Beach California, Refunding RB, 2.32%, 06/15/30 | | | |
Clovis Unified School District, GO, Series C, Election 2020, 4.00%, 08/01/48 | | | |
Coast Community College District, GO, Series B, Election 2002, (AGM), 0.00%, 08/01/30(c) | | | |
County of Ventura California, RB, 5.15%, 07/01/24 | | | |
Desert Community College District, GO, Election 2016, 4.00%, 08/01/45 | | | |
Desert Community College District, Refunding GO, 4.00%, 08/01/39 | | | |
| | | |
County/City/Special District/School District (continued) | |
Elk Grove Unified School District, GO, Election 2016, 4.00%, 08/01/44 | | | |
Elk Grove Unified School District, ST, Election 1998, (AGM), 4.00%, 12/01/42 | | | |
Fremont Union High School District, GO, Election 2022, 4.00%, 08/01/48 | | | |
Fremont Union High School District, Refunding GO, Series A, 4.00%, 08/01/46 | | | |
Garden Grove Public Financing Authority, RB, Series A, (BAM), 04/01/49(d) | | | |
Grossmont-Cuyamaca Community College District, GO, Series B, Election 2012, 5.00%, 08/01/44 | | | |
Hacienda La Puente Unified School District, GO, Series A, Election 2016, 5.00%, 08/01/47 | | | |
Irvine Facilities Financing Authority, ST, Series A, (BAM), 5.00%, 09/01/48 | | | |
Las Virgenes Unified School District, GO | | | |
Series A, Election 2022, 5.00%, 08/01/45 | | | |
Series A, Election 2022, 5.00%, 08/01/47 | | | |
Long Beach Unified School District, GO, Series A, 4.00%, 08/01/40 | | | |
Los Angeles Community College District, GO | | | |
Series J, Election 2008, 4.00%, 08/01/38 | | | |
Series J, Election 2008, 4.00%, 08/01/41 | | | |
Series K, Election 2008, 4.00%, 08/01/39 | | | |
Los Angeles County Metropolitan Transportation Authority Sales Tax Revenue, RB, Series A, 5.00%, 07/01/42 | | | |
Los Angeles County Public Works Financing Authority, Refunding RB, Series A, Sustainability Bonds, 5.00%, 12/01/45 | | | |
Los Angeles Unified School District, Refunding GO, Series A, 5.00%, 07/01/25 | | | |
Lucia Mar Unified School District, GO, Series D, Election 2016, 5.25%, 08/01/47 | | | |
Manhattan Beach Unified School District, GO, Series B, 4.00%, 09/01/45 | | | |
Mount San Antonio Community College District, Refunding GO, Series A, Election 2018, 5.00%, 08/01/44 | | | |
North Orange County Community College District, GO, Series B, Election 2014, 4.00%, 08/01/44 | | | |
Orange County Local Transportation Authority Sales Tax Revenue, RB, 4.00%, 02/15/38 | | | |
Peninsula Corridor Joint Powers Board Measure RR Sales Tax Revenue, RB, Series A, Sustainability Bonds, 5.00%, 06/01/47 | | | |
Peralta Community College District, Refunding GO, Series A, 4.00%, 08/01/31 | | | |
Pleasanton Unified School District, GO, Election 2022, 4.00%, 08/01/48 | | | |
Redwood City School District, GO, Series A, Election 2022, 5.00%, 08/01/48 | | | |
Sacramento Area Flood Control Agency, Refunding SAB, 5.00%, 10/01/41 | | | |
San Bernardino Community College District, GO | | | |
Series B, Election 2018, 4.13%, 08/01/49 | | | |
Series B, Election 2018, 5.00%, 08/01/49 | | | |
San Diego Community College District, Refunding GO, 2.38%, 08/01/33 | | | |
42024 BlackRock Annual Financial Statements
Schedule of Investments (continued)May 31, 2024
BlackRock California Municipal Opportunities Fund(Percentages shown are based on Net Assets)
| | | |
County/City/Special District/School District (continued) | |
San Diego County Regional Transportation Commission, Refunding RB, Series A, 5.00%, 04/01/41 | | | |
San Diego Unified School District, GO, Series L, 4.00%, 07/01/44 | | | |
San Francisco City & County Redevelopment Agency Successor Agency, Refunding TA | | | |
Series D, 3.25%, 08/01/29 | | | |
Series D, 3.38%, 08/01/30 | | | |
San Francisco City & County Redevelopment Agency Successor Agency, TA, CAB, Series D, 0.00%, 08/01/31(b)(c) | | | |
San Joaquin County Transportation Authority Measure K Sales Tax Revenue, Refunding RB, 4.00%, 03/01/41 | | | |
San Jose Redevelopment Agency Successor Agency, Refunding TA, Series A-T, 3.25%, 08/01/29 | | | |
San Jose Unified School District, GO | | | |
Series C, Election 2002, (NPFGC), 0.00%, 06/01/31(c) | | | |
Series F, Election 2012, 4.00%, 08/01/42 | | | |
San Luis Obispo County Financing Authority, Refunding RB, 5.50%, 11/15/47 | | | |
San Mateo County Community College District, GO, Series B, Election 2014, 5.00%, 09/01/45 | | | |
San Mateo County Transit District, Refunding RB, Series A, 4.00%, 06/01/33 | | | |
San Mateo Foster City Public Financing Authority, RB | | | |
| | | |
| | | |
Santa Clara County Financing Authority, RB, Series A, 4.00%, 04/01/37 | | | |
Santa Clara Unified School District, GO | | | |
| | | |
Election 2014, 4.00%, 07/01/41 | | | |
Santa Clarita Community College District, GO, Election 2016, 5.25%, 08/01/48 | | | |
South Orange County Public Financing Authority, RB, 5.00%, 06/01/47 | | | |
Tracy Public Financing Authority, RB, Series A, (BAM), 11/01/49(d) | | | |
West Valley-Mission Community College District, GO | | | |
Series A, 4.00%, 08/01/44 | | | |
Series B, 5.00%, 08/01/47 | | | |
Series B, Election 2012, 4.00%, 08/01/34 | | | |
| | | |
| |
California Educational Facilities Authority, RB, Series A, 3.56%, 04/01/31 | | | |
California Infrastructure & Economic Development | | | |
| | | |
| | | |
California Infrastructure & Economic Development Bank, RB, CAB, 0.00%, 01/01/60(c) | | | |
California Municipal Finance Authority, RB | | | |
| | | |
| | | |
| | | |
| | | |
| | | |
| |
California Municipal Finance Authority, RB (continued) | | | |
| | | |
California Municipal Finance Authority, Refunding | | | |
| | | |
| | | |
California Public Finance Authority, RB, Series B, 5.00%, 07/01/26(b) | | | |
California School Finance Authority, RB(b) | | | |
Series A, 5.00%, 06/01/33 | | | |
Series A, 5.00%, 06/01/43 | | | |
Series A, 5.00%, 06/01/49 | | | |
Series A, 6.00%, 07/01/51 | | | |
Series A, 5.00%, 06/01/55 | | | |
Series A, 5.00%, 06/01/58 | | | |
Series A, 6.00%, 06/01/59 | | | |
Series B, 6.00%, 06/01/31 | | | |
California School Finance Authority, Refunding RB, Series A, 06/01/44(b)(d) | | | |
California State University, Refunding RB | | | |
Series A, 5.00%, 11/01/43 | | | |
Series B, 1.67%, 11/01/29 | | | |
Series B, 1.85%, 11/01/31 | | | |
Series B, 2.53%, 11/01/33 | | | |
Series D, 1.69%, 11/01/29 | | | |
Los Angeles Community College District, Refunding GO, 2.11%, 08/01/32 | | | |
University of California, RB | | | |
Series AV, 5.25%, 05/15/42 | | | |
Series M, 5.00%, 05/15/42 | | | |
University of California, Refunding RB | | | |
Series AR, 5.00%, 05/15/41 | | | |
Series AZ, 5.00%, 05/15/43 | | | |
Series BV, 5.00%, 05/15/42 | | | |
Series BV, 5.00%, 05/15/43 | | | |
Series BV, 5.00%, 05/15/45 | | | |
Series Q, 4.00%, 05/15/41 | | | |
| | | |
| |
California Health Facilities Financing Authority, RB | | | |
Series A, 5.00%, 12/01/43 | | | |
Series A, 5.25%, 12/01/44 | | | |
Series A, 5.25%, 12/01/49 | | | |
California Health Facilities Financing Authority, Refunding RB | | | |
Series A, 4.00%, 08/15/40 | | | |
Series A, 4.00%, 08/15/48 | | | |
Series A-2, 4.00%, 11/01/44 | | | |
California Public Finance Authority, RB, Series A, 5.00%, 07/15/46 | | | |
California Public Finance Authority, Refunding RB | | | |
Series A, 4.00%, 08/01/47 | | | |
Series A, 5.00%, 08/01/47 | | | |
Regents of the University of California Medical Center Pooled Revenue, RB | | | |
Series P, 4.00%, 05/15/43 | | | |
Schedule of Investments (continued)May 31, 2024
BlackRock California Municipal Opportunities Fund(Percentages shown are based on Net Assets)
| | | |
| |
Regents of the University of California Medical Center Pooled Revenue, RB (continued) | | | |
Series P, 5.00%, 05/15/47 | | | |
Regents of the University of California Medical Center Pooled Revenue, Refunding RB, Series L, 5.00%, 05/15/41 | | | |
| | | |
| |
California Community Housing Agency, RB, M/F Housing | | | |
Series A-2, 4.00%, 02/01/50 | | | |
Series A-2, 4.00%, 08/01/51 | | | |
CMFA Special Finance Agency XII, RB, M/F Housing, 4.38%, 08/01/49 | | | |
CMFA Special Finance Agency, RB, M/F Housing, Series A-2, 4.00%, 08/01/45 | | | |
CSCDA Community Improvement Authority, RB, M/F Housing | | | |
Series B, Mezzanine Lien, Sustainability Bonds, 4.00%, 12/01/59 | | | |
Series B, Sub Lien, Sustainability Bonds, 4.00%, 12/01/59 | | | |
Sustainability Bonds, 4.00%, 07/01/58 | | | |
Series B, Sustainability Bonds, 4.00%, 07/01/58 | | | |
| | | |
| |
California State Public Works Board, RB | | | |
Series A, 5.00%, 09/01/39 | | | |
Series A, 5.00%, 04/01/49 | | | |
Sustainability Bonds, 4.00%, 11/01/41 | | | |
| | | |
| |
California County Tobacco Securitization Agency, Refunding RB, Series A, 5.00%, 06/01/47 | | | |
California County Tobacco Securitization Agency, Refunding RB, CAB, Series B-2, Subordinate, 0.00%, 06/01/55(c) | | | |
California Statewide Financing Authority, RB(b)(c) | | | |
Series D, 0.00%, 06/01/55 | | | |
Series L, 0.00%, 06/01/55 | | | |
Golden State Tobacco Securitization Corp., Refunding RB | | | |
Class B, (SAP), 2.75%, 06/01/34 | | | |
Subordinate, 3.85%, 06/01/50 | | | |
Inland Empire Tobacco Securitization Corp., RB, 0.00%, 06/01/57(c) | | | |
Inland Empire Tobacco Securitization Corp., Refunding RB, 3.68%, 06/01/38 | | | |
Tobacco Securitization Authority of Southern California, Refunding RB, 5.00%, 06/01/48 | | | |
| | | |
| |
Burbank-Glendale-Pasadena Airport Authority Brick Campaign, ARB | | | |
Series B, 5.56%, 07/01/32 | | | |
Series B, AMT, 5.25%, 07/01/49 | | | |
City of Long Beach California Harbor Revenue, ARB, Series A, AMT, 5.00%, 05/15/37 | | | |
City of Los Angeles Department of Airports, ARB | | | |
Series A, AMT, 5.00%, 05/15/42 | | | |
| | | |
Transportation (continued) | |
City of Los Angeles Department of Airports, ARB (continued) | | | |
Series A, AMT, 5.00%, 05/15/44 | | | |
Series A, AMT, 5.00%, 05/15/45 | | | |
Series C, AMT, 5.00%, 05/15/45 | | | |
Series D, AMT, 5.00%, 05/15/41 | | | |
AMT, Sustainability Bonds, 5.25%, 05/15/47 | | | |
City of Los Angeles Department of Airports, Refunding ARB, AMT, Subordinate, 5.00%, 05/15/35 | | | |
Port of Los Angeles, Refunding ARB, Series A, AMT, 5.00%, 08/01/44 | | | |
Port of Los Angeles, Refunding RB, Series C, Sustainability Bonds, 4.00%, 08/01/39 | | | |
San Diego County Regional Airport Authority, ARB, Series B, AMT, 5.00%, 07/01/48 | | | |
San Francisco City & County Airport Comm-San Francisco International Airport, ARB, Series A, AMT, 5.25%, 05/01/42 | | | |
San Francisco City & County Airport Comm-San Francisco International Airport, Refunding ARB | | | |
Series A, AMT, 5.00%, 05/01/38 | | | |
Series A, AMT, 5.00%, 05/01/47 | | | |
Series A, AMT, 05/01/49(d) | | | |
Series B, AMT, 5.00%, 05/01/46 | | | |
Series D, AMT, 5.00%, 05/01/28(e) | | | |
Series D, AMT, 5.00%, 05/01/43 | | | |
Series D, AMT, 5.00%, 05/01/48 | | | |
Series D, AMT, 5.25%, 05/01/48 | | | |
Series E, AMT, 5.00%, 05/01/37 | | | |
Series E, AMT, 5.00%, 05/01/45 | | | |
| | | |
| |
California Infrastructure & Economic Development Bank, RB | | | |
Sustainability Bonds, 4.00%, 10/01/42 | | | |
Sustainability Bonds, 4.00%, 10/01/43 | | | |
Sustainability Bonds, 4.00%, 10/01/45 | | | |
Sustainability Bonds, 4.00%, 10/01/46 | | | |
California Statewide Communities Development Authority, Refunding RB, Sustainability Bonds, 1.68%, 02/01/29 | | | |
City of Long Beach California Water Revenue, Refunding RB, 4.00%, 05/01/49 | | | |
City of Los Angeles California Wastewater System Revenue, RB, Series A, Sustainability Bonds, 5.25%, 06/01/47 | | | |
City of Sacramento California Water Revenue, RB, 5.00%, 09/01/42 | | | |
City of San Francisco California Public Utilities Commission Water Revenue, Refunding RB, 4.00%, 11/01/39 | | | |
East Bay Municipal Utility District Wastewater System Revenue, RB, Series A, Sustainability Bonds, 5.00%, 06/01/49 | | | |
East Bay Municipal Utility District Water System Revenue, RB | | | |
Series A, 5.00%, 06/01/42 | | | |
Series A, Sustainability Bonds, 4.00%, 06/01/45 | | | |
Series A, Sustainability Bonds, 5.00%, 06/01/49 | | | |
Eastern Municipal Water District Financing Authority, RB | | | |
Series D, 5.25%, 07/01/42 | | | |
62024 BlackRock Annual Financial Statements
Schedule of Investments (continued)May 31, 2024
BlackRock California Municipal Opportunities Fund(Percentages shown are based on Net Assets)
| | | |
| |
Eastern Municipal Water District Financing Authority, RB (continued) | | | |
Series D, 5.00%, 07/01/47 | | | |
Imperial Irrigation District, RB, (AMBAC), 6.94%, 01/01/26 | | | |
Irvine Facilities Financing Authority, RB, 5.25%, 05/01/43 | | | |
Irvine Ranch Water District Water Service Corp., RB, 5.00%, 03/01/46 | | | |
Los Angeles Department of Water & Power Water System Revenue, Refunding RB, Series A, 5.00%, 07/01/46 | | | |
Los Angeles Department of Water & Power, Refunding RB, Series A, 5.00%, 07/01/44 | | | |
Modesto Irrigation District, RB | | | |
Series A, 5.25%, 10/01/43 | | | |
Series A, 5.25%, 10/01/48 | | | |
Northern California Sanitation Agencies Financing Authority, Refunding RB, Series A, 5.00%, 12/01/45 | | | |
Sacramento County Sanitation Districts Financing Authority, Refunding RB, Series A, 5.00%, 12/01/50 | | | |
Sacramento Municipal Utility District, Refunding RB | | | |
Series H, Sustainability Bonds, 4.00%, 08/15/40 | | | |
Series H, Sustainability Bonds, 4.00%, 08/15/45 | | | |
Series M, Sustainability Bonds, 5.00%, 11/15/49 | | | |
San Diego Public Facilities Financing Authority, Refunding RB | | | |
Series A, 5.00%, 05/15/38 | | | |
Series A, 4.00%, 08/01/45 | | | |
Series B, 5.00%, 08/01/38 | | | |
Series B, 5.00%, 08/01/39 | | | |
San Francisco City & County Public Utilities Commission Wastewater Revenue, RB | | | |
Series B, 5.00%, 10/01/43 | | | |
Series B, Sustainability Bonds, 1.00%, 10/01/26(f) | | | |
San Francisco City & County Public Utilities Commission Wastewater Revenue, Refunding RB | | | |
Series B, 4.00%, 10/01/42 | | | |
Series A, Sustainability Bonds, 4.00%, 10/01/43 | | | |
San Jose Financing Authority, Refunding RB, Series B, Sustainability Bonds, 5.00%, 11/01/52 | | | |
San Mateo Foster City Public Financing Authority, RB, 4.00%, 08/01/44 | | | |
Santa Clara Valley Water District, Refunding RB, Series A, 5.00%, 06/01/45 | | | |
Southern California Public Power Authority, RB | | | |
| | | |
| | | |
| | | |
| | | |
Total Municipal Bonds in California | |
| |
| |
Florida Development Finance Corp., Refunding RB, AMT, 12.00%, 07/15/32(a)(b) | | | |
| | | |
| |
County/City/Special District/School District — 0.1% | |
Chicago Board of Education, GO, BAB, 6.14%, 12/01/39 | | | |
| |
| |
Commonwealth of Puerto Rico, GO | | | |
| | | |
Series A-1, 0.00%, 11/01/43(a) | | | |
Series A1, Restructured, 5.63%, 07/01/29 | | | |
Series A-1, Restructured, 5.75%, 07/01/31 | | | |
Series A-1, Restructured, 4.00%, 07/01/33 | | | |
Series A-1, Restructured, 4.00%, 07/01/35 | | | |
Series A-1, Restructured, 4.00%, 07/01/37 | | | |
Series A-1, Restructured, 4.00%, 07/01/41 | | | |
Series A-1, Restructured, 4.00%, 07/01/46 | | | |
Commonwealth of Puerto Rico, GO, CAB, Series A, Restructured, 0.00%, 07/01/33(c) | | | |
Commonwealth of Puerto Rico, RB, 0.01%, 11/01/51(a) | | | |
Puerto Rico Sales Tax Financing Corp. Sales Tax Revenue, RB | | | |
Series A-1, Restructured, 4.75%, 07/01/53 | | | |
Series A-2, Restructured, 4.54%, 07/01/53 | | | |
Series A-2, Restructured, 4.78%, 07/01/58 | | | |
Puerto Rico Sales Tax Financing Corp. Sales Tax | | | |
Series A-1, Restructured, 0.00%, 07/01/29 | | | |
Series A-1, Restructured, 0.00%, 07/01/33 | | | |
Series A-1, Restructured, 0.00%, 07/01/46 | | | |
Series B-1, Restructured, 0.00%, 07/01/46 | | | |
| | | |
| |
Children’s Trust Fund, RB, Series A, 0.00%, 05/15/57(c) | | | |
| |
Puerto Rico Electric Power Authority, RB | | | |
Series A, 5.00%, 07/01/29 | | | |
Series A, 7.00%, 07/01/33 | | | |
Series A, 6.75%, 07/01/36 | | | |
Series A, 5.00%, 07/01/42 | | | |
Series A, 7.00%, 07/01/43 | | | |
Series A-3, 10.00%, 07/01/19 | | | |
Series B-3, 10.00%, 07/01/19 | | | |
Series C-1, 5.40%, 01/01/18 | | | |
Series C-2, 5.40%, 07/01/18 | | | |
Series C-3, 5.40%, 07/01/20 | | | |
Series C-4, 5.40%, 07/01/20 | | | |
Series CCC, 5.25%, 07/01/26 | | | |
Series CCC, 5.25%, 07/01/28 | | | |
Series D-4, 7.50%, 07/01/20 | | | |
Series TT, 5.00%, 07/01/25 | | | |
Series TT, 5.00%, 07/01/26 | | | |
Series WW, 5.50%, 07/01/17 | | | |
Series WW, 5.50%, 07/01/18 | | | |
Series WW, 5.50%, 07/01/19 | | | |
Series WW, 5.38%, 07/01/24 | | | |
Series WW, 5.25%, 07/01/33 | | | |
Series WW, 5.50%, 07/01/38 | | | |
Series XX, 5.25%, 07/01/17 | | | |
Series XX, 5.25%, 07/01/35 | | | |
Schedule of Investments (continued)May 31, 2024
BlackRock California Municipal Opportunities Fund(Percentages shown are based on Net Assets)
| | | |
| |
Puerto Rico Electric Power Authority, RB (continued) | | | |
Series XX, 5.75%, 07/01/36 | | | |
Series XX, 5.25%, 07/01/40 | | | |
Puerto Rico Electric Power Authority, Refunding RB | | | |
Series AAA, 5.25%, 07/01/22 | | | |
Series AAA, 5.25%, 07/01/27 | | | |
Series AAA, 5.25%, 07/01/28 | | | |
Series AAA, 5.25%, 07/01/29 | | | |
Series BBB, 5.40%, 07/01/28 | | | |
Series UU, 1.00%, 07/01/17(a) | | | |
Series UU, 1.00%, 07/01/18(a) | | | |
Series UU, 1.00%, 07/01/20(a) | | | |
Series UU, 4.42%, 07/01/31(a) | | | |
Series ZZ, 5.25%, 07/01/19 | | | |
Series ZZ, 5.25%, 07/01/24 | | | |
Series ZZ, 5.00%, 07/01/28 | | | |
Series ZZ, 5.00%, 12/29/49 | | | |
Puerto Rico Electric Power Authority, Refunding RB, BAB, Series YY, 6.13%, 07/01/40 | | | |
| | | |
Total Municipal Bonds in Puerto Rico | |
Total Municipal Bonds — 85.9%
(Cost: $2,038,725,657) | |
Municipal Bonds Transferred to Tender Option Bond Trusts(i) |
|
| |
Los Angeles Department of Water & Power, RB, 5.00%, 07/01/46 | | | |
Total Municipal Bonds in California | |
Total Municipal Bonds Transferred to Tender Option Bond Trusts — 1.7%
(Cost: $41,371,801) | |
Total Long-Term Investments — 87.6%
(Cost: $2,082,197,458) | |
| | | |
|
Money Market Funds — 5.8% | |
BlackRock Liquidity Funds, MuniCash, Institutional Shares, 3.26%(j)(k) | | | |
| | | |
U.S. Treasury Obligations — 6.1% | |
| | | |
| | | |
| | | |
| | | |
| |
Total Short-Term Securities — 11.9%
(Cost: $271,938,729) | |
Total Investments — 99.5%
(Cost: $2,354,136,187) | |
Other Assets Less Liabilities — 1.3% | |
Liability for TOB Trust Certificates, Including Interest Expense and Fees Payable — (0.8)% | |
| |
| Variable rate security. Interest rate resets periodically. The rate shown is the effective interest rate as of period end. Security description also includes the reference rate and spread if published and available. |
| Security exempt from registration pursuant to Rule 144A under the Securities Act of 1933, as amended. These securities may be resold in transactions exempt from registration to qualified institutional investors. |
| |
| |
| U.S. Government securities held in escrow, are used to pay interest on this security as well as to retire the bond in full at the date indicated, typically at a premium to par. |
| Security is collateralized by municipal bonds or U.S. Treasury obligations. |
| Issuer filed for bankruptcy and/or is in default. |
| Non-income producing security. |
| Represent bonds transferred to a TOB Trust in exchange of cash and residual certificates received by the Fund. These bonds serve as collateral in a secured borrowing. See Note 4 of the Notes to Financial Statements for details. |
| |
| Annualized 7-day yield as of period end. |
| Rates are discount rates or a range of discount rates as of period end. |
For purposes of this report, industry and sector sub-classifications may differ from those utilized by the Fund for compliance purposes.
82024 BlackRock Annual Financial Statements
Schedule of Investments (continued)May 31, 2024
BlackRock California Municipal Opportunities Fund
Affiliates
Investments in issuers considered to be affiliate(s) of the Fund during the year ended May 31, 2024 for purposes of Section 2(a)(3) of the Investment Company Act of 1940, as amended, were as follows:
| | | | | Change in
Unrealized
Appreciation
(Depreciation) | | | | Capital Gain
Distributions
from
Underlying
Funds |
BlackRock Liquidity Funds California Money Fund, Institutional Shares(a) | | | | | | | | | |
BlackRock Liquidity Funds, MuniCash, Institutional Shares | | | | | | | | | |
| | | | | | | | | |
| As of period end, the entity is no longer held. |
| Represents net amount purchased (sold). |
Derivative Financial Instruments Outstanding as of Period End
| | | | Value/
Unrealized
Appreciation
(Depreciation) |
| | | | |
10-Year U.S. Treasury Note | | | | |
| | | | |
5-Year U.S. Treasury Note | | | | |
| | | | |
Derivative Financial Instruments Categorized by Risk Exposure
As of period end, the fair values of derivative financial instruments located in the Statements of Assets and Liabilities were as follows:
| | | | Foreign
Currency
Exchange
Contracts | | | |
Liabilities — Derivative Financial Instruments | | | | | | | |
Futures contracts
Unrealized depreciation on futures contracts(a) | | | | | | | |
| Net cumulative unrealized appreciation (depreciation) on futures contracts and centrally cleared swaps, if any, are reported in the Schedule of Investments. In the Statements of Assets and Liabilities, only current day’s variation margin is reported in receivables or payables and the net cumulative unrealized appreciation (depreciation) is included in accumulated earnings (loss). |
For the period ended May 31, 2024, the effect of derivative financial instruments in the Statements of Operations was as follows:
| | | | Foreign
Currency
Exchange
Contracts | | | |
Net Realized Gain (Loss) from: | | | | | | | |
| | | | | | | |
Net Change in Unrealized Appreciation (Depreciation) on: | | | | | | | |
| | | | | | | |
Schedule of Investments (continued)May 31, 2024
BlackRock California Municipal Opportunities Fund
Average Quarterly Balances of Outstanding Derivative Financial Instruments
| |
Average notional value of contracts — long | |
Average notional value of contracts — short | |
| Derivative financial instrument not held at any quarter-end. The risk exposure table serves as an indicator of activity during the period. |
For more information about the Fund’s investment risks regarding derivative financial instruments, refer to the Notes to Financial Statements.
Fair Value Hierarchy as of Period End
Various inputs are used in determining the fair value of financial instruments. For a description of the input levels and information about the Fund’s policy regarding valuation of financial instruments, refer to the Notes to Financial Statements.
The following table summarizes the Fund’s financial instruments categorized in the fair value hierarchy. The breakdown of the Fund’s financial instruments into major categories is disclosed in the Schedule of Investments above.
| | | | |
| | | | |
| | | | |
| | | | |
| | | | |
| | | | |
Municipal Bonds Transferred to Tender Option Bond Trusts | | | | |
| | | | |
| | | | |
U.S. Treasury Obligations | | | | |
| | | | |
| | | | |
Derivative Financial Instruments(b) | | | | |
| | | | |
| | | | |
| Unfunded commitments are valued at the unrealized appreciation (depreciation) on the commitment. |
| Derivative financial instruments are futures contracts. Futures contracts are valued at the unrealized appreciation (depreciation) on the instrument. |
The Fund may hold assets and/or liabilities in which the fair value approximates the carrying amount for financial statement purposes. As of period end, TOB Trust Certificates of $17,659,983 are categorized as Level 2 within the fair value hierarchy.
See notes to financial statements.
102024 BlackRock Annual Financial Statements
Schedule of InvestmentsMay 31, 2024
BlackRock New Jersey Municipal Bond Fund(Percentages shown are based on Net Assets)
| | | |
|
| |
| |
New Jersey Economic Development Authority, ARB, Series B, AMT, 5.63%, 11/15/30 | | | |
New Jersey Economic Development Authority, Refunding RB | | | |
| | | |
| | | |
| | | |
| | | |
| | | |
Series A, AMT, 2.20%, 10/01/39(a) | | | |
| | | |
County/City/Special District/School District — 11.1% | |
Carlstadt School District, Refunding GO, 4.00%, 05/01/30 | | | |
City of East Orange New Jersey, Refunding GO, (AGM), 3.00%, 09/15/31 | | | |
City of Newark New Jersey, GO, (SAW), 4.50%, 03/15/36 | | | |
Clifton Board of Education, GO | | | |
| | | |
| | | |
County of Bergen New Jersey, Refunding GO, 3.00%, 07/15/38 | | | |
Essex County Improvement Authority, Refunding RB, (NPFGC GTD), 5.50%, 10/01/29 | | | |
Ewing Township Board of Education, GO | | | |
| | | |
| | | |
Hudson County Improvement Authority, RB, 5.00%, 05/01/46 | | | |
Lenape Regional High School District, GO, (AGM), 3.50%, 01/01/39 | | | |
Monmouth Regional High School District, GO, 3.00%, 02/01/34 | | | |
New Jersey Economic Development Authority, RB | | | |
| | | |
Series B, 6.50%, 04/01/31 | | | |
New Jersey Economic Development Authority, Refunding SAB, 6.50%, 04/01/28 | | | |
Newark Board of Education, Refunding GO, Sustainability Bonds, (BAM), 3.00%, 07/15/39 | | | |
Township of Irvington New Jersey, Refunding GO, Series A, (AGM SAW), 5.00%, 07/15/24(b) | | | |
Township of Monroe New Jersey/Middlesex County, Refunding GO | | | |
| | | |
| | | |
Union County Utilities Authority, Refunding RB | | | |
Series A, AMT, (GTD), 4.75%, 12/01/31 | | | |
Series A, AMT, (GTD), 5.25%, 12/01/31 | | | |
| | | |
| |
Atlantic County Improvement Authority, RB, Series A, (AGM), 4.00%, 07/01/46 | | | |
Camden County Improvement Authority, RB, Sustainability Bonds, 6.00%, 06/15/52 | | | |
| | | |
| |
Gloucester County Improvement Authority, RB, 5.00%, 07/01/44 | | | |
Middlesex County Improvement Authority, RB, 5.00%, 08/15/53 | | | |
New Jersey Economic Development Authority, RB | | | |
Series A, 5.00%, 07/01/27(c) | | | |
Series A, 5.13%, 11/01/29(c) | | | |
Series A, 5.25%, 07/01/37(c) | | | |
Series A, 6.25%, 11/01/38(c) | | | |
Series A, 5.00%, 06/15/39(c) | | | |
Series A, 5.38%, 07/01/47(c) | | | |
Series A, 5.00%, 12/01/48 | | | |
Series A, 5.00%, 06/15/49(c) | | | |
Series A, 5.00%, 01/01/50 | | | |
Series A, 5.00%, 07/01/50 | | | |
Series A, 6.50%, 11/01/52(c) | | | |
Series A, 5.25%, 11/01/54(c) | | | |
Series AAA, 5.00%, 12/15/26(b) | | | |
Series DDD, 5.00%, 06/15/27(b) | | | |
New Jersey Economic Development Authority, Refunding RB | | | |
| | | |
| | | |
Series A, 4.75%, 08/01/24(c) | | | |
Series A, 5.63%, 08/01/34(c) | | | |
Series A, 5.00%, 09/01/37(c) | | | |
Series A, 5.88%, 08/01/44(c) | | | |
Series A, 5.13%, 09/01/52(c) | | | |
Series PP, 4.00%, 06/15/24(b) | | | |
New Jersey Educational Facilities Authority, RB | | | |
Series A, 5.25%, 09/01/53 | | | |
Series B, 5.25%, 03/01/54 | | | |
Series C, (AGM), 3.25%, 07/01/49 | | | |
Series C, (AGM), 4.00%, 07/01/50 | | | |
New Jersey Educational Facilities Authority, Refunding RB | | | |
Series A, 5.00%, 07/01/33 | | | |
Series B, 5.00%, 07/01/32 | | | |
Series H, (AGM), 4.00%, 07/01/39 | | | |
New Jersey Higher Education Student Assistance Authority, RB | | | |
Series B, AMT, 4.00%, 12/01/44 | | | |
Series B, AMT, 4.25%, 12/01/45 | | | |
Series C, AMT, 5.25%, 12/01/54 | | | |
Sub-Series C, AMT, 4.00%, 12/01/48 | | | |
Series C, AMT, Subordinate, 5.00%, 12/01/53 | | | |
New Jersey Higher Education Student Assistance Authority, Refunding RB | | | |
Series B, AMT, 4.00%, 12/01/41 | | | |
Sub-Series C, AMT, 3.63%, 12/01/49 | | | |
Series C, AMT, Subordinate, 5.00%, 12/01/52 | | | |
New Jersey Institute of Technology, RB, Series A, 5.00%, 07/01/40 | | | |
| | | |
| |
New Jersey Economic Development Authority, Refunding RB | | | |
| | | |
| | | |
| | | |
Schedule of Investments11
Schedule of Investments (continued)May 31, 2024
BlackRock New Jersey Municipal Bond Fund(Percentages shown are based on Net Assets)
| | | |
| |
New Jersey Health Care Facilities Financing Authority, RB | | | |
| | | |
| | | |
| | | |
| | | |
Series A, 5.25%, 07/01/35 | | | |
Series A, 5.00%, 07/01/39 | | | |
Series A, 5.00%, 07/01/43 | | | |
New Jersey Health Care Facilities Financing Authority, Refunding RB | | | |
| | | |
| | | |
| | | |
| | | |
Series A, 4.00%, 07/01/32 | | | |
Series A, 5.00%, 07/01/37 | | | |
Series A, 5.00%, 07/01/43 | | | |
| | | |
| |
New Jersey Housing & Mortgage Finance Agency, RB, 5.25%, 12/20/65 | | | |
New Jersey Housing & Mortgage Finance Agency, RB, S/F Housing | | | |
Series H, Sustainability Bonds, 2.15%, 10/01/41 | | | |
Series H, Sustainability Bonds, 2.30%, 10/01/46 | | | |
Series K, Sustainability Bonds, 4.70%, 10/01/50 | | | |
New Jersey Housing & Mortgage Finance Agency, Refunding RB, M/F Housing | | | |
Series A, 2.45%, 11/01/45 | | | |
Series A, 4.00%, 11/01/48 | | | |
Series A, 2.55%, 11/01/50 | | | |
Series A, 4.10%, 11/01/53 | | | |
Series A, 2.63%, 11/01/56 | | | |
Series A, Sustainability Bonds, 2.25%, 11/01/36 | | | |
Series A, Sustainability Bonds, 2.65%, 11/01/46 | | | |
Series A, Sustainability Bonds, 2.70%, 11/01/51 | | | |
Series A, Sustainability Bonds, 2.75%, 11/01/56 | | | |
New Jersey Housing & Mortgage Finance Agency, Refunding RB, S/F Housing | | | |
Series A, 3.75%, 10/01/35 | | | |
Series E, 2.25%, 10/01/40 | | | |
Series E, 2.40%, 10/01/45 | | | |
Newark Housing Authority, RB, M/F Housing | | | |
Series A, 5.00%, 12/01/30 | | | |
Series A, 4.38%, 12/01/33 | | | |
| | | |
| |
Casino Reinvestment Development Authority, Inc., Refunding RB | | | |
| | | |
| | | |
Class D, (AGM), 4.00%, 11/01/34 | | | |
Garden State Preservation Trust, RB | | | |
Series A, (AGM), 5.75%, 11/01/28 | | | |
Series B, (AGM), 0.00%, 11/01/24(d) | | | |
Series B, (AGM), 0.00%, 11/01/27(d) | | | |
New Jersey Economic Development Authority, RB | | | |
| | | |
| | | |
Series A, 5.00%, 06/15/42 | | | |
| | | |
| |
New Jersey Economic Development Authority, Refunding RB | | | |
Sub-Series A, 5.00%, 07/01/33 | | | |
Sub-Series A, 4.00%, 07/01/34 | | | |
New Jersey Educational Facilities Authority, RB, Series A, 5.00%, 09/01/33 | | | |
New Jersey Health Care Facilities Financing Authority, RB, 5.00%, 09/15/29 | | | |
| | | |
| | | |
| | | |
| | | |
| |
Tobacco Settlement Financing Corp., Refunding RB | | | |
Series A, 5.00%, 06/01/46 | | | |
Series A, 5.25%, 06/01/46 | | | |
Sub-Series B, 5.00%, 06/01/46 | | | |
| | | |
| |
New Jersey Economic Development Authority, RB | | | |
| | | |
AMT, (AGM), 5.13%, 01/01/39 | | | |
AMT, (AGM), 5.13%, 07/01/42 | | | |
| | | |
New Jersey Transportation Trust Fund Authority, RB | | | |
| | | |
| | | |
| | | |
Class BB, 5.00%, 06/15/36 | | | |
Class BB, 4.00%, 06/15/37 | | | |
Class BB, 4.00%, 06/15/50 | | | |
Series A, 5.00%, 06/15/30 | | | |
Series A, 0.00%, 12/15/32(d) | | | |
Series AA, 4.00%, 06/15/36 | | | |
Series AA, 4.00%, 06/15/45 | | | |
Series AA, 5.00%, 06/15/45 | | | |
Series AA, 4.00%, 06/15/50 | | | |
Series BB, 4.00%, 06/15/44 | | | |
Series BB, 4.00%, 06/15/50 | | | |
Series BB, 5.25%, 06/15/50 | | | |
New Jersey Transportation Trust Fund Authority, RB, | | | |
Series A, 0.00%, 12/15/35 | | | |
Series A, 0.00%, 12/15/38 | | | |
New Jersey Transportation Trust Fund Authority, Refunding RB | | | |
Series A, 5.00%, 06/15/31 | | | |
Series A, 5.00%, 12/15/35 | | | |
Series A, 4.00%, 06/15/36 | | | |
Series A, 5.25%, 06/15/41 | | | |
Series AA, 4.25%, 06/15/44 | | | |
New Jersey Turnpike Authority, RB | | | |
Series A, 4.00%, 01/01/42 | | | |
Series B, 5.25%, 01/01/49 | | | |
Series E, 5.00%, 01/01/45 | | | |
New Jersey Turnpike Authority, Refunding RB, Series A, 4.00%, 01/01/39 | | | |
South Jersey Port Corp., ARB, Series B, AMT, 5.00%, 01/01/42 | | | |
South Jersey Transportation Authority, Refunding RB | | | |
Series A, 5.00%, 11/01/32 | | | |
122024 BlackRock Annual Financial Statements
Schedule of Investments (continued)May 31, 2024
BlackRock New Jersey Municipal Bond Fund(Percentages shown are based on Net Assets)
| | | |
Transportation (continued) | |
South Jersey Transportation Authority, Refunding RB (continued) | | | |
Series A, 5.00%, 11/01/33 | | | |
Series A, 5.00%, 11/01/39 | | | |
| | | |
| |
Essex County Improvement Authority, RB, (GTD), 4.00%, 11/01/44 | | | |
Industrial Pollution Control Financing Authority of Gloucester County, Refunding RB, Series A, AMT, 5.00%, 12/01/24(e) | | | |
New Jersey Infrastructure Bank, RB, Sustainability Bonds, 2.00%, 09/01/43 | | | |
| | | |
Total Municipal Bonds in New Jersey | |
| |
| |
Port Authority of New York & New Jersey, ARB | | | |
Series 93, 6.13%, 06/01/94 | | | |
| | | |
| | | |
Series 218, AMT, 5.00%, 11/01/32 | | | |
Series 221, AMT, 4.00%, 07/15/50 | | | |
Port Authority of New York & New Jersey, Refunding ARB | | | |
Series 205, 5.00%, 11/15/47 | | | |
| | | |
186th Series, AMT, 5.00%, 10/15/44 | | | |
223rd Series, AMT, 4.00%, 07/15/46 | | | |
Series 223, AMT, 4.00%, 07/15/41 | | | |
Series 238, AMT, 5.00%, 07/15/39 | | | |
Total Municipal Bonds in New York | |
| |
| |
Delaware River Joint Toll Bridge Commission, RB, 5.00%, 07/01/42 | | | |
Delaware River Port Authority, RB, 5.00%, 01/01/40 | | | |
Total Municipal Bonds in Pennsylvania | |
| |
| |
Commonwealth of Puerto Rico, GO, Series A-1, Restructured, 5.75%, 07/01/31 | | | |
| | | |
| |
Puerto Rico Sales Tax Financing Corp. Sales Tax Revenue, RB | | | |
Series A-1, Restructured, 4.75%, 07/01/53 | | | |
Series A-2, Restructured, 4.78%, 07/01/58 | | | |
Puerto Rico Sales Tax Financing Corp. Sales Tax | | | |
Series A-1, Restructured, 0.00%, 07/01/46 | | | |
Series B-1, Restructured, 0.00%, 07/01/46 | | | |
Total Municipal Bonds in Puerto Rico | |
Total Long-Term Investments — 92.9%
(Cost: $275,511,715) | |
| | | |
|
Money Market Funds — 4.6% | |
BlackRock Liquidity Funds, MuniCash, Institutional Shares, 3.26%(f)(g) | | | |
Total Short-Term Securities — 4.6%
(Cost: $13,454,332) | |
Total Investments — 97.5%
(Cost: $288,966,047) | |
Other Assets Less Liabilities — 2.5% | |
| |
| Variable rate security. Interest rate resets periodically. The rate shown is the effective interest rate as of period end. Security description also includes the reference rate and spread if published and available. |
| U.S. Government securities held in escrow, are used to pay interest on this security as well as to retire the bond in full at the date indicated, typically at a premium to par. |
| Security exempt from registration pursuant to Rule 144A under the Securities Act of 1933, as amended. These securities may be resold in transactions exempt from registration to qualified institutional investors. |
| |
| Security is collateralized by municipal bonds or U.S. Treasury obligations. |
| |
| Annualized 7-day yield as of period end. |
For purposes of this report, industry and sector sub-classifications may differ from those utilized by the Fund for compliance purposes.
Investments in issuers considered to be affiliate(s) of the Fund during the year ended May 31, 2024 for purposes of Section 2(a)(3) of the Investment Company Act of 1940, as amended, were as follows:
| | | | | Change in
Unrealized
Appreciation
(Depreciation) | | | | Capital Gain
Distributions
from
Underlying
Funds |
BlackRock Liquidity Funds, MuniCash, Institutional Shares | | | | | | | | | |
| Represents net amount purchased (sold). |
Schedule of Investments13
Schedule of Investments (continued)May 31, 2024
BlackRock New Jersey Municipal Bond Fund
Fair Value Hierarchy as of Period End
Various inputs are used in determining the fair value of financial instruments. For a description of the input levels and information about the Fund’s policy regarding valuation of financial instruments, refer to the Notes to Financial Statements.
The following table summarizes the Fund’s financial instruments categorized in the fair value hierarchy. The breakdown of the Fund’s financial instruments into major categories is disclosed in the Schedule of Investments above.
See notes to financial statements.
142024 BlackRock Annual Financial Statements
Schedule of InvestmentsMay 31, 2024
BlackRock Pennsylvania Municipal Bond Fund(Percentages shown are based on Net Assets)
| | | |
|
| |
| |
Allegheny County Industrial Development Authority, Refunding RB, 4.88%, 11/01/24 | | | |
Lehigh County Industrial Development Authority, Refunding RB, Series A, 3.00%, 09/01/29 | | | |
Montgomery County Industrial Development Authority, Refunding RB, Series A, 4.10%, 04/01/53(a) | | | |
Pennsylvania Economic Development Financing Authority, | | | |
Class A, AMT, 4.25%, 06/01/41 | | | |
Series A, AMT, 0.58%, 08/01/37 | | | |
Pennsylvania Economic Development Financing Authority, Refunding RB | | | |
| | | |
Series A, AMT, 4.05%, 04/01/34(a) | | | |
| | | |
County/City/Special District/School District — 16.8% | |
Allentown Neighborhood Improvement Zone Development Authority, RB, 5.00%, 05/01/42(b) | | | |
Altoona Area School District, GO, Series A, (AGM SAW), 5.00%, 12/01/36 | | | |
Bethlehem Area School District, GO, Series A, (BAM SAW), 5.00%, 08/01/35 | | | |
Bristol Township School District, GO, (BAM SAW), 5.00%, 06/01/42 | | | |
Chester County Industrial Development Authority, SAB(b) | | | |
| | | |
| | | |
| | | |
| | | |
City of Lancaster Pennsylvania, GO, (BAM), 4.00%, 11/01/42 | | | |
City of Philadelphia Pennsylvania, GO, Series B, 5.00%, 02/01/39 | | | |
City of Philadelphia Pennsylvania, Refunding GO | | | |
Series A, 5.00%, 08/01/37 | | | |
Series B, 3.32%, 08/01/31(a) | | | |
City of Pittsburgh Pennsylvania, GO | | | |
| | | |
| | | |
| | | |
Coatesville School District, GO, CAB(c) | | | |
Series A, (BAM SAW), 0.00%, 10/01/34 | | | |
Series A, (BAM SAW), 0.00%, 10/01/35 | | | |
Series A, (BAM SAW), 0.00%, 10/01/37 | | | |
Coatesville School District, Refunding GO, CAB(c) | | | |
Series B, (BAM SAW), 0.00%, 10/01/33 | | | |
Series B, (BAM SAW), 0.00%, 10/01/34 | | | |
Series C, (BAM SAW), 0.00%, 10/01/33 | | | |
County of Lancaster Pennsylvania, Refunding GO | | | |
| | | |
| | | |
| | | |
| | | |
Fox Chapel Area School District, GO | | | |
| | | |
| | | |
| | | |
County/City/Special District/School District (continued) | |
Northampton County Industrial Development Authority, TA, 7.00%, 07/01/32 | | | |
Pennsylvania Economic Development Financing Authority, RB | | | |
| | | |
| | | |
| | | |
Redevelopment Authority of The County of Washington, Refunding TA, 5.00%, 07/01/28 | | | |
School District of Philadelphia, GO | | | |
Series A, (SAW), 5.50%, 09/01/48 | | | |
Series D, (AGM SAW), 3.00%, 09/01/44 | | | |
School District of Philadelphia, Refunding GO, Series F, (SAW), 5.00%, 09/01/37 | | | |
State Public School Building Authority, Refunding RB, Series A, (AGM SAW), 5.00%, 06/01/33 | | | |
| | | |
| |
Allegheny County Higher Education Building Authority, Refunding RB, 4.02%, 02/01/33(a) | | | |
Berks County Municipal Authority, Refunding RB | | | |
| | | |
| | | |
Chester County Industrial Development Authority, RB | | | |
Sustainability Bonds, 4.00%, 12/01/49 | | | |
Sustainability Bonds, 4.00%, 12/01/51 | | | |
East Hempfield Township Industrial Development Authority, RB, 5.00%, 07/01/25(d) | | | |
Latrobe Industrial Development Authority, Refunding RB, 4.00%, 03/01/46 | | | |
Northampton County General Purpose Authority, Refunding RB, 4.00%, 11/01/38 | | | |
Pennsylvania Higher Education Assistance Agency, RB | | | |
Series A, 2.63%, 06/01/42 | | | |
Series 1C, AMT, 5.00%, 06/01/51 | | | |
Series B, AMT, Subordinate, 3.13%, 06/01/48 | | | |
Series B, AMT, Subordinate, 5.00%, 06/01/50 | | | |
Pennsylvania Higher Educational Facilities Authority, RB, Series AT-1, 4.00%, 06/15/26(d) | | | |
Pennsylvania Higher Educational Facilities Authority, Refunding RB | | | |
| | | |
| | | |
Series A, 5.00%, 11/01/25 | | | |
Series A, 5.00%, 11/01/26 | | | |
Series A, 5.00%, 11/01/27 | | | |
Series A, 5.00%, 11/01/29 | | | |
Series A, 5.00%, 11/01/31 | | | |
Series A, (AGM), 4.00%, 05/01/50 | | | |
Pennsylvania State University, RB | | | |
| | | |
Series A, 5.00%, 09/01/43 | | | |
Philadelphia Authority for Industrial Development, RB | | | |
| | | |
| | | |
| | | |
| | | |
| | | |
Schedule of Investments15
Schedule of Investments (continued)May 31, 2024
BlackRock Pennsylvania Municipal Bond Fund(Percentages shown are based on Net Assets)
| | | |
| |
Philadelphia Authority for Industrial Development, Refunding RB | | | |
| | | |
| | | |
Series 2015, 5.00%, 04/01/45 | | | |
Series A, 5.25%, 06/15/52 | | | |
| | | |
| |
Allegheny County Hospital Development Authority, RB, Series D2, 4.06%, 11/15/47(a) | | | |
Allegheny County Hospital Development Authority, Refunding RB | | | |
Series A, 4.00%, 04/01/37 | | | |
Series A, 4.00%, 07/15/39 | | | |
Series A, 5.00%, 04/01/47 | | | |
Bucks County Industrial Development Authority, RB | | | |
| | | |
| | | |
Chester County Health and Education Facilities Authority, RB, Series A, 4.00%, 09/01/50 | | | |
Chester County Health and Education Facilities Authority, Refunding RB, Series A, 5.25%, 12/01/45 | | | |
Cumberland County Municipal Authority, Refunding RB | | | |
| | | |
| | | |
| | | |
| | | |
| | | |
Doylestown Hospital Authority, RB | | | |
| | | |
| | | |
| | | |
| | | |
DuBois Hospital Authority, Refunding RB, (BAM-TCRS), 4.00%, 07/15/48 | | | |
Geisinger Authority, Refunding RB, Series A-1, 5.00%, 02/15/45 | | | |
Lancaster County Hospital Authority, Refunding RB, 5.00%, 11/01/35 | | | |
Lancaster Industrial Development Authority, RB | | | |
| | | |
| | | |
Montgomery County Higher Education and Health Authority, Refunding RB | | | |
| | | |
Series A, 5.00%, 09/01/37 | | | |
Montgomery County Industrial Development Authority, Refunding RB | | | |
| | | |
| | | |
Moon Industrial Development Authority, Refunding RB, 6.00%, 07/01/45 | | | |
Mount Lebanon Hospital Authority, RB, 4.00%, 07/01/48 | | | |
Northampton County General Purpose Authority, Refunding RB | | | |
| | | |
Series A1, (AGM), 4.00%, 08/15/43 | | | |
Pennsylvania Economic Development Financing Authority, RB | | | |
Series A-2, 4.00%, 05/15/53 | | | |
| | | |
| |
Pennsylvania Economic Development Financing Authority, RB (continued) | | | |
Series B, 4.00%, 03/15/40 | | | |
Pennsylvania Economic Development Financing Authority, Refunding RB, Series A, 4.00%, 11/15/42 | | | |
Pennsylvania Higher Educational Facilities Authority, RB, 3.00%, 08/15/47 | | | |
Pottsville Hospital Authority, Refunding RB, Series B, 5.00%, 07/01/41 | | | |
St Mary Hospital Authority, Refunding RB | | | |
| | | |
| | | |
| | | |
| |
Pennsylvania Housing Finance Agency, RB, S/F Housing | | | |
Series 137, Sustainability Bonds, 2.60%, 04/01/46 | | | |
Series 143A, Sustainability Bonds, 5.38%, 10/01/46 | | | |
Series 145A, Sustainability Bonds, 10/01/44(e) | | | |
Series 145A, Sustainability Bonds, 10/01/54(e) | | | |
Pennsylvania Housing Finance Agency, Refunding RB, S/F Housing | | | |
Series 142-A, Sustainability Bonds, 5.00%, 10/01/43 | | | |
Series 142-A, Sustainability Bonds, 5.00%, 10/01/50 | | | |
Series 2022, Sustainability Bonds, 4.15%, 10/01/42 | | | |
Philadelphia Authority for Industrial Development, RB, M/F | | | |
Series A, 3.50%, 12/01/36 | | | |
Series A, 4.00%, 12/01/46 | | | |
Series A, 4.00%, 12/01/51 | | | |
| | | |
| |
Allentown Neighborhood Improvement Zone Development | | | |
| | | |
| | | |
Commonwealth of Pennsylvania, GO, Series A, 4.00%, 09/15/31 | | | |
Pennsylvania Turnpike Commission Oil Franchise Tax Revenue, RB, Series A, 5.25%, 12/01/44 | | | |
| | | |
| |
Commonwealth Financing Authority, RB | | | |
| | | |
| | | |
| | | |
| |
City of Philadelphia Pennsylvania Airport Revenue, Refunding ARB | | | |
AMT, (AGM), 4.00%, 07/01/40 | | | |
Series B, AMT, 5.00%, 07/01/37 | | | |
Delaware River Joint Toll Bridge Commission, RB, 5.00%, 07/01/42 | | | |
Pennsylvania Economic Development Financing Authority, RB | | | |
| | | |
| | | |
| | | |
Pennsylvania Turnpike Commission Oil Franchise Tax Revenue, Refunding RB, Series A, 4.00%, 12/01/51 | | | |
162024 BlackRock Annual Financial Statements
Schedule of Investments (continued)May 31, 2024
BlackRock Pennsylvania Municipal Bond Fund(Percentages shown are based on Net Assets)
| | | |
Transportation (continued) | |
Pennsylvania Turnpike Commission, RB | | | |
Sub-Series B-1, 5.00%, 06/01/42 | | | |
Sub-Series B-1, 5.25%, 06/01/47 | | | |
Series 1, Subordinate, 5.00%, 12/01/40 | | | |
Series A, Subordinate, 5.00%, 12/01/37 | | | |
Series A, Subordinate, 3.00%, 12/01/42 | | | |
Series A, Subordinate, 4.00%, 12/01/44 | | | |
Series A, Subordinate, 4.00%, 12/01/50 | | | |
Pennsylvania Turnpike Commission, RB, CAB(c) | | | |
Series A-3, (BAM-TCRS), 0.00%, 12/01/41 | | | |
Sub-Series A-3, 0.00%, 12/01/42 | | | |
Pennsylvania Turnpike Commission, Refunding RB | | | |
Series B, 5.25%, 12/01/52 | | | |
Series B-2, (AGM), 5.00%, 06/01/35 | | | |
Series C, 4.00%, 12/01/51 | | | |
Series 2017-3, Subordinate, 5.00%, 12/01/40 | | | |
Southeastern Pennsylvania Transportation Authority, RB | | | |
| | | |
| | | |
Susquehanna Area Regional Airport Authority, Refunding RB, AMT, 5.00%, 01/01/38 | | | |
| | | |
| |
City of Philadelphia Pennsylvania Water & Wastewater Revenue, RB | | | |
Series A, 5.00%, 10/01/43 | | | |
Series A, 5.25%, 10/01/52 | | | |
Series C, 5.50%, 06/01/52 | | | |
City of Philadelphia Pennsylvania Water & Wastewater Revenue, Refunding RB | | | |
Series B, (AGM), 4.50%, 09/01/48 | | | |
Series B, (AGM), 5.50%, 09/01/53 | | | |
Pennsylvania Economic Development Financing Authority, Refunding RB, Class B, 4.10%, 12/01/38(a) | | | |
Philadelphia Gas Works Co., Refunding RB | | | |
| | | |
| | | |
| | | |
| | | |
Williamsport Sanitary Authority, Refunding RB, (BAM), 4.00%, 01/01/40 | | | |
| | | |
Total Municipal Bonds in Pennsylvania | |
| | | |
| |
| |
Commonwealth of Puerto Rico, GO, Series A-1, Restructured, 5.75%, 07/01/31 | | | |
Puerto Rico Sales Tax Financing Corp. Sales Tax Revenue, RB, Series A-2, Restructured, 4.78%, 07/01/58 | | | |
Puerto Rico Sales Tax Financing Corp. Sales Tax Revenue, RB, CAB, Series B-1, Restructured, 0.00%, 07/01/46(c) | | | |
Total Municipal Bonds in Puerto Rico | |
Total Long-Term Investments — 98.5%
(Cost: $351,988,309) | |
| | | |
|
Money Market Funds — 2.0% | |
BlackRock Liquidity Funds, MuniCash, Institutional Shares, 3.26%(h)(i) | | | |
Total Short-Term Securities — 2.0%
(Cost: $7,065,274) | |
Total Investments — 100.5%
(Cost: $359,053,583) | |
Liabilities in Excess of Other Assets — (0.5)% | |
| |
| Variable rate security. Interest rate resets periodically. The rate shown is the effective interest rate as of period end. Security description also includes the reference rate and spread if published and available. |
| Security exempt from registration pursuant to Rule 144A under the Securities Act of 1933, as amended. These securities may be resold in transactions exempt from registration to qualified institutional investors. |
| |
| U.S. Government securities held in escrow, are used to pay interest on this security as well as to retire the bond in full at the date indicated, typically at a premium to par. |
| |
| Issuer filed for bankruptcy and/or is in default. |
| Non-income producing security. |
| |
| Annualized 7-day yield as of period end. |
For purposes of this report, industry and sector sub-classifications may differ from those utilized by the Fund for compliance purposes.
Investments in issuers considered to be affiliate(s) of the Fund during the year ended May 31, 2024 for purposes of Section 2(a)(3) of the Investment Company Act of 1940, as amended, were as follows:
| | | | | Change in
Unrealized
Appreciation
(Depreciation) | | | | Capital Gain
Distributions
from
Underlying
Funds |
BlackRock Liquidity Funds, MuniCash, Institutional Shares | | | | | | | | | |
| Represents net amount purchased (sold). |
Schedule of Investments17
Schedule of Investments (continued)May 31, 2024
BlackRock Pennsylvania Municipal Bond Fund
Fair Value Hierarchy as of Period End
Various inputs are used in determining the fair value of financial instruments. For a description of the input levels and information about the Fund’s policy regarding valuation of financial instruments, refer to the Notes to Financial Statements.
The following table summarizes the Fund’s financial instruments categorized in the fair value hierarchy. The breakdown of the Fund’s financial instruments into major categories is disclosed in the Schedule of Investments above.
See notes to financial statements.
182024 BlackRock Annual Financial Statements
Schedule of InvestmentsMay 31, 2024
BlackRock Impact Municipal Fund(Percentages shown are based on Net Assets)
| | | |
|
| |
Arizona Industrial Development Authority, RB | | | |
| | | |
Series A, 4.00%, 02/01/50 | | | |
| | | |
| |
Arkansas Development Finance Authority, RB | | | |
AMT, Sustainability Bonds, 5.70%, 05/01/53 | | | |
Series A, AMT, Sustainability Bonds, 6.88%, 07/01/48(a) | | | |
University of Arkansas, RB, Series A, 5.00%, 04/01/47 | | | |
| | | |
| |
California Community Choice Financing Authority, RB(b) | | | |
| | | |
Series A, Sustainability Bonds, 4.00%, 10/01/52 | | | |
Series G, Sustainability Bonds, 5.25%, 11/01/54 | | | |
California School Finance Authority, RB, 5.00%, 08/01/42(a) | | | |
California State Public Works Board, RB, Series D, Sustainability Bonds, 4.00%, 05/01/45 | | | |
CSCDA Community Improvement Authority, RB, M/F | | | |
| | | |
Series A-2, Sustainability Bonds, 3.00%, 02/01/57 | | | |
| | | |
| |
Colorado School of Mines, RB, Series A, Sustainability Bonds, (AGM), 5.25%, 12/01/47 | | | |
Denver City & County School District No. 1, GO, Series A, (SAW), 5.00%, 12/01/45 | | | |
| | | |
| |
Connecticut State Health & Educational Facilities Authority, RB, 5.25%, 07/15/48 | | | |
State of Connecticut, GO, Series B, Sustainability Bonds, 5.00%, 01/15/42 | | | |
University of Connecticut, RB, Series A, 5.00%, 05/01/39 | | | |
| | | |
| |
Affordable Housing Opportunities Trust, RB, Series AH-01, Class B, 6.88%, 05/01/39(a) | | | |
District of Columbia — 2.7% | |
District of Columbia, RB, Class A, AMT, 5.50%, 02/28/34 | | | |
Washington Metropolitan Area Transit Authority Dedicated Revenue, RB, Series A, Sustainability Bonds, 4.13%, 07/15/47 | | | |
| | | |
| |
Brevard County Health Facilities Authority, Refunding RB, Series A, 4.00%, 04/01/52 | | | |
Capital Projects Finance Authority, RB, 6.63%, 06/15/59(a) | | | |
Florida Development Finance Corp., RB | | | |
Series A, 4.00%, 06/15/42 | | | |
| | | |
| |
Florida Development Finance Corp., RB (continued) | | | |
Series A, 5.00%, 06/15/47 | | | |
St Lucie County School Board, COP, Series A, (AGM), 5.00%, 07/01/48 | | | |
| | | |
| |
Georgia Housing & Finance Authority, Refunding RB, S/F Housing, Series A, 4.00%, 06/01/49 | | | |
| |
Chicago Board of Education, GO | | | |
Series A, 5.00%, 12/01/33 | | | |
Series A, 5.00%, 12/01/47 | | | |
Chicago Transit Authority Sales Tax Receipts Fund, Refunding RB, Series A, 2nd Lien, 5.00%, 12/01/57 | | | |
Illinois Housing Development Authority, RB, S/F Housing, Series G, Sustainability Bonds, (FHLMC, FNMA, GNMA), 6.25%, 10/01/52 | | | |
Illinois Housing Development Authority, Refunding RB, S/F Housing, Series H, Sustainability Bonds, (FHLMC, FNMA, GNMA), 5.75%, 10/01/53 | | | |
| | | |
| |
City of Henderson Kentucky, RB, Series A, AMT, 4.70%, 01/01/52(a) | | | |
Louisville/Jefferson County Metropolitan Government, RB, Series A, (AGM), 5.00%, 05/15/47 | | | |
| | | |
| |
Jefferson Parish Consolidated Sewerage District No. 1, RB, (BAM), 4.00%, 02/01/39 | | | |
Louisiana Public Facilities Authority, RB, Series A, 6.38%, 06/01/52(a) | | | |
| | | |
| |
Finance Authority of Maine, RB, AMT, Sustainability Bonds, 8.00%, 12/01/51(a) | | | |
| |
Maryland Economic Development Corp., RB, Class B, AMT, Sustainability Bonds, 5.25%, 06/30/47 | | | |
| |
Commonwealth of Massachusetts Transportation Fund Revenue, RB, Sustainability Bonds, 5.00%, 06/01/50 | | | |
University of Massachusetts Building Authority, RB, Series 1, 4.00%, 11/01/46 | | | |
| | | |
| |
Ludington Area School District, GO, Series II, (BAM Q-SBLF), 4.00%, 05/01/51 | | | |
Michigan Finance Authority, RB | | | |
| | | |
Sustainability Bonds, 5.50%, 02/28/57 | | | |
Michigan State Housing Development Authority, RB, M/F Housing, Series A, 5.10%, 10/01/53 | | | |
| | | |
Schedule of Investments19
Schedule of Investments (continued)May 31, 2024
BlackRock Impact Municipal Fund(Percentages shown are based on Net Assets)
| | | |
| |
Duluth Economic Development Authority, RB, Class B, 5.25%, 06/15/42 | | | |
Minnesota Housing Finance Agency, RB, S/F Housing, Series M, Sustainability Bonds, (FHLMC, FNMA, GNMA), 6.00%, 01/01/53 | | | |
| | | |
| |
New Hampshire Business Finance Authority, RB, M/F Housing, Series 2022-1, Sustainability Bonds, 4.38%, 09/20/36 | | | |
| |
Camden County Improvement Authority, RB, Sustainability Bonds, 6.00%, 06/15/47 | | | |
New Jersey Housing & Mortgage Finance Agency, RB, S/F Housing, Series K, Sustainability Bonds, 6.00%, 10/01/55 | | | |
| | | |
| |
Build NYC Resource Corp., RB | | | |
Series A, 5.00%, 07/01/32 | | | |
Series A, 5.13%, 07/01/33 | | | |
Series A, 5.50%, 06/15/63(a) | | | |
Sustainability Bonds, 5.75%, 06/01/42(a) | | | |
Metropolitan Transportation Authority, Refunding RB, Series A-1, Sustainability Bonds, 5.00%, 11/15/49 | | | |
Nassau County Local Economic Assistance Corp., RB, Series A, 5.00%, 07/01/43 | | | |
New York City Housing Development Corp., RB, M/F Housing | | | |
Class F-1, Sustainability Bonds, 4.75%, 11/01/47 | | | |
Series A, Sustainability Bonds, 4.60%, 11/01/43 | | | |
New York Power Authority, RB, Sustainability Bonds, (AGM), 4.00%, 11/15/42 | | | |
New York State Housing Finance Agency, RB, M/F Housing, Seires A, Sustainability Bonds, (SONYMA), 3.80%, 11/01/62(b) | | | |
New York Transportation Development Corp., RB, AMT, Sustainability Bonds, (AGM), 5.50%, 06/30/44 | | | |
| | | |
| |
North Carolina Housing Finance Agency, RB, S/F Housing, Sustainability Bonds, (FHLMC, FNMA, GNMA), 3.75%, 07/01/52 | | | |
| |
North Dakota Housing Finance Agency, RB, S/F Housing, Sustainability Bonds, 5.75%, 01/01/54 | | | |
| |
Port of Portland Oregon Airport Revenue, Refunding ARB, Series 29, AMT, Sustainability Bonds, 5.50%, 07/01/48 | | | |
| |
City of Philadelphia Pennsylvania Water & Wastewater Revenue, RB, Series C, 5.50%, 06/01/47 | | | |
Pennsylvania Housing Finance Agency, RB, S/F Housing | | | |
Series 143A, Sustainability Bonds, 6.25%, 10/01/53 | | | |
Series 145A, Sustainability Bonds, 10/01/49(c) | | | |
Pennsylvania Housing Finance Agency, Refunding RB, S/F Housing, Series 2022, Sustainability Bonds, 4.25%, 10/01/52 | | | |
| | | |
| |
Pittsburgh Water & Sewer Authority, RB, Series A, 1st Lien, (AGM), 5.00%, 09/01/48 | | | |
Southeastern Pennsylvania Transportation Authority, RB, 5.25%, 06/01/47 | | | |
| | | |
| |
Tennessee Housing Development Agency, Refunding RB, S/F Housing, Series 1, Sustainability Bonds, 3.75%, 07/01/52 | | | |
| |
Arlington Higher Education Finance Corp., RB | | | |
| | | |
Series A, 5.25%, 08/15/32 | | | |
City of El Paso Texas Water & Sewer Revenue, Refunding RB, 5.00%, 03/01/46 | | | |
Tarrant County Cultural Education Facilities Finance Corp., RB, Class F, 5.00%, 11/15/52(b) | | | |
Texas State Technical College, RB, (AGM), 5.50%, 08/01/42 | | | |
| | | |
| |
University of Utah, RB, Series A, Sustainability Bonds, 4.00%, 08/01/43 | | | |
Utah Infrastructure Agency, RB, Series A, 5.00%, 10/15/32 | | | |
| | | |
| |
East Central Vermont Telecommunications District, RB, Series A, 6.88%, 12/01/46(a) | | | |
| |
Henrico County Economic Development Authority, RB, Class A, 5.00%, 10/01/47 | | | |
Total Long-Term Investments — 96.5%
(Cost: $47,997,821) | |
| | | |
|
Money Market Funds — 4.2% | |
BlackRock Liquidity Funds, MuniCash, Institutional Shares, 3.26%(d)(e) | | | |
Total Short-Term Securities — 4.2%
(Cost: $2,081,048) | |
Total Investments — 100.7%
(Cost: $50,078,869) | |
Liabilities in Excess of Other Assets — (0.7)% | |
| |
| Security exempt from registration pursuant to Rule 144A under the Securities Act of 1933, as amended. These securities may be resold in transactions exempt from registration to qualified institutional investors. |
| Variable rate security. Interest rate resets periodically. The rate shown is the effective interest rate as of period end. Security description also includes the reference rate and spread if published and available. |
| |
| |
| Annualized 7-day yield as of period end. |
For purposes of this report, industry and sector sub-classifications may differ from those utilized by the Fund for compliance purposes.
202024 BlackRock Annual Financial Statements
Schedule of Investments (continued)May 31, 2024
BlackRock Impact Municipal Fund
Affiliates
Investments in issuers considered to be affiliate(s) of the Fund during the year ended May 31, 2024 for purposes of Section 2(a)(3) of the Investment Company Act of 1940, as amended, were as follows:
| | | | | Change in
Unrealized
Appreciation
(Depreciation) | | | | Capital Gain
Distributions
from
Underlying
Funds |
BlackRock Liquidity Funds, MuniCash, Institutional Shares | | | | | | | | | |
| Represents net amount purchased (sold). |
Derivative Financial Instruments Outstanding as of Period End
| | | | Value/
Unrealized
Appreciation
(Depreciation) |
| | | | |
10-Year U.S. Treasury Note | | | | |
| | | | |
5-Year U.S. Treasury Note | | | | |
| | | | |
Derivative Financial Instruments Categorized by Risk Exposure
As of period end, the fair values of derivative financial instruments located in the Statements of Assets and Liabilities were as follows:
| | | | Foreign
Currency
Exchange
Contracts | | | |
Assets — Derivative Financial Instruments | | | | | | | |
Futures contracts
Unrealized appreciation on futures contracts(a) | | | | | | | |
Liabilities — Derivative Financial Instruments | | | | | | | |
Futures contracts
Unrealized depreciation on futures contracts(a) | | | | | | | |
| Net cumulative unrealized appreciation (depreciation) on futures contracts and centrally cleared swaps, if any, are reported in the Schedule of Investments. In the Statements of Assets and Liabilities, only current day’s variation margin is reported in receivables or payables and the net cumulative unrealized appreciation (depreciation) is included in accumulated earnings (loss). |
For the period ended May 31, 2024, the effect of derivative financial instruments in the Statements of Operations was as follows:
| | | | Foreign
Currency
Exchange
Contracts | | | |
Net Realized Gain (Loss) from: | | | | | | | |
| | | | | | | |
Net Change in Unrealized Appreciation (Depreciation) on: | | | | | | | |
| | | | | | | |
Average Quarterly Balances of Outstanding Derivative Financial Instruments
| |
Average notional value of contracts — short | |
For more information about the Fund’s investment risks regarding derivative financial instruments, refer to the Notes to Financial Statements.
Schedule of Investments21
Schedule of Investments (continued)May 31, 2024
BlackRock Impact Municipal Fund
Fair Value Hierarchy as of Period End
Various inputs are used in determining the fair value of financial instruments. For a description of the input levels and information about the Fund’s policy regarding valuation of financial instruments, refer to the Notes to Financial Statements.
The following table summarizes the Fund’s financial instruments categorized in the fair value hierarchy. The breakdown of the Fund’s financial instruments into major categories is disclosed in the Schedule of Investments above.
| | | | |
| | | | |
| | | | |
| | | | |
| | | | |
| | | | |
| | | | |
| | | | |
Derivative Financial Instruments(a) | | | | |
| | | | |
| | | | |
| | | | |
| | | | |
| | | | |
| Derivative financial instruments are futures contracts. Futures contracts are valued at the unrealized appreciation (depreciation) on the instrument. |
See notes to financial statements.
222024 BlackRock Annual Financial Statements
Schedule of InvestmentsMay 31, 2024
BlackRock Strategic Municipal Opportunities Fund(Percentages shown are based on Net Assets)
| | | |
|
Health Care Providers & Services — 0.0% |
Baylor Scott & White Holdings, Series 2021, 2.84%, 11/15/50 | | | |
Industrial Conglomerates — 0.8% |
Grand Canyon University, 5.13%, 10/01/28 | | | |
Total Corporate Bonds — 0.8%
(Cost: $36,920,000) | |
|
| |
Auburn University, Refunding RB, Series A, 4.00%, 06/01/38 | | | |
Black Belt Energy Gas District, RB(a) | | | |
Series A, 5.25%, 01/01/54 | | | |
Series A, 5.25%, 05/01/55 | | | |
Series B, 4.00%, 10/01/52 | | | |
Series B, 5.25%, 12/01/53 | | | |
Series C, 5.50%, 10/01/54 | | | |
County of Jefferson Alabama Sewer Revenue, Refunding RB, 5.50%, 10/01/53 | | | |
Energy Southeast A Cooperative District, RB(a) | | | |
Series A-1, 5.50%, 11/01/53 | | | |
Series B, 5.25%, 07/01/54 | | | |
Series B-1, 5.75%, 04/01/54 | | | |
Southeast Alabama Gas Supply District, Refunding RB, Series A, 5.00%, 08/01/54(a) | | | |
Southeast Energy Authority A Cooperative District, | | | |
Series A, 5.25%, 01/01/54 | | | |
Series B, 5.00%, 01/01/54 | | | |
State of Alabama, GO, Series B, 5.00%, 11/01/41 | | | |
| | | |
| |
Borough of North Slope Alaska, GO | | | |
Series A, 5.00%, 06/30/25 | | | |
Series A, 5.00%, 06/30/27 | | | |
Northern Tobacco Securitization Corp., Refunding RB, Series A, Class 1, 4.00%, 06/01/50 | | | |
| | | |
| |
Arizona Industrial Development Authority, RB, 7.10%, 01/01/55(b) | | | |
Chandler Industrial Development Authority, RB, AMT, 5.00%, 09/01/42(a) | | | |
City of Mesa Arizona Utility System Revenue, RB | | | |
| | | |
| | | |
| | | |
City of Phoenix Civic Improvement Corp., ARB, Junior Lien, 5.00%, 07/01/49 | | | |
City of Phoenix Civic Improvement Corp., RB, Junior Lien, 5.25%, 07/01/47 | | | |
| | | |
| |
City of Phoenix Civic Improvement Corp., Refunding RB, Series D, Junior Lien, 5.00%, 07/01/37 | | | |
Salt River Project Agricultural Improvement & Power District, RB, Series B, 5.00%, 01/01/48 | | | |
| | | |
| |
Arkansas Development Finance Authority, RB | | | |
| | | |
| | | |
| | | |
| | | |
| |
California Community Choice Financing Authority, RB, Series E-1, Sustainability Bonds, 5.00%, 02/01/54(a) | | | |
California Community Housing Agency, RB, M/F Housing, Series A-2, 4.00%, 08/01/51(b) | | | |
California Enterprise Development Authority, RB, 10.00%, 11/15/32(b) | | | |
California Health Facilities Financing Authority, RB | | | |
| | | |
| | | |
Series A, 5.25%, 12/01/40 | | | |
Series A, 5.25%, 12/01/41 | | | |
California Housing Finance Agency, RB, M/F Housing, Series A, 4.25%, 01/15/35 | | | |
California Infrastructure & Economic Development Bank, RB | | | |
Sustainability Bonds, 4.00%, 10/01/44 | | | |
Sustainability Bonds, 4.00%, 10/01/47 | | | |
California Municipal Finance Authority, RB | | | |
| | | |
| | | |
| | | |
| | | |
| | | |
Series A, AMT, 4.00%, 07/15/29 | | | |
California Municipal Finance Authority, RB, S/F Housing, Series B, 5.88%, 08/15/49 | | | |
California Pollution Control Financing Authority, Refunding RB, Series B-2, AMT, 3.13%, 11/01/40(a) | | | |
California School Finance Authority, RB, Series A, 6.75%, 11/01/45(b) | | | |
California Statewide Communities Development Authority, Refunding RB, Series A, 5.25%, 11/01/44(b) | | | |
City of Los Angeles Department of Airports, ARB, Series A, AMT, 4.00%, 05/15/39 | | | |
City of Los Angeles Department of Airports, Refunding ARB | | | |
| | | |
| | | |
Series A, AMT, Subordinate, 5.00%, 05/15/34 | | | |
City of San Francisco California Public Utilities Commission Water Revenue, Refunding RB, 5.25%, 11/01/52 | | | |
Cloverdale Unified School District, Refunding GO, Series B, 4.00%, 08/01/49 | | | |
Schedule of Investments23
Schedule of Investments (continued)May 31, 2024
BlackRock Strategic Municipal Opportunities Fund(Percentages shown are based on Net Assets)
| | | |
| |
CMFA Special Finance Agency XII, RB, M/F Housing, 4.38%, 08/01/49(b) | | | |
CSCDA Community Improvement Authority, RB, M/F | | | |
Mezzanine Lien, Sustainability Bonds, 4.00%, 06/01/57 | | | |
Series B, Mezzanine Lien, Sustainability Bonds, 4.00%, 12/01/59 | | | |
Senior Lien, Sustainability Bonds, 3.13%, 06/01/57 | | | |
Series B, Sub Lien, Sustainability Bonds, 4.00%, 12/01/59 | | | |
Sustainability Bonds, 4.00%, 07/01/58 | | | |
Series B, Sustainability Bonds, 4.00%, 07/01/58 | | | |
Golden State Tobacco Securitization Corp., Refunding RB, CAB, Series B-2, Subordinate, 0.00%, 06/01/66(c) | | | |
Los Angeles Department of Water & Power Water System Revenue, Refunding RB | | | |
Series A, 5.00%, 07/01/50 | | | |
Series D, 5.00%, 07/01/47 | | | |
Northern California Gas Authority No. 1, RB, Series B, 4.45%, 07/01/27(a) | | | |
Palomar Community College District, GO, Series D, Election 2006, 5.25%, 08/01/45 | | | |
Peralta Community College District, GO, Series B, 5.50%, 08/01/52 | | | |
Sacramento Municipal Utility District, Refunding RB, Series H, Sustainability Bonds, 5.00%, 08/15/50 | | | |
San Diego County Regional Airport Authority, ARB, Series B, AMT, Subordinate, 5.00%, 07/01/31 | | | |
San Francisco City & County Airport Comm-San Francisco International Airport, Refunding ARB, Series A, AMT, 05/01/49(d) | | | |
San Francisco City & County Airport Comm-San Francisco International Airport, Refunding RB, Series A, AMT, 5.00%, 05/01/34 | | | |
San Francisco City & County Public Utilities Commission Wastewater Revenue, Refunding RB | | | |
Series A, Sustainability Bonds, 4.00%, 10/01/43 | | | |
Series A, Sustainability Bonds, 5.00%, 10/01/44 | | | |
San Francisco City & County Redevelopment Agency Successor Agency, TA, CAB, Series D, 0.00%, 08/01/43(b)(c) | | | |
Santa Clara Valley Water District, Refunding RB | | | |
Series A, 5.00%, 06/01/48 | | | |
Series A, 5.00%, 06/01/49 | | | |
Series A, 5.00%, 06/01/50 | | | |
State of California, Refunding GO, 5.00%, 09/01/43 | | | |
University of California, Refunding RB, Series AY, 4.00%, 05/15/41 | | | |
| | | |
| |
Boulder Valley School District No. Re-2 Boulder, GO, (SAW), 5.00%, 12/01/42 | | | |
City of Colorado Springs Colorado Utilities System Revenue, RB, Series B, 5.00%, 11/15/47 | | | |
| | | |
| |
Colorado Health Facilities Authority, RB, 4.00%, 11/15/48 | | | |
Colorado Health Facilities Authority, Refunding RB, Series A, 3.00%, 11/15/51 | | | |
Flying Horse Metropolitan District No. 3, Refunding GO, 6.00%, 12/01/49(b) | | | |
| | | |
| |
Connecticut Housing Finance Authority, Refunding RB, S/F Housing, Series A, Sustainability Bonds, (FHLMC, FNMA, GNMA), 4.60%, 11/15/49 | | | |
Connecticut State Health & Educational Facilities Authority, RB, 5.25%, 07/15/48 | | | |
Mohegan Tribal Finance Authority, RB, 7.00%, 02/01/45(b) | | | |
| | | |
Series 2021 A, 4.00%, 01/15/28 | | | |
Series E, 5.00%, 11/15/28 | | | |
| | | |
| |
Affordable Housing Opportunities Trust, RB, Series AH-01, Class B, 6.88%, 05/01/39 | | | |
Town of Bridgeville Delaware, ST | | | |
| | | |
| | | |
| | | |
District of Columbia — 1.0% | |
Metropolitan Washington Airports Authority Aviation Revenue, Refunding ARB | | | |
Series A, AMT, 5.00%, 10/01/30 | | | |
Series A, AMT, 5.25%, 10/01/43 | | | |
Metropolitan Washington Airports Authority Aviation Revenue, Refunding RB | | | |
Series A, AMT, 5.00%, 10/01/29 | | | |
Series A, AMT, 5.00%, 10/01/30 | | | |
Series A, AMT, 5.00%, 10/01/33 | | | |
Series A, AMT, 5.00%, 10/01/34 | | | |
Washington Metropolitan Area Transit Authority Dedicated Revenue, RB, Sustainability Bonds, 5.00%, 07/15/48 | | | |
| | | |
| |
Alta Lakes Community Development District, SAB | | | |
| | | |
| | | |
Babcock Ranch Community Independent Special District, SAB | | | |
| | | |
| | | |
| | | |
Brevard County Health Facilities Authority, Refunding RB, 4.00%, 11/15/31(b) | | | |
Canaveral Port Authority, ARB | | | |
Series B, 5.00%, 06/01/48 | | | |
Series A, AMT, 5.00%, 06/01/45 | | | |
242024 BlackRock Annual Financial Statements
Schedule of Investments (continued)May 31, 2024
BlackRock Strategic Municipal Opportunities Fund(Percentages shown are based on Net Assets)
| | | |
| |
Capital Trust Agency, Inc., RB(b) | | | |
| | | |
Series A, 5.00%, 06/15/49 | | | |
Series A-2, 5.00%, 01/01/26 | | | |
Celebration Pointe Community Development District No. 1, SAB | | | |
| | | |
| | | |
Central Florida Expressway Authority, RB, Series B, Senior Lien, 5.00%, 07/01/44 | | | |
Charles Cove Community Development District, SAB, 4.00%, 05/01/52 | | | |
Charlotte County Industrial Development Authority, | | | |
| | | |
| | | |
City of Fort Lauderdale Florida Water & Sewer Revenue, RB, Series B, 5.50%, 09/01/48 | | | |
City of Miami Florida, RB, Series A, 01/01/49(d) | | | |
City of St. Petersburg Florida Public Utility Revenue, RB, Series B, 5.00%, 10/01/52 | | | |
City of Tampa Florida Water & Wastewater System Revenue, RB, Series A, Sustainability Bonds, 5.00%, 10/01/52 | | | |
Collier County Industrial Development Authority, Refunding RB, Series A, 8.25%, 05/15/49(b)(e)(f) | | | |
County of Broward Florida Airport System Revenue, ARB, Series A, AMT, 5.00%, 10/01/49 | | | |
County of Miami-Dade Florida Aviation Revenue, Refunding ARB, Series A, AMT, 5.00%, 10/01/49 | | | |
County of Miami-Dade Florida Transit System, RB, 5.00%, 07/01/51 | | | |
County of Miami-Dade Florida, RB, 0.00%, 10/01/39(c) | | | |
County of Miami-Dade Seaport Department, Refunding RB | | | |
Series A, AMT, 5.00%, 10/01/34 | | | |
Series A, AMT, 5.00%, 10/01/35 | | | |
Series A, AMT, 5.00%, 10/01/36 | | | |
Series A, AMT, 5.00%, 10/01/41 | | | |
County of Pasco Florida, RB, (AGM), 5.00%, 09/01/48 | | | |
County of Sarasota Florida Utility System Revenue, RB | | | |
| | | |
| | | |
Crossings At Fleming Island Community Development District, Refunding SAB, Series A-3, Senior Lien, 6.50%, 05/01/44 | | | |
Epperson North Community Development District, SAB, Series A, 4.00%, 11/01/51 | | | |
Florida Development Finance Corp., RB(b) | | | |
| | | |
Series A, 5.75%, 06/15/29 | | | |
Series A, 6.00%, 06/15/34 | | | |
Series C, 5.75%, 12/15/56 | | | |
| | | |
Florida Development Finance Corp., Refunding RB | | | |
Series A, 4.50%, 12/15/56(b) | | | |
AMT, 12.00%, 07/15/32(a)(b) | | | |
AMT, (AGM), 5.25%, 07/01/47 | | | |
| | | |
| |
Florida Development Finance Corp., Refunding RB (continued) | | | |
Series C, AMT, 8.25%, 07/01/57(a)(b) | | | |
Florida Housing Finance Corp., RB, S/F Housing | | | |
Series 1, (FHLMC, FNMA, GNMA), 3.80%, 07/01/43 | | | |
Series 1, (FHLMC, FNMA, GNMA), 3.70%, 07/01/38 | | | |
Harbor Bay Community Development District, Refunding SAB, Series A-2, 3.75%, 05/01/34 | | | |
Harbor Bay Community Development District, SAB | | | |
Series A-1, 3.88%, 05/01/39 | | | |
Series A-1, 4.10%, 05/01/48 | | | |
Hobe-St. Lucie Conservancy District, SAB, 5.88%, 05/01/55 | | | |
JEA Water & Sewer System Revenue, Refunding RB, Series A, 5.25%, 10/01/49 | | | |
Lakewood Ranch Stewardship District, SAB | | | |
| | | |
| | | |
| | | |
| | | |
| | | |
| | | |
North AR-1 Pasco Community Development District, SAB | | | |
Series A, 5.75%, 05/01/44 | | | |
Series A, 6.00%, 05/01/54 | | | |
Portico Community Development District, Refunding SAB, Series 1, 3.50%, 05/01/37 | | | |
Reunion East Community Development District, SAB | | | |
Series 2021, 2.40%, 05/01/26 | | | |
Series 2021, 4.00%, 05/01/51 | | | |
Sawyers Landing Community Development District, SAB, 4.25%, 05/01/53 | | | |
School District of Broward County, GO, 5.00%, 07/01/51 | | | |
Shadowlawn Community Development District, SAB, 5.50%, 05/01/44 | | | |
St Johns County School Board, COP | | | |
Series A, (AGM), 5.25%, 07/01/46 | | | |
Series A, (AGM), 5.50%, 07/01/49 | | | |
Sterling Hill Community Development District, Refunding SAB, Series B, 5.50%, 11/01/10(e)(f) | | | |
Sumter Landing Community Development District, RB, 4.17%, 10/01/47 | | | |
Talavera Community Development District, SAB, 4.50%, 05/01/50 | | | |
Tolomato Community Development District, Refunding SAB, Series 2015-2, 6.61%, 11/01/24(g) | | | |
Tolomato Community Development District, SAB, Series 2015-3, 6.61%, 05/01/40(e)(f) | | | |
Trout Creek Community Development District, SAB | | | |
| | | |
| | | |
Village Center Community Development District, Refunding RB, 5.02%, 11/01/36 | | | |
Westside Haines City Community Development District, SAB | | | |
| | | |
| | | |
Schedule of Investments25
Schedule of Investments (continued)May 31, 2024
BlackRock Strategic Municipal Opportunities Fund(Percentages shown are based on Net Assets)
| | | |
| |
Westside Haines City Community Development District, SAB (continued) | | | |
| | | |
| | | |
| | | |
| |
Atlanta Urban Redevelopment Agency, RB(b) | | | |
| | | |
| | | |
Barrow County School District, GO, (SAW), 5.00%, 02/01/40 | | | |
Clarke County Hospital Authority, Refunding RB, Series A, 5.00%, 07/01/46 | | | |
Columbia County Hospital Authority, RB, Series A, (AGM), 5.00%, 04/01/48 | | | |
County of DeKalb Georgia Water & Sewerage Revenue, Refunding RB | | | |
| | | |
| | | |
| | | |
| | | |
| | | |
East Point Business & Industrial Development Authority, RB, Series A, 5.25%, 06/15/62(b) | | | |
Georgia Housing & Finance Authority, RB, S/F Housing, Series B1, 3.65%, 06/01/44 | | | |
Main Street Natural Gas, Inc., RB(a) | | | |
Series A, 5.00%, 06/01/53 | | | |
Series D, 5.00%, 05/01/54 | | | |
State of Georgia, GO, Series A, 4.00%, 07/01/43 | | | |
| | | |
| |
State of Hawaii Airports System Revenue, ARB, Series A, AMT, 5.00%, 07/01/48 | | | |
| |
Idaho Housing & Finance Association, RB | | | |
| | | |
Series A, 5.00%, 08/15/40 | | | |
Series A, 5.00%, 08/15/48 | | | |
Series A, 6.95%, 06/15/55(b) | | | |
| | | |
| |
Chicago Board of Education, GO, BAB, 6.04%, 12/01/29 | | | |
Chicago Board of Education, Refunding GO, Series B, 4.00%, 12/01/35 | | | |
Chicago O’Hare International Airport, Refunding ARB, Series D, 5.00%, 01/01/46 | | | |
City of Chicago Illinois Lakeshore East Special Assessment Area, Refunding SAB(b) | | | |
| | | |
| | | |
| | | |
| | | |
Illinois Finance Authority, Refunding RB, Class A, 4.00%, 08/15/39 | | | |
| | | |
| |
Illinois Housing Development Authority, Refunding RB, S/F Housing, Series H, Sustainability Bonds, (FHLMC, FNMA, GNMA), 4.65%, 10/01/43 | | | |
Illinois State Toll Highway Authority, RB | | | |
Series A, 5.00%, 01/01/44 | | | |
Series A, 5.25%, 01/01/45 | | | |
Series A, 4.00%, 01/01/46 | | | |
| | | |
Series B, 5.25%, 05/01/47 | | | |
Series B, 5.25%, 05/01/48 | | | |
Series C, 5.00%, 12/01/45 | | | |
Series C, 5.00%, 12/01/46 | | | |
| | | |
| |
Indiana Finance Authority, RB, Series B, 1st Lien, 5.25%, 10/01/47 | | | |
Indiana Finance Authority, Refunding RB | | | |
Series B, Sustainability Bonds, 5.00%, 02/01/43 | | | |
Series B, Sustainability Bonds, 5.00%, 02/01/44 | | | |
Indianapolis Local Public Improvement Bond Bank, RB, Series D, 6.00%, 02/01/48 | | | |
| | | |
| |
Kansas Development Finance Authority, RB, Series SR, 5.00%, 05/01/41 | | | |
| |
Kentucky Economic Development Finance Authority, RB, Series B, 5.00%, 08/15/33 | | | |
Kentucky Economic Development Finance Authority, Refunding RB, Series A, 5.25%, 06/01/41 | | | |
Westvaco Corp., RB, 7.67%, 01/15/27(b) | | | |
| | | |
| |
Louisiana Local Government Environmental Facilities & Community Development Authority, RB, Series A2, 5.05%, 12/01/34 | | | |
Louisiana Stadium & Exposition District, Refunding RB, Series A, 5.00%, 07/01/48 | | | |
| | | |
| |
Finance Authority of Maine, RB, AMT, Sustainability Bonds, 8.00%, 12/01/51(b) | | | |
Maine Health & Higher Educational Facilities Authority, Refunding RB, 4.00%, 07/01/37(b) | | | |
Maine State Housing Authority, RB, S/F Housing, Series B, 3.75%, 11/15/38 | | | |
| | | |
| |
Anne Arundel County Consolidated Special Taxing District, ST, 5.25%, 07/01/44 | | | |
City of Baltimore Maryland, RB, Series A, 5.00%, 07/01/49 | | | |
County of Prince George’s Maryland, COP, 5.00%, 10/01/48 | | | |
County of Prince George’s Maryland, Refunding GO, Series A, 5.00%, 08/01/40 | | | |
Maryland Health & Higher Educational Facilities Authority, RB, 7.00%, 03/01/55(b) | | | |
262024 BlackRock Annual Financial Statements
Schedule of Investments (continued)May 31, 2024
BlackRock Strategic Municipal Opportunities Fund(Percentages shown are based on Net Assets)
| | | |
| |
Maryland Stadium Authority, RB, Series A, 5.00%, 05/01/47 | | | |
Maryland State Transportation Authority, Refunding RB, Series A, 5.00%, 07/01/46 | | | |
State of Maryland, GO, Series A, 5.00%, 06/01/37 | | | |
| | | |
| |
City of Boston Massachusetts, GO | | | |
Series A, 5.00%, 11/01/37 | | | |
Series A, 5.00%, 11/01/40 | | | |
Commonwealth of Massachusetts, GO | | | |
Series A, 5.00%, 05/01/48 | | | |
Series D, 5.00%, 10/01/53 | | | |
Commonwealth of Massachusetts, Refunding GO, Series B, 5.00%, 11/01/43 | | | |
Massachusetts Development Finance Agency, RB | | | |
| | | |
| | | |
Series J2, 5.00%, 07/01/48 | | | |
Massachusetts Development Finance Agency, | | | |
| | | |
| | | |
Massachusetts Water Resources Authority, Refunding RB, Series B, Sustainability Bonds, 5.25%, 08/01/48 | | | |
| | | |
| |
Lansing Board of Water & Light, Refunding RB | | | |
Series A, 5.00%, 07/01/54 | | | |
Series A, 5.25%, 07/01/54 | | | |
Michigan Finance Authority, RB | | | |
| | | |
| | | |
| | | |
Series A, 6.50%, 06/01/57(b)(e)(f) | | | |
Michigan Finance Authority, Refunding RB | | | |
| | | |
| | | |
Series A, 4.00%, 12/01/46 | | | |
Series A, Class 1, 4.00%, 06/01/49 | | | |
Michigan State Housing Development Authority, RB, M/F Housing, Series A, 4.15%, 10/01/53 | | | |
State of Michigan Trunk Line Revenue, RB | | | |
| | | |
| | | |
West Bloomfield School District, GO, Series I, (Q- SBLF), 5.00%, 05/01/42 | | | |
| | | |
| |
City of Minneapolis Minnesota, RB | | | |
| | | |
| | | |
| | | |
| |
State of Mississippi, GO, Series C, 4.00%, 10/01/37 | | | |
| |
Health & Educational Facilities Authority of the State of Missouri, RB | | | |
| | | |
| | | |
| |
Health & Educational Facilities Authority of the State of Missouri, RB (continued) | | | |
Series A, 4.00%, 05/15/48 | | | |
Kansas City Industrial Development Authority, ARB | | | |
Series A, AMT, 5.00%, 03/01/33 | | | |
Series A, AMT, 5.00%, 03/01/44 | | | |
Kansas City Industrial Development Authority, RB | | | |
Series A, 10.00%, 11/15/37 | | | |
Series C, 7.50%, 11/15/46 | | | |
Kansas City Industrial Development Authority, Refunding RB | | | |
| | | |
| | | |
Metropolitan St. Louis Sewer District, Refunding RB | | | |
Series A, 5.00%, 05/01/42 | | | |
Series B, 5.25%, 05/01/52 | | | |
St Louis Land Clearance for Redevelopment Authority, Refunding RB, 3.88%, 10/01/35 | | | |
| | | |
| |
Central Plains Energy Project, RB, Series 1, 5.00%, 05/01/53(a) | | | |
| |
City of North Las Vegas Nevada, GO, BAB, 6.57%, 06/01/40 | | | |
Clark County Water Reclamation District, GO | | | |
| | | |
| | | |
County of Clark Nevada, GO | | | |
Series B, 4.00%, 12/01/36 | | | |
Series B, 4.00%, 12/01/39 | | | |
Las Vegas Valley Water District, Refunding GO, Series A, 5.00%, 06/01/46 | | | |
State of Nevada Department of Business & Industry, RB, Series A, 4.50%, 12/15/29(b) | | | |
| | | |
| |
New Hampshire Business Finance Authority, RB, M/F Housing, Series 2, Sustainability Bonds, 4.25%, 07/20/41 | | | |
New Hampshire Business Finance Authority, Refunding RB, 3.30%, 04/01/32 | | | |
| | | |
| |
Industrial Pollution Control Financing Authority of Gloucester County, Refunding RB, Series A, AMT, 5.00%, 12/01/24(i) | | | |
New Jersey Economic Development Authority, RB, Series B, 5.50%, 11/01/26(b) | | | |
New Jersey Health Care Facilities Financing Authority, RB, 4.00%, 07/01/41 | | | |
New Jersey Transportation Trust Fund Authority, RB | | | |
| | | |
Class BB, 4.00%, 06/15/50 | | | |
New Jersey Turnpike Authority, Refunding RB, Series B, 4.00%, 01/01/37 | | | |
Tobacco Settlement Financing Corp., Refunding RB, Series A, 5.25%, 06/01/46 | | | |
| | | |
Schedule of Investments27
Schedule of Investments (continued)May 31, 2024
BlackRock Strategic Municipal Opportunities Fund(Percentages shown are based on Net Assets)
| | | |
| |
New Mexico Municipal Energy Acquisition Authority, Refunding RB, Series A, 5.00%, 11/01/39(a) | | | |
| |
| | | |
Series B, 5.25%, 10/01/47 | | | |
Series C, 5.00%, 03/01/45 | | | |
Series C, 5.25%, 03/01/47 | | | |
Series D, 5.25%, 04/01/54 | | | |
Series F-1, 4.00%, 03/01/47 | | | |
Series F-1, 5.00%, 03/01/50 | | | |
New York City Housing Development Corp., RB, M/F Housing | | | |
Series G-1, 3.90%, 05/01/45 | | | |
Sustainability Bonds, 4.80%, 02/01/53 | | | |
New York City Municipal Water Finance Authority, RB | | | |
Series BB-1, 5.00%, 06/15/50 | | | |
Series DD-1, 5.00%, 06/15/49 | | | |
Sub-Series BB-1, 5.25%, 06/15/54 | | | |
Sub-Series CC-1, 5.25%, 06/15/54 | | | |
New York City Municipal Water Finance Authority, Refunding RB | | | |
| | | |
Series BB-2, 4.00%, 06/15/42 | | | |
Sub-Series BB-2, 5.25%, 06/15/47 | | | |
New York City Transitional Finance Authority Future Tax Secured Revenue, RB | | | |
Series D-1, 5.25%, 11/01/48 | | | |
Series A, Subordinate, 5.00%, 05/01/43 | | | |
New York City Transitional Finance Authority, RB | | | |
Series C, 5.50%, 05/01/53 | | | |
Series B, Subordinate, 5.00%, 05/01/45 | | | |
Series B, Subordinate, 5.00%, 05/01/46 | | | |
New York State Dormitory Authority, Refunding RB | | | |
Series A, 5.25%, 03/15/37 | | | |
Series A, 4.00%, 03/15/40 | | | |
Series A, 4.00%, 03/15/42 | | | |
Series A, 4.00%, 03/15/46 | | | |
Series A, 5.00%, 03/15/46 | | | |
Series B, 5.75%, 07/01/24(h) | | | |
Series C, 5.00%, 03/15/41 | | | |
Series C, 5.00%, 03/15/42 | | | |
Series E, 5.00%, 02/15/25(h) | | | |
Series E, 5.00%, 03/15/48 | | | |
New York State Environmental Facilities Corp., RB, Series B, Subordinate, 5.00%, 06/15/48 | | | |
New York State Thruway Authority, RB, Series C, Sustainability Bonds, 5.00%, 03/15/53 | | | |
New York State Thruway Authority, Refunding RB | | | |
Series A, 4.00%, 03/15/42 | | | |
Series P, 5.00%, 01/01/49 | | | |
New York State Urban Development Corp., RB, Series A, 5.00%, 03/15/43 | | | |
New York State Urban Development Corp., Refunding RB | | | |
| | | |
Series E, 4.00%, 03/15/42 | | | |
New York Transportation Development Corp., ARB | | | |
| | | |
| | | |
| | | |
| |
New York Transportation Development Corp., RB, AMT, Sustainability Bonds, 5.38%, 06/30/60 | | | |
Port Authority of New York & New Jersey, Refunding ARB, Series 244, 5.00%, 07/15/39 | | | |
Port Authority of New York & New Jersey, Refunding RB, Series 241, 5.00%, 07/15/42 | | | |
Suffolk Regional Off-Track Betting Co., RB, 5.00%, 12/01/34 | | | |
Triborough Bridge & Tunnel Authority Sales Tax Revenue, RB | | | |
Series A, 5.00%, 05/15/41 | | | |
Series A, 5.00%, 05/15/42 | | | |
Series A-1, 5.00%, 05/15/49 | | | |
Triborough Bridge & Tunnel Authority, RB, Series C- 1A, Senior Lien, 5.00%, 05/15/51 | | | |
Triborough Bridge & Tunnel Authority, Refunding RB | | | |
Series A, 5.00%, 05/15/57 | | | |
Series A-1, 5.00%, 05/15/51 | | | |
Series C, 5.25%, 05/15/52 | | | |
Series C, Sustainability Bonds, 5.25%, 11/15/40 | | | |
| | | |
| |
City of Charlotte North Carolina Airport Revenue, Refunding ARB, 4.00%, 07/01/44 | | | |
City of Charlotte North Carolina Water & Sewer System Revenue, Refunding RB, Series A, 5.00%, 07/01/45 | | | |
City of Greensboro North Carolina Combined Water & Sewer System Revenue, Refunding RB, Series B, 06/01/49(d) | | | |
North Carolina Medical Care Commission, RB | | | |
Series A, 5.00%, 10/01/44 | | | |
Series A, 5.00%, 10/01/49 | | | |
Series A, 5.13%, 10/01/54 | | | |
North Carolina Medical Care Commission, Refunding RB, Series A, 5.25%, 01/01/41 | | | |
North Carolina Turnpike Authority, RB, Series A, (AGM), 5.00%, 01/01/58 | | | |
Town of Mooresville North Carolina, SAB, 5.38%, 03/01/40(b) | | | |
| | | |
| |
Buckeye Tobacco Settlement Financing Authority, Refunding RB, Series B-2, Class 2, 5.00%, 06/01/55 | | | |
County of Hamilton Ohio Sewer System Revenue, RB, Series A, 12/01/49(d) | | | |
Ohio Housing Finance Agency, RB, S/F Housing, Series B, Sustainability Bonds, (FHLMC, FNMA, GNMA), 6.00%, 03/01/55 | | | |
Ohio Turnpike & Infrastructure Commission, RB, Series A, 5.00%, 02/15/43 | | | |
Ohio Water Development Authority Water Pollution Control Loan Fund, RB, Series A, 3.10%, 12/01/36(a) | | | |
Worthington City School District, GO, Series C, 5.00%, 12/01/48 | | | |
| | | |
282024 BlackRock Annual Financial Statements
Schedule of Investments (continued)May 31, 2024
BlackRock Strategic Municipal Opportunities Fund(Percentages shown are based on Net Assets)
| | | |
| |
Oklahoma Development Finance Authority, RB, 7.25%, 09/01/51(b) | | | |
Oklahoma Water Resources Board, RB, Series A, 4.13%, 10/01/53 | | | |
University of Oklahoma, RB | | | |
Series A, (BAM), 5.00%, 07/01/49 | | | |
Series A, (BAM), 4.13%, 07/01/54 | | | |
| | | |
| |
City of Portland Oregon Sewer System Revenue, Refunding RB | | | |
Series A, 2nd Lien, 5.00%, 12/01/42 | | | |
Series A, 2nd Lien, 5.00%, 12/01/43 | | | |
Series A, 2nd Lien, 5.00%, 12/01/47 | | | |
Hospital Facilities Authority of Multnomah County Oregon, Refunding RB, Series A, 5.50%, 10/01/24(h) | | | |
| | | |
Series A, 5.00%, 04/01/39 | | | |
Series A, 5.00%, 04/01/40 | | | |
Port of Portland Oregon Airport Revenue, Refunding ARB, Series 28, AMT, 5.00%, 07/01/52 | | | |
State of Oregon Housing & Community Services Department, RB, M/F Housing, Series B, (FHLMC, FNMA, GNMA), 4.13%, 07/01/43 | | | |
University of Oregon, RB, Series A, 5.00%, 04/01/50 | | | |
| | | |
| |
Allegheny County Airport Authority, ARB, Series A, AMT, 5.00%, 01/01/56 | | | |
Chester County Health and Education Facilities Authority, Refunding RB | | | |
Series A, 5.00%, 12/01/25 | | | |
Series A, 5.25%, 12/01/45 | | | |
City of Philadelphia Pennsylvania Airport Revenue, Refunding ARB, AMT, 5.00%, 07/01/51 | | | |
Commonwealth Financing Authority, RB, (AGM), 4.00%, 06/01/39 | | | |
Lancaster County Hospital Authority, RB, 5.00%, 11/01/51 | | | |
Northampton County Industrial Development Authority, TA, 7.00%, 07/01/32 | | | |
Pennsylvania Economic Development Financing Authority, RB, 5.00%, 12/31/38 | | | |
Pennsylvania Economic Development Financing Authority, Refunding RB, AMT, 5.50%, 11/01/44 | | | |
Pennsylvania Higher Educational Facilities Authority, RB, 5.00%, 08/15/49 | | | |
Pennsylvania Housing Finance Agency, RB, S/F Housing, Series 145A, Sustainability Bonds, 10/01/54(d) | | | |
Philadelphia Authority for Industrial Development, Refunding RB, Series A, 5.00%, 09/01/35 | | | |
Pittsburgh Water & Sewer Authority, Refunding RB, Series B, 1st Lien, (AGM), 5.00%, 09/01/38 | | | |
| | | |
| |
Children’s Trust Fund, RB, Series A, 0.00%, 05/15/57(c) | | | |
Commonwealth of Puerto Rico, GO | | | |
| | | |
| | | |
| |
Commonwealth of Puerto Rico, GO (continued) | | | |
Series A-1, 0.00%, 11/01/43(a) | | | |
Series A-1, Restructured, 4.00%, 07/01/33 | | | |
Series A-1, Restructured, 4.00%, 07/01/35 | | | |
Series A-1, Restructured, 4.00%, 07/01/37 | | | |
Series A-1, Restructured, 4.00%, 07/01/41 | | | |
Series A-1, Restructured, 4.00%, 07/01/46 | | | |
Commonwealth of Puerto Rico, GO, CAB, Series A, Restructured, 0.00%, 07/01/33(c) | | | |
Commonwealth of Puerto Rico, RB, 0.01%, 11/01/51(a) | | | |
Puerto Rico Commonwealth Aqueduct & Sewer Authority, RB, Series A, 4.00%, 07/01/42(b) | | | |
Puerto Rico Commonwealth Aqueduct & Sewer Authority, Refunding RB(b) | | | |
Series B, 4.00%, 07/01/42 | | | |
Series C, 3.75%, 07/01/27 | | | |
Puerto Rico Electric Power Authority, RB(e)(f) | | | |
Series A, 5.00%, 07/01/29 | | | |
Series A, 7.00%, 07/01/33 | | | |
Series A, 6.75%, 07/01/36 | | | |
Series A, 5.00%, 07/01/42 | | | |
Series A, 7.00%, 07/01/43 | | | |
Series A-1, 10.00%, 07/01/19 | | | |
Series A-2, 10.00%, 07/01/19 | | | |
Series A-3, 10.00%, 07/01/19 | | | |
Series B-3, 10.00%, 07/01/19 | | | |
Series C-1, 5.40%, 01/01/18 | | | |
Series C-2, 5.40%, 07/01/18 | | | |
Series C-3, 5.40%, 07/01/20 | | | |
Series C-4, 5.40%, 07/01/20 | | | |
Series CCC, 5.25%, 07/01/26 | | | |
Series CCC, 5.25%, 07/01/28 | | | |
Series D-1, 7.50%, 01/01/20 | | | |
Series D-2, 7.50%, 01/01/20 | | | |
Series D-4, 7.50%, 07/01/20 | | | |
Series TT, 5.00%, 07/01/18 | | | |
Series TT, 5.00%, 07/01/20 | | | |
Series WW, 5.50%, 07/01/17 | | | |
Series WW, 5.50%, 07/01/18 | | | |
Series WW, 5.50%, 07/01/20 | | | |
Series WW, 5.38%, 07/01/24 | | | |
Series WW, 5.25%, 07/01/25 | | | |
Series WW, 5.25%, 07/01/33 | | | |
Series WW, 5.50%, 07/01/38 | | | |
Series XX, 5.25%, 07/01/17 | | | |
Series XX, 5.25%, 07/01/35 | | | |
Series XX, 5.75%, 07/01/36 | | | |
Series XX, 5.25%, 07/01/40 | | | |
Puerto Rico Electric Power Authority, Refunding | | | |
Series AAA, 5.25%, 07/01/22 | | | |
Series AAA, 5.25%, 07/01/25 | | | |
Series AAA, 5.25%, 07/01/28 | | | |
Series BBB, 5.40%, 07/01/28 | | | |
Series DDD, 5.00%, 07/01/19 | | | |
Series DDD, 5.00%, 07/01/20 | | | |
Series UU, 1.00%, 07/01/17(a) | | | |
Series UU, 1.00%, 07/01/18(a) | | | |
Series UU, 1.00%, 07/01/20(a) | | | |
Series UU, 4.42%, 07/01/31(a) | | | |
Series VV, 5.50%, 07/01/20 | | | |
Series ZZ, 5.25%, 07/01/18 | | | |
Schedule of Investments29
Schedule of Investments (continued)May 31, 2024
BlackRock Strategic Municipal Opportunities Fund(Percentages shown are based on Net Assets)
| | | |
| |
Puerto Rico Electric Power Authority, Refunding RB(e)(f) (continued) | | | |
Series ZZ, 5.25%, 07/01/19 | | | |
Series ZZ, 5.25%, 07/01/24 | | | |
Series ZZ, 5.25%, 07/01/25 | | | |
Puerto Rico Electric Power Authority, Refunding RB, BAB, Series YY, 6.13%, 07/01/40(e)(f) | | | |
Puerto Rico Industrial Tourist Educational Medical & Envirml Ctl Facs Fing Authority, ARB | | | |
Series A-1, AMT, 6.75%, 01/01/45 | | | |
Series A-2, AMT, 6.50%, 01/01/42 | | | |
Series A-2, AMT, 6.75%, 01/01/45 | | | |
| | | |
| |
City of Charleston South Carolina Waterworks & Sewer System Revenue, RB | | | |
| | | |
| | | |
| | | |
City of Columbia South Carolina Waterworks & Sewer System Revenue, RB, 5.25%, 02/01/52 | | | |
County of Dorchester South Carolina, SAB(b) | | | |
| | | |
| | | |
Patriots Energy Group Financing Agency, RB, Series A1, 5.25%, 10/01/54(a) | | | |
Patriots Energy Group Financing Agency, Refunding RB, Series B-1, 5.25%, 02/01/54(a) | | | |
South Carolina Jobs-Economic Development Authority, RB | | | |
| | | |
Series A, 5.25%, 11/01/43 | | | |
Series A, 5.25%, 11/01/44 | | | |
South Carolina Jobs-Economic Development Authority, Refunding RB, Series A, 5.00%, 05/01/38 | | | |
South Carolina Public Service Authority, RB, Series F, (AGM-CR), 5.74%, 01/01/30 | | | |
South Carolina Public Service Authority, Refunding RB, Series B, 5.00%, 12/01/41 | | | |
| | | |
| |
County of Shelby Tennessee, Refunding GO, Series B, 4.00%, 04/01/40 | | | |
Metropolitan Government Nashville & Davidson County Health & Educational Facilities Board, Refunding RB, 5.25%, 10/01/58 | | | |
Metropolitan Government of Nashville & Davidson County Tennessee, Refunding GO, Series A, 4.00%, 01/01/40 | | | |
Metropolitan Nashville Airport Authority, ARB | | | |
Series A, Subordinate, 5.00%, 07/01/44 | | | |
Series A, Subordinate, 5.00%, 07/01/54 | | | |
New Memphis Arena Public Building Authority, RB, CAB, Convertible, 4.00%, 04/01/26(g) | | | |
Tennessee Energy Acquisition Corp., Refunding RB, Series A-1, 5.00%, 05/01/53(a) | | | |
| | | |
| |
Tennessee Housing Development Agency, RB, S/F Housing | | | |
| | | |
| | | |
Series 2-A, Sustainability Bonds, (FHLMC, FNMA, GNMA), 01/01/55(d) | | | |
| | | |
| |
Alamo Regional Mobility Authority, RB, Series A, Senior Lien, 5.00%, 06/15/51 | | | |
Arlington Higher Education Finance Corp., RB(b) | | | |
| | | |
| | | |
| | | |
Series A, 5.30%, 04/01/62 | | | |
Arlington Independent School District, GO, (PSF), 4.00%, 02/15/40 | | | |
Celina Independent School District, GO, (PSF), 5.00%, 02/15/47 | | | |
City of Austin Texas Airport System Revenue, ARB, Series B, AMT, 5.00%, 11/15/44 | | | |
City of Austin Texas Electric Utility Revenue, Refunding RB, 5.00%, 11/15/39 | | | |
City of Austin Texas Water & Wastewater System Revenue, Refunding RB, 11/15/49(d) | | | |
City of Dallas Texas, Refunding GO | | | |
Series A, 5.00%, 02/15/38 | | | |
Series A, 5.00%, 02/15/40 | | | |
Series A, 5.00%, 02/15/41 | | | |
City of El Paso Texas Water & Sewer Revenue, Refunding RB | | | |
| | | |
| | | |
| | | |
City of Fort Worth Texas, GO, 5.00%, 03/01/39 | | | |
City of Houston Texas Airport System Revenue, ARB | | | |
Series A, AMT, 6.50%, 07/15/30 | | | |
Series A, AMT, 6.63%, 07/15/38 | | | |
City of Houston Texas Combined Utility System Revenue, Refunding RB, Series A, 1st Lien, 5.25%, 11/15/49 | | | |
City of Houston Texas, Refunding GO | | | |
Series A, 5.00%, 03/01/36 | | | |
Series A, 5.00%, 03/01/37 | | | |
Series A, 5.00%, 03/01/38 | | | |
Series A, 5.25%, 03/01/40 | | | |
Series A, 5.25%, 03/01/43 | | | |
City of Marble Falls Texas, SAB(b) | | | |
| | | |
| | | |
| | | |
| | | |
City of San Antonio Texas Electric & Gas Systems Revenue, RB, 4.00%, 02/01/37 | | | |
City of San Antonio Texas Electric & Gas Systems Revenue, Refunding RB | | | |
| | | |
Series A, 5.25%, 02/01/42 | | | |
Series A, 5.25%, 02/01/43 | | | |
302024 BlackRock Annual Financial Statements
Schedule of Investments (continued)May 31, 2024
BlackRock Strategic Municipal Opportunities Fund(Percentages shown are based on Net Assets)
| | | |
| |
City of Seguin Texas, GO, Series A, 5.25%, 09/01/57 | | | |
Corpus Christi Independent School District, GO, (PSF), 4.13%, 08/15/53 | | | |
County of Harris Texas, Refunding GO | | | |
Series A, 5.00%, 09/15/38 | | | |
Series A, 5.00%, 09/15/39 | | | |
Series A, 5.00%, 09/15/40 | | | |
Crowley Independent School District, GO, (PSF), 5.00%, 02/01/48 | | | |
Dalhart Independent School District, GO | | | |
| | | |
| | | |
| | | |
Dallas Area Rapid Transit, Refunding RB, Series B, Senior Lien, 5.00%, 12/01/47 | | | |
Denton Independent School District, GO, (PSF), 5.00%, 08/15/40 | | | |
Fort Bend Independent School District, Refunding | | | |
Series A, (PSF), 08/15/43 | | | |
Series A, (PSF), 08/15/44 | | | |
Frisco Independent School District, Refunding GO, Series A, (PSF), 4.00%, 08/15/41 | | | |
Hidalgo County Regional Mobility Authority, RB, | | | |
Series A, 0.00%, 12/01/42 | | | |
Series A, 0.00%, 12/01/43 | | | |
Series A, 0.00%, 12/01/44 | | | |
Series A, 0.00%, 12/01/45 | | | |
Series A, 0.00%, 12/01/46 | | | |
Series A, 0.00%, 12/01/47 | | | |
Series A, 0.00%, 12/01/49 | | | |
Series A, 0.00%, 12/01/50 | | | |
Hurst-Euless-Bedford Independent School District, GO, (PSF), 5.00%, 08/15/44 | | | |
Medina Valley Independent School District, GO, (PSF), 5.00%, 02/15/45 | | | |
Midland Independent School District, GO, (PSF), 5.00%, 02/15/50 | | | |
New Hope Cultural Education Facilities Finance Corp., Refunding RB | | | |
Series A, 6.75%, 10/01/52 | | | |
Series B2, 4.50%, 10/01/26 | | | |
Northwest Independent School District, GO, (PSF), 5.00%, 02/15/48 | | | |
Permanent University Fund - University of Texas System, Refunding RB, Series A, 5.00%, 07/01/40 | | | |
Plano Independent School District, GO, 5.00%, 02/15/41 | | | |
Port Authority of Houston of Harris County Texas, ARB | | | |
| | | |
1st Lien, 5.00%, 10/01/53 | | | |
Port of Beaumont Industrial Development Authority, RB, 4.10%, 01/01/28(b) | | | |
Port of Beaumont Navigation District, Refunding ARB, 07/01/26(d) | | | |
Port of Beaumont Navigation District, Refunding RB(b) | | | |
Series B, 6.00%, 01/01/25 | | | |
Series A, AMT, 4.00%, 01/01/50 | | | |
| | | |
| |
Pottsboro Independent School District, GO, (PSF), 5.00%, 02/15/47 | | | |
San Jacinto Community College District, GO, Series A, 4.00%, 02/15/41 | | | |
State of Texas, GO, Series A, AMT, 5.00%, 08/01/38 | | | |
Tarrant County Cultural Education Facilities Finance Corp., RB, 5.00%, 11/15/51 | | | |
Texas Department of Housing & Community Affairs, RB, S/F Housing, Series B, (GNMA), 5.25%, 07/01/53 | | | |
Texas State University System, Refunding RB(d) | | | |
| | | |
| | | |
Texas Water Development Board, RB | | | |
| | | |
| | | |
| | | |
| | | |
Van Alstyne Independent School District, GO, (PSF), 5.00%, 02/15/47 | | | |
Wylie Independent School District/Collin County, GO, (PSF), 5.25%, 08/15/49 | | | |
| | | |
| |
City of Phoenix Civic Improvement Corp., ARB | | | |
Series A, AMT, 5.00%, 07/01/46 | | | |
Series A, AMT, 5.25%, 07/01/48 | | | |
City of Salt Lake City Utah Public Utilities Revenue, RB, 5.00%, 02/01/52 | | | |
Utah Charter School Finance Authority, RB(b) | | | |
| | | |
| | | |
| | | |
| | | |
| | | |
| |
Albemarle County Economic Development Authority, RB, Series A, 5.00%, 06/01/42 | | | |
Ballston Quarter Community Development Authority, TA | | | |
Series A-1, 5.50%, 03/01/46 | | | |
Series A-2, 7.13%, 03/01/30(g) | | | |
Cherry Hill Community Development Authority, SAB, 5.15%, 03/01/35(b) | | | |
Chesapeake Bay Bridge & Tunnel District, RB | | | |
| | | |
| | | |
City of Norfolk Virginia Water Revenue, RB, 5.00%, 11/01/45 | | | |
County of Fairfax Virginia, GO, Series A, (SAW), 4.00%, 10/01/38 | | | |
Fairfax County Industrial Development Authority, Refunding RB, 4.00%, 05/15/42 | | | |
Hanover County Economic Development Authority, Refunding RB | | | |
| | | |
| | | |
Loudoun County Economic Development Authority, RB, CAB, 0.00%, 07/01/49(c) | | | |
Schedule of Investments31
Schedule of Investments (continued)May 31, 2024
BlackRock Strategic Municipal Opportunities Fund(Percentages shown are based on Net Assets)
| | | |
| |
Lower Magnolia Green Community Development | | | |
| | | |
| | | |
Tobacco Settlement Financing Corp., Refunding RB, Series A-1, 6.71%, 06/01/46 | | | |
Virginia College Building Authority, RB | | | |
Series A, 4.00%, 02/01/42 | | | |
Series A, 4.00%, 02/01/44 | | | |
Virginia Commonwealth University Health System Authority, RB, Series A, 5.25%, 07/01/49 | | | |
Virginia Housing Development Authority, RB, M/F Housing, Series D, 3.90%, 10/01/48 | | | |
Virginia Housing Development Authority, RB, S/F Housing | | | |
Series E-2, 4.40%, 10/01/44 | | | |
Series E-2, 4.55%, 10/01/49 | | | |
Virginia Small Business Financing Authority, RB | | | |
| | | |
| | | |
Virginia Small Business Financing Authority, Refunding RB, AMT, Senior Lien, 4.00%, 01/01/29 | | | |
| | | |
| |
County of King Washington Sewer Revenue, Refunding RB, Series A, 4.00%, 07/01/39 | | | |
Energy Northwest, Refunding RB, 5.00%, 07/01/41 | | | |
Mason County Public Hospital District No. 1, RB, 5.00%, 12/01/48 | | | |
Port of Seattle Washington, ARB, Series A, AMT, 4.00%, 05/01/43 | | | |
Seattle Housing Authority, Refunding RB, M/F Housing, 3.50%, 12/01/35 | | | |
Snohomish County School District No. 15 Edmonds, Refunding GO, (GTD), 12/01/42(d) | | | |
| | | |
Series 2024-A, 5.00%, 08/01/43 | | | |
Series A-2, 5.00%, 08/01/42 | | | |
Series B, 5.00%, 02/01/43 | | | |
Series B, 5.00%, 06/01/47 | | | |
Series B, 5.00%, 06/01/48 | | | |
Series C, 5.00%, 02/01/46 | | | |
Series D, 5.00%, 06/01/46 | | | |
Washington State Housing Finance Commission, RB, Series A, 4.00%, 07/01/27(b) | | | |
| | | |
| |
Public Finance Authority, ARB | | | |
| | | |
| | | |
Public Finance Authority, RB(b) | | | |
| | | |
| | | |
| | | |
| | | |
Series A, 7.00%, 11/01/46(e)(f) | | | |
| | | |
| |
Public Finance Authority, RB(b) (continued) | | | |
Series B, 5.50%, 06/15/25 | | | |
Public Finance Authority, Refunding RB | | | |
Series B, 6.13%, 10/01/49(b) | | | |
| | | |
Wisconsin Health & Educational Facilities Authority, RB, Series A, 5.75%, 08/15/59 | | | |
| | | |
Total Municipal Bonds — 91.3%
(Cost: $3,765,221,877) | |
Municipal Bonds Transferred to Tender Option Bond Trusts(j) |
| |
County of Broward Florida Convention Center Hotel Revenue, RB, 5.00%, 01/01/47 | | | |
County of Miami-Dade Florida Transit System, RB | | | |
| | | |
| | | |
| | | |
| |
Sales Tax Securitization Corp., Refunding RB, Series A, 2nd Lien, 5.00%, 01/01/33 | | | |
| |
Louisville and Jefferson County Metropolitan Sewer District, Refunding RB, Series C, 5.00%, 05/15/49 | | | |
| |
Commonwealth of Massachusetts, GO | | | |
Series C, 5.00%, 10/01/48 | | | |
Series D, 5.00%, 10/01/50 | | | |
| | | |
| |
Omaha Public Power District, RB, Series A, 5.25%, 02/01/48 | | | |
| |
New York State Urban Development Corp., RB, Series A, 5.00%, 03/15/50 | | | |
| |
Texas Water Development Board, RB, Series A, 5.00%, 10/15/44 | | | |
Total Municipal Bonds Transferred to Tender Option Bond
Trusts — 4.8%
(Cost: $183,283,927) | |
Total Long-Term Investments — 96.9%
(Cost: $3,985,425,804) | |
322024 BlackRock Annual Financial Statements
Schedule of Investments (continued)May 31, 2024
BlackRock Strategic Municipal Opportunities Fund(Percentages shown are based on Net Assets)
| | | |
|
Money Market Funds — 3.5% | |
BlackRock Liquidity Funds, MuniCash, Institutional Shares, 3.26%(k)(l) | | | |
| | | |
U.S. Treasury Obligations — 1.3% | |
U.S. Treasury Bills, 5.36%, 06/11/24(m) | | | |
Total Short-Term Securities — 4.8%
(Cost: $187,798,946) | |
Total Investments — 101.7%
(Cost: $4,173,224,750) | |
Other Assets Less Liabilities — 0.9% | |
Liability for TOB Trust Certificates, Including Interest Expense and Fees Payable — (2.6)% | |
| |
| Variable rate security. Interest rate resets periodically. The rate shown is the effective interest rate as of period end. Security description also includes the reference rate and spread if published and available. |
| Security exempt from registration pursuant to Rule 144A under the Securities Act of 1933, as amended. These securities may be resold in transactions exempt from registration to qualified institutional investors. |
| |
| |
| Issuer filed for bankruptcy and/or is in default. |
| Non-income producing security. |
| Step coupon security. Coupon rate will either increase (step-up bond) or decrease (step- down bond) at regular intervals until maturity. Interest rate shown reflects the rate currently in effect. |
| U.S. Government securities held in escrow, are used to pay interest on this security as well as to retire the bond in full at the date indicated, typically at a premium to par. |
| Security is collateralized by municipal bonds or U.S. Treasury obligations. |
| Represent bonds transferred to a TOB Trust in exchange of cash and residual certificates received by the Fund. These bonds serve as collateral in a secured borrowing. See Note 4 of the Notes to Financial Statements for details. |
| |
| Annualized 7-day yield as of period end. |
| Rates are discount rates or a range of discount rates as of period end. |
For purposes of this report, industry and sector sub-classifications may differ from those utilized by the Fund for compliance purposes.
Investments in issuers considered to be affiliate(s) of the Fund during the year ended May 31, 2024 for purposes of Section 2(a)(3) of the Investment Company Act of 1940, as amended, were as follows:
| | | | | Change in
Unrealized
Appreciation
(Depreciation) | | | | Capital Gain
Distributions
from
Underlying
Funds |
BlackRock Liquidity Funds, MuniCash, Institutional Shares | | | | | | | | | |
| Represents net amount purchased (sold). |
Derivative Financial Instruments Outstanding as of Period End
| | | | Value/
Unrealized
Appreciation
(Depreciation) |
| | | | |
10-Year U.S. Treasury Note | | | | |
| | | | |
5-Year U.S. Treasury Note | | | | |
| | | | |
Schedule of Investments33
Schedule of Investments (continued)May 31, 2024
BlackRock Strategic Municipal Opportunities Fund
Derivative Financial Instruments Categorized by Risk Exposure
As of period end, the fair values of derivative financial instruments located in the Statements of Assets and Liabilities were as follows:
| | | | Foreign
Currency
Exchange
Contracts | | | |
Liabilities — Derivative Financial Instruments | | | | | | | |
Futures contracts
Unrealized depreciation on futures contracts(a) | | | | | | | |
| Net cumulative unrealized appreciation (depreciation) on futures contracts and centrally cleared swaps, if any, are reported in the Schedule of Investments. In the Statements of Assets and Liabilities, only current day’s variation margin is reported in receivables or payables and the net cumulative unrealized appreciation (depreciation) is included in accumulated earnings (loss). |
For the period ended May 31, 2024, the effect of derivative financial instruments in the Statements of Operations was as follows:
| | | | Foreign
Currency
Exchange
Contracts | | | |
Net Realized Gain (Loss) from: | | | | | | | |
| | | | | | | |
Net Change in Unrealized Appreciation (Depreciation) on: | | | | | | | |
| | | | | | | |
Average Quarterly Balances of Outstanding Derivative Financial Instruments
| |
Average notional value of contracts — long | |
Average notional value of contracts — short | |
| Derivative financial instrument not held at any quarter-end. The risk exposure table serves as an indicator of activity during the period. |
For more information about the Fund’s investment risks regarding derivative financial instruments, refer to the Notes to Financial Statements.
Fair Value Hierarchy as of Period End
Various inputs are used in determining the fair value of financial instruments. For a description of the input levels and information about the Fund’s policy regarding valuation of financial instruments, refer to the Notes to Financial Statements.
The following table summarizes the Fund’s financial instruments categorized in the fair value hierarchy. The breakdown of the Fund’s financial instruments into major categories is disclosed in the Schedule of Investments above.
| | | | |
| | | | |
| | | | |
| | | | |
| | | | |
| | | | |
Municipal Bonds Transferred to Tender Option Bond Trusts | | | | |
| | | | |
| | | | |
U.S. Treasury Obligations | | | | |
| | | | |
| | | | |
Derivative Financial Instruments(b) | | | | |
| | | | |
| | | | |
| Unfunded commitments are valued at the unrealized appreciation (depreciation) on the commitment. |
| Derivative financial instruments are futures contracts. Futures contracts are valued at the unrealized appreciation (depreciation) on the instrument. |
342024 BlackRock Annual Financial Statements
Schedule of Investments (continued)May 31, 2024
BlackRock Strategic Municipal Opportunities Fund
The Fund may hold assets and/or liabilities in which the fair value approximates the carrying amount for financial statement purposes. As of period end, TOB Trust Certificates of $100,364,993 are categorized as Level 2 within the fair value hierarchy.
A reconciliation of Level 3 financial instruments is presented when the Fund had a significant amount of Level 3 investments and derivative financial instruments at the beginning and/or end of the year in relation to net assets. The following table is a reconciliation of Level 3 investments for which significant unobservable inputs were used in determining fair value:
| | | |
| | | |
Opening balance, as of May 31, 2023 | | | |
| | | |
| | | |
Accrued discounts/premiums | | | |
| | | |
Net change in unrealized appreciation (depreciation)(a)(b) | | | |
| | | |
| | | |
Closing balance, as of May 31, 2024 | | | |
Net change in unrealized appreciation (depreciation) on investments still held at May 31, 2024(b) | | | |
| Included in the related net change in unrealized appreciation (depreciation) in the Statements of Operations. |
| Any difference between net change in unrealized appreciation (depreciation) and net change in unrealized appreciation (depreciation) on investments still held at May 31, 2024 is generally due to investments no longer held or categorized as Level 3 at period end. |
The following table summarizes the valuation approaches used and unobservable inputs utilized by the BlackRock Valuation Committee (the “Valuation Committee”) to determine the value of certain of the Fund’s Level 3 financial instruments as of period end.
| | | | Range of
Unobservable
Inputs
| Weighted
Average of
Unobservable
Inputs Based
on Fair Value |
| | | | | |
| | | | | |
| | | | | |
| | | | | |
| A significant change in unobservable input would have resulted in a correlated (inverse) significant change to value. |
See notes to financial statements.
Schedule of Investments35
Statements of Assets and LiabilitiesMay 31, 2024
| BlackRock
California
Municipal
Opportunities Fund | BlackRock
New Jersey
Municipal
Bond Fund | BlackRock
Pennsylvania
Municipal
Bond Fund | BlackRock
Impact
Municipal
Fund |
| | | | |
Investments, at value — unaffiliated(a) | | | | |
Investments, at value — affiliated(b) | | | | |
Cash pledged for futures contracts | | | | |
| | | | |
| | | | |
| | | | |
| | | | |
| | | | |
Unrealized appreciation on unfunded commitments | | | | |
| | | | |
| | | | |
| | | | |
| | | | |
| | | | |
| | | | |
| | | | |
| | | | |
| | | | |
Income dividend distributions | | | | |
Interest expense and fees | | | | |
| | | | |
Trustees’ and Officer’s fees | | | | |
| | | | |
| | | | |
Service and distribution fees | | | | |
| | | | |
Variation margin on futures contracts | | | | |
Total accrued liabilities | | | | |
| | | | |
| | | | |
| | | | |
Commitments and contingent liabilities | | | | |
| | | | |
| | | | |
| | | | |
| | | | |
| | | | |
(a) Investments, at cost—unaffiliated | | | | |
(b) Investments, at cost—affiliated | | | | |
362024 BlackRock Annual Financial Statements
Statements of Assets and Liabilities (continued)May 31, 2024
| BlackRock
California
Municipal
Opportunities Fund | BlackRock
New Jersey
Municipal
Bond Fund | BlackRock
Pennsylvania
Municipal
Bond Fund | BlackRock
Impact
Municipal
Fund |
| | | | |
| | | | |
| | | | |
| | | | |
| | | | |
| | | | |
| | | | |
| | | | |
| | | | |
| | | | |
| | | | |
| | | | |
| | | | |
| | | | |
| | | | |
| | | | |
| | | | |
| | | | |
| | | | |
| | | | |
| | | | |
| | | | |
| | | | |
| | | | |
| | | | |
| | | | |
| | | | |
| | | | |
| | | | |
| | | | |
| | | | |
| | | | |
| | | | |
| | | | |
| | | | |
| | | | |
| | | | |
Statements of Assets and Liabilities (continued)May 31, 2024
| BlackRock
Strategic
Municipal
Opportunities Fund |
| |
Investments, at value — unaffiliated(a) | |
Investments, at value — affiliated(b) | |
Cash pledged for futures contracts | |
| |
| |
| |
| |
| |
Unrealized appreciation on unfunded commitments | |
| |
| |
| |
| |
| |
| |
| |
| |
| |
Income dividend distributions | |
Interest expense and fees | |
| |
Trustees’ and Officer’s fees | |
| |
| |
| |
Service and distribution fees | |
| |
Variation margin on futures contracts | |
Total accrued liabilities | |
| |
| |
| |
Commitments and contingent liabilities | |
| |
| |
| |
| |
| |
(a) Investments, at cost—unaffiliated | |
(b) Investments, at cost—affiliated | |
382024 BlackRock Annual Financial Statements
Statements of Assets and Liabilities (continued)May 31, 2024
| BlackRock
Strategic
Municipal
Opportunities Fund |
| |
| |
| |
| |
| |
| |
| |
| |
| |
| |
| |
| |
| |
| |
| |
| |
| |
| |
| |
| |
| |
| |
| |
| |
| |
| |
| |
| |
| |
| |
| |
See notes to financial statements.
Statements of OperationsYear Ended May 31, 2024
| BlackRock
California
Municipal
Opportunities Fund | BlackRock
New Jersey
Municipal
Bond Fund | BlackRock
Pennsylvania
Municipal
Bond Fund | BlackRock
Impact
Municipal
Fund |
| | | | |
| | | | |
| | | | |
| | | | |
| | | | |
| | | | |
Service and distribution — class specific | | | | |
Transfer agent — class specific | | | | |
| | | | |
| | | | |
| | | | |
| | | | |
| | | | |
| | | | |
| | | | |
| | | | |
Administration — class specific | | | | |
| | | | |
Total expenses excluding interest expense | | | | |
Interest expense and fees — unaffiliated(a) | | | | |
| | | | |
| | | | |
Administration fees waived | | | | |
Administration fees waived by the Manager — class specific | | | | |
Fees waived and/or reimbursed by the Manager | | | | |
Transfer agent fees waived and/or reimbursed by the Manager — class specific | | | | |
Total expenses after fees waived and/or reimbursed | | | | |
| | | | |
REALIZED AND UNREALIZED GAIN (LOSS) | | | | |
Net realized gain (loss) from: | | | | |
Investments — unaffiliated | | | | |
| | | | |
| | | | |
| | | | |
| | | | |
Net change in unrealized appreciation (depreciation) on: | | | | |
Investments — unaffiliated | | | | |
| | | | |
Foreign currency translations | | | | |
| | | | |
| | | | |
| | | | |
Net realized and unrealized gain (loss) | | | | |
NET INCREASE IN NET ASSETS RESULTING FROM OPERATIONS | | | | |
(a)All or a portion of is related to TOB Trusts. |
See notes to financial statements.
402024 BlackRock Annual Financial Statements
Statements of Operations (continued)Year Ended May 31, 2024
| BlackRock
Strategic
Municipal
Opportunities Fund |
| |
| |
| |
| |
| |
| |
Transfer agent — class specific | |
Service and distribution — class specific | |
| |
| |
| |
| |
| |
| |
| |
| |
Total expenses excluding interest expense | |
Interest expense and fees — unaffiliated(a) | |
| |
| |
Fees waived and/or reimbursed by the Manager | |
Total expenses after fees waived and/or reimbursed | |
| |
REALIZED AND UNREALIZED GAIN (LOSS) | |
Net realized gain (loss) from: | |
Investments — unaffiliated | |
| |
| |
| |
| |
Net change in unrealized appreciation (depreciation) on: | |
Investments — unaffiliated | |
| |
| |
| |
| |
Net realized and unrealized loss | |
NET INCREASE IN NET ASSETS RESULTING FROM OPERATIONS | |
(a)All or a portion of is related to TOB Trusts. |
See notes to financial statements.
Statements of Changes in Net Assets
| BlackRock California
Municipal Opportunities Fund | BlackRock New Jersey
Municipal Bond Fund |
| | | | |
|
INCREASE (DECREASE) IN NET ASSETS | | | | |
| | | | |
| | | | |
| | | | |
Net change in unrealized appreciation (depreciation) | | | | |
Net increase (decrease) in net assets resulting from operations | | | | |
DISTRIBUTIONS TO SHAREHOLDERS(a) | | | | |
| | | | |
| | | | |
| | | | |
| | | | |
| | | | |
| | | | |
Decrease in net assets resulting from distributions to shareholders | | | | |
CAPITAL SHARE TRANSACTIONS | | | | |
Net decrease in net assets derived from capital share transactions | | | | |
| | | | |
Total decrease in net assets | | | | |
| | | | |
| | | | |
| Distributions for annual periods determined in accordance with U.S. federal income tax regulations. |
See notes to financial statements.
422024 BlackRock Annual Financial Statements
Statements of Changes in Net Assets (continued)
| BlackRock Pennsylvania
Municipal Bond Fund | BlackRock Impact
Municipal Fund |
| | | | |
|
INCREASE (DECREASE) IN NET ASSETS | | | | |
| | | | |
| | | | |
| | | | |
Net change in unrealized appreciation (depreciation) | | | | |
Net increase (decrease) in net assets resulting from operations | | | | |
DISTRIBUTIONS TO SHAREHOLDERS(a) | | | | |
| | | | |
| | | | |
| | | | |
| | | | |
| | | | |
| | | | |
Decrease in net assets resulting from distributions to shareholders | | | | |
CAPITAL SHARE TRANSACTIONS | | | | |
Net increase (decrease) in net assets derived from capital share transactions | | | | |
| | | | |
Total increase (decrease) in net assets | | | | |
| | | | |
| | | | |
| Distributions for annual periods determined in accordance with U.S. federal income tax regulations. |
See notes to financial statements.
Statements of Changes in Net Assets (continued)
| BlackRock Strategic
Municipal Opportunities Fund |
| | |
|
INCREASE (DECREASE) IN NET ASSETS | | |
| | |
| | |
| | |
Net change in unrealized appreciation (depreciation) | | |
Net increase (decrease) in net assets resulting from operations | | |
DISTRIBUTIONS TO SHAREHOLDERS(a) | | |
| | |
| | |
| | |
| | |
| | |
Decrease in net assets resulting from distributions to shareholders | | |
CAPITAL SHARE TRANSACTIONS | | |
Net decrease in net assets derived from capital share transactions | | |
| | |
Total decrease in net assets | | |
| | |
| | |
| Distributions for annual periods determined in accordance with U.S. federal income tax regulations. |
See notes to financial statements.
442024 BlackRock Annual Financial Statements
Financial Highlights(For a share outstanding throughout each period)
| BlackRock California Municipal Opportunities Fund |
| |
| | | | | |
|
Net asset value, beginning of year | | | | | |
| | | | | |
Net realized and unrealized gain (loss) | | | | | |
Net increase (decrease) from investment operations | | | | | |
Distributions from net investment income(b) | | | | | |
Net asset value, end of year | | | | | |
| | | | | |
| | | | | |
Ratios to Average Net Assets(e) | | | | | |
| | | | | |
Total expenses after fees waived and/or reimbursed | | | | | |
Total expenses after fees waived and/or reimbursed and excluding interest expense and fees(g) | | | | | |
| | | | | |
| | | | | |
Net assets, end of year (000) | | | | | |
Borrowings outstanding, end of year (000) | | | | | |
| | | | | |
| Based on average shares outstanding. |
| Distributions for annual periods determined in accordance with U.S. federal income tax regulations. |
| Where applicable, assumes the reinvestment of distributions. |
| Includes payment from an affiliate, which had no impact on the Fund’s total return. |
| Excludes fees and expenses incurred indirectly as a result of investments in underlying funds. |
| Includes recoupment of past waived and/or reimbursed fees. Excluding the recoupment of past waived and/or reimbursed fees for the year ended May 31, 2020, the expense ratio would have been 0.56%. |
| Interest expense and fees relate to TOB Trusts. See Note 4 of the Notes to Financial Statements for details. |
See notes to financial statements.
Financial Highlights (continued)(For a share outstanding throughout each period)
| BlackRock California Municipal Opportunities Fund (continued) |
| |
| | | | | |
|
Net asset value, beginning of year | | | | | |
| | | | | |
Net realized and unrealized gain (loss) | | | | | |
Net increase (decrease) from investment operations | | | | | |
Distributions from net investment income(b) | | | | | |
Net asset value, end of year | | | | | |
| | | | | |
| | | | | |
Ratios to Average Net Assets(e) | | | | | |
| | | | | |
Total expenses after fees waived and/or reimbursed | | | | | |
Total expenses after fees waived and/or reimbursed and excluding interest expense and fees(g) | | | | | |
| | | | | |
| | | | | |
Net assets, end of year (000) | | | | | |
Borrowings outstanding, end of year (000) | | | | | |
| | | | | |
| Based on average shares outstanding. |
| Distributions for annual periods determined in accordance with U.S. federal income tax regulations. |
| Where applicable, excludes the effects of any sales charges and assumes the reinvestment of distributions. |
| Includes payment from an affiliate, which had no impact on the Fund’s total return. |
| Excludes fees and expenses incurred indirectly as a result of investments in underlying funds. |
| Includes recoupment of past waived and/or reimbursed fees with no financial impact to the expense ratio. |
| Interest expense and fees relate to TOB Trusts. See Note 4 of the Notes to Financial Statements for details. |
See notes to financial statements.
462024 BlackRock Annual Financial Statements
Financial Highlights (continued)(For a share outstanding throughout each period)
| BlackRock California Municipal Opportunities Fund (continued) |
| |
| | | | | |
|
Net asset value, beginning of year | | | | | |
| | | | | |
Net realized and unrealized gain (loss) | | | | | |
Net increase (decrease) from investment operations | | | | | |
Distributions from net investment income(b) | | | | | |
Net asset value, end of year | | | | | |
| | | | | |
| | | | | |
Ratios to Average Net Assets(e) | | | | | |
| | | | | |
Total expenses after fees waived and/or reimbursed | | | | | |
Total expenses after fees waived and/or reimbursed and excluding interest expense and fees(g) | | | | | |
| | | | | |
| | | | | |
Net assets, end of year (000) | | | | | |
Borrowings outstanding, end of year (000) | | | | | |
| | | | | |
| Based on average shares outstanding. |
| Distributions for annual periods determined in accordance with U.S. federal income tax regulations. |
| Where applicable, excludes the effects of any sales charges and assumes the reinvestment of distributions. |
| Includes payment from an affiliate, which had no impact on the Fund’s total return. |
| Excludes fees and expenses incurred indirectly as a result of investments in underlying funds. |
| Includes recoupment of past waived and/or reimbursed fees with no financial impact to the expense ratio. |
| Interest expense and fees relate to TOB Trusts. See Note 4 of the Notes to Financial Statements for details. |
See notes to financial statements.
482024 BlackRock Annual Financial Statements
Financial Highlights (continued)(For a share outstanding throughout each period)
| BlackRock California Municipal Opportunities Fund (continued) |
| |
| | | | | |
|
Net asset value, beginning of year | | | | | |
| | | | | |
Net realized and unrealized gain (loss) | | | | | |
Net increase (decrease) from investment operations | | | | | |
Distributions from net investment income(b) | | | | | |
Net asset value, end of year | | | | | |
| | | | | |
| | | | | |
Ratios to Average Net Assets(e) | | | | | |
| | | | | |
Total expenses after fees waived and/or reimbursed | | | | | |
Total expenses after fees waived and/or reimbursed and excluding interest expense and fees(g) | | | | | |
| | | | | |
| | | | | |
Net assets, end of year (000) | | | | | |
Borrowings outstanding, end of year (000) | | | | | |
| | | | | |
| Based on average shares outstanding. |
| Distributions for annual periods determined in accordance with U.S. federal income tax regulations. |
| Where applicable, assumes the reinvestment of distributions. |
| Includes payment from an affiliate, which had no impact on the Fund’s total return. |
| Excludes fees and expenses incurred indirectly as a result of investments in underlying funds. |
| Includes recoupment of past waived and/or reimbursed fees with no financial impact to the expense ratio. |
| Interest expense and fees relate to TOB Trusts. See Note 4 of the Notes to Financial Statements for details. |
See notes to financial statements.
Financial Highlights (continued)(For a share outstanding throughout each period)
| BlackRock New Jersey Municipal Bond Fund |
| |
| | | | | |
|
Net asset value, beginning of year | | | | | |
| | | | | |
Net realized and unrealized gain (loss) | | | | | |
Net increase (decrease) from investment operations | | | | | |
Distributions from net investment income(b) | | | | | |
Net asset value, end of year | | | | | |
| | | | | |
| | | | | |
Ratios to Average Net Assets(d) | | | | | |
| | | | | |
Total expenses after fees waived and/or reimbursed | | | | | |
Total expenses after fees waived and/or reimbursed and excluding interest expense(e) | | | | | |
| | | | | |
| | | | | |
Net assets, end of year (000) | | | | | |
Borrowings outstanding, end of year (000) | | | | | |
| | | | | |
| Based on average shares outstanding. |
| Distributions for annual periods determined in accordance with U.S. federal income tax regulations. |
| Where applicable, assumes the reinvestment of distributions. |
| Excludes fees and expenses incurred indirectly as a result of investments in underlying funds. |
| Interest expense and fees relate to TOB Trusts. See Note 4 of the Notes to Financial Statements for details. |
See notes to financial statements.
502024 BlackRock Annual Financial Statements
Financial Highlights (continued)(For a share outstanding throughout each period)
| BlackRock New Jersey Municipal Bond Fund (continued) |
| |
| | | | | |
|
Net asset value, beginning of year | | | | | |
| | | | | |
Net realized and unrealized gain (loss) | | | | | |
Net increase (decrease) from investment operations | | | | | |
Distributions from net investment income(b) | | | | | |
Net asset value, end of year | | | | | |
| | | | | |
| | | | | |
Ratios to Average Net Assets(d) | | | | | |
| | | | | |
Total expenses after fees waived and/or reimbursed | | | | | |
Total expenses after fees waived and/or reimbursed and excluding interest expense(e) | | | | | |
| | | | | |
| | | | | |
Net assets, end of year (000) | | | | | |
Borrowings outstanding, end of year (000) | | | | | |
| | | | | |
| Based on average shares outstanding. |
| Distributions for annual periods determined in accordance with U.S. federal income tax regulations. |
| Where applicable, assumes the reinvestment of distributions. |
| Excludes fees and expenses incurred indirectly as a result of investments in underlying funds. |
| Interest expense and fees relate to TOB Trusts. See Note 4 of the Notes to Financial Statements for details. |
See notes to financial statements.
Financial Highlights (continued)(For a share outstanding throughout each period)
| BlackRock New Jersey Municipal Bond Fund (continued) |
| |
| | | | | |
|
Net asset value, beginning of year | | | | | |
| | | | | |
Net realized and unrealized gain (loss) | | | | | |
Net increase (decrease) from investment operations | | | | | |
Distributions from net investment income(b) | | | | | |
Net asset value, end of year | | | | | |
| | | | | |
| | | | | |
Ratios to Average Net Assets(d) | | | | | |
| | | | | |
Total expenses after fees waived and/or reimbursed | | | | | |
Total expenses after fees waived and/or reimbursed and excluding interest expense(e) | | | | | |
| | | | | |
| | | | | |
Net assets, end of year (000) | | | | | |
Borrowings outstanding, end of year (000) | | | | | |
| | | | | |
| Based on average shares outstanding. |
| Distributions for annual periods determined in accordance with U.S. federal income tax regulations. |
| Where applicable, excludes the effects of any sales charges and assumes the reinvestment of distributions. |
| Excludes fees and expenses incurred indirectly as a result of investments in underlying funds. |
| Interest expense and fees relate to TOB Trusts. See Note 4 of the Notes to Financial Statements for details. |
See notes to financial statements.
522024 BlackRock Annual Financial Statements
Financial Highlights (continued)(For a share outstanding throughout each period)
| BlackRock New Jersey Municipal Bond Fund (continued) |
| |
| | | | | |
|
Net asset value, beginning of year | | | | | |
| | | | | |
Net realized and unrealized gain (loss) | | | | | |
Net increase (decrease) from investment operations | | | | | |
Distributions from net investment income(b) | | | | | |
Net asset value, end of year | | | | | |
| | | | | |
| | | | | |
Ratios to Average Net Assets(d) | | | | | |
| | | | | |
Total expenses after fees waived and/or reimbursed | | | | | |
Total expenses after fees waived and/or reimbursed and excluding interest expense(e) | | | | | |
| | | | | |
| | | | | |
Net assets, end of year (000) | | | | | |
Borrowings outstanding, end of year (000) | | | | | |
| | | | | |
| Based on average shares outstanding. |
| Distributions for annual periods determined in accordance with U.S. federal income tax regulations. |
| Where applicable, excludes the effects of any sales charges and assumes the reinvestment of distributions. |
| Excludes fees and expenses incurred indirectly as a result of investments in underlying funds. |
| Interest expense and fees relate to TOB Trusts. See Note 4 of the Notes to Financial Statements for details. |
See notes to financial statements.
542024 BlackRock Annual Financial Statements
Financial Highlights (continued)(For a share outstanding throughout each period)
| BlackRock New Jersey Municipal Bond Fund (continued) |
| |
| | | | | |
|
Net asset value, beginning of year | | | | | |
| | | | | |
Net realized and unrealized gain (loss) | | | | | |
Net increase (decrease) from investment operations | | | | | |
Distributions from net investment income(b) | | | | | |
Net asset value, end of year | | | | | |
| | | | | |
| | | | | |
Ratios to Average Net Assets(d) | | | | | |
| | | | | |
Total expenses after fees waived and/or reimbursed | | | | | |
Total expenses after fees waived and/or reimbursed and excluding interest expense(e) | | | | | |
| | | | | |
| | | | | |
Net assets, end of year (000) | | | | | |
Borrowings outstanding, end of year (000) | | | | | |
| | | | | |
| Based on average shares outstanding. |
| Distributions for annual periods determined in accordance with U.S. federal income tax regulations. |
| Where applicable, assumes the reinvestment of distributions. |
| Excludes fees and expenses incurred indirectly as a result of investments in underlying funds. |
| Interest expense and fees relate to TOB Trusts. See Note 4 of the Notes to Financial Statements for details. |
See notes to financial statements.
Financial Highlights (continued)(For a share outstanding throughout each period)
| BlackRock Pennsylvania Municipal Bond Fund |
| |
| | | | | |
|
Net asset value, beginning of year | | | | | |
| | | | | |
Net realized and unrealized gain (loss) | | | | | |
Net increase (decrease) from investment operations | | | | | |
Distributions from net investment income(b) | | | | | |
Net asset value, end of year | | | | | |
| | | | | |
| | | | | |
Ratios to Average Net Assets(d) | | | | | |
| | | | | |
Total expenses after fees waived and/or reimbursed | | | | | |
Total expenses after fees waived and/or reimbursed and excluding interest expense(e) | | | | | |
| | | | | |
| | | | | |
Net assets, end of year (000) | | | | | |
Borrowings outstanding, end of year (000) | | | | | |
| | | | | |
| Based on average shares outstanding. |
| Distributions for annual periods determined in accordance with U.S. federal income tax regulations. |
| Where applicable, assumes the reinvestment of distributions. |
| Excludes fees and expenses incurred indirectly as a result of investments in underlying funds. |
| Interest expense and fees relate to TOB Trusts. See Note 4 of the Notes to Financial Statements for details. |
See notes to financial statements.
562024 BlackRock Annual Financial Statements
Financial Highlights (continued)(For a share outstanding throughout each period)
| BlackRock Pennsylvania Municipal Bond Fund (continued) |
| |
| | | | | |
|
Net asset value, beginning of year | | | | | |
| | | | | |
Net realized and unrealized gain (loss) | | | | | |
Net increase (decrease) from investment operations | | | | | |
Distributions from net investment income(b) | | | | | |
Net asset value, end of year | | | | | |
| | | | | |
| | | | | |
Ratios to Average Net Assets(d) | | | | | |
| | | | | |
Total expenses after fees waived and/or reimbursed | | | | | |
Total expenses after fees waived and/or reimbursed and excluding interest expense(e) | | | | | |
| | | | | |
| | | | | |
Net assets, end of year (000) | | | | | |
Borrowings outstanding, end of year (000) | | | | | |
| | | | | |
| Based on average shares outstanding. |
| Distributions for annual periods determined in accordance with U.S. federal income tax regulations. |
| Where applicable, assumes the reinvestment of distributions. |
| Excludes fees and expenses incurred indirectly as a result of investments in underlying funds. |
| Interest expense and fees relate to TOB Trusts. See Note 4 of the Notes to Financial Statements for details. |
See notes to financial statements.
Financial Highlights (continued)(For a share outstanding throughout each period)
| BlackRock Pennsylvania Municipal Bond Fund (continued) |
| |
| | | | | |
|
Net asset value, beginning of year | | | | | |
| | | | | |
Net realized and unrealized gain (loss) | | | | | |
Net increase (decrease) from investment operations | | | | | |
Distributions from net investment income(b) | | | | | |
Net asset value, end of year | | | | | |
| | | | | |
| | | | | |
Ratios to Average Net Assets(d) | | | | | |
| | | | | |
Total expenses after fees waived and/or reimbursed | | | | | |
Total expenses after fees waived and/or reimbursed and excluding interest expense(e) | | | | | |
| | | | | |
| | | | | |
Net assets, end of year (000) | | | | | |
Borrowings outstanding, end of year (000) | | | | | |
| | | | | |
| Based on average shares outstanding. |
| Distributions for annual periods determined in accordance with U.S. federal income tax regulations. |
| Where applicable, excludes the effects of any sales charges and assumes the reinvestment of distributions. |
| Excludes fees and expenses incurred indirectly as a result of investments in underlying funds. |
| Interest expense and fees relate to TOB Trusts. See Note 4 of the Notes to Financial Statements for details. |
See notes to financial statements.
582024 BlackRock Annual Financial Statements
Financial Highlights (continued)(For a share outstanding throughout each period)
| BlackRock Pennsylvania Municipal Bond Fund (continued) |
| |
| | | | | |
|
Net asset value, beginning of year | | | | | |
| | | | | |
Net realized and unrealized gain (loss) | | | | | |
Net increase (decrease) from investment operations | | | | | |
Distributions from net investment income(b) | | | | | |
Net asset value, end of year | | | | | |
| | | | | |
| | | | | |
Ratios to Average Net Assets(d) | | | | | |
| | | | | |
Total expenses after fees waived and/or reimbursed | | | | | |
Total expenses after fees waived and/or reimbursed and excluding interest expense(e) | | | | | |
| | | | | |
| | | | | |
Net assets, end of year (000) | | | | | |
Borrowings outstanding, end of year (000) | | | | | |
| | | | | |
| Based on average shares outstanding. |
| Distributions for annual periods determined in accordance with U.S. federal income tax regulations. |
| Where applicable, excludes the effects of any sales charges and assumes the reinvestment of distributions. |
| Excludes fees and expenses incurred indirectly as a result of investments in underlying funds. |
| Interest expense and fees relate to TOB Trusts. See Note 4 of the Notes to Financial Statements for details. |
See notes to financial statements.
602024 BlackRock Annual Financial Statements
Financial Highlights (continued)(For a share outstanding throughout each period)
| BlackRock Pennsylvania Municipal Bond Fund (continued) |
| |
| | | | | |
|
Net asset value, beginning of year | | | | | |
| | | | | |
Net realized and unrealized gain (loss) | | | | | |
Net increase (decrease) from investment operations | | | | | |
Distributions from net investment income(b) | | | | | |
Net asset value, end of year | | | | | |
| | | | | |
| | | | | |
Ratios to Average Net Assets(d) | | | | | |
| | | | | |
Total expenses after fees waived and/or reimbursed | | | | | |
Total expenses after fees waived and/or reimbursed and excluding interest expense(e) | | | | | |
| | | | | |
| | | | | |
Net assets, end of year (000) | | | | | |
Borrowings outstanding, end of year (000) | | | | | |
| | | | | |
| Based on average shares outstanding. |
| Distributions for annual periods determined in accordance with U.S. federal income tax regulations. |
| Where applicable, assumes the reinvestment of distributions. |
| Excludes fees and expenses incurred indirectly as a result of investments in underlying funds. |
| Interest expense and fees relate to TOB Trusts. See Note 4 of the Notes to Financial Statements for details. |
See notes to financial statements.
Financial Highlights (continued)(For a share outstanding throughout each period)
| BlackRock Impact Municipal Fund |
| |
| | | |
|
Net asset value, beginning of period | | | |
| | | |
Net realized and unrealized gain (loss) | | | |
Net increase (decrease) from investment operations | | | |
| | | |
From net investment income | | | |
| | | |
| | | |
Net asset value, end of period | | | |
| | | |
| | | |
Ratios to Average Net Assets(f) | | | |
| | | |
Total expenses after fees waived and/or reimbursed | | | |
| | | |
| | | |
Net assets, end of period (000) | | | |
| | | |
| Commencement of operations. |
| Based on average shares outstanding. |
| Distributions for annual periods determined in accordance with U.S. federal income tax regulations. |
| Where applicable, assumes the reinvestment of distributions. |
| |
| Excludes fees and expenses incurred indirectly as a result of investments in underlying funds. |
| Includes non-recurring expenses of offering costs. Without these costs, total expenses would have been 1.04%. |
| Includes non-recurring expenses of organization and offering costs. Without these costs, total expenses would have been 1.05%. |
| |
| Audit, printing, offering and organization costs were not annualized in the calculation of the expense ratios. If these expenses were annualized, the total expenses would have been 1.77%. |
See notes to financial statements.
622024 BlackRock Annual Financial Statements
Financial Highlights (continued)(For a share outstanding throughout each period)
| BlackRock Impact Municipal Fund (continued) |
| |
| | | |
|
Net asset value, beginning of period | | | |
| | | |
Net realized and unrealized gain (loss) | | | |
Net increase (decrease) from investment operations | | | |
| | | |
From net investment income | | | |
| | | |
| | | |
Net asset value, end of period | | | |
| | | |
| | | |
Ratios to Average Net Assets(f) | | | |
| | | |
Total expenses after fees waived and/or reimbursed | | | |
| | | |
| | | |
Net assets, end of period (000) | | | |
| | | |
| Commencement of operations. |
| Based on average shares outstanding. |
| Distributions for annual periods determined in accordance with U.S. federal income tax regulations. |
| Where applicable, excludes the effects of any sales charges and assumes the reinvestment of distributions. |
| |
| Excludes fees and expenses incurred indirectly as a result of investments in underlying funds. |
| Includes non-recurring expenses of offering costs. Without these costs, total expenses would have been 1.34%. |
| Includes non-recurring expenses of organization and offering costs. Without these costs, total expenses would have been 1.30%. |
| |
| Audit, printing, offering and organization costs were not annualized in the calculation of the expense ratios. If these expenses were annualized, the total expenses would have been 2.02%. |
See notes to financial statements.
Financial Highlights (continued)(For a share outstanding throughout each period)
| BlackRock Impact Municipal Fund (continued) |
| |
| | | |
|
Net asset value, beginning of period | | | |
| | | |
Net realized and unrealized gain (loss) | | | |
Net increase (decrease) from investment operations | | | |
| | | |
From net investment income | | | |
| | | |
| | | |
Net asset value, end of period | | | |
| | | |
| | | |
Ratios to Average Net Assets(f) | | | |
| | | |
Total expenses after fees waived and/or reimbursed | | | |
| | | |
| | | |
Net assets, end of period (000) | | | |
| | | |
| Commencement of operations. |
| Based on average shares outstanding. |
| Distributions for annual periods determined in accordance with U.S. federal income tax regulations. |
| Where applicable, assumes the reinvestment of distributions. |
| |
| Excludes fees and expenses incurred indirectly as a result of investments in underlying funds. |
| Includes non-recurring expenses of offering costs. Without these costs, total expenses would have been 0.96%. |
| Includes non-recurring expenses of organization and offering costs. Without these costs, total expenses would have been 1.30%. |
| |
| Audit, printing, offering and organization costs were not annualized in the calculation of the expense ratios. If these expenses were annualized, the total expenses would have been 1.40%. |
See notes to financial statements.
642024 BlackRock Annual Financial Statements
Financial Highlights (continued)(For a share outstanding throughout each period)
| BlackRock Strategic Municipal Opportunities Fund |
| |
| | | | | |
|
Net asset value, beginning of year | | | | | |
| | | | | |
Net realized and unrealized gain (loss) | | | | | |
Net increase (decrease) from investment operations | | | | | |
Distributions from net investment income(b) | | | | | |
Net asset value, end of year | | | | | |
| | | | | |
| | | | | |
Ratios to Average Net Assets(e) | | | | | |
| | | | | |
Total expenses after fees waived and/or reimbursed | | | | | |
Total expenses after fees waived and/or reimbursed and excluding interest expense and fees(f) | | | | | |
| | | | | |
| | | | | |
Net assets, end of year (000) | | | | | |
Borrowings outstanding, end of year (000) | | | | | |
| | | | | |
| Based on average shares outstanding. |
| Distributions for annual periods determined in accordance with U.S. federal income tax regulations. |
| Where applicable, assumes the reinvestment of distributions. |
| Includes payment from an affiliate, which had no impact on the Fund’s total return. |
| Excludes fees and expenses incurred indirectly as a result of investments in underlying funds. |
| Interest expense and fees relate to TOB Trusts. See Note 4 of the Notes to Financial Statements for details. |
See notes to financial statements.
Financial Highlights (continued)(For a share outstanding throughout each period)
| BlackRock Strategic Municipal Opportunities Fund (continued) |
| |
| | | | | |
|
Net asset value, beginning of year | | | | | |
| | | | | |
Net realized and unrealized gain (loss) | | | | | |
Net increase (decrease) from investment operations | | | | | |
Distributions from net investment income(b) | | | | | |
Net asset value, end of year | | | | | |
| | | | | |
| | | | | |
Ratios to Average Net Assets(e) | | | | | |
| | | | | |
Total expenses after fees waived and/or reimbursed | | | | | |
Total expenses after fees waived and/or reimbursed and excluding interest expense and fees(f) | | | | | |
| | | | | |
| | | | | |
Net assets, end of year (000) | | | | | |
Borrowings outstanding, end of year (000) | | | | | |
| | | | | |
| Based on average shares outstanding. |
| Distributions for annual periods determined in accordance with U.S. federal income tax regulations. |
| Where applicable, excludes the effects of any sales charges and assumes the reinvestment of distributions. |
| Includes payment from an affiliate, which had no impact on the Fund’s total return. |
| Excludes fees and expenses incurred indirectly as a result of investments in underlying funds. |
| Interest expense and fees relate to TOB Trusts. See Note 4 of the Notes to Financial Statements for details. |
See notes to financial statements.
662024 BlackRock Annual Financial Statements
Financial Highlights (continued)(For a share outstanding throughout each period)
| BlackRock Strategic Municipal Opportunities Fund (continued) |
| |
| | | | | |
|
Net asset value, beginning of year | | | | | |
| | | | | |
Net realized and unrealized gain (loss) | | | | | |
Net increase (decrease) from investment operations | | | | | |
Distributions from net investment income(b) | | | | | |
Net asset value, end of year | | | | | |
| | | | | |
| | | | | |
Ratios to Average Net Assets(e) | | | | | |
| | | | | |
Total expenses after fees waived and/or reimbursed | | | | | |
Total expenses after fees waived and/or reimbursed and excluding interest expense and fees(f) | | | | | |
| | | | | |
| | | | | |
Net assets, end of year (000) | | | | | |
Borrowings outstanding, end of year (000) | | | | | |
| | | | | |
| Based on average shares outstanding. |
| Distributions for annual periods determined in accordance with U.S. federal income tax regulations. |
| Where applicable, excludes the effects of any sales charges and assumes the reinvestment of distributions. |
| Includes payment from an affiliate, which had no impact on the Fund’s total return. |
| Excludes fees and expenses incurred indirectly as a result of investments in underlying funds. |
| Interest expense and fees relate to TOB Trusts. See Note 4 of the Notes to Financial Statements for details. |
See notes to financial statements.
682024 BlackRock Annual Financial Statements
Financial Highlights (continued)(For a share outstanding throughout each period)
| BlackRock Strategic Municipal Opportunities Fund (continued) |
| |
| | | | | |
|
Net asset value, beginning of year | | | | | |
| | | | | |
Net realized and unrealized gain (loss) | | | | | |
Net increase (decrease) from investment operations | | | | | |
Distributions from net investment income(b) | | | | | |
Net asset value, end of year | | | | | |
| | | | | |
| | | | | |
Ratios to Average Net Assets(e) | | | | | |
| | | | | |
Total expenses after fees waived and/or reimbursed | | | | | |
Total expenses after fees waived and/or reimbursed and excluding interest expense and fees(f) | | | | | |
| | | | | |
| | | | | |
Net assets, end of year (000) | | | | | |
Borrowings outstanding, end of year (000) | | | | | |
| | | | | |
| Based on average shares outstanding. |
| Distributions for annual periods determined in accordance with U.S. federal income tax regulations. |
| Where applicable, assumes the reinvestment of distributions. |
| Includes payment from an affiliate, which had no impact on the Fund’s total return. |
| Excludes fees and expenses incurred indirectly as a result of investments in underlying funds. |
| Interest expense and fees relate to TOB Trusts. See Note 4 of the Notes to Financial Statements for details. |
See notes to financial statements.
Notes to Financial Statements
BlackRock California Municipal Series Trust, BlackRock Multi-State Municipal Series Trust, BlackRock Municipal Series Trust (each, a “Trust” or collectively, the “Trusts”) and BlackRock Municipal Bond Fund, Inc. (the “Corporation”) are each registered under the Investment Company Act of 1940, as amended (the “1940 Act”), as open-end management investment companies. Each Trust is organized as a Massachusetts business trust. The Corporation is organized as a Maryland corporation. The following are referred to herein collectively as the “Funds” or individually as a “Fund”:
| | | Diversification
Classification |
BlackRock California Municipal Series Trust | BlackRock California Municipal Opportunities Fund | California Municipal Opportunities | |
BlackRock Multi-State Municipal Series Trust | BlackRock New Jersey Municipal Bond Fund | New Jersey Municipal Bond | |
| BlackRock Pennsylvania Municipal Bond Fund | Pennsylvania Municipal Bond | |
BlackRock Municipal Bond Fund, Inc. | BlackRock Impact Municipal Fund | | |
BlackRock Municipal Series Trust | BlackRock Strategic Municipal Opportunities Fund | Strategic Municipal Opportunities | |
Each Fund offers multiple classes of shares. All classes of shares have identical voting, dividend, liquidation and other rights and are subject to the same terms and conditions, except that certain classes bear expenses related to the shareholder servicing and distribution of such shares. Institutional, Service and Class K Shares are sold only to certain eligible investors. Service, Investor A, Investor A1 and Investor C Shares bear certain expenses related to shareholder servicing of such shares, and Investor C Shares also bear certain expenses related to the distribution of such shares. Investor A and Investor C Shares are generally available through financial intermediaries. Investor A1 Shares are only available for dividend and capital gain reinvestment by existing shareholders, and for purchase by certain employer-sponsored retirement plans and, for California Municipal Opportunities only, fee based programs previously approved by the Fund. Each class has exclusive voting rights with respect to matters relating to its shareholder servicing and distribution expenditures (except that Investor C shareholders may vote on material changes to the Investor A Shares distribution and service plan).
| | | |
Institutional, Service and Class K Shares | | | |
| | | |
| | | |
| | | To Investor A Shares after approximately 8 years |
| Investor A Shares may be subject to a contingent deferred sales charge (“CDSC”) for certain redemptions where no initial sales charge was paid at the time of purchase. |
| Investor A1 Shares are subject to a maximum sales charge on purchases of 4.00% for all Funds other than Strategic Municipal Opportunities, which is subject to a maximum sales charge of 1.00%. The sales charge does not apply to dividend and capital gain reinvestments by existing shareholders and new purchases for certain employer-sponsored retirement plans or, for California Municipal Opportunities only, fee based programs previously approved by the Fund, which are currently the only investors who may invest in Investor A1 Shares. |
| Investor A1 Shares may be subject to CDSC for certain redemptions where no initial sales charge was paid at the time of purchase. However, the CDSC does not apply to redemptions by certain employer-sponsored retirement plans or to redemptions of shares acquired through reinvestment of dividends and capital gains by existing shareholders and, for California Municipal Opportunities only, fee based programs previously approved by the Fund. |
| A CDSC of 1.00% is assessed on certain redemptions of Investor C Shares made within one year after purchase. |
The Boards of Trustees of the Trusts and the Board of Directors of the Corporation are collectively referred to throughout this report as the “Board,” and the directors/trustees thereof are collectively referred to throughout this report as “Trustees”.
The Funds, together with certain other registered investment companies advised by BlackRock Advisors, LLC (the “Manager”) or its affiliates, are included in a complex of funds referred to as the BlackRock Fixed-Income Complex.
2.
SIGNIFICANT ACCOUNTING POLICIES
The financial statements are prepared in conformity with accounting principles generally accepted in the United States of America (“U.S. GAAP”), which may require management to make estimates and assumptions that affect the reported amounts of assets and liabilities in the financial statements, disclosure of contingent assets and liabilities at the date of the financial statements and the reported amounts of increases and decreases in net assets from operations during the reporting period. Actual results could differ from those estimates. Each Fund is considered an investment company under U.S. GAAP and follows the accounting and reporting guidance applicable to investment companies. Below is a summary of significant accounting policies:
Investment Transactions and Income Recognition: For financial reporting purposes, investment transactions are recorded on the dates the transactions are executed. Realized gains and losses on investment transactions are determined using the specific identification method. Dividend income and capital gain distributions, if any, are recorded on the ex-dividend dates. Non-cash dividends, if any, are recorded on the ex-dividend dates at fair value. Interest income, including amortization and accretion of premiums and discounts on debt securities, is recognized daily on an accrual basis. Income, expenses and realized and unrealized gains and losses are allocated daily to each class based on its relative net assets. For convertible securities, premiums attributable to the debt instrument are amortized, but premiums attributable to the conversion feature are not amortized.
Foreign Currency Translation: Each Fund’s books and records are maintained in U.S. dollars. Securities and other assets and liabilities denominated in foreign currencies are translated into U.S. dollars using exchange rates determined as of the close of trading on the New York Stock Exchange (“NYSE”). Purchases and sales of investments are recorded at the rates of exchange prevailing on the respective dates of such transactions. Generally, when the U.S. dollar rises in value against a foreign currency, the investments denominated in that currency will lose value; the opposite effect occurs if the U.S. dollar falls in relative value.
702024 BlackRock Annual Financial Statements
Notes to Financial Statements (continued)
Each Fund does not isolate the effect of fluctuations in foreign exchange rates from the effect of fluctuations in the market prices of investments for financial reporting purposes. Accordingly, the effects of changes in exchange rates on investments are not segregated in the Statements of Operations from the effects of changes in market prices of those investments, but are included as a component of net realized and unrealized gain (loss) from investments.
Bank Overdraft: Certain Funds had outstanding cash disbursements exceeding deposited cash amounts at the custodian during the reporting period. The Funds are obligated to repay the custodian for any overdraft, including any related costs or expenses, where applicable. For financial reporting purposes, overdraft fees, if any, are included in interest expense in the Statements of Operations.
Collateralization: If required by an exchange or counterparty agreement, the Funds may be required to deliver/deposit cash and/or securities to/with an exchange, or broker-dealer or custodian as collateral for certain investments.
Distributions: Distributions from net investment income are declared daily and paid monthly. Distributions of capital gains are recorded on the ex-dividend dates and made at least annually. The character and timing of distributions are determined in accordance with U.S. federal income tax regulations, which may differ from U.S. GAAP.
Deferred Compensation Plan: Under the Deferred Compensation Plan (the “Plan”) approved by each Fund’s Board, the trustees who are not “interested persons” of the Funds, as defined in the 1940 Act (“Independent Trustees”), may defer a portion of their annual complex-wide compensation. Deferred amounts earn an approximate return as though equivalent dollar amounts had been invested in common shares of certain funds in the BlackRock Fixed-Income Complex selected by the Independent Trustees. This has the same economic effect for the Independent Trustees as if the Independent Trustees had invested the deferred amounts directly in certain funds in the BlackRock Fixed-Income Complex.
The Plan is not funded and obligations thereunder represent general unsecured claims against the general assets of each Fund, as applicable. Deferred compensation liabilities, if any, are included in the Trustees’ and Officer’s fees payable in the Statements of Assets and Liabilities and will remain as a liability of the Funds until such amounts are distributed in accordance with the Plan. Net appreciation (depreciation) in the value of participants’ deferral accounts is allocated among the participating funds in the BlackRock Fixed-Income Complex and reflected as Trustees and Officer expense on the Statements of Operations. The Trustees and Officer expense may be negative as a result of a decrease in value of the deferred accounts.
Indemnifications: In the normal course of business, a Fund enters into contracts that contain a variety of representations that provide general indemnification. A Fund’s maximum exposure under these arrangements is unknown because it involves future potential claims against a Fund, which cannot be predicted with any certainty.
Other: Expenses directly related to a Fund or its classes are charged to that Fund or the applicable class. Expenses directly related to the Funds and other shared expenses prorated to the Funds are allocated daily to each class based on their relative net assets or other appropriate methods. Other operating expenses shared by several funds, including other funds managed by the Manager, are prorated among those funds on the basis of relative net assets or other appropriate methods.
3.
INVESTMENT VALUATION AND FAIR VALUE MEASUREMENTS
Investment Valuation Policies: Each Fund’s investments are valued at fair value (also referred to as “market value” within the financial statements) each day that the Fund is open for business and, for financial reporting purposes, as of the report date. U.S. GAAP defines fair value as the price a fund would receive to sell an asset or pay to transfer a liability in an orderly transaction between market participants at the measurement date. The Board has approved the designation of each Fund’s Manager as the valuation designee for each Fund. Each Fund determines the fair values of its financial instruments using various independent dealers or pricing services under the Manager’s policies. If a security’s market price is not readily available or does not otherwise accurately represent the fair value of the security, the security will be valued in accordance with the Manager’s policies and procedures as reflecting fair value. The Manager has formed a committee (the “Valuation Committee”) to develop pricing policies and procedures and to oversee the pricing function for all financial instruments, with assistance from other BlackRock pricing committees.
Fair Value Inputs and Methodologies: The following methods and inputs are used to establish the fair value of each Fund’s assets and liabilities:
•Fixed-income investments for which market quotations are readily available are generally valued using the last available bid price or current market quotations provided by independent dealers or third-party pricing services. Pricing services generally value fixed-income securities assuming orderly transactions of an institutional round lot size, but a fund may hold or transact in such securities in smaller, odd lot sizes. Odd lots may trade at lower prices than institutional round lots. The pricing services may use matrix pricing or valuation models that utilize certain inputs and assumptions to derive values, including transaction data (e.g., recent representative bids and offers), market data, credit quality information, perceived market movements, news, and other relevant information. Certain fixed-income securities, including asset-backed and mortgage related securities may be valued based on valuation models that consider the estimated cash flows of each tranche of the entity, establish a benchmark yield and develop an estimated tranche specific spread to the benchmark yield based on the unique attributes of the tranche. The amortized cost method of valuation may be used with respect to debt obligations with sixty days or less remaining to maturity unless the Manager determines such method does not represent fair value.
•Investments in open-end U.S. mutual funds (including money market funds) are valued at that day’s published net asset value (“NAV”).
•Futures contracts are valued based on that day’s last reported settlement or trade price on the exchange where the contract is traded.
If events (e.g., market volatility, company announcement or a natural disaster) occur that are expected to materially affect the value of such investment, or in the event that application of these methods of valuation results in a price for an investment that is deemed not to be representative of the market value of such investment, or if a price is not available, the investment will be valued by the Valuation Committee in accordance with the Manager’s policies and procedures as reflecting fair value (“Fair Valued Investments”). The fair valuation approaches that may be used by the Valuation Committee include market approach, income approach and cost approach. Valuation techniques such as discounted cash flow, use of market comparables and matrix pricing are types of valuation approaches and are typically used in determining fair value.
Notes to Financial Statements71
Notes to Financial Statements (continued)
When determining the price for Fair Valued Investments, the Valuation Committee seeks to determine the price that each Fund might reasonably expect to receive or pay from the current sale or purchase of that asset or liability in an arm’s-length transaction. Fair value determinations shall be based upon all available factors that the Valuation Committee deems relevant and consistent with the principles of fair value measurement.
For investments in equity or debt issued by privately held companies or funds (“Private Company” or collectively, the “Private Companies”) and other Fair Valued Investments, the fair valuation approaches that are used by the Valuation Committee and third-party pricing services utilized by the Valuation Committee include one or a combination of, but not limited to, the following inputs.
| Standard Inputs Generally Considered By The Valuation Committee And Third-Party Pricing Services |
| | recent market transactions, including subsequent rounds of financing, in the underlying investment or comparable issuers; |
| | recapitalizations and other transactions across the capital structure; and |
| | market multiples of comparable issuers. |
| | future cash flows discounted to present and adjusted as appropriate for liquidity, credit, and/or market risks; |
| | quoted prices for similar investments or assets in active markets; and |
| | other risk factors, such as interest rates, yield curves, volatilities, prepayment speeds, loss severities, credit risks, recovery rates, liquidation amounts and/or default rates. |
| | audited or unaudited financial statements, investor communications and financial or operational metrics issued by the Private Company; |
| | changes in the valuation of relevant indices or publicly traded companies comparable to the Private Company; |
| | relevant news and other public sources; and |
| | known secondary market transactions in the Private Company’s interests and merger or acquisition activity in companies comparable to the Private Company. |
Investments in series of preferred stock issued by Private Companies are typically valued utilizing market approach in determining the enterprise value of the company. Such investments often contain rights and preferences that differ from other series of preferred and common stock of the same issuer. Enterprise valuation techniques such as an option pricing model (“OPM”), a probability weighted expected return model (“PWERM”), current value method or a hybrid of those techniques are used as deemed appropriate under the circumstances. The use of these valuation techniques involves a determination of the exit scenarios of the investment in order to appropriately allocate the enterprise value of the company among the various parts of its capital structure.
The Private Companies are not subject to the public company disclosure, timing, and reporting standards applicable to other investments held by a Fund. Typically, the most recently available information by a Private Company is as of a date that is earlier than the date a Fund is calculating its NAV. This factor may result in a difference between the value of the investment and the price a Fund could receive upon the sale of the investment.
Fair Value Hierarchy: Various inputs are used in determining the fair value of financial instruments. These inputs to valuation techniques are categorized into a fair value hierarchy consisting of three broad levels for financial reporting purposes as follows:
•Level 1 – Unadjusted price quotations in active markets/exchanges for identical assets or liabilities that each Fund has the ability to access;
•Level 2 – Other observable inputs (including, but not limited to, quoted prices for similar assets or liabilities in markets that are active, quoted prices for identical or similar assets or liabilities in markets that are not active, inputs other than quoted prices that are observable for the assets or liabilities (such as interest rates, yield curves, volatilities, prepayment speeds, loss severities, credit risks and default rates) or other market–corroborated inputs); and
•Level 3 – Unobservable inputs based on the best information available in the circumstances, to the extent observable inputs are not available (including the Valuation Committee’s assumptions used in determining the fair value of financial instruments).
The hierarchy gives the highest priority to unadjusted quoted prices in active markets for identical assets or liabilities (Level 1 measurements) and the lowest priority to unobservable inputs (Level 3 measurements). Accordingly, the degree of judgment exercised in determining fair value is greatest for instruments categorized in Level 3. The inputs used to measure fair value may fall into different levels of the fair value hierarchy. In such cases, for disclosure purposes, the fair value hierarchy classification is determined based on the lowest level input that is significant to the fair value measurement in its entirety. Investments classified within Level 3 have significant unobservable inputs used by the Valuation Committee in determining the price for Fair Valued Investments. Level 3 investments include equity or debt issued by Private Companies that may not have a secondary market and/or may have a limited number of investors. The categorization of a value determined for financial instruments is based on the pricing transparency of the financial instruments and is not necessarily an indication of the risks associated with investing in those securities.
4.
SECURITIES AND OTHER INVESTMENTS
Zero-Coupon Bonds: Zero-coupon bonds are normally issued at a significant discount from face value and do not provide for periodic interest payments. These bonds may experience greater volatility in market value than other debt obligations of similar maturity which provide for regular interest payments.
Forward Commitments, When-Issued and Delayed Delivery Securities: The Funds may purchase securities on a when-issued basis and may purchase or sell securities on a forward commitment basis. Settlement of such transactions normally occurs within a month or more after the purchase or sale commitment is made. The Funds may purchase securities under such conditions with the intention of actually acquiring them but may enter into a separate agreement to sell the securities before the settlement date. Since the value of securities purchased may fluctuate prior to settlement, the Funds may be required to pay more at settlement than the security is worth. In addition, a fund is not entitled to any of the interest earned prior to settlement. When purchasing a security on a delayed delivery basis, the Funds assume the rights and risks of ownership of the security, including the risk of price and yield fluctuations. In the event of default by the counterparty, the Funds’ maximum amount of loss is the unrealized appreciation of
722024 BlackRock Annual Financial Statements
Notes to Financial Statements (continued)
unsettled when-issued transactions. These types of securities may be considered unfunded and may obligate the Funds to make future cash payments. An unfunded commitment is marked-to-market and any unrealized appreciation (depreciation) is separately presented in the Statements of Assets and Liabilities and Statements of Operations. As of period end, the Funds had the following unfunded commitments:
| | | | | Unrealized
Appreciation
(Depreciation) |
California Municipal Opportunities | Puerto Rico Electric Power Authority, Series B-1 | | | | |
| Puerto Rico Electric Power Authority, Series B-2 | | | | |
| | | | | |
Strategic Municipal Opportunities | Puerto Rico Electric Power Authority, Series B-1 | | | | |
| Puerto Rico Electric Power Authority, Series B-2 | | | | |
| | | | | |
Municipal Bonds Transferred to TOB Trusts: The Funds leverage their assets through the use of “TOB Trust” transactions. The funds transfer municipal bonds into a special purpose trust (a “TOB Trust”). A TOB Trust issues two classes of beneficial interests: short-term floating rate interests (“TOB Trust Certificates”), which are sold to third-party investors, and residual inverse floating rate interests (“TOB Residuals”), which are issued to the participating funds that contributed the municipal bonds to the TOB Trust. The TOB Trust Certificates have interest rates that reset weekly and their holders have the option to tender such certificates to the TOB Trust for redemption at par and any accrued interest at each reset date. The TOB Residuals held by a fund provide the fund with the right to cause the holders of a proportional share of the TOB Trust Certificates to tender their certificates to the TOB Trust at par plus accrued interest. The funds may withdraw a corresponding share of the municipal bonds from the TOB Trust. Other funds managed by the investment adviser may also contribute municipal bonds to a TOB Trust into which a fund has contributed bonds. If multiple BlackRock-advised funds participate in the same TOB Trust, the economic rights and obligations under the TOB Residuals will be shared among the funds ratably in proportion to their participation in the TOB Trust.
TOB Trusts are supported by a liquidity facility provided by a third-party bank or other financial institution (the “Liquidity Provider”) that allows the holders of the TOB Trust Certificates to tender their certificates in exchange for payment of par plus accrued interest on any business day. The tendered TOB Trust Certificates are remarketed by a Remarketing Agent. In the event of a failed remarketing, the TOB Trust may draw upon a loan from the Liquidity Provider to purchase the tendered TOB Trust Certificates. Any loans made by the Liquidity Provider will be secured by the purchased TOB Trust Certificates held by the TOB Trust and will be subject to an increased interest rate based on number of days the loan is outstanding.
The TOB Trust may be collapsed without the consent of a fund, upon the occurrence of a termination event as defined in the TOB Trust agreement. Upon the occurrence of a termination event, a TOB Trust would be liquidated with the proceeds applied first to any accrued fees owed to the trustee of the TOB Trust, the Remarketing Agent and the Liquidity Provider. Upon certain termination events, TOB Trust Certificates holders will be paid before the TOB Residuals holders (i.e., the Funds) whereas in other termination events, TOB Trust Certificates holders and TOB Residuals holders will be paid pro rata.
While a fund’s investment policies and restrictions expressly permit investments in inverse floating rate securities, such as TOB Residuals, they restrict the ability of a fund to borrow money for purposes of making investments. Each Fund’s transfer of the municipal bonds to a TOB Trust is considered a secured borrowing for financial reporting purposes. The cash received by the TOB Trust from the sale of the TOB Trust Certificates, less certain transaction expenses, is paid to a Fund. A Fund typically invests the cash received in additional municipal bonds.
Accounting for TOB Trusts: The municipal bonds deposited into a TOB Trust are presented in a Fund’s Schedule of Investments and the TOB Trust Certificates are shown in Other Liabilities in the Statements of Assets and Liabilities. Any loans drawn by the TOB Trust pursuant to the liquidity facility to purchase tendered TOB Trust Certificates are shown as Loan for TOB Trust Certificates. The carrying amount of a Fund’s payable to the holder of the TOB Trust Certificates, as reported in the Statements of Assets and Liabilities as TOB Trust Certificates, approximates its fair value.
Interest income, including amortization and accretion of premiums and discounts, from the underlying municipal bonds is recorded by a Fund on an accrual basis. Interest expense incurred on the TOB Trust transaction and other expenses related to remarketing, administration, trustee, liquidity and other services to a TOB Trust are shown as interest expense, fees and amortization of offering costs in the Statements of Operations. Fees paid upon creation of the TOB Trust are recorded as debt issuance costs and are amortized to interest expense, fees and amortization of offering costs in the Statements of Operations to the expected maturity of the TOB Trust. In connection with the restructurings of the TOB Trusts to non-bank sponsored TOB Trusts, a Fund incurred non-recurring, legal and restructuring fees, which are recorded as interest expense, fees and amortization of offering costs in the Statements of Operations. Amounts recorded within interest expense, fees and amortization of offering costs in the Statements of Operations are:
| | | | |
California Municipal Opportunities | | | | |
Strategic Municipal Opportunities | | | | |
Notes to Financial Statements73
Notes to Financial Statements (continued)
For the year ended May 31, 2024, the following table is a summary of each Fund’s TOB Trusts:
| Underlying
Municipal Bonds
Transferred to
TOB Trusts(a) | Liability for
TOB Trust
Certificates(b) | Range of
Interest Rates
on TOB Trust
Certificates at
Period End | Average
TOB Trust
Certificates
Outstanding | Daily Weighted
Average Rate
of Interest and
Other Expenses
on TOB Trusts |
California Municipal Opportunities | | | | | |
Strategic Municipal Opportunities | | | | | |
| The municipal bonds transferred to a TOB Trust are generally high grade municipal bonds. In certain cases, when municipal bonds transferred are lower grade municipal bonds, the TOB Trust transaction may include a credit enhancement feature that provides for the timely payment of principal and interest on the bonds to the TOB Trust by a credit enhancement provider in the event of default of the municipal bond. The TOB Trust would be responsible for the payment of the credit enhancement fee and the Funds, as TOB Residuals holders, would be responsible for reimbursement of any payments of principal and interest made by the credit enhancement provider. The maximum potential amounts owed by the Funds, for such reimbursements, as applicable, are included in the maximum potential amounts disclosed for recourse TOB Trusts in the Schedules of Investments. |
| TOB Trusts may be structured on a non-recourse or recourse basis. When a Fund invests in TOB Trusts on a non-recourse basis, the Liquidity Provider may be required to make a payment under the liquidity facility to allow the TOB Trust to repurchase TOB Trust Certificates. The Liquidity Provider will be reimbursed from the liquidation of bonds held in the TOB Trust. If a Fund invests in a TOB Trust on a recourse basis, a Fund enters into a reimbursement agreement with the Liquidity Provider where a Fund is required to reimburse the Liquidity Provider for any shortfall between the amount paid by the Liquidity Provider and proceeds received from liquidation of municipal bonds held in the TOB Trust (the “Liquidation Shortfall”). As a result, if a Fund invests in a recourse TOB Trust, a Fund will bear the risk of loss with respect to any Liquidation Shortfall. If multiple funds participate in any such TOB Trust, these losses will be shared ratably, including the maximum potential amounts owed by a Fund at May 31, 2024, in proportion to their participation in the TOB Trust. The recourse TOB Trusts are identified in the Schedules of Investments including the maximum potential amounts owed by a Fund at May 31, 2024. |
5.
DERIVATIVE FINANCIAL INSTRUMENTS
The Funds engage in various portfolio investment strategies using derivative contracts both to increase the returns of the Funds and/or to manage their exposure to certain risks such as credit risk, equity risk, interest rate risk, foreign currency exchange rate risk, commodity price risk or other risks (e.g., inflation risk). Derivative financial instruments categorized by risk exposure are included in the Schedules of Investments. These contracts may be transacted on an exchange or over-the-counter (“OTC”).
Futures Contracts: Futures contracts are purchased or sold to gain exposure to, or manage exposure to, changes in interest rates (interest rate risk) and changes in the value of equity securities (equity risk) or foreign currencies (foreign currency exchange rate risk).
Futures contracts are exchange-traded agreements between the Funds and a counterparty to buy or sell a specific quantity of an underlying instrument at a specified price and on a specified date. Depending on the terms of a contract, it is settled either through physical delivery of the underlying instrument on the settlement date or by payment of a cash amount on the settlement date. Upon entering into a futures contract, the Funds are required to deposit initial margin with the broker in the form of cash or securities in an amount that varies depending on a contract’s size and risk profile. The initial margin deposit must then be maintained at an established level over the life of the contract. Amounts pledged, which are considered restricted, are included in cash pledged for futures contracts in the Statements of Assets and Liabilities.
Securities deposited as initial margin are designated in the Schedules of Investments and cash deposited, if any, are shown as cash pledged for futures contracts in the Statements of Assets and Liabilities. Pursuant to the contract, the Funds agree to receive from or pay to the broker an amount of cash equal to the daily fluctuation in market value of the contract (“variation margin”). Variation margin is recorded as unrealized appreciation (depreciation) and, if any, shown as variation margin receivable (or payable) on futures contracts in the Statements of Assets and Liabilities. When the contract is closed, a realized gain or loss is recorded in the Statements of Operations equal to the difference between the notional amount of the contract at the time it was opened and the notional amount at the time it was closed. The use of futures contracts involves the risk of an imperfect correlation in the movements in the price of futures contracts and interest rates, foreign currency exchange rates or underlying assets.
6.
INVESTMENT ADVISORY AGREEMENT AND OTHER TRANSACTIONS WITH AFFILIATES
Investment Advisory: The Trusts and the Corporation, on behalf of the Funds, entered into an Investment Advisory Agreement with the Manager, the Funds’ investment adviser and an indirect, wholly-owned subsidiary of BlackRock, Inc. (“BlackRock”), to provide investment advisory services and with respect to the Funds except Impact Municipal, administrative services. The Manager is responsible for the management of each Fund’s portfolio and provides the personnel, facilities, equipment and certain other services necessary to the operations of each Fund.
For such services, each Fund pays the Manager a monthly fee at an annual rate equal to the following percentages of the average daily value of each Fund’s net assets:
| |
| California
Municipal
Opportunities | | Pennsylvania
Municipal
Bond | | Strategic
Municipal
Opportunities |
| | | | | |
| | | | | |
| | | | | |
| | | | | |
| | | | | |
Service and Distribution Fees: The Trusts and the Corporation, on behalf of the Funds, entered into a Distribution Agreement and a Distribution and Service Plan with BlackRock Investments, LLC (“BRIL”), an affiliate of the Manager. Pursuant to the Distribution and Service Plan and in accordance with Rule 12b-1 under the 1940 Act,
742024 BlackRock Annual Financial Statements
Notes to Financial Statements (continued)
each Fund pays BRIL ongoing service and distribution fees. The fees are accrued daily and paid monthly at annual rates based upon the average daily net assets of the relevant share class of each Fund as follows:
| California Municipal Opportunities | New Jersey Municipal Bond | Pennsylvania Municipal Bond | | Strategic Municipal Opportunities |
| | | | | | | | | | |
| | | | | | | | | | |
| | | | | | | | | | |
| | | | | | | | | | |
| | | | | | | | | | |
BRIL and broker-dealers, pursuant to sub-agreements with BRIL, provide shareholder servicing and distribution services to the Funds. The ongoing service and/or distribution fee compensates BRIL and each broker-dealer for providing shareholder servicing and/or distribution related services to shareholders.
For the year ended May 31, 2024, the following table shows the class specific service and distribution fees borne directly by each share class of each Fund:
| | | | | |
California Municipal Opportunities | | | | | |
New Jersey Municipal Bond | | | | | |
Pennsylvania Municipal Bond | | | | | |
| | | | | |
Strategic Municipal Opportunities | | | | | |
Administration: With respect to Impact Municipal, the Corporation, on behalf of Impact Municipal, entered into an Administration Agreement with the Manager, an indirect, wholly-owned subsidiary of BlackRock, to provide administrative services. For these services, the Manager receives an administration fee computed daily and payable monthly, based on a percentage of the average daily net assets of the Fund. The administration fee, which is shown as administration in the Statements of Operations, is paid at the annual rates below.
| |
| |
$500 million — $1 billion | |
| |
| |
| |
| |
In addition, with respect to Impact Municipal the Manager charges each of the share classes an administration fee, which is shown as administration – class specific in the Statements of Operations, at an annual rate of 0.02% of the average daily net assets of each respective class.
For the year ended May 31, 2024, the following table shows the class specific administration fees borne directly by each share class of each Fund:
Transfer Agent: Pursuant to written agreements, certain financial intermediaries, some of which may be affiliates, provide the Funds with sub-accounting, recordkeeping, sub-transfer agency and other administrative services with respect to servicing of underlying investor accounts. For these services, these entities receive an asset-based fee or an annual fee per shareholder account, which will vary depending on share class and/or net assets. For the year ended May 31, 2024, the Funds did not pay any amounts to affiliates in return for these services.
The Manager maintains a call center that is responsible for providing certain shareholder services to the Funds. Shareholder services include responding to inquiries and processing purchases and sales based upon instructions from shareholders. For the year ended May 31, 2024, each Fund reimbursed the Manager the following amounts for costs incurred in running the call center, which are included in transfer agent — class specific in the Statements of Operations:
| | | | | | | |
California Municipal Opportunities | | | | | | | |
New Jersey Municipal Bond | | | | | | | |
Pennsylvania Municipal Bond | | | | | | | |
| | | | | | | |
Strategic Municipal Opportunities | | | | | | | |
For the year ended May 31, 2024, the following table shows the class specific transfer agent fees borne directly by each share class of each Fund:
| | | | | | | |
California Municipal Opportunities | | | | | | | |
New Jersey Municipal Bond | | | | | | | |
Pennsylvania Municipal Bond | | | | | | | |
| | | | | | | |
Strategic Municipal Opportunities | | | | | | | |
Notes to Financial Statements75
Notes to Financial Statements (continued)
Other Fees: For the year ended May 31, 2024, affiliates earned underwriting discounts, direct commissions and dealer concessions on sales of each Fund’s Investor A Shares as follows:
| |
California Municipal Opportunities | |
New Jersey Municipal Bond | |
Pennsylvania Municipal Bond | |
| |
Strategic Municipal Opportunities | |
For the year ended May 31, 2024, affiliates received CDSCs as follows:
| | |
California Municipal Opportunities | | |
New Jersey Municipal Bond | | |
Pennsylvania Municipal Bond | | |
Strategic Municipal Opportunities | | |
Expense Limitations, Waivers, Reimbursements, and Recoupments: With respect to each Fund, the Manager contractually agreed to waive its investment advisory fees by the amount of investment advisory fees each Fund pays to the Manager indirectly through its investment in affiliated money market funds (the “affiliated money market fund waiver") through June 30, 2025. The contractual agreement may be terminated upon 90 days’ notice by a majority of the Independent Trustees, or by a vote of a majority of the outstanding voting securities of a Fund. With respect to California Municipal Opportunities, New Jersey Municipal Bond, Pennsylvania Municipal Bond and Impact Municipal the amount of waivers and/or reimbursements of fees and expenses made pursuant to the expense limitation described below will be reduced by the amount of the affiliated money market fund waiver. These amounts are included in fees waived and/or reimbursed by the Manager in the Statements of Operations. For the year ended May 31, 2024, the amounts waived were as follows:
| Fees Waived and/or Reimbursed
by the Manager |
California Municipal Opportunities | |
New Jersey Municipal Bond | |
Pennsylvania Municipal Bond | |
| |
Strategic Municipal Opportunities | |
With respect to California Municipal Opportunities, New Jersey Municipal Bond, Pennsylvania Municipal Bond and Impact Municipal, the Manager contractually agreed to waive and/or reimburse fees or expenses in order to limit expenses, excluding interest expense, dividend expense, acquired fund fees and expenses, and certain other fund expenses, which constitute extraordinary expenses not incurred in the ordinary course of each Fund’s business (“expense limitation”). The expense limitations as a percentage of average daily net assets are as follows:
| | | | | | |
California Municipal Opportunities | | | | | | |
New Jersey Municipal Bond | | | | | | |
Pennsylvania Municipal Bond | | | | | | |
| | | | | | |
The Manager has agreed not to reduce or discontinue the contractual expense limitations through June 30, 2025, with respect to California Municipal Opportunities, New Jersey Municipal Bond, Pennsylvania Municipal Bond and Impact Municipal unless approved by the Board, including a majority of the Independent Trustees, or by a vote of a majority of the outstanding voting securities of a Fund. For the year ended May 31, 2024, amounts included in the Statements of Operations were as follows:
| Fees Waived and/or Reimbursed
by the Manager |
California Municipal Opportunities | |
New Jersey Municipal Bond | |
Pennsylvania Municipal Bond | |
| |
With respect to Strategic Municipal Opportunities, the Manager contractually agreed to waive 0.05% of its investment advisory fees through June 30, 2025. The agreement may be terminated upon 90 days’ notice by a majority of Independent Trustees of BlackRock Municipal Series Trust or by a vote of a majority of the outstanding voting securities of the Fund. This amount is included in fees waived and/or reimbursed by the Manager in the Statements of Operations. For the year ended May 31, 2024, the Manager waived $2,185,276 pursuant to this agreement.
762024 BlackRock Annual Financial Statements
Notes to Financial Statements (continued)
In addition, these amounts waived and/or reimbursed by the Manager are included in administration fees waived by the Manager — class specific and transfer agent fees waived and/or reimbursed by the Manager — class specific in the Statements of Operations. For the year ended May 31, 2024, class specific expense waivers and/or reimbursements were as follows:
| Administration Fees Waived by the Manager- Class Specific |
| | | | |
| | | | |
| Transfer Agent Fees Waived and/or
Reimbursed by the Manager - Class Specific |
| | | | | | | |
California Municipal Opportunities | | | | | | | |
New Jersey Municipal Bond | | | | | | | |
Pennsylvania Municipal Bond | | | | | | | |
| | | | | | | |
Impact Municipal also had a waiver of administration fees, which are included in Administration fees waived in the Statements of Operations. For the year ended May 31, 2024, the amount was $3,151.
With respect to the contractual expense limitation, if during Impact Municipal’s fiscal year the operating expenses of a share class, that at any time during the prior two fiscal years received a waiver and/or reimbursement from the Manager, are less than the current expense limitation for that share class, the Manager is entitled to be reimbursed by such share class up to the lesser of: (a) the amount of fees waived and/or expenses reimbursed during those prior two fiscal years under the agreement and (b) an amount not to exceed either the current expense limitation of that share class or the expense limitation of the share class in effect at the time that the share class received the applicable waiver and/or reimbursement, provided that:
(1) the Fund, of which the share class is a part, has more than $50 million in assets for the fiscal year, and
(2) the Manager or an affiliate continues to serve as the Fund’s investment adviser or administrator.
This repayment applies only to the contractual expense limitation on net expenses and does not apply to the contractual investment advisory fee waiver described above or any voluntary waivers that may be in effect from time to time. Effective March 15, 2029, the repayment arrangement between the Fund and the Manager pursuant to which such Fund may be required to repay amounts waived and/or reimbursed under the Fund’s contractual caps on net expenses will be terminated.
As of May 31, 2024, the fund level and class specific waivers and/or reimbursements subject to possible future recoupment under the expense limitation agreement were as follows:
| |
Fund Name/Fund Level/Share Class | | |
| | |
| | |
| | |
| | |
| | |
The following fund level and class specific waivers and/or reimbursements previously recorded by the Funds, which were subject to recoupment by the Manager, expired on May 31, 2024:
| |
Fund Name/Fund Level/Share Class | |
| |
| |
| |
| |
| |
Interfund Lending: In accordance with an exemptive order (the “Order”) from the U.S. Securities and Exchange Commission (“SEC”), each Fund may participate in a joint lending and borrowing facility for temporary purposes (the “Interfund Lending Program”), subject to compliance with the terms and conditions of the Order, and to the extent permitted by each Fund’s investment policies and restrictions. California Municipal Opportunities, New Jersey Municipal Bond, Pennsylvania Municipal Bond and Strategic Municipal Opportunities are currently permitted to borrow under the Interfund Lending Program. Impact Municipal is currently permitted to borrow and lend under the Interfund Lending Program.
A lending BlackRock fund may lend in aggregate up to 15% of its net assets but may not lend more than 5% of its net assets to any one borrowing fund through the Interfund Lending Program. A borrowing BlackRock fund may not borrow through the Interfund Lending Program or from any other source more than 33 1/3% of its total assets (or any lower threshold provided for by the fund’s investment restrictions). If a borrowing BlackRock fund’s total outstanding borrowings exceed 10% of its total assets, each of its outstanding interfund loans will be subject to collateralization of at least 102% of the outstanding principal value of the loan. All interfund loans are for temporary or emergency
Notes to Financial Statements77
Notes to Financial Statements (continued)
purposes and the interest rate to be charged will be the average of the highest current overnight repurchase agreement rate available to a lending fund and the bank loan rate, as calculated according to a formula established by the Board.
During the year ended May 31, 2024, the Funds did not participate in the Interfund Lending Program.
Trustees and Officers: Certain trustees and/or officers of the Funds are directors and/or officers of BlackRock or its affiliates. The Funds reimburse the Manager for a portion of the compensation paid to the Funds’ Chief Compliance Officer, which is included in Trustees and Officer in the Statements of Operations.
Other Transactions: During the year ended May 31, 2024, California Municipal Opportunities and Strategic Municipal Opportunities recorded a reimbursement of $2,279 and $4,617, respectively, from an affiliate, which is included in payment by affiliates in the Statements of Operations, related to an operating event.
For the year ended May 31, 2024, purchases and sales of investments, excluding short-term securities, were as follows:
| U.S. Government Securities | |
| | | | |
California Municipal Opportunities | | | | |
New Jersey Municipal Bond | | | | |
Pennsylvania Municipal Bond | | | | |
| | | | |
Strategic Municipal Opportunities | | | | |
It is each Fund’s policy to comply with the requirements of the Internal Revenue Code of 1986, as amended, applicable to regulated investment companies, and to distribute substantially all of its taxable income to its shareholders. Therefore, no U.S. federal income tax provision is required.
Each Fund files U.S. federal and various state and local tax returns. No income tax returns are currently under examination. The statute of limitations on each Fund’ s U.S. federal tax returns generally remains open for a period of three years after they are filed. The statutes of limitations on each Fund’s state and local tax returns may remain open for an additional year depending upon the jurisdiction.
Management has analyzed tax laws and regulations and their application to the Funds as of May 31, 2024, inclusive of the open tax return years, and does not believe that there are any uncertain tax positions that require recognition of a tax liability in the Funds’ financial statements.
The tax character of distributions paid was as follows:
| | |
California Municipal Opportunities | | |
| | |
| | |
| | |
New Jersey Municipal Bond | | |
| | |
| | |
| | |
Pennsylvania Municipal Bond | | |
| | |
| | |
| | |
| | |
| | |
| | |
| | |
| | |
Strategic Municipal Opportunities | | |
| | |
| | |
| | |
782024 BlackRock Annual Financial Statements
Notes to Financial Statements (continued)
As of May 31, 2024, the tax components of accumulated earnings (loss) were as follows:
| Undistributed
Tax-Exempt Income | Undistributed
Ordinary Income | | | |
California Municipal Opportunities | | | | | |
New Jersey Municipal Bond | | | | | |
Pennsylvania Municipal Bond | | | | | |
| | | | | |
Strategic Municipal Opportunities | | | | | |
| Amounts available to offset future realized capital gains. |
| The difference between book-basis and tax-basis net unrealized gains was attributable primarily to the tax deferral of losses on wash sales, the realization for tax purposes of unrealized gains (losses) on certain futures contracts, amortization methods for premiums on fixed income securities, the treatment of residual interests in tender option bond trusts, the accrual of income on securities in default and the deferral of compensation to Trustees. |
As of May 31, 2024, gross unrealized appreciation and depreciation based on cost of investments (including short positions and derivatives, if any) for U.S. federal income tax purposes were as follows:
| | Gross Unrealized
Appreciation | Gross Unrealized
Depreciation | Net Unrealized
Appreciation
(Depreciation) |
California Municipal Opportunities | | | | |
New Jersey Municipal Bond | | | | |
Pennsylvania Municipal Bond | | | | |
| | | | |
Strategic Municipal Opportunities | | | | |
The Trusts and the Corporation, along with certain other funds managed by the Manager and its affiliates (“Participating Funds”), is party to a 364-day, $2.40 billion credit agreement with a group of lenders. Under this agreement, the Funds may borrow to fund shareholder redemptions. Excluding commitments designated for certain individual funds, the Participating Funds, including the Funds, can borrow up to an aggregate commitment amount of $1.75 billion at any time outstanding, subject to asset coverage and other limitations as specified in the agreement. The credit agreement has the following terms: a fee of 0.10% per annum on unused commitment amounts and interest at a rate equal to the higher of (a) Overnight Bank Funding Rate (“OBFR”) (but, in any event, not less than 0.00%) on the date the loan is made plus 0.80% per annum, (b) the Fed Funds rate (but, in any event, not less than 0.00%) in effect from time to time plus 0.80% per annum on amounts borrowed or (c) the sum of (x) Daily Simple Secured Overnight Financing Rate (“SOFR”) (but, in any event, not less than 0.00%) on the date the loan is made plus 0.10% and (y) 0.80% per annum. The agreement expires in April 2025 unless extended or renewed. Prior to April 11, 2024, the aggregate commitment amount was $2.50 billion. These fees were allocated among such funds based upon portions of the aggregate commitment available to them and relative net assets of Participating Funds. During the year ended May 31, 2024, the Funds did not borrow under the credit agreement.
In the normal course of business, the Funds invest in securities or other instruments and may enter into certain transactions, and such activities subject each Fund to various risks, including among others, fluctuations in the market (market risk) or failure of an issuer to meet all of its obligations. The value of securities or other instruments may also be affected by various factors, including, without limitation: (i) the general economy; (ii) the overall market as well as local, regional or global political and/or social instability; (iii) regulation, taxation or international tax treaties between various countries; or (iv) currency, interest rate and price fluctuations. Local, regional or global events such as war, acts of terrorism, the spread of infectious illness or other public health issues, recessions, or other events could have a significant impact on the Funds and their investments. Each Fund’s prospectus provides details of the risks to which each Fund is subject.
A Fund structures and “sponsors” the TOB Trusts in which it holds TOB Residuals and has certain duties and responsibilities, which may give rise to certain additional risks including, but not limited to, compliance, securities law and operational risks.
As short-term interest rates rise, the Funds’ investments in the TOB Trusts may adversely affect the Funds’ net investment income and dividends to shareholders. Also, fluctuations in the market value of municipal bonds deposited into the TOB Trust may adversely affect the Funds’ NAVs per share.
The SEC and various federal banking and housing agencies have adopted credit risk retention rules for securitizations (the “Risk Retention Rules”). The Risk Retention Rules would require the sponsor of a TOB Trust to retain at least 5% of the credit risk of the underlying assets supporting the TOB Trust’s municipal bonds. The Risk Retention Rules may adversely affect the Funds’ ability to engage in TOB Trust transactions or increase the costs of such transactions in certain circumstances.
TOB Trusts constitute an important component of the municipal bond market. Any modifications or changes to rules governing TOB Trusts may adversely impact the municipal market and the Funds, including through reduced demand for and liquidity of municipal bonds and increased financing costs for municipal issuers. The ultimate impact of any potential modifications on the TOB Trust market and the overall municipal market is not yet certain.
Market Risk: Each Fund may be exposed to prepayment risk, which is the risk that borrowers may exercise their option to prepay principal earlier than scheduled during periods of declining interest rates, which would force each Fund to reinvest in lower yielding securities. Each Fund may also be exposed to reinvestment risk, which is the risk
Notes to Financial Statements79
Notes to Financial Statements (continued)
that income from each Fund’s portfolio will decline if each Fund invests the proceeds from matured, traded or called fixed-income securities at market interest rates that are below each Fund portfolio’s current earnings rate.
Municipal securities are subject to the risk that litigation, legislation or other political events, local business or economic conditions, credit rating downgrades, or the bankruptcy of the issuer could have a significant effect on an issuer’s ability to make payments of principal and/or interest or otherwise affect the value of such securities. Municipal securities can be significantly affected by political or economic changes, including changes made in the law after issuance of the securities, as well as uncertainties in the municipal market related to, taxation, legislative changes or the rights of municipal security holders, including in connection with an issuer insolvency. Municipal securities backed by current or anticipated revenues from a specific project or specific assets can be negatively affected by the discontinuance of the tax benefits supporting the project or assets or the inability to collect revenues for the project or from the assets. Municipal securities may be less liquid than taxable bonds, and there may be less publicly available information on the financial condition of municipal security issuers than for issuers of other securities.
Valuation Risk: The price a Fund could receive upon the sale of any particular portfolio investment may differ from a Fund’s valuation of the investment, particularly for securities that trade in thin or volatile markets or that are valued using a fair valuation technique or a price provided by an independent pricing service. Changes to significant unobservable inputs and assumptions (i.e., publicly traded company multiples, growth rate, time to exit) due to the lack of observable inputs may significantly impact the resulting fair value and therefore a Fund’s results of operations. As a result, the price received upon the sale of an investment may be less than the value ascribed by a Fund, and a Fund could realize a greater than expected loss or lesser than expected gain upon the sale of the investment. A Fund’s ability to value its investments may also be impacted by technological issues and/or errors by pricing services or other third-party service providers.
Counterparty Credit Risk: The Funds may be exposed to counterparty credit risk, or the risk that an entity may fail to or be unable to perform on its commitments related to unsettled or open transactions, including making timely interest and/or principal payments or otherwise honoring its obligations. The Funds manage counterparty credit risk by entering into transactions only with counterparties that the Manager believes have the financial resources to honor their obligations and by monitoring the financial stability of those counterparties. Financial assets, which potentially expose the Funds to market, issuer and counterparty credit risks, consist principally of financial instruments and receivables due from counterparties. The extent of the Funds’ exposure to market, issuer and counterparty credit risks with respect to these financial assets is approximately their value recorded in the Statements of Assets and Liabilities, less any collateral held by the Funds.
A derivative contract may suffer a mark-to-market loss if the value of the contract decreases due to an unfavorable change in the market rates or values of the underlying instrument. Losses can also occur if the counterparty does not perform under the contract.
With exchange-traded futures, there is less counterparty credit risk to the Funds since the exchange or clearinghouse, as counterparty to such instruments, guarantees against a possible default. The clearinghouse stands between the buyer and the seller of the contract; therefore, credit risk is limited to failure of the clearinghouse. While offset rights may exist under applicable law, a Fund does not have a contractual right of offset against a clearing broker or clearinghouse in the event of a default (including the bankruptcy or insolvency). Additionally, credit risk exists in exchange-traded futures with respect to initial and variation margin that is held in a clearing broker’s customer accounts. While clearing brokers are required to segregate customer margin from their own assets, in the event that a clearing broker becomes insolvent or goes into bankruptcy and at that time there is a shortfall in the aggregate amount of margin held by the clearing broker for all its clients, typically the shortfall would be allocated on a pro rata basis across all the clearing broker’s customers, potentially resulting in losses to the Funds.
Geographic/Asset Class Risk: A diversified portfolio, where this is appropriate and consistent with a fund’s objectives, minimizes the risk that a price change of a particular investment will have a material impact on the NAV of a fund. The investment concentrations within each Fund’s portfolio are disclosed in its Schedule of Investments.
Certain Funds invest a substantial amount of their assets in issuers located in a single state or limited number of states. When a fund concentrates its investments in this manner, it assumes the risk that economic, regulatory, political or social conditions affecting that state or group of states could have a significant impact on the fund and could affect the income from, or the value or liquidity of, the fund’s portfolio. Investment percentages in specific states or U.S. territories are presented in the Schedules of Investments.
Certain Funds invest a significant portion of their assets in securities within a single or limited number of market sectors. When a fund concentrates its investments in this manner, it assumes the risk that economic, regulatory, political and social conditions affecting such sectors may have a significant impact on the Fund and could affect the income from, or the value or liquidity of, the Fund’s portfolio. Investment percentages in specific sectors are presented in the Schedules of Investments.
The Funds invest a significant portion of their assets in fixed-income securities and/or use derivatives tied to the fixed-income markets. Changes in market interest rates or economic conditions may affect the value and/or liquidity of such investments. Interest rate risk is the risk that prices of bonds and other fixed-income securities will decrease as interest rates rise and increase as interest rates fall. The Funds may be subject to a greater risk of rising interest rates due to the period of historically low interest rates that ended in March 2022. The Federal Reserve has raised the federal funds rate as part of its efforts to address inflation. There is a risk that interest rates will continue to rise, which will likely drive down the prices of bonds and other fixed-income securities, and could negatively impact the Funds’ performance.
The Funds invest a significant portion of their assets in securities of issuers located in the United States. A decrease in imports or exports, changes in trade regulations, inflation and/or an economic recession in the United States may have a material adverse effect on the U.S. economy and the securities listed on U.S. exchanges. Proposed and adopted policy and legislative changes in the United States may also have a significant effect on U.S. markets generally, as well as on the value of certain securities. Governmental agencies project that the United States will continue to maintain elevated public debt levels for the foreseeable future which may constrain future economic growth. Circumstances could arise that could prevent the timely payment of interest or principal on U.S. government debt, such as reaching the legislative “debt ceiling.” Such non-payment would result in substantial negative consequences for the U.S. economy and the global financial system. If U.S. relations with certain countries deteriorate, it could adversely affect issuers that rely on the United States for trade. The United States has also experienced increased internal unrest and discord. If these trends were to continue, they may have an adverse impact on the U.S. economy and the issuers in which the Funds invest.
802024 BlackRock Annual Financial Statements
Notes to Financial Statements (continued)
Significant Shareholder Redemption Risk: Certain shareholders may own or manage a substantial amount of fund shares and/or hold their fund investments for a limited period of time. Large redemptions of fund shares by these shareholders may force a fund to sell portfolio securities, which may negatively impact the fund’s NAV, increase the fund’s brokerage costs, and/or accelerate the realization of taxable income/gains and cause the fund to make additional taxable distributions to shareholders.
11.
CAPITAL SHARE TRANSACTIONS
Transactions in capital shares for each class were as follows:
| | |
| | | | |
California Municipal Opportunities | | | | |
| | | | |
| | | | |
Shares issued in reinvestment of distributions | | | | |
| | | | |
| | | | |
| | | | |
Shares sold and automatic conversion of shares | | | | |
Shares issued in reinvestment of distributions | | | | |
| | | | |
| | | | |
| | | | |
| | | | |
Shares issued in reinvestment of distributions | | | | |
| | | | |
| | | | |
| | | | |
| | | | |
Shares issued in reinvestment of distributions | | | | |
Shares redeemed and automatic conversion of shares | | | | |
| | | | |
| | | | |
| | | | |
Shares issued in reinvestment of distributions | | | | |
| | | | |
| | | | |
| | | | |
| | |
| | | | |
New Jersey Municipal Bond | | | | |
| | | | |
| | | | |
Shares issued in reinvestment of distributions | | | | |
| | | | |
| | | | |
| | | | |
| | | | |
Shares issued in reinvestment of distributions | | | | |
| | | | |
| | | | |
| | | | |
Shares sold and automatic conversion of shares | | | | |
Shares issued in reinvestment of distributions | | | | |
| | | | |
| | | | |
Notes to Financial Statements81
Notes to Financial Statements (continued)
| | |
Fund Name / Share Class (continued) | | | | |
New Jersey Municipal Bond (continued) | | | | |
| | | | |
| | | | |
Shares issued in reinvestment of distributions | | | | |
| | | | |
| | | | |
| | | | |
| | | | |
Shares issued in reinvestment of distributions | | | | |
Shares redeemed and automatic conversion of shares | | | | |
| | | | |
| | | | |
| | | | |
Shares issued in reinvestment of distributions | | | | |
| | | | |
| | | | |
| | | | |
| | |
| | | | |
Pennsylvania Municipal Bond | | | | |
| | | | |
| | | | |
Shares issued in reinvestment of distributions | | | | |
| | | | |
| | | | |
| | | | |
| | | | |
Shares issued in reinvestment of distributions | | | | |
| | | | |
| | | | |
| | | | |
Shares sold and automatic conversion of shares | | | | |
Shares issued in reinvestment of distributions | | | | |
| | | | |
| | | | |
| | | | |
Shares issued in reinvestment of distributions | | | | |
| | | | |
| | | | |
| | | | |
| | | | |
Shares issued in reinvestment of distributions | | | | |
Shares redeemed and automatic conversion of shares | | | | |
| | | | |
| | | | |
| | | | |
Shares issued in reinvestment of distributions | | | | |
| | | | |
| | | | |
| | | | |
822024 BlackRock Annual Financial Statements
Notes to Financial Statements (continued)
| | |
| | | | |
| | | | |
| | | | |
| | | | |
Shares issued in reinvestment of distributions | | | | |
| | | | |
| | | | |
| | | | |
| | | | |
Shares issued in reinvestment of distributions | | | | |
| | | | |
| | | | |
| | | | |
| | | | |
Shares issued in reinvestment of distributions | | | | |
| | | | |
| | | | |
| | | | |
| | |
| | | | |
Strategic Municipal Opportunities | | | | |
| | | | |
| | | | |
Shares issued in reinvestment of distributions | | | | |
| | | | |
| | | | |
| | | | |
Shares sold and automatic conversion of shares | | | | |
Shares issued in reinvestment of distributions | | | | |
| | | | |
| | | | |
| | | | |
| | | | |
Shares issued in reinvestment of distributions | | | | |
| | | | |
| | | | |
| | | | |
| | | | |
Shares issued in reinvestment of distributions | | | | |
Shares redeemed and automatic conversion of shares | | | | |
| | | | |
| | | | |
| | | | |
Shares issued in reinvestment of distributions | | | | |
| | | | |
| | | | |
| | | | |
As of May 31, 2024, shares owned by BlackRock Financial Management, Inc., an affiliate of the Funds, were as follows:
| | | |
New Jersey Municipal Bond | | | |
| | | |
Notes to Financial Statements83
Notes to Financial Statements (continued)
Management has evaluated the impact of all subsequent events on the Funds through the date the financial statements were issued and has determined that there were no subsequent events requiring adjustment or additional disclosure in the financial statements.
842024 BlackRock Annual Financial Statements
Report of Independent Registered Public Accounting Firm
To the Shareholders of BlackRock California Municipal Opportunities Fund, BlackRock New Jersey Municipal Bond Fund, BlackRock Pennsylvania Municipal Bond Fund, BlackRock Impact Municipal Fund, and BlackRock Strategic Municipal Opportunities Fund and the Boards of Trustees/Directors of BlackRock California Municipal Series Trust, BlackRock Multi-State Municipal Series Trust, BlackRock Municipal Bond Fund, Inc., and BlackRock Municipal Series Trust:
Opinion on the Financial Statements and Financial Highlights
We have audited the accompanying statements of assets and liabilities of BlackRock California Municipal Opportunities Fund of BlackRock California Municipal Series Trust, BlackRock New Jersey Municipal Bond Fund and BlackRock Pennsylvania Municipal Bond Fund of BlackRock Multi-State Municipal Series Trust, BlackRock Impact Municipal Fund of BlackRock Municipal Bond Fund, Inc., and BlackRock Strategic Municipal Opportunities Fund of BlackRock Municipal Series Trust (the “Funds”), including the schedules of investments, as of May 31, 2024, the related statements of operations for the year then ended, the statements of changes in net assets for each of the two years in the period then ended, the financial highlights for the periods indicated in the table below, and the related notes. In our opinion, the financial statements and financial highlights present fairly, in all material respects, the financial position of the Funds as of May 31, 2024, and the results of their operations for the year then ended, the changes in their net assets for each of the two years in the period then ended, and the financial highlights for the periods indicated in the table below, in conformity with accounting principles generally accepted in the United States of America.
| |
BlackRock California Municipal Opportunities Fund, BlackRock New Jersey Municipal Bond Fund, BlackRock Pennsylvania Municipal Bond Fund, BlackRock Strategic Municipal Opportunities Fund | For each of the five years in the period ended May 31, 2024 |
BlackRock Impact Municipal Fund | For each of the two years in the period ended May 31, 2024 and for the period from March 14, 2022 (commencement of operations) through May 31, 2022 |
These financial statements and financial highlights are the responsibility of the Funds’ management. Our responsibility is to express an opinion on the Funds’ financial statements and financial highlights based on our audits. We are a public accounting firm registered with the Public Company Accounting Oversight Board (United States) (PCAOB) and are required to be independent with respect to the Funds in accordance with the U.S. federal securities laws and the applicable rules and regulations of the Securities and Exchange Commission and the PCAOB.
We conducted our audits in accordance with the standards of the PCAOB. Those standards require that we plan and perform the audit to obtain reasonable assurance about whether the financial statements and financial highlights are free of material misstatement, whether due to error or fraud. The Funds are not required to have, nor were we engaged to perform, an audit of their internal control over financial reporting. As part of our audits we are required to obtain an understanding of internal control over financial reporting but not for the purpose of expressing an opinion on the effectiveness of the Funds’ internal control over financial reporting. Accordingly, we express no such opinion.
Our audits included performing procedures to assess the risks of material misstatement of the financial statements and financial highlights, whether due to error or fraud, and performing procedures that respond to those risks. Such procedures included examining, on a test basis, evidence regarding the amounts and disclosures in the financial statements and financial highlights. Our audits also included evaluating the accounting principles used and significant estimates made by management, as well as evaluating the overall presentation of the financial statements and financial highlights. Our procedures included confirmation of securities owned as of May 31, 2024, by correspondence with custodians or counterparties; when replies were not received, we performed other auditing procedures. We believe that our audits provide a reasonable basis for our opinion.
Deloitte & Touche LLP
Boston, Massachusetts
July 24, 2024
We have served as the auditor of one or more BlackRock investment companies since 1992.
Report of Independent Registered Public Accounting Firm85
Important Tax Information (unaudited)
The following amounts, or maximum amounts allowable by law, are hereby designated as tax-exempt interest dividends for the fiscal year ended May 31, 2024:
| |
California Municipal Opportunities | |
New Jersey Municipal Bond | |
Pennsylvania Municipal Bond | |
| |
Strategic Municipal Opportunities | |
The Funds hereby designate the following amounts, or maximum amounts allowable by law, of distributions from direct federal obligation interest for the fiscal year ended May 31, 2024:
| Federal Obligation
Interest |
California Municipal Opportunities | |
Strategic Municipal Opportunities | |
The law varies in each state as to whether and what percent of ordinary income dividends attributable to federal obligations is exempt from state income tax. Shareholders are advised to check with their tax advisers to determine if any portion of the dividends received is exempt from state income tax.
The Funds hereby designate the following amounts, or maximum amounts allowable by law, as interest income eligible to be treated as a Section 163(j) interest dividend for the fiscal year ended May 31, 2024:
| |
California Municipal Opportunities | |
New Jersey Municipal Bond | |
Pennsylvania Municipal Bond | |
| |
Strategic Municipal Opportunities | |
The Funds hereby designate the following amounts, or maximum amounts allowable by law, as interest-related dividends eligible for exemption from U.S. withholding tax for nonresident aliens and foreign corporations for the fiscal year ended May 31, 2024:
| Interest-
Related
Dividends |
California Municipal Opportunities | |
New Jersey Municipal Bond | |
Pennsylvania Municipal Bond | |
| |
Strategic Municipal Opportunities | |
862024 BlackRock Annual Financial Statements
Changes in and Disagreements with Accountants
Remuneration Paid to Trustees, Officers, and Others
Compensation to the independent trustees of the Trusts and Corporation is paid by the Trusts and Corporation, on behalf of the Funds.
Each Fund’s dividend policy is to make regular monthly cash distributions to holders of its common shares (stated in terms of a fixed cents per common share dividend distribution rate). Each Fund intends to distribute all or a portion of its net investment income to its shareholders on a monthly basis. In addition, in any monthly period, in order to maintain its declared distribution amount, each Fund may pay out more or less than the entire amount of net investment income earned in any particular month. In the event a Fund distributes more than its net investment income during any yearly period, such distributions may also come from sources other than net income, including return of capital. The Funds’ current accumulated but undistributed net investment income, if any, is disclosed as accumulated earnings (loss) in the Statements of Assets and Liabilities, which comprises part of the financial information included in this report.
Quarterly performance, semi-annual and annual reports, current net asset value and other information regarding the Funds may be found on BlackRock’s website, which can be accessed at blackrock.com. Any reference to BlackRock’s website in this report is intended to allow investors public access to information regarding the Funds and does not, and is not intended to, incorporate BlackRock’s website in this report.
Shareholders can sign up for e-mail notifications of quarterly statements, annual and semi-annual shareholder reports and prospectuses by enrolling in the electronic delivery program.
To enroll in electronic delivery:
Shareholders Who Hold Accounts with Investment Advisors, Banks or Brokerages:
Please contact your financial advisor. Please note that not all investment advisors, banks or brokerages may offer this service.
Shareholders Who Hold Accounts Directly with BlackRock:
1. Access the BlackRock website at blackrock.com
2. Select “Access Your Account”
3. Next, select “eDelivery” in the “Related Resources” box and follow the sign-up instructions.
BlackRock’s Mutual Fund Family
BlackRock offers a diverse lineup of open-end mutual funds crossing all investment styles and managed by experts in equity, fixed-income and tax-exempt investing. Visit blackrock.com for more information.
Call us at (800) 441-7762 from 8:00 AM to 6:00 PM ET on any business day to get information about your account balances, recent transactions and share prices. You can also visit blackrock.com for more information.
Automatic Investment Plans
Investor class shareholders who want to invest regularly can arrange to have $50 or more automatically deducted from their checking or savings account and invested in any of the BlackRock funds.
Additional Information (continued)
Systematic Withdrawal Plans
Investor class shareholders can establish a systematic withdrawal plan and receive periodic payments of $50 or more from their BlackRock funds, as long as their account balance is at least $10,000.
Shareholders may make investments in conjunction with Traditional, Rollover, Roth, Coverdell, Simple IRAs, SEP IRAs and 403(b) Plans.
Fund and Service Providers
Investment Adviser
BlackRock Advisors, LLC
Wilmington, DE 19809
Accounting Agent and Custodian
State Street Bank and Trust Company
Boston, MA 02114
BNY Mellon Investment Servicing (US) Inc.
Wilmington, DE 19809
BlackRock Investments, LLC
New York, NY 10001
Independent Registered Public Accounting Firm
Deloitte & Touche LLP
Boston, MA 02116
Willkie Farr & Gallagher LLP
New York, NY 10019
100 Bellevue Parkway
Wilmington, DE 19809
882024 BlackRock Annual Financial Statements
Glossary of Terms Used in this Report
|
| Assured Guaranty Municipal Corp. |
| AGM Insured Custodial Receipt |
| |
| |
| |
| |
| Build America Mutual Assurance Co. |
| Build America Mutual Assurance Co. - Transferable Custodial Receipts |
| Capital Appreciation Bonds |
| Certificates of Participation |
| |
| Federal Home Loan Mortgage Corp. |
| Federal National Mortgage Association |
| Government National Mortgage Association |
| |
| |
| |
| National Public Finance Guarantee Corp. |
| |
| Qualified School Bond Loan Fund |
| |
| |
| |
| Subject to Appropriations |
| |
| State of New York Mortgage Agency |
| |
| |
Glossary of Terms Used in This Report89
THIS PAGE INTENTIONALLY LEFT BLANK.
THIS PAGE INTENTIONALLY LEFT BLANK.
Want to know more?
blackrock.com | 800-441-7762
This report is intended for current holders. It is not authorized for use as an offer of sale or a solicitation of an offer to buy shares of the Funds unless preceded or accompanied by the Funds’ current prospectus. Past performance results shown in this report should not be considered a representation of future performance. Investment returns and principal value of shares will fluctuate so that shares, when redeemed, may be worth more or less than their original cost. Statements and other information herein are as dated and are subject to change.
| Item 8 – | Changes in and Disagreements with Accountants for Open-End Management Investment Companies – See Item 7 |
| Item 9 – | Proxy Disclosures for Open-End Management Investment Companies – See Item 7 |
| Item 10 – | Remuneration Paid to Directors, Officers, and Others of Open-End Management Investment Companies – See Item 7 |
| Item 11 – | Statement Regarding Basis for Approval of Investment Advisory Contract – See Item 7 |
| Item 12 – | Disclosure of Proxy Voting Policies and Procedures for Closed-End Management Investment Companies – Not Applicable |
| Item 13 – | Portfolio Managers of Closed-End Management Investment Companies – Not Applicable |
| Item 14 – | Purchases of Equity Securities by Closed-End Management Investment Company and Affiliated Purchasers – Not Applicable |
| Item 15 – | Submission of Matters to a Vote of Security Holders – There have been no material changes to these procedures. |
| Item 16 – | Controls and Procedures |
(a) The registrant’s principal executive and principal financial officers, or persons performing similar functions, have concluded that the registrant’s disclosure controls and procedures (as defined in Rule 30a-3(c) under the Investment Company Act of 1940, as amended (the “1940 Act”)) are effective as of a date within 90 days of the filing date of this report based on the evaluation of these controls and procedures required by Rule 30a-3(b) under the 1940 Act and Rule 13a-15(b) or 15d-15(b) under the Securities Exchange Act of 1934, as amended.
(b) There were no changes in the registrant’s internal control over financial reporting (as defined in Rule 30a-3(d) under the 1940 Act) that occurred during the period covered by this report that have materially affected, or are reasonably likely to materially affect, the registrant’s internal control over financial reporting.
| Item 17 – | Disclosure of Securities Lending Activities for Closed-End Management Investment Companies – Not Applicable |
| Item 18 – | Recovery of Erroneously Awarded Compensation – Not Applicable |
| Item 19 – | Exhibits attached hereto |
(a)(1) Code of Ethics – See Item 2
(a)(2) Any policy required by the listing standards adopted pursuant to Rule 10D-1 under the Exchange Act (17 CFR 240.10D-1) by the registered national securities exchange or registered national securities association upon which the registrant’s securities are listed – Not Applicable
(a)(3) Section 302 Certifications are attached.
(a)(4) Any written solicitation to purchase securities under Rule 23c-1 – Not Applicable
(a)(5) Change in Registrant’s independent public accountant – Not Applicable
(b) Section 906 Certifications are attached.
Pursuant to the requirements of the Securities Exchange Act of 1934 and the Investment Company Act of 1940, the registrant has duly caused this report to be signed on its behalf by the undersigned, thereunto duly authorized.
BlackRock California Municipal Series Trust
| | | | |
| | By: | | /s/ John M. Perlowski |
| | | | John M. Perlowski |
| | | | Chief Executive Officer (principal executive officer) of |
| | | | BlackRock California Municipal Series Trust |
Date: July 24, 2024
Pursuant to the requirements of the Securities Exchange Act of 1934 and the Investment Company Act of 1940, this report has been signed below by the following persons on behalf of the registrant and in the capacities and on the dates indicated.
| | | | |
| | By: | | /s/ John M. Perlowski |
| | | | John M. Perlowski |
| | | | Chief Executive Officer (principal executive officer) of |
| | | | BlackRock California Municipal Series Trust |
Date: July 24, 2024
| | | | |
| | By: | | /s/ Trent Walker |
| | | | Trent Walker |
| | | | Chief Financial Officer (principal financial officer) of |
| | | | BlackRock California Municipal Series Trust |
Date: July 24, 2024