UNITED STATES
SECURITIES AND EXCHANGE COMMISSION
Washington, D.C. 20549
FORM N-CSR
CERTIFIED SHAREHOLDER REPORT OF REGISTERED MANAGEMENT
INVESTMENT COMPANIES
Investment Company Act file number: 811-04264
Name of Fund: BlackRock California Municipal Opportunities Fund of BlackRock California Municipal Series Trust
Fund Address: 100 Bellevue Parkway, Wilmington, DE 19809
Name and address of agent for service: John M. Perlowski, Chief Executive Officer, BlackRock California Municipal Opportunities Fund of BlackRock California Municipal Series Trust, 55 East 52nd Street, New York, NY 10055
Registrant’s telephone number, including area code: (800) 441-7762
Date of fiscal year end: 05/31/2021
Date of reporting period: 05/31/2021
Item 1 – Report to Stockholders
(a) The Report to Shareholders is attached herewith.
| | |
| | |

| | MAY 31, 2021 |
BlackRock California Municipal Series Trust
| · | | BlackRock California Municipal Opportunities Fund |
BlackRock Multi-State Municipal Series Trust
| · | | BlackRock New Jersey Municipal Bond Fund |
| · | | BlackRock Pennsylvania Municipal Bond Fund |
BlackRock Municipal Series Trust
| · | | BlackRock Strategic Municipal Opportunities Fund |
|
| Not FDIC Insured • May Lose Value • No Bank Guarantee |
The Markets in Review
Dear Shareholder,
The 12-month reporting period as of May 31, 2021 was a remarkable period of adaptation and recovery, as the global economy dealt with the implications of the coronavirus (or “COVID-19”) pandemic. The United States, along with most of the world, began the reporting period in a severe recession, prompted by pandemic-related restrictions that disrupted many aspects of daily life. However, easing restrictions and robust government intervention led to a strong rebound, and the economy grew at a significant pace for most of the reporting period, recovering much of the output lost at the beginning of the pandemic.
Equity prices rose with the broader economy, as investors became increasingly optimistic about the economic outlook. Stocks rose through the summer of 2020, fed by strong fiscal and monetary support and positive economic indicators. The implementation of mass vaccination campaigns and passage of an additional $1.9 trillion of fiscal stimulus further boosted stocks, and many equity indices neared or surpassed all-time highs late in the reporting period. In the United States, both large- and small-capitalization stocks posted a significant advance. International equities also gained, as both developed countries and emerging markets rebounded substantially.
The 10-year U.S. Treasury yield (which is inversely related to bond prices) had fallen sharply prior to the beginning of the reporting period, which meant bonds were priced for extreme risk avoidance and economic disruption. Despite expectations of doom and gloom, the economy expanded rapidly, stoking inflation concerns late in the reporting period, which led to higher yields and a negative overall return for most U.S. Treasuries. In the corporate bond market, support from the U.S. Federal Reserve (the “Fed”) assuaged credit concerns and led to substantial returns for high-yield corporate bonds, although investment-grade corporates declined slightly.
The Fed remained committed to accommodative monetary policy by maintaining near zero interest rates and by announcing that inflation could exceed its 2% target for a sustained period without triggering a rate increase. To stabilize credit markets, the Fed also continued purchasing significant quantities of bonds, as did other influential central banks around the world, including the European Central Bank and the Bank of Japan.
Looking ahead, while coronavirus-related disruptions have clearly hindered worldwide economic growth, we believe that the global expansion will continue to accelerate as vaccination efforts ramp up and pent-up consumer demand leads to higher spending. While we expect inflation to increase somewhat as the expansion continues, we believe the recent uptick owes more to temporary supply disruptions than a lasting change in fundamentals. The change in Fed policy also means that moderate inflation is less likely to be followed by interest rate hikes that could threaten the economic expansion.
Overall, we favor a positive stance toward risk, with an overweight in equities. We see U.S. and Asian equities outside of Japan benefiting from structural growth trends in technology, while emerging markets should be particularly helped by a vaccine-led economic expansion and more stable U.S. trade policy. While we are underweight long-term on credit, global high-yield and Asian bonds present attractive opportunities, as do emerging market bonds denominated in local currencies. We believe that international diversification and a focus on sustainability can help provide portfolio resilience, and the disruption created by the coronavirus appears to be accelerating the shift toward sustainable investments.
In this environment, our view is that investors need to think globally, extend their scope across a broad array of asset classes, and be nimble as market conditions change. We encourage you to talk with your financial advisor and visit blackrock.com for further insight about investing in today’s markets.
Sincerely,

Rob Kapito
President, BlackRock Advisors, LLC

Rob Kapito
President, BlackRock Advisors, LLC
| | | | |
| Total Returns as of May 31, 2021 |
| | | 6-Month | | 12-Month |
U.S. large cap equities
(S&P 500® Index) | | 16.95% | | 40.32% |
U.S. small cap equities
(Russell 2000® Index) | | 25.28 | | 64.56 |
International equities
(MSCI Europe, Australasia, Far East Index) | | 15.19 | | 38.41 |
Emerging market equities
(MSCI Emerging Markets Index) | | 15.15 | | 51.00 |
3-month Treasury bills
(ICE BofA 3-Month U.S. Treasury Bill Index) | | 0.04 | | 0.11 |
U.S. Treasury securities
(ICE BofA 10-Year U.S. Treasury Index) | | (6.07) | | (7.30) |
U.S. investment grade bonds (Bloomberg Barclays U.S. Aggregate Bond Index) | | (2.16) | | (0.40) |
Tax-exempt municipal bonds (S&P Municipal Bond Index) | | 1.54 | | 4.70 |
U.S. high yield bonds
(Bloomberg Barclays U.S. Corporate High Yield 2% Issuer Capped Index) | | 4.18 | | 14.90 |
Past performance is not an indication of future results. Index performance is shown for illustrative purposes only. You cannot invest directly in an index. |
| | |
| 2 | | T H I S P A G E I S N O T P A R T O F Y O U R F U N D R E P O R T |
Table of Contents

| | |
| Fund Summary as of May 31, 2021 | | BlackRock California Municipal Opportunities Fund |
Investment Objective
BlackRock California Municipal Opportunities Fund’s (the “Fund”) investment objective is to provide shareholders with income exempt from Federal and California income taxes.
Portfolio Management Commentary
How did the Fund perform?
For the 12-month period ended May 31, 2021, the Fund outperformed its primary benchmark, the S&P® Municipal Bond Index, and its secondary benchmark, the S&P® California Municipal Bond Index. The following discussion of relative performance pertains to the S&P® California Municipal Bond Index.
What factors influenced performance?
Despite rising U.S. Treasury yields, municipal bonds delivered strong returns in the past 12 months. (Prices and yields move in opposite directions.) When the period began in June 2020, the market was still suffering the dislocations caused by COVID-19. However, tax-exempt bonds gradually climbed off of their pandemic-driven lows due to the release of multiple coronavirus vaccines, better-than-expected growth, improving municipal finances and robust investor demand. The prospect of substantial fiscal stimulus and higher taxes were additional tailwinds for the market. These factors led to a decline in yield spreads versus U.S. Treasuries, fueling impressive gains for municipal debt.
California’s municipal market performed well in the period. Despite the pandemic, the state’s credit improved as fears of revenue declines and the outward migration of people looking to avoid higher taxes proved unfounded. California’s financial picture is drastically different from a year ago, when the state was projecting a $54 billion deficit. A booming stock market and high-income earners’ transition to remote work led to significantly increased tax revenues. Reserves are now projected to reach a record $24.4 billion in the 2022 fiscal year. These factors led to elevated demand for the state’s tax-exempt debt, helping yields fall to record-low absolute levels and historical tight credit quality spreads.
The Fund’s positions in longer-maturity securities performed well and outpaced shorter-dated debt. An overweight in utilities was also a positive, as investors favored essential service revenue bonds over general obligations (“GOs”) due to the economic stresses caused by the pandemic. (Revenue bonds are backed by specific revenue streams, whereas GOs are backed by general tax receipts.) Holdings in high yield bonds made a strong contribution, since robust investor demand caused yield spreads to tighten considerably in this market segment.
The Fund used U.S. Treasury futures to manage interest-rate risk, which contributed to results given that Treasury yields rose as the economy recovered. The Fund’s use of leverage also boosted returns by augmenting income and amplifying the effect of rising prices.
The Fund’s cash position, while limited, detracted from performance in the rising market. Positions in higher-quality, lower-coupon bonds, while performing well on an absolute basis, also weighed on relative performance.
Describe recent portfolio activity.
The Fund continued to seek a balance of competitive total return and tax-free income using an active strategy designed to capitalize on credit, yield curve and interest rate trends.
The investment adviser used market volatility as an opportunity to reduce cash reserves and invest in longer-maturity, higher-yielding securities. New purchases were biased toward essential-service revenue bonds over GOs.
During the period, the Fund’s weighting in “green” securities rose. This shift was partially an intentional effort to increase the portfolio’s allocation to this area, together with new classifications of existing holdings.
Describe portfolio positioning at period end.
The Fund’s duration was 5.0 years, one year below the index and down from 6.0 as of November 30, 2020. The shift reflects a move to a more defensive stance due to the strong market performance of the past year. The Fund also continued to pursue risk-management strategies with respect to interest rates given the low absolute level of yields. The Fund maintained a high-quality bias, with an average credit rating of AA, despite an increase in its weighting in high-yield bonds to 19% of assets at the peak. At the end of the period, the Fund had a 5% allocation to high yield. The Fund’s position in taxable bonds stayed even at approximately 5%, and 9.5% of the portfolio was subject to the alternative minimum tax.
The views expressed reflect the opinions of BlackRock as of the date of this report and are subject to change based on changes in market, economic or other conditions. These views are not intended to be a forecast of future events and are no guarantee of future results.
| | |
| 4 | | 2 0 2 1 BLACK ROCK ANNUAL REPORT TO SHAREHOLDERS |
| | |
| Fund Summary as of May 31, 2021 (continued) | | BlackRock California Municipal Opportunities Fund |
TOTAL RETURN BASED ON A $10,000 INVESTMENT
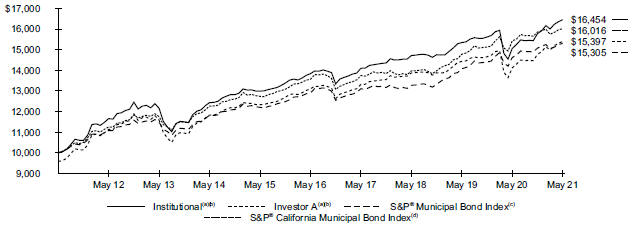
| | (a) | Assuming maximum sales charges, if any, transaction costs and other operating expenses, including advisory fees. Institutional Shares do not have a sales charge. | |
| | (b) | Under normal circumstances, the Fund will invest at least 80% of its assets in California municipal bonds. The Fund’s returns prior to January 26, 2015 are the returns of the Fund when it followed different investment strategies under the name BlackRock California Municipal Bond Fund. | |
| | (c) | The S&P® Municipal Bond Index, a broad, market value-weighted index that seeks to measure the performance of the U.S. municipal bond market. Bonds in the S&P® Municipal Bond Index must have an outstanding par value of at least $2 million and a remaining maturity of not less than one month. | |
| | (d) | The S&P® California Municipal Bond Index, a broad, market value-weighted index that seeks to measure the performance of bonds issued within California. | |
Performance Summary for the Period Ended May 31, 2021
| | | | | | | | | | | | | | | | | | | | | | | | | | | | | | | | | | | | | | | | | | | | | | | | | | | | | | | | |
| | | | | | | | | | | | | | | | | | | Average Annual Total Returns(a)(b) | |
| | | | | | | | | | | | | | | | | | | 1 Year | | | | | 5 Years | | | | | 10 Years | |
| | | Standardized
30-Day Yields | | | | | Unsubsidized
30-Day Yields | | | | | | 6-Month
Total
Returns | | | | | Without
Sales
Charge | | | | | | With
Sales
Charge | | | | | Without
Sales
Charge | | | | | With
Sales
Charge | | | | | Without
Sales
Charge | | | | | With
Sales
Charge | |
Institutional | | | 0.83 | % | | | | | 0.81 | % | | | | | | | 4.30 | % | | | | | 9.26 | % | | | | | | | N/A | | | | | | 3.52 | % | | | | | N/A | | | | | | 5.10 | % | | | | | N/A | |
Investor A | | | 0.57 | | | | | | 0.55 | | | | | | | | 4.26 | | | | | | 9.09 | | | | | | | | 4.45 | % | | | | | 3.29 | | | | | | 2.39 | % | | | | | 4.87 | | | | | | 4.41 | % |
Investor A1 | | | 0.71 | | | | | | 0.69 | | | | | | | | 4.25 | | | | | | 9.25 | | | | | | | | N/A | | | | | | 3.45 | | | | | | N/A | | | | | | 5.02 | | | | | | N/A | |
Investor C | | | (0.15 | ) | | | | | (0.18 | ) | | | | | | | 3.78 | | | | | | 8.17 | | | | | | | | 7.17 | | | | | | 2.49 | | | | | | 2.49 | | | | | | 4.23 | | | | | | 4.23 | |
Class K | | | 0.88 | | | | | | 0.86 | | | | | | | | 4.32 | | | | | | 9.31 | | | | | | | | N/A | | | | | | 3.56 | | | | | | N/A | | | | | | 5.12 | | | | | | N/A | |
S&P® Municipal Bond Index | | | — | | | | | | — | | | | | | | | 1.54 | | | | | | 4.70 | | | | | | | | N/A | | | | | | 3.48 | | | | | | N/A | | | | | | 4.35 | | | | | | N/A | |
S&P® California Municipal Bond | | | | | | | | | | | | | | | | | | | | | | | | | | | | | | | | | | | | | | | | | | | | | | | | | | | | | | | | |
Index | | | — | | | | | | — | | | | | | | | 1.02 | | | | | | 3.83 | | | | | | | | N/A | | | | | | 3.38 | | | | | | N/A | | | | | | 4.82 | | | | | | N/A | |
| | (a) | Assuming maximum sales charges, if any. Average annual total returns with and without sales charges reflect reductions for distribution and service fees. See “About Fund Performance” for a detailed description of share classes, including any related sales charges and fees, and how performance was calculated for certain share classes. | |
| | (b) | Under normal circumstances, the Fund will invest at least 80% of its assets in California municipal bonds. The Fund’s returns prior to January 26, 2015 are the returns of the Fund when it followed different investment strategies under the name BlackRock California Municipal Bond Fund. | |
N/A — Not applicable as the share class and index do not have a sales charge.
Past performance is not an indication of future results.
Performance results may include adjustments made for financial reporting purposes in accordance with U.S. generally accepted accounting principles.
Expense Example
| | | | | | | | | | | | | | | | | | | | | | | | | | | | | | | | | | | | | | | | | | | | | | | | |
| | | Actual | | | | | Hypothetical(a) | | | | | | | | | |
| | | | | | | | | Expenses Paid During the
Period | | | | | | | | Including Interest Expense
and Fees | | | Excluding Interest
Expense
and Fees | | | | | Annualized Expense Ratio | |
| | |
| Beginning
Account
Value
(12/01/20) |
| |
| Ending
Account
Value
(05/31/21) |
| |
| Including
Interest
Expense
and Fees |
(b) | |
| Excluding
Interest
Expense
and Fees |
| | | |
| Beginning
Account
Value
(12/01/20) |
| |
| Ending
Account
Value
(05/31/21) |
| |
| Expenses
Paid
During
the
Period |
(b) | |
| Ending
Account
Value
(05/31/21) |
| |
| Expenses
Paid
During
the
Period |
(b) | | | |
| Including
Interest
Expense
and
Fees |
| |
| Excluding
Interest
Expense
and Fees |
|
Institutional | | $ | 1,000.00 | | | $ | 1,043.00 | | | $ | 2.39 | | | $ | 2.24 | | | | | $ | 1,000.00 | | | $ | 1,022.59 | | | $ | 2.37 | | | $ | 1,022.74 | | | $ | 2.22 | | | | | | 0.47 | % | | | 0.44 | % |
Investor A | | | 1,000.00 | | | | 1,042.60 | | | | 3.62 | | | | 3.46 | | | | | | 1,000.00 | | | | 1,021.39 | | | | 3.58 | | | | 1,021.54 | | | | 3.43 | | | | | | 0.71 | | | | 0.68 | |
Investor A1 | | | 1,000.00 | | | | 1,042.50 | | | | 2.85 | | | | 2.70 | | | | | | 1,000.00 | | | | 1,022.14 | | | | 2.82 | | | | 1,022.29 | | | | 2.67 | | | | | | 0.56 | | | | 0.53 | |
Investor C | | | 1,000.00 | | | | 1,037.80 | | | | 7.47 | | | | 7.32 | | | | | | 1,000.00 | | | | 1,017.60 | | | | 7.39 | | | | 1,017.75 | | | | 7.24 | | | | | | 1.47 | | | | 1.44 | |
| | |
| Fund Summary as of May 31, 2021 (continued) | | BlackRock California Municipal Opportunities Fund |
Expense Example (continued)
| | | | | | | | | | | | | | | | | | | | | | | | | | | | | | | | | | | | | | | | | | | | | | | | |
| | | Actual | | | | | | Hypothetical(a) | | | | |
| | | | | | | | | Expenses Paid During the
Period | | | | | | | | | Including Interest Expense
and Fees | | | Excluding Interest Expense
and Fees | | | Annualized Expense
Ratio | |
| | |
| Beginning
Account
Value
(12/01/20) |
| |
| Ending
Account
Value
(05/31/21) |
| |
| Including
Interest Expense and Fees |
(b) | |
| Excluding
Interest
Expense
and Fees |
| | | | | |
| Beginning
Account
Value
(12/01/20) |
| |
| Ending
Account
Value
(05/31/21) |
| |
| Expenses
Paid
Duringthe
Period |
(b) | |
| Ending
Account
Value
(05/31/21) |
| |
| Expenses
Paid
During the
Period |
(b) | |
| Including
Interest
Expense
and Fees |
| |
| Excluding
Interest
Expense
and Fees |
|
Class K | | $ | 1,000.00 | | | $ | 1,043.20 | | | $ | 2.14 | | | $ | 1.99 | | | | | | | $ | 1,000.00 | | | $ | 1,022.84 | | | $ | 2.12 | | | $ | 1,022.99 | | | $ | 1.97 | | | | 0.42 | % | | | 0.39 | % |
| | (a) | Hypothetical 5% annual return before expenses is calculated by prorating the number of days in the most recent fiscal half year divided by 365. | |
| | (b) | For each class of the Fund, expenses are equal to the annualized expense ratio for the class, multiplied by the average account value over the period, multiplied by 182/365 (to reflect the six-month period shown). | |
See “Disclosure of Expenses” for further information on how expenses were calculated.
Portfolio Information
SECTOR ALLOCATION
| | | | |
| Sector(a)(b) | | Percent of
Total Investments | |
County/City/Special District/School District | | | 38 | % |
Utilities | | | 23 | |
Transportation | | | 13 | |
State | | | 10 | |
Education | | | 9 | |
Tobacco | | | 4 | |
Health | | | 3 | |
Other* | | | — | (c) |
CREDIT QUALITY ALLOCATION
| | | | |
| Credit Rating(a)(e) | | Percent of
Total Investments | |
AAA/Aaa | | | 15 | % |
AA/Aa | | | 55 | |
A | | | 8 | |
BBB/Baa | | | 1 | |
BB/Ba | | | 2 | |
B | | | — | (c) |
C | | | 2 | |
N/R(f) | | | 17 | |
CALL/MATURITY SCHEDULE
| | | | |
| Calendar Year Ended December 31,(a)(d) | | Percentage | |
2021 | | | 5 | % |
2022 | | | 3 | |
2023 | | | 1 | |
2024 | | | 11 | |
2025 | | | 3 | |
| (a) | Excludes short-term securities. |
| (b) | For Fund compliance purposes, the Fund’s sector classifications refer to one or more of the sector sub-classifications used by one or more widely recognized market indexes or rating group indexes, and/or as defined by the investment adviser. These definitions may not apply for purposes of this report, which may combine such sector sub-classifications for reporting ease. |
| (c) | Rounds to less than 1% of total investments. |
| (d) | Scheduled maturity dates and/or bonds that are subject to potential calls by issuers over the next five years. |
| (e) | For financial reporting purposes, credit quality ratings shown above reflect the highest rating assigned by either S&P Global Ratings or Moody’s Investors Service, Inc. if ratings differ. These rating agencies are independent, nationally recognized statistical rating organizations and are widely used. Investment grade ratings are credit ratings of BBB/Baa or higher. Below investment grade ratings are credit ratings of BB/Ba or lower. Investments designated N/R are not rated by either rating agency. Unrated investments do not necessarily indicate low credit quality. Credit quality ratings are subject to change. |
| (f) | The investment adviser evaluates the credit quality of unrated investments based upon certain factors including, but not limited to, credit ratings for similar investments and financial analysis of sectors and individual investments. Using this approach, the investment adviser has deemed certain of these unrated securities as investment grade quality. As of May 31, 2021, the market value of unrated securities deemed by the investment adviser to be investment grade represents 2% of the Fund’s total investments. |
| * | Includes one or more investment categories that individually represents less than 1% of the Fund’s total investments. Please refer to the Schedule of Investments for details. |
| | |
| 6 | | 2 0 2 1 BLACK ROCK ANNUAL REPORT TO SHAREHOLDERS |
| | |
| Fund Summary as of May 31, 2021 | | BlackRock New Jersey Municipal Bond Fund |
Investment Objective
BlackRock New Jersey Municipal Bond Fund’s (the “Fund”) investment objective is to provide shareholders with income exempt from Federal income tax and New Jersey personal income taxes.
Portfolio Management Commentary
How did the Fund perform?
For the 12-month period ended May 31, 2021, the Fund outperformed its primary benchmark, the S&P® Municipal Bond Index, but it underperformed its secondary benchmark, the Custom New Jersey Index. The following discussion of relative performance pertains to the Custom New Jersey Index.
What factors influenced performance?
Despite rising U.S. Treasury yields, municipal bonds delivered strong returns in the past 12 months. (Prices and yields move in opposite directions.) When the period began in June 2020, the market was still suffering the dislocations caused by COVID-19. However, tax-exempt bonds gradually climbed off of their pandemic-driven lows due to the release of multiple coronavirus vaccines, better-than-expected growth, improving municipal finances and robust investor demand. The prospect of substantial fiscal stimulus and higher taxes were additional tailwinds for the market. These factors led to a decline in yield spreads versus U.S. Treasuries, fueling impressive gains for municipal debt.
New Jersey’s credit fundamentals improved over the course of the period, and—in the view of the investment adviser—exceed pre-pandemic levels due in part to the American Rescue Plan Act. The aid far exceeded the revenue lost from the economic downturn. Moreover, revenues did not fall nearly as much as originally projected by the state. Revenue recovery has been evident as the state has rolled back occupancy guidelines at hospitality and leisure venues, such as restaurants, bars and sporting events. New Jersey’s positive credit features include its large economic base, high wealth levels, broad revenue base and meaningful balanced budget requirement. However, the state still needs to address longer-term issues such as high overall leverage and unfunded pension and retiree health care benefits.
The Fund delivered positive absolute returns for the period, but a few factors caused it to underperform the Custom New Jersey Index. Most notably, underweight positions in the local tax-backed and tobacco sectors detracted from results. In addition, the Fund was hurt by its underweights in AAA rated and pre-refunded debt, as well as its underweight in bonds with maturities of ten years and below.
On the other hand, the Fund’s credit positioning contributed to relative performance. Following the pandemic-induced market declines in March 2020, the investment adviser trimmed positions that it felt presented outsized risks and added bonds that it believed had durable cash flows and the ability to withstand the economic downturn. Believing lower-quality issues would be a source of outperformance, the investment adviser maintained an overweight in revenue sectors over tax-backed sectors and retained overweights in bonds rated BBB and below. It also kept an overweight in Puerto Rico, which outperformed the New Jersey state market. Together, these elements of the Fund’s positioning helped it capture the key credit trends that characterized the past 12 months.
The Fund used U.S. Treasury futures to manage interest-rate risk, which contributed to results given that Treasury yields rose as the economy recovered. The Fund’s use of leverage also boosted returns by augmenting income and amplifying the effect of rising prices.
Describe recent portfolio activity.
The Fund actively managed its credit and duration positioning in an effort to capitalize on potential market opportunities. (Duration is a measure of interest rate sensitivity.)
Describe portfolio positioning at period end.
At times during the period, the Fund’s cash position was greater than 5%. This did not have any material impact on Fund performance since the cash weighting was below this level for the majority of the period. The decline in New Jersey state-specific bond issuance, coupled with holdings that matured or were called away, temporarily led to the elevated level of cash.
The Fund’s duration was above that of the benchmark, and it had a lower average credit quality. This positioning reflected the investment adviser’s effort to capture the potential for continued strength in the municipal market stemming from a favorable supply-and-demand outlook and unprecedented fiscal stimulus.
The views expressed reflect the opinions of BlackRock as of the date of this report and are subject to change based on changes in market, economic or other conditions. These views are not intended to be a forecast of future events and are no guarantee of future results.
| | |
| Fund Summary as of May 31, 2021 (continued) | | BlackRock New Jersey Municipal Bond Fund |
TOTAL RETURN BASED ON A $10,000 INVESTMENT
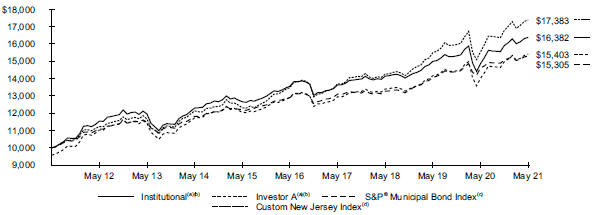
| | (a) | Assuming maximum sales charges, if any, transaction costs and other operating expenses, including advisory fees. Institutional Shares do not have a sales charge. | |
| | (b) | The Fund invests primarily in a portfolio of long-term investment grade New Jersey municipal bonds. | |
| | (c) | The S&P® Municipal Bond Index, a broad, market value-weighted index that seeks to measure the performance of the U.S. municipal bond market. Bonds in the S&P® Municipal Bond Index must have an outstanding par value of at least $2 million and a remaining maturity of not less than one month. | |
| | (d) | The Custom New Jersey Index is a customized benchmark that reflects the returns of the S&P® New Jersey Municipal Bond Index for periods prior to January 1, 2013, and the returns of only those New Jersey bonds in the S&P® New Jersey Municipal Bond Index that have maturities greater than 5 years for periods subsequent to January 1, 2013. | |
Performance Summary for the Period Ended May 31, 2021
| | | | | | | | | | | | | | | | | | | | | | | | | | | | | | | | | | | | |
| | | | | | | | | | | | Average Annual Total Returns(a) | |
| | | | | | | | | | | | 1 Year | | | 5 Years | | | 10 Years | |
| | | Standardized
30-Day Yields | | | Unsubsidized
30-Day Yields | | | 6-Month
Total
Returns | | | Without
Sales
Charge | | | With
Sales
Charge | | | Without
Sales
Charge | | | With
Sales
Charge | | | Without
Sales
Charge | | | With
Sales
Charge | |
Institutional | | | 1.07 | % | | | 0.85 | % | | | 2.99 | % | | | 10.23 | % | | | N/A | | | | 3.85 | % | | | N/A | | | | 5.06 | % | | | N/A | |
Service | | | 0.82 | | | | 0.60 | | | | 2.86 | | | | 9.96 | | | | N/A | | | | 3.60 | | | | N/A | | | | 4.88 | | | | N/A | |
Investor A | | | 0.79 | | | | 0.63 | | | | 2.86 | | | | 9.96 | | | | 5.28 | % | | | 3.61 | | | | 2.71 | % | | | 4.87 | | | | 4.41 | % |
Investor A1 | | | 0.93 | | | | 0.78 | | | | 2.94 | | | | 10.12 | | | | N/A | | | | 3.76 | | | | N/A | | | | 5.02 | | | | N/A | |
Investor C | | | 0.08 | | | | (0.09 | ) | | | 2.57 | | | | 9.14 | | | | 8.14 | | | | 2.83 | | | | 2.83 | | | | 4.24 | | | | 4.24 | |
Class K | | | 1.12 | | | | 0.96 | | | | 3.11 | | | | 10.39 | | | | N/A | | | | 3.89 | | | | N/A | | | | 5.08 | | | | N/A | |
S&P® Municipal Bond Index | | | — | | | | — | | | | 1.54 | | | | 4.70 | | | | N/A | | | | 3.48 | | | | N/A | | | | 4.35 | | | | N/A | |
Custom New Jersey Index | | | — | | | | — | | | | 3.61 | | | | 11.85 | | | | N/A | | | | 5.22 | | | | N/A | | | | 5.68 | | | | N/A | |
| | (a) | Assuming maximum sales charges, if any. Average annual total returns with and without sales charges reflect reductions for distribution and service fees. See “About Fund Performance” for a detailed description of share classes, including any related sales charges and fees, and how performance was calculated for certain share classes. | |
N/A — Not applicable as the share class and index do not have a sales charge.
Past performance is not an indication of future results.
Performance results may include adjustments made for financial reporting purposes in accordance with U.S. generally accepted accounting principles.
Expense Example
| | | | | | | | | | | | | | | | | | | | | | | | | | | | | | | | | | | | | | | | | | | | | | | | |
| | | Actual | | | | | | Hypothetical(a) | | | | | | | |
| | | | | | | | | Expenses Paid During the
Period | | | | | | | | | Including Interest Expense
and Fees | | | Excluding Interest Expense
and Fees | | | Annualized Expense
Ratio | |
| | |
| Beginning
Account
Value
(12/01/20) |
| |
| Ending
Account
Value
(05/31/21) |
| |
| Including
Interest
Expense
and Fees |
(b) | |
| Excluding
Interest
Expense
and Fees |
| | | | | |
| Beginning
Account
Value
(12/01/20) |
| |
| Ending
Account
Value
(05/31/21) |
| |
| Expenses
Paid
During the
Period |
(b) | |
| Ending
Account
Value
(05/31/21) |
| |
| Expenses
Paid
During the
Period |
(b) | |
| Including
Interest
Expense
and Fees |
| |
| Excluding
Interest
Expense
and Fees |
|
Institutional | | $ | 1,000.00 | | | $ | 1,029.90 | | | $ | 2.78 | | | $ | 2.63 | | | | | | | $ | 1,000.00 | | | $ | 1,022.19 | | | $ | 2.77 | | | $ | 1,022.34 | | | $ | 2.62 | | | | 0.55 | % | | | 0.52 | % |
Service | | | 1,000.00 | | | | 1,028.60 | | | | 4.05 | | | | 3.89 | | | | | | | | 1,000.00 | | | | 1,020.94 | | | | 4.03 | | | | 1,021.09 | | | | 3.88 | | | | 0.80 | | | | 0.77 | |
Investor A | | | 1,000.00 | | | | 1,028.60 | | | | 4.05 | | | | 3.89 | | | | | | | | 1,000.00 | | | | 1,020.94 | | | | 4.03 | | | | 1,021.09 | | | | 3.88 | | | | 0.80 | | | | 0.77 | |
Investor A1 | | | 1,000.00 | | | | 1,029.40 | | | | 3.29 | | | | 3.14 | | | | | | | | 1,000.00 | | | | 1,021.69 | | | | 3.28 | | | | 1,021.84 | | | | 3.13 | | | | 0.65 | | | | 0.62 | |
Investor C | | | 1,000.00 | | | | 1,025.70 | | | | 7.83 | | | | 7.68 | | | | | | | | 1,000.00 | | | | 1,017.20 | | | | 7.80 | | | | 1,017.35 | | | | 7.64 | | | | 1.55 | | | | 1.52 | |
| | |
| 8 | | 2 0 2 1 BLACK ROCK ANNUAL REPORT TO SHAREHOLDERS |
| | |
| Fund Summary as of May 31, 2021 (continued) | | BlackRock New Jersey Municipal Bond Fund |
Expense Example (continued)
| | | | | | | | | | | | | | | | | | | | | | | | | | | | | | | | | | | | | | | | | | | | | | | | |
| | | Actual | | | | | | Hypothetical(a) | | | | | | | |
| | | | | | | | | Expenses Paid During the
Period | | | | | | | | | Including Interest Expense
and Fees | | | Excluding Interest Expense
and Fees | | | Annualized Expense
Ratio | |
| | |
| Beginning
Account
Value
(12/01/20) |
| |
| Ending
Account
Value
(05/31/21) |
| |
| Including
Interest
Expense
and Fees |
(b) | |
| Excluding
Interest
Expense
and Fees |
| | | | | |
| Beginning
Account
Value
(12/01/20) |
| |
| Ending
Account
Value
(05/31/21) |
| |
| Expenses
Paid
During the
Period |
(b) | |
| Ending
Account
Value
(05/31/21) |
| |
| Expenses
Paid
During the
Period |
(b) | |
| Including
Interest
Expense
and Fees |
| |
| Excluding
Interest
Expense
and Fees |
|
Class K | | $ | 1,000.00 | | | $ | 1,031.10 | | | $ | 2.53 | | | $ | 2.38 | | | | | | | $ | 1,000.00 | | | $ | 1,022.44 | | | $ | 2.52 | | | $ | 1,022.59 | | | $ | 2.37 | | | | 0.50 | % | | | 0.47 | % |
| | (a) | Hypothetical 5% annual return before expenses is calculated by prorating the number of days in the most recent fiscal half year divided by 365. | |
| | (b) | For each class of the Fund, expenses are equal to the annualized expense ratio for the class, multiplied by the average account value over the period, multiplied by 182/365 (to reflect the six-month period shown). | |
See “Disclosure of Expenses” for further information on how expenses were calculated.
Portfolio Information
SECTOR ALLOCATION
| | | | |
| Sector(a)(b) | | Percent of
Total Investments | |
State | | | 23 | % |
County/City/Special District/School District | | | 21 | |
Transportation | | | 18 | |
Health | | | 15 | |
Education | | | 14 | |
Utilities | | | 3 | |
Corporate | | | 2 | |
Housing | | | 2 | |
Tobacco | | | 2 | |
CREDIT QUALITY ALLOCATION
| | | | | | | | |
| Credit Rating(a)(d) | | | | | Percent of
Total
Investments | |
AAA/Aaa | | | | | | | 5 | % |
AA/Aa | | | | | | | 38 | |
A | | | | | | | 21 | |
BBB/Baa | | | | | | | 28 | |
BB/Ba | | | | | | | 3 | |
B | | | | | | | — | (f) |
C | | | | | | | — | (f) |
N/R(e) | | | | | | | 5 | |
CALL/MATURITY SCHEDULE
| | | | |
| Calendar Year Ended December 31,(a)(c) | | Percentage | |
2021 | | | 7 | % |
2022 | | | 3 | |
2023 | | | 4 | |
2024 | | | 13 | |
2027 | | | 1 | |
| (a) | Excludes short-term securities. |
| (b) | For Fund compliance purposes, the Fund’s sector classifications refer to one or more of the sector sub-classifications used by one or more widely recognized market indexes or rating group indexes, and/or as defined by the investment adviser. These definitions may not apply for purposes of this report, which may combine such sector sub-classifications for reporting ease. |
| (c) | Scheduled maturity dates and/or bonds that are subject to potential calls by issuers over the next five years. |
| (d) | For financial reporting purposes, credit quality ratings shown above reflect the highest rating assigned by either S&P Global Ratings or Moody’s Investors Service, Inc. if ratings differ. These rating agencies are independent, nationally recognized statistical rating organizations and are widely used. Investment grade ratings are credit ratings of BBB/Baa or higher. Below investment grade ratings are credit ratings of BB/Ba or lower. Investments designated N/R are not rated by either rating agency. Unrated investments do not necessarily indicate low credit quality. Credit quality ratings are subject to change. |
| (e) | The investment adviser evaluates the credit quality of unrated investments based upon certain factors including, but not limited to, credit ratings for similar investments and financial analysis of sectors and individual investments. Using this approach, the investment adviser has deemed certain of these unrated securities as investment grade quality. As of May 31, 2021, the market value of unrated securities deemed by the investment adviser to be investment grade represents less than 1% of the Fund’s total investments. |
| (f) | Rounds to less than 1% of total investments. |
| | |
| Fund Summary as of May 31, 2021 | | BlackRock Pennsylvania Municipal Bond Fund |
Investment Objective
BlackRock Pennsylvania Municipal Bond Fund’s (the “Fund”) investment objective is to provide shareholders with income exempt from Federal income tax and Pennsylvania personal income taxes.
Portfolio Management Commentary
How did the Fund perform?
For the 12-month period ended May 31, 2021, the Fund outperformed both its primary benchmark, the S&P® Municipal Bond Index, and its secondary benchmark, the Custom Pennsylvania Index. The following discussion of relative performance pertains to the Custom Pennsylvania Index.
What factors influenced performance?
Despite rising U.S. Treasury yields, municipal bonds delivered strong returns in the past 12 months. (Prices and yields move in opposite directions.) When the period began in June 2020, the market was still suffering the dislocations caused by COVID-19. However, tax-exempt bonds gradually climbed off of their pandemic-driven lows due to the release of multiple coronavirus vaccines, better-than-expected growth, improving municipal finances and robust investor demand. The prospect of substantial fiscal stimulus and higher taxes were additional tailwinds for the market. These factors led to a decline in yield spreads versus U.S. Treasuries, fueling impressive gains for municipal debt.
Pennsylvania’s credit fundamentals improved over the course of the period, and—in the view of the investment adviser—exceed pre-pandemic levels due in part to the American Rescue Plan Act. The aid far exceeded the revenue lost from the economic downturn. Moreover, revenues did not fall nearly as much as originally projected by the state. While Pennsylvania’s near-term financial picture has stabilized, the pressures from high leverage, thin reserves, and structural imbalances remain adverse factors in the longer-term credit outlook.
The Fund’s credit positioning contributed to relative performance. Following the pandemic-induced market declines in March 2020, the investment adviser trimmed positions that it felt presented outsized risks and added bonds that it believed had durable cash flows and the ability to withstand the economic downturn. Believing lower-quality issues would be a source of outperformance, the investment adviser maintained an overweight in revenue sectors over tax-backed sectors and retained overweights in bonds rated BBB and below. It also kept an overweight in Puerto Rico, which outperformed the Pennsylvania state market. Together, these elements of the Fund’s positioning helped it capture the key credit trends that characterized the past 12 months.
The Fund used U.S. Treasury futures to manage interest-rate risk, which contributed to results given that Treasury yields rose as the economy recovered. The Fund’s use of leverage also boosted returns by augmenting income and amplifying the effect of rising prices.
Although the Fund delivered positive absolute returns for the period, a few factors detracted from results. Most notably, an underweight in the local tax-backed sector weighed on relative performance. In addition, the Fund was hurt by its underweight positions in AAA rated and pre-refunded debt, as well as its underweight in bonds with maturities of ten years and below.
Describe recent portfolio activity.
The investment adviser put cash to work by adding to Pennsylvania state general obligation bonds and high-grade hospital debt. It also added to the Fund’s position in the transportation sector through purchases of both Philadelphia airport and Pennsylvania turnpike issues. The portfolio’s duration increased as a result of these shifts. (Duration is a measure of interest rate sensitivity.)
Describe portfolio positioning at period end.
By period end, the Fund’s duration was above that of the benchmark, and it had a lower average credit quality. This positioning reflected the investment adviser’s effort to capture the potential for continued strength in the municipal market stemming from a favorable supply-and-demand outlook and unprecedented fiscal stimulus.
The views expressed reflect the opinions of BlackRock as of the date of this report and are subject to change based on changes in market, economic or other conditions. These views are not intended to be a forecast of future events and are no guarantee of future results.
| | |
| 10 | | 2 0 2 1 BLACK ROCK ANNUAL REPORT TO SHAREHOLDERS |
| | |
| Fund Summary as of May 31, 2021 (continued) | | BlackRock Pennsylvania Municipal Bond Fund |
TOTAL RETURN BASED ON A $10,000 INVESTMENT
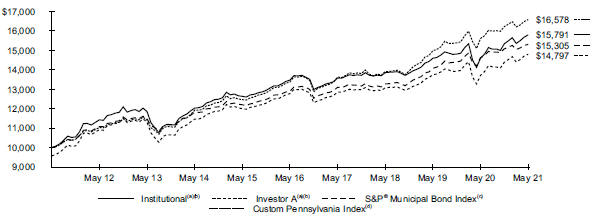
| | (a) | Assuming maximum sales charges, if any, transaction costs and other operating expenses, including advisory fees. Institutional Shares do not have a sales charge. | |
| | (b) | The Fund invests primarily in a portfolio of long-term investment grade Pennsylvania municipal bonds. | |
| | (c) | The S&P® Municipal Bond Index, a broad, market value-weighted index that seeks to measure the performance of the U.S. municipal bond market. Bonds in the S&P® Municipal Bond Index must have an outstanding par value of at least $2 million and a remaining maturity of not less than one month. | |
| | (d) | The Custom Pennsylvania Index is a customized benchmark that reflects the returns of the S&P® Pennsylvania Municipal Bond Index for periods prior to January 1, 2013, and the returns of only those Pennsylvania bonds in the S&P® Pennsylvania Municipal Bond Index that have maturities greater than 5 years for periods subsequent to January 1, 2013. | |
Performance Summary for the Period Ended May 31, 2021
| | | | | | | | | | | | | | | | | | | | | | | | | | | | | | | | | | | | |
| | | | | | | | | | | | Average Annual Total Returns(a) | |
| | | | | | | | | | | | 1 Year | | | 5 Years | | | 10 Years | |
| | | Standardized
30-Day Yields | | | Unsubsidized
30-Day Yields | | | 6-Month
Total
Returns | | | Without
Sales
Charge | | | With
Sales
Charge | | | Without
Sales
Charge | | | With
Sales
Charge | | | Without
Sales
Charge | | | With
Sales
Charge | |
Institutional | | | 1.17 | % | | | 0.96 | % | | | 2.99 | % | | | 8.20 | % | | | N/A | | | | 3.23 | % | | | N/A | | | | 4.67 | % | | | N/A | |
Service | | | 0.92 | | | | 0.75 | | | | 2.86 | | | | 7.93 | | | | N/A | | | | 2.98 | | | | N/A | | | | 4.46 | | | | N/A | |
Investor A | | | 0.89 | | | | 0.78 | | | | 2.86 | | | | 7.93 | | | | 3.34 | % | | | 2.98 | | | | 2.09 | % | | | 4.45 | | | | 4.00 | % |
Investor A1 | | | 1.03 | | | | 0.88 | | | | 2.94 | | | | 7.99 | | | | N/A | | | | 3.12 | | | | N/A | | | | 4.61 | | | | N/A | |
Investor C | | | 0.18 | | | | 0.05 | | | | 2.48 | | | | 7.12 | | | | 6.12 | | | | 2.21 | | | | 2.21 | | | | 3.81 | | | | 3.81 | |
Class K | | | 1.23 | | | | 1.11 | | | | 3.01 | | | | 8.25 | | | | N/A | | | | 3.27 | | | | N/A | | | | 4.69 | | | | N/A | |
S&P® Municipal Bond Index | | | — | | | | — | | | | 1.54 | | | | 4.70 | | | | N/A | | | | 3.48 | | | | N/A | | | | 4.35 | | | | N/A | |
Custom Pennsylvania Index | | | — | | | | — | | | | 2.23 | | | | 6.24 | | | | N/A | | | | 4.39 | | | | N/A | | | | 5.18 | | | | N/A | |
| | (a) | Assuming maximum sales charges, if any. Average annual total returns with and without sales charges reflect reductions for distribution and service fees. See “About Fund Performance” for a detailed description of share classes, including any related sales charges and fees, and how performance was calculated for certain share classes. | |
N/A — Not applicable as the share class and index do not have a sales charge. Past performance is not an indication of future results.
Performance results may include adjustments made for financial reporting purposes in accordance with U.S. generally accepted accounting principles.
Expense Example
| | | | | | | | | | | | | | | | | | | | | | | | | | | | | | | | | | | | | | | | | | | | | | | | |
| | | Actual | | | | | | Hypothetical(a) | | | | | | | |
| | | | | | | | | Expenses Paid During the
Period | | | | | | | | | Including Interest
Expense
and Fees | | | Excluding Interest
Expense
and Fees | | | Annualized Expense Ratio | |
| | | Beginning
Account
Value
(12/01/20) | | | Ending
Account
Value
(05/31/21) | | | Including
Interest
Expense
and Fees(b) | | | Excluding
Interest
Expense
and Fees | | | | | | Beginning
Account
Value
(12/01/20) | | | Ending
Account
Value
(05/31/21) | | | Expenses
Paid
During
the
Period(b) | | | Ending
Account
Value (05/31/21) | | | Expenses
Paid
During
the
Period(b) | | | Including
Interest
Expense
and Fees | | | Excluding
Interest
Expense
and Fees | |
Institutional | | $ | 1,000.00 | | | $ | 1,029.90 | | | $ | 3.04 | | | $ | 2.73 | | | | | | | $ | 1,000.00 | | | $ | 1,021.94 | | | $ | 3.02 | | | $ | 1,022.24 | | | $ | 2.72 | | | | 0.60 | % | | | 0.54 | % |
Service | | | 1,000.00 | | | | 1,028.60 | | | | 4.30 | | | | 4.00 | | | | | | | | 1,000.00 | | | | 1,020.69 | | | | 4.28 | | | | 1,020.99 | | | | 3.98 | | | | 0.85 | | | | 0.79 | |
Investor A | | | 1,000.00 | | | | 1,028.60 | | | | 4.30 | | | | 3.94 | | | | | | | | 1,000.00 | | | | 1,020.69 | | | | 4.28 | | | | 1,021.04 | | | | 3.93 | | | | 0.85 | | | | 0.78 | |
Investor A1 | | | 1,000.00 | | | | 1,029.40 | | | | 3.54 | | | | 3.24 | | | | | | | | 1,000.00 | | | | 1,021.44 | | | | 3.53 | | | | 1,021.74 | | | | 3.23 | | | | 0.70 | | | | 0.64 | |
Investor C | | | 1,000.00 | | | | 1,024.80 | | | | 8.08 | | | | 7.77 | | | | | | | | 1,000.00 | | | | 1,016.95 | | | | 8.05 | | | | 1,017.25 | | | | 7.74 | | | | 1.60 | | | | 1.54 | |
| | |
| Fund Summary as of May 31, 2021 (continued) | | BlackRock Pennsylvania Municipal Bond Fund |
Expense Example (continued)
| | | | | | | | | | | | | | | | | | | | | | | | | | | | | | | | | | | | | | | | | | | | | | | | |
| | | Actual | | | | | | Hypothetical(a) | | | | | | | |
| | | | | | | | | Expenses Paid During the
Period | | | | | | | | | Including Interest Expense
and Fees | | | Excluding Interest Expense
and Fees | | | Annualized Expense Ratio | |
| | |
| Beginning
Account
Value
(12/01/20) |
| |
| Ending
Account
Value
(05/31/21) |
| |
| Including
Interest
Expense
and Fees |
(b) | |
| Excluding
Interest
Expense
and Fees |
| | | | | |
| Beginning
Account
Value
(12/01/20) |
| |
| Ending
Account
Value
(05/31/21) |
| |
| Expenses
Paid
During the
Period |
(b) | |
| Ending
Account
Value
(05/31/21) |
| |
| Expenses
Paid
During the
Period |
(b) | |
| Including
Interest
Expense
and Fees |
| |
| Excluding
Interest
Expense
and Fees |
|
Class K | | $ | 1,000.00 | | | $ | 1,030.10 | | | $ | 2.78 | | | $ | 2.48 | | | | | | | $ | 1,000.00 | | | $ | 1,022.19 | | | $ | 2.77 | | | $ | 1,022.49 | | | $ | 2.47 | | | | 0.55 | % | | | 0.49 | % |
| | (a) | Hypothetical 5% annual return before expenses is calculated by prorating the number of days in the most recent fiscal half year divided by 365. |
| | (b) | For each class of the Fund, expenses are equal to the annualized expense ratio for the class, multiplied by the average account value over the period, multiplied by 182/365 (to reflect the six-month period shown). |
See “Disclosure of Expenses” for further information on how expenses were calculated.
Portfolio Information
SECTOR ALLOCATION
| | | | |
| Sector(a)(b) | | Percent of
Total Investments | |
Health | | | 24 | % |
County/City/Special District/School District | | | 20 | |
Education | | | 14 | |
Transportation | | | 14 | |
State | | | 12 | |
Utilities | | | 7 | |
Corporate | | | 5 | |
Housing | | | 3 | |
Tobacco | | | 1 | |
CREDIT QUALITY ALLOCATION
| | | | |
| Credit Rating(a)(d) | | Percent of
Total Investments | |
AAA/Aaa | | | — | %(e) |
AA/Aa | | | 47 | |
A. | | | 28 | |
BBB/Baa | | | 6 | |
BB/Ba | | | 3 | |
B | | | — | (e) |
CCC/Caa | | | 1 | |
C | | | 1 | |
N/R(f) | | | 14 | |
| | | | |
| CALL/MATURITY SCHEDULE | |
| Calendar Year Ended December 31,(a)(c) | | Percentage | |
2021 | | | 5 | % |
2022 | | | 2 | |
2023 | | | 2 | |
2024 | | | 3 | |
2025 | | | 8 | |
| (a) | | Excludes short-term securities. |
| (b) | | For Fund compliance purposes, the Fund’s sector classifications refer to one or more of the sector sub-classifications used by one or more widely recognized market indexes or rating group indexes, and/or as defined by the investment adviser. These definitions may not apply for purposes of this report, which may combine such sector sub-classifications for reporting ease. |
| (c) | | Scheduled maturity dates and/or bonds that are subject to potential calls by issuers over the next five years. |
| (d) | | For financial reporting purposes, credit quality ratings shown above reflect the highest rating assigned by either S&P Global Ratings or Moody’s Investors Service, Inc. if ratings differ. These rating agencies are independent, nationally recognized statistical rating organizations and are widely used. Investment grade ratings are credit ratings of BBB/Baa or higher. Below investment grade ratings are credit ratings of BB/Ba or lower. Investments designated N/R are not rated by either rating agency. Unrated investments do not necessarily indicate low credit quality. Credit quality ratings are subject to change. |
| (e) | | Rounds to less than 1% of total investments. |
| (f) | | The investment adviser evaluates the credit quality of unrated investments based upon certain factors including, but not limited to, credit ratings for similar investments and financial analysis of sectors and individual investments. Using this approach, the investment adviser has deemed certain of these unrated securities as investment grade quality. As of May 31, 2021, the market value of unrated securities deemed by the investment adviser to be investment grade represents 2% of the Fund’s total investments. |
| | |
| 12 | | 2 0 2 1 BLACK ROCK ANNUAL REPORT TO SHAREHOLDERS |
| | |
| Fund Summary as of May 31, 2021 | | BlackRock Strategic Municipal Opportunities Fund |
Investment Objective
BlackRock Strategic Municipal Opportunities Fund’s (the “Fund”) investment objective is to provide shareholders with a high level of income exempt from Federal income taxes.
Portfolio Management Commentary
How did the Fund perform?
For the 12-month period ended May 31, 2021, the Fund outperformed its primary benchmark, the S&P® Municipal Bond Index, as well as its custom blended secondary benchmark, comprised of 65% S&P® Municipal Bond Investment Grade Index, 30% S&P® Municipal Bond High Yield Index and 5% Bloomberg Barclays Taxable Municipal: U.S. Aggregate Eligible Index. The following discussion of relative performance pertains to the custom blended benchmark.
What factors influenced performance?
Despite rising U.S. Treasury yields, municipal bonds delivered strong returns in the past 12 months. (Prices and yields move in opposite directions.) When the period began in June 2020, the market was still suffering the dislocations caused by COVID-19. However, tax-exempt bonds gradually climbed off of their pandemic-driven lows due to the release of multiple coronavirus vaccines, better-than-expected growth, improving municipal finances and robust investor demand. The prospect of substantial fiscal stimulus and higher taxes were additional tailwinds for the market. These factors led to a decline in yield spreads versus U.S. Treasuries, fueling impressive gains for municipal debt.
The Fund’s duration management, security selection and sector allocation were the leading drivers of outperformance. (Duration is a measure of interest rate sensitivity.) With respect to security selection, the strongest performance occurred in the tax-backed state, utilities and school district sectors. In terms of sector allocation, overweight positions in the housing and transportation sectors contributed positively. An overweight in BBB rated securities, as well as those rated below investment grade, was also additive.
The Fund’s yield curve positioning detracted from performance, as did an underweight in non-rated securities.
The Fund used U.S. Treasury futures to manage interest-rate risk, which contributed to results given that Treasury yields rose as the economy recovered.
Describe recent portfolio activity.
The Fund opened the period with a duration of 6.94 years and closed with a duration of 6.99 years.
At the beginning of the period, the Fund’s largest sector weightings were in housing, transportation and health care. The investment adviser subsequently increased the portfolio’s allocation to tax-backed issues and reduced its weightings in the housing sector.
The Fund maintained a quality bias in the investment-grade category, with its largest allocations to the AA and A rating tiers. About 24% of the Fund’s assets were in high yield (below investment grade) bonds, up from 22% at the end of May 2020, with the majority in the tobacco sector and Puerto Rico.
The Fund held an allocation of approximately 44% in bonds with maturities of 20 years and above, down from 57% at the beginning of the period. Its weighting in taxable securities was 7%, versus 5% at the end of May 2020.
The Fund paired its largely neutral duration with a barbell yield curve strategy to balance the potential for both rising interest rates and continued outperformance for municipals. The management team sought opportunities in lower-rated bonds and sectors that had been adversely affected by the pandemic, including transportation, education, travel-related and health care issues.
Describe portfolio positioning at period end.
The Fund’s duration was slightly higher than that of the benchmark. The Fund was overweight in the transportation and housing sectors, and it was underweight in school districts and local tax-backed debt. The Fund’s average credit quality was AA-.
The views expressed reflect the opinions of BlackRock as of the date of this report and are subject to change based on changes in market, economic or other conditions. These views are not intended to be a forecast of future events and are no guarantee of future results.
| | |
| Fund Summary as of May 31, 2021 (continued) | | BlackRock Strategic Municipal Opportunities Fund |
TOTAL RETURN BASED ON A $10,000 INVESTMENT
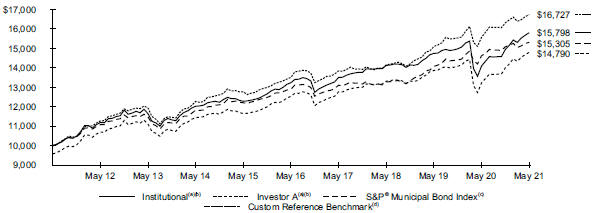
| | (a) | Assuming maximum sales charges, if any, transaction costs and other operating expenses, including advisory fees. Institutional Shares do not have a sales charge. | |
| | (b) | Under normal circumstances the Fund invests at least 80% of its assets in municipal bonds. The Fund’s returns prior to January 27, 2014 are the returns of the Fund when it followed different investment strategies under the name BlackRock Intermediate Municipal Fund. | |
| | (c) | The S&P® Municipal Bond Index, a broad, market value-weighted index that seeks to measure the performance of the U.S. municipal bond market. Bonds in the S&P® Municipal Bond Index must have an outstanding par value of at least $2 million and a remaining maturity of not less than one month. | |
| | (d) | A customized performance benchmark comprised of the returns of the S&P® Municipal Bond Investment Grade Index (65%), S&P® Municipal Bond High Yield Index (30%) and Bloomberg Barclays Taxable Municipal: U.S. Aggregate Eligible Index (5%). See “About Fund Performance” for descriptions of the indexes. | |
Performance Summary for the Period Ended May 31, 2021
| | | | | | | | | | | | | | | | | | | | | | | | | | | | | | | | | | | | |
| | | | | | | | | | | | Average Annual Total Returns(a)(b) | |
| | | | | | | | | | | | 1 Year | | | 5 Years | | | 10 Years | |
| | | Standardized 30-Day Yields | | | Unsubsidized 30-Day Yields | | | 6-Month
Total
Returns | | | Without
Sales
Charge | | | With
Sales
Charge | | | Without
Sales
Charge | | | With
Sales
Charge | | | Without
Sales
Charge | | | With
Sales
Charge | |
Institutional | | | 1.28 | % | | | 1.23 | % | | | 5.75 | % | | | 12.18 | % | | | N/A | | | | 3.61 | % | | | N/A | | | | 4.68 | % | | | N/A | |
Investor A | | | 1.03 | | | | 0.98 | | | | 5.65 | | | | 11.83 | | | | 7.08 | % | | | 3.37 | | | | 2.47 | % | | | 4.44 | | | | 3.99 | % |
Investor A1 | | | 1.21 | | | | 1.16 | | | | 5.73 | | | | 11.99 | | | | N/A | | | | 3.52 | | | | N/A | | | | 4.60 | | | | N/A | |
Investor C | | | 0.32 | | | | 0.27 | | | | 5.25 | | | | 11.07 | | | | 10.07 | | | | 2.60 | | | | 2.60 | | | | 3.81 | | | | 3.81 | |
Class K | | | 1.36 | | | | 1.31 | | | | 5.80 | | | | 12.24 | | | | N/A | | | | 3.65 | | | | N/A | | | | 4.70 | | | | N/A | |
S&P® Municipal Bond Index | | | — | | | | — | | | | 1.54 | | | | 4.70 | | | | N/A | | | | 3.48 | | | | N/A | | | | 4.35 | | | | N/A | |
S&P® Municipal Bond Investment Grade Index | | | — | | | | — | | | | 1.21 | | | | 3.96 | | | | N/A | | | | 3.27 | | | | N/A | | | | 4.15 | | | | N/A | |
S&P® Municipal Bond High Yield Index | | | — | | | | — | | | | 6.13 | | | | 15.81 | | | | N/A | | | | 6.43 | | | | N/A | | | | 7.35 | | | | N/A | |
Bloomberg Barclays Taxable Municipal:
U.S. Aggregate Eligible Index | | | — | | | | — | | | | (0.41 | ) | | | 5.38 | | | | N/A | | | | 6.00 | | | | N/A | | | | 7.32 | | | | N/A | |
65% S&P® Municipal Bond Investment Grade
Index, 30% S&P® Municipal Bond High Yield
Index and 5% Bloomberg Barclays Taxable
Municipal: U.S. Aggregate Eligible Index | | | — | | | | — | | | | 2.59 | | | | 7.48 | | | | N/A | | | | 4.37 | | | | N/A | | | | 5.28 | | | | N/A | |
| | (a) | Assuming maximum sales charges, if any. Average annual total returns with and without sales charges reflect reductions for distribution and service fees. See “About Fund Performance” for a detailed description of share classes, including any related sales charges and fees, and how performance was calculated for certain share classes. | |
| | (b) | Under normal circumstances the Fund invests at least 80% of its assets in municipal bonds. The Fund’s returns prior to January 27, 2014 are the returns of the Fund when it followed different investment strategies under the name BlackRock Intermediate Municipal Fund. | |
N/A — Not applicable as the share class and index do not have a sales charge.
Past performance is not an indication of future results.
Performance results may include adjustments made for financial reporting purposes in accordance with U.S. generally accepted accounting principles.
| | |
| 14 | | 2 0 2 1 BLACK ROCK ANNUAL REPORT TO SHAREHOLDERS |
| | |
| Fund Summary as of May 31, 2021 (continued) | | BlackRock Strategic Municipal Opportunities Fund |
Expense Example
| | | | | | | | | | | | | | | | | | | | | | | | | | | | | | | | | | | | | | | | | | | | | | | | |
| | | Actual | | | | | | Hypothetical(a) | | | | | | | |
| | | | | | | | | Expenses Paid During the
Period | | | | | | | | | Including Interest Expense
and Fees | | | Excluding Interest Expense
and Fees | | | Annualized Expense Ratio | |
| | |
| Beginning
Account
Value
(12/01/20) |
| |
| Ending
Account
Value
(05/31/21) |
| |
| Including
Interest
Expense
and Fees |
(b) | |
| Excluding
Interest
Expense
and Fees |
| | | | | |
| Beginning
Account
Value
(12/01/20) |
| |
| Ending
Account
Value
(05/31/21) |
| |
| Expenses
Paid
During the
Period |
(b) | |
| Ending
Account
Value
(05/31/21) |
| |
| Expenses
Paid
During the
Period |
(b) | |
| Including
Interest
Expense
and Fees |
| |
| Excluding
Interest
Expense
and Fees |
|
Institutional | | $ | 1,000.00 | | | $ | 1,057.50 | | | $ | 3.23 | | | $ | 2.92 | | | | | | | $ | 1,000.00 | | | $ | 1,021.79 | | | $ | 3.18 | | | $ | 1,022.09 | | | $ | 2.87 | | | | 0.63 | % | | | 0.57 | % |
Investor A | | | 1,000.00 | | | | 1,056.50 | | | | 4.31 | | | | 4.00 | | | | | | | | 1,000.00 | | | | 1,020.74 | | | | 4.23 | | | | 1,021.04 | | | | 3.93 | | | | 0.84 | | | | 0.78 | |
Investor A1 | | | 1,000.00 | | | | 1,057.30 | | | | 3.59 | | | | 3.23 | | | | | | | | 1,000.00 | | | | 1,021.44 | | | | 3.53 | | | | 1,021.79 | | | | 3.18 | | | | 0.70 | | | | 0.63 | |
Investor C | | | 1,000.00 | | | | 1,052.50 | | | | 8.24 | | | | 7.93 | | | | | | | | 1,000.00 | | | | 1,016.90 | | | | 8.10 | | | | 1,017.20 | | | | 7.79 | | | | 1.61 | | | | 1.55 | |
Class K | | | 1,000.00 | | | | 1,058.00 | | | | 2.87 | | | | 2.51 | | | | | | | | 1,000.00 | | | | 1,022.14 | | | | 2.82 | | | | 1,022.49 | | | | 2.47 | | | | 0.56 | | | | 0.49 | |
| | (a) | Hypothetical 5% annual return before expenses is calculated by prorating the number of days in the most recent fiscal half year divided by 365. |
| | (b) | For each class of the Fund, expenses are equal to the annualized expense ratio for the class, multiplied by the average account value over the period, multiplied by 182/365 (to reflect the six-month period shown). |
See “Disclosure of Expenses” for further information on how expenses were calculated.
Portfolio Information
SECTOR ALLOCATION
| | | | |
| Sector(a)(b) | | Percent of
Total Investments | |
Transportation | | | 18 | % |
Housing | | | 15 | |
State | | | 14 | |
County/City/Special District/School District | | | 13 | |
Utilities | | | 13 | |
Health | | | 12 | |
Education | | | 7 | |
Corporate | | | 4 | |
Tobacco | | | 3 | |
Health Care Providers & Services | | | 1 | |
Diversified Financial Services | | | — | (c) |
CREDIT QUALITY ALLOCATION
| | | | | | | | |
| Credit Rating(a)(e) | | | | | Percent of
Total Investments | |
AAA/Aaa | | | | | | | 13 | % |
AA/Aa | | | | | | | 41 | |
A. | | | | | | | 14 | |
BBB/Baa | | | | | | | 10 | |
BB/Ba | | | | | | | 4 | |
B | | | | | | | 2 | |
CCC/Caa | | | | | | | — | (c) |
C | | | | | | | 2 | |
N/R(f) | | | | | | | 14 | |
| | | | |
| CALL/MATURITY SCHEDULE | |
| Calendar Year Ended December 31,(a)(d) | | Percentage | |
2021 | | | 6 | % |
2022 | | | 4 | |
2023 | | | 3 | |
2024 | | | 5 | |
2025 | | | 2 | |
| (a) | | Excludes short-term securities. |
| (b) | | For Fund compliance purposes, the Fund’s sector classifications refer to one or more of the sector sub-classifications used by one or more widely recognized market indexes or rating group indexes, and/or as defined by the investment adviser. These definitions may not apply for purposes of this report, which may combine such sector sub-classifications for reporting ease. |
| (c) | | Rounds to less than 1% of total investments. |
| (d) | | Scheduled maturity dates and/or bonds that are subject to potential calls by issuers over the next five years. |
| (e) | | For financial reporting purposes, credit quality ratings shown above reflect the highest rating assigned by either S&P Global Ratings or Moody’s Investors Service, Inc. if ratings differ. These rating agencies are independent, nationally recognized statistical rating organizations and are widely used. Investment grade ratings are credit ratings of BBB/Baa or higher. Below investment grade ratings are credit ratings of BB/Ba or lower. Investments designated N/R are not rated by either rating agency. Unrated investments do not necessarily indicate low credit quality. Credit quality ratings are subject to change. |
| (f) | | The investment adviser evaluates the credit quality of unrated investments based upon certain factors including, but not limited to, credit ratings for similar investments and financial analysis of sectors and individual investments. Using this approach, the investment adviser has deemed certain of these unrated securities as investment grade quality. As of May 31, 2021, the market value of unrated securities deemed by the investment adviser to be investment grade represents less than 1% of the Fund’s total investments. |
About Fund Performance
Institutional Shares are not subject to any sales charge. These shares bear no ongoing distribution or service fees and are available only to certain eligible investors.
Class K Shares are not subject to any sales charge. These shares bear no ongoing distribution or service fees and are available only to certain eligible investors. For each Fund, Class K Shares performance shown prior to the Class K January 25, 2018 inception date is that of Institutional Shares. The performance of the Funds’ Class K Shares would be substantially similar to Institutional Shares because Class K Shares and Institutional Shares invest in the same portfolio of securities and performance would only differ to the extent that Class K Shares and Institutional Shares have different expenses. The actual returns of Class K Shares would have been higher than those of the Institutional Shares because Class K Shares have lower expenses than the Institutional Shares.
Service Shares (available only in BlackRock New Jersey Municipal Bond Fund and BlackRock Pennsylvania Municipal Bond Fund) are not subject to any sales charge. These shares are subject to a service fee of 0.25% per year (but no distribution fee) and are only available to certain eligible investors.
Investor A Shares are subject to a maximum initial sales charge (front-end load) of 4.25% and a service fee of 0.25% per year (but no distribution fee). Certain redemptions of these shares may be subject to a contingent deferred sales charge (“CDSC”) where no initial sales charge was paid at the time of purchase. These shares are generally available through financial intermediaries.
Investor A1 Shares (for all Funds except BlackRock Strategic Municipal Opportunities Fund) are subject to a maximum initial sales charge (front-end load) of 4.00% and a service fee of 0.10% per year (but no distribution fee). Investor A1 Shares for BlackRock Strategic Municipal Opportunities Fund incur a maximum initial sales charge (front-end load) of 1.00% and a service fee of 0.10% per year (but no distribution fee). The initial sales charge does not apply to current eligible shareholders of Investor A1 Shares of the Funds. Investor A1 Shares are only available for dividend and capital gain reinvestment by existing shareholders, and for purchase by certain employer-sponsored retirement plans and, for BlackRock California Municipal Opportunities Fund only, fee based programs previously approved by the Fund. Certain redemptions of these shares may be subject to a CDSC where no initial sales charge was paid at the time of purchase. However, the CDSC does not apply to redemptions by certain employer-sponsored retirement plans or to redemptions of shares acquired through the reinvestment of dividends and capital gains by existing shareholders and, for BlackRock California Municipal Opportunities Fund only, fee based programs previously approved by the Fund.
Investor C Shares are subject to a 1.00% CDSC if redeemed within one year of purchase. In addition, these shares are subject to a distribution fee of 0.75% per year and a service fee of 0.25% per year. These shares are generally available through financial intermediaries. These shares automatically convert to Investor A Shares after approximately eight years.
Past performance is not an indication of future results. Financial markets have experienced extreme volatility and trading in many instruments has been disrupted. These circumstances may continue for an extended period of time, and may continue to affect adversely the value and liquidity of the fund’s investments. As a result, current performance may be lower or higher than the performance data quoted. Refer to blackrock.com to obtain performance data current to the most recent month-end. Performance results do not reflect the deduction of taxes that a shareholder would pay on Fund distributions or the redemption of Fund shares. Figures shown in the performance tables assume reinvestment of all distributions, if any, at net asset value (“NAV”) on the ex-dividend date or payable date, as applicable. Investment return and principal value of shares will fluctuate so that shares, when redeemed, may be worth more or less than their original cost. Distributions paid to each class of shares will vary because of the different levels of service, distribution and transfer agency fees applicable to each class, which are deducted from the income available to be paid to shareholders.
BlackRock Advisors, LLC (the “Manager”), each Fund’s investment adviser, has contractually and/or voluntarily agreed to waive and/or reimburse a portion of each Fund’s expenses. Without such waiver(s) and/or reimbursement(s), each Fund’s performance would have been lower. With respect to each Fund’s voluntary waiver(s), if any, the Manager is under no obligation to waive and/or reimburse or to continue waiving and/or reimbursing its fees and such voluntary waiver(s) may be reduced or discontinued at any time. With respect to each Fund’s contractual waiver(s), if any, the Manager is under no obligation to continue waiving and/or reimbursing its fees after the applicable termination date of such agreement. See the Notes to Financial Statements for additional information on waivers and/or reimbursements.
The standardized 30-day yield includes the effects of any waivers and/or reimbursements. The unsubsidized 30-day yield excludes the effects of any waivers and/or reimbursements.
The following indexes are used to calculate BlackRock Strategic Opportunities Fund’s custom reference benchmark:
| | • | | Bloomberg Barclays Taxable Municipal: U.S. Aggregate Eligible Index — represents securities that are taxable, dollar-denominated, and issued by a U.S. state or territory, and have at least one year to final maturity regardless of call features, have at least $250 million par amount outstanding, and are rated investment-grade (at least BBB- by S&P or Fitch Ratings (“Fitch”) and/or Baa3 by Moody’s) by at least two of the following ratings agencies: S&P, Moody’s and Fitch. |
| | • | | S&P® Municipal Bond High Yield Index — a market-value-weighted index that consists of bonds in the S&P Municipal Bond Index that are nonrated or that are rated BB+ by S&P and/or Ba1 by Moody’s or lower; bonds that are prerefunded or escrowed to maturity are not included in this index. |
| | • | | S&P® Municipal Bond Investment Grade Index — a market-value-weighted index that consists of bonds in the S&P Municipal Bond Index that are rated at least BBB by S&P and/or Baa3 by Moody’s. |
| | |
| 16 | | 2 0 2 1 BLACK ROCK ANNUAL REPORT TO SHAREHOLDERS |
Disclosure of Expenses
Shareholders of each Fund may incur the following charges: (a) transactional expenses, such as sales charges; and (b) operating expenses, including investment advisory fees, service and distribution fees, including 12b-1 fees, acquired fund fees and expenses, and other fund expenses. The expense examples shown (which are based on a hypothetical investment of $1,000 invested on December 1, 2020 and held through May 31, 2021) are intended to assist shareholders both in calculating expenses based on an investment in each Fund and in comparing these expenses with similar costs of investing in other mutual funds.
The expense examples provide information about actual account values and actual expenses. In order to estimate the expenses a shareholder paid during the period covered by this report, shareholders can divide their account value by $1,000 and then multiply the result by the number corresponding to their Fund and share class under the heading entitled “Expenses Paid During the Period.”
The expense examples also provide information about hypothetical account values and hypothetical expenses based on a Fund’s actual expense ratio and an assumed rate of return of 5% per year before expenses. In order to assist shareholders in comparing the ongoing expenses of investing in these Funds and other funds, compare the 5% hypothetical examples with the 5% hypothetical examples that appear in shareholder reports of other funds.
The expenses shown in the expense examples are intended to highlight shareholders’ ongoing costs only and do not reflect transactional expenses, such as sales charges, if any. Therefore, the hypothetical examples are useful in comparing ongoing expenses only, and will not help shareholders determine the relative total expenses of owning different funds. If these transactional expenses were included, shareholder expenses would have been higher.
| | |
D I S C L O S U R E O F E X P E N S E S | | 17 |
The Benefits and Risks of Leveraging
The Funds may utilize leverage to seek to enhance returns and net asset value (“NAV”). However, there is no guarantee that these objectives can be achieved in all interest rate environments.
Each Fund may leverage its assets through the use of proceeds received in tender option bond (“TOB”) transactions, as described in the Notes to Financial Statements. In a TOB Trust transaction, the Funds transfers municipal bonds or other municipal securities into a special purpose entity (a “TOB Trust”). TOB investments generally provide the Funds with economic benefits in periods of declining short-term interest rates, but expose the Funds to risks during periods of rising short-term interest rates. Additionally, fluctuations in the market value of municipal bonds deposited into a TOB Trust may adversely affect the Funds’ NAV per share.
In general, the concept of leveraging is based on the premise that the financing cost of leverage, which is based on short-term interest rates, is normally lower than the income earned by each Fund on its longer-term portfolio investments purchased with the proceeds from leverage. To the extent that the total assets of each Fund (including the assets obtained from leverage) are invested in higher-yielding portfolio investments, the Fund’s shareholders benefit from the incremental net income.
The interest earned on securities purchased with the proceeds from leverage is distributed to the Funds’ shareholders, and the value of these portfolio holdings is reflected in each Fund’s per share NAV. However, in order to benefit shareholders, the return on assets purchased with leverage proceeds must exceed the ongoing costs associated with the leverage. If interest and other ongoing costs of leverage exceed a Fund’s return on assets purchased with leverage proceeds, income to shareholders is lower than if the Fund had not used leverage.
Furthermore, the value of each Fund’s portfolio investments generally varies inversely with the direction of long-term interest rates, although other factors can also influence the value of portfolio investments. As a result, changes in interest rates can influence each Fund’s NAV positively or negatively in addition to the impact on each Fund’s performance from leverage. Changes in the direction of interest rates are difficult to predict accurately, and there is no assurance that a Fund’s leveraging strategy will be successful.
The use of leverage also generally causes greater changes in each Fund’s NAV and dividend rates than comparable portfolios without leverage. In a declining market, leverage is likely to cause a greater decline in the NAV of a Fund’s shares than if the Fund was not leveraged. In addition, each Fund may be required to sell portfolio securities at inopportune times or at distressed values in order to comply with regulatory requirements applicable to the use of leverage or as required by the terms of the leverage instruments, which may cause the Funds to incur losses. The use of leverage may limit a Fund’s ability to invest in certain types of securities or use certain types of hedging strategies. Each Fund incurs expenses in connection with the use of leverage, all of which are borne by each Fund’s shareholders and may reduce income.
Derivative Financial Instruments
The Funds may invest in various derivative financial instruments. These instruments are used to obtain exposure to a security, commodity, index, market, and/or other assets without owning or taking physical custody of securities, commodities and/or other referenced assets or to manage market, equity, credit, interest rate, foreign currency exchange rate, commodity and/or other risks. Derivative financial instruments may give rise to a form of economic leverage and involve risks, including the imperfect correlation between the value of a derivative financial instrument and the underlying asset, possible default of the counterparty to the transaction or illiquidity of the instrument. The Funds’ successful use of a derivative financial instrument depends on the investment adviser’s ability to predict pertinent market movements accurately, which cannot be assured. The use of these instruments may result in losses greater than if they had not been used, may limit the amount of appreciation a Fund can realize on an investment and/or may result in lower distributions paid to shareholders. The Funds’ investments in these instruments, if any, are discussed in detail in the Notes to Financial Statements.
| | |
| 18 | | 2 0 2 1 BLACK ROCK ANNUAL REPORT TO SHAREHOLDERS |
| | |
Schedule of Investments May 31, 2021 | | BlackRock California Municipal Opportunities Fund (Percentages shown are based on Net Assets) |
| | | | | | | | |
| Security | | Par (000) | | | Value | |
| | |
Corporate Bonds | | | | | | | | |
|
Diversified Financial Services — 0.3% | |
Bank of America Corp., (SOFR + 1.32%), 2.69%, 04/22/32 | | $ | 6,312 | | | $ | 6,399,920 | |
Goldman Sachs Group, Inc., (SOFR + 1.28%), 2.62%, 04/22/32 | | | 3,322 | | | | 3,347,728 | |
| | | | | | | | |
| | | | | | | 9,747,648 | |
Education — 0.0% | | | | | | | | |
University of Southern California, 3.03%, 10/01/39 | | | 650 | | | | 674,859 | |
| | | | | | | | |
|
Health Care Providers & Services — 0.1% | |
UnitedHealth Group Inc., 3.05%, 05/15/41 | | | 3,639 | | | | 3,693,683 | |
| | | | | | | | |
| | |
Tobacco — 0.2% | | | | | | | | |
Altria Group, Inc., 3.70%, 02/04/51 | | | 7,915 | | | | 7,197,005 | |
| | | | | | | | |
| |
Total Corporate Bonds — 0.6%
(Cost: $21,707,963) | | | | 21,313,195 | |
| | | | | | | | |
| | |
Municipal Bonds | | | | | | | | |
| | |
California — 78.0% | | | | | | | | |
|
County/City/Special District/School District — 34.0% | |
Butte-Glenn Community College District, GO, Series A, Election 2016, 5.25%, 08/01/46 | | | 12,360 | | | | 15,420,212 | |
California Statewide Communities Development | | | | | | | | |
Authority, SAB | | | | | | | | |
Series A, 5.00%, 09/02/39 | | | 1,375 | | | | 1,687,744 | |
Series A, 5.00%, 09/02/44 | | | 675 | | | | 810,743 | |
Series A, 5.00%, 09/02/48 | | | 675 | | | | 804,688 | |
Cerritos Community College District, GO, Series A, 4.00%, 08/01/44 | | | 35,000 | | | | 38,196,900 | |
City & County of San Francisco California | | | | | | | | |
Community Facilities District No. 2014-1, ST | | | | | | | | |
Series B, 3.78%, 09/01/30 | | | 1,110 | | | | 1,238,105 | |
Series B, 3.92%, 09/01/31 | | | 3,410 | | | | 3,817,393 | |
Series B, 3.97%, 09/01/32 | | | 1,880 | | | | 2,099,922 | |
Series B, 4.02%, 09/01/33 | | | 2,070 | | | | 2,307,139 | |
City & County of San Francisco California, COP, Series A, 4.00%, 04/01/42 | | | 8,000 | | | | 9,195,520 | |
City & County of San Francisco California, GO | | | | | | | | |
Series D-1, 4.00%, 06/15/37 | | | 2,295 | | | | 2,736,581 | |
Series D-1, 4.00%, 06/15/44 | | | 4,970 | | | | 5,829,711 | |
Series D-1, 4.00%, 06/15/45 | | | 5,165 | | | | 6,052,089 | |
City of Huntington Beach California, Refunding RB, 2.32%, 06/15/30 | | | 2,750 | | | | 2,779,343 | |
City of Los Angeles California, COP, (AMBAC), 6.20%, 11/01/31 | | | 3,800 | | | | 3,817,898 | |
City of Los Angeles California, RB, 4.00%, 06/24/21 | | | 64,000 | | | | 64,152,320 | |
City of San Jose California Hotel Tax Revenue, RB, 6.50%, 05/01/42 | | | 2,395 | | | | 2,405,227 | |
Coast Community College District, GO, Series B, Election 2002, (AGM), 0.00%, 08/01/30(b) | | | 26,425 | | | | 23,014,589 | |
County of Los Angeles California, RB, Series A, 4.00%, 06/30/21 | | | 65,000 | | | | 65,196,950 | |
County of Santa Clara California, GO, Series B, Election 2008, 4.00%, 08/01/42 | | | 14,995 | | | | 15,588,052 | |
Fremont Unified School District/Alameda County California, GO, Series A, 4.00%, 08/01/46 | | | 65,000 | | | | 70,822,700 | |
Fremont Union High School District, GO 4.00%, 08/01/44 | | | 35,000 | | | | 38,223,500 | |
| | | | | | | | |
| Security | | Par (000) | | | Value | |
|
County/City/Special District/School District (continued) | |
Fremont Union High School District, GO (continued) | |
Series A, 4.00%, 08/01/46 | | $ | 13,875 | | | $ | 16,059,064 | |
Glendale Community College District, GO, Series A, Election 2016, 5.25%, 08/01/41 | | | 10,450 | | | | 13,056,439 | |
Grossmont-Cuyamaca Community College District, Series B, Election 2012, 5.00%, 08/01/44 | | | 30,215 | | | | 37,978,140 | |
Grossmont-Cuyamaca Community College District GO, Series C, 4.00%, 08/01/46(c) | | | 4,250 | | | | 5,150,957 | |
Hacienda La Puente Unified School District, GO, Series A, Election 2016, 5.25%, 08/01/42 | | | 5,000 | | | | 6,220,350 | |
Imperial Irrigation District, RB, (AMBAC), 6.94%, 01/01/26 | | | 15,570 | | | | 18,376,960 | |
Los Altos Elementary School District, Refunding GO, Series A-1, Election 2014, 4.00%, 08/01/44 | | | 5,000 | | | | 5,745,350 | |
Los Angeles Community College District, GO | | | | | | | | |
Series K, 4.00%, 08/01/36 | | | 4,125 | | | | 4,766,437 | |
Series K, Election 2008, 4.00%, 08/01/37 | | | 10,000 | | | | 11,540,700 | |
Series K, Election 2008, 4.00%, 08/01/38 | | | 20,000 | | | | 23,082,600 | |
Series K, Election 2008, 4.00%, 08/01/39 | | | 20,000 | | | | 23,074,600 | |
Los Angeles Community College District, Refunding GO, 2.11%, 08/01/32 | | | 2,590 | | | | 2,600,956 | |
Los Angeles Community College District/CA GO, 4.00%, 08/01/24(d) | | | 2,805 | | | | 3,137,953 | |
Los Angeles County Metropolitan Transportation Authority, RB, Series A, 5.00%, 07/01/46 | | | 20,000 | | | | 26,528,800 | |
Los Angeles County Metropolitan Transportation Authority, Refunding RB | | | | | | | | |
Series A, 5.00%, 07/01/37 | | | 19,235 | | | | 23,788,309 | |
Series A, 5.00%, 07/01/44 | | | 25,885 | | | | 32,763,939 | |
Los Angeles County Public Works Financing Authority Refunding RB, 5.00%, 12/01/45 | | | 8,500 | | | | 11,025,095 | |
Marin Healthcare District, GO, Series A, Election 2013, 5.00%, 08/01/41 | | | 21,670 | | | | 26,797,772 | |
Menifee Union School District, GO, Series A, 5.25%, 08/01/42 | | | 7,275 | | | | 9,036,350 | |
Mount San Antonio Community College District, Refunding GO | | | | | | | | |
Series 2018-A, Election 2018, 4.00%, 08/01/49 | | | 10,200 | | | | 11,905,644 | |
Series A, Election 2018, 5.00%, 08/01/44 | | | 11,000 | | | | 14,061,300 | |
Mountain View-Whisman School District, GO, Series B, Election 2012, 4.00%, 09/01/26(d) | | | 12,000 | | | | 14,161,320 | |
Orange County Local Transportation Authority, RB, 5.00%, 02/15/40 | | | 5,000 | | | | 6,370,700 | |
Palomar Community College District, GO, Series D, | | | | | | | | |
Election 2006, 5.25%, 08/01/45 | | | 3,000 | | | | 3,757,740 | |
Pomona Redevelopment Agency Successor Agency, Refunding TA, 3.98%, 02/01/27 | | | 4,155 | | | | 4,708,155 | |
Riverside County Public Financing Authority, RB, 5.25%, 11/01/45 | | | 11,210 | | | | 13,185,762 | |
San Diego Community College District, Refunding GO, 5.00%, 08/01/41 | | | 20,000 | | | | 23,990,000 | |
San Diego County Regional Transportation Commission, Refunding RB, Series A, 3.00%, 10/01/22 | | | 27,500 | | | | 28,553,250 | |
San Diego Public Facilities Financing Authority, Refunding RB | | | | | | | | |
Series A, 5.00%, 10/15/46 | | | 8,500 | | | | 10,956,670 | |
Series A, 4.00%, 10/15/50 | | | 15,600 | | | | 18,478,824 | |
San Diego Unified School District, GO, Series L-2, 4.00%, 07/01/39 | | | 3,680 | | | | 4,415,080 | |
| | |
SCHEDULE OF INVESTMENTS | | 19 |
| | |
Schedule of Investments (continued) May 31, 2021 | | BlackRock California Municipal Opportunities Fund (Percentages shown are based on Net Assets) |
| | | | | | | | |
| Security | | Par (000) | | | Value | |
|
County/City/Special District/School District (continued) | |
San Francisco Bay Area Rapid Transit District, GO, Series A, Election 2016, 5.00%, 08/01/47 | | $ | 8,980 | | | $ | 11,092,635 | |
San Francisco Bay Area Rapid Transit District, Refunding GO, Series D, Election 2004, 4.00%, 08/01/35 | | | 5,985 | | | | 6,840,256 | |
San Francisco City & County Redevelopment Agency Successor Agency, Refunding TA | | | | | | | | |
Series D, 3.13%, 08/01/28 | | | 1,150 | | | | 1,243,691 | |
Series D, 3.25%, 08/01/29 | | | 1,000 | | | | 1,078,500 | |
Series D, 3.38%, 08/01/30 | | | 1,250 | | | | 1,346,288 | |
San Francisco City & County Redevelopment Agency Successor Agency, TA, CAB(b)(e) | | | | | | | | |
Series D, 0.00%, 08/01/23 | | | 1,000 | | | | 911,020 | |
Series D, 0.00%, 08/01/31 | | | 3,000 | | | | 1,842,300 | |
San Francisco City & County Redevelopment Financing Authority, TA, Series A, (BHAC-CR), 5.75%, 08/01/37 | | | 5,000 | | | | 6,656,650 | |
San Francisco Unified School District, RB, 2.00%, 12/31/21 | | | 40,000 | | | | 40,435,200 | |
San Joaquin County Transportation Authority, Refunding RB, 5.00%, 03/01/41 | | | 17,955 | | | | 21,939,753 | |
San Jose Evergreen Community College District, GO, Series C, Election 2010, 4.13%, 09/01/24(d) | | | 18,435 | | | | 20,741,587 | |
San Jose Financing Authority, RB, 5.75%, 05/01/42 | | | 2,010 | | | | 2,018,462 | |
San Jose Redevelopment Agency Successor Agency Refunding TA, 3.23%, 08/01/27 | | | 9,965 | | | | 10,930,708 | |
San Jose Redevelopment Agency Successor Agency, Refunding TA, Series A-T, 3.25%, 08/01/29 | | | 8,730 | | | | 9,457,733 | |
San Jose Unified School District, GO, CAB, Series C, (NPFGC), 0.00%, 06/01/31(b) | | | 25,000 | | | | 21,449,250 | |
San Leandro Unified School District, GO, Series A, Election 2008, 5.75%, 08/01/41 | | | 5,000 | | | | 5,046,250 | |
San Leandro Unified School District, Refunding GO | | | | | | | | |
(BAM), 4.00%, 08/01/34 | | | 1,200 | | | | 1,466,532 | |
(BAM), 4.00%, 08/01/35 | | | 1,325 | | | | 1,616,023 | |
San Mateo County Community College District, GO, Series B, Election 2014, 5.00%, 09/01/45 | | | 30,000 | | | | 37,948,800 | |
Santa Clara County Financing Authority, RB, Series A, 4.00%, 04/01/35 | | | 6,975 | | | | 8,244,520 | |
Santa Monica Community College District, GO, Series B, Election 2008, 4.00%, 08/01/24(d) | | | 40,015 | | | | 44,753,176 | |
South San Francisco Public Facilities Financing Authority RB, 4.00%, 06/01/46(c) | | | 5,000 | | | | 6,004,350 | |
Vista Joint Powers Financing Authority, Refunding RB, 5.25%, 05/01/37 | | | 15,065 | | | | 17,726,232 | |
| | | | | | | | |
| | | | | | | 1,112,262,458 | |
Education — 5.0% | | | | | | | | |
California Educational Facilities Authority, RB | | | | | | | | |
Series A, 3.43%, 04/01/30 | | | 1,000 | | | | 1,049,250 | |
Series A, 3.56%, 04/01/31 | | | 2,000 | | | | 2,102,780 | |
California Educational Facilities Authority, Refunding RB, 5.00%, 04/01/51 | | | 3,000 | | | | 4,808,550 | |
California Infrastructure & Economic Development Bank, RB(e) | | | | | | | | |
Series A, 4.13%, 01/01/35 | | | 1,010 | | | | 1,097,799 | |
Series A, 5.00%, 01/01/55 | | | 2,300 | | | | 2,618,389 | |
Series A-2, 5.00%, 01/01/24 | | | 850 | | | | 854,284 | |
California Infrastructure & Economic Development | | | | | | | | |
Bank, RB, CAB(b) 0.00%, 01/01/35 | | | 2,750 | | | | 1,277,787 | |
| | | | | | | | |
| Security | | Par (000) | | | Value | |
| | |
Education (continued) | | | | | | | | |
|
California Infrastructure & Economic Development Bank, RB, CAB(b) (continued) | |
0.00%, 01/01/60 | | $ | 37,500 | | | $ | 4,116,000 | |
California Infrastructure & Economic Development Bank, Refunding RB, Series A, 1.84%, 10/01/31 | | | 1,100 | | | | 1,085,172 | |
California Municipal Finance Authority, RB | | | | | | | | |
5.00%, 06/15/41(e) | | | 925 | | | | 1,008,093 | |
6.00%, 07/01/44 | | | 500 | | | | 545,080 | |
5.00%, 06/15/51(e) | | | 1,385 | | | | 1,477,809 | |
Series A, 5.50%, 08/01/34(e) | | | 300 | | | | 323,265 | |
California Municipal Finance Authority, Refunding RB
5.00%, 08/01/39 | | | 1,785 | | | | 2,010,927 | |
5.00%, 08/01/48 | | | 2,140 | | | | 2,369,365 | |
California Public Finance Authority,
RB(e) | | | | | | | | |
Series A, 5.00%, 07/01/36 | | | 385 | | | | 414,391 | |
Series A, 5.00%, 07/01/44 | | | 375 | | | | 395,325 | |
Series A, 5.00%, 07/01/54 | | | 520 | | | | 540,150 | |
Series B, 5.00%, 07/01/26 | | | 265 | | | | 267,507 | |
California School Finance Authority, RB(e) | | | | | | | | |
5.00%, 06/01/40 | | | 1,420 | | | | 1,589,676 | |
5.00%, 06/01/50 | | | 2,240 | | | | 2,456,429 | |
5.00%, 06/01/59 | | | 3,565 | | | | 3,873,123 | |
Series A, 5.00%, 06/01/33 | | | 525 | | | | 597,608 | |
Series A, 5.00%, 06/01/43 | | | 525 | | | | 583,511 | |
Series A, 5.00%, 06/01/49 | | | 7,105 | | | | 7,839,444 | |
Series A, 6.00%, 07/01/51 | | | 1,500 | | | | 1,701,270 | |
Series A, 5.00%, 06/01/55 | | | 1,000 | | | | 1,089,040 | |
Series A, 5.00%, 06/01/58 | | | 3,355 | | | | 3,667,418 | |
Series A, 6.00%, 06/01/59 | | | 8,925 | | | | 9,818,392 | |
Series B, 6.00%, 06/01/31 | | | 735 | | | | 715,662 | |
California State University, Refunding RB | | | | | | | | |
Series A, 5.00%, 11/01/41 | | | 10,000 | | | | 11,983,300 | |
Series D, 1.69%, 11/01/29 | | | 5,000 | | | | 4,914,000 | |
California Statewide Communities Development Authority, RB, 5.00%, 06/01/51(e) | | | 1,035 | | | | 1,218,247 | |
California Statewide Communities Development Authority, Refunding RB(e) | | | | | | | | |
Series A, 5.00%, 06/01/36 | | | 2,900 | | | | 3,295,473 | |
Series A, 5.00%, 06/01/46 | | | 4,100 | | | | 4,584,292 | |
Hastings Campus Housing Finance Authority, RB, Series A, 5.00%, 07/01/61 | | | 15,170 | | | | 17,267,859 | |
Tamalpais Union High School District GO, 4.00%, 08/01/24(d) | | | 1,150 | | | | 1,286,068 | |
University of California, RB | | | | | | | | |
Series AV, 5.25%, 05/15/42 | | | 12,220 | | | | 15,203,635 | |
Series BE, 4.00%, 05/15/47 | | | 7,540 | | | | 8,945,607 | |
University of California, RB, BAB, 6.30%, 05/15/50 | | | 3,790 | | | | 4,893,610 | |
University of California, Refunding RB, Series Q, 5.00%, 05/15/46 | | | 21,000 | | | | 27,438,180 | |
| | | | | | | | |
| | | | | | | 163,323,767 | |
Health — 3.2% | | | | | | | | |
California Health Facilities Financing Authority, | | | | | | | | |
Series A, 5.00%, 11/15/38 | | | 15,075 | | | | 18,633,755 | |
California Health Facilities Financing Authority, RB | | | | | | | | |
Series A, 5.00%, 11/15/36 | | | 2,755 | | | | 3,412,894 | |
Series A, 5.00%, 11/15/40 | | | 20,220 | | | | 20,645,631 | |
Series A, 5.25%, 11/01/41 | | | 7,000 | | | | 7,141,330 | |
California Health Facilities Financing Authority, Refunding RB
3.00%, 08/15/54(a) | | | 18,125 | | | | 20,058,756 | |
Series A, 4.00%, 11/15/40 | | | 5,140 | | | | 5,956,438 | |
| | |
| 20 | | 2 0 2 1 BLACK ROCK ANNUAL REPORT TO SHAREHOLDERS |
| | |
Schedule of Investments (continued) May 31, 2021 | | BlackRock California Municipal Opportunities Fund (Percentages shown are based on Net Assets) |
| | | | | | | | |
| Security | | Par
(000) | | | Value | |
| | |
Health (continued) | | | | | | | | |
California Health Facilities Financing Authority, Refunding RB (continued) | | | | | | | | |
Series A, 4.00%, 04/01/44 | | $ | 12,215 | | | $ | 14,241,224 | |
Sub-Series A-2, 4.00%, 11/01/38 | | | 4,000 | | | | 4,628,800 | |
California Municipal Finance Authority, Refunding RB(e) | | | | | | | | |
Series A, 5.00%, 11/01/39 | | | 980 | | | | 1,131,635 | |
Series A, 5.00%, 11/01/49 | | | 1,105 | | | | 1,244,440 | |
California Public Finance Authority RB (c)(e)
2.88%, 05/15/27 | | | 705 | | | | 705,381 | |
2.38%, 11/15/28 | | | 3,000 | | | | 3,020,400 | |
3.13%, 05/15/29 | | | 2,510 | | | | 2,522,902 | |
5.00%, 11/15/36 | | | 500 | | | | 568,470 | |
5.00%, 11/15/46 | | | 500 | | | | 554,125 | |
5.00%, 11/15/51 | | | 500 | | | | 552,200 | |
5.00%, 11/15/56 | | | 500 | | | | 546,410 | |
| | | | | | | | |
| | | | | | | 105,564,791 | |
| | |
| Housing(e) — 0.4% | | | | | | |
California Community Housing Agency, RB, M/F Housing, Series A, 5.00%, 04/01/49 | | | 2,630 | | | | 2,995,018 | |
CSCDA Community Improvement Authority RB, 4.00%, 07/01/56(c) | | | 4,775 | | | | 5,131,931 | |
CSCDA Community Improvement Authority, RB, M/F Housing, Series A, 5.00%, 07/01/51 | | | 4,070 | | | | 4,739,271 | |
| | | | | | | | |
| | | | | | | 12,866,220 | |
| | |
| State — 3.7% | | | | | | |
California State Public Works Board, RB | | | | | | | | |
Series B, 4.00%, 05/01/46 | | | 15,000 | | | | 18,089,400 | |
Series C, 5.00%, 11/01/44 | | | 29,895 | | | | 38,190,265 | |
Series I, 5.25%, 11/01/32 | | | 1,115 | | | | 1,244,362 | |
Series I, 5.50%, 11/01/33 | | | 2,315 | | | | 2,596,018 | |
California State Public Works Board, Refunding RB, Series C, 5.00%, 11/01/33 | | | 10,000 | | | | 12,205,100 | |
State of California, Refunding GO | | | | | | | | |
4.00%, 10/01/36 | | | 5,100 | | | | 6,198,795 | |
5.00%, 10/01/39 | | | 11,305 | | | | 14,654,219 | |
5.00%, 11/01/39 | | | 20,695 | | | | 26,565,551 | |
| | | | | | | | |
| | | | | | | 119,743,710 | |
| | |
| Tobacco — 3.4% | | | | | | |
California County Tobacco Securitization Agency, Refunding RB
5.00%, 06/01/50 | | | 1,110 | | | | 1,308,957 | |
Series A, 5.00%, 06/01/36 | | | 2,410 | | | | 2,434,606 | |
Series A, 5.00%, 06/01/47 | | | 2,595 | | | | 2,621,365 | |
Series A, 4.00%, 06/01/49 | | | 1,540 | | | | 1,784,752 | |
California County Tobacco Securitization Agency, Refunding RB, CAB, Series B-2, Subordinate, 0.00%, 06/01/55(b) | | | 15,770 | | | | 3,100,540 | |
California Statewide Financing Authority, RB,
Series D, 0.00%, 06/01/55(b)(e) | | | 16,500 | | | | 1,058,970 | |
Golden State Tobacco Securitization Corp., Refunding RB | | | | | | | | |
Series A-1, 5.00%, 06/01/47 | | | 12,125 | | | | 12,548,041 | |
Series A-2, 5.00%, 06/01/47 | | | 55,680 | | | | 57,622,675 | |
| | | | | | | | |
| Security | | Par
(000) | | | Value | |
| | |
Tobacco (continued) | | | | | | | | |
Inland Empire Tobacco Securitization Corp., Refunding RB, 3.68%, 06/01/38 | | $ | 4,905 | | | $ | 5,133,181 | |
Silicon Valley Tobacco Securitization Authority, RB, CAB, Series D, 0.00%, 06/01/56(b) | | | 29,500 | | | | 2,795,125 | |
Tobacco Securitization Authority of Southern California, Refunding RB, 5.00%, 06/01/48 | | | 15,435 | | | | 18,865,125 | |
| | | | | | | | |
| | | | | | | 109,273,337 | |
| | |
| Transportation — 12.8% | | | | | | |
Burbank-Glendale-Pasadena Airport Authority Brick Campaign, ARB, Series B, 5.56%, 07/01/32 | | | 1,000 | | | | 1,219,340 | |
California Infrastructure & Economic Development Bank, RB, Series A, AMT, 0.45%, 01/01/50(a)(e) | | | 50,000 | | | | 49,996,550 | |
California Municipal Finance Authority, RB, Series A, AMT, 4.00%, 07/15/29 | | | 6,605 | | | | 7,607,705 | |
City & County of San Francisco California Airports Commission, Series B, AMT, 5.00%, 05/01/41 | | | 23,960 | | | | 28,154,677 | |
City of Los Angeles Department of Airports, ARB | | | | | | | | |
Series A, AMT, 5.00%, 05/15/40 | | | 6,615 | | | | 7,666,653 | |
Series A, AMT, 5.00%, 05/15/42 | | | 23,725 | | | | 28,430,616 | |
Series B, AMT, 5.00%, 05/15/41 | | | 18,710 | | | | 21,992,669 | |
Series D, AMT, 5.00%, 05/15/41 | | | 8,850 | | | | 10,249,539 | |
Sub-Series A, AMT, 5.00%, 05/15/42 | | | 10,100 | | | | 11,855,481 | |
City of Los Angeles Department of Airports, Refunding RB | | | | | | | | |
Series A, 5.00%, 05/15/36 | | | 11,260 | | | | 14,611,539 | |
Series A, 5.00%, 05/15/38 | | | 7,230 | | | | 9,349,836 | |
Kansas City Industrial Development Authority, ARB, Series A, 5.00%, 05/15/44 | | | 10,000 | | | | 12,727,700 | |
Los Angeles County Metropolitan Transportation
Authority, Refunding RB, Series A, 5.00%, 07/01/42 | | | 10,000 | | | | 12,334,700 | |
Norman Y Mineta San Jose International Airport
SJC, Refunding RB, Series A, AMT, 5.00%, 03/01/41 | | | 20,000 | | | | 23,847,600 | |
San Francisco City & County Airport Comm-San Francisco International Airport, Refunding ARB | | | | | | | | |
Series A, AMT, 5.00%, 05/01/39 | | | 5,125 | | | | 5,744,818 | |
Series A, AMT, 5.00%, 05/01/40 | | | 14,000 | | | | 15,683,360 | |
Series A, AMT, 5.00%, 05/01/42 | | | 29,480 | | | | 35,317,335 | |
Series A, AMT, 5.25%, 05/01/42 | | | 40,370 | | | | 48,998,280 | |
Series A, AMT, 5.00%, 05/01/44 | | | 10,125 | | | | 11,362,882 | |
Series A, AMT, 5.00%, 05/01/49 | | | 8,000 | | | | 9,820,800 | |
Series E, AMT, 5.00%, 05/01/38 | | | 9,025 | | | | 11,326,285 | |
San Francisco City & County Airport Comm-San Francisco International Airport, Refunding RB,
Series 2020, AMT, 4.00%, 05/01/39 | | | 2,250 | | | | 2,651,490 | |
San Francisco Municipal Transportation Agency, RB | | | | | | | | |
Series C, 4.00%, 03/01/46 | | | 18,000 | | | | 21,592,440 | |
Series C, 5.00%, 03/01/51 | | | 12,395 | | | | 16,052,145 | |
| | | | | | | | |
| | | | | | | 418,594,440 | |
| | |
| Utilities — 15.5% | | | | | | |
California Statewide Communities Development
Authority, Refunding RB, 1.68%, 02/01/29 | | | 1,000 | | | | 975,820 | |
City of Los Angeles California Wastewater System Revenue, RB, Series A, 5.25%, 06/01/47 | | | 20,000 | | | | 24,829,200 | |
| | |
SCHEDULE OF INVESTMENTS | | 21 |
| | |
Schedule of Investments (continued) May 31, 2021 | | BlackRock California Municipal Opportunities Fund (Percentages shown are based on Net Assets) |
| | | | | | | | |
| Security | | Par
(000) | | | Value | |
| | |
Utilities (continued) | | | | | | | | |
City of Los Angeles California Wastewater System Revenue, Refunding RB | | | | | | | | |
Series A, 5.00%, 06/01/43 | | $ | 10,000 | | | $ | 12,566,800 | |
Series C, 5.00%, 06/01/35 | | | 4,520 | | | | 5,321,351 | |
City of Sacramento California Water Revenue, RB, 5.00%, 09/01/42 | | | 6,465 | | | | 8,013,432 | |
City of San Francisco California Public Utilities Commission Water Revenue, Refunding RB, Series A, 4.00%, 11/01/30 | | | 19,910 | | | | 23,385,689 | |
East Bay Municipal Utility District Water System Revenue, RB, Series A, 4.00%, 06/01/45 | | | 4,885 | | | | 5,646,913 | |
East Bay Municipal Utility District Water System Revenue, Refunding RB, Series A, 5.00%, 06/01/37 | | | 7,160 | | | | 8,404,909 | |
Eastern Municipal Water District Financing Authority, RB, Series D, 5.25%, 07/01/42 | | | 18,500 | | | | 23,091,515 | |
Los Angeles Department of Water, Refunding RB | | | | | | | | |
Series A, 5.00%, 07/01/41 | | | 52,860 | | | | 63,732,397 | |
Series A, 5.25%, 07/01/44 | | | 10,650 | | | | 13,116,007 | |
Metropolitan Water District of Southern California, Series E, Refunding RB, 0.17%, 07/01/37(a) | | | 8,625 | | | | 8,813,517 | |
Metropolitan Water District of Southern California, RB, Series A, 5.00%, 07/01/40 | | | 16,105 | | | | 18,952,686 | |
Metropolitan Water District of Southern California, | | | | | | | | |
Refunding RB 5.00%, 01/01/38 | | | 7,000 | | | | 8,908,410 | |
Series A, 5.00%, 10/01/35 | | | 5,000 | | | | 5,198,400 | |
Northern California Power Agency, RB, Series A, 7.31%, 06/01/40 | | | 2,150 | | | | 3,142,504 | |
Sacramento Municipal Utility District, RB | | | | | | | | |
Series G, 5.00%, 08/15/38 | | | 22,390 | | | | 28,930,791 | |
Series G, 5.00%, 08/15/41 | | | 20,000 | | | | 25,684,200 | |
San Diego Public Facilities Financing Authority, Refunding RB | | | | | | | | |
Series A, 5.00%, 05/15/36 | | | 5,000 | | | | 6,072,450 | |
Series A, 5.00%, 05/15/38 | | | 13,595 | | | | 16,444,512 | |
Series A, 4.00%, 08/01/39 | | | 2,515 | | | | 3,069,734 | |
Series A, 4.00%, 08/01/40 | | | 2,000 | | | | 2,431,900 | |
Series A, 3.00%, 08/01/49 | | | 10,000 | | | | 10,882,500 | |
Series B, 5.00%, 08/01/38 | | | 16,460 | | | | 19,888,124 | |
Series A, Subordinate, 5.00%, 08/01/43 | | | 33,820 | | | | 42,152,910 | |
Series A, Subordinate, 5.25%, 08/01/47 | | | 15,180 | | | | 19,121,791 | |
San Francisco City & County Public Utilities Commission Wastewater Revenue, Refunding RB, Series B, 4.00%, 10/01/42 | | | 17,010 | | | | 17,811,341 | |
Southern California Public Power Authority, Refunding RB, 5.00%, 07/01/30 | | | 41,400 | | | | 46,346,058 | |
State of California Department of Water Resources, Refunding RB | | | | | | | | |
Series AW, 4.00%, 12/01/34 | | | 24,000 | | | | 28,008,480 | |
Series BC, 1.32%, 12/01/28 | | | 4,000 | | | | 3,942,200 | |
State of California Department of Water Resources,Refunding RB, Series BB, 5.00%, 12/01/35 | | | 2,000 | | | | 2,712,500 | |
| | | | | | | | |
| | | | | | | 507,599,041 | |
| | | | | | | | |
Total Municipal Bonds in California | | | | | | | 2,549,227,764 | |
| | | | | | | | |
| Security | | Par
(000) | | | Value | |
| | |
Connecticut — 0.4% | | | | | | | | |
| | |
| Corporate — 0.4% | | | | | | |
Mashantucket Western Pequot Tribe,
7.35%, 07/01/26(f)(g)(h) | | $ | 36,909 | | | $ | 11,995,458 | |
| | | | | | | | |
| | |
| Guam(c) — 0.2% | | | | | | |
| | |
| State — 0.2% | | | | | | |
Territory of Guam, Refunding RB | | | | | | | | |
Series F, 4.00%, 01/01/36. | | | 2,480 | | | | 2,875,833 | |
Series F, 4.00%, 01/01/42 | | | 3,170 | | | | 3,600,866 | |
| | | | | | | | |
Total Municipal Bonds in Guam | | | | | | | 6,476,699 | |
| | |
| Illinois — 1.2% | | | | | | |
|
| County/City/Special District/School District — 1.2% | |
Chicago Board of Education, GO, 6.32%, 11/01/29 | | | 3,650 | | | | 4,400,258 | |
Chicago Board of Education, GO, BAB
6.04%, 12/01/29 | | | 7,590 | | | | 8,832,711 | |
6.14%, 12/01/39 | | | 13,850 | | | | 16,817,639 | |
6.52%, 12/01/40 | | | 8,075 | | | | 10,074,289 | |
| | | | | | | | |
Total Municipal Bonds in Illinois | | | | | | | 40,124,897 | |
| | |
| Puerto Rico — 8.1% | | | | | | |
| | |
| State — 4.8% | | | | | | |
Commonwealth of Puerto Rico, GO(f)(g) | | | | | | | | |
Series A, 5.25%, 07/01/22 | | | 940 | | | | 841,535 | |
Series A, 5.25%, 07/01/26 | | | 330 | | | | 295,433 | |
Series A, 5.13%, 07/01/31 | | | 3,340 | | | | 2,990,135 | |
Series A, 5.38%, 07/01/33 | | | 1,025 | | | | 917,631 | |
Series A, 6.00%, 07/01/38 | | | 1,630 | | | | 1,477,867 | |
Commonwealth of Puerto Rico, Refunding GO(f)(g) | | | | | | | | |
5.00%, 07/01/18 | | | 470 | | | | 396,758 | |
Series A, 5.50%, 07/01/18 | | | 1,025 | | | | 865,271 | |
Series A, 5.50%, 07/01/32 | | | 1,170 | | | | 1,047,443 | |
Series A, 6.00%, 07/01/34 | | | 955 | | | | 848,756 | |
Series A, 8.00%, 07/01/35 | | | 27,405 | | | | 22,025,563 | |
Series A, 5.50%, 07/01/39 | | | 8,805 | | | | 7,473,244 | |
Series A, 5.00%, 07/01/41 | | | 10,546 | | | | 8,542,773 | |
Series B, 6.00%, 07/01/39 | | | 3,970 | | | | 3,599,468 | |
Series C, 6.00%, 07/01/39 | | | 470 | | | | 426,133 | |
Series D, 5.75%, 07/01/41 | | | 1,110 | | | | 972,638 | |
Puerto Rico Public Buildings Authority, Refunding RB(f)(g) | | | | | | | | |
Series F, (GTD), 5.25%, 07/01/24 | | | 500 | | | | 498,594 | |
Series M-2, (GTD), 10.00%, 07/01/34 | | | 1,045 | | | | 1,102,475 | |
Puerto Rico Sales Tax Financing Corp. Sales Tax Revenue, RB | | | | | | | | |
Series A-1, Restructured, 4.75%, 07/01/53 | | | 38,748 | | | | 43,437,283 | |
Series A-1, Restructured, 5.00%, 07/01/58 | | | 16,743 | | | | 19,047,339 | |
Series A-2, Restructured, 4.33%, 07/01/40 | | | 11,004 | | | | 12,206,187 | |
Series A-2, Restructured, 4.54%, 07/01/53 | | | 114 | | | | 126,189 | |
Series A-2, Restructured, 4.78%, 07/01/58 | | | 15,623 | | | | 17,553,690 | |
Puerto Rico Sales Tax Financing Corp. Sales Tax Revenue, RB, CAB(b) | | | | | | | | |
Series A-1, Restructured, 0.00%, 07/01/29 | | | 1,117 | | | | 954,130 | |
Series A-1, Restructured, 0.00%, 07/01/31 | | | 1,330 | | | | 1,050,926 | |
Series A-1, Restructured, 0.00%, 07/01/33 | | | 1,909 | | | | 1,399,182 | |
Series A-1, Restructured, 0.00%, 07/01/46 | | | 8,062 | | | | 2,614,668 | |
Series A-1, Restructured, 0.00%, 07/01/51 | | | 12,267 | | | | 2,879,924 | |
Series B-1, Restructured, 0.00%, 07/01/46 | | | 5,761 | | | | 1,870,021 | |
| | | | | | | | |
| | | | | | | 157,461,256 | |
| | |
| 22 | | 2 0 2 1 BLACK ROCK ANNUAL REPORT TO SHAREHOLDERS |
| | |
Schedule of Investments (continued) May 31, 2021 | | BlackRock California Municipal Opportunities Fund (Percentages shown are based on Net Assets) |
| | | | | | | | |
| Security | | Par (000) | | | Value | |
| | |
Tobacco(b) — 0.3% | | | | | | | | |
Children’s Trust Fund, RB | | | | | | | | |
Series A, 0.00%, 05/15/57 | | $ | 150,000 | | | $ | 9,873,000 | |
Series B, 0.00%, 05/15/57 | | | 19,975 | | | | 1,106,016 | |
| | | | | | | | |
| | | | | | | 10,979,016 | |
| | |
Utilities(f)(g) — 3.0% | | | | | | | | |
Puerto Rico Electric Power Authority, 3rd Series, 1.00%, 01/01/21(a) | | | 593 | | | | 568,972 | |
Puerto Rico Electric Power Authority, RB | | | | | | | | |
Series A, 5.00%, 07/01/29 | | | 4,130 | | | | 3,969,963 | |
Series A, 7.00%, 07/01/33 | | | 2,230 | | | | 2,186,098 | |
Series A, 6.75%, 07/01/36 | | | 7,630 | | | | 7,479,788 | |
Series A, 5.00%, 07/01/42 | | | 8,830 | | | | 8,487,837 | |
Series A, 7.00%, 07/01/43 | | | 955 | | | | 936,199 | |
Series A-3, 10.00%, 07/01/19 | | | 2,137 | | | | 2,029,686 | |
Series B-3, 10.00%, 07/01/19 | | | 2,137 | | | | 2,029,686 | |
Series C-1, 5.40%, 01/01/18 | | | 5,870 | | | | 5,627,813 | |
Series C-2, 5.40%, 07/01/18 | | | 5,871 | | | | 5,628,723 | |
Series C-4, 5.40%, 07/01/20 | | | 593 | | | | 568,972 | |
Series CCC, 5.25%, 07/01/26 | | | 1,680 | | | | 1,614,900 | |
Series CCC, 5.25%, 07/01/28 | | | 955 | | | | 917,994 | |
Series D-4, 7.50%, 07/01/20 | | | 1,638 | | | | 1,605,753 | |
Series TT, 5.00%, 07/01/25 | | | 480 | | | | 461,400 | |
Series TT, 5.00%, 07/01/26 | | | 1,285 | | | | 1,235,206 | |
Series WW, 5.50%, 07/01/19 | | | 2,470 | | | | 2,368,112 | |
Series WW, 5.38%, 07/01/24 | | | 875 | | | | 841,094 | |
Series WW, 5.25%, 07/01/33 | | | 885 | | | | 850,706 | |
Series WW, 5.50%, 07/01/38 | | | 1,170 | | | | 1,124,663 | |
Series WW, 5.50%, 07/01/49 | | | 935 | | | | 896,431 | |
Series XX, 5.25%, 07/01/27 | | | 645 | | | | 620,006 | |
Series XX, 5.25%, 07/01/35 | | | 400 | | | | 384,500 | |
Series XX, 5.75%, 07/01/36 | | | 555 | | | | 533,494 | |
Series XX, 5.25%, 07/01/40 | | | 11,490 | | | | 11,044,762 | |
Puerto Rico Electric Power Authority, Refunding RB | | | | | | | | |
Series AAA, 5.25%, 07/01/22 | | | 2,150 | | | | 2,066,688 | |
Series AAA, 5.25%, 07/01/27 | | | 6,540 | | | | 6,286,575 | |
Series AAA, 5.25%, 07/01/28 | | | 4,690 | | | | 4,508,262 | |
Series AAA, 5.25%, 07/01/29 | | | 530 | | | | 509,463 | |
Series BBB, 5.40%, 07/01/28 | | | 2,805 | | | | 2,627,059 | |
Series UU, 1.00%, 07/01/19(a) | | | 750 | | | | 611,250 | |
Series UU, 1.00%, 07/01/20(a) | | | 3,175 | | | | 2,651,795 | |
Series UU, 0.84%, 07/01/31(a) | | | 3,765 | | | | 3,144,569 | |
Series ZZ, 5.25%, 07/01/19 | | | 2,945 | | | | 2,823,519 | |
Series ZZ, 5.25%, 07/01/24 | | | 1,990 | | | | 1,912,888 | |
Series ZZ, 5.00%, 07/01/28 | | | 990 | | | | 951,638 | |
Series ZZ, 5.00%, 07/01/49 | | | 925 | | | | 886,844 | |
Puerto Rico Electric Power Authority, Refunding RB, BAB, Series YY, 6.13%, 07/01/40 | | | 4,060 | | | | 3,802,446 | |
| | | | | | | | |
| | | | | | | 96,795,754 | |
| | | | | | | | |
Total Municipal Bonds in Puerto Rico | | | | | | | 265,236,026 | |
| | | | | | | | |
Total Municipal Bonds — 87.9%
(Cost: $2,669,239,194) | | | | | | | 2,873,060,844 | |
| | | | | | | | |
| | | | | | | | |
| Security | | Par (000) | | | Value | |
|
Municipal Bonds Transferred to Tender Option Bond Trusts(i) | |
| | |
California — 10.7% | | | | | | | | |
|
County/City/Special District/School District — 2.3% | |
Irvine Ranch Water District, COP, 5.00%, 03/01/46 | | $ | 19,330 | | | $ | 23,060,110 | �� |
Ohlone Community College District, GO, Series B, 4.00%, 08/01/24(d) | | | 47,250 | | | | 52,844,873 | |
| | | | | | | | |
| | | | | | | 75,904,983 | |
| | |
Education — 3.7% | | | | | | | | |
California State University, Refunding RB, Series A, 5.00%, 11/01/43 | | | 35,250 | | | | 44,934,585 | |
University of California, RB, Series M, 5.00%, 05/15/42 | | | 20,000 | | | | 24,556,800 | |
University of California, Refunding RB, Series AZ, 5.00%, 05/15/43 | | | 41,740 | | | | 52,308,985 | |
| | | | | | | | |
| | | | | | | 121,800,370 | |
| | |
State — 0.7% | | | | | | | | |
State of California, Refunding GO, 5.25%, 10/01/39 | | | 18,150 | | | | 21,900,879 | |
| | | | | | | | |
| | |
Utilities — 4.0% | | | | | | | | |
East Bay Municipal Utility District Water System Revenue, RB, Series A, 5.00%, 06/01/42 | | | 27,045 | | | | 33,341,334 | |
Eastern Municipal Water District Financing Authority, RB, Series D, 5.00%, 07/01/47 | | | 36,105 | | | | 44,325,746 | |
San Francisco City & County Public Utilities Commission Wastewater Revenue, RB, Series B, 5.00%, 10/01/43. | | | 41,405 | | | | 51,770,307 | |
| | | | | | | | |
| | | | | | | 129,437,387 | |
| | | | | | | | |
Total Municipal Bonds in California | | | | | | | 349,043,619 | |
| | | | | | | | |
Total Municipal Bonds Transferred to Tender Option Bond Trusts — 10.7%
(Cost: $313,899,001) | | | | | | | 349,043,619 | |
| | | | | | | | |
Total Long-Term Investments — 99.2%
(Cost: $3,004,846,158) | | | | | | | 3,243,417,658 | |
| | | | | | | | |
| | |
| | | Shares | | | | |
Short-Term Securities | | | | | | | | |
| | |
Money Market Funds — 4.7% | | | | | | | | |
BlackRock Liquidity Funds California Money Fund, Institutional Class,
0.01%(j)(k) | | | 153,034,073 | | | | 153,125,894 | |
| | | | | | | | |
Total Short-Term Securities — 4.7%
(Cost: $153,090,262) | | | | 153,125,894 | |
| | | | | | | | |
Total Investments — 103.9%
(Cost: $3,157,936,420) | | | | 3,396,543,552 | |
Other Assets Less Liabilities — 0.5% | | | | 14,157,972 | |
Liability for TOB Trust Certificates, Including Interest Expense and Fees Payable — (4.4)% | | | | (143,170,731 | ) |
| | | | | | | | |
| |
Net Assets — 100.0% | | | $ | 3,267,530,793 | |
| | | | | | | | |
| (a) | Variable rate security. Interest rate resets periodically. The rate shown is the effective interest rate as of period end. Security description also includes the reference rate and spread if published and available. |
| (c) | When-issued security. |
| (d) | U.S. Government securities held in escrow, are used to pay interest on this security as well as to retire the bond in full at the date indicated, typically at a premium to par. |
| (e) | Security exempt from registration pursuant to Rule 144A under the Securities Act of 1933, as amended. These securities may be resold in transactions exempt from registration to qualified institutional investors. |
| | |
SCHEDULE OF INVESTMENTS | | 23 |
| | |
Schedule of Investments (continued) May 31, 2021 | | BlackRock California Municipal Opportunities Fund |
| (f) | Issuer filed for bankruptcy and/or is in default. |
| (g) | Non-income producing security. |
| (h) | Payment-in-kind security which may pay interest/dividends in additional par/shares and/or in cash. Rates shown are the current rate and possible payment rates. |
| (i) | Represent bonds transferred to a TOB Trust in exchange of cash and residual certificates received by the Fund. These bonds serve as collateral in a secured borrowing. See Note 4 of the Notes to Financial Statements for details. |
| (j) | Affiliate of the Fund. |
| (k) | Annualized 7-day yield as of period end. |
For Fund compliance purposes, the Fund’s sector classifications refer to one or more of the sector sub-classifications used by one or more widely recognized market indexes or rating group indexes, and/or as defined by the investment adviser. These definitions may not apply for purposes of this report, which may combine such sector sub-classifications for reporting ease.
Affiliates
Investments in issuers considered to be affiliate(s) of the Fund during the year ended May 31, 2021 for purposes of Section 2(a)(3) of the Investment Company Act of 1940, as amended, were as follows:
| | | | | | | | | | | | | | | | | | | | | | | | | | | | | | | | | | | | |
| Affiliated Issuer | | Value at
05/31/20 | | | Purchases
at Cost | | | Proceeds
from Sales | | | Net
Realized
Gain (Loss) | | | Change in
Unrealized
Appreciation
(Depreciation) | | | Value at
05/31/21 | | | Shares Held at
05/31/21 | | | Income | | | Capital Gain
Distributions
from
Underlying
Funds | |
BlackRock Liquidity Funds California Money Fund, Institutional Class | | $ | 322,516,448 | | | $ | — | | | $ | (169,467,419 | )(a) | | $ | 83,418 | | | $ | (6,553 | ) | | $ | 153,125,894 | | | | 153,034,073 | | | $ | 17,749 | | | $ | — | |
| | | | | | | | | | | | | | | | | | | | | | | | | | | | | | | | | | | | |
| | (a) | Represents net amount purchased (sold). | |
Derivative Financial Instruments Outstanding as of Period End
Futures Contracts
| | | | | | | | | | | | | | | | |
| Description | | Number of
Contracts | | | Expiration
Date | | | Notional
Amount (000) | | | Value/ Unrealized Appreciation (Depreciation) | |
Short Contracts | | | | | | | | | | | | | | | | |
10-Year U.S. Treasury Notes | | | 2,727 | | | | 09/21/21 | | | $ | 359,453 | | | $ | (134,449 | ) |
U.S. Long Bond | | | 984 | | | | 09/21/21 | | | | 153,658 | | | | (477,975 | ) |
| | | | | | | | | | | | | | | | |
| | | | | | | | | | | | | | $ | (612,424 | ) |
| | | | | | | | | | | | | | | | |
Derivative Financial Instruments Categorized by Risk Exposure
As of period end, the fair values of derivative financial instruments located in the Statements of Assets and Liabilities were as follows:
| | | | | | | | | | | | | | | | | | | | | | | | | | | | |
| | | Commodity Contracts | | | Credit Contracts | | | Equity Contracts | | | Foreign Currency Exchange Contracts | | | Interest Rate Contracts | | | Other Contracts | | | Total | |
Liabilities — Derivative Financial Instruments | | | | | | | | | | | | | | | | | | | | | | | | | | | | |
Futures contracts | | | | | | | | | | | | | | | | | | | | | | | | | | | | |
Unrealized depreciation on futures contracts(a) | | $ | — | | | $ | — | | | $ | — | | | $ | — | | | $ | 612,424 | | | $ | — | | | $ | 612,424 | |
| | | | | | | | | | | | | | | | | | | | | | | | | | | | |
| | (a) | Net cumulative unrealized appreciation (depreciation) on futures contracts and centrally cleared swaps, if any, are reported in the Schedule of Investments. In the Statements of Assets and Liabilities, only current day’s variation margin is reported in receivables or payables and the net cumulative unrealized appreciation (depreciation) is included in accumulated earnings (loss). | |
| | |
| 24 | | 2 0 2 1 BLACK ROCK ANNUAL REPORT TO SHAREHOLDERS |
| | |
Schedule of Investments (continued) May 31, 2021 | | BlackRock California Municipal Opportunities Fund |
For the year ended May 31, 2021, the effect of derivative financial instruments in the Statements of Operations was as follows:
| | | | | | | | | | | | | | | | | | | | | | | | | | | | |
| | | Commodity
Contracts | | | Credit
Contracts | | | Equity
Contracts | | | Foreign
Currency
Exchange
Contracts | | | Interest
Rate
Contracts | | | Other
Contracts | | | Total | |
Net Realized Gain (Loss) from | | | | | | | | | | | | | | | | | | | | | | | | | | | | |
Futures contracts | | $ | — | | | $ | — | | | $ | — | | | $ | — | | | $ | 37,029,913 | | | $ | — | | | $ | 37,029,913 | |
| | | | | | | | | | | | | | | | | | | | | | | | | | | | |
Net Change in Unrealized Appreciation (Depreciation) on | | | | | | | | | | | | | | | | | | | | | | | | | | | | |
Futures contracts | | $ | — | | | $ | — | | | $ | — | | | $ | — | | | $ | (67,636 | ) | | $ | — | | | $ | (67,636 | ) |
| | | | | | | | | | | | | | | | | | | | | | | | | | | | |
Average Quarterly Balances of Outstanding Derivative Financial Instruments
| | | | |
Futures contracts | | | | |
Average notional value of contracts — short | | $ | 550,002,012 | |
For more information about the Fund’s investment risks regarding derivative financial instruments, refer to the Notes to Financial Statements.
Fair Value Hierarchy as of Period End
Various inputs are used in determining the fair value of financial instruments. For a description of the input levels and information about the Fund’s policy regarding valuation of financial instruments, refer to the Notes to Financial Statements.
The following tables summarize the Fund’s financial instruments categorized in the fair value hierarchy. The breakdown of the Fund’s investments into major categories is disclosed in the Schedule of Investments above.
| | | | | | | | | | | | | | | | |
| | | Level 1 | | | Level 2 | | | Level 3 | | | Total | |
Assets | | | | | | | | | | | | | | | | |
Investments | | | | | | | | | | | | | | | | |
Long-Term Investments | | | | | | | | | | | | | | | | |
Corporate Bonds | | $ | — | | | $ | 21,313,195 | | | $ | — | | | $ | 21,313,195 | |
Municipal Bonds | | | — | | | | 2,873,060,844 | | | | — | | | | 2,873,060,844 | |
Municipal Bonds Transferred to Tender Option Bond Trusts | | | — | | | | 349,043,619 | | | | — | | | | 349,043,619 | |
Short-Term Securities | | | | | | | | | | | | | | | | |
Money Market Funds | | | 153,125,894 | | | | — | | | | — | | | | 153,125,894 | |
| | | | | | | | | | | | | | | | |
| | $ | 153,125,894 | | | $ | 3,243,417,658 | | | $ | — | | | $ | 3,396,543,552 | |
| | | | | | | | | | | | | | | | |
| Derivative Financial Instruments(a) | | | | | | | | | | | | |
Liabilities | | | | | | | | | | | | | | | | |
Interest Rate Contracts | | $ | (612,424 | ) | | $ | — | | | $ | — | | | $ | (612,424 | ) |
| | | | | | | | | | | | | | | | |
| | (a) | Derivative financial instruments are futures contracts. Futures contracts are valued at the unrealized appreciation (depreciation) on the instrument. | |
The Fund may hold assets and/or liabilities in which the fair value approximates the carrying amount for financial statement purposes. As of period end, TOB Trust Certificates of $143,144,977 are categorized as Level 2 within the fair value hierarchy.
See notes to financial statements.
| | |
SCHEDULE OF INVESTMENTS | | 25 |
| | |
Schedule of Investments May 31, 2021 | | BlackRock New Jersey Municipal Bond Fund (Percentages shown are based on Net Assets) |
| | | | | | | | |
| Security | | Par (000) | | | Value | |
| | |
Municipal Bonds | | | | | | | | |
| | |
Guam — 0.3% | | | | | | | | |
State(a) — 0.2% | | | | | | | | |
Territory of Guam, Refunding RB | | | | | | | | |
Series F, 4.00%, 01/01/36 | | $ | 300 | | | $ | 347,883 | |
Series F, 4.00%, 01/01/42 | | | 385 | | | | 437,329 | |
| | | | | | | | |
| | | | | | | 785,212 | |
Utilities — 0.1% | | | | | | | | |
Guam Government Waterworks Authority, RB, Series A, 5.00%, 01/01/50 | | | 500 | | | | 609,015 | |
| | | | | | | | |
| | |
Total Municipal Bonds in Guam | | | | | | | 1,394,227 | |
| | | | | | | | |
| | |
New Jersey — 77.8% | | | | | | | | |
| | |
Corporate — 2.3% | | | | | | | | |
New Jersey Economic Development Authority, RB, AMT, 4.00%, 08/01/59 | | | 4,200 | | | | 4,656,708 | |
New Jersey Economic Development Authority, Refunding RB | | | | | | | | |
3.38%, 04/01/38 | | | 1,360 | | | | 1,440,757 | |
3.50%, 04/01/42 | | | 720 | | | | 761,688 | |
Series A, AMT, 2.20%, 10/01/39(b) | | | 2,130 | | | | 2,259,994 | |
| | | | | | | | |
| | | | | | | 9,119,147 | |
|
County/City/Special District/School District — 16.9% | |
Carlstadt School District, Refunding GO, (SCH BD RES FD), 4.00%, 05/01/30 | | | 1,415 | | | | 1,561,849 | |
Casino Reinvestment Development Authority, Inc., Refunding RB | | | | | | | | |
5.25%, 11/01/39 | | | 1,020 | | | | 1,105,517 | |
5.25%, 11/01/44 | | | 1,590 | | | | 1,711,142 | |
City of Bayonne New Jersey, Refunding GO, (BAM SAW), 5.00%, 07/01/39 | | | 660 | | | | 770,062 | |
City of East Orange New Jesery, Refunding GO | | | | | | | | |
(AGM), 3.00%, 09/15/30 | | | 2,200 | | | | 2,413,026 | |
(AGM), 3.00%, 09/15/31 | | | 2,200 | | | | 2,401,454 | |
City of Perth Amboy New Jersey, Refunding GO, Series A, (BAM), 4.00%, 03/15/29(a) | | | 1,200 | | | | 1,457,352 | |
County of Mercer New Jersey, Refunding GO, 3.00%, 02/15/31 | | | 1,585 | | | | 1,741,741 | |
Egg Harbor Township School District, Refunding GO, (AGM SCH BD RES FD), 5.75%, 07/15/25 | | | 2,000 | | | | 2,415,480 | |
Essex County Improvement Authority, RB, (GTD), 4.00%, 11/01/44 | | | 7,470 | | | | 8,406,738 | |
Essex County Improvement Authority, Refunding RB, (NPFGC GTD), 5.50%, 10/01/29 | | | 1,500 | | | | 2,031,690 | |
Ewing Township Board of Education, GO | | | | | | | | |
(SCH BD RES FD), 4.00%, 07/15/38 | | | 920 | | | | 1,078,774 | |
(SCH BD RES FD), 4.00%, 07/15/39 | | | 840 | | | | 982,019 | |
Hudson County Improvement Authority, RB | | | | | | | | |
3.00%, 10/01/36 | | | 5,950 | | | | 6,634,607 | |
4.00%, 10/01/51 | | | 3,500 | | | | 4,102,000 | |
Monmouth County Improvement Authority, RB | | | | | | | | |
Series B, (GTD), 4.00%, 12/01/38 | | | 250 | | | | 297,630 | |
Series B, (GTD), 4.00%, 12/01/39 | | | 590 | | | | 699,297 | |
Monmouth Regional High School District, GO, (SCH BD RES FD), 3.00%, 02/01/34 | | | 1,260 | | | | 1,372,745 | |
New Jersey Economic Development Authority, RB | | | | | | | | |
5.00%, 06/15/23(c) | | | 2,000 | | | | 2,195,000 | |
Series A, (NPFGC), 0.00%, 07/01/21(d) | | | 1,675 | | | | 1,674,280 | |
Series AAA, 5.00%, 06/15/41 | | | 1,990 | | | | 2,331,325 | |
Series KK, 5.00%, 09/01/22(c) | | | 1,070 | | | | 1,134,981 | |
| | | | | | | | |
| Security | | Par (000) | | | Value | |
| | |
County/City/Special District/School District (continued) | | | | | | | | |
New Jersey Economic Development Authority, RB (continued) | | | | | | | | |
Series B, AMT, 6.50%, 04/01/31 | | $ | 1,725 | | | $ | 1,861,620 | |
New Jersey Economic Development Authority, Refunding SAB, 6.50%, 04/01/28. | | | 2,500 | | | | 2,754,125 | |
Sparta Township Board of Education, Refunding GO, (SCH BD RES FD), 5.00%, 02/15/25(c) | | | 1,350 | | | | 1,581,309 | |
Toms River Board of Education, GO, (SCH BD RES FD), 3.00%, 07/15/37 | | | 4,605 | | | | 4,913,120 | |
Township of Bloomfield New Jersey, Refunding GO
3.00%, 02/01/32 | | | 1,000 | | | | 1,094,979 | |
3.00%, 02/01/33 | | | 1,040 | | | | 1,134,546 | |
Township of Irvington New Jersey, Refunding GO, Series A, (AGM SAW), 5.00%, 07/15/31 | | | 2,445 | | | | 2,754,146 | |
Township of Monroe New Jersey/Gloucester County, Refunding GO | | | | | | | | |
3.00%, 05/01/32 | | | 405 | | | | 438,971 | |
3.00%, 06/01/37 | | | 385 | | | | 414,391 | |
3.00%, 06/01/38 | | | 410 | | | | 439,782 | |
Union County Utilities Authority, Refunding RB, | | | | | | | | |
Series A, AMT, (GTD), 4.75%, 12/01/31 | | | 1,250 | | | | 1,277,062 | |
| | | | | | | | |
| | | | | | | 67,182,760 | |
Education — 9.6% | | | | | | | | |
Atlantic County Improvement Authority, RB, Series A, (AGM), 4.00%, 07/01/46 | | | 1,250 | | | | 1,359,537 | |
Gloucester County Improvement Authority, RB 5.00%, 07/01/44 | | | 530 | | | | 612,765 | |
Series A, 5.00%, 07/01/34 | | | 1,855 | | | | 2,162,874 | |
New Jersey Economic Development Authority, RB 6.00%, 10/01/43 | | | 1,000 | | | | 1,099,450 | |
Series A, 5.00%, 07/01/27(e) | | | 170 | | | | 186,067 | |
Series A, 5.13%, 11/01/29(e) | | | 100 | | | | 112,166 | |
Series A, 5.25%, 07/01/37(e) | | | 470 | | | | 514,189 | |
Series A, 6.25%, 11/01/38(e) | | | 210 | | | | 246,196 | |
Series A, 5.00%, 06/15/39(e) | | | 825 | | | | 916,088 | |
Series A, 5.00%, 07/01/47 | | | 265 | | | | 278,743 | |
Series A, 5.38%, 07/01/47(e) | | | 815 | | | | 875,204 | |
Series A, 5.00%, 12/01/48 | | | 2,190 | | | | 2,531,049 | |
Series A, 5.00%, 06/15/49(e) | | | 135 | | | | 147,095 | |
Series A, 5.00%, 07/01/50 | | | 200 | | | | 227,456 | |
Series A, 6.50%, 11/01/52(e) | | | 1,210 | | | | 1,390,193 | |
Series A, 5.25%, 11/01/54(e) | | | 1,100 | | | | 1,165,912 | |
New Jersey Economic Development Authority, Refunding RB | | | | | | | | |
(AGM), 5.00%, 06/01/37 | | | 2,760 | | | | 3,290,389 | |
(AGM), 5.00%, 06/01/42 | | | 690 | | | | 817,726 | |
Series A, 3.50%, 09/01/22(e) | | | 85 | | | | 86,226 | |
Series A, 4.75%, 08/01/24(e) | | | 195 | | | | 201,909 | |
Series A, 5.63%, 08/01/34(e) | | | 250 | | | | 265,180 | |
Series A, 5.00%, 09/01/37(e) | | | 315 | | | | 354,677 | |
Series A, 5.88%, 08/01/44(e) | | | 430 | | | | 453,293 | |
Series A, 5.13%, 09/01/52(e) | | | 1,000 | | | | 1,100,840 | |
New Jersey Educational Facilities Authority, RB | | | | | | | | |
Series C, (AGM), 3.25%, 07/01/49 | | | 290 | | | | 309,363 | |
Series C, (AGM), 4.00%, 07/01/50 | | | 245 | | | | 277,877 | |
New Jersey Educational Facilities Authority, Refunding RB | | | | | | | | |
Series A, 5.00%, 07/01/33 | | | 2,005 | | | | 2,267,234 | |
Series B, 5.00%, 07/01/32 | | | 2,465 | | | | 2,964,705 | |
Series B, 5.00%, 07/01/42 | | | 560 | | | | 585,967 | |
| | |
| 26 | | 2 0 2 1 BLACK ROCK ANNUAL REPORT TO SHAREHOLDERS |
| | |
Schedule of Investments (continued) May 31, 2021 | | BlackRock New Jersey Municipal Bond Fund (Percentages shown are based on Net Assets) |
| | | | | | | | |
| Security | | Par (000) | | | Value | |
| | |
Education (continued) | | | | | | | | |
New Jersey Educational Facilities Authority, Refunding RB (continued) | | | | | | | | |
Series H, (AGM), 4.00%, 07/01/39 | | $ | 715 | | | $ | 785,685 | |
New Jersey Higher Education Student Assistance Authority, RB, Sub-Series C, AMT, 4.00%, 12/01/48 | | | 700 | | | | 759,675 | |
New Jersey Higher Education Student Assistance Authority, Refunding RB | | | | | | | | |
Series A, 2.38%, 12/01/29 | | | 2,040 | | | | 2,110,400 | |
1st Series, AMT, 5.75%, 12/01/28 | | | 360 | | | | 368,262 | |
Sub-Series C, AMT, 3.63%, 12/01/49 | | | 1,065 | | | | 1,092,914 | |
New Jersey Institute of Technology, RB | | | | | | | | |
Series A, 5.00%, 07/01/22(c) | | | 460 | | | | 484,228 | |
Series A, 5.00%, 07/01/40 | | | 5,000 | | | | 5,819,300 | |
| | | | | | | | |
| | | | | | | 38,220,834 | |
Health — 12.3% | | | | | | | | |
New Jersey Economic Development Authority, Refunding RB | | | | | | | | |
5.00%, 01/01/34 | | | 270 | | | | 313,494 | |
5.00%, 01/01/39 | | | 270 | | | | 310,951 | |
New Jersey Health Care Facilities Financing Authority, RB | | | | | | | | |
5.00%, 07/01/42 | | | 4,660 | | | | 5,636,410 | |
4.00%, 07/01/44 | | | 4,120 | | | | 4,792,425 | |
Series A, 5.25%, 07/01/35 | | | 1,460 | | | | 1,602,657 | |
Series A, 5.00%, 07/01/39 | | | 1,150 | | | | 1,300,190 | |
Series A, 5.00%, 07/01/43 | | | 1,535 | | | | 1,731,618 | |
Series A, 5.50%, 07/01/43 | | | 920 | | | | 1,011,319 | |
New Jersey Health Care Facilities Financing Authority, Refunding RB | | | | | | | | |
5.00%, 07/01/24(c) | | | 2,950 | | | | 3,380,228 | |
5.00%, 07/01/27 | | | 1,500 | | | | 1,577,790 | |
5.00%, 07/01/29 | | | 285 | | | | 318,128 | |
5.00%, 07/01/34 | | | 1,000 | | | | 1,207,150 | |
5.00%, 08/15/34 | | | 460 | | | | 504,183 | |
5.00%, 07/01/39 | | | 4,060 | | | | 4,859,982 | |
4.00%, 07/01/41 | | | 1,000 | | | | 1,089,800 | |
Series A, 5.63%, 07/01/21(c) | | | 1,540 | | | | 1,546,791 | |
Series A, 6.00%, 07/01/21(c) | | | 2,985 | | | | 2,999,179 | |
Series A, 5.00%, 07/01/24 | | | 1,000 | | | | 1,051,620 | |
Series A, 5.00%, 07/01/25 | | | 2,230 | | | | 2,344,957 | |
Series A, 4.00%, 07/01/32 | | | 2,300 | | | | 2,647,553 | |
Series A, 5.00%, 07/01/37 | | | 6,000 | | | | 7,318,020 | |
Series A, 5.00%, 07/01/43 | | | 1,290 | | | | 1,549,458 | |
| | | | | | | | |
| | | | | | | 49,093,903 | |
Housing — 2.0% | | | | | | | | |
New Jersey Housing & Mortgage Finance Agency, Refunding RB, M/F Housing | | | | | | | | |
Series A, (HUD SECT 8), 2.45%, 11/01/45 | | | 240 | | | | 235,486 | |
Series A, 4.00%, 11/01/48 | | | 150 | | | | 162,815 | |
Series A, (HUD SECT 8), 2.55%, 11/01/50 | | | 220 | | | | 215,842 | |
Series A, 4.10%, 11/01/53 | | | 100 | | | | 108,226 | |
Series A, (HUD SECT 8), 2.63%, 11/01/56 | | | 220 | | | | 217,129 | |
New Jersey Housing & Mortgage Finance Agency, Refunding RB, S/F Housing
Series A, 3.75%, 10/01/35 | | | 1,035 | | | | 1,135,250 | |
| | | | | | | | |
| Security | | Par (000) | | | Value | |
| | |
Housing (continued) | | | | | | | | |
New Jersey Housing & Mortgage Finance Agency, Refunding RB, S/F Housing (continued) | | | | | | | | |
Series E, 2.25%, 10/01/40 | | $ | 810 | | | $ | 819,364 | |
Series E, 2.40%, 10/01/45 | | | 620 | | | | 627,669 | |
Newark Housing Authority Scholarship Foundation A New Jersey Non, RB, M/F Housing | | | | | | | | |
Series A, 5.00%, 12/01/30 | | | 1,640 | | | | 1,818,694 | |
Series A, 4.38%, 12/01/33 | | | 2,515 | | | | 2,697,262 | |
| | | | | | | | |
| | | | | | | 8,037,737 | |
State — 19.2% | | | | | | | | |
Casino Reinvestment Development Authority, Inc., Refunding RB, (AGM), 4.00%, 11/01/34 | | | 500 | | | | 530,195 | |
Garden State Preservation Trust, RB | | | | | | | | |
Series A, (AGM), 5.75%, 11/01/28 | | | 2,565 | | | | 3,153,077 | |
Series B, (AGM), 0.00%, 11/01/27(d) | | | 4,135 | | | | 3,793,408 | |
Garden State Preservation Trust, RB, CAB, Series B, (AGM), 0.00%, 11/01/24(d) | | | 10,000 | | | | 9,727,700 | |
New Jersey Economic Development Authority, RB
4.00%, 06/15/49 | | | 1,190 | | | | 1,336,870 | |
Series A, (NPFGC), 5.25%, 07/01/26 | | | 1,000 | | | | 1,227,300 | |
Series A, 5.00%, 06/15/42 | | | 4,545 | | | | 5,413,731 | |
Series DDD, 5.00%, 06/15/42 | | | 3,000 | | | | 3,549,120 | |
Series EEE, 5.00%, 06/15/43 | | | 2,155 | | | | 2,613,843 | |
Series QQQ, 4.00%, 06/15/50 | | | 665 | | | | 759,450 | |
New Jersey Economic Development Authority, Refunding RB | | | | | | | | |
5.00%, 06/15/22 | | | 1,700 | | | | 1,775,854 | |
5.00%, 06/15/29 | | | 640 | | | | 668,243 | |
Series N-1, (AMBAC), 5.50%, 09/01/26 | | | 600 | | | | 747,708 | |
Series PP, 4.00%, 06/15/30 | | | 4,875 | | | | 5,359,770 | |
Sub-Series A, 5.00%, 07/01/33 | | | 125 | | | | 146,065 | |
Sub-Series A, 4.00%, 07/01/34 | | | 165 | | | | 182,419 | |
New Jersey Educational Facilities Authority, RB, Series A, 5.00%, 09/01/33 | | | 1,750 | | | | 1,983,327 | |
New Jersey Health Care Facilities Financing Authority, RB, 5.00%, 09/15/29 | | | 2,000 | | | | 2,183,980 | |
New Jersey Transportation Trust Fund Authority, RB | | | | | | | | |
Series AA, 5.25%, 06/15/31 | | | 2,000 | | | | 2,190,500 | |
Series AA, 5.00%, 06/15/45 | | | 1,000 | | | | 1,131,850 | |
Series B, 5.25%, 06/15/26 | | | 1,500 | | | | 1,502,700 | |
Series B, 5.00%, 06/15/33 | | | 550 | | | | 676,720 | |
Series B, 5.25%, 06/15/36 | | | 5,000 | | | | 5,009,000 | |
Series BB, 5.00%, 06/15/44 | | | 500 | | | | 602,705 | |
Series BB, 4.00%, 06/15/50 | | | 2,545 | | | | 2,846,633 | |
Series BB, 5.00%, 06/15/50 | | | 535 | | | | 635,222 | |
Series S, 5.25%, 06/15/43 | | | 1,720 | | | | 2,146,973 | |
New Jersey Transportation Trust Fund Authority, Refunding RB | | | | | | | | |
Series A, 5.00%, 12/15/32 | | | 1,775 | | | | 2,187,954 | |
Series A, 5.00%, 12/15/35 | | | 455 | | | | 558,435 | |
Series B, (NPFGC), 5.50%, 12/15/21 | | | 1,800 | | | | 1,852,002 | |
South Jersey Port Corp., ARB, Series B, AMT, 5.00%, 01/01/48 | | | 2,380 | | | | 2,720,887 | |
State of New Jersey, GO, Series A, 4.00%, 06/01/32 | | | 5,570 | | | | 7,067,439 | |
| | | | | | | | |
| | | | | | | 76,281,080 | |
| | |
SCHEDULE OF INVESTMENTS | | 27 |
| | |
Schedule of Investments (continued) May 31, 2021 | | BlackRock New Jersey Municipal Bond Fund (Percentages shown are based on Net Assets) |
| | | | | | | | |
| Security | | Par (000) | | | Value | |
| | |
Tobacco — 1.5% | | | | | | | | |
Tobacco Settlement Financing Corp., Refunding RB | | | | | | | | |
Series A, 5.00%, 06/01/46 | | $ | 1,500 | | | $ | 1,784,925 | |
Series A, 5.25%, 06/01/46 | | | 915 | | | | 1,103,728 | |
Sub-Series B, 5.00%, 06/01/46 | | | 2,790 | | | | 3,274,288 | |
| | | | | | | | |
| | | | | | | 6,162,941 | |
Transportation — 11.7% | | | | | | | | |
New Jersey Economic Development Authority, RB | | | | | | | | |
AMT, (AGM), 5.13%, 01/01/39 | | | 1,000 | | | | 1,100,320 | |
AMT, (AGM), 5.13%, 07/01/42 | | | 1,000 | | | | 1,098,040 | |
AMT, 5.38%, 01/01/43 | | | 905 | | | | 1,000,966 | |
New Jersey Transportation Trust Fund Authority, RB | | | | | | | | |
Series A, 6.00%, 06/15/21(c) | | | 3,185 | | | | 3,191,784 | |
Series A, 5.00%, 06/15/30 | | | 1,250 | | | | 1,481,087 | |
Series B, 5.00%, 06/15/21(c) | | | 600 | | | | 601,110 | |
New Jersey Transportation Trust Fund Authority, RB, CAB(d) | | | | | | | | |
Series A, 0.00%, 12/15/32 | | | 10,000 | | | | 7,705,700 | |
Series A, 0.00%, 12/15/35 | | | 8,900 | | | | 6,275,924 | |
Series A, 0.00%, 12/15/38 | | | 10,000 | | | | 6,383,500 | |
New Jersey Transportation Trust Fund Authority, Refunding RB,
Series A, 5.00%, 06/15/31 | | | 2,730 | | | | 3,228,607 | |
New Jersey Turnpike Authority, RB, Series E, 5.00%, 01/01/45 | | | 2,000 | | | | 2,285,820 | |
New Jersey Turnpike Authority, Refunding RB | | | | | | | | |
Series A, (BHAC-CR AGM), 5.25%, 01/01/30 | | | 1,000 | | | | 1,355,710 | |
Series B, 5.00%, 01/01/34 | | | 1,600 | | | | 1,976,992 | |
Series E, 5.00%, 01/01/32 | | | 1,350 | | | | 1,676,092 | |
South Jersey Transportation Authority, RB,
Series A, 5.00%, 11/01/45 | | | 3,545 | | | | 4,425,507 | |
South Jersey Transportation Authority, Refunding RB | | | | | | | | |
Series A, 5.00%, 11/01/22(c) | | | 295 | | | | 315,288 | |
Series A, 5.00%, 11/01/32 | | | 440 | | | | 499,374 | |
Series A, 5.00%, 11/01/33 | | | 250 | | | | 283,633 | |
Series A, 5.00%, 11/01/39 | | | 1,500 | | | | 1,662,900 | |
| | | | | | | | |
| | | | | | | 46,548,354 | |
Utilities — 2.3% | | | | | | | | |
Industrial Pollution Control Financing Authority of | | | | | | | | |
Gloucester County, Refunding RB, Series A, AMT, 5.00%, 12/01/24 | | | 340 | | | | 355,966 | |
New Jersey Infrastructure Bank, RB 2.00%, 09/01/42(a) | | | 710 | | | | 698,228 | |
2.00%, 09/01/43(a) | | | 485 | | | | 474,122 | |
2.25%, 09/01/50(a) | | | 1,190 | | | | 1,173,304 | |
Series B, AMT, 5.00%, 09/01/21(c) | | | 1,355 | | | | 1,370,813 | |
North Hudson Sewerage Authority, Refunding RB, | | | | | | | | |
Series A, (NPFGC), 0.00%, 08/01/21(d)(f) | | | 5,000 | | | | 4,996,350 | |
| | | | | | | | |
| | | | | | | 9,068,783 | |
| | | | | | | | |
| | |
| Total Municipal Bonds in New Jersey | | | | | 309,715,539 | |
| | |
New York — 4.8% | | | | | | | | |
| | |
Transportation — 4.8% | | | | | | | | |
Port Authority of New York & New Jersey, ARB | | | | | | | | |
Consolidated, 93rd Series, 6.13%, 06/01/94 | | | 1,000 | | | | 1,169,040 | |
Consolidated, 218th Series, AMT, 4.00%, 11/01/34 | | | 2,345 | | | | 2,794,537 | |
Consolidated, 218th Series, AMT, 4.00%, 11/01/47 | | | 3,545 | | | | 4,051,970 | |
Consolidated, 221st Series, AMT, 4.00%, 07/15/45 | | | 2,170 | | | | 2,514,835 | |
Port Authority of New York & New Jersey, Refunding ARB
Series 205th, 5.00%, 11/15/42 | | | 1,975 | | | | 2,441,969 | |
| | | | | | | | |
| Security | | Par (000) | | | Value | |
| | |
Transportation (continued) | | | | | | | | |
Port Authority of New York & New Jersey, Refunding ARB (continued) | | | | | | | | |
178th Series, AMT, 5.00%, 12/01/43 | | $ | 285 | | | $ | 314,574 | |
Consolidated, 169th Series, AMT, 5.00%, 10/15/41 | | | 500 | | | | 508,260 | |
Consolidated, 186th Series, AMT, 5.00%, 10/15/44 | | | 3,000 | | | | 3,407,100 | |
Series 223, AMT, 4.00%, 07/15/51 | | | 1,540 | | | | 1,808,176 | |
| | | | | | | | |
| | |
Total Municipal Bonds in New York | | | | | | | 19,010,461 | |
| | |
Pennsylvania — 0.4% | | | | | | | | |
| | |
Transportation — 0.4% | | | | | | | | |
Delaware River Port Authority, RB, 5.00%, 01/01/40 | | | 1,500 | | | | 1,666,590 | |
| | | | | | | | |
| | |
Puerto Rico — 3.1% | | | | | | | | |
| | |
State — 2.7% | | | | | | | | |
Puerto Rico Sales Tax Financing Corp. Sales Tax Revenue, RB | | | | | | | | |
Series A-1, Restructured, 4.75%, 07/01/53 | | | 2,932 | | | | 3,286,831 | |
Series A-1, Restructured, 5.00%, 07/01/58 | | | 3,105 | | | | 3,532,341 | |
Series A-2, Restructured, 4.33%, 07/01/40 | | | 580 | | | | 643,365 | |
Series A-2, Restructured, 4.78%, 07/01/58 | | | 1,757 | | | | 1,974,130 | |
Puerto Rico Sales Tax Financing Corp. Sales Tax Revenue, RB, CAB(d) | | | | | | | | |
Series A-1, Restructured, 0.00%, 07/01/46 | | | 1,842 | | | | 597,397 | |
Series A-1, Restructured, 0.00%, 07/01/51 | | | 1,885 | | | | 442,542 | |
Series B-1, Restructured, 0.00%, 07/01/46 | | | 567 | | | | 184,048 | |
| | | | | | | | |
| | | | | | | 10,660,654 | |
Utilities — 0.4% | | | | | | | | |
Puerto Rico Commonwealth Aqueduct & Sewer Authority, RB | | | | | | | | |
Series A, Senior Lien, 5.13%, 07/01/37 | | | 160 | | | | 166,253 | |
Series A, Senior Lien, 5.25%, 07/01/42 | | | 1,445 | | | | 1,499,780 | |
| | | | | | | | |
| | | | | | | 1,666,033 | |
| | | | | | | | |
Total Municipal Bonds in Puerto Rico | | | | | | | 12,326,687 | |
| | | | | | | | |
Total Municipal Bonds — 86.4%
(Cost: $308,100,481) | | | | | | | 344,113,504 | |
| | | | | | | | |
|
Municipal Bonds Transferred to Tender Option Bond Trusts(g) | |
| | |
New Jersey — 8.2% | | | | | | | | |
| |
County/City/Special District/School District — 2.6% | | | | | |
Hudson County Improvement Authority, RB, 5.25%, 05/01/51 | | | 1,440 | | | | 1,737,605 | |
Union County Utilities Authority, Refunding RB | | | | | | | | |
Series A, 5.00%, 06/15/41 | | | 2,000 | | | | 2,007,200 | |
Series A, AMT, 5.25%, 12/01/31 | | | 6,300 | | | | 6,452,019 | |
| | | | | | | | |
| | | | | | | 10,196,824 | |
Education — 3.6% | | | | | | | | |
New Jersey Economic Development Authority, Refunding RB(h) | | | | | | | | |
AMT, 3.00%, 08/01/41 | | | 4,622 | | | | 4,736,024 | |
AMT, 3.00%, 08/01/43(e) | | | 6,648 | | | | 6,811,359 | |
Rutgers The State University of New Jersey, Refunding RB, Series L, 5.00%, 05/01/43(f) | | | 2,500 | | | | 2,731,800 | |
| | | | | | | | |
| | | | | | | 14,279,183 | |
| | |
| 28 | | 2 0 2 1 BLACK ROCK ANNUAL REPORT TO SHAREHOLDERS |
| | |
Schedule of Investments (continued) May 31, 2021 | | BlackRock New Jersey Municipal Bond Fund (Percentages shown are based on Net Assets) |
| | | | | | | | |
| Security | | Par (000) | | | Value | |
| | |
Health — 2.0% | | | | | | | | |
New Jersey Health Care Facilities Financing Authority, RB, 4.00%, 07/01/47 | | $ | 7,332 | | | $ | 8,168,156 | |
| | | | | | | | |
| | |
Total Municipal Bonds in New Jersey | | | | | | | 32,644,163 | |
| | | | | | | | |
| | |
New York — 0.5% | | | | | | | | |
| | |
Transportation — 0.5% | | | | | | | | |
Port Authority of New York & New Jersey, Refunding ARB, 194th Series, 5.25%, 10/15/55 | | | 1,455 | | | | 1,726,270 | |
| | | | | | | | |
| |
Total Municipal Bonds Transferred to Tender Option Bond Trusts — 8.7%
(Cost: $32,713,166) | | | | 34,370,433 | |
| | | | | | | | |
Total Long-Term Investments — 95.1%
(Cost: $340,813,647) | | | | | | | 378,483,937 | |
| | | | | | | | |
| | |
Short-Term Securities | | | | | | | | |
| | |
Commercial Paper — 2.2% | | | | | | | | |
Port Authority of New York & New Jersey, Refunding ARB, 0.16%, 10/01/21 | | | 8,840 | | | | 8,840,610 | |
| | | | | | | | |
| | | | | | | 8,840,610 | |
| | | | | | | | |
| | |
| | | Shares | | | | |
| | |
Money Market Funds — 7.2% | | | | | | | | |
BlackRock Liquidity Funds, MuniCash, Institutional Class, 0.01%(i)(j) | | | 28,649,650 | | | | 28,655,380 | |
| | | | | | | | |
Total Short-Term Securities — 9.4%
(Cost: $37,493,774) | | | | | | | 37,495,990 | |
| | | | | | | | |
Total Investments — 104.5% (Cost: $378,307,421) | | | | | | | 415,979,927 | |
Other Assets Less Liabilities — 0.0% | | | | | | | 221,637 | |
Liability for TOB Trust Certificates, Including Interest Expense and | | | | | |
Fees Payable — (4.5)% | | | | | | | (17,980,471 | ) |
| | | | | | | | |
| | |
Net Assets — 100.0% | | | | | | $ | 398,221,093 | |
| | | | | | | | |
| (a) | When-issued security. |
| (b) | Variable rate security. Interest rate resets periodically. The rate shown is the effective interest rate as of period end. Security description also includes the reference rate and spread if published and available. |
| (c) | U.S. Government securities held in escrow, are used to pay interest on this security as well as to retire the bond in full at the date indicated, typically at a premium to par. |
| (e) | Security exempt from registration pursuant to Rule 144A under the Securities Act of 1933, as amended. These securities may be resold in transactions exempt from registration to qualified institutional investors. |
| (f) | Security is collateralized by municipal bonds or U.S. Treasury obligations. |
| (g) | Represent bonds transferred to a TOB Trust in exchange of cash and residual certificates received by the Fund. These bonds serve as collateral in a secured borrowing. See Note 4 of the Notes to Financial Statements for details. |
| (h) | All or a portion of the security is subject to a recourse agreement. The aggregate maximum potential amount the Fund could ultimately be required to pay under the agreement, which expires on February 1, 2037, is $5,808,746. See Note 4 of the Notes to Financial Statements for details. |
| (i) | Affiliate of the Fund. |
| (j) | Annualized 7-day yield as of period end. |
For Fund compliance purposes, the Fund’s sector classifications refer to one or more of the sector sub-classifications used by one or more widely recognized market indexes or rating group indexes, and/or as defined by the investment adviser. These definitions may not apply for purposes of this report, which may combine such sector sub-classifications for reporting ease.
Affiliates
Investments in issuers considered to be affiliate(s) of the Fund during the year ended May 31, 2021 for purposes of Section 2(a)(3) of the Investment Company Act of 1940, as amended, were as follows:
| | | | | | | | | | | | | | | | | | | | | | | | | | | | | | | | | | | | |
| Affiliated Issuer | | Value at
05/31/20 | | | Purchases
at Cost | | | Proceeds
from Sales | | | Net
Realized
Gain (Loss) | | | Change in
Unrealized
Appreciation
(Depreciation) | | | Value at
05/31/21 | | | Shares
Held at
05/31/21 | | | Income | | | Capital Gain
Distributions
from
Underlying
Funds | |
BlackRock Liquidity Funds, MuniCash, Institutional Class | | $ | 9,091,474 | | | $ | 19,564,070 | (a) | | $ | — | | | $ | (772) | | | $ | 608 | | | $ | 28,655,380 | | | | 28,649,650 | | | $ | 2,174 | | | $ | — | |
| | | | | | | | | | | | | | | | | | | | | | | | | | | | | | | | | | | | |
| | (a) | Represents net amount purchased (sold). |
| | |
SCHEDULE OF INVESTMENTS | | 29 |
| | |
Schedule of Investments (continued) May 31, 2021 | | BlackRock New Jersey Municipal Bond Fund |
Derivative Financial Instruments Outstanding as of Period End
Futures Contracts
| | | | | | | | | | | | | | | | |
| Description | | Number of
Contracts | | | Expiration
Date | | | Notional
Amount
(000) | | | Value/
Unrealized
Appreciation
(Depreciation) | |
Short Contracts | | | | | | | | | | | | | | | | |
10-Year U.S. Treasury Notes | | | 136 | | | | 09/21/21 | | | $ | 17,927 | | | $ | 2,297 | |
U.S. Long Bond | | | 50 | | | | 09/21/21 | | | | 7,808 | | | | (6,541 | ) |
| | | | | | | | | | | | | | | | |
| | | | | | | | | | | | | | $ | (4,244 | ) |
| | | | | | | | | | | | | | | | |
Derivative Financial Instruments Categorized by Risk Exposure
As of period end, the fair values of derivative financial instruments located in the Statements of Assets and Liabilities were as follows:
| | | | | | | | | | | | | | | | | | | | | | | | | | | | |
| | | Commodity
Contracts | | | Credit
Contracts | | | Equity
Contracts | | | Foreign
Currency
Exchange
Contracts | | | Interest
Rate
Contracts | | | Other
Contracts | | | Total | |
Assets — Derivative Financial Instruments | | | | | | | | | | | | | | | | | | | | | | | | | | | | |
Futures contracts | | | | | | | | | | | | | | | | | | | | | | | | | | | | |
Unrealized appreciation on futures contracts(a) | | $ | — | | | $ | — | | | $ | — | | | $ | — | | | $ | 2,297 | | | $ | — | | | $ | 2,297 | |
| | | | | | | | | | | | | | | | | | | | | | | | | | | | |
Liabilities — Derivative Financial Instruments | | | | | | | | | | | | | | | | | | | | | | | | | | | | |
Futures contracts | | | | | | | | | | | | | | | | | | | | | | | | | | | | |
Unrealized depreciation on futures contracts(a) | | $ | — | | | $ | — | | | $ | — | | | $ | — | | | $ | 6,541 | | | $ | — | | | $ | 6,541 | |
| | | | | | | | | | | | | | | | | | | | | | | | | | | | |
| | (a) | Net cumulative unrealized appreciation (depreciation) on futures contracts and centrally cleared swaps, if any, are reported in the Schedule of Investments. In the Statements of Assets and Liabilities, only current day’s variation margin is reported in receivables or payables and the net cumulative unrealized appreciation (depreciation) is included in accumulated earnings (loss). | |
For the year ended May 31, 2021, the effect of derivative financial instruments in the Statements of Operations was as follows:
| | | | | | | | | | | | | | | | | | | | | | | | | | | | |
| | | Commodity
Contracts | | | Credit
Contracts | | | Equity
Contracts | | | Foreign
Currency
Exchange
Contracts | | | Interest
Rate
Contracts | | | Other
Contracts | | | Total | |
Net Realized Gain (Loss) from | | | | | | | | | | | | | | | | | | | | | | | | | | | | |
Futures contracts | | $ | — | | | $ | — | | | $ | — | | | $ | — | | | $ | 1,249,472 | | | $ | — | | | $ | 1,249,472 | |
| | | | | | | | | | | | | | | | | | | | | | | | | | | | |
Net Change in Unrealized Appreciation (Depreciation) on | | | | | | | | | | | | | | | | | | | | | | | | | | | | |
Futures contracts | | $ | — | | | $ | — | | | $ | — | | | $ | — | | | $ | (4,244 | ) | | $ | — | | | $ | (4,244 | ) |
| | | | | | | | | | | | | | | | | | | | | | | | | | | | |
Average Quarterly Balances of Outstanding Derivative Financial Instruments
| | | | |
Futures contracts | | | | |
Average notional value of contracts — short. | | $ | 10,907,153 | |
For more information about the Fund’s investment risks regarding derivative financial instruments, refer to the Notes to Financial Statements.
Fair Value Hierarchy as of Period End
Various inputs are used in determining the fair value of financial instruments. For a description of the input levels and information about the Fund’s policy regarding valuation of financial instruments, refer to the Notes to Financial Statements.
The following tables summarize the Fund’s financial instruments categorized in the fair value hierarchy. The breakdown of the Fund’s investments into major categories is disclosed in the Schedule of Investments above.
| | | | | | | | | | | | | | | | |
| | | Level 1 | | | Level 2 | | | Level 3 | | | Total | |
Assets | | | | | | | | | | | | | | | | |
Investments | | | | | | | | | | | | | | | | |
Long-Term Investments | | | | | | | | | | | | | | | | |
Municipal Bonds | | $ | — | | | $ | 344,113,504 | | | $ | — | | | $ | 344,113,504 | |
Municipal Bonds Transferred to Tender Option Bond Trusts | | | — | | | | 34,370,433 | | | | — | | | | 34,370,433 | |
| | |
| 30 | | 2 0 2 1 BLACK ROCK ANNUAL REPORT TO SHAREHOLDERS |
| | |
Schedule of Investments (continued) May 31, 2021 | | BlackRock New Jersey Municipal Bond Fund |
Fair Value Hierarchy as of Period End (continued)
| | | | | | | | | | | | | | | | |
| | | Level 1 | | | Level 2 | | | Level 3 | | | Total | |
Short-Term Securities | | | | | | | | | | | | | | | | |
Commercial Paper | | $ | — | | | $ | 8,840,610 | | | $ | — | | | $ | 8,840,610 | |
Money Market Funds | | | 28,655,380 | | | | — | | | | — | | | | 28,655,380 | |
| | | | | | | | | | | | | | | | |
| | $ | 28,655,380 | | | $ | 387,324,547 | | | $ | — | | | $ | 415,979,927 | |
| | | | | | | | | | | | | | | | |
Derivative Financial Instruments(a) | | | | | | | | | | | | | | | | |
Assets | | | | | | | | | | | | | | | | |
Interest Rate Contracts | | $ | 2,297 | | | $ | — | | | $ | — | | | $ | 2,297 | |
Liabilities | | | | | | | | | | | | | | | | |
Interest Rate Contracts | | | (6,541 | ) | | | — | | | | — | | | | (6,541 | ) |
| | | | | | | | | | | | | | | | |
| | $ | (4,244 | ) | | $ | — | | | $ | — | | | $ | (4,244 | ) |
| | | | | | | | | | | | | | | | |
| | (a) | Derivative financial instruments are futures contracts. Futures contracts are valued at the unrealized appreciation (depreciation) on the instrument. | |
The Fund may hold assets and/or liabilities in which the fair value approximates the carrying amount for financial statement purposes. As of period end, TOB Trust Certificates of $17,972,276 are categorized as Level 2 within the fair value hierarchy.
See notes to financial statements.
| | |
SCHEDULE OF INVESTMENTS | | 31 |
| | |
Schedule of Investments May 31, 2021 | | BlackRock Pennsylvania Municipal Bond Fund (Percentages shown are based on Net Assets) |
| | | | | | | | |
| Security | | Par (000) | | | Value | |
| | |
Municipal Bonds | | | | | | | | |
|
| Guam — 0.4% | |
| | |
| State(a) — 0.2% | | | | | | |
Territory of Guam, Refunding RB | | | | | | | | |
Series F, 4.00%, 01/01/36. | | $ | 470 | | | $ | 545,017 | |
Series F, 4.00%, 01/01/42. | | | 605 | | | | 687,231 | |
| | | | | | | | |
| | | | | | | 1,232,248 | |
| | |
| Utilities — 0.2% | | | | | | |
Guam Government Waterworks Authority, RB, Series A, 5.00%, 01/01/50 | | | 820 | | | | 998,785 | |
| | | | | | | | |
| |
Total Municipal Bonds in Guam | | | | 2,231,033 | |
| | | | | | | | |
| | |
| Pennsylvania — 87.7% | | | | | | |
| | |
| Corporate — 5.1% | | | | | | |
Pennsylvania Economic Development Financing Authority RB, AMT, 0.45%, 06/01/41(b) | | | 13,335 | | | | 13,482,565 | |
Pennsylvania Economic Development Financing Authority, RB | | | | | | | | |
Series A, AMT, 3.25%, 08/01/39(c) | | | 2,800 | | | | 2,868,824 | |
Series B-1, AMT, 0.18%, 04/01/49(b) | | | 4,200 | | | | 4,200,000 | |
Pennsylvania Economic Development Financing Authority, Refunding RB | | | | | | | | |
AMT, 5.50%, 11/01/44 | | | 1,355 | | | | 1,443,251 | |
Series A, AMT, 0.18%, 04/01/34(b) | | | 8,750 | | | | 8,750,000 | |
| | | | | | | | |
| | | | | | | 30,744,640 | |
| |
| County/City/Special District/School District — 21.9% | | | | |
Allentown Neighborhood Improvement Zone Development Authority, RB, 5.00%,
05/01/42(c) | | | 330 | | | | 382,335 | |
Allentown Neighborhood Improvement Zone Development Authority, Refunding RB | | | | | | | | |
Series A, 5.00%, 05/01/35 | | | 2,310 | | | | 2,390,018 | |
Series A, 5.00%, 05/01/42 | | | 3,900 | | | | 4,035,135 | |
Altoona Area School District, GO | | | | | | | | |
(BAM SAW), 5.00%, 12/01/36 | | | 215 | | | | 253,365 | |
(BAM SAW), 5.00%, 12/01/45 | | | 1,000 | | | | 1,156,070 | |
Series A, (AGM SAW), 5.00%, 12/01/36 | | | 2,895 | | | | 3,411,584 | |
Bethlehem Area School District, GO | | | | | | | | |
Series A, (BAM SAW), 5.00%, 08/01/34 | | | 2,390 | | | | 2,794,699 | |
Series A, (BAM SAW), 5.00%, 08/01/35 | | | 1,790 | | | | 2,091,329 | |
Boyertown Area School District, GO | | | | | | | | |
(SAW), 5.00%, 10/01/36 | | | 890 | | | | 995,777 | |
(SAW), 5.00%, 10/01/38 | | | 1,335 | | | | 1,492,023 | |
Bristol Township School District, GO, (BAM SAW), 5.00%, 06/01/42 | | | 2,550 | | | | 3,093,379 | |
Catasauqua Area School District, Refunding GO, (BAM SAW), 4.00%, 02/15/42 | | | 2,255 | | | | 2,490,918 | |
Chester County Industrial Development Authority, SAB(c) | | | | | | | | |
4.25%, 03/01/35 | | | 1,285 | | | | 1,320,350 | |
5.00%, 03/01/38 | | | 525 | | | | 626,115 | |
5.13%, 03/01/48 | | | 1,048 | | | | 1,236,661 | |
4.75%, 03/01/50 | | | 2,725 | | | | 2,797,458 | |
City of Lancaster Pennsylvania, GO, (BAM), 4.00%, 11/01/42 | | | 3,720 | | | | 4,286,296 | |
City of Philadelphia Pennsylvania, GO, Series B, 5.00%, 02/01/39 | | | 2,155 | | | | 2,715,946 | |
City of Philadelphia Pennsylvania, Refunding GO, Series A, 5.00%, 08/01/37 | | | 2,140 | | | | 2,600,314 | |
Coatesville School District, GO, CAB(d) | | | | | | | | |
Series A, (BAM SAW), 0.00%, 10/01/34 | | | 290 | | | | 188,596 | |
| | | | | | | | |
| Security | | Par (000) | | | Value | |
|
County/City/Special District/School District (continued) | |
Coatesville School District, GO, CAB(d) (continued) | | | | | | | | |
Series A, (BAM SAW), 0.00%, 10/01/35 | | $ | 2,565 | | | $ | 1,589,864 | |
Series A, (BAM SAW), 0.00%, 10/01/37 | | | 2,505 | | | | 1,421,738 | |
Coatesville School District, Refunding GO, CAB(d) | | | | | | | | |
Series B, (BAM SAW), 0.00%, 10/01/33 | | | 500 | | | | 341,325 | |
Series B, (BAM SAW), 0.00%, 10/01/34 | | | 980 | | | | 637,323 | |
Series C, (BAM SAW), 0.00%, 10/01/33 | | | 640 | | | | 438,899 | |
County of Lancaster Pennsylvania, Refunding GO 4.00%, 11/01/34 | | | 500 | | | | 578,565 | |
4.00%, 11/01/35 | | | 520 | | | | 600,959 | |
4.00%, 11/01/36 | | | 540 | | | | 623,581 | |
4.00%, 11/01/37 | | | 565 | | | | 651,733 | |
4.00%, 11/01/38 | | | 585 | | | | 673,932 | |
Dallastown Area School District, Refunding GO, (SAW), 5.00%, 04/15/34 | | | 1,835 | | | | 2,127,022 | |
East Pennsboro Area School District, GO | | | | | | | | |
(BAM SAW), 4.00%, 10/01/40 | | | 645 | | | | 743,679 | |
(BAM SAW), 4.00%, 10/01/44 | | | 1,530 | | | | 1,745,118 | |
Easton Area School District, GO, Series B, (SAW), 5.00%, 02/01/31 | | | 1,650 | | | | 2,057,946 | |
Fox Chapel Area School District, GO | | | | | | | | |
(SAW), 5.00%, 02/01/39 | | | 4,100 | | | | 4,964,772 | |
(SAW), 5.00%, 02/01/42 | | | 6,365 | | | | 7,587,780 | |
Governor Mifflin School District, GO | | | | | | | | |
Series A, (SAW), 4.00%, 04/01/39 | | | 640 | | | | 738,982 | |
Series A, (SAW), 4.00%, 04/01/40 | | | 400 | | | | 459,988 | |
Series A, (SAW), 4.00%, 04/01/42 | | | 1,150 | | | | 1,322,017 | |
Series A, (SAW), 4.00%, 04/01/43 | | | 1,010 | | | | 1,160,823 | |
Series A, (SAW), 4.00%, 04/01/46 | | | 1,185 | | | | 1,358,484 | |
Marple Newtown School District, GO, (SAW),
3.00%, 06/01/40 | | | 2,365 | | | | 2,572,387 | |
Mechanicsburg Area School District, GO | | | | | | | | |
Series A, (SAW), 4.00%, 03/01/40 | | | 2,160 | | | | 2,508,581 | |
Series A, (SAW), 4.00%, 03/01/41 | | | 2,245 | | | | 2,602,202 | |
Series A, (SAW), 4.00%, 03/01/42 | | | 2,335 | | | | 2,703,276 | |
Monroe County GO(a) | | | | | | | | |
Series A, 4.00%, 07/15/30 | | | 840 | | | | 1,023,473 | |
Series A, 4.00%, 07/15/31 | | | 970 | | | | 1,176,697 | |
Series A, 4.00%, 07/15/32 | | | 1,280 | | | | 1,546,803 | |
North Allegheny School District, GO, (SAW),
4.00%, 05/01/39 | | | 1,000 | | | | 1,197,630 | |
Northampton County Industrial Development Authority, TA, 7.00%, 07/01/32 | | | 1,525 | | | | 1,641,723 | |
Pittsburgh School District, GO | | | | | | | | |
Series A, (SAW), 4.00%, 09/01/37 | | | 2,240 | | | | 2,590,717 | |
Series A, (SAW), 4.00%, 09/01/38 | | | 2,235 | | | | 2,574,899 | |
Redevelopment Authority of The County of Washington, Refunding TA | | | | | | | | |
4.00%, 07/01/23 | | | 550 | | | | 558,646 | |
5.00%, 07/01/28 | | | 600 | | | | 656,760 | |
School District of Philadelphia, RB, Series A,
4.00%, 06/30/21 | | | 6,000 | | | | 6,017,820 | |
School District of Philadelphia, Refunding GO,
Series F, (SAW), 5.00%, 09/01/37 | | | 1,815 | | | | 2,172,047 | |
Springfield School District/Delaware County, GO, (SAW), 5.00%, 03/01/40 | | | 1,710 | | | | 2,117,955 | |
State Public School Building Authority, RB, (AGM), 5.00%, 07/15/34 | | | 5,070 | | | | 5,099,305 | |
State Public School Building Authority, Refunding RB, Series A, (AGM SAW), 5.00%, 06/01/33 | | | 5,000 | | | | 6,059,750 | |
| | |
| 32 | | 2 0 2 1 BLACK ROCK ANNUAL REPORT TO SHAREHOLDERS |
| | |
Schedule of Investments (continued) May 31, 2021 | | BlackRock Pennsylvania Municipal Bond Fund (Percentages shown are based on Net Assets) |
| | | | | | | | |
| Security | | Par (000) | | | Value | |
|
County/City/Special District/School District (continued) | |
Township of Lower Paxton Pennsylvania, GO 5.00%, 04/01/24(e) | | $ | 630 | | | $ | 713,985 | |
Series A, 4.00%, 04/01/41 | | | 260 | | | | 306,597 | |
Series A, 4.00%, 04/01/42 | | | 185 | | | | 217,773 | |
Series A, 4.00%, 04/01/43 | | | 345 | | | | 405,720 | |
Series A, 4.00%, 04/01/44 | | | 390 | | | | 458,075 | |
Series A, 4.00%, 04/01/50 | | | 705 | | | | 825,696 | |
Township of West Bradford Pennsylvania, GO, 4.00%, 12/15/49 | | | 1,125 | | | | 1,274,512 | |
Tredyffrin Easttown School District, GO, (SAW), 5.00%, 02/15/39 | | | 1,130 | | | | 1,374,735 | |
West Shore School District, GO | | | | | | | | |
(SAW), 5.00%, 11/15/43 | | | 4,045 | | | | 4,934,819 | |
(SAW), 4.00%, 11/15/45 | | | 1,285 | | | | 1,491,448 | |
(SAW), 4.00%, 11/15/48 | | | 640 | | | | 741,427 | |
(SAW), 5.00%, 11/15/48 | | | 1,975 | | | | 2,389,236 | |
| | | | | | | | |
| | | | | | | 132,137,592 | |
| | |
| Education — 11.7% | | | | | | |
Allegheny County Higher Education Building Authority, Refunding RB, Series A,
5.00%, 08/01/27 | | | 965 | | | | 1,208,161 | |
Berks County Municipal Authority, Refunding RB
5.00%, 10/01/39 | | | 290 | | | | 316,347 | |
5.00%, 10/01/49 | | | 795 | | | | 856,112 | |
Chester County Industrial Development Authority, RB, 4.00%, 12/01/49 | | | 3,750 | | | | 4,300,162 | |
City of Erie Higher Education Building Authority, Refunding RB
4.00%, 05/01/36 | | | 195 | | | | 221,584 | |
5.00%, 05/01/47 | | | 615 | | | | 741,136 | |
Delaware County Authority, RB, 5.00%, 08/01/40 | | | 1,795 | | | | 2,064,358 | |
Delaware County Authority, Refunding RB,
5.00%, 07/01/47 | | | 3,870 | | | | 4,324,686 | |
East Hempfield Township Industrial Development Authority, RB | | | | | | | | |
5.00%, 07/01/35 | | | 1,395 | | | | 1,472,733 | |
5.00%, 07/01/45 | | | 450 | | | | 463,977 | |
5.00%, 07/01/47 | | | 1,180 | | | | 1,247,508 | |
Latrobe Industrial Development Authority, Refunding RB, 4.00%, 03/01/46 | | | 515 | | | | 561,020 | |
Lehigh County Industrial Development Authority Refunding RB, 4.00%, 05/01/51(a) | | | 1,545 | | | | 1,639,539 | |
Pennsylvania Higher Education Assistance Agency, RB(a) | | | | | | | | |
Series A, 5.00%, 06/01/26 | | | 310 | | | | 369,033 | |
Series A, 5.00%, 06/01/27 | | | 340 | | | | 413,406 | |
Series A, 5.00%, 06/01/28 | | | 355 | | | | 439,380 | |
Series A, 5.00%, 06/01/29 | | | 345 | | | | 433,672 | |
Series A, 5.00%, 06/01/30 | | | 260 | | | | 331,144 | |
Series A, 2.63%, 06/01/42 | | | 2,300 | | | | 2,304,577 | |
Series B, 3.13%, 06/01/48 | | | 650 | | | | 649,994 | |
Pennsylvania Higher Educational Facilities Authority, RB, Series AT-1, 4.00%, 06/15/34 | | | 5,790 | | | | 6,589,831 | |
Pennsylvania Higher Educational Facilities Authority, Refunding RB
4.00%, 05/01/36 | | | 500 | | | | 560,200 | |
5.00%, 05/01/37 | | | 1,595 | | | | 1,623,120 | |
Series A, 5.25%, 07/15/33 | | | 2,420 | | | | 2,621,973 | |
Series A, 5.50%, 07/15/38 | | | 365 | | | | 396,120 | |
Pennsylvania State University, RB
5.00%, 09/01/48 | | | 2,615 | | | | 3,247,725 | |
Series A, 5.00%, 09/01/43 | | | 3,935 | | | | 5,007,681 | |
| | | | | | | | |
| Security | | Par
(000) | | | Value | |
|
Education (continued) | |
Philadelphia Authority for Industrial Development, RB | | | | | | | | |
4.00%, 06/15/29 | | $ | 485 | | | $ | 514,338 | |
5.00%, 06/15/39 | | | 840 | | | | 911,932 | |
5.00%, 11/01/42 | | | 3,525 | | | | 4,165,774 | |
5.00%, 06/15/50 | | | 800 | | | | 857,664 | |
Philadelphia Authority for Industrial Development, Refunding RB | | | | | | | | |
5.00%, 05/01/30 | | | 785 | | | | 919,329 | |
5.00%, 05/01/40 | | | 675 | | | | 764,390 | |
5.00%, 06/15/40(c) | | | 580 | | | | 675,694 | |
4.00%, 05/01/42 | | | 4,780 | | | | 4,795,583 | |
4.00%, 11/01/45 | | | 4,260 | | | | 4,841,959 | |
5.00%, 05/01/50 | | | 2,010 | | | | 2,249,612 | |
5.00%, 06/15/50(c) | | | 1,090 | | | | 1,245,826 | |
Series 2015, 5.00%, 04/01/45 | | | 3,330 | | | | 3,837,226 | |
| | | | | | | | |
| | | | | | | 70,184,506 | |
| | |
| Health — 19.5% | | | | | | |
Allegheny County Hospital Development Authority, Refunding RB | | | | | | | | |
Series A, 4.00%, 04/01/37 | | | 4,300 | | | | 4,959,921 | |
Series A, 4.00%, 07/15/38 | | | 2,500 | | | | 2,942,425 | |
Series A, 5.00%, 04/01/47 | | | 1,950 | | | | 2,363,224 | |
Bucks County Industrial Development Authority, RB 4.00%, 08/15/44 | | | 1,690 | | | | 1,917,119 | |
4.00%, 07/01/51 | | | 2,500 | | | | 2,773,850 | |
Bucks County Industrial Development Authority, | | | | | | | | |
Refunding RB, 5.00%, 10/01/37 | | | 1,560 | | | | 1,752,738 | |
Centre County Hospital Authority, RB,
7.00%, 11/15/21(e) | | | 4,110 | | | | 4,237,492 | |
Chester County Health and Education Facilities | | | | | | | | |
Authority, Refunding RB, Series A, 5.25%, 12/01/45 | | | 1,500 | | | | 1,538,235 | |
County of Lehigh Pennsylvania, Refunding RB, | | | | | | | | |
Series A, 4.00%, 07/01/49 | | | 1,430 | | | | 1,652,794 | |
Cumberland County Municipal Authority, Refunding RB | | | | | | | | |
5.00%, 01/01/25(e) | | | 430 | | | | 500,709 | |
4.00%, 01/01/36 | | | 645 | | | | 724,245 | |
4.13%, 01/01/38 | | | 260 | | | | 292,575 | |
5.00%, 01/01/38 | | | 3,970 | | | | 4,455,610 | |
5.00%, 01/01/39 | | | 1,240 | | | | 1,480,932 | |
Doylestown Hospital Authority, RB, Series A, 4.00%, 07/01/45 | | | 1,250 | | | | 1,372,388 | |
DuBois Hospital Authority, Refunding RB, 4.00%, 07/15/48 | | | 3,440 | | | | 3,843,822 | |
Franklin County Industrial Development Authority, RB | | | | | | | | |
5.00%, 12/01/29 | | | 125 | | | | 138,548 | |
5.00%, 12/01/39 | | | 235 | | | | 256,228 | |
5.00%, 12/01/49 | | | 150 | | | | 161,207 | |
5.00%, 12/01/54 | | | 635 | | | | 679,660 | |
Geisinger Authority, Refunding RB
5.13%, 06/01/41 | | | 12,570 | | | | 12,570,000 | |
Series A-2, 5.00%, 02/15/39 | | | 5,950 | | | | 7,230,440 | |
Lancaster County Hospital Authority, Refunding RB, 5.00%, 11/01/35 | | | 925 | | | | 1,058,450 | |
Lancaster Industrial Development Authority, RB 4.00%, 12/01/44 | | | 730 | | | | 799,627 | |
5.00%, 12/01/44 | | | 1,170 | | | | 1,359,692 | |
4.00%, 12/01/49 | | | 985 | | | | 1,075,482 | |
Lancaster Industrial Development Authority, Refunding RB(e)
5.38%, 05/01/23 | | | 730 | | | | 802,190 | |
5.75%, 05/01/23 | | | 1,285 | | | | 1,421,287 | |
| | |
SCHEDULE OF INVESTMENTS | | 33 |
| | |
Schedule of Investments (continued) May 31, 2021 | | BlackRock Pennsylvania Municipal Bond Fund (Percentages shown are based on Net Assets) |
| | | | | | | | |
| Security | | Par (000) | | | Value | |
| | |
Health (continued) | | | | | | | | |
Montgomery County Higher Education and Health Authority, Refunding RB, Series A, 5.00%, 09/01/37 | | $ | 1,365 | | | $ | 1,680,383 | |
Montgomery County Industrial Development Authority, Refunding RB
5.00%, 05/15/22(e) | | | 2,280 | | | | 2,384,857 | |
5.25%, 01/01/40 | | | 5,000 | | | | 5,265,150 | |
Moon Industrial Development Authority, Refunding RB, 6.00%, 07/01/45 | | | 2,250 | | | | 2,423,947 | |
Mount Lebanon Hospital Authority, RB, 4.00%, 07/01/48 | | | 3,910 | | | | 4,387,646 | |
Northampton County General Purpose Authority, Refunding RB, 5.00%, 08/15/46 | | | 1,350 | | | | 1,592,406 | |
Pennsylvania Economic Development Financing Authority, Refunding RB, Series A,
4.00%, 11/15/42 | | | 4,000 | | | | 4,563,400 | |
Pennsylvania Higher Educational Facilities Authority, RB, Series A, 5.75%, 08/15/21(e) | | | 9,275 | | | | 9,380,457 | |
Philadelphia Authority for Industrial Development, Refunding RB, 4.00%, 07/01/35 | | | 2,450 | | | | 2,841,387 | |
Philadelphia Hospitals & Higher Education Facilities Authority, RB, Series C,
5.00%, 07/01/41 | | | 9,375 | | | | 9,410,062 | |
Pottsville Hospital Authority, Refunding RB, Series B, 5.00%, 07/01/41 | | | 5,000 | | | | 5,997,400 | |
West Cornwall Township Municipal Authority, Refunding RB | | | | | | | | |
Series A, 4.00%, 11/15/36 | | | 500 | | | | 570,240 | |
Series A, 4.00%, 11/15/41 | | | 445 | | | | 501,199 | |
Series A, 4.00%, 11/15/46 | | | 715 | | | | 797,032 | |
Westmoreland County Industrial Development Authority, Refunding RB, Series A, 4.00%, 07/01/37 | | | 1,040 | | | | 1,235,062 | |
| | | | | | | | |
| | | | | | | 117,391,518 | |
| | |
| Housing — 1.8% | | | | | | |
Pennsylvania Housing Finance Agency, RB, M/F Housing | | | | | | | | |
Series A, 4.25%, 10/01/35 | | | 565 | | | | 454,413 | |
Series A, 4.50%, 10/01/40 | | | 600 | | | | 480,318 | |
Pennsylvania Housing Finance Agency, RB, S/F Housing, Series 128B, 4.00%, 10/01/47 | | | 3,340 | | | | 3,591,869 | |
Philadelphia Authority for Industrial Development, RB, | | | | | | | | |
M/F Housing | | | | | | | | |
Series A, 3.50%, 12/01/36 | | | 1,260 | | | | 841,100 | |
Series A, 4.00%, 12/01/46 | | | 5,740 | | | | 4,065,298 | |
Series A, 4.00%, 12/01/51 | | | 2,300 | | | | 1,623,777 | |
| | | | | | | | |
| | | | | | | 11,056,775 | |
| | |
| State — 7.5% | | | | | | |
Commonwealth Financing Authority, Refunding RB, Series A, 5.00%, 06/01/32 | | | 2,040 | | | | 2,665,158 | |
Commonwealth of Pennsylvania GO | | | | | | | | |
5.00%, 05/15/28 | | | 3,745 | | | | 4,794,686 | |
5.00%, 05/15/29 | | | 8,240 | | | | 10,771,905 | |
2.00%, 05/15/39 | | | 5,000 | | | | 4,852,900 | |
Commonwealth of Pennsylvania, GO,
Series 2020, 5.00%, 05/01/27 | | | 2,000 | | | | 2,497,260 | |
Commonwealth of Pennsylvania, Refunding GO, 1st Series, 5.00%, 01/01/24 | | | 1,360 | | | | 1,527,022 | |
Pennsylvania Economic Development Financing Authority, RB, AMT, 5.00%, 06/30/42 | | | 10,500 | | | | 12,175,800 | |
| | | | | | | | |
| Security | | Par
(000) | | | Value | |
| | |
State (continued) | | | | | | | | |
Pennsylvania Turnpike Commission, RB | | | | | | | | |
Series A, 5.25%, 12/01/44 | | $ | 1,500 | | | $ | 1,905,405 | |
Sub-Series B, 5.25%, 12/01/48. | | | 3,215 | | | | 3,981,906 | |
| | | | | | | | |
| | | | | | | 45,172,042 | |
| | |
| Tobacco — 0.7% | | | | | | |
Commonwealth Financing Authority, RB 5.00%, 06/01/33 | | | 1,000 | | | | 1,231,850 | |
5.00%, 06/01/35 | | | 2,205 | | | | 2,703,793 | |
| | | | | | | | |
| | | | | | | 3,935,643 | |
| | |
| Transportation — 13.4% | | | | | | |
City of Philadelphia Pennsylvania Airport Revenue, Refunding ARB | | | | | | | | |
Series B, AMT, 5.00%, 07/01/37 | | | 1,800 | | | | 2,167,722 | |
Series B, AMT, 5.00%, 07/01/47 | | | 7,490 | | | | 8,916,470 | |
City of Philadelphia Pennsylvania Airport Revenue, Refunding RB | | | | | | | | |
Series A, 5.00%, 07/01/24 | | | 735 | | | | 839,899 | |
Series A, 5.00%, 07/01/25 | | | 1,545 | | | | 1,825,402 | |
Series A, 5.00%, 07/01/26 | | | 1,160 | | | | 1,412,834 | |
Series A, 5.00%, 07/01/27 | | | 1,400 | | | | 1,752,422 | |
Series A, 5.00%, 07/01/28 | | | 1,750 | | | | 2,243,203 | |
Series C, AMT, 4.00%, 07/01/45 | | | 4,000 | | | | 4,613,840 | |
Series C, AMT, 4.00%, 07/01/50 | | | 4,000 | | | | 4,581,080 | |
Delaware River Joint Toll Bridge Commission, RB, 5.00%, 07/01/42 | | | 2,500 | | | | 3,033,125 | |
Pennsylvania Economic Development Financing | | | | | | | | |
Authority, Refunding RB, Series A, AMT, 5.00%, 11/01/41 | | | 1,510 | | | | 1,599,015 | |
Pennsylvania Turnpike Commission, RB | | | | | | | | |
Series A-1, 5.00%, 12/01/41 | | | 100 | | | | 118,942 | |
Series B, 5.00%, 12/01/23 | | | 500 | | | | 560,035 | |
Series B, 5.00%, 12/01/24 | | | 500 | | | | 581,455 | |
Series B, 5.00%, 12/01/25 | | | 425 | | | | 510,880 | |
Series B, 5.00%, 12/01/26 | | | 500 | | | | 619,595 | |
Series B, 5.00%, 12/01/27 | | | 500 | | | | 636,650 | |
Series B, 5.00%, 12/01/28 | | | 990 | | | | 1,290,326 | |
Series B, 5.00%, 12/01/35 | | | 885 | | | | 1,169,466 | |
Sub-Series B-1, 5.00%, 06/01/42 | | | 4,705 | | | | 5,644,212 | |
Series A, Subordinate, 5.00%, 12/01/39 | | | 4,735 | | | | 5,961,412 | |
Pennsylvania Turnpike Commission, RB, CAB(d) | | | | | | | | |
Sub-Series A-3, (AGM), 0.00%, 12/01/40 | | | 2,225 | | | | 1,366,195 | |
Sub-Series A-3, 0.00%, 12/01/42 | | | 6,740 | | | | 3,796,642 | |
Pennsylvania Turnpike Commission, Refunding RB | | | | | | | | |
Series A, (BHAC-CR AGM), 5.25%, 07/15/26 | | | 5,000 | | | | 6,144,650 | |
Series A-1, 5.25%, 12/01/45 | | | 4,730 | | | | 5,562,385 | |
Series B-2, (AGM), 5.00%, 06/01/33 | | | 1,215 | | | | 1,493,612 | |
Southeastern Pennsylvania Transportation Authority, RB | | | | | | | | |
5.00%, 06/01/21(e) | | | 7,295 | | | | 7,295,000 | |
5.00%, 06/01/32 | | | 1,925 | | | | 2,505,541 | |
Susquehanna Area Regional Airport Authority, Refunding RB, AMT, 5.00%, 01/01/38 | | | 2,200 | | | | 2,537,546 | |
| | | | | | | | |
| | | | | | | 80,779,556 | |
| | |
| Utilities — 6.1% | | | | | | |
Allegheny County Sanitary Authority, RB (BAM), 5.25%, 12/01/41 | | | 2,090 | | | | 2,314,383 | |
5.00%, 06/01/43 | | | 4,000 | | | | 4,953,200 | |
City of Philadelphia Pennsylvania Water & Wastewater Revenue, RB Series A, 5.00%, 10/01/43 | | | 3,460 | | | | 4,342,266 | |
| | |
| 34 | | 2 0 2 1 BLACK ROCK ANNUAL REPORT TO SHAREHOLDERS |
| | |
Schedule of Investments (continued) May 31, 2021 | | BlackRock Pennsylvania Municipal Bond Fund (Percentages shown are based on Net Assets) |
| | | | | | | | |
| Security | | Par (000) | | | Value | |
| | |
Utilities (continued) | | | | | | | | |
City of Philadelphia Pennsylvania Water & Wastewater Revenue, RB (continued) | | | | | | | | |
Series A, 5.00%, 11/01/45. | | $ | 3,210 | | | $ | 4,158,330 | |
Series A, 5.25%, 10/01/52 | | | 1,190 | | | | 1,472,470 | |
Delaware County Regional Water Quality Control Authority, RB, 5.00%, 05/01/23(e) | | | 980 | | | | 1,069,895 | |
Falls Township Authority, Refunding RB, (MUN GOVT GTD), 5.00%, 12/01/37 | | | 2,115 | | | | 2,164,470 | |
New Kensington Municipal Sanitary Authority, RB, (AGM), 3.25%, 12/01/47 | | | 2,055 | | | | 2,135,823 | |
Philadelphia Gas Works Co., Refunding RB 5.00%, 08/01/30 | | | 700 | | | | 816,473 | |
5.00%, 08/01/31 | | | 900 | | | | 1,048,914 | |
5.00%, 08/01/32 | | | 1,200 | | | | 1,397,376 | |
5.00%, 08/01/33 | | | 600 | | | | 698,154 | |
5.00%, 08/01/34 | | | 1,050 | | | | 1,220,793 | |
Pittsburgh Water & Sewer Authority, RB | | | | | | | | |
Series B, (AGM), 4.00%, 09/01/50 | | | 1,600 | | | | 1,889,040 | |
Series A, 1st Lien, (AGM), 5.00%, 09/01/44 | | | 2,045 | | | | 2,605,146 | |
Westmoreland County Municipal Authority, Refunding RB, (BAM), 5.00%, 08/15/36 | | | 2,500 | | | | 3,020,000 | |
Williamsport Sanitary Authority, Refunding RB, (BAM), 4.00%, 01/01/40 | | | 1,420 | | | | 1,631,821 | |
| | | | | | | | |
| | | | | | | 36,938,554 | |
| | | | | | | | |
| | |
Total Municipal Bonds in Pennsylvania | | | | | | | 528,340,826 | |
| | |
| Puerto Rico — 3.6% | | | | | | |
| | |
| State — 3.0% | | | | | | |
Puerto Rico Sales Tax Financing Corp. Sales Tax | | | | | | | | |
Revenue, RB | | | | | | | | |
Series A-1, Restructured, 4.75%, 07/01/53 | | | 4,797 | | | | 5,377,533 | |
Series A-1, Restructured, 5.00%, 07/01/58 | | | 4,566 | | | | 5,194,419 | |
Series A-2, Restructured, 4.33%, 07/01/40 | | | 1,950 | | | | 2,163,037 | |
Series A-2, Restructured, 4.78%, 07/01/58 | | | 3,034 | | | | 3,408,942 | |
Puerto Rico Sales Tax Financing Corp. Sales Tax Revenue, RB, CAB(d) | | | | | | | | |
Series A-1, Restructured, 0.00%, 07/01/46 | | | 3,364 | | | | 1,091,012 | |
Series A-1, Restructured, 0.00%, 07/01/51 | | | 3,765 | | | | 883,909 | |
Series B-1, Restructured, 0.00%, 07/01/46 | | | 925 | | | | 300,255 | |
| | | | | | | | |
| | | | | | | 18,419,107 | |
| | |
| Utilities — 0.6% | | | | | | |
Puerto Rico Commonwealth Aqueduct & Sewer | | | | | | | | |
Authority, RB | | | | | | | | |
Series A, Senior Lien, 5.13%, 07/01/37 | | | 270 | | | | 280,551 | |
Series A, Senior Lien, 5.25%, 07/01/42 | | | 3,125 | | | | 3,243,469 | |
| | | | | | | | |
| | | | | | | 3,524,020 | |
| | | | | | | | |
Total Municipal Bonds in Puerto Rico | | | | | | | 21,943,127 | |
| | | | | | | | |
| |
Total Municipal Bonds — 91.7%
(Cost: $519,538,421) | | | | 552,514,986 | |
| | | | | | | | |
| | | | | | | | |
| Security | | Par
(000) | | | Value | |
|
Municipal Bonds Transferred to Tender Option Bond Trusts(f) | |
| | |
| Pennsylvania — 15.7% | | | | | | |
| | |
| Education — 3.9% | | | | | | |
Northampton County General Purpose Authority, Refunding RB | | | | | | | | |
4.00%, 11/01/38(g) | | $ | 6,002 | | | $ | 6,954,954 | |
5.00%, 11/01/47 | | | 6,100 | | | | 7,312,192 | |
Philadelphia Authority for Industrial Development, RB, 4.00%, 12/01/48(g) | | | 8,090 | | | | 9,327,527 | |
| | | | | | | | |
| | | | | | | 23,594,673 | |
| | |
| Health — 6.7% | | | | | | |
County of Lehigh Pennsylvania, Refunding RB, Series A, 4.00%, 07/01/49(g) | | | 4,997 | | | | 5,775,530 | |
General Authority of Southcentral Pennsylvania, Refunding RB | | | | | | | | |
4.00%, 06/01/49 | | | 9,015 | | | | 10,377,437 | |
Series A, 5.00%, 06/01/24(e) | | | 5,000 | | | | 5,703,250 | |
Montgomery County Higher Education and Health Authority, Refunding RB, 4.00%, 09/01/44(g) | | | 7,550 | | | | 8,626,102 | |
Pennsylvania Economic Development Financing Authority, RB, Series B, 4.00%, 03/15/40 | | | 2,000 | | | | 2,221,180 | |
St Mary Hospital Authority, Refunding RB, 5.00%, 12/01/48 | | | 6,096 | | | | 7,798,044 | |
| | | | | | | | |
| | | | | | | 40,501,543 | |
| | |
| Housing — 0.9% | | | | | | |
Pennsylvania Housing Finance Agency, RB, S/F Housing, Series 114C, 3.70%, 10/01/42(g) | | | 5,197 | | | | 5,235,571 | |
| | | | | | | | |
| | |
| State — 2.1% | | | | | | |
Commonwealth of Pennsylvania, GO, 1st Series, 4.00%, 03/01/38(g) | | | 11,000 | | | | 12,723,810 | |
| | | | | | | | |
| | |
| Transportation — 1.1% | | | | | | |
Pennsylvania Turnpike Commission, RB, Sub-Series A, 5.50%, 12/01/42 | | | 2,520 | | | | 3,063,085 | |
Pennsylvania Turnpike Commission, Refunding RB, Sub-Series B-2, 5.00%, 06/01/35 | | | 2,900 | | | | 3,559,025 | |
| | | | | | | | |
| | | | | | | 6,622,110 | |
| | |
| Utilities — 1.0% | | | | | | |
Westmoreland County Municipal Authority, Refunding RB, 5.00%, 08/15/42 | | | 5,007 | | | | 5,747,547 | |
| | | | | | | | |
Total Municipal Bonds in Pennsylvania | | | | | | | 94,425,254 | |
| | | | | | | | |
Total Municipal Bonds Transferred to Tender Option Bond Trusts — 15.7%
(Cost: $84,839,994) | | | | | | | 94,425,254 | |
| | | | | | | | |
| |
Total Long-Term Investments — 107.4%
(Cost: $604,378,415) | | | | 646,940,240 | |
| | | | | | | | |
| | |
SCHEDULE OF INVESTMENTS | | 35 |
| | |
Schedule of Investments (continued) May 31, 2021 | | BlackRock Pennsylvania Municipal Bond Fund (Percentages shown are based on Net Assets) |
| | | | | | | | |
| Security | | Shares | | | Value | |
| | |
Short-Term Securities | | | | | | | | |
|
| Money Market Funds — 3.6% | |
BlackRock Liquidity Funds, MuniCash, Institutional Class, 0.01%(h)(i) | | | 21,881,373 | | | $ | 21,885,750 | |
| | | | | | | | |
| |
Total Short-Term Securities — 3.6%
(Cost: $21,884,617) | | | | 21,885,750 | |
| | | | | | | | |
| |
Total Investments — 111.0%
(Cost: $626,263,032) | | | | 668,825,990 | |
| |
Liabilities in Excess of Other Assets — (2.8)% | | | | (16,985,973 | ) |
| |
Liability for TOB Trust Certificates, Including Interest Expense and Fees Payable — (8.2)% | | | | (49,186,527 | ) |
| | | | | | | | |
| |
Net Assets — 100.0% | | | $ | 602,653,490 | |
| | | | | | | | |
| (b) | Variable rate security. Interest rate resets periodically. The rate shown is the effective interest rate as of period end. Security description also includes the reference rate and spread if published and available. |
| (c) | Security exempt from registration pursuant to Rule 144A under the Securities Act of 1933, as amended. These securities may be resold in transactions exempt from registration to qualified institutional investors. |
| (e) | U.S. Government securities held in escrow, are used to pay interest on this security as well as to retire the bond in full at the date indicated, typically at a premium to par. |
| (f) | Represent bonds transferred to a TOB Trust in exchange of cash and residual certificates received by the Fund. These bonds serve as collateral in a secured borrowing. See Note 4 of the Notes to Financial Statements for details. |
| (g) | All or a portion of the security is subject to a recourse agreement. The aggregate maximum potential amount the Fund could ultimately be required to pay under the agreements, which expire between March 1, 2026 to October 1, 2042, is $25,258,217. See Note 4 of the Notes to Financial Statements for details. |
| (h) | Affiliate of the Fund. |
| (i) | Annualized 7-day yield as of period end. |
For Fund compliance purposes, the Fund’s sector classifications refer to one or more of the sector sub-classifications used by one or more widely recognized market indexes or rating group indexes, and/or as defined by the investment adviser. These definitions may not apply for purposes of this report, which may combine such sector sub-classifications for reporting ease.
Affiliates
Investments in issuers considered to be affiliate(s) of the Fund during the year ended May 31, 2021 for purposes of Section 2(a)(3) of the Investment Company Act of 1940, as amended, were as follows:
| | | | | | | | | | | | | | | | | | | | | | | | | | | | | | | | | | | | |
Affiliated Issuer | | | Value at 05/31/20 | | | | Purchases at Cost | | | | Proceeds from Sales | | |
| Net
Realized Gain (Loss) |
| |
| Change in
Unrealized Appreciation (Depreciation) |
| | | Value at 05/31/21 | | |
| Shares
Held at 05/31/21 |
| | | Income | | |
| Capital Gain
Distributions from Underlying Funds |
|
BlackRock Liquidity Funds, MuniCash, Institutional Class | | $ | 23,554,839 | | | $ | — | | | $ | (1,667,086 | )(a) | | $ | 2,629 | | | $ | (4,632 | ) | | $ | 21,885,750 | | | | 21,881,373 | | | $ | 2,899 | | | $ | — | |
| | | | | | | | | | | | | | | | | | | | | | | | | | | | | | | | | | | | |
| | (a) | Represents net amount purchased (sold). | |
Derivative Financial Instruments Outstanding as of Period End
Futures Contracts
| | | | | | | | | | | | | | | | |
Description | | Number of Contracts | | | Expiration Date | | | Notional Amount (000) | | | Value/ Unrealized Appreciation (Depreciation) | |
Short Contracts
10-Year U.S. Treasury Notes | | | 212 | | | | 09/21/21 | | | $ | 27,944 | | | $ | 3,754 | |
U.S. Long Bond | | | 94 | | | | 09/21/21 | | | | 14,679 | | | | (12,386 | ) |
| | | | | | | | | | | | | | | | |
| | | | | | | | | | | | | | $ | (8,632 | ) |
| | | | | | | | | | | | | | | | |
| | |
| 36 | | 2 0 2 1 BLACK ROCK ANNUAL REPORT TO SHAREHOLDERS |
| | |
Schedule of Investments (continued) May 31, 2021 | | BlackRock Pennsylvania Municipal Bond Fund |
Derivative Financial Instruments Categorized by Risk Exposure
As of period end, the fair values of derivative financial instruments located in the Statements of Assets and Liabilities were as follows:
| | | | | | | | | | | | | | | | | | | | | | | | | | | | |
| | | Commodity Contracts | | | Credit Contracts | | | Equity Contracts | | | Foreign Currency Exchange Contracts | | | Interest Rate Contracts | | | Other Contracts | | | Total | |
| | | | | | | |
Assets — Derivative Financial Instruments | | | | | | | | | | | | | | | | | | | | | | | | | | | | |
Futures contracts | | | | | | | | | | | | | | | | | | | | | | | | | | | | |
Unrealized appreciation on futures contracts(a) | | $ | — | | | $ | — | | | $ | — | | | $ | — | | | $ | 3,754 | | | $ | — | | | $ | 3,754 | |
| | | | | | | | | | | | | | | | | | | | | | | | | | | | |
| | | | | | | |
Liabilities — Derivative Financial Instruments | | | | | | | | | | | | | | | | | | | | | | | | | | | | |
Futures contracts | | | | | | | | | | | | | | | | | | | | | | | | | | | | |
Unrealized depreciation on futures contracts(a) | | $ | — | | | $ | — | | | $ | — | | | $ | — | | | $ | 12,386 | | | $ | — | | | $ | 12,386 | |
| | | | | | | | | | | | | | | | | | | | | | | | | | | | |
| | (a) | Net cumulative unrealized appreciation (depreciation) on futures contracts and centrally cleared swaps, if any, are reported in the Schedule of Investments. In the Statements of Assets and Liabilities, only current day’s variation margin is reported in receivables or payables and the net cumulative unrealized appreciation (depreciation) is included in accumulated earnings (loss). | |
For the year ended May 31, 2021, the effect of derivative financial instruments in the Statements of Operations was as follows:
| | | | | | | | | | | | | | | | | | | | | | | | | | | | |
| | | | | | | | |
| | | Commodity Contracts | | | Credit Contracts | | | Equity Contracts | | | Foreign Currency Exchange Contracts | | | Interest Rate Contracts | | | Other Contracts | | | Total | |
Net Realized Gain (Loss) from | | | | | | | | | | | | | | | | | | | | | | | | | | | | |
Futures contracts | | $ | — | | | $ | — | | | $ | — | | | $ | — | | | $ | 2,205,681 | | | $ | — | | | $ | 2,205,681 | |
| | | | | | | | | | | | | | | | | | | | | | | | | | | | |
Net Change in Unrealized Appreciation (Depreciation) on | | | | | | | | | | | | | | | | | | | | | | | | | | | | |
Futures contracts | | $ | — | | | $ | — | | | $ | — | | | $ | — | | | $ | (8,632 | ) | | $ | — | | | $ | (8,632 | ) |
| | | | | | | | | | | | | | | | | | | | | | | | | | | | |
Average Quarterly Balances of Outstanding Derivative Financial Instruments
| | | | |
Futures contracts | | | | |
Average notional value of contracts — short. | | $ | 18,149,887 | |
For more information about the Fund’s investment risks regarding derivative financial instruments, refer to the Notes to Financial Statements.
Fair Value Hierarchy as of Period End
Various inputs are used in determining the fair value of financial instruments. For a description of the input levels and information about the Fund’s policy regarding valuation of financial instruments, refer to the Notes to Financial Statements.
The following tables summarize the Fund’s financial instruments categorized in the fair value hierarchy. The breakdown of the Fund’s investments into major categories is disclosed in the Schedule of Investments above.
| | | | | | | | | | | | | | | | |
| | | Level 1 | | | Level 2 | | | Level 3 | | | Total | |
Assets | | | | | | | | | | | | | | | | |
Investments | | | | | | | | | | | | | | | | |
Long-Term Investments | | | | | | | | | | | | | | | | |
Municipal Bonds | | $ | — | | | $ | 552,514,986 | | | $ | — | | | $ | 552,514,986 | |
Municipal Bonds Transferred to Tender Option Bond Trusts | | | — | | | | 94,425,254 | | | | — | | | | 94,425,254 | |
Short-Term Securities | | | | | | | | | | | | | | | | |
Money Market Funds | | | 21,885,750 | | | | — | | | | — | | | | 21,885,750 | |
| | | | | | | | | | | | | | | | |
| | $ | 21,885,750 | | | $ | 646,940,240 | | | $ | — | | | $ | 668,825,990 | |
| | | | | | | | | | | | | | | | |
Derivative Financial Instruments(a) | | | | | | | | | | | | | | | | |
Assets | | | | | | | | | | | | | | | | |
Interest Rate Contracts | | $ | 3,754 | | | $ | — | | | $ | — | | | $ | 3,754 | |
Liabilities | | | | | | | | | | | | | | | | |
Interest Rate Contracts | | | (12,386 | ) | | | — | | | | — | | | | (12,386 | ) |
| | | | | | | | | | | | | | | | |
| | $ | (8,632 | ) | | $ | — | | | $ | — | | | $ | (8,632 | ) |
| | | | | | | | | | | | | | | | |
| | (a) | Derivative financial instruments are futures contracts. Futures contracts are valued at the unrealized appreciation (depreciation) on the instrument. | |
| | |
SCHEDULE OF INVESTMENTS | | 37 |
| | |
Schedule of Investments (continued) May 31, 2021 | | BlackRock Pennsylvania Municipal Bond Fund |
The Fund may hold assets and/or liabilities in which the fair value approximates the carrying amount for financial statement purposes. As of period end, TOB Trust Certificates of $49,168,902 are categorized as Level 2 within the fair value hierarchy.
See notes to financial statements.
| | |
| 38 | | 2 0 2 1 BLACK ROCK ANNUAL REPORT TO SHAREHOLDERS |
| | |
Schedule of Investments May 31, 2021 | | BlackRock Strategic Municipal Opportunities Fund (Percentages shown are based on Net Assets) |
| | | | | | | | |
Security | | Par (000) | | | Value | |
| | |
Corporate Bonds | | | | | | | | |
| | |
Diversified Financial Services — 0.3% | | | | | | | | |
Bank of America Corp., (SOFR + 1.32%), 2.69%, 04/22/32 | | $ | 16,502 | | | $ | 16,731,857 | |
Goldman Sachs Group, Inc., (SOFR + 1.28%), 2.62%, 04/22/32. | | | 8,685 | | | | 8,752,262 | |
| | | | | | | | |
| | | | | | | 25,484,119 | |
| | |
Education — 0.1% | | | | | | | | |
Conservation Fund A Nonprofit Corp.,, Series 2019, 3.47%, 12/15/29. | | | 2,677 | | | | 2,817,831 | |
| | | | | | | | |
| |
Health Care Providers & Services — 1.0% | | | | | |
Ascension Health, Series B, 3.11%, 11/15/39 | | | 7,853 | | | | 8,157,838 | |
Baylor Scott & White Holdings, 2.84%, 11/15/50 | | | 9,091 | | | | 8,725,428 | |
Hackensack Meridian Health, Inc. | | | | | | | | |
Series 2020, 2.68%, 09/01/41 | | | 22,500 | | | | 21,348,083 | |
Series 2020, 2.88%, 09/01/50 | | | 8,395 | | | | 7,890,278 | |
Methodist Hospital (The), Series 20A, 2.71%, 12/01/50 | | | 10,039 | | | | 9,290,767 | |
Novant Health Inc., 3.17%, 11/01/51 | | | 21,685 | | | | 21,766,908 | |
PeaceHealth Obligated Group, Series 2018, 4.79%, 11/15/48 | | | 232 | | | | 295,958 | |
Sutter Health, Series 2018, 3.70%, 08/15/28 | | | 192 | | | | 212,107 | |
UnitedHealth Group Inc., 3.05%, 05/15/41 | | | 9,533 | | | | 9,676,253 | |
| | | | | | | | |
| | | | | | | 87,363,620 | |
| | |
Housing — 0.2% | | | | | | | | |
Community Preservation Corp., 2.87%, 02/01/30 | | | 18,210 | | | | 18,698,005 | |
| | | | | | | | |
| | |
Tobacco — 0.2% | | | | | | | | |
Altria Group, Inc., 3.70%, 02/04/51 | | | 20,085 | | | | 18,263,026 | |
| | | | | | | | |
Total Corporate Bonds — 1.8%
(Cost: $155,685,800) | | | | | | | 152,626,601 | |
| | | | | | | | |
| | |
Municipal Bonds | | | | | | | | |
| | |
Alabama — 0.3% | | | | | | | | |
County of Jefferson Alabama Sewer Revenue, Refunding RB | | | | | | | | |
Series D, Sub Lien, 7.00%, 10/01/51 | | | 3,000 | | | | 3,530,340 | |
Series D, Sub-Lien, 6.50%, 10/01/53 | | | 15,110 | | | | 17,481,817 | |
Tuscaloosa County Industrial Development Authority, Refunding RB, Series A, 4.50%, 05/01/32(a) | | | 6,870 | | | | 7,325,982 | |
| | | | | | | | |
| | | | | | | 28,338,139 | |
| | |
Alaska — 0.1% | | | | | | | | |
State of Alaska International Airports System, Refunding RB | | | | | | | | |
Series B, 5.00%, 10/01/32 | | | 5,000 | | | | 5,906,600 | |
Series B, 5.00%, 10/01/34 | | | 5,000 | | | | 5,897,100 | |
| | | | | | | | |
| | | | | | | 11,803,700 | |
| | |
Arizona — 2.4% | | | | | | | | |
Arizona Health Facilities Authority, RB, Series B, 0.95%, 01/01/37(b) | | | 50,000 | | | | 49,858,650 | |
Arizona Health Facilities Authority, Refunding RB | | | | | | | | |
5.00%, 12/01/39 | | | 5,000 | | | | 5,747,350 | |
Series A, 5.00%, 02/01/42 | | | 5,000 | | | | 5,153,200 | |
Arizona Industrial Development Authority, RB(a) | | | | | | | | |
7.10%, 01/01/55 | | | 3,350 | | | | 3,381,758 | |
Series A, 5.00%, 07/01/39 | | | 1,335 | | | | 1,419,599 | |
| | | | | | | | |
Security | | Par (000) | | | Value | |
| | |
Arizona (continued) | | | | | | | | |
Arizona Industrial Development Authority, RB(a) (continued) | | | | | | | | |
Series A, 5.00%, 07/01/49 | | $ | 2,075 | | | $ | 2,182,423 | |
Arizona Industrial Development Authority, RB, M/F Housing, Series 2019-2, Class A, 3.63%, 05/20/33(b) | | | 58,380 | | | | 66,416,280 | |
City of Phoenix Civic Improvement Corp., ARB | | | | | | | | |
Junior Lien, 5.00%, 07/01/44 | | | 10,000 | | | | 12,703,700 | |
Series B, Junior Lien, AMT, 5.00%, 07/01/49 | | | 5,000 | | | | 6,095,500 | |
City of Phoenix Civic Improvement Corp., Refunding RB | | | | | | | | |
Series B, 5.00%, 07/01/38 | | | 5,000 | | | | 6,089,650 | |
Series D, Junior Lien, 5.00%, 07/01/37 | | | 10,000 | | | | 12,260,200 | |
Industrial Development Authority of the City of Phoenix, RB(a) | | | | | | | | |
Series A, 6.50%, 07/01/34 | | | 965 | | | | 1,111,574 | |
Series A, 5.00%, 07/01/36 | | | 7,315 | | | | 8,174,878 | |
Series A, 5.00%, 07/01/41 | | | 5,000 | | | | 5,531,900 | |
Industrial Development Authority of the City of Phoenix, Refunding RB(a) | | | | | | | | |
5.00%, 07/01/35 | | | 4,000 | | | | 4,393,259 | |
5.00%, 07/01/45 | | | 1,495 | | | | 1,616,693 | |
Maricopa County Industrial Development Authority, RB | | | | | | | | |
Series A, 5.00%, 09/01/28 | | | 550 | | | | 710,913 | |
Series A, 5.00%, 09/01/31 | | | 1,000 | | | | 1,357,700 | |
Series A, 5.00%, 09/01/32 | | | 1,000 | | | | 1,348,010 | |
Series A, 5.00%, 09/01/33 | | | 900 | | | | 1,208,547 | |
Series A, 5.00%, 09/01/34 | | | 1,000 | | | | 1,337,050 | |
Series A, 5.00%, 09/01/35 | | | 1,000 | | | | 1,332,730 | |
Series A, 5.00%, 09/01/36 | | | 750 | | | | 995,767 | |
Series A, 4.00%, 09/01/37 | | | 695 | | | | 848,644 | |
Maricopa County Industrial Development Authority, Refunding RB, 5.00%, 07/01/36(a) | | | 250 | | | | 275,830 | |
Salt River Project Agricultural Improvement & Power District, RB, 5.00%, 01/01/47. | | | 5,000 | | | | 6,430,700 | |
| | | | | | | | |
| | | | | | | 207,982,505 | |
| | |
Arkansas — 0.5% | | | | | | | | |
Arkansas Development Finance Authority, RB, AMT, 4.50%, 09/01/49(a) | | | 37,355 | | | | 41,051,651 | |
| | | | | | | | |
| | |
California — 8.0% | | | | | | | | |
Bay Area Toll Authority, Refunding RB, Series A,
2.00%, 04/01/56(b) | | | 18,900 | | | | 20,214,306 | |
California Health Facilities Financing Authority, RB
5.00%, 02/01/36 | | | 5,000 | | | | 6,036,400 | |
5.00%, 02/01/37 | | | 5,000 | | | | 6,029,650 | |
California Health Facilities Financing Authority, Refunding RB | | | | | | | | |
Series A, 5.00%, 08/15/42 | | | 5,000 | | | | 5,935,050 | |
Series A, 5.00%, 08/15/47 | | | 10,000 | | | | 11,770,600 | |
Sub-Series A-2, 5.00%, 11/01/47 | | | 27,000 | | | | 40,847,220 | |
California Housing Finance, RB, M/F Housing | | | | | | | | |
Series 2021-1, Class A, 3.50%, 11/20/35 | | | 59,569 | | | | 69,779,960 | |
Series A, 4.25%, 01/15/35 | | | 19 | | | | 23,114 | |
California Infrastructure & Economic Development Bank, RB, Series A, 5.00%, 11/01/30 | | | 10,000 | | | | 13,418,700 | |
| | |
SCHEDULE OF INVESTMENTS | | 39 |
| | |
Schedule of Investments (continued) May 31, 2021 | | BlackRock Strategic Municipal Opportunities Fund (Percentages shown are based on Net Assets) |
| | | | | | | | |
Security | | Par (000) | | | Value | |
| | |
California (continued) | | | | | | | | |
California Infrastructure & Economic Development
Bank, Refunding RB
5.00%, 06/01/31. | | $ | 7,870 | | | $ | 10,802,598 | |
5.00%, 11/01/41 | | | 10,000 | | | | 11,034,400 | |
Series B, 0.73%, 12/01/50(b) | | | 4,700 | | | | 4,736,810 | |
California Municipal Finance Authority, RB | | | | | | | | |
(BAM), 5.00%, 05/15/24 | | | 600 | | | | 680,910 | |
(BAM), 5.00%, 05/15/25 | | | 500 | | | | 586,345 | |
(BAM), 5.00%, 05/15/26 | | | 400 | | | | 482,856 | |
(BAM), 5.00%, 05/15/27 | | | 500 | | | | 619,045 | |
(BAM), 5.00%, 05/15/28 | | | 525 | | | | 664,813 | |
5.38%, 07/01/34(a) | | | 1,000 | | | | 1,059,760 | |
5.63%, 07/01/44(a) | | | 2,760 | | | | 2,907,688 | |
6.00%, 07/01/44 | | | 1,960 | | | | 2,136,714 | |
(BAM), 4.00%, 05/15/46 | | | 2,000 | | | | 2,370,500 | |
Series A, 6.00%, 08/01/44(a) | | | 330 | | | | 355,819 | |
Series A, 6.13%, 08/01/49(a) | | | 285 | | | | 306,993 | |
California Municipal Finance Authority, RB, S/F Housing, Series B, 5.88%, 08/15/49 | | | 1,000 | | | | 1,064,880 | |
California Municipal Finance Authority, Refunding RB, Series A, 5.00%, 07/01/47 | | | 10,000 | | | | 11,731,300 | |
California Pollution Control Financing Authority, RB(a) | | | | | | | | |
AMT, 5.00%, 07/01/37 | | | 20,000 | | | | 20,956,800 | |
Series A, AMT, 5.00%, 11/21/45 | | | 50,000 | | | | 52,121,000 | |
California School Finance Authority, RB(a) | | | | | | | | |
Series A, 6.50%, 11/01/34 | | | 1,015 | | | | 1,150,706 | |
Series A, 6.75%, 11/01/45 | | | 1,395 | | | | 1,568,901 | |
California Statewide Communities Development Authority, Refunding RB, Series A, 5.25%, 11/01/44(a) | | | 1,250 | | | | 1,328,500 | |
City of Irvine California, ST, 5.00%, 09/01/49 | | | 1,500 | | | | 1,682,205 | |
City of Los Angeles Department of Airports, | | | | | | | | |
Refunding ARB | | | | | | | | |
Series B, 5.00%, 05/15/26 | | | 2,500 | | | | 3,039,175 | |
Series B, 5.00%, 05/15/27 | | | 1,670 | | | | 2,088,569 | |
Series B, 5.00%, 05/15/28 | | | 865 | | | | 1,108,757 | |
Series B, 5.00%, 05/15/29 | | | 275 | | | | 359,747 | |
Series B, 5.00%, 05/15/30 | | | 340 | | | | 453,094 | |
Series B, 5.00%, 05/15/31 | | | 460 | | | | 626,009 | |
Series B, 5.00%, 05/15/32 | | | 460 | | | | 624,133 | |
Series B, 5.00%, 05/15/33 | | | 1,750 | | | | 2,361,555 | |
Series B, 5.00%, 05/15/34 | | | 2,075 | | | | 2,788,385 | |
Series B, 5.00%, 05/15/35 | | | 1,875 | | | | 2,513,400 | |
Series B, 5.00%, 05/15/36 | | | 3,165 | | | | 4,228,788 | |
Series B, 5.00%, 05/15/37 | | | 2,725 | | | | 3,631,335 | |
Series B, 5.00%, 05/15/38 | | | 3,140 | | | | 4,178,681 | |
Series B, 5.00%, 05/15/39 | | | 3,500 | | | | 4,646,635 | |
Series B, 5.00%, 05/15/40 | | | 4,930 | | | | 6,528,158 | |
Series B, 5.00%, 05/15/41 | | | 5,200 | | | | 6,869,148 | |
Series B, 5.00%, 05/15/48 | | | 9,000 | | | | 11,698,920 | |
AMT, 5.00%, 05/15/48 | | | 20,520 | | | | 25,178,861 | |
Series A, AMT, 5.00%, 05/15/46 | | | 32,605 | | | | 41,701,143 | |
CSCDA Community Improvement Authority, RB, M/F Housing, Series A-2, 4.00%, 10/01/56(a) | | | 23,320 | | | | 25,181,169 | |
Foothill-Eastern Transportation Corridor Agency, RB, Series A, Senior Lien, 4.00%, 01/15/46 | | | 15,000 | | | | 17,748,150 | |
Golden State Tobacco Securitization Corp., Refunding RB | | | | | | | | |
Series A-1, 5.00%, 06/01/29 | | | 10,000 | | | | 12,264,500 | |
Series A-1, 5.00%, 06/01/30 | | | 6,955 | | | | 8,605,630 | |
| | | | | | | | |
Security | | Par (000) | | | Value | |
| | |
California (continued) | | | | | | | | |
Golden State Tobacco Securitization Corp., | | | | | | | | |
Refunding RB (continued) | | | | | | | | |
Series A-1, 5.00%, 06/01/31 | | $ | 5,630 | | | $ | 6,920,677 | |
Series A-1, 5.25%, 06/01/47 | | | 9,085 | | | | 9,424,688 | |
Series A-2, 5.00%, 06/01/47 | | | 16,130 | | | | 16,692,776 | |
Modesto Irrigation District, RB, (NPFGC), 0.72%, 09/01/37(b) | | | 10,000 | | | | 9,710,520 | |
Northern California Gas Authority No. 1, RB, | | | | | | | | |
Series B, 0.86%, 07/01/27(b) | | | 4,580 | | | | 4,609,907 | |
Sacramento County Water Financing Authority, RB, Series B, (NPFGC), 0.64%, 06/01/34(b) | | | 10,000 | | | | 9,879,030 | |
Sacramento Municipal Utility District, Refunding RB, 5.00%, 08/15/50 | | | 36,700 | | | | 47,603,937 | |
San Diego Unified School District, GO,
Series D2, 4.00%, 07/01/50 | | | 17,720 | | | | 21,172,388 | |
San Francisco City & County Airport Comm-San Francisco International Airport, Refunding ARB | | | | | | | | |
Class B, 5.00%, 05/01/49 | | | 7,215 | | | | 9,006,990 | |
Series A, AMT, 5.00%, 05/01/49 | | | 14,000 | | | | 17,186,400 | |
San Francisco City & County Redevelopment Agency Successor Agency, TA, Sub-Series D, 3.00%, 08/01/21(a) | | | 980 | | | | 983,361 | |
San Francisco City & County Redevelopment Agency Successor Agency, TA, CAB(a)(c) | | | | | | | | |
Series D, 0.00%, 08/01/26 | | | 1,170 | | | | 920,556 | |
Series D, 0.00%, 08/01/43 | | | 20,000 | | | | 6,694,400 | |
State of California Department of Water Resources, Refunding RB, Series BC, 1.41%, 12/01/29 | | | 4,600 | | | | 4,493,602 | |
Tobacco Securitization Authority of Northern | | | | | | | | |
California, Refunding RB | | | | | | | | |
Series A, 5.00%, 06/01/25 | | | 1,250 | | | | 1,473,812 | |
Series A, 5.00%, 06/01/26 | | | 2,000 | | | | 2,431,560 | |
Series A, 5.00%, 06/01/27 | | | 1,550 | | | | 1,937,453 | |
Series A, 5.00%, 06/01/28 | | | 1,000 | | | | 1,278,940 | |
Series A, 5.00%, 06/01/29 | | | 1,050 | | | | 1,368,265 | |
Series A, 5.00%, 06/01/30 | | | 750 | | | | 996,413 | |
Series A, 5.00%, 06/01/32 | | | 1,300 | | | | 1,721,811 | |
Series A, 4.00%, 06/01/34 | | | 1,335 | | | | 1,624,802 | |
Series A, 4.00%, 06/01/40 | | | 1,150 | | | | 1,367,937 | |
University of California, Refunding RB,
Series BE, 4.00%, 05/15/50 | | | 12,755 | | | | 15,049,114 | |
| | | | | | | | |
| | | | | | | 687,377,824 | |
| | |
Colorado — 2.1% | | | | | | | | |
Arapahoe County School District No. 5 Cherry | | | | | | | | |
Creek, GO | | | | | | | | |
(SAW), 5.00%, 12/15/27 | | | 3,555 | | | | 4,532,696 | |
(SAW), 5.00%, 12/15/28 | | | 3,725 | | | | 4,862,839 | |
(SAW), 5.00%, 12/15/29 | | | 3,920 | | | | 5,226,026 | |
Centerra Metropolitan District No.1, TA, 5.00%, 12/01/47(a) | | | 4,125 | | | | 4,326,630 | |
Colorado Educational & Cultural Facilities Authority, RB | | | | | | | | |
5.00%, 12/01/22 | | | 55 | | | | 56,996 | |
5.00%, 07/01/46(a) | | | 2,000 | | | | 2,159,740 | |
Colorado Health Facilities Authority, Refunding RB | | | | | | | | |
Series A, 5.00%, 08/01/26 | | | 5,000 | | | | 6,110,600 | |
Series A, 5.00%, 08/01/27 | | | 5,000 | | | | 6,275,500 | |
Series A, 5.00%, 08/01/30 | | | 10,000 | | | | 12,877,600 | |
Series A, 5.00%, 08/01/31 | | | 5,000 | | | | 6,410,450 | |
Series A, 5.00%, 08/01/32 | | | 5,000 | | | | 6,391,450 | |
| | |
| 40 | | 2 0 2 1 BLACK ROCK ANNUAL REPORT TO SHAREHOLDERS |
| | |
Schedule of Investments (continued) May 31, 2021 | | BlackRock Strategic Municipal Opportunities Fund (Percentages shown are based on Net Assets) |
| | | | | | | | |
Security | | Par (000) | | | Value | |
| | |
Colorado (continued) | | | | | | | | |
Colorado Health Facilities Authority, Refunding RB (continued) | | | | | | | | |
Series A, 5.00%, 08/01/35 | | $ | 5,000 | | | $ | 6,410,250 | |
Series A, 5.00%, 08/01/36 | | | 10,000 | | | | 12,793,300 | |
Series A, 5.00%, 08/01/38 | | | 5,000 | | | | 6,327,900 | |
Series A, 5.00%, 08/01/39 | | | 5,000 | | | | 6,315,350 | |
Colorado Housing and Finance Authority, RB, S/F Housing, Series C, Class I, (GNMA), 3.60%, 11/01/38 | | | 1,390 | | | | 1,473,664 | |
Colorado Housing and Finance Authority, Refunding RB, S/F Housing, Series B, Class I, (GNMA), 3.00%, 05/01/51. | | | 5,000 | | | | 5,461,050 | |
Denver City & County School District No. 1, GO | | | | | | | | |
(SAW), 5.00%, 12/01/28 | | | 1,850 | | | | 2,411,253 | |
(SAW), 5.00%, 12/01/29 | | | 1,250 | | | | 1,663,988 | |
(SAW), 5.00%, 12/01/30 | | | 4,390 | | | | 5,971,936 | |
(SAW), 5.00%, 12/01/31 | | | 6,300 | | | | 8,551,683 | |
(SAW), 5.00%, 12/01/34 | | | 6,225 | | | | 8,364,097 | |
(SAW), 5.00%, 12/01/38 | | | 10,000 | | | | 13,331,300 | |
(SAW), 5.00%, 12/01/39 | | | 10,000 | | | | 13,305,700 | |
DIATC Metropolitan District, GO(a) | | | | | | | | |
5.00%, 12/01/39 | | | 1,245 | | | | 1,363,250 | |
5.00%, 12/01/49 | | | 2,000 | | | | 2,166,020 | |
Fitzsimons Village Metropolitan District No. 1, | | | | | | | | |
Refunding GO, Senior Lien, 5.00%, 12/01/49 | | | 1,045 | | | | 1,130,450 | |
Flying Horse Metropolitan District No. 3, Refunding GO, 6.00%, 12/01/49(a) | | | 2,965 | | | | 3,197,723 | |
Plaza Metropolitan District No.1, Refunding TA, 4.00%, 12/01/23(a) | | | 1,000 | | | | 1,036,770 | |
Public Authority for Colorado Energy, RB, 6.25%, 11/15/28 | | | 5,000 | | | | 6,279,650 | |
State of Colorado, COP, Series R, 4.00%, 03/15/45 | | | 11,255 | | | | 13,285,402 | |
STC Metropolitan District No.2, Refunding GO, Series A, 4.00%, 12/01/29 | | | 1,000 | | | | 1,074,350 | |
Village at Dry Creek Metropolitan District No. 2, GO, 4.38%, 12/01/44. | | | 3,010 | | | | 3,172,660 | |
| | | | | | | | |
| | | | | | | 184,318,273 | |
| | |
Connecticut — 1.7% | | | | | | | | |
Connecticut Housing Finance Authority, Refunding RB, M/F Housing, Series A-1, 2.88%, 11/15/30 | | | 5,700 | | | | 5,986,767 | |
Connecticut Housing Finance Authority, Refunding RB, S/F Housing | | | | | | | | |
0.40%, 05/15/25 | | | 1,000 | | | | 994,830 | |
0.55%, 05/15/26 | | | 1,000 | | | | 991,370 | |
0.60%, 11/15/26 | | | 1,000 | | | | 987,860 | |
0.70%, 05/15/27 | | | 2,500 | | | | 2,467,175 | |
0.75%, 11/15/27 | | | 2,250 | | | | 2,210,467 | |
0.85%, 05/15/28 | | | 2,940 | | | | 2,883,875 | |
0.90%, 11/15/28 | | | 1,150 | | | | 1,121,837 | |
1.05%, 05/15/29 | | | 3,000 | | | | 2,931,420 | |
1.10%, 11/15/29 | | | 5,630 | | | | 5,474,950 | |
1.30%, 05/15/30 | | | 3,450 | | | | 3,381,034 | |
1.35%, 11/15/30 | | | 4,050 | | | | 3,966,327 | |
1.45%, 05/15/31 | | | 1,220 | | | | 1,199,760 | |
1.50%, 11/15/31 | | | 4,910 | | | | 4,825,695 | |
1.60%, 05/15/32 | | | 3,740 | | | | 3,692,577 | |
1.70%, 05/15/34 | | | 2,635 | | | | 2,602,300 | |
(FHLMC, FNMA, GNMA), 3.00%, 11/15/49 | | | 2,000 | | | | 2,175,680 | |
Sub-Series A-1, 3.50%, 11/15/45 | | | 7,320 | | | | 8,131,276 | |
| | | | | | | | |
Security | | Par (000) | | | Value | |
| | |
Connecticut (continued) | | | | | | | | |
Connecticut Housing Finance Authority, Refunding RB, S/F Housing (continued) | | | | | | | | |
Sub-Series C-1, 3.63%, 11/15/38 | | $ | 9,025 | | | $ | 9,797,089 | |
Connecticut State Health & Educational Facilities | | | | | | | | |
Authority, RB, Series A-1, 5.00%, 10/01/54(a) | | | 2,370 | | | | 2,497,127 | |
Mashantucket Western Pequot Tribe, 7.35%, 07/01/26(d)(e)(f) | | | 123,303 | | | | 40,073,356 | |
Mohegan Tribal Finance Authority, RB, 7.00%, 02/01/45(a) | | | 10,580 | | | | 10,875,182 | |
Mohegan Tribe of Indians of Connecticut, RB, | | | | | | | | |
Series A, 6.75%, 02/01/45(a) | | | 5,507 | | | | 5,583,626 | |
Mohegan Tribe of Indians of Connecticut, Refunding RB(a) | | | | | | | | |
Series C, 5.75%, 02/01/24 | | | 3,320 | | | | 3,604,358 | |
Series C, 5.75%, 02/01/25 | | | 3,755 | | | | 4,157,273 | |
Series C, 6.25%, 02/01/30 | | | 4,930 | | | | 5,656,090 | |
State of Connecticut Special Tax Revenue, RB, | | | | | | | | |
Series A, 5.00%, 05/01/41 | | | 5,200 | | | | 6,820,892 | |
| | | | | | | | |
| | | | | | | 145,090,193 | |
| | |
District of Columbia — 0.1% | | | | | | | | |
Metropolitan Washington Airports Authority, Refunding ARB | | | | | | | | |
AMT, 5.00%, 10/01/27 | | | 5,000 | | | | 6,297,750 | |
Series A, AMT, 5.00%, 10/01/30 | | | 5,000 | | | | 5,722,600 | |
| | | | | | | | |
| | | | | | | 12,020,350 | |
| | |
Florida — 3.2% | | | | | | | | |
Alta Lakes Community Development District, SAB
3.50%, 05/01/24 | | | 285 | | | | 292,467 | |
3.75%, 05/01/29 | | | 550 | | | | 590,766 | |
4.40%, 05/01/39 | | | 1,030 | | | | 1,129,591 | |
4.63%, 05/01/49 | | | 1,775 | | | | 1,944,122 | |
Babcock Ranch Community Independent Special District, SAB
4.75%, 11/01/26 | | | 400 | | | | 429,424 | |
5.00%, 11/01/31 | | | 500 | | | | 542,190 | |
5.25%, 11/01/46 | | | 3,480 | | | | 3,730,108 | |
Broward County Florida Port Facilities, Revenue | | | | | | | | |
ARB, Series A, 5.00%, 09/01/44 | | | 5,000 | | | | 6,318,850 | |
Canaveral Port Authority, ARB | | | | | | | | |
Series B, 5.00%, 06/01/48 | | | 10,000 | | | | 11,905,900 | |
Series A, AMT, 5.00%, 06/01/45 | | | 5,000 | | | | 5,954,200 | |
Capital Trust Agency, Inc., RB | | | | | | | | |
8.00%, 01/01/34 | | | 550 | | | | 11,000 | |
8.25%, 01/01/44 | | | 940 | | | | 18,800 | |
8.25%, 01/01/49 | | | 3,010 | | | | 60,200 | |
5.00%, 12/15/55(a) | | | 2,845 | | | | 3,078,091 | |
Series A, 5.00%, 12/15/39 | | | 1,775 | | | | 1,984,166 | |
Series A, 5.00%, 06/15/49(a) | | | 5,000 | | | | 5,394,200 | |
Series A, 5.00%, 12/15/49 | | | 3,380 | | | | 3,725,199 | |
Series A, 5.00%, 12/15/54 | | | 1,955 | | | | 2,152,494 | |
Series A-1, 5.00%, 07/01/56(a) | | | 8,220 | | | | 9,632,689 | |
Series A-2, 5.00%, 01/01/26(a) | | | 2,850 | | | | 2,879,326 | |
Celebration Pointe Community Development District, SAB
4.75%, 05/01/24 | | | 145 | | | | 151,366 | |
5.00%, 05/01/34 | | | 710 | | | | 748,006 | |
5.13%, 05/01/45 | | | 985 | | | | 1,030,340 | |
| | |
SCHEDULE OF INVESTMENTS | | 41 |
| | |
Schedule of Investments (continued) May 31, 2021 | | BlackRock Strategic Municipal Opportunities Fund (Percentages shown are based on Net Assets) |
| | | | | | | | |
Security | | Par (000) | | | Value | |
| | |
Florida (continued) | | | | | | | | |
Charlotte County Industrial Development Authority, RB, AMT, 5.50%, 10/01/36(a) | | $ | 3,500 | | | $ | 3,884,580 | |
Collier County Industrial Development Authority, Refunding RB, Series A, 8.25%, 05/15/49(a)(d)(e) | | | 1,000 | | | | 770,758 | |
County of Miami-Dade Florida Aviation Revenue, Refunding RB, Series C, 4.06%, 10/01/31 | | | 11,120 | | | | 12,573,606 | |
County of Miami-Dade Florida Transit System, RB | | | | | | | | |
Series A, 4.00%, 07/01/49 | | | 13,725 | | | | 16,189,461 | |
Series A, 4.00%, 07/01/50 | | | 25,160 | | | | 29,665,401 | |
County of Miami-Dade Florida Water & Sewer | | | | | | | | |
System Revenue, RB, 4.00%, 10/01/51 | | | 17,805 | | | | 21,171,391 | |
County of Palm Beach Florida, RB(a) | | | | | | | | |
5.25%, 04/01/23 | | | 440 | | | | 440,277 | |
5.00%, 04/01/39 | | | 2,700 | | | | 2,927,178 | |
5.00%, 04/01/51 | | | 2,305 | | | | 2,447,864 | |
Crossings At Fleming Island Community Development District, Refunding SAB, Series A-3, Senior Lien, 6.50%, 05/01/44 | | | 2,240 | | | | 2,388,042 | |
Escambia County Health Facilities Authority, Refunding RB, 4.00%, 08/15/50 | | | 15,000 | | | | 17,149,800 | |
Florida Development Finance Corp., RB
3.00%, 06/01/32(g) | | | 4,240 | | | | 4,450,134 | |
7.00%, 12/01/48(a)(d)(e) | | | 5,500 | | | | 5,350,950 | |
Series A, 5.75%, 06/15/29 | | | 365 | | | | 397,365 | |
Series A, 6.00%, 06/15/34 | | | 440 | | | | 479,283 | |
Series A, 6.13%, 06/15/44 | | | 1,685 | | | | 1,825,917 | |
Series B, AMT, 7.38%, 01/01/49(a) | | | 5,845 | | | | 6,371,634 | |
Florida Housing Finance Corp., RB, S/F Housing | | | | | | | | |
Series 1, (FHLMC, FNMA, GNMA), 1.80%, 07/01/36 | | | 2,500 | | | | 2,477,550 | |
Series 1, (FHLMC, FNMA, GNMA), 2.10%, 07/01/46 | | | 6,000 | | | | 5,959,320 | |
Series 1, (FHLMC, FNMA, GNMA), 2.15%, 07/01/51 | | | 6,500 | | | | 6,285,955 | |
Series 1, (FHLMC, FNMA, GNMA), 3.00%, 01/01/52 | | | 16,000 | | | | 17,539,040 | |
Harbor Bay Community Development District, Refunding SAB, Series A-2, 3.75%, 05/01/34 | | | 1,020 | | | | 1,078,273 | |
Harbor Bay Community Development District, SAB | | | | | | | | |
Series A-1, 3.88%, 05/01/39 | | | 2,170 | | | | 2,277,849 | |
Series A-1, 4.10%, 05/01/48 | | | 1,400 | | | | 1,469,482 | |
Lakewood Ranch Stewardship District, SAB
4.25%, 05/01/25 | | | 285 | | | | 298,837 | |
4.25%, 05/01/26 | | | 1,065 | | | | 1,117,025 | |
4.88%, 05/01/35 | | | 1,105 | | | | 1,185,422 | |
4.40%, 05/01/39 | | | 855 | | | | 934,122 | |
4.88%, 05/01/45 | | | 2,275 | | | | 2,408,269 | |
5.13%, 05/01/46 | | | 5,940 | | | | 6,364,888 | |
4.50%, 05/01/49 | | | 1,780 | | | | 1,919,588 | |
Midtown Miami Community Development District, Refunding SAB, Series B, 5.00%, 05/01/37 | | | 1,870 | | | | 1,934,833 | |
Palm Beach County Health Facilities Authority, Refunding RB, Series A, 7.50%, 06/01/49 | | | 1,000 | | | | 1,072,240 | |
Pinellas County Industrial Development Authority, RB, 5.00%, 07/01/39 | | | 2,030 | | | | 2,407,661 | |
Portico Community Development District, SAB | | | | | | | | |
Series 1, 3.20%, 05/01/31 | | | 1,000 | | | | 1,067,490 | |
Series 1, 3.50%, 05/01/37 | | | 1,250 | | | | 1,302,463 | |
| | | | | | | | |
Security | | Par (000) | | | Value | |
| | |
Florida (continued) | | | | | | | | |
State Board of Administration Finance Corp., RB, Series A, 1.26%, 07/01/25 | | $ | 10,000 | | | $ | 10,130,100 | |
Sterling Hill Community Development District, Refunding SAB, Series B, 5.50%,
11/01/10(d)(e) | | | 143 | | | | 90,783 | |
Sumter Landing Community Development District, RB, 4.17%, 10/01/47 | | | 2,030 | | | | 2,210,934 | |
Talavera Community Development District, SAB
4.35%, 05/01/40 | | | 495 | | | | 532,976 | |
4.50%, 05/01/50 | | | 770 | | | | 825,140 | |
Tolomato Community Development District, Refunding SAB, Series 2015-2, 6.61%,
05/01/40(h) | | | 490 | | | | 359,008 | |
Tolomato Community Development District, Refunding SAB, CAB, Series A-4, Convertible, 6.61%, 05/01/40(h) | | | 190 | | | | 182,520 | |
Tolomato Community Development District, SAB(d)(e) | | | | | | | | |
Series 2015-1, 6.61%, 05/01/40(h) | | | 800 | | | | 741,992 | |
Series 2015-3, 6.61%, 05/01/40 | | | 535 | | | | 5 | |
Series 3, 6.38%, 05/01/17 | | | 425 | | | | 4 | |
Trout Creek Community Development District, SAB
5.50%, 05/01/35 | | | 2,325 | | | | 2,528,437 | |
5.63%, 05/01/45 | | | 3,635 | | | | 3,922,056 | |
V-Dana Community Development District, SAB,
4.00%, 05/01/52 | | | 750 | | | | 775,178 | |
Village Center Community Development District, | | | | | | | | |
Refunding RB, 5.02%, 11/01/36 | | | 1,500 | | | | 1,804,845 | |
Village Community Development District No.10, | | | | | | | | |
SAB, 4.50%, 05/01/23 | | | 785 | | | | 807,969 | |
| | | | | | | | |
| | | | | | | 276,199,390 | |
| | |
Georgia — 1.7% | | | | | | | | |
Brookhaven Development Authority, RB | | | | | | | | |
Series A, 5.00%, 07/01/26 | | | 1,250 | | | | 1,532,450 | |
Series A, 4.00%, 07/01/49 | | | 10,235 | | | | 11,915,280 | |
City of Atlanta Georgia Airport Passenger Facility Charge, ARB, Series C, Subordinate, 5.00%, 07/01/37 | | | 25,000 | | | | 32,015,500 | |
City of Atlanta Georgia Department of Aviation, ARB, Series B, AMT, 5.00%, 07/01/44 | | | 10,000 | | | | 12,505,600 | |
Development Authority for Fulton County, Refunding RB, Series C, 5.00%, 07/01/26 | | | 1,285 | | | | 1,575,359 | |
George L Smith II Congress Center Authority, RB, 4.00%, 01/01/54 | | | 10,000 | | | | 11,656,000 | |
Georgia State Road & Tollway Authority, RB
5.00%, 06/01/26 | | | 1,950 | | | | 2,370,128 | |
5.00%, 06/01/28 | | | 6,800 | | | | 8,725,846 | |
5.00%, 06/01/29 | | | 12,625 | | | | 16,547,601 | |
5.00%, 06/01/30 | | | 14,135 | | | | 18,891,485 | |
5.00%, 06/01/31 | | | 8,950 | | | | 11,942,346 | |
Main Street Natural Gas, Inc., RB | | | | | | | | |
Series A, 5.00%, 05/15/25 | | | 2,500 | | | | 2,914,525 | |
Series A, 5.00%, 05/15/26 | | | 3,000 | | | | 3,594,660 | |
Series A, 5.00%, 05/15/27 | | | 2,000 | | | | 2,454,720 | |
State of Georgia, GO, Series A, 5.00%, 08/01/31 | | | 5,000 | | | | 6,733,100 | |
| | | | | | | | |
| | | | | | | 145,374,600 | |
| | |
| 42 | | 2 0 2 1 BLACK ROCK ANNUAL REPORT TO SHAREHOLDERS |
| | |
Schedule of Investments (continued) May 31, 2021 | | BlackRock Strategic Municipal Opportunities Fund (Percentages shown are based on Net Assets) |
| | | | | | | | |
Security | | Par (000) | | | Value | |
| | |
Hawaii — 0.1% | | | | | | | | |
Kauai County Community Facilities District, ST
5.00%, 05/15/44 | | $ | 625 | | | $ | 711,306 | |
5.00%, 05/15/49 | | | 2,750 | | | | 3,118,225 | |
| | | | | | | | |
| | | | | | | 3,829,531 | |
| | |
Idaho — 0.3% | | | | | | | | |
Idaho Housing & Finance Association, RB,
Series A, 6.95%, 06/15/55(a) | | | 5,150 | | | | 5,451,378 | |
Idaho Housing & Finance Association, Refunding RB | | | | | | | | |
Series A, 5.00%, 07/15/30 | | | 500 | | | | 664,345 | |
Series A, 5.00%, 07/15/31 | | | 725 | | | | 982,063 | |
Series A, 5.00%, 07/15/32 | | | 1,000 | | | | 1,350,440 | |
Series A, 5.00%, 07/15/33 | | | 1,100 | | | | 1,475,188 | |
Series A, 5.00%, 07/15/34 | | | 1,250 | | | | 1,668,225 | |
Series A, 5.00%, 07/15/35 | | | 1,250 | | | | 1,662,650 | |
Series A, 4.00%, 07/15/36 | | | 1,500 | | | | 1,827,480 | |
Series A, 4.00%, 07/15/37 | | | 2,100 | | | | 2,550,660 | |
Series A, 4.00%, 07/15/38 | | | 3,000 | | | | 3,636,960 | |
Series A, 4.00%, 07/15/39 | | | 3,250 | | | | 3,926,488 | |
| | | | | | | | |
| | | | | | | 25,195,877 | |
| | |
Illinois — 3.3% | | | | | | | | |
Chicago Board of Education, GO
6.32%, 11/01/29 | | | 14,270 | | | | 17,203,198 | |
Series A, 5.00%, 12/01/42 | | | 50,165 | | | | 52,852,339 | |
Series C, 5.25%, 12/01/39 | | | 7,050 | | | | 7,817,040 | |
Series D, 5.00%, 12/01/46 | | | 38,080 | | | | 41,798,758 | |
Series H, 5.00%, 12/01/46 | | | 5,000 | | | | 5,798,450 | |
Chicago Board of Education, GO, BAB
6.04%, 12/01/29 | | | 19,810 | | | | 23,053,491 | |
6.14%, 12/01/39 | | | 8,460 | | | | 10,272,724 | |
6.52%, 12/01/40 | | | 7,045 | | | | 8,789,272 | |
Chicago Board of Education, Refunding GO | | | | | | | | |
Series B, 4.00%, 12/01/35 | | | 11,230 | | | | 11,603,061 | |
Series C, 5.00%, 12/01/23 | | | 4,145 | | | | 4,579,023 | |
Series C, 5.00%, 12/01/24 | | | 4,280 | | | | 4,878,772 | |
Series C, 5.00%, 12/01/25 | | | 1,440 | | | | 1,686,917 | |
Series C, 5.00%, 12/01/27 | | | 4,585 | | | | 5,615,249 | |
Series C, 5.00%, 12/01/34 | | | 5,590 | | | | 6,648,243 | |
Series F, 5.00%, 12/01/23 | | | 7,220 | | | | 7,976,006 | |
City of Chicago Illinois, GO, Series B, 7.38%, 01/01/33 | | | 4,395 | | | | 5,614,656 | |
City of Chicago Illinois, Refunding GO,
Series A, 6.00%, 01/01/38 | | | 6,020 | | | | 7,302,260 | |
Illinois Finance Authority, Refunding RB | | | | | | | | |
Series A, 5.00%, 08/15/25 | | | 1,485 | | | | 1,765,739 | |
Series A, 5.00%, 08/15/26 | | | 1,925 | | | | 2,356,470 | |
Series A, 5.00%, 08/15/27 | | | 2,165 | | | | 2,719,002 | |
Series A, 5.00%, 08/15/28 | | | 3,310 | | | | 4,249,213 | |
Series A, 5.00%, 08/15/29 | | | 2,450 | | | | 3,203,767 | |
Series A, 5.00%, 08/15/30 | | | 2,560 | | | | 3,407,360 | |
Series A, 5.00%, 08/15/31 | | | 2,530 | | | | 3,433,185 | |
Series A, 5.00%, 08/15/32 | | | 2,960 | | | | 4,003,074 | |
Series A, 5.00%, 08/15/33 | | | 3,640 | | | | 4,892,488 | |
Series A, 5.00%, 08/15/34 | | | 4,870 | | | | 6,517,277 | |
Series A, 5.00%, 08/15/35 | | | 5,000 | | | | 6,669,650 | |
Series A, 5.00%, 08/15/36 | | | 4,830 | | | | 6,417,186 | |
Series C, 5.00%, 02/15/26 | | | 5,000 | | | | 5,998,800 | |
| | | | | | | | |
Security | | Par (000) | | | Value | |
| | |
Illinois (continued) | | | | | | | | |
Illinois Housing Development Authority, RB, S/F Housing | | | | | | | | |
Series D, (FHLMC, FNMA, GNMA), 2.25%, 04/01/30 | | $ | 1,135 | | | $ | 1,205,200 | |
Series D, (FHLMC, FNMA, GNMA), 2.35%, 04/01/31 | | | 1,050 | | | | 1,120,371 | |
Series D, (FHLMC, FNMA, GNMA), 2.70%, 10/01/34 | | | 5,000 | | | | 5,226,000 | |
Illinois Housing Development Authority, Refunding | | | | | | | | |
RB, Sub-Series A-1, 3.70%, 07/01/34 | | | 415 | | | | 440,477 | |
| | | | | | | | |
| | | | | | | 287,114,718 | |
| | |
Indiana — 0.2% | | | | | | | | |
City of Valparaiso Indiana, RB, AMT, 5.88%,
01/01/24 | | | 320 | | | | 336,934 | |
Indiana Finance Authority, Refunding RB | | | | | | | | |
Series B, 3.53%, 09/15/34 | | | 4,520 | | | | 4,288,441 | |
Series B, 3.75%, 09/15/37 | | | 7,715 | | | | 7,291,061 | |
Series B, 3.83%, 09/15/41 | | | 2,780 | | | | 2,550,622 | |
| | | | | | | | |
| | | | | | | 14,467,058 | |
| | |
Iowa — 0.5% | | | | | | | | |
Iowa Tobacco Settlement Authority, Refunding RB | | | | | | | | |
Series A2, Class 1, 5.00%, 06/01/27 | | | 400 | | | | 496,700 | |
Series A2, Class 1, 5.00%, 06/01/28 | | | 600 | | | | 760,812 | |
Series A2, Class 1, 5.00%, 06/01/29 | | | 700 | | | | 902,825 | |
Series A2, Class 1, 5.00%, 06/01/30 | | | 700 | | | | 919,002 | |
Series A2, Class 1, 5.00%, 06/01/31 | | | 700 | | | | 930,643 | |
Series A2, Class 1, 5.00%, 06/01/32 | | | 700 | | | | 928,627 | |
Series A2, Class 1, 5.00%, 06/01/33 | | | 1,000 | | | | 1,316,970 | |
Series A2, Class 1, 4.00%, 06/01/34 | | | 1,000 | | | | 1,210,360 | |
Series A2, Class 1, 4.00%, 06/01/35 | | | 1,000 | | | | 1,202,540 | |
Series A2, Class 1, 4.00%, 06/01/36 | | | 860 | | | | 1,029,325 | |
Series A2, Class 1, 4.00%, 06/01/37 | | | 800 | | | | 953,848 | |
Series A2, Class 1, 4.00%, 06/01/38 | | | 1,000 | | | | 1,188,640 | |
Series A2, Class 1, 4.00%, 06/01/39 | | | 1,000 | | | | 1,184,650 | |
Series A2, Class 1, 4.00%, 06/01/40 | | | 1,000 | | | | 1,181,200 | |
Series A2, Class 1, 4.00%, 06/01/49 | | | 6,000 | | | | 6,929,940 | |
Series B1, 4.00%, 06/01/49 | | | 15,000 | | | | 17,301,000 | |
| | | | | | | | |
| | | | | | | 38,437,082 | |
| | |
Kentucky — 0.1% | | | | | | | | |
Kentucky Economic Development Finance Authority, RB, Series B, 5.00%, 08/15/33 | | | 5,000 | | | | 6,143,650 | |
Westvaco Corp., RB, 7.67%, 01/15/27(a) | | | 3,100 | | | | 3,839,102 | |
| | | | | | | | |
| | | | | | | 9,982,752 | |
| | |
Louisiana — 0.6% | | | | | | | | |
Juban Crossing Economic Development District, | | | | | | | | |
Refunding RB, Series C, 7.00%, 09/15/44(a) | | | 5,730 | | | | 5,553,745 | |
Louisiana Public Facilities Authority, RB, Series A,
5.00%, 04/01/57(a) | | | 4,965 | | | | 5,165,636 | |
New Orleans Aviation Board, ARB, Series B, AMT,
5.00%, 01/01/40 | | | 5,000 | | | | 5,648,650 | |
Parish of St. John the Baptist Louisiana, Refunding RB, 2.10%, 06/01/37(b) | | | 2,180 | | | | 2,256,780 | |
State of Louisiana, GO | | | | | | | | |
Series A, 5.00%, 03/01/38 | | | 13,770 | | | | 18,406,221 | |
Series A, 5.00%, 03/01/39 | | | 13,505 | | | | 18,011,078 | |
| | | | | | | | |
| | | | | | | 55,042,110 | |
| | |
SCHEDULE OF INVESTMENTS | | 43 |
| | |
Schedule of Investments (continued) May 31, 2021 | | BlackRock Strategic Municipal Opportunities Fund (Percentages shown are based on Net Assets) |
| | | | | | | | |
Security | | Par (000) | | | Value | |
| | |
Maine — 0.3% | | | | | | | | |
Maine State Housing Authority, RB, M/F Housing | | | | | | | | |
Series A, 0.40%, 11/15/24 | | $ | 2,250 | | | $ | 2,248,245 | |
Series A, 0.50%, 11/15/25 | | | 3,130 | | | | 3,114,882 | |
Series A, 0.60%, 11/15/26 | | | 2,000 | | | | 1,978,940 | |
Series A, 1.85%, 11/15/36 | | | 2,750 | | | | 2,694,808 | |
Series A, 2.05%, 11/15/41 | | | 1,185 | | | | 1,173,233 | |
Series A, 2.15%, 11/15/46 | | | 5,000 | | | | 4,840,250 | |
Maine State Housing Authority, RB, S/F Housing | | | | | | | | |
Series A, 3.00%, 11/15/44 | | | 2,500 | | | | 2,654,425 | |
Series C, 2.75%, 11/15/34 | | | 6,165 | | | | 6,556,847 | |
Series H, 3.55%, 11/15/37 | | | 2,000 | | | | 2,189,880 | |
| | | | | | | | |
| | | | | | | 27,451,510 | |
| | |
Maryland — 3.5% | | | | | | | | |
Anne Arundel County Consolidated Special Taxing District, ST
5.13%, 07/01/36. | | | 600 | | | | 621,120 | |
5.25%, 07/01/44 | | | 1,220 | | | | 1,254,758 | |
County of Anne Arundel Maryland, GO
5.00%, 10/01/29 | | | 6,225 | | | | 8,261,073 | |
5.00%, 10/01/31 | | | 6,225 | | | | 8,414,333 | |
County of Howard Maryland, TA, 6.10%, 02/15/44 | | | 1,170 | | | | 1,176,002 | |
Maryland Community Development Administration, RB, M/F Housing | | | | | | | | |
Series D, 2.75%, 07/01/34 | | | 1,005 | | | | 1,074,566 | |
Series D, (FHA), 2.95%, 07/01/62 | | | 2,000 | | | | 2,059,880 | |
Maryland Community Development Administration, Refunding RB, S/F Housing | | | | | | | | |
Series A, 2.50%, 09/01/40 | | | 5,000 | | | | 5,113,250 | |
Series A, 2.60%, 03/01/42 | | | 3,490 | | | | 3,573,097 | |
Series A, 3.75%, 03/01/50 | | | 18,655 | | | | 20,694,551 | |
Maryland Economic Development Corp., RB | | | | | | | | |
Series D, AMT, 5.00%, 03/31/41 | | | 10,000 | | | | 11,514,100 | |
Series D, AMT, 5.00%, 03/31/46 | | | 10,000 | | | | 11,407,500 | |
Series D, AMT, 5.00%, 03/31/51 | | | 10,000 | | | | 11,338,300 | |
Maryland Health & Higher Educational Facilities | | | | | | | | |
Authority, RB, Series A, 7.00%, 03/01/55(a) | | | 10,405 | | | | 11,791,050 | |
Maryland State Transportation Authority, RB, | | | | | | | | |
Series A, 5.00%, 07/01/51 | | | 28,200 | | | | 36,912,954 | |
State of Maryland, GO | | | | | | | | |
Series A, 5.00%, 03/01/27 | | | 10,845 | | | | 13,513,195 | |
Series A, 5.00%, 03/01/29 | | | 34,010 | | | | 44,537,115 | |
Series A, 5.00%, 03/01/30 | | | 35,710 | | | | 47,772,838 | |
Series A, 5.00%, 03/01/33 | | | 41,305 | | | | 56,249,149 | |
| | | | | | | | |
| | | | | | | 297,278,831 | |
| | |
Massachusetts — 2.7% | | | | | | | | |
Commonwealth of Massachusetts, Refunding GO, Series A, (AMBAC), 5.50%, 08/01/30 | | | 20,000 | | | | 27,565,400 | |
Massachusetts Bay Transportation Authority, Refunding RB
5.00%, 07/01/25 | | | 850 | | | | 1,007,692 | |
5.00%, 07/01/26 | | | 750 | | | | 917,047 | |
5.00%, 07/01/28 | | | 1,535 | | | | 1,977,157 | |
5.00%, 07/01/31 | | | 340 | | | | 465,827 | |
5.00%, 07/01/42 | | | 3,000 | | | | 3,822,210 | |
Massachusetts Development Finance Agency, RB
5.00%, 10/01/38 | | | 5,000 | | | | 5,402,400 | |
5.00%, 10/01/43 | | | 5,000 | | | | 5,334,900 | |
Series D, 5.00%, 07/01/44 | | | 10,000 | | | | 11,315,600 | |
Series J2, 5.00%, 07/01/43 | | | 10,000 | | | | 12,221,300 | |
| | | | | | | | |
Security | | Par (000) | | | Value | |
| | |
Massachusetts (continued) | | | | | | | | |
Massachusetts Development Finance Agency, | | | | | | | | |
RB (continued) | | | | | | | | |
Series J2, 5.00%, 07/01/48 | | $ | 25,000 | | | $ | 30,313,500 | |
Series J2, 5.00%, 07/01/53 | | | 5,000 | | | | 6,004,100 | |
Massachusetts Development Finance Agency, | | | | | | | | |
Refunding RB 5.00%, 07/01/25 | | | 2,000 | | | | 2,352,340 | |
4.00%, 10/01/32(a) | | | 2,560 | | | | 2,769,997 | |
4.13%, 10/01/42(a) | | | 8,225 | | | | 8,865,974 | |
5.00%, 07/01/44 | | | 5,000 | | | | 5,961,950 | |
Class K, 5.00%, 07/01/38 | | | 5,000 | | | | 5,956,400 | |
Series G, 5.00%, 07/01/29 | | | 150 | | | | 191,735 | |
Series G, 5.00%, 07/01/30 | | | 225 | | | | 292,093 | |
Series G, 5.00%, 07/01/32 | | | 425 | | | | 560,124 | |
Series G, 5.00%, 07/01/34 | | | 375 | | | | 487,350 | |
Series G, 5.00%, 07/01/38 | | | 300 | | | | 384,597 | |
Series G, 5.00%, 07/01/39 | | | 650 | | | | 830,739 | |
Series G, 4.00%, 07/01/46 | | | 1,250 | | | | 1,441,150 | |
Series G, 5.00%, 07/01/50 | | | 2,300 | | | | 2,872,378 | |
Series H-1, 5.00%, 07/01/25 | | | 5,000 | | | | 5,880,850 | |
Massachusetts Housing Finance Agency, RB, M/F Housing (FHA HUD SECT 8), 2.75%, 12/01/55 | | | 2,250 | | | | 2,307,082 | |
Series A, 3.40%, 12/01/49 | | | 3,115 | | | | 3,315,575 | |
Series C-1, 2.65%, 12/01/34 | | | 2,950 | | | | 3,104,963 | |
Series C-1, 3.10%, 12/01/44 | | | 2,500 | | | | 2,640,875 | |
Series C-1, 3.15%, 12/01/49 | | | 2,890 | | | | 3,037,448 | |
Series C-1, 3.25%, 12/01/54 | | | 7,790 | | | | 8,220,242 | |
Series C-1, 3.35%, 06/01/62 | | | 5,010 | | | | 5,301,432 | |
Massachusetts Housing Finance Agency, Refunding RB, M/F Housing | | | | | | | | |
Series B-1, (FHA INS), 2.75%, 12/01/34 | | | 2,225 | | | | 2,357,076 | |
Series B-1, (FHA INS), 3.30%, 12/01/56 | | | 5,930 | | | | 6,268,603 | |
Massachusetts Housing Finance Agency, Refunding RB, S/F Housing, Series 172, 3.65%, 12/01/35 | | | 2,510 | | | | 2,663,612 | |
Massachusetts Port Authority, ARB | | | | | | | | |
Series B, 5.00%, 07/01/44 | | | 10,000 | | | | 12,705,100 | |
Series E, AMT, 5.00%, 07/01/51 | | | 10,000 | | | | 12,749,800 | |
Massachusetts School Building Authority, Refunding RB, Series B, 1.28%, 08/15/27 | | | 13,400 | | | | 13,318,930 | |
Metropolitan Boston Transit Parking Corp., | | | | | | | | |
Refunding RB, 5.00%, 07/01/41 | | | 5,000 | | | | 5,019,450 | |
| | | | | | | | |
| | | | | | | 228,204,998 | |
| | |
Michigan — 1.6% | | | | | | | | |
City of Detroit Michigan Sewage Disposal System | | | | | | | | |
Revenue, Refunding RB, Series D, (AGM),
0.74%, 07/01/32(b) | | | 100,000 | | | | 99,096,600 | |
Michigan Finance Authority, RB
5.00%, 11/01/44 | | | 5,000 | | | | 5,828,500 | |
Series A, 5.00%, 11/15/48 | | | 5,000 | | | | 6,195,250 | |
Michigan Finance Authority, Refunding RB
5.00%, 11/15/37 | | | 5,000 | | | | 6,056,650 | |
Series B, 5.00%, 07/01/44 | | | 5,000 | | | | 5,335,300 | |
Michigan State Housing Development Authority, RB, M/F Housing, Series A-1, 3.00%, 10/01/39 | | | 3,500 | | | | 3,755,640 | |
| | |
| 44 | | 2 0 2 1 BLACK ROCK ANNUAL REPORT TO SHAREHOLDERS |
| | |
Schedule of Investments (continued) May 31, 2021 | | BlackRock Strategic Municipal Opportunities Fund (Percentages shown are based on Net Assets) |
| | | | | | | | |
| Security | | Par (000) | | | Value | |
| | |
| Michigan (continued) | | | | | | |
Michigan State University, RB,
Series B, (AMBAC), 0.75%, 02/15/37(b) | | $ | 5,000 | | | $ | 5,087,225 | |
Royal Oak Hospital Finance Authority, Refunding RB, Series D, 5.00%, 09/01/39 | | | 5,000 | | | | 5,575,850 | |
| | | | | | | | |
| | | | | | | 136,931,015 | |
| | |
| Minnesota — 1.4% | | | | | | |
City of Deephaven Minnesota, Refunding RB, Series A, 5.50%, 07/01/50 | | | 2,500 | | | | 2,750,875 | |
City of Minneapolis Minnesota, RB,
Series A, 5.00%, 07/01/47 | | | 3,000 | | | | 3,197,250 | |
City of Minneapolis Minnesota, RB,
M/F Housing, (FNMA), 2.35%, 02/01/38 | | | 7,000 | | | | 7,118,440 | |
Metropolitan Council, GO | | | | | | | | |
Series C, 5.00%, 12/01/27 | | | 25,000 | | | | 31,797,750 | |
Series C, 5.00%, 12/01/28 | | | 25,000 | | | | 32,589,250 | |
Minneapolis-St Paul Metropolitan Airports Commission, Refunding RB, Series A, 5.00%, 01/01/28 | | | 5,000 | | | | 6,159,200 | |
Minnesota Housing Finance Agency, RB, S/F Housing | | | | | | | | |
Series B, (FHLMC, FNMA, GNMA), 2.40%, 01/01/35 | | | 1,565 | | | | 1,645,942 | |
Series B, (FHLMC, FNMA, GNMA), 2.63%, 01/01/40 | | | 6,265 | | | | 6,531,952 | |
Series B, (FHLMC, FNMA, GNMA), 2.80%, 01/01/44 | | | 1,565 | | | | 1,624,893 | |
Series B, (FHLMC, FNMA, GNMA), 3.50%, 07/01/50 | | | 9,490 | | | | 10,441,847 | |
Series E, (FHLMC, FNMA, GNMA), 1.85%, 01/01/29 | | | 885 | | | | 914,860 | |
Series E, (FHLMC, FNMA, GNMA), 1.90%, 07/01/29 | | | 890 | | | | 922,948 | |
Series E, (FHLMC, FNMA, GNMA), 1.95%, 01/01/30 | | | 1,725 | | | | 1,793,189 | |
Series E, (FHLMC, FNMA, GNMA), 2.05%, 01/01/31 | | | 1,755 | | | | 1,813,284 | |
Series E, (FHLMC, FNMA, GNMA), 2.50%, 07/01/40 | | | 4,435 | | | | 4,598,784 | |
Series E, (FHLMC, FNMA, GNMA), 3.50%, 07/01/50 | | | 4,875 | | | | 5,379,416 | |
Minnesota Housing Finance Agency, Refunding RB, S/F Housing, Series B, (FHLMC, FNMA, GNMA), 3.10%, 07/01/35. | | | 985 | | | | 1,049,921 | |
| | | | | | | | |
| | | | | | | 120,329,801 | |
| | |
| Mississippi — 0.1% | | | | | | |
Mississippi Home Corp. RB, S/F Housing | | | | | | | | |
Series A, (FHLMC, FNMA, GNMA), 2.13%, 12/01/44 | | | 1,000 | | | | 990,750 | |
Series A, (FHLMC, FNMA, GNMA), 3.00%, 12/01/50 | | | 4,000 | | | | 4,376,560 | |
Mississippi Hospital Equipment & Facilities Authority, RB, 5.00%, 09/01/46 | | | 5,000 | | | | 5,850,200 | |
| | | | | | | | |
| | | | | | | 11,217,510 | |
| | |
| Missouri — 1.5% | | | | | | |
City of St. Louis Missouri Airport Revenue, ARB | | | | | | | | |
Series C, (AGM), 5.00%, 07/01/42 | | | 5,000 | | | | 6,045,600 | |
Series C, (AGM), 5.00%, 07/01/47 | | | 5,000 | | | | 6,013,150 | |
Health & Educational Facilities Authority of the State of Missouri, Refunding RB
Series A, 5.00%, 07/01/31 | | | 6,200 | | | | 8,398,148 | |
| | | | | | | | |
| Security | | Par
(000) | | | Value | |
| | |
| Missouri (continued) | | | | | | |
Health & Educational Facilities Authority of the State of Missouri, Refunding RB (continued)
Series A, 5.00%, 07/01/32 | | $ | 2,200 | | | $ | 2,970,858 | |
Kansas City Industrial Development Authority, ARB | | | | | | | | |
AMT, (AGM), 4.00%, 03/01/50 | | | 10,000 | | | | 11,537,500 | |
AMT, (AGM), 5.00%, 03/01/57 | | | 5,000 | | | | 6,197,750 | |
Series A, AMT, 5.00%, 03/01/34 | | | 5,105 | | | | 6,325,095 | |
Series A, AMT, 5.00%, 03/01/35 | | | 5,360 | | | | 6,630,963 | |
Series A, AMT, 5.00%, 03/01/36 | | | 5,000 | | | | 6,171,450 | |
Series A, AMT, 5.00%, 03/01/37 | | | 5,910 | | | | 7,289,099 | |
Series A, AMT, 5.00%, 03/01/39 | | | 5,000 | | | | 6,155,300 | |
Series B, AMT, 5.00%, 03/01/39 | | | 5,000 | | | | 6,173,750 | |
Kansas City Industrial Development Authority, Refunding RB(a)(d)(e)
5.75%, 11/15/36 | | | 8,055 | | | | 2,762,478 | |
6.00%, 11/15/46 | | | 5,125 | | | | 1,757,629 | |
6.00%, 11/15/51 | | | 2,060 | | | | 706,481 | |
Missouri Housing Development Commission, RB, S/F Housing | | | | | | | | |
Series A, (FHLMC, FNMA, GNMA), 2.55%, 11/01/40. | | | 1,725 | | | | 1,825,775 | |
Series A, (FHLMC, FNMA, GNMA), 2.70%, 11/01/45 | | | 2,460 | | | | 2,628,215 | |
Series A, (FHLMC, FNMA, GNMA), 3.50%, 11/01/50 | | | 9,400 | | | | 10,382,864 | |
Missouri State Environmental Improvement & Energy Resources Authority, Refunding RB,
Series C, 2.75%, 09/01/33 | | | 25,000 | | | | 27,286,750 | |
St. Louis Land Clearance for Redevelopment Authority, Refunding RB, 3.88%, 10/01/35 | | | 2,570 | | | | 2,521,992 | |
| | | | | | | | |
| | | | | | | 129,780,847 | |
| | |
| Nevada — 0.7% | | | | | | |
City of Las Vegas Nevada Special Improvement District No. 607, Refunding
SAB 5.00%, 06/01/23. | | | 265 | | | | 281,873 | |
5.00%, 06/01/24 | | | 135 | | | | 147,380 | |
City of North Las Vegas Nevada, GO, BAB, 6.57%, 06/01/40 | | | 5,175 | | | | 6,853,149 | |
Clark County School District, GO | | | | | | | | |
Series B, (BAM), 5.00%, 06/15/27 | | | 6,210 | | | | 7,758,774 | |
Series B, (BAM), 5.00%, 06/15/28 | | | 7,975 | | | | 10,207,202 | |
Series B, (BAM), 5.00%, 06/15/29 | | | 9,615 | | | | 12,557,094 | |
County of Clark Nevada, Refunding RB,
Series C, 5.00%, 07/01/30 | | | 15,000 | | | | 20,091,450 | |
State of Nevada Department of Business & Industry, RB(a) | | | | | | | | |
Series A, 4.50%, 12/15/29 | | | 305 | | | | 330,028 | |
Series A, 5.00%, 12/15/38 | | | 965 | | | | 1,046,031 | |
| | | | | | | | |
| | | | | | | 59,272,981 | |
| | |
| New Hampshire — 0.5% | | | | | | |
National Finance Authority,
Series 2020-1, Class A, 4.13%, 01/20/34. | | | 25,538 | | | | 30,660,307 | |
New Hampshire Business Finance Authority, Refunding RB(a) | | | | | | | | |
Series B, 4.63%, 11/01/42 | | | 7,900 | | | | 8,271,932 | |
Series C, AMT, 4.88%, 11/01/42 | | | 2,995 | | | | 3,151,069 | |
| | | | | | | | |
| | | | | | | 42,083,308 | |
| | |
| New Jersey — 1.5% | | | | | | |
Essex County Improvement Authority, RB
Series A, (BAM), 5.00%, 08/01/33 | | | 170 | | | | 226,732 | |
| | |
SCHEDULE OF INVESTMENTS | | 45 |
| | |
Schedule of Investments (continued) May 31, 2021 | | BlackRock Strategic Municipal Opportunities Fund (Percentages shown are based on Net Assets) |
| | | | | | | | |
| Security | | Par
(000) | | | Value | |
| | |
| New Jersey (continued) | | | | | | |
Essex County Improvement Authority, RB (continued) | | | | | | | | |
Series A, (BAM), 5.00%, 08/01/34 | | $ | 150 | | | $ | 199,062 | |
Series A, (BAM), 5.00%, 08/01/35 | | | 250 | | | | 330,528 | |
Series A, (BAM), 4.00%, 08/01/37 | | | 300 | | | | 361,257 | |
Series A, (BAM), 4.00%, 08/01/38 | | | 610 | | | | 731,896 | |
Series A, (BAM), 4.00%, 08/01/39 | | | 630 | | | | 753,902 | |
Series A, (BAM), 4.00%, 08/01/40 | | | 330 | | | | 393,911 | |
Series A, (BAM), 4.00%, 08/01/41 | | | 350 | | | | 416,759 | |
Series A, (BAM), 4.00%, 08/01/46 | | | 1,200 | | | | 1,425,924 | |
Series A, (BAM), 4.00%, 08/01/51 | | | 1,500 | | | | 1,776,885 | |
Series A, (BAM), 4.00%, 08/01/56 | | | 2,600 | | | | 3,069,690 | |
Series A, (BAM), 4.00%, 08/01/60 | | | 2,250 | | | | 2,646,788 | |
Industrial Pollution Control Financing Authority of Gloucester County, Refunding RB, Series A, AMT, 5.00%, 12/01/24. | | | 1,015 | | | | 1,062,664 | |
New Jersey Economic Development Authority, RB | | | | | | | | |
Series B, 5.50%, 11/01/26(a) | | | 265 | | | | 264,799 | |
AMT, 5.13%, 09/15/23 | | | 3,600 | | | | 3,826,620 | |
AMT, 5.38%, 01/01/43 | | | 8,325 | | | | 9,207,783 | |
New Jersey Economic Development Authority, Refunding RB, Series A, AMT, 2.20%, 10/01/39(b) . | | | 50,000 | | | | 53,051,500 | |
New Jersey Educational Facilities Authority, Refunding RB | | | | | | | | |
Series B, 5.00%, 03/01/29 | | | 4,895 | | | | 6,436,631 | |
Series B, 5.00%, 03/01/30 | | | 3,520 | | | | 4,725,811 | |
New Jersey Health Care Facilities Financing Authority, RB, 5.00%, 07/01/31 | | | 6,430 | | | | 8,338,553 | |
New Jersey Health Care Facilities Financing Authority, Refunding RB | | | | | | | | |
Series A, 4.00%, 07/01/35 | | | 5,000 | | | | 5,717,150 | |
Series A, 5.00%, 07/01/39 | | | 5,000 | | | | 6,083,700 | |
New Jersey Transportation Trust Fund Authority, RB | | | | | | | | |
Series AA, 5.00%, 06/15/35 | | | 3,000 | | | | 3,841,920 | |
Series AA, 5.00%, 06/15/36 | | | 4,000 | | | | 5,109,560 | |
Series AA, 5.00%, 06/15/50 | | | 2,225 | | | | 2,741,066 | |
New Jersey Turnpike Authority, Refunding RB, Series B, 1.71%, 01/01/29 | | | 8,000 | | | | 7,886,320 | |
| | | | | | | | |
| | | | | | | 130,627,411 | |
| | |
| New Mexico — 0.1% | | | | | | |
New Mexico Mortgage Finance Authority, RB, S/F Housing | | | | | | | | |
Series A, (FHLMC, FNMA, GNMA), 2.70%, 07/01/40 | | | 2,735 | | | | 2,899,948 | |
Series A, (FHLMC, FNMA, GNMA), 3.50%, 01/01/51 | | | 4,785 | | | | 5,263,931 | |
Series B-1, (FHLMC, FNMA, GNMA), 3.70%, 09/01/42 | | | 3,245 | | | | 3,514,951 | |
| | | | | | | | |
| | | | | | | 11,678,830 | |
| | |
| New York — 11.9% | | | | | | |
Chautauqua Tobacco Asset Securitization Corp., Refunding RB, 5.00%, 06/01/48 | | | 5,000 | | | | 5,176,050 | |
City of New York, GO, Sub-Series F-2, 1.94%, 03/01/29 | | | 7,500 | | | | 7,506,825 | |
City of New York, Refunding GO, Series D, 1.72%, 08/01/29 | | | 8,760 | | | | 8,676,692 | |
Dutchess County Local Development Corp., RB, Series B, 5.00%, 07/01/46 | | | 24,225 | | | | 28,712,439 | |
| | | | | | | | |
| Security | | Par
(000) | | | Value | |
| | |
| New York (continued) | | | | | | |
Erie Tobacco Asset Securitization Corp., Refunding RB, Series A, 5.00%, 06/01/45 | | $ | 18,765 | | | $ | 18,933,885 | |
Metropolitan Transportation Authority, Refunding RB | | | | | | | | |
Series C, (AGM-CR), 5.00%, 11/15/40 | | | 10,000 | | | | 12,617,500 | |
Series C, 5.00%, 11/15/40 | | | 10,000 | | | | 12,454,600 | |
Series C, (AGM-CR), 5.00%, 11/15/41 | | | 10,000 | | | | 12,595,900 | |
Series C, 5.00%, 11/15/42 | | | 10,000 | | | | 12,387,200 | |
Series C, (BAM), 5.00%, 11/15/43 | | | 10,000 | | | | 12,565,100 | |
Sub-Series C-1, 5.00%, 11/15/34 | | | 5,000 | | | | 6,150,700 | |
Nassau County Interim Finance Authority, Refunding RB, Series B, 1.28%, 11/15/28 | | | 11,250 | | | | 11,093,625 | |
Nassau County Tobacco Settlement Corp., Refunding RB, Series A-1, 6.83%, 06/01/21 | | | 2,326 | | | | 2,326,895 | |
New York City Housing Development Corp., RB, M/F Housing | | | | | | | | |
Series A, (HUD SECT 8), 2.80%, 02/01/50 | | | 50,000 | | | | 50,822,000 | |
Series C-1-A, 3.50%, 11/01/33 | | | 5,000 | | | | 5,426,250 | |
Series I-1, (FHA), 2.10%, 11/01/35 | | | 2,915 | | | | 2,919,751 | |
Series I-1, (FHA), 2.55%, 11/01/45 | | | 28,970 | | | | 29,434,389 | |
Series I-1, (FHA), 2.65%, 11/01/50 | | | 5,000 | | | | 5,033,100 | |
Series I-1, (FHA), 2.70%, 11/01/55 | | | 5,000 | | | | 5,036,000 | |
Series I-1, (FHA), 2.80%, 11/01/60 | | | 5,000 | | | | 5,061,050 | |
Series J, 2.85%, 11/01/39 | | | 8,000 | | | | 8,273,680 | |
Series J, 3.00%, 11/01/44 | | | 8,135 | | | | 8,395,483 | |
Series J, 3.05%, 11/01/49 | | | 10,000 | | | | 10,285,500 | |
Series J, 3.15%, 11/01/54 | | | 15,000 | | | | 15,481,200 | |
Series J, 3.25%, 11/01/59 | | | 10,000 | | | | 10,410,300 | |
Series J, 3.35%, 11/01/65 | | | 5,000 | | | | 5,197,800 | |
New York City Housing Development Corp., Refunding RB, M/F Housing
2.25%, 11/01/31 | | | 1,500 | | | | 1,540,545 | |
Series B-1-A, 3.10%, 11/01/34 | | | 3,000 | | | | 3,192,120 | |
Series B-1-A, 3.40%, 11/01/39 | | | 3,000 | | | | 3,191,400 | |
Series B-1-A, 3.55%, 11/01/44 | | | 5,000 | | | | 5,308,600 | |
Series B-1-A, 3.65%, 11/01/49 | | | 5,000 | | | | 5,299,500 | |
Series B-1-A, 3.75%, 11/01/54 | | | 5,000 | | | | 5,297,200 | |
Series B-1-A, 3.85%, 05/01/58 | | | 5,000 | | | | 5,327,650 | |
Series C, 2.25%, 11/01/41 | | | 8,495 | | | | 8,453,459 | |
Series C, 2.40%, 11/01/46 | | | 14,050 | | | | 13,962,047 | |
Series C, 2.50%, 11/01/51 | | | 14,155 | | | | 14,080,828 | |
Series C, 2.60%, 11/01/56 | | | 7,210 | | | | 7,200,843 | |
New York City Industrial Development Agency, Refunding RB (AGM), | | | | | | | | |
5.00%, 03/01/28 | | | 850 | | | | 1,064,175 | |
4.00%, 03/01/45 | | | 1,250 | | | | 1,422,738 | |
Series A, (AGM), 5.00%, 01/01/29 | | | 1,200 | | | | 1,545,684 | |
Series A, (AGM), 5.00%, 01/01/30 | | | 1,750 | | | | 2,294,268 | |
Series A, (AGM), 5.00%, 01/01/31 | | | 625 | | | | 833,781 | |
New York City Transitional Finance Authority Future Tax Secured Revenue, RB | | | | | | | | |
Series B-3, 3.90%, 08/01/31 | | | 10,000 | | | | 11,227,900 | |
Series C-3, 3.50%, 11/01/32 | | | 22,000 | | | | 24,013,880 | |
New York City Water & Sewer System, RB | | | | | | | | |
Series CC-1, Subordinate, 4.00%, 06/15/51 | | | 9,535 | | | | 11,370,201 | |
Series CC-1, Subordinate, 5.00%, 06/15/51 | | | 2,470 | | | | 3,212,927 | |
New York Counties Tobacco Trust IV, Refunding RB | | | | | | | | |
Series A, 6.25%, 06/01/41(a) | | | 13,700 | | | | 13,906,322 | |
Series A, 5.00%, 06/01/45 | | | 6,930 | | | | 6,999,508 | |
New York Counties Tobacco Trust VI, Refunding RB, Series A-2-B, 5.00%, 06/01/51 | | | 3,630 | | | | 3,846,094 | |
| | |
| 46 | | 2 0 2 1 BLACK ROCK ANNUAL REPORT TO SHAREHOLDERS |
| | |
Schedule of Investments (continued) May 31, 2021 | | BlackRock Strategic Municipal Opportunities Fund (Percentages shown are based on Net Assets) |
| | | | | | | | |
| Security | | Par (000) | | | Value | |
| | |
| New York (continued) | | | | | | |
New York Liberty Development Corp., Refunding RB
5.00%, 11/15/44 | | $ | 5,000 | | | $ | 5,092,600 | |
Series 1, Class 1, 5.00%, 11/15/44(a) | | | 49,285 | | | | 54,469,782 | |
Series 2, Class 2, 5.15%, 11/15/34(a) | | | 240 | | | | 271,562 | |
Series 2, Class 2, 5.38%, 11/15/40(a) | | | 570 | | | | 647,132 | |
New York State Dormitory Authority, Refunding RB
5.00%, 07/01/26 | | | 100 | | | | 120,821 | |
5.00%, 07/01/27 | | | 300 | | | | 372,168 | |
5.00%, 07/01/30 | | | 250 | | | | 321,888 | |
5.00%, 07/01/32 | | | 360 | | | | 455,893 | |
5.00%, 07/01/34 | | | 515 | | | | 647,298 | |
5.00%, 07/01/35 | | | 600 | | | | 750,696 | |
5.00%, 07/01/36 | | | 975 | | | | 1,215,776 | |
4.00%, 07/01/37 | | | 1,860 | | | | 2,150,941 | |
4.00%, 07/01/38 | | | 1,650 | | | | 1,901,312 | |
4.00%, 03/15/39 | | | 19,000 | | | | 22,987,720 | |
Series B, 5.75%, 01/01/29 | | | 990 | | | | 1,076,863 | |
New York State Housing Finance Agency, RB, M/F Housing | | | | | | | | |
Series E, (FHLMC, FNMA, GNMA, SONYMA),
3.45%, 05/01/49 | | | 2,850 | | | | 2,963,231 | |
Series H, (FNMA, SONYMA), 2.25%, 11/01/29 | | | 275 | | | | 292,889 | |
Series H, (FNMA, SONYMA), 2.35%, 11/01/30 | | | 250 | | | | 265,243 | |
Series H, (FNMA, SONYMA), 2.40%, 11/01/31 | | | 250 | | | | 264,280 | |
Series H, (FNMA, SONYMA), 3.15%, 11/01/44 | | | 1,000 | | | | 1,046,500 | |
Series H, (FNMA, SONYMA), 3.25%, 11/01/52 | | | 3,430 | | | | 3,584,144 | |
Series I, (FNMA, SONYMA), 2.40%, 05/01/31 | | | 280 | | | | 297,018 | |
Series I, (FNMA, SONYMA), 2.75%, 11/01/34 | | | 1,250 | | | | 1,330,238 | |
Series I, (FNMA, SONYMA), 3.15%, 11/01/44 | | | 3,275 | | | | 3,427,288 | |
Series I, (FNMA, SONYMA), 3.25%, 11/01/52 | | | 5,895 | | | | 6,159,921 | |
Series K, (FHLMC, FNMA, GNMA, SONYMA), 3.00%, 11/01/32 | | | 1,500 | | | | 1,596,885 | |
Series M, (FHLMC, FNMA, GNMA, SONYMA), 3.15%, 11/01/32 | | | 1,000 | | | | 1,074,080 | |
Series M, (FHLMC, FNMA, GNMA, SONYMA), 3.50%, 11/01/37 | | | 415 | | | | 444,913 | |
New York State Urban Development Corp., RB
2.13%, 03/15/32 | | | 500 | | | | 497,095 | |
2.23%, 03/15/33 | | | 1,500 | | | | 1,493,280 | |
4.00%, 03/15/40 | | | 8,885 | | | | 10,637,566 | |
Series E, 4.00%, 03/15/43 | | | 57,700 | | | | 68,403,350 | |
New York State Urban Development Corp., Refunding RB, Series B, 2.84%, 03/15/32 | | | 10,000 | | | | 10,470,600 | |
New York Transportation Development Corp., ARB | | | | | | | | |
Series A, AMT, 5.00%, 07/01/34 | | | 5,000 | | | | 5,658,250 | |
Series A, AMT, 5.00%, 07/01/41 | | | 5,000 | | | | 5,632,000 | |
Series A, AMT, 5.00%, 07/01/46 | | | 50,000 | | | | 55,968,000 | |
Series A, AMT, 5.25%, 01/01/50 | | | 25,000 | | | | 28,138,250 | |
New York Transportation Development Corp., RB | | | | | | | | |
AMT, 5.00%, 01/01/26 | | | 10,000 | | | | 11,763,600 | |
AMT, 5.00%, 01/01/27 | | | 10,000 | | | | 12,052,300 | |
AMT, 5.00%, 01/01/28 | | | 10,000 | | | | 12,309,800 | |
AMT, 5.00%, 01/01/29 | | | 10,000 | | | | 12,284,800 | |
AMT, 5.00%, 01/01/30 | | | 10,000 | | | | 12,215,500 | |
AMT, 5.00%, 01/01/32 | | | 15,000 | | | | 18,125,400 | |
AMT, 5.00%, 01/01/34 | | | 15,500 | | | | 18,627,125 | |
AMT, 4.00%, 04/30/53 | | | 2,915 | | | | 3,318,873 | |
New York Transportation Development Corp., Refunding RB 5.00%, 12/01/24 | | | 1,025 | | | | 1,185,167 | |
| | | | | | | | |
| Security | | Par (000) | | | Value | |
| | |
| New York (continued) | | | | | | |
New York Transportation Development Corp., Refunding RB (continued)
5.00%, 12/01/25. | | $ | 1,300 | | | $ | 1,553,487 | |
5.00%, 12/01/26. | | | 1,450 | | | | 1,785,443 | |
5.00%, 12/01/27 | | | 1,500 | | | | 1,896,540 | |
5.00%, 12/01/28 | | | 1,300 | | | | 1,681,134 | |
Series A, Class A, AMT, 5.00%, 12/01/24 | | | 1,750 | | | | 2,011,170 | |
Series A, Class A, AMT, 5.00%, 12/01/25 | | | 1,400 | | | | 1,659,966 | |
Series A, Class A, AMT, 5.00%, 12/01/26 | | | 510 | | | | 623,541 | |
Series A, Class A, AMT, 5.00%, 12/01/27 | | | 700 | | | | 873,285 | |
Series A, Class A, AMT, 5.00%, 12/01/28 | | | 350 | | | | 446,761 | |
Series A, Class A, AMT, 5.00%, 12/01/30 | | | 250 | | | | 330,630 | |
Series A, Class A, AMT, 5.00%, 12/01/31 | | | 300 | | | | 395,070 | |
Series A, Class A, AMT, 5.00%, 12/01/32 | | | 375 | | | | 488,344 | |
Series A, Class A, AMT, 5.00%, 12/01/33 | | | 300 | | | | 388,422 | |
Port Authority of New York & New Jersey, RB, Series AAA, 1.09%, 07/01/23 | | | 11,785 | | | | 11,939,383 | |
Port Authority of New York & New Jersey, Refunding ARB, 4.00%, 07/15/51 | | | 6,355 | | | | 7,556,159 | |
Port Authority of New York & New Jersey, Refunding RB | | | | | | | | |
5.00%, 09/01/34. | | | 5,125 | | | | 6,644,767 | |
Series 226, AMT, 5.00%, 10/15/24(g) | | | 4,250 | | | | 4,866,590 | |
Series 226, AMT, 5.00%, 10/15/25(g) | | | 5,000 | | | | 5,912,650 | |
Series 226, AMT, 5.00%, 10/15/26(g) | | | 5,000 | | | | 6,087,350 | |
Series 226, AMT, 5.00%, 10/15/27(g) | | | 4,000 | | | | 4,998,720 | |
Series 226, AMT, 5.00%, 10/15/28(g) | | | 4,000 | | | | 5,110,280 | |
Series 226, AMT, 5.00%, 10/15/30(g) | | | 2,000 | | | | 2,649,220 | |
Series 226, AMT, 5.00%, 10/15/31(g) | | | 2,760 | | | | 3,723,516 | |
Series 226, AMT, 5.00%, 10/15/32(g) | | | 1,850 | | | | 2,487,510 | |
Series 226, AMT, 5.00%, 10/15/33(g) | | | 1,350 | | | | 1,801,386 | |
Puerto Rico Electric Power Authority, 3rd Series, 1.00%, 01/01/21 | | | 1,907 | | | | 1,828,794 | |
State of New York Mortgage Agency, RB, S/F Housing | | | | | | | | |
Series 225, 2.45%, 10/01/45 | | | 15,000 | | | | 14,968,500 | |
Series 227, 2.30%, 10/01/40 | | | 7,000 | | | | 7,001,750 | |
Series 227, 2.50%, 10/01/47 | | | 13,000 | | | | 13,024,180 | |
Series 226, AMT, 1.80%, 04/01/28 | | | 1,000 | | | | 1,013,170 | |
Series 226, AMT, 3.50%, 10/01/50 | | | 2,015 | | | | 2,199,655 | |
State of New York, Refunding GO, Series B, 1.74%, 03/15/29 | | | 15,000 | | | | 15,097,800 | |
Triborough Bridge & Tunnel Authority, RB | | | | | | | | |
Series A, 5.00%, 11/15/51 | | | 8,825 | | | | 11,361,128 | |
Series A, 5.00%, 11/15/56 | | | 9,560 | | | | 12,230,490 | |
| | | | | | | | |
| | | | | | | 1,028,212,413 | |
| | |
| North Carolina — 2.7% | | | | | | |
City of Charlotte North Carolina Airport Special Facilities Revenue, Refunding ARB
5.00%, 07/01/27. | | | 1,030 | | | | 1,293,144 | |
5.00%, 07/01/34 | | | 3,095 | | | | 3,999,947 | |
5.00%, 07/01/36 | | | 1,860 | | | | 2,395,475 | |
4.00%, 07/01/44 | | | 5,000 | | | | 5,856,000 | |
5.00%, 07/01/49 | | | 10,000 | | | | 12,533,200 | |
City of Charlotte North Carolina Airport Special Facilities Revenue, Refunding RB | | | | | | | | |
Series A, 5.00%, 07/01/28 | | | 2,395 | | | | 3,086,437 | |
Series A, 5.00%, 07/01/29 | | | 1,750 | | | | 2,301,198 | |
Series A, 5.00%, 07/01/30 | | | 2,250 | | | | 3,016,305 | |
Series A, 5.00%, 07/01/31 | | | 5,120 | | | | 7,011,379 | |
| | |
SCHEDULE OF INVESTMENTS | | 47 |
| | |
Schedule of Investments (continued) May 31, 2021 | | BlackRock Strategic Municipal Opportunities Fund (Percentages shown are based on Net Assets) |
| | | | | | | | |
| Security | | Par (000) | | | Value | |
| | |
| North Carolina (continued) | | | | | | |
City of Charlotte North Carolina Airport Special Facilities Revenue, Refunding RB (continued) | | | | | | | | |
Series A, 5.00%, 07/01/33 | | $ | 5,750 | | | $ | 7,816,320 | |
Series A, 5.00%, 07/01/34 | | | 3,000 | | | | 4,064,940 | |
Series A, 4.00%, 07/01/35 | | | 3,100 | | | | 3,856,555 | |
Series A, 4.00%, 07/01/36 | | | 3,375 | | | | 4,197,015 | |
Series A, 5.00%, 07/01/37 | | | 7,125 | | | | 9,583,552 | |
Series A, 4.00%, 07/01/38 | | | 4,250 | | | | 5,254,657 | |
Series A, 4.00%, 07/01/39 | | | 5,000 | | | | 6,143,500 | |
Series A, 4.00%, 07/01/40 | | | 2,250 | | | | 2,758,028 | |
Series A, 4.00%, 07/01/41 | | | 2,410 | | | | 2,945,791 | |
Series A, 4.00%, 07/01/51 | | | 25,190 | | | | 30,365,034 | |
Series B, AMT, 4.00%, 07/01/51 | | | 6,000 | | | | 7,140,480 | |
County of Alamance North Carolina, GO, 5.00%, 05/01/30 | | | 7,460 | | | | 9,990,903 | |
County of Wake North Carolina, RB
5.00%, 03/01/26 | | | 1,255 | | | | 1,516,241 | |
5.00%, 03/01/27 | | | 2,870 | | | | 3,570,481 | |
5.00%, 03/01/28 | | | 2,840 | | | | 3,628,838 | |
5.00%, 03/01/29 | | | 1,015 | | | | 1,326,838 | |
5.00%, 03/01/30 | | | 1,680 | | | | 2,242,414 | |
5.00%, 03/01/31 | | | 2,590 | | | | 3,536,049 | |
5.00%, 03/01/32 | | | 4,000 | | | | 5,449,360 | |
North Carolina Housing Finance Agency, RB, M/F Housing, (FHLMC, FNMA, GNMA), 3.00%, 07/01/51 | | | 22,535 | | | | 24,694,980 | |
North Carolina Housing Finance Agency, RB, S/F Housing Series 43, (FHLMC, FNMA, GNMA), 2.63%, 01/01/35 | | | 3,500 | | | | 3,732,085 | |
Series 43, (FHLMC, FNMA, GNMA), 2.80%, 01/01/40 | | | 6,000 | | | | 6,304,860 | |
Series 44, 1.75%, 01/01/26 | | | 1,000 | | | | 1,044,210 | |
Series 44, 1.80%, 07/01/26 | | | 1,265 | | | | 1,324,835 | |
Series 44, 2.05%, 01/01/28 | | | 1,360 | | | | 1,439,193 | |
Series 44, 2.20%, 07/01/29 | | | 1,065 | | | | 1,128,474 | |
Series 44, 2.30%, 01/01/31 | | | 1,120 | | | | 1,178,822 | |
Series 44, 2.35%, 07/01/31 | | | 1,000 | | | | 1,053,090 | |
Series 44, 2.55%, 07/01/35 | | | 1,250 | | | | 1,312,013 | |
North Carolina Medical Care Commission, Refunding RB
5.00%, 06/01/45 | | | 5,000 | | | | 5,786,100 | |
Series A, 5.25%, 01/01/41 | | | 2,470 | | | | 2,598,292 | |
North Carolina Turnpike Authority, RB, Senior Lien, (AGM), 5.00%, 01/01/49 | | | 5,000 | | | | 6,295,400 | |
Raleigh Durham Airport Authority, Refunding RB | | | | | | | | |
Series A, AMT, 5.00%, 05/01/34 | | | 5,000 | | | | 6,061,200 | |
Series A, AMT, 5.00%, 05/01/35 | | | 5,000 | | | | 6,042,850 | |
Town of Mooresville North Carolina, SAB, 5.38%, 03/01/40(a) | | | 2,100 | | | | 2,274,783 | |
| | | | | | | | |
| | | | | | | 229,151,268 | |
| | |
| North Dakota — 0.0% | | | | | | |
North Dakota Housing Finance Agency, RB, S/F Housing, 3.05%, 07/01/43 | | | 1,025 | | | | 1,088,735 | |
| | | | | | | | |
| | |
| Ohio — 1.2% | | | | | | |
Buckeye Tobacco Settlement Financing Authority, Refunding RB, Series B-2, Class 2, 5.00%, 06/01/55 | | | 36,460 | | | | 42,201,356 | |
| | | | | | | | |
| Security | | Par (000) | | | Value | |
| | |
| Ohio (continued) | | | | | | |
County of Hamilton Ohio, RB, Series CC, RB, 5.00%, 11/15/49 | | $ | 5,000 | | | $ | 7,818,600 | |
Ohio Housing Finance Agency, RB, M/F Housing | | | | | | | | |
Series A, 3.00%, 03/01/52 | | | 21,000 | | | | 23,113,230 | |
Series B, (FHLMC, FNMA, GNMA), 2.55%, 09/01/50 | | | 3,480 | | | | 3,543,406 | |
Ohio Housing Finance Agency, RB, S/F Housing | | | | | | | | |
Series A, (FHLMC, FNMA, GNMA), 2.50%, 09/01/35 | | | 2,050 | | | | 2,131,282 | |
Series A, (FHLMC, FNMA, GNMA), 2.75%, 09/01/40 | | | 3,740 | | | | 3,884,140 | |
Series A, (FHLMC, FNMA, GNMA), 2.90%, 09/01/45 | | | 16,145 | | | | 16,913,825 | |
Series A, (FHLMC, FNMA, GNMA), 3.75%, 09/01/50 | | | 4,875 | | | | 5,462,389 | |
| | | | | | | | |
| | | | | | | 105,068,228 | |
| | |
| Oklahoma — 0.6% | | | | | | |
Norman Regional Hospital Authority, RB
4.00%, 09/01/45. | | | 6,000 | | | | 6,873,840 | |
5.00%, 09/01/45 | | | 5,000 | | | | 6,161,150 | |
Oklahoma Development Finance Authority, RB
7.25%, 09/01/51(a) | | | 5,010 | | | | 5,096,723 | |
Series B, 5.25%, 08/15/48 | | | 10,000 | | | | 12,181,700 | |
Series B, 5.50%, 08/15/52 | | | 11,620 | | | | 14,285,860 | |
Oklahoma State University, RB | | | | | | | | |
Series A, 4.00%, 09/01/34 | | | 350 | | | | 435,624 | |
Series A, 4.00%, 09/01/35 | | | 655 | | | | 811,571 | |
Series A, 4.00%, 09/01/36 | | | 505 | | | | 623,049 | |
Series A, 4.00%, 09/01/37 | | | 1,185 | | | | 1,457,811 | |
Series A, 4.00%, 09/01/39 | | | 910 | | | | 1,115,751 | |
Series A, 4.00%, 09/01/46 | | | 500 | | | | 606,755 | |
Series A, 4.00%, 09/01/51 | | | 1,945 | | | | 2,331,452 | |
| | | | | | | | |
| | | | | | | 51,981,286 | |
| | |
| Oregon — 0.7% | | | | | | |
County of Multnomah Oregon, GO, Series B, 0.80%, 06/15/26 | | | 26,870 | | | | 26,672,506 | |
Hospital Facilities Authority of Multnomah County Oregon, Refunding RB, Series A, 5.50%, 10/01/49 | | | 865 | | | | 919,460 | |
Port of Portland Oregon Airport Revenue, ARB | | | | | | | | |
Series 24A, 5.00%, 07/01/47 | | | 5,000 | | | | 5,969,900 | |
Series 24B, AMT, 5.00%, 07/01/44 | | | 5,000 | | | | 6,130,850 | |
Series 24B, AMT, 5.00%, 07/01/47 | | | 5,000 | | | | 5,874,000 | |
State of Oregon Housing & Community Services Department, RB, M/F Housing | | | | | | | | |
Series B, AMT, (FHLMC, FNMA, GNMA), 4.00%, 07/01/37 | | | 185 | | | | 189,094 | |
Series B, AMT, (FHLMC, FNMA, GNMA), 4.13%, 07/01/43 | | | 165 | | | | 168,610 | |
Water Environment Services Sewer Revenue, RB
5.00%, 06/01/27 | | | 2,640 | | | | 3,323,364 | |
5.00%, 06/01/28 | | | 2,770 | | | | 3,575,710 | |
5.00%, 06/01/29 | | | 2,910 | | | | 3,836,166 | |
| | | | | | | | |
| | | | | | | 56,659,660 | |
| | |
| Pennsylvania — 3.2% | | | | | | |
Allegheny County Hospital Development Authority, Refunding RB, Series A, 5.00%, 04/01/47 | | | 10,000 | | | | 12,119,100 | |
| | |
| 48 | | 2 0 2 1 BLACK ROCK ANNUAL REPORT TO SHAREHOLDERS |
| | |
Schedule of Investments (continued) May 31, 2021 | | BlackRock Strategic Municipal Opportunities Fund (Percentages shown are based on Net Assets) |
| | | | | | | | |
| Security | | Par (000) | | | Value | |
| | |
| Pennsylvania (continued) | | | | | | |
Allentown Neighborhood Improvement Zone Development Authority, RB(a)
5.00%, 05/01/33 | | $ | 1,250 | | | $ | 1,494,200 | |
Subordinate, 5.00%, 05/01/28 | | | 3,745 | | | | 4,292,369 | |
Subordinate, 5.13%, 05/01/32 | | | 4,700 | | | | 5,556,951 | |
Subordinate, 5.38%, 05/01/42 | | | 8,550 | | | | 9,969,471 | |
Bucks County Industrial Development Authority, RB
4.00%, 07/01/46 | | | 1,390 | | | | 1,556,800 | |
4.00%, 07/01/51 | | | 1,000 | | | | 1,109,540 | |
Chester County Health and Education Facilities Authority, Refunding RB | | | | | | | | |
Series A, 5.00%, 12/01/22 | | | 895 | | | | 909,499 | |
Series A, 5.00%, 12/01/23 | | | 985 | | | | 1,009,605 | |
Series A, 5.00%, 12/01/24 | | | 1,035 | | | | 1,068,544 | |
Series A, 5.00%, 12/01/25 | | | 1,075 | | | | 1,117,226 | |
Series A, 5.25%, 12/01/45 | | | 1,500 | | | | 1,538,235 | |
City of Philadelphia Pennsylvania Airport Revenue, Refunding ARB | | | | | | | | |
Series B, AMT, 5.00%, 07/01/29 | | | 5,000 | | | | 6,149,900 | |
Series B, AMT, 5.00%, 07/01/30 | | | 5,000 | | | | 6,132,050 | |
Series B, AMT, 5.00%, 07/01/42 | | | 5,000 | | | | 5,986,850 | |
Series B, AMT, 5.00%, 07/01/47 | | | 5,000 | | | | 5,952,250 | |
Commonwealth Financing Authority, RB, Series A, 3.81%, 06/01/41 | | | 5,545 | | | | 6,111,921 | |
County of Allegheny Pennsylvania, Refunding GO, Series C, (AGM), 0.67%, 11/01/26(b) | | | 15,440 | | | | 15,340,782 | |
County of Lehigh Pennsylvania, Refunding RB, 5.00%, 07/01/44 | | | 15,825 | | | | 19,884,587 | |
Geisinger Authority, Refunding RB, 5.00%, 04/01/43(b) | | | 10,000 | | | | 12,217,500 | |
Hospitals & Higher Education Facilities Authority of Philadelphia, RB, Series A, 5.63%, 07/01/42 | | | 1,675 | | | | 1,756,623 | |
Montgomery County Industrial Development Authority, Refunding RB, 5.38%, 01/01/50 | | | 4,815 | | | | 5,036,153 | |
Northampton County Industrial Development Authority, TA, 7.00%, 07/01/32 | | | 1,845 | | | | 1,986,216 | |
Pennsylvania Economic Development Financing Authority, RB
1.75%, 06/15/27 | | | 9,000 | | | | 9,118,530 | |
2.30%, 06/15/30 | | | 13,000 | | | | 13,156,390 | |
Series A, 4.00%, 10/15/22 | | | 1,000 | | | | 1,051,960 | |
Series A, 4.00%, 10/15/23 | | | 700 | | | | 761,600 | |
Series A, 4.00%, 10/15/24 | | | 425 | | | | 475,983 | |
Series A, 4.00%, 10/15/25 | | | 1,000 | | | | 1,147,550 | |
Series A, 4.00%, 10/15/26 | | | 1,000 | | | | 1,172,950 | |
Series A, 5.00%, 10/15/28 | | | 1,500 | | | | 1,928,265 | |
Series A, 5.00%, 10/15/29 | | | 1,650 | | | | 2,161,269 | |
Series A, 5.00%, 10/15/31 | | | 1,400 | | | | 1,904,672 | |
Series A, 5.00%, 10/15/32 | | | 1,100 | | | | 1,492,513 | |
Series A, 5.00%, 10/15/33 | | | 1,150 | | | | 1,550,672 | |
Series A, 5.00%, 10/15/34 | | | 1,400 | | | | 1,879,962 | |
Series A, 5.00%, 10/15/35 | | | 1,100 | | | | 1,471,965 | |
Series A, 5.00%, 10/15/36 | | | 1,250 | | | | 1,664,887 | |
Series A, 4.00%, 10/15/37 | | | 1,400 | | | | 1,710,520 | |
Series A, 4.00%, 10/15/39 | | | 1,325 | | | | 1,607,570 | |
Series A, 4.00%, 10/15/40 | | | 1,200 | | | | 1,450,908 | |
Series A, 4.00%, 10/15/41 | | | 1,300 | | | | 1,565,980 | |
Series A, 4.00%, 10/15/51 | | | 4,400 | | | | 5,192,748 | |
AMT, 5.00%, 12/31/38 | | | 5,000 | | | | 5,889,100 | |
| | | | | | | | |
| Security | | Par (000) | | | Value | |
| | |
| Pennsylvania (continued) | | | | | | |
Pennsylvania Economic Development Financing Authority, RB (continued) | | | | | | | | |
AMT, 5.00%, 06/30/42 | | $ | 5,000 | | | $ | 5,798,000 | |
Pennsylvania Economic Development Financing Authority, Refunding RB, AMT, 5.50%, 11/01/44 | | | 3,250 | | | | 3,461,672 | |
Pennsylvania Higher Educational Facilities Authority, RB, 4.00%, 08/15/49 | | | 10,000 | | | | 11,576,900 | |
Pennsylvania Higher Educational Facilities Authority, Refunding RB(g) | | | | | | | | |
Series B, 5.00%, 08/15/23 | | | 1,165 | | | | 1,226,291 | |
Series B, 5.00%, 08/15/24 | | | 1,000 | | | | 1,092,560 | |
Series B, 5.00%, 08/15/25 | | | 1,300 | | | | 1,466,803 | |
Series B, 5.00%, 08/15/26 | | | 1,575 | | | | 1,828,134 | |
Series B, 5.00%, 08/15/27 | | | 1,050 | | | | 1,245,731 | |
Series B, 5.00%, 08/15/31 | | | 1,910 | | | | 2,425,757 | |
Series B, 5.00%, 08/15/34 | | | 1,055 | | | | 1,352,299 | |
Series B, 5.00%, 08/15/35 | | | 1,335 | | | | 1,714,901 | |
Series B, 4.00%, 08/15/37 | | | 1,000 | | | | 1,158,110 | |
Series B, 4.00%, 08/15/39 | | | 1,000 | | | | 1,149,030 | |
Series B, 4.00%, 08/15/41 | | | 1,115 | | | | 1,275,504 | |
Series B, 4.00%, 08/15/42 | | | 4,750 | | | | 5,415,285 | |
Pennsylvania Housing Finance Agency, RB, S/F Housing | | | | | | | | |
Series 2019-131A, 1.85%, 04/01/26 | | | 1,550 | | | | 1,619,301 | |
Series 2019-131A, 2.10%, 04/01/28 | | | 1,915 | | | | 2,016,610 | |
Pennsylvania Housing Finance Agency, Refunding RB, S/F Housing | | | | | | | | |
Series 121, 2.80%, 10/01/31 | | | 11,770 | | | | 12,255,748 | |
Series 134A, 3.00%, 10/01/49 | | | 15,380 | | | | 16,579,332 | |
Series 134B, AMT, 5.00%, 10/01/24 | | | 1,000 | | | | 1,145,570 | |
Series 134B, AMT, 5.00%, 04/01/26 | | | 1,000 | | | | 1,187,610 | |
Series 134B, AMT, 5.00%, 10/01/26 | | | 1,545 | | | | 1,857,167 | |
Series 134B, AMT, 5.00%, 04/01/27 | | | 1,500 | | | | 1,824,225 | |
Series 134B, AMT, 5.00%, 10/01/27 | | | 1,250 | | | | 1,537,188 | |
Philadelphia Authority for Industrial Development, Refunding RB, Series A, 5.00%, 09/01/35 | | | 5,000 | | | | 5,994,150 | |
Susquehanna Area Regional Airport Authority, Refunding RB, Series A, AMT, 5.00%, 01/01/27 | | | 3,100 | | | | 3,278,405 | |
| | | | | | | | |
| | | | | | | 278,134,649 | |
| | |
| Puerto Rico — 9.4% | | | | | | |
Children’s Trust Fund, RB, Series B, 0.00%, 05/15/57(c) | | | 57,655 | | | | 3,192,357 | |
Commonwealth of Puerto Rico,
GO(d)(e) | | | | | | | | |
Series A, 5.25%, 07/01/22 | | | 3,075 | | | | 2,752,894 | |
Series A, 5.25%, 07/01/23 | | | 2,620 | | | | 2,345,555 | |
Series A, 5.25%, 07/01/26 | | | 1,085 | | | | 971,346 | |
Series A, 5.00%, 07/01/29 | | | 5,220 | | | | 4,673,205 | |
Series A, 5.13%, 07/01/31 | | | 10,900 | | | | 9,758,225 | |
Series A, 6.00%, 07/01/38 | | | 9,995 | | | | 9,062,137 | |
Series B, 5.25%, 07/01/17 | | | 1,605 | | | | 1,354,888 | |
Commonwealth of Puerto Rico, Refunding GO | | | | | | | | |
Series A, 5.50%, 07/01/19 | | | 1,176 | | | | 992,740 | |
Series A, 5.25%, 07/01/24(d)(e) | | | 1,765 | | | | 1,498,044 | |
Series A, 5.00%, 07/01/32(d)(e) | | | 1,050 | | | | 891,188 | |
Series A, 5.50%, 07/01/32(d)(e) | | | 4,245 | | | | 3,800,336 | |
Series A, 8.00%, 07/01/35(d)(e) | | | 86,908 | | | | 69,848,481 | |
Series A, 5.13%, 07/01/37(d)(e) | | | 1,490 | | | | 1,264,638 | |
Series A, 5.50%, 07/01/39(d)(e) | | | 14,225 | | | | 12,073,469 | |
Series A, 5.00%, 07/01/41(d)(e) | | | 23,430 | | | | 18,979,003 | |
| | |
SCHEDULE OF INVESTMENTS | | 49 |
| | |
Schedule of Investments (continued) May 31, 2021 | | BlackRock Strategic Municipal Opportunities Fund (Percentages shown are based on Net Assets) |
| | | | | | | | |
| Security | | Par (000) | | | Value | |
| | |
| Puerto Rico (continued) | | | | | | |
Commonwealth of Puerto Rico, Refunding GO (continued) | | | | | | | | |
Series B, 6.00%, 07/01/39(d)(e) | | $ | 2,555 | | | $ | 2,316,534 | |
Series C, 6.00%, 07/01/39(d)(e) | | | 1,510 | | | | 1,369,067 | |
Series D, 5.75%, 07/01/41(d)(e) | | | 3,530 | | | | 3,093,162 | |
Puerto Rico Commonwealth Aqueduct & Sewer Authority, RB, Series A, Senior Lien, 5.25%, 07/01/42 | | | 313 | | | | 324,866 | |
Puerto Rico Commonwealth Aqueduct & Sewer Authority, Refunding RB(a) | | | | | | | | |
Series A, Senior Lien, 5.00%, 07/01/35 | | | 26,225 | | | | 31,285,900 | |
Series A, Senior Lien, 5.00%, 07/01/47 | | | 46,180 | | | | 54,275,354 | |
Puerto Rico Electric Power Authority, RB | | | | | | | | |
Series A, 5.00%, 07/01/29(d)(e) | | | 5,540 | | | | 5,325,325 | |
Series A, 7.00%, 07/01/33(d)(e) | | | 7,445 | | | | 7,298,430 | |
Series A, 6.75%, 07/01/36(d)(e) | | | 24,370 | | | | 23,890,228 | |
Series A, 5.00%, 07/01/42(d)(e) | | | 23,970 | | | | 23,041,162 | |
Series A, 7.00%, 07/01/43(d)(e) | | | 3,350 | | | | 3,284,049 | |
Series A-3, 10.00%, 07/01/19(d)(e) | | | 6,867 | | | | 6,523,835 | |
Series B-3, 10.00%, 07/01/19(d)(e) | | | 6,867 | | | | 6,523,834 | |
Series C-1, 5.40%, 01/01/18(d)(e) | | | 18,867 | | | | 18,088,963 | |
Series C-2, 5.40%, 07/01/18(d)(e) | | | 18,870 | | | | 18,091,888 | |
Series C-4, 5.40%, 07/01/20(d)(e) | | | 1,908 | | | | 1,828,794 | |
Series CCC, 5.25%, 07/01/26(d)(e) | | | 8,495 | | | | 8,165,819 | |
Series CCC, 5.25%, 07/01/28(d)(e) | | | 3,120 | | | | 2,999,100 | |
Series D-4, 7.50%, 07/01/20 | | | 5,100 | | | | 4,999,596 | |
Series TT, 5.00%, 07/01/20(d)(e) | | | 1,690 | | | | 1,620,288 | |
Series WW, 5.50%, 07/01/19(d)(e) | | | 10,325 | | | | 9,899,094 | |
Series WW, 5.50%, 07/01/20(d)(e) | | | 1,000 | | | | 958,750 | |
Series WW, 5.38%, 07/01/24(d)(e) | | | 4,545 | | | | 4,368,881 | |
Series WW, 5.25%, 07/01/25(d)(e) | | | 2,300 | | | | 2,210,875 | |
Series WW, 5.25%, 07/01/33(d)(e) | | | 2,725 | | | | 2,619,406 | |
Series WW, 5.50%, 07/01/38(d)(e) | | | 3,980 | | | | 3,825,775 | |
Series XX, 5.25%, 07/01/27(d)(e) | | | 2,630 | | | | 2,528,087 | |
Series XX, 5.25%, 07/01/35(d)(e) | | | 1,310 | | | | 1,259,238 | |
Series XX, 5.75%, 07/01/36(d)(e) | | | 1,825 | | | | 1,754,281 | |
Series XX, 5.25%, 07/01/40(d)(e) | | | 36,125 | | | | 34,725,156 | |
Puerto Rico Electric Power Authority, Refunding RB(d)(e) | | | | | | | | |
5.00%, 07/01/19 | | | 2,000 | | | | 1,917,500 | |
Series AAA, 5.25%, 07/01/22 | | | 7,025 | | | | 6,752,781 | |
Series AAA, 5.25%, 07/01/25 | | | 5,750 | | | | 5,527,187 | |
Series AAA, 5.25%, 07/01/28 | | | 4,870 | | | | 4,681,287 | |
Series BBB, 5.40%, 07/01/28 | | | 9,505 | | | | 8,902,031 | |
Series DDD, 5.00%, 07/01/20 | | | 1,810 | | | | 1,735,338 | |
Series UU, 1.00%, 07/01/19(b) | | | 2,460 | | | | 2,004,900 | |
Series UU, 1.00%, 07/01/20(b) | | | 10,400 | | | | 8,686,194 | |
Series UU, 0.84%, 07/01/31(b) | | | 12,285 | | | | 10,260,567 | |
Series V, 5.50%, 07/01/20 | | | 6,440 | | | | 6,174,350 | |
Series ZZ, 5.25%, 07/01/19 | | | 14,930 | | | | 14,314,138 | |
Series ZZ, 5.25%, 07/01/24 | | | 1,435 | | | | 1,379,394 | |
Series ZZ, 5.25%, 07/01/25 | | | 2,440 | | | | 2,345,450 | |
Puerto Rico Electric Power Authority, Refunding RB, BAB, Series YY, 6.13%, 07/01/40(d)(e) | | | 13,440 | | | | 12,587,407 | |
Puerto Rico Public Buildings Authority, RB,
Series R1, (GTD), 5.65%, 07/01/28 | | | 3,500 | | | | 3,206,875 | |
Puerto Rico Public Buildings Authority, Refunding RB | | | | | | | | |
Series F, (GTD), 5.25%, 07/01/24(d)(e) | | | 2,175 | | | | 2,168,884 | |
Series M-2, (GTD), 10.00%,
07/01/34(d)(e) | | | 3,325 | | | | 3,507,875 | |
Series N, (GTD), 5.00%, 07/01/37(d)(e) | | | 1,335 | | | | 1,331,246 | |
| | | | | | | | |
| Security | | Par (000) | | | Value | |
| | |
| Puerto Rico (continued) | | | | | | |
Puerto Rico Public Buildings Authority, Refunding RB (continued) | | | | | | | | |
Series U, (GTD), 5.25%, 07/01/42 | | $ | 3,120 | | | $ | 2,883,735 | |
Puerto Rico Sales Tax Financing Corp. Sales Tax Revenue, RB | | | | | | | | |
Series A-1, Restructured, 4.75%, 07/01/53 | | | 86,193 | | | | 96,624,077 | |
Series A-1, Restructured, 5.00%, 07/01/58 | | | 16,830 | | | | 19,146,313 | |
Series A-2, Restructured, 4.33%, 07/01/40 | | | 57,460 | | | | 63,737,504 | |
Series A-2, Restructured, 4.54%, 07/01/53 | | | 14,353 | | | | 15,887,623 | |
Series A-2, Restructured, 4.78%, 07/01/58 | | | 39,524 | | | | 44,408,376 | |
Puerto Rico Sales Tax Financing Corp. Sales Tax Revenue, RB, CAB(c) | | | | | | | | |
Series A-1, Restructured, 0.00%, 07/01/29 | | | 3,745 | | | | 3,198,942 | |
Series A-1, Restructured, 0.00%, 07/01/31 | | | 4,464 | | | | 3,527,319 | |
Series A-1, Restructured, 0.00%, 07/01/33 | | | 6,377 | | | | 4,673,958 | |
Series A-1, Restructured, 0.00%, 07/01/46 | | | 29,186 | | | | 9,465,604 | |
Series A-1, Restructured, 0.00%, 07/01/51 | | | 33,447 | | | | 7,852,352 | |
Series B-1, Restructured, 0.00%, 07/01/46 | | | 18,521 | | | | 6,011,917 | |
| | | | | | | | |
| | | | | | | 806,855,367 | |
| | |
| Rhode Island — 0.7% | | | | | | |
Rhode Island Housing and Mortgage Finance Corp., RB, S/F Housing 2.50%, 04/01/45. | | | 10,000 | | | | 10,140,000 | |
3.00%, 10/01/50 | | | 9,960 | | | | 10,811,580 | |
Series 71, (GNMA), 2.75%, 10/01/34 | | | 3,965 | | | | 4,194,098 | |
Rhode Island Housing and Mortgage Finance Corp., Refunding RB, S/F Housing, 3.00%, 04/01/49 | | | 7,800 | | | | 8,581,482 | |
State of Rhode Island, GO | | | | | | | | |
Series A, 5.00%, 05/01/29 | | | 4,685 | | | | 6,126,528 | |
Series A, 5.00%, 05/01/30 | | | 4,920 | | | | 6,566,576 | |
Series A, 5.00%, 05/01/32 | | | 7,280 | | | | 9,911,065 | |
Tobacco Settlement Financing Corp., Refunding RB, Series B, 4.50%, 06/01/45 | | | 5,000 | | | | 5,418,900 | |
| | | | | | | | |
| | | | | | | 61,750,229 | |
| | |
| South Carolina — 1.9% | | | | | | |
County of Dorchester South Carolina, SAB(a)
5.88%, 10/01/40. | | | 2,310 | | | | 2,566,733 | |
6.00%, 10/01/51 | | | 6,240 | | | | 6,866,683 | |
County of Richland South Carolina, Refunding GO | | | | | | | | |
Series A, (SAW), 5.00%, 03/01/27 | | | 12,995 | | | | 16,271,299 | |
Series A, (SAW), 5.00%, 03/01/28 | | | 13,365 | | | | 17,187,925 | |
Lexington County Health Services District, Inc., RB, 5.00%, 11/01/41 | | | 10,000 | | | | 11,863,400 | |
South Carolina Jobs-Economic Development Authority, Refunding RB | | | | | | | | |
Series A, 5.00%, 05/01/38 | | | 10,000 | | | | 12,091,900 | |
Series A, 5.00%, 05/01/43 | | | 5,000 | | | | 5,988,300 | |
South Carolina Public Service Authority, RB | | | | | | | | |
Series A, 5.00%, 12/01/49 | | | 10,000 | | | | 11,090,200 | |
Series E, 5.00%, 12/01/48 | | | 10,000 | | | | 11,017,100 | |
Series E, 5.50%, 12/01/53 | | | 5,000 | | | | 5,565,000 | |
Series F, (AGM-CR), 5.74%, 01/01/30 | | | 5,000 | | | | 6,149,800 | |
South Carolina Public Service Authority, RB, BAB, Series C, (AGM-CR), 6.45%, 01/01/50 | | | 10,950 | | | | 16,919,174 | |
South Carolina Public Service Authority, Refunding RB | | | | | | | | |
Series A, 5.00%, 12/01/50 | | | 5,000 | | | | 5,703,350 | |
Series B, 5.00%, 12/01/41 | | | 5,000 | | | | 5,961,600 | |
Series C, 5.00%, 12/01/46 | | | 10,000 | | | | 11,319,900 | |
Series E, (AGM-CR), 3.92%, 12/01/24 | | | 3,405 | | | | 3,788,778 | |
| | |
| 50 | | 2 0 2 1 BLACK ROCK ANNUAL REPORT TO SHAREHOLDERS |
| | |
Schedule of Investments (continued) May 31, 2021 | | BlackRock Strategic Municipal Opportunities Fund (Percentages shown are based on Net Assets) |
| | | | | | | | |
| Security | | Par (000) | | | Value | |
| | |
| South Carolina (continued) | | | | | | |
South Carolina State Housing Finance & Development Authority, RB, S/F Housing | | | | | | | | |
Series A, 1.75%, 01/01/26 | | $ | 1,215 | | | $ | 1,266,528 | |
Series A, 1.85%, 01/01/27 | | | 1,040 | | | | 1,089,015 | |
Series A, 1.88%, 07/01/27 | | | 1,000 | | | | 1,047,330 | |
Series A, 2.40%, 07/01/32 | | | 1,195 | | | | 1,268,469 | |
Series A, 2.80%, 07/01/34 | | | 1,675 | | | | 1,786,354 | |
Series A, 3.00%, 07/01/39 | | | 3,245 | | | | 3,452,680 | |
South Carolina State Housing Finance & Development Authority, Refunding RB, S/F Housing | | | | | | | | |
Series B, 2.25%, 07/01/30 | | | 965 | | | | 1,019,947 | |
Series B, 2.35%, 07/01/31 | | | 965 | | | | 1,024,676 | |
Series B, 2.45%, 07/01/32 | | | 965 | | | | 1,029,317 | |
| | | | | | | | |
| | | | | | | 163,335,458 | |
| | |
| South Dakota — 0.1% | | | | | | |
South Dakota Housing Development Authority, Refunding RB, S/F Housing, Series A, Class A, (FHLMC, FNMA, GNMA), 3.00%, 11/01/51 | | | 7,000 | | | | 7,660,170 | |
| | | | | | | | |
| | |
| Tennessee — 0.9% | | | | | | |
Knox County Health Educational & Housing Facility Board, Refunding RB
5.00%, 04/01/27. | | | 1,400 | | | | 1,714,958 | |
5.00%, 04/01/28 | | | 1,000 | | | | 1,223,220 | |
Metropolitan Nashville Airport Authority, ARB | | | | | | | | |
Series A, Subordinate, 5.00%, 07/01/32 | | | 1,000 | | | | 1,309,540 | |
Series A, Subordinate, 5.00%, 07/01/33 | | | 1,000 | | | | 1,306,020 | |
Series A, Subordinate, 5.00%, 07/01/35 | | | 1,000 | | | | 1,299,770 | |
Series A, Subordinate, 5.00%, 07/01/36 | | | 1,435 | | | | 1,861,468 | |
Series A, Subordinate, 5.00%, 07/01/38 | | | 2,160 | | | | 2,794,673 | |
Series A, Subordinate, 5.00%, 07/01/39 | | | 1,430 | | | | 1,848,690 | |
Series A, Subordinate, 5.00%, 07/01/44 | | | 10,000 | | | | 12,794,900 | |
Series A, Subordinate, 4.00%, 07/01/49 | | | 10,000 | | | | 11,703,600 | |
Series A, Subordinate, 5.00%, 07/01/49 | | | 10,000 | | | | 12,646,000 | |
Series A, Subordinate, 4.00%, 07/01/54 | | | 5,000 | | | | 5,827,350 | |
Series A, Subordinate, 5.00%, 07/01/54 | | | 5,000 | | | | 6,297,250 | |
Tennessee Housing Development Agency, RB, S/F Housing, Series 4B, 3.00%, 07/01/32 | | | 1,120 | | | | 1,210,014 | |
Tennessee Housing Development Agency, Refunding RB, S/F Housing 3.00%, 07/01/51 | | | 6,500 | | | | 7,132,190 | |
Series 2019-4, 2.65%, 07/01/34 | | | 2,360 | | | | 2,549,720 | |
Series 2019-4, 2.90%, 07/01/39 | | | 5,335 | | | | 5,822,192 | |
| | | | | | | | |
| | | | | | | 79,341,555 | |
| | |
| Texas — 5.8% | | | | | | |
Arlington Higher Education Finance Corp., RB
6.25%, 08/15/24(a) | | | 365 | | | | 367,723 | |
Series A, 7.13%, 03/01/44 | | | 1,250 | | | | 1,362,175 | |
Board of Regents of the University of Texas System, Refunding RB, Series B, 5.00%, 08/15/29 | | | 5,000 | | | | 6,601,400 | |
City of Austin Texas Airport System Revenue, Refunding RB, AMT, 5.00%, 11/15/25 | | | 5,000 | | | | 5,977,700 | |
City of Houston Texas Airport System Revenue, RB | | | | | | | | |
Series A, AMT, 6.50%, 07/15/30 | | | 1,000 | | | | 1,006,430 | |
Series B-1, AMT, 5.00%, 07/15/35 | | | 7,400 | | | | 8,180,182 | |
City of Houston Texas Airport System Revenue, Refunding RB | | | | | | | | |
Sub-Series D, 5.00%, 07/01/37 | | | 5,000 | | | | 6,226,750 | |
Sub-Series D, 5.00%, 07/01/38 | | | 5,000 | | | | 6,219,900 | |
| | | | | | | | |
| Security | | Par (000) | | | Value | |
| | |
| Texas (continued) | | | | | | |
City of Houston Texas Airport System Revenue, Refunding RB (continued) | | | | | | | | |
Series A, AMT, 6.63%, 07/15/38 | | $ | 3,000 | | | $ | 3,019,380 | |
City of Houston Texas Combined Utility System Revenue, Refunding RB(g) | | | | | | | | |
Series A, 4.00%, 11/15/46 | | | 6,930 | | | | 8,420,227 | |
Series A, 4.00%, 11/15/51 | | | 5,750 | | | | 6,943,930 | |
City of San Antonio Texas Electric & Gas Systems Revenue, Refunding RB | | | | | | | | |
Series A, Junior Lien, 5.00%, 02/01/46 | | | 7,200 | | | | 9,307,008 | |
Series A, Junior Lien, 5.00%, 02/01/49 | | | 10,000 | | | | 12,879,400 | |
County of Harris Texas, Refunding RB,
Series B, (AMBAC), 0.77%, 08/15/35(b) | | | 5,000 | | | | 4,939,580 | |
Dallas Independent School District, Refunding GO | | | | | | | | |
Series B, (PSF-GTD), 4.00%, 08/15/27 | | | 6,750 | | | | 7,875,765 | |
Series B, (PSF-GTD), 4.00%, 08/15/29 | | | 9,000 | | | | 10,684,530 | |
Leander Independent School District, GO, CAB, Series C, (PSF-GTD), 0.00%, 08/15/24(c)(i) | | | 95,000 | | | | 33,143,750 | |
Lower Colorado River Authority, Refunding RB
5.00%, 05/15/26 | | | 3,160 | | | | 3,823,252 | |
5.00%, 05/15/27 | | | 1,770 | | | | 2,199,455 | |
5.00%, 05/15/28 | | | 1,770 | | | | 2,250,413 | |
5.00%, 05/15/29 | | | 1,880 | | | | 2,437,044 | |
5.00%, 05/15/30 | | | 1,405 | | | | 1,852,774 | |
5.00%, 05/15/31 | | | 1,720 | | | | 2,264,242 | |
5.00%, 05/15/32 | | | 3,600 | | | | 4,704,984 | |
5.00%, 05/15/33 | | | 3,500 | | | | 4,561,655 | |
5.00%, 05/15/41 | | | 3,500 | | | | 4,458,545 | |
5.00%, 05/15/46 | | | 5,250 | | | | 6,601,507 | |
5.00%, 05/15/51 | | | 6,500 | | | | 8,146,450 | |
Matagorda County Navigation District No. 1, Refunding RB, 2.60%, 11/01/29 | | | 15,000 | | | | 16,080,750 | |
New Hope Cultural Education Facilities Finance Corp., RB(a) | | | | | | | | |
Series A, 5.00%, 08/15/39 | | | 1,210 | | | | 1,371,281 | |
Series A, 5.00%, 08/15/51 | | | 2,670 | | | | 2,948,641 | |
New Hope Cultural Education Facilities Finance Corp., Refunding RB(a) | | | | | | | | |
Series A, 5.00%, 08/15/36 | | | 4,055 | | | | 4,073,694 | |
Series A, 5.00%, 08/15/46 | | | 4,055 | | | | 4,069,639 | |
North Texas Tollway Authority, Refunding RB, CAB, Series D, (AGC), 0.00%, 01/01/28(c) | | | 10,000 | | | | 9,251,900 | |
Northwest Independent School District, Refunding GO, Series A, (PSF-GTD), 1.78%, 02/15/31 | | | 14,790 | | | | 14,753,617 | |
Port Beaumont Navigation District, Refunding RB, Series B, 6.00%,
01/01/25(a) | | | 6,415 | | | | 6,641,385 | |
Red River Health Facilities Development Corp., RB, 5.63%, 12/15/22(d)(e) | | | 2,570 | | | | 1,700,225 | |
San Antonio Water System, Refunding RB, Series A, 4.00%, 05/15/40 | | | 5,925 | | | | 7,151,653 | |
Tarrant County Cultural Education Facilities Finance Corp., RB, Series B, 5.00%, 07/01/43 | | | 6,000 | | | | 7,381,920 | |
Tarrant Regional Water District, RB | | | | | | | | |
Series A, 4.00%, 09/01/26 | | | 5,855 | | | | 6,903,279 | |
Series A, 4.00%, 09/01/27 | | | 5,830 | | | | 7,022,585 | |
Series A, 4.00%, 09/01/28 | | | 5,665 | | | | 6,948,802 | |
Series A, 4.00%, 09/01/29 | | | 5,730 | | | | 7,134,308 | |
Series A, 4.00%, 09/01/31 | | | 5,120 | | | | 6,372,762 | |
Texas Municipal Gas Acquisition & Supply Corp. III, Refunding RB
5.00%, 12/15/27 | | | 5,000 | | | | 6,228,700 | |
| | |
SCHEDULE OF INVESTMENTS | | 51 |
| | |
Schedule of Investments (continued) May 31, 2021 | | BlackRock Strategic Municipal Opportunities Fund (Percentages shown are based on Net Assets) |
| | | | | | | | |
| Security | | Par (000) | | | Value | |
| | |
| Texas (continued) | | | | | | |
Texas Municipal Gas Acquisition & Supply Corp. III, Refunding RB (continued) | | | | | | | | |
5.00%, 12/15/29. | | $ | 5,000 | | | $ | 6,450,050 | |
5.00%, 12/15/30. | | | 10,300 | | | | 13,470,031 | |
5.00%, 12/15/31 | | | 33,070 | | | | 43,824,364 | |
5.00%, 12/15/32 | | | 25,000 | | | | 33,632,000 | |
Texas Municipal Gas Acquisition and Supply Corp. I, RB | | | | | | | | |
Series B, Senior Lien, 0.82%,
12/15/26(b) | | | 18,440 | | | | 18,715,494 | |
Series D, Senior Lien, 6.25%, 12/15/26 | | | 20,430 | | | | 23,925,164 | |
Texas Private Activity Bond Surface Transportation Corp., RB, AMT, 5.00%, 06/30/58 | | | 10,000 | | | | 12,170,000 | |
Texas Private Activity Bond Surface Transportation Corp., Refunding RB | | | | | | | | |
Series A, 5.00%, 12/31/30 | | | 5,365 | | | | 6,888,982 | |
Series A, 5.00%, 12/31/31 | | | 10,000 | | | | 12,744,900 | |
Series A, 5.00%, 12/31/32 | | | 7,000 | | | | 8,891,050 | |
Series A, 5.00%, 12/31/34 | | | 8,000 | | | | 10,122,560 | |
Series A, 5.00%, 12/31/35 | | | 7,000 | | | | 8,850,240 | |
Series A, 5.00%, 12/31/36 | | | 8,000 | | | | 10,102,240 | |
| | | | | | | | |
| | | | | | | 502,278,367 | |
| | |
| Utah — 0.4% | | | | | | |
Salt Lake City Corp. Airport Revenue, ARB | | | | | | | | |
Series B, 5.00%, 07/01/47 | | | 5,000 | | | | 5,968,850 | |
Series A, AMT, 5.00%, 07/01/47 | | | 10,000 | | | | 11,701,800 | |
Utah Charter School Finance Authority, RB(a)
5.63%, 06/15/26 | | | 440 | | | | 439,226 | |
(UT), 5.00%, 07/15/34 | | | 530 | | | | 530,943 | |
(UT), 5.13%, 07/15/49 | | | 4,830 | | | | 4,836,810 | |
5.63%, 06/15/54 | | | 4,945 | | | | 5,022,686 | |
Utah State Board of Regents, RB 2.55%, 06/01/38 | | | 1,250 | | | | 1,309,950 | |
2.63%, 06/01/39 | | | 1,250 | | | | 1,314,038 | |
| | | | | | | | |
| | | | | | | 31,124,303 | |
| | |
| Vermont — 0.6% | | | | | | |
State of Vermont, GO | | | | | | | | |
Series A, 5.00%, 08/15/29 | | | 4,325 | | | | 5,735,858 | |
Series A, 5.00%, 08/15/30 | | | 4,325 | | | | 5,857,131 | |
Series A, 5.00%, 08/15/31 | | | 4,270 | | | | 5,914,035 | |
Series A, 4.00%, 08/15/32 | | | 4,325 | | | | 5,543,569 | |
Series A, 4.00%, 08/15/33 | | | 2,325 | | | | 2,958,098 | |
Series A, 4.00%, 08/15/34 | | | 4,325 | | | | 5,475,191 | |
Series A, 4.00%, 08/15/35 | | | 2,825 | | | | 3,569,359 | |
State of Vermont, Refunding GO | | | | | | | | |
Series B, 5.00%, 08/15/27 | | | 3,210 | | | | 4,063,090 | |
Series B, 5.00%, 08/15/29 | | | 3,315 | | | | 4,396,386 | |
Series B, 5.00%, 08/15/30 | | | 3,400 | | | | 4,604,450 | |
| | | | | | | | |
| | | | | | | 48,117,167 | |
| | |
| Virginia — 3.9% | | | | | | |
Ballston Quarter Community Development Authority, TA | | | | | | | | |
Series A, 5.38%, 03/01/36 | | | 1,050 | | | | 1,062,863 | |
Series A, 5.50%, 03/01/46 | | | 6,210 | | | | 6,211,615 | |
Cherry Hill Community Development Authority, SAB(a) | | | | | | | | |
5.15%, 03/01/35 | | | 1,000 | | | | 1,083,500 | |
5.40%, 03/01/45 | | | 1,995 | | | | 2,152,027 | |
Chesapeake Bay Bridge & Tunnel District, RB (AGM), 5.00%, 07/01/41 | | | 5,000 | | | | 5,947,050 | |
| | | | | | | | |
| Security | | Par (000) | | | Value | |
| | |
| Virginia (continued) | | | | | | |
Chesapeake Bay Bridge & Tunnel District, RB (continued) | | | | | | | | |
5.00%, 07/01/46. | | $ | 5,000 | | | $ | 5,803,450 | |
5.00%, 07/01/51. | | | 10,000 | | | | 11,561,100 | |
County of Fairfax Virginia, GO | | | | | | | | |
Series A, (SAW), 4.00%, 10/01/27 | | | 12,770 | | | | 15,403,174 | |
Series A, (SAW), 4.00%, 10/01/31 | | | 12,660 | | | | 16,154,287 | |
Series A, (SAW), 4.00%, 10/01/32 | | | 2,000 | | | | 2,536,580 | |
County of Fairfax Virginia, Refunding GO,
Series A, (SAW), 5.00%, 10/01/28 | | | 5,000 | | | | 6,494,350 | |
Dulles Town Center Community Development Authority, Refunding SAB, 4.00%, 03/01/23 | | | 1,000 | | | | 1,012,330 | |
FHLMC Multifamily VRD Certificates, Series M053, Class A, 2.55%, 06/15/35 | | | 19,845 | | | | 22,041,048 | |
Glendale Community College District, GO, Series B, 4.00%, 08/01/50 | | | 34,950 | | | | 40,906,878 | |
Hanover County Economic Development Authority, Refunding RB
5.00%, 07/01/38 | | | 125 | | | | 137,016 | |
5.00%, 07/01/48 | | | 365 | | | | 397,240 | |
Series A, 4.00%, 07/01/22 | | | 420 | | | | 425,162 | |
Series A, 5.00%, 07/01/47 | | | 1,985 | | | | 2,029,325 | |
Henrico County Economic Development Authority, Refunding RB 5.00%, 06/01/22 | | | 625 | | | | 648,806 | |
5.00%, 06/01/23 | | | 420 | | | | 435,968 | |
Loudoun County Economic Development Authority, RB, CAB, 0.00%, 07/01/49(c) | | | 25,115 | | | | 10,768,559 | |
Lower Magnolia Green Community Development Authority, SAB(a)
5.00%, 03/01/35 | | | 2,875 | | | | 3,099,825 | |
5.00%, 03/01/45 | | | 2,955 | | | | 3,146,129 | |
Norfolk Airport Authority, ARB, 5.00%, 07/01/43 | | | 2,700 | | | | 3,372,786 | |
Tobacco Settlement Financing Corp., Refunding RB, Series A-1, 6.71%, 06/01/46 | | | 15,760 | | | | 16,417,507 | |
University of Nebraska Facilities Corp.,
RB(g) | | | | | | | | |
5.00%, 07/15/51 | | | 10,000 | | | | 13,074,100 | |
4.00%, 07/15/59 | | | 34,970 | | | | 41,169,132 | |
Series A, 4.00%, 07/15/62 | | | 40,000 | | | | 46,891,200 | |
Virginia Housing Development Authority, RB, M/F Housing | | | | | | | | |
Series A, 3.65%, 03/01/43 | | | 5,000 | | | | 5,400,700 | |
Series A, 3.75%, 03/01/48 | | | 5,000 | | | | 5,388,000 | |
Series B, 3.50%, 06/01/33 | | | 1,335 | | | | 1,462,653 | |
Series B, 3.63%, 06/01/38 | | | 3,730 | | | | 4,067,490 | |
Series B, 3.10%, 05/01/41 | | | 1,040 | | | | 1,101,568 | |
Virginia Small Business Financing Authority, RB | | | | | | | | |
AMT, 5.00%, 12/31/49 | | | 5,000 | | | | 5,866,300 | |
AMT, 5.00%, 12/31/52 | | | 15,000 | | | | 17,516,700 | |
AMT, 5.00%, 12/31/56 | | | 10,000 | | | | 11,663,100 | |
| | | | | | | | |
| | | | | | | 332,849,518 | |
| | |
| Washington — 3.5% | | | | | | |
Clark County School District No. 114 Evergreen, GO, (GTD), 5.00%, 12/01/31 | | | 6,200 | | | | 8,279,542 | |
Greater Wenatchee Regional Events Center Public Facilities District, Refunding RB, Series A, 5.25%, 09/01/32 | | | 800 | | | | 817,560 | |
King County Housing Authority, Refunding RB, (HUD SECT 8), 2.75%, 01/01/40 | | | 1,900 | | | | 2,001,023 | |
| | |
| 52 | | 2 0 2 1 BLACK ROCK ANNUAL REPORT TO SHAREHOLDERS |
| | |
Schedule of Investments (continued) May 31, 2021 | | BlackRock Strategic Municipal Opportunities Fund (Percentages shown are based on Net Assets) |
| | | | | | | | |
| Security | | Par (000) | | | Value | |
| | |
| Washington (continued) | | | | | | |
Mason County Public Hospital District No. 1, RB, 5.00%, 12/01/48. | | $ | 5,000 | | | $ | 6,008,300 | |
Pierce County School District No. 10 Tacoma, Refunding GO, (GTD), 1.73%, 12/01/31 | | | 4,525 | | | | 4,445,360 | |
Seattle Housing Authority, Refunding RB, M/F Housing, (HUD SECT 8), 3.50%, 12/01/35 | | | 1,500 | | | | 1,641,375 | |
State of Washington, GO | | | | | | | | |
Series C, 5.00%, 02/01/43 | | | 29,830 | | | | 39,191,251 | |
Series C, 5.00%, 02/01/44 | | | 31,320 | | | | 41,023,876 | |
Series C, 5.00%, 02/01/46 | | | 20,000 | | | | 26,088,400 | |
Series E, 5.00%, 06/01/42 | | | 9,905 | | | | 13,134,723 | |
Series E, 5.00%, 06/01/46 | | | 10,000 | | | | 13,137,800 | |
Series F, 5.00%, 06/01/29 | | | 7,115 | | | | 9,365,119 | |
Series F, 5.00%, 06/01/30 | | | 6,470 | | | | 8,682,869 | |
State of Washington, Refunding GO | | | | | | | | |
Series D, 5.00%, 07/01/26 | | | 6,125 | | | | 7,495,101 | |
Series D, 5.00%, 07/01/27 | | | 6,435 | | | | 8,086,543 | |
Series D, 5.00%, 07/01/28 | | | 6,775 | | | | 8,738,327 | |
Series D, 5.00%, 07/01/29 | | | 6,835 | | | | 9,006,206 | |
Series D, 5.00%, 07/01/30 | | | 7,480 | | | | 10,057,608 | |
Series D, 5.00%, 07/01/31 | | | 7,325 | | | | 10,071,069 | |
Washington Health Care Facilities Authority, Refunding RB, Series A, 5.00%, 08/01/37 | | | 5,000 | | | | 6,381,300 | |
Washington Metropolitan Area Transit Authority, RB(g)
5.00%, 07/15/41 | | | 5,970 | | | | 7,922,668 | |
4.00%, 07/15/43 | | | 10,000 | | | | 12,186,900 | |
4.00%, 07/15/46 | | | 10,000 | | | | 12,038,100 | |
5.00%, 07/15/46 | | | 5,000 | | | | 6,568,500 | |
Washington State Convention Center Public Facilities District, RB
4.00%, 07/01/31 | | | 11,045 | | | | 12,747,034 | |
4.00%, 07/01/58 | | | 6,070 | | | | 6,657,394 | |
Washington State Housing Finance Commission, RB, M/F Housing, 3.50%, 12/20/35 | | | 10,000 | | | | 11,629,591 | |
| | | | | | | | |
| | | | | | | 303,403,539 | |
| | |
| West Virginia — 0.3% | | | | | | |
Tobacco Settlement Finance Authority, Refunding RB, Series A, Class 1, 4.31%, 06/01/49 | | | 10,000 | | | | 10,165,600 | |
West Virginia Hospital Finance Authority, Refunding RB
5.00%, 09/01/31 | | | 2,775 | | | | 3,545,340 | |
5.00%, 09/01/38 | | | 4,550 | | | | 5,698,101 | |
5.00%, 09/01/39 | | | 1,970 | | | | 2,459,939 | |
West Virginia Housing Development Fund, RB, S/F Housing, Series B, 3.95%, 11/01/34 | | | 4,910 | | | | 5,132,718 | |
West Virginia Housing Development Fund, | | | | | | | | |
Refunding RB, Series A, AMT, 3.70%, 11/01/29 | | | 1,280 | | | | 1,365,696 | |
| | | | | | | | |
| | | | | | | 28,367,394 | |
| | |
| Wisconsin — 1.7% | | | | | | |
Public Finance Authority, RB(a) | | | | | | | | |
6.00%, 06/15/24 | | | 385 | | | | 386,698 | |
6.75%, 11/01/24 | | | 21,420 | | | | 21,705,100 | |
5.00%, 04/01/40 | | | 1,175 | | | | 1,418,848 | |
7.00%, 11/01/46 | | | 5,085 | | | | 5,401,745 | |
5.00%, 04/01/50 | | | 1,470 | | | | 1,729,337 | |
Series A, 6.25%, 10/01/31 | | | 1,285 | | | | 1,375,053 | |
Series A, 7.00%, 10/01/47 | | | 1,285 | | | | 1,352,527 | |
Series A-2, 5.00%, 01/01/24 | | | 2,135 | | | | 2,144,650 | |
| | | | | | | | |
| Security | | Par (000) | | | Value | |
| | |
| Wisconsin (continued) | | | | | | |
Public Finance Authority, RB(a) (continued) | | | | | | | | |
Series B, 5.50%, 06/15/25 | | $ | 555 | | | $ | 558,968 | |
Series B, 5.62%, 06/01/29 | | | 965 | | | | 975,538 | |
Public Finance Authority, Refunding RB | | | | | | | | |
Series A, 5.00%, 10/01/34(a) | | | 2,620 | | | | 3,186,182 | |
Series A, 5.00%, 10/01/39(a) | | | 6,155 | | | | 7,408,343 | |
Series A, 5.00%, 10/01/44 | | | 10,000 | | | | 12,386,800 | |
Series B, 6.13%, 10/01/49(a) | | | 8,530 | | | | 9,176,574 | |
AMT, 4.00%, 08/01/35 | | | 4,840 | | | | 4,883,269 | |
State of Wisconsin, Refunding GO, Series 3, 0.80%, 05/01/26 | | | 11,250 | | | | 11,178,562 | |
Wisconsin Health & Educational Facilities Authority, RB | | | | | | | | |
Series B, 5.00%, 02/15/40 | | | 10,000 | | | | 10,297,700 | |
Series B, 5.00%, 02/15/42 | | | 10,000 | | | | 11,582,200 | |
Wisconsin Health & Educational Facilities Authority, Refunding RB | | | | | | | | |
5.00%, 12/15/44 | | | 10,000 | | | | 11,295,500 | |
Series A, 5.00%, 11/15/35 | | | 10,000 | | | | 12,127,600 | |
Series A, 5.00%, 04/01/42 | | | 10,000 | | | | 10,553,500 | |
Wisconsin Housing & Economic Development Authority, RB, S/F Housing, Series A, 3.00%, 03/01/52(g) | | | 4,200 | | | | 4,616,556 | |
| | | | | | | | |
| | | | | | | 145,741,250 | |
| | | | | | | | |
Total Municipal Bonds — 88.6%
(Cost: $7,226,195,478) | | | | 7,629,603,351 | |
| | | | | | | | |
|
Municipal Bonds Transferred to Tender Option Bond Trusts(j) | |
| | |
| Alaska — 0.0% | | | | | | |
Alaska Housing Finance Corp., RB, S/F Housing, Series A, 3.70%, 12/01/38 | | | 2,090 | | | | 2,419,921 | |
| | | | | | | | |
| | |
| Arizona — 0.3% | | | | | | |
City of Phoenix Civic Improvement Corp., ARB, | | | | | | | | |
Series A, AMT, 5.00%, 07/01/47 | | | 10,000 | | | | 11,884,700 | |
Salt River Project Agricultural Improvement & Power District, Refunding RB, Series A, 5.00%, 12/01/45. | | | 10,000 | | | | 11,560,100 | |
| | | | | | | | |
| | | | | | | 23,444,800 | |
| | |
| California — 2.3% | | | | | | |
California Educational Facilities Authority, Refunding RB | | | | | | | | |
5.00%, 09/01/45. | | | 10,490 | | | | 12,289,766 | |
5.00%, 10/01/46 | | | 10,000 | | | | 11,802,999 | |
California Health Facilities Financing Authority, RB | | | | | | | | |
Series A, 5.00%, 08/15/23(i) | | | 10,000 | | | | 11,064,500 | |
Series A, 5.00%, 08/15/43 | | | 10,000 | | | | 11,353,897 | |
California Infrastructure & Economic Development Bank, RB | | | | | | | | |
5.00%, 05/15/47 | | | 10,000 | | | | 12,374,600 | |
5.00%, 05/15/52 | | | 10,000 | | | | 12,359,200 | |
California Public Finance Authority, Refunding RB, | | | | | | | | |
Series A, 5.00%, 08/01/47 | | | 10,000 | | | | 12,172,100 | |
Chaffey Joint Union High School District, GO, Series C, 5.25%, 08/01/47 | | | 10,000 | | | | 12,262,700 | |
Chino Valley Unified School District, GO, Series A, 5.25%, 08/01/47 | | | 10,000 | | | | 12,399,300 | |
City of Los Angeles Department of Airports, ARB Series A, AMT, 5.00%, 05/15/45 | | | 10,000 | | | | 11,545,797 | |
| | |
SCHEDULE OF INVESTMENTS | | 53 |
| | |
Schedule of Investments (continued) May 31, 2021 | | BlackRock Strategic Municipal Opportunities Fund (Percentages shown are based on Net Assets) |
| | | | | | | | |
| Security | | Par
(000) | | | Value | |
| | |
| California (continued) | | | | | | |
City of Los Angeles Department of Airports, ARB (continued) | | | | | | | | |
Series A, AMT, 5.25%, 05/15/48 | | $ | 10,000 | | | $ | 12,289,500 | |
City of San Francisco California Public Utilities Commission Water Revenue, RB, 5.00%, 05/01/22(i) | | | 10,000 | | | | 10,445,200 | |
East Bay Municipal Utility District Water System Revenue, RB, Series A, 5.00%, 06/01/42 | | | 10,000 | | | | 12,328,100 | |
Fresno Unified School District, GO, 5.00%, 08/01/24(i) | | | 10,000 | | | | 11,499,100 | |
Manteca Unified School District, GO, Series A, 5.00%, 08/01/40 | | | 10,000 | | | | 11,770,501 | |
Port of Los Angeles, Refunding ARB, Series A, AMT, 5.00%, 08/01/44. | | | 10,000 | | | | 11,257,400 | |
San Marcos Unified School District, GO, Series C, 5.00%, 02/15/24(i) | | | 10,000 | | | | 11,276,399 | |
| | | | | | | | |
| | | | | | | 200,491,059 | |
| | |
| Connecticut — 0.3% | | | | | | |
Connecticut Housing Finance Authority, RB, S/F Housing, Series A, 3.85%, 05/15/45(k) | | | 10,000 | | | | 10,489,600 | |
Connecticut State Health & Educational Facilities Authority, Refunding RB, 5.00%, 12/01/45 | | | 10,000 | | | | 11,913,600 | |
| | | | | | | | |
| | | | | | | 22,403,200 | |
| | |
| District of Columbia — 0.4% | | | | | | |
District of Columbia Water & Sewer Authority, RB | | | | | | | | |
Series A, 5.00%, 10/01/52 | | | 10,000 | | | | 12,093,800 | |
Series A, Sub-Lien, 5.00%, 10/01/23(i) | | | 10,000 | | | | 11,117,000 | |
Metropolitan Washington Airports Authority Aviation Revenue, Refunding ARB, AMT, 5.00%, 10/01/42 . | | | 10,000 | | | | 12,359,100 | |
| | | | | | | | |
| | | | | | | 35,569,900 | |
| | |
| Florida — 0.6% | | | | | | |
East Central Regional Wastewater Treatment Facilities Operation Board, Refunding RB, 5.00%, 10/01/44 | | | 10,000 | | | | 12,264,100 | |
Florida Housing Finance Corp., RB, S/F Housing | | | | | | | | |
Series 1, (FHLMC, FNMA, GNMA), 3.70%, 07/01/38 | | | 5,520 | | | | 5,983,525 | |
Series 1, (FHLMC, FNMA, GNMA), 3.80%, 07/01/43 | | | 5,517 | | | | 6,011,405 | |
Greater Orlando Aviation Authority, ARB, Series A, AMT, 5.00%, 10/01/46 | | | 10,000 | | | | 11,763,900 | |
Tampa Bay Water, RB, 5.00%, 10/01/38 | | | 10,000 | | | | 11,031,600 | |
| | | | | | | | |
| | | | | | | 47,054,530 | |
| | |
| Georgia — 1.1% | | | | | | |
City of Atlanta Georgia Water & Wastewater Revenue, Refunding RB, 5.00%, 11/01/40 | | | 20,000 | | | | 23,307,002 | |
Clarke County Hospital Authority, Refunding RB, Series A, 5.00%, 07/01/46(k) | | | 10,000 | | | | 11,832,500 | |
Development Authority of Cobb County, RB, Series A, 5.00%, 06/01/49(k) | | | 10,000 | | | | 12,035,100 | |
Gainesville & Hall County Hospital Authority, Refunding RB, Series A, (GTD), 5.50%, 08/15/54 | | | 10,000 | | | | 11,571,800 | |
Georgia Housing & Finance Authority, RB, S/F Housing | | | | | | | | |
Series B, 3.55%, 12/01/42 | | | 10,000 | | | | 10,699,196 | |
Series B1, 3.65%, 06/01/44(k) | | | 9,740 | | | | 10,164,871 | |
Georgia Housing & Finance Authority, Refunding RB, S/F Housing, Series A-1, 3.80%, 12/01/40(k) | | | 10,000 | | | | 10,605,100 | |
| | | | | | | | |
| | | | | | | 90,215,569 | |
| | | | | | | | |
| Security | | Par
(000) | | | Value | |
| | |
| Illinois — 0.1% | | | | | | |
Illinois State Toll Highway Authority, RB, Series B, 5.00%, 01/01/36. | | $ | 10,000 | | | $ | 11,879,700 | |
| | | | | | | | |
| | |
| Indiana — 0.1% | | | | | | |
Indiana Finance Authority, Refunding RB, 5.00%, 11/01/41 | | | 10,000 | | | | 11,722,400 | |
| | | | | | | | |
| | |
| Iowa — 0.2% | | | | | | |
Iowa Finance Authority, Refunding RB, 5.00%, 08/01/42 | | | 10,000 | | | | 12,327,400 | |
| | | | | | | | |
| | |
| Maine — 0.1% | | | | | | |
Maine State Housing Authority, RB, S/F Housing, Series B, 3.75%, 11/15/38 | | | 10,000 | | | | 11,137,900 | |
| | | | | | | | |
| | |
| Maryland — 0.4% | | | | | | |
City of Baltimore Maryland, RB, Series A, 5.00%, 01/01/24(i) | | | 10,000 | | | | 11,217,296 | |
County of Montgomery Maryland, RB, Series 2016, 5.00%, 12/01/45 | | | 10,000 | | | | 11,824,800 | |
Maryland Stadium Authority, RB, 5.00%, 05/01/47 | | | 10,000 | | | | 12,387,730 | |
| | | | | | | | |
| | | | | | | 35,429,826 | |
| | |
| Massachusetts — 0.4% | | | | | | |
Commonwealth of Massachusetts, GO, Series A, 5.00%, 03/01/46. | | | 10,000 | | | | 11,179,800 | |
Massachusetts Development Finance Agency, RB, Series M-4, 5.00%, 07/01/23(i) | | | 10,000 | | | | 10,998,800 | |
Massachusetts Housing Finance Agency, RB, M/F Housing, Series C-1, 3.30%, 12/01/59(k) | | | 10,015 | | | | 10,571,516 | |
| | | | | | | | |
| | | | | | | 32,750,116 | |
| | |
| Michigan — 0.5% | | | | | | |
Michigan Finance Authority, Refunding RB, Series 2016, 5.00%, 12/01/45 | | | 10,000 | | | | 11,808,205 | |
Michigan State Housing Development Authority, RB, M/F Housing | | | | | | | | |
Series A, 3.80%, 10/01/38 | | | 10,000 | | | | 11,215,200 | |
Series A, 4.15%, 10/01/53(k) | | | 20,000 | | | | 22,081,000 | |
| | | | | | | | |
| | | | | | | 45,104,405 | |
| | |
| Minnesota — 0.1% | | | | | | |
Western Minnesota Municipal Power Agency, RB, Series A, 5.00%, 01/01/24(i) | | | 10,000 | | | | 11,217,499 | |
| | | | | | | | |
| | |
| Missouri — 0.4% | | | | | | |
Health & Educational Facilities Authority of the State of Missouri, RB, 5.00%, 01/01/44 | | | 10,000 | | | | 11,081,500 | |
Metropolitan St Louis Sewer District, Refunding RB | | | | | | | | |
Series A, 5.00%, 05/01/47 | | | 10,000 | | | | 12,111,500 | |
Series B, 5.00%, 05/01/45 | | | 10,000 | | | | 11,678,700 | |
| | | | | | | | |
| | | | | | | 34,871,700 | |
| | |
| New York — 2.0% | | | | | | |
City of New York Water & Sewer System, RB, Series CC, 5.00%, 06/15/47. | | | 10,000 | | | | 10,926,235 | |
Metropolitan Transportation Authority, RB, Series A, 5.00%, 11/15/42 | | | 10,000 | | | | 12,128,900 | |
Metropolitan Transportation Authority, Refunding RB, Sub-Series B-1, 5.00%, 11/15/46 | | | 10,000 | | | | 12,010,000 | |
New York City Housing Development Corp., RB, M/F Housing | | | | | | | | |
Series A-1, 3.95%, 11/15/44(k) | | | 10,000 | | | | 10,552,400 | |
Series C-1A, 4.00%, 11/01/53 | | | 10,000 | | | | 10,609,300 | |
Series C-1-A, 4.13%, 05/01/58(k) | | | 10,000 | | | | 10,744,800 | |
Series G-1, 3.90%, 05/01/45(k) | | | 10,000 | | | | 10,383,000 | |
| | |
| 54 | | 2 0 2 1 BLACK ROCK ANNUAL REPORT TO SHAREHOLDERS |
| | |
Schedule of Investments (continued) May 31, 2021 | | BlackRock Strategic Municipal Opportunities Fund (Percentages shown are based on Net Assets) |
| | | | | | | | |
| Security | | Par
(000) | | | Value | |
| | |
| New York (continued) | | | | | | |
New York City Housing Development Corp., RB, M/F Housing (continued) | | | | | | | | |
Series J, 3.35%, 11/01/65 | | $ | 10,000 | | | $ | 10,395,600 | |
New York City Water & Sewer System, RB, Series DD, 5.00%, 06/15/47. | | | 20,000 | | | | 24,231,400 | |
New York State Dormitory Authority, RB Series A, 5.00%, 03/15/39 | | | 10,000 | | | | 11,219,897 | |
Series A, 5.00%, 03/15/45 | | | 10,000 | | | | 12,392,300 | |
New York State Dormitory Authority, Refunding RB,
Series E, 5.00%, 02/15/39 | | | 10,000 | | | | 11,550,163 | |
Port Authority of New York & New Jersey, Refunding ARB,
Series 194th, 5.00%, 10/15/41 | | | 10,000 | | | | 11,788,500 | |
Utility Debt Securitization Authority, Refunding RB, | | | | | | | | |
Restructured, 5.00%, 12/15/37 | | | 10,000 | | | | 11,959,600 | |
| | | | | | | | |
| | | | | | | 170,892,095 | |
North Carolina — 0.6% | | | | | | | | |
City of Charlotte North Carolina Airport Special Facilities Revenue, ARB | | | | | | | | |
Series A, 5.00%, 07/01/42 | | | 10,000 | | | | 12,192,900 | |
Series A, 5.00%, 07/01/47 | | | 10,000 | | | | 12,344,400 | |
North Carolina Capital Facilities Finance Agency, Refunding RB, Series B, 5.00%, 10/01/25(i) | | | 10,000 | | | | 11,971,400 | |
North Carolina Housing Finance Agency, RB, S/F Housing | | | | | | | | |
Series 39-B, (FHLMC, FNMA, GNMA), 3.85%, 07/01/38 | | | 8,320 | | | | 9,330,622 | |
Series 39-B, (FHLMC, FNMA, GNMA), 4.00%, 01/01/48 | | | 8,260 | | | | 9,133,410 | |
| | | | | | | | |
| | | | | | | 54,972,732 | |
Ohio — 0.2% | | | | | | | | |
University of Cincinnati, Refunding RB, Series A, 5.00%, 06/01/44 | | | 10,000 | | | | 12,593,100 | |
| | | | | | | | |
Oklahoma — 0.1% | | | | | | | | |
Oklahoma Turnpike Authority, RB, Sereis C, 5.00%, 01/01/47 | | | 10,000 | | | | 12,051,700 | |
| | | | | | | | |
Oregon — 0.3% | | | | | | | | |
Oregon State Facilities Authority, Refunding RB, Series A, 5.00%, 07/01/47 | | | 10,000 | | | | 12,158,500 | |
University of Oregon, RB, Series A, 5.00%, 04/01/48. | | | 10,000 | | | | 12,280,000 | |
| | | | | | | | |
| | | | | | | 24,438,500 | |
Pennsylvania — 0.9% | | | | | | | | |
General Authority of Southcentral Pennsylvania, Refunding RB, Series A, 5.00%, 06/01/24(i) | | | 10,000 | | | | 11,406,499 | |
Lancaster County Hospital Authority, Refunding RB, 5.00%, 08/15/46 | | | 10,000 | | | | 11,896,200 | |
Pennsylvania Housing Finance Agency, RB, S/F Housing | | | | | | | | |
Series 125B, 3.65%, 10/01/42(k) | | | 20,000 | | | | 21,554,600 | |
Series 127B, 3.55%, 10/01/33 | | | 10,000 | | | | 10,894,500 | |
Philadelphia Authority for Industrial Development, RB, Series A, 5.00%, 07/01/42 | | | 20,000 | | | | 22,606,000 | |
| | | | | | | | |
| | | | | | | 78,357,799 | |
| | | | | | | | |
| Security | | Par
(000) | | | Value | |
| | |
| Tennessee — 0.5% | | | | | | |
Rutherford County Health & Educational Facilities Board, RB,
Series C, 5.00%, 11/15/21(i) | | $ | 10,000 | | | $ | 10,220,600 | |
Tennessee Housing Development Agency, RB, S/F Housing | | | | | | | | |
Series 3, 3.85%, 07/01/43 | | | 8,840 | | | | 9,587,239 | |
Series 3, 3.95%, 01/01/49 | | | 8,800 | | | | 9,641,049 | |
Tennessee Housing Development Agency, Refunding RB, S/F Housing, 3.85%, 07/01/42 | | | 9,120 | | | | 10,030,142 | |
| | | | | | | | |
| | | | | | | 39,479,030 | |
Texas — 0.8% | | | | | | | | |
Alamo Regional Mobility Authority, RB, Senior Lien, 5.00%, 06/15/46. | | | 10,000 | | | | 11,635,400 | |
City of San Antonio Texas Electric & Gas Systems Revenue, RB, Junior Lien, 5.00%, 02/01/23(i) | | | 10,000 | | | | 10,791,200 | |
County of Harris Texas, Refunding RB, Series A, Senior Lien, 5.00%, 08/15/47 | | | 10,000 | | | | 11,957,800 | |
Midlothian Independent School District, GO, (PSF-GTD), 5.00%, 02/15/47 | | | 10,000 | | | | 12,043,900 | |
Tarrant Regional Water District Water Supply System Revenue, RB, 5.00%, 03/01/22(i) | | | 10,000 | | | | 10,361,500 | |
Texas Water Development Board, RB,
Series A, 5.00%, 10/15/47 | | | 10,000 | | | | 12,302,300 | |
| | | | | | | | |
| | | | | | | 69,092,100 | |
Utah — 0.1% | | | | | | | | |
Utah Transit Authority, Refunding RB,
Series A, 5.00%, 06/15/25(i) | | | 10,000 | | | | 11,837,201 | |
| | | | | | | | |
Virginia — 0.8% | | | | | | | | |
City of Norfolk Virginia Water Revenue, Refunding RB, 5.00%, 11/01/42. | | | 10,000 | | | | 12,385,700 | |
Fairfax County Industrial Development Authority, RB, Series A, 5.00%, 05/15/44 | | | 10,000 | | | | 11,234,900 | |
Fairfax County Water Authority, Refunding RB, 5.00%, 04/01/46 | | | 10,000 | | | | 12,158,400 | |
University of Virginia, Refunding RB,
Series A-2, 5.00%, 04/01/45 | | | 10,000 | | | | 11,509,000 | |
Virginia Housing Development Authority, RB, M/F Housing | | | | | | | | |
Series D, 3.90%, 10/01/48 | | | 10,000 | | | | 10,934,900 | |
Series D, 4.00%, 10/01/53 | | | 10,000 | | | | 10,936,200 | |
| | | | | | | | |
| | | | | | | 69,159,100 | |
Washington — 1.0% | | | | | | | | |
Central Puget Sound Regional Transit Authority, RB, Series S-1, 5.00%, 11/01/46 | | | 10,000 | | | | 15,295,700 | |
King County Housing Authority, Refunding RB, (GTD), 3.50%, 05/01/38 | | | 10,000 | | | | 11,160,699 | |
Port of Seattle Washington, GO, 5.00%, 01/01/42 | | | 10,000 | | | | 12,060,100 | |
State of Washington, GO | | | | | | | | |
Series A, 5.00%, 08/01/38 | | | 10,000 | | | | 10,974,498 | |
Series B, 5.00%, 02/01/33 | | | 10,000 | | | | 11,623,500 | |
Washington Health Care Facilities Authority, Refunding RB, Series D, 5.00%, 10/01/38 | | | 10,000 | | | | 11,398,697 | |
Washington State Convention Center Public | | | | | | | | |
Facilities District, RB, 5.00%, 07/01/58 | | | 10,000 | | | | 12,044,500 | |
| | | | | | | | |
| | | | | | | 84,557,694 | |
| | |
SCHEDULE OF INVESTMENTS | | 55 |
| | |
Schedule of Investments (continued) May 31, 2021 | | BlackRock Strategic Municipal Opportunities Fund (Percentages shown are based on Net Assets) |
| | | | | | | | |
| Security | | Par (000) | | | Value | |
| | |
| Wisconsin — 0.1% | | | | | | |
Wisconsin Health & Educational Facilities Authority, RB, Series D, 5.00%, 11/15/21(i) | | $ | 10,000 | | | $ | 10,217,000 | |
| | | | | | | | |
Total Municipal Bonds Transferred to Tender Option Bond Trusts — 14.7%
(Cost: $1,163,220,579) | | | | 1,265,687,976 | |
| | | | | | | | |
Total Long-Term Investments — 105.1%
(Cost: $8,545,101,857) | | | | 9,047,917,928 | |
| | | | | | | | |
| | | | | | | | |
| | | Shares | | | | |
| | |
| Short-Term Securities | | | | | | |
| | |
Money Market Funds — 4.9% | | | | | | | | |
BlackRock Liquidity Funds, MuniCash, Institutional Class, 0.01%(l)(m) | | | 424,870,855 | | | | 424,955,829 | |
| | | | | | | | |
| | |
Total Short-Term Securities — 4.9%
(Cost: $424,943,377) | | | | | | | 424,955,829 | |
| | | | | | | | |
Total Investments — 110.0%
(Cost: $8,970,045,234) | | | | | | | 9,472,873,757 | |
Liabilities in Excess of Other Assets — (1.1)% | | | | (97,960,455 | ) |
Liability for TOB Trust Certificates, Including Interest Expense and Fees Payable — (8.9)% | | | | (764,909,392 | ) |
| | | | | | | | |
| | |
Net Assets — 100.0% | | | | | | $ | 8,610,003,910 | |
| | | | | | | | |
| (a) | Security exempt from registration pursuant to Rule 144A under the Securities Act of 1933, as amended. These securities may be resold in transactions exempt from registration to qualified institutional investors. |
| (b) | Variable rate security. Interest rate resets periodically. The rate shown is the effective interest rate as of period end. Security description also includes the reference rate and spread if published and available. |
| (d) | Issuer filed for bankruptcy and/or is in default. |
| (e) | Non-income producing security. |
| (f) | Payment-in-kind security which may pay interest/dividends in additional par/shares and/or in cash. Rates shown are the current rate and possible payment rates. |
| (g) | When-issued security. |
| (h) | Step coupon security. Coupon rate will either increase (step-up bond) or decrease (step-down bond) at regular intervals until maturity. Interest rate shown reflects the rate currently in effect. |
| (i) | U.S. Government securities held in escrow, are used to pay interest on this security as well as to retire the bond in full at the date indicated, typically at a premium to par. |
| (j) | Represent bonds transferred to a TOB Trust in exchange of cash and residual certificates received by the Fund. These bonds serve as collateral in a secured borrowing. See Note 4 of the Notes to Financial Statements for details. |
| (k) | All or a portion of the security is subject to a recourse agreement. The aggregate maximum potential amount the Fund could ultimately be required to pay under the agreements, which expire between May 1, 2022 to November 1, 2048, is $83,760,775. See Note 4 of the Notes to Financial Statements for details. |
| (l) | Affiliate of the Fund. |
| (m) | Annualized 7-day yield as of period end. |
For Fund compliance purposes, the Fund’s sector classifications refer to one or more of the sector sub-classifications used by one or more widely recognized market indexes or rating group indexes, and/or as defined by the investment adviser. These definitions may not apply for purposes of this report, which may combine such sector sub-classifications for reporting ease.
Affiliates
Investments in issuers considered to be affiliate(s) of the Fund during the year ended May 31, 2021 for purposes of Section 2(a)(3) of the Investment Company Act of 1940, as amended, were as follows:
| | | | | | | | | | | | | | | | | | | | | | | | | | | | | | | | | | |
| Affiliated Issuer | | Value at
05/31/20 | |
| Purchases
at Cost |
| |
| Proceeds
from Sales |
| |
| Net
Realized
Gain (Loss) |
| |
| Change in
Unrealized
Appreciation
(Depreciation) |
| |
| Value at
05/31/21 |
| |
| Shares
Held at
05/31/21 |
| | | Income | | |
| Capital Gain
Distributions
from
Underlying
Funds |
|
BlackRock Liquidity Funds, MuniCash, Institutional Class | | $ 368,379,391 | | $ | 56,593,408 | (a) | | $ | — | | | $ | 42,936 | | | $ | (59,906 | ) | | $ | 424,955,829 | | | | 424,870,855 | | | $ | 43,027 | | | $ | — | |
| | | | | | | | | | | | | | | | | | | | | | | | | | | | | | | | | | |
| | (a) | Represents net amount purchased (sold). |
| | |
| 56 | | 2 0 2 1 BLACK ROCK ANNUAL REPORT TO SHAREHOLDERS |
| | |
Schedule of Investments (continued) May 31, 2021 | | BlackRock Strategic Municipal Opportunities Fund |
Derivative Financial Instruments Outstanding as of Period End
Futures Contracts
| | | | | | | | | | | | | | | | |
| | | | | |
| Description | | Number of Contracts | | | Expiration Date | | | Notional
Amount (000) | | | Value/ Unrealized Appreciation (Depreciation) | |
Short Contracts
10-Year U.S. Treasury Notes | | | 9,040 | | | | 09/21/21 | | | $ | 1,191,585 | | | $ | (445,699 | ) |
U.S. Long Bond | | | 3,774 | | | | 09/21/21 | | | | 589,334 | | | | 288,616 | |
| | | | | | | | | | | | | | | | |
| | | | | | | | | | | | | | $ | (157,083 | ) |
| | | | | | | | | | | | | | | | |
Derivative Financial Instruments Categorized by Risk Exposure
As of period end, the fair values of derivative financial instruments located in the Statements of Assets and Liabilities were as follows:
| | | | | | | | | | | | | | | | | | | | | | | | | | | | |
| | | Commodity Contracts | | | Credit Contracts | | | Equity Contracts | | | Foreign Currency Exchange Contracts | | | Interest Rate Contracts | | | Other Contracts | | | Total | |
Assets — Derivative Financial Instruments | | | | | | | | | | | | | | | | | | | | | | | | | | | | |
Futures contracts | | | | | | | | | | | | | | | | | | | | | | | | | | | | |
Unrealized appreciation on futures contracts(a) | | $ | — | | | $ | — | | | $ | — | | | $ | — | | | $ | 288,616 | | | $ | — | | | $ | 288,616 | |
| | | | | | | | | | | | | | | | | | | | | | | | | | | | |
| | | | | | | |
Liabilities — Derivative Financial Instruments | | | | | | | | | | | | | | | | | | | | | | | | | | | | |
Futures contracts | | | | | | | | | | | | | | | | | | | | | | | | | | | | |
Unrealized depreciation on futures contracts(a) | | $ | — | | | $ | — | | | $ | — | | | $ | — | | | $ | 445,699 | | | $ | — | | | $ | 445,699 | |
| | | | | | | | | | | | | | | | | | | | | | | | | | | | |
| | (a) | Net cumulative unrealized appreciation (depreciation) on futures contracts and centrally cleared swaps, if any, are reported in the Schedule of Investments. In the Statements of Assets and Liabilities, only current day’s variation margin is reported in receivables or payables and the net cumulative unrealized appreciation (depreciation) is included in accumulated earnings (loss). |
For the year ended May 31, 2021, the effect of derivative financial instruments in the Statements of Operations was as follows:
| | | | | | | | | | | | | | | | | | | | | | | | | | | | |
| | | Commodity Contracts | | | Credit Contracts | | | Equity Contracts | | | Foreign Currency Exchange Contracts | | | Interest Rate Contracts | | | Other Contracts | | | Total | |
Net Realized Gain (Loss) from | | | | | | | | | | | | | | | | | | | | | | | | | | | | |
Futures contracts | | $ | — | | | $ | — | | | $ | — | | | $ | — | | | $ | 115,909,414 | | | $ | — | | | $ | 115,909,414 | |
| | | | | | | | | | | | | | | | | | | | | | | | | | | | |
Net Change in Unrealized Appreciation (Depreciation) on | | | | | | | | | | | | | | | | | | | | | | | | | | | | |
Futures contracts | | $ | — | | | $ | — | | | $ | — | | | $ | — | | | $ | 1,514,389 | | | $ | — | | | $ | 1,514,389 | |
| | | | | | | | | | | | | | | | | | | | | | | | | | | | |
Average Quarterly Balances of Outstanding Derivative Financial Instruments
| | | | | | | | | | | | | | | | | | | | | | | | | | | | |
Futures contracts | | | | | | | | | | | | | | | | | | | | | | | | | | | | |
Average notional value of contracts — short | | | | | | | | | | | | | | | | | | | | | | | | | | $ | 1,720,582,606 | |
For more information about the Fund’s investment risks regarding derivative financial instruments, refer to the Notes to Financial Statements.
Fair Value Hierarchy as of Period End
Various inputs are used in determining the fair value of financial instruments. For a description of the input levels and information about the Fund’s policy regarding valuation of financial instruments, refer to the Notes to Financial Statements.
The following tables summarize the Fund’s financial instruments categorized in the fair value hierarchy. The breakdown of the Fund’s investments into major categories is disclosed in the Schedule of Investments above.
| | | | | | | | | | | | | | | | |
| | | Level 1 | | | Level 2 | | | Level 3 | | | Total | |
Assets | | | | | | | | | | | | | | | | |
Investments | | | | | | | | | | | | | | | | |
Long-Term Investments | | | | | | | | | | | | | | | | |
Corporate Bonds | | $ | — | | | $ | 152,626,601 | | | $ | — | | | $ | 152,626,601 | |
| | | | |
| SCHEDULE OF INVESTMENTS | | | 57 | |
| | |
Schedule of Investments (continued) May 31, 2021 | | BlackRock Strategic Municipal Opportunities Fund |
Fair Value Hierarchy as of Period End (continued)
| | | | | | | | | | | | | | | | |
| | | Level 1 | | | Level 2 | | | Level 3 | | | Total | |
Municipal Bonds | | $ | — | | | $ | 7,629,603,351 | | | $ | — | | | $ | 7,629,603,351 | |
Municipal Bonds Transferred to Tender Option Bond Trusts | | | — | | | | 1,265,687,976 | | | | — | | | | 1,265,687,976 | |
Short-Term Securities | | | | | | | | | | | | | | | | |
Money Market Funds | | | 424,955,829 | | | | — | | | | — | | | | 424,955,829 | |
| | | | | | | | | | | | | | | | |
| | $ | 424,955,829 | | | $ | 9,047,917,928 | | | $ | — | | | $ | 9,472,873,757 | |
| | | | | | | | | | | | | | | | |
Derivative Financial Instruments(a) | | | | | | | | | | | | | | | | |
Assets | | | | | | | | | | | | | | | | |
Interest Rate Contracts | | $ | 288,616 | | | $ | — | | | $ | — | | | $ | 288,616 | |
Liabilities | | | | | | | | | | | | | | | | |
Interest Rate Contracts | | | (445,699 | ) | | | — | | | | — | | | | (445,699 | ) |
| | | | | | | | | | | | | | | | |
| | $ | (157,083 | ) | | $ | — | | | $ | — | | | $ | (157,083 | ) |
| | | | | | | | | | | | | | | | |
| (a) | | Derivative financial instruments are futures contracts. Futures contracts are valued at the unrealized appreciation (depreciation) on the instrument. |
The Fund may hold assets and/or liabilities in which the fair value approximates the carrying amount for financial statement purposes. As of period end, TOB Trust Certificates of $764,711,654 are categorized as Level 2 within the fair value hierarchy.
See notes to financial statements.
| | |
| 58 | | 2 0 2 1 BLACK ROCK ANNUAL REPORT TO SHAREHOLDERS |
| | |
Statements of Assets and Liabilities May 31, 2021 | | |
| | | | | | | | | | | | | | | | |
| | | BlackRock California Municipal Opportunities Fund | | | BlackRock New Jersey Municipal Bond Fund | | | BlackRock
Pennsylvania Municipal Bond Fund | | | BlackRock Strategic Municipal
Opportunities Fund | |
| | | | |
ASSETS | | | | | | | | | | | | | | | | |
Investments, at value — unaffiliated(a) | | $ | 3,243,417,658 | | | $ | 387,324,547 | | | $ | 646,940,240 | | | $ | 9,047,917,928 | |
Investments, at value — affiliated(b) | | | 153,125,894 | | | | 28,655,380 | | | | 21,885,750 | | | | 424,955,829 | |
Cash | | | 1,618,750 | | | | 81,500 | | | | 142,500 | | | | 615 | |
Cash pledged for futures contracts | | | 7,679,000 | | | | 387,000 | | | | 659,000 | | | | 27,265,000 | |
Receivables: | | | | | | | | | | | | | | | | |
Investments sold | | | 8,141,108 | | | | 45,000 | | | | 100,000 | | | | 22,225,823 | |
Capital shares sold | | | 5,791,447 | | | | 471,836 | | | | 1,236,739 | | | | 24,114,408 | |
Dividends — affiliated | | | 996 | | | | 211 | | | | 255 | | | | 1,895 | |
Interest — unaffiliated | | | 34,679,395 | | | | 4,861,061 | | | | 8,091,468 | | | | 85,126,164 | |
Variation margin on futures contracts | | | 30,750 | | | | 1,562 | | | | 2,938 | | | | 117,937 | |
Prepaid expenses | | | 55,167 | | | | 74,627 | | | | 81,816 | | | | 153,902 | |
| | | | | | | | | | | | | | | | |
Total assets | | | 3,454,540,165 | | | | 421,902,724 | | | | 679,140,706 | | | | 9,631,879,501 | |
| | | | | | | | | | | | | | | | |
ACCRUED LIABILITIES | | | | | | | | | | | | | | | | |
Payables: | | | | | | | | | | | | | | | | |
Investments purchased | | | 32,278,184 | | | | 4,570,374 | | | | 24,868,866 | | | | 226,157,258 | |
Capital shares redeemed | | | 7,535,212 | | | | 368,809 | | | | 1,239,867 | | | | 17,937,400 | |
Income dividend distributions | | | 1,075,021 | | | | 294,866 | | | | 529,961 | | | | 3,973,441 | |
Interest expense and fees | | | 25,754 | | | | 8,195 | | | | 17,625 | | | | 197,738 | |
Investment advisory fees | | | 1,884,138 | | | | 248,753 | | | | 417,572 | | | | 6,365,053 | |
Trustees’ and Officer’s fees | | | 8,831 | | | | 1,275 | | | | 1,795 | | | | 80,205 | |
Other accrued expenses | | | 637,101 | | | | 158,636 | | | | 180,271 | | | | 1,593,706 | |
Other affiliates | | | 19,407 | | | | 2,228 | | | | 3,380 | | | | 51,944 | |
Service and distribution fees | | | 315,453 | | | | 51,969 | | | | 52,347 | | | | 524,676 | |
Variation margin on futures contracts | | | 85,294 | | | | 4,250 | | | | 6,630 | | | | 282,516 | |
| | | | | | | | | | | | | | | | |
Total accrued liabilities | | | 43,864,395 | | | | 5,709,355 | | | | 27,318,314 | | | | 257,163,937 | |
| | | | | | | | | | | | | | | | |
| | | | |
OTHER LIABILITIES | | | | | | | | | | | | | | | | |
TOB Trust Certificates | | | 143,144,977 | | | | 17,972,276 | | | | 49,168,902 | | | | 764,711,654 | |
| | | | | | | | | | | | | | | | |
Total liabilities | | | 187,009,372 | | | | 23,681,631 | | | | 76,487,216 | | | | 1,021,875,591 | |
| | | | | | | | | | | | | | | | |
| | | | |
NET ASSETS | | $ | 3,267,530,793 | | | $ | 398,221,093 | | | $ | 602,653,490 | | | $ | 8,610,003,910 | |
| | | | | | | | | | | | | | | | |
| | | | |
NET ASSETS CONSIST OF | | | | | | | | | | | | | | | | |
Paid-in capital | | $ | 3,177,232,964 | | | $ | 370,472,902 | | | $ | 581,244,966 | | | $ | 8,656,076,755 | |
Accumumlated earnings (loss) | | | 90,297,829 | | | | 27,748,191 | | | | 21,408,524 | | | | (46,072,845 | ) |
| | | | | | | | | | | | | | | | |
NET ASSETS | | $ | 3,267,530,793 | | | $ | 398,221,093 | | | $ | 602,653,490 | | | $ | 8,610,003,910 | |
| | | | | | | | | | | | | | | | |
(a) Investments, at cost — unaffiliated | | $ | 3,004,846,158 | | | $ | 349,653,647 | | | $ | 604,378,415 | | | $ | 8,545,101,857 | |
(b) Investments, at cost — affiliated | | $ | 153,090,262 | | | $ | 28,653,774 | | | $ | 21,884,617 | | | $ | 424,943,377 | |
| | |
F I N A N C I A L S T A T E M E N T S | | 59 |
Statements of Assets and Liabilities (continued)
May 31, 2021
| | | | | | | | | | | | | | | | |
| | | BlackRock California Municipal
Opportunities Fund | | | BlackRock New Jersey Municipal Bond Fund | | | BlackRock Pennsylvania Municipal Bond Fund | | | BlackRock Strategic Municipal Opportunities Fund | |
| | | | |
NET ASSET VALUE | | | | | | | | | | | | | | | | |
Institutional | | | | | | | | | | | | | | | | |
Net assets | | $ | 1,922,917,743 | | | $ | 215,902,823 | | | $ | 403,080,227 | | | $ | 6,514,428,214 | |
| | | | | | | | | | | | | | | | |
Shares outstanding | | | 147,012,750 | | | | 18,627,797 | | | | 35,709,782 | | | | 545,316,312 | |
| | | | | | | | | | | | | | | | |
Net asset value | | $ | 13.08 | | | $ | 11.59 | | | $ | 11.29 | | | $ | 11.95 | |
| | | | | | | | | | | | | | | | |
Shares authorized | | | Unlimited | | | | Unlimited | | | | Unlimited | | | | Unlimited | |
| | | | | | | | | | | | | | | | |
Par value | | $ | 0.10 | | | $ | 0.10 | | | $ | 0.10 | | | $ | 0.10 | |
| | | | | | | | | | | | | | | | |
| | | | |
| Service | | | | | | | | | | | | |
Net assets | | | N/A | | | $ | 7,954,829 | | | $ | 2,366,526 | | | | N/A | |
| | | | | | | | | | | | | | | | |
Shares outstanding | | | N/A | | | | 686,363 | | | | 209,421 | | | | N/A | |
| | | | | | | | | | | | | | | | |
Net asset value | | | N/A | | | $ | 11.59 | | | $ | 11.30 | | | | N/A | |
| | | | | | | | | | | | | | | | |
Shares authorized | | | N/A | | | | Unlimited | | | | Unlimited | | | | N/A | |
| | | | | | | | | | | | | | | | |
Par value | | | N/A | | | $ | 0.10 | | | $ | 0.10 | | | | N/A | |
| | | | | | | | | | | | | | | | |
| | | | |
| Investor A | | | | | | | | | | | | |
Net assets | | $ | 1,025,162,357 | | | $ | 128,040,100 | | | $ | 161,081,190 | | | $ | 1,717,909,683 | |
| | | | | | | | | | | | | | | | |
Shares outstanding | | | 78,446,969 | | | | 11,038,640 | | | | 14,255,047 | | | | 143,868,358 | |
| | | | | | | | | | | | | | | | |
Net asset value | | $ | 13.07 | | | $ | 11.60 | | | $ | 11.30 | | | $ | 11.94 | |
| | | | | | | | | | | | | | | | |
Shares authorized | | | Unlimited | | | | Unlimited | | | | Unlimited | | | | Unlimited | |
| | | | | | | | | | | | | | | | |
Par value | | $ | 0.10 | | | $ | 0.10 | | | $ | 0.10 | | | $ | 0.10 | |
| | | | | | | | | | | | | | | | |
| | | | |
| Investor A1 | | | | | | | | | | | | |
Net assets | | $ | 103,726,278 | | | $ | 17,417,201 | | | $ | 8,925,210 | | | $ | 24,644,691 | |
| | | | | | | | | | | | | | | | |
Shares outstanding | | | 7,930,369 | | | | 1,501,011 | | | | 789,532 | | | | 2,063,352 | |
| | | | | | | | | | | | | | | | |
Net asset value | | $ | 13.08 | | | $ | 11.60 | | | $ | 11.30 | | | $ | 11.94 | |
| | | | | | | | | | | | | | | | |
Shares authorized | | | Unlimited | | | | Unlimited | | | | Unlimited | | | | Unlimited | |
| | | | | | | | | | | | | | | | |
Par value | | $ | 0.10 | | | $ | 0.10 | | | $ | 0.10 | | | $ | 0.10 | |
| | | | | | | | | | | | | | | | |
| | | | |
| Investor C | | | | | | | | | | | | |
Net assets | | $ | 107,235,380 | | | $ | 26,004,267 | | | $ | 20,866,098 | | | $ | 184,220,079 | |
| | | | | | | | | | | | | | | | |
Shares outstanding | | | 8,198,172 | | | | 2,244,388 | | | | 1,846,948 | | | | 15,421,133 | |
| | | | | | | | | | | | | | | | |
Net asset value | | $ | 13.08 | | | $ | 11.59 | | | $ | 11.30 | | | $ | 11.95 | |
| | | | | | | | | | | | | | | | |
Shares authorized | | | Unlimited | | | | Unlimited | | | | Unlimited | | | | Unlimited | |
| | | | | | | | | | | | | | | | |
Par value | | $ | 0.10 | | | $ | 0.10 | | | $ | 0.10 | | | $ | 0.10 | |
| | | | | | | | | | | | | | | | |
| | | | |
| Class K | | | | | | | | | | | | |
Net assets | | $ | 108,489,035 | | | $ | 2,901,873 | | | $ | 6,334,239 | | | $ | 168,801,243 | |
| | | | | | | | | | | | | | | | |
Shares outstanding | | | 8,291,210 | | | | 250,465 | | | | 561,263 | | | | 14,128,477 | |
| | | | | | | | | | | | | | | | |
Net asset value | | $ | 13.08 | | | $ | 11.59 | | | $ | 11.29 | | | $ | 11.95 | |
| | | | | | | | | | | | | | | | |
Shares authorized | | | Unlimited | | | | Unlimited | | | | Unlimited | | | | Unlimited | |
| | | | | | | | | | | | | | | | |
Par value | | $ | 0.10 | | | $ | 0.10 | | | $ | 0.10 | | | $ | 0.10 | |
| | | | | | | | | | | | | | | | |
See notes to financial statements.
| | |
| 60 | | 2 0 2 1 B L A C K R O C K A N N U A L R E P O R T T O S H A R E H O L D E R S |
Statements of Operations
Year Ended May 31, 2021
| | | | | | | | | | | | | | | | | | | | | | | | | | | | | | | | |
| | | | | | BlackRock California Municipal Opportunities Fund | | | | | | BlackRock New Jersey Municipal Bond Fund | | | | | | BlackRock Pennsylvania Municipal Bond Fund | | | | | | BlackRock Strategic Municipal Opportunities Fund | |
| | | | | | | | |
INVESTMENT INCOME | | | | | | | | | | | | | | | | | | | | | | | | | | | | | | | | |
Dividends — affiliated | | | | | | $ | 17,749 | | | | | | | $ | 2,174 | | | | | | | $ | 2,899 | | | | | | | $ | 43,027 | |
Interest — unaffiliated | | | | | | | 78,056,179 | | | | | | | | 13,700,539 | | | | | | | | 20,563,941 | | | | | | | | 246,900,604 | |
| | | | | | | | | | | | | | | | | | | | | | | | | | | | | | | | |
Total investment income | | | | | | | 78,073,928 | | | | | | | | 13,702,713 | | | | | | | | 20,566,840 | | | | | | | | 246,943,631 | |
| | | | | | | | | | | | | | | | | | | | | | | | | | | | | | | | |
| | | | | | | | |
EXPENSES | | | | | | | | | | | | | | | | | | | | | | | | | | | | | | | | |
Investment advisory | | | | | | | 11,665,963 | | | | | | | | 1,970,400 | | | | | | | | 2,983,361 | | | | | | | | 42,272,280 | |
Service and distribution — class specific | | | | | | | 3,944,107 | | | | | | | | 615,779 | | | | | | | | 631,459 | | | | | | | | 6,589,262 | |
Transfer agent — class specific | | | | | | | 1,391,528 | | | | | | | | 286,131 | | | | | | | | 643,309 | | | | | | | | 4,617,102 | |
Professional | | | | | | | 378,398 | | | | | | | | 77,040 | | | | | | | | 79,964 | | | | | | | | 1,025,041 | |
Accounting services | | | | | | | 360,123 | | | | | | | | 77,007 | | | | | | | | 106,197 | | | | | | | | 865,138 | |
Registration | | | | | | | 111,839 | | | | | | | | 48,909 | | | | | | | | 52,079 | | | | | | | | 422,973 | |
Custodian | | | | | | | 62,726 | | | | | | | | 5,173 | | | | | | | | 9,295 | | | | | | | | 195,418 | |
Printing and postage | | | | | | | 35,286 | | | | | | | | 37,970 | | | | | | | | 37,855 | | | | | | | | 52,251 | |
Trustees and Officer | | | | | | | 34,098 | | | | | | | | 5,505 | | | | | | | | 7,560 | | | | | | | | 95,138 | |
Miscellaneous | | | | | | | 132,713 | | | | | | | | 26,339 | | | | | | | | 30,800 | | | | | | | | 358,035 | |
| | | | | | | | | | | | | | | | | | | | | | | | | | | | | | | | |
Total expenses excluding interest expense | | | | | | | 18,116,781 | | | | | | | | 3,150,253 | | | | | | | | 4,581,879 | | | | | | | | 56,492,638 | |
Interest expense(a) | | | | | | | 931,190 | | | | | | | | 142,904 | | | | | | | | 401,856 | | | | | | | | 5,643,923 | |
| | | | | | | | | | | | | | | | | | | | | | | | | | | | | | | | |
Total expenses | | | | | | | 19,047,971 | | | | | | | | 3,293,157 | | | | | | | | 4,983,735 | | | | | | | | 62,136,561 | |
Less: | | | | | | | | | | | | | | | | | | | | | | | | | | | | | | | | |
Fees waived and/or reimbursed by the Manager | | | | | | | (327,608 | ) | | | | | | | (466,347 | ) | | | | | | | (494,810 | ) | | | | | | | (4,437,182 | ) |
Transfer agent fees waived and/or reimbursed — class specific | | | | | | | (71,366 | ) | | | | | | | (104,035 | ) | | | | | | | (366,672 | ) | | | | | | | — | |
| | | | | | | | | | | | | | | | | | | | | | | | | | | | | | | | |
Total expenses after fees waived and/or reimbursed | | | | | | | 18,648,997 | | | | | | | | 2,722,775 | | | | | | | | 4,122,253 | | | | | | | | 57,699,379 | |
| | | | | | | | | | | | | | | | | | | | | | | | | | | | | | | | |
Net investment income | | | | | | | 59,424,931 | | | | | | | | 10,979,938 | | | | | | | | 16,444,587 | | | | | | | | 189,244,252 | |
| | | | | | | | | | | | | | | | | | | | | | | | | | | | | | | | |
| | | | | | | | |
REALIZED AND UNREALIZED GAIN (LOSS) | | | | | | | | | | | | | | | | | | | | | | | | | | | | | | | | |
Net realized gain (loss) from: | | | | | | | | | | | | | | | | | | | | | | | | | | | | | | | | |
Investments — unaffiliated | | | | | | | 47,268,391 | | | | | | | | 1,676,142 | | | | | | | | 2,399,686 | | | | | | | | 203,162,374 | |
Investments — affiliated | | | | | | | 83,418 | | | | | | | | (772 | ) | | | | | | | 2,629 | | | | | | | | 42,936 | |
Futures contracts | | | | | | | 37,029,913 | | | | | | | | 1,249,472 | | | | | | | | 2,205,681 | | | | | | | | 115,909,414 | |
| | | | | | | | | | | | | | | | | | | | | | | | | | | | | | | | |
| | | | | | | 84,381,722 | | | | | | | | 2,924,842 | | | | | | | | 4,607,996 | | | | | | | | 319,114,724 | |
| | | | | | | | | | | | | | | | | | | | | | | | | | | | | | | | |
Net change in unrealized appreciation (depreciation) on: | | | | | | | | | | | | | | | | | | | | | | | | | | | | | | | | |
Investments — unaffiliated | | | | | | | 135,419,371 | | | | | | | | 21,743,693 | | | | | | | | 22,903,896 | | | | | | | | 443,385,528 | |
Investments — affiliated | | | | | | | (6,553 | ) | | | | | | | 608 | | | | | | | | (4,632 | ) | | | | | | | (59,906 | ) |
Futures contracts | | | | | | | (67,636 | ) | | | | | | | (4,244 | ) | | | | | | | (8,632 | ) | | | | | | | 1,514,389 | |
| | | | | | | | | | | | | | | | | | | | | | | | | | | | | | | | |
| | | | | | | 135,345,182 | | | | | | | | 21,740,057 | | | | | | | | 22,890,632 | | | | | | | | 444,840,011 | |
| | | | | | | | | | | | | | | | | | | | | | | | | | | | | | | | |
Net realized and unrealized gain | | | | | | | 219,726,904 | | | | | | | | 24,664,899 | | | | | | | | 27,498,628 | | | | | | | | 763,954,735 | |
| | | | | | | | | | | | | | | | | | | | | | | | | | | | | | | | |
NET INCREASE IN NET ASSETS RESULTING FROM OPERATIONS | | | | | | $ | 279,151,835 | | | | | | | $ | 35,644,837 | | | | | | | $ | 43,943,215 | | | | | | | $ | 953,198,987 | |
| | | | | | | | | | | | | | | | | | | | | | | | | | | | | | | | |
| (a) | Related to TOBs Trusts. |
See notes to financial statements.
| | |
F I N A N C I A L S T A T E M E N T S | | 61 |
Statements of Changes in Net Assets
| | | | | | | | | | | | | | | | | | | | | | | | | | | | | | | | |
| | | | | | BlackRock California
Municipal Opportunities Fund | | | | | | BlackRock New Jersey
Municipal Bond Fund | |
| | | | | | Year Ended May 31, | | | | | | Year Ended May 31, | |
| | | | | | 2021 | | | | | | 2020 | | | | | | 2021 | | | | | | 2020 | |
| | | | | | | | |
INCREASE (DECREASE) IN NET ASSETS | | | | | | | | | | | | | | | | | | | | | | | | | | | | | | | | |
| | | | | | | | |
OPERATIONS | | | | | | | | | | | | | | | | | | | | | | | | | | | | | | | | |
Net investment income | | | | | | $ | 59,424,931 | | | | | | | $ | 74,502,683 | | | | | | | $ | 10,979,938 | | | | | | | $ | 11,198,630 | |
Net realized gain (loss) | | | | | | | 84,381,722 | | | | | | | | (164,917,661 | ) | | | | | | | 2,924,842 | | | | | | | | (7,829,126 | ) |
Net change in unrealized appreciation (depreciation) | | | | | | | 135,345,182 | | | | | | | | (22,802,453 | ) | | | | | | | 21,740,057 | | | | | | | | (9,077,136 | ) |
| | | | | | | | | | | | | | | | | | | | | | | | | | | | | | | | |
Net increase (decrease) in net assets resulting from operations | | | | | | | 279,151,835 | | | | | | | | (113,217,431 | ) | | | | | | | 35,644,837 | | | | | | | | (5,707,632 | ) |
| | | | | | | | | | | | | | | | | | | | | | | | | | | | | | | | |
| | | | | | | | |
DISTRIBUTIONS TO SHAREHOLDERS(a) | | | | | | | | | | | | | | | | | | | | | | | | | | | | | | | | |
Institutional | | | | | | | (35,993,789 | ) | | | | | | | (46,598,483 | ) | | | | | | | (6,219,420 | ) | | | | | | | (6,319,333 | ) |
Service | | | | | | | — | | | | | | | | — | | | | | | | | (218,557 | ) | | | | | | | (232,863 | ) |
Investor A | | | | | | | (18,229,406 | ) | | | | | | | (20,907,590 | ) | | | | | | | (3,359,637 | ) | | | | | | | (3,169,958 | ) |
Investor A1 | | | | | | | (1,949,482 | ) | | | | | | | (2,258,176 | ) | | | | | | | (524,575 | ) | | | | | | | (597,949 | ) |
Investor C | | | | | | | (1,197,450 | ) | | | | | | | (1,782,575 | ) | | | | | | | (579,084 | ) | | | | | | | (761,510 | ) |
Investor C1 | | | | | | | — | | | | | | | | (2,285 | ) | | | | | | | — | | | | | | | | (445 | ) |
Class K | | | | | | | (2,039,731 | ) | | | | | | | (2,688,705 | ) | | | | | | | (75,516 | ) | | | | | | | (62,897 | ) |
| | | | | | | | | | | | | | | | | | | | | | | | | | | | | | | | |
Decrease in net assets resulting from distributions to shareholders | | | | | | | (59,409,858 | ) | | | | | | | (74,237,814 | ) | | | | | | | (10,976,789 | ) | | | | | | | (11,144,955 | ) |
| | | | | | | | | | | | | | | | | | | | | | | | | | | | | | | | |
| | | | | | | | |
CAPITAL SHARE TRANSACTIONS | | | | | | | | | | | | | | | | | | | | | | | | | | | | | | | | |
Net increase (decrease) in net assets derived from capital share transactions | | | | | | | (244,079,259 | ) | | | | | | | 145,089,557 | | | | | | | | 19,898,331 | | | | | | | | 41,185,822 | |
| | | | | | | | | | | | | | | | | | | | | | | | | | | | | | | | |
| | | | | | | | |
NET ASSETS | | | | | | | | | | | | | | | | | | | | | | | | | | | | | | | | |
Total increase (decrease) in net assets | | | | | | | (24,337,282 | ) | | | | | | | (42,365,688 | ) | | | | | | | 44,566,379 | | | | | | | | 24,333,235 | |
Beginning of year | | | | | | | 3,291,868,075 | | | | | | | | 3,334,233,763 | | | | | | | | 353,654,714 | | | | | | | | 329,321,479 | |
| | | | | | | | | | | | | | | | | | | | | | | | | | | | | | | | |
End of year | | | | | | $ | 3,267,530,793 | | | | | | | $ | 3,291,868,075 | | | | | | | $ | 398,221,093 | | | | | | | $ | 353,654,714 | |
| | | | | | | | | | | | | | | | | | | | | | | | | | | | | | | | |
| (a) | Distributions for annual periods determined in accordance with U.S. federal income tax regulations. |
See notes to financial statements.
| | |
| 62 | | 2 0 2 1 B L A C K R O C K A N N U A L R E P O R T T O S H A R E H O L D E R S |
Statements of Changes in Net Assets (continued)
| | | | | | | | | | | | | | | | | | | | | | | | | | | | | | | | |
| | | | | | BlackRock Pennsylvania
Municipal Bond Fund | | | | | | BlackRock Strategic
Municipal Opportunities Fund | |
| | | | | | Year Ended May 31, | | | | | | Year Ended May 31, | |
| | | | | | 2021 | | | | | | 2020 | | | | | | 2021 | | | | | | 2020 | |
| | | | | | | | |
INCREASE (DECREASE) IN NET ASSETS | | | | | | | | | | | | | | | | | | | | | | | | | | | | | | | | |
| | | | | | | | |
OPERATIONS | | | | | | | | | | | | | | | | | | | | | | | | | | | | | | | | |
Net investment income | | | | | | $ | 16,444,587 | | | | | | | $ | 18,678,886 | | | | | | | $ | 189,244,252 | | | | | | | $ | 280,602,542 | |
Net realized gain (loss) | | | | | | | 4,607,996 | | | | | | | | (10,809,100 | ) | | | | | | | 319,114,724 | | | | | | | | (593,963,030 | ) |
Net change in unrealized appreciation (depreciation) | | | | | | | 22,890,632 | | | | | | | | (9,373,867 | ) | | | | | | | 444,840,011 | | | | | | | | (357,377,876 | ) |
| | | | | | | | | | | | | | | | | | | | | | | | | | | | | | | | |
Net increase (decrease) in net assets resulting from operations | | | | | | | 43,943,215 | | | | | | | | (1,504,081 | ) | | | | | | | 953,198,987 | | | | | | | | (670,738,364 | ) |
| | | | | | | | | | | | | | | | | | | | | | | | | | | | | | | | |
| | | | | | | | |
DISTRIBUTIONS TO SHAREHOLDERS(a) | | | | | | | | | | | | | | | | | | | | | | | | | | | | | | | | |
Institutional | | | | | | | (11,509,115 | ) | | | | | | | (13,323,193 | ) | | | | | | | (143,714,628 | ) | | | | | | | (220,891,704 | ) |
Service | | | | | | | (59,039 | ) | | | | | | | (68,557 | ) | | | | | | | — | | | | | | | | — | |
Investor A | | | | | | | (4,009,250 | ) | | | | | | | (3,995,842 | ) | | | | | | | (36,971,138 | ) | | | | | | | (46,246,783 | ) |
Investor A1 | | | | | | | (267,887 | ) | | | | | | | (338,836 | ) | | | | | | | (540,624 | ) | | | | | | | (651,181 | ) |
Investor C | | | | | | | (501,222 | ) | | | | | | | (725,675 | ) | | | | | | | (2,813,627 | ) | | | | | | | (4,710,313 | ) |
Investor C1 | | | | | | | — | | | | | | | | (37 | ) | | | | | | | — | | | | | | | | — | |
Class K | | | | | | | (144,867 | ) | | | | | | | (116,866 | ) | | | | | | | (3,661,475 | ) | | | | | | | (4,456,594 | ) |
| | | | | | | | | | | | | | | | | | | | | | | | | | | | | | | | |
Decrease in net assets resulting from distributions to shareholders | | | | | | | (16,491,380 | ) | | | | | | | (18,569,006 | ) | | | | | | | (187,701,492 | ) | | | | | | | (276,956,575 | ) |
| | | | | | | | | | | | | | | | | | | | | | | | | | | | | | | | |
| | | | | | | | |
CAPITAL SHARE TRANSACTIONS | | | | | | | | | | | | | | | | | | | | | | | | | | | | | | | | |
Net increase (decrease) in net assets derived from capital share transactions | | | | | | | 28,957,774 | | | | | | | | 30,795,831 | | | | | | | | (1,312,434,238 | ) | | | | | | | (742,778,148 | ) |
| | | | | | | | | | | | | | | | | | | | | | | | | | | | | | | | |
| | | | | | | | |
NET ASSETS | | | | | | | | | | | | | | | | | | | | | | | | | | | | | | | | |
Total increase (decrease) in net assets | | | | | | | 56,409,609 | | | | | | | | 10,722,744 | | | | | | | | (546,936,743 | ) | | | | | | | (1,690,473,087 | ) |
Beginning of year | | | | | | | 546,243,881 | | | | | | | | 535,521,137 | | | | | | | | 9,156,940,653 | | | | | | | | 10,847,413,740 | |
| | | | | | | | | | | | | | | | | | | | | | | | | | | | | | | | |
End of year | | | | | | $ | 602,653,490 | | | | | | | $ | 546,243,881 | | | | | | | $ | 8,610,003,910 | | | | | | | $ | 9,156,940,653 | |
| | | | | | | | | | | | | | | | | | | | | | | | | | | | | | | | |
| (a) | Distributions for annual periods determined in accordance with U.S. federal income tax regulations. |
See notes to financial statements.
| | |
F I N A N C I A L S T A T E M E N T S | | 63 |
Financial Highlights
(For a share outstanding throughout each period)
| | | | | | | | | | | | | | | | | | | | | | | | |
| | | BlackRock California Municipal Opportunities Fund | |
| | | Institutional | |
| | | Year Ended May 31, | |
| | | | | | 2021 | | | 2020 | | | 2019 | | | 2018 | | | 2017 | |
Net asset value, beginning of year | | | | | | $ | 12.21 | | | $ | 12.71 | | | $ | 12.76 | | | $ | 12.60 | | | $ | 12.73 | |
| | | | | | | | | | | | | | | | | | | | | | | | |
Net investment income(a) | | | | | | | 0.25 | | | | 0.27 | | | | 0.34 | | | | 0.34 | | | | 0.36 | |
Net realized and unrealized gain (loss) | | | | | | | 0.87 | | | | (0.50 | ) | | | 0.19 | | | | 0.20 | | | | (0.13 | ) |
| | | | | | | | | | | | | | | | | | | | | | | | |
Net increase (decrease) from investment operations | | | | | | | 1.12 | | | | (0.23 | ) | | | 0.53 | | | | 0.54 | | | | 0.23 | |
| | | | | | | | | | | | | | | | | | | | | | | | |
| | | | | | |
Distributions(b) | | | | | | | | | | | | | | | | | | | | | | | | |
From net investment income | | | | | | | (0.25 | ) | | | (0.27 | ) | | | (0.34 | ) | | | (0.34 | ) | | | (0.36 | ) |
From net realized gain | | | | | | | — | | | | — | | | | (0.24 | ) | | | (0.04 | ) | | | — | |
| | | | | | | | | | | | | | | | | | | | | | | | |
Total distributions | | | | | | | (0.25 | ) | | | (0.27 | ) | | | (0.58 | ) | | | (0.38 | ) | | | (0.36 | ) |
| | | | | | | | | | | | | | | | | | | | | | | | |
| | | | | | |
Net asset value, end of year | | | | | | $ | 13.08 | | | $ | 12.21 | | | $ | 12.71 | | | $ | 12.76 | | | $ | 12.60 | |
| | | | | | | | | | | | | | | | | | | | | | | | |
| | | | | | |
Total Return(c) | | | | | | | | | | | | | | | | | | | | | | | | |
Based on net asset value | | | | | | | 9.26 | % | | | (1.85 | )% | | | 4.28 | % | | | 4.37 | % | | | 1.88 | % |
| | | | | | | | | | | | | | | | | | | | | | | | |
| | | | | | |
Ratios to Average Net Assets(d) | | | | | | | | | | | | | | | | | | | | | | | | |
Total expenses(e) | | | | | | | 0.48 | % | | | 0.57 | % | | | 0.63 | % | | | 0.57 | % | | | 0.61 | % |
| | | | | | | | | | | | | | | | | | | | | | | | |
Total expenses after fees waived and/or reimbursed | | | | | | | 0.46 | % | | | 0.55 | % | | | 0.61 | % | | | 0.54 | % | | | 0.54 | % |
| | | | | | | | | | | | | | | | | | | | | | | | |
Total expenses after fees waived and/or reimbursed and excluding interest expense(f) | | | | | | | 0.43 | % | | | 0.43 | % | | | 0.44 | % | | | 0.44 | % | | | 0.46 | % |
| | | | | | | | | | | | | | | | | | | | | | | | |
Net investment income | | | | | | | 1.98 | % | | | 2.13 | % | | | 2.70 | % | | | 2.68 | % | | | 2.88 | % |
| | | | | | | | | | | | | | | | | | | | | | | | |
| | | | | | |
Supplemental Data | | | | | | | | | | | | | | | | | | | | | | | | |
Net assets, end of year (000) | | | | | | $ | 1,922,918 | | | $ | 1,865,633 | | | $ | 2,016,387 | | | $ | 1,190,045 | | | $ | 611,571 | |
| | | | | | | | | | | | | | | | | | | | | | | | |
Borrowings outstanding, end of year (000) | | | | | | $ | 143,145 | | | $ | 148,145 | | | $ | 253,167 | | | $ | 141,267 | | | $ | 60,642 | |
| | | | | | | | | | | | | | | | | | | | | | | | |
Portfolio turnover rate | | | | | | | 53 | % | | | 117 | % | | | 126 | % | | | 129 | % | | | 142 | % |
| | | | | | | | | | | | | | | | | | | | | | | | |
| (a) | Based on average shares outstanding. |
| (b) | Distributions for annual periods determined in accordance with U.S. federal income tax regulations. |
| (c) | Where applicable, assumes the reinvestment of distributions. |
| (d) | Excludes expenses incurred indirectly as a result of investments in underlying funds as follows: |
| | | | | | | | | | | | | | | | | | | | | | | | |
| | | | Year Ended May 31, | |
| | | | | | 2021 | | | 2020 | | | 2019 | | | 2018 | | | 2017 | |
Investments in underlying funds | | | | | | | 0.01 | % | | | 0.02 | % | | | 0.02 | % | | | 0.01 | % | | | 0.01 | % |
| | | | | | | | | | | | | | | | | | | | | | | | |
|
(e) Includes recoupment of past waived and/or reimbursed fees. Excluding the recoupment of past waived and/or reimbursed fees, the expense ratios were as follows: | |
| | | | Year Ended May 31, | |
| | | | | | 2021 | | | 2020 | | | 2019 | | | 2018 | | | 2017 | |
Expense ratios | | | | | | | N/A | % | | | 0.56 | % | | | 0.62 | % | | | 0.57 | % | | | N/A | % |
| | | | | | | | | | | | | | | | | | | | | | | | |
| (f) | Interest expense and fees relate to TOB Trusts. See Note 4 of the Notes to Financial Statements for details. |
See notes to financial statements.
| | |
| 64 | | 2 0 2 1 B L A C K R O C K A N N U A L R E P O R T T O S H A R E H O L D E R S |
Financial Highlights (continued)
(For a share outstanding throughout each period)
| | | | | | | | | | | | | | | | | | | | | | | | |
| | | BlackRock California Municipal Opportunities Fund (continued) | |
| | | Investor A | |
| | | Year Ended May 31, | |
| | | | | | 2021 | | | 2020 | | | 2019 | | | 2018 | | | 2017 | |
Net asset value, beginning of year | | | | | | $ | 12.19 | | | $ | 12.70 | | | $ | 12.75 | | | $ | 12.58 | | | $ | 12.71 | |
| | | | | | | | | | | | | | | | | | | | | | | | |
Net investment income(a) | | | | | | | 0.22 | | | | 0.24 | | | | 0.31 | | | | 0.31 | | | | 0.33 | |
Net realized and unrealized gain (loss) | | | | | | | 0.88 | | | | (0.51 | ) | | | 0.19 | | | | 0.21 | | | | (0.13 | ) |
| | | | | | | | | | | | | | | | | | | | | | | | |
Net increase (decrease) from investment operations | | | | | | | 1.10 | | | | (0.27 | ) | | | 0.50 | | | | 0.52 | | | | 0.20 | |
| | | | | | | | | | | | | | | | | | | | | | | | |
| | | | | | |
Distributions(b) | | | | | | | | | | | | | | | | | | | | | | | | |
From net investment income | | | | | | | (0.22 | ) | | | (0.24 | ) | | | (0.31 | ) | | | (0.31 | ) | | | (0.33 | ) |
From net realized gain | | | | | | | — | | | | — | | | | (0.24 | ) | | | (0.04 | ) | | | — | |
| | | | | | | | | | | | | | | | | | | | | | | | |
Total distributions | | | | | | | (0.22 | ) | | | (0.24 | ) | | | (0.55 | ) | | | (0.35 | ) | | | (0.33 | ) |
| | | | | | | | | | | | | | | | | | | | | | | | |
| | | | | | |
Net asset value, end of year | | | | | | $ | 13.07 | | | $ | 12.19 | | | $ | 12.70 | | | $ | 12.75 | | | $ | 12.58 | |
| | | | | | | | | | | | | | | | | | | | | | | | |
| | | | | | |
Total Return(c) | | | | | | | | | | | | | | | | | | | | | | | | |
Based on net asset value | | | | | | | 9.09 | % | | | (2.18 | )% | | | 4.02 | % | | | 4.19 | % | | | 1.63 | % |
| | | | | | | | | | | | | | | | | | | | | | | | |
| | | | | | |
Ratios to Average Net Assets(d) | | | | | | | | | | | | | | | | | | | | | | | | |
Total expenses(e) | | | | | | | 0.72 | % | | | 0.82 | % | | | 0.88 | % | | | 0.81 | % | | | 0.85 | % |
| | | | | | | | | | | | | | | | | | | | | | | | |
Total expenses after fees waived and/or reimbursed | | | | | | | 0.71 | % | | | 0.80 | % | | | 0.86 | % | | | 0.79 | % | | | 0.79 | % |
| | | | | | | | | | | | | | | | | | | | | | | | |
Total expenses after fees waived and/or reimbursed and excluding interest expense(f) | | | | | | | 0.68 | % | | | 0.68 | % | | | 0.69 | % | | | 0.69 | % | | | 0.71 | % |
| | | | | | | | | | | | | | | | | | | | | | | | |
Net investment income | | | | | | | 1.74 | % | | | 1.88 | % | | | 2.45 | % | | | 2.45 | % | | | 2.64 | % |
| | | | | | | | | | | | | | | | | | | | | | | | |
| | | | | | |
Supplemental Data | | | | | | | | | | | | | | | | | | | | | | | | |
Net assets, end of year (000) | | | | | | $ | 1,025,162 | | | $ | 1,069,541 | | | $ | 941,069 | | | $ | 631,410 | | | $ | 438,543 | |
| | | | | | | | | | | | | | | | | | | | | | | | |
Borrowings outstanding, end of year (000) | | | | | | $ | 143,145 | | | $ | 148,145 | | | $ | 253,167 | | | $ | 141,267 | | | $ | 60,642 | |
| | | | | | | | | | | | | | | | | | | | | | | | |
Portfolio turnover rate | | | | | | | 53 | % | | | 117 | % | | | 126 | % | | | 129 | % | | | 142 | % |
| | | | | | | | | | | | | | | | | | | | | | | | |
(a) Based on average shares outstanding.
(b) Distributions for annual periods determined in accordance with U.S. federal income tax regulations.
(c) Where applicable, excludes the effects of any sales charges and assumes the reinvestment of distributions.
(d) Excludes expenses incurred indirectly as a result of investments in underlying funds as follows:
| | | | | | | | | | | | | | | | | | | | | | | | |
| | | | Year Ended May 31, | |
| | | | | | 2021 | | | 2020 | | | 2019 | | | 2018 | | | 2017 | |
Investments in underlying funds | | | | | | | 0.01 | % | | | 0.02 | % | | | 0.02 | % | | | 0.01 | % | | | 0.01 | % |
| | | | | | | | | | | | | | | | | | | | | | | | |
|
(e) Includes recoupment of past waived and/or reimbursed fees. Excluding the recoupment of past waived and/or reimbursed fees, the expense ratios were as follows: | |
| | | | Year Ended May 31, | |
| | | | | | 2021 | | | 2020 | | | 2019 | | | 2018 | | | 2017 | |
Expense ratios | | | | | | | N/A | % | | | 0.82 | % | | | 0.88 | % | | | 0.81 | % | | | 0.85 | % |
| | | | | | | | | | | | | | | | | | | | | | | | |
(f) Interest expense and fees relate to TOB Trusts. See Note 4 of the Notes to Financial Statements for details.
See notes to financial statements.
| | |
F I N A N C I A L H I G H L I G H T S | | 65 |
Financial Highlights (continued)
(For a share outstanding throughout each period)
| | | | | | | | | | | | | | | | | | | | | | | | |
| | | BlackRock California Municipal Opportunities Fund (continued) | |
| | | Investor A1 | |
| | | Year Ended May 31, | |
| | | | | | 2021 | | | 2020 | | | 2019 | | | 2018 | | | 2017 | |
Net asset value, beginning of year | | | | | | $ | 12.20 | | | $ | 12.71 | | | $ | 12.76 | | | $ | 12.59 | | | $ | 12.72 | |
| | | | | | | | | | | | | | | | | | | | | | | | |
Net investment income(a) | | | | | | | 0.24 | | | | 0.26 | | | | 0.33 | | | | 0.33 | | | | 0.35 | |
Net realized and unrealized gain (loss) | | | | | | | 0.88 | | | | (0.51 | ) | | | 0.19 | | | | 0.21 | | | | (0.13 | ) |
| | | | | | | | | | | | | | | | | | | | | | | | |
Net increase (decrease) from investment operations | | | | | | | 1.12 | | | | (0.25 | ) | | | 0.52 | | | | 0.54 | | | | 0.22 | |
| | | | | | | | | | | | | | | | | | | | | | | | |
| | | | | | |
Distributions(b) | | | | | | | | | | | | | | | | | | | | | | | | |
From net investment income | | | | | | | (0.24 | ) | | | (0.26 | ) | | | (0.33 | ) | | | (0.33 | ) | | | (0.35 | ) |
From net realized gain | | | | | | | — | | | | — | | | | (0.24 | ) | | | (0.04 | ) | | | — | |
| | | | | | | | | | | | | | | | | | | | | | | | |
Total distributions | | | | | | | (0.24 | ) | | | (0.26 | ) | | | (0.57 | ) | | | (0.37 | ) | | | (0.35 | ) |
| | | | | | | | | | | | | | | | | | | | | | | | |
| | | | | | |
Net asset value, end of year | | | | | | $ | 13.08 | | | $ | 12.20 | | | $ | 12.71 | | | $ | 12.76 | | | $ | 12.59 | |
| | | | | | | | | | | | | | | | | | | | | | | | |
| | | | | | |
Total Return(c) | | | | | | | | | | | | | | | | | | | | | | | | |
Based on net asset value | | | | | | | 9.25 | % | | | (2.01 | )% | | | 4.18 | % | | | 4.35 | % | | | 1.78 | % |
| | | | | | | | | | | | | | | | | | | | | | | | |
| | | | | | |
Ratios to Average Net Assets(d) | | | | | | | | | | | | | | | | | | | | | | | | |
Total expenses(e) | | | | | | | 0.57 | % | | | 0.65 | % | | | 0.72 | % | | | 0.66 | % | | | 0.70 | % |
| | | | | | | | | | | | | | | | | | | | | | | | |
Total expenses after fees waived and/or reimbursed | | | | | | | 0.56 | % | | | 0.63 | % | | | 0.70 | % | | | 0.64 | % | | | 0.64 | % |
| | | | | | | | | | | | | | | | | | | | | | | | |
Total expenses after fees waived and/or reimbursed and excluding interest expense(f) | | | | | | | 0.53 | % | | | 0.51 | % | | | 0.53 | % | | | 0.54 | % | | | 0.56 | % |
| | | | | | | | | | | | | | | | | | | | | | | | |
Net investment income | | | | | | | 1.89 | % | | | 2.08 | % | | | 2.61 | % | | | 2.61 | % | | | 2.78 | % |
| | | | | | | | | | | | | | | | | | | | | | | | |
| | | | | | |
Supplemental Data | | | | | | | | | | | | | | | | | | | | | | | | |
Net assets, end of year (000) | | | | | | $ | 103,726 | | | $ | 103,229 | | | $ | 112,554 | | | $ | 118,780 | | | $ | 126,274 | |
| | | | | | | | | | | | | | | | | | | | | | | | |
Borrowings outstanding, end of year (000) | | | | | | $ | 143,145 | | | $ | 148,145 | | | $ | 253,167 | | | $ | 141,267 | | | $ | 60,642 | |
| | | | | | | | | | | | | | | | | | | | | | | | |
Portfolio turnover rate | | | | | | | 53 | % | | | 117 | % | | | 126 | % | | | 129 | % | | | 142 | % |
| | | | | | | | | | | | | | | | | | | | | | | | |
|
(a) Based on average shares outstanding. |
(b) Distributions for annual periods determined in accordance with U.S. federal income tax regulations. |
(c) Where applicable, excludes the effects of any sales charges and assumes the reinvestment of distributions. |
(d) Excludes expenses incurred indirectly as a result of investments in underlying funds as follows: |
| | | | | | | | | | | | | | | | | | | | | | | | |
| | | | Year Ended May 31, | |
| | | | | | 2021 | | | 2020 | | | 2019 | | | 2018 | | | 2017 | |
Investments in underlying funds | | | | | | | 0.01 | % | | | 0.02 | % | | | 0.02 | % | | | 0.01 | % | | | 0.01 | % |
| | | | | | | | | | | | | | | | | | | | | | | | |
|
(e) Includes recoupment of past waived and/or reimbursed fees. Excluding the recoupment of past waived and/or reimbursed fees, the expense ratios were as follows: | |
| | | | Year Ended May 31, | |
| | | | | | 2021 | | | 2020 | | | 2019 | | | 2018 | | | 2017 | |
Expense ratios | | | | | | | N/A | % | | | 0.65 | % | | | 0.71 | % | | | 0.66 | % | | | N/A | % |
| | | | | | | | | | | | | | | | | | | | | | | | |
| (f) | Interest expense and fees relate to TOB Trusts. See Note 4 of the Notes to Financial Statements for details. |
See notes to financial statements.
| | |
| 66 | | 2 0 2 1 B L A C K R O C K A N N U A L R E P O R T T O S H A R E H O L D E R S |
Financial Highlights (continued)
(For a share outstanding throughout each period)
| | | | | | | | | | | | | | | | | | | | | | | | |
| | | BlackRock California Municipal Opportunities Fund (continued) | |
| | | Investor C | |
| | | Year Ended May 31, | |
| | | | | | 2021 | | | 2020 | | | 2019 | | | 2018 | | | 2017 | |
Net asset value, beginning of year | | | | | | $ | 12.21 | | | $ | 12.71 | | | $ | 12.76 | | | $ | 12.60 | | | $ | 12.73 | |
| | | | | | | | | | | | | | | | | | | | | | | | |
Net investment income(a) | | | | | | | 0.12 | | | | 0.14 | | | | 0.21 | | | | 0.22 | | | | 0.24 | |
Net realized and unrealized gain (loss) | | | | | | | 0.87 | | | | (0.50 | ) | | | 0.19 | | | | 0.20 | | | | (0.13 | ) |
| | | | | | | | | | | | | | | | | | | | | | | | |
Net increase (decrease) from investment operations | | | | | | | 0.99 | | | | (0.36 | ) | | | 0.40 | | | | 0.42 | | | | 0.11 | |
| | | | | | | | | | | | | | | | | | | | | | | | |
| | | | | | |
Distributions(b) | | | | | | | | | | | | | | | | | | | | | | | | |
From net investment income | | | | | | | (0.12 | ) | | | (0.14 | ) | | | (0.21 | ) | | | (0.22 | ) | | | (0.24 | ) |
From net realized gain | | | | | | | — | | | | — | | | | (0.24 | ) | | | (0.04 | ) | | | — | |
| | | | | | | | | | | | | | | | | | | | | | | | |
Total distributions | | | | | | | (0.12 | ) | | | (0.14 | ) | | | (0.45 | ) | | | (0.26 | ) | | | (0.24 | ) |
| | | | | | | | | | | | | | | | | | | | | | | | |
| | | | | | |
Net asset value, end of year | | | | | | $ | 13.08 | | | $ | 12.21 | | | $ | 12.71 | | | $ | 12.76 | | | $ | 12.60 | |
| | | | | | | | | | | | | | | | | | | | | | | | |
| | | | | | |
Total Return(c) | | | | | | | | | | | | | | | | | | | | | | | | |
Based on net asset value | | | | | | | 8.17 | % | | | (2.82 | )% | | | 3.24 | % | | | 3.33 | % | | | 0.87 | % |
| | | | | | | | | | | | | | | | | | | | | | | | |
| | | | | | |
Ratios to Average Net Assets(d) | | | | | | | | | | | | | | | | | | | | | | | | |
Total expenses | | | | | | | 1.48 | % | | | 1.57 | %(e) | | | 1.63 | %(e) | | | 1.57 | %(e) | | | 1.61 | %(e) |
| | | | | | | | | | | | | | | | | | | | | | | | |
Total expenses after fees waived and/or reimbursed | | | | | | | 1.47 | % | | | 1.56 | % | | | 1.61 | % | | | 1.54 | % | | | 1.54 | % |
| | | | | | | | | | | | | | | | | | | | | | | | |
Total expenses after fees waived and/or reimbursed and excluding interest expense(f) | | | | | | | 1.44 | % | | | 1.43 | % | | | 1.44 | % | | | 1.44 | % | | | 1.46 | % |
| | | | | | | | | | | | | | | | | | | | | | | | |
Net investment income | | | | | | | 0.99 | % | | | 1.14 | % | | | 1.70 | % | | | 1.70 | % | | | 1.89 | % |
| | | | | | | | | | | | | | | | | | | | | | | | |
| | | | | | |
Supplemental Data | | | | | | | | | | | | | | | | | | | | | | | | |
Net assets, end of year (000) | | | | | | $ | 107,235 | | | $ | 144,972 | | | $ | 150,543 | | | $ | 124,032 | | | $ | 112,978 | |
| | | | | | | | | | | | | | | | | | | | | | | | |
Borrowings outstanding, end of year (000) | | | | | | $ | 143,145 | | | $ | 148,145 | | | $ | 253,167 | | | $ | 141,267 | | | $ | 60,642 | |
| | | | | | | | | | | | | | | | | | | | | | | | |
Portfolio turnover rate | | | | | | | 53 | % | | | 117 | % | | | 126 | % | | | 129 | % | | | 142 | % |
| | | | | | | | | | | | | | | | | | | | | | | | |
| (a) | Based on average shares outstanding. |
| (b) | Distributions for annual periods determined in accordance with U.S. federal income tax regulations. |
| (c) | Where applicable, excludes the effects of any sales charges and assumes the reinvestment of distributions. |
| (d) | Excludes expenses incurred indirectly as a result of investments in underlying funds as follows: |
| | | | | | | | | | | | | | | | | | | | | | | | |
| | | | Year Ended May 31, | |
| | | | | | 2021 | | | 2020 | | | 2019 | | | 2018 | | | 2017 | |
Investments in underlying funds | | | | | | | 0.01 | % | | | 0.02 | % | | | 0.02 | % | | | 0.01 | %�� | | | 0.01 | % |
| | | | | | | | | | | | | | | | | | | | | | | | |
| (e) | Includes recoupment of past waived and/or reimbursed fees with no financial impact to the expense ratio. |
| (f) | Interest expense and fees relate to TOB Trusts. See Note 4 of the Notes to Financial Statements for details. |
See notes to financial statements.
| | |
F I N A N C I A L H I G H L I G H T S | | 67 |
Financial Highlights (continued)
(For a share outstanding throughout each period)
| | | | | | | | | | | | | | | | | | | | |
| | | BlackRock California Municipal Opportunities Fund (continued) | |
| | | Class K | |
| | | Year Ended May 31, | | |
| Period from
01/25/18to 05/31/18 |
(a) |
| | | | | | 2021 | | | 2020 | | | 2019 | |
Net asset value, beginning of period | | | | | | $ | 12.21 | | | $ | 12.71 | | | $ | 12.76 | | | $ | 12.71 | |
| | | | | | | | | | | | | | | | | | | | |
Net investment income(b) | | | | | | | 0.26 | | | | 0.28 | | | | 0.34 | | | | 0.11 | |
Net realized and unrealized gain (loss) | | | | | | | 0.87 | | | | (0.50 | ) | | | 0.19 | | | | 0.06 | |
| | | | | | | | | | | | | | | | | | | | |
Net increase (decrease) from investment operations | | | | | | | 1.13 | | | | (0.22 | ) | | | 0.53 | | | | 0.17 | |
| | | | | | | | | | | | | | | | | | | | |
| | | | | |
Distributions(c) | | | | | | | | | | | | | | | | | | | | |
From net investment income | | | | | | | (0.26 | ) | | | (0.28 | ) | | | (0.34 | ) | | | (0.12 | ) |
From net realized gain | | | | | | | — | | | | — | | | | (0.24 | ) | | | — | |
| | | | | | | | | | | | | | | | | | | | |
Total distributions | | | | | | | (0.26 | ) | | | (0.28 | ) | | | (0.58 | ) | | | (0.12 | ) |
| | | | | | | | | | | | | | | | | | | | |
| | | | | |
Net asset value, end of period | | | | | | $ | 13.08 | | | $ | 12.21 | | | $ | 12.71 | | | $ | 12.76 | |
| | | | | | | | | | | | | | | | | | | | |
| | | | | |
Total Return(d) | | | | | | | | | | | | | | | | | | | | |
Based on net asset value | | | | | | | 9.31 | % | | | (1.80 | )% | | | 4.33 | % | | | 1.31 | %(e) |
| | | | | | | | | | | | | | | | | | | | |
| | | | | |
Ratios to Average Net Assets(f) | | | | | | | | | | | | | | | | | | | | |
Total expenses | | | | | | | 0.43 | % | | | 0.51 | %(g) | | | 0.58 | % | | | 0.54 | %(h)(i) |
| | | | | | | | | | | | | | | | | | | | |
Total expenses after fees waived and/or reimbursed | | | | | | | 0.42 | % | | | 0.50 | % | | | 0.56 | % | | | 0.49 | %(h) |
| | | | | | | | | | | | | | | | | | | | |
Total expenses after fees waived and/or reimbursed and excluding interest expense(j) | | | | | | | 0.39 | % | | | 0.38 | % | | | 0.39 | % | | | 0.39 | %(h) |
| | | | | | | | | | | | | | | | | | | | |
Net investment income | | | | | | | 2.02 | % | | | 2.19 | % | | | 2.71 | % | | | 2.76 | %(h) |
| | | | | | | | | | | | | | | | | | | | |
| | | | | |
Supplemental Data | | | | | | | | | | | | | | | | | | | | |
Net assets, end of period (000) | | | | | | $ | 108,489 | | | $ | 108,494 | | | $ | 113,480 | | | $ | 36,441 | |
| | | | | | | | | | | | | | | | | | | | |
Borrowings outstanding, end of year (000) | | | | | | $ | 143,145 | | | $ | 148,145 | | | $ | 253,167 | | | $ | 141,267 | |
| | | | | | | | | | | | | | | | | | | | |
Portfolio turnover rate | | | | | | | 53 | % | | | 117 | % | | | 126 | % | | | 129 | % |
| | | | | | | | | | | | | | | | | | | | |
| (a) | Commencement of operations. |
| (b) | Based on average shares outstanding. |
| (c) | Distributions for annual periods determined in accordance with U.S. federal income tax regulations. |
| (d) | Where applicable, assumes the reinvestment of distributions. |
| (e) | Aggregate total return. |
| (f) | Excludes expenses incurred indirectly as a result of investments in underlying funds as follows: |
| | | | | | | | | | | | | | | | | | | | |
| | | | Year Ended May 31, | | |
| Period from
01/25/18to 05/31/18 |
(a) |
| | | | | | | | 2021 | | | | 2020 | | | | 2019 | |
Investments in underlying funds | | | | | | | 0.01 | % | | | 0.02 | % | | | 0.02 | % | | | 0.01 | % |
| | | | | | | | | | | | | | | | | | | | |
| (g) | Includes recoupment of past waived and/or reimbursed fees with no financial impact to the expense ratio. |
| (i) | Offering costs were not annualized in the calculation of the expense ratios. If these expenses were annualized, the total expenses would have been 0.54%. |
| (j) | Interest expense and fees relate to TOB Trusts. See Note 4 of the Notes to Financial Statements for details. |
See notes to financial statements.
| | |
| 68 | | 2 0 2 1 B L A C K R O C K A N N U A L R E P O R T T O S H A R E H O L D E R S |
Financial Highlights (continued)
(For a share outstanding throughout each period)
| | | | | | | | | | | | | | | | | | | | | | | | |
| | | BlackRock New Jersey Municipal Bond Fund | |
| | | Institutional | |
| | | Year Ended May 31, | |
| | | | | | 2021 | | | 2020 | | | 2019 | | | 2018 | | | 2017 | |
Net asset value, beginning of year | | | | | | $ | 10.84 | | | $ | 11.30 | | | $ | 11.05 | | | $ | 11.05 | | | $ | 11.38 | |
| | | | | | | | | | | | | | | | | | | | | | | | |
Net investment income(a) | | | | | | | 0.35 | | | | 0.37 | | | | 0.40 | | | | 0.40 | | | | 0.39 | |
Net realized and unrealized gain (loss) | | | | | | | 0.75 | | | | (0.46 | ) | | | 0.25 | | | | (0.00 | )(b) | | | (0.33 | ) |
| | | | | | | | | | | | | | | | | | | | | | | | |
Net increase (decrease) from investment operations | | | | | | | 1.10 | | | | (0.09 | ) | | | 0.65 | | | | 0.40 | | | | 0.06 | |
| | | | | | | | | | | | | | | | | | | | | | | | |
Distributions from net investment income(c) | | | | | | | (0.35 | ) | | | (0.37 | ) | | | (0.40 | ) | | | (0.40 | ) | | | (0.39 | ) |
| | | | | | | | | | | | | | | | | | | | | | | | |
| | | | | | |
Net asset value, end of year | | | | | | $ | 11.59 | | | $ | 10.84 | | | $ | 11.30 | | | $ | 11.05 | | | $ | 11.05 | |
| | | | | | | | | | | | | | | | | | | | | | | | |
| | | | | | |
Total Return(d) | | | | | | | | | | | | | | | | | | | | | | | | |
Based on net asset value | | | | | | | 10.23 | % | | | (0.89 | )% | | | 6.05 | % | | | 3.69 | % | | | 0.56 | % |
| | | | | | | | | | | | | | | | | | | | | | | | |
| | | | | | |
Ratios to Average Net Assets(e) | | | | | | | | | | | | | | | | | | | | | | | | |
Total expenses | | | | | | | 0.73 | % | | | 0.81 | % | | | 0.85 | % | | | 0.84 | % | | | 0.80 | % |
| | | | | | | | | | | | | | | | | | | | | | | | |
Total expenses after fees waived and/or reimbursed | | | | | | | 0.56 | % | | | 0.63 | % | | | 0.65 | % | | | 0.64 | % | | | 0.66 | % |
| | | | | | | | | | | | | | | | | | | | | | | | |
Total expenses after fees waived and/or reimbursed and excluding interest expense(f) | | | | | | | 0.52 | % | | | 0.52 | % | | | 0.52 | % | | | 0.54 | % | | | 0.61 | % |
| | | | | | | | | | | | | | | | | | | | | | | | |
Net investment income | | | | | | | 3.06 | % | | | 3.27 | % | | | 3.65 | % | | | 3.60 | % | | | 3.51 | % |
| | | | | | | | | | | | | | | | | | | | | | | | |
| | | | | | |
Supplemental Data | | | | | | | | | | | | | | | | | | | | | | | | |
Net assets, end of year (000) | | | | | | $ | 215,903 | | | $ | 188,512 | | | $ | 178,716 | | | $ | 152,759 | | | $ | 141,585 | |
| | | | | | | | | | | | | | | | | | | | | | | | |
Borrowings outstanding, end of year (000) | | | | | | $ | 17,972 | | | $ | 22,054 | | | $ | 16,419 | | | $ | 16,419 | | | $ | 9,281 | |
| | | | | | | | | | | | | | | | | | | | | | | | |
Portfolio turnover rate | | | | | | | 16 | % | | | 21 | % | | | 15 | % | | | 16 | % | | | 21 | % |
| | | | | | | | | | | | | | | | | | | | | | | | |
| (a) | Based on average shares outstanding. |
| (b) | Amount is less than $0.005 per share. |
| (c) | Distributions for annual periods determined in accordance with U.S. federal income tax regulations. |
| (d) | Where applicable, assumes the reinvestment of distributions. |
| (e) | Excludes expenses incurred indirectly as a result of investments in underlying funds as follows: |
| | | | | | | | | | | | | | | | | | | | | | | | |
| | | | Year Ended May 31, | |
| | | | | | 2021 | | | 2020 | | | 2019 | | | 2018 | | | 2017 | |
Investments in underlying funds | | | | | | | 0.01 | % | | | 0.01 | % | | | 0.01 | % | | | — | % | | | 0.01 | % |
| | | | | | | | | | | | | | | | | | | | | | | | |
(f) Interest expense and fees relate to TOB Trusts. See Note 4 of the Notes to Financial Statements for details.
See notes to financial statements.
| | |
F I N A N C I A L H I G H L I G H T S | | 69 |
Financial Highlights (continued)
(For a share outstanding throughout each period)
| | | | | | | | | | | | | | | | | | | | | | | | |
| | | BlackRock New Jersey Municipal Bond Fund (continued) | |
| | | Service | |
| | | Year Ended May 31, | |
| | | | | | 2021 | | | 2020 | | | 2019 | | | 2018 | | | 2017 | |
Net asset value, beginning of year | | | | | | $ | 10.84 | | | $ | 11.30 | | | $ | 11.05 | | | $ | 11.05 | | | $ | 11.38 | |
| | | | | | | | | | | | | | | | | | | | | | | | |
Net investment income(a) | | | | | | | 0.32 | | | | 0.34 | | | | 0.37 | | | | 0.37 | | | | 0.36 | |
Net realized and unrealized gain (loss) | | | | | | | 0.75 | | | | (0.46 | ) | | | 0.25 | | | | (0.00 | )(b) | | | (0.32 | ) |
| | | | | | | | | | | | | | | | | | | | | | | | |
Net increase (decrease) from investment operations | | | | | | | 1.07 | | | | (0.12 | ) | | | 0.62 | | | | 0.37 | | | | 0.04 | |
| | | | | | | | | | | | | | | | | | | | | | | | |
Distributions from net investment income(c) | | | | | | | (0.32 | ) | | | (0.34 | ) | | | (0.37 | ) | | | (0.37 | ) | | | (0.37 | ) |
| | | | | | | | | | | | | | | | | | | | | | | | |
| | | | | | |
Net asset value, end of year | | | | | | $ | 11.59 | | | $ | 10.84 | | | $ | 11.30 | | | $ | 11.05 | | | $ | 11.05 | |
| | | | | | | | | | | | | | | | | | | | | | | | |
| | | | | | |
Total Return(d) | | | | | | | | | | | | | | | | | | | | | | | | |
Based on net asset value | | | | | | | 9.96 | % | | | (1.13 | )% | | | 5.79 | % | | | 3.43 | % | | | 0.36 | % |
| | | | | | | | | | | | | | | | | | | | | | | | |
| | | | | | |
Ratios to Average Net Assets(e) | | | | | | | | | | | | | | | | | | | | | | | | |
Total expenses | | | | | | | 0.96 | % | | | 1.02 | % | | | 1.08 | % | | | 1.09 | % | | | 1.05 | % |
| | | | | | | | | | | | | | | | | | | | | | | | |
Total expenses after fees waived and/or reimbursed | | | | | | | 0.81 | % | | | 0.88 | % | | | 0.90 | % | | | 0.89 | % | | | 0.86 | % |
| | | | | | | | | | | | | | | | | | | | | | | | |
Total expenses after fees waived and/or reimbursed and excluding interest expense(f) | | | | | | | 0.77 | % | | | 0.77 | % | | | 0.77 | % | | | 0.79 | % | | | 0.82 | % |
| | | | | | | | | | | | | | | | | | | | | | | | |
Net investment income | | | | | | | 2.77 | % | | | 2.98 | % | | | 3.34 | % | | | 3.35 | % | | | 3.27 | % |
| | | | | | | | | | | | | | | | | | | | | | | | |
| | | | | | |
Supplemental Data | | | | | | | | | | | | | | | | | | | | | | | | |
Net assets, end of year (000) | | | | | | $ | 7,955 | | | $ | 7,466 | | | $ | 7,874 | | | $ | 7,921 | | | $ | 9,594 | |
| | | | | | | | | | | | | | | | | | | | | | | | |
Borrowings outstanding, end of year (000) | | | | | | $ | 17,972 | | | $ | 22,054 | | | $ | 16,419 | | | $ | 16,419 | | | $ | 9,281 | |
| | | | | | | | | | | | | | | | | | | | | | | | |
Portfolio turnover rate | | | | | | | 16 | % | | | 21 | % | | | 15 | % | | | 16 | % | | | 21 | % |
| | | | | | | | | | | | | | | | | | | | | | | | |
| (a) | Based on average shares outstanding. |
| (b) | Amount is greater than $(0.005) per share. |
| (c) | Distributions for annual periods determined in accordance with U.S. federal income tax regulations. |
| (d) | Where applicable, assumes the reinvestment of distributions. |
| (e) | Excludes expenses incurred indirectly as a result of investments in underlying funds as follows: |
| | | | | | | | | | | | | | | | | | | | | | | | |
| | | | Year Ended May 31, | |
| | | | | | 2021 | | | 2020 | | | 2019 | | | 2018 | | | 2017 | |
Investments in underlying funds | | | | | | | 0.01 | % | | | 0.01 | % | | | 0.01 | % | | | — | % | | | 0.01 | % |
| | | | | | | | | | | | | | | | | | | | | | | | |
| (f) | Interest expense and fees relate to TOB Trusts. See Note 4 of the Notes to Financial Statements for details. |
See notes to financial statements.
| | |
| 70 | | 2 0 2 1 B L A C K R O C K A N N U A L R E P O R T T O S H A R E H O L D E R S |
Financial Highlights (continued)
(For a share outstanding throughout each period)
| | | | | | | | | | | | | | | | | | | | | | | | |
| | | BlackRock New Jersey Municipal Bond Fund (continued) | |
| | | Investor A | |
| | | Year Ended May 31, | |
| | | | | | 2021 | | | 2020 | | | 2019 | | | 2018 | | | 2017 | |
| | | | | | |
Net asset value, beginning of year | | | | | | $ | 10.85 | | | $ | 11.31 | | | $ | 11.06 | | | $ | 11.06 | | | $ | 11.39 | |
| | | | | | | | | | | | | | | | | | | | | | | | |
Net investment income(a) | | | | | | | 0.32 | | | | 0.34 | | | | 0.37 | | | | 0.37 | | | | 0.37 | |
Net realized and unrealized gain (loss) | | | | | | | 0.75 | | | | (0.46 | ) | | | 0.25 | | | | (0.00 | )(b) | | | (0.33 | ) |
| | | | | | | | | | | | | | | | | | | | | | | | |
Net increase (decrease) from investment operations | | | | | | | 1.07 | | | | (0.12 | ) | | | 0.62 | | | | 0.37 | | | | 0.04 | |
| | | | | | | | | | | | | | | | | | | | | | | | |
Distributions from net investment income(c) | | | | | | | (0.32 | ) | | | (0.34 | ) | | | (0.37 | ) | | | (0.37 | ) | | | (0.37 | ) |
| | | | | | | | | | | | | | | | | | | | | | | | |
| | | | | | |
Net asset value, end of year | | | | | | $ | 11.60 | | | $ | 10.85 | | | $ | 11.31 | | | $ | 11.06 | | | $ | 11.06 | |
| | | | | | | | | | | | | | | | | | | | | | | | |
| | | | | | |
Total Return(d) | | | | | | | | | | | | | | | | | | | | | | | | |
Based on net asset value | | | | | | | 9.96 | % | | | (1.13 | )% | | | 5.79 | % | | | 3.43 | % | | | 0.36 | % |
| | | | | | | | | | | | | | | | | | | | | | | | |
| | | | | | |
Ratios to Average Net Assets(e) | | | | | | | | | | | | | | | | | | | | | | | | |
Total expenses | | | | | | | 0.93 | % | | | 1.02 | % | | | 1.05 | % | | | 1.02 | % | | | 0.99 | % |
| | | | | | | | | | | | | | | | | | | | | | | | |
Total expenses after fees waived and/or reimbursed | | | | | | | 0.80 | % | | | 0.88 | % | | | 0.90 | % | | | 0.89 | % | | | 0.86 | % |
| | | | | | | | | | | | | | | | | | | | | | | | |
Total expenses after fees waived and/or reimbursed and excluding interest expense(f) | | | | | | | 0.77 | % | | | 0.77 | % | | | 0.77 | % | | | 0.79 | % | | | 0.82 | % |
| | | | | | | | | | | | | | | | | | | | | | | | |
Net investment income | | | | | | | 2.81 | % | | | 3.01 | % | | | 3.39 | % | | | 3.35 | % | | | 3.29 | % |
| | | | | | | | | | | | | | | | | | | | | | | | |
| | | | | | |
Supplemental Data | | | | | | | | | | | | | | | | | | | | | | | | |
Net assets, end of year (000) | | | | | | $ | 128,040 | | | $ | 106,048 | | | $ | 90,055 | | | $ | 72,565 | | | $ | 77,920 | |
| | | | | | | | | | | | | | | | | | | | | | | | |
Borrowings outstanding, end of year (000) | | | | | | $ | 17,972 | | | $ | 22,054 | | | $ | 16,419 | | | $ | 16,419 | | | $ | 9,281 | |
| | | | | | | | | | | | | | | | | | | | | | | | |
Portfolio turnover rate | | | | | | | 16 | % | | | 21 | % | | | 15 | % | | | 16 | % | | | 21 | % |
| | | | | | | | | | | | | | | | | | | | | | | | |
|
(a) Based on average shares outstanding. (b) Amount is greater than $(0.005) per share. (c) Distributions for annual periods determined in accordance with U.S. federal income tax regulations. (d) Where applicable, excludes the effects of any sales charges and assumes the reinvestment of distributions. (e) Excludes expenses incurred indirectly as a result of investments in underlying funds as follows: | |
| | | | | | | | | | | | | | | | | | | | | | | | |
| | | Year Ended May 31, | |
| | | | | | 2021 | | | 2020 | | | 2019 | | | 2018 | | | 2017 | |
Investments in underlying funds | | | | | | | 0.01 | % | | | 0.01 | % | | | 0.01 | % | | | — | % | | | 0.01 | % |
| | | | | | | | | | | | | | | | | | | | | | | | |
| (f) | Interest expense and fees relate to TOB Trusts. See Note 4 of the Notes to Financial Statements for details. |
See notes to financial statements.
| | |
F I N A N C I A L H I G H L I G H T S | | 71 |
Financial Highlights (continued)
(For a share outstanding throughout each period)
| | | | | | | | | | | | | | | | | | | | | | | | |
| | | BlackRock New Jersey Municipal Bond Fund (continued) | |
| | | Investor A1 | |
| | | Year Ended May 31, | |
| | | | | | 2021 | | | 2020 | | | 2019 | | | 2018 | | | 2017 | |
| | | | | | |
Net asset value, beginning of year | | | | | | $ | 10.85 | | | $ | 11.31 | | | $ | 11.06 | | | $ | 11.07 | | | $ | 11.39 | |
| | | | | | | | | | | | | | | | | | | | | | | | |
Net investment income(a) | | | | | | | 0.34 | | | | 0.36 | | | | 0.39 | | | | 0.39 | | | | 0.38 | |
Net realized and unrealized gain (loss) | | | | | | | 0.75 | | | | (0.46 | ) | | | 0.25 | | | | (0.01 | ) | | | (0.32 | ) |
| | | | | | | | | | | | | | | | | | | | | | | | |
Net increase (decrease) from investment operations | | | | | | | 1.09 | | | | (0.10 | ) | | | 0.64 | | | | 0.38 | | | | 0.06 | |
| | | | | | | | | | | | | | | | | | | | | | | | |
Distributions from net investment income(b) | | | | | | | (0.34 | ) | | | (0.36 | ) | | | (0.39 | ) | | | (0.39 | ) | | | (0.38 | ) |
| | | | | | | | | | | | | | | | | | | | | | | | |
| | | | | | |
Net asset value, end of year | | | | | | $ | 11.60 | | | $ | 10.85 | | | $ | 11.31 | | | $ | 11.06 | | | $ | 11.07 | |
| | | | | | | | | | | | | | | | | | | | | | | | |
| | | | | | |
Total Return(c) | | | | | | | | | | | | | | | | | | | | | | | | |
Based on net asset value | | | | | | | 10.12 | % | | | (0.97 | )% | | | 5.95 | % | | | 3.49 | % | | | 0.59 | % |
| | | | | | | | | | | | | | | | | | | | | | | | |
| | | | | | |
Ratios to Average Net Assets(d) | | | | | | | | | | | | | | | | | | | | | | | | |
Total expenses | | | | | | | 0.78 | % | | | 0.85 | % | | | 0.88 | % | | | 0.87 | % | | | 0.83 | % |
| | | | | | | | | | | | | | | | | | | | | | | | |
Total expenses after fees waived and/or reimbursed | | | | | | | 0.65 | % | | | 0.73 | % | | | 0.74 | % | | | 0.74 | % | | | 0.72 | % |
| | | | | | | | | | | | | | | | | | | | | | | | |
Total expenses after fees waived and/or reimbursed and excluding interest expense(e) | | | | | | | 0.62 | % | | | 0.61 | % | | | 0.62 | % | | | 0.64 | % | | | 0.68 | % |
| | | | | | | | | | | | | | | | | | | | | | | | |
Net investment income | | | | | | | 2.96 | % | | | 3.16 | % | | | 3.54 | % | | | 3.50 | % | | | 3.43 | % |
| | | | | | | | | | | | | | | | | | | | | | | | |
| | | | | | |
Supplemental Data | | | | | | | | | | | | | | | | | | | | | | | | |
Net assets, end of year (000) | | | | | | $ | 17,417 | | | $ | 17,241 | | | $ | 19,760 | | | $ | 20,534 | | | $ | 22,697 | |
| | | | | | | | | | | | | | | | | | | | | | | | |
Borrowings outstanding, end of year (000) | | | | | | $ | 17,972 | | | $ | 22,054 | | | $ | 16,419 | | | $ | 16,419 | | | $ | 9,281 | |
| | | | | | | | | | | | | | | | | | | | | | | | |
Portfolio turnover rate | | | | | | | 16 | % | | | 21 | % | | | 15 | % | | | 16 | % | | | 21 | % |
| | | | | | | | | | | | | | | | | | | | | | | | |
|
(a) Based on average shares outstanding. (b) Distributions for annual periods determined in accordance with U.S. federal income tax regulations. (c) Where applicable, excludes the effects of any sales charges and assumes the reinvestment of distributions. (d) Excludes expenses incurred indirectly as a result of investments in underlying funds as follows: | |
| | | | | | | | | | | | | | | | | | | | | | | | |
| | | Year Ended May 31, | |
| | | | | | 2021 | | | 2020 | | | 2019 | | | 2018 | | | 2017 | |
Investments in underlying funds | | | | | | | 0.01 | % | | | 0.01 | % | | | 0.01 | % | | | — | % | | | 0.01 | % |
| | | | | | | | | | | | | | | | | | | | | | | | |
| (e) | Interest expense and fees relate to TOB Trusts. See Note 4 of the Notes to Financial Statements for details. |
See notes to financial statements.
| | |
| 72 | | 2 0 2 1 BLACK ROCK ANNUAL REPORT TO SHAREHOLDERS |
Financial Highlights (continued)
(For a share outstanding throughout each period)
| | | | | | | | | | | | | | | | | | | | | | | | |
| | | BlackRock New Jersey Municipal Bond Fund (continued) | |
| | | Investor C | |
| | | Year Ended May 31, | |
| | | | | | 2021 | | | 2020 | | | 2019 | | | 2018 | | | 2017 | |
| | | | | | |
Net asset value, beginning of year | | | | | | $ | 10.84 | | | $ | 11.30 | | | $ | 11.05 | | | $ | 11.05 | | | $ | 11.38 | |
| | | | | | | | | | | | | | | | | | | | | | | | |
Net investment income(a) | | | | | | | 0.23 | | | | 0.25 | | | | 0.29 | | | | 0.29 | | | | 0.28 | |
Net realized and unrealized gain (loss) | | | | | | | 0.75 | | | | (0.45 | ) | | | 0.25 | | | | 0.00 | (b) | | | (0.33 | ) |
| | | | | | | | | | | | | | | | | | | | | | | | |
Net increase (decrease) from investment operations | | | | | | | 0.98 | | | | (0.20 | ) | | | 0.54 | | | | 0.29 | | | | (0.05 | ) |
| | | | | | | | | | | | | | | | | | | | | | | | |
Distributions from net investment income(c) | | | | | | | (0.23 | ) | | | (0.26 | ) | | | (0.29 | ) | | | (0.29 | ) | | | (0.28 | ) |
| | | | | | | | | | | | | | | | | | | | | | | | |
| | | | | | |
Net asset value, end of year | | | | | | $ | 11.59 | | | $ | 10.84 | | | $ | 11.30 | | | $ | 11.05 | | | $ | 11.05 | |
| | | | | | | | | | | | | | | | | | | | | | | | |
| | | | | | |
Total Return(d) | | | | | | | | | | | | | | | | | | | | | | | | |
Based on net asset value | | | | | | | 9.14 | % | | | (1.87 | )% | | | 5.00 | % | | | 2.65 | % | | | (0.41 | )% |
| | | | | | | | | | | | | | | | | | | | | | | | |
| | | | | | |
Ratios to Average Net Assets(e) | | | | | | | | | | | | | | | | | | | | | | | | |
Total expenses | | | | | | | 1.68 | % | | | 1.76 | % | | | 1.79 | % | | | 1.78 | % | | | 1.73 | % |
| | | | | | | | | | | | | | | | | | | | | | | | |
Total expenses after fees waived and/or reimbursed | | | | | | | 1.56 | % | | | 1.63 | % | | | 1.64 | % | | | 1.64 | % | | | 1.62 | % |
| | | | | | | | | | | | | | | | | | | | | | | | |
Total expenses after fees waived and/or reimbursed and excluding interest expense(f) | | | | | | | 1.52 | % | | | 1.52 | % | | | 1.52 | % | | | 1.54 | % | | | 1.57 | % |
| | | | | | | | | | | | | | | | | | | | | | | | |
Net investment income | | | | | | | 2.06 | % | | | 2.26 | % | | | 2.64 | % | | | 2.60 | % | | | 2.53 | % |
| | | | | | | | | | | | | | | | | | | | | | | | |
| | | | | | |
Supplemental Data | | | | | | | | | | | | | | | | | | | | | | | | |
Net assets, end of year (000) | | | | | | $ | 26,004 | | | $ | 32,313 | | | $ | 31,234 | | | $ | 29,509 | | | $ | 29,276 | |
| | | | | | | | | | | | | | | | | | | | | | | | |
Borrowings outstanding, end of year (000) | | | | | | $ | 17,972 | | | $ | 22,054 | | | $ | 16,419 | | | $ | 16,419 | | | $ | 9,281 | |
| | | | | | | | | | | | | | | | | | | | | | | | |
Portfolio turnover rate | | | | | | | 16 | % | | | 21 | % | | | 15 | % | | | 16 | % | | | 21 | % |
| | | | | | | | | | | | | | | | | | | | | | | | |
|
(a) Based on average shares outstanding. (b) Amount is less than $0.005 per share. (c) Distributions for annual periods determined in accordance with U.S. federal income tax regulations. (d) Where applicable, excludes the effects of any sales charges and assumes the reinvestment of distributions. (e) Excludes expenses incurred indirectly as a result of investments in underlying funds as follows: | |
| | | | | | | | | | | | | | | | | | | | | | | | |
| | | Year Ended May 31, | |
| | | | | | 2021 | | | 2020 | | | 2019 | | | 2018 | | | 2017 | |
Investments in underlying funds | | | | | | | 0.01 | % | | | 0.01 | % | | | 0.01 | % | | | — | % | | | 0.01 | % |
| | | | | | | | | | | | | | | | | | | | | | | | |
| (f) | Interest expense and fees relate to TOB Trusts. See Note 4 of the Notes to Financial Statements for details. |
See notes to financial statements.
| | |
F I N A N C I A L H I G H L I G H T S | | 73 |
Financial Highlights (continued)
(For a share outstanding throughout each period)
| | | | | | | | | | | | | | | | | | | | |
| | | BlackRock New Jersey Municipal Bond Fund (continued) | |
| | | Class K | |
| | | | | | | | | | | | | | | Period from | |
| | | Year Ended May 31, | | |
| 01/25/18
to 05/31/18 | (a)
|
| | | | | | 2021 | | | 2020 | | | 2019 | |
Net asset value, beginning of period | | | | | | $ | 10.83 | | | $ | 11.30 | | | $ | 11.04 | | | $ | 11.11 | |
| | | | | | | | | | | | | | | | | | | | |
Net investment income(b) | | | | | | | 0.35 | | | | 0.37 | | | | 0.41 | | | | 0.14 | |
Net realized and unrealized gain (loss) | | | | | | | 0.76 | | | | (0.47 | ) | | | 0.26 | | | | (0.07 | ) |
| | | | | | | | | | | | | | | | | | | | |
Net increase (decrease) from investment operations | | | | | | | 1.11 | | | | (0.10 | ) | | | 0.67 | | | | 0.07 | |
| | | | | | | | | | | | | | | | | | | | |
Distributions from net investment income(c) | | | | | | | (0.35 | ) | | | (0.37 | ) | | | (0.41 | ) | | | (0.14 | ) |
| | | | | | | | | | | | | | | | | | | | |
| | | | | |
Net asset value, end of period | | | | | | $ | 11.59 | | | $ | 10.83 | | | $ | 11.30 | | | $ | 11.04 | |
| | | | | | | | | | | | | | | | | | | | |
| | | | | |
Total Return(d) | | | | | | | | | | | | | | | | | | | | |
Based on net asset value | | | | | | | 10.39 | % | | | (0.93 | )% | | | 6.20 | % | | | 0.66 | %(e) |
| | | | | | | | | | | | | | | | | | | | |
| | | | | |
Ratios to Average Net Assets(f) | | | | | | | | | | | | | | | | | | | | |
Total expenses | | | | | | | 0.64 | % | | | 0.72 | % | | | 0.75 | % | | | 0.74 | %(g)(h) |
| | | | | | | | | | | | | | | | | | | | |
Total expenses after fees waived and/or reimbursed | | | | | | | 0.51 | % | | | 0.58 | % | | | 0.60 | % | | | 0.57 | %(g) |
| | | | | | | | | | | | | | | | | | | | |
Total expenses after fees waived and/or reimbursed and excluding interest expense(i) | | | | | | | 0.47 | % | | | 0.47 | % | | | 0.47 | % | | | 0.47 | %(g) |
| | | | | | | | | | | | | | | | | | | | |
Net investment income | | | | | | | 3.10 | % | | | 3.32 | % | | | 3.70 | % | | | 3.88 | %(g) |
| | | | | | | | | | | | | | | | | | | | |
| | | | | |
Supplemental Data | | | | | | | | | | | | | | | | | | | | |
Net assets, end of period (000) | | | | | | $ | 2,902 | | | $ | 2,075 | | | $ | 1,660 | | | $ | 1,776 | |
| | | | | | | | | | | | | | | | | | | | |
Borrowings outstanding, end of year (000) | | | | | | $ | 17,972 | | | $ | 22,054 | | | $ | 16,419 | | | $ | 16,419 | |
| | | | | | | | | | | | | | | | | | | | |
Portfolio turnover rate | | | | | | | 16 | % | | | 21 | % | | | 15 | % | | | 16 | % |
| | | | | | | | | | | | | | | | | | | | |
| (a) | Commencement of operations. |
| (b) | Based on average shares outstanding. |
| (c) | Distributions for annual periods determined in accordance with U.S. federal income tax regulations. |
| (d) | Where applicable, assumes the reinvestment of distributions. |
| (e) | Aggregate total return. |
| (f) | Excludes expenses incurred indirectly as a result of investments in underlying funds as follows: |
| | | | | | | | | | | | | | | | | | | | |
| | | | | | | | Year Ended May 31, | | |
| Period from
01/25/18 to 05/31/18 |
(a) |
| | | | | | 2021 | | | 2020 | | | 2019 | |
Investments in underlying funds | | | | | | | 0.01 | % | | | 0.01 | % | | | 0.01 | % | | | — | % |
| | | | | | | | | | | | | | | | | | | | |
| (h) | Offering costs were not annualized in the calculation of the expense ratios. If these expenses were annualized, the total expenses would have been 0.74%. |
| (i) | Interest expense and fees relate to TOB Trusts. See Note 4 of the Notes to Financial Statements for details. |
See notes to financial statements.
| | |
| 74 | | 2 0 2 1 BLACK ROCK ANNUAL REPORT TO SHAREHOLDERS |
Financial Highlights (continued)
(For a share outstanding throughout each period)
| | | | | | | | | | | | | | | | | | | | | | | | |
| | | BlackRock Pennsylvania Municipal Bond Fund | |
| | | Institutional | |
| | | Year Ended May 31, | |
| | | | | | 2021 | | | 2020 | | | 2019 | | | 2018 | | | 2017 | |
| | | | | | |
Net asset value, beginning of year | | | | | | $ | 10.75 | | | $ | 11.11 | | | $ | 10.98 | | | $ | 11.21 | | | $ | 11.58 | |
| | | | | | | | | | | | | | | | | | | | | | | | |
Net investment income(a) | | | | | | | 0.33 | | | | 0.38 | | | | 0.43 | | | | 0.45 | | | | 0.46 | |
Net realized and unrealized gain (loss) | | | | | | | 0.54 | | | | (0.36 | ) | | | 0.13 | | | | (0.23 | ) | | | (0.37 | ) |
| | | | | | | | | | | | | | | | | | | | | | | | |
Net increase from investment operations | | | | | | | 0.87 | | | | 0.02 | | | | 0.56 | | | | 0.22 | | | | 0.09 | |
| | | | | | | | | | | | | | | | | | | | | | | | |
Distributions from net investment income(b) | | | | | | | (0.33 | ) | | | (0.38 | ) | | | (0.43 | ) | | | (0.45 | ) | | | (0.46 | ) |
| | | | | | | | | | | | | | | | | | | | | | | | |
| | | | | | |
Net asset value, end of year | | | | | | $ | 11.29 | | | $ | 10.75 | | | $ | 11.11 | | | $ | 10.98 | | | $ | 11.21 | |
| | | | | | | | | | | | | | | | | | | | | | | | |
| | | | | | |
Total Return(c) | | | | | | | | | | | | | | | | | | | | | | | | |
Based on net asset value | | | | | | | 8.20 | % | | | 0.14 | % | | | 5.22 | % | | | 2.02 | % | | | 0.81 | % |
| | | | | | | | | | | | | | | | | | | | | | | | |
| | | | | | |
Ratios to Average Net Assets(d) | | | | | | | | | | | | | | | | | | | | | | | | |
Total expenses | | | | | | | 0.79 | % | | | 0.93 | % | | | 1.04 | % | | | 0.97 | % | | | 0.95 | % |
| | | | | | | | | | | | | | | | | | | | | | | | |
Total expenses after fees waived and/or reimbursed | | | | | | | 0.61 | % | | | 0.75 | % | | | 0.84 | % | | | 0.78 | % | | | 0.78 | % |
| | | | | | | | | | | | | | | | | | | | | | | | |
Total expenses after fees waived and/or reimbursed and excluding interest expense(e) | | | | | | | 0.54 | % | | | 0.54 | % | | | 0.54 | % | | | 0.55 | % | | | 0.61 | % |
| | | | | | | | | | | | | | | | | | | | | | | | |
Net investment income | | | | | | | 2.98 | % | | | 3.44 | % | | | 3.93 | % | | | 4.06 | % | | | 4.05 | % |
| | | | | | | | | | | | | | | | | | | | | | | | |
| | | | | | |
Supplemental Data | | | | | | | | | | | | | | | | | | | | | | | | |
Net assets, end of year (000) | | | | | | $ | 403,080 | | | $ | 370,399 | | | $ | 379,911 | | | $ | 356,315 | | | $ | 298,557 | |
| | | | | | | | | | | | | | | | | | | | | | | | |
Borrowings outstanding, end of year (000) | | | | | | $ | 49,169 | | | $ | 64,784 | | | $ | 64,404 | | | $ | 70,199 | | | $ | 59,064 | |
| | | | | | | | | | | | | | | | | | | | | | | | |
Portfolio turnover rate | | | | | | | 27 | % | | | 26 | % | | | 23 | % | | | 17 | % | | | 18 | % |
| | | | | | | | | | | | | | | | | | | | | | | | |
|
(a) Based on average shares outstanding. (b) Distributions for annual periods determined in accordance with U.S. federal income tax regulations. (c) Where applicable, assumes the reinvestment of distributions. (d) Excludes expenses incurred indirectly as a result of investments in underlying funds as follows: | |
| | | | | | | | | | | | | | | | | | | | | | | | |
| | | Year Ended May 31, | |
| | | | | | 2021 | | | 2020 | | | 2019 | | | 2018 | | | 2017 | |
Investments in underlying funds | | | | | | | 0.01 | % | | | 0.01 | % | | | — | % | | | — | % | | | — | % |
| | | | | | | | | | | | | | | | | | | | | | | | |
(e) Interest expense and fees relate to TOB Trusts. See Note 4 of the Notes to Financial Statements for details.
See notes to financial statements.
| | |
F I N A N C I A L H I G H L I G H T S | | 75 |
Financial Highlights (continued)
(For a share outstanding throughout each period)
| | | | | | | | | | | | | | | | | | | | | | | | |
| | | BlackRock Pennsylvania Municipal Bond Fund (continued) | |
| | | Service | |
| | | Year Ended May 31, | |
| | | | | | 2021 | | | 2020 | | | 2019 | | | 2018 | | | 2017 | |
| | | | | | |
Net asset value, beginning of year | | | | | | $ | 10.76 | | | $ | 11.13 | | | $ | 10.99 | | | $ | 11.22 | | | $ | 11.59 | |
| | | | | | | | | | | | | | | | | | | | | | | | |
Net investment income(a) | | | | | | | 0.30 | | | | 0.35 | | | | 0.40 | | | | 0.42 | | | | 0.43 | |
Net realized and unrealized gain (loss) | | | | | | | 0.54 | | | | (0.37 | ) | | | 0.14 | | | | (0.23 | ) | | | (0.37 | ) |
| | | | | | | | | | | | | | | | | | | | | | | | |
Net increase (decrease) from investment operations | | | | | | | 0.84 | | | | (0.02 | ) | | | 0.54 | | | | 0.19 | | | | 0.06 | |
| | | | | | | | | | | | | | | | | | | | | | | | |
Distributions from net investment income(b) | | | | | | | (0.30 | ) | | | (0.35 | ) | | | (0.40 | ) | | | (0.42 | ) | | | (0.43 | ) |
| | | | | | | | | | | | | | | | | | | | | | | | |
| | | | | | |
Net asset value, end of year | | | | | | $ | 11.30 | | | $ | 10.76 | | | $ | 11.13 | | | $ | 10.99 | | | $ | 11.22 | |
| | | | | | | | | | | | | | | | | | | | | | | | |
| | | | | | |
Total Return(c) | | | | | | | | | | | | | | | | | | | | | | | | |
Based on net asset value | | | | | | | 7.93 | % | | | (0.20 | )% | | | 5.05 | % | | | 1.76 | % | | | 0.59 | % |
| | | | | | | | | | | | | | | | | | | | | | | | |
| | | | | | |
Ratios to Average Net Assets(d) | | | | | | | | | | | | | | | | | | | | | | | | |
Total expenses | | | | | | | 0.97 | % | | | 1.14 | % | | | 1.26 | % | | | 1.19 | % | | | 1.13 | % |
| | | | | | | | | | | | | | | | | | | | | | | | |
Total expenses after fees waived and/or reimbursed | | | | | | | 0.86 | % | | | 1.00 | % | | | 1.09 | % | | | 1.03 | % | | | 1.00 | % |
| | | | | | | | | | | | | | | | | | | | | | | | |
Total expenses after fees waived and/or reimbursed and excluding interest expense(e) | | | | | | | 0.79 | % | | | 0.79 | % | | | 0.79 | % | | | 0.80 | % | | | 0.83 | % |
| | | | | | | | | | | | | | | | | | | | | | | | |
Net investment income | | | | | | | 2.72 | % | | | 3.19 | % | | | 3.67 | % | | | 3.81 | % | | | 3.84 | % |
| | | | | | | | | | | | | | | | | | | | | | | | |
| | | | | | |
Supplemental Data | | | | | | | | | | | | | | | | | | | | | | | | |
Net assets, end of year (000) | | | | | | $ | 2,367 | | | $ | 1,986 | | | $ | 2,080 | | | $ | 1,783 | | | $ | 1,427 | |
| | | | | | | | | | | | | | | | | | | | | | | | |
Borrowings outstanding, end of year (000) | | | | | | $ | 49,169 | | | $ | 64,784 | | | $ | 64,404 | | | $ | 70,199 | | | $ | 59,064 | |
| | | | | | | | | | | | | | | | | | | | | | | | |
Portfolio turnover rate | | | | | | | 27 | % | | | 26 | % | | | 23 | % | | | 17 | % | | | 18 | % |
| | | | | | | | | | | | | | | | | | | | | | | | |
|
(a) Based on average shares outstanding. (b) Distributions for annual periods determined in accordance with U.S. federal income tax regulations. (c) Where applicable, assumes the reinvestment of distributions. (d) Excludes expenses incurred indirectly as a result of investments in underlying funds as follows: | |
| | | | | | | | | | | | | | | | | | | | | | | | |
| | | Year Ended May 31, | |
| | | | | | 2021 | | | 2020 | | | 2019 | | | 2018 | | | 2017 | |
Investments in underlying funds | | | | | | | 0.01 | % | | | 0.01 | % | | | — | % | | | — | % | | | — | % |
| | | | | | | | | | | | | | | | | | | | | | | | |
| (e) | Interest expense and fees relate to TOB Trusts. See Note 4 of the Notes to Financial Statements for details. |
See notes to financial statements.
| | |
| 76 | | 2 0 2 1 BLACK ROCK ANNUAL REPORT TO SHAREHOLDERS |
Financial Highlights (continued)
(For a share outstanding throughout each period)
| | | | | | | | | | | | | | | | | | | | | | | | |
| | | BlackRock Pennsylvania Municipal Bond Fund (continued) | |
| | | Investor A | |
| | | Year Ended May 31, | |
| | | | | | 2021 | | | 2020 | | | 2019 | | | 2018 | | | 2017 | |
| | | | | | |
Net asset value, beginning of year | | | | | | $ | 10.76 | | | $ | 11.13 | | | $ | 10.99 | | | $ | 11.22 | | | $ | 11.59 | |
| | | | | | | | | | | | | | | | | | | | | | | | |
Net investment income(a) | | | | | | | 0.30 | | | | 0.35 | | | | 0.40 | | | | 0.42 | | | | 0.43 | |
Net realized and unrealized gain (loss) | | | | | | | 0.54 | | | | (0.37 | ) | | | 0.14 | | | | (0.23 | ) | | | (0.37 | ) |
| | | | | | | | | | | | | | | | | | | | | | | | |
Net increase (decrease) from investment operations | | | | | | | 0.84 | | | | (0.02 | ) | | | 0.54 | | | | 0.19 | | | | 0.06 | |
| | | | | | | | | | | | | | | | | | | | | | | | |
Distributions from net investment income(b) | | | | | | | (0.30 | ) | | | (0.35 | ) | | | (0.40 | ) | | | (0.42 | ) | | | (0.43 | ) |
| | | | | | | | | | | | | | | | | | | | | | | | |
| | | | | | |
Net asset value, end of year | | | | | | $ | 11.30 | | | $ | 10.76 | | | $ | 11.13 | | | $ | 10.99 | | | $ | 11.22 | |
| | | | | | | | | | | | | | | | | | | | | | | | |
| | | | | | |
Total Return(c) | | | | | | | | | | | | | | | | | | | | | | | | |
Based on net asset value | | | | | | | 7.93 | % | | | (0.20 | )% | | | 5.05 | % | | | 1.76 | % | | | 0.59 | % |
| | | | | | | | | | | | | | | | | | | | | | | | |
| | | | | | |
Ratios to Average Net Assets(d) | | | | | | | | | | | | | | | | | | | | | | | | |
Total expenses | | | | | | | 0.94 | % | | | 1.09 | % | | | 1.19 | % | | | 1.16 | % | | | 1.11 | % |
| | | | | | | | | | | | | | | | | | | | | | | | |
Total expenses after fees waived and/or reimbursed | | | | | | | 0.85 | % | | | 1.00 | % | | | 1.09 | % | | | 1.03 | % | | | 1.00 | % |
| | | | | | | | | | | | | | | | | | | | | | | | |
Total expenses after fees waived and/or reimbursed and excluding interest expense(e) | | | | | | | 0.78 | % | | | 0.79 | % | | | 0.79 | % | | | 0.80 | % | | | 0.83 | % |
| | | | | | | | | | | | | | | | | | | | | | | | |
Net investment income | | | | | | | 2.72 | % | | | 3.19 | % | | | 3.67 | % | | | 3.82 | % | | | 3.83 | % |
| | | | | | | | | | | | | | | | | | | | | | | | |
| | | | | | |
Supplemental Data | | | | | | | | | | | | | | | | | | | | | | | | |
Net assets, end of year (000) | | | | | | $ | 161,081 | | | $ | 131,336 | | | $ | 110,756 | | | $ | 98,414 | | | $ | 130,405 | |
| | | | | | | | | | | | | | | | | | | | | | | | |
Borrowings outstanding, end of year (000) | | | | | | $ | 49,169 | | | $ | 64,784 | | | $ | 64,404 | | | $ | 70,199 | | | $ | 59,064 | |
| | | | | | | | | | | | | | | | | | | | | | | | |
Portfolio turnover rate | | | | | | | 27 | % | | | 26 | % | | | 23 | % | | | 17 | % | | | 18 | % |
| | | | | | | | | | | | | | | | | | | | | | | | |
|
(a) Based on average shares outstanding. (b) Distributions for annual periods determined in accordance with U.S. federal income tax regulations. (c) Where applicable, excludes the effects of any sales charges and assumes the reinvestment of distributions. (d) Excludes expenses incurred indirectly as a result of investments in underlying funds as follows: | |
| | | | | | | | | | | | | | | | | | | | | | | | |
| | | Year Ended May 31, | |
| | | | | | 2021 | | | 2020 | | | 2019 | | | 2018 | | | 2017 | |
Investments in underlying funds | | | | | | | 0.01 | % | | | 0.01 | % | | | — | % | | | — | % | | | — | % |
| | | | | | | | | | | | | | | | | | | | | | | | |
| (e) | Interest expense and fees relate to TOB Trusts. See Note 4 of the Notes to Financial Statements for details. |
See notes to financial statements.
| | |
F I N A N C I A L H I G H L I G H T S | | 77 |
Financial Highlights (continued)
(For a share outstanding throughout each period)
| | | | | | | | | | | | | | | | | | | | | | | | |
| | | BlackRock Pennsylvania Municipal Bond Fund (continued) | |
| | | Investor A1 | |
| | | Year Ended May 31, | |
| | | | | | 2021 | | | 2020 | | | 2019 | | | 2018 | | | 2017 | |
| | | | | | |
Net asset value, beginning of year | | | | | | $ | 10.77 | | | $ | 11.13 | | | $ | 11.00 | | | $ | 11.22 | | | $ | 11.60 | |
| | | | | | | | | | | | | | | | | | | | | | | | |
Net investment income(a) | | | | | | | 0.32 | | | | 0.37 | | | | 0.42 | | | | 0.44 | | | | 0.45 | |
Net realized and unrealized gain (loss) | | | | | | | 0.53 | | | | (0.36 | ) | | | 0.13 | | | | (0.22 | ) | | | (0.38 | ) |
| | | | | | | | | | | | | | | | | | | | | | | | |
Net increase from investment operations | | | | | | | 0.85 | | | | 0.01 | | | | 0.55 | | | | 0.22 | | | | 0.07 | |
| | | | | | | | | | | | | | | | | | | | | | | | |
Distributions from net investment income(b) | | | | | | | (0.32 | ) | | | (0.37 | ) | | | (0.42 | ) | | | (0.44 | ) | | | (0.45 | ) |
| | | | | | | | | | | | | | | | | | | | | | | | |
| | | | | | |
Net asset value, end of year | | | | | | $ | 11.30 | | | $ | 10.77 | | | $ | 11.13 | | | $ | 11.00 | | | $ | 11.22 | |
| | | | | | | | | | | | | | | | | | | | | | | | |
| | | | | | |
Total Return(c) | | | | | | | | | | | | | | | | | | | | | | | | |
Based on net asset value | | | | | | | 7.99 | % | | | 0.04 | % | | | 5.11 | % | | | 2.01 | % | | | 0.66 | % |
| | | | | | | | | | | | | | | | | | | | | | | | |
| | | | | | |
Ratios to Average Net Assets(d) | | | | | | | | | | | | | | | | | | | | | | | | |
Total expenses | | | | | | | 0.82 | % | | | 0.96 | % | | | 1.05 | % | | | 0.98 | % | | | 0.94 | % |
| | | | | | | | | | | | | | | | | | | | | | | | |
Total expenses after fees waived and/or reimbursed | | | | | | | 0.71 | % | | | 0.85 | % | | | 0.94 | % | | | 0.88 | % | | | 0.85 | % |
| | | | | | | | | | | | | | | | | | | | | | | | |
Total expenses after fees waived and/or reimbursed and excluding interest expense(e) | | | | | | | 0.64 | % | | | 0.64 | % | | | 0.64 | % | | | 0.65 | % | | | 0.68 | % |
| | | | | | | | | | | | | | | | | | | | | | | | |
Net investment income | | | | | | | 2.88 | % | | | 3.34 | % | | | 3.83 | % | | | 3.96 | % | | | 3.99 | % |
| | | | | | | | | | | | | | | | | | | | | | | | |
| | | | | | |
Supplemental Data | | | | | | | | | | | | | | | | | | | | | | | | |
Net assets, end of year (000) | | | | | | $ | 8,925 | | | $ | 9,462 | | | $ | 10,502 | | | $ | 13,763 | | | $ | 15,266 | |
| | | | | | | | | | | | | | | | | | | | | | | | |
Borrowings outstanding, end of year (000) | | | | | | $ | 49,169 | | | $ | 64,784 | | | $ | 64,404 | | | $ | 70,199 | | | $ | 59,064 | |
| | | | | | | | | | | | | | | | | | | | | | | | |
Portfolio turnover rate | | | | | | | 27 | % | | | 26 | % | | | 23 | % | | | 17 | % | | | 18 | % |
| | | | | | | | | | | | | | | | | | | | | | | | |
|
(a) Based on average shares outstanding. (b) Distributions for annual periods determined in accordance with U.S. federal income tax regulations. (c) Where applicable, excludes the effects of any sales charges and assumes the reinvestment of distributions. (d) Excludes expenses incurred indirectly as a result of investments in underlying funds as follows: | |
| | | | | | | | | | | | | | | | | | | | | | | | |
| | | Year Ended May 31, | |
| | | | | | 2021 | | | 2020 | | | 2019 | | | 2018 | | | 2017 | |
Investments in underlying funds | | | | | | | 0.01 | % | | | 0.01 | % | | | — | % | | | — | % | | | — | % |
| | | | | | | | | | | | | | | | | | | | | | | | |
| (e) | Interest expense and fees relate to TOB Trusts. See Note 4 of the Notes to Financial Statements for details. |
See notes to financial statements.
| | |
| 78 | | 2 0 2 1 BLACK ROCK ANNUAL REPORT TO SHAREHOLDERS |
Financial Highlights (continued)
(For a share outstanding throughout each period)
| | | | | | | | | | | | | | | | | | | | | | | | |
| | | BlackRock Pennsylvania Municipal Bond Fund (continued) | |
| | | Investor C | |
| | | Year Ended May 31, | |
| | | | | | 2021 | | | 2020 | | | 2019 | | | 2018 | | | 2017 | |
| | | | | | |
Net asset value, beginning of year | | | | | | $ | 10.76 | | | $ | 11.12 | | | $ | 10.99 | | | $ | 11.22 | | | $ | 11.59 | |
| | | | | | | | | | | | | | | | | | | | | | | | |
Net investment income(a) | | | | | | | 0.22 | | | | 0.27 | | | | 0.32 | | | | 0.34 | | | | 0.35 | |
Net realized and unrealized gain (loss) | | | | | | | 0.54 | | | | (0.36 | ) | | | 0.13 | | | | (0.23 | ) | | | (0.37 | ) |
| | | | | | | | | | | | | | | | | | | | | | | | |
Net increase (decrease) from investment operations | | | | | | | 0.76 | | | | (0.09 | ) | | | 0.45 | | | | 0.11 | | | | (0.02 | ) |
| | | | | | | | | | | | | | | | | | | | | | | | |
Distributions from net investment income(b) | | | | | | | (0.22 | ) | | | (0.27 | ) | | | (0.32 | ) | | | (0.34 | ) | | | (0.35 | ) |
| | | | | | | | | | | | | | | | | | | | | | | | |
| | | | | | |
Net asset value, end of year | | | | | | $ | 11.30 | | | $ | 10.76 | | | $ | 11.12 | | | $ | 10.99 | | | $ | 11.22 | |
| | | | | | | | | | | | | | | | | | | | | | | | |
| | | | | | |
Total Return(c) | | | | | | | | | | | | | | | | | | | | | | | | |
Based on net asset value | | | | | | | 7.12 | % | | | (0.85 | )% | | | 4.18 | % | | | 1.01 | % | | | (0.17 | )% |
| | | | | | | | | | | | | | | | | | | | | | | | |
| | | | | | |
Ratios to Average Net Assets(d) | | | | | | | | | | | | | | | | | | | | | | | | |
Total expenses | | | | | | | 1.71 | % | | | 1.85 | % | | | 1.95 | % | | | 1.87 | % | | | 1.84 | % |
| | | | | | | | | | | | | | | | | | | | | | | | |
Total expenses after fees waived and/or reimbursed | | | | | | | 1.61 | % | | | 1.75 | % | | | 1.84 | % | | | 1.78 | % | | | 1.76 | % |
| | | | | | | | | | | | | | | | | | | | | | | | |
Total expenses after fees waived and/or reimbursed and excluding interest expense(e) | | | | | | | 1.54 | % | | | 1.54 | % | | | 1.54 | % | | | 1.54 | % | | | 1.59 | % |
| | | | | | | | | | | | | | | | | | | | | | | | |
Net investment income | | | | | | | 2.00 | % | | | 2.44 | % | | | 2.93 | % | | | 3.06 | % | | | 3.08 | % |
| | | | | | | | | | | | | | | | | | | | | | | | |
| | | | | | |
Supplemental Data | | | | | | | | | | | | | | | | | | | | | | | | |
Net assets, end of year (000) | | | | | | $ | 20,866 | | | $ | 29,078 | | | $ | 29,936 | | | $ | 32,105 | | | $ | 33,427 | |
| | | | | | | | | | | | | | | | | | | | | | | | |
Borrowings outstanding, end of year (000) | | | | | | $ | 49,169 | | | $ | 64,784 | | | $ | 64,404 | | | $ | 70,199 | | | $ | 59,064 | |
| | | | | | | | | | | | | | | | | | | | | | | | |
Portfolio turnover rate | | | | | | | 27 | % | | | 26 | % | | | 23 | % | | | 17 | % | | | 18 | % |
| | | | | | | | | | | | | | | | | | | | | | | | |
|
(a) Based on average shares outstanding. (b) Distributions for annual periods determined in accordance with U.S. federal income tax regulations. (c) Where applicable, excludes the effects of any sales charges and assumes the reinvestment of distributions. (d) Excludes expenses incurred indirectly as a result of investments in underlying funds as follows: | |
| | | | | | | | | | | | | | | | | | | | | | | | |
| | | Year Ended May 31, | |
| | | | | | 2021 | | | 2020 | | | 2019 | | | 2018 | | | 2017 | |
Investments in underlying funds | | | | | | | 0.01 | % | | | 0.01 | % | | | — | % | | | — | % | | | — | % |
| | | | | | | | | | | | | | | | | | | | | | | | |
| (e) | Interest expense and fees relate to TOB Trusts. See Note 4 of the Notes to Financial Statements for details. |
See notes to financial statements.
| | |
F I N A N C I A L H I G H L I G H T S | | 79 |
Financial Highlights (continued)
(For a share outstanding throughout each period)
| | | | | | | | | | | | | | | | | | | | |
| | | BlackRock Pennsylvania Municipal Bond Fund (continued) | |
| | | Class K | |
| | | | | | | | | | | | | | | | | |
| Period from
01/25/18 to 05/31/18 |
(a) |
| | | Year Ended May 31, | |
| | | | | | 2021 | | | 2020 | | | 2019 | |
Net asset value, beginning of period | | | | | | $ | 10.75 | | | $ | 11.11 | | | $ | 10.98 | | | $ | 11.07 | |
| | | | | | | | | | | | | | | | | | | | |
Net investment income(b) | | | | | | | 0.33 | | | | 0.38 | | | | 0.43 | | | | 0.15 | |
Net realized and unrealized gain (loss) | | | | | | | 0.55 | | | | (0.35 | ) | | | 0.13 | | | | (0.09 | ) |
| | | | | | | | | | | | | | | | | | | | |
Net increase from investment operations | | | | | | | 0.88 | | | | 0.03 | | | | 0.56 | | | | 0.06 | |
| | | | | | | | | | | | | | | | | | | | |
Distributions from net investment income(c) | | | | | | | (0.34 | ) | | | (0.39 | ) | | | (0.43 | ) | | | (0.15 | ) |
| | | | | | | | | | | | | | | | | | | | |
| | | | | |
Net asset value, end of period | | | | | | $ | 11.29 | | | $ | 10.75 | | | $ | 11.11 | | | $ | 10.98 | |
| | | | | | | | | | | | | | | | | | | | |
| | | | | |
Total Return(d) | | | | | | | | | | | | | | | | | | | | |
Based on net asset value | | | | | | | 8.25 | % | | | 0.19 | % | | | 5.28 | % | | | 0.60 | %(e) |
| | | | | | | | | | | | | | | | | | | | |
| | | | | |
Ratios to Average Net Assets(f) | | | | | | | | | | | | | | | | | | | | |
Total expenses | | | | | | | 0.65 | % | | | 0.80 | % | | | 0.90 | % | | | 0.84 | %(g)(h) |
| | | | | | | | | | | | | | | | | | | | |
Total expenses after fees waived and/or reimbursed | | | | | | | 0.56 | % | | | 0.70 | % | | | 0.79 | % | | | 0.72 | %(g) |
| | | | | | | | | | | | | | | | | | | | |
Total expenses after fees waived and/or reimbursed and excluding interest expense(i) | | | | | | | 0.49 | % | | | 0.49 | % | | | 0.49 | % | | | 0.49 | %(g) |
| | | | | | | | | | | | | | | | | | | | |
Net investment income | | | | | | | 3.01 | % | | | 3.48 | % | | | 3.98 | % | | | 4.41 | %(g) |
| | | | | | | | | | | | | | | | | | | | |
| | | | | |
Supplemental Data | | | | | | | | | | | | | | | | | | | | |
Net assets, end of period (000) | | | | | | $ | 6,334 | | | $ | 3,982 | | | $ | 2,329 | | | $ | 2,488 | |
| | | | | | | | | | | | | | | | | | | | |
Borrowings outstanding, end of year (000) | | | | | | $ | 49,169 | | | $ | 64,784 | | | $ | 64,404 | | | $ | 70,199 | |
| | | | | | | | | | | | | | | | | | | | |
Portfolio turnover rate | | | | | | | 27 | % | | | 26 | % | | | 23 | % | | | 17 | % |
| | | | | | | | | | | | | | | | | | | | |
| (a) | Commencement of operations. |
| (b) | Based on average shares outstanding. |
| (c) | Distributions for annual periods determined in accordance with U.S. federal income tax regulations. |
| (d) | Where applicable, assumes the reinvestment of distributions. |
| (e) | Aggregate total return. |
| (f) | Excludes expenses incurred indirectly as a result of investments in underlying funds as follows: |
| | | | | | | | | | | | | | | | | | | | |
| | | | Year Ended May 31, | | |
| Period from
01/25/18( to 05/31/18 |
a) |
| | | | | | 2021 | | | 2020 | | | 2019 | |
Investments in underlying funds | | | | | | | 0.01 | % | | | 0.01 | % | | | — | % | | | — | % |
| | | | | | | | | | | | | | | | | | | | |
| (h) | Offering costs were not annualized in the calculation of the expense ratios. If these expenses were annualized, the total expenses would have been 0.84%. |
| (i) | Interest expense and fees relate to TOB Trusts. See Note 4 of the Notes to Financial Statements for details. |
See notes to financial statements.
| | |
| 80 | | 2 0 2 1 BLACK ROCK ANNUAL REPORT TO SHAREHOLDERS |
Financial Highlights (continued)
(For a share outstanding throughout each period)
| | | | | | | | | | | | | | | | | | | | | | | | |
| | | BlackRock Strategic Municipal Opportunities Fund | |
| | | Institutional | |
| | | Year Ended May 31, | |
| | | | | | 2021 | | | 2020 | | | 2019 | | | 2018 | | | 2017 | |
Net asset value, beginning of year | | | | | | $ | 10.90 | | | $ | 11.70 | | | $ | 11.75 | | | $ | 11.57 | | | $ | 11.79 | |
| | | | | | | | | | | | | | | | | | | | | | | | |
Net investment income(a) | | | | | | | 0.27 | | | | 0.29 | | | | 0.35 | | | | 0.33 | | | | 0.31 | |
Net realized and unrealized gain (loss) | | | | | | | 1.04 | | | | (0.80 | ) | | | 0.14 | | | | 0.18 | | | | (0.07 | ) |
| | | | | | | | | | | | | | | | | | | | | | | | |
Net increase (decrease) from investment operations | | | | | | | 1.31 | | | | (0.51 | ) | | | 0.49 | | | | 0.51 | | | | 0.24 | |
| | | | | | | | | | | | | | | | | | | | | | | | |
| | | | | | |
Distributions(b) | | | | | | | | | | | | | | | | | | | | | | | | |
From net investment income | | | | | | | (0.26 | ) | | | (0.29 | ) | | | (0.35 | ) | | | (0.33 | ) | | | (0.31 | ) |
From net realized gain | | | | | | | — | | | | — | | | | (0.19 | ) | | | — | | | | (0.15 | ) |
| | | | | | | | | | | | | | | | | | | | | | | | |
Total distributions | | | | | | | (0.26 | ) | | | (0.29 | ) | | | (0.54 | ) | | | (0.33 | ) | | | (0.46 | ) |
| | | | | | | | | | | | | | | | | | | | | | | | |
| | | | | | |
Net asset value, end of year | | | | | | $ | 11.95 | | | $ | 10.90 | | | $ | 11.70 | | | $ | 11.75 | | | $ | 11.57 | |
| | | | | | | | | | | | | | | | | | | | | | | | |
| | | | | | |
Total Return(c) | | | | | | | | | | | | | | | | | | | | | | | | |
Based on net asset value | | | | | | | 12.18 | % | | | (4.46 | )% | | | 4.41 | % | | | 4.47 | % | | | 2.13 | % |
| | | | | | | | | | | | | | | | | | | | | | | | |
| | | | | | |
Ratios to Average Net Assets(d) | | | | | | | | | | | | | | | | | | | | | | | | |
Total expenses | | | | | | | 0.67 | % | | | 0.75 | % | | | 0.82 | % | | | 0.81 | % | | | 0.74 | % |
| | | | | | | | | | | | | | | | | | | | | | | | |
Total expenses after fees waived and/or reimbursed | | | | | | | 0.61 | % | | | 0.70 | % | | | 0.77 | % | | | 0.75 | % | | | 0.69 | % |
| | | | | | | | | | | | | | | | | | | | | | | | |
Total expenses after fees waived and/or reimbursed and excluding interest expense(e) | | | | | | | 0.55 | % | | | 0.54 | % | | | 0.55 | % | | | 0.57 | % | | | 0.57 | % |
| | | | | | | | | | | | | | | | | | | | | | | | |
Net investment income | | | | | | | 2.32 | % | | | 2.53 | % | | | 3.05 | % | | | 2.83 | % | | | 2.71 | % |
| | | | | | | | | | | | | | | | | | | | | | | | |
| | | | | | |
Supplemental Data | | | | | | | | | | | | | | | | | | | | | | | | |
Net assets, end of year (000) | | | | | | $ | 6,514,428 | | | $ | 6,827,755 | | | $ | 8,539,776 | | | $ | 5,791,442 | | | $ | 3,512,455 | |
| | | | | | | | | | | | | | | | | | | | | | | | |
Borrowings outstanding, end of year (000) | | | | | | $ | 764,712 | | | $ | 869,463 | | | $ | 960,205 | | | $ | 767,480 | | | $ | 526,645 | |
| | | | | | | | | | | | | | | | | | | | | | | | |
Portfolio turnover rate | | | | | | | 100 | % | | | 119 | % | | | 68 | % | | | 145 | % | | | 171 | % |
| | | | | | | | | | | | | | | | | | | | | | | | |
(a) Based on average shares outstanding. (b) Distributions for annual periods determined in accordance with U.S. federal income tax regulations. (c) Where applicable, assumes the reinvestment of distributions. (d) Excludes expenses incurred indirectly as a result of investments in underlying funds as follows: | |
| | | | | | | | | | | | | | | | | | | | | | | | |
| | | Year Ended May 31, | |
| | | | | | 2021 | | | 2020 | | | 2019 | | | 2018 | | | 2017 | |
Investments in underlying funds | | | | | | | 0.01 | % | | | 0.01 | % | | | 0.01 | % | | | 0.01 | % | | | 0.01 | % |
| | | | | | | | | | | | | | | | | | | | | | | | |
| (e) | Interest expense and fees relate to TOB Trusts. See Note 4 of the Notes to Financial Statements for details. |
See notes to financial statements.
| | |
F I N A N C I A L H I G H L I G H T S | | 81 |
Financial Highlights (continued)
(For a share outstanding throughout each period)
| | | | | | | | | | | | | | | | | | | | | | | | |
| | | BlackRock Strategic Municipal Opportunities Fund (continued) | |
| | | Investor A | |
| | | Year Ended May 31, | |
| | | | | | 2021 | | | 2020 | | | 2019 | | | 2018 | | | 2017 | |
Net asset value, beginning of year | | | | | | $ | 10.90 | | | $ | 11.69 | | | $ | 11.74 | | | $ | 11.56 | | | $ | 11.78 | |
| | | | | | | | | | | | | | | | | | | | | | | | |
Net investment income(a) | | | | | | | 0.24 | | | | 0.27 | | | | 0.33 | | | | 0.31 | | | | 0.29 | |
Net realized and unrealized gain (loss) | | | | | | | 1.04 | | | | (0.79 | ) | | | 0.14 | | | | 0.18 | | | | (0.07 | ) |
| | | | | | | | | | | | | | | | | | | | | | | | |
Net increase (decrease) from investment operations | | | | | | | 1.28 | | | | (0.52 | ) | | | 0.47 | | | | 0.49 | | | | 0.22 | |
| | | | | | | | | | | | | | | | | | | | | | | | |
| | | | | | |
Distributions(b) | | | | | | | | | | | | | | | | | | | | | | | | |
From net investment income | | | | | | | (0.24 | ) | | | (0.27 | ) | | | (0.33 | ) | | | (0.31 | ) | | | (0.29 | ) |
From net realized gain | | | | | | | — | | | | — | | | | (0.19 | ) | | | — | | | | (0.15 | ) |
| | | | | | | | | | | | | | | | | | | | | | | | |
Total distributions | | | | | | | (0.24 | ) | | | (0.27 | ) | | | (0.52 | ) | | | (0.31 | ) | | | (0.44 | ) |
| | | | | | | | | | | | | | | | | | | | | | | | |
| | | | | | |
Net asset value, end of year | | | | | | $ | 11.94 | | | $ | 10.90 | | | $ | 11.69 | | | $ | 11.74 | | | $ | 11.56 | |
| | | | | | | | | | | | | | | | | | | | | | | | |
| | | | | | |
Total Return(c) | | | | | | | | | | | | | | | | | | | | | | | | |
Based on net asset value | | | | | | | 11.83 | % | | | (4.59 | )% | | | 4.17 | % | | | 4.26 | % | | | 1.92 | % |
| | | | | | | | | | | | | | | | | | | | | | | | |
| | | | | | |
Ratios to Average Net Assets(d) | | | | | | | | | | | | | | | | | | | | | | | | |
Total expenses | | | | | | | 0.89 | % | | | 0.98 | % | | | 1.05 | % | | | 1.02 | % | | | 0.95 | % |
| | | | | | | | | | | | | | | | | | | | | | | | |
Total expenses after fees waived and/or reimbursed | | | | | | | 0.84 | % | | | 0.92 | % | | | 1.00 | % | | | 0.96 | % | | | 0.90 | % |
| | | | | | | | | | | | | | | | | | | | | | | | |
Total expenses after fees waived and/or reimbursed and excluding interest expense(e) | | | | | | | 0.77 | % | | | 0.76 | % | | | 0.78 | % | | | 0.78 | % | | | 0.78 | % |
| | | | | | | | | | | | | | | | | | | | | | | | |
Net investment income | | | | | | | 2.10 | % | | | 2.31 | % | | | 2.82 | % | | | 2.63 | % | | | 2.50 | % |
| | | | | | | | | | | | | | | | | | | | | | | | |
| | | | | | |
Supplemental Data | | | | | | | | | | | | | | | | | | | | | | | | |
Net assets, end of year (000) | | | | | | $ | 1,717,910 | | | $ | 1,871,557 | | | $ | 1,846,094 | | | $ | 1,441,879 | | | $ | 1,049,555 | |
| | | | | | | | | | | | | | | | | | | | | | | | |
Borrowings outstanding, end of year (000) | | | | | | $ | 764,712 | | | $ | 869,463 | | | $ | 960,205 | | | $ | 767,480 | | | $ | 526,645 | |
| | | | | | | | | | | | | | | | | | | | | | | | |
Portfolio turnover rate | | | | | | | 100 | % | | | 119 | % | | | 68 | % | | | 145 | % | | | 171 | % |
| | | | | | | | | | | | | | | | | | | | | | | | |
|
(a) Based on average shares outstanding. (b) Distributions for annual periods determined in accordance with U.S. federal income tax regulations. (c) Where applicable, excludes the effects of any sales charges and assumes the reinvestment of distributions. (d) Excludes expenses incurred indirectly as a result of investments in underlying funds as follows: | |
| | | | | | | | | | | | | | | | | | | | | | | | |
| | | Year Ended May 31, | |
| | | | | | 2021 | | | 2020 | | | 2019 | | | 2018 | | | 2017 | |
Investments in underlying funds | | | | | | | 0.01 | % | | | 0.01 | % | | | 0.01 | % | | | 0.01 | % | | | 0.01 | % |
| | | | | | | | | | | | | | | | | | | | | | | | |
| (e) | Interest expense and fees relate to TOB Trusts. See Note 4 of the Notes to Financial Statements for details. |
See notes to financial statements.
| | |
| 82 | | 2 0 2 1 BLACK ROCK ANNUAL REPORT TO SHAREHOLDERS |
Financial Highlights (continued)
(For a share outstanding throughout each period)
| | | | | | | | | | | | | | | | | | | | | | | | |
| | | BlackRock Strategic Municipal Opportunities Fund (continued) | |
| | | Investor A1 | |
| | | Year Ended May 31, | |
| | | | | | 2021 | | | 2020 | | | 2019 | | | 2018 | | | 2017 | |
Net asset value, beginning of year | | | | | | $ | 10.90 | | | $ | 11.70 | | | $ | 11.75 | | | $ | 11.56 | | | $ | 11.79 | |
| | | | | | | | | | | | | | | | | | | | | | | | |
Net investment income(a) | | | | | | | 0.26 | | | | 0.29 | | | | 0.35 | | | | 0.32 | | | | 0.31 | |
Net realized and unrealized gain (loss) | | | | | | | 1.03 | | | | (0.81 | ) | | | 0.14 | | | | 0.19 | | | | (0.09 | ) |
| | | | | | | | | | | | | | | | | | | | | | | | |
Net increase (decrease) from investment operations | | | | | | | 1.29 | | | | (0.52 | ) | | | 0.49 | | | | 0.51 | | | | 0.22 | |
| | | | | | | | | | | | | | | | | | | | | | | | |
| | | | | | |
Distributions(b) | | | | | | | | | | | | | | | | | | | | | | | | |
From net investment income | | | | | | | (0.25 | ) | | | (0.28 | ) | | | (0.35 | ) | | | (0.32 | ) | | | (0.30 | ) |
From net realized gain | | | | | | | — | | | | — | | | | (0.19 | ) | | | — | | | | (0.15 | ) |
| | | | | | | | | | | | | | | | | | | | | | | | |
Total distributions | | | | | | | (0.25 | ) | | | (0.28 | ) | | | (0.54 | ) | | | (0.32 | ) | | | (0.45 | ) |
| | | | | | | | | | | | | | | | | | | | | | | | |
| | | | | | |
Net asset value, end of year | | | | | | $ | 11.94 | | | $ | 10.90 | | | $ | 11.70 | | | $ | 11.75 | | | $ | 11.56 | |
| | | | | | | | | | | | | | | | | | | | | | | | |
| | | | | | |
Total Return(c) | | | | | | | | | | | | | | | | | | | | | | | | |
Based on net asset value | | | | | | | 11.99 | % | | | (4.52 | )% | | | 4.33 | % | | | 4.49 | % | | | 1.98 | % |
| | | | | | | | | | | | | | | | | | | | | | | | |
| | | | | | |
Ratios to Average Net Assets(d) | | | | | | | | | | | | | | | | | | | | | | | | |
Total expenses | | | | | | | 0.75 | % | | | 0.82 | % | | | 0.90 | % | | | 0.88 | % | | | 0.81 | % |
| | | | | | | | | | | | | | | | | | | | | | | | |
Total expenses after fees waived and/or reimbursed | | | | | | | 0.69 | % | | | 0.76 | % | | | 0.84 | % | | | 0.83 | % | | | 0.76 | % |
| | | | | | | | | | | | | | | | | | | | | | | | |
Total expenses after fees waived and/or reimbursed and excluding interest expense(e) | | | | | | | 0.63 | % | | | 0.60 | % | | | 0.62 | % | | | 0.64 | % | | | 0.64 | % |
| | | | | | | | | | | | | | | | | | | | | | | | |
Net investment income | | | | | | | 2.25 | % | | | 2.48 | % | | | 2.99 | % | | | 2.77 | % | | | 2.64 | % |
| | | | | | | | | | | | | | | | | | | | | | | | |
| | | | | | |
Supplemental Data | | | | | | | | | | | | | | | | | | | | | | | | |
Net assets, end of year (000) | | | | | | $ | 24,645 | | | $ | 23,881 | | | $ | 27,606 | | | $ | 29,233 | | | $ | 30,691 | |
| | | | | | | | | | | | | | | | | | | | | | | | |
Borrowings outstanding, end of year (000) | | | | | | $ | 764,712 | | | $ | 869,463 | | | $ | 960,205 | | | $ | 767,480 | | | $ | 526,645 | |
| | | | | | | | | | | | | | | | | | | | | | | | |
Portfolio turnover rate | | | | | | | 100 | % | | | 119 | % | | | 68 | % | | | 145 | % | | | 171 | % |
| | | | | | | | | | | | | | | | | | | | | | | | |
|
(a) Based on average shares outstanding. (b) Distributions for annual periods determined in accordance with U.S. federal income tax regulations. (c) Where applicable, excludes the effects of any sales charges and assumes the reinvestment of distributions. (d) Excludes expenses incurred indirectly as a result of investments in underlying funds as follows: | |
| | | | | | | | | | | | | | | | | | | | | | | | |
| | | Year Ended May 31, | |
| | | | | | 2021 | | | 2020 | | | 2019 | | | 2018 | | | 2017 | |
Investments in underlying funds | | | | | | | 0.01 | % | | | 0.01 | % | | | 0.01 | % | | | 0.01 | % | | | 0.01 | % |
| | | | | | | | | | | | | | | | | | | | | | | | |
| (e) | Interest expense and fees relate to TOB Trusts. See Note 4 of the Notes to Financial Statements for details. |
See notes to financial statements.
| | |
F I N A N C I A L H I G H L I G H T S | | 83 |
Financial Highlights (continued)
(For a share outstanding throughout each period)
| | | | | | | | | | | | | | | | | | | | | | | | |
| | | BlackRock Strategic Municipal Opportunities Fund (continued) | |
| | | Investor C | |
| | | Year Ended May 31, | |
| | | | | | 2021 | | | 2020 | | | 2019 | | | 2018 | | | 2017 | |
Net asset value, beginning of year | | | | | | $ | 10.90 | | | $ | 11.70 | | | $ | 11.75 | | | $ | 11.56 | | | $ | 11.79 | |
| | | | | | | | | | | | | | | | | | | | | | | | |
Net investment income(a) | | | | | | | 0.15 | | | | 0.18 | | | | 0.24 | | | | 0.22 | | | | 0.20 | |
Net realized and unrealized gain (loss) | | | | | | | 1.05 | | | | (0.80 | ) | | | 0.14 | | | | 0.19 | | | | (0.08 | ) |
| | | | | | | | | | | | | | | | | | | | | | | | |
Net increase (decrease) from investment operations | | | | | | | 1.20 | | | | (0.62 | ) | | | 0.38 | | | | 0.41 | | | | 0.12 | |
| | | | | | | | | | | | | | | | | | | | | | | | |
| | | | | | |
Distributions(b) | | | | | | | | | | | | | | | | | | | | | | | | |
From net investment income | | | | | | | (0.15 | ) | | | (0.18 | ) | | | (0.24 | ) | | | (0.22 | ) | | | (0.20 | ) |
From net realized gain | | | | | | | — | | | | — | | | | (0.19 | ) | | | — | | | | (0.15 | ) |
| | | | | | | | | | | | | | | | | | | | | | | | |
Total distributions | | | | | | | (0.15 | ) | | | (0.18 | ) | | | (0.43 | ) | | | (0.22 | ) | | | (0.35 | ) |
| | | | | | | | | | | | | | | | | | | | | | | | |
| | | | | | |
Net asset value, end of year | | | | | | $ | 11.95 | | | $ | 10.90 | | | $ | 11.70 | | | $ | 11.75 | | | $ | 11.56 | |
| | | | | | | | | | | | | | | | | | | | | | | | |
| | | | | | |
Total Return(c) | | | | | | | | | | | | | | | | | | | | | | | | |
Based on net asset value | | | | | | | 11.07 | % | | | (5.39 | )% | | | 3.39 | % | | | 3.54 | % | | | 1.05 | % |
| | | | | | | | | | | | | | | | | | | | | | | | |
| | | | | | |
Ratios to Average Net Assets(d) | | | | | | | | | | | | | | | | | | | | | | | | |
Total expenses | | | | | | | 1.66 | % | | | 1.73 | % | | | 1.81 | % | | | 1.79 | % | | | 1.72 | % |
| | | | | | | | | | | | | | | | | | | | | | | | |
Total expenses after fees waived and/or reimbursed | | | | | | | 1.61 | % | | | 1.68 | % | | | 1.75 | % | | | 1.73 | % | | | 1.67 | % |
| | | | | | | | | | | | | | | | | | | | | | | | |
Total expenses after fees waived and/or reimbursed and excluding interest expense(e) | | | | | | | 1.54 | % | | | 1.52 | % | | | 1.53 | % | | | 1.55 | % | | | 1.55 | % |
| | | | | | | | | | | | | | | | | | | | | | | | |
Net investment income | | | | | | | 1.35 | % | | | 1.56 | % | | | 2.07 | % | | | 1.86 | % | | | 1.73 | % |
| | | | | | | | | | | | | | | | | | | | | | | | |
| | | | | | |
Supplemental Data | | | | | | | | | | | | | | | | | | | | | | | | |
Net assets, end of year (000) | | | | | | $ | 184,220 | | | $ | 271,382 | | | $ | 307,887 | | | $ | 269,156 | | | $ | 251,966 | |
| | | | | | | | | | | | | | | | | | | | | | | | |
Borrowings outstanding, end of year (000) | | | | | | $ | 764,712 | | | $ | 869,463 | | | $ | 960,205 | | | $ | 767,480 | | | $ | 526,645 | |
| | | | | | | | | | | | | | | | | | | | | | | | |
Portfolio turnover rate | | | | | | | 100 | % | | | 119 | % | | | 68 | % | | | 145 | % | | | 171 | % |
| | | | | | | | | | | | | | | | | | | | | | | | |
|
(a) Based on average shares outstanding. (b) Distributions for annual periods determined in accordance with U.S. federal income tax regulations. (c) Where applicable, excludes the effects of any sales charges and assumes the reinvestment of distributions. (d) Excludes expenses incurred indirectly as a result of investments in underlying funds as follows: | |
| | | | | | | | | | | | | | | | | | | | | | | | |
| | | Year Ended May 31, | |
| | | | | | 2021 | | | 2020 | | | 2019 | | | 2018 | | | 2017 | |
Investments in underlying funds | | | | | | | 0.01 | % | | | 0.01 | % | | | 0.01 | % | | | 0.01 | % | | | 0.01 | % |
| | | | | | | | | | | | | | | | | | | | | | | | |
| (e) | Interest expense and fees relate to TOB Trusts. See Note 4 of the Notes to Financial Statements for details. |
See notes to financial statements.
| | |
| 84 | | 2 0 2 1 BLACK ROCK ANNUAL REPORT TO SHAREHOLDERS |
Financial Highlights (continued)
(For a share outstanding throughout each period)
| | | | | | | | | | | | | | | | | | | | |
| | | BlackRock Strategic Municipal Opportunities Fund (continued) | |
| | | Class K | |
| | | Year Ended May 31, | | |
| Period from
01/25/18 to 05/31/18 |
(a) |
| | | | | | | | 2021 | | | | 2020 | | | | 2019 | |
Net asset value, beginning of period | | | | | | $ | 10.90 | | | $ | 11.70 | | | $ | 11.75 | | | $ | 11.73 | |
| | | | | | | | | | | | | | | | | | | | |
Net investment income(b) | | | | | | | 0.27 | | | | 0.30 | | | | 0.36 | | | | 0.11 | |
Net realized and unrealized gain (loss) | | | | | | | 1.05 | | | | (0.80 | ) | | | 0.14 | | | | 0.02 | |
| | | | | | | | | | | | | | | | | | | | |
Net increase (decrease) from investment operations | | | | | | | 1.32 | | | | (0.50 | ) | | | 0.50 | | | | 0.13 | |
| | | | | | | | | | | | | | | | | | | | |
| | | | | |
Distributions(c) | | | | | | | | | | | | | | | | | | | | |
From net investment income | | | | | | | (0.27 | ) | | | (0.30 | ) | | | (0.36 | ) | | | (0.11 | ) |
From net realized gain | | | | | | | — | | | | — | | | | (0.19 | ) | | | — | |
| | | | | | | | | | | | | | | | | | | | |
Total distributions | | | | | | | (0.27 | ) | | | (0.30 | ) | | | (0.55 | ) | | | (0.11 | ) |
| | | | | | | | | | | | | | | | | | | | |
| | | | | |
Net asset value, end of period | | | | | | $ | 11.95 | | | $ | 10.90 | | | $ | 11.70 | | | $ | 11.75 | |
| | | | | | | | | | | | | | | | | | | | |
| | | | | |
Total Return(d) | | | | | | | | | | | | | | | | | | | | |
Based on net asset value | | | | | | | 12.24 | % | | | (4.39 | )% | | | 4.47 | % | | | 1.16 | %(e) |
| | | | | | | | | | | | | | | | | | | | |
| | | | | |
Ratios to Average Net Assets(f) | | | | | | | | | | | | | | | | | | | | |
Total expenses | | | | | | | 0.61 | % | | | 0.69 | % | | | 0.76 | % | | | 0.74 | %(g)(h) |
| | | | | | | | | | | | | | | | | | | | |
Total expenses after fees waived and/or reimbursed | | | | | | | 0.56 | % | | | 0.63 | % | | | 0.71 | % | | | 0.68 | %(g) |
| | | | | | | | | | | | | | | | | | | | |
Total expenses after fees waived and/or reimbursed and excluding interest expense(i) | | | | | | | 0.49 | % | | | 0.47 | % | | | 0.48 | % | | | 0.50 | %(g) |
| | | | | | | | | | | | | | | | | | | | |
Net investment income | | | | | | | 2.37 | % | | | 2.59 | % | | | 3.11 | % | | | 3.20 | %(g) |
| | | | | | | | | | | | | | | | | | | | |
| | | | | |
Supplemental Data | | | | | | | | | | | | | | | | | | | | |
Net assets, end of period (000) | | | | | | $ | 168,801 | | | $ | 162,366 | | | $ | 126,051 | | | $ | 63,971 | |
| | | | | | | | | | | | | | | | | | | | |
Borrowings outstanding, end of year (000) | | | | | | $ | 764,712 | | | $ | 869,463 | | | $ | 960,205 | | | $ | 767,480 | |
| | | | | | | | | | | | | | | | | | | | |
Portfolio turnover rate | | | | | | | 100 | % | | | 119 | % | | | 68 | % | | | 145 | % |
| | | | | | | | | | | | | | | | | | | | |
|
(a) Commencement of operations. (b) Based on average shares outstanding. (c) Distributions for annual periods determined in accordance with U.S. federal income tax regulations. (d) Where applicable, assumes the reinvestment of distributions. (e) Aggregate total return. (f) Excludes expenses incurred indirectly as a result of investments in underlying funds as follows: | |
| | | | | | | | | | | | | | | | | |
| Period from
01/25/18 to 05/31/18 |
(a) |
| | | | | | Year Ended May 31, | |
| | | | | | 2021 | | | 2020 | | | 2019 | |
Investments in underlying funds | | | | | | | 0.01 | % | | | 0.01 | % | | | 0.01 | % | | | 0.01 | % |
| | | | | | | | | | | | | | | | | | | | |
| (h) | Offering costs were not annualized in the calculation of the expense ratios. If these expenses were annualized, the total expenses would have been 0.74%. |
| (i) | Interest expense and fees relate to TOB Trusts. See Note 4 of the Notes to Financial Statements for details. |
See notes to financial statements.
| | |
F I N A N C I A L H I G H L I G H T S | | 85 |
Notes to Financial Statements
BlackRock California Municipal Series Trust, BlackRock Multi-State Municipal Series Trust and BlackRock Municipal Series Trust (each, a “Trust” or collectively, the “Trusts”) are each registered under the Investment Company Act of 1940, as amended (the “1940 Act”), as open-end management investment companies. Each Trust is organized as a Massachusetts business trust.
| | | | | | |
| Registrant Name | | Fund Name | | Herein Referred To As | | Diversification
Classification |
BlackRock California Municipal Series Trust | | BlackRock California Municipal Opportunities Fund | | California Municipal Opportunities | | Diversified |
BlackRock Multi-State Municipal Series Trust | | BlackRock New Jersey Municipal Bond Fund | | New Jersey Municipal Bond | | Non-diversified |
| | BlackRock Pennsylvania Municipal Bond Fund | | Pennsylvania Municipal Bond | | Non-diversified |
BlackRock Municipal Series Trust | | BlackRock Strategic Municipal Opportunities Fund | | Strategic Municipal Opportunities | | Diversified |
Each Fund offers multiple classes of shares. All classes of shares have identical voting, dividend, liquidation and other rights and are subject to the same terms and conditions, except that certain classes bear expenses related to the shareholder servicing and distribution of such shares. Institutional, Service and Class K Shares are sold only to certain eligible investors. Service, Investor A, Investor A1 and Investor C Shares bear certain expenses related to shareholder servicing of such shares, and Investor C Shares also bear certain expenses related to the distribution of such shares. Investor A and Investor C Shares are generally available through financial intermediaries. Investor A1 Shares are only available for dividend and capital gain reinvestment by existing shareholders, and for purchase by certain employer-sponsored retirement plans and, for California Municipal Opportunities only, fee based programs previously approved by the Fund. Each class has exclusive voting rights with respect to matters relating to its shareholder servicing and distribution expenditures (except that Investor C shareholders may vote on material changes to the Investor A Shares distribution and service plan).
| | | | | | | | |
| Share Class | | Initial Sales Charge | | | CDSC | | Conversion Privilege |
Institutional, Service and Class K Shares | | | No | | | No | | None |
Investor A Shares | | | Yes | | | No(a) | | None |
Investor A1 Shares | | | No | (b) | | No(c) | | None |
Investor C Shares | | | No | | | Yes(d) | | To Investor A Shares after approximately 8 years |
| | (a) | Investor A Shares may be subject to a contingent deferred sales charge (“CDSC”) for certain redemptions where no initial sales charge was paid at the time of purchase. |
| | (b) | Investor A1 Shares are subject to a maximum sales charge on purchases of 4.00% for all Funds other than Strategic Municipal Opportunities, which is subject to a maximum sales charge of 1.00%. The sales charge does not apply to dividend and capital gain reinvestments by existing shareholders and new purchases for certain employer-sponsored retirement plans or, for California Municipal Opportunities only, fee based programs previously approved by the Fund, which are currently the only investors who may invest in Investor A1 Shares. |
| | (c) | Investor A1 Shares may be subject to CDSC for certain redemptions where no initial sales charge was paid at the time of purchase. However, the CDSC does not apply to redemptions by certain employer-sponsored retirement plans or to redemptions of shares acquired through reinvestment of dividends and capital gains by existing shareholders and, for California Municipal Opportunities only, fee based programs previously approved by the Fund. |
| | (d) | A CDSC of 1.00% is assessed on certain redemptions of Investor C Shares made within one year after purchase. |
The Funds, together with certain other registered investment companies advised by BlackRock Advisors, LLC (the “Manager”) or its affiliates, are included in a complex of non-index fixed-income mutual funds and all BlackRock-advised closed-end funds referred to as the BlackRock Fixed-Income Complex.
| 2. | SIGNIFICANT ACCOUNTING POLICIES |
The financial statements are prepared in conformity with accounting principles generally accepted in the United States of America (“U.S. GAAP”), which may require management to make estimates and assumptions that affect the reported amounts of assets and liabilities in the financial statements, disclosure of contingent assets and liabilities at the date of the financial statements and the reported amounts of increases and decreases in net assets from operations during the reporting period. Actual results could differ from those estimates. Each Fund is considered an investment company under U.S. GAAP and follows the accounting and reporting guidance applicable to investment companies. Below is a summary of significant accounting policies:
Investment Transactions and Income Recognition: For financial reporting purposes, investment transactions are recorded on the dates the transactions are executed. Realized gains and losses on investment transactions are determined using the specific identification method. Dividend income and capital gain distributions, if any, are recorded on the ex-dividend dates. Non-cash dividends, if any, are recorded on the ex-dividend dates at fair value. Interest income, including amortization and accretion of premiums and discounts on debt securities, is recognized daily on an accrual basis. Income, expenses and realized and unrealized gains and losses are allocated daily to each class based on its relative net assets.
Segregation and Collateralization: In cases where a Fund enters into certain investments (e.g., futures contracts) or certain borrowings (e.g., TOB Trust transactions) that would be treated as “senior securities” for 1940 Act purposes, a Fund may segregate or designate on its books and records cash or liquid assets having a market value at least equal to the amount of its future obligations under such investments or borrowings. Doing so allows the investment or borrowings to be excluded from treatment as a “senior security.” Furthermore, if required by an exchange or counterparty agreement, the Funds may be required to deliver/deposit cash and/or securities to/with an exchange, or broker-dealer or custodian as collateral for certain investments or obligations.
Distributions: Distributions from net investment income are declared daily and paid monthly. Distributions of capital gains are recorded on the ex-dividend dates and made at least annually. The portion of distributions, if any, that exceeds a fund’s current and accumulated earnings and profits, as measured on a tax basis, constitute a non-taxable return of capital. The character and timing of distributions are determined in accordance with U.S. federal income tax regulations, which may differ from U.S. GAAP.
Deferred Compensation Plan: Under the Deferred Compensation Plan (the “Plan”) approved by each Board of Trustees of the Trust (the “Board”), the trustees who are not “interested persons” of the Funds, as defined in the 1940 Act (“Independent Trustees”), may defer a portion of their annual complex-wide compensation. Deferred amounts earn an approximate return as though equivalent dollar amounts had been invested in common shares of certain funds in the BlackRock Fixed-Income Complex selected by the Independent Trustees. This has the same economic effect for the Independent Trustees as if the Independent Trustees had invested the deferred amounts directly in certain funds in the BlackRock Fixed-Income Complex.
| | |
| 86 | | 2 0 2 1 B L A C K R O C K A N N U A L R E P O R T T O S H A R E H O L D E R S |
Notes to Financial Statements (continued)
The Plan is not funded and obligations thereunder represent general unsecured claims against the general assets of each Fund, as applicable. Deferred compensation liabilities, if any, are included in the Trustees’ and Officer’s fees payable in the Statements of Assets and Liabilities and will remain as a liability of the Funds until such amounts are distributed in accordance with the Plan.
Indemnifications: In the normal course of business, a Fund enters into contracts that contain a variety of representations that provide general indemnification. A Fund’s maximum exposure under these arrangements is unknown because it involves future potential claims against a Fund, which cannot be predicted with any certainty.
Other: Expenses directly related to a Fund or its classes are charged to that Fund or the applicable class. Expenses directly related to the Funds and other shared expenses prorated to the Funds are allocated daily to each class based on their relative net assets or other appropriate methods. Other operating expenses shared by several funds, including other funds managed by the Manager, are prorated among those funds on the basis of relative net assets or other appropriate methods.
| 3. | INVESTMENT VALUATION AND FAIR VALUE MEASUREMENTS |
Investment Valuation Policies: Each Fund’s investments are valued at fair value (also referred to as “market value” within the financial statements) each day that the Fund is open for business and, for financial reporting purposes, as of the report date. U.S. GAAP defines fair value as the price a fund would receive to sell an asset or pay to transfer a liability in an orderly transaction between market participants at the measurement date. Each Fund determines the fair values of its financial instruments using various independent dealers or pricing services under policies approved by the Board. If a security’s market price is not readily available or does not otherwise accurately represent the fair value of the security, the security will be valued in accordance with a policy approved by the Board as reflecting fair value. The BlackRock Global Valuation Methodologies Committee (the “Global Valuation Committee”) is the committee formed by management to develop global pricing policies and procedures and to oversee the pricing function for all financial instruments.
Fair Value Inputs and Methodologies: The following methods and inputs are used to establish the fair value of each Fund’s assets and liabilities:
| | • | | Fixed-income investments for which market quotations are readily available are generally valued using the last available bid price or current market quotations provided by independent dealers or third party pricing services. Floating rate loan interests are valued at the mean of the bid prices from one or more independent brokers or dealers as obtained from a third party pricing service. Pricing services generally value fixed-income securities assuming orderly transactions of an institutional round lot size, but a fund may hold or transact in such securities in smaller, odd lot sizes. Odd lots may trade at lower prices than institutional round lots. The pricing services may use matrix pricing or valuation models that utilize certain inputs and assumptions to derive values, including transaction data (e.g., recent representative bids and offers), market data, credit quality information, perceived market movements, news, and other relevant information. Certain fixed-income securities, including asset-backed and mortgage related securities may be valued based on valuation models that consider the estimated cash flows of each tranche of the entity, establish a benchmark yield and develop an estimated tranche specific spread to the benchmark yield based on the unique attributes of the tranche. The amortized cost method of valuation may be used with respect to debt obligations with sixty days or less remaining to maturity unless the Manager determines such method does not represent fair value. |
| | • | | Investments in open-end U.S. mutual funds (including money market funds) are valued at that day’s published net asset value (“NAV”). |
| | • | | Futures contracts are valued based on that day’s last reported settlement or trade price on the exchange where the contract is traded. |
If events (e.g., a market closure, market volatility, company announcement or a natural disaster) occur that are expected to materially affect the value of such investment, or in the event that application of these methods of valuation results in a price for an investment that is deemed not to be representative of the market value of such investment, or if a price is not available, the investment will be valued by the Global Valuation Committee, or its delegate, in accordance with a policy approved by the Board as reflecting fair value (“Fair Valued Investments”). The fair valuation approaches that may be used by the Global Valuation Committee include market approach, income approach and cost approach. Valuation techniques such as discounted cash flow, use of market comparables and matrix pricing are types of valuation approaches and are typically used in determining fair value. When determining the price for Fair Valued Investments, the Global Valuation Committee, or its delegate, seeks to determine the price that each Fund might reasonably expect to receive or pay from the current sale or purchase of that asset or liability in an arm’s-length transaction. Fair value determinations shall be based upon all available factors that the Global Valuation Committee, or its delegate, deems relevant and consistent with the principles of fair value measurement. The pricing of all Fair Valued Investments is subsequently reported to the Board or a committee thereof on a quarterly basis.
Fair Value Hierarchy: Various inputs are used in determining the fair value of financial instruments. These inputs to valuation techniques are categorized into a fair value hierarchy consisting of three broad levels for financial reporting purposes as follows:
| | • | | Level 1 – Unadjusted price quotations in active markets/exchanges for identical assets or liabilities that each Fund has the ability to access; |
| | • | | Level 2 – Other observable inputs (including, but not limited to, quoted prices for similar assets or liabilities in markets that are active, quoted prices for identical or similar assets or liabilities in markets that are not active, inputs other than quoted prices that are observable for the assets or liabilities (such as interest rates, yield curves, volatilities, prepayment speeds, loss severities, credit risks and default rates) or other market–corroborated inputs); and |
| | • | | Level 3 – Unobservable inputs based on the best information available in the circumstances, to the extent observable inputs are not available (including the Global Valuation Committee’s assumptions used in determining the fair value of financial instruments). |
| | |
N O T E S T O F I N A N C I A L S T A T E M E N T S | | 87 |
Notes to Financial Statements (continued)
The hierarchy gives the highest priority to unadjusted quoted prices in active markets for identical assets or liabilities (Level 1 measurements) and the lowest priority to unobservable inputs (Level 3 measurements). Accordingly, the degree of judgment exercised in determining fair value is greatest for instruments categorized in Level 3. The inputs used to measure fair value may fall into different levels of the fair value hierarchy. In such cases, for disclosure purposes, the fair value hierarchy classification is determined based on the lowest level input that is significant to the fair value measurement in its entirety. Investments classified within Level 3 have significant unobservable inputs used by the Global Valuation Committee in determining the price for Fair Valued Investments. Level 3 investments include equity or debt issued by privately held companies or funds that may not have a secondary market and/or may have a limited number of investors. The categorization of a value determined for financial instruments is based on the pricing transparency of the financial instruments and is not necessarily an indication of the risks associated with investing in those securities.
| 4. | SECURITIES AND OTHER INVESTMENTS |
Zero-Coupon Bonds: Zero-coupon bonds are normally issued at a significant discount from face value and do not provide for periodic interest payments. These bonds may experience greater volatility in market value than other debt obligations of similar maturity which provide for regular interest payments.
Forward Commitments, When-Issued and Delayed Delivery Securities: The Funds may purchase securities on a when-issued basis and may purchase or sell securities on a forward commitment basis. Settlement of such transactions normally occurs within a month or more after the purchase or sale commitment is made. A Fund may purchase securities under such conditions with the intention of actually acquiring them, but may enter into a separate agreement to sell the securities before the settlement date. Since the value of securities purchased may fluctuate prior to settlement, a Fund may be required to pay more at settlement than the security is worth. In addition, a Fund is not entitled to any of the interest earned prior to settlement. When purchasing a security on a delayed delivery basis, a Fund assumes the rights and risks of ownership of the security, including the risk of price and yield fluctuations. In the event of default by the counterparty, a Fund’s maximum amount of loss is the unrealized appreciation of unsettled when-issued transactions.
Municipal Bonds Transferred to TOB Trusts: The Funds leverage their assets through the use of “TOB Trust” transactions. The funds transfer municipal bonds into a special purpose trust (a “TOB Trust”). A TOB Trust issues two classes of beneficial interests: short-term floating rate interests (“TOB Trust Certificates”), which are sold to third party investors, and residual inverse floating rate interests (“TOB Residuals”), which are issued to the participating funds that contributed the municipal bonds to the TOB Trust. The TOB Trust Certificates have interest rates that reset weekly and their holders have the option to tender such certificates to the TOB Trust for redemption at par and any accrued interest at each reset date. The TOB Residuals held by a fund provide the fund with the right to cause the holders of a proportional share of the TOB Trust Certificates to tender their certificates to the TOB Trust at par plus accrued interest. The funds may withdraw a corresponding share of the municipal bonds from the TOB Trust. Other funds managed by the investment adviser may also contribute municipal bonds to a TOB Trust into which a fund has contributed bonds. If multiple BlackRock-advised funds participate in the same TOB Trust, the economic rights and obligations under the TOB Residuals will be shared among the funds ratably in proportion to their participation in the TOB Trust.
TOB Trusts are supported by a liquidity facility provided by a third party bank or other financial institution (the “Liquidity Provider”) that allows the holders of the TOB Trust Certificates to tender their certificates in exchange for payment of par plus accrued interest on any business day. The tendered TOB Trust Certificates are remarketed by a Remarketing Agent. In the event of a failed remarketing, the TOB Trust may draw upon a loan from the Liquidity Provider to purchase the tendered TOB Trust Certificates. Any loans made by the Liquidity Provider will be secured by the purchased TOB Trust Certificates held by the TOB Trust and will be subject to an increased interest rate based on number of days the loan is outstanding.
The TOB Trust may be collapsed without the consent of a fund, upon the occurrence of a termination event as defined in the TOB Trust agreement. Upon the occurrence of a termination event, a TOB Trust would be liquidated with the proceeds applied first to any accrued fees owed to the trustee of the TOB Trust, the Remarketing Agent and the Liquidity Provider. Upon certain termination events, TOB Trust Certificates holders will be paid before the TOB Residuals holders (i.e., the Funds) whereas in other termination events, TOB Trust Certificates holders and TOB Residuals holders will be paid pro rata.
While a fund’s investment policies and restrictions expressly permit investments in inverse floating rate securities, such as TOB Residuals, they restrict the ability of a fund to borrow money for purposes of making investments. Each fund’s transfer of the municipal bonds to a TOB Trust is considered a secured borrowing for financial reporting purposes. The cash received by the TOB Trust from the sale of the TOB Trust Certificates, less certain transaction expenses, is paid to a fund. A fund typically invests the cash received in additional municipal bonds.
Accounting for TOB Trusts: The municipal bonds deposited into a TOB Trust are presented in a fund’s Schedule of Investments and the TOB Trust Certificates are shown in Other Liabilities in the Statements of Assets and Liabilities. Any loans drawn by the TOB Trust pursuant to the liquidity facility to purchase tendered TOB Trust Certificates are shown as Loan for TOB Trust Certificates. The carrying amount of a fund’s payable to the holder of the TOB Trust Certificates, as reported in the Statements of Assets and Liabilities as TOB Trust Certificates, approximates its fair value.
Interest income, including amortization and accretion of premiums and discounts, from the underlying municipal bonds is recorded by a fund on an accrual basis. Interest expense incurred on the TOB Trust transaction and other expenses related to remarketing, administration, trustee, liquidity and other services to a TOB Trust are shown as interest expense, fees and amortization of offering costs in the Statements of Operations. Fees paid upon creation of the TOB Trust are recorded as debt issuance costs and are amortized to interest expense, fees and amortization of offering costs in the Statements of Operations to the expected maturity of the TOB Trust. In connection with the restructurings of the TOB Trusts to non-bank sponsored TOB Trusts, a fund incurred non-recurring, legal and restructuring fees, which are recorded as interest expense, fees and amortization of offering costs in the Statements of Operations. Amounts recorded within interest expense, fees and amortization of offering costs in the Statements of Operations are:
| | | | | | | | | | | | | | | | |
| Fund Name | | Interest Expense | | | Liquidity Fees | | | Other Expenses | | | Total | |
California Municipal Opportunities | | $ | 158,746 | | | $ | 606,943 | | | $ | 165,501 | | | $ | 931,190 | |
New Jersey Municipal Bond | | | 31,382 | | | | 75,163 | | | | 36,359 | | | | 142,904 | |
| | |
| 88 | | 2 0 2 1 B L A C K R O C K A N N U A L R E P O R T T O S H A R E H O L D E R S |
Notes to Financial Statements (continued)
| | | | | | | | | | | | | | | | |
| Fund Name | | Interest Expense | | | Liquidity Fees | | | Other Expenses | | | Total | |
Pennsylvania Municipal Bond | | $ | 84,690 | | | $ | 234,581 | | | $ | 82,585 | | | $ | 401,856 | |
Strategic Municipal Opportunities | | | 1,058,849 | | | | 3,506,191 | | | | 1,078,883 | | | | 5,643,923 | |
For the year ended May 31, 2021, the following table is a summary of each Fund’s TOB Trusts:
| | | | | | | | | | | | | | | | | | | | |
Fund Name | |
| Underlying
Municipal Bonds
Transferred to
TOB Trusts |
(a) | |
| Liability for
TOB Trust
Certificates |
(b) | |
| Range of
Interest Rates
on TOB Trust
Certificates at
Period End |
| |
| Average
TOB Trust Certificates Outstanding |
| |
| Daily Weighted
Average Rate
of Interest and
Other Expenses
on TOB Trusts |
|
California Municipal Opportunities | | $ | 349,043,619 | | | $ | 143,144,977 | | | | 0.07% — 0.08 | % | | $ | 143,199,772 | | | | 0.65% | |
New Jersey Municipal Bond | | | 34,370,433 | | | | 17,972,276 | | | | 0.05 — 0.15 | | | | 19,146,007 | | | | 0.75 | |
Pennsylvania Municipal Bond | | | 94,425,254 | | | | 49,168,902 | | | | 0.08 — 0.23 | | | | 58,453,067 | | | | 0.69 | |
Strategic Municipal Opportunities | | | 1,265,687,976 | | | | 764,711,654 | | | | 0.07 — 0.35 | | | | 803,794,369 | | | | 0.70 | |
| | (a) | The municipal bonds transferred to a TOB Trust are generally high grade municipal bonds. In certain cases, when municipal bonds transferred are lower grade municipal bonds, the TOB Trust transaction may include a credit enhancement feature that provides for the timely payment of principal and interest on the bonds to the TOB Trust by a credit enhancement provider in the event of default of the municipal bond. The TOB Trust would be responsible for the payment of the credit enhancement fee and the funds, as TOB Residuals holders, would be responsible for reimbursement of any payments of principal and interest made by the credit enhancement provider. The maximum potential amounts owed by the funds, for such reimbursements, as applicable, are included in the maximum potential amounts disclosed for recourse TOB Trusts in the Schedules of Investments. |
| | (b) | TOB Trusts may be structured on a non-recourse or recourse basis. When a Fund invests in TOB Trusts on a non-recourse basis, the Liquidity Provider may be required to make a payment under the liquidity facility to allow the TOB Trust to repurchase TOB Trust Certificates. The Liquidity Provider will be reimbursed from the liquidation of bonds held in the TOB Trust. If a fund invests in a TOB Trust on a recourse basis, a fund enters into a reimbursement agreement with the Liquidity Provider where a fund is required to reimburse the Liquidity Provider for any shortfall between the amount paid by the Liquidity Provider and proceeds received from liquidation of municipal bonds held in the TOB Trust (the “Liquidation Shortfall”). As a result, if a fund invests in a recourse TOB Trust, a fund will bear the risk of loss with respect to any Liquidation Shortfall. If multiple funds participate in any such TOB Trust, these losses will be shared ratably, including the maximum potential amounts owed by a fund at May 31, 2021, in proportion to their participation in the TOB Trust. The recourse TOB Trusts are identified in the Schedules of Investments including the maximum potential amounts owed by a fund at May 31, 2021. |
For the year ended May 31, 2021, the following table is a summary of each Fund’s Loan for TOB Trust Certificates:
| | | | | | | | | | | | | | | | |
| Fund Name | | Loans
Outstanding
at Period End | | | Range of
Interest Rates
on Loans at
Period End | | | Average
Loans
Outstanding | | | Daily Weighted
Average Rate
of Interest and
Other Expenses
on Loans | |
Pennsylvania Municipal Bond | | $ | — | | | | — | % | | $ | 41,425 | | | | 0.71 | % |
Strategic Municipal Opportunities | | | — | | | | — | | | | 383,735 | | | | 0.71 | |
| 5. | DERIVATIVE FINANCIAL INSTRUMENTS |
The Funds engage in various portfolio investment strategies using derivative contracts both to increase the returns of the Funds and/or to manage their exposure to certain risks such as credit risk, equity risk, interest rate risk, foreign currency exchange rate risk, commodity price risk or other risks (e.g., inflation risk). Derivative financial instruments categorized by risk exposure are included in the Schedules of Investments. These contracts may be transacted on an exchange or over-the-counter (“OTC”).
Futures Contracts: Futures contracts are purchased or sold to gain exposure to, or manage exposure to, changes in interest rates (interest rate risk) and changes in the value of equity securities (equity risk), foreign currencies (foreign currency exchange rate risk).
Futures contracts are exchange-traded agreements between the Funds and a counterparty to buy or sell a specific quantity of an underlying instrument at a specified price and on a specified date. Depending on the terms of a contract, it is settled either through physical delivery of the underlying instrument on the settlement date or by payment of a cash amount on the settlement date. Upon entering into a futures contract, the Funds are required to deposit initial margin with the broker in the form of cash or securities in an amount that varies depending on a contract’s size and risk profile. The initial margin deposit must then be maintained at an established level over the life of the contract. Amounts pledged, which are considered restricted, are included in cash pledged for futures contracts in the Statements of Assets and Liabilities.
Securities deposited as initial margin are designated in the Schedules of Investments and cash deposited, if any, are shown as cash pledged for futures contracts in the Statements of Assets and Liabilities. Pursuant to the contract, the Funds agree to receive from or pay to the broker an amount of cash equal to the daily fluctuation in market value of the contract (“variation margin”). Variation margin is recorded as unrealized appreciation (depreciation) and, if any, shown as variation margin receivable (or payable) on futures contracts in the Statements of Assets and Liabilities. When the contract is closed, a realized gain or loss is recorded in the Statements of Operations equal to the difference between the notional amount of the contract at the time it was opened and the notional amount at the time it was closed. The use of futures contracts involves the risk of an imperfect correlation in the movements in the price of futures contracts and interest rates, foreign currency exchange rates or underlying assets.
| 6. | INVESTMENT ADVISORY AGREEMENT AND OTHER TRANSACTIONS WITH AFFILIATES |
Investment Advisory: Each Trust, on behalf of the Funds, entered into an Investment Advisory Agreement with the Manager, the Funds’ investment adviser and an indirect, wholly-owned subsidiary of BlackRock, Inc. (“BlackRock”), to provide investment advisory and administrative services. The Manager is responsible for the management of each Fund’s portfolio and provides the personnel, facilities, equipment and certain other services necessary to the operations of each Fund.
| | |
N O T E S T O F I N A N C I A L S T A T E M E N T S | | 89 |
Notes to Financial Statements (continued)
For such services, each Fund pays the Manager a monthly fee at an annual rate equal to the following percentages of the average daily value of each Fund’s net assets:
| | | | | | | | | | | | | | | | |
| | | Investment Advisory Fees | |
| Average Daily Net Assets | | California
Municipal
Opportunities | | | New Jersey
Municipal
Bond | | | Pennsylvania
Municipal
Bond | | | Strategic
Municipal
Opportunities | |
First $1 billion | | | 0.38 | % | | | 0.52 | % | | | 0.52 | % | | | 0.55 | % |
$1 billion — $3 billion | | | 0.36 | | | | 0.49 | | | | 0.49 | | | | 0.52 | |
$3 billion — $5 billion | | | 0.34 | | | | 0.47 | | | | 0.47 | | | | 0.50 | |
$5 billion — $10 billion | | | 0.33 | | | | 0.45 | | | | 0.45 | | | | 0.48 | |
Greater than $10 billion | | | 0.32 | | | | 0.44 | | | | 0.44 | | | | 0.47 | |
For the year ended May 31, 2021, the Funds reimbursed the Manager for certain accounting services, which is included in accounting services in the Statements of Operations. The reimbursements were as follows:
| | | | |
| Fund Name | | Amounts Reimbursed | |
California Municipal Opportunities | | $ | 41,126 | |
New Jersey Municipal Bond | | | 4,553 | |
Pennsylvania Municipal Bond | | | 6,868 | |
Strategic Municipal Opportunities | | | 108,508 | |
Service and Distribution Fees: Each Trust, on behalf of the Funds, entered into a Distribution Agreement and a Distribution and Service Plan with BlackRock Investments, LLC (“BRIL”), an affiliate of the Manager. Pursuant to the Distribution and Service Plan and in accordance with Rule 12b-1 under the 1940 Act, each Fund pays BRIL ongoing service and distribution fees. The fees are accrued daily and paid monthly at annual rates based upon the average daily net assets of the relevant share class of the Fund as follows:
| | | | | | | | | | | | | | | | | | | | | | | | | | | | | | | | |
| | | California Municipal Opportunities | | | New Jersey Municipal Bond | | | Pennsylvania Municipal Bond | | | Strategic Municipal Opportunities | |
| Share Class | | Service Fees | | | Distribution Fees | | | Service Fees | | | Distribution Fees | | | Service Fees | | | Distribution Fees | | | Service Fees | | | Distribution Fees | |
Service | | | N/A | | | | N/A | | | | 0.25 | % | | | N/A | | | | 0.25 | % | | | N/A | | | | N/A | | | | N/A | |
Investor A | | | 0.25 | % | | | N/A | | | | 0.25 | | | | N/A | | | | 0.25 | | | | N/A | | | | 0.25 | % | | | N/A | |
Investor A1 | | | 0.10 | | | | N/A | | | | 0.10 | | | | N/A | | | | 0.10 | | | | N/A | | | | 0.10 | | | | N/A | |
Investor C | | | 0.25 | | | | 0.75 | % | | | 0.25 | | | | 0.75 | % | | | 0.25 | | | | 0.75 | % | | | 0.25 | | | | 0.75 | % |
BRIL and broker-dealers, pursuant to sub-agreements with BRIL, provide shareholder servicing and distribution services to the Funds. The ongoing service and/or distribution fee compensates BRIL and each broker-dealer for providing shareholder servicing and/or distribution related services to shareholders.
For the year ended May 31, 2021, the following table shows the class specific service and distribution fees borne directly by each share class of each Fund:
| | | | | | | | | | | | | | | | | | | | |
| Fund Name | | Service | | | Investor A | | | Investor A1 | | | Investor C | | | Total | |
California Municipal Opportunities | | $ | — | | | $ | 2,625,776 | | | $ | 103,357 | | | $ | 1,214,974 | | | $ | 3,944,107 | |
New Jersey Municipal Bond | | | 19,449 | | | | 298,979 | | | | 17,690 | | | | 279,661 | | | | 615,779 | |
Pennsylvania Municipal Bond | | | 5,414 | | | | 366,771 | | | | 9,269 | | | | 250,005 | | | | 631,459 | |
Strategic Municipal Opportunities | | | — | | | | 4,445,765 | | | | 24,370 | | | | 2,119,127 | | | | 6,589,262 | |
Transfer Agent: Pursuant to written agreements, certain financial intermediaries, some of which may be affiliates, provide the Funds with sub-accounting, recordkeeping, sub-transfer agency and other administrative services with respect to servicing of underlying investor accounts. For these services, these entities receive an asset-based fee or an annual fee per shareholder account, which will vary depending on share class and/or net assets. For the year ended May 31, 2021, the Funds paid the following amounts to affiliates of BlackRock in return for these services, which are included in transfer agent — class specific in the Statements of Operations:
| | | | |
| Fund Name | | Institutional | |
New Jersey Municipal Bond | | $ | 105,663 | |
Pennsylvania Municipal Bond | | | 392,542 | |
Strategic Municipal Opportunities | | | 756,982 | |
The Manager maintains a call center that is responsible for providing certain shareholder services to the Funds. Shareholder services include responding to inquiries and processing purchases and sales based upon instructions from shareholders. For the year ended May 31, 2021, each Fund reimbursed the Manager the following amounts for costs incurred in running the call center, which are included in transfer agent — class specific in the Statements of Operations:
| | | | | | | | | | | | | | | | | | | | | | | | | | | | |
| Fund Name | | Institutional | | | Service | | | Investor A | | | Investor A1 | | | Investor C | | | Class K | | | Total | |
California Municipal Opportunities | | $ | 3,979 | | | $ | — | | | $ | 4,523 | | | $ | 2,120 | | | $ | 827 | | | $ | 224 | | | $ | 11,673 | |
New Jersey Municipal Bond | | | 548 | | | | 1,823 | | | | 1,094 | | | | 410 | | | | 413 | | | | 4 | | | | 4,292 | |
Pennsylvania Municipal Bond | | | 790 | | | | 103 | | | | 1,520 | | | | 611 | | | | 481 | | | | 17 | | | | 3,522 | |
Strategic Municipal Opportunities | | | 14,321 | | | | — | | | | 9,147 | | | | 187 | | | | 2,067 | | | | 476 | | | | 26,198 | |
| | |
| 90 | | 2 0 2 1 B L A C K R O C K A N N U A L R E P O R T T O S H A R E H O L D E R S |
Notes to Financial Statements (continued)
For the year ended May 31, 2021, the following table shows the class specific transfer agent fees borne directly by each share class of each Fund:
| | | | | | | | | | | | | | | | | | | | | | | | | | | | |
| Fund Name | | Institutional | | | Service | | | Investor A | | | Investor A1 | | | Investor C | | | Class K | | | Total | |
California Municipal Opportunities | | $ | 885,612 | | | $ | — | | | $ | 408,715 | | | $ | 38,417 | | | $ | 57,268 | | | $ | 1,516 | | | $ | 1,391,528 | |
New Jersey Municipal Bond | | | 201,875 | | | | 6,492 | | | | 54,927 | | | | 8,298 | | | | 14,334 | | | | 205 | | | | 286,131 | |
Pennsylvania Municipal Bond | | | 552,678 | | | | 1,674 | | | | 65,531 | | | | 7,284 | | | | 15,778 | | | | 364 | | | | 643,309 | |
Strategic Municipal Opportunities | | | 3,833,187 | | | | — | | | | 652,181 | | | | 9,965 | | | | 112,981 | | | | 8,788 | | | | 4,617,102 | |
Other Fees: For the year ended May 31, 2021, affiliates earned underwriting discounts, direct commissions and dealer concessions on sales of each Fund’s Investor A Shares as follows:
| | | | |
| Fund Name | | Investor A | |
California Municipal Opportunities | | $ | 2,760 | |
New Jersey Municipal Bond | | | 3,026 | |
Pennsylvania Municipal Bond | | | 10,107 | |
Strategic Municipal Opportunities | | | 9,890 | |
For the year ended May 31, 2021, affiliates received CDSCs as follows:
| | | | | | | | |
| Fund Name | | Investor A | | | Investor C | |
California Municipal Opportunities | | $ | 198,700 | | | $ | 12,665 | |
New Jersey Municipal Bond | | | 7,035 | | | | 3,470 | |
Pennsylvania Municipal Bond | | | 18,111 | | | | 1,697 | |
Strategic Municipal Opportunities | | | 353,516 | | | | 21,080 | |
Expense Limitations, Waivers and Reimbursements: With respect to each Fund, the Manager contractually agreed to waive its investment advisory fees by the amount of investment advisory fees each Fund pays to the Manager indirectly through its investment in affiliated money market funds (the “affiliated money market fund waiver”) through September 30, 2021. The contractual agreement may be terminated upon 90 days’ notice by a majority of the Independent Trustees, or by a vote of a majority of the outstanding voting securities of a Fund. With respect to California Municipal Opportunities, New Jersey Municipal Bond and Pennsylvania Municipal Bond, the amount of waivers and/or reimbursements of fees and expenses made pursuant to the expense limitation described below will be reduced by the amount of the affiliated money market fund waiver. These amounts are included in fees waived and/or reimbursed by the Manager in the Statements of Operations. For the year ended May 31, 2021, the amounts waived were as follows:
| | | | |
| Fund Name | | Amounts Waived | |
California Municipal Opportunities | | $ | 39,570 | |
New Jersey Municipal Bond | | | 10,912 | |
Pennsylvania Municipal Bond | | | 14,482 | |
Strategic Municipal Opportunities | | | 231,736 | |
The Manager has contractually agreed to waive its investment advisory fee with respect to any portion of each Fund’s assets invested in affiliated equity and fixed-income mutual funds and affiliated exchange-traded funds that have a contractual management fee through September 30, 2021. The contractual agreement may be terminated upon 90 days’ notice by a majority of the Independent Trustees, or by a vote of a majority of the outstanding voting securities of a Fund. For the year ended May 31, 2021, there were no fees waived and/or reimbursed by the Manager pursuant to this arrangement.
With respect to California Municipal Opportunities, New Jersey Municipal Bond and Pennsylvania Municipal Bond, the Manager contractually agreed to waive and/or reimburse fees or expenses in order to limit expenses, excluding interest expense, dividend expense, tax expense, acquired fund fees and expenses, and certain other fund expenses, which constitute extraordinary expenses not incurred in the ordinary course of each Fund’s business (“expense limitation”). The expense limitations as a percentage of average daily net assets are as follows:
| | | | | | | | | | | | | | | | | | | | | | | | |
| Fund Name | | Institutional | | | Service | | | Investor A | | | Investor A1 | | | Investor C | | | Class K | |
California Municipal Opportunities | | | 0.44 | % | | | — | % | | | 0.69 | % | | | 0.54 | % | | | 1.44 | % | | | 0.39 | % |
New Jersey Municipal Bond | | | 0.52 | | | | 0.77 | | | | 0.77 | | | | 0.62 | | | | 1.52 | | | | 0.47 | |
Pennsylvania Municipal Bond | | | 0.54 | | | | 0.79 | | | | 0.79 | | | | 0.64 | | | | 1.54 | | | | 0.49 | |
The Manager has agreed not to reduce or discontinue these contractual expense limitations through September 30, 2021, unless approved by the Board, including a majority of the Independent Trustees, or by a vote of a majority of the outstanding voting securities of a Fund. These amounts of investment advisory fees waived and/or reimbursed are included in fees waived and/or reimbursed by the Manager in the Statements of Operations. For the year ended May 31, 2021, the Funds waived the following amounts:
| | | | |
| Fund Name | | Amounts Waived | |
California Municipal Opportunities | | $ | 288,038 | |
New Jersey Municipal Bond | | | 455,435 | |
Pennsylvania Municipal Bond | | | 480,328 | |
With respect to Strategic Municipal Opportunities, the Manager contractually agreed to waive a portion of its investment advisory fees equal to the annual rate of 0.05% of the Fund’s average daily net assets through September 30, 2021. The agreement may be terminated upon 90 days’ notice by a majority of Independent Trustees of BlackRock Municipal Series Trust or by a vote of a majority of the outstanding voting securities of the Fund. This amount is included in fees waived and/or reimbursed by the Manager in the Statements of Operations. For the year ended May 31, 2021, the Manager waived $4,205,446 pursuant to this agreement.
| | |
N O T E S T O F I N A N C I A L S T A T E M E N T S | | 91 |
Notes to Financial Statements (continued)
For the year ended May 31, 2021, transfer agent fees waived and/or reimbursed — class specific were as follows:
| | | | | | | | | | | | | | | | | | | | | | | | | | | | |
| | | Transfer Agent Fees Waived and/or
Reimbursed - Class Specific | |
| Fund Name | | Institutional | | | Service | | | Investor A | | | Investor A1 | | | Investor C | | | Class K | | | Total | |
California Municipal Opportunities | | $ | 69,330 | | | $ | — | | | $ | — | | | $ | — | | | $ | 746 | | | $ | 1,290 | | | $ | 71,366 | |
New Jersey Municipal Bond | | | 100,145 | | | | 2,604 | | | | 458 | | | | 70 | | | | 554 | | | | 204 | | | | 104,035 | |
Pennsylvania Municipal Bond | | | 359,792 | | | | 592 | | | | — | | | | 2,649 | | | | 3,277 | | | | 362 | | | | 366,672 | |
Interfund Lending: In accordance with an exemptive order (the “Order”) from the U.S. Securities and Exchange Commission (“SEC”), each Fund may participate in a joint lending and borrowing facility for temporary purposes (the “Interfund Lending Program”), subject to compliance with the terms and conditions of the Order, and to the extent permitted by each Fund’s investment policies and restrictions. Each Fund is currently permitted to borrow under the Interfund Lending Program.
A lending BlackRock fund may lend in aggregate up to 15% of its net assets, but may not lend more than 5% of its net assets to any one borrowing fund through the Interfund Lending Program. A borrowing BlackRock fund may not borrow through the Interfund Lending Program or from any other source more than 33 1/3% of its total assets (or any lower threshold provided for by the fund’s investment restrictions). If a borrowing BlackRock fund’s total outstanding borrowings exceed 10% of its total assets, each of its outstanding interfund loans will be subject to collateralization of at least 102% of the outstanding principal value of the loan. All interfund loans are for temporary or emergency purposes and the interest rate to be charged will be the average of the highest current overnight repurchase agreement rate available to a lending fund and the bank loan rate, as calculated according to a formula established by the Board.
During the year ended May 31, 2021, the Funds did not participate in the Interfund Lending Program.
Trustees and Officers: Certain trustees and/or officers of the Funds are directors and/or officers of BlackRock or its affiliates. The Funds reimburse the Manager for a portion of the compensation paid to the Funds’ Chief Compliance Officer, which is included in Trustees and Officer in the Statements of Operations.
For the year ended May 31, 2021, purchases and sales of investments, excluding short-term investments, were as follows:
| | | | | | | | |
| Fund Name | | Purchases | | | Sales | |
California Municipal Opportunities | | $ | 1,608,149,364 | | | $ | 1,736,460,043 | |
New Jersey Municipal Bond | | | 60,555,347 | | | | 67,766,554 | |
Pennsylvania Municipal Bond | | | 203,395,680 | | | | 166,430,203 | |
Strategic Municipal Opportunities | | | 8,986,239,905 | | | | 10,075,084,109 | |
It is each Fund’s policy to comply with the requirements of the Internal Revenue Code of 1986, as amended, applicable to regulated investment companies, and to distribute substantially all of its taxable income to its shareholders. Therefore, no U.S. federal income tax provision is required.
Each Fund files U.S. federal and various state and local tax returns. No income tax returns are currently under examination. The statute of limitations on each Fund’s U.S. federal tax returns generally remains open for a period of three fiscal years after they are filed. The statutes of limitations on each Fund’s state and local tax returns may remain open for an additional year depending upon the jurisdiction.
Management has analyzed tax laws and regulations and their application to the Funds as of May 31, 2021, inclusive of the open tax return years, and does not believe that there are any uncertain tax positions that require recognition of a tax liability in the Funds’ financial statements.
The tax character of distributions paid was as follows:
| | | | | | | | | | | | |
| Fund Name | | Year Ended 05/31/21 | | | | | | Year Ended
05/31/20 | |
California Municipal Opportunities | | | | | | | | | | | | |
Tax-exempt income(a) | | $ | 55,303,219 | | | | | | | $ | 66,563,174 | |
Ordinary income(b) | | | 4,106,639 | | | | | | | | 7,674,640 | |
| | | | | | | | | | | | |
| | $ | 59,409,858 | | | | | | | $ | 74,237,814 | |
| | | | | | | | | | | | |
New Jersey Municipal Bond | | | | | | | | | | | | |
Tax-exempt income(a) | | $ | 10,976,008 | | | | | | | $ | 11,137,126 | |
Ordinary income(b) | | | 781 | | | | | | | | 7,829 | |
| | | | | | | | | | | | |
| | $ | 10,976,789 | | | | | | | $ | 11,144,955 | |
| | | | | | | | | | | | |
Pennsylvania Municipal Bond | | | | | | | | | | | | |
Tax-exempt income(a) | | $ | 16,433,149 | | | | | | | $ | 18,554,612 | |
Ordinary income(b) | | | 58,231 | | | | | | | | 14,394 | |
| | | | | | | | | | | | |
| | $ | 16,491,380 | | | | | | | $ | 18,569,006 | |
| | | | | | | | | | | | |
| | |
| 92 | | 2 0 2 1 B L A C K R O C K A N N U A L R E P O R T T O S H A R E H O L D E R S |
Notes to Financial Statements (continued)
| | | | | | | | | | | | |
| Fund Name (continued) | | Year Ended 05/31/21 | | | | | | Year Ended 05/31/20 | |
Strategic Municipal Opportunities | | | | | | | | | | | | |
Tax-exempt income(a) | | $ | 170,921,604 | | | | | | | $ | 252,282,790 | |
Ordinary income(b) | | | 16,779,888 | | | | | | | | 24,673,785 | |
| | | | | | | | | | | | |
| | $ | 187,701,492 | | | | | | | $ | 276,956,575 | |
| | | | | | | | | | | | |
| | (a) | The Funds designate these amounts paid during the fiscal year ended May 31, 2021, as exempt-interest dividends. | |
| | (b) | Ordinary income consists primarily of taxable income from bonds not federally tax-exempt and recognized market discount. Additionally, all ordinary income distributions are comprised of interest related dividends for non-U.S. residents and are eligible for exemption from U.S. withholding tax for nonresident aliens and foreign corporations. | |
As of period end, the tax components of accumulated earnings (loss) were as follows:
| | | | | | | | | | | | | | | | | | | | |
| Fund Name | | Undistributed
Tax-Exempt Income | | | Undistributed
Ordinary Income | | | Non-Expiring
Capital Loss
Carryforwards(a) | | | Net Unrealized
Gains (Losses)(b) | | | Total | |
California Municipal Opportunities | | $ | 538,989 | | | $ | 68,812 | | | $ | (143,574,731 | ) | | $ | 233,264,759 | | | $ | 90,297,829 | |
New Jersey Municipal Bond | | | 325,292 | | | | — | | | | (9,790,023 | ) | | | 37,212,922 | | | | 27,748,191 | |
Pennsylvania Municipal Bond | | | — | | | | — | | | | (20,779,230 | ) | | | 42,187,754 | | | | 21,408,524 | |
Strategic Municipal Opportunities | | | 566,533 | | | | 417,050 | | | | (529,357,736 | ) | | | 482,301,308 | | | | (46,072,845 | ) |
| | (a) | Amounts available to offset future realized capital gains. | |
| | (b) | The difference between book-basis and tax-basis net unrealized gains was attributable primarily to the tax deferral of losses on wash sales, amortization methods for premiums and discounts on fixed income securities, the accrual of income on securities in default, the realization for tax purposes of unrealized gains/losses on certain futures contracts, the treatment of residual interests in tender option bond trusts and the deferral of compensation to trustees. | |
During the year ended May 31, 2021, the Funds listed below utilized the following amounts of their respective capital loss carryforward:
| | | | |
| Fund Name | | Amounts | |
California Municipal Opportunities | | $ | 84,232,362 | |
New Jersey Municipal Bond | | | 2,877,481 | |
Pennsylvania Municipal Bond | | | 4,605,649 | |
Strategic Municipal Opportunities | | | 312,487,952 | |
As of May 31, 2021, gross unrealized appreciation and depreciation based on cost of investments (including short positions and derivatives, if any) for U.S. federal income tax purposes were as follows:
| | | | | | | | | | | | | | | | |
| Fund Name | | Tax Cost | | | Gross Unrealized
Appreciation | | | Gross Unrealized
Depreciation | | | Net Unrealized
Appreciation
(Depreciation) | |
California Municipal Opportunities | | $ | 3,020,133,816 | | | $ | 233,557,057 | | | $ | (292,297 | ) | | $ | 233,264,760 | |
New Jersey Municipal Bond | | | 360,794,728 | | | | 37,242,251 | | | | (29,329 | ) | | | 37,212,922 | |
Pennsylvania Municipal Bond | | | 577,293,289 | | | | 45,354,760 | | | | (2,990,959 | ) | | | 42,363,801 | |
Strategic Municipal Opportunities | | | 8,225,799,439 | | | | 523,214,640 | | | | (40,851,974 | ) | | | 482,362,666 | |
Each Trust, on behalf of the Funds, along with certain other funds managed by the Manager and its affiliates (“Participating Funds”), is a party to a 364-day, $2.25 billion credit agreement with a group of lenders. Under this agreement, the Funds may borrow to fund shareholder redemptions. Excluding commitments designated for certain individual funds, the Participating Funds, including the Funds, can borrow up to an aggregate commitment amount of $1.75 billion at any time outstanding, subject to asset coverage and other limitations as specified in the agreement. The credit agreement has the following terms: a fee of 0.10% per annum on unused commitment amounts and interest at a rate equal to the higher of (a) one-month LIBOR (but, in any event, not less than 0.00%) on the date the loan is made plus 0.80% per annum or (b) the Fed Funds rate (but, in any event, not less than 0.00%) in effect from time to time plus 0.80% per annum on amounts borrowed. The agreement expires in April 2022 unless extended or renewed. These fees were allocated among such funds based upon portions of the aggregate commitment available to them and relative net assets of Participating Funds. During the year ended May 31, 2021, the Funds did not borrow under the credit agreement.
In the normal course of business, the Funds invest in securities or other instruments and may enter into certain transactions, and such activities subject each Fund to various risks, including among others, fluctuations in the market (market risk) or failure of an issuer to meet all of its obligations. The value of securities or other instruments may also be affected by various factors, including, without limitation: (i) the general economy; (ii) the overall market as well as local, regional or global political and/or social instability; (iii) regulation, taxation or international tax treaties between various countries; or (iv) currency, interest rate and price fluctuations. Local, regional or global events such as war, acts of terrorism, the spread of infectious illness or other public health issues, recessions, or other events could have a significant impact on the Funds and their investments. Each Fund’s prospectus provides details of the risks to which each Fund is subject.
| | |
N O T E S T O F I N A N C I A L S T A T E M E N T S | | 93 |
Notes to Financial Statements (continued)
A Fund structures and “sponsors” the TOB Trusts in which it holds TOB Residuals and has certain duties and responsibilities, which may give rise to certain additional risks including, but not limited to, compliance, securities law and operational risks.
Should short-term interest rates rise, the Funds’ investments in the TOB Trusts may adversely affect the Funds’ net investment income and dividends to Shareholders. Also, fluctuations in the market value of municipal bonds deposited into the TOB Trust may adversely affect the Funds’ NAVs per share.
The SEC and various federal banking and housing agencies have adopted credit risk retention rules for securitizations (the “Risk Retention Rules”). The Risk Retention Rules would require the sponsor of a TOB Trust to retain at least 5% of the credit risk of the underlying assets supporting the TOB Trust’s municipal bonds. The Risk Retention Rules may adversely affect the Funds’ ability to engage in TOB Trust transactions or increase the costs of such transactions in certain circumstances.
TOB Trusts constitute an important component of the municipal bond market. Any modifications or changes to rules governing TOB Trusts may adversely impact the municipal market and the Funds, including through reduced demand for and liquidity of municipal bonds and increased financing costs for municipal issuers. The ultimate impact of any potential modifications on the TOB Trust market and the overall municipal market is not yet certain.
Market Risk: Each Fund may be exposed to prepayment risk, which is the risk that borrowers may exercise their option to prepay principal earlier than scheduled during periods of declining interest rates, which would force each Fund to reinvest in lower yielding securities. Each Fund may also be exposed to reinvestment risk, which is the risk that income from each Fund’s portfolio will decline if each Fund invests the proceeds from matured, traded or called fixed-income securities at market interest rates that are below each Fund portfolio’s current earnings rate.
Municipal securities are subject to the risk that litigation, legislation or other political events, local business or economic conditions, credit rating downgrades, or the bankruptcy of the issuer could have a significant effect on an issuer’s ability to make payments of principal and/or interest or otherwise affect the value of such securities. Municipal securities can be significantly affected by political or economic changes, including changes made in the law after issuance of the securities, as well as uncertainties in the municipal market related to, taxation, legislative changes or the rights of municipal security holders, including in connection with an issuer insolvency. Municipal securities backed by current or anticipated revenues from a specific project or specific assets can be negatively affected by the discontinuance of the tax benefits supporting the project or assets or the inability to collect revenues for the project or from the assets. Municipal securities may be less liquid than taxable bonds, and there may be less publicly available information on the financial condition of municipal security issuers than for issuers of other securities.
An outbreak of respiratory disease caused by a novel coronavirus has developed into a global pandemic and has resulted in closing borders, quarantines, disruptions to supply chains and customer activity, as well as general concern and uncertainty. The impact of this pandemic, and other global health crises that may arise in the future, could affect the economies of many nations, individual companies and the market in general in ways that cannot necessarily be foreseen at the present time. This pandemic may result in substantial market volatility and may adversely impact the prices and liquidity of a fund’s investments. The duration of this pandemic and its effects cannot be determined with certainty.
Counterparty Credit Risk: The Funds may be exposed to counterparty credit risk, or the risk that an entity may fail to or be unable to perform on its commitments related to unsettled or open transactions, including making timely interest and/or principal payments or otherwise honoring its obligations. The Funds manage counterparty credit risk by entering into transactions only with counterparties that the Manager believes have the financial resources to honor their obligations and by monitoring the financial stability of those counterparties. Financial assets, which potentially expose the Funds to market, issuer and counterparty credit risks, consist principally of financial instruments and receivables due from counterparties. The extent of the Funds’ exposure to market, issuer and counterparty credit risks with respect to these financial assets is approximately their value recorded in the Statements of Assets and Liabilities, less any collateral held by the Funds.
A derivative contract may suffer a mark-to-market loss if the value of the contract decreases due to an unfavorable change in the market rates or values of the underlying instrument. Losses can also occur if the counterparty does not perform under the contract.
With exchange-traded futures, there is less counterparty credit risk to the Funds since the exchange or clearinghouse, as counterparty to such instruments, guarantees against a possible default. The clearinghouse stands between the buyer and the seller of the contract; therefore, credit risk is limited to failure of the clearinghouse. While offset rights may exist under applicable law, a Fund does not have a contractual right of offset against a clearing broker or clearinghouse in the event of a default (including the bankruptcy or insolvency). Additionally, credit risk exists in exchange-traded futures with respect to initial and variation margin that is held in a clearing broker’s customer accounts. While clearing brokers are required to segregate customer margin from their own assets, in the event that a clearing broker becomes insolvent or goes into bankruptcy and at that time there is a shortfall in the aggregate amount of margin held by the clearing broker for all its clients, typically the shortfall would be allocated on a pro rata basis across all the clearing broker’s customers, potentially resulting in losses to the Funds.
Concentration Risk: A diversified portfolio, where this is appropriate and consistent with a fund’s objectives, minimizes the risk that a price change of a particular investment will have a material impact on the NAV of a fund. The investment concentrations within each Fund’s portfolio are disclosed in its Schedule of Investments.
Certain Funds invest a substantial amount of their assets in issuers located in a single state or limited number of states. When a Fund concentrates its investments in this manner, it assumes the risk that economic, regulatory, political or social conditions affecting that state or group of states could have a significant impact on the fund and could affect the income from, or the value or liquidity of, the fund’s portfolio. Investment percentages in specific states or U.S. territories are presented in the Schedules of Investments.
Certain Funds invest a significant portion of their assets in securities within a single or limited number of market sectors. When a Fund concentrates its investments in this manner, it assumes the risk that economic, regulatory, political and social conditions affecting such sectors may have a significant impact on the Fund and could affect the income from, or the value or liquidity of, the Fund’s portfolio. Investment percentages in specific sectors are presented in the Schedules of Investments.
| | |
| 94 | | 2 0 2 1 B L A C K R O C K A N N U A L R E P O R T T O S H A R E H O L D E R S |
Notes to Financial Statements (continued)
Certain Funds invest a significant portion of their assets in fixed-income securities and/or use derivatives tied to the fixed-income markets. Changes in market interest rates or economic conditions may affect the value and/or liquidity of such investments. Interest rate risk is the risk that prices of bonds and other fixed-income securities will increase as interest rates fall and decrease as interest rates rise. The Funds may be subject to a greater risk of rising interest rates due to the current period of historically low rates.
LIBOR Transition Risk: The United Kingdom’s Financial Conduct Authority announced a phase out of the London Interbank Offered Rate (“LIBOR”). Although many LIBOR rates will be phased out by the end of 2021, a selection of widely used USD LIBOR rates will continue to be published through June 2023 in order to assist with the transition. The Funds may be exposed to financial instruments tied to LIBOR to determine payment obligations, financing terms, hedging strategies or investment value. The transition process away from LIBOR might lead to increased volatility and illiquidity in markets for, and reduce the effectiveness of new hedges placed against, instruments whose terms currently include LIBOR. The ultimate effect of the LIBOR transition process on the Funds is uncertain.
| 11. | CAPITAL SHARE TRANSACTIONS |
Transactions in capital shares for each class were as follows:
| | | | | | | | | | | | | | | | |
| | | Year Ended
05/31/21 | | | Year Ended
05/31/20 | |
| Fund Name / Share Class | | Shares | | | Amounts | | | Shares | | | Amounts | |
California Municipal Opportunities | | | | | | | | | | | | | | | | |
Institutional | | | | | | | | | | | | | | | | |
Shares sold | | | 47,489,528 | | | $ | 602,299,494 | | | | 80,671,530 | | | $ | 1,020,668,423 | |
Shares issued in reinvestment of distributions | | | 2,360,095 | | | | 29,912,637 | | | | 3,147,367 | | | | 39,748,171 | |
Shares redeemed | | | (55,694,811 | ) | | | (699,264,271 | ) | | | (89,603,098 | ) | | | (1,100,509,206 | ) |
| | | | | | | | | | | | | | | | |
| | | (5,845,188 | ) | | $ | (67,052,140 | ) | | | (5,784,201 | ) | | $ | (40,092,612 | ) |
| | | | | | | | | | | | | | | | |
Investor A | | | | | | | | | | | | | | | | |
Shares sold and automatic conversion of shares | | | 12,285,554 | | | $ | 155,709,391 | | | | 36,985,652 | | | $ | 471,317,122 | |
Shares issued in reinvestment of distributions | | | 1,329,826 | | | | 16,835,970 | | | | 1,559,250 | | | | 19,650,622 | |
Shares redeemed | | | (22,880,551 | ) | | | (289,598,946 | ) | | | (24,939,474 | ) | | | (307,195,670 | ) |
| | | | | | | | | | | | | | | | |
| | | (9,265,171 | ) | | $ | (117,053,585 | ) | | | 13,605,428 | | | $ | 183,772,074 | |
| | | | | | | | | | | | | | | | |
Investor A1 | | | | | | | | | | | | | | | | |
Shares sold | | | 2 | | | $ | 31 | | | | 22 | | | $ | 274 | |
Shares issued in reinvestment of distributions | | | 94,828 | | | | 1,201,994 | | | | 107,798 | | | | 1,360,745 | |
Shares redeemed | | | (622,695 | ) | | | (7,864,611 | ) | | | (505,244 | ) | | | (6,334,055 | ) |
| | | | | | | | | | | | | | | | |
| | | (527,865 | ) | | $ | (6,662,586 | ) | | | (397,424 | ) | | $ | (4,973,036 | ) |
| | | | | | | | | | | | | | | | |
Investor C | | | | | | | | | | | | | | | | |
Shares sold | | | 609,827 | | | $ | 7,737,378 | | | | 3,106,412 | | | $ | 39,610,966 | |
Shares issued in reinvestment of distributions | | | 90,774 | | | | 1,147,831 | | | | 131,424 | | | | 1,657,881 | |
Shares redeemed and automatic conversion of shares | | | (4,380,003 | ) | | | (55,194,533 | ) | | | (3,203,262 | ) | | | (39,836,061 | ) |
| | | | | | | | | | | | | | | | |
| | | (3,679,402 | ) | | $ | (46,309,324 | ) | | | 34,574 | | | $ | 1,432,786 | |
| | | | | | | | | | | | | | | | |
Investor C1(a) | | | | | | | | | | | | | | | | |
Shares sold | | | — | | | $ | — | | | | — | | | $ | — | |
Shares issued in reinvestment of distributions | | | — | | | | — | | | | — | | | | 2 | |
Shares redeemed | | | — | | | | — | | | | (15,891 | ) | | | (206,596 | ) |
| | | | | | | | | | | | | | | | |
| | | — | | | $ | — | | | | (15,891 | ) | | $ | (206,594 | ) |
| | | | | | | | | | | | | | | | |
Class K | | | | | | | | | | | | | | | | |
Shares sold | | | 2,701,803 | | | $ | 34,520,036 | | | | 7,672,224 | | | $ | 97,769,190 | |
Shares issued in reinvestment of distributions | | | 145,621 | | | | 1,845,840 | | | | 160,372 | | | | 2,019,859 | |
Shares redeemed | | | (3,442,370 | ) | | | (43,367,500 | ) | | | (7,871,338 | ) | | | (94,632,110 | ) |
| | | | | | | | | | | | | | | | |
| | | (594,946 | ) | | $ | (7,001,624 | ) | | | (38,742 | ) | | $ | 5,156,939 | |
| | | | | | | | | | | | | | | | |
| | | (19,912,572 | ) | | $ | (244,079,259 | ) | | | 7,403,744 | | | $ | 145,089,557 | |
| | | | | | | | | | | | | | | | |
| | | | | | | | | | | | | | | | |
| | | Year Ended
05/31/21 | | | Year Ended
05/31/20 | |
| Fund Name / Share Class | | Shares | | | Amounts | | | Shares | | | Amounts | |
New Jersey Municipal Bond | | | | | | | | | | | | | | | | |
Institutional | | | | | | | | | | | | | | | | |
Shares sold | | | 3,629,290 | | | $ | 41,335,411 | | | | 4,824,332 | | | $ | 54,566,741 | |
Shares issued in reinvestment of distributions | | | 369,672 | | | | 4,211,080 | | | | 368,838 | | | | 4,148,676 | |
Shares redeemed | | | (2,762,363 | ) | | | (31,338,336 | ) | | | (3,617,675 | ) | | | (39,891,335 | ) |
| | | | | | | | | | | | | | | | |
| | | 1,236,599 | | | $ | 14,208,155 | | | | 1,575,495 | | | $ | 18,824,082 | |
| | | | | | | | | | | | | | | | |
| | |
N O T E S T O F I N A N C I A L S T A T E M E N T S | | 95 |
Notes to Financial Statements (continued)
| | | | | | | | | | | | | | | | |
| | | Year Ended
05/31/21 | | | Year Ended
05/31/20 | |
| Fund Name / Share Class (continued) | | Shares | | | Amounts | | | Shares | | | Amounts | |
New Jersey Municipal Bond (continued) | | | | | | | | | | | | | | | | |
Service | | | | | | | | | | | | | | | | |
Shares sold | | | 1,584 | | | $ | 18,050 | | | | 2,949 | | | $ | 32,067 | |
Shares issued in reinvestment of distributions | | | 18,060 | | | | 205,629 | | | | 19,434 | | | | 218,731 | |
Shares redeemed | | | (22,082 | ) | | | (249,284 | ) | | | (30,381 | ) | | | (337,724 | ) |
| | | | | | | | | | | | | | | | |
| | | (2,438 | ) | | $ | (25,605 | ) | | | (7,998 | ) | | $ | (86,926 | ) |
| | | | | | | | | | | | | | | | |
| | | | |
Investor A | | | | | | | | | | | | | | | | |
Shares sold and automatic conversion of shares | | | 2,569,125 | | | $ | 29,294,441 | | | | 4,061,579 | | | $ | 46,088,376 | |
Shares issued in reinvestment of distributions | | | 266,106 | | | | 3,033,653 | | | | 261,193 | | | | 2,941,842 | |
Shares redeemed | | | (1,572,681 | ) | | | (17,959,479 | ) | | | (2,509,844 | ) | | | (27,917,059 | ) |
| | | | | | | | | | | | | | | | |
| | | 1,262,550 | | | $ | 14,368,615 | | | | 1,812,928 | | | $ | 21,113,159 | |
| | | | | | | | | | | | | | | | |
| | | | |
Investor A1 | | | | | | | | | | | | | | | | |
Shares sold | | | — | | | $ | — | | | | 2 | | | $ | 28 | |
Shares issued in reinvestment of distributions | | | 30,898 | | | | 352,099 | | | | 36,105 | | | | 407,053 | |
Shares redeemed | | | (118,606 | ) | | | (1,351,403 | ) | | | (194,083 | ) | | | (2,193,404 | ) |
| | | | | | | | | | | | | | | | |
| | | (87,708 | ) | | $ | (999,304 | ) | | | (157,976 | ) | | $ | (1,786,323 | ) |
| | | | | | | | | | | | | | | | |
| | | | |
Investor C | | | | | | | | | | | | | | | | |
Shares sold | | | 288,975 | | | $ | 3,286,078 | | | | 826,582 | | | $ | 9,394,118 | |
Shares issued in reinvestment of distributions | | | 46,458 | | | | 528,326 | | | | 59,478 | | | | 668,894 | |
Shares redeemed and automatic conversion of shares | | | (1,073,041 | ) | | | (12,147,572 | ) | | | (668,851 | ) | | | (7,417,679 | ) |
| | | | | | | | | | | | | | | | |
| | | (737,608 | ) | | $ | (8,333,168 | ) | | | 217,209 | | | $ | 2,645,333 | |
| | | | | | | | | | | | | | | | |
| | | | |
Investor C1(a) | | | | | | | | | | | | | | | | |
Shares sold | | | — | | | $ | — | | | | 3 | | | $ | 44 | |
Shares issued in reinvestment of distributions | | | — | | | | — | | | | 23 | | | | 260 | |
Shares redeemed | | | — | | | | — | | | | (2,019 | ) | | | (23,542 | ) |
| | | | | | | | | | | | | | | | |
| | | — | | | $ | — | | | | (1,993 | ) | | $ | (23,238 | ) |
| | | | | | | | | | | | | | | | |
| | | | |
Class K | | | | | | | | | | | | | | | | |
Shares sold | | | 88,860 | | | $ | 1,020,896 | | | | 48,368 | | | $ | 539,457 | |
Shares issued in reinvestment of distributions | | | 6,058 | | | | 69,046 | | | | 5,021 | | | | 56,444 | |
Shares redeemed | | | (36,006 | ) | | | (410,304 | ) | | | (8,833 | ) | | | (96,166 | ) |
| | | | | | | | | | | | | | | | |
| | | 58,912 | | | $ | 679,638 | | | | 44,556 | | | $ | 499,735 | |
| | | | | | | | | | | | | | | | |
| | | 1,730,307 | | | $ | 19,898,331 | | | | 3,482,221 | | | $ | 41,185,822 | |
| | | | | | | | | | | | | | | | |
| | | | | | | | | | | | | | | | |
| | | Year Ended
05/31/21 | | | Year Ended
05/31/20 | |
| Fund Name / Share Class | | Shares | | | Amounts | | | Shares | | | Amounts | |
Pennsylvania Municipal Bond | | | | | | | | | | | | | | | | |
Institutional | | | | | | | | | | | | | | | | |
Shares sold | | | 5,886,955 | | | $ | 65,333,355 | | | | 6,635,531 | | | $ | 73,402,433 | |
Shares issued in reinvestment of distributions | | | 489,288 | | | | 5,426,153 | | | | 555,062 | | | | 6,134,012 | |
Shares redeemed | | | (5,121,016 | ) | | | (56,574,354 | ) | | | (6,921,554 | ) | | | (75,151,282 | ) |
| | | | | | | | | | | | | | | | |
| | | 1,255,227 | | | $ | 14,185,154 | | | | 269,039 | | | $ | 4,385,163 | |
| | | | | | | | | | | | | | | | |
| | | | |
Service | | | | | | | | | | | | | | | | |
Shares sold | | | 49,867 | | | $ | 552,617 | | | | 141,441 | | | $ | 1,583,639 | |
Shares issued in reinvestment of distributions | | | 5,265 | | | | 58,470 | | | | 6,168 | | | | 68,277 | |
Shares redeemed | | | (30,224 | ) | | | (333,144 | ) | | | (150,019 | ) | | | (1,659,534 | ) |
| | | | | | | | | | | | | | | | |
| | | 24,908 | | | $ | 277,943 | | | | (2,410 | ) | | $ | (7,618 | ) |
| | | | | | | | | | | | | | | | |
| | | | |
Investor A | | | | | | | | | | | | | | | | |
Shares sold and automatic conversion of shares | | | 4,017,437 | | | $ | 44,679,598 | | | | 3,456,983 | | | $ | 38,450,860 | |
Shares issued in reinvestment of distributions | | | 339,559 | | | | 3,770,922 | | | | 345,859 | | | | 3,824,111 | |
Shares redeemed | | | (2,305,304 | ) | | | (25,569,875 | ) | | | (1,554,429 | ) | | | (17,100,294 | ) |
| | | | | | | | | | | | | | | | |
| | | 2,051,692 | | | $ | 22,880,645 | | | | 2,248,413 | | | $ | 25,174,677 | |
| | | | | | | | | | | | | | | | |
| | |
| 96 | | 2 0 2 1 B L A C K R O C K A N N U A L R E P O R T T O S H A R E H O L D E R S |
Notes to Financial Statements (continued)
| | | | | | | | | | | | | | | | |
| | | Year Ended
05/31/21 | | | Year Ended
05/31/20 | |
| Fund Name / Share Class (continued) | | Shares | | | Amounts | | | Shares | | | Amounts | |
Pennsylvania Municipal Bond (continued) | | | | | | | | | | | | | | | | |
Investor A1 | | | | | | | | | | | | | | | | |
Shares sold | | | — | | | $ | — | | | | — | | | $ | — | |
Shares issued in reinvestment of distributions | | | 14,443 | | | | 160,380 | | | | 18,134 | | | | 200,819 | |
Shares redeemed | | | (103,751 | ) | | | (1,153,942 | ) | | | (82,870 | ) | | | (922,432 | ) |
| | | | | | | | | | | | | | | | |
| | | (89,308 | ) | | $ | (993,562 | ) | | | (64,736 | ) | | $ | (721,613 | ) |
| | | | | | | | | | | | | | | | |
| | | | |
Investor C | | | | | | | | | | | | | | | | |
Shares sold | | | 160,745 | | | $ | 1,780,029 | | | | 707,983 | | | $ | 7,845,586 | |
Shares issued in reinvestment of distributions | | | 42,603 | | | | 472,249 | | | | 60,574 | | | | 670,191 | |
Shares redeemed and automatic conversion of shares | | | (1,058,967 | ) | | | (11,771,624 | ) | | | (757,294 | ) | | | (8,341,781 | ) |
| | | | | | | | | | | | | | | | |
| | | (855,619 | ) | | $ | (9,519,346 | ) | | | 11,263 | | | $ | 173,996 | |
| | | | | | | | | | | | | | | | |
| | | | |
Investor C1(a) | | | | | | | | | | | | | | | | |
Shares sold | | | — | | | $ | — | | | | — | | | $ | — | |
Shares issued in reinvestment of distributions | | | — | | | | — | | | | 3 | | | | 38 | |
Shares redeemed | | | — | | | | — | | | | (746 | ) | | | (8,342 | ) |
| | | | | | | | | | | | | | | | |
| | | — | | | $ | — | | | | (743 | ) | | $ | (8,304 | ) |
| | | | | | | | | | | | | | | | |
| | | | |
Class K | | | | | | | | | | | | | | | | |
Shares sold | | | 240,075 | | | $ | 2,673,865 | | | | 237,976 | | | $ | 2,631,025 | |
Shares issued in reinvestment of distributions | | | 13,050 | | | | 144,867 | | | | 10,246 | | | | 112,845 | |
Shares redeemed | | | (62,353 | ) | | | (691,792 | ) | | | (87,302 | ) | | | (944,340 | ) |
| | | | | | | | | | | | | | | | |
| | | 190,772 | | | $ | 2,126,940 | | | | 160,920 | | | $ | 1,799,530 | |
| | | | | | | | | | | | | | | | |
| | | 2,577,672 | | | $ | 28,957,774 | | | | 2,621,746 | | | $ | 30,795,831 | |
| | | | | | | | | | | | | | | | |
| | | | | | | | | | | | | | | | |
| | | Year Ended
05/31/21 | | | Year Ended
05/31/20 | |
| Fund Name / Share Class | | Shares | | | Amounts | | | Shares | | | Amounts | |
Strategic Municipal Opportunities | | | | | | | | | | | | | | | | |
Institutional | | | | | | | | | | | | | | | | |
Shares sold | | | 185,242,061 | | | $ | 2,130,901,084 | | | | 315,544,558 | | | $ | 3,644,033,630 | |
Shares issued in reinvestment of distributions | | | 9,512,836 | | | | 108,840,179 | | | | 14,850,481 | | | | 171,358,616 | |
Shares redeemed | | | (275,748,408 | ) | | | (3,119,772,435 | ) | | | (434,132,060 | ) | | | (4,777,669,748 | ) |
| | | | | | | | | | | | | | | | |
| | | (80,993,511 | ) | | $ | (880,031,172 | ) | | | (103,737,021 | ) | | $ | (962,277,502 | ) |
| | | | | | | | | | | | | | | | |
| | | | |
Investor A | | | | | | | | | | | | | | | | |
Shares sold and automatic conversion of shares | | | 28,786,463 | | | $ | 329,332,901 | | | | 62,666,949 | | | $ | 726,027,777 | |
Shares issued in reinvestment of distributions | | | 2,978,218 | | | | 34,052,427 | | | | 3,763,107 | | | | 43,316,515 | |
Shares redeemed | | | (59,650,651 | ) | | | (679,418,936 | ) | | | (52,565,272 | ) | | | (586,188,189 | ) |
| | | | | | | | | | | | | | | | |
| | | (27,885,970 | ) | | $ | (316,033,608 | ) | | | 13,864,784 | | | $ | 183,156,103 | |
| | | | | | | | | | | | | | | | |
| | | | |
Investor A1 | | | | | | | | | | | | | | | | |
Shares sold | | | 10,421 | | | $ | 121,726 | | | | 2 | | | $ | 17 | |
Shares issued in reinvestment of distributions | | | 30,236 | | | | 346,149 | | | | 35,533 | | | | 409,360 | |
Shares redeemed | | | (168,278 | ) | | | (1,930,602 | ) | | | (204,948 | ) | | | (2,295,999 | ) |
| | | | | | | | | | | | | | | | |
| | | (127,621 | ) | | $ | (1,462,727 | ) | | | (169,413 | ) | | $ | (1,886,622 | ) |
| | | | | | | | | | | | | | | | |
| | | | |
Investor C | | | | | | | | | | | | | | | | |
Shares sold | | | 1,305,958 | | | $ | 14,985,157 | | | | 5,151,244 | | | $ | 60,181,739 | |
Shares issued in reinvestment of distributions | | | 227,209 | | | | 2,592,034 | | | | 366,506 | | | | 4,222,255 | |
Shares redeemed and automatic conversion of shares | | | (11,007,931 | ) | | | (124,835,671 | ) | | | (6,943,658 | ) | | | (78,577,192 | ) |
| | | | | | | | | | | | | | | | |
| | | (9,474,764 | ) | | $ | (107,258,480 | ) | | | (1,425,908 | ) | | $ | (14,173,198 | ) |
| | | | | | | | | | | | | | | | |
| | | | |
Class K | | | | | | | | | | | | | | | | |
Shares sold | | | 5,703,967 | | | $ | 66,067,741 | | | | 11,725,456 | | | $ | 136,433,122 | |
Shares issued in reinvestment of distributions | | | 245,352 | | | | 2,812,012 | | | | 303,001 | | | | 3,481,189 | |
Shares redeemed | | | (6,713,128 | ) | | | (76,528,004 | ) | | | (7,910,959 | ) | | | (87,511,240 | ) |
| | | | | | | | | | | | | | | | |
| | | (763,809 | ) | | $ | (7,648,251 | ) | | | 4,117,498 | | | $ | 52,403,071 | |
| | | | | | | | | | | | | | | | |
| | | (119,245,675 | ) | | $ | (1,312,434,238 | ) | | | (87,350,060 | ) | | $ | (742,778,148 | ) |
| | | | | | | | | | | | | | | | |
| | (a) | On February 24, 2020, the Fund’s issued and outstanding Investor C1 Shares converted into Investor A Shares. | |
| | |
N O T E S T O F I N A N C I A L S T A T E M E N T S | | 97 |
Notes to Financial Statements (continued)
As of May 31, 2021, shares owned by BlackRock Financial Management, Inc., an affiliate of the Funds, were as follows:
| | | | |
| Fund Name | | Class K | |
New Jersey Municipal Bond | | | 18,124 | |
12. SUBSEQUENT EVENTS
Management has evaluated the impact of all subsequent events on the Funds through the date the financial statements were issued and has determined that there were no subsequent events requiring adjustment or additional disclosure in the financial statements.
| | |
| 98 | | 2 0 2 1 B L A C K R O C K A N N U A L R E P O R T T O S H A R E H O L D E R S |
Report of Independent Registered Public Accounting Firm
To the Shareholders of BlackRock California Municipal Opportunities Fund, BlackRock New Jersey Municipal Bond Fund, BlackRock Pennsylvania Municipal Bond Fund, and BlackRock Strategic Municipal Opportunities Fund and the Boards of Trustees of BlackRock California Municipal Series Trust, BlackRock Multi-State Municipal Series Trust, and BlackRock Municipal Series Trust:
Opinion on the Financial Statements and Financial Highlights
We have audited the accompanying statements of assets and liabilities of BlackRock California Municipal Opportunities Fund of BlackRock California Municipal Series Trust, BlackRock New Jersey Municipal Bond Fund and BlackRock Pennsylvania Municipal Bond Fund of BlackRock Multi-State Municipal Series Trust, and BlackRock Strategic Municipal Opportunities Fund of BlackRock Municipal Series Trust (the “Funds”), including the schedules of investments, as of May 31, 2021, the related statements of operations for the year then ended, the statements of changes in net assets for each of the two years in the period then ended, the financial highlights for each of the five years in the period then ended, and the related notes. In our opinion, the financial statements and financial highlights present fairly, in all material respects, the financial position of the Funds as of May 31, 2021, and the results of their operations for the year then ended, the changes in their net assets for each of the two years in the period then ended, and the financial highlights for each of the five years in the period then ended, in conformity with accounting principles generally accepted in the United States of America.
Basis for Opinion
These financial statements and financial highlights are the responsibility of the Funds’ management. Our responsibility is to express an opinion on the Funds’ financial statements and financial highlights based on our audits. We are a public accounting firm registered with the Public Company Accounting Oversight Board (United States) (PCAOB) and are required to be independent with respect to the Funds in accordance with the U.S. federal securities laws and the applicable rules and regulations of the Securities and Exchange Commission and the PCAOB.
We conducted our audits in accordance with the standards of the PCAOB. Those standards require that we plan and perform the audit to obtain reasonable assurance about whether the financial statements and financial highlights are free of material misstatement, whether due to error or fraud. The Funds are not required to have, nor were we engaged to perform, an audit of their internal control over financial reporting. As part of our audits we are required to obtain an understanding of internal control over financial reporting but not for the purpose of expressing an opinion on the effectiveness of the Funds’ internal control over financial reporting. Accordingly, we express no such opinion.
Our audits included performing procedures to assess the risks of material misstatement of the financial statements and financial highlights, whether due to error or fraud, and performing procedures that respond to those risks. Such procedures included examining, on a test basis, evidence regarding the amounts and disclosures in the financial statements and financial highlights. Our audits also included evaluating the accounting principles used and significant estimates made by management, as well as evaluating the overall presentation of the financial statements and financial highlights. Our procedures included confirmation of securities owned as of May 31, 2021, by correspondence with the custodian and brokers; when replies were not received from brokers, we performed other auditing procedures. We believe that our audits provide a reasonable basis for our opinion.
Deloitte & Touche LLP
Boston, Massachusetts
July 21, 2021
We have served as the auditor of one or more BlackRock investment companies since 1992.
| | |
REPORT OF INDEPENDENT REGISTERED PUBLIC ACCOUNTING FIRM | | 99 |
Trustee and Officer Information
Independent Trustees(a)
| | | | | | | | |
| | | | | |
Name Year of Birth(b) | | Position(s) Held (Length of Service)(c) | | Principal Occupation(s) During Past Five Years | | Number of BlackRock-Advised
Registered Investment Companies
(“RICs”) Consisting of
Investment Portfolios
(“Portfolios”) Overseen | | Public Company
and Other
Investment
Company
Directorships Held
During Past Five Years |
| | | | |
Richard E. Cavanagh 1946 | | Co-Chair of the Board and Trustee (Since 2019) | | Director, The Guardian Life Insurance Company of America since 1998; Board Chair, Volunteers of America (a not-for-profit organization) from 2015 to 2018 (board member since 2009); Director, Arch Chemicals (chemical and allied products) from 1999 to 2011; Trustee, Educational Testing Service from 1997 to 2009 and Chairman thereof from 2005 to 2009; Senior Advisor, The Fremont Group since 2008 and Director thereof since 1996; Faculty Member/Adjunct Lecturer, Harvard University since 2007 and Executive Dean from 1987 to 1995; President and Chief Executive Officer, The Conference Board, Inc. (global business research organization) from 1995 to 2007. | | 73 RICs consisting of 99 Portfolios | | None |
| | | | |
Karen P. Robards 1950 | | Co-Chair of the Board and Trustee (Since 2019) | | Principal of Robards & Company, LLC (consulting and private investing) since 1987; Co-founder and Director of the Cooke Center for Learning and Development (a not- for-profit organization) since 1987; Director of Enable Injections, LLC (medical devices) since 2019; Investment Banker at Morgan Stanley from 1976 to 1987. | | 73 RICs consisting of 99 Portfolios | | Greenhill & Co., Inc.; AtriCure, Inc. (medical devices) from 2000 until 2017. |
| | | | |
Michael J. Castellano 1946 | | Trustee (Since 2019) | | Chief Financial Officer of Lazard Group LLC from 2001 to 2011; Chief Financial Officer of Lazard Ltd from 2004 to 2011; Director, Support Our Aging Religious (non-profit) from 2009 to June 2015 and from 2017 to September 2020; Director, National Advisory Board of Church Management at Villanova University since 2010; Trustee, Domestic Church Media Foundation since 2012; Director, CircleBlack Inc. (financial technology company) from 2015 to July 2020. | | 73 RICs consisting of 99 Portfolios | | None |
| | | | |
Cynthia L. Egan 1955 | | Trustee (Since 2019) | | Advisor, U.S. Department of the Treasury from 2014 to 2015; President, Retirement Plan Services, for T. Rowe Price Group, Inc. from 2007 to 2012; executive positions within Fidelity Investments from 1989 to 2007. | | 73 RICs consisting of 99 Portfolios | | Unum (insurance); The Hanover Insurance Group (Board Chair) (insurance); Huntsman Corporation (chemical products); Envestnet (investment platform) from 2013 until 2016. |
| | | | |
Frank J. Fabozzi(d) 1948 | | Trustee (Since 2019) | | Editor of The Journal of Portfolio Management since 1986; Professor of Finance, EDHEC Business School (France) since 2011; Visiting Professor, Princeton University for the 2013 to 2014 academic year and Spring 2017 semester; Professor in the Practice of Finance, Yale University School of Management from 1994 to 2011 and currently a Teaching Fellow in Yale’s Executive Programs; Board Member, BlackRock Equity-Liquidity Funds from 2014 to 2016; affiliated professor Karlsruhe Institute of Technology from 2008 to 2011; Visiting Professor, Rutgers University for the Spring 2019 semester; Visiting Professor, New York University for the 2019 academic year. Adjunct Professor of Finance, Carnegie Mellon University in fall 2020 semester. | | 75 RICs consisting of 101 Portfolios | | None |
| | |
| 100 | | 2 0 2 1 B L A C K R O C K A N N U A L R E P O R T T O S H A R E H O L D E R S |
Trustee and Officer Information (continued)
Independent Trustees(a) (continued)
| | | | | | | | |
| | | | | |
Name Year of Birth(b) | | Position(s) Held (Length of Service)(c) | | Principal Occupation(s) During Past Five Years | | Number of BlackRock-Advised
Registered Investment Companies
(“RICs”) Consisting of
Investment Portfolios
(“Portfolios”) Overseen | | Public Company
and Other
Investment
Company
Directorships Held
During Past Five Years |
| | | | |
R. Glenn Hubbard 1958 | | Trustee (Since 2019) | | Dean, Columbia Business School from 2004 to 2019; Faculty member, Columbia Business School since 1988. | | 73 RICs consisting of 99 Portfolios | | ADP (data and information services) 2004-2020; Metropolitan Life Insurance Company (insurance); KKR Financial Corporation (finance) from 2004 until 2014. |
| | | | |
W. Carl Kester(d) 1951 | | Trustee (Since 2019) | | George Fisher Baker Jr. Professor of Business Administration, Harvard Business School since 2008; Deputy Dean for Academic Affairs from 2006 to 2010; Chairman of the Finance Unit, from 2005 to 2006; Senior Associate Dean and Chairman of the MBA Program from 1999 to 2005; Member of the faculty of Harvard Business School since 1981. | | 75 RICs consisting of 101 Portfolios | | None |
| | | | |
Catherine A. Lynch(d) 1961 | | Trustee (Since 2019) | | Chief Executive Officer, Chief Investment Officer and various other positions, National Railroad Retirement Investment Trust from 2003 to 2016; Associate Vice President for Treasury Management, The George Washington University from 1999 to 2003; Assistant Treasurer, Episcopal Church of America from 1995 to 1999. | | 75 RICs consisting of 101 Portfolios | | None |
Interested Trustees(a)(e)
| | | | | | | | |
| | | | | |
Name Year of Birth(b) | | Position(s) Held (Length of Service)(c) | | Principal Occupation(s) During Past Five Years | | Number of BlackRock-Advised
Registered Investment Companies
(“RICs”) Consisting of
Investment Portfolios
(“Portfolios”) Overseen | | Public Company
and Other
Investment
Company
Directorships Held
During
Past Five Years |
| | | | |
Robert Fairbairn 1965 | | Trustee (Since 2015) | | Vice Chairman of BlackRock, Inc. since 2019; Member of BlackRock’s Global Executive and Global Operating Committees; Co-Chair of BlackRock’s Human Capital Committee; Senior Managing Director of BlackRock, Inc. from 2010 to 2019; oversaw BlackRock’s Strategic Partner Program and Strategic Product Management Group from 2012 to 2019; Member of the Board of Managers of BlackRock Investments, LLC from 2011 to 2018; Global Head of BlackRock’s Retail and iShares® businesses from 2012 to 2016. | | 103 RICs consisting of 251 Portfolios | | None |
| | | | |
John M. Perlowski(d) 1964 | | Trustee (Since 2015) President and Chief Executive Officer (Since 2010) | | Managing Director of BlackRock, Inc. since 2009; Head of BlackRock Global Accounting and Product Services since 2009; Advisory Director of Family Resource Network (charitable foundation) since 2009. | | 105 RICs consisting of 253 Portfolios | | None |
| (a) | The address of each Trustee is c/o BlackRock, Inc., 55 East 52nd Street, New York, New York 10055. |
| (b) | Each Independent Trustee holds office until his or her successor is duly elected and qualifies or until his or her earlier death, resignation, retirement or removal as provided by the Trust’s by-laws or charter or statute, or until December 31 of the year in which he or she turns 75. Trustees who are “interested persons,” as defined in the Investment Company Act serve until their successor is duly elected and qualifies or until their earlier death, resignation, retirement or removal as provided by the Trust’s by-laws or statute, or until December 31 of the year in which they turn 72. The Board may determine to extend the terms of Independent Trustees on a case-by-case basis, as appropriate. |
| | |
T R U S T E E A N D O F F I C E R I N F O R M A T I O N | | 101 |
Trustee and Officer Information (continued)
| (c) | Following the combination of Merrill Lynch Investment Managers, L.P. (“MLIM”) and BlackRock, Inc. in September 2006, the various legacy MLIM and legacy BlackRock fund boards were realigned and consolidated into three new fund boards in 2007. Certain Independent Trustees first became members of the boards of other legacy MLIM or legacy BlackRock funds as follows: Richard E. Cavanagh, 1994; Frank J. Fabozzi, 1988; R. Glenn Hubbard, 2004; W. Carl Kester, 1995; and Karen P. Robards, 1998. Certain other Independent Trustees became members of the boards of the closed-end funds in the Fixed-Income Complex as follows: Michael J. Castellano, 2011; Cynthia L. Egan, 2016; and Catherine A. Lynch, 2016. |
| (d) | Dr. Fabozzi, Dr. Kester, Ms. Lynch and Mr. Perlowski are also trustees of the BlackRock Credit Strategies Fund and BlackRock Private Investments Fund. |
| (e) | Mr. Fairbairn and Mr. Perlowski are both “interested persons,” as defined in the 1940 Act, of the Trust based on their positions with BlackRock, Inc. and its affiliates. Mr. Fairbairn and Mr. Perlowski are also board members of the BlackRock Multi-Asset Complex. |
Officers Who Are Not Trustees(a)
| | | | |
Name Year of Birth(b) | | Position(s) Held (Length of Service) | | Principal Occupation(s) During Past Five Years |
| | | |
Jennifer McGovern 1977 | | Vice President (Since 2014) | | Managing Director of BlackRock, Inc. since 2016; Director of BlackRock, Inc. from 2011 to 2015; Head of Americas Product Development and Governance for BlackRock’s Global Product Group since 2019; Head of Product Structure and Oversight for BlackRock’s U.S. Wealth Advisory Group from 2013 to 2019. |
| | | |
Trent Walker 1974 | | Chief Financial Officer (Since 2021) | | Managing Director of BlackRock, Inc. since September 2019; Executive Vice President of PIMCO from 2016 to 2019; Senior Vice President of PIMCO from 2008 to 2015; Treasurer from 2013 to 2019 and Assistant Treasurer from 2007 to 2017 of PIMCO Funds, PIMCO Variable Insurance Trust, PIMCO ETF Trust, PIMCO Equity Series, PIMCO Equity Series VIT, PIMCO Managed Accounts Trust, 2 PIMCO-sponsored interval funds and 21 PIMCO-sponsored closed-end funds. |
| | | |
Jay M. Fife 1970 | | Treasurer (Since 2007) | | Managing Director of BlackRock, Inc. since 2007. |
| | | |
Charles Park 1967 | | Chief Compliance Officer (Since 2014) | | Anti-Money Laundering Compliance Officer for certain BlackRock-advised Funds from 2014 to 2015; Chief Compliance Officer of BlackRock Advisors, LLC and the BlackRock-advised Funds in the BlackRock Multi-Asset Complex and the BlackRock Fixed-Income Complex since 2014; Principal of and Chief Compliance Officer for iShares® Delaware Trust Sponsor LLC since 2012 and BlackRock Fund Advisors (“BFA”) since 2006; Chief Compliance Officer for the BFA-advised iShares® exchange traded funds since 2006; Chief Compliance Officer for BlackRock Asset Management International Inc. since 2012. |
| | | |
Lisa Belle 1968 | | Anti-Money Laundering Compliance Officer (Since 2019) | | Managing Director of BlackRock, Inc. since 2019; Global Financial Crime Head for Asset and Wealth Management of JP Morgan from 2013 to 2019; Managing Director of RBS Securities from 2012 to 2013; Head of Financial Crimes for Barclays Wealth Americas from 2010 to 2012. |
| | | |
Janey Ahn 1975 | | Secretary (Since 2019) | | Managing Director of BlackRock, Inc. since 2018; Director of BlackRock, Inc. from 2009 to 2017. |
| (a) | The address of each Officer is c/o BlackRock, Inc., 55 East 52nd Street, New York, New York 10055. |
| (b) | Officers of the Trusts serve at the pleasure of the Board. |
Further information about the Trust’s Trustees and Officers is available in the Trust’s Statement of Additional Information, which can be obtained without charge by calling (800) 441-7762.
|
| |
Neal J. Andrews retired as the Chief Financial Officer effective December 31, 2020, and Trent Walker was elected as the Chief Financial Officer effective January 1, 2021. Effective June 10, 2021, Stayce D. Harris and J. Phillip Holloman were each appointed to serve as a Trustee of the Trusts. |
| | |
| 102 | | 2 0 2 1 B L A C K R O C K A N N U A L R E P O R T T O S H A R E H O L D E R S |
Additional Information
Regulation Regarding Derivatives
On October 28, 2020, the Securities and Exchange Commission (the “SEC”) adopted new regulations governing the use of derivatives by registered investment companies (“Rule 18f-4”). The Funds will be required to implement and comply with Rule 18f-4 by August 19, 2022. Once implemented, Rule 18f-4 will impose limits on the amount of derivatives a fund can enter into, eliminate the asset segregation framework currently used by funds to comply with Section 18 of the 1940 Act, treat derivatives as senior securities and require funds whose use of derivatives is more than a limited specified exposure amount to establish and maintain a comprehensive derivatives risk management program and appoint a derivatives risk manager.
Dividend Policy
Each Fund’s dividend policy is to distribute all or a portion of its net investment income to its shareholders on a monthly/quarterly basis. In order to provide shareholders with a more stable level of dividend distributions, the distributions paid by a Fund for any particular month/quarter may be more or less than the amount of net investment income earned by a Fund during such month/quarter. The portion of distributions that exceeds a Fund current and accumulated earnings and profits, which are measured on a tax basis, will constitute a nontaxable return of capital. The Funds’ current accumulated but undistributed net investment income, if any, is disclosed as accumulated earnings (loss) in the Statements of Assets and Liabilities, which comprises part of the financial information included in this report.
General Information
Quarterly performance, semi-annual and annual reports, current net asset value and other information regarding the Funds may be found on BlackRock’s website, which can be accessed at blackrock.com. Any reference to BlackRock’s website in this report is intended to allow investors public access to information regarding the Funds and does not, and is not intended to, incorporate BlackRock’s website in this report.
Householding
The Funds will mail only one copy of shareholder documents, including prospectuses, annual and semi-annual reports, Rule 30e-3 notices and proxy statements, to shareholders with multiple accounts at the same address. This practice is commonly called “householding” and is intended to reduce expenses and eliminate duplicate mailings of shareholder documents. Mailings of your shareholder documents may be householded indefinitely unless you instruct us otherwise. If you do not want the mailing of these documents to be combined with those for other members of your household, please call the Funds at (800) 441-7762.
Availability of Quarterly Schedule of Investments
The Funds file their complete schedules of portfolio holdings with the SEC for the first and third quarters of each fiscal year as an exhibit to their reports on Form N-PORT. The Funds’ Forms N-PORT are available on the SEC’s website at sec.gov. Additionally, each Fund makes its portfolio holdings for the first and third quarters of each fiscal year available at blackrock.com/fundreports.
Availability of Proxy Voting Policies, Procedures and Voting Records
A description of the policies and procedures that the Funds use to determine how to vote proxies relating to portfolio securities and information about how the Funds voted proxies relating to securities held in the Funds’ portfolios during the most recent 12-month period ended June 30 is available without charge, upon request (1) by calling (800) 441-7762; (2) on the BlackRock website at blackrock.com; and (3) on the SEC’s website at sec.gov.
BlackRock’s Mutual Fund Family
BlackRock offers a diverse lineup of open-end mutual funds crossing all investment styles and managed by experts in equity, fixed-income and tax-exempt investing. Visit blackrock.com for more information.
Shareholder Privileges
Account Information
Call us at (800) 441-7762 from 8:00 AM to 6:00 PM ET on any business day to get information about your account balances, recent transactions and share prices. You can also visit blackrock.com for more information.
Automatic Investment Plans
Investor class shareholders who want to invest regularly can arrange to have $50 or more automatically deducted from their checking or savings account and invested in any of the BlackRock funds.
| | |
A D D I T I O N A L I N F O R M A T I O N | | 103 |
Additional Information (continued)
Systematic Withdrawal Plans
Investor class shareholders can establish a systematic withdrawal plan and receive periodic payments of $50 or more from their BlackRock funds, as long as their account balance is at least $10,000.
Retirement Plans
Shareholders may make investments in conjunction with Traditional, Rollover, Roth, Coverdell, Simple IRAs, SEP IRAs and 403(b) Plans.
BlackRock Privacy Principles
BlackRock is committed to maintaining the privacy of its current and former fund investors and individual clients (collectively, “Clients”) and to safeguarding their non-public personal information. The following information is provided to help you understand what personal information BlackRock collects, how we protect that information and why in certain cases we share such information with select parties.
If you are located in a jurisdiction where specific laws, rules or regulations require BlackRock to provide you with additional or different privacy-related rights beyond what is set forth below, then BlackRock will comply with those specific laws, rules or regulations.
BlackRock obtains or verifies personal non-public information from and about you from different sources, including the following: (i) information we receive from you or, if applicable, your financial intermediary, on applications, forms or other documents; (ii) information about your transactions with us, our affiliates, or others; (iii) information we receive from a consumer reporting agency; and (iv) from visits to our websites.
BlackRock does not sell or disclose to non-affiliated third parties any non-public personal information about its Clients, except as permitted by law or as is necessary to respond to regulatory requests or to service Client accounts. These non-affiliated third parties are required to protect the confidentiality and security of this information and to use it only for its intended purpose.
We may share information with our affiliates to service your account or to provide you with information about other BlackRock products or services that may be of interest to you. In addition, BlackRock restricts access to non-public personal information about its Clients to those BlackRock employees with a legitimate business need for the information. BlackRock maintains physical, electronic and procedural safeguards that are designed to protect the non-public personal information of its Clients, including procedures relating to the proper storage and disposal of such information.
Fund and Service Providers
| | |
| Investment Adviser | | Independent Registered Public Accounting Firm |
| BlackRock Advisors, LLC | | Deloitte & Touche LLP |
| Wilmington, DE 19809 | | Boston, MA 02116 |
| |
| Accounting Agent and Custodian | | Legal Counsel |
| State Street Bank and Trust Company | | Willkie Farr & Gallagher LLP |
| Boston, MA 02111 | | New York, NY 10019 |
| |
| Transfer Agent | | Address of the Funds |
| BNY Mellon Investment Servicing (US) Inc. | | 100 Bellevue Parkway |
| Wilmington, DE 19809 | | Wilmington, DE 19809 |
| |
| Distributor | | |
| BlackRock Investments, LLC | | |
| New York, NY 10022 | | |
| | |
| 104 | | 2 0 2 1 B L A C K R O C K A N N U A L R E P O R T T O S H A R E H O L D E R S |
Glossary of Terms Used in this Report
Portfolio Abbreviation
| | |
| |
| AGC | | Assured Guaranty Corp. |
| |
| AGM | | Assured Guaranty Municipal Corp. |
| |
| AGM-CR | | AGM Insured Custodial Receipt |
| |
| AMBAC | | AMBAC Assurance Corp. |
| |
| AMT | | Alternative Minimum Tax |
| |
| ARB | | Airport Revenue Bonds |
| |
| BAB | | Build America Bond |
| |
| BAM | | Build America Mutual Assurance Co. |
| |
| BHAC-CR | | Berkshire Hathaway Assurance Corp. - Custodian Receipt |
| |
| CAB | | Capital Appreciation Bonds |
| |
| COP | | Certificates of Participation |
| |
| CR | | Custodian Receipt |
| |
| FHA | | Federal Housing Administration |
| |
| FHLMC | | Federal Home Loan Mortgage Corp. |
| |
| FNMA | | Federal National Mortgage Association |
| |
| GNMA | | Government National Mortgage Association |
| |
| GO | | General Obligation Bonds |
| |
| GTD | | GTD Guaranteed |
| |
| HUD SECT 8 | | U.S. Department of Housing and Urban Development Section 8 |
| |
| INS | | Insured |
| |
| M/F | | Multi-Family |
| |
| NPFGC | | National Public Finance Guarantee Corp. |
| |
| PSF-GTD | | Permanent School Fund Guaranteed |
| |
| RB | | Revenue Bond |
| |
| S/F | | Single-Family |
| |
| SAB | | Special Assessment Bonds |
| |
| SAN | | State Aid Notes |
| |
| SAW | | State Aid Withholding |
| |
| SCH BD RES FD | | School Board Resolution Fund |
| |
| SOFR | | Secured Overnight Financing Rate |
| |
| SONYMA | | State of New York Mortgage Agency |
| |
| ST | | Special Tax |
| |
| TA | | Tax Allocation |
| |
| UT | | Unlimited Tax |
| | |
GLOSSARY OF TERMS USED IN THIS REPORT | | 105 |
Want to know more?
blackrock.com | 800-441-7762
This report is intended for current holders. It is not authorized for use as an offer of sale or a solicitation of an offer to buy shares of the Funds unless preceded or accompanied by the Funds’ current prospectus. Past performance results shown in this report should not be considered a representation of future performance. Investment returns and principal value of shares will fluctuate so that shares, when redeemed, may be worth more or less than their original cost. Statements and other information herein are as dated and are subject to change.
MUNI4-05/21-AR
(b) Not Applicable
| Item 2 – | Code of Ethics – The registrant (or the “Fund”) has adopted a code of ethics, as of the end of the period covered by this report, applicable to the registrant’s principal executive officer, principal financial officer, principal accounting officer or controller, or persons performing similar functions. During the period covered by this report, the code of ethics was amended to update certain information and to make other non-material changes. During the period covered by this report, there have been no waivers granted under the code of ethics. The registrant undertakes to provide a copy of the code of ethics to any person upon request, without charge, who calls 1-800-441-7762. |
| Item 3 – | Audit Committee Financial Expert – The registrant’s board of trustees (the “board of trustees”), has determined that (i) the registrant has the following audit committee financial experts serving on its audit committee and (ii) each audit committee financial expert is independent: |
Michael Castellano
Frank J. Fabozzi
Catherine A. Lynch
Karen P. Robards
The registrant’s board of trustees has determined that Karen P. Robards qualifies as an audit committee financial expert pursuant to Item 3(c)(4) of Form N-CSR.
Ms. Robards has a thorough understanding of generally accepted accounting principles, financial statements and internal control over financial reporting as well as audit committee functions. Ms. Robards has been President of Robards & Company, a financial advisory firm, since 1987. Ms. Robards was formerly an investment banker for more than 10 years where she was responsible for evaluating and assessing the performance of companies based on their financial results. Ms. Robards has over 30 years of experience analyzing financial statements. She also is a member of the audit committee of one publicly held company and a non-profit organization.
Under applicable securities laws, a person determined to be an audit committee financial expert will not be deemed an “expert” for any purpose, including without limitation for the purposes of Section 11 of the Securities Act of 1933, as a result of being designated or identified as an audit committee financial expert. The designation or identification as an audit committee financial expert does not impose on such person any duties, obligations, or liabilities greater than the duties, obligations, and liabilities imposed on such person as a member of the audit committee and board of trustees in the absence of such designation or identification. The designation or identification of a person as an audit committee financial expert does not affect the duties, obligations, or liability of any other member of the audit committee or board of trustees.
| Item 4 – | Principal Accountant Fees and Services |
The following table presents fees billed by Deloitte & Touche LLP (“D&T”) in each of the last two fiscal years for the services rendered to the Fund:
| | | | | | | | | | | | | | | | |
| | | (a) Audit Fees | | (b) Audit-Related Fees1 | | (c) Tax Fees2 | | (d) All Other Fees |
| Entity Name | | Current
Fiscal
Year End | | Previous
Fiscal
Year End | | Current
Fiscal
Year End | | Previous
Fiscal
Year End | | Current
Fiscal
Year End | | Previous
Fiscal
Year End | | Current
Fiscal
Year End | | Previous
Fiscal
Year End |
| BlackRock California Municipal Opportunities Fund of BlackRock California Municipal Series Trust | | $34,542 | | $35,598 | | $0 | | $0 | | $13,700 | | $12,500 | | $0 | | $0 |
2
The following table presents fees billed by D&T that were required to be approved by the registrant’s audit committee (the “Committee”) for services that relate directly to the operations or financial reporting of the Fund and that are rendered on behalf of BlackRock Advisors, LLC ( the “Investment Adviser” or “BlackRock”) and entities controlling, controlled by, or under common control with BlackRock (not including any sub-adviser whose role is primarily portfolio management and is subcontracted with or overseen by another investment adviser) that provide ongoing services to the Fund (“Affiliated Service Providers”):
| | | | |
| | | Current Fiscal Year End | | Previous Fiscal Year End |
(b) Audit-Related Fees1 | | $0 | | $0 |
(c) Tax Fees2 | | $0 | | $0 |
(d) All Other Fees3 | | $2,032,000 | | $1,984,000 |
1 The nature of the services includes assurance and related services reasonably related to the performance of the audit or review of financial statements not included in Audit Fees, including accounting consultations, agreed-upon procedure reports, attestation reports, comfort letters, out-of-pocket expenses and internal control reviews not required by regulators.
2 The nature of the services includes tax compliance and/or tax preparation, including services relating to the filing or amendment of federal, state or local income tax returns, regulated investment company qualification reviews, taxable income and tax distribution calculations.
3 Non-audit fees of $2,032,000 and $1,984,000 for the current fiscal year and previous fiscal year, respectively, were paid to the Fund’s principal accountant in their entirety by BlackRock, in connection with services provided to the Affiliated Service Providers of the Fund and of certain other funds sponsored and advised by BlackRock or its affiliates for a service organization review and an accounting research tool subscription. These amounts represent aggregate fees paid by BlackRock and were not allocated on a per fund basis.
(e)(1) Audit Committee Pre-Approval Policies and Procedures:
The Committee has adopted policies and procedures with regard to the pre-approval of services. Audit, audit-related and tax compliance services provided to the registrant on an annual basis require specific pre-approval by the Committee. The Committee also must approve other non-audit services provided to the registrant and those non-audit services provided to the Investment Adviser and Affiliated Service Providers that relate directly to the operations and the financial reporting of the registrant. Certain of these non-audit services that the Committee believes are (a) consistent with the SEC’s auditor independence rules and (b) routine and recurring services that will not impair the independence of the independent accountants may be approved by the Committee without consideration on a specific case-by-case basis (“general pre-approval”). The term of any general pre-approval is 12 months from the date of the pre-approval, unless the Committee provides for a different period. Tax or other non-audit services provided to the registrant which have a direct impact on the operations or financial reporting of the registrant will only be deemed pre-approved provided that any individual project does not exceed $10,000 attributable to the registrant or $50,000 per project. For this purpose, multiple projects will be aggregated to determine if they exceed the previously mentioned cost levels.
Any proposed services exceeding the pre-approved cost levels will require specific pre-approval by the Committee, as will any other services not subject to general pre-approval (e.g., unanticipated but permissible services). The Committee is informed of each service approved
3
subject to general pre-approval at the next regularly scheduled in-person board meeting. At this meeting, an analysis of such services is presented to the Committee for ratification. The Committee may delegate to the Committee Chairman the authority to approve the provision of and fees for any specific engagement of permitted non-audit services, including services exceeding pre-approved cost levels.
(e)(2) None of the services described in each of Items 4(b) through (d) were approved by the Committee pursuant to the de minimis exception in paragraph (c)(7)(i)(C) of Rule 2-01 of Regulation S-X.
(f) Not Applicable
(g) The aggregate non-audit fees, defined as the sum of the fees shown under “Audit-Related Fees,” “Tax Fees” and “All Other Fees,” paid to the accountant for services rendered by the accountant to the registrant, the Investment Adviser and the Affiliated Service Providers were:
| | | | | | |
| | | Entity Name | | Current Fiscal
Year End | | Previous Fiscal
Year End |
| | BlackRock California Municipal Opportunities Fund of BlackRock California Municipal Series Trust | | $13,700 | | $12,500 |
Additionally, the amounts billed by D&T in connection with services provided to the Affiliated Service Providers of the Fund and of other funds sponsored and advised by BlackRock or its affiliates during the current and previous fiscal years for a service organization review and an accounting research tool subscription were:
| | |
Current Fiscal Year End | | Previous Fiscal Year End |
$2,032,000 | | $1,984,000 |
These amounts represent aggregate fees paid by BlackRock and were not allocated on a per fund basis.
(h) The Committee has considered and determined that the provision of non-audit services that were rendered to the Investment Adviser and the Affiliated Service Providers that were not pre-approved pursuant to paragraph (c)(7)(ii) of Rule 2-01 of Regulation S-X is compatible with maintaining the principal accountant’s independence.
| Item 5 – | Audit Committee of Listed Registrant – Not Applicable |
(a) The registrant’s Schedule of Investments is included as part of the Report to Stockholders filed under Item 1(a) of this Form.
(b) Not Applicable due to no such divestments during the semi-annual period covered since the previous Form N-CSR filing.
4
| Item 7 – | Disclosure of Proxy Voting Policies and Procedures for Closed-End Management Investment Companies – Not Applicable |
| Item 8 – | Portfolio Managers of Closed-End Management Investment Companies – Not Applicable |
| Item 9 – | Purchases of Equity Securities by Closed-End Management Investment Company and Affiliated Purchasers – Not Applicable |
| Item 10 – | Submission of Matters to a Vote of Security Holders – There have been no material changes to these procedures. |
| Item 11 – | Controls and Procedures |
(a) The registrant’s principal executive and principal financial officers, or persons performing similar functions, have concluded that the registrant’s disclosure controls and procedures (as defined in Rule 30a-3(c) under the Investment Company Act of 1940, as amended (the “1940 Act”)) are effective as of a date within 90 days of the filing of this report based on the evaluation of these controls and procedures required by Rule 30a-3(b) under the 1940 Act and Rule 15d-15(b) under the Securities Exchange Act of 1934, as amended.
(b) There were no changes in the registrant’s internal control over financial reporting (as defined in Rule 30a-3(d) under the 1940 Act) that occurred during the period covered by this report that have materially affected, or are reasonably likely to materially affect, the registrant’s internal control over financial reporting.
| Item 12 – | Disclosure of Securities Lending Activities for Closed-End Management Investment Companies – Not Applicable |
| Item 13 – | Exhibits attached hereto |
(a)(1) Code of Ethics – See Item 2
(a)(2) Section 302 Certifications are attached
(a)(3) Not Applicable
(a)(4) Not Applicable
(b) Section 906 Certifications are attached
5
Pursuant to the requirements of the Securities Exchange Act of 1934 and the Investment Company Act of 1940, the registrant has duly caused this report to be signed on its behalf by the undersigned, thereunto duly authorized.
BlackRock California Municipal Opportunities Fund of BlackRock California Municipal Series Trust
| | |
| By: | | /s/ John M. Perlowski |
| | John M. Perlowski |
| | Chief Executive Officer (principal executive officer) of |
| | BlackRock California Municipal Opportunities Fund of BlackRock California Municipal Series Trust |
Date: August 4, 2021
Pursuant to the requirements of the Securities Exchange Act of 1934 and the Investment Company Act of 1940, this report has been signed below by the following persons on behalf of the registrant and in the capacities and on the dates indicated.
| | |
| By: | | /s/ John M. Perlowski |
| | John M. Perlowski |
| | Chief Executive Officer (principal executive officer) of |
| | BlackRock California Municipal Opportunities Fund of BlackRock California Municipal Series Trust |
Date: August 4, 2021
| | |
| By: | | /s/ Trent Walker |
| | Trent Walker |
| | Chief Financial Officer (principal financial officer) of |
| | BlackRock California Municipal Opportunities Fund of BlackRock California Municipal Series Trust |
Date: August 4, 2021
6